
| 2023-12-31 | 2023-09-30 | 2023-06-30 | 2023-03-31 | 2022-12-31 | 2022-09-30 | 2022-06-30 | 2022-03-31 | 2021-12-31 | 2021-09-30 | 2021-06-30 | 2021-03-31 | 2020-12-31 | 2020-09-30 | 2020-06-30 | 2020-03-31 | 2019-12-31 | 2019-09-30 | 2019-06-30 | 2019-03-31 | 2018-12-31 | 2018-09-30 | 2018-06-30 | 2018-03-31 | 2017-12-31 | 2017-09-30 | 2017-06-30 | 2017-03-31 | 2016-12-31 | 2016-09-30 | 2016-06-30 | 2016-03-31 | 2015-12-31 | 2015-09-30 | 2015-06-30 | 2015-03-31 | 2014-12-31 | 2014-09-30 | 2014-06-30 | 2014-03-31 | 2013-12-31 | 2013-09-30 | 2013-06-30 | 2013-03-31 | 2012-12-31 | 2012-09-30 | 2012-06-30 | 2012-03-31 | 2011-12-31 | 2011-09-30 | 2011-06-30 | 2011-03-31 | ||
|---|---|---|---|---|---|---|---|---|---|---|---|---|---|---|---|---|---|---|---|---|---|---|---|---|---|---|---|---|---|---|---|---|---|---|---|---|---|---|---|---|---|---|---|---|---|---|---|---|---|---|---|---|---|
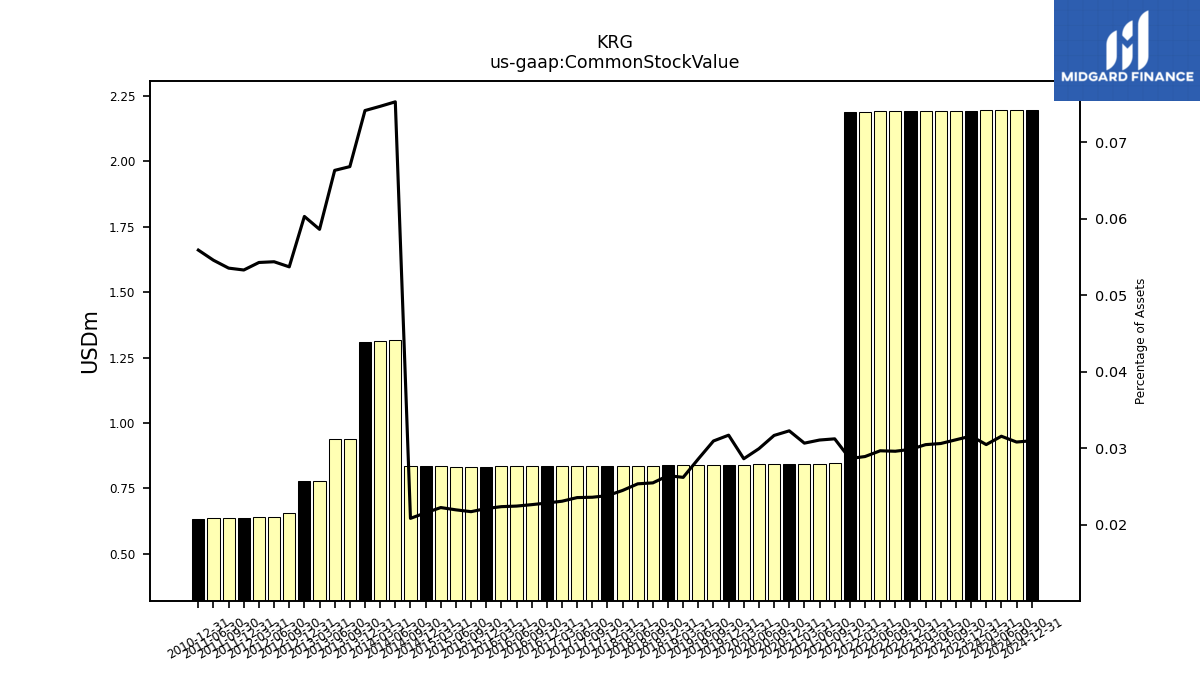
| Common Stock Value | 2.19 | 2.19 | 2.19 | 2.19 | 2.19 | 2.19 | 2.19 | 2.19 | 2.19 | 0.85 | 0.84 | 0.84 | 0.84 | 0.84 | 0.84 | 0.84 | 0.84 | 0.84 | 0.84 | 0.84 | 0.84 | 0.84 | 0.84 | 0.84 | 0.84 | 0.84 | 0.84 | 0.84 | 0.83 | 0.83 | 0.83 | 0.83 | 0.83 | 0.83 | 0.83 | 0.84 | 0.83 | 0.83 | 1.32 | 1.31 | 1.31 | 0.94 | 0.94 | 0.78 | 0.78 | 0.66 | 0.64 | 0.64 | 0.64 | 0.64 | 0.64 | NA | |
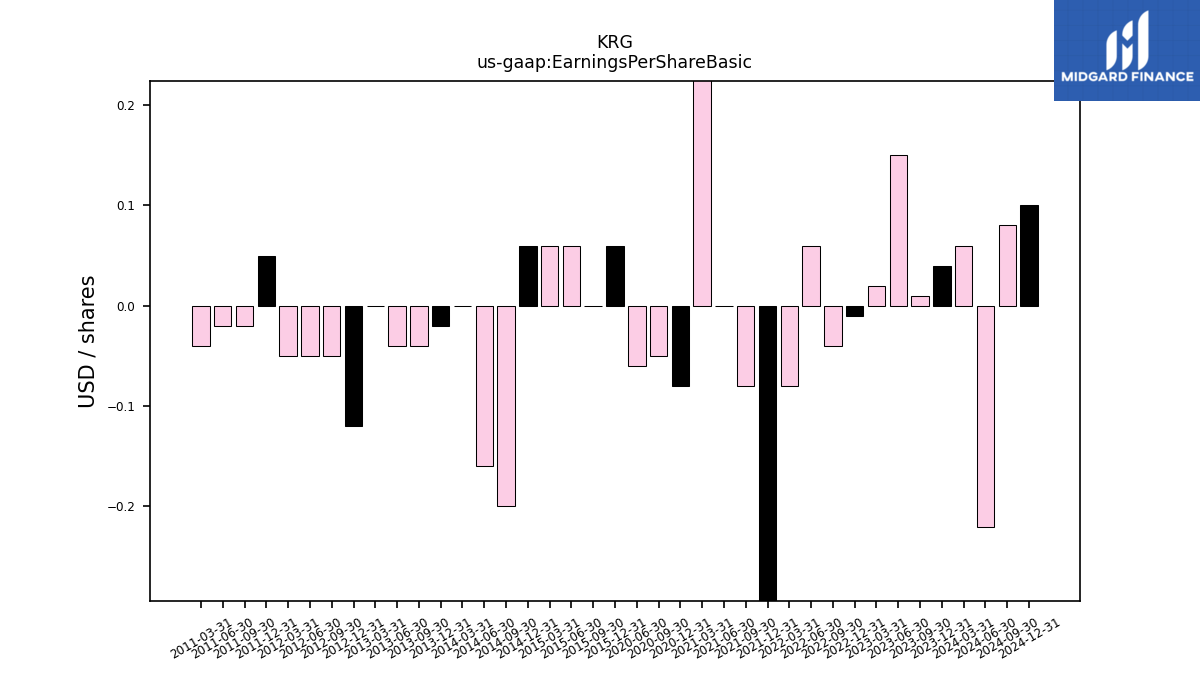
| Earnings Per Share Basic | 0.04 | 0.01 | 0.15 | 0.02 | -0.01 | -0.04 | 0.06 | -0.08 | -0.94 | -0.08 | 0.00 | 0.29 | -0.08 | -0.05 | -0.06 | NA | NA | NA | NA | NA | NA | NA | NA | NA | NA | NA | NA | NA | NA | NA | NA | NA | 0.06 | 0.00 | 0.06 | 0.06 | 0.06 | -0.20 | -0.16 | 0.00 | -0.02 | -0.04 | -0.04 | 0.00 | -0.12 | -0.05 | -0.05 | -0.05 | 0.05 | -0.02 | -0.02 | -0.04 | |
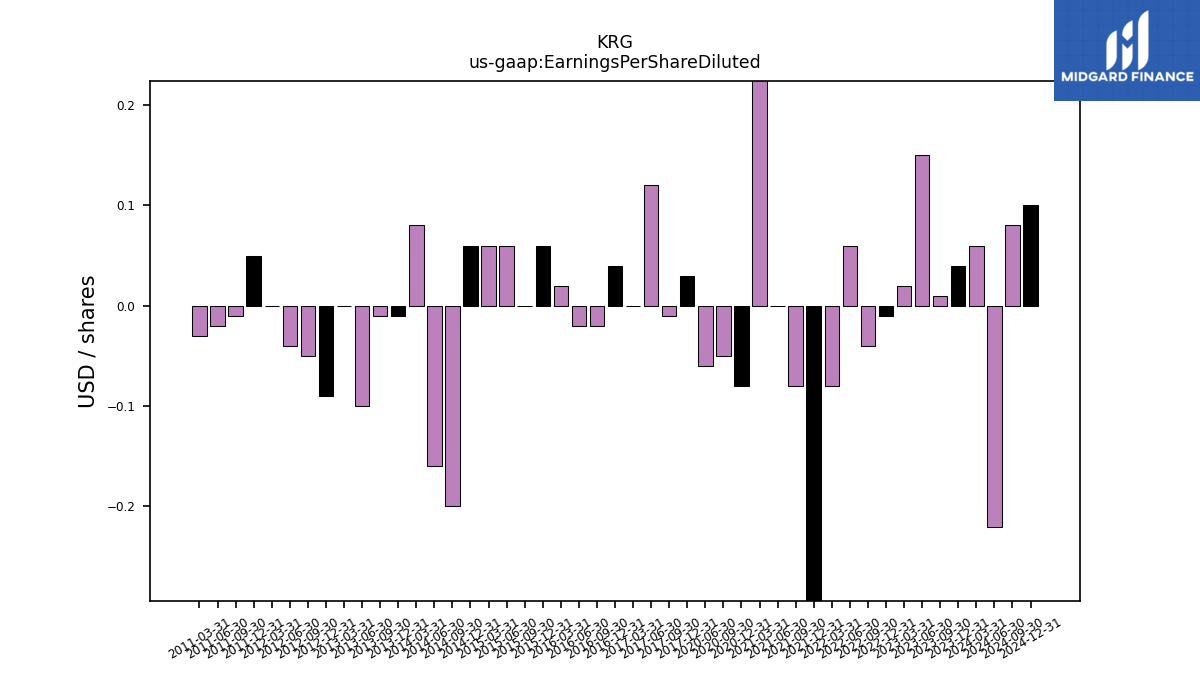
| Earnings Per Share Diluted | 0.04 | 0.01 | 0.15 | 0.02 | -0.01 | -0.04 | 0.06 | -0.08 | -0.93 | -0.08 | 0.00 | 0.29 | -0.08 | -0.05 | -0.06 | NA | NA | NA | NA | NA | NA | NA | NA | NA | 0.03 | -0.01 | 0.12 | 0.00 | 0.04 | -0.02 | -0.02 | 0.02 | 0.06 | 0.00 | 0.06 | 0.06 | 0.06 | -0.20 | -0.16 | 0.08 | -0.01 | -0.01 | -0.10 | 0.00 | -0.09 | -0.05 | -0.04 | 0.00 | 0.05 | -0.01 | -0.02 | -0.03 |
| 2023-12-31 | 2023-09-30 | 2023-06-30 | 2023-03-31 | 2022-12-31 | 2022-09-30 | 2022-06-30 | 2022-03-31 | 2021-12-31 | 2021-09-30 | 2021-06-30 | 2021-03-31 | 2020-12-31 | 2020-09-30 | 2020-06-30 | 2020-03-31 | 2019-12-31 | 2019-09-30 | 2019-06-30 | 2019-03-31 | 2018-12-31 | 2018-09-30 | 2018-06-30 | 2018-03-31 | 2017-12-31 | 2017-09-30 | 2017-06-30 | 2017-03-31 | 2016-12-31 | 2016-09-30 | 2016-06-30 | 2016-03-31 | 2015-12-31 | 2015-09-30 | 2015-06-30 | 2015-03-31 | 2014-12-31 | 2014-09-30 | 2014-06-30 | 2014-03-31 | 2013-12-31 | 2013-09-30 | 2013-06-30 | 2013-03-31 | 2012-12-31 | 2012-09-30 | 2012-06-30 | 2012-03-31 | 2011-12-31 | 2011-09-30 | 2011-06-30 | 2011-03-31 | ||
|---|---|---|---|---|---|---|---|---|---|---|---|---|---|---|---|---|---|---|---|---|---|---|---|---|---|---|---|---|---|---|---|---|---|---|---|---|---|---|---|---|---|---|---|---|---|---|---|---|---|---|---|---|---|
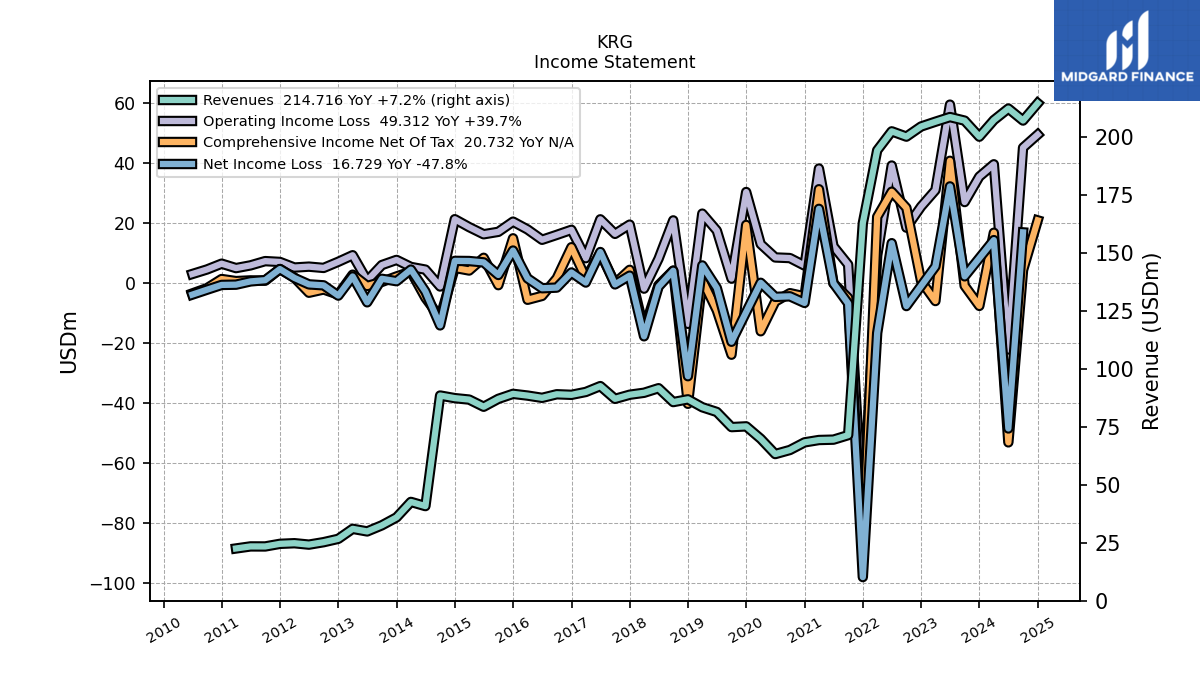
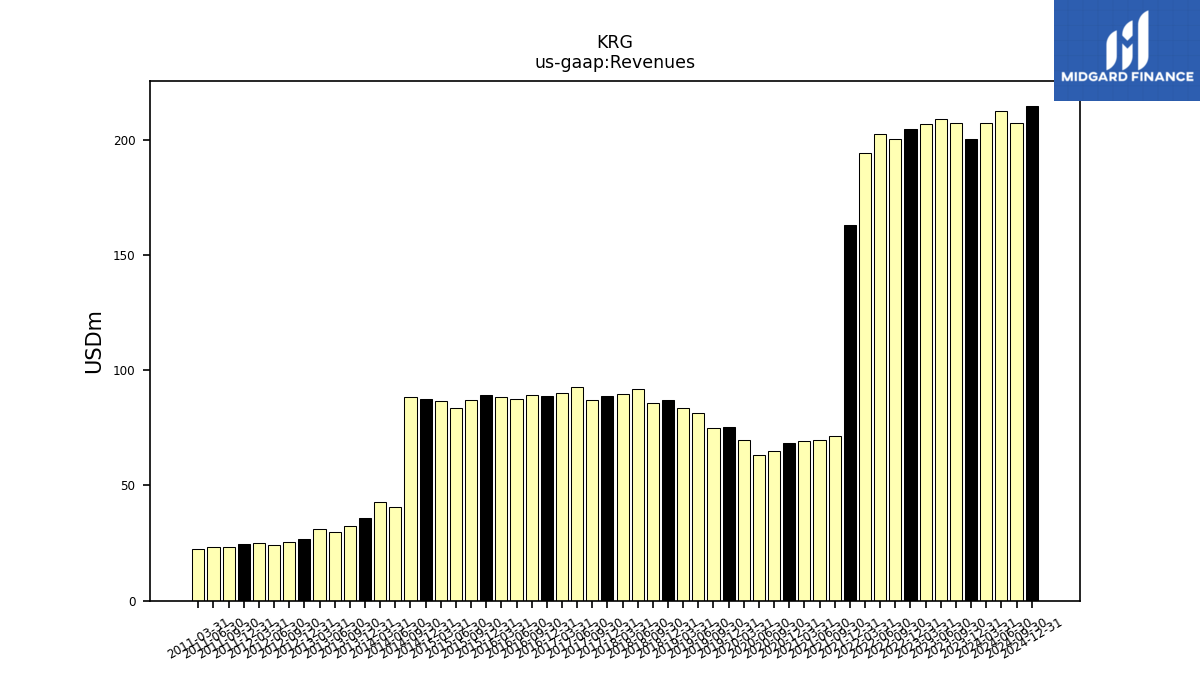
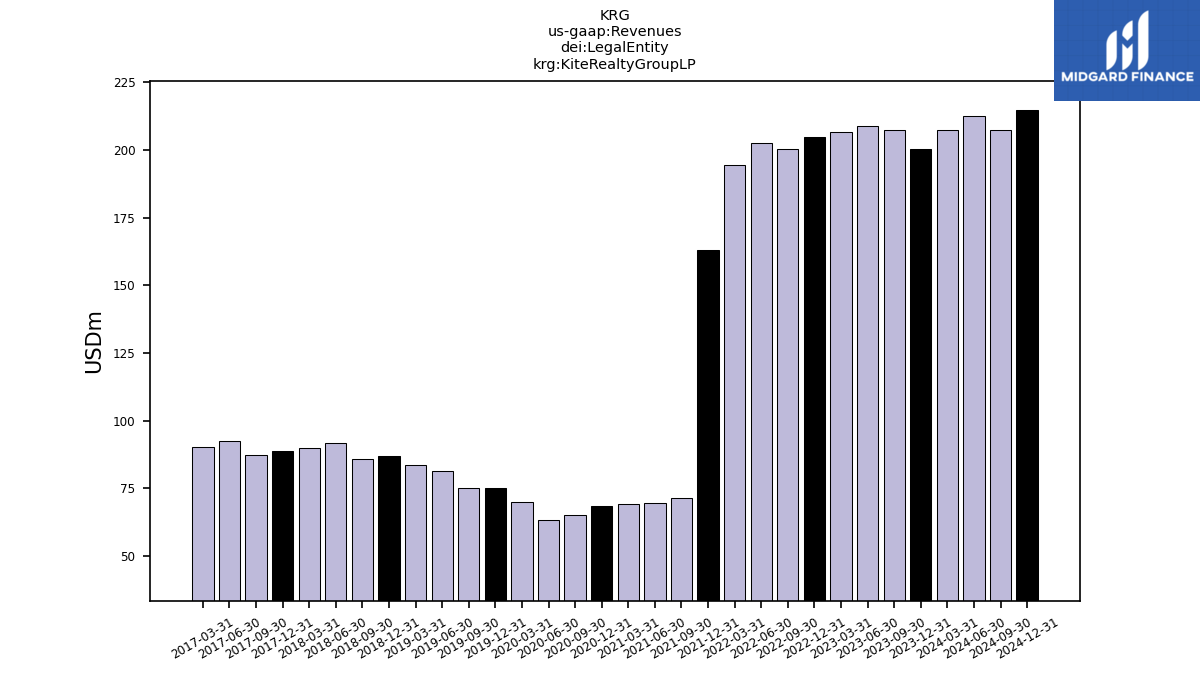
| Revenues | 200.28 | 207.22 | 208.76 | 206.75 | 204.69 | 200.31 | 202.60 | 194.39 | 162.95 | 71.47 | 69.53 | 69.38 | 68.36 | 65.07 | 63.30 | 69.91 | 75.27 | 74.94 | 81.48 | 83.52 | 86.94 | 85.75 | 91.74 | 89.76 | 88.92 | 87.14 | 92.65 | 90.11 | 88.87 | 89.12 | 87.58 | 88.55 | 89.30 | 87.15 | 83.73 | 86.83 | 87.45 | 88.58 | 40.84 | 42.66 | 35.98 | 32.55 | 29.92 | 31.04 | 26.72 | 25.28 | 24.22 | 24.83 | 24.56 | 23.43 | 23.45 | 22.56 | |
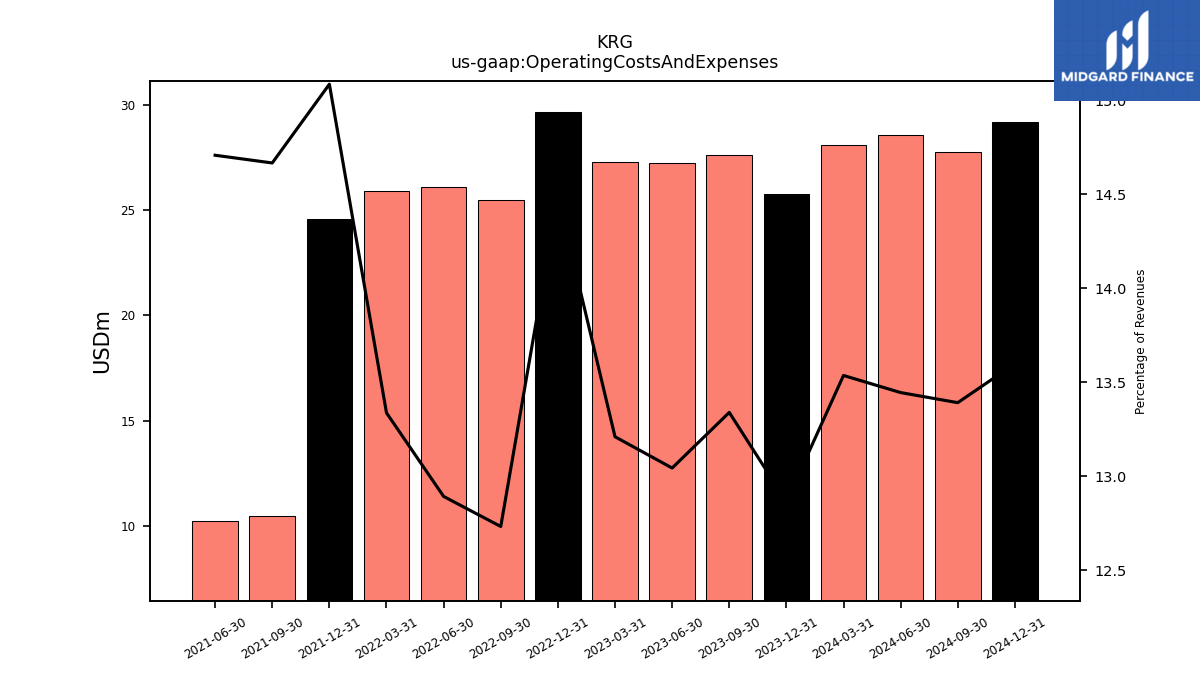
| Operating Costs And Expenses | 25.77 | 27.64 | 27.23 | 27.31 | 29.66 | 25.51 | 26.12 | 25.93 | 24.58 | 10.48 | 10.23 | NA | NA | NA | NA | NA | NA | NA | NA | NA | NA | NA | NA | NA | NA | NA | NA | NA | NA | NA | NA | NA | NA | NA | NA | NA | NA | NA | NA | NA | NA | NA | NA | NA | NA | NA | NA | NA | NA | NA | NA | NA | |
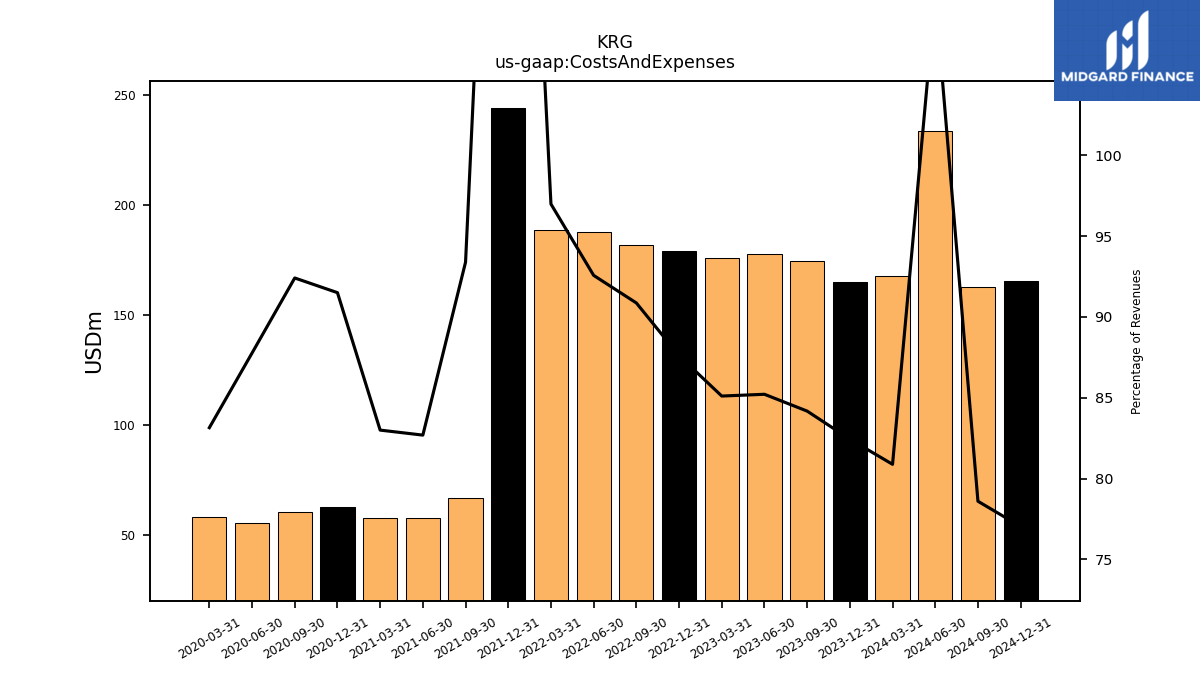
| Costs And Expenses | 165.10 | 174.42 | 177.89 | 175.95 | 179.31 | 182.01 | 187.55 | 188.53 | 244.25 | 66.74 | 57.49 | 57.58 | 62.55 | 60.13 | 55.56 | 58.13 | NA | NA | NA | NA | NA | NA | NA | NA | NA | NA | NA | NA | NA | NA | NA | NA | NA | NA | NA | NA | NA | NA | NA | NA | NA | NA | NA | NA | NA | NA | NA | NA | NA | NA | NA | NA | |
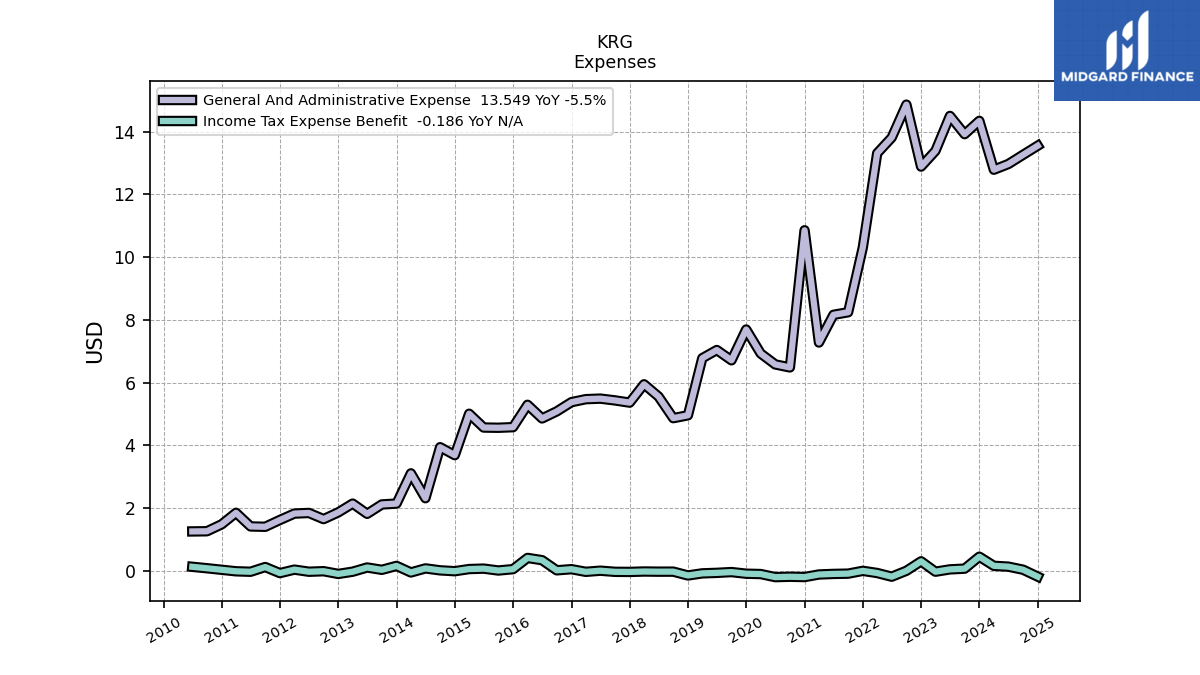
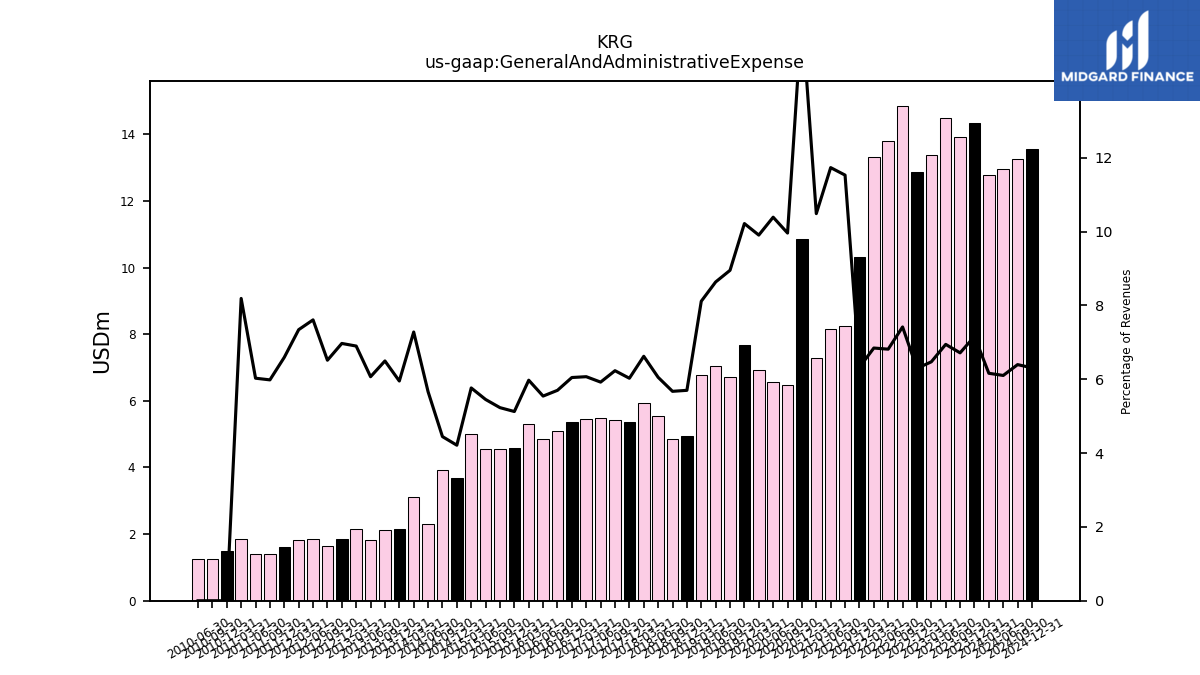
| General And Administrative Expense | 14.34 | 13.92 | 14.50 | 13.38 | 12.88 | 14.86 | 13.81 | 13.31 | 10.31 | 8.24 | 8.16 | 7.28 | 10.85 | 6.48 | 6.58 | 6.93 | 7.69 | 6.71 | 7.04 | 6.78 | 4.96 | 4.87 | 5.55 | 5.95 | 5.36 | 5.43 | 5.49 | 5.47 | 5.38 | 5.08 | 4.86 | 5.29 | 4.58 | 4.56 | 4.57 | 5.01 | 3.69 | 3.94 | 2.31 | 3.11 | 2.14 | 2.11 | 1.82 | 2.14 | 1.86 | 1.65 | 1.84 | 1.82 | 1.62 | 1.40 | 1.41 | 1.85 | |
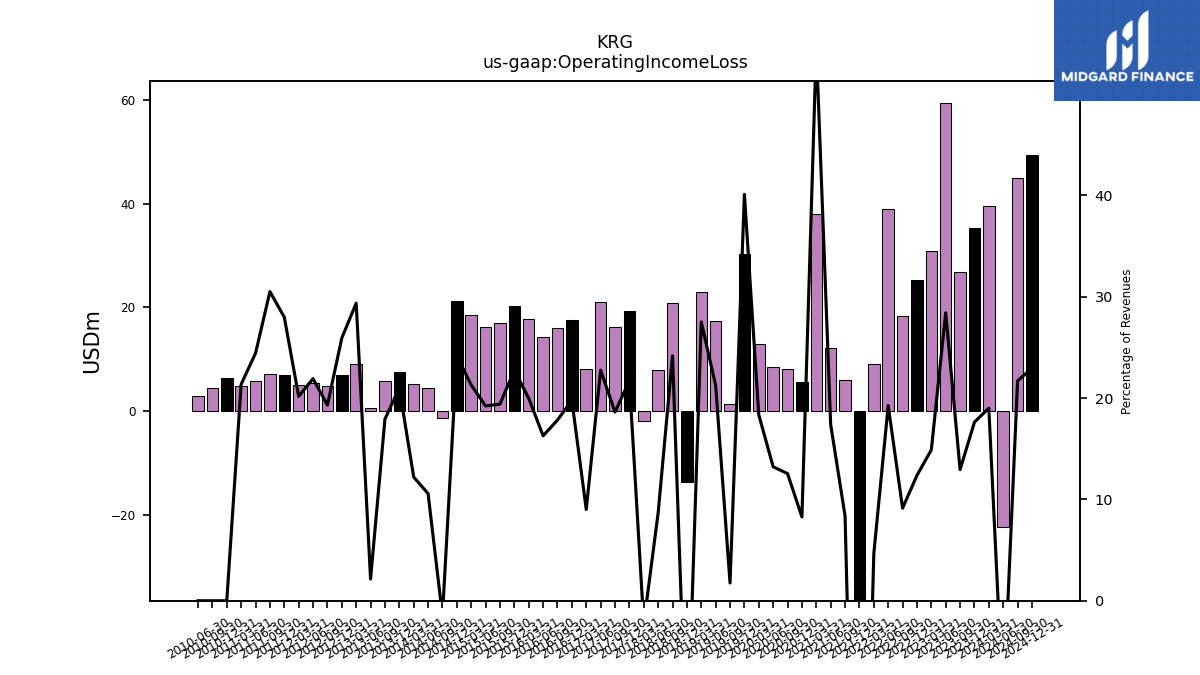
| Operating Income Loss | 35.31 | 26.83 | 59.31 | 30.80 | 25.32 | 18.30 | 39.01 | 9.03 | -77.60 | 5.99 | 12.09 | 38.00 | 5.65 | 8.17 | 8.37 | 12.83 | 30.19 | 1.32 | 17.32 | 22.98 | -13.76 | 20.73 | 7.94 | -2.03 | 19.31 | 16.23 | 21.08 | 8.12 | 17.58 | 15.89 | 14.26 | 17.69 | 20.31 | 16.91 | 16.10 | 18.48 | 21.12 | -1.32 | 4.32 | 5.21 | 7.55 | 5.84 | 0.64 | 9.11 | 6.93 | 4.88 | 5.31 | 5.01 | 6.87 | 7.15 | 5.73 | 4.82 | |
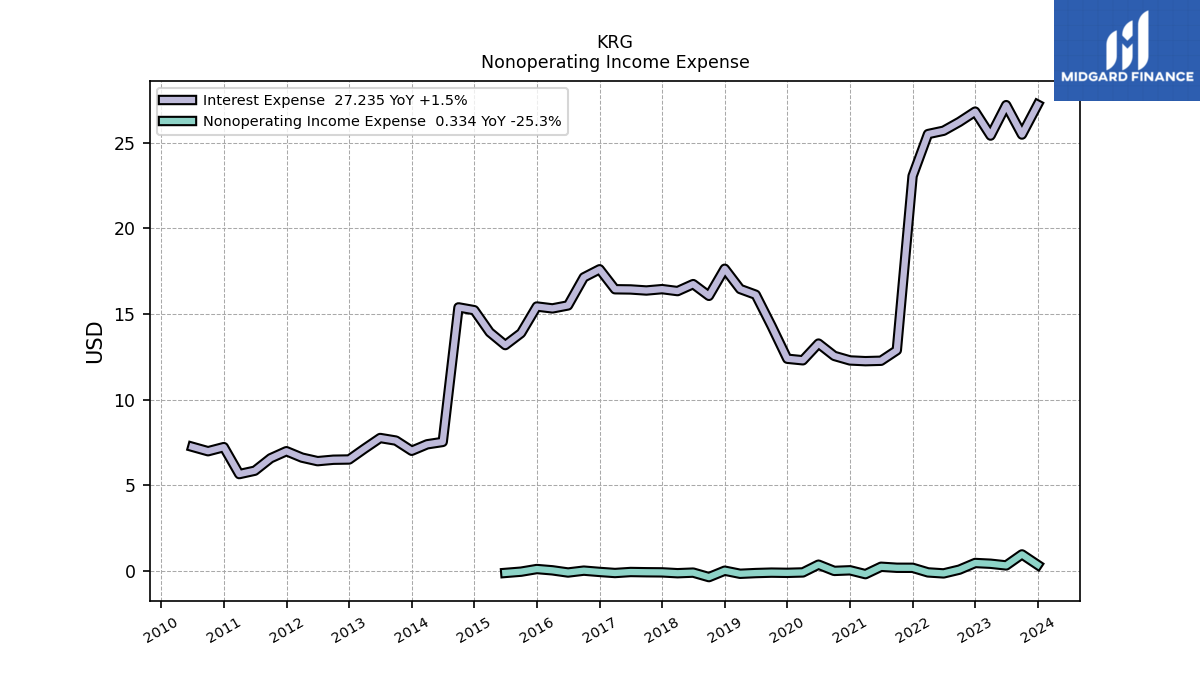
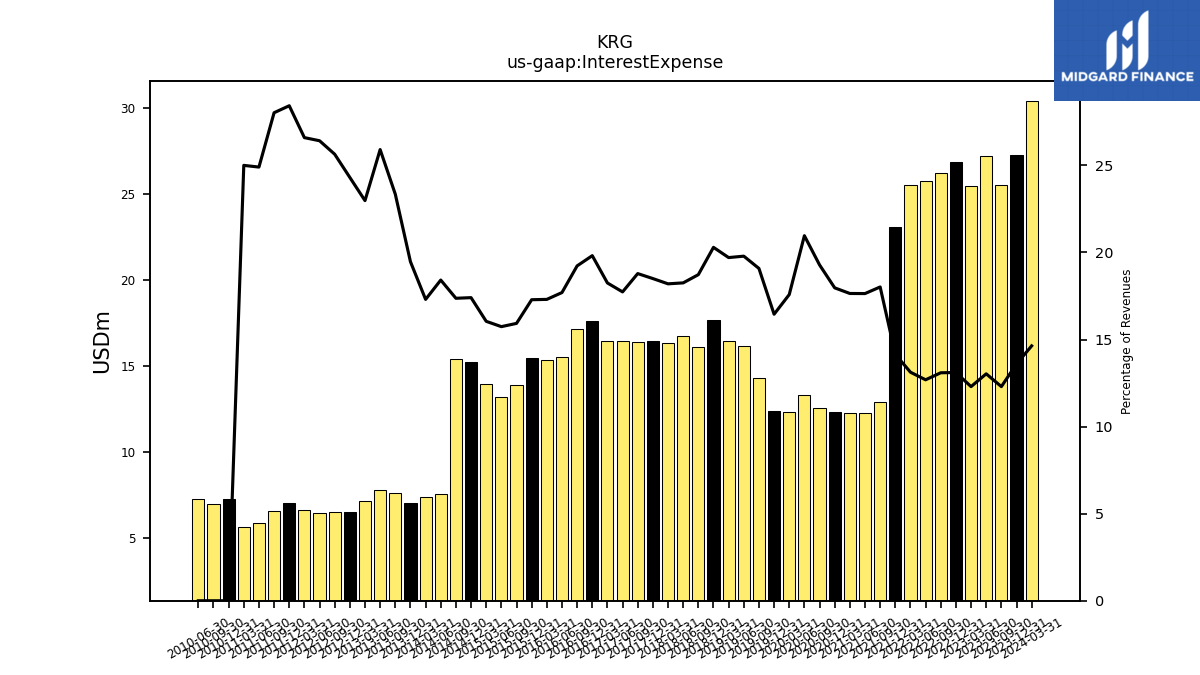
| Interest Expense | 27.23 | 25.48 | 27.20 | 25.43 | 26.83 | 26.23 | 25.71 | 25.51 | 23.06 | 12.88 | 12.27 | 12.24 | 12.28 | 12.55 | 13.27 | 12.29 | 12.38 | 14.30 | 16.12 | 16.46 | 17.64 | 16.06 | 16.75 | 16.34 | 16.45 | 16.37 | 16.43 | 16.45 | 17.61 | 17.14 | 15.50 | 15.32 | 15.44 | 13.88 | 13.18 | 13.93 | 15.22 | 15.39 | 7.52 | 7.38 | 7.00 | 7.60 | 7.75 | 7.13 | 6.50 | 6.48 | 6.40 | 6.60 | 6.98 | 6.57 | 5.84 | 5.64 | |
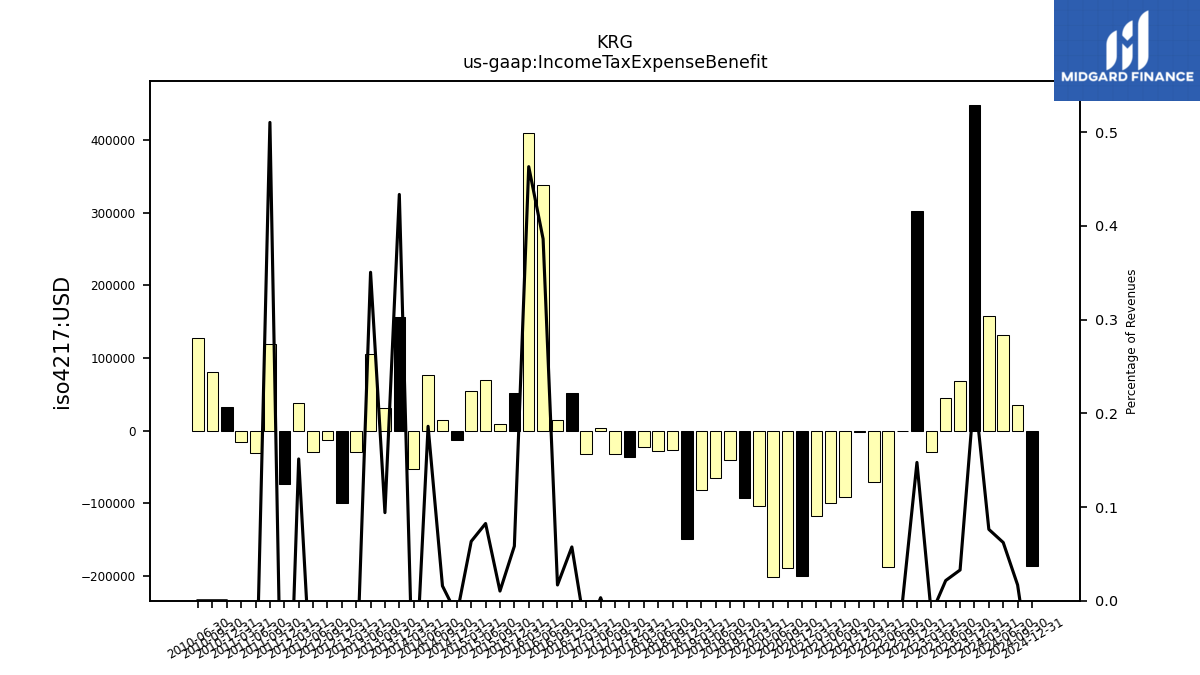
| Income Tax Expense Benefit | 0.45 | 0.07 | 0.04 | -0.03 | 0.30 | 0.00 | -0.19 | -0.07 | -0.00 | -0.09 | -0.10 | -0.12 | -0.20 | -0.19 | -0.20 | -0.10 | -0.09 | -0.04 | -0.07 | -0.08 | -0.15 | -0.03 | -0.03 | -0.02 | -0.04 | -0.03 | 0.00 | -0.03 | 0.05 | 0.01 | 0.34 | 0.41 | 0.05 | 0.01 | 0.07 | 0.06 | -0.01 | 0.01 | 0.08 | -0.05 | 0.16 | 0.03 | 0.10 | -0.03 | -0.10 | -0.01 | -0.03 | 0.04 | -0.07 | 0.12 | -0.03 | -0.02 | |
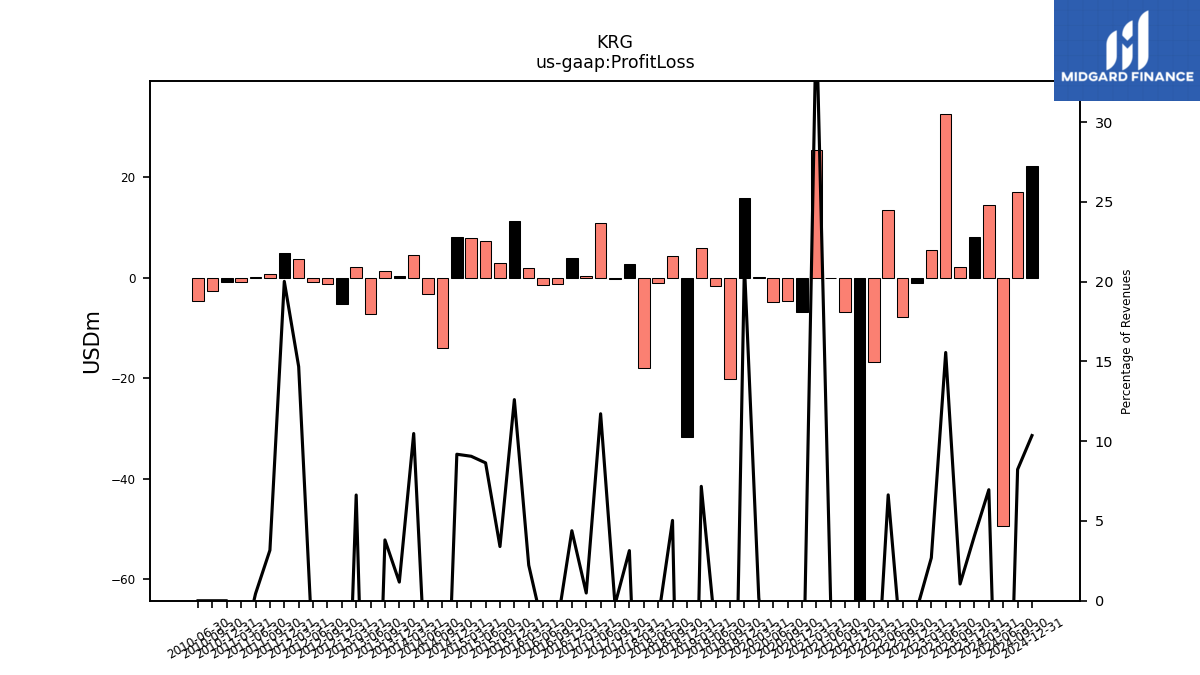
| Profit Loss | 8.16 | 2.18 | 32.48 | 5.56 | -1.05 | -7.72 | 13.45 | -16.83 | -100.16 | -6.83 | -0.10 | 25.36 | -6.84 | -4.63 | -4.79 | 0.13 | 15.86 | -20.12 | -1.70 | 5.99 | -31.71 | 4.32 | -1.06 | -18.00 | 2.79 | -0.20 | 10.86 | 0.44 | 3.90 | -1.26 | -1.50 | 1.98 | 11.26 | 2.96 | 7.24 | 7.86 | 8.03 | -13.98 | -3.20 | 4.47 | 0.42 | 1.24 | -7.25 | 2.06 | -5.24 | -1.24 | -0.87 | 3.64 | 4.92 | 0.74 | 0.10 | -0.78 | |
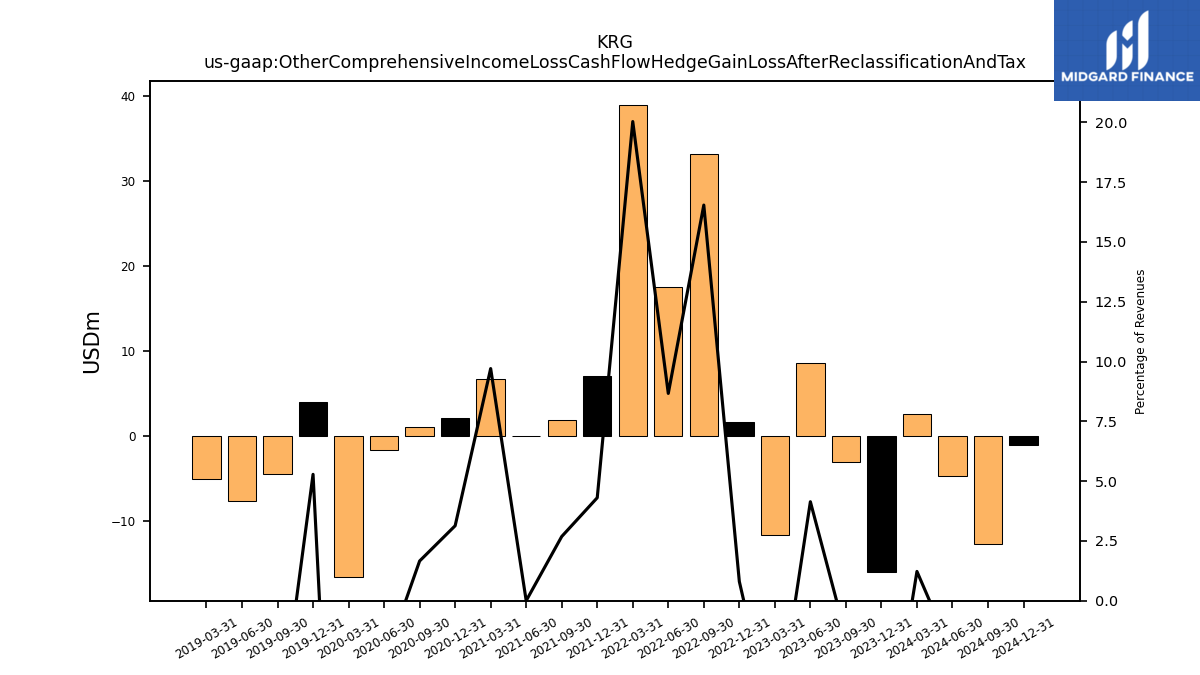
| Other Comprehensive Income Loss Cash Flow Hedge Gain Loss After Reclassification And Tax | -15.96 | -3.04 | 8.64 | -11.64 | 1.64 | 33.13 | 17.56 | 38.94 | 7.02 | 1.92 | 0.00 | 6.73 | 2.14 | 1.08 | -1.62 | -16.57 | 3.98 | -4.42 | -7.65 | -5.06 | NA | NA | NA | NA | NA | NA | NA | NA | NA | NA | NA | NA | NA | NA | NA | NA | NA | NA | NA | NA | NA | NA | NA | NA | NA | NA | NA | NA | NA | NA | NA | NA | |
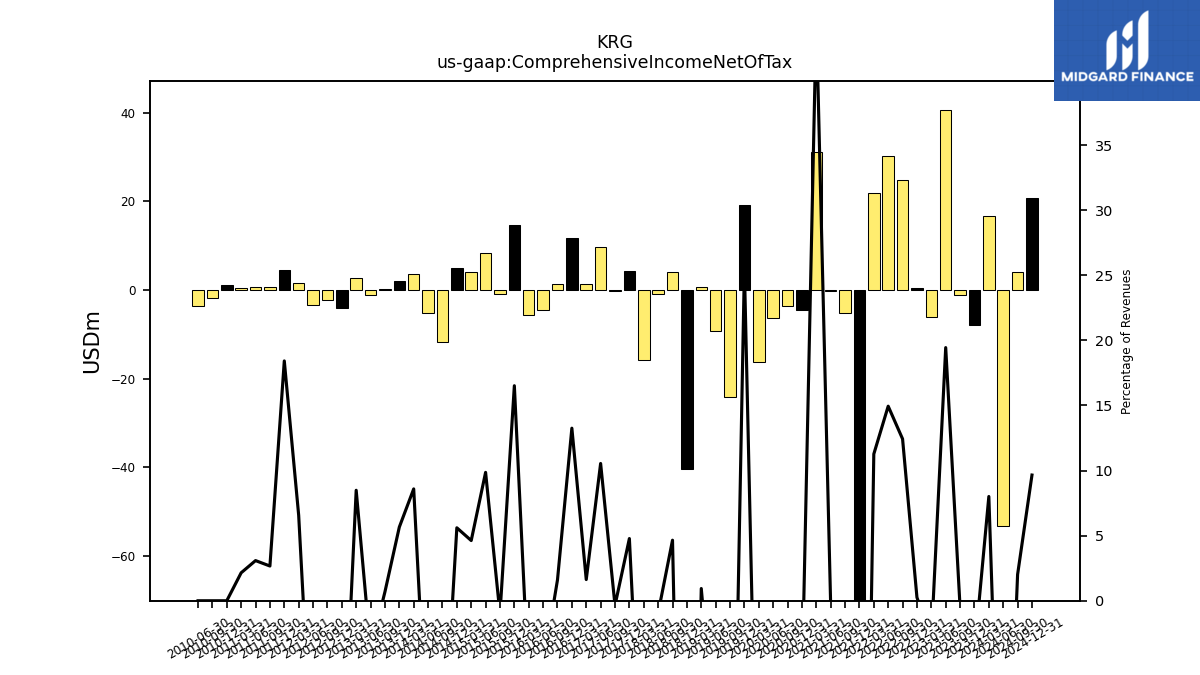
| Comprehensive Income Net Of Tax | -7.78 | -1.06 | 40.59 | -6.17 | 0.53 | 24.90 | 30.28 | 21.91 | -91.61 | -5.08 | -0.25 | 31.11 | -4.60 | -3.53 | -6.35 | -16.24 | 19.21 | -24.05 | -9.26 | 0.79 | -40.42 | 3.99 | -0.86 | -15.76 | 4.25 | -0.31 | 9.77 | 1.47 | 11.78 | 1.43 | -4.46 | -5.74 | 14.75 | -0.87 | 8.26 | 4.01 | 4.90 | -11.71 | -5.09 | 3.67 | 2.04 | 0.22 | -1.13 | 2.63 | -4.00 | -2.31 | -3.39 | 1.63 | 4.52 | 0.63 | 0.72 | 0.48 | |
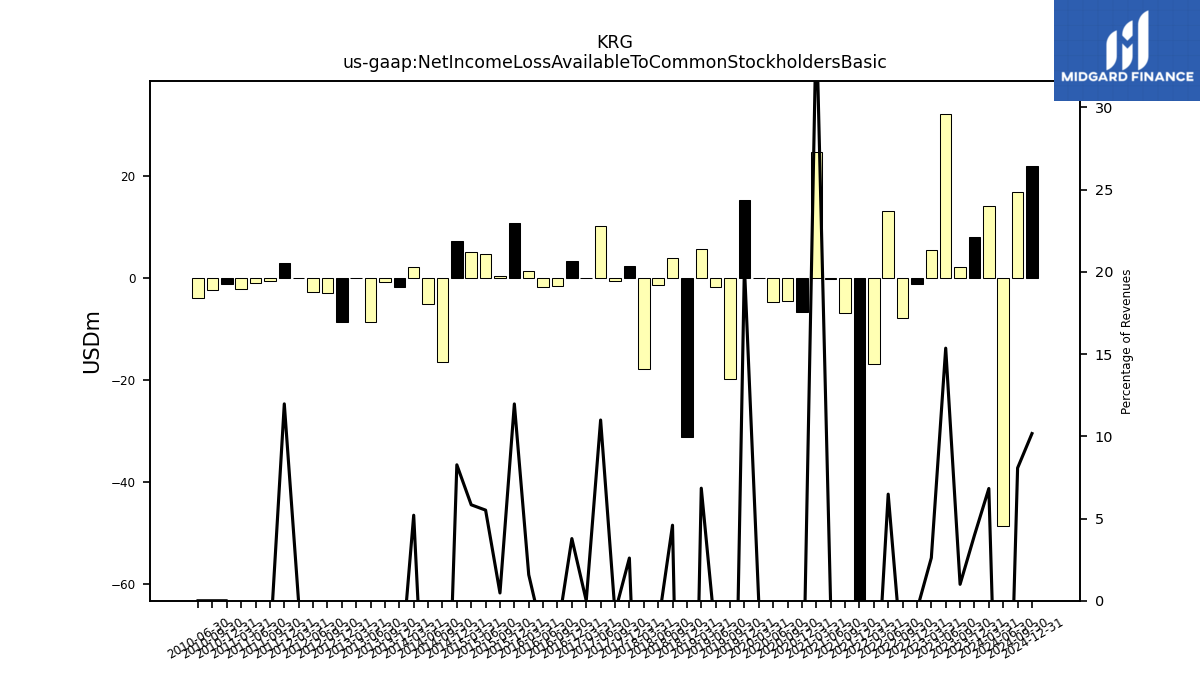
| Net Income Loss Available To Common Stockholders Basic | 7.98 | 2.07 | 32.06 | 5.39 | -1.13 | -7.84 | 13.13 | -16.80 | -98.18 | -6.96 | -0.24 | 24.58 | -6.79 | -4.59 | -4.77 | -0.07 | 15.31 | -19.73 | -1.80 | 5.71 | -31.22 | 3.94 | -1.37 | -17.92 | 2.31 | -0.62 | 10.18 | 0.01 | 3.36 | -1.68 | -1.90 | 1.40 | 10.69 | 0.41 | 4.61 | 5.07 | 7.23 | -16.40 | -5.09 | 2.22 | -1.88 | -0.86 | -8.71 | -0.08 | -8.68 | -3.04 | -2.72 | -0.03 | 2.94 | -0.64 | -1.06 | -2.15 |
| 2023-12-31 | 2023-09-30 | 2023-06-30 | 2023-03-31 | 2022-12-31 | 2022-09-30 | 2022-06-30 | 2022-03-31 | 2021-12-31 | 2021-09-30 | 2021-06-30 | 2021-03-31 | 2020-12-31 | 2020-09-30 | 2020-06-30 | 2020-03-31 | 2019-12-31 | 2019-09-30 | 2019-06-30 | 2019-03-31 | 2018-12-31 | 2018-09-30 | 2018-06-30 | 2018-03-31 | 2017-12-31 | 2017-09-30 | 2017-06-30 | 2017-03-31 | 2016-12-31 | 2016-09-30 | 2016-06-30 | 2016-03-31 | 2015-12-31 | 2015-09-30 | 2015-06-30 | 2015-03-31 | 2014-12-31 | 2014-09-30 | 2014-06-30 | 2014-03-31 | 2013-12-31 | 2013-09-30 | 2013-06-30 | 2013-03-31 | 2012-12-31 | 2012-09-30 | 2012-06-30 | 2012-03-31 | 2011-12-31 | 2011-09-30 | 2011-06-30 | 2011-03-31 | ||
|---|---|---|---|---|---|---|---|---|---|---|---|---|---|---|---|---|---|---|---|---|---|---|---|---|---|---|---|---|---|---|---|---|---|---|---|---|---|---|---|---|---|---|---|---|---|---|---|---|---|---|---|---|---|
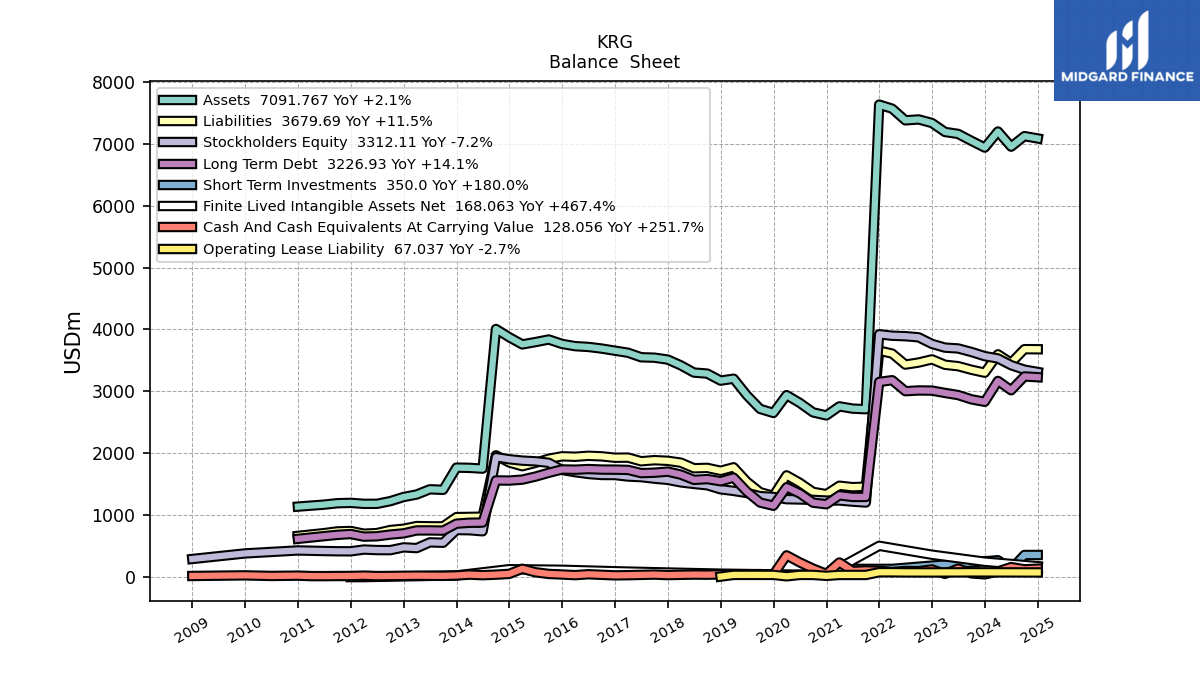
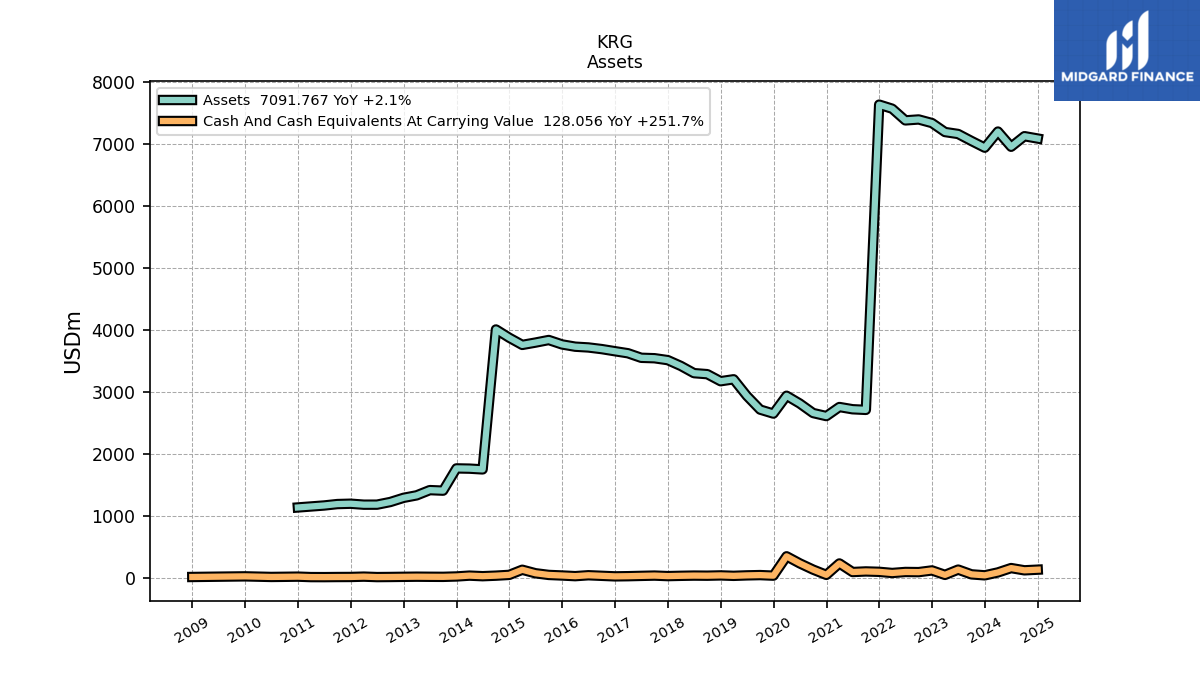
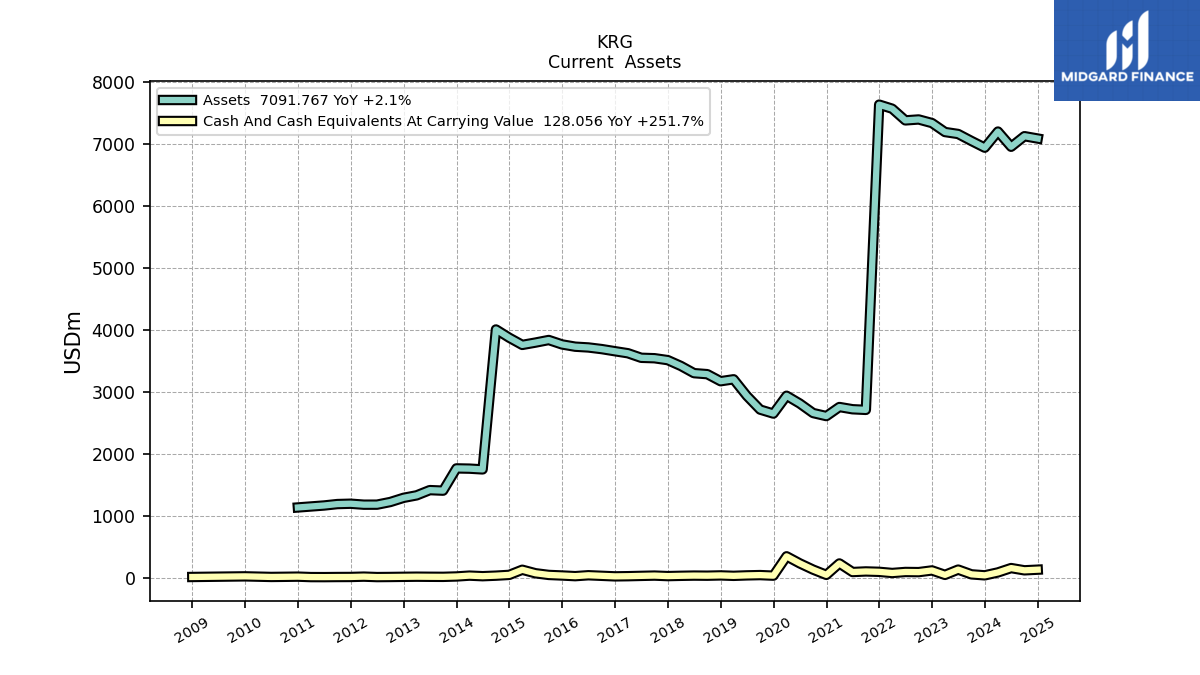
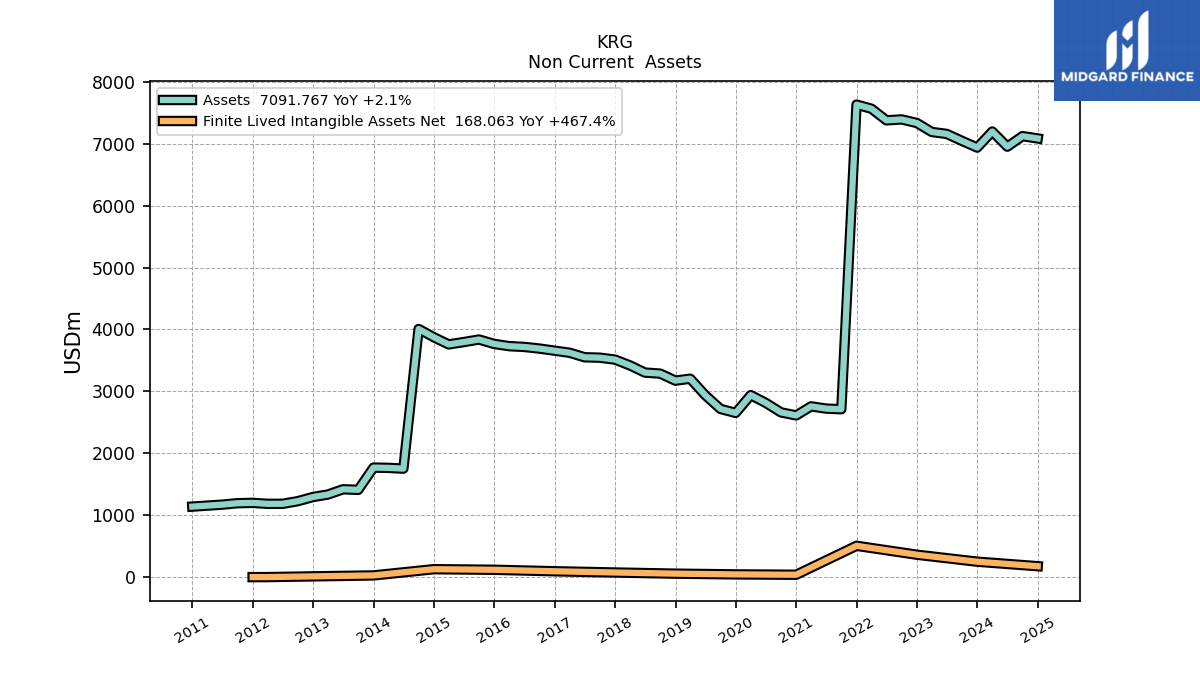
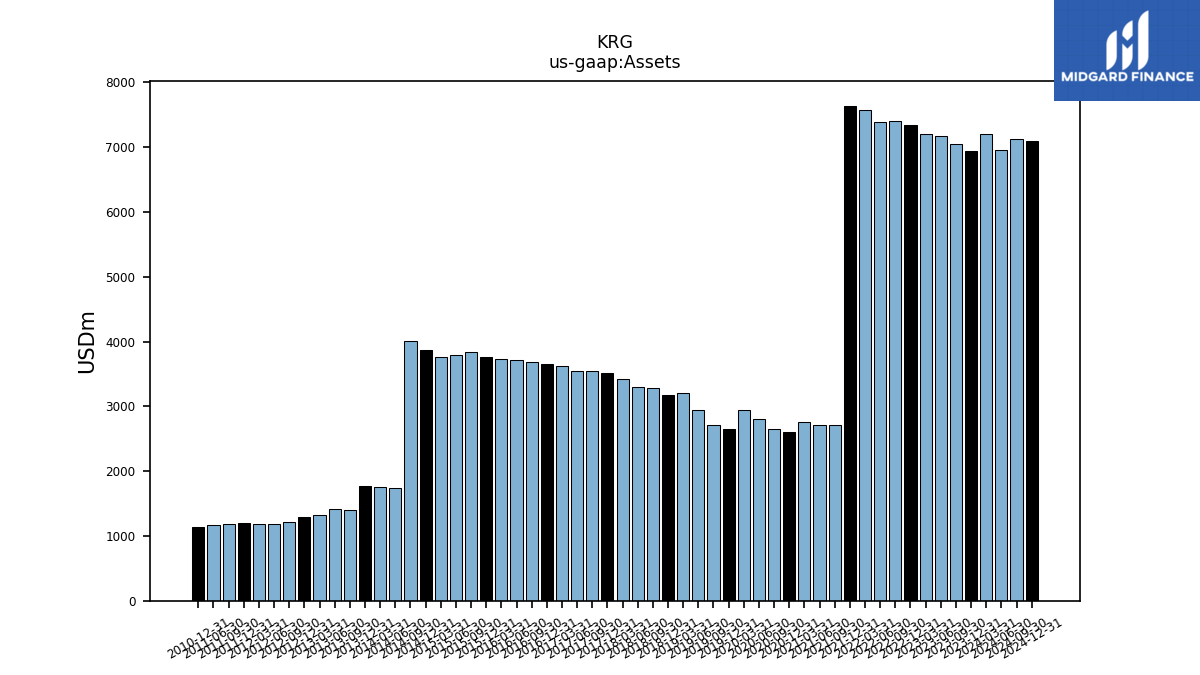
| Assets | 6944.08 | 7052.50 | 7165.10 | 7196.94 | 7341.98 | 7399.94 | 7384.89 | 7573.69 | 7639.57 | 2708.88 | 2719.20 | 2755.32 | 2608.54 | 2658.12 | 2811.79 | 2937.41 | 2648.89 | 2713.88 | 2936.32 | 3203.18 | 3172.01 | 3285.88 | 3302.20 | 3418.86 | 3512.50 | 3543.39 | 3550.28 | 3623.47 | 3656.37 | 3690.92 | 3717.18 | 3729.75 | 3766.04 | 3837.65 | 3795.88 | 3758.32 | 3874.22 | 4008.08 | 1747.48 | 1759.89 | 1763.93 | 1404.29 | 1413.09 | 1328.57 | 1288.66 | 1221.09 | 1178.10 | 1177.71 | 1193.27 | 1187.63 | 1164.64 | NA | |
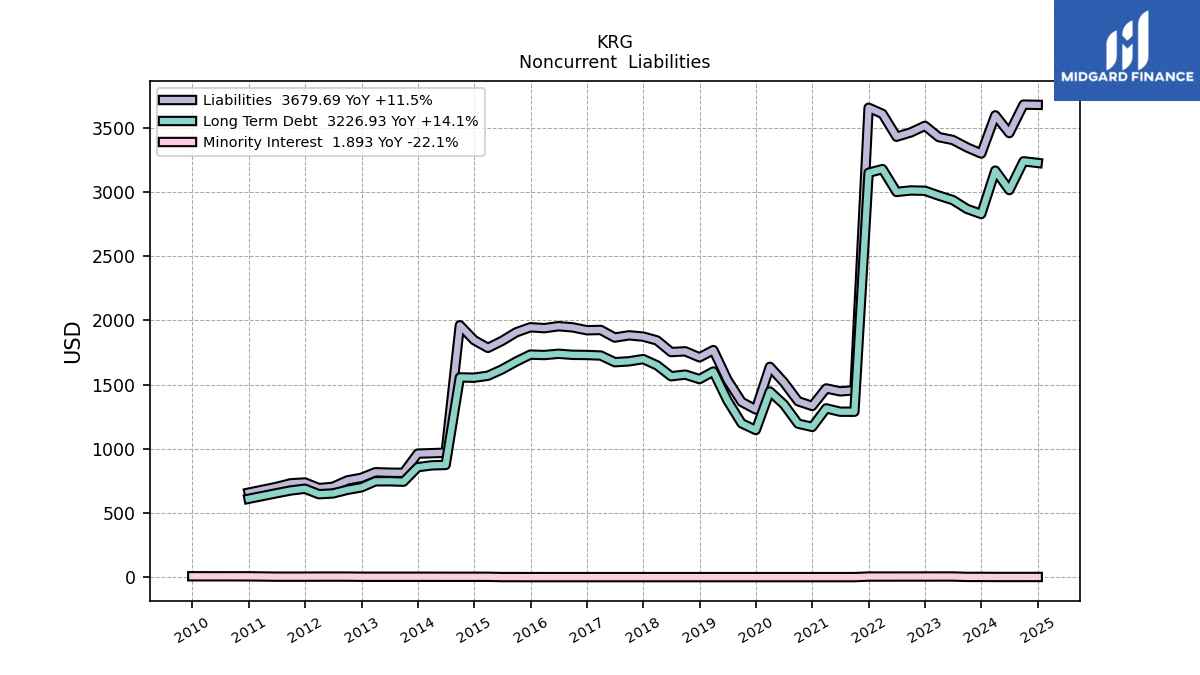
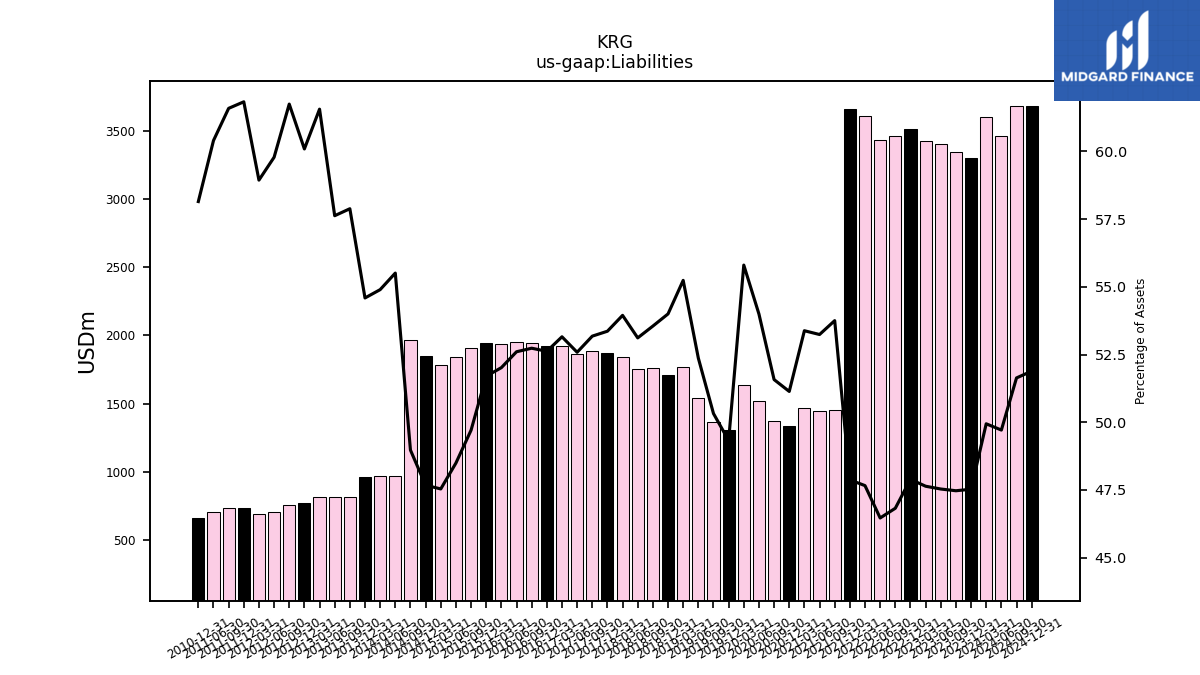
| Liabilities | 3300.22 | 3347.83 | 3405.86 | 3428.41 | 3516.13 | 3464.89 | 3431.36 | 3609.58 | 3657.21 | 1456.06 | 1447.66 | 1470.75 | 1333.91 | 1370.91 | 1518.24 | 1639.13 | 1306.58 | 1365.63 | 1537.65 | 1769.36 | 1712.87 | 1759.59 | 1753.95 | 1844.34 | 1874.29 | 1884.32 | 1866.85 | 1926.04 | 1923.94 | 1946.33 | 1955.30 | 1940.04 | 1946.97 | 1907.55 | 1840.70 | 1786.59 | 1846.99 | 1962.82 | 969.98 | 966.11 | 962.89 | 812.84 | 814.30 | 817.86 | 774.37 | 753.98 | 704.31 | 694.14 | 737.81 | 731.45 | 703.45 | NA | |
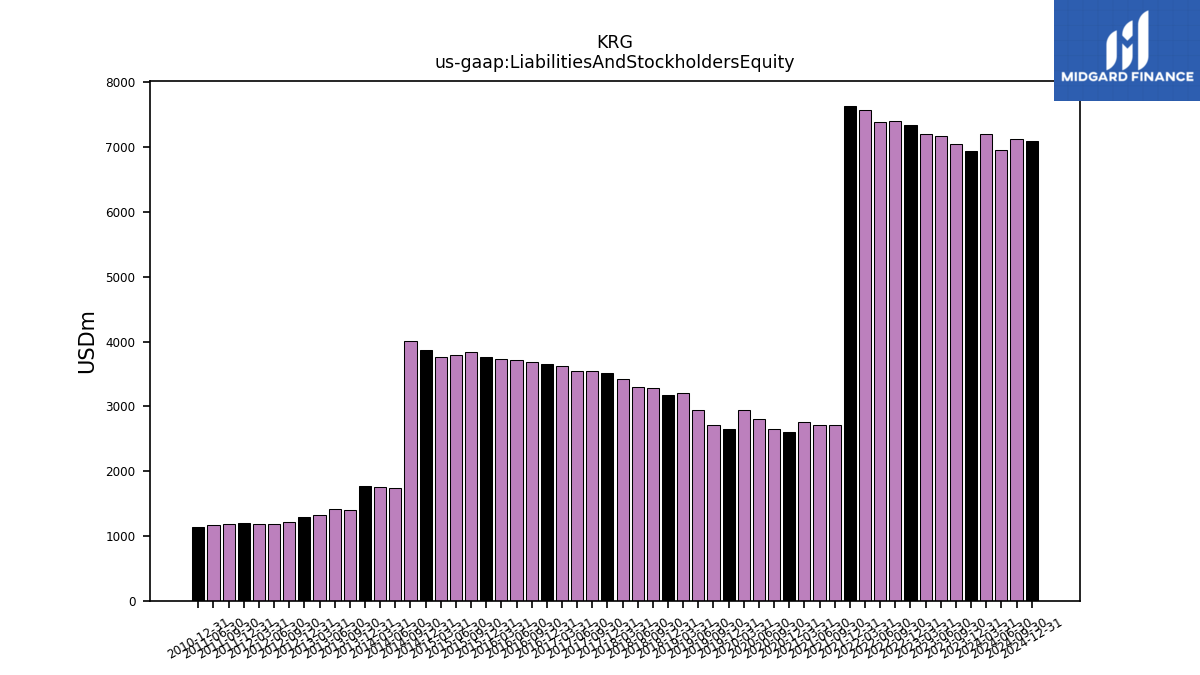
| Liabilities And Stockholders Equity | 6944.08 | 7052.50 | 7165.10 | 7196.94 | 7341.98 | 7399.94 | 7384.89 | 7573.69 | 7639.57 | 2708.88 | 2719.20 | 2755.32 | 2608.54 | 2658.12 | 2811.79 | 2937.41 | 2648.89 | 2713.88 | 2936.32 | 3203.18 | 3172.01 | 3285.88 | 3302.20 | 3418.86 | 3512.50 | 3543.39 | 3550.28 | 3623.47 | 3656.37 | 3690.92 | 3717.18 | 3729.75 | 3766.04 | 3837.65 | 3795.88 | 3758.32 | 3874.22 | 4008.08 | 1747.48 | 1759.89 | 1763.93 | 1404.29 | 1413.09 | 1328.57 | 1288.66 | 1221.09 | 1178.10 | 1177.71 | 1193.27 | 1187.63 | 1164.64 | NA | |
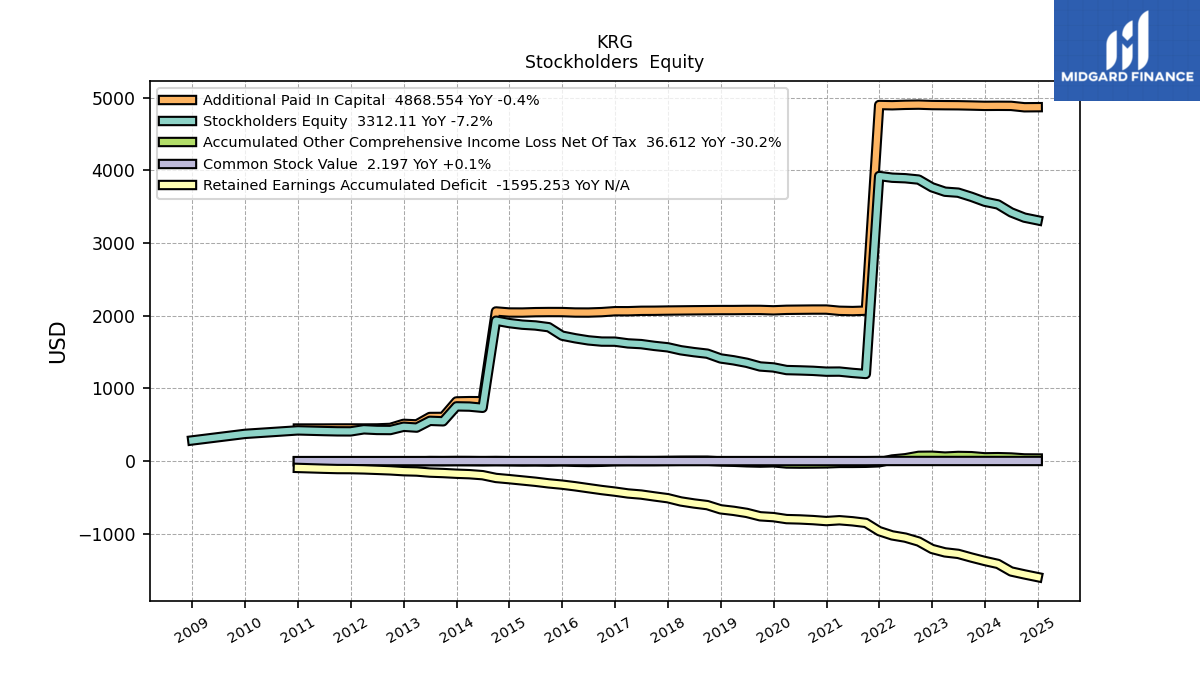
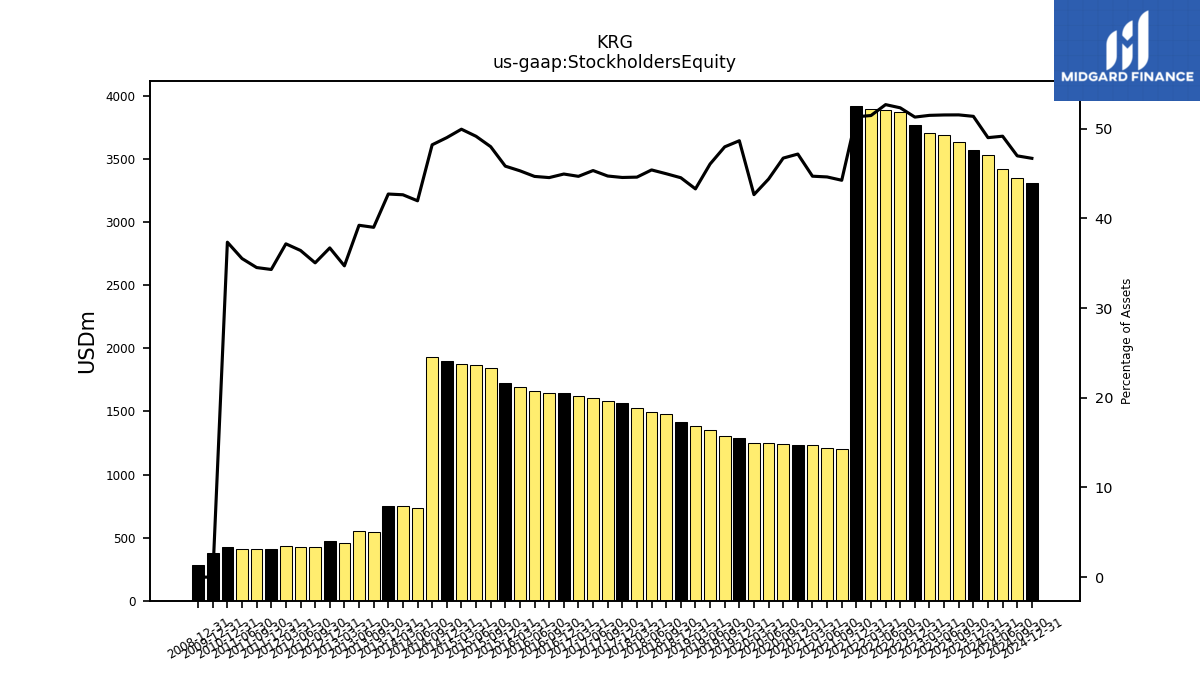
| Stockholders Equity | 3568.14 | 3635.29 | 3692.81 | 3706.00 | 3766.51 | 3872.81 | 3891.14 | 3898.58 | 3922.05 | 1198.85 | 1213.47 | 1231.87 | 1230.65 | 1242.07 | 1248.21 | 1252.83 | 1289.04 | 1302.17 | 1352.66 | 1386.82 | 1412.70 | 1478.17 | 1499.43 | 1524.99 | 1565.41 | 1584.92 | 1609.68 | 1619.48 | 1643.57 | 1644.41 | 1661.01 | 1689.99 | 1725.98 | 1842.14 | 1866.05 | 1877.22 | 1898.78 | 1932.35 | 733.36 | 750.38 | 753.56 | 547.79 | 554.43 | 461.18 | 473.09 | 427.94 | 429.17 | 437.72 | 409.37 | 409.99 | 413.77 | NA |
| 2023-12-31 | 2023-09-30 | 2023-06-30 | 2023-03-31 | 2022-12-31 | 2022-09-30 | 2022-06-30 | 2022-03-31 | 2021-12-31 | 2021-09-30 | 2021-06-30 | 2021-03-31 | 2020-12-31 | 2020-09-30 | 2020-06-30 | 2020-03-31 | 2019-12-31 | 2019-09-30 | 2019-06-30 | 2019-03-31 | 2018-12-31 | 2018-09-30 | 2018-06-30 | 2018-03-31 | 2017-12-31 | 2017-09-30 | 2017-06-30 | 2017-03-31 | 2016-12-31 | 2016-09-30 | 2016-06-30 | 2016-03-31 | 2015-12-31 | 2015-09-30 | 2015-06-30 | 2015-03-31 | 2014-12-31 | 2014-09-30 | 2014-06-30 | 2014-03-31 | 2013-12-31 | 2013-09-30 | 2013-06-30 | 2013-03-31 | 2012-12-31 | 2012-09-30 | 2012-06-30 | 2012-03-31 | 2011-12-31 | 2011-09-30 | 2011-06-30 | 2011-03-31 | ||
|---|---|---|---|---|---|---|---|---|---|---|---|---|---|---|---|---|---|---|---|---|---|---|---|---|---|---|---|---|---|---|---|---|---|---|---|---|---|---|---|---|---|---|---|---|---|---|---|---|---|---|---|---|---|
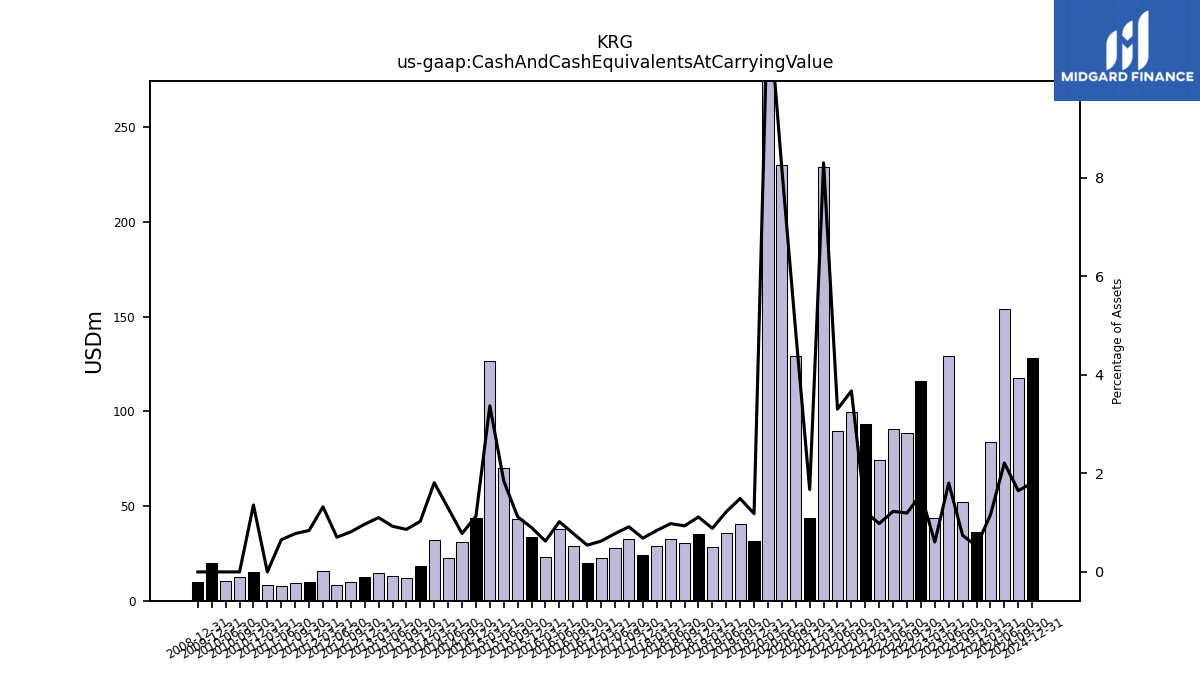
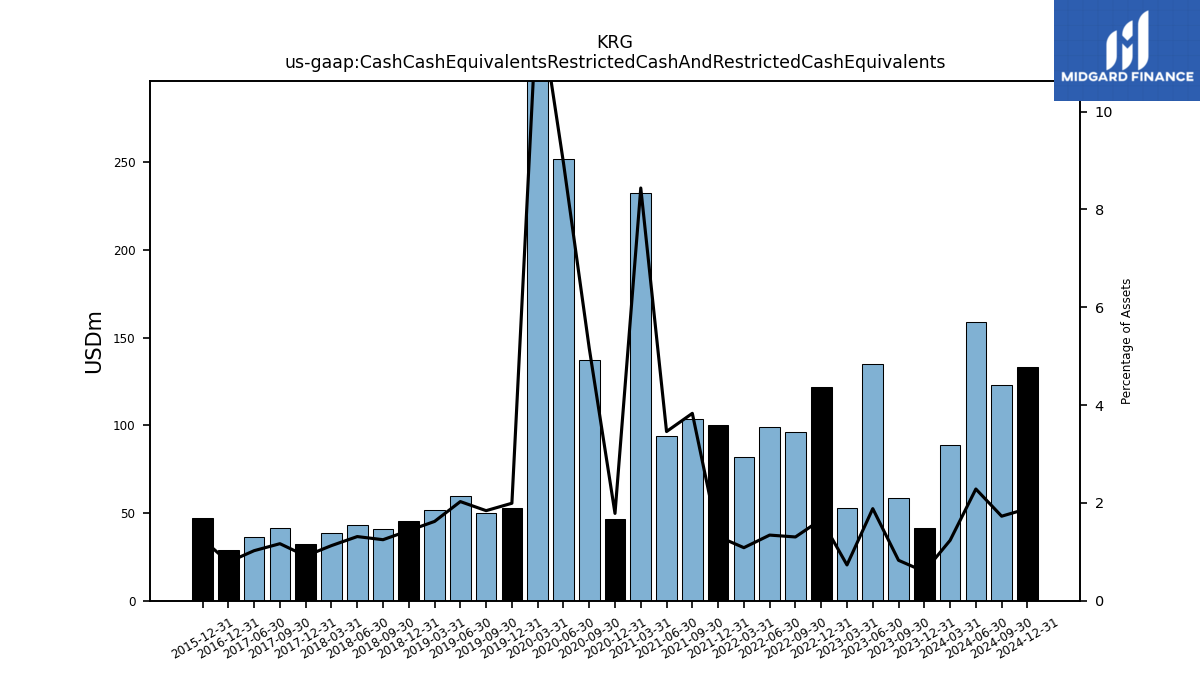
| Cash And Cash Equivalents At Carrying Value | 36.41 | 52.32 | 129.25 | 43.73 | 115.80 | 88.45 | 90.79 | 74.34 | 93.24 | 99.51 | 89.89 | 228.84 | 43.65 | 129.28 | 229.97 | 343.89 | 31.34 | 40.44 | 35.84 | 28.36 | 35.38 | 30.71 | 32.38 | 28.75 | 24.08 | 32.47 | 27.64 | 22.64 | 19.87 | 28.79 | 37.90 | 23.31 | 33.88 | 42.95 | 70.12 | 126.74 | 43.83 | 31.21 | 22.63 | 31.88 | 18.13 | 12.13 | 13.10 | 14.65 | 12.48 | 9.93 | 8.30 | 15.57 | 10.04 | 9.24 | 7.59 | 8.14 | |
| Cash Cash Equivalents Restricted Cash And Restricted Cash Equivalents | 41.43 | 58.31 | 134.95 | 52.70 | 121.97 | 96.51 | 99.15 | 82.19 | 100.36 | 103.80 | 94.08 | 232.53 | 46.59 | 137.32 | 251.81 | 365.63 | 52.81 | 49.99 | 59.53 | 51.95 | 45.51 | 41.02 | 43.33 | 38.55 | 32.18 | 41.34 | 36.35 | NA | 28.91 | NA | NA | NA | 47.36 | NA | NA | NA | NA | NA | NA | NA | NA | NA | NA | NA | NA | NA | NA | NA | NA | NA | NA | NA |
| 2023-12-31 | 2023-09-30 | 2023-06-30 | 2023-03-31 | 2022-12-31 | 2022-09-30 | 2022-06-30 | 2022-03-31 | 2021-12-31 | 2021-09-30 | 2021-06-30 | 2021-03-31 | 2020-12-31 | 2020-09-30 | 2020-06-30 | 2020-03-31 | 2019-12-31 | 2019-09-30 | 2019-06-30 | 2019-03-31 | 2018-12-31 | 2018-09-30 | 2018-06-30 | 2018-03-31 | 2017-12-31 | 2017-09-30 | 2017-06-30 | 2017-03-31 | 2016-12-31 | 2016-09-30 | 2016-06-30 | 2016-03-31 | 2015-12-31 | 2015-09-30 | 2015-06-30 | 2015-03-31 | 2014-12-31 | 2014-09-30 | 2014-06-30 | 2014-03-31 | 2013-12-31 | 2013-09-30 | 2013-06-30 | 2013-03-31 | 2012-12-31 | 2012-09-30 | 2012-06-30 | 2012-03-31 | 2011-12-31 | 2011-09-30 | 2011-06-30 | 2011-03-31 | ||
|---|---|---|---|---|---|---|---|---|---|---|---|---|---|---|---|---|---|---|---|---|---|---|---|---|---|---|---|---|---|---|---|---|---|---|---|---|---|---|---|---|---|---|---|---|---|---|---|---|---|---|---|---|---|
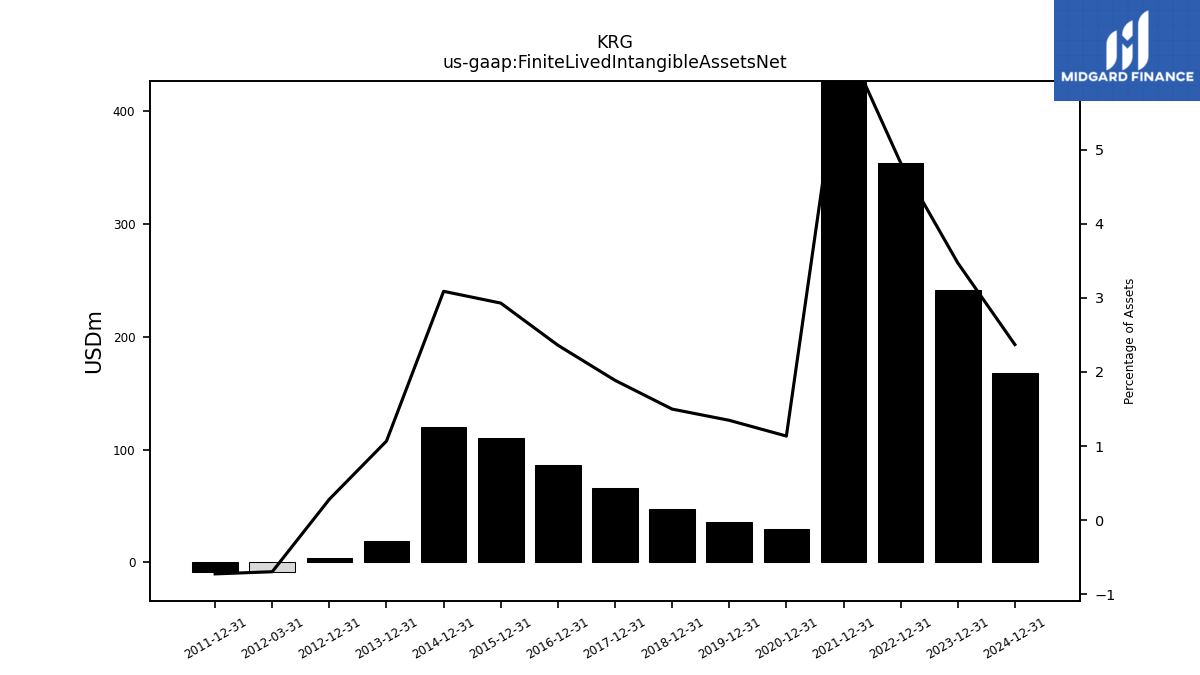
| Finite Lived Intangible Assets Net | 241.11 | NA | NA | NA | 354.05 | NA | NA | NA | 498.43 | NA | NA | NA | 29.62 | NA | NA | NA | 35.70 | NA | NA | NA | 47.56 | NA | NA | NA | 66.30 | NA | NA | NA | 86.33 | NA | NA | NA | 110.32 | NA | NA | NA | 119.64 | NA | NA | NA | 18.84 | NA | NA | NA | 3.65 | NA | NA | -8.18 | -8.64 | NA | NA | NA |
| 2023-12-31 | 2023-09-30 | 2023-06-30 | 2023-03-31 | 2022-12-31 | 2022-09-30 | 2022-06-30 | 2022-03-31 | 2021-12-31 | 2021-09-30 | 2021-06-30 | 2021-03-31 | 2020-12-31 | 2020-09-30 | 2020-06-30 | 2020-03-31 | 2019-12-31 | 2019-09-30 | 2019-06-30 | 2019-03-31 | 2018-12-31 | 2018-09-30 | 2018-06-30 | 2018-03-31 | 2017-12-31 | 2017-09-30 | 2017-06-30 | 2017-03-31 | 2016-12-31 | 2016-09-30 | 2016-06-30 | 2016-03-31 | 2015-12-31 | 2015-09-30 | 2015-06-30 | 2015-03-31 | 2014-12-31 | 2014-09-30 | 2014-06-30 | 2014-03-31 | 2013-12-31 | 2013-09-30 | 2013-06-30 | 2013-03-31 | 2012-12-31 | 2012-09-30 | 2012-06-30 | 2012-03-31 | 2011-12-31 | 2011-09-30 | 2011-06-30 | 2011-03-31 | ||
|---|---|---|---|---|---|---|---|---|---|---|---|---|---|---|---|---|---|---|---|---|---|---|---|---|---|---|---|---|---|---|---|---|---|---|---|---|---|---|---|---|---|---|---|---|---|---|---|---|---|---|---|---|---|
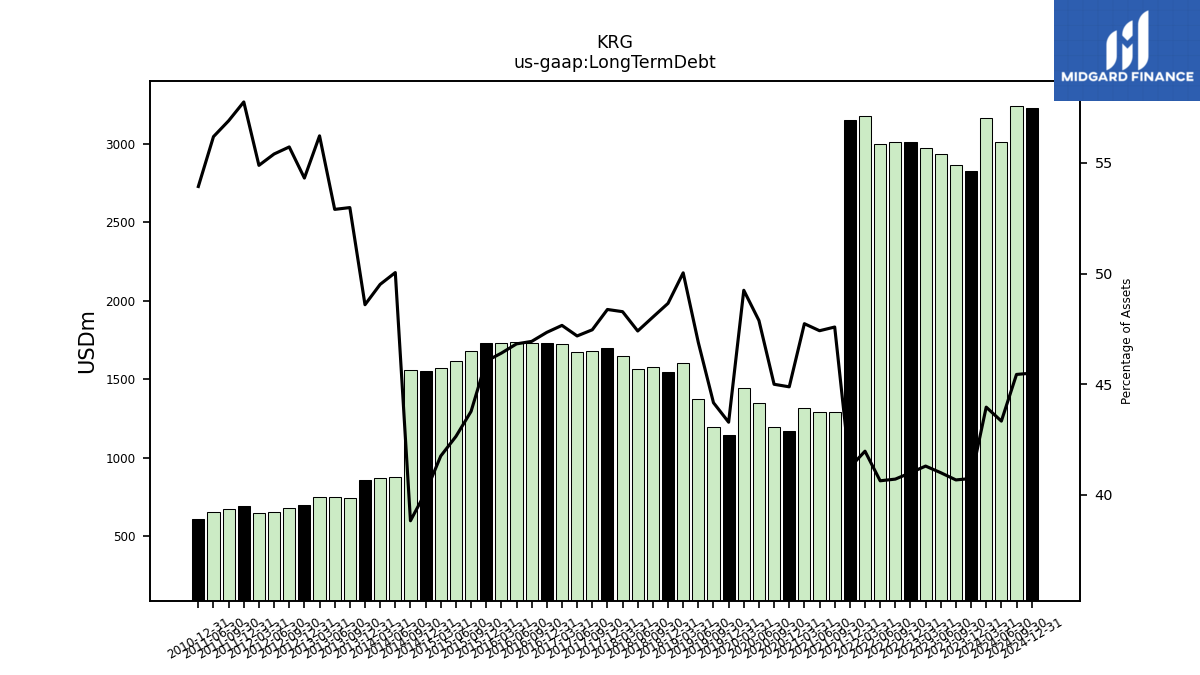
| Long Term Debt | 2829.20 | 2868.83 | 2937.96 | 2972.57 | 3010.30 | 3012.87 | 3001.17 | 3179.12 | 3150.81 | 1288.99 | 1289.37 | 1315.25 | 1170.79 | 1196.12 | 1346.26 | 1446.49 | 1146.58 | 1198.58 | 1376.61 | 1602.60 | 1543.30 | 1578.33 | 1565.43 | 1650.55 | 1699.24 | 1681.68 | 1675.06 | 1726.87 | 1731.07 | 1732.34 | 1740.49 | 1730.79 | 1734.06 | 1679.84 | 1618.61 | 1569.42 | 1554.26 | 1556.50 | 874.52 | 871.33 | 857.14 | 743.98 | 747.49 | 746.92 | 699.91 | 680.36 | 652.67 | 646.41 | 689.12 | 675.76 | 654.34 | NA | |
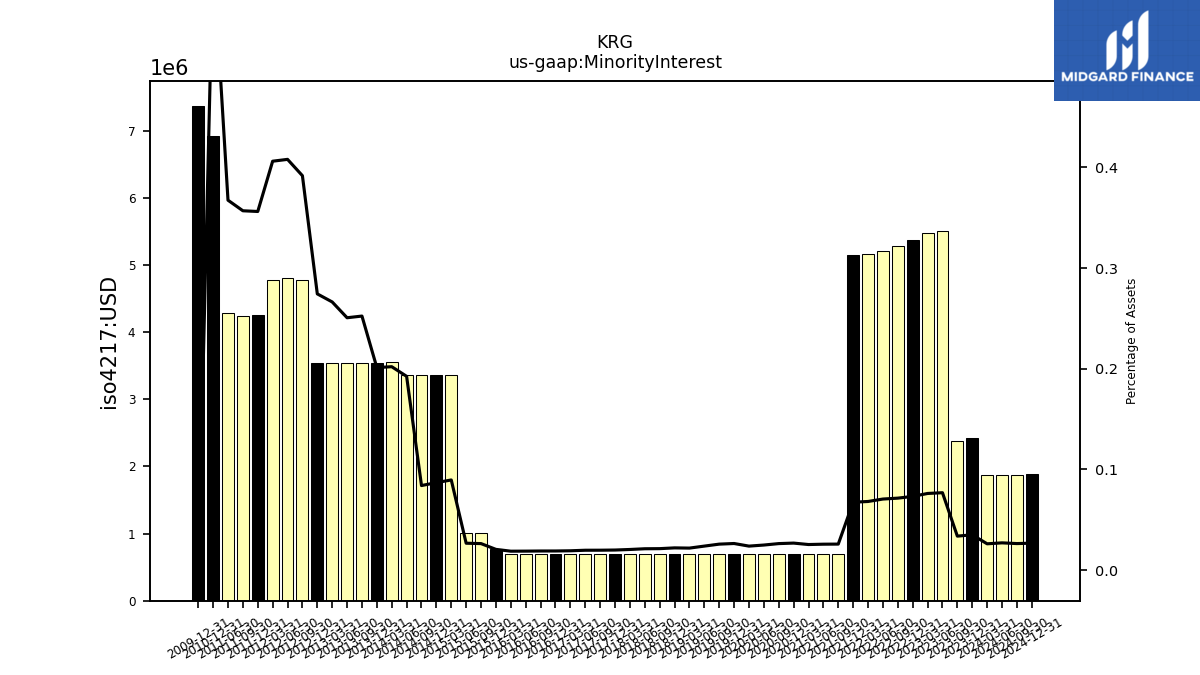
| Minority Interest | 2.43 | 2.38 | 5.50 | 5.47 | 5.37 | 5.29 | 5.21 | 5.16 | 5.15 | 0.70 | 0.70 | 0.70 | 0.70 | 0.70 | 0.70 | 0.70 | 0.70 | 0.70 | 0.70 | 0.70 | 0.70 | 0.70 | 0.70 | 0.70 | 0.70 | 0.70 | 0.70 | 0.69 | 0.69 | 0.70 | 0.70 | 0.70 | 0.77 | 1.01 | 1.01 | 3.36 | 3.36 | 3.36 | 3.36 | 3.56 | 3.55 | 3.54 | 3.54 | 3.54 | 3.54 | 4.78 | 4.81 | 4.78 | 4.25 | 4.24 | 4.28 | NA |
| 2023-12-31 | 2023-09-30 | 2023-06-30 | 2023-03-31 | 2022-12-31 | 2022-09-30 | 2022-06-30 | 2022-03-31 | 2021-12-31 | 2021-09-30 | 2021-06-30 | 2021-03-31 | 2020-12-31 | 2020-09-30 | 2020-06-30 | 2020-03-31 | 2019-12-31 | 2019-09-30 | 2019-06-30 | 2019-03-31 | 2018-12-31 | 2018-09-30 | 2018-06-30 | 2018-03-31 | 2017-12-31 | 2017-09-30 | 2017-06-30 | 2017-03-31 | 2016-12-31 | 2016-09-30 | 2016-06-30 | 2016-03-31 | 2015-12-31 | 2015-09-30 | 2015-06-30 | 2015-03-31 | 2014-12-31 | 2014-09-30 | 2014-06-30 | 2014-03-31 | 2013-12-31 | 2013-09-30 | 2013-06-30 | 2013-03-31 | 2012-12-31 | 2012-09-30 | 2012-06-30 | 2012-03-31 | 2011-12-31 | 2011-09-30 | 2011-06-30 | 2011-03-31 | ||
|---|---|---|---|---|---|---|---|---|---|---|---|---|---|---|---|---|---|---|---|---|---|---|---|---|---|---|---|---|---|---|---|---|---|---|---|---|---|---|---|---|---|---|---|---|---|---|---|---|---|---|---|---|---|
| Stockholders Equity | 3568.14 | 3635.29 | 3692.81 | 3706.00 | 3766.51 | 3872.81 | 3891.14 | 3898.58 | 3922.05 | 1198.85 | 1213.47 | 1231.87 | 1230.65 | 1242.07 | 1248.21 | 1252.83 | 1289.04 | 1302.17 | 1352.66 | 1386.82 | 1412.70 | 1478.17 | 1499.43 | 1524.99 | 1565.41 | 1584.92 | 1609.68 | 1619.48 | 1643.57 | 1644.41 | 1661.01 | 1689.99 | 1725.98 | 1842.14 | 1866.05 | 1877.22 | 1898.78 | 1932.35 | 733.36 | 750.38 | 753.56 | 547.79 | 554.43 | 461.18 | 473.09 | 427.94 | 429.17 | 437.72 | 409.37 | 409.99 | 413.77 | NA | |
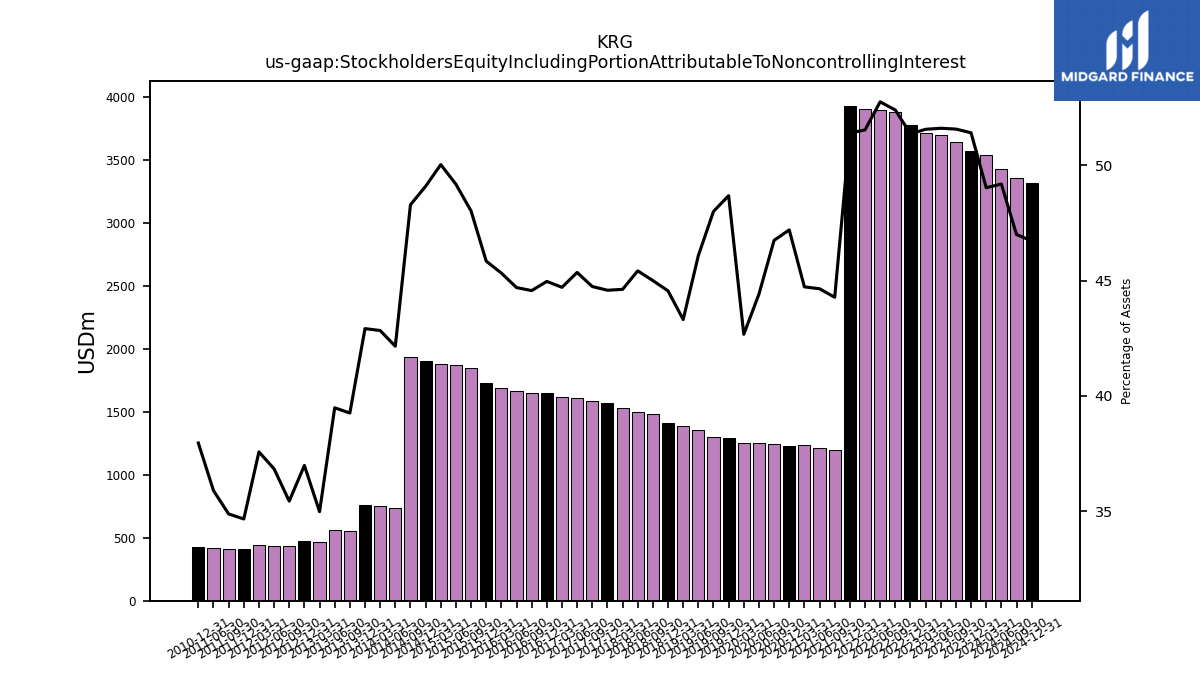
| Stockholders Equity Including Portion Attributable To Noncontrolling Interest | 3570.57 | 3637.67 | 3698.31 | 3711.48 | 3771.89 | 3878.10 | 3896.35 | 3903.74 | 3927.19 | 1199.54 | 1214.17 | 1232.57 | 1231.35 | 1242.77 | 1248.91 | 1253.53 | 1289.74 | 1302.87 | 1353.36 | 1387.52 | 1413.40 | 1478.87 | 1500.13 | 1525.68 | 1566.11 | 1585.62 | 1610.38 | 1620.17 | 1644.27 | 1645.11 | 1661.71 | 1690.69 | 1726.75 | 1843.14 | 1867.07 | 1880.59 | 1902.15 | 1935.71 | 736.72 | 753.93 | 757.10 | 551.33 | 557.98 | 464.72 | 476.62 | 432.73 | 433.97 | 442.50 | 413.62 | 414.23 | 418.05 | NA | |
| Common Stock Value | 2.19 | 2.19 | 2.19 | 2.19 | 2.19 | 2.19 | 2.19 | 2.19 | 2.19 | 0.85 | 0.84 | 0.84 | 0.84 | 0.84 | 0.84 | 0.84 | 0.84 | 0.84 | 0.84 | 0.84 | 0.84 | 0.84 | 0.84 | 0.84 | 0.84 | 0.84 | 0.84 | 0.84 | 0.83 | 0.83 | 0.83 | 0.83 | 0.83 | 0.83 | 0.83 | 0.84 | 0.83 | 0.83 | 1.32 | 1.31 | 1.31 | 0.94 | 0.94 | 0.78 | 0.78 | 0.66 | 0.64 | 0.64 | 0.64 | 0.64 | 0.64 | NA | |
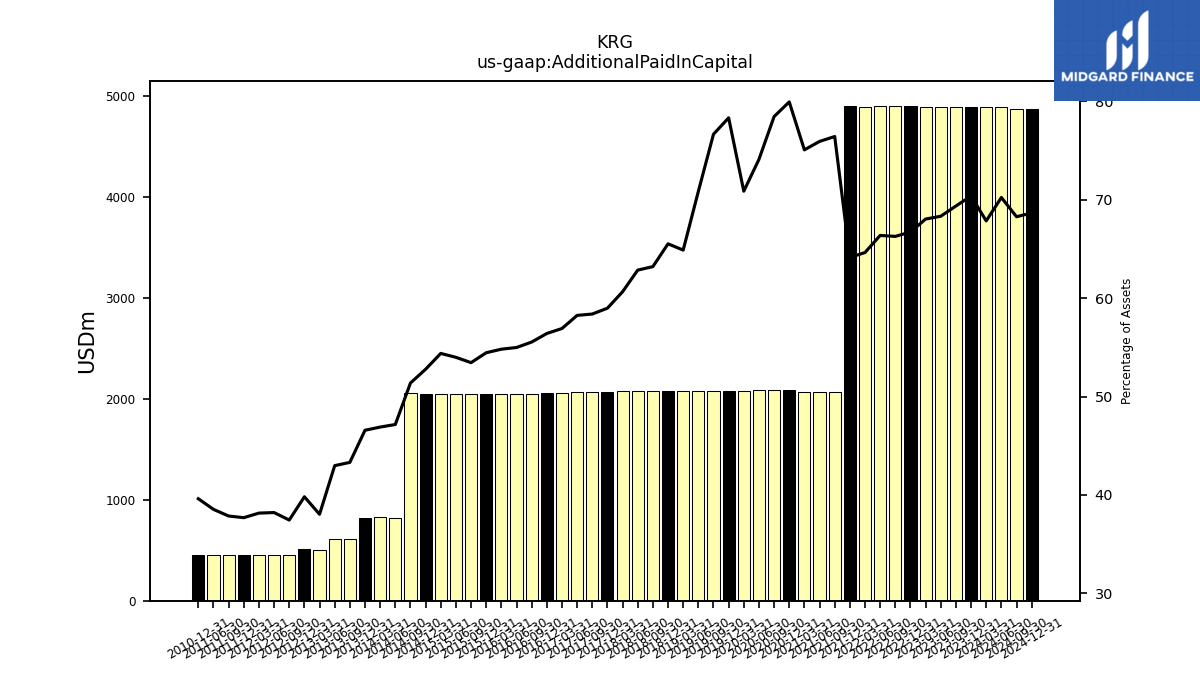
| Additional Paid In Capital | 4886.59 | 4891.10 | 4894.91 | 4896.05 | 4897.74 | 4903.77 | 4900.99 | 4894.90 | 4898.67 | 2069.98 | 2064.31 | 2068.09 | 2085.00 | 2084.98 | 2083.21 | 2081.48 | 2074.44 | 2080.09 | 2079.87 | 2078.10 | 2078.10 | 2076.55 | 2075.19 | 2073.32 | 2071.42 | 2068.64 | 2067.80 | 2062.08 | 2062.36 | 2049.70 | 2043.71 | 2044.27 | 2050.55 | 2050.91 | 2049.14 | 2043.74 | 2044.42 | 2059.06 | 824.07 | 825.34 | 821.53 | 608.20 | 607.32 | 505.36 | 513.11 | 457.31 | 450.19 | 449.39 | 449.76 | 449.65 | 448.79 | NA | |
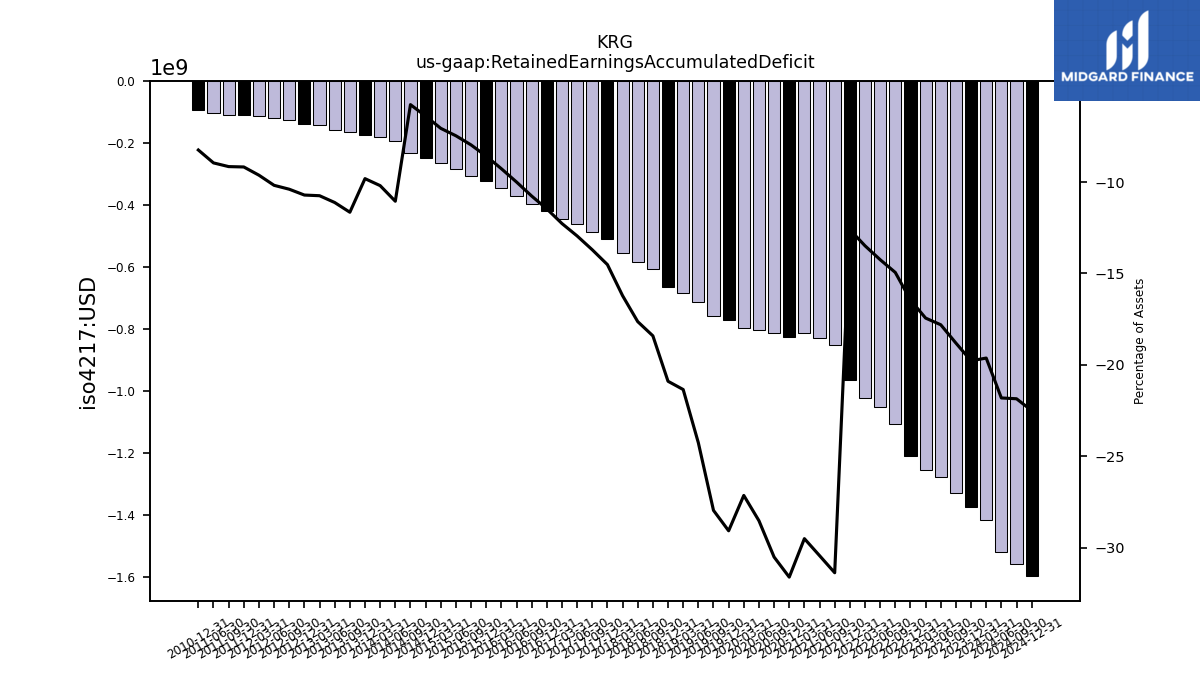
| Retained Earnings Accumulated Deficit | -1373.08 | -1326.20 | -1275.62 | -1255.03 | -1207.76 | -1105.85 | -1051.99 | -1021.32 | -962.91 | -849.51 | -827.33 | -812.72 | -824.31 | -810.78 | -801.81 | -797.04 | -769.96 | -758.56 | -712.15 | -683.69 | -662.74 | -604.92 | -582.25 | -554.31 | -509.83 | -485.60 | -459.69 | -444.58 | -419.31 | -397.39 | -371.69 | -345.82 | -323.26 | -305.90 | -283.61 | -265.51 | -247.80 | -231.20 | -193.10 | -179.46 | -173.13 | -163.62 | -157.13 | -142.80 | -138.04 | -126.91 | -119.94 | -113.37 | -109.50 | -108.74 | -104.28 | NA | |
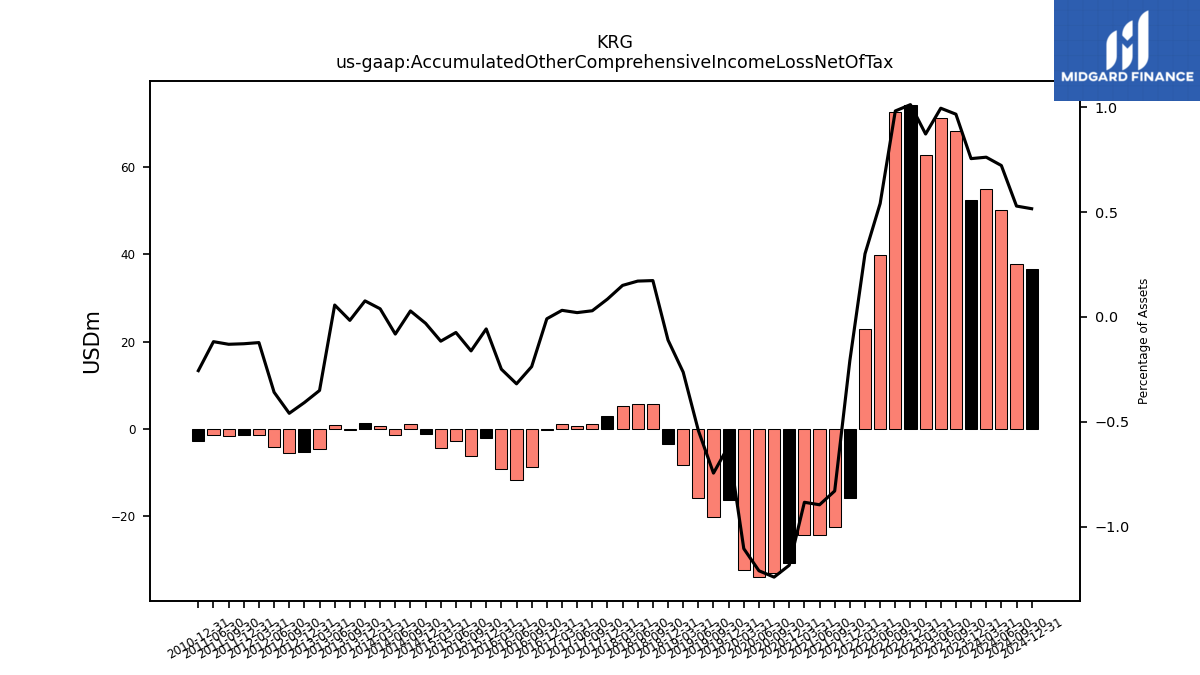
| Accumulated Other Comprehensive Income Loss Net Of Tax | 52.44 | 68.19 | 71.32 | 62.79 | 74.34 | 72.69 | 39.96 | 22.81 | -15.90 | -22.48 | -24.35 | -24.35 | -30.89 | -32.98 | -34.03 | -32.45 | -16.28 | -20.21 | -15.89 | -8.43 | -3.50 | 5.70 | 5.65 | 5.15 | 2.99 | 1.05 | 0.74 | 1.15 | -0.32 | -8.74 | -11.85 | -9.29 | -2.15 | -6.21 | -2.81 | -4.34 | -1.18 | 1.15 | -1.43 | 0.69 | 1.35 | -0.23 | 0.80 | -4.66 | -5.26 | -5.61 | -4.23 | -1.44 | -1.52 | -1.55 | -1.37 | NA | |
| Minority Interest | 2.43 | 2.38 | 5.50 | 5.47 | 5.37 | 5.29 | 5.21 | 5.16 | 5.15 | 0.70 | 0.70 | 0.70 | 0.70 | 0.70 | 0.70 | 0.70 | 0.70 | 0.70 | 0.70 | 0.70 | 0.70 | 0.70 | 0.70 | 0.70 | 0.70 | 0.70 | 0.70 | 0.69 | 0.69 | 0.70 | 0.70 | 0.70 | 0.77 | 1.01 | 1.01 | 3.36 | 3.36 | 3.36 | 3.36 | 3.56 | 3.55 | 3.54 | 3.54 | 3.54 | 3.54 | 4.78 | 4.81 | 4.78 | 4.25 | 4.24 | 4.28 | NA |
| 2023-12-31 | 2023-09-30 | 2023-06-30 | 2023-03-31 | 2022-12-31 | 2022-09-30 | 2022-06-30 | 2022-03-31 | 2021-12-31 | 2021-09-30 | 2021-06-30 | 2021-03-31 | 2020-12-31 | 2020-09-30 | 2020-06-30 | 2020-03-31 | 2019-12-31 | 2019-09-30 | 2019-06-30 | 2019-03-31 | 2018-12-31 | 2018-09-30 | 2018-06-30 | 2018-03-31 | 2017-12-31 | 2017-09-30 | 2017-06-30 | 2017-03-31 | 2016-12-31 | 2016-09-30 | 2016-06-30 | 2016-03-31 | 2015-12-31 | 2015-09-30 | 2015-06-30 | 2015-03-31 | 2014-12-31 | 2014-09-30 | 2014-06-30 | 2014-03-31 | 2013-12-31 | 2013-09-30 | 2013-06-30 | 2013-03-31 | 2012-12-31 | 2012-09-30 | 2012-06-30 | 2012-03-31 | 2011-12-31 | 2011-09-30 | 2011-06-30 | 2011-03-31 | ||
|---|---|---|---|---|---|---|---|---|---|---|---|---|---|---|---|---|---|---|---|---|---|---|---|---|---|---|---|---|---|---|---|---|---|---|---|---|---|---|---|---|---|---|---|---|---|---|---|---|---|---|---|---|---|
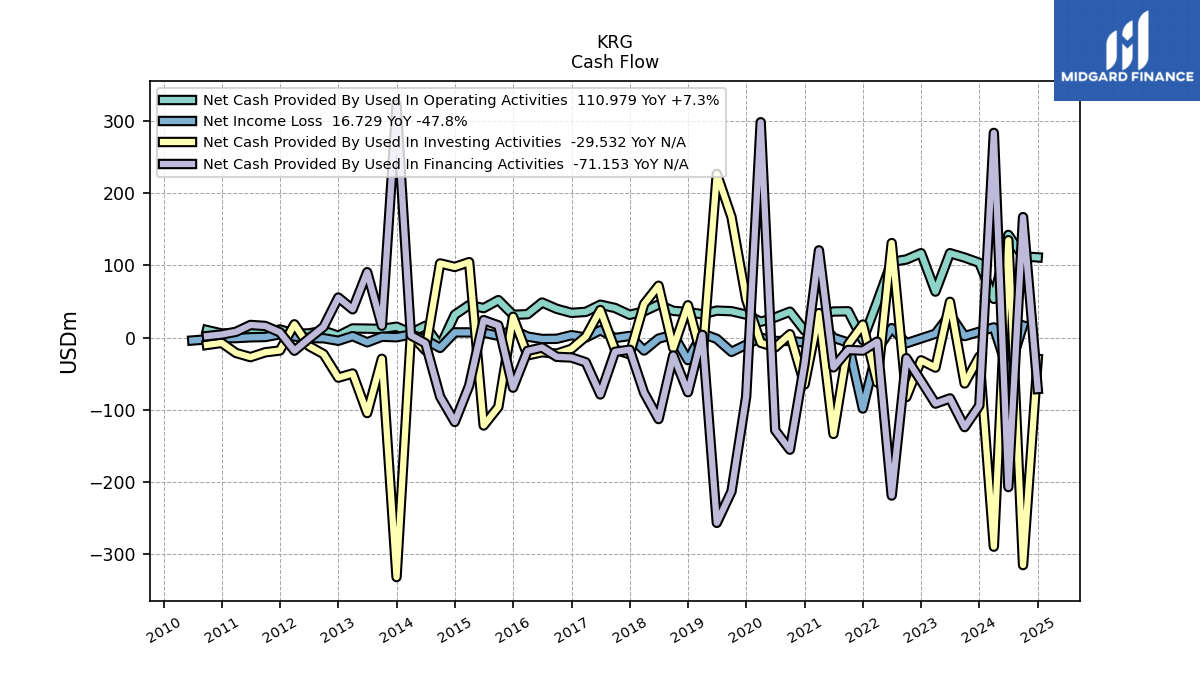
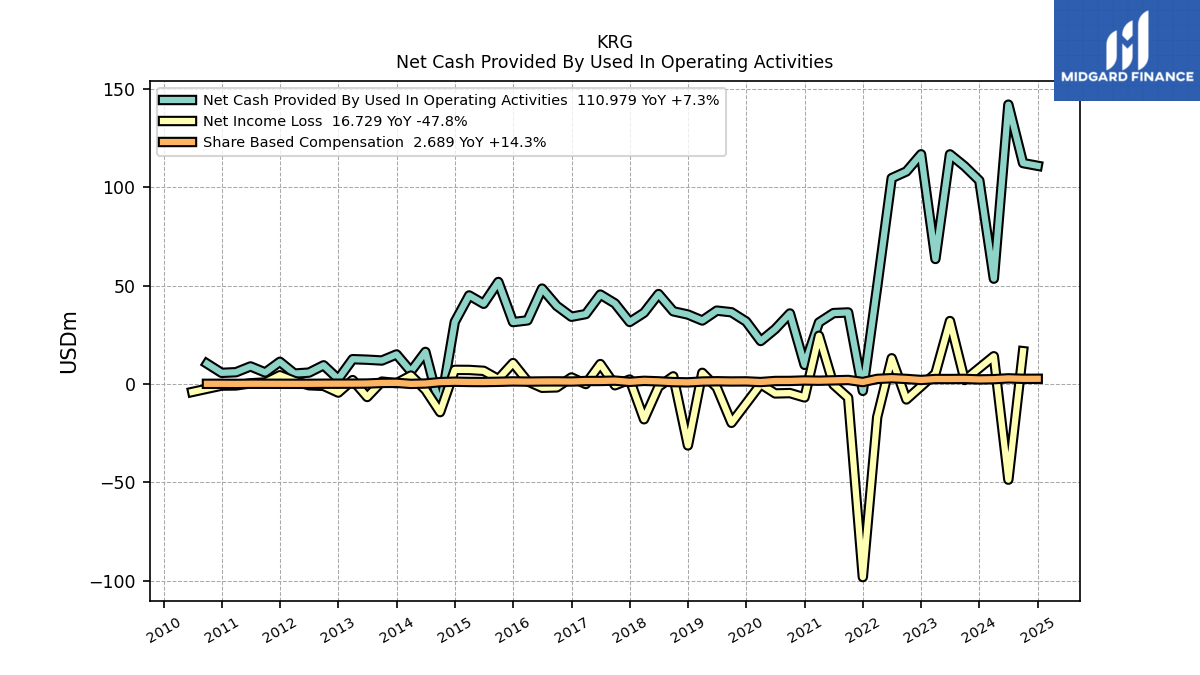
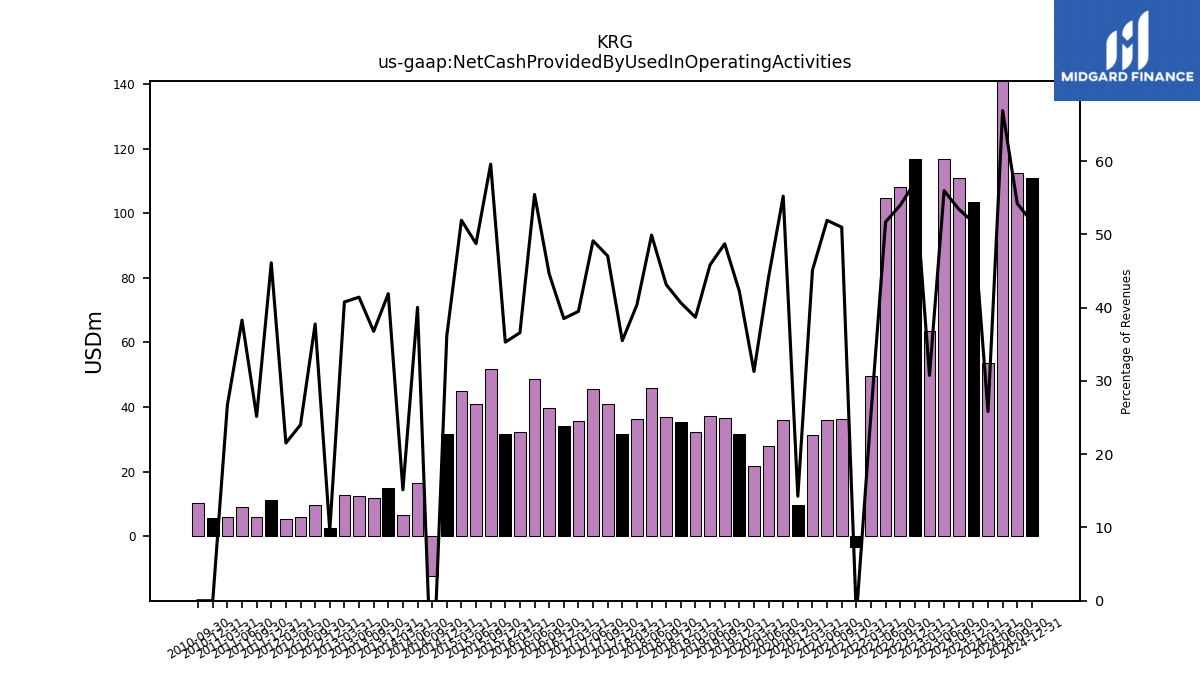
| Net Cash Provided By Used In Operating Activities | 103.47 | 110.75 | 116.82 | 63.60 | 116.85 | 108.11 | 104.74 | 49.58 | -3.48 | 36.43 | 36.09 | 31.30 | 9.75 | 35.92 | 27.96 | 21.87 | 31.80 | 36.51 | 37.35 | 32.31 | 35.35 | 37.00 | 45.78 | 36.26 | 31.56 | 41.00 | 45.51 | 35.59 | 34.23 | 39.76 | 48.56 | 32.39 | 31.52 | 51.93 | 40.81 | 45.08 | 31.61 | -12.25 | 16.36 | 6.46 | 15.08 | 11.97 | 12.40 | 12.65 | 2.56 | 9.55 | 5.82 | 5.35 | 11.33 | 5.90 | 8.98 | 6.03 | |
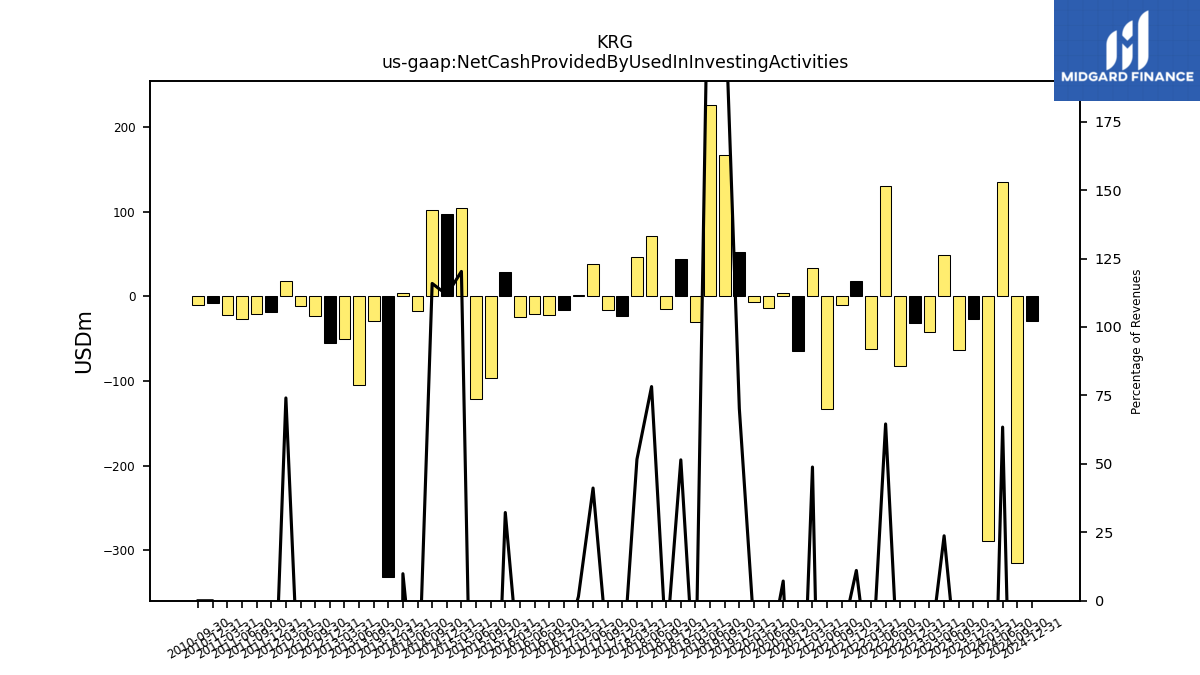
| Net Cash Provided By Used In Investing Activities | -26.25 | -63.50 | 49.53 | -41.51 | -31.45 | -82.34 | 130.83 | -62.18 | 18.03 | -9.60 | -133.35 | 33.88 | -64.91 | 4.68 | -13.52 | -7.09 | 52.82 | 166.87 | 226.61 | -29.70 | 44.74 | -14.54 | 71.76 | 46.37 | -23.18 | -16.48 | 38.14 | 1.39 | -15.56 | -22.25 | -20.26 | -24.59 | 28.77 | -95.97 | -121.63 | 104.43 | 97.77 | 102.65 | -17.70 | 4.21 | -331.46 | -29.32 | -104.48 | -49.65 | -55.46 | -22.88 | -11.68 | 18.40 | -17.86 | -20.35 | -27.02 | -21.31 | |
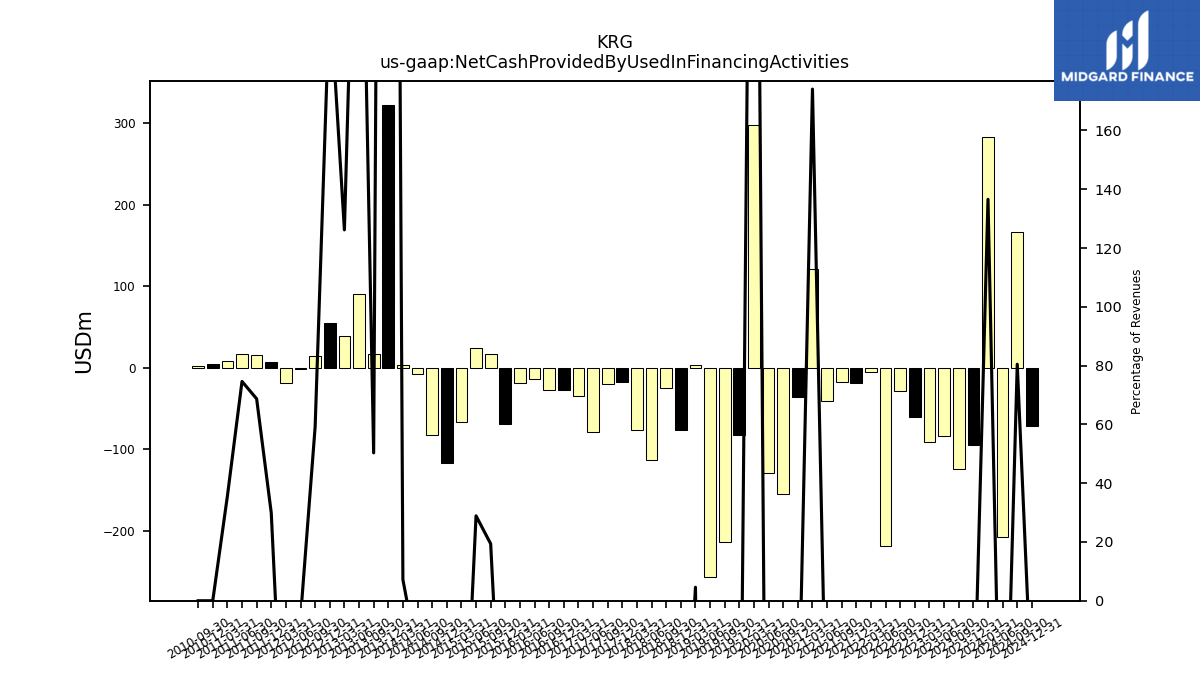
| Net Cash Provided By Used In Financing Activities | -94.11 | -123.90 | -84.09 | -91.36 | -59.94 | -28.41 | -218.61 | -5.57 | -17.99 | -17.12 | -41.20 | 120.76 | -35.58 | -155.10 | -128.26 | 298.04 | -81.79 | -212.92 | -256.37 | 3.83 | -75.60 | -24.77 | -112.75 | -76.26 | -16.77 | -19.69 | -78.66 | -34.21 | -27.58 | -26.62 | -13.71 | -18.37 | -69.36 | 16.88 | 24.19 | -66.60 | -116.76 | -81.82 | -7.90 | 3.07 | 322.39 | 16.38 | 90.53 | 39.16 | 55.45 | 14.96 | -1.40 | -18.22 | 7.34 | 16.10 | 17.50 | 8.02 |
| 2023-12-31 | 2023-09-30 | 2023-06-30 | 2023-03-31 | 2022-12-31 | 2022-09-30 | 2022-06-30 | 2022-03-31 | 2021-12-31 | 2021-09-30 | 2021-06-30 | 2021-03-31 | 2020-12-31 | 2020-09-30 | 2020-06-30 | 2020-03-31 | 2019-12-31 | 2019-09-30 | 2019-06-30 | 2019-03-31 | 2018-12-31 | 2018-09-30 | 2018-06-30 | 2018-03-31 | 2017-12-31 | 2017-09-30 | 2017-06-30 | 2017-03-31 | 2016-12-31 | 2016-09-30 | 2016-06-30 | 2016-03-31 | 2015-12-31 | 2015-09-30 | 2015-06-30 | 2015-03-31 | 2014-12-31 | 2014-09-30 | 2014-06-30 | 2014-03-31 | 2013-12-31 | 2013-09-30 | 2013-06-30 | 2013-03-31 | 2012-12-31 | 2012-09-30 | 2012-06-30 | 2012-03-31 | 2011-12-31 | 2011-09-30 | 2011-06-30 | 2011-03-31 | ||
|---|---|---|---|---|---|---|---|---|---|---|---|---|---|---|---|---|---|---|---|---|---|---|---|---|---|---|---|---|---|---|---|---|---|---|---|---|---|---|---|---|---|---|---|---|---|---|---|---|---|---|---|---|---|
| Net Cash Provided By Used In Operating Activities | 103.47 | 110.75 | 116.82 | 63.60 | 116.85 | 108.11 | 104.74 | 49.58 | -3.48 | 36.43 | 36.09 | 31.30 | 9.75 | 35.92 | 27.96 | 21.87 | 31.80 | 36.51 | 37.35 | 32.31 | 35.35 | 37.00 | 45.78 | 36.26 | 31.56 | 41.00 | 45.51 | 35.59 | 34.23 | 39.76 | 48.56 | 32.39 | 31.52 | 51.93 | 40.81 | 45.08 | 31.61 | -12.25 | 16.36 | 6.46 | 15.08 | 11.97 | 12.40 | 12.65 | 2.56 | 9.55 | 5.82 | 5.35 | 11.33 | 5.90 | 8.98 | 6.03 | |
| Profit Loss | 8.16 | 2.18 | 32.48 | 5.56 | -1.05 | -7.72 | 13.45 | -16.83 | -100.16 | -6.83 | -0.10 | 25.36 | -6.84 | -4.63 | -4.79 | 0.13 | 15.86 | -20.12 | -1.70 | 5.99 | -31.71 | 4.32 | -1.06 | -18.00 | 2.79 | -0.20 | 10.86 | 0.44 | 3.90 | -1.26 | -1.50 | 1.98 | 11.26 | 2.96 | 7.24 | 7.86 | 8.03 | -13.98 | -3.20 | 4.47 | 0.42 | 1.24 | -7.25 | 2.06 | -5.24 | -1.24 | -0.87 | 3.64 | 4.92 | 0.74 | 0.10 | -0.78 | |
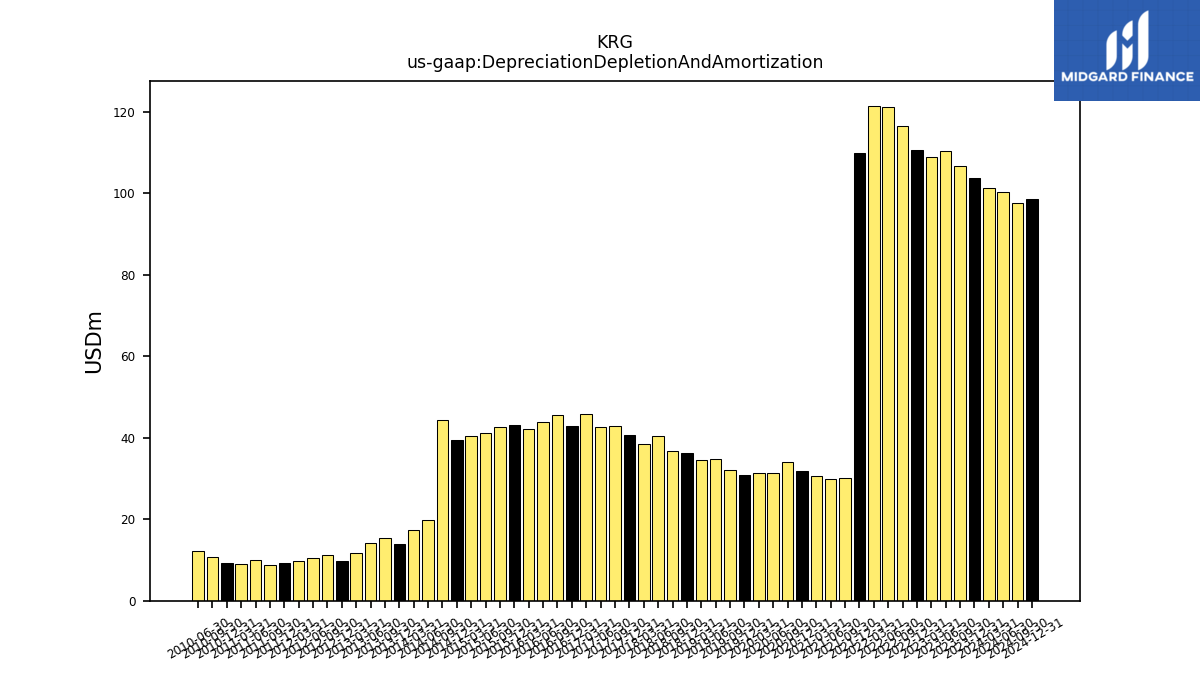
| Depreciation Depletion And Amortization | 103.82 | 106.83 | 110.36 | 108.96 | 110.54 | 116.63 | 121.13 | 121.50 | 109.83 | 30.19 | 29.80 | 30.63 | 31.82 | 33.95 | 31.41 | 31.47 | 30.77 | 31.98 | 34.71 | 34.63 | 36.30 | 36.86 | 40.45 | 38.56 | 40.76 | 42.79 | 42.71 | 45.83 | 42.94 | 45.54 | 43.84 | 42.24 | 43.12 | 42.55 | 41.21 | 40.44 | 39.44 | 44.38 | 19.74 | 17.44 | 13.85 | 15.39 | 14.18 | 11.75 | 9.65 | 11.24 | 10.49 | 9.73 | 9.20 | 8.80 | 9.89 | 9.00 | |
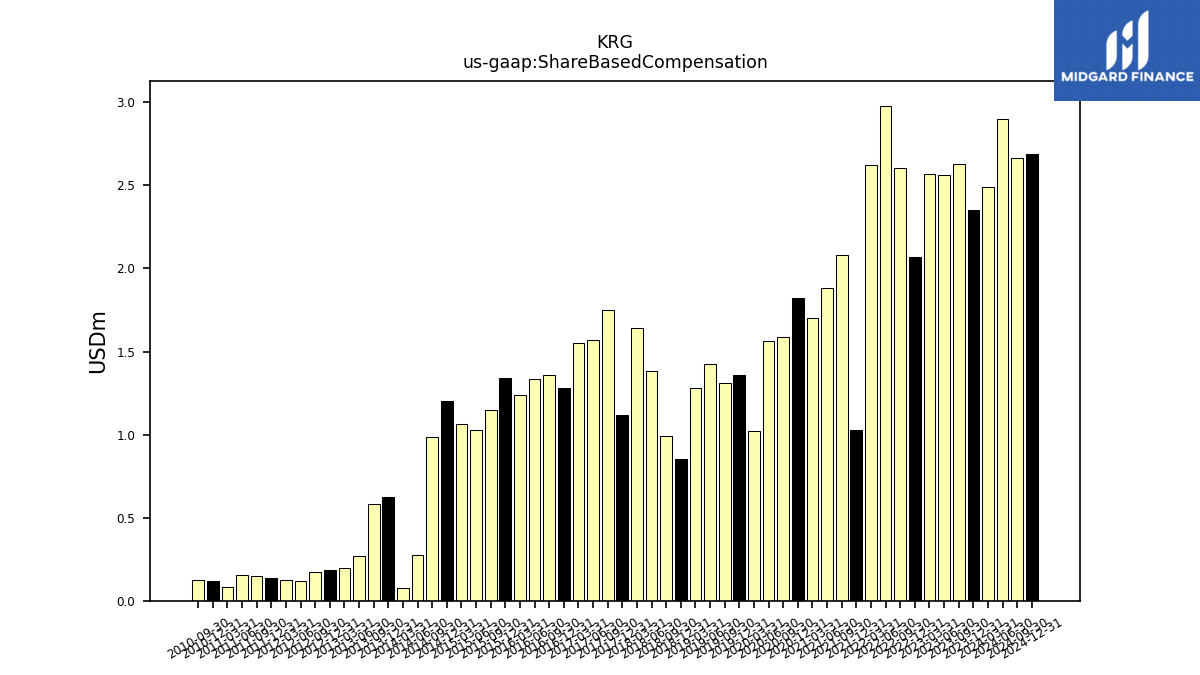
| Share Based Compensation | 2.35 | 2.63 | 2.56 | 2.57 | 2.07 | 2.61 | 2.98 | 2.62 | 1.03 | 2.08 | 1.89 | 1.70 | 1.82 | 1.59 | 1.56 | 1.02 | 1.36 | 1.31 | 1.42 | 1.28 | 0.85 | 0.99 | 1.38 | 1.64 | 1.12 | 1.75 | 1.57 | 1.55 | 1.28 | 1.36 | 1.33 | 1.24 | 1.34 | 1.15 | 1.03 | 1.06 | 1.20 | 0.98 | 0.27 | 0.08 | 0.63 | 0.58 | 0.27 | 0.20 | 0.19 | 0.17 | 0.12 | 0.12 | 0.14 | 0.15 | 0.15 | 0.08 | |
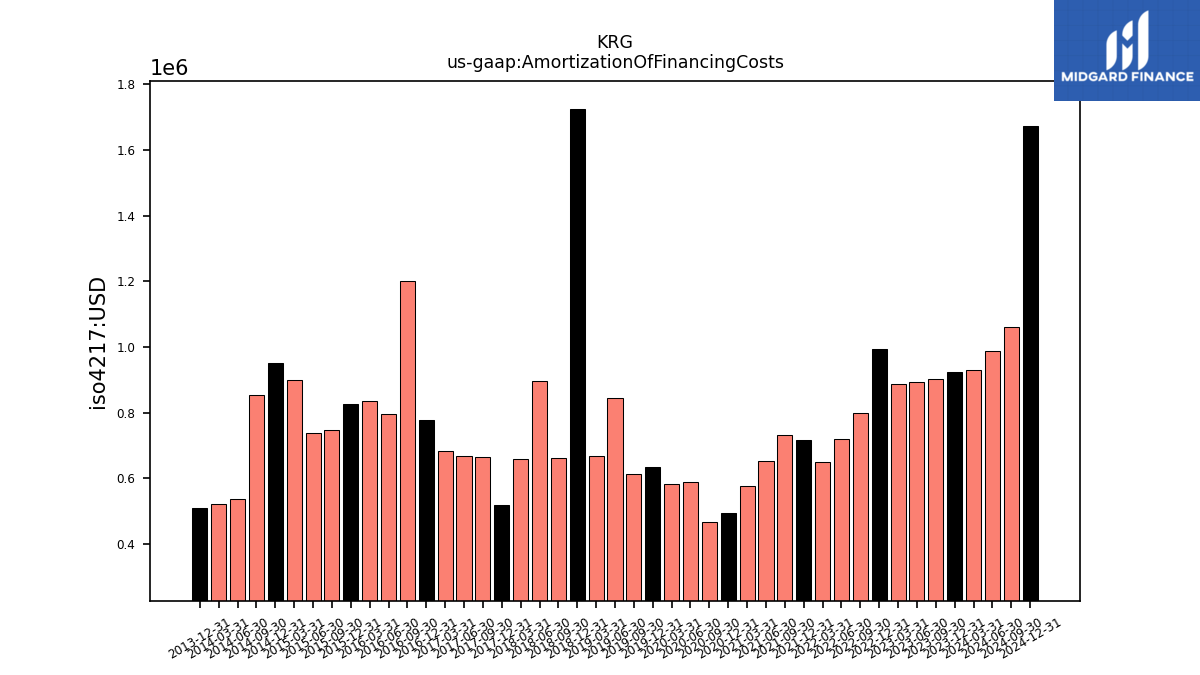
| Amortization Of Financing Costs | 0.92 | 0.90 | 0.89 | 0.89 | 0.99 | 0.80 | 0.72 | 0.65 | 0.72 | 0.73 | 0.65 | 0.58 | 0.49 | 0.47 | 0.59 | 0.58 | 0.63 | 0.61 | 0.84 | 0.67 | 1.72 | 0.66 | 0.90 | 0.66 | 0.52 | 0.66 | 0.67 | 0.68 | 0.78 | 1.20 | 0.80 | 0.83 | 0.82 | 0.75 | 0.74 | 0.90 | 0.95 | 0.85 | 0.54 | 0.52 | 0.51 | NA | NA | NA | NA | NA | NA | NA | NA | NA | NA | NA |
| 2023-12-31 | 2023-09-30 | 2023-06-30 | 2023-03-31 | 2022-12-31 | 2022-09-30 | 2022-06-30 | 2022-03-31 | 2021-12-31 | 2021-09-30 | 2021-06-30 | 2021-03-31 | 2020-12-31 | 2020-09-30 | 2020-06-30 | 2020-03-31 | 2019-12-31 | 2019-09-30 | 2019-06-30 | 2019-03-31 | 2018-12-31 | 2018-09-30 | 2018-06-30 | 2018-03-31 | 2017-12-31 | 2017-09-30 | 2017-06-30 | 2017-03-31 | 2016-12-31 | 2016-09-30 | 2016-06-30 | 2016-03-31 | 2015-12-31 | 2015-09-30 | 2015-06-30 | 2015-03-31 | 2014-12-31 | 2014-09-30 | 2014-06-30 | 2014-03-31 | 2013-12-31 | 2013-09-30 | 2013-06-30 | 2013-03-31 | 2012-12-31 | 2012-09-30 | 2012-06-30 | 2012-03-31 | 2011-12-31 | 2011-09-30 | 2011-06-30 | 2011-03-31 | ||
|---|---|---|---|---|---|---|---|---|---|---|---|---|---|---|---|---|---|---|---|---|---|---|---|---|---|---|---|---|---|---|---|---|---|---|---|---|---|---|---|---|---|---|---|---|---|---|---|---|---|---|---|---|---|
| Net Cash Provided By Used In Investing Activities | -26.25 | -63.50 | 49.53 | -41.51 | -31.45 | -82.34 | 130.83 | -62.18 | 18.03 | -9.60 | -133.35 | 33.88 | -64.91 | 4.68 | -13.52 | -7.09 | 52.82 | 166.87 | 226.61 | -29.70 | 44.74 | -14.54 | 71.76 | 46.37 | -23.18 | -16.48 | 38.14 | 1.39 | -15.56 | -22.25 | -20.26 | -24.59 | 28.77 | -95.97 | -121.63 | 104.43 | 97.77 | 102.65 | -17.70 | 4.21 | -331.46 | -29.32 | -104.48 | -49.65 | -55.46 | -22.88 | -11.68 | 18.40 | -17.86 | -20.35 | -27.02 | -21.31 |
| 2023-12-31 | 2023-09-30 | 2023-06-30 | 2023-03-31 | 2022-12-31 | 2022-09-30 | 2022-06-30 | 2022-03-31 | 2021-12-31 | 2021-09-30 | 2021-06-30 | 2021-03-31 | 2020-12-31 | 2020-09-30 | 2020-06-30 | 2020-03-31 | 2019-12-31 | 2019-09-30 | 2019-06-30 | 2019-03-31 | 2018-12-31 | 2018-09-30 | 2018-06-30 | 2018-03-31 | 2017-12-31 | 2017-09-30 | 2017-06-30 | 2017-03-31 | 2016-12-31 | 2016-09-30 | 2016-06-30 | 2016-03-31 | 2015-12-31 | 2015-09-30 | 2015-06-30 | 2015-03-31 | 2014-12-31 | 2014-09-30 | 2014-06-30 | 2014-03-31 | 2013-12-31 | 2013-09-30 | 2013-06-30 | 2013-03-31 | 2012-12-31 | 2012-09-30 | 2012-06-30 | 2012-03-31 | 2011-12-31 | 2011-09-30 | 2011-06-30 | 2011-03-31 | ||
|---|---|---|---|---|---|---|---|---|---|---|---|---|---|---|---|---|---|---|---|---|---|---|---|---|---|---|---|---|---|---|---|---|---|---|---|---|---|---|---|---|---|---|---|---|---|---|---|---|---|---|---|---|---|
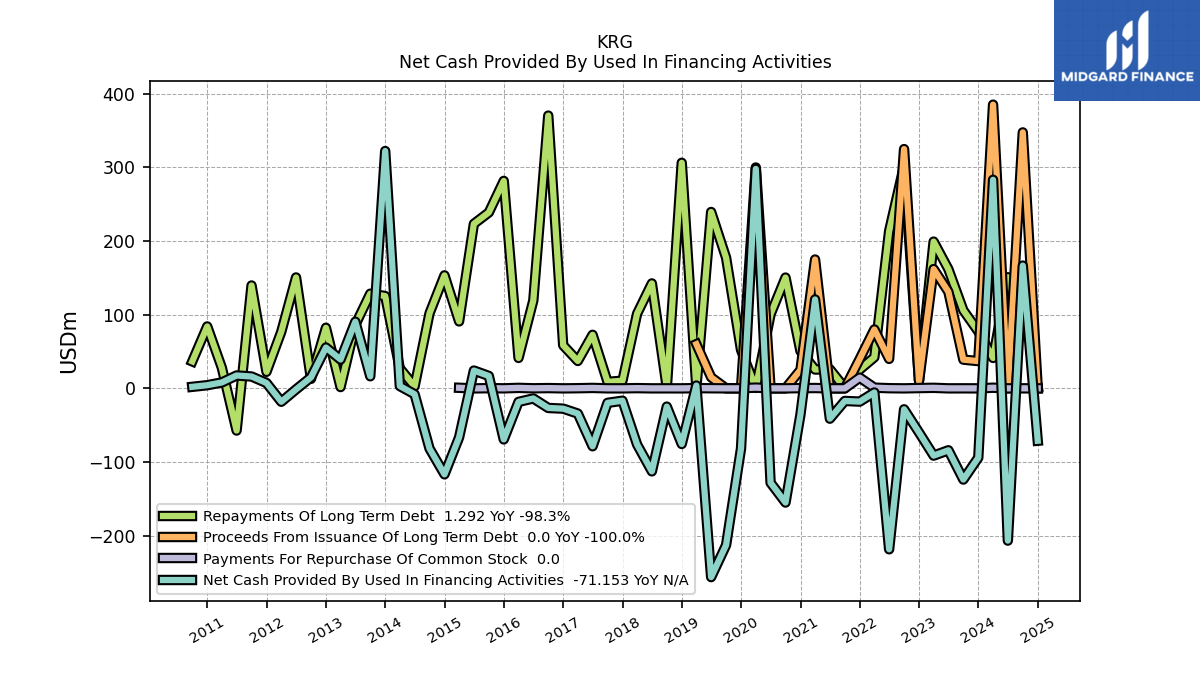
| Net Cash Provided By Used In Financing Activities | -94.11 | -123.90 | -84.09 | -91.36 | -59.94 | -28.41 | -218.61 | -5.57 | -17.99 | -17.12 | -41.20 | 120.76 | -35.58 | -155.10 | -128.26 | 298.04 | -81.79 | -212.92 | -256.37 | 3.83 | -75.60 | -24.77 | -112.75 | -76.26 | -16.77 | -19.69 | -78.66 | -34.21 | -27.58 | -26.62 | -13.71 | -18.37 | -69.36 | 16.88 | 24.19 | -66.60 | -116.76 | -81.82 | -7.90 | 3.07 | 322.39 | 16.38 | 90.53 | 39.16 | 55.45 | 14.96 | -1.40 | -18.22 | 7.34 | 16.10 | 17.50 | 8.02 | |
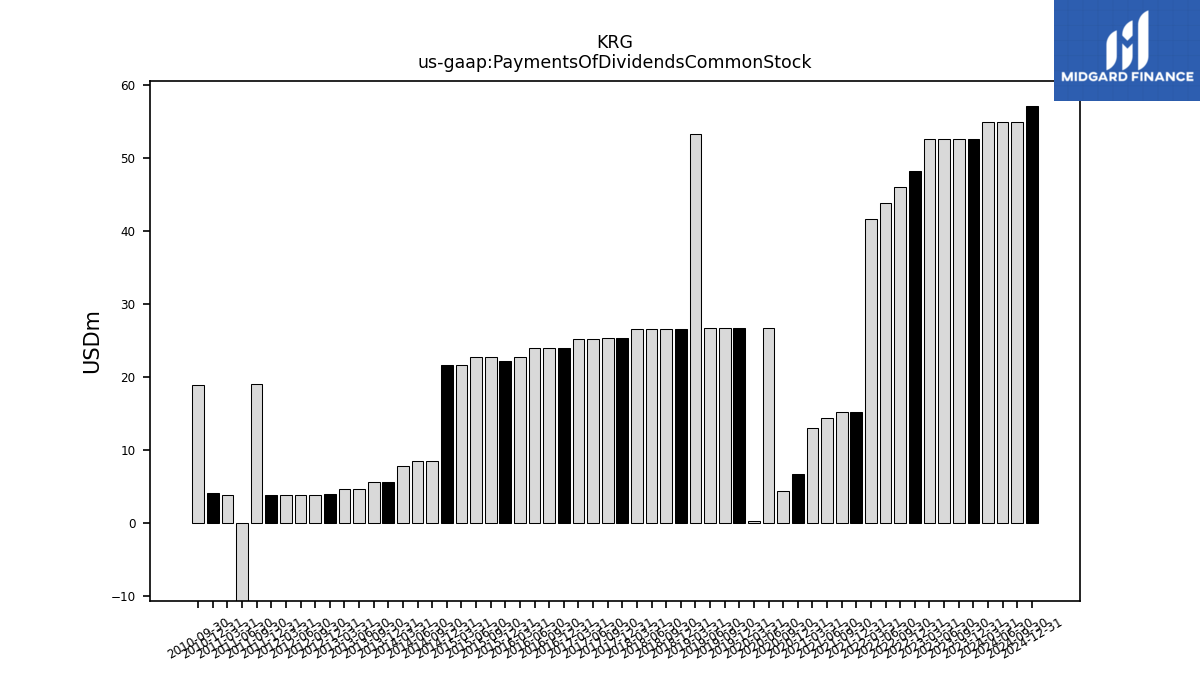
| Payments Of Dividends Common Stock | 52.65 | 52.65 | 52.64 | 52.60 | 48.20 | 46.01 | 43.81 | 41.60 | 15.22 | 15.22 | 14.36 | 12.99 | 6.74 | 4.38 | 26.71 | 0.30 | 26.67 | 26.66 | 26.66 | 53.26 | 26.59 | 26.61 | 26.57 | 26.55 | 25.29 | 25.29 | 25.28 | 25.27 | 24.02 | 23.97 | 23.97 | 22.71 | 22.19 | 22.71 | 22.77 | 21.71 | 21.70 | 8.55 | 8.55 | 7.85 | 5.63 | 5.62 | 4.67 | 4.66 | 3.94 | 3.85 | 3.84 | 3.82 | 3.82 | 19.04 | -11.42 | 3.80 | |
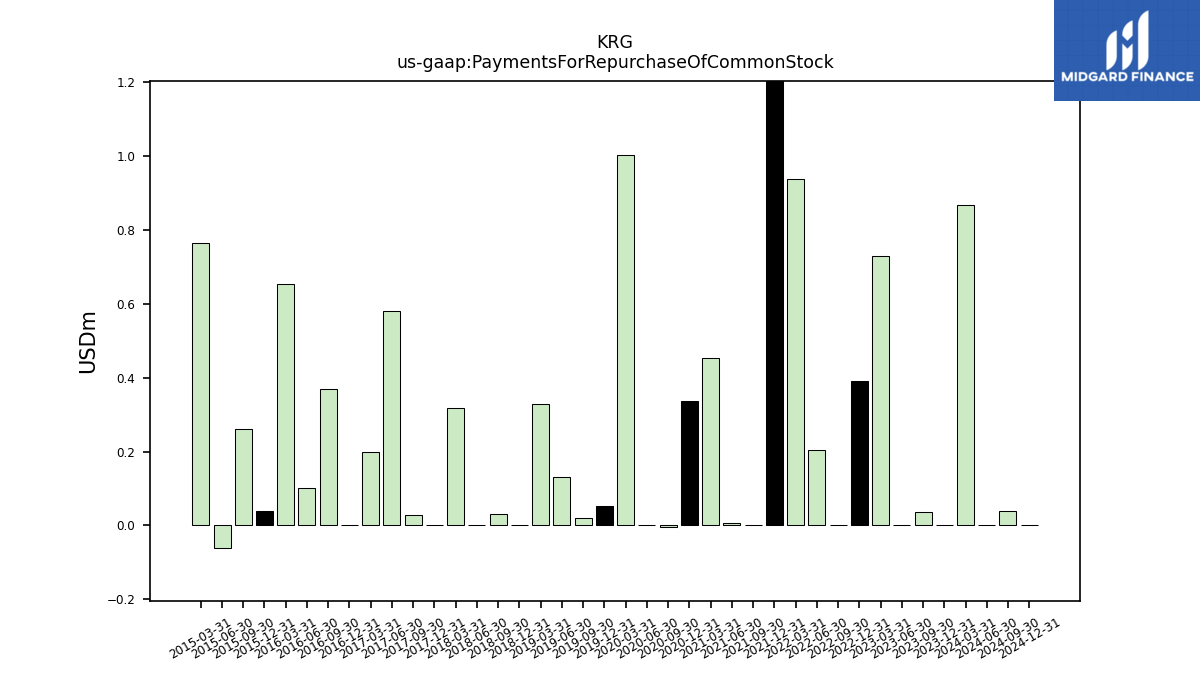
| Payments For Repurchase Of Common Stock | 0.00 | 0.04 | 0.00 | 0.73 | 0.39 | 0.00 | 0.20 | 0.94 | 14.57 | 0.00 | 0.01 | 0.45 | 0.34 | -0.00 | 0.00 | 1.00 | 0.05 | 0.02 | 0.13 | 0.33 | 0.00 | 0.03 | 0.00 | 0.32 | 0.00 | 0.03 | 0.58 | 0.20 | 0.00 | 0.37 | 0.10 | 0.65 | 0.04 | 0.26 | -0.06 | 0.77 | NA | NA | NA | NA | NA | NA | NA | NA | NA | NA | NA | NA | NA | NA | NA | NA |
| 2023-12-31 | 2023-09-30 | 2023-06-30 | 2023-03-31 | 2022-12-31 | 2022-09-30 | 2022-06-30 | 2022-03-31 | 2021-12-31 | 2021-09-30 | 2021-06-30 | 2021-03-31 | 2020-12-31 | 2020-09-30 | 2020-06-30 | 2020-03-31 | 2019-12-31 | 2019-09-30 | 2019-06-30 | 2019-03-31 | 2018-12-31 | 2018-09-30 | 2018-06-30 | 2018-03-31 | 2017-12-31 | 2017-09-30 | 2017-06-30 | 2017-03-31 | 2016-12-31 | 2016-09-30 | 2016-06-30 | 2016-03-31 | 2015-12-31 | 2015-09-30 | 2015-06-30 | 2015-03-31 | 2014-12-31 | 2014-09-30 | 2014-06-30 | 2014-03-31 | 2013-12-31 | 2013-09-30 | 2013-06-30 | 2013-03-31 | 2012-12-31 | 2012-09-30 | 2012-06-30 | 2012-03-31 | 2011-12-31 | 2011-09-30 | 2011-06-30 | 2011-03-31 | ||
|---|---|---|---|---|---|---|---|---|---|---|---|---|---|---|---|---|---|---|---|---|---|---|---|---|---|---|---|---|---|---|---|---|---|---|---|---|---|---|---|---|---|---|---|---|---|---|---|---|---|---|---|---|---|
| Revenues | 200.28 | 207.22 | 208.76 | 206.75 | 204.69 | 200.31 | 202.60 | 194.39 | 162.95 | 71.47 | 69.53 | 69.38 | 68.36 | 65.07 | 63.30 | 69.91 | 75.27 | 74.94 | 81.48 | 83.52 | 86.94 | 85.75 | 91.74 | 89.76 | 88.92 | 87.14 | 92.65 | 90.11 | 88.87 | 89.12 | 87.58 | 88.55 | 89.30 | 87.15 | 83.73 | 86.83 | 87.45 | 88.58 | 40.84 | 42.66 | 35.98 | 32.55 | 29.92 | 31.04 | 26.72 | 25.28 | 24.22 | 24.83 | 24.56 | 23.43 | 23.45 | 22.56 | |
| Kite Realty Group L P | 200.28 | 207.22 | 208.76 | 206.75 | 204.69 | 200.31 | 202.60 | 194.39 | 162.95 | 71.47 | 69.53 | 69.38 | 68.36 | 65.07 | 63.30 | 69.91 | 75.23 | 74.94 | 81.48 | 83.52 | 86.94 | 85.75 | 91.74 | 89.76 | 88.92 | 87.14 | 92.65 | 90.11 | NA | NA | NA | NA | NA | NA | NA | NA | NA | NA | NA | NA | NA | NA | NA | NA | NA | NA | NA | NA | NA | NA | NA | NA | |
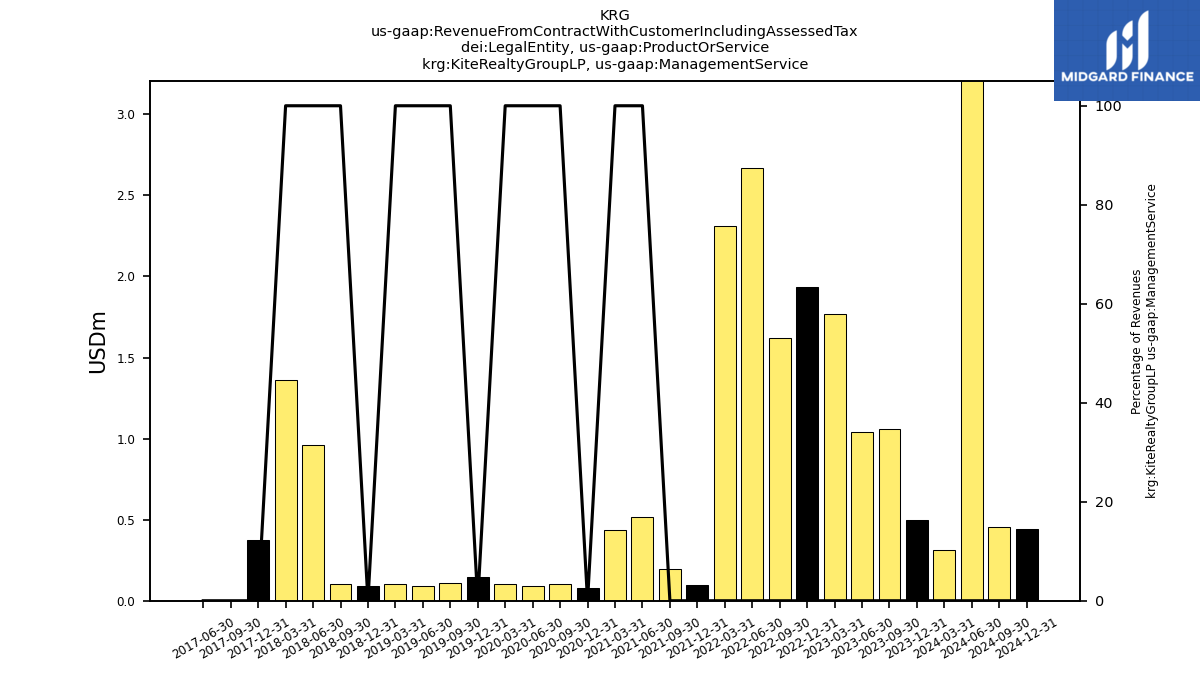
| Kite Realty Group L P, Management Service | 0.50 | 1.06 | 1.04 | 1.77 | 1.94 | 1.62 | 2.67 | 2.31 | 0.10 | 0.20 | 0.52 | 0.43 | 0.08 | 0.10 | 0.09 | 0.10 | 0.14 | 0.11 | 0.09 | 0.10 | 0.09 | 0.10 | 0.96 | 1.36 | 0.38 | 0.00 | 0.00 | NA | NA | NA | NA | NA | NA | NA | NA | NA | NA | NA | NA | NA | NA | NA | NA | NA | NA | NA | NA | NA | NA | NA | NA | NA | |
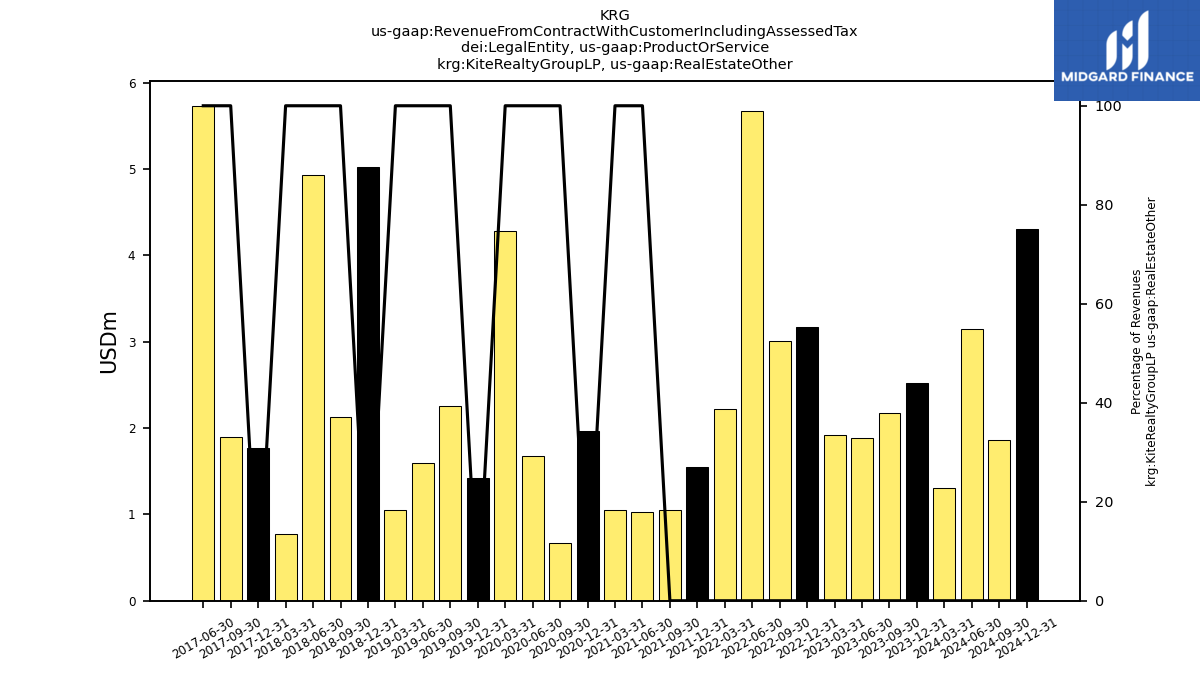
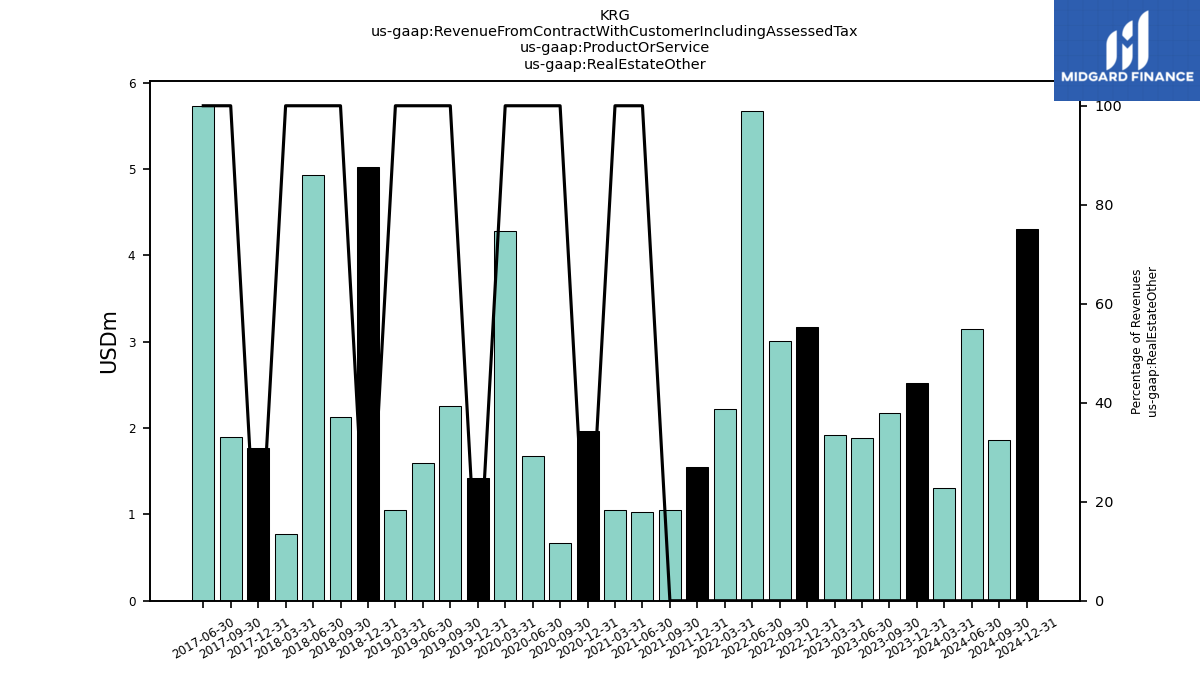
| Kite Realty Group L P, Real Estate Other | 2.52 | 2.17 | 1.88 | 1.92 | 3.18 | 3.01 | 5.67 | 2.22 | 1.55 | 1.05 | 1.03 | 1.05 | 1.97 | 0.67 | 1.68 | 4.28 | 1.42 | 2.26 | 1.59 | 1.05 | 5.02 | 2.13 | 4.93 | 0.78 | 1.77 | 1.90 | 5.73 | NA | NA | NA | NA | NA | NA | NA | NA | NA | NA | NA | NA | NA | NA | NA | NA | NA | NA | NA | NA | NA | NA | NA | NA | NA | |
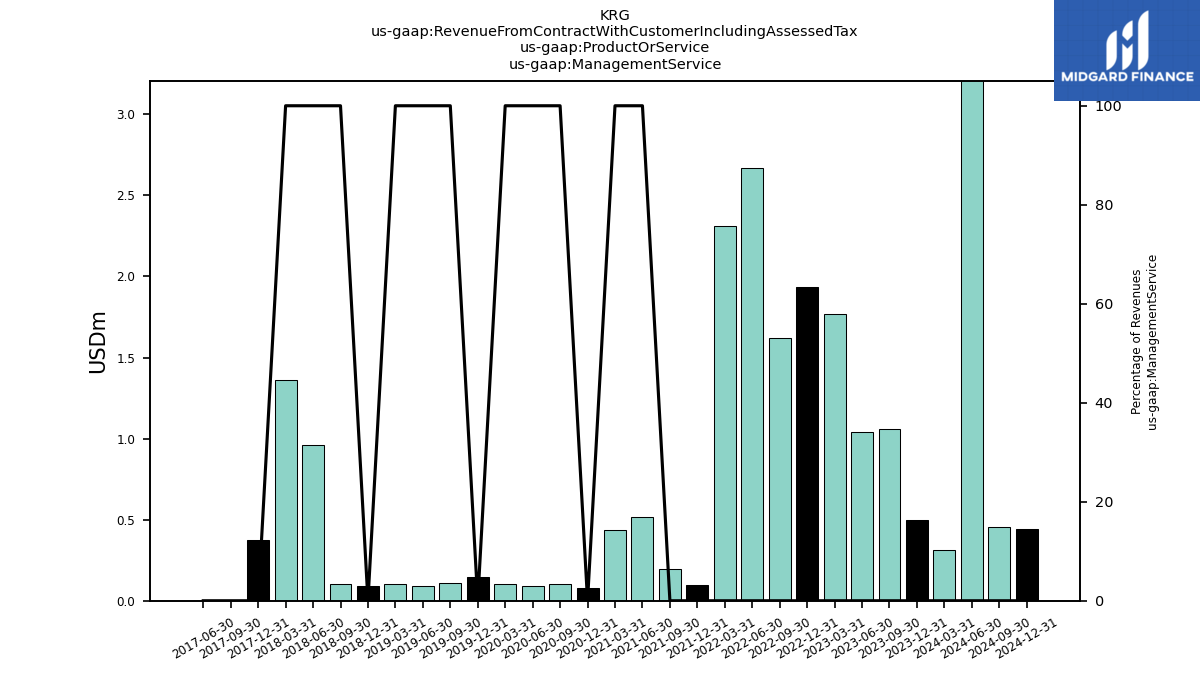
| Management Service | 0.50 | 1.06 | 1.04 | 1.77 | 1.94 | 1.62 | 2.67 | 2.31 | 0.10 | 0.20 | 0.52 | 0.43 | 0.08 | 0.10 | 0.09 | 0.10 | 0.14 | 0.11 | 0.09 | 0.10 | 0.09 | 0.10 | 0.96 | 1.36 | 0.38 | 0.00 | 0.00 | NA | NA | NA | NA | NA | NA | NA | NA | NA | NA | NA | NA | NA | NA | NA | NA | NA | NA | NA | NA | NA | NA | NA | NA | NA | |
| Real Estate Other | 2.52 | 2.17 | 1.88 | 1.92 | 3.18 | 3.01 | 5.67 | 2.22 | 1.55 | 1.05 | 1.03 | 1.05 | 1.97 | 0.67 | 1.68 | 4.28 | 1.42 | 2.26 | 1.59 | 1.05 | 5.02 | 2.13 | 4.93 | 0.78 | 1.77 | 1.90 | 5.73 | NA | NA | NA | NA | NA | NA | NA | NA | NA | NA | NA | NA | NA | NA | NA | NA | NA | NA | NA | NA | NA | NA | NA | NA | NA |
