
| 2023-12-30 | 2023-09-30 | 2023-07-01 | 2023-04-01 | 2022-12-31 | 2022-10-01 | 2022-07-02 | 2022-04-02 | 2022-01-01 | 2021-10-02 | 2021-07-03 | 2021-04-03 | 2020-09-26 | 2020-06-27 | 2020-03-28 | 2019-12-28 | 2019-09-28 | 2019-06-29 | 2019-03-30 | 2018-12-29 | 2018-09-29 | 2018-06-30 | 2018-03-31 | ||
|---|---|---|---|---|---|---|---|---|---|---|---|---|---|---|---|---|---|---|---|---|---|---|---|---|
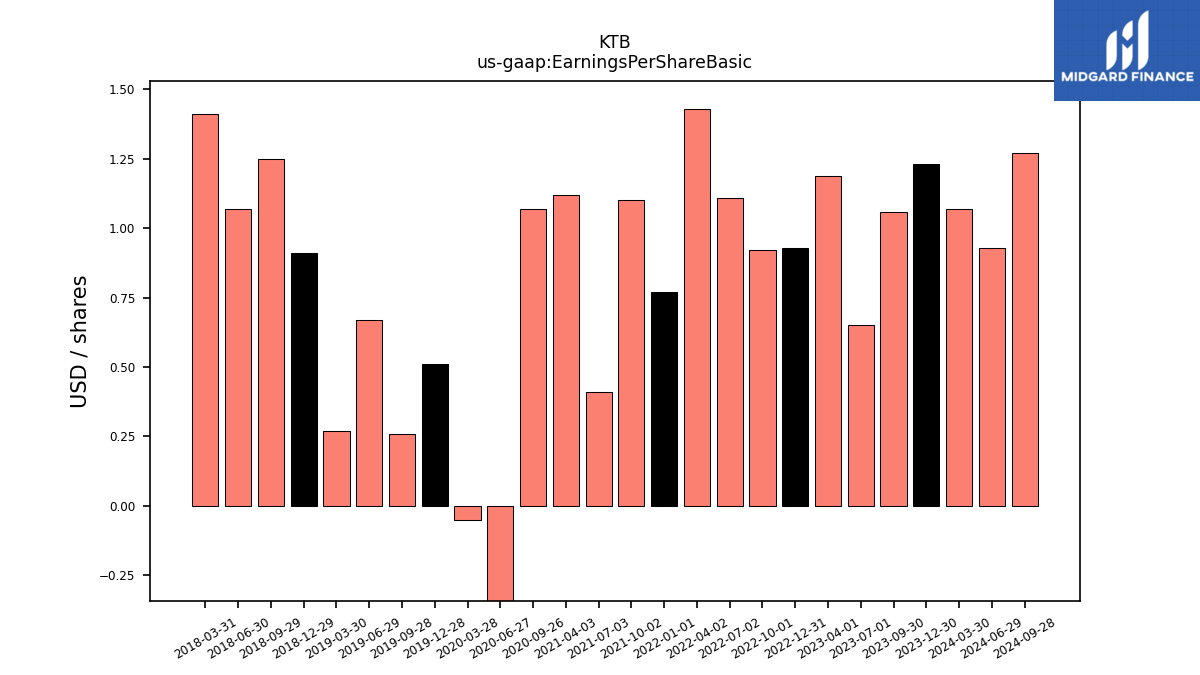
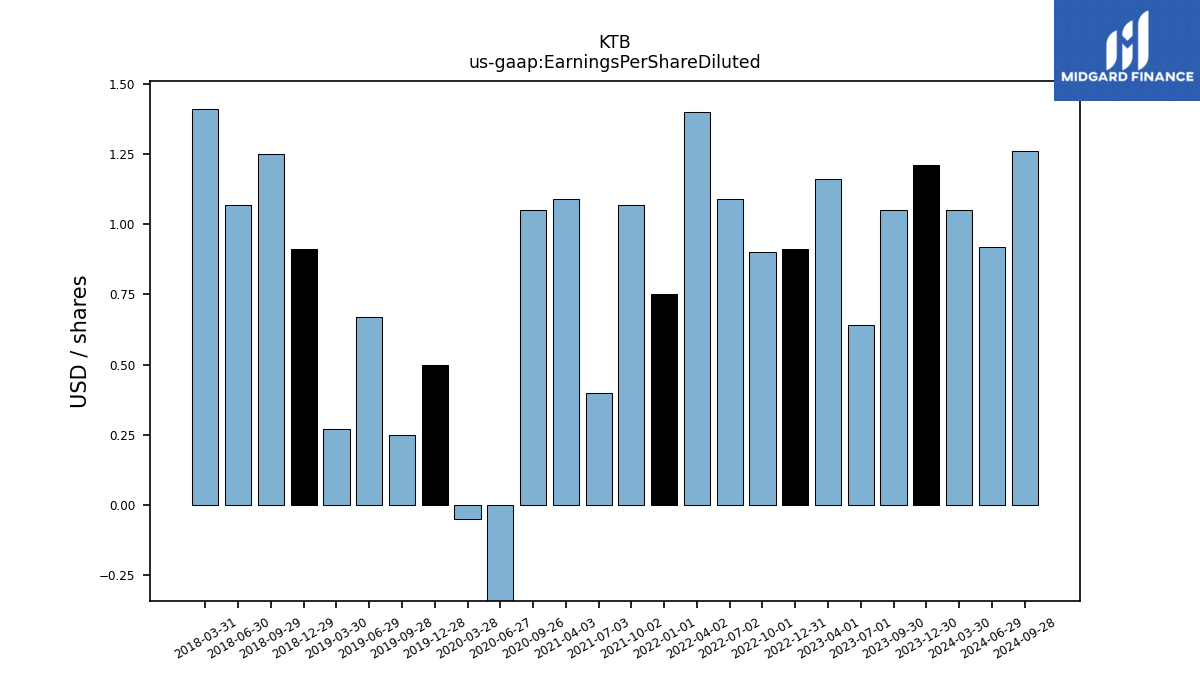
| Earnings Per Share Basic | 1.23 | 1.06 | 0.65 | 1.19 | 0.93 | 0.92 | 1.11 | 1.43 | 0.77 | 1.10 | 0.41 | 1.12 | 1.07 | -0.58 | -0.05 | 0.51 | 0.26 | 0.67 | 0.27 | 0.91 | 1.25 | 1.07 | 1.41 | |
| Earnings Per Share Diluted | 1.21 | 1.05 | 0.64 | 1.16 | 0.91 | 0.90 | 1.09 | 1.40 | 0.75 | 1.07 | 0.40 | 1.09 | 1.05 | -0.58 | -0.05 | 0.50 | 0.25 | 0.67 | 0.27 | 0.91 | 1.25 | 1.07 | 1.41 |
| 2023-12-30 | 2023-09-30 | 2023-07-01 | 2023-04-01 | 2022-12-31 | 2022-10-01 | 2022-07-02 | 2022-04-02 | 2022-01-01 | 2021-10-02 | 2021-07-03 | 2021-04-03 | 2020-09-26 | 2020-06-27 | 2020-03-28 | 2019-12-28 | 2019-09-28 | 2019-06-29 | 2019-03-30 | 2018-12-29 | 2018-09-29 | 2018-06-30 | 2018-03-31 | ||
|---|---|---|---|---|---|---|---|---|---|---|---|---|---|---|---|---|---|---|---|---|---|---|---|---|
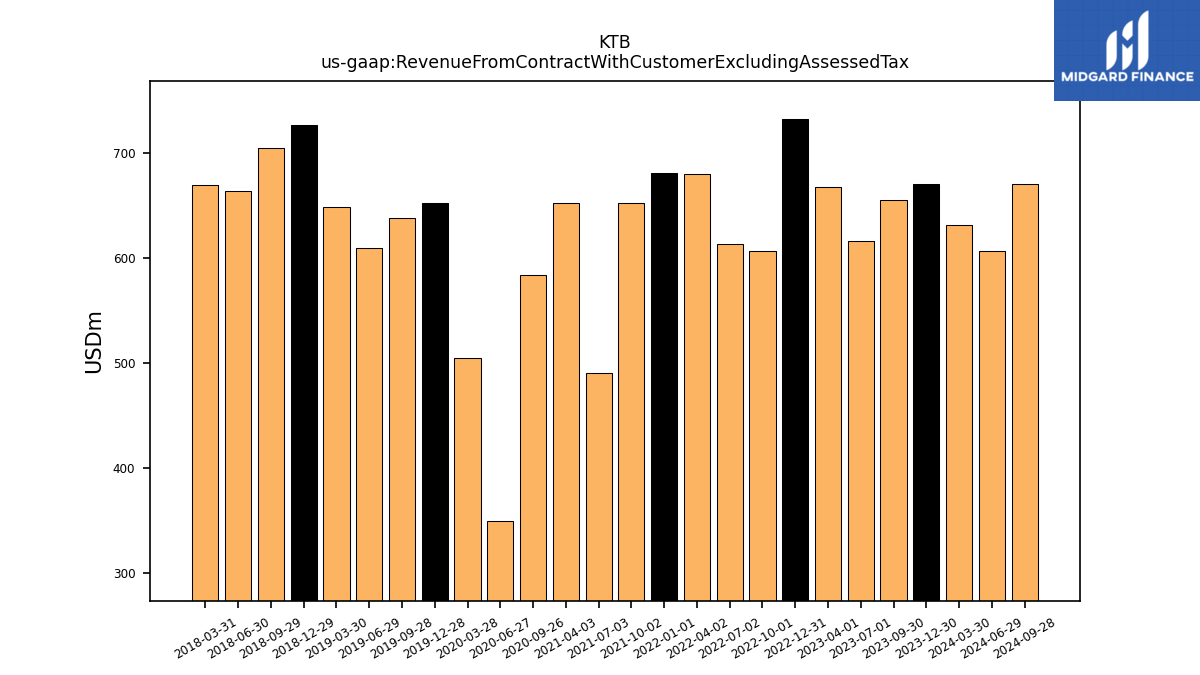
| Revenue From Contract With Customer Excluding Assessed Tax | 669.80 | 654.54 | 616.01 | 667.12 | 731.61 | 606.52 | 613.57 | 679.74 | 681.09 | 652.30 | 490.76 | 651.76 | 583.22 | 349.25 | 504.50 | 652.61 | 638.14 | 609.75 | 648.34 | 726.23 | 704.25 | 663.86 | 669.66 | |
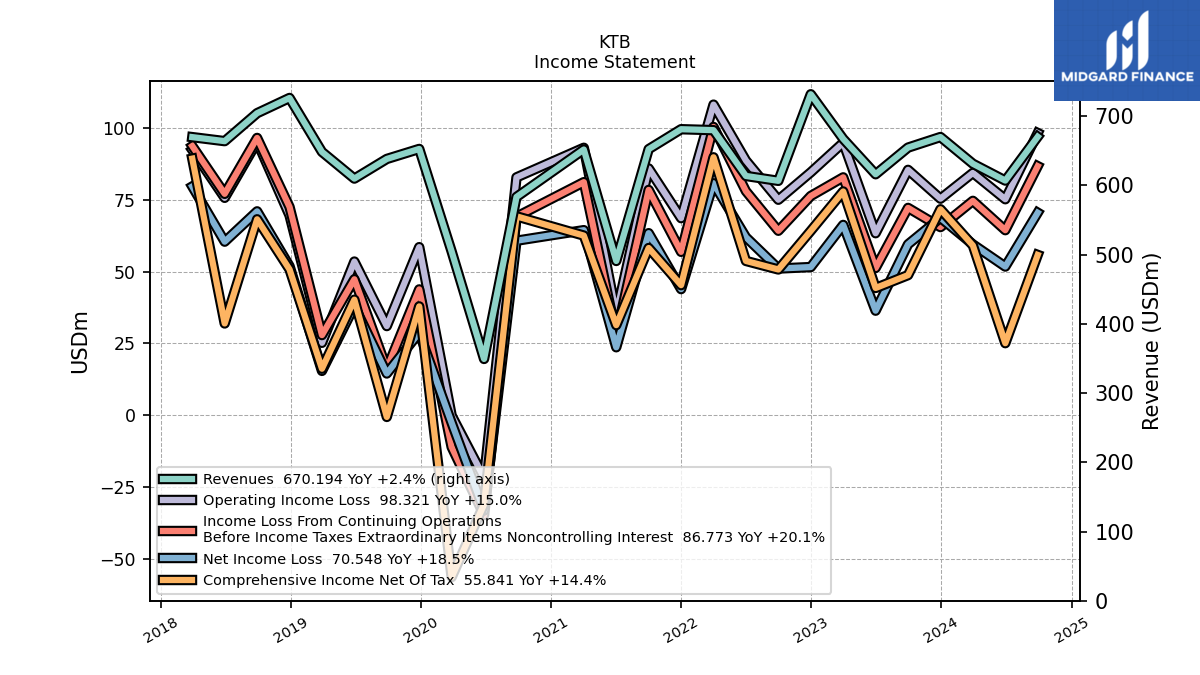
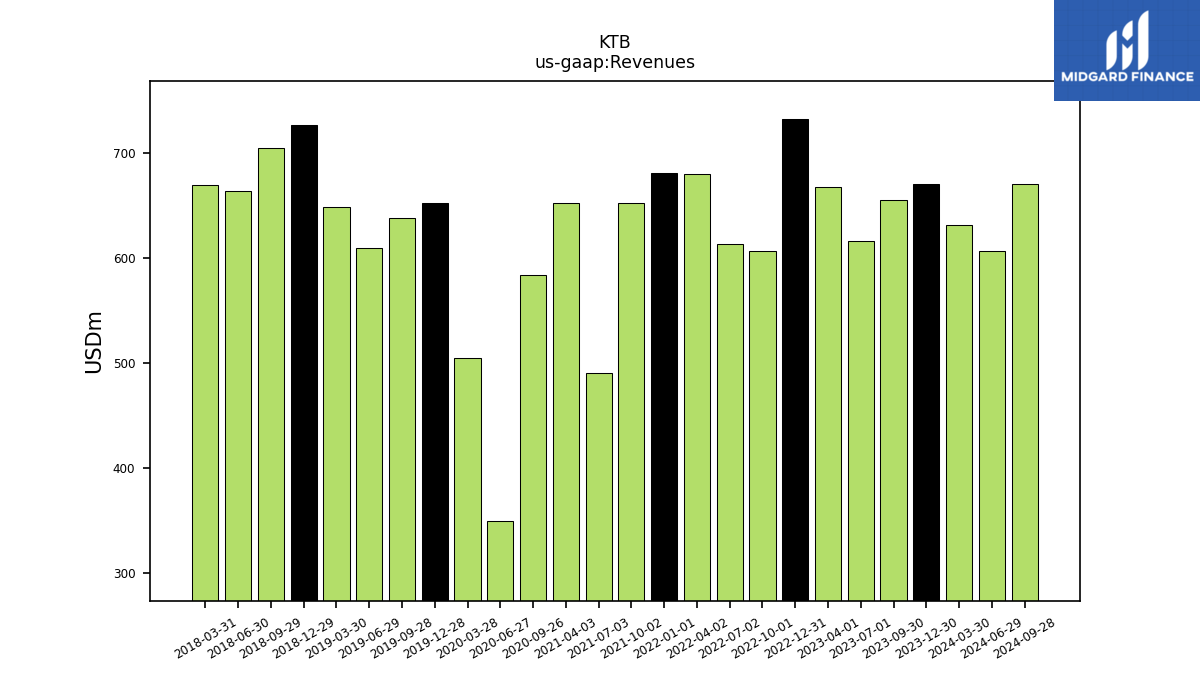
| Revenues | 669.80 | 654.54 | 616.01 | 667.12 | 731.61 | 606.52 | 613.57 | 679.74 | 681.09 | 652.30 | 490.76 | 651.76 | 583.22 | 349.25 | 504.50 | 652.61 | 638.14 | 609.75 | 648.34 | 726.23 | 704.25 | 663.86 | 669.66 | |
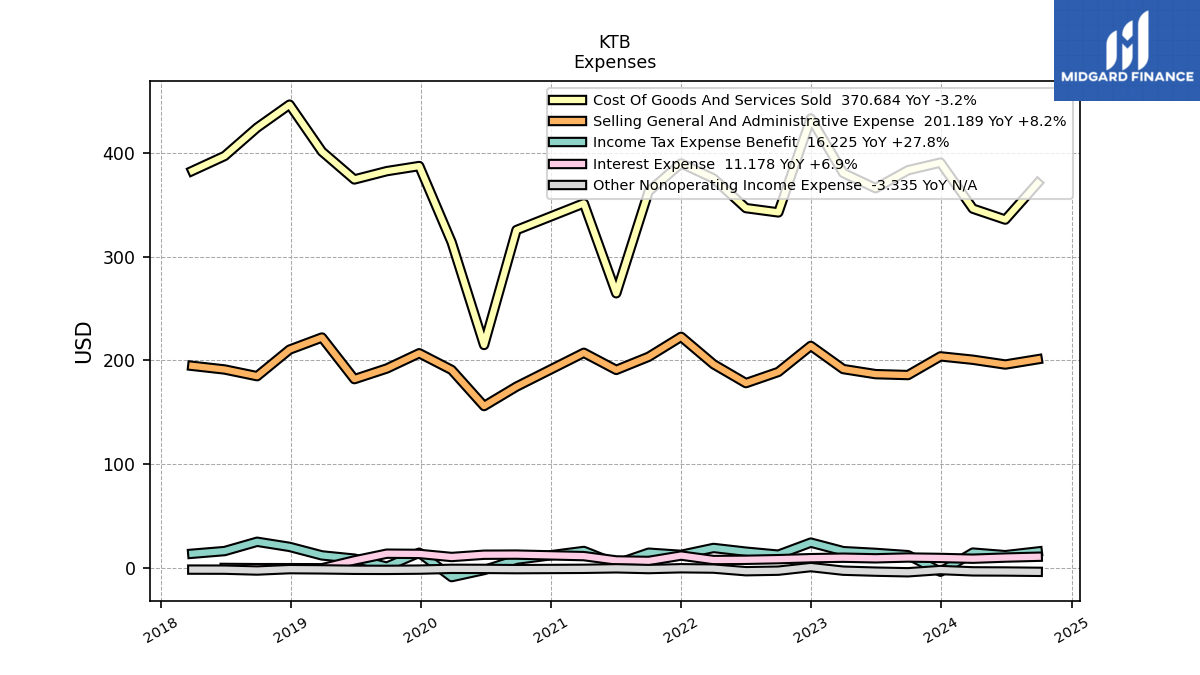
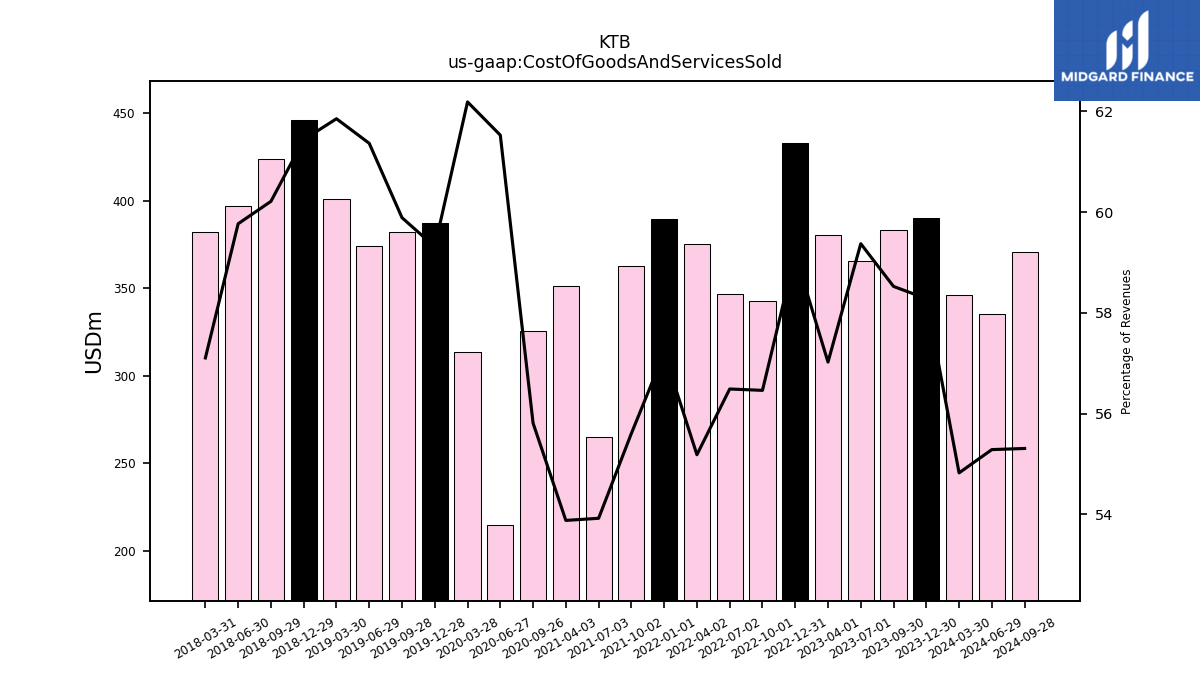
| Cost Of Goods And Services Sold | 390.39 | 383.07 | 365.75 | 380.42 | 432.89 | 342.46 | 346.61 | 375.12 | 389.63 | 362.74 | 264.64 | 351.18 | 325.51 | 214.89 | 313.73 | 387.08 | 382.18 | 374.18 | 401.02 | 446.18 | 424.05 | 396.79 | 382.42 | |
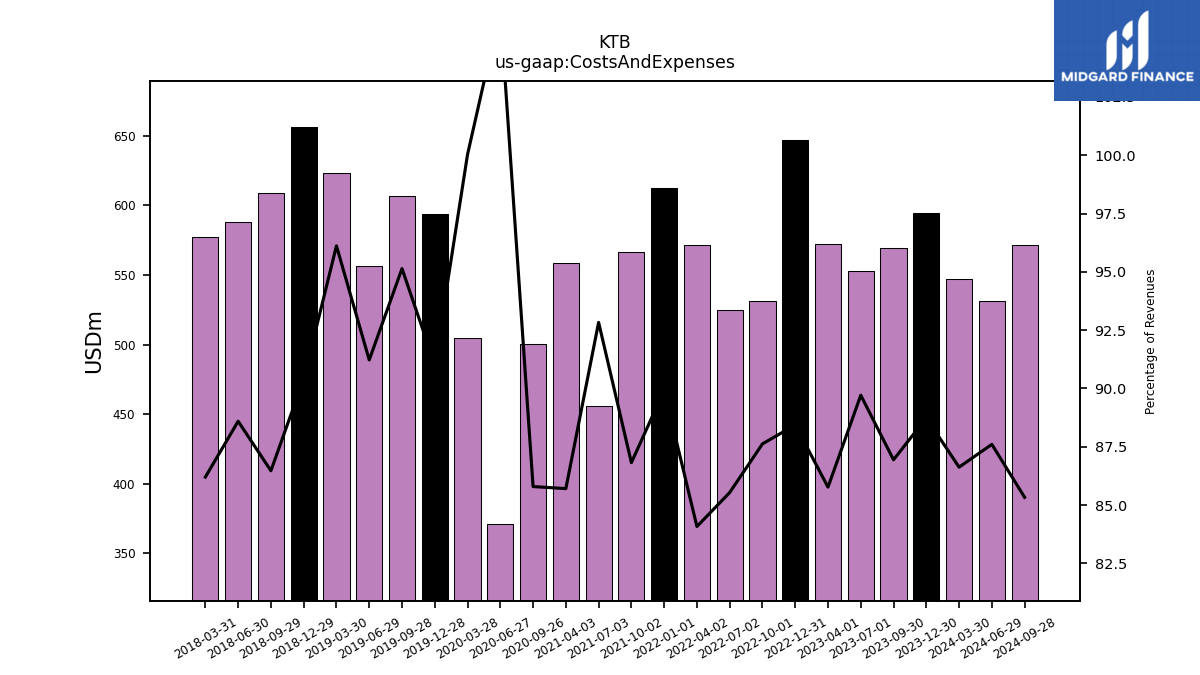
| Costs And Expenses | 594.36 | 569.06 | 552.61 | 572.17 | 646.98 | 531.46 | 524.83 | 571.52 | 612.45 | 566.32 | 455.59 | 558.59 | 500.36 | 371.05 | 504.66 | 594.06 | 607.11 | 556.23 | 623.15 | 656.62 | 608.96 | 588.12 | 577.25 | |
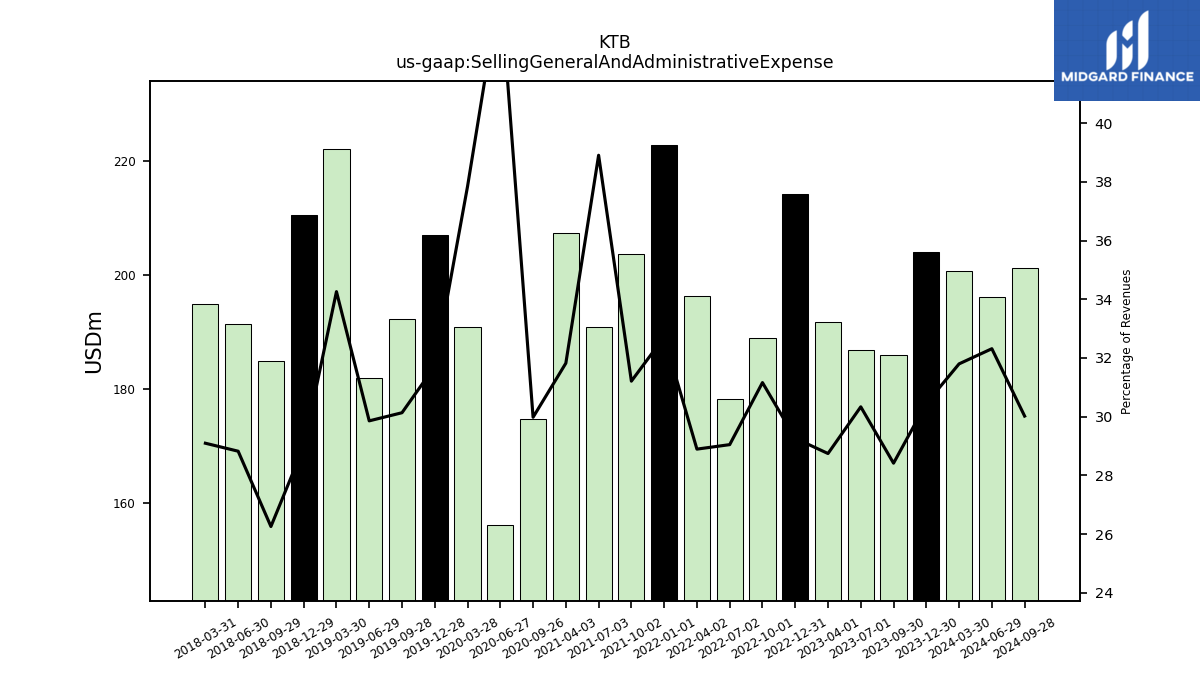
| Selling General And Administrative Expense | 203.97 | 185.98 | 186.86 | 191.75 | 214.09 | 189.00 | 178.22 | 196.40 | 222.81 | 203.58 | 190.95 | 207.40 | 174.85 | 156.16 | 190.93 | 206.98 | 192.29 | 182.05 | 222.12 | 210.44 | 184.91 | 191.34 | 194.83 | |
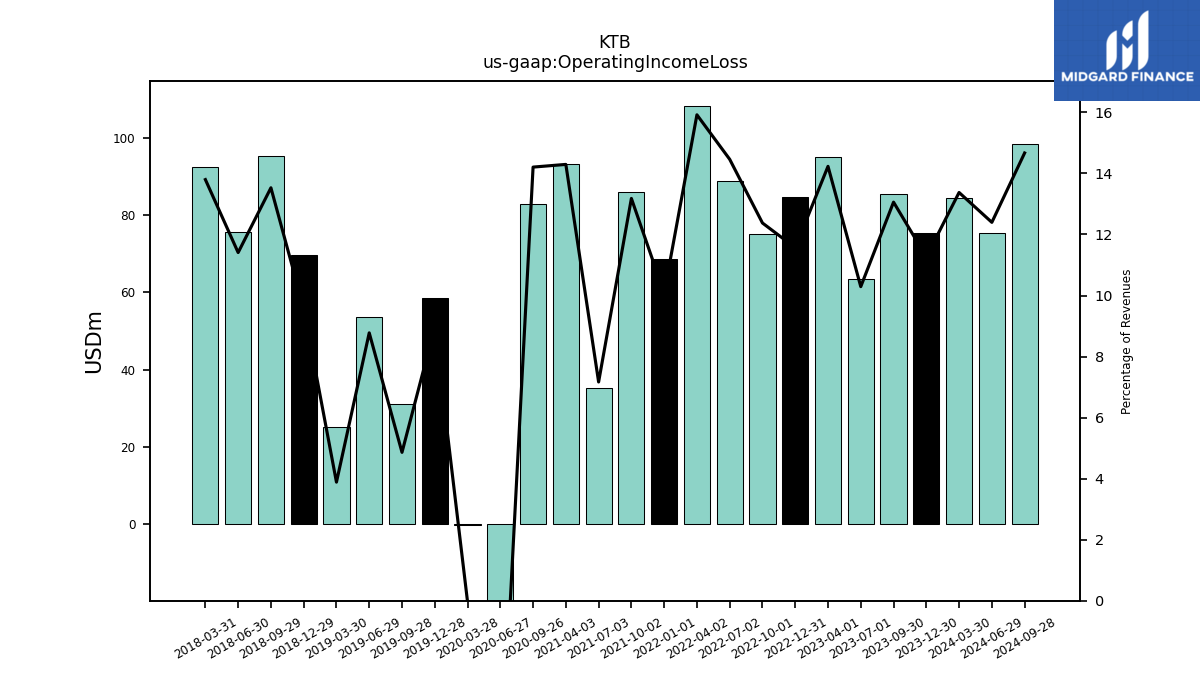
| Operating Income Loss | 75.44 | 85.48 | 63.40 | 94.95 | 84.63 | 75.07 | 88.75 | 108.22 | 68.65 | 85.98 | 35.18 | 93.18 | 82.86 | -21.80 | -0.16 | 58.55 | 31.03 | 53.52 | 25.20 | 69.62 | 95.28 | 75.73 | 92.41 | |
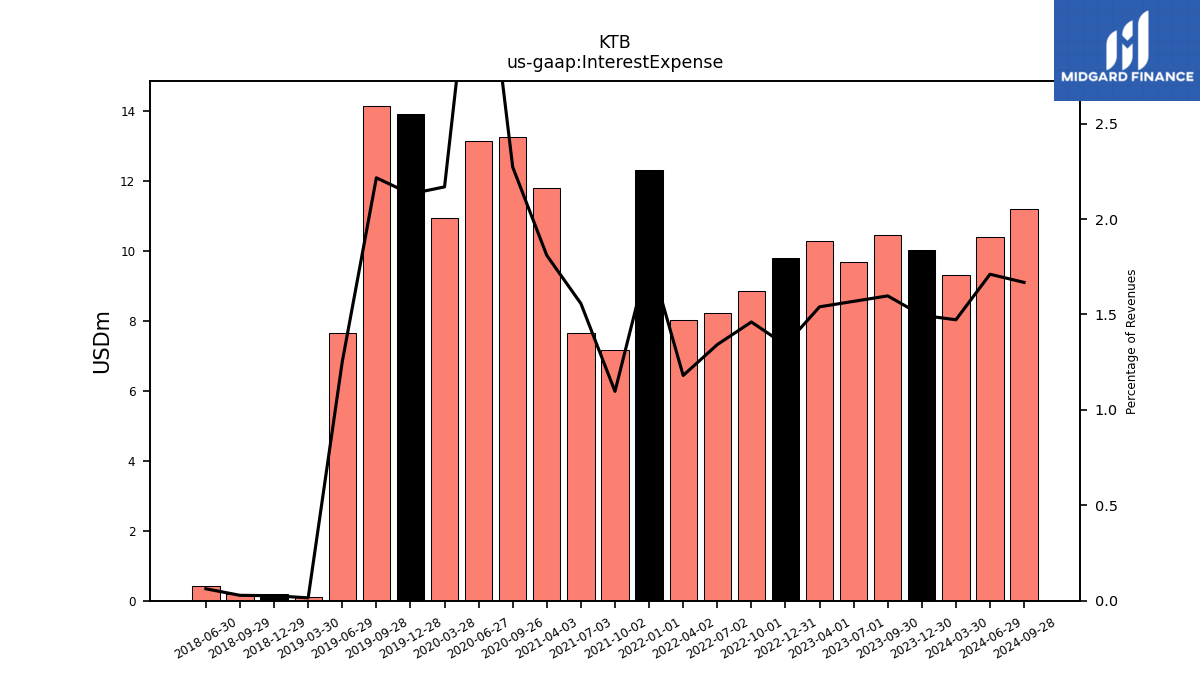
| Interest Expense | 10.02 | 10.45 | 9.66 | 10.27 | 9.80 | 8.86 | 8.23 | 8.02 | 12.31 | 7.16 | 7.64 | 11.79 | 13.25 | 13.12 | 10.94 | 13.91 | 14.14 | 7.64 | 0.10 | 0.19 | 0.20 | 0.42 | NA | |
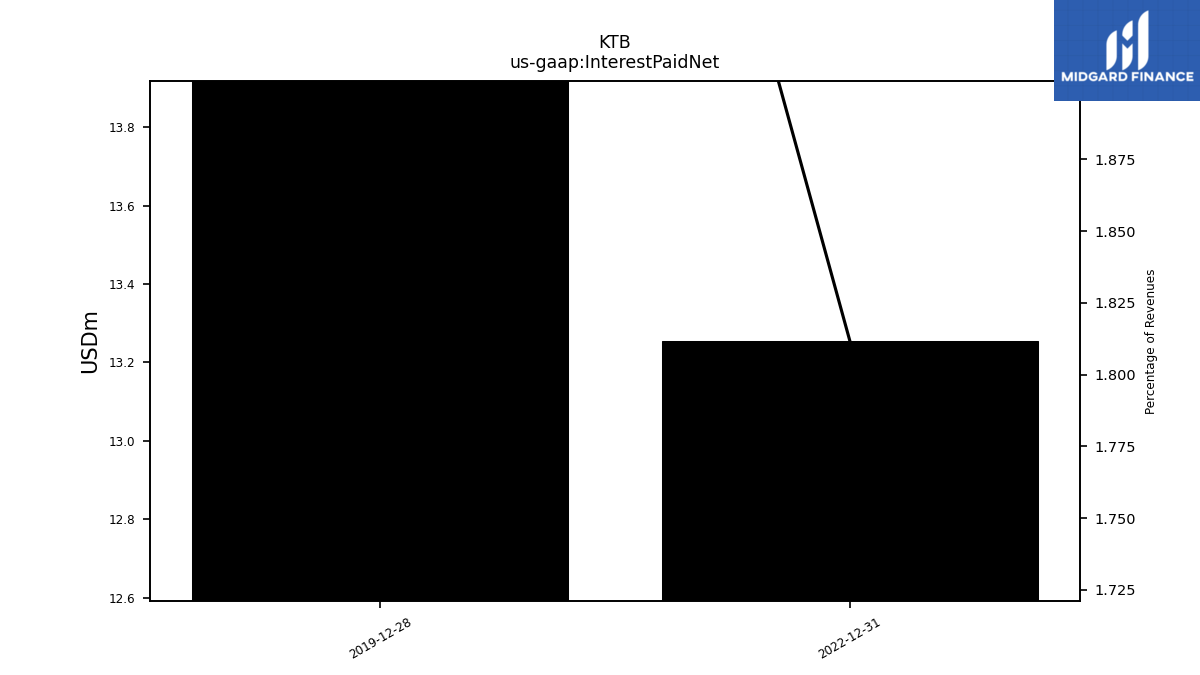
| Interest Paid Net | 12.90 | NA | NA | NA | 13.26 | NA | NA | NA | NA | NA | NA | NA | NA | NA | NA | 15.71 | NA | NA | NA | NA | NA | NA | NA | |
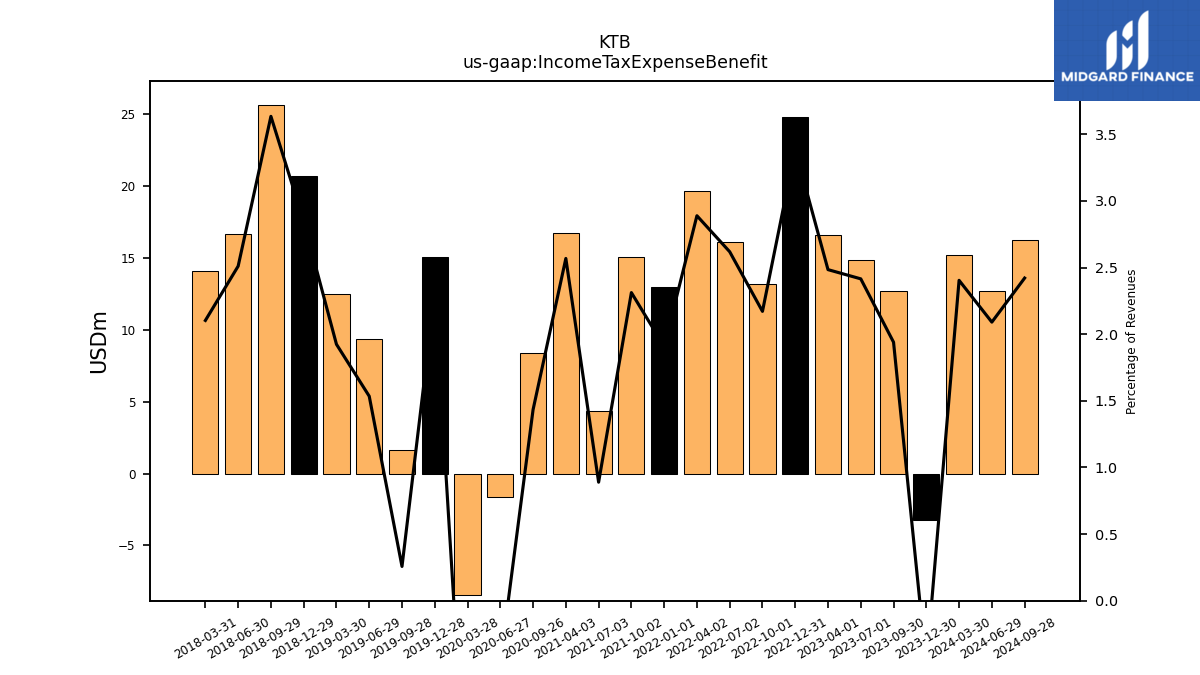
| Income Tax Expense Benefit | -3.24 | 12.70 | 14.88 | 16.57 | 24.77 | 13.17 | 16.07 | 19.64 | 12.99 | 15.08 | 4.37 | 16.74 | 8.36 | -1.61 | -8.43 | 15.07 | 1.64 | 9.36 | 12.47 | 20.66 | 25.59 | 16.66 | 14.08 | |
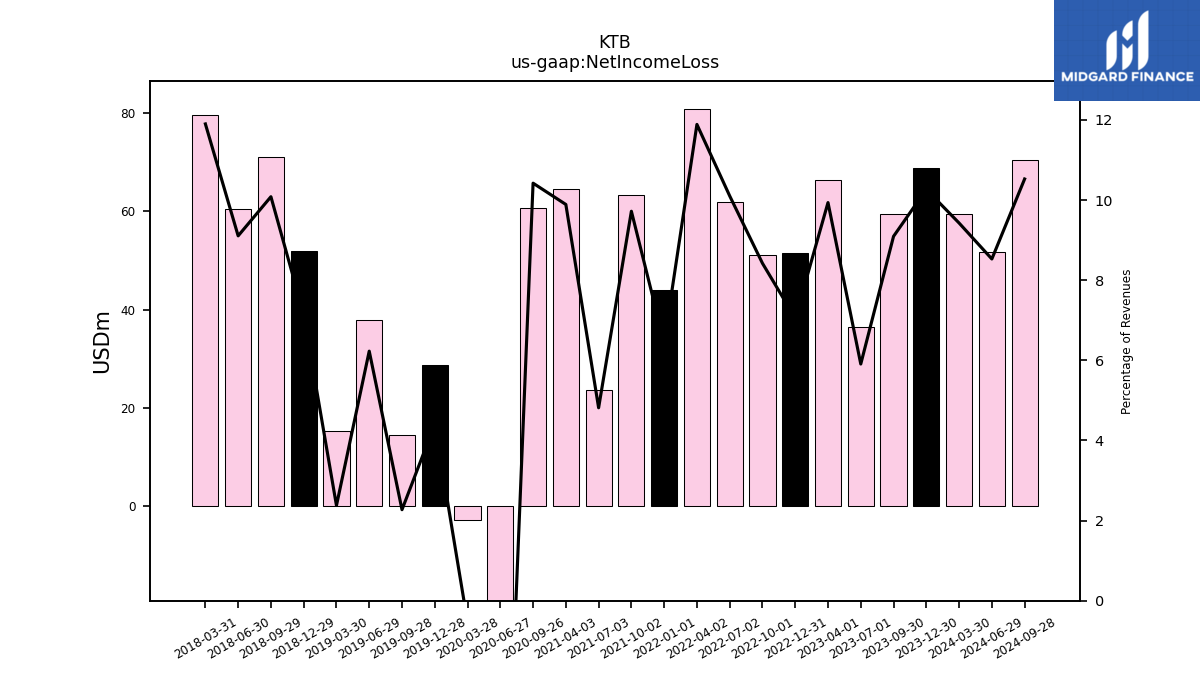
| Net Income Loss | 68.77 | 59.53 | 36.40 | 66.30 | 51.60 | 51.08 | 61.99 | 80.81 | 43.91 | 63.41 | 23.64 | 64.46 | 60.78 | -33.26 | -2.71 | 28.75 | 14.50 | 37.99 | 15.41 | 51.90 | 71.02 | 60.46 | 79.70 | |
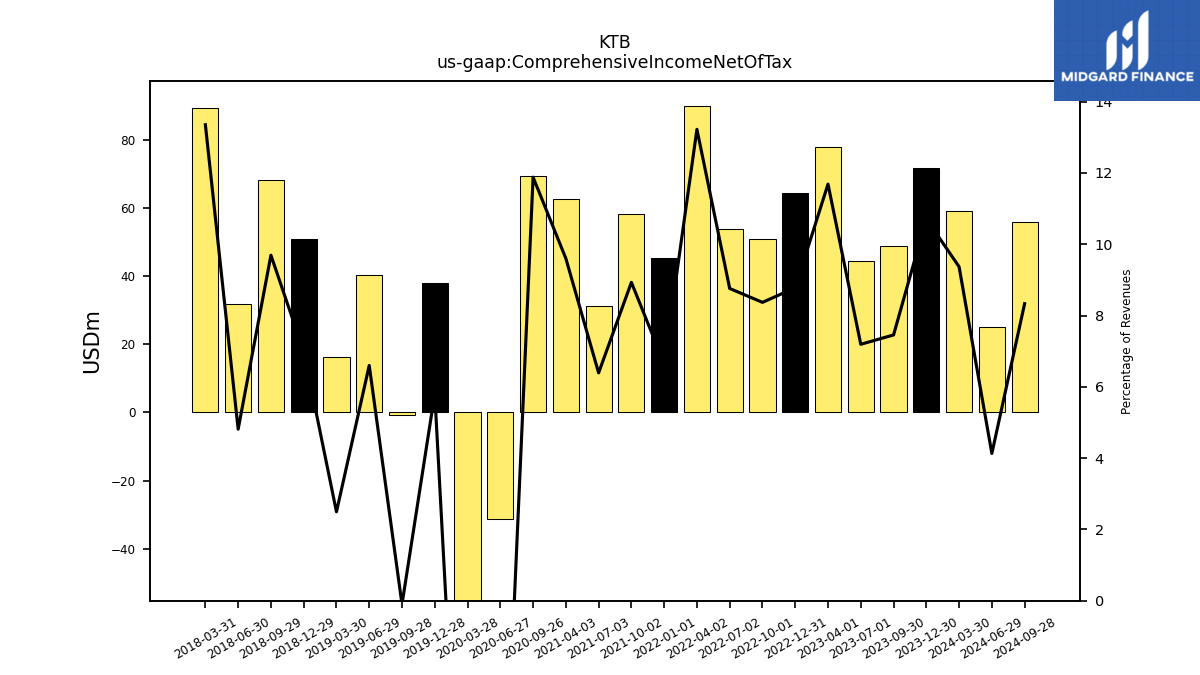
| Comprehensive Income Net Of Tax | 71.75 | 48.79 | 44.31 | 77.96 | 64.22 | 50.76 | 53.73 | 89.87 | 45.29 | 58.25 | 31.36 | 62.57 | 69.29 | -31.10 | -56.48 | 37.89 | -0.65 | 40.24 | 16.17 | 50.79 | 68.25 | 31.94 | 89.40 |
| 2023-12-30 | 2023-09-30 | 2023-07-01 | 2023-04-01 | 2022-12-31 | 2022-10-01 | 2022-07-02 | 2022-04-02 | 2022-01-01 | 2021-10-02 | 2021-07-03 | 2021-04-03 | 2020-09-26 | 2020-06-27 | 2020-03-28 | 2019-12-28 | 2019-09-28 | 2019-06-29 | 2019-03-30 | 2018-12-29 | 2018-09-29 | 2018-06-30 | 2018-03-31 | ||
|---|---|---|---|---|---|---|---|---|---|---|---|---|---|---|---|---|---|---|---|---|---|---|---|---|
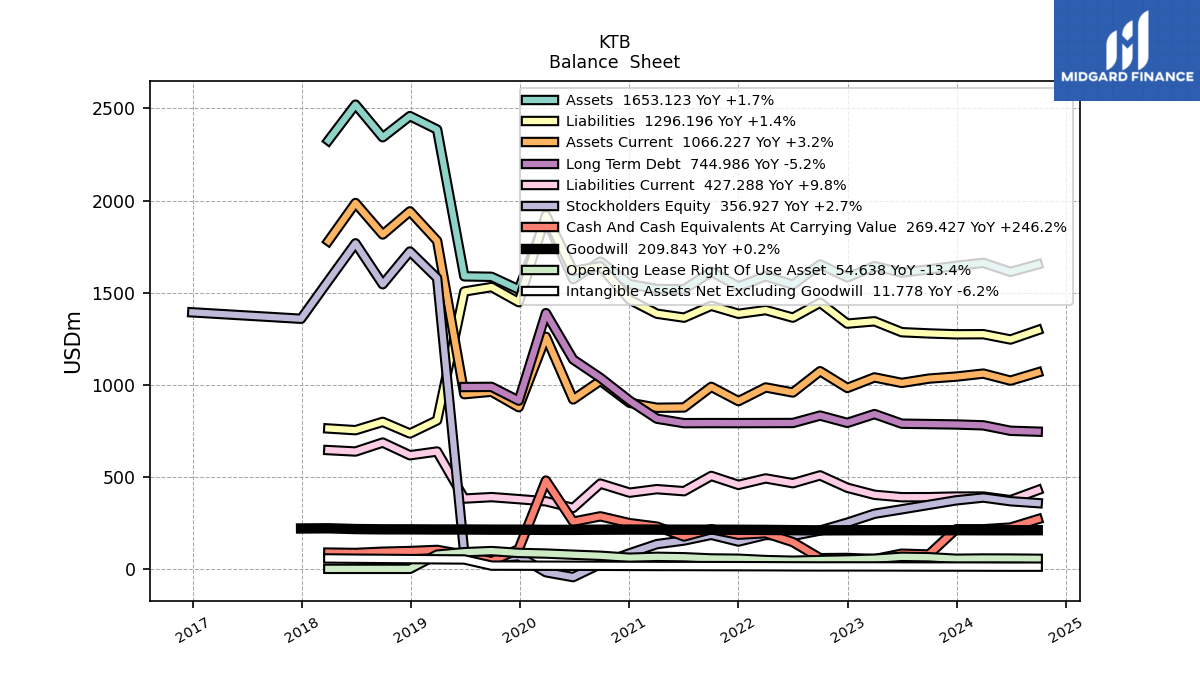
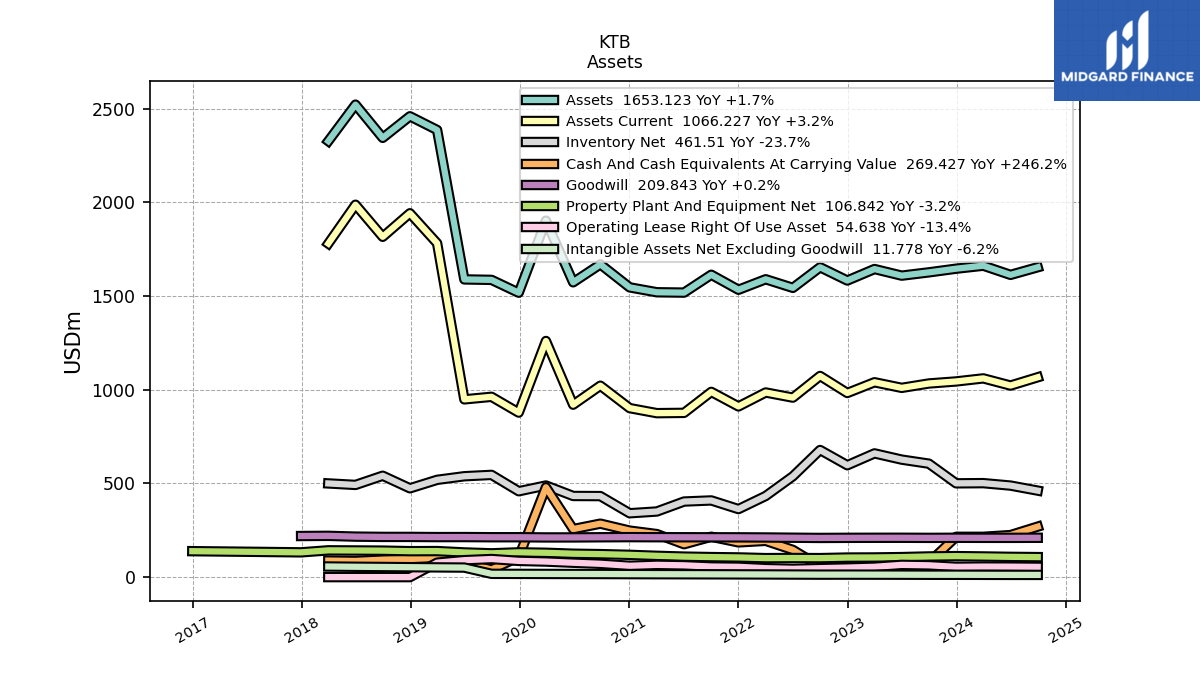
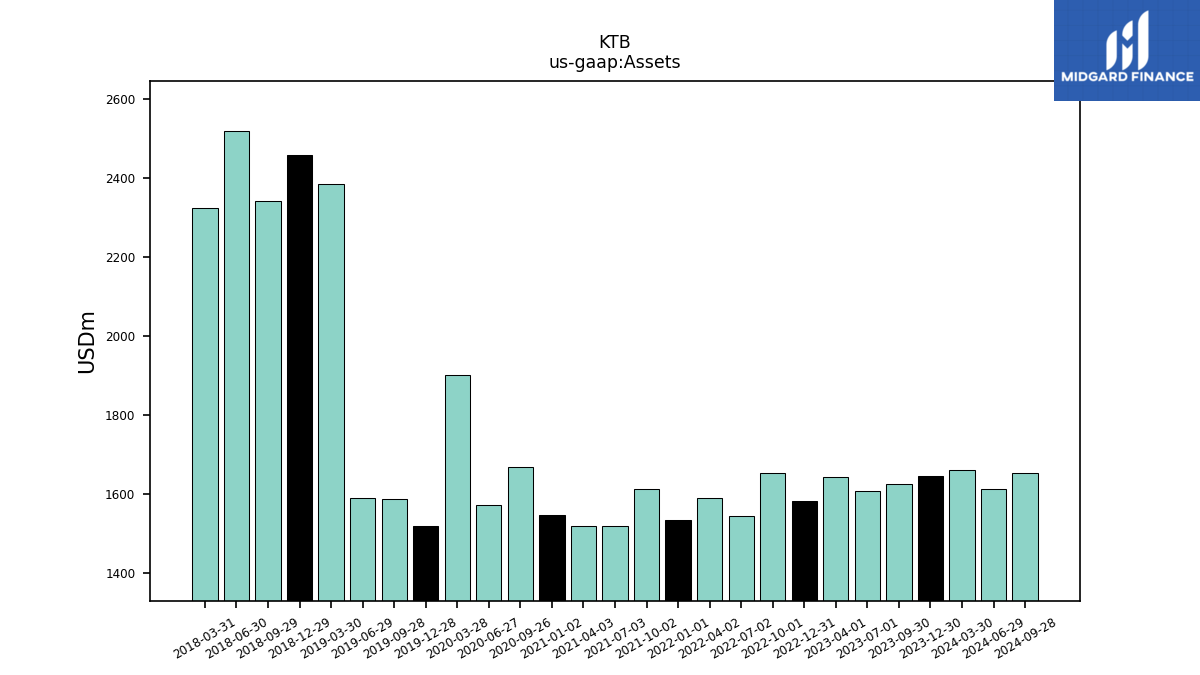
| Assets | 1645.44 | 1625.93 | 1608.32 | 1643.57 | 1582.26 | 1653.01 | 1543.15 | 1589.05 | 1533.02 | 1613.18 | 1517.85 | 1519.67 | 1668.72 | 1572.77 | 1901.80 | 1517.16 | 1585.77 | 1588.20 | 2385.41 | 2458.47 | 2343.31 | 2520.68 | 2325.97 | |
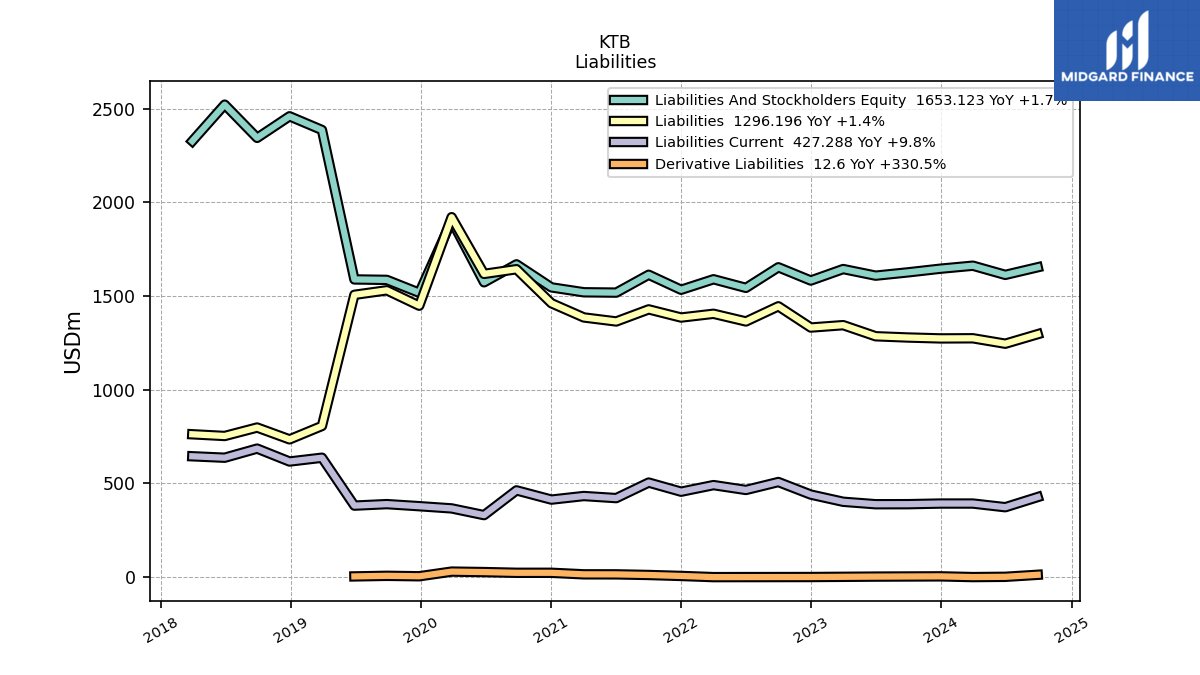
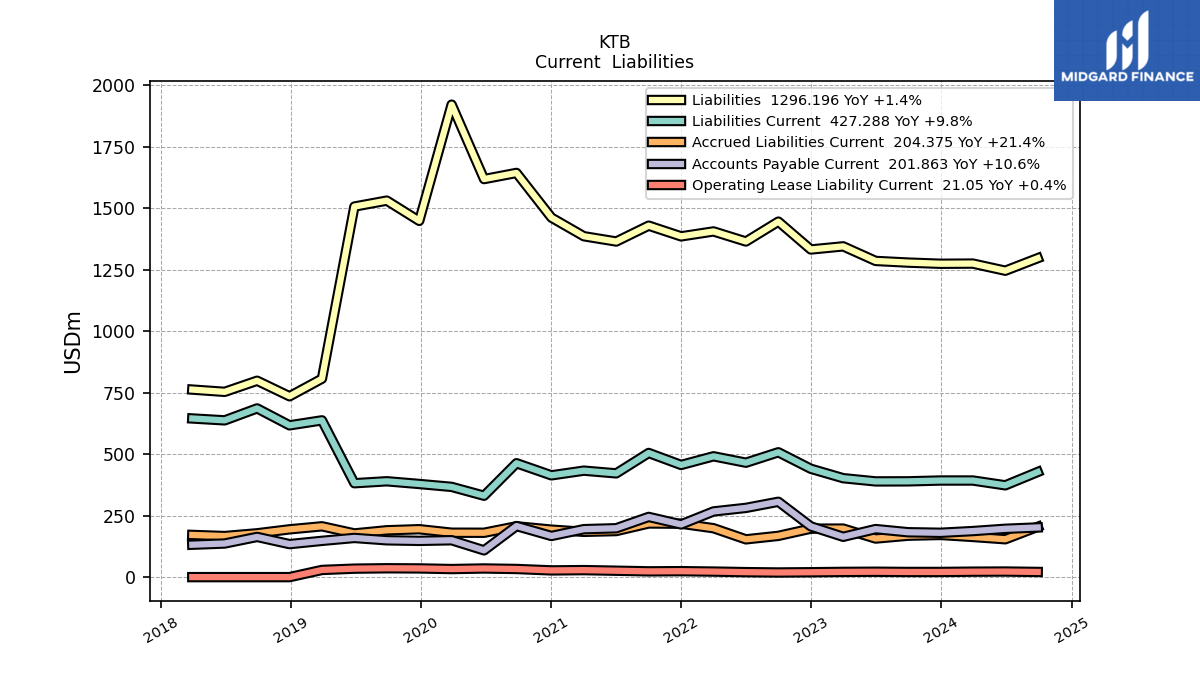
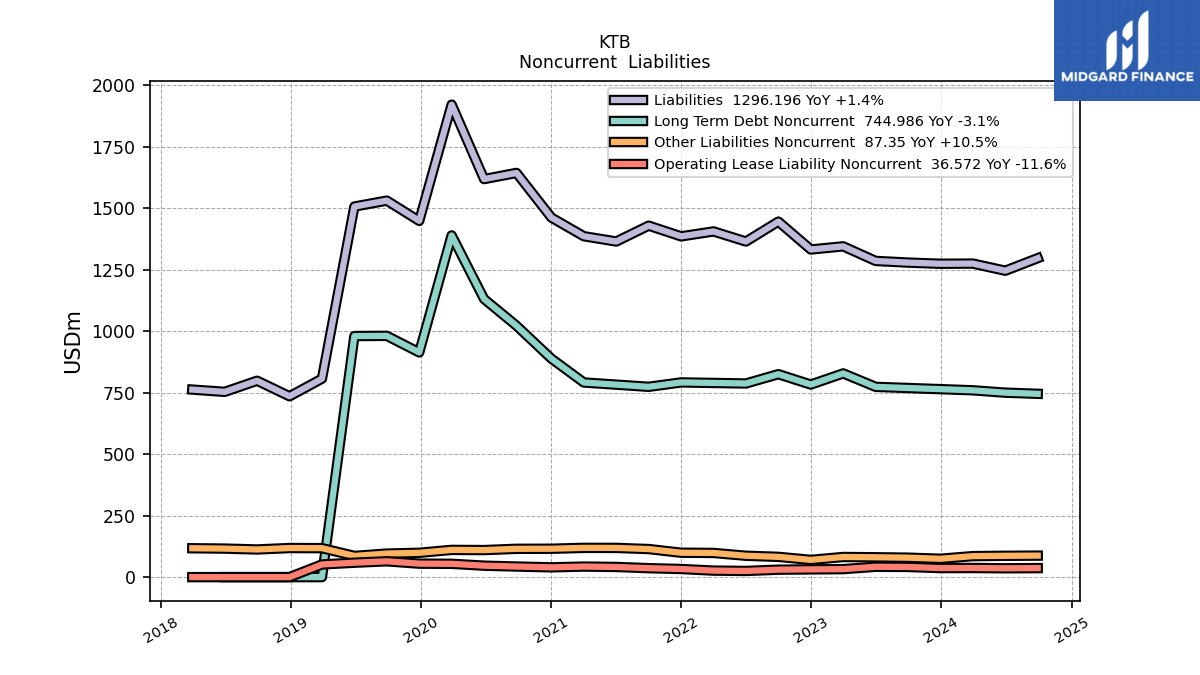
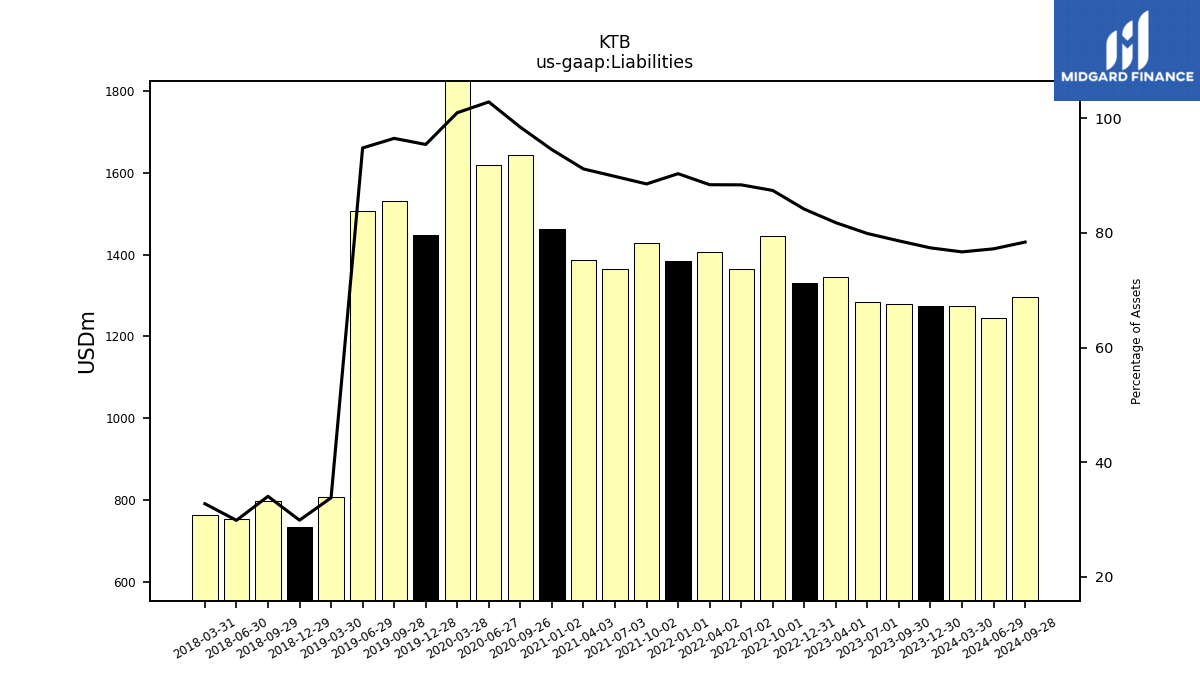
| Liabilities | 1273.53 | 1278.31 | 1285.07 | 1344.28 | 1331.50 | 1444.91 | 1363.96 | 1404.96 | 1384.89 | 1428.43 | 1363.96 | 1385.41 | 1642.70 | 1617.66 | 1920.28 | 1447.90 | 1530.19 | 1506.03 | 806.43 | 735.01 | 798.15 | 752.99 | 762.18 | |
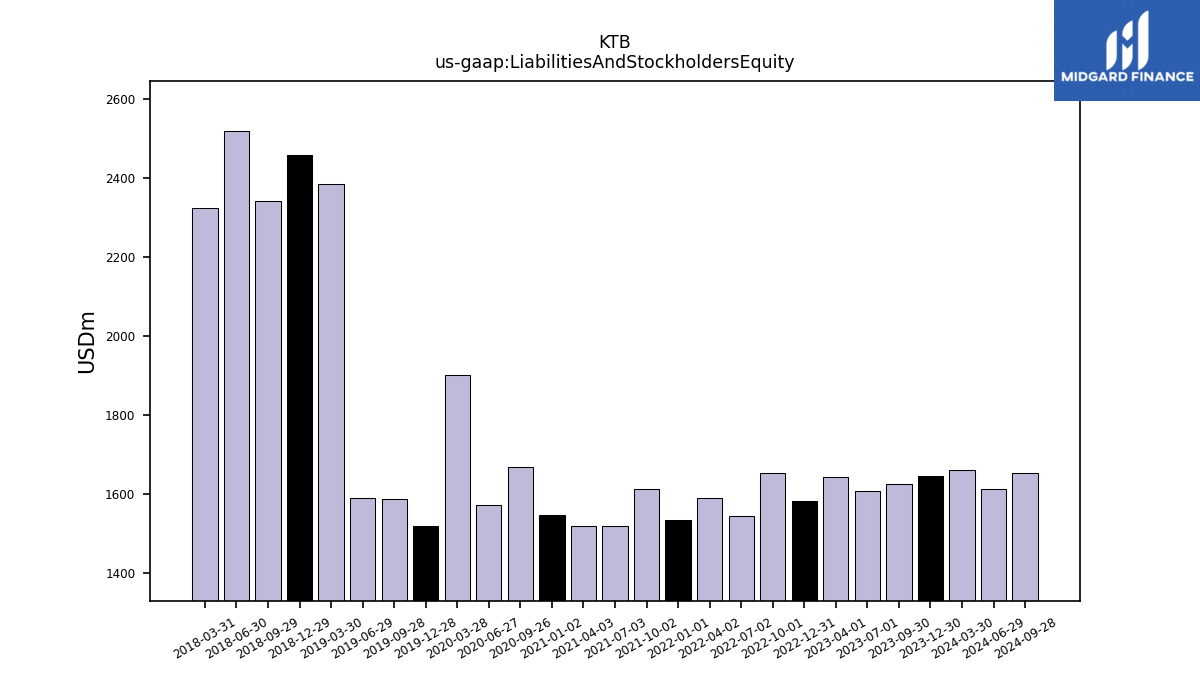
| Liabilities And Stockholders Equity | 1645.44 | 1625.93 | 1608.32 | 1643.57 | 1582.26 | 1653.01 | 1543.15 | 1589.05 | 1533.02 | 1613.18 | 1517.85 | 1519.67 | 1668.72 | 1572.77 | 1901.80 | 1517.16 | 1585.77 | 1588.20 | 2385.41 | 2458.47 | 2343.31 | 2520.68 | 2325.97 | |
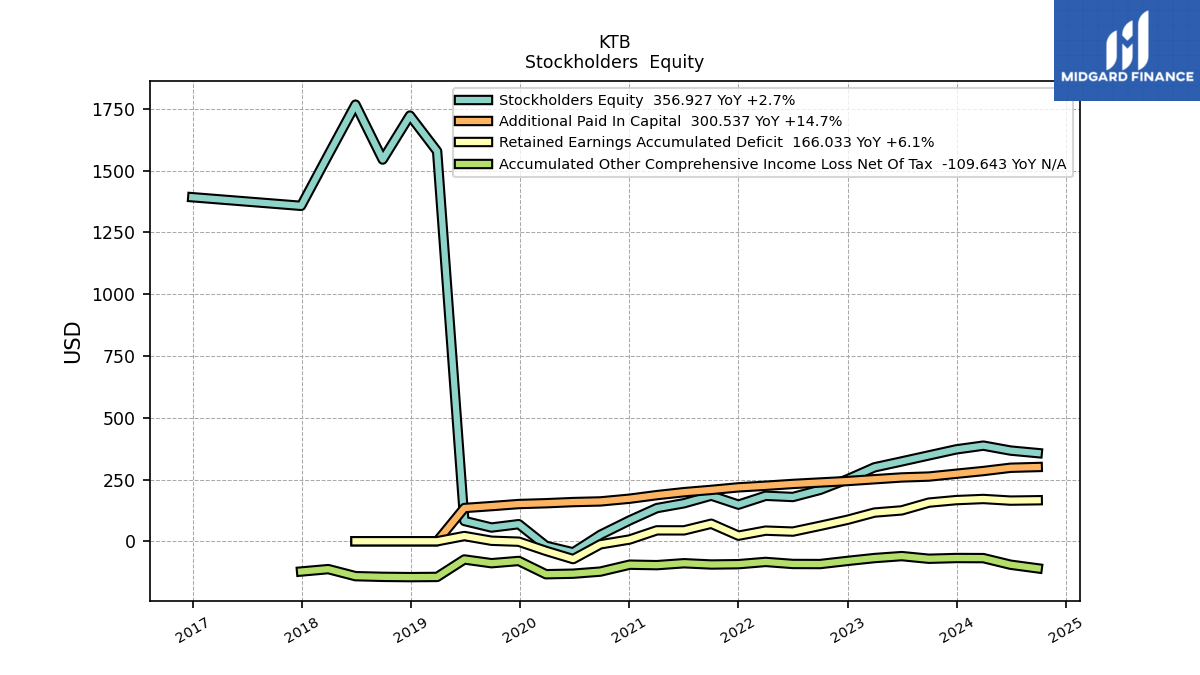
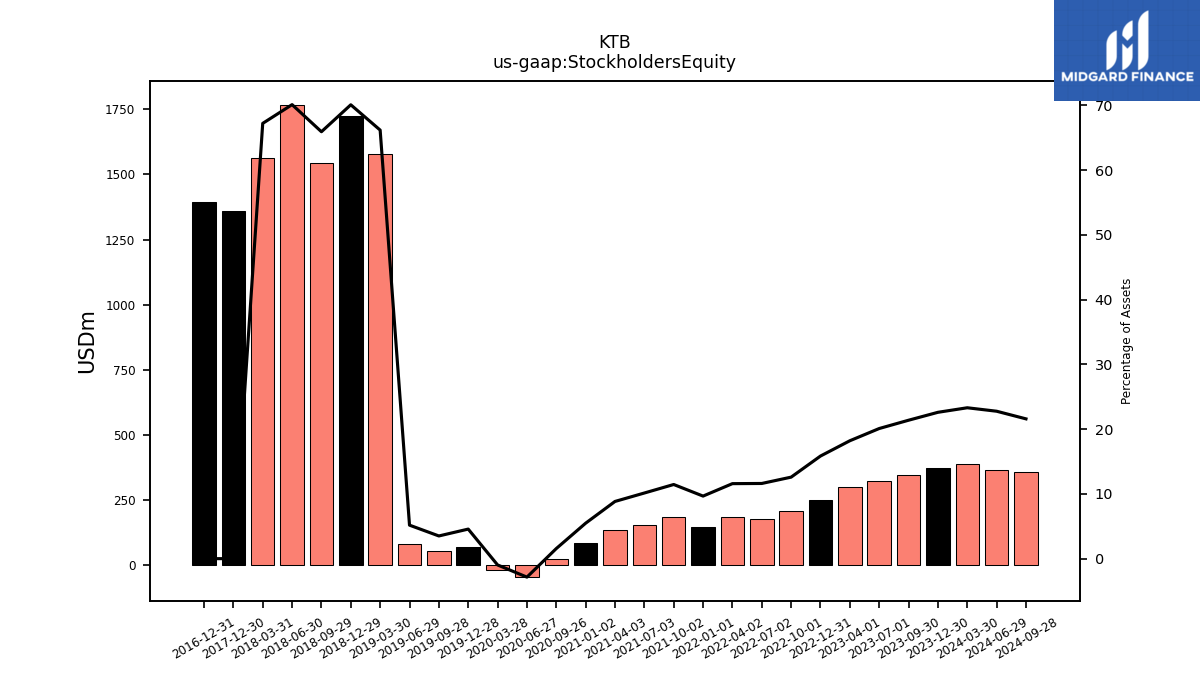
| Stockholders Equity | 371.91 | 347.62 | 323.25 | 299.29 | 250.76 | 208.10 | 179.19 | 184.09 | 148.14 | 184.75 | 153.89 | 134.26 | 26.03 | -44.89 | -18.48 | 69.26 | 55.57 | 82.17 | 1578.98 | 1723.45 | 1545.16 | 1767.69 | 1563.78 |
| 2023-12-30 | 2023-09-30 | 2023-07-01 | 2023-04-01 | 2022-12-31 | 2022-10-01 | 2022-07-02 | 2022-04-02 | 2022-01-01 | 2021-10-02 | 2021-07-03 | 2021-04-03 | 2020-09-26 | 2020-06-27 | 2020-03-28 | 2019-12-28 | 2019-09-28 | 2019-06-29 | 2019-03-30 | 2018-12-29 | 2018-09-29 | 2018-06-30 | 2018-03-31 | ||
|---|---|---|---|---|---|---|---|---|---|---|---|---|---|---|---|---|---|---|---|---|---|---|---|---|
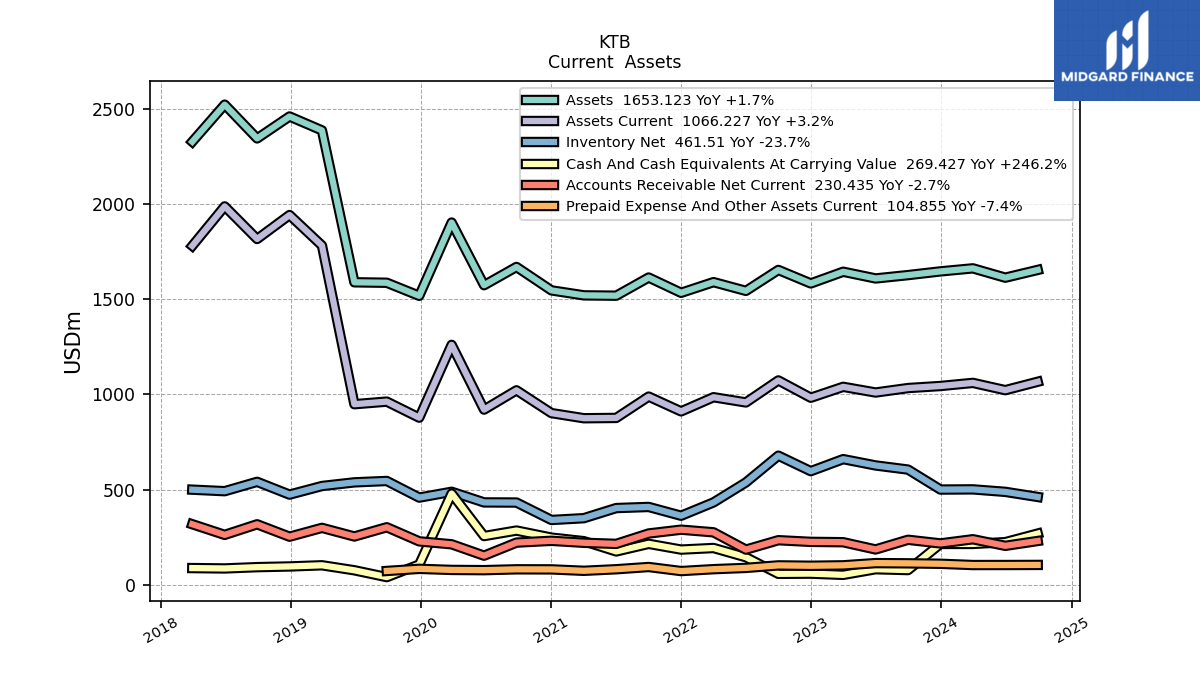
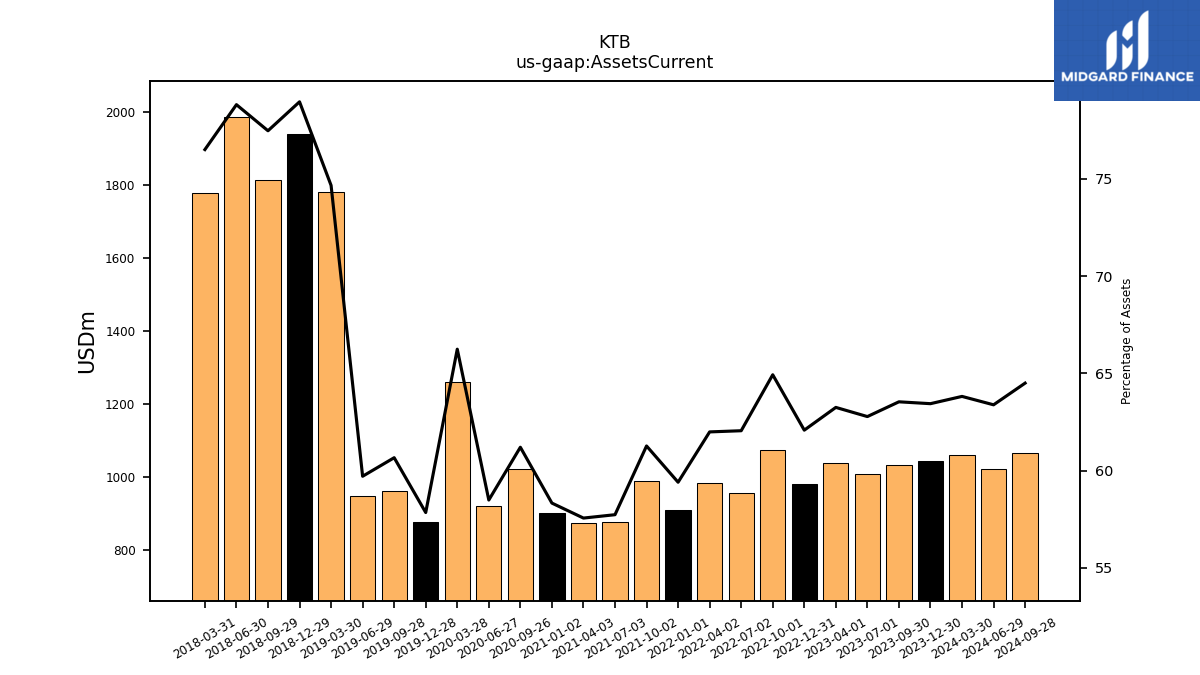
| Assets Current | 1043.88 | 1033.06 | 1009.67 | 1039.55 | 982.27 | 1073.25 | 957.52 | 985.05 | 910.66 | 988.35 | 876.30 | 874.73 | 1021.28 | 919.88 | 1259.79 | 877.60 | 961.97 | 948.30 | 1781.02 | 1941.20 | 1815.39 | 1986.63 | 1779.45 | |
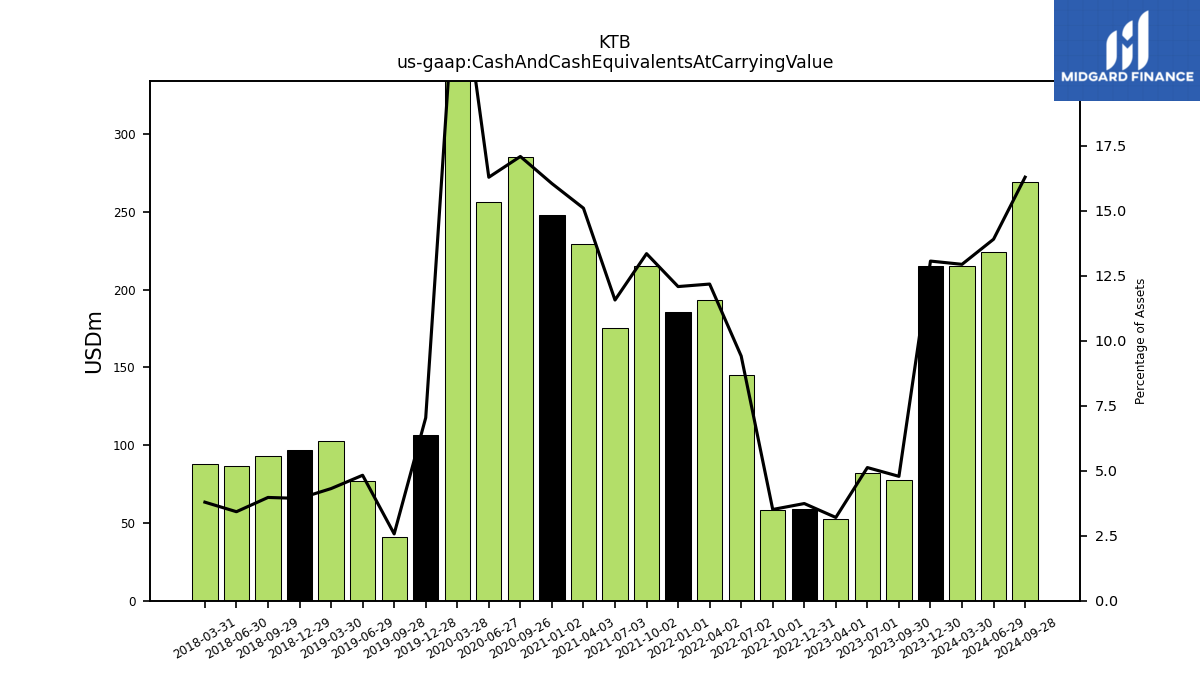
| Cash And Cash Equivalents At Carrying Value | 215.05 | 77.83 | 82.42 | 52.68 | 59.18 | 58.05 | 145.30 | 193.63 | 185.32 | 215.44 | 175.63 | 229.54 | 285.25 | 256.28 | 479.37 | 106.81 | 40.80 | 76.69 | 102.94 | 96.78 | 93.14 | 86.36 | 88.23 | |
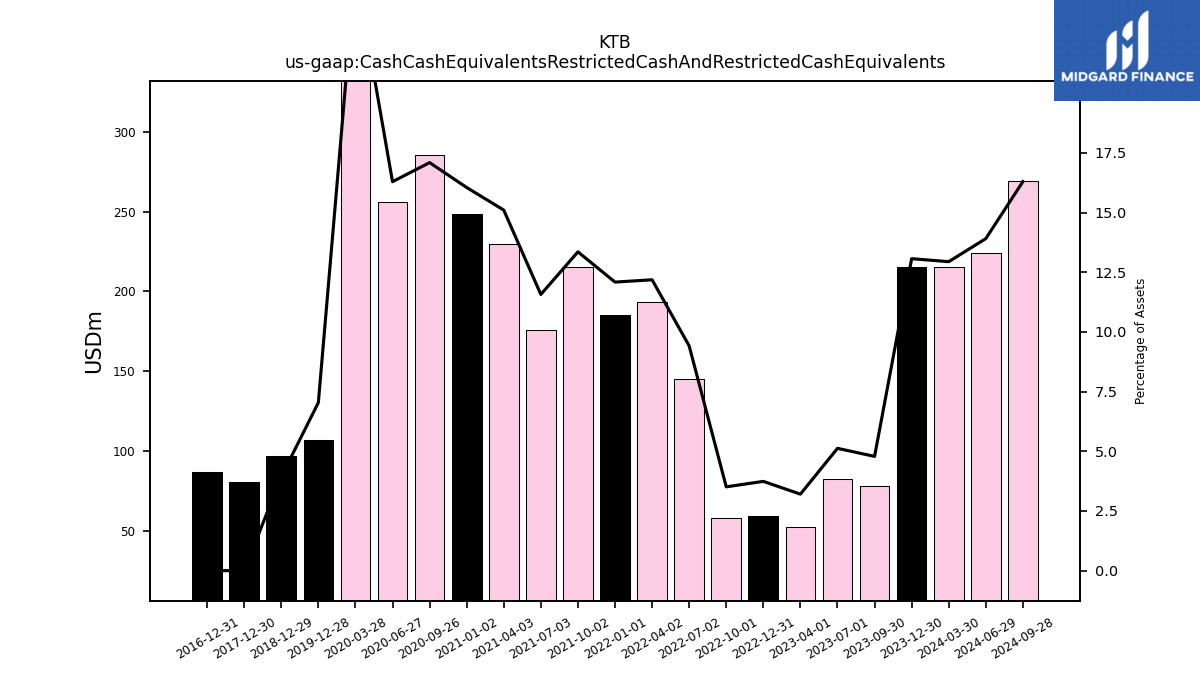
| Cash Cash Equivalents Restricted Cash And Restricted Cash Equivalents | 215.05 | 77.83 | 82.42 | 52.68 | 59.18 | 58.05 | 145.30 | 193.63 | 185.32 | 215.44 | 175.63 | 229.54 | 285.25 | 256.28 | 479.37 | 106.81 | NA | NA | NA | 96.78 | NA | NA | NA | |
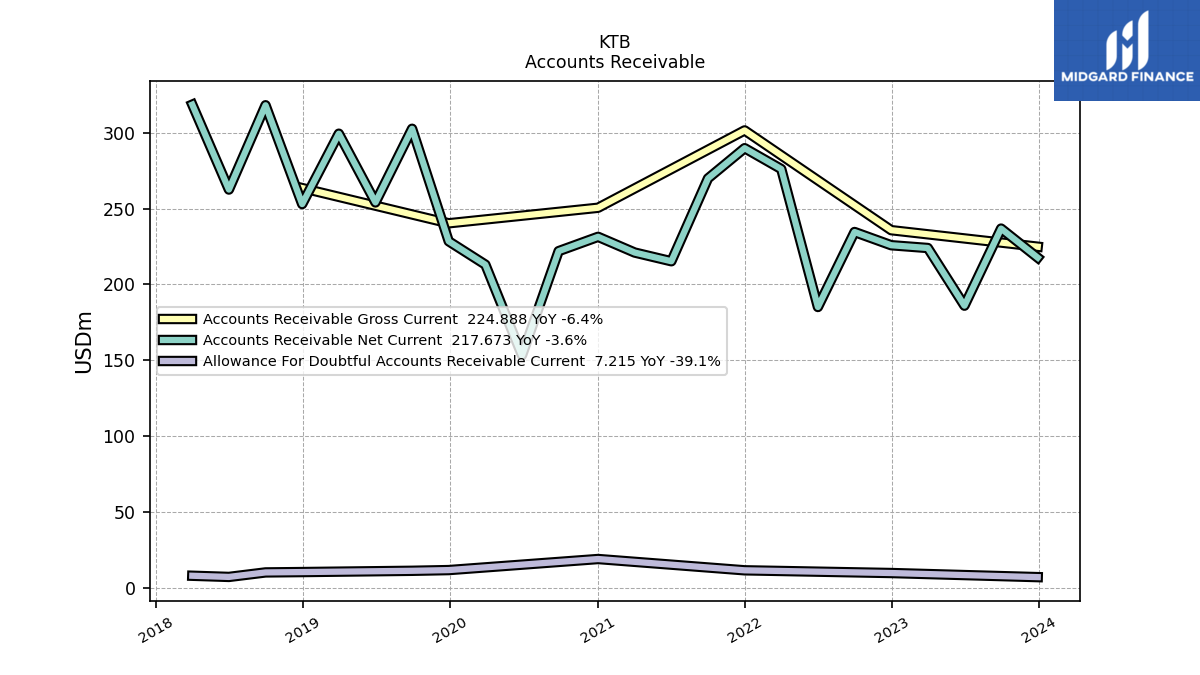
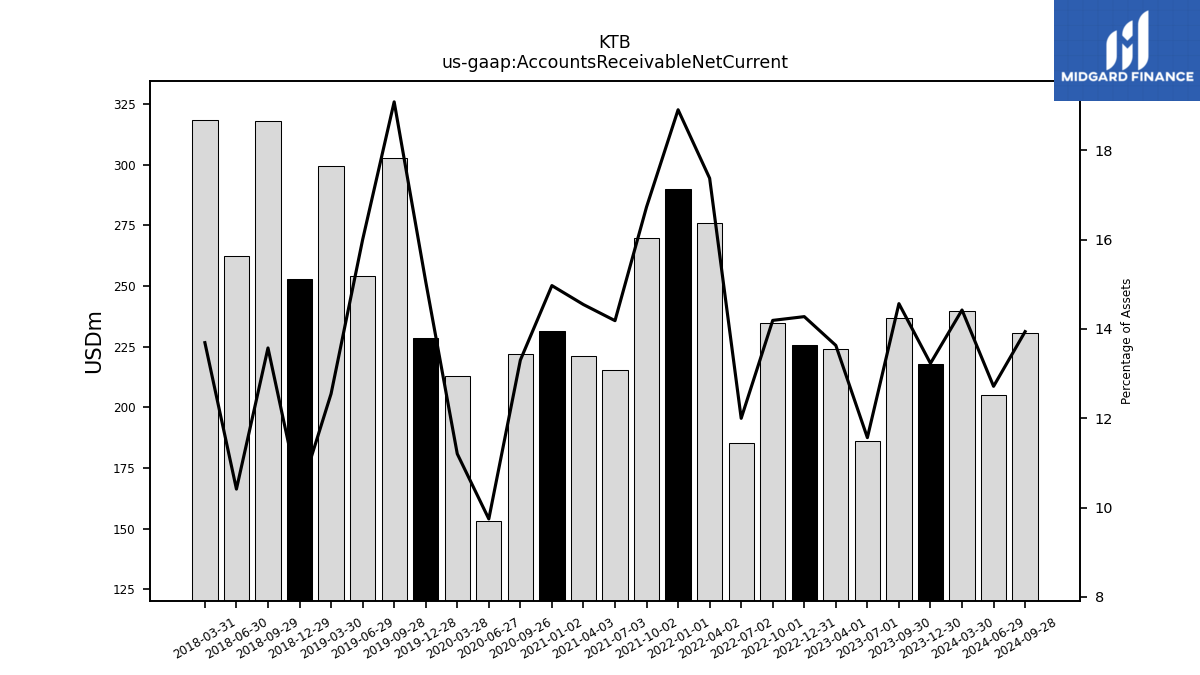
| Accounts Receivable Net Current | 217.67 | 236.82 | 186.02 | 224.02 | 225.86 | 234.57 | 185.16 | 276.04 | 289.80 | 269.87 | 215.30 | 221.03 | 221.97 | 153.30 | 213.08 | 228.46 | 302.58 | 254.05 | 299.33 | 252.97 | 318.07 | 262.52 | 318.48 | |
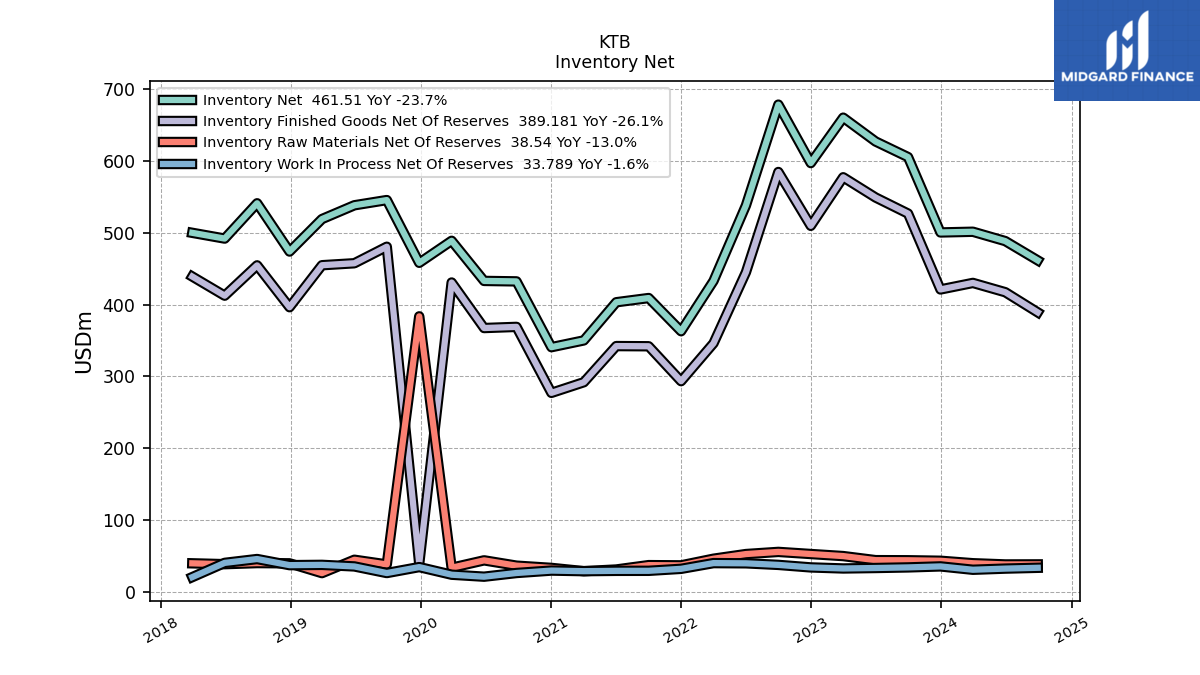
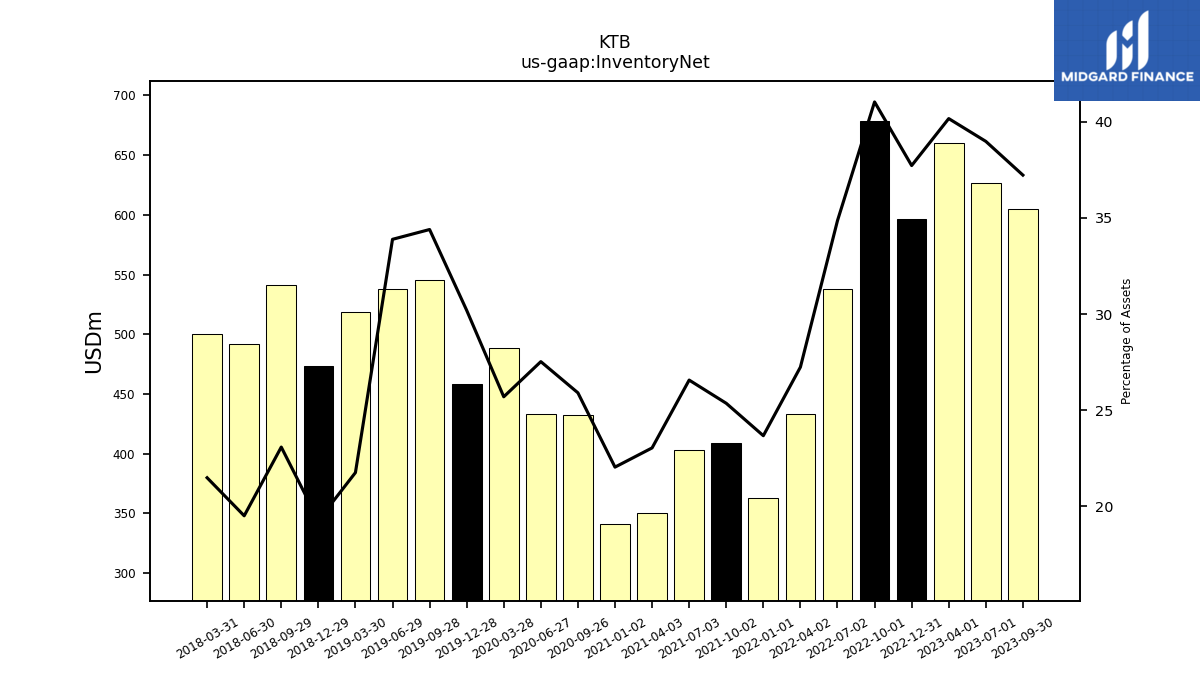
| Inventory Net | 500.35 | 605.23 | 626.88 | 660.09 | 596.84 | 678.21 | 537.90 | 432.89 | 362.96 | 409.11 | 403.25 | 350.15 | 432.28 | 432.93 | 488.75 | 458.10 | 545.43 | 538.17 | 519.01 | 473.81 | 540.94 | 491.84 | 499.85 | |
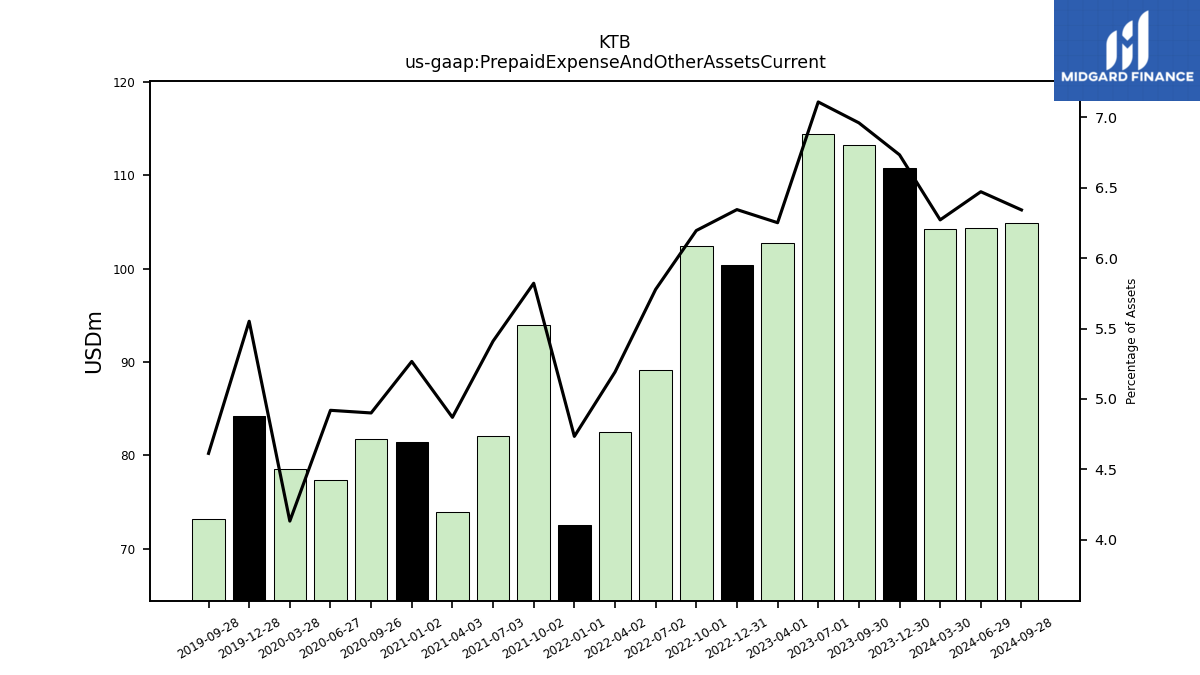
| Prepaid Expense And Other Assets Current | 110.81 | 113.19 | 114.34 | 102.76 | 100.40 | 102.42 | 89.17 | 82.50 | 72.58 | 93.92 | 82.13 | 74.00 | 81.78 | 77.37 | 78.60 | 84.23 | 73.16 | NA | NA | NA | NA | NA | NA |
| 2023-12-30 | 2023-09-30 | 2023-07-01 | 2023-04-01 | 2022-12-31 | 2022-10-01 | 2022-07-02 | 2022-04-02 | 2022-01-01 | 2021-10-02 | 2021-07-03 | 2021-04-03 | 2020-09-26 | 2020-06-27 | 2020-03-28 | 2019-12-28 | 2019-09-28 | 2019-06-29 | 2019-03-30 | 2018-12-29 | 2018-09-29 | 2018-06-30 | 2018-03-31 | ||
|---|---|---|---|---|---|---|---|---|---|---|---|---|---|---|---|---|---|---|---|---|---|---|---|---|
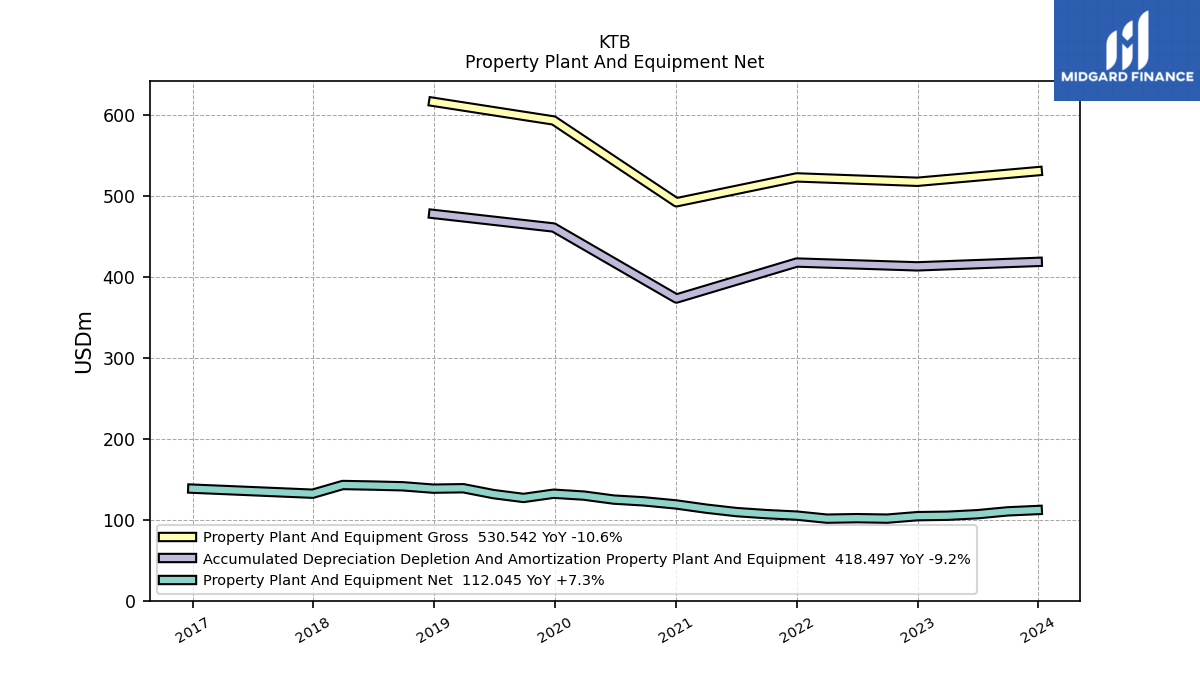
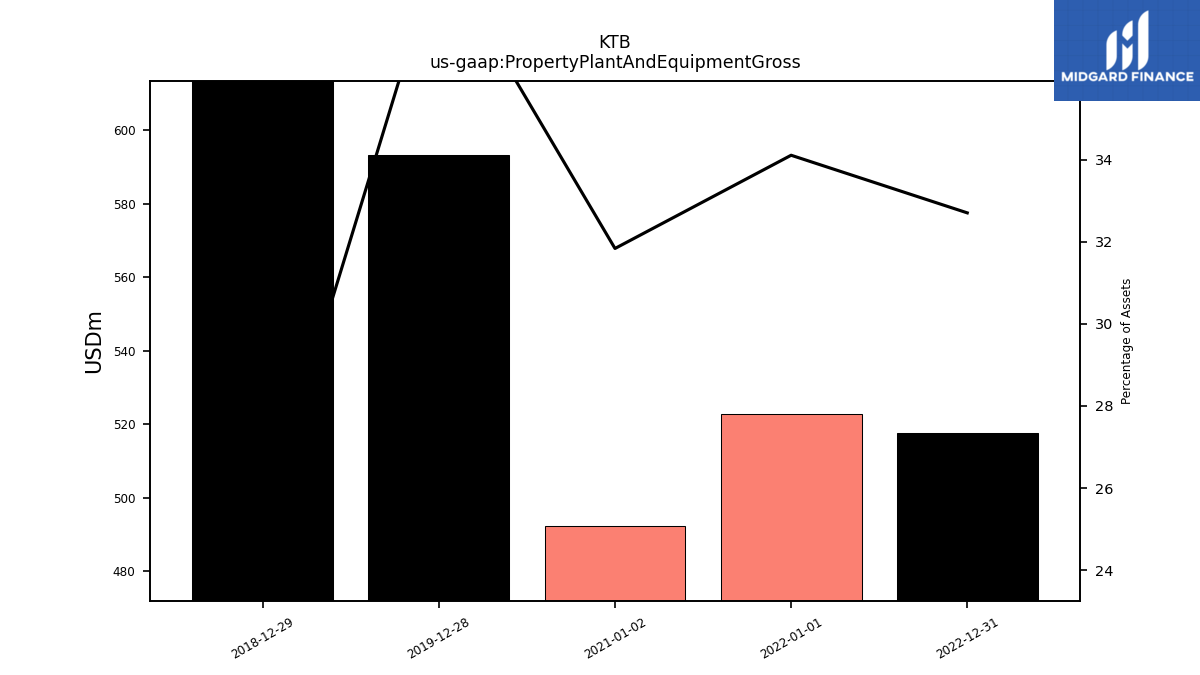
| Property Plant And Equipment Gross | 530.54 | NA | NA | NA | 517.46 | NA | NA | NA | 522.87 | NA | NA | NA | NA | NA | NA | 593.17 | NA | NA | NA | 616.20 | NA | NA | NA | |
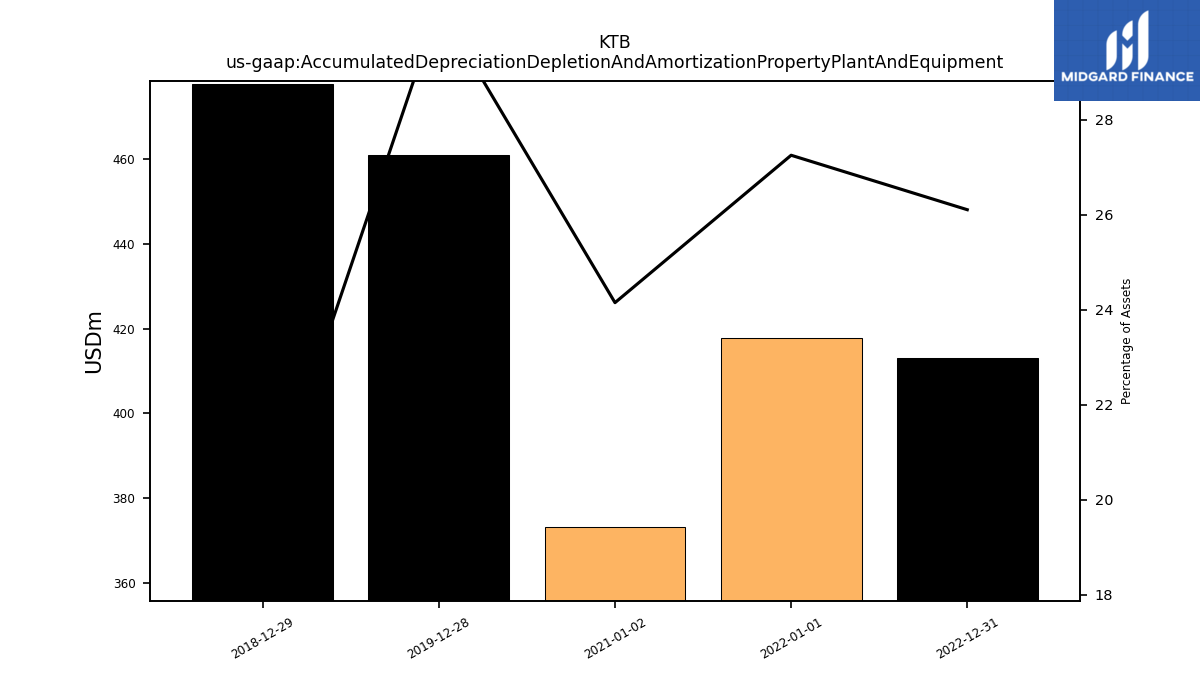
| Accumulated Depreciation Depletion And Amortization Property Plant And Equipment | 418.50 | NA | NA | NA | 413.00 | NA | NA | NA | 417.72 | NA | NA | NA | NA | NA | NA | 460.98 | NA | NA | NA | 477.75 | NA | NA | NA | |
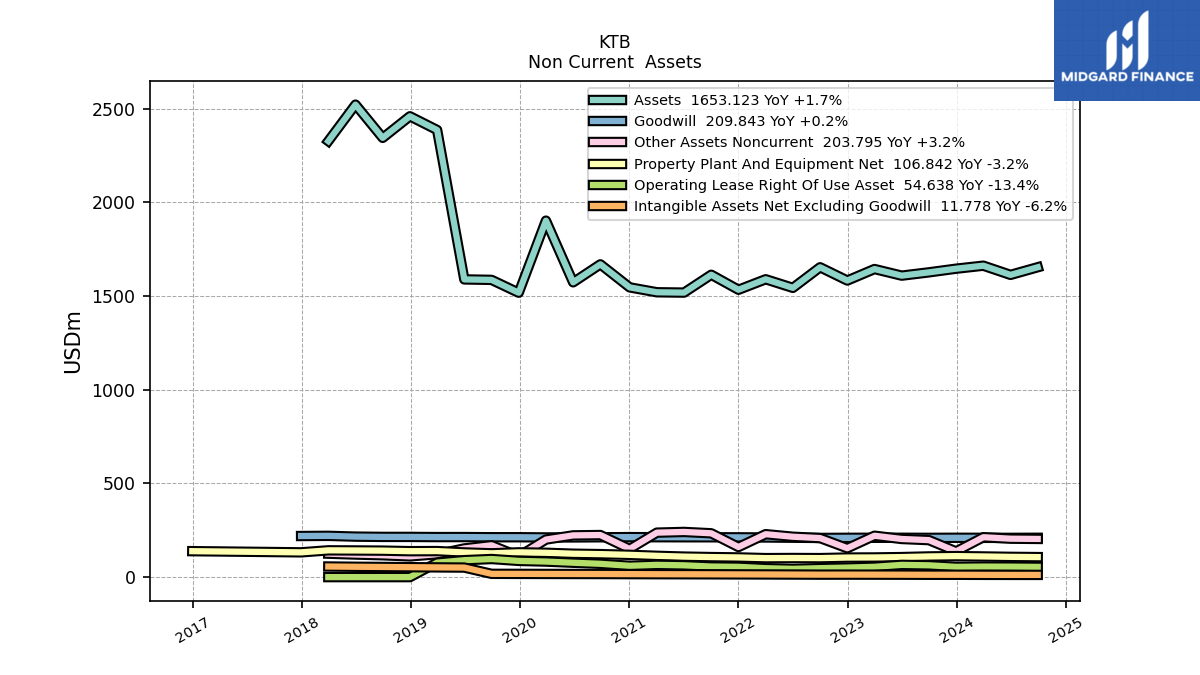
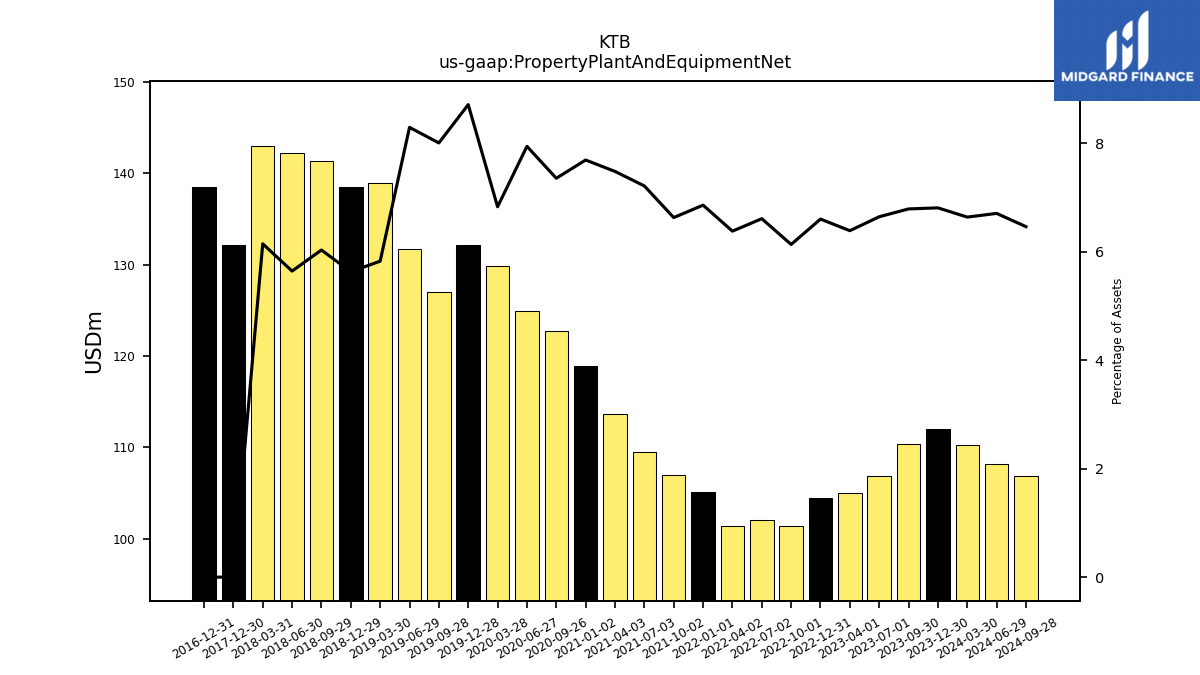
| Property Plant And Equipment Net | 112.05 | 110.40 | 106.88 | 105.00 | 104.47 | 101.41 | 101.99 | 101.38 | 105.16 | 106.96 | 109.49 | 113.69 | 122.74 | 124.94 | 129.88 | 132.19 | 126.96 | 131.73 | 138.97 | 138.45 | 141.35 | 142.26 | 142.96 | |
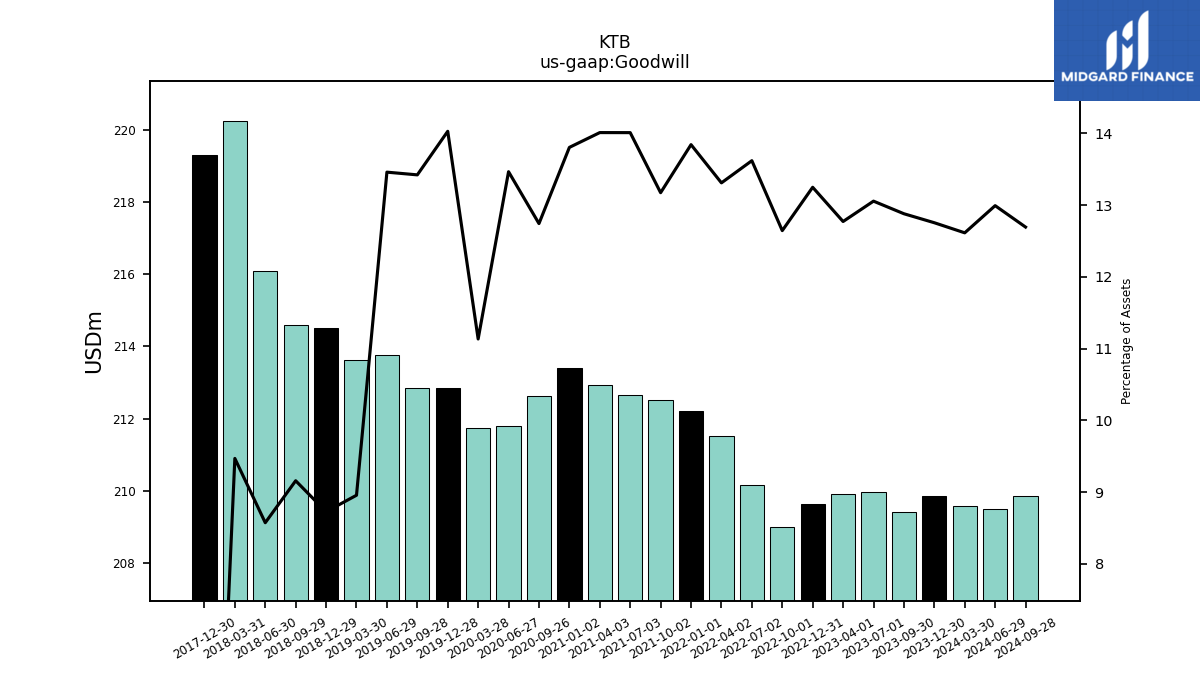
| Goodwill | 209.86 | 209.41 | 209.97 | 209.90 | 209.63 | 209.01 | 210.16 | 211.50 | 212.21 | 212.50 | 212.65 | 212.92 | 212.64 | 211.78 | 211.74 | 212.84 | 212.83 | 213.76 | 213.62 | 214.52 | 214.59 | 216.08 | 220.23 | |
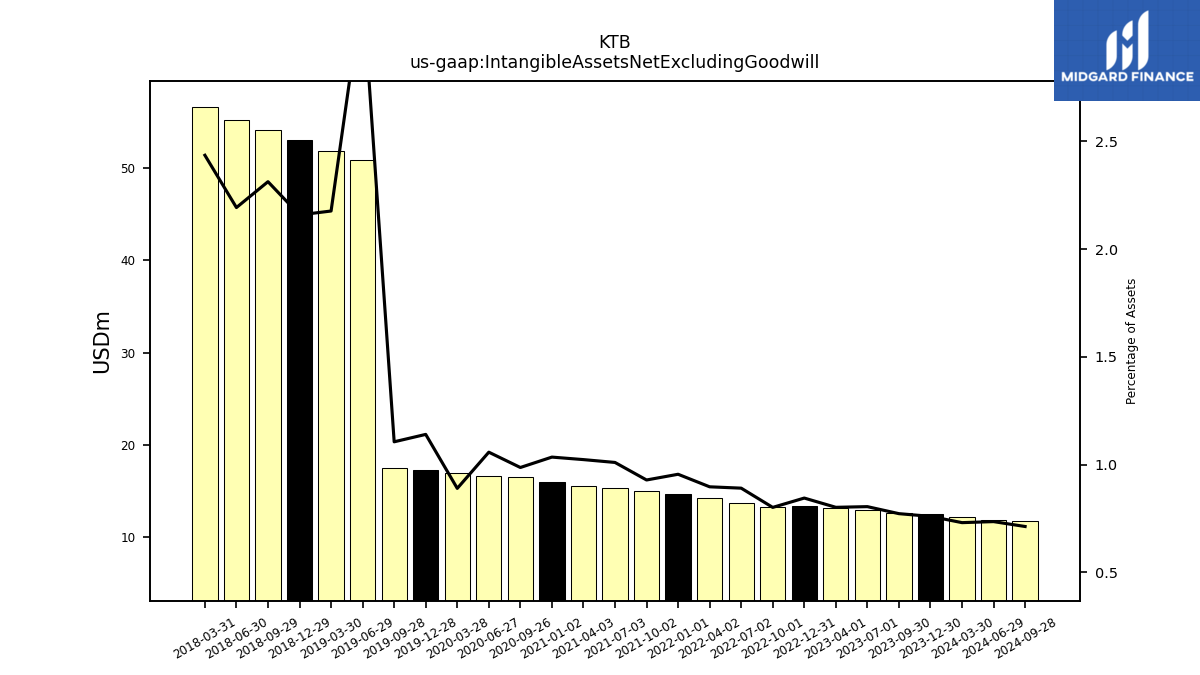
| Intangible Assets Net Excluding Goodwill | 12.50 | 12.55 | 12.94 | 13.17 | 13.36 | 13.24 | 13.74 | 14.25 | 14.64 | 14.97 | 15.32 | 15.54 | 16.46 | 16.63 | 16.91 | 17.29 | 17.53 | 50.95 | 51.91 | 53.06 | 54.19 | 55.26 | 56.64 | |
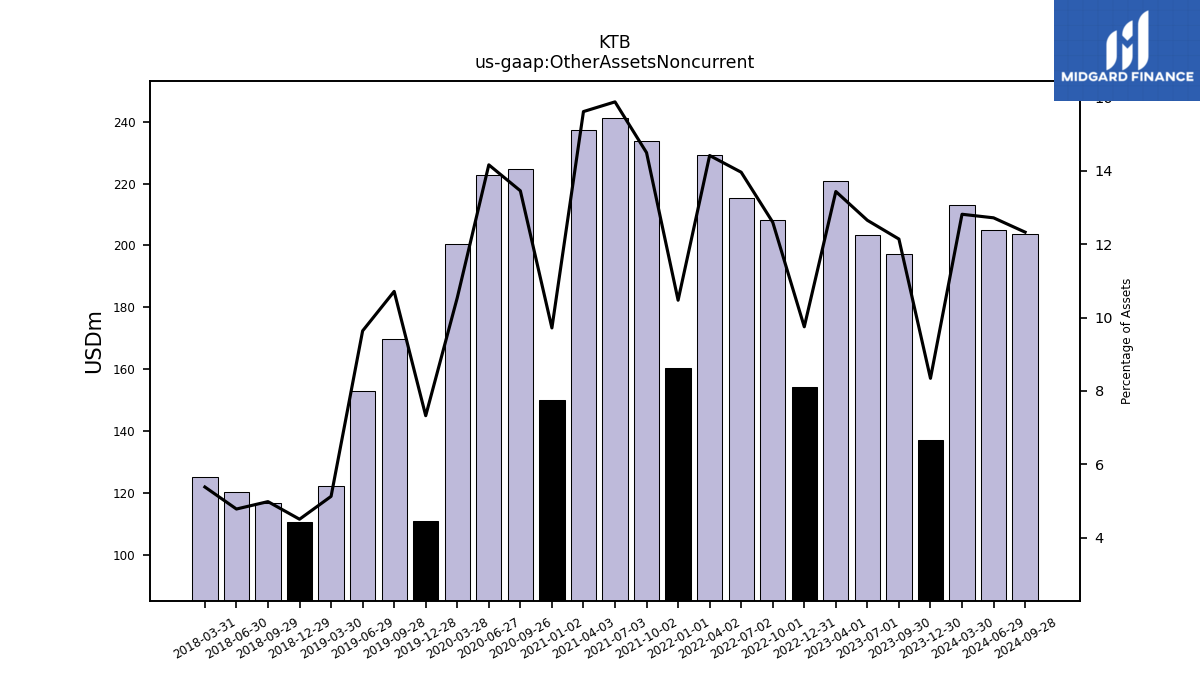
| Other Assets Noncurrent | 137.26 | 197.39 | 203.47 | 220.83 | 154.23 | 208.26 | 215.46 | 229.11 | 160.53 | 233.84 | 241.04 | 237.31 | 224.53 | 222.76 | 200.44 | 111.10 | 169.87 | 153.04 | 122.21 | 110.63 | 116.70 | 120.44 | 125.11 |
| 2023-12-30 | 2023-09-30 | 2023-07-01 | 2023-04-01 | 2022-12-31 | 2022-10-01 | 2022-07-02 | 2022-04-02 | 2022-01-01 | 2021-10-02 | 2021-07-03 | 2021-04-03 | 2020-09-26 | 2020-06-27 | 2020-03-28 | 2019-12-28 | 2019-09-28 | 2019-06-29 | 2019-03-30 | 2018-12-29 | 2018-09-29 | 2018-06-30 | 2018-03-31 | ||
|---|---|---|---|---|---|---|---|---|---|---|---|---|---|---|---|---|---|---|---|---|---|---|---|---|
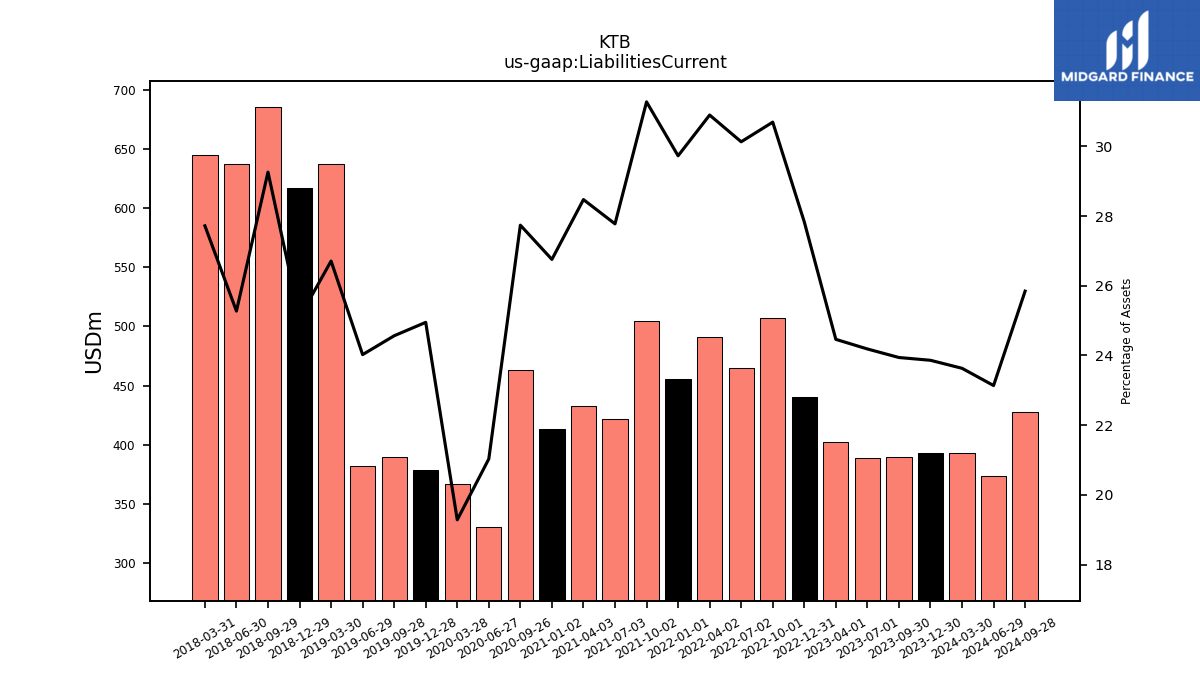
| Liabilities Current | 392.64 | 389.28 | 389.01 | 402.07 | 440.43 | 507.45 | 465.02 | 491.05 | 455.81 | 504.60 | 421.64 | 432.73 | 462.92 | 330.77 | 366.73 | 378.55 | 389.56 | 381.56 | 637.18 | 616.82 | 685.75 | 637.10 | 644.81 | |
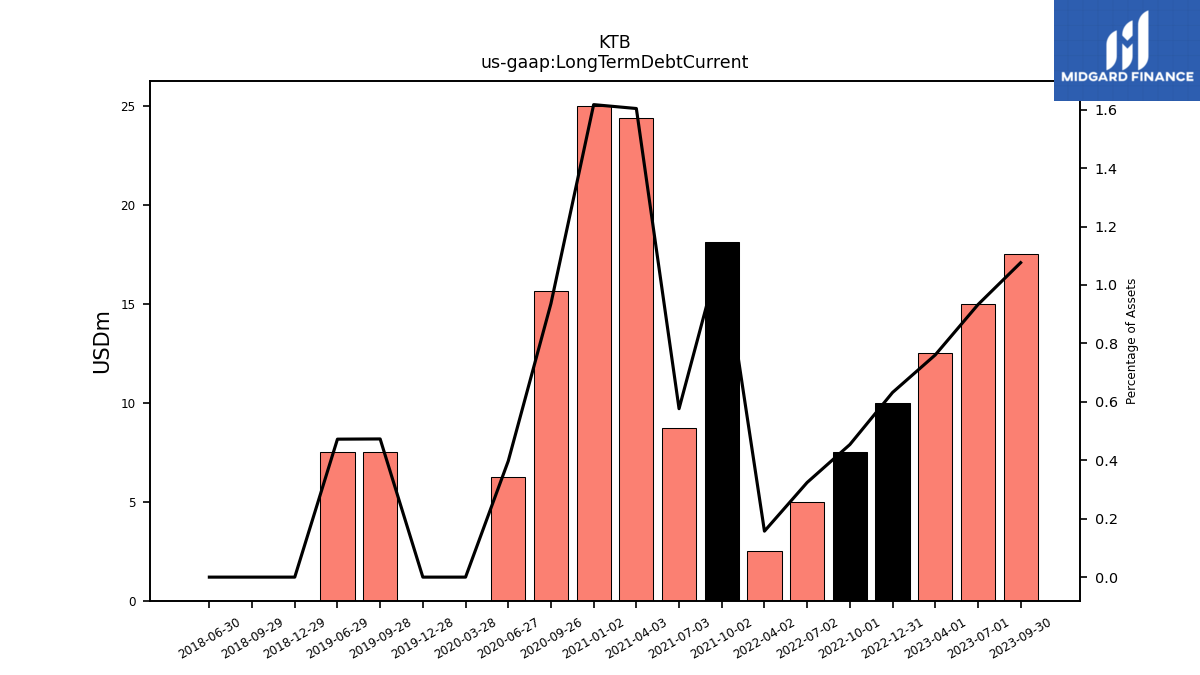
| Long Term Debt Current | 20.00 | 17.50 | 15.00 | 12.50 | 10.00 | 7.50 | 5.00 | 2.50 | NA | 18.12 | 8.75 | 24.38 | 15.62 | 6.25 | 0.00 | 0.00 | 7.50 | 7.50 | NA | 0.00 | 0.00 | 0.00 | NA | |
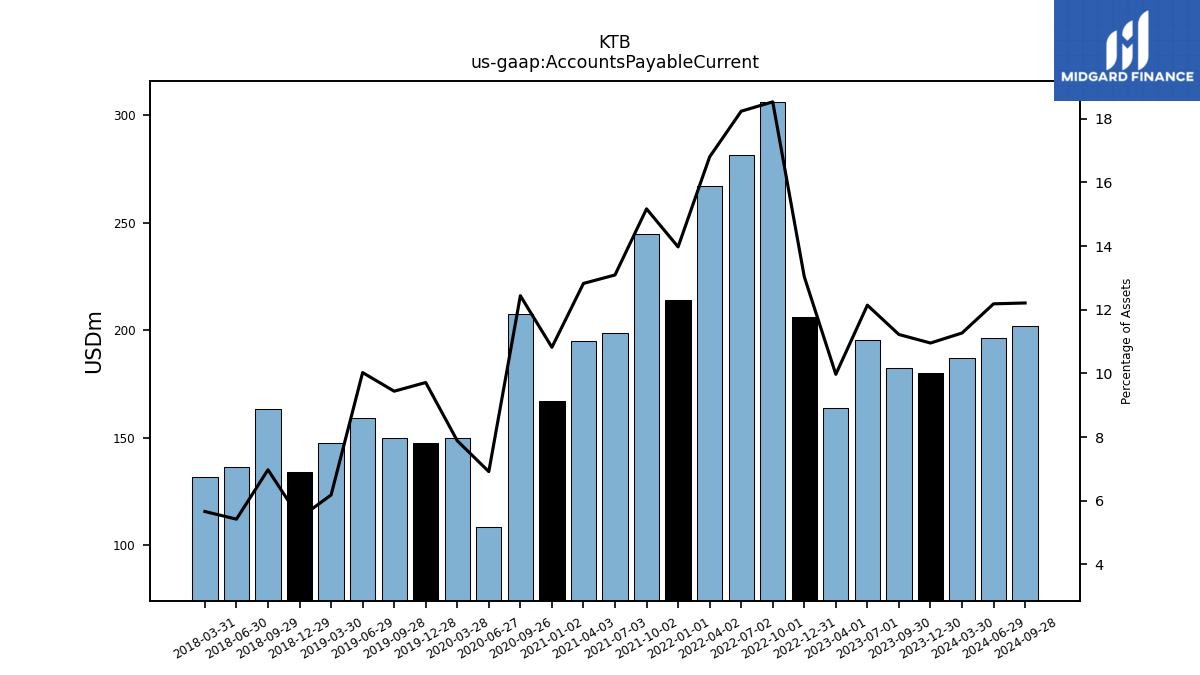
| Accounts Payable Current | 180.22 | 182.45 | 195.28 | 163.87 | 206.26 | 306.28 | 281.39 | 266.97 | 214.20 | 244.68 | 198.70 | 194.89 | 207.56 | 108.75 | 149.92 | 147.35 | 149.69 | 159.21 | 147.40 | 134.13 | 163.38 | 136.62 | 131.67 | |
| Other Accrued Liabilities Current | 20.39 | NA | NA | NA | 21.94 | NA | NA | NA | 12.38 | NA | NA | NA | NA | NA | NA | 21.03 | NA | NA | NA | 16.19 | NA | NA | NA | |
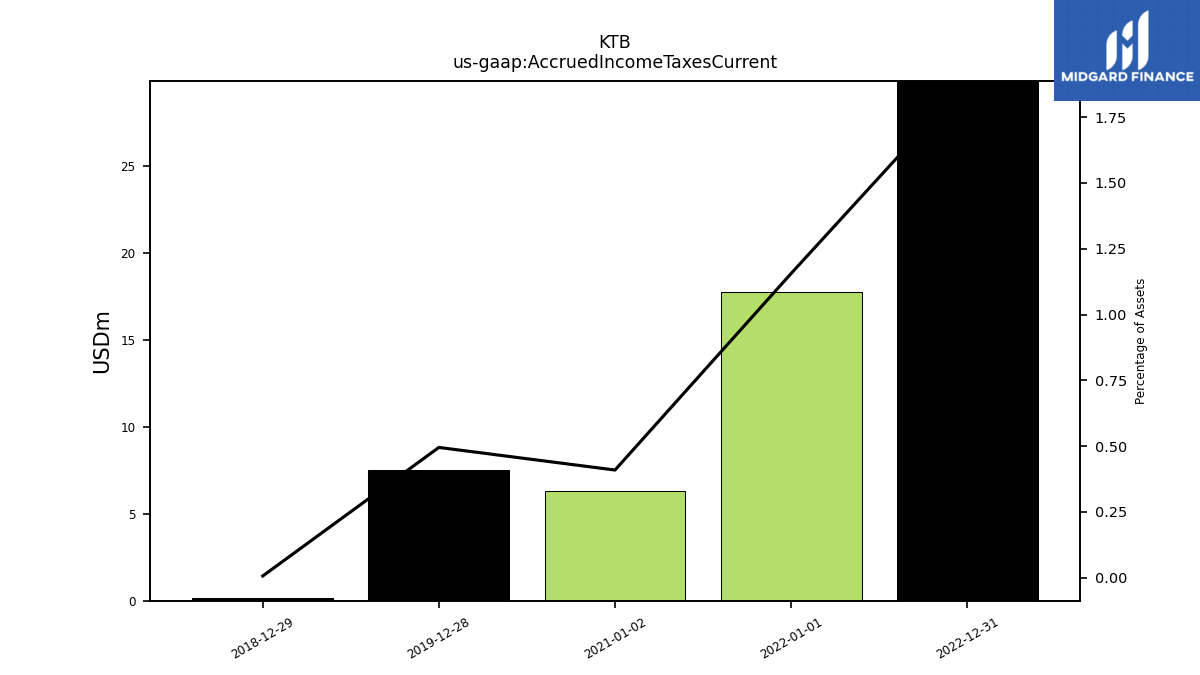
| Accrued Income Taxes Current | 11.55 | NA | NA | NA | 29.86 | NA | NA | NA | 17.72 | NA | NA | NA | NA | NA | NA | 7.51 | NA | NA | NA | 0.17 | NA | NA | NA | |
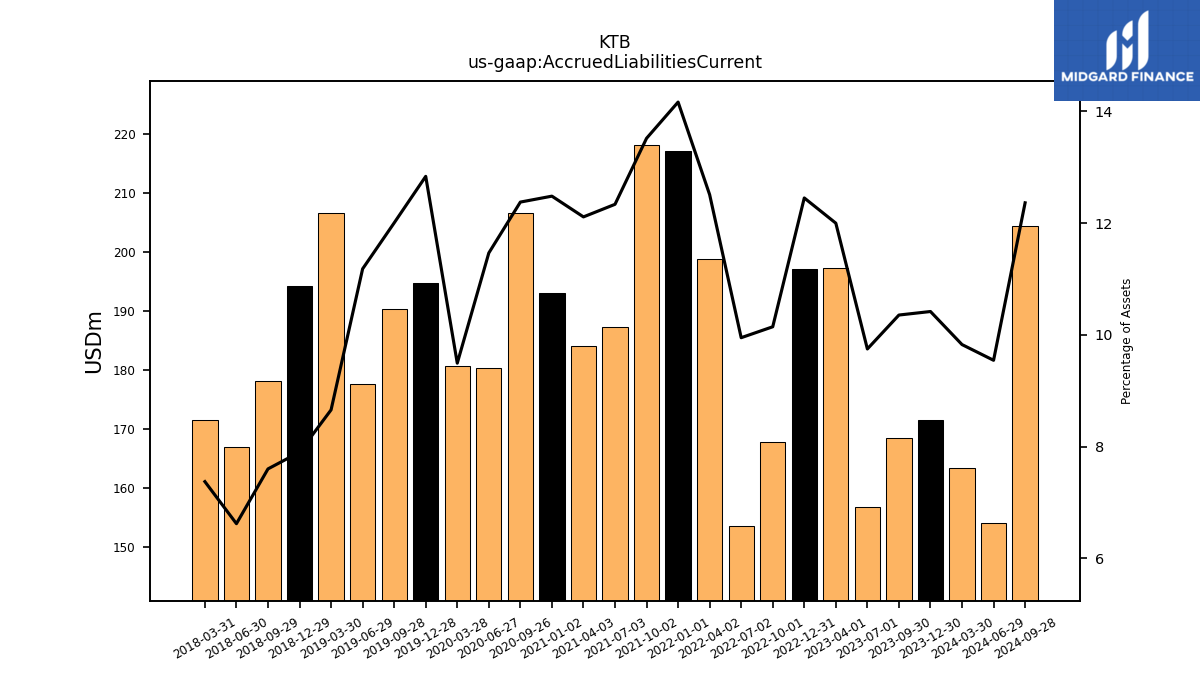
| Accrued Liabilities Current | 171.41 | 168.36 | 156.77 | 197.20 | 196.99 | 167.69 | 153.53 | 198.78 | 217.16 | 218.06 | 187.24 | 184.05 | 206.52 | 180.32 | 180.54 | 194.74 | 190.35 | 177.58 | 206.52 | 194.23 | 178.11 | 166.88 | 171.50 | |
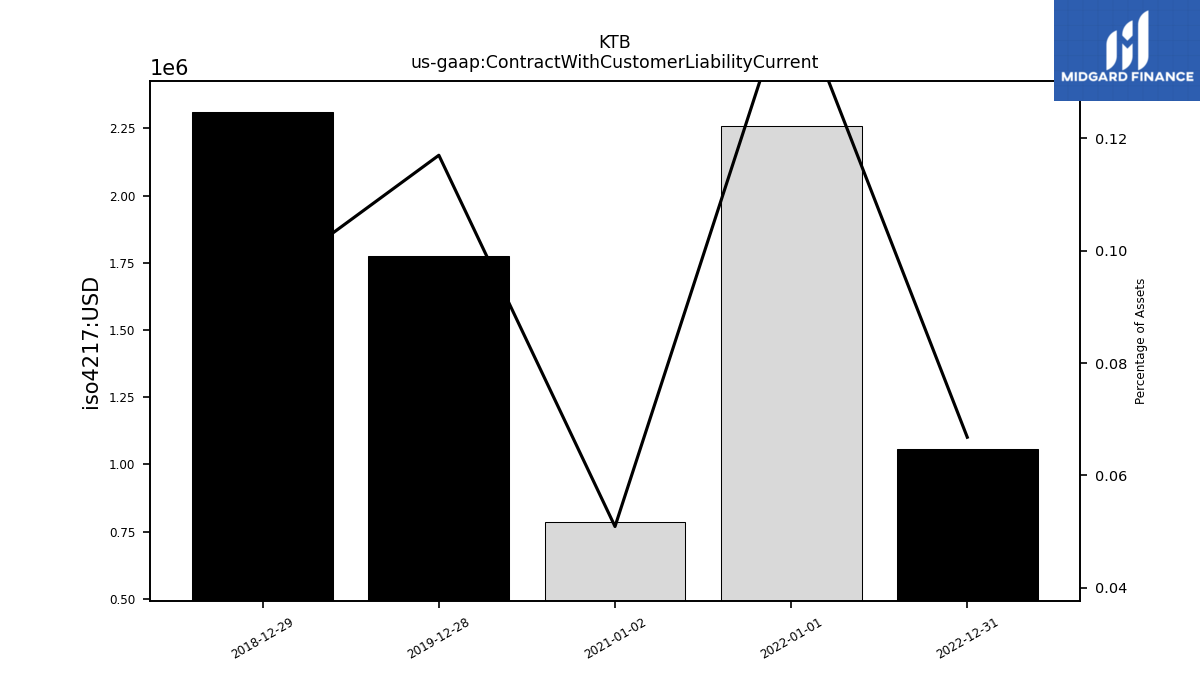
| Contract With Customer Liability Current | 1.71 | NA | NA | NA | 1.06 | NA | NA | NA | 2.26 | NA | NA | NA | NA | NA | NA | 1.77 | NA | NA | NA | 2.31 | NA | NA | NA |
| 2023-12-30 | 2023-09-30 | 2023-07-01 | 2023-04-01 | 2022-12-31 | 2022-10-01 | 2022-07-02 | 2022-04-02 | 2022-01-01 | 2021-10-02 | 2021-07-03 | 2021-04-03 | 2020-09-26 | 2020-06-27 | 2020-03-28 | 2019-12-28 | 2019-09-28 | 2019-06-29 | 2019-03-30 | 2018-12-29 | 2018-09-29 | 2018-06-30 | 2018-03-31 | ||
|---|---|---|---|---|---|---|---|---|---|---|---|---|---|---|---|---|---|---|---|---|---|---|---|---|
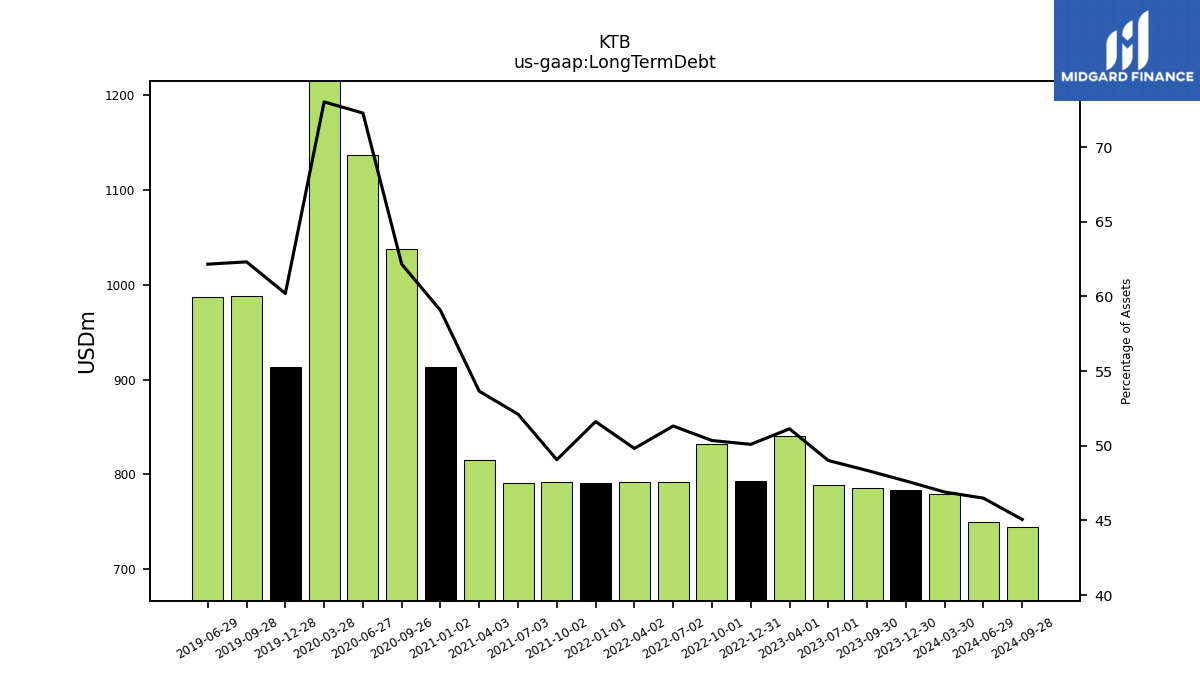
| Long Term Debt | 783.92 | 786.10 | 788.27 | 840.44 | 792.62 | 832.29 | 791.97 | 791.64 | 791.32 | 791.54 | 791.01 | 815.30 | 1037.34 | 1136.71 | 1388.74 | 913.27 | 988.11 | 987.19 | NA | NA | NA | NA | NA | |
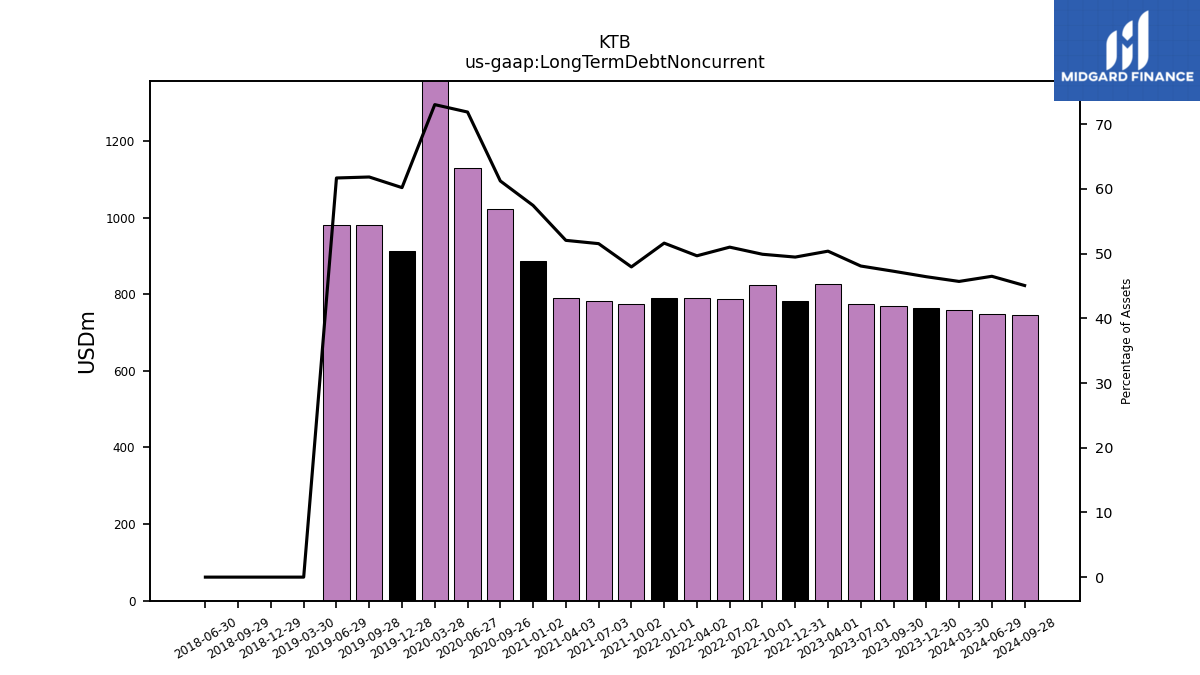
| Long Term Debt Noncurrent | 763.92 | 768.60 | 773.27 | 827.94 | 782.62 | 824.79 | 786.97 | 789.14 | 791.32 | 773.41 | 782.26 | 790.93 | 1021.71 | 1130.46 | 1388.74 | 913.27 | 980.61 | 979.69 | 0.00 | 0.00 | 0.00 | 0.00 | NA | |
| Deferred Income Tax Liabilities Net | 5.61 | NA | NA | NA | 6.92 | NA | NA | NA | 5.57 | NA | NA | NA | NA | NA | NA | 2.46 | NA | NA | NA | NA | NA | NA | NA | |
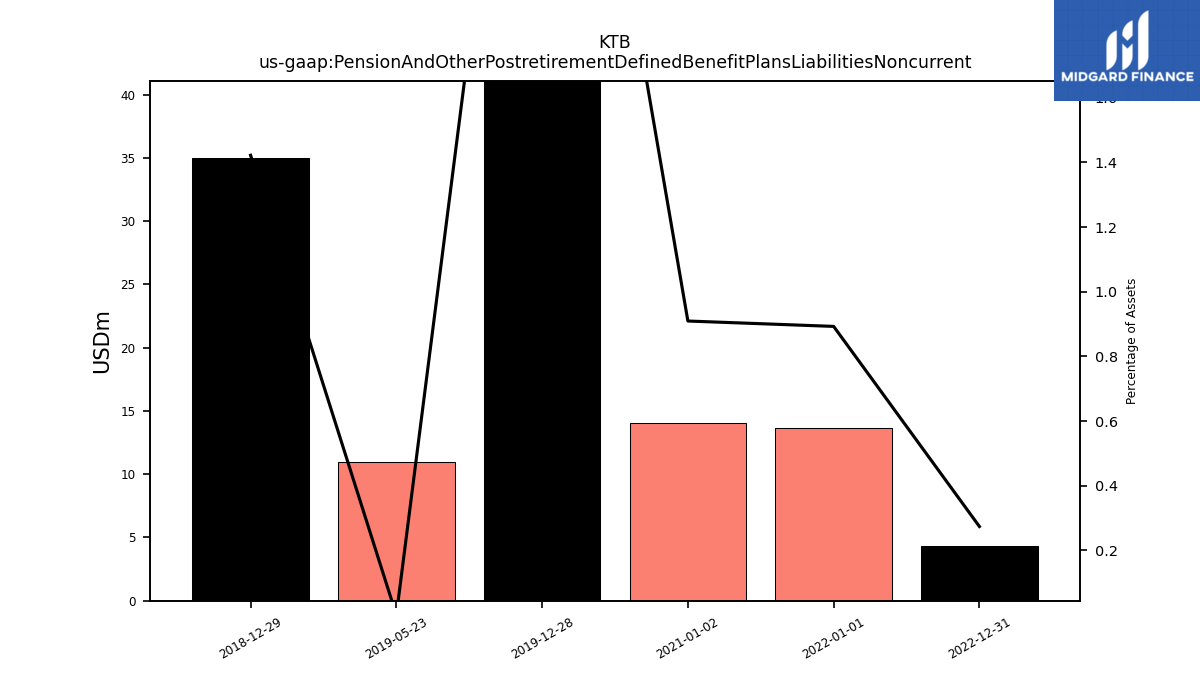
| Pension And Other Postretirement Defined Benefit Plans Liabilities Noncurrent | 3.49 | NA | NA | NA | 4.33 | NA | NA | NA | 13.69 | NA | NA | NA | NA | NA | NA | 53.60 | NA | NA | NA | 34.96 | NA | NA | NA | |
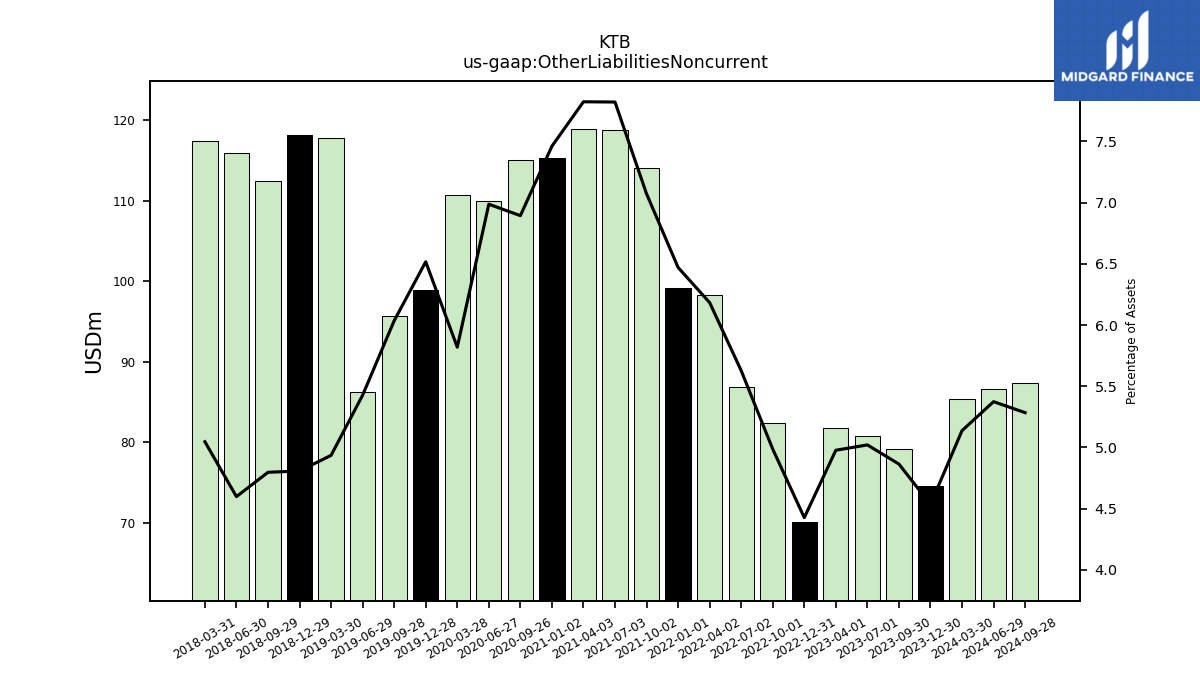
| Other Liabilities Noncurrent | 74.60 | 79.08 | 80.74 | 81.80 | 70.03 | 82.42 | 86.84 | 98.26 | 99.19 | 114.09 | 118.73 | 118.91 | 115.04 | 109.89 | 110.67 | 98.88 | 95.70 | 86.19 | 117.72 | 118.19 | 112.39 | 115.89 | 117.38 | |
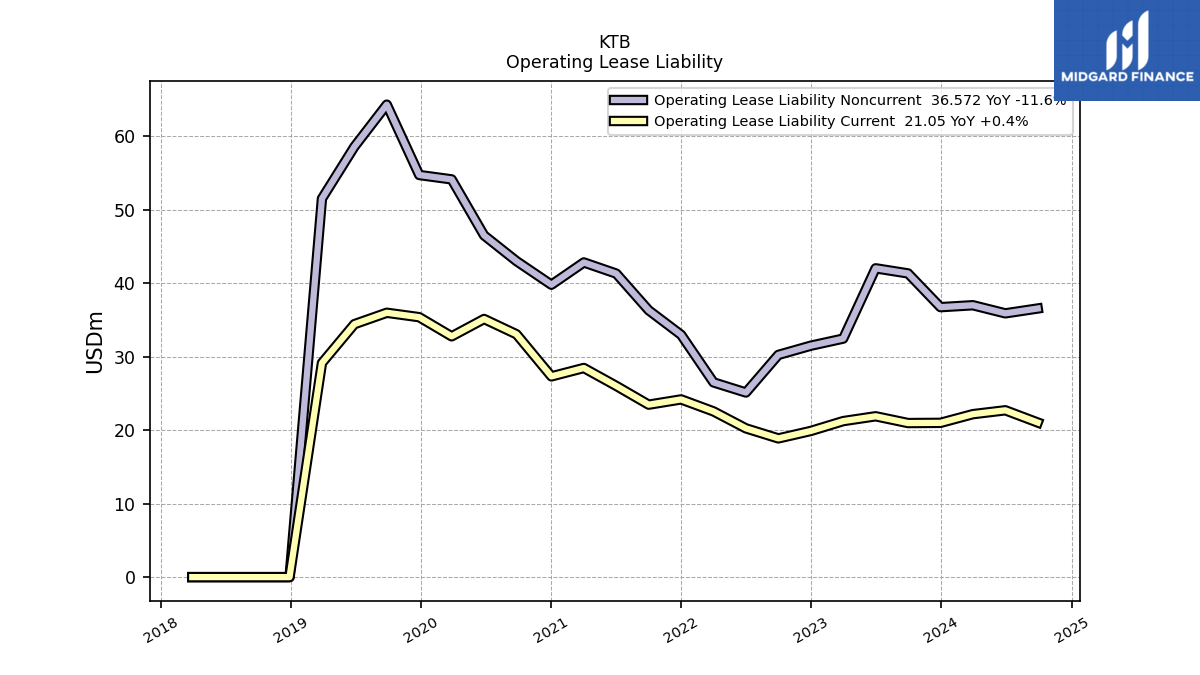
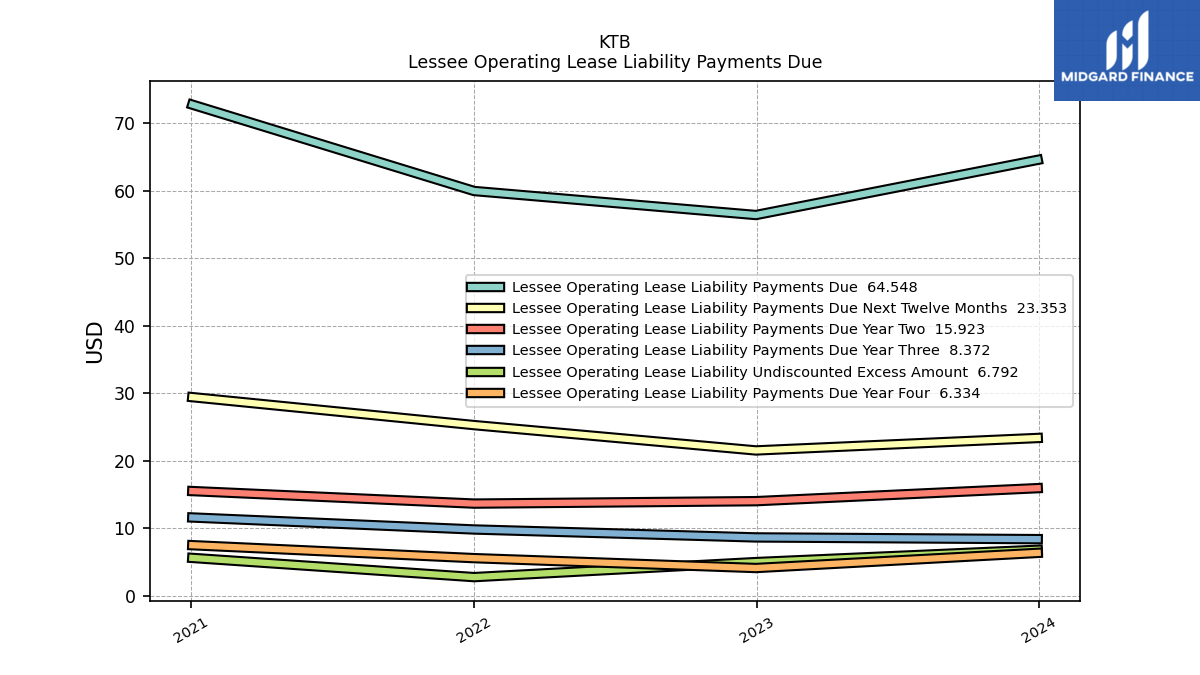
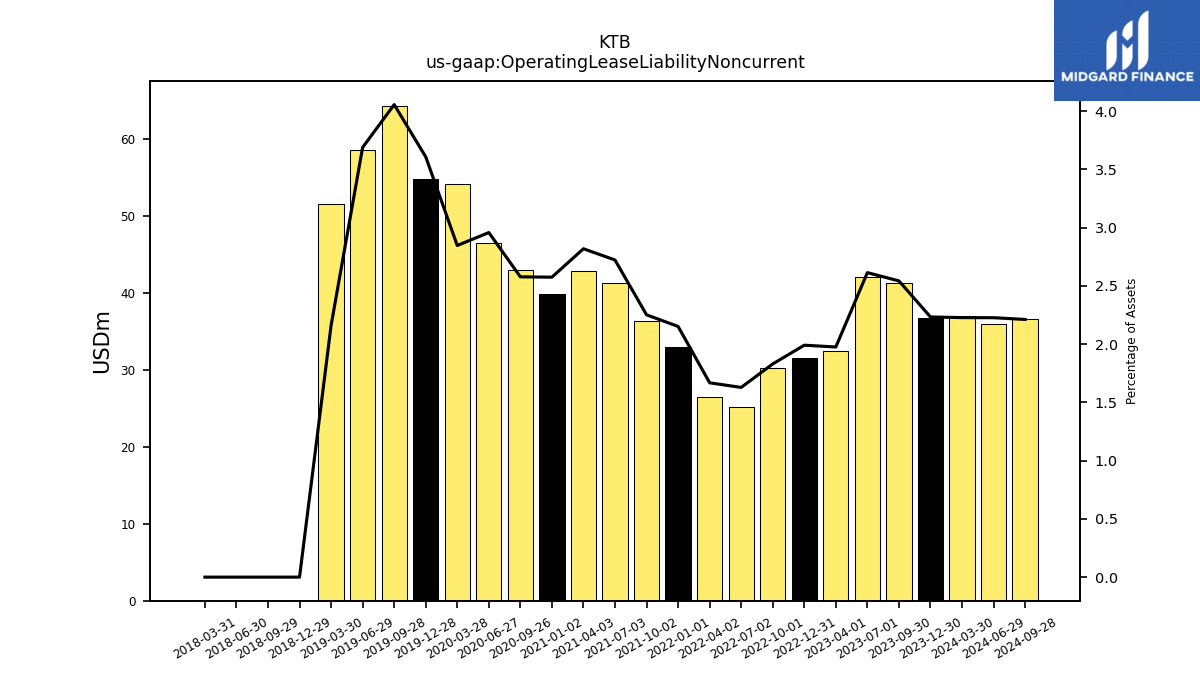
| Operating Lease Liability Noncurrent | 36.75 | 41.35 | 42.04 | 32.47 | 31.51 | 30.25 | 25.13 | 26.51 | 32.99 | 36.33 | 41.33 | 42.84 | 43.02 | 46.53 | 54.15 | 54.75 | 64.33 | 58.59 | 51.53 | 0.00 | 0.00 | 0.00 | 0.00 |
| 2023-12-30 | 2023-09-30 | 2023-07-01 | 2023-04-01 | 2022-12-31 | 2022-10-01 | 2022-07-02 | 2022-04-02 | 2022-01-01 | 2021-10-02 | 2021-07-03 | 2021-04-03 | 2020-09-26 | 2020-06-27 | 2020-03-28 | 2019-12-28 | 2019-09-28 | 2019-06-29 | 2019-03-30 | 2018-12-29 | 2018-09-29 | 2018-06-30 | 2018-03-31 | ||
|---|---|---|---|---|---|---|---|---|---|---|---|---|---|---|---|---|---|---|---|---|---|---|---|---|
| Stockholders Equity | 371.91 | 347.62 | 323.25 | 299.29 | 250.76 | 208.10 | 179.19 | 184.09 | 148.14 | 184.75 | 153.89 | 134.26 | 26.03 | -44.89 | -18.48 | 69.26 | 55.57 | 82.17 | 1578.98 | 1723.45 | 1545.16 | 1767.69 | 1563.78 | |
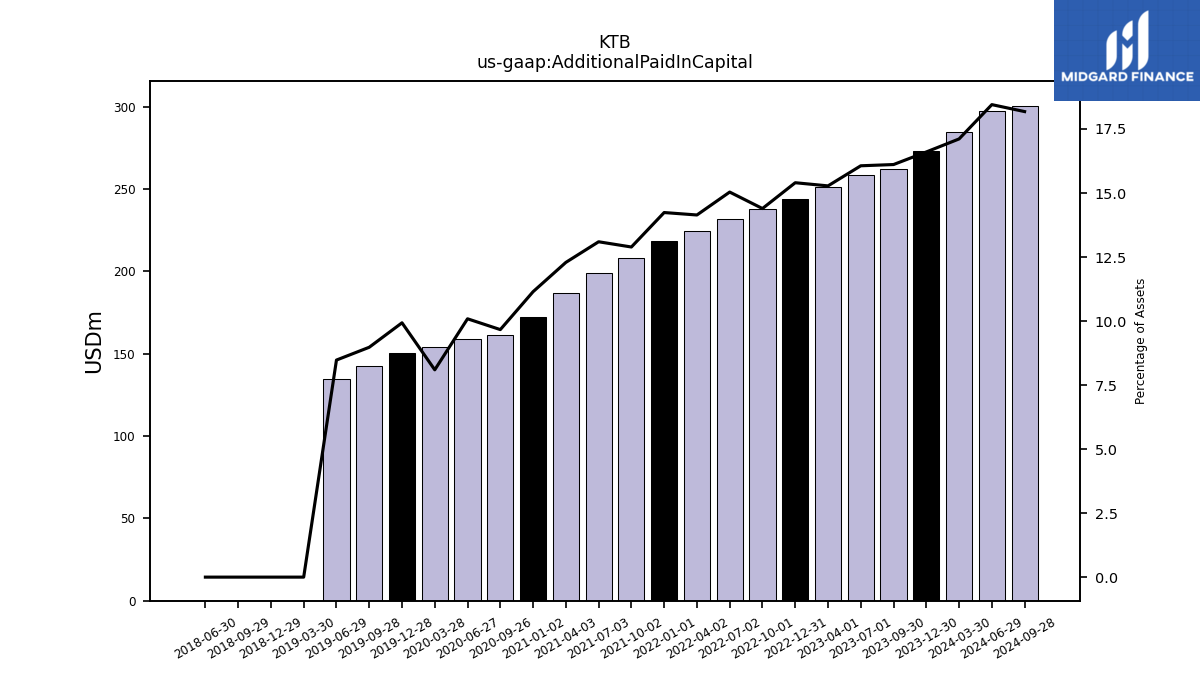
| Additional Paid In Capital | 273.20 | 261.97 | 258.35 | 251.11 | 243.70 | 237.93 | 232.04 | 224.72 | 218.26 | 207.96 | 198.78 | 186.77 | 161.30 | 158.66 | 153.97 | 150.67 | 142.34 | 134.62 | 0.00 | 0.00 | 0.00 | 0.00 | NA | |
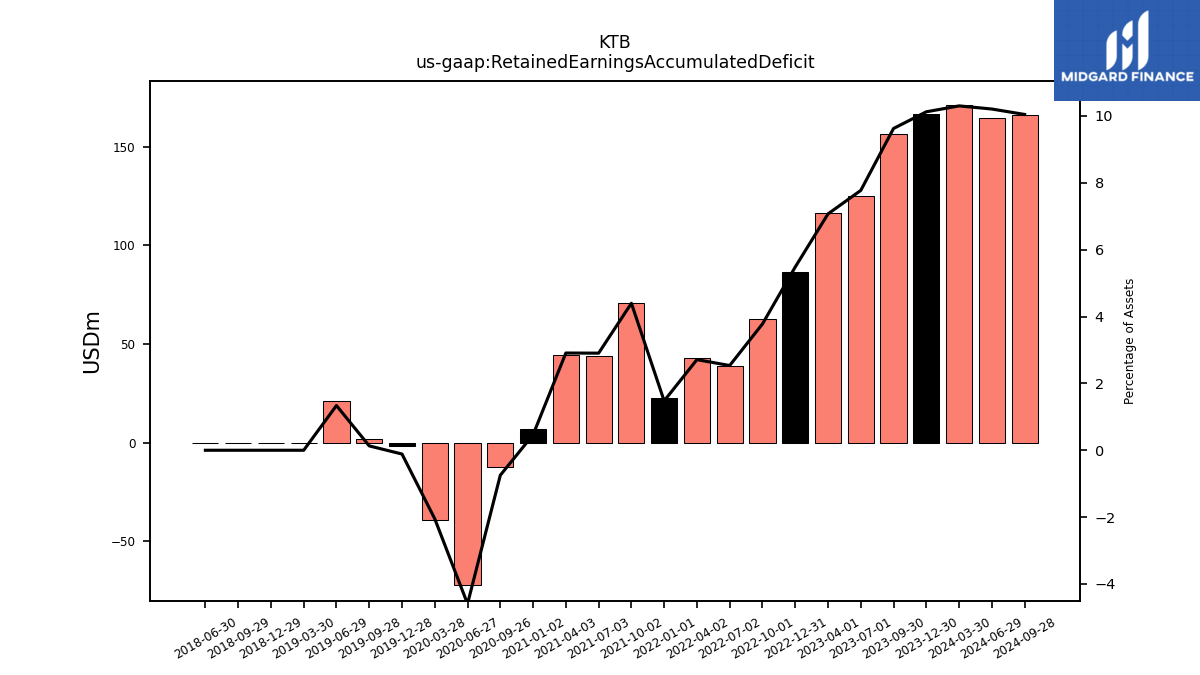
| Retained Earnings Accumulated Deficit | 166.57 | 156.49 | 125.00 | 116.19 | 86.73 | 62.45 | 39.10 | 43.07 | 22.64 | 70.93 | 44.08 | 44.19 | -12.47 | -72.25 | -38.99 | -1.72 | 2.07 | 21.23 | 0.00 | 0.00 | 0.00 | 0.00 | NA | |
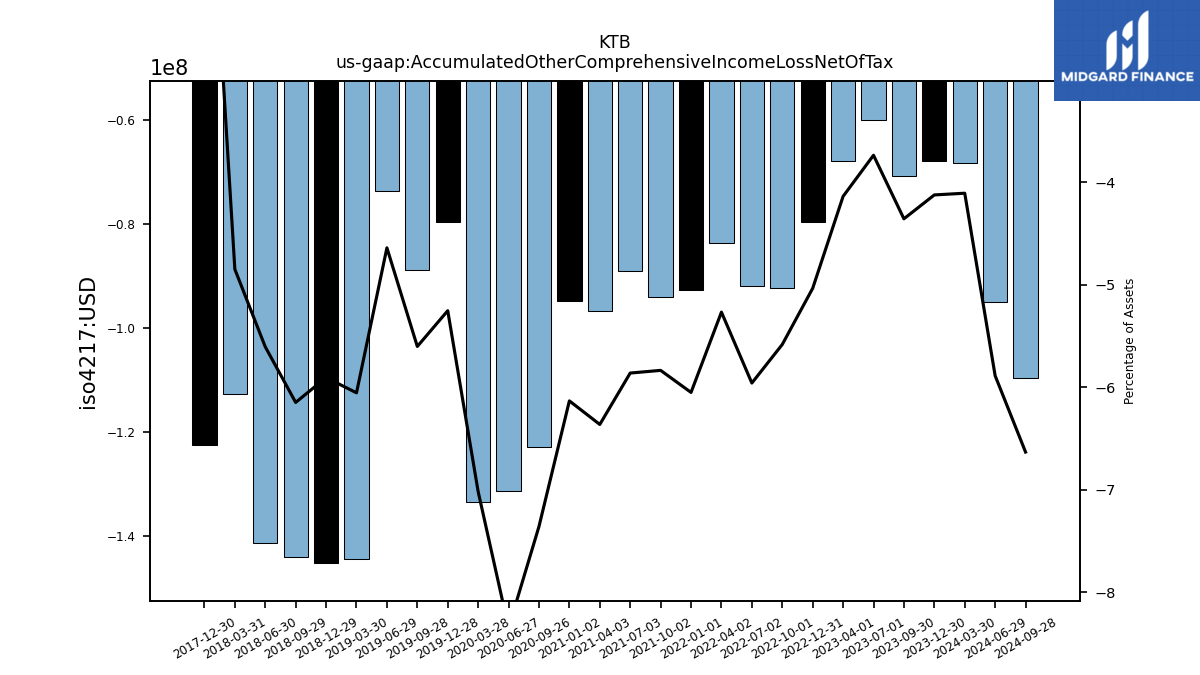
| Accumulated Other Comprehensive Income Loss Net Of Tax | -67.85 | -70.83 | -60.09 | -68.00 | -79.67 | -92.28 | -91.96 | -83.70 | -92.76 | -94.14 | -88.97 | -96.70 | -122.80 | -131.30 | -133.46 | -79.70 | -88.83 | -73.69 | -144.42 | -145.18 | -144.07 | -141.30 | -112.78 |
| 2023-12-30 | 2023-09-30 | 2023-07-01 | 2023-04-01 | 2022-12-31 | 2022-10-01 | 2022-07-02 | 2022-04-02 | 2022-01-01 | 2021-10-02 | 2021-07-03 | 2021-04-03 | 2020-09-26 | 2020-06-27 | 2020-03-28 | 2019-12-28 | 2019-09-28 | 2019-06-29 | 2019-03-30 | 2018-12-29 | 2018-09-29 | 2018-06-30 | 2018-03-31 | ||
|---|---|---|---|---|---|---|---|---|---|---|---|---|---|---|---|---|---|---|---|---|---|---|---|---|
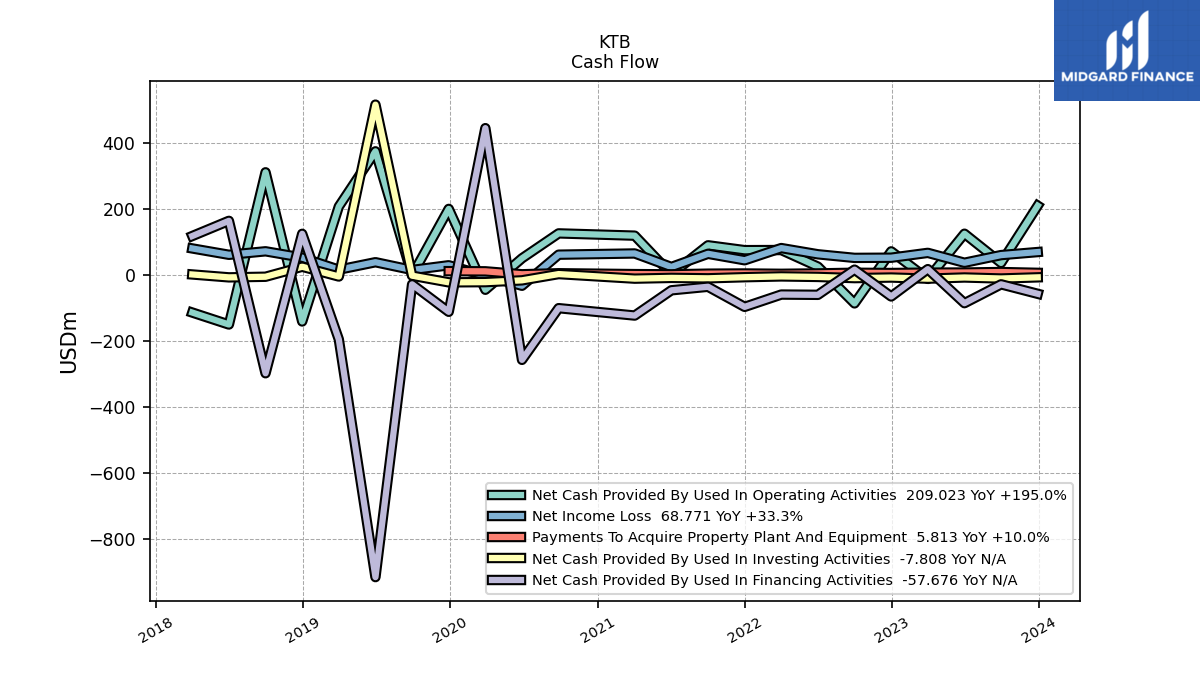
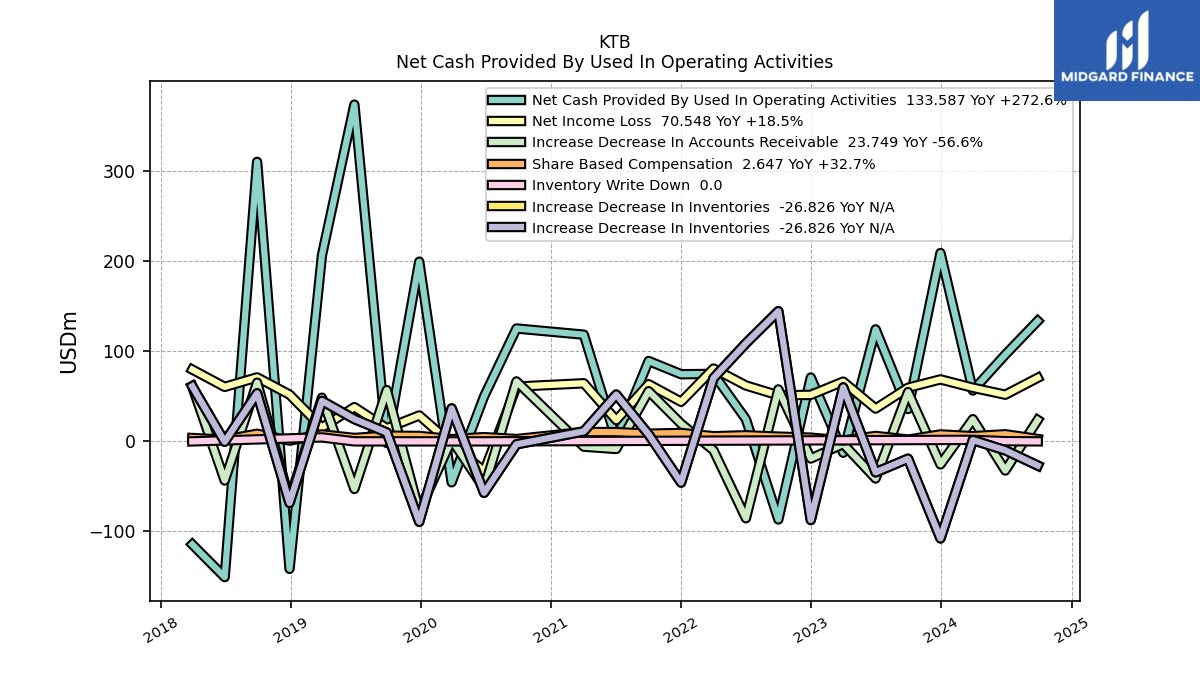
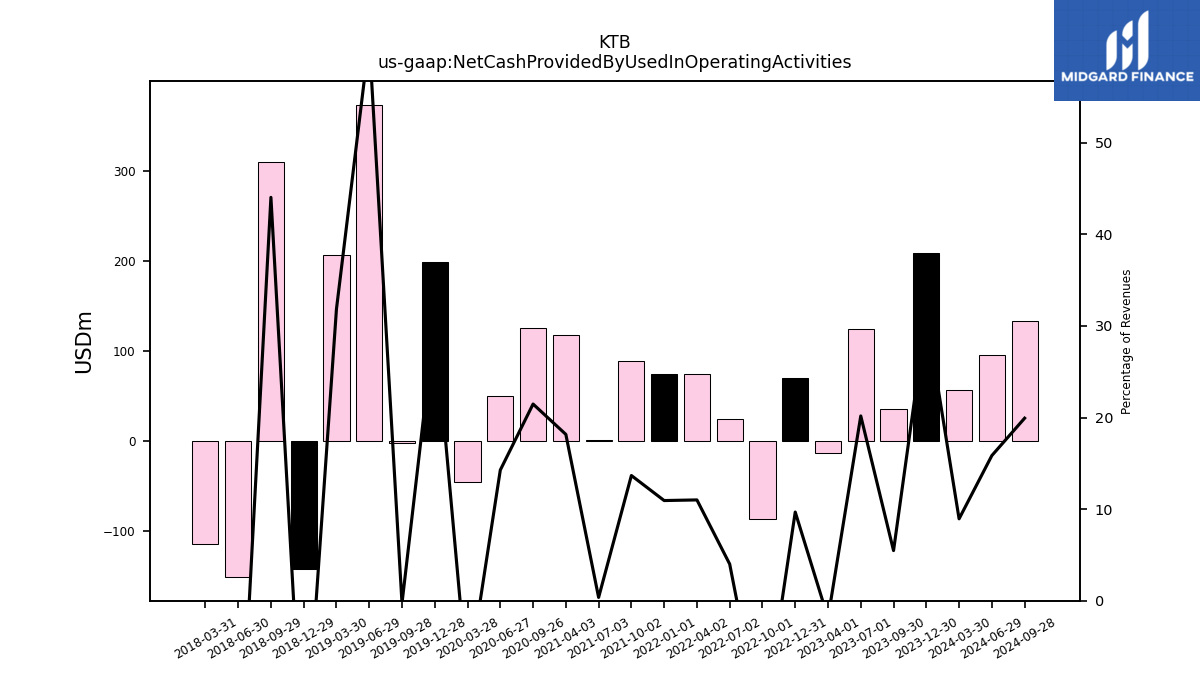
| Net Cash Provided By Used In Operating Activities | 209.02 | 35.85 | 124.30 | -12.62 | 70.86 | -86.66 | 24.55 | 74.83 | 74.51 | 89.19 | 1.78 | 118.39 | 125.26 | 49.84 | -45.42 | 199.41 | -1.77 | 373.66 | 206.49 | -141.47 | 310.17 | -150.63 | -114.36 | |
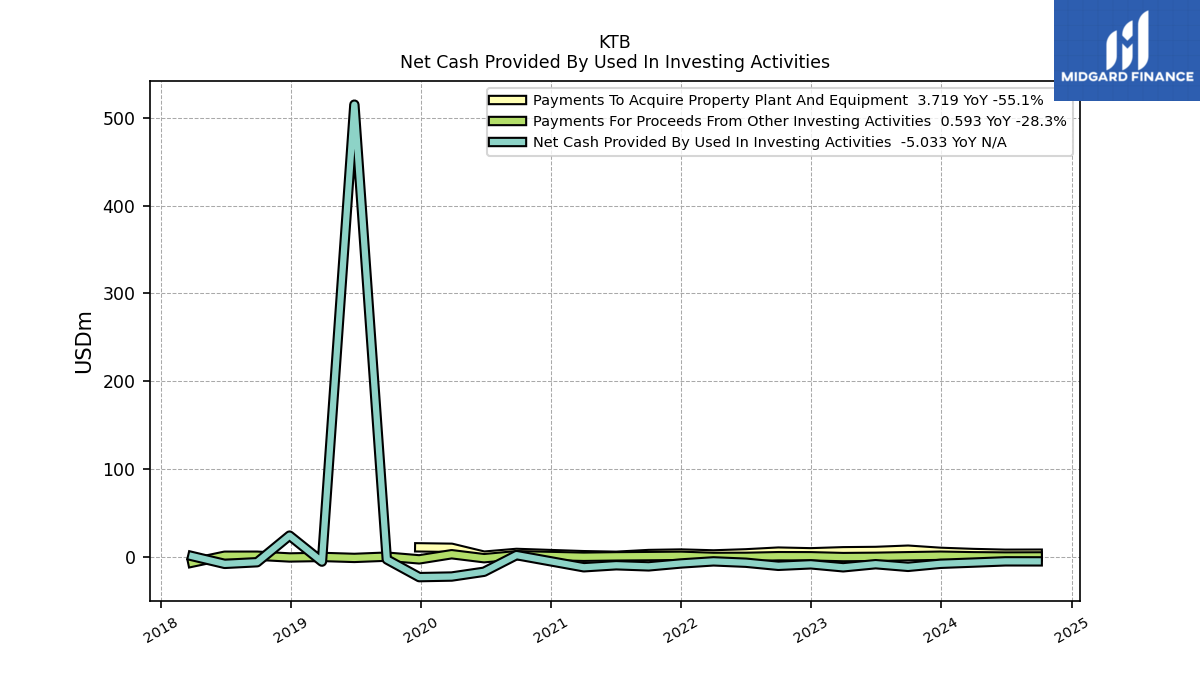
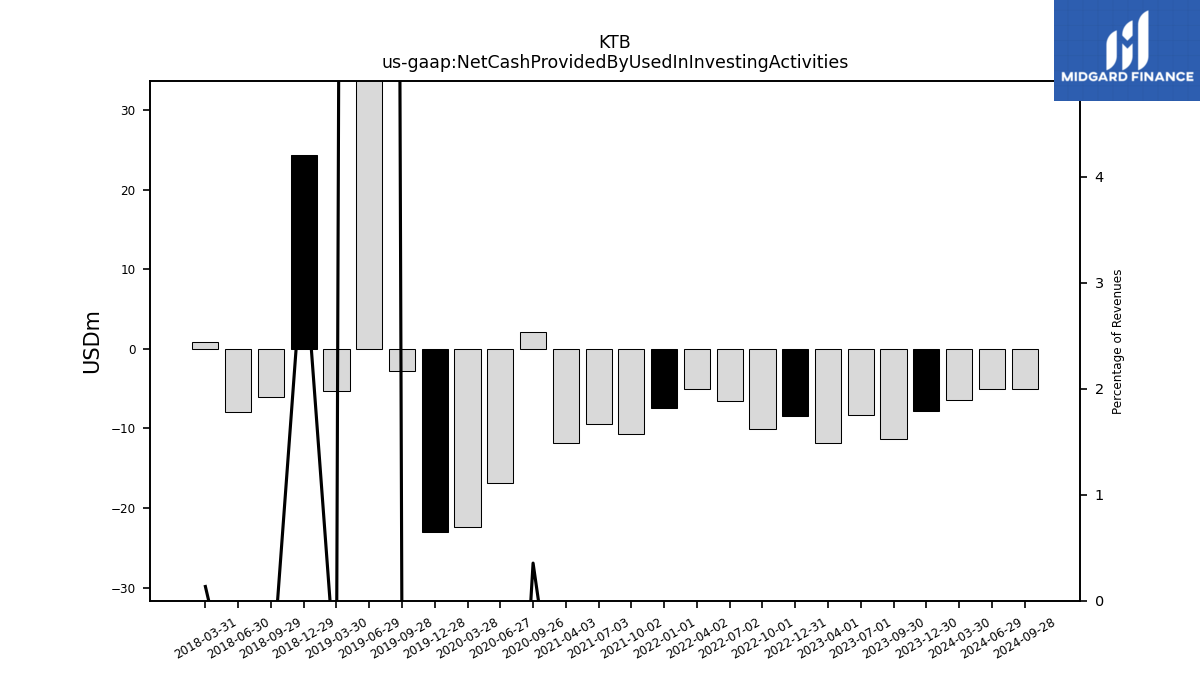
| Net Cash Provided By Used In Investing Activities | -7.81 | -11.29 | -8.25 | -11.80 | -8.40 | -10.11 | -6.58 | -5.03 | -7.42 | -10.74 | -9.45 | -11.76 | 2.07 | -16.86 | -22.31 | -22.97 | -2.80 | 515.04 | -5.32 | 24.31 | -6.00 | -7.88 | 0.90 | |
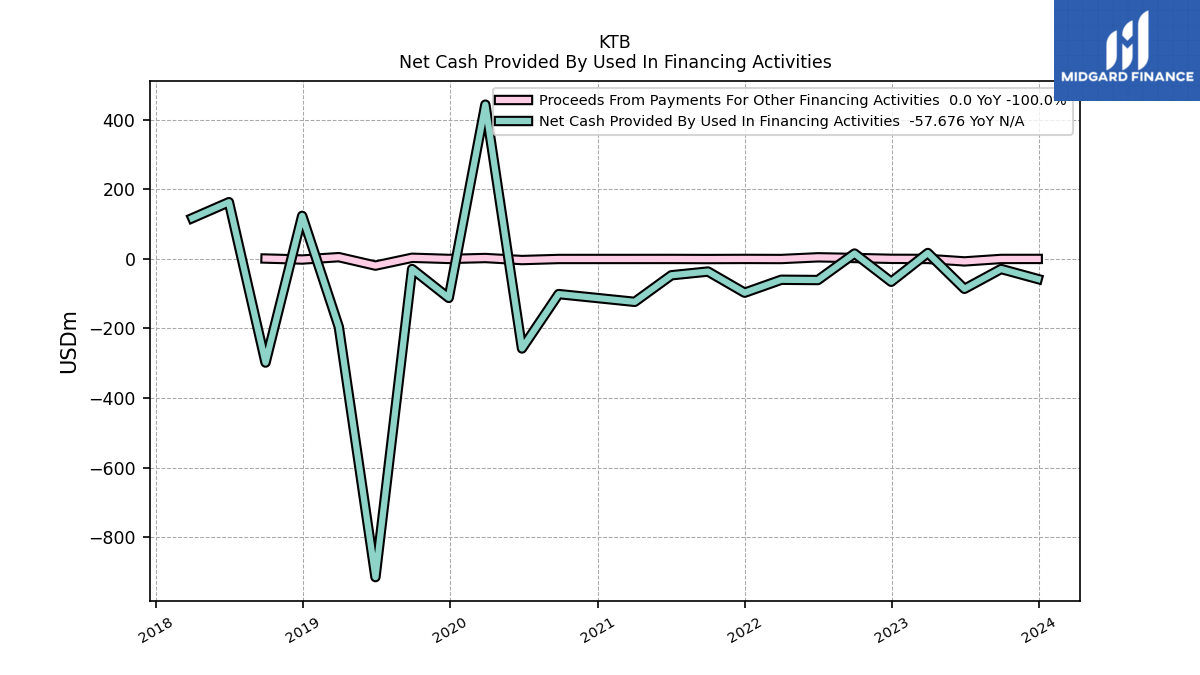
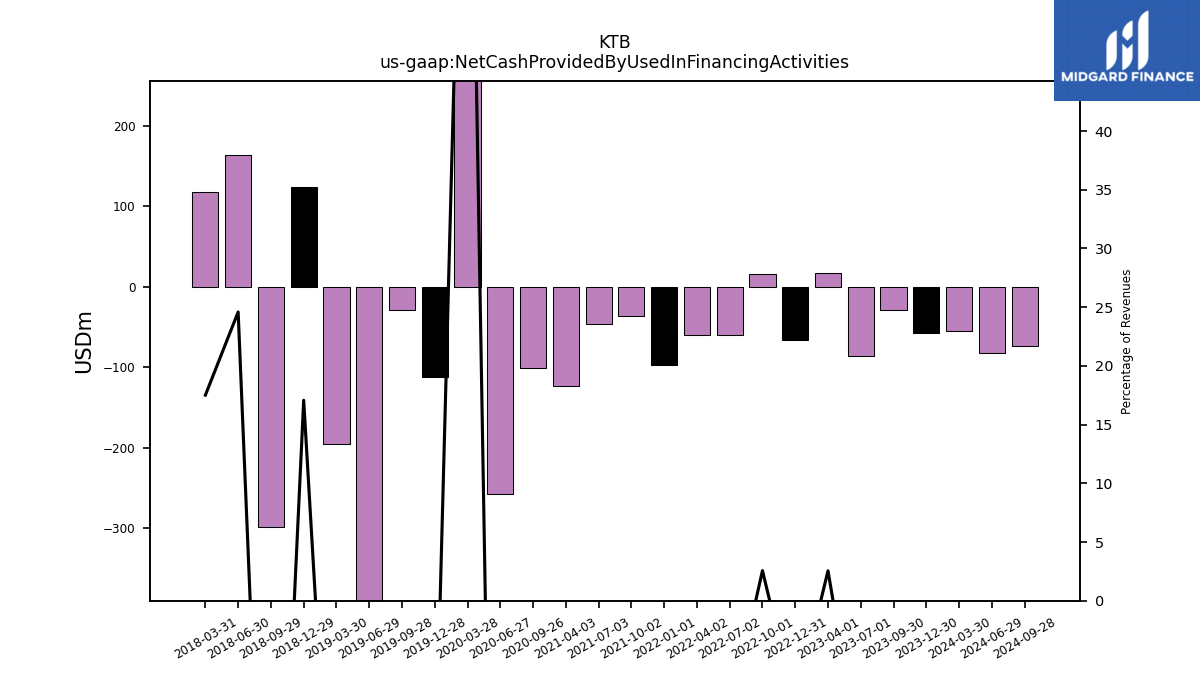
| Net Cash Provided By Used In Financing Activities | -57.68 | -28.97 | -86.06 | 17.02 | -65.75 | 15.54 | -60.75 | -59.95 | -97.22 | -36.32 | -47.03 | -123.50 | -101.11 | -257.63 | 443.83 | -112.16 | -28.98 | -915.31 | -195.65 | 123.97 | -298.17 | 163.26 | 117.27 |
| 2023-12-30 | 2023-09-30 | 2023-07-01 | 2023-04-01 | 2022-12-31 | 2022-10-01 | 2022-07-02 | 2022-04-02 | 2022-01-01 | 2021-10-02 | 2021-07-03 | 2021-04-03 | 2020-09-26 | 2020-06-27 | 2020-03-28 | 2019-12-28 | 2019-09-28 | 2019-06-29 | 2019-03-30 | 2018-12-29 | 2018-09-29 | 2018-06-30 | 2018-03-31 | ||
|---|---|---|---|---|---|---|---|---|---|---|---|---|---|---|---|---|---|---|---|---|---|---|---|---|
| Net Cash Provided By Used In Operating Activities | 209.02 | 35.85 | 124.30 | -12.62 | 70.86 | -86.66 | 24.55 | 74.83 | 74.51 | 89.19 | 1.78 | 118.39 | 125.26 | 49.84 | -45.42 | 199.41 | -1.77 | 373.66 | 206.49 | -141.47 | 310.17 | -150.63 | -114.36 | |
| Net Income Loss | 68.77 | 59.53 | 36.40 | 66.30 | 51.60 | 51.08 | 61.99 | 80.81 | 43.91 | 63.41 | 23.64 | 64.46 | 60.78 | -33.26 | -2.71 | 28.75 | 14.50 | 37.99 | 15.41 | 51.90 | 71.02 | 60.46 | 79.70 | |
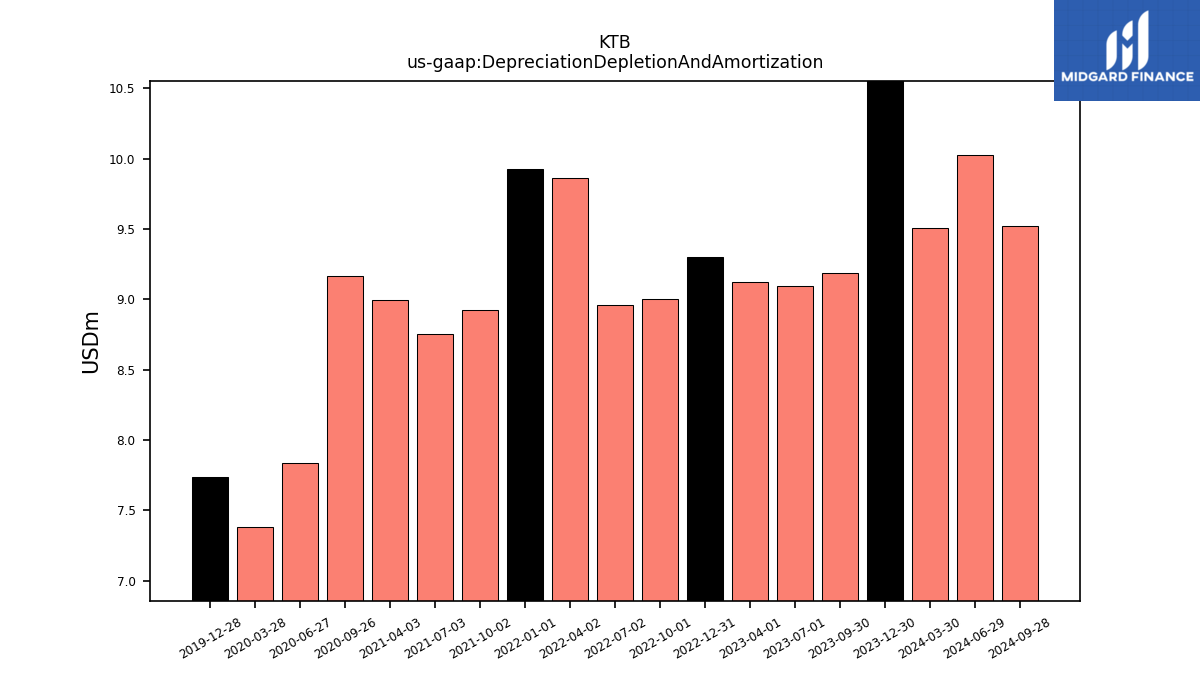
| Depreciation Depletion And Amortization | 10.64 | 9.19 | 9.09 | 9.13 | 9.30 | 9.01 | 8.96 | 9.86 | 9.92 | 8.93 | 8.76 | 8.99 | 9.16 | 7.83 | 7.38 | 7.74 | NA | NA | NA | NA | NA | NA | NA | |
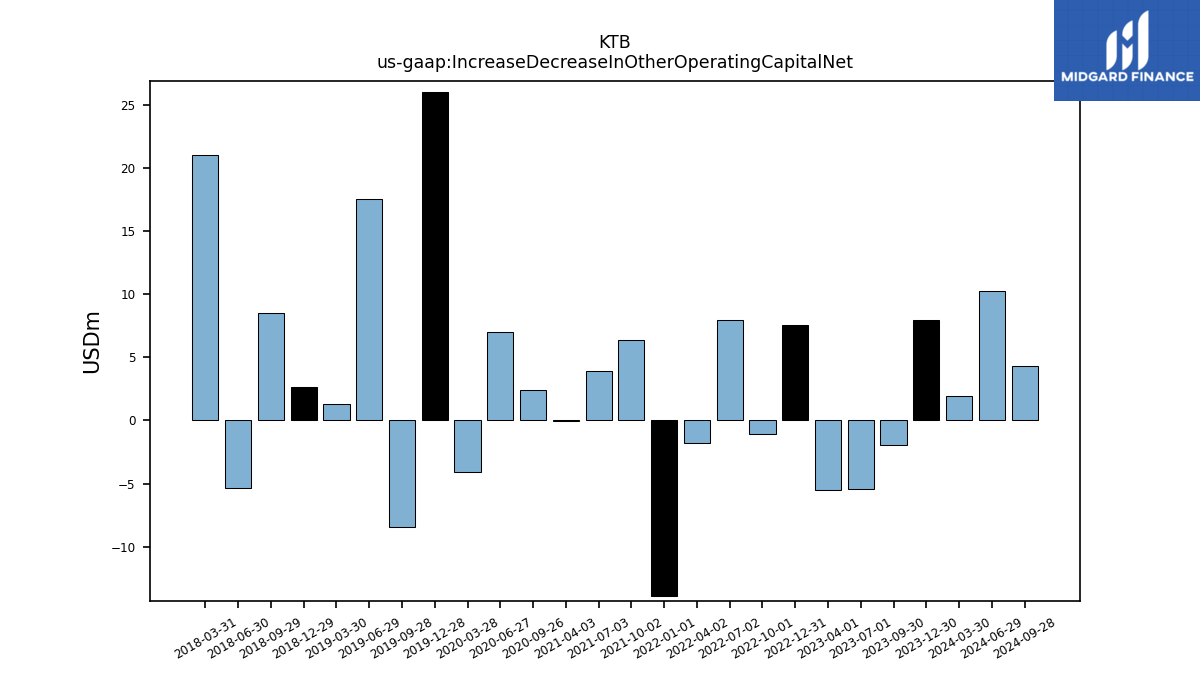
| Increase Decrease In Other Operating Capital Net | 7.95 | -1.97 | -5.42 | -5.47 | 7.53 | -1.04 | 7.92 | -1.78 | -13.90 | 6.34 | 3.92 | -0.00 | 2.44 | 7.01 | -4.10 | 26.02 | -8.39 | 17.51 | 1.34 | 2.65 | 8.52 | -5.38 | 20.99 | |
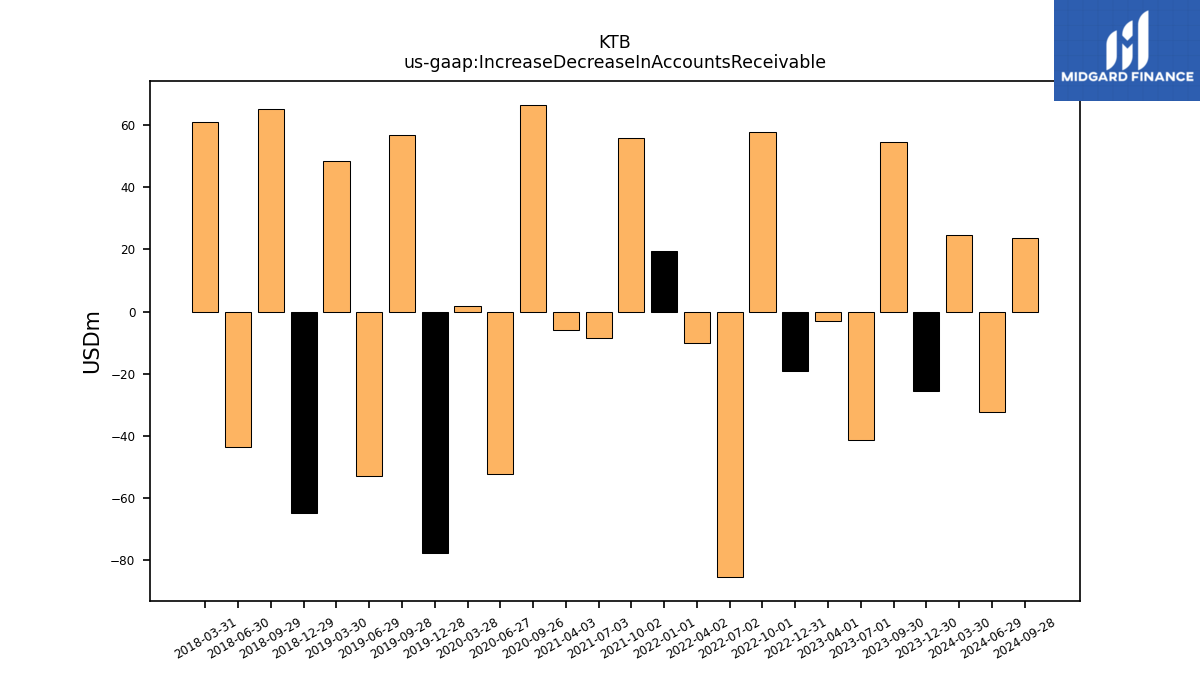
| Increase Decrease In Accounts Receivable | -25.57 | 54.70 | -41.19 | -2.85 | -19.02 | 57.67 | -85.35 | -9.99 | 19.59 | 55.68 | -8.44 | -5.87 | 66.57 | -52.08 | 1.76 | -77.50 | 56.88 | -52.83 | 48.47 | -64.83 | 65.15 | -43.42 | 60.85 | |
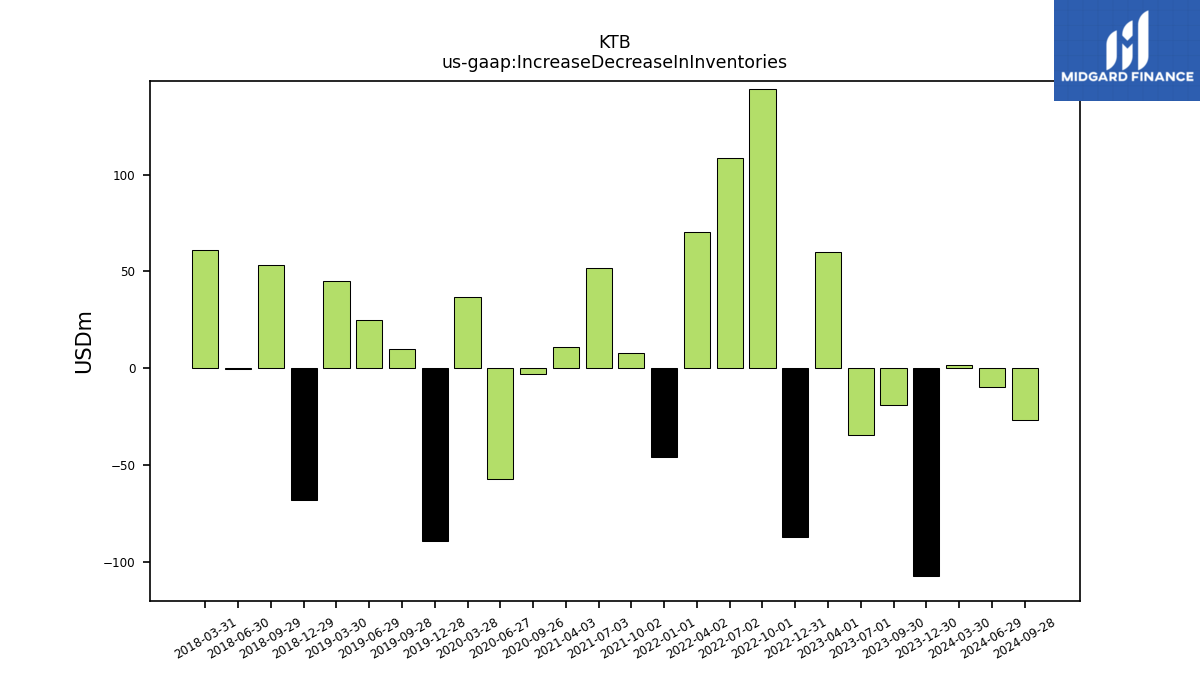
| Increase Decrease In Inventories | -107.64 | -19.22 | -34.33 | 59.90 | -87.28 | 144.43 | 108.84 | 70.18 | -45.72 | 7.64 | 51.88 | 11.13 | -3.27 | -57.08 | 36.57 | -89.22 | 9.88 | 24.73 | 44.93 | -68.25 | 53.29 | -0.42 | 61.15 | |
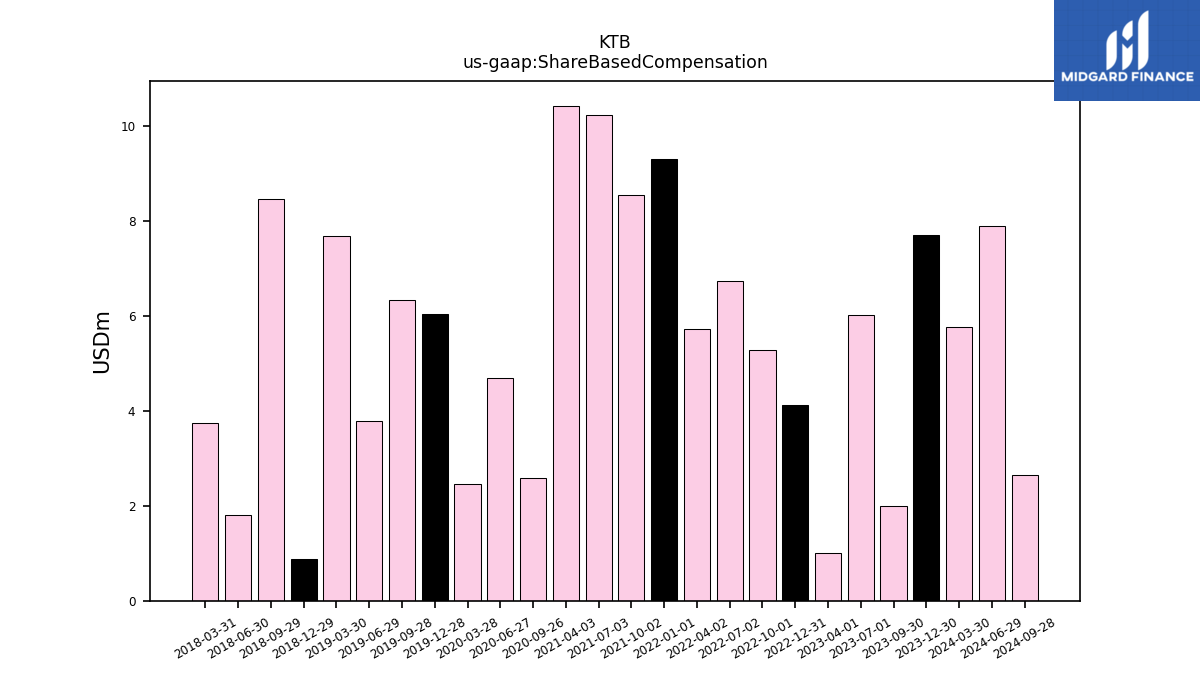
| Share Based Compensation | 7.71 | 1.99 | 6.02 | 1.00 | 4.13 | 5.28 | 6.74 | 5.73 | 9.30 | 8.55 | 10.23 | 10.43 | 2.58 | 4.69 | 2.47 | 6.05 | 6.33 | 3.79 | 7.68 | 0.88 | 8.46 | 1.81 | 3.74 |
| 2023-12-30 | 2023-09-30 | 2023-07-01 | 2023-04-01 | 2022-12-31 | 2022-10-01 | 2022-07-02 | 2022-04-02 | 2022-01-01 | 2021-10-02 | 2021-07-03 | 2021-04-03 | 2020-09-26 | 2020-06-27 | 2020-03-28 | 2019-12-28 | 2019-09-28 | 2019-06-29 | 2019-03-30 | 2018-12-29 | 2018-09-29 | 2018-06-30 | 2018-03-31 | ||
|---|---|---|---|---|---|---|---|---|---|---|---|---|---|---|---|---|---|---|---|---|---|---|---|---|
| Net Cash Provided By Used In Investing Activities | -7.81 | -11.29 | -8.25 | -11.80 | -8.40 | -10.11 | -6.58 | -5.03 | -7.42 | -10.74 | -9.45 | -11.76 | 2.07 | -16.86 | -22.31 | -22.97 | -2.80 | 515.04 | -5.32 | 24.31 | -6.00 | -7.88 | 0.90 | |
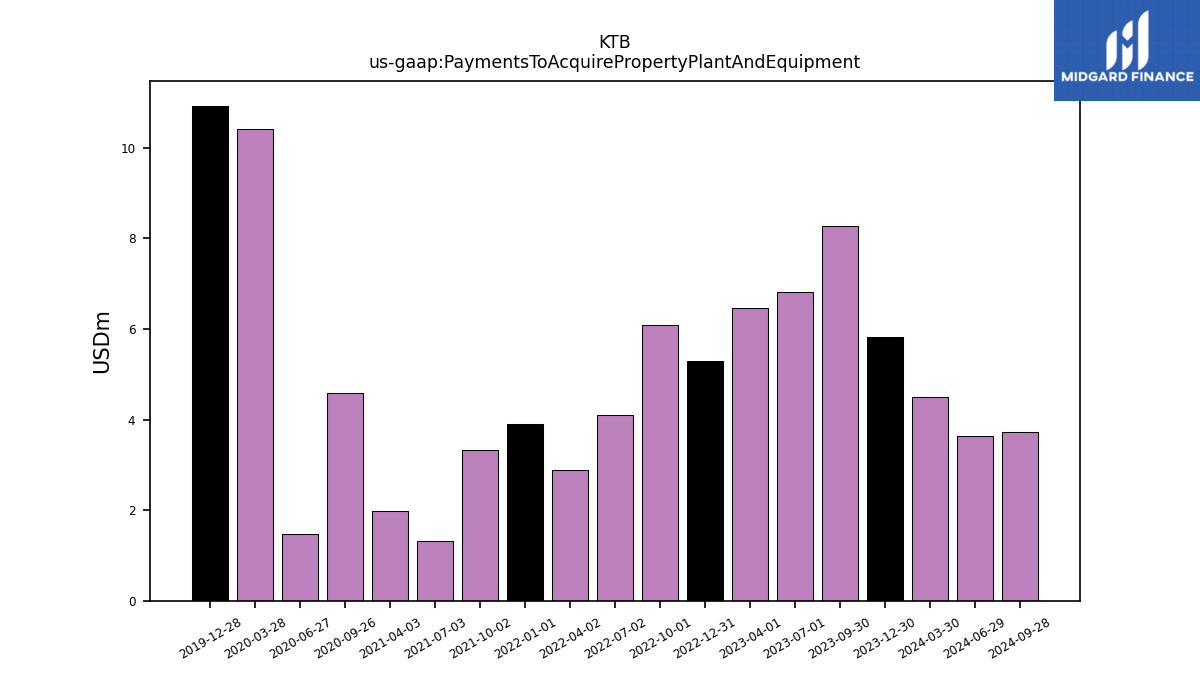
| Payments To Acquire Property Plant And Equipment | 5.81 | 8.28 | 6.81 | 6.46 | 5.28 | 6.10 | 4.11 | 2.88 | 3.91 | 3.32 | 1.33 | 1.99 | 4.59 | 1.47 | 10.42 | 10.93 | NA | NA | NA | NA | NA | NA | NA |
| 2023-12-30 | 2023-09-30 | 2023-07-01 | 2023-04-01 | 2022-12-31 | 2022-10-01 | 2022-07-02 | 2022-04-02 | 2022-01-01 | 2021-10-02 | 2021-07-03 | 2021-04-03 | 2020-09-26 | 2020-06-27 | 2020-03-28 | 2019-12-28 | 2019-09-28 | 2019-06-29 | 2019-03-30 | 2018-12-29 | 2018-09-29 | 2018-06-30 | 2018-03-31 | ||
|---|---|---|---|---|---|---|---|---|---|---|---|---|---|---|---|---|---|---|---|---|---|---|---|---|
| Net Cash Provided By Used In Financing Activities | -57.68 | -28.97 | -86.06 | 17.02 | -65.75 | 15.54 | -60.75 | -59.95 | -97.22 | -36.32 | -47.03 | -123.50 | -101.11 | -257.63 | 443.83 | -112.16 | -28.98 | -915.31 | -195.65 | 123.97 | -298.17 | 163.26 | 117.27 | |
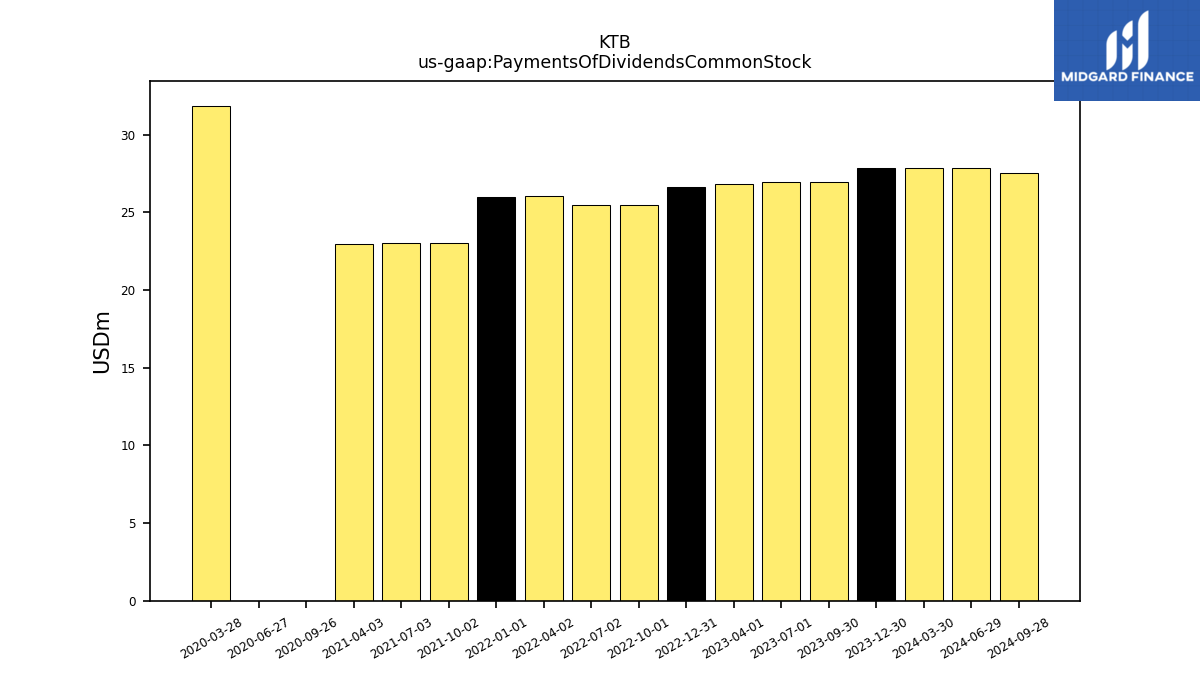
| Payments Of Dividends Common Stock | 27.86 | 26.96 | 26.95 | 26.81 | 26.64 | 25.51 | 25.48 | 26.03 | 26.01 | 23.05 | 23.05 | 22.96 | 0.00 | 0.00 | 31.88 | NA | NA | NA | NA | NA | NA | NA | NA |
| 2023-12-30 | 2023-09-30 | 2023-07-01 | 2023-04-01 | 2022-12-31 | 2022-10-01 | 2022-07-02 | 2022-04-02 | 2022-01-01 | 2021-10-02 | 2021-07-03 | 2021-04-03 | 2020-09-26 | 2020-06-27 | 2020-03-28 | 2019-12-28 | 2019-09-28 | 2019-06-29 | 2019-03-30 | 2018-12-29 | 2018-09-29 | 2018-06-30 | 2018-03-31 | ||
|---|---|---|---|---|---|---|---|---|---|---|---|---|---|---|---|---|---|---|---|---|---|---|---|---|
| Revenues | 669.80 | 654.54 | 616.01 | 667.12 | 731.61 | 606.52 | 613.57 | 679.74 | 681.09 | 652.30 | 490.76 | 651.76 | 583.22 | 349.25 | 504.50 | 652.61 | 638.14 | 609.75 | 648.34 | 726.23 | 704.25 | 663.86 | 669.66 | |
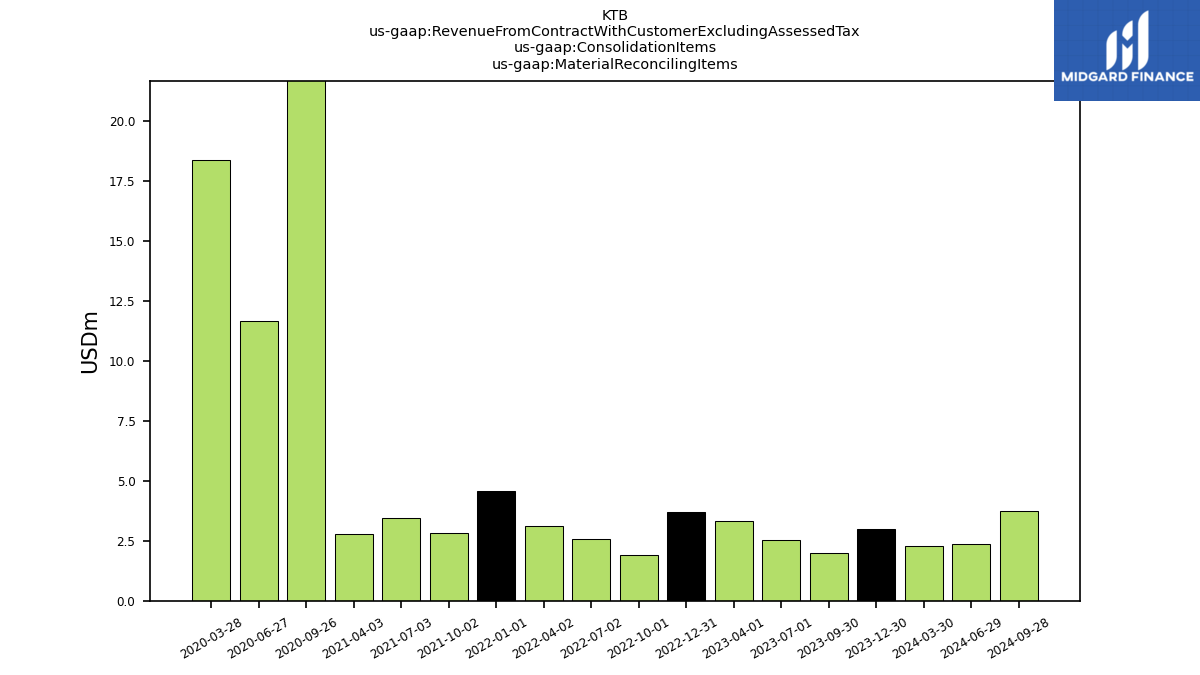
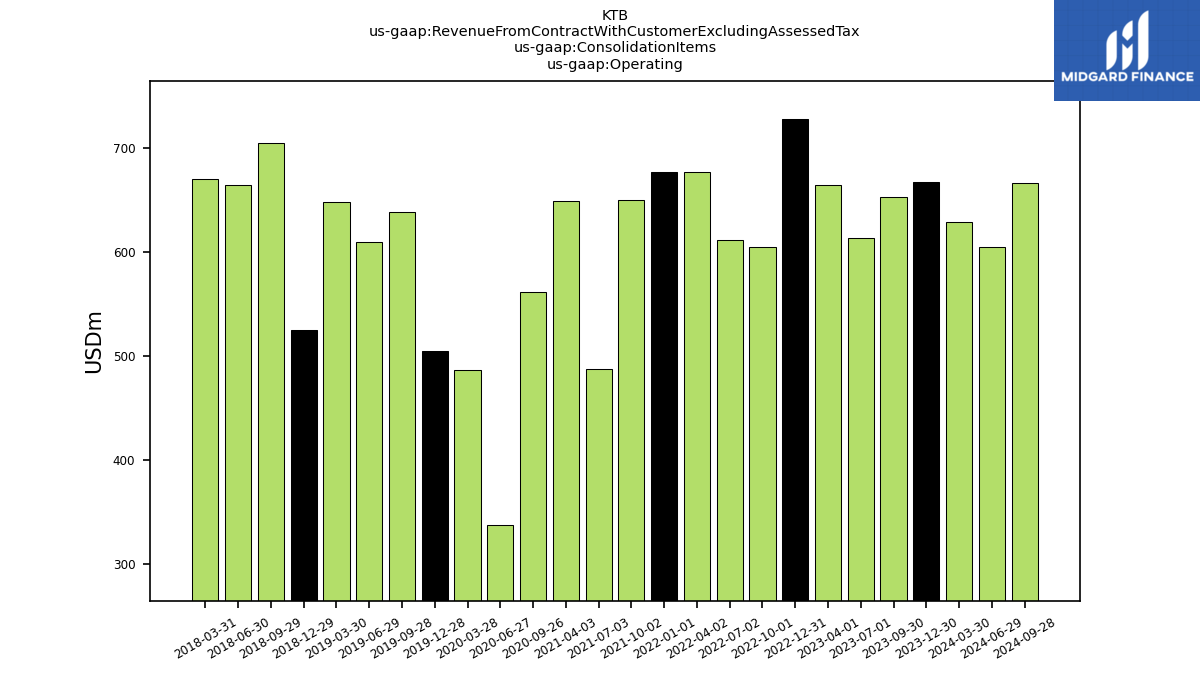
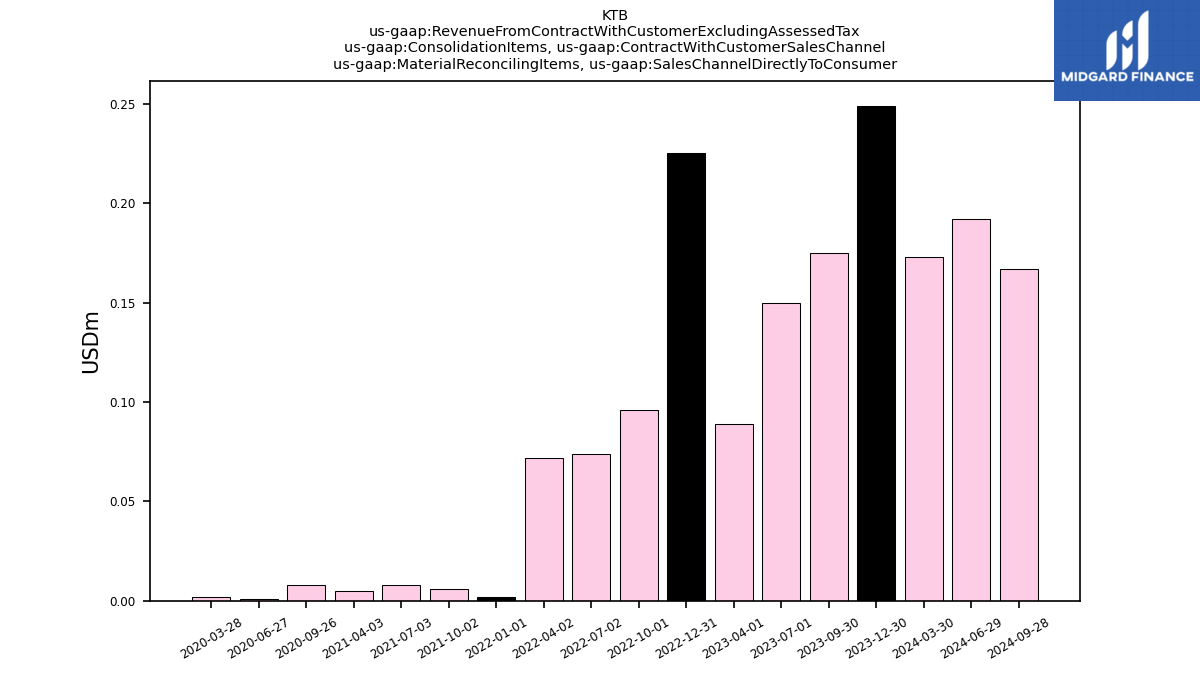
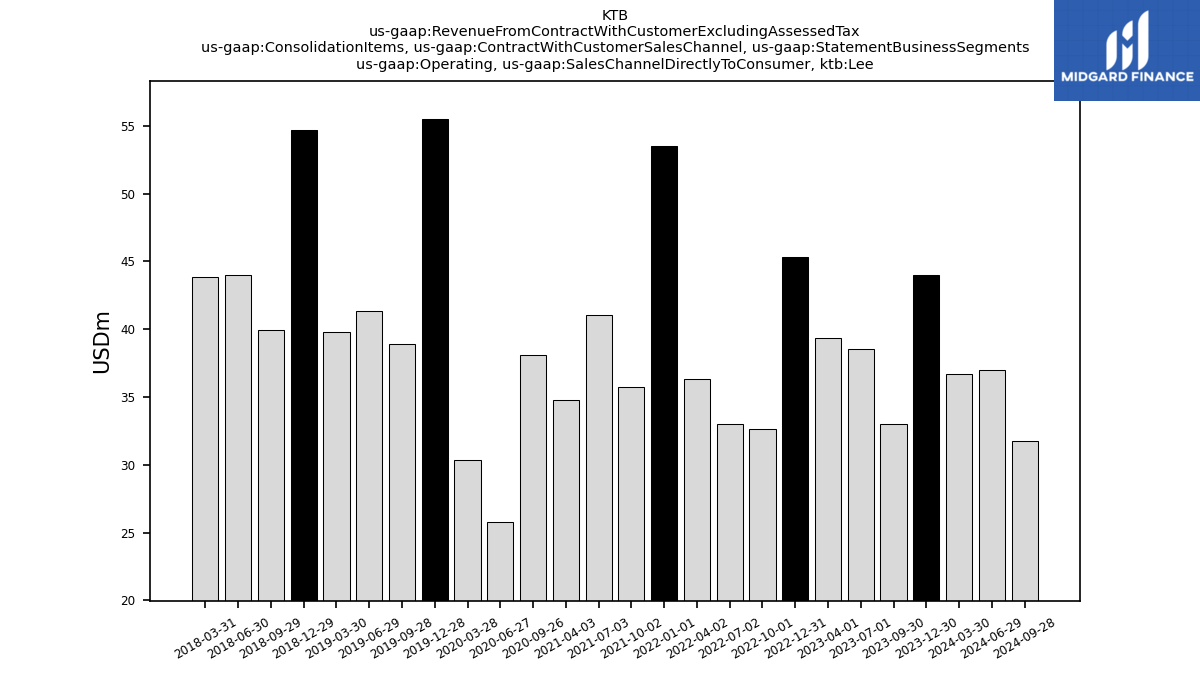
| Revenue From Contract With Customer Excluding Assessed Tax | 669.80 | 654.54 | 616.01 | 667.12 | 731.61 | 606.52 | 613.57 | 679.74 | 681.09 | 652.30 | 490.76 | 651.76 | 583.22 | 349.25 | 504.50 | 652.61 | 638.14 | 609.75 | 648.34 | 726.23 | 704.25 | 663.86 | 669.66 | |
| Material Reconciling Items | 3.00 | 1.97 | 2.52 | 3.33 | 3.70 | 1.90 | 2.58 | 3.10 | 4.57 | 2.82 | 3.45 | 2.79 | 22.15 | 11.63 | 18.36 | NA | NA | NA | NA | NA | NA | NA | NA | |
| Operating | 666.79 | 652.57 | 613.49 | 663.80 | 727.90 | 604.63 | 611.00 | 676.64 | 676.52 | 649.48 | 487.31 | 648.97 | 561.07 | 337.62 | 486.14 | 504.16 | 638.14 | 609.75 | 648.34 | 524.68 | 704.25 | 663.86 | 669.66 | |
| Material Reconciling Items, Sales Channel Directly To Consumer | 0.25 | 0.17 | 0.15 | 0.09 | 0.23 | 0.10 | 0.07 | 0.07 | 0.00 | 0.01 | 0.01 | 0.01 | 0.01 | 0.00 | 0.00 | NA | NA | NA | NA | NA | NA | NA | NA | |
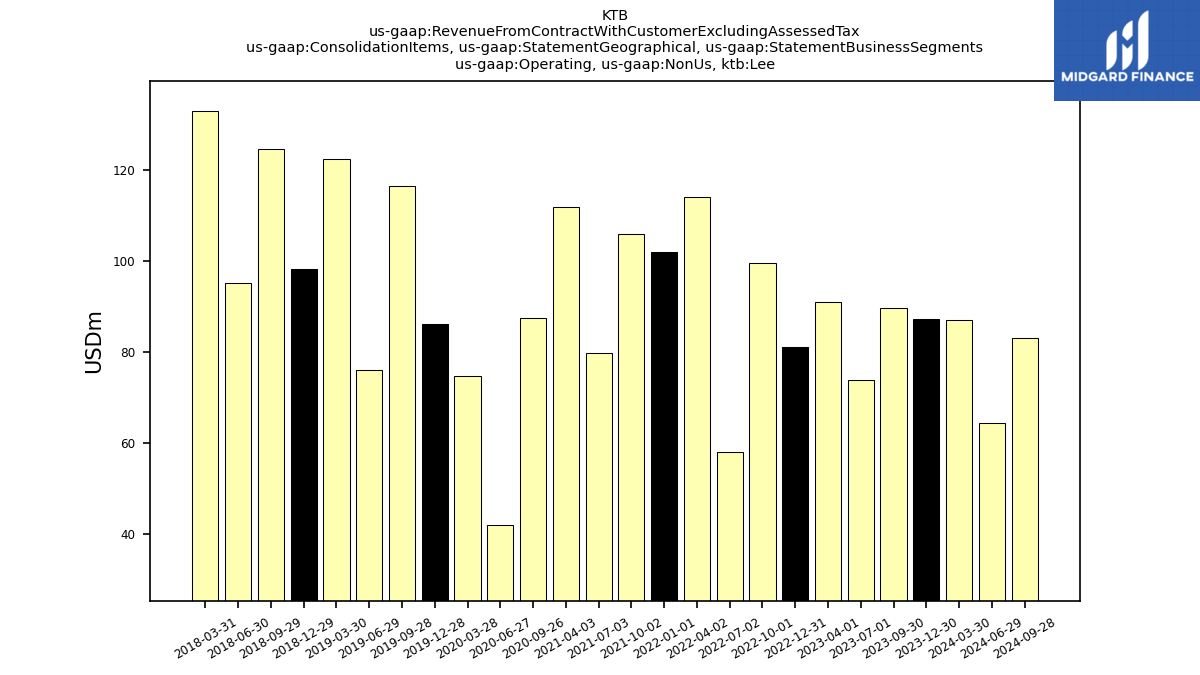
| Operating, Sales Channel Directly To Consumer, Lee | 44.02 | 33.03 | 38.56 | 39.34 | 45.34 | 32.66 | 33.00 | 36.36 | 53.52 | 35.70 | 41.01 | 34.77 | 38.13 | 25.77 | 30.32 | 55.52 | 38.90 | 41.31 | 39.78 | 54.72 | 39.95 | 44.02 | 43.84 | |
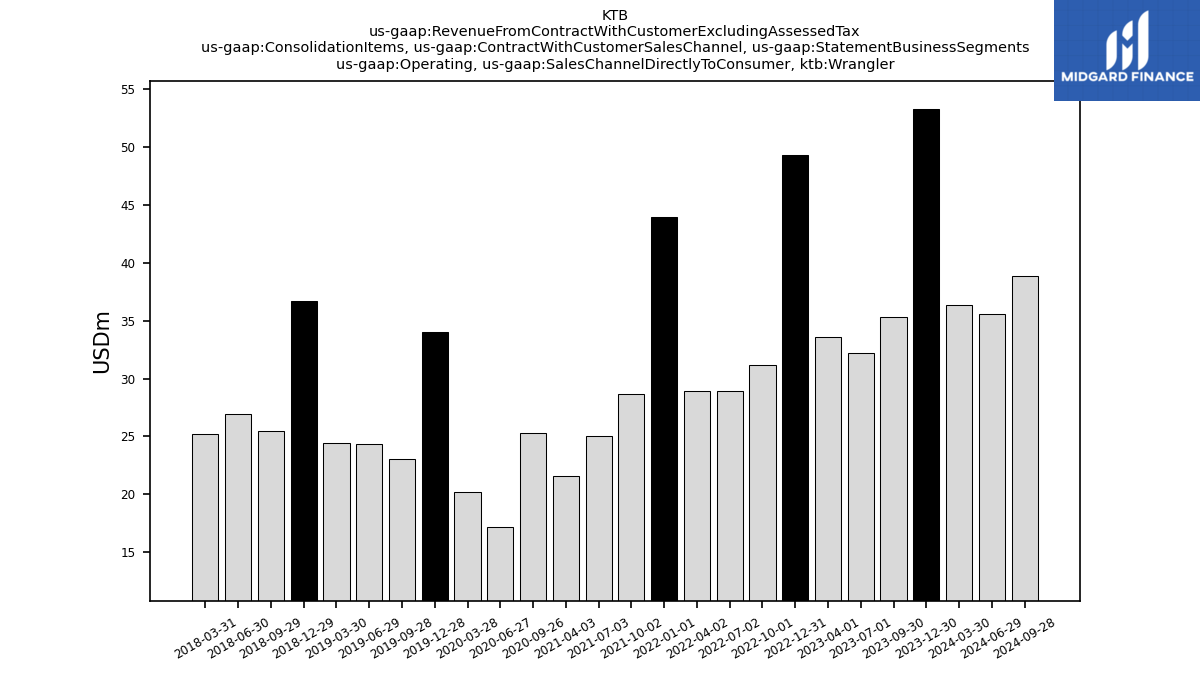
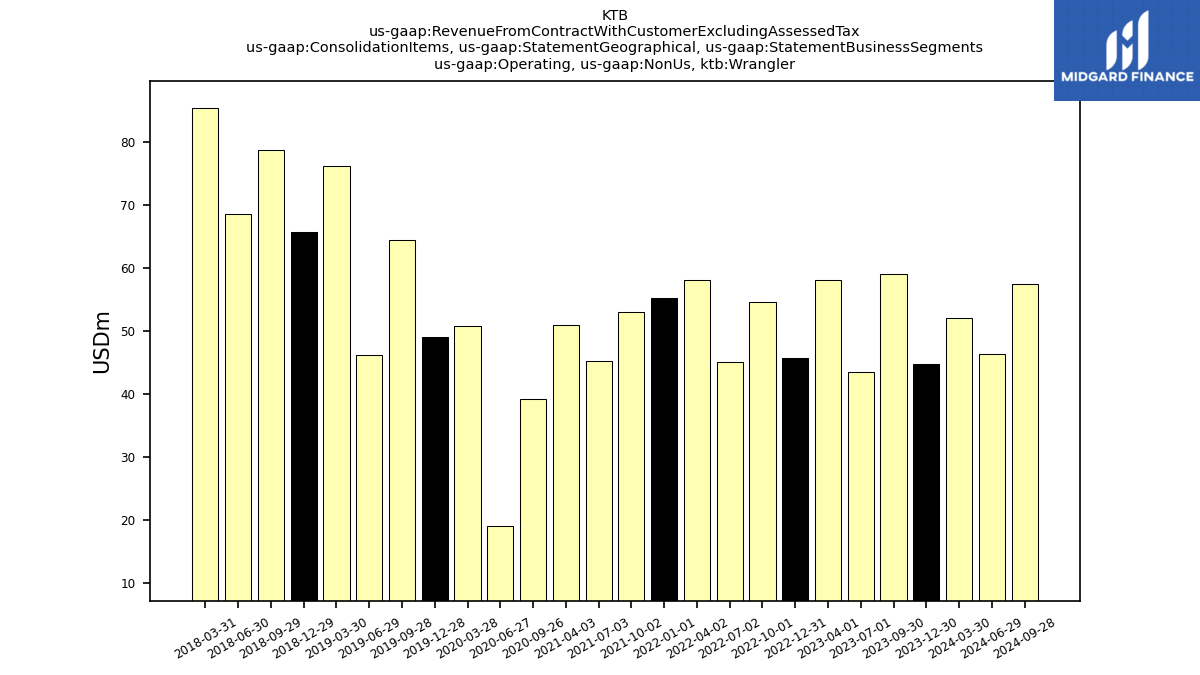
| Operating, Sales Channel Directly To Consumer, Wrangler | 53.25 | 35.29 | 32.17 | 33.55 | 49.28 | 31.15 | 28.95 | 28.95 | 43.91 | 28.67 | 25.03 | 21.55 | 25.27 | 17.22 | 20.17 | 34.00 | 23.07 | 24.38 | 24.45 | 36.74 | 25.48 | 26.90 | 25.19 | |
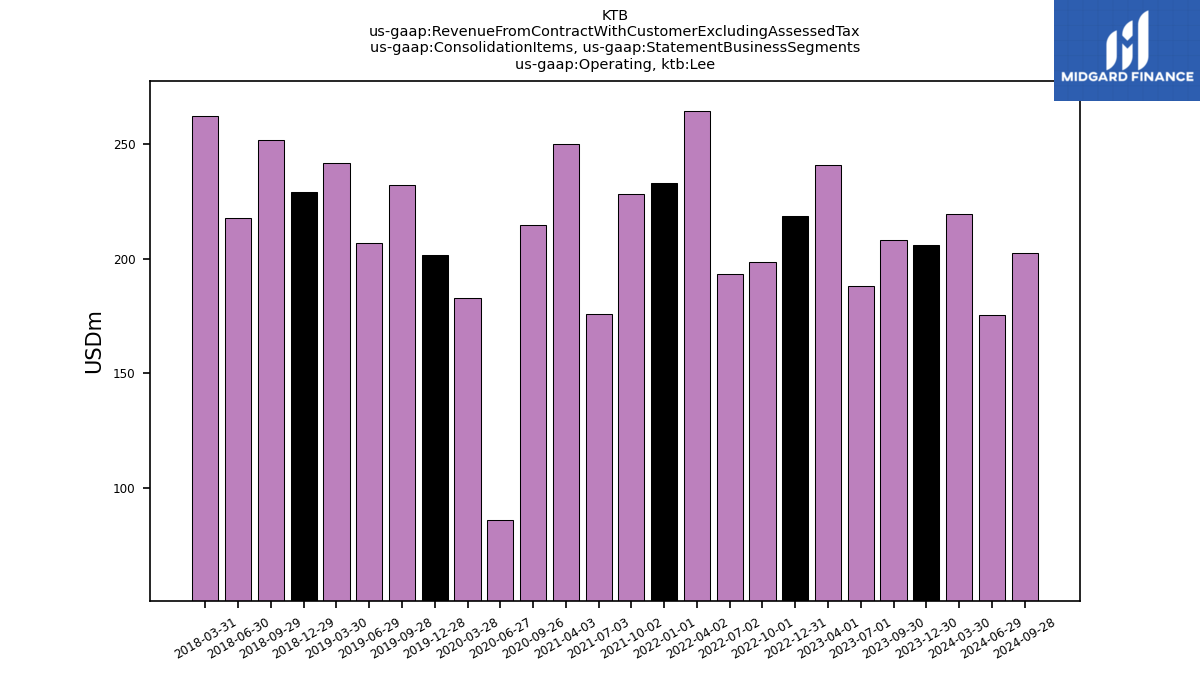
| Operating, Lee | 205.84 | 208.03 | 188.01 | 240.65 | 218.63 | 198.47 | 193.05 | 264.22 | 232.92 | 227.97 | 176.01 | 250.15 | 214.44 | 85.97 | 182.76 | 201.62 | 232.22 | 206.91 | 241.53 | 229.00 | 251.51 | 217.77 | 261.96 | |
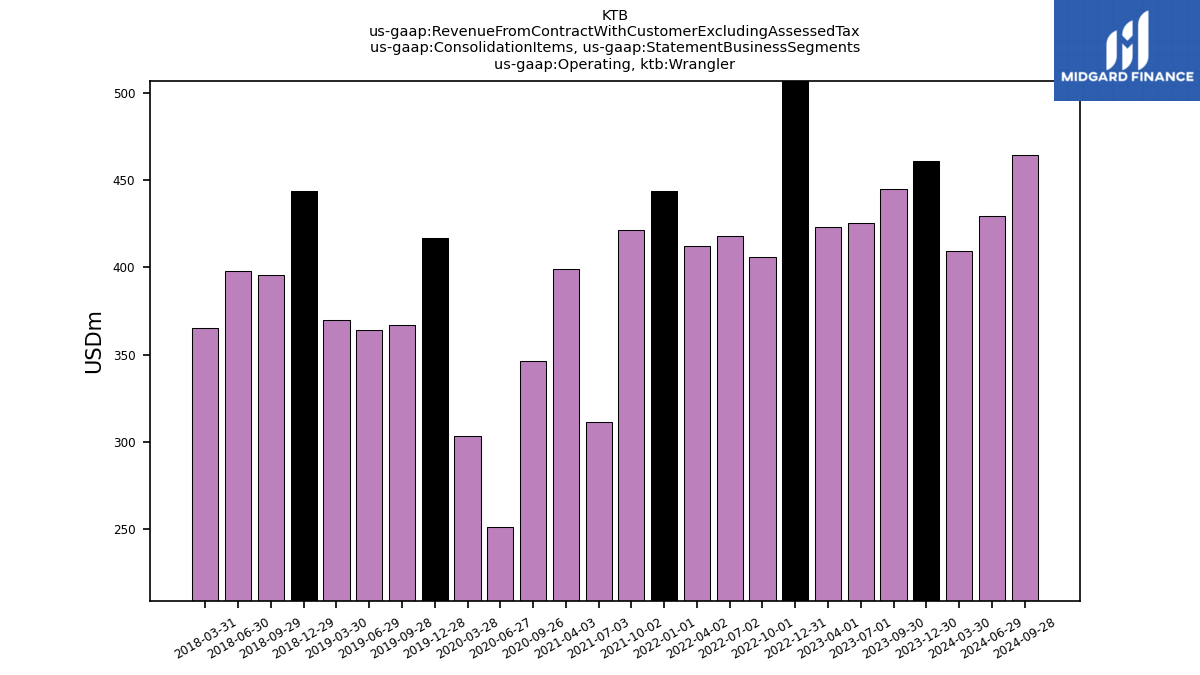
| Operating, Wrangler | 460.96 | 444.54 | 425.49 | 423.15 | 509.28 | 406.16 | 417.94 | 412.42 | 443.60 | 421.51 | 311.30 | 398.82 | 346.63 | 251.66 | 303.39 | 416.98 | 367.21 | 363.99 | 369.94 | 443.87 | 395.61 | 397.75 | 364.98 | |
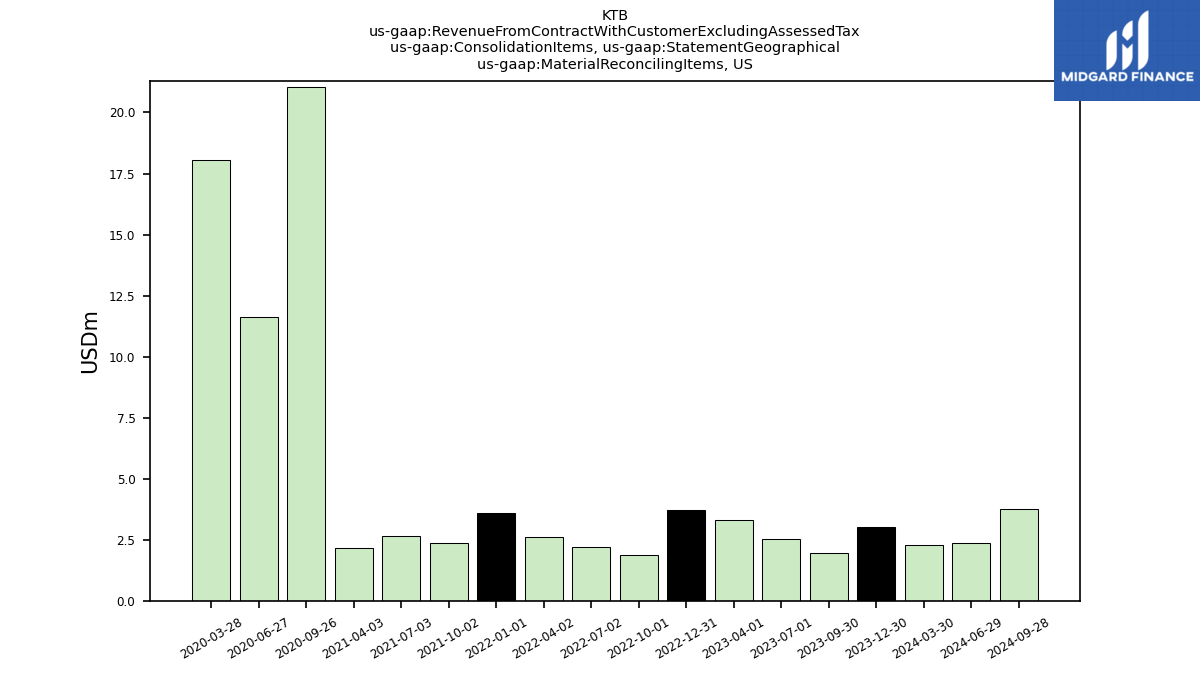
| Material Reconciling Items,US | 3.00 | 1.97 | 2.52 | 3.32 | 3.70 | 1.87 | 2.20 | 2.60 | 3.61 | 2.37 | 2.65 | 2.15 | 21.03 | 11.63 | 18.05 | NA | NA | NA | NA | NA | NA | NA | NA | |
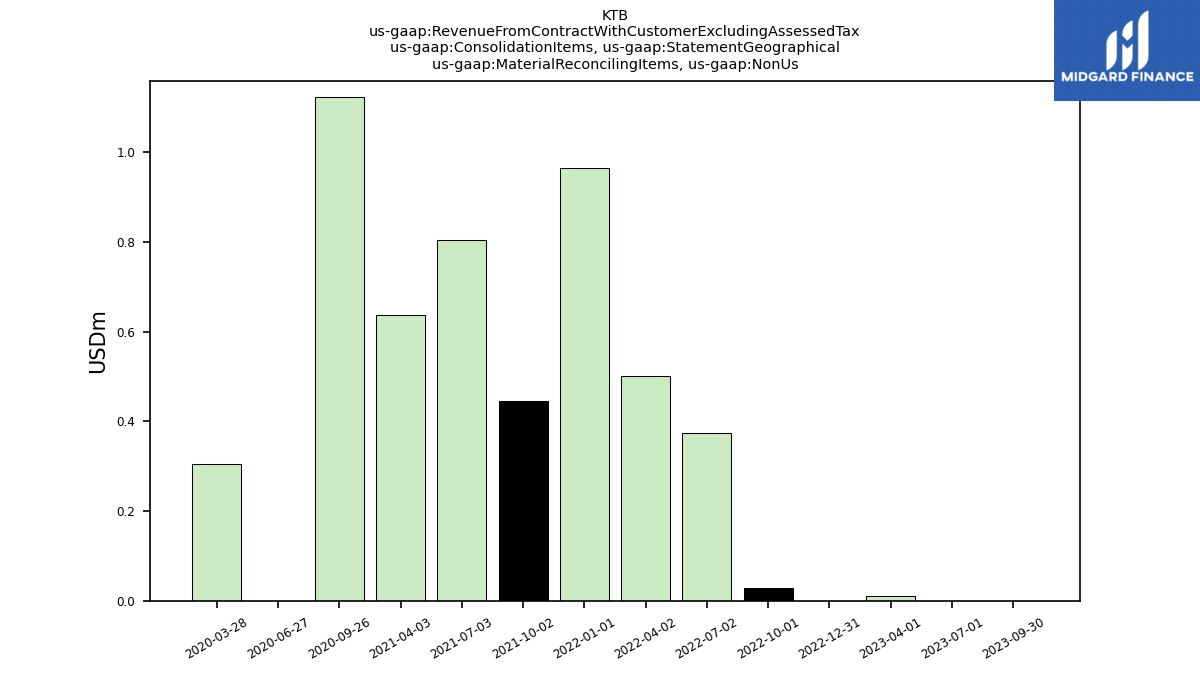
| Material Reconciling Items, Non Us | 0.00 | 0.00 | 0.00 | 0.01 | 0.00 | 0.03 | 0.37 | 0.50 | 0.97 | 0.45 | 0.81 | 0.64 | 1.12 | 0.00 | 0.30 | NA | NA | NA | NA | NA | NA | NA | NA | |
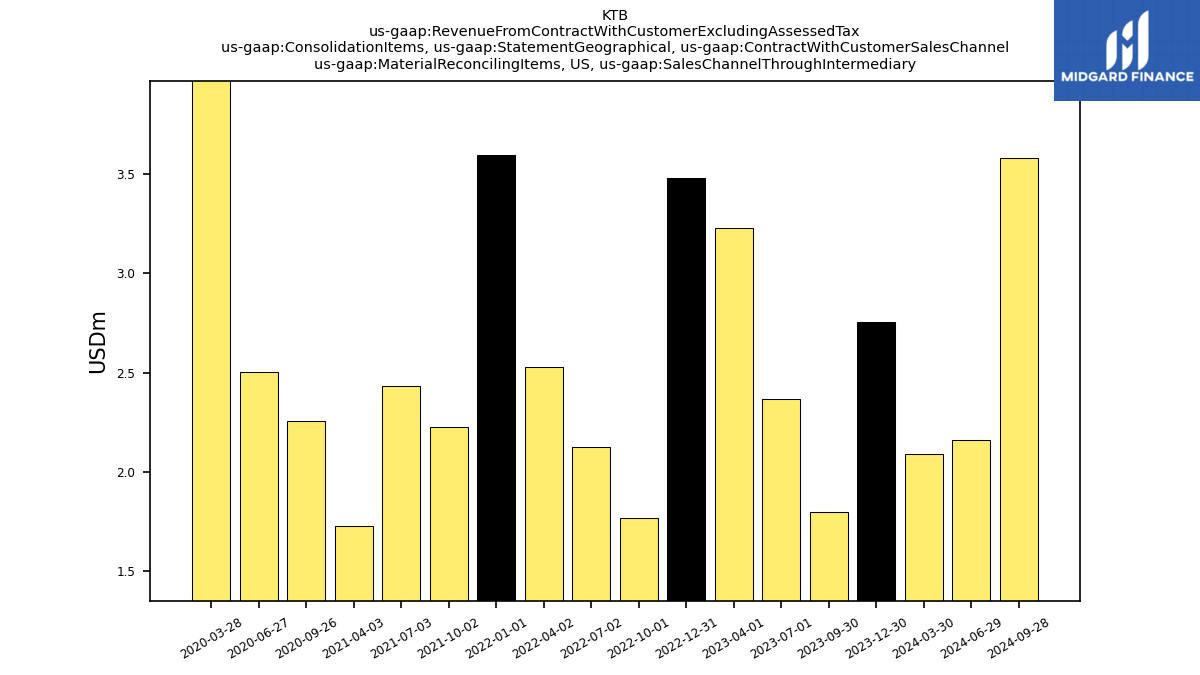
| Material Reconciling Items,US, Sales Channel Through Intermediary | 2.76 | 1.80 | 2.37 | 3.23 | 3.48 | 1.77 | 2.13 | 2.53 | 3.59 | 2.23 | 2.43 | 1.73 | 2.26 | 2.50 | 4.06 | NA | NA | NA | NA | NA | NA | NA | NA | |
| Material Reconciling Items, Non Us, Sales Channel Through Intermediary | 0.00 | 0.00 | 0.00 | 0.01 | 0.00 | 0.03 | 0.37 | 0.50 | 0.97 | 0.45 | 0.81 | 0.64 | 1.12 | 0.00 | 0.30 | NA | NA | NA | NA | NA | NA | NA | NA | |
| Operating,US, Sales Channel Through Intermediary, Lee | 103.61 | 103.56 | 98.22 | 135.30 | 119.67 | 84.12 | 120.20 | 136.81 | 111.05 | 105.78 | 79.31 | 124.58 | 105.76 | 33.19 | 92.58 | 88.34 | 93.93 | 108.76 | 100.86 | 105.17 | 104.14 | 100.67 | 110.26 | |
| Operating,US, Sales Channel Through Intermediary, Wrangler | 369.61 | 355.61 | 355.21 | 337.68 | 420.00 | 324.56 | 348.54 | 330.65 | 350.54 | 344.28 | 245.20 | 329.70 | 285.64 | 217.18 | 236.28 | 338.82 | 283.62 | 299.04 | 276.82 | 350.46 | 298.75 | 311.22 | 263.79 | |
| Operating, Non Us, Sales Channel Through Intermediary, Lee | 58.20 | 71.43 | 51.23 | 66.00 | 53.61 | 81.68 | 39.86 | 91.05 | 68.35 | 86.49 | 55.69 | 90.80 | 70.56 | 27.00 | 59.85 | 57.76 | 99.39 | 56.84 | 100.90 | 69.11 | 107.42 | 73.08 | 107.86 | |
| Operating, Non Us, Sales Channel Through Intermediary, Wrangler | 38.10 | 53.64 | 38.10 | 51.92 | 39.99 | 50.45 | 40.46 | 52.82 | 49.15 | 48.56 | 41.07 | 47.58 | 35.72 | 17.25 | 46.94 | 44.16 | 60.52 | 40.57 | 68.66 | 56.66 | 71.38 | 59.62 | 76.01 | |
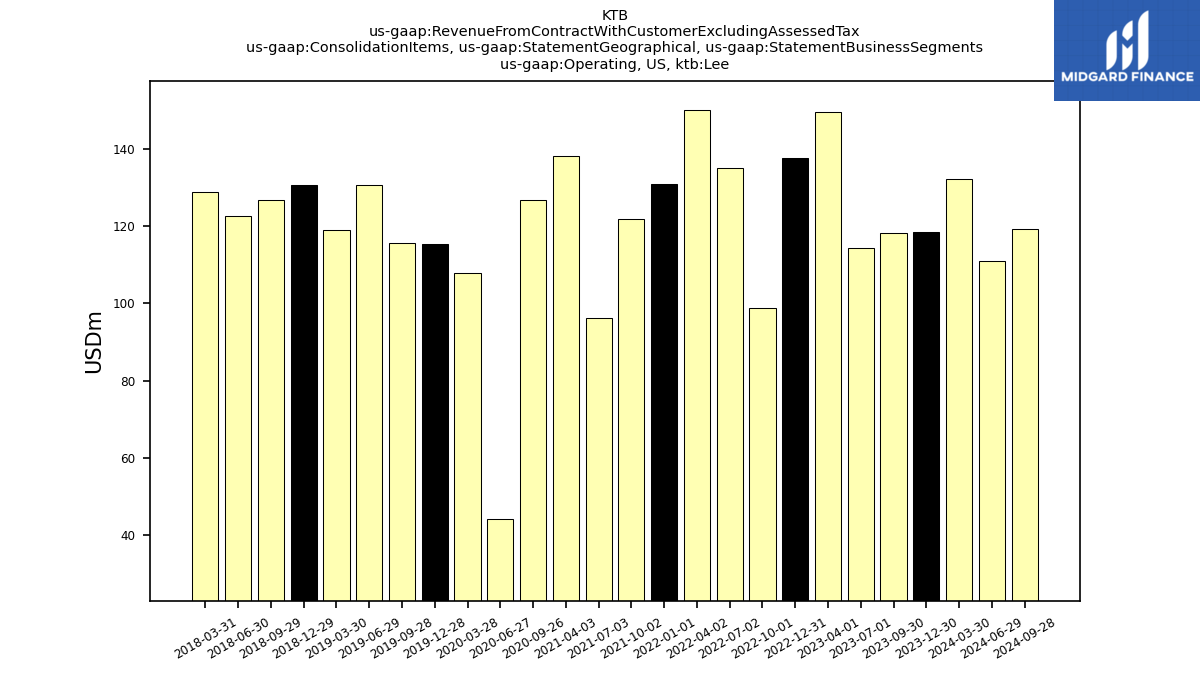
| Operating,US, Lee | 118.53 | 118.35 | 114.25 | 149.69 | 137.60 | 98.86 | 135.06 | 150.12 | 130.85 | 121.95 | 96.18 | 138.23 | 126.91 | 44.12 | 107.97 | 115.44 | 115.70 | 130.79 | 119.12 | 130.76 | 126.78 | 122.66 | 128.96 | |
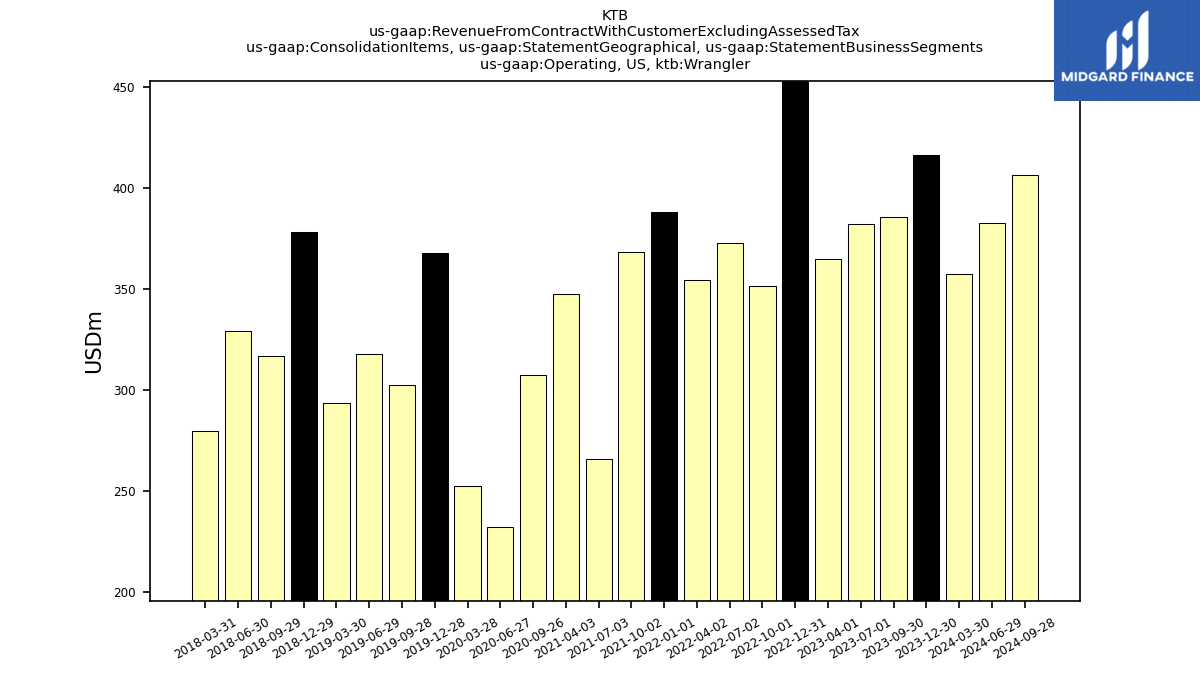
| Operating,US, Wrangler | 416.31 | 385.50 | 382.11 | 365.13 | 463.60 | 351.62 | 372.98 | 354.39 | 388.38 | 368.51 | 266.15 | 347.88 | 307.51 | 232.57 | 252.58 | 367.91 | 302.82 | 317.83 | 293.87 | 378.23 | 316.91 | 329.17 | 279.64 | |
| Operating, Non Us, Lee | 87.31 | 89.67 | 73.76 | 90.96 | 81.03 | 99.60 | 58.00 | 114.10 | 102.06 | 106.02 | 79.83 | 111.92 | 87.53 | 41.85 | 74.79 | 86.18 | 116.52 | 76.11 | 122.41 | 98.24 | 124.73 | 95.12 | 133.00 | |
| Operating, Non Us, Wrangler | 44.65 | 59.04 | 43.37 | 58.02 | 45.68 | 54.54 | 44.96 | 58.03 | 55.22 | 53.00 | 45.16 | 50.94 | 39.12 | 19.09 | 50.80 | 49.07 | 64.39 | 46.16 | 76.07 | 65.63 | 78.70 | 68.58 | 85.34 | |
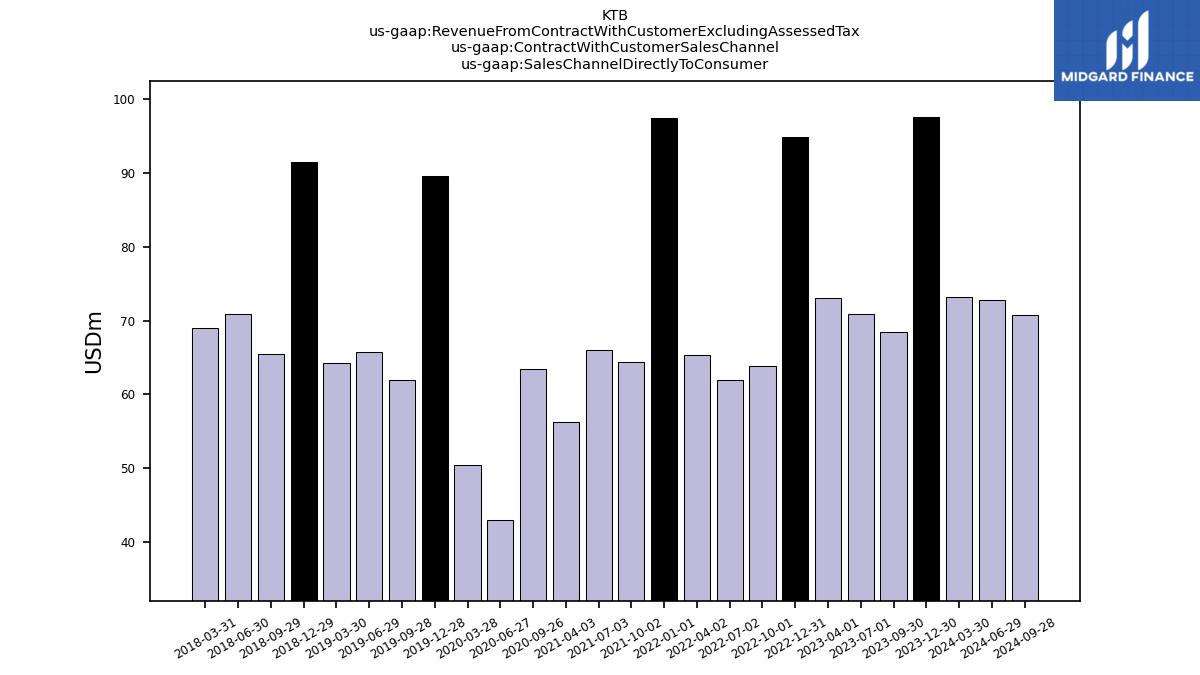
| Sales Channel Directly To Consumer | 97.52 | 68.49 | 70.88 | 72.99 | 94.85 | 63.91 | 62.02 | 65.39 | 97.43 | 64.38 | 66.05 | 56.32 | 63.40 | 42.99 | 50.49 | 89.52 | 61.98 | 65.70 | 64.23 | 91.38 | 65.48 | 70.95 | 69.03 | |
| Foreign Exchange Contract, Reclassification Out Of Accumulated Other Comprehensive Income, Accumulated Gain Loss Net Cash Flow Hedge Parent | 0.05 | -0.04 | -0.06 | -0.17 | -0.30 | -0.40 | -0.26 | -0.13 | -0.04 | 0.05 | 0.12 | 0.07 | -0.04 | -0.19 | -0.36 | -0.37 | -0.38 | -0.10 | 0.00 | NA | NA | NA | NA | |
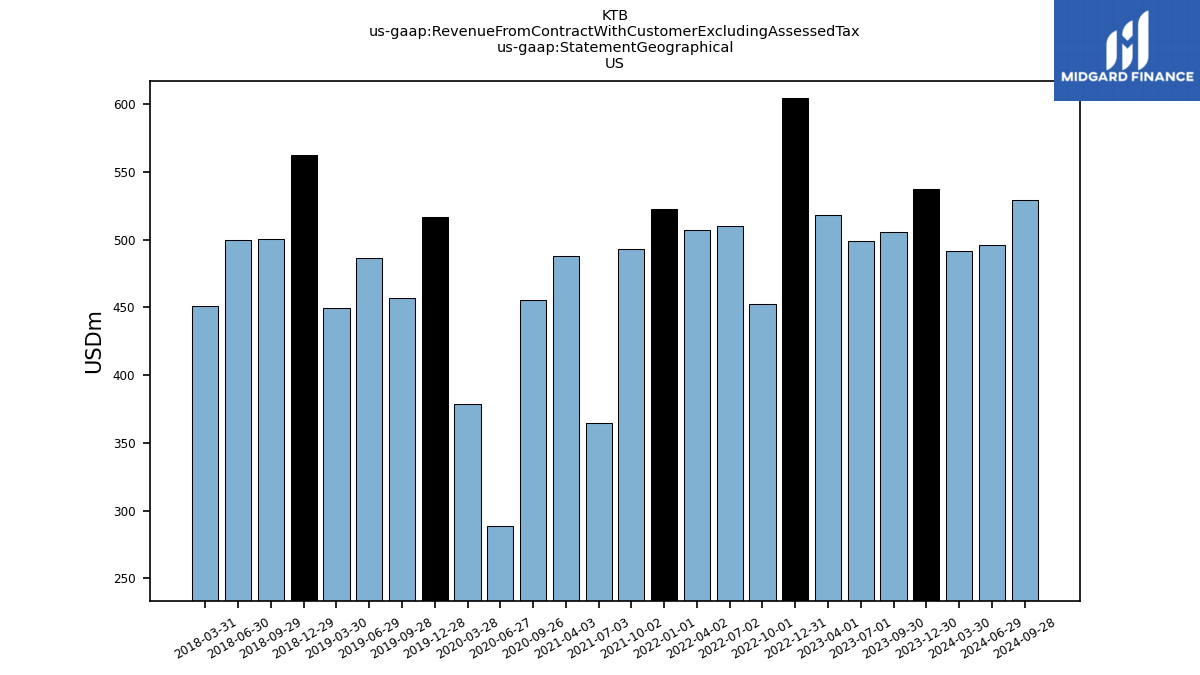
| US | 537.84 | 505.83 | 498.88 | 518.14 | 604.90 | 452.35 | 510.24 | 507.11 | 522.84 | 492.83 | 364.97 | 488.27 | 455.45 | 288.32 | 378.60 | 516.67 | 456.78 | 486.63 | 449.87 | 562.39 | 500.81 | 500.13 | 451.32 | |
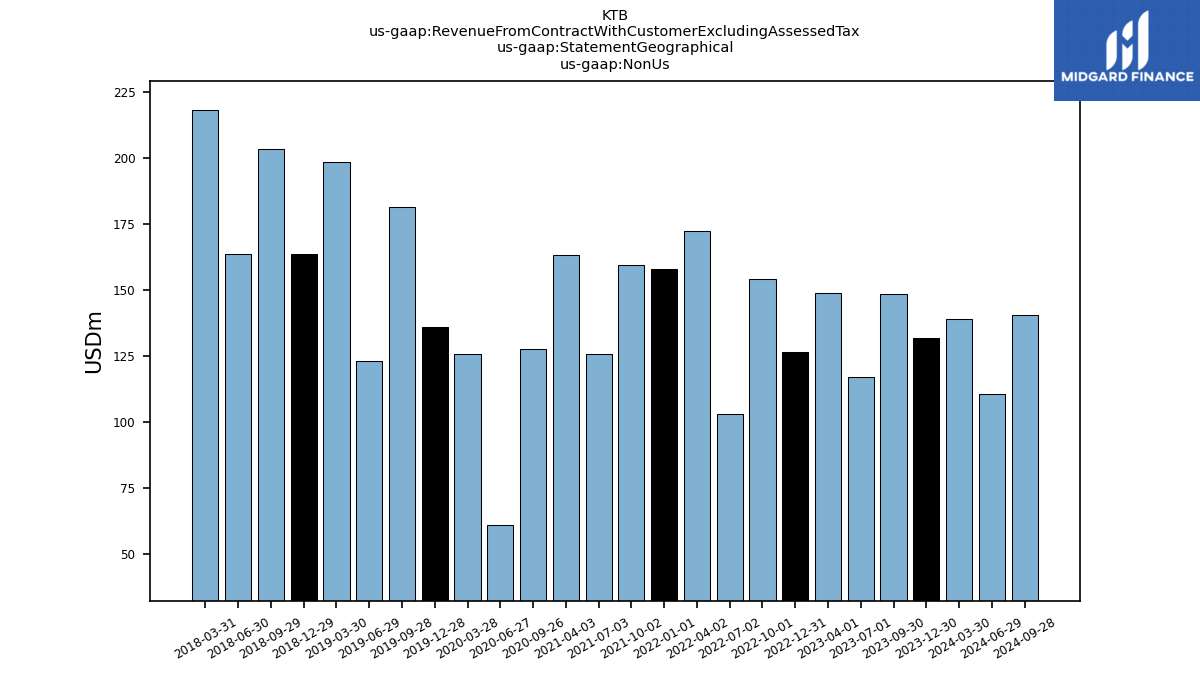
| Non Us | 131.96 | 148.71 | 117.13 | 148.99 | 126.71 | 154.17 | 103.33 | 172.63 | 158.25 | 159.47 | 125.80 | 163.50 | 127.77 | 60.94 | 125.89 | 135.94 | 181.36 | 123.12 | 198.48 | 163.84 | 203.44 | 163.72 | 218.34 | |
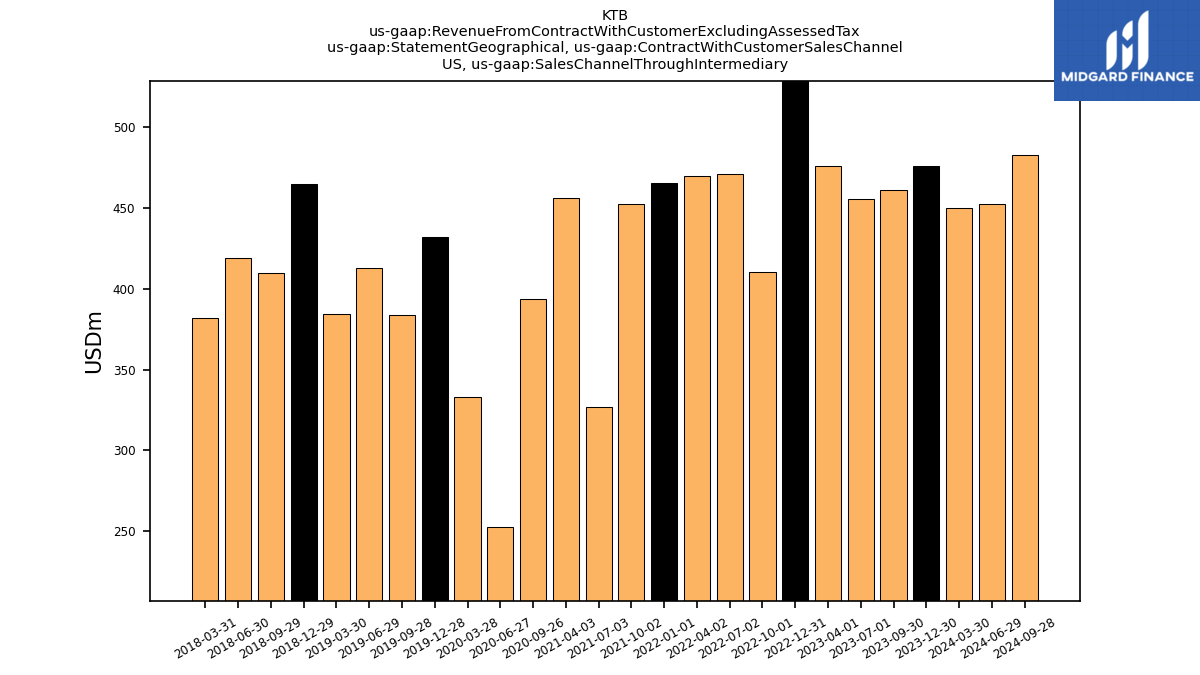
| US, Sales Channel Through Intermediary | 475.98 | 460.97 | 455.79 | 476.20 | 543.16 | 410.46 | 470.86 | 469.99 | 465.18 | 452.28 | 326.95 | 456.01 | 393.65 | 252.88 | 332.92 | 431.89 | 383.52 | 412.51 | 384.41 | 464.53 | 409.44 | 418.99 | 381.61 | |
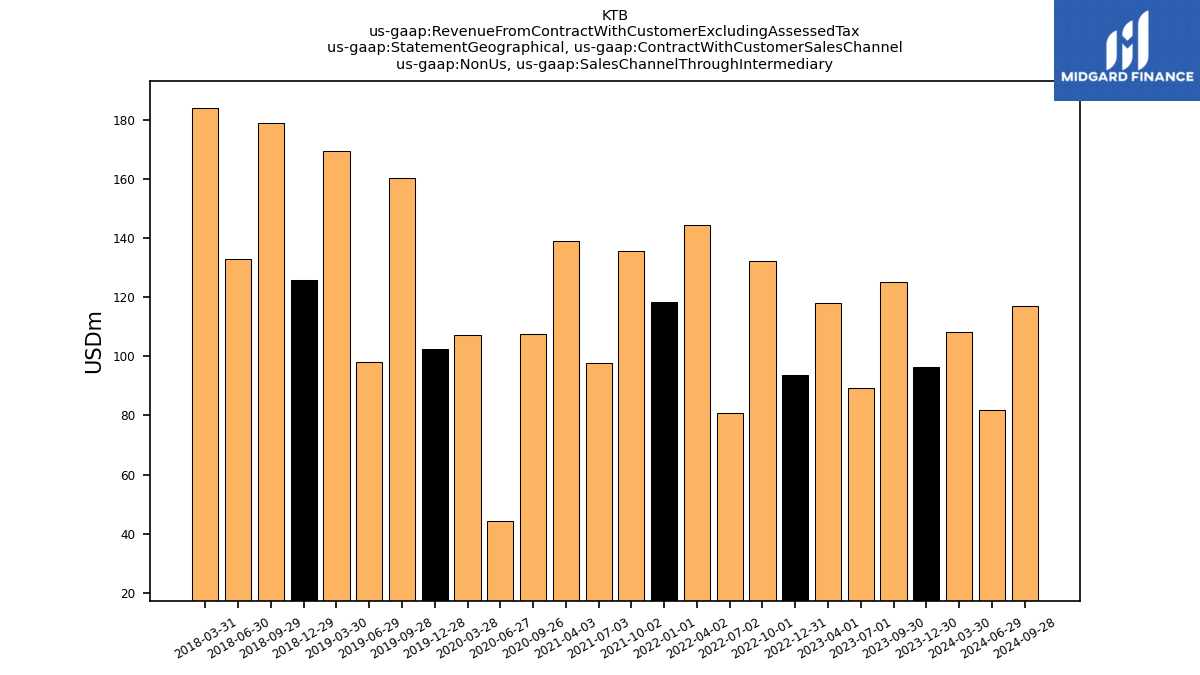
| Non Us, Sales Channel Through Intermediary | 96.30 | 125.08 | 89.34 | 117.93 | 93.60 | 132.16 | 80.69 | 144.37 | 118.46 | 135.50 | 97.57 | 139.01 | 107.40 | 44.26 | 107.09 | 102.53 | 160.25 | 98.05 | 169.55 | 125.75 | 178.81 | 132.73 | 183.87 |