
| 2023-12-31 | 2023-09-30 | 2023-06-30 | 2023-03-31 | 2022-12-31 | 2022-09-30 | 2022-06-30 | 2022-03-31 | 2021-12-31 | 2021-09-30 | 2021-06-30 | 2021-03-31 | 2020-12-31 | 2020-09-30 | 2020-06-30 | 2020-03-31 | 2019-12-31 | 2019-09-30 | 2019-06-30 | 2019-03-31 | 2018-12-31 | 2018-09-30 | 2018-06-30 | 2018-03-31 | 2017-12-31 | 2017-09-30 | 2017-06-30 | 2017-03-31 | ||
|---|---|---|---|---|---|---|---|---|---|---|---|---|---|---|---|---|---|---|---|---|---|---|---|---|---|---|---|---|---|
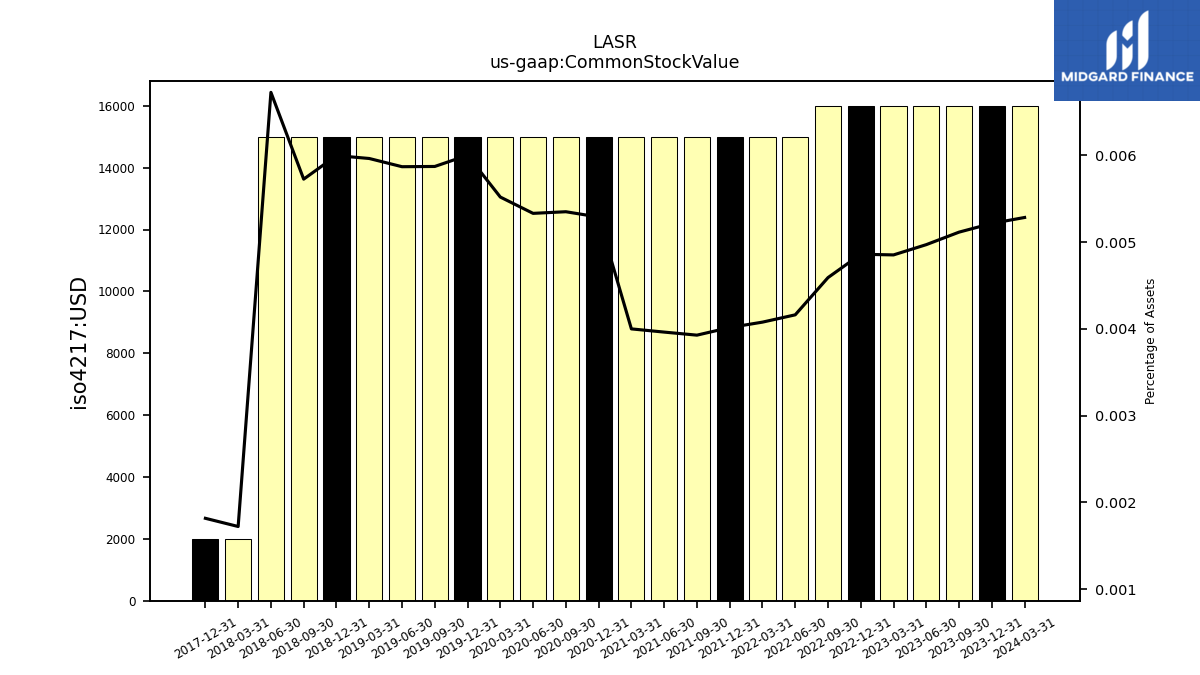
| Common Stock Value | 0.02 | 0.02 | 0.02 | 0.02 | 0.02 | 0.02 | 0.01 | 0.01 | 0.01 | 0.01 | 0.01 | 0.01 | 0.01 | 0.01 | 0.01 | 0.01 | 0.01 | 0.01 | 0.01 | 0.01 | 0.01 | 0.01 | 0.01 | 0.00 | 0.00 | NA | NA | NA | |
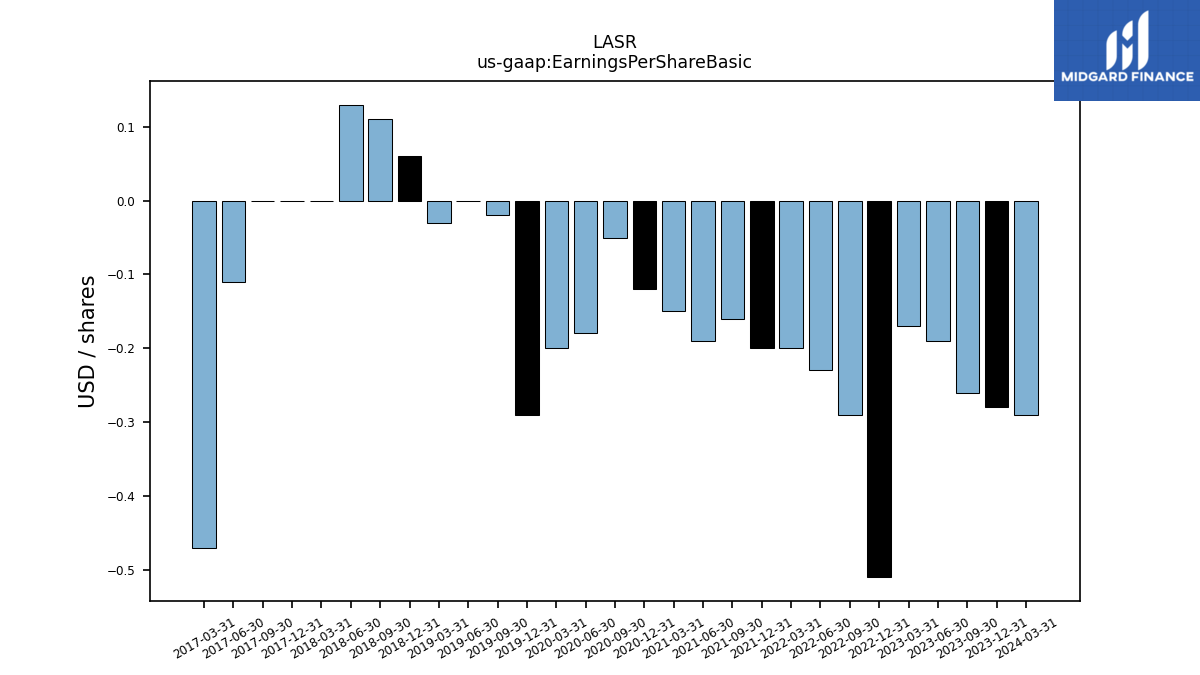
| Earnings Per Share Basic | -0.28 | -0.26 | -0.19 | -0.17 | -0.51 | -0.29 | -0.23 | -0.20 | -0.20 | -0.16 | -0.19 | -0.15 | -0.12 | -0.05 | -0.18 | -0.20 | -0.29 | -0.02 | 0.00 | -0.03 | 0.06 | 0.11 | 0.13 | 0.00 | 0.00 | 0.00 | -0.11 | -0.47 | |
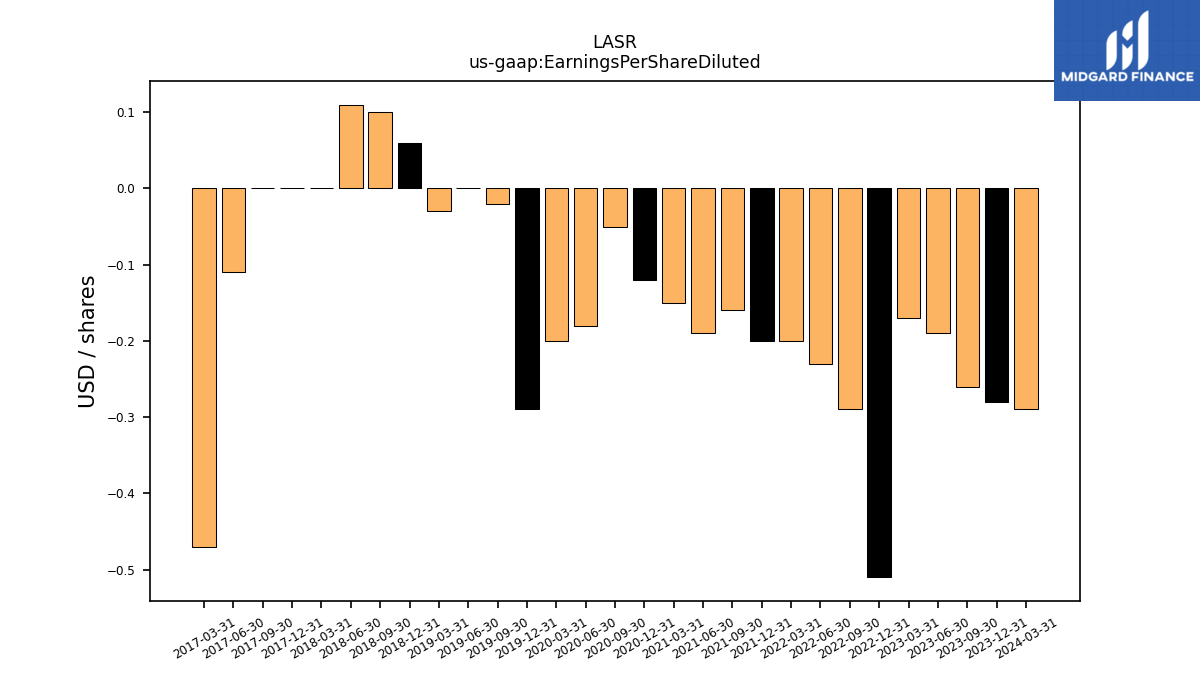
| Earnings Per Share Diluted | -0.28 | -0.26 | -0.19 | -0.17 | -0.51 | -0.29 | -0.23 | -0.20 | -0.20 | -0.16 | -0.19 | -0.15 | -0.12 | -0.05 | -0.18 | -0.20 | -0.29 | -0.02 | 0.00 | -0.03 | 0.06 | 0.10 | 0.11 | 0.00 | 0.00 | 0.00 | -0.11 | -0.47 |
| 2023-12-31 | 2023-09-30 | 2023-06-30 | 2023-03-31 | 2022-12-31 | 2022-09-30 | 2022-06-30 | 2022-03-31 | 2021-12-31 | 2021-09-30 | 2021-06-30 | 2021-03-31 | 2020-12-31 | 2020-09-30 | 2020-06-30 | 2020-03-31 | 2019-12-31 | 2019-09-30 | 2019-06-30 | 2019-03-31 | 2018-12-31 | 2018-09-30 | 2018-06-30 | 2018-03-31 | 2017-12-31 | 2017-09-30 | 2017-06-30 | 2017-03-31 | ||
|---|---|---|---|---|---|---|---|---|---|---|---|---|---|---|---|---|---|---|---|---|---|---|---|---|---|---|---|---|---|
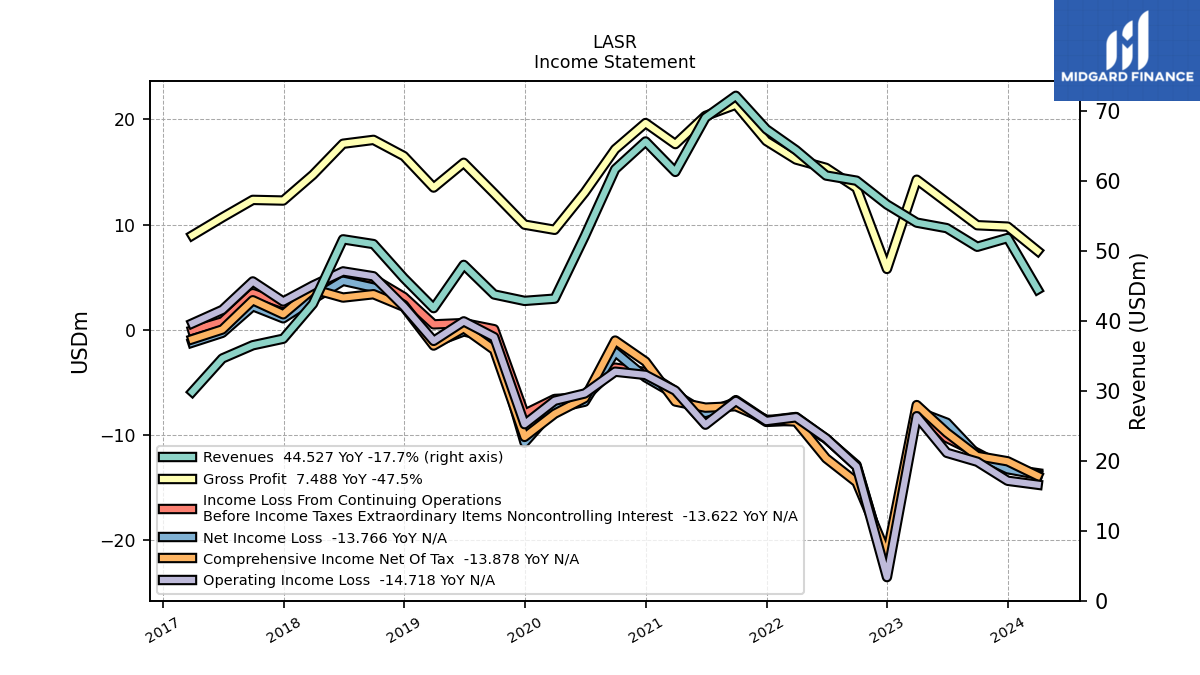
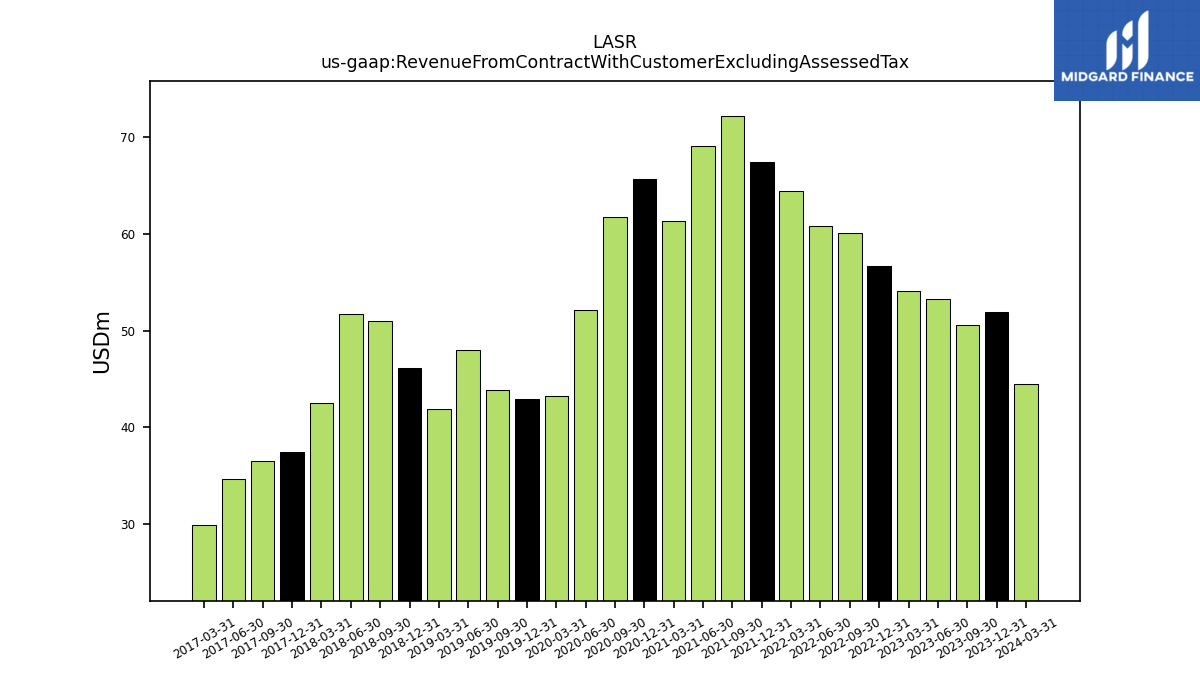
| Revenue From Contract With Customer Excluding Assessed Tax | 51.89 | 50.63 | 53.30 | 54.09 | 56.68 | 60.09 | 60.83 | 64.46 | 67.45 | 72.23 | 69.11 | 61.34 | 65.70 | 61.73 | 52.14 | 43.22 | 42.90 | 43.81 | 48.05 | 41.86 | 46.16 | 51.02 | 51.70 | 42.47 | 37.48 | 36.55 | 34.66 | 29.89 | |
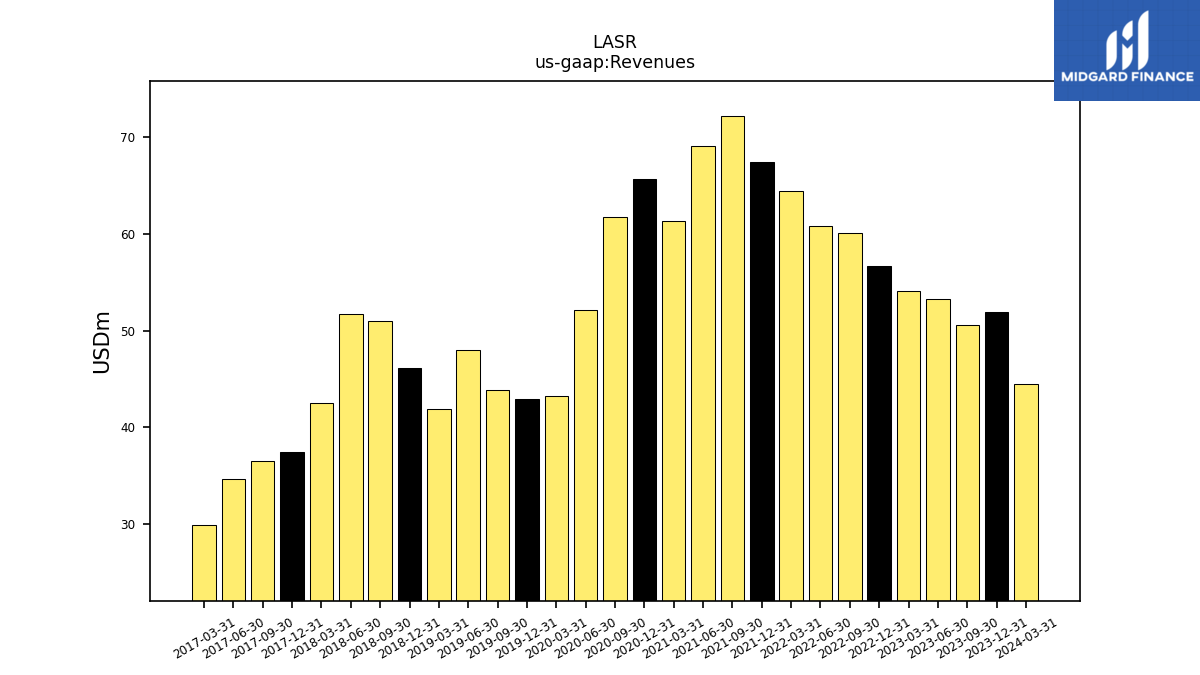
| Revenues | 51.89 | 50.63 | 53.30 | 54.09 | 56.68 | 60.09 | 60.83 | 64.46 | 67.45 | 72.23 | 69.11 | 61.34 | 65.70 | 61.73 | 52.14 | 43.22 | 42.90 | 43.81 | 48.05 | 41.86 | 46.16 | 51.02 | 51.70 | 42.47 | 37.48 | 36.55 | 34.66 | 29.89 | |
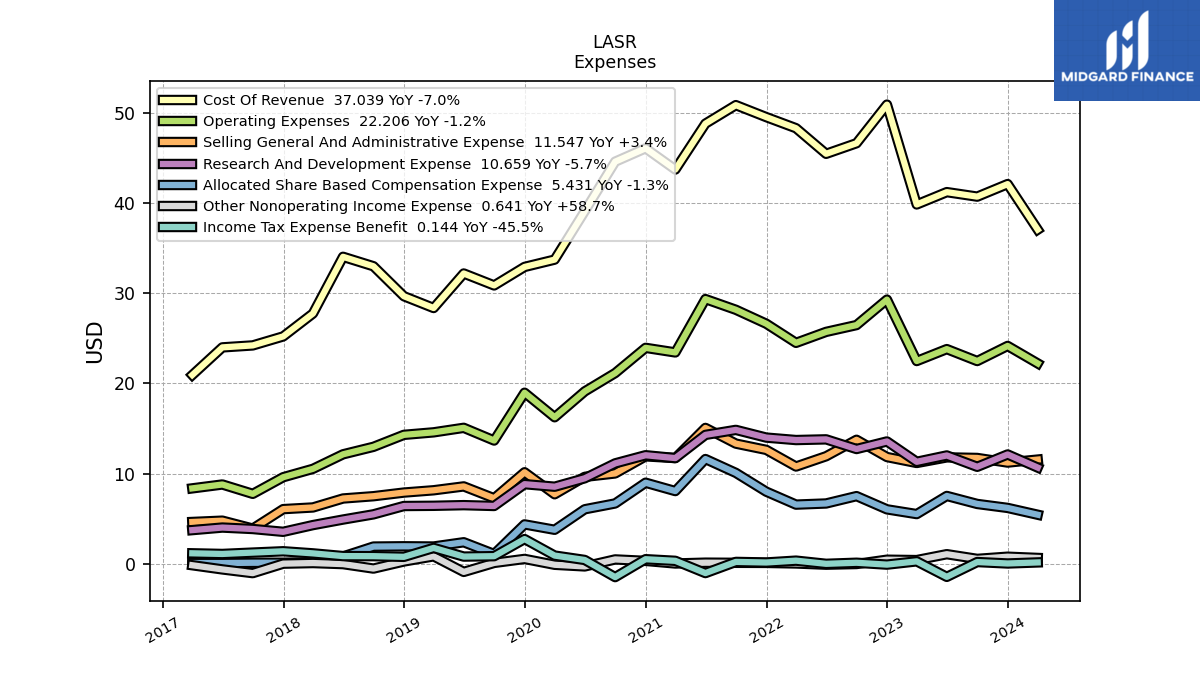
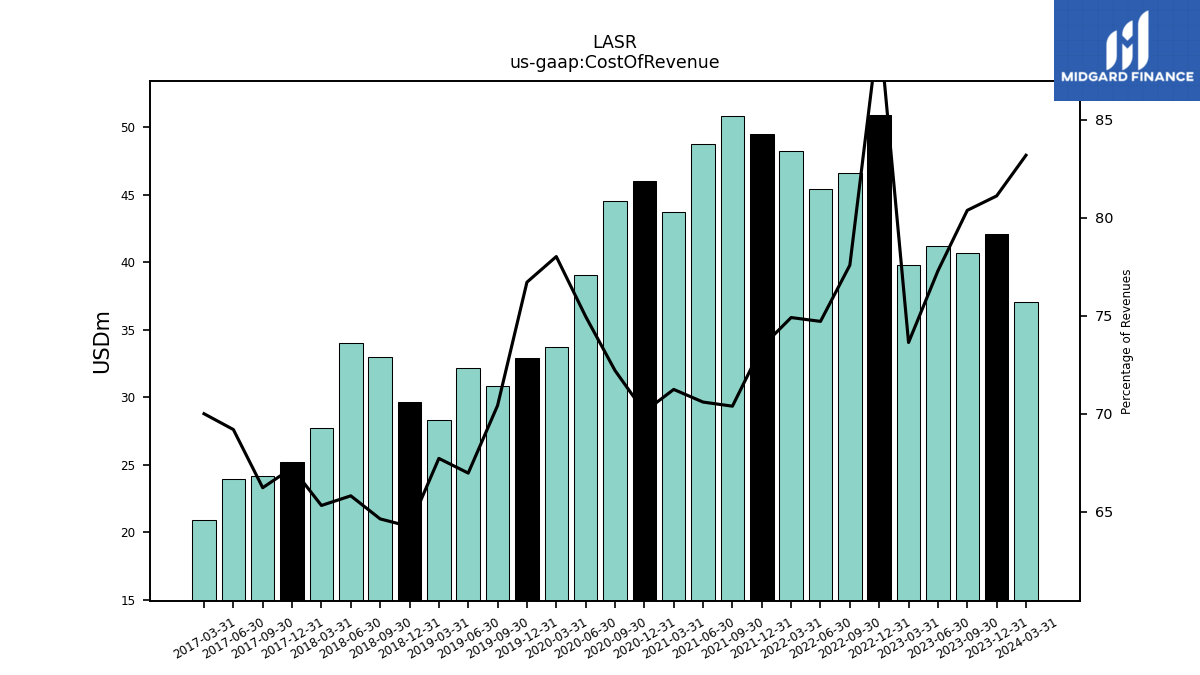
| Cost Of Revenue | 42.09 | 40.70 | 41.20 | 39.83 | 50.90 | 46.62 | 45.44 | 48.28 | 49.51 | 50.84 | 48.79 | 43.70 | 46.06 | 44.57 | 39.08 | 33.71 | 32.90 | 30.85 | 32.18 | 28.35 | 29.66 | 32.98 | 34.03 | 27.74 | 25.20 | 24.20 | 23.98 | 20.92 | |
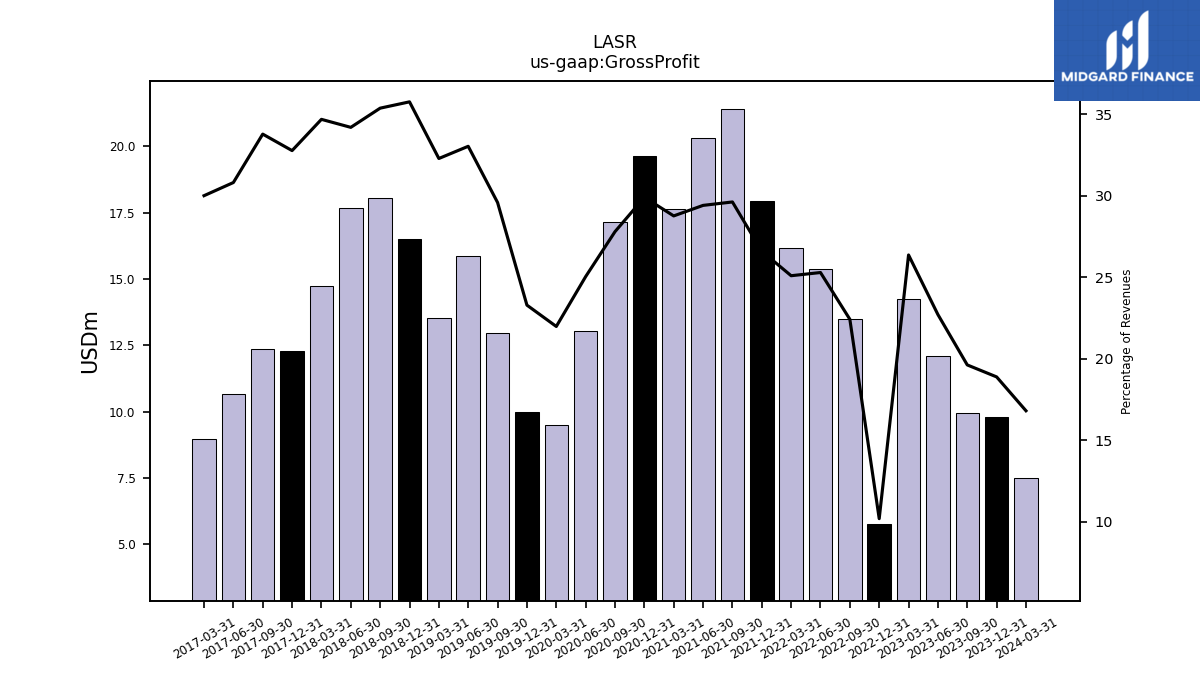
| Gross Profit | 9.80 | 9.94 | 12.11 | 14.26 | 5.78 | 13.48 | 15.38 | 16.18 | 17.94 | 21.39 | 20.32 | 17.64 | 19.65 | 17.16 | 13.06 | 9.50 | 9.99 | 12.96 | 15.87 | 13.51 | 16.51 | 18.05 | 17.68 | 14.73 | 12.28 | 12.35 | 10.68 | 8.97 | |
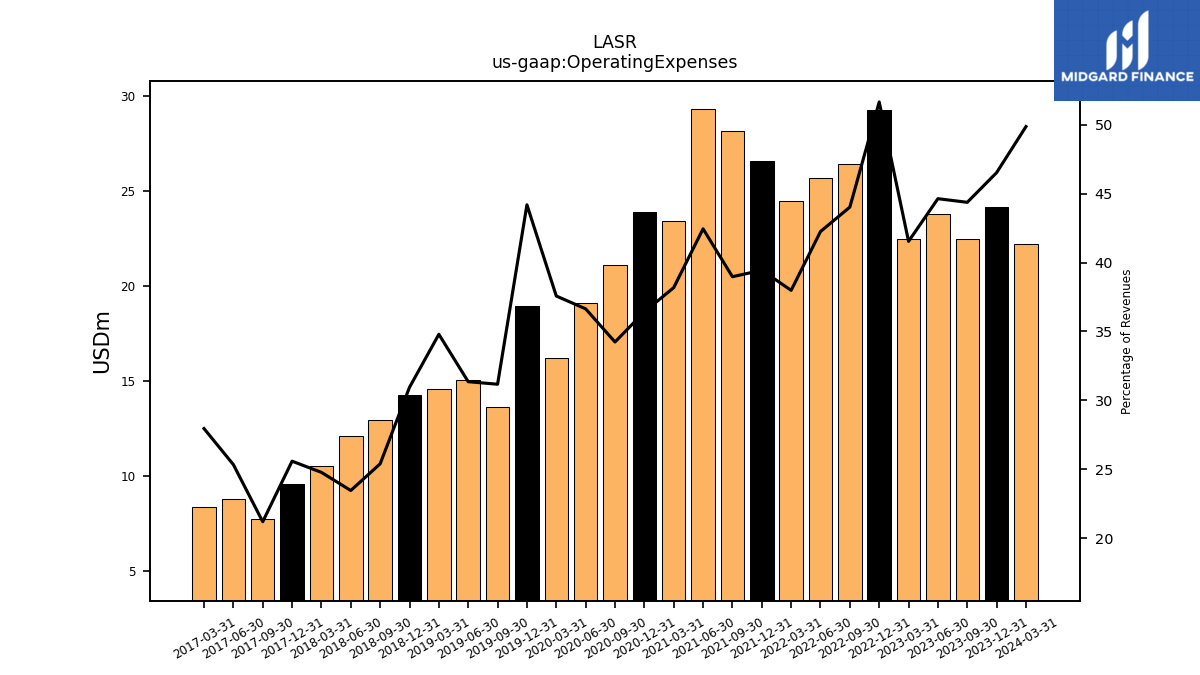
| Operating Expenses | 24.15 | 22.47 | 23.79 | 22.47 | 29.28 | 26.46 | 25.70 | 24.49 | 26.61 | 28.15 | 29.34 | 23.42 | 23.93 | 21.14 | 19.11 | 16.24 | 18.96 | 13.66 | 15.07 | 14.57 | 14.29 | 12.96 | 12.13 | 10.52 | 9.59 | 7.75 | 8.78 | 8.36 | |
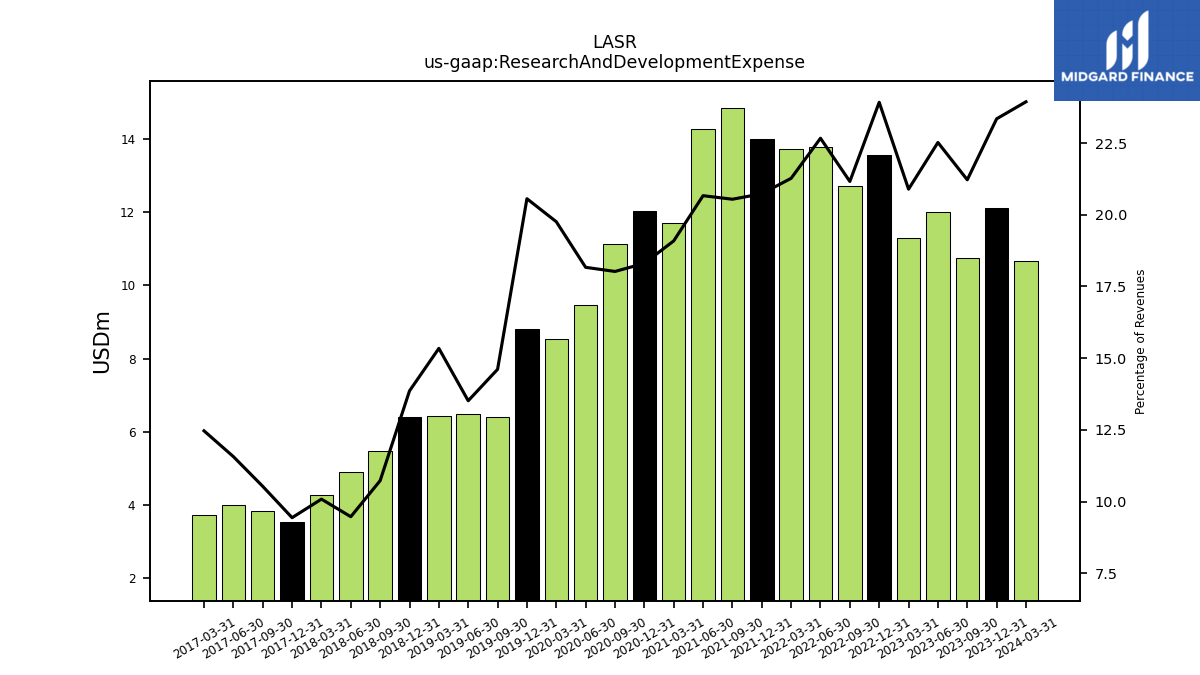
| Research And Development Expense | 12.11 | 10.74 | 12.00 | 11.30 | 13.56 | 12.72 | 13.79 | 13.71 | 13.98 | 14.84 | 14.28 | 11.71 | 12.03 | 11.13 | 9.47 | 8.54 | 8.82 | 6.40 | 6.49 | 6.42 | 6.40 | 5.47 | 4.90 | 4.28 | 3.54 | 3.85 | 4.01 | 3.73 | |
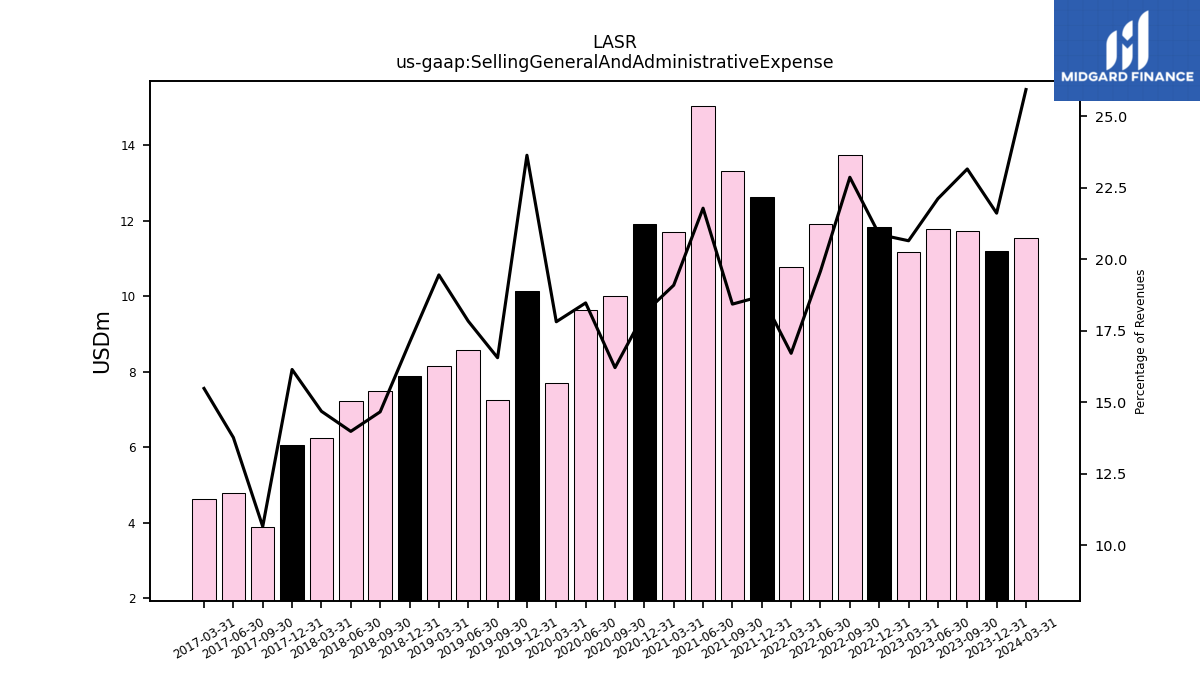
| Selling General And Administrative Expense | 11.21 | 11.72 | 11.79 | 11.17 | 11.83 | 13.74 | 11.91 | 10.78 | 12.62 | 13.32 | 15.06 | 11.71 | 11.90 | 10.01 | 9.63 | 7.70 | 10.14 | 7.26 | 8.57 | 8.14 | 7.89 | 7.49 | 7.23 | 6.24 | 6.05 | 3.90 | 4.77 | 4.63 | |
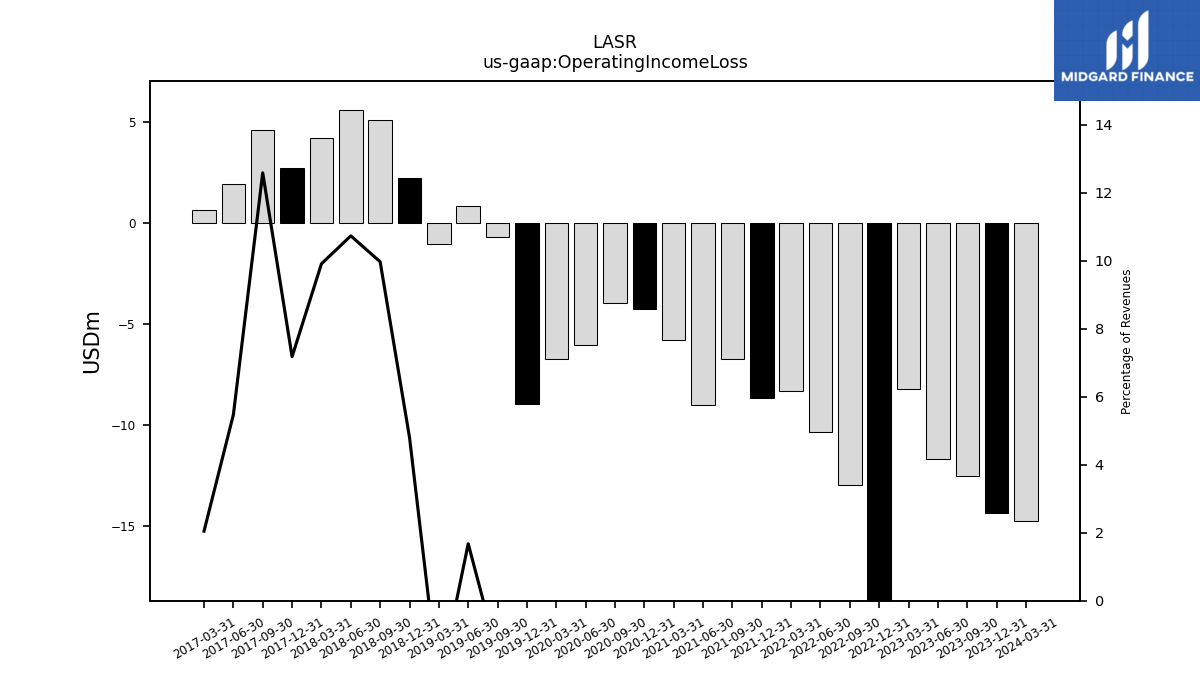
| Operating Income Loss | -14.34 | -12.53 | -11.69 | -8.21 | -23.50 | -12.98 | -10.32 | -8.31 | -8.66 | -6.76 | -9.01 | -5.78 | -4.29 | -3.98 | -6.05 | -6.74 | -8.97 | -0.70 | 0.81 | -1.05 | 2.22 | 5.09 | 5.55 | 4.21 | 2.69 | 4.60 | 1.90 | 0.61 | |
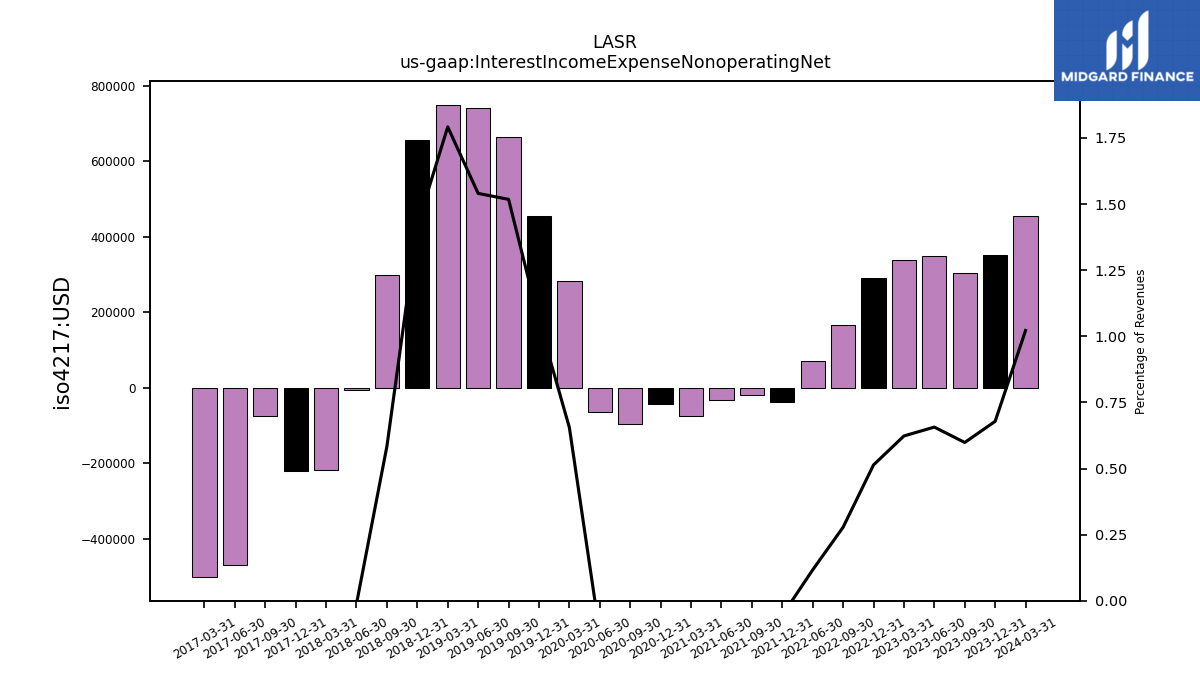
| Interest Income Expense Nonoperating Net | 0.35 | 0.30 | 0.35 | 0.34 | 0.29 | 0.17 | 0.07 | NA | -0.04 | -0.02 | -0.03 | -0.07 | -0.04 | -0.10 | -0.07 | 0.28 | 0.45 | 0.67 | 0.74 | 0.75 | 0.66 | 0.30 | -0.01 | -0.22 | -0.22 | -0.08 | -0.47 | -0.50 | |
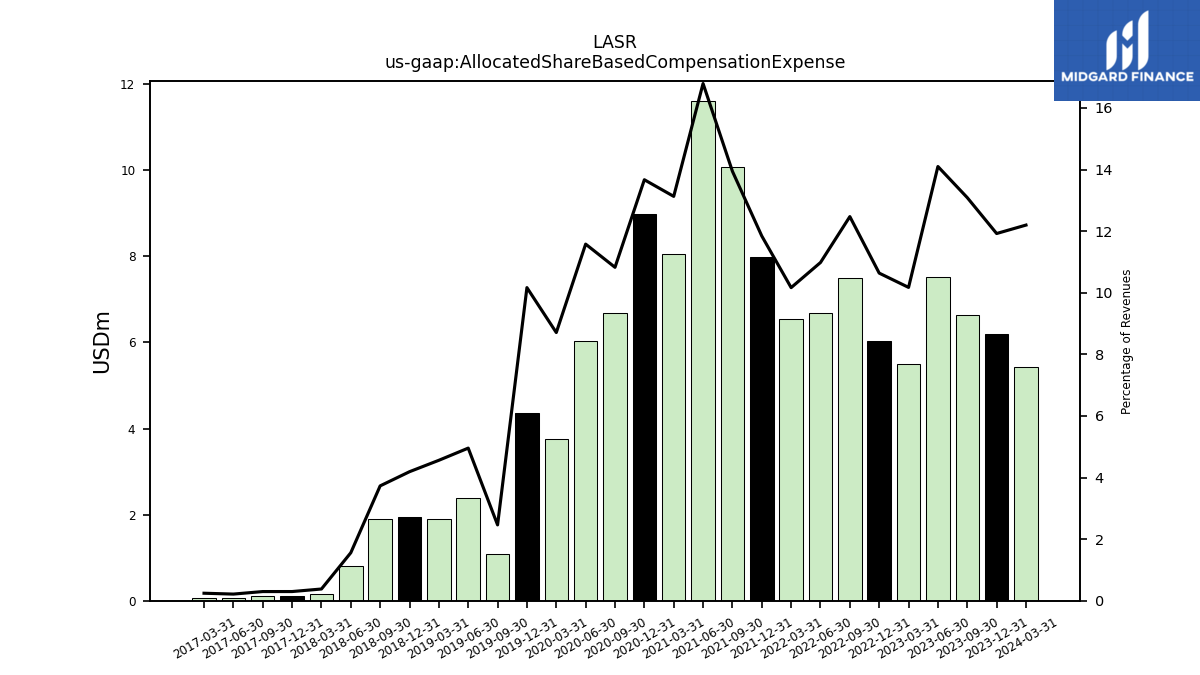
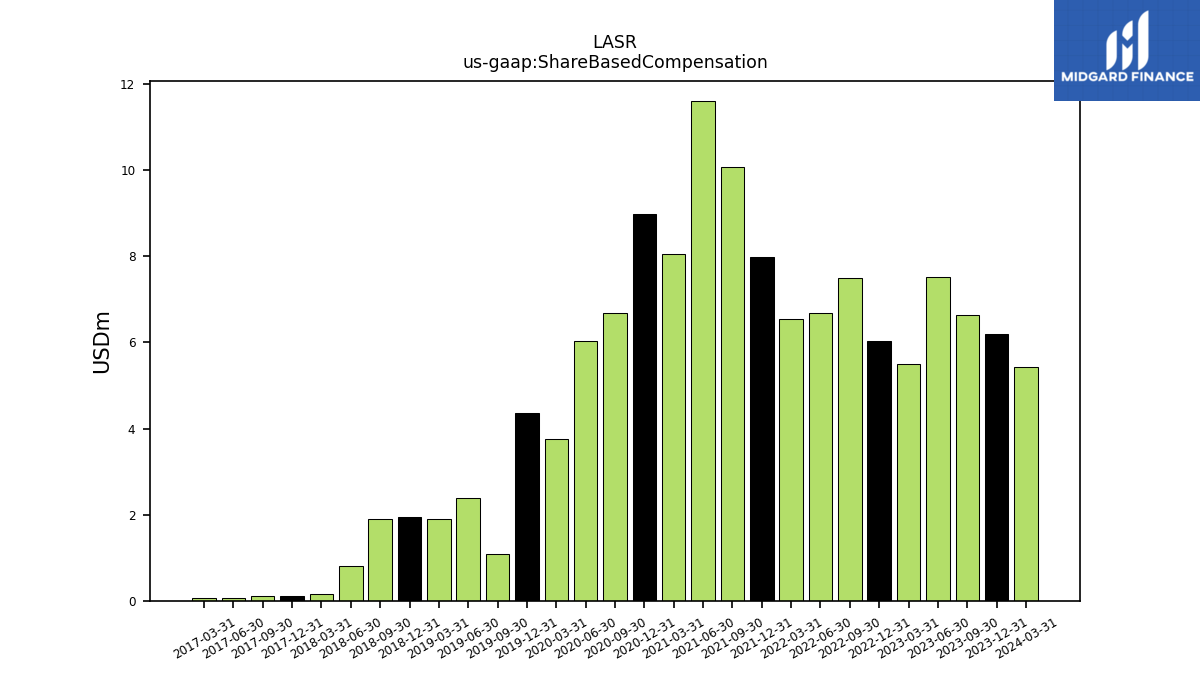
| Allocated Share Based Compensation Expense | 6.19 | 6.63 | 7.51 | 5.50 | 6.03 | 7.50 | 6.68 | 6.55 | 7.99 | 10.07 | 11.61 | 8.05 | 8.98 | 6.68 | 6.04 | 3.76 | 4.36 | 1.08 | 2.38 | 1.91 | 1.93 | 1.90 | 0.81 | 0.16 | 0.11 | 0.11 | 0.07 | 0.07 | |
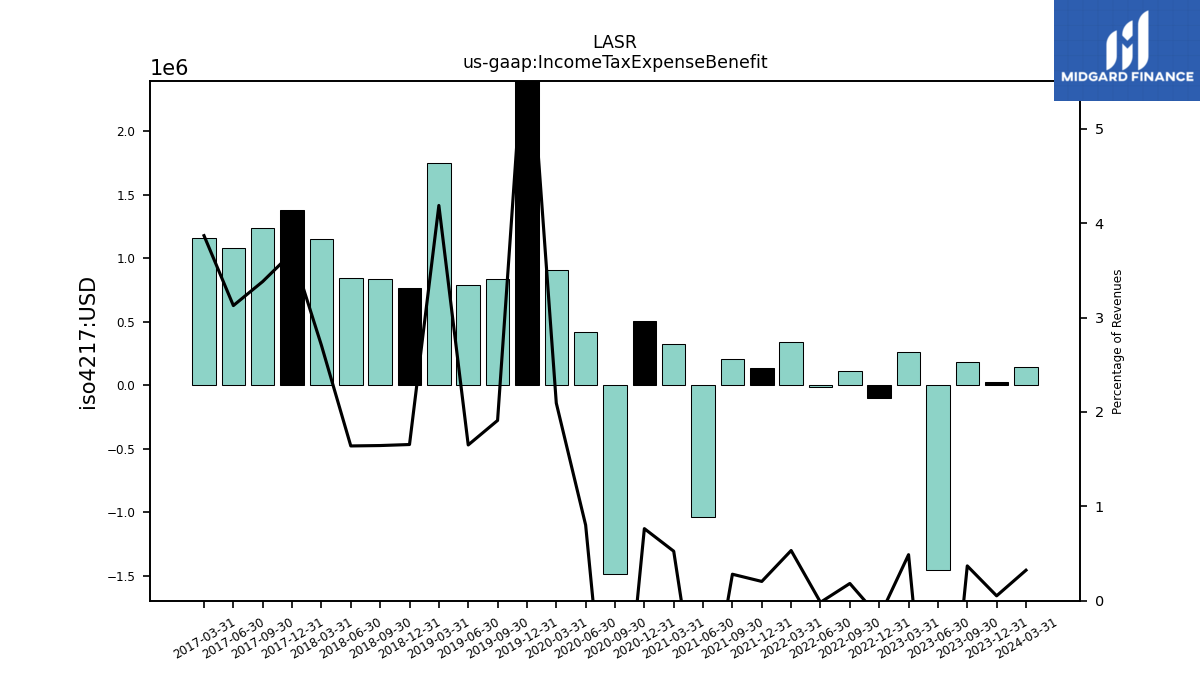
| Income Tax Expense Benefit | 0.03 | 0.19 | -1.46 | 0.26 | -0.10 | 0.11 | -0.01 | 0.34 | 0.14 | 0.20 | -1.04 | 0.32 | 0.50 | -1.49 | 0.42 | 0.91 | 2.74 | 0.84 | 0.79 | 1.75 | 0.76 | 0.84 | 0.85 | 1.15 | 1.38 | 1.24 | 1.08 | 1.16 | |
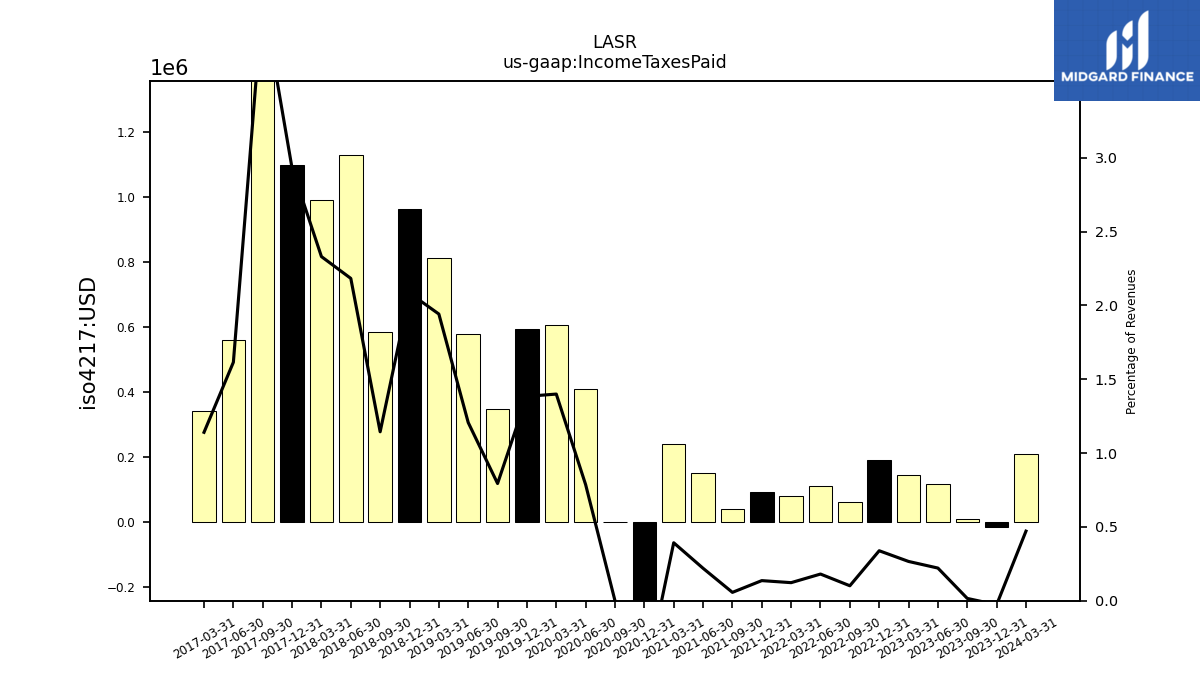
| Income Taxes Paid | -0.01 | 0.01 | 0.12 | 0.14 | 0.19 | 0.06 | 0.11 | 0.08 | 0.09 | 0.04 | 0.15 | 0.24 | -0.37 | 0.00 | 0.41 | 0.60 | 0.59 | 0.35 | 0.58 | 0.81 | 0.96 | 0.58 | 1.13 | 0.99 | 1.10 | 1.49 | 0.56 | 0.34 | |
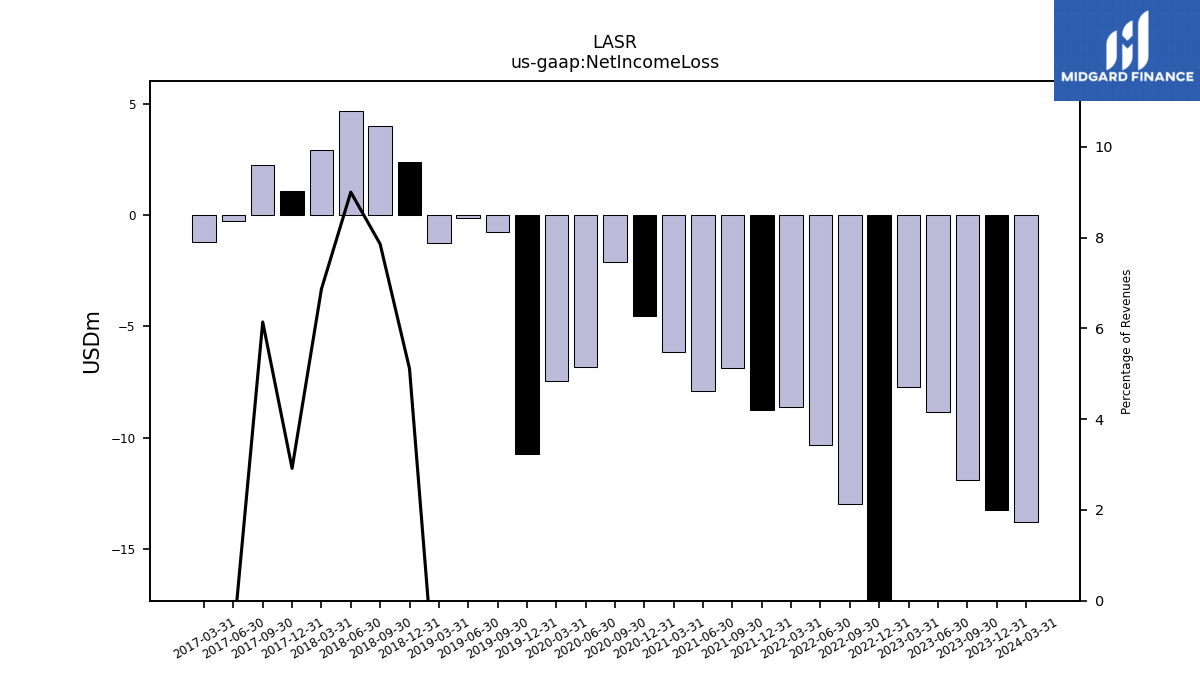
| Net Income Loss | -13.24 | -11.88 | -8.82 | -7.73 | -22.66 | -12.96 | -10.34 | -8.62 | -8.75 | -6.88 | -7.89 | -6.15 | -4.52 | -2.11 | -6.83 | -7.47 | -10.72 | -0.78 | -0.15 | -1.24 | 2.36 | 4.01 | 4.65 | 2.92 | 1.09 | 2.24 | -0.29 | -1.21 | |
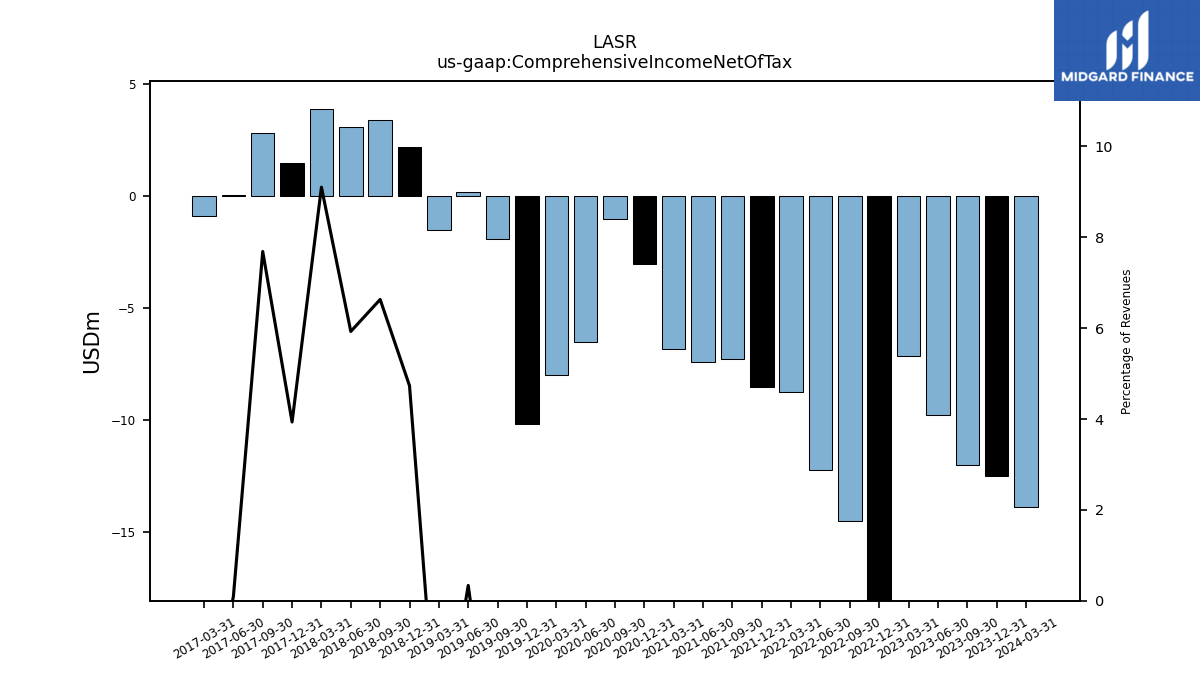
| Comprehensive Income Net Of Tax | -12.49 | -11.99 | -9.77 | -7.15 | -21.34 | -14.47 | -12.21 | -8.72 | -8.54 | -7.26 | -7.39 | -6.81 | -3.02 | -1.02 | -6.50 | -7.97 | -10.18 | -1.90 | 0.16 | -1.50 | 2.19 | 3.38 | 3.06 | 3.87 | 1.48 | 2.81 | 0.03 | -0.90 |
| 2023-12-31 | 2023-09-30 | 2023-06-30 | 2023-03-31 | 2022-12-31 | 2022-09-30 | 2022-06-30 | 2022-03-31 | 2021-12-31 | 2021-09-30 | 2021-06-30 | 2021-03-31 | 2020-12-31 | 2020-09-30 | 2020-06-30 | 2020-03-31 | 2019-12-31 | 2019-09-30 | 2019-06-30 | 2019-03-31 | 2018-12-31 | 2018-09-30 | 2018-06-30 | 2018-03-31 | 2017-12-31 | 2017-09-30 | 2017-06-30 | 2017-03-31 | ||
|---|---|---|---|---|---|---|---|---|---|---|---|---|---|---|---|---|---|---|---|---|---|---|---|---|---|---|---|---|---|
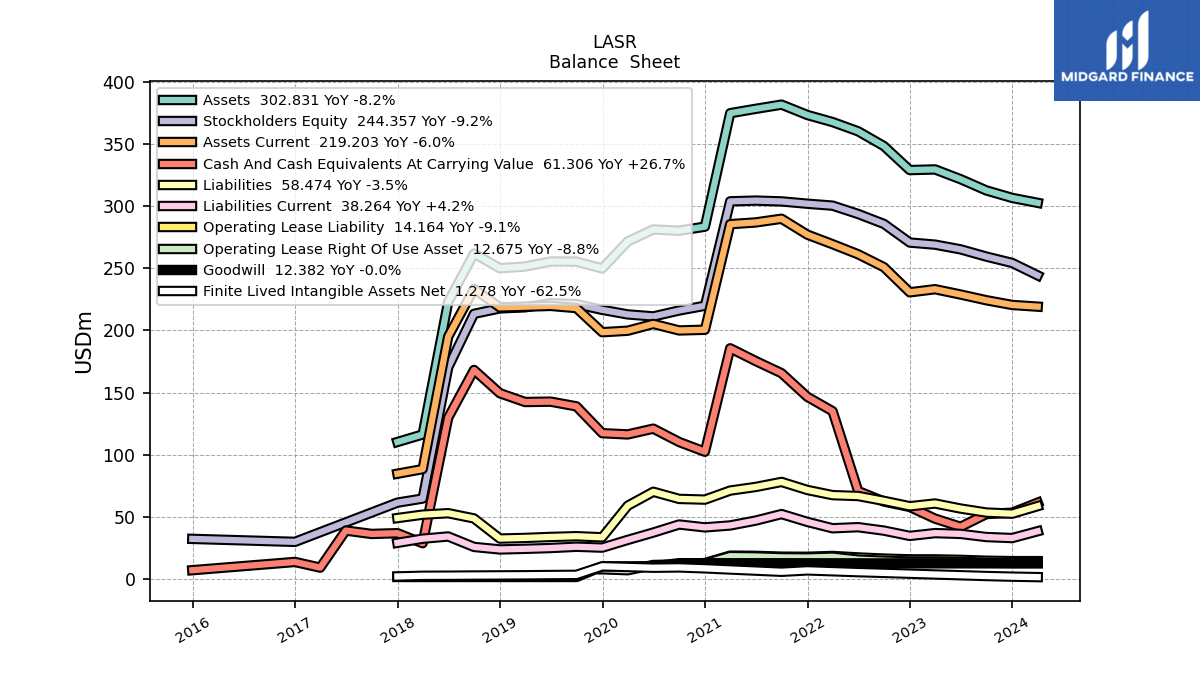
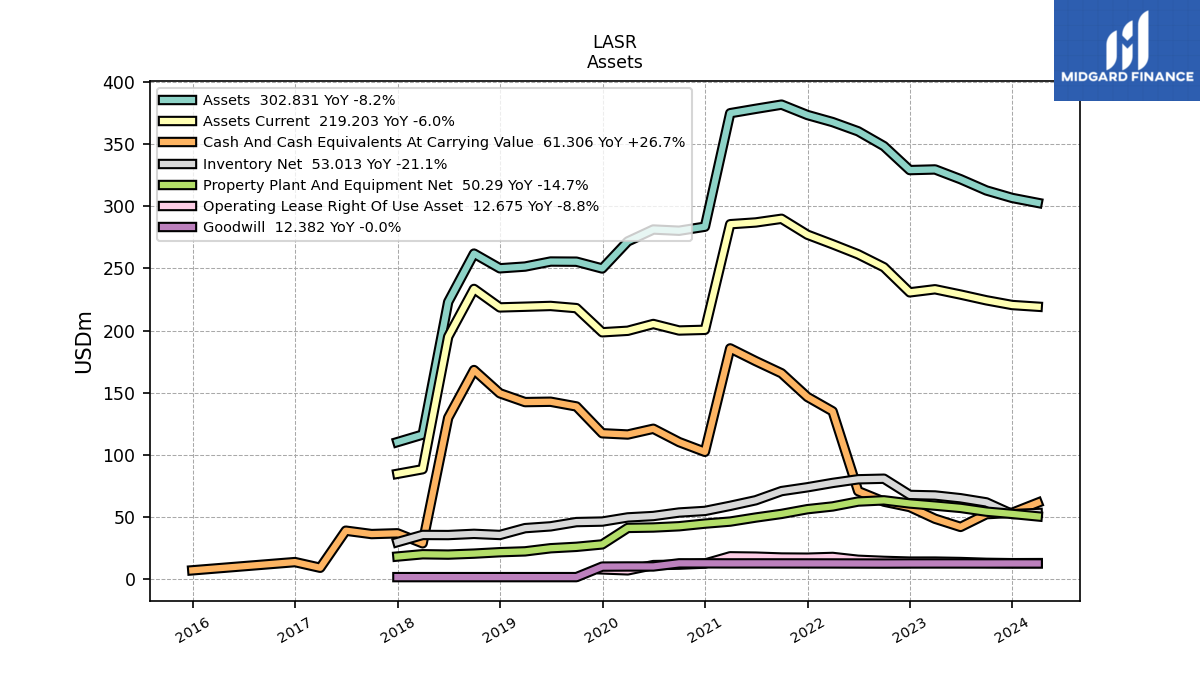
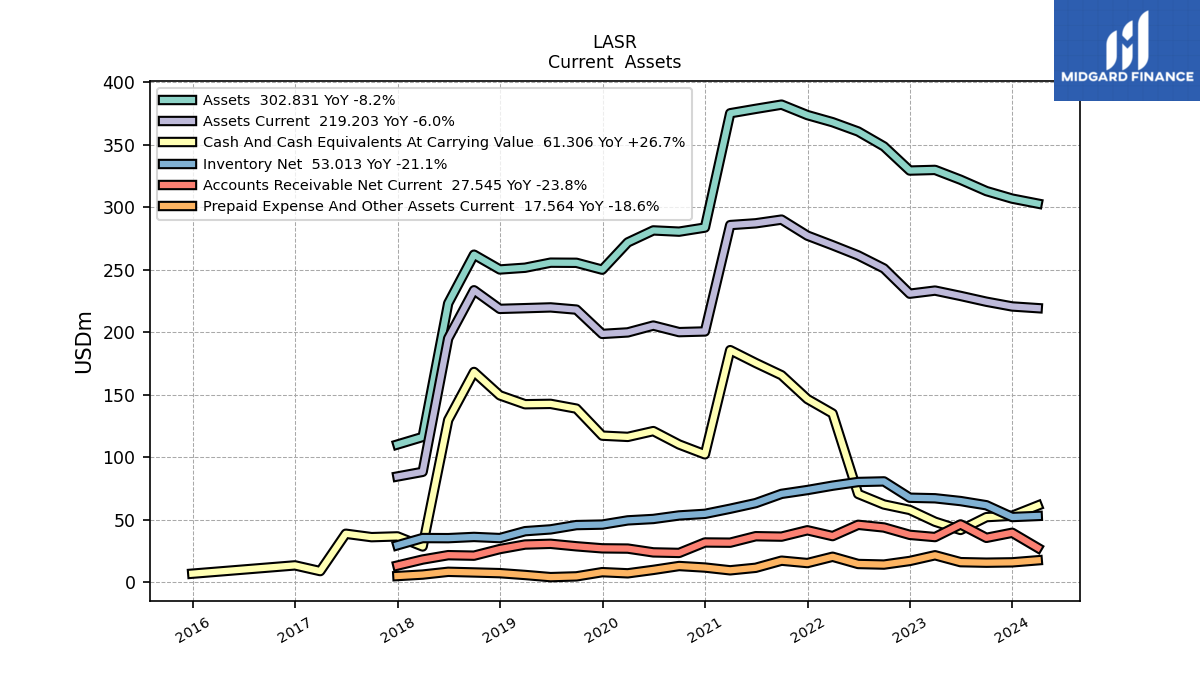
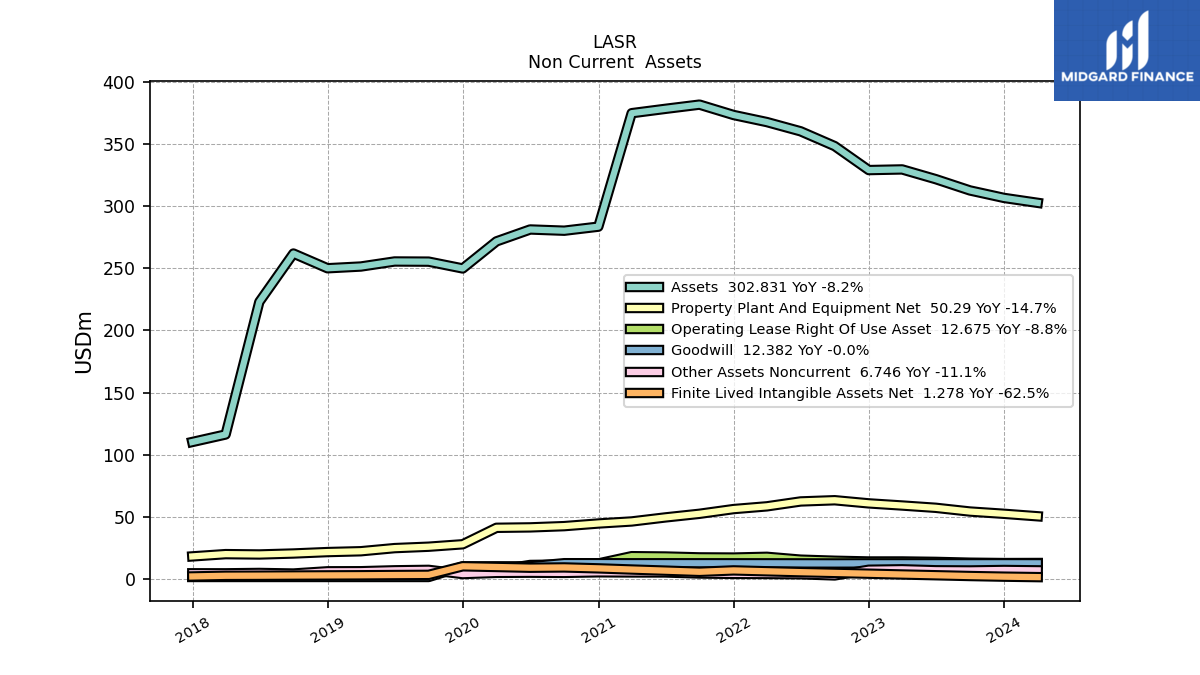
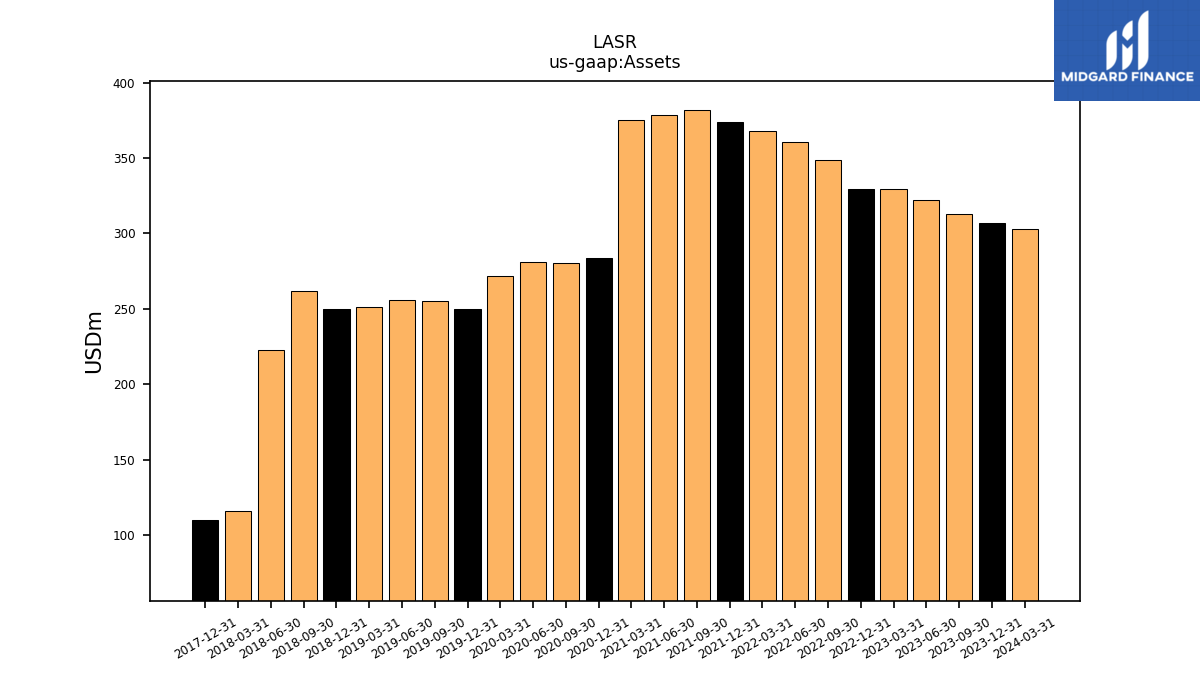
| Assets | 306.80 | 312.83 | 321.90 | 329.76 | 329.23 | 348.55 | 360.47 | 367.91 | 373.62 | 381.97 | 378.57 | 375.07 | 283.64 | 280.39 | 281.37 | 271.79 | 249.97 | 255.47 | 255.59 | 251.53 | 250.13 | 262.00 | 223.02 | 116.20 | 110.15 | NA | NA | NA | |
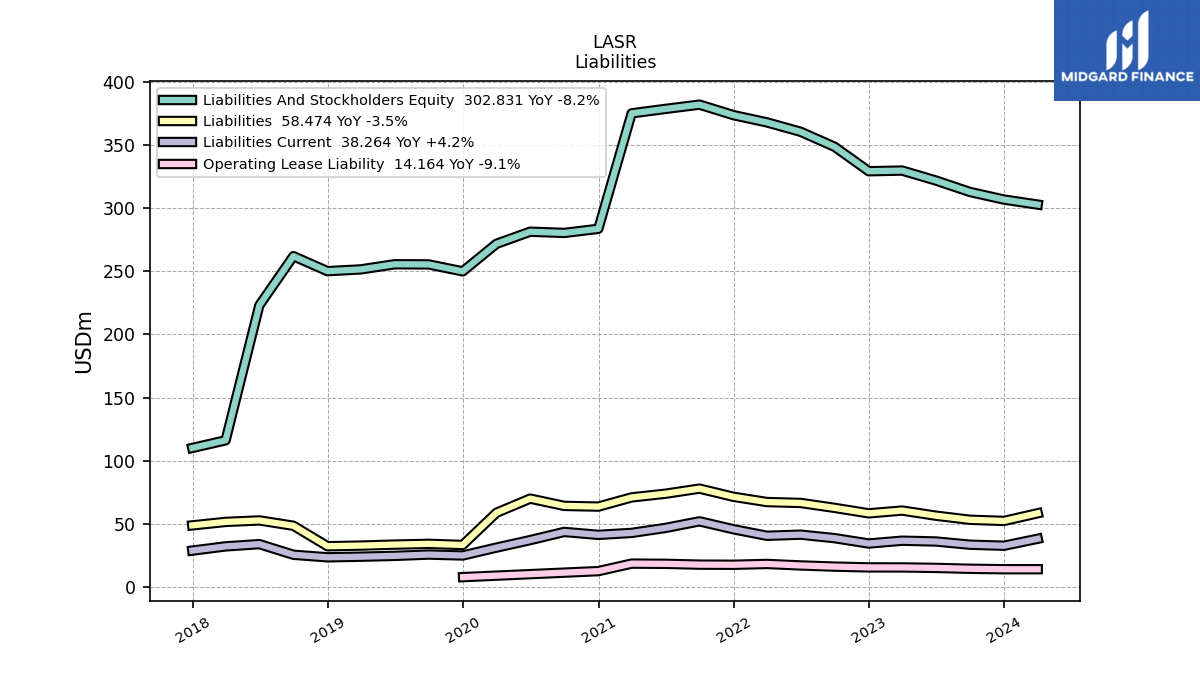
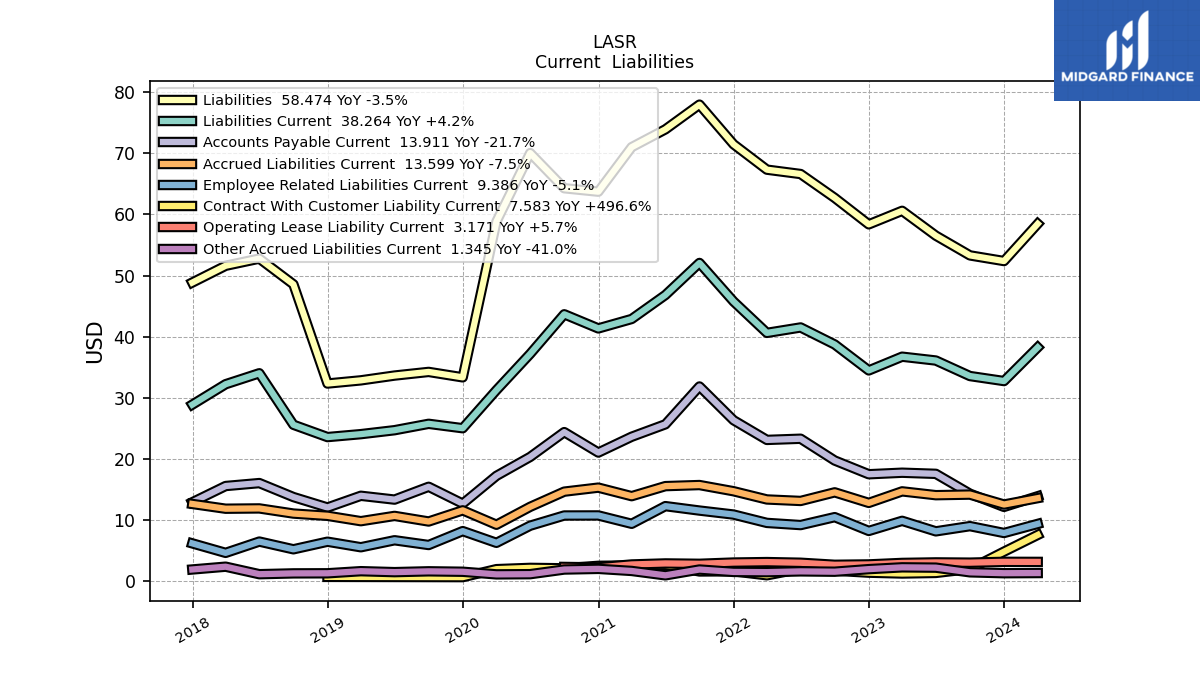
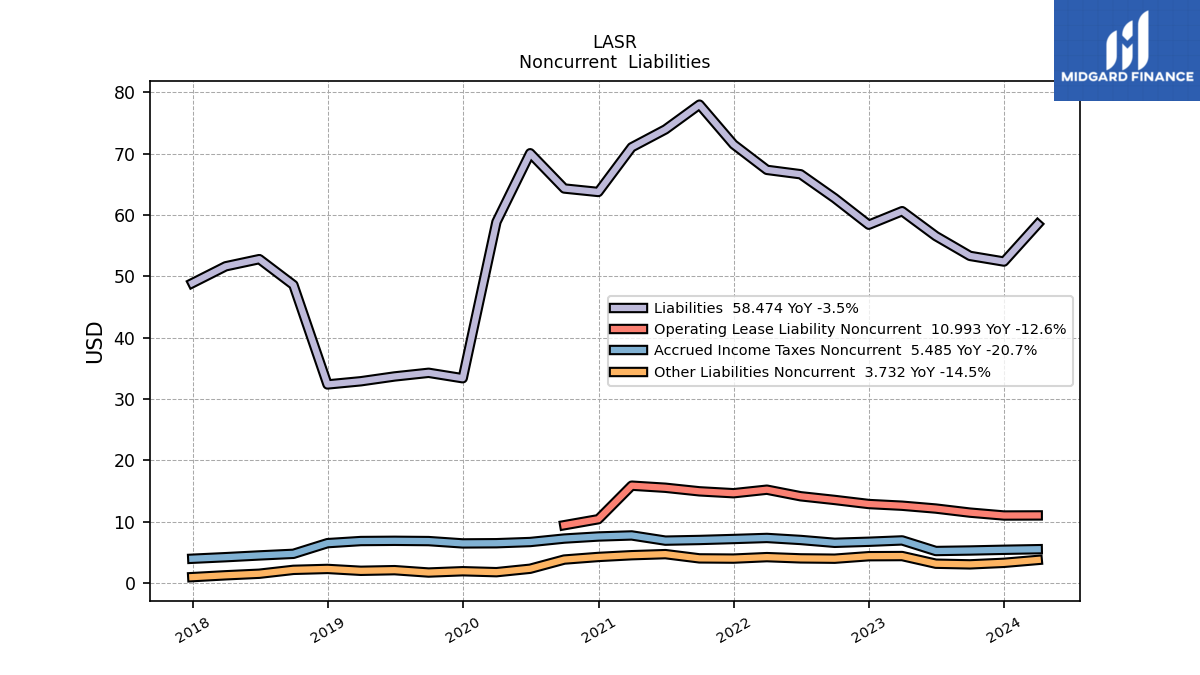
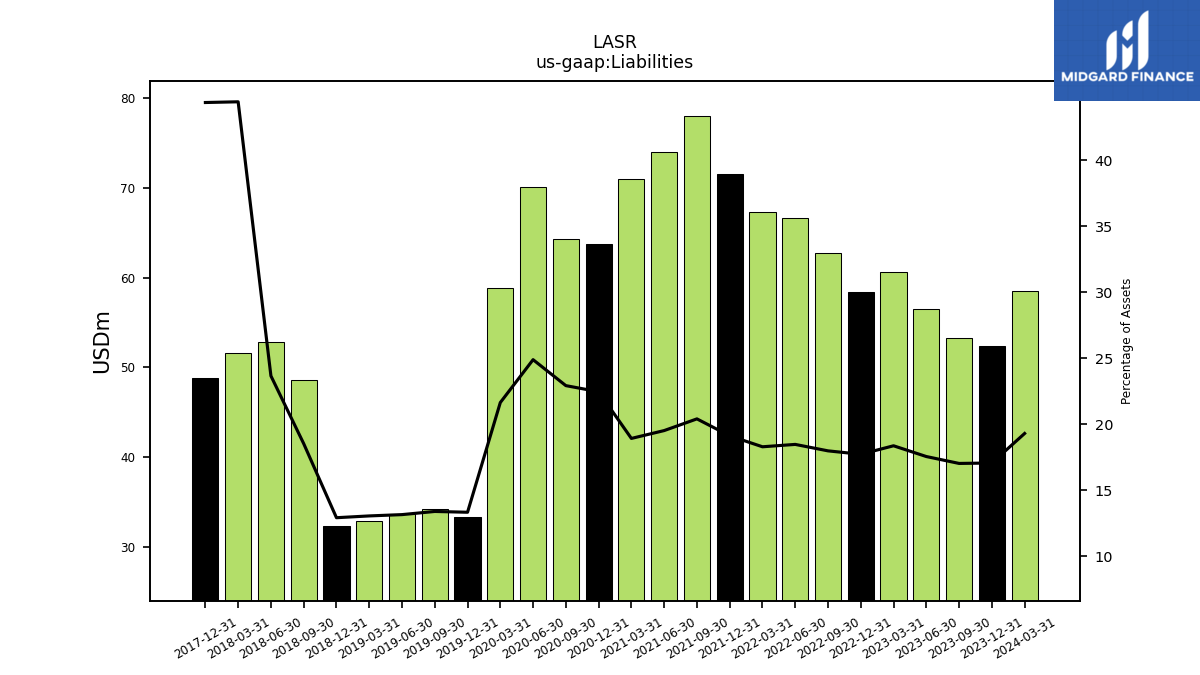
| Liabilities | 52.38 | 53.31 | 56.54 | 60.60 | 58.39 | 62.72 | 66.62 | 67.33 | 71.48 | 77.97 | 73.93 | 71.02 | 63.73 | 64.30 | 70.05 | 58.84 | 33.36 | 34.25 | 33.65 | 32.87 | 32.35 | 48.58 | 52.78 | 51.61 | 48.87 | NA | NA | NA | |
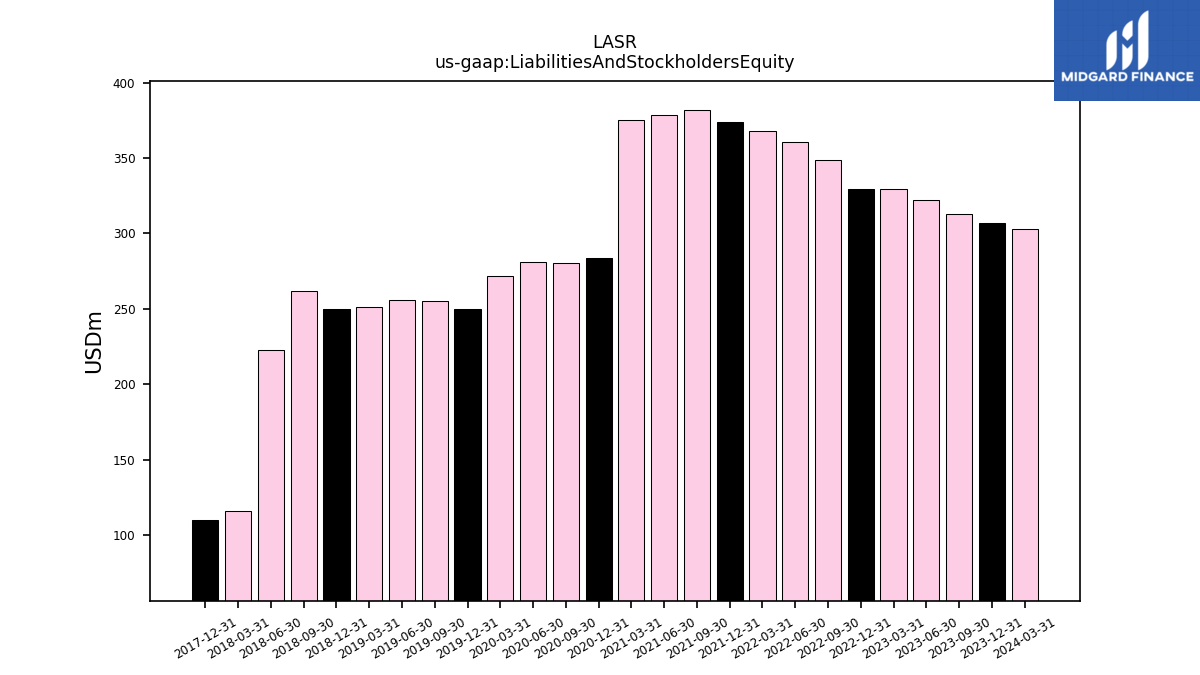
| Liabilities And Stockholders Equity | 306.80 | 312.83 | 321.90 | 329.76 | 329.23 | 348.55 | 360.47 | 367.91 | 373.62 | 381.97 | 378.57 | 375.07 | 283.64 | 280.39 | 281.37 | 271.79 | 249.97 | 255.47 | 255.59 | 251.53 | 250.13 | 262.00 | 223.02 | 116.20 | 110.15 | NA | NA | NA | |
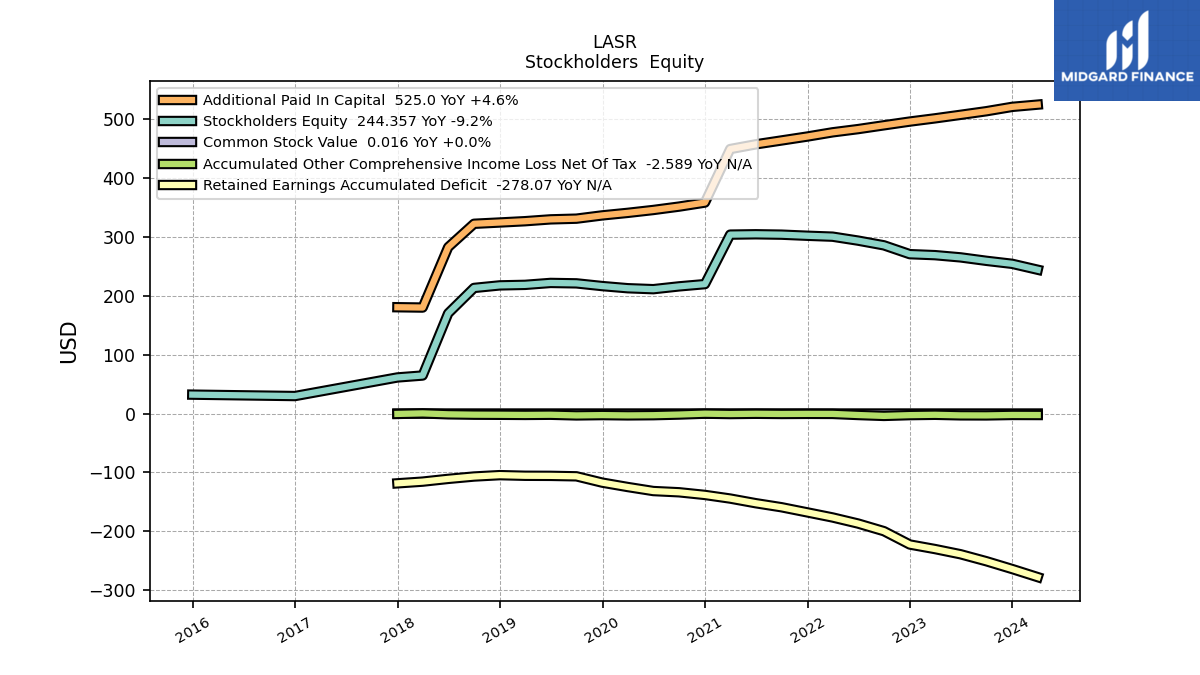
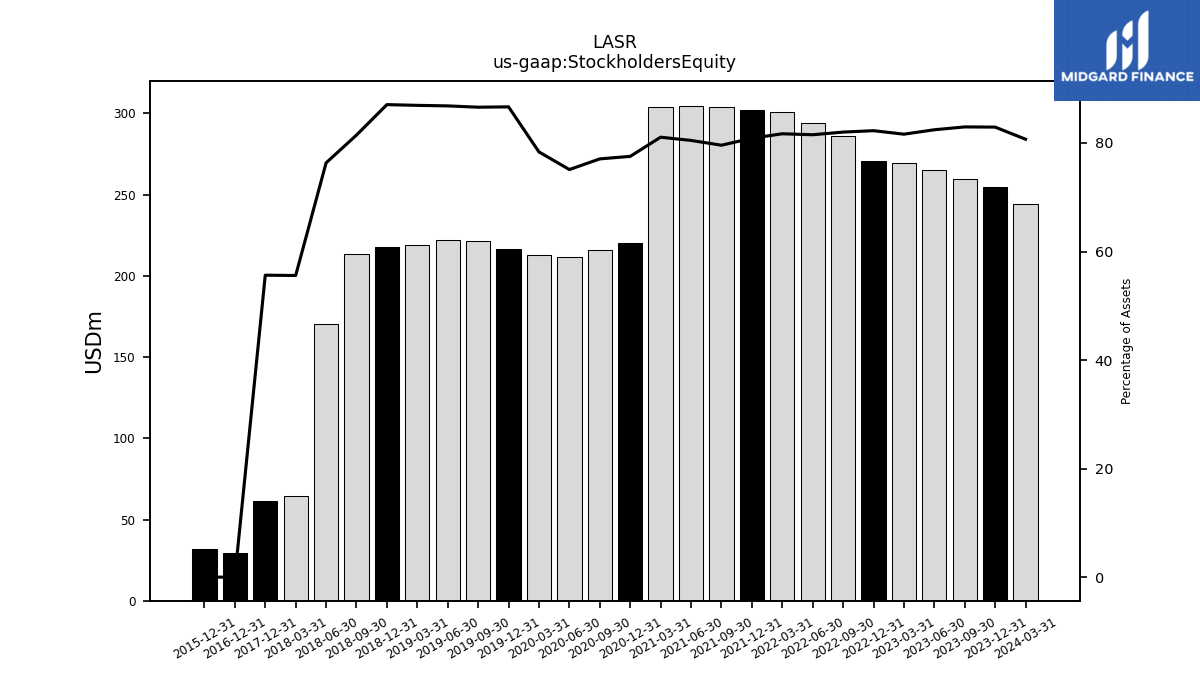
| Stockholders Equity | 254.42 | 259.52 | 265.36 | 269.16 | 270.85 | 285.84 | 293.85 | 300.58 | 302.13 | 304.00 | 304.65 | 304.06 | 219.91 | 216.09 | 211.32 | 212.95 | 216.61 | 221.22 | 221.94 | 218.66 | 217.78 | 213.42 | 170.24 | 64.58 | 61.28 | NA | NA | NA |
| 2023-12-31 | 2023-09-30 | 2023-06-30 | 2023-03-31 | 2022-12-31 | 2022-09-30 | 2022-06-30 | 2022-03-31 | 2021-12-31 | 2021-09-30 | 2021-06-30 | 2021-03-31 | 2020-12-31 | 2020-09-30 | 2020-06-30 | 2020-03-31 | 2019-12-31 | 2019-09-30 | 2019-06-30 | 2019-03-31 | 2018-12-31 | 2018-09-30 | 2018-06-30 | 2018-03-31 | 2017-12-31 | 2017-09-30 | 2017-06-30 | 2017-03-31 | ||
|---|---|---|---|---|---|---|---|---|---|---|---|---|---|---|---|---|---|---|---|---|---|---|---|---|---|---|---|---|---|
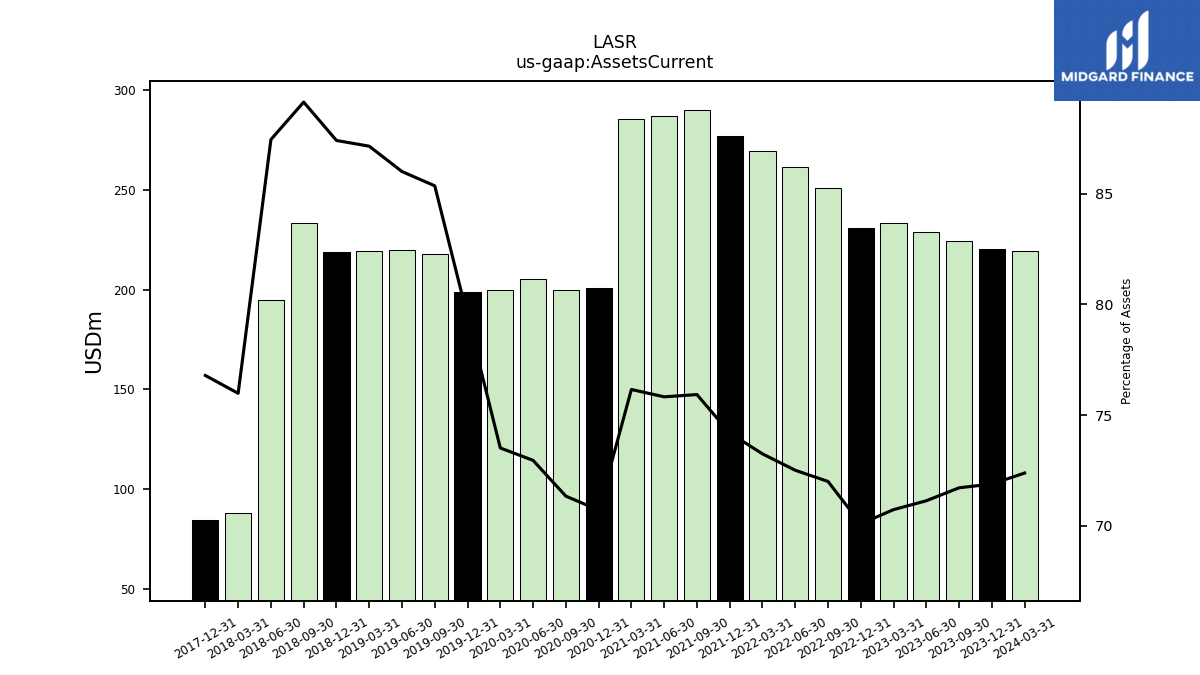
| Assets Current | 220.55 | 224.35 | 228.98 | 233.25 | 230.76 | 250.97 | 261.38 | 269.50 | 277.20 | 290.02 | 287.06 | 285.65 | 200.57 | 200.03 | 205.28 | 199.81 | 198.59 | 218.05 | 219.81 | 219.19 | 218.62 | 233.53 | 195.02 | 88.29 | 84.58 | NA | NA | NA | |
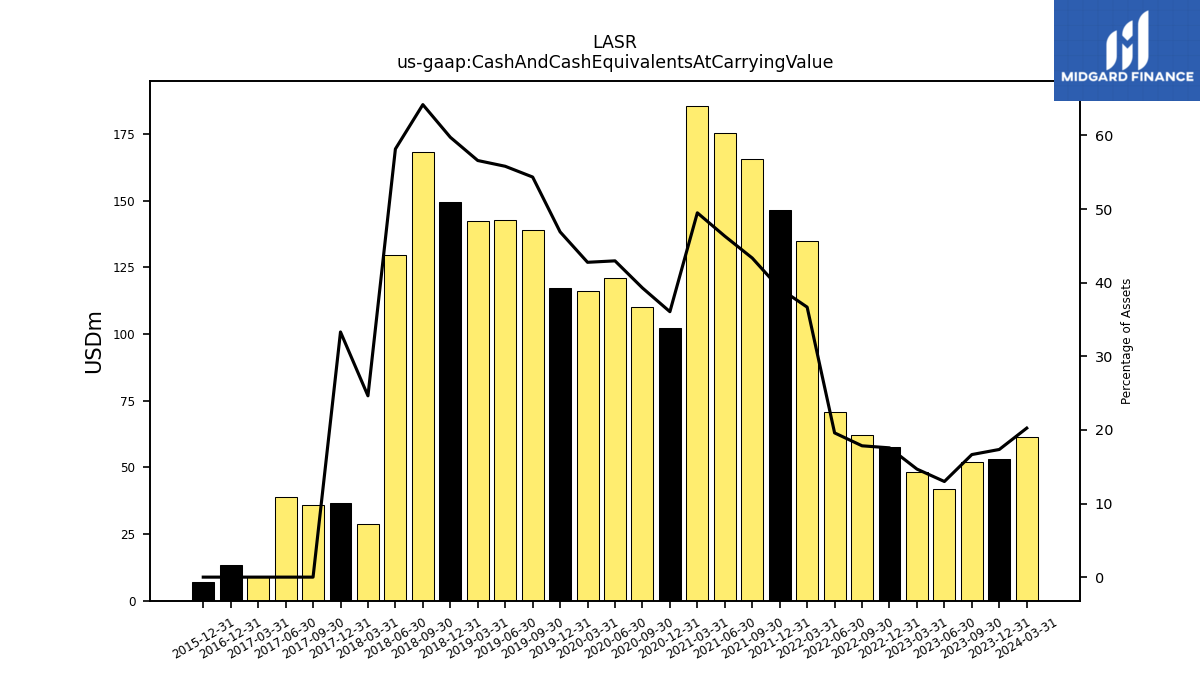
| Cash And Cash Equivalents At Carrying Value | 53.21 | 52.09 | 41.82 | 48.40 | 57.83 | 62.18 | 70.63 | 134.95 | 146.53 | 165.58 | 175.36 | 185.64 | 102.28 | 110.15 | 120.90 | 116.25 | 117.25 | 138.86 | 142.66 | 142.37 | 149.48 | 168.18 | 129.72 | 28.62 | 36.69 | 36.07 | 38.81 | 8.91 | |
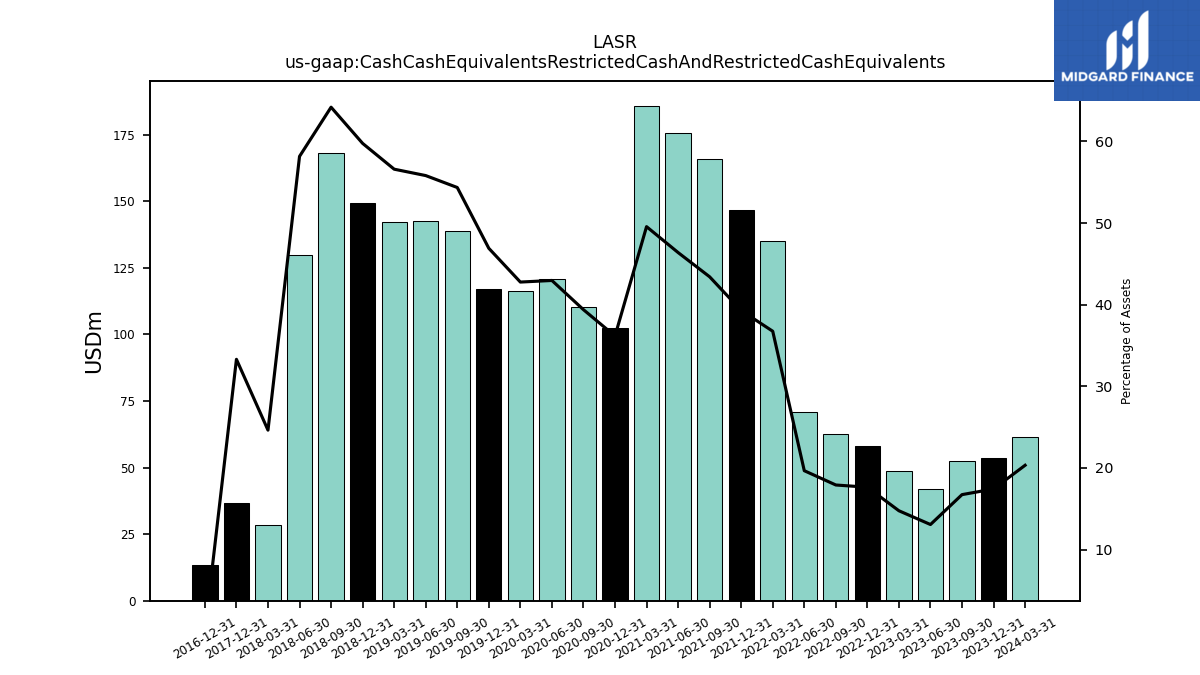
| Cash Cash Equivalents Restricted Cash And Restricted Cash Equivalents | 53.47 | 52.34 | 42.07 | 48.66 | 58.08 | 62.44 | 70.88 | 135.20 | 146.78 | 165.83 | 175.61 | 185.89 | 102.57 | 110.44 | 120.90 | 116.25 | 117.25 | 138.86 | 142.66 | 142.37 | 149.48 | 168.18 | 129.72 | 28.62 | 36.69 | NA | NA | NA | |
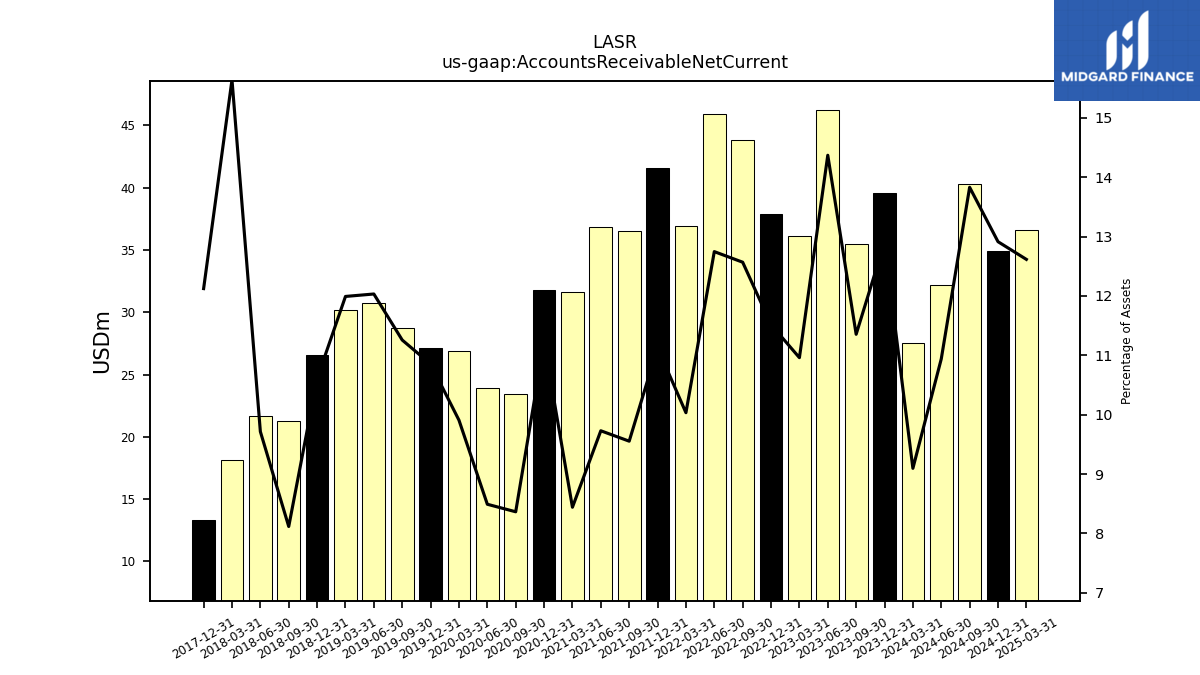
| Accounts Receivable Net Current | 39.59 | 35.52 | 46.25 | 36.14 | 37.91 | 43.80 | 45.94 | 36.91 | 41.57 | 36.49 | 36.83 | 31.66 | 31.82 | 23.45 | 23.89 | 26.93 | 27.13 | 28.76 | 30.75 | 30.16 | 26.53 | 21.26 | 21.66 | 18.17 | 13.35 | NA | NA | NA | |
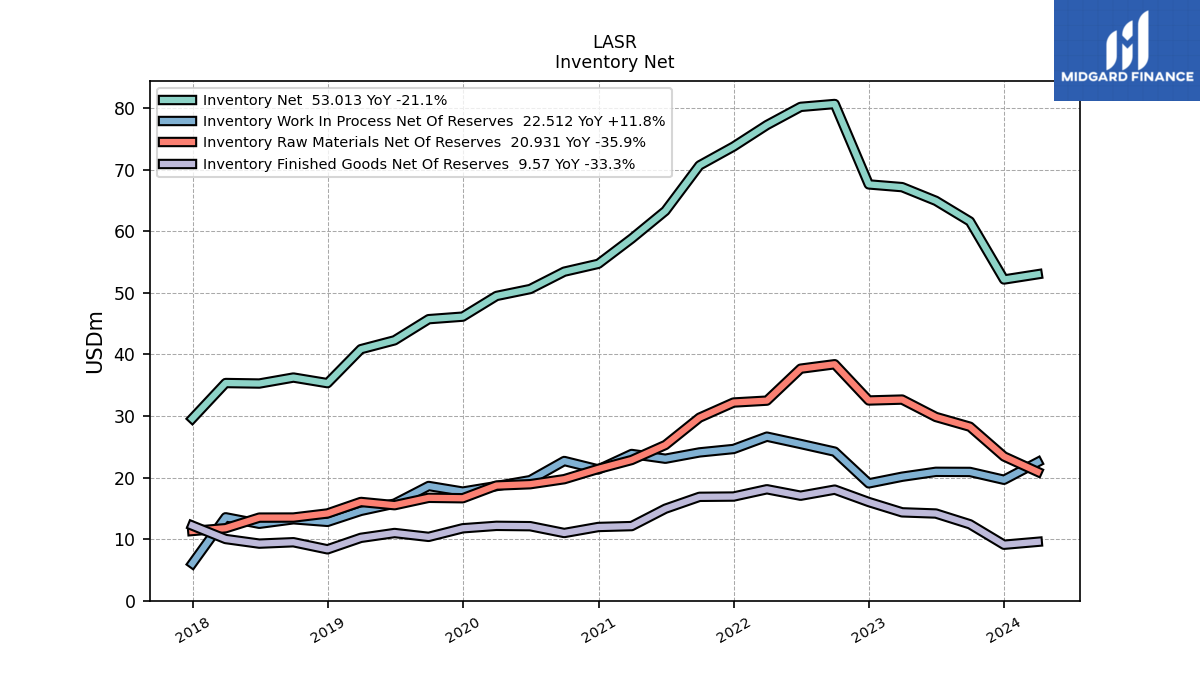
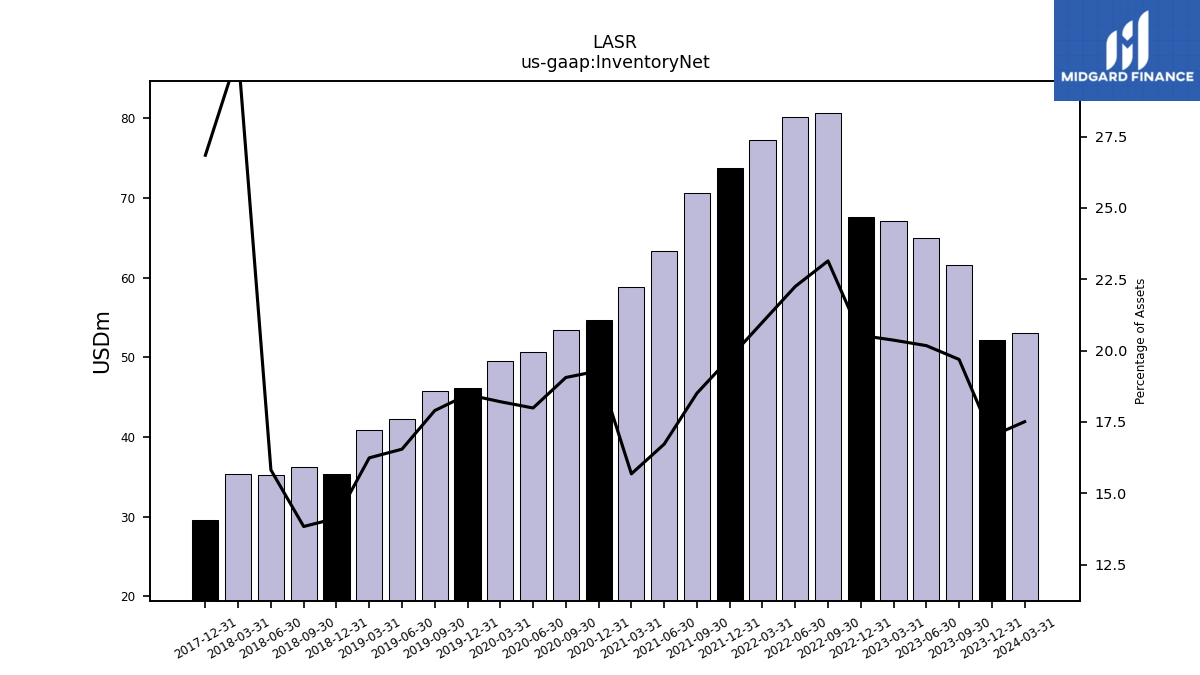
| Inventory Net | 52.16 | 61.59 | 64.94 | 67.16 | 67.60 | 80.66 | 80.19 | 77.24 | 73.75 | 70.68 | 63.30 | 58.80 | 54.71 | 53.43 | 50.61 | 49.49 | 46.13 | 45.72 | 42.28 | 40.85 | 35.33 | 36.24 | 35.27 | 35.35 | 29.57 | NA | NA | NA | |
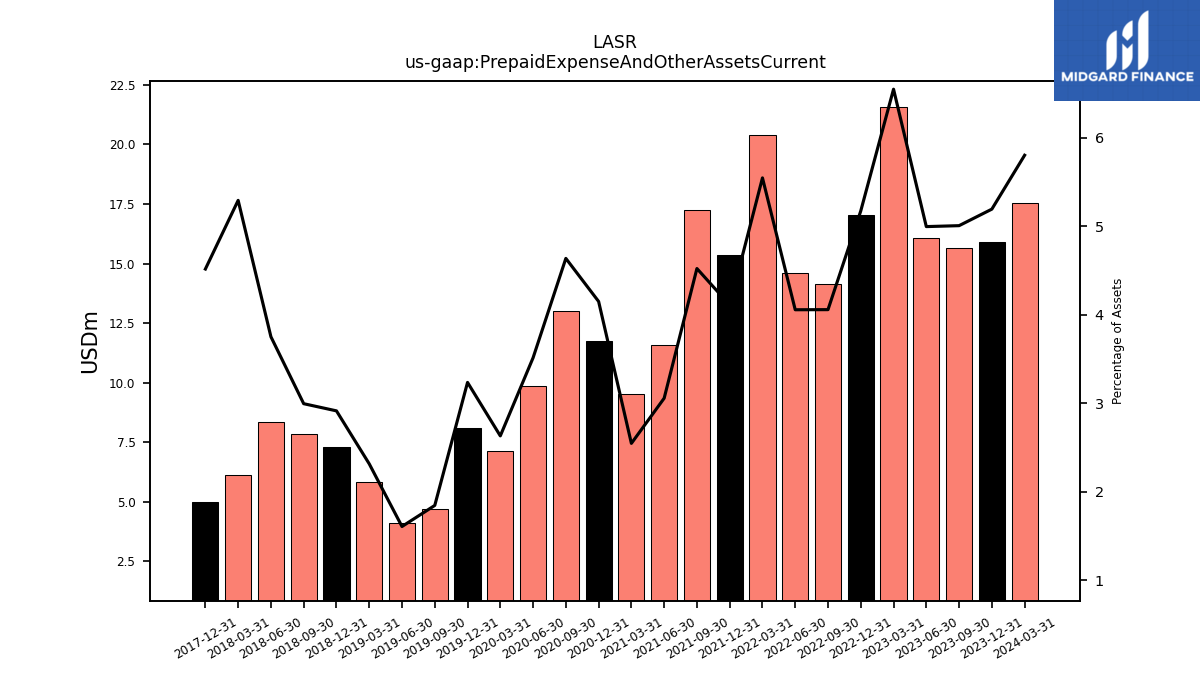
| Prepaid Expense And Other Assets Current | 15.93 | 15.66 | 16.08 | 21.59 | 17.03 | 14.14 | 14.62 | 20.40 | 15.35 | 17.27 | 11.57 | 9.55 | 11.77 | 13.00 | 9.88 | 7.15 | 8.08 | 4.71 | 4.11 | 5.82 | 7.29 | 7.84 | 8.36 | 6.15 | 4.97 | NA | NA | NA |
| 2023-12-31 | 2023-09-30 | 2023-06-30 | 2023-03-31 | 2022-12-31 | 2022-09-30 | 2022-06-30 | 2022-03-31 | 2021-12-31 | 2021-09-30 | 2021-06-30 | 2021-03-31 | 2020-12-31 | 2020-09-30 | 2020-06-30 | 2020-03-31 | 2019-12-31 | 2019-09-30 | 2019-06-30 | 2019-03-31 | 2018-12-31 | 2018-09-30 | 2018-06-30 | 2018-03-31 | 2017-12-31 | 2017-09-30 | 2017-06-30 | 2017-03-31 | ||
|---|---|---|---|---|---|---|---|---|---|---|---|---|---|---|---|---|---|---|---|---|---|---|---|---|---|---|---|---|---|
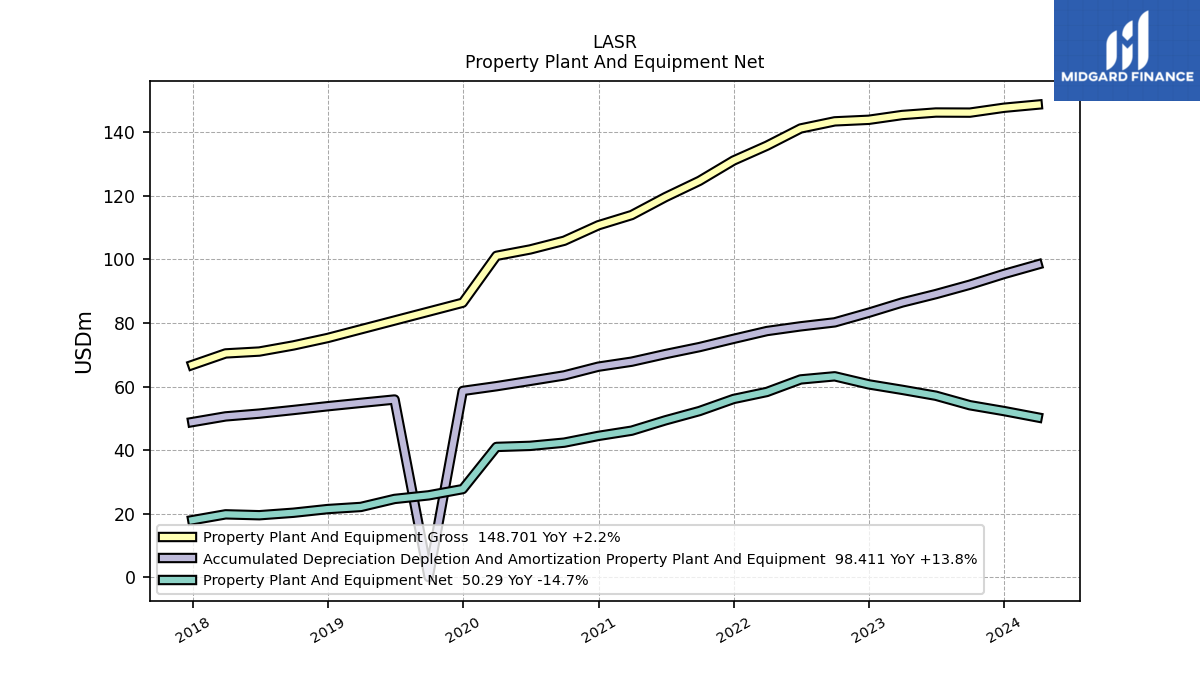
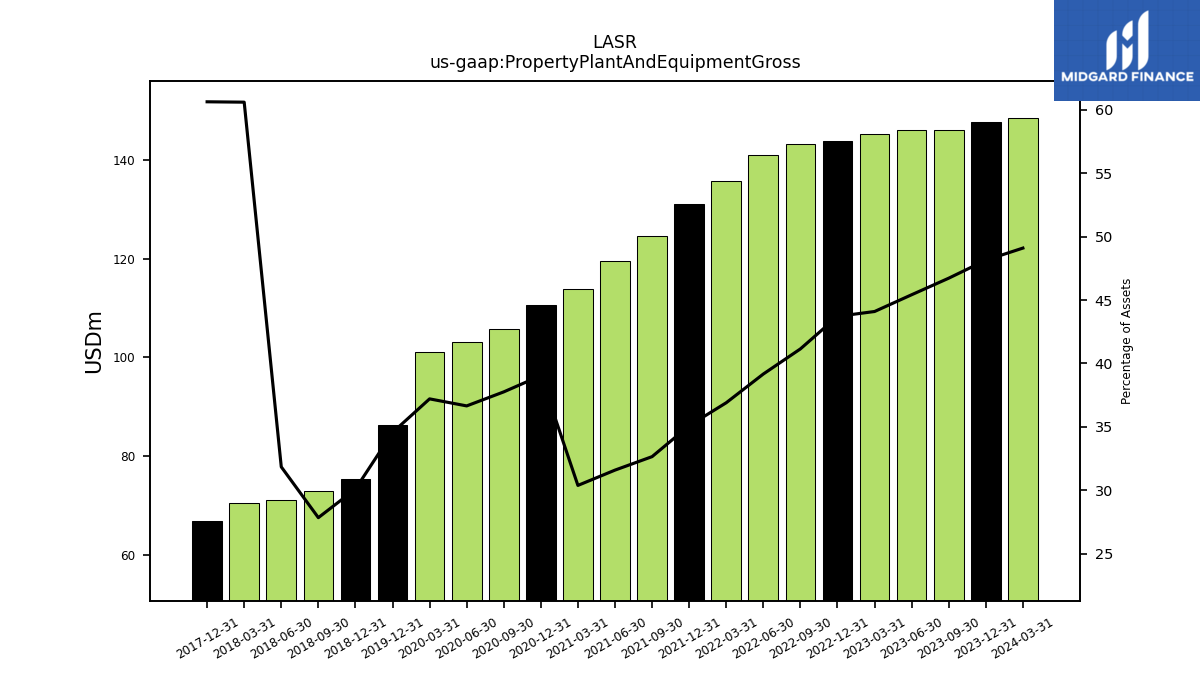
| Property Plant And Equipment Gross | 147.72 | 146.18 | 146.22 | 145.43 | 143.93 | 143.44 | 141.20 | 135.78 | 131.12 | 124.73 | 119.59 | 113.96 | 110.74 | 105.88 | 103.14 | 101.13 | 86.38 | NA | NA | NA | 75.27 | 72.94 | 71.02 | 70.43 | 66.80 | NA | NA | NA | |
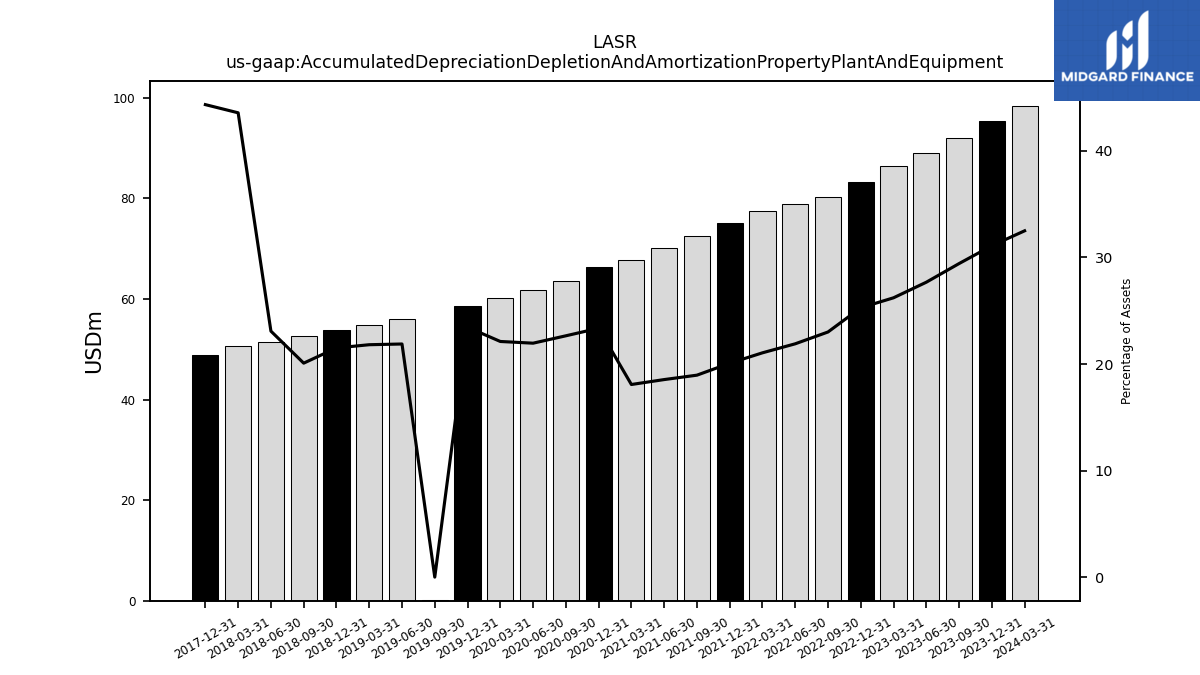
| Accumulated Depreciation Depletion And Amortization Property Plant And Equipment | 95.42 | 92.05 | 89.09 | 86.45 | 83.23 | 80.20 | 78.95 | 77.47 | 75.01 | 72.42 | 70.22 | 67.83 | 66.26 | 63.51 | 61.79 | 60.12 | 58.63 | 0.06 | 55.93 | 54.87 | 53.81 | 52.63 | 51.49 | 50.62 | 48.83 | NA | NA | NA | |
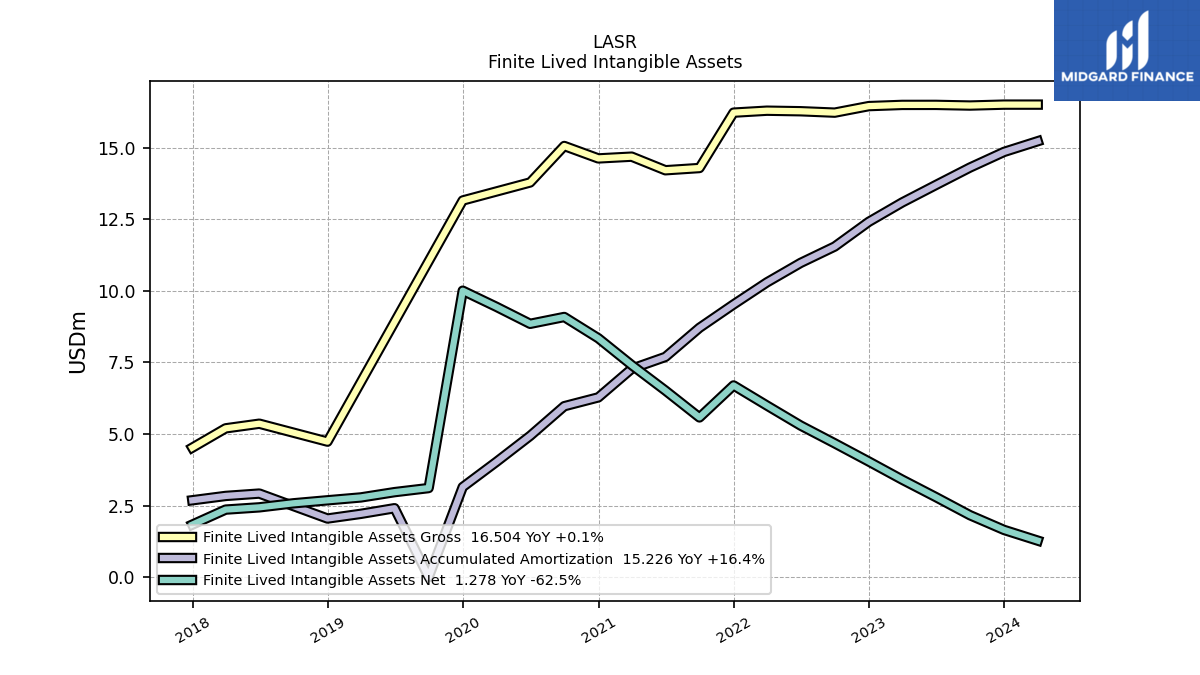
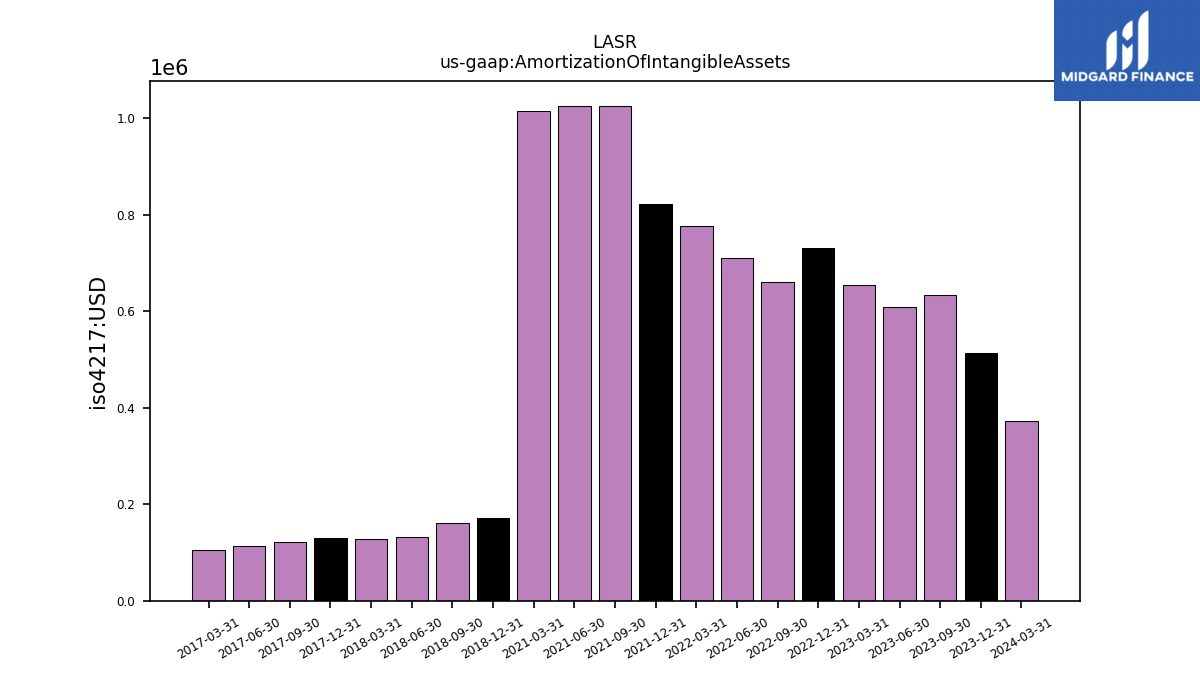
| Amortization Of Intangible Assets | 0.51 | 0.63 | 0.61 | 0.65 | 0.73 | 0.66 | 0.71 | 0.78 | 0.82 | 1.03 | 1.03 | 1.02 | NA | NA | NA | NA | NA | NA | NA | NA | 0.17 | 0.16 | 0.13 | 0.13 | 0.13 | 0.12 | 0.11 | 0.11 | |
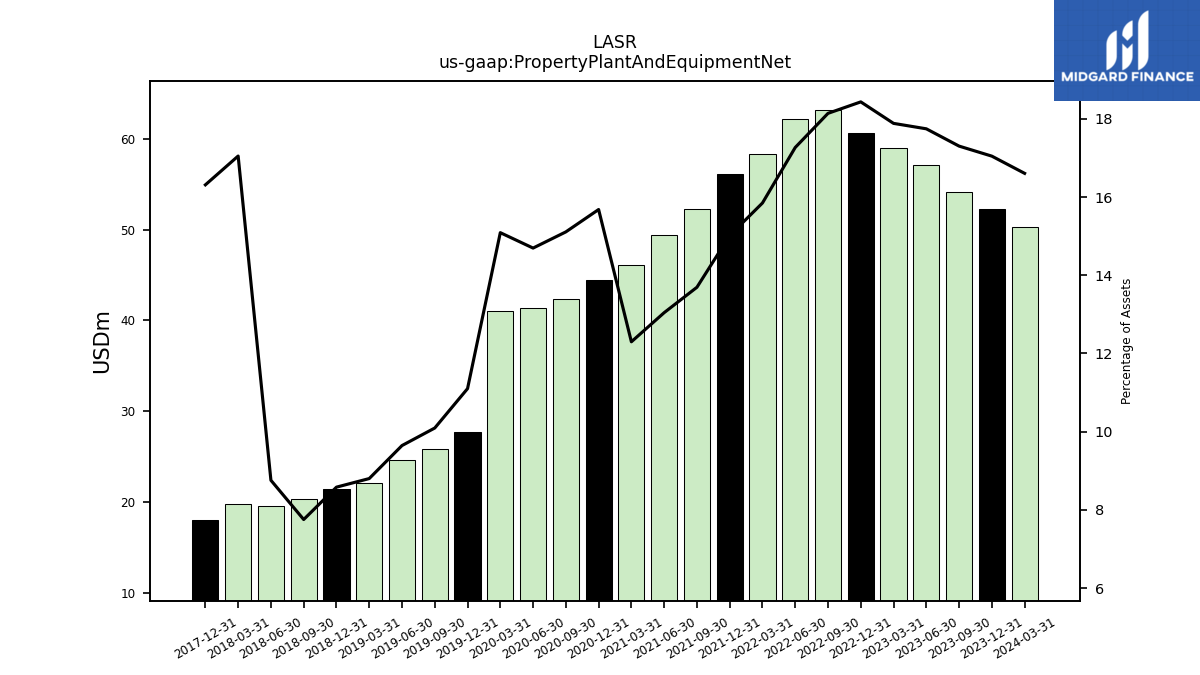
| Property Plant And Equipment Net | 52.30 | 54.13 | 57.12 | 58.98 | 60.69 | 63.23 | 62.25 | 58.31 | 56.10 | 52.30 | 49.38 | 46.13 | 44.48 | 42.37 | 41.35 | 41.01 | 27.75 | 25.78 | 24.65 | 22.14 | 21.46 | 20.31 | 19.53 | 19.81 | 17.97 | NA | NA | NA | |
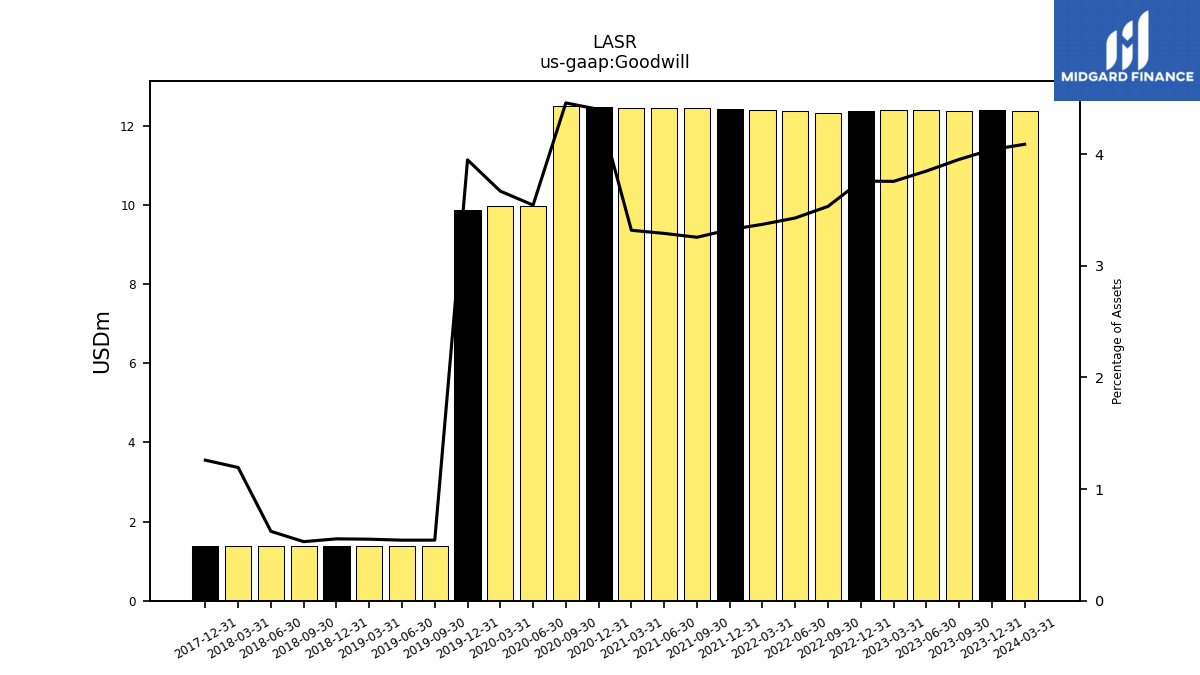
| Goodwill | 12.40 | 12.37 | 12.39 | 12.39 | 12.38 | 12.31 | 12.36 | 12.40 | 12.42 | 12.44 | 12.46 | 12.45 | 12.48 | 12.50 | 9.97 | 9.97 | 9.87 | 1.39 | 1.39 | 1.39 | 1.39 | 1.39 | 1.39 | 1.39 | 1.39 | NA | NA | NA | |
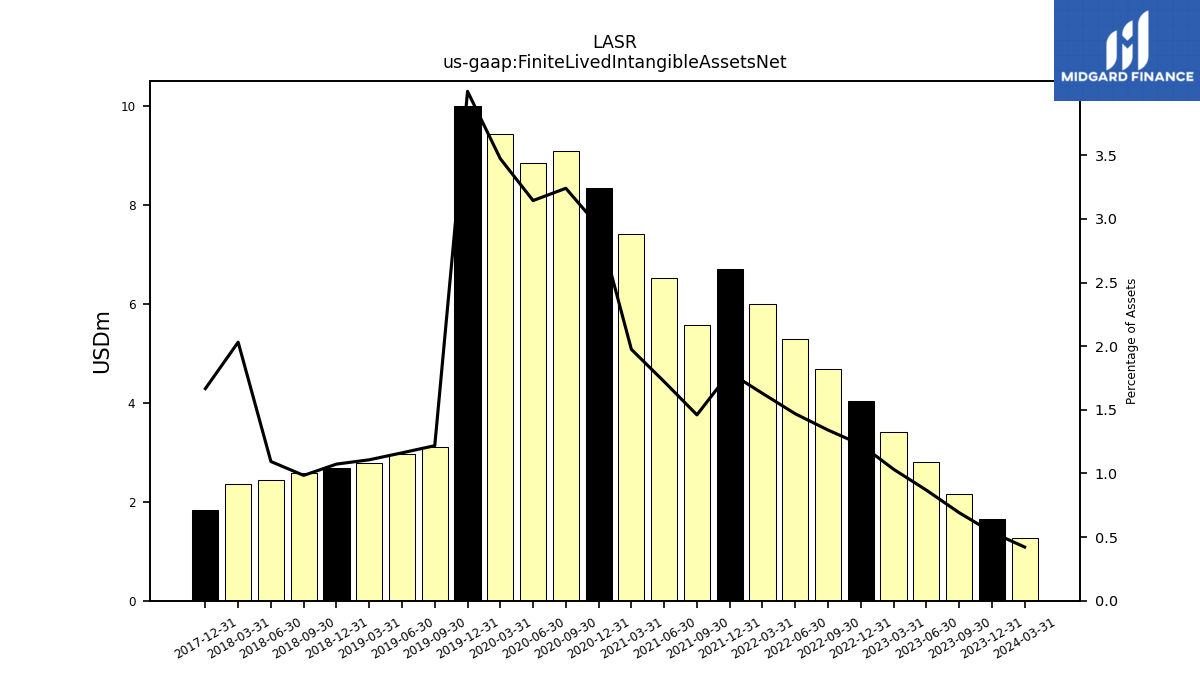
| Finite Lived Intangible Assets Net | 1.65 | 2.17 | 2.80 | 3.41 | 4.04 | 4.68 | 5.30 | 6.00 | 6.70 | 5.58 | 6.52 | 7.41 | 8.35 | 9.09 | 8.85 | 9.44 | 10.01 | 3.11 | 2.97 | 2.79 | 2.69 | 2.58 | 2.44 | 2.36 | 1.84 | NA | NA | NA | |
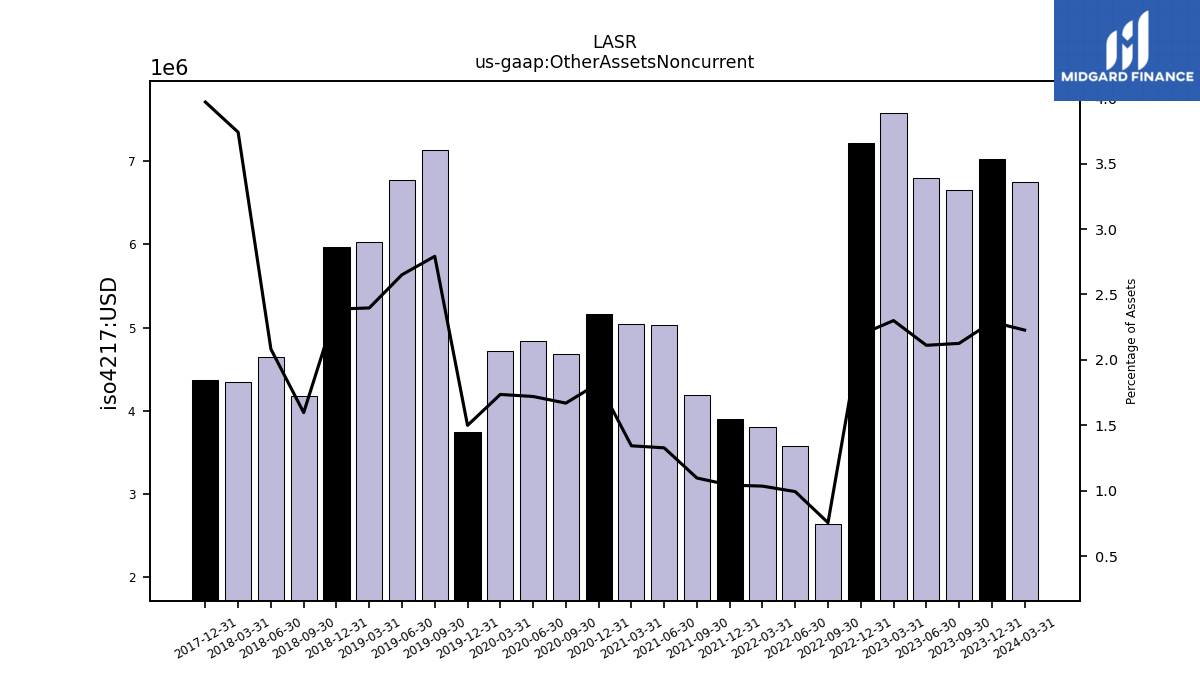
| Other Assets Noncurrent | 7.03 | 6.65 | 6.80 | 7.59 | 7.22 | 2.63 | 3.58 | 3.81 | 3.90 | 4.19 | 5.03 | 5.04 | 5.17 | 4.68 | 4.84 | 4.72 | 3.75 | 7.13 | 6.78 | 6.03 | 5.97 | 4.18 | 4.64 | 4.35 | 4.37 | NA | NA | NA |
| 2023-12-31 | 2023-09-30 | 2023-06-30 | 2023-03-31 | 2022-12-31 | 2022-09-30 | 2022-06-30 | 2022-03-31 | 2021-12-31 | 2021-09-30 | 2021-06-30 | 2021-03-31 | 2020-12-31 | 2020-09-30 | 2020-06-30 | 2020-03-31 | 2019-12-31 | 2019-09-30 | 2019-06-30 | 2019-03-31 | 2018-12-31 | 2018-09-30 | 2018-06-30 | 2018-03-31 | 2017-12-31 | 2017-09-30 | 2017-06-30 | 2017-03-31 | ||
|---|---|---|---|---|---|---|---|---|---|---|---|---|---|---|---|---|---|---|---|---|---|---|---|---|---|---|---|---|---|
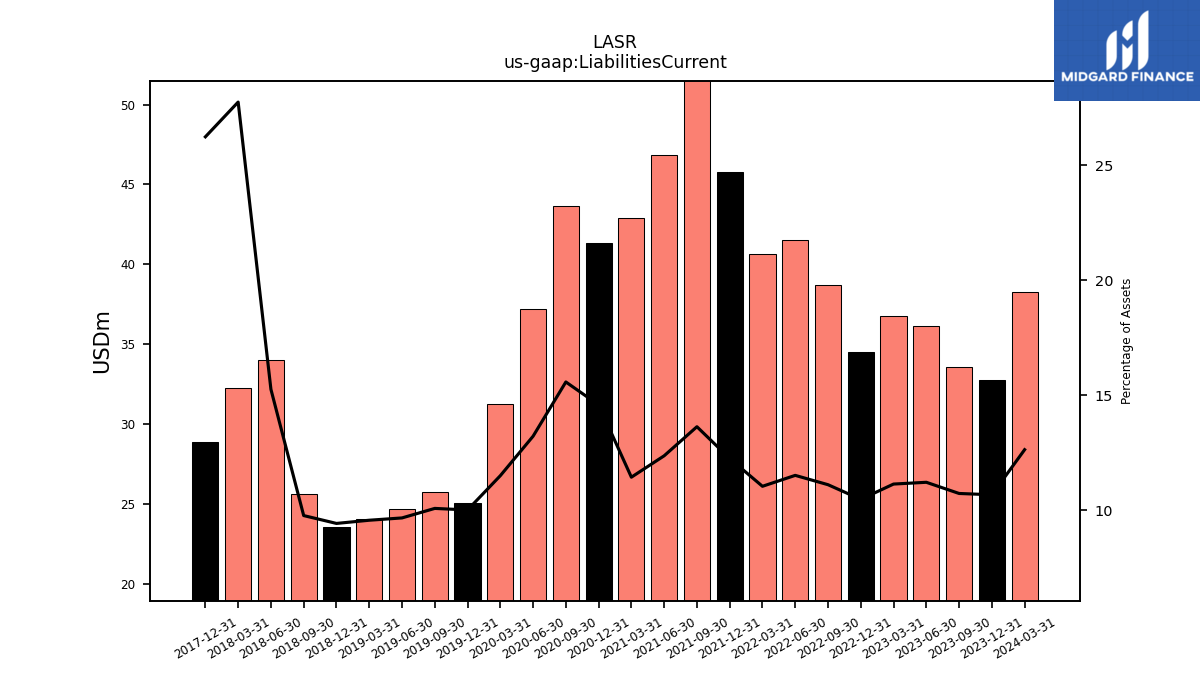
| Liabilities Current | 32.75 | 33.57 | 36.11 | 36.74 | 34.49 | 38.74 | 41.52 | 40.63 | 45.77 | 52.08 | 46.83 | 42.91 | 41.36 | 43.68 | 37.20 | 31.27 | 25.04 | 25.76 | 24.71 | 24.07 | 23.59 | 25.60 | 34.03 | 32.24 | 28.89 | NA | NA | NA | |
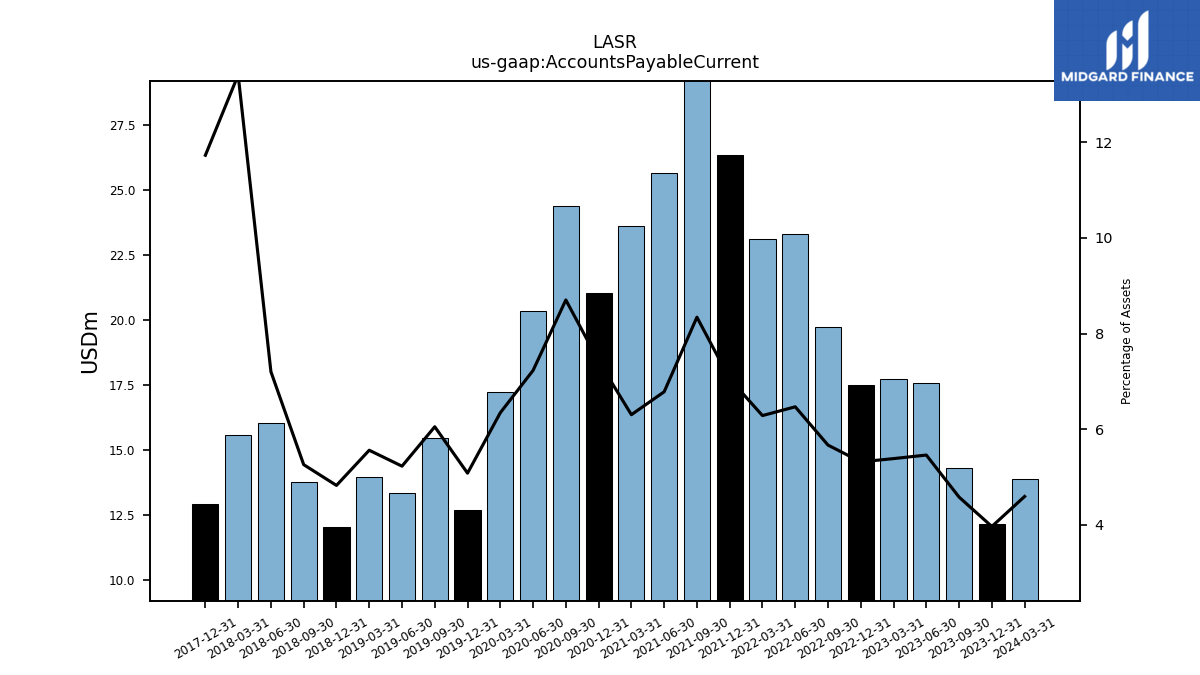
| Accounts Payable Current | 12.17 | 14.33 | 17.57 | 17.76 | 17.51 | 19.75 | 23.32 | 23.12 | 26.35 | 31.87 | 25.68 | 23.64 | 21.06 | 24.40 | 20.34 | 17.24 | 12.70 | 15.46 | 13.36 | 13.99 | 12.07 | 13.78 | 16.06 | 15.58 | 12.92 | NA | NA | NA | |
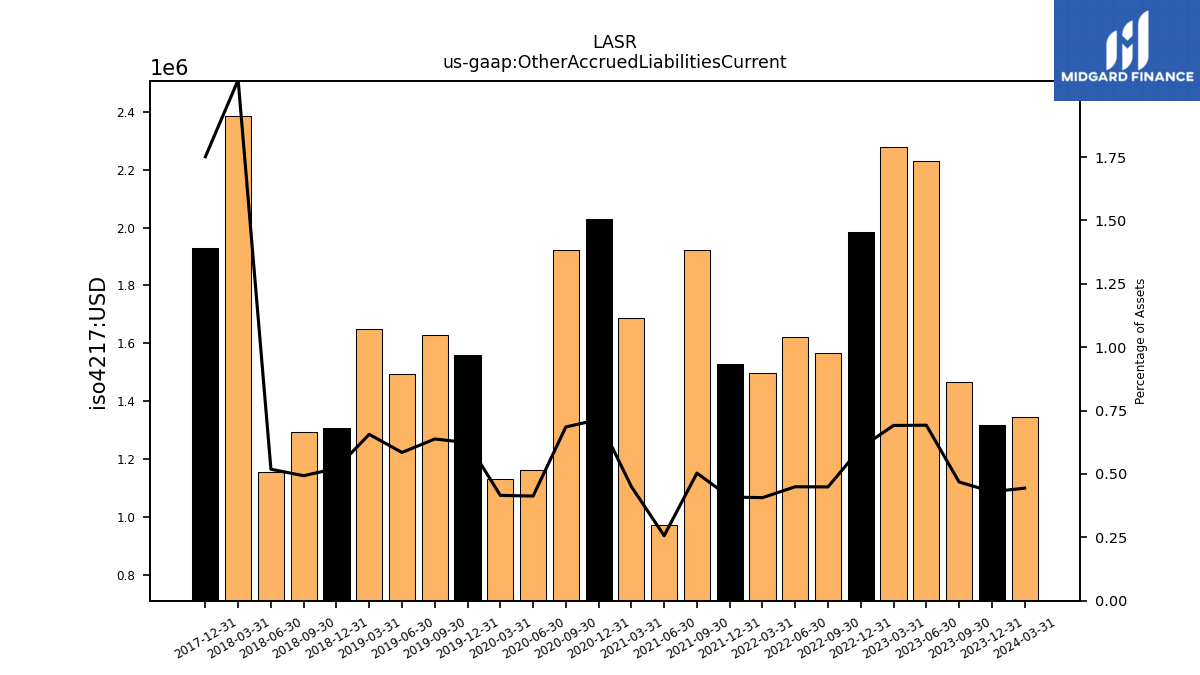
| Other Accrued Liabilities Current | 1.32 | 1.47 | 2.23 | 2.28 | 1.99 | 1.56 | 1.62 | 1.50 | 1.53 | 1.92 | 0.97 | 1.69 | 2.03 | 1.92 | 1.16 | 1.13 | 1.56 | 1.63 | 1.50 | 1.65 | 1.31 | 1.29 | 1.16 | 2.39 | 1.93 | NA | NA | NA | |
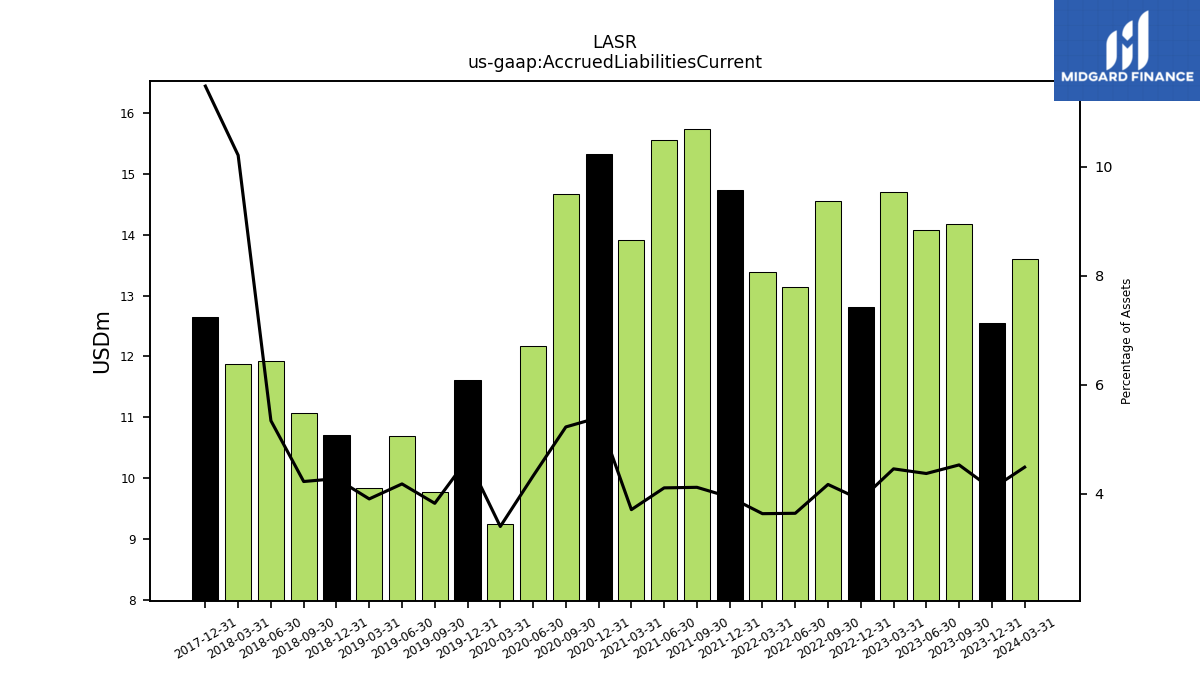
| Accrued Liabilities Current | 12.56 | 14.18 | 14.08 | 14.71 | 12.82 | 14.55 | 13.14 | 13.38 | 14.73 | 15.74 | 15.56 | 13.92 | 15.32 | 14.66 | 12.18 | 9.25 | 11.61 | 9.78 | 10.69 | 9.83 | 10.71 | 11.08 | 11.92 | 11.87 | 12.65 | NA | NA | NA | |
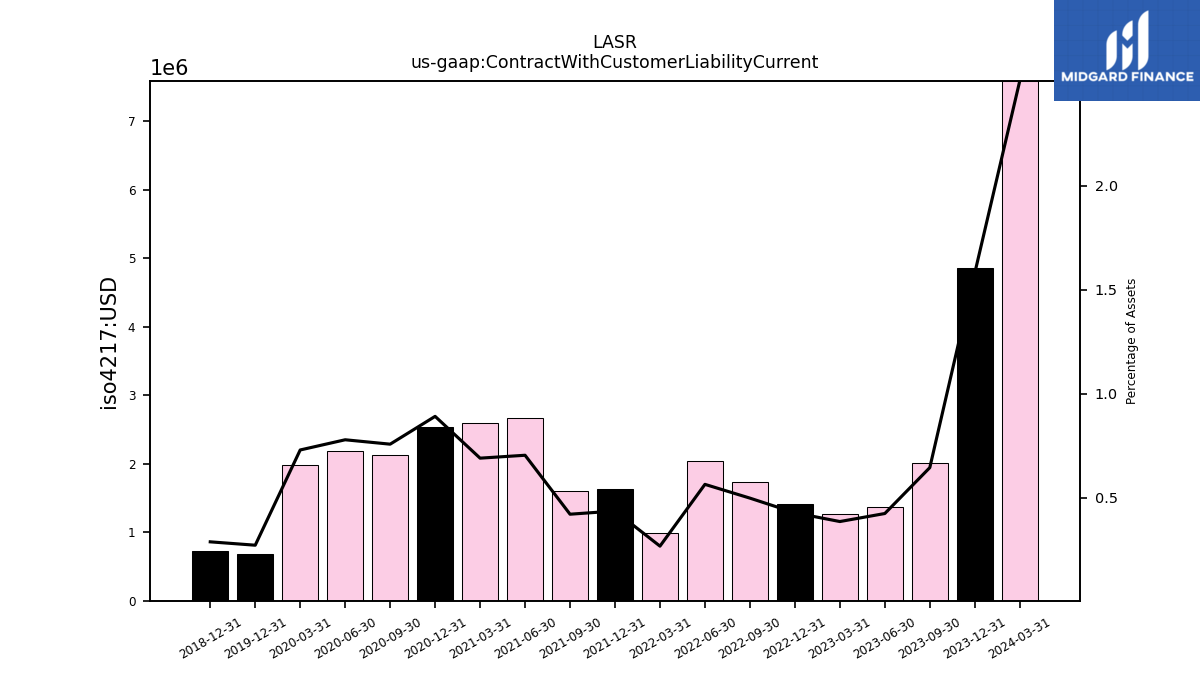
| Contract With Customer Liability Current | 4.85 | 2.02 | 1.36 | 1.27 | 1.41 | 1.74 | 2.03 | 0.98 | 1.63 | 1.61 | 2.67 | 2.59 | 2.53 | 2.12 | 2.19 | 1.98 | 0.68 | NA | NA | NA | 0.72 | NA | NA | NA | NA | NA | NA | NA |
| 2023-12-31 | 2023-09-30 | 2023-06-30 | 2023-03-31 | 2022-12-31 | 2022-09-30 | 2022-06-30 | 2022-03-31 | 2021-12-31 | 2021-09-30 | 2021-06-30 | 2021-03-31 | 2020-12-31 | 2020-09-30 | 2020-06-30 | 2020-03-31 | 2019-12-31 | 2019-09-30 | 2019-06-30 | 2019-03-31 | 2018-12-31 | 2018-09-30 | 2018-06-30 | 2018-03-31 | 2017-12-31 | 2017-09-30 | 2017-06-30 | 2017-03-31 | ||
|---|---|---|---|---|---|---|---|---|---|---|---|---|---|---|---|---|---|---|---|---|---|---|---|---|---|---|---|---|---|
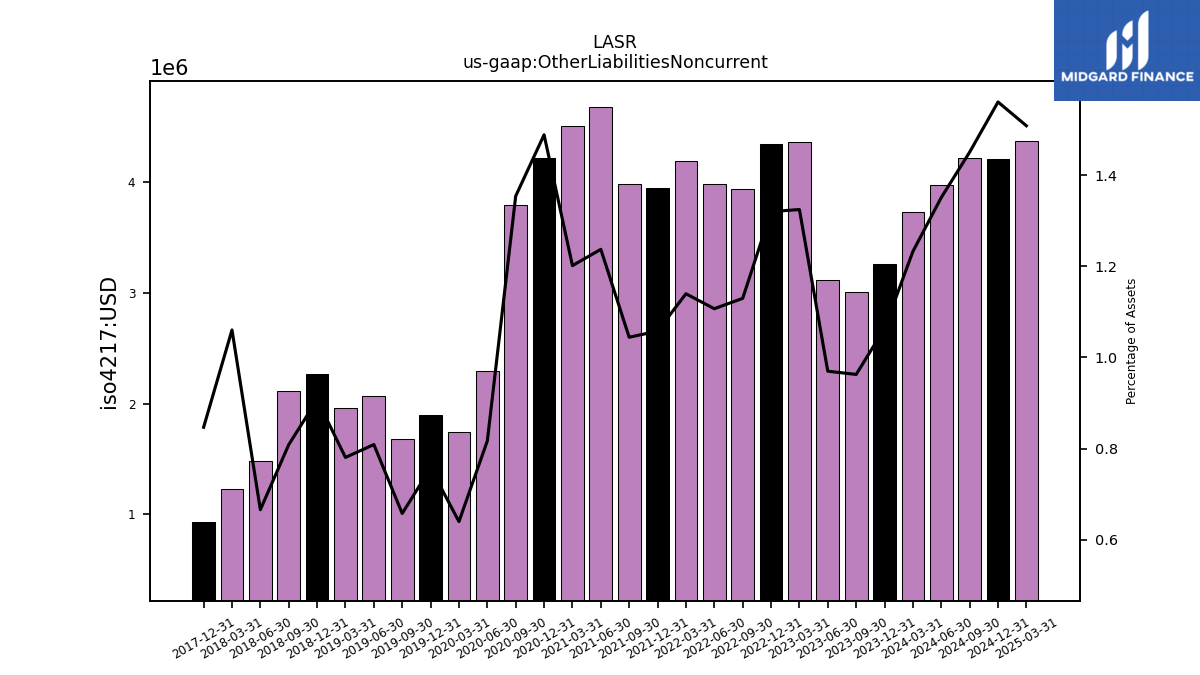
| Other Liabilities Noncurrent | 3.26 | 3.01 | 3.12 | 4.37 | 4.34 | 3.94 | 3.99 | 4.19 | 3.95 | 3.99 | 4.68 | 4.51 | 4.22 | 3.80 | 2.30 | 1.74 | 1.89 | 1.68 | 2.07 | 1.96 | 2.27 | 2.12 | 1.49 | 1.23 | 0.93 | NA | NA | NA | |
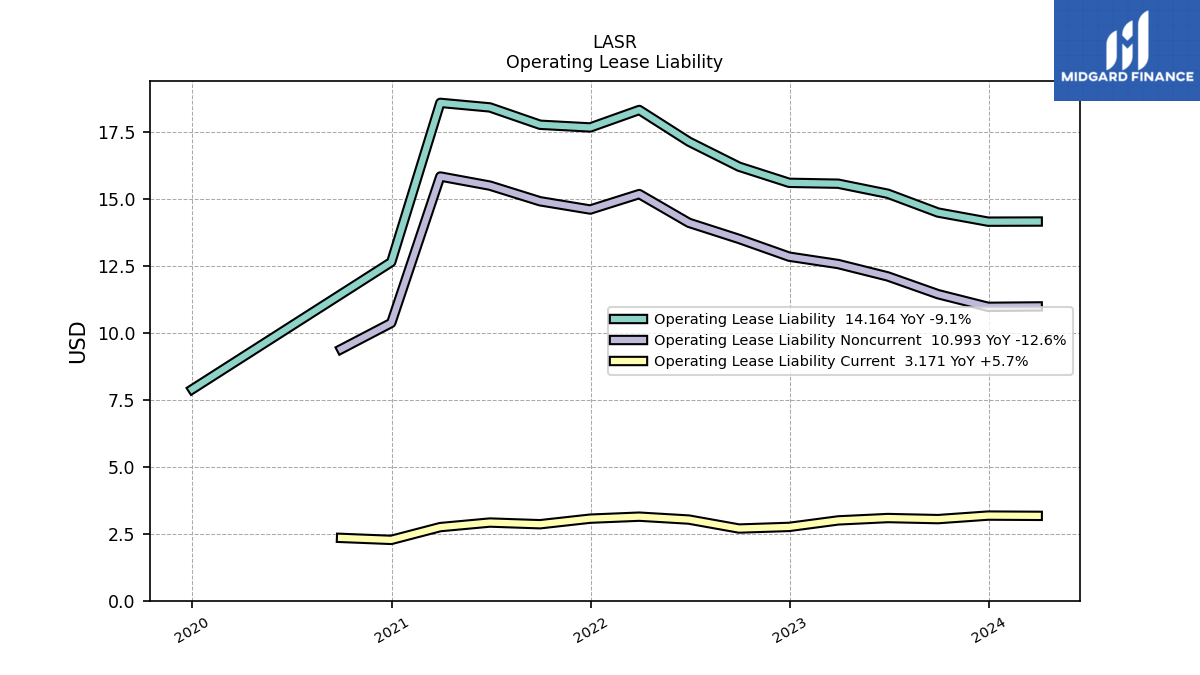
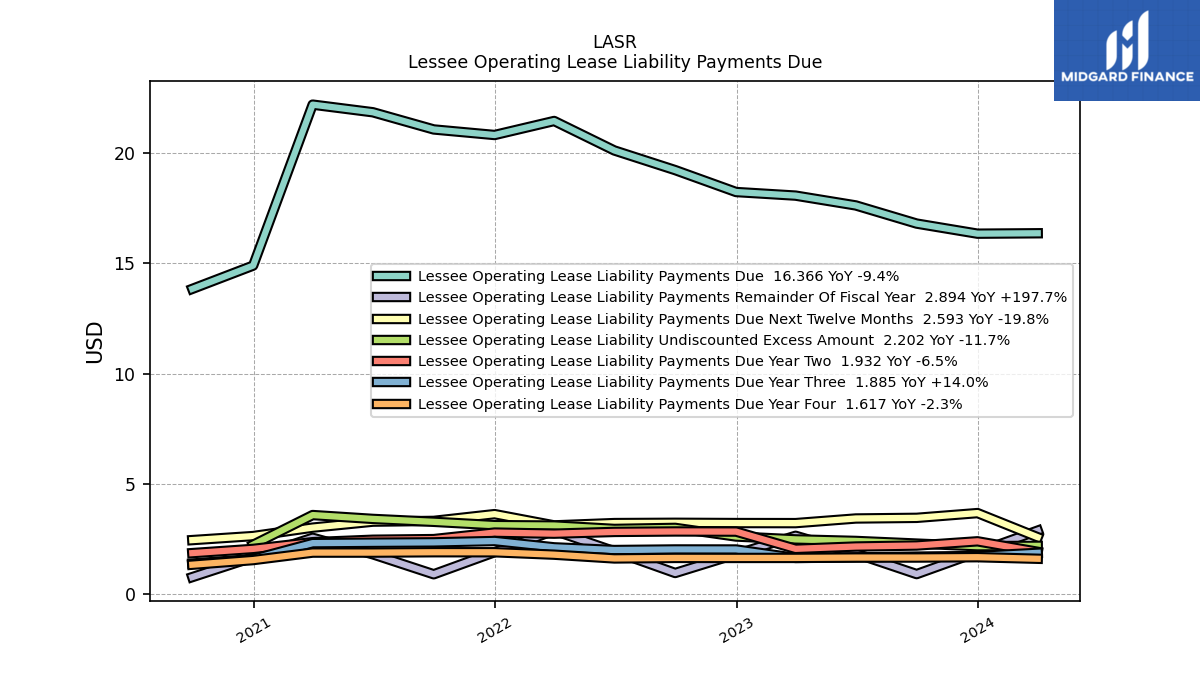
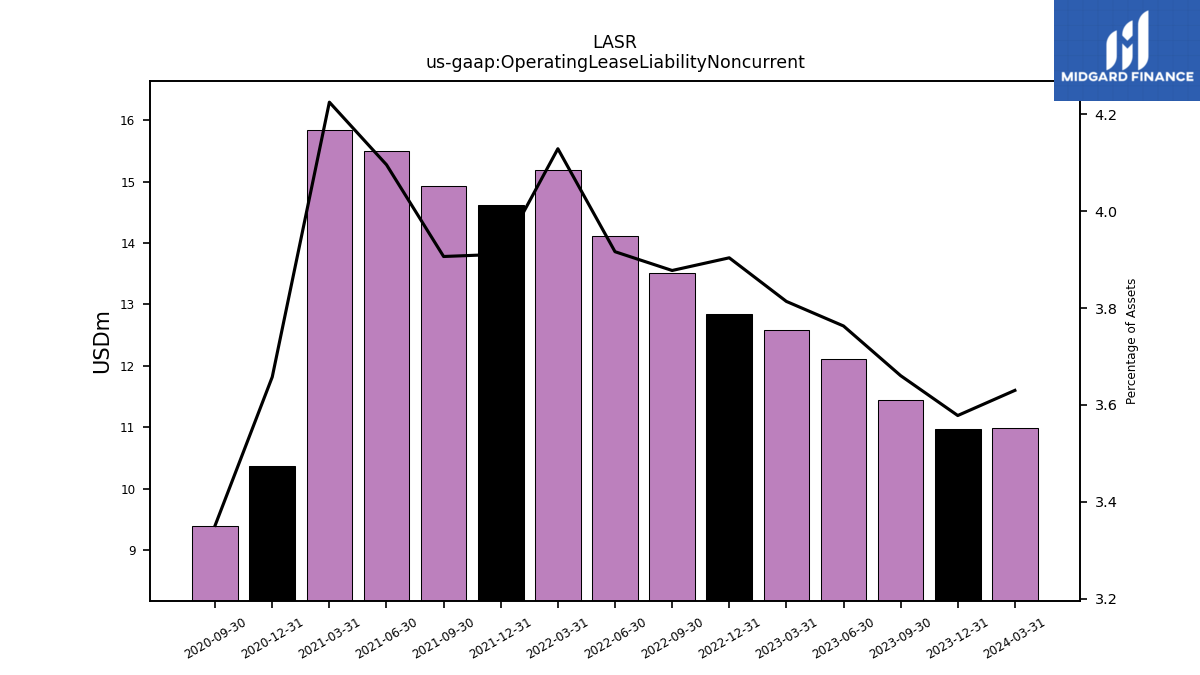
| Operating Lease Liability Noncurrent | 10.98 | 11.45 | 12.11 | 12.58 | 12.85 | 13.52 | 14.12 | 15.19 | 14.61 | 14.92 | 15.51 | 15.85 | 10.38 | 9.40 | NA | NA | NA | NA | NA | NA | NA | NA | NA | NA | NA | NA | NA | NA |
| 2023-12-31 | 2023-09-30 | 2023-06-30 | 2023-03-31 | 2022-12-31 | 2022-09-30 | 2022-06-30 | 2022-03-31 | 2021-12-31 | 2021-09-30 | 2021-06-30 | 2021-03-31 | 2020-12-31 | 2020-09-30 | 2020-06-30 | 2020-03-31 | 2019-12-31 | 2019-09-30 | 2019-06-30 | 2019-03-31 | 2018-12-31 | 2018-09-30 | 2018-06-30 | 2018-03-31 | 2017-12-31 | 2017-09-30 | 2017-06-30 | 2017-03-31 | ||
|---|---|---|---|---|---|---|---|---|---|---|---|---|---|---|---|---|---|---|---|---|---|---|---|---|---|---|---|---|---|
| Stockholders Equity | 254.42 | 259.52 | 265.36 | 269.16 | 270.85 | 285.84 | 293.85 | 300.58 | 302.13 | 304.00 | 304.65 | 304.06 | 219.91 | 216.09 | 211.32 | 212.95 | 216.61 | 221.22 | 221.94 | 218.66 | 217.78 | 213.42 | 170.24 | 64.58 | 61.28 | NA | NA | NA | |
| Common Stock Value | 0.02 | 0.02 | 0.02 | 0.02 | 0.02 | 0.02 | 0.01 | 0.01 | 0.01 | 0.01 | 0.01 | 0.01 | 0.01 | 0.01 | 0.01 | 0.01 | 0.01 | 0.01 | 0.01 | 0.01 | 0.01 | 0.01 | 0.01 | 0.00 | 0.00 | NA | NA | NA | |
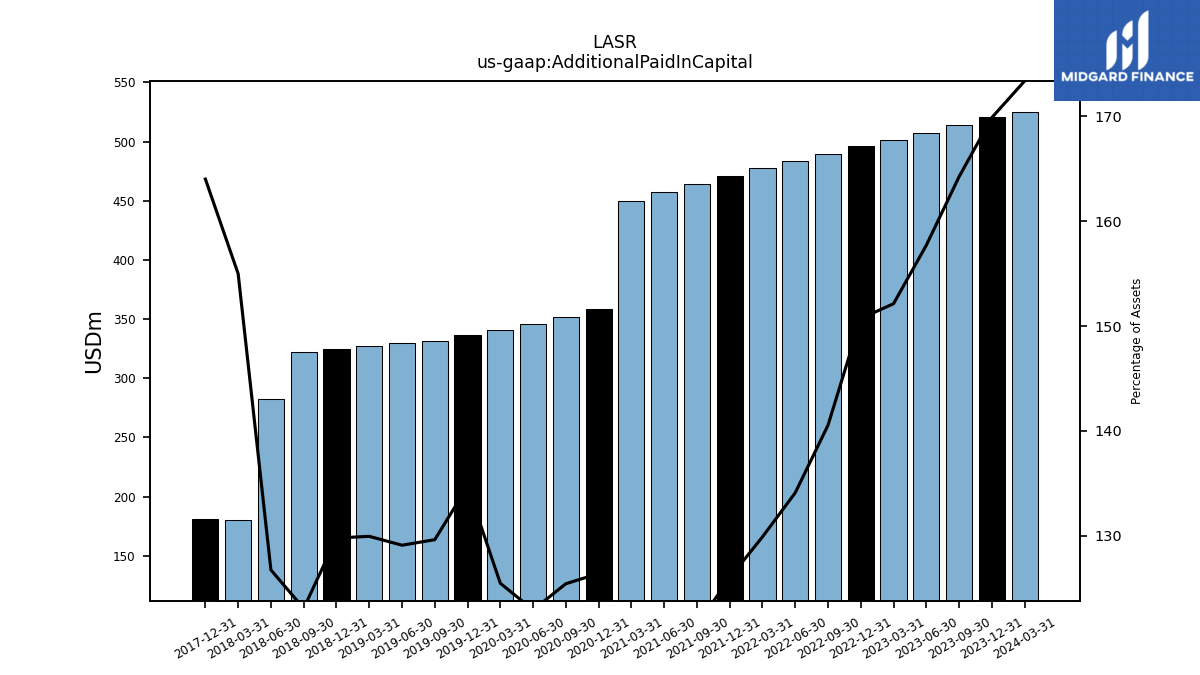
| Additional Paid In Capital | 521.18 | 513.79 | 507.65 | 501.68 | 496.21 | 489.87 | 483.41 | 477.92 | 470.76 | 464.09 | 457.48 | 449.50 | 358.54 | 351.70 | 345.92 | 341.04 | 336.73 | 331.17 | 329.98 | 326.87 | 324.66 | 322.48 | 282.68 | 180.09 | 180.66 | NA | NA | NA | |
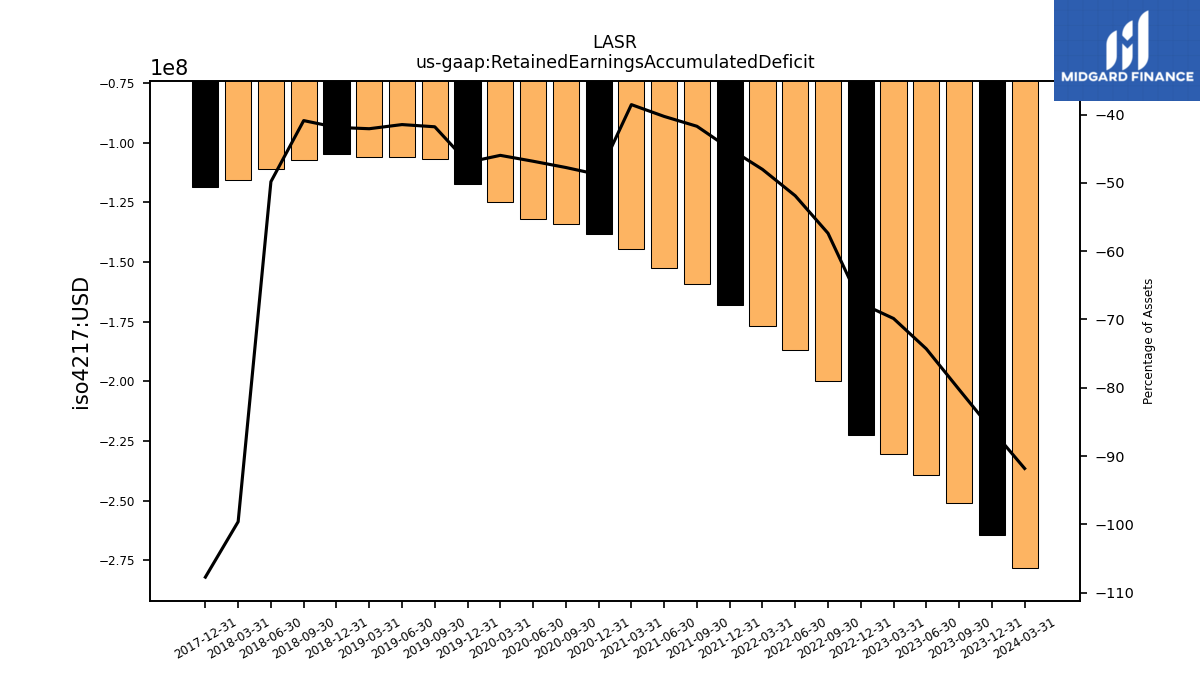
| Retained Earnings Accumulated Deficit | -264.30 | -251.07 | -239.19 | -230.36 | -222.63 | -199.97 | -187.02 | -176.68 | -168.06 | -159.31 | -152.43 | -144.53 | -138.39 | -133.87 | -131.76 | -124.93 | -117.45 | -106.74 | -105.96 | -105.81 | -104.73 | -107.09 | -111.10 | -115.75 | -118.67 | NA | NA | NA | |
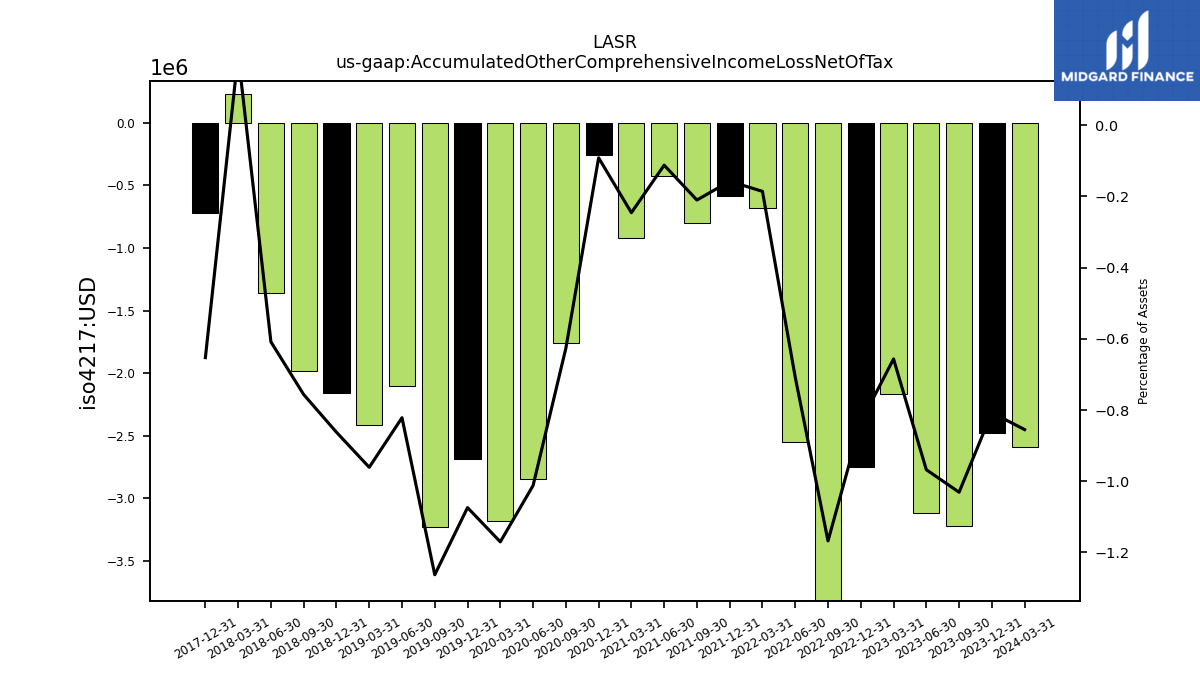
| Accumulated Other Comprehensive Income Loss Net Of Tax | -2.48 | -3.23 | -3.12 | -2.17 | -2.75 | -4.07 | -2.55 | -0.68 | -0.59 | -0.80 | -0.42 | -0.92 | -0.26 | -1.76 | -2.85 | -3.18 | -2.69 | -3.23 | -2.10 | -2.42 | -2.16 | -1.98 | -1.36 | 0.23 | -0.72 | NA | NA | NA | |
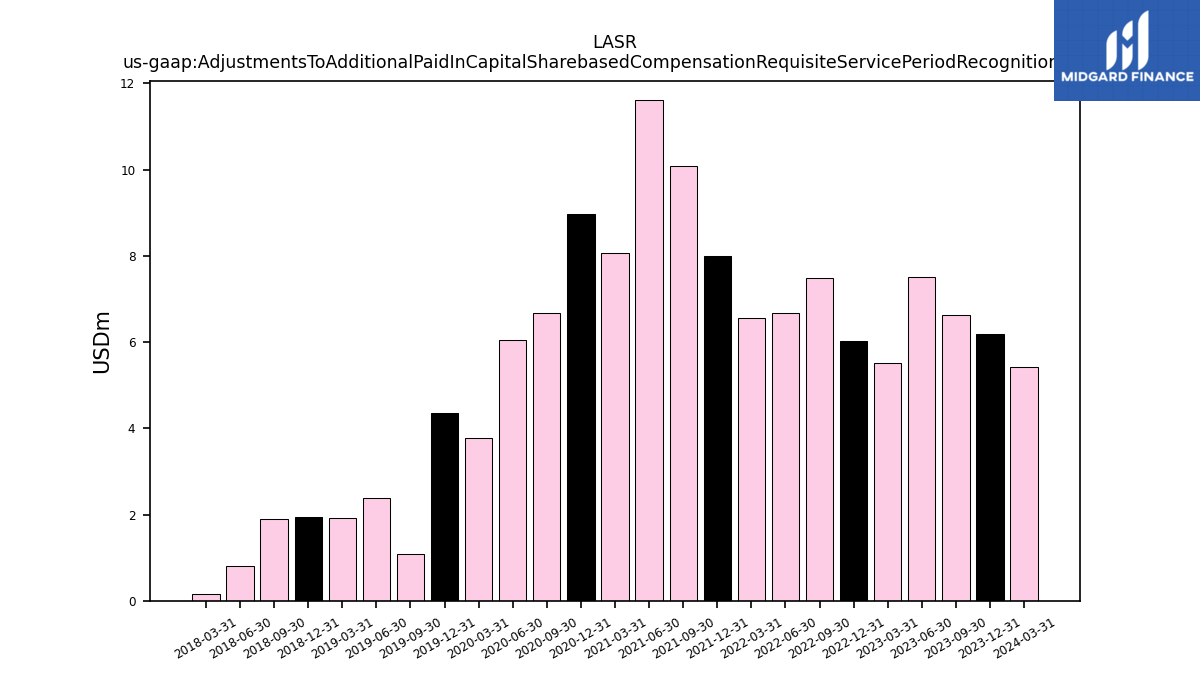
| Adjustments To Additional Paid In Capital Sharebased Compensation Requisite Service Period Recognition Value | 6.19 | 6.63 | 7.51 | 5.50 | 6.03 | 7.50 | 6.68 | 6.55 | 7.99 | 10.07 | 11.61 | 8.05 | 8.98 | 6.68 | 6.04 | 3.76 | 4.36 | 1.08 | 2.38 | 1.91 | 1.93 | 1.90 | 0.81 | 0.16 | NA | NA | NA | NA |
| 2023-12-31 | 2023-09-30 | 2023-06-30 | 2023-03-31 | 2022-12-31 | 2022-09-30 | 2022-06-30 | 2022-03-31 | 2021-12-31 | 2021-09-30 | 2021-06-30 | 2021-03-31 | 2020-12-31 | 2020-09-30 | 2020-06-30 | 2020-03-31 | 2019-12-31 | 2019-09-30 | 2019-06-30 | 2019-03-31 | 2018-12-31 | 2018-09-30 | 2018-06-30 | 2018-03-31 | 2017-12-31 | 2017-09-30 | 2017-06-30 | 2017-03-31 | ||
|---|---|---|---|---|---|---|---|---|---|---|---|---|---|---|---|---|---|---|---|---|---|---|---|---|---|---|---|---|---|
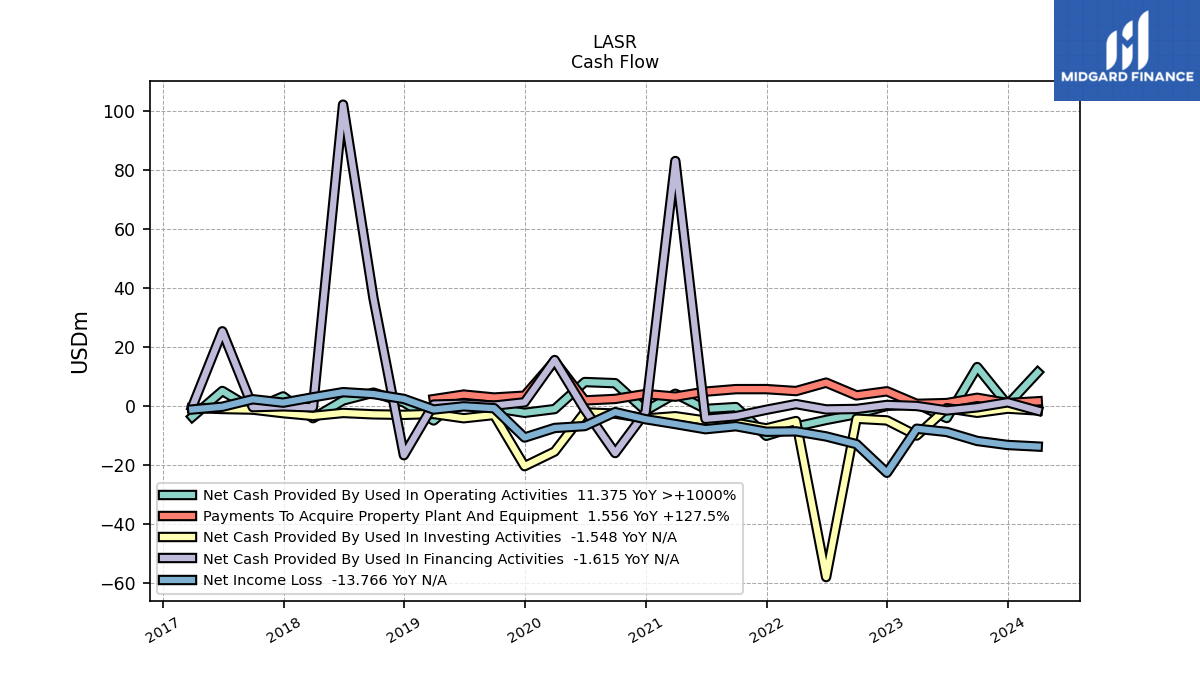
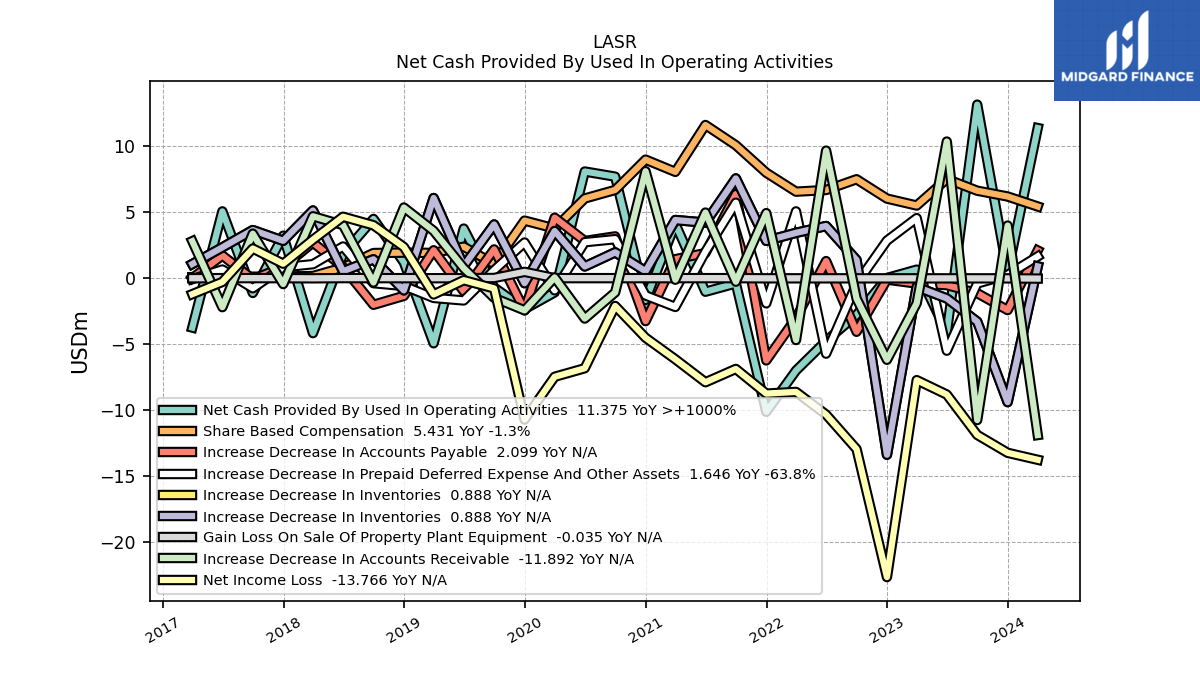
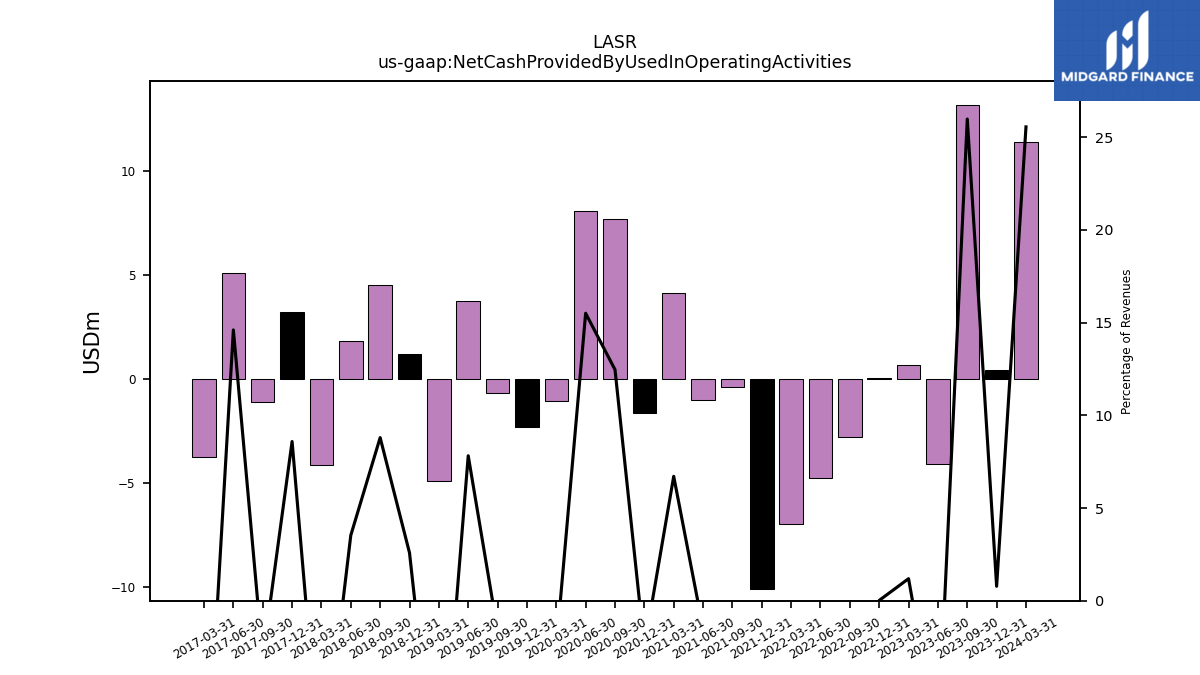
| Net Cash Provided By Used In Operating Activities | 0.40 | 13.15 | -4.11 | 0.64 | 0.01 | -2.79 | -4.76 | -7.00 | -10.13 | -0.40 | -1.03 | 4.12 | -1.65 | 7.69 | 8.08 | -1.08 | -2.35 | -0.71 | 3.76 | -4.94 | 1.19 | 4.49 | 1.82 | -4.17 | 3.22 | -1.12 | 5.06 | -3.75 | |
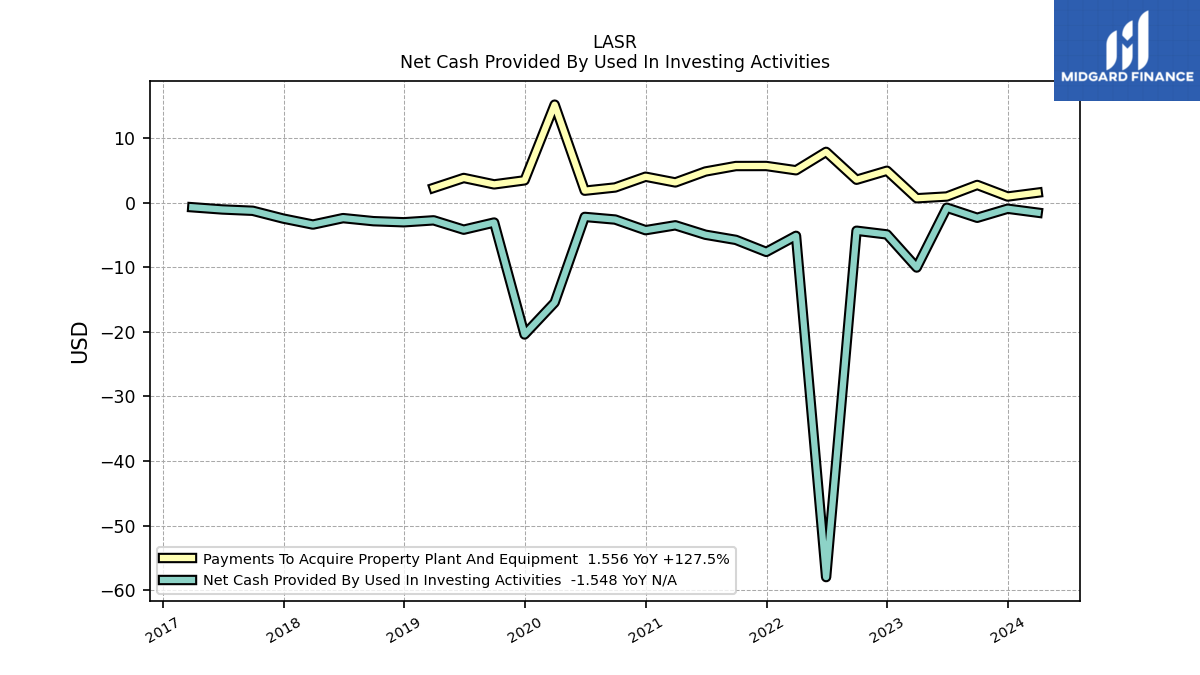
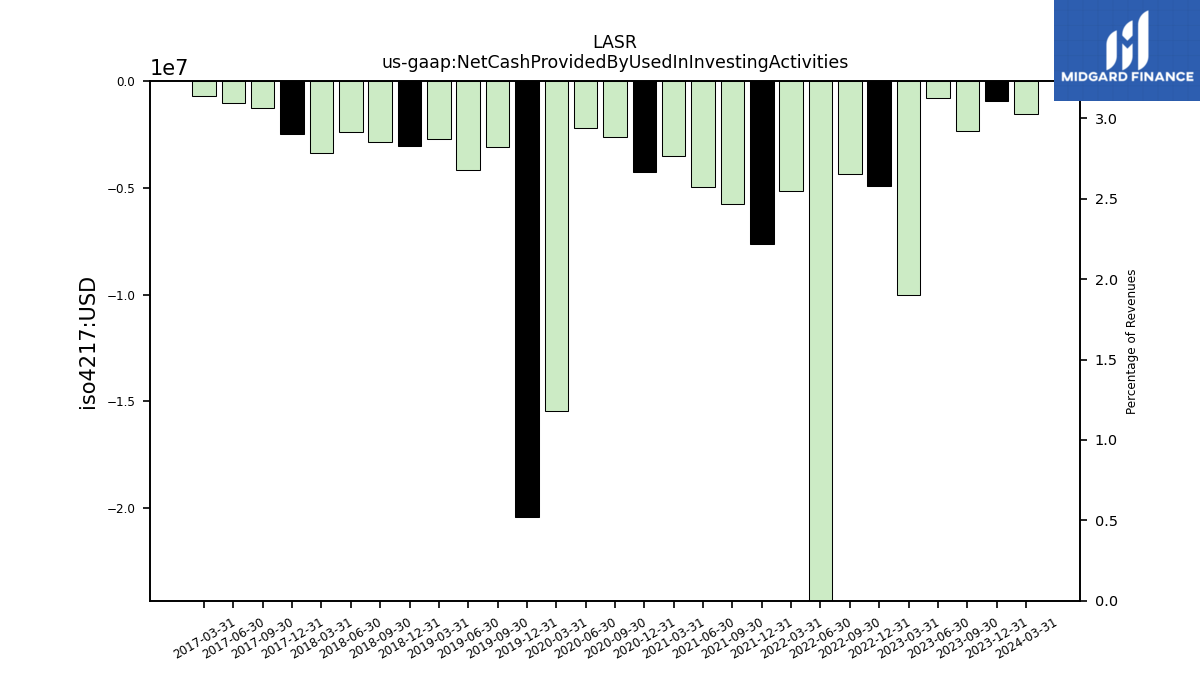
| Net Cash Provided By Used In Investing Activities | -0.94 | -2.34 | -0.78 | -10.04 | -4.92 | -4.34 | -57.99 | -5.13 | -7.62 | -5.76 | -4.96 | -3.50 | -4.26 | -2.61 | -2.20 | -15.46 | -20.42 | -3.07 | -4.18 | -2.73 | -3.03 | -2.87 | -2.39 | -3.39 | -2.46 | -1.26 | -1.05 | -0.71 | |
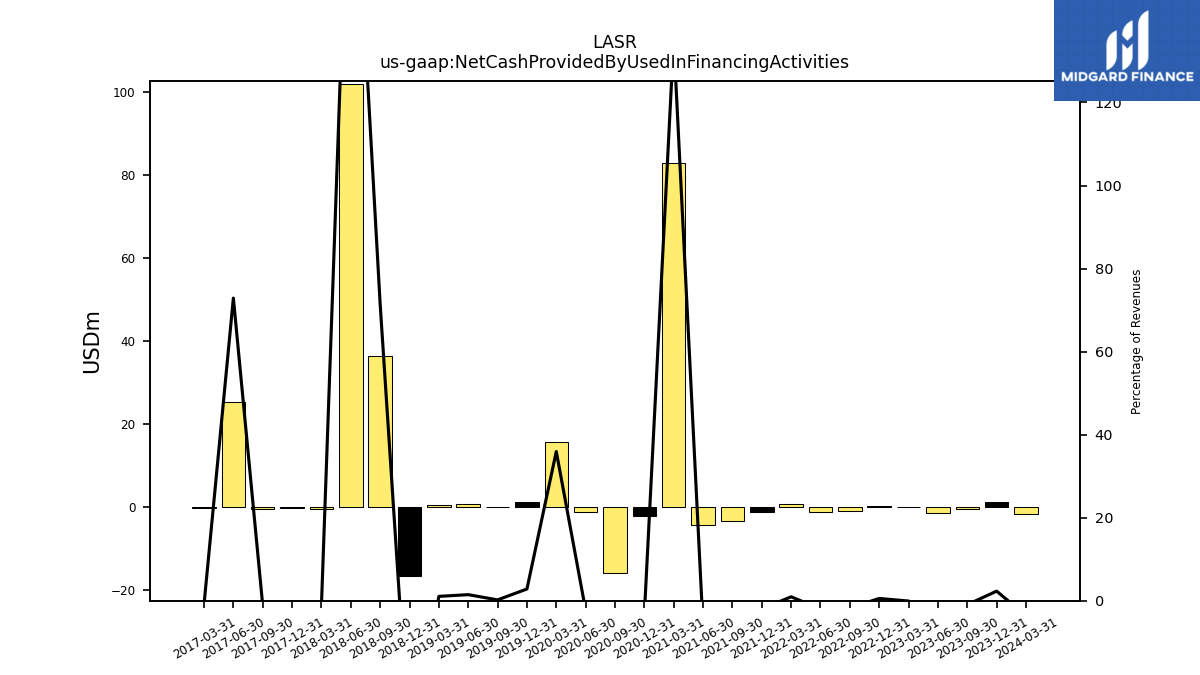
| Net Cash Provided By Used In Financing Activities | 1.20 | -0.48 | -1.54 | -0.04 | 0.31 | -1.04 | -1.19 | 0.61 | -1.32 | -3.49 | -4.38 | 82.93 | -2.13 | -15.98 | -1.19 | 15.53 | 1.21 | 0.09 | 0.70 | 0.44 | -16.70 | 36.47 | 102.02 | -0.49 | -0.15 | -0.42 | 25.27 | -0.27 |
| 2023-12-31 | 2023-09-30 | 2023-06-30 | 2023-03-31 | 2022-12-31 | 2022-09-30 | 2022-06-30 | 2022-03-31 | 2021-12-31 | 2021-09-30 | 2021-06-30 | 2021-03-31 | 2020-12-31 | 2020-09-30 | 2020-06-30 | 2020-03-31 | 2019-12-31 | 2019-09-30 | 2019-06-30 | 2019-03-31 | 2018-12-31 | 2018-09-30 | 2018-06-30 | 2018-03-31 | 2017-12-31 | 2017-09-30 | 2017-06-30 | 2017-03-31 | ||
|---|---|---|---|---|---|---|---|---|---|---|---|---|---|---|---|---|---|---|---|---|---|---|---|---|---|---|---|---|---|
| Net Cash Provided By Used In Operating Activities | 0.40 | 13.15 | -4.11 | 0.64 | 0.01 | -2.79 | -4.76 | -7.00 | -10.13 | -0.40 | -1.03 | 4.12 | -1.65 | 7.69 | 8.08 | -1.08 | -2.35 | -0.71 | 3.76 | -4.94 | 1.19 | 4.49 | 1.82 | -4.17 | 3.22 | -1.12 | 5.06 | -3.75 | |
| Net Income Loss | -13.24 | -11.88 | -8.82 | -7.73 | -22.66 | -12.96 | -10.34 | -8.62 | -8.75 | -6.88 | -7.89 | -6.15 | -4.52 | -2.11 | -6.83 | -7.47 | -10.72 | -0.78 | -0.15 | -1.24 | 2.36 | 4.01 | 4.65 | 2.92 | 1.09 | 2.24 | -0.29 | -1.21 | |
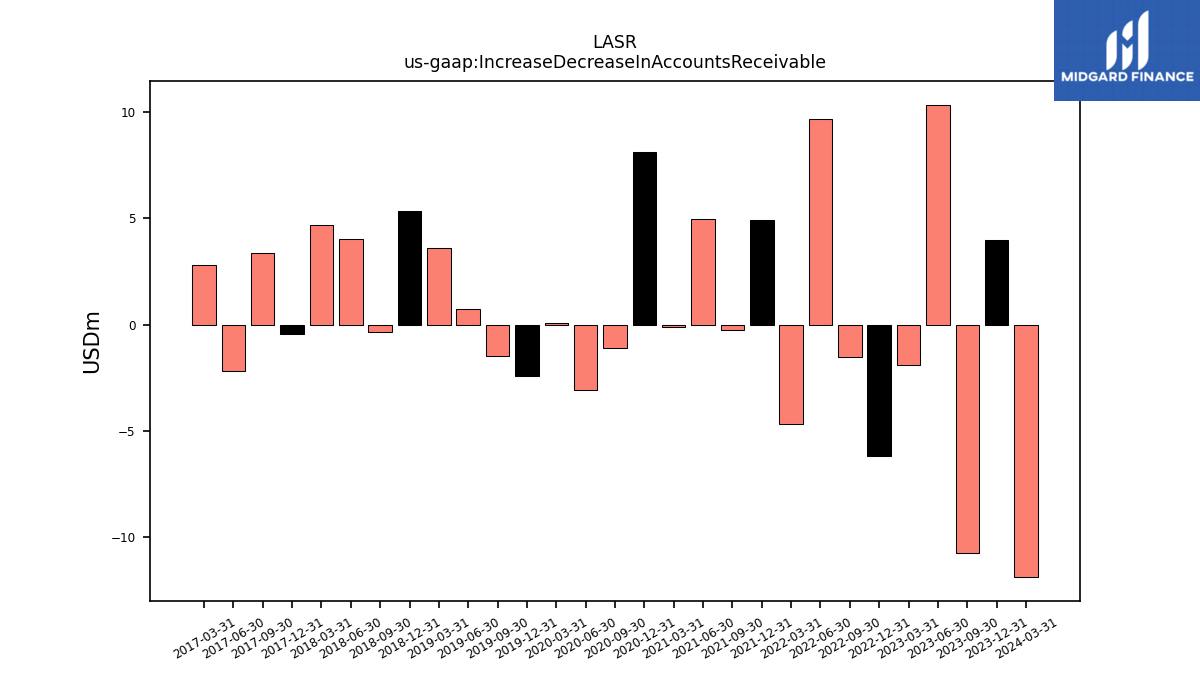
| Increase Decrease In Accounts Receivable | 3.98 | -10.76 | 10.35 | -1.91 | -6.19 | -1.54 | 9.66 | -4.69 | 4.93 | -0.27 | 4.97 | -0.12 | 8.10 | -1.08 | -3.06 | 0.05 | -2.44 | -1.50 | 0.75 | 3.58 | 5.35 | -0.33 | 4.02 | 4.69 | -0.45 | 3.37 | -2.20 | 2.80 | |
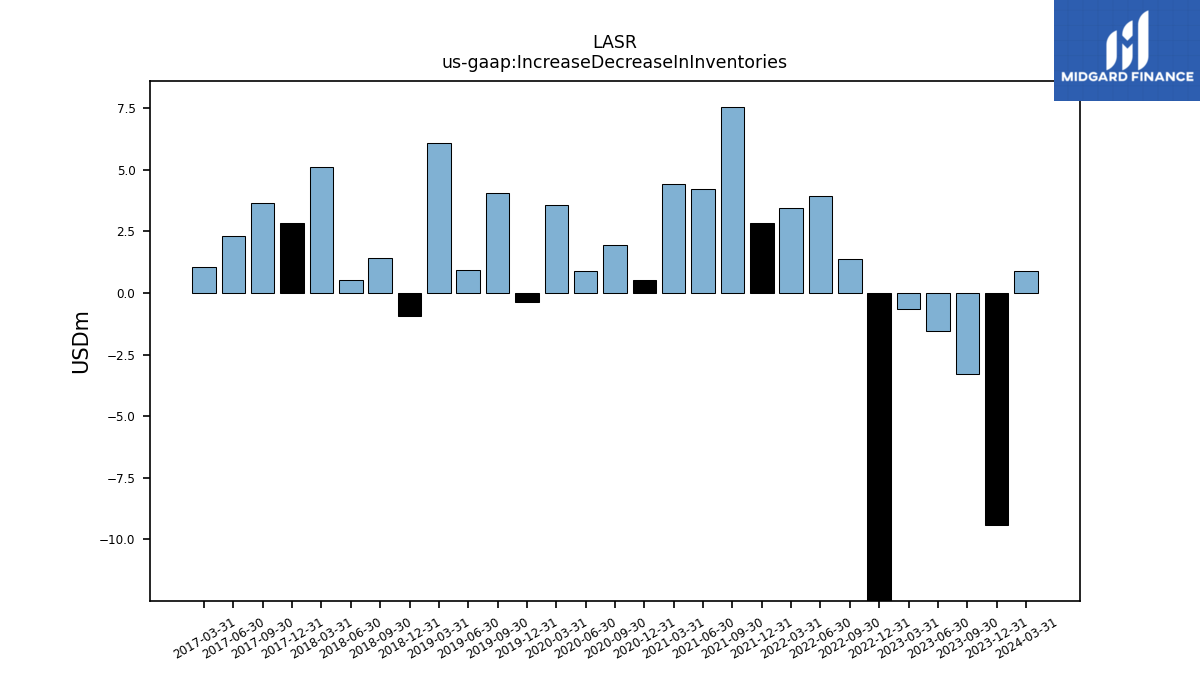
| Increase Decrease In Inventories | -9.40 | -3.29 | -1.53 | -0.66 | -13.38 | 1.38 | 3.95 | 3.43 | 2.83 | 7.56 | 4.21 | 4.41 | 0.53 | 1.95 | 0.89 | 3.57 | -0.39 | 4.07 | 0.92 | 6.07 | -0.93 | 1.43 | 0.52 | 5.13 | 2.83 | 3.64 | 2.33 | 1.07 | |
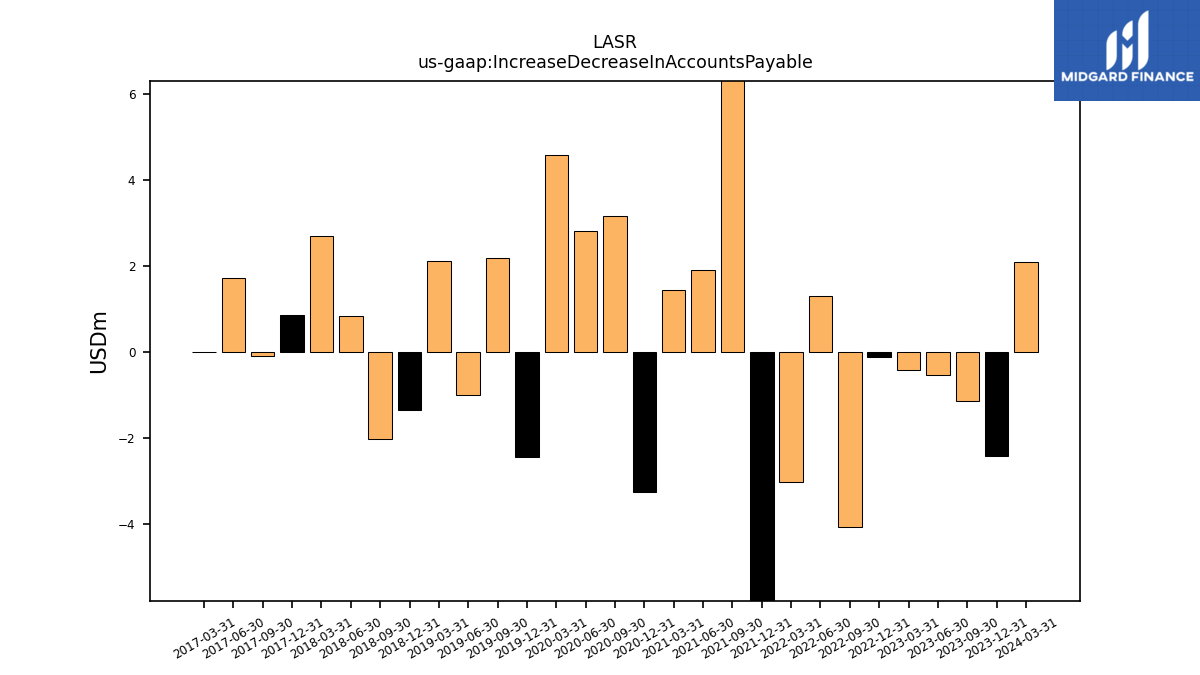
| Increase Decrease In Accounts Payable | -2.42 | -1.14 | -0.53 | -0.41 | -0.11 | -4.07 | 1.29 | -3.02 | -6.24 | 6.36 | 1.90 | 1.44 | -3.26 | 3.17 | 2.82 | 4.58 | -2.45 | 2.18 | -1.00 | 2.11 | -1.34 | -2.02 | 0.84 | 2.70 | 0.85 | -0.09 | 1.72 | 0.00 | |
| Share Based Compensation | 6.19 | 6.63 | 7.51 | 5.50 | 6.03 | 7.50 | 6.68 | 6.55 | 7.99 | 10.07 | 11.61 | 8.05 | 8.98 | 6.68 | 6.04 | 3.76 | 4.36 | 1.08 | 2.38 | 1.91 | 1.93 | 1.90 | 0.81 | 0.16 | 0.11 | 0.11 | 0.07 | 0.07 |
| 2023-12-31 | 2023-09-30 | 2023-06-30 | 2023-03-31 | 2022-12-31 | 2022-09-30 | 2022-06-30 | 2022-03-31 | 2021-12-31 | 2021-09-30 | 2021-06-30 | 2021-03-31 | 2020-12-31 | 2020-09-30 | 2020-06-30 | 2020-03-31 | 2019-12-31 | 2019-09-30 | 2019-06-30 | 2019-03-31 | 2018-12-31 | 2018-09-30 | 2018-06-30 | 2018-03-31 | 2017-12-31 | 2017-09-30 | 2017-06-30 | 2017-03-31 | ||
|---|---|---|---|---|---|---|---|---|---|---|---|---|---|---|---|---|---|---|---|---|---|---|---|---|---|---|---|---|---|
| Net Cash Provided By Used In Investing Activities | -0.94 | -2.34 | -0.78 | -10.04 | -4.92 | -4.34 | -57.99 | -5.13 | -7.62 | -5.76 | -4.96 | -3.50 | -4.26 | -2.61 | -2.20 | -15.46 | -20.42 | -3.07 | -4.18 | -2.73 | -3.03 | -2.87 | -2.39 | -3.39 | -2.46 | -1.26 | -1.05 | -0.71 | |
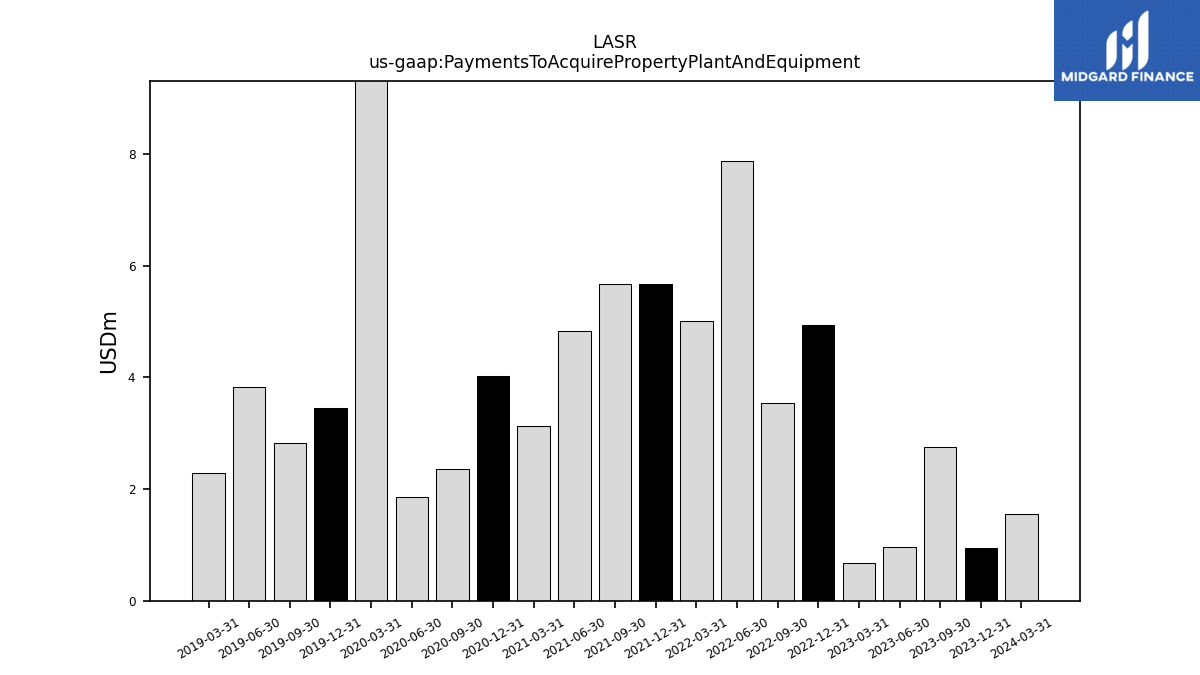
| Payments To Acquire Property Plant And Equipment | 0.95 | 2.75 | 0.96 | 0.68 | 4.95 | 3.55 | 7.87 | 5.02 | 5.68 | 5.67 | 4.83 | 3.13 | 4.02 | 2.35 | 1.85 | 15.19 | 3.46 | 2.83 | 3.83 | 2.28 | NA | NA | NA | NA | NA | NA | NA | NA |
| 2023-12-31 | 2023-09-30 | 2023-06-30 | 2023-03-31 | 2022-12-31 | 2022-09-30 | 2022-06-30 | 2022-03-31 | 2021-12-31 | 2021-09-30 | 2021-06-30 | 2021-03-31 | 2020-12-31 | 2020-09-30 | 2020-06-30 | 2020-03-31 | 2019-12-31 | 2019-09-30 | 2019-06-30 | 2019-03-31 | 2018-12-31 | 2018-09-30 | 2018-06-30 | 2018-03-31 | 2017-12-31 | 2017-09-30 | 2017-06-30 | 2017-03-31 | ||
|---|---|---|---|---|---|---|---|---|---|---|---|---|---|---|---|---|---|---|---|---|---|---|---|---|---|---|---|---|---|
| Net Cash Provided By Used In Financing Activities | 1.20 | -0.48 | -1.54 | -0.04 | 0.31 | -1.04 | -1.19 | 0.61 | -1.32 | -3.49 | -4.38 | 82.93 | -2.13 | -15.98 | -1.19 | 15.53 | 1.21 | 0.09 | 0.70 | 0.44 | -16.70 | 36.47 | 102.02 | -0.49 | -0.15 | -0.42 | 25.27 | -0.27 |
| 2023-12-31 | 2023-09-30 | 2023-06-30 | 2023-03-31 | 2022-12-31 | 2022-09-30 | 2022-06-30 | 2022-03-31 | 2021-12-31 | 2021-09-30 | 2021-06-30 | 2021-03-31 | 2020-12-31 | 2020-09-30 | 2020-06-30 | 2020-03-31 | 2019-12-31 | 2019-09-30 | 2019-06-30 | 2019-03-31 | 2018-12-31 | 2018-09-30 | 2018-06-30 | 2018-03-31 | 2017-12-31 | 2017-09-30 | 2017-06-30 | 2017-03-31 | ||
|---|---|---|---|---|---|---|---|---|---|---|---|---|---|---|---|---|---|---|---|---|---|---|---|---|---|---|---|---|---|
| Revenues | 51.89 | 50.63 | 53.30 | 54.09 | 56.68 | 60.09 | 60.83 | 64.46 | 67.45 | 72.23 | 69.11 | 61.34 | 65.70 | 61.73 | 52.14 | 43.22 | 42.90 | 43.81 | 48.05 | 41.86 | 46.16 | 51.02 | 51.70 | 42.47 | 37.48 | 36.55 | 34.66 | 29.89 | |
| Revenue From Contract With Customer Excluding Assessed Tax | 51.89 | 50.63 | 53.30 | 54.09 | 56.68 | 60.09 | 60.83 | 64.46 | 67.45 | 72.23 | 69.11 | 61.34 | 65.70 | 61.73 | 52.14 | 43.22 | 42.90 | 43.81 | 48.05 | 41.86 | 46.16 | 51.02 | 51.70 | 42.47 | 37.48 | 36.55 | 34.66 | 29.89 | |
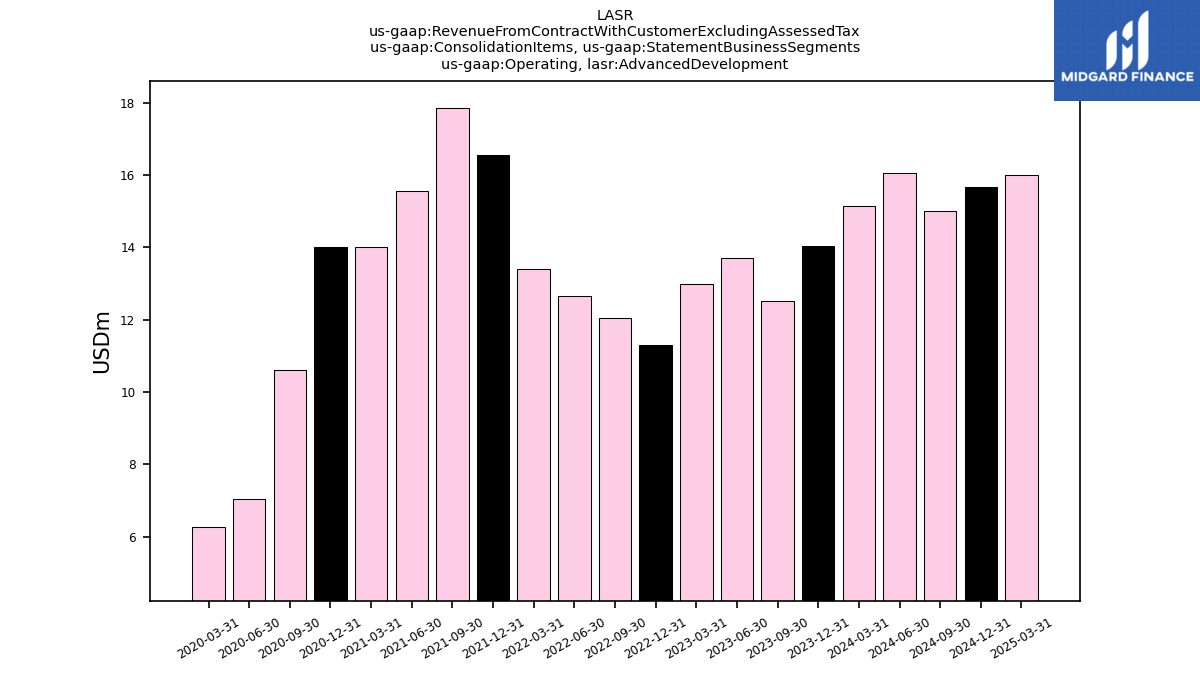
| Operating, Advanced Development | 14.03 | 12.53 | 13.71 | 12.98 | 11.30 | 12.05 | 12.65 | 13.40 | 16.55 | 17.84 | 15.55 | 14.01 | 14.01 | 10.62 | 7.03 | 6.29 | NA | NA | NA | NA | NA | NA | NA | NA | NA | NA | NA | NA | |
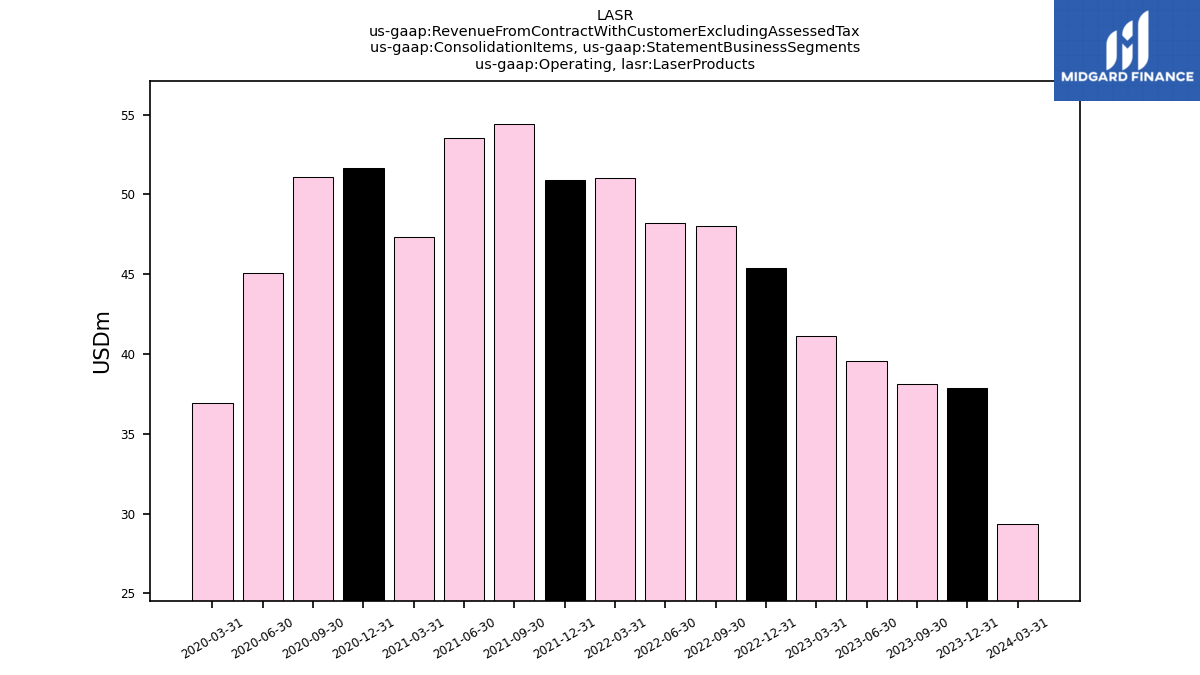
| Operating, Laser Products | 37.86 | 38.10 | 39.59 | 41.11 | 45.38 | 48.04 | 48.18 | 51.06 | 50.91 | 54.39 | 53.56 | 47.34 | 51.69 | 51.12 | 45.10 | 36.93 | NA | NA | NA | NA | NA | NA | NA | NA | NA | NA | NA | NA | |
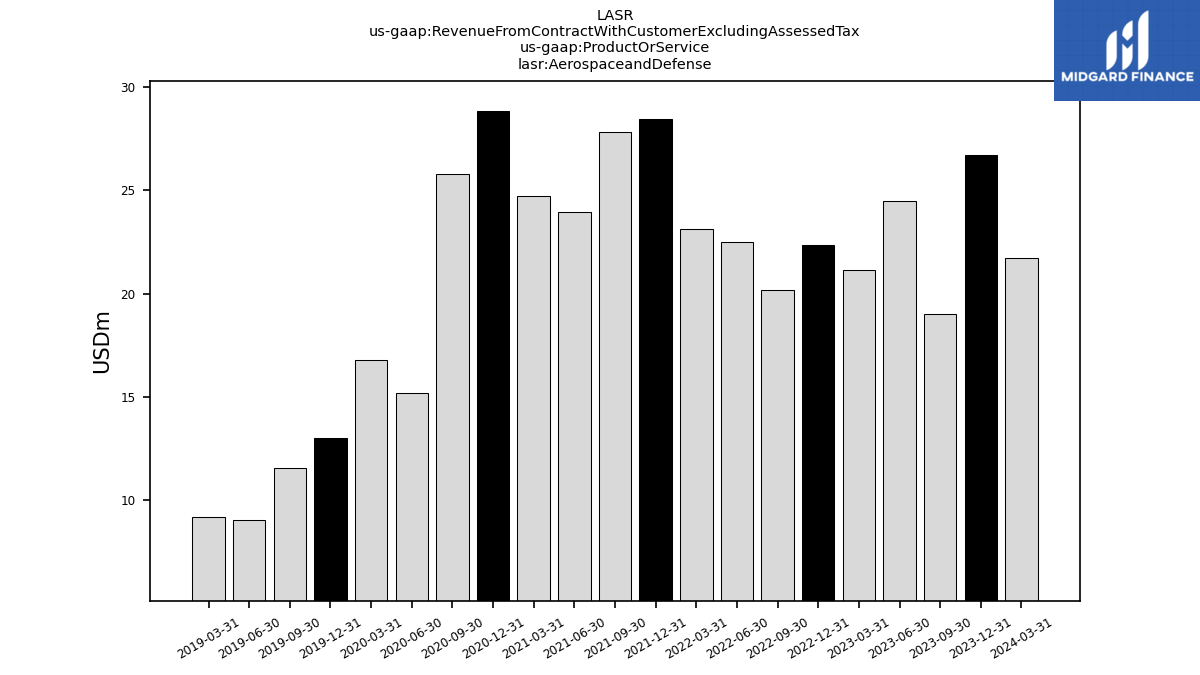
| Aerospaceand Defense | 26.73 | 19.03 | 24.51 | 21.13 | 22.34 | 20.19 | 22.51 | 23.14 | 28.47 | 27.80 | 23.93 | 24.73 | 28.85 | 25.80 | 15.21 | 16.81 | 13.00 | 11.56 | 9.03 | 9.20 | NA | NA | NA | NA | NA | NA | NA | NA | |
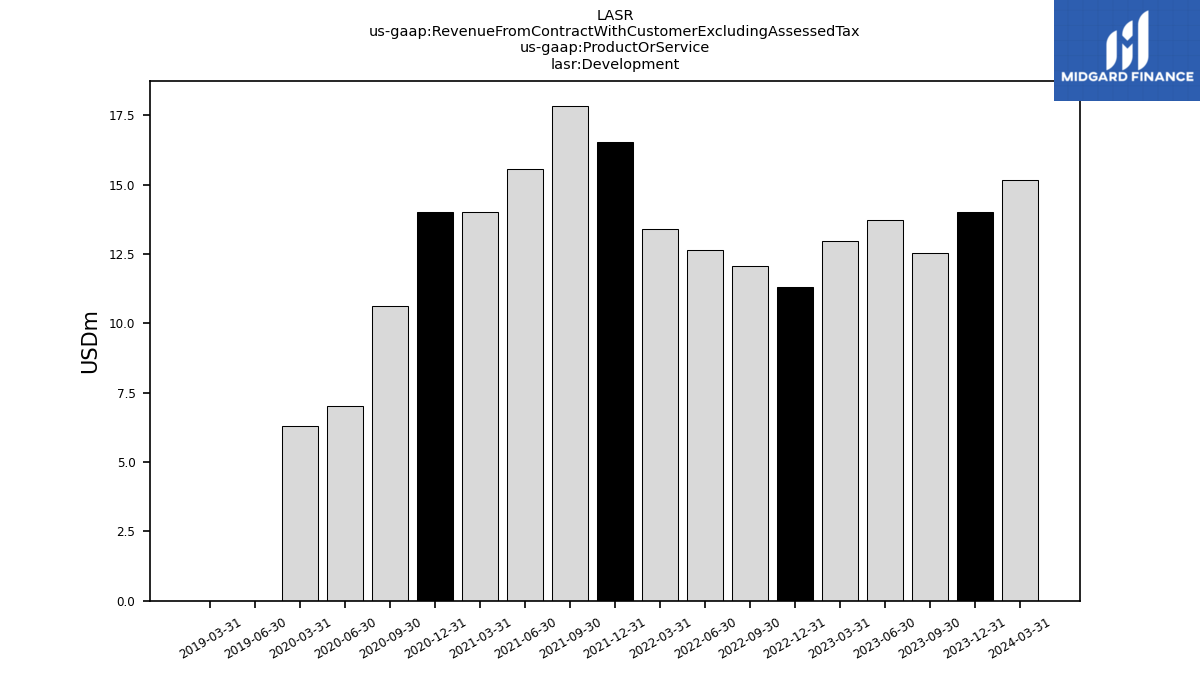
| Development | 14.03 | 12.53 | 13.71 | 12.98 | 11.30 | 12.05 | 12.65 | 13.40 | 16.55 | 17.84 | 15.55 | 14.01 | 14.01 | 10.62 | 7.03 | 6.29 | NA | NA | 0.00 | 0.00 | NA | NA | NA | NA | NA | NA | NA | NA | |
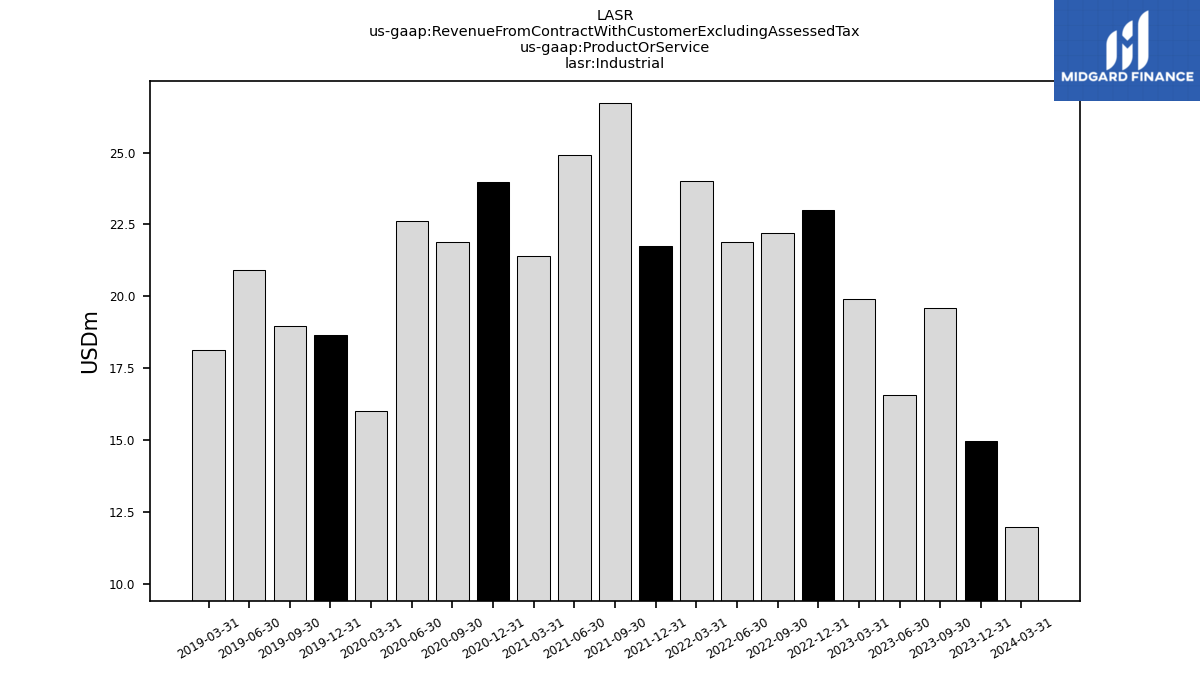
| Industrial | 14.97 | 19.61 | 16.57 | 19.90 | 22.99 | 22.22 | 21.90 | 24.00 | 21.75 | 26.74 | 24.91 | 21.40 | 23.98 | 21.88 | 22.63 | 15.99 | 18.65 | 18.98 | 20.92 | 18.12 | NA | NA | NA | NA | NA | NA | NA | NA | |
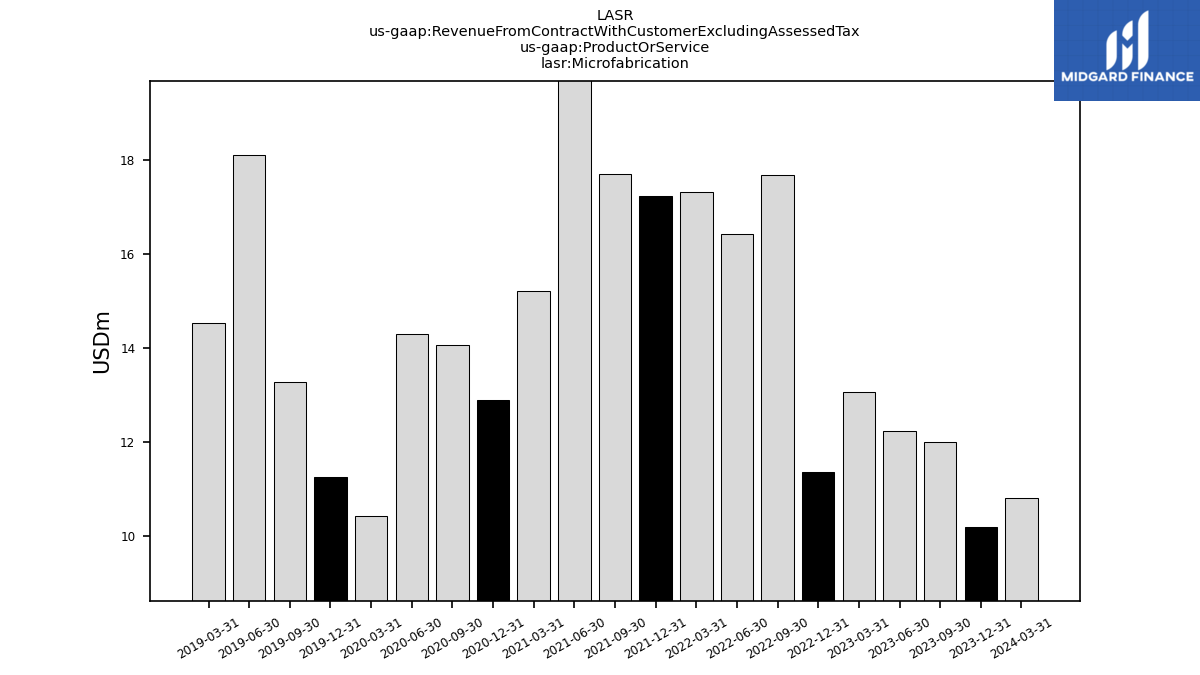
| Microfabrication | 10.20 | 12.00 | 12.23 | 13.06 | 11.35 | 17.68 | 16.41 | 17.32 | 17.23 | 17.70 | 20.27 | 15.21 | 12.88 | 14.05 | 14.30 | 10.42 | 11.25 | 13.28 | 18.09 | 14.53 | NA | NA | NA | NA | NA | NA | NA | NA | |
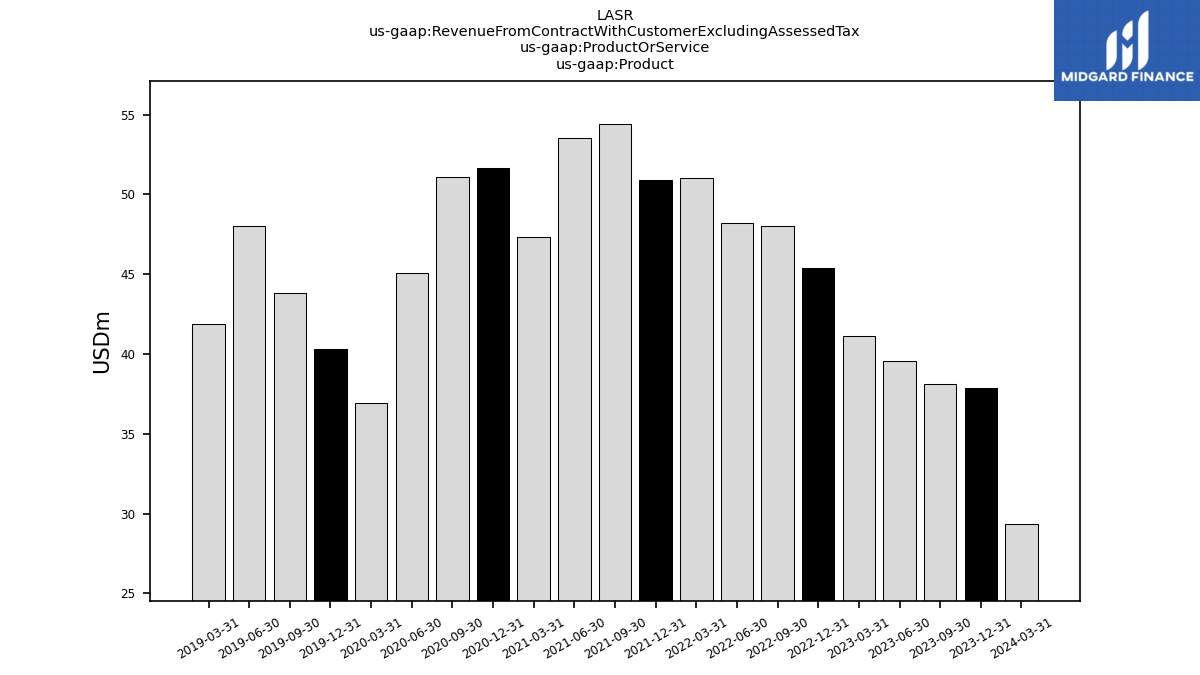
| Product | 37.86 | 38.10 | 39.59 | 41.11 | 45.38 | 48.04 | 48.18 | 51.06 | 50.91 | 54.39 | 53.56 | 47.34 | 51.69 | 51.12 | 45.10 | 36.93 | 40.34 | 43.81 | 48.05 | 41.86 | NA | NA | NA | NA | NA | NA | NA | NA | |
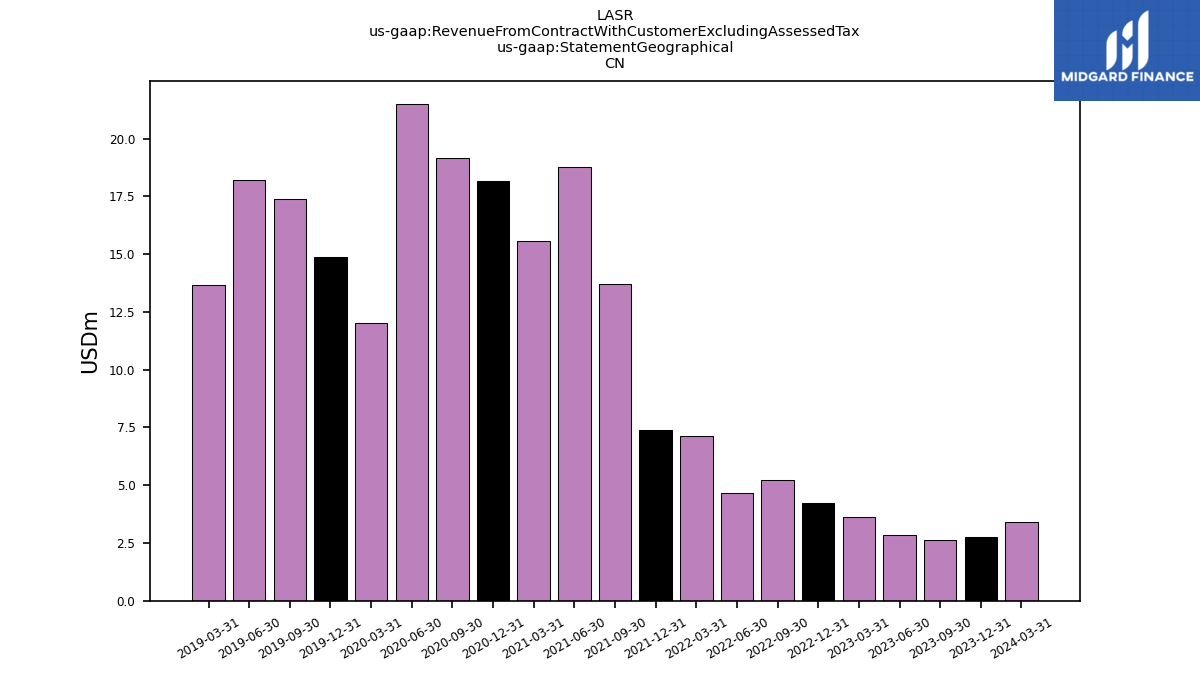
| 2.76 | 2.62 | 2.86 | 3.65 | 4.25 | 5.23 | 4.67 | 7.14 | 7.40 | 13.71 | 18.76 | 15.58 | 18.16 | 19.19 | 21.50 | 12.04 | 14.88 | 17.40 | 18.20 | 13.65 | NA | NA | NA | NA | NA | NA | NA | NA | ||
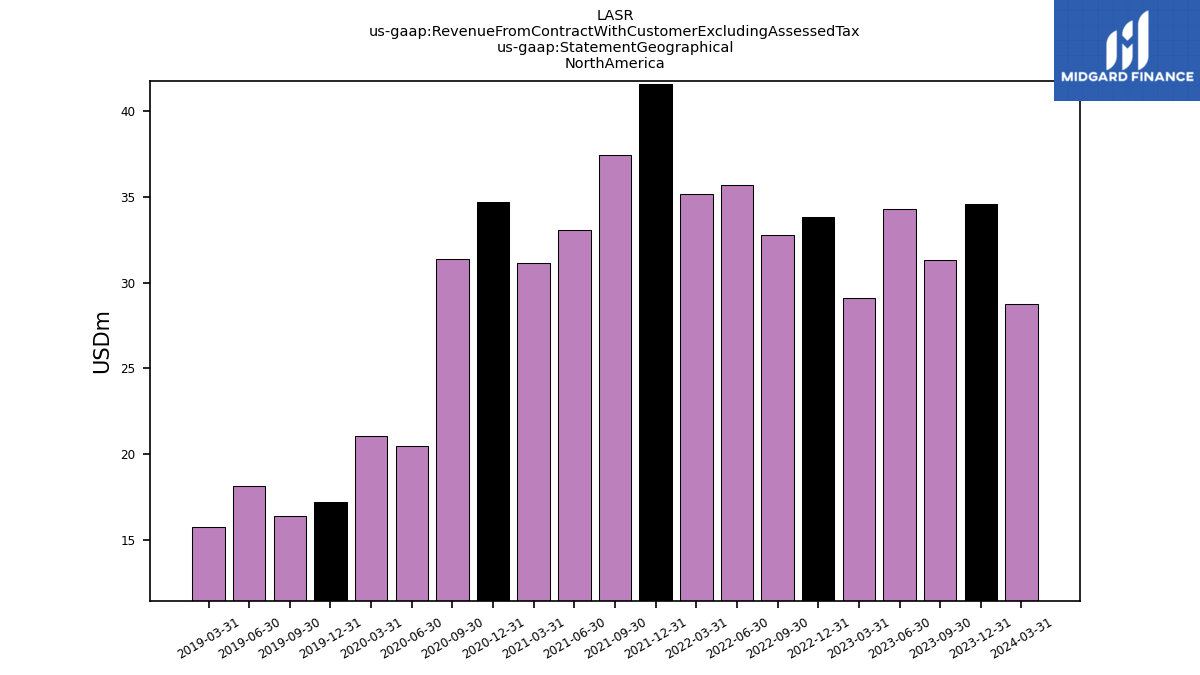
| 34.56 | 31.33 | 34.32 | 29.10 | 33.84 | 32.79 | 35.68 | 35.14 | 41.57 | 37.43 | 33.09 | 31.13 | 34.70 | 31.38 | 20.49 | 21.05 | 17.22 | 16.38 | 18.14 | 15.77 | NA | NA | NA | NA | NA | NA | NA | NA | ||
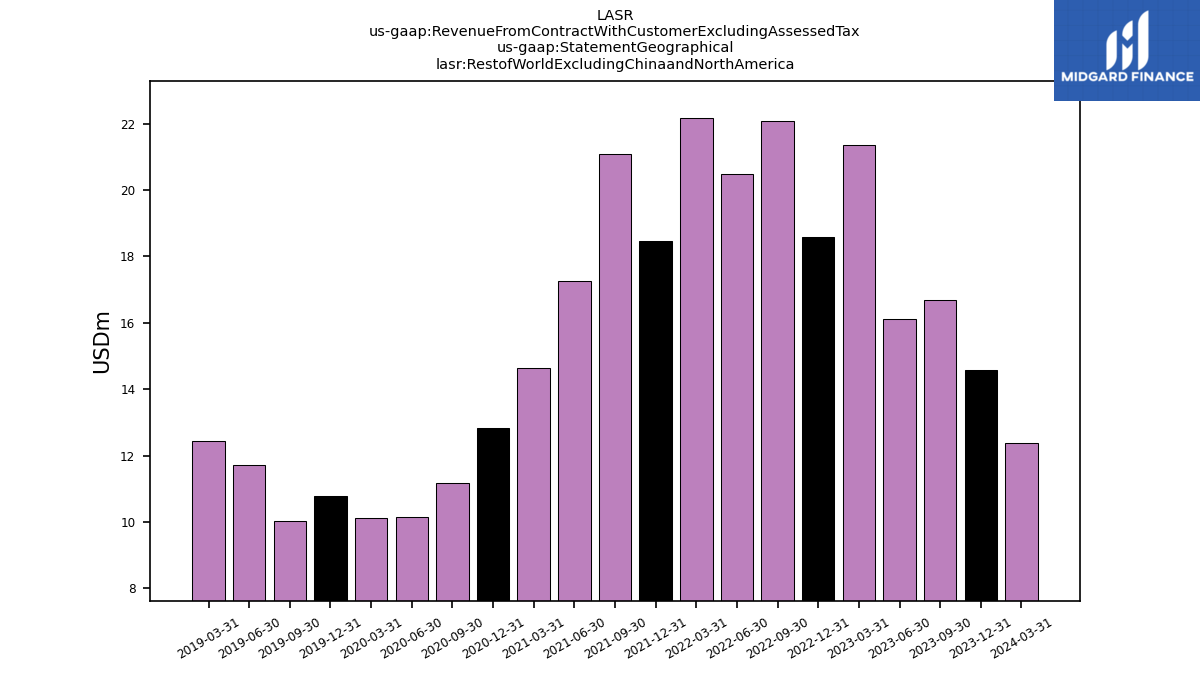
| Restof World Excluding Chinaand North America | 14.57 | 16.68 | 16.12 | 21.34 | 18.60 | 22.07 | 20.47 | 22.18 | 18.48 | 21.10 | 17.26 | 14.63 | 12.85 | 11.16 | 10.15 | 10.13 | 10.80 | 10.04 | 11.71 | 12.44 | NA | NA | NA | NA | NA | NA | NA | NA | |
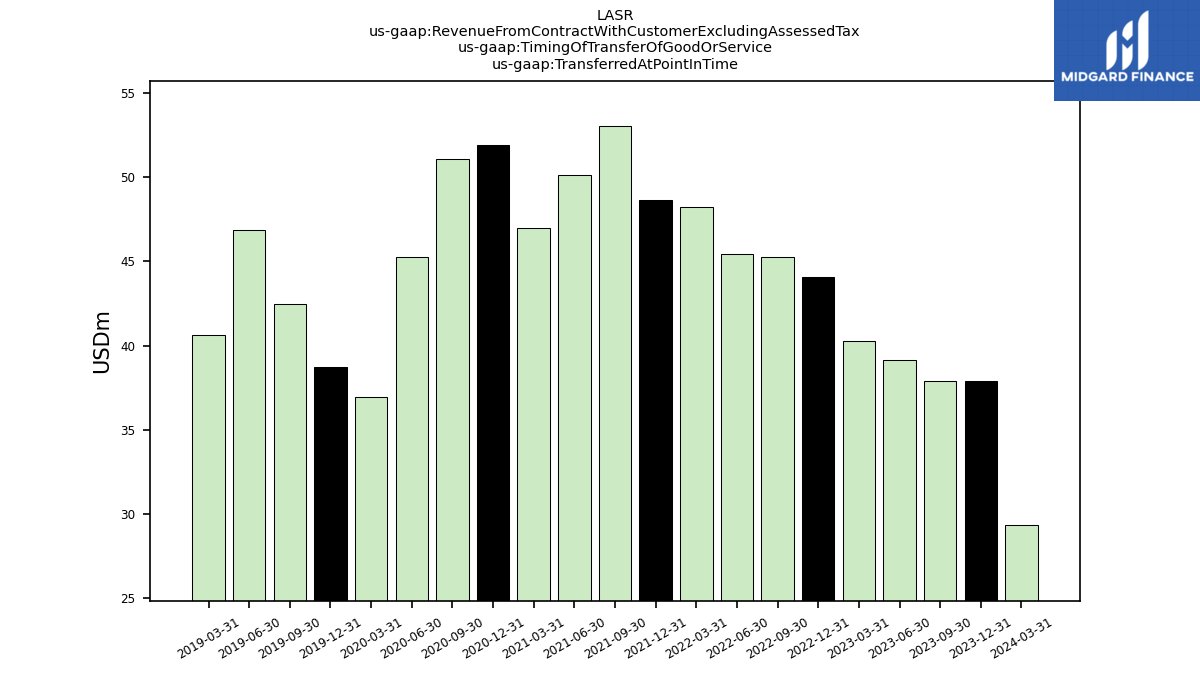
| Transferred At Point In Time | 37.90 | 37.91 | 39.18 | 40.27 | 44.07 | 45.27 | 45.45 | 48.22 | 48.65 | 53.07 | 50.12 | 46.99 | 51.91 | 51.10 | 45.27 | 36.93 | 38.75 | 42.46 | 46.89 | 40.61 | NA | NA | NA | NA | NA | NA | NA | NA | |
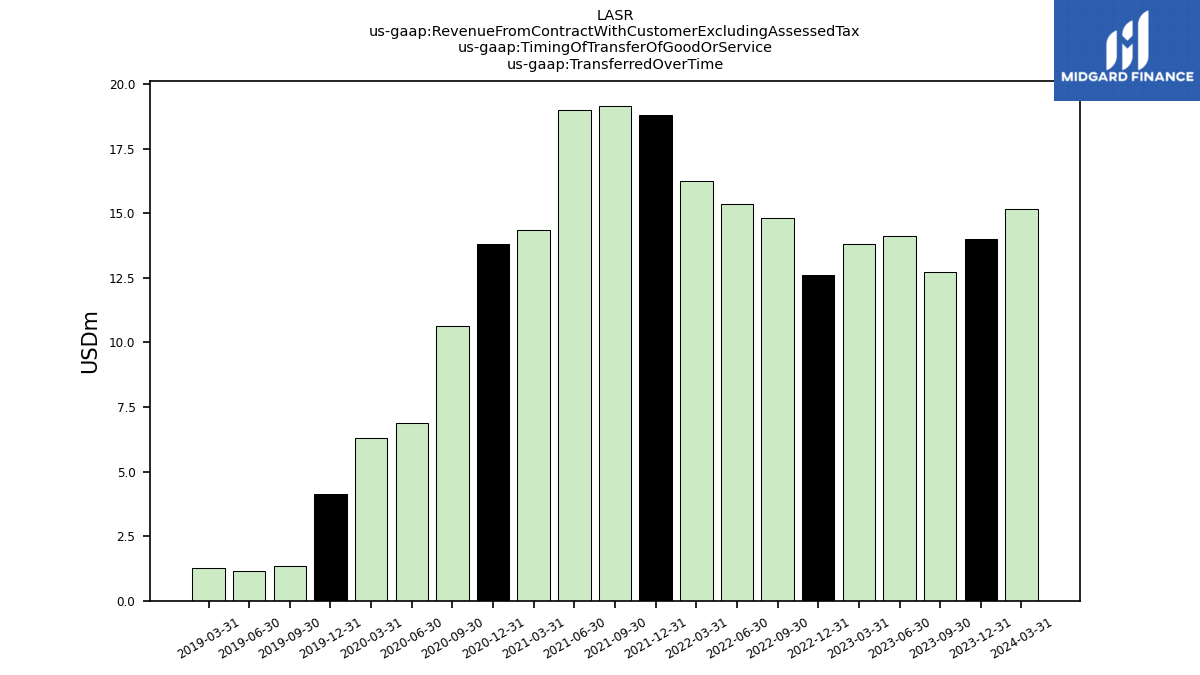
| Transferred Over Time | 13.99 | 12.72 | 14.13 | 13.82 | 12.61 | 14.82 | 15.38 | 16.24 | 18.80 | 19.16 | 18.99 | 14.35 | 13.79 | 10.63 | 6.87 | 6.29 | 4.15 | 1.36 | 1.16 | 1.25 | NA | NA | NA | NA | NA | NA | NA | NA |