

| 2023-12-31 | 2023-09-30 | 2023-06-30 | 2023-03-31 | 2022-12-31 | 2022-09-30 | 2022-06-30 | 2022-03-31 | 2021-12-31 | 2021-09-30 | 2021-06-30 | 2021-03-31 | 2020-12-31 | 2020-09-30 | 2020-06-30 | 2020-03-31 | 2019-12-31 | 2019-09-30 | 2019-06-30 | 2019-03-31 | 2018-12-31 | 2018-09-30 | 2018-06-30 | 2018-03-31 | 2017-12-31 | 2017-09-30 | 2017-06-30 | 2017-03-31 | ||
|---|---|---|---|---|---|---|---|---|---|---|---|---|---|---|---|---|---|---|---|---|---|---|---|---|---|---|---|---|---|
| Common Stock Value | 1.00 | NA | NA | NA | 1.00 | 1.00 | 1.00 | 1.00 | 1.00 | 1.00 | 1.00 | 1.00 | 1.00 | 1.00 | 1.00 | 1.00 | 1.00 | 1.00 | 1.00 | 1.00 | 1.00 | 0.03 | NA | NA | 0.03 | 0.03 | 0.03 | NA | |
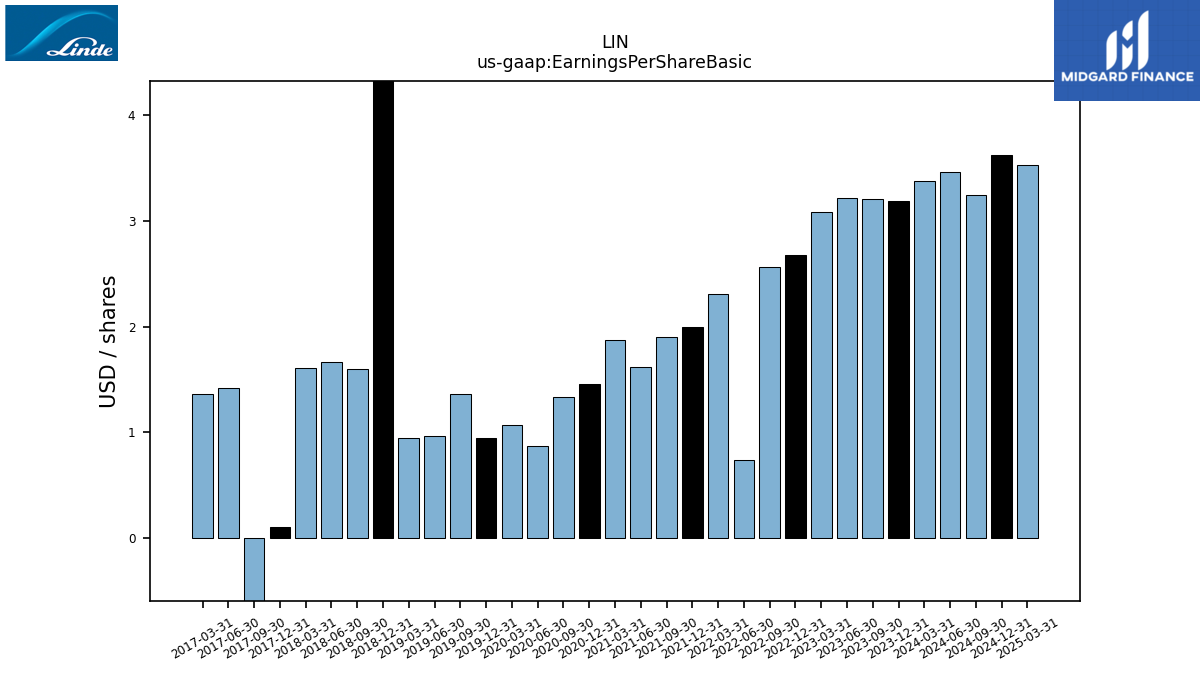
| Earnings Per Share Basic | 3.19 | 3.21 | 3.22 | 3.08 | 2.68 | 2.56 | 0.74 | 2.31 | 2.00 | 1.90 | 1.62 | 1.87 | 1.46 | 1.33 | 0.87 | 1.07 | 0.95 | 1.36 | 0.97 | 0.95 | 8.39 | 1.60 | 1.67 | 1.61 | 0.11 | -11.63 | 1.42 | 1.36 | |
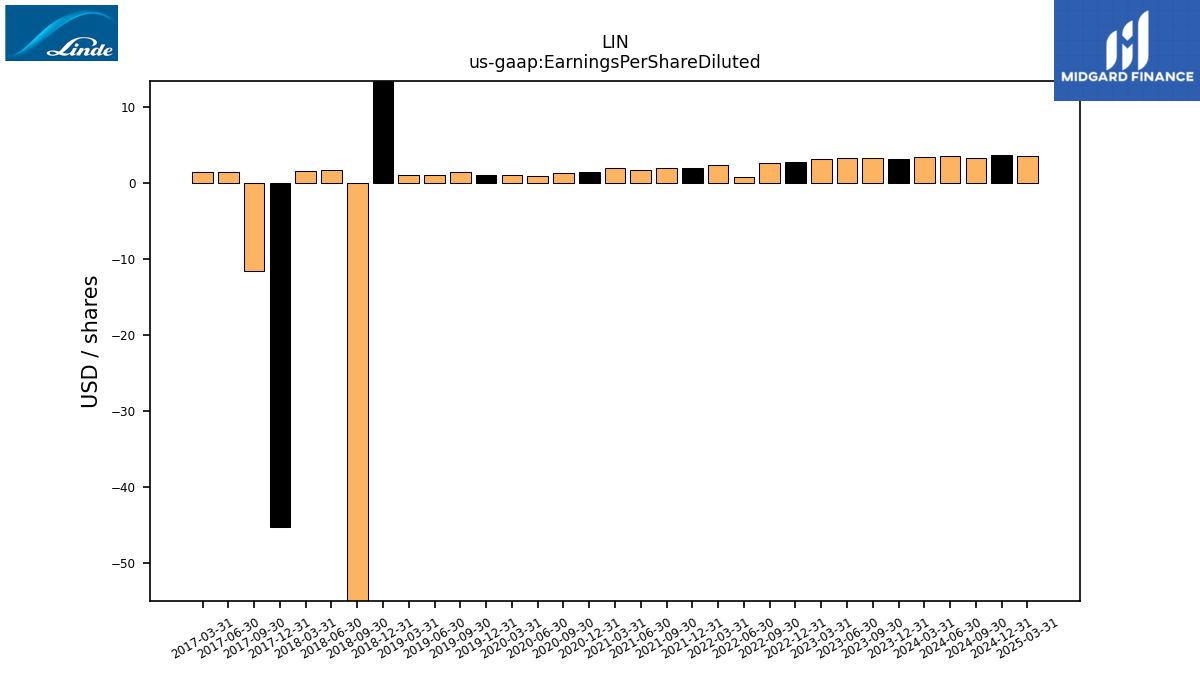
| Earnings Per Share Diluted | 3.16 | 3.19 | 3.19 | 3.06 | 2.66 | 2.54 | 0.74 | 2.30 | 1.98 | 1.88 | 1.60 | 1.86 | 1.45 | 1.32 | 0.87 | 1.07 | 0.94 | 1.35 | 0.96 | 0.94 | 388.99 | -182.16 | 1.65 | 1.59 | -45.17 | -11.63 | 1.41 | 1.35 |
| 2023-12-31 | 2023-09-30 | 2023-06-30 | 2023-03-31 | 2022-12-31 | 2022-09-30 | 2022-06-30 | 2022-03-31 | 2021-12-31 | 2021-09-30 | 2021-06-30 | 2021-03-31 | 2020-12-31 | 2020-09-30 | 2020-06-30 | 2020-03-31 | 2019-12-31 | 2019-09-30 | 2019-06-30 | 2019-03-31 | 2018-12-31 | 2018-09-30 | 2018-06-30 | 2018-03-31 | 2017-12-31 | 2017-09-30 | 2017-06-30 | 2017-03-31 | ||
|---|---|---|---|---|---|---|---|---|---|---|---|---|---|---|---|---|---|---|---|---|---|---|---|---|---|---|---|---|---|
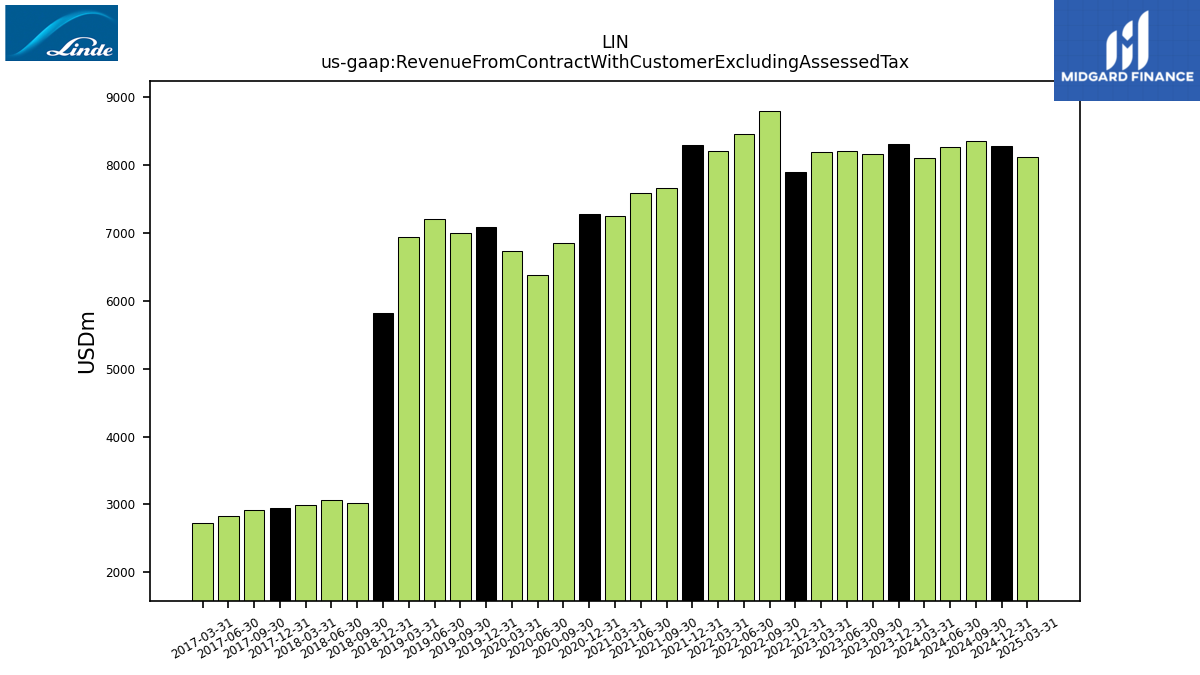
| Revenue From Contract With Customer Excluding Assessed Tax | 8302.00 | 8155.00 | 8204.00 | 8193.00 | 7899.00 | 8797.00 | 8457.00 | 8211.00 | 8298.00 | 7668.00 | 7584.00 | 7243.00 | 7272.00 | 6855.00 | 6377.00 | 6739.00 | 7080.00 | 7000.00 | 7204.00 | 6944.00 | 5816.00 | 3024.00 | 3061.00 | 2999.00 | 2953.00 | 2922.00 | 2834.00 | 2728.00 | |
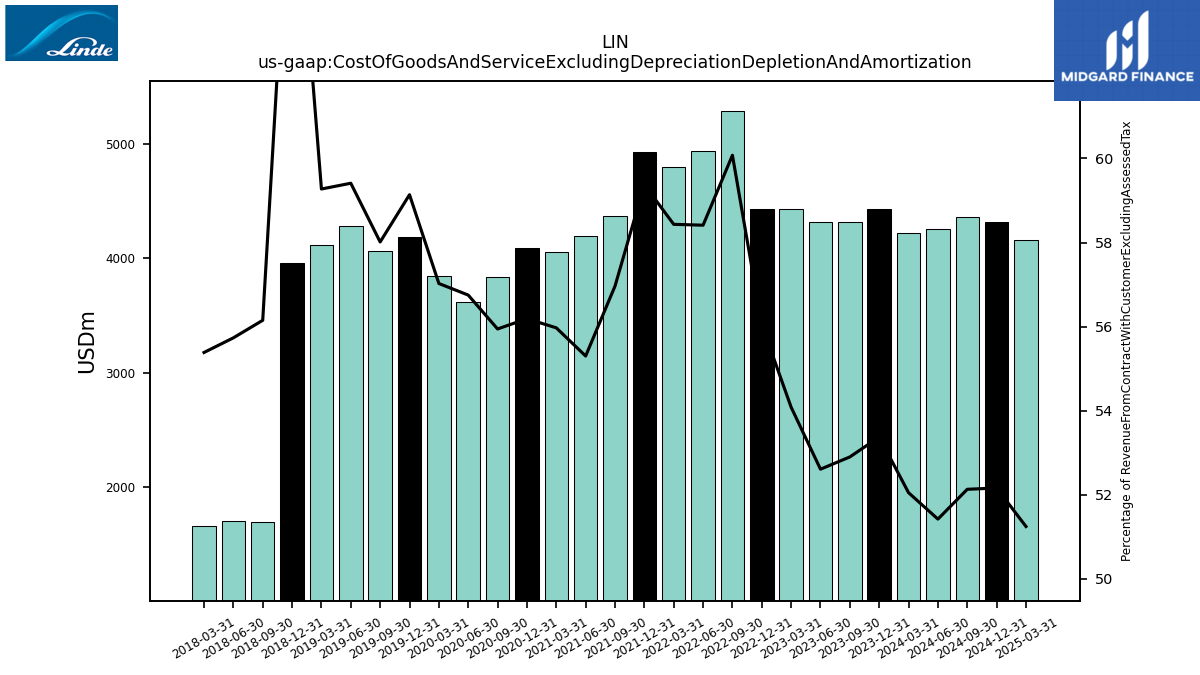
| Cost Of Goods And Service Excluding Depreciation Depletion And Amortization | 4431.00 | 4314.00 | 4316.00 | 4431.00 | 4427.00 | 5285.00 | 4940.00 | 4798.00 | 4927.00 | 4368.00 | 4194.00 | 4054.00 | 4086.00 | 3835.00 | 3619.00 | 3843.00 | 4187.00 | 4061.00 | 4280.00 | 4116.00 | 3955.00 | 1698.00 | 1706.00 | 1661.00 | NA | NA | NA | NA | |
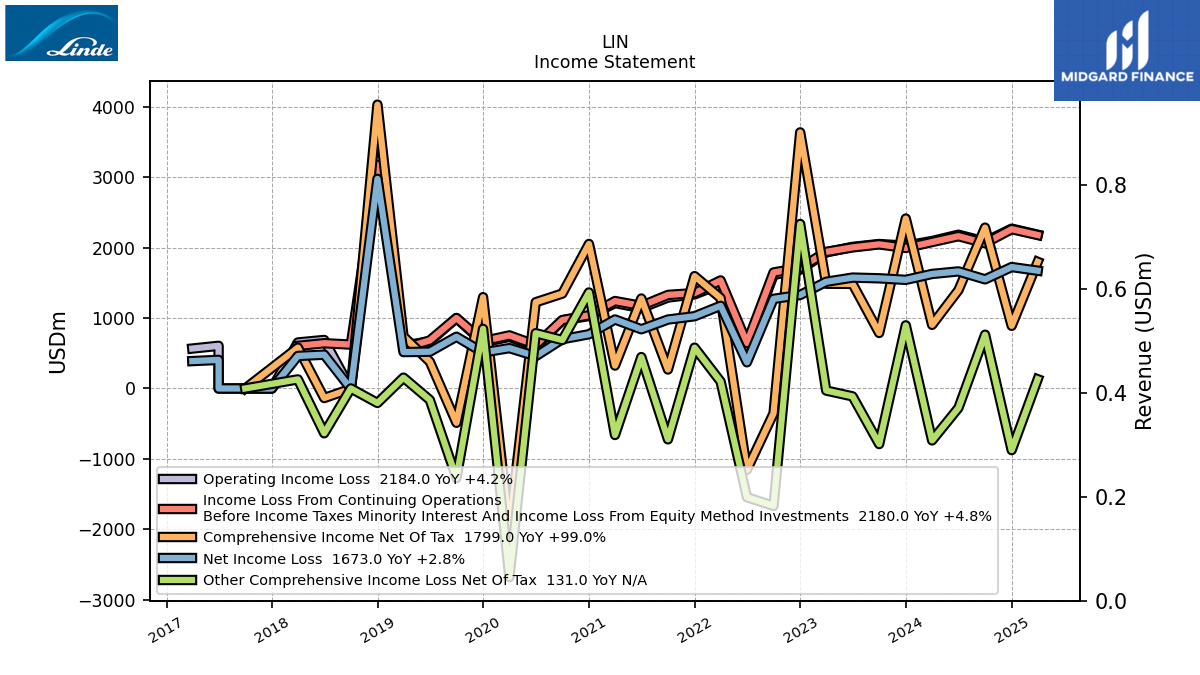
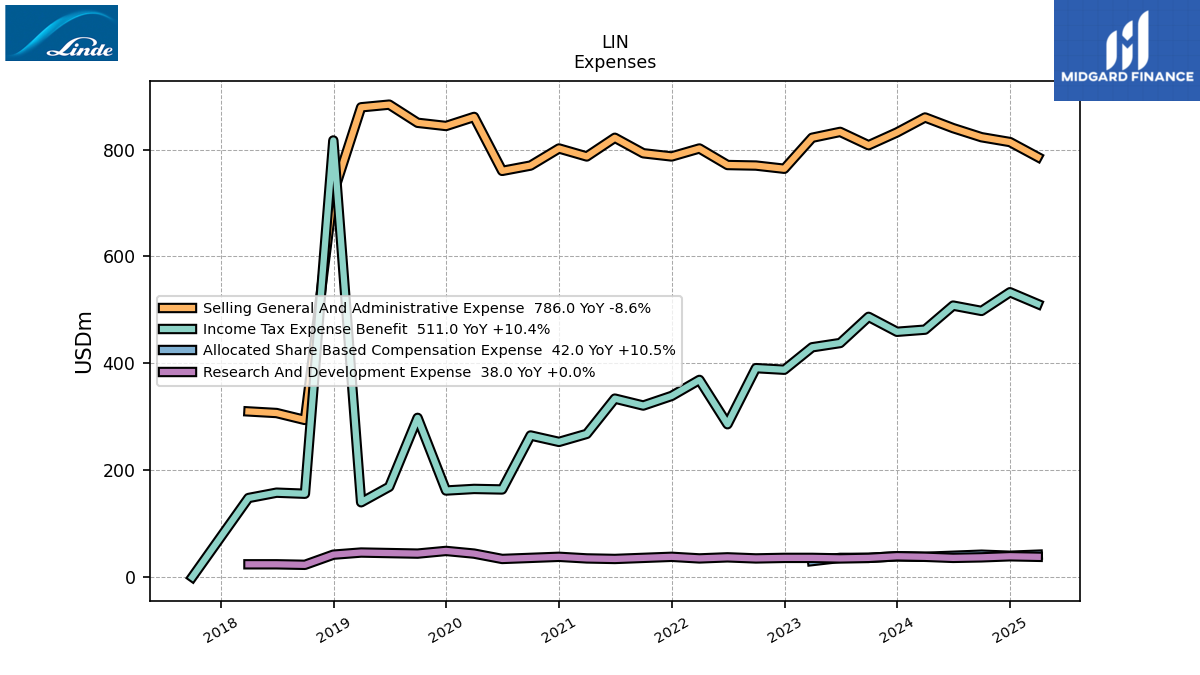
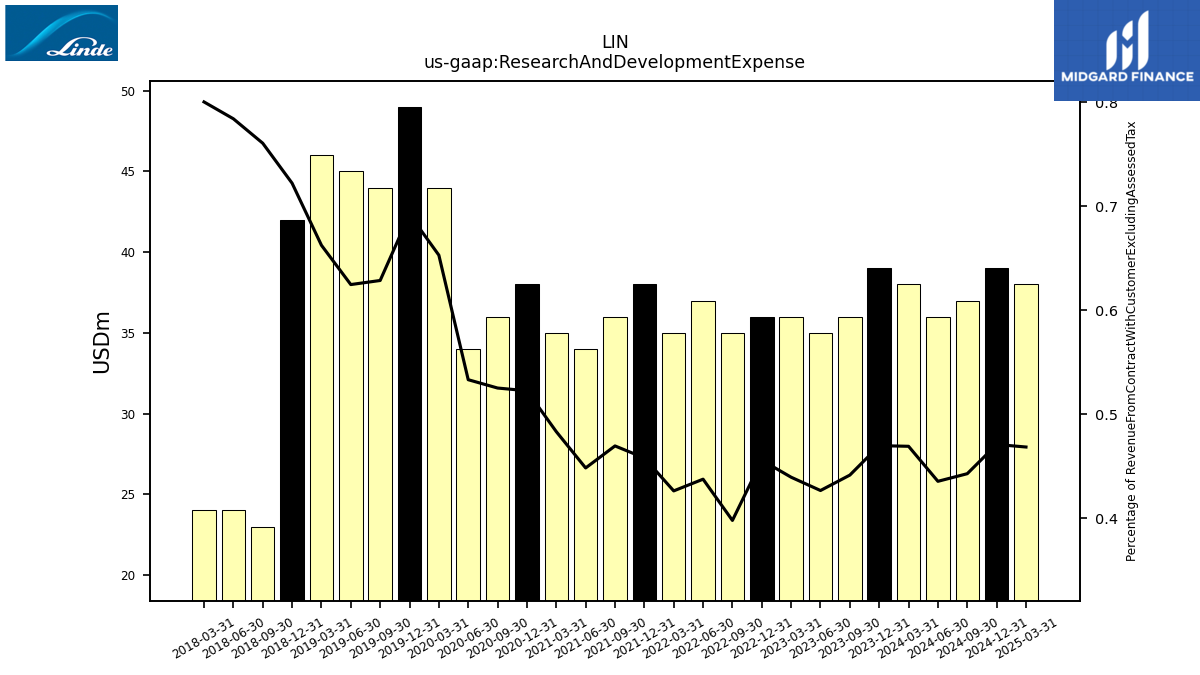
| Research And Development Expense | 39.00 | 36.00 | 35.00 | 36.00 | 36.00 | 35.00 | 37.00 | 35.00 | 38.00 | 36.00 | 34.00 | 35.00 | 38.00 | 36.00 | 34.00 | 44.00 | 49.00 | 44.00 | 45.00 | 46.00 | 42.00 | 23.00 | 24.00 | 24.00 | NA | NA | NA | NA | |
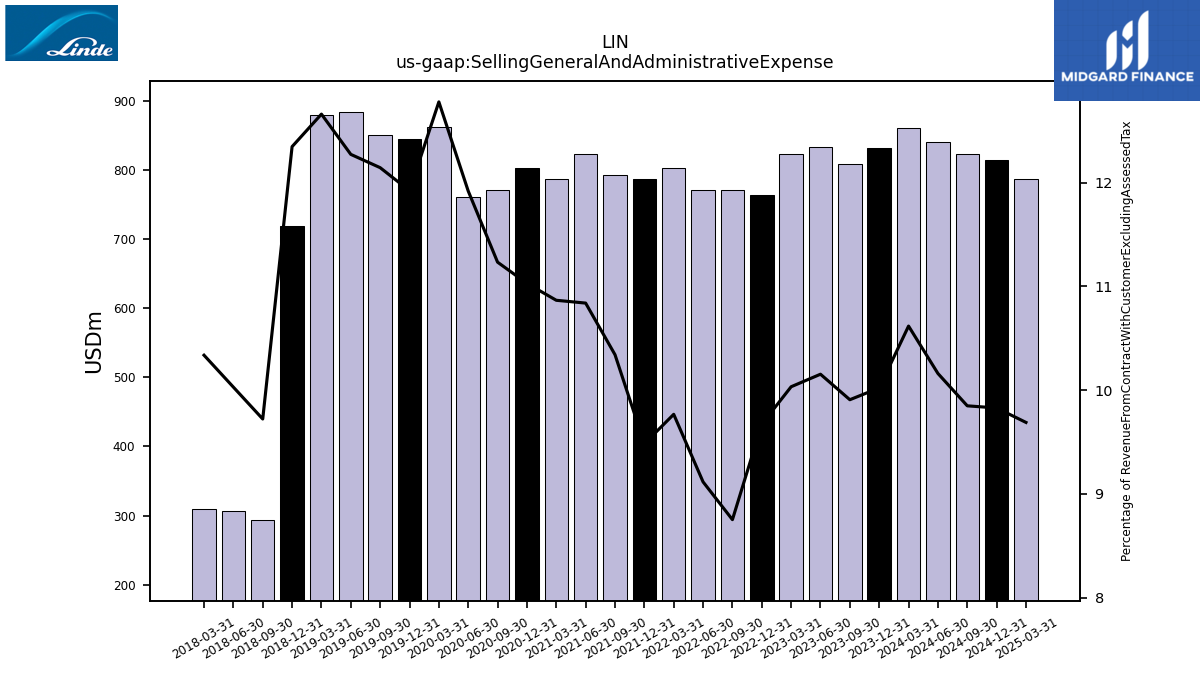
| Selling General And Administrative Expense | 832.00 | 808.00 | 833.00 | 822.00 | 764.00 | 770.00 | 771.00 | 802.00 | 787.00 | 793.00 | 822.00 | 787.00 | 802.00 | 770.00 | 760.00 | 861.00 | 844.00 | 850.00 | 884.00 | 879.00 | 718.00 | 294.00 | 307.00 | 310.00 | NA | NA | NA | NA | |
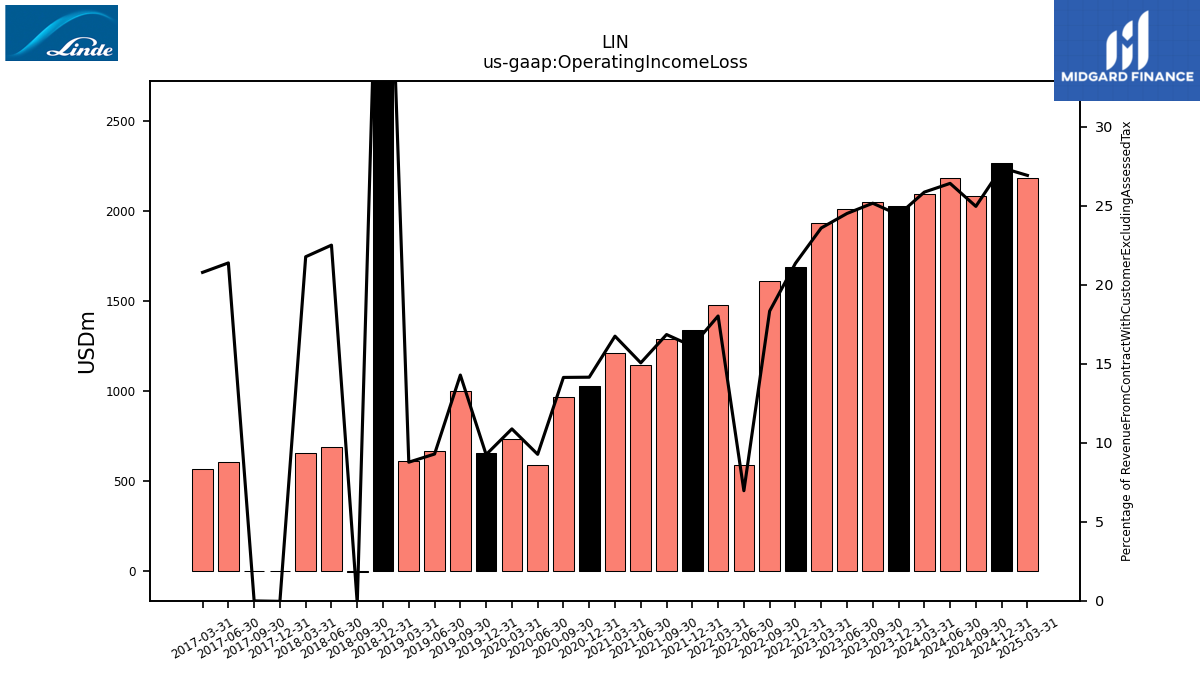
| Operating Income Loss | 2028.00 | 2052.00 | 2011.00 | 1933.00 | 1687.00 | 1613.00 | 589.00 | 1480.00 | 1337.00 | 1292.00 | 1142.00 | 1213.00 | 1029.00 | 969.00 | 591.00 | 733.00 | 655.00 | 1000.00 | 669.00 | 609.00 | 3236.00 | -4.55 | 689.00 | 653.00 | -1.13 | -0.29 | 606.00 | 567.00 | |
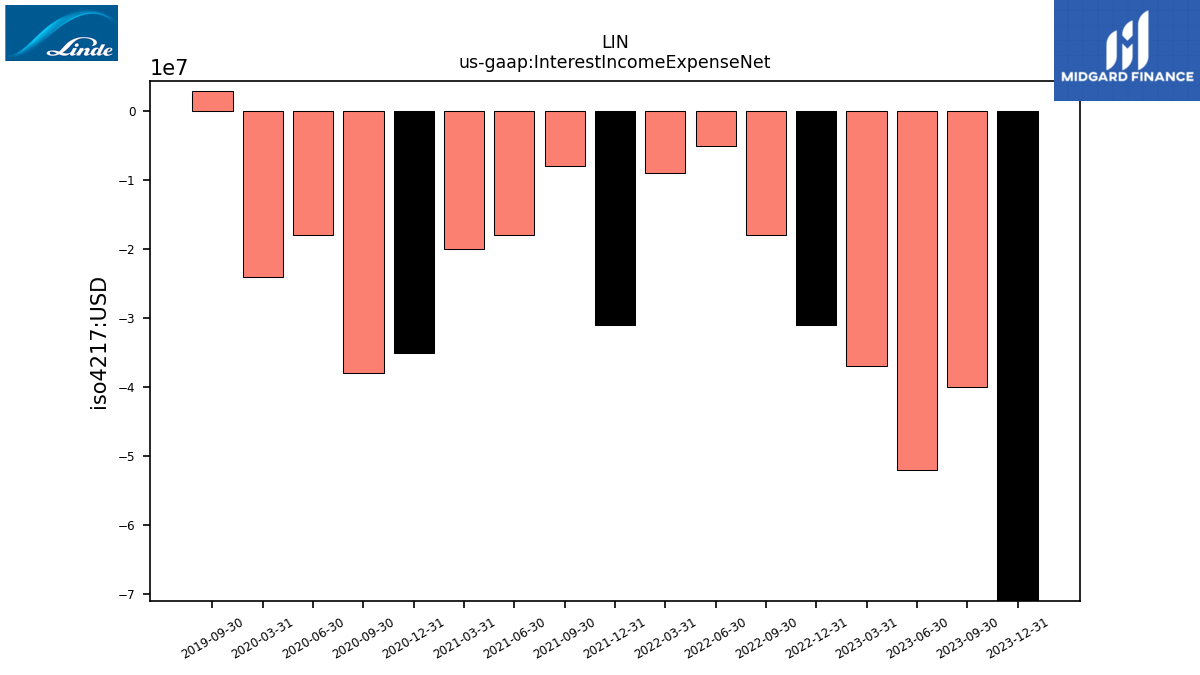
| Interest Income Expense Net | -71.00 | -40.00 | -52.00 | -37.00 | -31.00 | -18.00 | -5.00 | -9.00 | -31.00 | -8.00 | -18.00 | -20.00 | -35.00 | -38.00 | -18.00 | -24.00 | NA | 3.00 | NA | NA | NA | NA | NA | NA | NA | NA | NA | NA | |
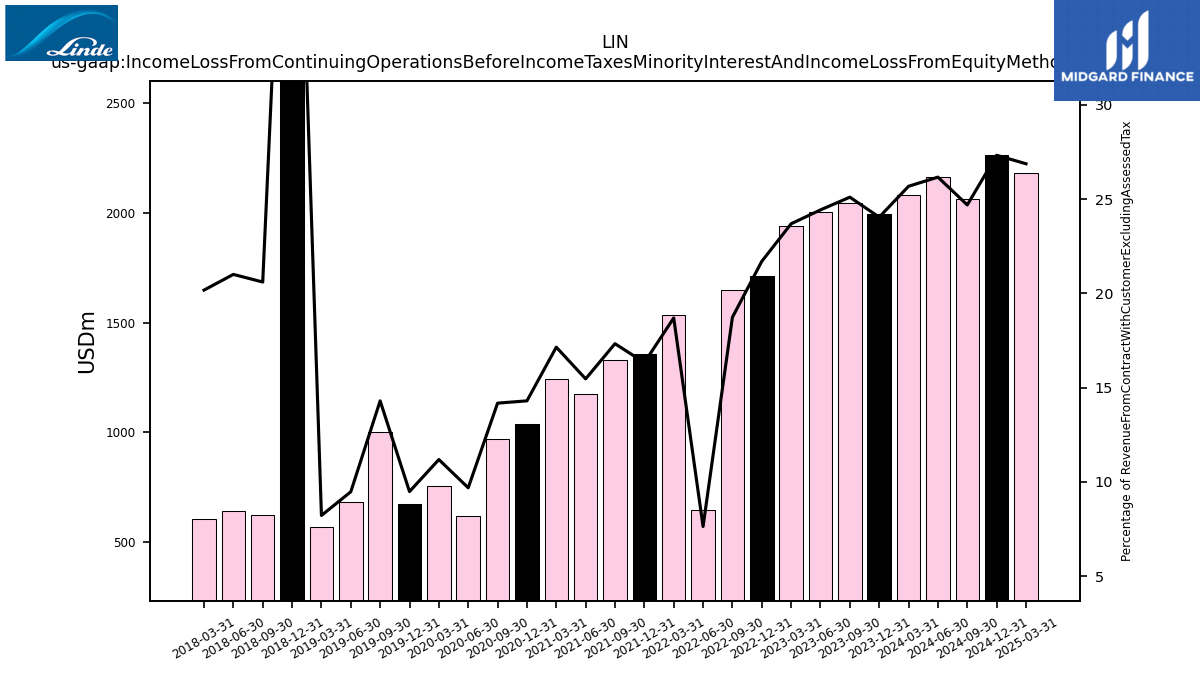
| Income Loss From Continuing Operations Before Income Taxes Minority Interest And Income Loss From Equity Method Investments | 1996.00 | 2047.00 | 2004.00 | 1941.00 | 1714.00 | 1648.00 | 646.00 | 1535.00 | 1355.00 | 1329.00 | 1173.00 | 1242.00 | 1040.00 | 972.00 | 618.00 | 754.00 | 672.00 | 1001.00 | 683.00 | 571.00 | 3178.00 | 623.00 | 643.00 | 605.00 | NA | NA | NA | NA | |
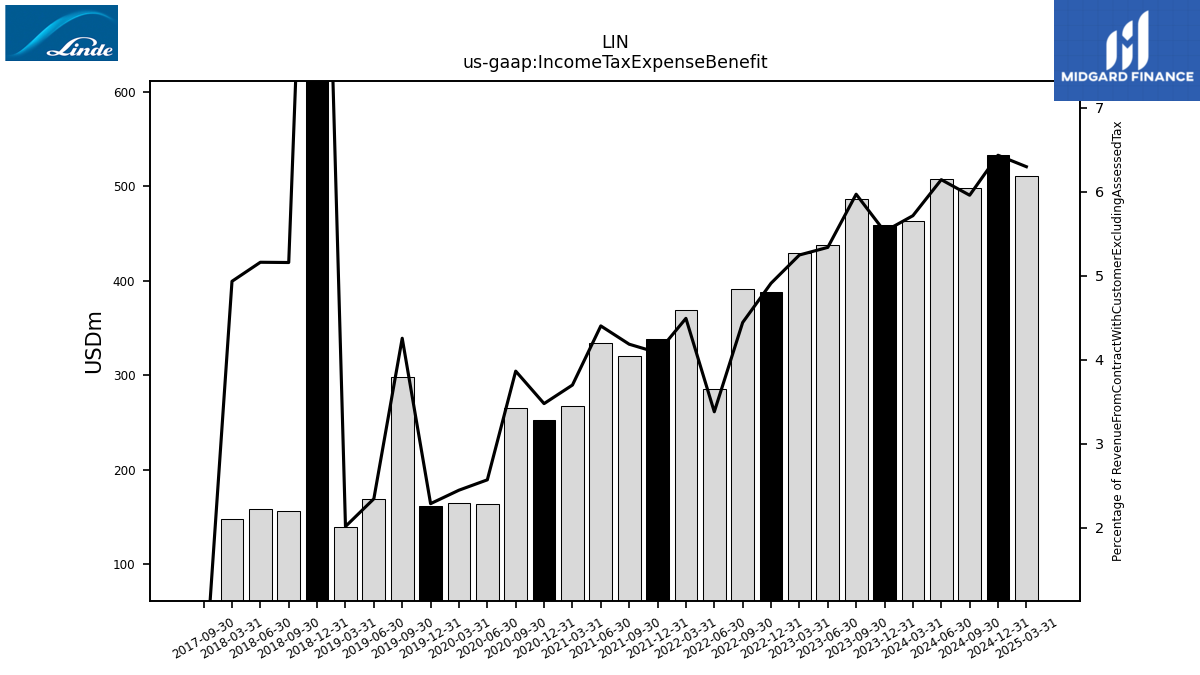
| Income Tax Expense Benefit | 459.00 | 487.00 | 438.00 | 430.00 | 388.00 | 391.00 | 286.00 | 369.00 | 339.00 | 321.00 | 334.00 | 268.00 | 253.00 | 265.00 | 164.00 | 165.00 | 162.00 | 298.00 | 169.00 | 140.00 | 817.00 | 156.00 | 158.00 | 148.00 | NA | 0.00 | NA | NA | |
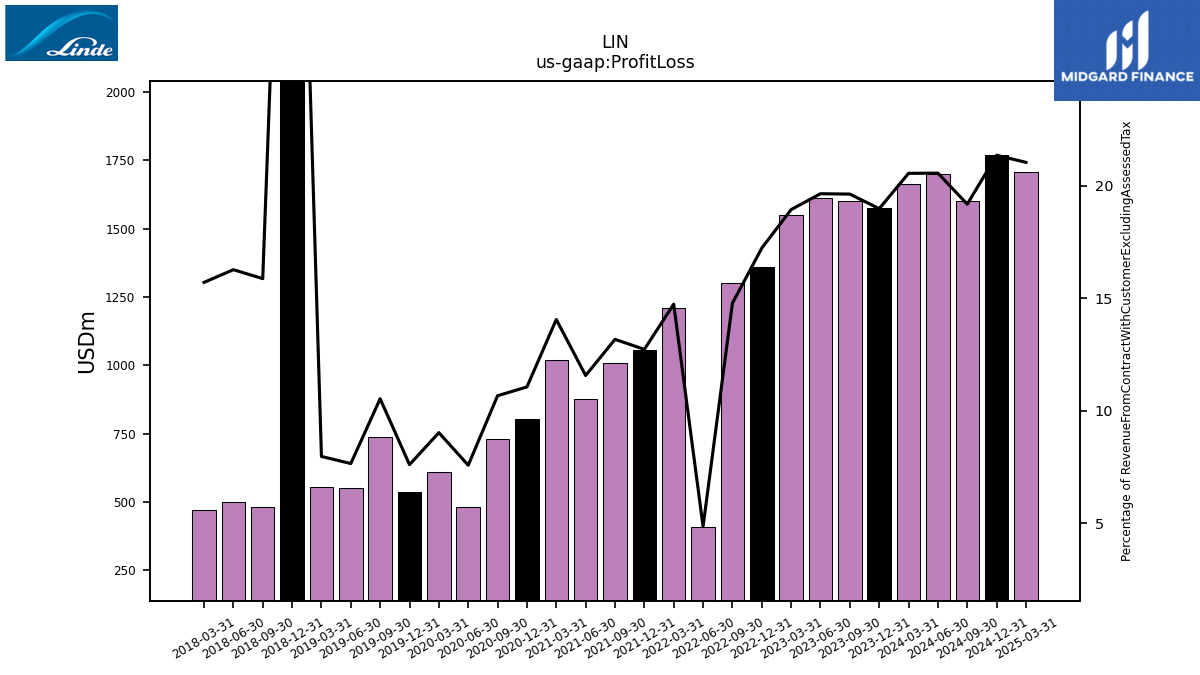
| Profit Loss | 1576.00 | 1601.00 | 1612.00 | 1552.00 | 1361.00 | 1300.00 | 410.00 | 1210.00 | 1056.00 | 1010.00 | 877.00 | 1018.00 | 804.00 | 731.00 | 483.00 | 608.00 | 538.00 | 737.00 | 551.00 | 553.00 | 2953.00 | 480.00 | 498.00 | 471.00 | NA | NA | NA | NA | |
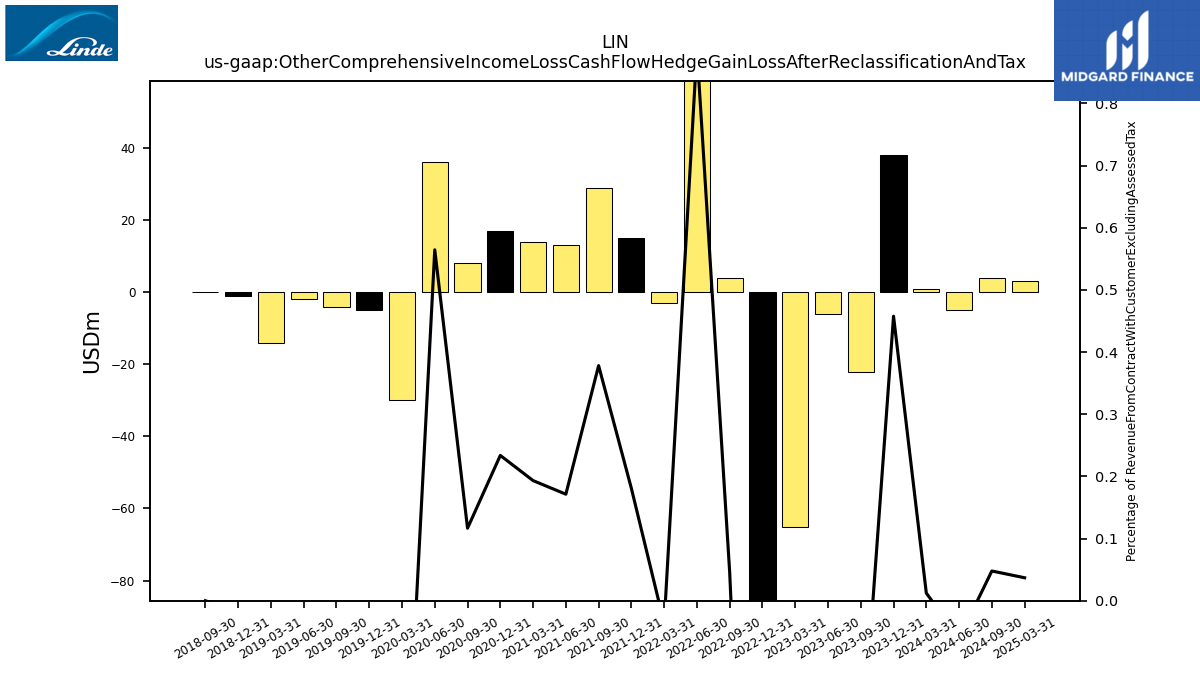
| Other Comprehensive Income Loss Cash Flow Hedge Gain Loss After Reclassification And Tax | 38.00 | -22.00 | -6.00 | -65.00 | -89.00 | 4.00 | 75.00 | -3.00 | 15.00 | 29.00 | 13.00 | 14.00 | 17.00 | 8.00 | 36.00 | -30.00 | -5.00 | -4.00 | -2.00 | -14.00 | -1.00 | 0.00 | NA | NA | NA | NA | NA | NA | |
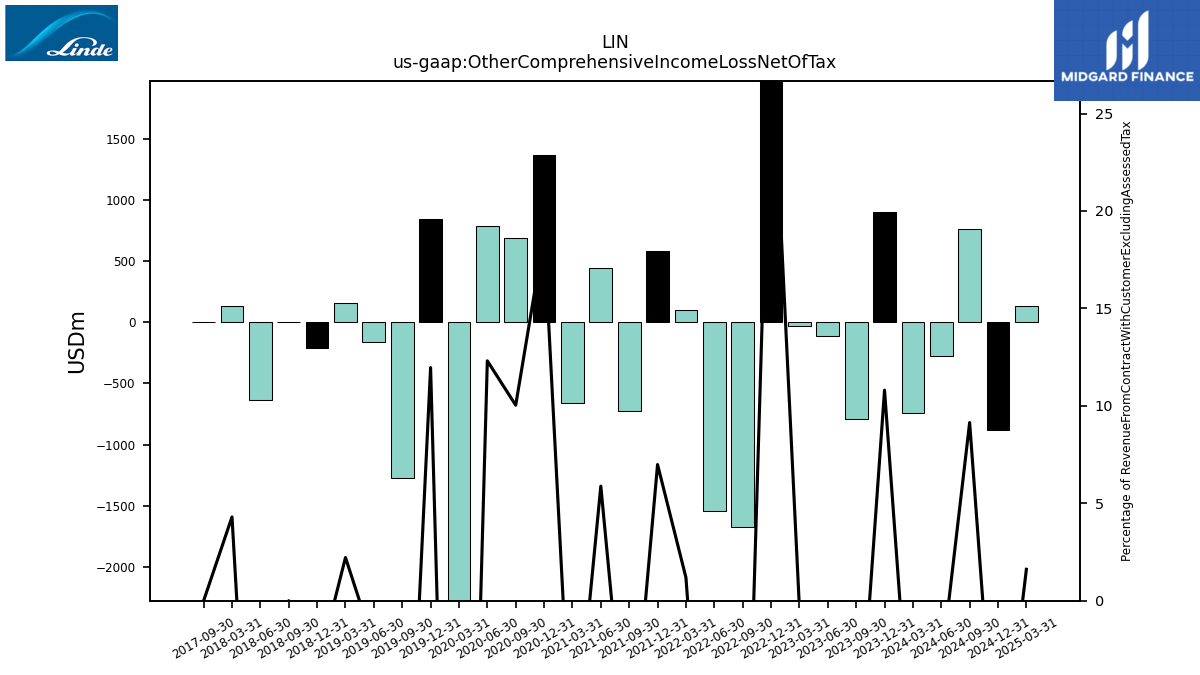
| Other Comprehensive Income Loss Net Of Tax | 897.00 | -790.00 | -112.00 | -30.00 | 2337.00 | -1668.00 | -1545.00 | 98.00 | 580.00 | -723.00 | 446.00 | -661.00 | 1364.00 | 688.00 | 785.00 | -2680.00 | 847.00 | -1273.00 | -163.00 | 154.00 | -206.18 | 0.06 | -637.00 | 129.00 | NA | -0.02 | NA | NA | |
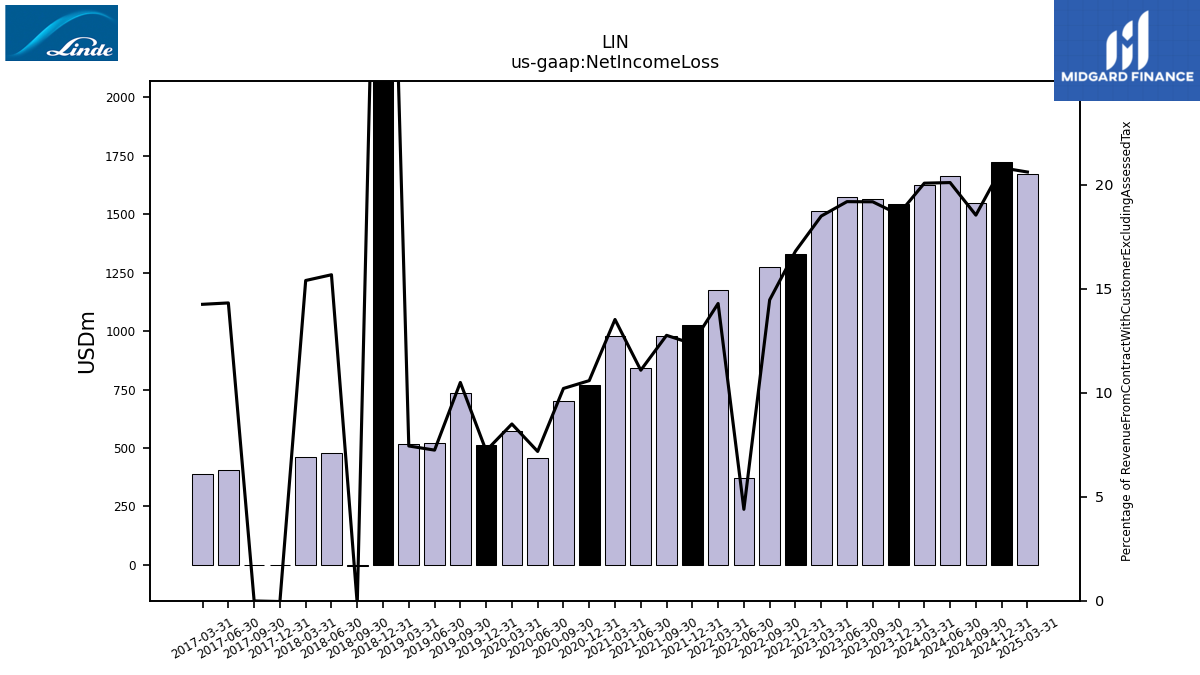
| Net Income Loss | 1543.00 | 1565.00 | 1575.00 | 1516.00 | 1328.00 | 1273.00 | 372.00 | 1174.00 | 1026.00 | 979.00 | 841.00 | 980.00 | 770.00 | 700.00 | 458.00 | 573.00 | 511.00 | 735.00 | 522.00 | 517.00 | 2978.00 | -4.55 | 480.00 | 462.00 | -1.13 | -0.29 | 406.00 | 389.00 | |
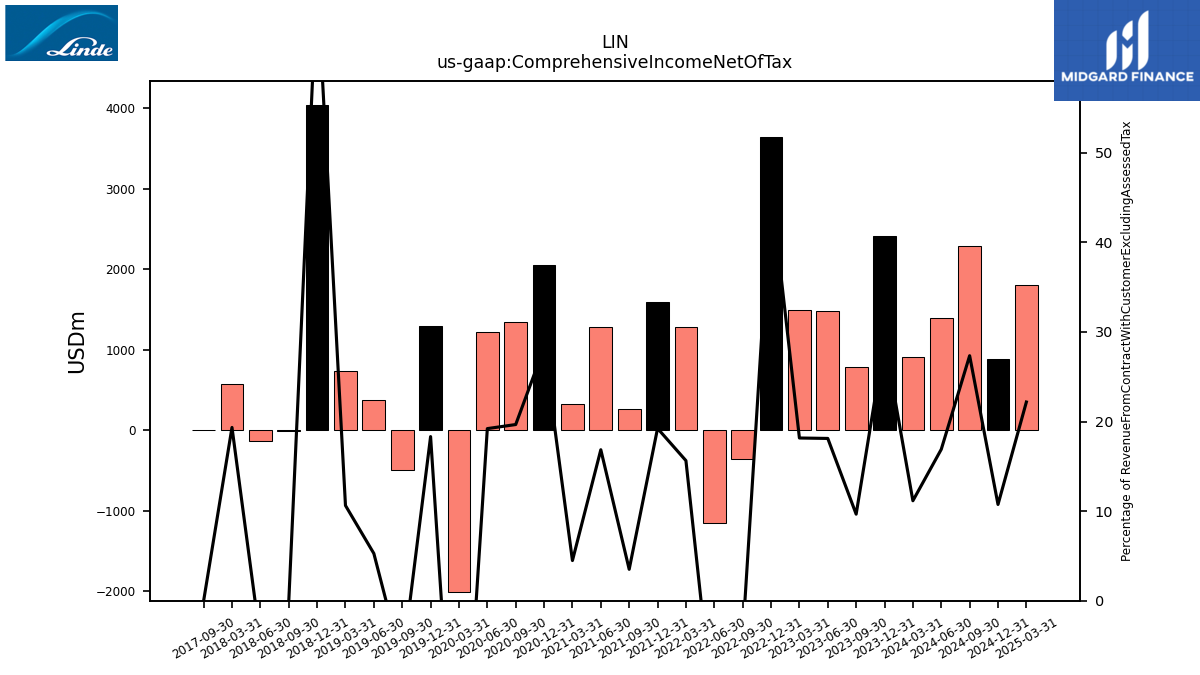
| Comprehensive Income Net Of Tax | 2414.00 | 788.00 | 1486.00 | 1488.00 | 3638.00 | -353.00 | -1156.00 | 1284.00 | 1596.00 | 269.00 | 1278.00 | 325.00 | 2053.00 | 1348.00 | 1225.00 | -2001.00 | 1297.00 | -488.00 | 380.00 | 738.00 | 4032.22 | -4.49 | -136.00 | 580.00 | NA | -0.31 | NA | NA |
| 2023-12-31 | 2023-09-30 | 2023-06-30 | 2023-03-31 | 2022-12-31 | 2022-09-30 | 2022-06-30 | 2022-03-31 | 2021-12-31 | 2021-09-30 | 2021-06-30 | 2021-03-31 | 2020-12-31 | 2020-09-30 | 2020-06-30 | 2020-03-31 | 2019-12-31 | 2019-09-30 | 2019-06-30 | 2019-03-31 | 2018-12-31 | 2018-09-30 | 2018-06-30 | 2018-03-31 | 2017-12-31 | 2017-09-30 | 2017-06-30 | 2017-03-31 | ||
|---|---|---|---|---|---|---|---|---|---|---|---|---|---|---|---|---|---|---|---|---|---|---|---|---|---|---|---|---|---|
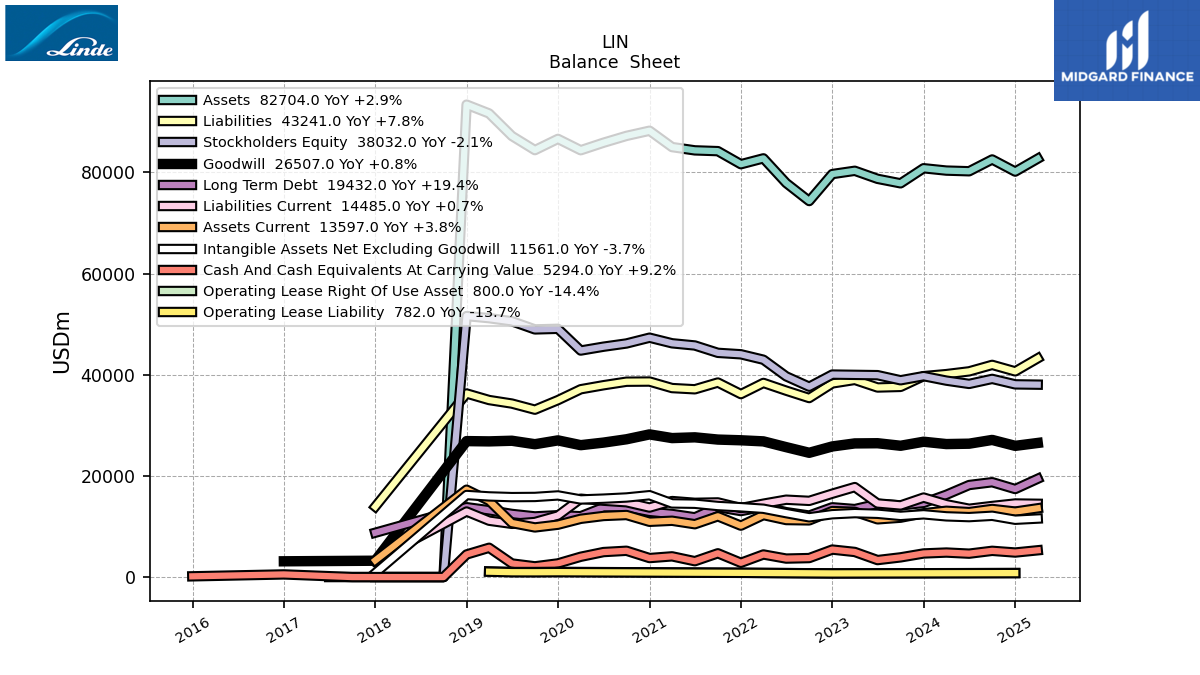
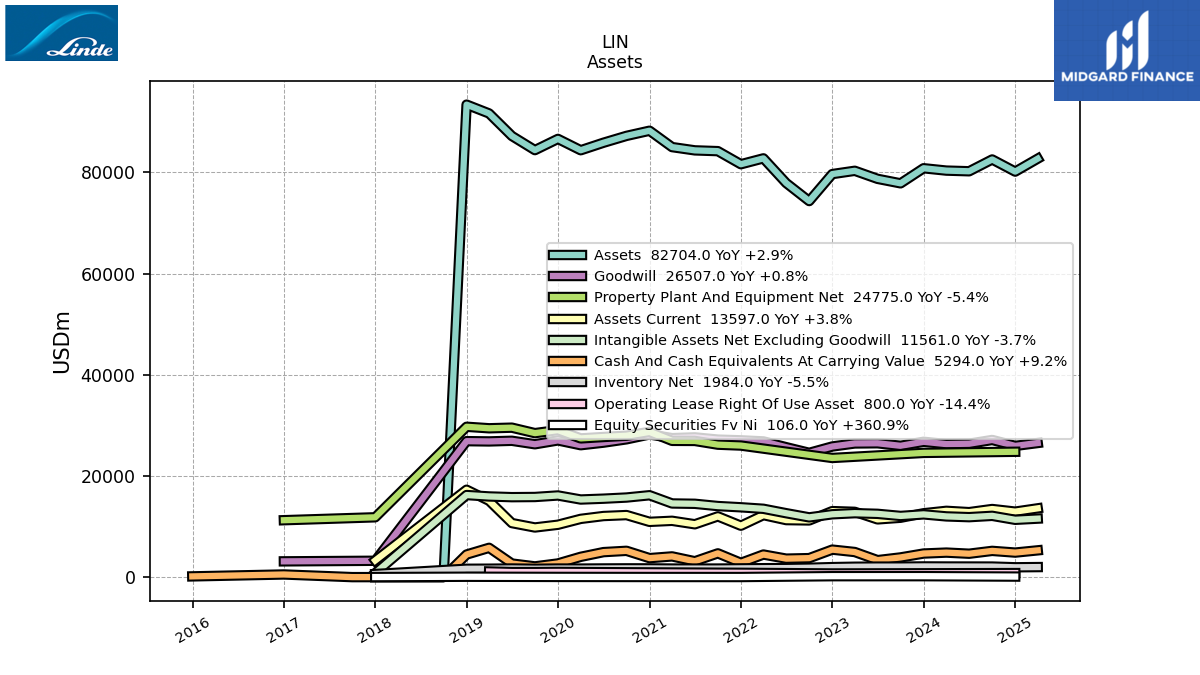
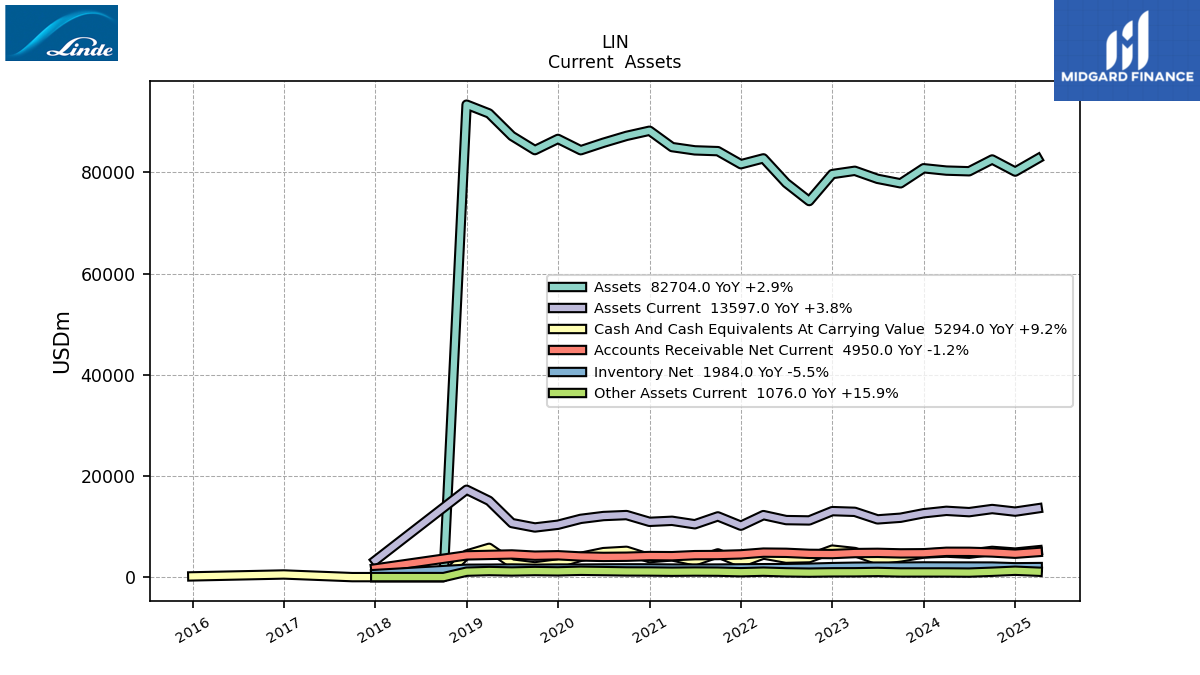
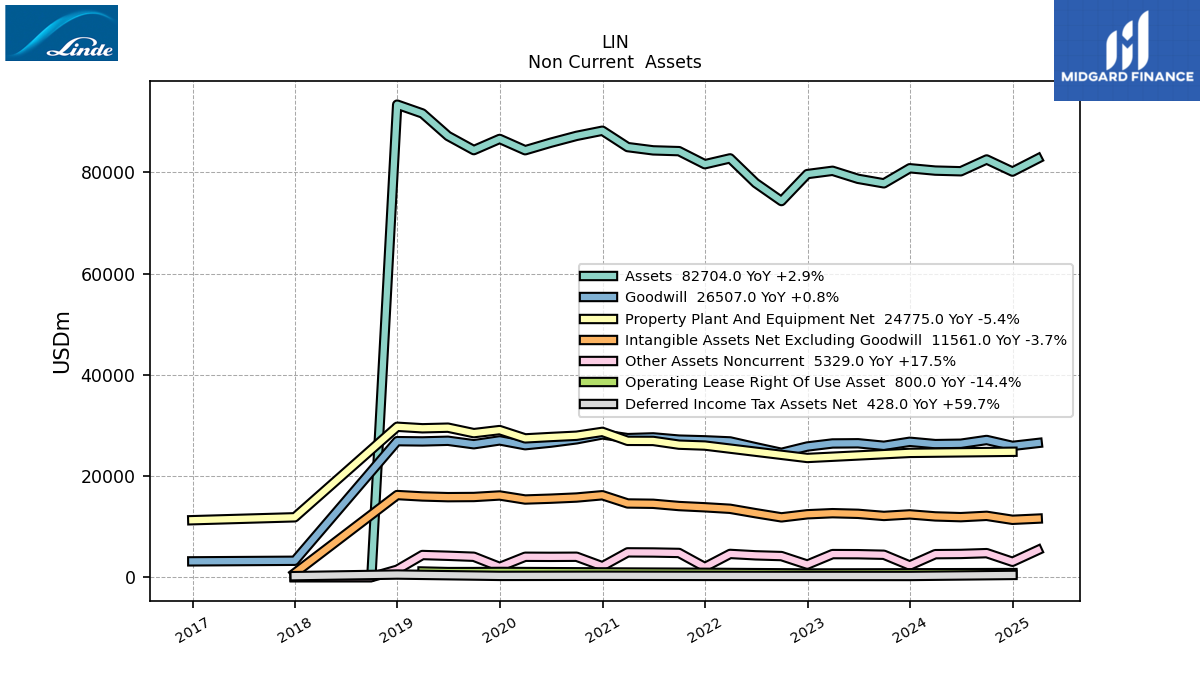
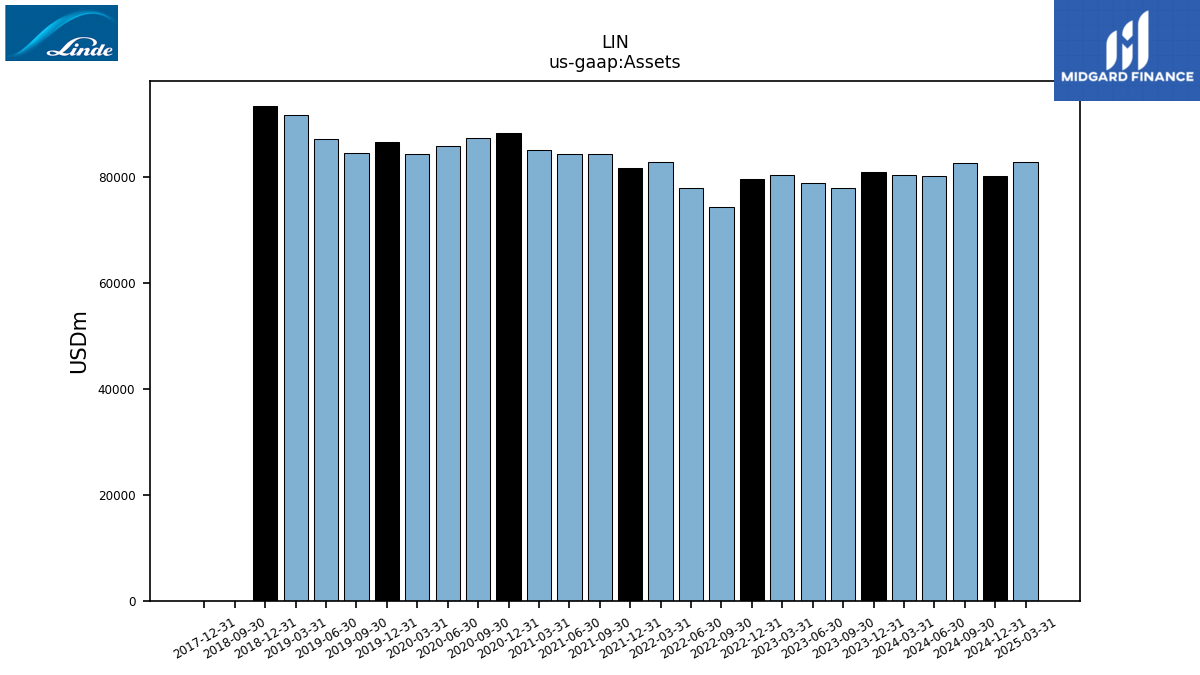
| Assets | 80811.00 | 77827.00 | 78718.00 | 80308.00 | 79658.00 | 74323.00 | 77885.00 | 82767.00 | 81605.00 | 84191.00 | 84345.00 | 84993.00 | 88229.00 | 87209.00 | 85856.00 | 84369.00 | 86612.00 | 84394.00 | 87189.00 | 91641.00 | 93386.00 | 8.93 | NA | NA | 9.21 | NA | NA | NA | |
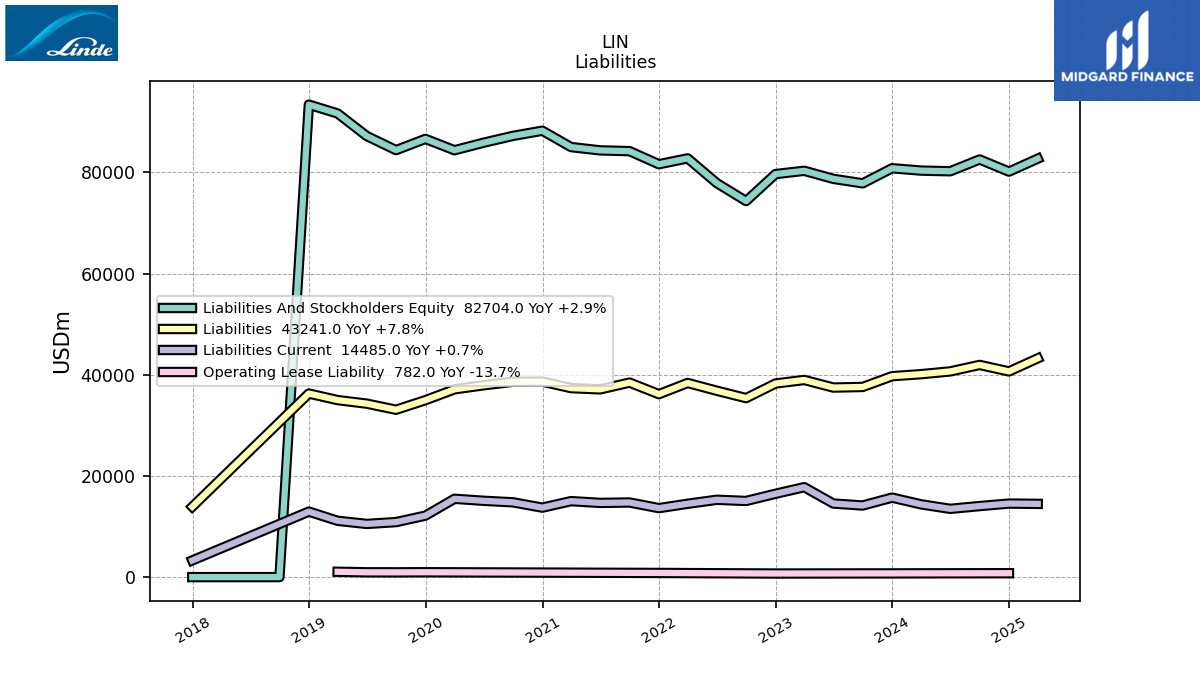
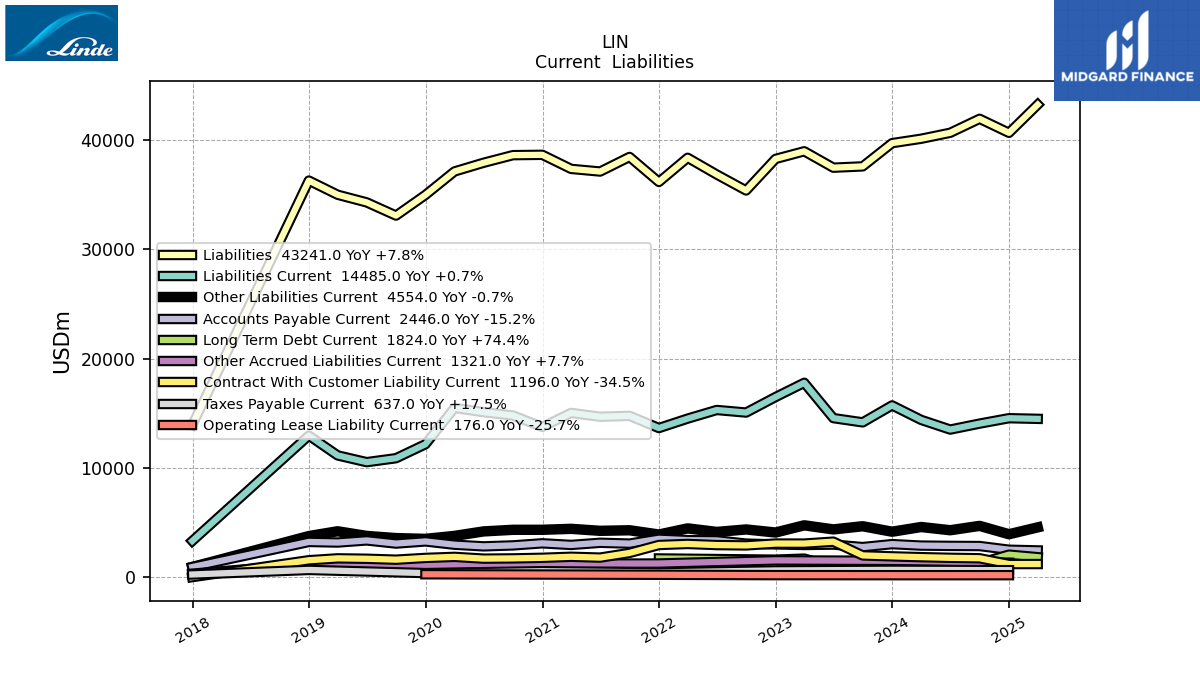
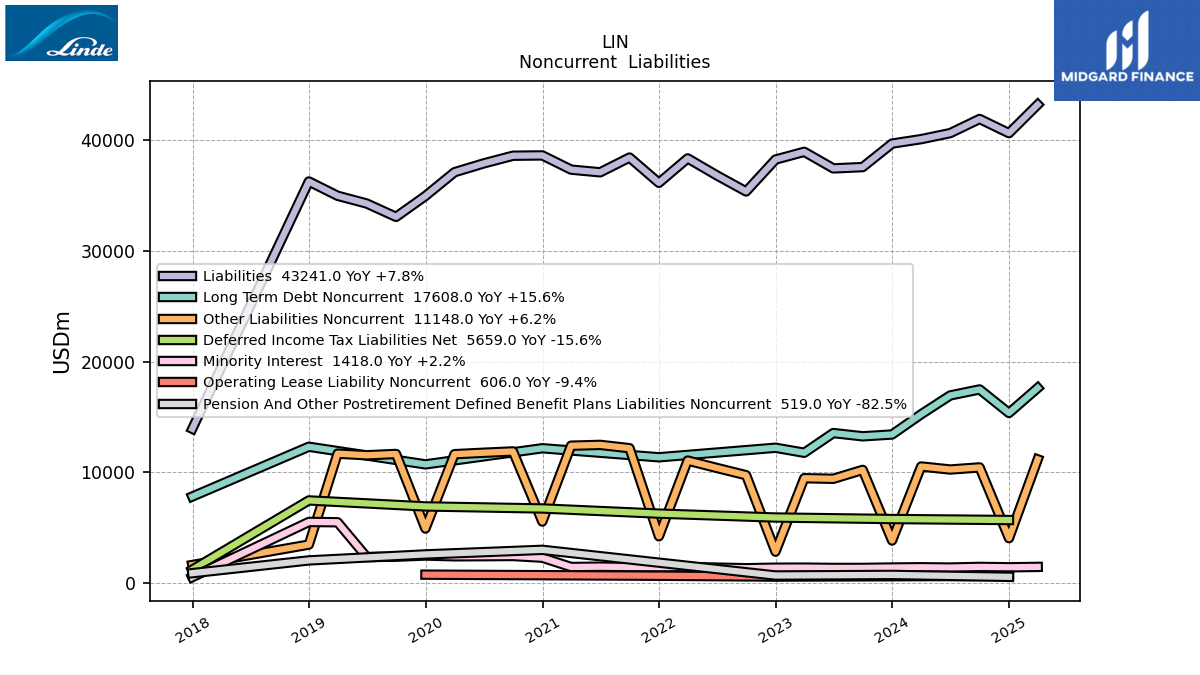
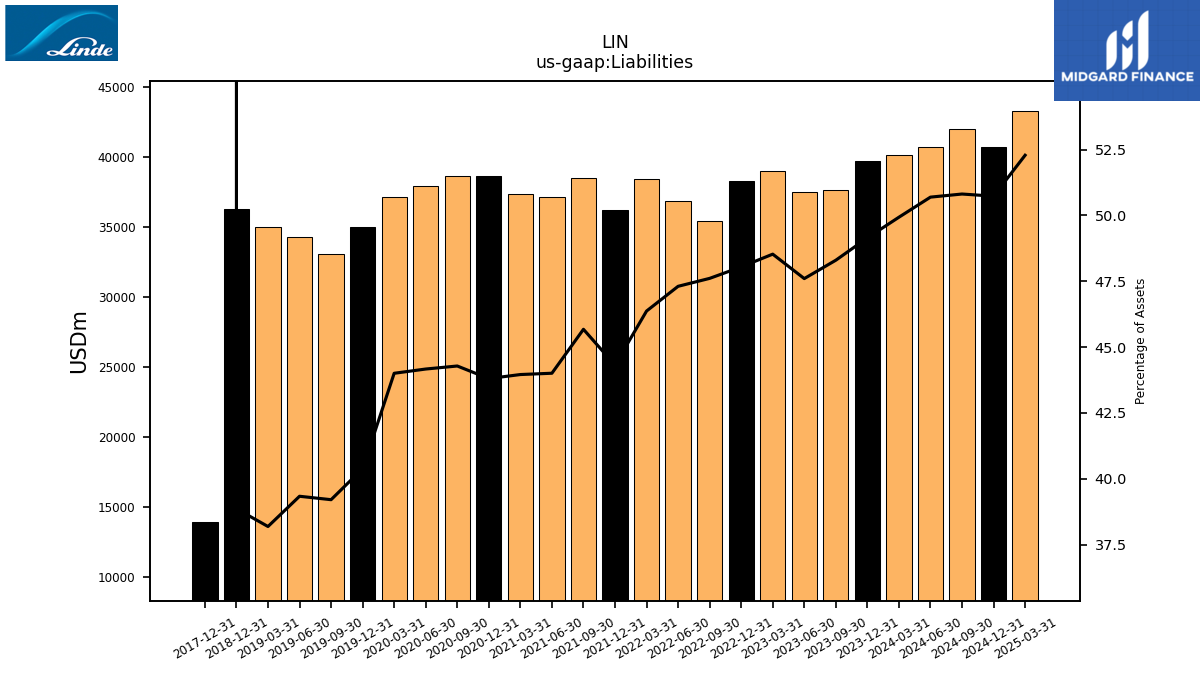
| Liabilities | 39716.00 | 37589.00 | 37470.00 | 38972.00 | 38271.00 | 35384.00 | 36845.00 | 38377.00 | 36164.00 | 38454.00 | 37117.00 | 37360.00 | 38647.00 | 38617.00 | 37919.00 | 37126.00 | 34977.00 | 33086.00 | 34295.00 | 34994.00 | 36290.00 | NA | NA | NA | 13914.00 | NA | NA | NA | |
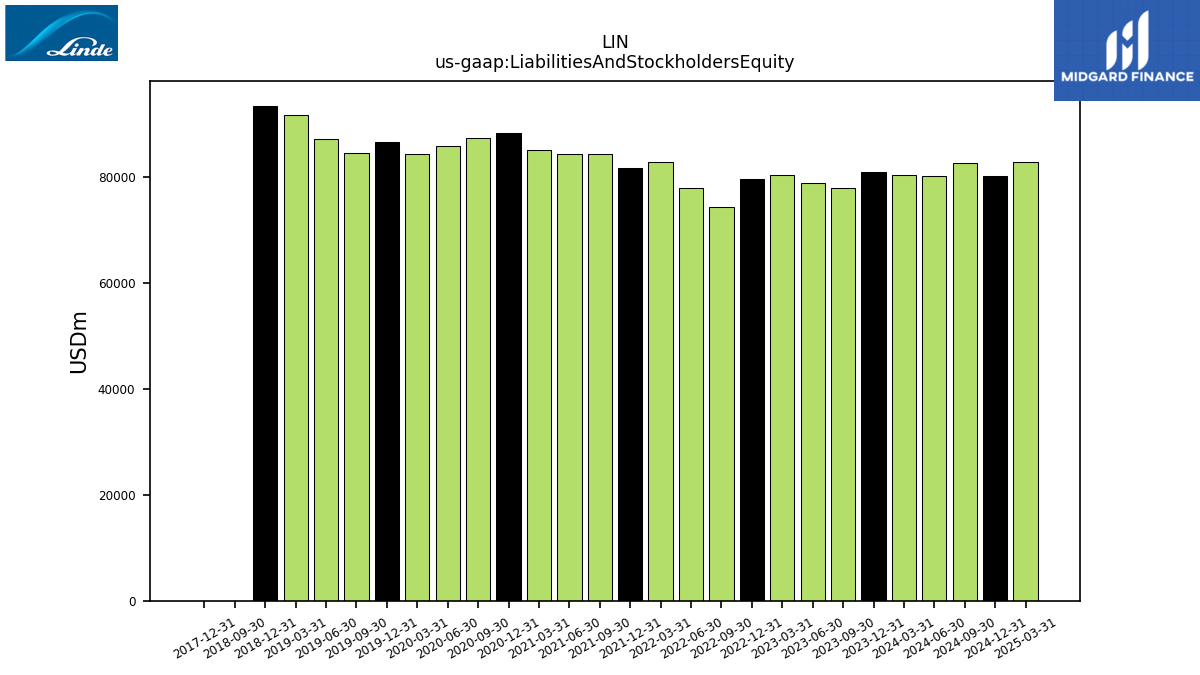
| Liabilities And Stockholders Equity | 80811.00 | 77827.00 | 78718.00 | 80308.00 | 79658.00 | 74323.00 | 77885.00 | 82767.00 | 81605.00 | 84191.00 | 84345.00 | 84993.00 | 88229.00 | 87209.00 | 85856.00 | 84369.00 | 86612.00 | 84394.00 | 87189.00 | 91641.00 | 93386.00 | 8.93 | NA | NA | 9.21 | NA | NA | NA | |
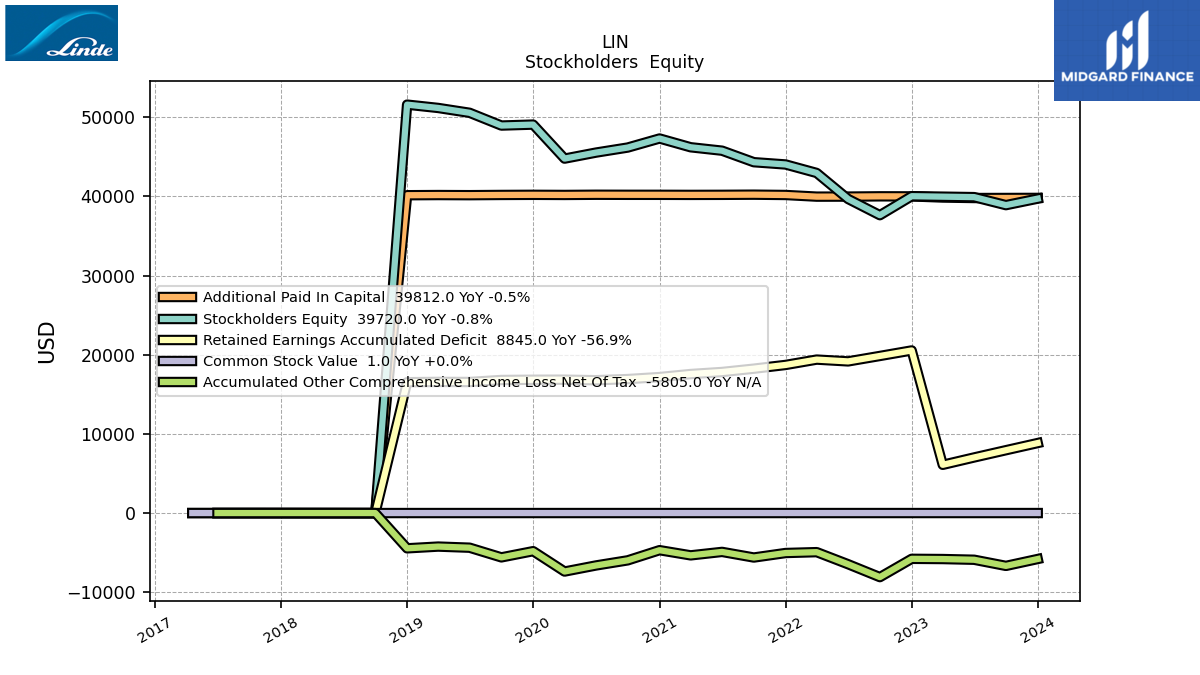
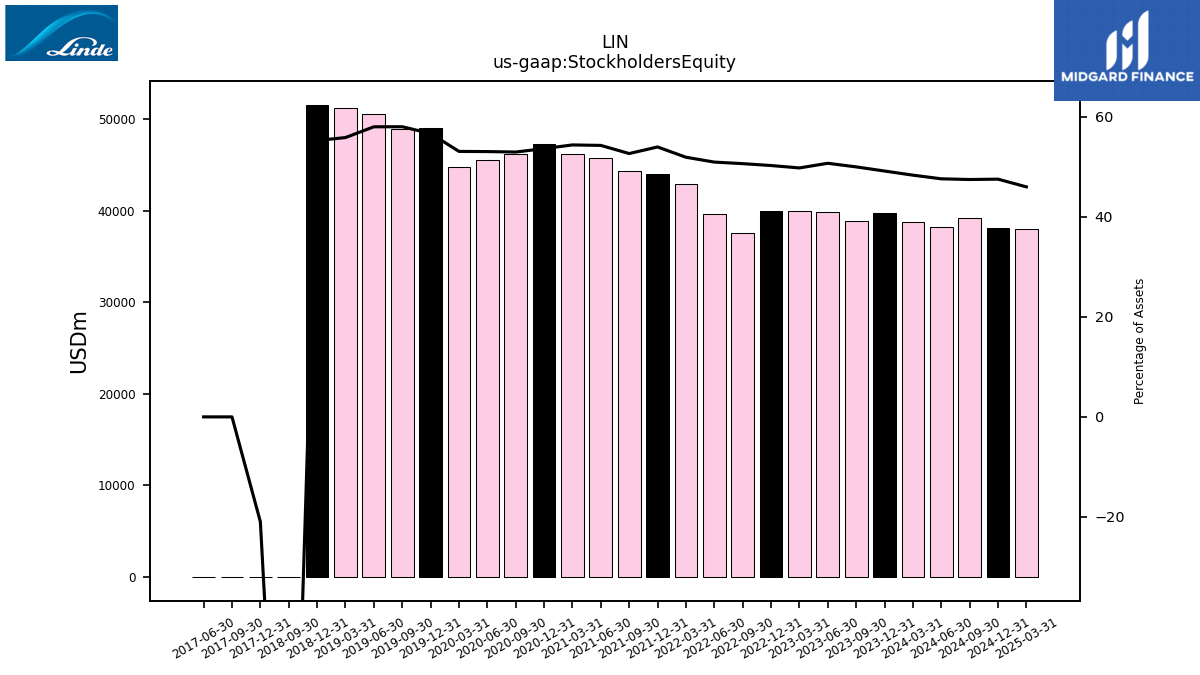
| Stockholders Equity | 39720.00 | 38898.00 | 39911.00 | 39970.00 | 40028.00 | 37628.00 | 39674.00 | 42963.00 | 44035.00 | 44323.00 | 45777.00 | 46210.00 | 47317.00 | 46175.00 | 45537.00 | 44776.00 | 49074.00 | 48953.00 | 50564.00 | 51175.00 | 51596.00 | -11.15 | NA | NA | -1.93 | -0.77 | -0.46 | NA |
| 2023-12-31 | 2023-09-30 | 2023-06-30 | 2023-03-31 | 2022-12-31 | 2022-09-30 | 2022-06-30 | 2022-03-31 | 2021-12-31 | 2021-09-30 | 2021-06-30 | 2021-03-31 | 2020-12-31 | 2020-09-30 | 2020-06-30 | 2020-03-31 | 2019-12-31 | 2019-09-30 | 2019-06-30 | 2019-03-31 | 2018-12-31 | 2018-09-30 | 2018-06-30 | 2018-03-31 | 2017-12-31 | 2017-09-30 | 2017-06-30 | 2017-03-31 | ||
|---|---|---|---|---|---|---|---|---|---|---|---|---|---|---|---|---|---|---|---|---|---|---|---|---|---|---|---|---|---|
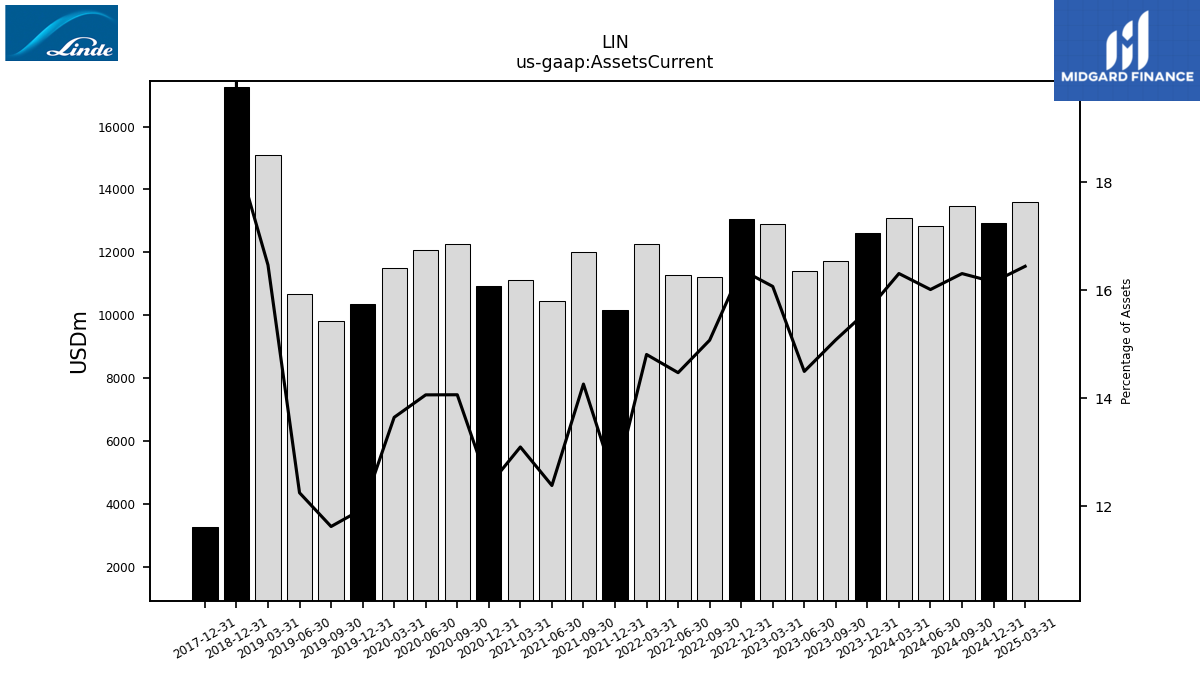
| Assets Current | 12620.00 | 11737.00 | 11411.00 | 12904.00 | 13047.00 | 11203.00 | 11272.00 | 12257.00 | 10159.00 | 12007.00 | 10446.00 | 11132.00 | 10924.00 | 12265.00 | 12073.00 | 11513.00 | 10352.00 | 9812.00 | 10681.00 | 15088.00 | 17272.00 | NA | NA | NA | 3285.00 | NA | NA | NA | |
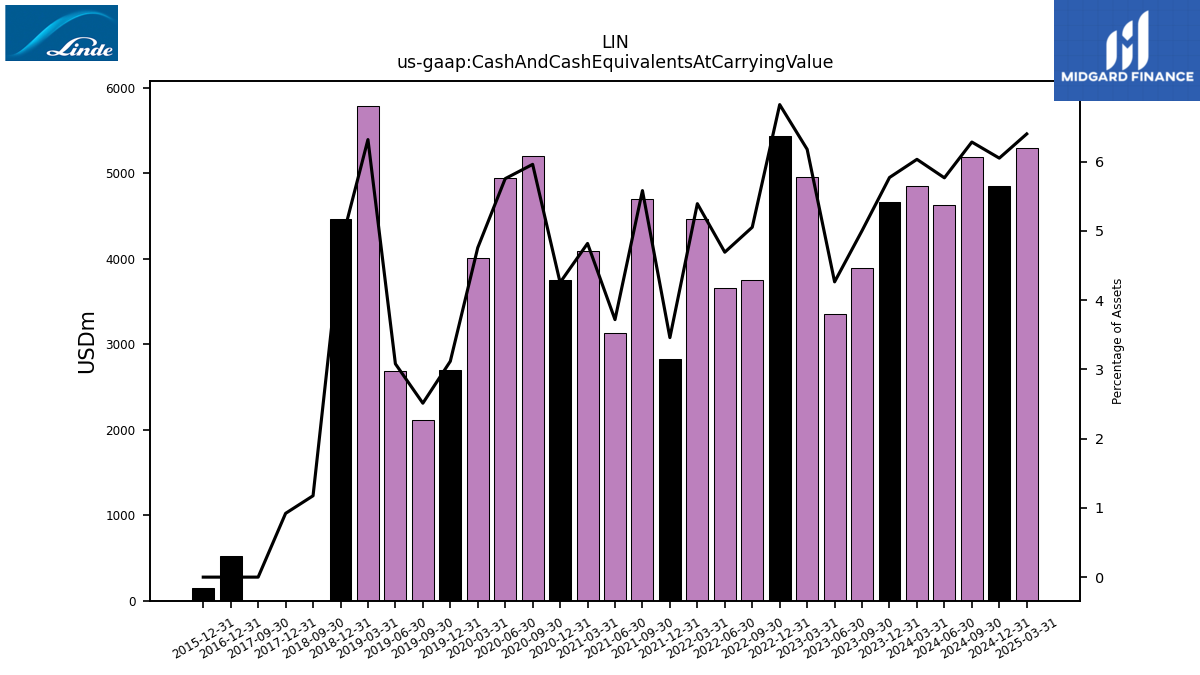
| Cash And Cash Equivalents At Carrying Value | 4664.00 | 3894.00 | 3357.00 | 4962.00 | 5436.00 | 3756.00 | 3655.00 | 4464.00 | 2823.00 | 4700.00 | 3137.00 | 4096.00 | 3754.00 | 5199.00 | 4941.00 | 4014.00 | 2700.00 | 2120.00 | 2686.00 | 5791.00 | 4466.00 | 0.10 | NA | NA | 0.08 | 0.08 | NA | NA | |
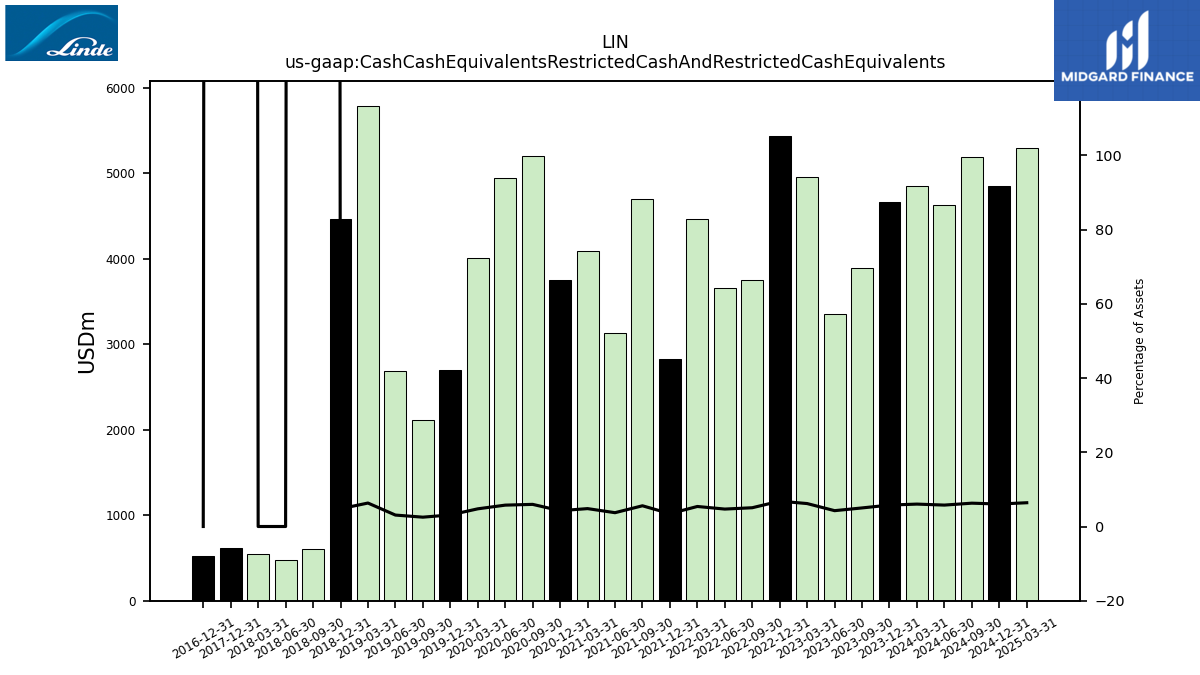
| Cash Cash Equivalents Restricted Cash And Restricted Cash Equivalents | 4664.00 | 3894.00 | 3357.00 | 4962.00 | 5436.00 | 3756.00 | 3655.00 | 4464.00 | 2823.00 | 4700.00 | 3137.00 | 4096.00 | 3754.00 | 5199.00 | 4941.00 | 4014.00 | 2700.00 | 2120.00 | 2686.00 | 5791.00 | 4466.00 | 600.00 | 479.00 | 545.00 | 617.00 | NA | NA | NA | |
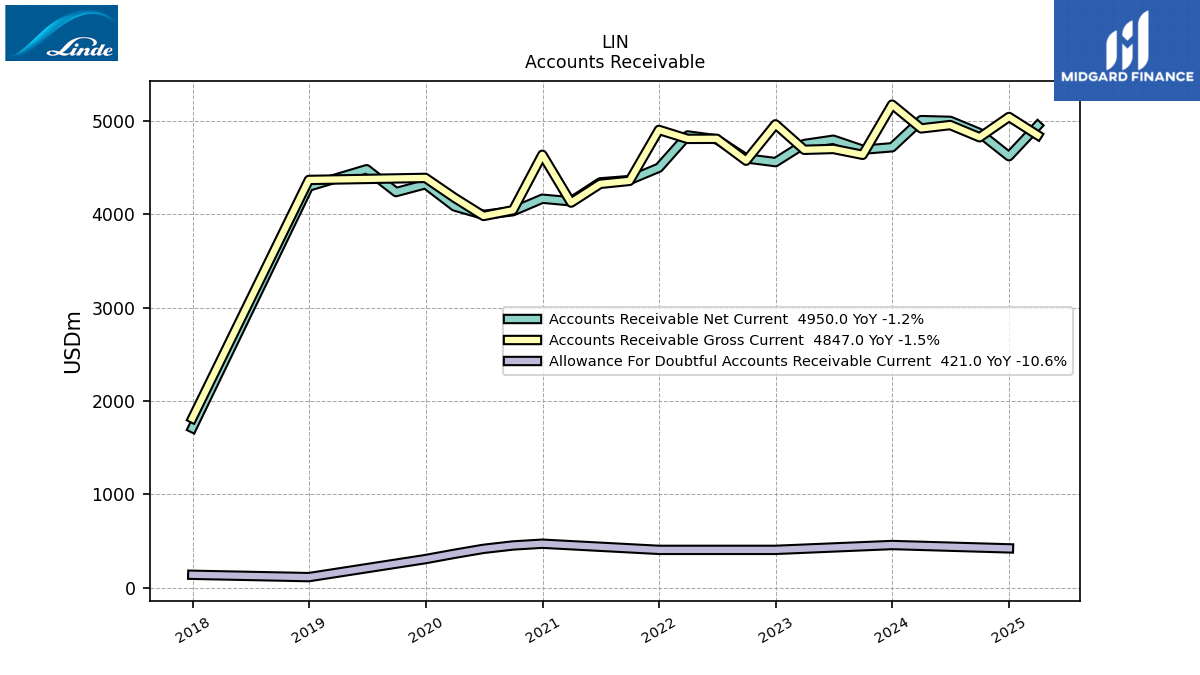
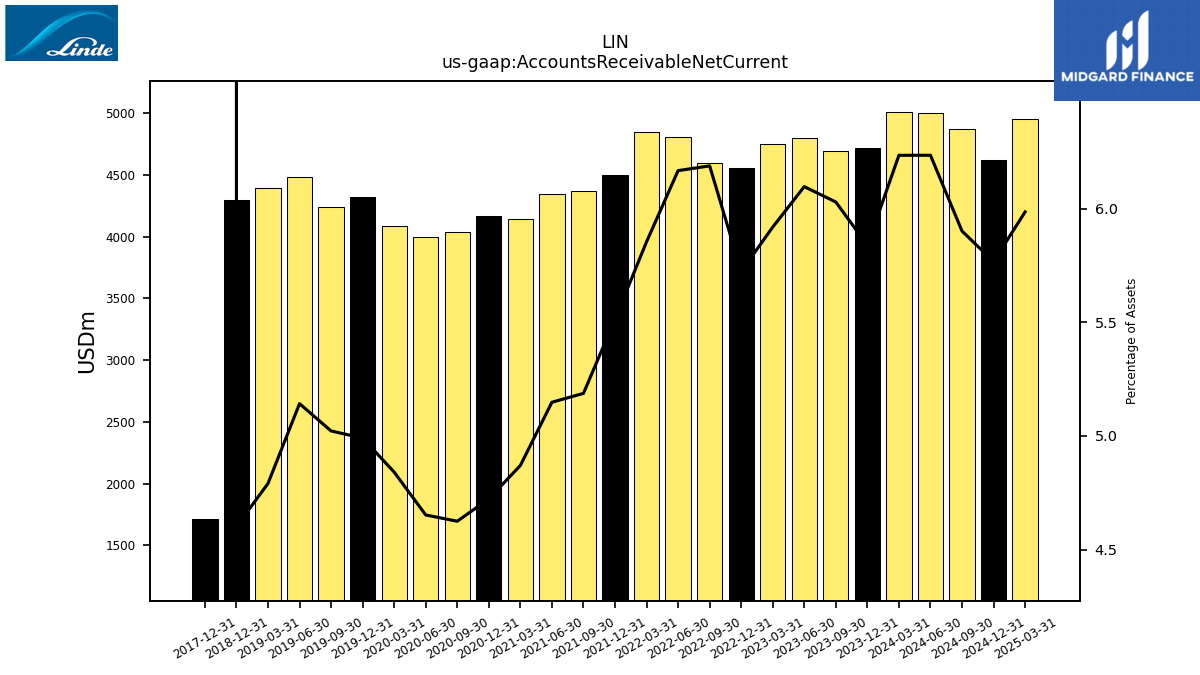
| Accounts Receivable Net Current | 4718.00 | 4692.00 | 4799.00 | 4753.00 | 4559.00 | 4599.00 | 4803.00 | 4845.00 | 4499.00 | 4367.00 | 4342.00 | 4139.00 | 4167.00 | 4033.00 | 3994.00 | 4084.00 | 4322.00 | 4238.00 | 4483.00 | 4390.00 | 4297.00 | NA | NA | NA | 1710.00 | NA | NA | NA | |
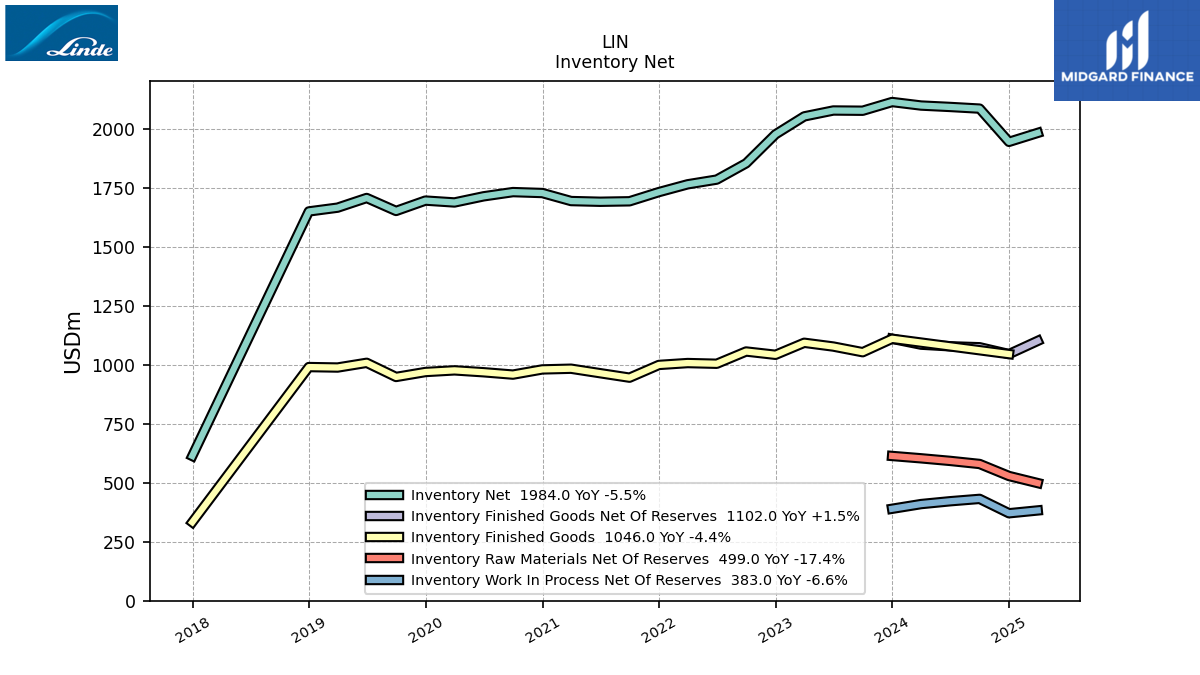
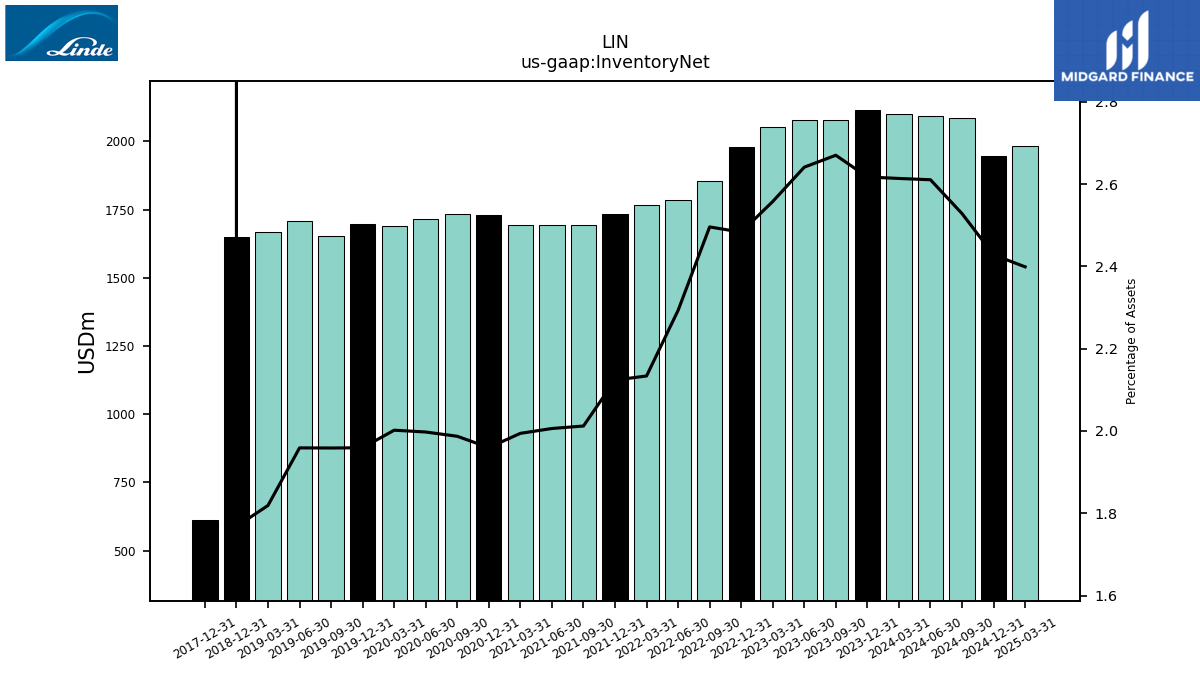
| Inventory Net | 2115.00 | 2078.00 | 2079.00 | 2054.00 | 1978.00 | 1855.00 | 1786.00 | 1766.00 | 1733.00 | 1694.00 | 1692.00 | 1695.00 | 1729.00 | 1733.00 | 1715.00 | 1689.00 | 1697.00 | 1653.00 | 1708.00 | 1667.00 | 1651.00 | NA | NA | NA | 614.00 | NA | NA | NA | |
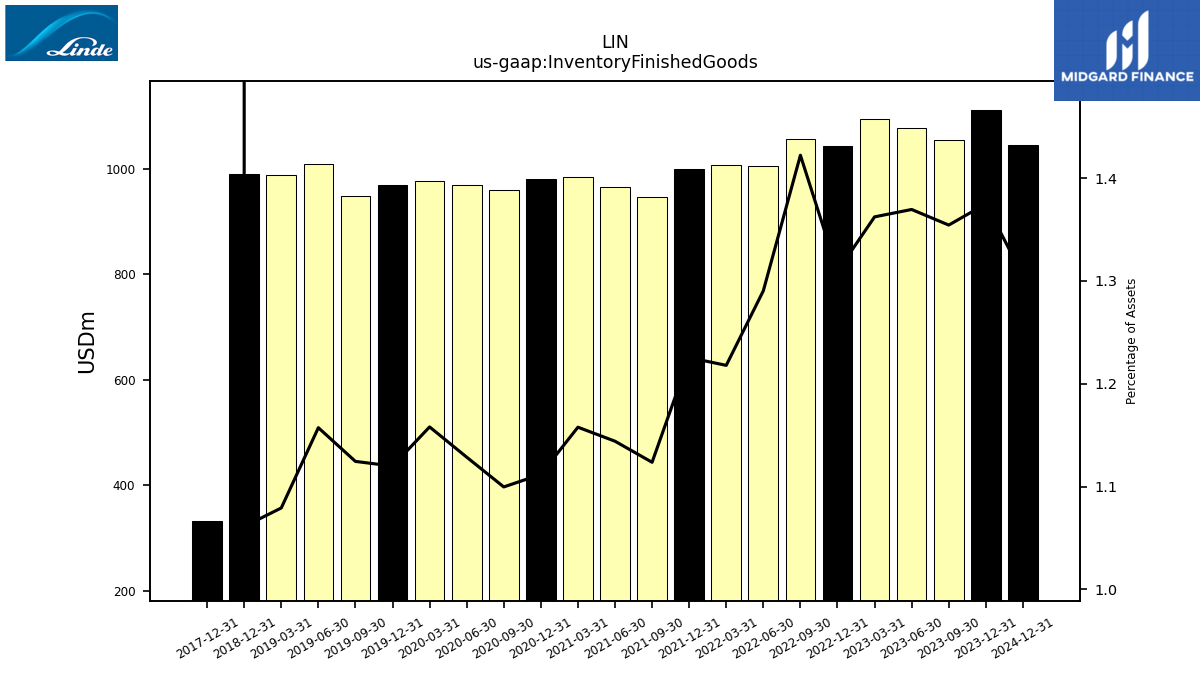
| Inventory Finished Goods | 1111.00 | 1054.00 | 1078.00 | 1094.00 | 1043.00 | 1057.00 | 1005.00 | 1008.00 | 1000.00 | 946.00 | 965.00 | 984.00 | 981.00 | 959.00 | 969.00 | 977.00 | 970.00 | 949.00 | 1009.00 | 989.00 | 991.00 | NA | NA | NA | 333.00 | NA | NA | NA | |
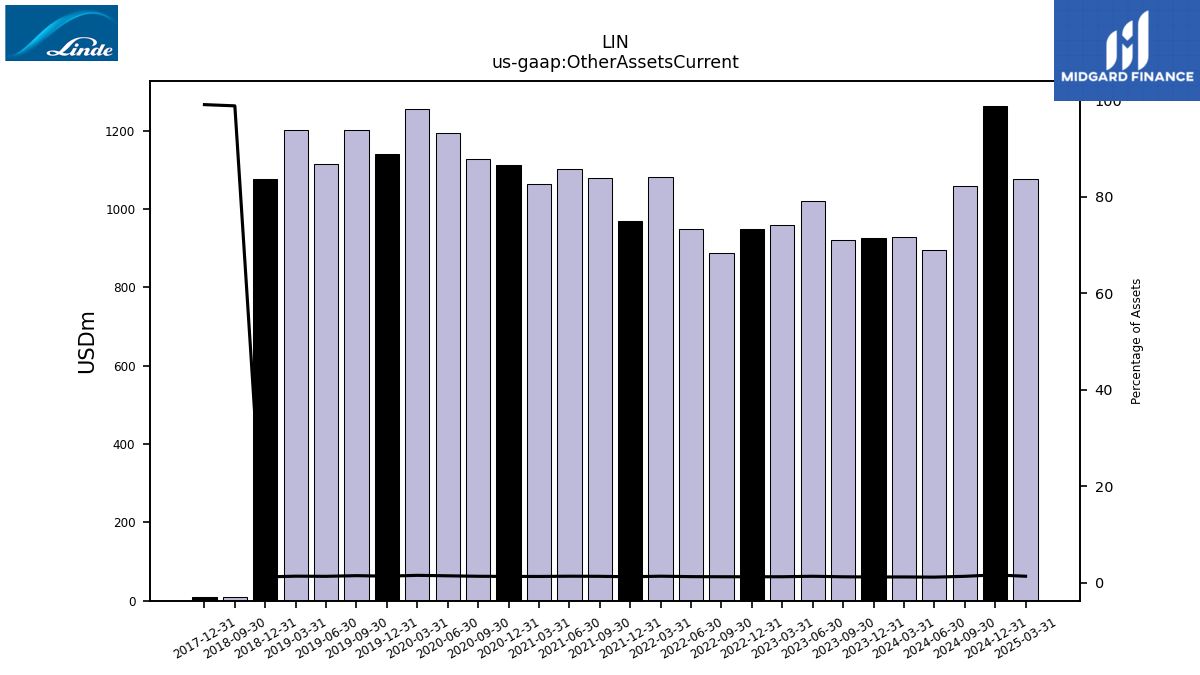
| Other Assets Current | 927.00 | 922.00 | 1020.00 | 960.00 | 950.00 | 889.00 | 950.00 | 1082.00 | 970.00 | 1080.00 | 1102.00 | 1065.00 | 1112.00 | 1127.00 | 1194.00 | 1255.00 | 1140.00 | 1202.00 | 1116.00 | 1203.00 | 1077.00 | 8.82 | NA | NA | 9.13 | NA | NA | NA | |
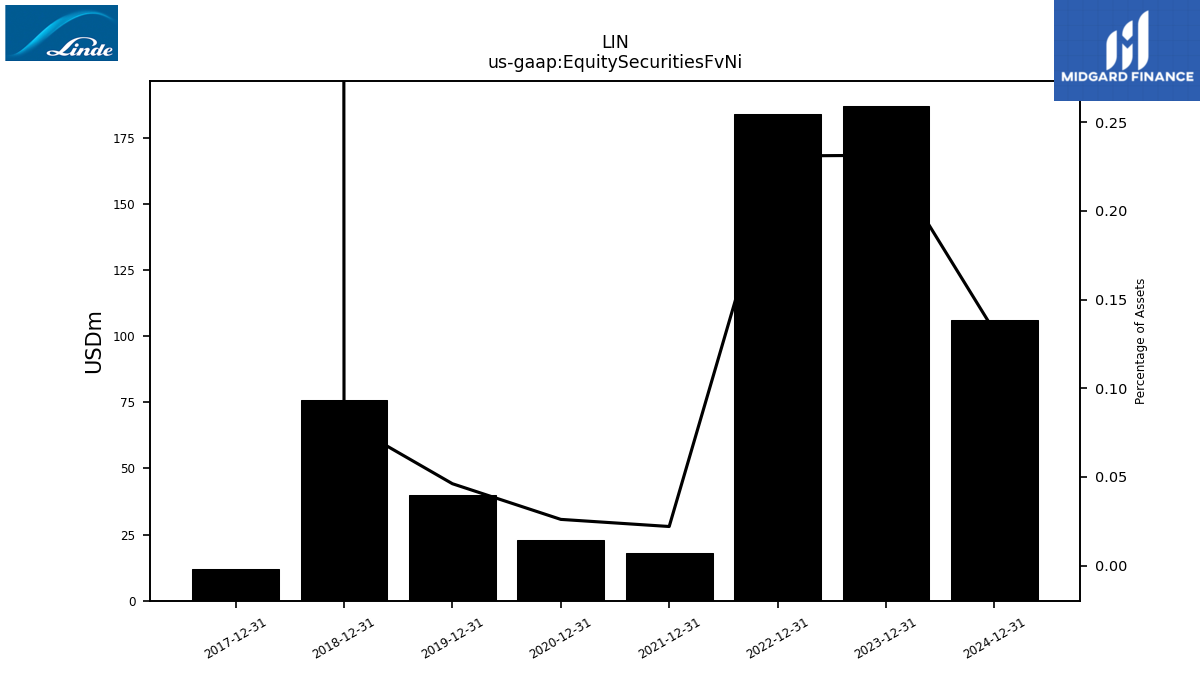
| Equity Securities Fv Ni | 187.00 | NA | NA | NA | 184.00 | NA | NA | NA | 18.00 | NA | NA | NA | 23.00 | NA | NA | NA | 40.00 | NA | NA | NA | 76.00 | NA | NA | NA | 12.00 | NA | NA | NA |
| 2023-12-31 | 2023-09-30 | 2023-06-30 | 2023-03-31 | 2022-12-31 | 2022-09-30 | 2022-06-30 | 2022-03-31 | 2021-12-31 | 2021-09-30 | 2021-06-30 | 2021-03-31 | 2020-12-31 | 2020-09-30 | 2020-06-30 | 2020-03-31 | 2019-12-31 | 2019-09-30 | 2019-06-30 | 2019-03-31 | 2018-12-31 | 2018-09-30 | 2018-06-30 | 2018-03-31 | 2017-12-31 | 2017-09-30 | 2017-06-30 | 2017-03-31 | ||
|---|---|---|---|---|---|---|---|---|---|---|---|---|---|---|---|---|---|---|---|---|---|---|---|---|---|---|---|---|---|
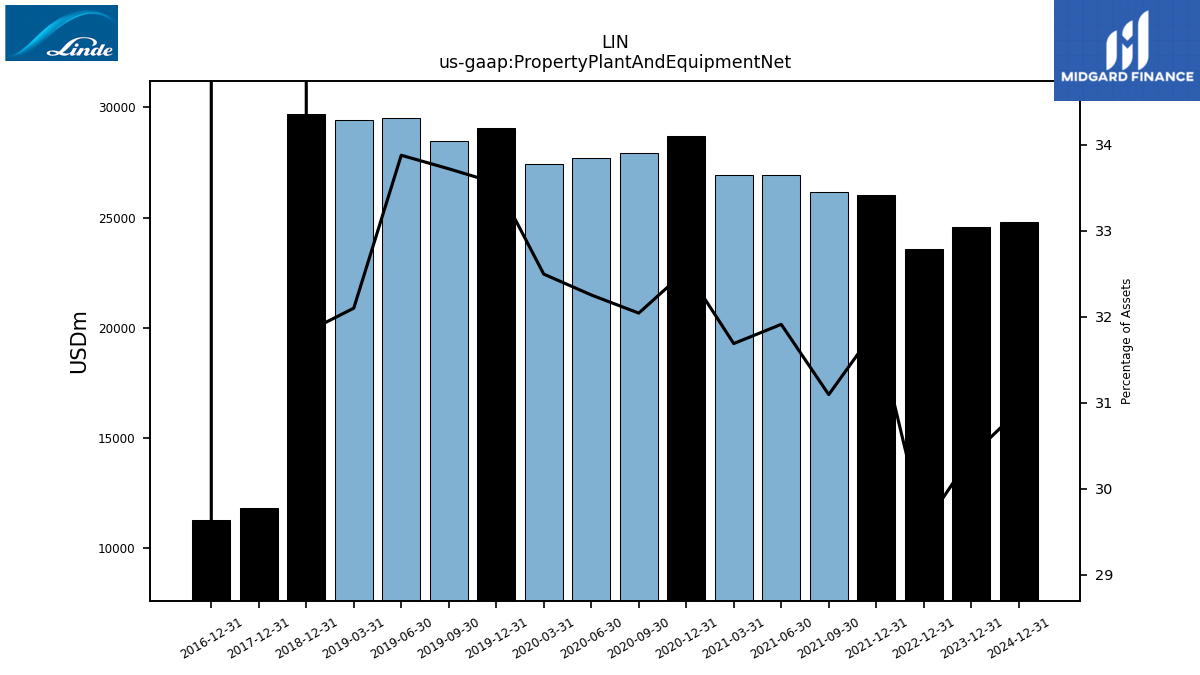
| Property Plant And Equipment Net | 24552.00 | NA | NA | NA | 23548.00 | NA | NA | NA | 26003.00 | 26180.00 | 26917.00 | 26934.00 | 28711.00 | 27945.00 | 27693.00 | 27418.00 | 29064.00 | 28460.00 | 29540.00 | 29418.00 | 29717.00 | NA | NA | NA | 11825.00 | NA | NA | NA | |
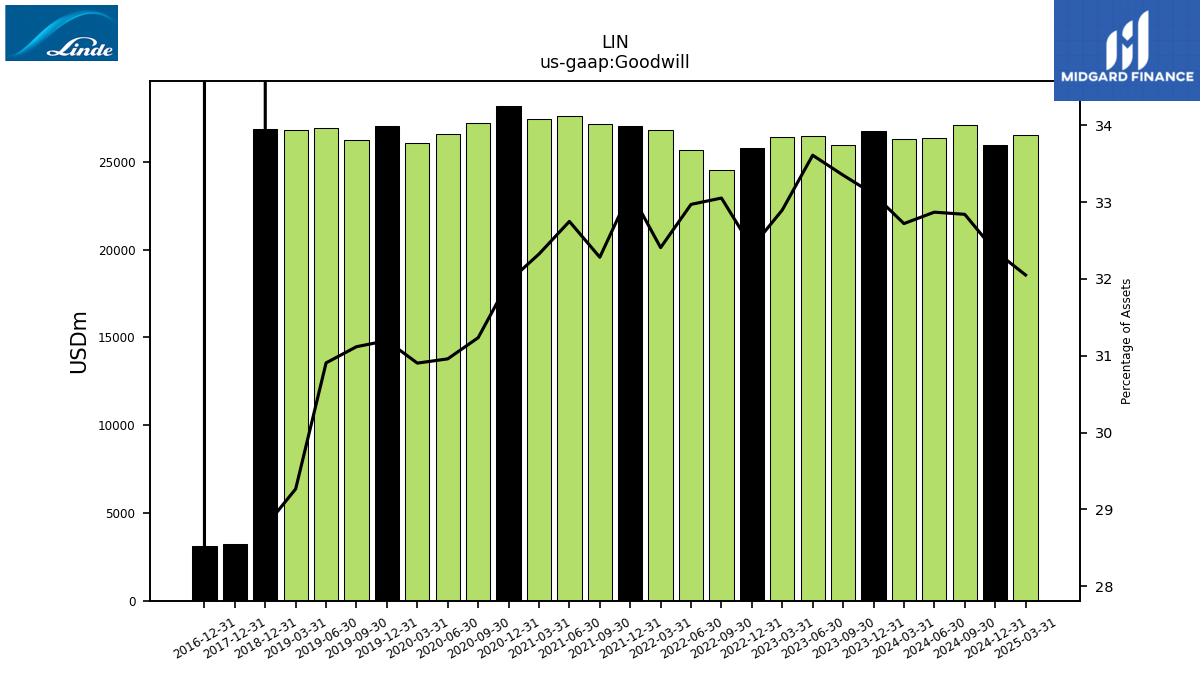
| Goodwill | 26751.00 | 25955.00 | 26456.00 | 26418.00 | 25817.00 | 24565.00 | 25678.00 | 26822.00 | 27038.00 | 27178.00 | 27621.00 | 27472.00 | 28201.00 | 27239.00 | 26580.00 | 26073.00 | 27019.00 | 26261.00 | 26947.00 | 26820.00 | 26874.00 | NA | NA | NA | 3233.00 | NA | NA | NA | |
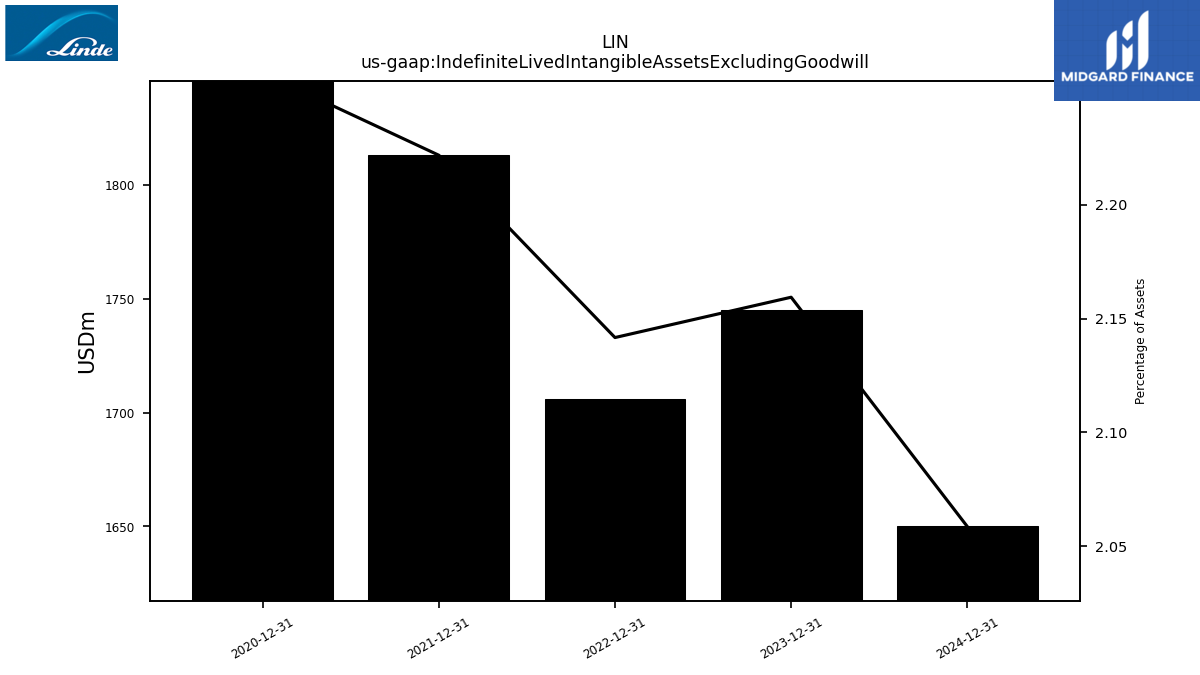
| Indefinite Lived Intangible Assets Excluding Goodwill | 1745.00 | NA | NA | NA | 1706.00 | NA | NA | NA | 1813.00 | NA | NA | NA | 1992.00 | NA | NA | NA | NA | NA | NA | NA | NA | NA | NA | NA | NA | NA | NA | NA | |
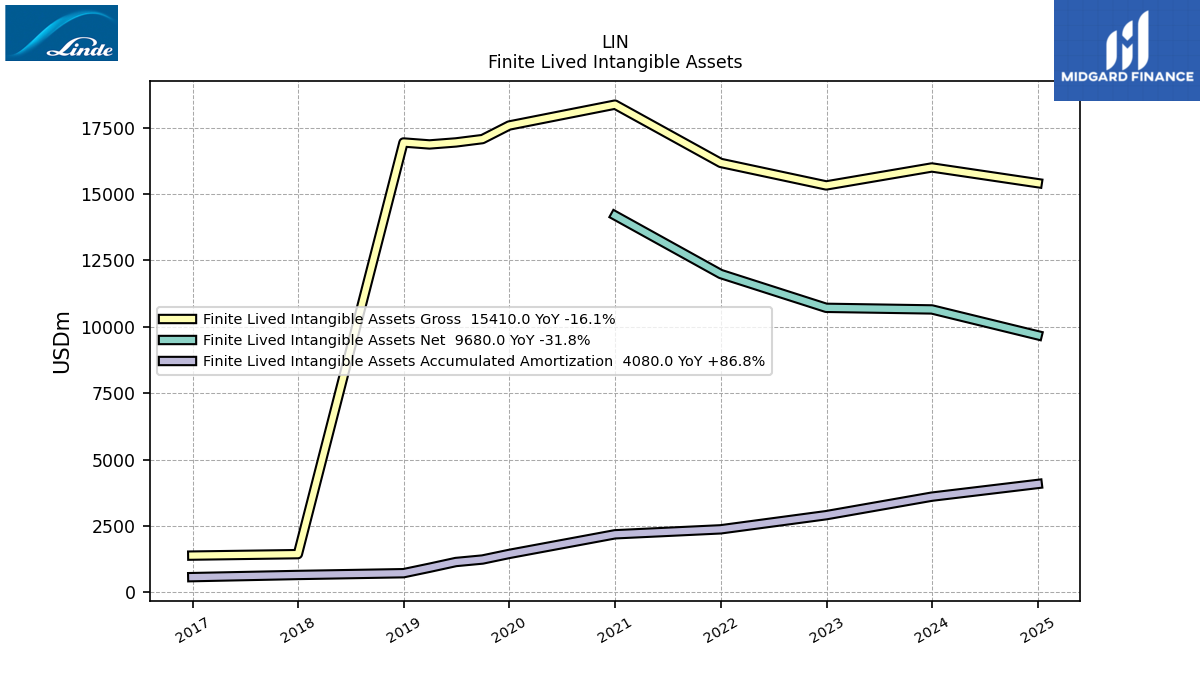
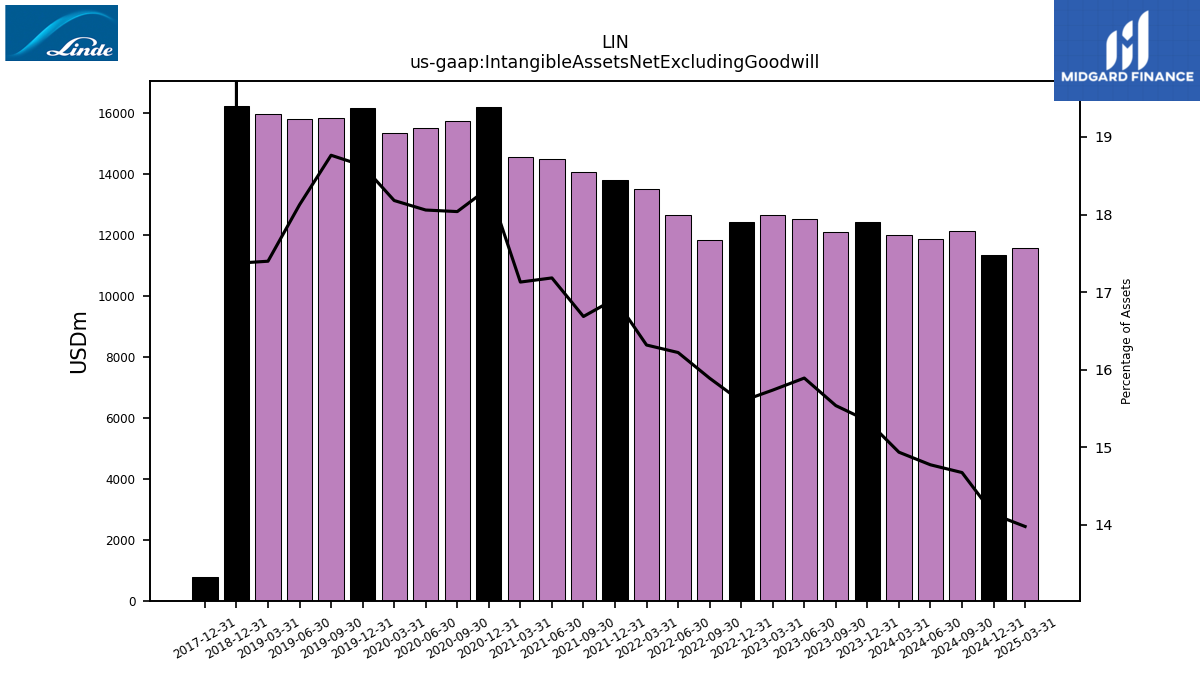
| Intangible Assets Net Excluding Goodwill | 12399.00 | 12092.00 | 12510.00 | 12638.00 | 12420.00 | 11810.00 | 12634.00 | 13506.00 | 13802.00 | 14048.00 | 14493.00 | 14559.00 | 16184.00 | 15731.00 | 15504.00 | 15339.00 | 16137.00 | 15836.00 | 15804.00 | 15944.00 | 16223.00 | NA | NA | NA | 785.00 | NA | NA | NA | |
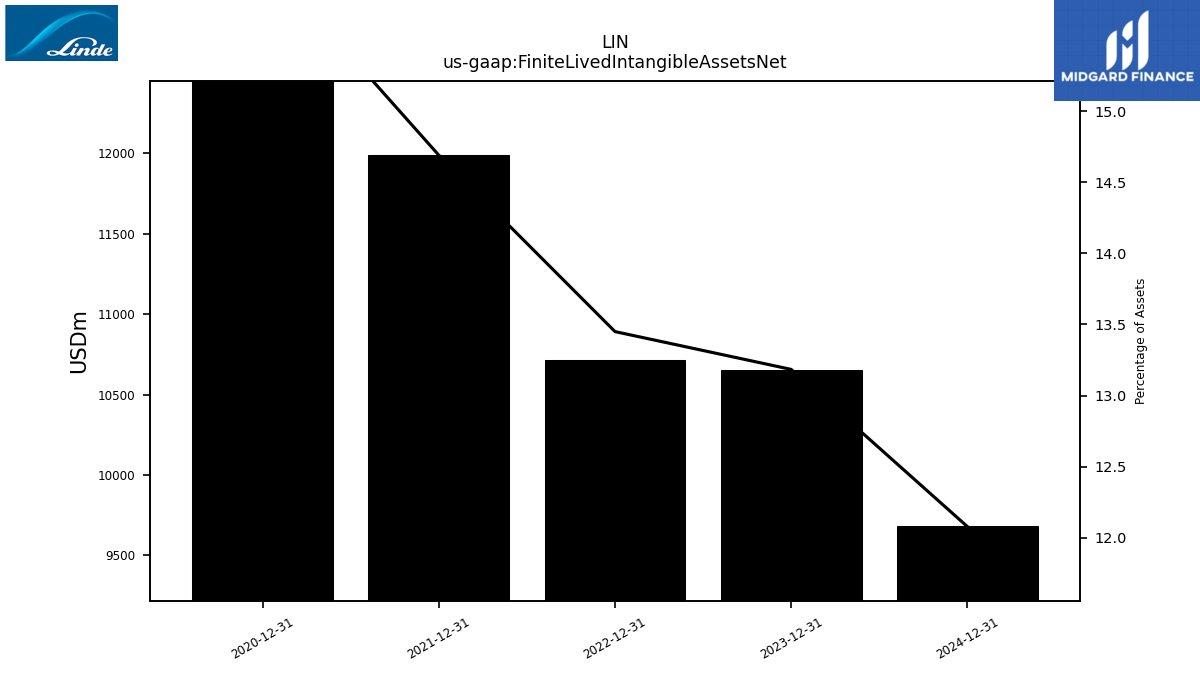
| Finite Lived Intangible Assets Net | 10654.00 | NA | NA | NA | 10714.00 | NA | NA | NA | 11989.00 | NA | NA | NA | 14192.00 | NA | NA | NA | NA | NA | NA | NA | NA | NA | NA | NA | NA | NA | NA | NA | |
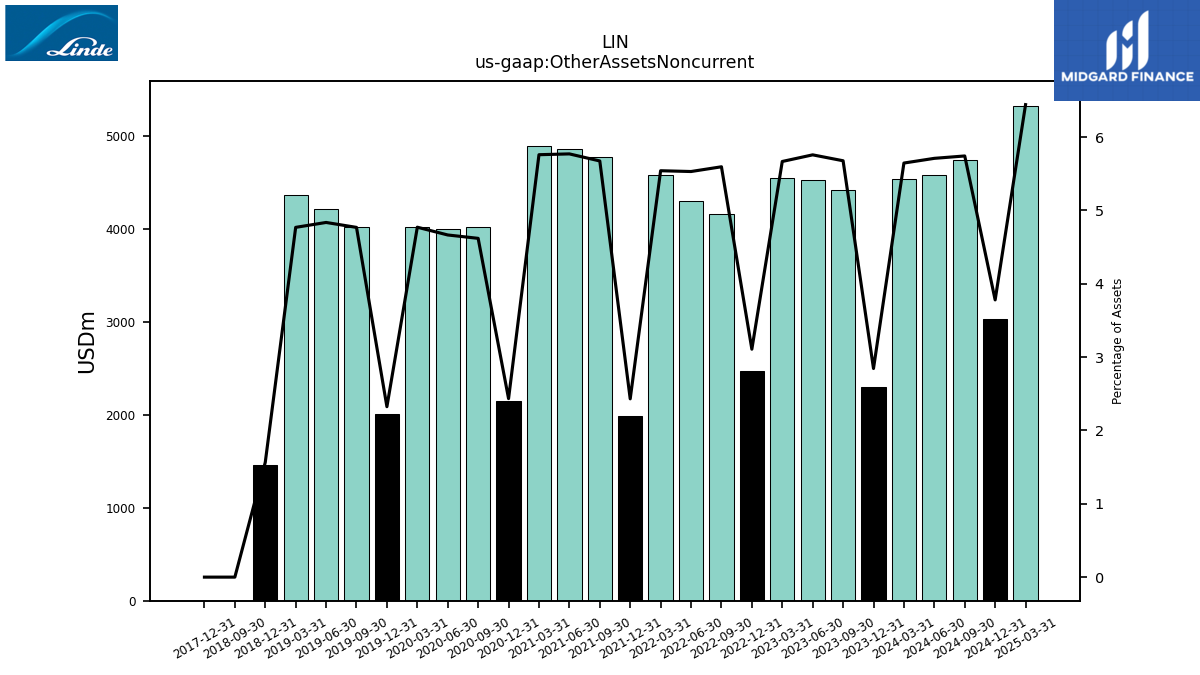
| Other Assets Noncurrent | 2299.00 | 4419.00 | 4533.00 | 4552.00 | 2476.00 | 4159.00 | 4308.00 | 4587.00 | 1984.00 | 4778.00 | 4868.00 | 4896.00 | 2148.00 | 4029.00 | 4006.00 | 4026.00 | 2013.00 | 4025.00 | 4217.00 | 4371.00 | 1462.00 | 0.00 | NA | NA | 0.00 | NA | NA | NA | |
| Equity Securities Fv Ni | 187.00 | NA | NA | NA | 184.00 | NA | NA | NA | 18.00 | NA | NA | NA | 23.00 | NA | NA | NA | 40.00 | NA | NA | NA | 76.00 | NA | NA | NA | 12.00 | NA | NA | NA |
| 2023-12-31 | 2023-09-30 | 2023-06-30 | 2023-03-31 | 2022-12-31 | 2022-09-30 | 2022-06-30 | 2022-03-31 | 2021-12-31 | 2021-09-30 | 2021-06-30 | 2021-03-31 | 2020-12-31 | 2020-09-30 | 2020-06-30 | 2020-03-31 | 2019-12-31 | 2019-09-30 | 2019-06-30 | 2019-03-31 | 2018-12-31 | 2018-09-30 | 2018-06-30 | 2018-03-31 | 2017-12-31 | 2017-09-30 | 2017-06-30 | 2017-03-31 | ||
|---|---|---|---|---|---|---|---|---|---|---|---|---|---|---|---|---|---|---|---|---|---|---|---|---|---|---|---|---|---|
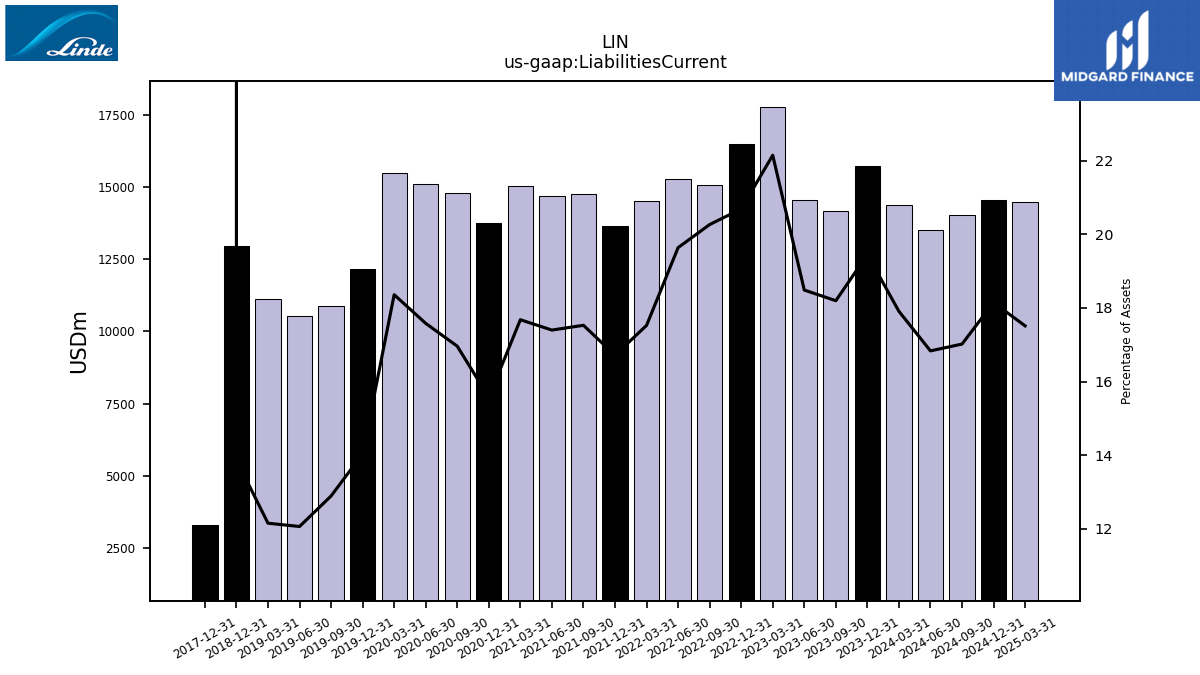
| Liabilities Current | 15717.00 | 14162.00 | 14552.00 | 17785.00 | 16479.00 | 15061.00 | 15295.00 | 14506.00 | 13643.00 | 14758.00 | 14676.00 | 15027.00 | 13740.00 | 14792.00 | 15095.00 | 15490.00 | 12160.00 | 10883.00 | 10521.00 | 11140.00 | 12956.00 | NA | NA | NA | 3307.00 | NA | NA | NA | |
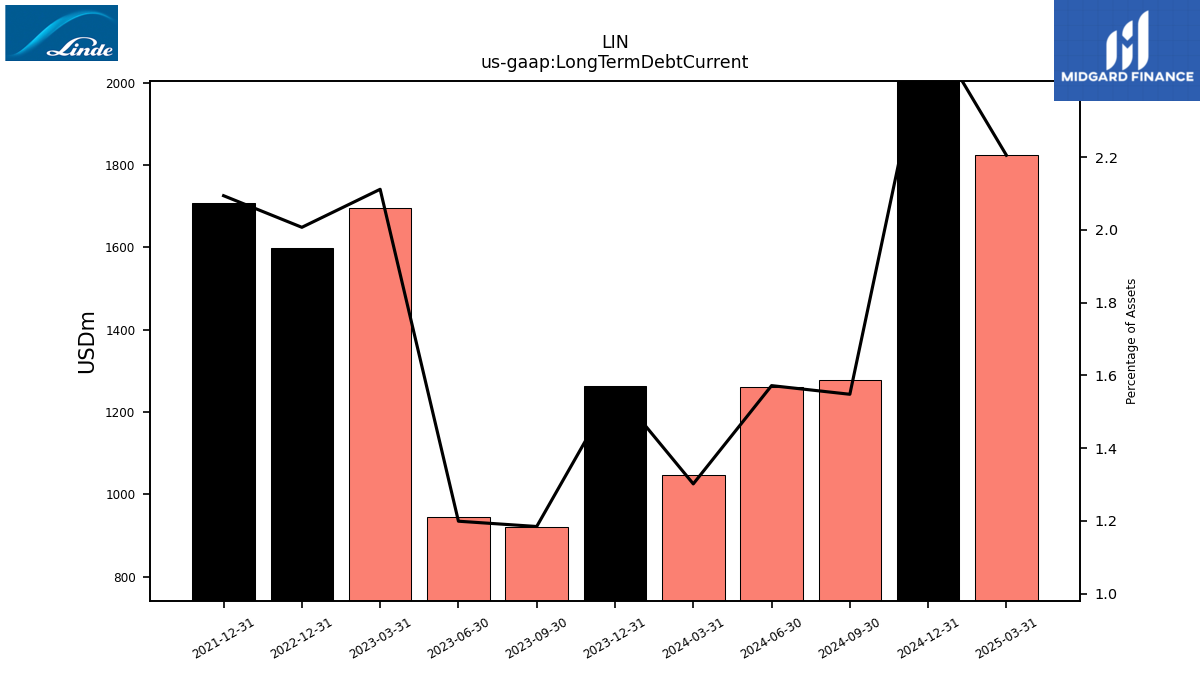
| Long Term Debt Current | 1263.00 | 922.00 | 944.00 | 1696.00 | 1599.00 | NA | NA | NA | 1709.00 | NA | NA | NA | NA | NA | NA | NA | NA | NA | NA | NA | NA | NA | NA | NA | NA | NA | NA | NA | |
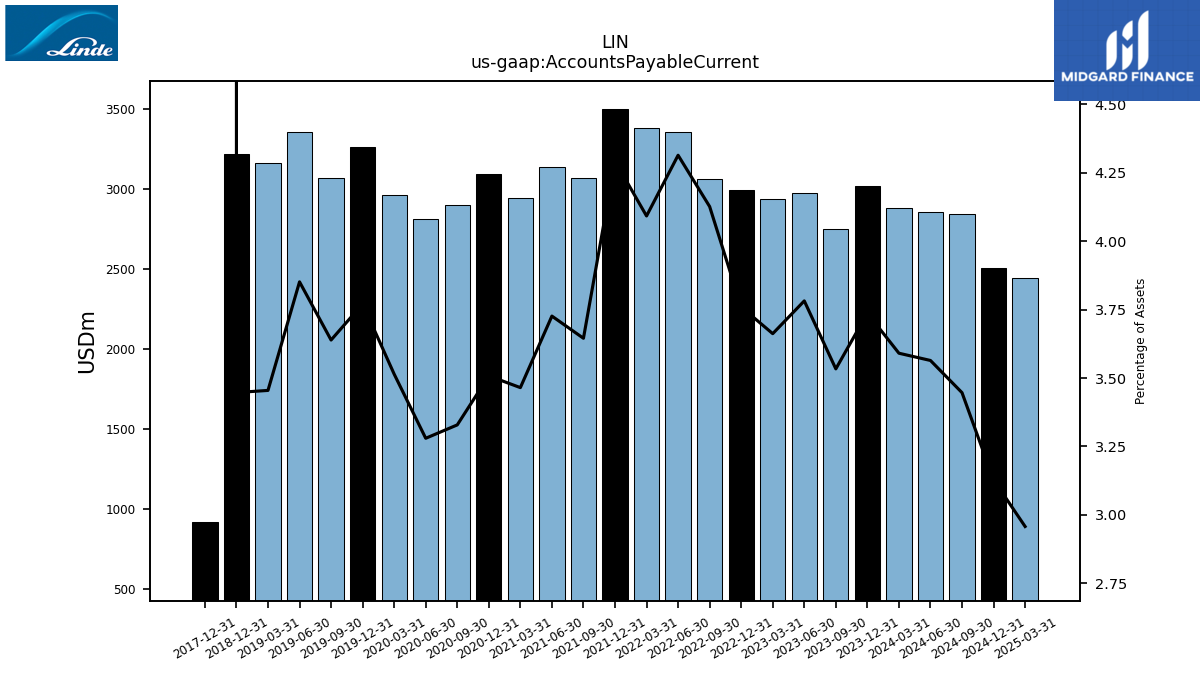
| Accounts Payable Current | 3020.00 | 2750.00 | 2977.00 | 2941.00 | 2995.00 | 3067.00 | 3360.00 | 3387.00 | 3503.00 | 3069.00 | 3143.00 | 2945.00 | 3095.00 | 2903.00 | 2816.00 | 2965.00 | 3266.00 | 3071.00 | 3358.00 | 3166.00 | 3219.00 | NA | NA | NA | 922.00 | NA | NA | NA | |
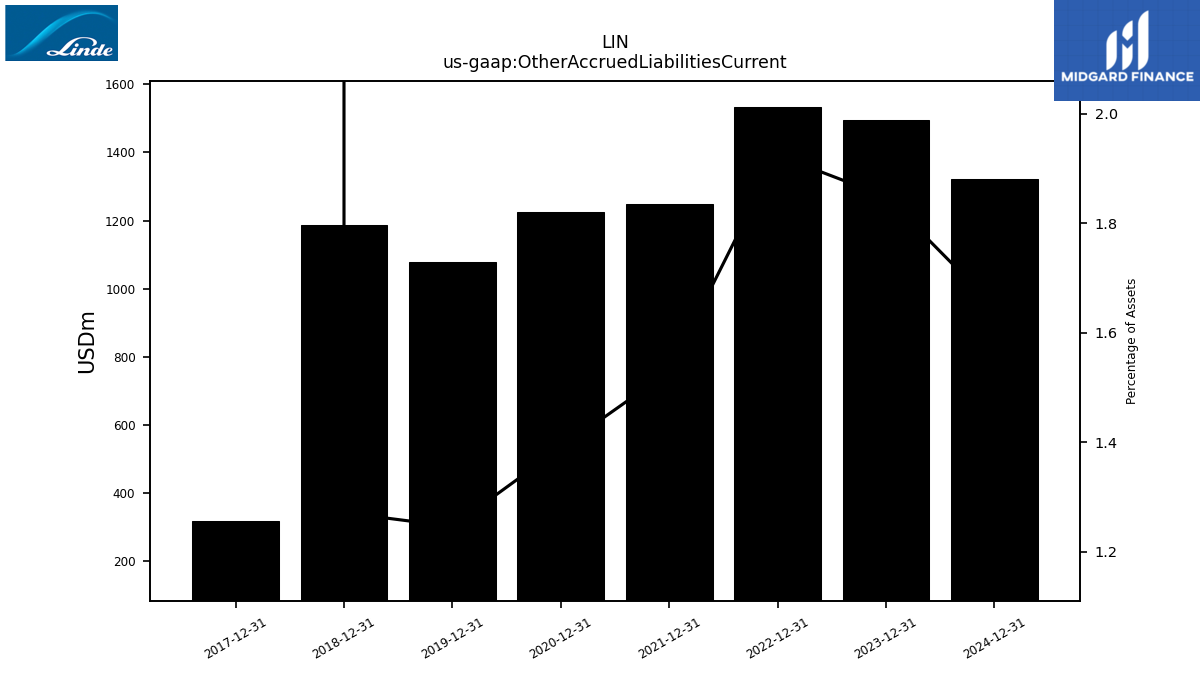
| Other Accrued Liabilities Current | 1494.00 | NA | NA | NA | 1533.00 | NA | NA | NA | 1248.00 | NA | NA | NA | 1226.00 | NA | NA | NA | 1079.00 | NA | NA | NA | 1187.00 | NA | NA | NA | 319.00 | NA | NA | NA | |
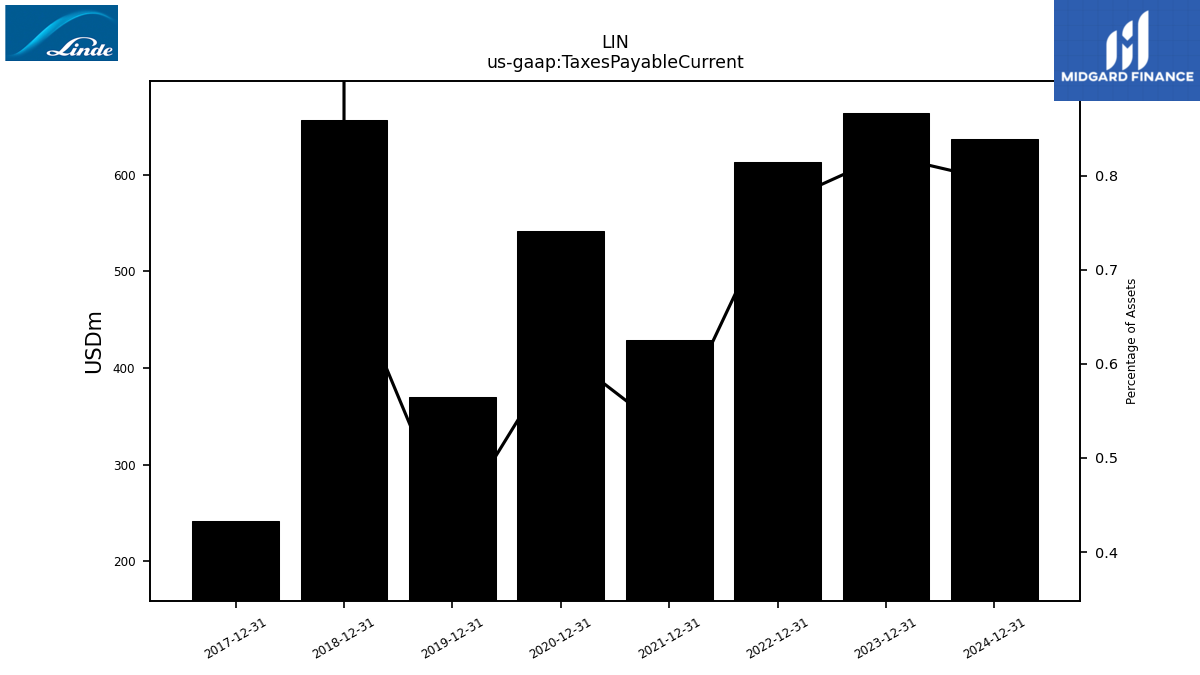
| Taxes Payable Current | 664.00 | NA | NA | NA | 613.00 | NA | NA | NA | 429.00 | NA | NA | NA | 542.00 | NA | NA | NA | 370.00 | NA | NA | NA | 657.00 | NA | NA | NA | 242.00 | NA | NA | NA | |
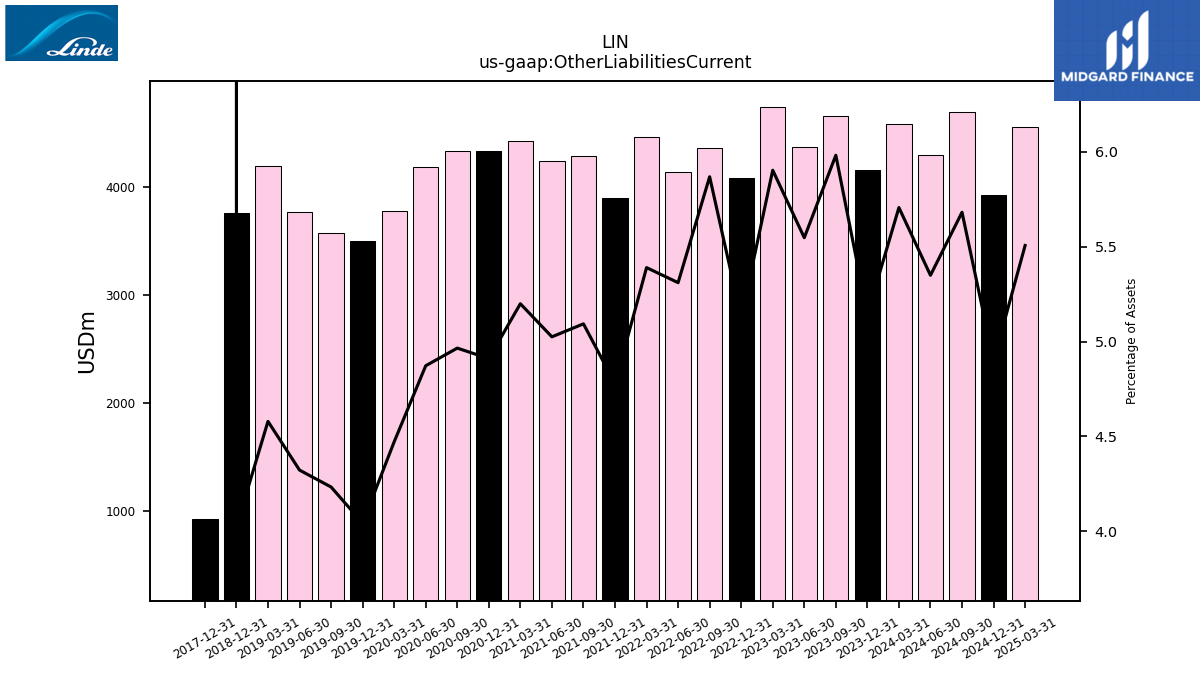
| Other Liabilities Current | 4156.00 | 4656.00 | 4367.00 | 4741.00 | 4082.00 | 4362.00 | 4136.00 | 4461.00 | 3899.00 | 4288.00 | 4238.00 | 4419.00 | 4332.00 | 4330.00 | 4183.00 | 3772.00 | 3501.00 | 3572.00 | 3768.00 | 4196.00 | 3758.00 | NA | NA | NA | 926.00 | NA | NA | NA | |
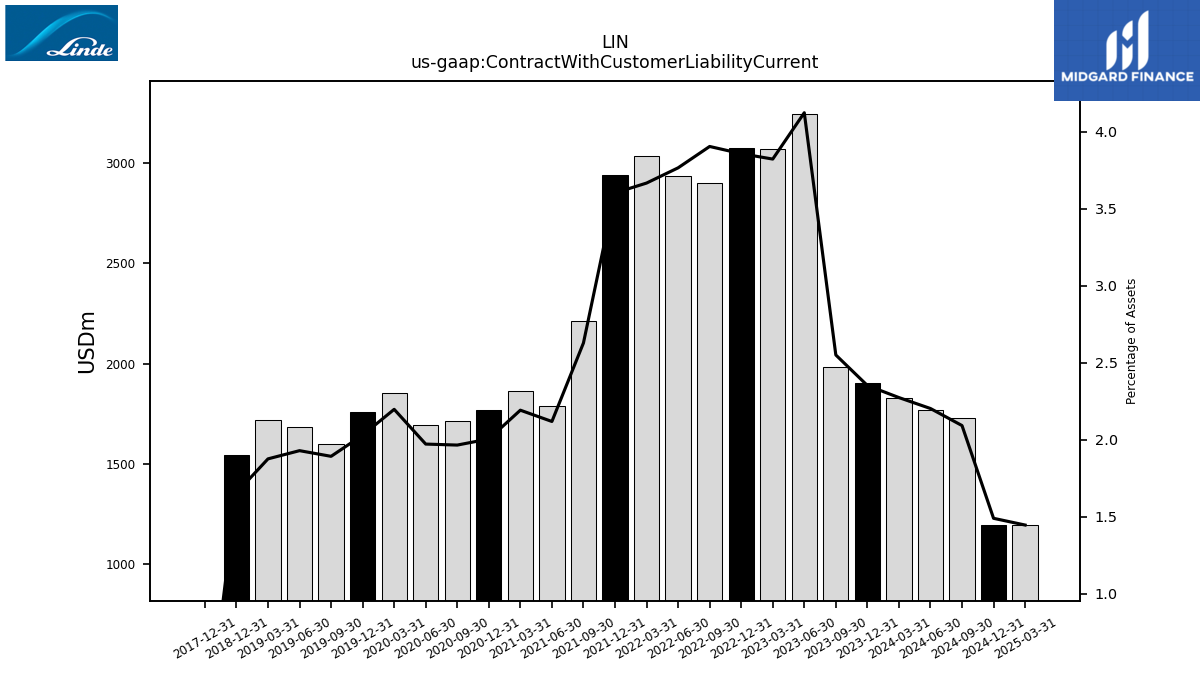
| Contract With Customer Liability Current | 1901.00 | 1985.00 | 3246.00 | 3070.00 | 3073.00 | 2902.00 | 2933.00 | 3035.00 | 2940.00 | 2213.00 | 1787.00 | 1863.00 | 1769.00 | 1714.00 | 1693.00 | 1854.00 | 1758.00 | 1597.00 | 1682.00 | 1719.00 | 1546.00 | NA | NA | NA | 0.00 | NA | NA | NA |
| 2023-12-31 | 2023-09-30 | 2023-06-30 | 2023-03-31 | 2022-12-31 | 2022-09-30 | 2022-06-30 | 2022-03-31 | 2021-12-31 | 2021-09-30 | 2021-06-30 | 2021-03-31 | 2020-12-31 | 2020-09-30 | 2020-06-30 | 2020-03-31 | 2019-12-31 | 2019-09-30 | 2019-06-30 | 2019-03-31 | 2018-12-31 | 2018-09-30 | 2018-06-30 | 2018-03-31 | 2017-12-31 | 2017-09-30 | 2017-06-30 | 2017-03-31 | ||
|---|---|---|---|---|---|---|---|---|---|---|---|---|---|---|---|---|---|---|---|---|---|---|---|---|---|---|---|---|---|
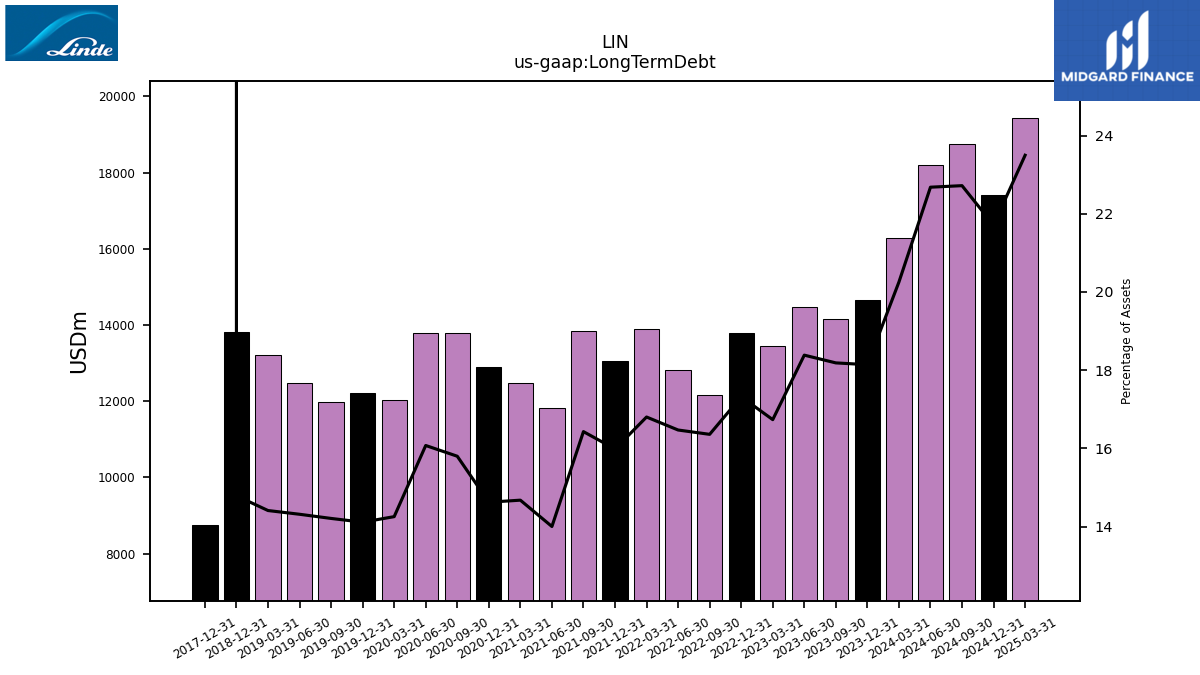
| Long Term Debt | 14660.00 | 14154.00 | 14472.00 | 13440.00 | 13797.00 | 12159.00 | 12828.00 | 13907.00 | 13044.00 | 13832.00 | 11811.00 | 12474.00 | 12903.00 | 13779.00 | 13801.00 | 12027.00 | 12224.00 | 11992.00 | 12482.00 | 13207.00 | 13811.00 | NA | NA | NA | 8762.00 | NA | NA | NA | |
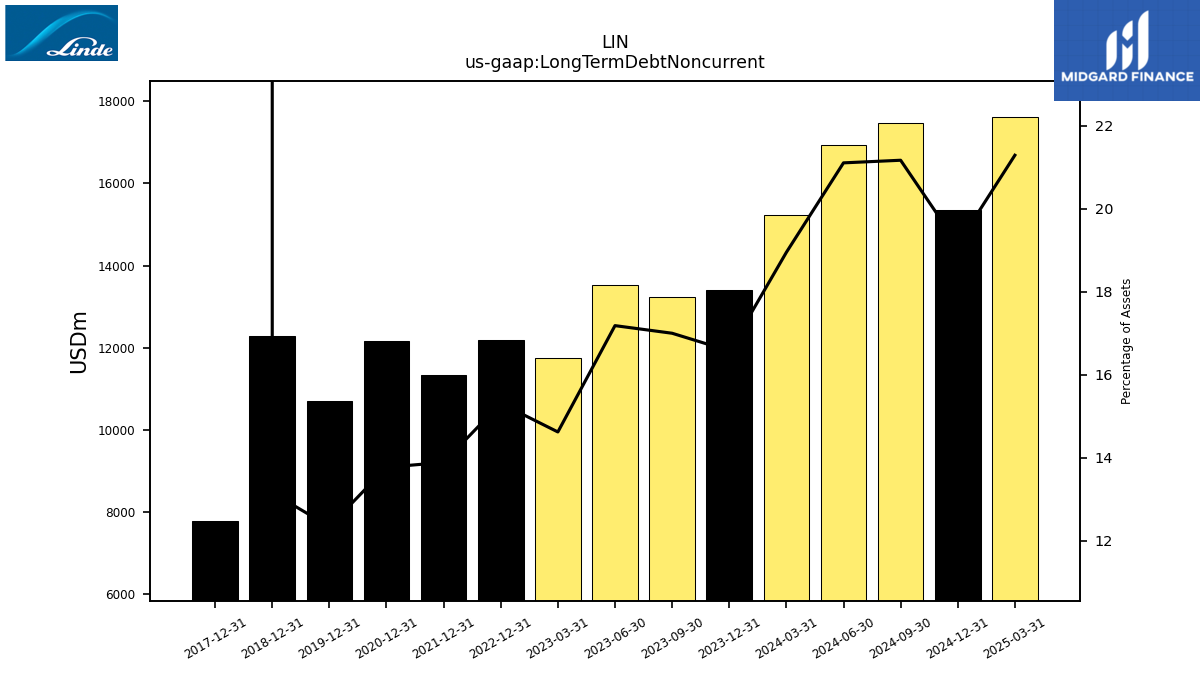
| Long Term Debt Noncurrent | 13397.00 | 13232.00 | 13528.00 | 11744.00 | 12198.00 | NA | NA | NA | 11335.00 | NA | NA | NA | 12152.00 | NA | NA | NA | 10693.00 | NA | NA | NA | 12288.00 | NA | NA | NA | 7783.00 | NA | NA | NA | |
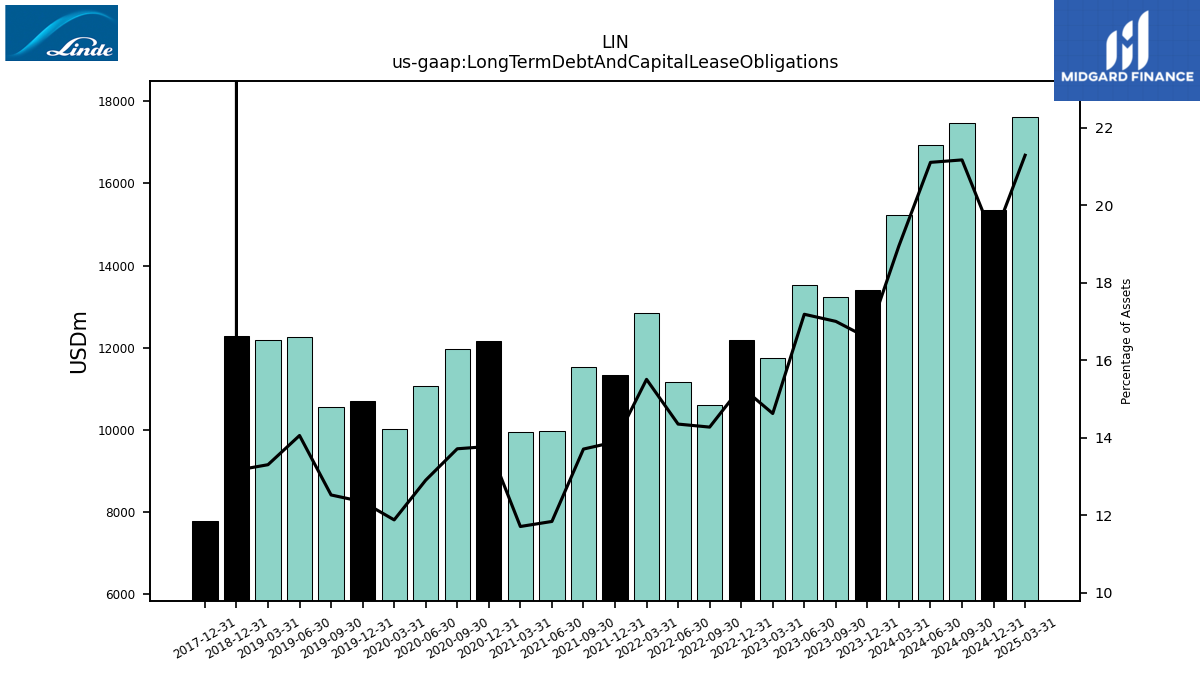
| Long Term Debt And Capital Lease Obligations | 13397.00 | 13232.00 | 13528.00 | 11744.00 | 12198.00 | 10608.00 | 11177.00 | 12833.00 | 11335.00 | 11539.00 | 9984.00 | 9950.00 | 12152.00 | 11959.00 | 11078.00 | 10021.00 | 10693.00 | 10567.00 | 12255.00 | 12190.00 | 12288.00 | NA | NA | NA | 7783.00 | NA | NA | NA | |
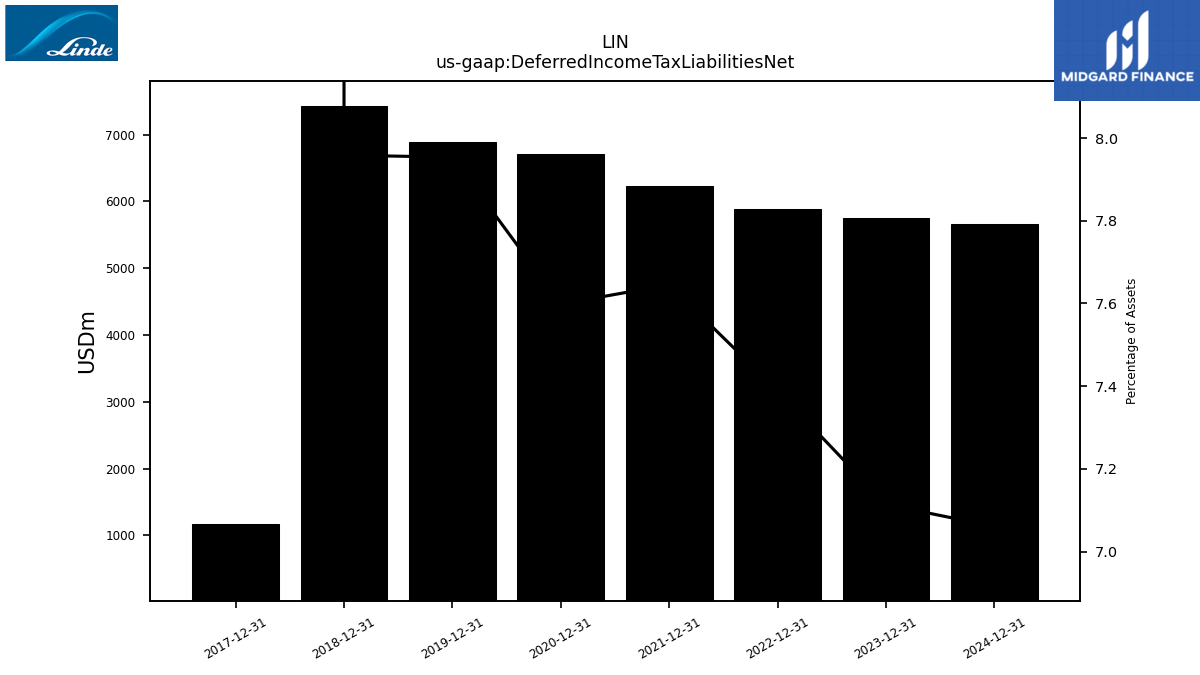
| Deferred Income Tax Liabilities Net | 5749.00 | NA | NA | NA | 5886.00 | NA | NA | NA | 6239.00 | NA | NA | NA | 6704.00 | NA | NA | NA | 6889.00 | NA | NA | NA | 7432.00 | NA | NA | NA | 1167.00 | NA | NA | NA | |
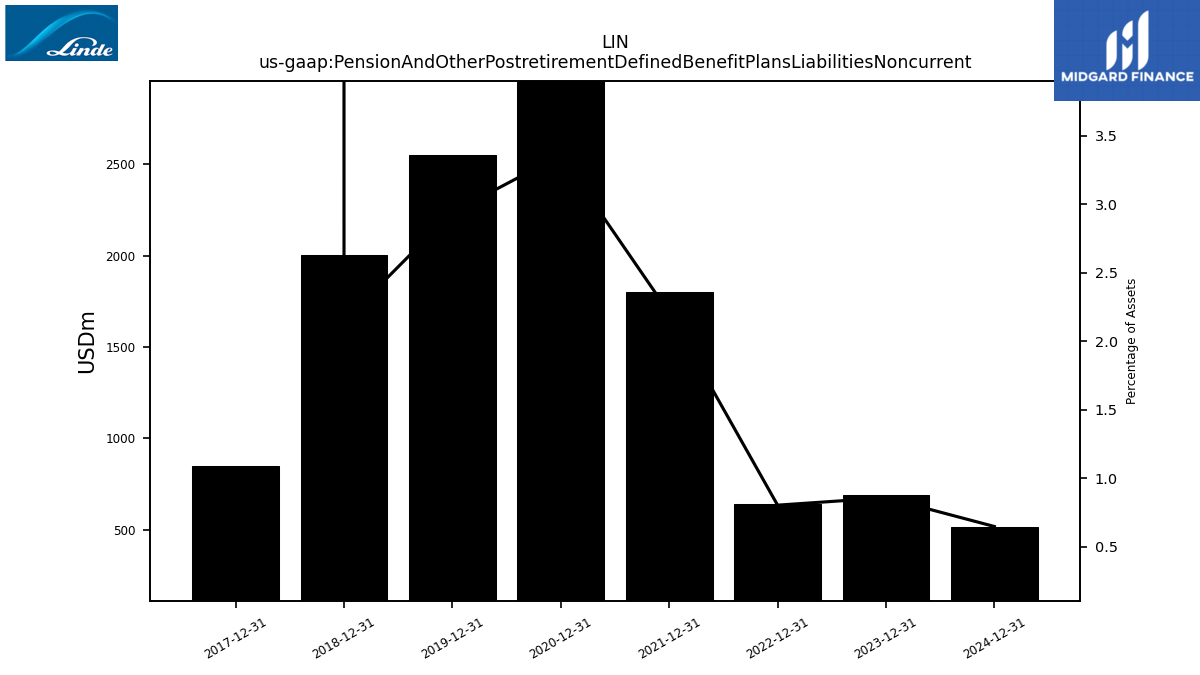
| Pension And Other Postretirement Defined Benefit Plans Liabilities Noncurrent | 693.00 | NA | NA | NA | 640.00 | NA | NA | NA | 1802.00 | NA | NA | NA | 2963.00 | NA | NA | NA | 2548.00 | NA | NA | NA | 2004.00 | NA | NA | NA | 851.00 | NA | NA | NA | |
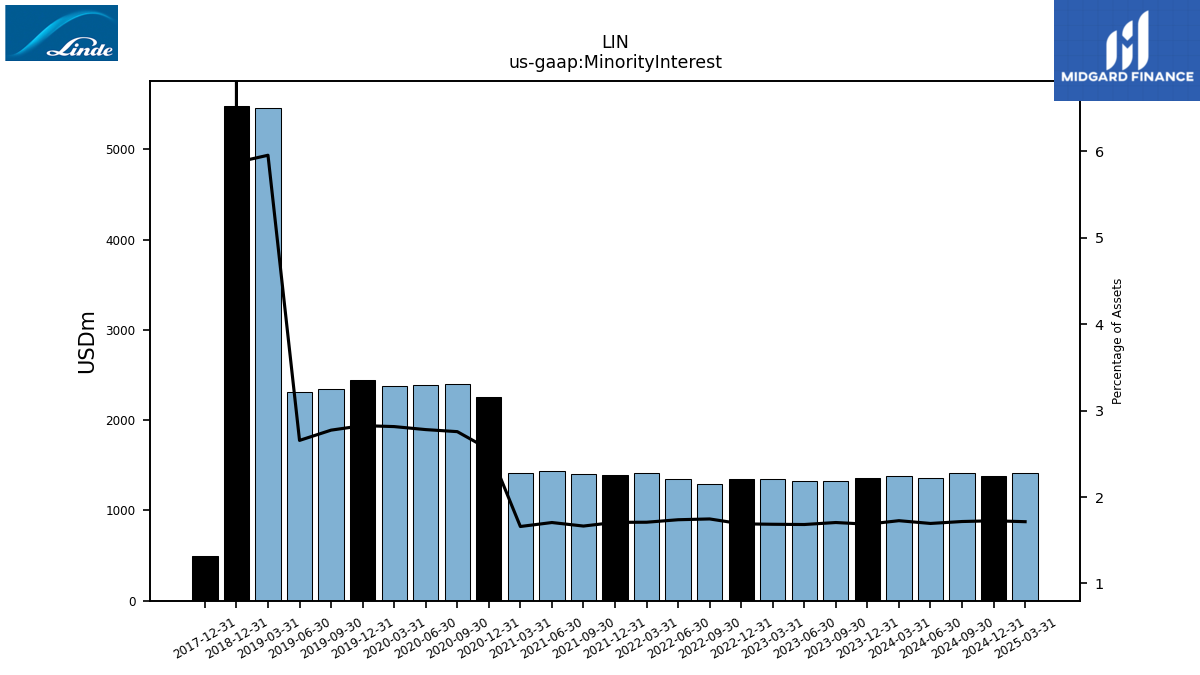
| Minority Interest | 1362.00 | 1327.00 | 1324.00 | 1353.00 | 1346.00 | 1298.00 | 1353.00 | 1414.00 | 1393.00 | 1401.00 | 1438.00 | 1410.00 | 2252.00 | 2404.00 | 2387.00 | 2375.00 | 2448.00 | 2341.00 | 2315.00 | 5457.00 | 5484.00 | NA | NA | NA | 493.00 | NA | NA | NA | |
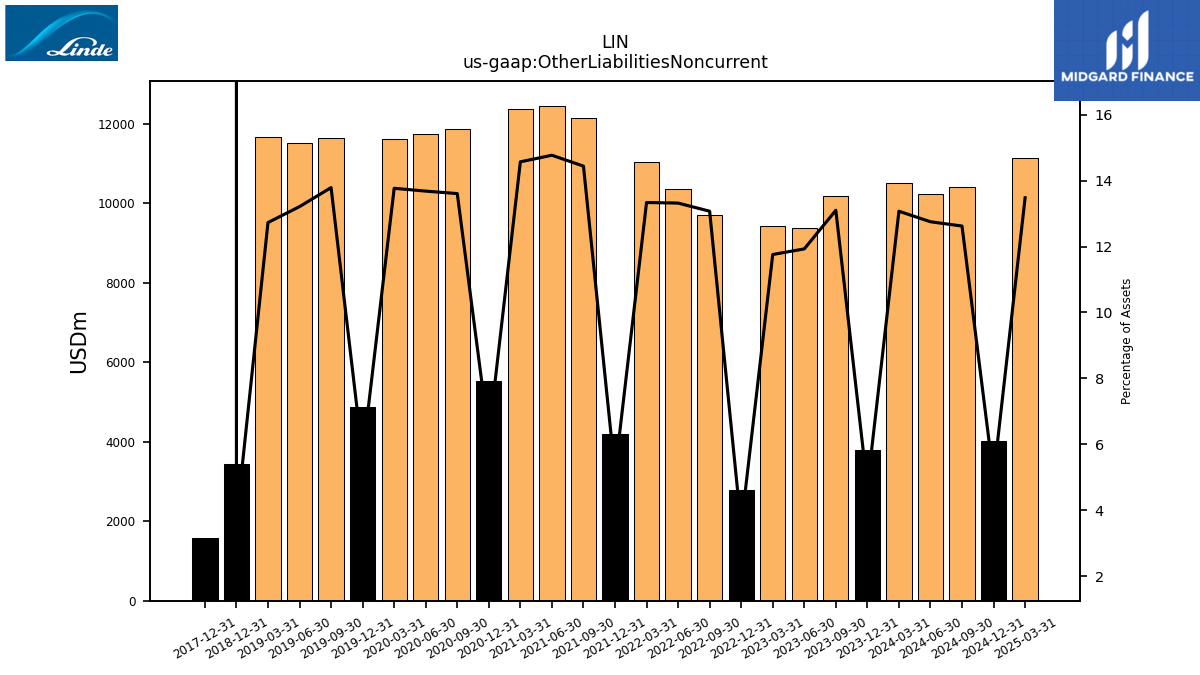
| Other Liabilities Noncurrent | 3804.00 | 10195.00 | 9390.00 | 9443.00 | 2795.00 | 9715.00 | 10373.00 | 11038.00 | 4188.00 | 12157.00 | 12457.00 | 12383.00 | 5519.00 | 11866.00 | 11746.00 | 11615.00 | 4888.00 | 11636.00 | 11519.00 | 11664.00 | 3435.00 | NA | NA | NA | 1588.00 | NA | NA | NA | |
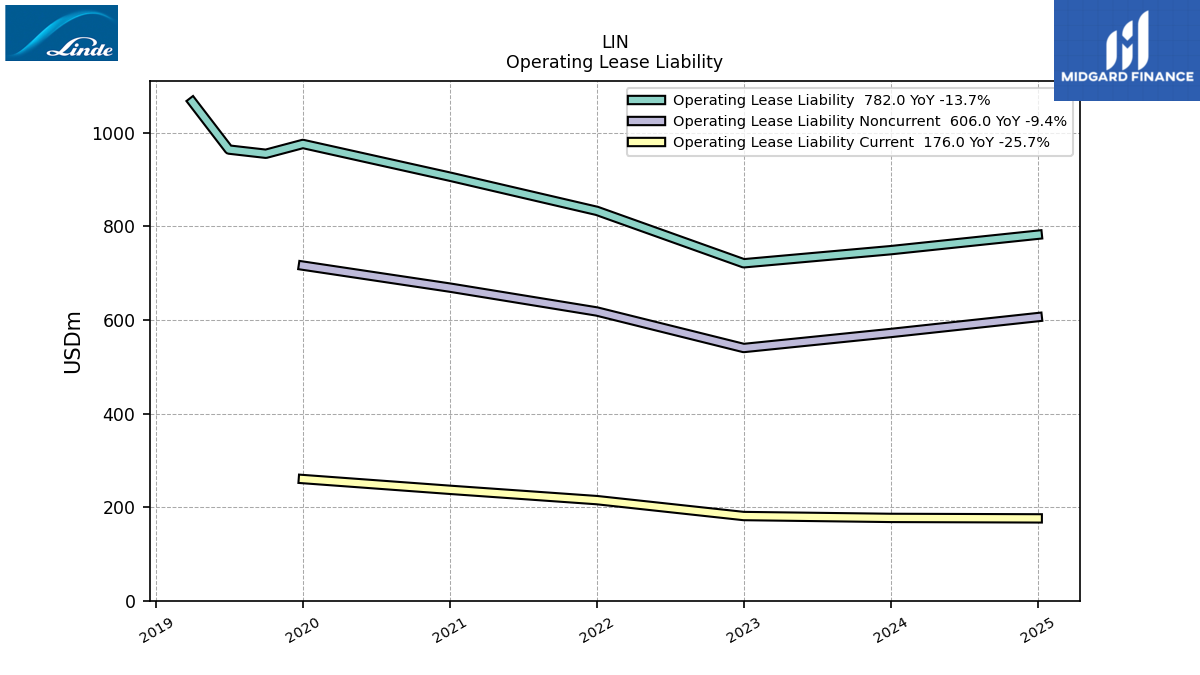
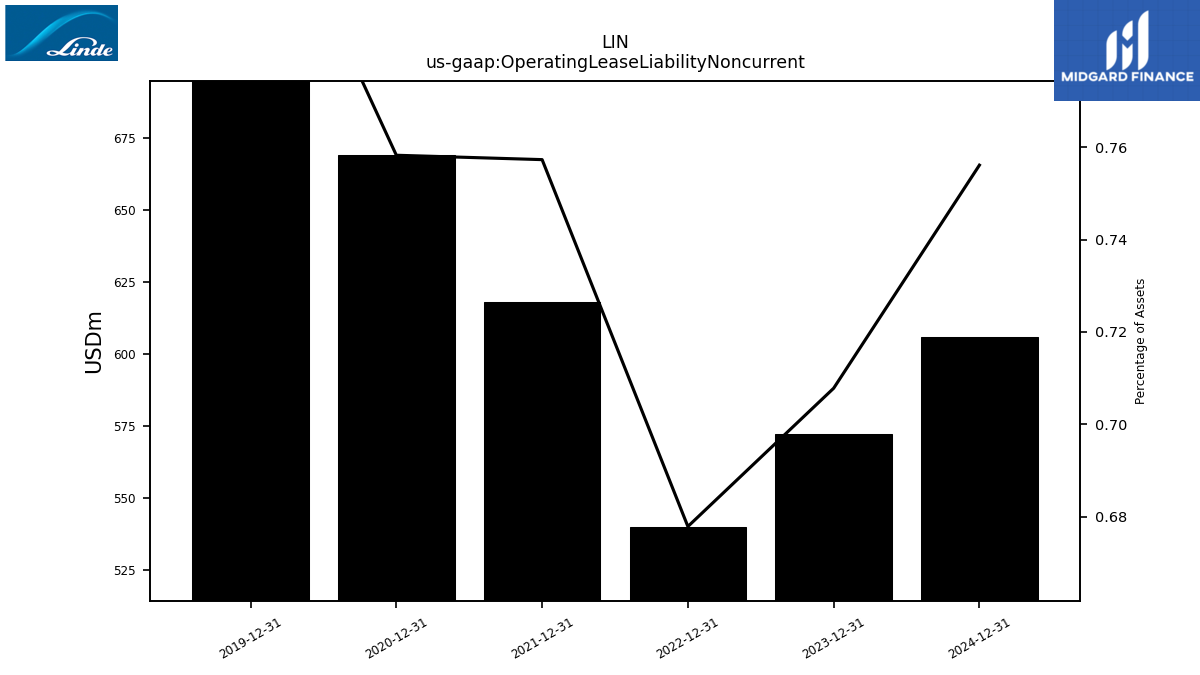
| Operating Lease Liability Noncurrent | 572.00 | NA | NA | NA | 540.00 | NA | NA | NA | 618.00 | NA | NA | NA | 669.00 | NA | NA | NA | 716.00 | NA | NA | NA | NA | NA | NA | NA | NA | NA | NA | NA |
| 2023-12-31 | 2023-09-30 | 2023-06-30 | 2023-03-31 | 2022-12-31 | 2022-09-30 | 2022-06-30 | 2022-03-31 | 2021-12-31 | 2021-09-30 | 2021-06-30 | 2021-03-31 | 2020-12-31 | 2020-09-30 | 2020-06-30 | 2020-03-31 | 2019-12-31 | 2019-09-30 | 2019-06-30 | 2019-03-31 | 2018-12-31 | 2018-09-30 | 2018-06-30 | 2018-03-31 | 2017-12-31 | 2017-09-30 | 2017-06-30 | 2017-03-31 | ||
|---|---|---|---|---|---|---|---|---|---|---|---|---|---|---|---|---|---|---|---|---|---|---|---|---|---|---|---|---|---|
| Stockholders Equity | 39720.00 | 38898.00 | 39911.00 | 39970.00 | 40028.00 | 37628.00 | 39674.00 | 42963.00 | 44035.00 | 44323.00 | 45777.00 | 46210.00 | 47317.00 | 46175.00 | 45537.00 | 44776.00 | 49074.00 | 48953.00 | 50564.00 | 51175.00 | 51596.00 | -11.15 | NA | NA | -1.93 | -0.77 | -0.46 | NA | |
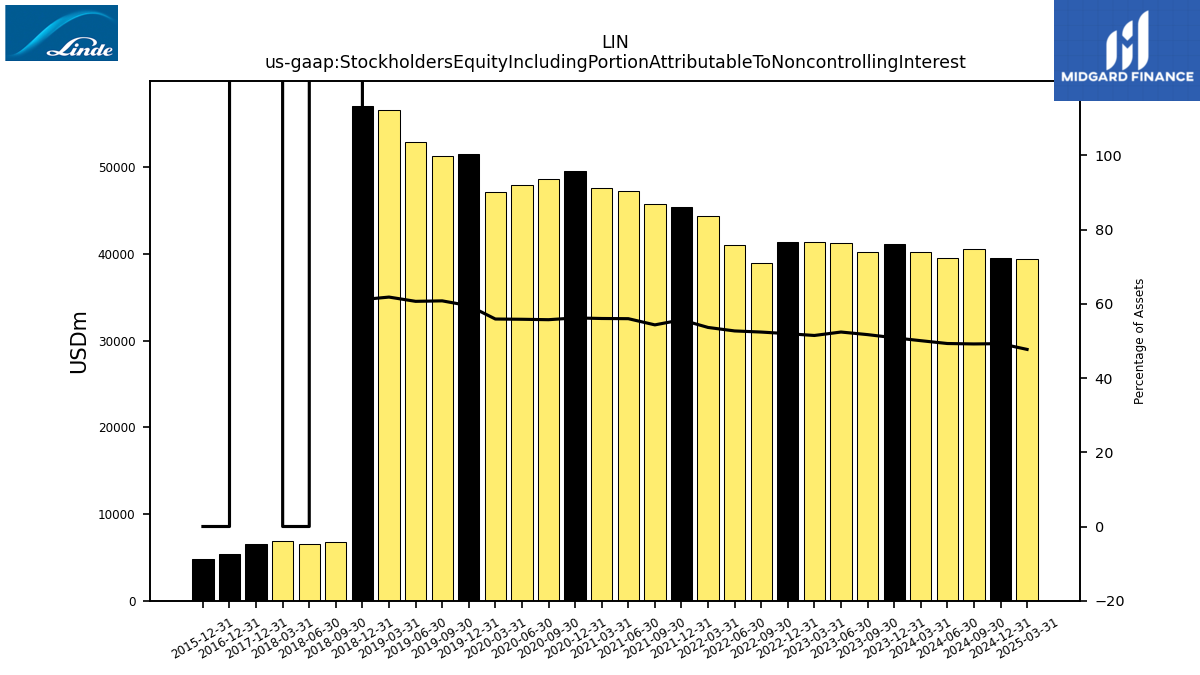
| Stockholders Equity Including Portion Attributable To Noncontrolling Interest | 41082.00 | 40225.00 | 41235.00 | 41323.00 | 41374.00 | 38926.00 | 41027.00 | 44377.00 | 45428.00 | 45724.00 | 47215.00 | 47620.00 | 49569.00 | 48579.00 | 47924.00 | 47151.00 | 51522.00 | 51294.00 | 52879.00 | 56632.00 | 57080.00 | 6735.00 | 6528.00 | 6884.00 | 6511.00 | NA | NA | NA | |
| Common Stock Value | 1.00 | NA | NA | NA | 1.00 | 1.00 | 1.00 | 1.00 | 1.00 | 1.00 | 1.00 | 1.00 | 1.00 | 1.00 | 1.00 | 1.00 | 1.00 | 1.00 | 1.00 | 1.00 | 1.00 | 0.03 | NA | NA | 0.03 | 0.03 | 0.03 | NA | |
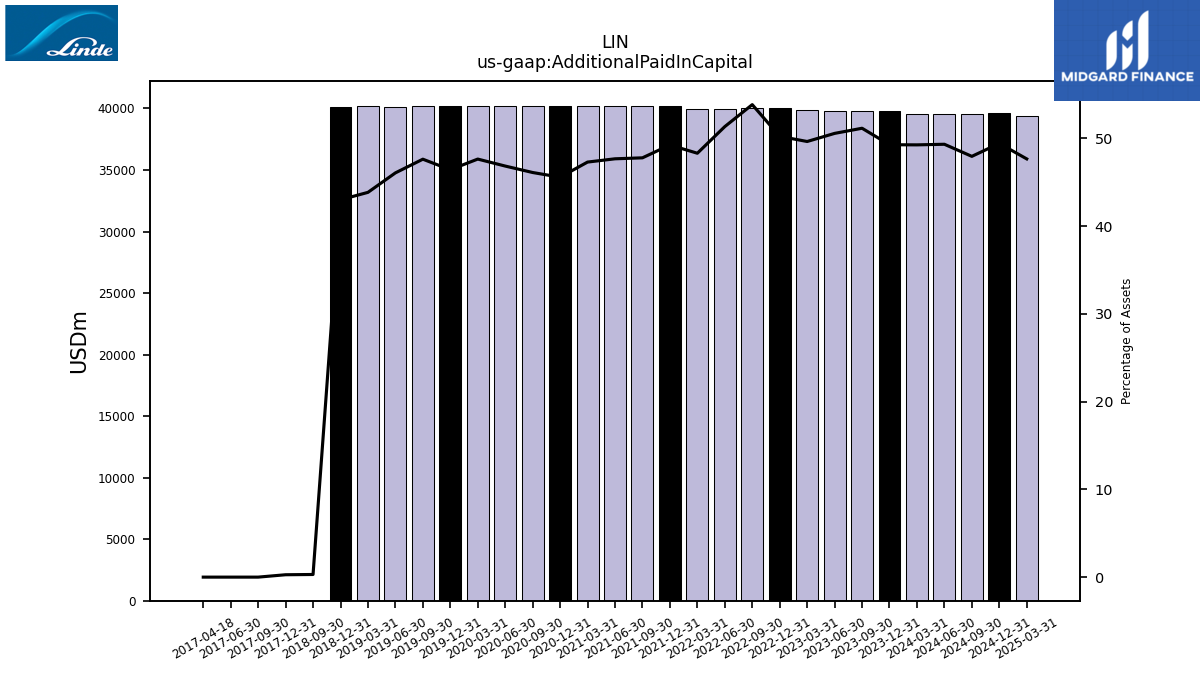
| Additional Paid In Capital | 39812.00 | 39803.00 | 39797.00 | 39859.00 | 40005.00 | 40011.00 | 39978.00 | 39972.00 | 40180.00 | 40220.00 | 40200.00 | 40192.00 | 40202.00 | 40203.00 | 40211.00 | 40185.00 | 40201.00 | 40185.00 | 40157.00 | 40173.00 | 40151.00 | 0.03 | NA | NA | 0.03 | 0.03 | 0.03 | NA | |
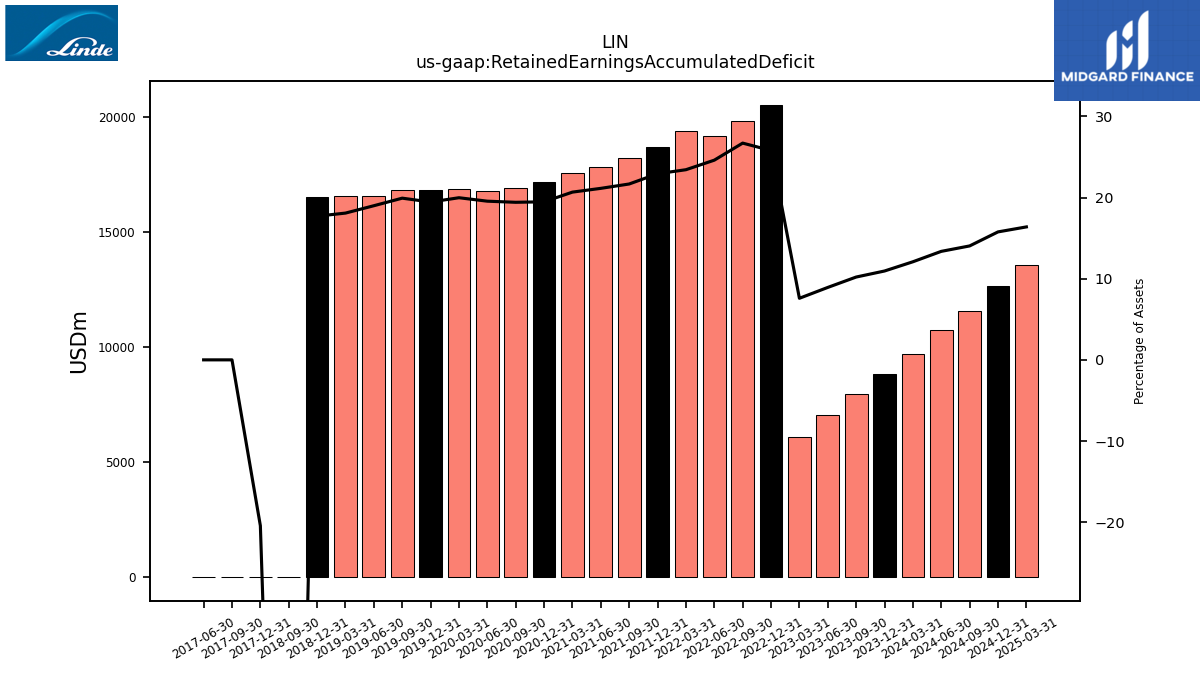
| Retained Earnings Accumulated Deficit | 8845.00 | 7940.00 | 7024.00 | 6092.00 | 20541.00 | 19845.00 | 19159.00 | 19387.00 | 18710.00 | 18240.00 | 17820.00 | 17563.00 | 17178.00 | 16927.00 | 16782.00 | 16850.00 | 16842.00 | 16810.00 | 16555.00 | 16569.00 | 16529.00 | -11.28 | NA | NA | -1.88 | -0.75 | -0.46 | NA | |
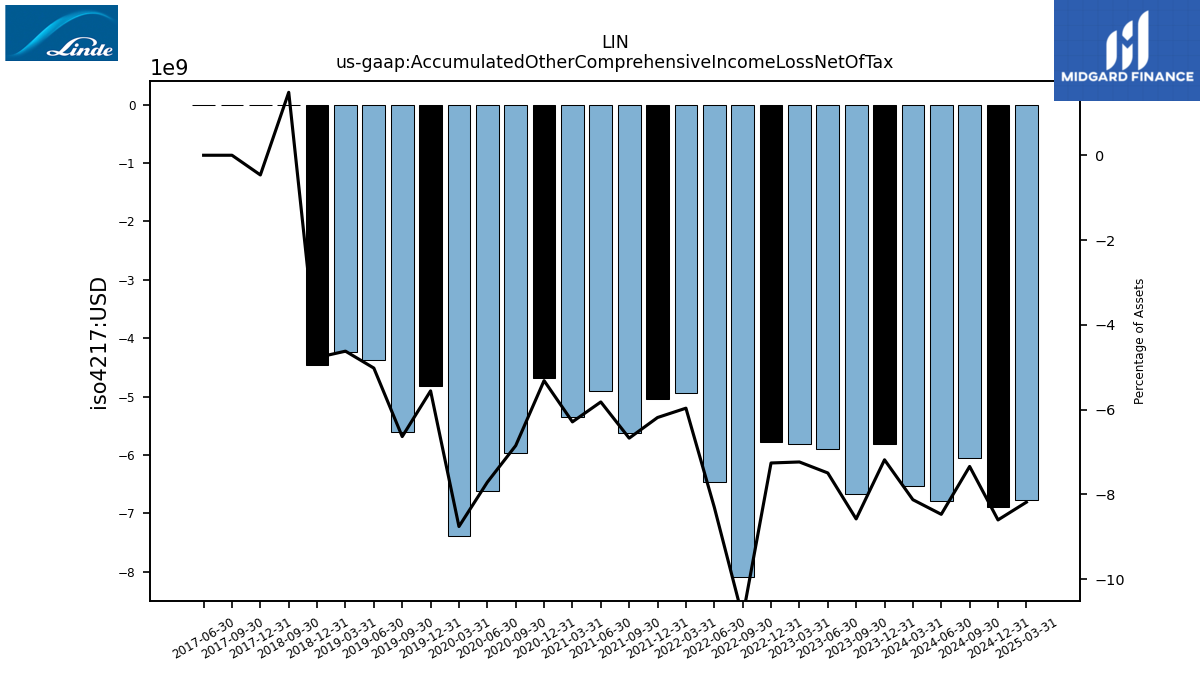
| Accumulated Other Comprehensive Income Loss Net Of Tax | -5805.00 | -6676.00 | -5899.00 | -5810.00 | -5782.00 | -8094.00 | -6466.00 | -4938.00 | -5048.00 | -5618.00 | -4908.00 | -5345.00 | -4690.00 | -5973.00 | -6621.00 | -7388.00 | -4814.00 | -5600.00 | -4377.00 | -4235.00 | -4456.00 | 0.13 | NA | NA | -0.04 | -0.02 | -0.00 | NA | |
| Minority Interest | 1362.00 | 1327.00 | 1324.00 | 1353.00 | 1346.00 | 1298.00 | 1353.00 | 1414.00 | 1393.00 | 1401.00 | 1438.00 | 1410.00 | 2252.00 | 2404.00 | 2387.00 | 2375.00 | 2448.00 | 2341.00 | 2315.00 | 5457.00 | 5484.00 | NA | NA | NA | 493.00 | NA | NA | NA | |
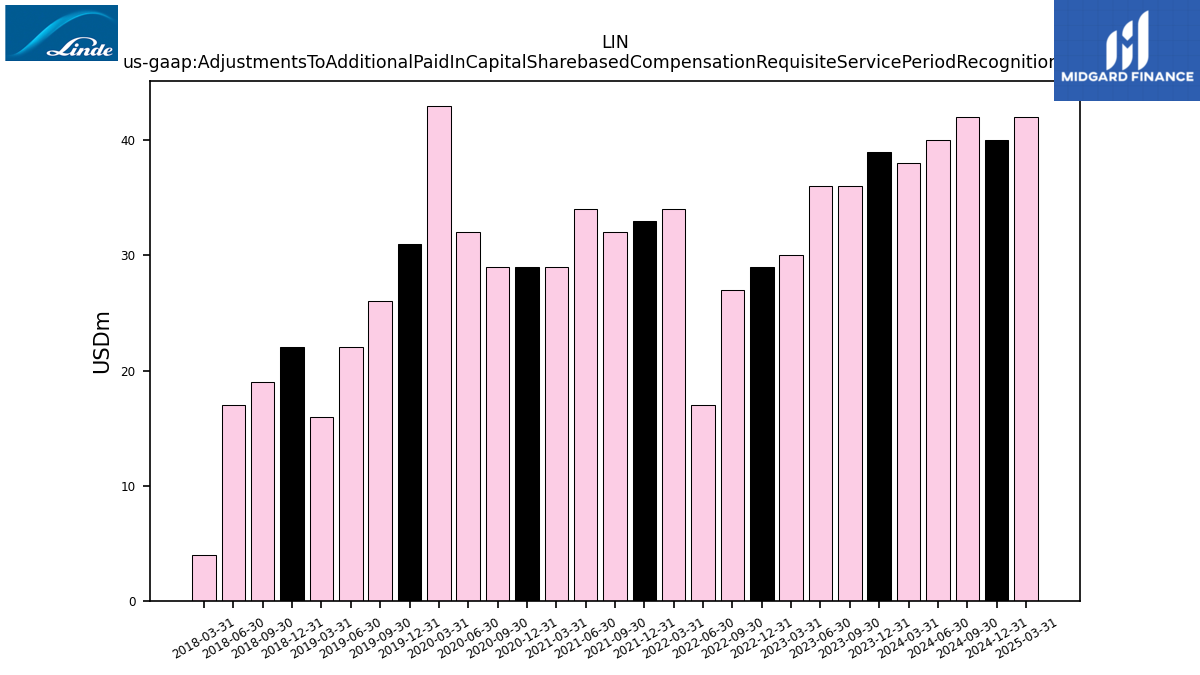
| Adjustments To Additional Paid In Capital Sharebased Compensation Requisite Service Period Recognition Value | 39.00 | 36.00 | 36.00 | 30.00 | 29.00 | 27.00 | 17.00 | 34.00 | 33.00 | 32.00 | 34.00 | 29.00 | 29.00 | 29.00 | 32.00 | 43.00 | 31.00 | 26.00 | 22.00 | 16.00 | 22.00 | 19.00 | 17.00 | 4.00 | NA | NA | NA | NA | |
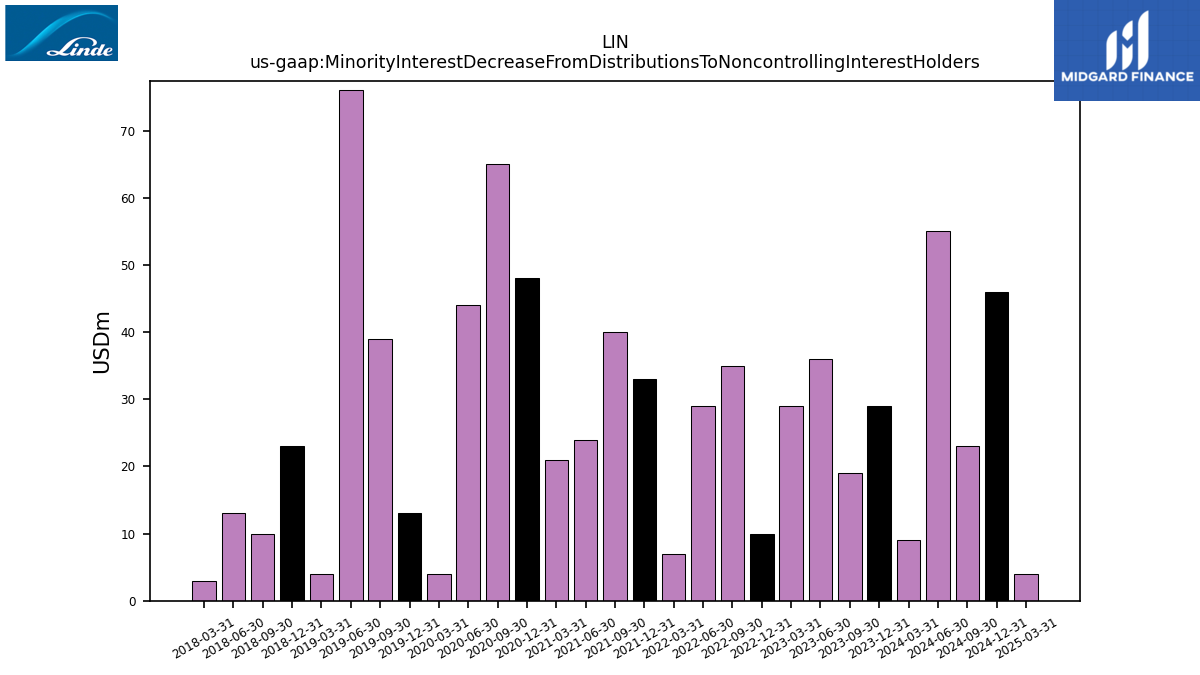
| Minority Interest Decrease From Distributions To Noncontrolling Interest Holders | 29.00 | 19.00 | 36.00 | 29.00 | 10.00 | 35.00 | 29.00 | 7.00 | 33.00 | 40.00 | 24.00 | 21.00 | 48.00 | 65.00 | 44.00 | 4.00 | 13.00 | 39.00 | 76.00 | 4.00 | 23.00 | 10.00 | 13.00 | 3.00 | NA | NA | NA | NA |
| 2023-12-31 | 2023-09-30 | 2023-06-30 | 2023-03-31 | 2022-12-31 | 2022-09-30 | 2022-06-30 | 2022-03-31 | 2021-12-31 | 2021-09-30 | 2021-06-30 | 2021-03-31 | 2020-12-31 | 2020-09-30 | 2020-06-30 | 2020-03-31 | 2019-12-31 | 2019-09-30 | 2019-06-30 | 2019-03-31 | 2018-12-31 | 2018-09-30 | 2018-06-30 | 2018-03-31 | 2017-12-31 | 2017-09-30 | 2017-06-30 | 2017-03-31 | ||
|---|---|---|---|---|---|---|---|---|---|---|---|---|---|---|---|---|---|---|---|---|---|---|---|---|---|---|---|---|---|
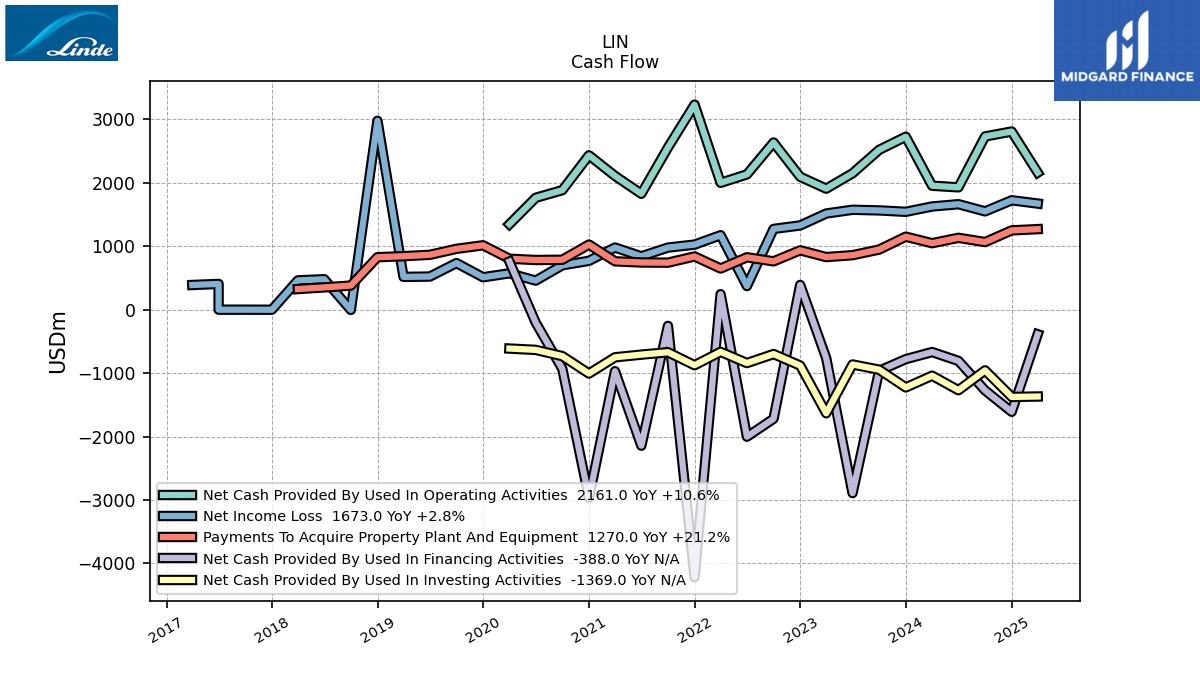
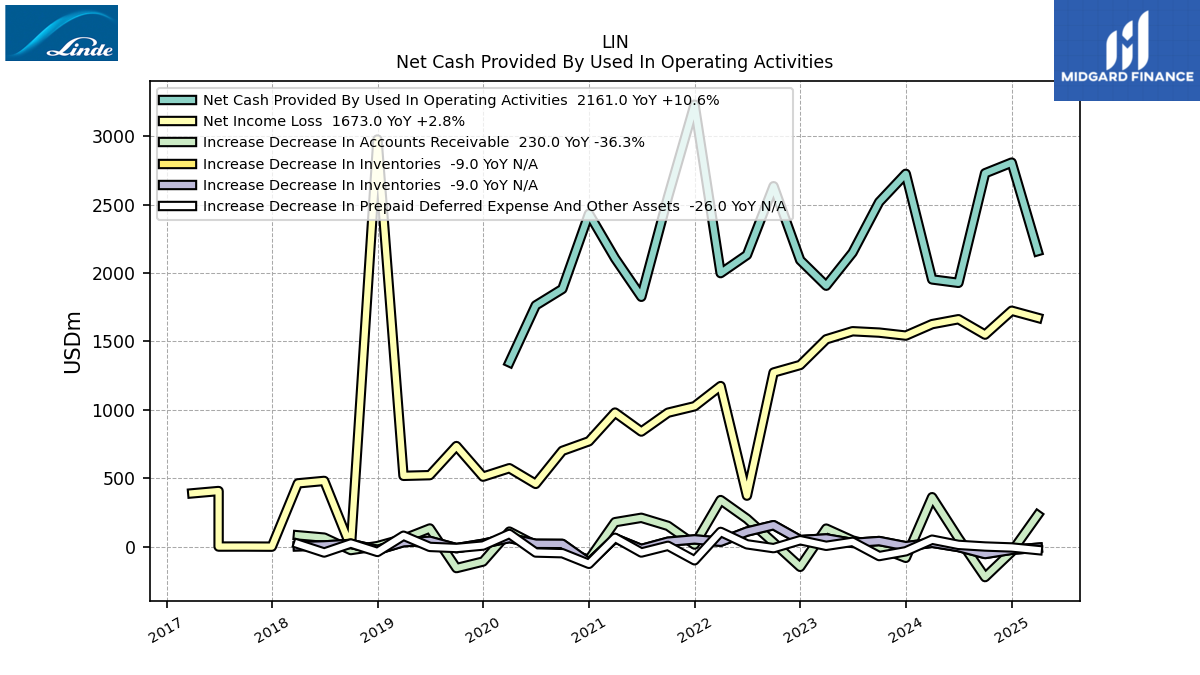
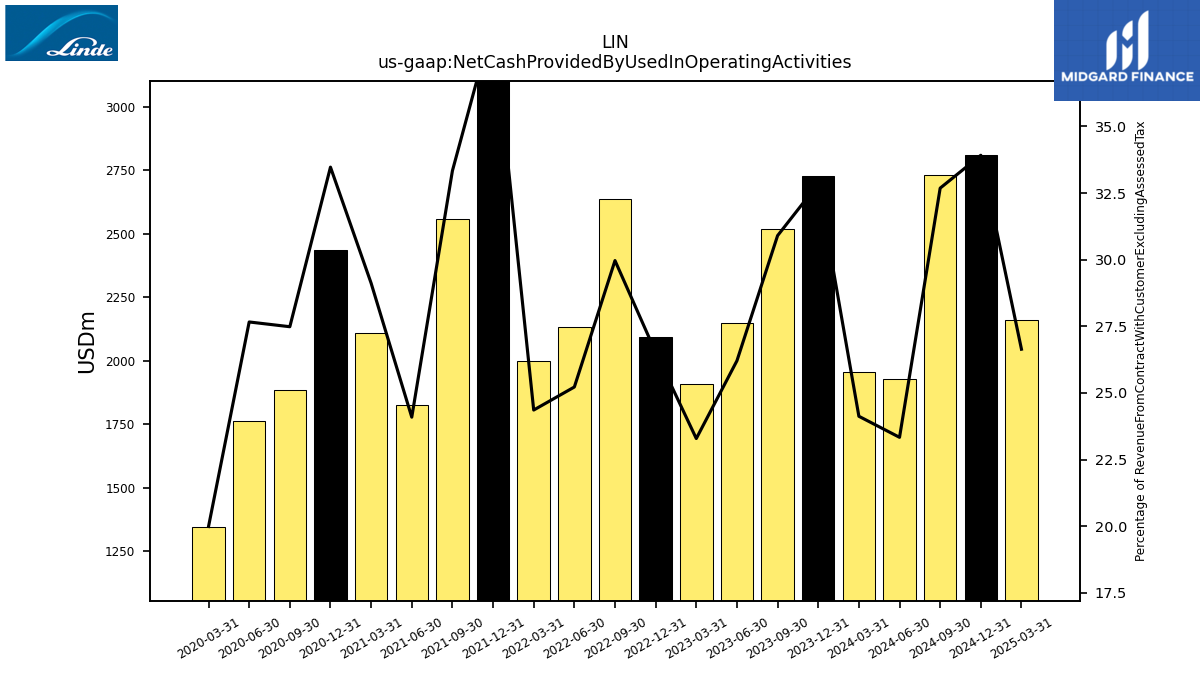
| Net Cash Provided By Used In Operating Activities | 2727.00 | 2520.00 | 2150.00 | 1908.00 | 2095.00 | 2636.00 | 2133.00 | 2000.00 | 3233.00 | 2556.00 | 1827.00 | 2109.00 | 2434.00 | 1884.00 | 1764.00 | 1347.00 | NA | NA | NA | NA | NA | NA | NA | NA | NA | NA | NA | NA | |
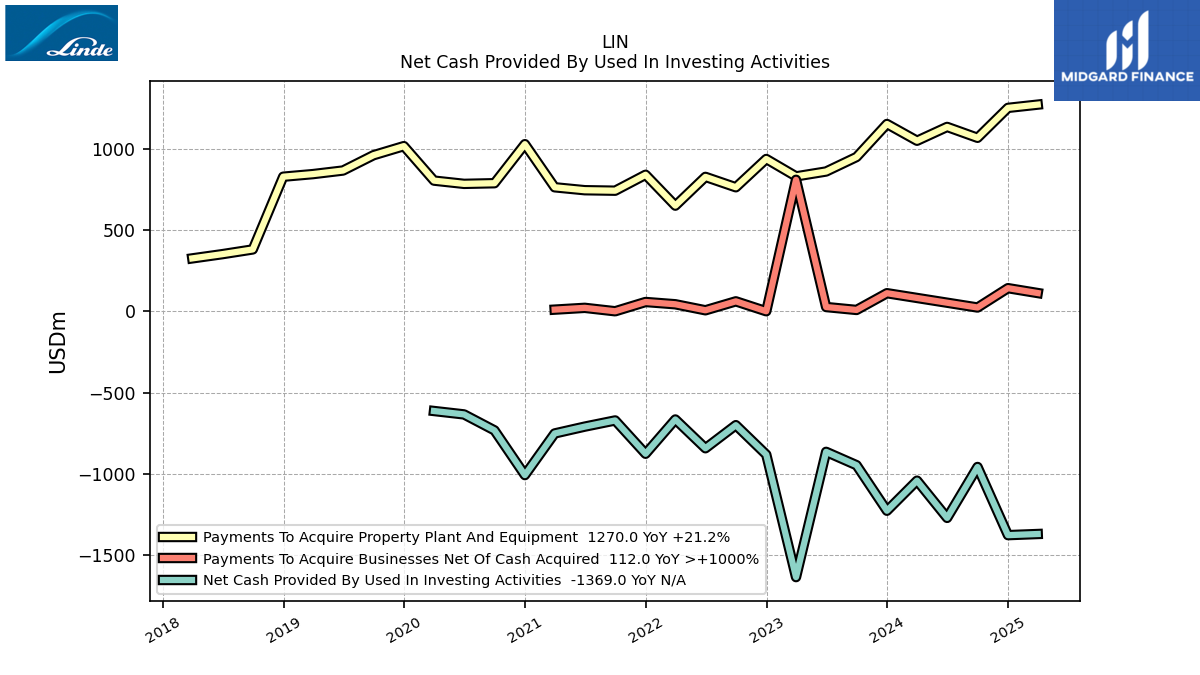
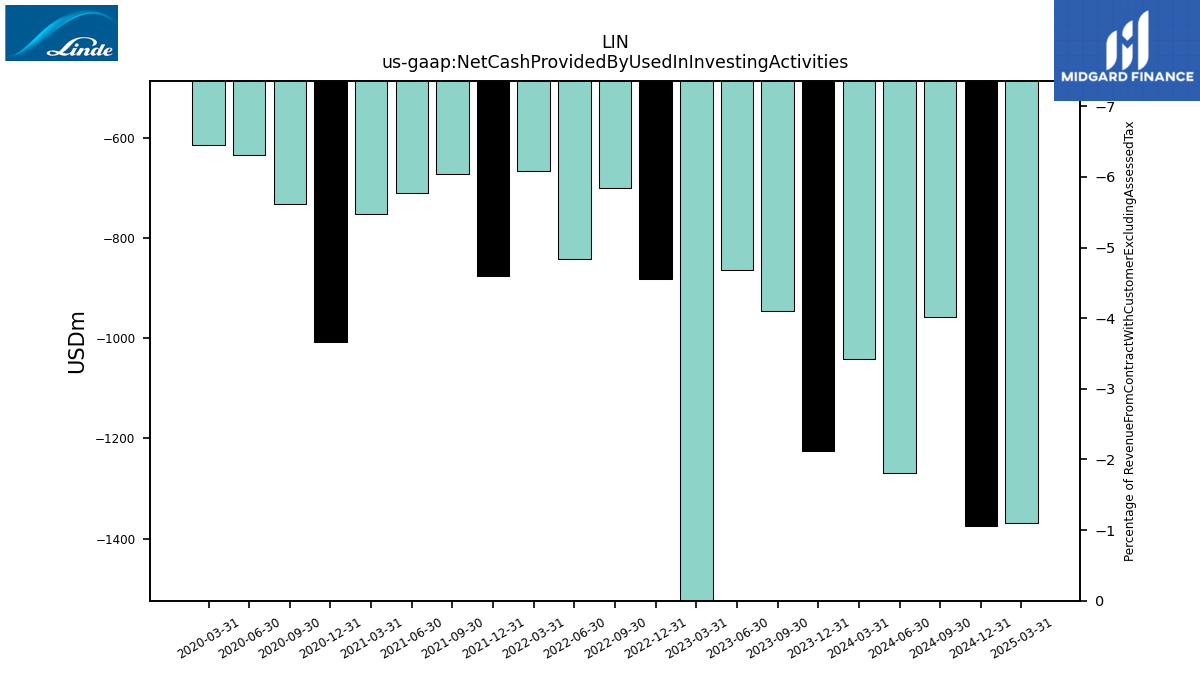
| Net Cash Provided By Used In Investing Activities | -1226.00 | -946.00 | -864.00 | -1634.00 | -881.00 | -700.00 | -842.00 | -665.00 | -876.00 | -671.00 | -709.00 | -751.00 | -1007.00 | -732.00 | -634.00 | -613.00 | NA | NA | NA | NA | NA | NA | NA | NA | NA | NA | NA | NA | |
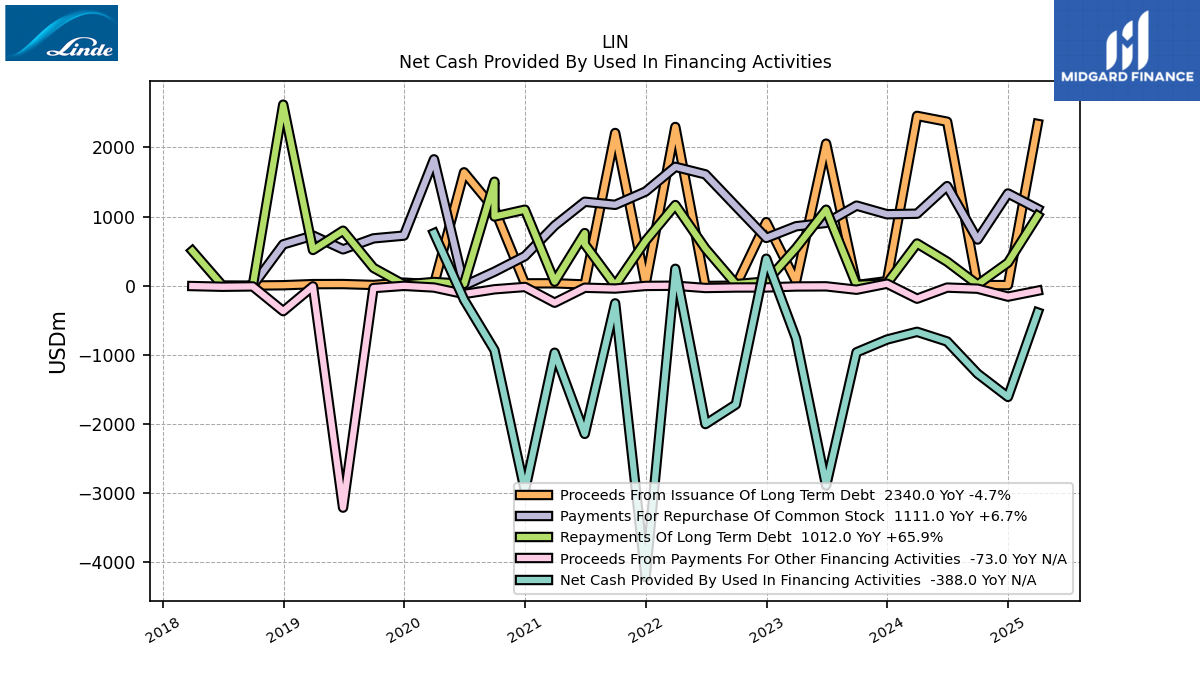
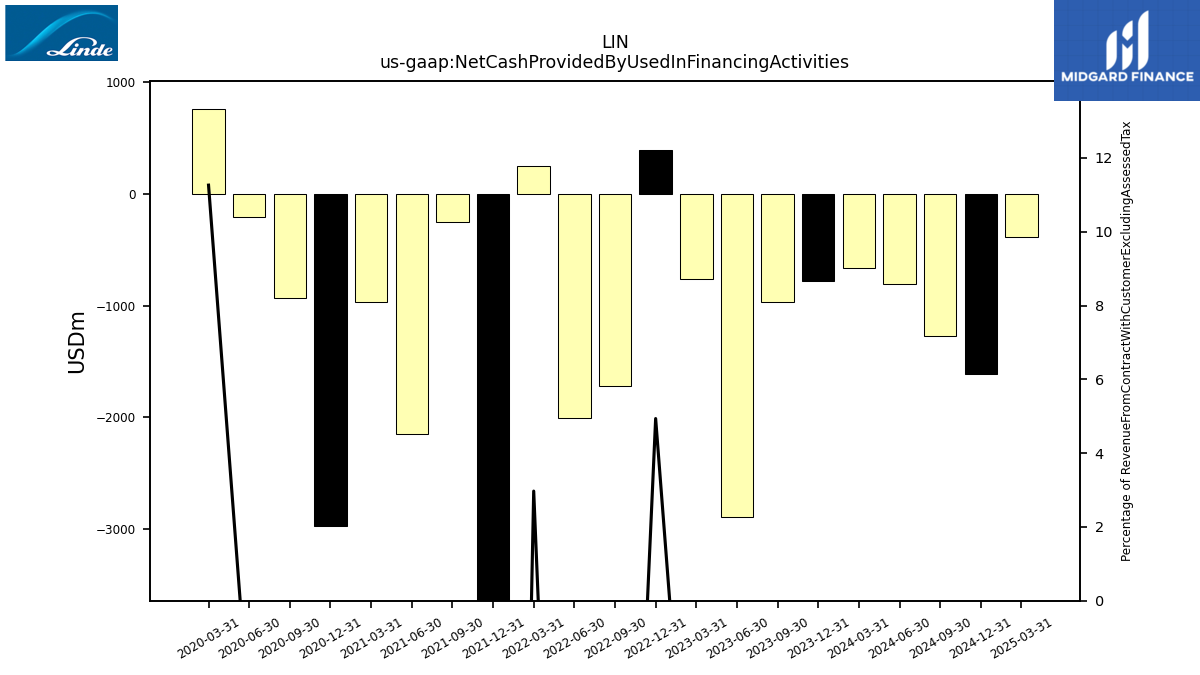
| Net Cash Provided By Used In Financing Activities | -780.00 | -964.00 | -2892.00 | -764.00 | 390.00 | -1720.00 | -2003.00 | 244.00 | -4217.00 | -256.00 | -2145.00 | -970.00 | -2967.00 | -933.00 | -204.00 | 759.00 | NA | NA | NA | NA | NA | NA | NA | NA | NA | NA | NA | NA |
| 2023-12-31 | 2023-09-30 | 2023-06-30 | 2023-03-31 | 2022-12-31 | 2022-09-30 | 2022-06-30 | 2022-03-31 | 2021-12-31 | 2021-09-30 | 2021-06-30 | 2021-03-31 | 2020-12-31 | 2020-09-30 | 2020-06-30 | 2020-03-31 | 2019-12-31 | 2019-09-30 | 2019-06-30 | 2019-03-31 | 2018-12-31 | 2018-09-30 | 2018-06-30 | 2018-03-31 | 2017-12-31 | 2017-09-30 | 2017-06-30 | 2017-03-31 | ||
|---|---|---|---|---|---|---|---|---|---|---|---|---|---|---|---|---|---|---|---|---|---|---|---|---|---|---|---|---|---|
| Net Cash Provided By Used In Operating Activities | 2727.00 | 2520.00 | 2150.00 | 1908.00 | 2095.00 | 2636.00 | 2133.00 | 2000.00 | 3233.00 | 2556.00 | 1827.00 | 2109.00 | 2434.00 | 1884.00 | 1764.00 | 1347.00 | NA | NA | NA | NA | NA | NA | NA | NA | NA | NA | NA | NA | |
| Net Income Loss | 1543.00 | 1565.00 | 1575.00 | 1516.00 | 1328.00 | 1273.00 | 372.00 | 1174.00 | 1026.00 | 979.00 | 841.00 | 980.00 | 770.00 | 700.00 | 458.00 | 573.00 | 511.00 | 735.00 | 522.00 | 517.00 | 2978.00 | -4.55 | 480.00 | 462.00 | -1.13 | -0.29 | 406.00 | 389.00 | |
| Profit Loss | 1576.00 | 1601.00 | 1612.00 | 1552.00 | 1361.00 | 1300.00 | 410.00 | 1210.00 | 1056.00 | 1010.00 | 877.00 | 1018.00 | 804.00 | 731.00 | 483.00 | 608.00 | 538.00 | 737.00 | 551.00 | 553.00 | 2953.00 | 480.00 | 498.00 | 471.00 | NA | NA | NA | NA | |
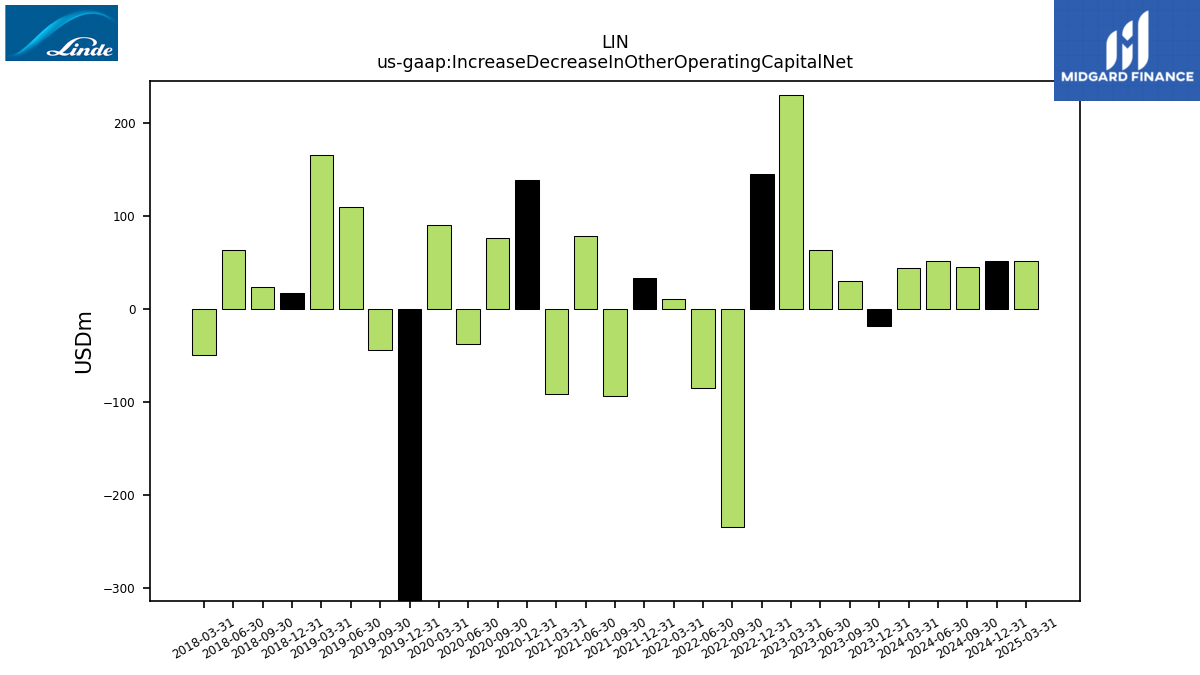
| Increase Decrease In Other Operating Capital Net | -18.00 | 30.00 | 63.00 | 230.00 | 145.00 | -234.00 | -85.00 | 11.00 | 33.00 | -94.00 | 78.00 | -92.00 | 138.00 | 76.00 | -38.00 | 90.00 | -323.00 | -44.00 | 109.00 | 165.00 | 17.00 | 23.00 | 63.00 | -50.00 | NA | NA | NA | NA | |
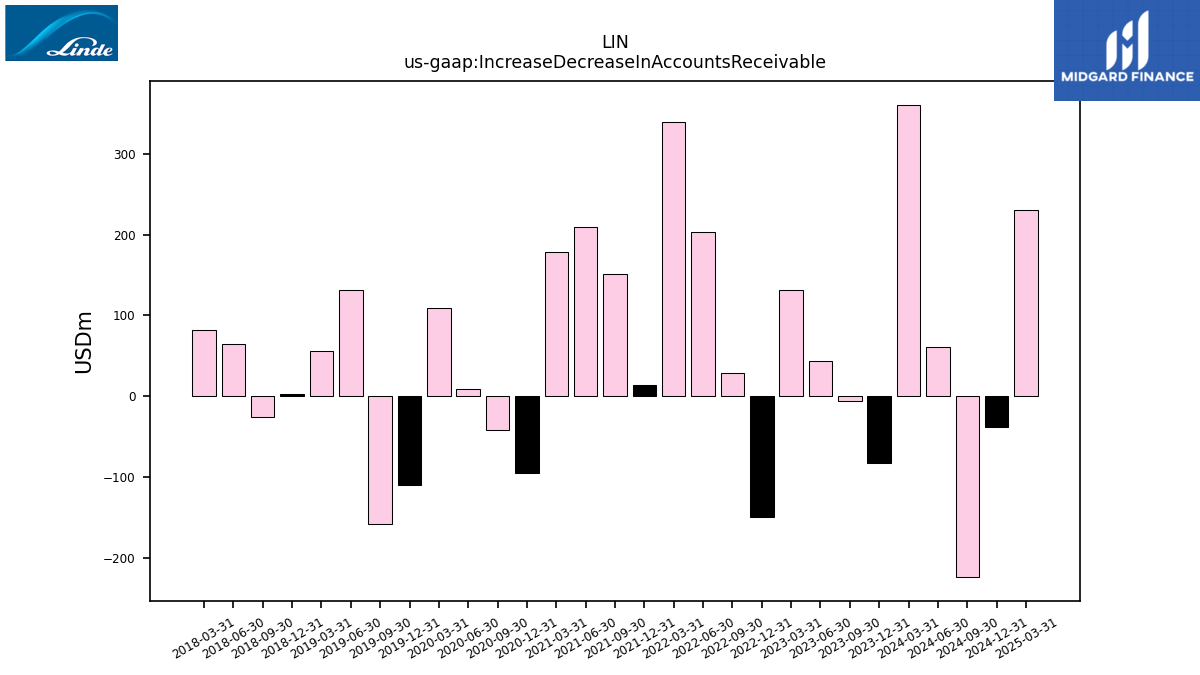
| Increase Decrease In Accounts Receivable | -83.00 | -6.00 | 44.00 | 131.00 | -149.00 | 29.00 | 203.00 | 340.00 | 14.00 | 151.00 | 210.00 | 178.00 | -95.00 | -42.00 | 9.00 | 109.00 | -110.00 | -158.00 | 132.00 | 56.00 | 3.00 | -26.00 | 65.00 | 82.00 | NA | NA | NA | NA | |
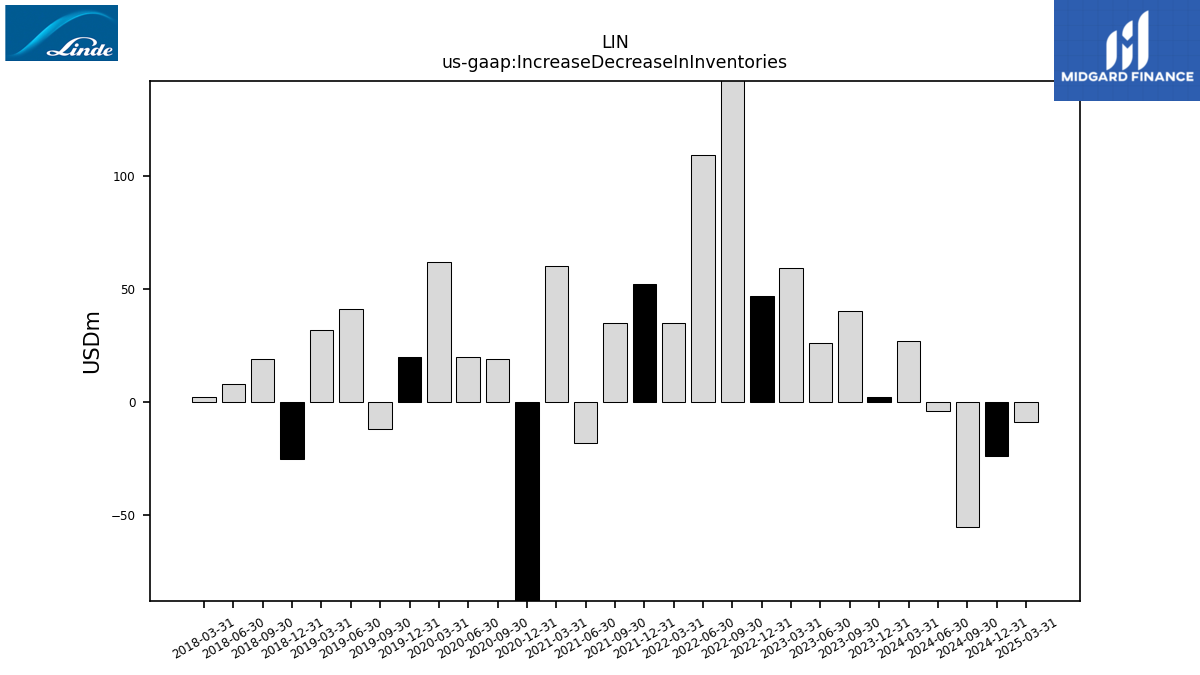
| Increase Decrease In Inventories | 2.00 | 40.00 | 26.00 | 59.00 | 47.00 | 156.00 | 109.00 | 35.00 | 52.00 | 35.00 | -18.00 | 60.00 | -119.00 | 19.00 | 20.00 | 62.00 | 20.00 | -12.00 | 41.00 | 32.00 | -25.00 | 19.00 | 8.00 | 2.00 | NA | NA | NA | NA |
| 2023-12-31 | 2023-09-30 | 2023-06-30 | 2023-03-31 | 2022-12-31 | 2022-09-30 | 2022-06-30 | 2022-03-31 | 2021-12-31 | 2021-09-30 | 2021-06-30 | 2021-03-31 | 2020-12-31 | 2020-09-30 | 2020-06-30 | 2020-03-31 | 2019-12-31 | 2019-09-30 | 2019-06-30 | 2019-03-31 | 2018-12-31 | 2018-09-30 | 2018-06-30 | 2018-03-31 | 2017-12-31 | 2017-09-30 | 2017-06-30 | 2017-03-31 | ||
|---|---|---|---|---|---|---|---|---|---|---|---|---|---|---|---|---|---|---|---|---|---|---|---|---|---|---|---|---|---|
| Net Cash Provided By Used In Investing Activities | -1226.00 | -946.00 | -864.00 | -1634.00 | -881.00 | -700.00 | -842.00 | -665.00 | -876.00 | -671.00 | -709.00 | -751.00 | -1007.00 | -732.00 | -634.00 | -613.00 | NA | NA | NA | NA | NA | NA | NA | NA | NA | NA | NA | NA | |
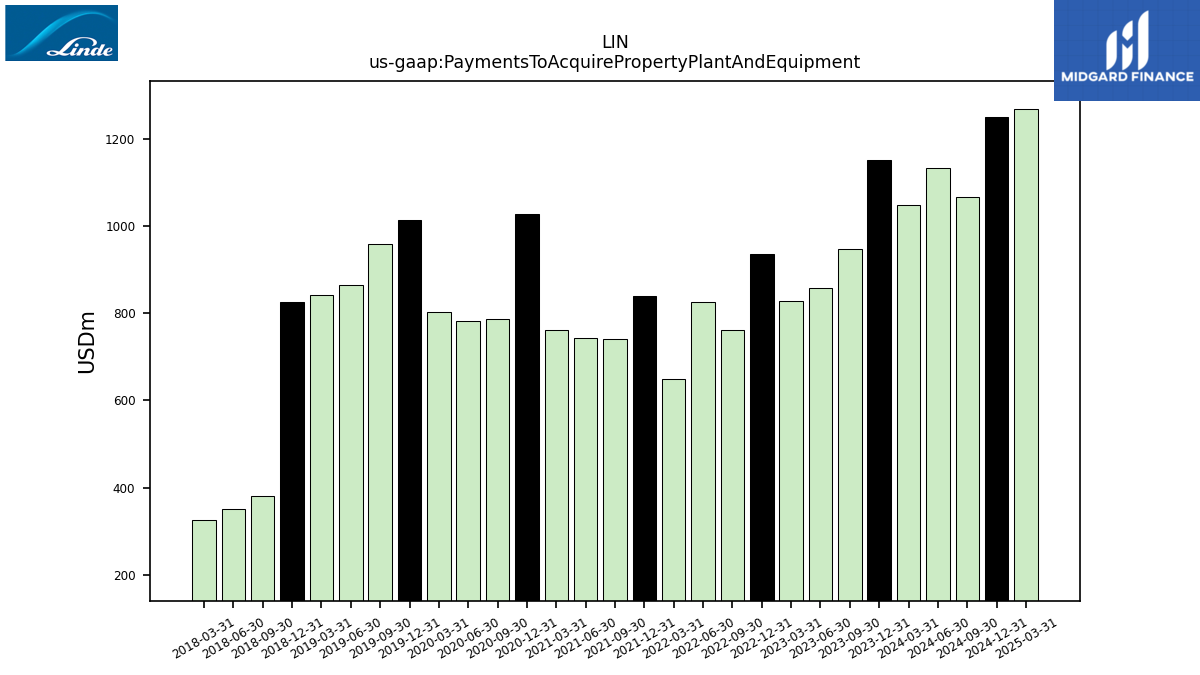
| Payments To Acquire Property Plant And Equipment | 1151.00 | 948.00 | 859.00 | 829.00 | 936.00 | 762.00 | 826.00 | 649.00 | 839.00 | 741.00 | 744.00 | 762.00 | 1027.00 | 787.00 | 783.00 | 803.00 | 1015.00 | 959.00 | 865.00 | 843.00 | 827.00 | 380.00 | 351.00 | 325.00 | NA | NA | NA | NA |
| 2023-12-31 | 2023-09-30 | 2023-06-30 | 2023-03-31 | 2022-12-31 | 2022-09-30 | 2022-06-30 | 2022-03-31 | 2021-12-31 | 2021-09-30 | 2021-06-30 | 2021-03-31 | 2020-12-31 | 2020-09-30 | 2020-06-30 | 2020-03-31 | 2019-12-31 | 2019-09-30 | 2019-06-30 | 2019-03-31 | 2018-12-31 | 2018-09-30 | 2018-06-30 | 2018-03-31 | 2017-12-31 | 2017-09-30 | 2017-06-30 | 2017-03-31 | ||
|---|---|---|---|---|---|---|---|---|---|---|---|---|---|---|---|---|---|---|---|---|---|---|---|---|---|---|---|---|---|
| Net Cash Provided By Used In Financing Activities | -780.00 | -964.00 | -2892.00 | -764.00 | 390.00 | -1720.00 | -2003.00 | 244.00 | -4217.00 | -256.00 | -2145.00 | -970.00 | -2967.00 | -933.00 | -204.00 | 759.00 | NA | NA | NA | NA | NA | NA | NA | NA | NA | NA | NA | NA | |
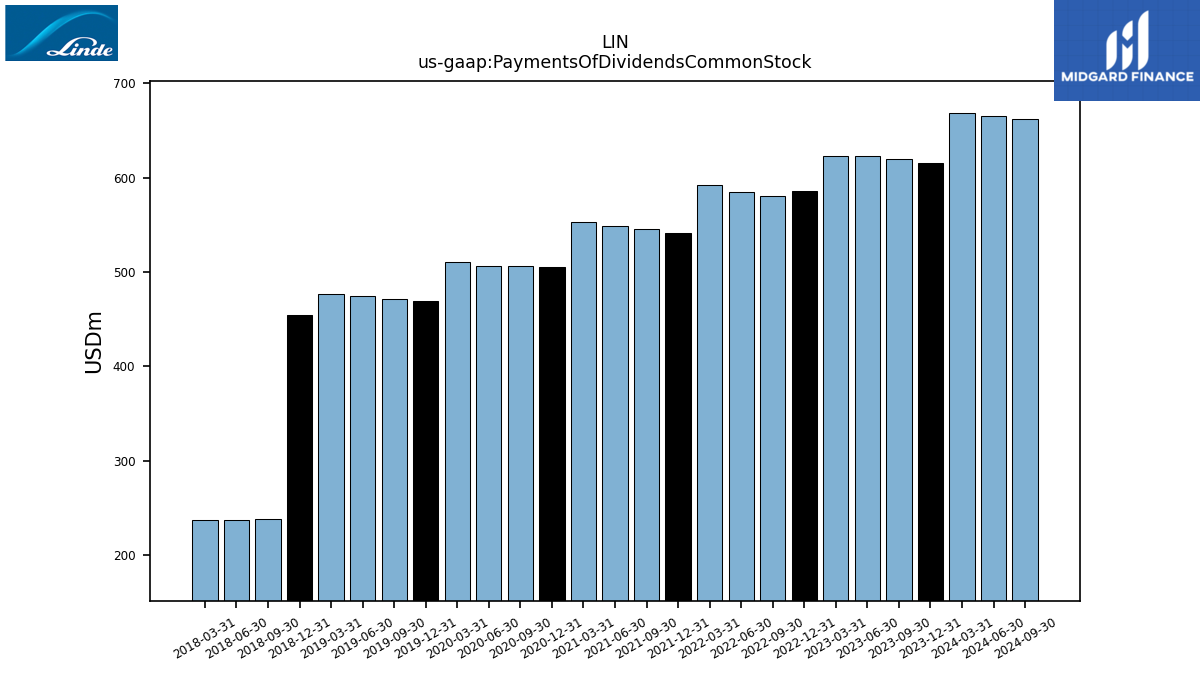
| Payments Of Dividends Common Stock | 616.00 | 620.00 | 623.00 | 623.00 | 586.00 | 581.00 | 585.00 | 592.00 | 541.00 | 546.00 | 549.00 | 553.00 | 505.00 | 506.00 | 506.00 | 511.00 | 469.00 | 471.00 | 474.00 | 477.00 | 454.00 | 238.00 | 237.00 | 237.00 | NA | NA | NA | NA | |
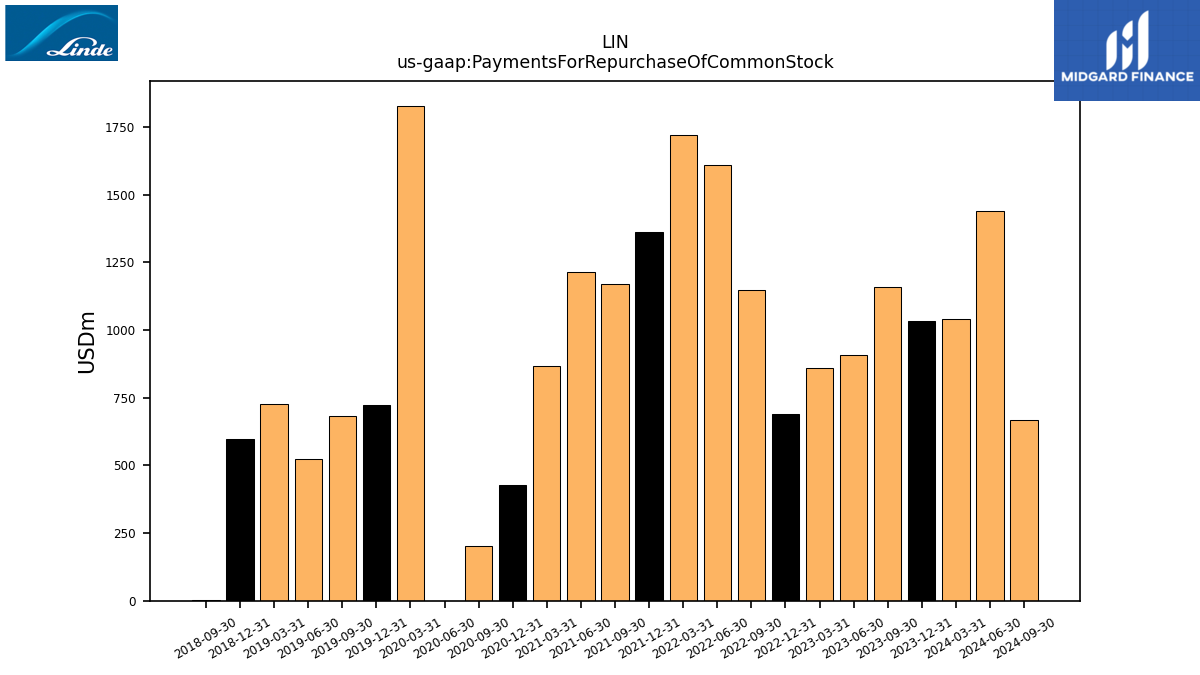
| Payments For Repurchase Of Common Stock | 1033.00 | 1158.00 | 908.00 | 859.00 | 690.00 | 1149.00 | 1610.00 | 1719.00 | 1361.00 | 1169.00 | 1214.00 | 868.00 | 427.00 | 202.00 | 0.00 | 1828.00 | 724.00 | 684.00 | 525.00 | 725.00 | 597.00 | 1.00 | NA | NA | NA | NA | NA | NA |
| 2023-12-31 | 2023-09-30 | 2023-06-30 | 2023-03-31 | 2022-12-31 | 2022-09-30 | 2022-06-30 | 2022-03-31 | 2021-12-31 | 2021-09-30 | 2021-06-30 | 2021-03-31 | 2020-12-31 | 2020-09-30 | 2020-06-30 | 2020-03-31 | 2019-12-31 | 2019-09-30 | 2019-06-30 | 2019-03-31 | 2018-12-31 | 2018-09-30 | 2018-06-30 | 2018-03-31 | 2017-12-31 | 2017-09-30 | 2017-06-30 | 2017-03-31 | ||
|---|---|---|---|---|---|---|---|---|---|---|---|---|---|---|---|---|---|---|---|---|---|---|---|---|---|---|---|---|---|
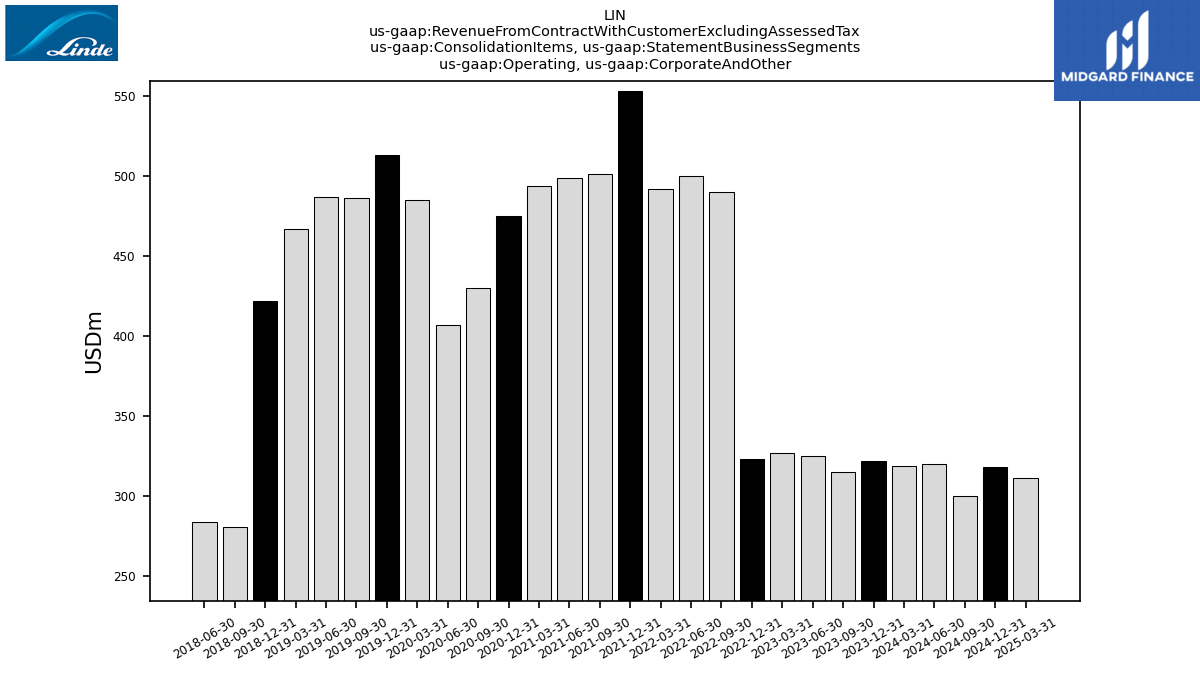
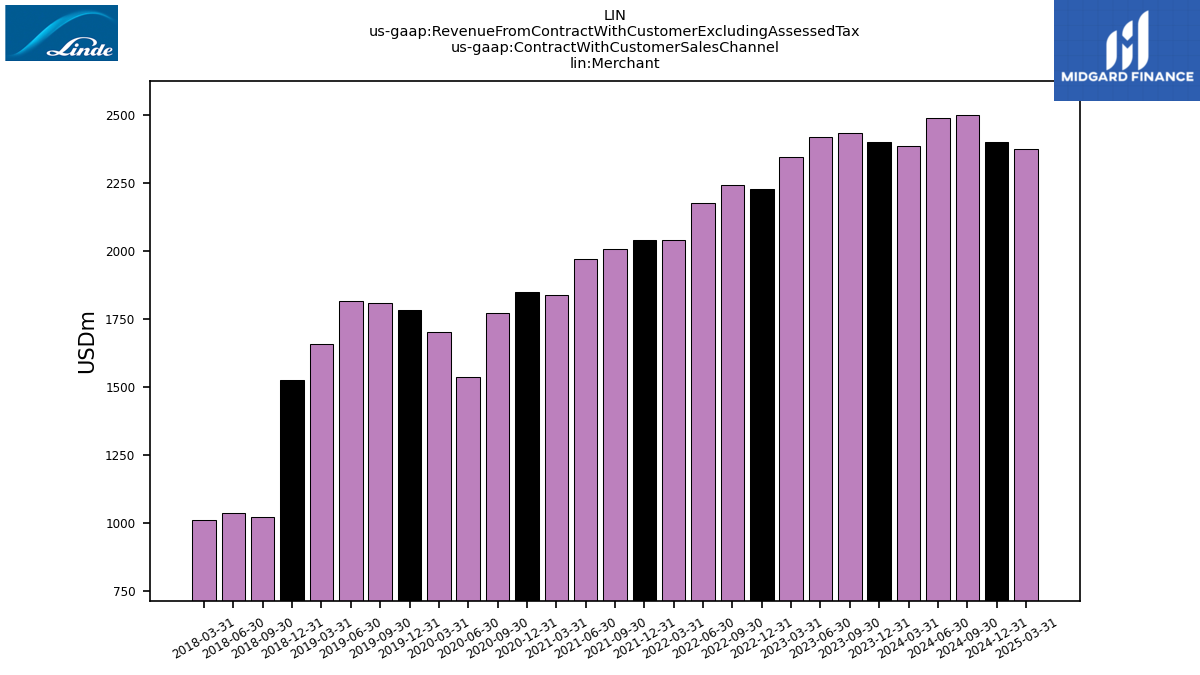
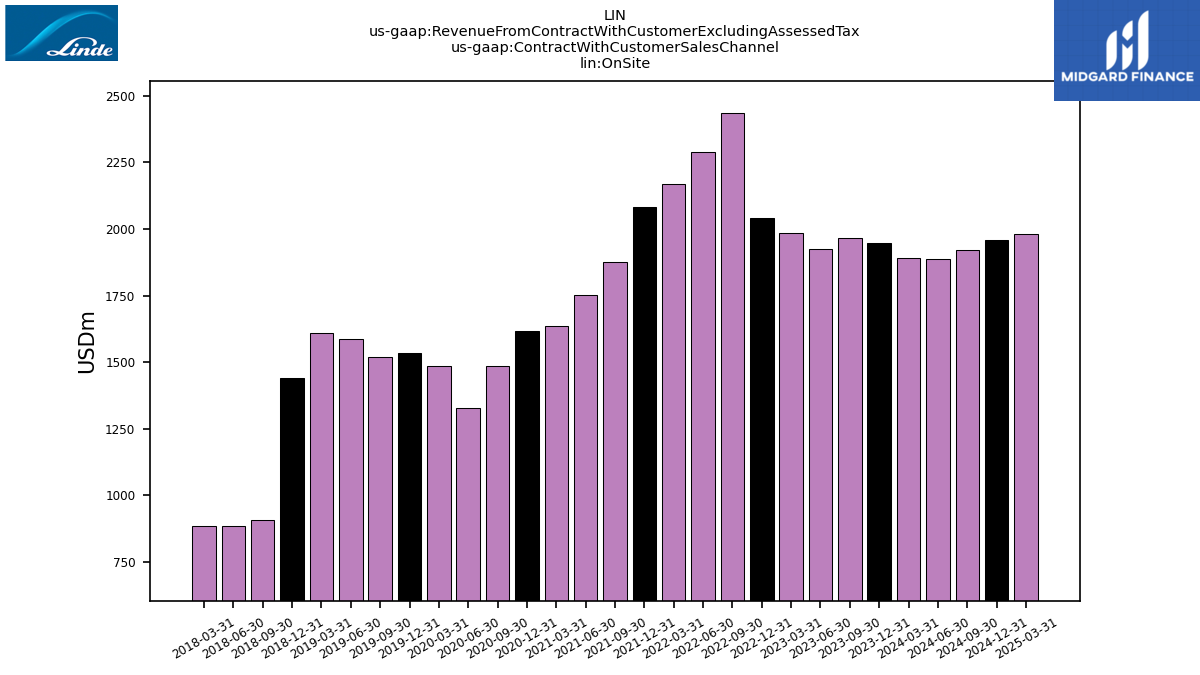
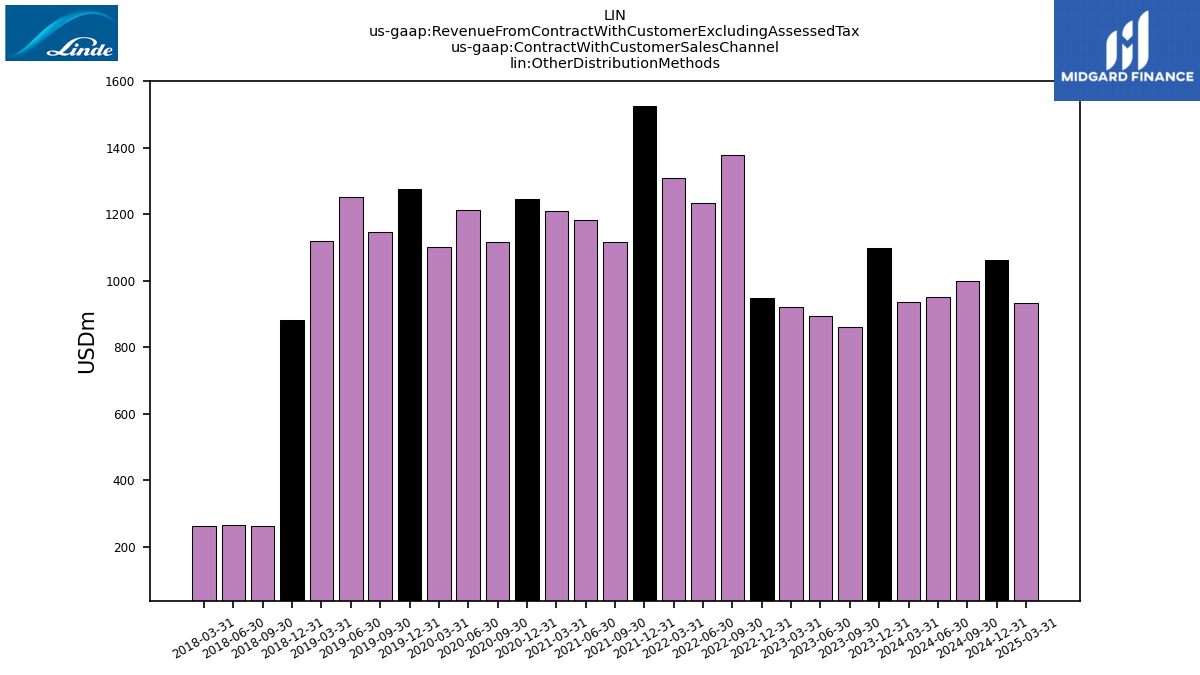
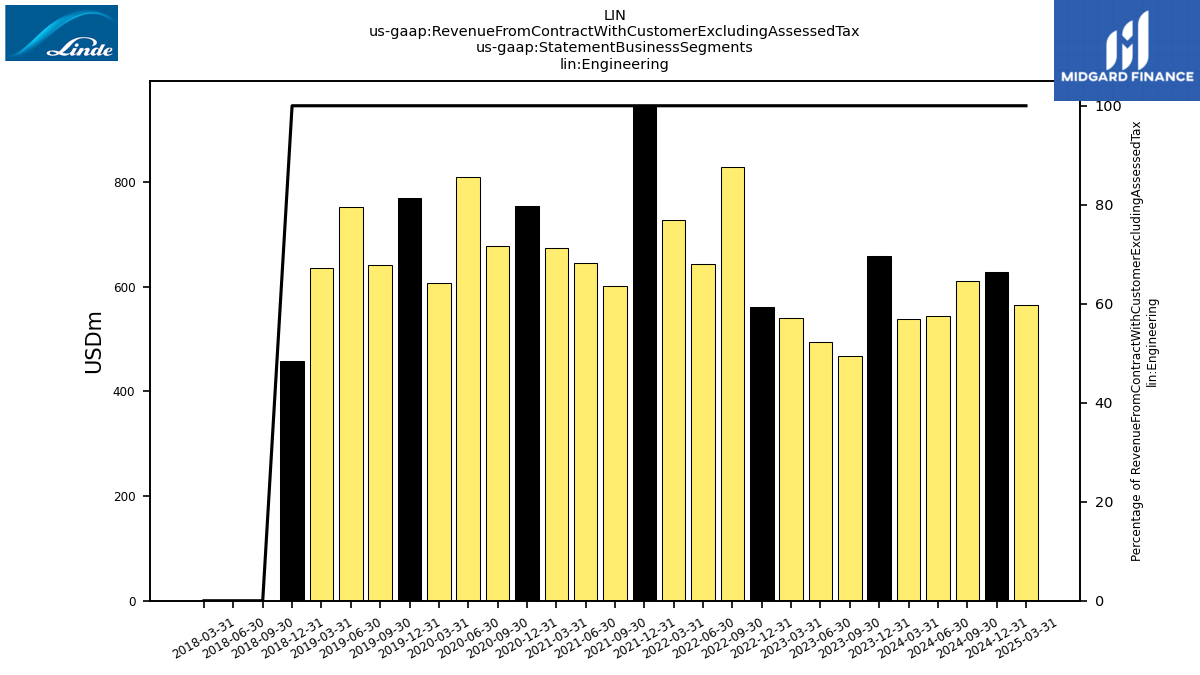
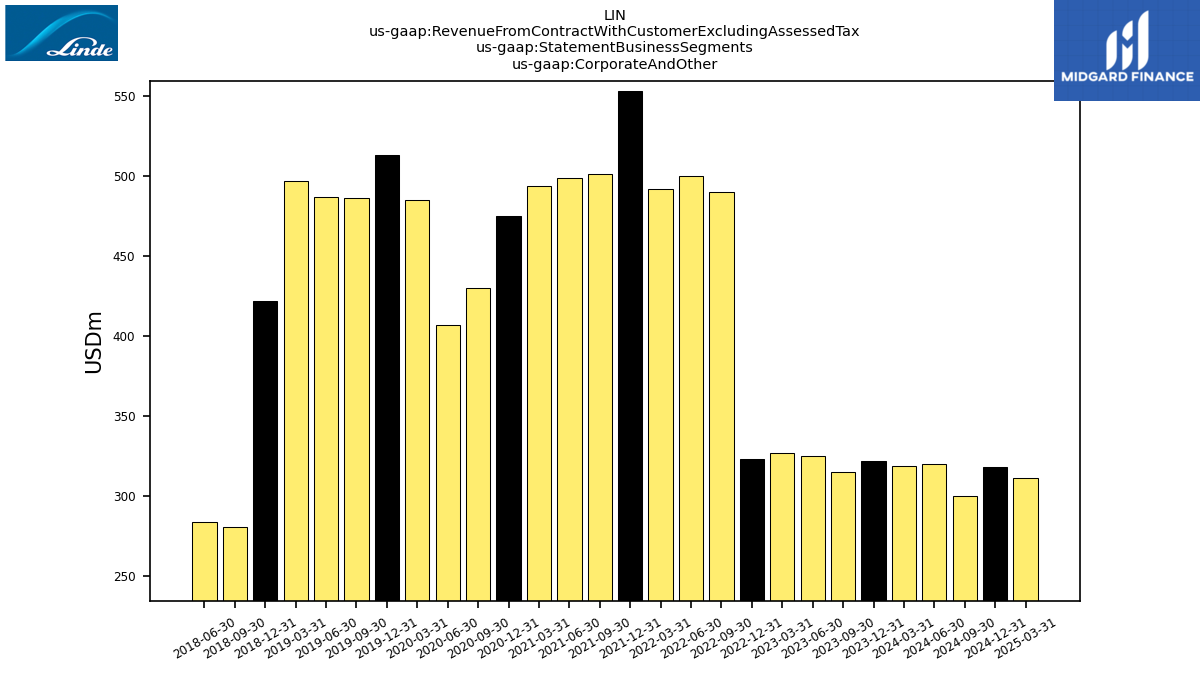
| Revenue From Contract With Customer Excluding Assessed Tax | 8302.00 | 8155.00 | 8204.00 | 8193.00 | 7899.00 | 8797.00 | 8457.00 | 8211.00 | 8298.00 | 7668.00 | 7584.00 | 7243.00 | 7272.00 | 6855.00 | 6377.00 | 6739.00 | 7080.00 | 7000.00 | 7204.00 | 6944.00 | 5816.00 | 3024.00 | 3061.00 | 2999.00 | 2953.00 | 2922.00 | 2834.00 | 2728.00 | |
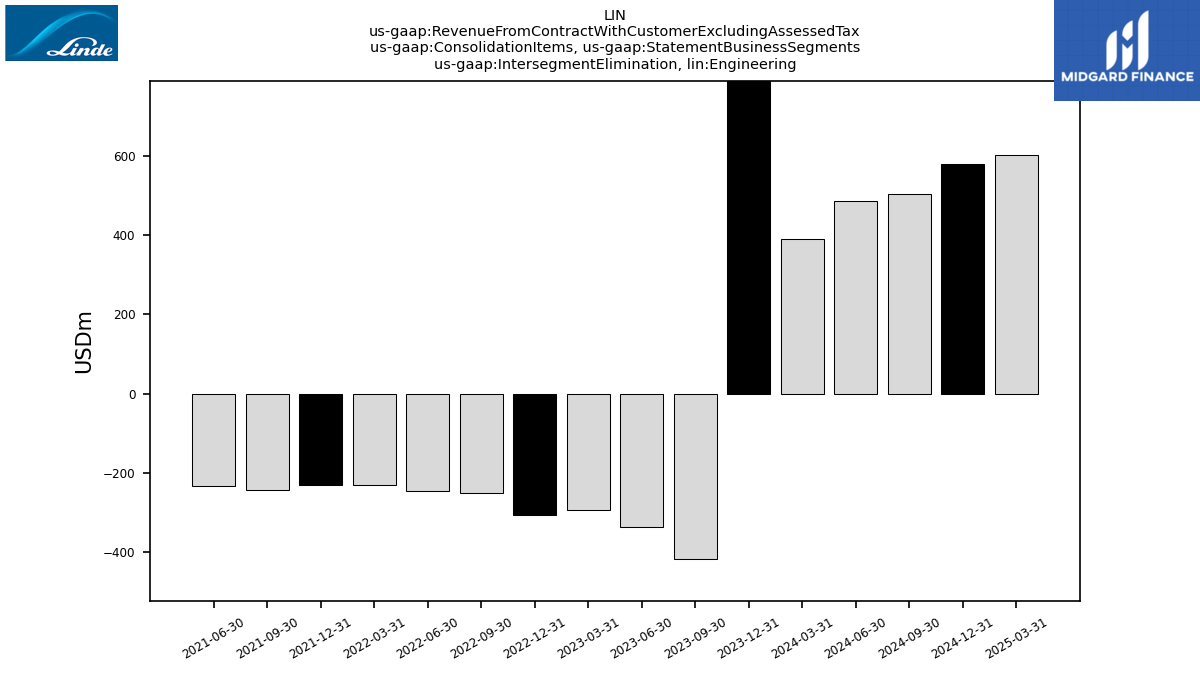
| Intersegment Elimination, Engineering | 2525.00 | -417.00 | -335.00 | -294.00 | -307.00 | -251.00 | -246.00 | -231.00 | -230.00 | -243.00 | -234.00 | NA | NA | NA | NA | NA | NA | NA | NA | NA | NA | NA | NA | NA | NA | NA | NA | NA | |
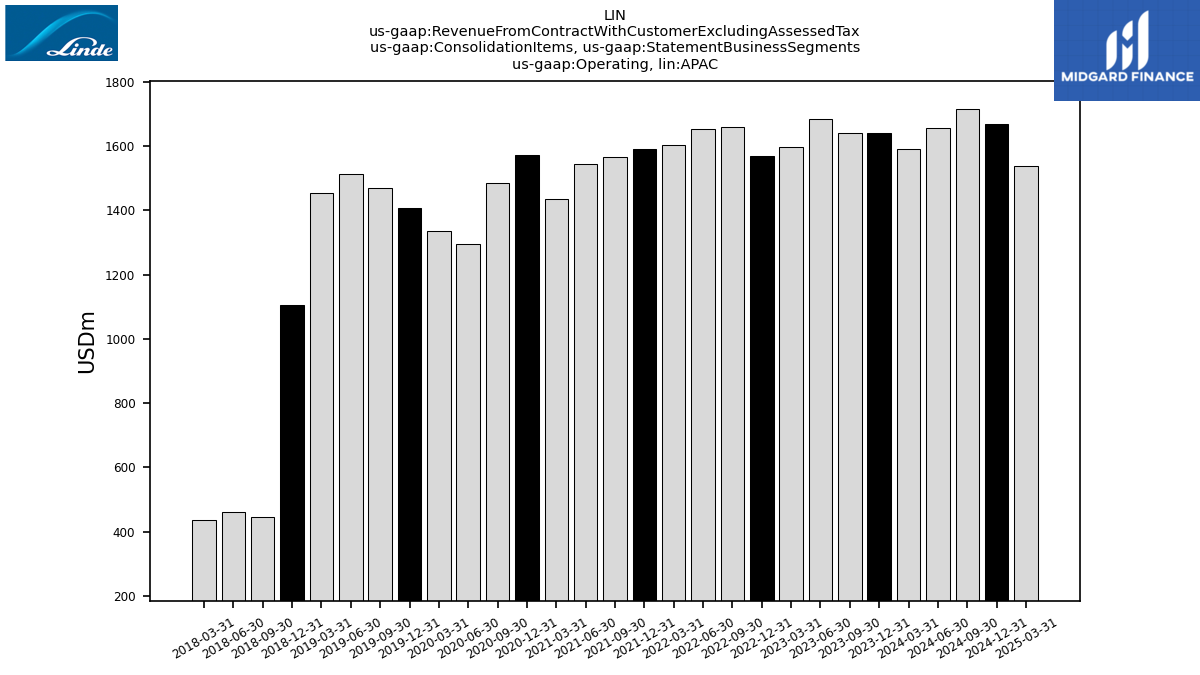
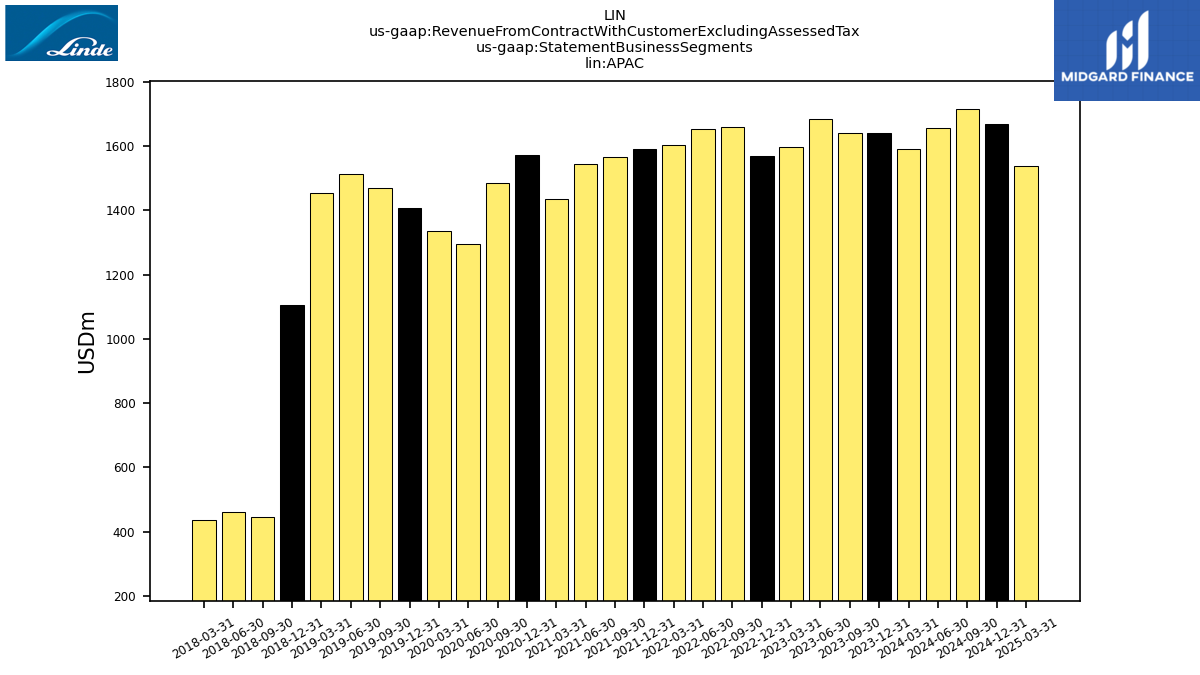
| Operating,APAC | 1639.00 | 1639.00 | 1683.00 | 1598.00 | 1567.00 | 1660.00 | 1651.00 | 1602.00 | 1589.00 | 1564.00 | 1544.00 | 1436.00 | 1572.00 | 1484.00 | 1295.00 | 1336.00 | 1406.00 | 1468.00 | 1513.00 | 1452.00 | 1104.00 | 447.00 | 460.00 | 435.00 | NA | NA | NA | NA | |
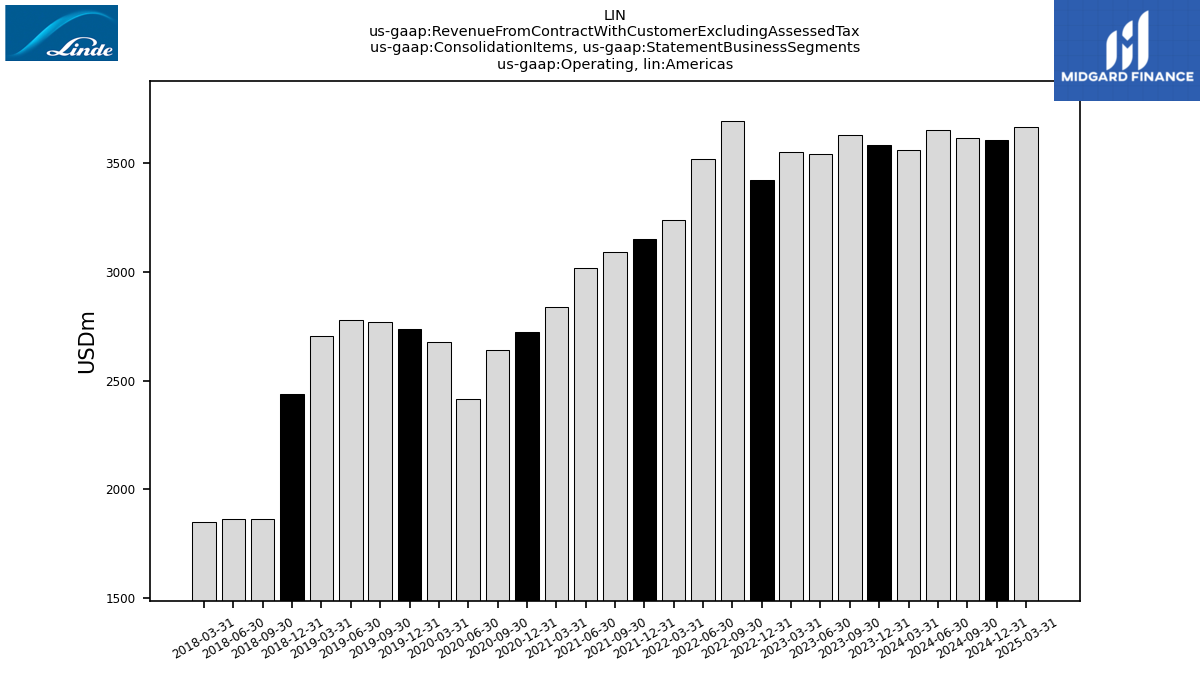
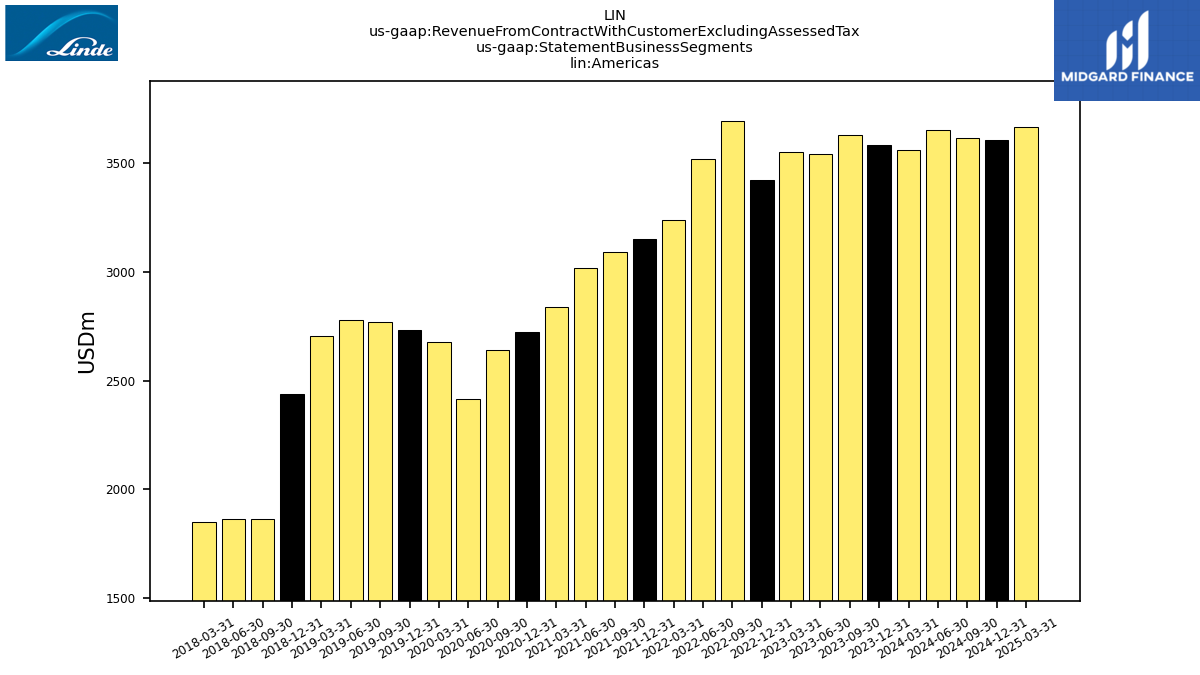
| Operating, Americas | 3583.00 | 3629.00 | 3541.00 | 3551.00 | 3421.00 | 3694.00 | 3518.00 | 3241.00 | 3152.00 | 3091.00 | 3020.00 | 2840.00 | 2724.00 | 2641.00 | 2417.00 | 2677.00 | 2737.00 | 2771.00 | 2779.00 | 2706.00 | 2437.00 | 1865.00 | 1865.00 | 1850.00 | NA | NA | NA | NA | |
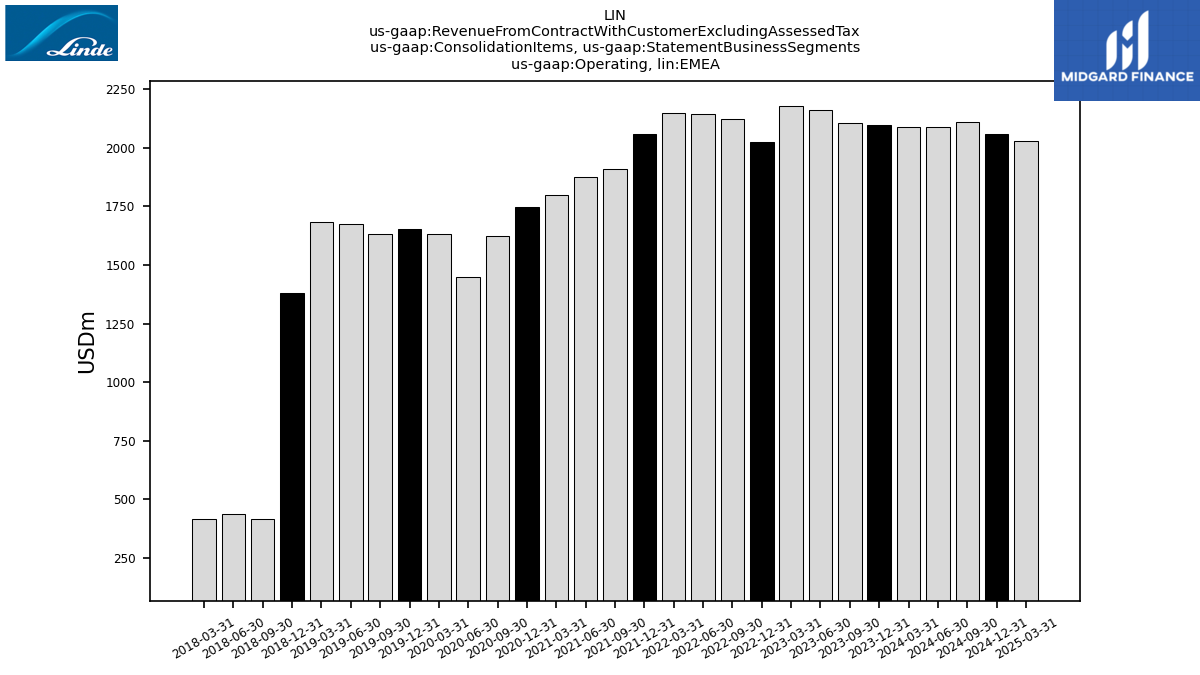
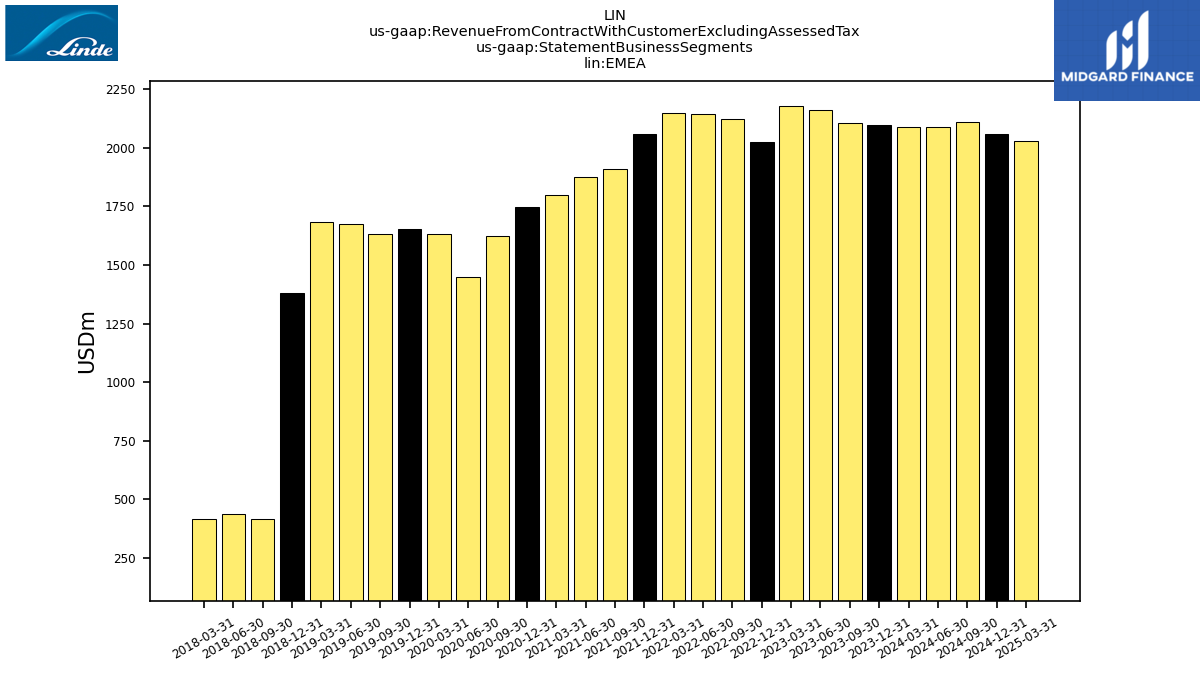
| Operating,EMEA | 2100.00 | 2105.00 | 2160.00 | 2177.00 | 2026.00 | 2125.00 | 2144.00 | 2148.00 | 2058.00 | 1911.00 | 1875.00 | 1799.00 | 1746.00 | 1622.00 | 1448.00 | 1633.00 | 1654.00 | 1634.00 | 1673.00 | 1682.00 | 1379.00 | 415.00 | 435.00 | 415.00 | NA | NA | NA | NA | |
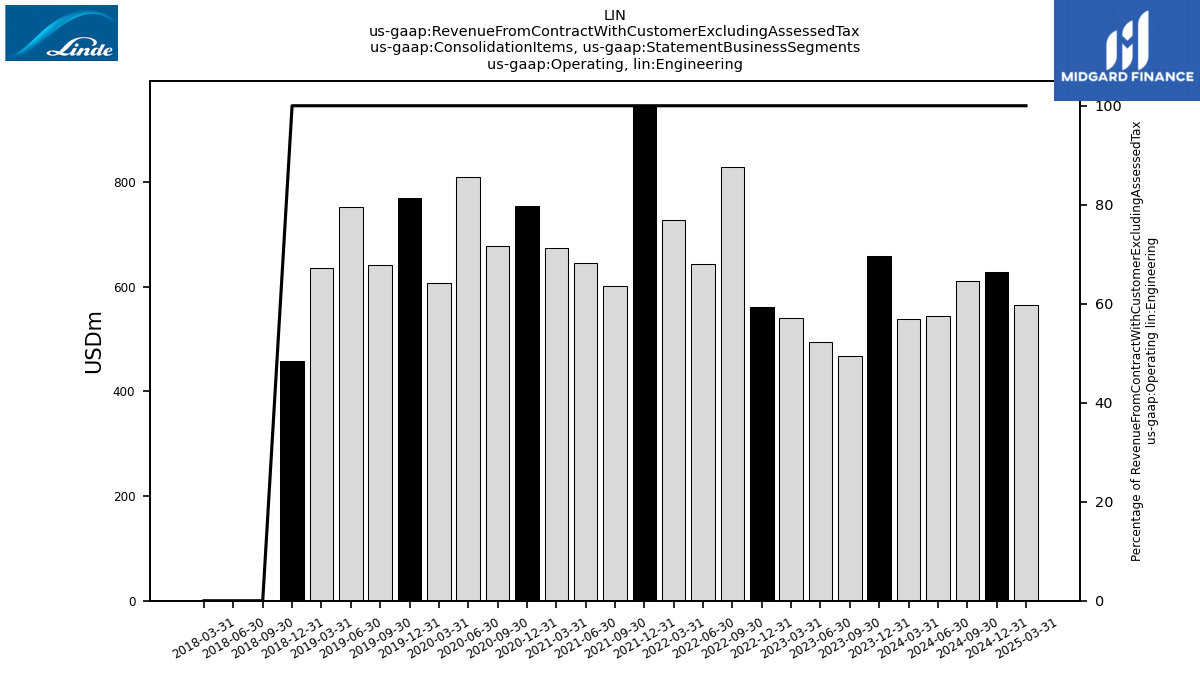
| Operating, Engineering | 658.00 | 467.00 | 495.00 | 540.00 | 562.00 | 828.00 | 644.00 | 728.00 | 946.00 | 601.00 | 646.00 | 674.00 | 755.00 | 678.00 | 810.00 | 608.00 | 770.00 | 641.00 | 752.00 | 636.00 | 459.00 | 0.00 | 0.00 | 0.00 | NA | NA | NA | NA | |
| Operating, Corporate And Other | 322.00 | 315.00 | 325.00 | 327.00 | 323.00 | 490.00 | 500.00 | 492.00 | 553.00 | 501.00 | 499.00 | 494.00 | 475.00 | 430.00 | 407.00 | 485.00 | 513.00 | 486.00 | 487.00 | 467.00 | 422.00 | 281.00 | 284.00 | NA | NA | NA | NA | NA | |
| Merchant | 2400.00 | 2433.00 | 2421.00 | 2348.00 | 2229.00 | 2242.00 | 2177.00 | 2043.00 | 2042.00 | 2009.00 | 1971.00 | 1839.00 | 1849.00 | 1771.00 | 1537.00 | 1702.00 | 1783.00 | 1809.00 | 1815.00 | 1659.00 | 1526.00 | 1022.00 | 1037.00 | 1010.00 | NA | NA | NA | NA | |
| On Site | 1946.00 | 1967.00 | 1926.00 | 1985.00 | 2041.00 | 2434.00 | 2290.00 | 2169.00 | 2084.00 | 1876.00 | 1752.00 | 1634.00 | 1618.00 | 1484.00 | 1329.00 | 1485.00 | 1536.00 | 1518.00 | 1588.00 | 1610.00 | 1439.00 | 906.00 | 885.00 | 885.00 | NA | NA | NA | NA | |
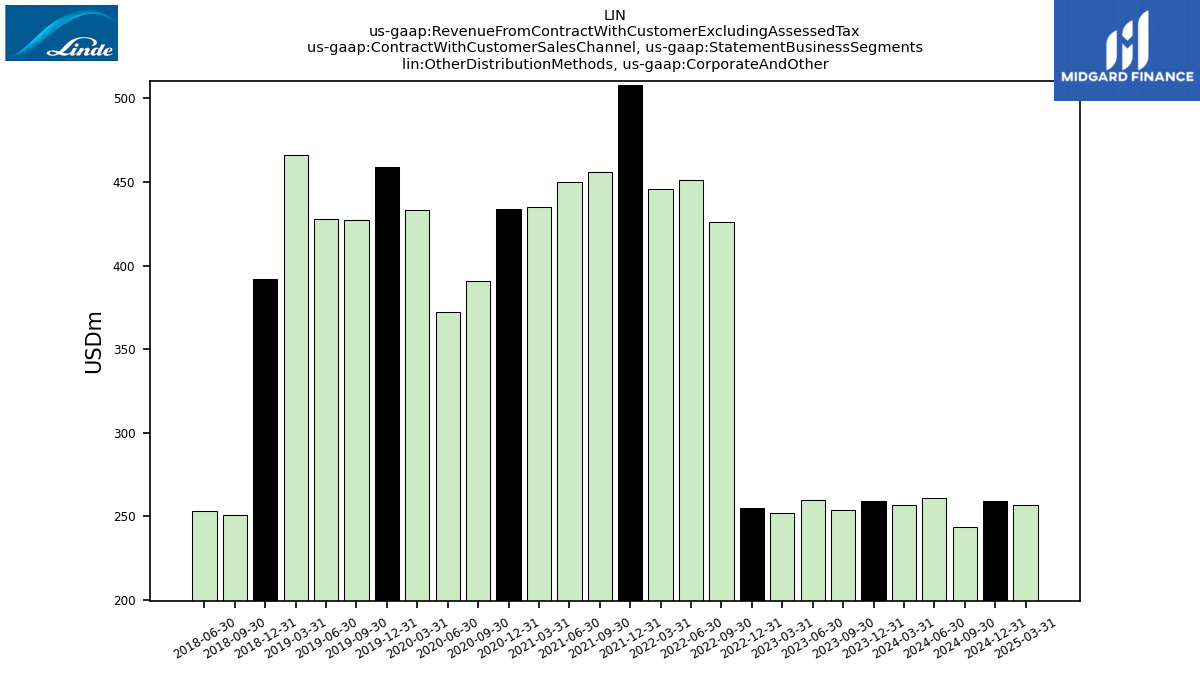
| Other Distribution Methods | 1099.00 | 860.00 | 895.00 | 920.00 | 947.00 | 1378.00 | 1235.00 | 1308.00 | 1525.00 | 1117.00 | 1182.00 | 1210.00 | 1245.00 | 1118.00 | 1214.00 | 1101.00 | 1276.00 | 1148.00 | 1252.00 | 1121.00 | 883.00 | 261.00 | 265.00 | 262.00 | NA | NA | NA | NA | |
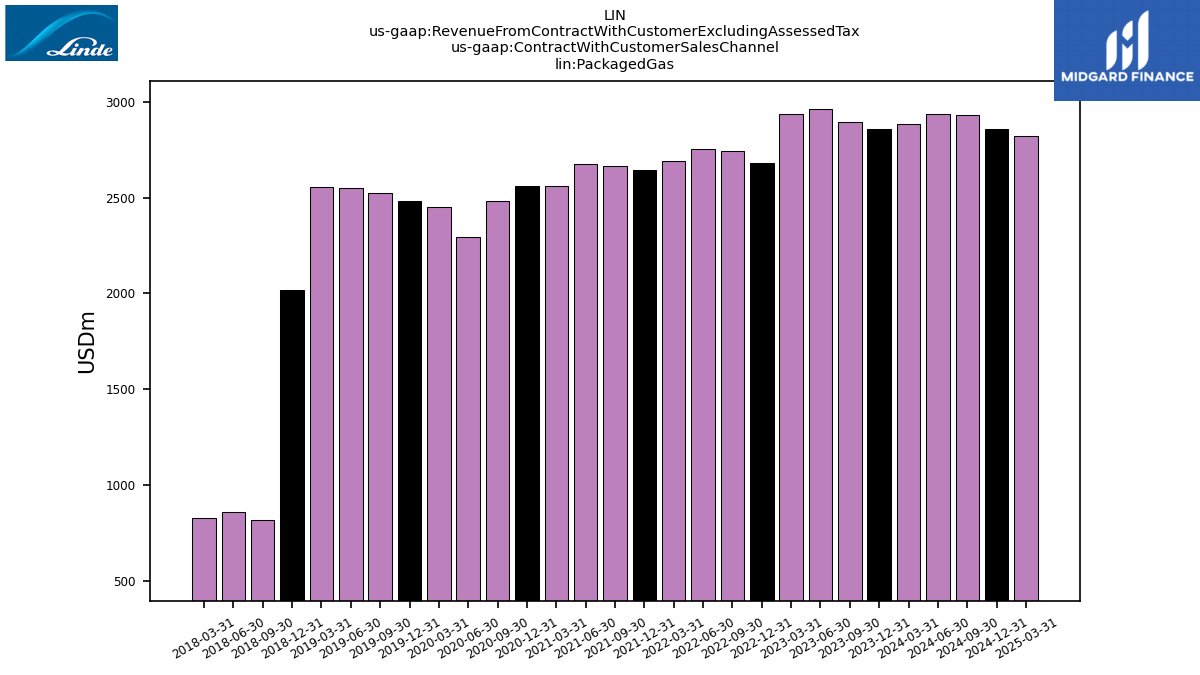
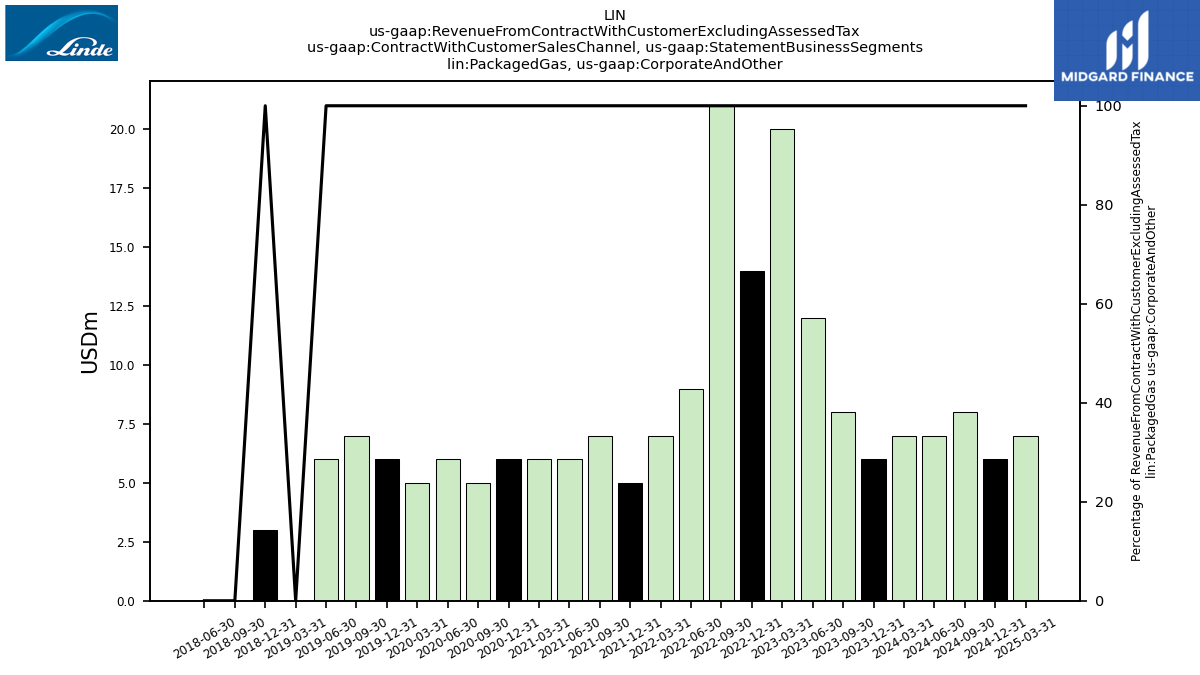
| Packaged Gas | 2857.00 | 2895.00 | 2962.00 | 2940.00 | 2682.00 | 2743.00 | 2755.00 | 2691.00 | 2647.00 | 2666.00 | 2679.00 | 2560.00 | 2560.00 | 2482.00 | 2297.00 | 2451.00 | 2485.00 | 2525.00 | 2549.00 | 2554.00 | 2017.00 | 819.00 | 857.00 | 826.00 | NA | NA | NA | NA | |
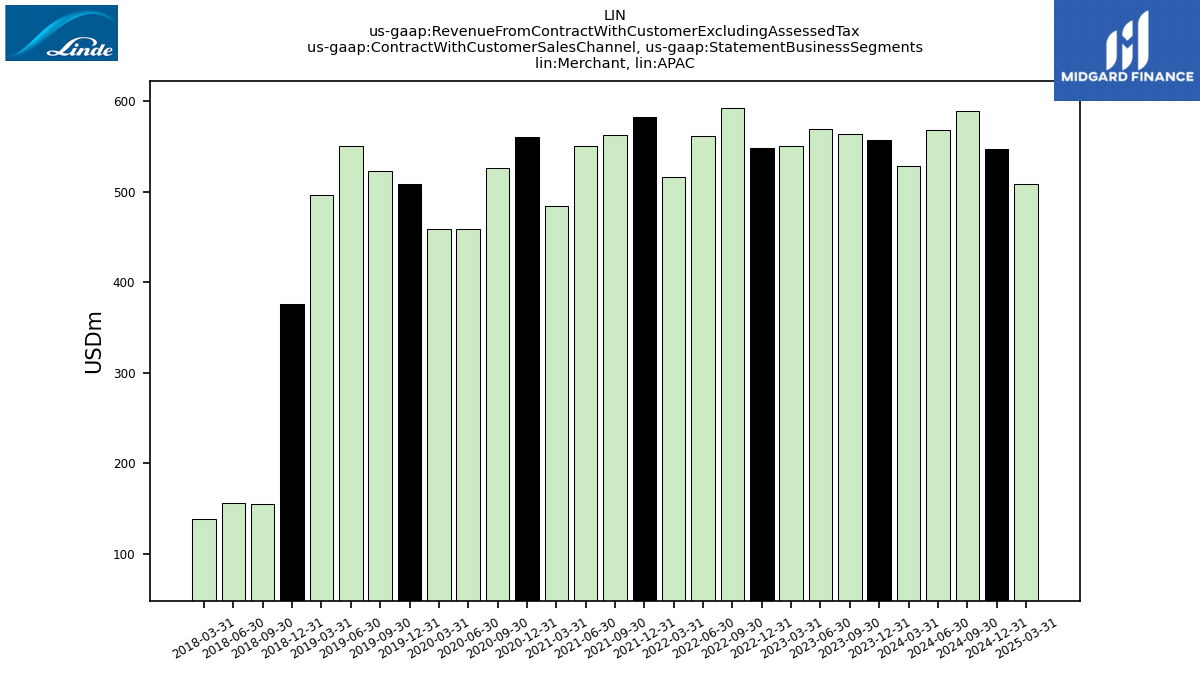
| Merchant,APAC | 557.00 | 564.00 | 570.00 | 551.00 | 549.00 | 593.00 | 562.00 | 516.00 | 583.00 | 563.00 | 551.00 | 484.00 | 561.00 | 526.00 | 459.00 | 459.00 | 509.00 | 523.00 | 551.00 | 497.00 | 376.00 | 155.00 | 156.00 | 138.00 | NA | NA | NA | NA | |
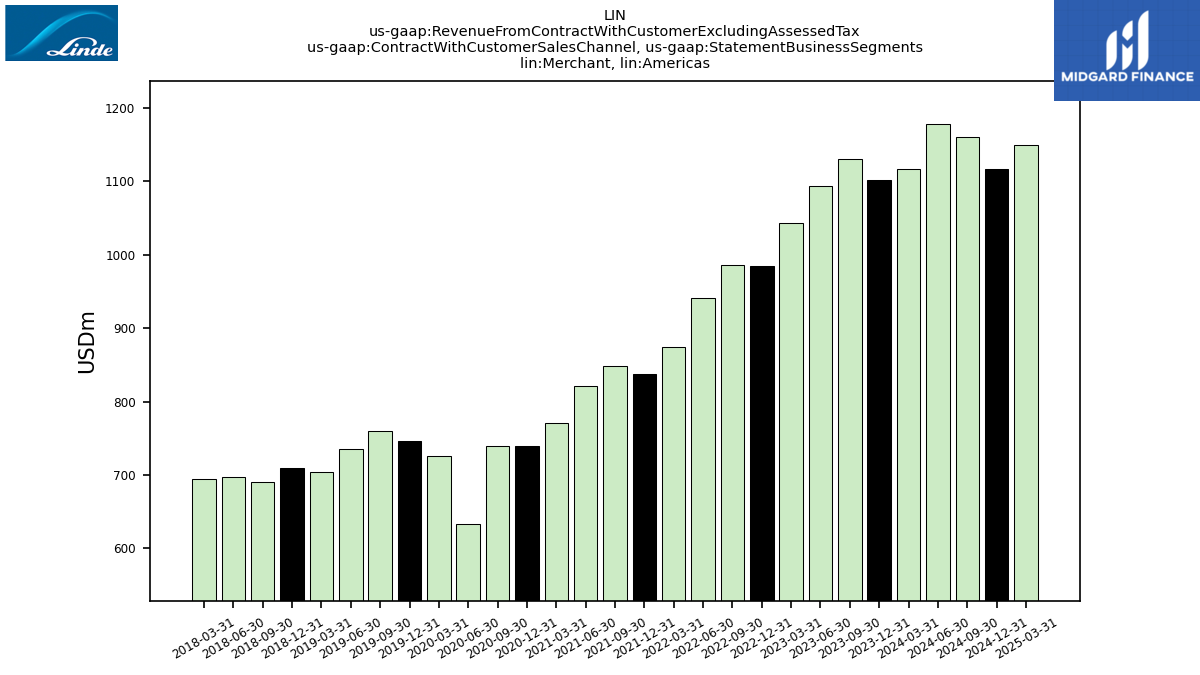
| Merchant, Americas | 1102.00 | 1131.00 | 1094.00 | 1043.00 | 985.00 | 986.00 | 941.00 | 874.00 | 838.00 | 849.00 | 821.00 | 771.00 | 740.00 | 739.00 | 634.00 | 726.00 | 746.00 | 760.00 | 735.00 | 704.00 | 710.00 | 690.00 | 697.00 | 694.00 | NA | NA | NA | NA | |
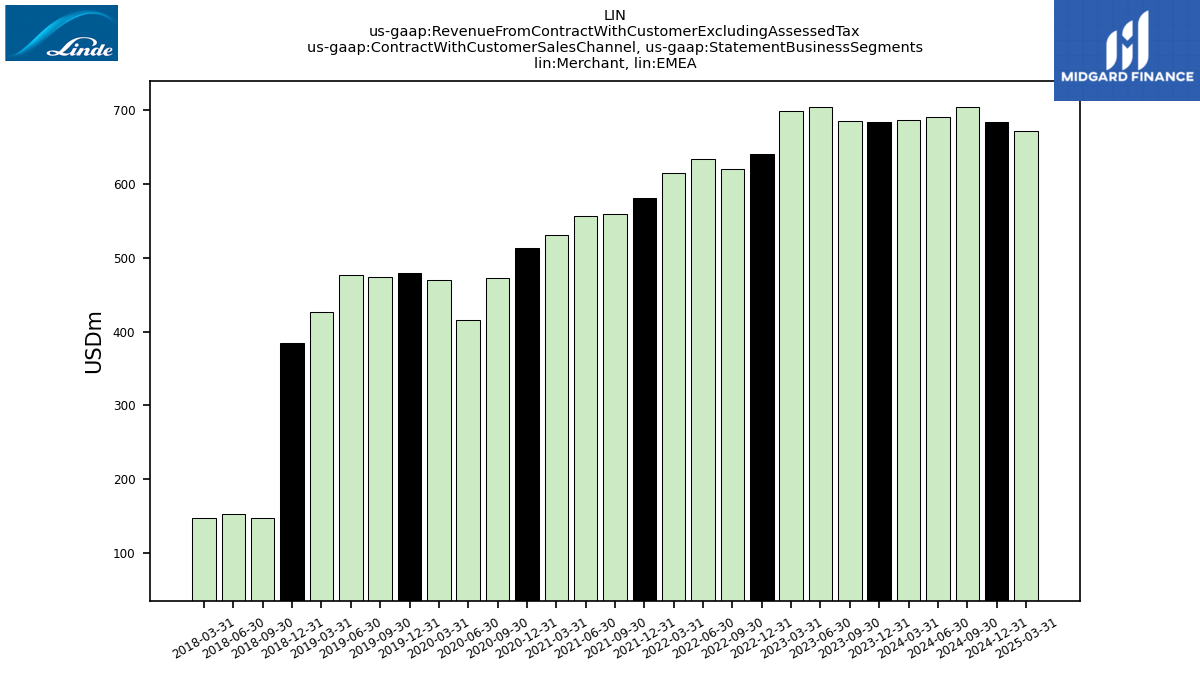
| Merchant,EMEA | 684.00 | 685.00 | 704.00 | 699.00 | 641.00 | 620.00 | 634.00 | 614.00 | 581.00 | 559.00 | 556.00 | 531.00 | 513.00 | 472.00 | 415.00 | 470.00 | 479.00 | 474.00 | 476.00 | 427.00 | 385.00 | 147.00 | 153.00 | 148.00 | NA | NA | NA | NA | |
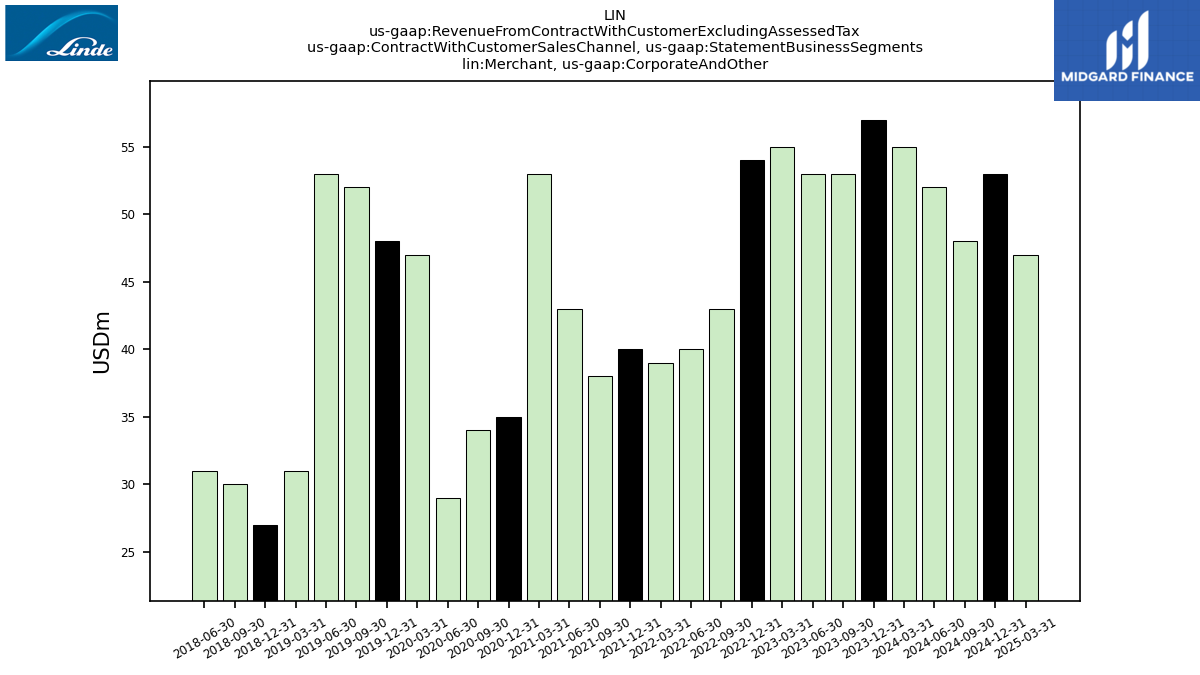
| Merchant, Corporate And Other | 57.00 | 53.00 | 53.00 | 55.00 | 54.00 | 43.00 | 40.00 | 39.00 | 40.00 | 38.00 | 43.00 | 53.00 | 35.00 | 34.00 | 29.00 | 47.00 | 48.00 | 52.00 | 53.00 | 31.00 | 27.00 | 30.00 | 31.00 | NA | NA | NA | NA | NA | |
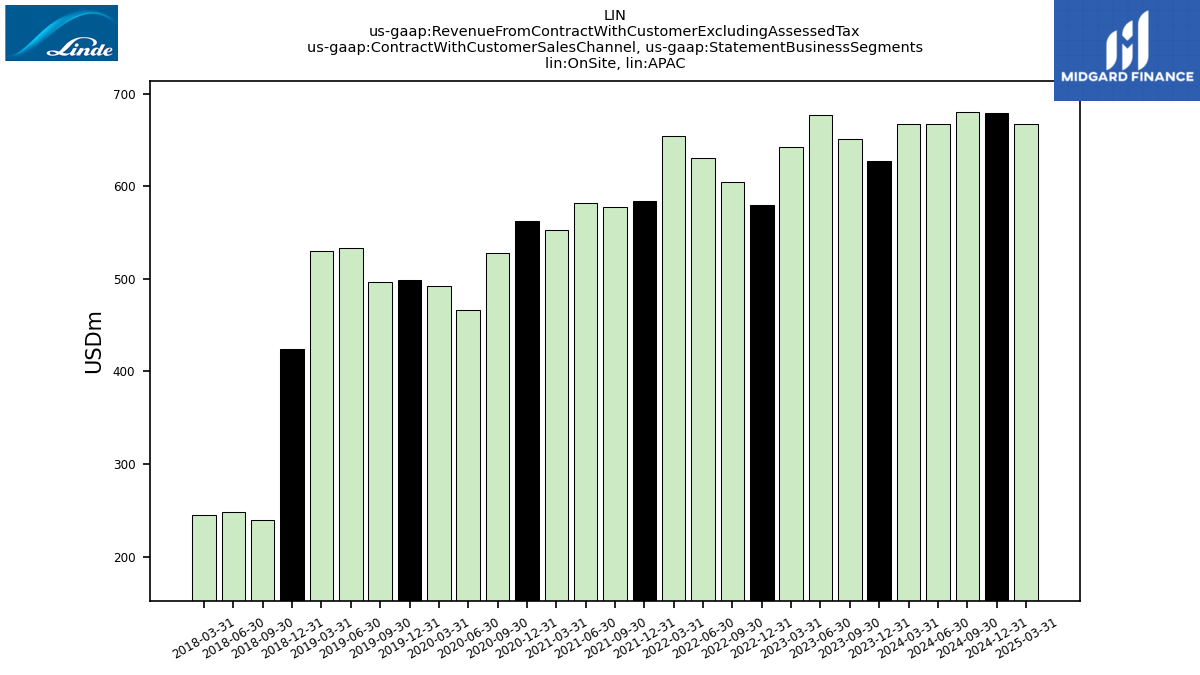
| On Site,APAC | 627.00 | 651.00 | 677.00 | 643.00 | 580.00 | 605.00 | 631.00 | 655.00 | 584.00 | 578.00 | 582.00 | 553.00 | 563.00 | 528.00 | 466.00 | 492.00 | 499.00 | 497.00 | 534.00 | 530.00 | 424.00 | 240.00 | 248.00 | 245.00 | NA | NA | NA | NA | |
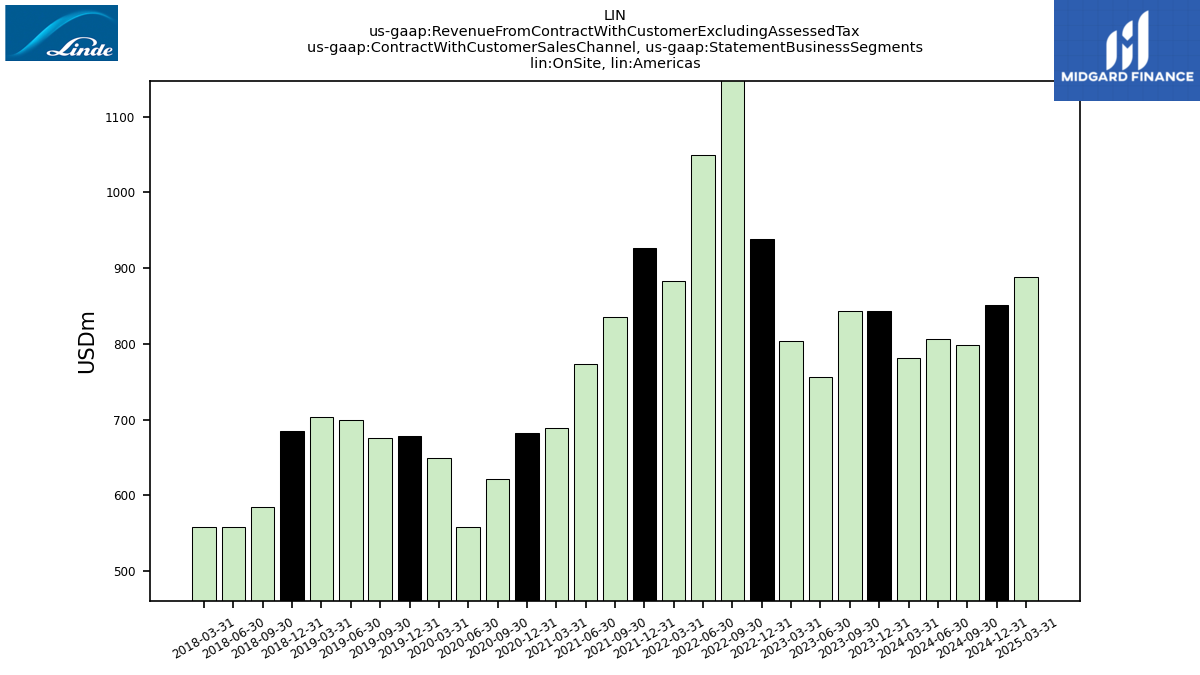
| On Site, Americas | 843.00 | 843.00 | 756.00 | 804.00 | 938.00 | 1178.00 | 1049.00 | 883.00 | 926.00 | 836.00 | 774.00 | 689.00 | 682.00 | 622.00 | 559.00 | 650.00 | 679.00 | 676.00 | 699.00 | 703.00 | 685.00 | 585.00 | 559.00 | 559.00 | NA | NA | NA | NA | |
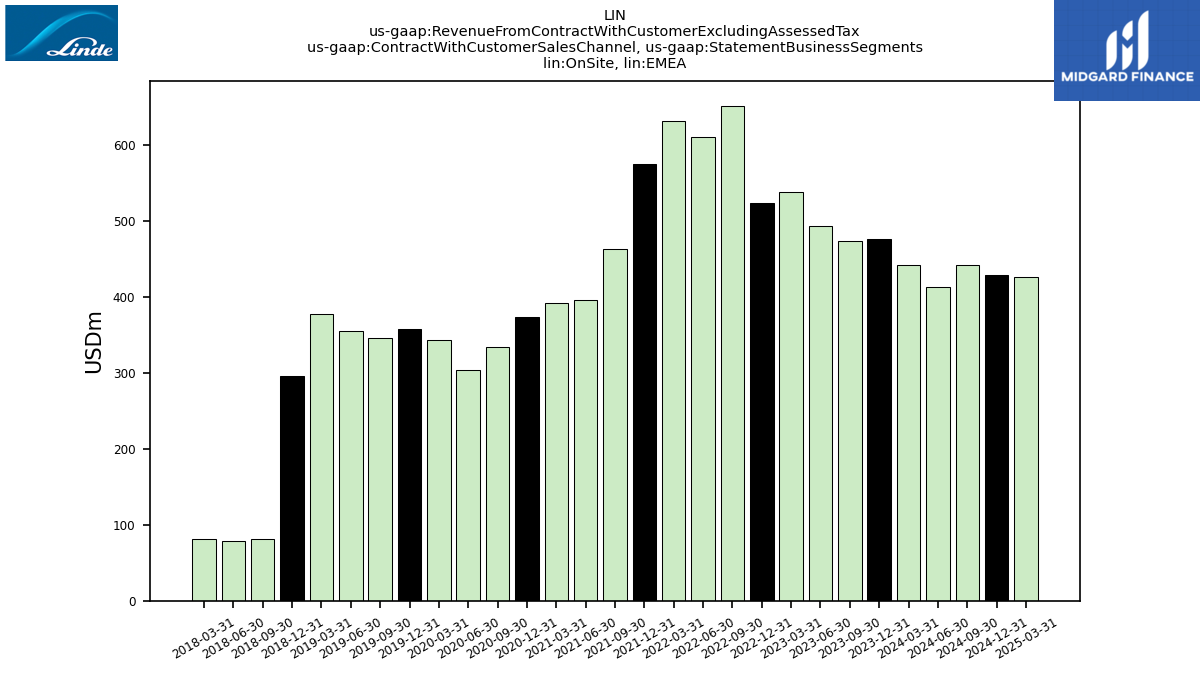
| On Site,EMEA | 476.00 | 473.00 | 493.00 | 538.00 | 523.00 | 651.00 | 610.00 | 631.00 | 574.00 | 462.00 | 396.00 | 392.00 | 373.00 | 334.00 | 304.00 | 343.00 | 357.00 | 345.00 | 355.00 | 377.00 | 296.00 | 81.00 | 78.00 | 81.00 | NA | NA | NA | NA | |
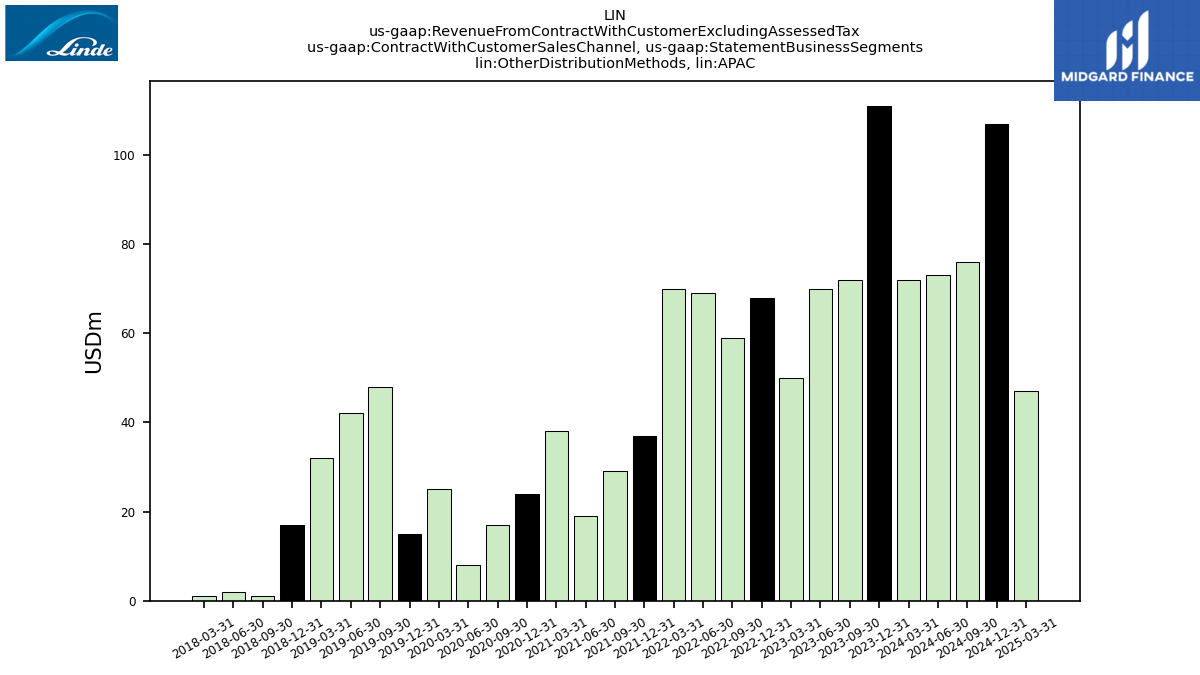
| Other Distribution Methods,APAC | 111.00 | 72.00 | 70.00 | 50.00 | 68.00 | 59.00 | 69.00 | 70.00 | 37.00 | 29.00 | 19.00 | 38.00 | 24.00 | 17.00 | 8.00 | 25.00 | 15.00 | 48.00 | 42.00 | 32.00 | 17.00 | 1.00 | 2.00 | 1.00 | NA | NA | NA | NA | |
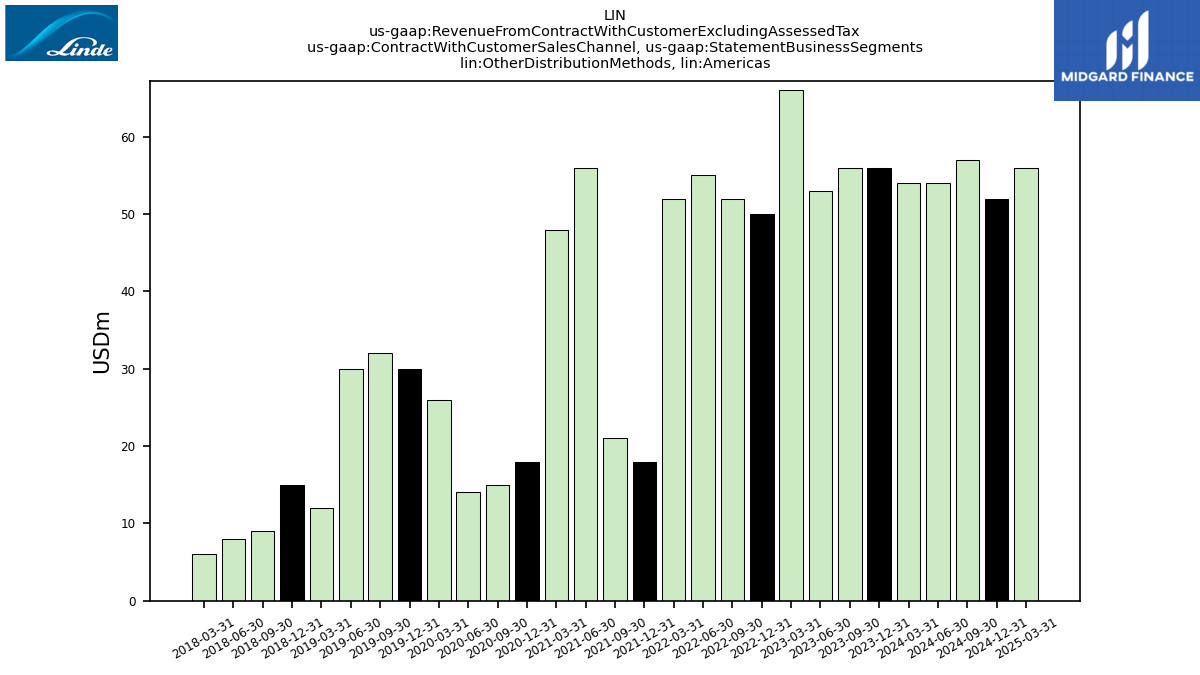
| Other Distribution Methods, Americas | 56.00 | 56.00 | 53.00 | 66.00 | 50.00 | 52.00 | 55.00 | 52.00 | 18.00 | 21.00 | 56.00 | 48.00 | 18.00 | 15.00 | 14.00 | 26.00 | 30.00 | 32.00 | 30.00 | 12.00 | 15.00 | 9.00 | 8.00 | 6.00 | NA | NA | NA | NA | |
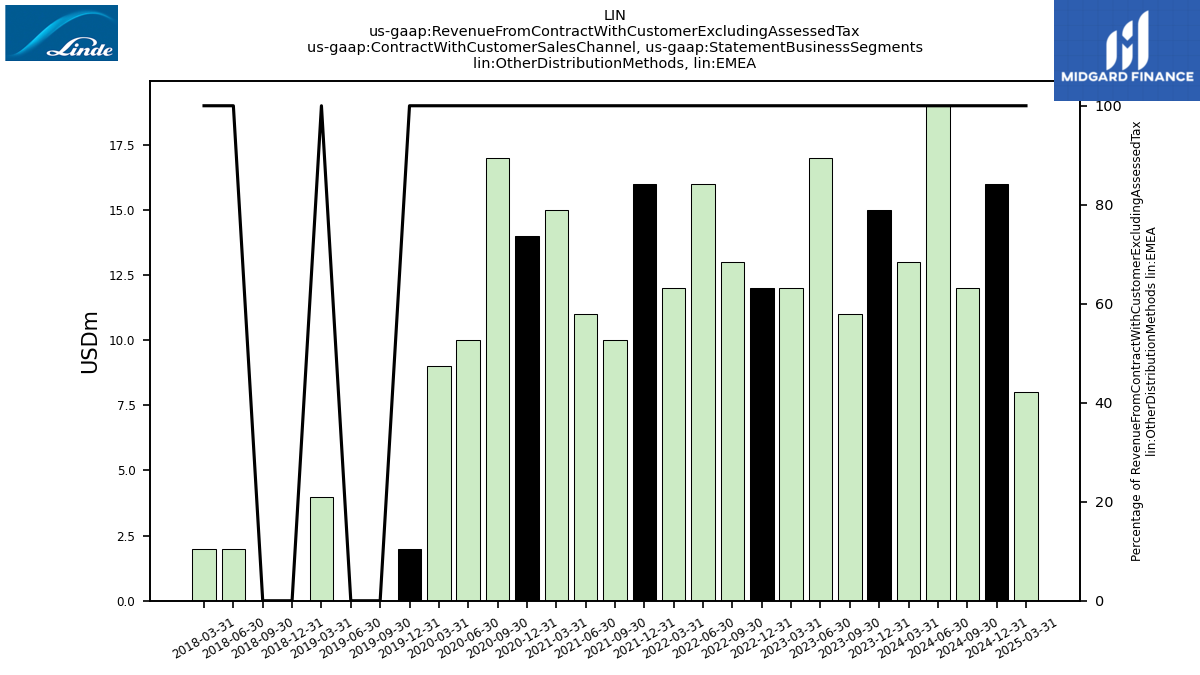
| Other Distribution Methods,EMEA | 15.00 | 11.00 | 17.00 | 12.00 | 12.00 | 13.00 | 16.00 | 12.00 | 16.00 | 10.00 | 11.00 | 15.00 | 14.00 | 17.00 | 10.00 | 9.00 | 2.00 | 0.00 | 0.00 | 4.00 | 0.00 | 0.00 | 2.00 | 2.00 | NA | NA | NA | NA | |
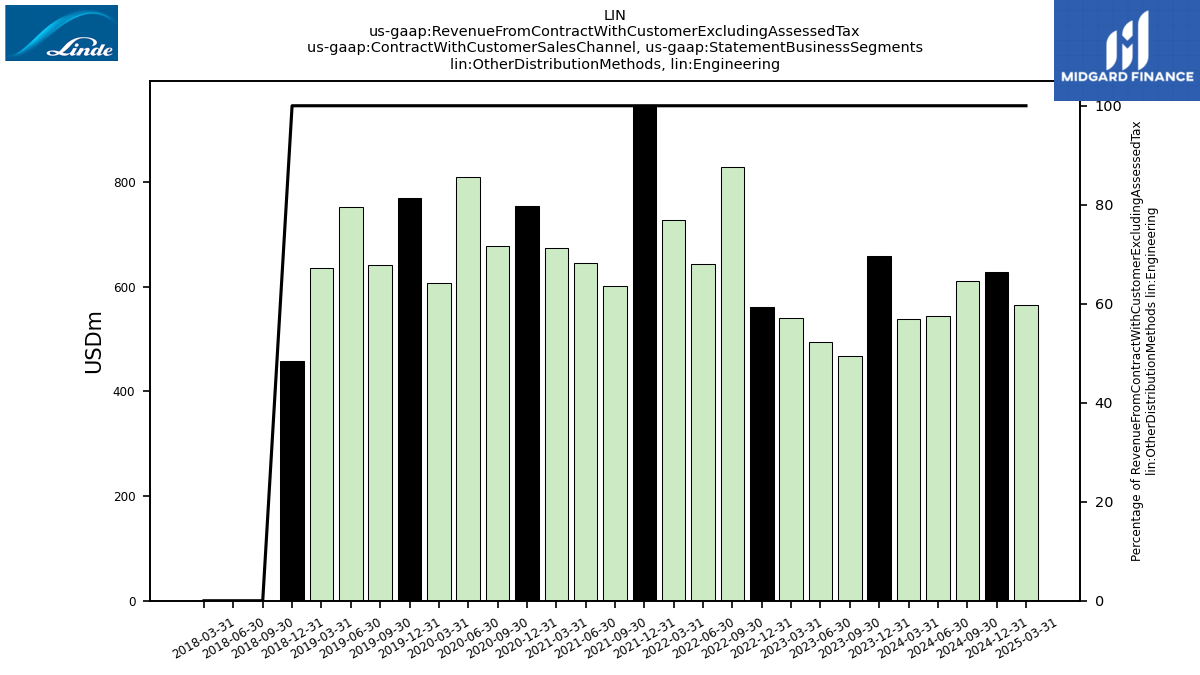
| Other Distribution Methods, Engineering | 658.00 | 467.00 | 495.00 | 540.00 | 562.00 | 828.00 | 644.00 | 728.00 | 946.00 | 601.00 | 646.00 | 674.00 | 755.00 | 678.00 | 810.00 | 608.00 | 770.00 | 641.00 | 752.00 | 636.00 | 459.00 | 0.00 | 0.00 | 0.00 | NA | NA | NA | NA | |
| Other Distribution Methods, Corporate And Other | 259.00 | 254.00 | 260.00 | 252.00 | 255.00 | 426.00 | 451.00 | 446.00 | 508.00 | 456.00 | 450.00 | 435.00 | 434.00 | 391.00 | 372.00 | 433.00 | 459.00 | 427.00 | 428.00 | 466.00 | 392.00 | 251.00 | 253.00 | NA | NA | NA | NA | NA | |
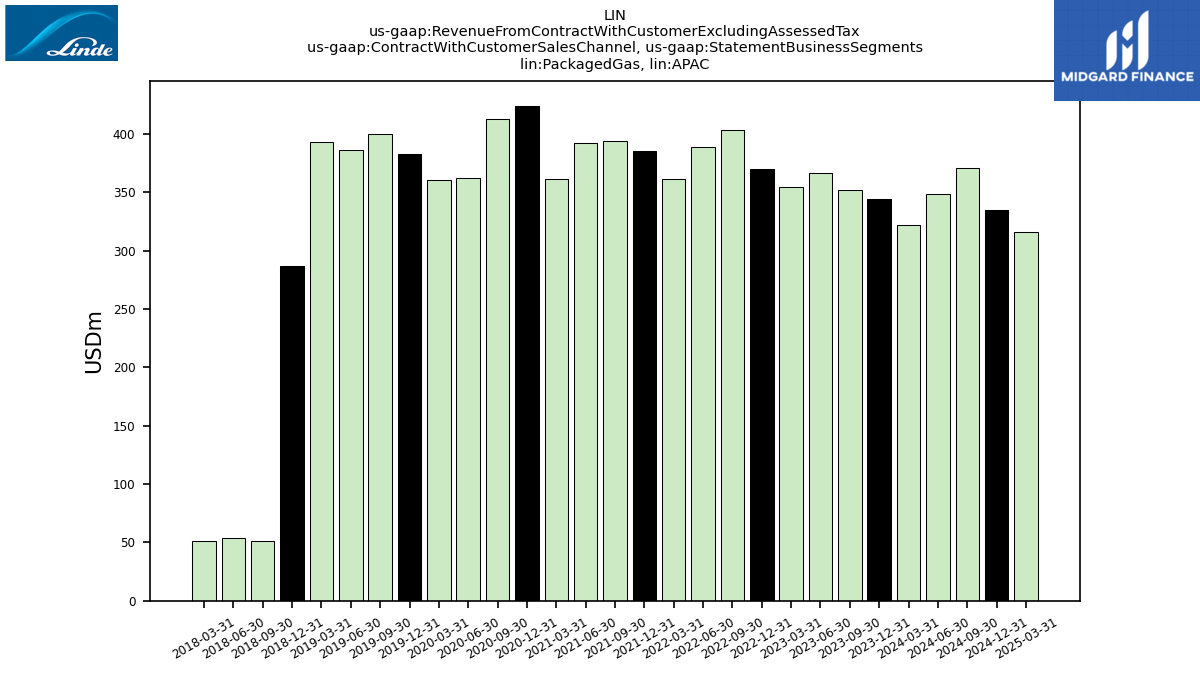
| Packaged Gas,APAC | 344.00 | 352.00 | 366.00 | 354.00 | 370.00 | 403.00 | 389.00 | 361.00 | 385.00 | 394.00 | 392.00 | 361.00 | 424.00 | 413.00 | 362.00 | 360.00 | 383.00 | 400.00 | 386.00 | 393.00 | 287.00 | 51.00 | 54.00 | 51.00 | NA | NA | NA | NA | |
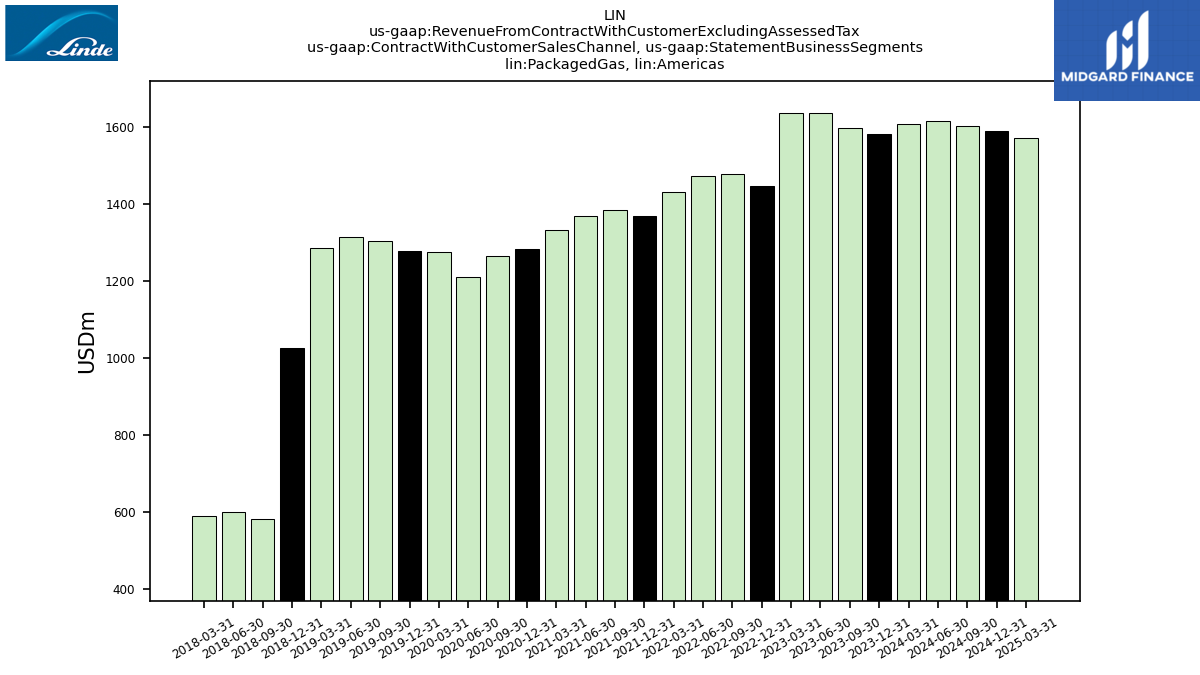
| Packaged Gas, Americas | 1582.00 | 1599.00 | 1638.00 | 1638.00 | 1448.00 | 1478.00 | 1473.00 | 1432.00 | 1370.00 | 1385.00 | 1369.00 | 1332.00 | 1284.00 | 1265.00 | 1210.00 | 1275.00 | 1278.00 | 1303.00 | 1315.00 | 1287.00 | 1027.00 | 581.00 | 601.00 | 591.00 | NA | NA | NA | NA | |
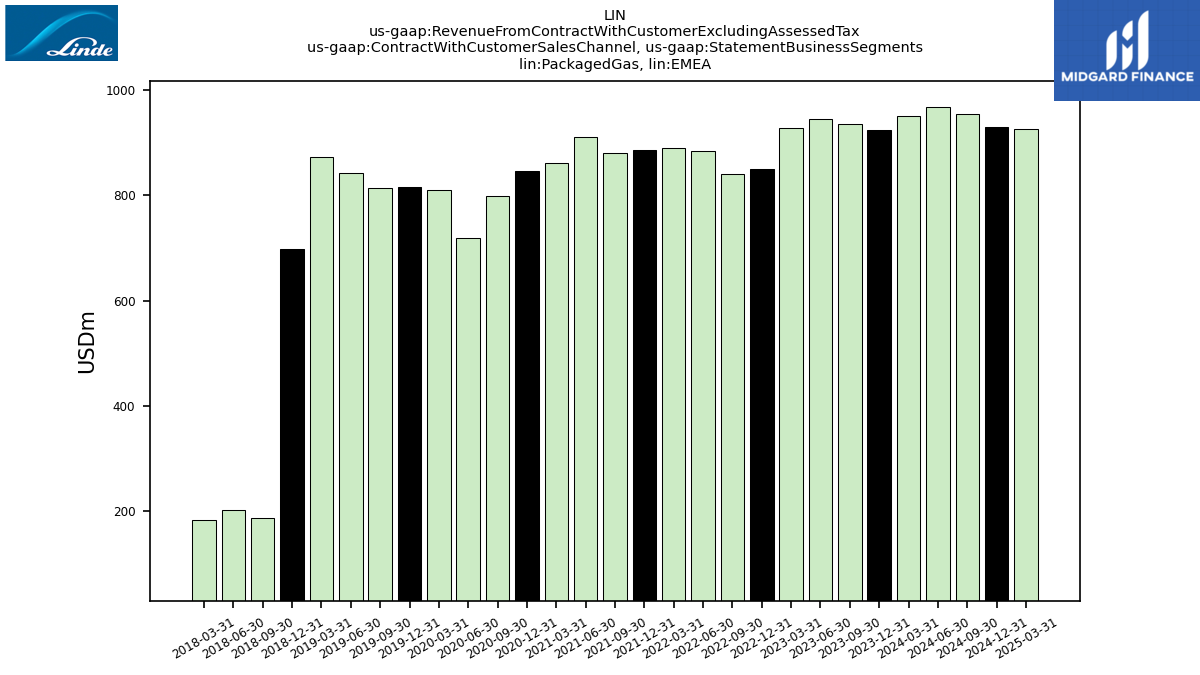
| Packaged Gas,EMEA | 925.00 | 936.00 | 946.00 | 928.00 | 850.00 | 841.00 | 884.00 | 891.00 | 887.00 | 880.00 | 912.00 | 861.00 | 846.00 | 799.00 | 719.00 | 811.00 | 816.00 | 815.00 | 842.00 | 874.00 | 698.00 | 187.00 | 202.00 | 184.00 | NA | NA | NA | NA | |
| Packaged Gas, Corporate And Other | 6.00 | 8.00 | 12.00 | 20.00 | 14.00 | 21.00 | 9.00 | 7.00 | 5.00 | 7.00 | 6.00 | 6.00 | 6.00 | 5.00 | 6.00 | 5.00 | 6.00 | 7.00 | 6.00 | 0.00 | 3.00 | 0.00 | 0.00 | NA | NA | NA | NA | NA | |
| APAC | 1639.00 | 1639.00 | 1683.00 | 1598.00 | 1567.00 | 1660.00 | 1651.00 | 1602.00 | 1589.00 | 1564.00 | 1544.00 | 1436.00 | 1572.00 | 1484.00 | 1295.00 | 1336.00 | 1406.00 | 1468.00 | 1513.00 | 1452.00 | 1104.00 | 447.00 | 460.00 | 435.00 | NA | NA | NA | NA | |
| Americas | 3583.00 | 3629.00 | 3541.00 | 3551.00 | 3421.00 | 3694.00 | 3518.00 | 3241.00 | 3152.00 | 3091.00 | 3020.00 | 2840.00 | 2724.00 | 2641.00 | 2417.00 | 2677.00 | 2733.00 | 2771.00 | 2779.00 | 2706.00 | 2437.00 | 1865.00 | 1865.00 | 1850.00 | NA | NA | NA | NA | |
| EMEA | 2100.00 | 2105.00 | 2160.00 | 2177.00 | 2026.00 | 2125.00 | 2144.00 | 2148.00 | 2058.00 | 1911.00 | 1875.00 | 1799.00 | 1746.00 | 1622.00 | 1448.00 | 1633.00 | 1654.00 | 1634.00 | 1673.00 | 1682.00 | 1379.00 | 415.00 | 435.00 | 415.00 | NA | NA | NA | NA | |
| Engineering | 658.00 | 467.00 | 495.00 | 540.00 | 562.00 | 828.00 | 644.00 | 728.00 | 946.00 | 601.00 | 646.00 | 674.00 | 755.00 | 678.00 | 810.00 | 608.00 | 770.00 | 641.00 | 752.00 | 636.00 | 459.00 | 0.00 | 0.00 | 0.00 | NA | NA | NA | NA | |
| Corporate And Other | 322.00 | 315.00 | 325.00 | 327.00 | 323.00 | 490.00 | 500.00 | 492.00 | 553.00 | 501.00 | 499.00 | 494.00 | 475.00 | 430.00 | 407.00 | 485.00 | 513.00 | 486.00 | 487.00 | 497.00 | 422.00 | 281.00 | 284.00 | NA | NA | NA | NA | NA |