
| 2023-11-30 | 2023-08-31 | 2023-05-31 | 2023-02-28 | 2022-11-30 | 2022-08-31 | 2022-05-31 | 2022-02-28 | 2021-11-30 | 2021-08-31 | 2021-05-31 | 2021-02-28 | 2020-11-30 | 2020-08-31 | 2020-05-31 | 2020-02-29 | 2019-11-30 | 2019-08-31 | 2019-05-31 | 2019-02-28 | 2018-11-30 | 2018-08-31 | 2018-05-31 | 2018-02-28 | 2017-11-30 | 2017-08-31 | 2017-05-31 | 2017-02-28 | 2016-11-30 | 2016-08-31 | 2016-05-31 | 2016-02-29 | 2015-11-30 | 2015-08-31 | 2015-05-31 | 2015-02-28 | 2014-11-30 | 2014-08-31 | 2014-05-31 | 2014-02-28 | 2013-11-30 | 2013-08-31 | 2013-05-31 | 2013-02-28 | 2012-11-30 | 2012-08-31 | 2012-05-31 | 2012-02-29 | 2011-11-30 | 2011-08-31 | 2011-05-31 | 2011-02-28 | 2010-11-30 | ||
|---|---|---|---|---|---|---|---|---|---|---|---|---|---|---|---|---|---|---|---|---|---|---|---|---|---|---|---|---|---|---|---|---|---|---|---|---|---|---|---|---|---|---|---|---|---|---|---|---|---|---|---|---|---|---|
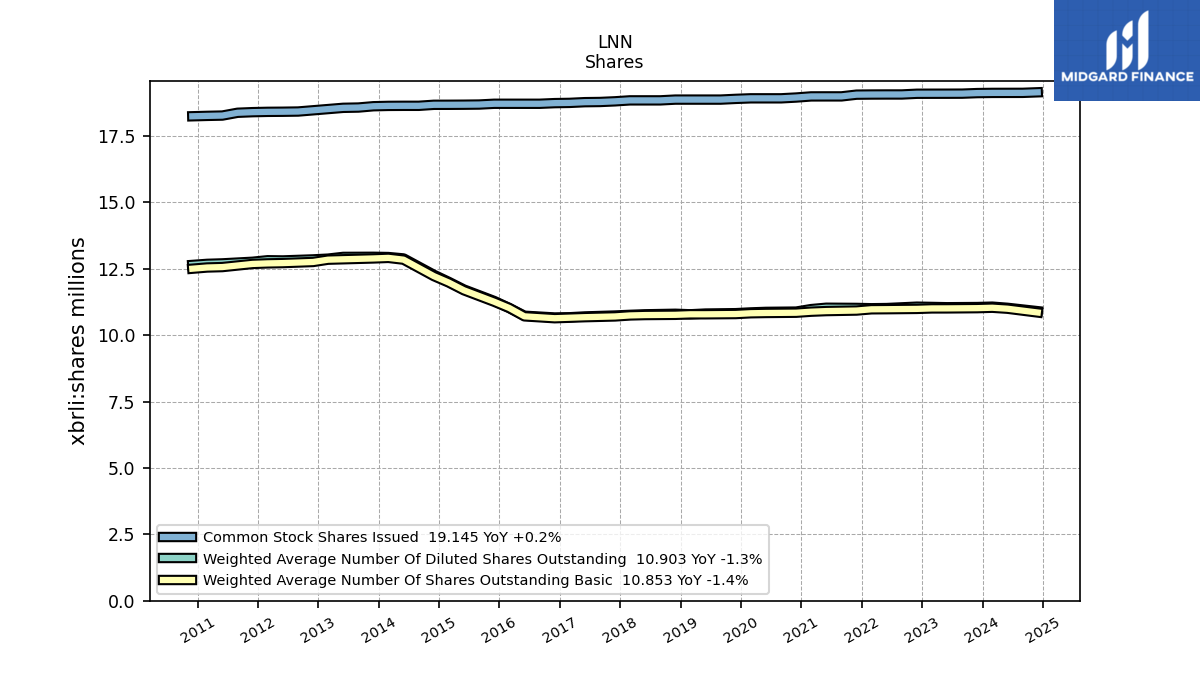
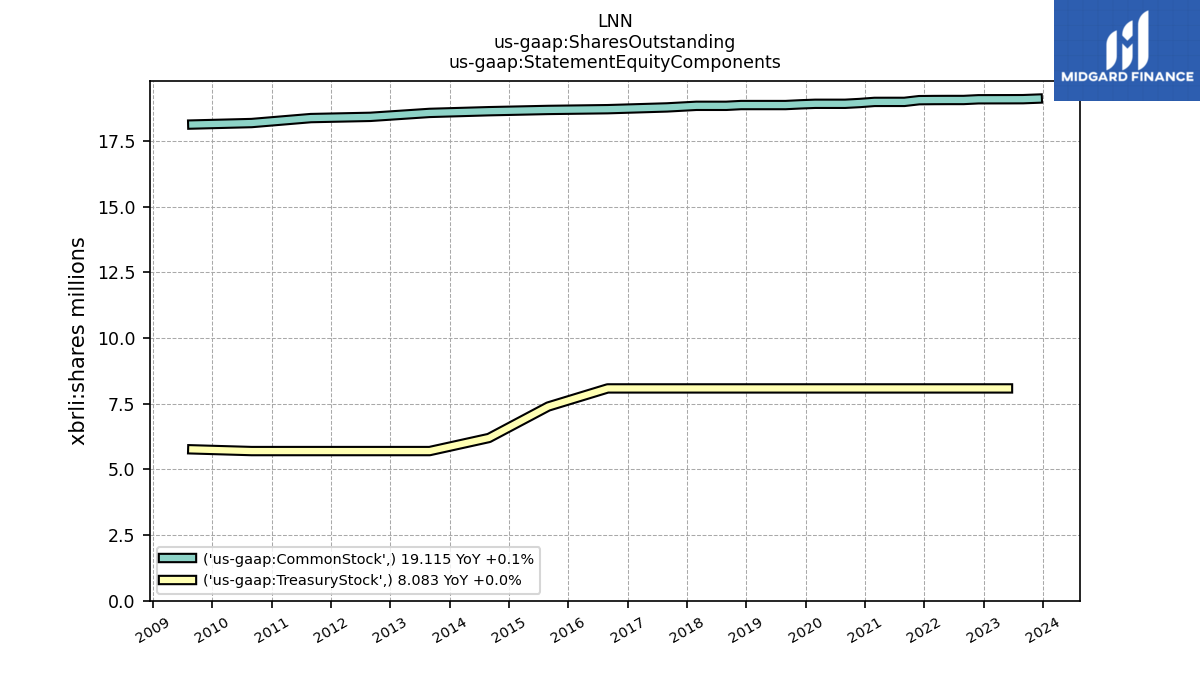
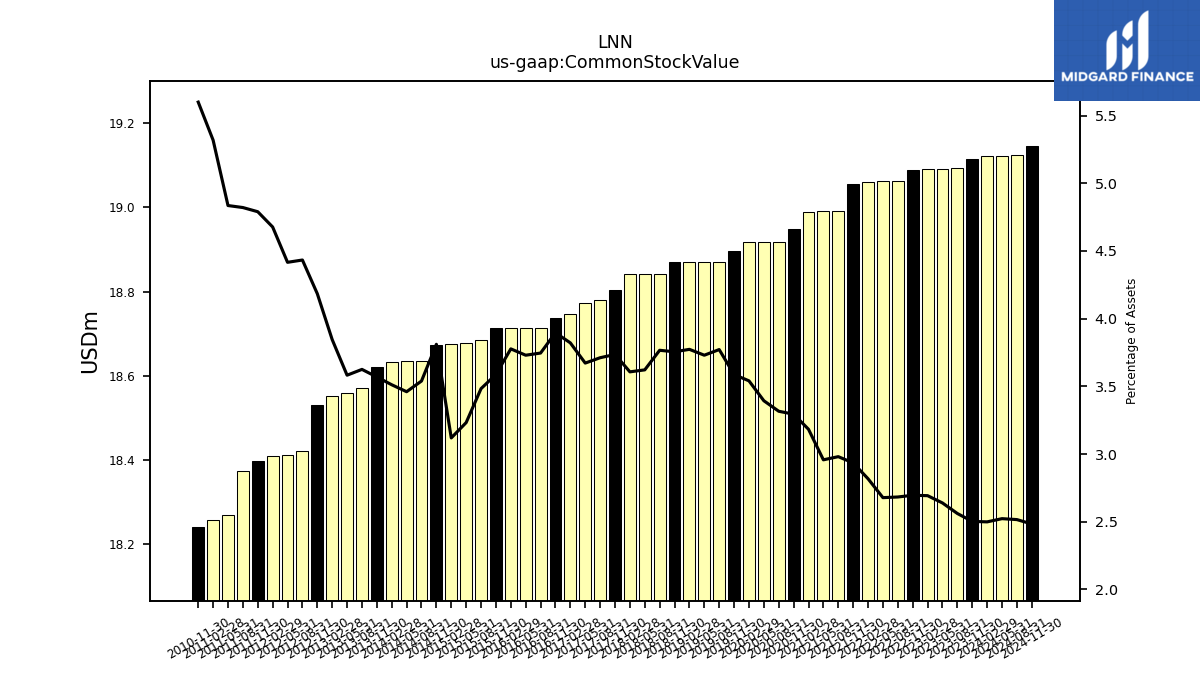
| Common Stock Value | 19.11 | 19.09 | 19.09 | 19.09 | 19.09 | 19.06 | 19.06 | 19.06 | 19.06 | 18.99 | 18.99 | 18.99 | 18.95 | 18.92 | 18.92 | 18.92 | 18.90 | 18.87 | 18.87 | 18.87 | 18.87 | 18.84 | 18.84 | 18.84 | 18.80 | 18.78 | 18.77 | 18.75 | 18.74 | 18.71 | 18.71 | 18.71 | 18.71 | 18.68 | 18.68 | 18.68 | 18.67 | 18.64 | 18.64 | 18.63 | 18.62 | 18.57 | 18.56 | 18.55 | 18.53 | 18.42 | 18.41 | 18.41 | 18.40 | 18.37 | 18.27 | 18.26 | 18.24 | |
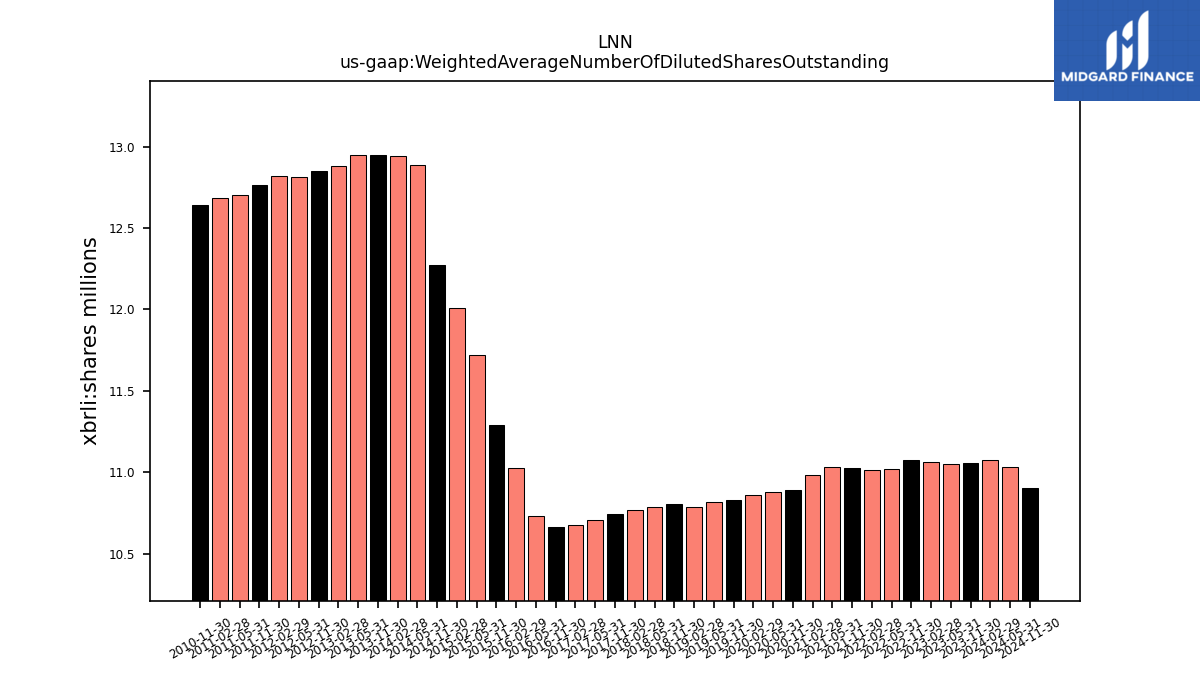
| Weighted Average Number Of Diluted Shares Outstanding | 11.06 | NA | 11.05 | 11.06 | 11.07 | NA | 11.02 | 11.01 | 11.03 | NA | 11.03 | 10.98 | 10.89 | NA | 10.88 | 10.86 | 10.83 | NA | 10.81 | 10.79 | 10.81 | NA | 10.79 | 10.77 | 10.74 | NA | 10.71 | 10.67 | 10.67 | NA | 10.73 | 11.02 | 11.29 | NA | 11.72 | 12.01 | 12.27 | NA | 12.89 | 12.94 | 12.95 | NA | 12.95 | 12.88 | 12.85 | NA | 12.81 | 12.82 | 12.76 | NA | 12.70 | 12.69 | 12.64 | |
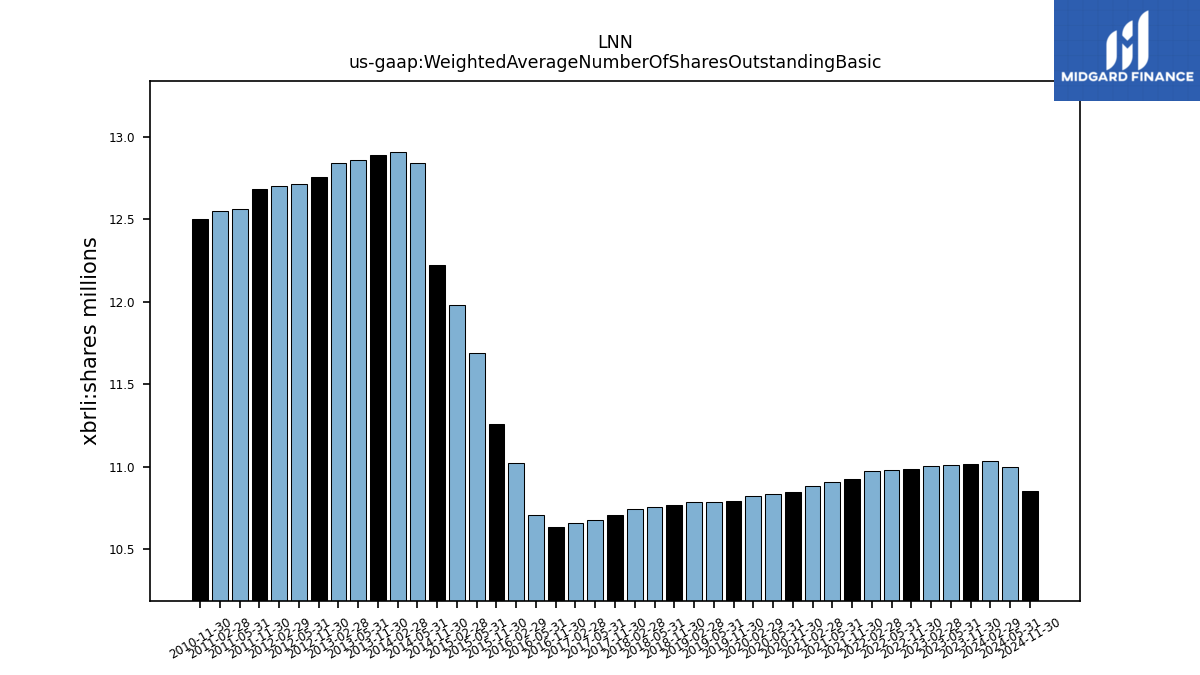
| Weighted Average Number Of Shares Outstanding Basic | 11.02 | NA | 11.01 | 11.01 | 10.99 | NA | 10.98 | 10.97 | 10.93 | NA | 10.91 | 10.88 | 10.85 | NA | 10.84 | 10.82 | 10.79 | NA | 10.79 | 10.79 | 10.77 | NA | 10.76 | 10.74 | 10.71 | NA | 10.68 | 10.66 | 10.64 | NA | 10.71 | 11.02 | 11.26 | NA | 11.69 | 11.98 | 12.22 | NA | 12.84 | 12.91 | 12.89 | NA | 12.86 | 12.84 | 12.76 | NA | 12.71 | 12.70 | 12.68 | NA | 12.56 | 12.55 | 12.50 | |
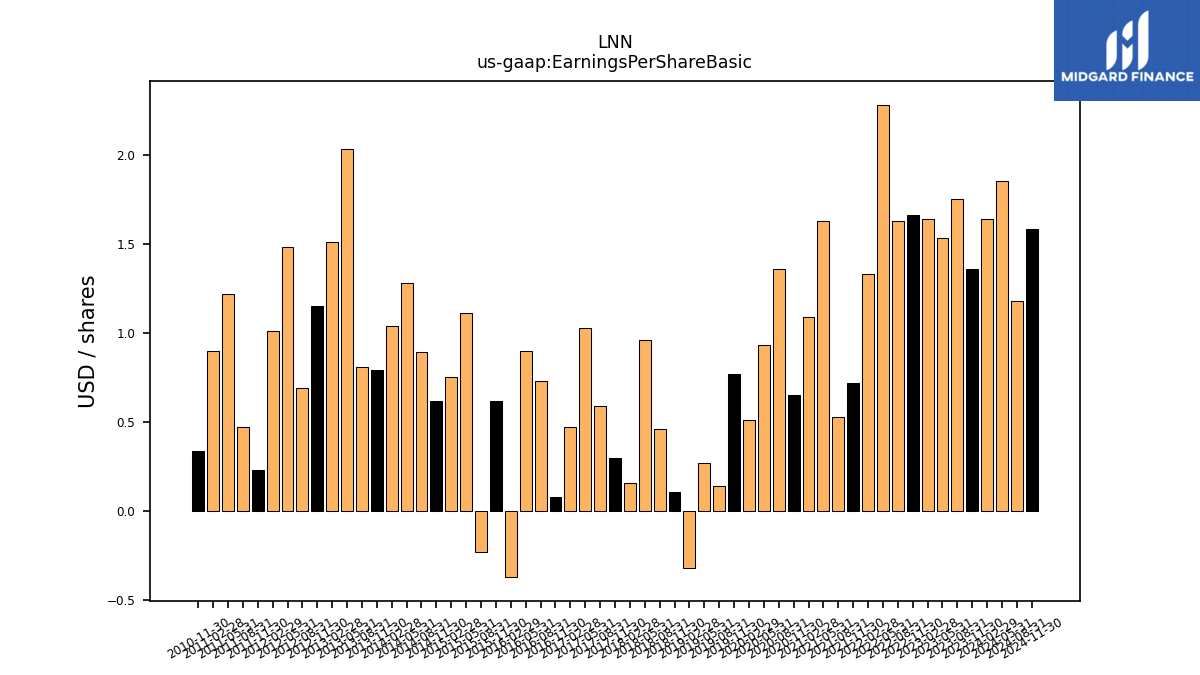
| Earnings Per Share Basic | 1.36 | 1.75 | 1.53 | 1.64 | 1.66 | 1.63 | 2.28 | 1.33 | 0.72 | 0.53 | 1.63 | 1.09 | 0.65 | 1.36 | 0.93 | 0.51 | 0.77 | 0.14 | 0.27 | -0.32 | 0.11 | 0.46 | 0.96 | 0.16 | 0.30 | 0.59 | 1.03 | 0.47 | 0.08 | 0.73 | 0.90 | -0.37 | 0.62 | -0.23 | 1.11 | 0.75 | 0.62 | 0.89 | 1.28 | 1.04 | 0.79 | 0.81 | 2.03 | 1.51 | 1.15 | 0.69 | 1.48 | 1.01 | 0.23 | 0.47 | 1.22 | 0.90 | 0.34 | |
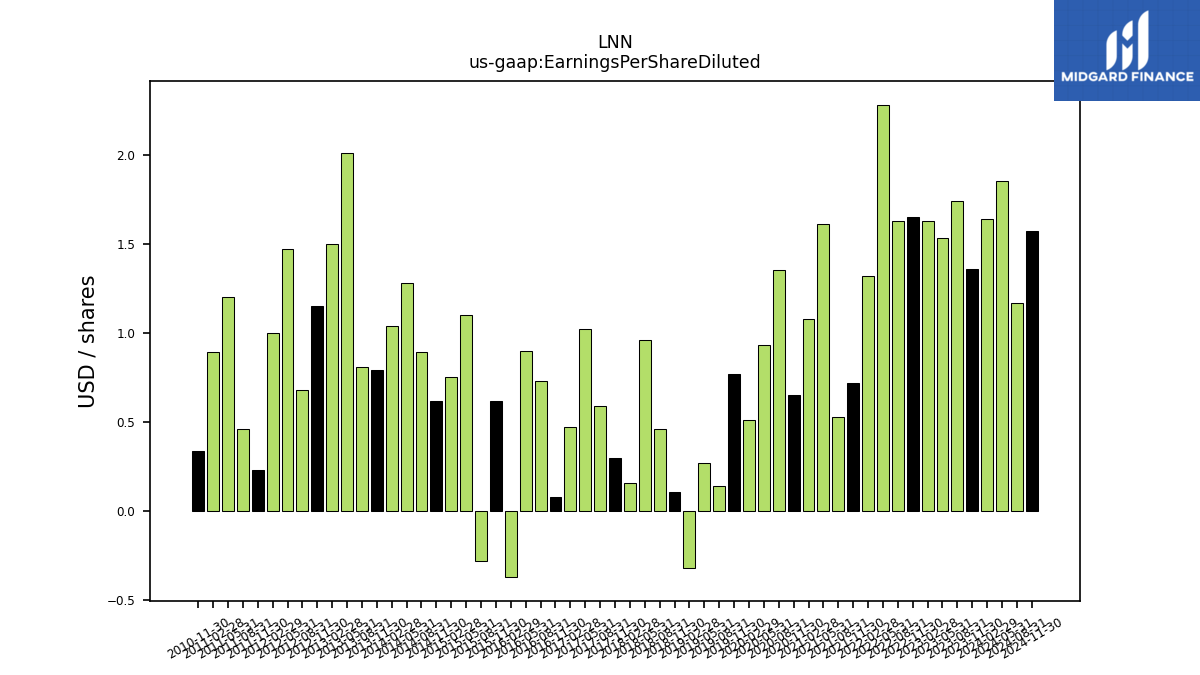
| Earnings Per Share Diluted | 1.36 | 1.74 | 1.53 | 1.63 | 1.65 | 1.63 | 2.28 | 1.32 | 0.72 | 0.53 | 1.61 | 1.08 | 0.65 | 1.35 | 0.93 | 0.51 | 0.77 | 0.14 | 0.27 | -0.32 | 0.11 | 0.46 | 0.96 | 0.16 | 0.30 | 0.59 | 1.02 | 0.47 | 0.08 | 0.73 | 0.90 | -0.37 | 0.62 | -0.28 | 1.10 | 0.75 | 0.62 | 0.89 | 1.28 | 1.04 | 0.79 | 0.81 | 2.01 | 1.50 | 1.15 | 0.68 | 1.47 | 1.00 | 0.23 | 0.46 | 1.20 | 0.89 | 0.34 |
| 2023-11-30 | 2023-08-31 | 2023-05-31 | 2023-02-28 | 2022-11-30 | 2022-08-31 | 2022-05-31 | 2022-02-28 | 2021-11-30 | 2021-08-31 | 2021-05-31 | 2021-02-28 | 2020-11-30 | 2020-08-31 | 2020-05-31 | 2020-02-29 | 2019-11-30 | 2019-08-31 | 2019-05-31 | 2019-02-28 | 2018-11-30 | 2018-08-31 | 2018-05-31 | 2018-02-28 | 2017-11-30 | 2017-08-31 | 2017-05-31 | 2017-02-28 | 2016-11-30 | 2016-08-31 | 2016-05-31 | 2016-02-29 | 2015-11-30 | 2015-08-31 | 2015-05-31 | 2015-02-28 | 2014-11-30 | 2014-08-31 | 2014-05-31 | 2014-02-28 | 2013-11-30 | 2013-08-31 | 2013-05-31 | 2013-02-28 | 2012-11-30 | 2012-08-31 | 2012-05-31 | 2012-02-29 | 2011-11-30 | 2011-08-31 | 2011-05-31 | 2011-02-28 | 2010-11-30 | ||
|---|---|---|---|---|---|---|---|---|---|---|---|---|---|---|---|---|---|---|---|---|---|---|---|---|---|---|---|---|---|---|---|---|---|---|---|---|---|---|---|---|---|---|---|---|---|---|---|---|---|---|---|---|---|---|
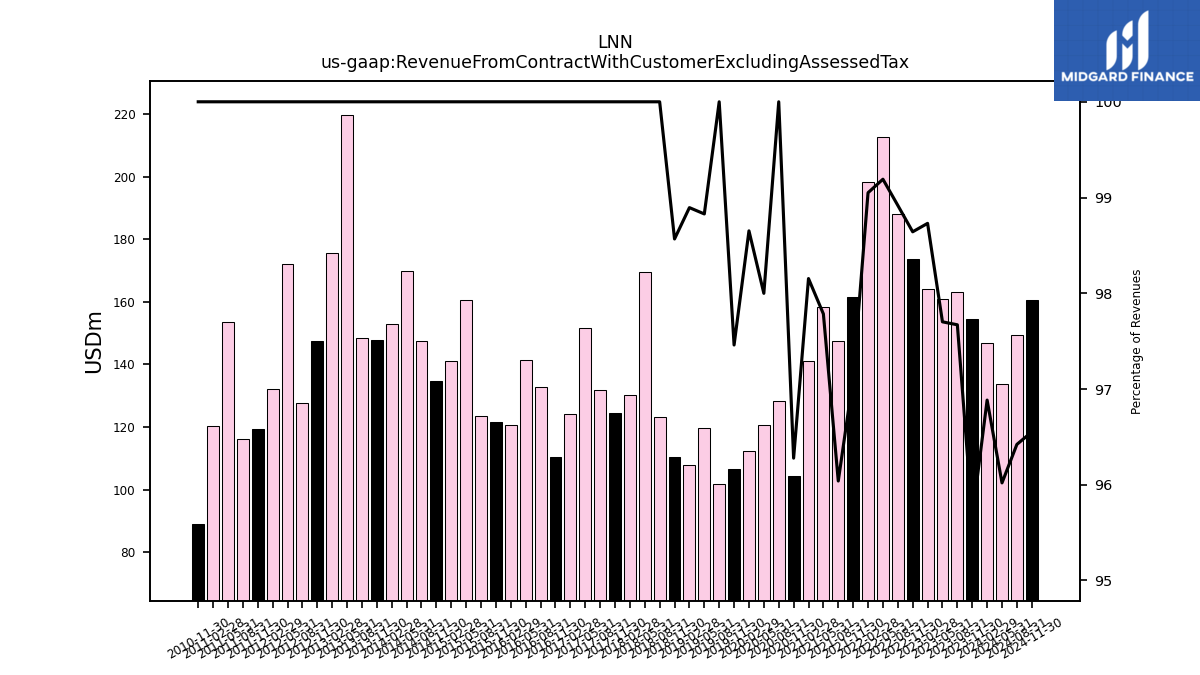
| Revenue From Contract With Customer Excluding Assessed Tax | 154.35 | 163.24 | 160.77 | 164.13 | 173.77 | 188.14 | 212.53 | 198.24 | 161.36 | 147.56 | 158.35 | 140.93 | 104.45 | 128.41 | 120.64 | 112.25 | 106.61 | 101.89 | 119.64 | 107.97 | 110.35 | 123.27 | 169.57 | 130.34 | 124.53 | 131.94 | 151.53 | 124.12 | 110.39 | 132.90 | 141.32 | 120.57 | 121.62 | 123.54 | 160.71 | 141.09 | 134.84 | 147.52 | 169.94 | 152.80 | 147.67 | 148.40 | 219.54 | 175.54 | 147.37 | 127.82 | 172.10 | 132.13 | 119.20 | 116.11 | 153.45 | 120.17 | 89.17 | |
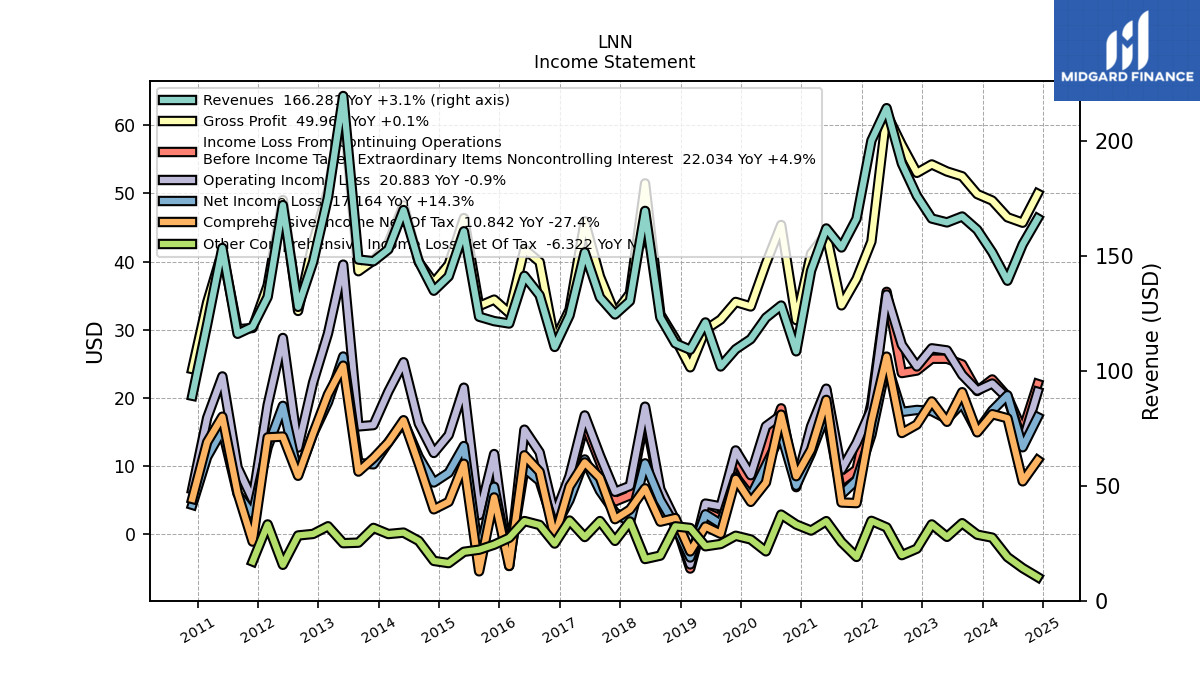
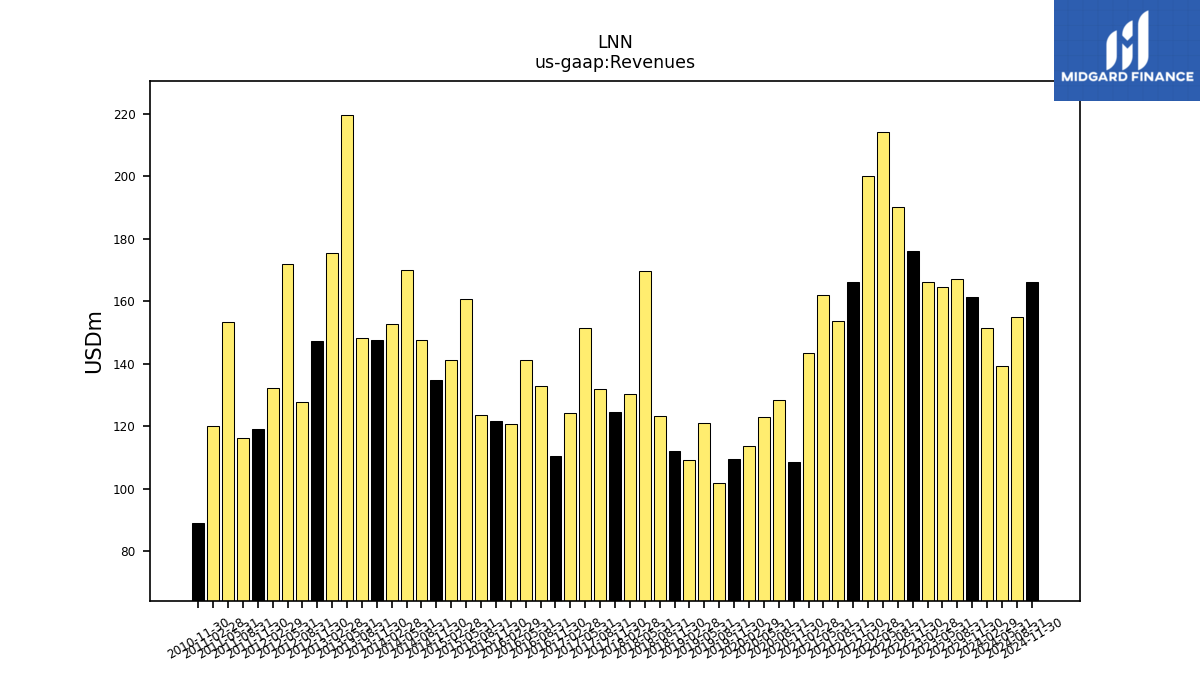
| Revenues | 161.36 | 167.13 | 164.55 | 166.24 | 176.16 | 190.20 | 214.26 | 200.14 | 166.15 | 153.65 | 161.94 | 143.58 | 108.48 | 128.41 | 123.11 | 113.79 | 109.39 | 101.89 | 121.05 | 109.18 | 111.95 | 123.27 | 169.57 | 130.34 | 124.53 | 131.94 | 151.53 | 124.12 | 110.39 | 132.90 | 141.32 | 120.57 | 121.62 | 123.54 | 160.71 | 141.09 | 134.84 | 147.52 | 169.94 | 152.80 | 147.67 | 148.40 | 219.54 | 175.54 | 147.37 | 127.82 | 172.10 | 132.13 | 119.20 | 116.11 | 153.45 | 120.17 | 89.17 | |
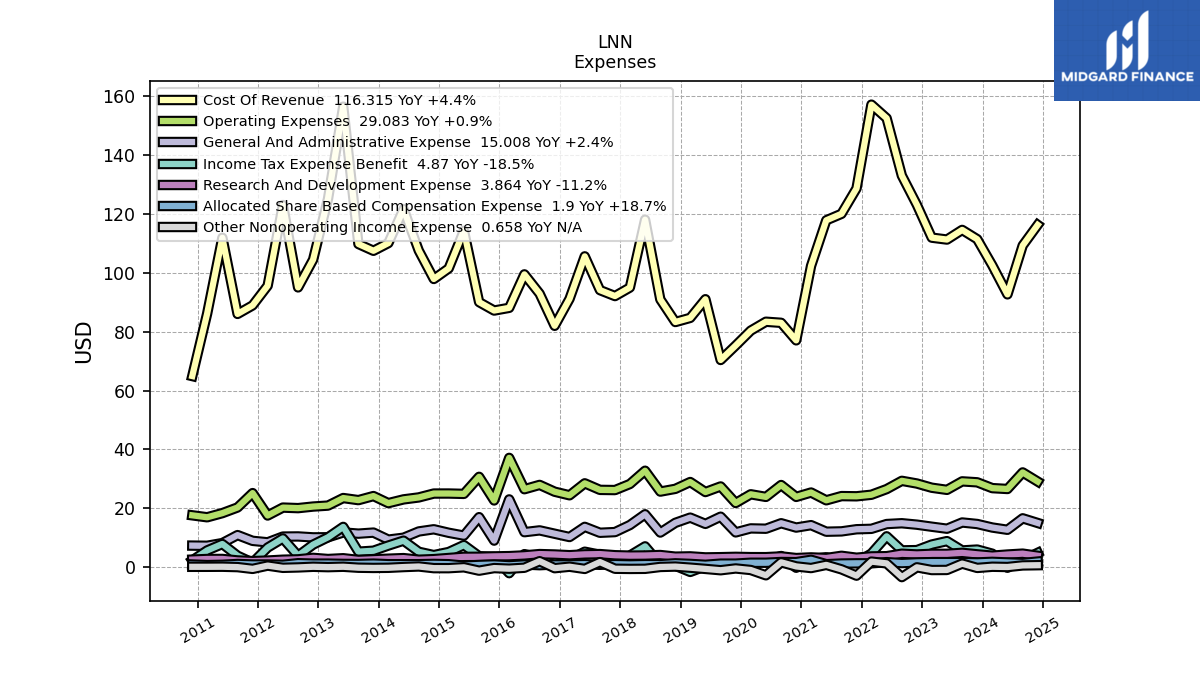
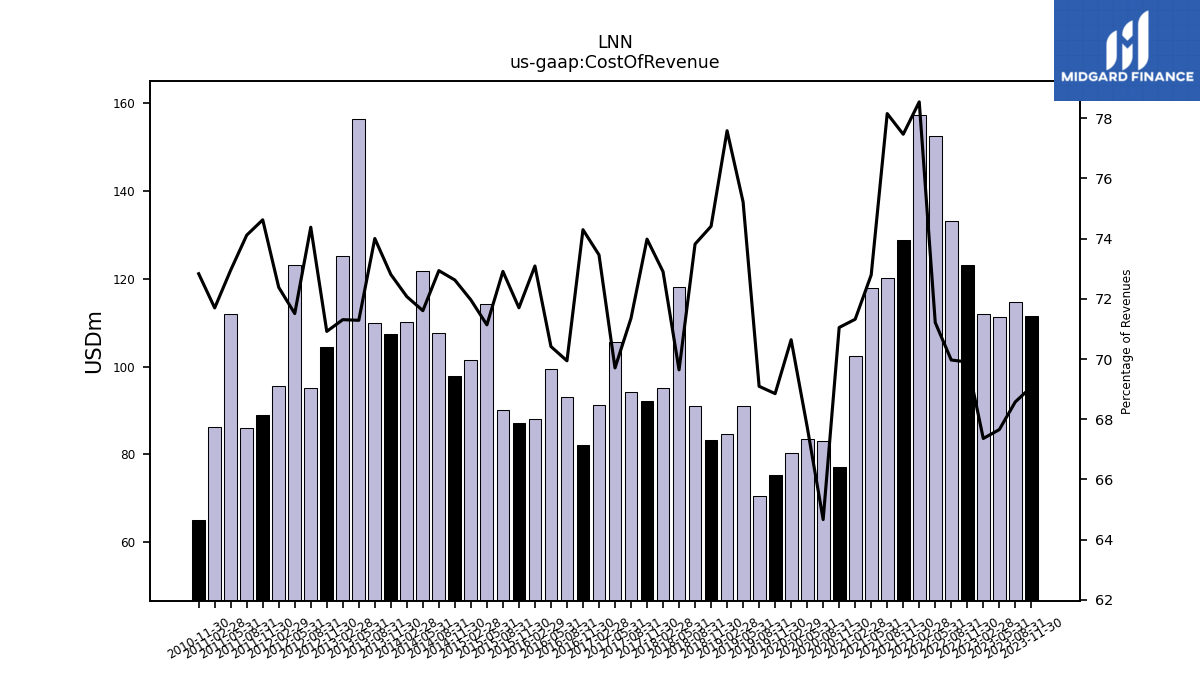
| Cost Of Revenue | 111.45 | 114.61 | 111.33 | 111.98 | 123.14 | 133.08 | 152.58 | 157.19 | 128.71 | 120.08 | 117.88 | 102.40 | 77.08 | 83.04 | 83.41 | 80.38 | 75.32 | 70.40 | 91.06 | 84.71 | 83.30 | 91.00 | 118.09 | 95.02 | 92.13 | 94.15 | 105.63 | 91.18 | 82.02 | 92.95 | 99.51 | 88.13 | 87.21 | 90.08 | 114.32 | 101.53 | 97.93 | 107.60 | 121.69 | 110.13 | 107.52 | 109.82 | 156.51 | 125.17 | 104.51 | 95.07 | 123.07 | 95.64 | 88.96 | 86.06 | 111.95 | 86.16 | 64.94 | |
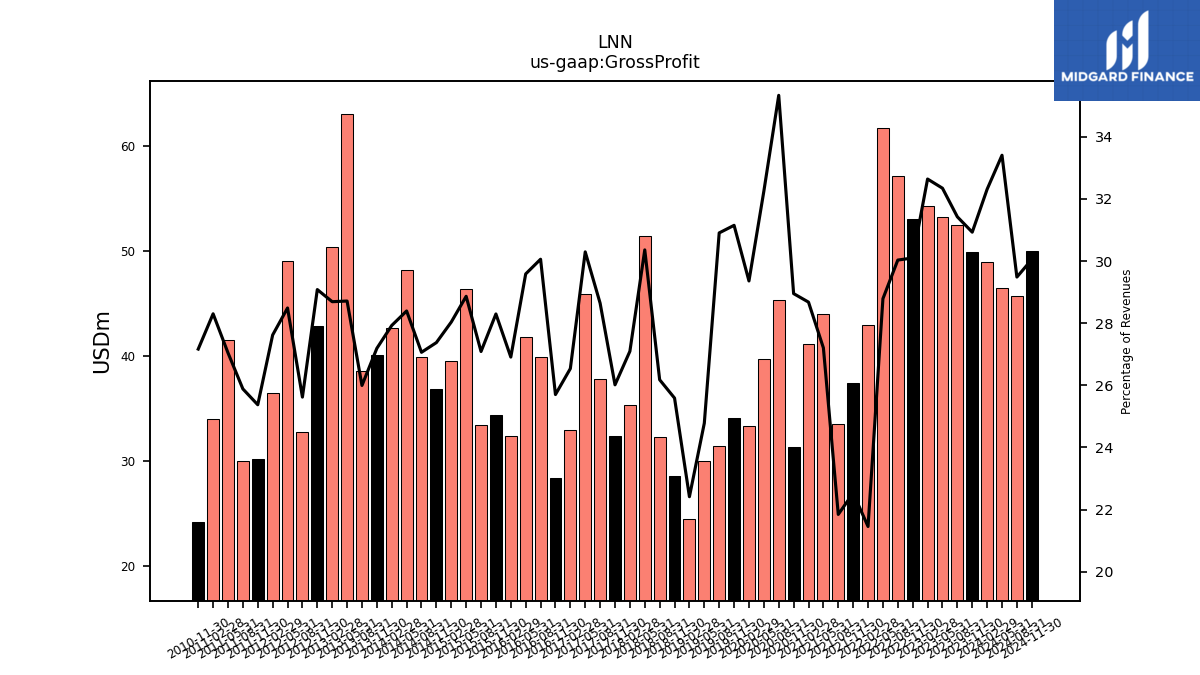
| Gross Profit | 49.91 | 52.52 | 53.22 | 54.26 | 53.02 | 57.12 | 61.68 | 42.94 | 37.44 | 33.57 | 44.06 | 41.17 | 31.41 | 45.37 | 39.70 | 33.41 | 34.07 | 31.49 | 30.00 | 24.47 | 28.65 | 32.27 | 51.48 | 35.32 | 32.40 | 37.79 | 45.91 | 32.94 | 28.37 | 39.95 | 41.81 | 32.45 | 34.41 | 33.47 | 46.39 | 39.56 | 36.91 | 39.92 | 48.25 | 42.67 | 40.15 | 38.58 | 63.04 | 50.36 | 42.86 | 32.75 | 49.03 | 36.49 | 30.25 | 30.05 | 41.50 | 34.01 | 24.22 | |
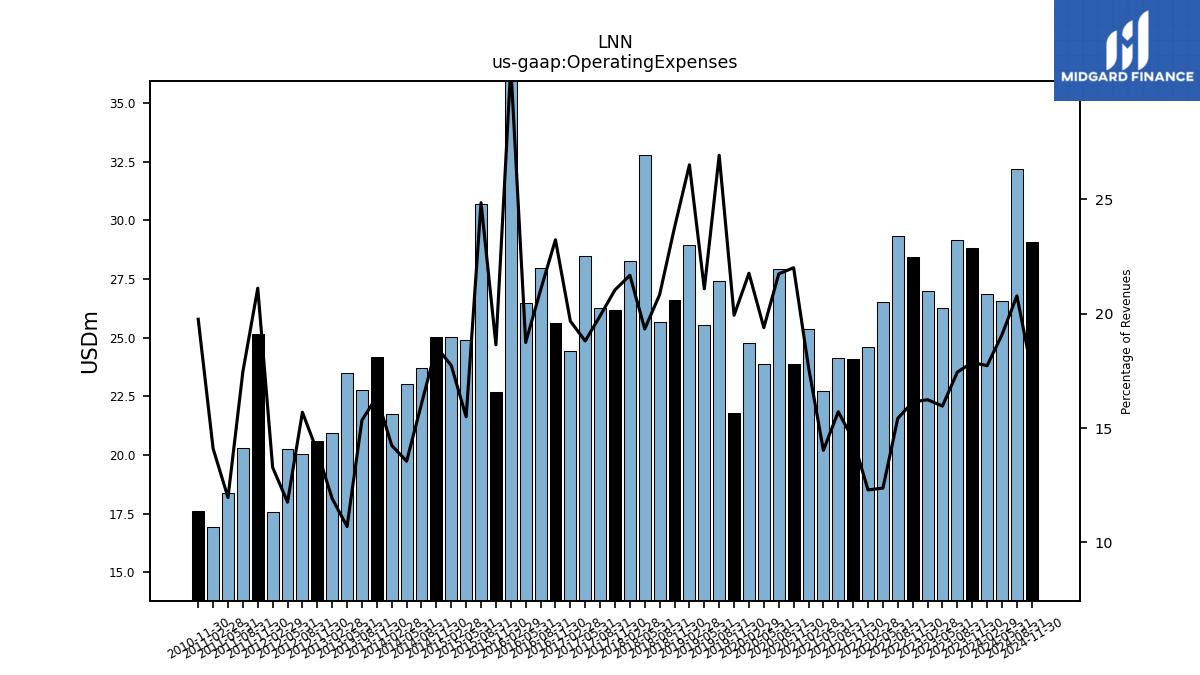
| Operating Expenses | 28.83 | 29.15 | 26.26 | 26.99 | 28.42 | 29.34 | 26.52 | 24.61 | 24.08 | 24.14 | 22.71 | 25.36 | 23.87 | 27.91 | 23.87 | 24.76 | 21.80 | 27.43 | 25.52 | 28.93 | 26.61 | 25.68 | 32.78 | 28.25 | 26.20 | 26.26 | 28.49 | 24.42 | 25.64 | 27.95 | 26.48 | 37.14 | 22.67 | 30.70 | 24.90 | 25.02 | 25.01 | 23.69 | 23.03 | 21.76 | 24.16 | 22.78 | 23.49 | 20.92 | 20.59 | 20.06 | 20.24 | 17.55 | 25.16 | 20.28 | 18.36 | 16.95 | 17.61 | |
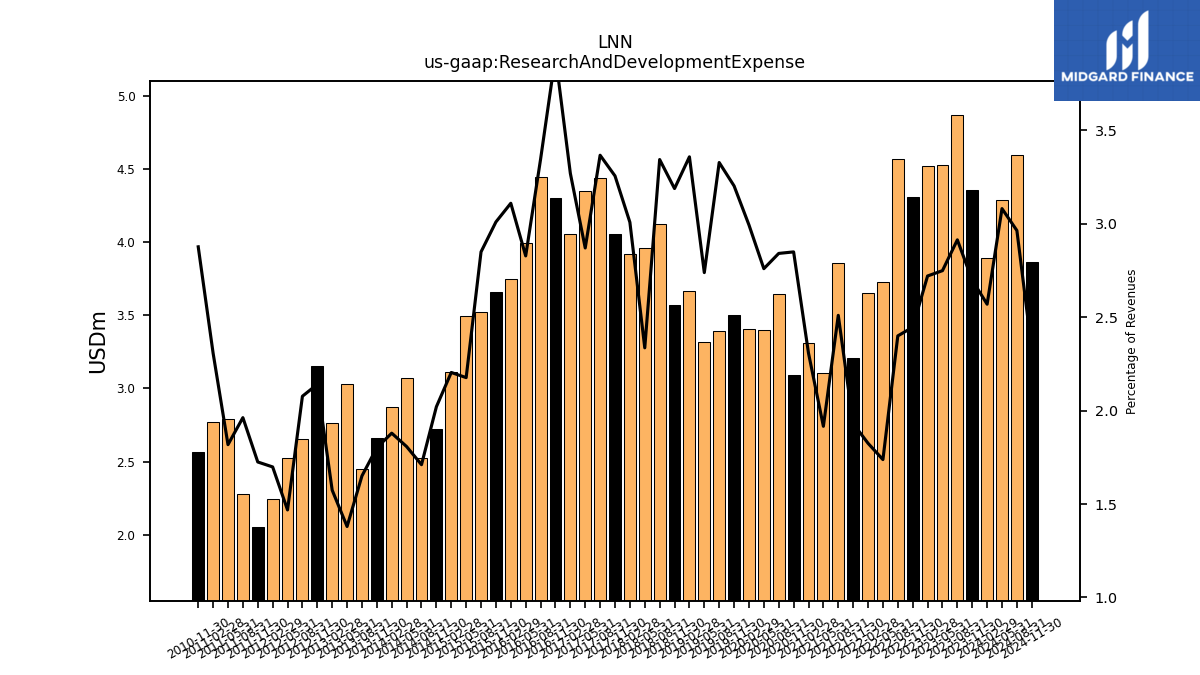
| Research And Development Expense | 4.35 | 4.87 | 4.52 | 4.52 | 4.31 | 4.56 | 3.72 | 3.65 | 3.21 | 3.85 | 3.10 | 3.31 | 3.09 | 3.65 | 3.40 | 3.40 | 3.50 | 3.39 | 3.31 | 3.67 | 3.57 | 4.12 | 3.96 | 3.92 | 4.05 | 4.44 | 4.35 | 4.06 | 4.30 | 4.44 | 4.00 | 3.75 | 3.66 | 3.52 | 3.50 | 3.11 | 2.72 | 2.52 | 3.07 | 2.87 | 2.66 | 2.45 | 3.03 | 2.76 | 3.15 | 2.65 | 2.53 | 2.24 | 2.06 | 2.28 | 2.79 | 2.77 | 2.56 | |
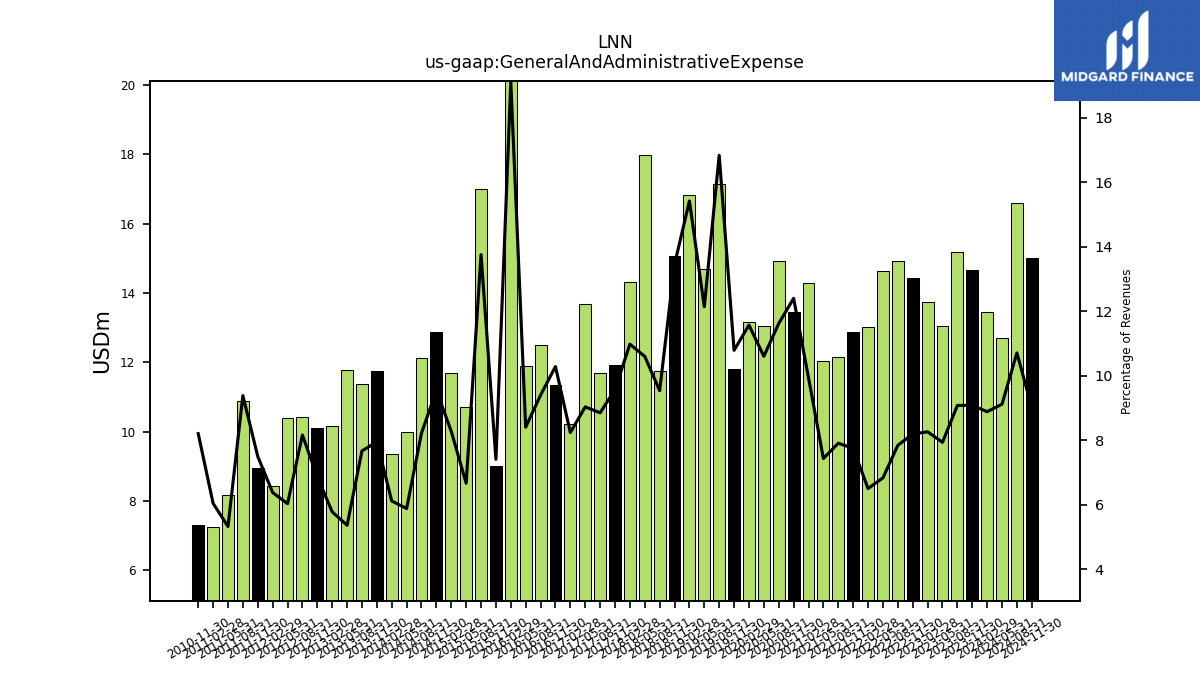
| General And Administrative Expense | 14.66 | 15.18 | 13.06 | 13.74 | 14.44 | 14.92 | 14.65 | 13.02 | 12.88 | 12.15 | 12.04 | 14.28 | 13.45 | 14.92 | 13.05 | 13.17 | 11.80 | 17.15 | 14.70 | 16.83 | 15.06 | 11.76 | 17.97 | 14.31 | 11.92 | 11.68 | 13.69 | 10.23 | 11.36 | 12.49 | 11.88 | 23.03 | 9.02 | 16.99 | 10.72 | 11.68 | 12.87 | 12.13 | 10.00 | 9.35 | 11.74 | 11.38 | 11.78 | 10.15 | 10.12 | 10.43 | 10.39 | 8.43 | 8.94 | 10.90 | 8.18 | 7.26 | 7.32 | |
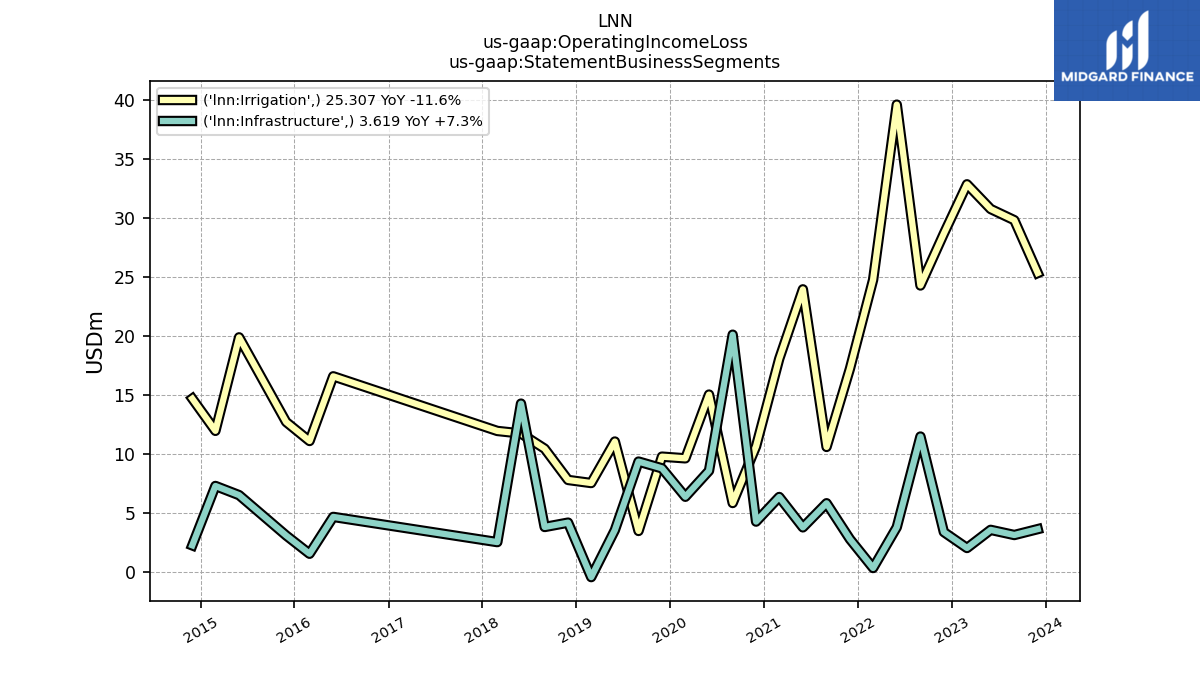
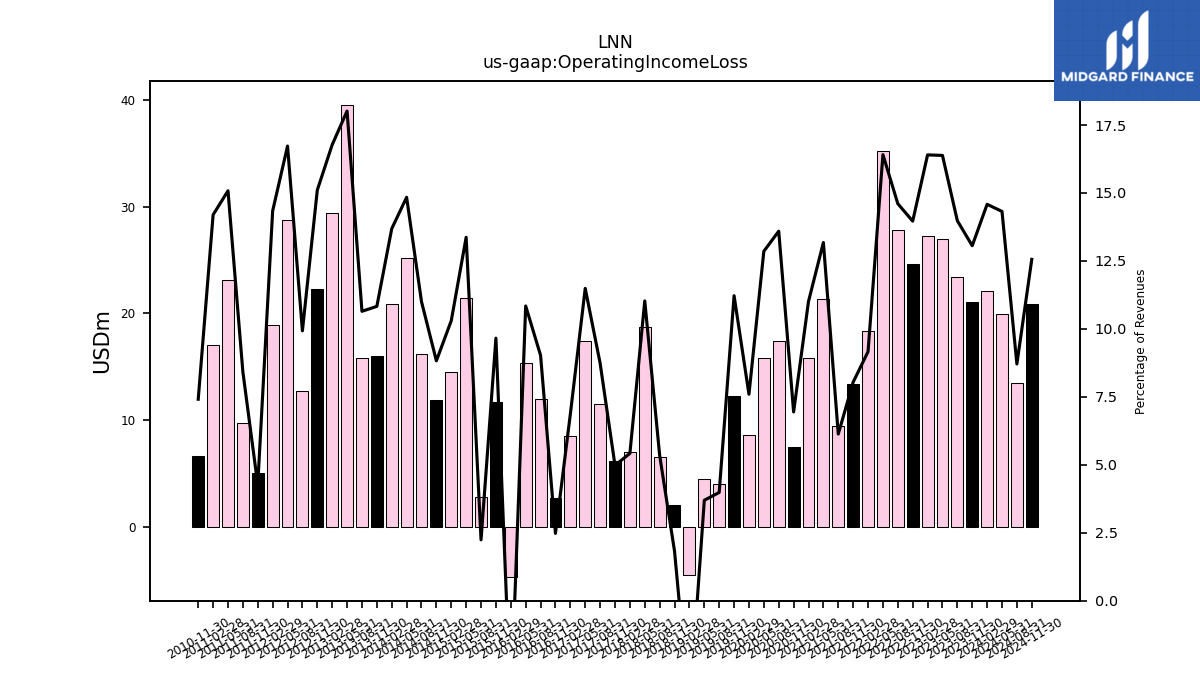
| Operating Income Loss | 21.07 | 23.36 | 26.96 | 27.27 | 24.60 | 27.78 | 35.16 | 18.34 | 13.36 | 9.42 | 21.34 | 15.81 | 7.54 | 17.46 | 15.83 | 8.64 | 12.28 | 4.06 | 4.47 | -4.46 | 2.04 | 6.59 | 18.70 | 7.07 | 6.20 | 11.53 | 17.41 | 8.52 | 2.73 | 12.00 | 15.32 | -4.69 | 11.75 | 2.77 | 21.49 | 14.54 | 11.90 | 16.23 | 25.22 | 20.91 | 15.99 | 15.80 | 39.55 | 29.45 | 22.26 | 12.69 | 28.79 | 18.95 | 5.08 | 9.77 | 23.14 | 17.06 | 6.61 | |
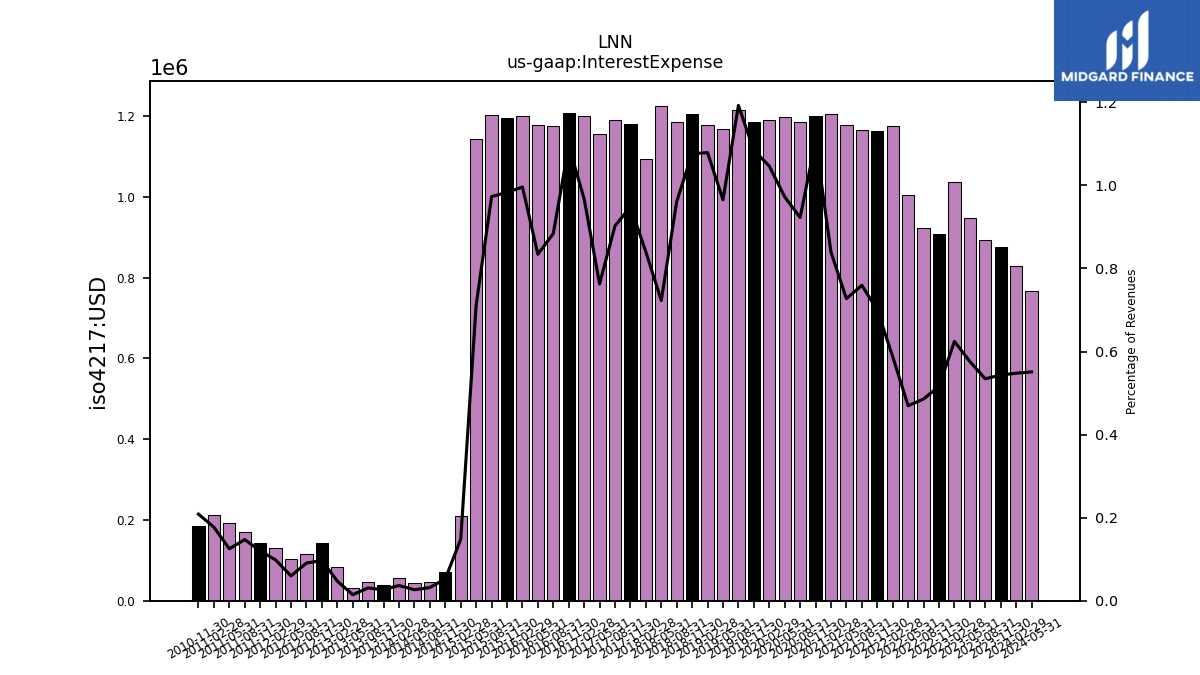
| Interest Expense | 0.88 | 0.89 | 0.95 | 1.04 | 0.91 | 0.92 | 1.01 | 1.18 | 1.16 | 1.17 | 1.18 | 1.21 | 1.20 | 1.19 | 1.20 | 1.19 | 1.19 | 1.22 | 1.17 | 1.18 | 1.21 | 1.19 | 1.23 | 1.09 | 1.18 | 1.19 | 1.16 | 1.20 | 1.21 | 1.18 | 1.18 | 1.20 | 1.20 | 1.20 | 1.14 | 0.21 | 0.07 | 0.05 | 0.04 | 0.06 | 0.04 | 0.05 | 0.03 | 0.08 | 0.14 | 0.12 | 0.10 | 0.13 | 0.14 | 0.17 | 0.19 | 0.21 | 0.19 | |
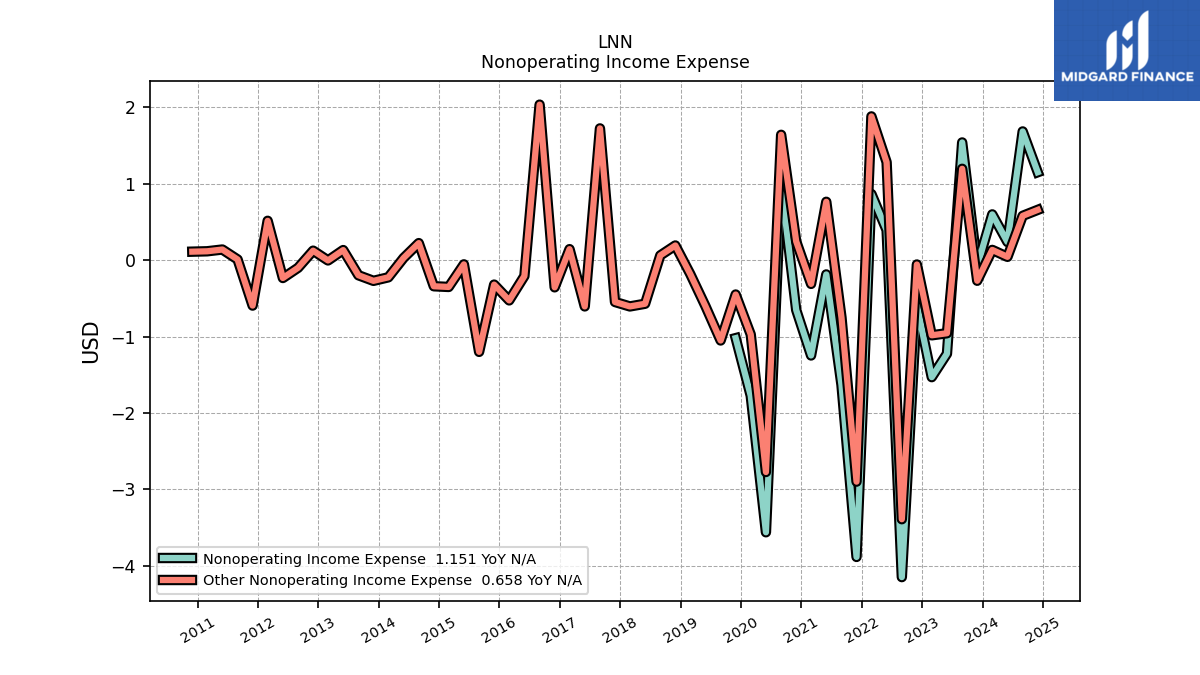
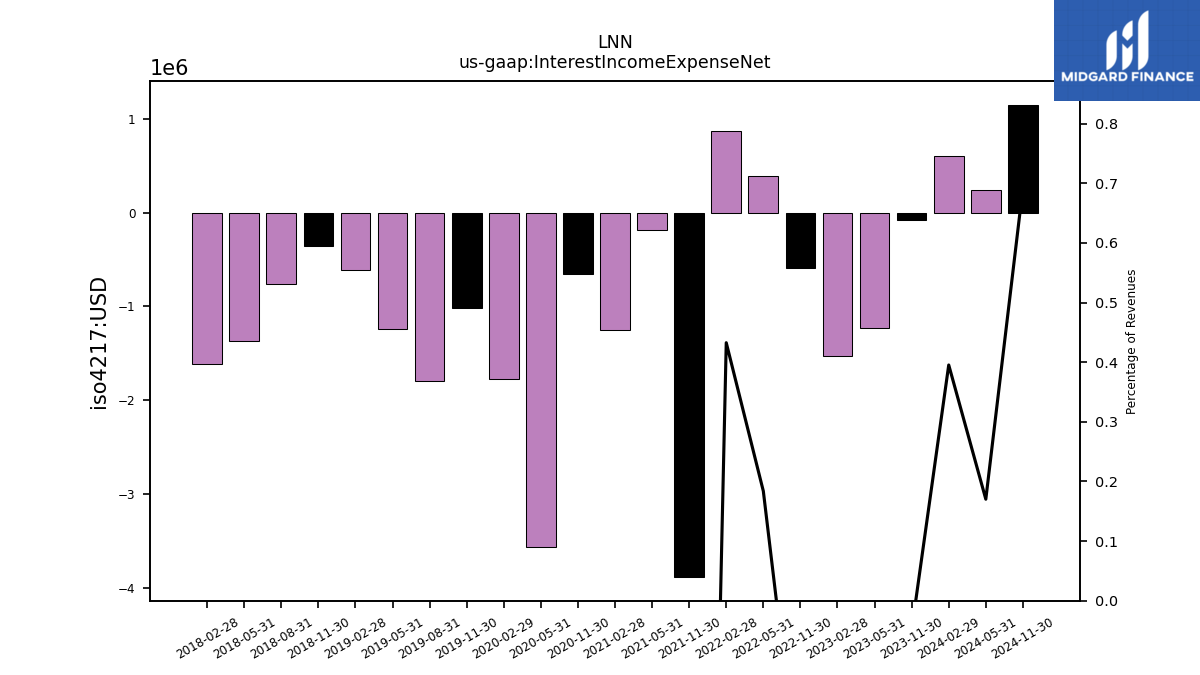
| Interest Income Expense Net | -0.08 | NA | -1.23 | -1.53 | -0.59 | NA | 0.39 | 0.87 | -3.89 | NA | -0.19 | -1.25 | -0.65 | NA | -3.56 | -1.77 | -1.02 | -1.79 | -1.25 | -0.61 | -0.36 | -0.77 | -1.37 | -1.61 | NA | NA | NA | NA | NA | NA | NA | NA | NA | NA | NA | NA | NA | NA | NA | NA | NA | NA | NA | NA | NA | NA | NA | NA | NA | NA | NA | NA | NA | |
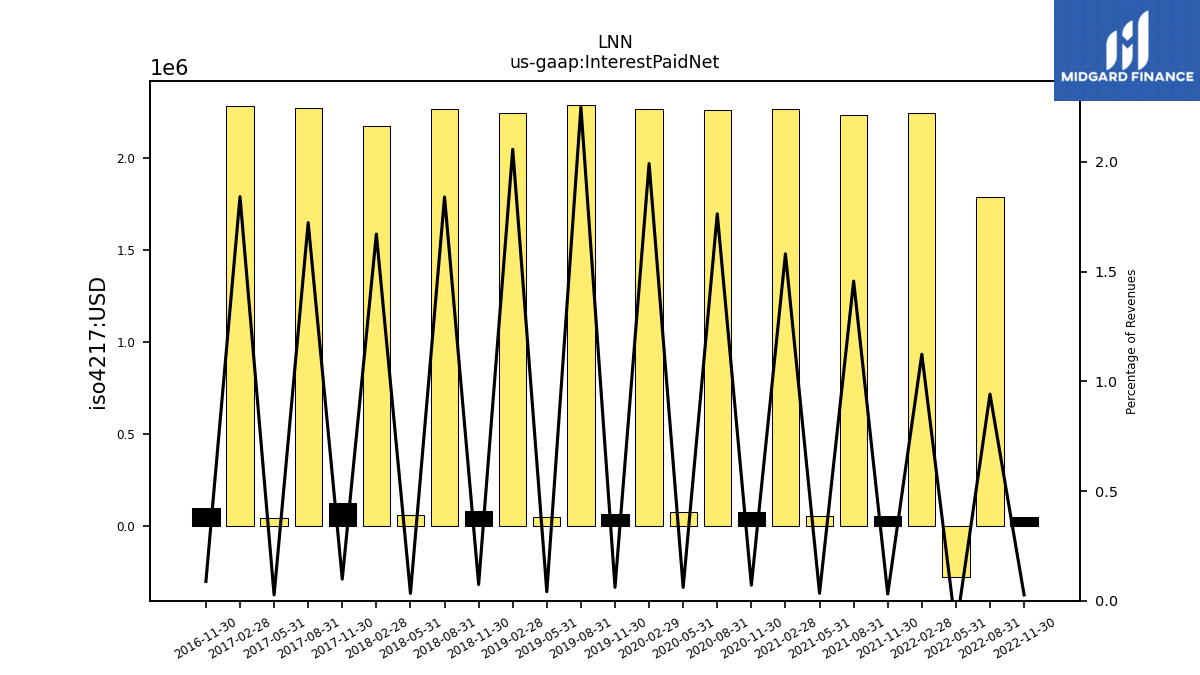
| Interest Paid Net | NA | NA | NA | NA | 0.05 | 1.79 | -0.28 | 2.25 | 0.05 | 2.24 | 0.06 | 2.27 | 0.08 | 2.26 | 0.07 | 2.27 | 0.07 | 2.29 | 0.05 | 2.25 | 0.08 | 2.27 | 0.06 | 2.18 | 0.12 | 2.27 | 0.04 | 2.29 | 0.10 | NA | NA | NA | NA | NA | NA | NA | NA | NA | NA | NA | NA | NA | NA | NA | NA | NA | NA | NA | NA | NA | NA | NA | NA | |
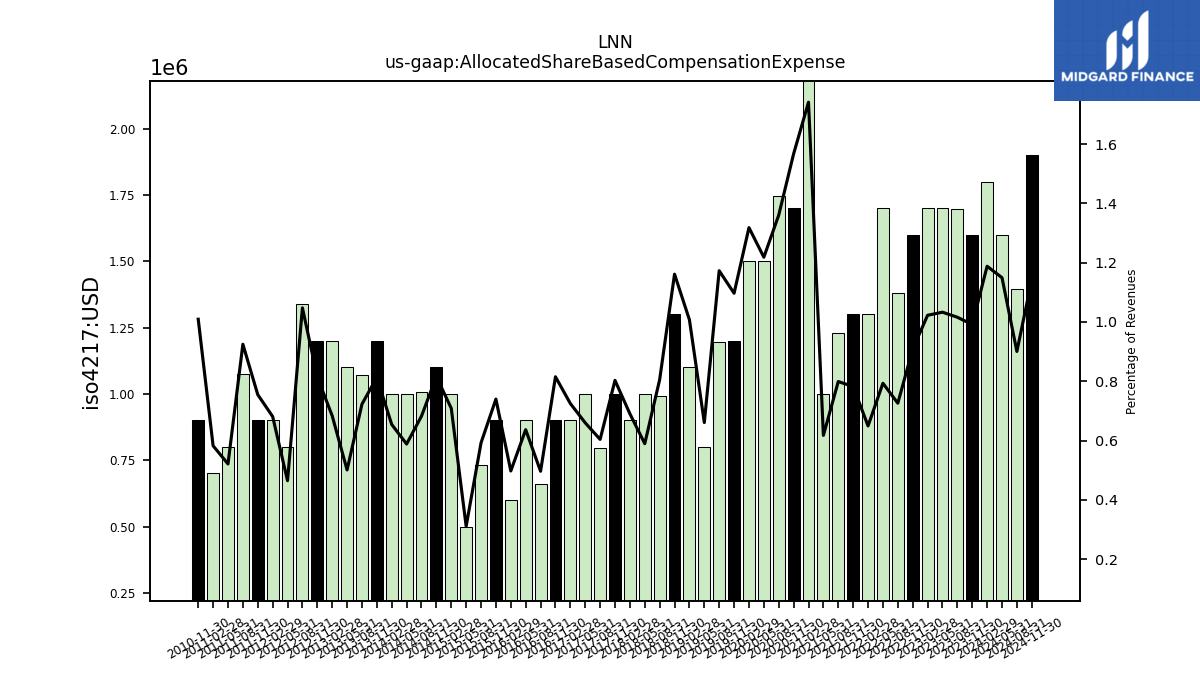
| Allocated Share Based Compensation Expense | 1.60 | 1.70 | 1.70 | 1.70 | 1.60 | 1.38 | 1.70 | 1.30 | 1.30 | 1.23 | 1.00 | 2.50 | 1.70 | 1.75 | 1.50 | 1.50 | 1.20 | 1.20 | 0.80 | 1.10 | 1.30 | 0.99 | 1.00 | 0.90 | 1.00 | 0.80 | 1.00 | 0.90 | 0.90 | 0.66 | 0.90 | 0.60 | 0.90 | 0.73 | 0.50 | 1.00 | 1.10 | 1.01 | 1.00 | 1.00 | 1.20 | 1.07 | 1.10 | 1.20 | 1.20 | 1.34 | 0.80 | 0.90 | 0.90 | 1.07 | 0.80 | 0.70 | 0.90 | |
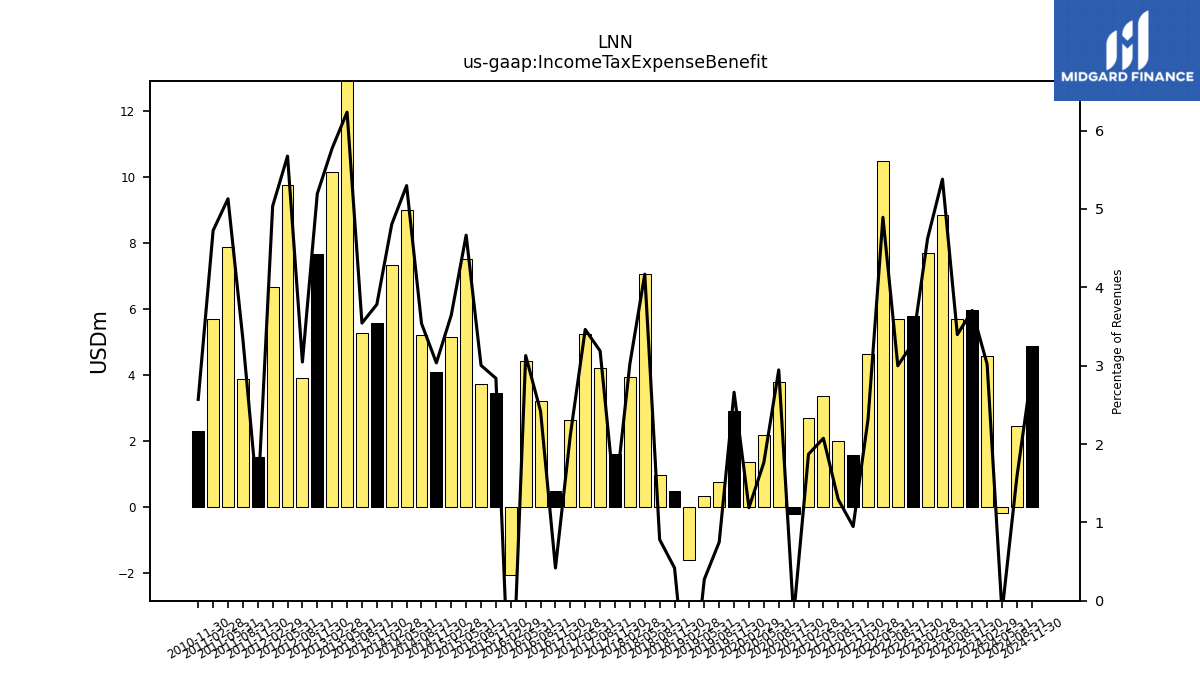
| Income Tax Expense Benefit | 5.98 | 5.68 | 8.85 | 7.68 | 5.79 | 5.70 | 10.48 | 4.64 | 1.57 | 1.99 | 3.36 | 2.69 | -0.21 | 3.78 | 2.17 | 1.35 | 2.91 | 0.76 | 0.33 | -1.63 | 0.47 | 0.96 | 7.07 | 3.94 | 1.61 | 4.21 | 5.25 | 2.62 | 0.46 | 3.21 | 4.42 | -2.06 | 3.45 | 3.71 | 7.50 | 5.14 | 4.09 | 5.22 | 9.00 | 7.34 | 5.58 | 5.26 | 13.69 | 10.14 | 7.66 | 3.89 | 9.76 | 6.65 | 1.52 | 3.88 | 7.87 | 5.68 | 2.29 | |
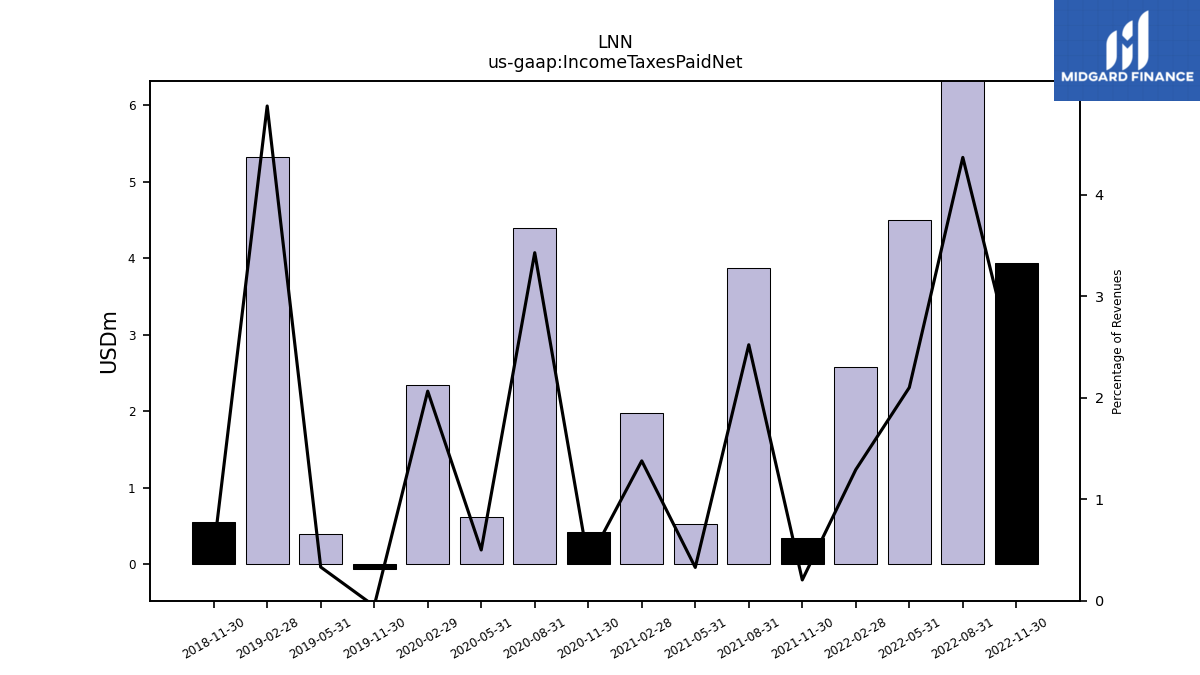
| Income Taxes Paid Net | NA | NA | NA | NA | 3.94 | 8.31 | 4.50 | 2.59 | 0.34 | 3.88 | 0.53 | 1.98 | 0.42 | 4.40 | 0.62 | 2.35 | -0.06 | NA | 0.40 | 5.32 | 0.55 | NA | NA | NA | NA | NA | NA | NA | NA | NA | NA | NA | NA | NA | NA | NA | NA | NA | NA | NA | NA | NA | NA | NA | NA | NA | NA | NA | NA | NA | NA | NA | NA | |
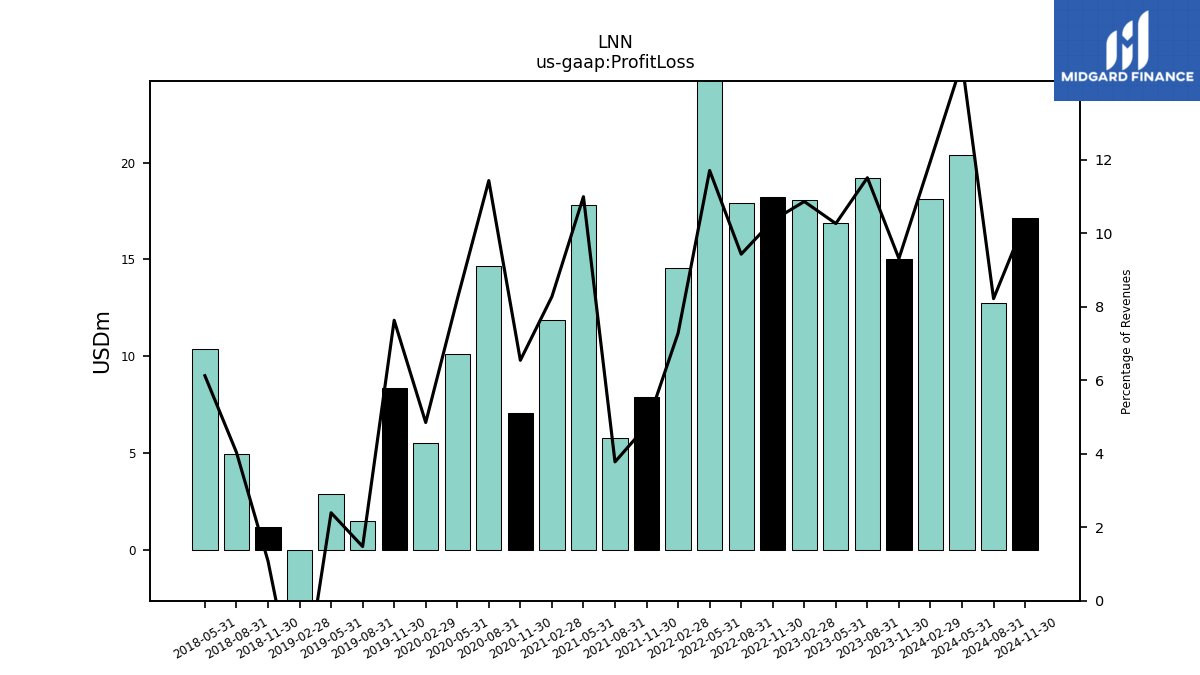
| Profit Loss | 15.02 | 19.23 | 16.88 | 18.05 | 18.22 | 17.93 | 25.07 | 14.57 | 7.90 | 5.80 | 17.80 | 11.88 | 7.09 | 14.67 | 10.09 | 5.52 | 8.35 | 1.50 | 2.90 | -3.44 | 1.21 | 4.98 | 10.38 | NA | NA | NA | NA | NA | NA | NA | NA | NA | NA | NA | NA | NA | NA | NA | NA | NA | NA | NA | NA | NA | NA | NA | NA | NA | NA | NA | NA | NA | NA | |
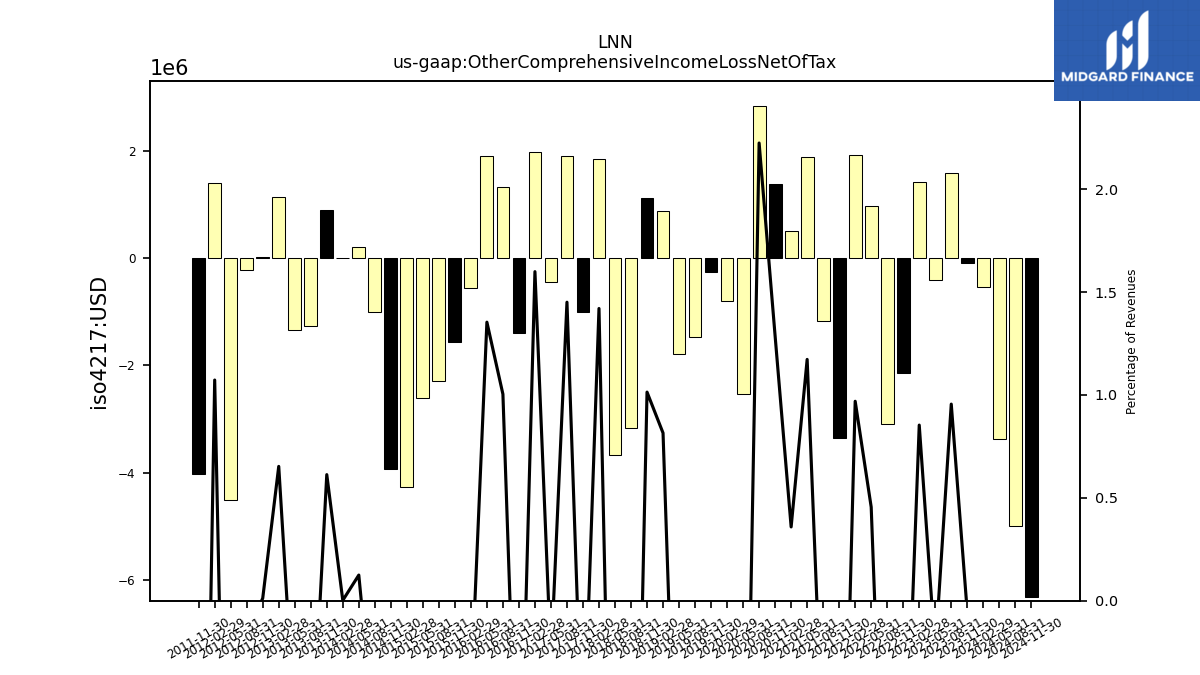
| Other Comprehensive Income Loss Net Of Tax | -0.09 | 1.60 | -0.41 | 1.42 | -2.15 | -3.10 | 0.97 | 1.94 | -3.36 | -1.17 | 1.90 | 0.52 | 1.40 | 2.86 | -2.54 | -0.79 | -0.25 | -1.46 | -1.79 | 0.89 | 1.14 | -3.16 | -3.67 | 1.85 | -1.00 | 1.91 | -0.44 | 1.99 | -1.40 | 1.33 | 1.91 | -0.55 | -1.56 | -2.29 | -2.60 | -4.27 | -3.94 | -1.00 | 0.21 | 0.00 | 0.91 | -1.26 | -1.34 | 1.15 | 0.02 | -0.21 | -4.52 | 1.42 | -4.03 | NA | NA | NA | NA | |
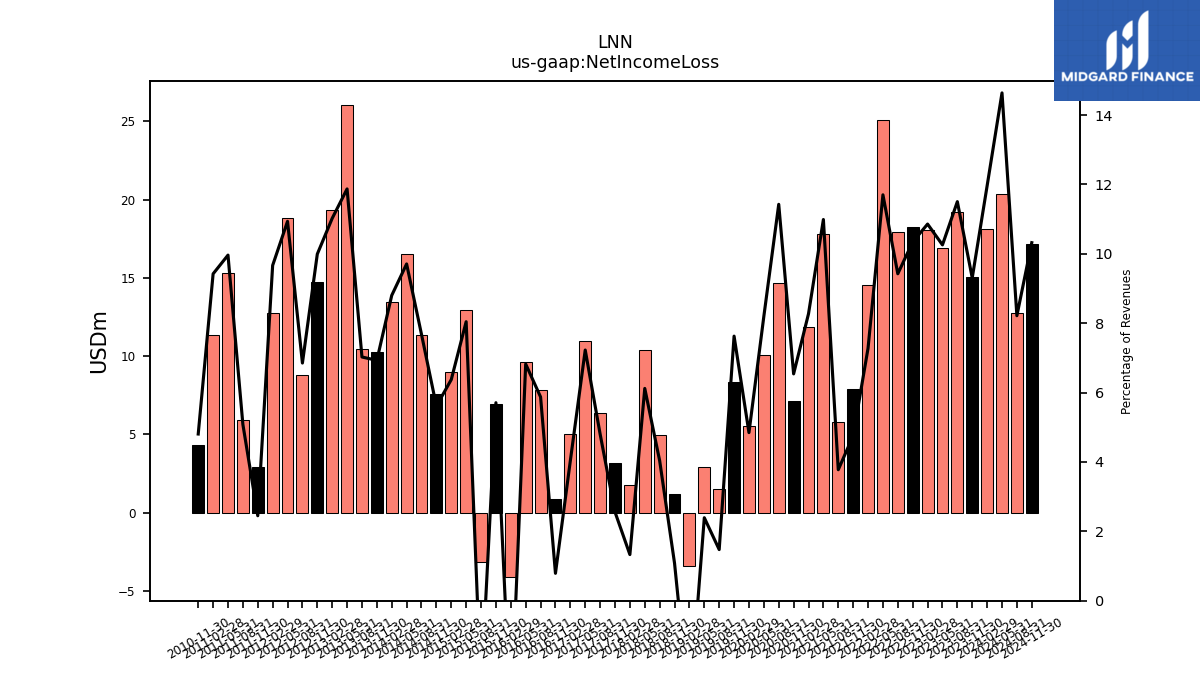
| Net Income Loss | 15.02 | 19.23 | 16.88 | 18.05 | 18.22 | 17.93 | 25.07 | 14.57 | 7.90 | 5.80 | 17.80 | 11.88 | 7.09 | 14.67 | 10.09 | 5.52 | 8.35 | 1.50 | 2.90 | -3.44 | 1.21 | 4.98 | 10.38 | 1.74 | 3.19 | 6.34 | 10.95 | 5.01 | 0.87 | 7.81 | 9.64 | -4.13 | 6.94 | -3.18 | 12.93 | 8.99 | 7.57 | 11.33 | 16.50 | 13.45 | 10.23 | 10.43 | 26.06 | 19.35 | 14.73 | 8.76 | 18.82 | 12.77 | 2.92 | 5.90 | 15.29 | 11.32 | 4.29 | |
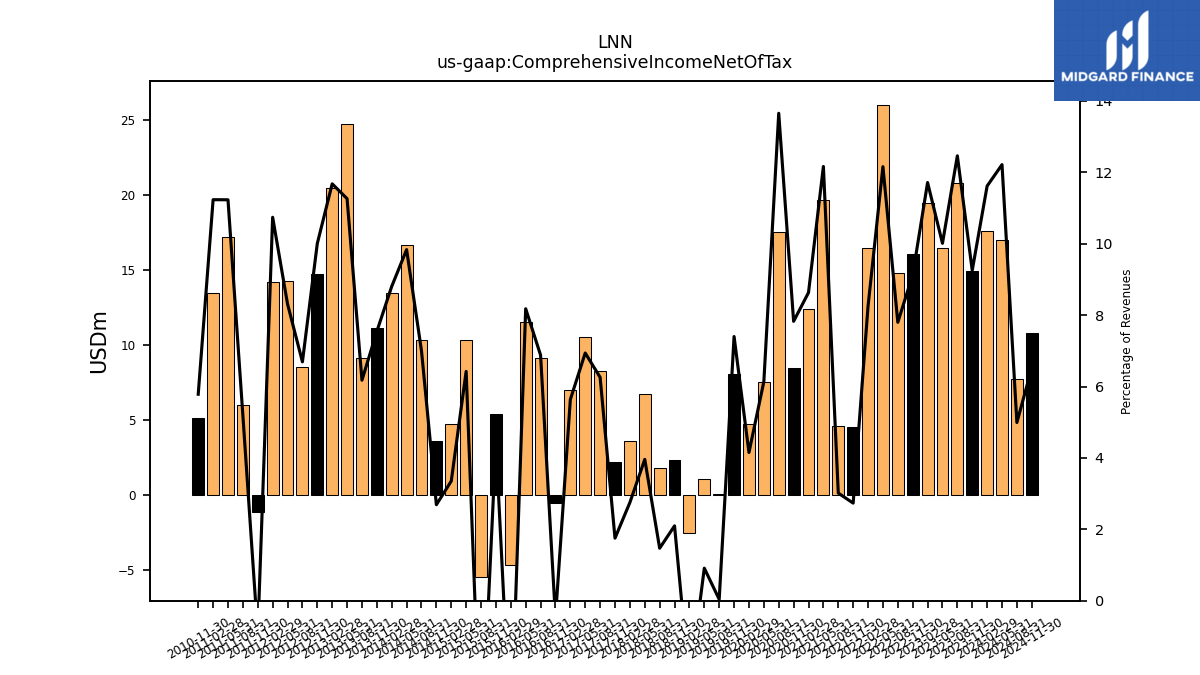
| Comprehensive Income Net Of Tax | 14.93 | 20.83 | 16.47 | 19.47 | 16.07 | 14.83 | 26.05 | 16.51 | 4.54 | 4.63 | 19.70 | 12.39 | 8.49 | 17.53 | 7.55 | 4.72 | 8.10 | 0.04 | 1.10 | -2.55 | 2.35 | 1.81 | 6.71 | 3.59 | 2.18 | 8.26 | 10.51 | 7.00 | -0.52 | 9.14 | 11.56 | -4.68 | 5.38 | -5.48 | 10.32 | 4.73 | 3.63 | 10.32 | 16.71 | 13.45 | 11.14 | 9.17 | 24.72 | 20.50 | 14.75 | 8.55 | 14.31 | 14.19 | -1.11 | 6.02 | 17.23 | 13.50 | 5.16 |
| 2023-11-30 | 2023-08-31 | 2023-05-31 | 2023-02-28 | 2022-11-30 | 2022-08-31 | 2022-05-31 | 2022-02-28 | 2021-11-30 | 2021-08-31 | 2021-05-31 | 2021-02-28 | 2020-11-30 | 2020-08-31 | 2020-05-31 | 2020-02-29 | 2019-11-30 | 2019-08-31 | 2019-05-31 | 2019-02-28 | 2018-11-30 | 2018-08-31 | 2018-05-31 | 2018-02-28 | 2017-11-30 | 2017-08-31 | 2017-05-31 | 2017-02-28 | 2016-11-30 | 2016-08-31 | 2016-05-31 | 2016-02-29 | 2015-11-30 | 2015-08-31 | 2015-05-31 | 2015-02-28 | 2014-11-30 | 2014-08-31 | 2014-05-31 | 2014-02-28 | 2013-11-30 | 2013-08-31 | 2013-05-31 | 2013-02-28 | 2012-11-30 | 2012-08-31 | 2012-05-31 | 2012-02-29 | 2011-11-30 | 2011-08-31 | 2011-05-31 | 2011-02-28 | 2010-11-30 | ||
|---|---|---|---|---|---|---|---|---|---|---|---|---|---|---|---|---|---|---|---|---|---|---|---|---|---|---|---|---|---|---|---|---|---|---|---|---|---|---|---|---|---|---|---|---|---|---|---|---|---|---|---|---|---|---|
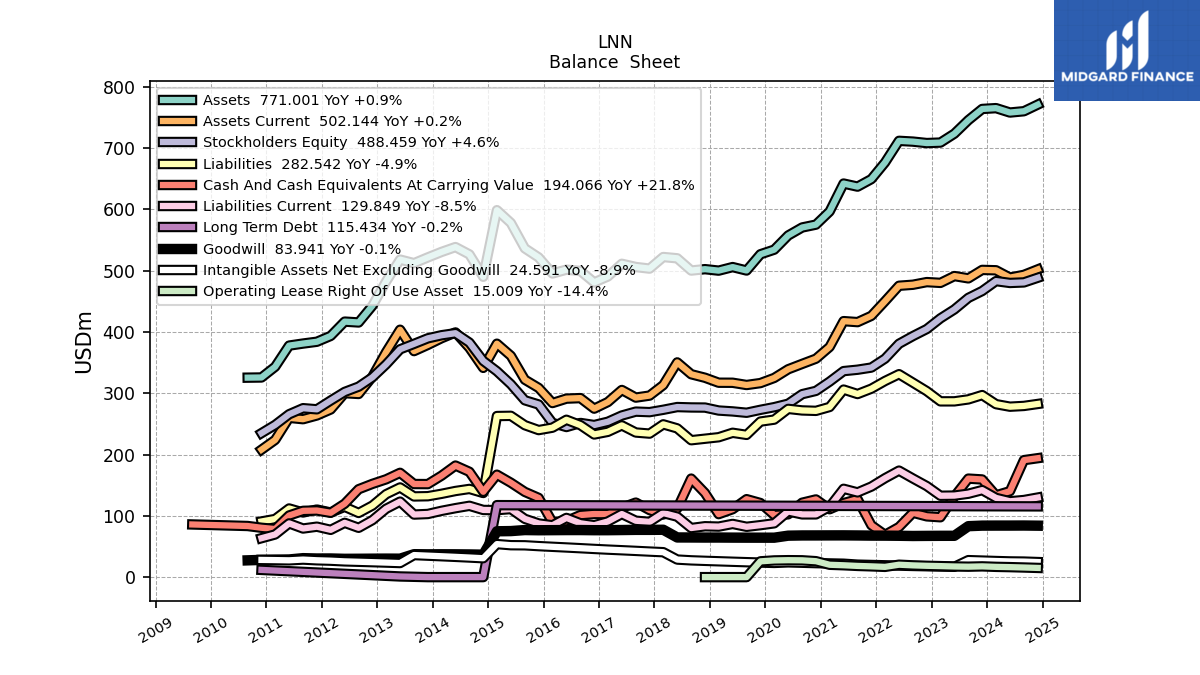
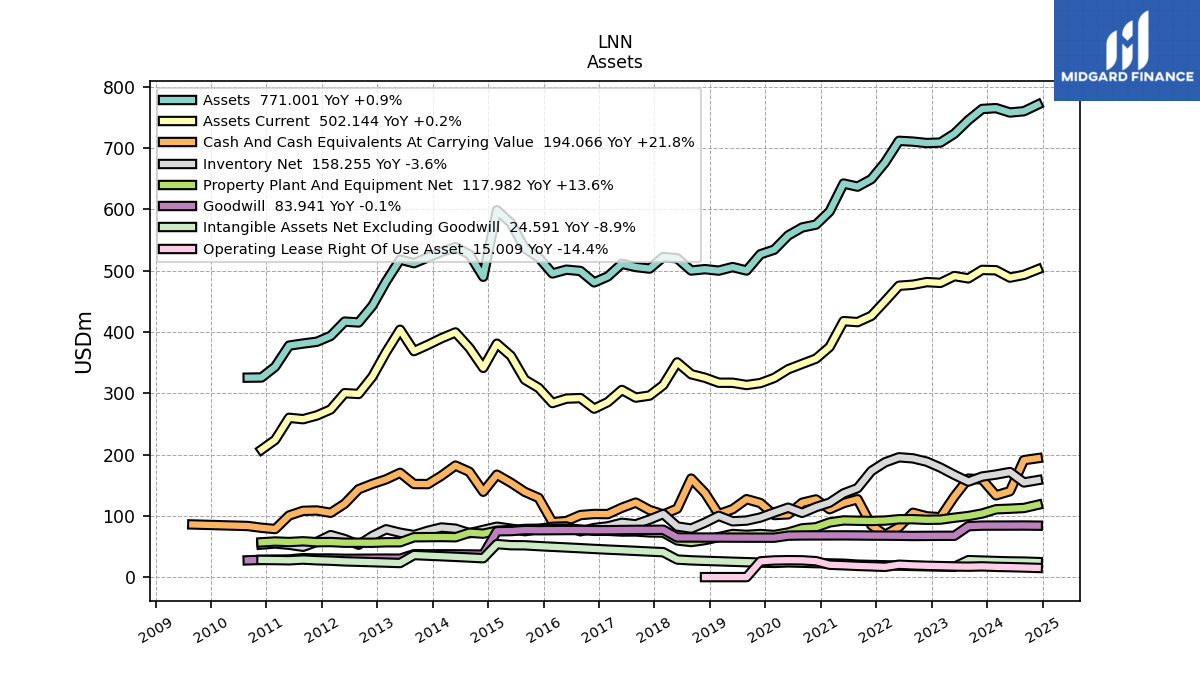
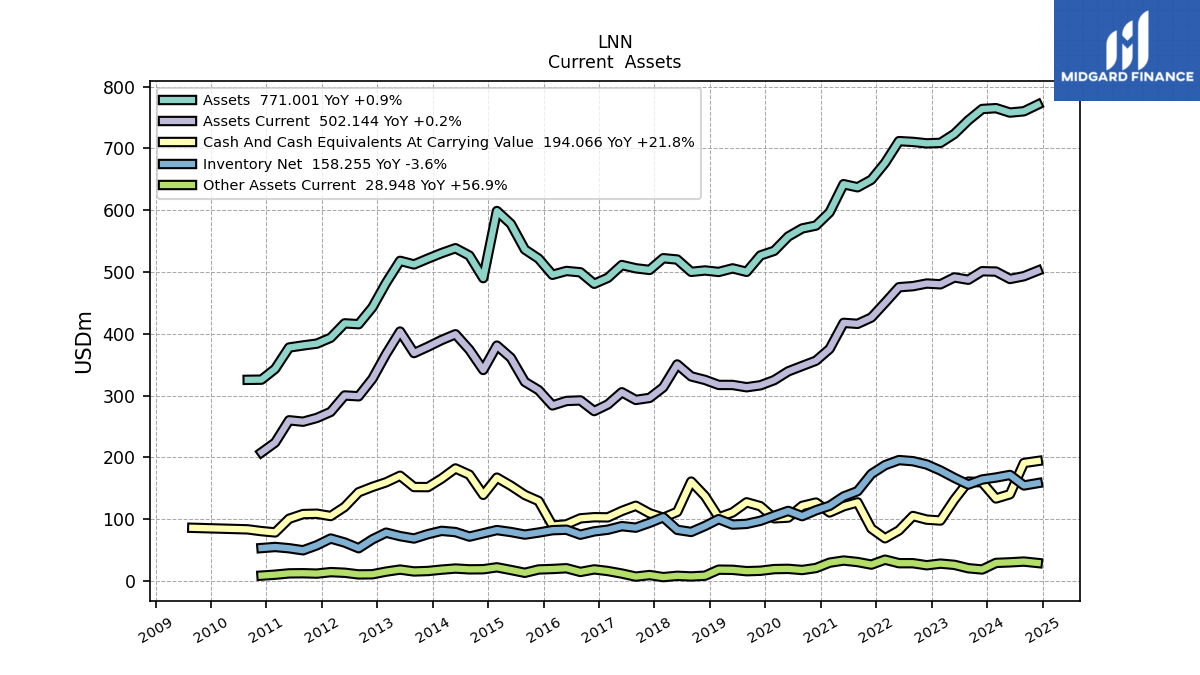
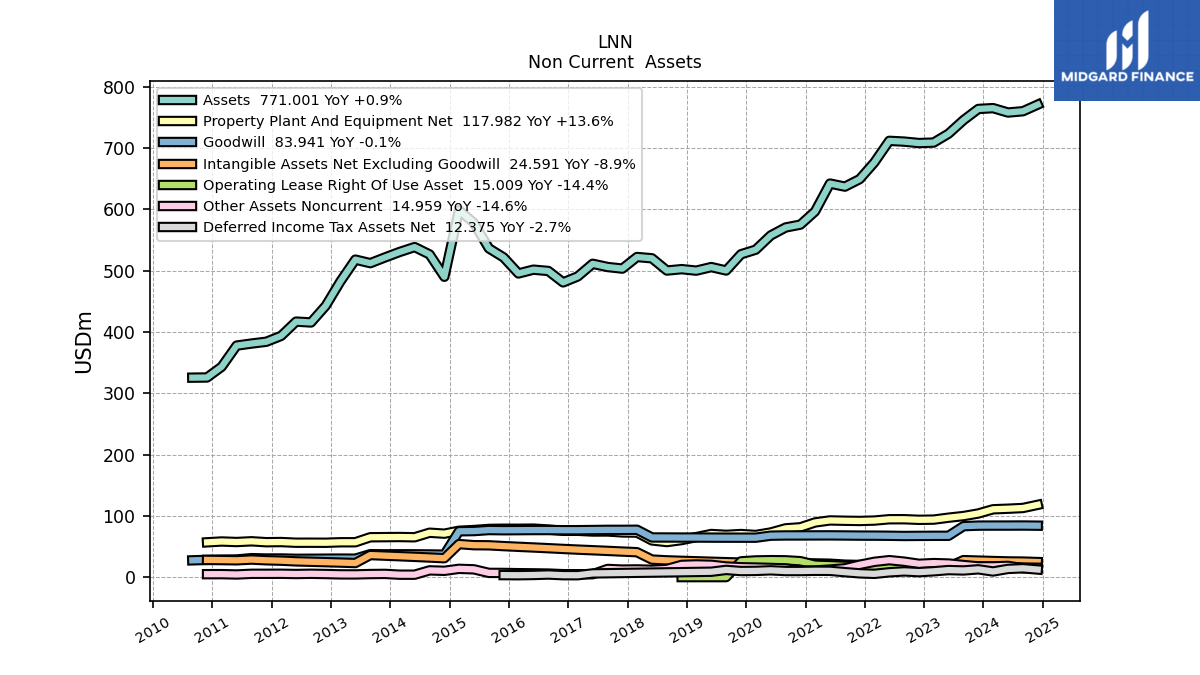
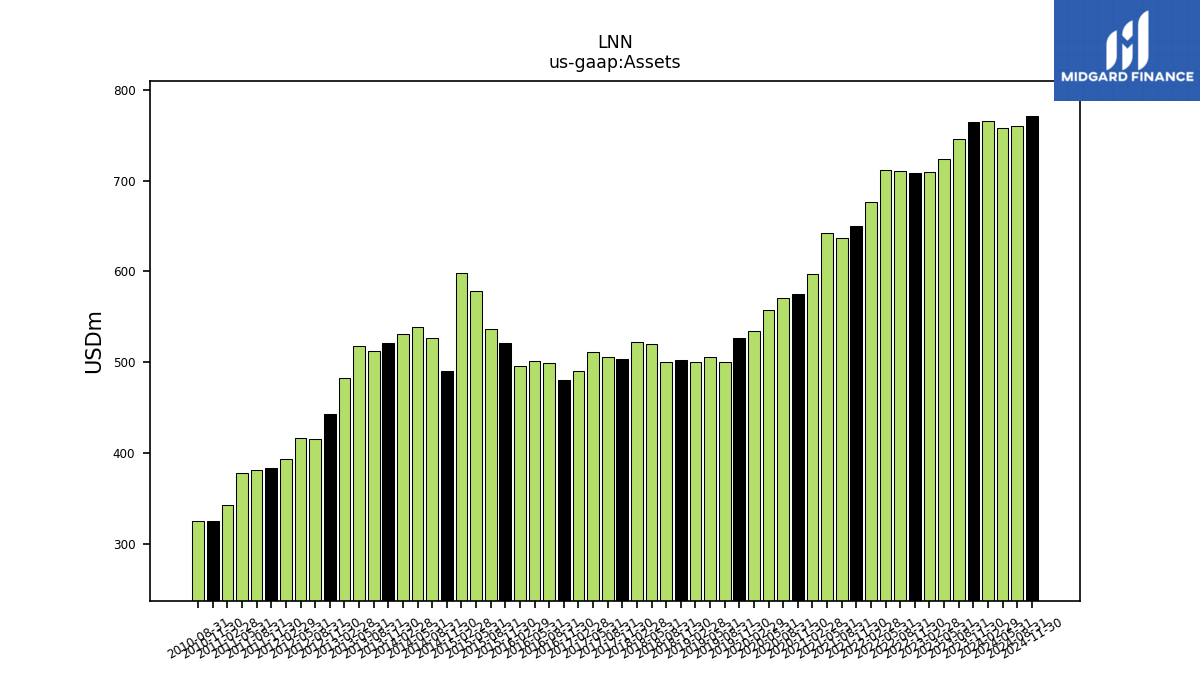
| Assets | 763.92 | 745.66 | 723.62 | 709.08 | 708.30 | 710.65 | 711.92 | 676.58 | 649.45 | 637.18 | 642.22 | 596.65 | 575.20 | 570.53 | 557.49 | 534.33 | 526.81 | 500.31 | 505.92 | 500.11 | 502.52 | 500.26 | 520.23 | 522.35 | 503.41 | 506.03 | 511.29 | 490.62 | 480.94 | 499.56 | 501.70 | 495.48 | 521.62 | 536.47 | 577.89 | 598.78 | 490.08 | 526.55 | 538.57 | 530.62 | 521.70 | 512.30 | 518.12 | 482.48 | 442.88 | 415.53 | 416.95 | 393.60 | 384.08 | 381.14 | 377.81 | 343.26 | 325.77 | |
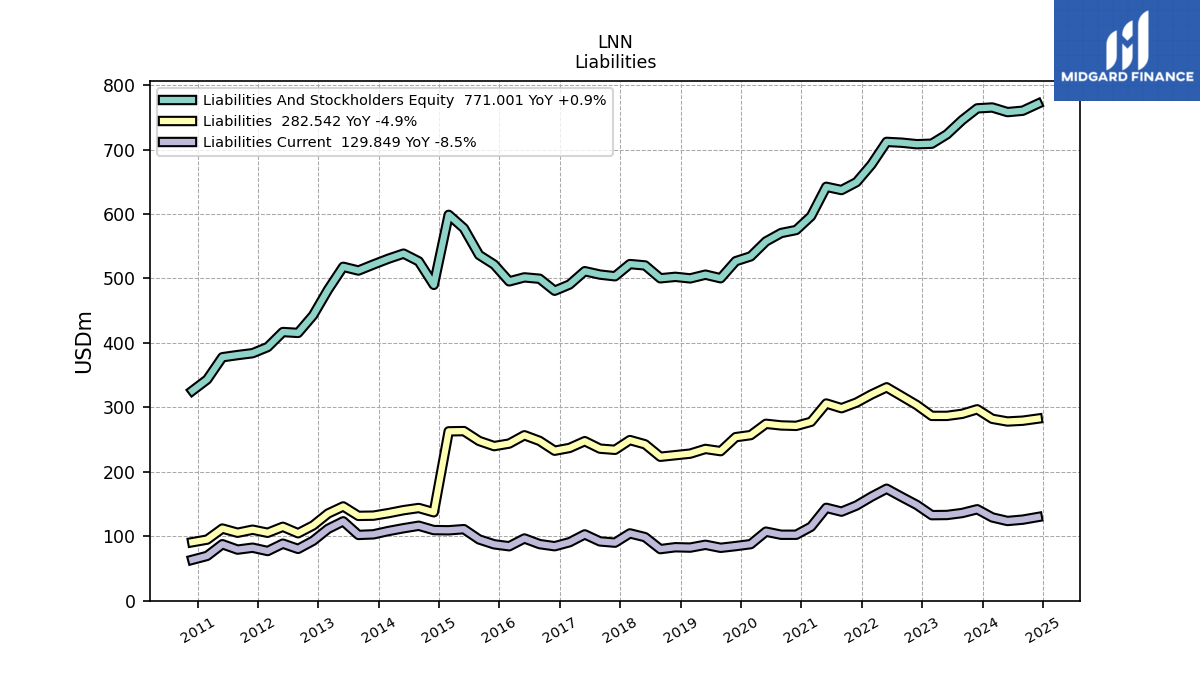
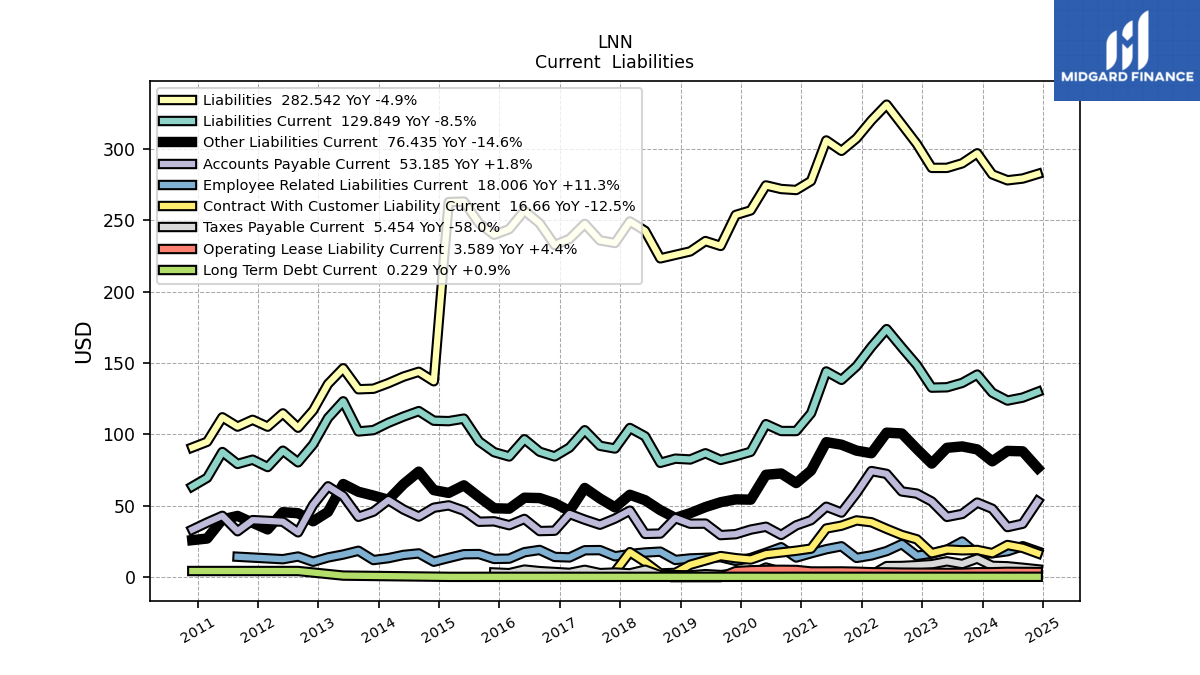
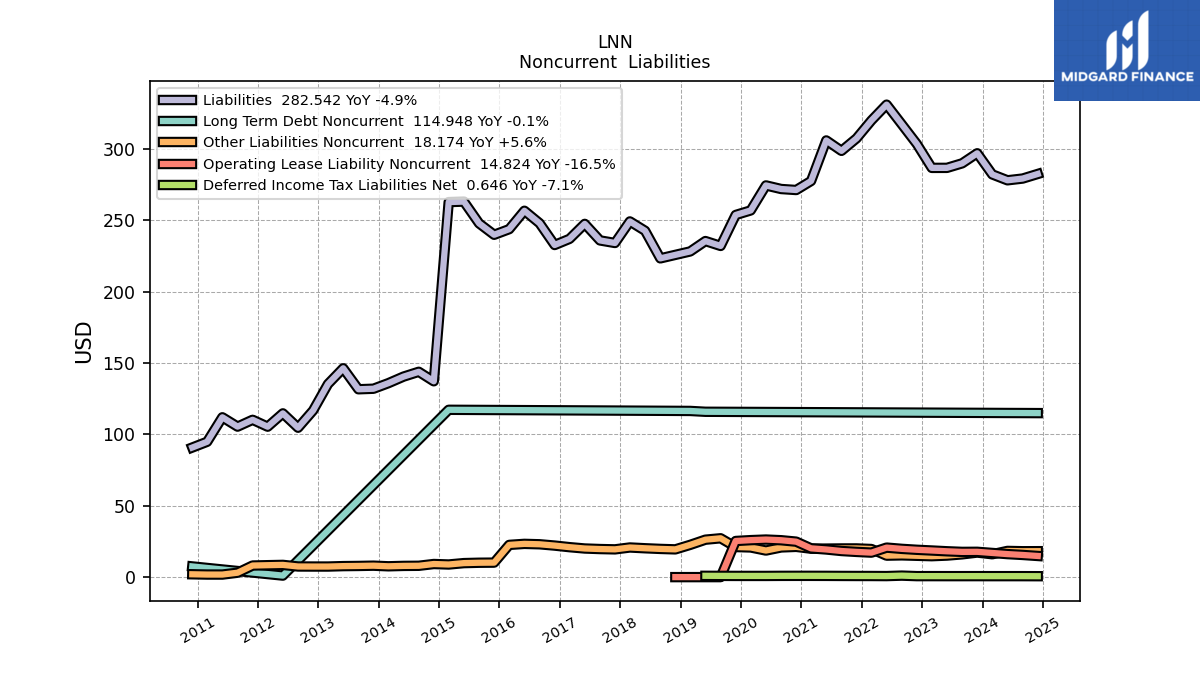
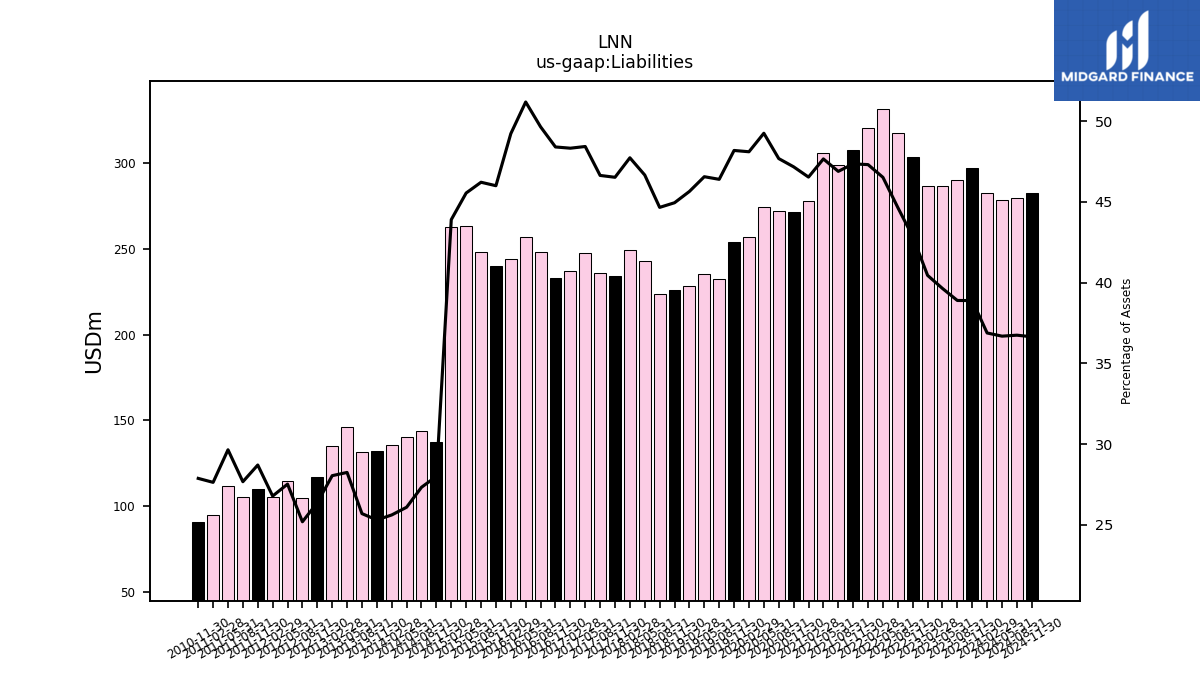
| Liabilities | 297.06 | 290.01 | 286.82 | 286.81 | 303.51 | 317.30 | 331.15 | 320.05 | 307.50 | 298.74 | 306.04 | 277.62 | 271.30 | 272.01 | 274.53 | 257.00 | 253.81 | 232.10 | 235.53 | 228.26 | 225.84 | 223.39 | 242.72 | 249.29 | 234.18 | 235.98 | 247.58 | 237.06 | 232.75 | 248.00 | 256.77 | 243.86 | 239.92 | 247.91 | 263.20 | 262.84 | 137.24 | 143.90 | 140.53 | 135.93 | 132.03 | 131.66 | 146.36 | 135.32 | 116.81 | 104.69 | 114.77 | 105.43 | 110.26 | 105.48 | 112.02 | 94.86 | 90.82 | |
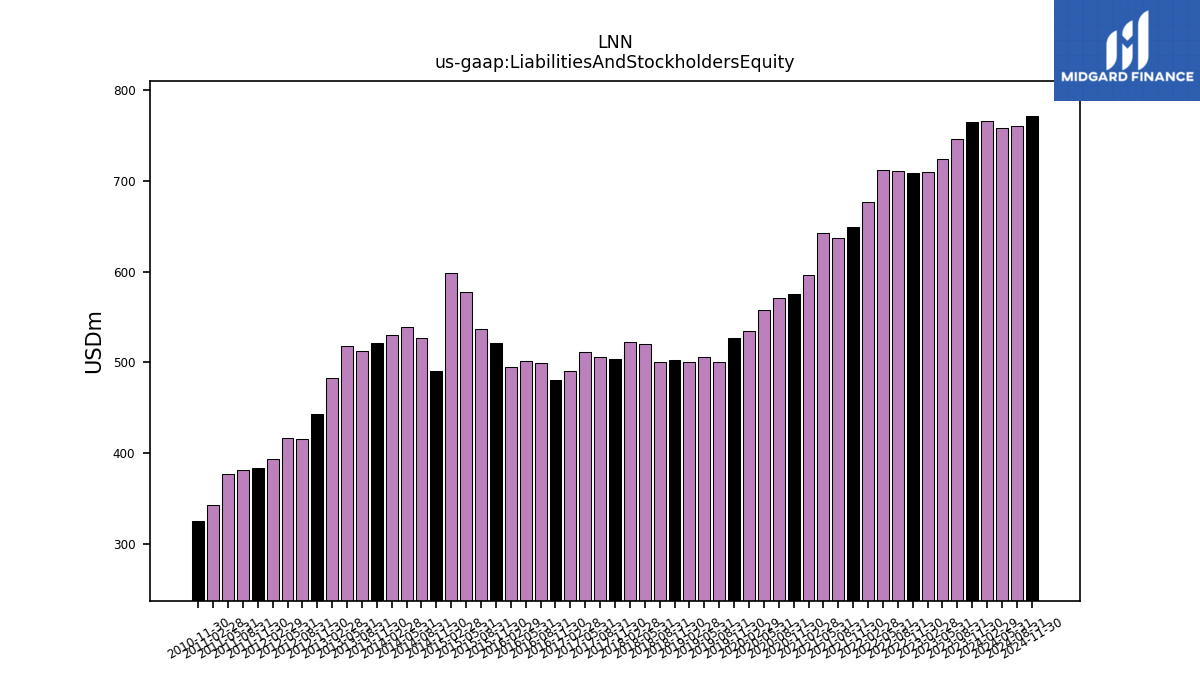
| Liabilities And Stockholders Equity | 763.92 | 745.66 | 723.62 | 709.08 | 708.30 | 710.65 | 711.92 | 676.58 | 649.45 | 637.18 | 642.22 | 596.65 | 575.20 | 570.53 | 557.49 | 534.33 | 526.81 | 500.31 | 505.92 | 500.11 | 502.52 | 500.26 | 520.23 | 522.35 | 503.41 | 506.03 | 511.29 | 490.62 | 480.94 | 499.56 | 501.70 | 495.48 | 521.62 | 536.47 | 577.89 | 598.78 | 490.08 | 526.55 | 538.57 | 530.62 | 521.70 | 512.30 | 518.12 | 482.48 | 442.88 | 415.53 | 416.95 | 393.60 | 384.08 | 381.14 | 377.81 | 343.26 | 325.77 | |
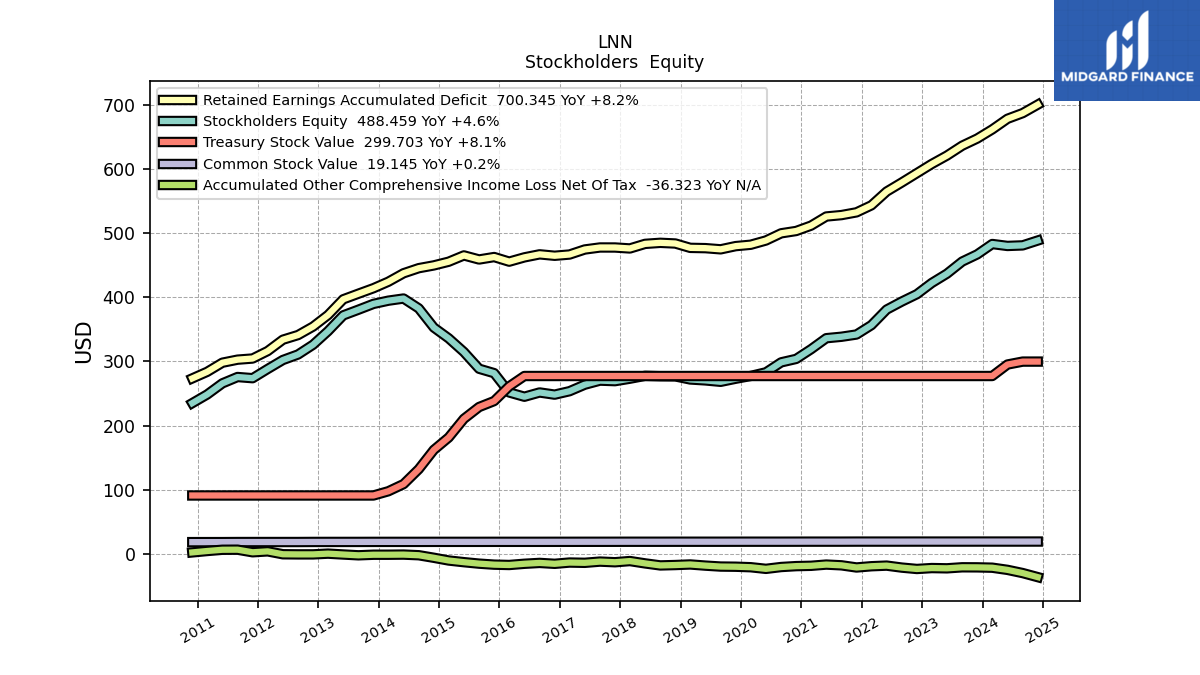
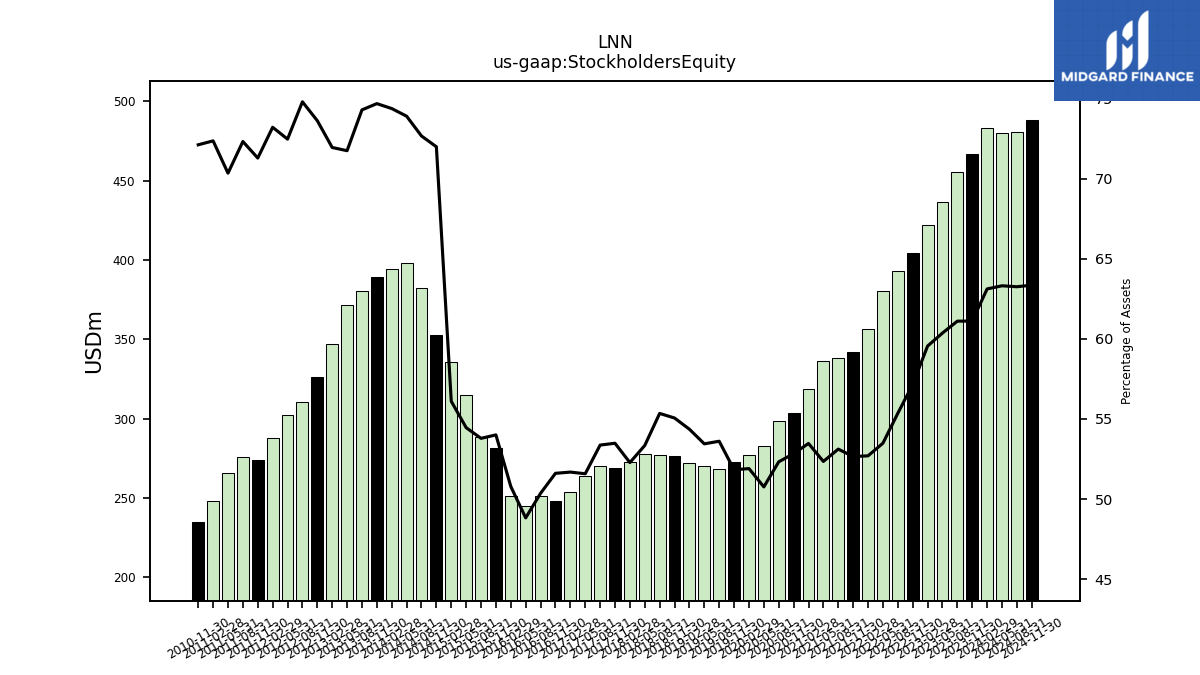
| Stockholders Equity | 466.86 | 455.65 | 436.80 | 422.27 | 404.79 | 393.36 | 380.77 | 356.54 | 341.94 | 338.44 | 336.17 | 319.02 | 303.90 | 298.52 | 282.96 | 277.33 | 273.00 | 268.21 | 270.39 | 271.84 | 276.68 | 276.87 | 277.51 | 273.06 | 269.23 | 270.06 | 263.70 | 253.56 | 248.19 | 251.57 | 244.94 | 251.62 | 281.69 | 288.56 | 314.69 | 335.94 | 352.83 | 382.65 | 398.04 | 394.69 | 389.67 | 380.64 | 371.76 | 347.16 | 326.07 | 310.84 | 302.18 | 288.17 | 273.82 | 275.67 | 265.78 | 248.40 | 234.94 |
| 2023-11-30 | 2023-08-31 | 2023-05-31 | 2023-02-28 | 2022-11-30 | 2022-08-31 | 2022-05-31 | 2022-02-28 | 2021-11-30 | 2021-08-31 | 2021-05-31 | 2021-02-28 | 2020-11-30 | 2020-08-31 | 2020-05-31 | 2020-02-29 | 2019-11-30 | 2019-08-31 | 2019-05-31 | 2019-02-28 | 2018-11-30 | 2018-08-31 | 2018-05-31 | 2018-02-28 | 2017-11-30 | 2017-08-31 | 2017-05-31 | 2017-02-28 | 2016-11-30 | 2016-08-31 | 2016-05-31 | 2016-02-29 | 2015-11-30 | 2015-08-31 | 2015-05-31 | 2015-02-28 | 2014-11-30 | 2014-08-31 | 2014-05-31 | 2014-02-28 | 2013-11-30 | 2013-08-31 | 2013-05-31 | 2013-02-28 | 2012-11-30 | 2012-08-31 | 2012-05-31 | 2012-02-29 | 2011-11-30 | 2011-08-31 | 2011-05-31 | 2011-02-28 | 2010-11-30 | ||
|---|---|---|---|---|---|---|---|---|---|---|---|---|---|---|---|---|---|---|---|---|---|---|---|---|---|---|---|---|---|---|---|---|---|---|---|---|---|---|---|---|---|---|---|---|---|---|---|---|---|---|---|---|---|---|
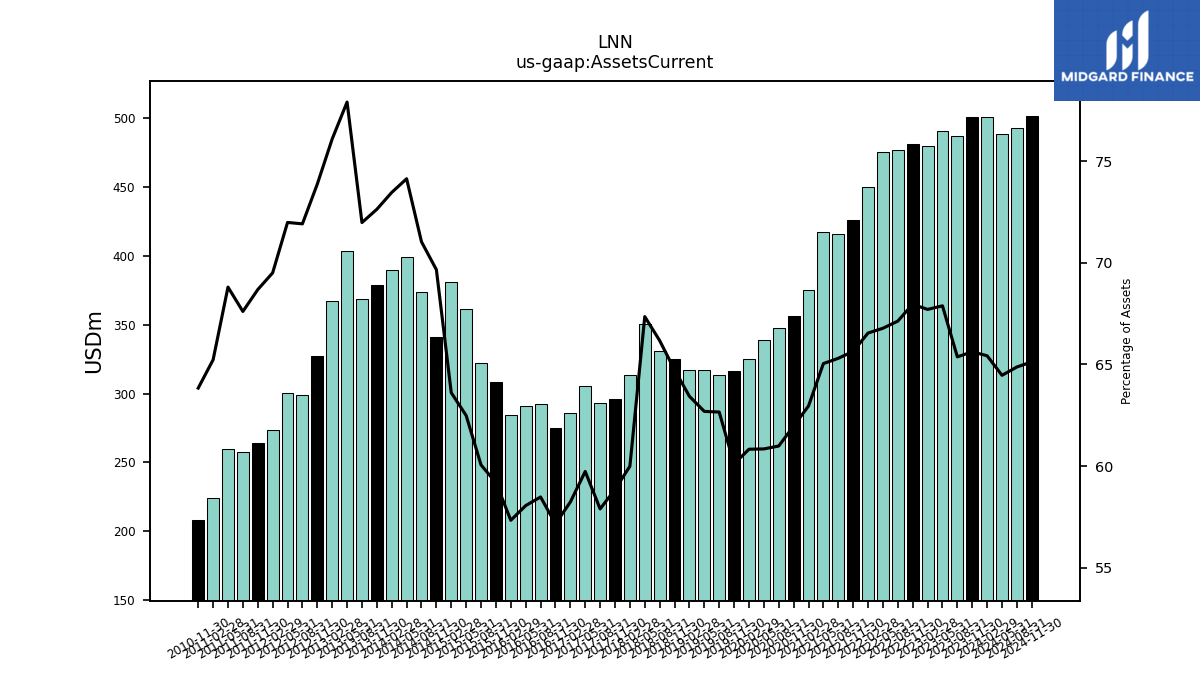
| Assets Current | 501.30 | 487.48 | 491.25 | 480.12 | 481.41 | 477.10 | 475.43 | 450.26 | 426.33 | 416.10 | 417.73 | 375.62 | 356.45 | 347.94 | 339.19 | 325.02 | 316.63 | 313.49 | 317.16 | 317.23 | 325.32 | 331.05 | 350.41 | 313.36 | 296.23 | 292.93 | 305.41 | 285.68 | 274.89 | 292.12 | 291.25 | 284.05 | 308.71 | 322.17 | 361.10 | 380.88 | 341.42 | 374.06 | 399.31 | 389.85 | 378.97 | 368.79 | 403.71 | 367.18 | 327.21 | 298.87 | 300.17 | 273.60 | 263.81 | 257.69 | 259.96 | 223.91 | 207.96 | |
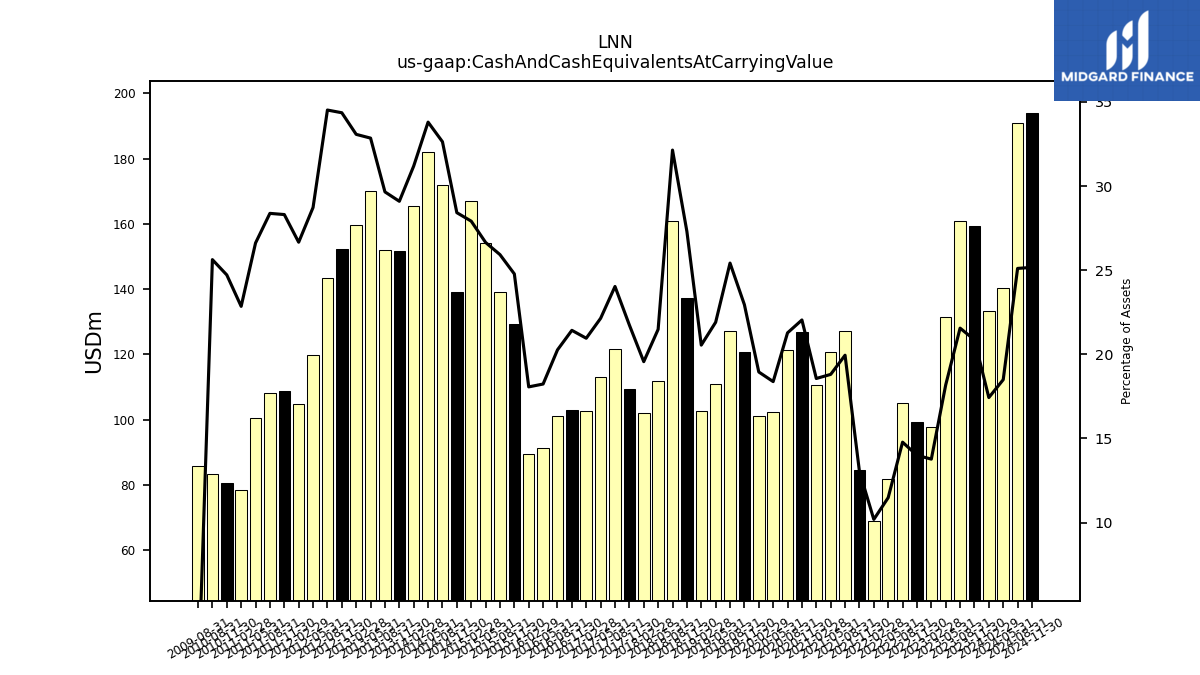
| Cash And Cash Equivalents At Carrying Value | 159.38 | 160.75 | 131.58 | 97.67 | 99.17 | 105.05 | 81.76 | 68.95 | 84.72 | 127.11 | 120.80 | 110.78 | 126.80 | 121.40 | 102.47 | 101.27 | 120.91 | 127.20 | 110.84 | 102.78 | 137.22 | 160.79 | 111.78 | 102.21 | 109.45 | 121.62 | 113.21 | 102.83 | 103.06 | 101.25 | 91.50 | 89.52 | 129.26 | 139.09 | 154.02 | 167.16 | 139.29 | 171.84 | 182.05 | 165.51 | 151.80 | 151.93 | 170.22 | 159.58 | 152.17 | 143.44 | 119.78 | 104.95 | 108.73 | 108.17 | 100.57 | 78.45 | 80.53 | |
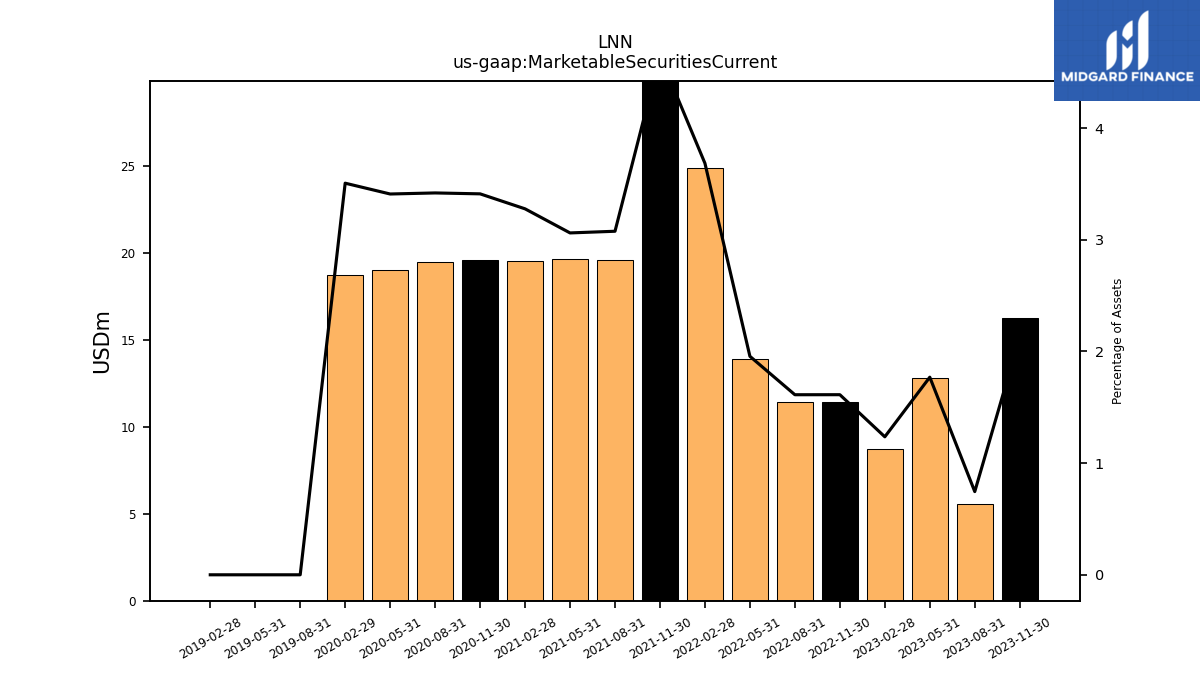
| Marketable Securities Current | 16.28 | 5.56 | 12.81 | 8.76 | 11.42 | 11.46 | 13.93 | 24.93 | 30.20 | 19.60 | 19.66 | 19.55 | 19.62 | 19.51 | 19.01 | 18.74 | NA | 0.00 | 0.00 | 0.00 | NA | NA | NA | NA | NA | NA | NA | NA | NA | NA | NA | NA | NA | NA | NA | NA | NA | NA | NA | NA | NA | NA | NA | NA | NA | NA | NA | NA | NA | NA | NA | NA | NA | |
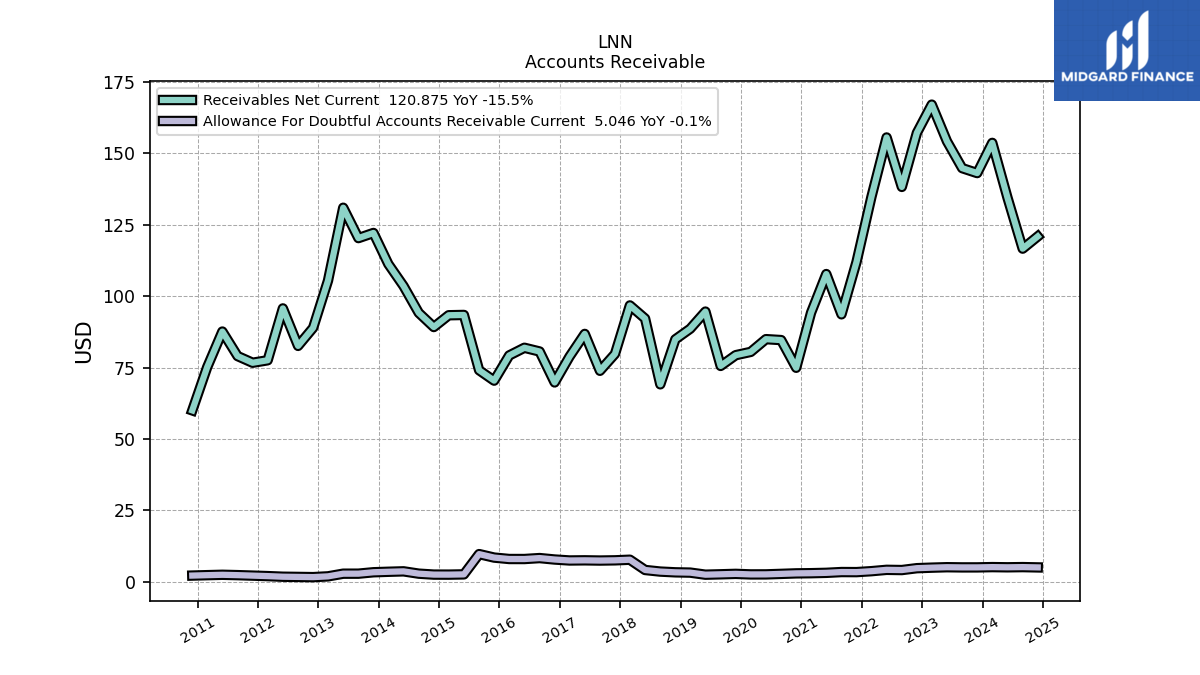
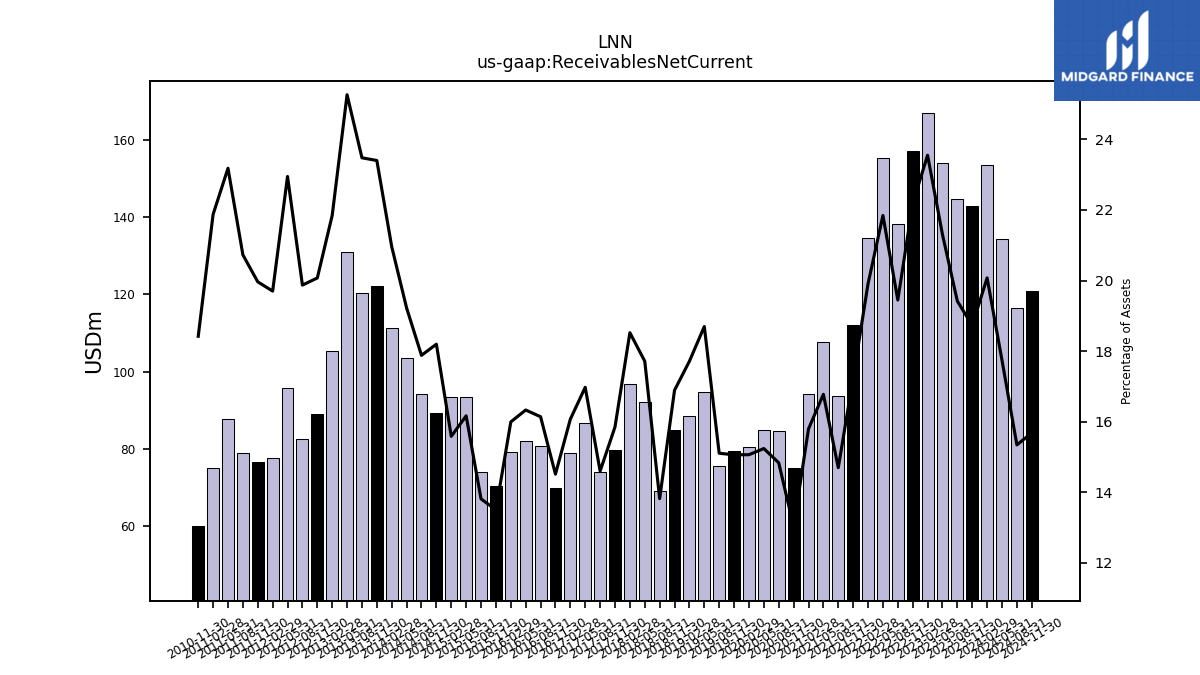
| Receivables Net Current | 143.05 | 144.77 | 154.17 | 167.01 | 157.12 | 138.20 | 155.52 | 134.69 | 111.96 | 93.61 | 107.71 | 94.21 | 74.91 | 84.60 | 84.93 | 80.47 | 79.32 | 75.55 | 94.58 | 88.58 | 84.86 | 69.11 | 92.14 | 96.74 | 79.77 | 73.85 | 86.77 | 78.83 | 69.77 | 80.61 | 81.92 | 79.22 | 70.40 | 74.06 | 93.40 | 93.29 | 89.17 | 94.14 | 103.51 | 111.21 | 122.09 | 120.29 | 130.92 | 105.40 | 88.89 | 82.56 | 95.69 | 77.54 | 76.67 | 79.01 | 87.59 | 75.10 | 60.00 | |
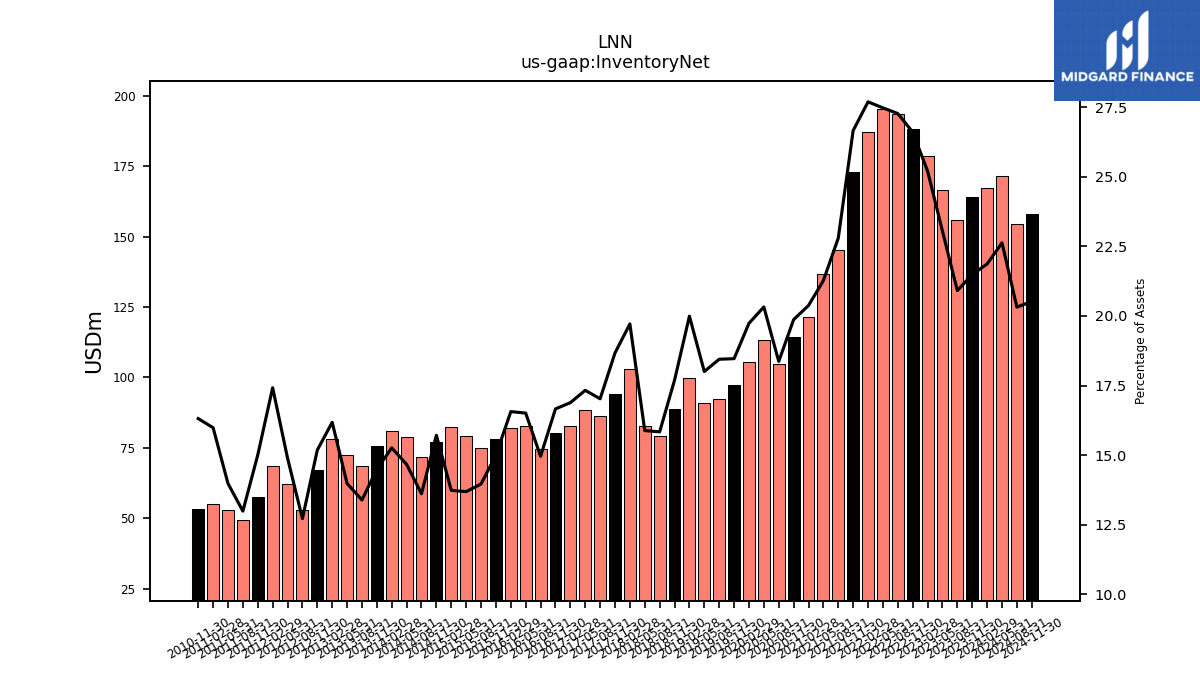
| Inventory Net | 164.14 | 155.93 | 166.76 | 178.70 | 188.40 | 193.78 | 195.57 | 187.33 | 173.12 | 145.24 | 136.60 | 121.57 | 114.28 | 104.79 | 113.30 | 105.45 | 97.28 | 92.29 | 91.09 | 99.98 | 88.91 | 79.23 | 82.64 | 102.97 | 93.99 | 86.16 | 88.60 | 82.85 | 80.14 | 74.75 | 82.84 | 82.08 | 78.25 | 74.93 | 79.12 | 82.26 | 77.01 | 71.70 | 79.01 | 80.99 | 75.61 | 68.61 | 72.46 | 78.07 | 67.25 | 52.87 | 62.12 | 68.58 | 57.65 | 49.52 | 52.83 | 54.88 | 53.15 | |
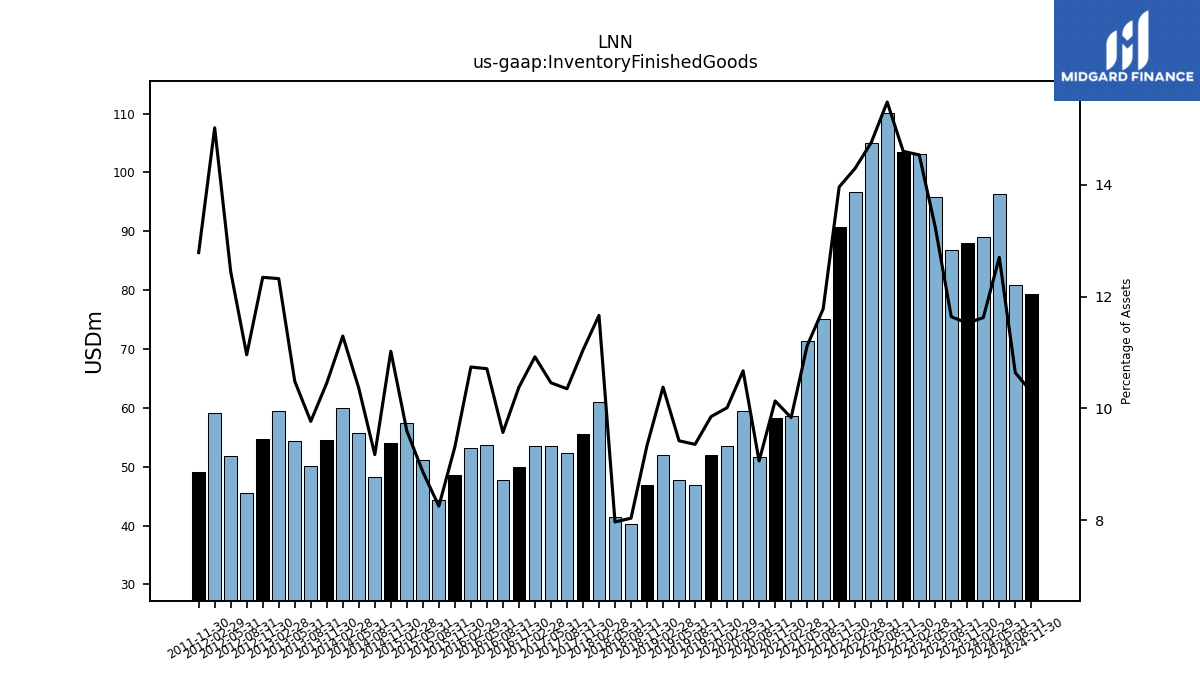
| Inventory Finished Goods | 88.04 | 86.79 | 95.85 | 103.07 | 103.40 | 110.02 | 105.04 | 96.72 | 90.68 | 75.05 | 71.41 | 58.68 | 58.28 | 51.68 | 59.50 | 53.50 | 51.91 | 46.81 | 47.66 | 51.91 | 46.92 | 40.20 | 41.45 | 60.92 | 55.59 | 52.38 | 53.47 | 53.59 | 49.92 | 47.80 | 53.73 | 53.22 | 48.57 | 44.27 | 51.22 | 57.47 | 54.02 | 48.30 | 55.80 | 59.93 | 54.54 | 50.04 | 54.33 | 59.45 | 54.67 | 45.54 | 51.90 | 59.12 | 49.12 | NA | NA | NA | NA | |
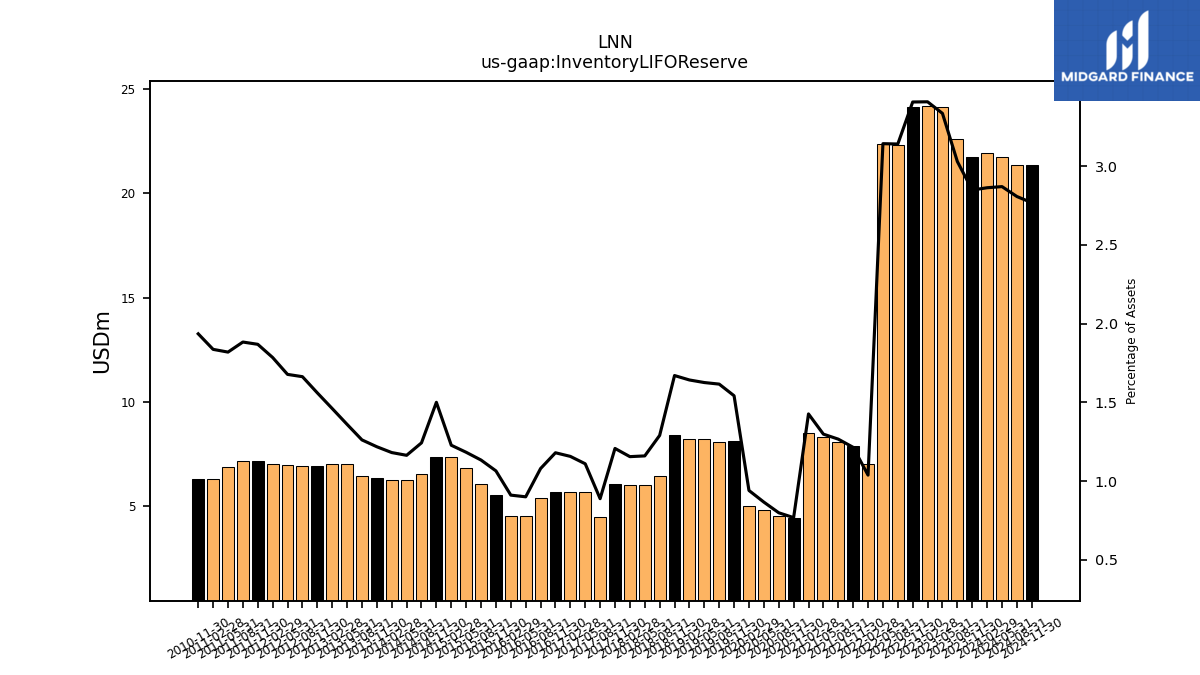
| Inventory L I F O Reserve | 21.76 | 22.59 | 24.13 | 24.17 | 24.13 | 22.32 | 22.37 | 7.03 | 7.89 | 8.07 | 8.34 | 8.51 | 4.42 | 4.56 | 4.83 | 5.03 | 8.12 | 8.09 | 8.23 | 8.21 | 8.39 | 6.46 | 6.04 | 6.04 | 6.08 | 4.50 | 5.68 | 5.68 | 5.68 | 5.40 | 4.52 | 4.52 | 5.56 | 6.08 | 6.84 | 7.35 | 7.35 | 6.55 | 6.27 | 6.27 | 6.36 | 6.46 | 7.05 | 7.05 | 6.91 | 6.91 | 7.00 | 7.03 | 7.18 | 7.18 | 6.87 | 6.30 | 6.30 | |
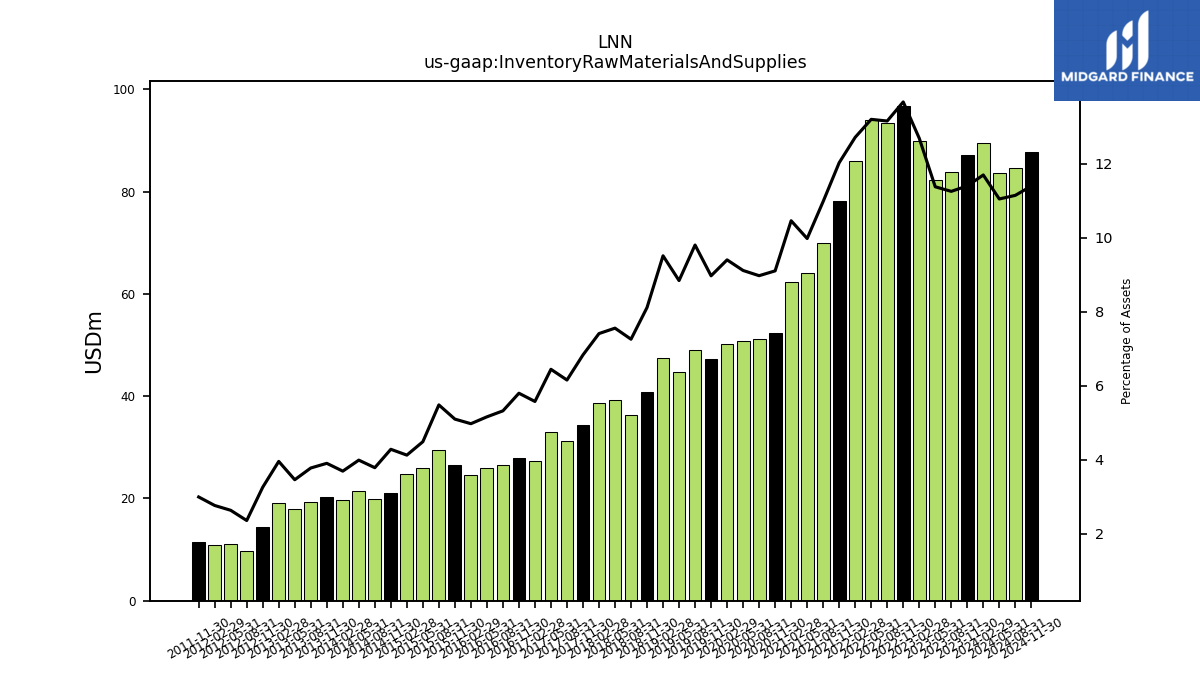
| Inventory Raw Materials And Supplies | 87.08 | 83.91 | 82.32 | 89.97 | 96.81 | 93.47 | 93.96 | 86.01 | 78.10 | 69.96 | 64.09 | 62.40 | 52.37 | 51.20 | 50.82 | 50.24 | 47.27 | 49.05 | 44.74 | 47.57 | 40.78 | 36.32 | 39.32 | 38.72 | 34.41 | 31.16 | 32.96 | 27.37 | 27.90 | 26.60 | 25.90 | 24.66 | 26.61 | 29.43 | 25.95 | 24.72 | 21.01 | 19.95 | 21.51 | 19.61 | 20.39 | 19.37 | 17.95 | 19.10 | 14.45 | 9.82 | 11.00 | 10.90 | 11.52 | NA | NA | NA | NA | |
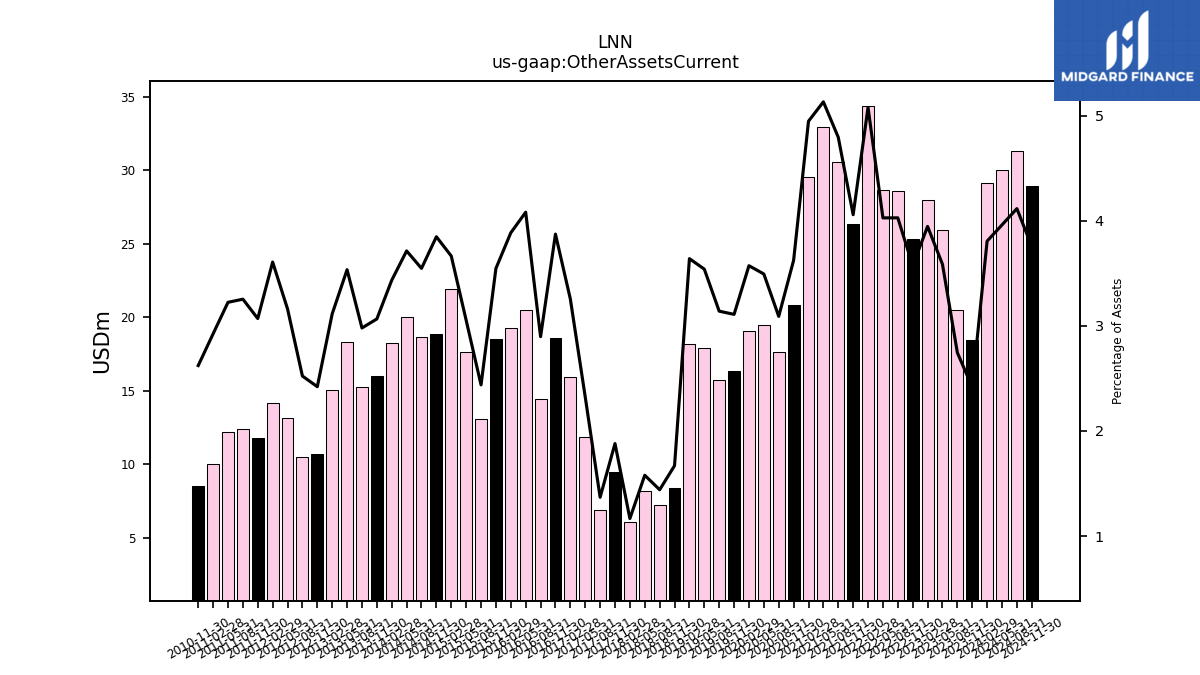
| Other Assets Current | 18.45 | 20.47 | 25.94 | 27.97 | 25.30 | 28.62 | 28.66 | 34.35 | 26.34 | 30.54 | 32.95 | 29.51 | 20.84 | 17.62 | 19.47 | 19.08 | 16.38 | 15.70 | 17.90 | 18.20 | 8.39 | 7.20 | 8.21 | 6.09 | 9.46 | 6.92 | 11.88 | 15.97 | 18.62 | 14.47 | 20.47 | 19.25 | 18.49 | 13.08 | 17.64 | 21.94 | 18.85 | 18.67 | 19.99 | 18.22 | 15.99 | 15.26 | 18.31 | 15.02 | 10.72 | 10.48 | 13.18 | 14.19 | 11.79 | 12.40 | 12.18 | 10.04 | 8.54 |
| 2023-11-30 | 2023-08-31 | 2023-05-31 | 2023-02-28 | 2022-11-30 | 2022-08-31 | 2022-05-31 | 2022-02-28 | 2021-11-30 | 2021-08-31 | 2021-05-31 | 2021-02-28 | 2020-11-30 | 2020-08-31 | 2020-05-31 | 2020-02-29 | 2019-11-30 | 2019-08-31 | 2019-05-31 | 2019-02-28 | 2018-11-30 | 2018-08-31 | 2018-05-31 | 2018-02-28 | 2017-11-30 | 2017-08-31 | 2017-05-31 | 2017-02-28 | 2016-11-30 | 2016-08-31 | 2016-05-31 | 2016-02-29 | 2015-11-30 | 2015-08-31 | 2015-05-31 | 2015-02-28 | 2014-11-30 | 2014-08-31 | 2014-05-31 | 2014-02-28 | 2013-11-30 | 2013-08-31 | 2013-05-31 | 2013-02-28 | 2012-11-30 | 2012-08-31 | 2012-05-31 | 2012-02-29 | 2011-11-30 | 2011-08-31 | 2011-05-31 | 2011-02-28 | 2010-11-30 | ||
|---|---|---|---|---|---|---|---|---|---|---|---|---|---|---|---|---|---|---|---|---|---|---|---|---|---|---|---|---|---|---|---|---|---|---|---|---|---|---|---|---|---|---|---|---|---|---|---|---|---|---|---|---|---|---|
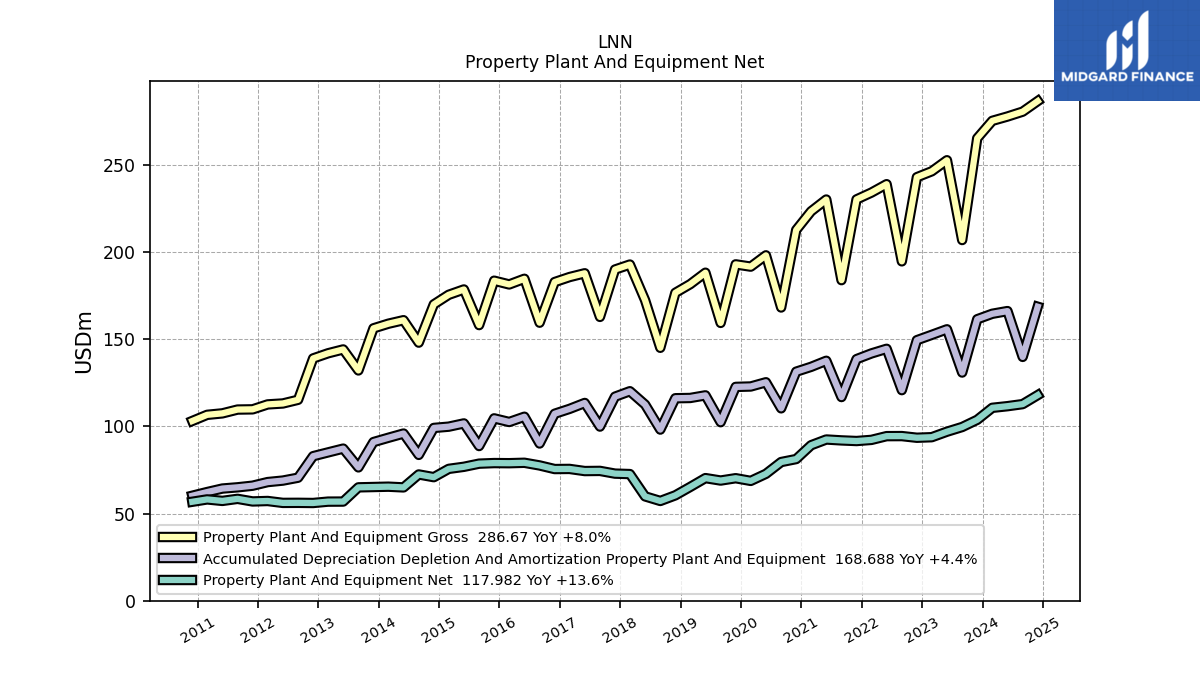
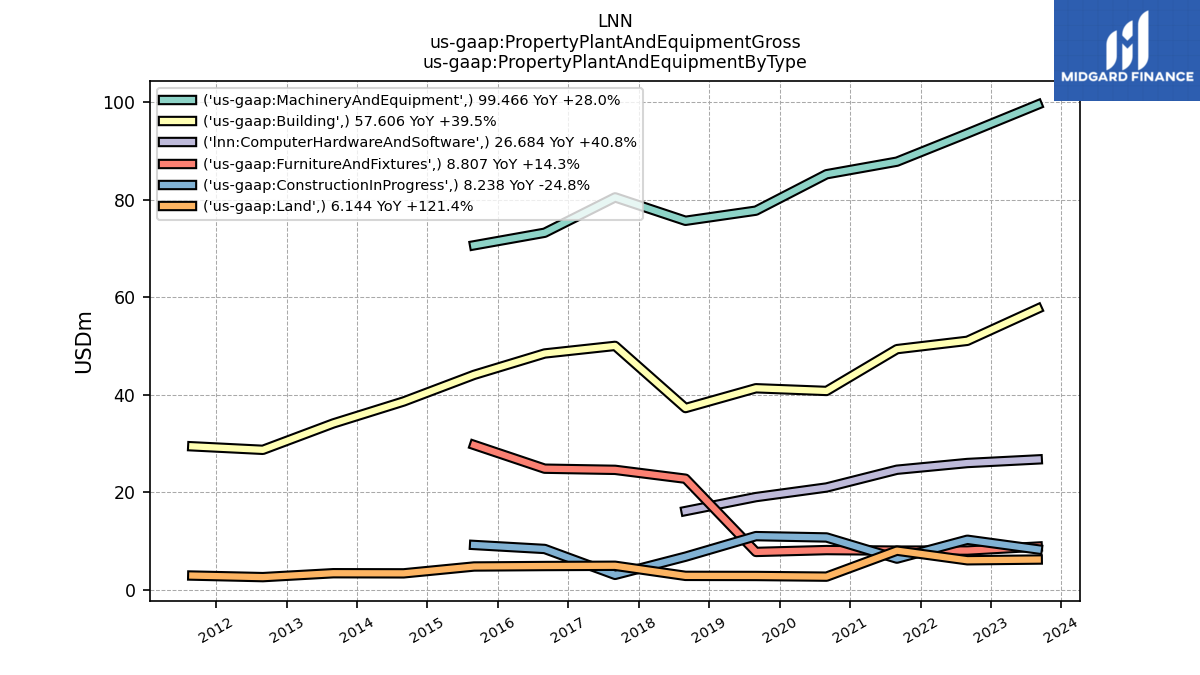
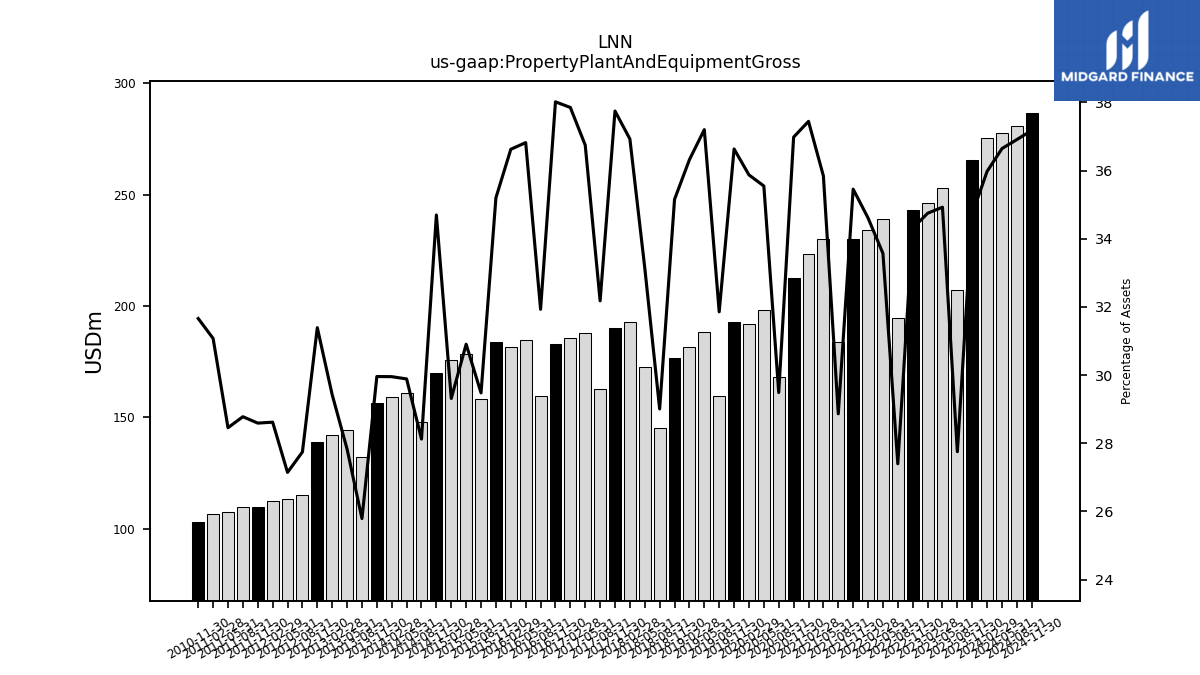
| Property Plant And Equipment Gross | 265.34 | 206.94 | 252.74 | 246.40 | 243.01 | 194.72 | 239.00 | 234.18 | 230.27 | 183.93 | 230.21 | 223.42 | 212.72 | 168.25 | 198.18 | 191.69 | 193.00 | 159.39 | 188.22 | 181.64 | 176.67 | 145.11 | 172.44 | 192.90 | 190.03 | 162.84 | 187.89 | 185.71 | 182.85 | 159.52 | 184.74 | 181.48 | 183.63 | 158.14 | 178.61 | 175.54 | 170.05 | 148.09 | 160.97 | 158.95 | 156.30 | 132.13 | 144.20 | 141.97 | 139.03 | 115.29 | 113.19 | 112.65 | 109.82 | 109.69 | 107.51 | 106.67 | 103.14 | |
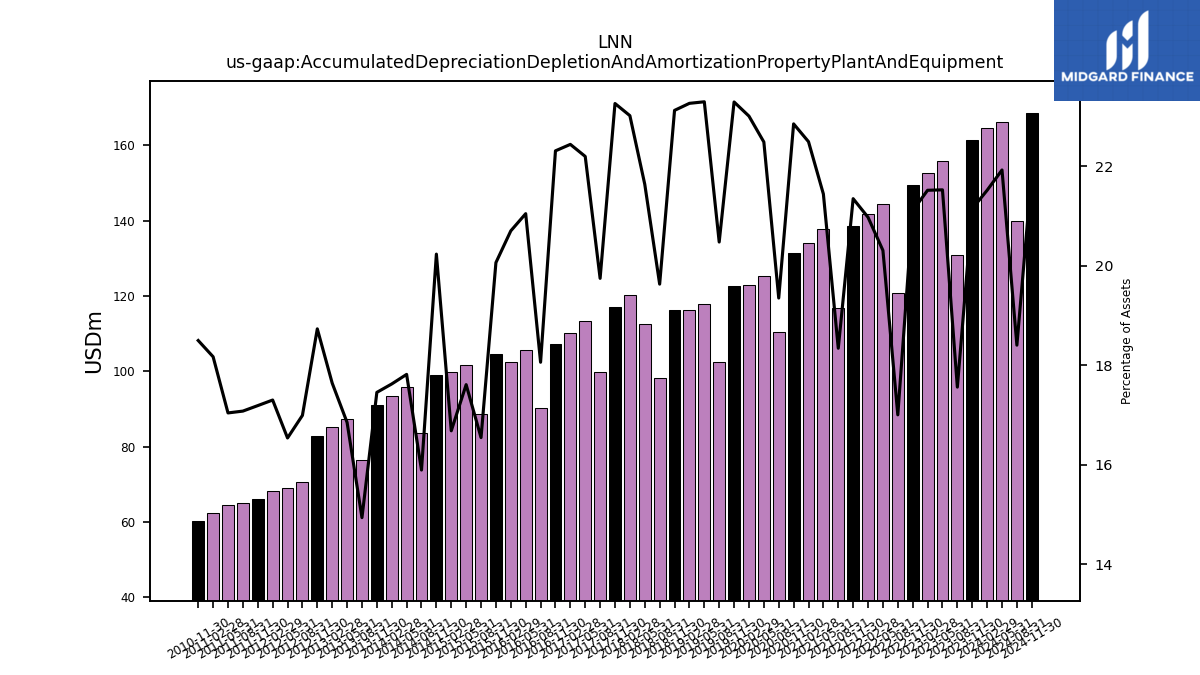
| Accumulated Depreciation Depletion And Amortization Property Plant And Equipment | 161.52 | 130.92 | 155.75 | 152.56 | 149.49 | 120.82 | 144.56 | 141.89 | 138.63 | 116.86 | 137.69 | 134.20 | 131.43 | 110.39 | 125.35 | 122.93 | 122.69 | 102.44 | 117.85 | 116.34 | 116.19 | 98.19 | 112.55 | 120.22 | 117.09 | 99.91 | 113.48 | 110.08 | 107.29 | 90.21 | 105.58 | 102.56 | 104.64 | 88.75 | 101.75 | 99.88 | 99.15 | 83.67 | 95.94 | 93.50 | 91.05 | 76.51 | 87.29 | 85.10 | 82.95 | 70.60 | 68.94 | 68.08 | 66.01 | 65.08 | 64.37 | 62.36 | 60.25 | |
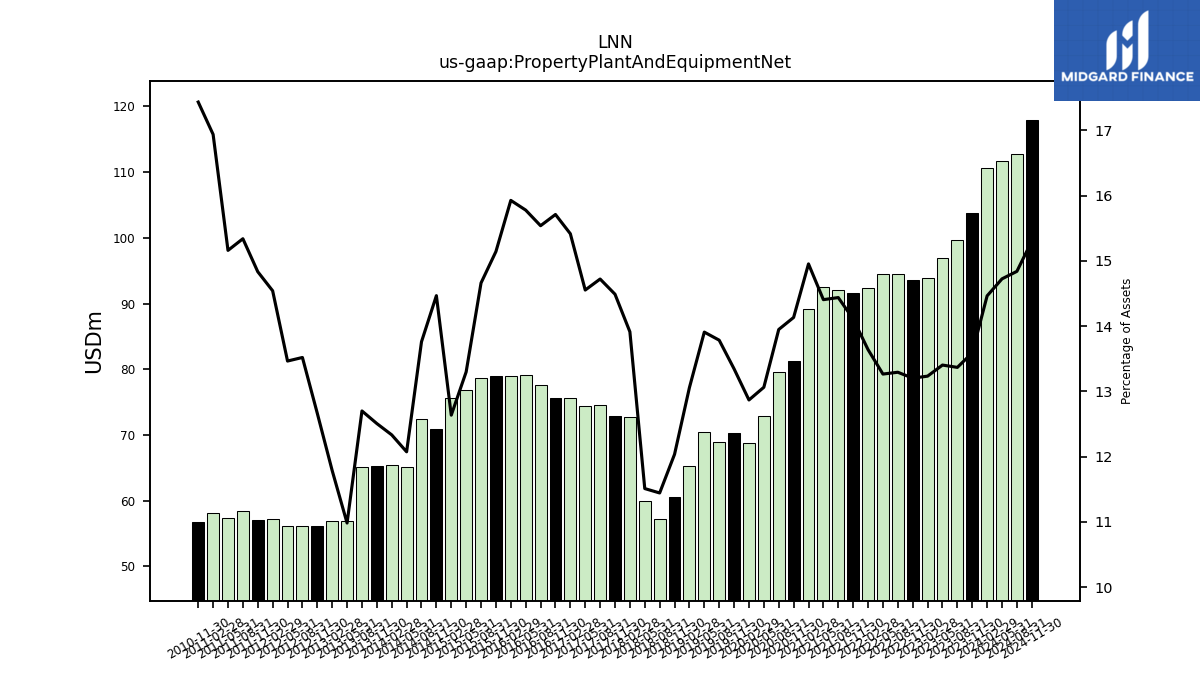
| Property Plant And Equipment Net | 103.82 | 99.68 | 96.99 | 93.84 | 93.52 | 94.47 | 94.44 | 92.29 | 91.64 | 92.00 | 92.52 | 89.22 | 81.30 | 79.58 | 72.83 | 68.76 | 70.31 | 68.97 | 70.37 | 65.31 | 60.48 | 57.25 | 59.88 | 72.68 | 72.94 | 74.50 | 74.41 | 75.63 | 75.56 | 77.63 | 79.16 | 78.92 | 78.99 | 78.66 | 76.85 | 75.66 | 70.90 | 72.46 | 65.03 | 65.45 | 65.25 | 65.06 | 56.91 | 56.87 | 56.09 | 56.18 | 56.14 | 57.24 | 56.98 | 58.47 | 57.28 | 58.14 | 56.79 | |
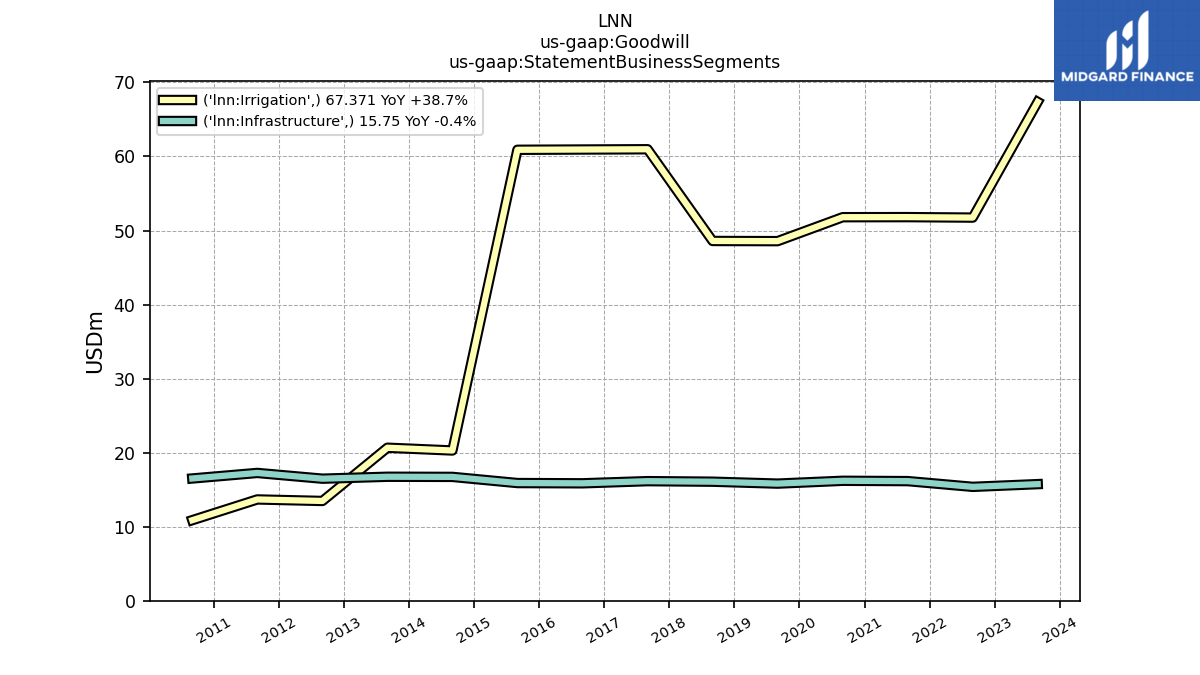
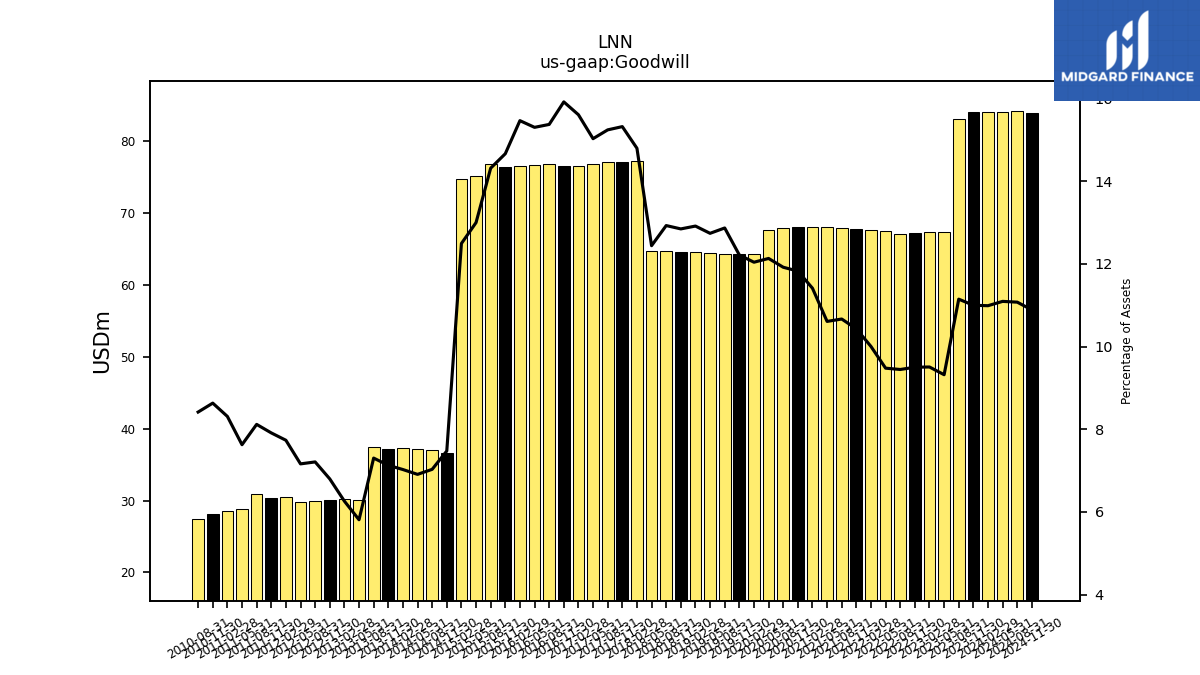
| Goodwill | 84.03 | 83.12 | 67.44 | 67.41 | 67.30 | 67.13 | 67.48 | 67.68 | 67.73 | 67.97 | 68.13 | 68.09 | 68.03 | 68.00 | 67.64 | 64.34 | 64.36 | 64.39 | 64.45 | 64.59 | 64.56 | 64.67 | 64.72 | 77.30 | 77.13 | 77.13 | 76.84 | 76.58 | 76.56 | 76.80 | 76.78 | 76.63 | 76.50 | 76.80 | 75.12 | 74.81 | 36.63 | 37.02 | 37.21 | 37.28 | 37.19 | 37.41 | 30.11 | 30.21 | 30.11 | 29.96 | 29.87 | 30.44 | 30.39 | 30.94 | 28.82 | 28.53 | 28.12 | |
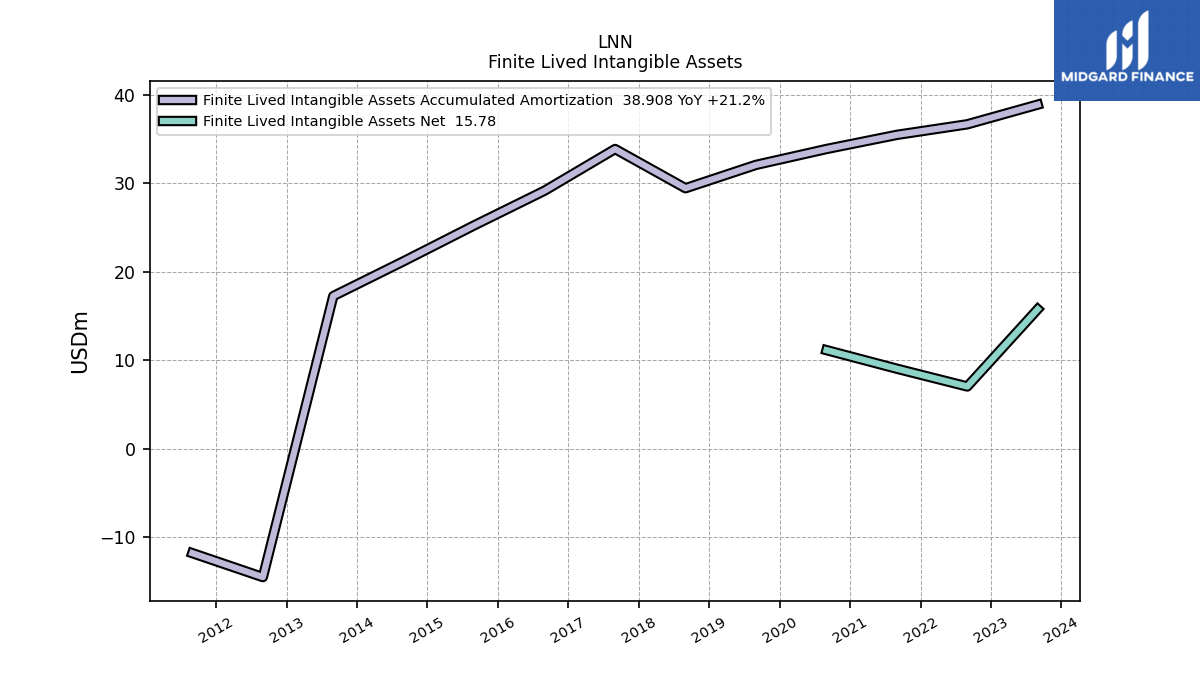
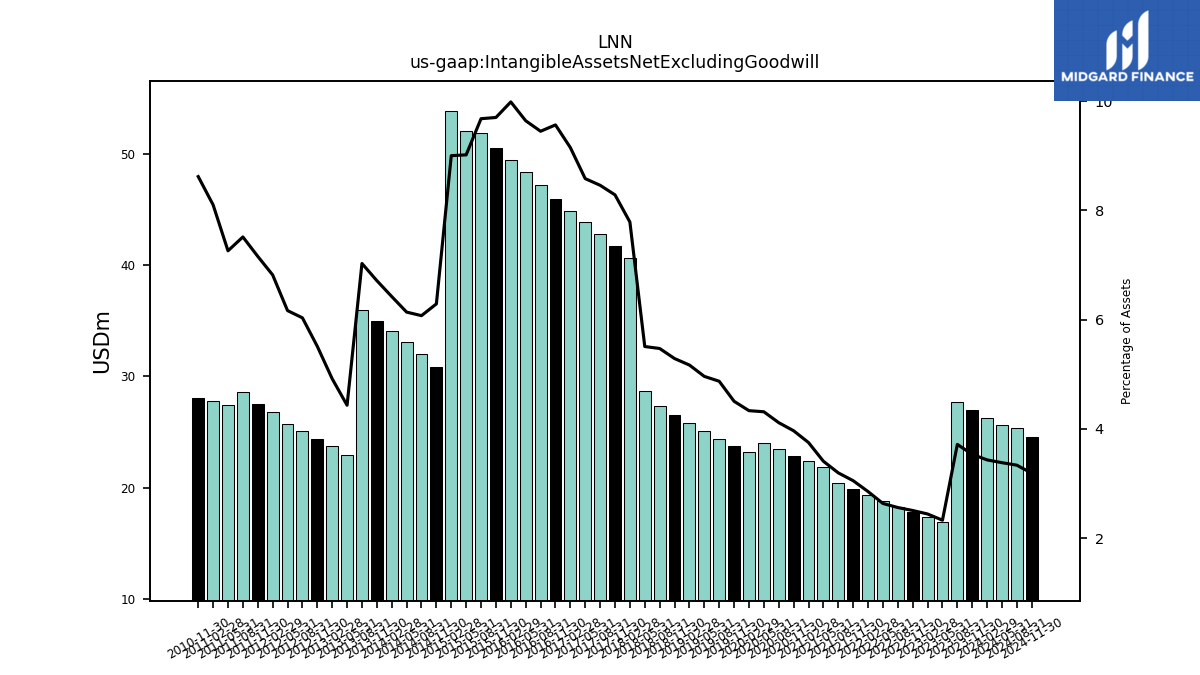
| Intangible Assets Net Excluding Goodwill | 27.00 | 27.72 | 16.86 | 17.33 | 17.76 | 18.21 | 18.77 | 19.31 | 19.83 | 20.37 | 21.89 | 22.38 | 22.82 | 23.48 | 24.05 | 23.16 | 23.74 | 24.38 | 25.10 | 25.85 | 26.58 | 27.38 | 28.66 | 40.68 | 41.70 | 42.81 | 43.87 | 44.89 | 46.00 | 47.20 | 48.37 | 49.48 | 50.60 | 51.92 | 52.10 | 53.90 | 30.82 | 31.98 | 33.06 | 34.08 | 35.03 | 36.01 | 22.97 | 23.73 | 24.41 | 25.07 | 25.71 | 26.84 | 27.49 | 28.64 | 27.43 | 27.81 | 28.08 | |
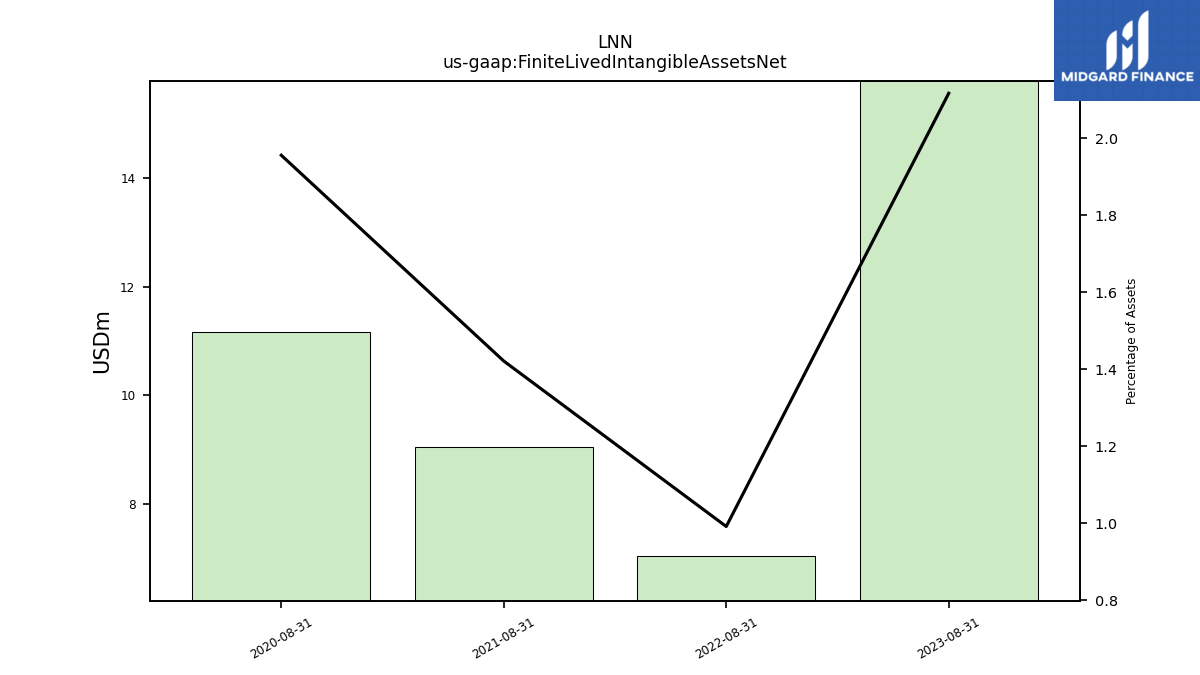
| Finite Lived Intangible Assets Net | NA | 15.78 | NA | NA | NA | 7.05 | NA | NA | NA | 9.05 | NA | NA | NA | 11.16 | NA | NA | NA | NA | NA | NA | NA | NA | NA | NA | NA | NA | NA | NA | NA | NA | NA | NA | NA | NA | NA | NA | NA | NA | NA | NA | NA | NA | NA | NA | NA | NA | NA | NA | NA | NA | NA | NA | NA | |
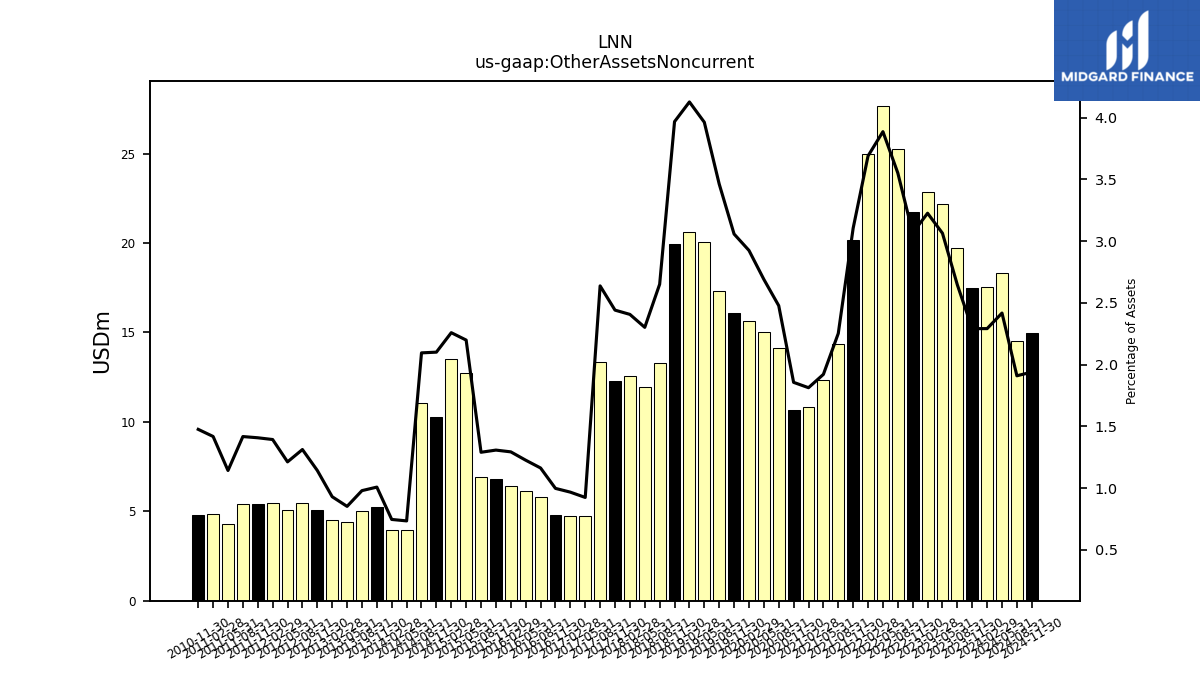
| Other Assets Noncurrent | 17.51 | 19.73 | 22.18 | 22.88 | 21.72 | 25.25 | 27.68 | 24.97 | 20.17 | 14.36 | 12.34 | 10.82 | 10.68 | 14.14 | 15.00 | 15.63 | 16.11 | 17.33 | 20.05 | 20.64 | 19.94 | 13.27 | 11.98 | 12.57 | 12.29 | 13.35 | 4.73 | 4.75 | 4.80 | 5.81 | 6.15 | 6.41 | 6.82 | 6.92 | 12.71 | 13.53 | 10.30 | 11.04 | 3.96 | 3.96 | 5.26 | 5.02 | 4.42 | 4.49 | 5.06 | 5.46 | 5.06 | 5.49 | 5.41 | 5.40 | 4.32 | 4.87 | 4.81 |
| 2023-11-30 | 2023-08-31 | 2023-05-31 | 2023-02-28 | 2022-11-30 | 2022-08-31 | 2022-05-31 | 2022-02-28 | 2021-11-30 | 2021-08-31 | 2021-05-31 | 2021-02-28 | 2020-11-30 | 2020-08-31 | 2020-05-31 | 2020-02-29 | 2019-11-30 | 2019-08-31 | 2019-05-31 | 2019-02-28 | 2018-11-30 | 2018-08-31 | 2018-05-31 | 2018-02-28 | 2017-11-30 | 2017-08-31 | 2017-05-31 | 2017-02-28 | 2016-11-30 | 2016-08-31 | 2016-05-31 | 2016-02-29 | 2015-11-30 | 2015-08-31 | 2015-05-31 | 2015-02-28 | 2014-11-30 | 2014-08-31 | 2014-05-31 | 2014-02-28 | 2013-11-30 | 2013-08-31 | 2013-05-31 | 2013-02-28 | 2012-11-30 | 2012-08-31 | 2012-05-31 | 2012-02-29 | 2011-11-30 | 2011-08-31 | 2011-05-31 | 2011-02-28 | 2010-11-30 | ||
|---|---|---|---|---|---|---|---|---|---|---|---|---|---|---|---|---|---|---|---|---|---|---|---|---|---|---|---|---|---|---|---|---|---|---|---|---|---|---|---|---|---|---|---|---|---|---|---|---|---|---|---|---|---|---|
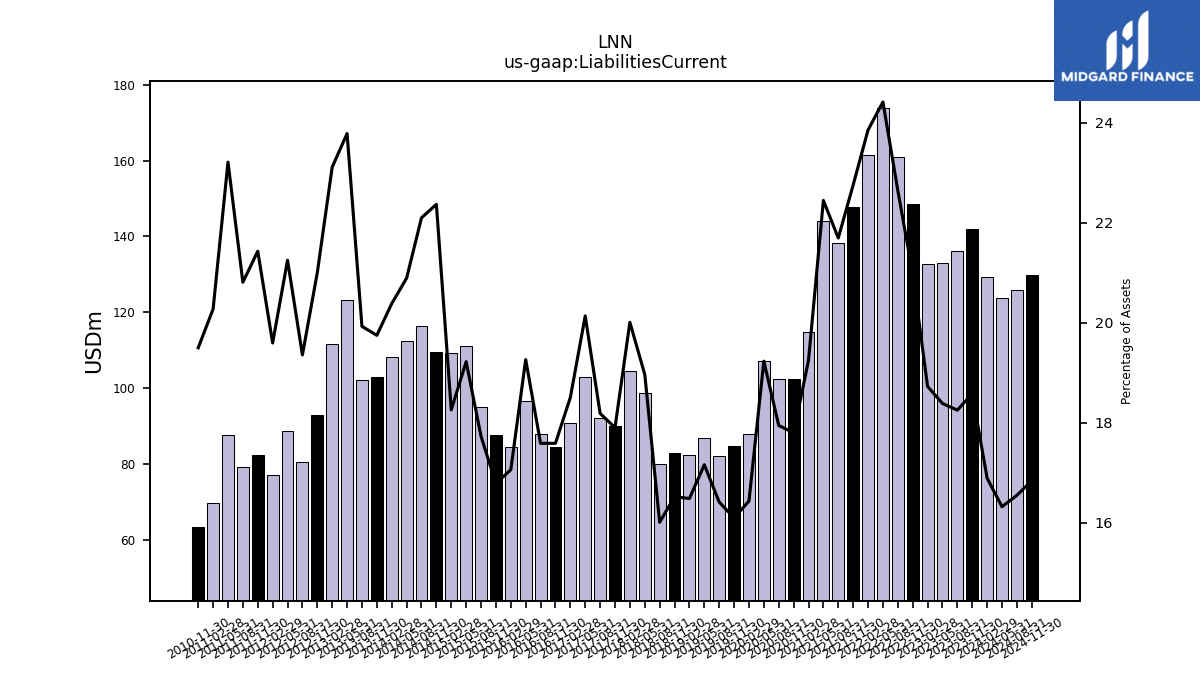
| Liabilities Current | 141.97 | 136.11 | 133.05 | 132.79 | 148.59 | 160.94 | 173.81 | 161.40 | 147.78 | 138.24 | 144.16 | 114.84 | 102.39 | 102.39 | 107.22 | 87.82 | 84.80 | 82.13 | 86.82 | 82.45 | 83.02 | 80.09 | 98.67 | 104.52 | 90.12 | 92.04 | 102.96 | 90.80 | 84.60 | 87.87 | 96.65 | 84.54 | 87.56 | 95.11 | 111.08 | 109.32 | 109.62 | 116.37 | 112.53 | 108.16 | 103.03 | 102.09 | 123.23 | 111.52 | 93.02 | 80.44 | 88.61 | 77.13 | 82.31 | 79.32 | 87.70 | 69.60 | 63.52 | |
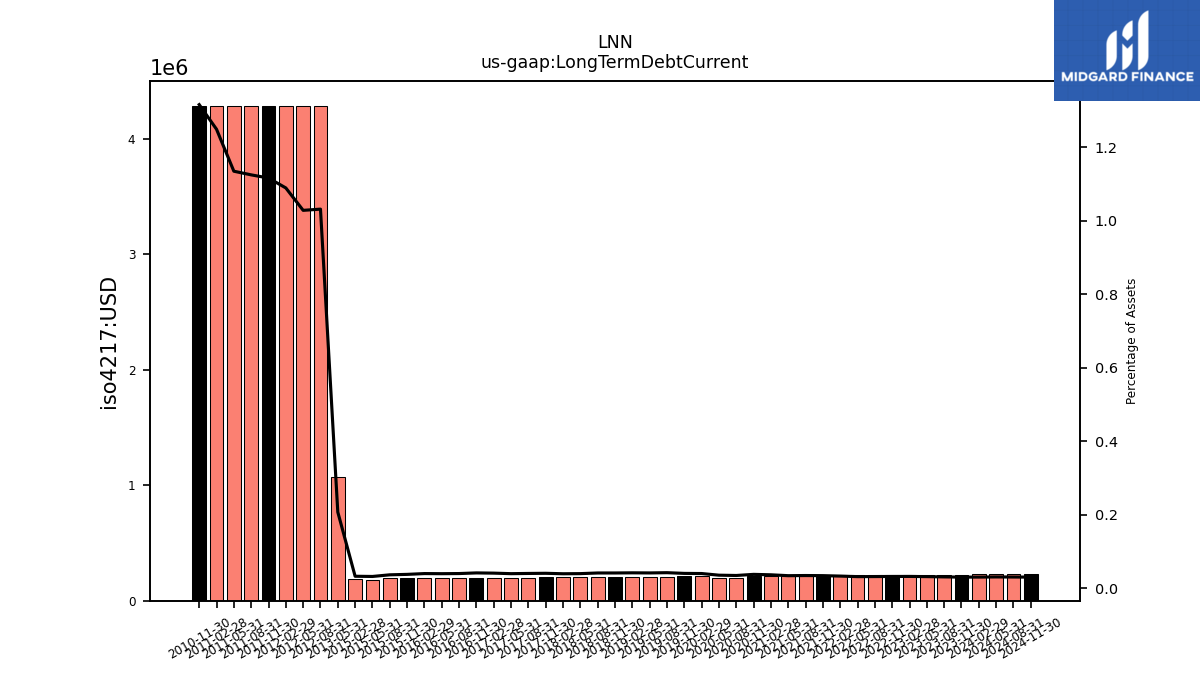
| Long Term Debt Current | 0.23 | 0.23 | 0.23 | 0.22 | 0.22 | 0.22 | 0.22 | 0.22 | 0.22 | 0.22 | 0.22 | 0.21 | 0.21 | 0.20 | 0.20 | 0.21 | 0.21 | 0.21 | 0.21 | 0.21 | 0.21 | 0.20 | 0.20 | 0.20 | 0.20 | 0.20 | 0.20 | 0.20 | 0.20 | 0.20 | 0.20 | 0.20 | 0.19 | 0.19 | 0.18 | 0.19 | NA | NA | NA | NA | NA | NA | 1.07 | NA | NA | 4.29 | 4.29 | 4.29 | 4.29 | 4.29 | 4.29 | 4.29 | 4.29 | |
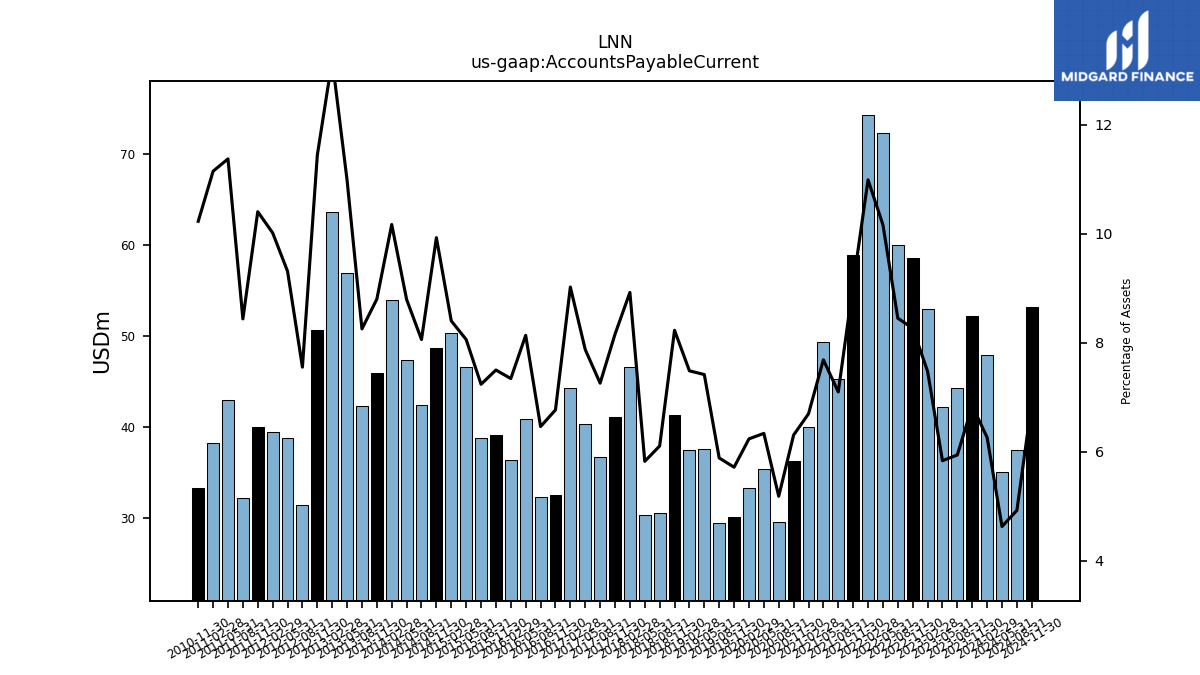
| Accounts Payable Current | 52.24 | 44.28 | 42.21 | 53.00 | 58.53 | 60.04 | 72.35 | 74.34 | 58.91 | 45.21 | 49.35 | 39.93 | 36.26 | 29.55 | 35.31 | 33.31 | 30.10 | 29.43 | 37.51 | 37.42 | 41.34 | 30.53 | 30.28 | 46.60 | 41.05 | 36.72 | 40.26 | 44.25 | 32.53 | 32.27 | 40.80 | 36.37 | 39.11 | 38.81 | 46.56 | 50.29 | 48.65 | 42.42 | 47.35 | 53.95 | 45.90 | 42.28 | 56.90 | 63.65 | 50.66 | 31.37 | 38.82 | 39.42 | 39.95 | 32.15 | 42.97 | 38.26 | 33.32 | |
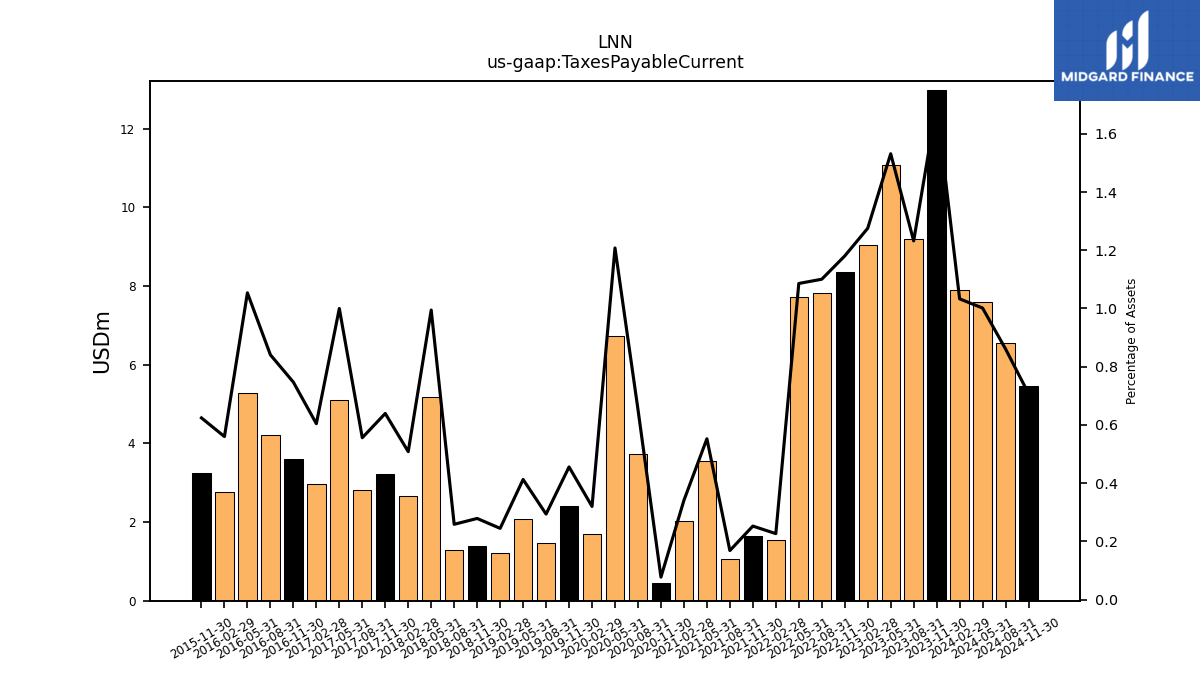
| Taxes Payable Current | 12.99 | 9.19 | 11.08 | 9.04 | 8.36 | 7.82 | 7.73 | 1.53 | 1.64 | 1.07 | 3.55 | 2.03 | 0.44 | 3.73 | 6.73 | 1.71 | 2.40 | 1.47 | 2.09 | 1.22 | 1.40 | 1.29 | 5.17 | 2.65 | 3.22 | 2.81 | 5.11 | 2.96 | 3.59 | 4.20 | 5.29 | 2.77 | 3.25 | NA | NA | NA | NA | NA | NA | NA | NA | NA | NA | NA | NA | NA | NA | NA | NA | NA | NA | NA | NA | |
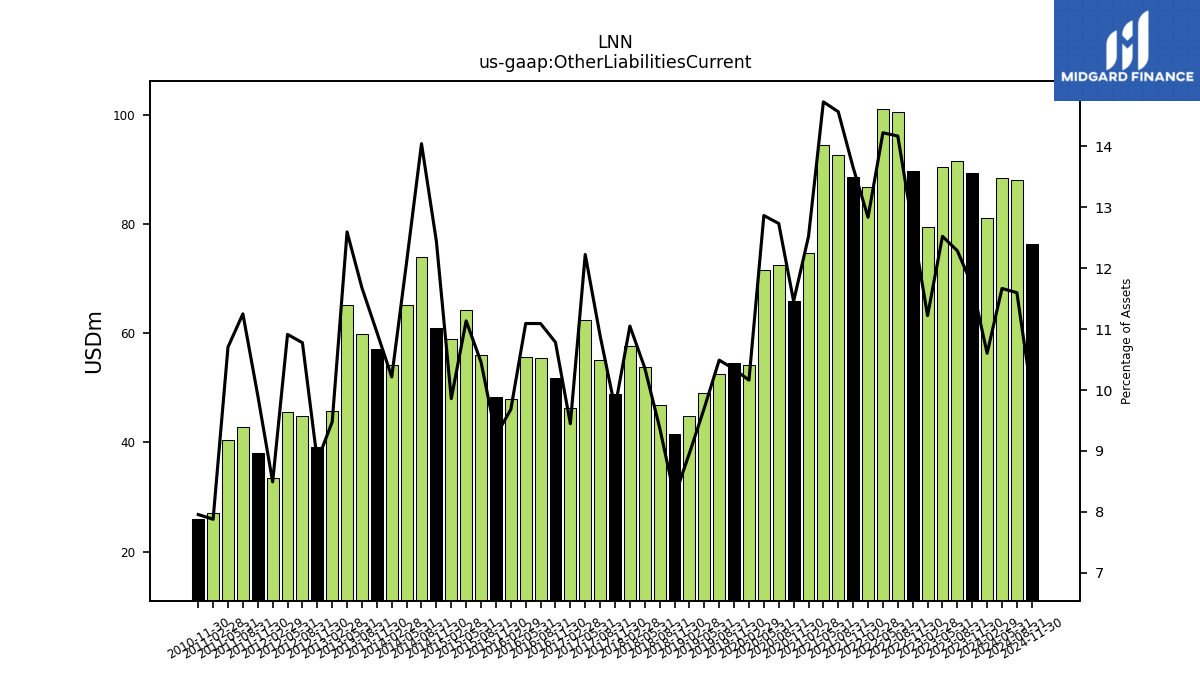
| Other Liabilities Current | 89.50 | 91.60 | 90.62 | 79.57 | 89.83 | 100.68 | 101.24 | 86.84 | 88.66 | 92.81 | 94.59 | 74.69 | 65.91 | 72.65 | 71.71 | 54.30 | 54.49 | 52.49 | 49.10 | 44.83 | 41.48 | 46.94 | 53.91 | 57.72 | 48.88 | 55.12 | 62.50 | 46.35 | 51.87 | 55.41 | 55.65 | 47.97 | 48.26 | 56.10 | 64.34 | 59.03 | 60.97 | 73.94 | 65.17 | 54.20 | 57.13 | 59.82 | 65.26 | 45.72 | 39.14 | 44.78 | 45.50 | 33.43 | 38.07 | 42.88 | 40.45 | 27.05 | 25.92 | |
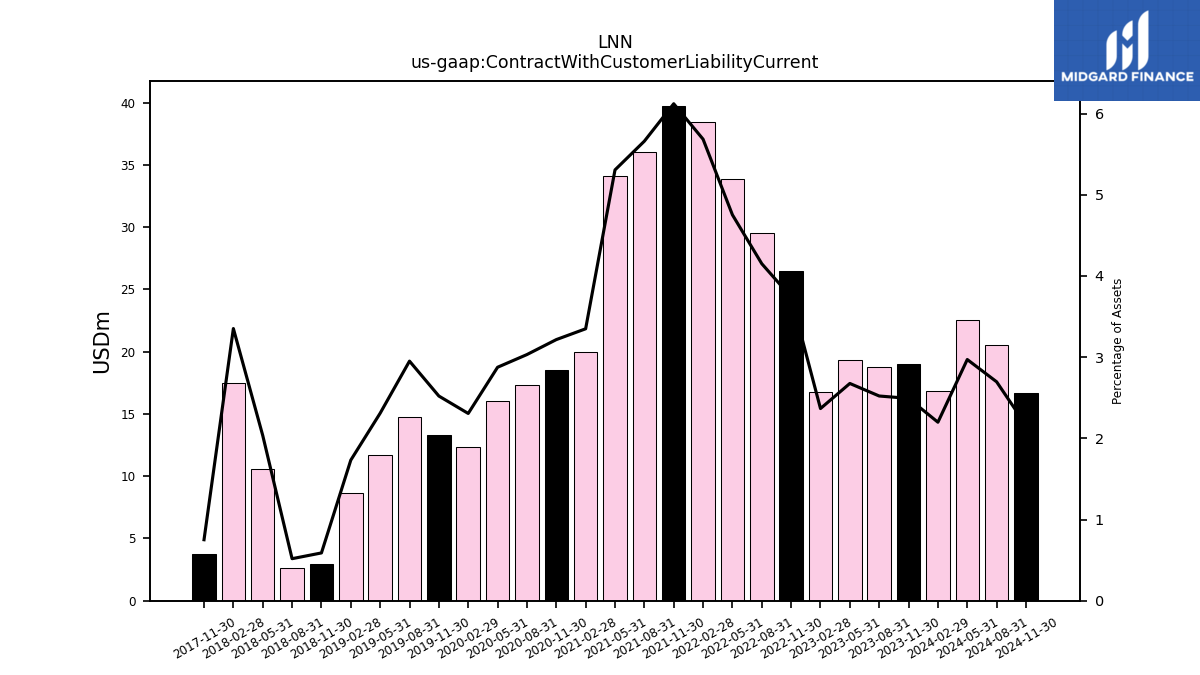
| Contract With Customer Liability Current | 19.04 | 18.80 | 19.36 | 16.78 | 26.49 | 29.49 | 33.83 | 38.45 | 39.75 | 36.06 | 34.07 | 19.98 | 18.50 | 17.30 | 16.03 | 12.32 | 13.28 | 14.76 | 11.68 | 8.66 | 2.96 | 2.59 | 10.59 | 17.51 | 3.78 | NA | NA | NA | NA | NA | NA | NA | NA | NA | NA | NA | NA | NA | NA | NA | NA | NA | NA | NA | NA | NA | NA | NA | NA | NA | NA | NA | NA |
| 2023-11-30 | 2023-08-31 | 2023-05-31 | 2023-02-28 | 2022-11-30 | 2022-08-31 | 2022-05-31 | 2022-02-28 | 2021-11-30 | 2021-08-31 | 2021-05-31 | 2021-02-28 | 2020-11-30 | 2020-08-31 | 2020-05-31 | 2020-02-29 | 2019-11-30 | 2019-08-31 | 2019-05-31 | 2019-02-28 | 2018-11-30 | 2018-08-31 | 2018-05-31 | 2018-02-28 | 2017-11-30 | 2017-08-31 | 2017-05-31 | 2017-02-28 | 2016-11-30 | 2016-08-31 | 2016-05-31 | 2016-02-29 | 2015-11-30 | 2015-08-31 | 2015-05-31 | 2015-02-28 | 2014-11-30 | 2014-08-31 | 2014-05-31 | 2014-02-28 | 2013-11-30 | 2013-08-31 | 2013-05-31 | 2013-02-28 | 2012-11-30 | 2012-08-31 | 2012-05-31 | 2012-02-29 | 2011-11-30 | 2011-08-31 | 2011-05-31 | 2011-02-28 | 2010-11-30 | ||
|---|---|---|---|---|---|---|---|---|---|---|---|---|---|---|---|---|---|---|---|---|---|---|---|---|---|---|---|---|---|---|---|---|---|---|---|---|---|---|---|---|---|---|---|---|---|---|---|---|---|---|---|---|---|---|
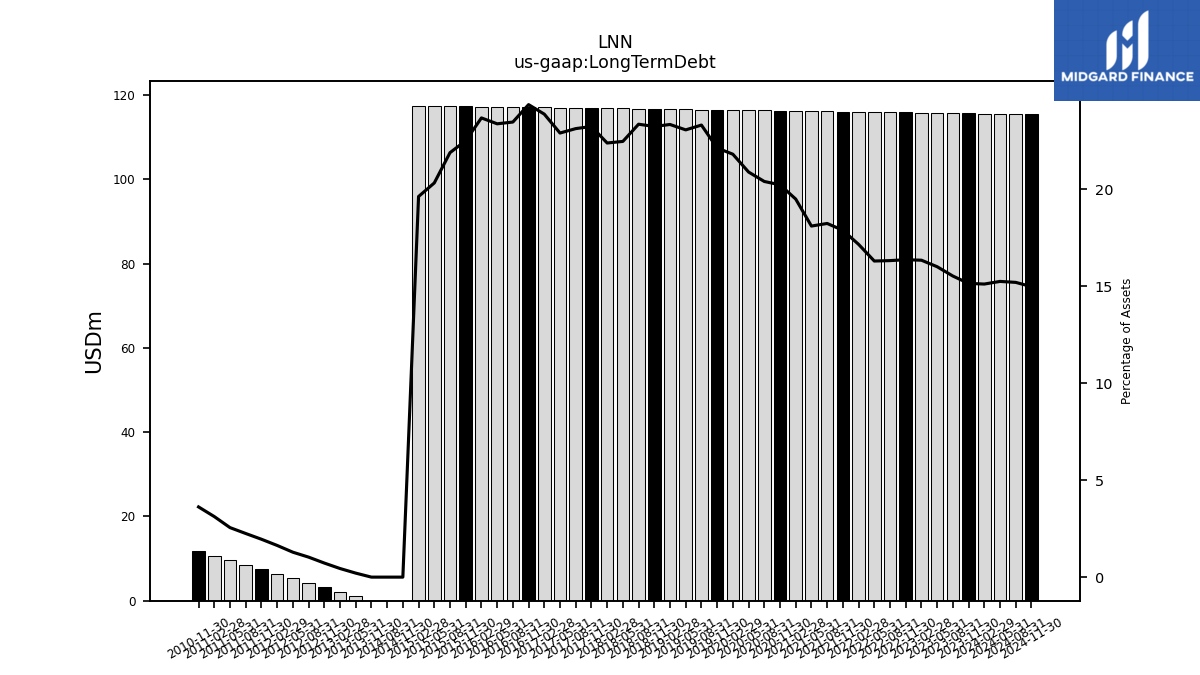
| Long Term Debt | 115.65 | 115.71 | 115.77 | 115.82 | 115.88 | 115.93 | 115.98 | 116.04 | 116.10 | 116.15 | 116.20 | 116.26 | 116.31 | 116.34 | 116.40 | 116.47 | 116.52 | 116.57 | 116.62 | 116.67 | 116.72 | 116.78 | 116.83 | 116.88 | 116.93 | 116.98 | 117.03 | 117.08 | 117.12 | 117.17 | 117.22 | 117.27 | 117.32 | 117.37 | 117.40 | 117.46 | 0.00 | 0.00 | NA | NA | 0.00 | NA | 1.07 | 2.14 | 3.21 | 4.29 | 5.36 | 6.43 | 7.50 | 8.57 | 9.64 | 10.71 | 11.79 | |
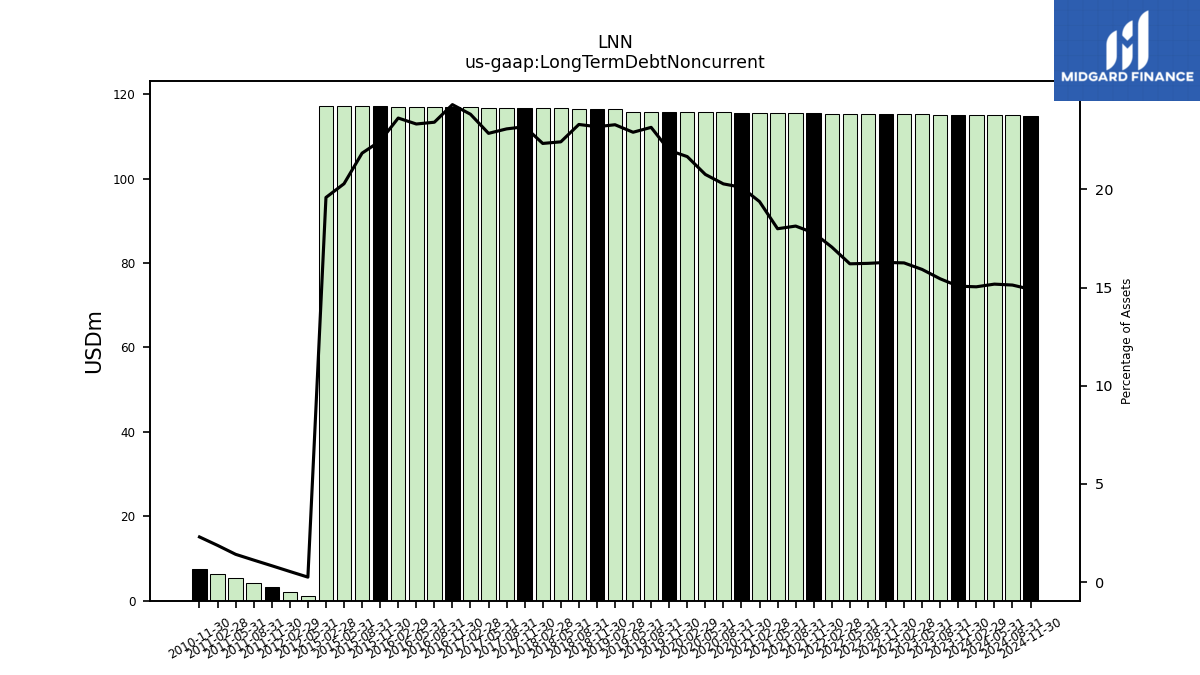
| Long Term Debt Noncurrent | 115.12 | 115.16 | 115.21 | 115.25 | 115.30 | 115.34 | 115.38 | 115.43 | 115.47 | 115.51 | 115.56 | 115.60 | 115.64 | 115.68 | 115.72 | 115.77 | 115.81 | 115.85 | 115.89 | 116.47 | 116.52 | 116.57 | 116.62 | 116.67 | 116.72 | 116.78 | 116.83 | 116.88 | 116.93 | 116.98 | 117.03 | 117.08 | 117.12 | 117.17 | 117.22 | 117.27 | NA | NA | NA | NA | NA | NA | NA | NA | NA | NA | 1.07 | 2.14 | 3.21 | 4.29 | 5.36 | 6.43 | 7.50 | |
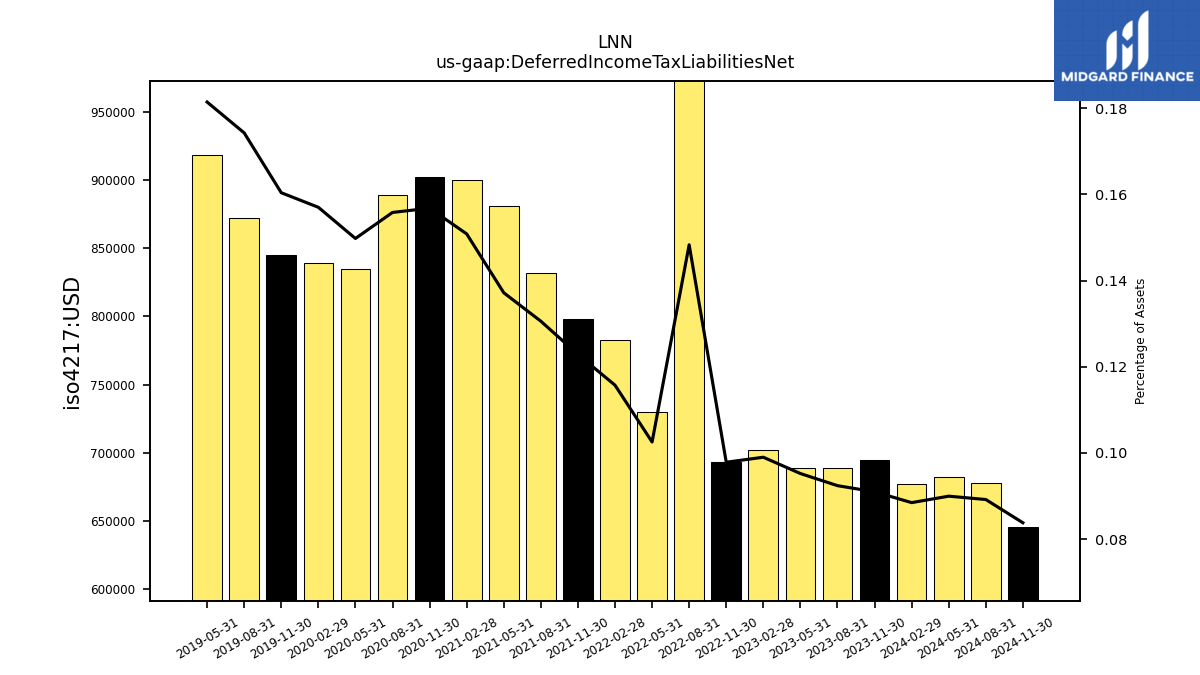
| Deferred Income Tax Liabilities Net | 0.69 | 0.69 | 0.69 | 0.70 | 0.69 | 1.05 | 0.73 | 0.78 | 0.80 | 0.83 | 0.88 | 0.90 | 0.90 | 0.89 | 0.83 | 0.84 | 0.84 | 0.87 | 0.92 | NA | NA | NA | NA | NA | NA | NA | NA | NA | NA | NA | NA | NA | NA | NA | NA | NA | NA | NA | NA | NA | NA | NA | NA | NA | NA | NA | NA | NA | NA | NA | NA | NA | NA | |
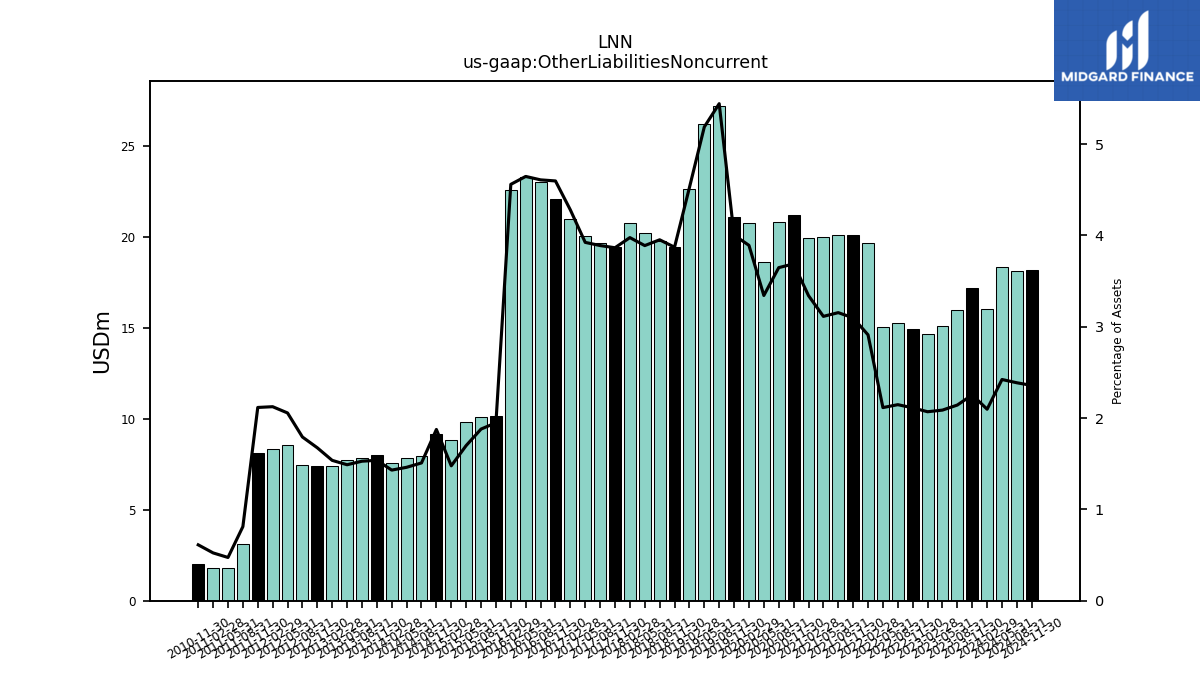
| Other Liabilities Noncurrent | 17.22 | 15.98 | 15.10 | 14.67 | 14.96 | 15.26 | 15.06 | 19.70 | 20.11 | 20.10 | 20.00 | 19.93 | 21.21 | 20.81 | 18.63 | 20.79 | 21.09 | 27.23 | 26.25 | 22.62 | 19.45 | 19.77 | 20.23 | 20.77 | 19.46 | 19.68 | 20.06 | 21.00 | 22.11 | 23.02 | 23.31 | 22.59 | 10.16 | 10.08 | 9.82 | 8.85 | 9.19 | 7.95 | 7.87 | 7.59 | 8.02 | 7.83 | 7.71 | 7.42 | 7.42 | 7.45 | 8.57 | 8.36 | 8.13 | 3.09 | 1.79 | 1.80 | 1.99 | |
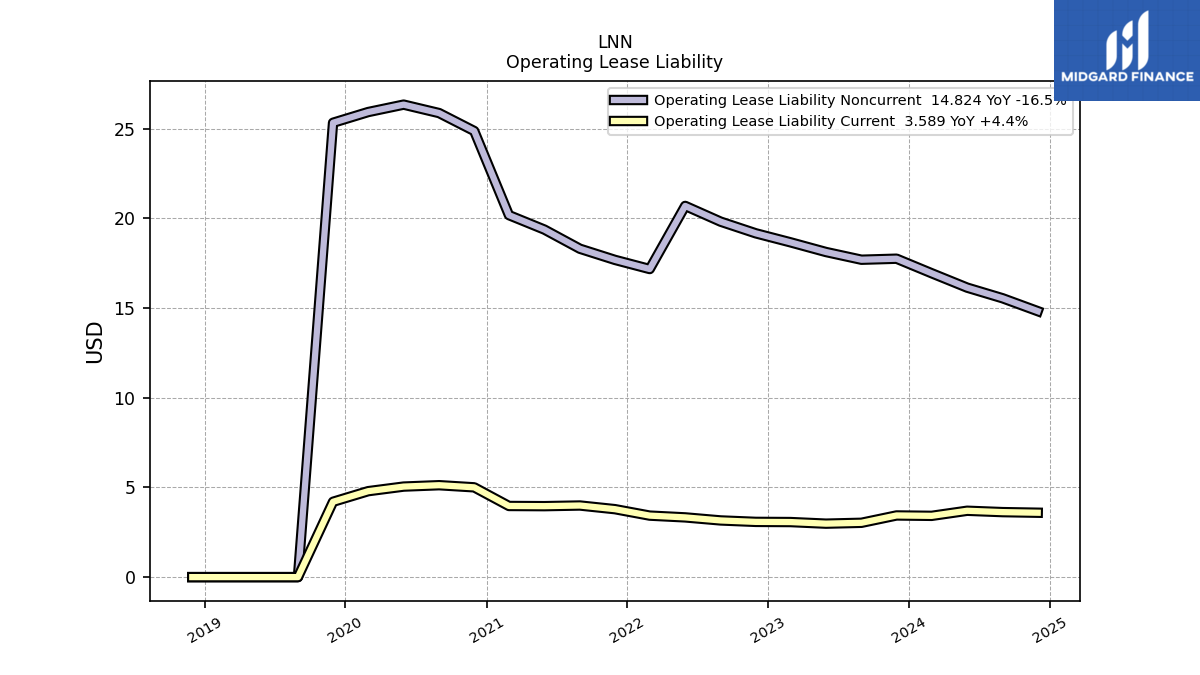
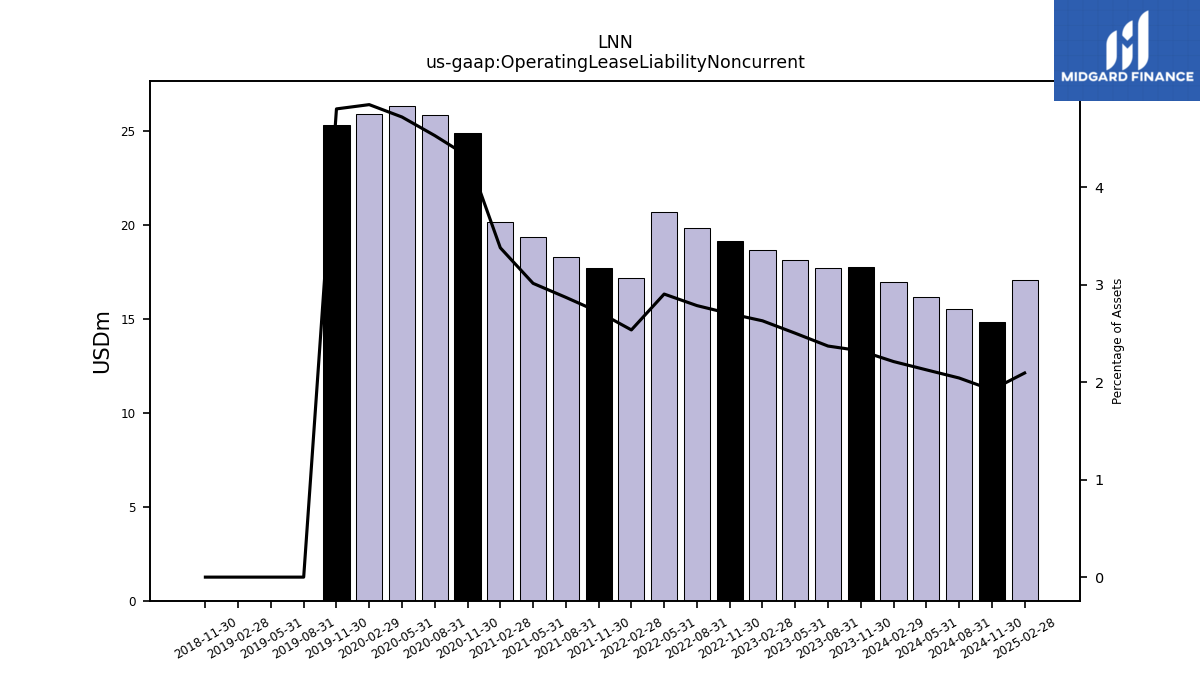
| Operating Lease Liability Noncurrent | 17.75 | 17.69 | 18.12 | 18.66 | 19.16 | 19.81 | 20.69 | 17.17 | 17.68 | 18.30 | 19.37 | 20.17 | 24.86 | 25.86 | 26.33 | 25.92 | 25.32 | 0.00 | 0.00 | 0.00 | 0.00 | NA | NA | NA | NA | NA | NA | NA | NA | NA | NA | NA | NA | NA | NA | NA | NA | NA | NA | NA | NA | NA | NA | NA | NA | NA | NA | NA | NA | NA | NA | NA | NA |
| 2023-11-30 | 2023-08-31 | 2023-05-31 | 2023-02-28 | 2022-11-30 | 2022-08-31 | 2022-05-31 | 2022-02-28 | 2021-11-30 | 2021-08-31 | 2021-05-31 | 2021-02-28 | 2020-11-30 | 2020-08-31 | 2020-05-31 | 2020-02-29 | 2019-11-30 | 2019-08-31 | 2019-05-31 | 2019-02-28 | 2018-11-30 | 2018-08-31 | 2018-05-31 | 2018-02-28 | 2017-11-30 | 2017-08-31 | 2017-05-31 | 2017-02-28 | 2016-11-30 | 2016-08-31 | 2016-05-31 | 2016-02-29 | 2015-11-30 | 2015-08-31 | 2015-05-31 | 2015-02-28 | 2014-11-30 | 2014-08-31 | 2014-05-31 | 2014-02-28 | 2013-11-30 | 2013-08-31 | 2013-05-31 | 2013-02-28 | 2012-11-30 | 2012-08-31 | 2012-05-31 | 2012-02-29 | 2011-11-30 | 2011-08-31 | 2011-05-31 | 2011-02-28 | 2010-11-30 | ||
|---|---|---|---|---|---|---|---|---|---|---|---|---|---|---|---|---|---|---|---|---|---|---|---|---|---|---|---|---|---|---|---|---|---|---|---|---|---|---|---|---|---|---|---|---|---|---|---|---|---|---|---|---|---|---|
| Stockholders Equity | 466.86 | 455.65 | 436.80 | 422.27 | 404.79 | 393.36 | 380.77 | 356.54 | 341.94 | 338.44 | 336.17 | 319.02 | 303.90 | 298.52 | 282.96 | 277.33 | 273.00 | 268.21 | 270.39 | 271.84 | 276.68 | 276.87 | 277.51 | 273.06 | 269.23 | 270.06 | 263.70 | 253.56 | 248.19 | 251.57 | 244.94 | 251.62 | 281.69 | 288.56 | 314.69 | 335.94 | 352.83 | 382.65 | 398.04 | 394.69 | 389.67 | 380.64 | 371.76 | 347.16 | 326.07 | 310.84 | 302.18 | 288.17 | 273.82 | 275.67 | 265.78 | 248.40 | 234.94 | |
| Common Stock Value | 19.11 | 19.09 | 19.09 | 19.09 | 19.09 | 19.06 | 19.06 | 19.06 | 19.06 | 18.99 | 18.99 | 18.99 | 18.95 | 18.92 | 18.92 | 18.92 | 18.90 | 18.87 | 18.87 | 18.87 | 18.87 | 18.84 | 18.84 | 18.84 | 18.80 | 18.78 | 18.77 | 18.75 | 18.74 | 18.71 | 18.71 | 18.71 | 18.71 | 18.68 | 18.68 | 18.68 | 18.67 | 18.64 | 18.64 | 18.63 | 18.62 | 18.57 | 18.56 | 18.55 | 18.53 | 18.42 | 18.41 | 18.41 | 18.40 | 18.37 | 18.27 | 18.26 | 18.24 | |
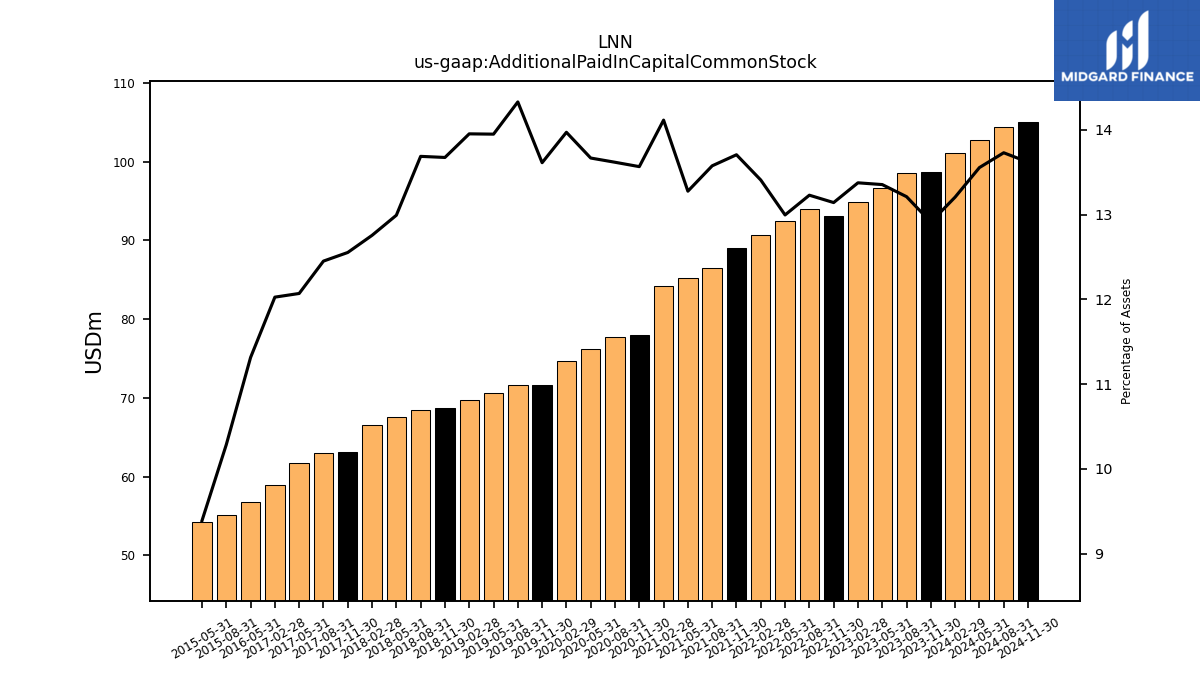
| Additional Paid In Capital Common Stock | 98.63 | 98.51 | 96.63 | 94.83 | 93.08 | 94.01 | 92.52 | 90.71 | 89.01 | 86.50 | 85.26 | 84.21 | 78.03 | 77.69 | 76.19 | 74.64 | 71.71 | 71.68 | 70.57 | 69.77 | 68.71 | 68.47 | 67.59 | 66.62 | 63.19 | 63.01 | 61.71 | 59.00 | NA | NA | 56.77 | NA | NA | 55.18 | 54.27 | NA | NA | NA | NA | NA | NA | NA | NA | NA | NA | NA | NA | NA | NA | NA | NA | NA | NA | |
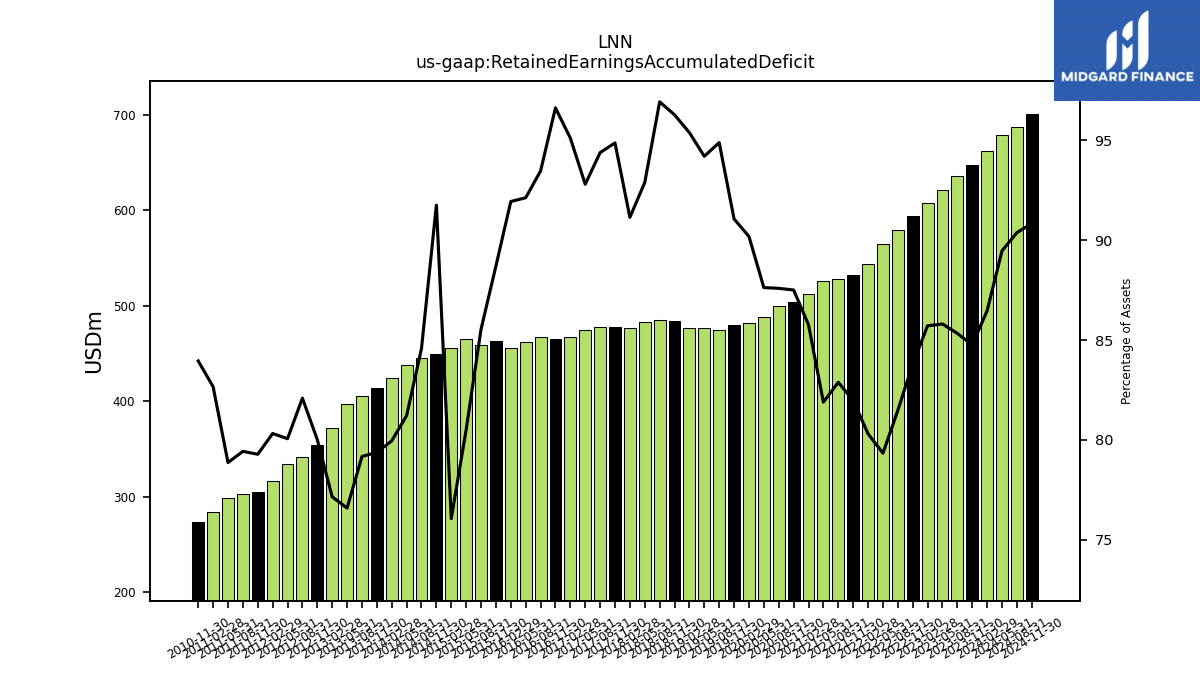
| Retained Earnings Accumulated Deficit | 647.46 | 636.30 | 620.92 | 607.78 | 593.48 | 579.00 | 564.80 | 543.36 | 532.41 | 528.13 | 525.93 | 511.73 | 503.34 | 499.72 | 488.52 | 481.89 | 479.73 | 474.74 | 476.58 | 477.03 | 483.81 | 484.89 | 483.24 | 476.09 | 477.58 | 477.62 | 474.48 | 466.63 | 464.71 | 466.93 | 462.20 | 455.54 | 462.71 | 458.90 | 465.25 | 455.44 | 449.66 | 445.37 | 437.42 | 424.24 | 414.13 | 405.58 | 396.82 | 372.24 | 354.37 | 341.12 | 333.82 | 316.14 | 304.51 | 302.73 | 297.97 | 283.75 | 273.49 | |
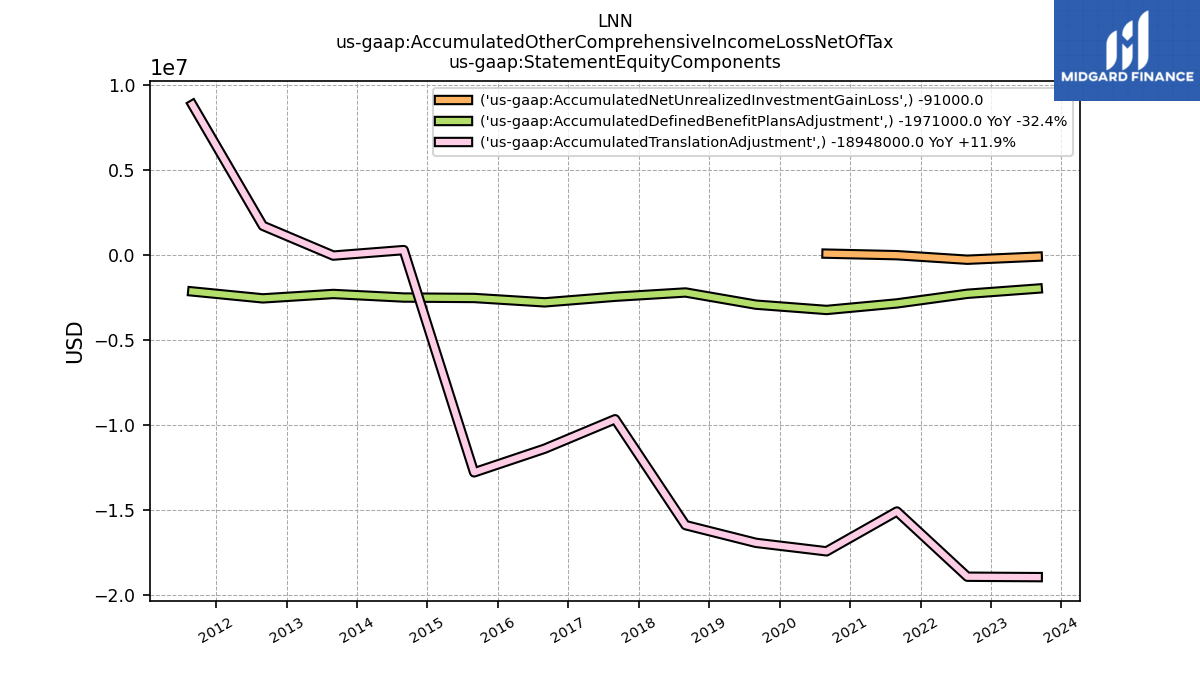
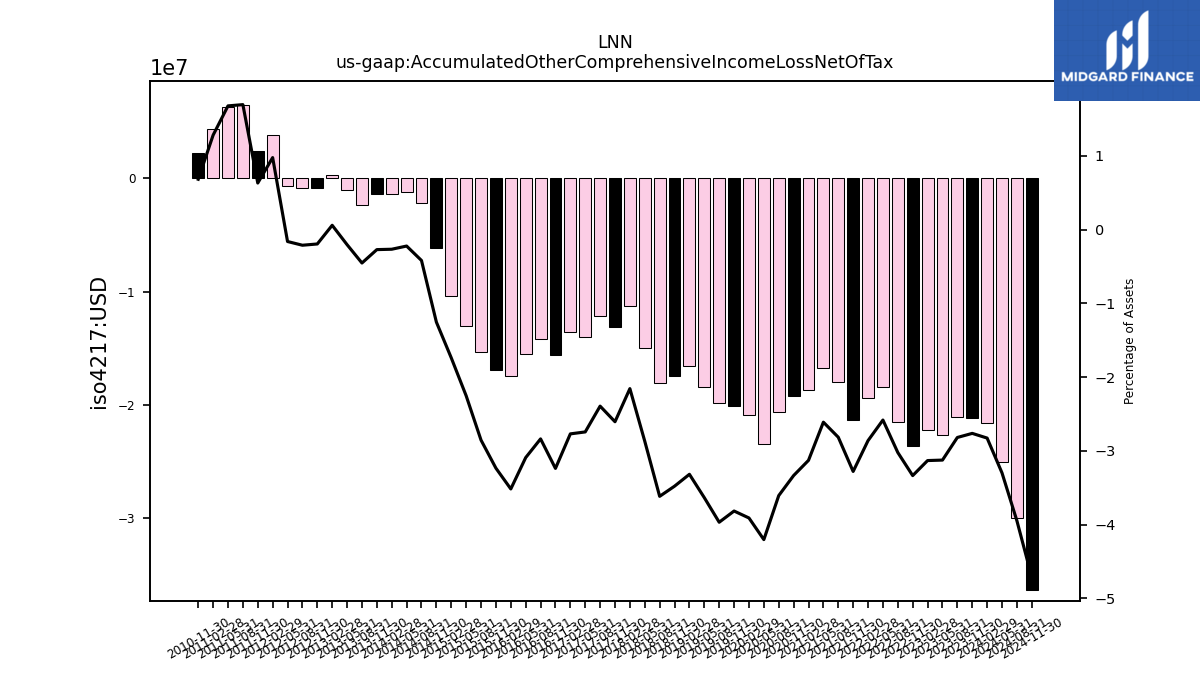
| Accumulated Other Comprehensive Income Loss Net Of Tax | -21.10 | -21.01 | -22.61 | -22.20 | -23.62 | -21.47 | -18.38 | -19.35 | -21.29 | -17.93 | -16.76 | -18.66 | -19.18 | -20.57 | -23.43 | -20.89 | -20.10 | -19.85 | -18.38 | -16.59 | -17.48 | -18.09 | -14.92 | -11.26 | -13.11 | -12.11 | -14.02 | -13.58 | -15.57 | -14.17 | -15.51 | -17.42 | -16.87 | -15.31 | -13.01 | -10.41 | -6.14 | -2.20 | -1.20 | -1.41 | -1.41 | -2.32 | -1.05 | 0.29 | -0.86 | -0.88 | -0.67 | 3.85 | 2.43 | 6.46 | 6.34 | 4.40 | 2.23 | |
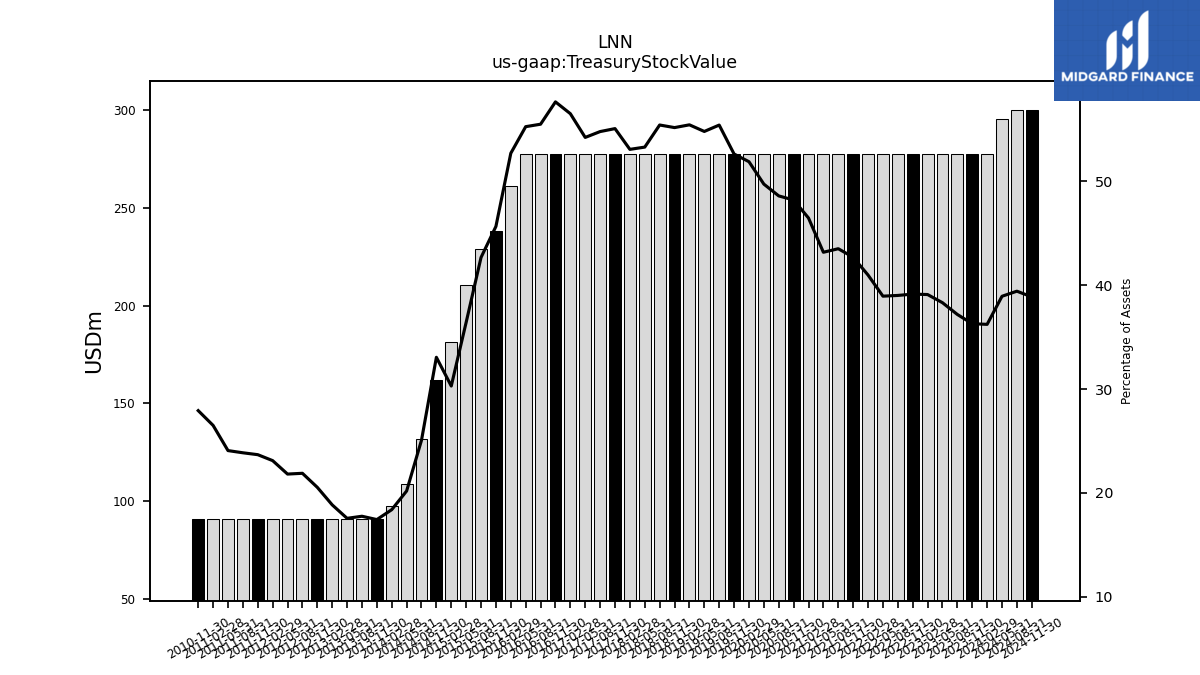
| Treasury Stock Value | 277.24 | 277.24 | 277.24 | 277.24 | 277.24 | 277.24 | 277.24 | 277.24 | 277.24 | 277.24 | 277.24 | 277.24 | 277.24 | 277.24 | 277.24 | 277.24 | 277.24 | 277.24 | 277.24 | 277.24 | 277.24 | 277.24 | 277.24 | 277.24 | 277.24 | 277.24 | 277.24 | 277.24 | 277.24 | 277.24 | 277.24 | 261.12 | 238.15 | 228.90 | 210.48 | 181.38 | 162.01 | 132.02 | 108.71 | 97.57 | 90.96 | 90.96 | 90.96 | 90.96 | 90.96 | 90.96 | 90.96 | 90.96 | 90.96 | 90.96 | 90.96 | 90.96 | 90.96 | |
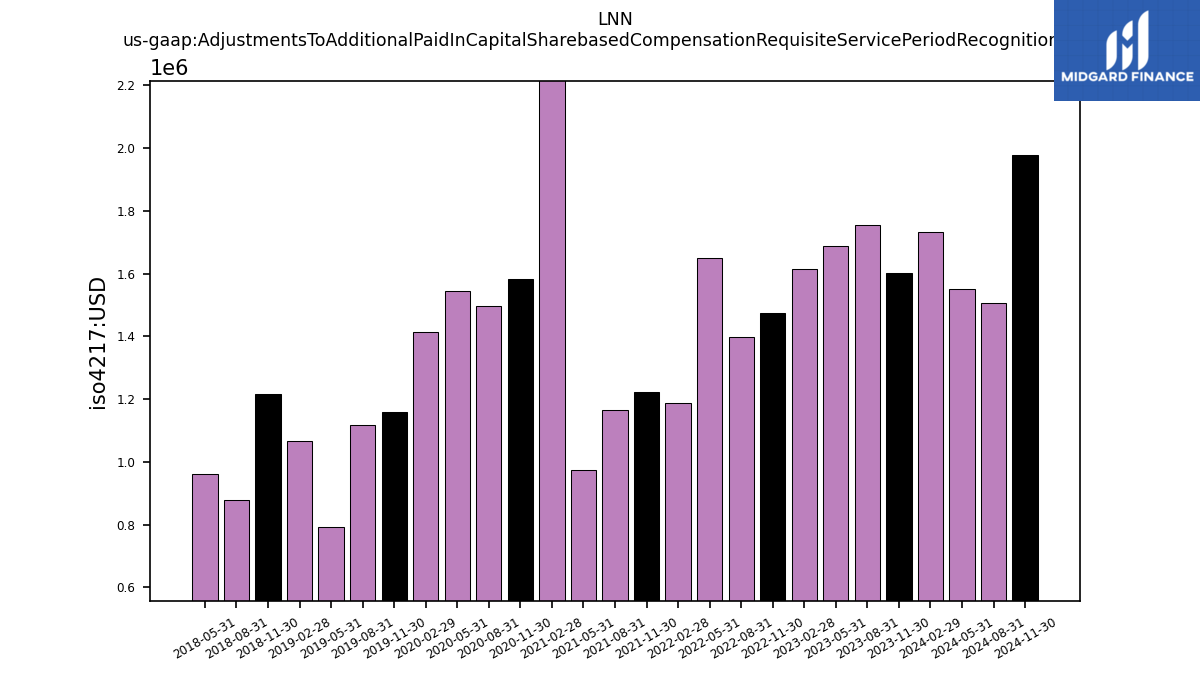
| Adjustments To Additional Paid In Capital Sharebased Compensation Requisite Service Period Recognition Value | 1.60 | 1.75 | 1.69 | 1.62 | 1.47 | 1.40 | 1.65 | 1.19 | 1.22 | 1.17 | 0.97 | 2.46 | 1.58 | 1.50 | 1.54 | 1.42 | 1.16 | 1.12 | 0.79 | 1.07 | 1.22 | 0.88 | 0.96 | NA | NA | NA | NA | NA | NA | NA | NA | NA | NA | NA | NA | NA | NA | NA | NA | NA | NA | NA | NA | NA | NA | NA | NA | NA | NA | NA | NA | NA | NA |
| 2023-11-30 | 2023-08-31 | 2023-05-31 | 2023-02-28 | 2022-11-30 | 2022-08-31 | 2022-05-31 | 2022-02-28 | 2021-11-30 | 2021-08-31 | 2021-05-31 | 2021-02-28 | 2020-11-30 | 2020-08-31 | 2020-05-31 | 2020-02-29 | 2019-11-30 | 2019-08-31 | 2019-05-31 | 2019-02-28 | 2018-11-30 | 2018-08-31 | 2018-05-31 | 2018-02-28 | 2017-11-30 | 2017-08-31 | 2017-05-31 | 2017-02-28 | 2016-11-30 | 2016-08-31 | 2016-05-31 | 2016-02-29 | 2015-11-30 | 2015-08-31 | 2015-05-31 | 2015-02-28 | 2014-11-30 | 2014-08-31 | 2014-05-31 | 2014-02-28 | 2013-11-30 | 2013-08-31 | 2013-05-31 | 2013-02-28 | 2012-11-30 | 2012-08-31 | 2012-05-31 | 2012-02-29 | 2011-11-30 | 2011-08-31 | 2011-05-31 | 2011-02-28 | 2010-11-30 | ||
|---|---|---|---|---|---|---|---|---|---|---|---|---|---|---|---|---|---|---|---|---|---|---|---|---|---|---|---|---|---|---|---|---|---|---|---|---|---|---|---|---|---|---|---|---|---|---|---|---|---|---|---|---|---|---|
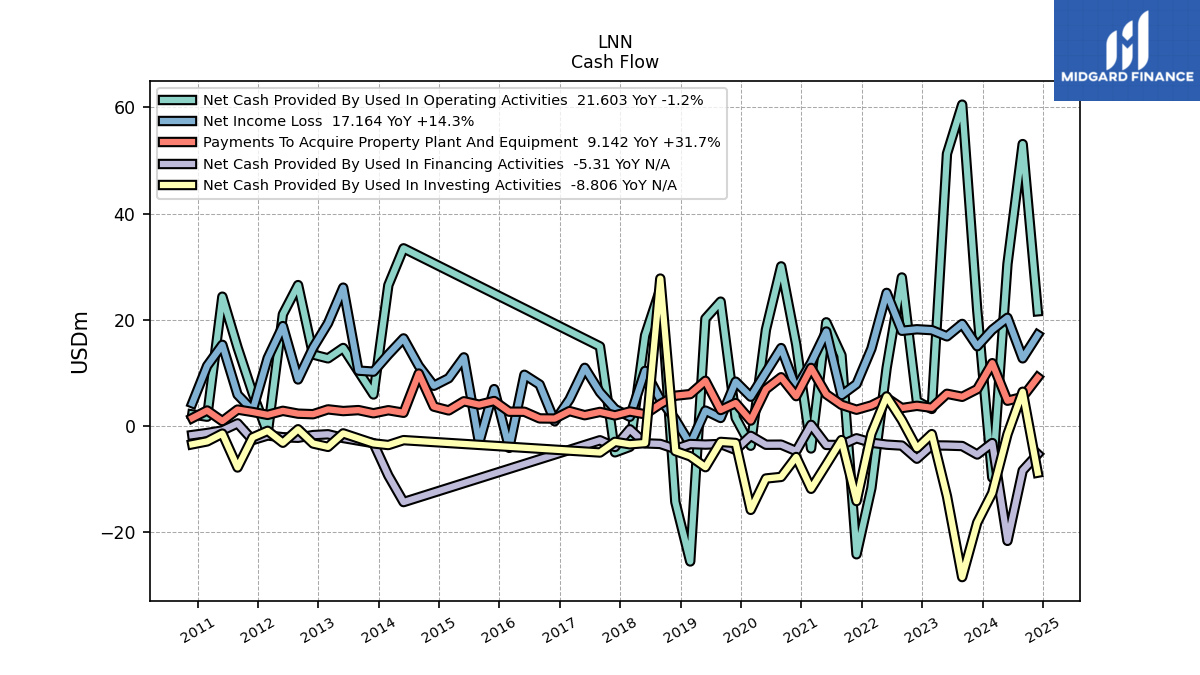
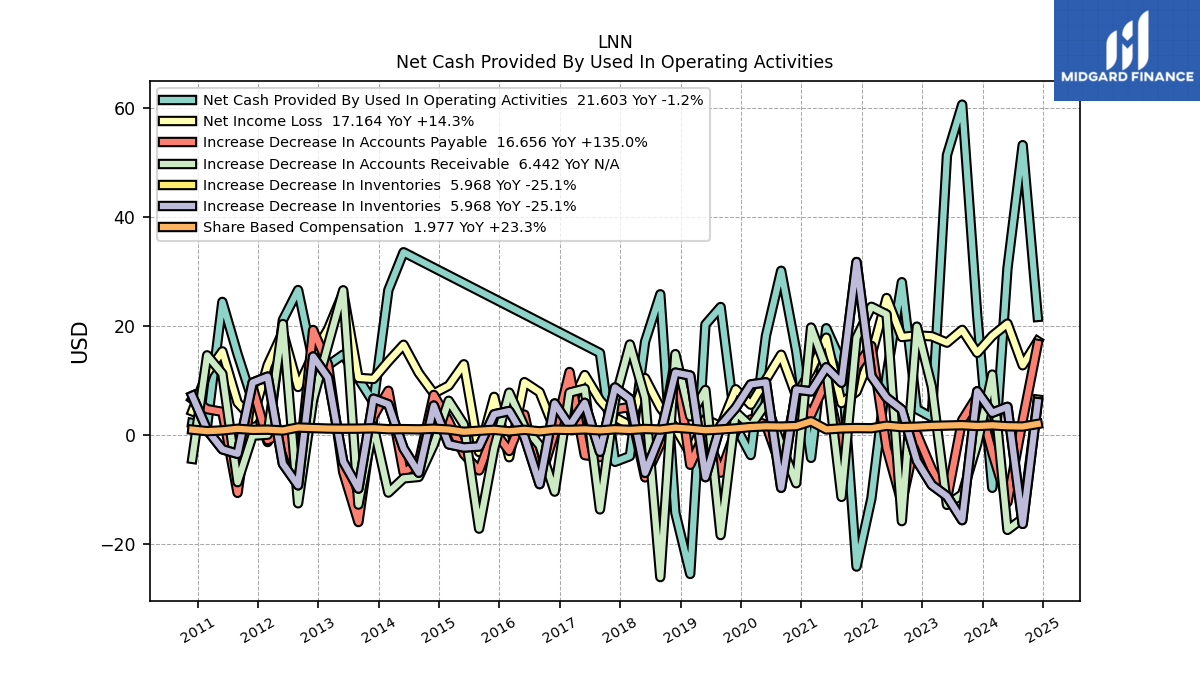
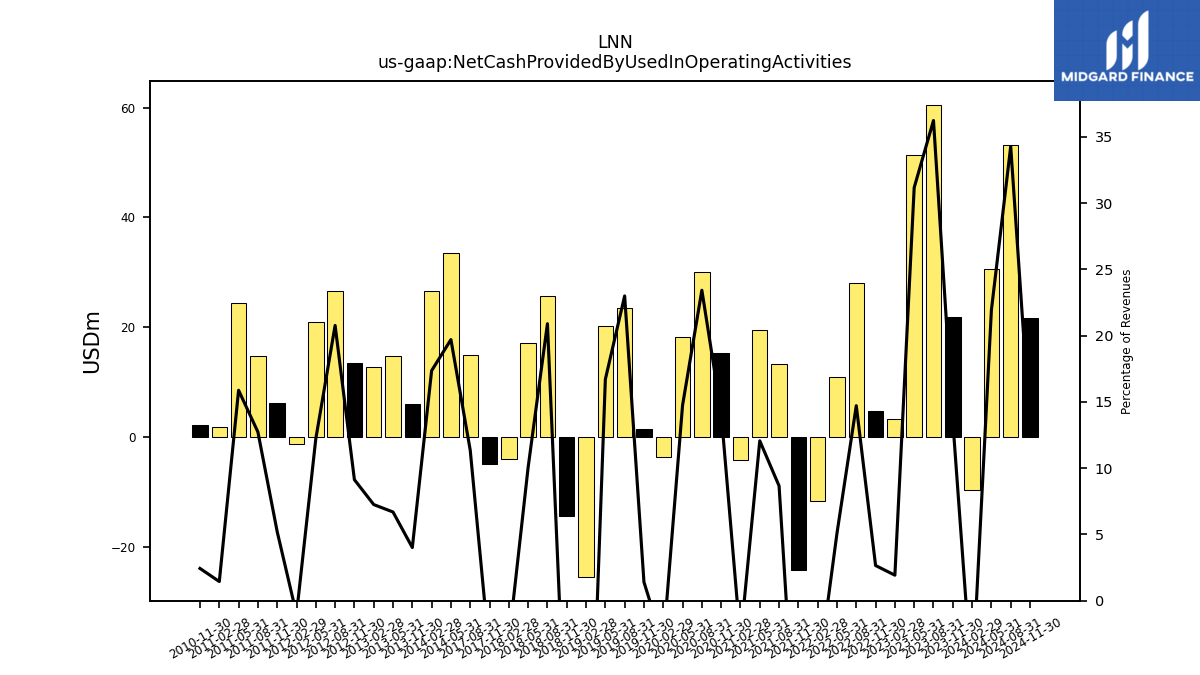
| Net Cash Provided By Used In Operating Activities | 21.87 | 60.54 | 51.28 | 3.21 | 4.68 | 27.98 | 10.92 | -11.67 | -24.18 | 13.31 | 19.53 | -4.25 | 15.37 | 30.07 | 18.15 | -3.73 | 1.54 | 23.43 | 20.22 | -25.53 | -14.32 | 25.76 | 17.07 | -3.93 | -4.97 | 14.98 | NA | NA | NA | NA | NA | NA | NA | NA | NA | NA | NA | NA | 33.47 | 26.52 | 5.93 | NA | 14.69 | 12.73 | 13.46 | 26.54 | 21.03 | -1.34 | 6.21 | 14.78 | 24.36 | 1.74 | 2.17 | |
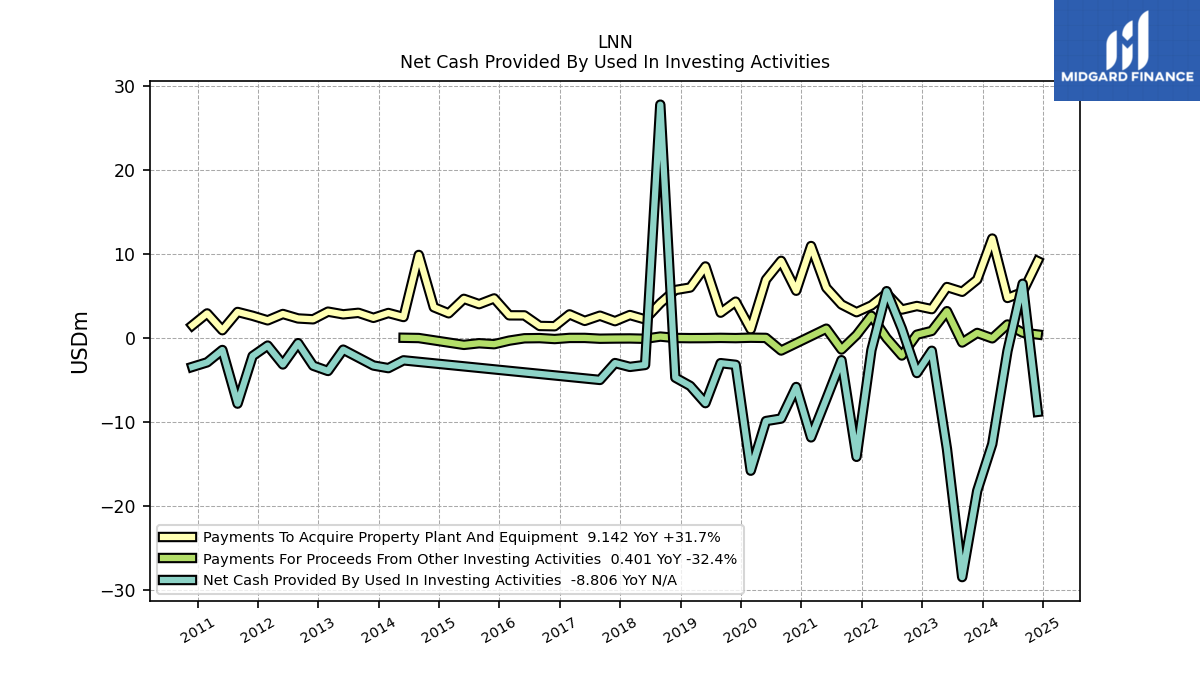
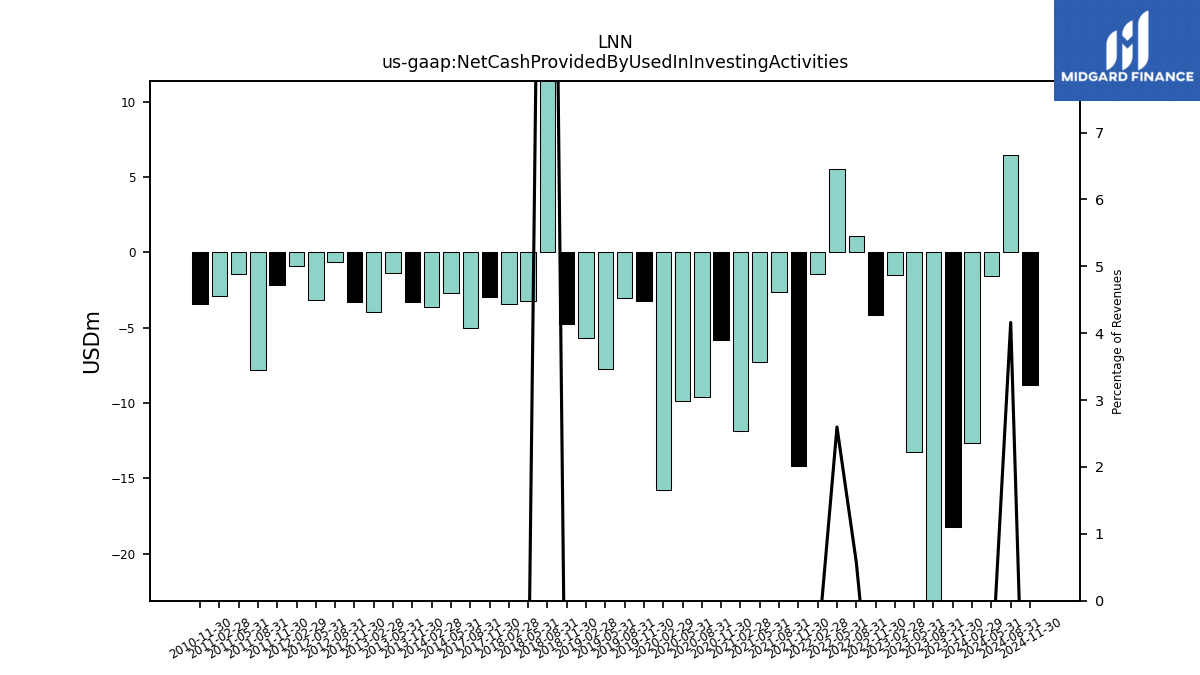
| Net Cash Provided By Used In Investing Activities | -18.20 | -28.48 | -13.23 | -1.53 | -4.18 | 1.10 | 5.57 | -1.46 | -14.16 | -2.65 | -7.28 | -11.84 | -5.84 | -9.60 | -9.90 | -15.81 | -3.21 | -3.00 | -7.77 | -5.71 | -4.73 | 27.77 | -3.22 | -3.45 | -2.99 | -5.00 | NA | NA | NA | NA | NA | NA | NA | NA | NA | NA | NA | NA | -2.67 | -3.60 | -3.29 | NA | -1.40 | -3.94 | -3.31 | -0.62 | -3.16 | -0.91 | -2.16 | -7.83 | -1.44 | -2.91 | -3.45 | |
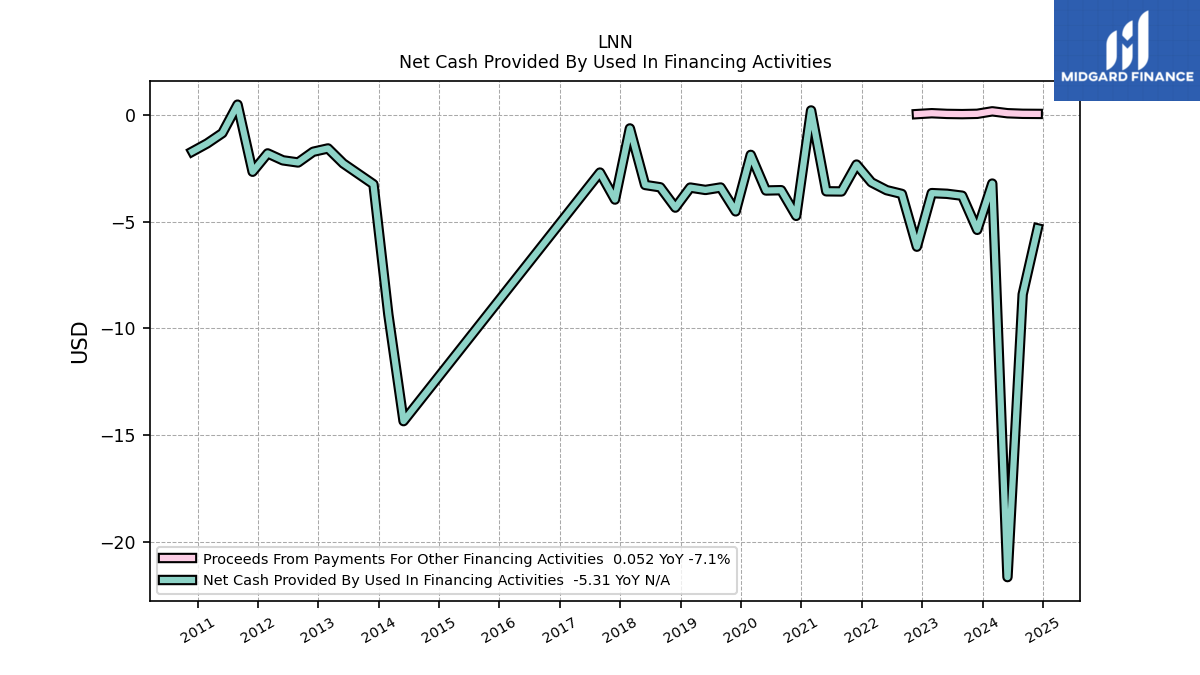
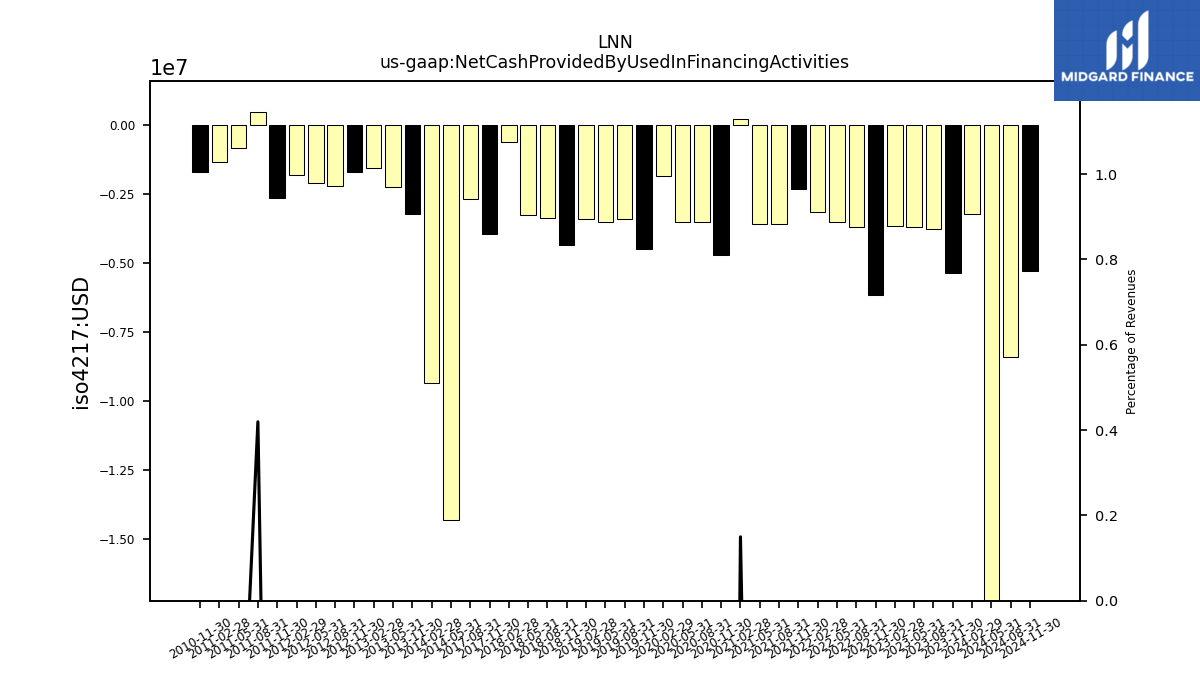
| Net Cash Provided By Used In Financing Activities | -5.38 | -3.78 | -3.69 | -3.66 | -6.17 | -3.70 | -3.52 | -3.15 | -2.32 | -3.58 | -3.57 | 0.21 | -4.72 | -3.52 | -3.54 | -1.87 | -4.51 | -3.40 | -3.51 | -3.40 | -4.34 | -3.39 | -3.28 | -0.63 | -3.96 | -2.69 | NA | NA | NA | NA | NA | NA | NA | NA | NA | NA | NA | NA | -14.34 | -9.35 | -3.24 | NA | -2.27 | -1.56 | -1.72 | -2.22 | -2.12 | -1.80 | -2.66 | 0.49 | -0.85 | -1.33 | -1.71 |
| 2023-11-30 | 2023-08-31 | 2023-05-31 | 2023-02-28 | 2022-11-30 | 2022-08-31 | 2022-05-31 | 2022-02-28 | 2021-11-30 | 2021-08-31 | 2021-05-31 | 2021-02-28 | 2020-11-30 | 2020-08-31 | 2020-05-31 | 2020-02-29 | 2019-11-30 | 2019-08-31 | 2019-05-31 | 2019-02-28 | 2018-11-30 | 2018-08-31 | 2018-05-31 | 2018-02-28 | 2017-11-30 | 2017-08-31 | 2017-05-31 | 2017-02-28 | 2016-11-30 | 2016-08-31 | 2016-05-31 | 2016-02-29 | 2015-11-30 | 2015-08-31 | 2015-05-31 | 2015-02-28 | 2014-11-30 | 2014-08-31 | 2014-05-31 | 2014-02-28 | 2013-11-30 | 2013-08-31 | 2013-05-31 | 2013-02-28 | 2012-11-30 | 2012-08-31 | 2012-05-31 | 2012-02-29 | 2011-11-30 | 2011-08-31 | 2011-05-31 | 2011-02-28 | 2010-11-30 | ||
|---|---|---|---|---|---|---|---|---|---|---|---|---|---|---|---|---|---|---|---|---|---|---|---|---|---|---|---|---|---|---|---|---|---|---|---|---|---|---|---|---|---|---|---|---|---|---|---|---|---|---|---|---|---|---|
| Net Cash Provided By Used In Operating Activities | 21.87 | 60.54 | 51.28 | 3.21 | 4.68 | 27.98 | 10.92 | -11.67 | -24.18 | 13.31 | 19.53 | -4.25 | 15.37 | 30.07 | 18.15 | -3.73 | 1.54 | 23.43 | 20.22 | -25.53 | -14.32 | 25.76 | 17.07 | -3.93 | -4.97 | 14.98 | NA | NA | NA | NA | NA | NA | NA | NA | NA | NA | NA | NA | 33.47 | 26.52 | 5.93 | NA | 14.69 | 12.73 | 13.46 | 26.54 | 21.03 | -1.34 | 6.21 | 14.78 | 24.36 | 1.74 | 2.17 | |
| Net Income Loss | 15.02 | 19.23 | 16.88 | 18.05 | 18.22 | 17.93 | 25.07 | 14.57 | 7.90 | 5.80 | 17.80 | 11.88 | 7.09 | 14.67 | 10.09 | 5.52 | 8.35 | 1.50 | 2.90 | -3.44 | 1.21 | 4.98 | 10.38 | 1.74 | 3.19 | 6.34 | 10.95 | 5.01 | 0.87 | 7.81 | 9.64 | -4.13 | 6.94 | -3.18 | 12.93 | 8.99 | 7.57 | 11.33 | 16.50 | 13.45 | 10.23 | 10.43 | 26.06 | 19.35 | 14.73 | 8.76 | 18.82 | 12.77 | 2.92 | 5.90 | 15.29 | 11.32 | 4.29 | |
| Profit Loss | 15.02 | 19.23 | 16.88 | 18.05 | 18.22 | 17.93 | 25.07 | 14.57 | 7.90 | 5.80 | 17.80 | 11.88 | 7.09 | 14.67 | 10.09 | 5.52 | 8.35 | 1.50 | 2.90 | -3.44 | 1.21 | 4.98 | 10.38 | NA | NA | NA | NA | NA | NA | NA | NA | NA | NA | NA | NA | NA | NA | NA | NA | NA | NA | NA | NA | NA | NA | NA | NA | NA | NA | NA | NA | NA | NA | |
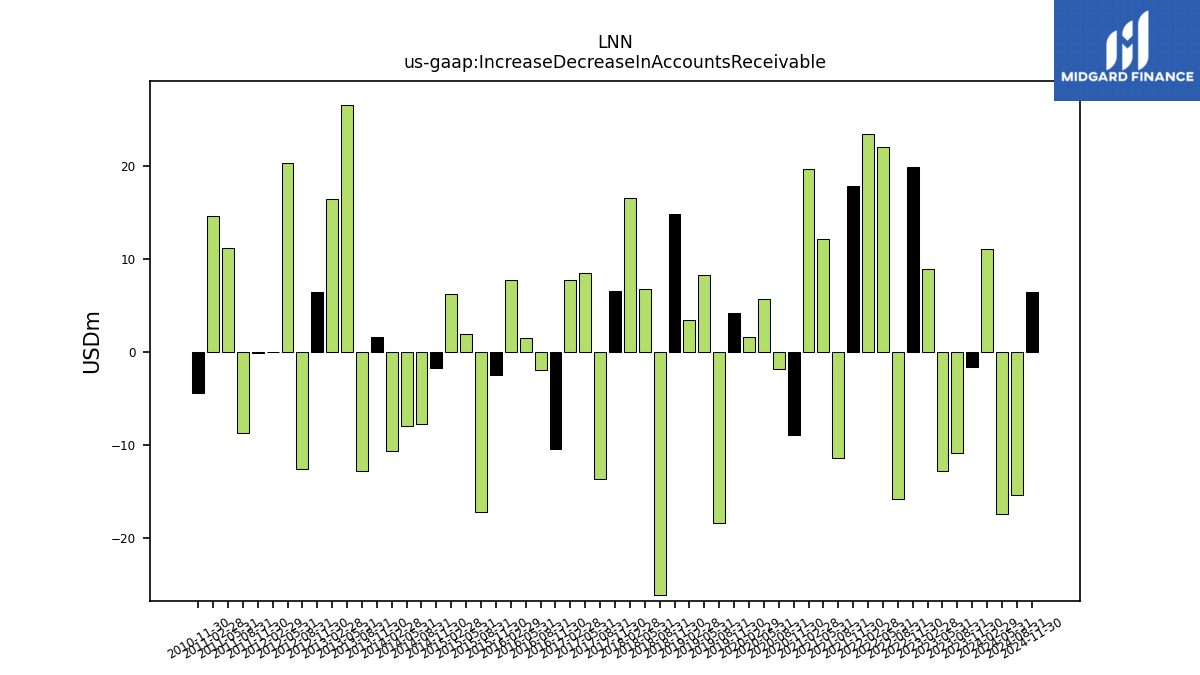
| Increase Decrease In Accounts Receivable | -1.69 | -10.92 | -12.87 | 8.88 | 19.83 | -15.85 | 22.08 | 23.47 | 17.82 | -11.40 | 12.16 | 19.66 | -8.90 | -1.86 | 5.66 | 1.59 | 4.12 | -18.40 | 8.21 | 3.38 | 14.78 | -26.11 | 6.74 | 16.56 | 6.53 | -13.70 | 8.45 | 7.73 | -10.44 | -1.97 | 1.48 | 7.72 | -2.50 | -17.23 | 1.89 | 6.23 | -1.79 | -7.74 | -8.00 | -10.62 | 1.61 | -12.82 | 26.50 | 16.44 | 6.44 | -12.58 | 20.30 | 0.01 | -0.16 | -8.70 | 11.19 | 14.57 | -4.43 | |
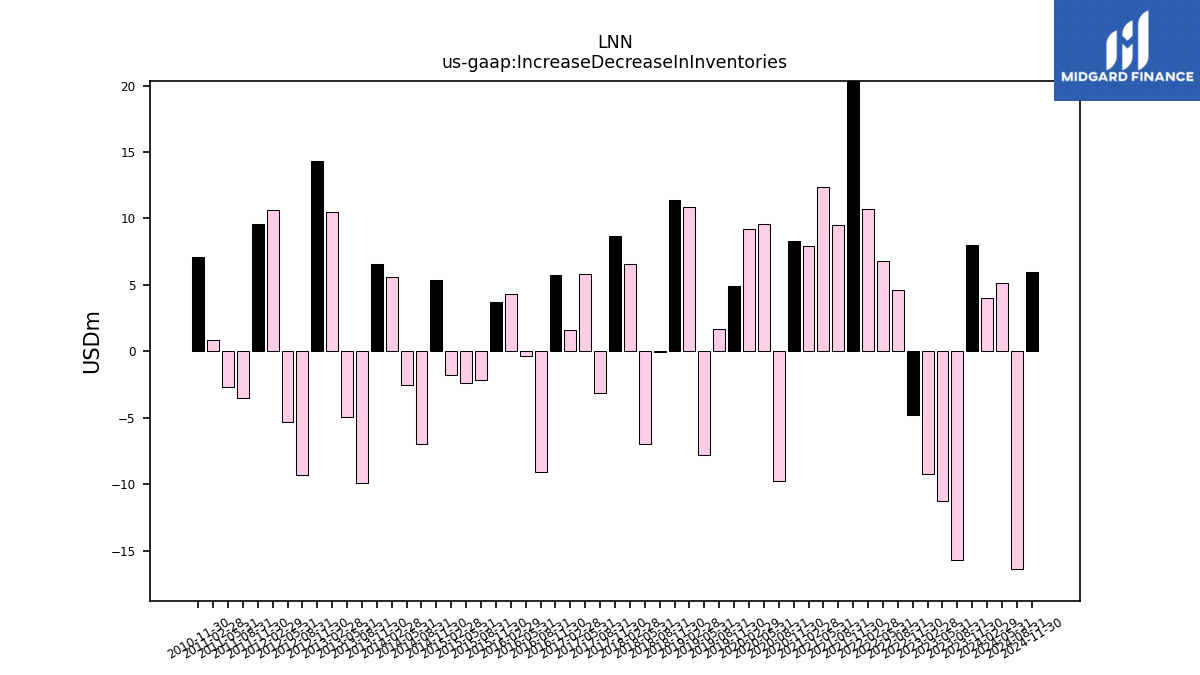
| Increase Decrease In Inventories | 7.97 | -15.66 | -11.28 | -9.21 | -4.80 | 4.59 | 6.80 | 10.74 | 31.67 | 9.55 | 12.37 | 7.95 | 8.29 | -9.73 | 9.61 | 9.22 | 4.93 | 1.72 | -7.78 | 10.86 | 11.39 | -0.07 | -6.99 | 6.57 | 8.67 | -3.12 | 5.85 | 1.63 | 5.74 | -9.06 | -0.36 | 4.34 | 3.75 | -2.16 | -2.34 | -1.76 | 5.35 | -6.97 | -2.50 | 5.58 | 6.61 | -9.88 | -4.93 | 10.49 | 14.34 | -9.28 | -5.33 | 10.66 | 9.56 | -3.50 | -2.67 | 0.87 | 7.13 | |
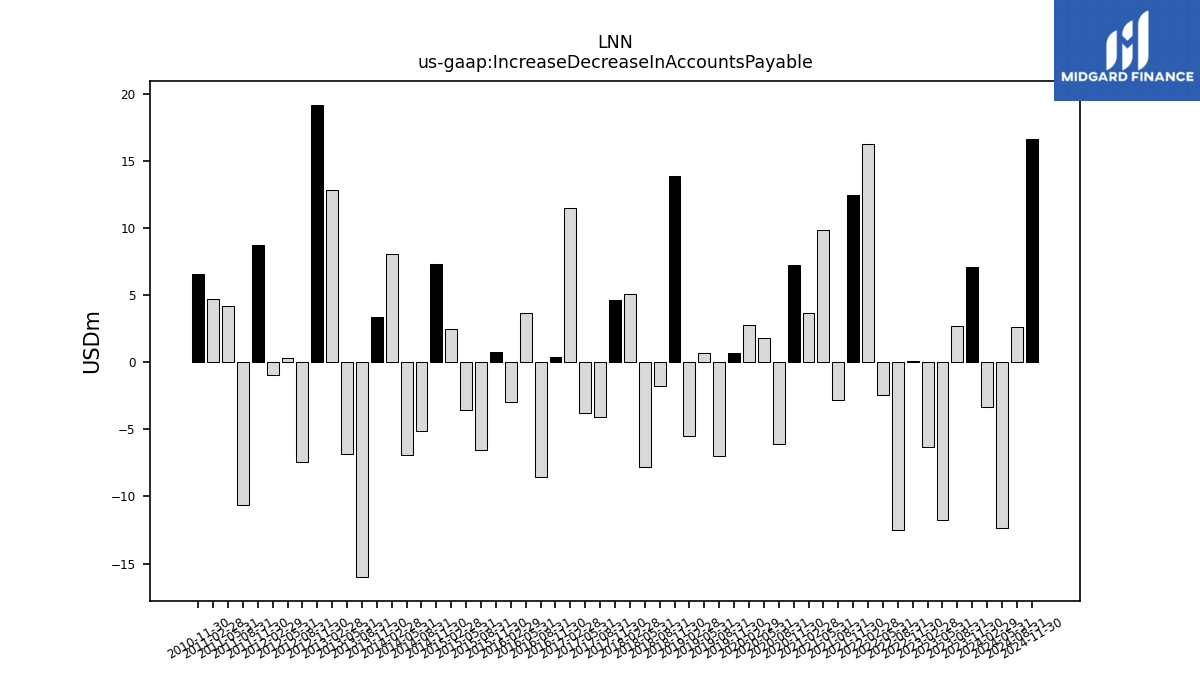
| Increase Decrease In Accounts Payable | 7.09 | 2.68 | -11.78 | -6.30 | 0.12 | -12.49 | -2.44 | 16.30 | 12.46 | -2.83 | 9.87 | 3.68 | 7.29 | -6.08 | 1.84 | 2.81 | 0.72 | -6.95 | 0.67 | -5.51 | 13.92 | -1.74 | -7.83 | 5.09 | 4.64 | -4.11 | -3.74 | 11.51 | 0.41 | -8.55 | 3.70 | -2.98 | 0.73 | -6.55 | -3.57 | 2.48 | 7.30 | -5.12 | -6.92 | 8.07 | 3.36 | -16.02 | -6.86 | 12.86 | 19.21 | -7.40 | 0.33 | -0.98 | 8.78 | -10.66 | 4.20 | 4.70 | 6.55 | |
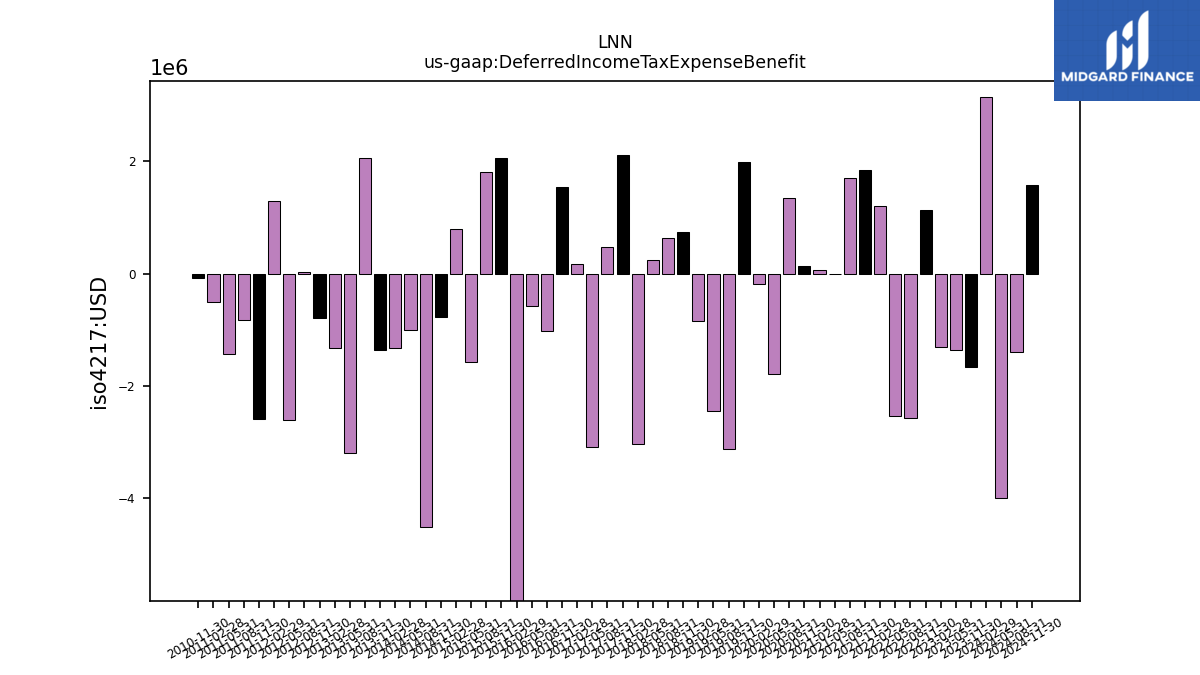
| Deferred Income Tax Expense Benefit | -1.67 | NA | -1.36 | -1.31 | 1.13 | -2.58 | -2.54 | 1.21 | 1.84 | 1.71 | -0.00 | 0.07 | 0.14 | 1.36 | -1.78 | -0.18 | 1.99 | -3.13 | -2.45 | -0.85 | 0.74 | 0.64 | 0.24 | -3.04 | 2.11 | 0.48 | -3.09 | 0.17 | 1.54 | -1.02 | -0.57 | -6.22 | 2.06 | 1.82 | -1.57 | 0.80 | -0.77 | -4.50 | -1.00 | -1.33 | -1.36 | 2.07 | -3.20 | -1.32 | -0.78 | 0.03 | -2.60 | 1.30 | -2.60 | -0.83 | -1.43 | -0.50 | -0.08 | |
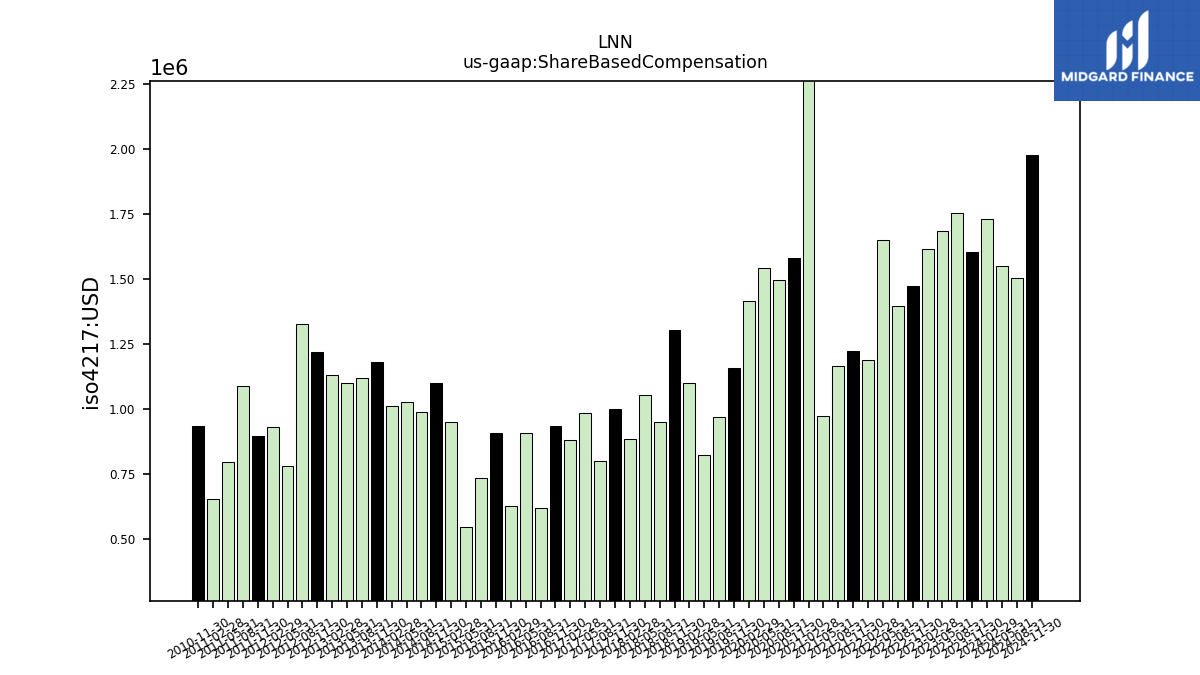
| Share Based Compensation | 1.60 | 1.75 | 1.69 | 1.62 | 1.47 | 1.40 | 1.65 | 1.19 | 1.22 | 1.17 | 0.97 | 2.46 | 1.58 | 1.50 | 1.54 | 1.42 | 1.16 | 0.97 | 0.82 | 1.10 | 1.30 | 0.95 | 1.05 | 0.89 | 1.00 | 0.80 | 0.98 | 0.88 | 0.94 | 0.62 | 0.91 | 0.63 | 0.91 | 0.73 | 0.55 | 0.95 | 1.10 | 0.99 | 1.03 | 1.01 | 1.18 | 1.12 | 1.10 | 1.13 | 1.22 | 1.33 | 0.78 | 0.93 | 0.90 | 1.09 | 0.80 | 0.65 | 0.93 |
| 2023-11-30 | 2023-08-31 | 2023-05-31 | 2023-02-28 | 2022-11-30 | 2022-08-31 | 2022-05-31 | 2022-02-28 | 2021-11-30 | 2021-08-31 | 2021-05-31 | 2021-02-28 | 2020-11-30 | 2020-08-31 | 2020-05-31 | 2020-02-29 | 2019-11-30 | 2019-08-31 | 2019-05-31 | 2019-02-28 | 2018-11-30 | 2018-08-31 | 2018-05-31 | 2018-02-28 | 2017-11-30 | 2017-08-31 | 2017-05-31 | 2017-02-28 | 2016-11-30 | 2016-08-31 | 2016-05-31 | 2016-02-29 | 2015-11-30 | 2015-08-31 | 2015-05-31 | 2015-02-28 | 2014-11-30 | 2014-08-31 | 2014-05-31 | 2014-02-28 | 2013-11-30 | 2013-08-31 | 2013-05-31 | 2013-02-28 | 2012-11-30 | 2012-08-31 | 2012-05-31 | 2012-02-29 | 2011-11-30 | 2011-08-31 | 2011-05-31 | 2011-02-28 | 2010-11-30 | ||
|---|---|---|---|---|---|---|---|---|---|---|---|---|---|---|---|---|---|---|---|---|---|---|---|---|---|---|---|---|---|---|---|---|---|---|---|---|---|---|---|---|---|---|---|---|---|---|---|---|---|---|---|---|---|---|
| Net Cash Provided By Used In Investing Activities | -18.20 | -28.48 | -13.23 | -1.53 | -4.18 | 1.10 | 5.57 | -1.46 | -14.16 | -2.65 | -7.28 | -11.84 | -5.84 | -9.60 | -9.90 | -15.81 | -3.21 | -3.00 | -7.77 | -5.71 | -4.73 | 27.77 | -3.22 | -3.45 | -2.99 | -5.00 | NA | NA | NA | NA | NA | NA | NA | NA | NA | NA | NA | NA | -2.67 | -3.60 | -3.29 | NA | -1.40 | -3.94 | -3.31 | -0.62 | -3.16 | -0.91 | -2.16 | -7.83 | -1.44 | -2.91 | -3.45 | |
| Payments To Acquire Property Plant And Equipment | 6.94 | 5.49 | 6.06 | 3.42 | 3.80 | 3.37 | 5.30 | 3.87 | 3.06 | 3.98 | 5.98 | 10.94 | 5.61 | 9.18 | 6.93 | 1.01 | 4.32 | 3.00 | 8.51 | 6.00 | 5.70 | 4.13 | 2.21 | 2.72 | 1.99 | 2.64 | 2.02 | 2.80 | 1.39 | 1.42 | 2.68 | 2.69 | 4.71 | 4.02 | 4.65 | 2.93 | 3.65 | 9.88 | 2.48 | 2.97 | 2.39 | 2.99 | 2.81 | 3.13 | 2.21 | 2.32 | 2.85 | 2.09 | 2.63 | 3.09 | 0.91 | 2.92 | 1.48 |
| 2023-11-30 | 2023-08-31 | 2023-05-31 | 2023-02-28 | 2022-11-30 | 2022-08-31 | 2022-05-31 | 2022-02-28 | 2021-11-30 | 2021-08-31 | 2021-05-31 | 2021-02-28 | 2020-11-30 | 2020-08-31 | 2020-05-31 | 2020-02-29 | 2019-11-30 | 2019-08-31 | 2019-05-31 | 2019-02-28 | 2018-11-30 | 2018-08-31 | 2018-05-31 | 2018-02-28 | 2017-11-30 | 2017-08-31 | 2017-05-31 | 2017-02-28 | 2016-11-30 | 2016-08-31 | 2016-05-31 | 2016-02-29 | 2015-11-30 | 2015-08-31 | 2015-05-31 | 2015-02-28 | 2014-11-30 | 2014-08-31 | 2014-05-31 | 2014-02-28 | 2013-11-30 | 2013-08-31 | 2013-05-31 | 2013-02-28 | 2012-11-30 | 2012-08-31 | 2012-05-31 | 2012-02-29 | 2011-11-30 | 2011-08-31 | 2011-05-31 | 2011-02-28 | 2010-11-30 | ||
|---|---|---|---|---|---|---|---|---|---|---|---|---|---|---|---|---|---|---|---|---|---|---|---|---|---|---|---|---|---|---|---|---|---|---|---|---|---|---|---|---|---|---|---|---|---|---|---|---|---|---|---|---|---|---|
| Net Cash Provided By Used In Financing Activities | -5.38 | -3.78 | -3.69 | -3.66 | -6.17 | -3.70 | -3.52 | -3.15 | -2.32 | -3.58 | -3.57 | 0.21 | -4.72 | -3.52 | -3.54 | -1.87 | -4.51 | -3.40 | -3.51 | -3.40 | -4.34 | -3.39 | -3.28 | -0.63 | -3.96 | -2.69 | NA | NA | NA | NA | NA | NA | NA | NA | NA | NA | NA | NA | -14.34 | -9.35 | -3.24 | NA | -2.27 | -1.56 | -1.72 | -2.22 | -2.12 | -1.80 | -2.66 | 0.49 | -0.85 | -1.33 | -1.71 | |
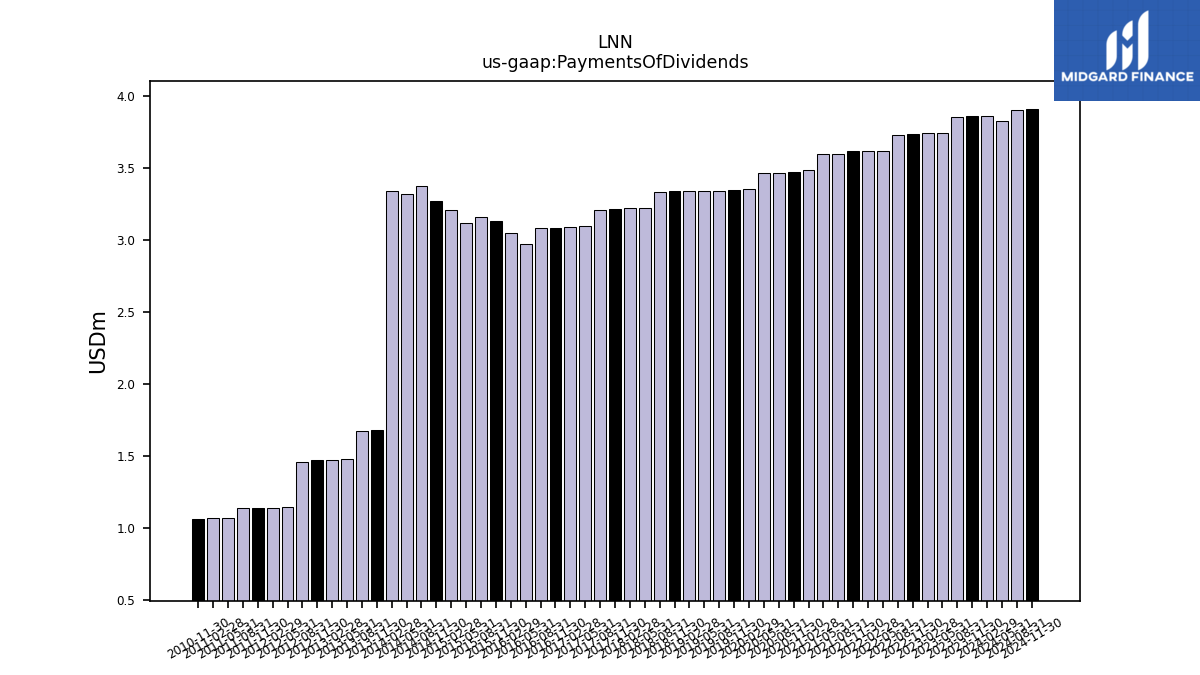
| Payments Of Dividends | 3.86 | 3.85 | 3.74 | 3.74 | 3.74 | 3.73 | 3.62 | 3.62 | 3.62 | 3.60 | 3.60 | 3.49 | 3.48 | 3.47 | 3.47 | 3.36 | 3.35 | 3.34 | 3.34 | 3.34 | 3.34 | 3.33 | 3.23 | 3.23 | 3.22 | 3.21 | 3.10 | 3.09 | 3.09 | 3.08 | 2.98 | 3.05 | 3.13 | 3.16 | 3.12 | 3.21 | 3.28 | 3.38 | 3.33 | 3.34 | 1.68 | 1.67 | 1.48 | 1.48 | 1.48 | 1.46 | 1.15 | 1.14 | 1.14 | 1.14 | 1.07 | 1.07 | 1.06 |
| 2023-11-30 | 2023-08-31 | 2023-05-31 | 2023-02-28 | 2022-11-30 | 2022-08-31 | 2022-05-31 | 2022-02-28 | 2021-11-30 | 2021-08-31 | 2021-05-31 | 2021-02-28 | 2020-11-30 | 2020-08-31 | 2020-05-31 | 2020-02-29 | 2019-11-30 | 2019-08-31 | 2019-05-31 | 2019-02-28 | 2018-11-30 | 2018-08-31 | 2018-05-31 | 2018-02-28 | 2017-11-30 | 2017-08-31 | 2017-05-31 | 2017-02-28 | 2016-11-30 | 2016-08-31 | 2016-05-31 | 2016-02-29 | 2015-11-30 | 2015-08-31 | 2015-05-31 | 2015-02-28 | 2014-11-30 | 2014-08-31 | 2014-05-31 | 2014-02-28 | 2013-11-30 | 2013-08-31 | 2013-05-31 | 2013-02-28 | 2012-11-30 | 2012-08-31 | 2012-05-31 | 2012-02-29 | 2011-11-30 | 2011-08-31 | 2011-05-31 | 2011-02-28 | 2010-11-30 | ||
|---|---|---|---|---|---|---|---|---|---|---|---|---|---|---|---|---|---|---|---|---|---|---|---|---|---|---|---|---|---|---|---|---|---|---|---|---|---|---|---|---|---|---|---|---|---|---|---|---|---|---|---|---|---|---|
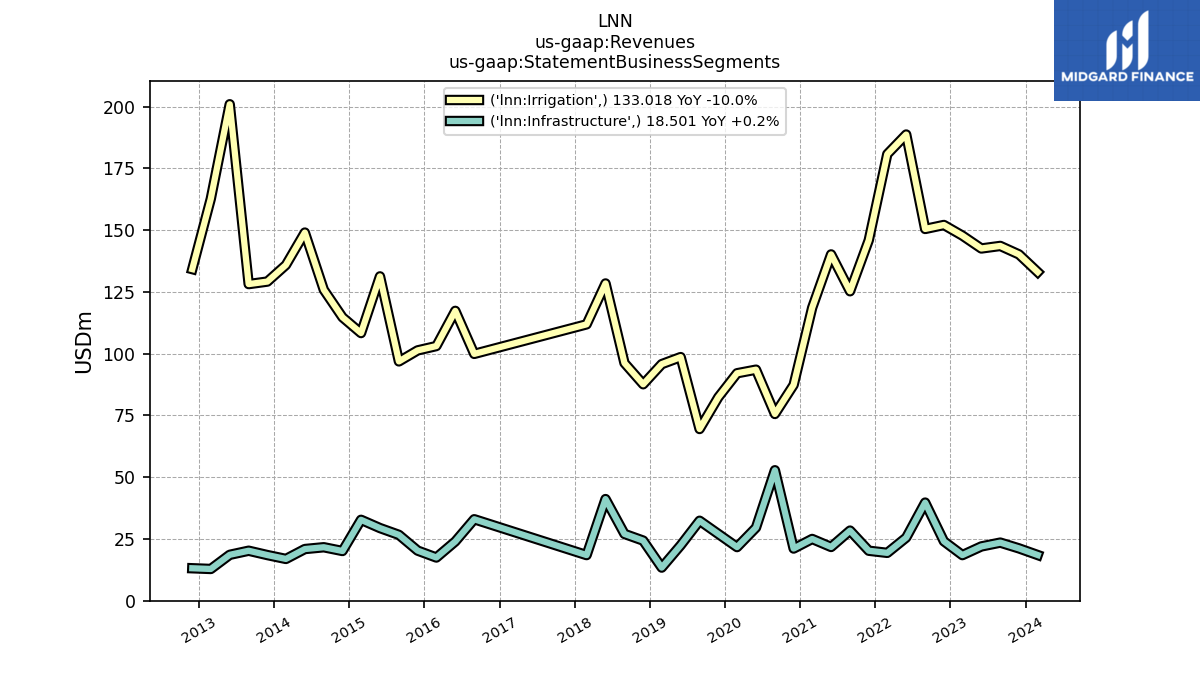
| Revenues | 161.36 | 167.13 | 164.55 | 166.24 | 176.16 | 190.20 | 214.26 | 200.14 | 166.15 | 153.65 | 161.94 | 143.58 | 108.48 | 128.41 | 123.11 | 113.79 | 109.39 | 101.89 | 121.05 | 109.18 | 111.95 | 123.27 | 169.57 | 130.34 | 124.53 | 131.94 | 151.53 | 124.12 | 110.39 | 132.90 | 141.32 | 120.57 | 121.62 | 123.54 | 160.71 | 141.09 | 134.84 | 147.52 | 169.94 | 152.80 | 147.67 | 148.40 | 219.54 | 175.54 | 147.37 | 127.82 | 172.10 | 132.13 | 119.20 | 116.11 | 153.45 | 120.17 | 89.17 | |
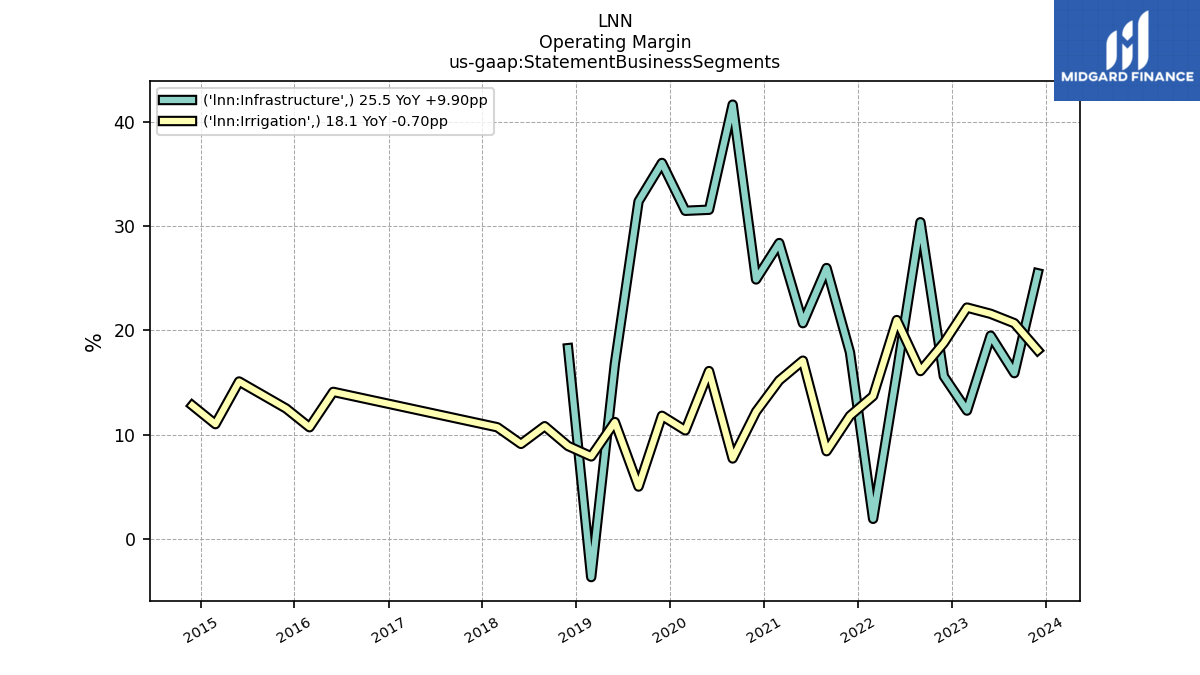
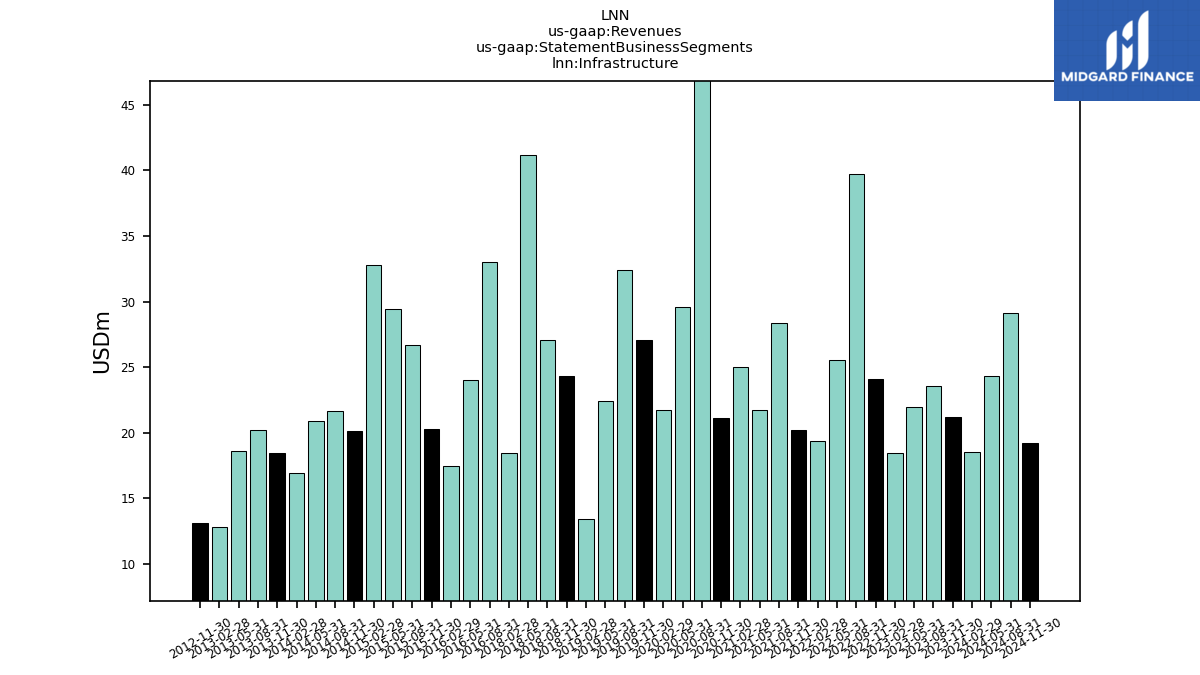
| Infrastructure | 21.19 | 23.53 | 21.98 | 18.46 | 24.08 | 39.73 | 25.57 | 19.38 | 20.24 | 28.39 | 21.76 | 25.00 | 21.13 | 52.82 | 29.58 | 21.71 | 27.04 | 32.38 | 22.44 | 13.42 | 24.34 | 27.05 | 41.15 | 18.47 | NA | NA | NA | NA | NA | 32.99 | 23.99 | 17.49 | 20.30 | 26.67 | 29.42 | 32.76 | 20.13 | 21.66 | 20.93 | 16.92 | 18.49 | 20.25 | 18.59 | 12.86 | 13.15 | NA | NA | NA | NA | NA | NA | NA | NA | |
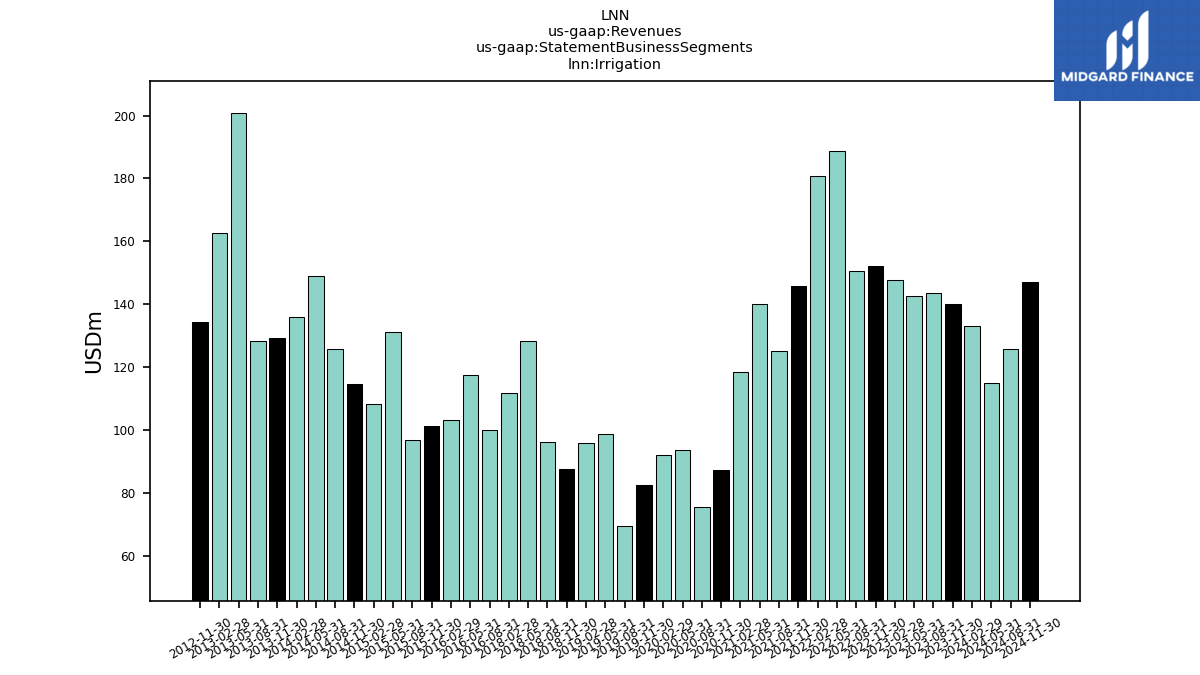
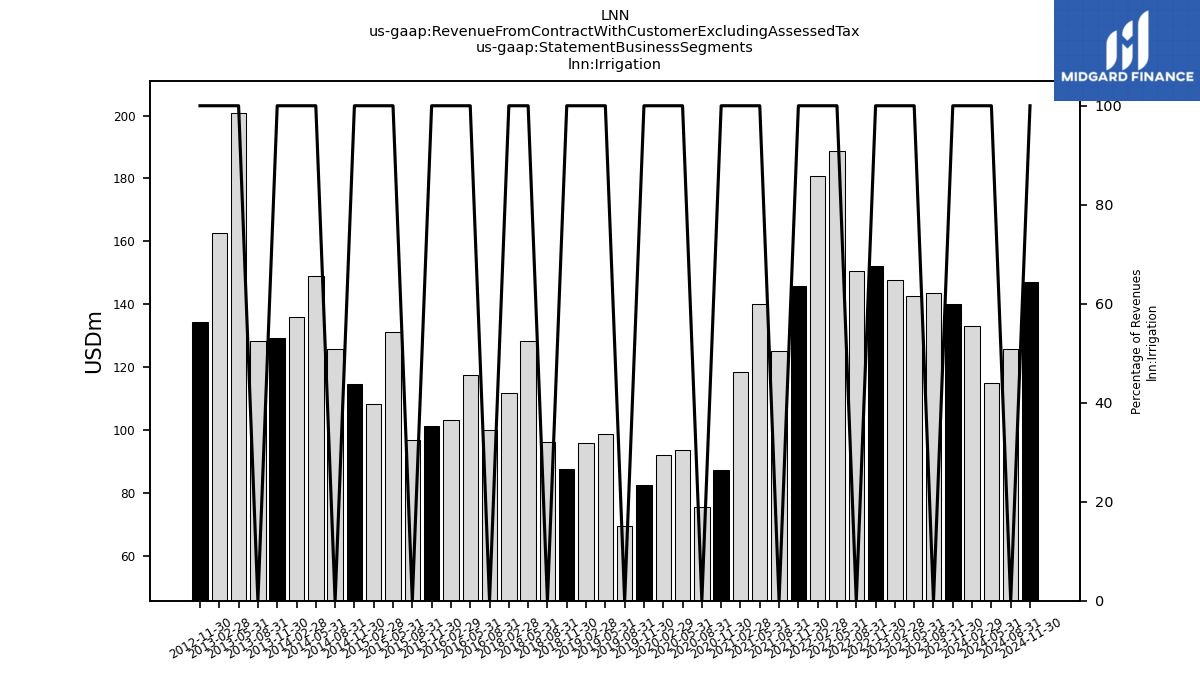
| Irrigation | 140.17 | 143.60 | 142.57 | 147.78 | 152.08 | 150.47 | 188.69 | 180.76 | 145.91 | 125.25 | 140.18 | 118.57 | 87.36 | 75.58 | 93.52 | 92.07 | 82.35 | 69.50 | 98.62 | 95.77 | 87.61 | 96.22 | 128.42 | 111.86 | NA | NA | NA | NA | NA | 99.91 | 117.33 | 103.08 | 101.33 | 96.87 | 131.29 | 108.33 | 114.72 | 125.87 | 149.01 | 135.88 | 129.18 | 128.15 | 200.95 | 162.68 | 134.22 | NA | NA | NA | NA | NA | NA | NA | NA | |
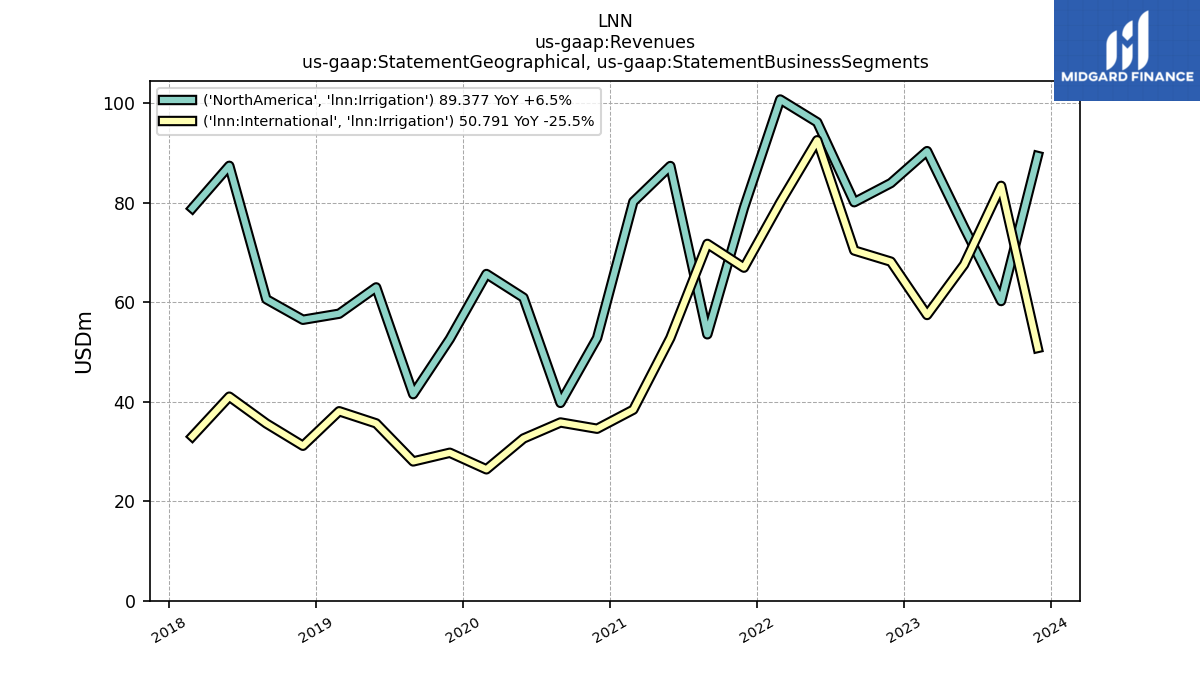
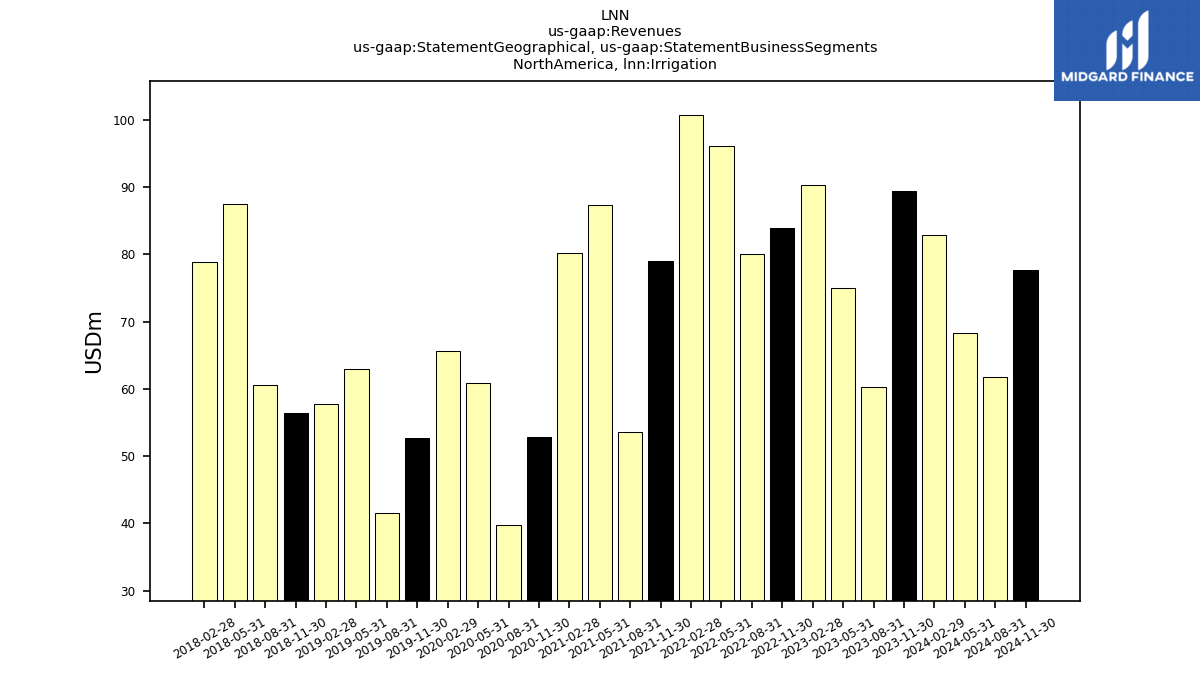
| , Irrigation | 89.38 | 60.22 | 75.03 | 90.35 | 83.93 | 80.08 | 96.15 | 100.73 | 78.98 | 53.54 | 87.36 | 80.18 | 52.79 | 39.76 | 60.92 | 65.67 | 52.61 | 41.51 | 62.97 | 57.68 | 56.46 | 60.59 | 87.41 | 78.86 | NA | NA | NA | NA | NA | NA | NA | NA | NA | NA | NA | NA | NA | NA | NA | NA | NA | NA | NA | NA | NA | NA | NA | NA | NA | NA | NA | NA | NA | |
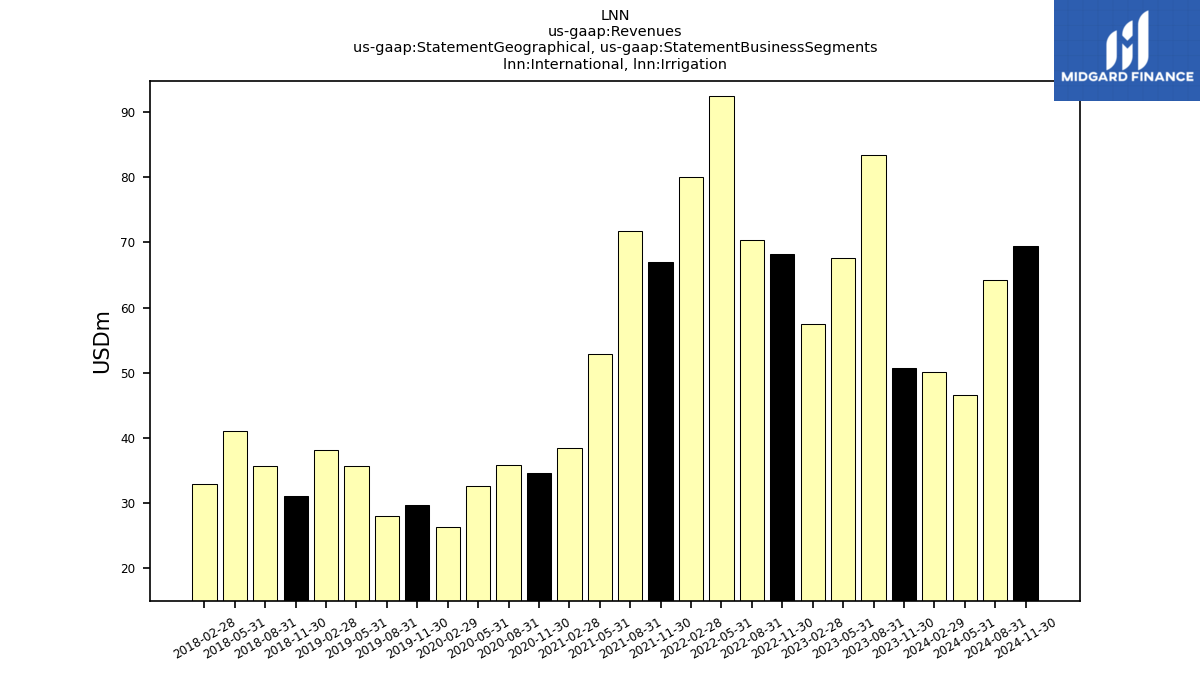
| International, Irrigation | 50.79 | 83.38 | 67.54 | 57.42 | 68.15 | 70.39 | 92.54 | 80.03 | 66.93 | 71.72 | 52.81 | 38.39 | 34.57 | 35.82 | 32.61 | 26.41 | 29.74 | 28.00 | 35.64 | 38.09 | 31.15 | 35.62 | 41.02 | 33.00 | NA | NA | NA | NA | NA | NA | NA | NA | NA | NA | NA | NA | NA | NA | NA | NA | NA | NA | NA | NA | NA | NA | NA | NA | NA | NA | NA | NA | NA | |
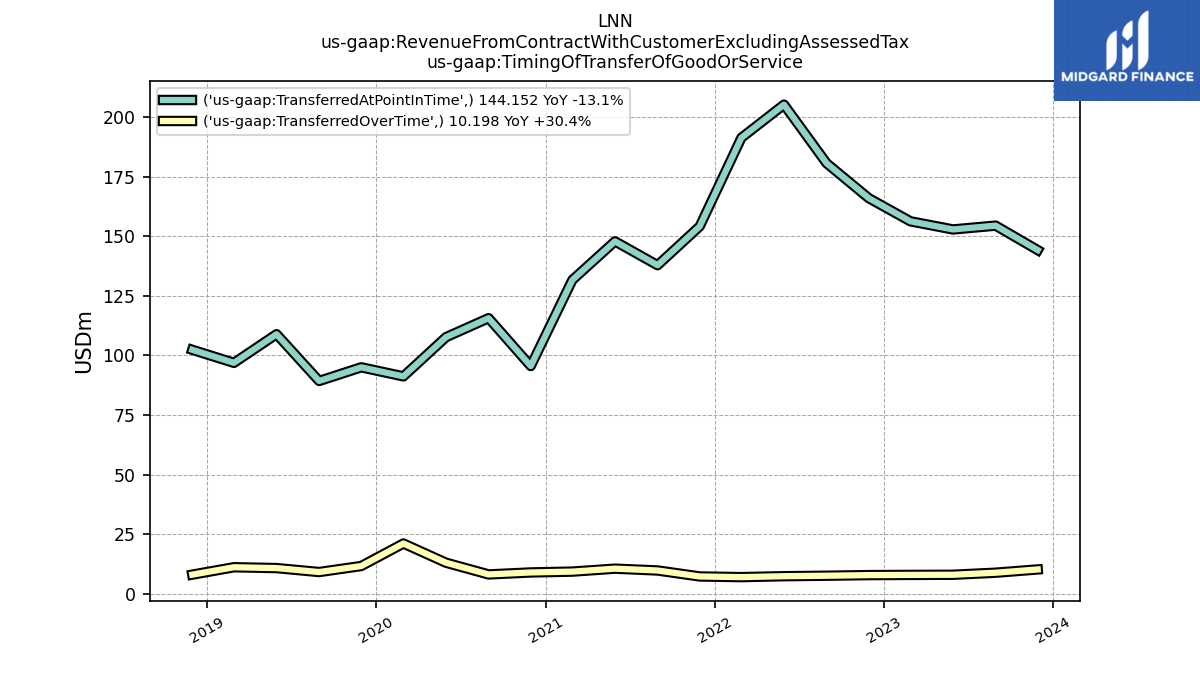
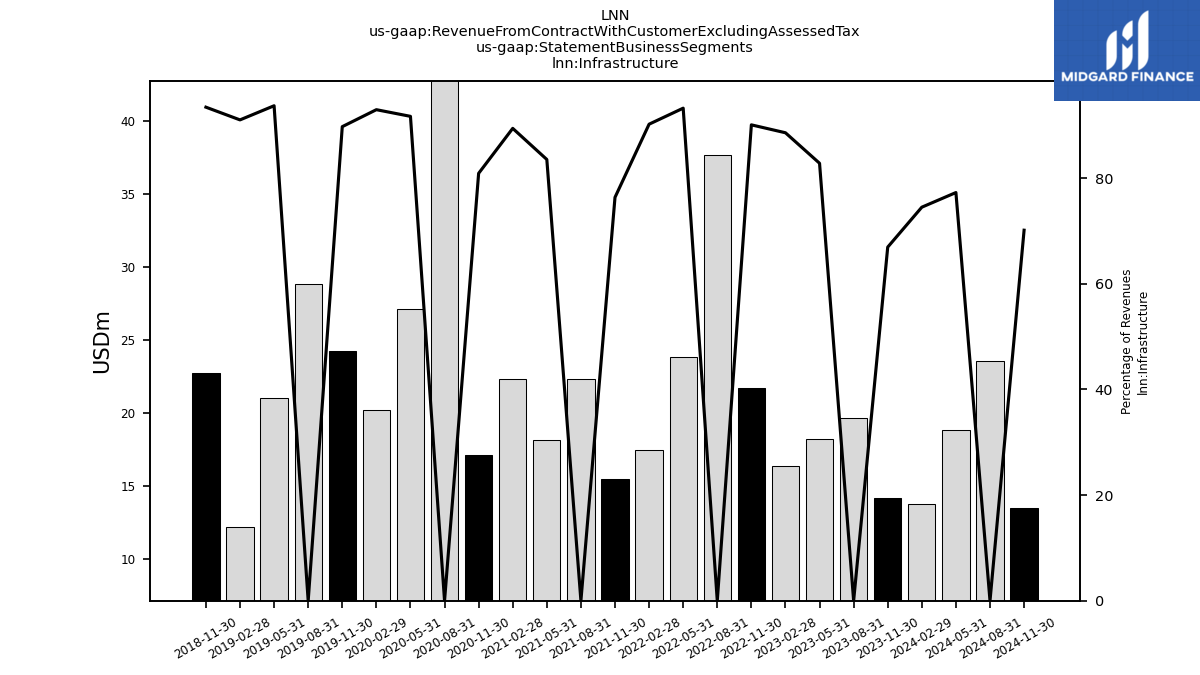
| Revenue From Contract With Customer Excluding Assessed Tax | 154.35 | 163.24 | 160.77 | 164.13 | 173.77 | 188.14 | 212.53 | 198.24 | 161.36 | 147.56 | 158.35 | 140.93 | 104.45 | 128.41 | 120.64 | 112.25 | 106.61 | 101.89 | 119.64 | 107.97 | 110.35 | 123.27 | 169.57 | 130.34 | 124.53 | 131.94 | 151.53 | 124.12 | 110.39 | 132.90 | 141.32 | 120.57 | 121.62 | 123.54 | 160.71 | 141.09 | 134.84 | 147.52 | 169.94 | 152.80 | 147.67 | 148.40 | 219.54 | 175.54 | 147.37 | 127.82 | 172.10 | 132.13 | 119.20 | 116.11 | 153.45 | 120.17 | 89.17 | |
| Infrastructure | 14.18 | 19.64 | 18.20 | 16.35 | 21.68 | 37.67 | 23.83 | 17.48 | 15.45 | 22.31 | 18.17 | 22.35 | 17.09 | 48.12 | 27.12 | 20.18 | 24.26 | 28.86 | 21.02 | 12.21 | 22.74 | NA | NA | NA | NA | NA | NA | NA | NA | NA | NA | NA | NA | NA | NA | NA | NA | NA | NA | NA | NA | NA | NA | NA | NA | NA | NA | NA | NA | NA | NA | NA | NA | |
| Irrigation | 140.17 | 143.60 | 142.57 | 147.78 | 152.08 | 150.47 | 188.69 | 180.76 | 145.91 | 125.25 | 140.18 | 118.57 | 87.36 | 75.58 | 93.52 | 92.07 | 82.35 | 69.50 | 98.62 | 95.77 | 87.61 | 96.22 | 128.42 | 111.86 | NA | NA | NA | NA | NA | 99.91 | 117.33 | 103.08 | 101.33 | 96.87 | 131.29 | 108.33 | 114.72 | 125.87 | 149.01 | 135.88 | 129.18 | 128.15 | 200.95 | 162.68 | 134.22 | NA | NA | NA | NA | NA | NA | NA | NA | |
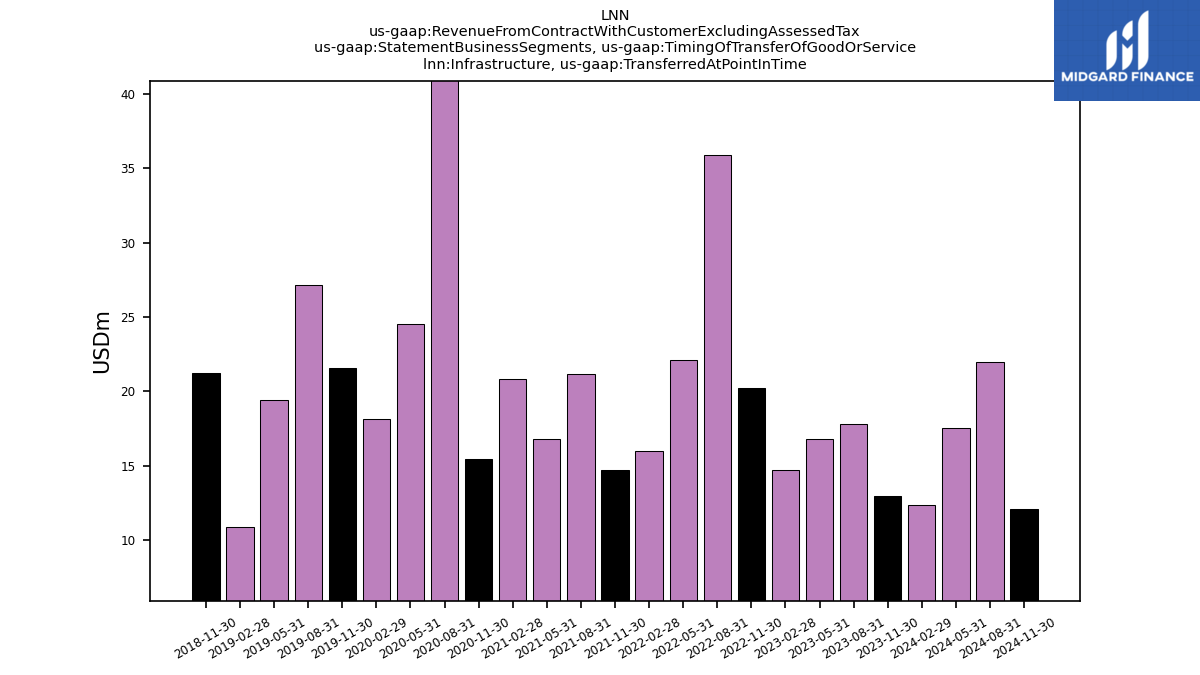
| Infrastructure, Transferred At Point In Time | 12.95 | 17.80 | 16.82 | 14.70 | 20.23 | 35.88 | 22.08 | 16.01 | 14.71 | 21.17 | 16.79 | 20.82 | 15.45 | 46.61 | 24.50 | 18.15 | 21.61 | 27.18 | 19.43 | 10.92 | 21.25 | NA | NA | NA | NA | NA | NA | NA | NA | NA | NA | NA | NA | NA | NA | NA | NA | NA | NA | NA | NA | NA | NA | NA | NA | NA | NA | NA | NA | NA | NA | NA | NA | |
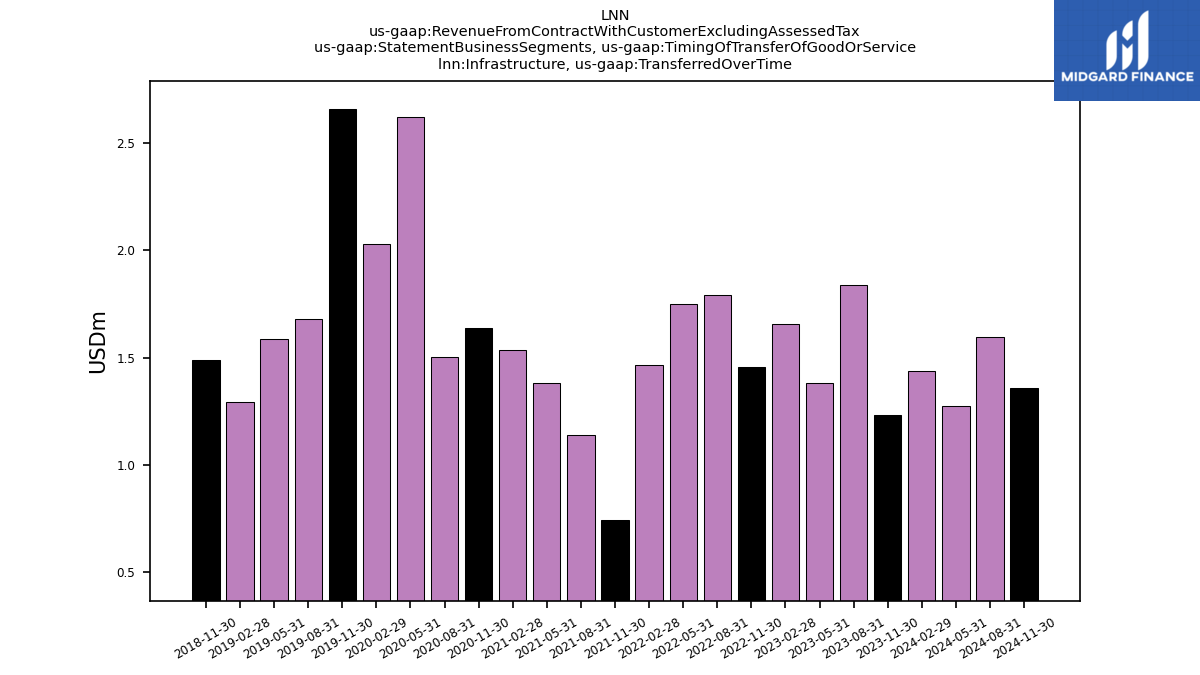
| Infrastructure, Transferred Over Time | 1.23 | 1.84 | 1.38 | 1.66 | 1.45 | 1.79 | 1.75 | 1.47 | 0.74 | 1.14 | 1.38 | 1.53 | 1.64 | 1.50 | 2.62 | 2.03 | 2.66 | 1.68 | 1.59 | 1.29 | 1.49 | NA | NA | NA | NA | NA | NA | NA | NA | NA | NA | NA | NA | NA | NA | NA | NA | NA | NA | NA | NA | NA | NA | NA | NA | NA | NA | NA | NA | NA | NA | NA | NA | |
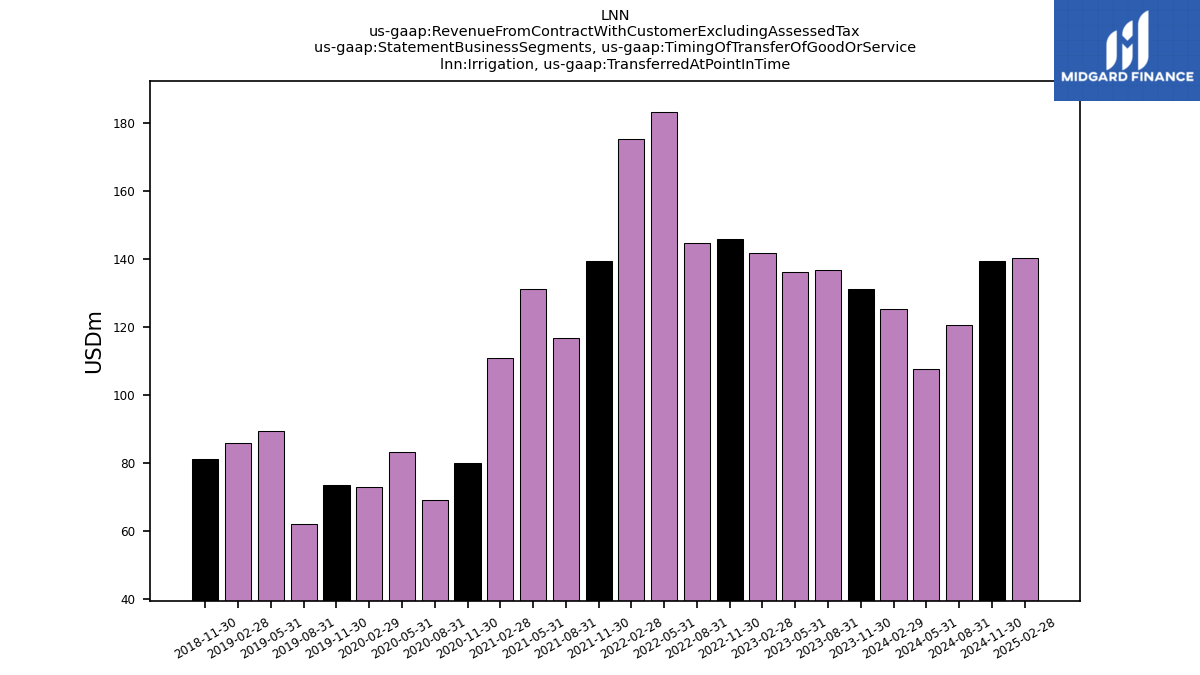
| Irrigation, Transferred At Point In Time | 131.20 | 136.61 | 135.99 | 141.53 | 145.72 | 144.70 | 183.09 | 175.25 | 139.40 | 116.63 | 131.03 | 110.81 | 80.06 | 68.98 | 83.13 | 73.03 | 73.38 | 62.08 | 89.44 | 85.94 | 81.09 | NA | NA | NA | NA | NA | NA | NA | NA | NA | NA | NA | NA | NA | NA | NA | NA | NA | NA | NA | NA | NA | NA | NA | NA | NA | NA | NA | NA | NA | NA | NA | NA | |
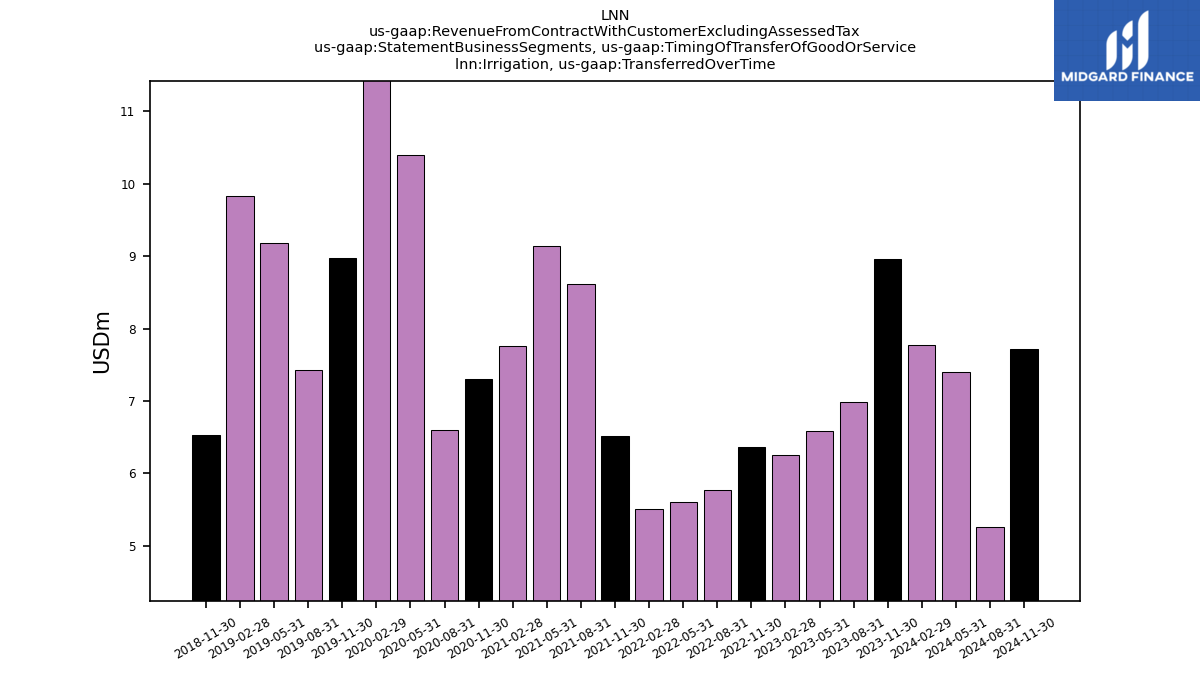
| Irrigation, Transferred Over Time | 8.97 | 6.99 | 6.58 | 6.25 | 6.37 | 5.77 | 5.61 | 5.51 | 6.51 | 8.62 | 9.14 | 7.76 | 7.30 | 6.60 | 10.39 | 19.05 | 8.98 | 7.43 | 9.18 | 9.83 | 6.52 | NA | NA | NA | NA | NA | NA | NA | NA | NA | NA | NA | NA | NA | NA | NA | NA | NA | NA | NA | NA | NA | NA | NA | NA | NA | NA | NA | NA | NA | NA | NA | NA | |
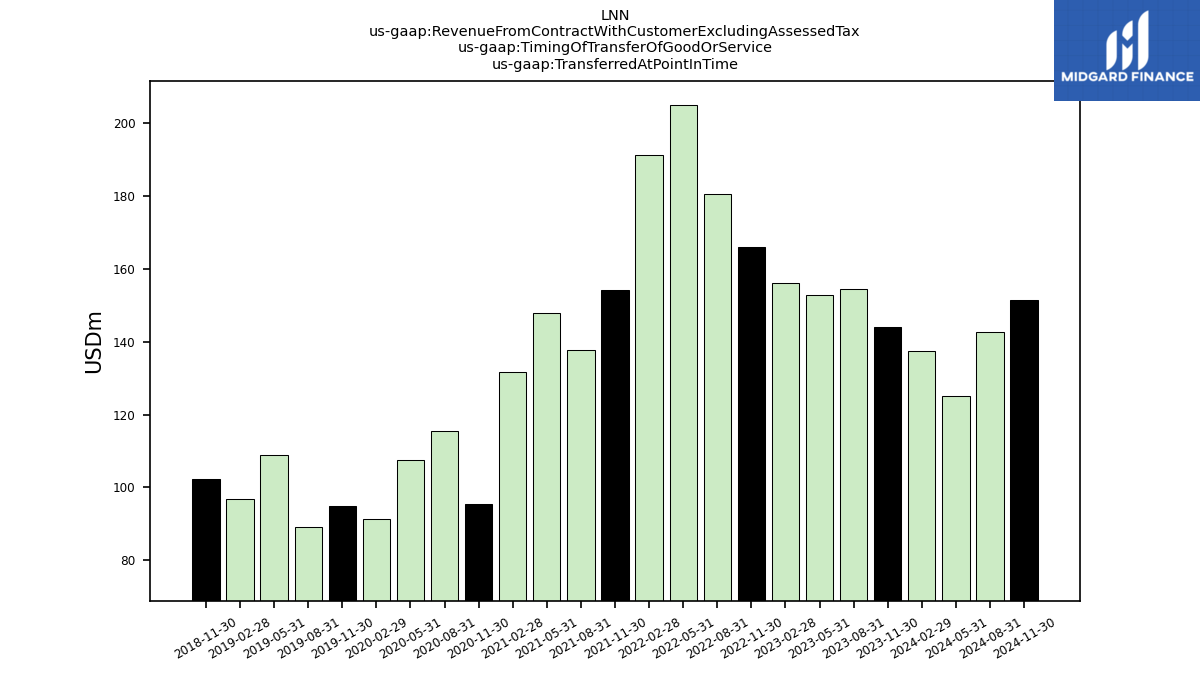
| Transferred At Point In Time | 144.15 | 154.41 | 152.81 | 156.22 | 165.95 | 180.58 | 205.17 | 191.26 | 154.11 | 137.80 | 147.82 | 131.63 | 95.51 | 115.59 | 107.63 | 91.18 | 94.98 | 89.25 | 108.87 | 96.86 | 102.33 | NA | NA | NA | NA | NA | NA | NA | NA | NA | NA | NA | NA | NA | NA | NA | NA | NA | NA | NA | NA | NA | NA | NA | NA | NA | NA | NA | NA | NA | NA | NA | NA | |
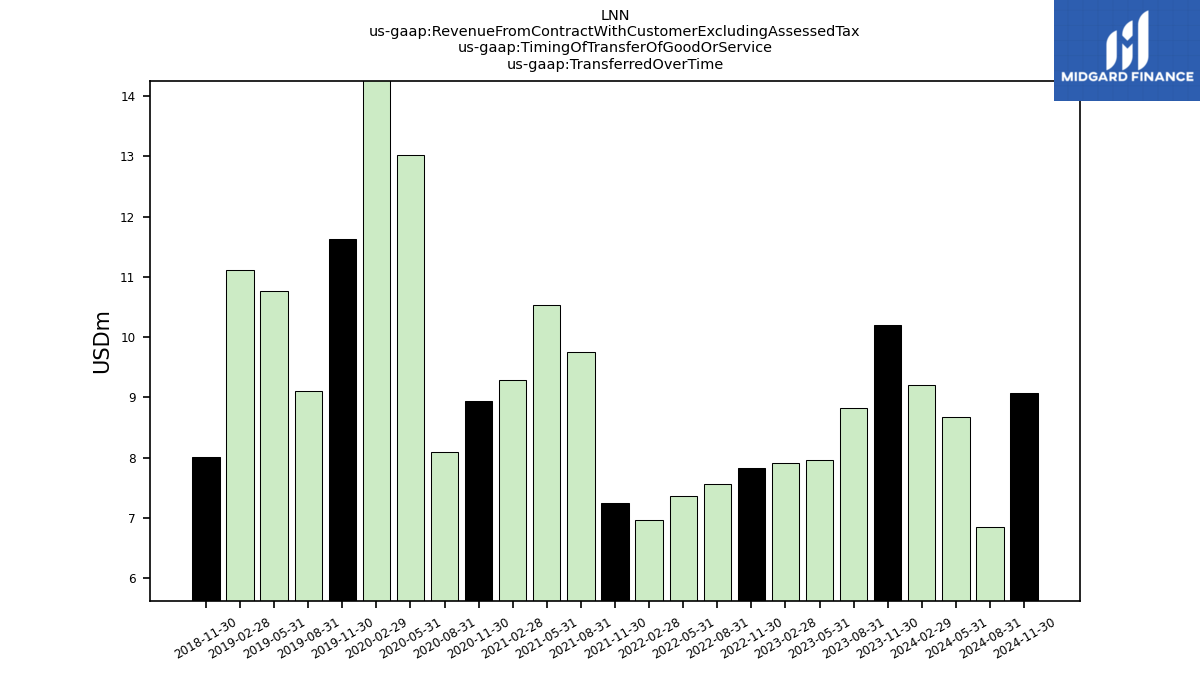
| Transferred Over Time | 10.20 | 8.83 | 7.96 | 7.91 | 7.82 | 7.56 | 7.36 | 6.97 | 7.25 | 9.76 | 10.53 | 9.29 | 8.94 | 8.10 | 13.02 | 21.08 | 11.63 | 9.11 | 10.77 | 11.12 | 8.01 | NA | NA | NA | NA | NA | NA | NA | NA | NA | NA | NA | NA | NA | NA | NA | NA | NA | NA | NA | NA | NA | NA | NA | NA | NA | NA | NA | NA | NA | NA | NA | NA |


