
| 2023-12-31 | 2023-09-30 | 2023-06-30 | 2023-03-31 | 2022-12-31 | 2022-09-30 | 2022-06-30 | 2022-03-31 | 2021-12-31 | 2021-09-30 | 2021-06-30 | 2021-03-31 | 2020-12-31 | 2020-09-30 | 2020-06-30 | 2020-03-31 | 2019-12-31 | 2019-09-30 | 2019-06-30 | 2019-03-31 | 2018-12-31 | 2018-09-30 | 2018-06-30 | 2018-03-31 | 2017-12-31 | 2017-09-30 | 2017-06-30 | 2017-03-31 | 2016-12-31 | 2016-09-30 | 2016-06-30 | 2016-03-31 | 2015-12-31 | 2015-09-30 | 2015-06-30 | 2015-03-31 | 2014-12-31 | 2014-09-30 | 2014-06-30 | 2014-03-31 | 2013-12-31 | 2013-09-30 | 2013-06-30 | 2013-03-31 | 2012-12-31 | 2012-09-30 | 2012-06-30 | 2012-03-31 | 2011-12-31 | 2011-09-30 | 2011-06-30 | 2011-03-31 | 2010-12-31 | 2010-09-30 | ||
|---|---|---|---|---|---|---|---|---|---|---|---|---|---|---|---|---|---|---|---|---|---|---|---|---|---|---|---|---|---|---|---|---|---|---|---|---|---|---|---|---|---|---|---|---|---|---|---|---|---|---|---|---|---|---|---|
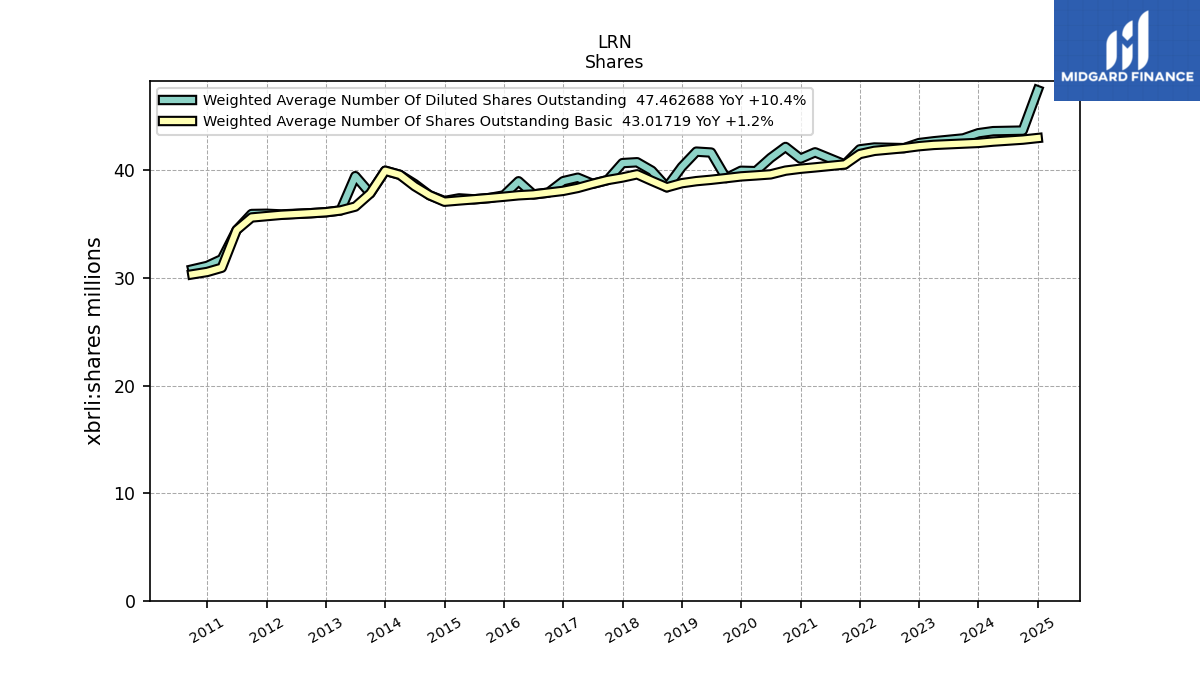
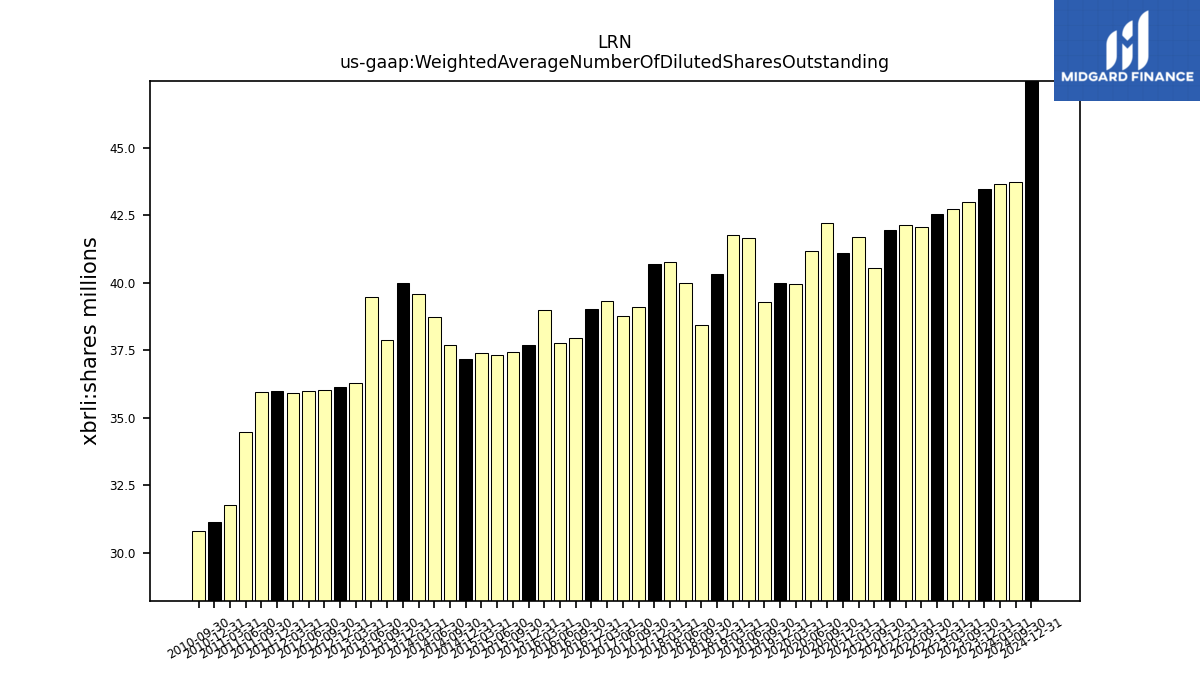
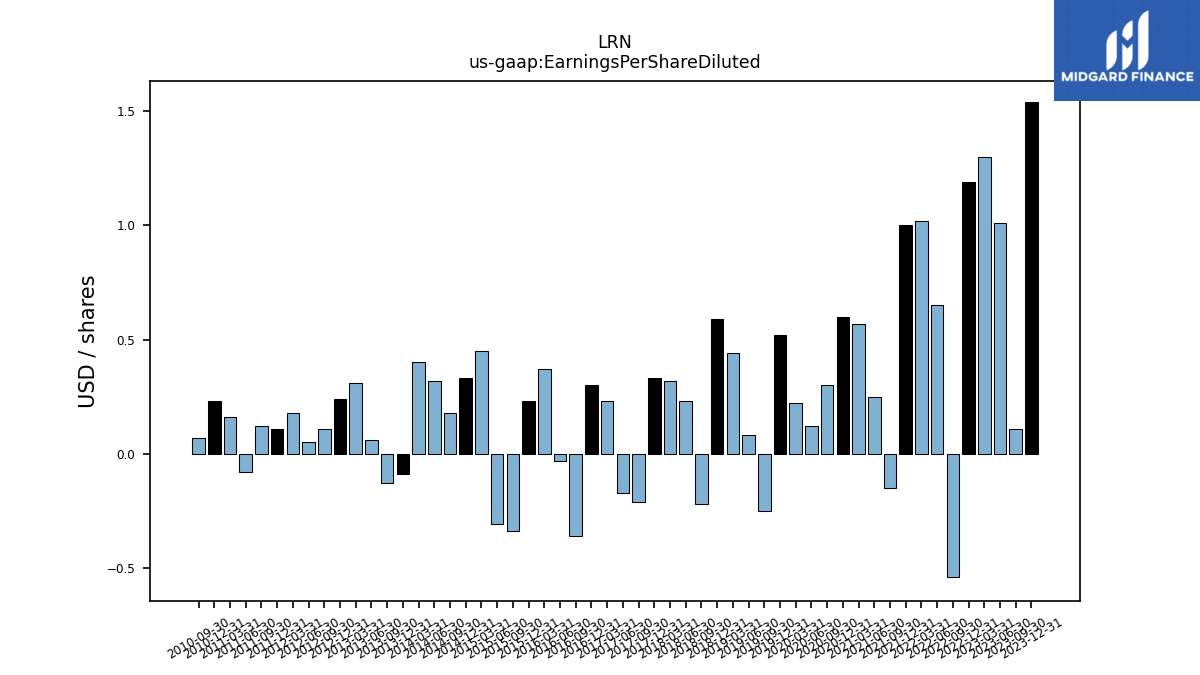
| Weighted Average Number Of Diluted Shares Outstanding | 43.46 | 42.98 | NA | 42.71 | 42.55 | 42.08 | NA | 42.14 | 41.96 | 40.56 | NA | 41.69 | 41.10 | 42.19 | 41.17 | 39.94 | 39.97 | 39.29 | 41.67 | 41.75 | 40.33 | 38.43 | 39.98 | 40.77 | 40.69 | 39.11 | 38.76 | 39.33 | 39.01 | 37.94 | 37.77 | 39.00 | 37.68 | 37.43 | 37.32 | 37.41 | 37.16 | 37.70 | 38.74 | 39.60 | 39.98 | 37.87 | 39.48 | 36.28 | 36.12 | 36.03 | 35.97 | 35.91 | 35.98 | 35.95 | 34.46 | 31.76 | 31.13 | 30.81 | |
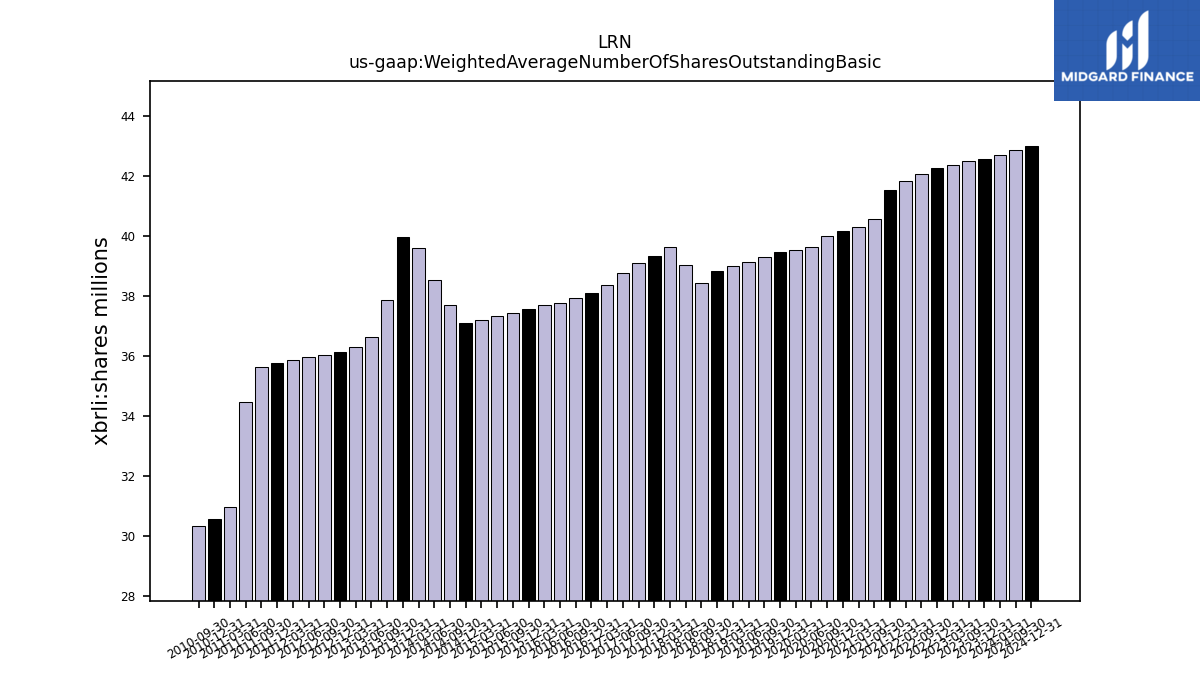
| Weighted Average Number Of Shares Outstanding Basic | 42.56 | 42.50 | NA | 42.38 | 42.26 | 42.08 | NA | 41.82 | 41.53 | 40.56 | NA | 40.29 | 40.16 | 39.99 | 39.64 | 39.54 | 39.45 | 39.29 | 39.14 | 39.01 | 38.82 | 38.43 | 39.03 | 39.64 | 39.35 | 39.11 | 38.76 | 38.38 | 38.10 | 37.94 | 37.77 | 37.69 | 37.56 | 37.43 | 37.32 | 37.21 | 37.10 | 37.70 | 38.54 | 39.60 | 39.98 | 37.87 | 36.64 | 36.28 | 36.12 | 36.03 | 35.95 | 35.88 | 35.76 | 35.63 | 34.46 | 30.96 | 30.57 | 30.34 | |
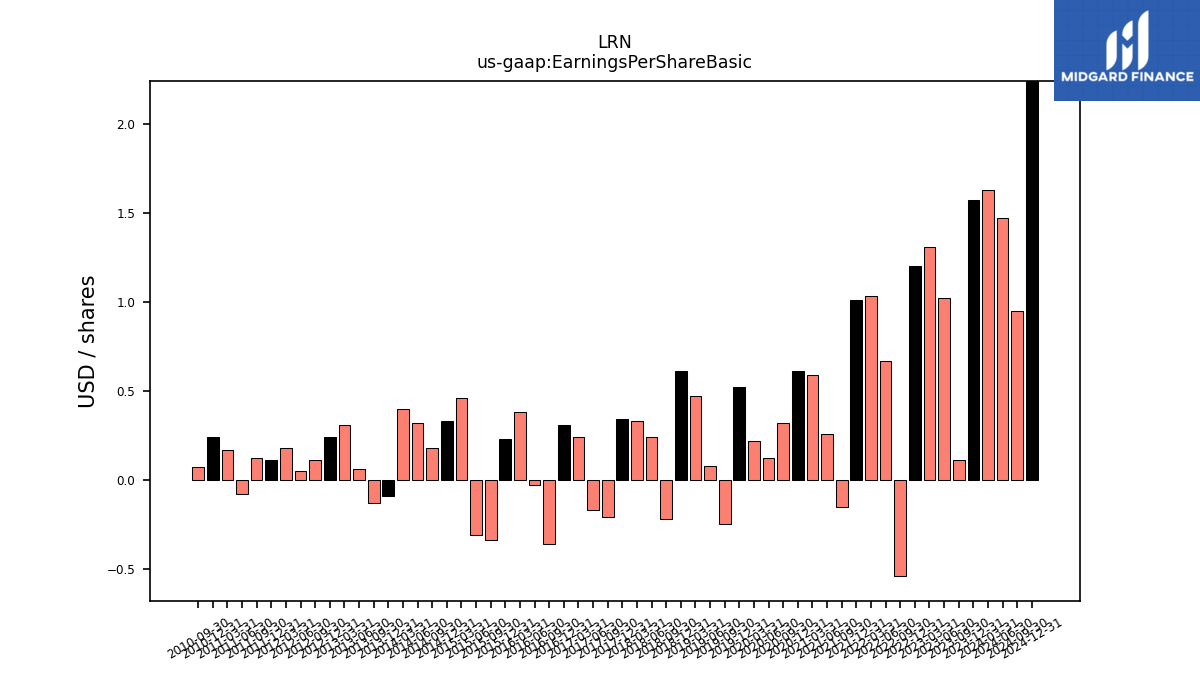
| Earnings Per Share Basic | 1.57 | 0.11 | 1.02 | 1.31 | 1.20 | -0.54 | 0.67 | 1.03 | 1.01 | -0.15 | 0.26 | 0.59 | 0.61 | 0.32 | 0.12 | 0.22 | 0.52 | -0.25 | 0.08 | 0.47 | 0.61 | -0.22 | 0.24 | 0.33 | 0.34 | -0.21 | -0.17 | 0.24 | 0.31 | -0.36 | -0.03 | 0.38 | 0.23 | -0.34 | -0.31 | 0.46 | 0.33 | 0.18 | 0.32 | 0.40 | -0.09 | -0.13 | 0.06 | 0.31 | 0.24 | 0.11 | 0.05 | 0.18 | 0.11 | 0.12 | -0.08 | 0.17 | 0.24 | 0.07 | |
| Earnings Per Share Diluted | 1.54 | 0.11 | 1.01 | 1.30 | 1.19 | -0.54 | 0.65 | 1.02 | 1.00 | -0.15 | 0.25 | 0.57 | 0.60 | 0.30 | 0.12 | 0.22 | 0.52 | -0.25 | 0.08 | 0.44 | 0.59 | -0.22 | 0.23 | 0.32 | 0.33 | -0.21 | -0.17 | 0.23 | 0.30 | -0.36 | -0.03 | 0.37 | 0.23 | -0.34 | -0.31 | 0.45 | 0.33 | 0.18 | 0.32 | 0.40 | -0.09 | -0.13 | 0.06 | 0.31 | 0.24 | 0.11 | 0.05 | 0.18 | 0.11 | 0.12 | -0.08 | 0.16 | 0.23 | 0.07 |
| 2023-12-31 | 2023-09-30 | 2023-06-30 | 2023-03-31 | 2022-12-31 | 2022-09-30 | 2022-06-30 | 2022-03-31 | 2021-12-31 | 2021-09-30 | 2021-06-30 | 2021-03-31 | 2020-12-31 | 2020-09-30 | 2020-06-30 | 2020-03-31 | 2019-12-31 | 2019-09-30 | 2019-06-30 | 2019-03-31 | 2018-12-31 | 2018-09-30 | 2018-06-30 | 2018-03-31 | 2017-12-31 | 2017-09-30 | 2017-06-30 | 2017-03-31 | 2016-12-31 | 2016-09-30 | 2016-06-30 | 2016-03-31 | 2015-12-31 | 2015-09-30 | 2015-06-30 | 2015-03-31 | 2014-12-31 | 2014-09-30 | 2014-06-30 | 2014-03-31 | 2013-12-31 | 2013-09-30 | 2013-06-30 | 2013-03-31 | 2012-12-31 | 2012-09-30 | 2012-06-30 | 2012-03-31 | 2011-12-31 | 2011-09-30 | 2011-06-30 | 2011-03-31 | 2010-12-31 | 2010-09-30 | ||
|---|---|---|---|---|---|---|---|---|---|---|---|---|---|---|---|---|---|---|---|---|---|---|---|---|---|---|---|---|---|---|---|---|---|---|---|---|---|---|---|---|---|---|---|---|---|---|---|---|---|---|---|---|---|---|---|
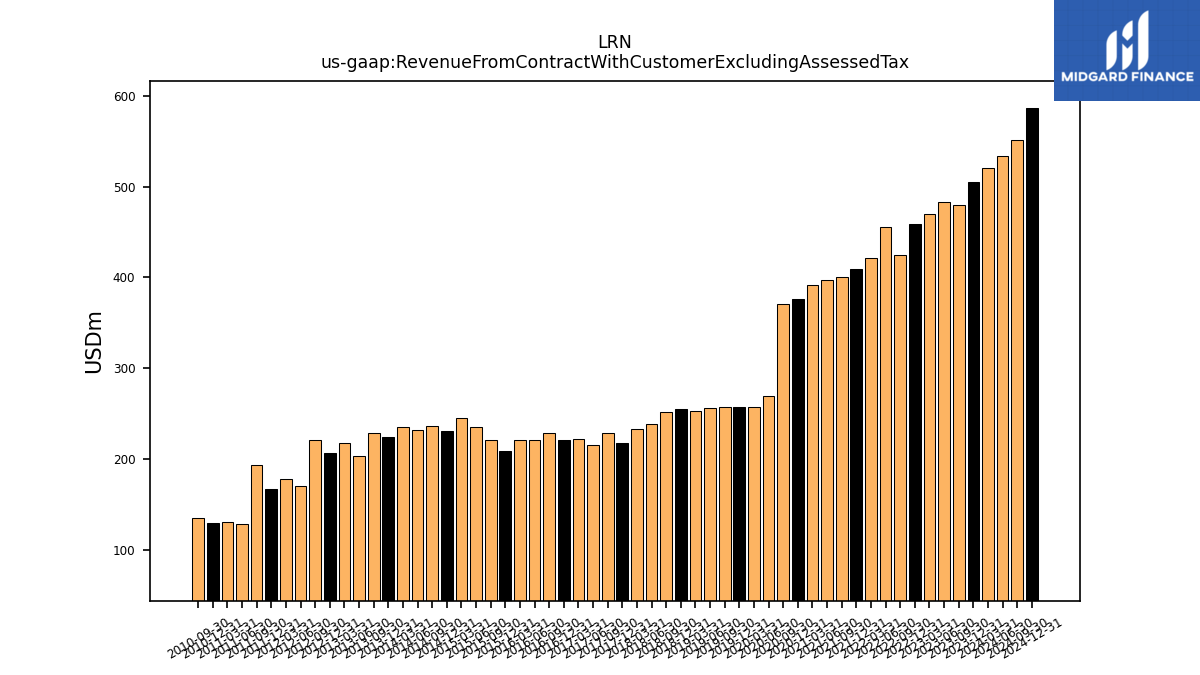
| Revenue From Contract With Customer Excluding Assessed Tax | 504.87 | 480.18 | 483.49 | 470.28 | 458.44 | 425.15 | 455.21 | 421.72 | 409.51 | 400.23 | 397.51 | 392.14 | 376.14 | 370.96 | 268.93 | 257.15 | 257.56 | 257.12 | 256.31 | 253.25 | 254.87 | 251.31 | 238.87 | 232.86 | 217.21 | 228.78 | 215.76 | 222.53 | 221.09 | 229.14 | 221.32 | 221.34 | 208.81 | 221.23 | 235.66 | 244.62 | 231.30 | 236.71 | 232.05 | 235.22 | 223.92 | 228.37 | 203.09 | 218.01 | 206.03 | 221.10 | 170.40 | 178.18 | 166.50 | 193.33 | 128.27 | 130.29 | 129.00 | 134.87 | |
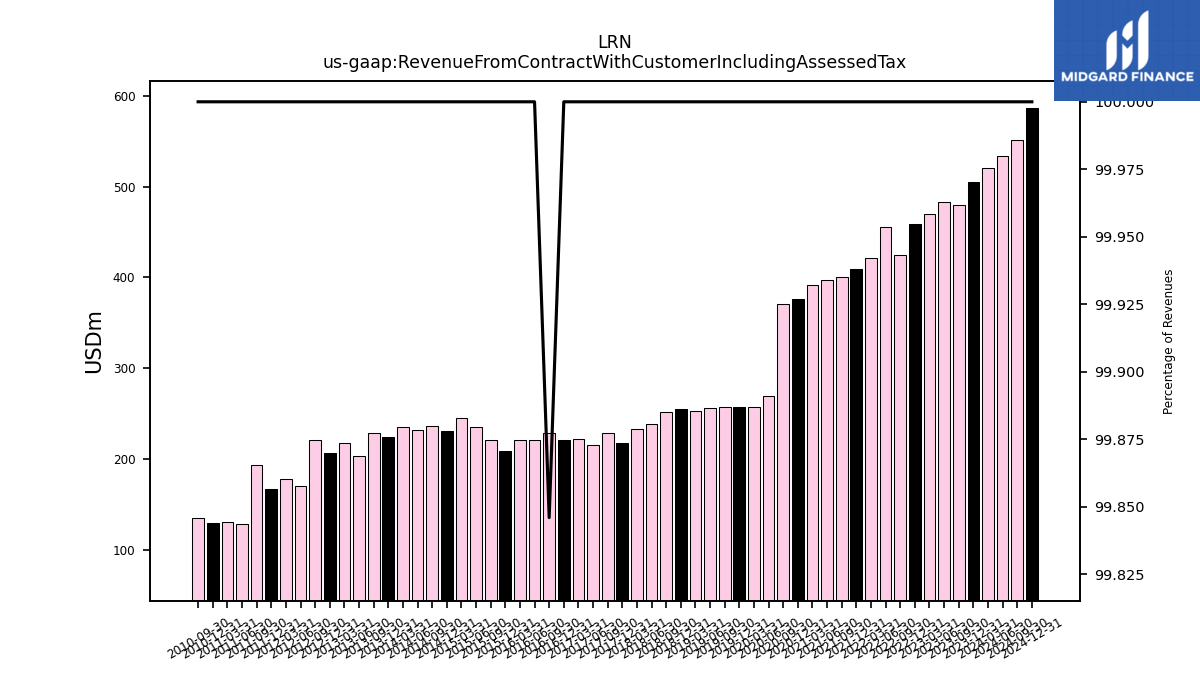
| Revenue From Contract With Customer Including Assessed Tax | 504.87 | 480.18 | 483.49 | 470.28 | 458.44 | 425.15 | 455.21 | 421.72 | 409.51 | 400.23 | 397.51 | 392.14 | 376.14 | 370.96 | 268.93 | 257.15 | 257.56 | 257.12 | 256.31 | 253.25 | 254.87 | 251.31 | 238.87 | 232.86 | 217.21 | 228.78 | 215.76 | 222.53 | 221.09 | 228.78 | 221.32 | 221.34 | 208.81 | 221.23 | 235.66 | 244.62 | 231.30 | 236.71 | 232.05 | 235.22 | 223.92 | 228.37 | 203.09 | 218.01 | 206.03 | 221.10 | 170.40 | 178.18 | 166.50 | 193.33 | 128.27 | 130.29 | 129.00 | 134.87 | |
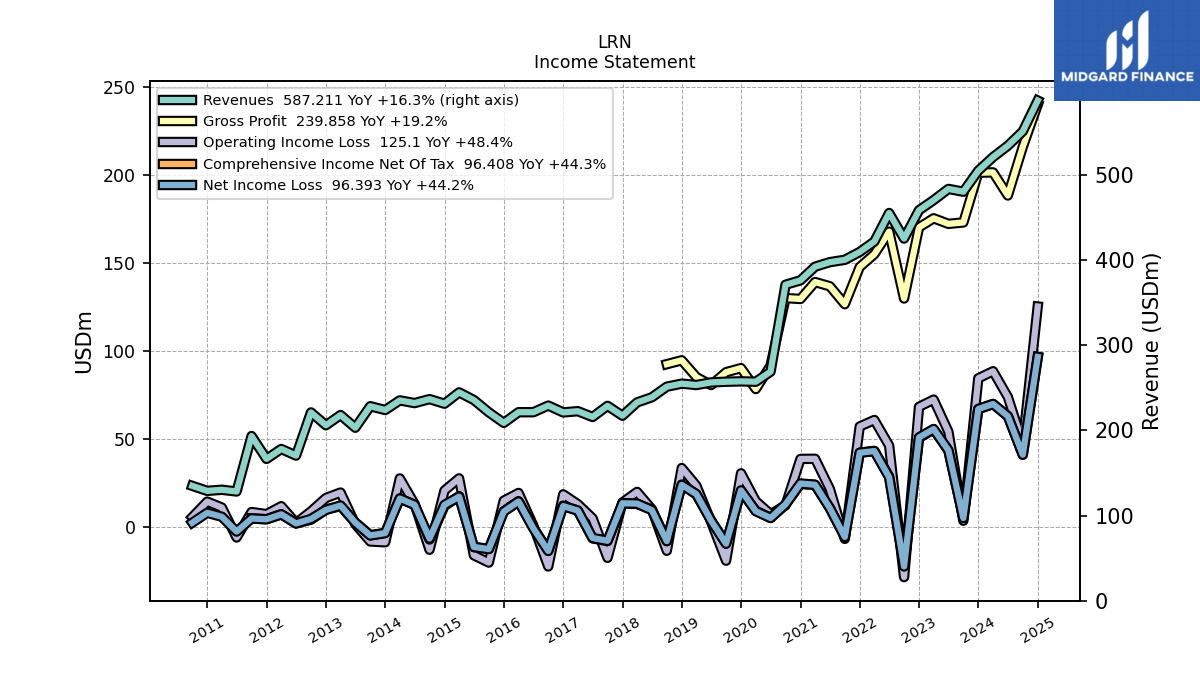
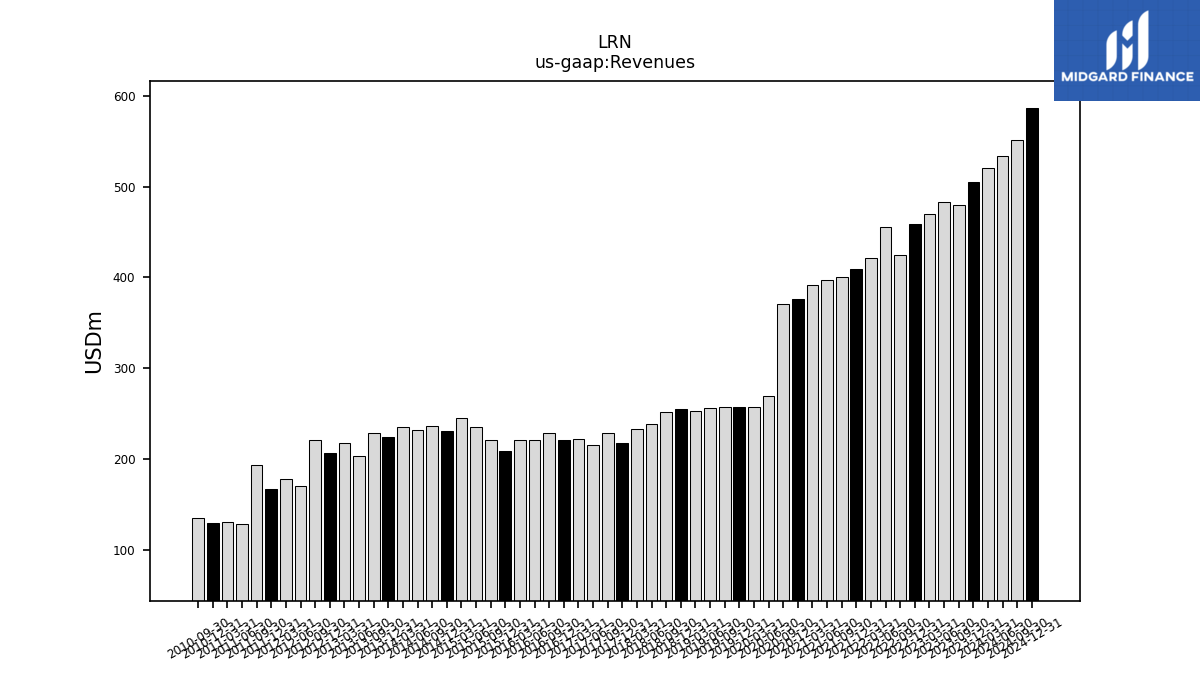
| Revenues | 504.87 | 480.18 | 483.49 | 470.28 | 458.44 | 425.15 | 455.21 | 421.72 | 409.51 | 400.23 | 397.51 | 392.14 | 376.14 | 370.96 | 268.93 | 257.15 | 257.56 | 257.12 | 256.31 | 253.25 | 254.87 | 251.31 | 238.87 | 232.86 | 217.21 | 228.78 | 215.76 | 222.53 | 221.09 | 229.14 | 221.32 | 221.34 | 208.81 | 221.23 | 235.66 | 244.62 | 231.30 | 236.71 | 232.05 | 235.22 | 223.92 | 228.37 | 203.09 | 218.01 | 206.03 | 221.10 | 170.40 | 178.18 | 166.50 | 193.33 | 128.27 | 130.29 | 129.00 | 134.87 | |
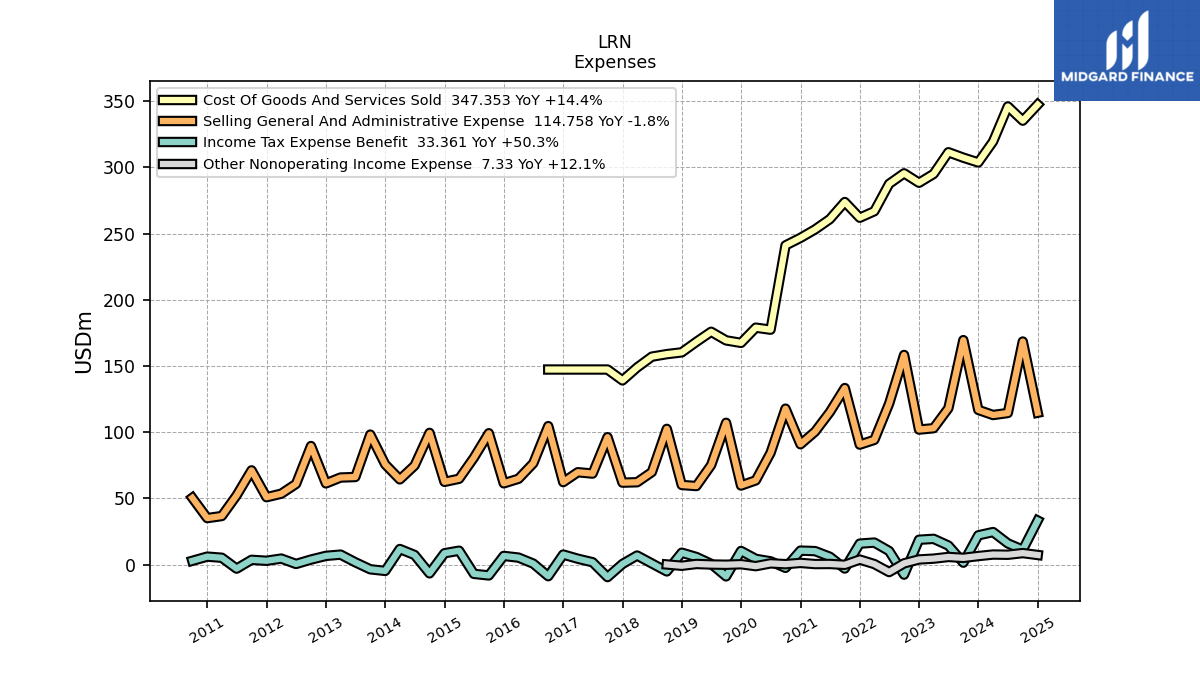
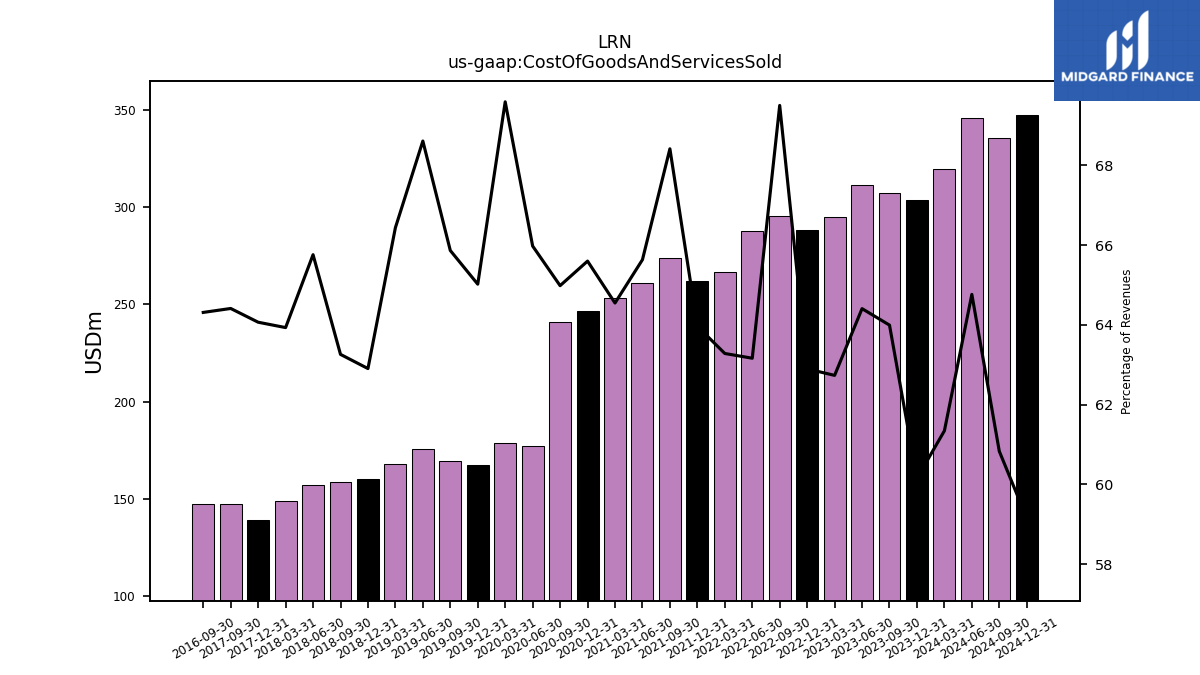
| Cost Of Goods And Services Sold | 303.69 | 307.29 | 311.41 | 295.03 | 288.35 | 295.50 | 287.53 | 266.88 | 261.95 | 273.82 | 260.91 | 253.13 | 246.75 | 241.07 | 177.44 | 178.97 | 167.47 | 169.36 | 175.86 | 168.26 | 160.33 | 158.99 | 157.09 | 148.88 | 139.16 | 147.37 | NA | NA | NA | 147.37 | NA | NA | NA | NA | NA | NA | NA | NA | NA | NA | NA | NA | NA | NA | NA | NA | NA | NA | NA | NA | NA | NA | NA | NA | |
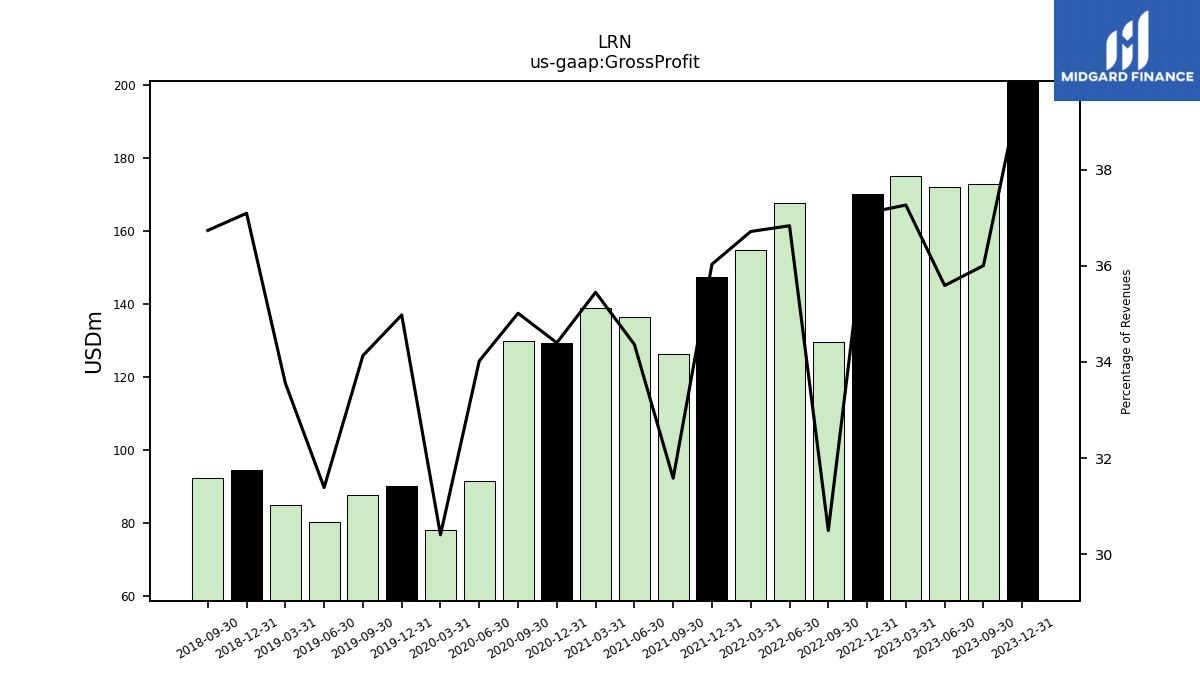
| Gross Profit | 201.17 | 172.89 | 172.08 | 175.25 | 170.09 | 129.65 | 167.68 | 154.84 | 147.56 | 126.40 | 136.60 | 139.02 | 129.39 | 129.89 | 91.50 | 78.19 | 90.09 | 87.76 | 80.45 | 84.99 | 94.54 | 92.33 | NA | NA | NA | NA | NA | NA | NA | NA | NA | NA | NA | NA | NA | NA | NA | NA | NA | NA | NA | NA | NA | NA | NA | NA | NA | NA | NA | NA | NA | NA | NA | NA | |
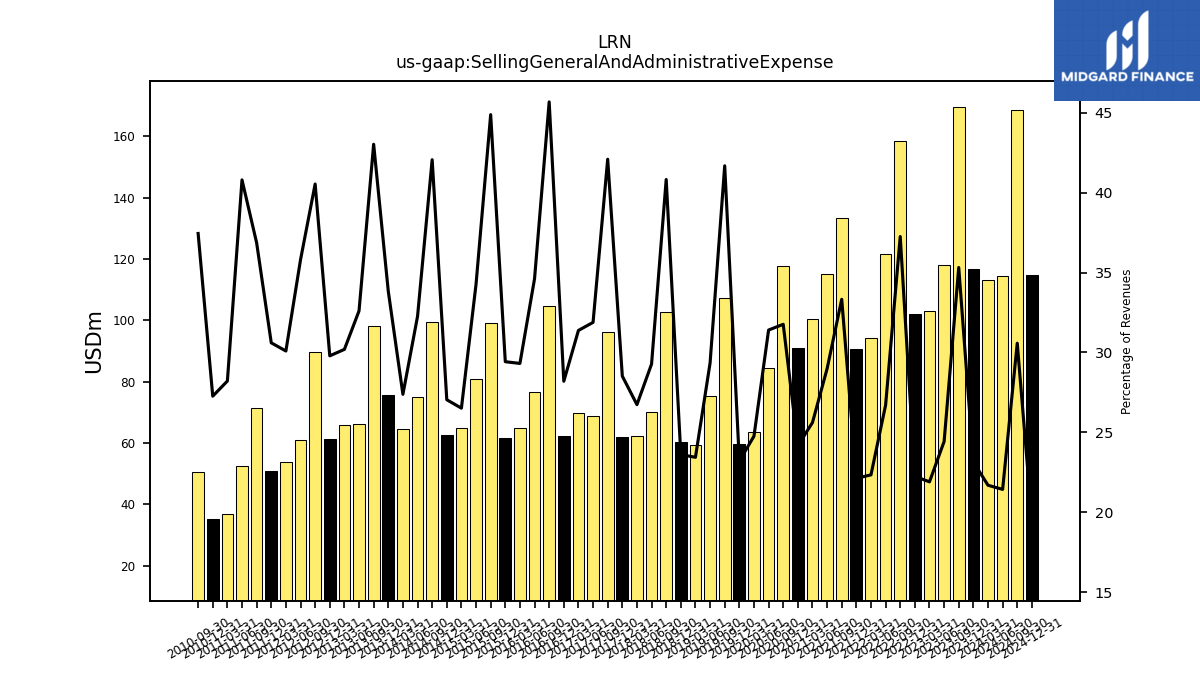
| Selling General And Administrative Expense | 116.89 | 169.57 | 118.14 | 103.05 | 102.02 | 158.37 | 121.58 | 94.25 | 90.64 | 133.38 | 115.21 | 100.46 | 90.94 | 117.83 | 84.45 | 63.69 | 59.78 | 107.15 | 75.21 | 59.38 | 60.18 | 102.58 | 69.94 | 62.27 | 61.96 | 96.28 | 68.79 | 69.83 | 62.35 | 104.65 | 76.61 | 64.89 | 61.44 | 99.27 | 80.76 | 64.87 | 62.56 | 99.55 | 74.85 | 64.41 | 75.75 | 98.24 | 66.21 | 65.83 | 61.38 | 89.62 | 61.00 | 53.62 | 50.96 | 71.26 | 52.32 | 36.76 | 35.18 | 50.50 | |
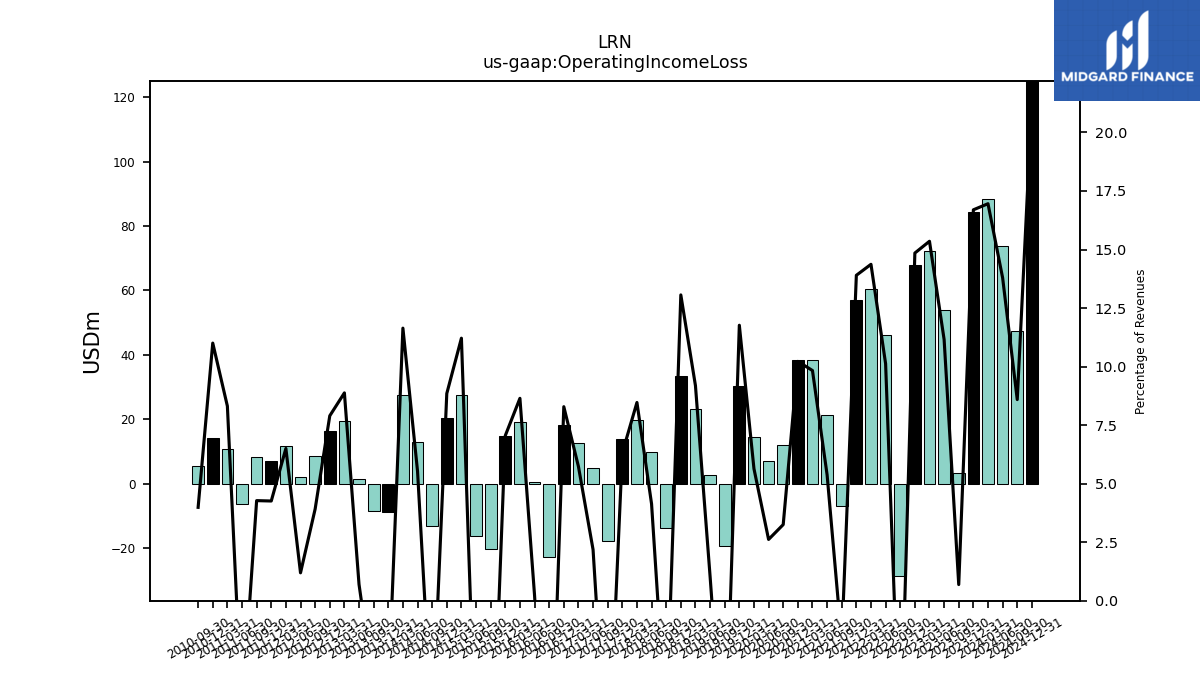
| Operating Income Loss | 84.29 | 3.32 | 53.95 | 72.20 | 68.07 | -28.72 | 46.10 | 60.59 | 56.91 | -6.98 | 21.39 | 38.55 | 38.45 | 12.06 | 7.04 | 14.50 | 30.30 | -19.39 | 2.68 | 23.27 | 33.29 | -13.75 | 9.88 | 19.72 | 13.71 | -17.76 | 4.71 | 12.76 | 18.32 | -22.67 | 0.51 | 19.13 | 14.73 | -20.46 | -16.32 | 27.43 | 20.47 | -13.16 | 12.84 | 27.39 | -8.91 | -8.46 | 1.42 | 19.35 | 16.27 | 8.66 | 2.03 | 11.59 | 7.09 | 8.27 | -6.19 | 10.83 | 14.20 | 5.38 | |
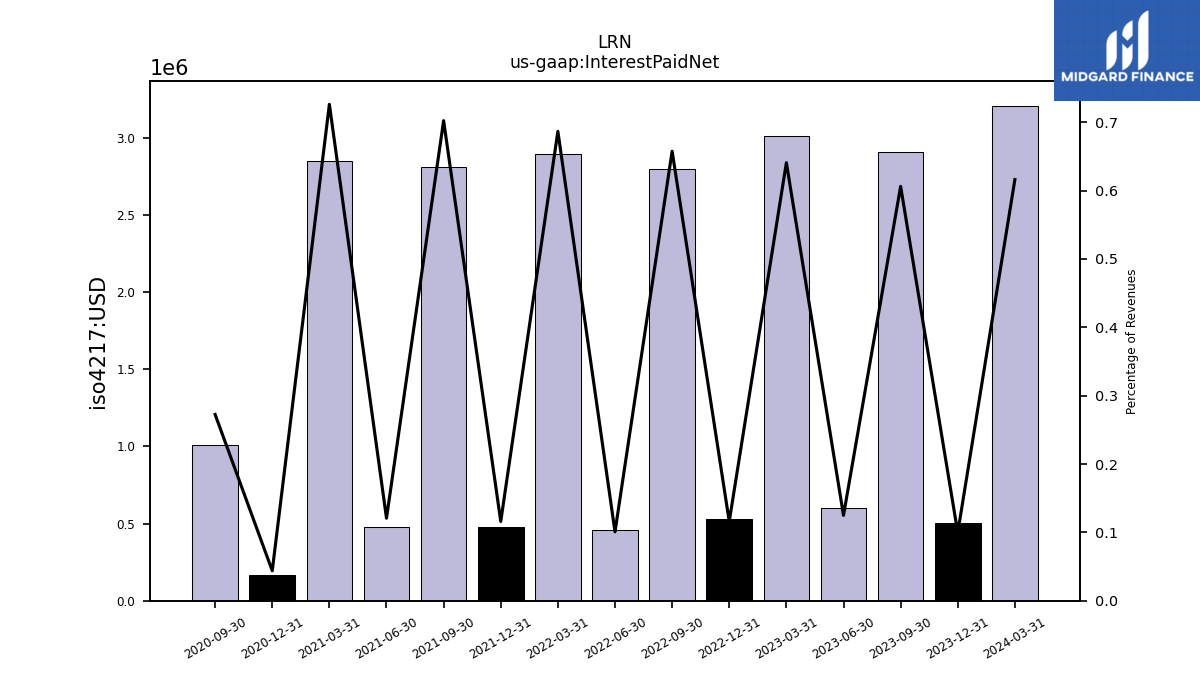
| Interest Paid Net | 0.50 | 2.91 | 0.60 | 3.01 | 0.53 | 2.80 | 0.46 | 2.90 | 0.47 | 2.81 | 0.48 | 2.85 | 0.17 | 1.01 | NA | NA | NA | NA | NA | NA | NA | NA | NA | NA | NA | NA | NA | NA | NA | NA | NA | NA | NA | NA | NA | NA | NA | NA | NA | NA | NA | NA | NA | NA | NA | NA | NA | NA | NA | NA | NA | NA | NA | NA | |
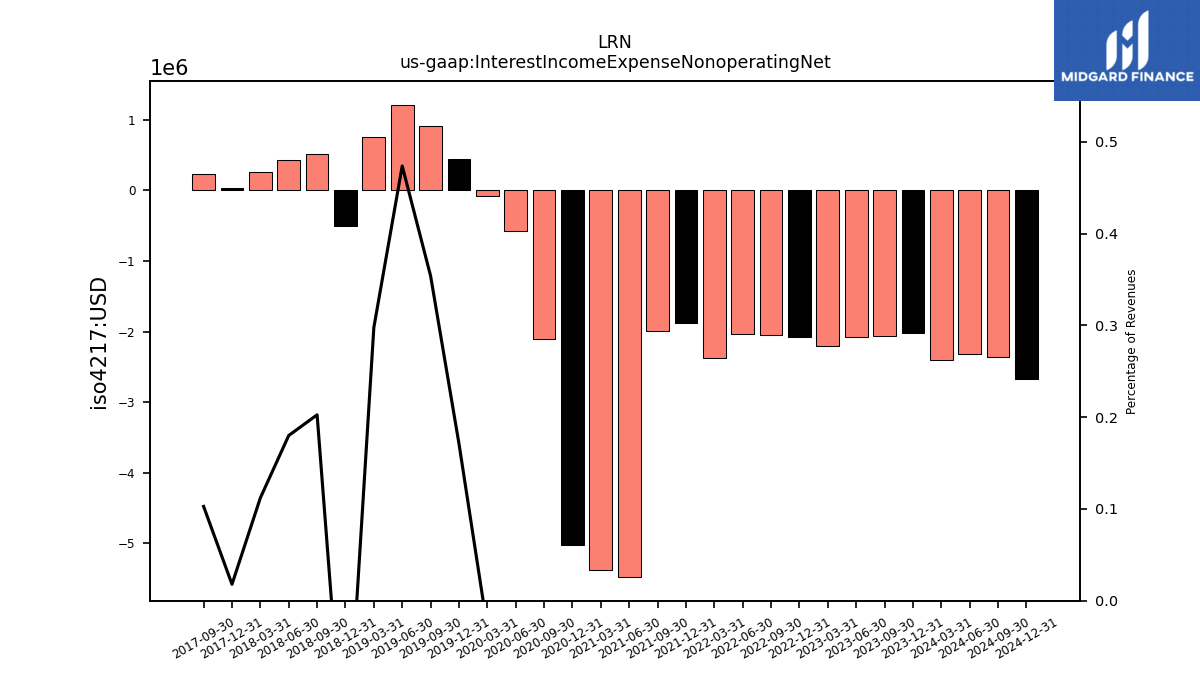
| Interest Income Expense Nonoperating Net | -2.02 | -2.07 | -2.07 | -2.21 | -2.08 | -2.05 | -2.04 | -2.37 | -1.88 | -1.99 | -5.48 | -5.37 | -5.02 | -2.11 | -0.58 | -0.08 | 0.44 | 0.91 | 1.21 | 0.75 | -0.50 | 0.51 | 0.43 | 0.26 | 0.04 | 0.23 | NA | NA | NA | NA | NA | NA | NA | NA | NA | NA | NA | NA | NA | NA | NA | NA | NA | NA | NA | NA | NA | NA | NA | NA | NA | NA | NA | NA | |
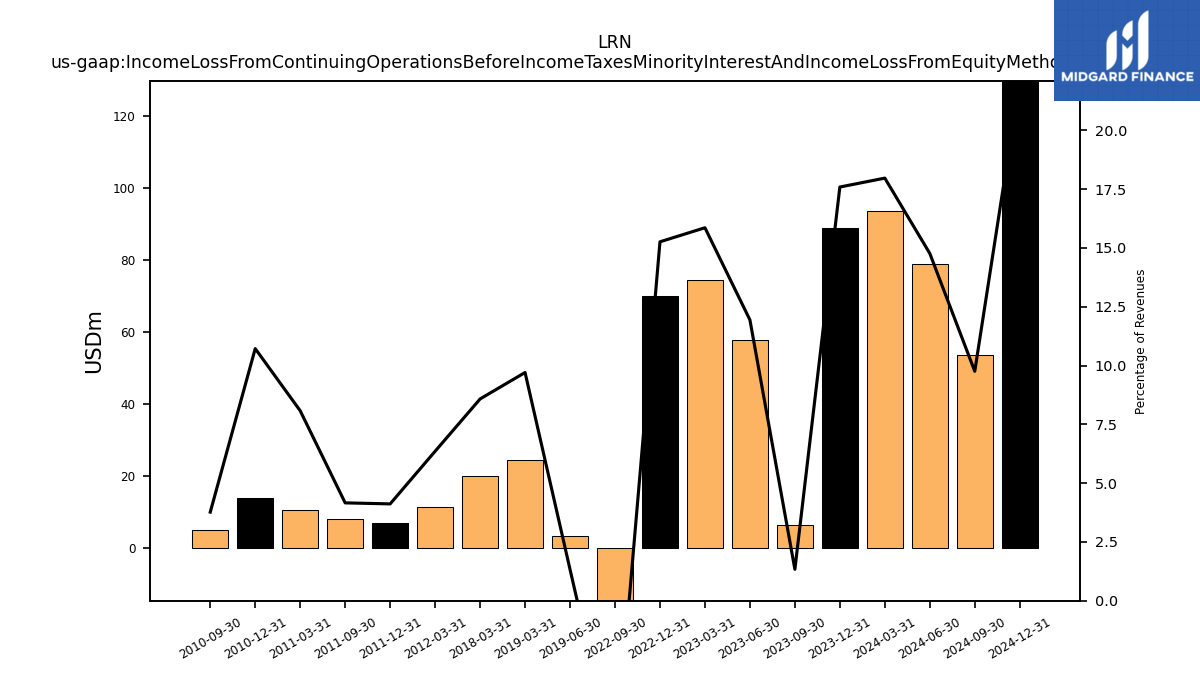
| Income Loss From Continuing Operations Before Income Taxes Minority Interest And Income Loss From Equity Method Investments | 88.81 | 6.42 | NA | NA | 69.96 | -29.73 | NA | NA | NA | NA | NA | NA | NA | NA | NA | NA | NA | NA | 3.42 | 24.58 | NA | NA | NA | 19.98 | NA | NA | NA | NA | NA | NA | NA | NA | NA | NA | NA | NA | NA | NA | NA | NA | NA | NA | NA | NA | NA | NA | NA | 11.32 | 6.86 | 8.05 | NA | 10.52 | 13.83 | 5.08 | |
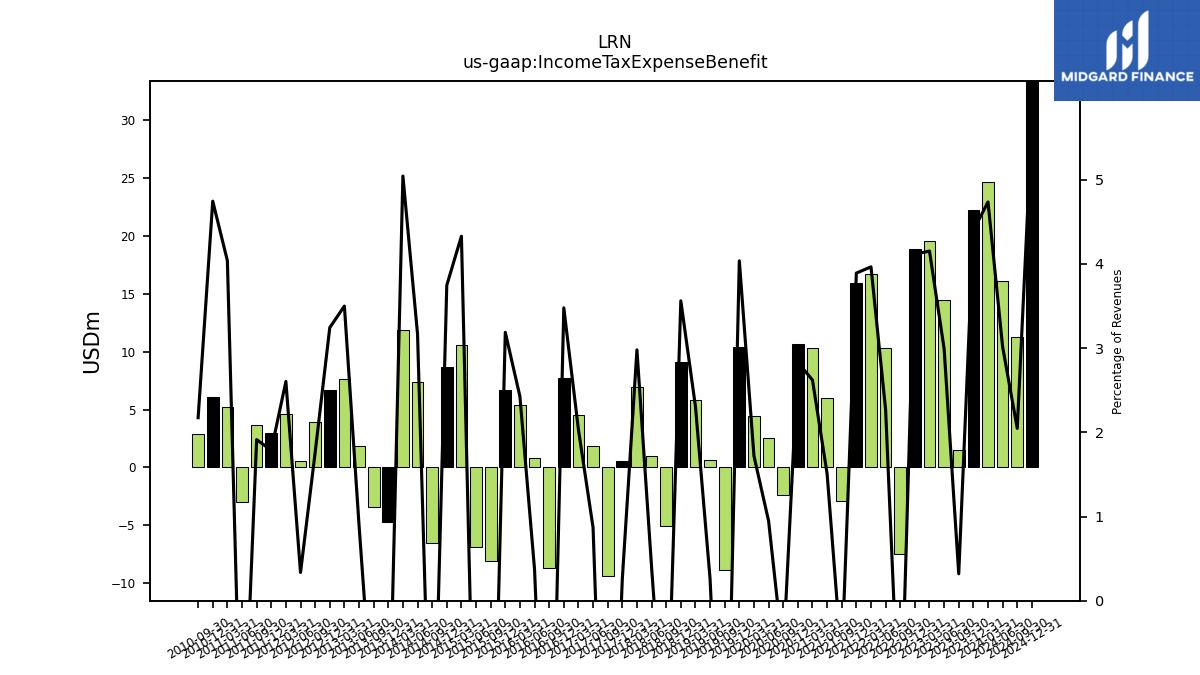
| Income Tax Expense Benefit | 22.19 | 1.54 | 14.47 | 19.52 | 18.86 | -7.51 | 10.34 | 16.72 | 15.93 | -2.89 | 6.00 | 10.28 | 10.64 | -2.38 | 2.55 | 4.42 | 10.39 | -8.82 | 0.66 | 5.84 | 9.07 | -5.06 | 0.96 | 6.93 | 0.56 | -9.37 | 1.88 | 4.52 | 7.69 | -8.69 | 0.82 | 5.37 | 6.65 | -8.10 | -6.90 | 10.59 | 8.66 | -6.54 | 7.35 | 11.86 | -4.68 | -3.45 | 1.83 | 7.63 | 6.68 | 3.89 | 0.57 | 4.64 | 2.98 | 3.70 | -2.97 | 5.26 | 6.12 | 2.93 | |
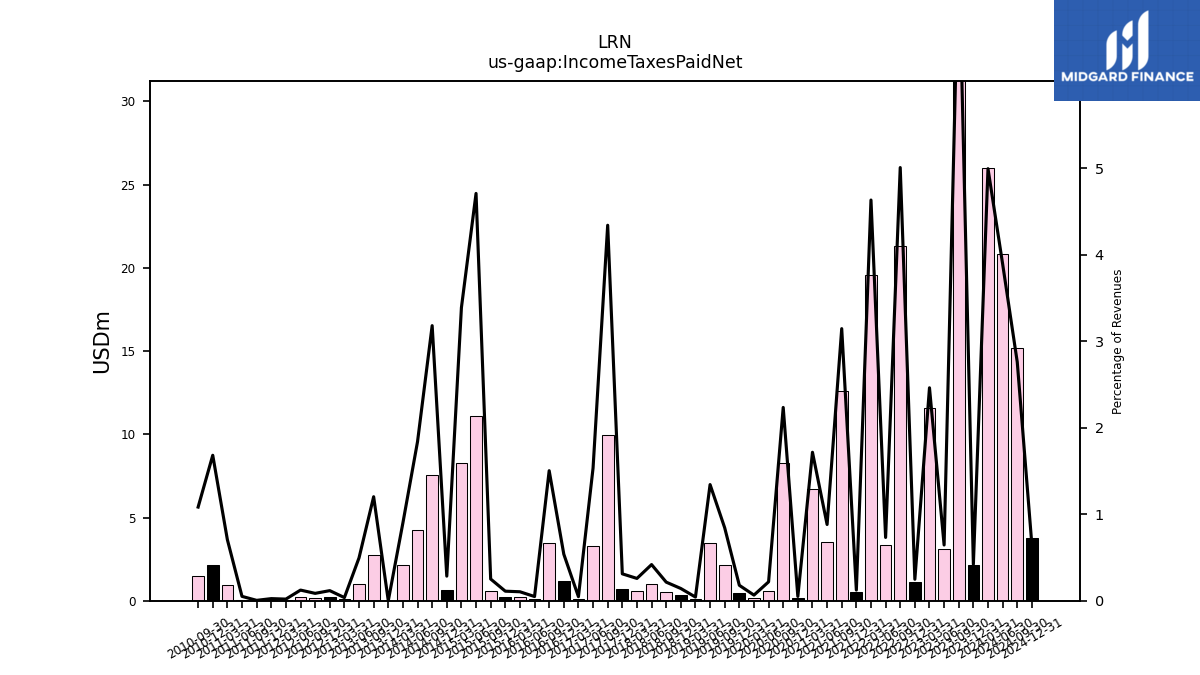
| Income Taxes Paid Net | 2.12 | 36.27 | 3.12 | 11.58 | 1.14 | 21.30 | 3.33 | 19.54 | 0.51 | 12.59 | 3.50 | 6.73 | 0.19 | 8.29 | 0.59 | 0.17 | 0.46 | 2.17 | 3.44 | 0.11 | 0.36 | 0.54 | 1.00 | 0.60 | 0.68 | 9.93 | 3.31 | 0.10 | 1.19 | 3.45 | 0.11 | 0.23 | 0.23 | 0.56 | 11.10 | 8.29 | 0.66 | 7.53 | 4.27 | 2.12 | 0.00 | 2.75 | 1.01 | 0.08 | 0.24 | 0.19 | 0.21 | 0.03 | 0.04 | 0.01 | 0.07 | 0.92 | 2.17 | 1.46 | |
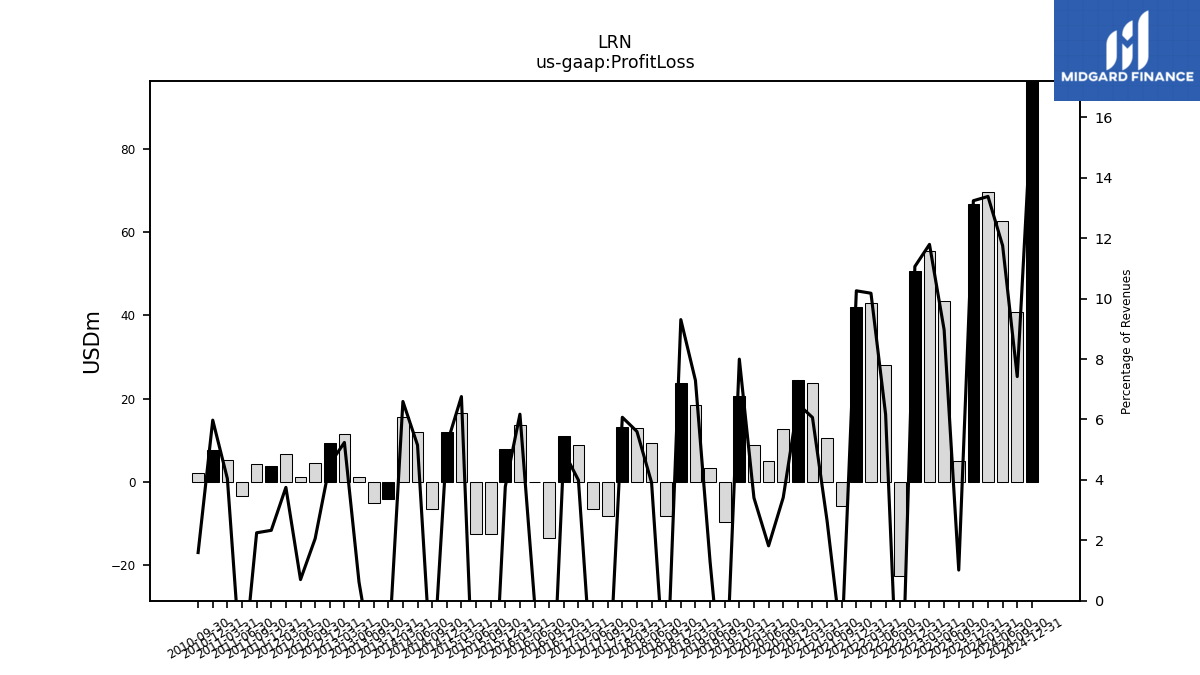
| Profit Loss | 66.84 | 4.88 | 43.37 | 55.46 | 50.70 | -22.67 | 28.09 | 42.92 | 42.00 | -5.88 | 10.49 | 23.79 | 24.50 | 12.67 | 4.89 | 8.75 | 20.59 | -9.73 | 3.32 | 18.46 | 23.71 | -8.28 | 9.35 | 13.04 | 13.19 | -8.16 | -6.60 | 8.88 | 10.90 | -13.64 | -0.12 | 13.66 | 7.88 | -12.66 | -12.57 | 16.53 | 11.96 | -6.59 | 11.95 | 15.51 | -4.25 | -5.10 | 1.25 | 11.42 | 9.32 | 4.54 | 1.19 | 6.69 | 3.88 | 4.35 | -3.46 | 5.26 | 7.71 | 2.15 | |
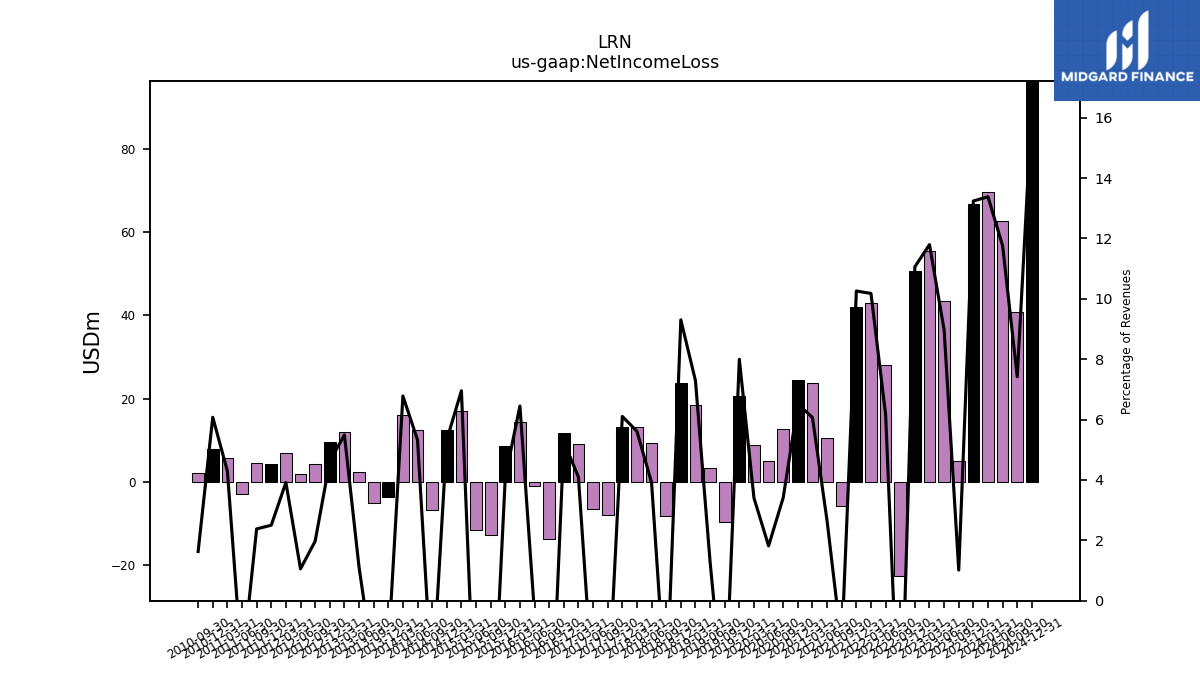
| Net Income Loss | 66.84 | 4.88 | 43.37 | 55.46 | 50.70 | -22.67 | 28.09 | 42.92 | 42.00 | -5.88 | 10.49 | 23.79 | 24.50 | 12.67 | 4.89 | 8.75 | 20.59 | -9.73 | 3.32 | 18.46 | 23.71 | -8.28 | 9.35 | 13.07 | 13.26 | -8.06 | -6.48 | 9.12 | 11.65 | -13.83 | -0.98 | 14.27 | 8.54 | -12.79 | -11.58 | 17.01 | 12.33 | -6.78 | 12.36 | 15.95 | -3.67 | -5.04 | 2.27 | 11.97 | 9.51 | 4.36 | 1.80 | 6.98 | 4.17 | 4.60 | -2.84 | 5.60 | 7.84 | 2.20 | |
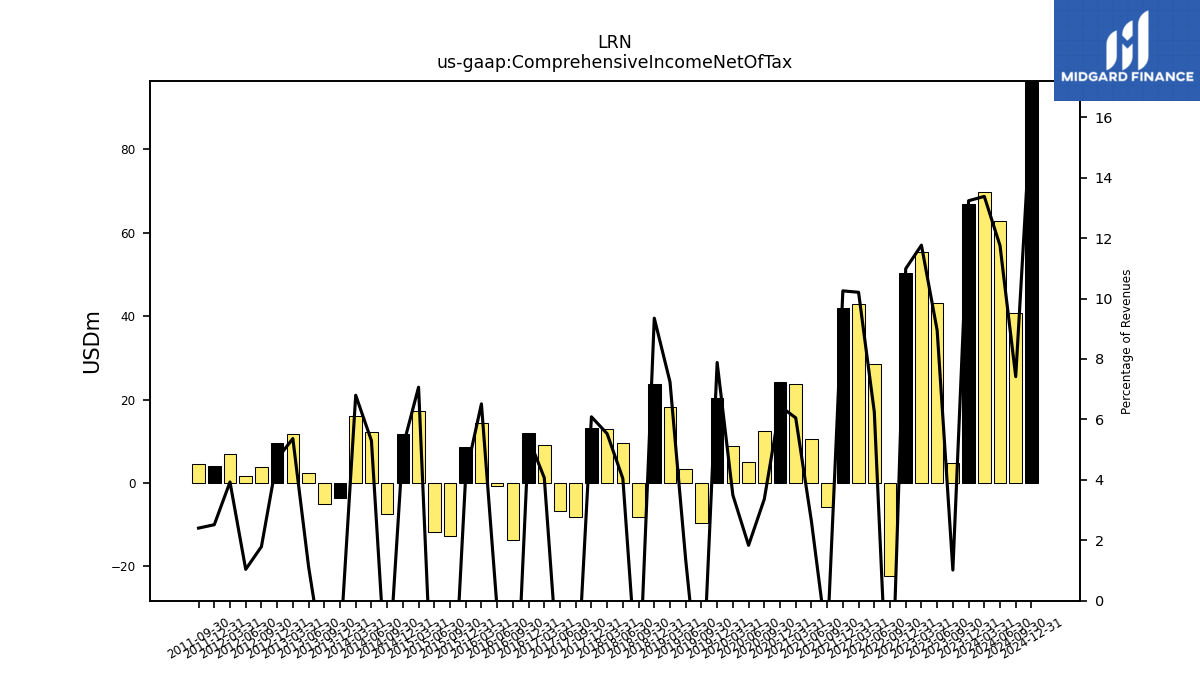
| Comprehensive Income Net Of Tax | 66.83 | 4.88 | 43.28 | 55.33 | 50.37 | -22.30 | 28.45 | 43.05 | 41.99 | -5.74 | 10.45 | 23.73 | 24.23 | 12.47 | 4.93 | 8.99 | 20.31 | -9.59 | 3.46 | 18.34 | 23.83 | -8.21 | 9.66 | 12.87 | 13.22 | -8.21 | -6.69 | 9.05 | 11.89 | -13.68 | -0.63 | 14.42 | 8.66 | -12.64 | -11.69 | 17.29 | 11.76 | -7.32 | 12.30 | 16.00 | -3.58 | -4.93 | 2.30 | 11.70 | 9.68 | 3.96 | 1.77 | 7.00 | 4.19 | 4.65 | NA | NA | NA | NA |
| 2023-12-31 | 2023-09-30 | 2023-06-30 | 2023-03-31 | 2022-12-31 | 2022-09-30 | 2022-06-30 | 2022-03-31 | 2021-12-31 | 2021-09-30 | 2021-06-30 | 2021-03-31 | 2020-12-31 | 2020-09-30 | 2020-06-30 | 2020-03-31 | 2019-12-31 | 2019-09-30 | 2019-06-30 | 2019-03-31 | 2018-12-31 | 2018-09-30 | 2018-06-30 | 2018-03-31 | 2017-12-31 | 2017-09-30 | 2017-06-30 | 2017-03-31 | 2016-12-31 | 2016-09-30 | 2016-06-30 | 2016-03-31 | 2015-12-31 | 2015-09-30 | 2015-06-30 | 2015-03-31 | 2014-12-31 | 2014-09-30 | 2014-06-30 | 2014-03-31 | 2013-12-31 | 2013-09-30 | 2013-06-30 | 2013-03-31 | 2012-12-31 | 2012-09-30 | 2012-06-30 | 2012-03-31 | 2011-12-31 | 2011-09-30 | 2011-06-30 | 2011-03-31 | 2010-12-31 | 2010-09-30 | ||
|---|---|---|---|---|---|---|---|---|---|---|---|---|---|---|---|---|---|---|---|---|---|---|---|---|---|---|---|---|---|---|---|---|---|---|---|---|---|---|---|---|---|---|---|---|---|---|---|---|---|---|---|---|---|---|---|
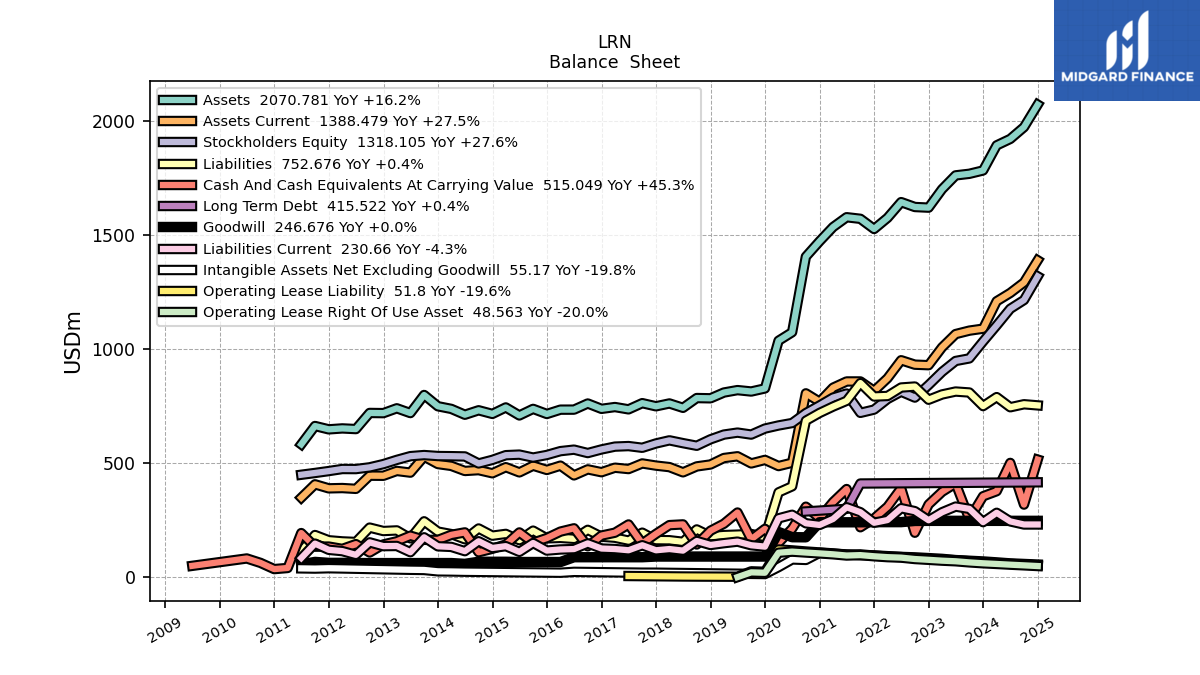
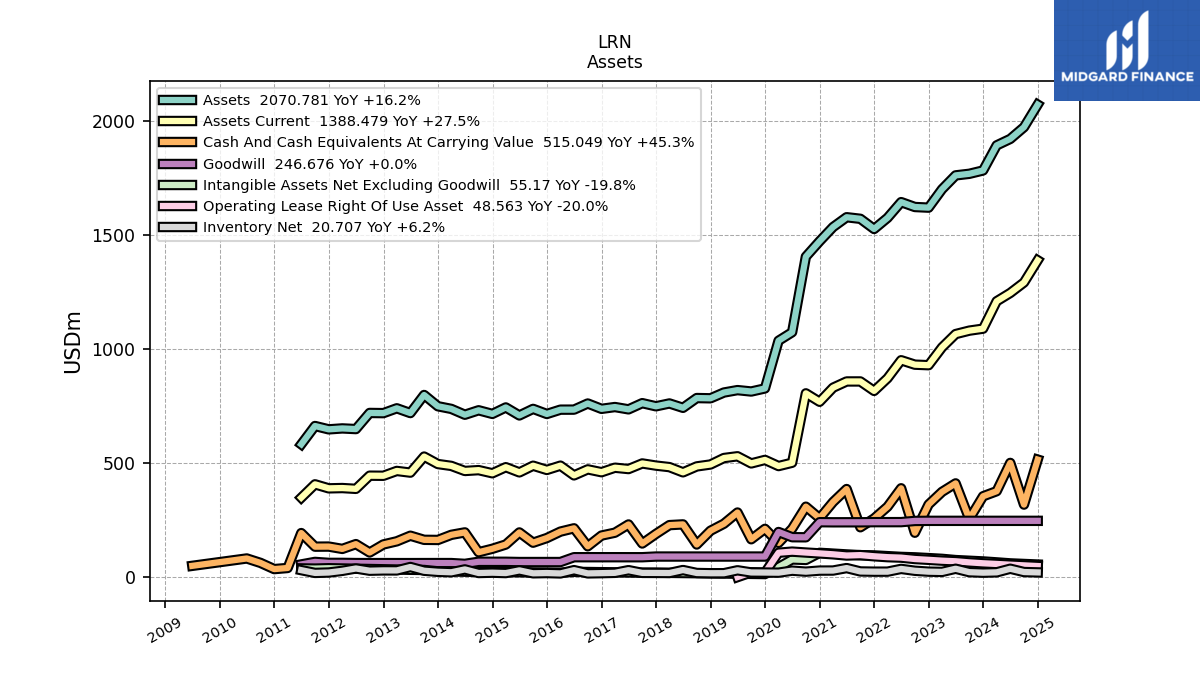
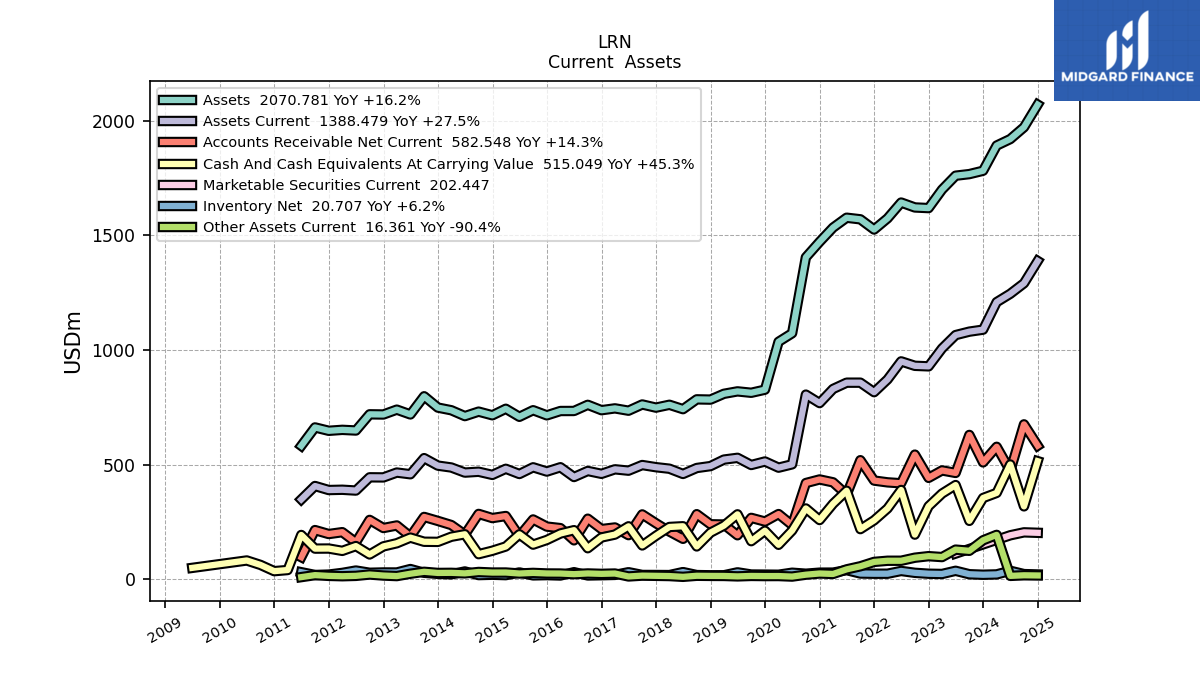
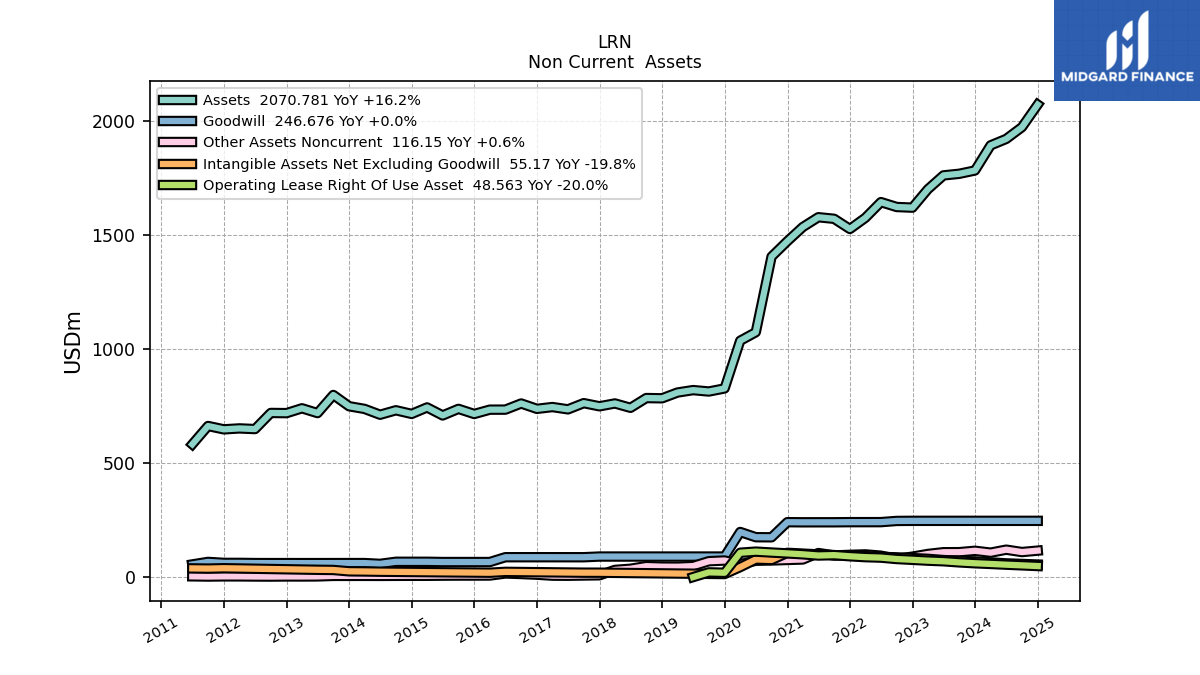
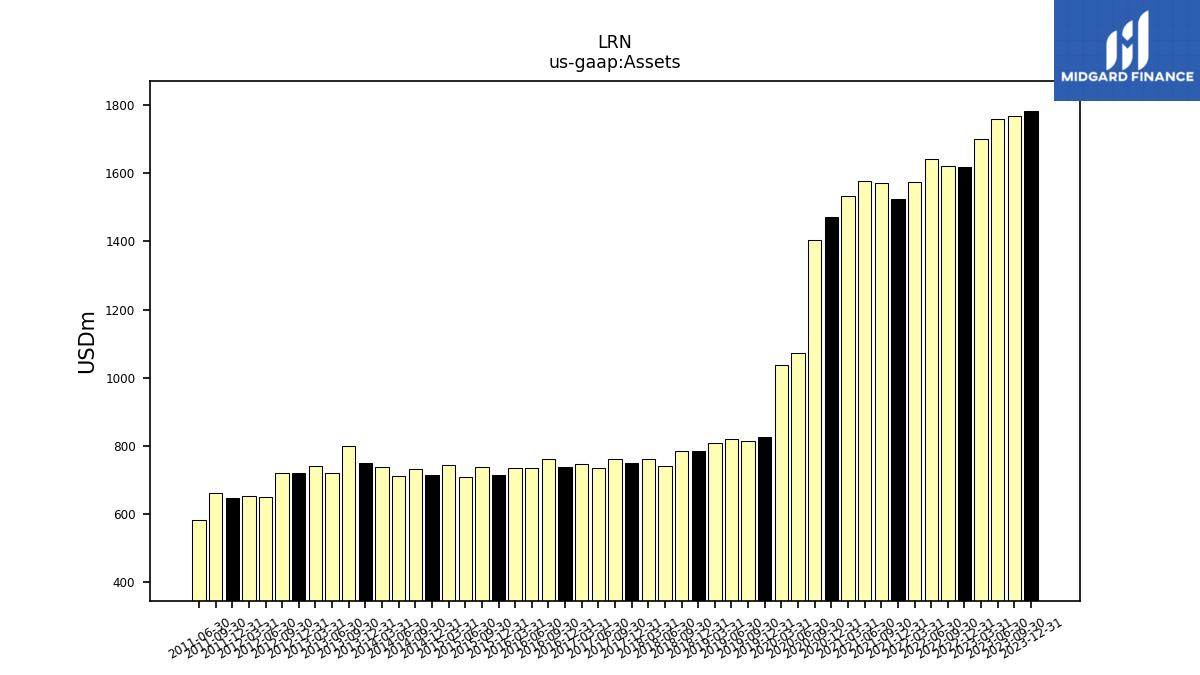
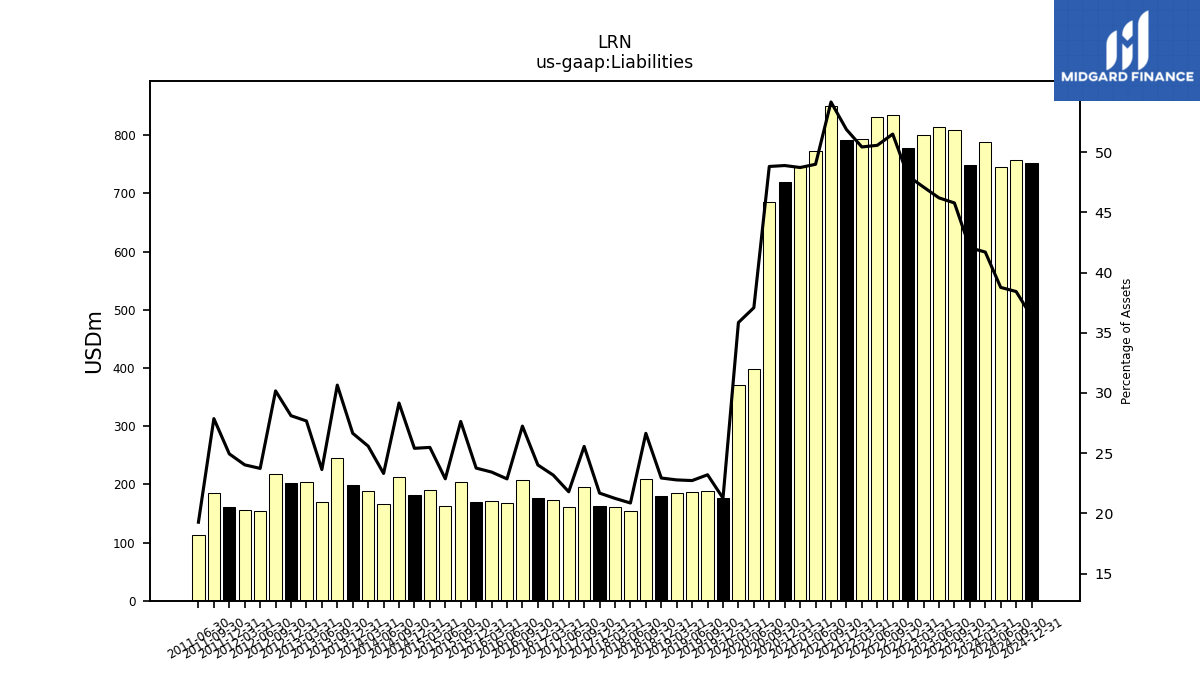
| Assets | 1782.20 | 1767.64 | 1760.67 | 1699.85 | 1619.29 | 1622.10 | 1643.55 | 1574.53 | 1525.74 | 1570.37 | 1577.30 | 1534.17 | 1471.95 | 1404.48 | 1073.26 | 1036.01 | 826.95 | 813.50 | 819.61 | 809.01 | 783.70 | 784.80 | 741.96 | 761.12 | 748.66 | 762.44 | 735.28 | 745.42 | 737.49 | 760.97 | 734.05 | 733.91 | 714.99 | 737.41 | 708.60 | 743.70 | 715.28 | 731.22 | 711.67 | 737.25 | 748.89 | 798.30 | 718.90 | 739.92 | 718.71 | 719.50 | 648.84 | 651.73 | 647.63 | 662.32 | 582.10 | NA | NA | NA | |
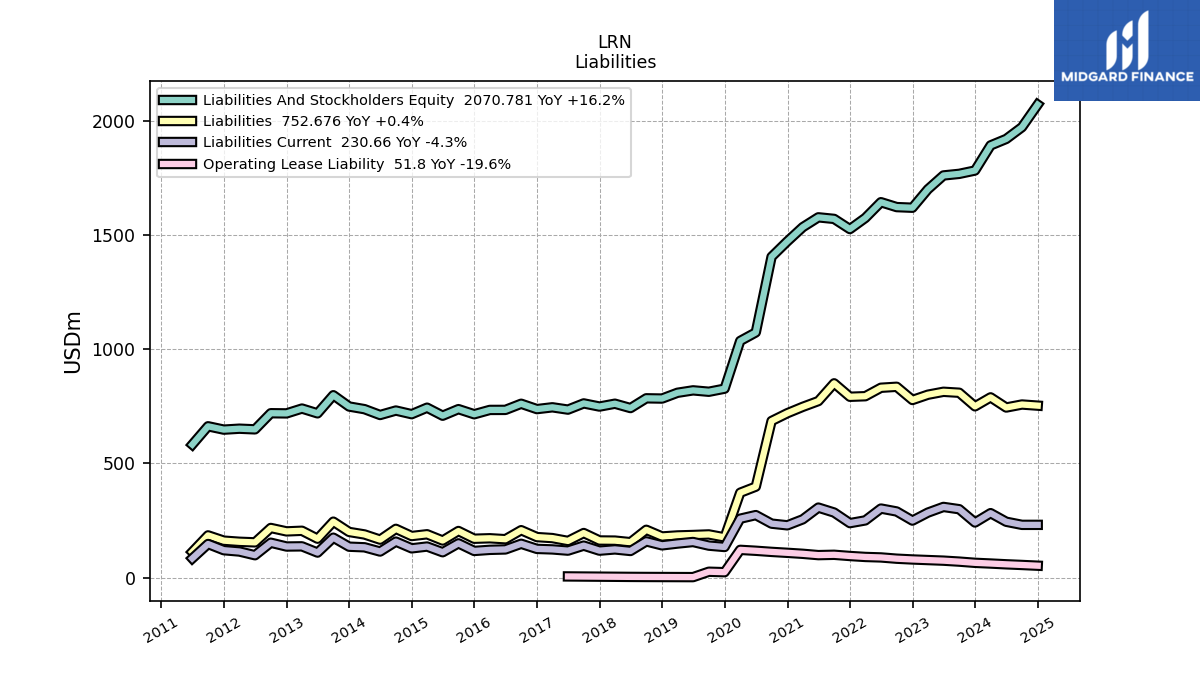
| Liabilities | 749.52 | 809.15 | 813.37 | 800.49 | 777.39 | 835.27 | 830.96 | 793.96 | 791.51 | 850.46 | 772.65 | 747.39 | 719.52 | 685.46 | 397.93 | 371.38 | 175.85 | 188.78 | 186.24 | 184.27 | 179.75 | 209.11 | 154.77 | 161.69 | 162.31 | 194.87 | 160.24 | 172.74 | 177.14 | 207.32 | 167.83 | 171.95 | 169.89 | 203.77 | 162.06 | 189.48 | 181.69 | 213.24 | 165.94 | 188.62 | 199.58 | 244.67 | 169.94 | 204.76 | 202.03 | 217.05 | 153.99 | 156.60 | 161.52 | 184.57 | 112.15 | NA | NA | NA | |
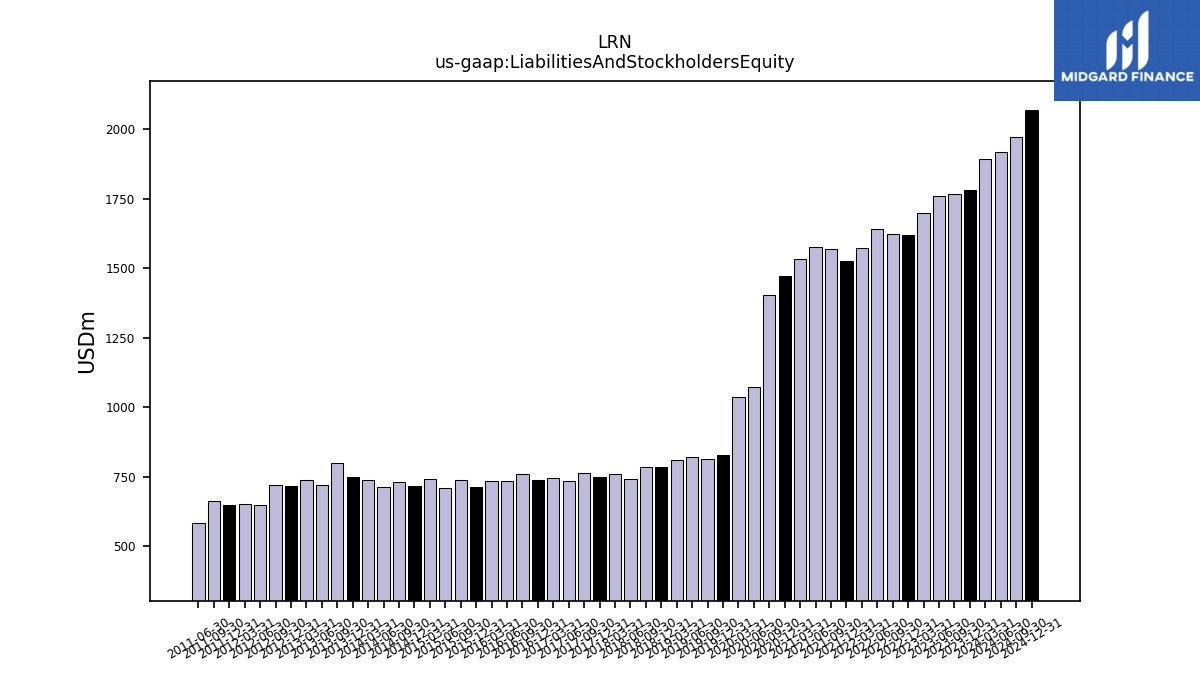
| Liabilities And Stockholders Equity | 1782.20 | 1767.64 | 1760.67 | 1699.85 | 1619.29 | 1622.10 | 1643.55 | 1574.53 | 1525.74 | 1570.37 | 1577.30 | 1534.17 | 1471.95 | 1404.48 | 1073.26 | 1036.01 | 826.95 | 813.50 | 819.61 | 809.01 | 783.70 | 784.80 | 741.96 | 761.12 | 748.66 | 762.44 | 735.28 | 745.42 | 737.49 | 760.97 | 734.05 | 733.91 | 714.99 | 737.41 | 708.60 | 743.70 | 715.28 | 731.22 | 711.67 | 737.25 | 748.89 | 798.30 | 718.90 | 739.92 | 718.71 | 719.50 | 648.84 | 651.73 | 647.63 | 662.32 | 582.10 | NA | NA | NA | |
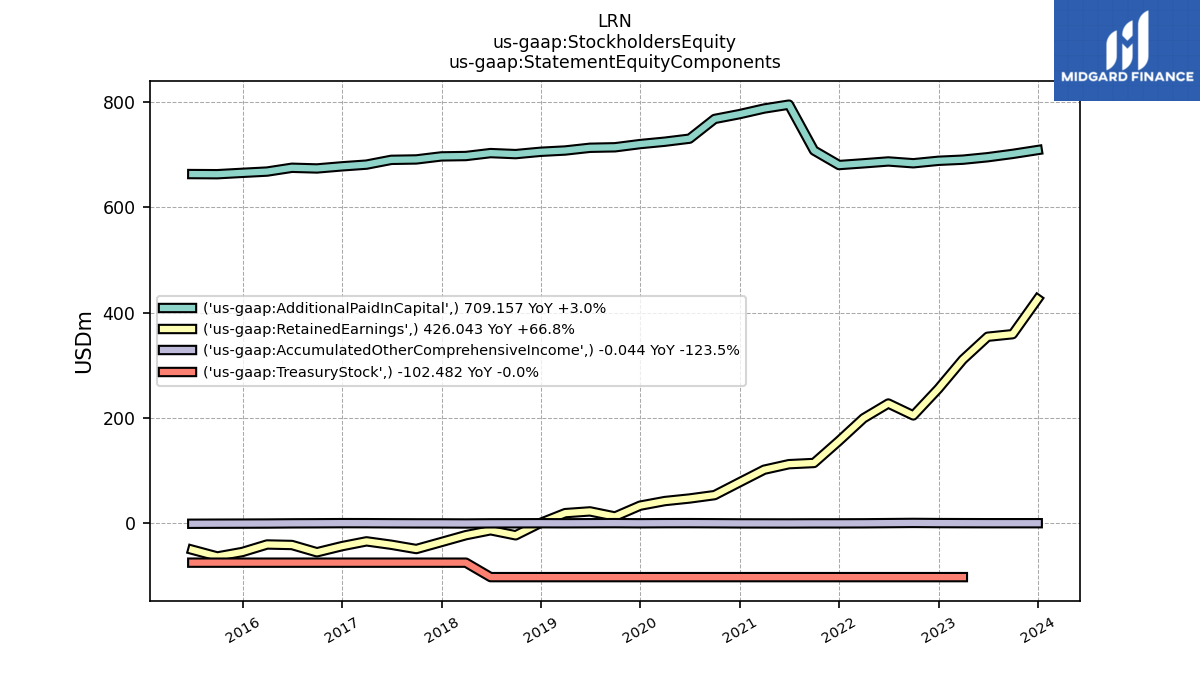
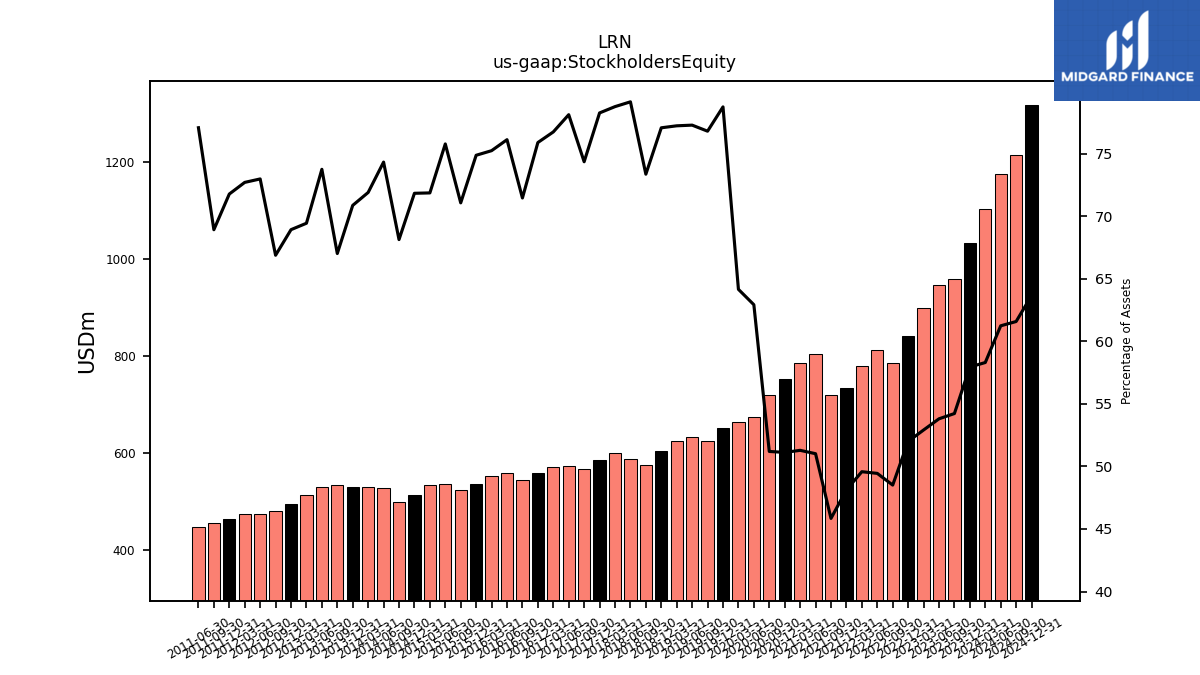
| Stockholders Equity | 1032.68 | 958.49 | 947.30 | 899.36 | 841.90 | 786.82 | 812.58 | 780.57 | 734.23 | 719.91 | 804.65 | 786.78 | 752.43 | 719.02 | 675.33 | 664.63 | 651.10 | 624.71 | 633.37 | 624.74 | 603.96 | 575.70 | 587.19 | 599.43 | 585.84 | 566.87 | 574.35 | 571.98 | 559.65 | 543.74 | 558.72 | 552.15 | 535.30 | 524.04 | 536.94 | 534.42 | 513.79 | 498.18 | 528.93 | 530.05 | 530.69 | 534.98 | 530.16 | 513.76 | 495.35 | 481.18 | 473.49 | 473.81 | 464.80 | 456.45 | 448.62 | NA | NA | NA |
| 2023-12-31 | 2023-09-30 | 2023-06-30 | 2023-03-31 | 2022-12-31 | 2022-09-30 | 2022-06-30 | 2022-03-31 | 2021-12-31 | 2021-09-30 | 2021-06-30 | 2021-03-31 | 2020-12-31 | 2020-09-30 | 2020-06-30 | 2020-03-31 | 2019-12-31 | 2019-09-30 | 2019-06-30 | 2019-03-31 | 2018-12-31 | 2018-09-30 | 2018-06-30 | 2018-03-31 | 2017-12-31 | 2017-09-30 | 2017-06-30 | 2017-03-31 | 2016-12-31 | 2016-09-30 | 2016-06-30 | 2016-03-31 | 2015-12-31 | 2015-09-30 | 2015-06-30 | 2015-03-31 | 2014-12-31 | 2014-09-30 | 2014-06-30 | 2014-03-31 | 2013-12-31 | 2013-09-30 | 2013-06-30 | 2013-03-31 | 2012-12-31 | 2012-09-30 | 2012-06-30 | 2012-03-31 | 2011-12-31 | 2011-09-30 | 2011-06-30 | 2011-03-31 | 2010-12-31 | 2010-09-30 | ||
|---|---|---|---|---|---|---|---|---|---|---|---|---|---|---|---|---|---|---|---|---|---|---|---|---|---|---|---|---|---|---|---|---|---|---|---|---|---|---|---|---|---|---|---|---|---|---|---|---|---|---|---|---|---|---|---|
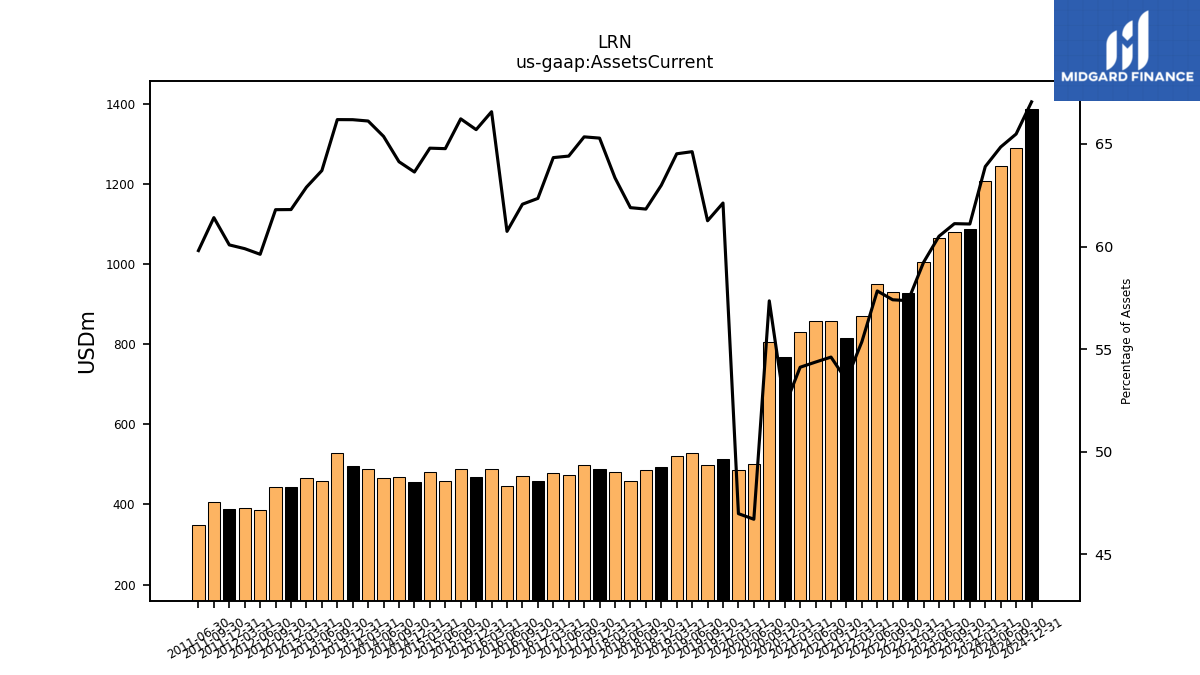
| Assets Current | 1088.87 | 1080.28 | 1065.20 | 1006.81 | 928.82 | 931.14 | 950.53 | 871.58 | 816.13 | 857.58 | 857.53 | 830.21 | 768.48 | 805.49 | 501.27 | 486.70 | 513.69 | 498.31 | 529.66 | 521.97 | 493.61 | 485.20 | 459.23 | 482.14 | 488.75 | 498.22 | 473.58 | 479.56 | 459.79 | 472.27 | 445.86 | 488.58 | 469.73 | 488.33 | 458.96 | 481.88 | 455.14 | 468.94 | 465.20 | 487.45 | 495.63 | 528.36 | 457.95 | 465.35 | 444.17 | 444.62 | 386.84 | 390.36 | 389.08 | 406.72 | 348.10 | NA | NA | NA | |
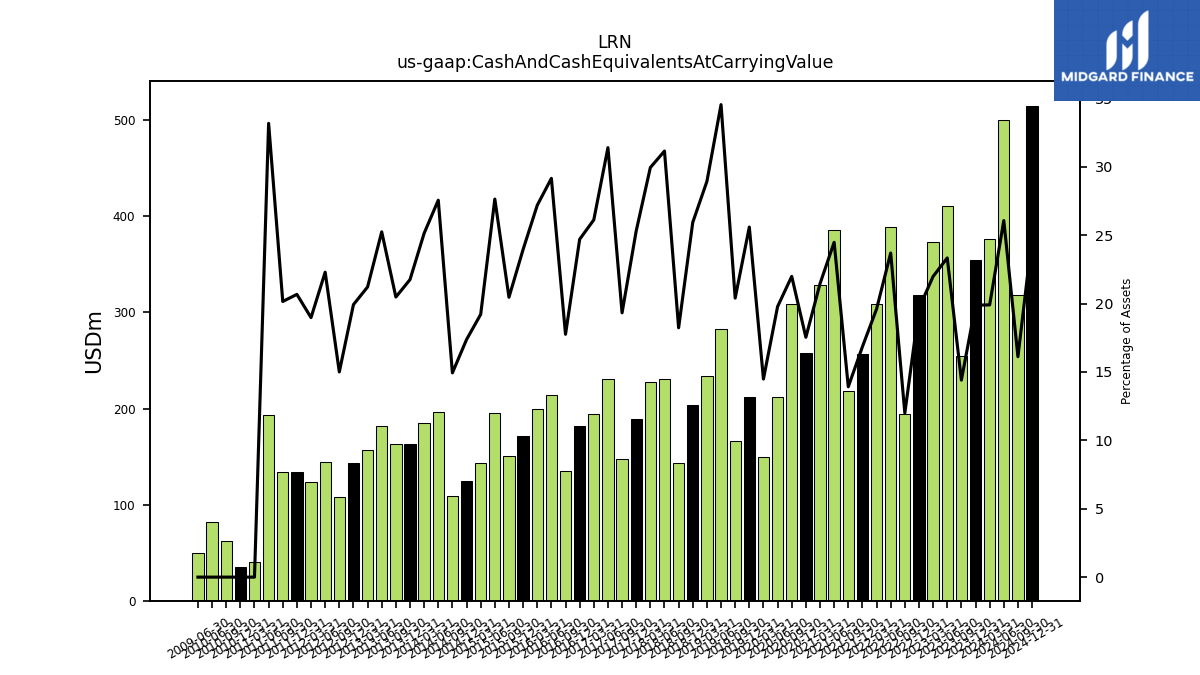
| Cash And Cash Equivalents At Carrying Value | 354.39 | 254.63 | 410.81 | 373.68 | 318.28 | 194.52 | 389.40 | 308.56 | 256.99 | 218.52 | 386.08 | 329.03 | 258.11 | 308.78 | 212.30 | 150.03 | 211.64 | 165.94 | 283.12 | 234.03 | 203.28 | 143.05 | 231.11 | 227.91 | 189.50 | 147.34 | 230.86 | 194.71 | 182.15 | 135.09 | 213.99 | 199.51 | 171.28 | 150.86 | 195.85 | 142.85 | 124.23 | 109.20 | 196.11 | 185.33 | 162.89 | 163.47 | 181.48 | 156.97 | 143.19 | 107.94 | 144.65 | 123.65 | 133.87 | 133.47 | 193.10 | 40.08 | 35.16 | 62.35 | |
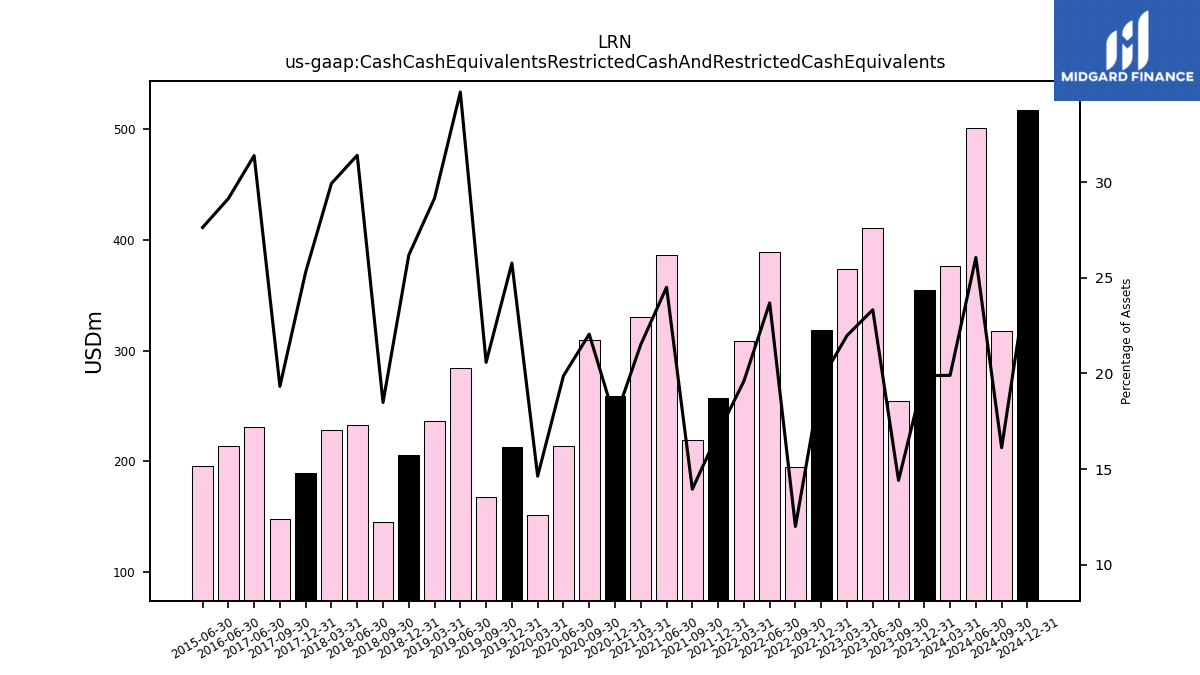
| Cash Cash Equivalents Restricted Cash And Restricted Cash Equivalents | 354.39 | 254.63 | 410.81 | 373.68 | 318.28 | 194.52 | 389.40 | 308.56 | 257.49 | 219.02 | 386.58 | 330.03 | 259.18 | 309.78 | 213.30 | 151.53 | 213.14 | 167.44 | 284.62 | 236.03 | 205.28 | 145.05 | 233.11 | 227.91 | 189.50 | 147.34 | 230.86 | NA | NA | NA | 213.99 | NA | NA | NA | 195.85 | NA | NA | NA | NA | NA | NA | NA | NA | NA | NA | NA | NA | NA | NA | NA | NA | NA | NA | NA | |
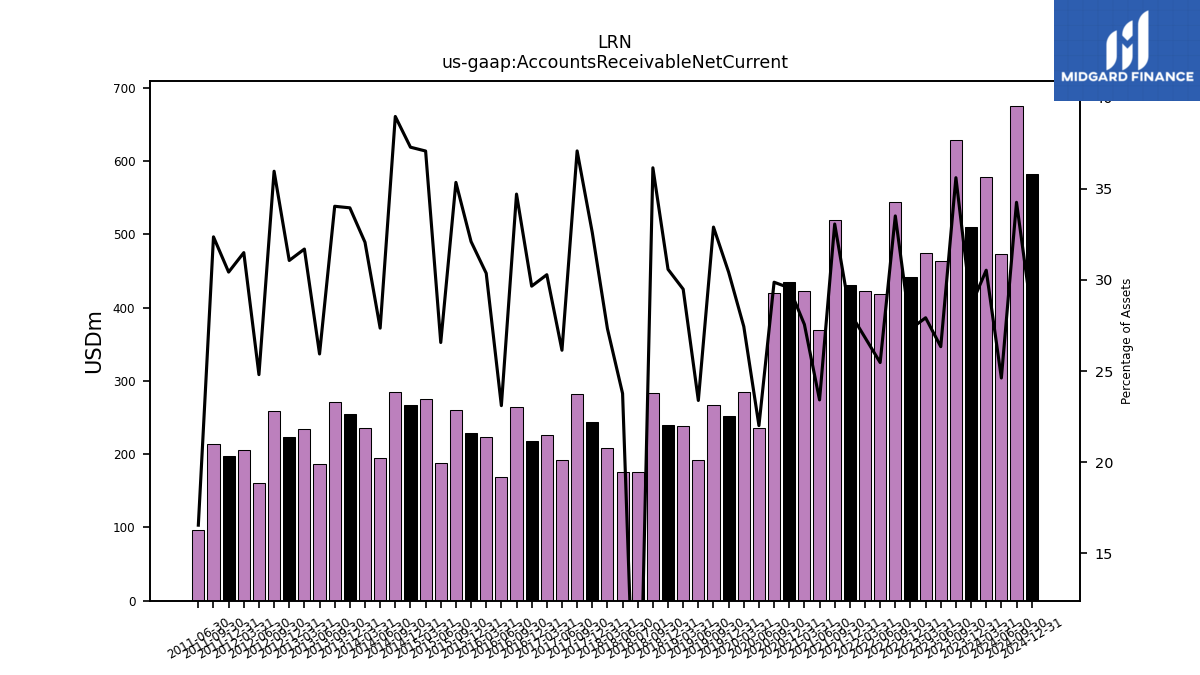
| Accounts Receivable Net Current | 509.63 | 629.60 | 463.72 | 474.66 | 442.17 | 543.71 | 418.56 | 422.62 | 430.44 | 519.39 | 369.30 | 422.79 | 435.25 | 419.62 | 236.13 | 284.33 | 251.62 | 267.69 | 191.64 | 238.61 | 239.70 | 283.81 | 176.32 | 208.00 | 244.12 | 282.79 | 192.21 | 225.78 | 218.74 | 264.19 | 169.55 | 222.88 | 229.59 | 260.75 | 188.25 | 275.80 | 266.76 | 285.04 | 194.68 | 236.44 | 254.35 | 271.81 | 186.46 | 234.55 | 223.31 | 258.83 | 160.92 | 205.31 | 197.10 | 214.39 | 96.23 | NA | NA | NA | |
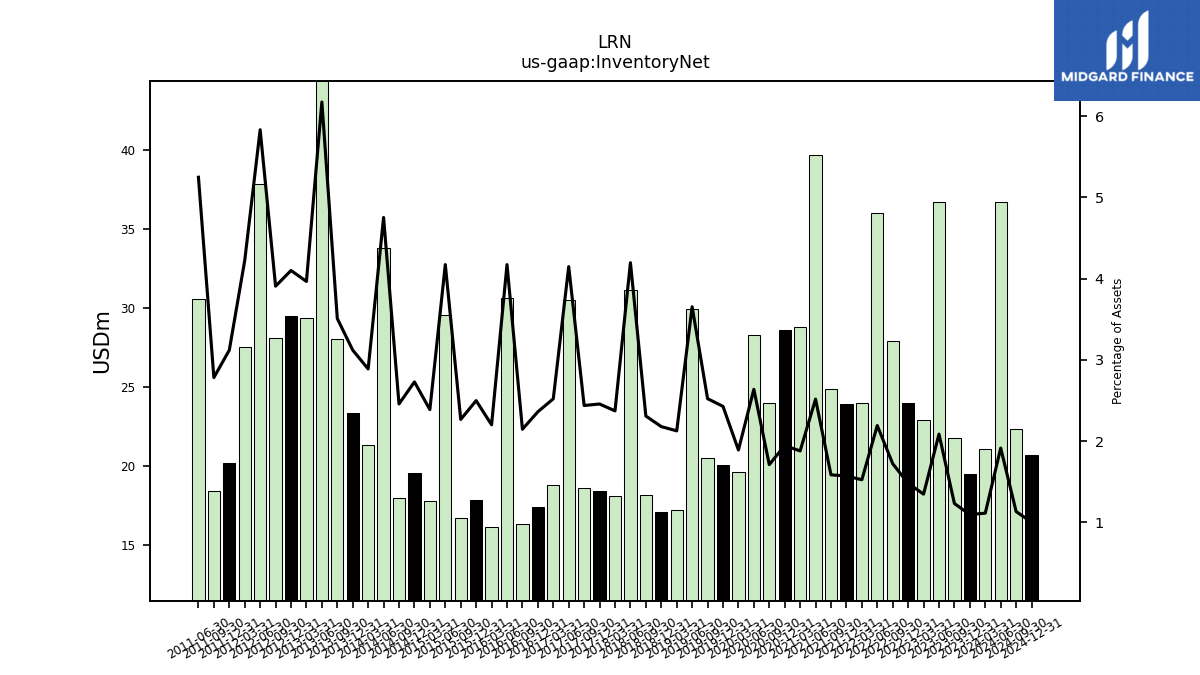
| Inventory Net | 19.51 | 21.75 | 36.72 | 22.88 | 23.96 | 27.92 | 36.00 | 23.99 | 23.94 | 24.87 | 39.69 | 28.81 | 28.62 | 24.01 | 28.30 | 19.58 | 20.07 | 20.52 | 29.95 | 17.20 | 17.07 | 18.12 | 31.13 | 18.05 | 18.39 | 18.59 | 30.50 | 18.79 | 17.41 | 16.33 | 30.63 | 16.15 | 17.86 | 16.71 | 29.57 | 17.76 | 19.52 | 17.97 | 33.83 | 21.29 | 23.36 | 28.01 | 44.40 | 29.34 | 29.47 | 28.11 | 37.85 | 27.52 | 20.20 | 18.43 | 30.55 | NA | NA | NA | |
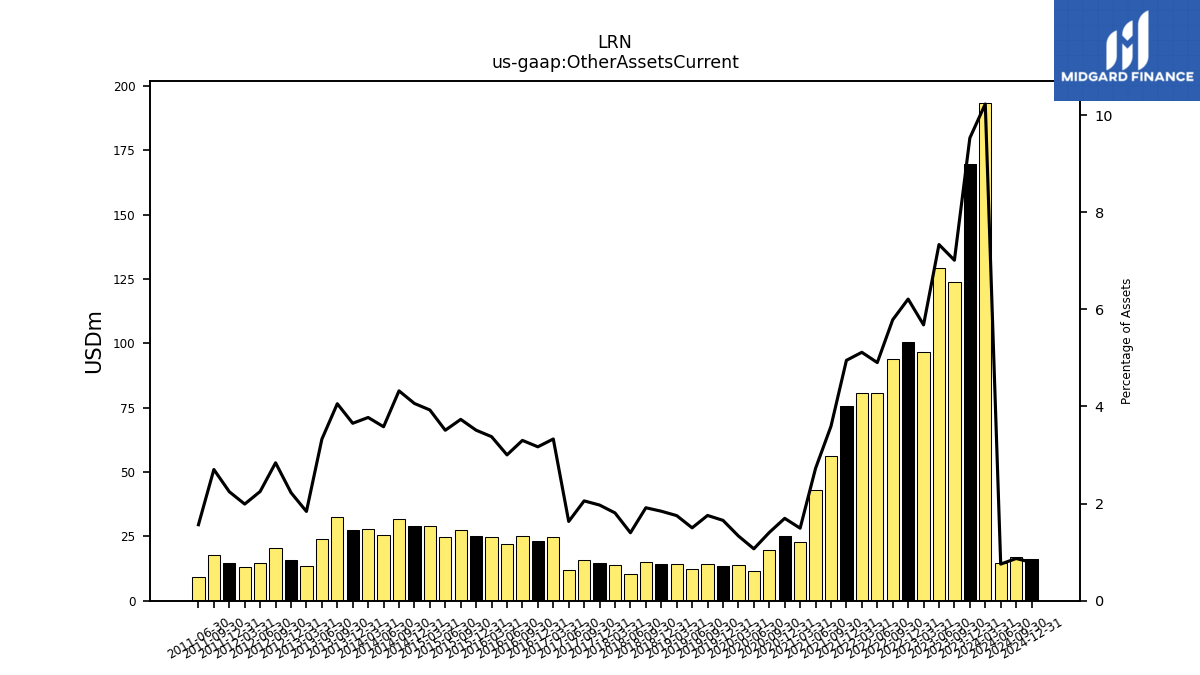
| Other Assets Current | 169.81 | 123.95 | 129.14 | 96.57 | 100.59 | 93.84 | 80.60 | 80.55 | 75.53 | 56.44 | 43.00 | 22.92 | 24.97 | 19.75 | 11.48 | 13.81 | 13.69 | 14.29 | 12.31 | 14.18 | 14.45 | 15.03 | 10.39 | 13.77 | 14.75 | 15.68 | 12.00 | 24.83 | 23.38 | 25.12 | 22.05 | 24.80 | 25.11 | 27.54 | 24.88 | 29.22 | 29.06 | 31.60 | 25.50 | 27.82 | 27.37 | 32.38 | 23.92 | 13.61 | 16.00 | 20.44 | 14.60 | 12.97 | 14.54 | 17.90 | 9.11 | NA | NA | NA |
| 2023-12-31 | 2023-09-30 | 2023-06-30 | 2023-03-31 | 2022-12-31 | 2022-09-30 | 2022-06-30 | 2022-03-31 | 2021-12-31 | 2021-09-30 | 2021-06-30 | 2021-03-31 | 2020-12-31 | 2020-09-30 | 2020-06-30 | 2020-03-31 | 2019-12-31 | 2019-09-30 | 2019-06-30 | 2019-03-31 | 2018-12-31 | 2018-09-30 | 2018-06-30 | 2018-03-31 | 2017-12-31 | 2017-09-30 | 2017-06-30 | 2017-03-31 | 2016-12-31 | 2016-09-30 | 2016-06-30 | 2016-03-31 | 2015-12-31 | 2015-09-30 | 2015-06-30 | 2015-03-31 | 2014-12-31 | 2014-09-30 | 2014-06-30 | 2014-03-31 | 2013-12-31 | 2013-09-30 | 2013-06-30 | 2013-03-31 | 2012-12-31 | 2012-09-30 | 2012-06-30 | 2012-03-31 | 2011-12-31 | 2011-09-30 | 2011-06-30 | 2011-03-31 | 2010-12-31 | 2010-09-30 | ||
|---|---|---|---|---|---|---|---|---|---|---|---|---|---|---|---|---|---|---|---|---|---|---|---|---|---|---|---|---|---|---|---|---|---|---|---|---|---|---|---|---|---|---|---|---|---|---|---|---|---|---|---|---|---|---|---|
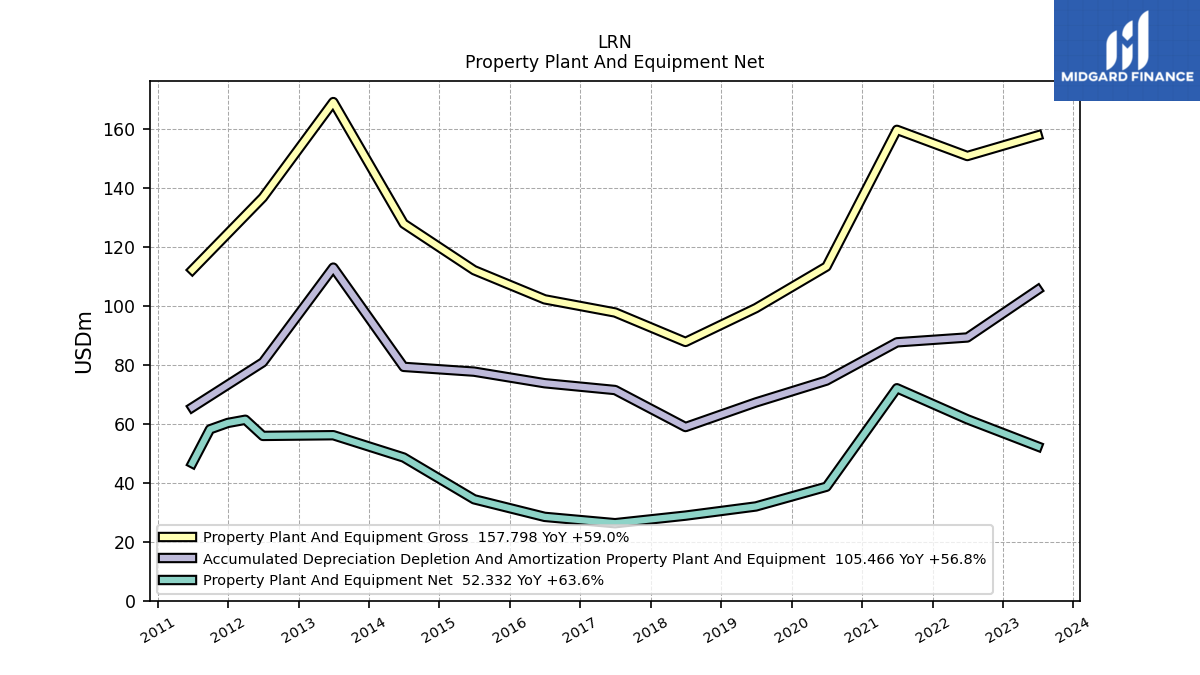
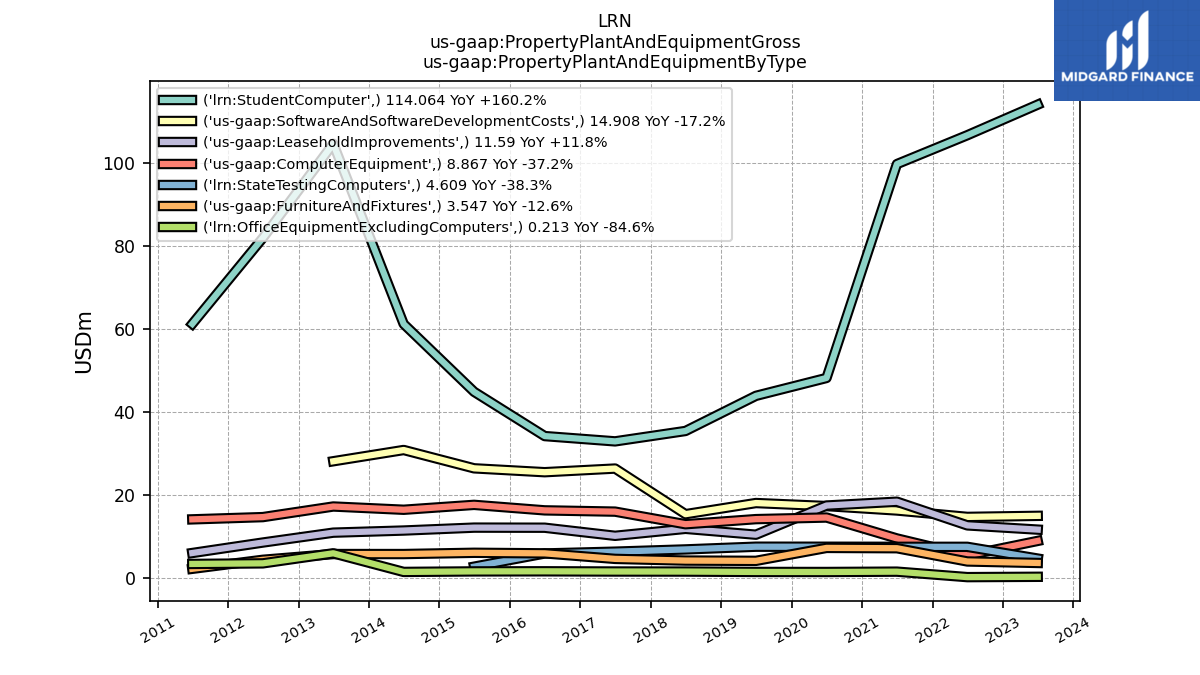
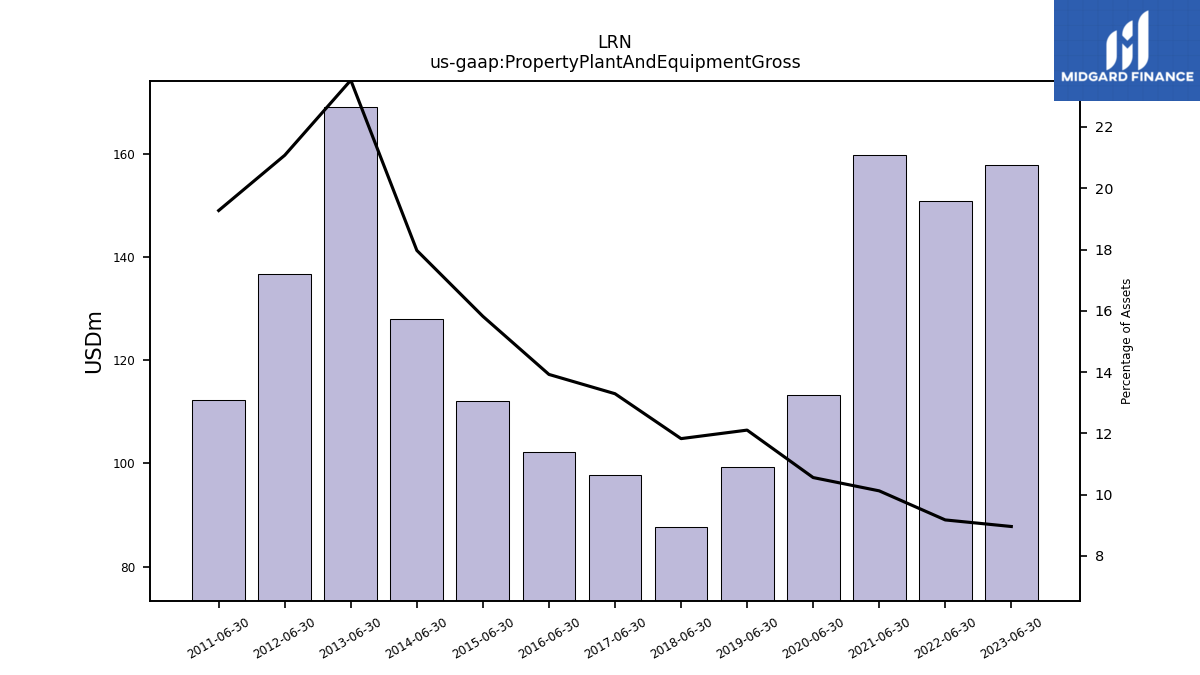
| Property Plant And Equipment Gross | NA | NA | 157.80 | NA | NA | NA | 150.82 | NA | NA | NA | 159.71 | NA | NA | NA | 113.33 | NA | NA | NA | 99.24 | NA | NA | NA | 87.78 | NA | NA | NA | 97.76 | NA | NA | NA | 102.22 | NA | NA | NA | 112.11 | NA | NA | NA | 127.90 | NA | NA | NA | 169.13 | NA | NA | NA | 136.76 | NA | NA | NA | 112.19 | NA | NA | NA | |
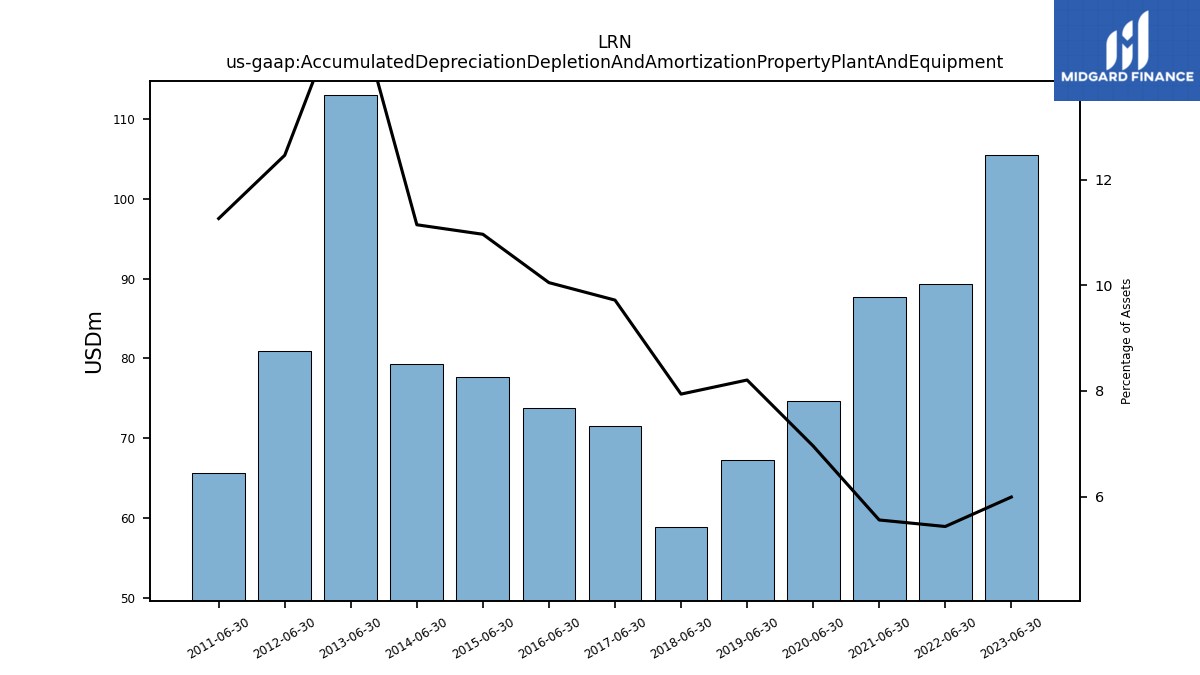
| Accumulated Depreciation Depletion And Amortization Property Plant And Equipment | NA | NA | 105.47 | NA | NA | NA | 89.29 | NA | NA | NA | 87.64 | NA | NA | NA | 74.67 | NA | NA | NA | 67.26 | NA | NA | NA | 58.91 | NA | NA | NA | 71.46 | NA | NA | NA | 73.77 | NA | NA | NA | 77.70 | NA | NA | NA | 79.32 | NA | NA | NA | 112.99 | NA | NA | NA | 80.86 | NA | NA | NA | 65.56 | NA | NA | NA | |
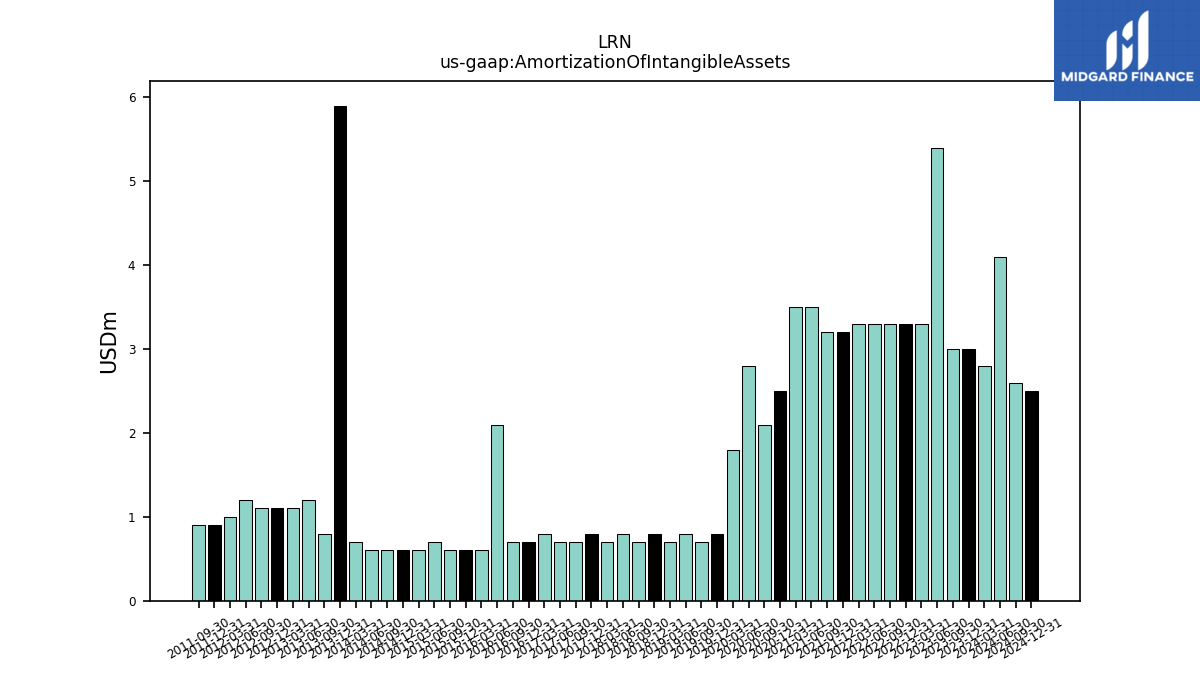
| Amortization Of Intangible Assets | 3.00 | 3.00 | 5.40 | 3.30 | 3.30 | 3.30 | 3.30 | 3.30 | 3.20 | 3.20 | 3.50 | 3.50 | 2.50 | 2.10 | 2.80 | 1.80 | 0.80 | 0.70 | 0.80 | 0.70 | 0.80 | 0.70 | 0.80 | 0.70 | 0.80 | 0.70 | 0.70 | 0.80 | 0.70 | 0.70 | 2.10 | 0.60 | 0.60 | 0.60 | 0.70 | 0.60 | 0.60 | 0.60 | 0.60 | 0.70 | 5.90 | 0.80 | 1.20 | 1.10 | 1.10 | 1.10 | 1.20 | 1.00 | 0.90 | 0.90 | NA | NA | NA | NA | |
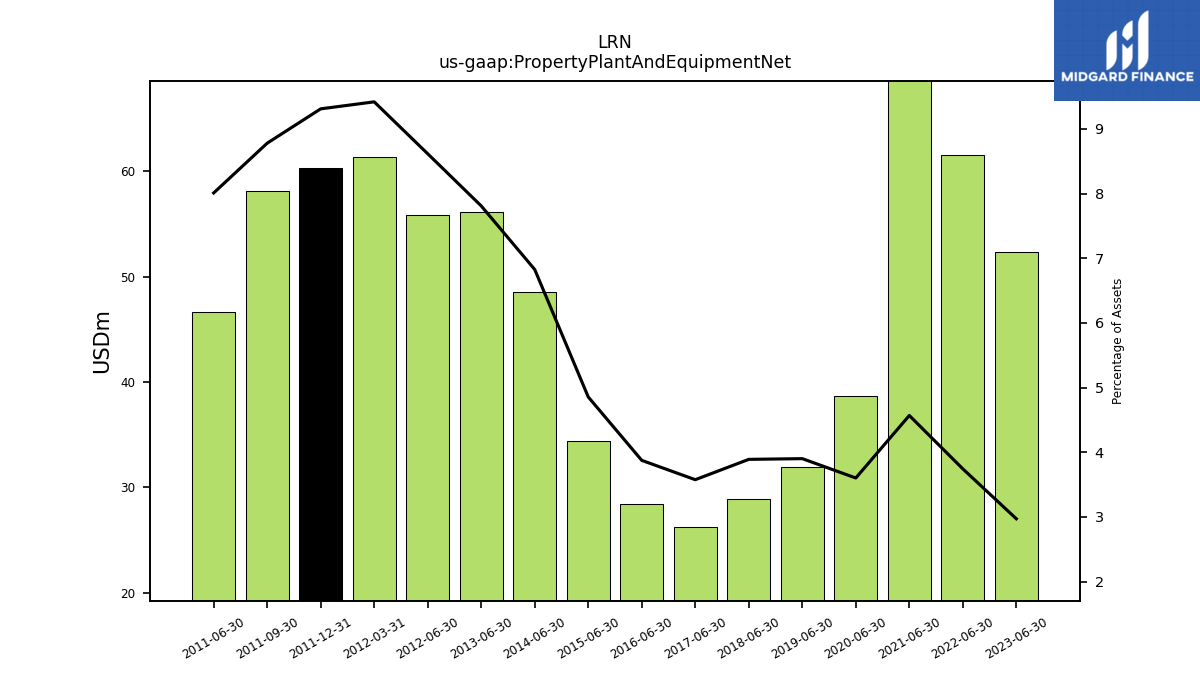
| Property Plant And Equipment Net | NA | NA | 52.33 | NA | NA | NA | 61.54 | NA | NA | NA | 72.07 | NA | NA | NA | 38.67 | NA | NA | NA | 31.98 | NA | NA | NA | 28.87 | NA | NA | NA | 26.30 | NA | NA | NA | 28.45 | NA | NA | NA | 34.41 | NA | NA | NA | 48.58 | NA | NA | NA | 56.14 | NA | NA | NA | 55.90 | 61.38 | 60.30 | 58.15 | 46.62 | NA | NA | NA | |
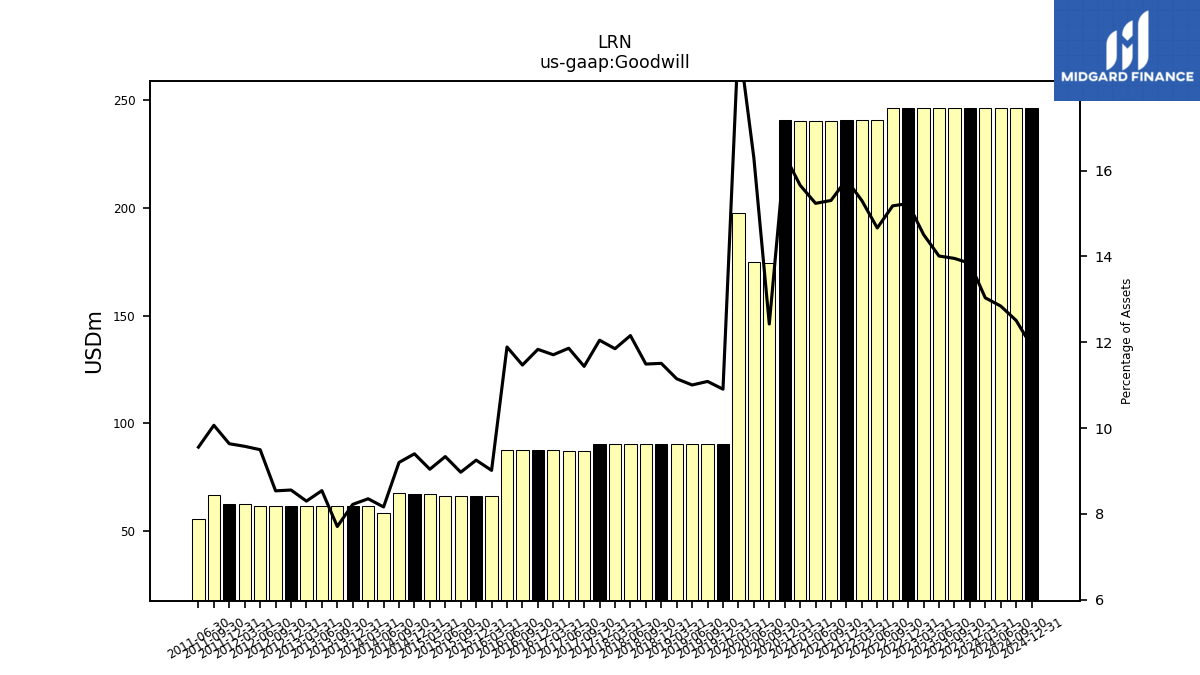
| Goodwill | 246.68 | 246.68 | 246.68 | 246.68 | 246.68 | 246.24 | 241.02 | 240.95 | 240.92 | 240.35 | 240.35 | 240.25 | 240.80 | 174.52 | 174.94 | 197.80 | 90.20 | 90.20 | 90.20 | 90.20 | 90.20 | 90.20 | 90.20 | 90.20 | 90.20 | 87.21 | 87.21 | 87.28 | 87.28 | 87.28 | 87.28 | 66.16 | 66.16 | 66.16 | 66.16 | 67.24 | 67.24 | 67.27 | 58.09 | 61.58 | 61.57 | 61.52 | 61.41 | 61.40 | 61.50 | 61.43 | 61.62 | 62.40 | 62.40 | 66.67 | 55.63 | NA | NA | NA | |
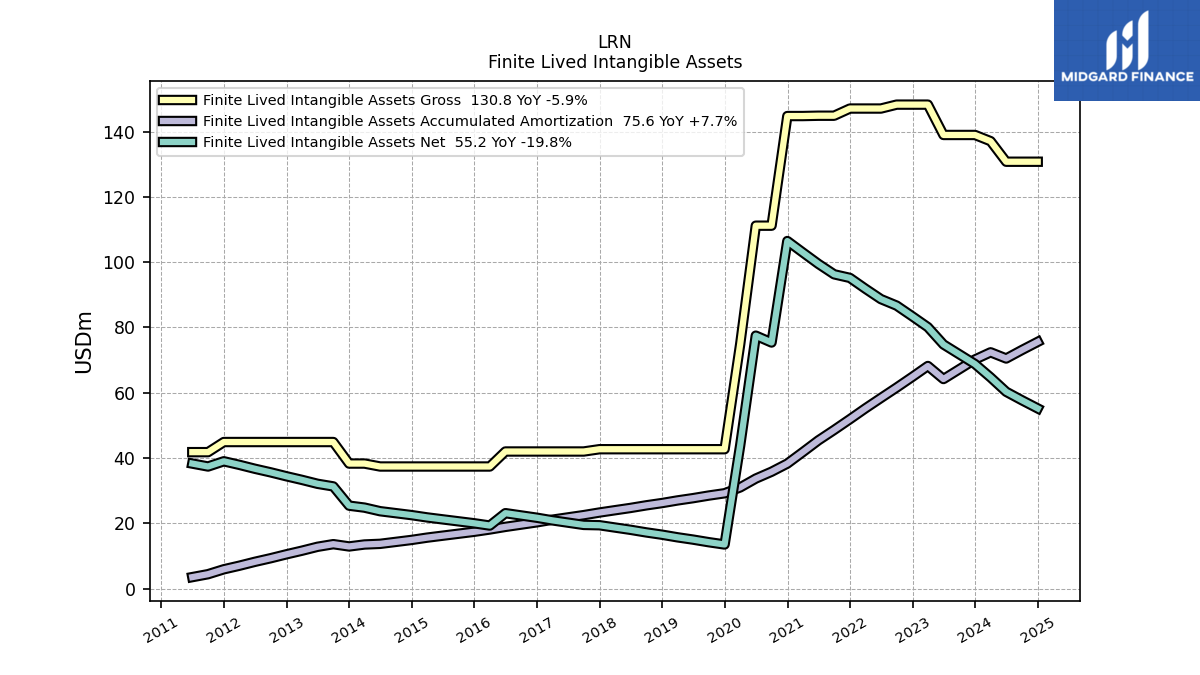
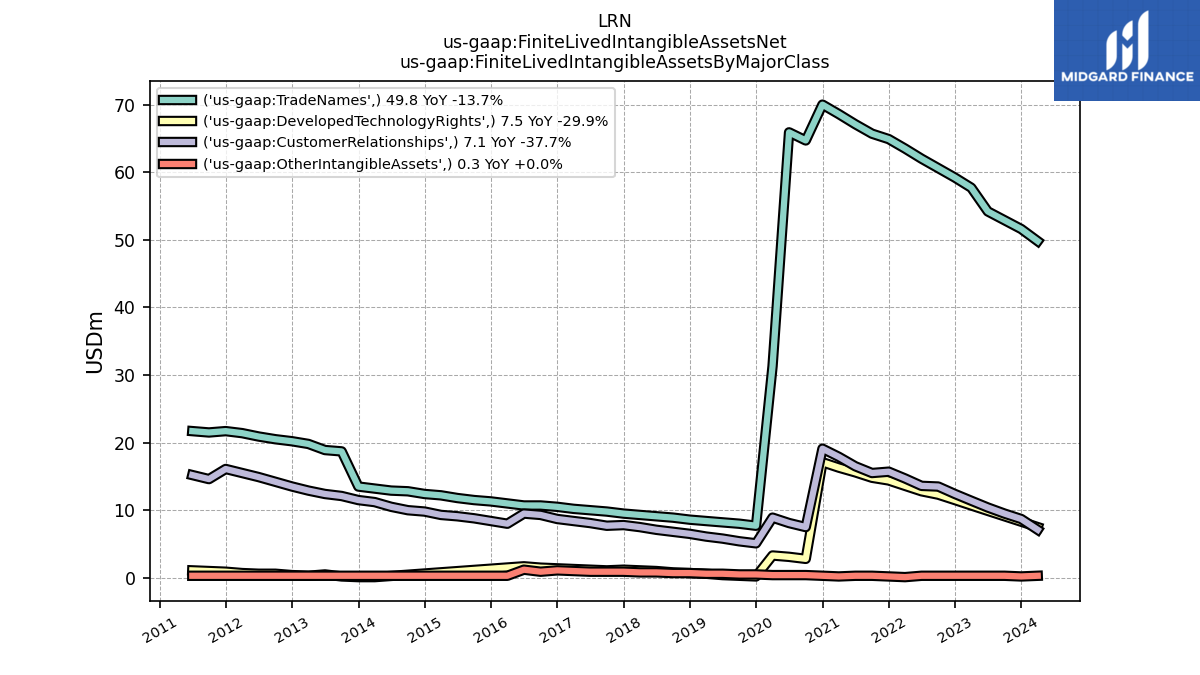
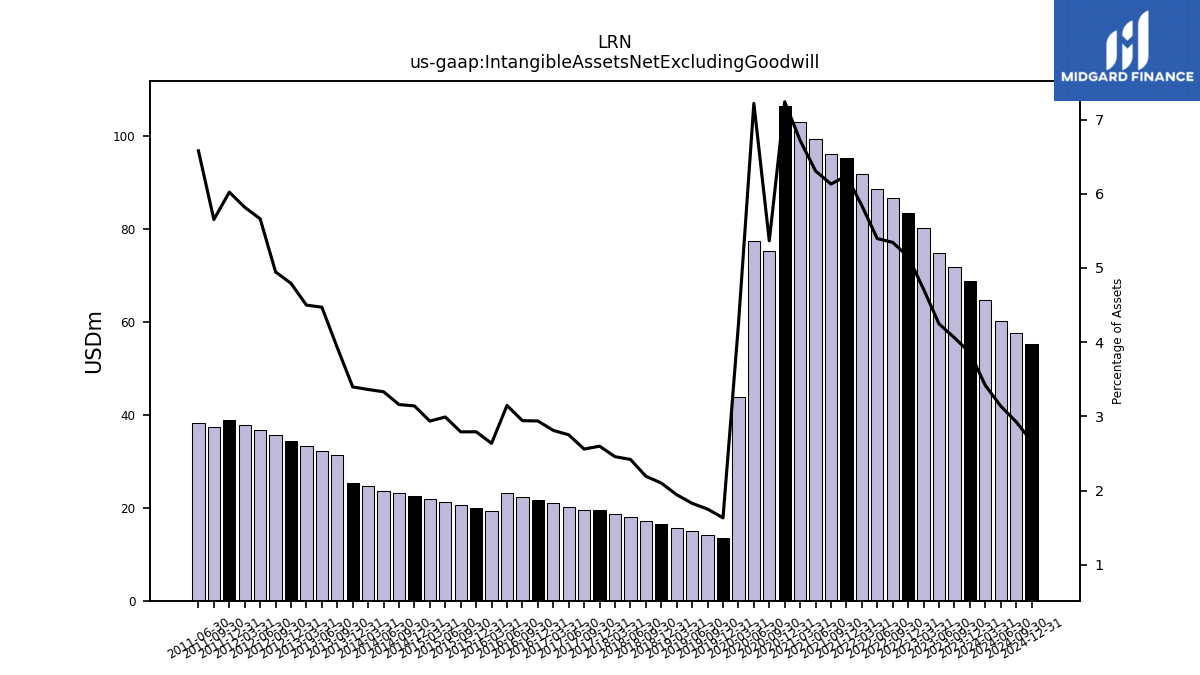
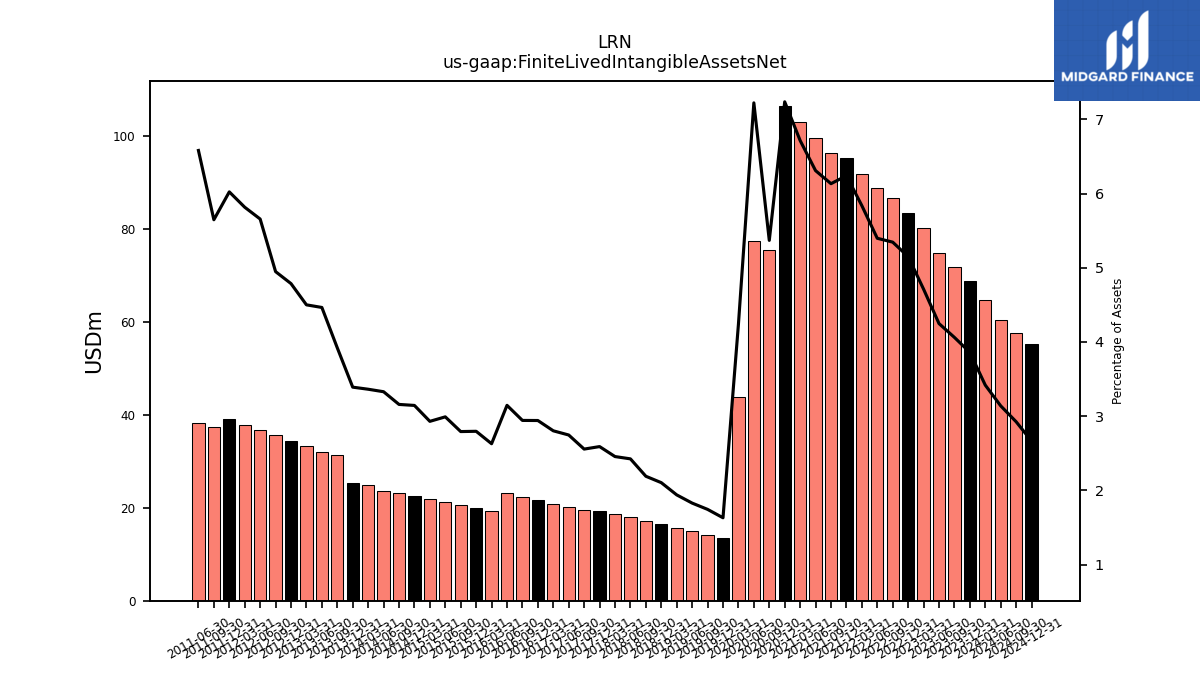
| Intangible Assets Net Excluding Goodwill | 68.77 | 71.75 | 74.77 | 80.13 | 83.41 | 86.69 | 88.67 | 91.94 | 95.21 | 96.27 | 99.48 | 103.05 | 106.55 | 75.36 | 77.45 | 43.89 | 13.49 | 14.24 | 14.98 | 15.72 | 16.47 | 17.21 | 17.95 | 18.69 | 19.45 | 19.51 | 20.23 | 20.95 | 21.66 | 22.38 | 23.10 | 19.35 | 19.96 | 20.58 | 21.20 | 21.83 | 22.46 | 23.10 | 23.71 | 24.78 | 25.44 | 31.33 | 32.14 | 33.29 | 34.44 | 35.59 | 36.74 | 37.91 | 38.99 | 37.44 | 38.29 | NA | NA | NA | |
| Finite Lived Intangible Assets Net | 68.80 | 71.80 | 74.80 | 80.10 | 83.40 | 86.70 | 88.70 | 91.90 | 95.20 | 96.30 | 99.50 | 103.00 | 106.50 | 75.40 | 77.50 | 43.90 | 13.50 | 14.20 | 15.00 | 15.70 | 16.50 | 17.20 | 18.00 | 18.70 | 19.40 | 19.50 | 20.20 | 20.90 | 21.70 | 22.40 | 23.10 | 19.30 | 20.00 | 20.60 | 21.20 | 21.80 | 22.50 | 23.10 | 23.70 | 24.80 | 25.40 | 31.30 | 32.10 | 33.30 | 34.40 | 35.60 | 36.70 | 37.90 | 39.00 | 37.40 | 38.30 | NA | NA | NA | |
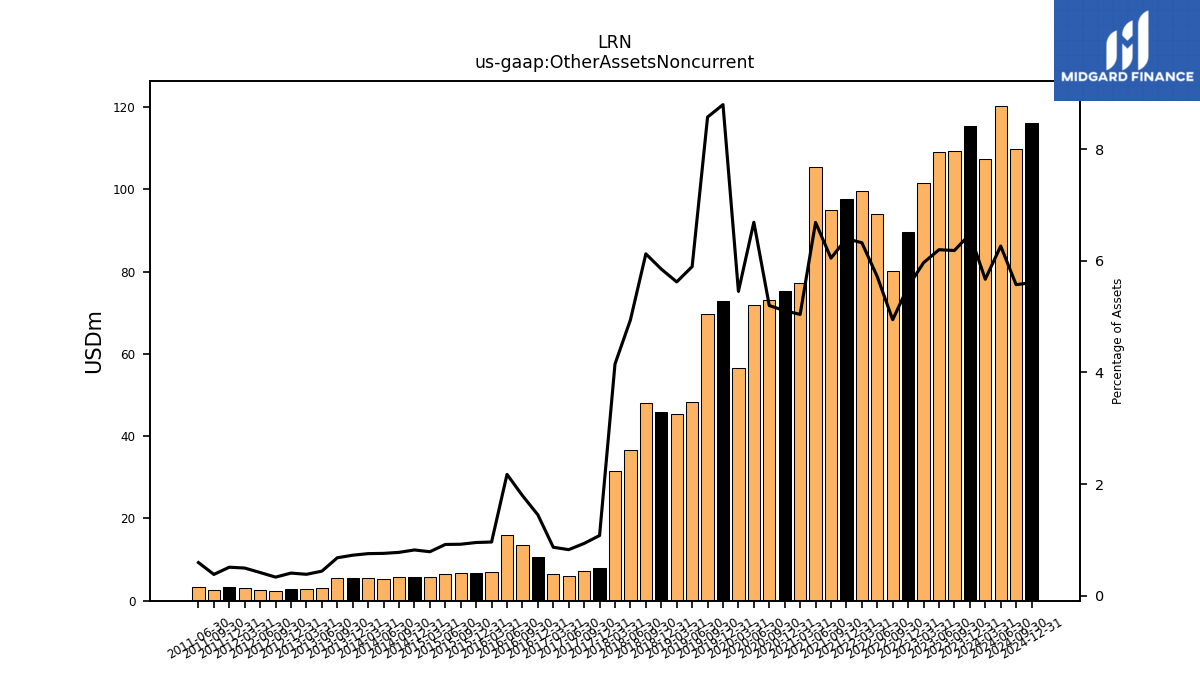
| Other Assets Noncurrent | 115.44 | 109.34 | 109.15 | 101.42 | 89.69 | 80.22 | 93.95 | 99.58 | 97.62 | 94.98 | 105.51 | 77.32 | 75.17 | 73.01 | 71.82 | 56.49 | 72.77 | 69.77 | 48.33 | 45.49 | 45.87 | 48.08 | 36.67 | 31.59 | 8.06 | 7.13 | 6.06 | 6.46 | 10.68 | 13.65 | 15.94 | 7.05 | 6.81 | 6.79 | 6.50 | 5.85 | 5.85 | 5.67 | 5.39 | 5.55 | 5.42 | 5.42 | 3.15 | 2.83 | 2.90 | 2.38 | 2.68 | 3.22 | 3.30 | 2.52 | 3.45 | NA | NA | NA | |
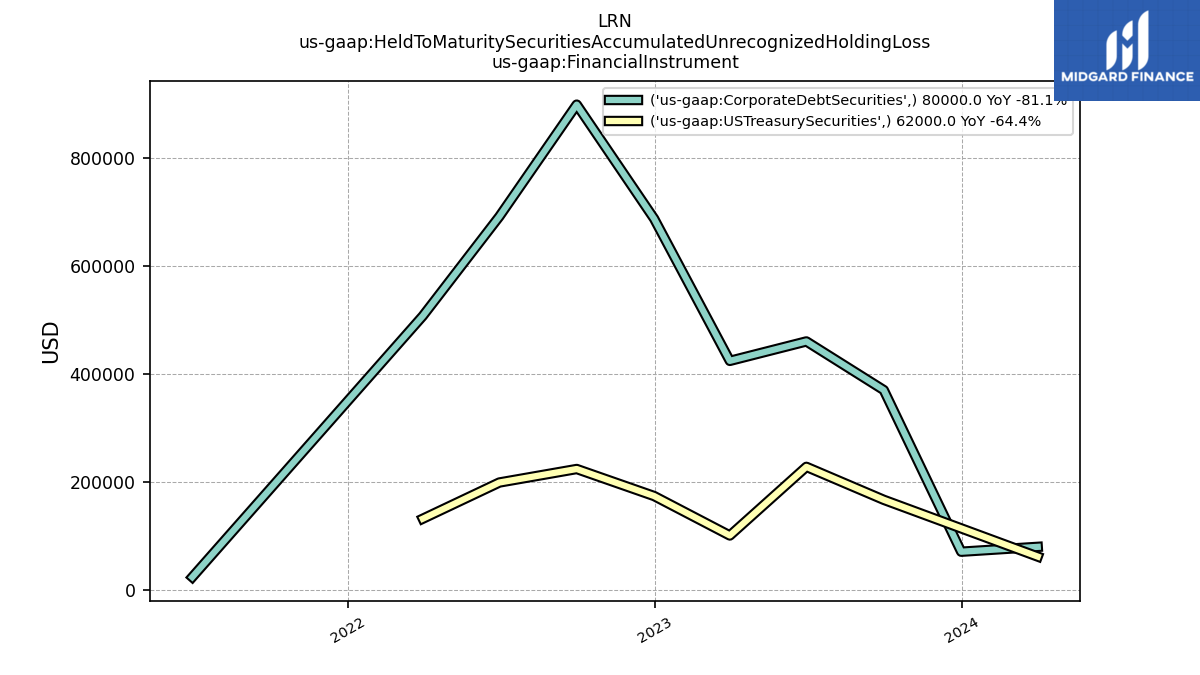
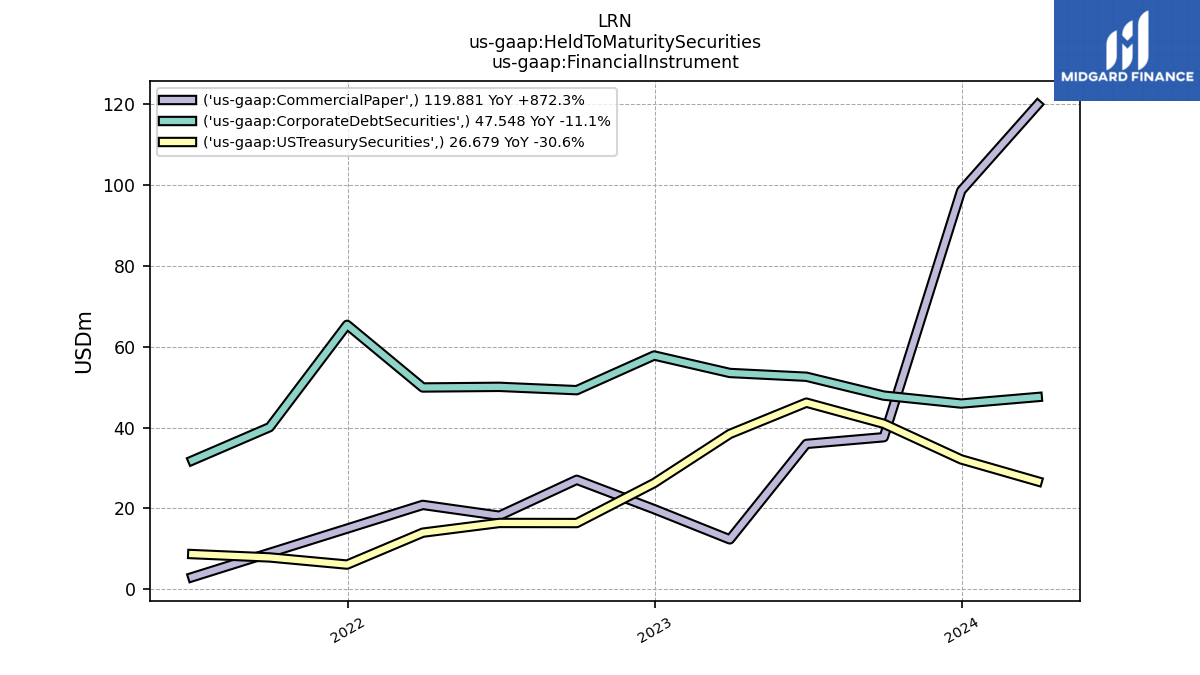
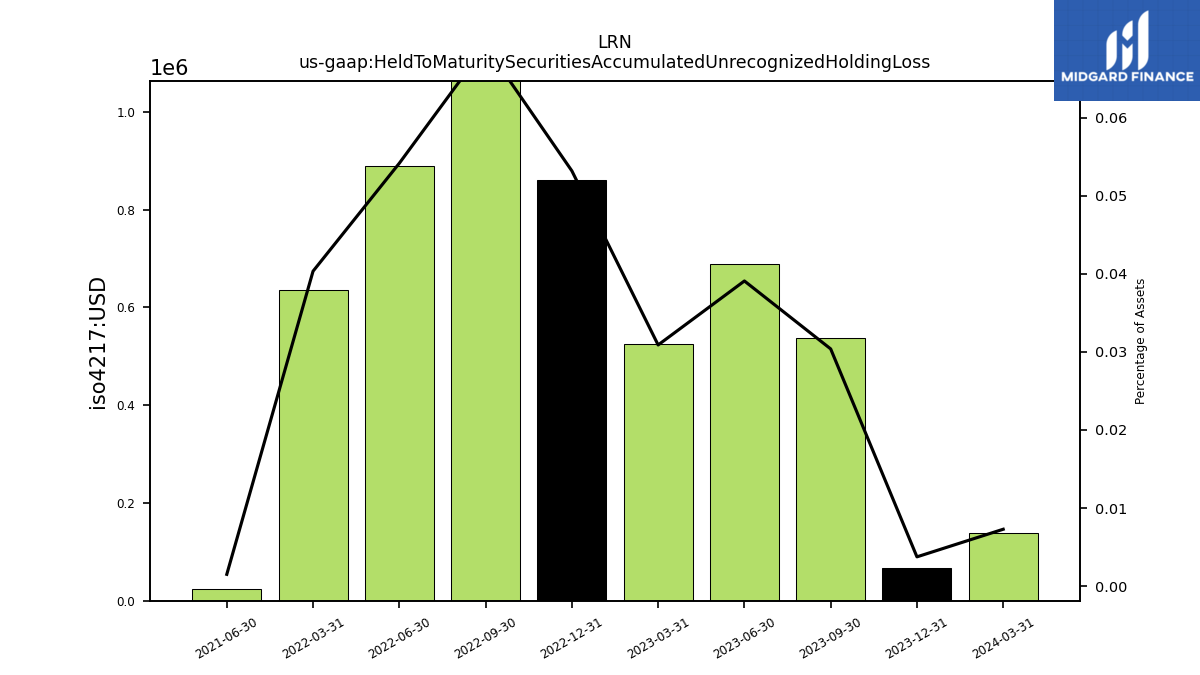
| Held To Maturity Securities Accumulated Unrecognized Holding Loss | 0.07 | 0.54 | 0.69 | 0.53 | 0.86 | 1.12 | 0.89 | 0.64 | NA | NA | 0.02 | NA | NA | NA | NA | NA | NA | NA | NA | NA | NA | NA | NA | NA | NA | NA | NA | NA | NA | NA | NA | NA | NA | NA | NA | NA | NA | NA | NA | NA | NA | NA | NA | NA | NA | NA | NA | NA | NA | NA | NA | NA | NA | NA | |
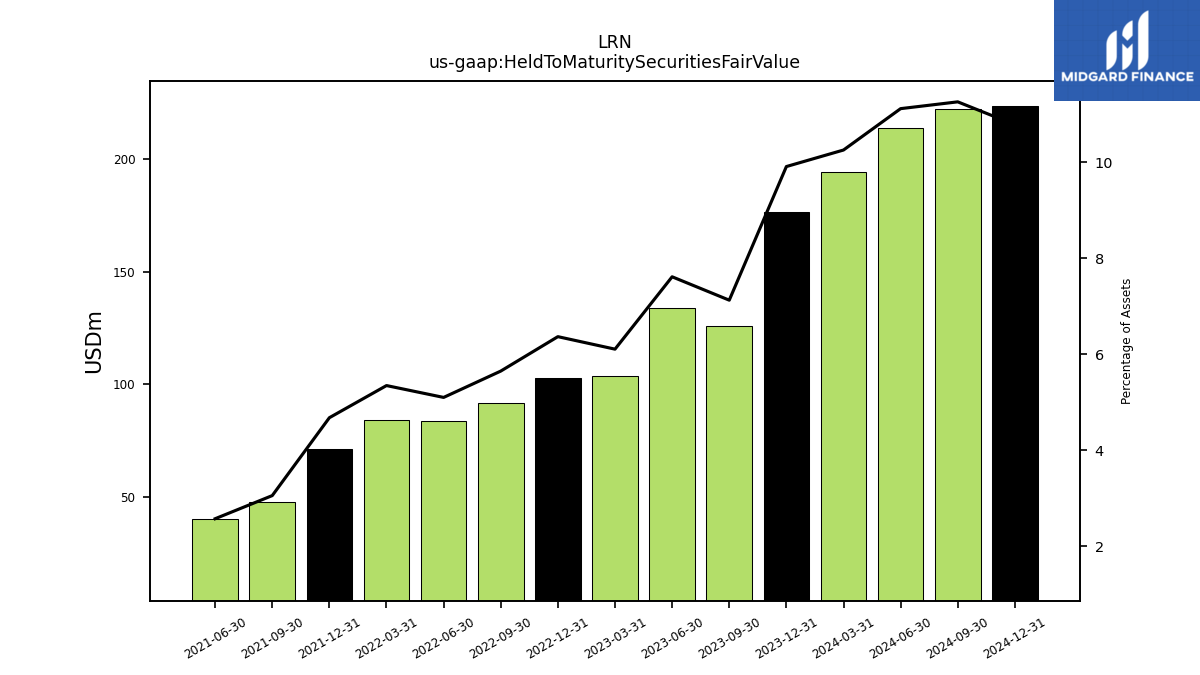
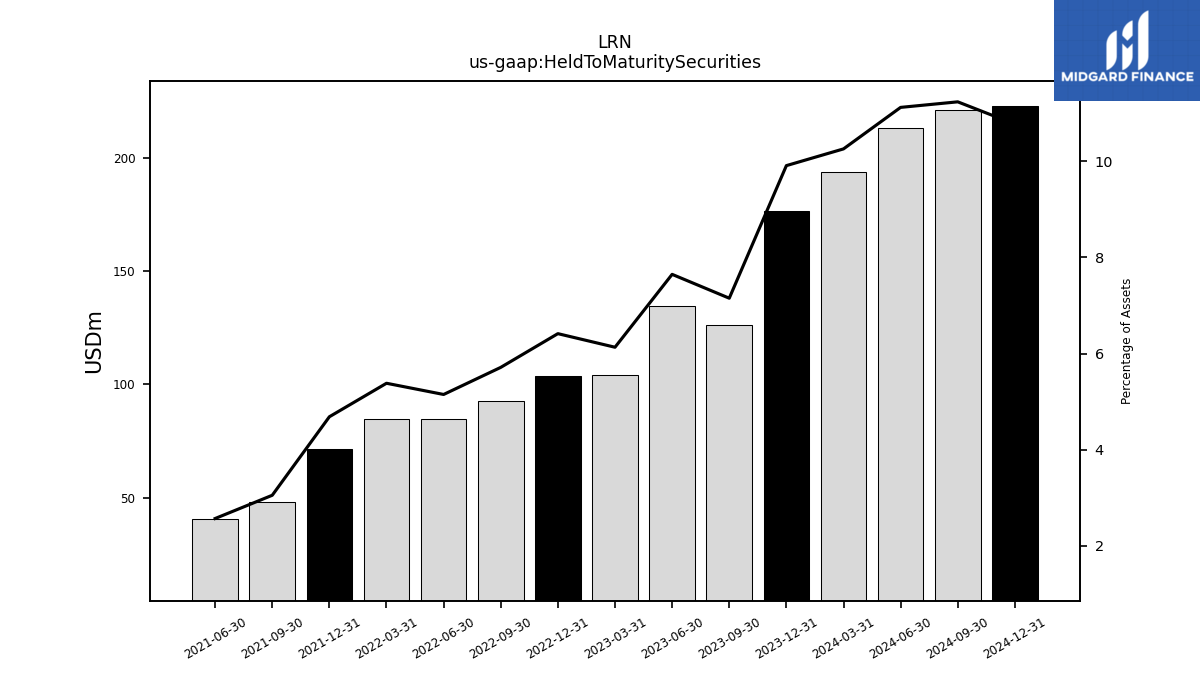
| Held To Maturity Securities Fair Value | 176.55 | 125.90 | 133.98 | 103.72 | 103.03 | 91.57 | 83.76 | 84.13 | 71.31 | 47.91 | 40.52 | NA | NA | NA | NA | NA | NA | NA | NA | NA | NA | NA | NA | NA | NA | NA | NA | NA | NA | NA | NA | NA | NA | NA | NA | NA | NA | NA | NA | NA | NA | NA | NA | NA | NA | NA | NA | NA | NA | NA | NA | NA | NA | NA | |
| Held To Maturity Securities | 176.62 | 126.44 | 134.67 | 104.25 | 103.89 | 92.69 | 84.65 | 84.77 | 71.51 | 47.96 | 40.54 | NA | NA | NA | NA | NA | NA | NA | NA | NA | NA | NA | NA | NA | NA | NA | NA | NA | NA | NA | NA | NA | NA | NA | NA | NA | NA | NA | NA | NA | NA | NA | NA | NA | NA | NA | NA | NA | NA | NA | NA | NA | NA | NA | |
| Held To Maturity Securities Accumulated Unrecognized Holding Loss | 0.07 | 0.54 | 0.69 | 0.53 | 0.86 | 1.12 | 0.89 | 0.64 | NA | NA | 0.02 | NA | NA | NA | NA | NA | NA | NA | NA | NA | NA | NA | NA | NA | NA | NA | NA | NA | NA | NA | NA | NA | NA | NA | NA | NA | NA | NA | NA | NA | NA | NA | NA | NA | NA | NA | NA | NA | NA | NA | NA | NA | NA | NA |
| 2023-12-31 | 2023-09-30 | 2023-06-30 | 2023-03-31 | 2022-12-31 | 2022-09-30 | 2022-06-30 | 2022-03-31 | 2021-12-31 | 2021-09-30 | 2021-06-30 | 2021-03-31 | 2020-12-31 | 2020-09-30 | 2020-06-30 | 2020-03-31 | 2019-12-31 | 2019-09-30 | 2019-06-30 | 2019-03-31 | 2018-12-31 | 2018-09-30 | 2018-06-30 | 2018-03-31 | 2017-12-31 | 2017-09-30 | 2017-06-30 | 2017-03-31 | 2016-12-31 | 2016-09-30 | 2016-06-30 | 2016-03-31 | 2015-12-31 | 2015-09-30 | 2015-06-30 | 2015-03-31 | 2014-12-31 | 2014-09-30 | 2014-06-30 | 2014-03-31 | 2013-12-31 | 2013-09-30 | 2013-06-30 | 2013-03-31 | 2012-12-31 | 2012-09-30 | 2012-06-30 | 2012-03-31 | 2011-12-31 | 2011-09-30 | 2011-06-30 | 2011-03-31 | 2010-12-31 | 2010-09-30 | ||
|---|---|---|---|---|---|---|---|---|---|---|---|---|---|---|---|---|---|---|---|---|---|---|---|---|---|---|---|---|---|---|---|---|---|---|---|---|---|---|---|---|---|---|---|---|---|---|---|---|---|---|---|---|---|---|---|
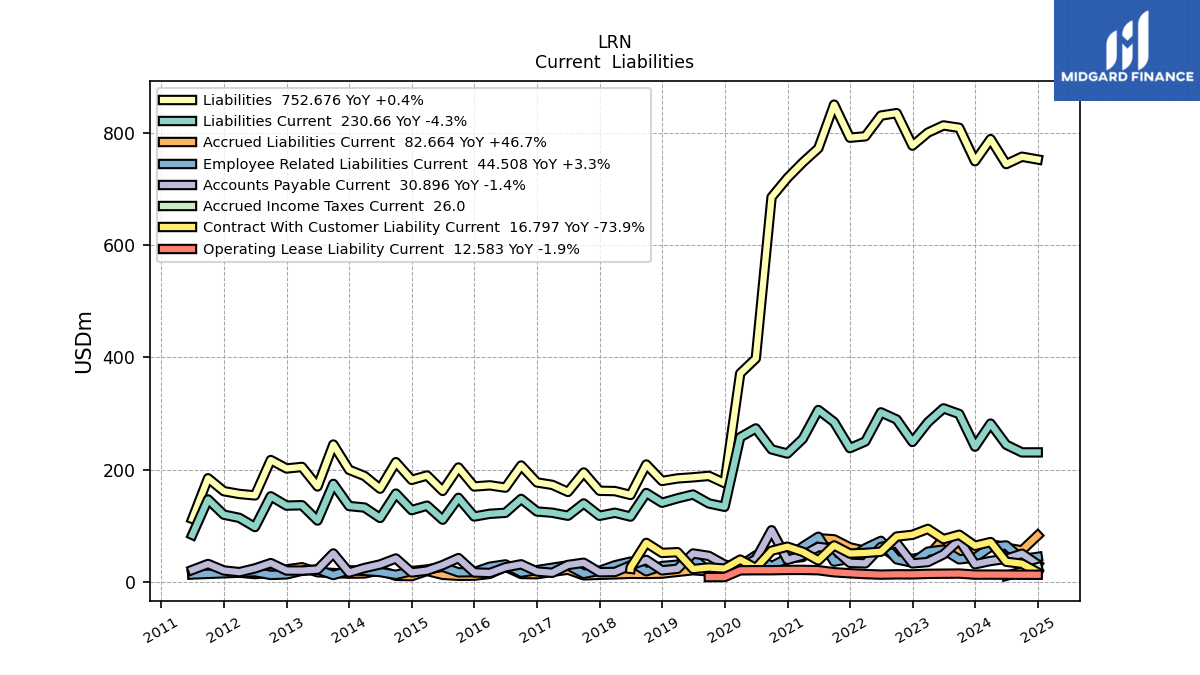
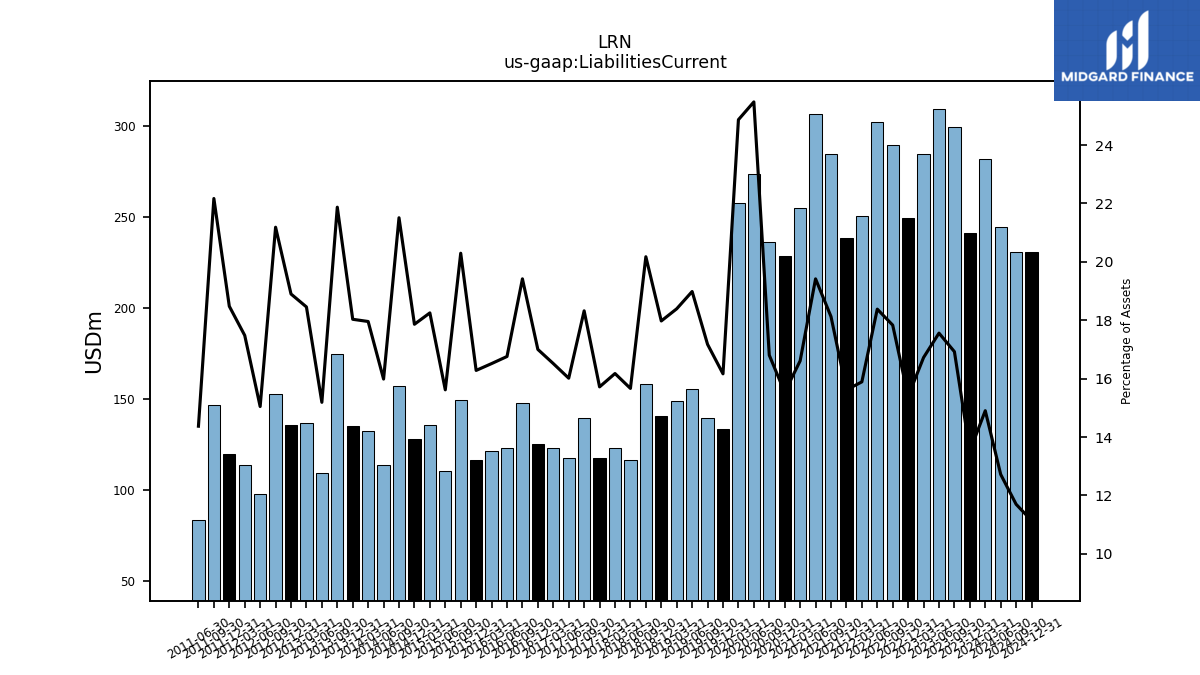
| Liabilities Current | 240.90 | 299.14 | 309.13 | 284.25 | 249.26 | 289.25 | 302.07 | 250.18 | 238.20 | 284.63 | 306.24 | 254.80 | 228.61 | 235.99 | 273.42 | 257.62 | 133.67 | 139.70 | 155.59 | 148.79 | 140.87 | 158.32 | 116.22 | 123.11 | 117.67 | 139.69 | 117.75 | 123.11 | 125.37 | 147.76 | 123.01 | 121.20 | 116.41 | 149.65 | 110.66 | 135.73 | 127.76 | 157.28 | 113.76 | 132.38 | 135.04 | 174.59 | 109.19 | 136.55 | 135.82 | 152.43 | 97.61 | 113.92 | 119.67 | 146.82 | 83.65 | NA | NA | NA | |
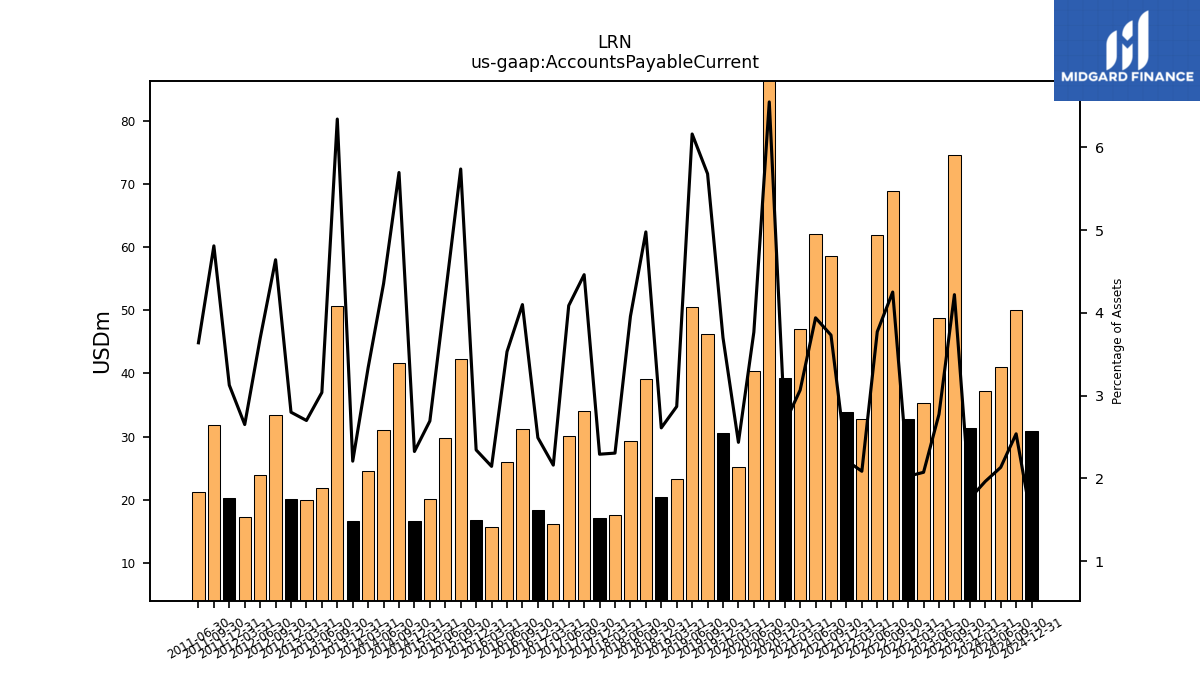
| Accounts Payable Current | 31.32 | 74.59 | 48.85 | 35.25 | 32.81 | 68.96 | 62.00 | 32.85 | 33.82 | 58.59 | 62.14 | 47.04 | 39.25 | 91.96 | 40.43 | 25.23 | 30.60 | 46.20 | 50.49 | 23.21 | 20.46 | 39.06 | 29.36 | 17.55 | 17.16 | 34.01 | 30.05 | 16.11 | 18.38 | 31.20 | 25.92 | 15.74 | 16.76 | 42.31 | 29.82 | 20.03 | 16.63 | 41.64 | 30.98 | 24.61 | 16.54 | 50.62 | 21.84 | 19.98 | 20.12 | 33.39 | 23.95 | 17.28 | 20.25 | 31.85 | 21.18 | NA | NA | NA | |
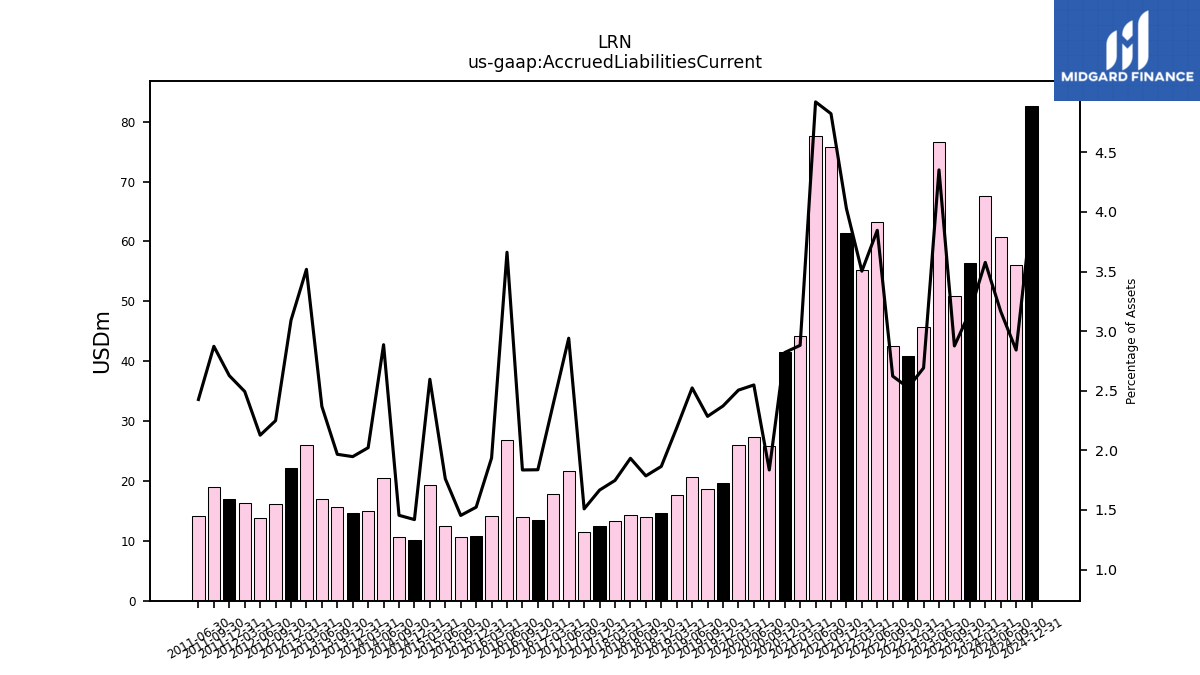
| Accrued Liabilities Current | 56.33 | 50.83 | 76.63 | 45.74 | 40.91 | 42.54 | 63.20 | 55.15 | 61.46 | 75.75 | 77.64 | 44.20 | 41.51 | 25.78 | 27.35 | 25.95 | 19.62 | 18.59 | 20.68 | 17.71 | 14.62 | 14.02 | 14.35 | 13.30 | 12.48 | 11.51 | 21.62 | 17.82 | 13.55 | 13.97 | 26.88 | 14.21 | 10.89 | 10.72 | 12.49 | 19.31 | 10.15 | 10.64 | 20.54 | 14.91 | 14.59 | 15.70 | 17.03 | 26.03 | 22.22 | 16.18 | 13.80 | 16.25 | 17.01 | 19.02 | 14.13 | NA | NA | NA | |
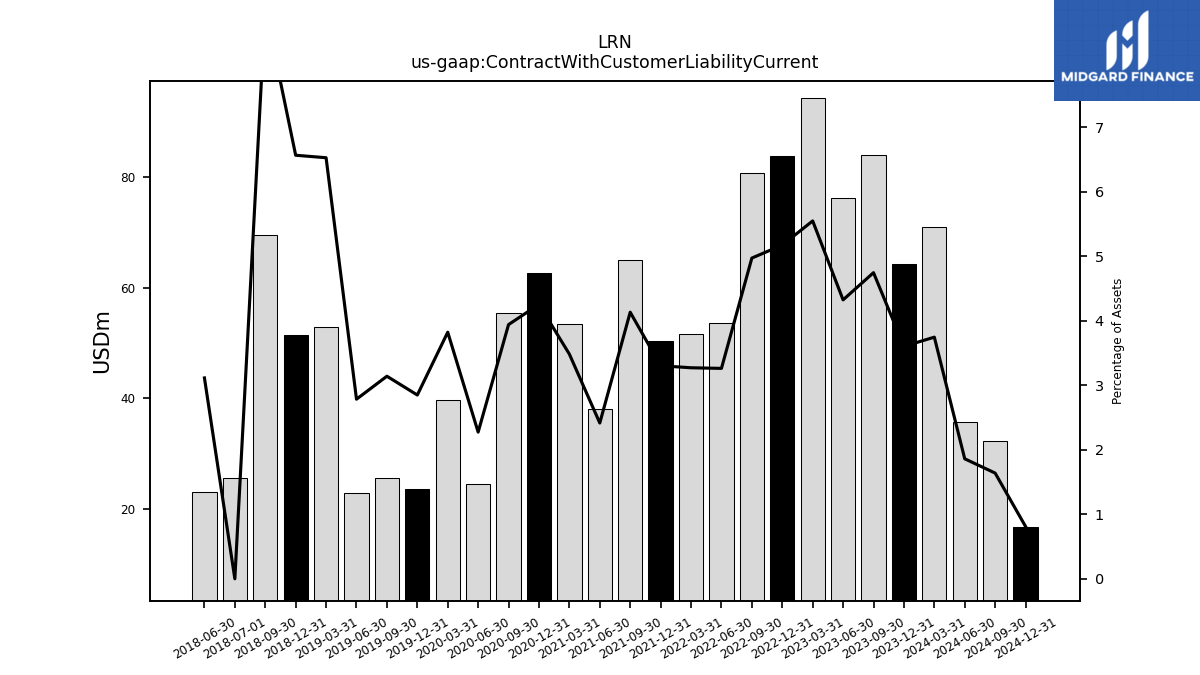
| Contract With Customer Liability Current | 64.24 | 83.92 | 76.16 | 94.34 | 83.80 | 80.68 | 53.63 | 51.53 | 50.41 | 64.92 | 38.11 | 53.45 | 62.63 | 55.37 | 24.42 | 39.62 | 23.57 | 25.56 | 22.83 | 52.83 | 51.48 | 69.43 | 23.11 | NA | NA | NA | NA | NA | NA | NA | NA | NA | NA | NA | NA | NA | NA | NA | NA | NA | NA | NA | NA | NA | NA | NA | NA | NA | NA | NA | NA | NA | NA | NA |
| 2023-12-31 | 2023-09-30 | 2023-06-30 | 2023-03-31 | 2022-12-31 | 2022-09-30 | 2022-06-30 | 2022-03-31 | 2021-12-31 | 2021-09-30 | 2021-06-30 | 2021-03-31 | 2020-12-31 | 2020-09-30 | 2020-06-30 | 2020-03-31 | 2019-12-31 | 2019-09-30 | 2019-06-30 | 2019-03-31 | 2018-12-31 | 2018-09-30 | 2018-06-30 | 2018-03-31 | 2017-12-31 | 2017-09-30 | 2017-06-30 | 2017-03-31 | 2016-12-31 | 2016-09-30 | 2016-06-30 | 2016-03-31 | 2015-12-31 | 2015-09-30 | 2015-06-30 | 2015-03-31 | 2014-12-31 | 2014-09-30 | 2014-06-30 | 2014-03-31 | 2013-12-31 | 2013-09-30 | 2013-06-30 | 2013-03-31 | 2012-12-31 | 2012-09-30 | 2012-06-30 | 2012-03-31 | 2011-12-31 | 2011-09-30 | 2011-06-30 | 2011-03-31 | 2010-12-31 | 2010-09-30 | ||
|---|---|---|---|---|---|---|---|---|---|---|---|---|---|---|---|---|---|---|---|---|---|---|---|---|---|---|---|---|---|---|---|---|---|---|---|---|---|---|---|---|---|---|---|---|---|---|---|---|---|---|---|---|---|---|---|
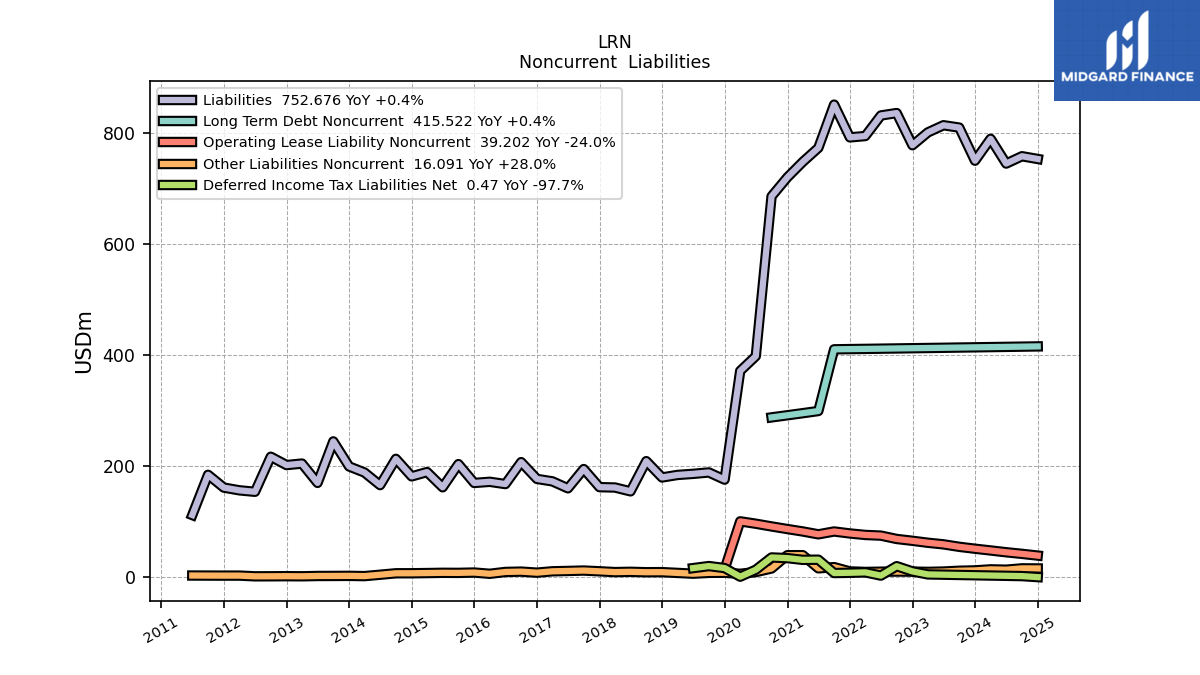
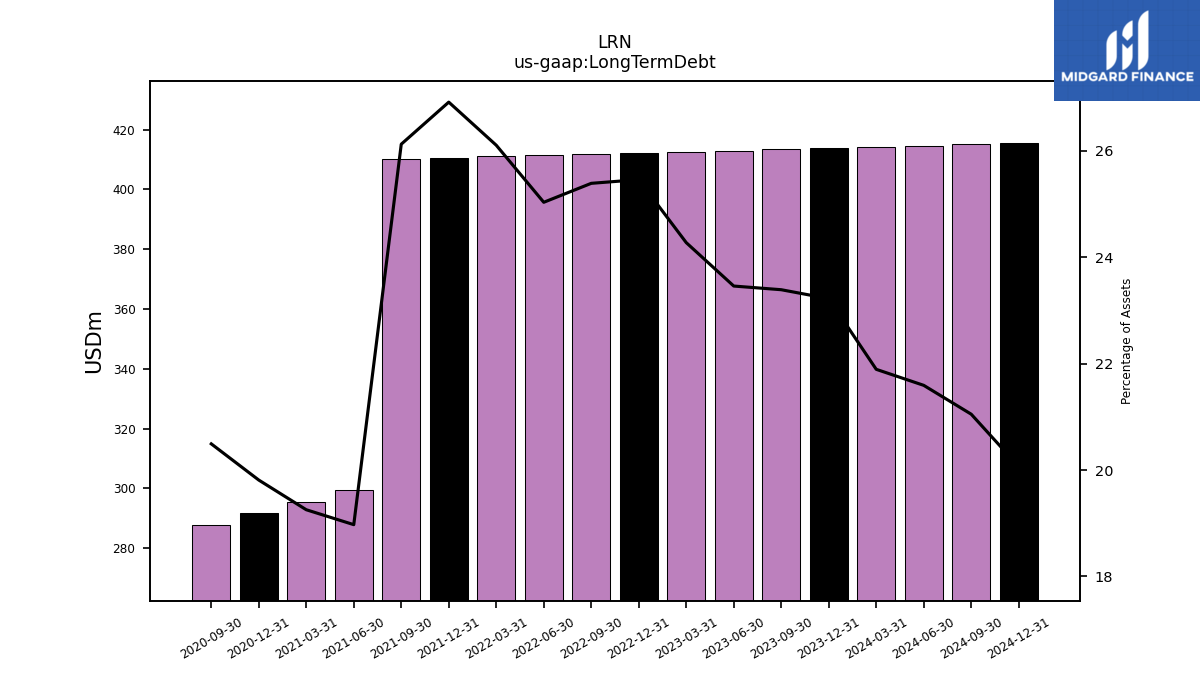
| Long Term Debt | 413.87 | 413.45 | 413.04 | 412.64 | 412.26 | 411.85 | 411.44 | 411.05 | 410.67 | 410.27 | 299.27 | 295.39 | 291.62 | 287.81 | NA | NA | NA | NA | NA | NA | NA | NA | NA | NA | NA | NA | NA | NA | NA | NA | NA | NA | NA | NA | NA | NA | NA | NA | NA | NA | NA | NA | NA | NA | NA | NA | NA | NA | NA | NA | NA | NA | NA | NA | |
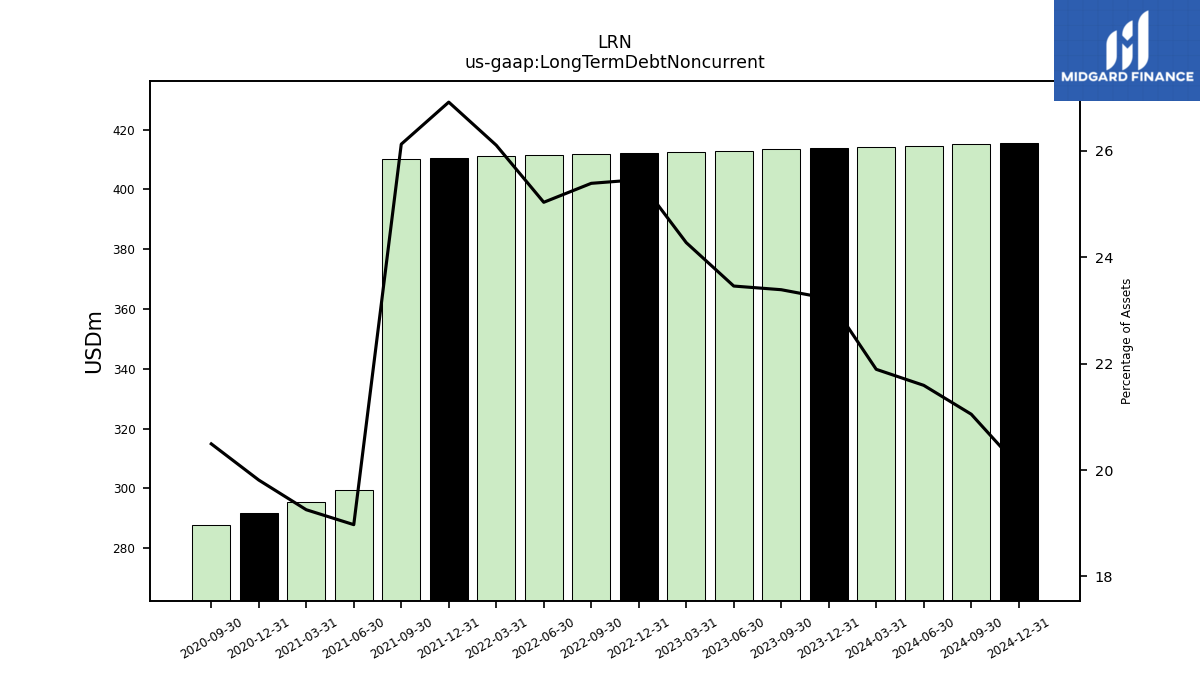
| Long Term Debt Noncurrent | 413.87 | 413.45 | 413.04 | 412.64 | 412.26 | 411.85 | 411.44 | 411.05 | 410.67 | 410.27 | 299.27 | 295.39 | 291.62 | 287.81 | NA | NA | NA | NA | NA | NA | NA | NA | NA | NA | NA | NA | NA | NA | NA | NA | NA | NA | NA | NA | NA | NA | NA | NA | NA | NA | NA | NA | NA | NA | NA | NA | NA | NA | NA | NA | NA | NA | NA | NA | |
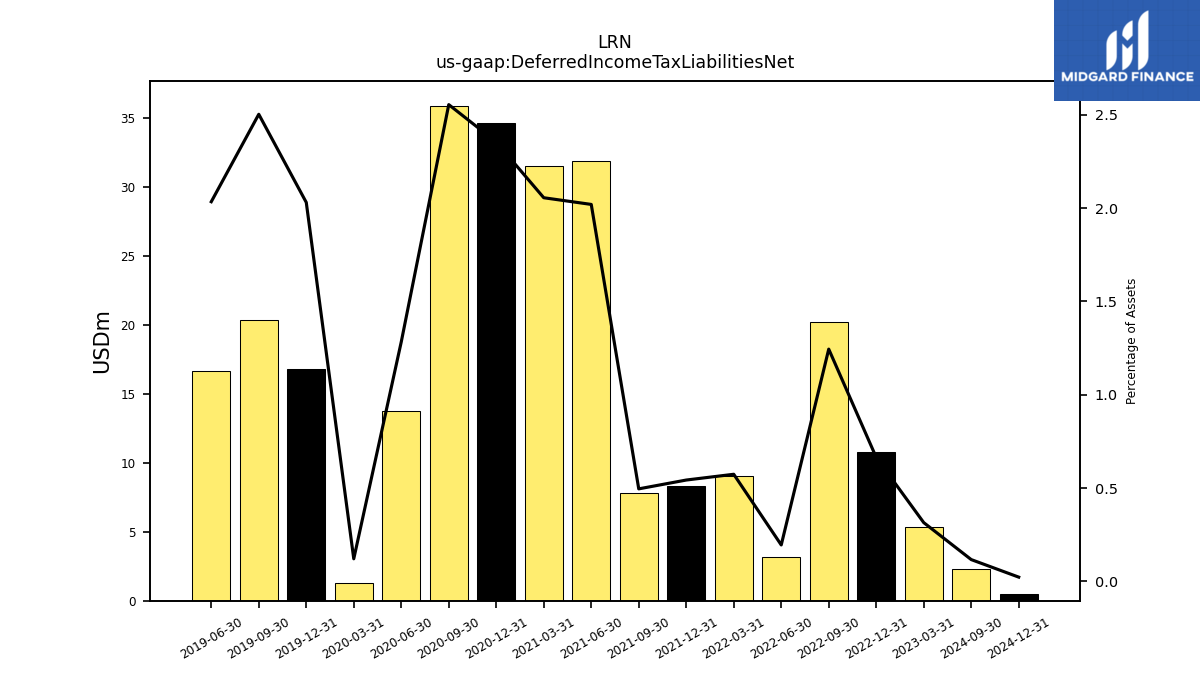
| Deferred Income Tax Liabilities Net | NA | NA | NA | 5.35 | 10.75 | 20.18 | 3.21 | 9.03 | 8.28 | 7.78 | 31.85 | 31.53 | 34.65 | 35.87 | 13.77 | 1.25 | 16.79 | 20.36 | 16.67 | NA | NA | NA | NA | NA | NA | NA | NA | NA | NA | NA | NA | NA | NA | NA | NA | NA | NA | NA | NA | NA | NA | NA | NA | NA | NA | NA | NA | NA | NA | NA | NA | NA | NA | NA | |
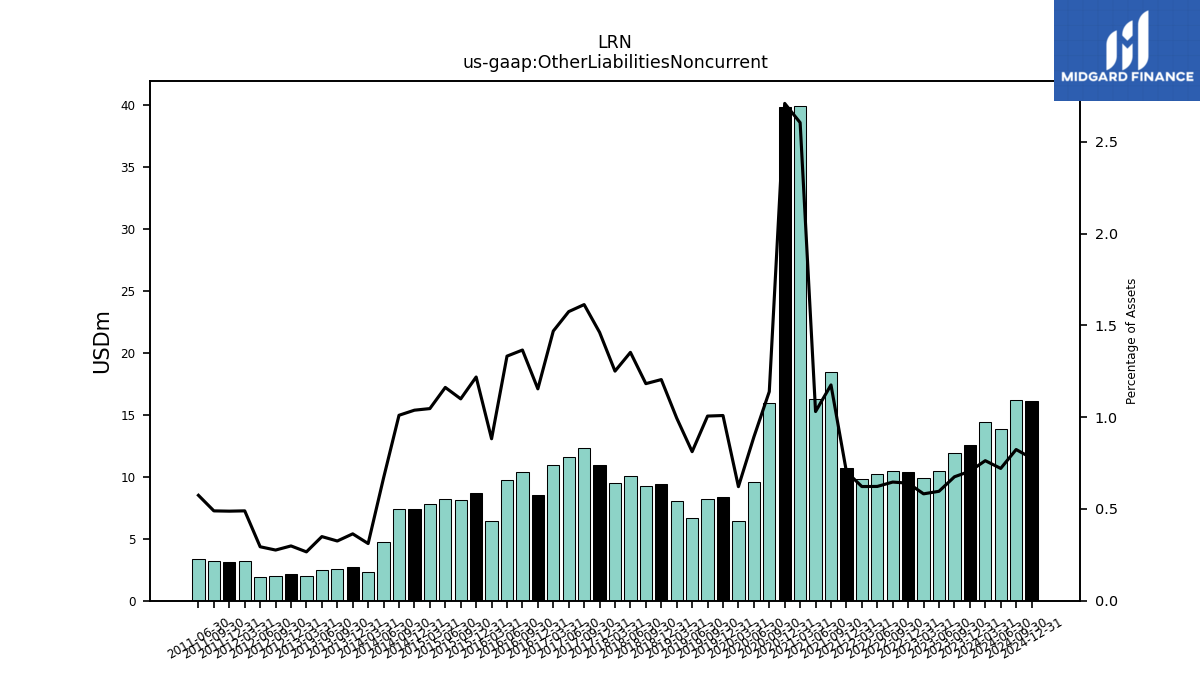
| Other Liabilities Noncurrent | 12.57 | 11.93 | 10.50 | 9.90 | 10.37 | 10.49 | 10.23 | 9.79 | 10.73 | 18.46 | 16.25 | 39.95 | 39.87 | 16.00 | 9.57 | 6.44 | 8.34 | 8.18 | 6.66 | 8.05 | 9.44 | 9.28 | 10.04 | 9.52 | 10.95 | 12.30 | 11.58 | 10.95 | 8.51 | 10.39 | 9.78 | 6.47 | 8.71 | 8.11 | 8.23 | 7.78 | 7.42 | 7.39 | 4.76 | 2.30 | 2.73 | 2.60 | 2.51 | 1.97 | 2.15 | 1.99 | 1.91 | 3.19 | 3.16 | 3.24 | 3.34 | NA | NA | NA | |
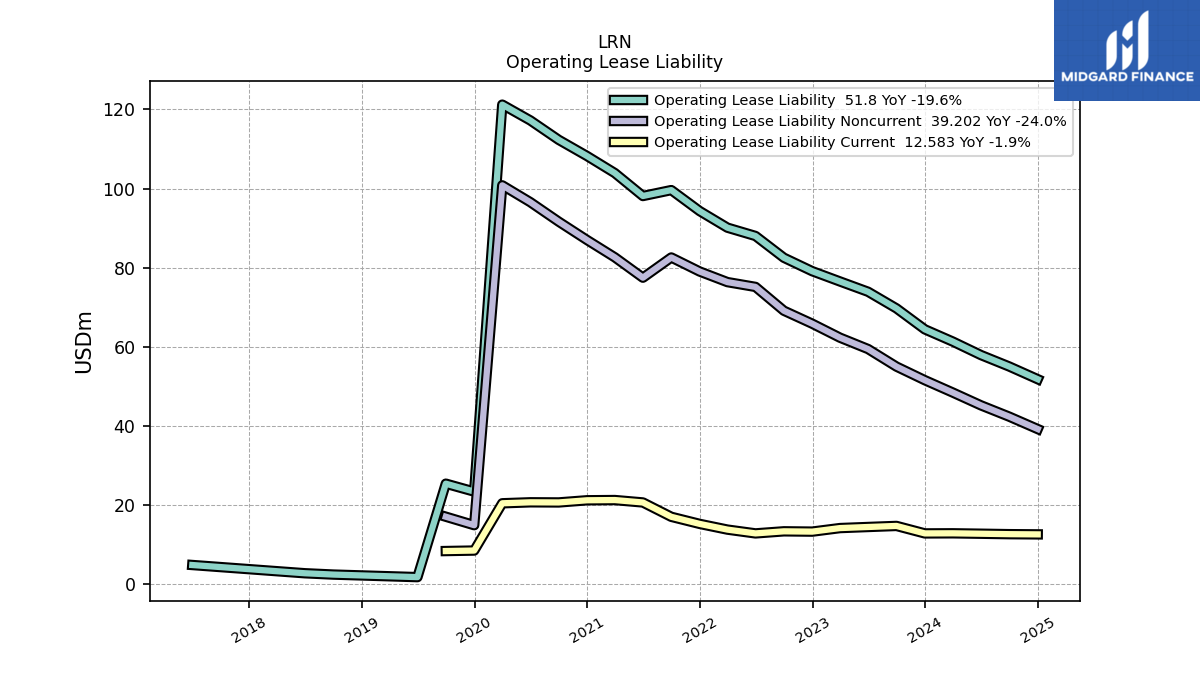
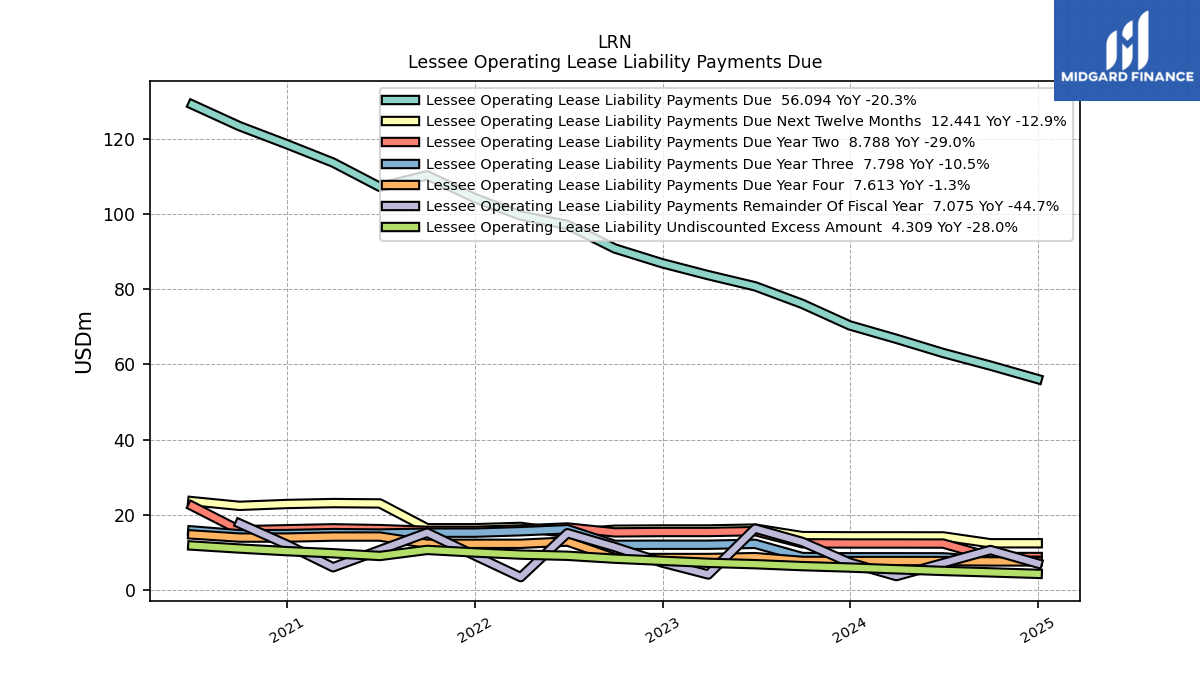
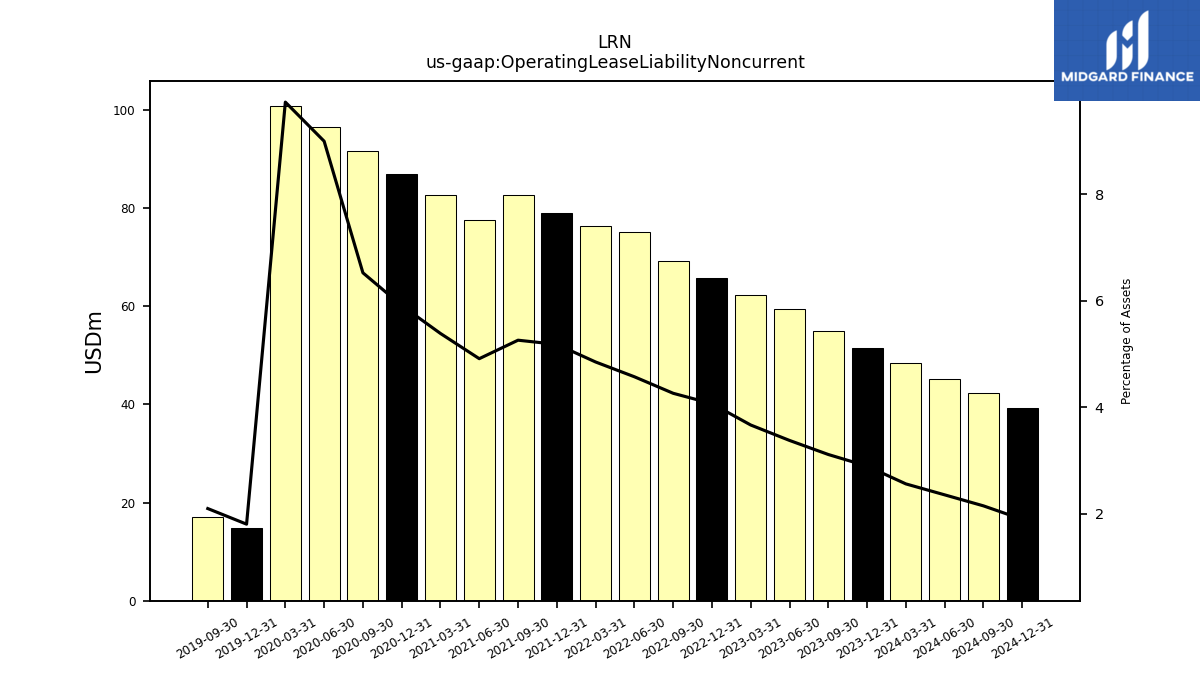
| Operating Lease Liability Noncurrent | 51.55 | 54.99 | 59.42 | 62.30 | 65.83 | 69.11 | 75.13 | 76.34 | 79.02 | 82.57 | 77.46 | 82.60 | 86.98 | 91.62 | 96.54 | 100.80 | 14.91 | 17.05 | NA | NA | NA | NA | NA | NA | NA | NA | NA | NA | NA | NA | NA | NA | NA | NA | NA | NA | NA | NA | NA | NA | NA | NA | NA | NA | NA | NA | NA | NA | NA | NA | NA | NA | NA | NA |
| 2023-12-31 | 2023-09-30 | 2023-06-30 | 2023-03-31 | 2022-12-31 | 2022-09-30 | 2022-06-30 | 2022-03-31 | 2021-12-31 | 2021-09-30 | 2021-06-30 | 2021-03-31 | 2020-12-31 | 2020-09-30 | 2020-06-30 | 2020-03-31 | 2019-12-31 | 2019-09-30 | 2019-06-30 | 2019-03-31 | 2018-12-31 | 2018-09-30 | 2018-06-30 | 2018-03-31 | 2017-12-31 | 2017-09-30 | 2017-06-30 | 2017-03-31 | 2016-12-31 | 2016-09-30 | 2016-06-30 | 2016-03-31 | 2015-12-31 | 2015-09-30 | 2015-06-30 | 2015-03-31 | 2014-12-31 | 2014-09-30 | 2014-06-30 | 2014-03-31 | 2013-12-31 | 2013-09-30 | 2013-06-30 | 2013-03-31 | 2012-12-31 | 2012-09-30 | 2012-06-30 | 2012-03-31 | 2011-12-31 | 2011-09-30 | 2011-06-30 | 2011-03-31 | 2010-12-31 | 2010-09-30 | ||
|---|---|---|---|---|---|---|---|---|---|---|---|---|---|---|---|---|---|---|---|---|---|---|---|---|---|---|---|---|---|---|---|---|---|---|---|---|---|---|---|---|---|---|---|---|---|---|---|---|---|---|---|---|---|---|---|
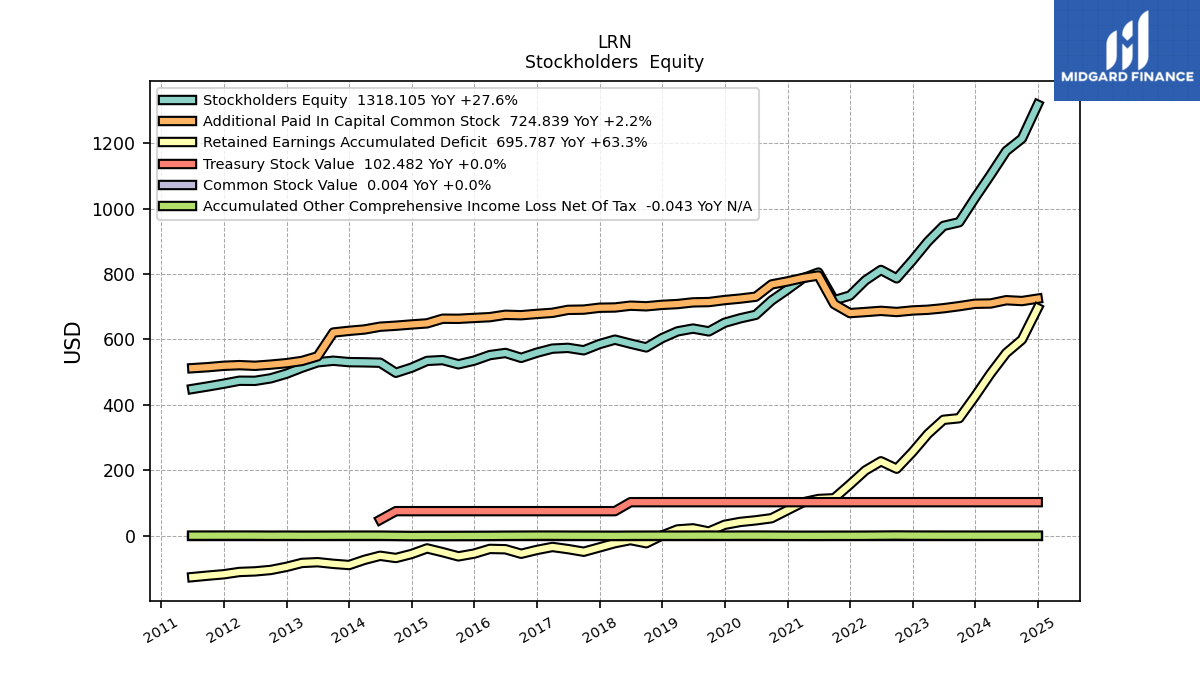
| Stockholders Equity | 1032.68 | 958.49 | 947.30 | 899.36 | 841.90 | 786.82 | 812.58 | 780.57 | 734.23 | 719.91 | 804.65 | 786.78 | 752.43 | 719.02 | 675.33 | 664.63 | 651.10 | 624.71 | 633.37 | 624.74 | 603.96 | 575.70 | 587.19 | 599.43 | 585.84 | 566.87 | 574.35 | 571.98 | 559.65 | 543.74 | 558.72 | 552.15 | 535.30 | 524.04 | 536.94 | 534.42 | 513.79 | 498.18 | 528.93 | 530.05 | 530.69 | 534.98 | 530.16 | 513.76 | 495.35 | 481.18 | 473.49 | 473.81 | 464.80 | 456.45 | 448.62 | NA | NA | NA | |
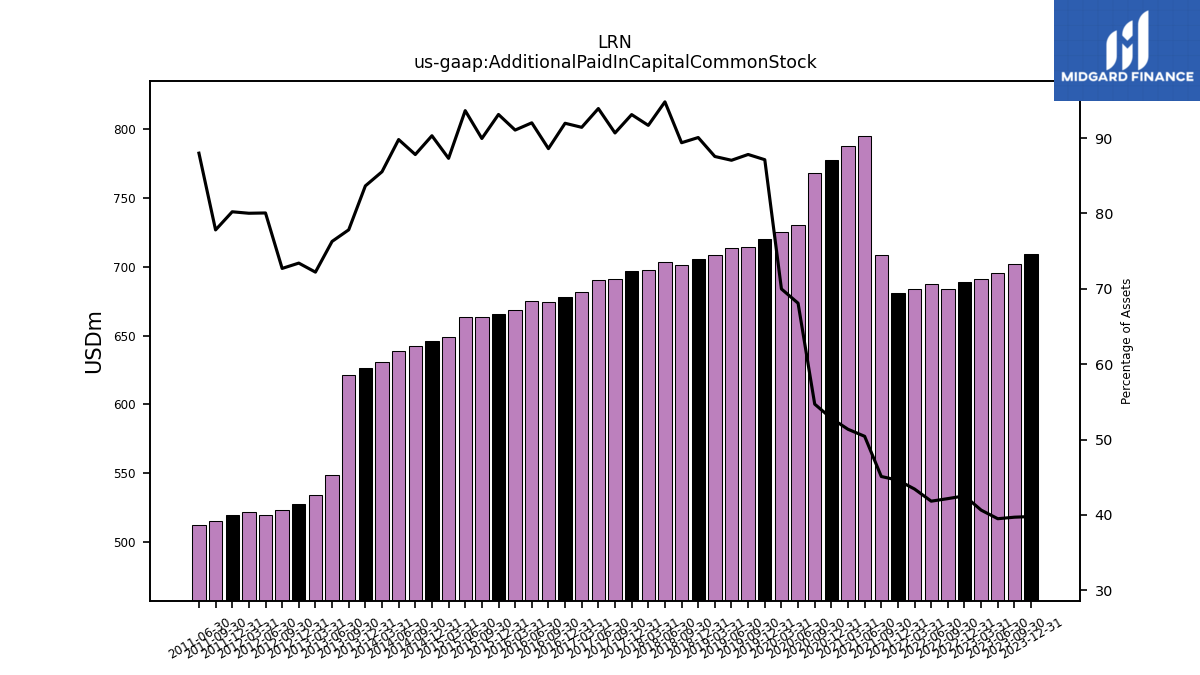
| Additional Paid In Capital Common Stock | 709.16 | 701.80 | 695.48 | 690.82 | 688.70 | 683.99 | 687.45 | 683.89 | 680.60 | 708.26 | 795.45 | 788.03 | 777.41 | 768.23 | 730.76 | 724.99 | 720.45 | 714.37 | 713.44 | 708.27 | 705.83 | 701.40 | 703.35 | 697.76 | 697.04 | 691.29 | 690.49 | 681.43 | 678.15 | 674.14 | 675.44 | 668.24 | 665.81 | 663.20 | 663.46 | 649.25 | 645.90 | 642.06 | 639.04 | 630.53 | 626.42 | 621.25 | 548.39 | 534.29 | 527.57 | 523.08 | 519.44 | 521.50 | 519.49 | 515.33 | 512.18 | NA | NA | NA | |
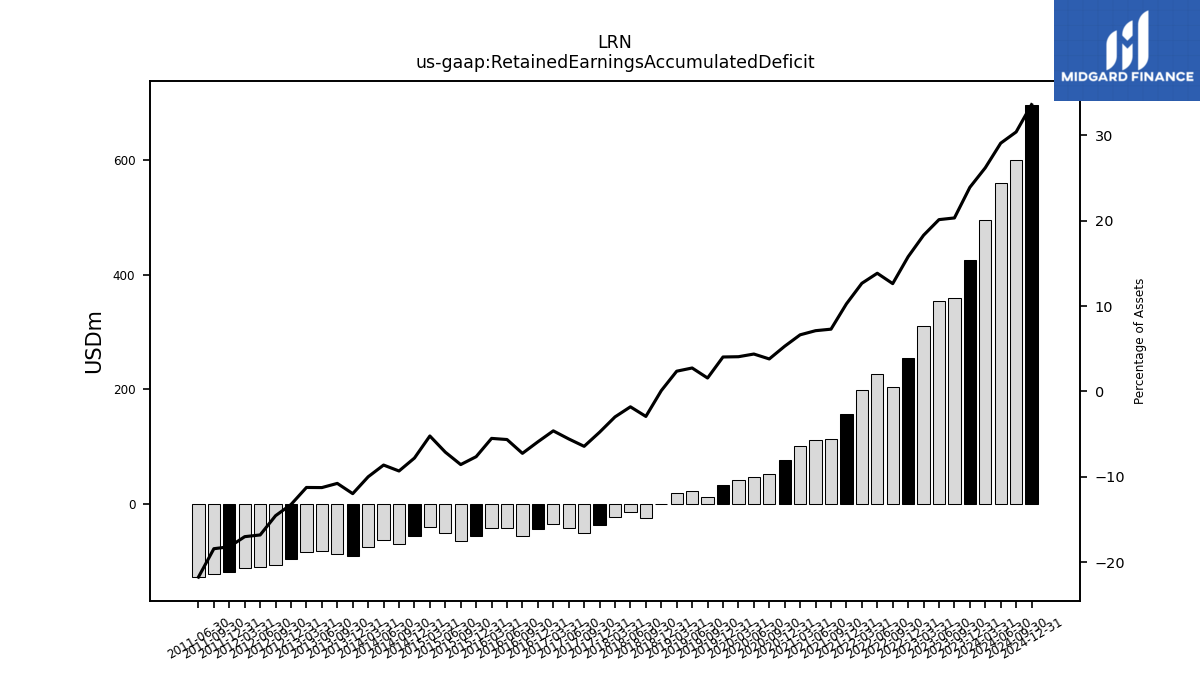
| Retained Earnings Accumulated Deficit | 426.04 | 359.21 | 354.33 | 310.96 | 255.50 | 204.79 | 227.46 | 199.37 | 156.45 | 114.45 | 112.15 | 101.66 | 77.87 | 53.37 | 46.95 | 42.06 | 33.31 | 12.72 | 22.45 | 19.13 | 0.67 | -23.04 | -13.43 | -22.77 | -35.84 | -49.10 | -40.98 | -34.49 | -43.61 | -55.26 | -41.43 | -40.44 | -54.72 | -63.26 | -50.46 | -38.88 | -55.89 | -68.23 | -61.45 | -73.81 | -89.75 | -86.09 | -81.05 | -83.32 | -95.29 | -104.80 | -109.16 | -110.96 | -117.94 | -122.10 | -126.70 | NA | NA | NA | |
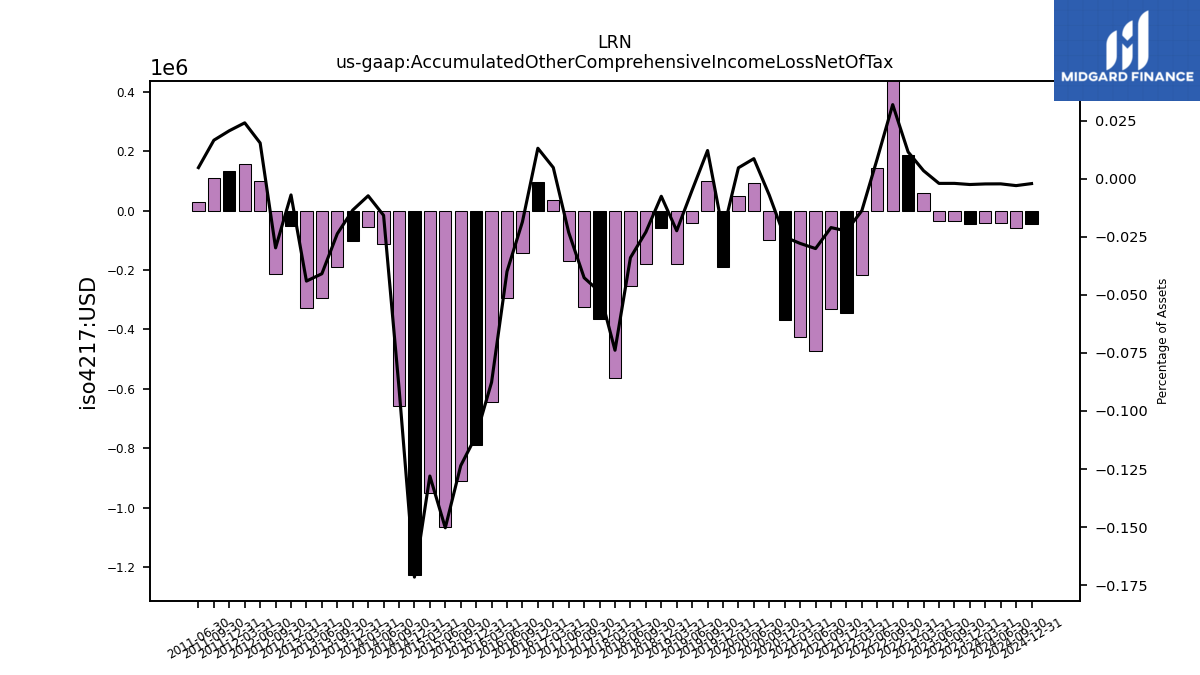
| Accumulated Other Comprehensive Income Loss Net Of Tax | -0.04 | -0.04 | -0.04 | 0.06 | 0.19 | 0.52 | 0.14 | -0.22 | -0.34 | -0.33 | -0.47 | -0.43 | -0.37 | -0.10 | 0.09 | 0.05 | -0.19 | 0.10 | -0.04 | -0.18 | -0.06 | -0.18 | -0.25 | -0.56 | -0.36 | -0.33 | -0.17 | 0.04 | 0.10 | -0.14 | -0.29 | -0.64 | -0.79 | -0.91 | -1.06 | -0.95 | -1.23 | -0.66 | -0.11 | -0.05 | -0.10 | -0.19 | -0.29 | -0.33 | -0.05 | -0.21 | 0.10 | 0.16 | 0.13 | 0.11 | 0.03 | NA | NA | NA | |
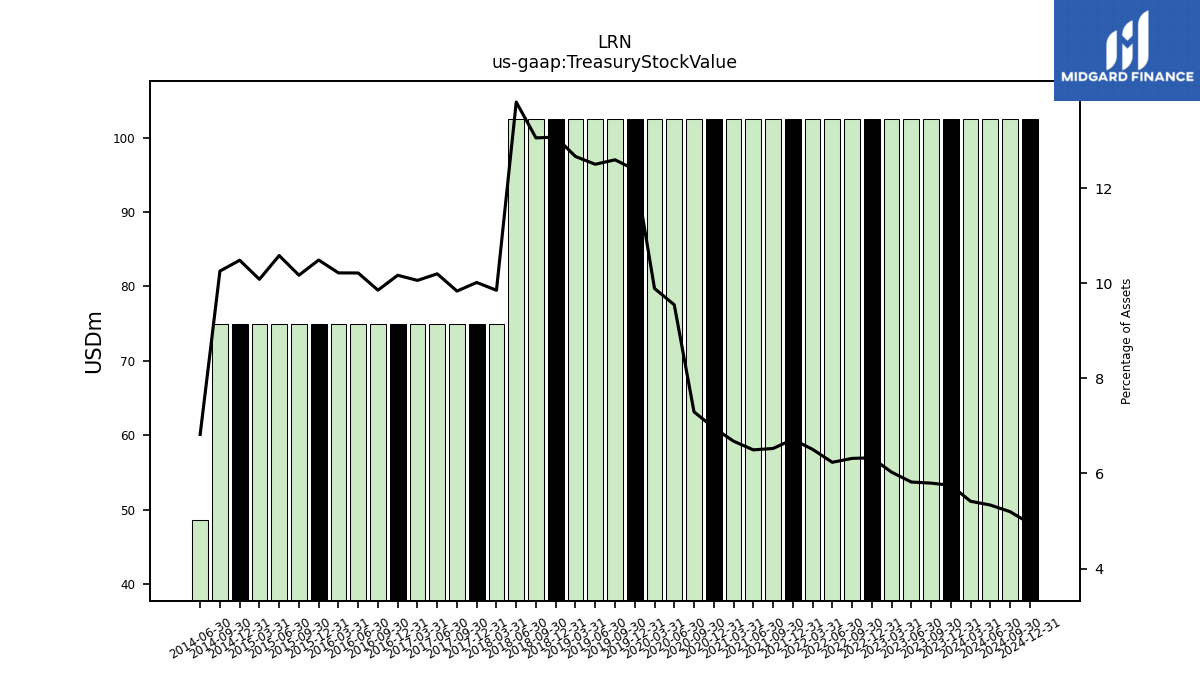
| Treasury Stock Value | 102.48 | 102.48 | 102.48 | 102.48 | 102.48 | 102.48 | 102.48 | 102.48 | 102.48 | 102.48 | 102.48 | 102.48 | 102.48 | 102.48 | 102.48 | 102.48 | 102.48 | 102.48 | 102.48 | 102.48 | 102.48 | 102.48 | 102.48 | 75.00 | 75.00 | 75.00 | 75.00 | 75.00 | 75.00 | 75.00 | 75.00 | 75.00 | 75.00 | 75.00 | 75.00 | 75.00 | 75.00 | 75.00 | 48.55 | NA | NA | NA | NA | NA | NA | NA | NA | NA | NA | NA | NA | NA | NA | NA | |
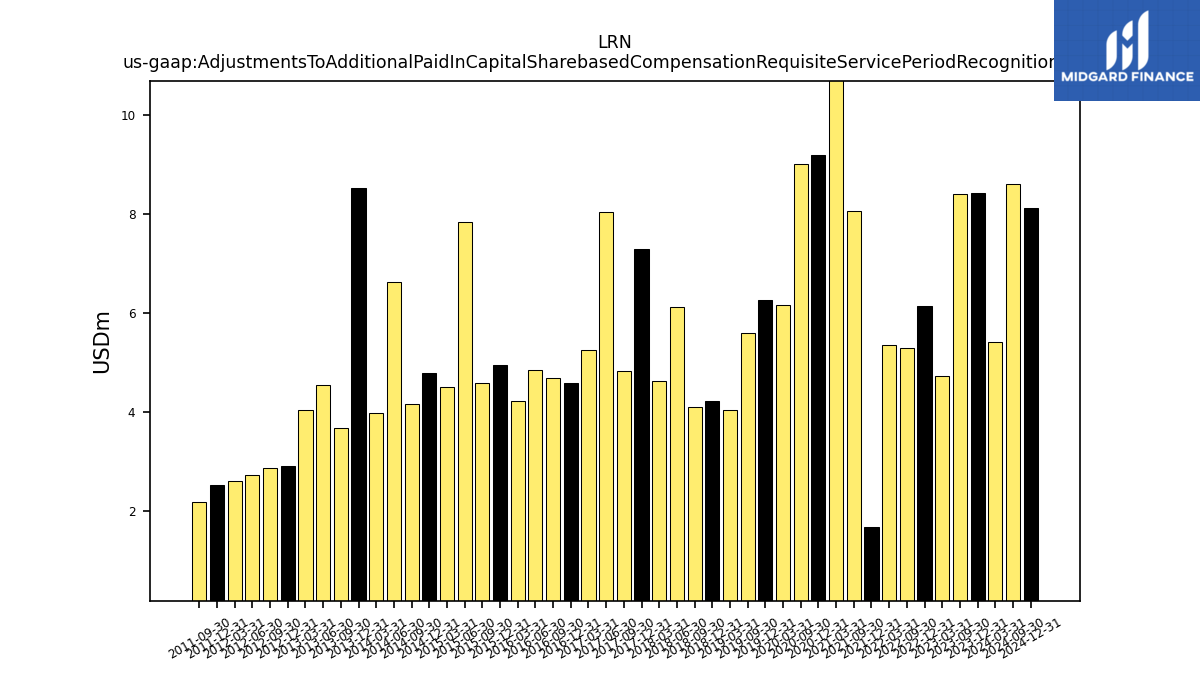
| Adjustments To Additional Paid In Capital Sharebased Compensation Requisite Service Period Recognition Value | 8.43 | 8.40 | NA | 4.72 | 6.13 | 5.29 | NA | 5.35 | 1.70 | 8.05 | NA | 12.96 | 9.18 | 9.01 | NA | 6.16 | 6.26 | 5.59 | NA | 4.05 | 4.24 | 4.11 | 6.13 | 4.62 | 7.28 | 4.83 | 8.04 | 5.26 | 4.60 | 4.69 | 4.86 | 4.22 | 4.95 | 4.59 | 7.83 | 4.50 | 4.80 | 4.17 | 6.63 | 3.99 | 8.53 | 3.68 | 4.54 | 4.05 | 2.91 | 2.87 | 2.73 | 2.62 | 2.53 | 2.19 | NA | NA | NA | NA |
| 2023-12-31 | 2023-09-30 | 2023-06-30 | 2023-03-31 | 2022-12-31 | 2022-09-30 | 2022-06-30 | 2022-03-31 | 2021-12-31 | 2021-09-30 | 2021-06-30 | 2021-03-31 | 2020-12-31 | 2020-09-30 | 2020-06-30 | 2020-03-31 | 2019-12-31 | 2019-09-30 | 2019-06-30 | 2019-03-31 | 2018-12-31 | 2018-09-30 | 2018-06-30 | 2018-03-31 | 2017-12-31 | 2017-09-30 | 2017-06-30 | 2017-03-31 | 2016-12-31 | 2016-09-30 | 2016-06-30 | 2016-03-31 | 2015-12-31 | 2015-09-30 | 2015-06-30 | 2015-03-31 | 2014-12-31 | 2014-09-30 | 2014-06-30 | 2014-03-31 | 2013-12-31 | 2013-09-30 | 2013-06-30 | 2013-03-31 | 2012-12-31 | 2012-09-30 | 2012-06-30 | 2012-03-31 | 2011-12-31 | 2011-09-30 | 2011-06-30 | 2011-03-31 | 2010-12-31 | 2010-09-30 | ||
|---|---|---|---|---|---|---|---|---|---|---|---|---|---|---|---|---|---|---|---|---|---|---|---|---|---|---|---|---|---|---|---|---|---|---|---|---|---|---|---|---|---|---|---|---|---|---|---|---|---|---|---|---|---|---|---|
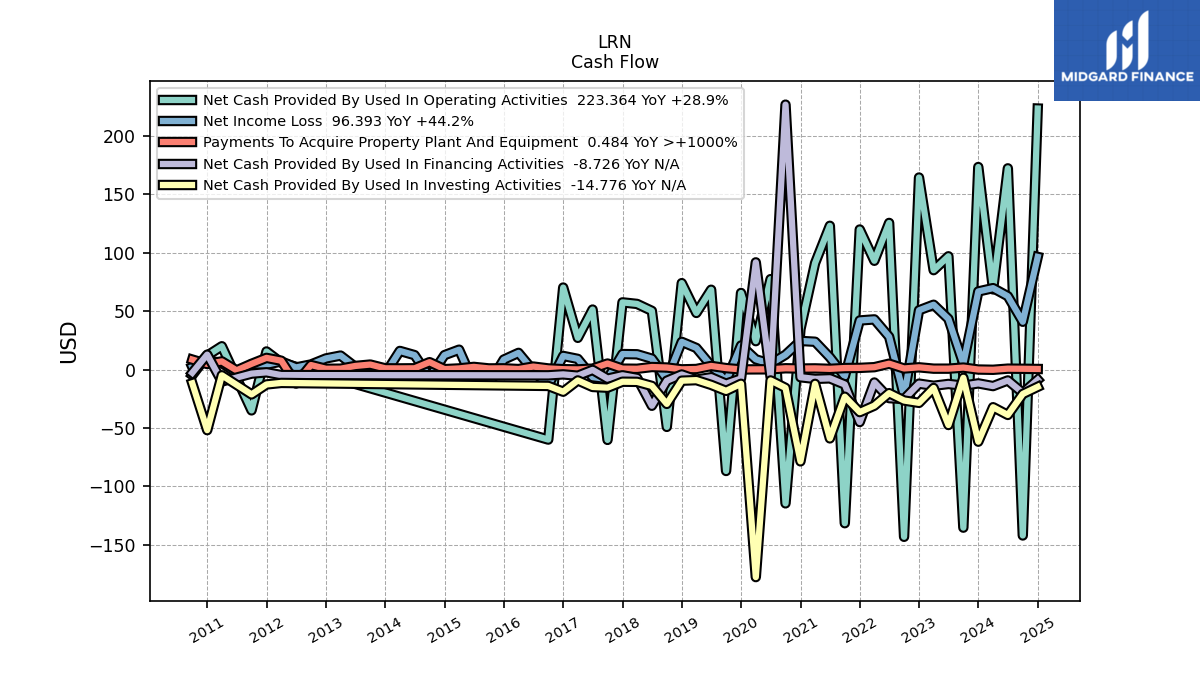
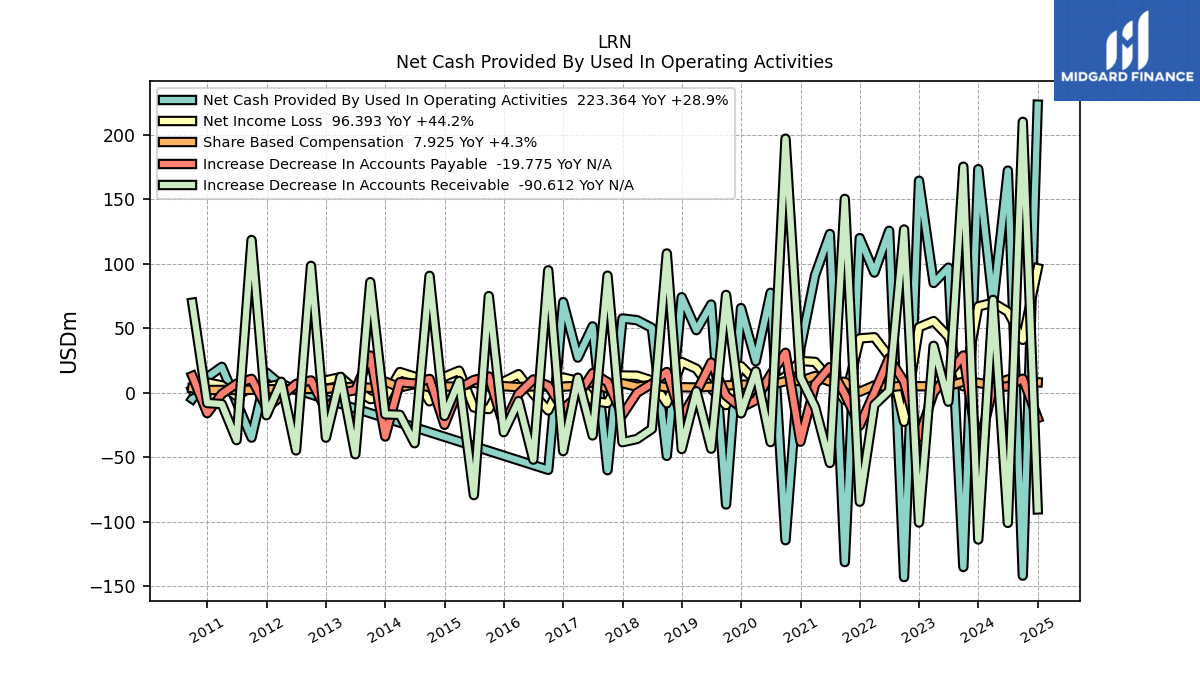
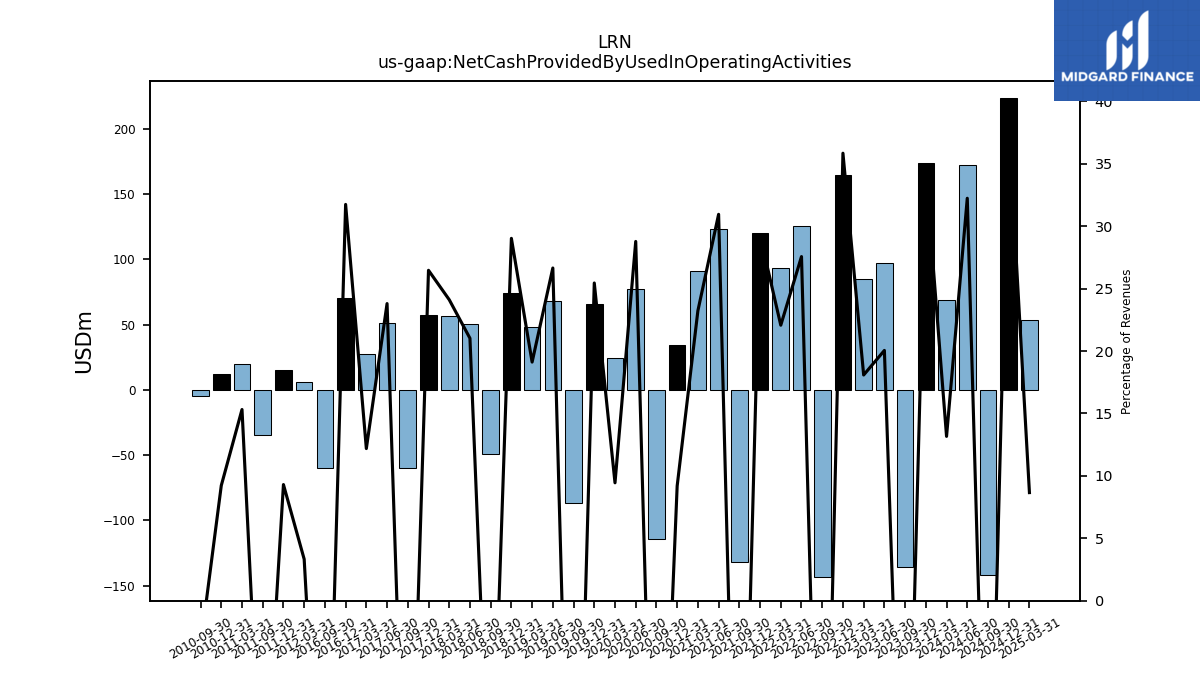
| Net Cash Provided By Used In Operating Activities | 173.33 | -135.31 | 96.93 | 85.04 | 164.33 | -143.15 | 125.48 | 93.07 | 119.84 | -131.51 | 123.03 | 91.08 | 34.58 | -114.53 | 77.39 | 24.29 | 65.55 | -86.81 | 68.31 | 48.41 | 73.98 | -49.09 | 50.22 | 56.15 | 57.48 | -60.22 | 51.35 | 27.12 | 70.18 | -59.93 | NA | NA | NA | NA | NA | NA | NA | NA | NA | NA | NA | NA | NA | NA | NA | NA | NA | 5.94 | 15.49 | -34.96 | NA | 19.96 | 11.91 | -4.84 | |
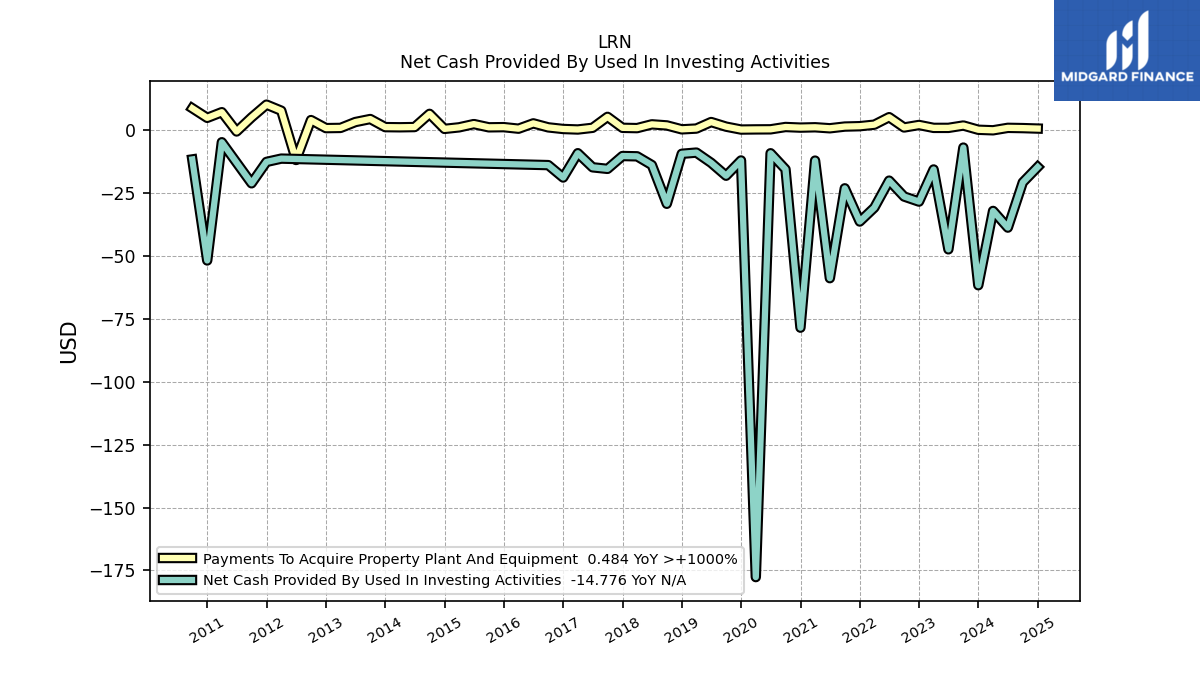
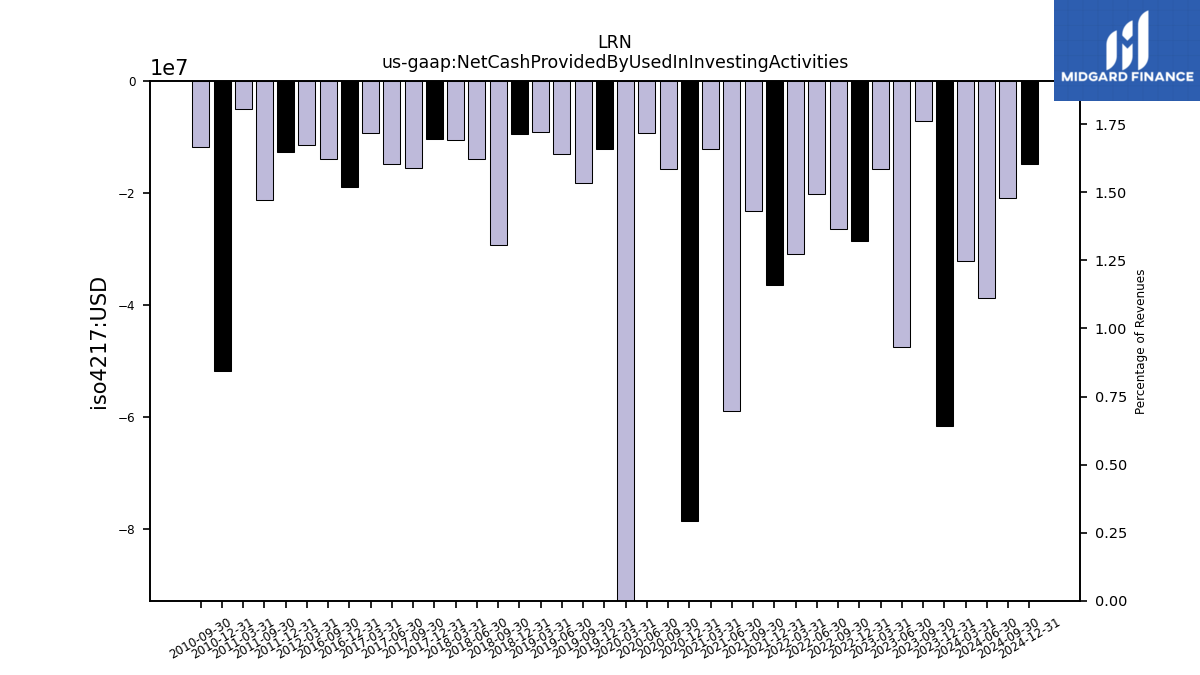
| Net Cash Provided By Used In Investing Activities | -61.73 | -7.07 | -47.48 | -15.75 | -28.52 | -26.50 | -20.19 | -30.91 | -36.43 | -23.23 | -58.94 | -12.23 | -78.59 | -15.69 | -9.31 | -177.63 | -12.17 | -18.25 | -13.12 | -9.06 | -9.54 | -29.39 | -14.00 | -10.54 | -10.42 | -15.52 | -14.90 | -9.30 | -18.97 | -14.03 | NA | NA | NA | NA | NA | NA | NA | NA | NA | NA | NA | NA | NA | NA | NA | NA | NA | -11.45 | -12.75 | -21.26 | NA | -4.94 | -51.90 | -11.77 | |
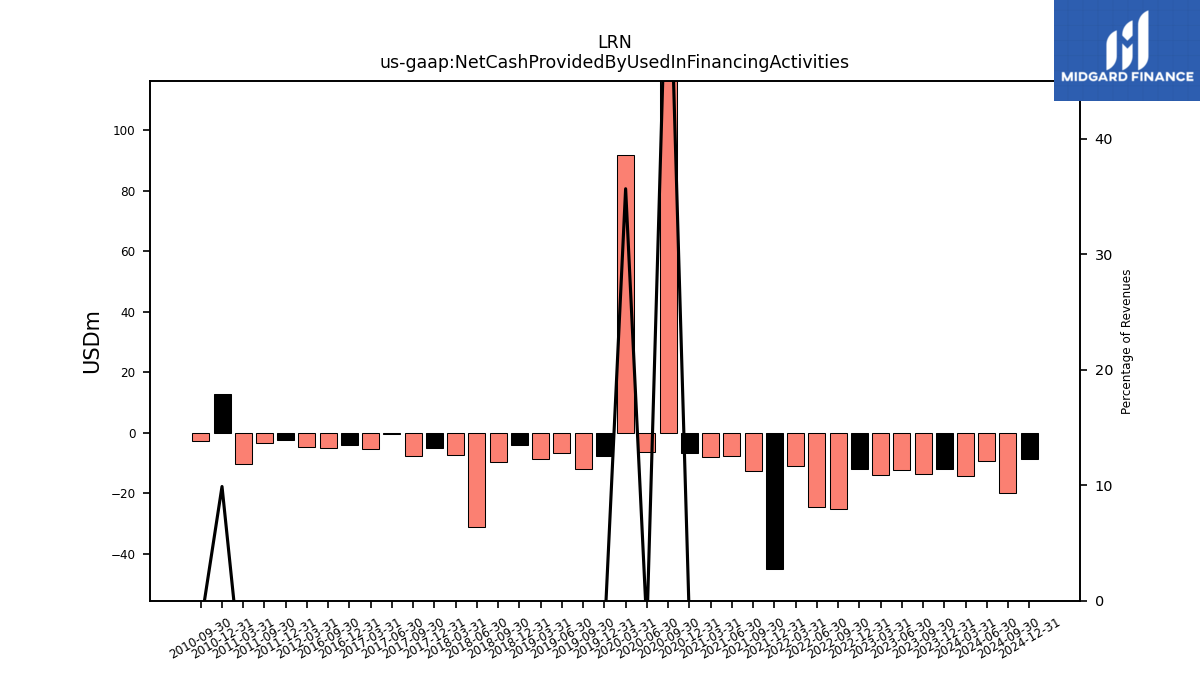
| Net Cash Provided By Used In Financing Activities | -11.84 | -13.81 | -12.32 | -13.89 | -12.05 | -25.23 | -24.46 | -11.09 | -44.94 | -12.82 | -7.54 | -7.99 | -6.59 | 226.71 | -6.31 | 91.73 | -7.68 | -12.12 | -6.59 | -8.60 | -4.21 | -9.58 | -31.01 | -7.21 | -4.91 | -7.78 | -0.30 | -5.27 | -4.14 | -4.93 | NA | NA | NA | NA | NA | NA | NA | NA | NA | NA | NA | NA | NA | NA | NA | NA | NA | -4.73 | -2.36 | -3.49 | NA | -10.23 | 12.76 | -2.79 |
| 2023-12-31 | 2023-09-30 | 2023-06-30 | 2023-03-31 | 2022-12-31 | 2022-09-30 | 2022-06-30 | 2022-03-31 | 2021-12-31 | 2021-09-30 | 2021-06-30 | 2021-03-31 | 2020-12-31 | 2020-09-30 | 2020-06-30 | 2020-03-31 | 2019-12-31 | 2019-09-30 | 2019-06-30 | 2019-03-31 | 2018-12-31 | 2018-09-30 | 2018-06-30 | 2018-03-31 | 2017-12-31 | 2017-09-30 | 2017-06-30 | 2017-03-31 | 2016-12-31 | 2016-09-30 | 2016-06-30 | 2016-03-31 | 2015-12-31 | 2015-09-30 | 2015-06-30 | 2015-03-31 | 2014-12-31 | 2014-09-30 | 2014-06-30 | 2014-03-31 | 2013-12-31 | 2013-09-30 | 2013-06-30 | 2013-03-31 | 2012-12-31 | 2012-09-30 | 2012-06-30 | 2012-03-31 | 2011-12-31 | 2011-09-30 | 2011-06-30 | 2011-03-31 | 2010-12-31 | 2010-09-30 | ||
|---|---|---|---|---|---|---|---|---|---|---|---|---|---|---|---|---|---|---|---|---|---|---|---|---|---|---|---|---|---|---|---|---|---|---|---|---|---|---|---|---|---|---|---|---|---|---|---|---|---|---|---|---|---|---|---|
| Net Cash Provided By Used In Operating Activities | 173.33 | -135.31 | 96.93 | 85.04 | 164.33 | -143.15 | 125.48 | 93.07 | 119.84 | -131.51 | 123.03 | 91.08 | 34.58 | -114.53 | 77.39 | 24.29 | 65.55 | -86.81 | 68.31 | 48.41 | 73.98 | -49.09 | 50.22 | 56.15 | 57.48 | -60.22 | 51.35 | 27.12 | 70.18 | -59.93 | NA | NA | NA | NA | NA | NA | NA | NA | NA | NA | NA | NA | NA | NA | NA | NA | NA | 5.94 | 15.49 | -34.96 | NA | 19.96 | 11.91 | -4.84 | |
| Net Income Loss | 66.84 | 4.88 | 43.37 | 55.46 | 50.70 | -22.67 | 28.09 | 42.92 | 42.00 | -5.88 | 10.49 | 23.79 | 24.50 | 12.67 | 4.89 | 8.75 | 20.59 | -9.73 | 3.32 | 18.46 | 23.71 | -8.28 | 9.35 | 13.07 | 13.26 | -8.06 | -6.48 | 9.12 | 11.65 | -13.83 | -0.98 | 14.27 | 8.54 | -12.79 | -11.58 | 17.01 | 12.33 | -6.78 | 12.36 | 15.95 | -3.67 | -5.04 | 2.27 | 11.97 | 9.51 | 4.36 | 1.80 | 6.98 | 4.17 | 4.60 | -2.84 | 5.60 | 7.84 | 2.20 | |
| Profit Loss | 66.84 | 4.88 | 43.37 | 55.46 | 50.70 | -22.67 | 28.09 | 42.92 | 42.00 | -5.88 | 10.49 | 23.79 | 24.50 | 12.67 | 4.89 | 8.75 | 20.59 | -9.73 | 3.32 | 18.46 | 23.71 | -8.28 | 9.35 | 13.04 | 13.19 | -8.16 | -6.60 | 8.88 | 10.90 | -13.64 | -0.12 | 13.66 | 7.88 | -12.66 | -12.57 | 16.53 | 11.96 | -6.59 | 11.95 | 15.51 | -4.25 | -5.10 | 1.25 | 11.42 | 9.32 | 4.54 | 1.19 | 6.69 | 3.88 | 4.35 | -3.46 | 5.26 | 7.71 | 2.15 | |
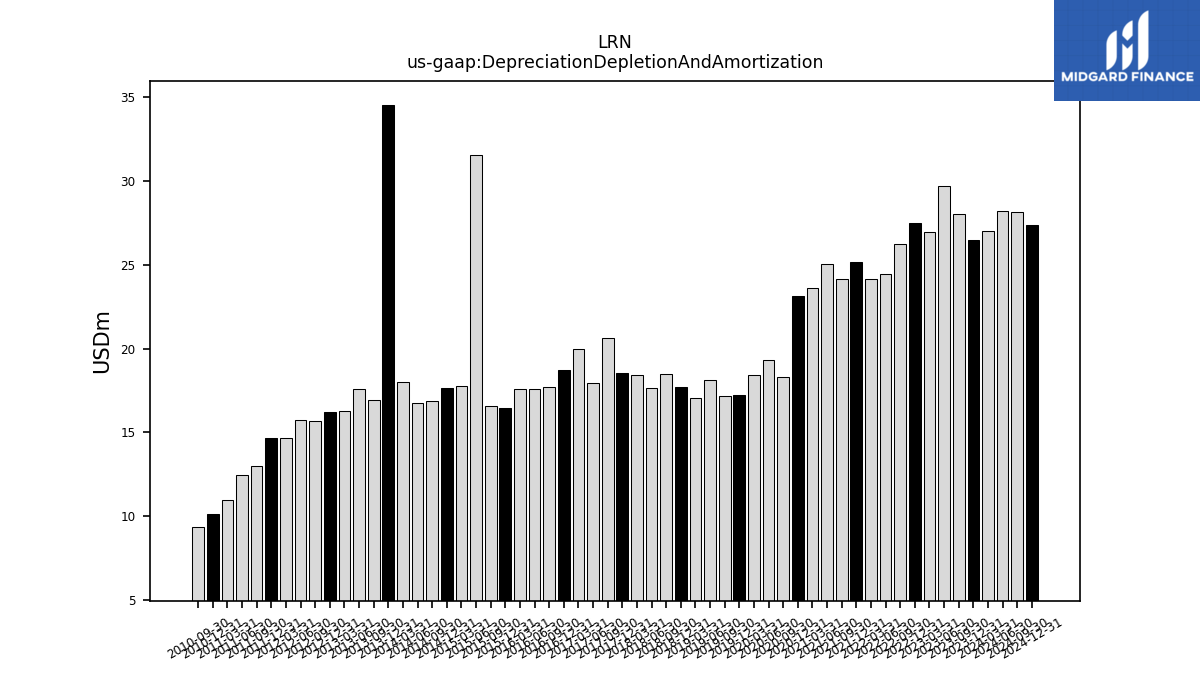
| Depreciation Depletion And Amortization | 26.46 | 28.02 | 29.70 | 26.94 | 27.46 | 26.25 | 24.45 | 24.14 | 25.18 | 24.15 | 25.04 | 23.60 | 23.16 | 18.28 | 19.30 | 18.41 | 17.23 | 17.15 | 18.14 | 17.04 | 17.71 | 18.51 | 17.65 | 18.43 | 18.55 | 20.64 | 17.95 | 19.95 | 18.70 | 17.68 | 17.60 | 17.59 | 16.47 | 16.57 | 31.53 | 17.76 | 17.63 | 16.88 | 16.78 | 18.02 | 34.52 | 16.95 | 17.56 | 16.28 | 16.23 | 15.66 | 15.72 | 14.64 | 14.68 | 12.99 | 12.47 | 10.95 | 10.12 | 9.39 | |
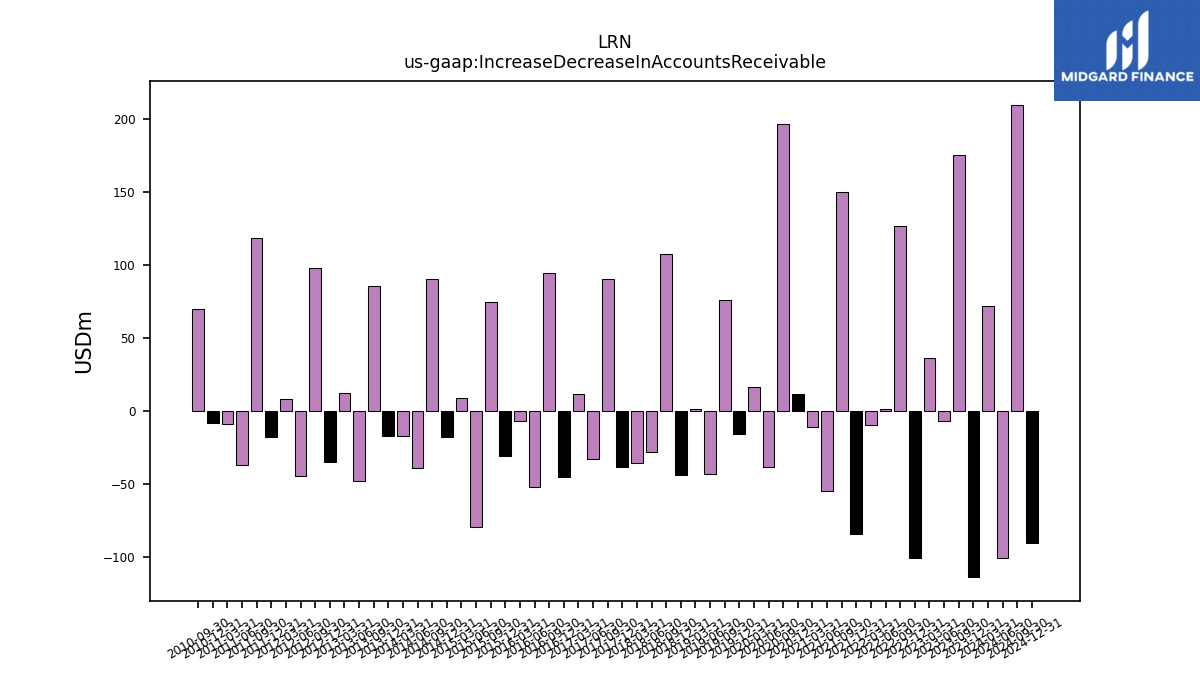
| Increase Decrease In Accounts Receivable | -113.97 | 175.22 | -7.04 | 36.27 | -100.84 | 126.52 | 1.43 | -9.53 | -84.66 | 150.26 | -54.59 | -11.21 | 11.92 | 196.95 | -38.41 | 16.54 | -16.11 | 75.77 | -43.51 | 1.03 | -43.81 | 107.93 | -28.21 | -35.98 | -38.50 | 90.70 | -33.26 | 11.55 | -45.42 | 94.87 | -51.98 | -6.58 | -30.74 | 74.84 | -79.53 | 9.01 | -18.14 | 90.55 | -39.29 | -17.24 | -16.87 | 85.66 | -47.84 | 12.21 | -34.96 | 98.30 | -44.86 | 8.36 | -17.59 | 118.35 | -36.92 | -8.90 | -8.11 | 69.74 | |
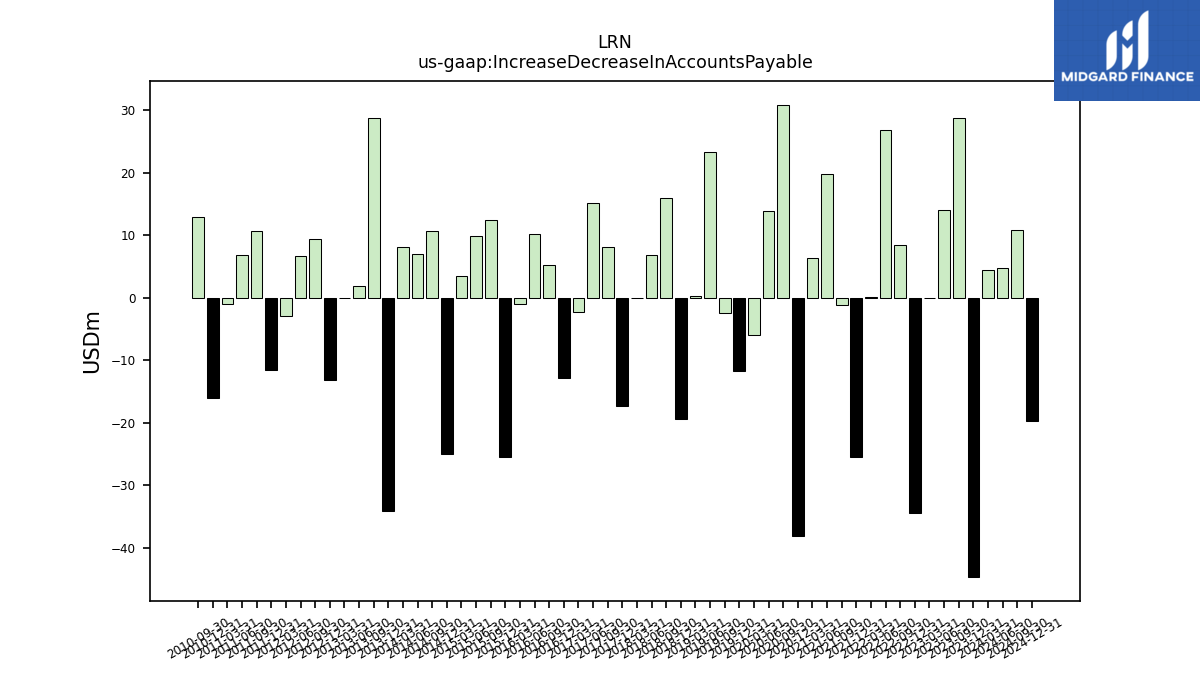
| Increase Decrease In Accounts Payable | -44.74 | 28.75 | 14.10 | -0.04 | -34.48 | 8.43 | 26.77 | 0.05 | -25.55 | -1.26 | 19.84 | 6.29 | -38.09 | 30.89 | 13.85 | -5.92 | -11.74 | -2.40 | 23.31 | 0.29 | -19.43 | 16.00 | 6.88 | -0.11 | -17.27 | 8.17 | 15.13 | -2.27 | -12.82 | 5.28 | 10.17 | -1.01 | -25.55 | 12.49 | 9.79 | 3.40 | -25.01 | 10.63 | 7.02 | 8.07 | -34.08 | 28.77 | 1.86 | -0.14 | -13.26 | 9.42 | 6.70 | -2.97 | -11.60 | 10.67 | 6.88 | -1.02 | -15.99 | 12.87 | |
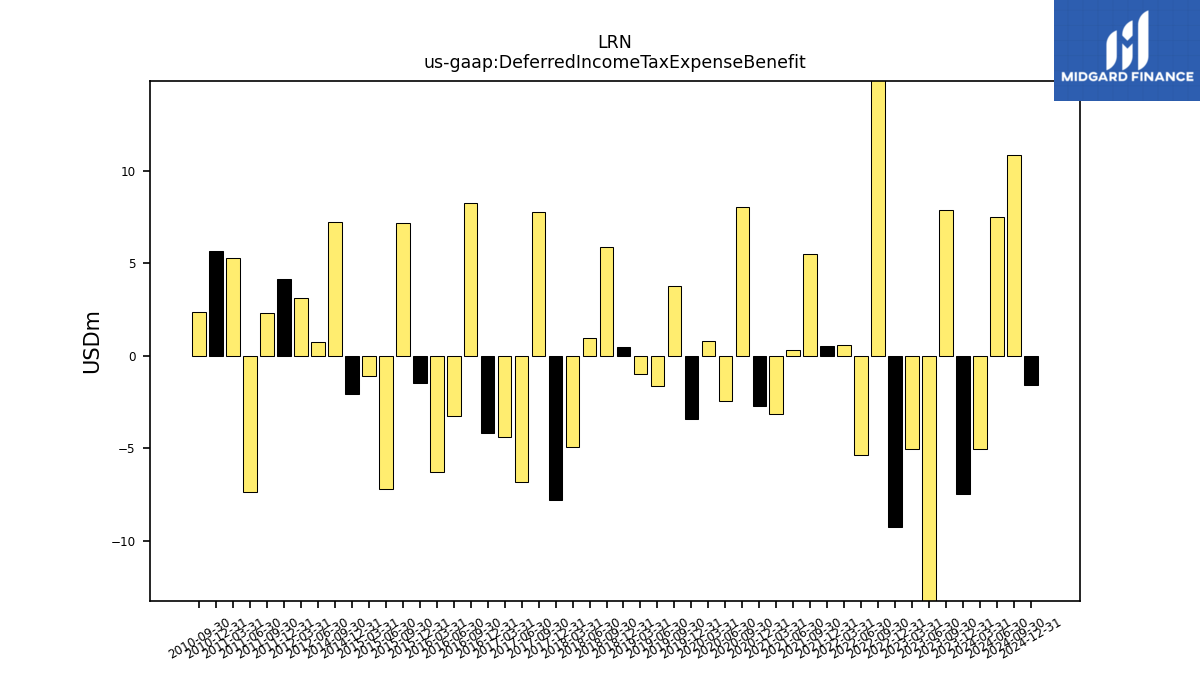
| Deferred Income Tax Expense Benefit | -7.48 | 7.90 | -13.36 | -5.01 | -9.23 | 17.22 | -5.38 | 0.56 | 0.52 | 5.48 | 0.29 | -3.12 | -2.69 | 8.06 | -2.46 | 0.81 | -3.43 | 3.78 | -1.63 | -1.01 | 0.47 | 5.87 | 0.96 | -4.93 | -7.82 | 7.76 | -6.81 | -4.38 | -4.17 | 8.29 | -3.27 | -6.30 | -1.44 | 7.19 | -7.22 | -1.07 | -2.06 | 7.26 | NA | NA | NA | NA | NA | NA | NA | NA | 0.73 | 3.14 | 4.13 | 2.30 | -7.36 | 5.30 | 5.67 | 2.36 | |
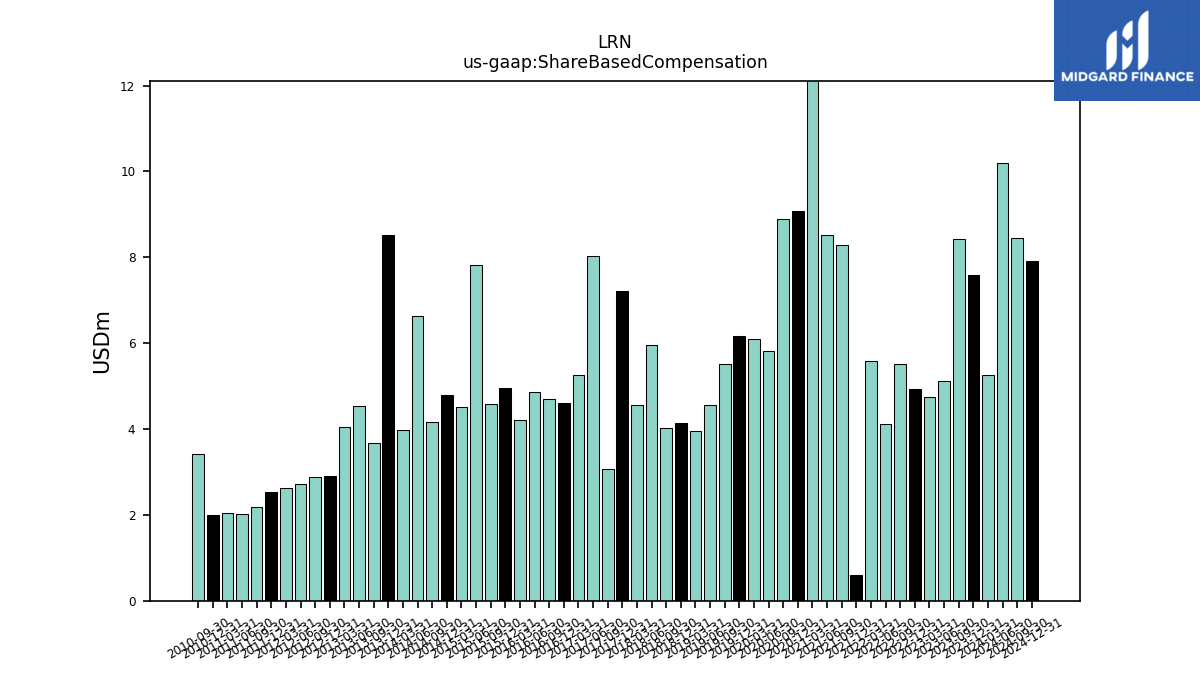
| Share Based Compensation | 7.60 | 8.43 | 5.12 | 4.75 | 4.94 | 5.51 | 4.11 | 5.58 | 0.60 | 8.29 | 8.51 | 12.85 | 9.07 | 8.89 | 5.82 | 6.09 | 6.18 | 5.52 | 4.56 | 3.95 | 4.14 | 4.02 | 5.96 | 4.56 | 7.22 | 3.08 | 8.04 | 5.26 | 4.60 | 4.69 | 4.86 | 4.22 | 4.95 | 4.59 | 7.83 | 4.50 | 4.80 | 4.17 | 6.63 | 3.99 | 8.53 | 3.68 | 4.54 | 4.05 | 2.91 | 2.87 | 2.73 | 2.62 | 2.53 | 2.19 | 2.01 | 2.05 | 1.99 | 3.41 | |
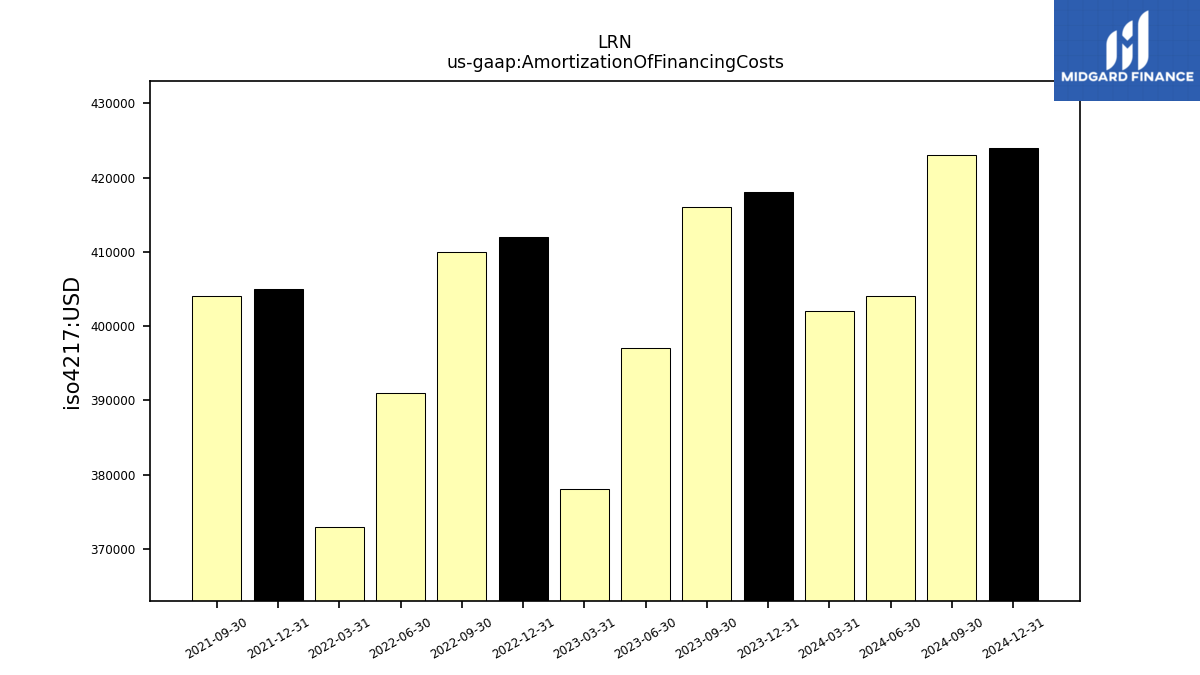
| Amortization Of Financing Costs | 0.42 | 0.42 | NA | 0.38 | 0.41 | 0.41 | NA | 0.37 | 0.41 | 0.40 | NA | NA | NA | NA | NA | NA | NA | NA | NA | NA | NA | NA | NA | NA | NA | NA | NA | NA | NA | NA | NA | NA | NA | NA | NA | NA | NA | NA | NA | NA | NA | NA | NA | NA | NA | NA | NA | NA | NA | NA | NA | NA | NA | NA |
| 2023-12-31 | 2023-09-30 | 2023-06-30 | 2023-03-31 | 2022-12-31 | 2022-09-30 | 2022-06-30 | 2022-03-31 | 2021-12-31 | 2021-09-30 | 2021-06-30 | 2021-03-31 | 2020-12-31 | 2020-09-30 | 2020-06-30 | 2020-03-31 | 2019-12-31 | 2019-09-30 | 2019-06-30 | 2019-03-31 | 2018-12-31 | 2018-09-30 | 2018-06-30 | 2018-03-31 | 2017-12-31 | 2017-09-30 | 2017-06-30 | 2017-03-31 | 2016-12-31 | 2016-09-30 | 2016-06-30 | 2016-03-31 | 2015-12-31 | 2015-09-30 | 2015-06-30 | 2015-03-31 | 2014-12-31 | 2014-09-30 | 2014-06-30 | 2014-03-31 | 2013-12-31 | 2013-09-30 | 2013-06-30 | 2013-03-31 | 2012-12-31 | 2012-09-30 | 2012-06-30 | 2012-03-31 | 2011-12-31 | 2011-09-30 | 2011-06-30 | 2011-03-31 | 2010-12-31 | 2010-09-30 | ||
|---|---|---|---|---|---|---|---|---|---|---|---|---|---|---|---|---|---|---|---|---|---|---|---|---|---|---|---|---|---|---|---|---|---|---|---|---|---|---|---|---|---|---|---|---|---|---|---|---|---|---|---|---|---|---|---|
| Net Cash Provided By Used In Investing Activities | -61.73 | -7.07 | -47.48 | -15.75 | -28.52 | -26.50 | -20.19 | -30.91 | -36.43 | -23.23 | -58.94 | -12.23 | -78.59 | -15.69 | -9.31 | -177.63 | -12.17 | -18.25 | -13.12 | -9.06 | -9.54 | -29.39 | -14.00 | -10.54 | -10.42 | -15.52 | -14.90 | -9.30 | -18.97 | -14.03 | NA | NA | NA | NA | NA | NA | NA | NA | NA | NA | NA | NA | NA | NA | NA | NA | NA | -11.45 | -12.75 | -21.26 | NA | -4.94 | -51.90 | -11.77 | |
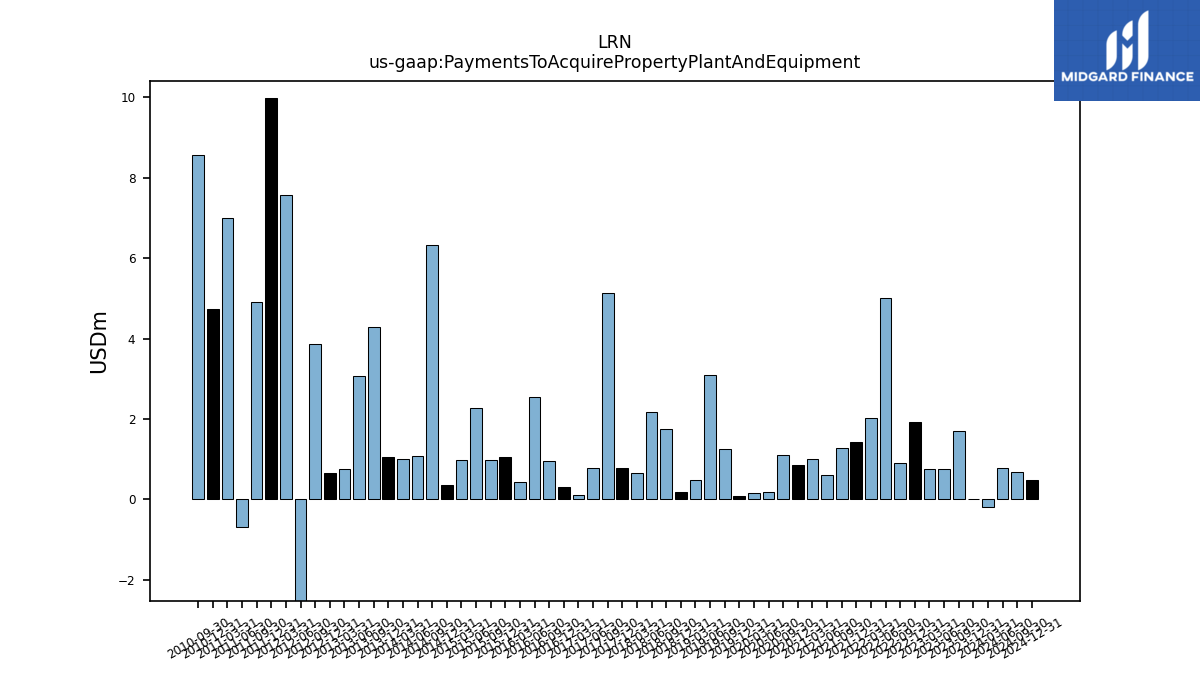
| Payments To Acquire Property Plant And Equipment | 0.01 | 1.69 | 0.76 | 0.76 | 1.91 | 0.91 | 5.01 | 2.03 | 1.43 | 1.28 | 0.60 | 1.00 | 0.86 | 1.11 | 0.18 | 0.15 | 0.09 | 1.25 | 3.08 | 0.48 | 0.18 | 1.74 | 2.16 | 0.66 | 0.77 | 5.14 | 0.78 | 0.12 | 0.32 | 0.96 | 2.55 | 0.43 | 1.05 | 0.98 | 2.27 | 0.97 | 0.35 | 6.33 | 1.08 | 0.99 | 1.05 | 4.27 | 3.07 | 0.74 | 0.66 | 3.86 | -11.99 | 7.58 | 9.99 | 4.91 | -0.68 | 7.00 | 4.74 | 8.56 |
| 2023-12-31 | 2023-09-30 | 2023-06-30 | 2023-03-31 | 2022-12-31 | 2022-09-30 | 2022-06-30 | 2022-03-31 | 2021-12-31 | 2021-09-30 | 2021-06-30 | 2021-03-31 | 2020-12-31 | 2020-09-30 | 2020-06-30 | 2020-03-31 | 2019-12-31 | 2019-09-30 | 2019-06-30 | 2019-03-31 | 2018-12-31 | 2018-09-30 | 2018-06-30 | 2018-03-31 | 2017-12-31 | 2017-09-30 | 2017-06-30 | 2017-03-31 | 2016-12-31 | 2016-09-30 | 2016-06-30 | 2016-03-31 | 2015-12-31 | 2015-09-30 | 2015-06-30 | 2015-03-31 | 2014-12-31 | 2014-09-30 | 2014-06-30 | 2014-03-31 | 2013-12-31 | 2013-09-30 | 2013-06-30 | 2013-03-31 | 2012-12-31 | 2012-09-30 | 2012-06-30 | 2012-03-31 | 2011-12-31 | 2011-09-30 | 2011-06-30 | 2011-03-31 | 2010-12-31 | 2010-09-30 | ||
|---|---|---|---|---|---|---|---|---|---|---|---|---|---|---|---|---|---|---|---|---|---|---|---|---|---|---|---|---|---|---|---|---|---|---|---|---|---|---|---|---|---|---|---|---|---|---|---|---|---|---|---|---|---|---|---|
| Net Cash Provided By Used In Financing Activities | -11.84 | -13.81 | -12.32 | -13.89 | -12.05 | -25.23 | -24.46 | -11.09 | -44.94 | -12.82 | -7.54 | -7.99 | -6.59 | 226.71 | -6.31 | 91.73 | -7.68 | -12.12 | -6.59 | -8.60 | -4.21 | -9.58 | -31.01 | -7.21 | -4.91 | -7.78 | -0.30 | -5.27 | -4.14 | -4.93 | NA | NA | NA | NA | NA | NA | NA | NA | NA | NA | NA | NA | NA | NA | NA | NA | NA | -4.73 | -2.36 | -3.49 | NA | -10.23 | 12.76 | -2.79 |
| 2023-12-31 | 2023-09-30 | 2023-06-30 | 2023-03-31 | 2022-12-31 | 2022-09-30 | 2022-06-30 | 2022-03-31 | 2021-12-31 | 2021-09-30 | 2021-06-30 | 2021-03-31 | 2020-12-31 | 2020-09-30 | 2020-06-30 | 2020-03-31 | 2019-12-31 | 2019-09-30 | 2019-06-30 | 2019-03-31 | 2018-12-31 | 2018-09-30 | 2018-06-30 | 2018-03-31 | 2017-12-31 | 2017-09-30 | 2017-06-30 | 2017-03-31 | 2016-12-31 | 2016-09-30 | 2016-06-30 | 2016-03-31 | 2015-12-31 | 2015-09-30 | 2015-06-30 | 2015-03-31 | 2014-12-31 | 2014-09-30 | 2014-06-30 | 2014-03-31 | 2013-12-31 | 2013-09-30 | 2013-06-30 | 2013-03-31 | 2012-12-31 | 2012-09-30 | 2012-06-30 | 2012-03-31 | 2011-12-31 | 2011-09-30 | 2011-06-30 | 2011-03-31 | 2010-12-31 | 2010-09-30 | ||
|---|---|---|---|---|---|---|---|---|---|---|---|---|---|---|---|---|---|---|---|---|---|---|---|---|---|---|---|---|---|---|---|---|---|---|---|---|---|---|---|---|---|---|---|---|---|---|---|---|---|---|---|---|---|---|---|
| Revenues | 504.87 | 480.18 | 483.49 | 470.28 | 458.44 | 425.15 | 455.21 | 421.72 | 409.51 | 400.23 | 397.51 | 392.14 | 376.14 | 370.96 | 268.93 | 257.15 | 257.56 | 257.12 | 256.31 | 253.25 | 254.87 | 251.31 | 238.87 | 232.86 | 217.21 | 228.78 | 215.76 | 222.53 | 221.09 | 229.14 | 221.32 | 221.34 | 208.81 | 221.23 | 235.66 | 244.62 | 231.30 | 236.71 | 232.05 | 235.22 | 223.92 | 228.37 | 203.09 | 218.01 | 206.03 | 221.10 | 170.40 | 178.18 | 166.50 | 193.33 | 128.27 | 130.29 | 129.00 | 134.87 | |
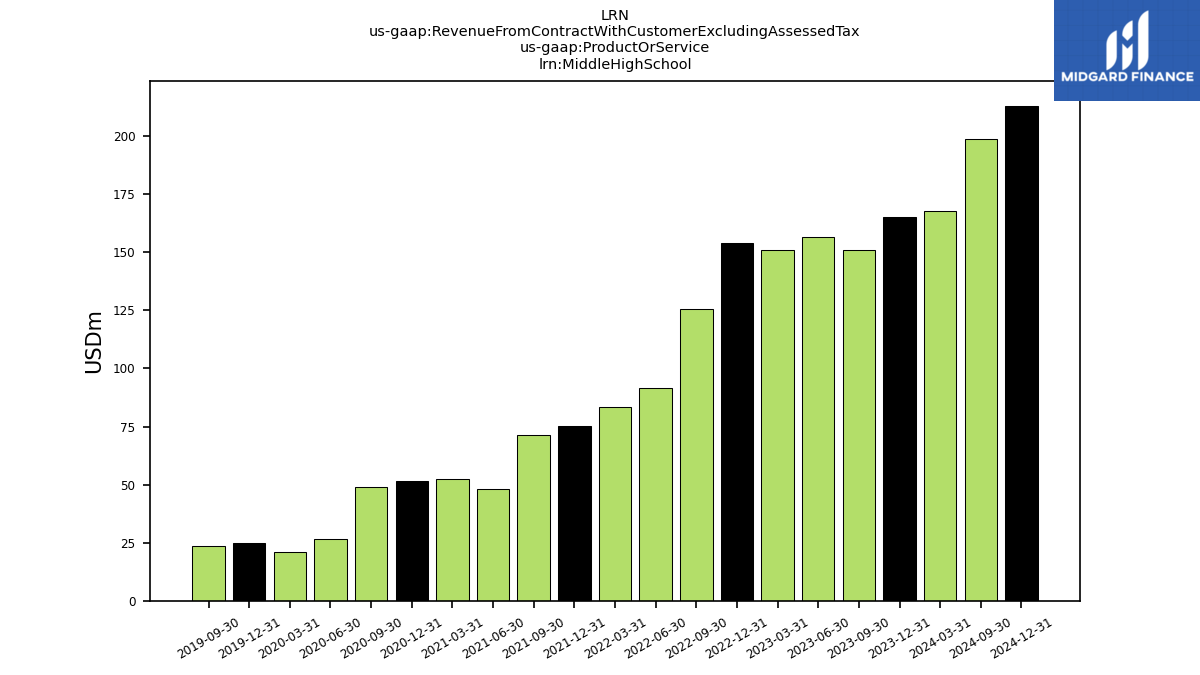
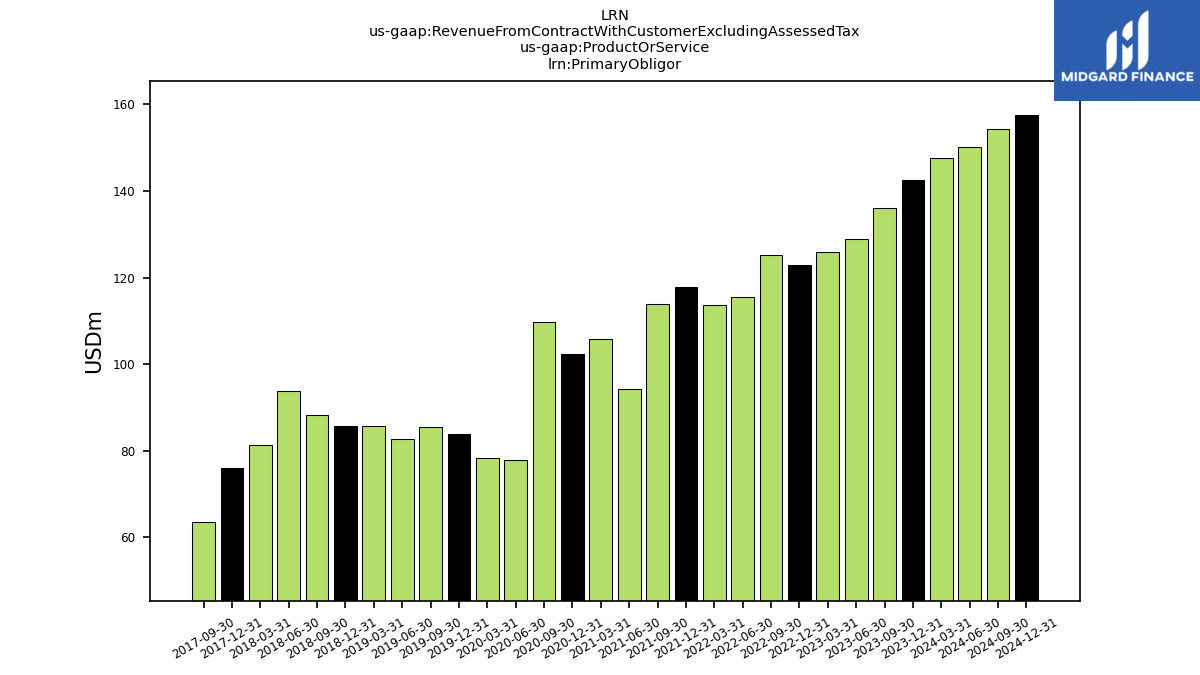
| Revenue From Contract With Customer Excluding Assessed Tax | 504.87 | 480.18 | 483.49 | 470.28 | 458.44 | 425.15 | 455.21 | 421.72 | 409.51 | 400.23 | 397.51 | 392.14 | 376.14 | 370.96 | 268.93 | 257.15 | 257.56 | 257.12 | 256.31 | 253.25 | 254.87 | 251.31 | 238.87 | 232.86 | 217.21 | 228.78 | 215.76 | 222.53 | 221.09 | 229.14 | 221.32 | 221.34 | 208.81 | 221.23 | 235.66 | 244.62 | 231.30 | 236.71 | 232.05 | 235.22 | 223.92 | 228.37 | 203.09 | 218.01 | 206.03 | 221.10 | 170.40 | 178.18 | 166.50 | 193.33 | 128.27 | 130.29 | 129.00 | 134.87 | |
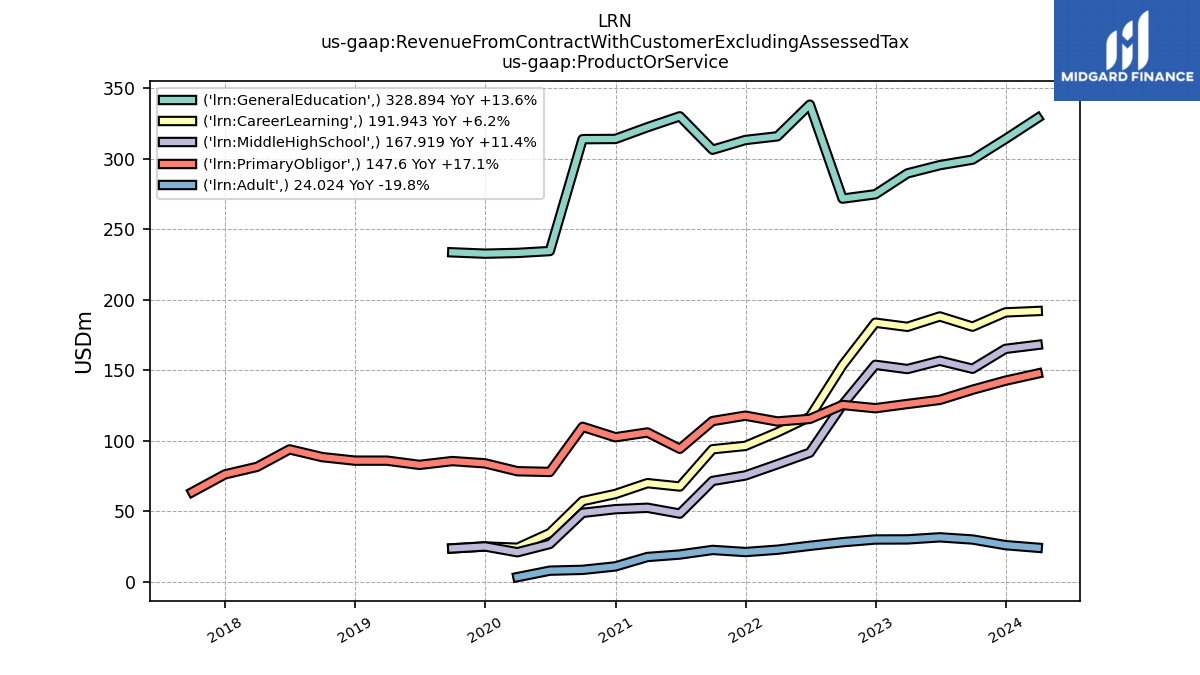
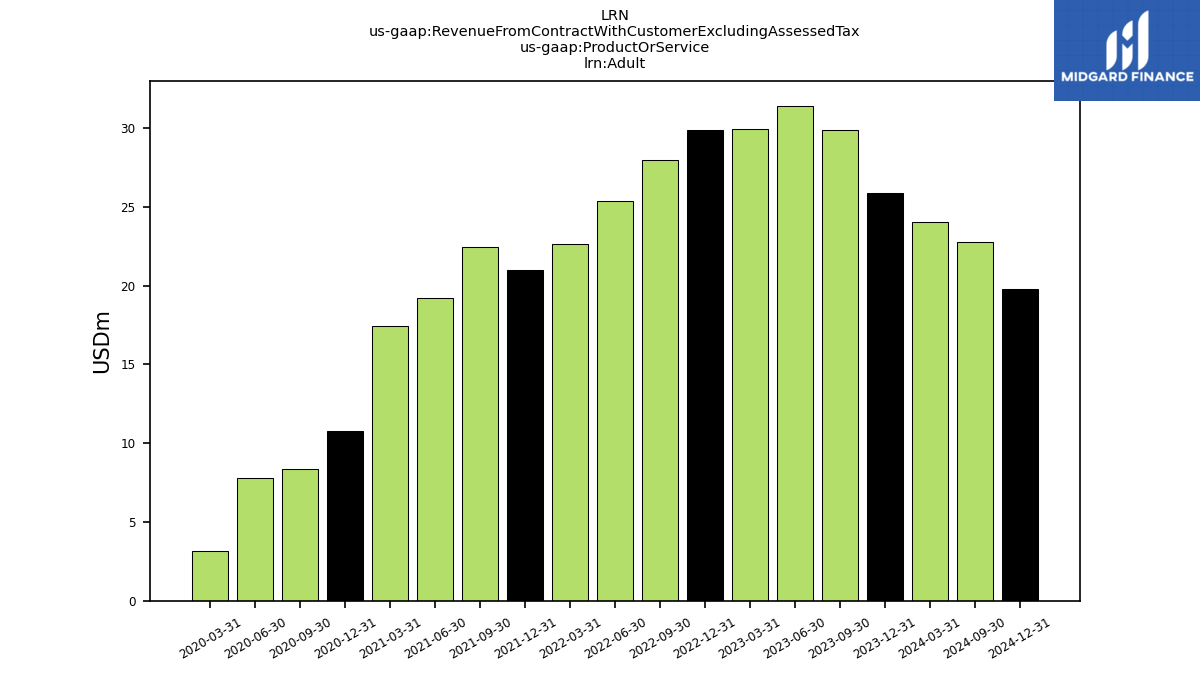
| Adult | 25.89 | 29.87 | 31.42 | 29.95 | 29.88 | 27.96 | 25.39 | 22.63 | 20.98 | 22.47 | 19.21 | 17.46 | 10.78 | 8.34 | 7.77 | 3.19 | NA | NA | NA | NA | NA | NA | NA | NA | NA | NA | NA | NA | NA | NA | NA | NA | NA | NA | NA | NA | NA | NA | NA | NA | NA | NA | NA | NA | NA | NA | NA | NA | NA | NA | NA | NA | NA | NA | |
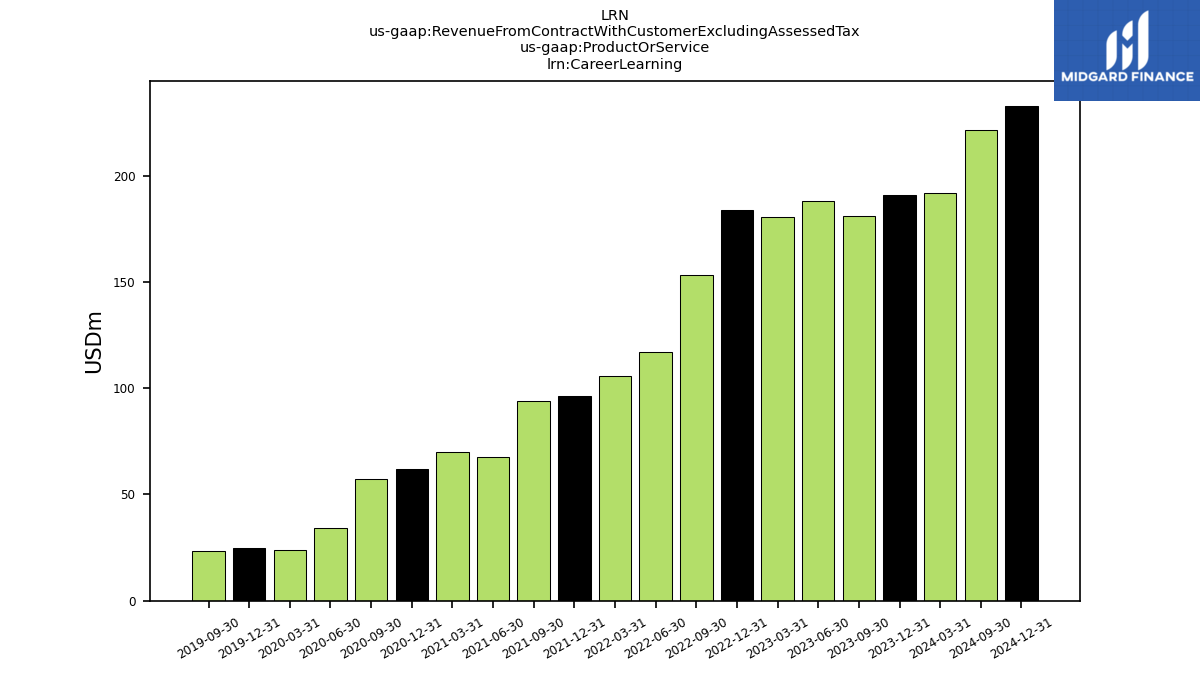
| Career Learning | 190.97 | 180.84 | 188.09 | 180.72 | 183.67 | 153.49 | 116.87 | 105.86 | 96.27 | 93.89 | 67.45 | 69.84 | 62.16 | 57.11 | 34.45 | 24.01 | 24.94 | 23.55 | NA | NA | NA | NA | NA | NA | NA | NA | NA | NA | NA | NA | NA | NA | NA | NA | NA | NA | NA | NA | NA | NA | NA | NA | NA | NA | NA | NA | NA | NA | NA | NA | NA | NA | NA | NA | |
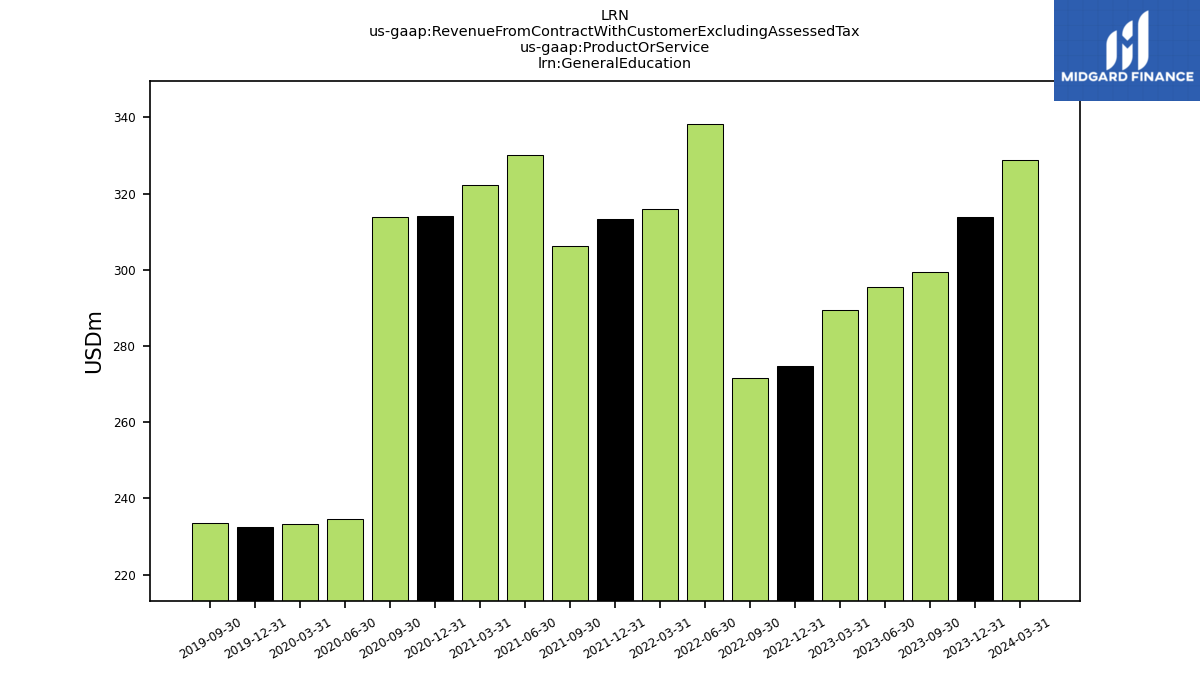
| General Education | 313.90 | 299.34 | 295.40 | 289.57 | 274.76 | 271.66 | 338.34 | 315.86 | 313.24 | 306.34 | 330.06 | 322.30 | 313.99 | 313.85 | 234.48 | 233.15 | 232.62 | 233.57 | NA | NA | NA | NA | NA | NA | NA | NA | NA | NA | NA | NA | NA | NA | NA | NA | NA | NA | NA | NA | NA | NA | NA | NA | NA | NA | NA | NA | NA | NA | NA | NA | NA | NA | NA | NA | |
| Middle High School | 165.08 | 150.97 | 156.67 | 150.77 | 153.79 | 125.53 | 91.48 | 83.24 | 75.29 | 71.41 | 48.24 | 52.38 | 51.38 | 48.77 | 26.69 | 20.82 | 24.94 | 23.55 | NA | NA | NA | NA | NA | NA | NA | NA | NA | NA | NA | NA | NA | NA | NA | NA | NA | NA | NA | NA | NA | NA | NA | NA | NA | NA | NA | NA | NA | NA | NA | NA | NA | NA | NA | NA | |
| Primary Obligor | 142.50 | 136.10 | 128.90 | 126.00 | 123.00 | 125.30 | 115.40 | 113.60 | 117.70 | 113.90 | 94.20 | 105.80 | 102.40 | 109.80 | 77.80 | 78.30 | 83.90 | 85.50 | 82.80 | 85.80 | 85.80 | 88.30 | 93.80 | 81.40 | 76.10 | 63.50 | NA | NA | NA | NA | NA | NA | NA | NA | NA | NA | NA | NA | NA | NA | NA | NA | NA | NA | NA | NA | NA | NA | NA | NA | NA | NA | NA | NA | |
| Revenue From Contract With Customer Including Assessed Tax | 504.87 | 480.18 | 483.49 | 470.28 | 458.44 | 425.15 | 455.21 | 421.72 | 409.51 | 400.23 | 397.51 | 392.14 | 376.14 | 370.96 | 268.93 | 257.15 | 257.56 | 257.12 | 256.31 | 253.25 | 254.87 | 251.31 | 238.87 | 232.86 | 217.21 | 228.78 | 215.76 | 222.53 | 221.09 | 228.78 | 221.32 | 221.34 | 208.81 | 221.23 | 235.66 | 244.62 | 231.30 | 236.71 | 232.05 | 235.22 | 223.92 | 228.37 | 203.09 | 218.01 | 206.03 | 221.10 | 170.40 | 178.18 | 166.50 | 193.33 | 128.27 | 130.29 | 129.00 | 134.87 |

