
| 2023-09-30 | 2023-06-30 | 2023-03-31 | 2022-12-31 | 2022-09-30 | 2022-06-30 | 2022-03-31 | 2021-12-31 | 2021-09-30 | 2021-06-30 | 2021-03-31 | 2020-12-31 | 2020-09-30 | 2020-06-30 | 2020-03-31 | 2019-12-31 | 2019-09-30 | 2019-06-30 | 2019-03-31 | 2018-12-31 | 2018-09-30 | 2018-06-30 | 2018-03-31 | 2017-12-31 | 2017-09-30 | 2017-06-30 | 2017-03-31 | 2016-12-31 | 2016-09-30 | 2016-06-30 | 2016-03-31 | 2015-12-31 | 2015-09-30 | 2015-06-30 | 2015-03-31 | 2014-12-31 | 2014-09-30 | 2014-06-30 | 2014-03-31 | 2013-12-31 | 2013-09-30 | 2013-06-30 | 2013-03-31 | 2012-12-31 | 2012-09-30 | 2012-06-30 | 2012-03-31 | 2011-12-31 | 2011-09-30 | 2011-06-30 | 2011-03-31 | 2010-12-31 | 2010-09-30 | 2010-06-30 | ||
|---|---|---|---|---|---|---|---|---|---|---|---|---|---|---|---|---|---|---|---|---|---|---|---|---|---|---|---|---|---|---|---|---|---|---|---|---|---|---|---|---|---|---|---|---|---|---|---|---|---|---|---|---|---|---|---|
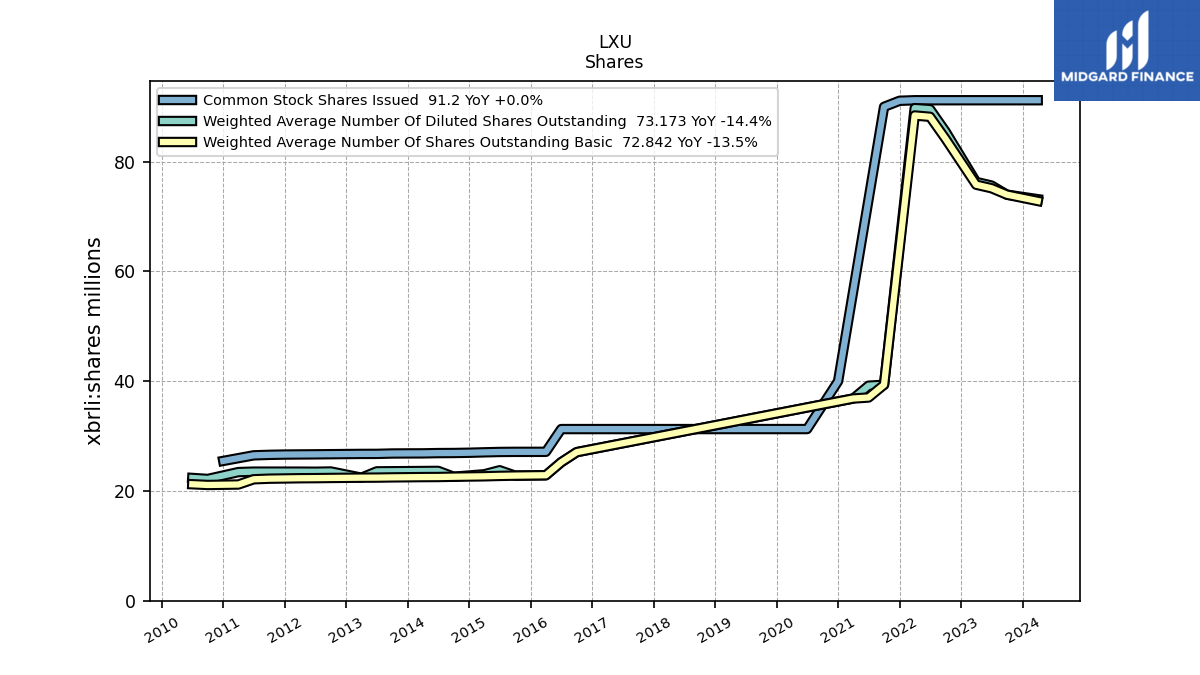
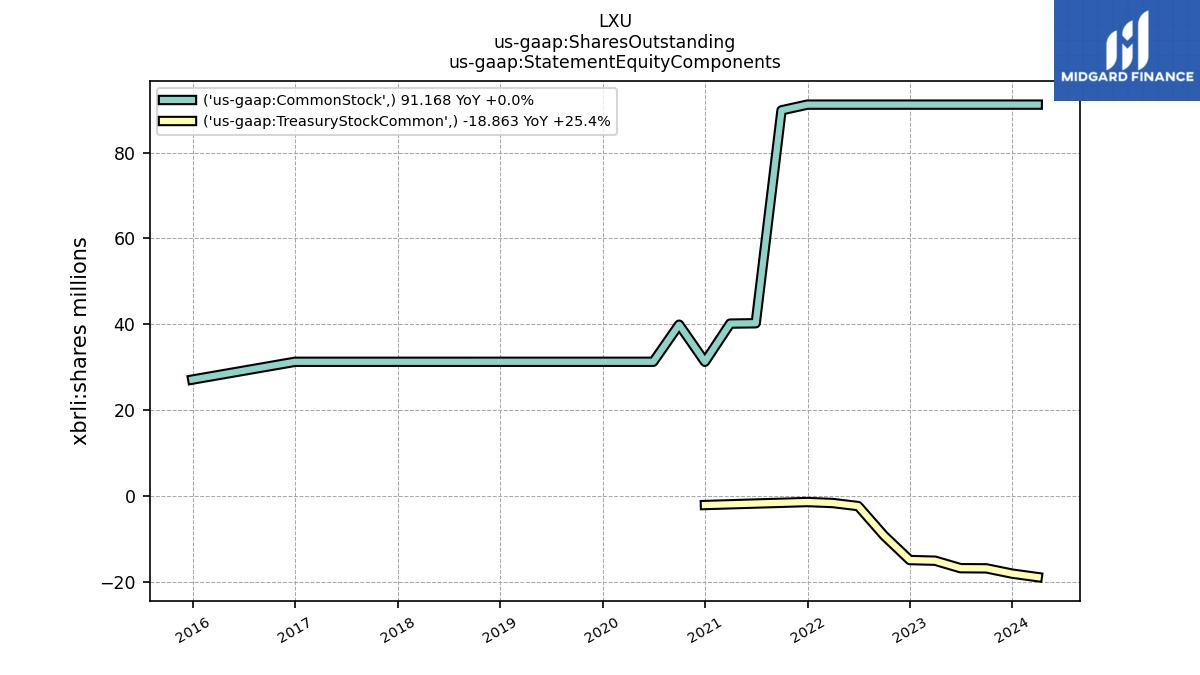
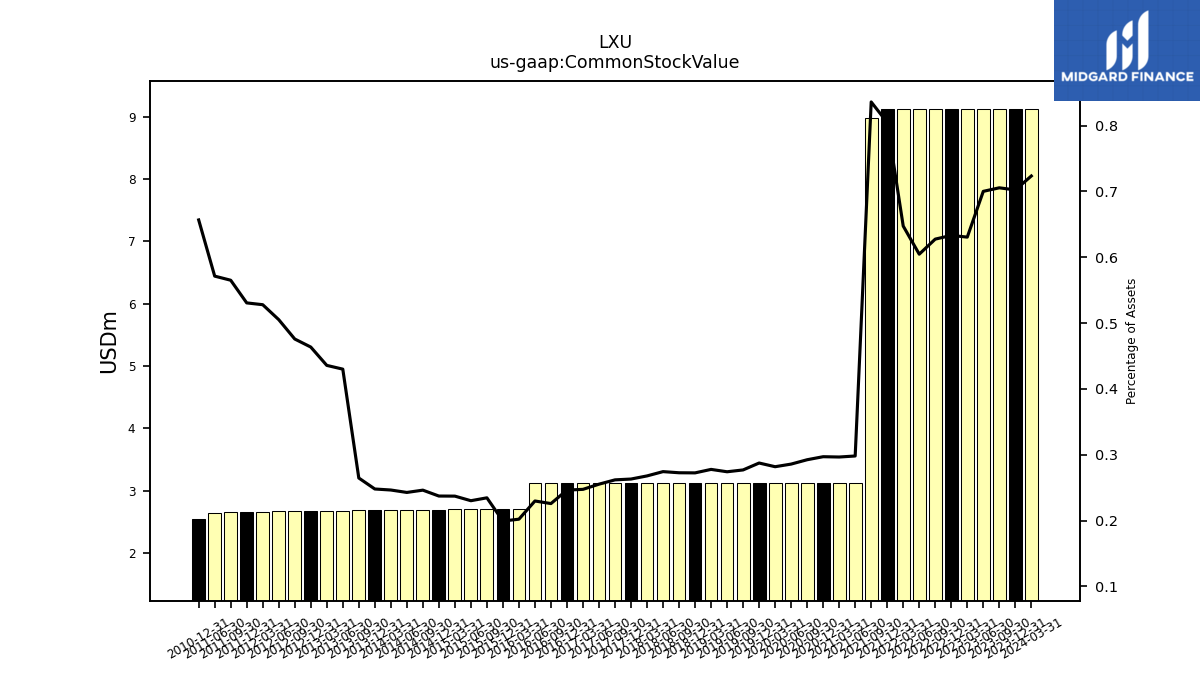
| Common Stock Value | 9.12 | 9.12 | 9.12 | 9.12 | 9.12 | 9.12 | 9.12 | 9.12 | 8.98 | 3.13 | 3.13 | 3.13 | 3.13 | 3.13 | 3.13 | 3.13 | 3.13 | 3.13 | 3.13 | 3.13 | 3.13 | 3.13 | 3.13 | 3.13 | 3.13 | 3.13 | 3.13 | 3.13 | 3.13 | 3.13 | 2.71 | 2.71 | 2.71 | 2.71 | 2.70 | 2.70 | 2.69 | 2.69 | 2.69 | 2.69 | 2.68 | 2.68 | 2.68 | 2.67 | 2.67 | 2.67 | 2.67 | 2.66 | 2.66 | 2.65 | NA | 2.55 | NA | NA | |
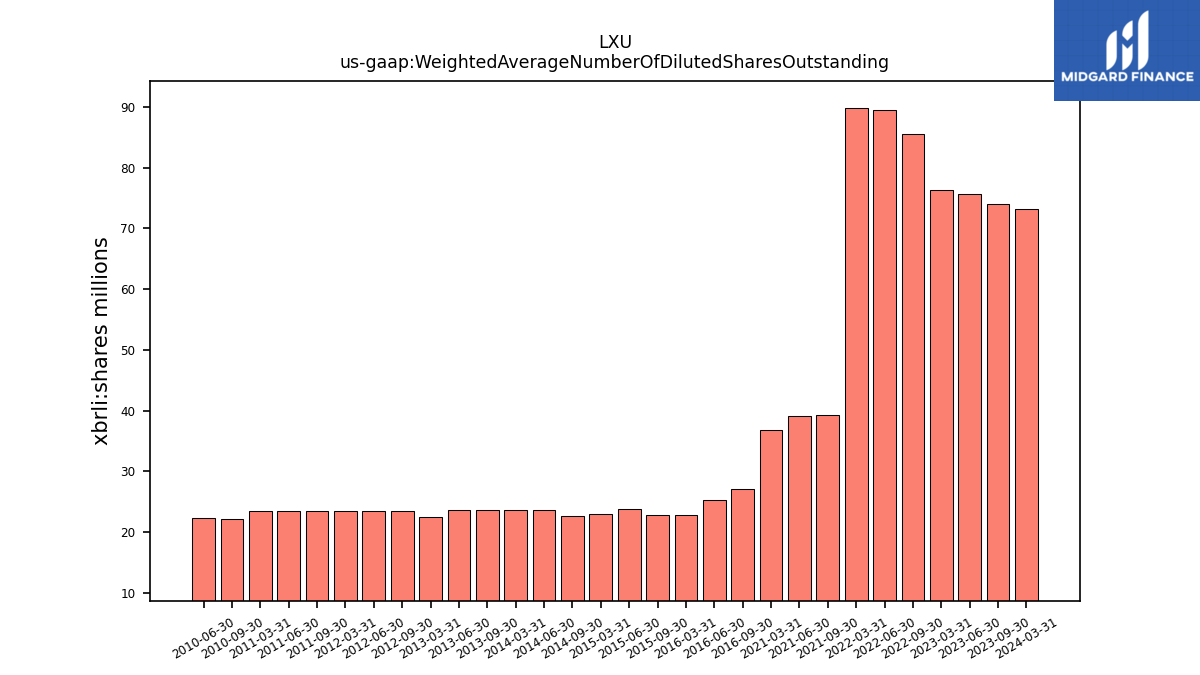
| Weighted Average Number Of Diluted Shares Outstanding | 73.99 | 75.66 | 76.31 | NA | 85.52 | 89.56 | 89.77 | NA | 39.35 | 39.19 | 36.85 | NA | NA | NA | NA | NA | NA | NA | NA | NA | NA | NA | NA | NA | NA | NA | NA | NA | 27.08 | 25.24 | 22.87 | NA | 22.80 | 23.78 | 23.05 | NA | 22.60 | 23.66 | 23.64 | NA | 23.60 | 23.58 | 22.42 | NA | 23.55 | 23.51 | 23.52 | NA | 23.53 | 23.53 | 23.44 | NA | 22.19 | 22.38 | |
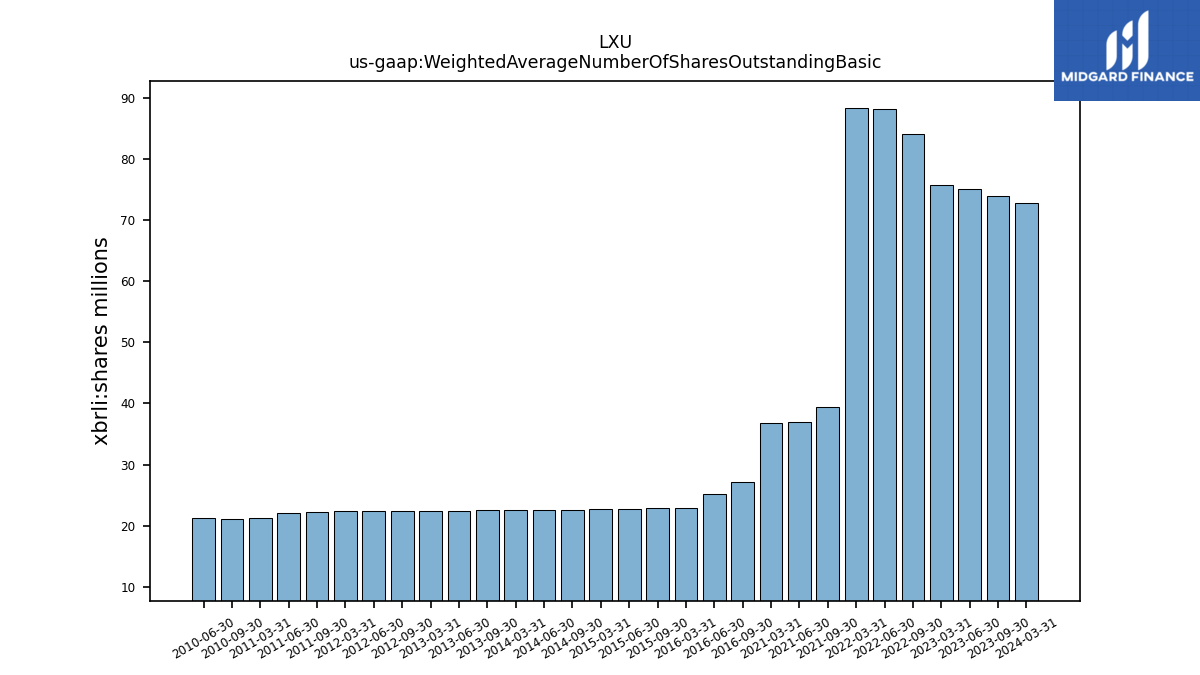
| Weighted Average Number Of Shares Outstanding Basic | 73.99 | 75.17 | 75.81 | NA | 84.19 | 88.18 | 88.42 | NA | 39.35 | 37.03 | 36.85 | NA | NA | NA | NA | NA | NA | NA | NA | NA | NA | NA | NA | NA | NA | NA | NA | NA | 27.08 | 25.24 | 22.87 | NA | 22.80 | 22.75 | 22.67 | NA | 22.60 | 22.54 | 22.53 | NA | 22.48 | 22.44 | 22.42 | NA | 22.37 | 22.34 | 22.32 | NA | 22.24 | 22.13 | 21.18 | NA | 21.09 | 21.23 | |
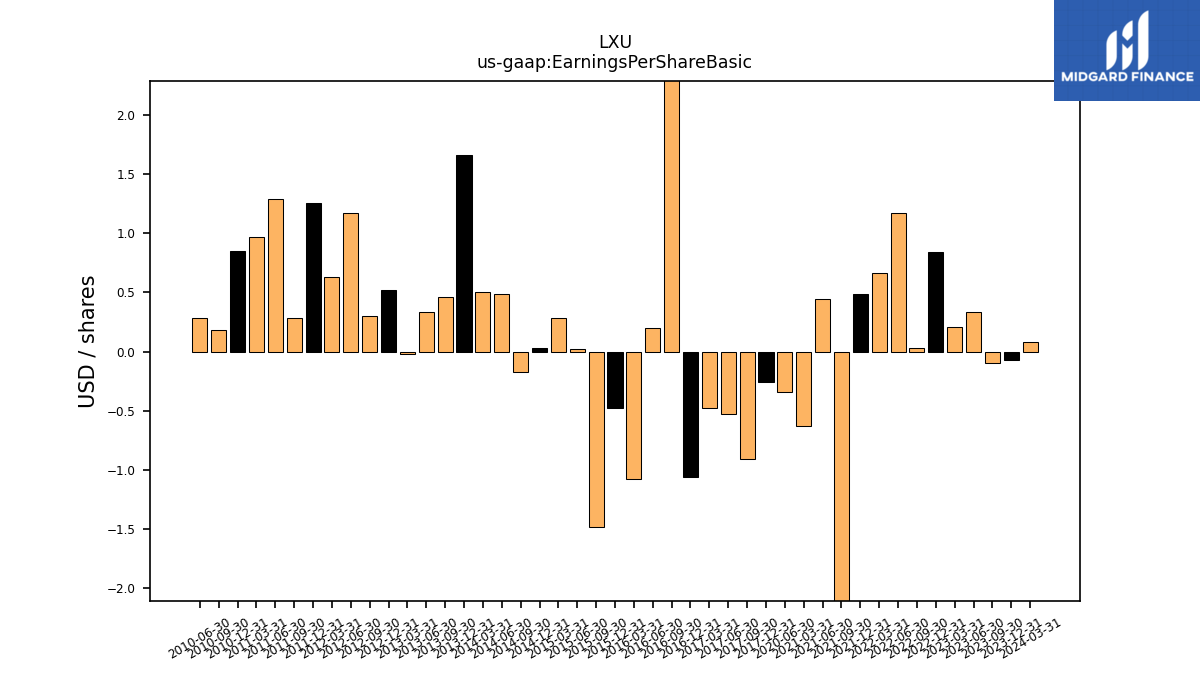
| Earnings Per Share Basic | -0.10 | 0.33 | 0.21 | 0.84 | 0.03 | 1.17 | 0.66 | 0.49 | -6.39 | 0.44 | -0.63 | NA | NA | -0.34 | NA | NA | NA | NA | NA | NA | NA | NA | NA | -0.26 | -0.91 | -0.53 | -0.48 | -1.06 | 4.14 | 0.20 | -1.08 | -0.48 | -1.48 | 0.02 | 0.28 | 0.03 | -0.17 | 0.49 | 0.50 | 1.66 | 0.46 | 0.33 | -0.02 | 0.52 | 0.30 | 1.17 | 0.63 | 1.26 | 0.28 | 1.29 | 0.97 | 0.85 | 0.18 | 0.28 | |
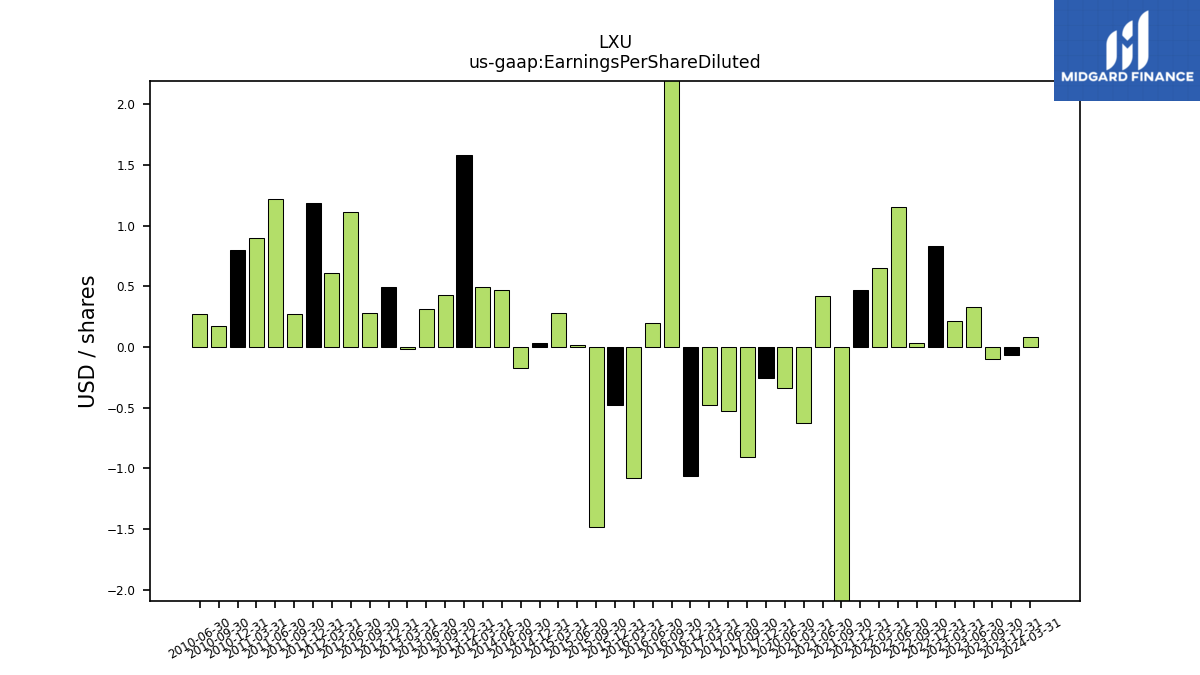
| Earnings Per Share Diluted | -0.10 | 0.33 | 0.21 | 0.83 | 0.03 | 1.15 | 0.65 | 0.47 | -6.39 | 0.42 | -0.63 | NA | NA | -0.34 | NA | NA | NA | NA | NA | NA | NA | NA | NA | -0.26 | -0.91 | -0.53 | -0.48 | -1.06 | 4.14 | 0.20 | -1.08 | -0.48 | -1.48 | 0.02 | 0.28 | 0.03 | -0.17 | 0.47 | 0.49 | 1.58 | 0.43 | 0.31 | -0.02 | 0.49 | 0.28 | 1.11 | 0.61 | 1.19 | 0.27 | 1.22 | 0.90 | 0.80 | 0.17 | 0.27 |
| 2023-09-30 | 2023-06-30 | 2023-03-31 | 2022-12-31 | 2022-09-30 | 2022-06-30 | 2022-03-31 | 2021-12-31 | 2021-09-30 | 2021-06-30 | 2021-03-31 | 2020-12-31 | 2020-09-30 | 2020-06-30 | 2020-03-31 | 2019-12-31 | 2019-09-30 | 2019-06-30 | 2019-03-31 | 2018-12-31 | 2018-09-30 | 2018-06-30 | 2018-03-31 | 2017-12-31 | 2017-09-30 | 2017-06-30 | 2017-03-31 | 2016-12-31 | 2016-09-30 | 2016-06-30 | 2016-03-31 | 2015-12-31 | 2015-09-30 | 2015-06-30 | 2015-03-31 | 2014-12-31 | 2014-09-30 | 2014-06-30 | 2014-03-31 | 2013-12-31 | 2013-09-30 | 2013-06-30 | 2013-03-31 | 2012-12-31 | 2012-09-30 | 2012-06-30 | 2012-03-31 | 2011-12-31 | 2011-09-30 | 2011-06-30 | 2011-03-31 | 2010-12-31 | 2010-09-30 | 2010-06-30 | ||
|---|---|---|---|---|---|---|---|---|---|---|---|---|---|---|---|---|---|---|---|---|---|---|---|---|---|---|---|---|---|---|---|---|---|---|---|---|---|---|---|---|---|---|---|---|---|---|---|---|---|---|---|---|---|---|---|
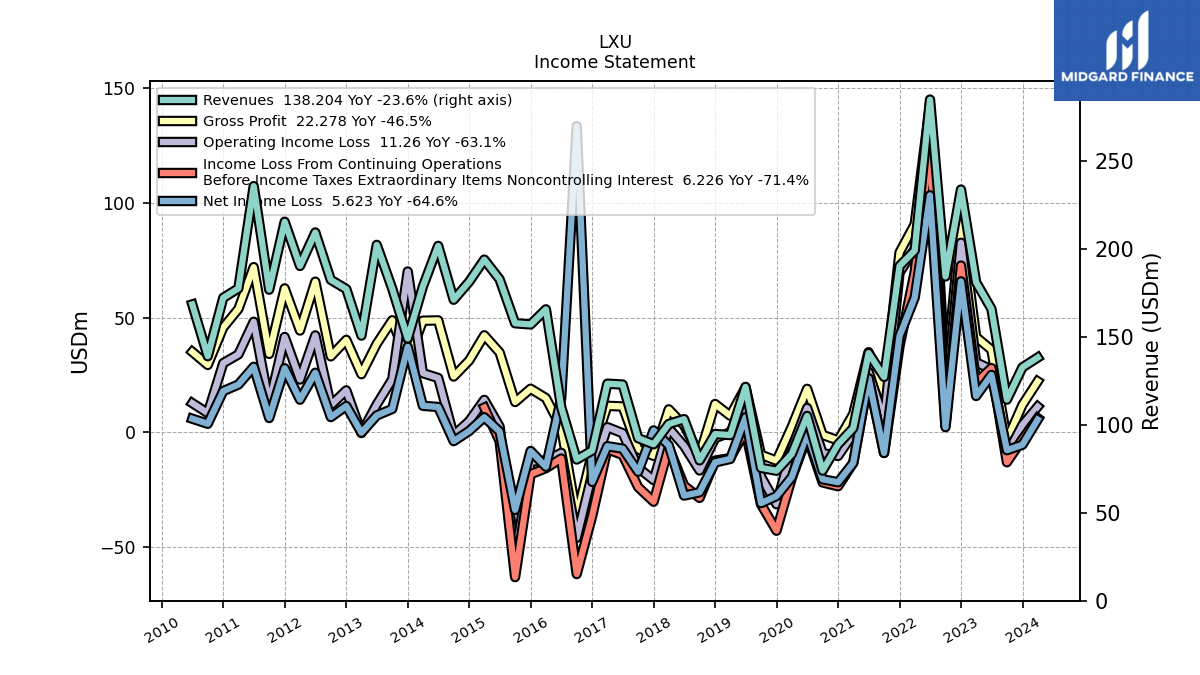
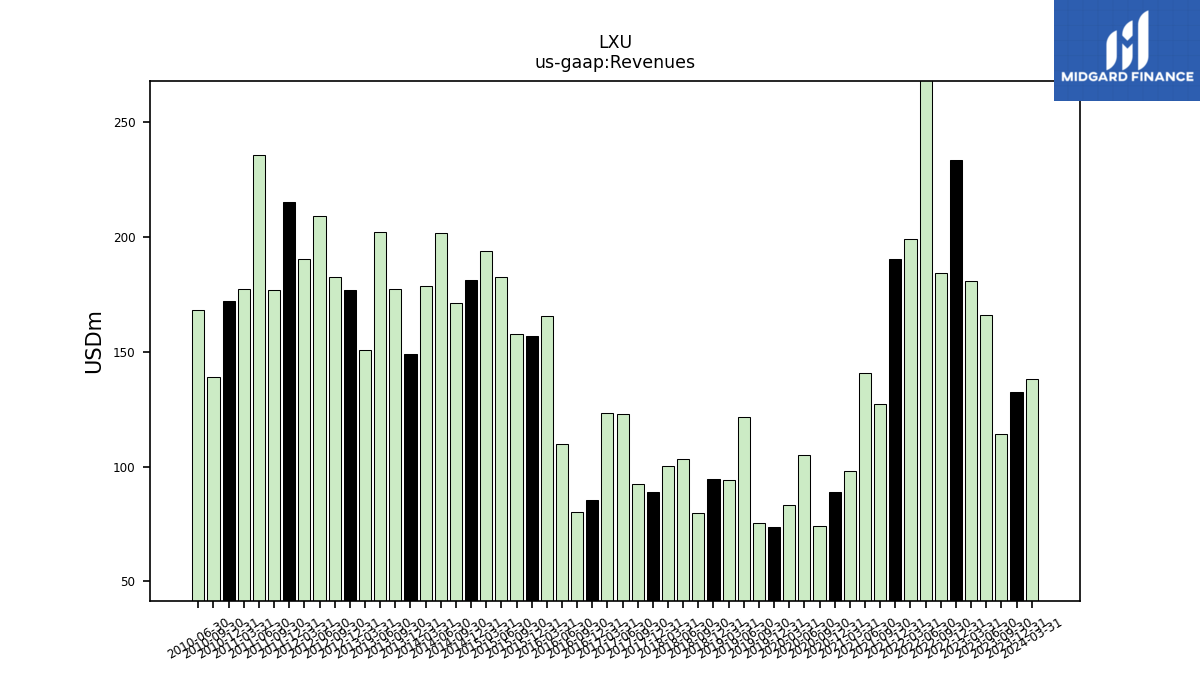
| Revenue From Contract With Customer Excluding Assessed Tax | 114.29 | 165.84 | 180.96 | 233.65 | 184.27 | 284.80 | 198.98 | 190.23 | 127.20 | 140.70 | 98.12 | 88.90 | 73.97 | 105.03 | 83.41 | 73.90 | 75.50 | 121.53 | 94.15 | 94.73 | 79.78 | 103.20 | 100.45 | 88.92 | 92.39 | 122.85 | 123.34 | 85.37 | 80.26 | 109.98 | 165.60 | 157.02 | 157.69 | 182.66 | 193.86 | 181.28 | 171.05 | 201.66 | 178.53 | 149.03 | 177.35 | 202.22 | 150.68 | 177.14 | 182.37 | 209.28 | 190.25 | 215.36 | 176.78 | 235.62 | 177.49 | 172.16 | 138.95 | 168.39 | |
| Revenues | 114.29 | 165.84 | 180.96 | 233.65 | 184.27 | 284.80 | 198.98 | 190.23 | 127.20 | 140.70 | 98.12 | 88.90 | 73.97 | 105.03 | 83.41 | 73.90 | 75.50 | 121.53 | 94.15 | 94.73 | 79.78 | 103.20 | 100.45 | 88.92 | 92.39 | 122.85 | 123.34 | 85.37 | 80.26 | 109.98 | 165.60 | 157.02 | 157.69 | 182.66 | 193.86 | 181.28 | 171.05 | 201.66 | 178.53 | 149.03 | 177.35 | 202.22 | 150.68 | 177.14 | 182.37 | 209.28 | 190.25 | 215.36 | 176.78 | 235.62 | 177.49 | 172.16 | 138.95 | 168.39 | |
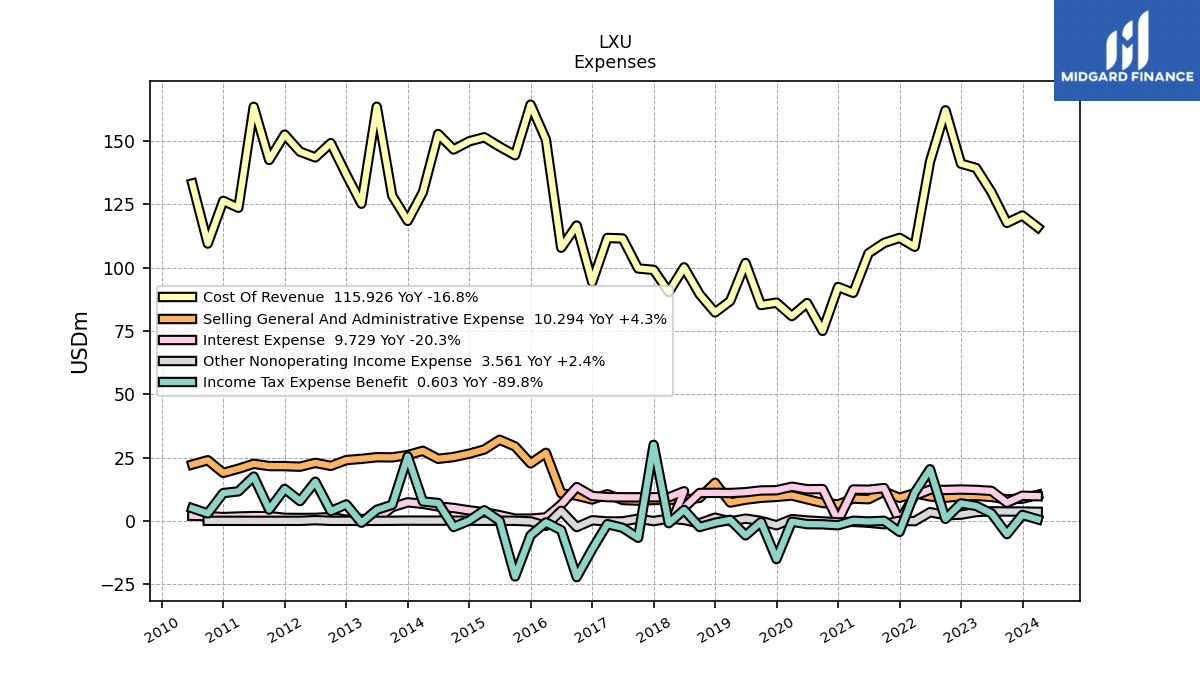
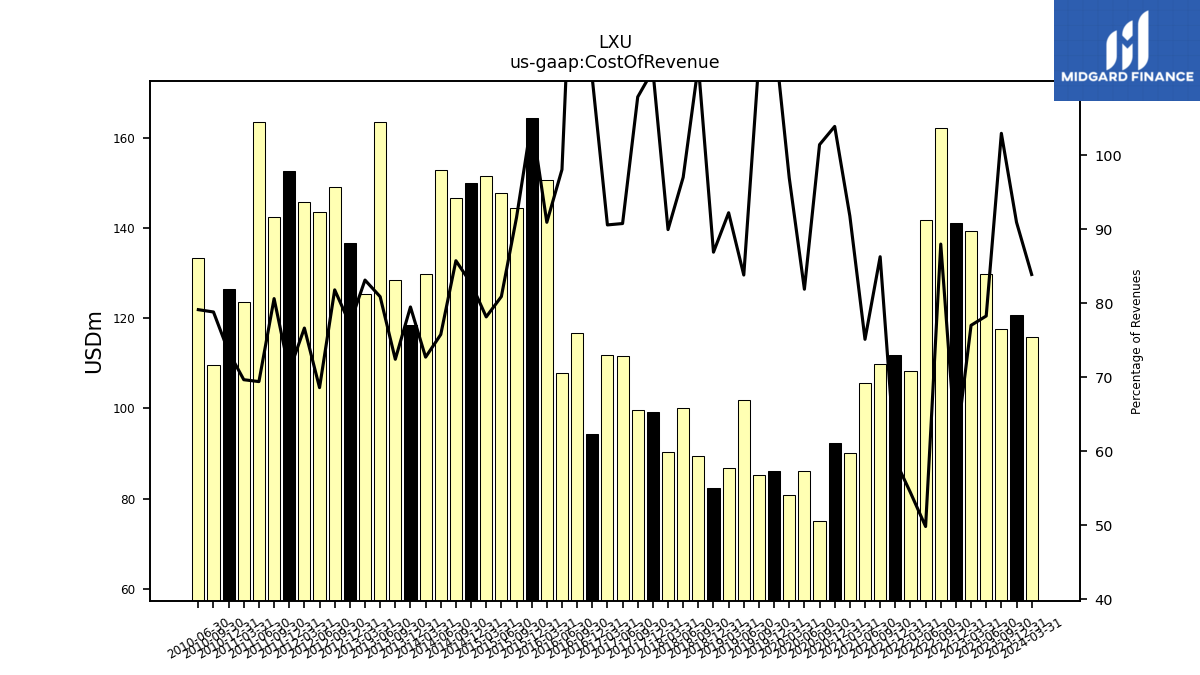
| Cost Of Revenue | 117.67 | 129.81 | 139.36 | 141.07 | 162.14 | 141.88 | 108.25 | 111.76 | 109.75 | 105.69 | 90.06 | 92.37 | 75.03 | 86.01 | 80.86 | 86.17 | 85.23 | 101.85 | 86.83 | 82.32 | 89.52 | 100.13 | 90.36 | 99.12 | 99.67 | 111.51 | 111.73 | 94.26 | 116.64 | 107.85 | 150.59 | 164.39 | 144.41 | 147.78 | 151.50 | 149.90 | 146.66 | 152.79 | 129.80 | 118.47 | 128.44 | 163.56 | 125.26 | 136.77 | 149.19 | 143.54 | 145.80 | 152.54 | 142.52 | 163.53 | 123.64 | 126.38 | 109.51 | 133.24 | |
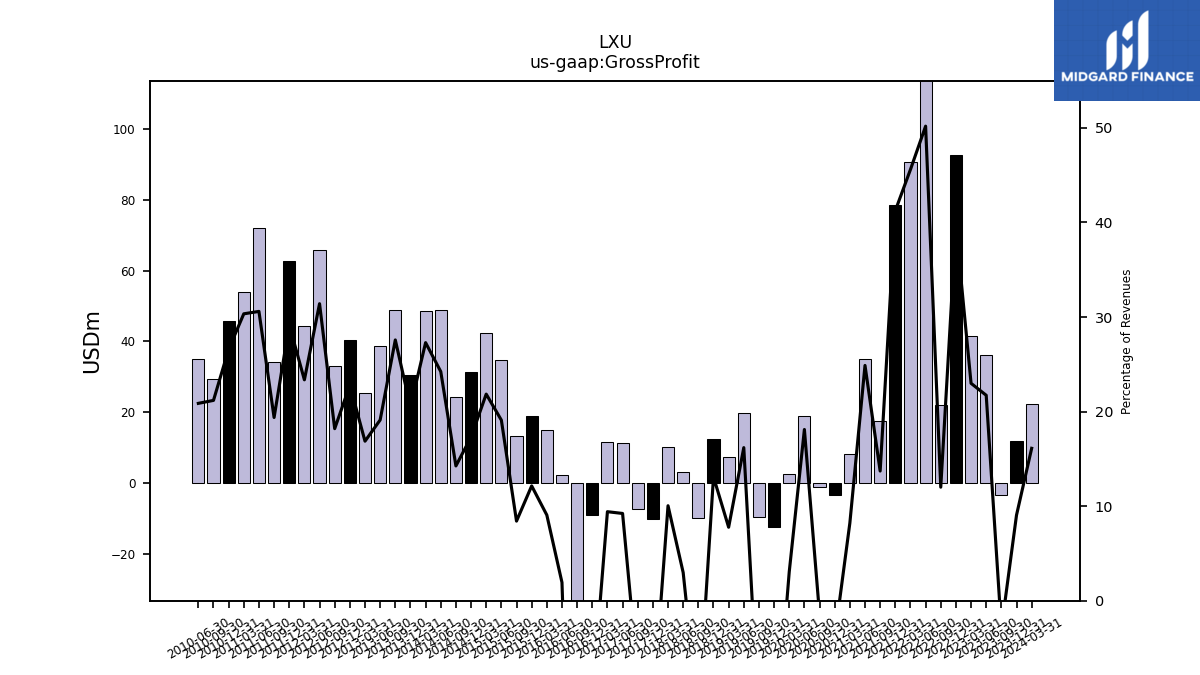
| Gross Profit | -3.39 | 36.03 | 41.60 | 92.58 | 22.13 | 142.92 | 90.73 | 78.46 | 17.45 | 35.01 | 8.06 | -3.46 | -1.06 | 19.02 | 2.55 | -12.28 | -9.73 | 19.68 | 7.32 | 12.41 | -9.74 | 3.07 | 10.09 | -10.20 | -7.29 | 11.34 | 11.62 | -8.89 | -36.38 | 2.13 | 15.01 | 19.07 | 13.28 | 34.88 | 42.36 | 31.38 | 24.39 | 48.87 | 48.72 | 30.57 | 48.91 | 38.66 | 25.42 | 40.37 | 33.19 | 65.73 | 44.44 | 62.82 | 34.26 | 72.09 | 53.85 | 45.77 | 29.44 | 35.15 | |
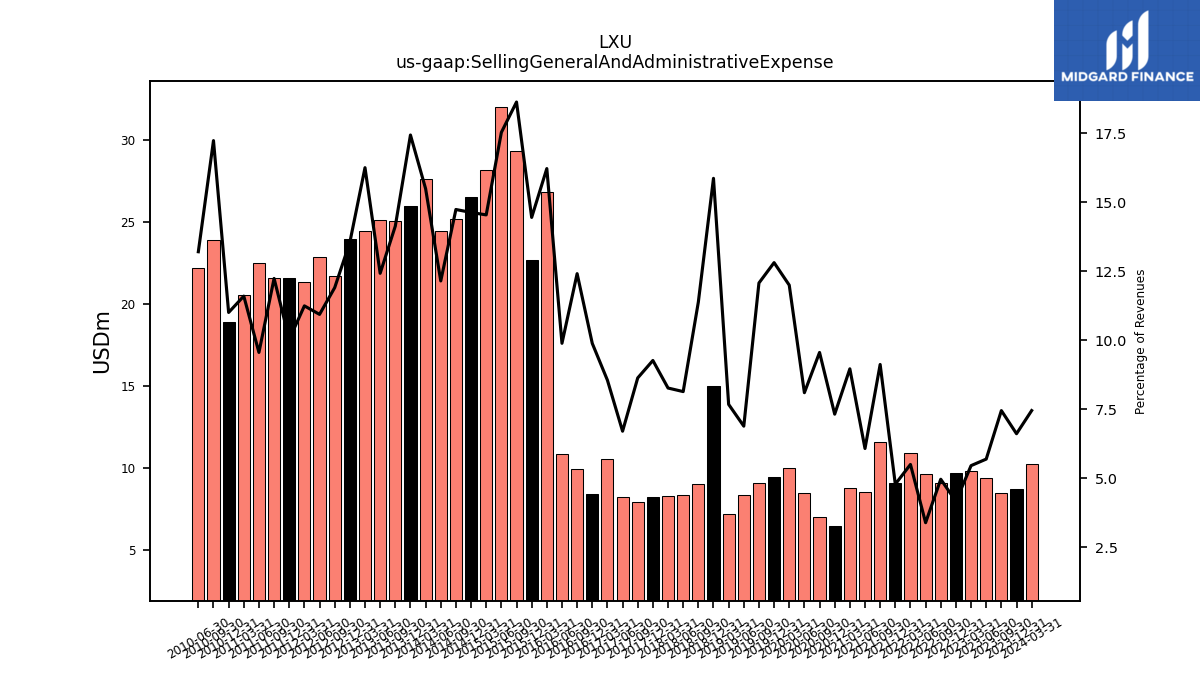
| Selling General And Administrative Expense | 8.51 | 9.44 | 9.87 | 9.72 | 9.14 | 9.64 | 10.94 | 9.09 | 11.60 | 8.54 | 8.79 | 6.51 | 7.07 | 8.50 | 10.01 | 9.47 | 9.12 | 8.37 | 7.22 | 15.03 | 9.08 | 8.40 | 8.30 | 8.24 | 7.97 | 8.23 | 10.54 | 8.44 | 9.96 | 10.87 | 26.86 | 22.69 | 29.38 | 32.02 | 28.19 | 26.52 | 25.21 | 24.50 | 27.66 | 25.99 | 25.07 | 25.12 | 24.49 | 24.00 | 21.71 | 22.89 | 21.39 | 21.61 | 21.64 | 22.52 | 20.59 | 18.95 | 23.95 | 22.24 | |
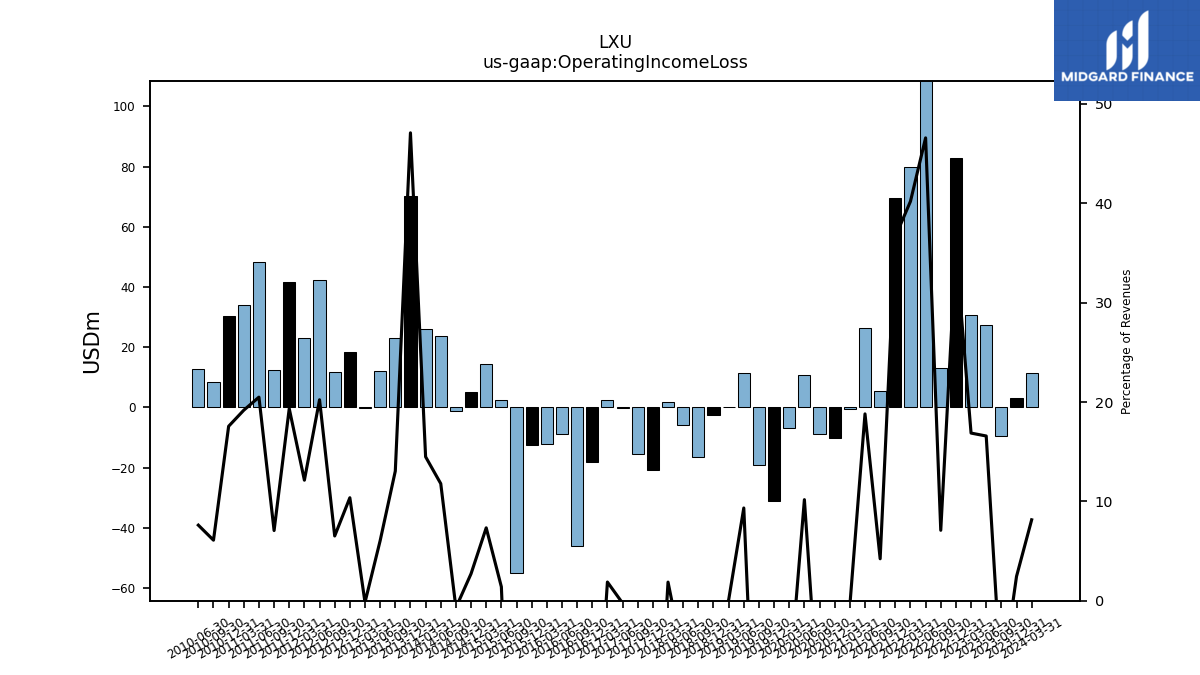
| Operating Income Loss | -9.50 | 27.50 | 30.54 | 82.68 | 13.07 | 132.66 | 79.97 | 69.69 | 5.37 | 26.46 | -0.47 | -10.23 | -9.00 | 10.68 | -6.99 | -31.28 | -19.23 | 11.35 | 0.07 | -2.48 | -16.56 | -5.87 | 1.88 | -20.75 | -15.36 | -0.30 | 2.32 | -18.10 | -45.93 | -8.88 | -12.24 | -12.65 | -54.89 | 2.56 | 14.22 | 4.93 | -1.20 | 23.76 | 25.86 | 70.18 | 23.14 | 12.22 | -0.24 | 18.36 | 11.89 | 42.32 | 23.08 | 41.64 | 12.49 | 48.27 | 34.04 | 30.23 | 8.47 | 12.81 | |
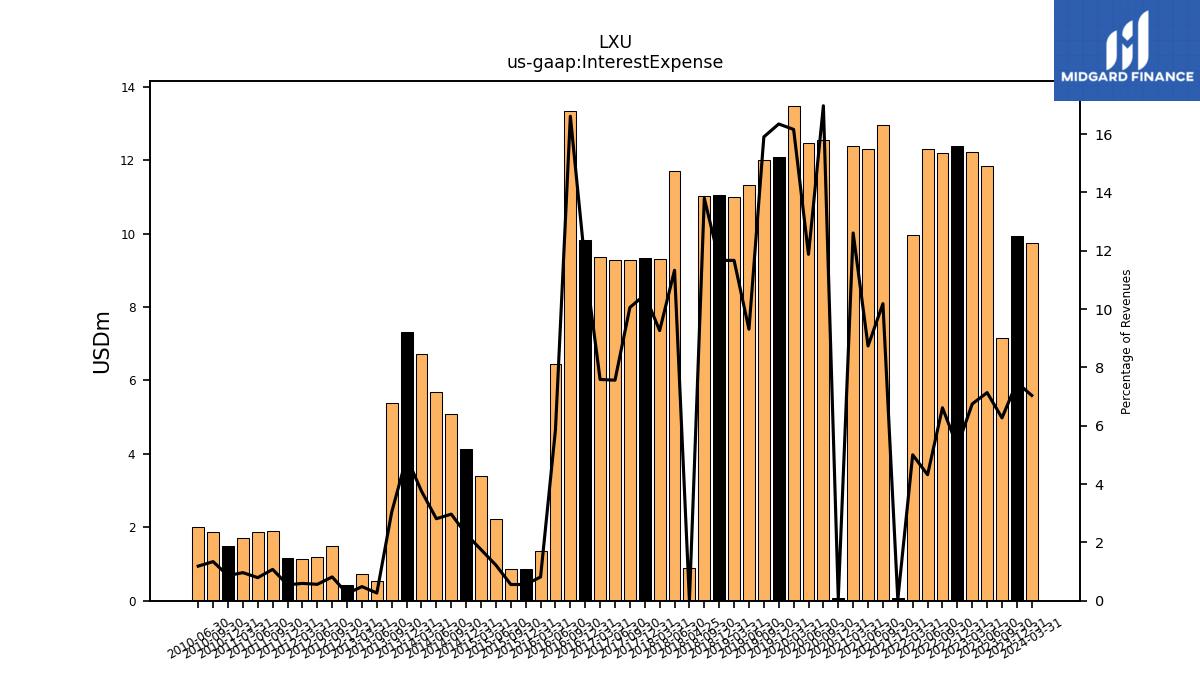
| Interest Expense | 7.17 | 11.84 | 12.21 | 12.37 | 12.19 | 12.31 | 9.96 | 0.08 | 12.96 | 12.29 | 12.37 | 0.08 | 12.55 | 12.48 | 13.48 | 12.08 | 12.01 | 11.31 | 10.99 | 11.06 | 11.01 | 11.69 | 9.31 | 9.33 | 9.29 | 9.29 | 9.36 | 9.82 | 13.33 | 6.45 | 1.35 | 0.88 | 0.88 | 2.23 | 3.40 | 4.14 | 5.08 | 5.67 | 6.71 | 7.32 | 5.39 | 0.54 | 0.73 | 0.44 | 1.49 | 1.18 | 1.13 | 1.18 | 1.90 | 1.87 | 1.71 | 1.48 | 1.86 | 2.00 | |
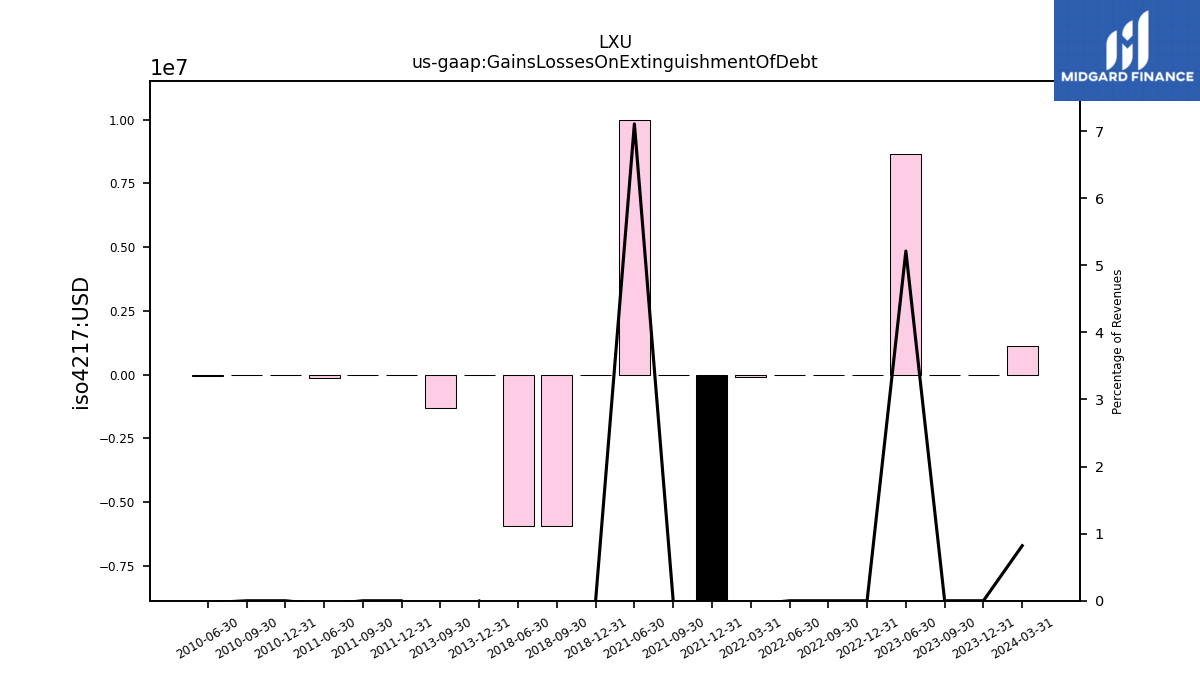
| Gains Losses On Extinguishment Of Debt | 0.00 | 8.64 | NA | 0.00 | 0.00 | 0.00 | -0.11 | -20.26 | 0.00 | 10.00 | NA | NA | NA | NA | NA | NA | NA | NA | NA | 0.00 | -5.95 | -5.95 | NA | NA | NA | NA | NA | NA | NA | NA | NA | NA | NA | NA | NA | NA | NA | NA | NA | 0.00 | -1.30 | NA | NA | NA | NA | NA | NA | 0.00 | 0.00 | -0.14 | NA | 0.00 | 0.00 | -0.05 | |
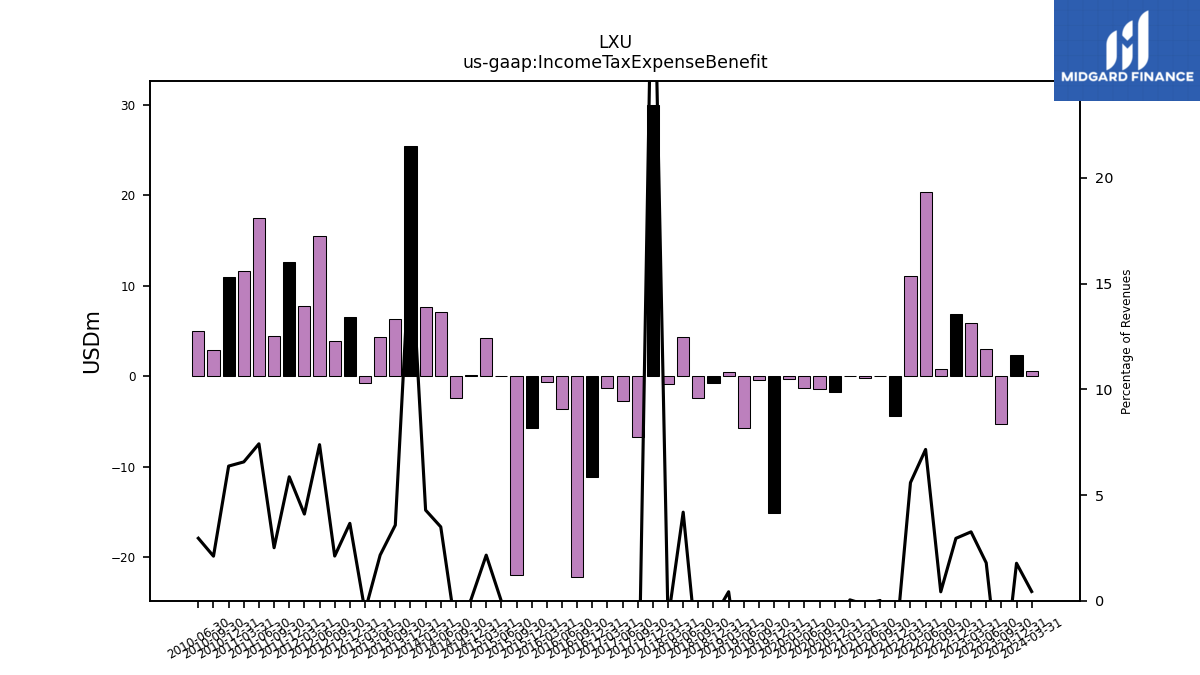
| Income Tax Expense Benefit | -5.25 | 2.97 | 5.90 | 6.90 | 0.78 | 20.38 | 11.12 | -4.37 | 0.02 | -0.25 | 0.04 | -1.74 | -1.37 | -1.30 | -0.34 | -15.11 | -0.48 | -5.73 | 0.40 | -0.76 | -2.43 | 4.32 | -0.92 | 30.02 | -6.70 | -2.76 | -1.28 | -11.21 | -22.23 | -3.67 | -0.61 | -5.71 | -21.98 | -0.04 | 4.18 | 0.11 | -2.42 | 7.05 | 7.65 | 25.45 | 6.34 | 4.37 | -0.74 | 6.48 | 3.86 | 15.45 | 7.80 | 12.63 | 4.43 | 17.49 | 11.66 | 10.97 | 2.93 | 4.98 | |
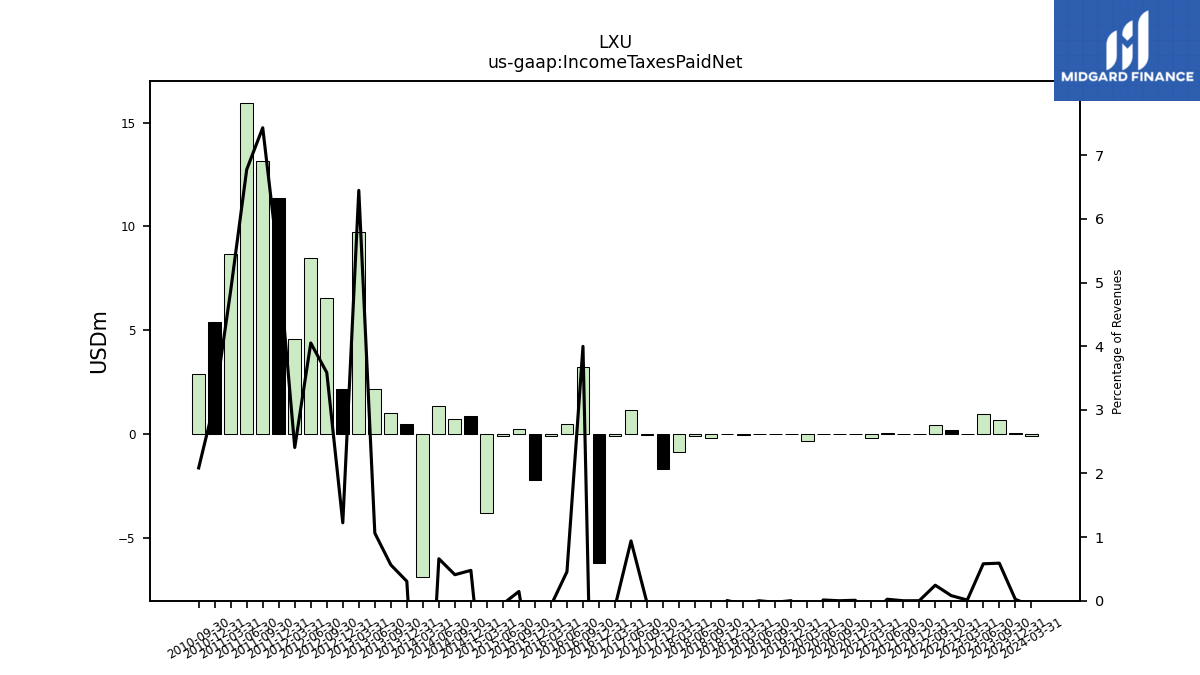
| Income Taxes Paid Net | 0.68 | 0.96 | 0.02 | 0.19 | 0.45 | NA | NA | 0.00 | 0.00 | 0.03 | -0.22 | 0.01 | 0.00 | 0.01 | -0.33 | 0.00 | -0.02 | 0.00 | -0.05 | 0.00 | -0.18 | -0.11 | -0.85 | -1.68 | -0.03 | 1.16 | -0.12 | -6.20 | 3.21 | 0.50 | -0.12 | -2.20 | 0.23 | -0.09 | -3.79 | 0.86 | 0.70 | 1.33 | -6.89 | 0.46 | 1.00 | 2.15 | 9.71 | 2.17 | 6.54 | 8.48 | 4.58 | 11.37 | 13.14 | 15.96 | 8.65 | 5.38 | 2.90 | NA | |
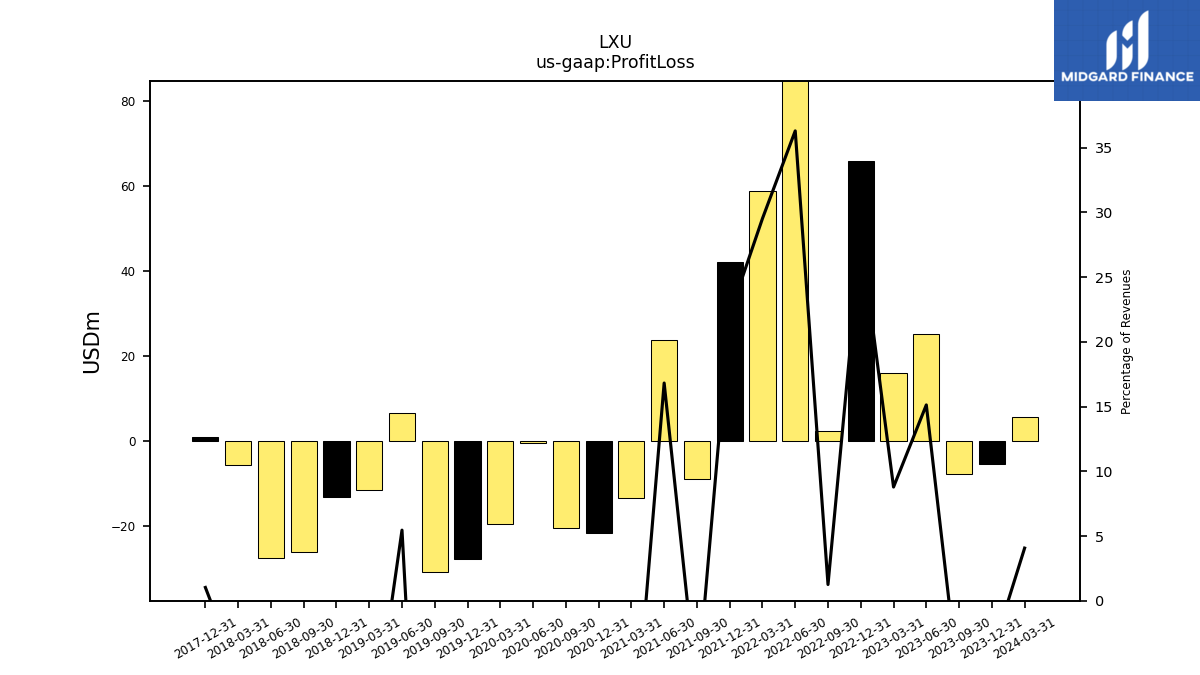
| Profit Loss | -7.73 | 25.09 | 15.90 | 65.87 | 2.31 | 103.40 | 58.77 | 42.08 | -8.93 | 23.67 | -13.28 | -21.69 | -20.40 | -0.36 | -19.45 | -27.71 | -30.79 | 6.63 | -11.54 | -13.04 | -26.08 | -27.51 | -5.59 | 0.91 | NA | NA | NA | NA | NA | NA | NA | NA | NA | NA | NA | NA | NA | NA | NA | NA | NA | NA | NA | NA | NA | NA | NA | NA | NA | NA | NA | NA | NA | NA | |
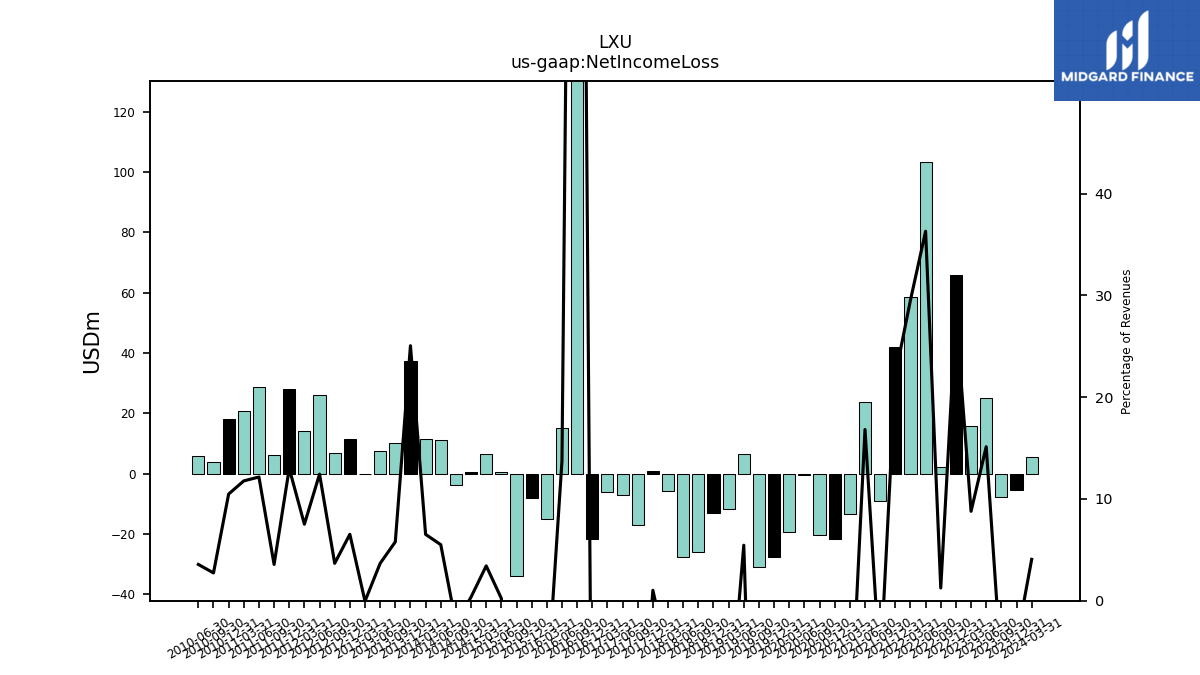
| Net Income Loss | -7.73 | 25.09 | 15.90 | 65.87 | 2.31 | 103.40 | 58.77 | 42.08 | -8.93 | 23.67 | -13.28 | -21.69 | -20.40 | -0.36 | -19.45 | -27.71 | -30.79 | 6.63 | -11.54 | -13.04 | -26.08 | -27.51 | -5.59 | 0.91 | -17.11 | -7.03 | -5.99 | -21.53 | 133.55 | 15.09 | -14.94 | -8.07 | -33.76 | 0.42 | 6.65 | 0.66 | -3.78 | 11.11 | 11.64 | 37.34 | 10.26 | 7.43 | -0.07 | 11.56 | 6.71 | 26.03 | 14.30 | 27.99 | 6.31 | 28.64 | 20.90 | 18.05 | 3.80 | 6.01 | |
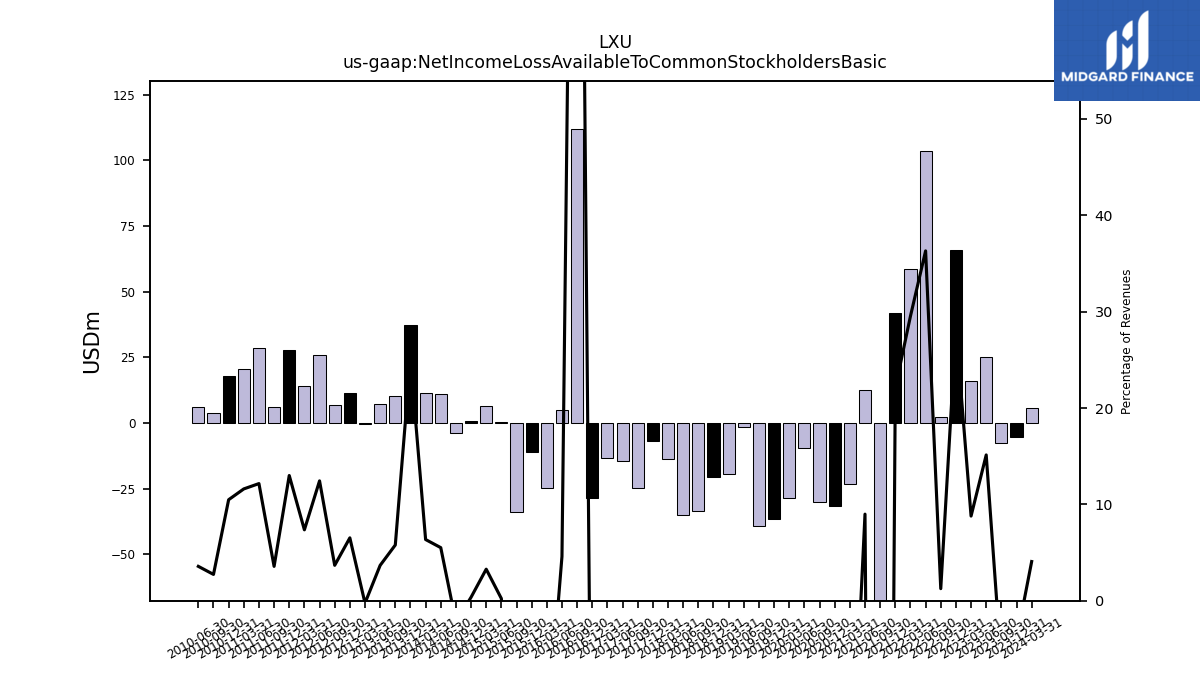
| Net Income Loss Available To Common Stockholders Basic | -7.73 | 25.09 | 15.90 | 65.87 | 2.31 | 103.40 | 58.77 | 42.01 | -251.50 | 12.65 | -23.38 | -31.57 | -29.87 | -9.63 | -28.34 | -36.41 | -39.13 | -1.53 | -19.37 | -20.70 | -33.42 | -35.01 | -13.60 | -6.99 | -24.75 | -14.52 | -13.20 | -28.65 | 112.05 | 5.05 | -24.61 | -11.04 | -33.76 | 0.42 | 6.35 | 0.66 | -3.78 | 11.11 | 11.34 | 37.34 | 10.26 | 7.43 | -0.37 | 11.56 | 6.71 | 26.03 | 14.00 | 27.99 | 6.31 | 28.64 | 20.60 | 18.05 | 3.80 | 6.01 | |
| Net Income Loss Available To Common Stockholders Diluted | -7.73 | 25.09 | 15.90 | 65.87 | 2.31 | 103.40 | 58.77 | 42.01 | -251.50 | 12.72 | NA | NA | NA | -9.63 | NA | NA | NA | NA | NA | NA | NA | NA | NA | NA | NA | NA | NA | -28.03 | 112.05 | 5.05 | -24.61 | -11.04 | -33.76 | 0.42 | 6.41 | 0.66 | -3.78 | 11.11 | 11.64 | 37.34 | 10.26 | 7.43 | -0.37 | 11.56 | 6.71 | 26.03 | 14.30 | 27.99 | 6.31 | 28.67 | 21.17 | NA | NA | NA |
| 2023-09-30 | 2023-06-30 | 2023-03-31 | 2022-12-31 | 2022-09-30 | 2022-06-30 | 2022-03-31 | 2021-12-31 | 2021-09-30 | 2021-06-30 | 2021-03-31 | 2020-12-31 | 2020-09-30 | 2020-06-30 | 2020-03-31 | 2019-12-31 | 2019-09-30 | 2019-06-30 | 2019-03-31 | 2018-12-31 | 2018-09-30 | 2018-06-30 | 2018-03-31 | 2017-12-31 | 2017-09-30 | 2017-06-30 | 2017-03-31 | 2016-12-31 | 2016-09-30 | 2016-06-30 | 2016-03-31 | 2015-12-31 | 2015-09-30 | 2015-06-30 | 2015-03-31 | 2014-12-31 | 2014-09-30 | 2014-06-30 | 2014-03-31 | 2013-12-31 | 2013-09-30 | 2013-06-30 | 2013-03-31 | 2012-12-31 | 2012-09-30 | 2012-06-30 | 2012-03-31 | 2011-12-31 | 2011-09-30 | 2011-06-30 | 2011-03-31 | 2010-12-31 | 2010-09-30 | 2010-06-30 | ||
|---|---|---|---|---|---|---|---|---|---|---|---|---|---|---|---|---|---|---|---|---|---|---|---|---|---|---|---|---|---|---|---|---|---|---|---|---|---|---|---|---|---|---|---|---|---|---|---|---|---|---|---|---|---|---|---|
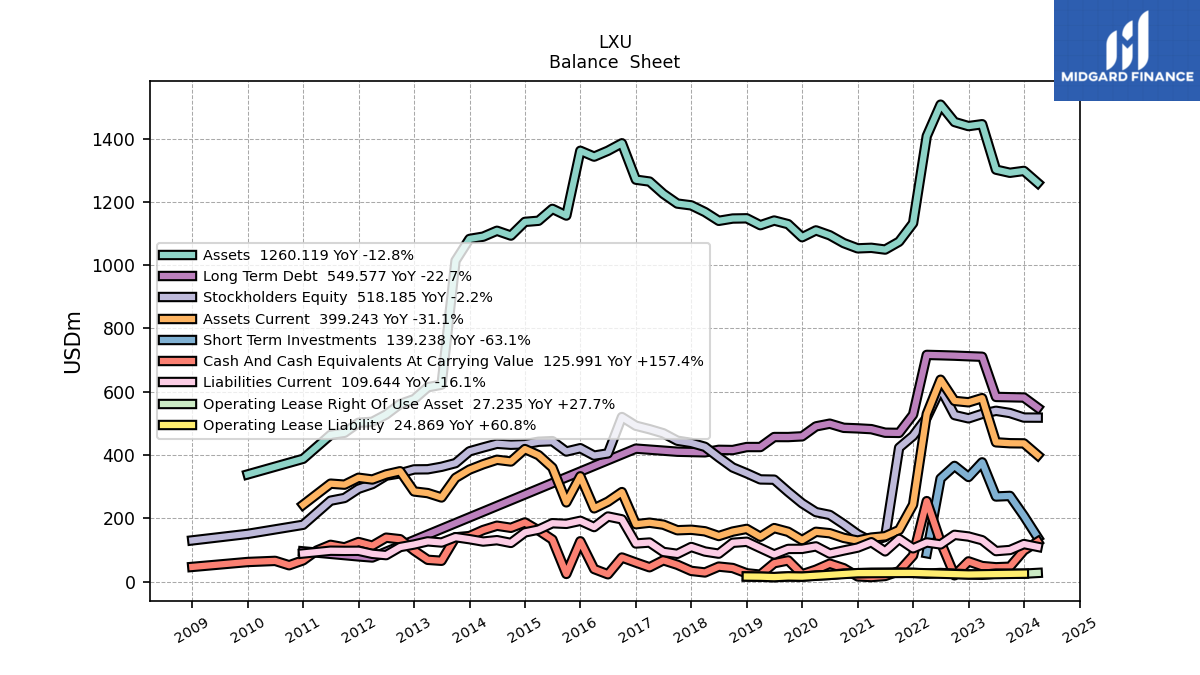
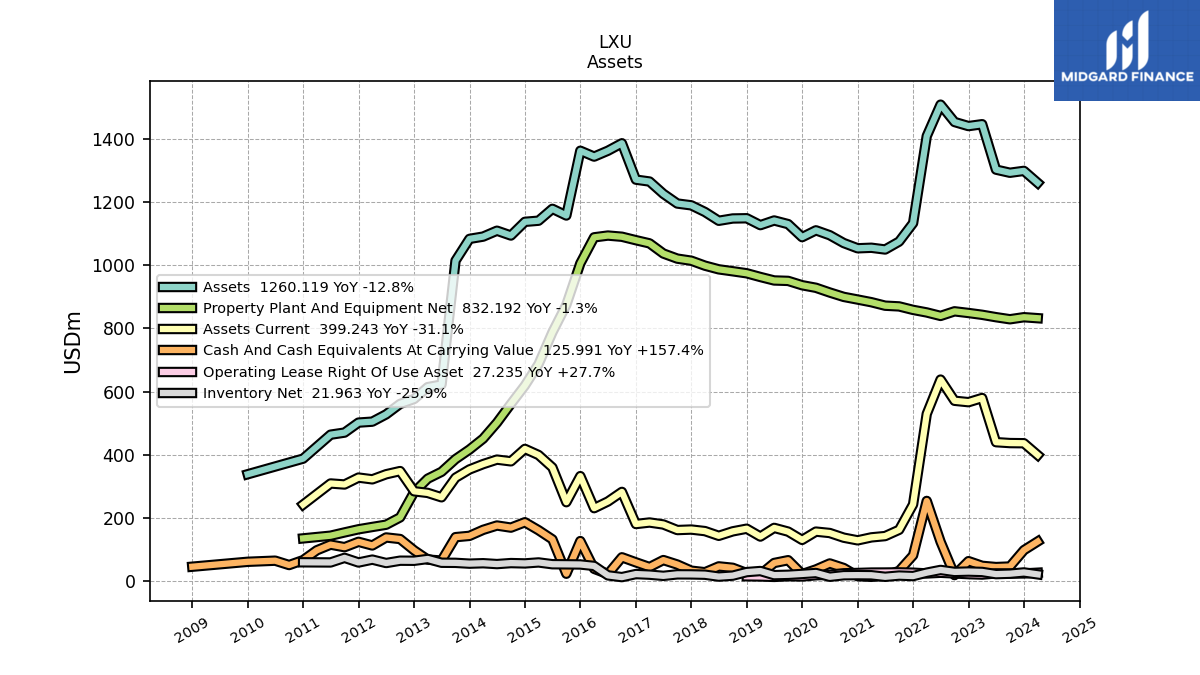
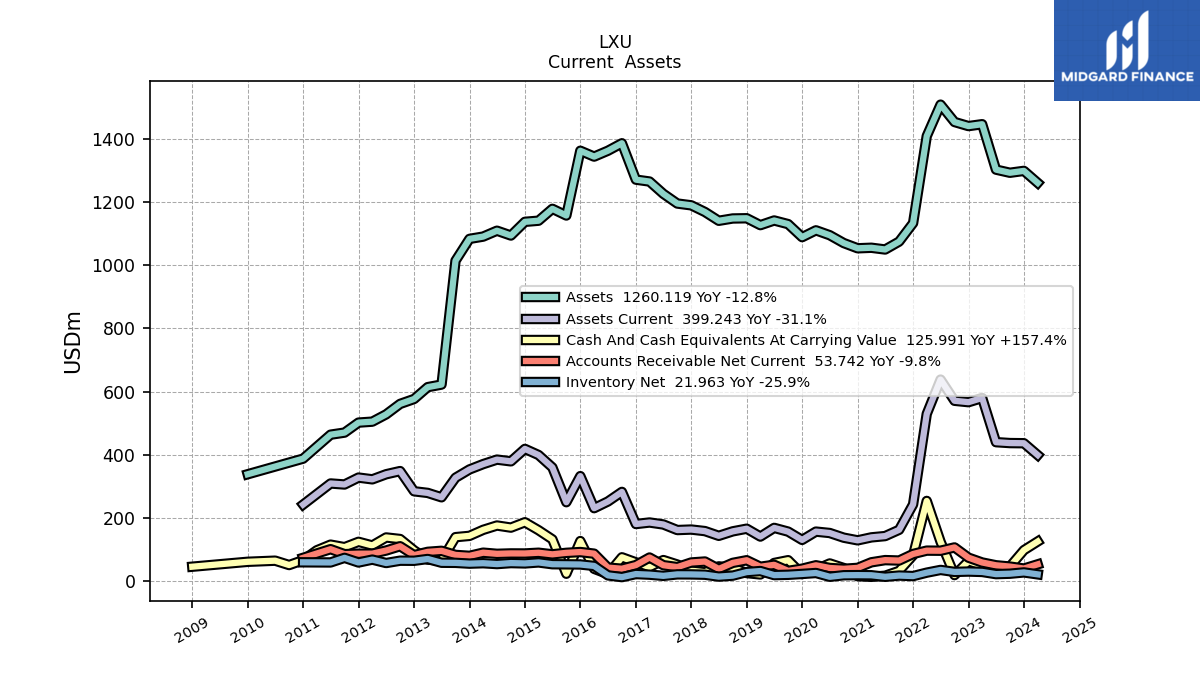
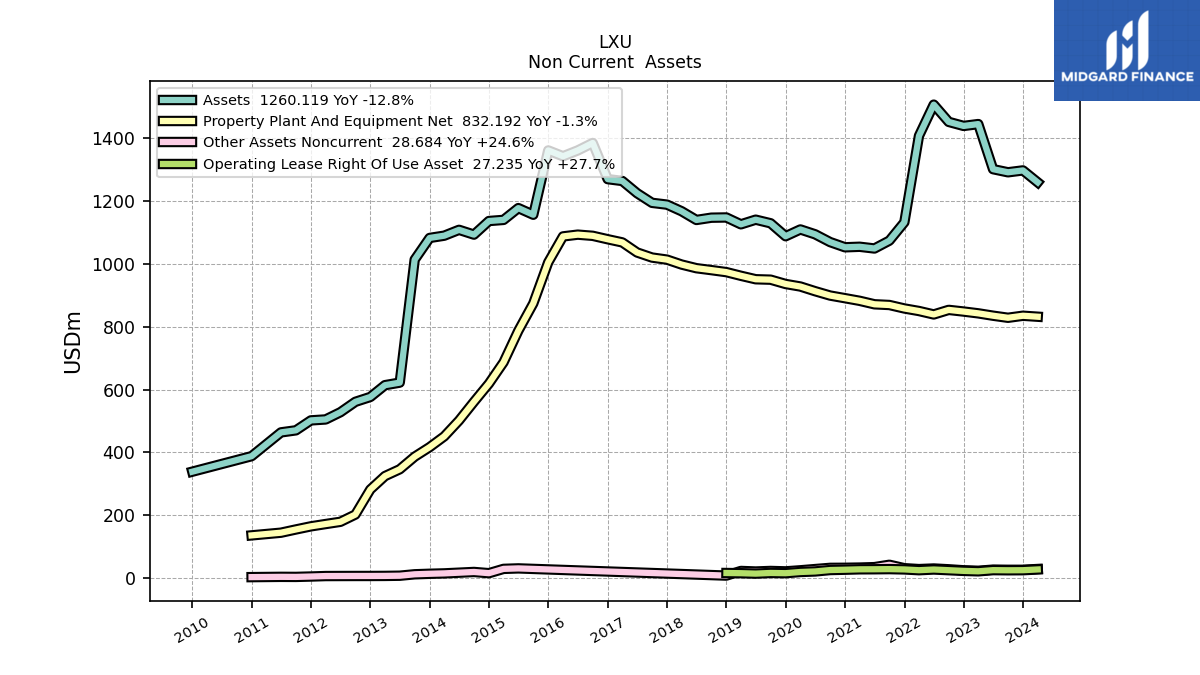
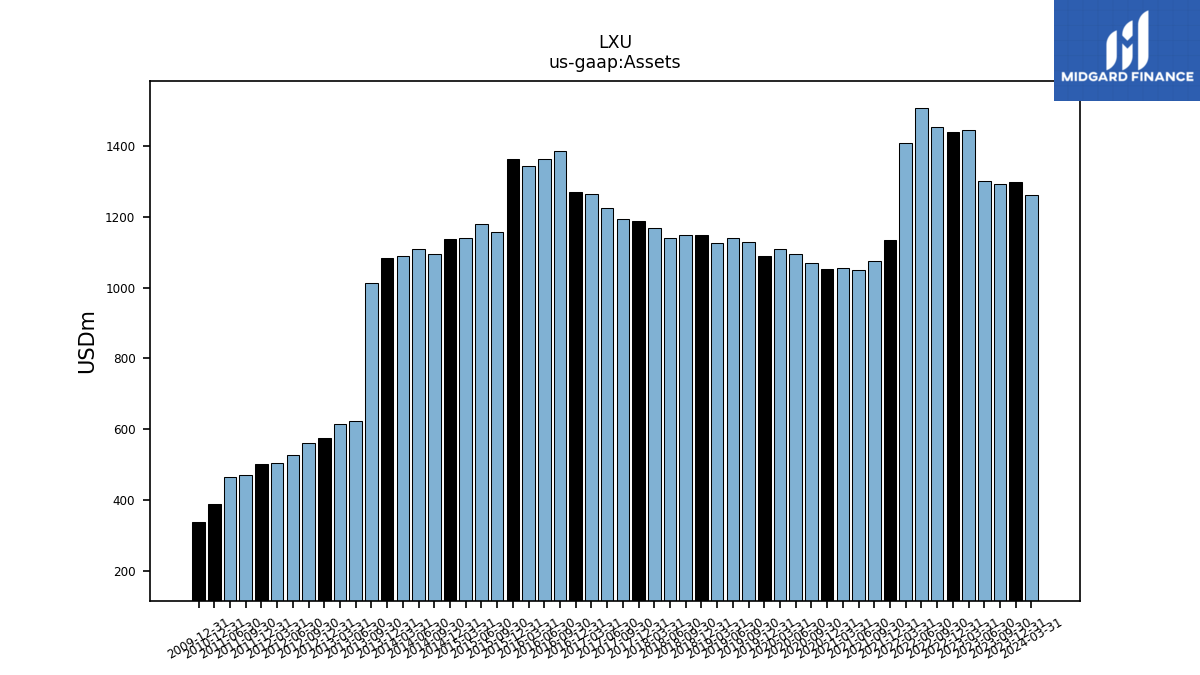
| Assets | 1292.21 | 1302.14 | 1445.77 | 1439.82 | 1452.73 | 1507.71 | 1408.19 | 1132.84 | 1074.54 | 1049.48 | 1055.00 | 1053.30 | 1069.92 | 1094.66 | 1110.15 | 1088.49 | 1129.78 | 1141.27 | 1126.47 | 1148.33 | 1147.59 | 1140.34 | 1168.15 | 1189.18 | 1194.89 | 1225.60 | 1264.50 | 1270.42 | 1385.60 | 1361.91 | 1343.30 | 1361.83 | 1156.99 | 1178.18 | 1140.57 | 1137.01 | 1093.64 | 1108.92 | 1090.31 | 1083.10 | 1014.00 | 622.29 | 614.16 | 576.61 | 561.17 | 528.10 | 504.99 | 502.01 | 470.36 | 463.81 | NA | 387.98 | NA | NA | |
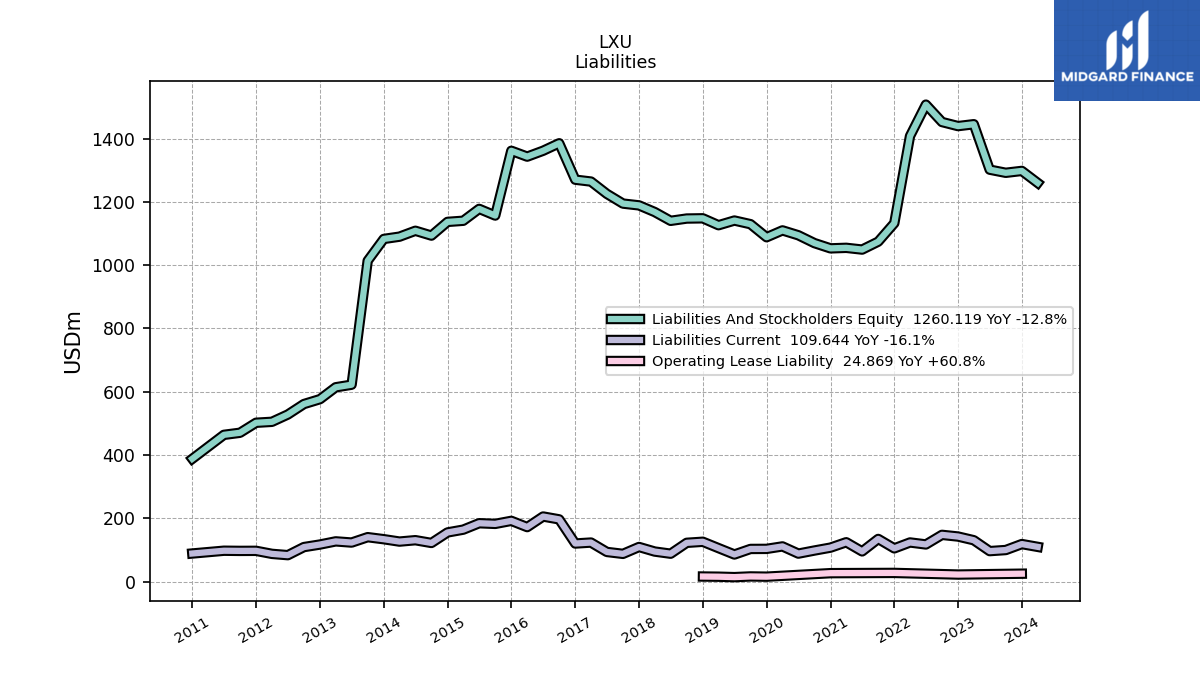
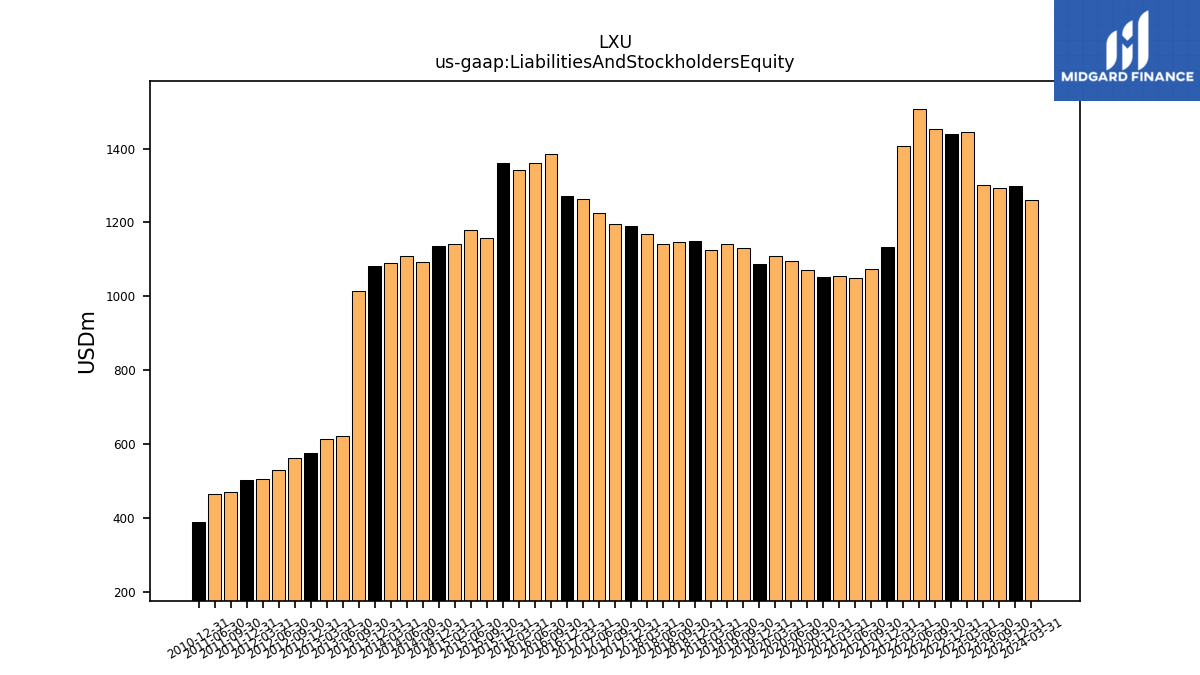
| Liabilities And Stockholders Equity | 1292.21 | 1302.14 | 1445.77 | 1439.82 | 1452.73 | 1507.71 | 1408.19 | 1132.84 | 1074.54 | 1049.48 | 1055.00 | 1053.30 | 1069.92 | 1094.66 | 1110.15 | 1088.49 | 1129.78 | 1141.27 | 1126.47 | 1148.33 | 1147.59 | 1140.34 | 1168.15 | 1189.18 | 1194.89 | 1225.60 | 1264.50 | 1270.42 | 1385.60 | 1361.91 | 1343.30 | 1361.83 | 1156.99 | 1178.18 | 1140.57 | 1137.01 | 1093.64 | 1108.92 | 1090.31 | 1083.10 | 1014.00 | 622.29 | 614.16 | 576.61 | 561.17 | 528.10 | 504.99 | 502.01 | 470.36 | 463.81 | NA | 387.98 | NA | NA | |
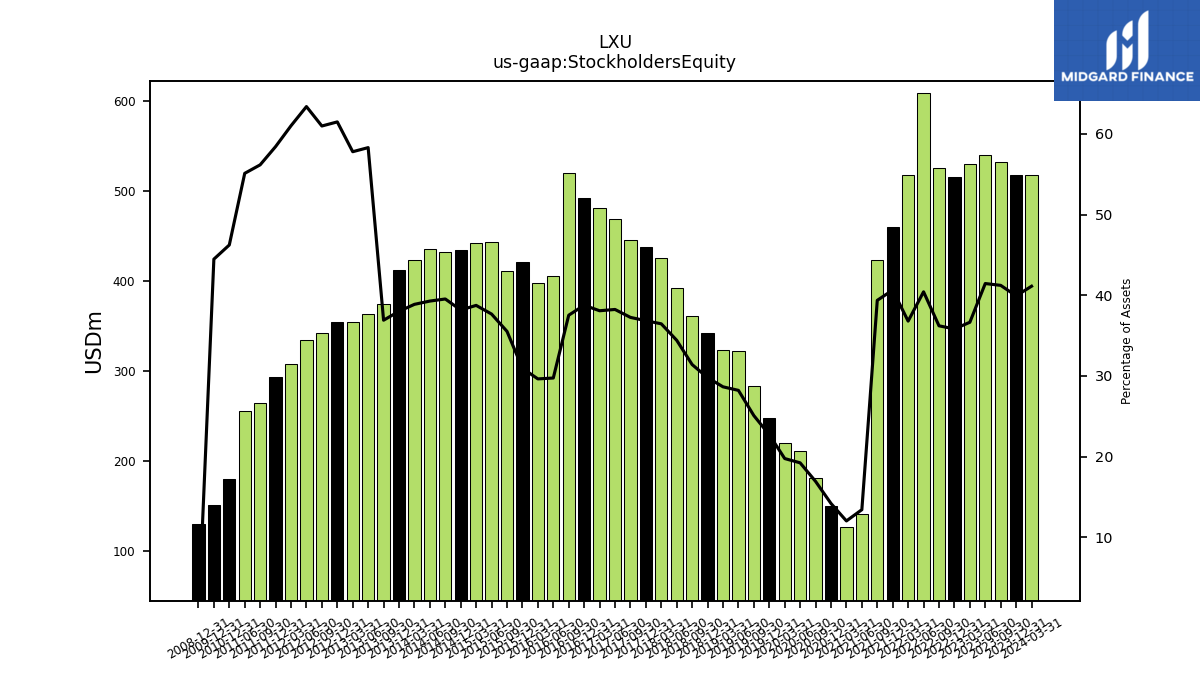
| Stockholders Equity | 532.74 | 539.80 | 529.95 | 515.87 | 526.14 | 609.56 | 518.19 | 460.49 | 423.07 | 141.01 | 127.04 | 149.64 | 181.27 | 210.62 | 219.50 | 247.33 | 283.50 | 322.06 | 322.83 | 342.20 | 360.52 | 392.52 | 425.95 | 438.20 | 445.22 | 468.69 | 481.56 | 492.51 | 520.00 | 405.14 | 398.15 | 421.58 | 411.03 | 443.85 | 441.94 | 434.05 | 432.43 | 435.60 | 423.87 | 411.71 | 374.28 | 362.76 | 354.90 | 354.50 | 342.15 | 334.70 | 308.05 | 293.27 | 264.15 | 255.59 | NA | 179.37 | NA | NA |
| 2023-09-30 | 2023-06-30 | 2023-03-31 | 2022-12-31 | 2022-09-30 | 2022-06-30 | 2022-03-31 | 2021-12-31 | 2021-09-30 | 2021-06-30 | 2021-03-31 | 2020-12-31 | 2020-09-30 | 2020-06-30 | 2020-03-31 | 2019-12-31 | 2019-09-30 | 2019-06-30 | 2019-03-31 | 2018-12-31 | 2018-09-30 | 2018-06-30 | 2018-03-31 | 2017-12-31 | 2017-09-30 | 2017-06-30 | 2017-03-31 | 2016-12-31 | 2016-09-30 | 2016-06-30 | 2016-03-31 | 2015-12-31 | 2015-09-30 | 2015-06-30 | 2015-03-31 | 2014-12-31 | 2014-09-30 | 2014-06-30 | 2014-03-31 | 2013-12-31 | 2013-09-30 | 2013-06-30 | 2013-03-31 | 2012-12-31 | 2012-09-30 | 2012-06-30 | 2012-03-31 | 2011-12-31 | 2011-09-30 | 2011-06-30 | 2011-03-31 | 2010-12-31 | 2010-09-30 | 2010-06-30 | ||
|---|---|---|---|---|---|---|---|---|---|---|---|---|---|---|---|---|---|---|---|---|---|---|---|---|---|---|---|---|---|---|---|---|---|---|---|---|---|---|---|---|---|---|---|---|---|---|---|---|---|---|---|---|---|---|---|
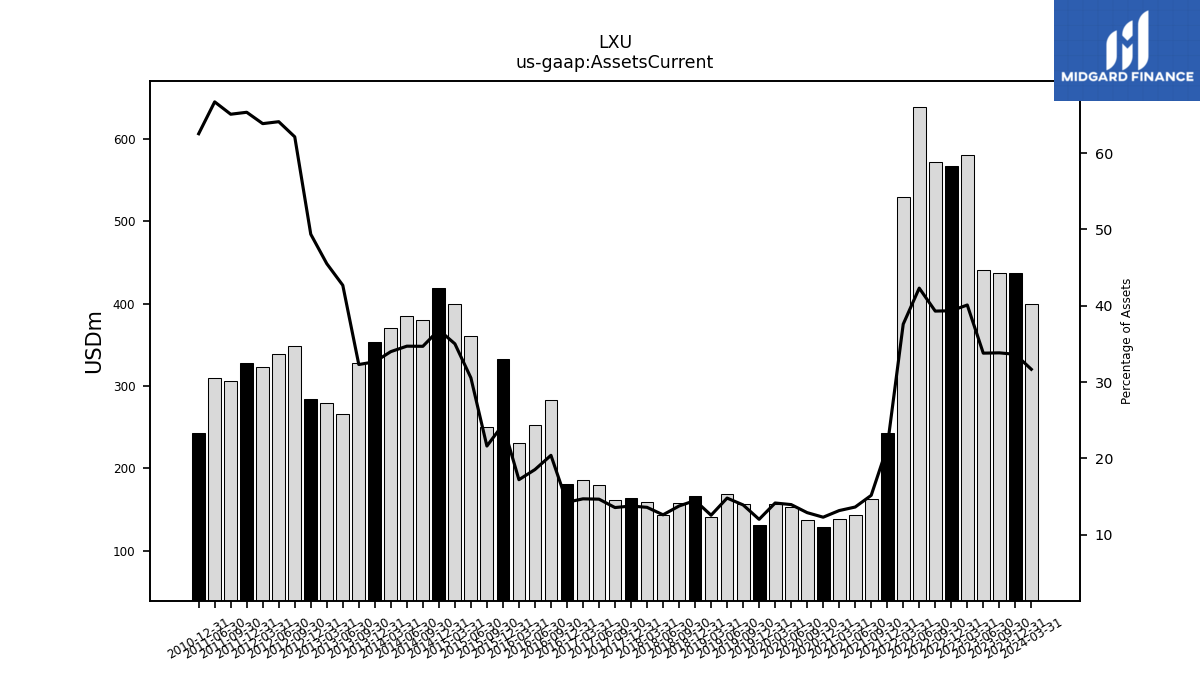
| Assets Current | 437.25 | 440.09 | 579.83 | 566.60 | 571.05 | 638.03 | 529.43 | 243.14 | 162.96 | 143.10 | 138.96 | 129.58 | 138.03 | 152.78 | 157.24 | 130.87 | 157.18 | 169.02 | 141.50 | 166.41 | 158.02 | 143.87 | 158.82 | 163.74 | 162.11 | 179.76 | 186.02 | 181.15 | 282.81 | 252.55 | 231.28 | 332.70 | 250.22 | 360.12 | 399.46 | 418.88 | 379.43 | 384.93 | 370.68 | 353.84 | 327.60 | 265.66 | 279.59 | 284.75 | 348.71 | 338.63 | 322.54 | 328.11 | 306.22 | 309.46 | NA | 242.67 | NA | NA | |
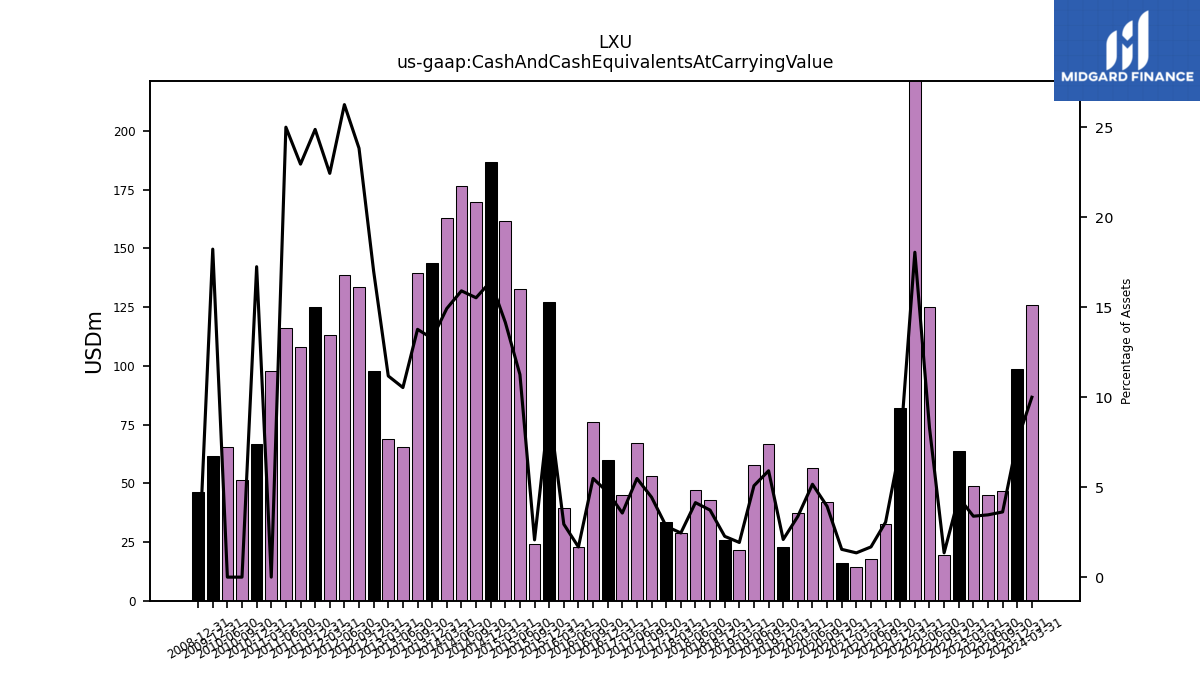
| Cash And Cash Equivalents At Carrying Value | 46.82 | 45.07 | 48.95 | 63.77 | 19.64 | 125.23 | 254.30 | 82.14 | 32.85 | 17.62 | 14.23 | 16.26 | 42.09 | 56.51 | 37.48 | 22.79 | 66.78 | 57.97 | 21.70 | 26.05 | 42.75 | 47.22 | 28.67 | 33.62 | 53.06 | 67.21 | 45.04 | 60.02 | 76.01 | 22.84 | 39.53 | 127.31 | 23.96 | 132.71 | 161.56 | 186.81 | 169.82 | 176.46 | 162.78 | 143.75 | 139.65 | 65.57 | 68.67 | 98.02 | 133.77 | 138.70 | 113.34 | 124.93 | 107.98 | 116.00 | 98.05 | 66.95 | 51.44 | 65.28 | |
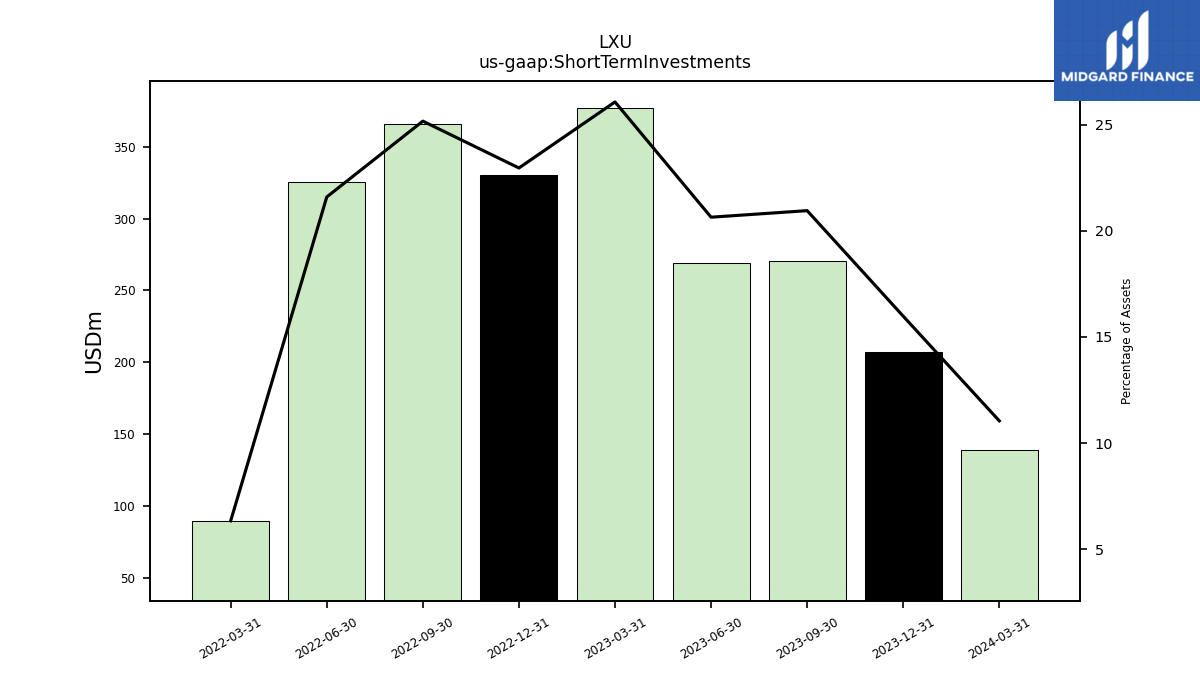
| Short Term Investments | 270.70 | 268.76 | 376.88 | 330.55 | 365.57 | 325.57 | 89.31 | NA | NA | NA | NA | NA | NA | NA | NA | NA | NA | NA | NA | NA | NA | NA | NA | NA | NA | NA | NA | NA | NA | NA | NA | NA | NA | NA | NA | NA | NA | NA | NA | NA | NA | NA | NA | NA | NA | NA | NA | NA | NA | NA | NA | NA | NA | NA | |
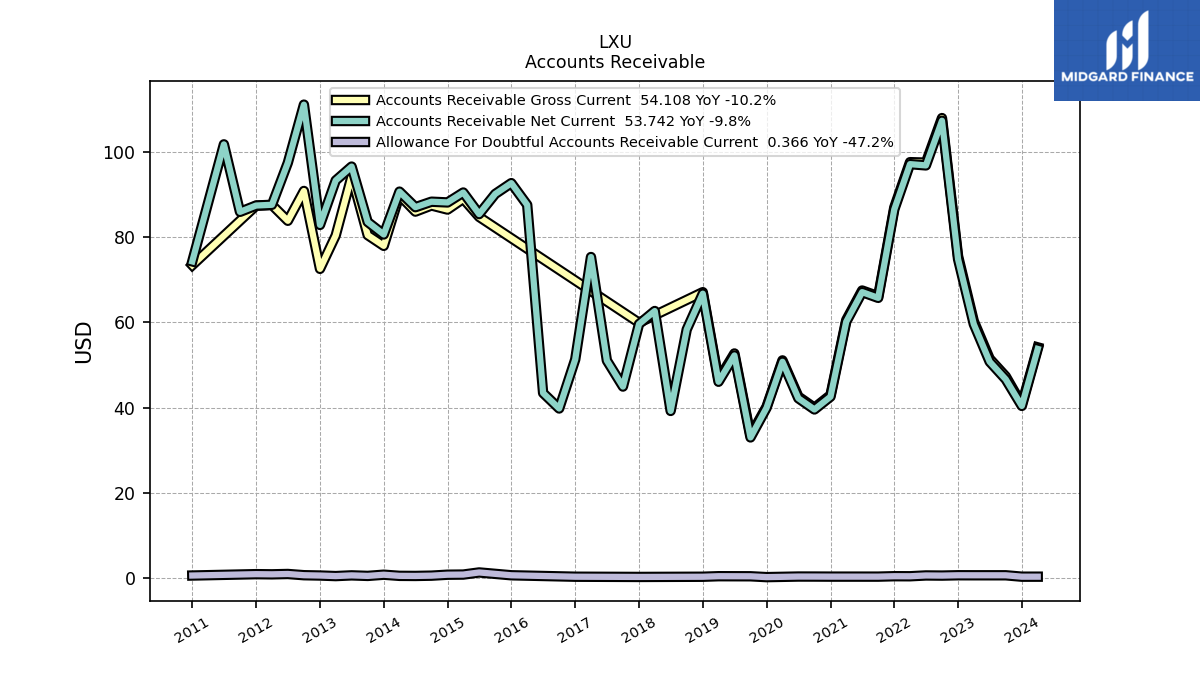
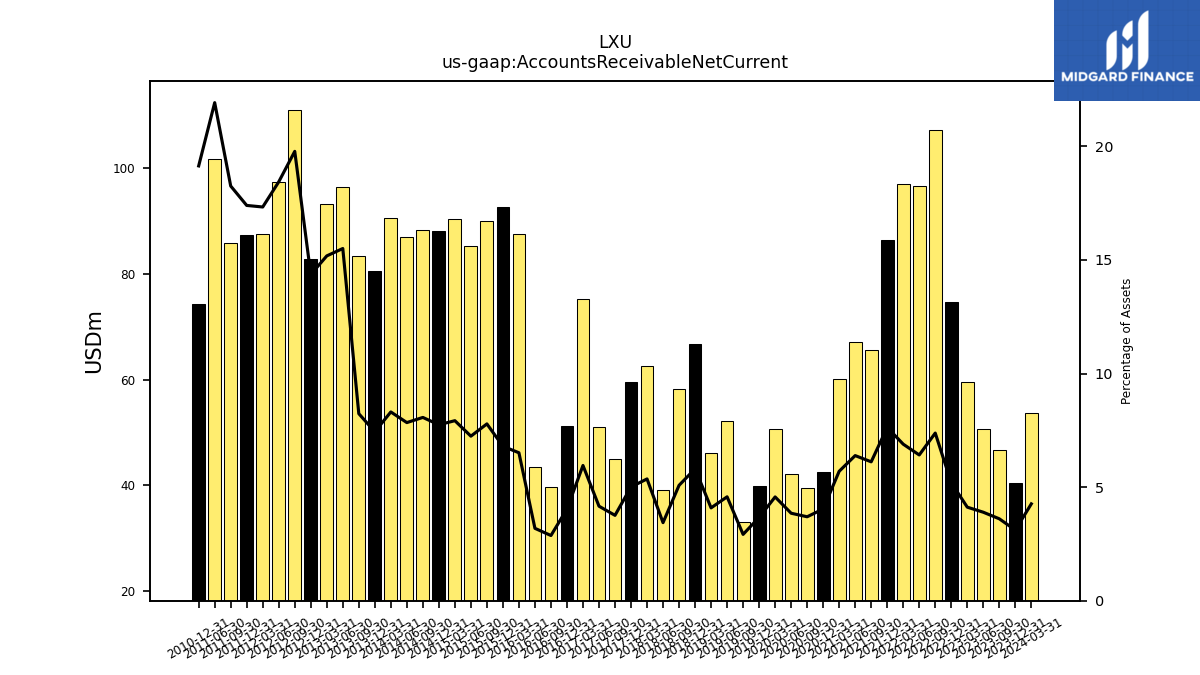
| Accounts Receivable Net Current | 46.61 | 50.74 | 59.56 | 74.80 | 107.23 | 96.75 | 97.05 | 86.43 | 65.70 | 67.05 | 60.12 | 42.55 | 39.55 | 42.17 | 50.73 | 39.94 | 33.00 | 52.21 | 46.05 | 66.69 | 58.30 | 39.21 | 62.63 | 59.57 | 44.92 | 51.01 | 75.28 | 51.30 | 39.78 | 43.41 | 87.50 | 92.60 | 90.06 | 85.34 | 90.40 | 88.07 | 88.25 | 86.96 | 90.61 | 80.57 | 83.50 | 96.48 | 93.22 | 82.80 | 111.00 | 97.38 | 87.52 | 87.35 | 85.87 | 101.69 | NA | 74.26 | NA | NA | |
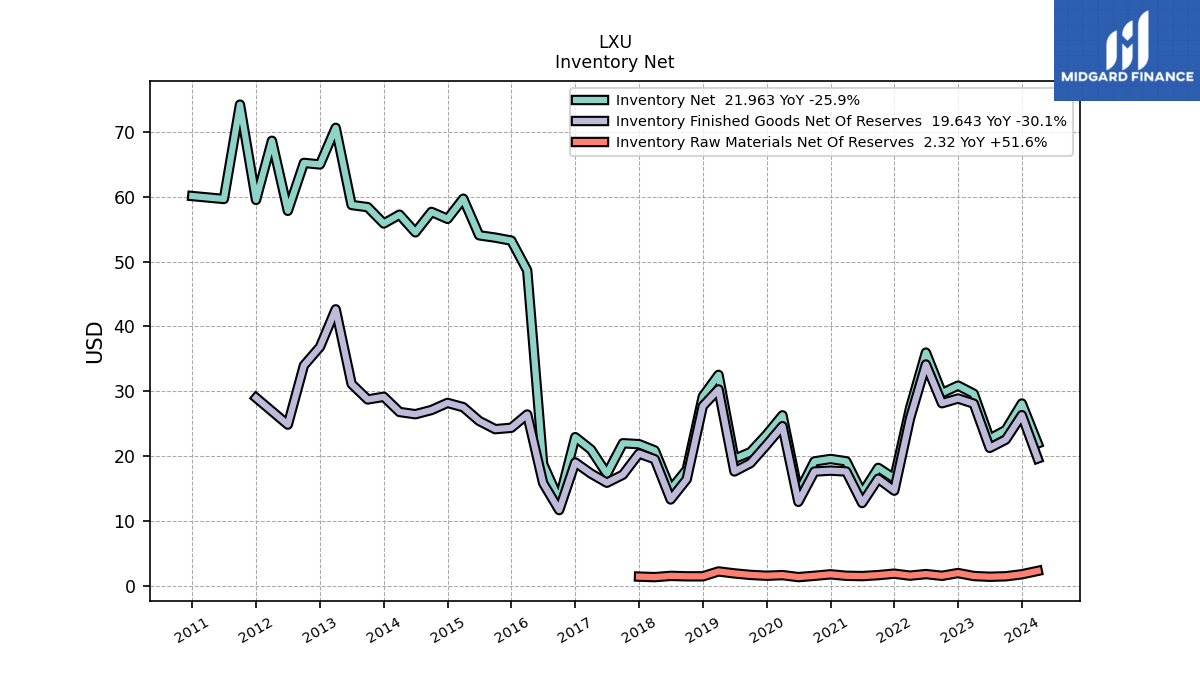
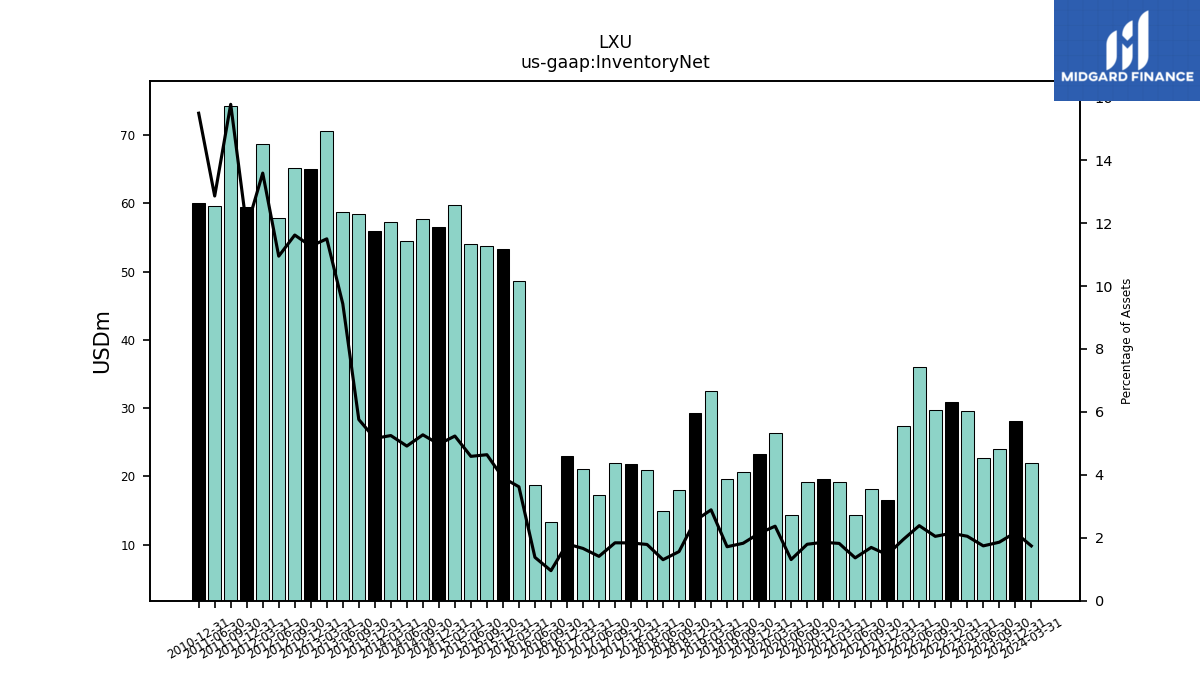
| Inventory Net | 24.04 | 22.70 | 29.63 | 30.88 | 29.73 | 35.98 | 27.40 | 16.58 | 18.21 | 14.30 | 19.22 | 19.57 | 19.20 | 14.33 | 26.30 | 23.31 | 20.64 | 19.59 | 32.54 | 29.21 | 17.93 | 14.88 | 20.89 | 21.86 | 22.00 | 17.29 | 21.02 | 22.94 | 13.25 | 18.79 | 48.64 | 53.24 | 53.70 | 54.05 | 59.70 | 56.59 | 57.66 | 54.51 | 57.23 | 55.87 | 58.39 | 58.72 | 70.62 | 64.97 | 65.21 | 57.82 | 68.62 | 59.51 | 74.20 | 59.65 | NA | 60.11 | NA | NA |
| 2023-09-30 | 2023-06-30 | 2023-03-31 | 2022-12-31 | 2022-09-30 | 2022-06-30 | 2022-03-31 | 2021-12-31 | 2021-09-30 | 2021-06-30 | 2021-03-31 | 2020-12-31 | 2020-09-30 | 2020-06-30 | 2020-03-31 | 2019-12-31 | 2019-09-30 | 2019-06-30 | 2019-03-31 | 2018-12-31 | 2018-09-30 | 2018-06-30 | 2018-03-31 | 2017-12-31 | 2017-09-30 | 2017-06-30 | 2017-03-31 | 2016-12-31 | 2016-09-30 | 2016-06-30 | 2016-03-31 | 2015-12-31 | 2015-09-30 | 2015-06-30 | 2015-03-31 | 2014-12-31 | 2014-09-30 | 2014-06-30 | 2014-03-31 | 2013-12-31 | 2013-09-30 | 2013-06-30 | 2013-03-31 | 2012-12-31 | 2012-09-30 | 2012-06-30 | 2012-03-31 | 2011-12-31 | 2011-09-30 | 2011-06-30 | 2011-03-31 | 2010-12-31 | 2010-09-30 | 2010-06-30 | ||
|---|---|---|---|---|---|---|---|---|---|---|---|---|---|---|---|---|---|---|---|---|---|---|---|---|---|---|---|---|---|---|---|---|---|---|---|---|---|---|---|---|---|---|---|---|---|---|---|---|---|---|---|---|---|---|---|
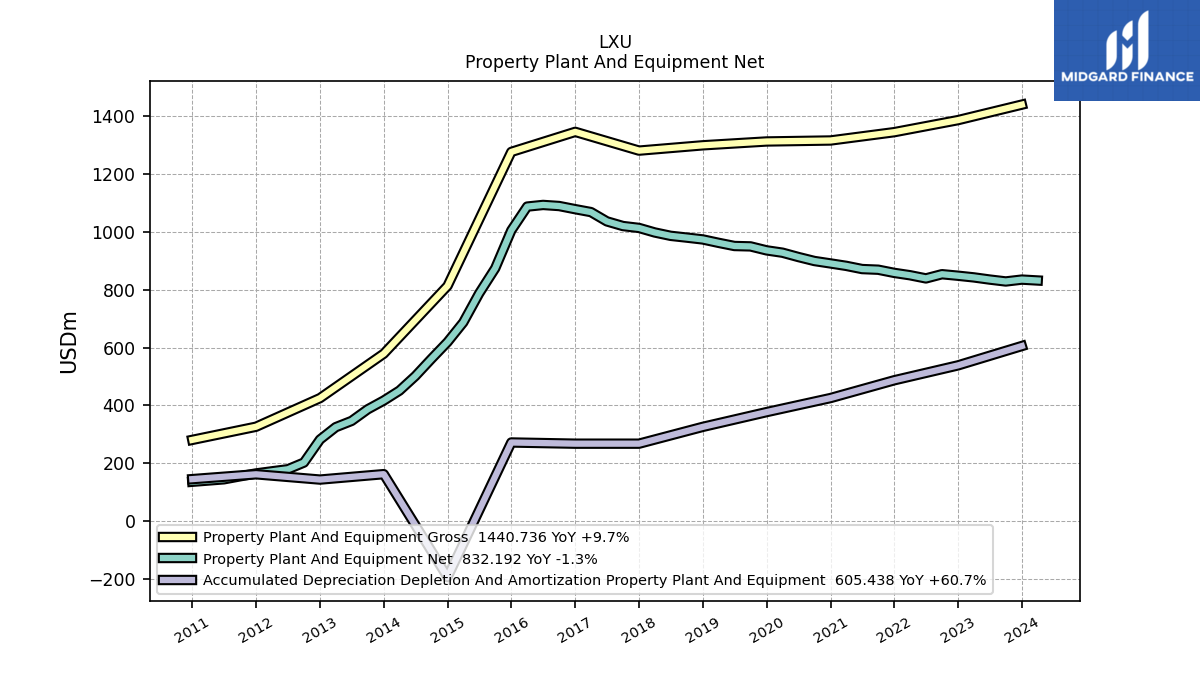
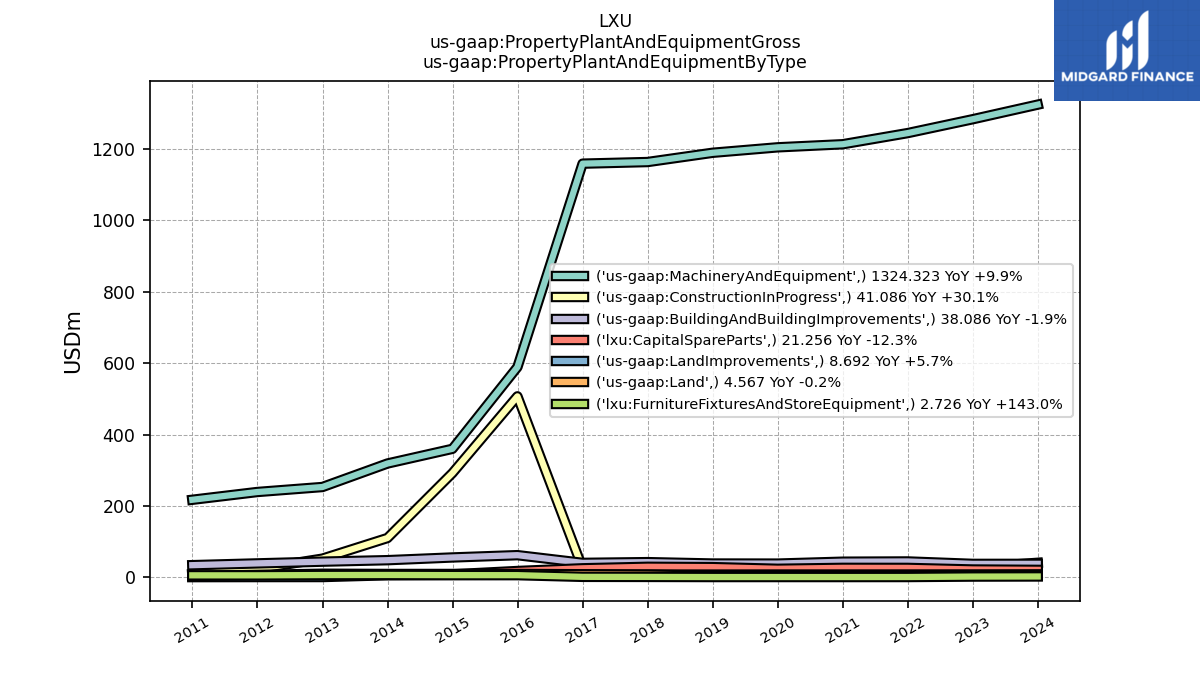
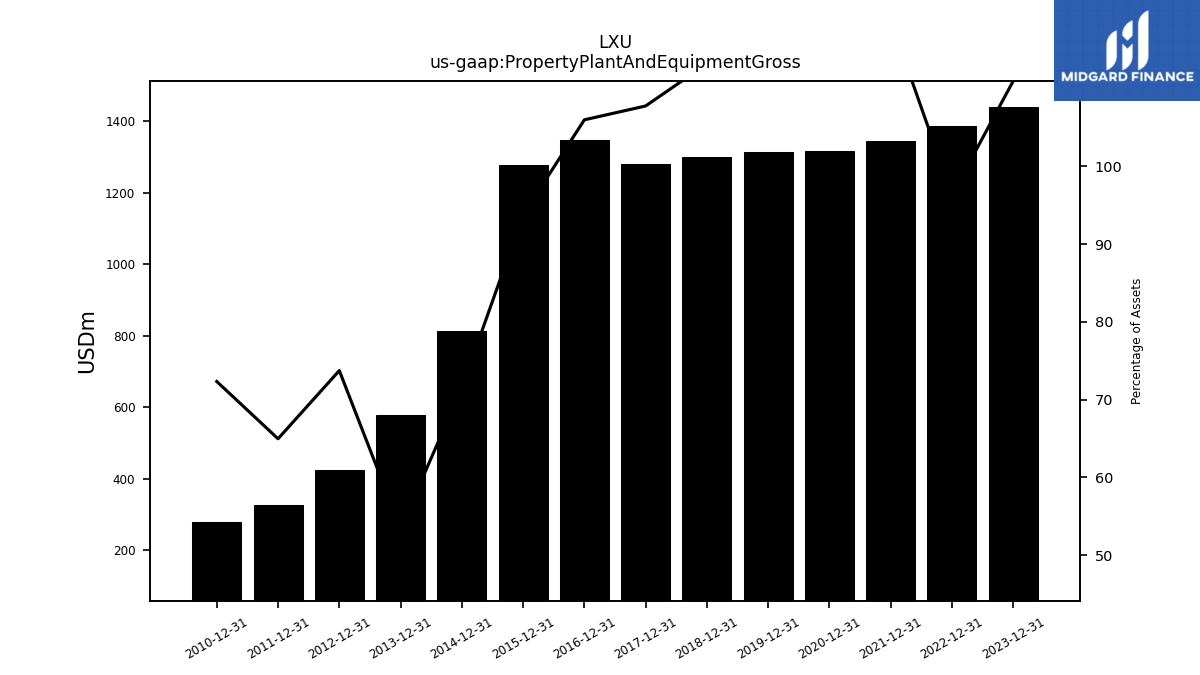
| Property Plant And Equipment Gross | NA | NA | NA | 1387.17 | NA | NA | NA | 1345.47 | NA | NA | NA | 1316.63 | NA | NA | NA | 1313.24 | NA | NA | NA | 1299.95 | NA | NA | NA | 1281.57 | NA | NA | NA | 1346.50 | NA | NA | NA | 1277.17 | NA | NA | NA | 813.41 | NA | NA | NA | 578.92 | NA | NA | NA | 425.19 | NA | NA | NA | 326.18 | NA | NA | NA | 280.65 | NA | NA | |
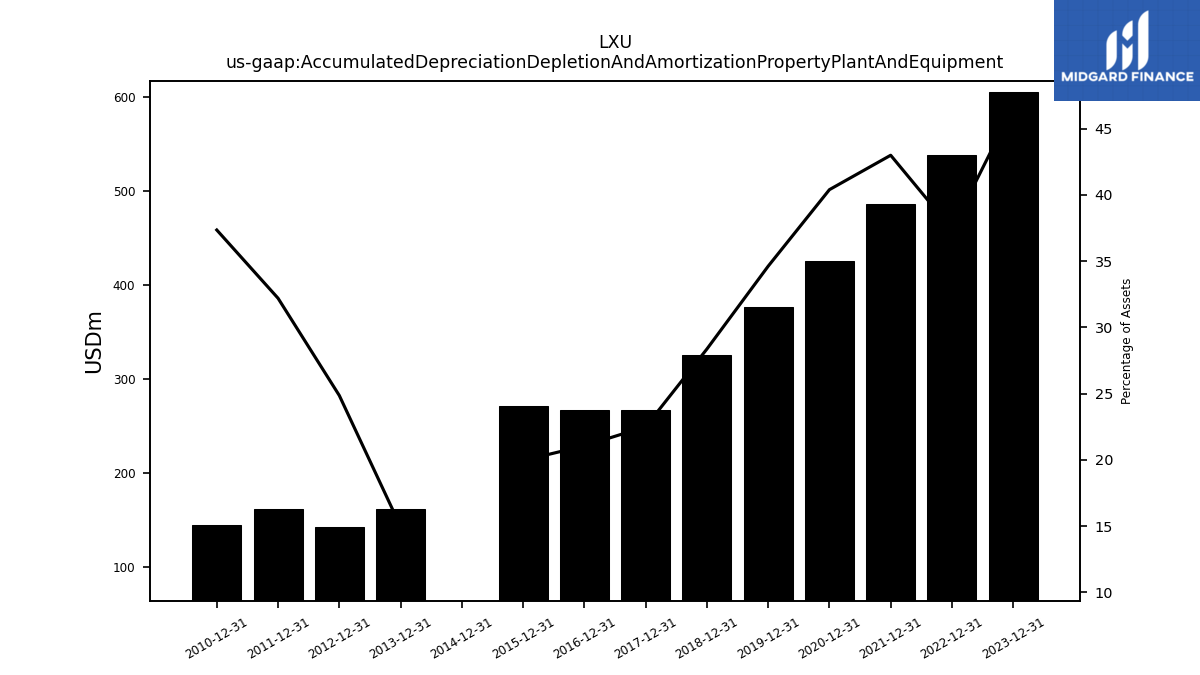
| Accumulated Depreciation Depletion And Amortization Property Plant And Equipment | NA | NA | NA | 538.51 | NA | NA | NA | 486.99 | NA | NA | NA | 425.44 | NA | NA | NA | 376.77 | NA | NA | NA | 325.70 | NA | NA | NA | 267.53 | NA | NA | NA | 267.54 | NA | NA | NA | 271.68 | NA | NA | NA | -194.20 | NA | NA | NA | 162.12 | NA | NA | NA | 143.32 | NA | NA | NA | 161.63 | NA | NA | NA | 144.90 | NA | NA | |
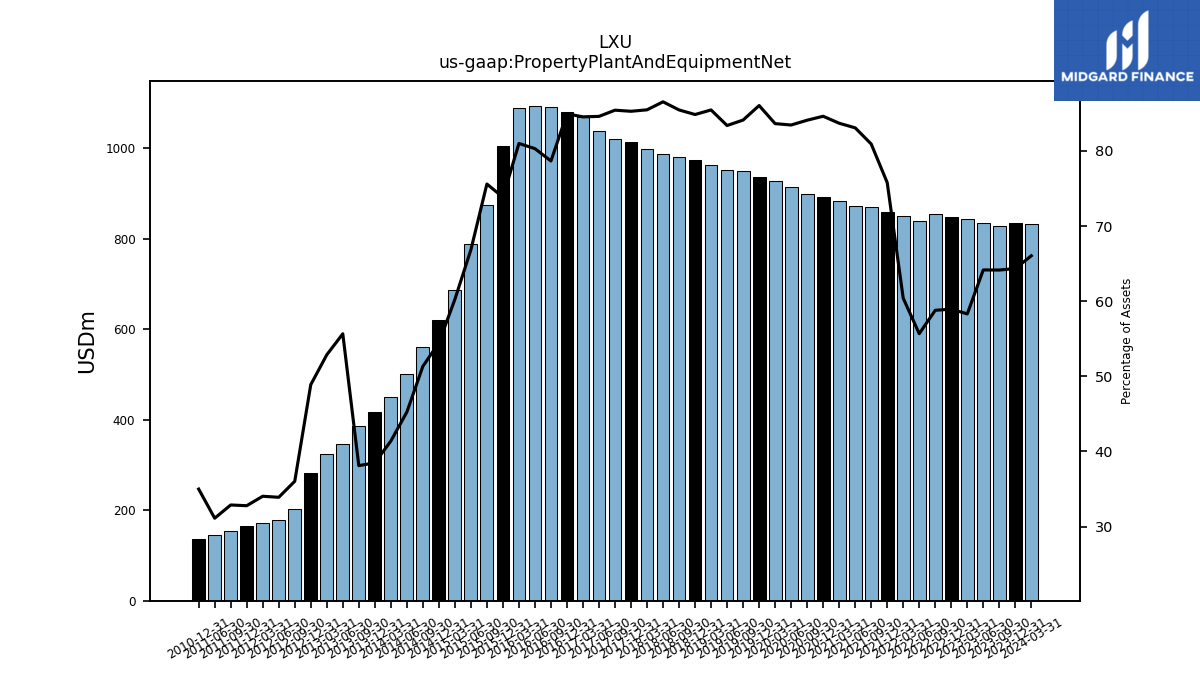
| Property Plant And Equipment Net | 828.83 | 835.42 | 842.92 | 848.66 | 853.94 | 839.41 | 850.37 | 858.48 | 869.50 | 871.78 | 882.82 | 891.20 | 899.61 | 913.44 | 928.39 | 936.47 | 950.17 | 951.55 | 962.54 | 974.25 | 980.62 | 986.74 | 998.37 | 1014.04 | 1020.64 | 1036.76 | 1068.89 | 1078.96 | 1089.85 | 1093.61 | 1087.95 | 1005.49 | 874.58 | 787.47 | 687.05 | 619.21 | 561.27 | 501.66 | 451.18 | 416.80 | 386.45 | 346.33 | 324.64 | 281.87 | 202.17 | 179.01 | 171.87 | 164.55 | 154.62 | 144.30 | NA | 135.75 | NA | NA | |
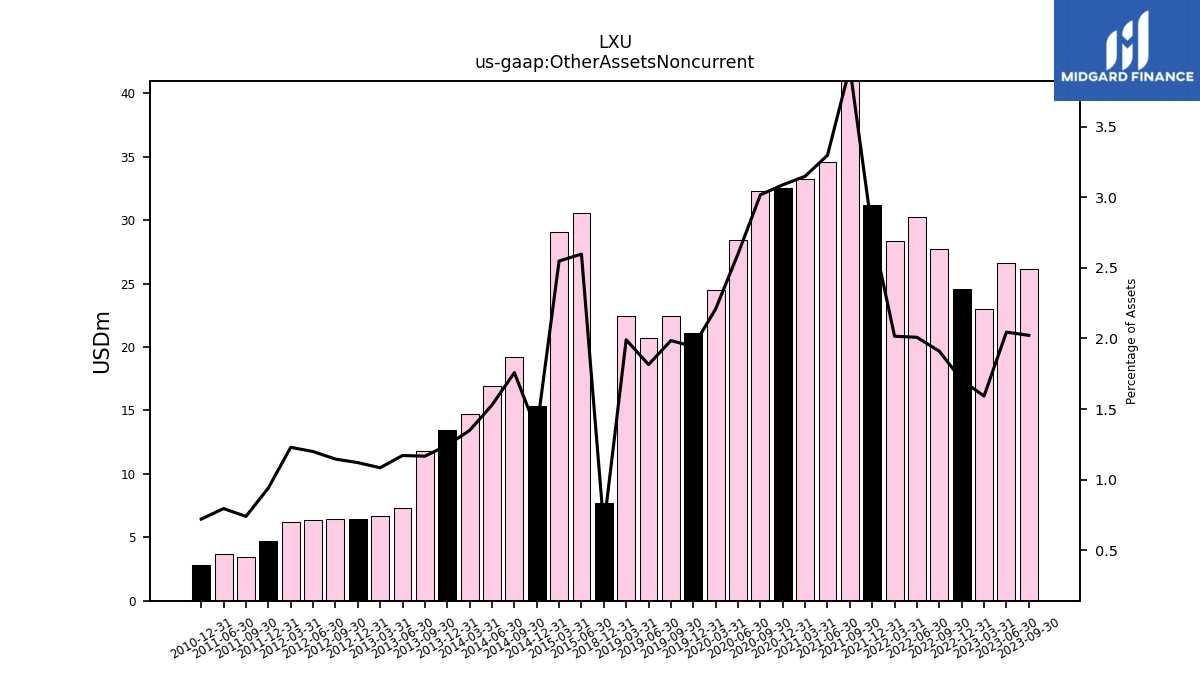
| Other Assets Noncurrent | 26.13 | 26.62 | 23.02 | 24.56 | 27.74 | 30.28 | 28.38 | 31.22 | 42.09 | 34.61 | 33.22 | 32.52 | 32.28 | 28.45 | 24.52 | 21.14 | 22.43 | 20.71 | 22.43 | 7.67 | NA | NA | NA | NA | NA | NA | NA | NA | NA | NA | NA | NA | NA | 30.60 | 29.07 | 15.35 | 19.23 | 16.95 | 14.71 | 13.47 | 11.82 | 7.29 | 6.66 | 6.46 | 6.43 | 6.33 | 6.21 | 4.72 | 3.48 | 3.69 | NA | 2.79 | NA | NA |
| 2023-09-30 | 2023-06-30 | 2023-03-31 | 2022-12-31 | 2022-09-30 | 2022-06-30 | 2022-03-31 | 2021-12-31 | 2021-09-30 | 2021-06-30 | 2021-03-31 | 2020-12-31 | 2020-09-30 | 2020-06-30 | 2020-03-31 | 2019-12-31 | 2019-09-30 | 2019-06-30 | 2019-03-31 | 2018-12-31 | 2018-09-30 | 2018-06-30 | 2018-03-31 | 2017-12-31 | 2017-09-30 | 2017-06-30 | 2017-03-31 | 2016-12-31 | 2016-09-30 | 2016-06-30 | 2016-03-31 | 2015-12-31 | 2015-09-30 | 2015-06-30 | 2015-03-31 | 2014-12-31 | 2014-09-30 | 2014-06-30 | 2014-03-31 | 2013-12-31 | 2013-09-30 | 2013-06-30 | 2013-03-31 | 2012-12-31 | 2012-09-30 | 2012-06-30 | 2012-03-31 | 2011-12-31 | 2011-09-30 | 2011-06-30 | 2011-03-31 | 2010-12-31 | 2010-09-30 | 2010-06-30 | ||
|---|---|---|---|---|---|---|---|---|---|---|---|---|---|---|---|---|---|---|---|---|---|---|---|---|---|---|---|---|---|---|---|---|---|---|---|---|---|---|---|---|---|---|---|---|---|---|---|---|---|---|---|---|---|---|---|
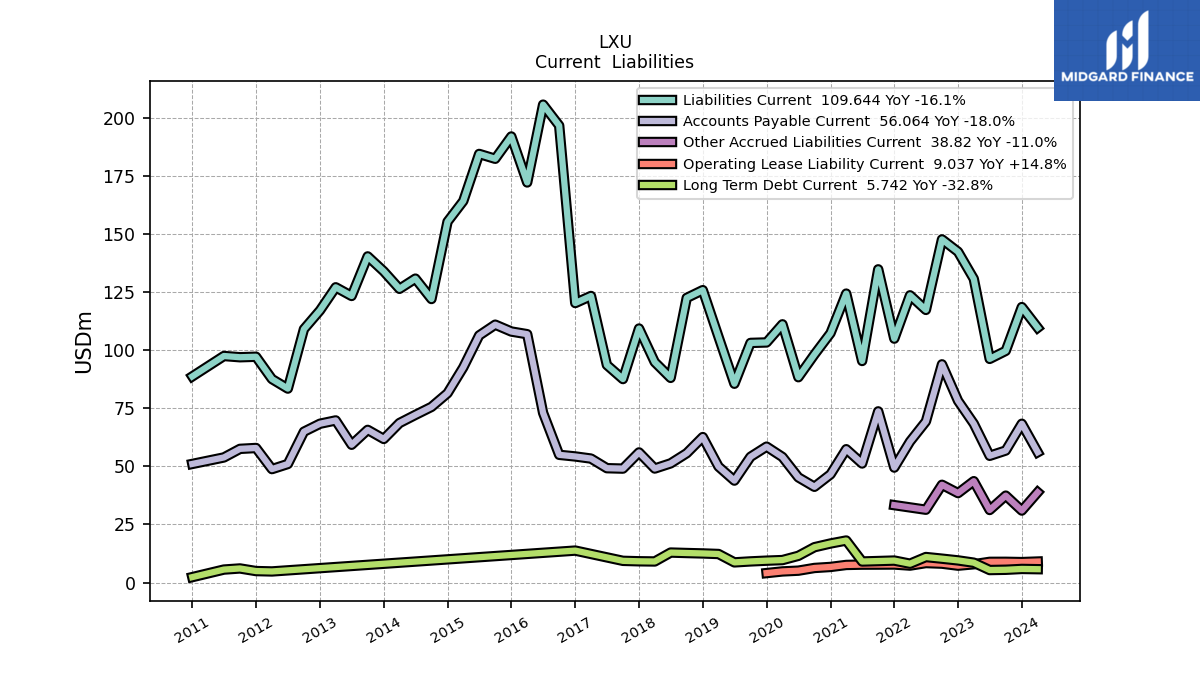
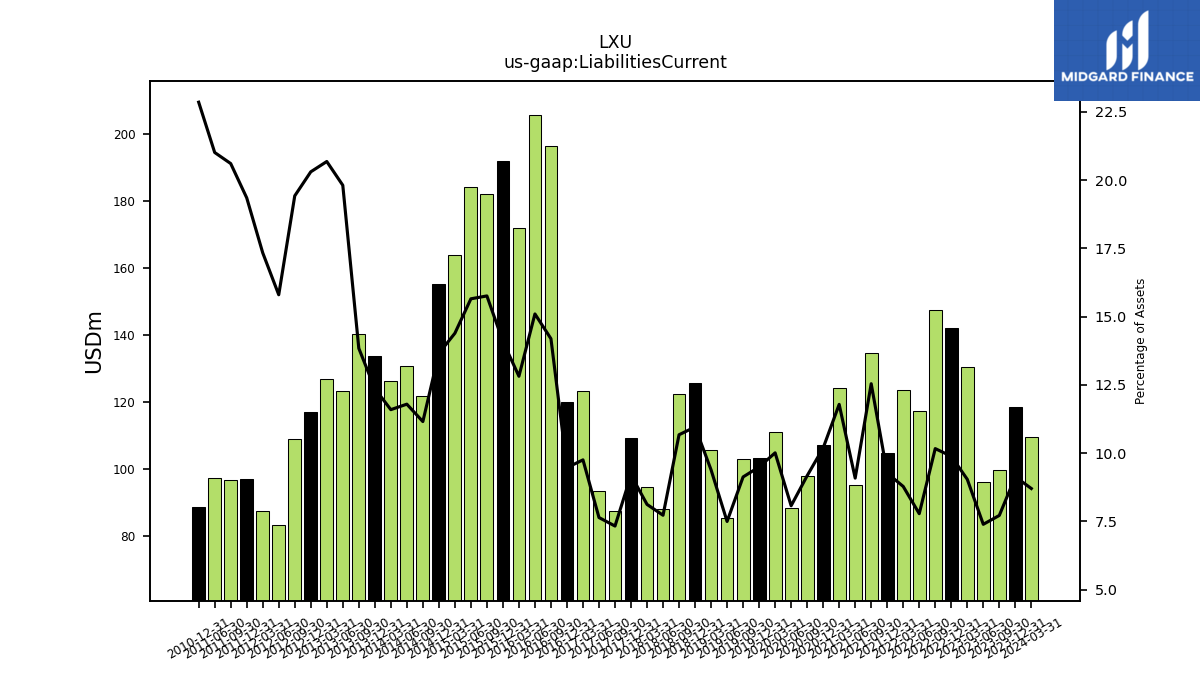
| Liabilities Current | 99.68 | 96.22 | 130.67 | 142.31 | 147.64 | 117.29 | 123.58 | 104.93 | 134.76 | 95.32 | 124.32 | 107.30 | 98.10 | 88.34 | 111.11 | 103.30 | 103.09 | 85.53 | 105.71 | 125.81 | 122.47 | 88.04 | 94.84 | 109.30 | 87.54 | 93.60 | 123.30 | 120.25 | 196.61 | 205.62 | 172.14 | 191.92 | 182.32 | 184.41 | 164.13 | 155.26 | 121.98 | 130.76 | 126.37 | 133.89 | 140.33 | 123.29 | 127.03 | 117.08 | 109.01 | 83.44 | 87.56 | 97.15 | 96.93 | 97.47 | NA | 88.68 | NA | NA | |
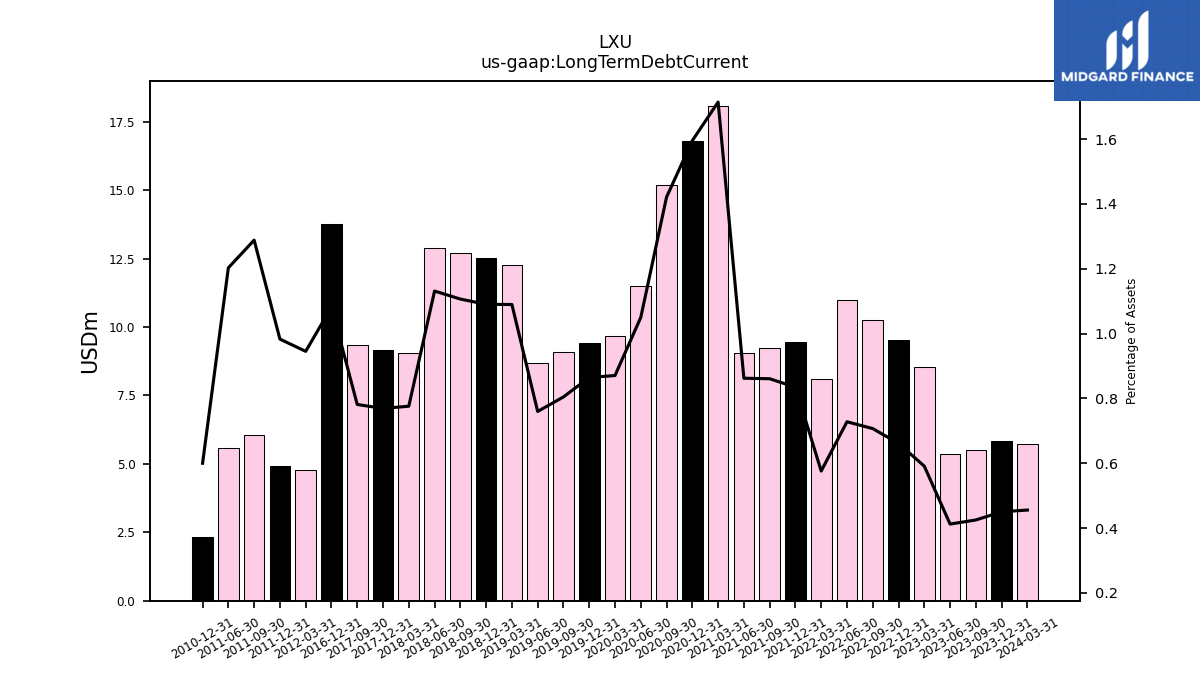
| Long Term Debt Current | 5.49 | 5.37 | 8.54 | 9.52 | 10.27 | 10.98 | 8.11 | 9.45 | 9.25 | 9.05 | 18.08 | 16.80 | 15.20 | 11.49 | 9.66 | 9.41 | 9.09 | 8.67 | 12.28 | 12.52 | 12.70 | 12.90 | 9.06 | 9.15 | 9.34 | NA | NA | 13.74 | NA | NA | NA | NA | NA | NA | NA | NA | NA | NA | NA | NA | NA | NA | NA | NA | NA | NA | 4.77 | 4.93 | 6.06 | 5.58 | NA | 2.33 | NA | NA | |
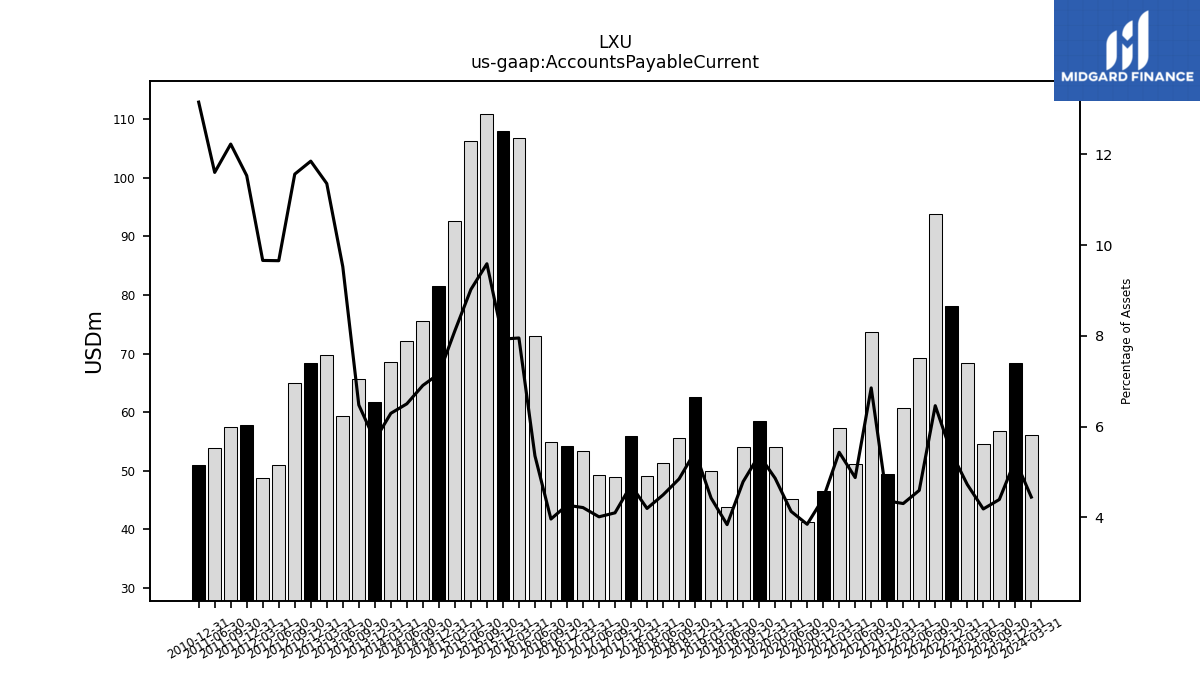
| Accounts Payable Current | 56.80 | 54.52 | 68.34 | 78.18 | 93.89 | 69.31 | 60.65 | 49.46 | 73.66 | 51.21 | 57.36 | 46.55 | 41.19 | 45.24 | 54.01 | 58.48 | 54.09 | 43.85 | 49.90 | 62.59 | 55.65 | 51.28 | 49.05 | 55.99 | 49.02 | 49.20 | 53.34 | 54.25 | 54.95 | 72.99 | 106.85 | 108.00 | 110.95 | 106.32 | 92.54 | 81.46 | 75.57 | 72.13 | 68.63 | 61.77 | 65.69 | 59.28 | 69.75 | 68.33 | 64.90 | 51.00 | 48.80 | 57.89 | 57.51 | 53.82 | NA | 51.02 | NA | NA | |
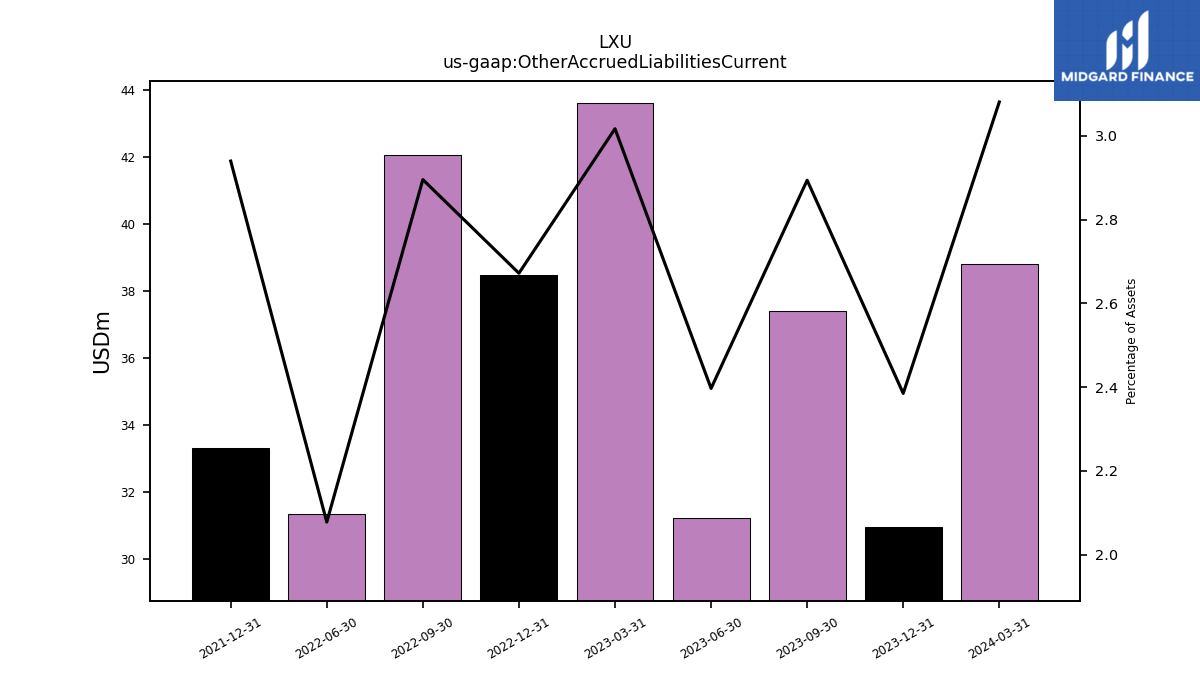
| Other Accrued Liabilities Current | 37.40 | 31.21 | 43.62 | 38.47 | 42.06 | 31.32 | NA | 33.30 | NA | NA | NA | NA | NA | NA | NA | NA | NA | NA | NA | NA | NA | NA | NA | NA | NA | NA | NA | NA | NA | NA | NA | NA | NA | NA | NA | NA | NA | NA | NA | NA | NA | NA | NA | NA | NA | NA | NA | NA | NA | NA | NA | NA | NA | NA |
| 2023-09-30 | 2023-06-30 | 2023-03-31 | 2022-12-31 | 2022-09-30 | 2022-06-30 | 2022-03-31 | 2021-12-31 | 2021-09-30 | 2021-06-30 | 2021-03-31 | 2020-12-31 | 2020-09-30 | 2020-06-30 | 2020-03-31 | 2019-12-31 | 2019-09-30 | 2019-06-30 | 2019-03-31 | 2018-12-31 | 2018-09-30 | 2018-06-30 | 2018-03-31 | 2017-12-31 | 2017-09-30 | 2017-06-30 | 2017-03-31 | 2016-12-31 | 2016-09-30 | 2016-06-30 | 2016-03-31 | 2015-12-31 | 2015-09-30 | 2015-06-30 | 2015-03-31 | 2014-12-31 | 2014-09-30 | 2014-06-30 | 2014-03-31 | 2013-12-31 | 2013-09-30 | 2013-06-30 | 2013-03-31 | 2012-12-31 | 2012-09-30 | 2012-06-30 | 2012-03-31 | 2011-12-31 | 2011-09-30 | 2011-06-30 | 2011-03-31 | 2010-12-31 | 2010-09-30 | 2010-06-30 | ||
|---|---|---|---|---|---|---|---|---|---|---|---|---|---|---|---|---|---|---|---|---|---|---|---|---|---|---|---|---|---|---|---|---|---|---|---|---|---|---|---|---|---|---|---|---|---|---|---|---|---|---|---|---|---|---|---|
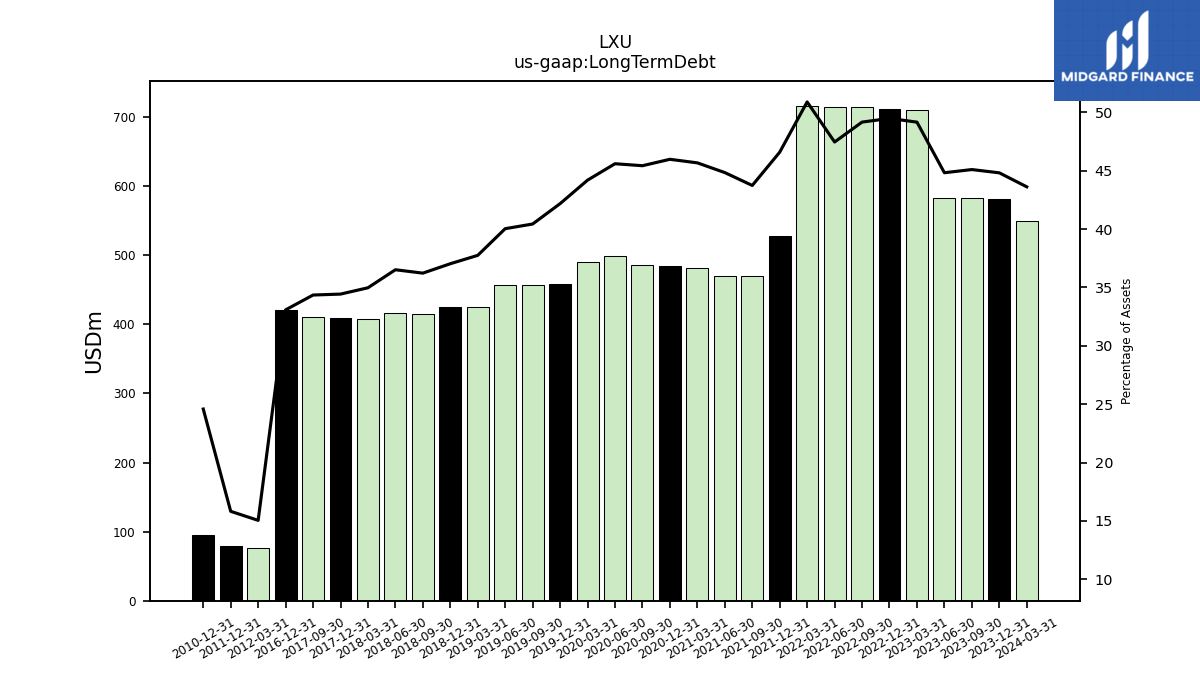
| Long Term Debt | 582.67 | 583.59 | 710.62 | 712.25 | 714.08 | 715.40 | 716.51 | 527.64 | 469.89 | 470.51 | 481.75 | 484.19 | 485.95 | 499.04 | 490.50 | 459.04 | 456.75 | 456.84 | 425.19 | 425.20 | 415.67 | 416.36 | 408.48 | 409.40 | 410.41 | NA | NA | 420.22 | NA | NA | NA | NA | NA | NA | NA | NA | NA | NA | NA | NA | NA | NA | NA | NA | NA | NA | 76.02 | 79.46 | NA | NA | NA | 95.39 | NA | NA | |
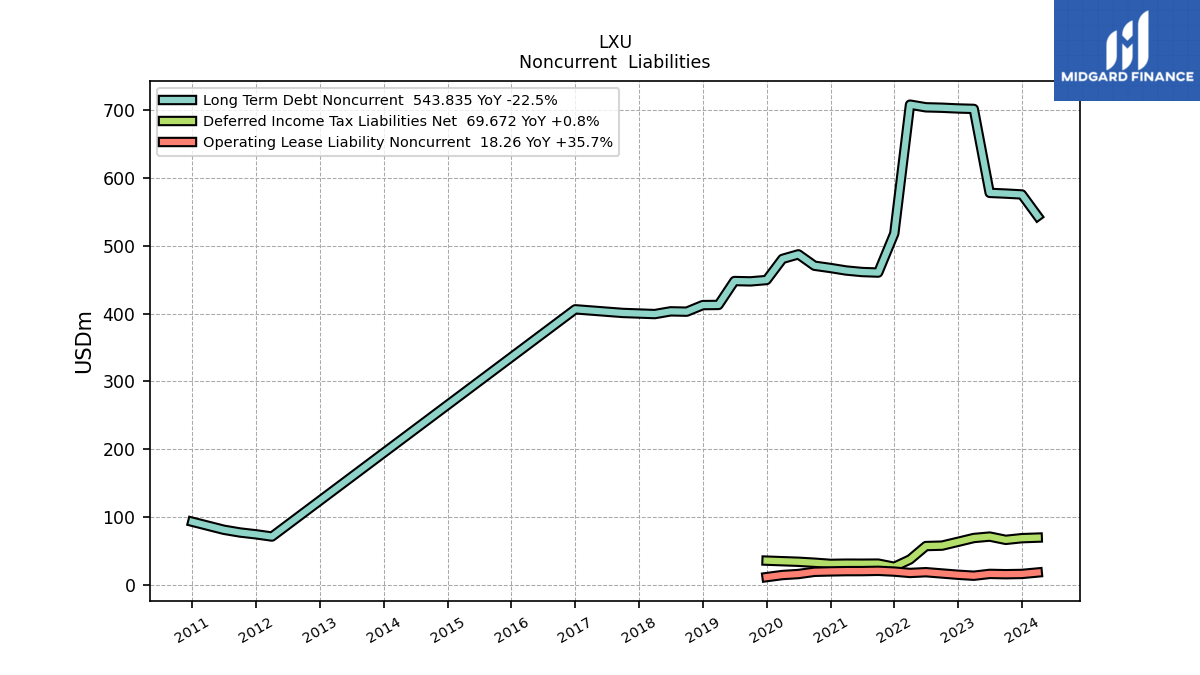
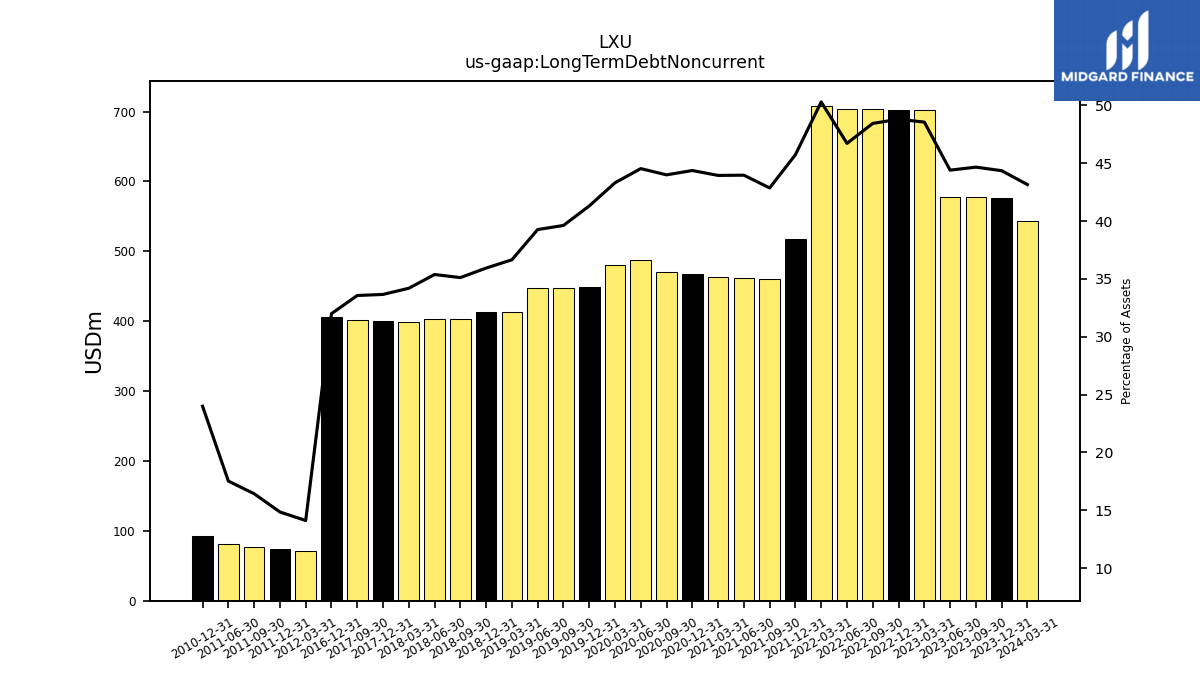
| Long Term Debt Noncurrent | 577.17 | 578.21 | 702.07 | 702.73 | 703.81 | 704.43 | 708.40 | 518.19 | 460.64 | 461.46 | 463.67 | 467.39 | 470.75 | 487.55 | 480.84 | 449.63 | 447.66 | 448.16 | 412.91 | 412.68 | 402.98 | 403.46 | 399.42 | 400.25 | 401.08 | NA | NA | 406.48 | NA | NA | NA | NA | NA | NA | NA | NA | NA | NA | NA | NA | NA | NA | NA | NA | NA | NA | 71.25 | 74.53 | 77.25 | 81.25 | NA | 93.06 | NA | NA | |
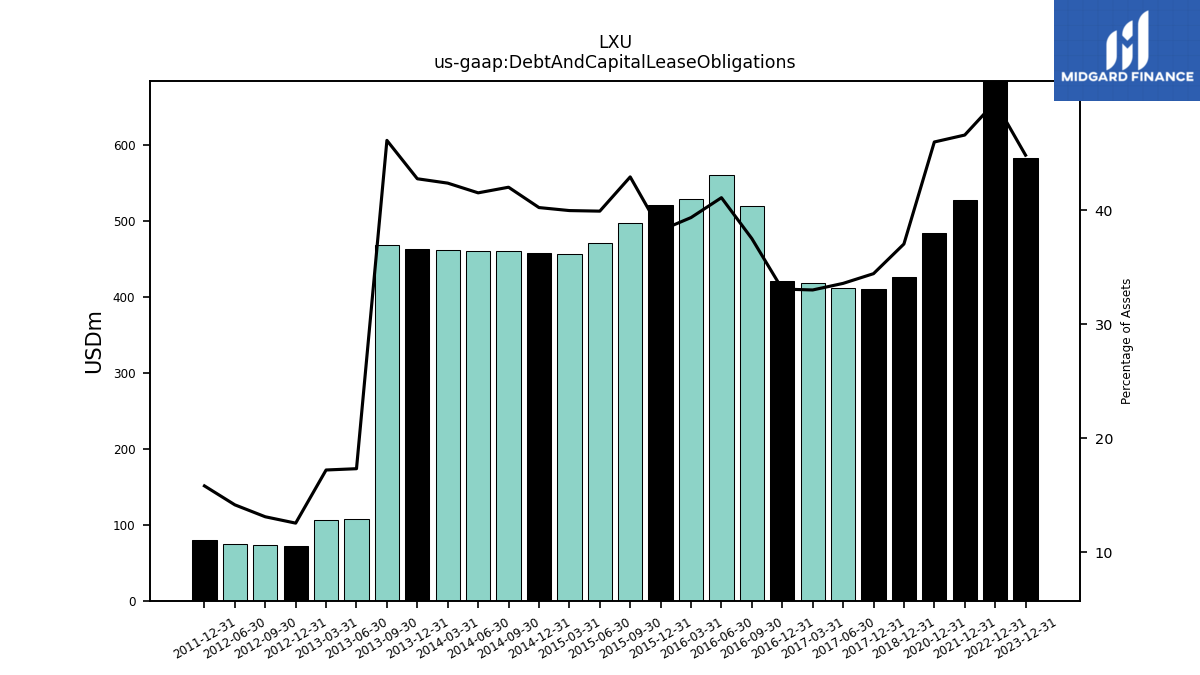
| Debt And Capital Lease Obligations | NA | NA | NA | 712.25 | NA | NA | NA | 527.64 | NA | NA | NA | 484.19 | NA | NA | NA | NA | NA | NA | NA | 425.20 | NA | NA | NA | 409.40 | NA | 411.51 | 417.27 | 420.22 | 519.59 | 559.59 | 528.51 | 520.42 | 496.45 | 470.19 | 455.74 | 457.32 | 459.37 | 460.33 | 461.88 | 462.97 | 467.53 | 107.86 | 105.76 | 72.44 | 73.63 | 74.81 | NA | 79.46 | NA | NA | NA | NA | NA | NA | |
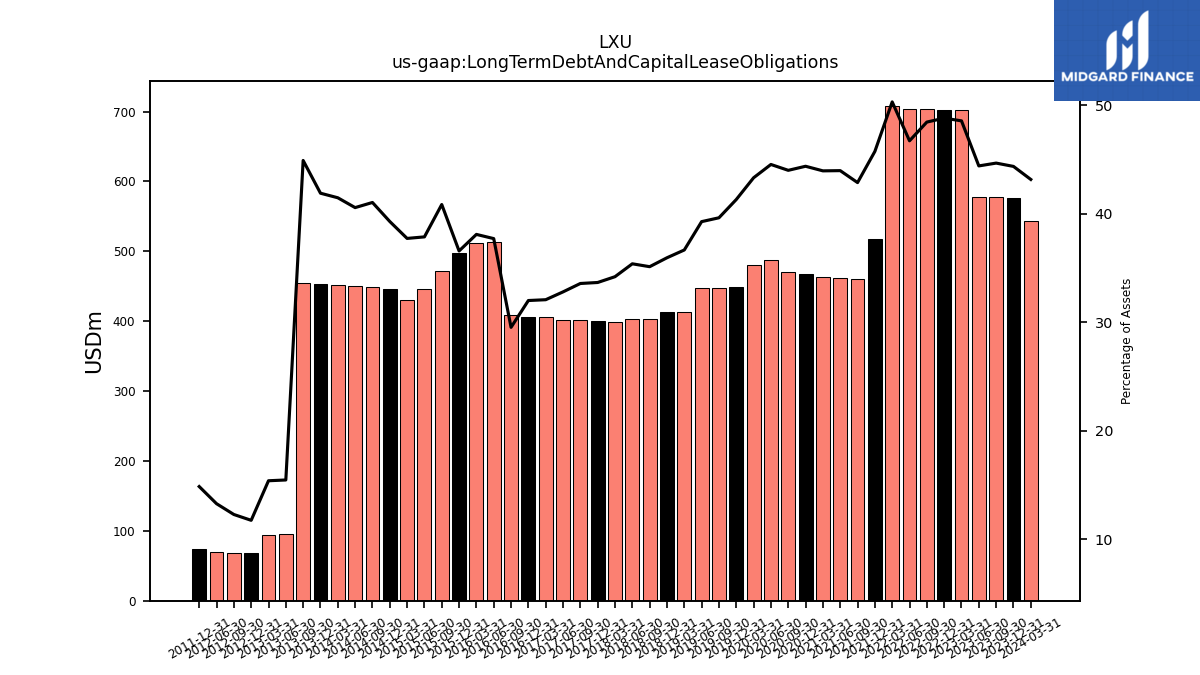
| Long Term Debt And Capital Lease Obligations | 577.17 | 578.21 | 702.07 | 702.73 | 703.81 | 704.43 | 708.40 | 518.19 | 460.64 | 461.46 | 463.67 | 467.39 | 470.75 | 487.55 | 480.84 | 449.63 | 447.66 | 448.16 | 412.91 | 412.68 | 402.98 | 403.46 | 399.42 | 400.25 | 401.08 | 401.89 | 405.52 | 406.48 | 409.09 | 513.50 | 511.68 | 497.95 | 472.60 | 446.09 | 430.24 | 446.64 | 448.77 | 449.80 | 452.14 | 453.70 | 455.37 | 96.15 | 94.46 | 67.64 | 68.85 | 70.05 | NA | 74.53 | NA | NA | NA | NA | NA | NA | |
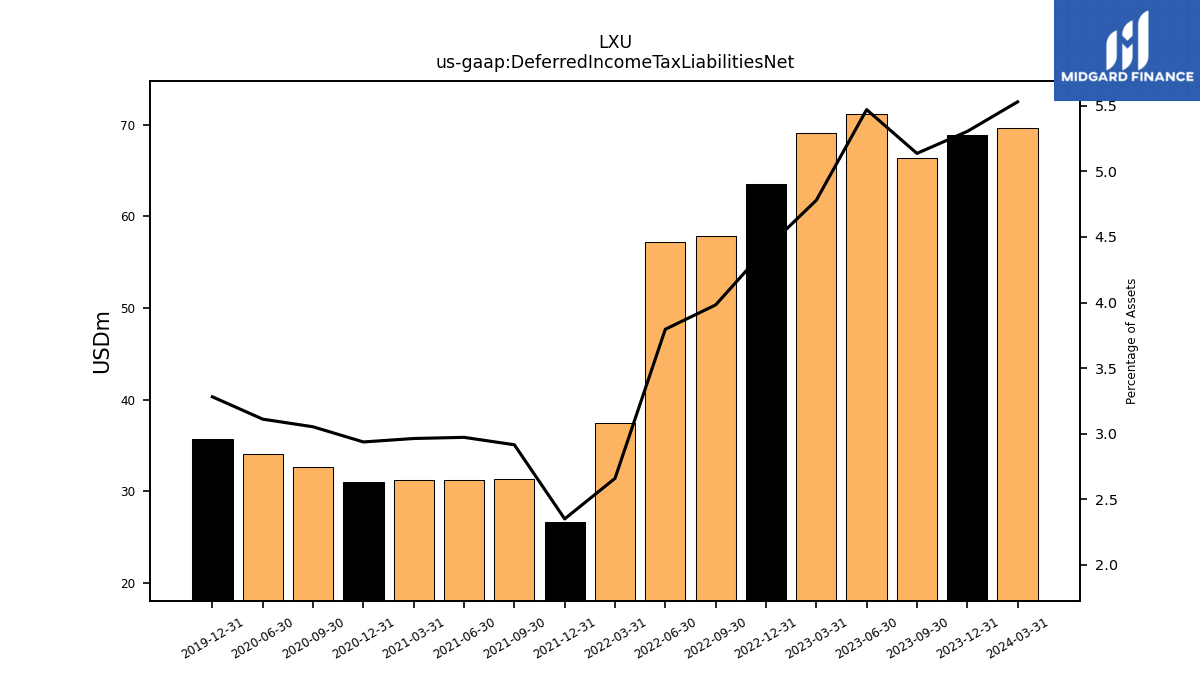
| Deferred Income Tax Liabilities Net | 66.37 | 71.22 | 69.09 | 63.49 | 57.84 | 57.23 | 37.45 | 26.63 | 31.33 | 31.20 | 31.27 | 30.94 | 32.66 | 34.06 | NA | 35.72 | NA | NA | NA | NA | NA | NA | NA | NA | NA | NA | NA | NA | NA | NA | NA | NA | NA | NA | NA | NA | NA | NA | NA | NA | NA | NA | NA | NA | NA | NA | NA | NA | NA | NA | NA | NA | NA | NA | |
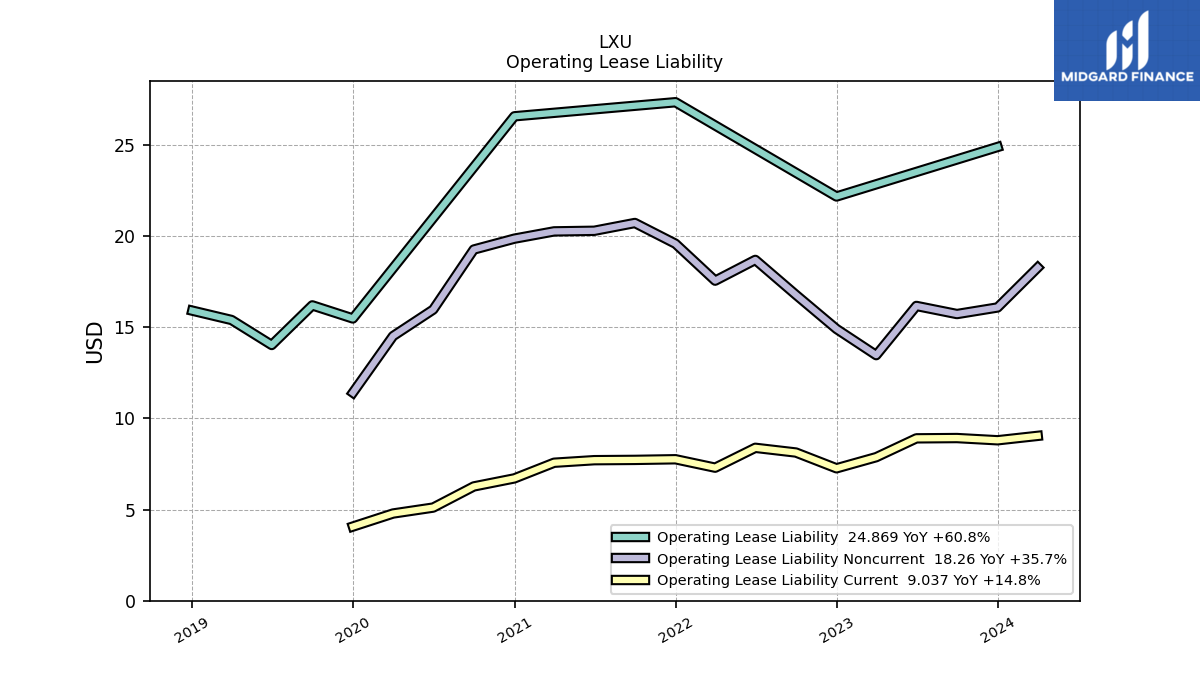
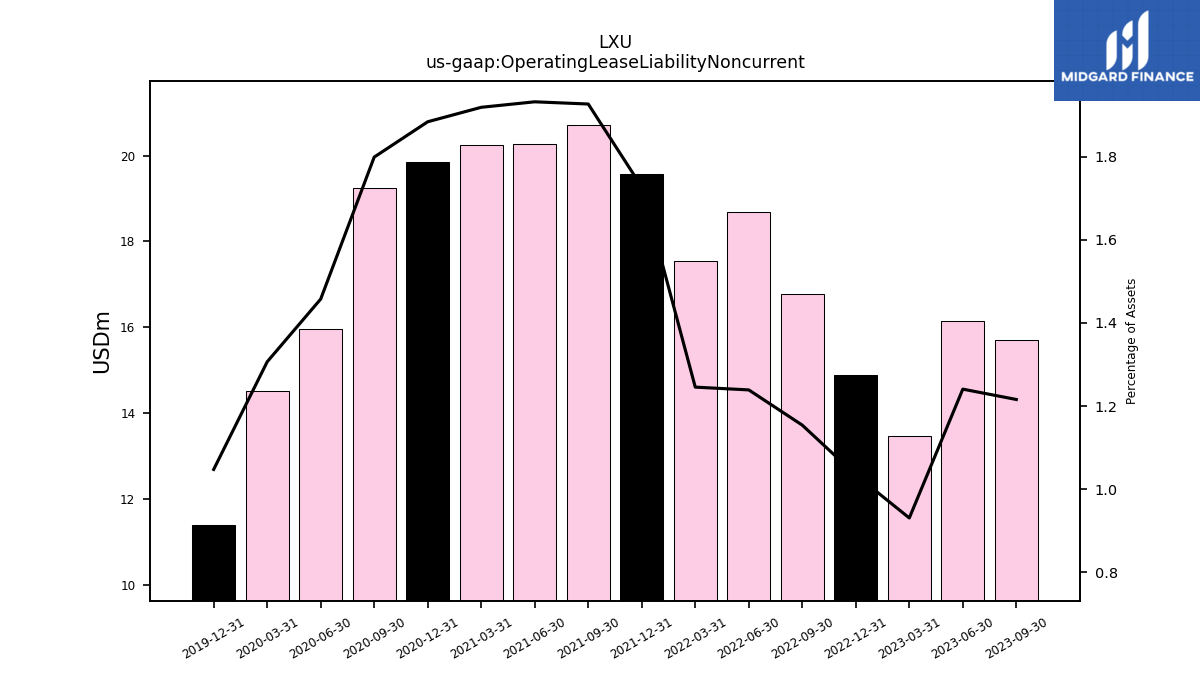
| Operating Lease Liability Noncurrent | 15.71 | 16.16 | 13.46 | 14.90 | 16.77 | 18.68 | 17.54 | 19.57 | 20.70 | 20.28 | 20.24 | 19.84 | 19.25 | 15.96 | 14.51 | 11.40 | NA | NA | NA | NA | NA | NA | NA | NA | NA | NA | NA | NA | NA | NA | NA | NA | NA | NA | NA | NA | NA | NA | NA | NA | NA | NA | NA | NA | NA | NA | NA | NA | NA | NA | NA | NA | NA | NA |
| 2023-09-30 | 2023-06-30 | 2023-03-31 | 2022-12-31 | 2022-09-30 | 2022-06-30 | 2022-03-31 | 2021-12-31 | 2021-09-30 | 2021-06-30 | 2021-03-31 | 2020-12-31 | 2020-09-30 | 2020-06-30 | 2020-03-31 | 2019-12-31 | 2019-09-30 | 2019-06-30 | 2019-03-31 | 2018-12-31 | 2018-09-30 | 2018-06-30 | 2018-03-31 | 2017-12-31 | 2017-09-30 | 2017-06-30 | 2017-03-31 | 2016-12-31 | 2016-09-30 | 2016-06-30 | 2016-03-31 | 2015-12-31 | 2015-09-30 | 2015-06-30 | 2015-03-31 | 2014-12-31 | 2014-09-30 | 2014-06-30 | 2014-03-31 | 2013-12-31 | 2013-09-30 | 2013-06-30 | 2013-03-31 | 2012-12-31 | 2012-09-30 | 2012-06-30 | 2012-03-31 | 2011-12-31 | 2011-09-30 | 2011-06-30 | 2011-03-31 | 2010-12-31 | 2010-09-30 | 2010-06-30 | ||
|---|---|---|---|---|---|---|---|---|---|---|---|---|---|---|---|---|---|---|---|---|---|---|---|---|---|---|---|---|---|---|---|---|---|---|---|---|---|---|---|---|---|---|---|---|---|---|---|---|---|---|---|---|---|---|---|
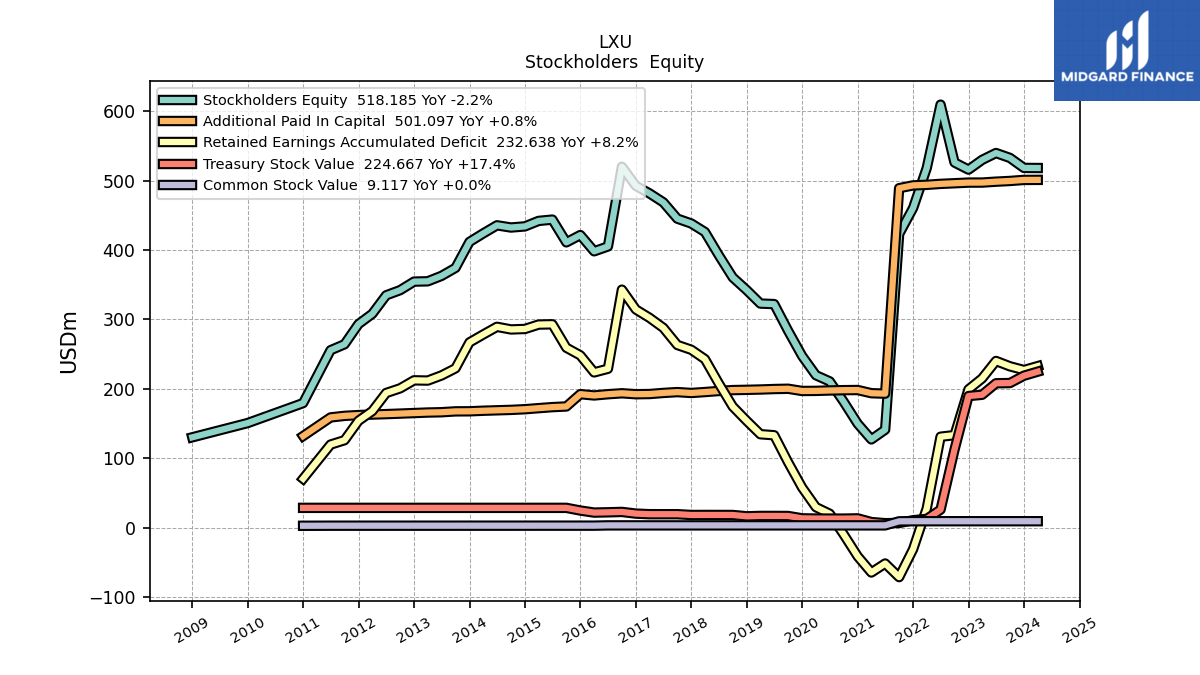
| Stockholders Equity | 532.74 | 539.80 | 529.95 | 515.87 | 526.14 | 609.56 | 518.19 | 460.49 | 423.07 | 141.01 | 127.04 | 149.64 | 181.27 | 210.62 | 219.50 | 247.33 | 283.50 | 322.06 | 322.83 | 342.20 | 360.52 | 392.52 | 425.95 | 438.20 | 445.22 | 468.69 | 481.56 | 492.51 | 520.00 | 405.14 | 398.15 | 421.58 | 411.03 | 443.85 | 441.94 | 434.05 | 432.43 | 435.60 | 423.87 | 411.71 | 374.28 | 362.76 | 354.90 | 354.50 | 342.15 | 334.70 | 308.05 | 293.27 | 264.15 | 255.59 | NA | 179.37 | NA | NA | |
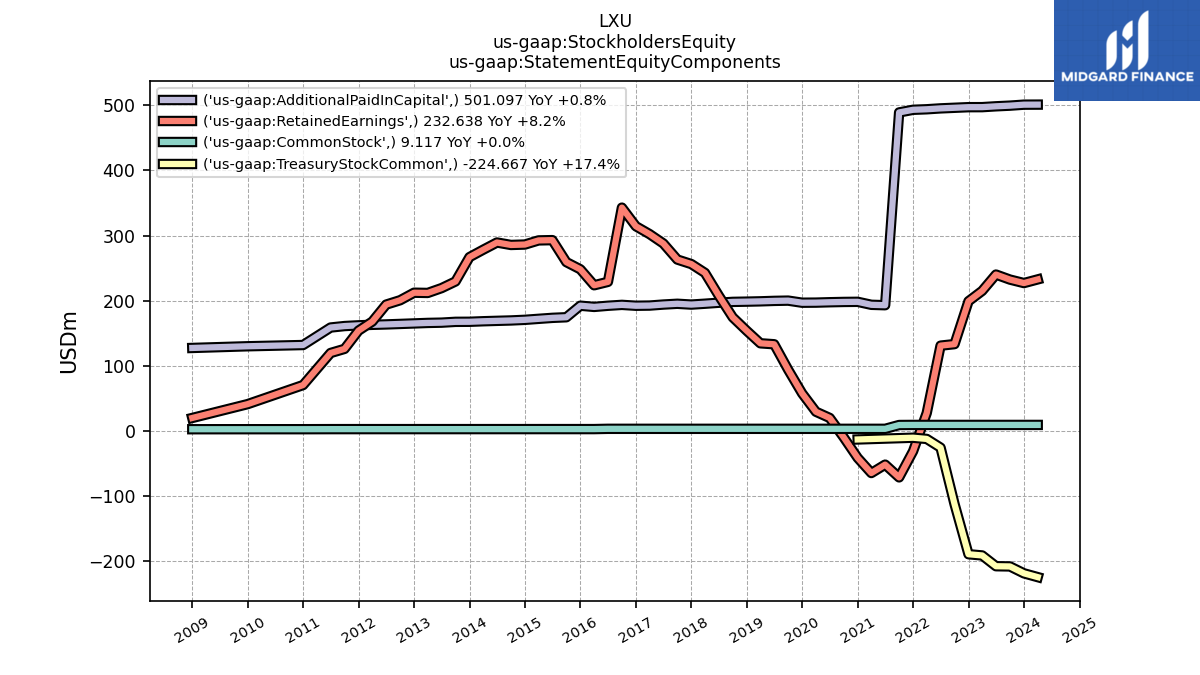
| Common Stock Value | 9.12 | 9.12 | 9.12 | 9.12 | 9.12 | 9.12 | 9.12 | 9.12 | 8.98 | 3.13 | 3.13 | 3.13 | 3.13 | 3.13 | 3.13 | 3.13 | 3.13 | 3.13 | 3.13 | 3.13 | 3.13 | 3.13 | 3.13 | 3.13 | 3.13 | 3.13 | 3.13 | 3.13 | 3.13 | 3.13 | 2.71 | 2.71 | 2.71 | 2.71 | 2.70 | 2.70 | 2.69 | 2.69 | 2.69 | 2.69 | 2.68 | 2.68 | 2.68 | 2.67 | 2.67 | 2.67 | 2.67 | 2.66 | 2.66 | 2.65 | NA | 2.55 | NA | NA | |
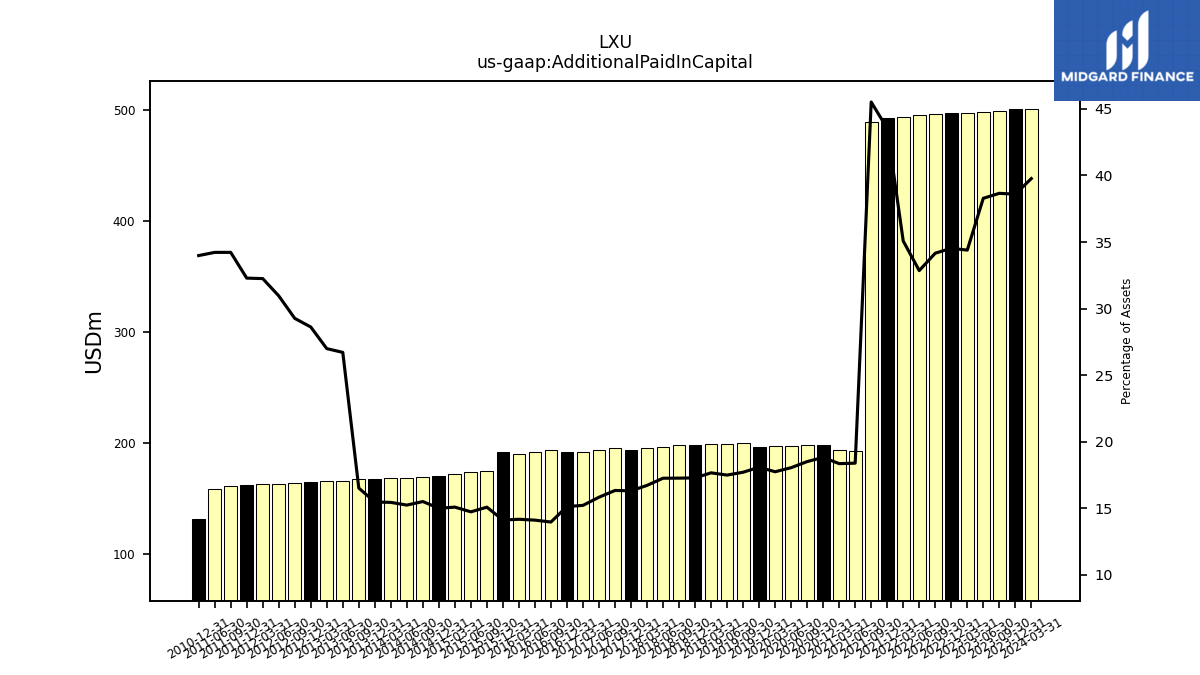
| Additional Paid In Capital | 499.53 | 498.52 | 497.22 | 497.18 | 496.25 | 495.33 | 493.96 | 493.16 | 489.11 | 192.98 | 193.62 | 198.22 | 198.01 | 197.57 | 196.97 | 196.83 | 200.04 | 199.64 | 198.95 | 198.48 | 198.10 | 196.79 | 195.29 | 193.96 | 195.21 | 194.01 | 192.43 | 192.17 | 193.52 | 192.15 | 190.38 | 192.25 | 174.50 | 173.56 | 172.07 | 170.54 | 169.58 | 168.98 | 168.36 | 167.55 | 167.46 | 166.20 | 165.78 | 165.01 | 164.22 | 163.48 | 162.87 | 162.09 | 160.97 | 158.72 | NA | 131.84 | NA | NA | |
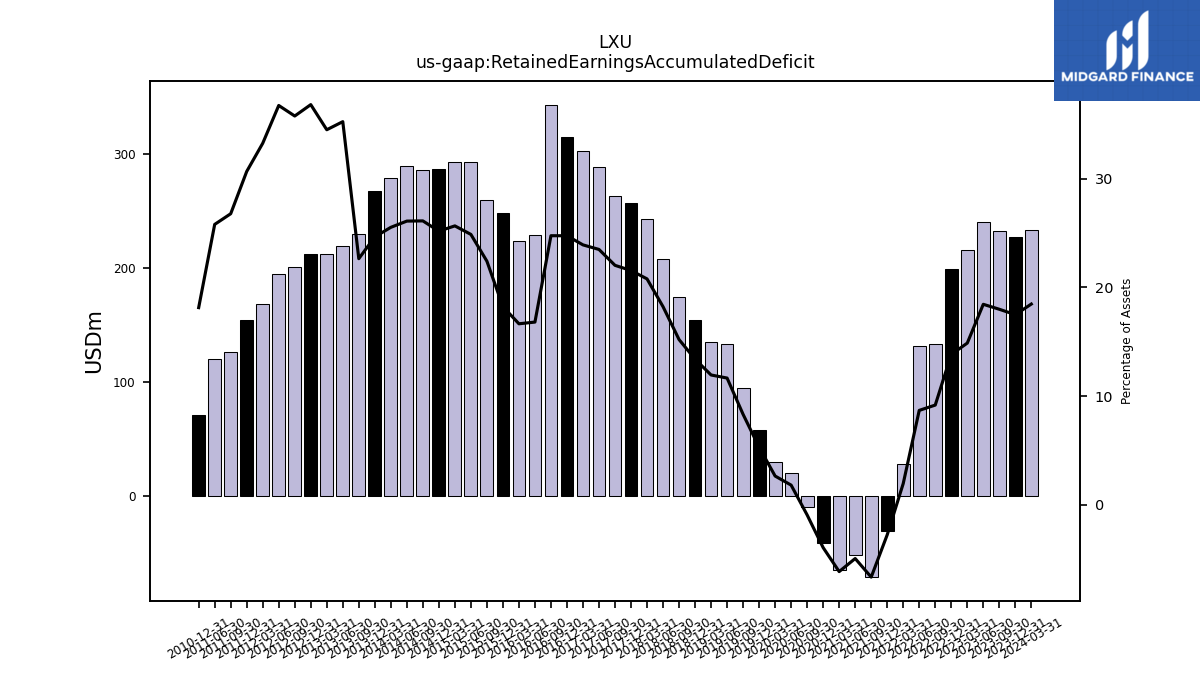
| Retained Earnings Accumulated Deficit | 232.36 | 240.09 | 214.99 | 199.09 | 133.22 | 130.91 | 27.51 | -31.25 | -71.46 | -51.84 | -64.79 | -41.49 | -9.99 | 19.81 | 29.37 | 57.63 | 93.97 | 133.03 | 134.48 | 153.77 | 174.40 | 207.75 | 242.69 | 256.21 | 263.13 | 287.80 | 302.24 | 314.30 | 342.88 | 228.84 | 223.62 | 248.15 | 259.19 | 292.95 | 292.54 | 286.19 | 285.53 | 289.31 | 278.19 | 266.85 | 229.51 | 219.25 | 211.82 | 212.19 | 200.63 | 193.92 | 167.89 | 153.89 | 125.90 | 119.59 | NA | 70.35 | NA | NA | |
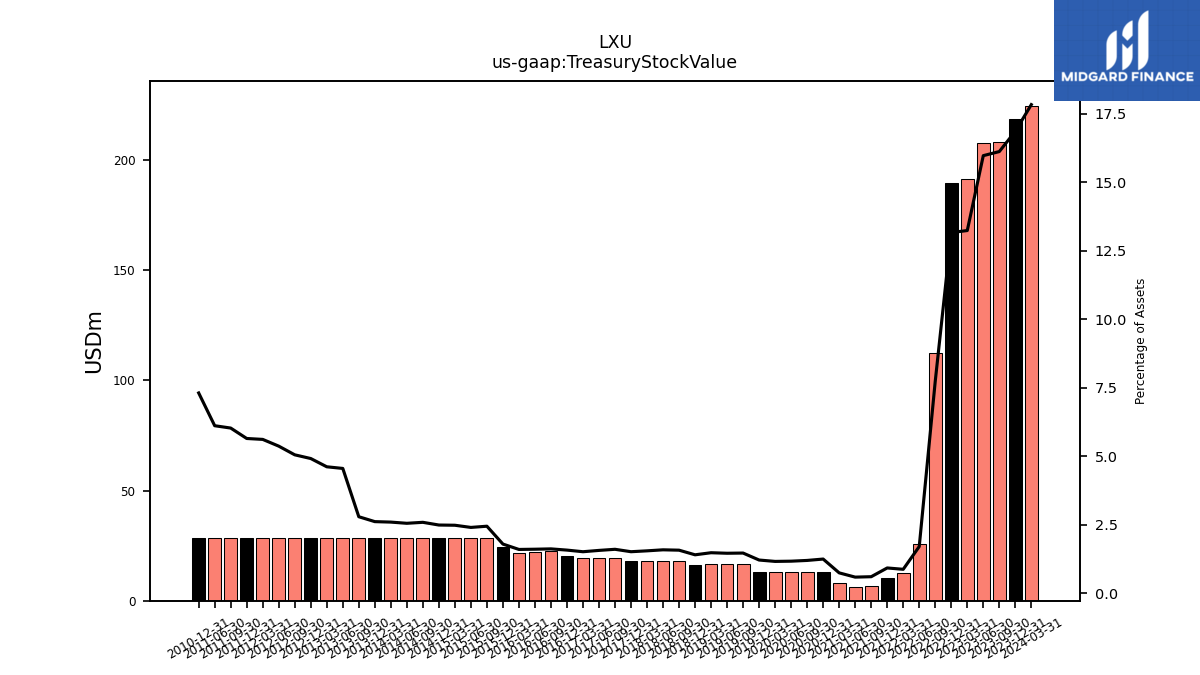
| Treasury Stock Value | 208.26 | 207.93 | 191.37 | 189.51 | 112.45 | 25.80 | 12.40 | 10.53 | 6.56 | 6.25 | 7.92 | 13.21 | 12.88 | 12.88 | 12.97 | 13.27 | 16.64 | 16.73 | 16.73 | 16.19 | 18.11 | 18.15 | 18.16 | 18.10 | 19.24 | 19.24 | 19.24 | 20.09 | 22.52 | 21.97 | 21.56 | 24.53 | 28.37 | 28.37 | 28.37 | 28.37 | 28.37 | 28.37 | 28.37 | 28.37 | 28.37 | 28.37 | 28.37 | 28.37 | 28.37 | 28.37 | 28.37 | 28.37 | 28.37 | 28.37 | NA | 28.37 | NA | NA | |
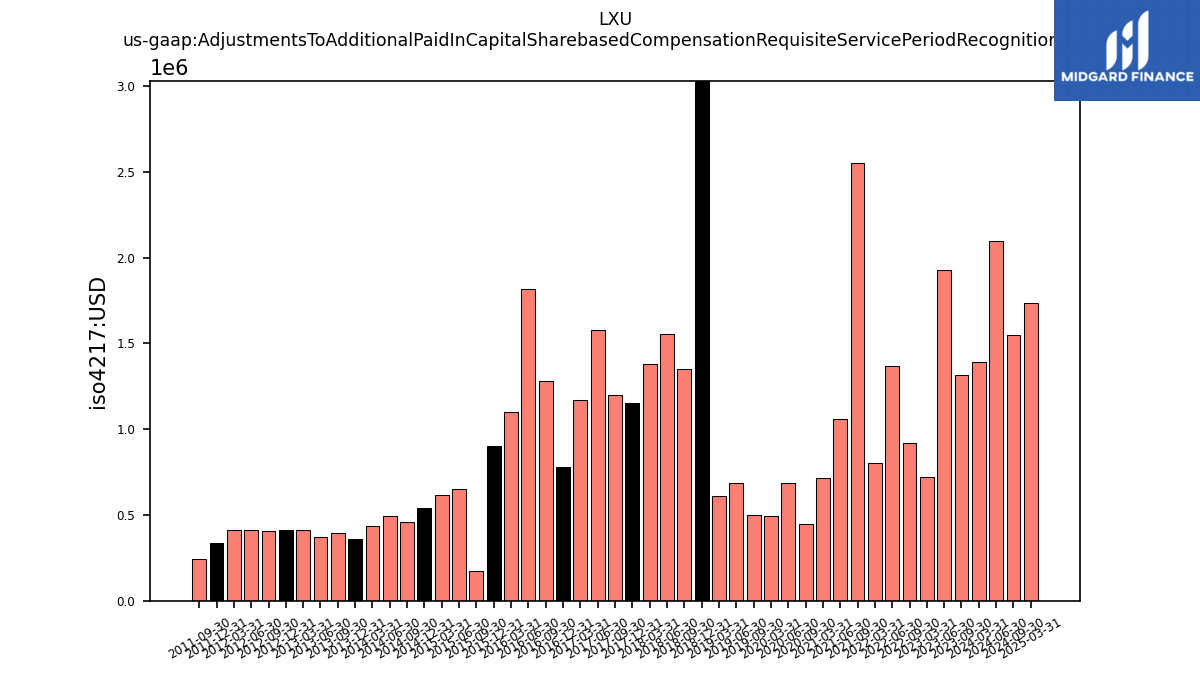
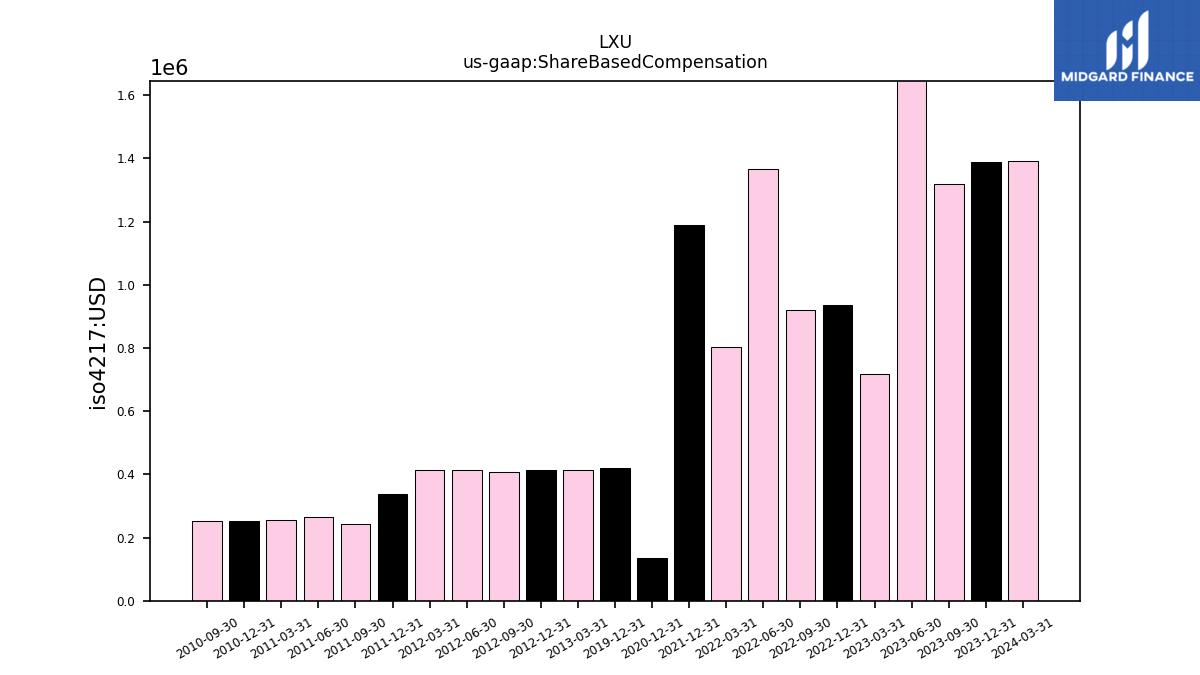
| Adjustments To Additional Paid In Capital Sharebased Compensation Requisite Service Period Recognition Value | 1.32 | 1.93 | 0.72 | NA | 0.92 | 1.37 | 0.80 | NA | 2.55 | 1.06 | 0.71 | NA | 0.45 | 0.68 | 0.49 | NA | 0.50 | 0.69 | 0.61 | 4.07 | 1.35 | 1.55 | 1.38 | 1.15 | 1.20 | 1.58 | 1.17 | 0.78 | 1.28 | 1.82 | 1.10 | 0.90 | 0.17 | 0.65 | 0.62 | 0.54 | 0.46 | 0.49 | 0.43 | 0.36 | 0.40 | 0.37 | 0.41 | 0.41 | 0.41 | 0.41 | 0.41 | 0.34 | 0.24 | NA | NA | NA | NA | NA |
| 2023-09-30 | 2023-06-30 | 2023-03-31 | 2022-12-31 | 2022-09-30 | 2022-06-30 | 2022-03-31 | 2021-12-31 | 2021-09-30 | 2021-06-30 | 2021-03-31 | 2020-12-31 | 2020-09-30 | 2020-06-30 | 2020-03-31 | 2019-12-31 | 2019-09-30 | 2019-06-30 | 2019-03-31 | 2018-12-31 | 2018-09-30 | 2018-06-30 | 2018-03-31 | 2017-12-31 | 2017-09-30 | 2017-06-30 | 2017-03-31 | 2016-12-31 | 2016-09-30 | 2016-06-30 | 2016-03-31 | 2015-12-31 | 2015-09-30 | 2015-06-30 | 2015-03-31 | 2014-12-31 | 2014-09-30 | 2014-06-30 | 2014-03-31 | 2013-12-31 | 2013-09-30 | 2013-06-30 | 2013-03-31 | 2012-12-31 | 2012-09-30 | 2012-06-30 | 2012-03-31 | 2011-12-31 | 2011-09-30 | 2011-06-30 | 2011-03-31 | 2010-12-31 | 2010-09-30 | 2010-06-30 | ||
|---|---|---|---|---|---|---|---|---|---|---|---|---|---|---|---|---|---|---|---|---|---|---|---|---|---|---|---|---|---|---|---|---|---|---|---|---|---|---|---|---|---|---|---|---|---|---|---|---|---|---|---|---|---|---|---|
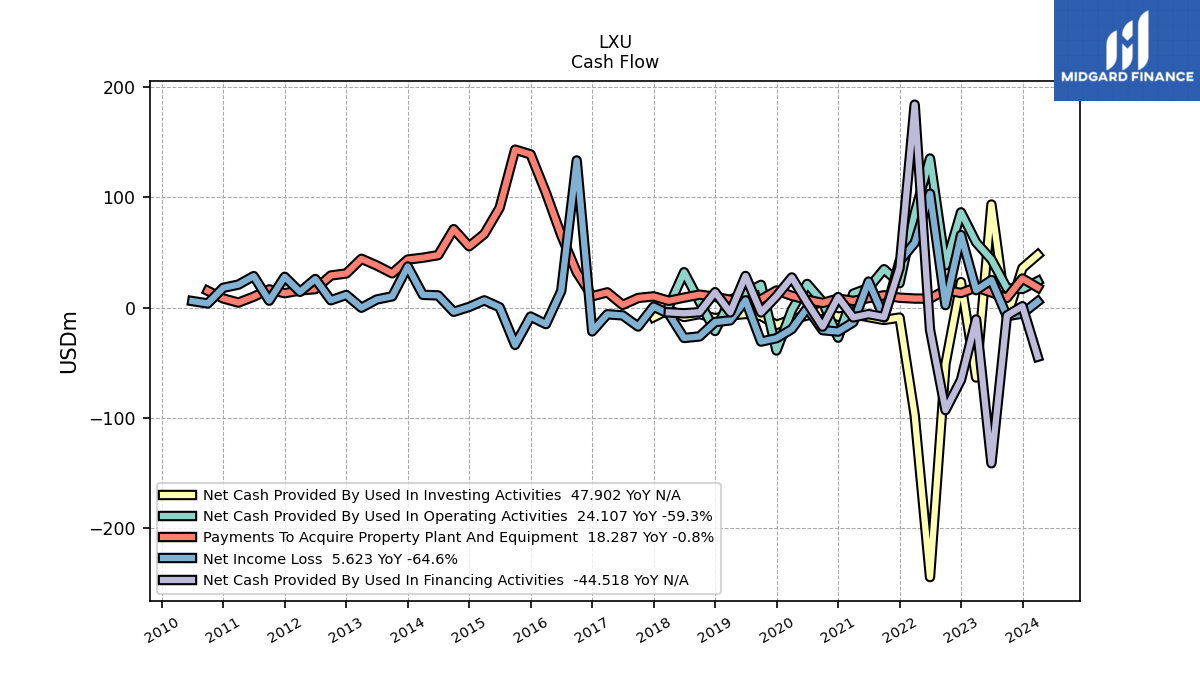
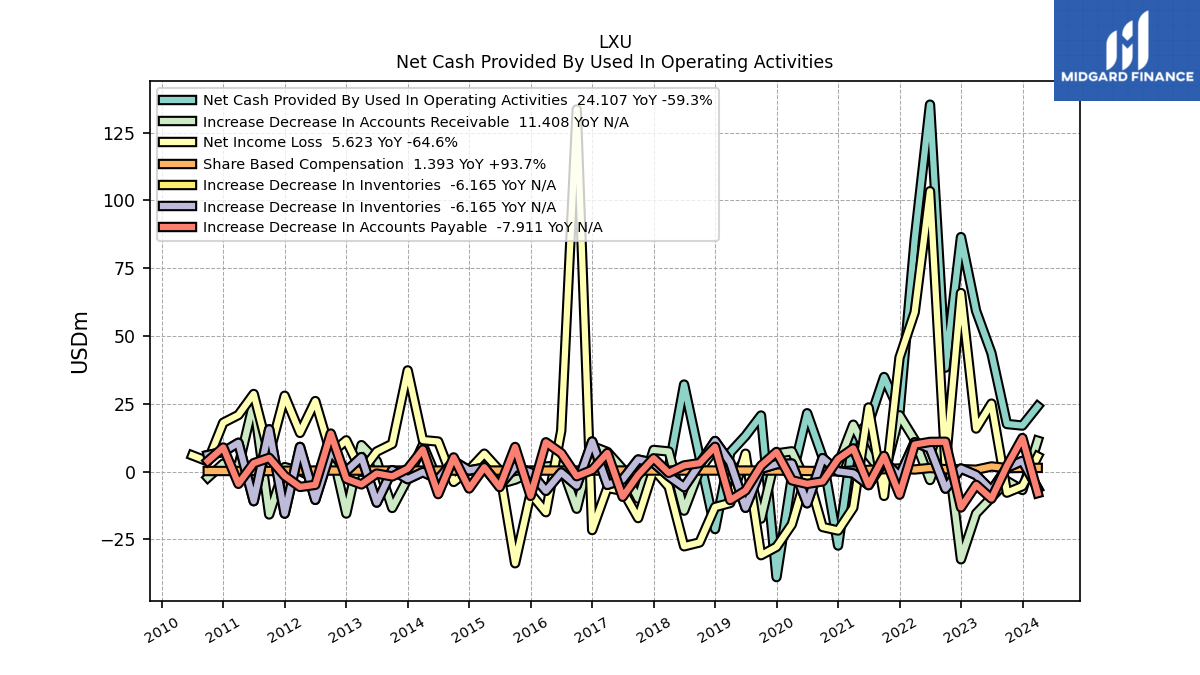
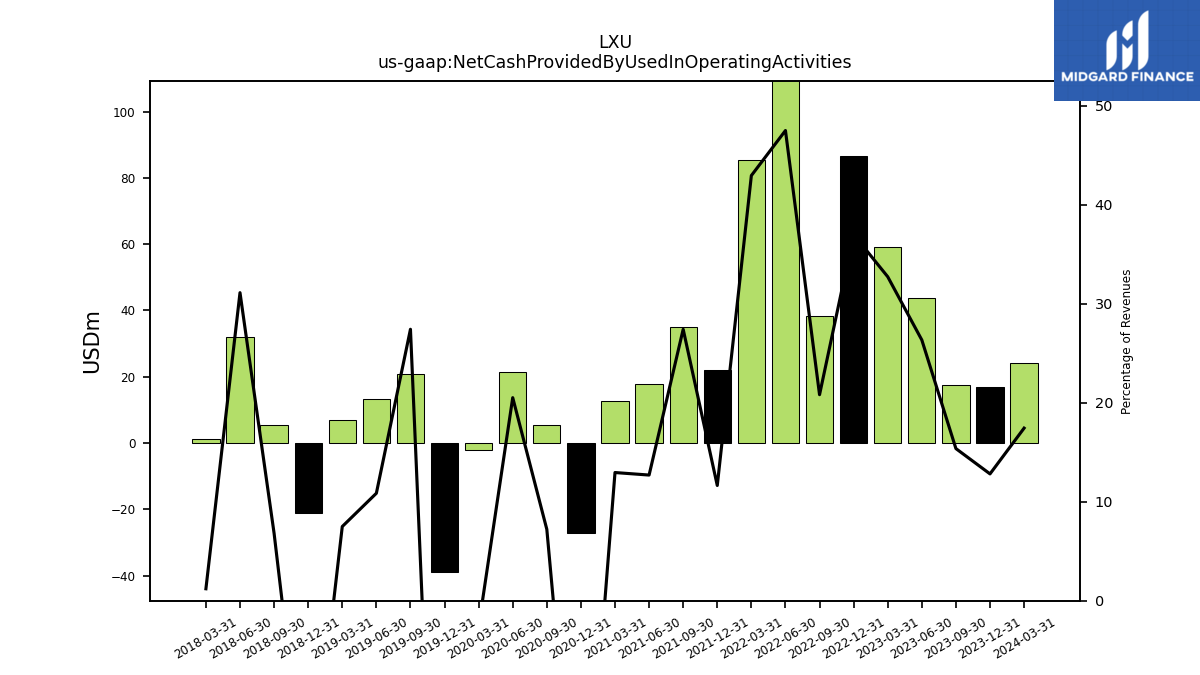
| Net Cash Provided By Used In Operating Activities | 17.57 | 43.70 | 59.25 | 86.47 | 38.37 | 135.32 | 85.49 | 22.16 | 34.89 | 17.87 | 12.71 | -27.23 | 5.34 | 21.55 | -2.18 | -38.87 | 20.71 | 13.20 | 7.06 | -21.16 | 5.44 | 32.13 | 1.22 | NA | NA | NA | NA | NA | NA | NA | NA | NA | NA | NA | NA | NA | NA | NA | NA | NA | NA | NA | NA | NA | NA | NA | NA | NA | NA | NA | NA | NA | NA | NA | |
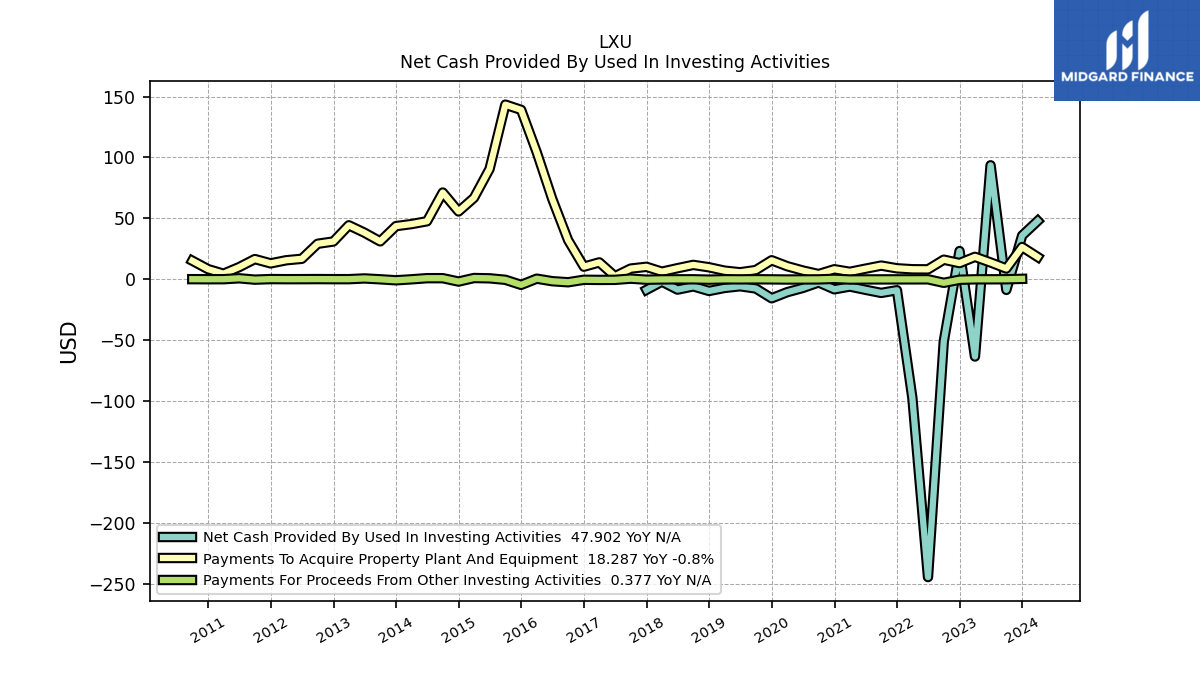
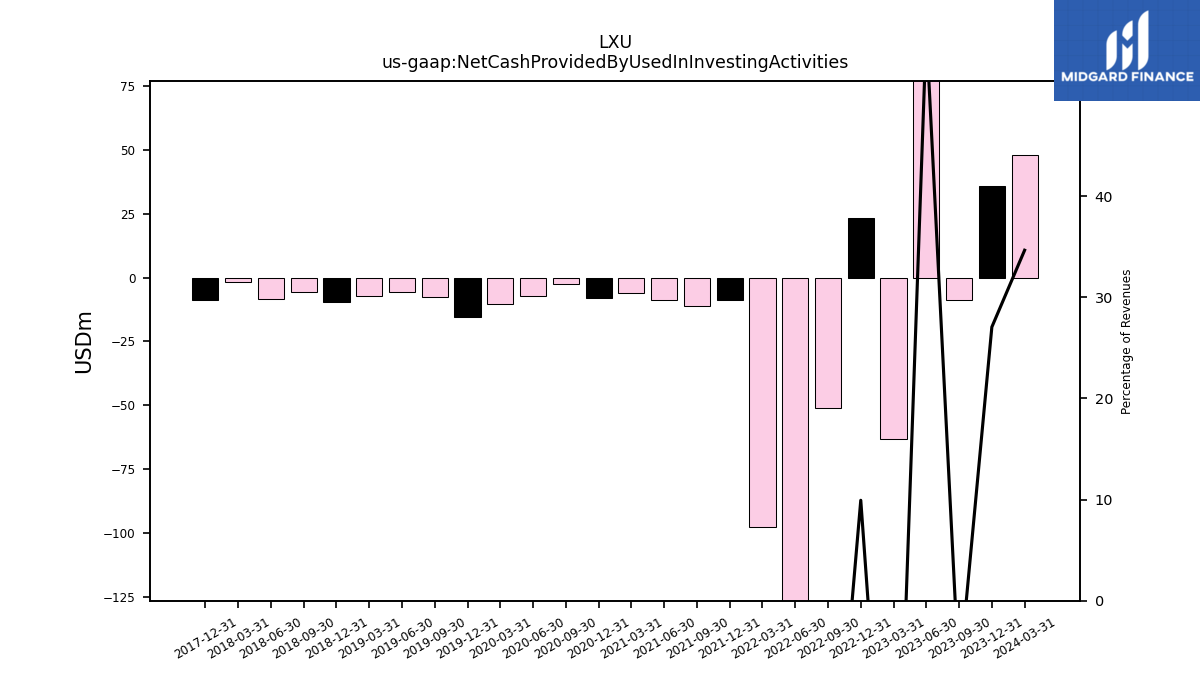
| Net Cash Provided By Used In Investing Activities | -8.70 | 93.59 | -63.38 | 23.21 | -51.01 | -244.42 | -97.51 | -8.97 | -11.17 | -8.61 | -5.93 | -8.21 | -2.56 | -7.10 | -10.56 | -15.57 | -7.55 | -5.70 | -7.11 | -9.58 | -5.81 | -8.46 | -1.89 | -8.65 | NA | NA | NA | NA | NA | NA | NA | NA | NA | NA | NA | NA | NA | NA | NA | NA | NA | NA | NA | NA | NA | NA | NA | NA | NA | NA | NA | NA | NA | NA | |
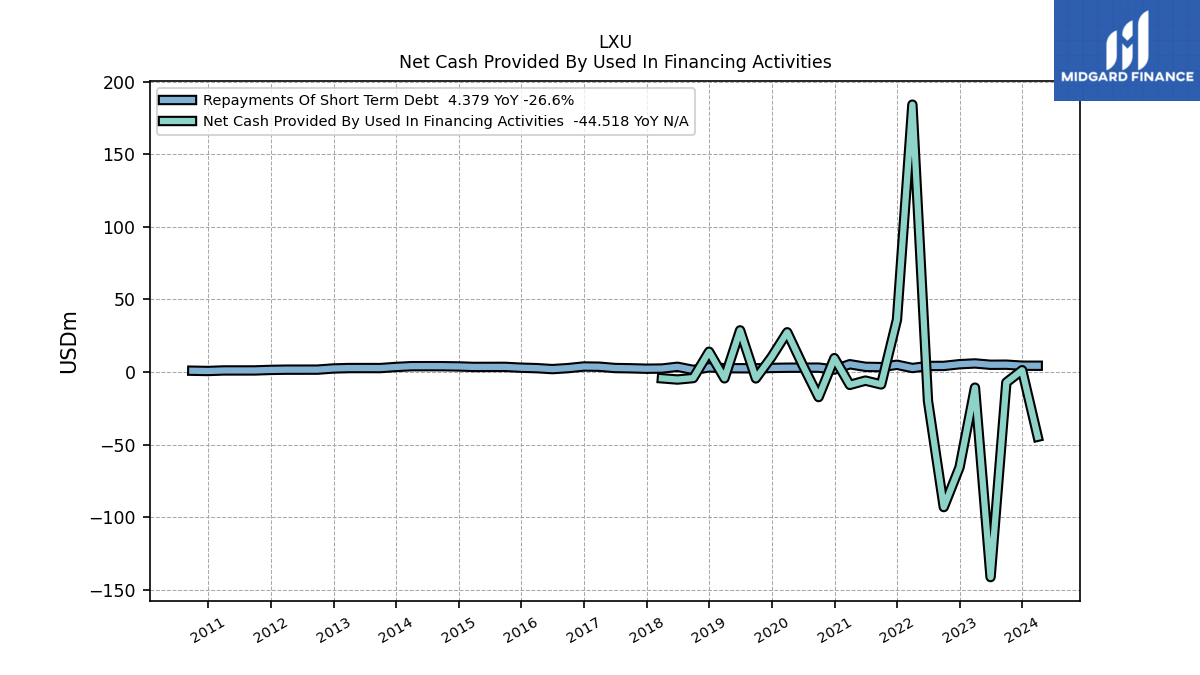
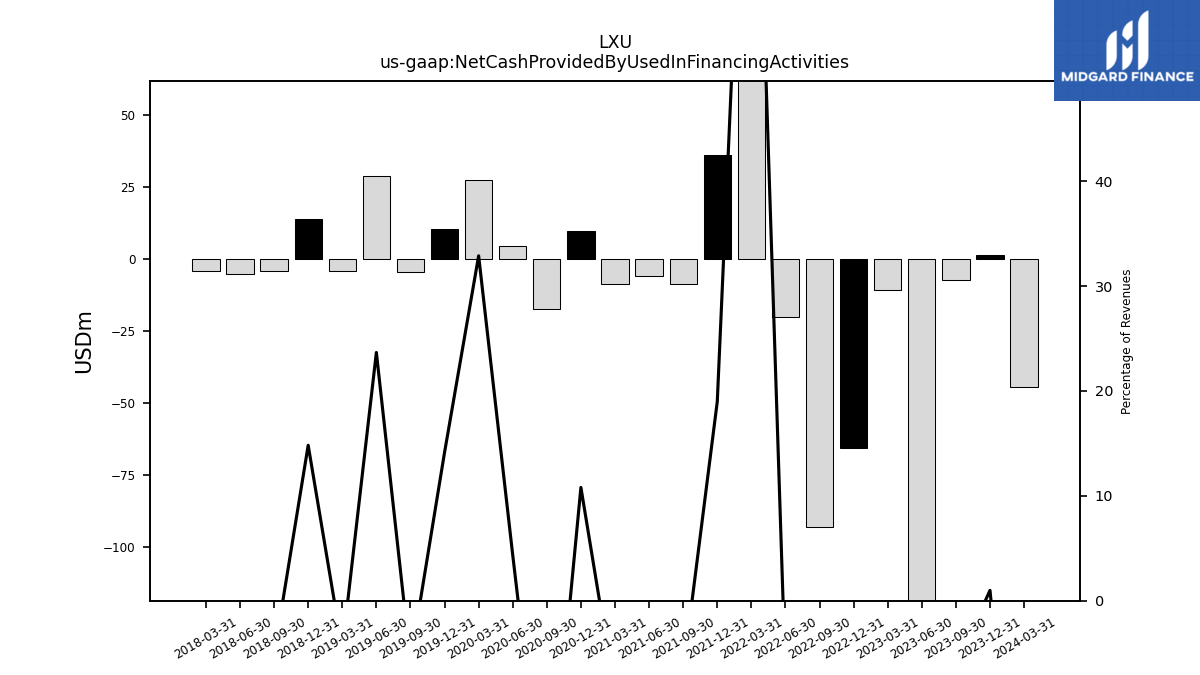
| Net Cash Provided By Used In Financing Activities | -7.12 | -141.17 | -10.69 | -65.55 | -92.95 | -19.97 | 184.18 | 36.11 | -8.49 | -5.86 | -8.81 | 9.61 | -17.19 | 4.57 | 27.43 | 10.45 | -4.34 | 28.76 | -4.30 | 14.04 | -4.10 | -5.12 | -4.28 | NA | NA | NA | NA | NA | NA | NA | NA | NA | NA | NA | NA | NA | NA | NA | NA | NA | NA | NA | NA | NA | NA | NA | NA | NA | NA | NA | NA | NA | NA | NA |
| 2023-09-30 | 2023-06-30 | 2023-03-31 | 2022-12-31 | 2022-09-30 | 2022-06-30 | 2022-03-31 | 2021-12-31 | 2021-09-30 | 2021-06-30 | 2021-03-31 | 2020-12-31 | 2020-09-30 | 2020-06-30 | 2020-03-31 | 2019-12-31 | 2019-09-30 | 2019-06-30 | 2019-03-31 | 2018-12-31 | 2018-09-30 | 2018-06-30 | 2018-03-31 | 2017-12-31 | 2017-09-30 | 2017-06-30 | 2017-03-31 | 2016-12-31 | 2016-09-30 | 2016-06-30 | 2016-03-31 | 2015-12-31 | 2015-09-30 | 2015-06-30 | 2015-03-31 | 2014-12-31 | 2014-09-30 | 2014-06-30 | 2014-03-31 | 2013-12-31 | 2013-09-30 | 2013-06-30 | 2013-03-31 | 2012-12-31 | 2012-09-30 | 2012-06-30 | 2012-03-31 | 2011-12-31 | 2011-09-30 | 2011-06-30 | 2011-03-31 | 2010-12-31 | 2010-09-30 | 2010-06-30 | ||
|---|---|---|---|---|---|---|---|---|---|---|---|---|---|---|---|---|---|---|---|---|---|---|---|---|---|---|---|---|---|---|---|---|---|---|---|---|---|---|---|---|---|---|---|---|---|---|---|---|---|---|---|---|---|---|---|
| Net Cash Provided By Used In Operating Activities | 17.57 | 43.70 | 59.25 | 86.47 | 38.37 | 135.32 | 85.49 | 22.16 | 34.89 | 17.87 | 12.71 | -27.23 | 5.34 | 21.55 | -2.18 | -38.87 | 20.71 | 13.20 | 7.06 | -21.16 | 5.44 | 32.13 | 1.22 | NA | NA | NA | NA | NA | NA | NA | NA | NA | NA | NA | NA | NA | NA | NA | NA | NA | NA | NA | NA | NA | NA | NA | NA | NA | NA | NA | NA | NA | NA | NA | |
| Net Income Loss | -7.73 | 25.09 | 15.90 | 65.87 | 2.31 | 103.40 | 58.77 | 42.08 | -8.93 | 23.67 | -13.28 | -21.69 | -20.40 | -0.36 | -19.45 | -27.71 | -30.79 | 6.63 | -11.54 | -13.04 | -26.08 | -27.51 | -5.59 | 0.91 | -17.11 | -7.03 | -5.99 | -21.53 | 133.55 | 15.09 | -14.94 | -8.07 | -33.76 | 0.42 | 6.65 | 0.66 | -3.78 | 11.11 | 11.64 | 37.34 | 10.26 | 7.43 | -0.07 | 11.56 | 6.71 | 26.03 | 14.30 | 27.99 | 6.31 | 28.64 | 20.90 | 18.05 | 3.80 | 6.01 | |
| Profit Loss | -7.73 | 25.09 | 15.90 | 65.87 | 2.31 | 103.40 | 58.77 | 42.08 | -8.93 | 23.67 | -13.28 | -21.69 | -20.40 | -0.36 | -19.45 | -27.71 | -30.79 | 6.63 | -11.54 | -13.04 | -26.08 | -27.51 | -5.59 | 0.91 | NA | NA | NA | NA | NA | NA | NA | NA | NA | NA | NA | NA | NA | NA | NA | NA | NA | NA | NA | NA | NA | NA | NA | NA | NA | NA | NA | NA | NA | NA | |
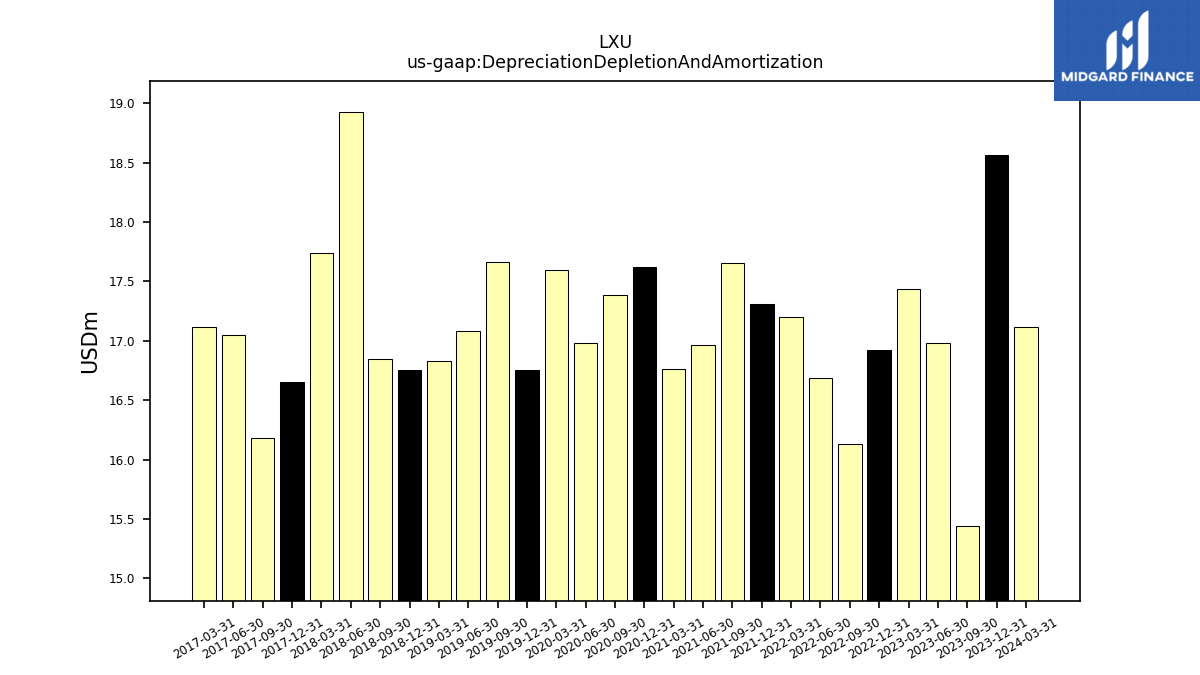
| Depreciation Depletion And Amortization | 15.44 | 16.98 | 17.44 | 16.92 | 16.13 | 16.69 | 17.20 | 17.31 | 17.66 | 16.96 | 16.76 | 17.62 | 17.39 | 16.98 | 17.59 | 16.75 | 17.66 | 17.08 | 16.83 | 16.75 | 16.85 | 18.93 | 17.74 | 16.66 | 16.18 | 17.05 | 17.11 | NA | NA | NA | NA | NA | NA | NA | NA | NA | NA | NA | NA | NA | NA | NA | NA | NA | NA | NA | NA | NA | NA | NA | NA | NA | NA | NA | |
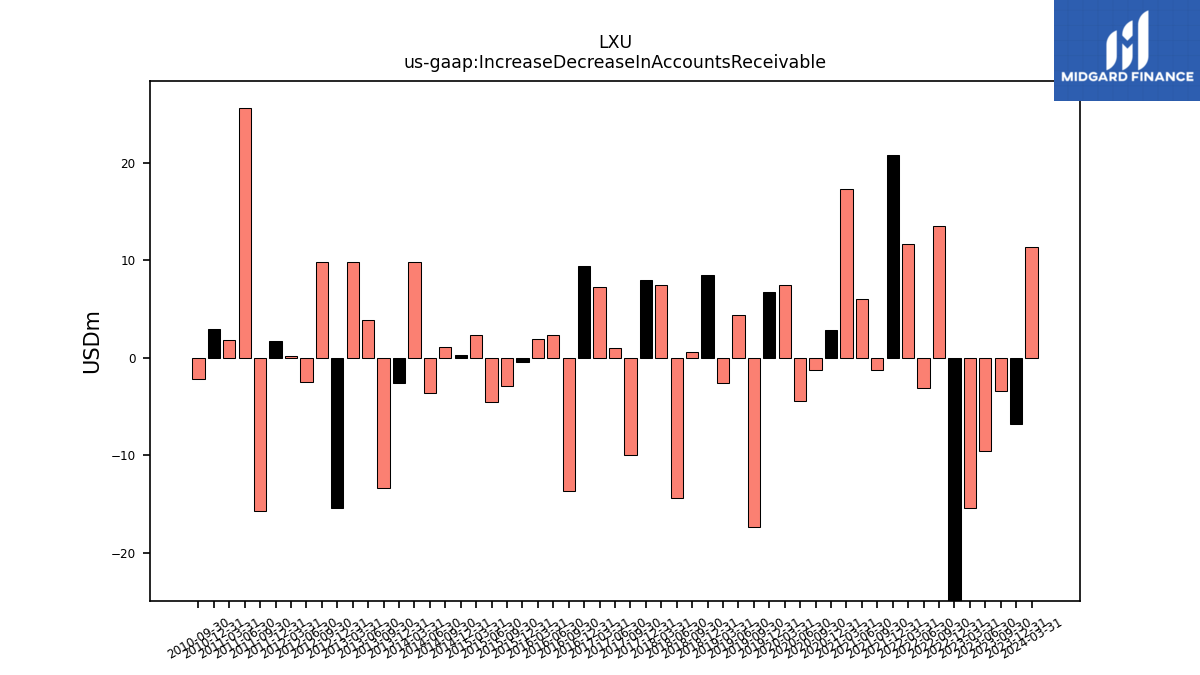
| Increase Decrease In Accounts Receivable | -3.43 | -9.52 | -15.42 | -32.30 | 13.47 | -3.08 | 11.71 | 20.78 | -1.24 | 6.05 | 17.32 | 2.84 | -1.26 | -4.39 | 7.51 | 6.71 | -17.32 | 4.35 | -2.54 | 8.47 | 0.62 | -14.37 | 7.44 | 8.01 | -9.93 | 0.97 | 7.28 | 9.43 | -13.66 | 2.32 | 1.91 | -0.41 | -2.94 | -4.56 | 2.35 | 0.31 | 1.09 | -3.64 | 9.88 | -2.58 | -13.38 | 3.90 | 9.80 | -15.44 | 9.81 | -2.52 | 0.21 | 1.67 | -15.77 | 25.68 | 1.87 | 2.97 | -2.21 | NA | |
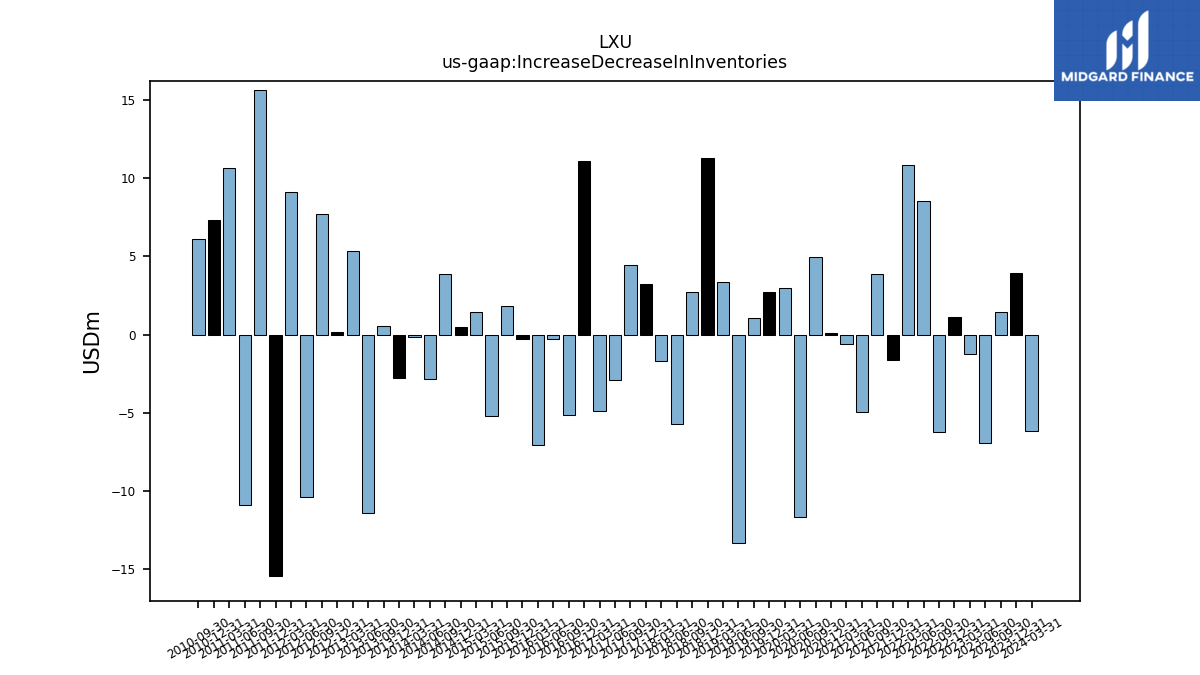
| Increase Decrease In Inventories | 1.44 | -6.92 | -1.25 | 1.15 | -6.25 | 8.57 | 10.82 | -1.62 | 3.90 | -4.91 | -0.62 | 0.11 | 4.99 | -11.65 | 3.00 | 2.76 | 1.05 | -13.29 | 3.39 | 11.30 | 2.74 | -5.69 | -1.65 | 3.23 | 4.48 | -2.90 | -4.86 | 11.13 | -5.15 | -0.30 | -7.05 | -0.30 | 1.86 | -5.19 | 1.48 | 0.48 | 3.88 | -2.81 | -0.15 | -2.76 | 0.57 | -11.38 | 5.37 | 0.18 | 7.68 | -10.38 | 9.12 | -15.45 | 15.62 | -10.88 | 10.65 | 7.31 | 6.09 | NA | |
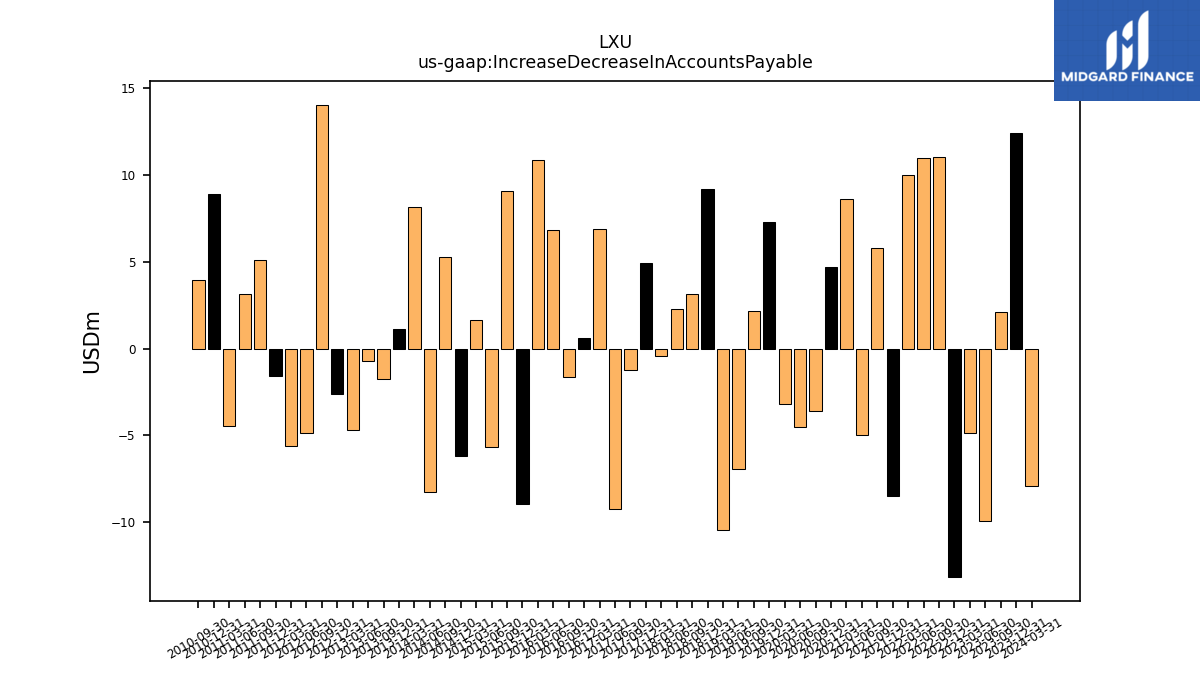
| Increase Decrease In Accounts Payable | 2.12 | -9.93 | -4.86 | -13.18 | 11.03 | 10.97 | 10.00 | -8.50 | 5.80 | -4.97 | 8.60 | 4.71 | -3.60 | -4.50 | -3.17 | 7.27 | 2.18 | -6.96 | -10.48 | 9.19 | 3.16 | 2.30 | -0.43 | 4.95 | -1.22 | -9.26 | 6.89 | 0.63 | -1.66 | 6.82 | 10.84 | -8.94 | 9.11 | -5.70 | 1.63 | -6.20 | 5.26 | -8.28 | 8.18 | 1.11 | -1.75 | -0.70 | -4.70 | -2.61 | 14.06 | -4.85 | -5.63 | -1.57 | 5.10 | 3.13 | -4.49 | 8.92 | 3.94 | NA | |
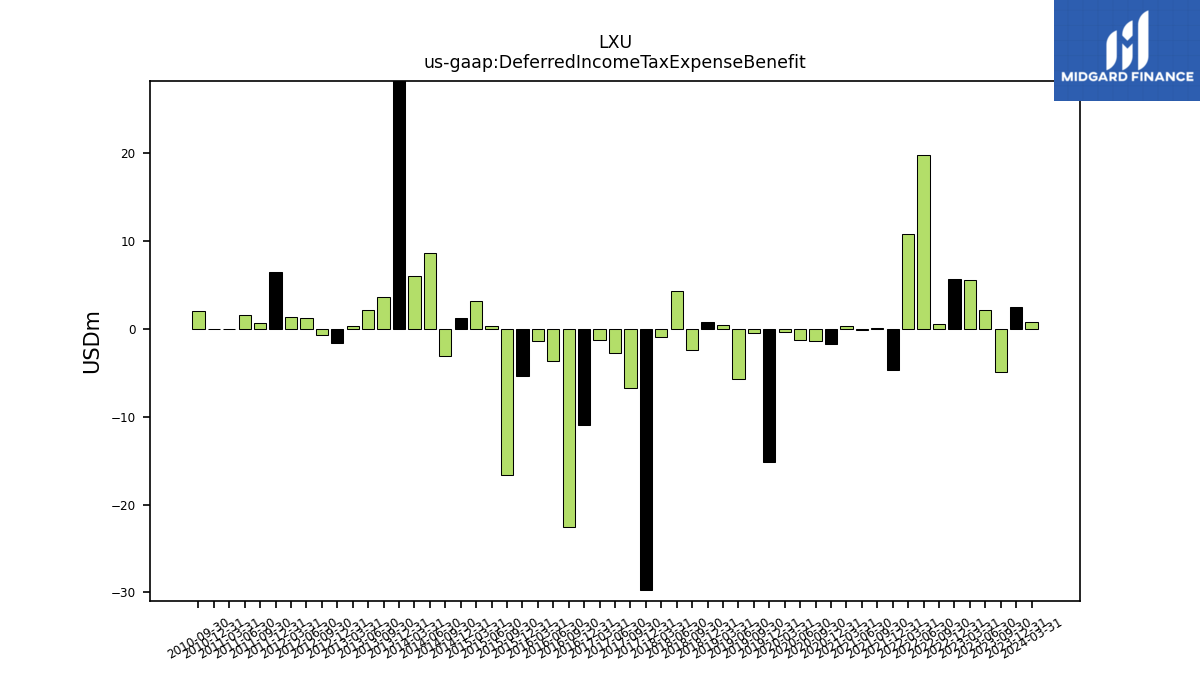
| Deferred Income Tax Expense Benefit | -4.85 | 2.13 | 5.61 | 5.64 | 0.61 | 19.78 | 10.82 | -4.70 | 0.14 | -0.07 | 0.33 | -1.72 | -1.39 | -1.29 | -0.37 | -15.10 | -0.51 | -5.74 | 0.45 | 0.81 | -2.43 | 4.35 | -0.91 | -29.74 | -6.70 | -2.76 | -1.24 | -10.88 | -22.50 | -3.69 | -1.33 | -5.39 | -16.60 | 0.29 | 3.18 | 1.30 | -3.11 | 8.65 | 6.00 | 29.12 | 3.63 | 2.20 | 0.34 | -1.55 | -0.75 | 1.20 | 1.34 | 6.47 | 0.65 | 1.60 | -0.04 | -0.01 | 2.08 | NA | |
| Share Based Compensation | 1.32 | 1.93 | 0.72 | 0.94 | 0.92 | 1.36 | 0.80 | 1.19 | NA | NA | NA | 0.14 | NA | NA | NA | 0.42 | NA | NA | NA | NA | NA | NA | NA | NA | NA | NA | NA | NA | NA | NA | NA | NA | NA | NA | NA | NA | NA | NA | NA | NA | NA | NA | 0.41 | 0.41 | 0.41 | 0.41 | 0.41 | 0.34 | 0.24 | 0.27 | 0.25 | 0.25 | 0.25 | NA |
| 2023-09-30 | 2023-06-30 | 2023-03-31 | 2022-12-31 | 2022-09-30 | 2022-06-30 | 2022-03-31 | 2021-12-31 | 2021-09-30 | 2021-06-30 | 2021-03-31 | 2020-12-31 | 2020-09-30 | 2020-06-30 | 2020-03-31 | 2019-12-31 | 2019-09-30 | 2019-06-30 | 2019-03-31 | 2018-12-31 | 2018-09-30 | 2018-06-30 | 2018-03-31 | 2017-12-31 | 2017-09-30 | 2017-06-30 | 2017-03-31 | 2016-12-31 | 2016-09-30 | 2016-06-30 | 2016-03-31 | 2015-12-31 | 2015-09-30 | 2015-06-30 | 2015-03-31 | 2014-12-31 | 2014-09-30 | 2014-06-30 | 2014-03-31 | 2013-12-31 | 2013-09-30 | 2013-06-30 | 2013-03-31 | 2012-12-31 | 2012-09-30 | 2012-06-30 | 2012-03-31 | 2011-12-31 | 2011-09-30 | 2011-06-30 | 2011-03-31 | 2010-12-31 | 2010-09-30 | 2010-06-30 | ||
|---|---|---|---|---|---|---|---|---|---|---|---|---|---|---|---|---|---|---|---|---|---|---|---|---|---|---|---|---|---|---|---|---|---|---|---|---|---|---|---|---|---|---|---|---|---|---|---|---|---|---|---|---|---|---|---|
| Net Cash Provided By Used In Investing Activities | -8.70 | 93.59 | -63.38 | 23.21 | -51.01 | -244.42 | -97.51 | -8.97 | -11.17 | -8.61 | -5.93 | -8.21 | -2.56 | -7.10 | -10.56 | -15.57 | -7.55 | -5.70 | -7.11 | -9.58 | -5.81 | -8.46 | -1.89 | -8.65 | NA | NA | NA | NA | NA | NA | NA | NA | NA | NA | NA | NA | NA | NA | NA | NA | NA | NA | NA | NA | NA | NA | NA | NA | NA | NA | NA | NA | NA | NA | |
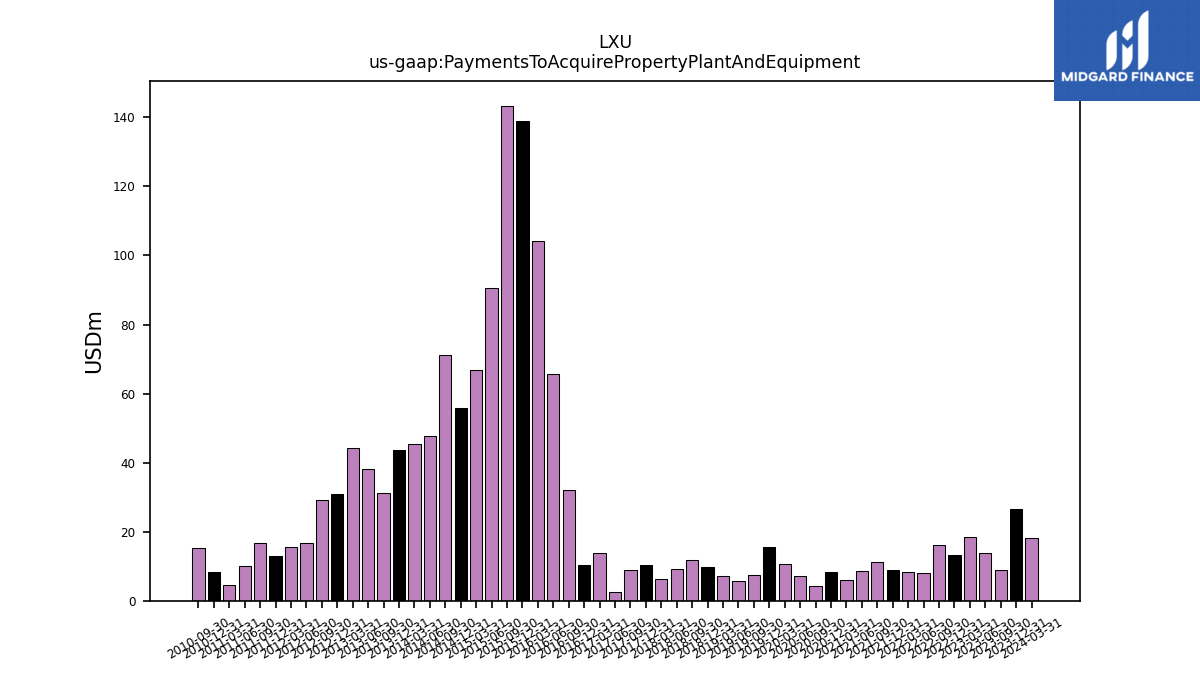
| Payments To Acquire Property Plant And Equipment | 8.86 | 13.83 | 18.44 | 13.30 | 16.10 | 8.18 | 8.25 | 9.03 | 11.25 | 8.72 | 6.13 | 8.24 | 4.28 | 7.22 | 10.74 | 15.63 | 7.59 | 5.75 | 7.12 | 9.86 | 11.82 | 9.12 | 6.25 | 10.25 | 8.81 | 2.47 | 13.89 | 10.36 | 32.13 | 65.77 | 104.29 | 139.04 | 143.36 | 90.57 | 66.84 | 55.68 | 71.22 | 47.63 | 45.31 | 43.65 | 31.12 | 38.26 | 44.34 | 31.03 | 29.16 | 16.82 | 15.63 | 13.08 | 16.59 | 9.98 | 4.58 | 8.35 | 15.27 | NA |
| 2023-09-30 | 2023-06-30 | 2023-03-31 | 2022-12-31 | 2022-09-30 | 2022-06-30 | 2022-03-31 | 2021-12-31 | 2021-09-30 | 2021-06-30 | 2021-03-31 | 2020-12-31 | 2020-09-30 | 2020-06-30 | 2020-03-31 | 2019-12-31 | 2019-09-30 | 2019-06-30 | 2019-03-31 | 2018-12-31 | 2018-09-30 | 2018-06-30 | 2018-03-31 | 2017-12-31 | 2017-09-30 | 2017-06-30 | 2017-03-31 | 2016-12-31 | 2016-09-30 | 2016-06-30 | 2016-03-31 | 2015-12-31 | 2015-09-30 | 2015-06-30 | 2015-03-31 | 2014-12-31 | 2014-09-30 | 2014-06-30 | 2014-03-31 | 2013-12-31 | 2013-09-30 | 2013-06-30 | 2013-03-31 | 2012-12-31 | 2012-09-30 | 2012-06-30 | 2012-03-31 | 2011-12-31 | 2011-09-30 | 2011-06-30 | 2011-03-31 | 2010-12-31 | 2010-09-30 | 2010-06-30 | ||
|---|---|---|---|---|---|---|---|---|---|---|---|---|---|---|---|---|---|---|---|---|---|---|---|---|---|---|---|---|---|---|---|---|---|---|---|---|---|---|---|---|---|---|---|---|---|---|---|---|---|---|---|---|---|---|---|
| Net Cash Provided By Used In Financing Activities | -7.12 | -141.17 | -10.69 | -65.55 | -92.95 | -19.97 | 184.18 | 36.11 | -8.49 | -5.86 | -8.81 | 9.61 | -17.19 | 4.57 | 27.43 | 10.45 | -4.34 | 28.76 | -4.30 | 14.04 | -4.10 | -5.12 | -4.28 | NA | NA | NA | NA | NA | NA | NA | NA | NA | NA | NA | NA | NA | NA | NA | NA | NA | NA | NA | NA | NA | NA | NA | NA | NA | NA | NA | NA | NA | NA | NA |
| 2023-09-30 | 2023-06-30 | 2023-03-31 | 2022-12-31 | 2022-09-30 | 2022-06-30 | 2022-03-31 | 2021-12-31 | 2021-09-30 | 2021-06-30 | 2021-03-31 | 2020-12-31 | 2020-09-30 | 2020-06-30 | 2020-03-31 | 2019-12-31 | 2019-09-30 | 2019-06-30 | 2019-03-31 | 2018-12-31 | 2018-09-30 | 2018-06-30 | 2018-03-31 | 2017-12-31 | 2017-09-30 | 2017-06-30 | 2017-03-31 | 2016-12-31 | 2016-09-30 | 2016-06-30 | 2016-03-31 | 2015-12-31 | 2015-09-30 | 2015-06-30 | 2015-03-31 | 2014-12-31 | 2014-09-30 | 2014-06-30 | 2014-03-31 | 2013-12-31 | 2013-09-30 | 2013-06-30 | 2013-03-31 | 2012-12-31 | 2012-09-30 | 2012-06-30 | 2012-03-31 | 2011-12-31 | 2011-09-30 | 2011-06-30 | 2011-03-31 | 2010-12-31 | 2010-09-30 | 2010-06-30 | ||
|---|---|---|---|---|---|---|---|---|---|---|---|---|---|---|---|---|---|---|---|---|---|---|---|---|---|---|---|---|---|---|---|---|---|---|---|---|---|---|---|---|---|---|---|---|---|---|---|---|---|---|---|---|---|---|---|
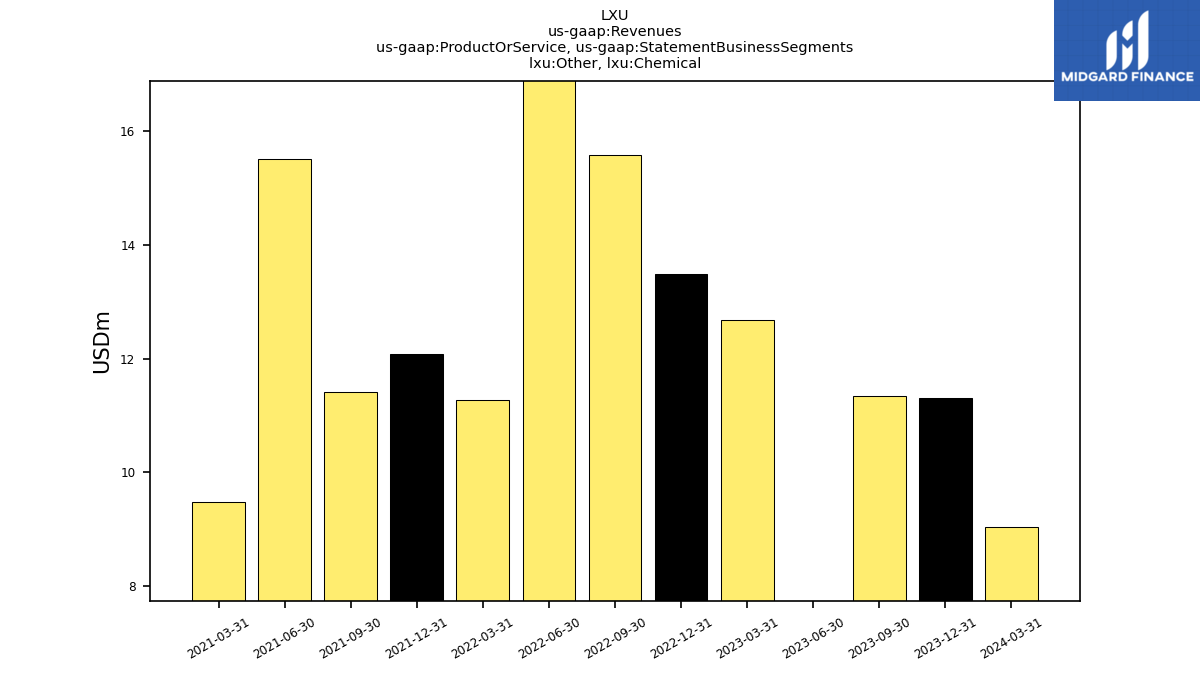
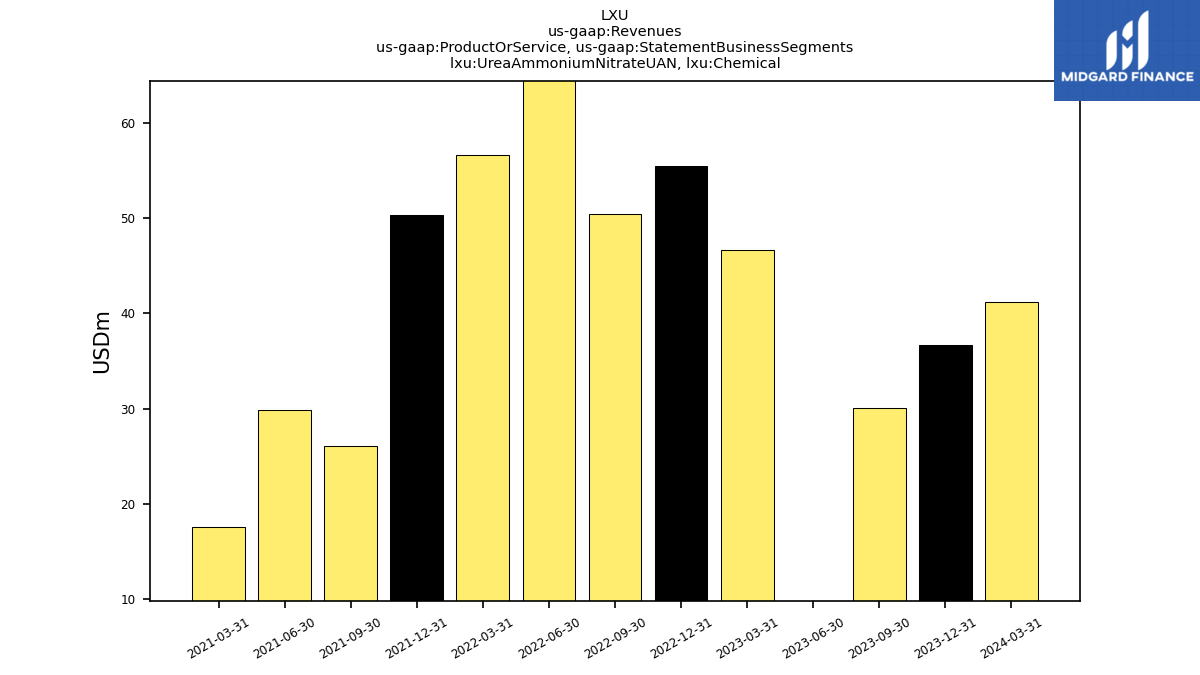
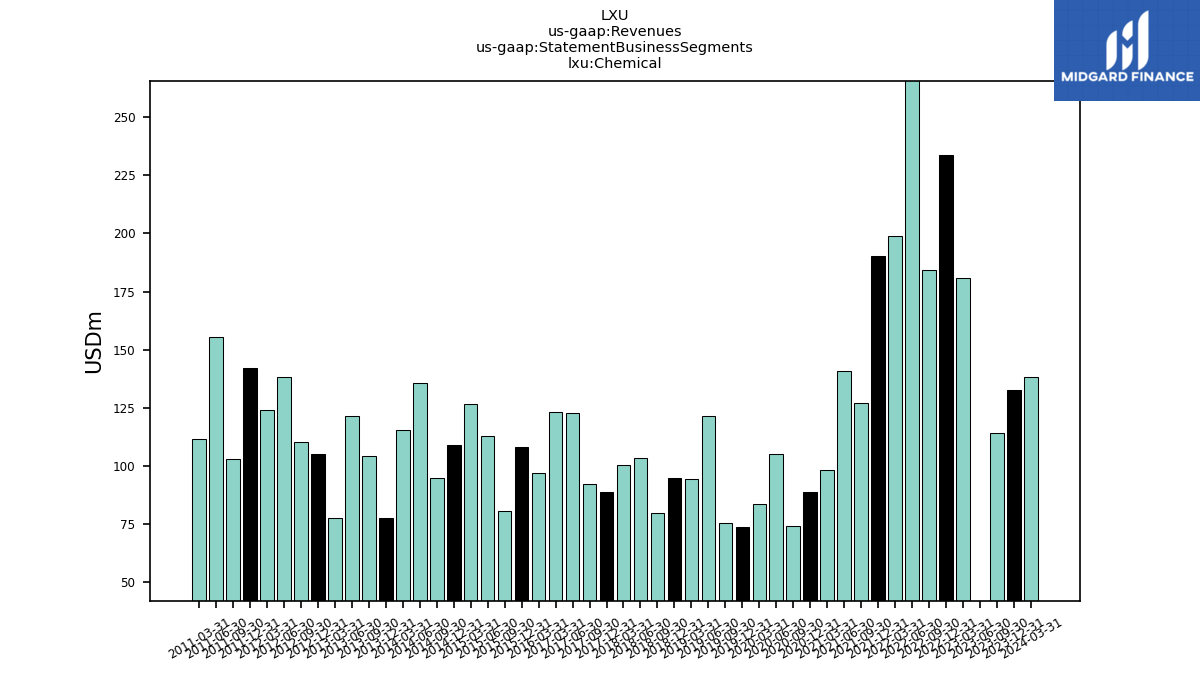
| Revenues | 114.29 | 165.84 | 180.96 | 233.65 | 184.27 | 284.80 | 198.98 | 190.23 | 127.20 | 140.70 | 98.12 | 88.90 | 73.97 | 105.03 | 83.41 | 73.90 | 75.50 | 121.53 | 94.15 | 94.73 | 79.78 | 103.20 | 100.45 | 88.92 | 92.39 | 122.85 | 123.34 | 85.37 | 80.26 | 109.98 | 165.60 | 157.02 | 157.69 | 182.66 | 193.86 | 181.28 | 171.05 | 201.66 | 178.53 | 149.03 | 177.35 | 202.22 | 150.68 | 177.14 | 182.37 | 209.28 | 190.25 | 215.36 | 176.78 | 235.62 | 177.49 | 172.16 | 138.95 | 168.39 | |
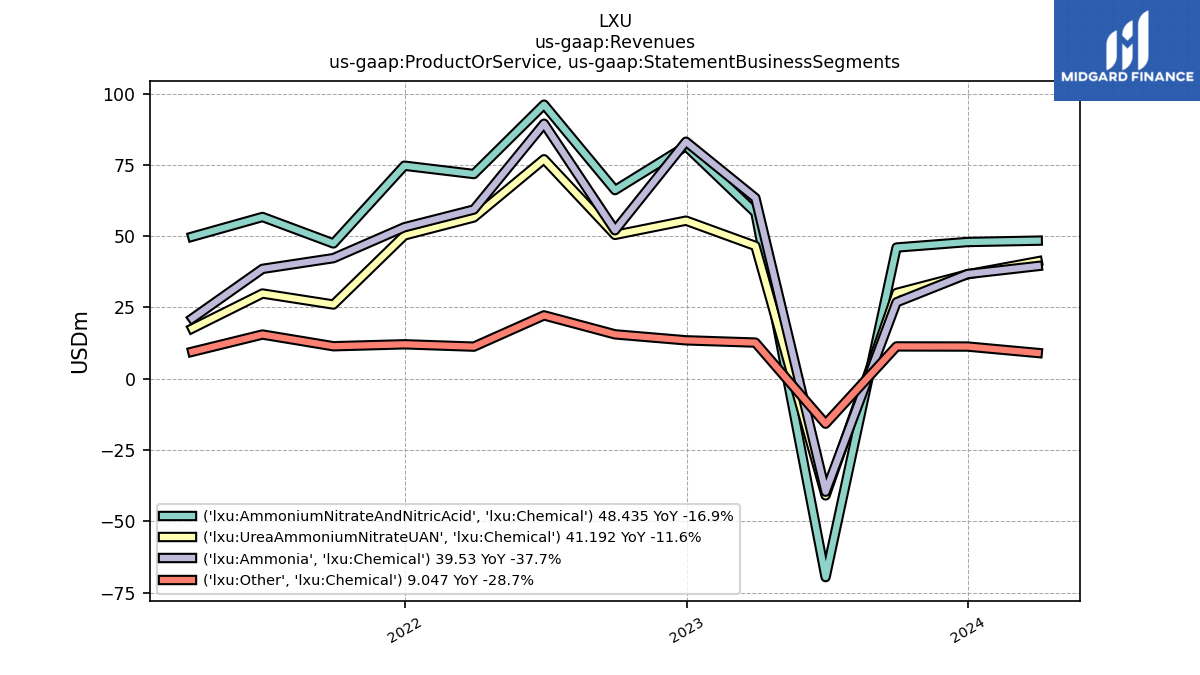
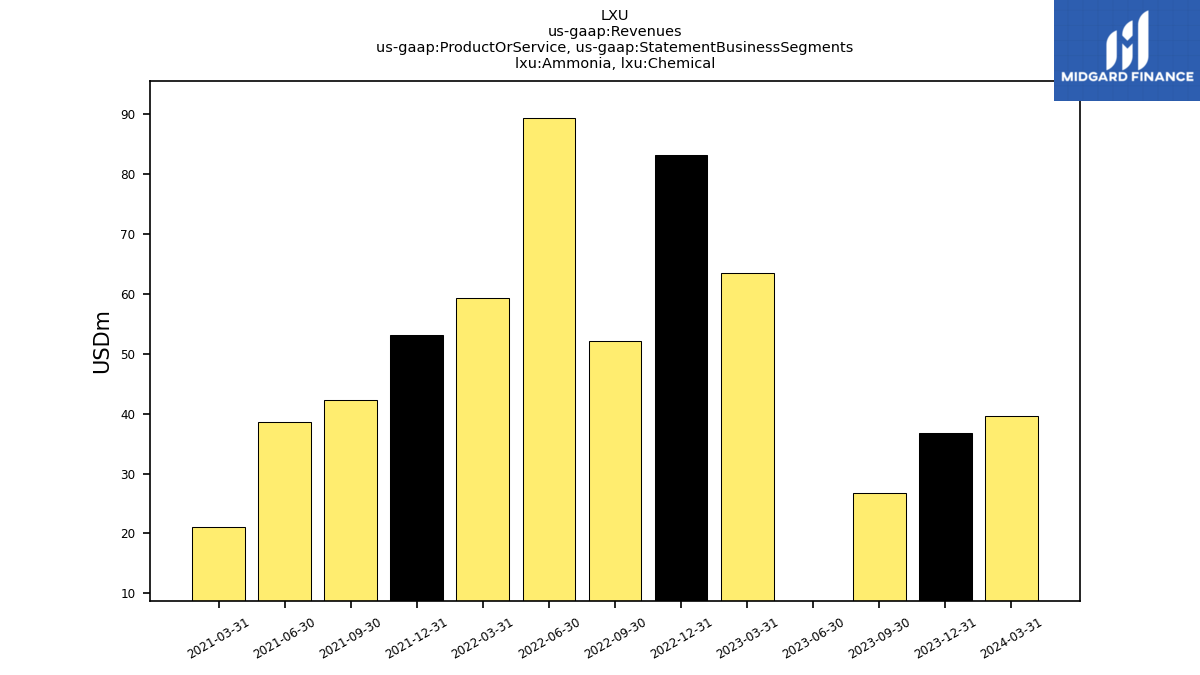
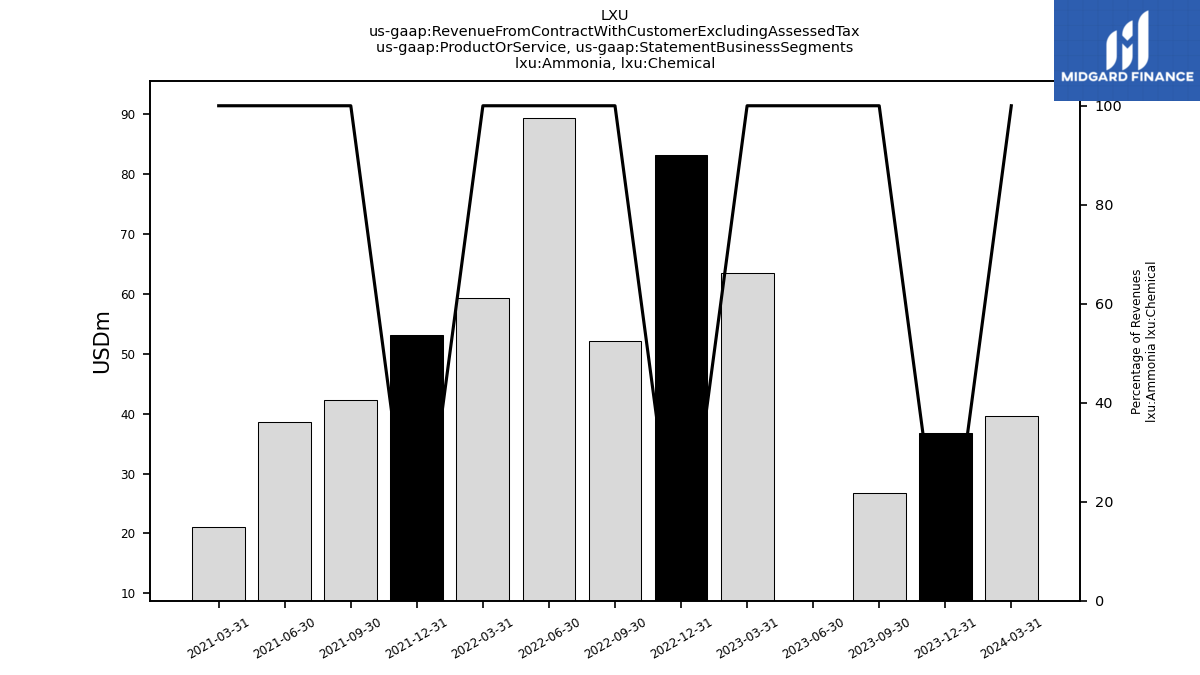
| Ammonia, Chemical | 26.82 | -39.61 | 63.41 | 83.14 | 52.08 | 89.44 | 59.34 | 53.15 | 42.31 | 38.54 | 21.16 | NA | NA | NA | NA | NA | NA | NA | NA | NA | NA | NA | NA | NA | NA | NA | NA | NA | NA | NA | NA | NA | NA | NA | NA | NA | NA | NA | NA | NA | NA | NA | NA | NA | NA | NA | NA | NA | NA | NA | NA | NA | NA | NA | |
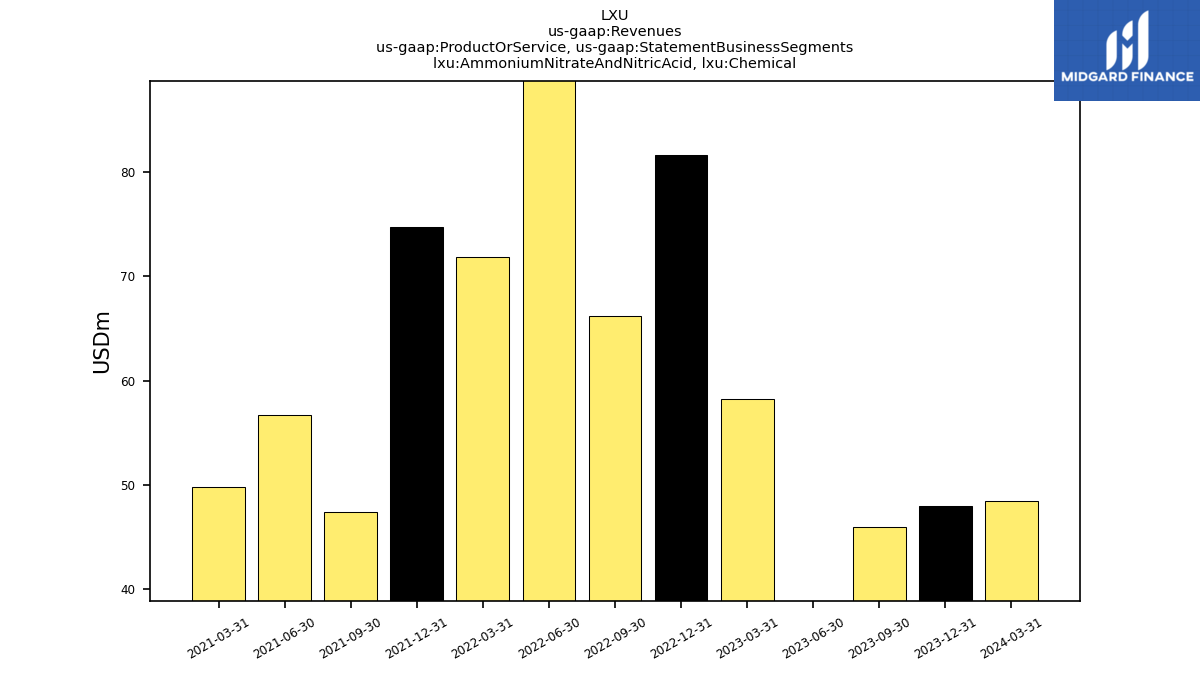
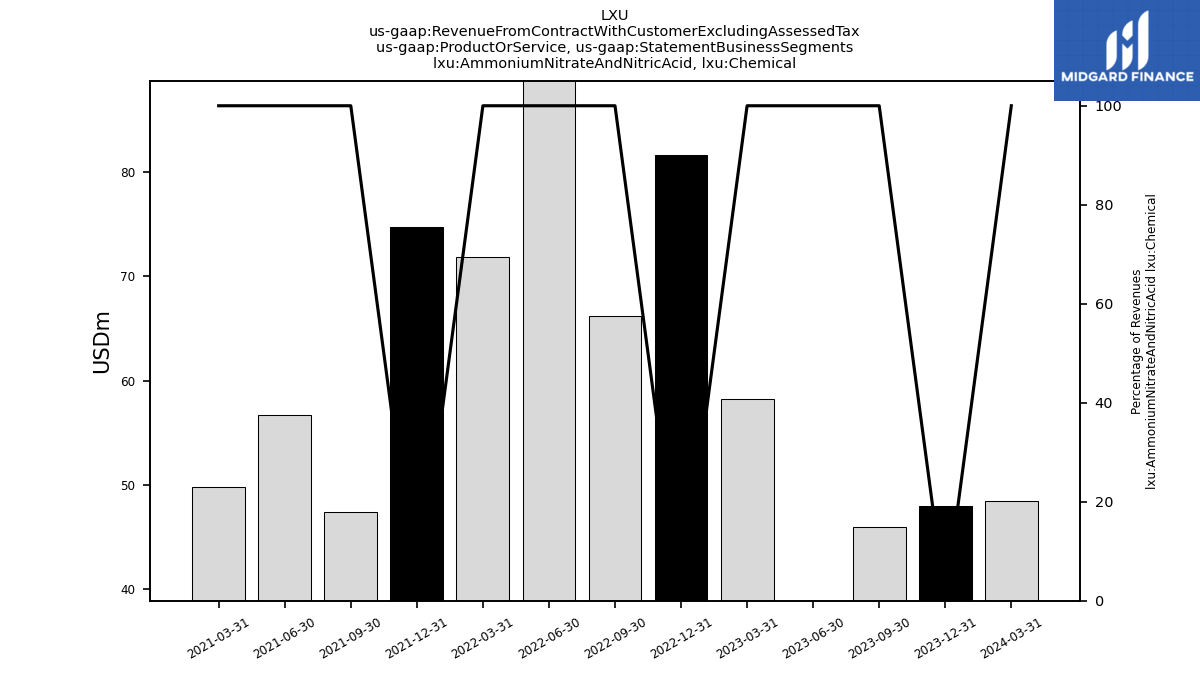
| Ammonium Nitrate And Nitric Acid, Chemical | 46.03 | -69.56 | 58.27 | 81.58 | 66.16 | 96.14 | 71.80 | 74.72 | 47.45 | 56.74 | 49.84 | NA | NA | NA | NA | NA | NA | NA | NA | NA | NA | NA | NA | NA | NA | NA | NA | NA | NA | NA | NA | NA | NA | NA | NA | NA | NA | NA | NA | NA | NA | NA | NA | NA | NA | NA | NA | NA | NA | NA | NA | NA | NA | NA | |
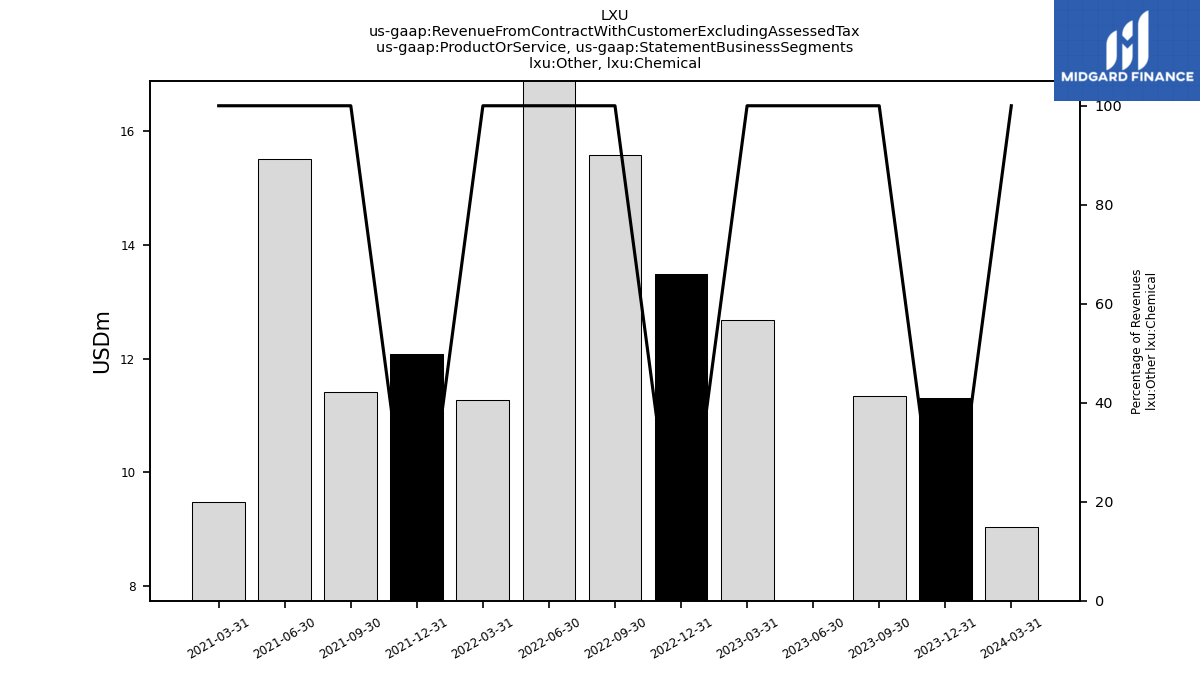
| Other, Chemical | 11.35 | -15.77 | 12.69 | 13.48 | 15.58 | 22.23 | 11.27 | 12.09 | 11.40 | 15.52 | 9.48 | NA | NA | NA | NA | NA | NA | NA | NA | NA | NA | NA | NA | NA | NA | NA | NA | NA | NA | NA | NA | NA | NA | NA | NA | NA | NA | NA | NA | NA | NA | NA | NA | NA | NA | NA | NA | NA | NA | NA | NA | NA | NA | NA | |
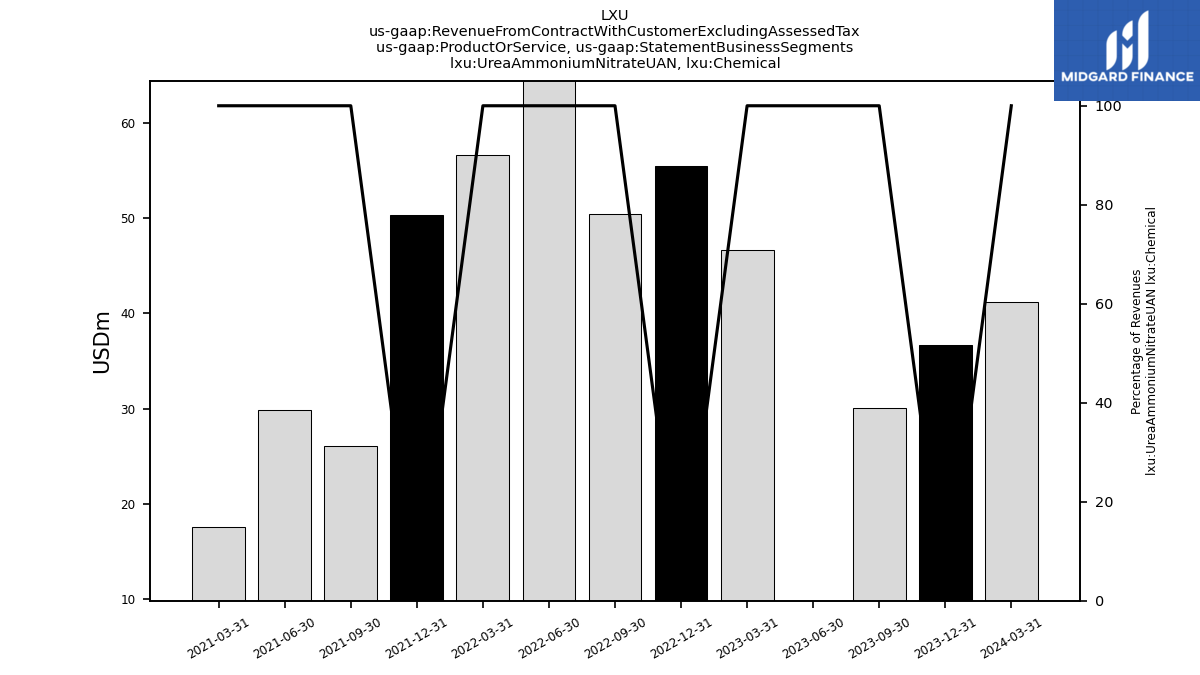
| Urea Ammonium Nitrate U A N, Chemical | 30.09 | -40.91 | 46.59 | 55.45 | 50.46 | 76.99 | 56.57 | 50.27 | 26.03 | 29.90 | 17.64 | NA | NA | NA | NA | NA | NA | NA | NA | NA | NA | NA | NA | NA | NA | NA | NA | NA | NA | NA | NA | NA | NA | NA | NA | NA | NA | NA | NA | NA | NA | NA | NA | NA | NA | NA | NA | NA | NA | NA | NA | NA | NA | NA | |
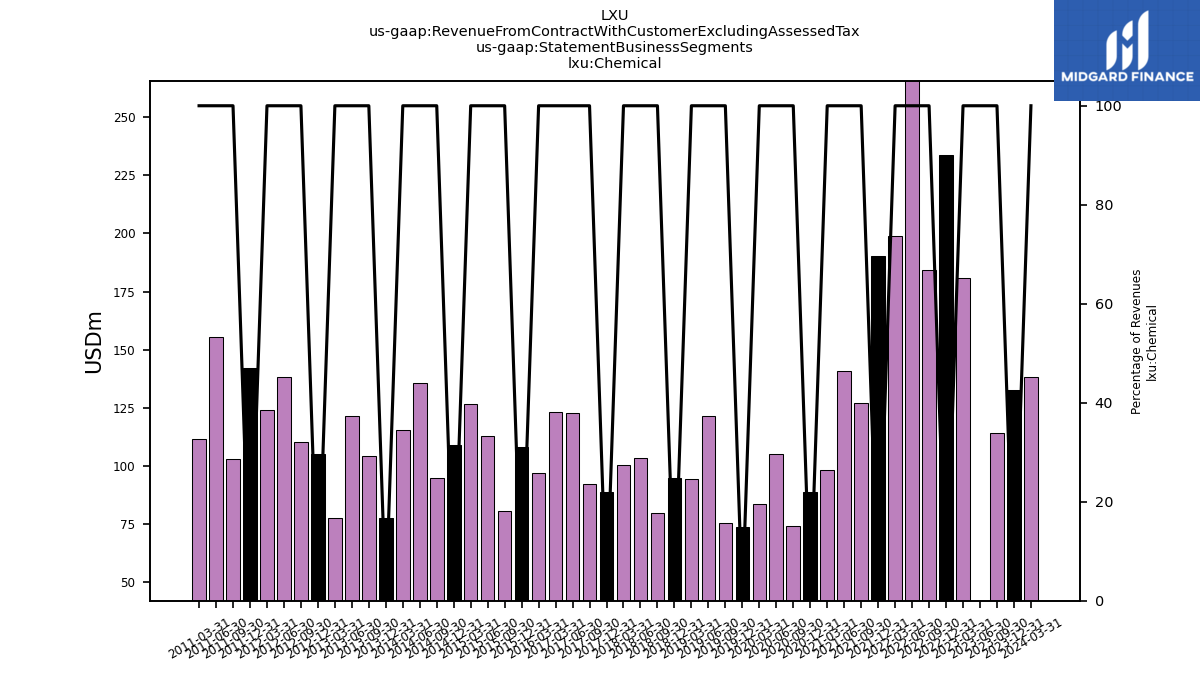
| Chemical | 114.29 | -165.84 | 180.96 | 233.65 | 184.27 | 284.80 | 198.98 | 190.23 | 127.20 | 140.70 | 98.12 | 88.90 | 73.97 | 105.03 | 83.41 | 73.90 | 75.50 | 121.53 | 94.15 | 94.73 | 79.78 | 103.20 | 100.45 | 88.92 | 92.39 | 122.85 | 123.34 | NA | NA | NA | 97.00 | 107.92 | 80.62 | 112.77 | 126.81 | 109.16 | 94.77 | 135.76 | 115.22 | 77.65 | 104.20 | 121.33 | 77.49 | 105.26 | 110.21 | 138.13 | 124.20 | 142.03 | 102.77 | 155.62 | 111.43 | NA | NA | NA | |
| Revenue From Contract With Customer Excluding Assessed Tax | 114.29 | 165.84 | 180.96 | 233.65 | 184.27 | 284.80 | 198.98 | 190.23 | 127.20 | 140.70 | 98.12 | 88.90 | 73.97 | 105.03 | 83.41 | 73.90 | 75.50 | 121.53 | 94.15 | 94.73 | 79.78 | 103.20 | 100.45 | 88.92 | 92.39 | 122.85 | 123.34 | 85.37 | 80.26 | 109.98 | 165.60 | 157.02 | 157.69 | 182.66 | 193.86 | 181.28 | 171.05 | 201.66 | 178.53 | 149.03 | 177.35 | 202.22 | 150.68 | 177.14 | 182.37 | 209.28 | 190.25 | 215.36 | 176.78 | 235.62 | 177.49 | 172.16 | 138.95 | 168.39 | |
| Ammonia, Chemical | 26.82 | -39.61 | 63.41 | 83.14 | 52.08 | 89.44 | 59.34 | 53.15 | 42.31 | 38.54 | 21.16 | NA | NA | NA | NA | NA | NA | NA | NA | NA | NA | NA | NA | NA | NA | NA | NA | NA | NA | NA | NA | NA | NA | NA | NA | NA | NA | NA | NA | NA | NA | NA | NA | NA | NA | NA | NA | NA | NA | NA | NA | NA | NA | NA | |
| Ammonium Nitrate And Nitric Acid, Chemical | 46.03 | -69.56 | 58.27 | 81.58 | 66.16 | 96.14 | 71.80 | 74.72 | 47.45 | 56.74 | 49.84 | NA | NA | NA | NA | NA | NA | NA | NA | NA | NA | NA | NA | NA | NA | NA | NA | NA | NA | NA | NA | NA | NA | NA | NA | NA | NA | NA | NA | NA | NA | NA | NA | NA | NA | NA | NA | NA | NA | NA | NA | NA | NA | NA | |
| Other, Chemical | 11.35 | -15.77 | 12.69 | 13.48 | 15.58 | 22.23 | 11.27 | 12.09 | 11.40 | 15.52 | 9.48 | NA | NA | NA | NA | NA | NA | NA | NA | NA | NA | NA | NA | NA | NA | NA | NA | NA | NA | NA | NA | NA | NA | NA | NA | NA | NA | NA | NA | NA | NA | NA | NA | NA | NA | NA | NA | NA | NA | NA | NA | NA | NA | NA | |
| Urea Ammonium Nitrate U A N, Chemical | 30.09 | -40.91 | 46.59 | 55.45 | 50.46 | 76.99 | 56.57 | 50.27 | 26.03 | 29.90 | 17.64 | NA | NA | NA | NA | NA | NA | NA | NA | NA | NA | NA | NA | NA | NA | NA | NA | NA | NA | NA | NA | NA | NA | NA | NA | NA | NA | NA | NA | NA | NA | NA | NA | NA | NA | NA | NA | NA | NA | NA | NA | NA | NA | NA | |
| Chemical | 114.29 | -165.84 | 180.96 | 233.65 | 184.27 | 284.80 | 198.98 | 190.23 | 127.20 | 140.70 | 98.12 | 88.90 | 73.97 | 105.03 | 83.41 | 73.90 | 75.50 | 121.53 | 94.15 | 94.73 | 79.78 | 103.20 | 100.45 | 88.92 | 92.39 | 122.85 | 123.34 | NA | NA | NA | 97.00 | 107.92 | 80.62 | 112.77 | 126.81 | 109.16 | 94.77 | 135.76 | 115.22 | 77.65 | 104.20 | 121.33 | 77.49 | 105.26 | 110.21 | 138.13 | 124.20 | 142.03 | 102.77 | 155.62 | 111.43 | NA | NA | NA |
