
| 2023-09-30 | 2023-06-30 | 2023-03-31 | 2022-12-31 | 2022-09-30 | 2022-06-30 | 2022-03-31 | 2021-12-31 | 2021-09-30 | 2021-06-30 | 2021-03-31 | 2020-12-31 | 2020-09-30 | 2020-06-30 | 2020-03-31 | 2019-12-31 | 2019-09-30 | 2019-06-30 | 2019-03-31 | 2018-12-31 | 2018-09-30 | 2018-06-30 | 2018-03-31 | ||
|---|---|---|---|---|---|---|---|---|---|---|---|---|---|---|---|---|---|---|---|---|---|---|---|---|
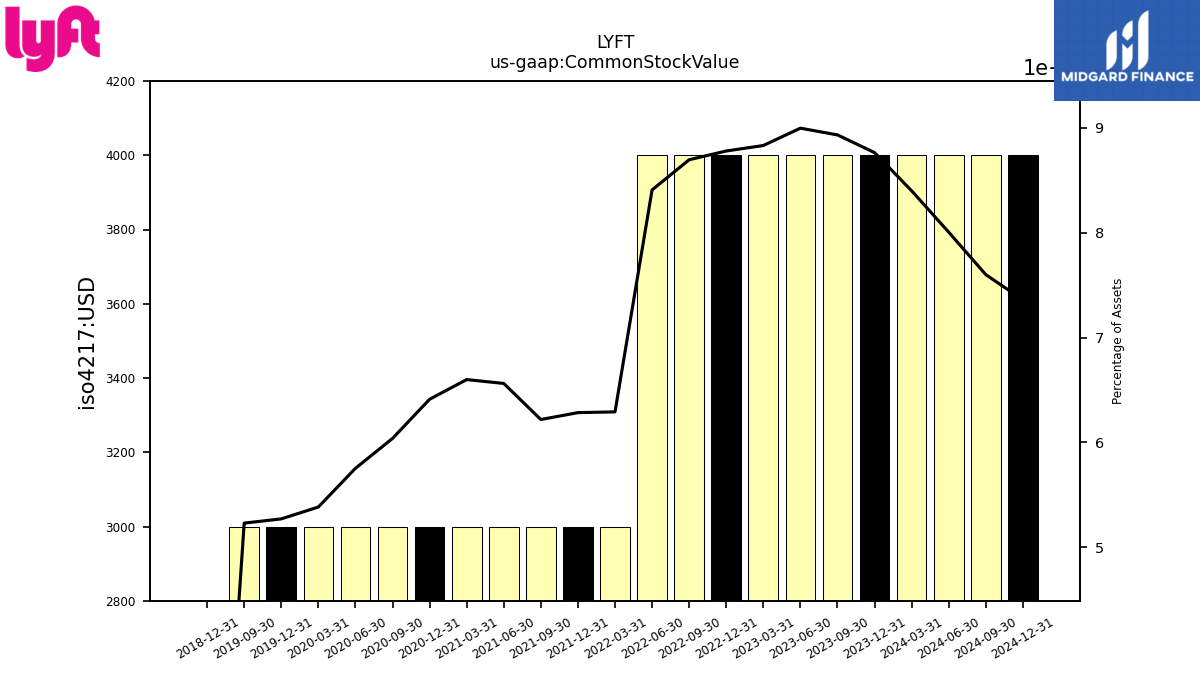
| Common Stock Value | 0.00 | 0.00 | 0.00 | 0.00 | 0.00 | 0.00 | 0.00 | 0.00 | 0.00 | 0.00 | 0.00 | 0.00 | 0.00 | 0.00 | 0.00 | 0.00 | 0.00 | NA | NA | 0.00 | NA | NA | NA | |
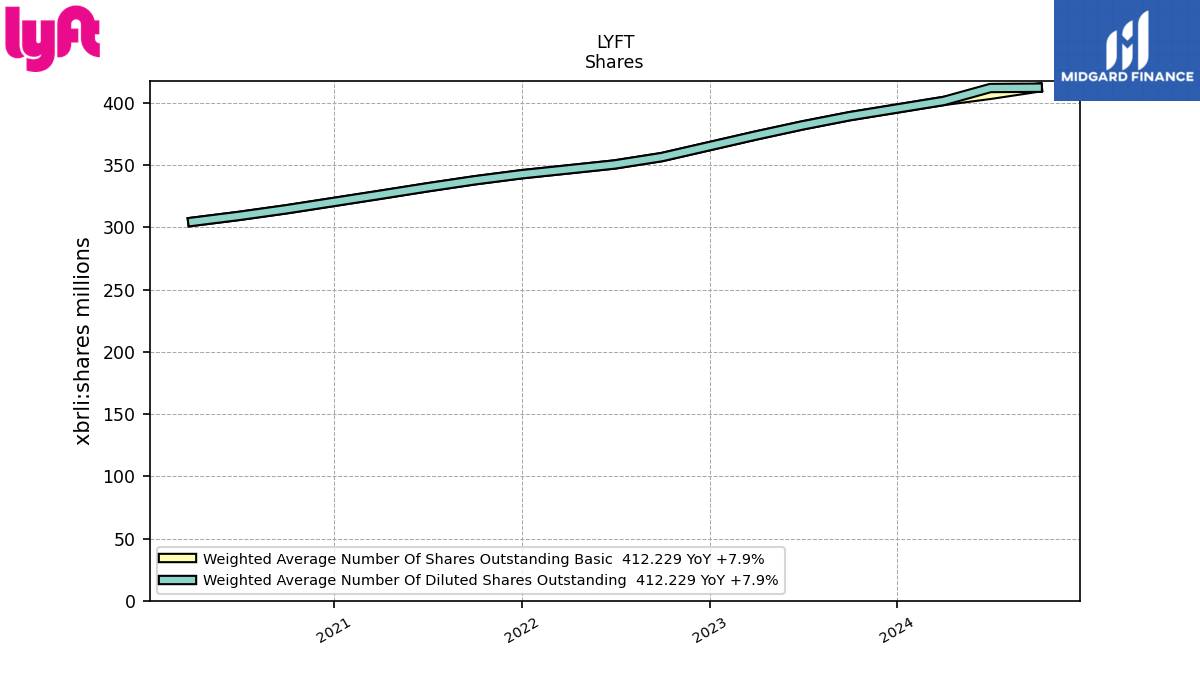
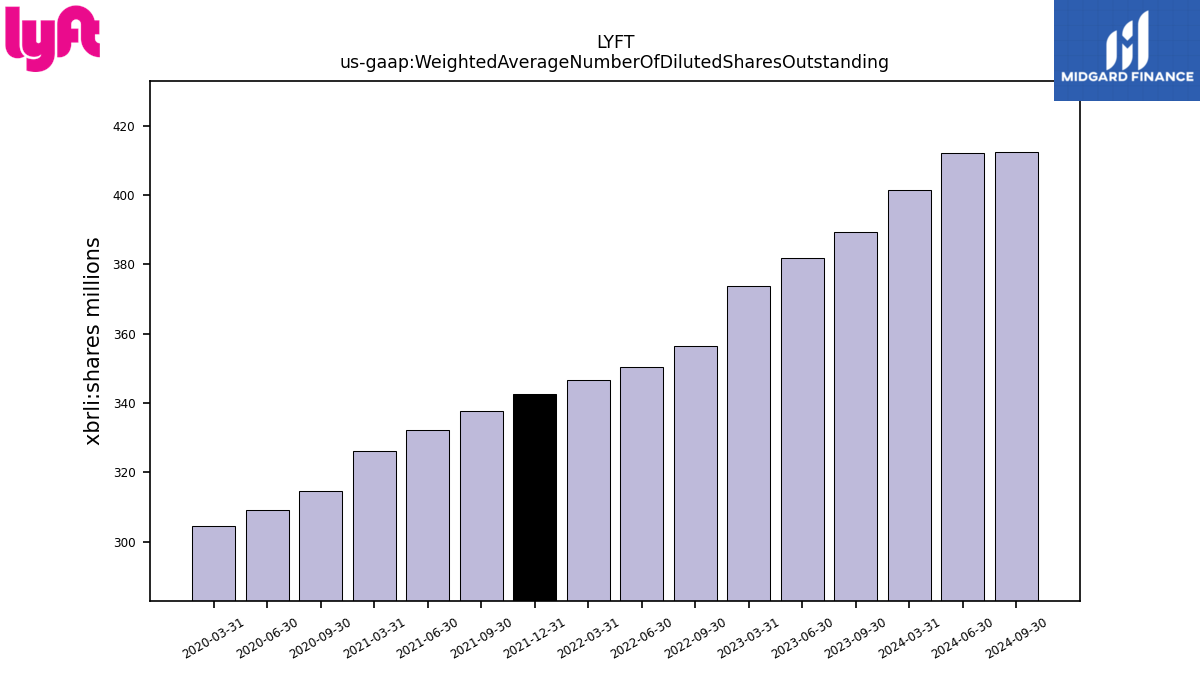
| Weighted Average Number Of Diluted Shares Outstanding | 389.31 | 381.88 | 373.73 | NA | 356.48 | 350.53 | 346.56 | 342.66 | 337.75 | 332.10 | 326.17 | NA | 314.53 | 309.21 | 304.50 | NA | NA | NA | NA | NA | NA | NA | NA | |
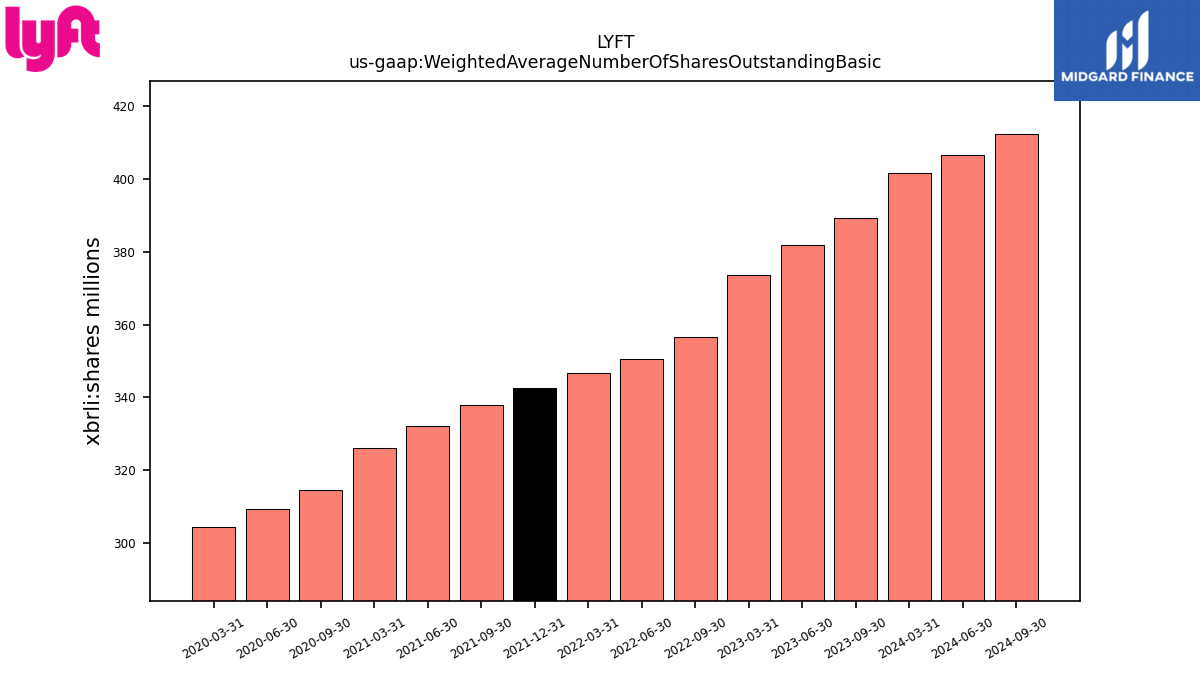
| Weighted Average Number Of Shares Outstanding Basic | 389.31 | 381.88 | 373.73 | NA | 356.48 | 350.53 | 346.56 | 342.66 | 337.75 | 332.10 | 326.17 | NA | 314.53 | 309.21 | 304.50 | NA | NA | NA | NA | NA | NA | NA | NA | |
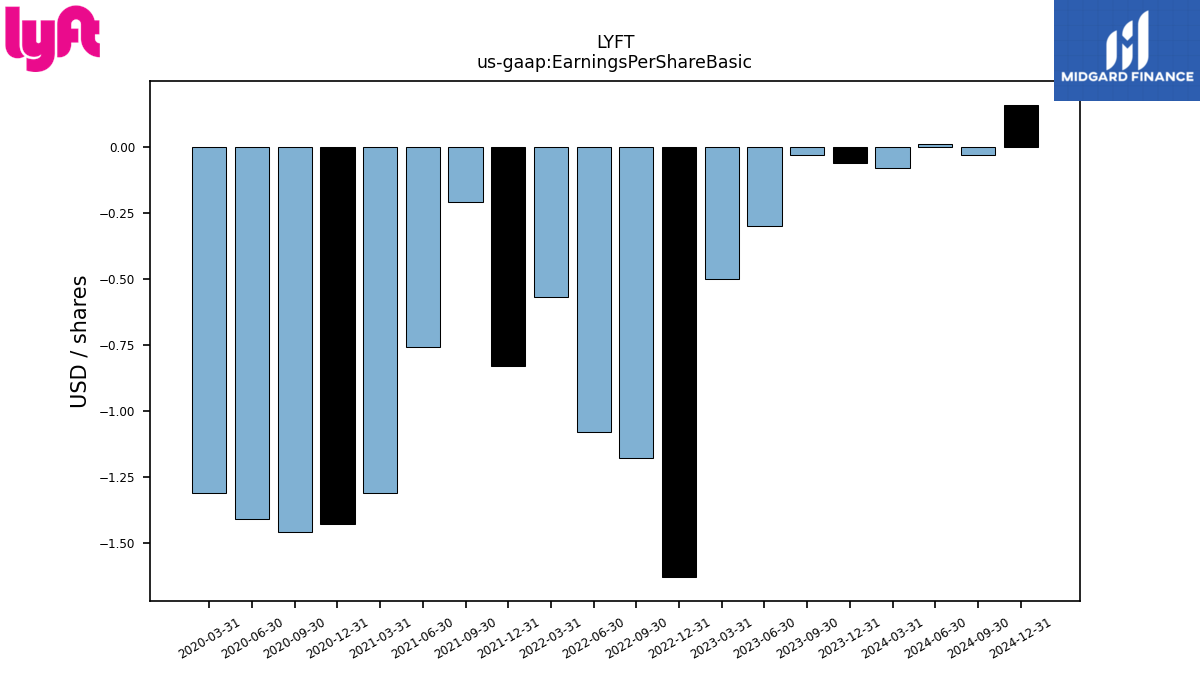
| Earnings Per Share Basic | -0.03 | -0.30 | -0.50 | -1.63 | -1.18 | -1.08 | -0.57 | -0.83 | -0.21 | -0.76 | -1.31 | -1.43 | -1.46 | -1.41 | -1.31 | NA | NA | NA | NA | NA | NA | NA | NA | |
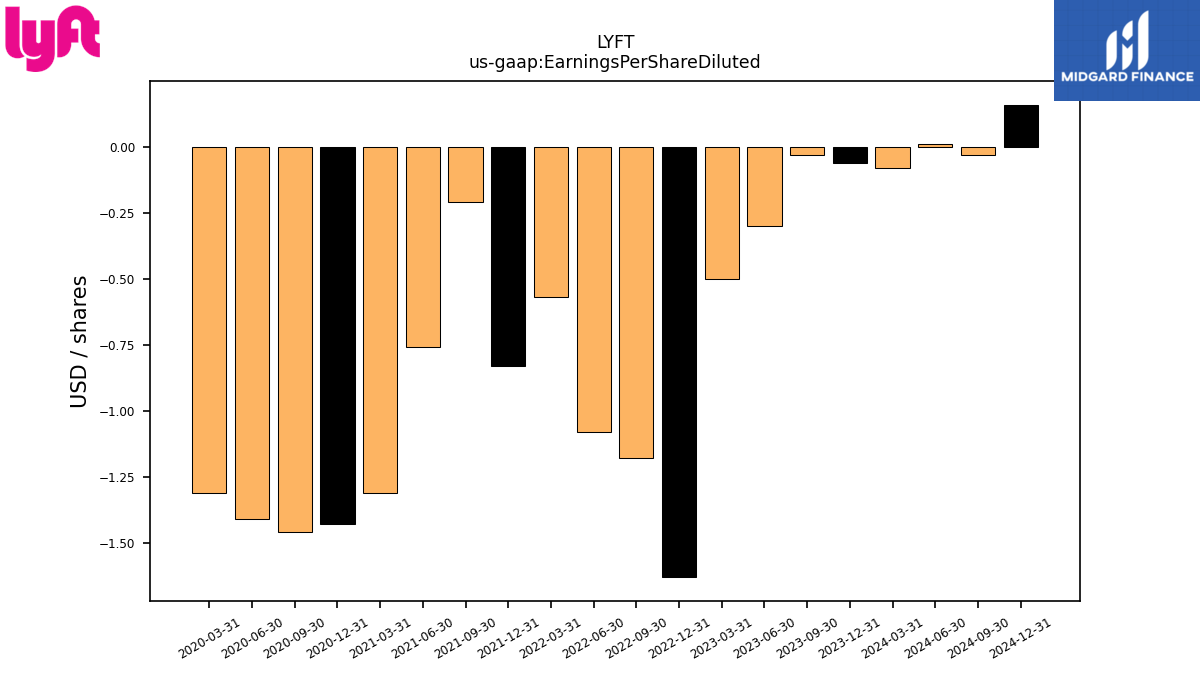
| Earnings Per Share Diluted | -0.03 | -0.30 | -0.50 | -1.63 | -1.18 | -1.08 | -0.57 | -0.83 | -0.21 | -0.76 | -1.31 | -1.43 | -1.46 | -1.41 | -1.31 | NA | NA | NA | NA | NA | NA | NA | NA |
| 2023-09-30 | 2023-06-30 | 2023-03-31 | 2022-12-31 | 2022-09-30 | 2022-06-30 | 2022-03-31 | 2021-12-31 | 2021-09-30 | 2021-06-30 | 2021-03-31 | 2020-12-31 | 2020-09-30 | 2020-06-30 | 2020-03-31 | 2019-12-31 | 2019-09-30 | 2019-06-30 | 2019-03-31 | 2018-12-31 | 2018-09-30 | 2018-06-30 | 2018-03-31 | ||
|---|---|---|---|---|---|---|---|---|---|---|---|---|---|---|---|---|---|---|---|---|---|---|---|---|
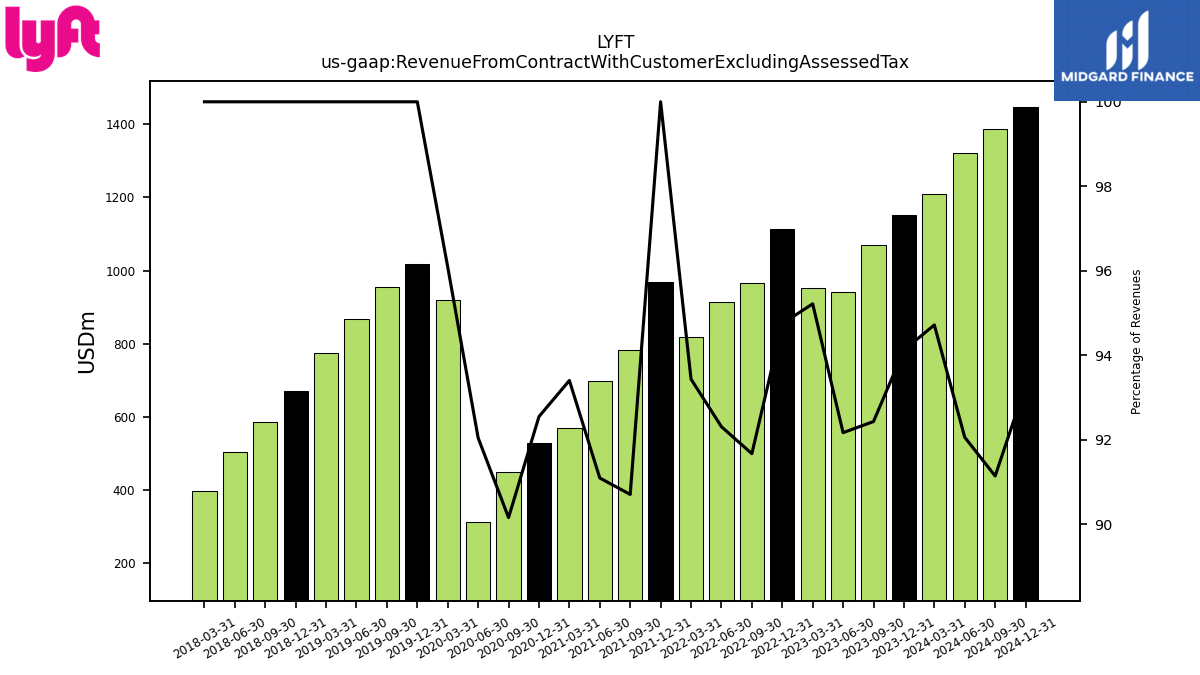
| Revenue From Contract With Customer Excluding Assessed Tax | 1069.94 | 940.96 | 952.70 | 1113.30 | 966.05 | 914.55 | 818.10 | 969.93 | 784.07 | 696.90 | 568.79 | 527.42 | 450.56 | 312.35 | 918.33 | 1017.07 | 955.60 | 867.26 | 776.03 | 669.57 | 584.95 | 504.91 | 397.19 | |
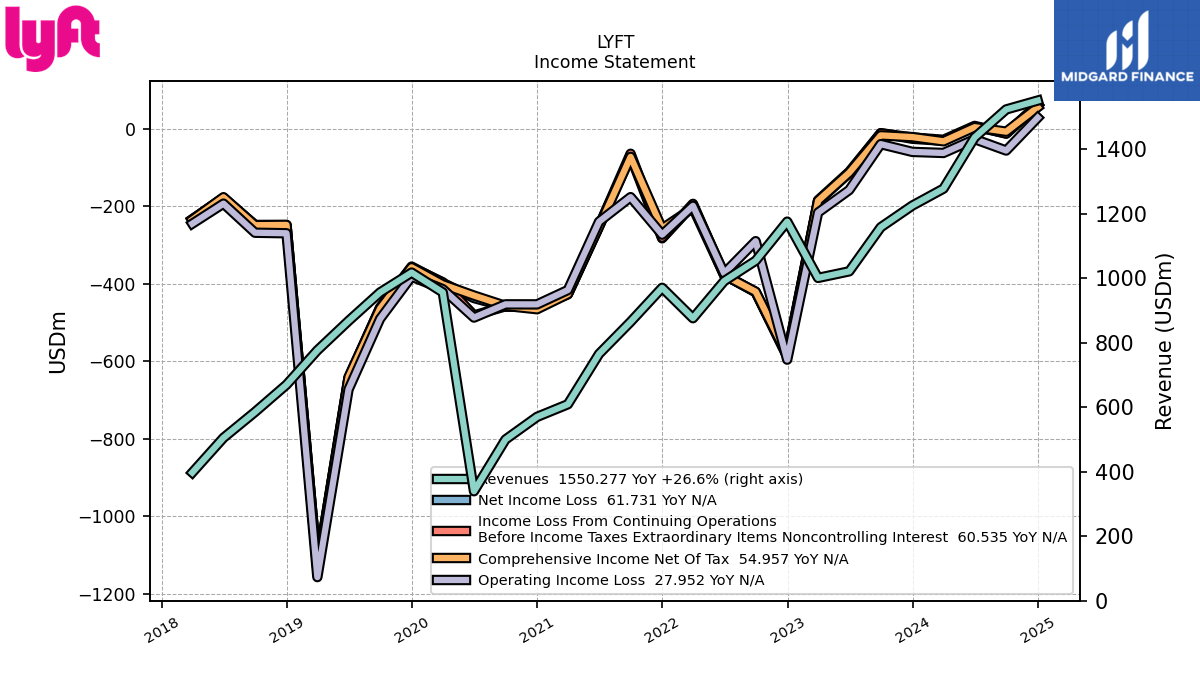
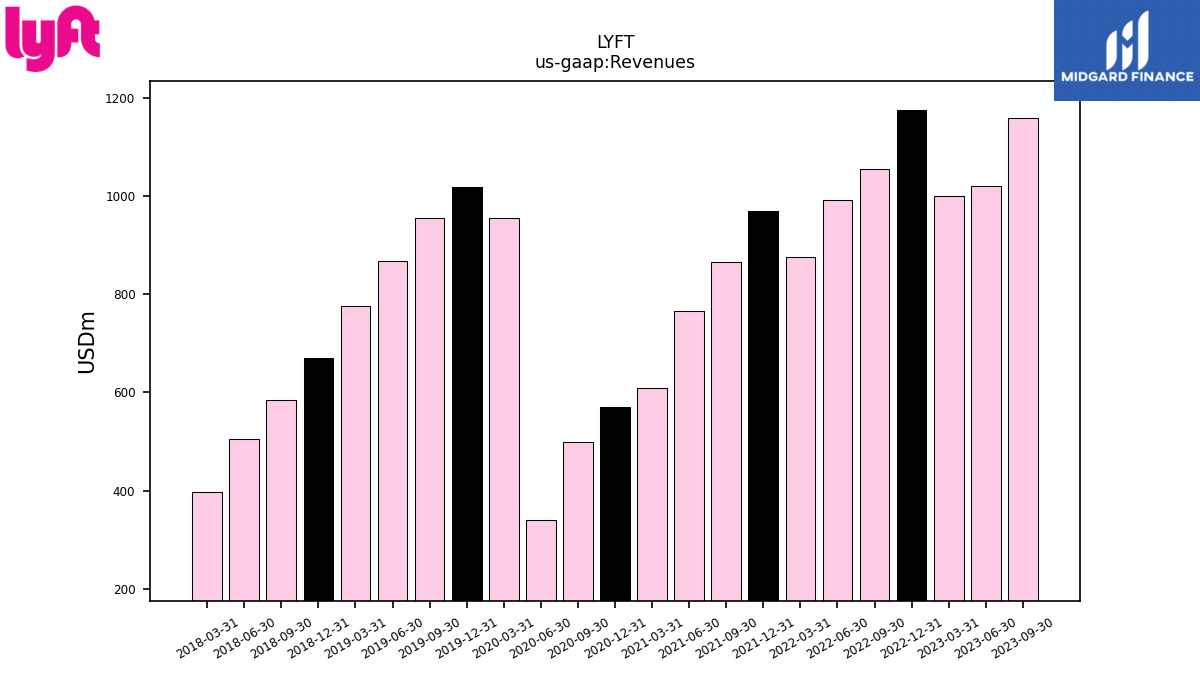
| Revenues | 1157.55 | 1020.91 | 1000.55 | 1174.99 | 1053.82 | 990.75 | 875.58 | 969.93 | 864.40 | 765.02 | 608.96 | 569.88 | 499.74 | 339.35 | 955.71 | 1017.07 | 955.60 | 867.26 | 776.03 | 669.57 | 584.95 | 504.91 | 397.19 | |
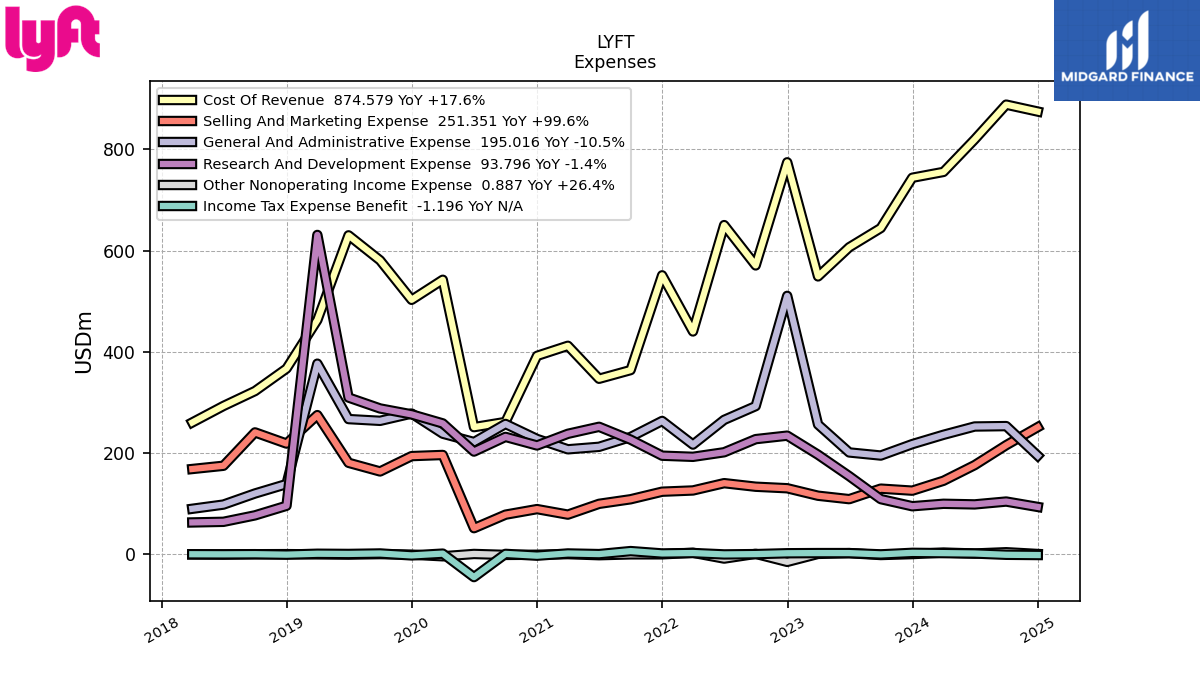
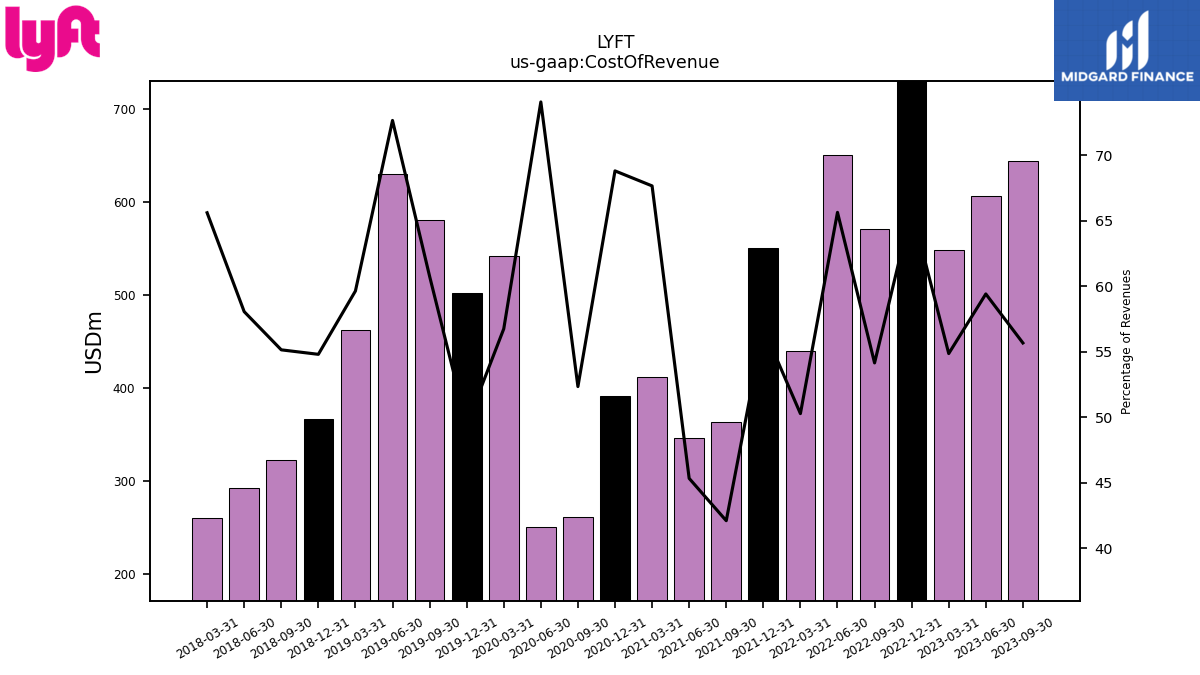
| Cost Of Revenue | 644.50 | 606.60 | 548.99 | 774.38 | 570.70 | 650.36 | 440.29 | 551.18 | 364.03 | 346.89 | 412.04 | 392.13 | 261.61 | 251.35 | 542.42 | 502.76 | 580.71 | 630.14 | 462.86 | 366.99 | 322.61 | 293.19 | 260.61 | |
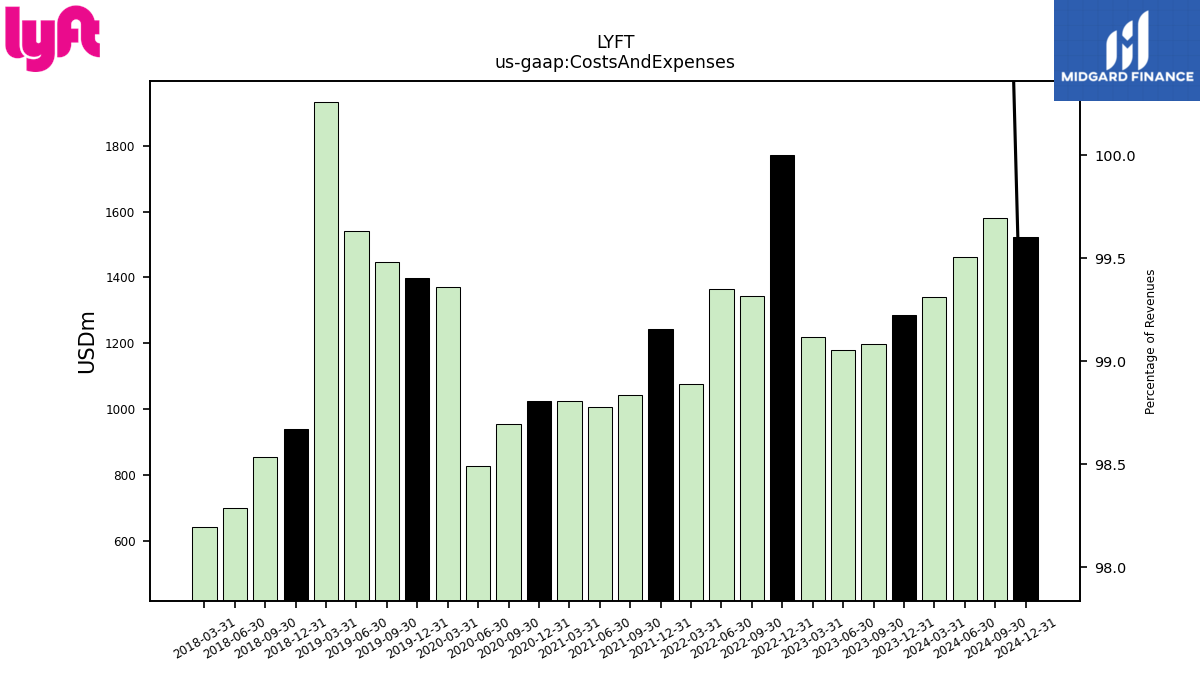
| Costs And Expenses | 1197.73 | 1179.42 | 1217.30 | 1771.01 | 1344.20 | 1363.92 | 1074.92 | 1243.55 | 1041.27 | 1005.14 | 1025.40 | 1023.31 | 953.10 | 826.84 | 1369.82 | 1398.88 | 1446.46 | 1540.18 | 1932.92 | 939.59 | 853.63 | 698.55 | 642.57 | |
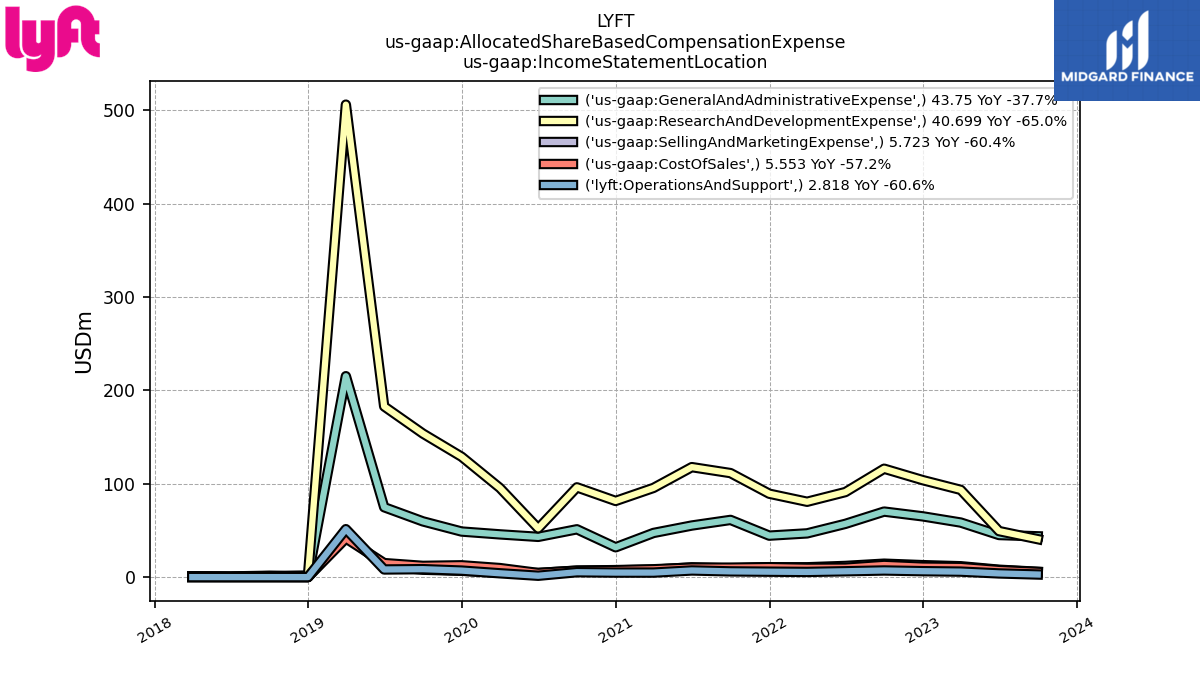
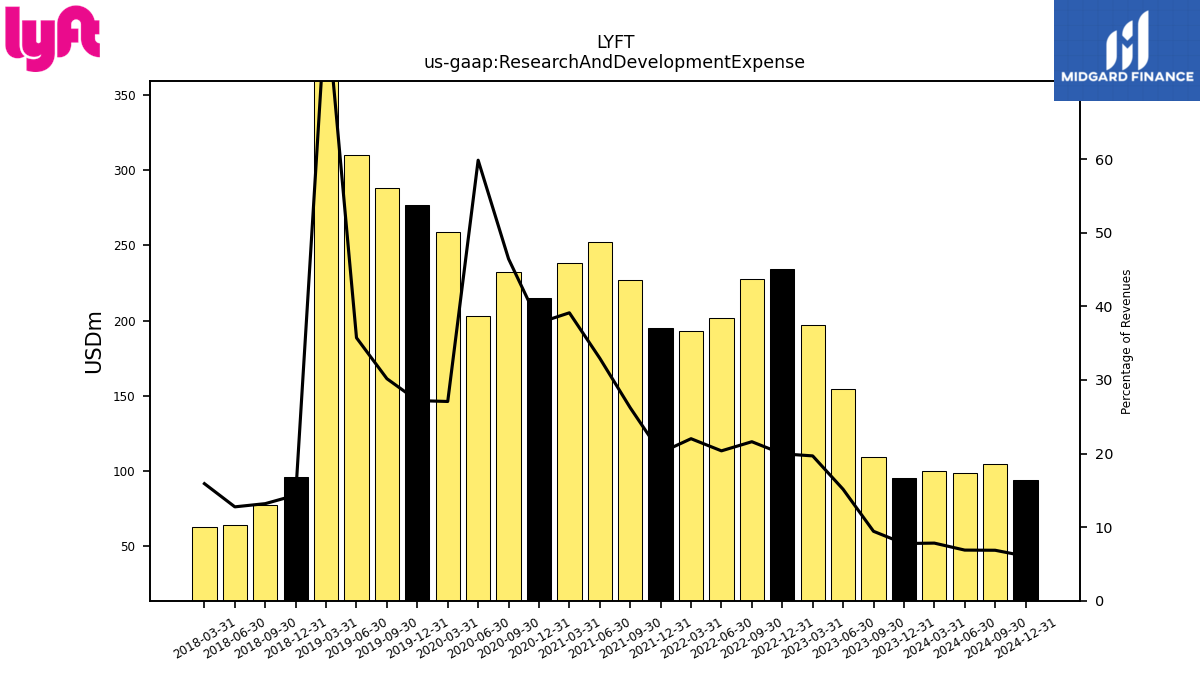
| Research And Development Expense | 109.23 | 154.61 | 196.90 | 234.58 | 227.68 | 201.77 | 192.75 | 195.00 | 226.69 | 252.04 | 238.22 | 215.18 | 232.11 | 203.10 | 258.74 | 276.57 | 288.27 | 309.83 | 630.96 | 96.06 | 77.17 | 64.42 | 63.19 | |
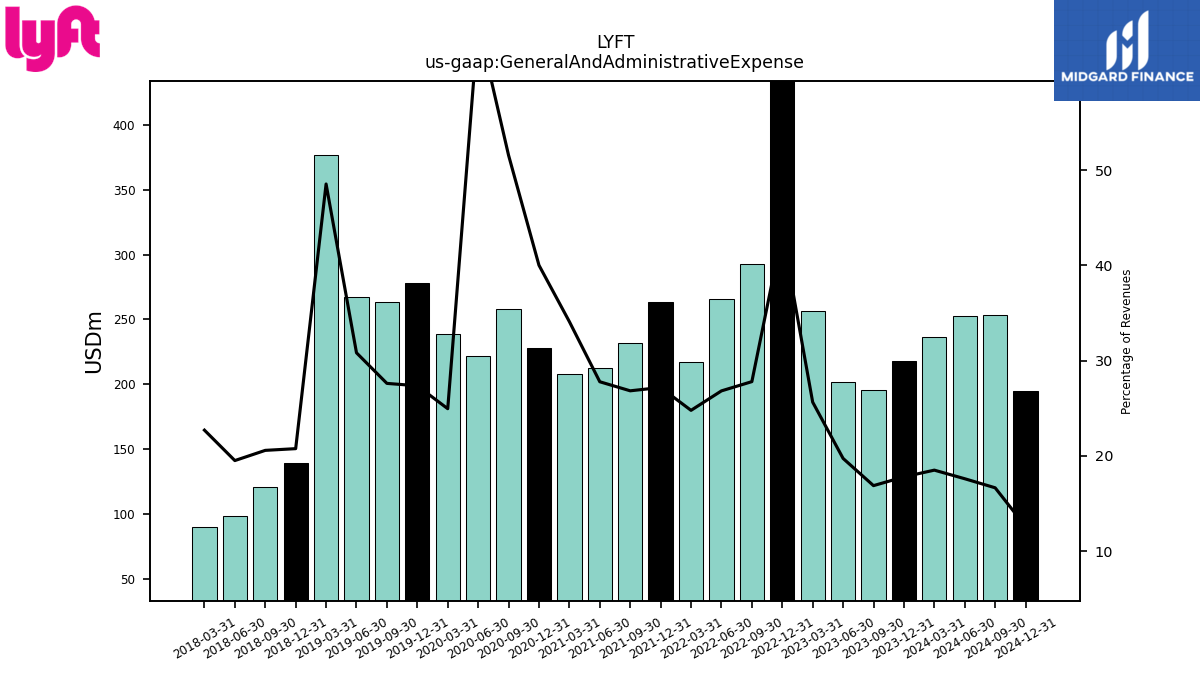
| General And Administrative Expense | 195.29 | 201.40 | 256.54 | 510.64 | 292.87 | 265.73 | 216.94 | 263.62 | 231.91 | 212.52 | 207.59 | 228.04 | 257.69 | 221.95 | 238.44 | 278.25 | 263.82 | 267.29 | 376.74 | 138.96 | 120.35 | 98.47 | 90.15 | |
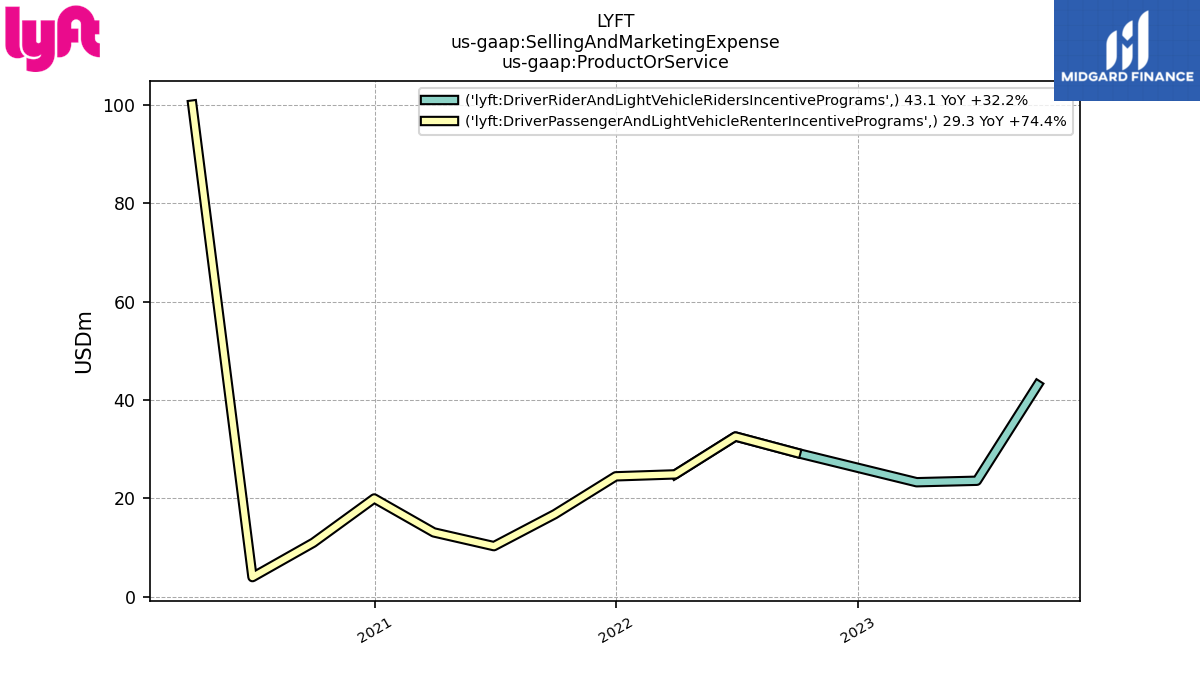
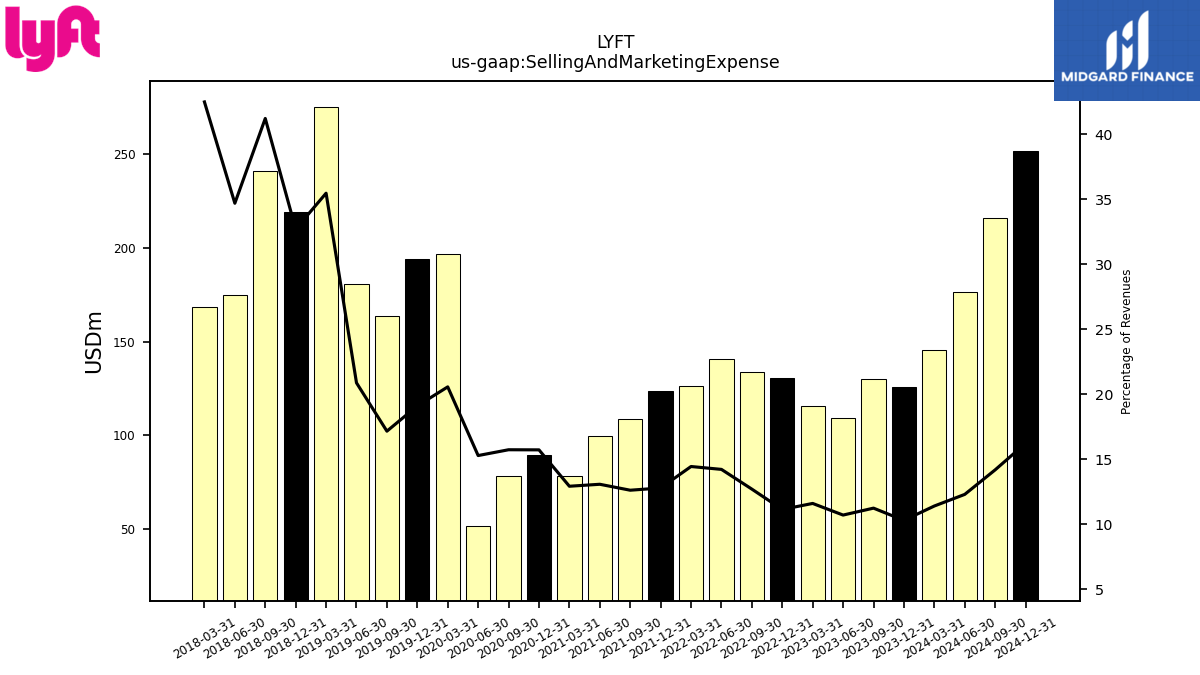
| Selling And Marketing Expense | 129.95 | 109.17 | 115.94 | 130.71 | 133.72 | 140.75 | 126.33 | 123.90 | 108.95 | 99.93 | 78.62 | 89.52 | 78.55 | 51.82 | 196.44 | 194.18 | 163.86 | 180.95 | 275.13 | 218.92 | 241.01 | 175.11 | 168.71 | |
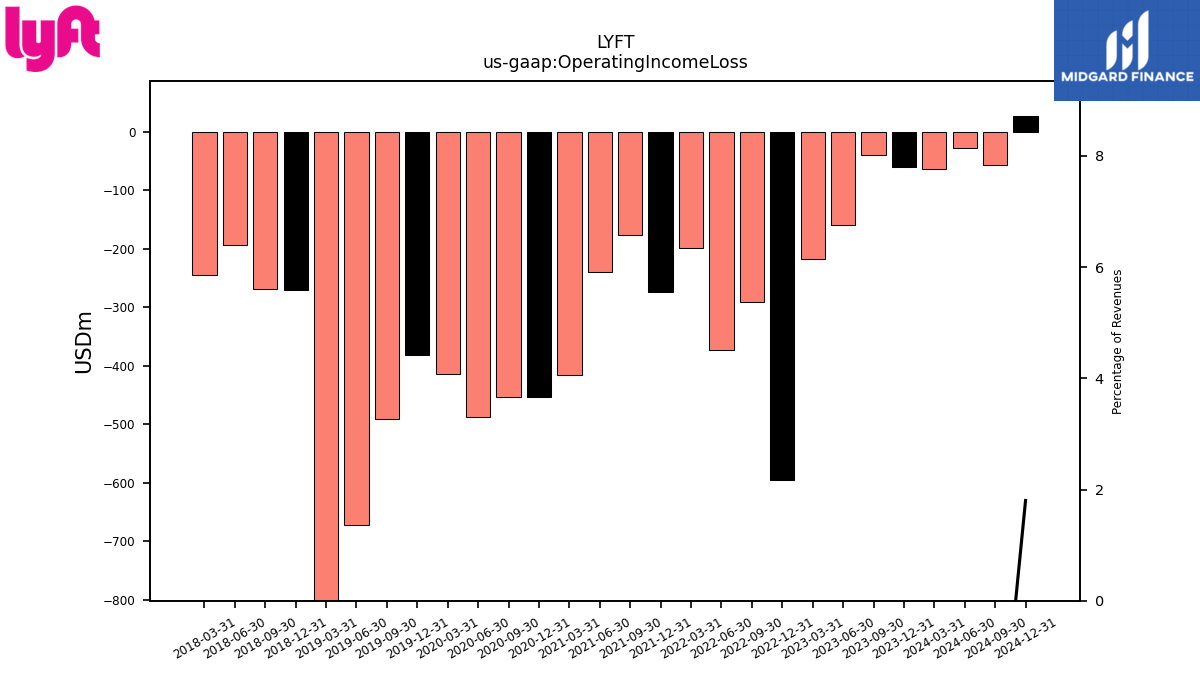
| Operating Income Loss | -40.18 | -158.52 | -216.75 | -596.02 | -290.38 | -373.18 | -199.34 | -273.62 | -176.86 | -240.12 | -416.44 | -453.43 | -453.35 | -487.50 | -414.11 | -381.81 | -490.86 | -672.92 | -1156.89 | -270.02 | -268.68 | -193.63 | -245.38 | |
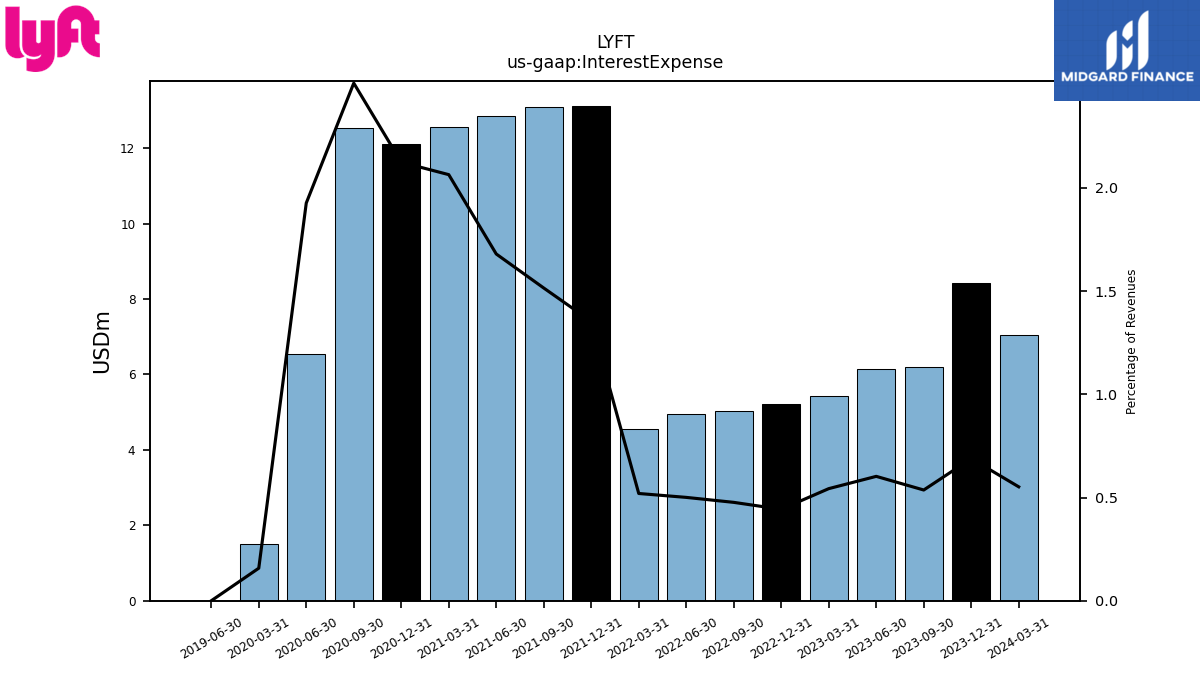
| Interest Expense | 6.21 | 6.15 | 5.43 | 5.20 | 5.02 | 4.96 | 4.55 | 13.12 | 13.09 | 12.85 | 12.57 | 12.11 | 12.53 | 6.54 | 1.51 | NA | NA | 0.00 | NA | NA | NA | NA | NA | |
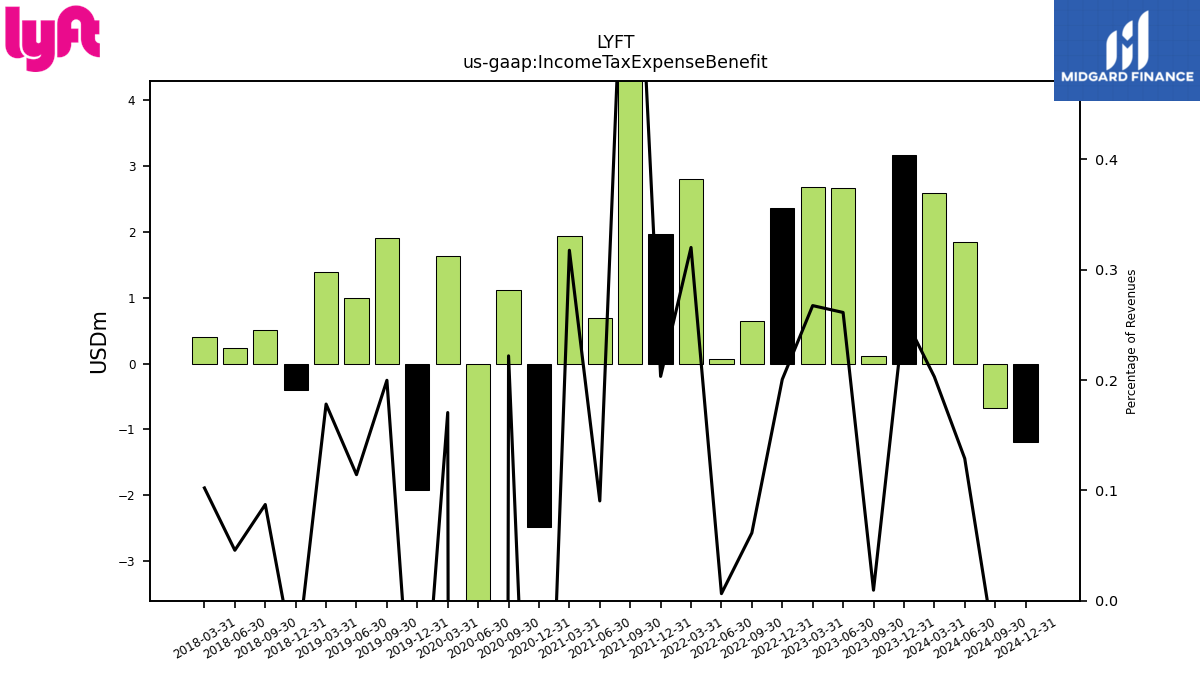
| Income Tax Expense Benefit | 0.11 | 2.67 | 2.68 | 2.36 | 0.65 | 0.06 | 2.80 | 1.97 | 6.63 | 0.69 | 1.93 | -2.47 | 1.11 | -44.80 | 1.63 | -1.93 | 1.91 | 0.99 | 1.38 | -0.41 | 0.51 | 0.23 | 0.41 | |
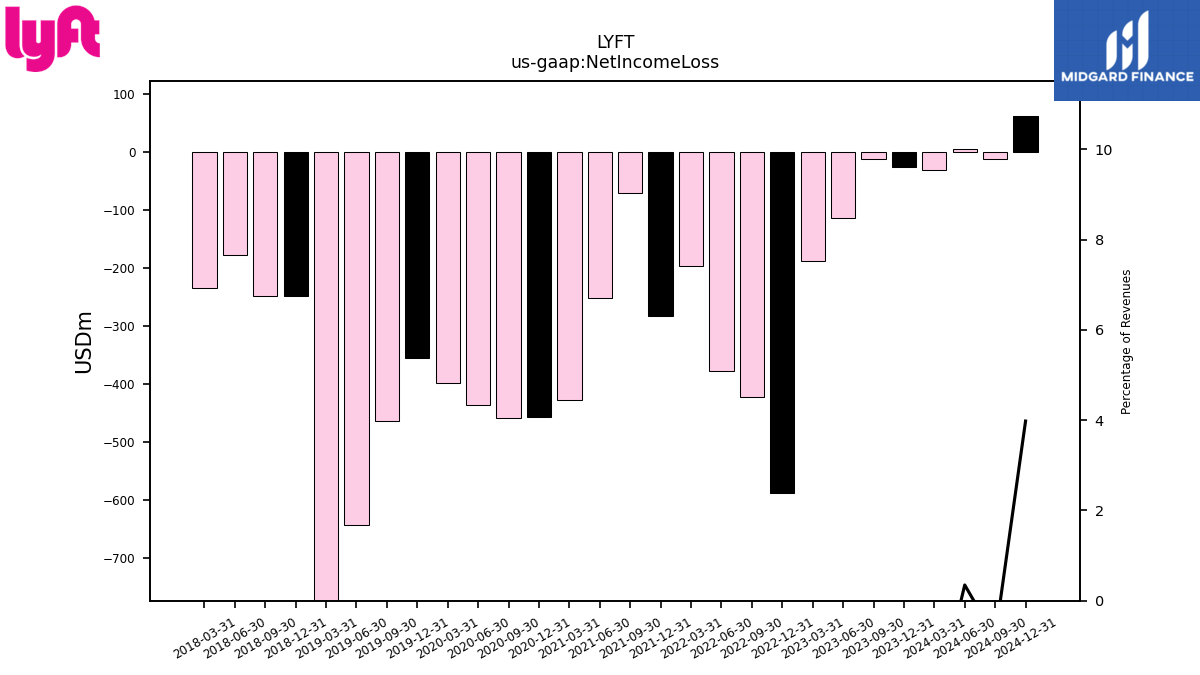
| Net Income Loss | -12.10 | -114.26 | -187.65 | -588.13 | -422.20 | -377.25 | -196.93 | -283.17 | -71.54 | -251.92 | -427.34 | -458.15 | -459.52 | -437.11 | -398.07 | -356.05 | -463.48 | -644.24 | -1138.47 | -248.93 | -249.16 | -178.90 | -234.34 | |
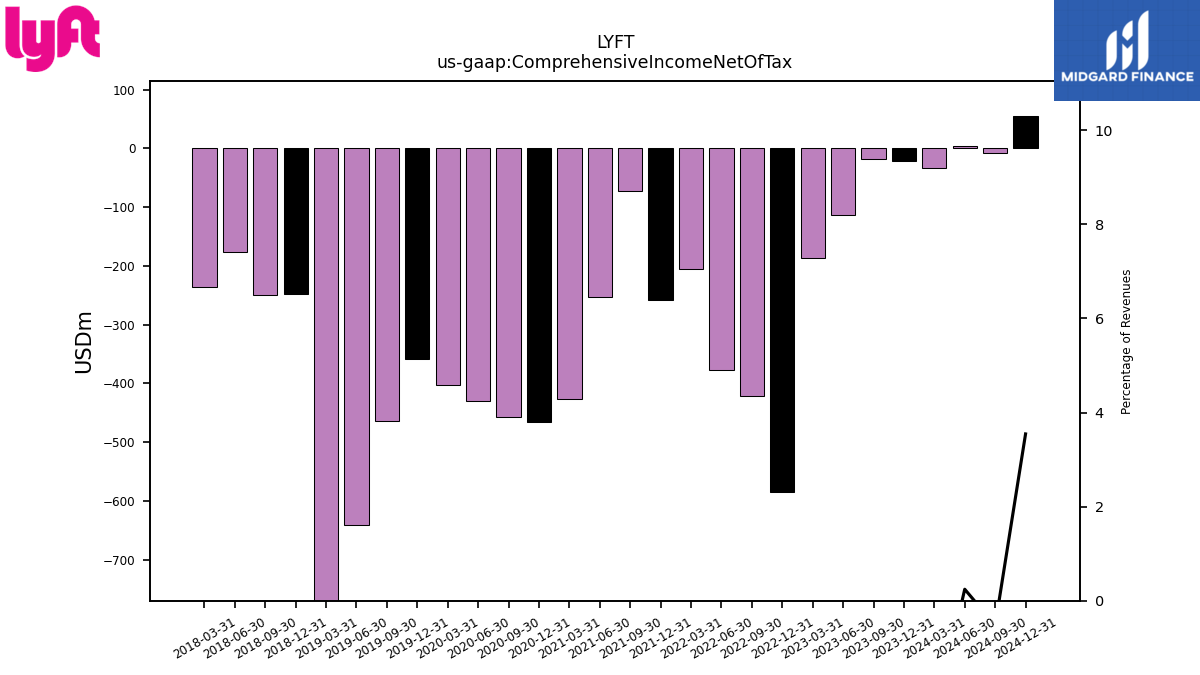
| Comprehensive Income Net Of Tax | -17.56 | -113.79 | -186.19 | -584.38 | -420.72 | -378.02 | -204.63 | -257.97 | -73.03 | -253.27 | -427.12 | -465.97 | -457.28 | -430.67 | -402.14 | -357.96 | -464.34 | -640.93 | -1136.42 | -248.49 | -249.26 | -177.09 | -235.35 |
| 2023-09-30 | 2023-06-30 | 2023-03-31 | 2022-12-31 | 2022-09-30 | 2022-06-30 | 2022-03-31 | 2021-12-31 | 2021-09-30 | 2021-06-30 | 2021-03-31 | 2020-12-31 | 2020-09-30 | 2020-06-30 | 2020-03-31 | 2019-12-31 | 2019-09-30 | 2019-06-30 | 2019-03-31 | 2018-12-31 | 2018-09-30 | 2018-06-30 | 2018-03-31 | ||
|---|---|---|---|---|---|---|---|---|---|---|---|---|---|---|---|---|---|---|---|---|---|---|---|---|
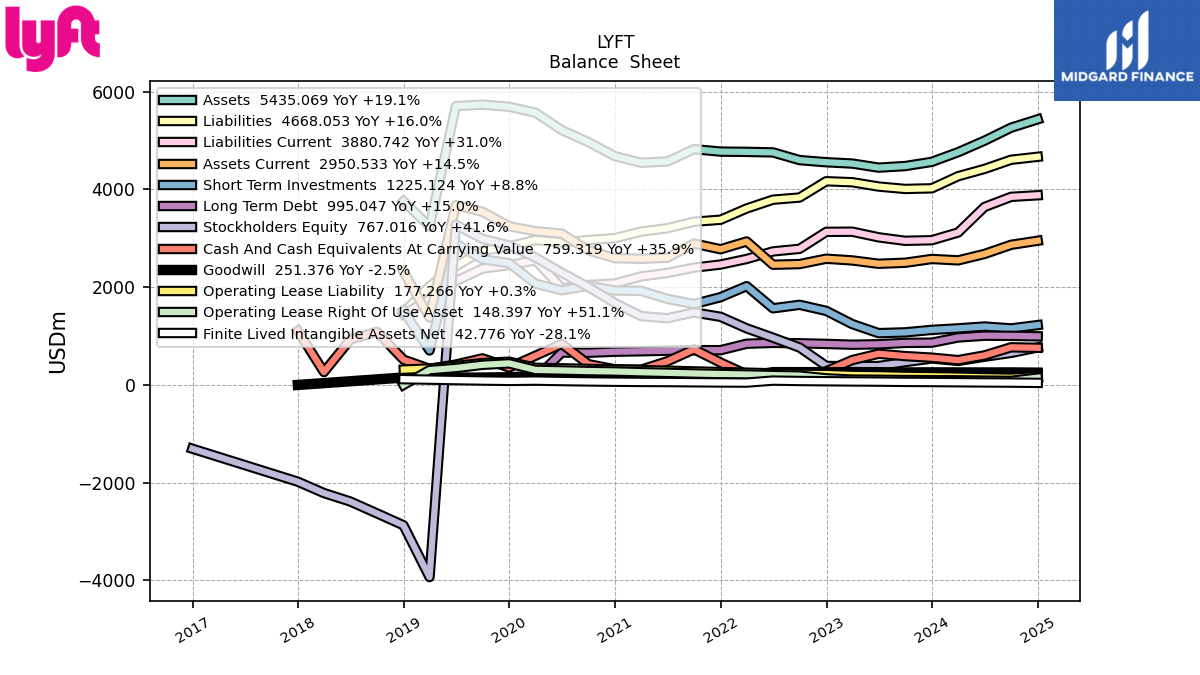
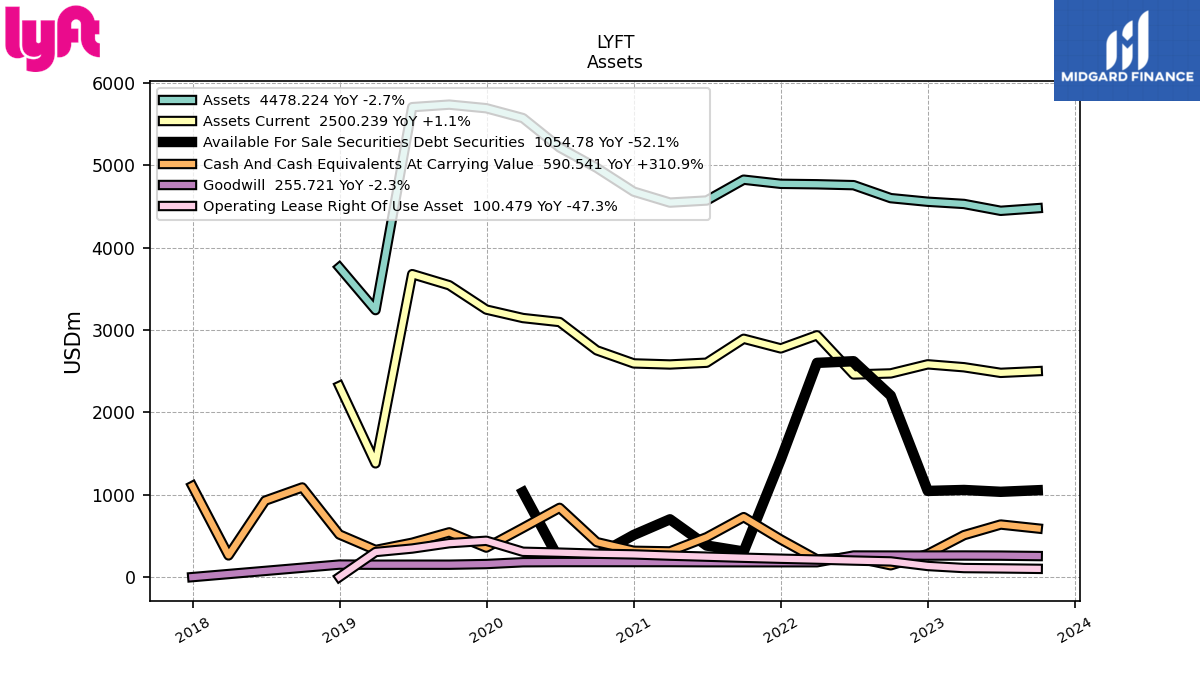
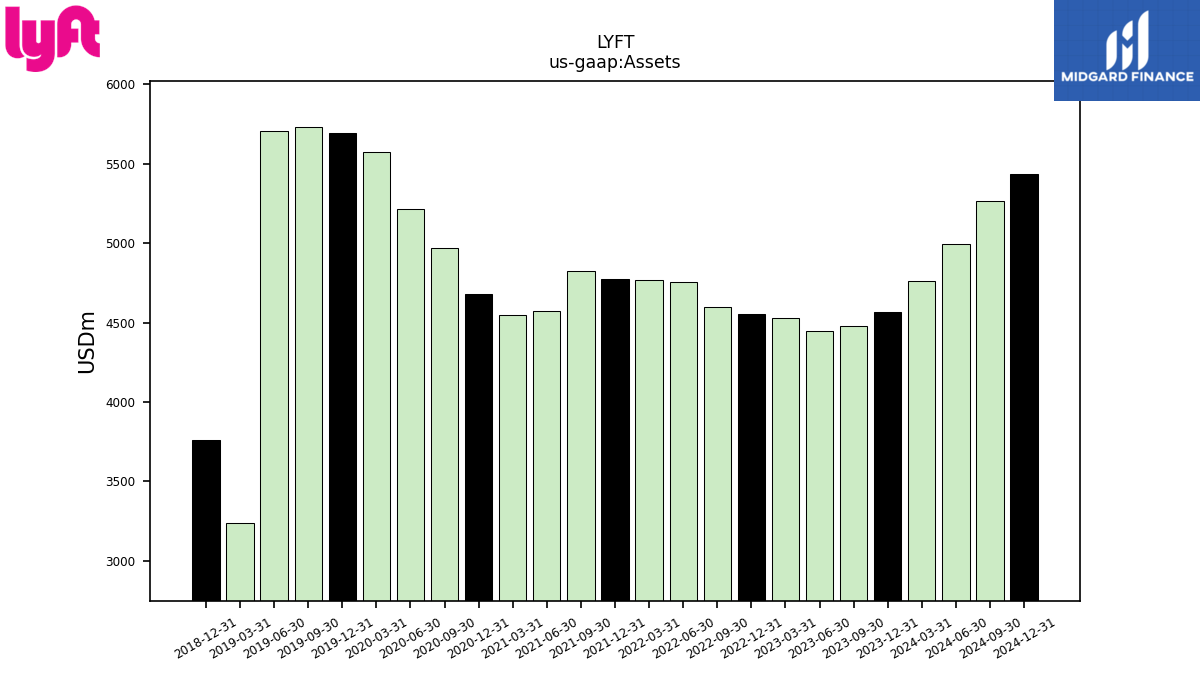
| Assets | 4478.22 | 4446.23 | 4529.47 | 4556.43 | 4600.19 | 4757.53 | 4768.46 | 4773.88 | 4824.27 | 4571.35 | 4545.84 | 4678.96 | 4968.33 | 5214.44 | 5571.76 | 5691.38 | 5735.16 | 5704.48 | 3240.91 | 3760.04 | NA | NA | NA | |
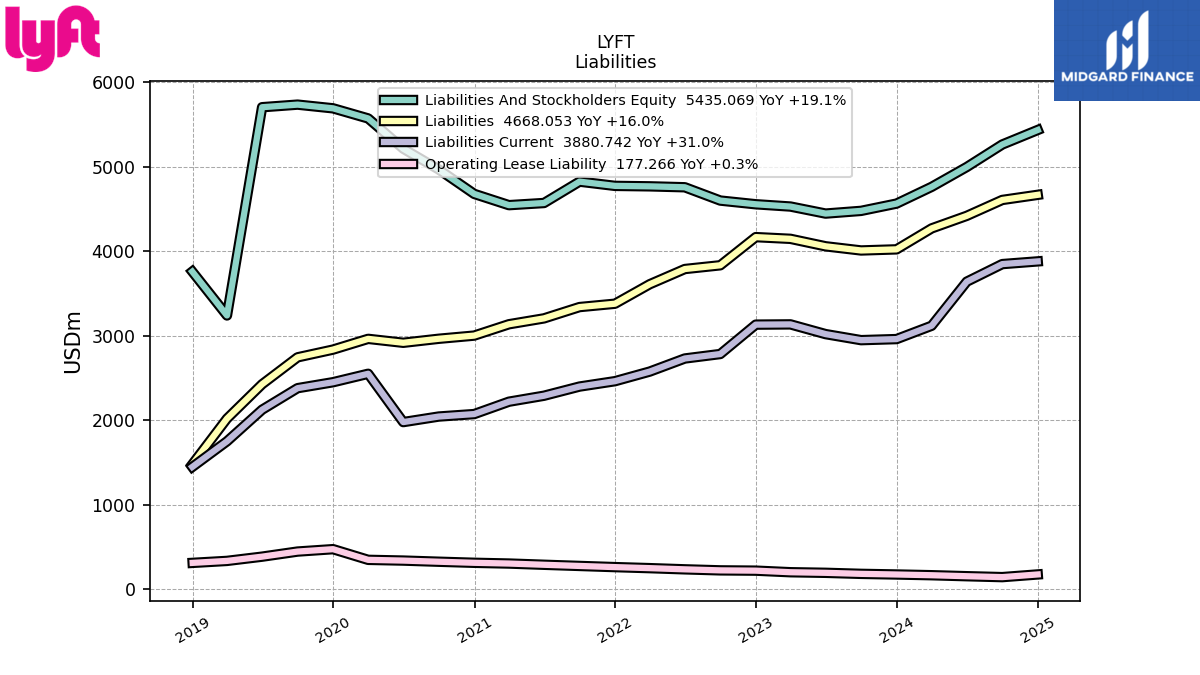
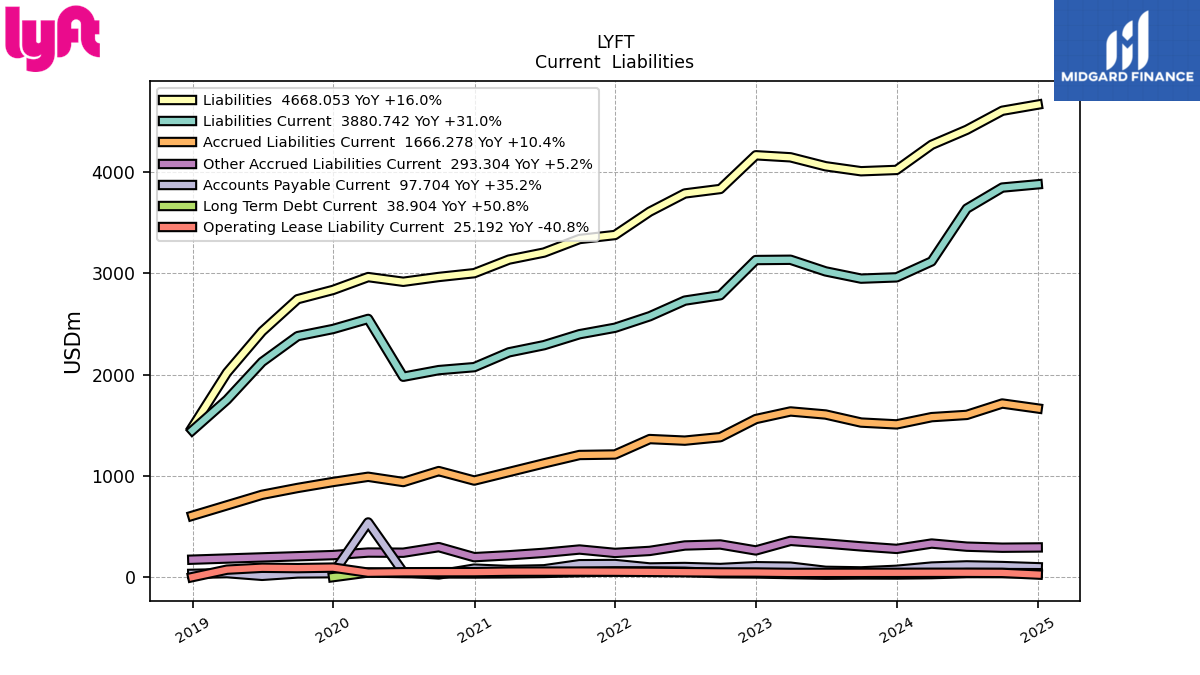
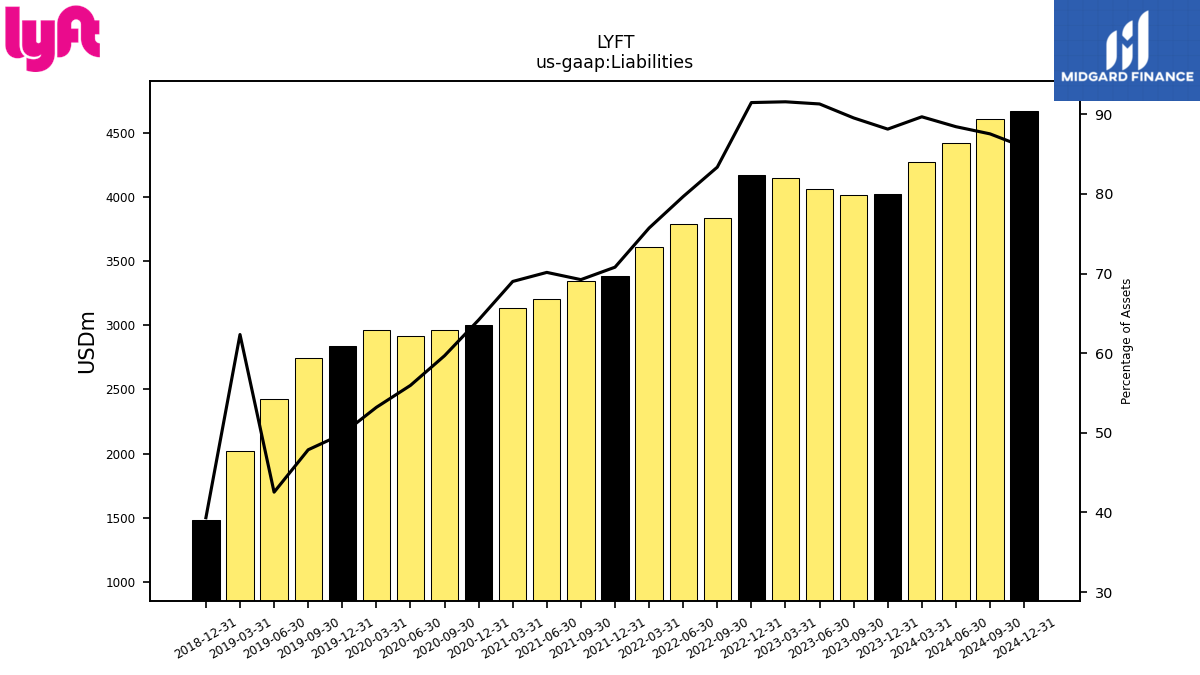
| Liabilities | 4009.90 | 4059.19 | 4147.47 | 4167.76 | 3834.66 | 3790.27 | 3610.48 | 3379.89 | 3340.19 | 3206.60 | 3136.98 | 3002.80 | 2965.24 | 2917.89 | 2964.27 | 2837.30 | 2745.65 | 2427.34 | 2020.48 | 1479.28 | NA | NA | NA | |
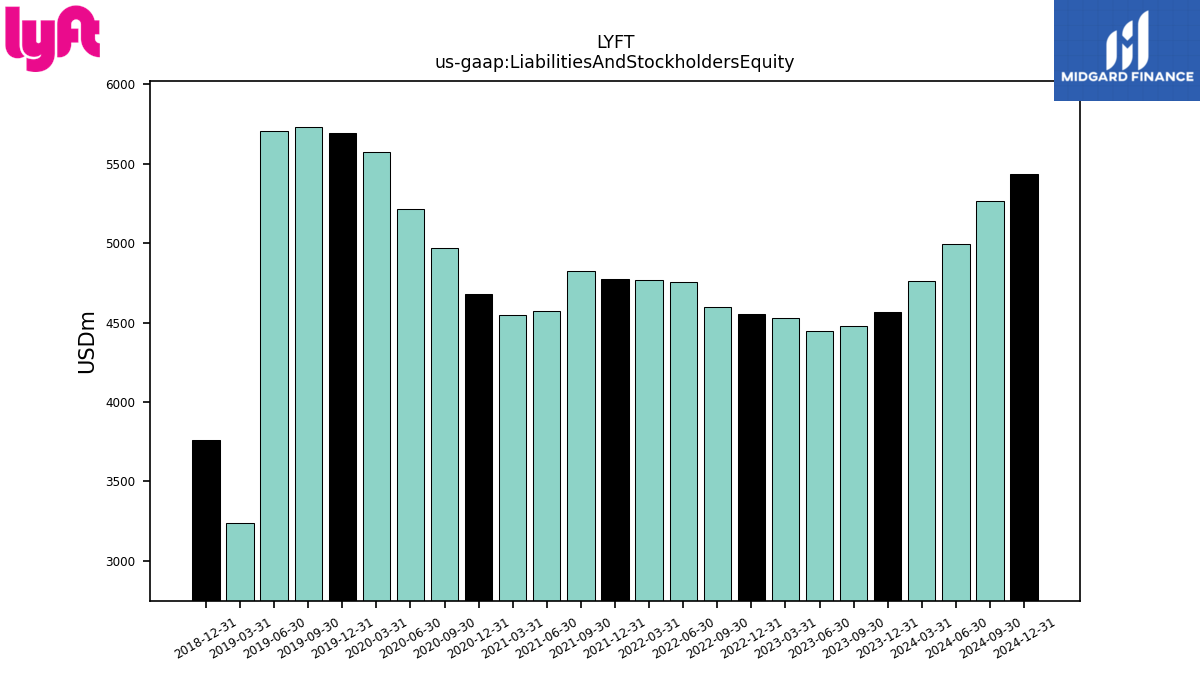
| Liabilities And Stockholders Equity | 4478.22 | 4446.23 | 4529.47 | 4556.43 | 4600.19 | 4757.53 | 4768.46 | 4773.88 | 4824.27 | 4571.35 | 4545.84 | 4678.96 | 4968.33 | 5214.44 | 5571.76 | 5691.38 | 5735.16 | 5704.48 | 3240.91 | 3760.04 | NA | NA | NA | |
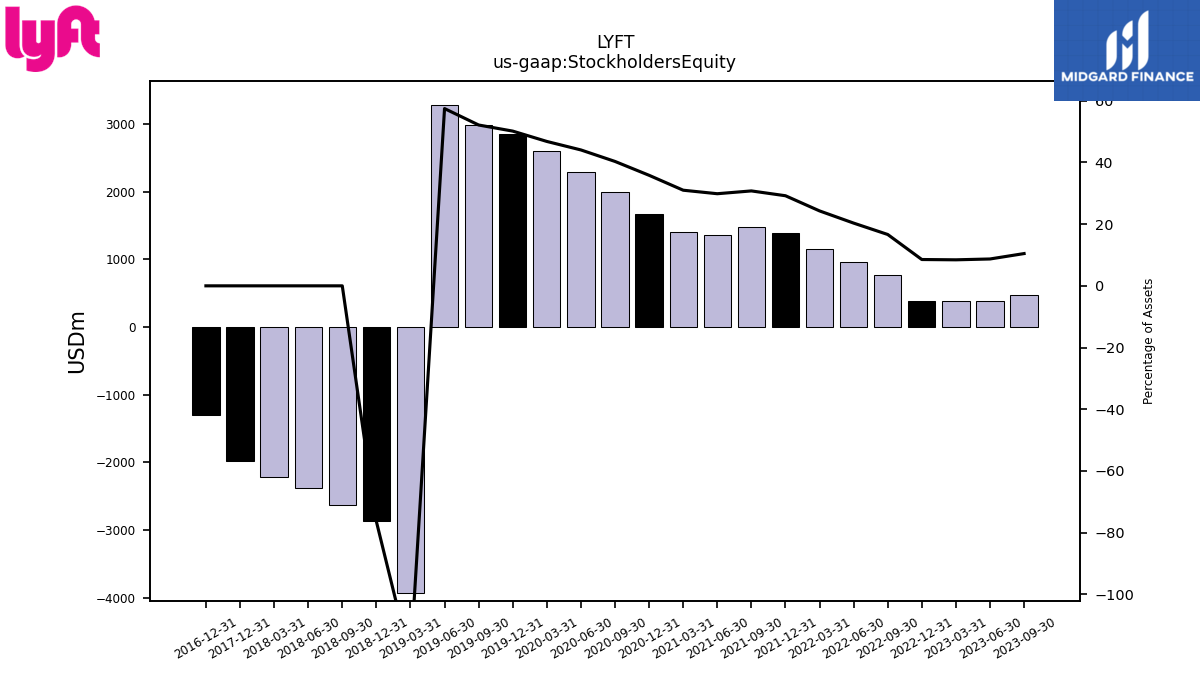
| Stockholders Equity | 468.33 | 387.04 | 382.00 | 388.67 | 765.52 | 967.27 | 1157.99 | 1394.00 | 1484.07 | 1364.76 | 1408.86 | 1676.16 | 2003.09 | 2296.56 | 2607.49 | 2854.08 | 2989.51 | 3277.13 | -3931.62 | -2871.28 | -2626.50 | -2384.26 | -2211.61 |
| 2023-09-30 | 2023-06-30 | 2023-03-31 | 2022-12-31 | 2022-09-30 | 2022-06-30 | 2022-03-31 | 2021-12-31 | 2021-09-30 | 2021-06-30 | 2021-03-31 | 2020-12-31 | 2020-09-30 | 2020-06-30 | 2020-03-31 | 2019-12-31 | 2019-09-30 | 2019-06-30 | 2019-03-31 | 2018-12-31 | 2018-09-30 | 2018-06-30 | 2018-03-31 | ||
|---|---|---|---|---|---|---|---|---|---|---|---|---|---|---|---|---|---|---|---|---|---|---|---|---|
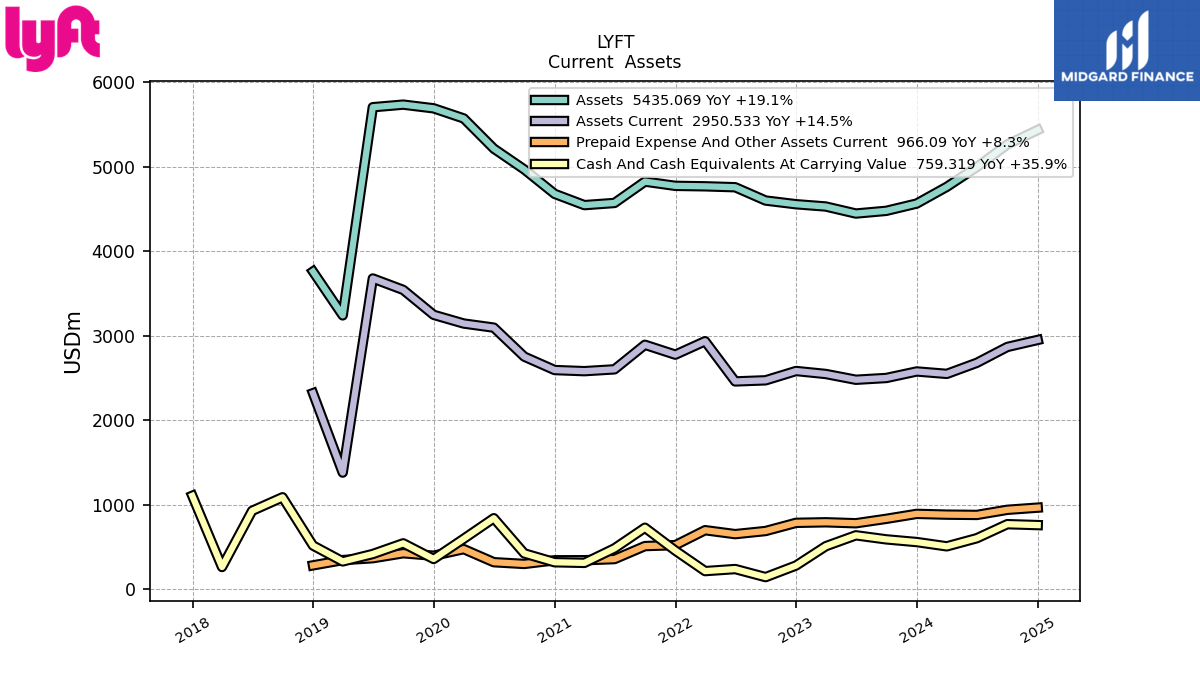
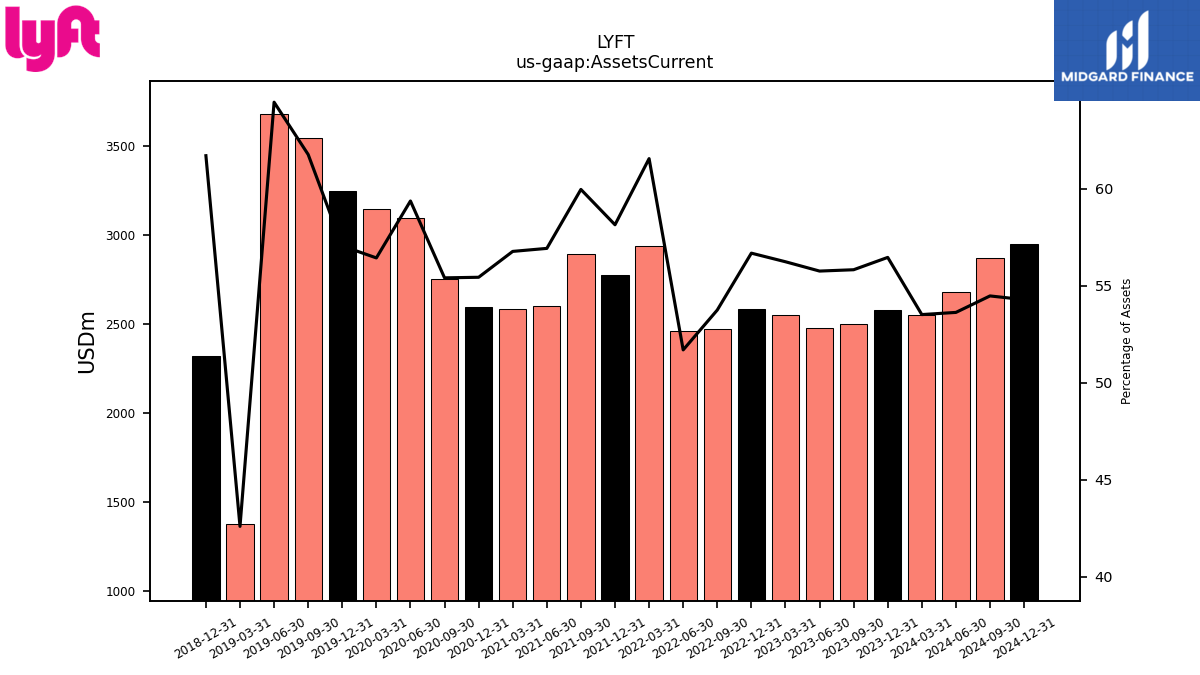
| Assets Current | 2500.24 | 2479.32 | 2547.50 | 2582.86 | 2472.74 | 2459.48 | 2935.55 | 2776.07 | 2893.25 | 2602.57 | 2580.99 | 2594.14 | 2753.05 | 3096.21 | 3144.75 | 3247.36 | 3542.82 | 3677.80 | 1380.41 | 2320.44 | NA | NA | NA | |
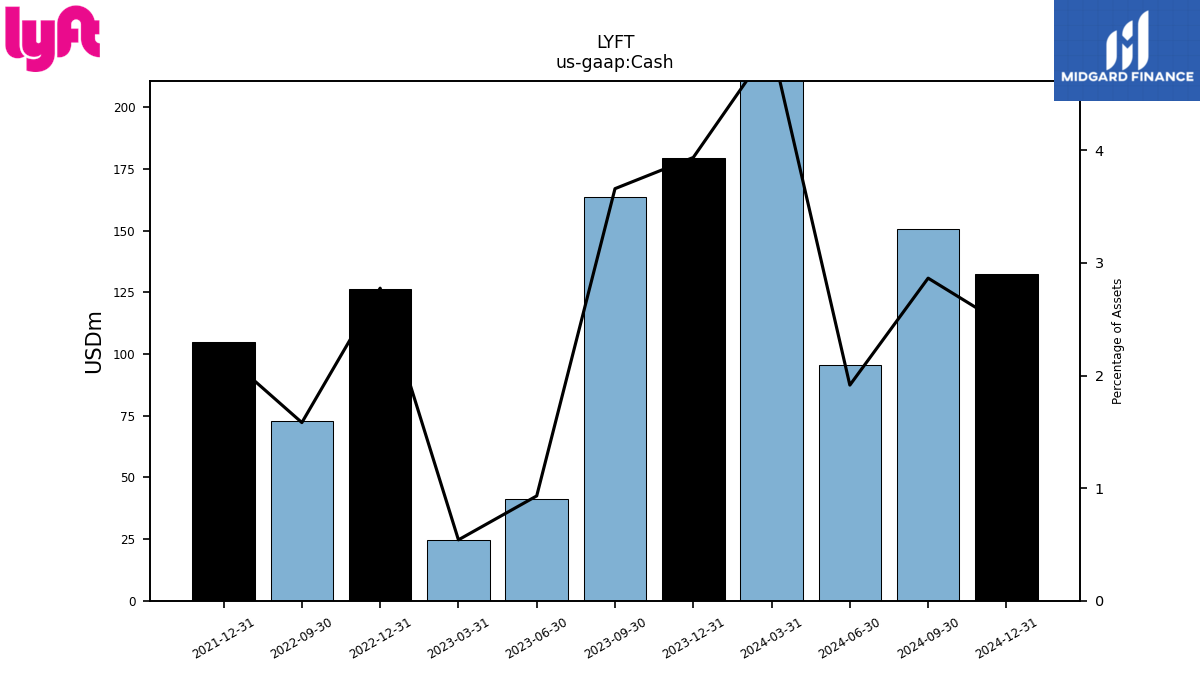
| Cash | 163.90 | 41.40 | 24.50 | 126.50 | 72.80 | NA | NA | 104.80 | NA | NA | NA | NA | NA | NA | NA | NA | NA | NA | NA | NA | NA | NA | NA | |
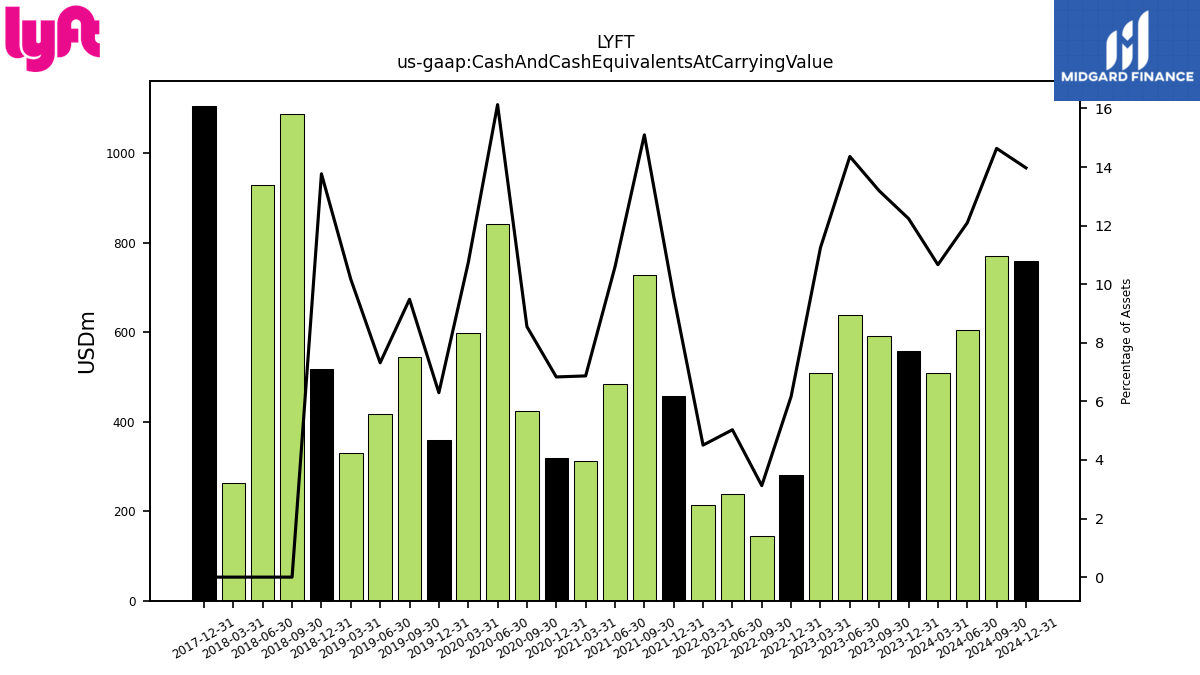
| Cash And Cash Equivalents At Carrying Value | 590.54 | 638.43 | 509.58 | 281.09 | 143.72 | 239.30 | 214.87 | 457.32 | 728.38 | 484.18 | 312.23 | 319.73 | 424.81 | 841.06 | 597.89 | 358.32 | 543.87 | 417.39 | 329.51 | 517.69 | 1088.64 | 928.44 | 263.23 | |
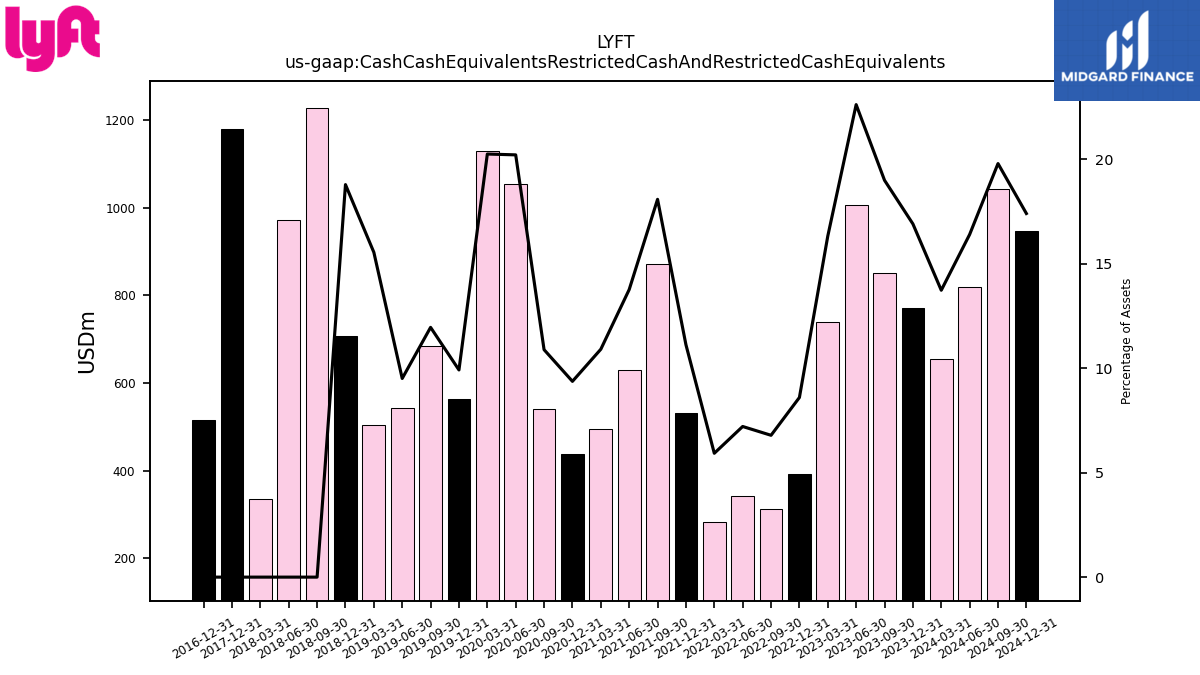
| Cash Cash Equivalents Restricted Cash And Restricted Cash Equivalents | 850.70 | 1005.65 | 739.43 | 391.82 | 312.32 | 343.06 | 282.68 | 531.19 | 872.44 | 629.23 | 495.89 | 438.49 | 540.92 | 1053.98 | 1128.44 | 564.47 | 685.68 | 542.50 | 503.92 | 706.49 | 1227.81 | 972.63 | 335.66 | |
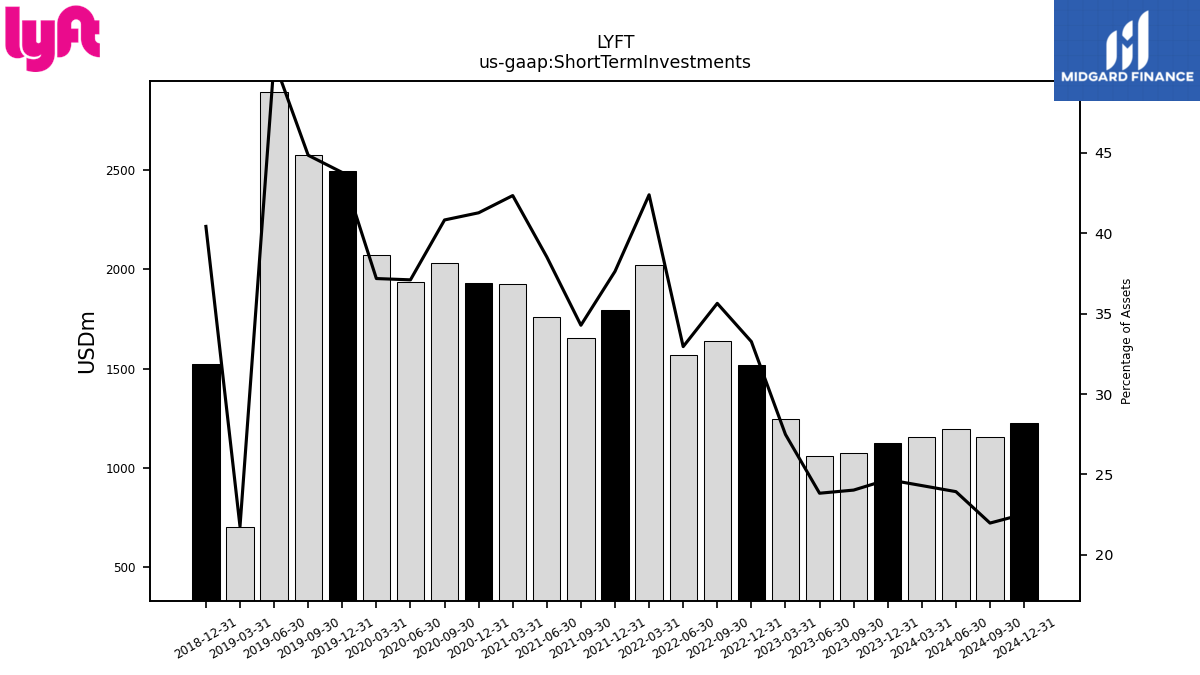
| Short Term Investments | 1076.09 | 1059.73 | 1245.22 | 1515.70 | 1639.68 | 1567.75 | 2021.66 | 1796.53 | 1653.90 | 1761.34 | 1925.09 | 1931.33 | 2028.64 | 1934.88 | 2071.99 | 2491.80 | 2572.57 | 2892.92 | 705.37 | 1520.18 | NA | NA | NA | |
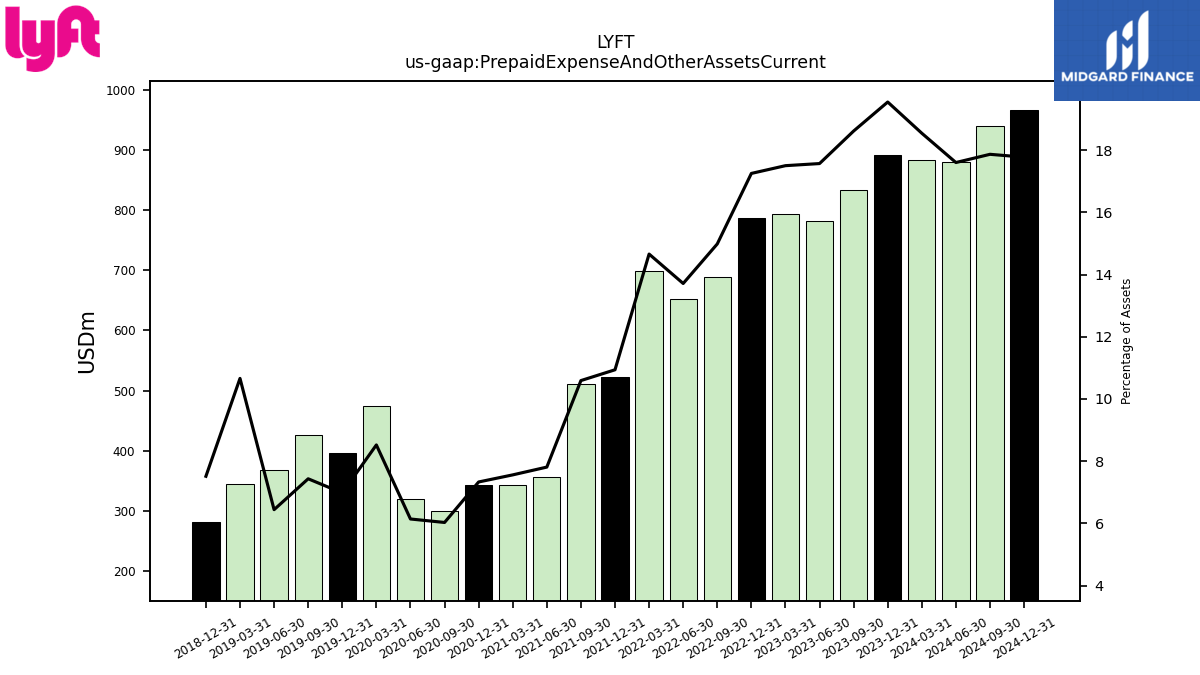
| Prepaid Expense And Other Assets Current | 833.61 | 781.15 | 792.71 | 786.07 | 689.34 | 652.43 | 699.02 | 522.21 | 510.97 | 357.05 | 343.67 | 343.07 | 299.61 | 320.27 | 474.87 | 397.24 | 426.38 | 367.49 | 345.53 | 282.57 | NA | NA | NA | |
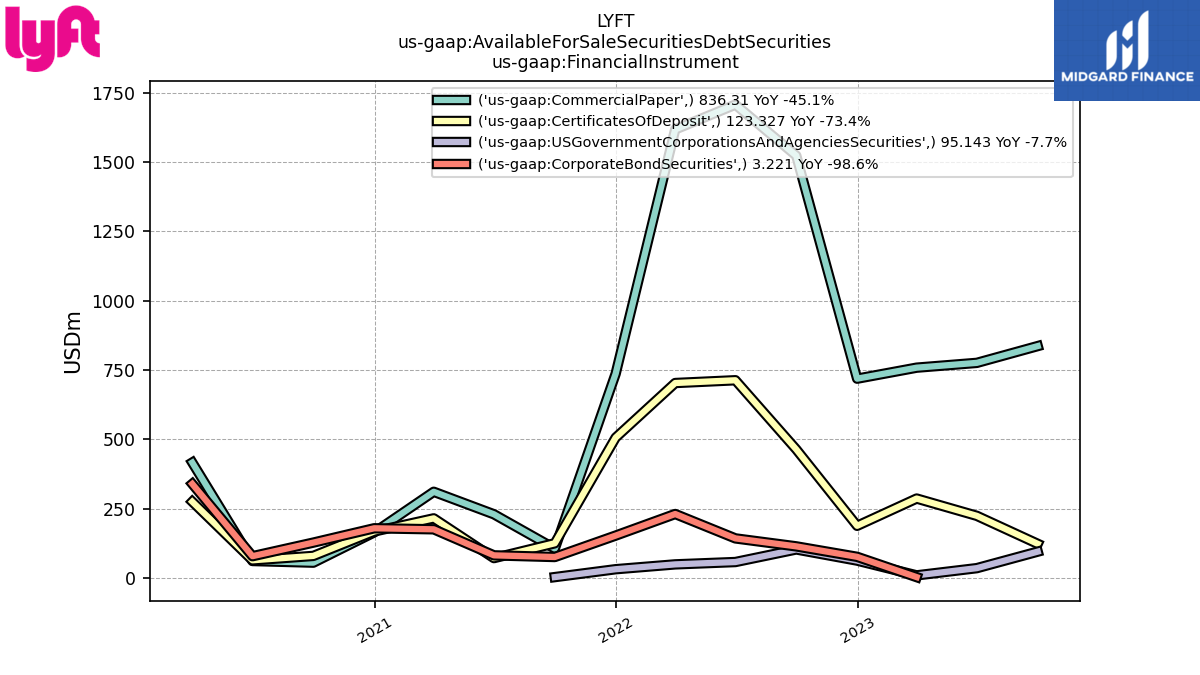
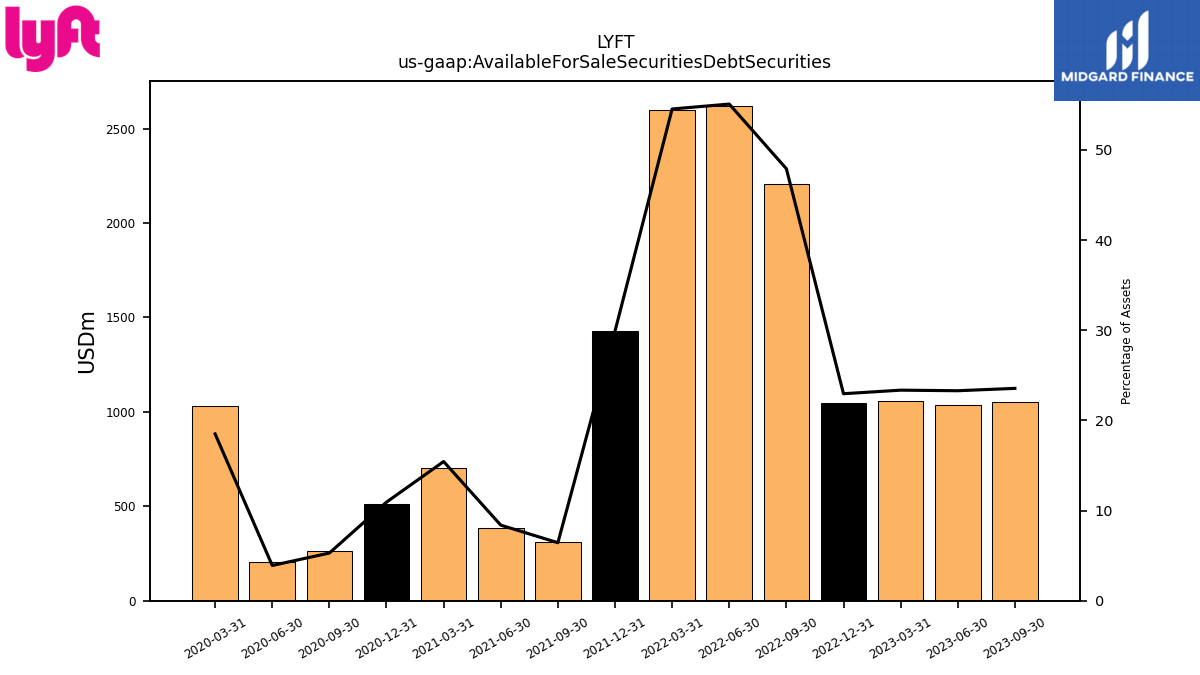
| Available For Sale Securities Debt Securities | 1054.78 | 1035.61 | 1057.86 | 1046.20 | 2204.08 | 2620.60 | 2600.61 | 1427.48 | 310.55 | 383.34 | 701.79 | 511.76 | 262.86 | 203.97 | 1031.00 | NA | NA | NA | NA | NA | NA | NA | NA |
| 2023-09-30 | 2023-06-30 | 2023-03-31 | 2022-12-31 | 2022-09-30 | 2022-06-30 | 2022-03-31 | 2021-12-31 | 2021-09-30 | 2021-06-30 | 2021-03-31 | 2020-12-31 | 2020-09-30 | 2020-06-30 | 2020-03-31 | 2019-12-31 | 2019-09-30 | 2019-06-30 | 2019-03-31 | 2018-12-31 | 2018-09-30 | 2018-06-30 | 2018-03-31 | ||
|---|---|---|---|---|---|---|---|---|---|---|---|---|---|---|---|---|---|---|---|---|---|---|---|---|
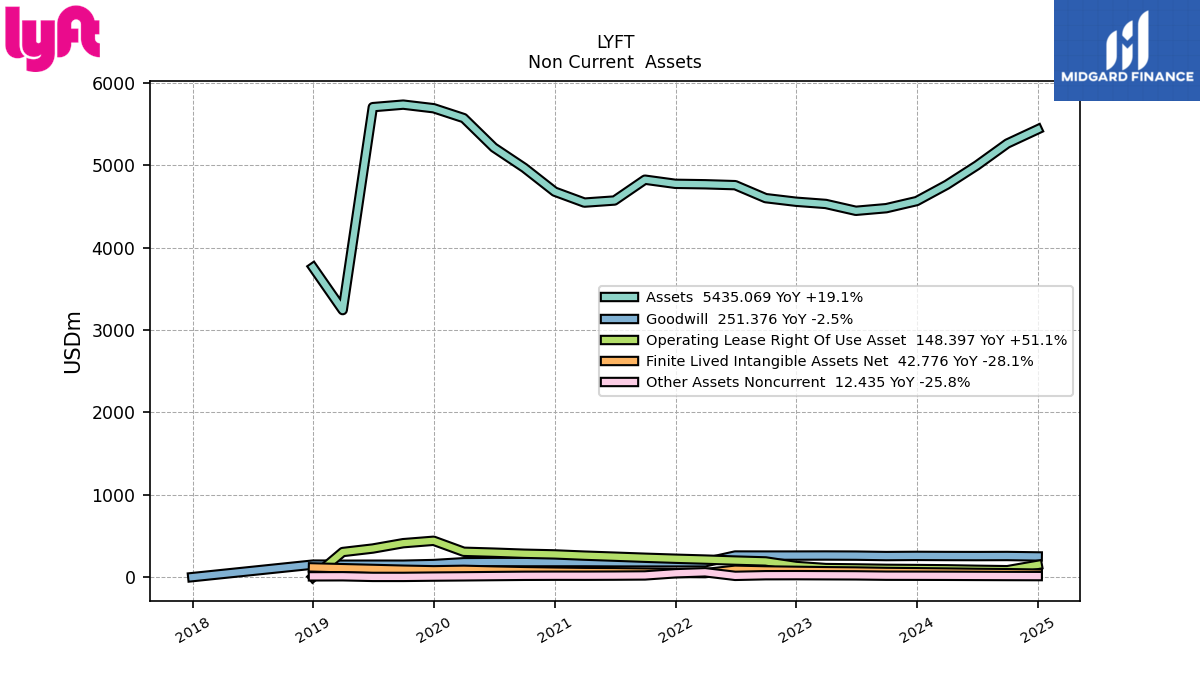
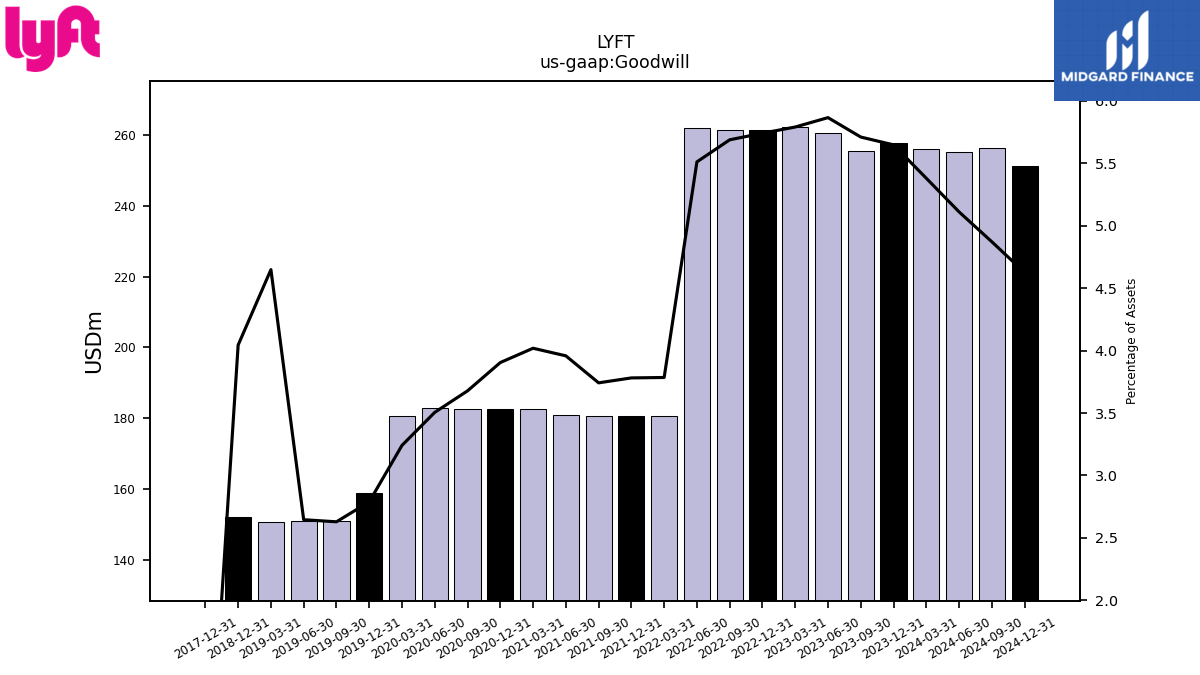
| Goodwill | 255.72 | 260.81 | 262.29 | 261.58 | 261.67 | 262.21 | 180.47 | 180.52 | 180.52 | 180.94 | 182.69 | 182.69 | 182.72 | 182.80 | 180.59 | 158.72 | 150.78 | 150.93 | 150.65 | 152.09 | NA | NA | NA | |
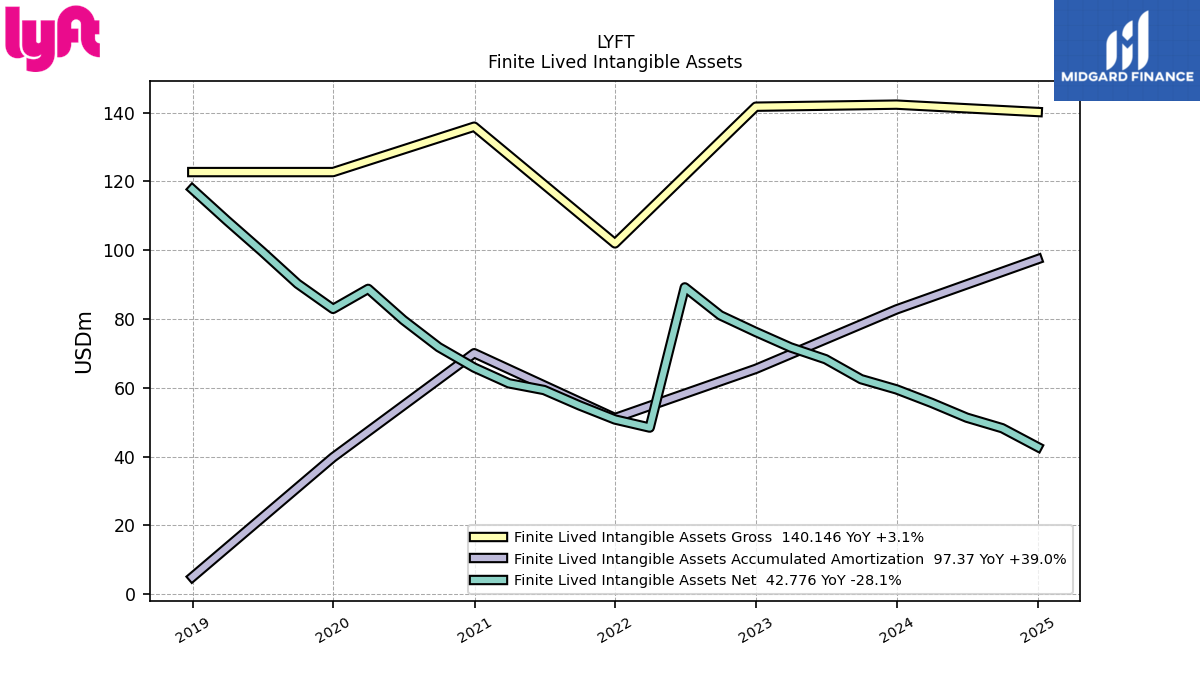
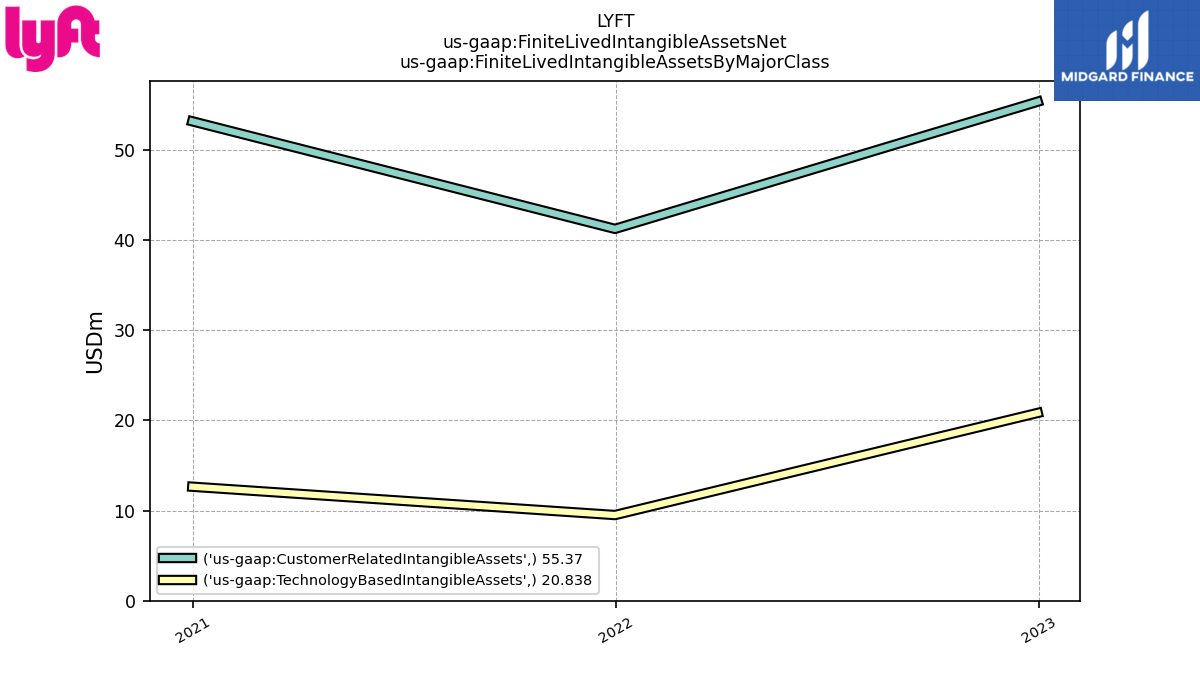
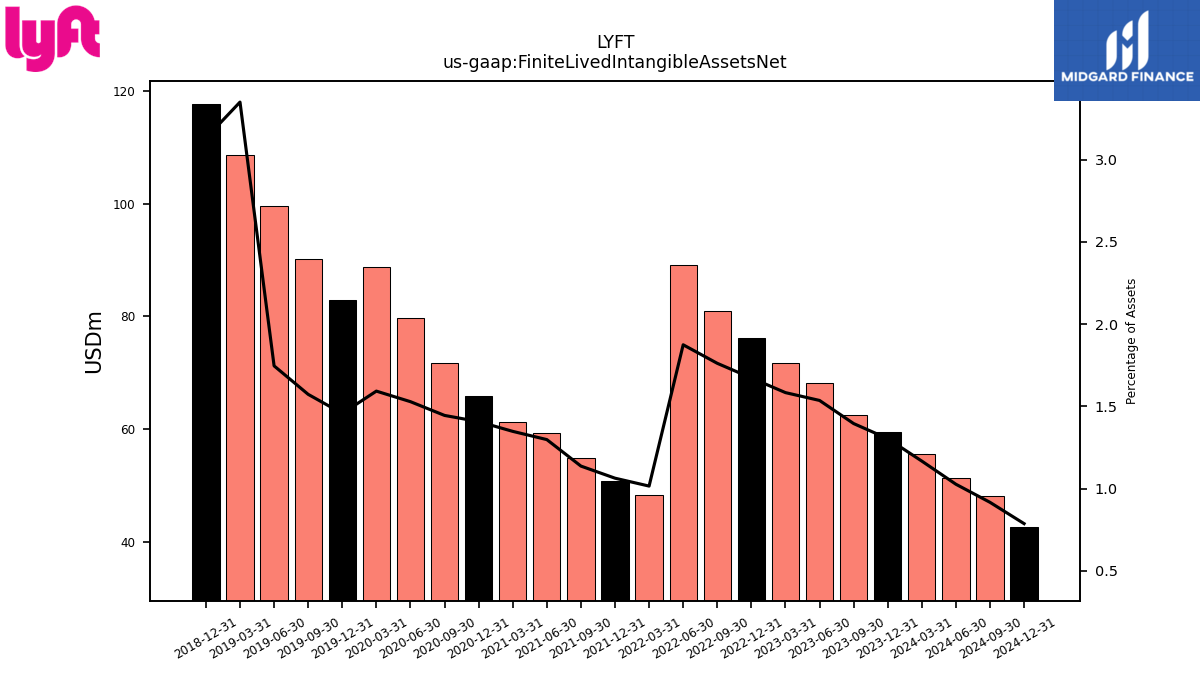
| Finite Lived Intangible Assets Net | 62.49 | 68.29 | 71.73 | 76.21 | 81.05 | 89.18 | 48.42 | 50.77 | 54.85 | 59.34 | 61.28 | 65.84 | 71.79 | 79.70 | 88.74 | 82.92 | 90.22 | 99.61 | 108.57 | 117.73 | NA | NA | NA | |
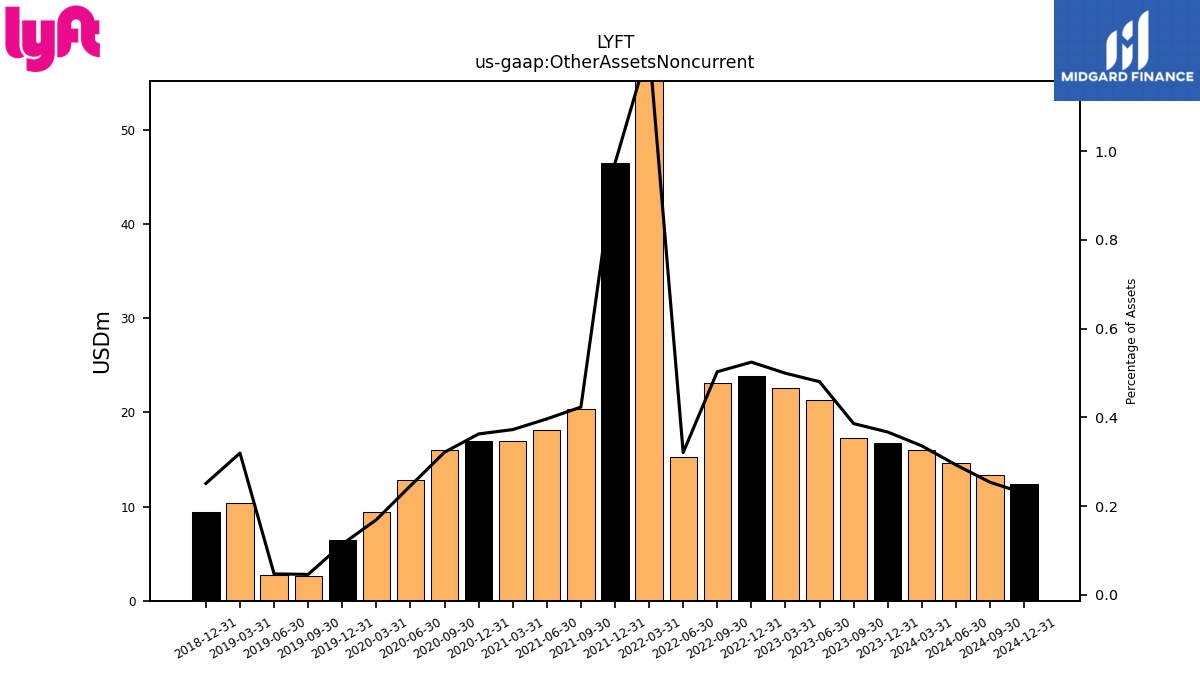
| Other Assets Noncurrent | 17.29 | 21.36 | 22.63 | 23.90 | 23.13 | 15.26 | 58.92 | 46.45 | 20.42 | 18.13 | 16.93 | 16.97 | 15.97 | 12.81 | 9.43 | 6.49 | 2.64 | 2.68 | 10.35 | 9.44 | NA | NA | NA |
| 2023-09-30 | 2023-06-30 | 2023-03-31 | 2022-12-31 | 2022-09-30 | 2022-06-30 | 2022-03-31 | 2021-12-31 | 2021-09-30 | 2021-06-30 | 2021-03-31 | 2020-12-31 | 2020-09-30 | 2020-06-30 | 2020-03-31 | 2019-12-31 | 2019-09-30 | 2019-06-30 | 2019-03-31 | 2018-12-31 | 2018-09-30 | 2018-06-30 | 2018-03-31 | ||
|---|---|---|---|---|---|---|---|---|---|---|---|---|---|---|---|---|---|---|---|---|---|---|---|---|
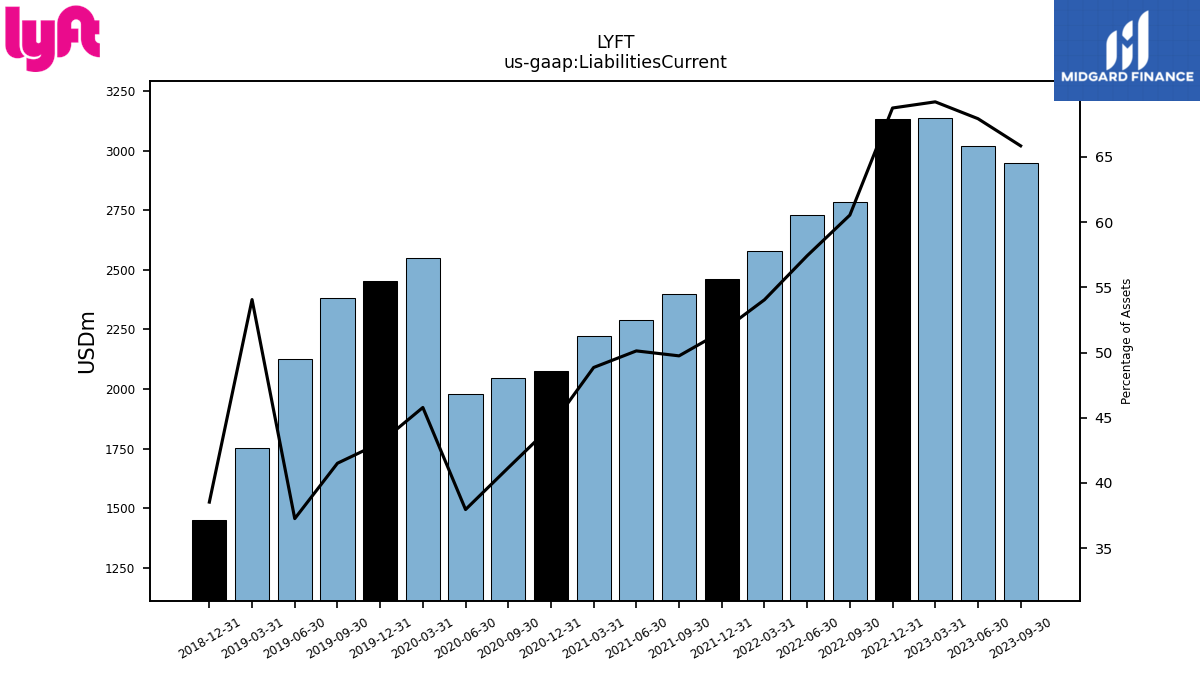
| Liabilities Current | 2948.86 | 3020.44 | 3135.42 | 3132.56 | 2784.85 | 2731.87 | 2577.18 | 2463.58 | 2399.88 | 2291.45 | 2220.85 | 2074.47 | 2045.17 | 1979.56 | 2551.14 | 2451.36 | 2380.79 | 2125.82 | 1752.06 | 1448.82 | NA | NA | NA | |
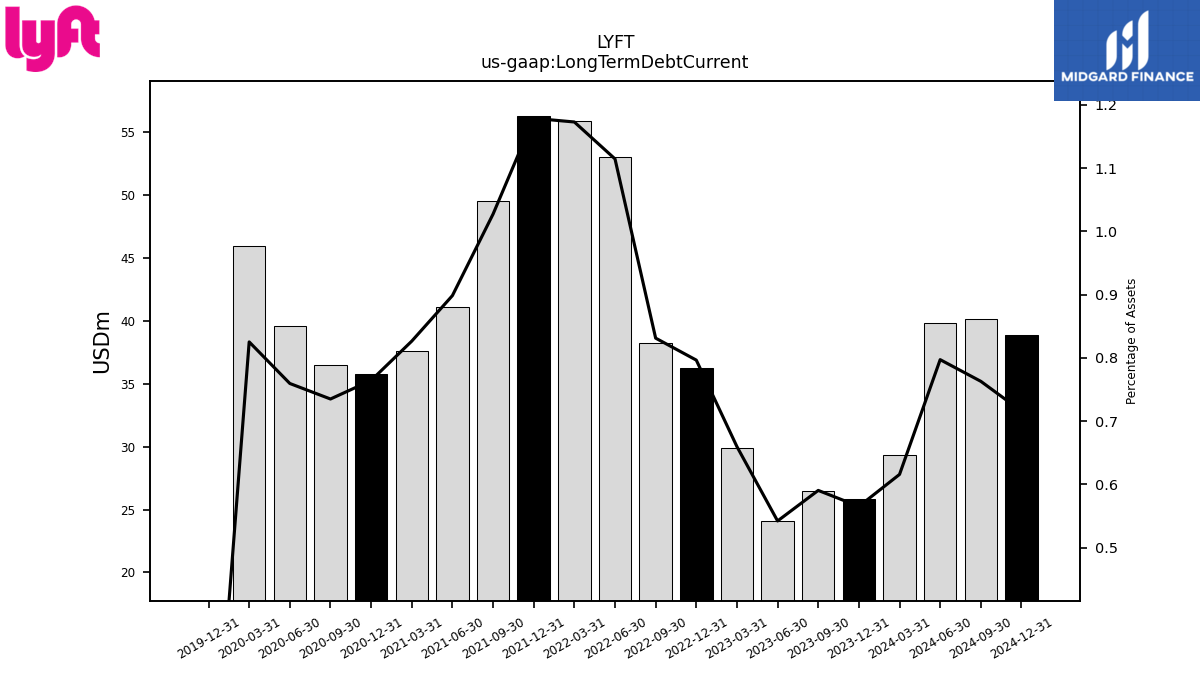
| Long Term Debt Current | 26.44 | 24.11 | 29.88 | 36.29 | 38.23 | 53.02 | 55.92 | 56.26 | 49.55 | 41.07 | 37.57 | 35.76 | 36.51 | 39.60 | 45.98 | 0.00 | NA | NA | NA | NA | NA | NA | NA | |
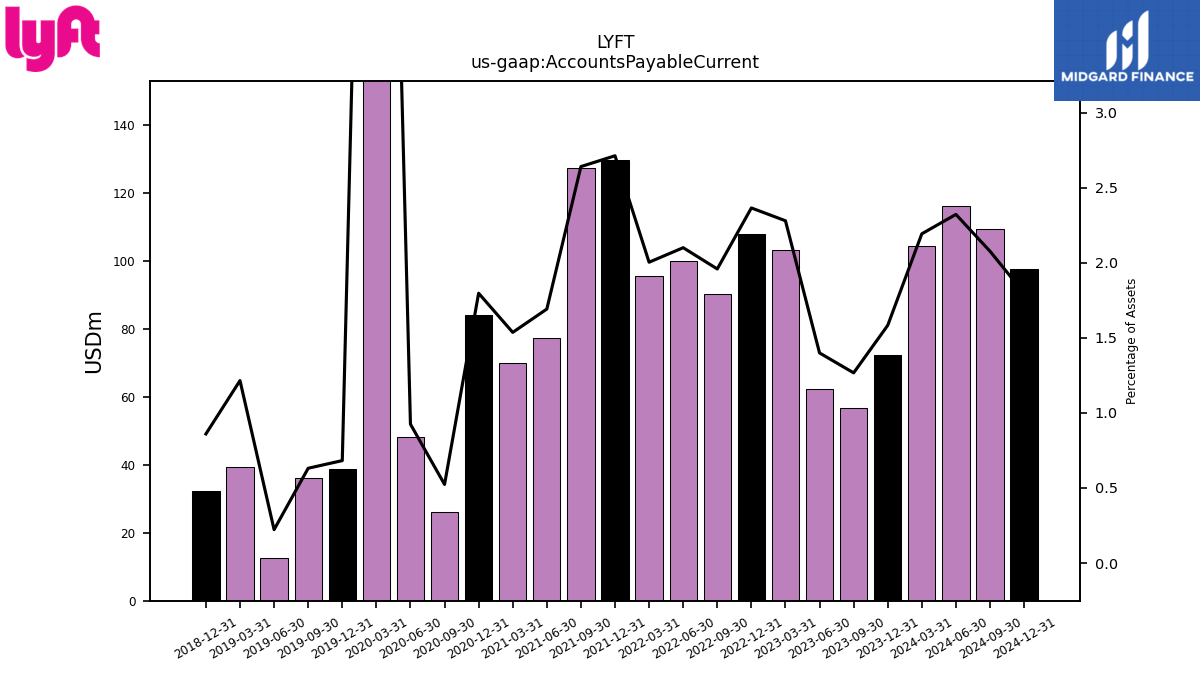
| Accounts Payable Current | 56.74 | 62.23 | 103.30 | 107.80 | 90.13 | 99.96 | 95.57 | 129.54 | 127.43 | 77.35 | 69.86 | 84.11 | 26.02 | 48.24 | 540.50 | 38.84 | 36.21 | 12.69 | 39.39 | 32.34 | NA | NA | NA | |
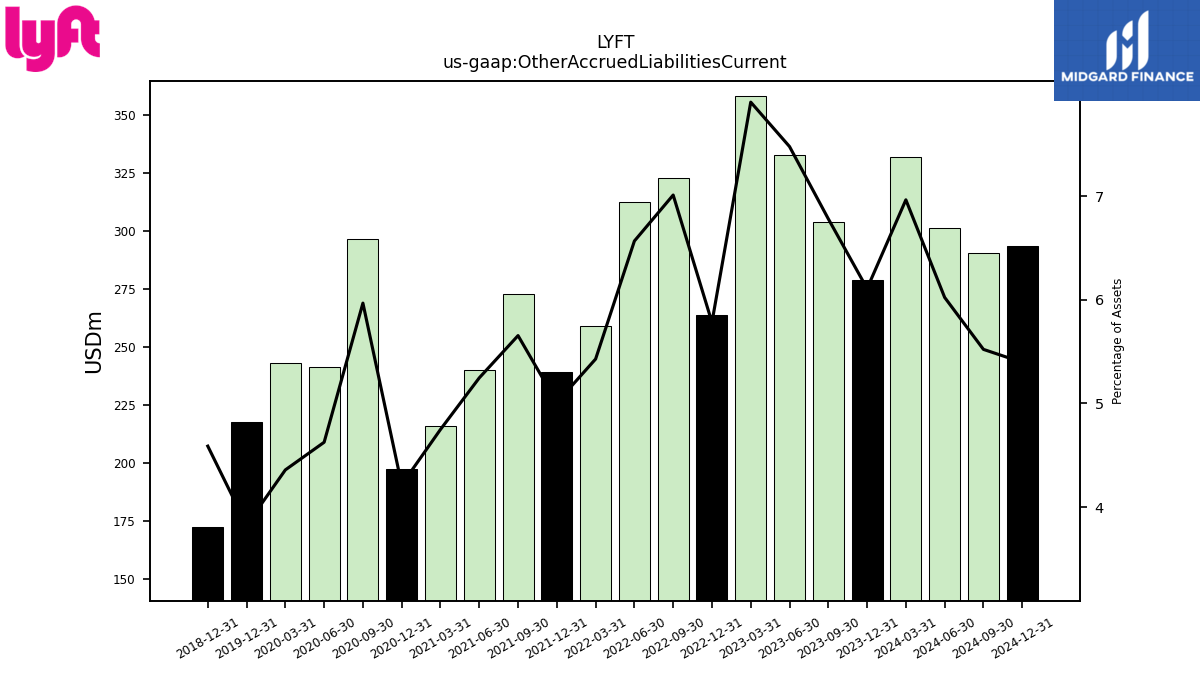
| Other Accrued Liabilities Current | 303.73 | 332.59 | 358.24 | 263.51 | 322.57 | 312.48 | 258.87 | 239.11 | 272.81 | 239.85 | 215.88 | 197.23 | 296.54 | 241.18 | 242.84 | 217.74 | NA | NA | NA | 172.50 | NA | NA | NA | |
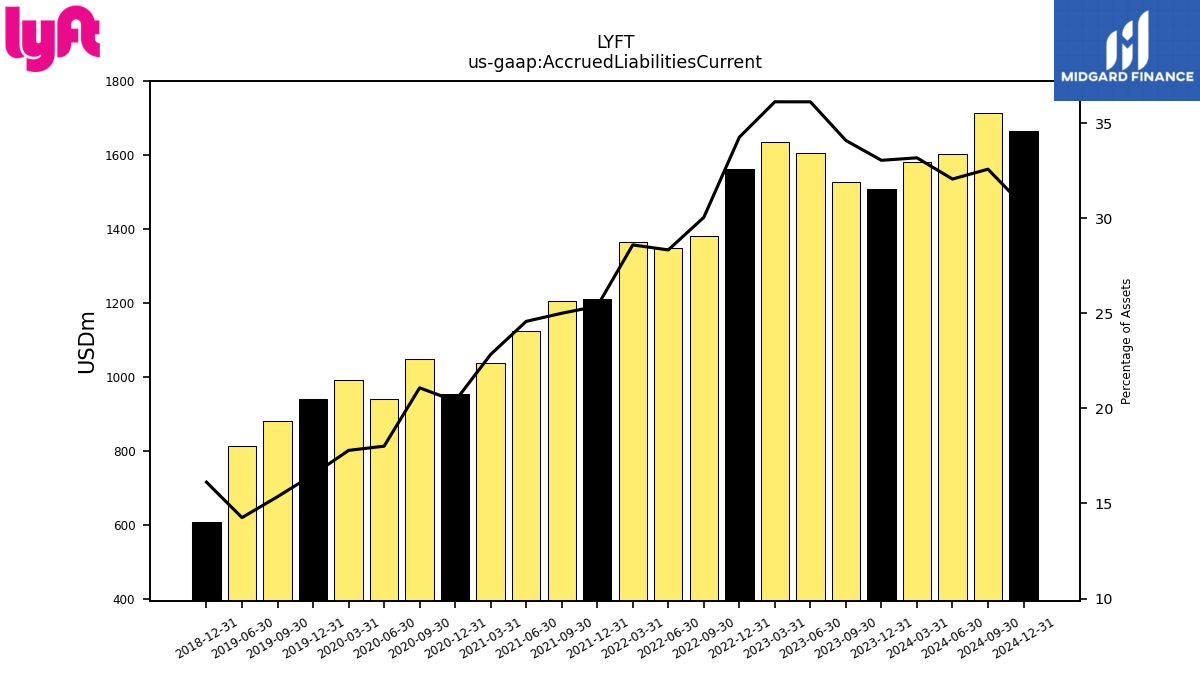
| Accrued Liabilities Current | 1527.02 | 1606.57 | 1636.76 | 1561.61 | 1382.61 | 1348.36 | 1364.02 | 1211.64 | 1206.52 | 1123.74 | 1038.37 | 954.01 | 1047.55 | 939.41 | 991.39 | 939.87 | 880.77 | 813.29 | NA | 606.20 | NA | NA | NA |
| 2023-09-30 | 2023-06-30 | 2023-03-31 | 2022-12-31 | 2022-09-30 | 2022-06-30 | 2022-03-31 | 2021-12-31 | 2021-09-30 | 2021-06-30 | 2021-03-31 | 2020-12-31 | 2020-09-30 | 2020-06-30 | 2020-03-31 | 2019-12-31 | 2019-09-30 | 2019-06-30 | 2019-03-31 | 2018-12-31 | 2018-09-30 | 2018-06-30 | 2018-03-31 | ||
|---|---|---|---|---|---|---|---|---|---|---|---|---|---|---|---|---|---|---|---|---|---|---|---|---|
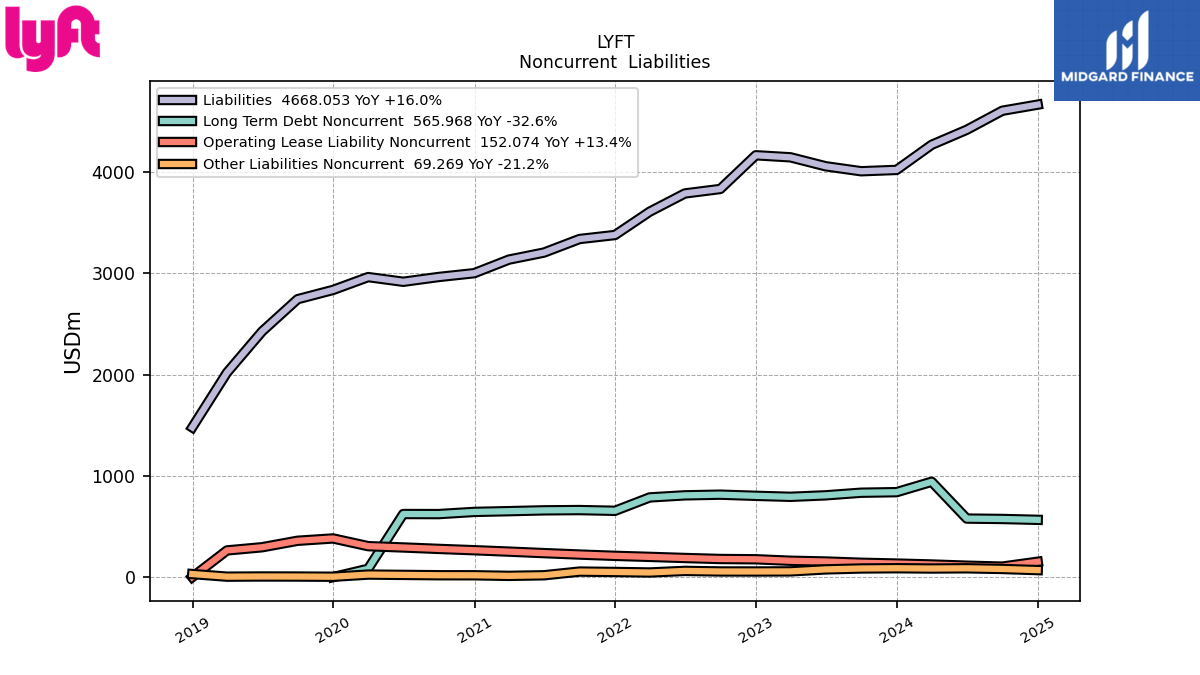
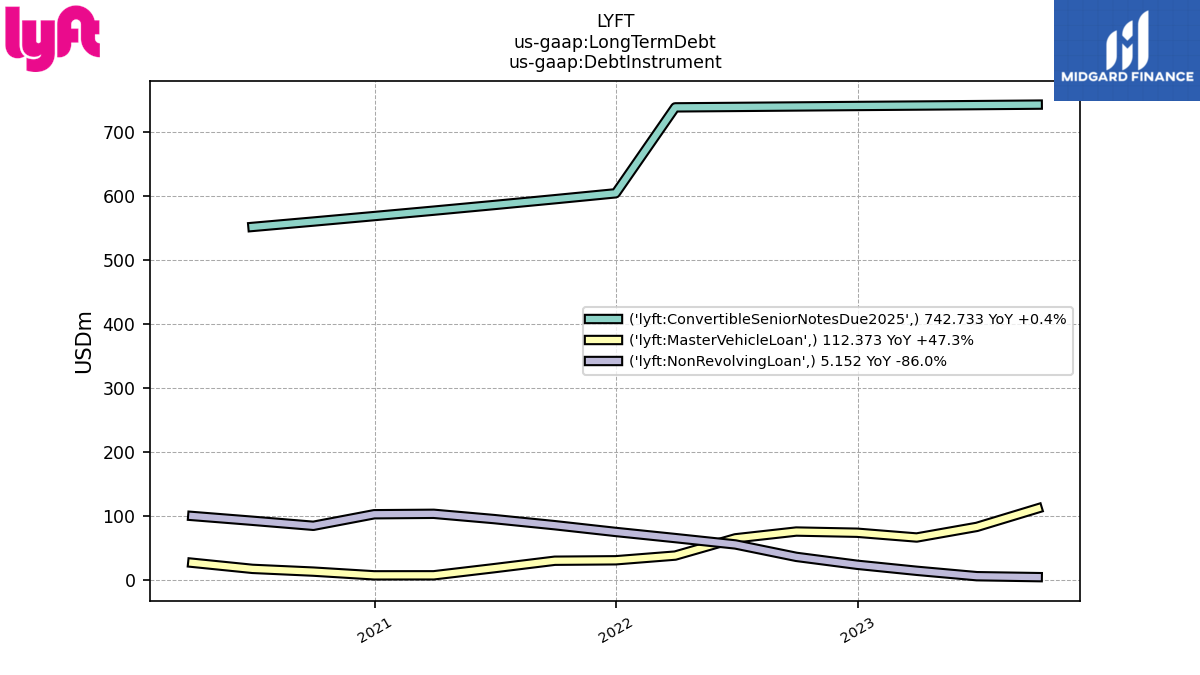
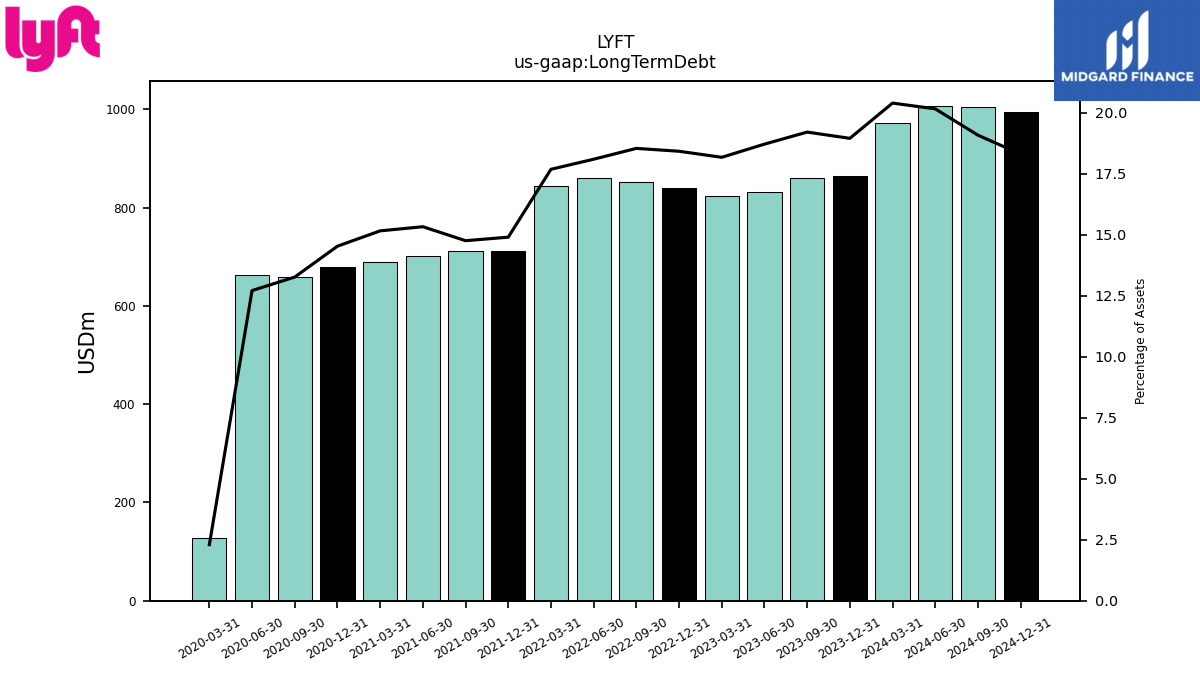
| Long Term Debt | 860.26 | 832.17 | 823.30 | 839.49 | 852.97 | 861.01 | 843.33 | 711.44 | 712.01 | 700.85 | 689.20 | 680.00 | 659.20 | 662.96 | 128.12 | NA | NA | NA | NA | NA | NA | NA | NA | |
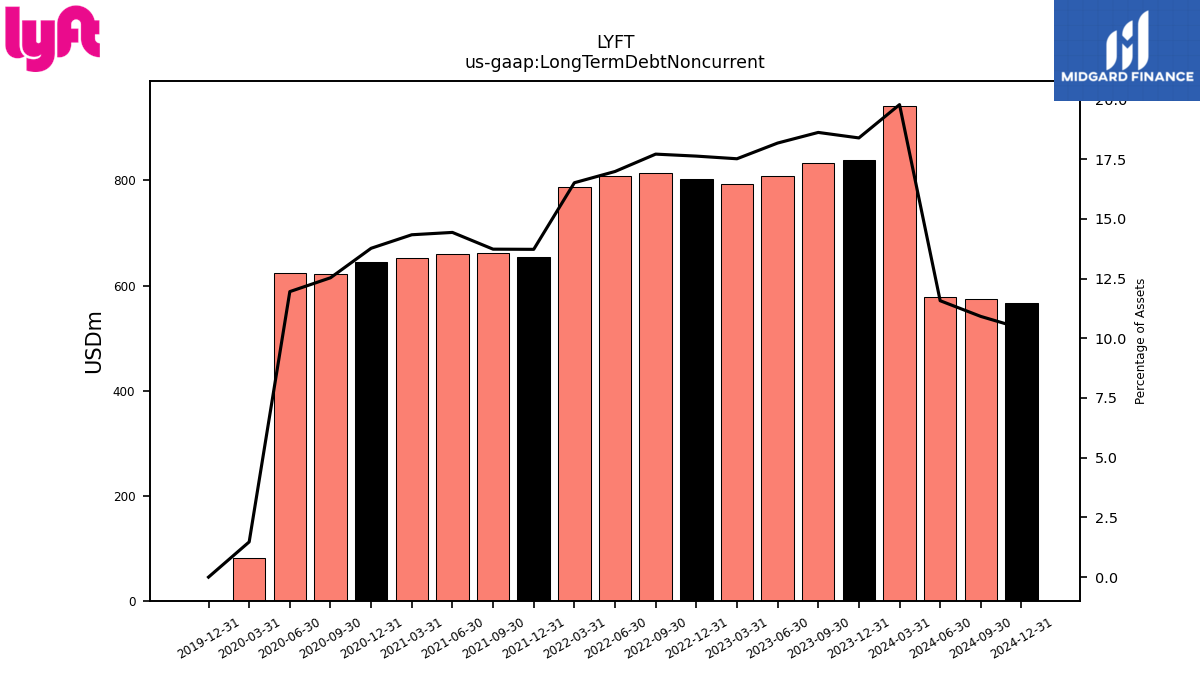
| Long Term Debt Noncurrent | 833.82 | 808.06 | 793.42 | 803.21 | 814.74 | 807.99 | 787.40 | 655.17 | 662.46 | 659.78 | 651.64 | 644.24 | 622.68 | 623.36 | 82.14 | 0.00 | NA | NA | NA | NA | NA | NA | NA | |
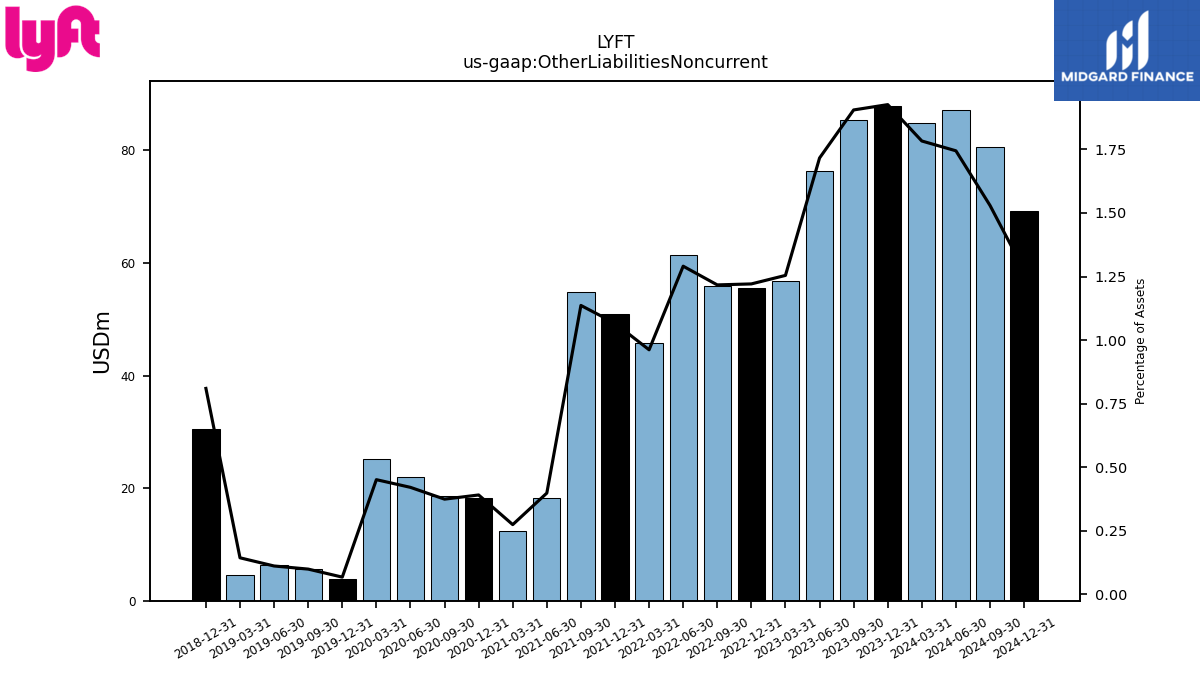
| Other Liabilities Noncurrent | 85.33 | 76.31 | 56.82 | 55.64 | 55.99 | 61.41 | 45.87 | 50.91 | 54.82 | 18.21 | 12.47 | 18.29 | 18.61 | 21.95 | 25.14 | 3.86 | 5.70 | 6.36 | 4.66 | 30.46 | NA | NA | NA | |
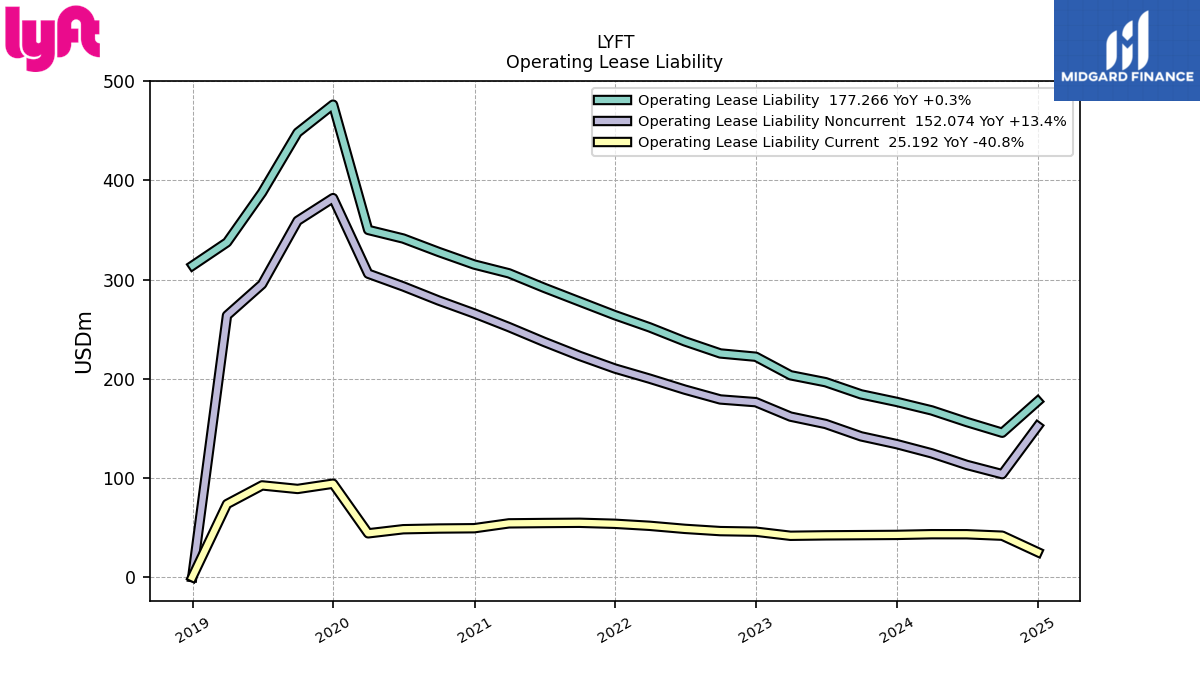
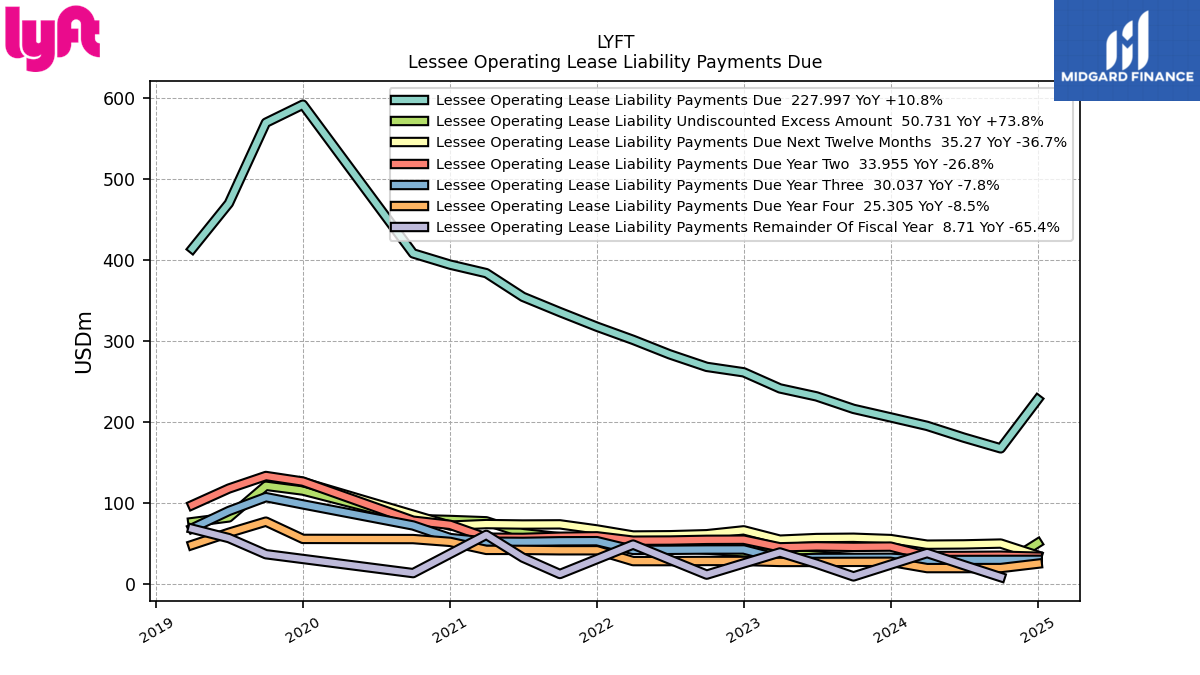
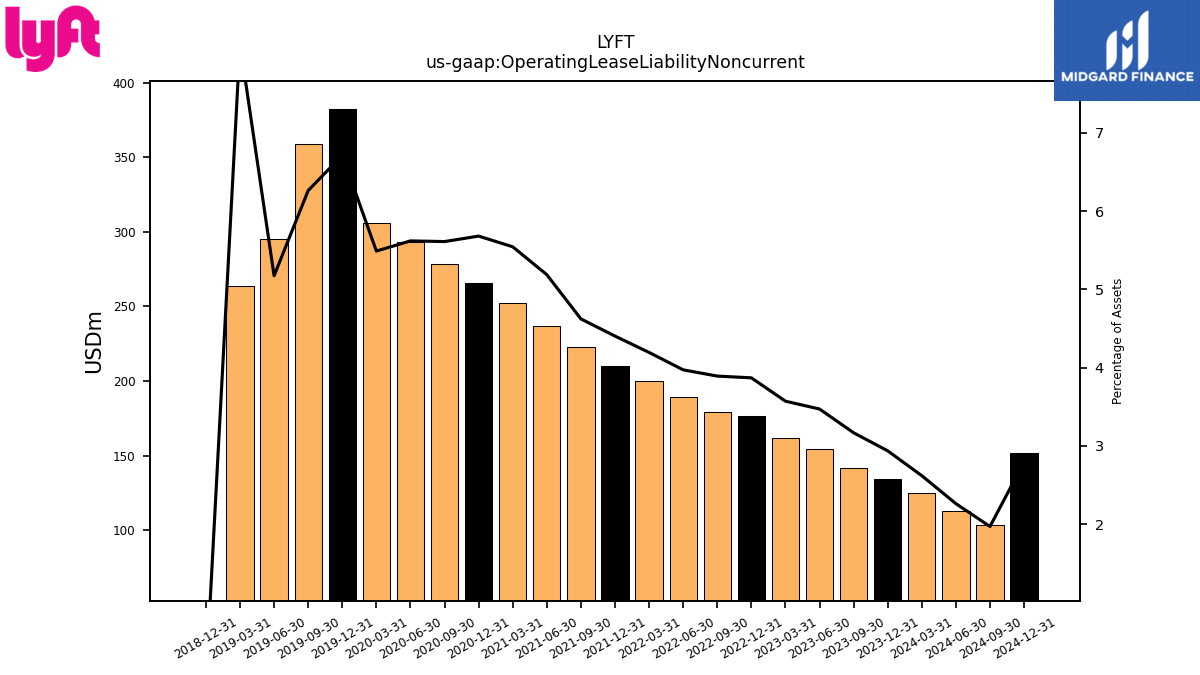
| Operating Lease Liability Noncurrent | 141.89 | 154.38 | 161.80 | 176.36 | 179.08 | 188.99 | 200.02 | 210.23 | 223.03 | 237.15 | 252.03 | 265.80 | 278.77 | 293.02 | 305.85 | 382.08 | 359.16 | 295.16 | 263.75 | 0.00 | NA | NA | NA |
| 2023-09-30 | 2023-06-30 | 2023-03-31 | 2022-12-31 | 2022-09-30 | 2022-06-30 | 2022-03-31 | 2021-12-31 | 2021-09-30 | 2021-06-30 | 2021-03-31 | 2020-12-31 | 2020-09-30 | 2020-06-30 | 2020-03-31 | 2019-12-31 | 2019-09-30 | 2019-06-30 | 2019-03-31 | 2018-12-31 | 2018-09-30 | 2018-06-30 | 2018-03-31 | ||
|---|---|---|---|---|---|---|---|---|---|---|---|---|---|---|---|---|---|---|---|---|---|---|---|---|
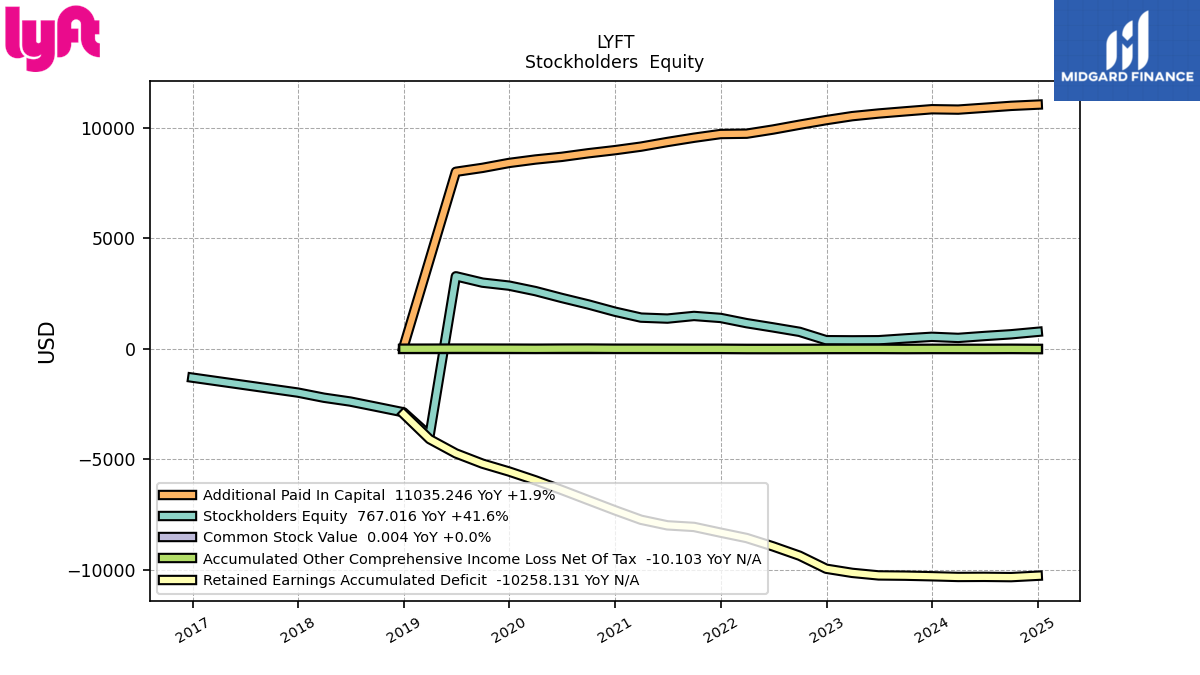
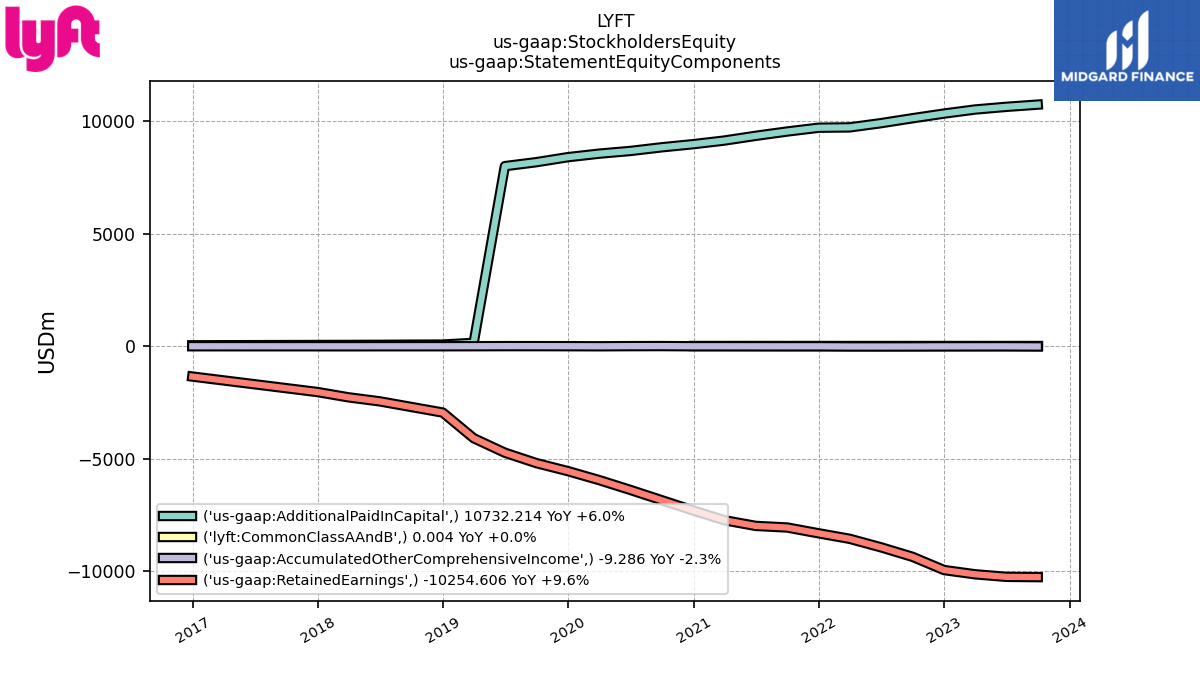
| Stockholders Equity | 468.33 | 387.04 | 382.00 | 388.67 | 765.52 | 967.27 | 1157.99 | 1394.00 | 1484.07 | 1364.76 | 1408.86 | 1676.16 | 2003.09 | 2296.56 | 2607.49 | 2854.08 | 2989.51 | 3277.13 | -3931.62 | -2871.28 | -2626.50 | -2384.26 | -2211.61 | |
| Common Stock Value | 0.00 | 0.00 | 0.00 | 0.00 | 0.00 | 0.00 | 0.00 | 0.00 | 0.00 | 0.00 | 0.00 | 0.00 | 0.00 | 0.00 | 0.00 | 0.00 | 0.00 | NA | NA | 0.00 | NA | NA | NA | |
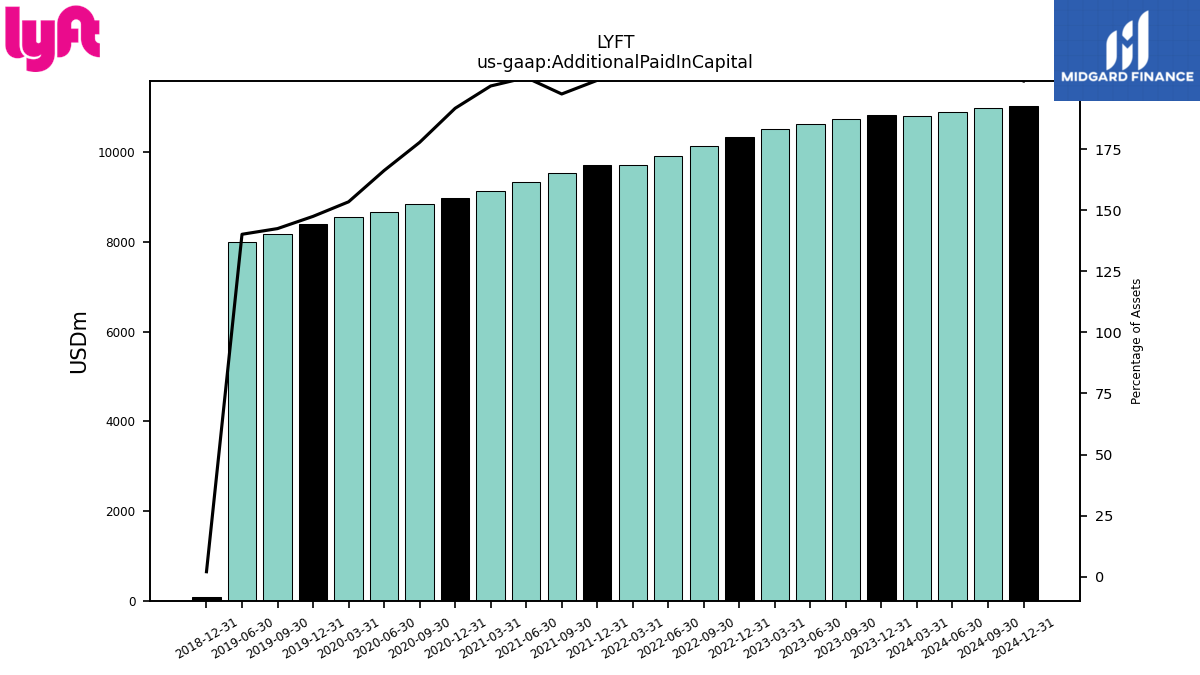
| Additional Paid In Capital | 10732.21 | 10633.37 | 10514.53 | 10335.01 | 10127.49 | 9908.51 | 9721.21 | 9706.29 | 9538.40 | 9346.05 | 9136.88 | 8977.06 | 8838.02 | 8674.21 | 8554.47 | 8398.93 | 8176.40 | 7999.68 | NA | 73.92 | NA | NA | NA | |
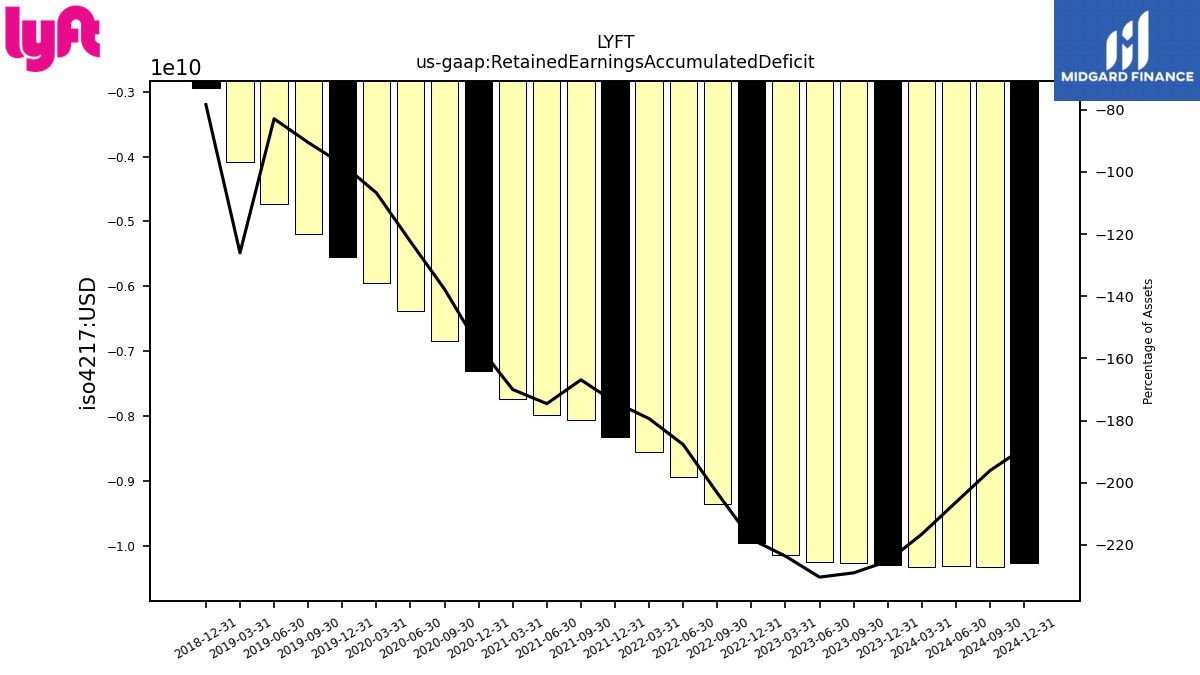
| Retained Earnings Accumulated Deficit | -10254.61 | -10242.51 | -10128.24 | -9940.59 | -9352.46 | -8930.26 | -8553.02 | -8309.79 | -8051.22 | -7979.69 | -7727.77 | -7300.43 | -6842.27 | -6382.76 | -5945.64 | -5547.57 | -5191.52 | -4728.04 | -4083.80 | -2945.33 | NA | NA | NA | |
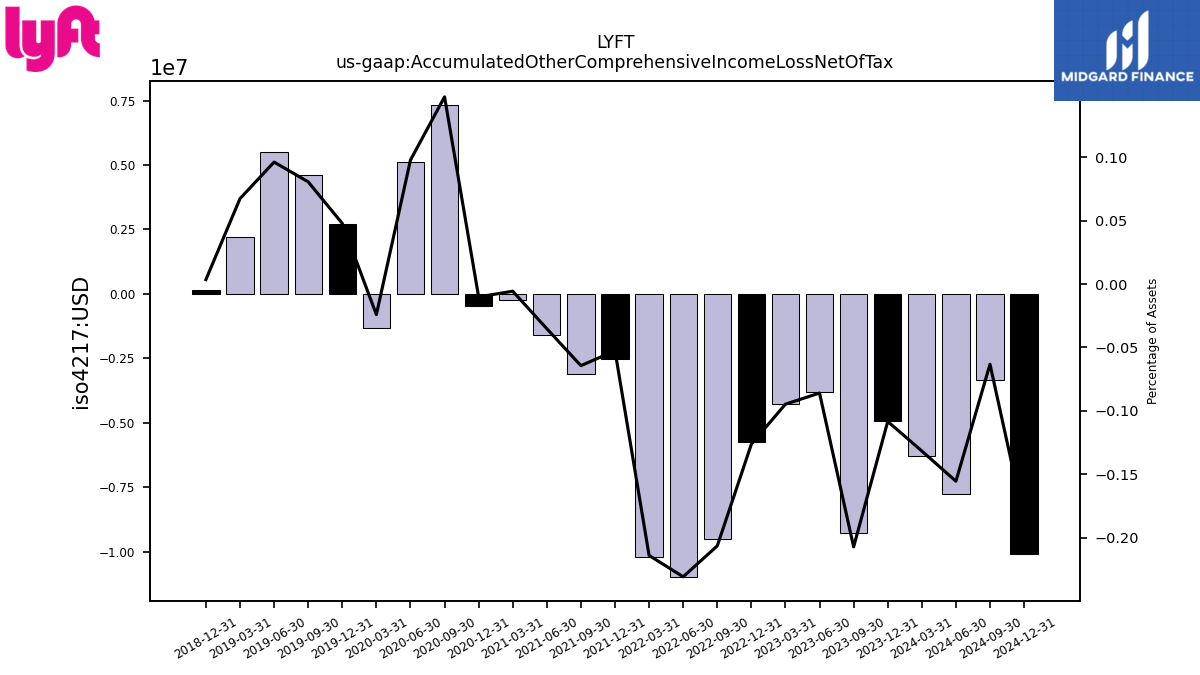
| Accumulated Other Comprehensive Income Loss Net Of Tax | -9.29 | -3.82 | -4.29 | -5.75 | -9.50 | -10.99 | -10.21 | -2.51 | -3.10 | -1.61 | -0.26 | -0.47 | 7.34 | 5.10 | -1.34 | 2.73 | 4.63 | 5.49 | 2.19 | 0.13 | NA | NA | NA | |
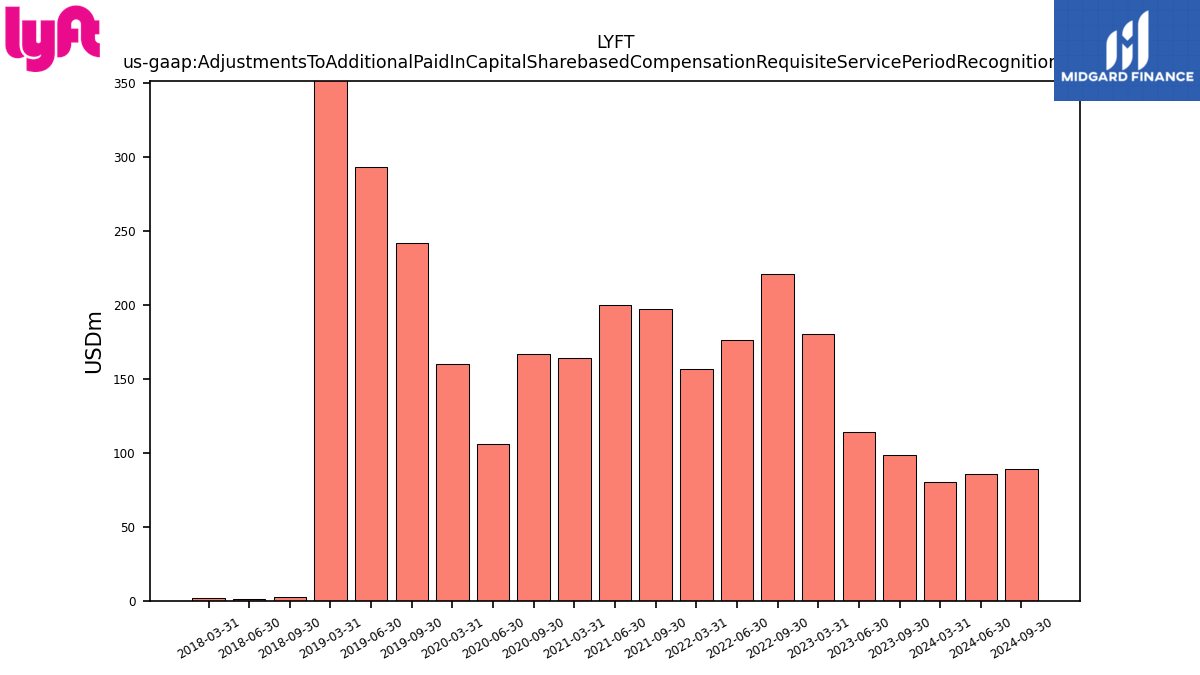
| Adjustments To Additional Paid In Capital Sharebased Compensation Requisite Service Period Recognition Value | 98.54 | 113.93 | 180.38 | NA | 220.98 | 176.64 | 156.59 | NA | 197.49 | 200.11 | 164.23 | NA | 166.72 | 105.80 | 159.98 | NA | 242.18 | 293.24 | 859.49 | NA | 2.85 | 1.50 | 2.00 |
| 2023-09-30 | 2023-06-30 | 2023-03-31 | 2022-12-31 | 2022-09-30 | 2022-06-30 | 2022-03-31 | 2021-12-31 | 2021-09-30 | 2021-06-30 | 2021-03-31 | 2020-12-31 | 2020-09-30 | 2020-06-30 | 2020-03-31 | 2019-12-31 | 2019-09-30 | 2019-06-30 | 2019-03-31 | 2018-12-31 | 2018-09-30 | 2018-06-30 | 2018-03-31 | ||
|---|---|---|---|---|---|---|---|---|---|---|---|---|---|---|---|---|---|---|---|---|---|---|---|---|
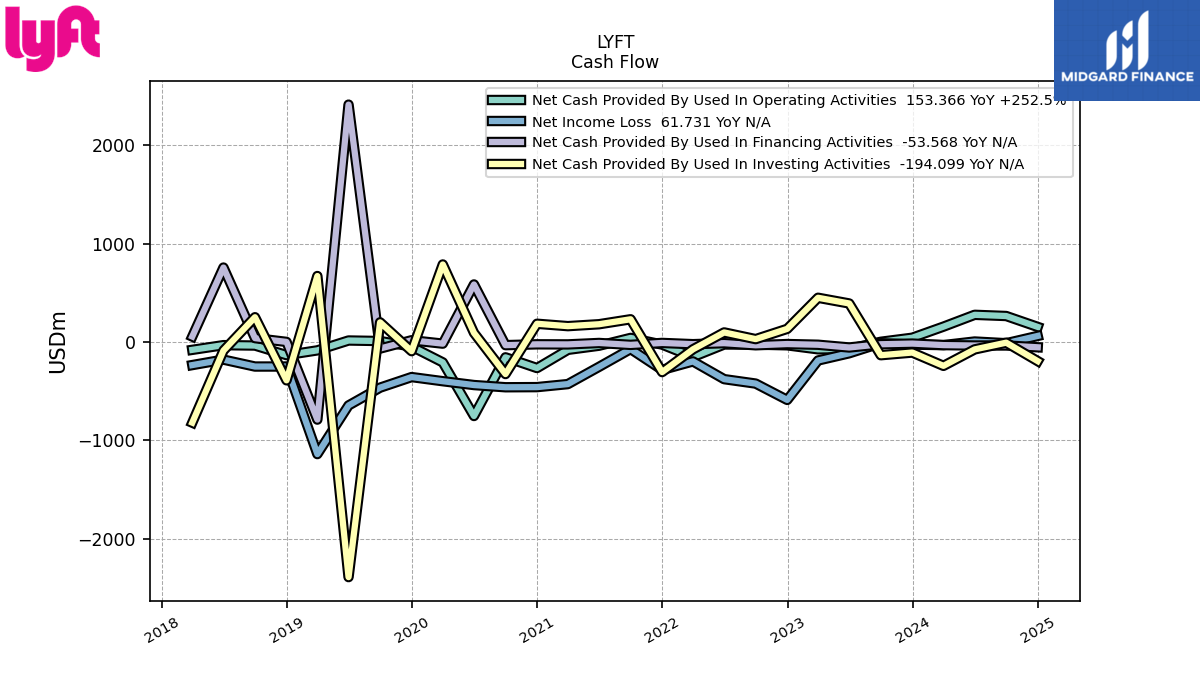
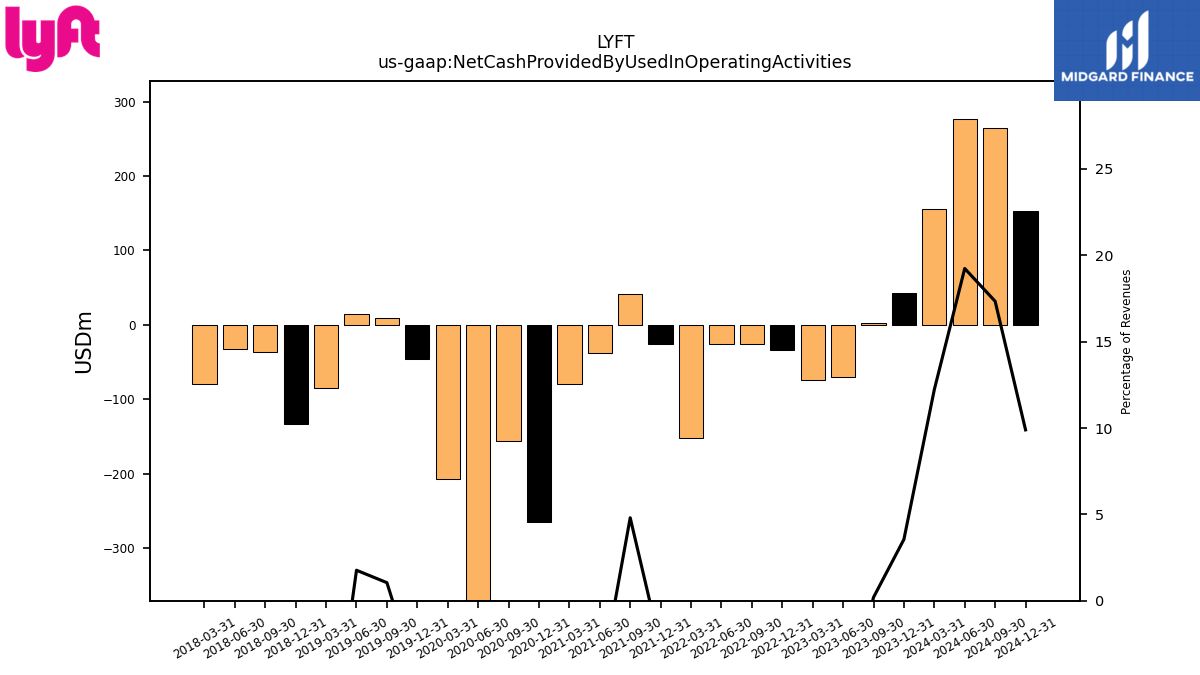
| Net Cash Provided By Used In Operating Activities | 2.26 | -69.97 | -74.04 | -33.56 | -26.20 | -25.19 | -152.34 | -26.22 | 41.53 | -37.57 | -79.46 | -264.61 | -155.64 | -751.72 | -206.93 | -46.19 | 10.00 | 15.32 | -84.83 | -133.09 | -35.99 | -31.97 | -79.62 | |
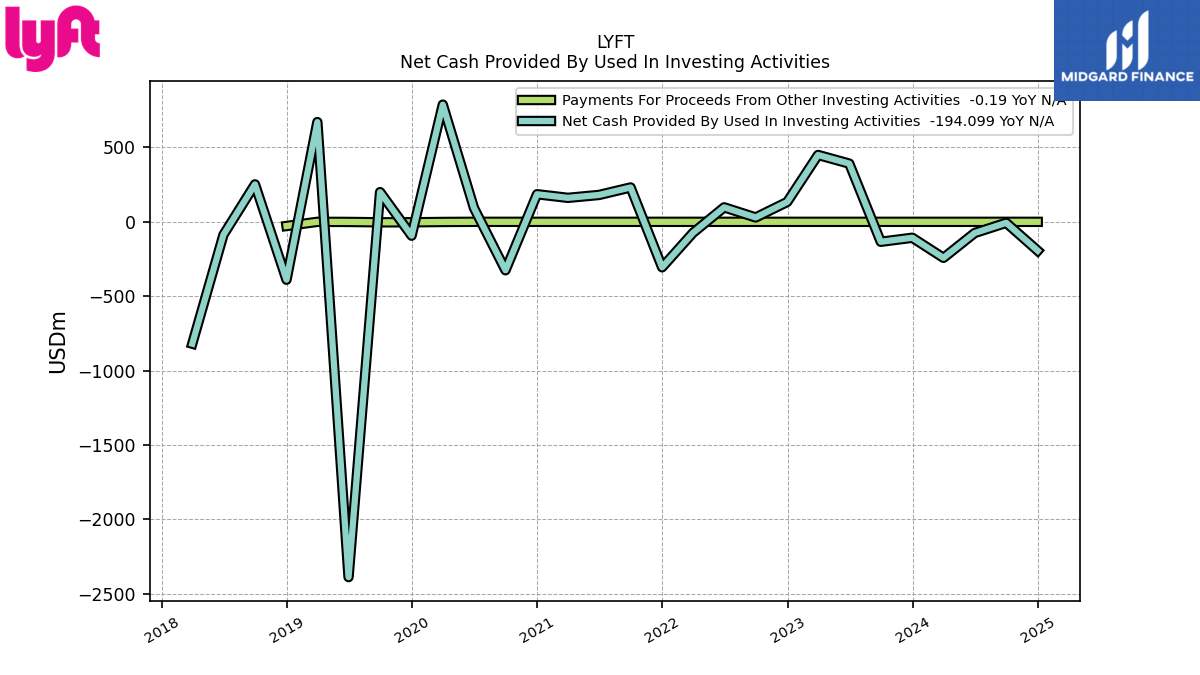
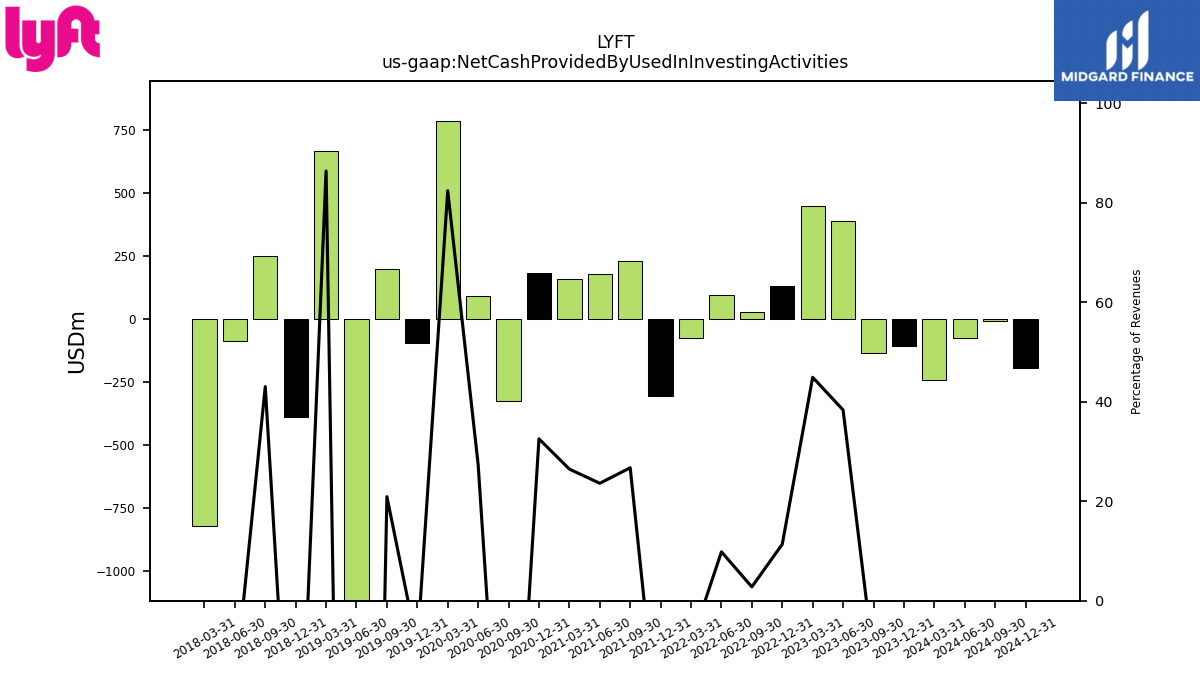
| Net Cash Provided By Used In Investing Activities | -134.08 | 391.48 | 449.37 | 133.54 | 29.38 | 97.36 | -74.24 | -305.72 | 230.99 | 180.62 | 161.12 | 185.42 | -325.55 | 92.89 | 787.67 | -93.11 | 199.86 | -2387.91 | 670.32 | -389.19 | 251.72 | -87.15 | -819.13 | |
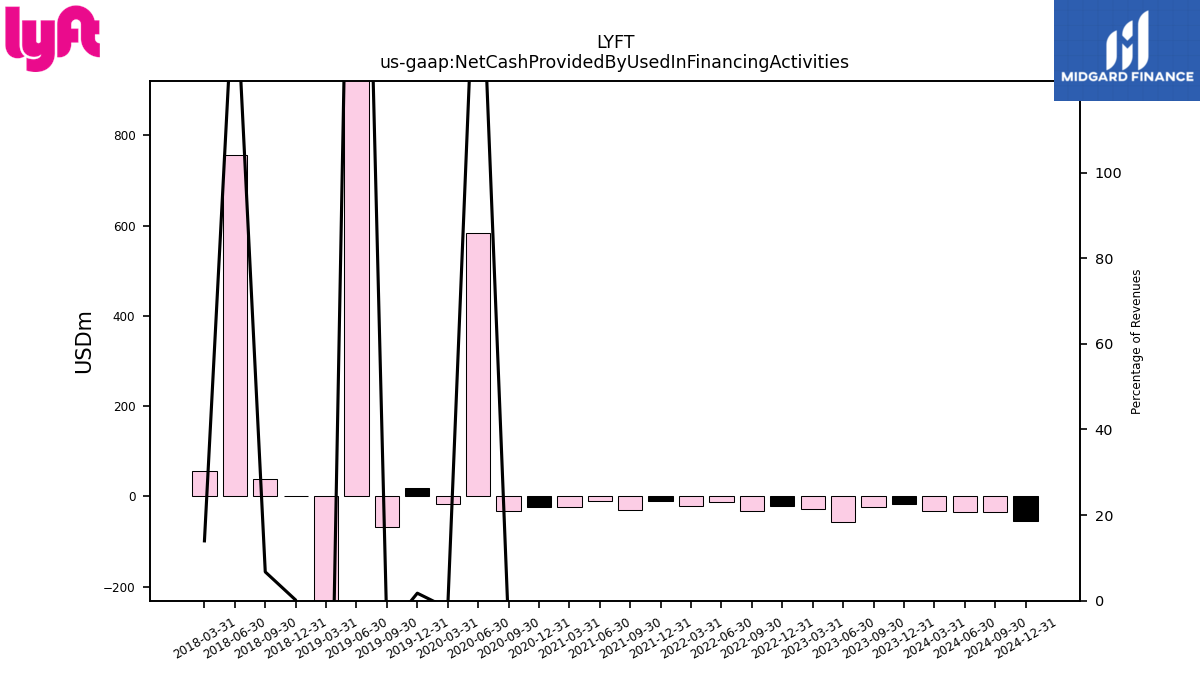
| Net Cash Provided By Used In Financing Activities | -22.71 | -55.61 | -27.74 | -20.63 | -33.26 | -11.59 | -22.01 | -9.33 | -29.14 | -9.71 | -24.29 | -23.45 | -31.95 | 584.62 | -16.64 | 17.96 | -66.58 | 2410.98 | -788.17 | 1.10 | 39.42 | 756.18 | 55.54 |
| 2023-09-30 | 2023-06-30 | 2023-03-31 | 2022-12-31 | 2022-09-30 | 2022-06-30 | 2022-03-31 | 2021-12-31 | 2021-09-30 | 2021-06-30 | 2021-03-31 | 2020-12-31 | 2020-09-30 | 2020-06-30 | 2020-03-31 | 2019-12-31 | 2019-09-30 | 2019-06-30 | 2019-03-31 | 2018-12-31 | 2018-09-30 | 2018-06-30 | 2018-03-31 | ||
|---|---|---|---|---|---|---|---|---|---|---|---|---|---|---|---|---|---|---|---|---|---|---|---|---|
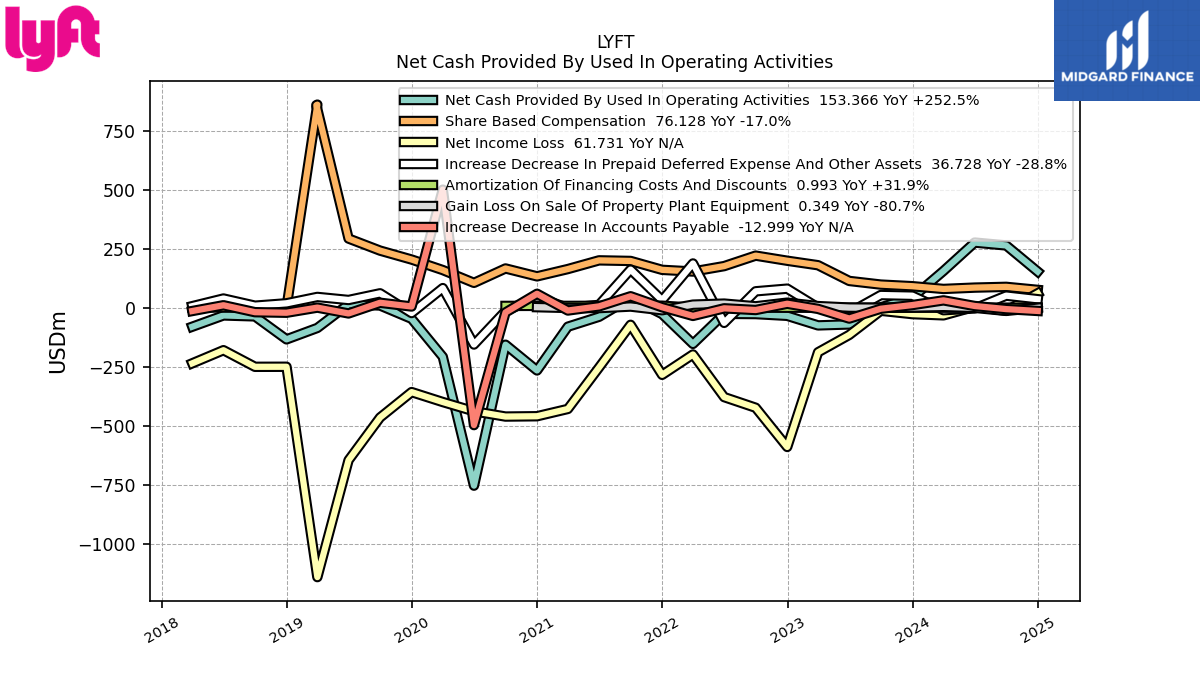
| Net Cash Provided By Used In Operating Activities | 2.26 | -69.97 | -74.04 | -33.56 | -26.20 | -25.19 | -152.34 | -26.22 | 41.53 | -37.57 | -79.46 | -264.61 | -155.64 | -751.72 | -206.93 | -46.19 | 10.00 | 15.32 | -84.83 | -133.09 | -35.99 | -31.97 | -79.62 | |
| Net Income Loss | -12.10 | -114.26 | -187.65 | -588.13 | -422.20 | -377.25 | -196.93 | -283.17 | -71.54 | -251.92 | -427.34 | -458.15 | -459.52 | -437.11 | -398.07 | -356.05 | -463.48 | -644.24 | -1138.47 | -248.93 | -249.16 | -178.90 | -234.34 | |
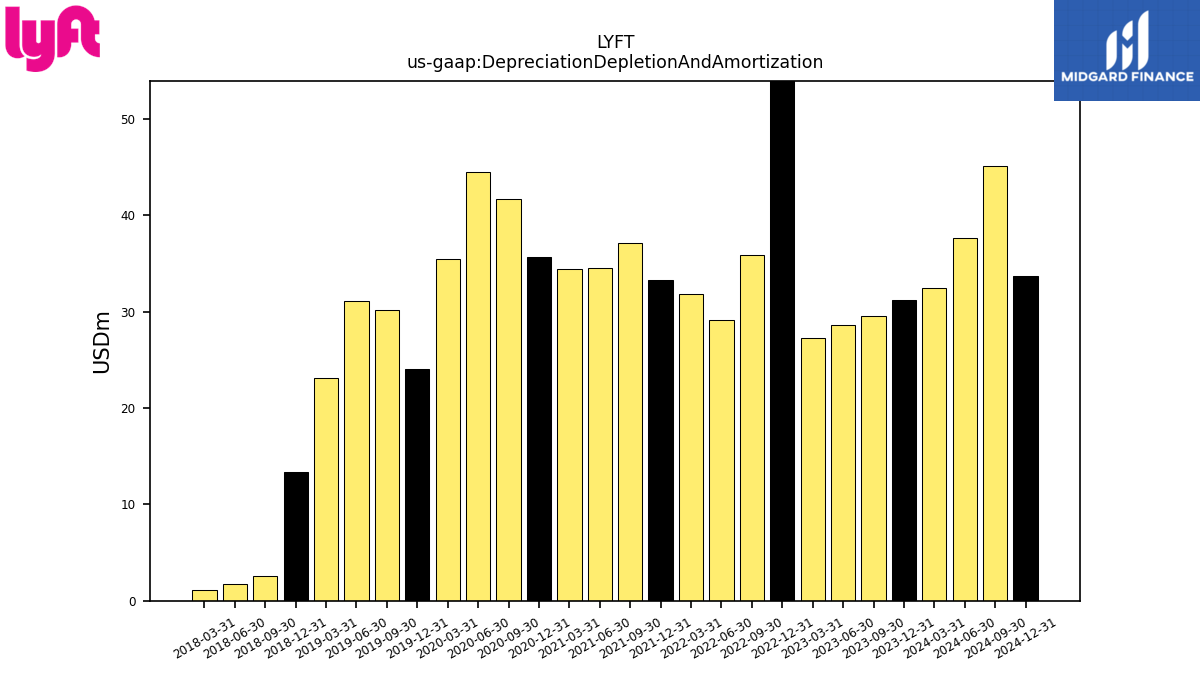
| Depreciation Depletion And Amortization | 29.51 | 28.61 | 27.23 | 58.01 | 35.88 | 29.12 | 31.79 | 33.28 | 37.06 | 34.56 | 34.45 | 35.70 | 41.71 | 44.46 | 35.47 | 24.08 | 30.14 | 31.08 | 23.14 | 13.33 | 2.58 | 1.70 | 1.14 | |
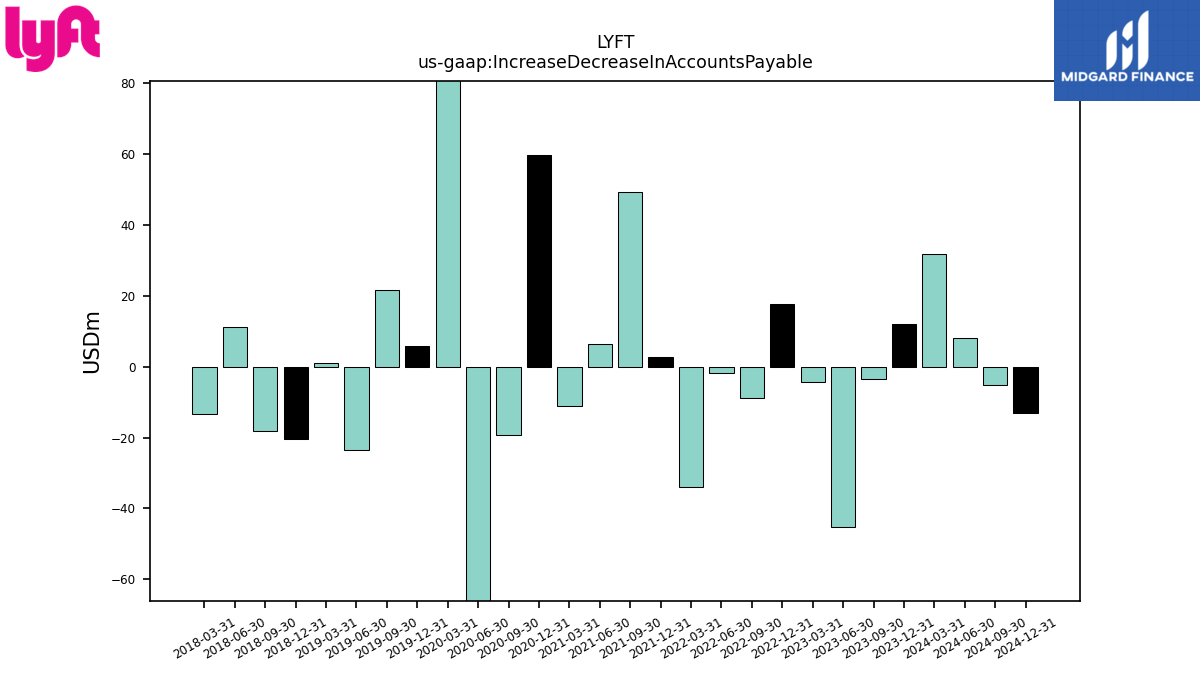
| Increase Decrease In Accounts Payable | -3.58 | -45.11 | -4.29 | 17.55 | -8.98 | -1.85 | -33.93 | 2.63 | 49.17 | 6.40 | -11.12 | 59.64 | -19.39 | -495.77 | 500.00 | 5.80 | 21.67 | -23.56 | 1.16 | -20.52 | -18.19 | 11.17 | -13.27 | |
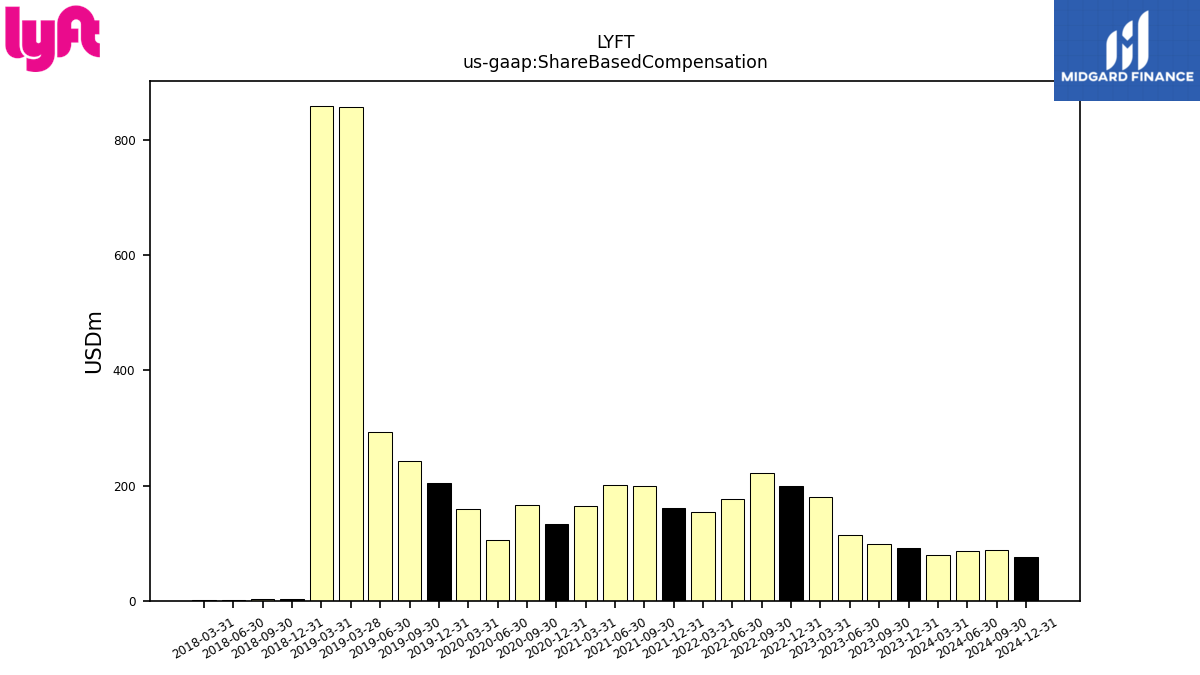
| Share Based Compensation | 98.54 | 113.93 | 180.38 | 199.40 | 220.98 | 176.64 | 153.74 | 160.88 | 198.44 | 201.00 | 164.23 | 133.31 | 166.72 | 105.80 | 159.98 | 204.41 | 242.18 | 293.24 | 859.49 | 2.23 | 2.85 | 1.50 | 2.00 |
| 2023-09-30 | 2023-06-30 | 2023-03-31 | 2022-12-31 | 2022-09-30 | 2022-06-30 | 2022-03-31 | 2021-12-31 | 2021-09-30 | 2021-06-30 | 2021-03-31 | 2020-12-31 | 2020-09-30 | 2020-06-30 | 2020-03-31 | 2019-12-31 | 2019-09-30 | 2019-06-30 | 2019-03-31 | 2018-12-31 | 2018-09-30 | 2018-06-30 | 2018-03-31 | ||
|---|---|---|---|---|---|---|---|---|---|---|---|---|---|---|---|---|---|---|---|---|---|---|---|---|
| Net Cash Provided By Used In Investing Activities | -134.08 | 391.48 | 449.37 | 133.54 | 29.38 | 97.36 | -74.24 | -305.72 | 230.99 | 180.62 | 161.12 | 185.42 | -325.55 | 92.89 | 787.67 | -93.11 | 199.86 | -2387.91 | 670.32 | -389.19 | 251.72 | -87.15 | -819.13 |
| 2023-09-30 | 2023-06-30 | 2023-03-31 | 2022-12-31 | 2022-09-30 | 2022-06-30 | 2022-03-31 | 2021-12-31 | 2021-09-30 | 2021-06-30 | 2021-03-31 | 2020-12-31 | 2020-09-30 | 2020-06-30 | 2020-03-31 | 2019-12-31 | 2019-09-30 | 2019-06-30 | 2019-03-31 | 2018-12-31 | 2018-09-30 | 2018-06-30 | 2018-03-31 | ||
|---|---|---|---|---|---|---|---|---|---|---|---|---|---|---|---|---|---|---|---|---|---|---|---|---|
| Net Cash Provided By Used In Financing Activities | -22.71 | -55.61 | -27.74 | -20.63 | -33.26 | -11.59 | -22.01 | -9.33 | -29.14 | -9.71 | -24.29 | -23.45 | -31.95 | 584.62 | -16.64 | 17.96 | -66.58 | 2410.98 | -788.17 | 1.10 | 39.42 | 756.18 | 55.54 |
| 2023-09-30 | 2023-06-30 | 2023-03-31 | 2022-12-31 | 2022-09-30 | 2022-06-30 | 2022-03-31 | 2021-12-31 | 2021-09-30 | 2021-06-30 | 2021-03-31 | 2020-12-31 | 2020-09-30 | 2020-06-30 | 2020-03-31 | 2019-12-31 | 2019-09-30 | 2019-06-30 | 2019-03-31 | 2018-12-31 | 2018-09-30 | 2018-06-30 | 2018-03-31 | ||
|---|---|---|---|---|---|---|---|---|---|---|---|---|---|---|---|---|---|---|---|---|---|---|---|---|
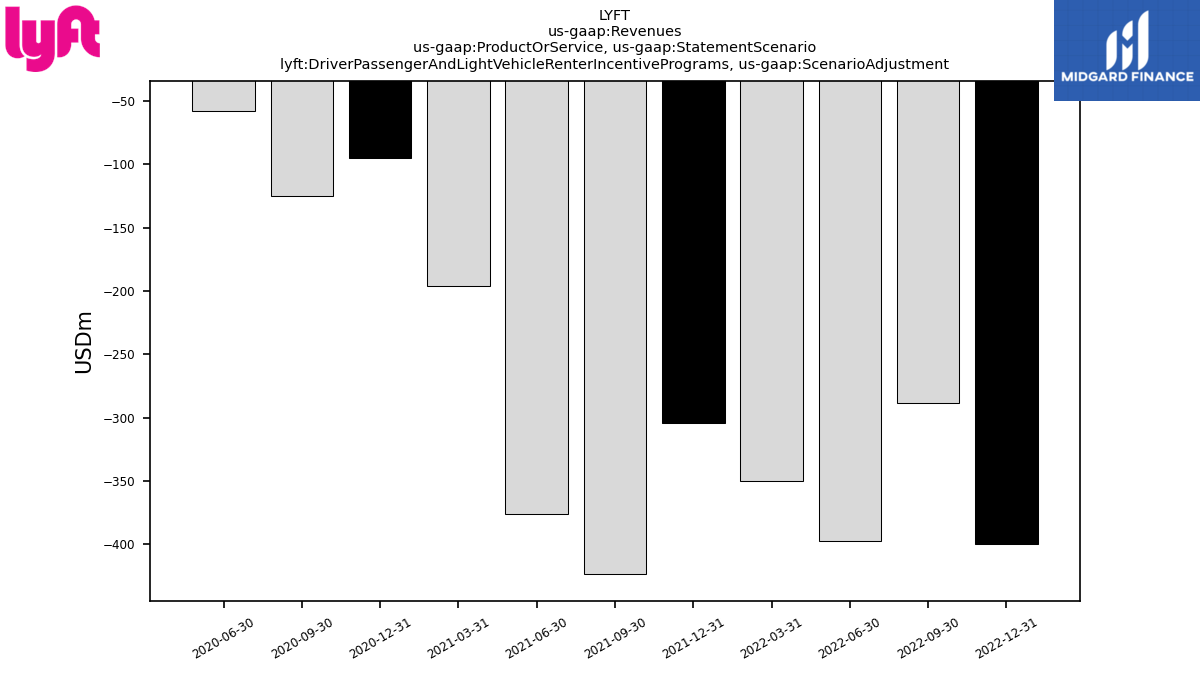
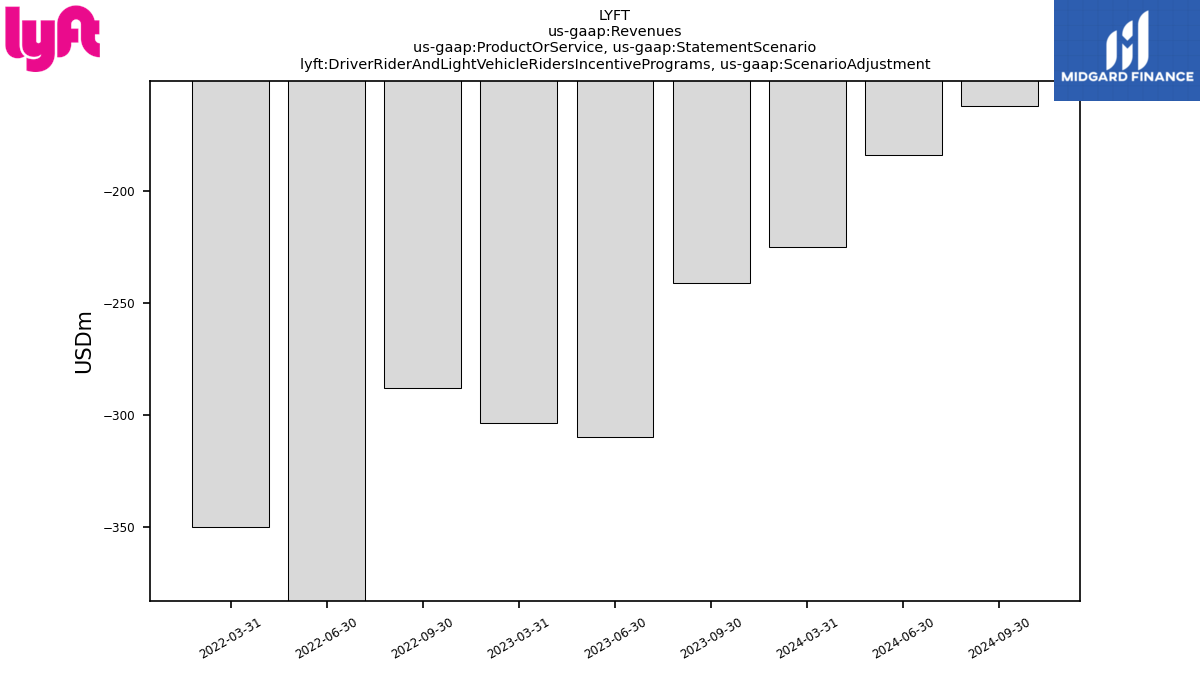
| Revenues | 1157.55 | 1020.91 | 1000.55 | 1174.99 | 1053.82 | 990.75 | 875.58 | 969.93 | 864.40 | 765.02 | 608.96 | 569.88 | 499.74 | 339.35 | 955.71 | 1017.07 | 955.60 | 867.26 | 776.03 | 669.57 | 584.95 | 504.91 | 397.19 | |
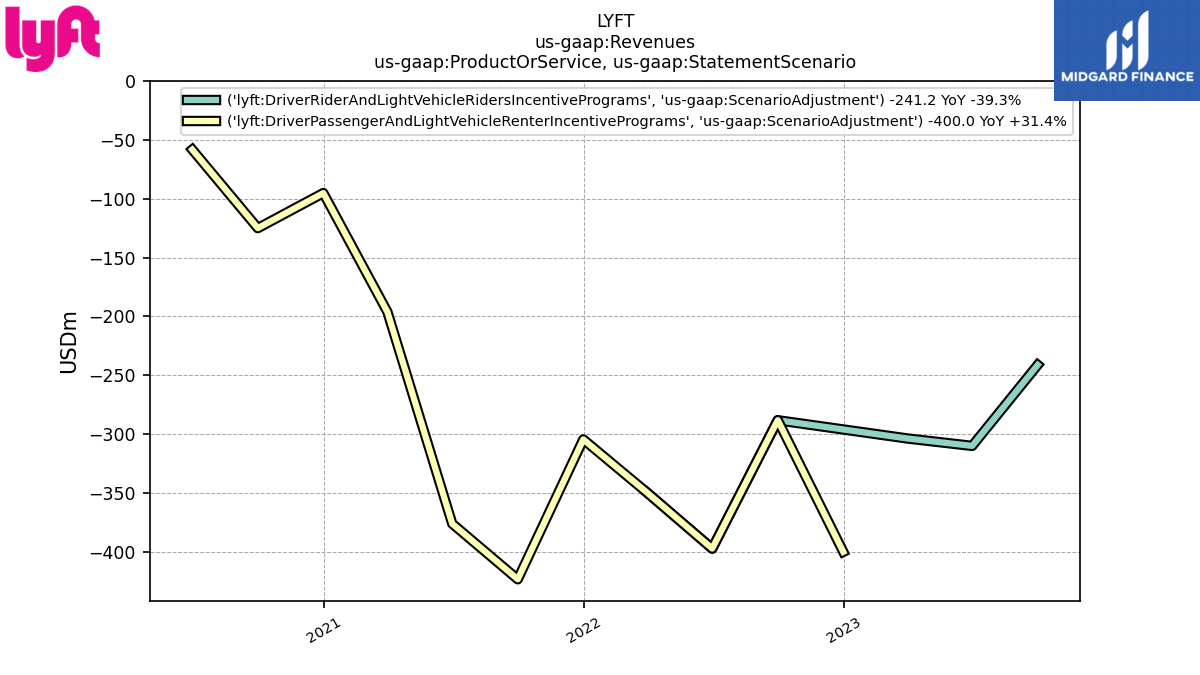
| Driver Passenger And Light Vehicle Renter Incentive Programs, Scenario Adjustment | NA | NA | NA | -400.00 | -288.20 | -397.20 | -349.90 | -304.50 | -423.30 | -376.10 | -196.20 | -95.20 | -125.00 | -58.30 | NA | NA | NA | NA | NA | NA | NA | NA | NA | |
| Driver Rider And Light Vehicle Riders Incentive Programs, Scenario Adjustment | -241.20 | -310.00 | -303.70 | NA | -288.20 | -397.20 | -349.90 | NA | NA | NA | NA | NA | NA | NA | NA | NA | NA | NA | NA | NA | NA | NA | NA | |
| Revenue From Contract With Customer Excluding Assessed Tax | 1069.94 | 940.96 | 952.70 | 1113.30 | 966.05 | 914.55 | 818.10 | 969.93 | 784.07 | 696.90 | 568.79 | 527.42 | 450.56 | 312.35 | 918.33 | 1017.07 | 955.60 | 867.26 | 776.03 | 669.57 | 584.95 | 504.91 | 397.19 |