
| 2023-10-31 | 2023-07-31 | 2023-04-30 | 2023-01-31 | 2022-10-31 | 2022-07-31 | 2022-04-30 | 2022-01-31 | 2021-10-31 | 2021-07-31 | 2021-04-30 | 2021-01-31 | 2020-10-31 | 2020-07-31 | 2020-04-30 | 2020-01-31 | 2019-10-31 | 2019-07-31 | 2019-04-30 | 2019-01-31 | 2018-10-31 | 2018-07-31 | 2018-04-30 | 2018-01-31 | 2017-10-31 | 2017-07-31 | 2017-04-30 | 2017-01-31 | 2016-10-31 | ||
|---|---|---|---|---|---|---|---|---|---|---|---|---|---|---|---|---|---|---|---|---|---|---|---|---|---|---|---|---|---|---|
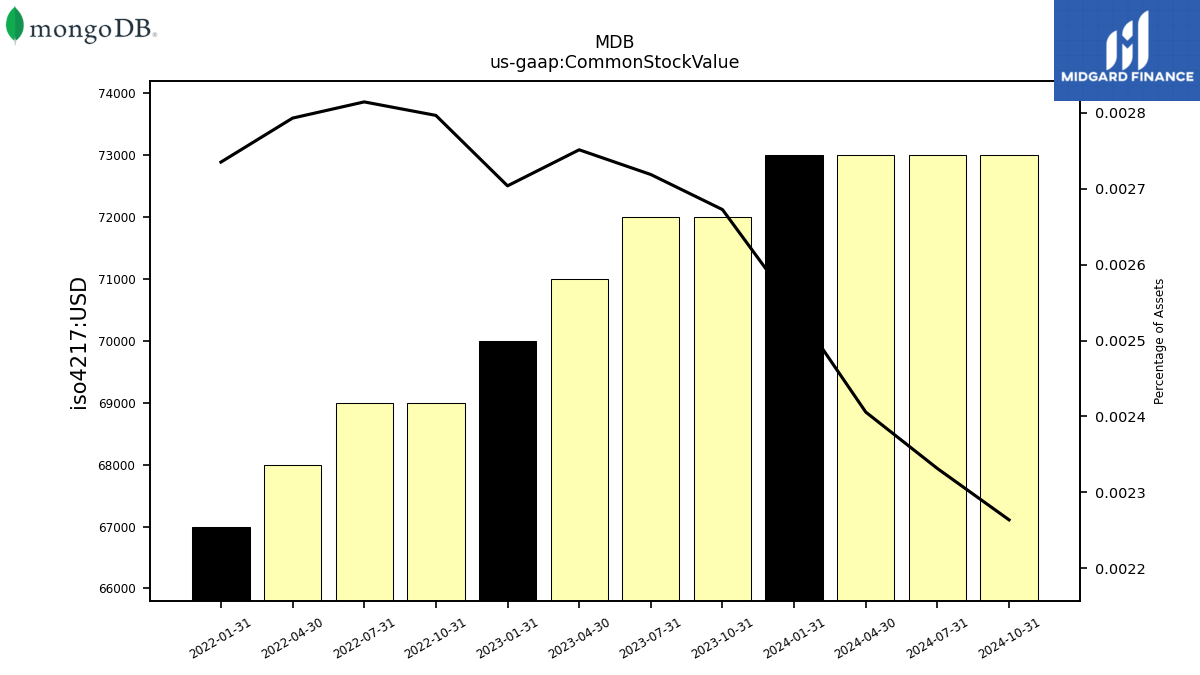
| Common Stock Value | 0.07 | 0.07 | 0.07 | 0.07 | 0.07 | 0.07 | 0.07 | 0.07 | NA | NA | NA | NA | NA | NA | NA | NA | NA | NA | NA | NA | NA | NA | NA | NA | NA | NA | NA | NA | NA | |
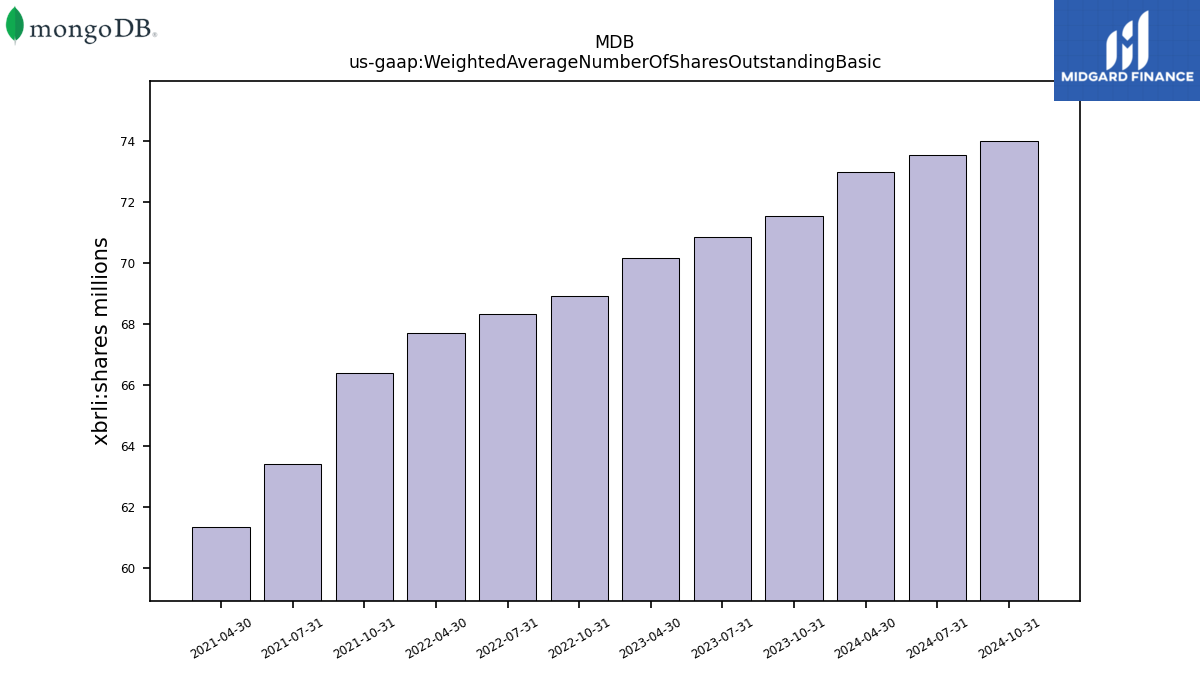
| Weighted Average Number Of Shares Outstanding Basic | 71.56 | 70.87 | 70.18 | NA | 68.92 | 68.33 | 67.71 | NA | 66.39 | 63.43 | 61.36 | NA | NA | NA | NA | NA | NA | NA | NA | NA | NA | NA | NA | NA | NA | NA | NA | NA | NA | |
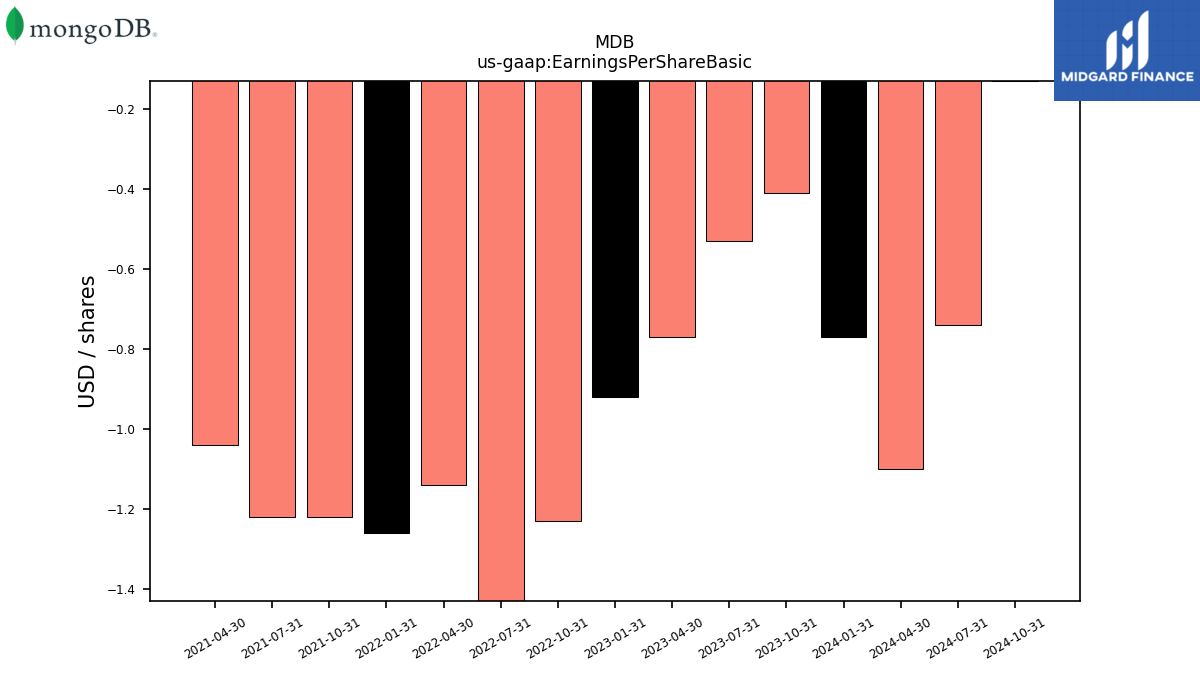
| Earnings Per Share Basic | -0.41 | -0.53 | -0.77 | -0.92 | -1.23 | -1.74 | -1.14 | -1.26 | -1.22 | -1.22 | -1.04 | NA | NA | NA | NA | NA | NA | NA | NA | NA | NA | NA | NA | NA | NA | NA | NA | NA | NA |
| 2023-10-31 | 2023-07-31 | 2023-04-30 | 2023-01-31 | 2022-10-31 | 2022-07-31 | 2022-04-30 | 2022-01-31 | 2021-10-31 | 2021-07-31 | 2021-04-30 | 2021-01-31 | 2020-10-31 | 2020-07-31 | 2020-04-30 | 2020-01-31 | 2019-10-31 | 2019-07-31 | 2019-04-30 | 2019-01-31 | 2018-10-31 | 2018-07-31 | 2018-04-30 | 2018-01-31 | 2017-10-31 | 2017-07-31 | 2017-04-30 | 2017-01-31 | 2016-10-31 | ||
|---|---|---|---|---|---|---|---|---|---|---|---|---|---|---|---|---|---|---|---|---|---|---|---|---|---|---|---|---|---|---|
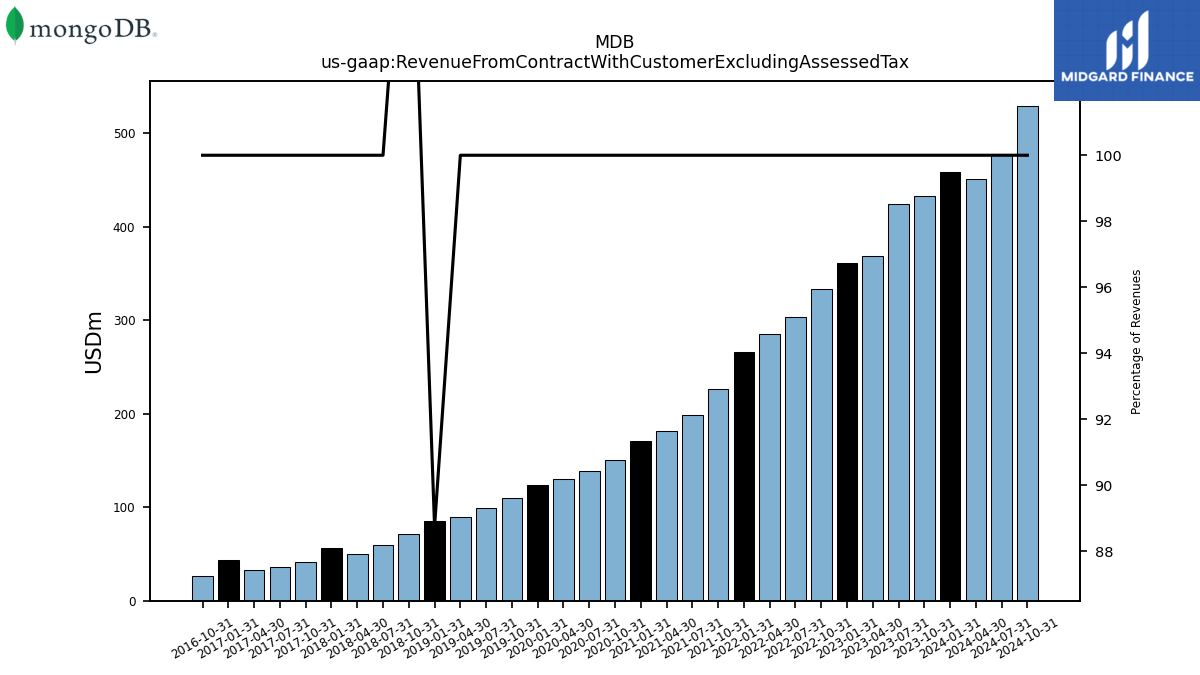
| Revenue From Contract With Customer Excluding Assessed Tax | 432.94 | 423.79 | 368.28 | 361.31 | 333.62 | 303.66 | 285.45 | 266.49 | 226.89 | 198.75 | 181.65 | 171.00 | 150.77 | 138.28 | 130.33 | 123.52 | 109.44 | 99.37 | 89.39 | 85.48 | 71.78 | 59.61 | 50.14 | 56.55 | 41.49 | 35.60 | 32.39 | 43.38 | 26.30 | |
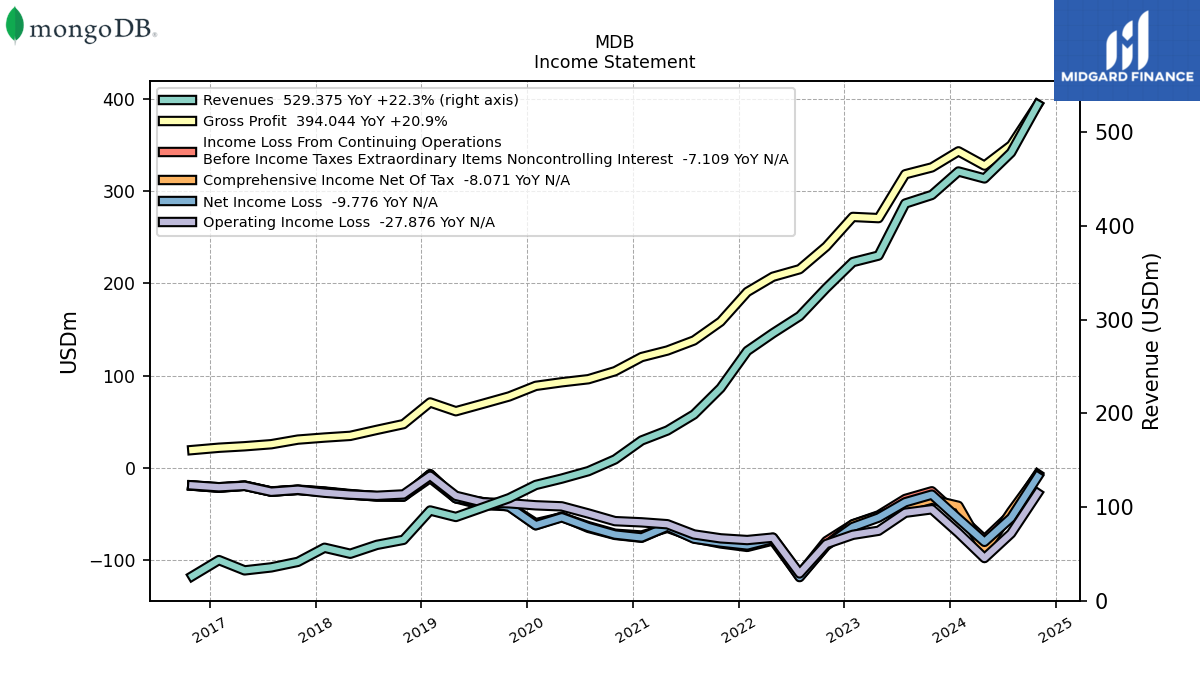
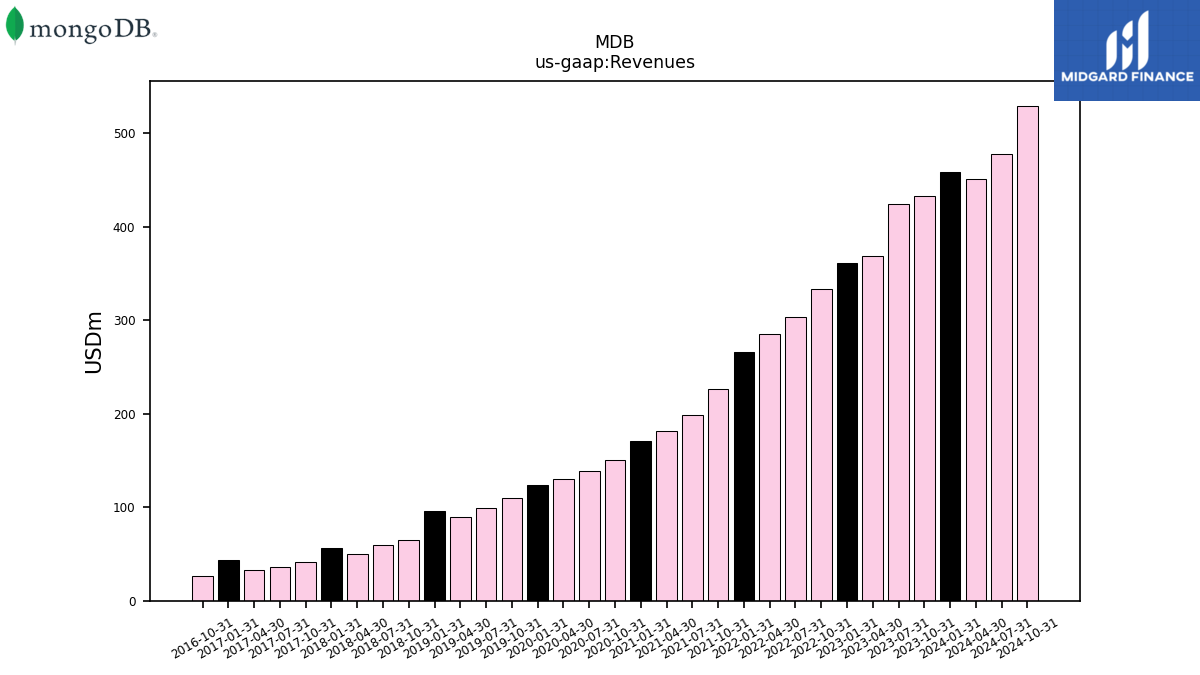
| Revenues | 432.94 | 423.79 | 368.28 | 361.31 | 333.62 | 303.66 | 285.45 | 266.49 | 226.89 | 198.75 | 181.65 | 171.00 | 150.77 | 138.28 | 130.33 | 123.52 | 109.44 | 99.37 | 89.39 | 96.32 | 64.98 | 59.61 | 50.14 | 56.55 | 41.49 | 35.60 | 32.39 | 43.38 | 26.30 | |
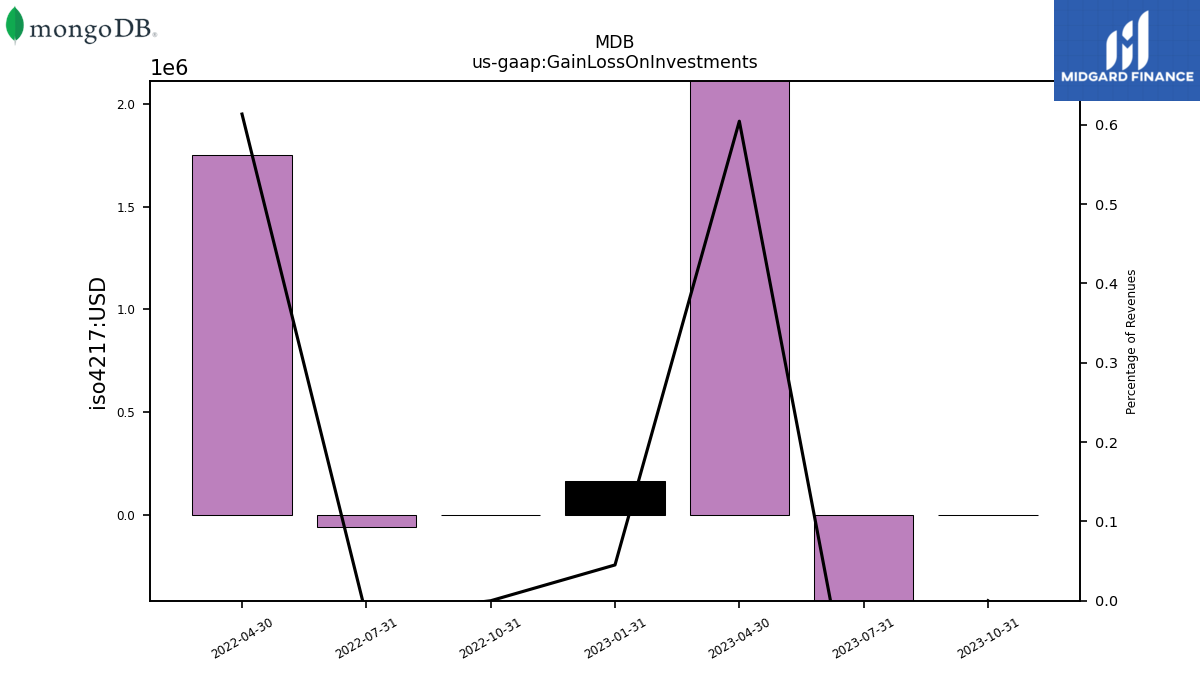
| Gain Loss On Investments | 0.00 | -0.93 | 2.23 | 0.16 | 0.00 | -0.06 | 1.75 | NA | NA | NA | NA | NA | NA | NA | NA | NA | NA | NA | NA | NA | NA | NA | NA | NA | NA | NA | NA | NA | NA | |
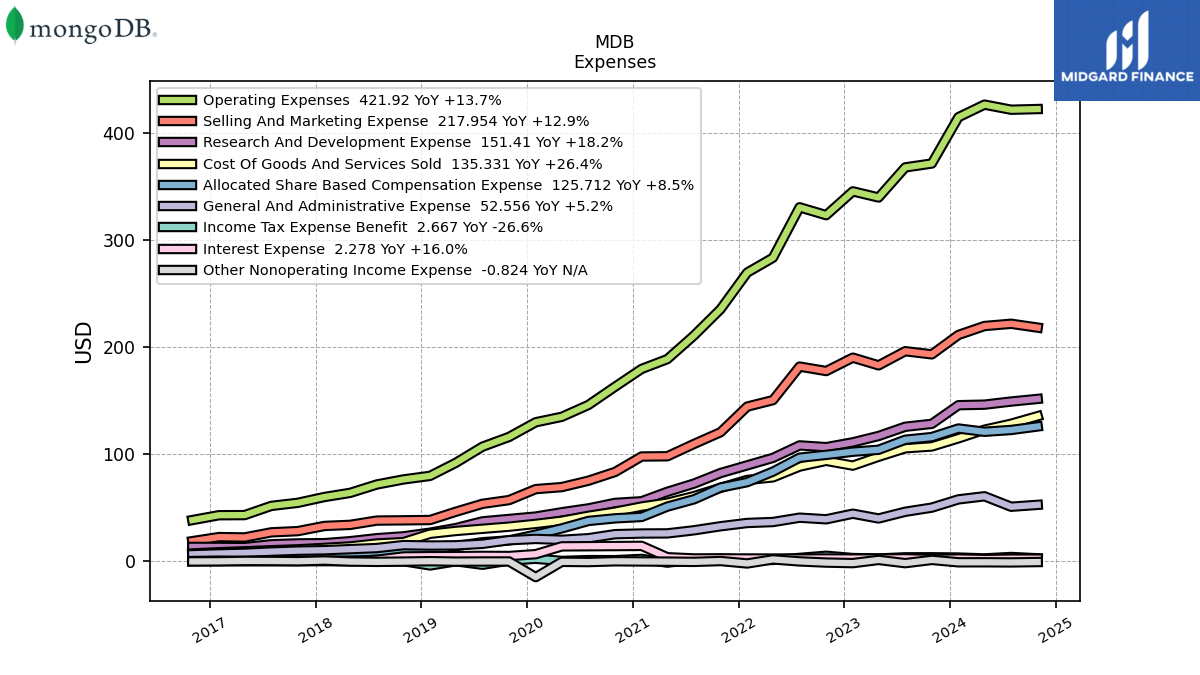
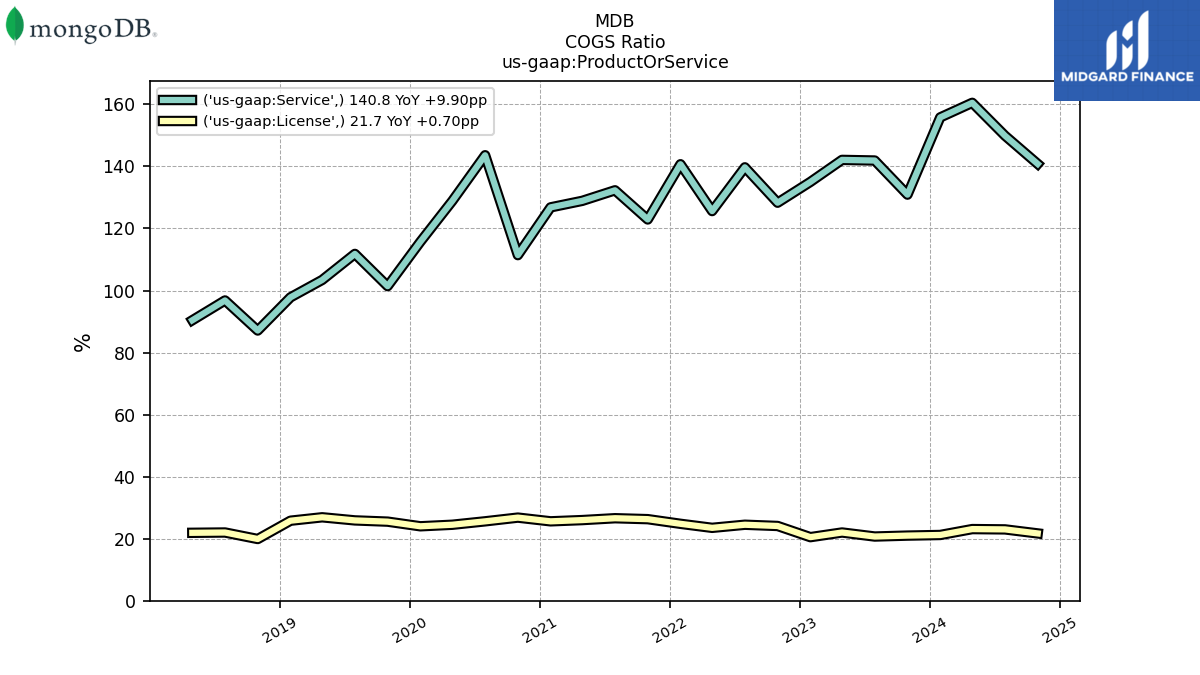
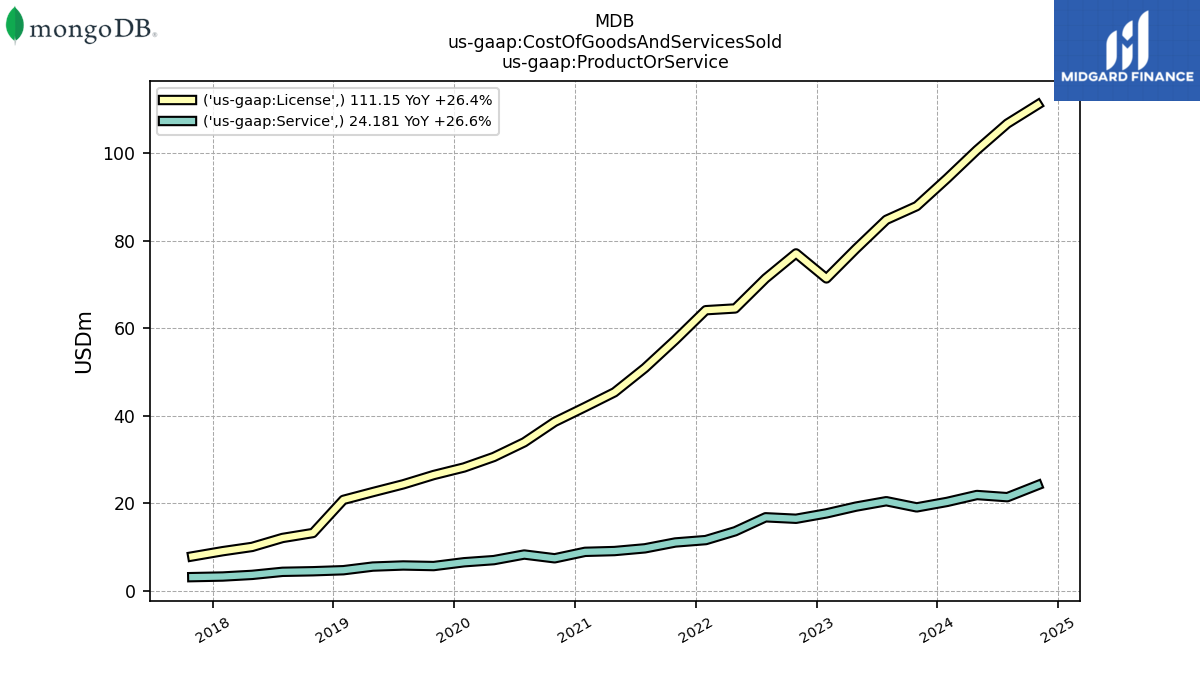
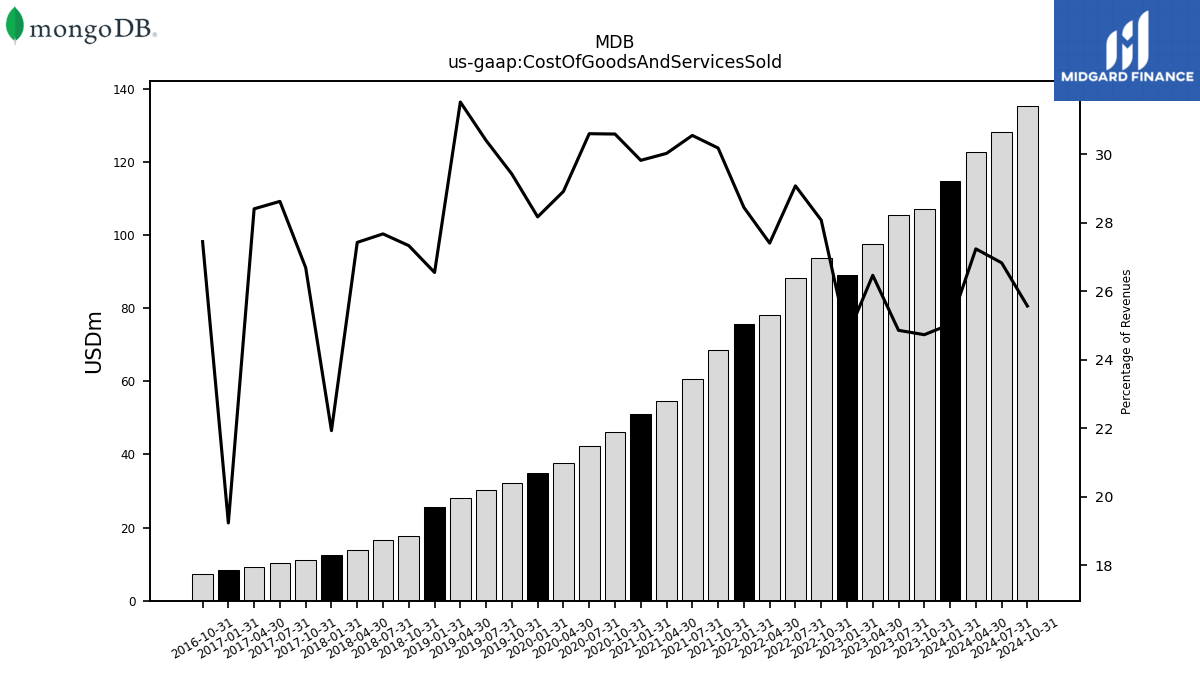
| Cost Of Goods And Services Sold | 107.06 | 105.34 | 97.45 | 89.16 | 93.65 | 88.28 | 78.22 | 75.80 | 68.46 | 60.70 | 54.53 | 50.98 | 46.11 | 42.30 | 37.68 | 34.79 | 32.19 | 30.20 | 28.17 | 25.57 | 17.76 | 16.49 | 13.75 | 12.40 | 11.07 | 10.19 | 9.20 | 8.35 | 7.22 | |
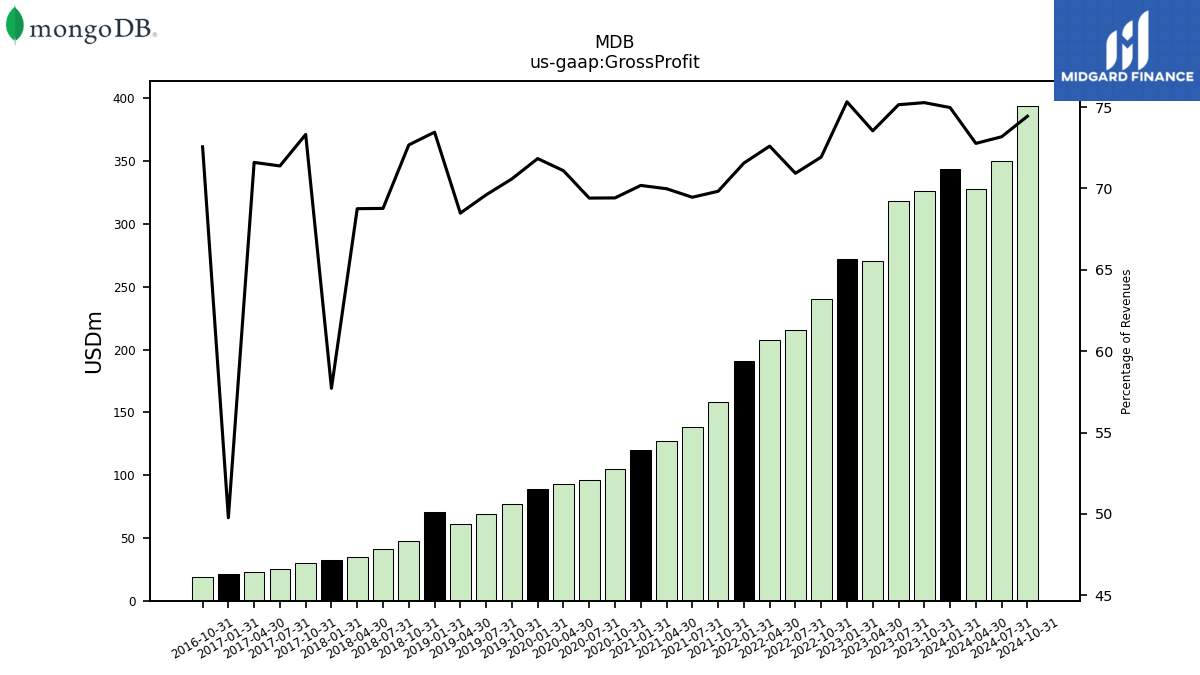
| Gross Profit | 325.88 | 318.45 | 270.83 | 272.15 | 239.97 | 215.38 | 207.23 | 190.70 | 158.43 | 138.04 | 127.12 | 120.01 | 104.66 | 95.98 | 92.65 | 88.73 | 77.25 | 69.17 | 61.22 | 70.75 | 47.23 | 41.00 | 34.47 | 32.64 | 30.42 | 25.41 | 23.19 | 21.59 | 19.09 | |
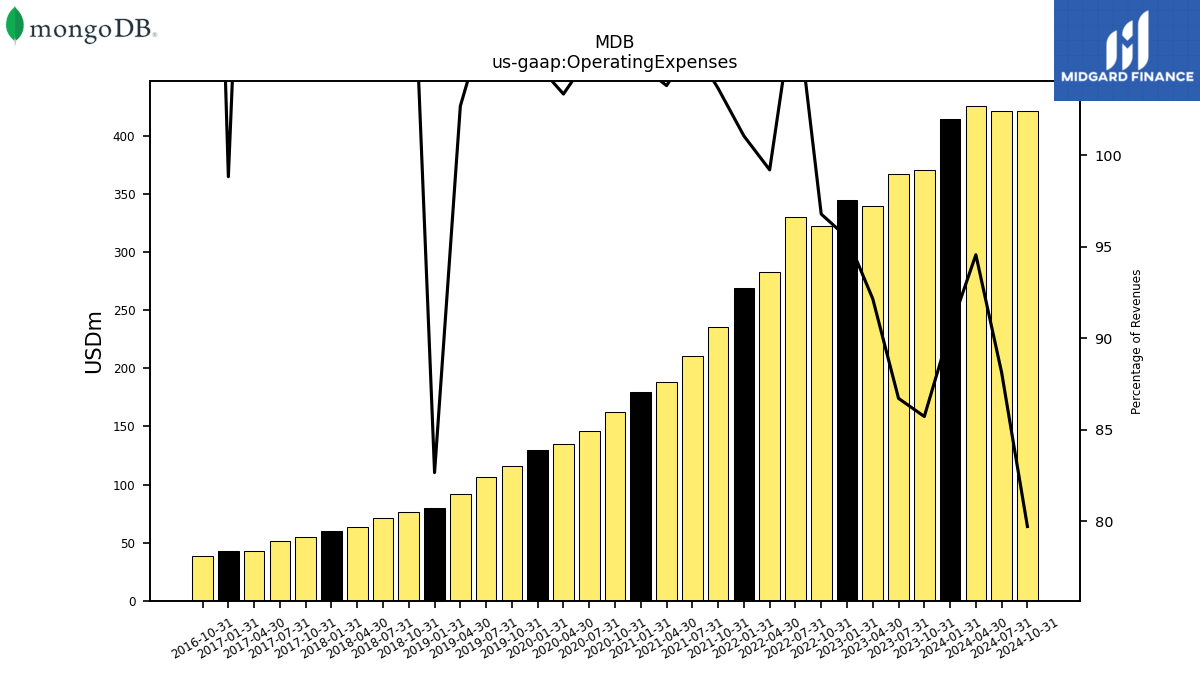
| Operating Expenses | 371.10 | 367.46 | 339.38 | 345.10 | 322.89 | 330.23 | 283.17 | 269.31 | 235.20 | 210.58 | 188.57 | 179.41 | 162.75 | 145.76 | 134.69 | 129.63 | 115.96 | 106.84 | 91.79 | 79.61 | 76.28 | 71.56 | 63.76 | 59.89 | 54.47 | 51.57 | 42.99 | 42.87 | 38.34 | |
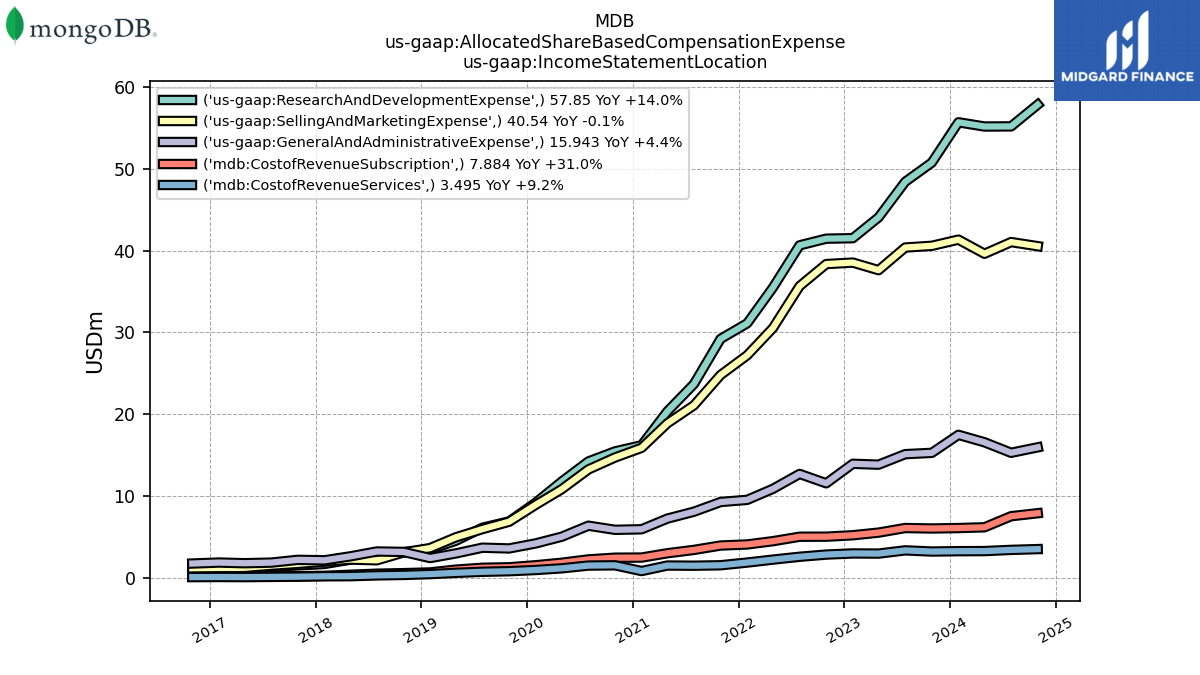
| Research And Development Expense | 128.15 | 125.42 | 116.82 | 110.89 | 106.39 | 108.04 | 96.37 | 89.42 | 82.26 | 72.40 | 64.75 | 55.91 | 54.36 | 49.26 | 45.63 | 41.64 | 39.39 | 37.14 | 30.87 | 26.60 | 23.18 | 21.43 | 18.64 | 16.79 | 16.59 | 15.75 | 13.08 | 13.23 | 13.30 | |
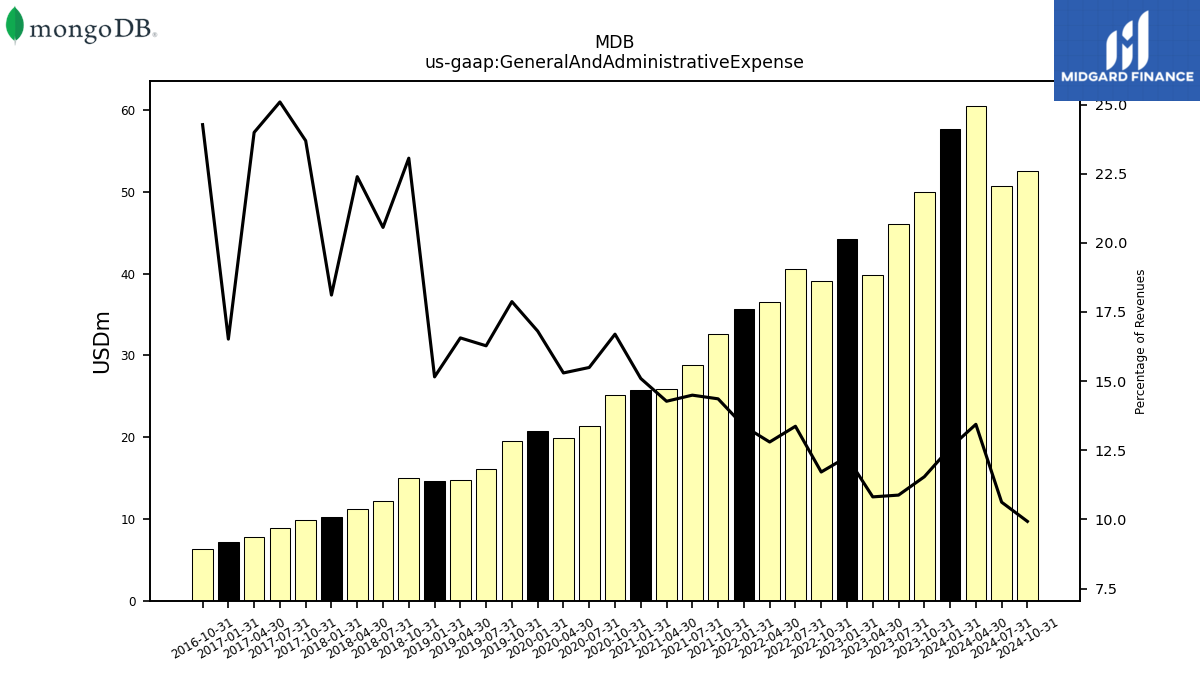
| General And Administrative Expense | 49.97 | 46.10 | 39.83 | 44.29 | 39.08 | 40.59 | 36.53 | 35.63 | 32.58 | 28.80 | 25.93 | 25.81 | 25.18 | 21.42 | 19.93 | 20.76 | 19.56 | 16.17 | 14.80 | 14.60 | 14.99 | 12.25 | 11.23 | 10.24 | 9.83 | 8.93 | 7.77 | 7.17 | 6.38 | |
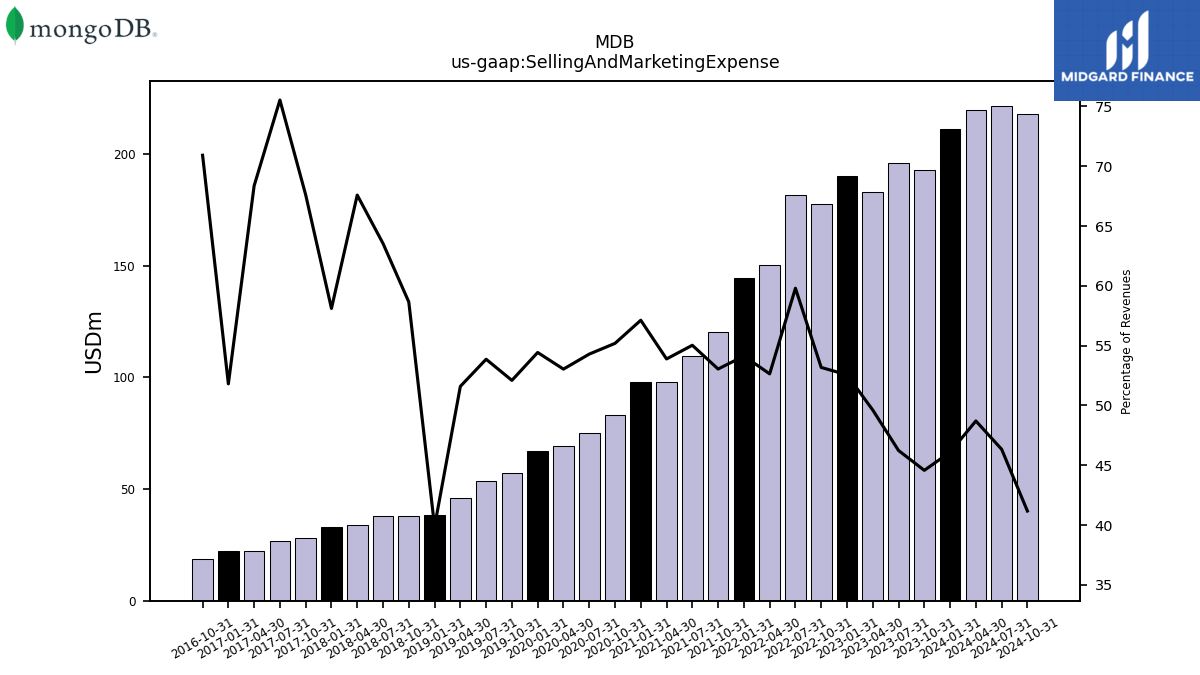
| Selling And Marketing Expense | 192.98 | 195.93 | 182.73 | 189.92 | 177.42 | 181.60 | 150.27 | 144.26 | 120.36 | 109.38 | 97.89 | 97.68 | 83.21 | 75.08 | 69.12 | 67.23 | 57.02 | 53.52 | 46.12 | 38.41 | 38.12 | 37.88 | 33.89 | 32.86 | 28.05 | 26.89 | 22.14 | 22.47 | 18.66 | |
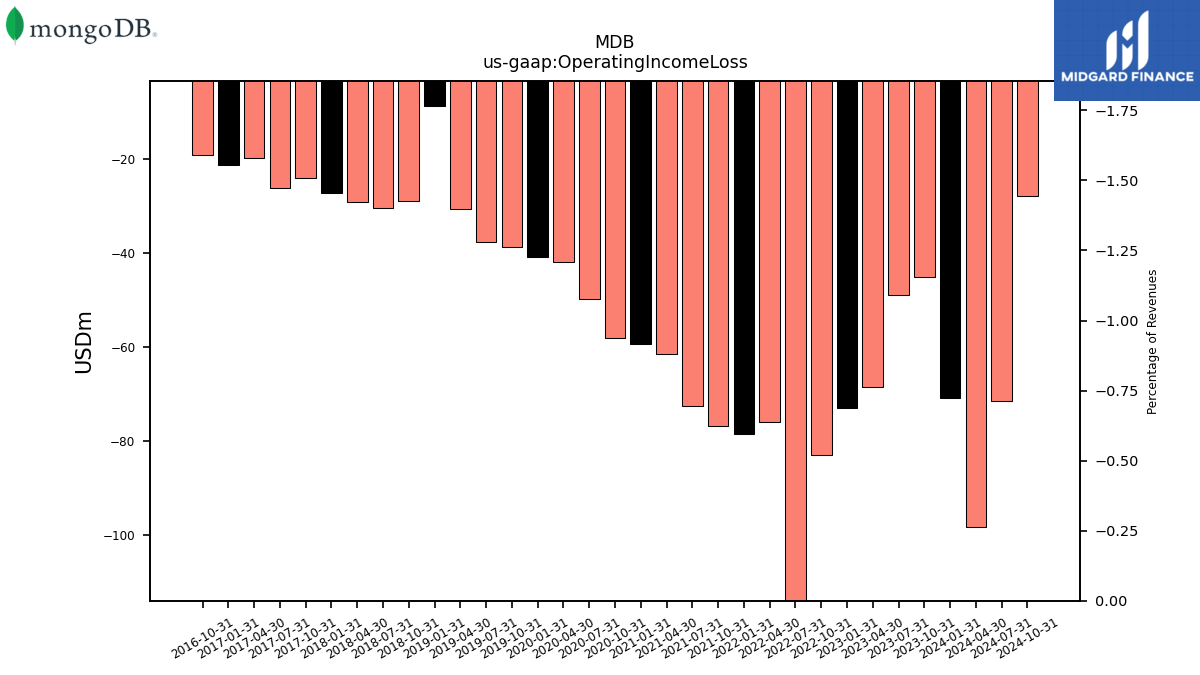
| Operating Income Loss | -45.22 | -49.00 | -68.55 | -72.95 | -82.92 | -114.84 | -75.94 | -78.62 | -76.77 | -72.53 | -61.45 | -59.39 | -58.09 | -49.78 | -42.04 | -40.90 | -38.71 | -37.67 | -30.58 | -8.86 | -29.05 | -30.57 | -29.29 | -27.25 | -24.05 | -26.16 | -19.80 | -21.28 | -19.25 | |
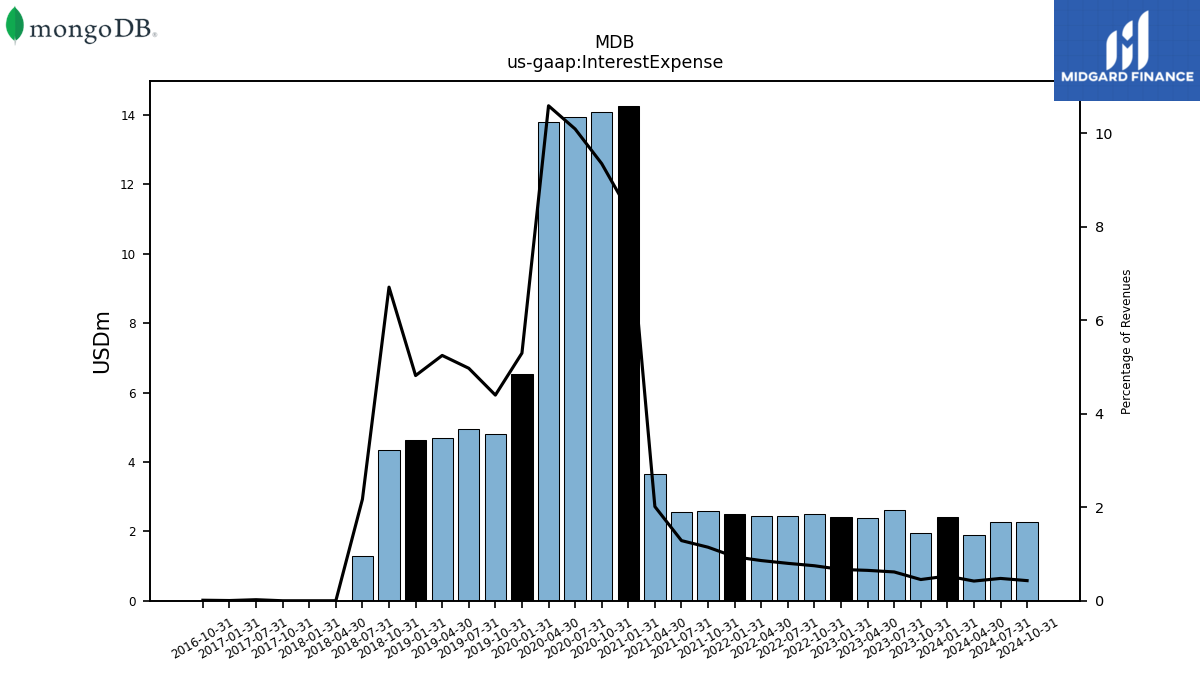
| Interest Expense | 1.96 | 2.61 | 2.39 | 2.42 | 2.50 | 2.43 | 2.45 | 2.50 | 2.60 | 2.56 | 3.66 | 14.27 | 14.09 | 13.95 | 13.79 | 6.54 | 4.81 | 4.94 | 4.69 | 4.64 | 4.36 | 1.29 | 0.00 | 0.00 | 0.00 | 0.01 | NA | 0.00 | 0.00 | |
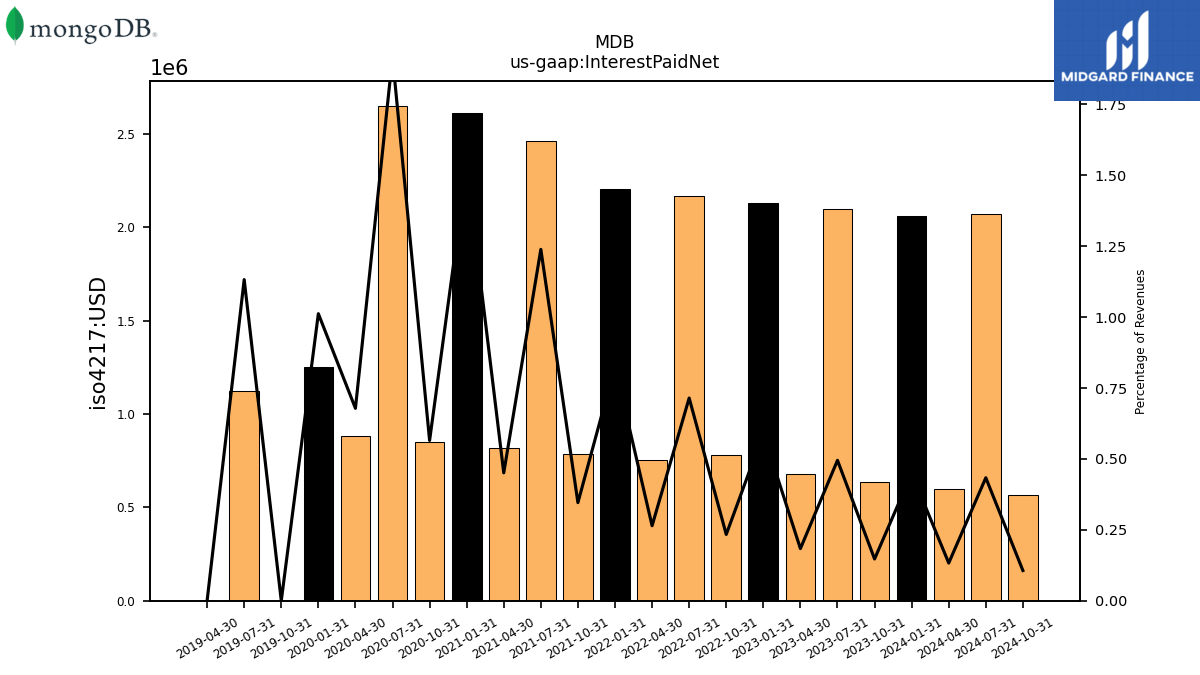
| Interest Paid Net | 0.64 | 2.10 | 0.68 | 2.13 | 0.78 | 2.17 | 0.76 | 2.21 | 0.79 | 2.46 | 0.82 | 2.61 | 0.85 | 2.65 | 0.88 | 1.25 | 0.00 | 1.12 | 0.00 | NA | NA | NA | NA | NA | NA | NA | NA | NA | NA | |
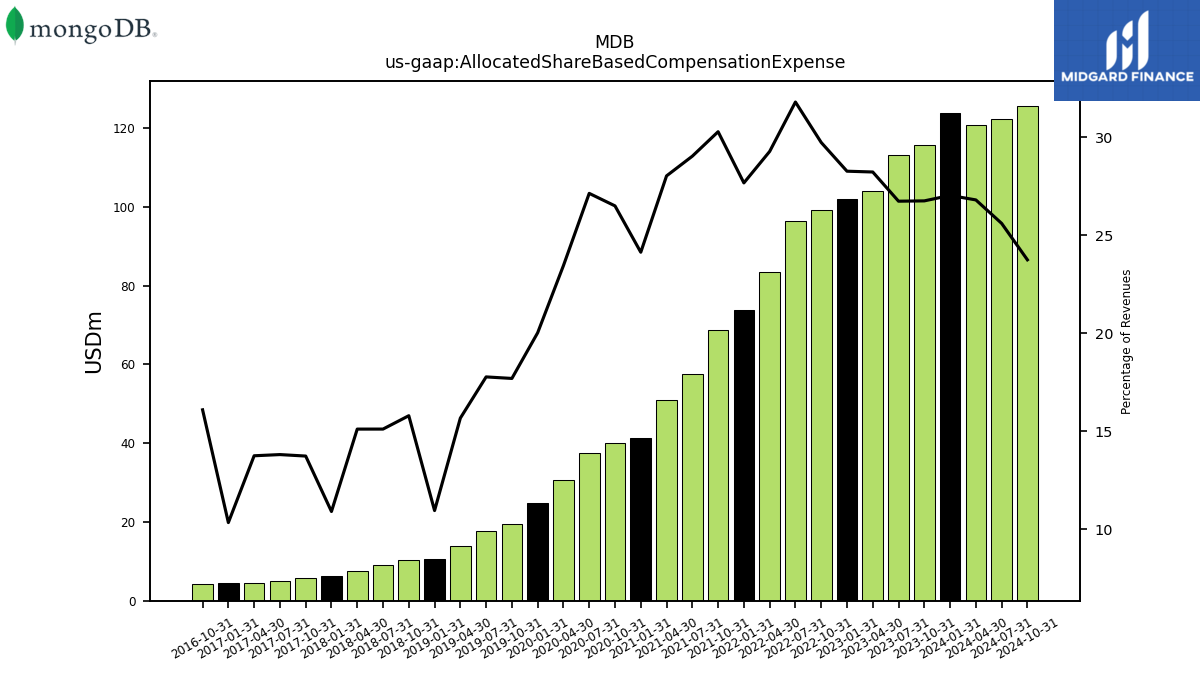
| Allocated Share Based Compensation Expense | 115.83 | 113.31 | 103.95 | 102.14 | 99.20 | 96.55 | 83.57 | 73.74 | 68.71 | 57.70 | 50.91 | 41.27 | 39.95 | 37.52 | 30.57 | 24.74 | 19.37 | 17.66 | 14.01 | 10.55 | 10.26 | 9.01 | 7.58 | 6.17 | 5.70 | 4.92 | 4.45 | 4.49 | 4.23 | |
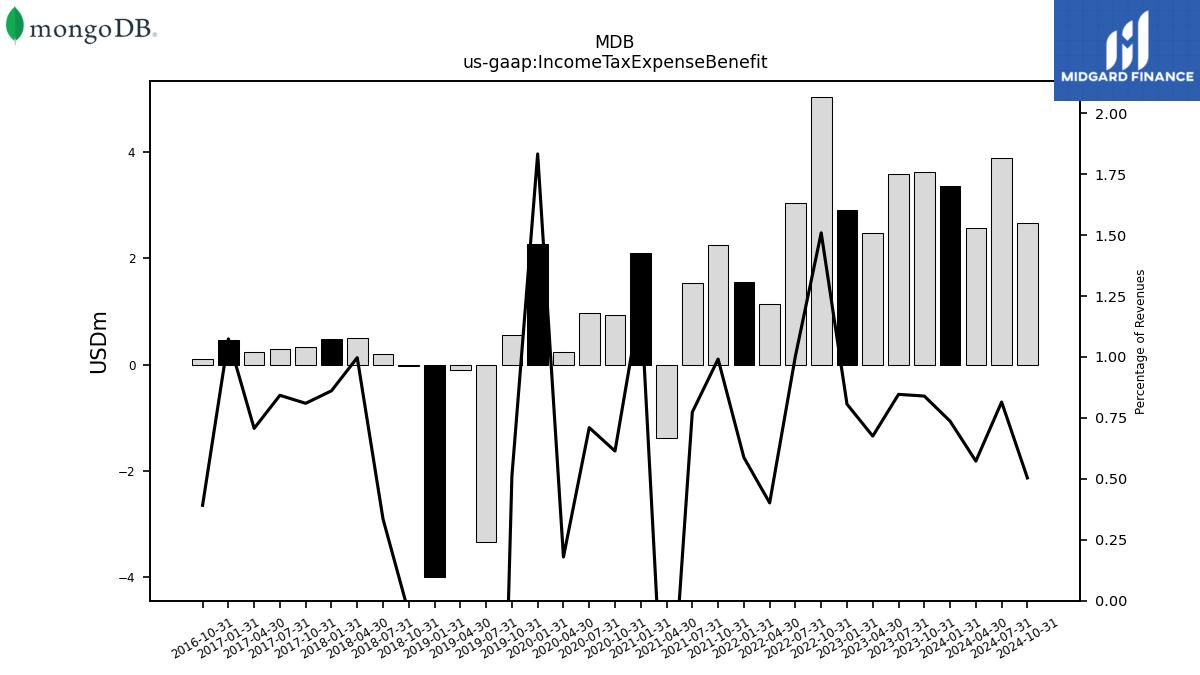
| Income Tax Expense Benefit | 3.63 | 3.59 | 2.49 | 2.91 | 5.04 | 3.05 | 1.15 | 1.57 | 2.25 | 1.54 | -1.38 | 2.11 | 0.93 | 0.98 | 0.23 | 2.26 | 0.56 | -3.34 | -0.10 | -4.00 | -0.03 | 0.20 | 0.50 | 0.49 | 0.34 | 0.30 | 0.23 | 0.47 | 0.10 | |
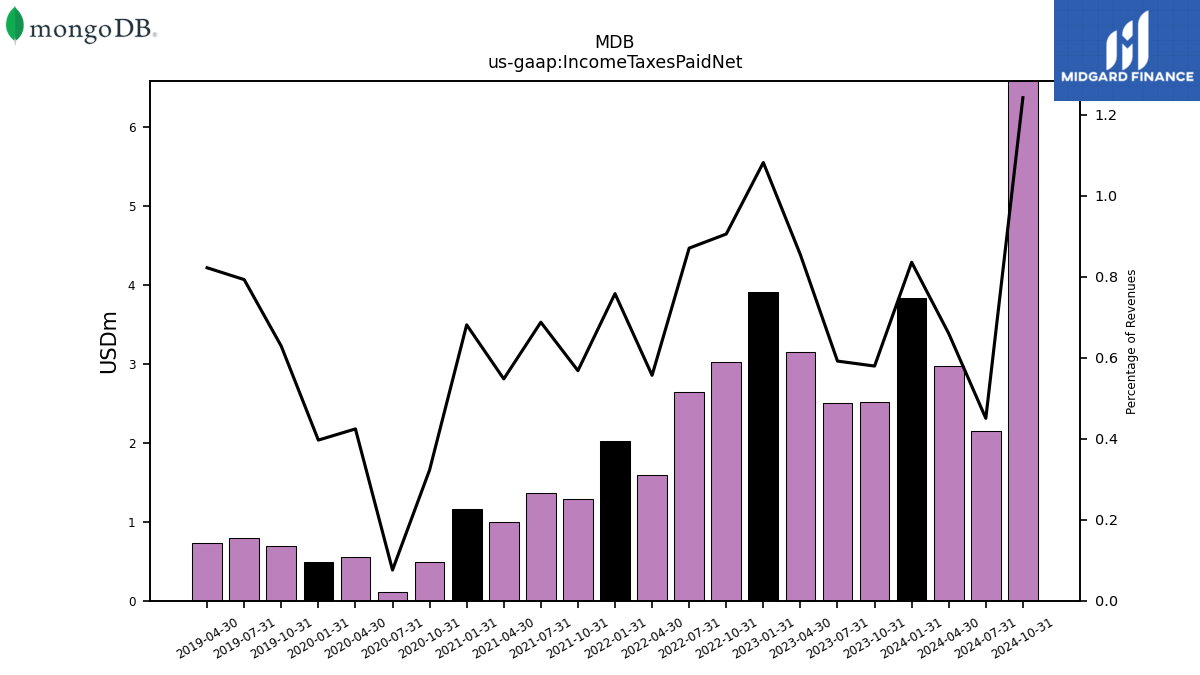
| Income Taxes Paid Net | 2.51 | 2.51 | 3.15 | 3.91 | 3.02 | 2.64 | 1.59 | 2.02 | 1.29 | 1.37 | 0.99 | 1.17 | 0.49 | 0.10 | 0.55 | 0.49 | 0.69 | 0.79 | 0.73 | NA | NA | NA | NA | NA | NA | NA | NA | NA | NA | |
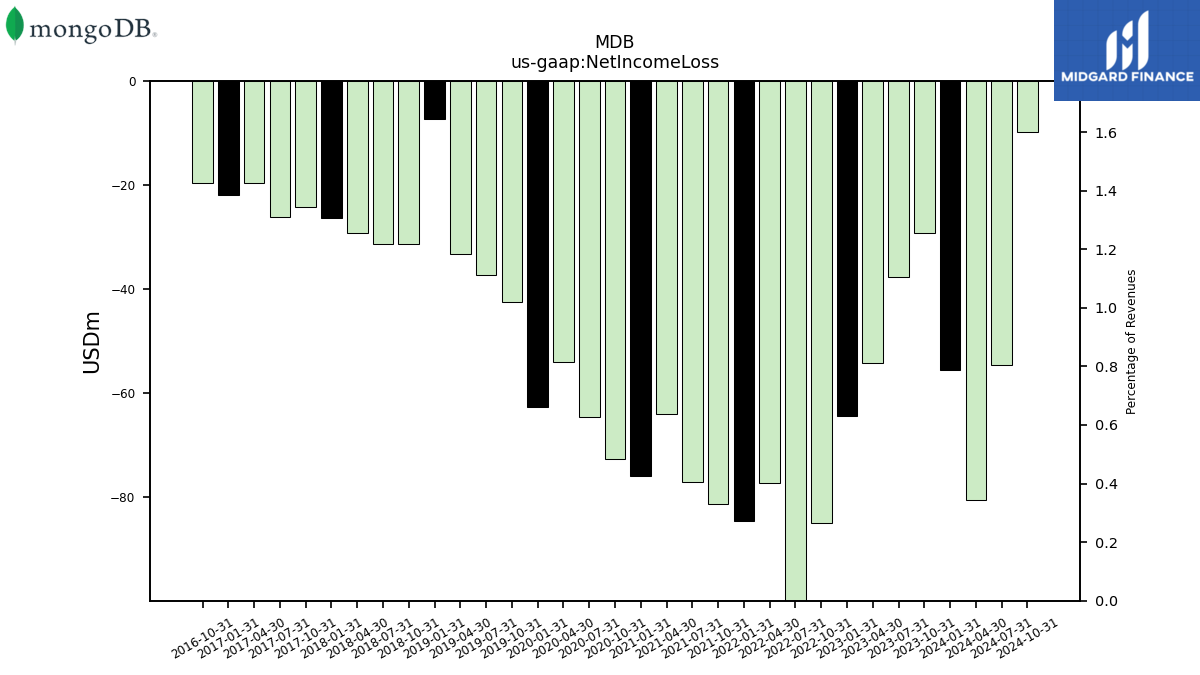
| Net Income Loss | -29.30 | -37.60 | -54.25 | -64.40 | -84.84 | -118.86 | -77.29 | -84.45 | -81.29 | -77.13 | -63.99 | -75.80 | -72.65 | -64.53 | -53.97 | -62.56 | -42.38 | -37.34 | -33.24 | -7.28 | -31.32 | -31.25 | -29.16 | -26.37 | -24.22 | -26.08 | -19.69 | -21.82 | -19.54 | |
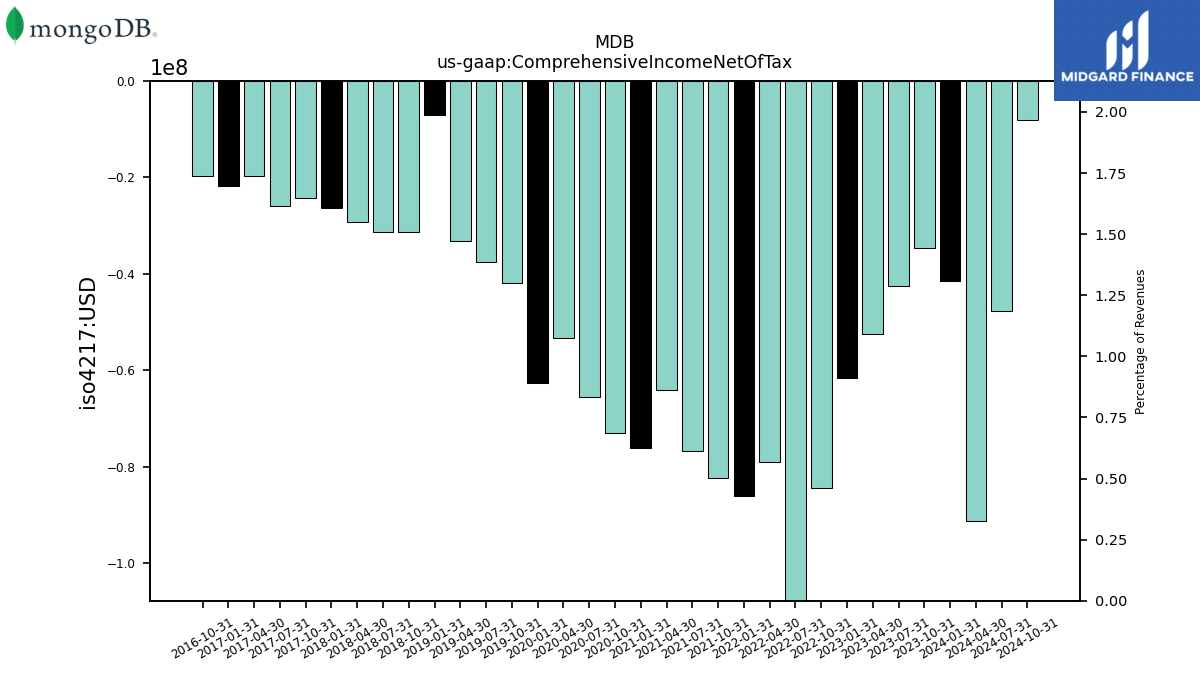
| Comprehensive Income Net Of Tax | -34.68 | -42.47 | -52.51 | -61.51 | -84.44 | -118.38 | -79.05 | -86.08 | -82.31 | -76.65 | -64.05 | -76.17 | -73.06 | -65.45 | -53.19 | -62.53 | -41.86 | -37.56 | -33.17 | -7.08 | -31.36 | -31.31 | -29.28 | -26.32 | -24.19 | -26.01 | -19.63 | -21.83 | -19.61 |
| 2023-10-31 | 2023-07-31 | 2023-04-30 | 2023-01-31 | 2022-10-31 | 2022-07-31 | 2022-04-30 | 2022-01-31 | 2021-10-31 | 2021-07-31 | 2021-04-30 | 2021-01-31 | 2020-10-31 | 2020-07-31 | 2020-04-30 | 2020-01-31 | 2019-10-31 | 2019-07-31 | 2019-04-30 | 2019-01-31 | 2018-10-31 | 2018-07-31 | 2018-04-30 | 2018-01-31 | 2017-10-31 | 2017-07-31 | 2017-04-30 | 2017-01-31 | 2016-10-31 | ||
|---|---|---|---|---|---|---|---|---|---|---|---|---|---|---|---|---|---|---|---|---|---|---|---|---|---|---|---|---|---|---|
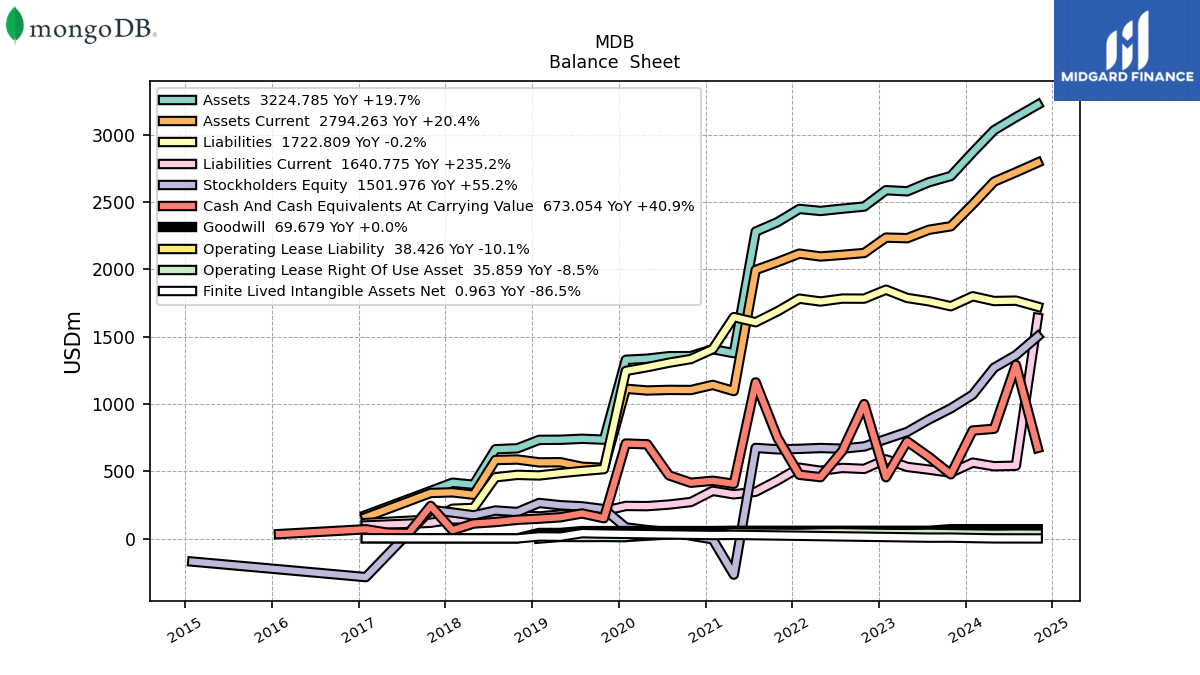
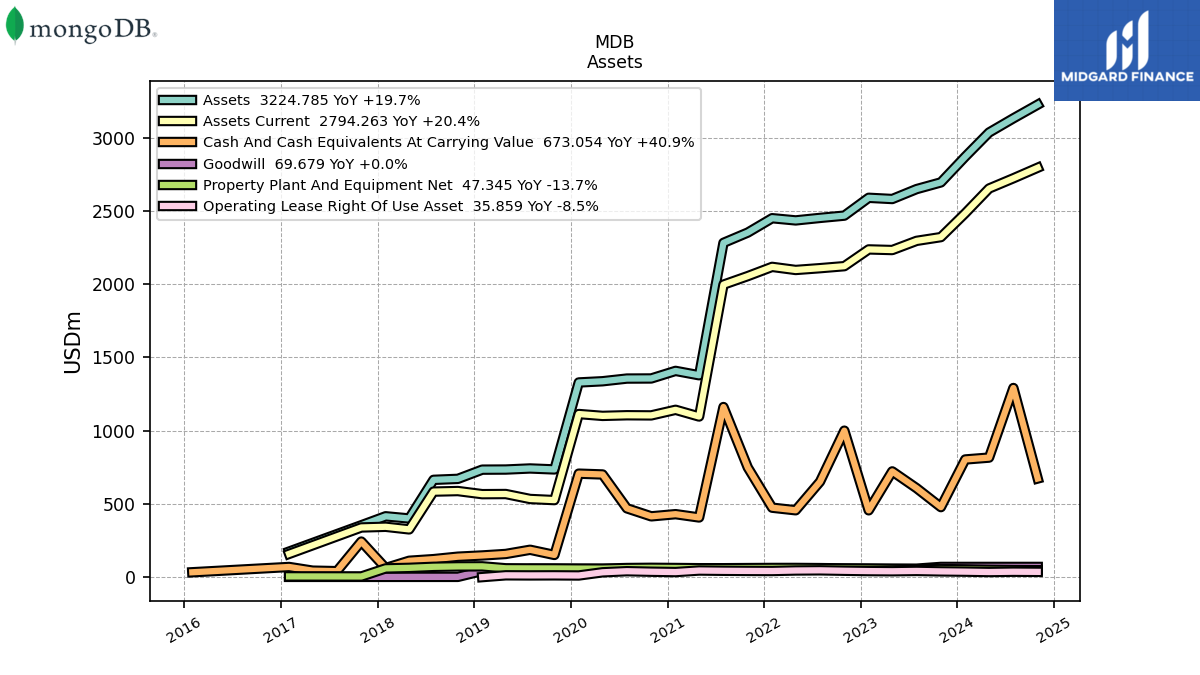
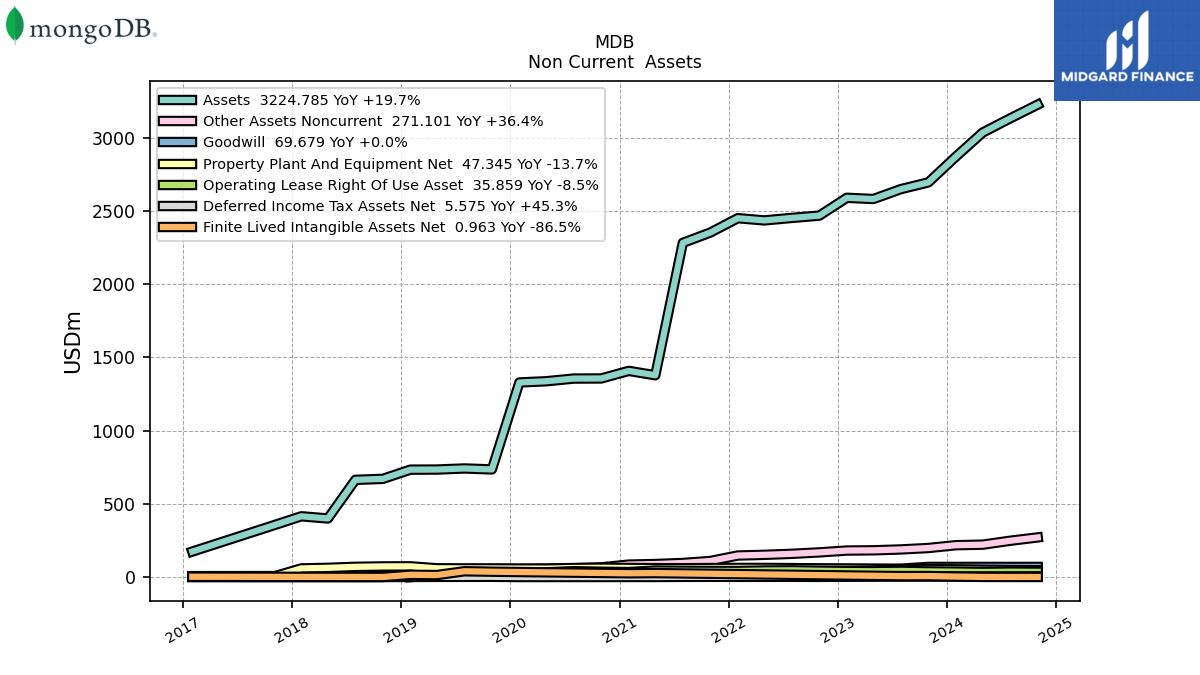
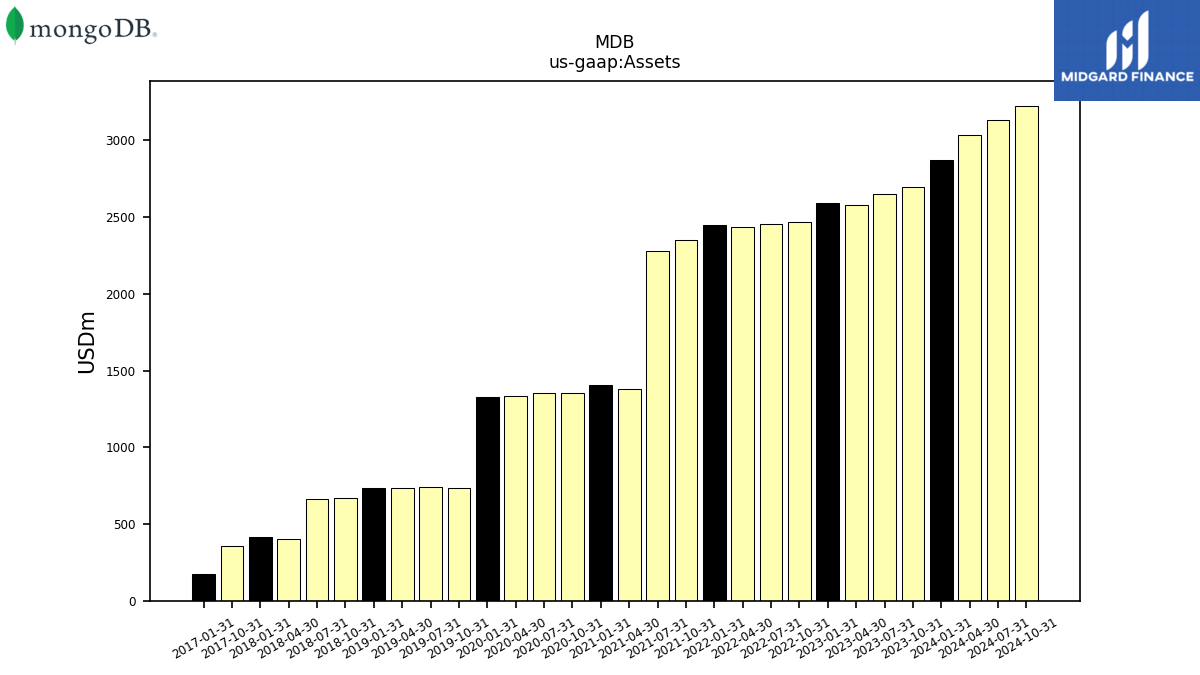
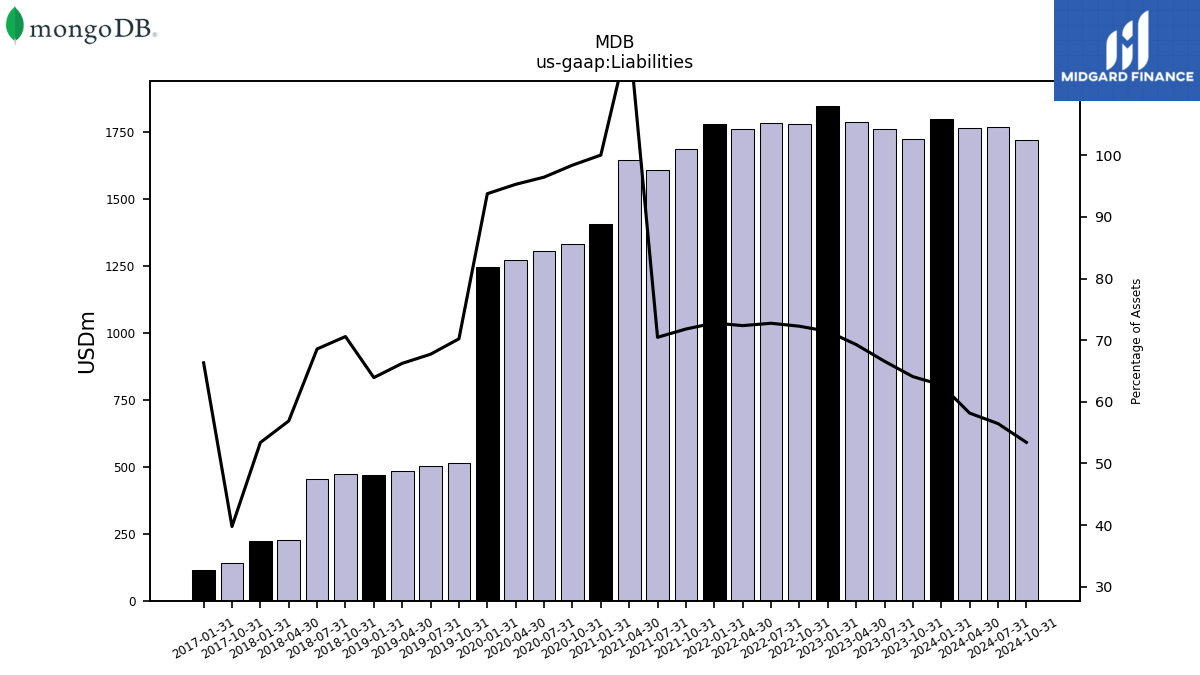
| Assets | 2694.02 | 2648.23 | 2580.53 | 2588.89 | 2467.19 | 2451.60 | 2434.54 | 2449.59 | 2351.61 | 2281.41 | 1377.63 | 1407.49 | 1355.86 | 1355.16 | 1336.84 | 1328.57 | 734.99 | 741.60 | 734.24 | 733.48 | 670.67 | 663.93 | 400.23 | 415.20 | 354.00 | NA | NA | 174.43 | NA | |
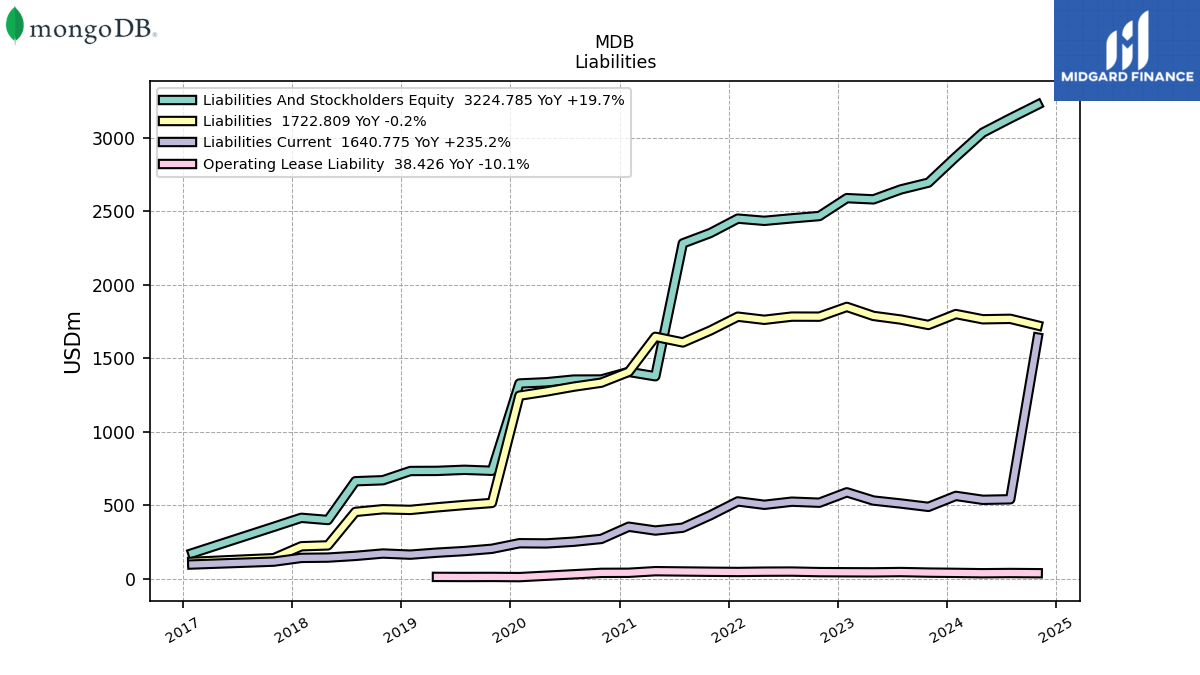
| Liabilities | 1726.48 | 1763.15 | 1788.10 | 1849.38 | 1782.90 | 1783.43 | 1761.66 | 1782.89 | 1688.71 | 1607.69 | 1645.99 | 1407.81 | 1334.06 | 1307.01 | 1273.80 | 1245.71 | 516.15 | 502.25 | 486.37 | 468.91 | 473.43 | 455.31 | 227.72 | 221.70 | 140.81 | NA | NA | 115.69 | NA | |
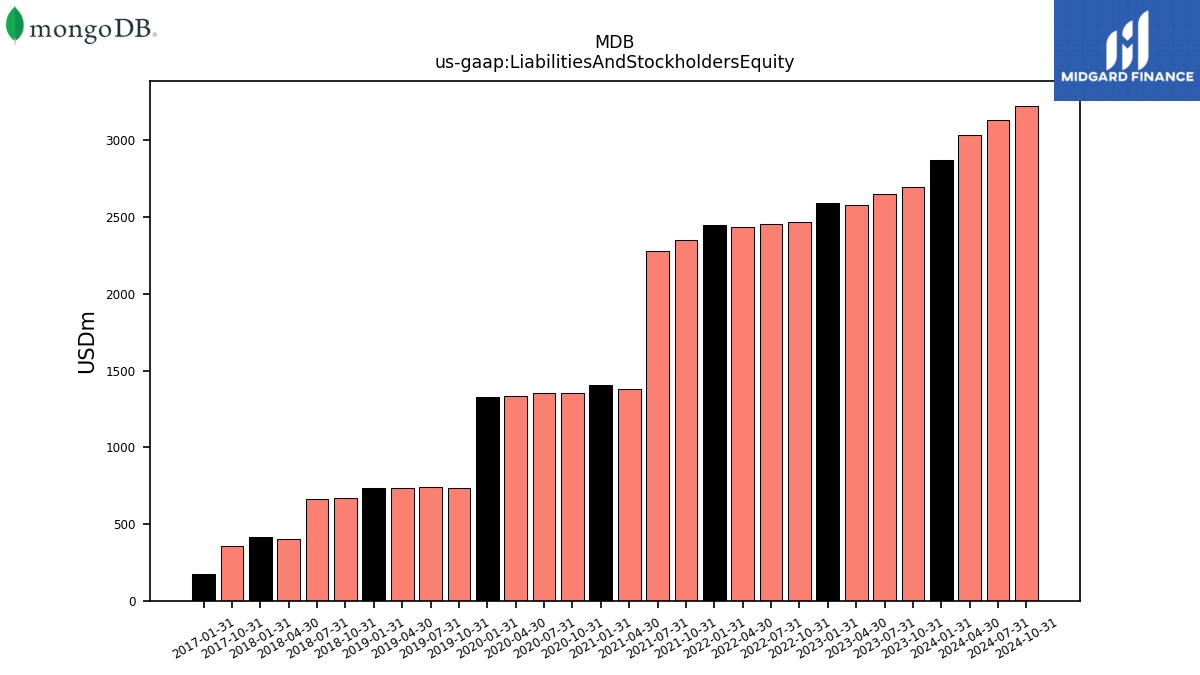
| Liabilities And Stockholders Equity | 2694.02 | 2648.23 | 2580.53 | 2588.89 | 2467.19 | 2451.60 | 2434.54 | 2449.59 | 2351.61 | 2281.41 | 1377.63 | 1407.49 | 1355.86 | 1355.16 | 1336.84 | 1328.57 | 734.99 | 741.60 | 734.24 | 733.48 | 670.67 | 663.93 | 400.23 | 415.20 | 354.00 | NA | NA | 174.43 | NA | |
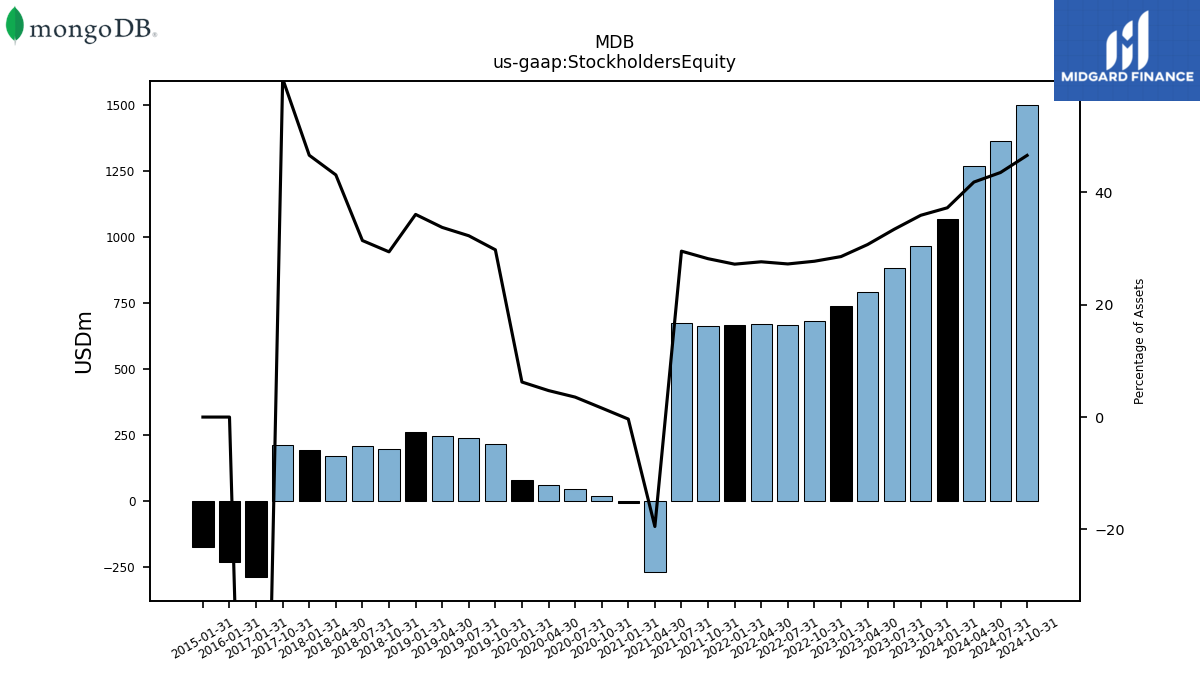
| Stockholders Equity | 967.54 | 885.09 | 792.43 | 739.51 | 684.28 | 668.17 | 672.88 | 666.70 | 662.90 | 673.72 | -268.36 | -5.03 | 21.80 | 48.15 | 63.04 | 82.86 | 218.84 | 239.34 | 247.87 | 264.57 | 197.25 | 208.62 | 172.51 | 193.49 | 213.19 | NA | NA | -286.51 | NA |
| 2023-10-31 | 2023-07-31 | 2023-04-30 | 2023-01-31 | 2022-10-31 | 2022-07-31 | 2022-04-30 | 2022-01-31 | 2021-10-31 | 2021-07-31 | 2021-04-30 | 2021-01-31 | 2020-10-31 | 2020-07-31 | 2020-04-30 | 2020-01-31 | 2019-10-31 | 2019-07-31 | 2019-04-30 | 2019-01-31 | 2018-10-31 | 2018-07-31 | 2018-04-30 | 2018-01-31 | 2017-10-31 | 2017-07-31 | 2017-04-30 | 2017-01-31 | 2016-10-31 | ||
|---|---|---|---|---|---|---|---|---|---|---|---|---|---|---|---|---|---|---|---|---|---|---|---|---|---|---|---|---|---|---|
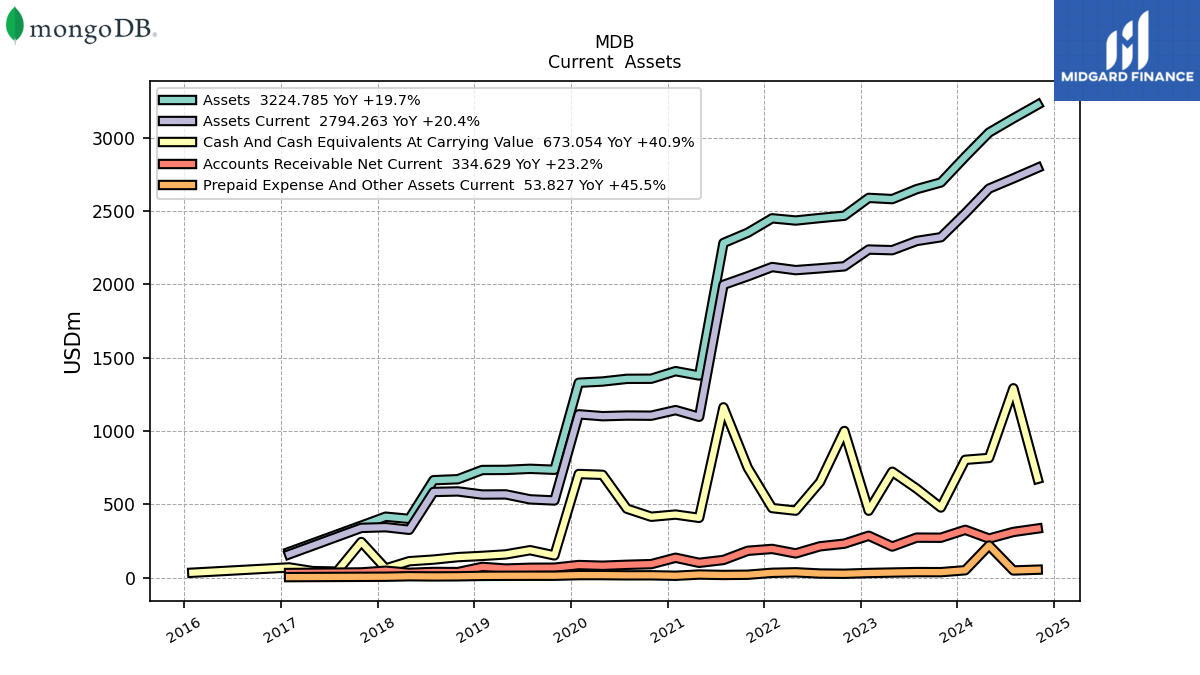
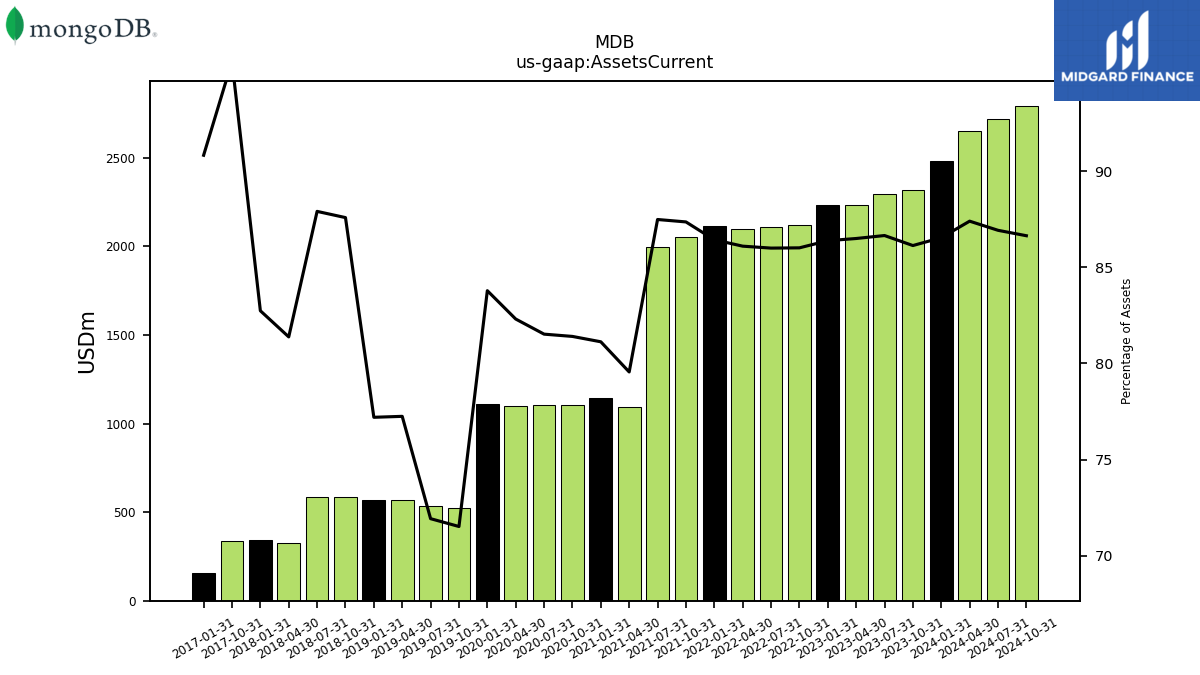
| Assets Current | 2320.59 | 2294.96 | 2232.29 | 2236.58 | 2122.26 | 2108.51 | 2096.31 | 2117.40 | 2054.57 | 1996.11 | 1096.02 | 1141.89 | 1103.79 | 1104.82 | 1100.41 | 1113.20 | 525.62 | 533.37 | 567.19 | 566.24 | 587.46 | 583.71 | 325.72 | 343.55 | 338.86 | NA | NA | 158.45 | NA | |
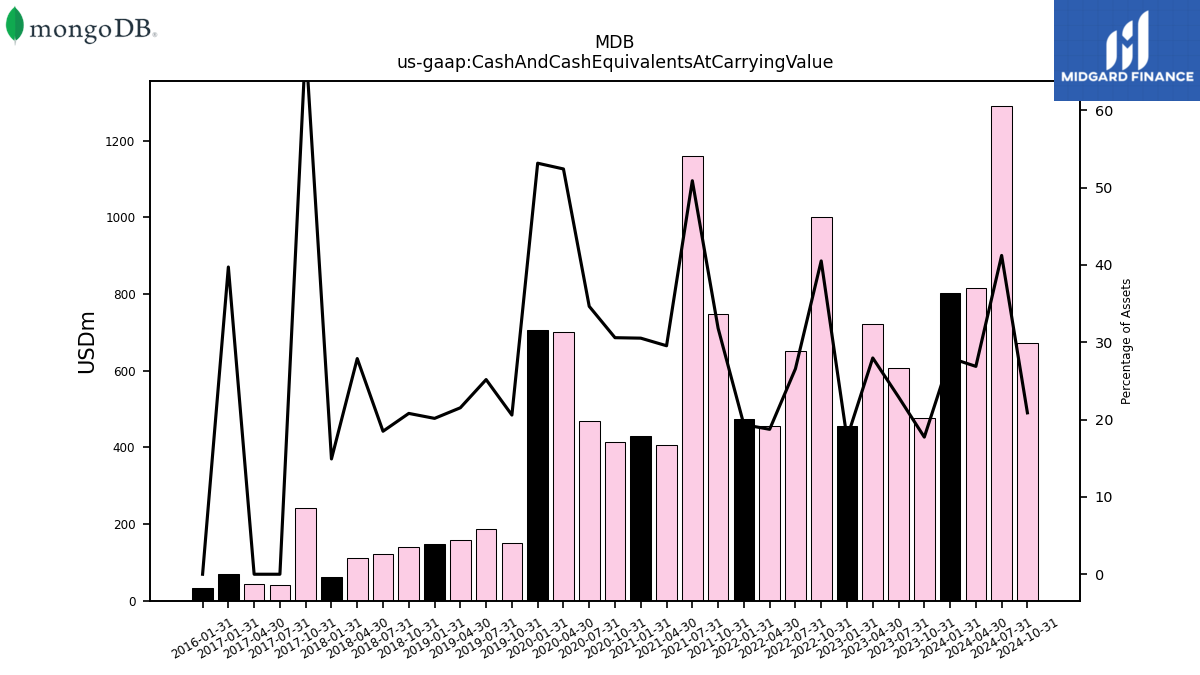
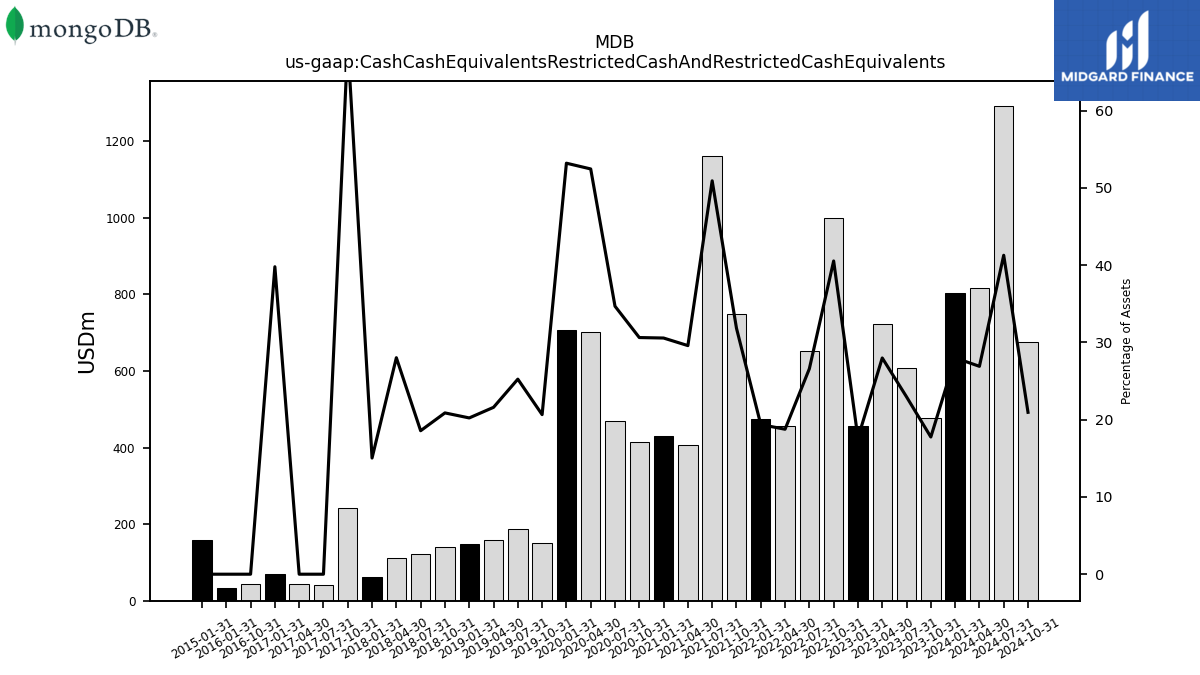
| Cash And Cash Equivalents At Carrying Value | 477.68 | 607.17 | 721.79 | 455.83 | 999.67 | 651.42 | 456.27 | 473.90 | 748.14 | 1161.00 | 407.06 | 429.70 | 414.76 | 469.49 | 700.64 | 706.19 | 151.31 | 186.68 | 158.06 | 147.83 | 139.49 | 122.77 | 111.62 | 61.90 | 242.75 | 40.77 | 44.19 | 69.31 | NA | |
| Cash Cash Equivalents Restricted Cash And Restricted Cash Equivalents | 478.36 | 607.86 | 722.19 | 456.34 | 1000.18 | 651.93 | 456.79 | 474.42 | 748.66 | 1161.52 | 407.58 | 430.22 | 415.28 | 470.01 | 701.16 | 706.71 | 151.82 | 187.20 | 158.57 | 148.35 | 140.00 | 123.29 | 112.14 | 62.43 | 243.26 | 41.29 | 44.30 | 69.41 | 43.86 | |
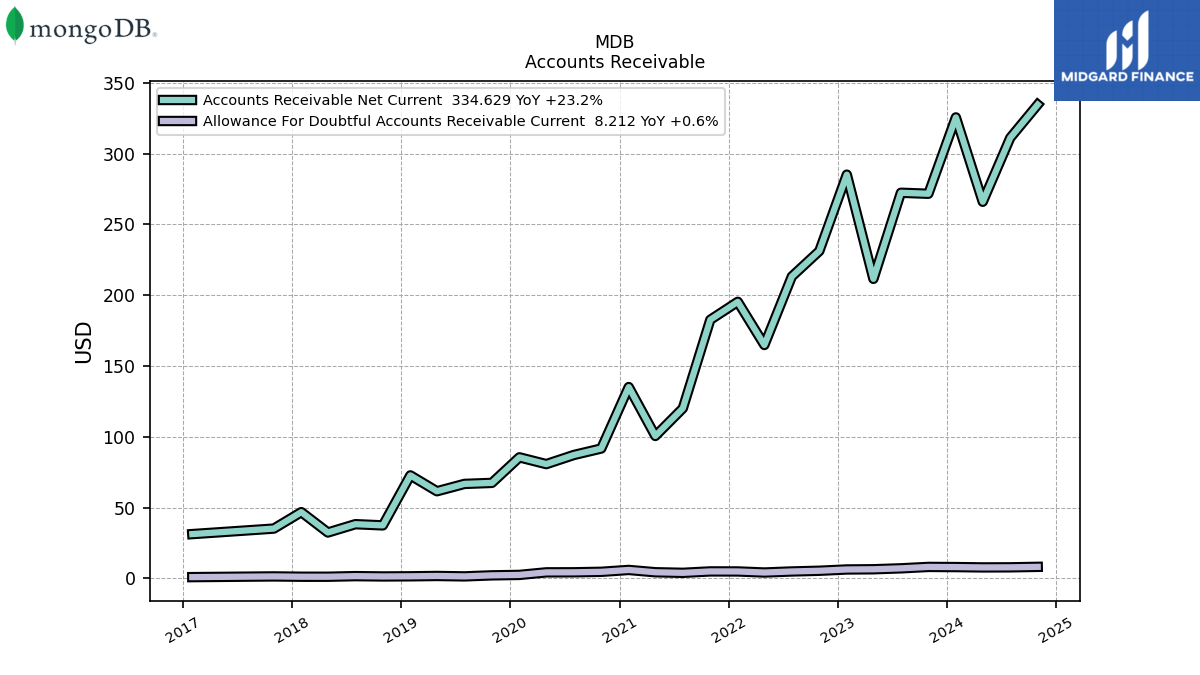
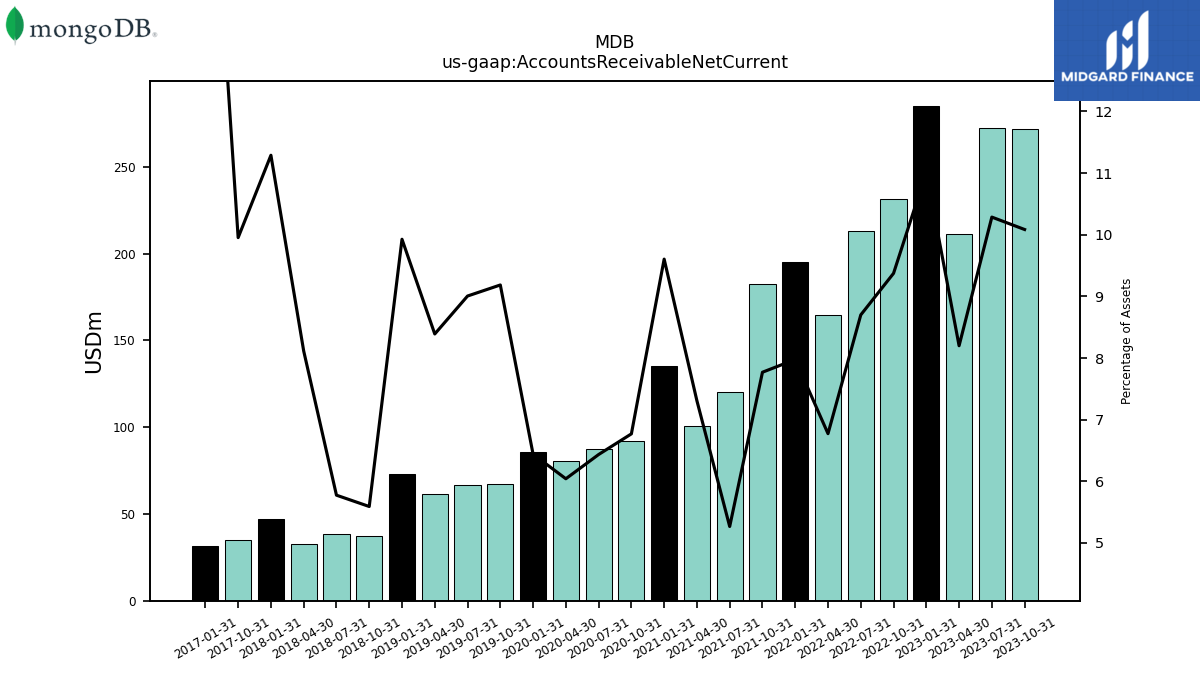
| Accounts Receivable Net Current | 271.68 | 272.39 | 211.57 | 285.19 | 231.26 | 213.27 | 164.88 | 195.38 | 182.70 | 120.15 | 100.65 | 135.18 | 91.78 | 87.19 | 80.76 | 85.55 | 67.51 | 66.78 | 61.60 | 72.81 | 37.50 | 38.34 | 32.48 | 46.87 | 35.23 | NA | NA | 31.34 | NA | |
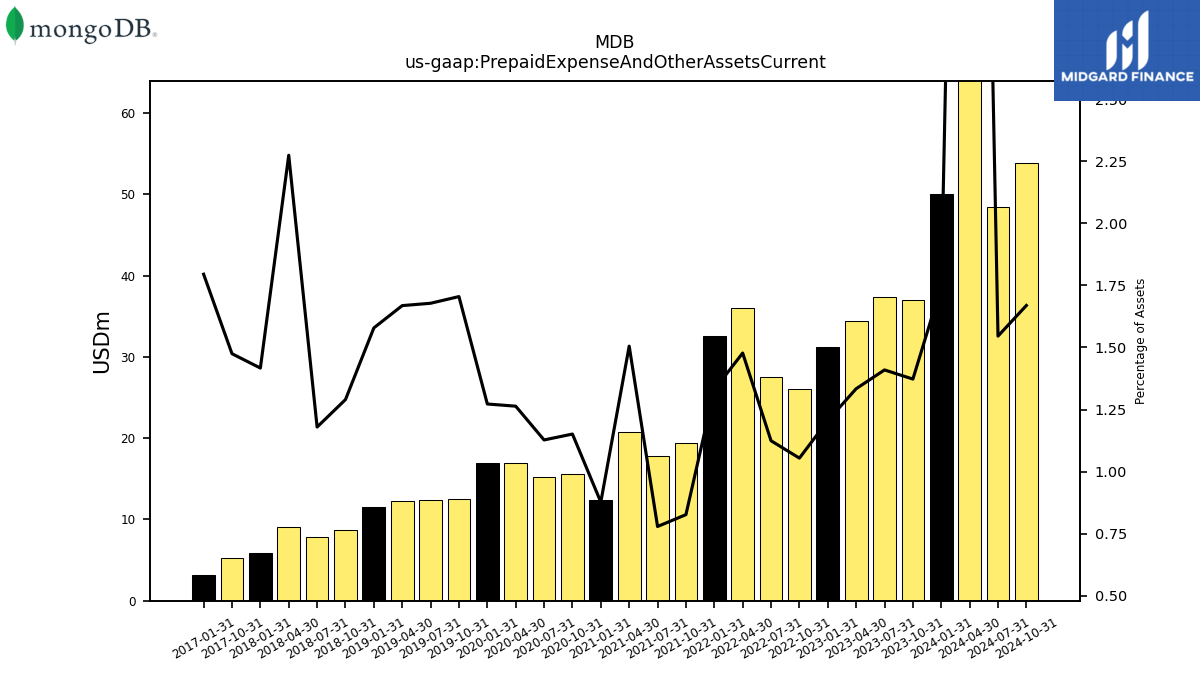
| Prepaid Expense And Other Assets Current | 36.98 | 37.33 | 34.42 | 31.21 | 26.02 | 27.57 | 35.97 | 32.57 | 19.45 | 17.78 | 20.74 | 12.35 | 15.61 | 15.28 | 16.89 | 16.91 | 12.53 | 12.44 | 12.25 | 11.58 | 8.65 | 7.83 | 9.10 | 5.88 | 5.22 | NA | NA | 3.13 | NA |
| 2023-10-31 | 2023-07-31 | 2023-04-30 | 2023-01-31 | 2022-10-31 | 2022-07-31 | 2022-04-30 | 2022-01-31 | 2021-10-31 | 2021-07-31 | 2021-04-30 | 2021-01-31 | 2020-10-31 | 2020-07-31 | 2020-04-30 | 2020-01-31 | 2019-10-31 | 2019-07-31 | 2019-04-30 | 2019-01-31 | 2018-10-31 | 2018-07-31 | 2018-04-30 | 2018-01-31 | 2017-10-31 | 2017-07-31 | 2017-04-30 | 2017-01-31 | 2016-10-31 | ||
|---|---|---|---|---|---|---|---|---|---|---|---|---|---|---|---|---|---|---|---|---|---|---|---|---|---|---|---|---|---|---|
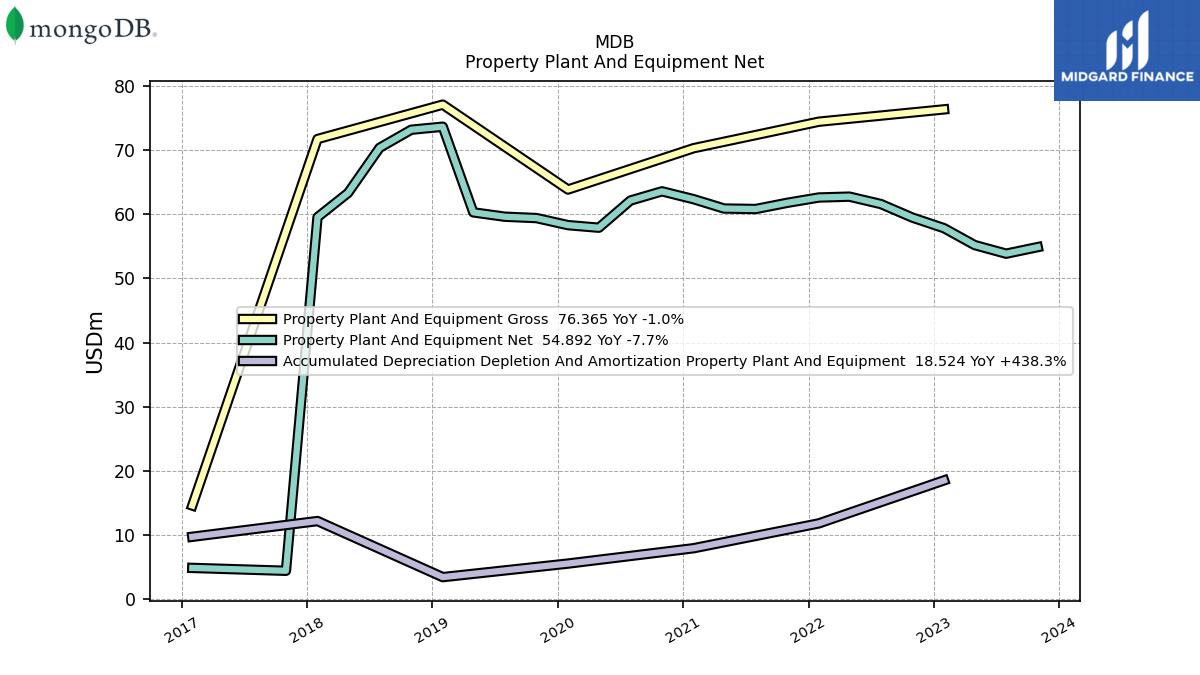
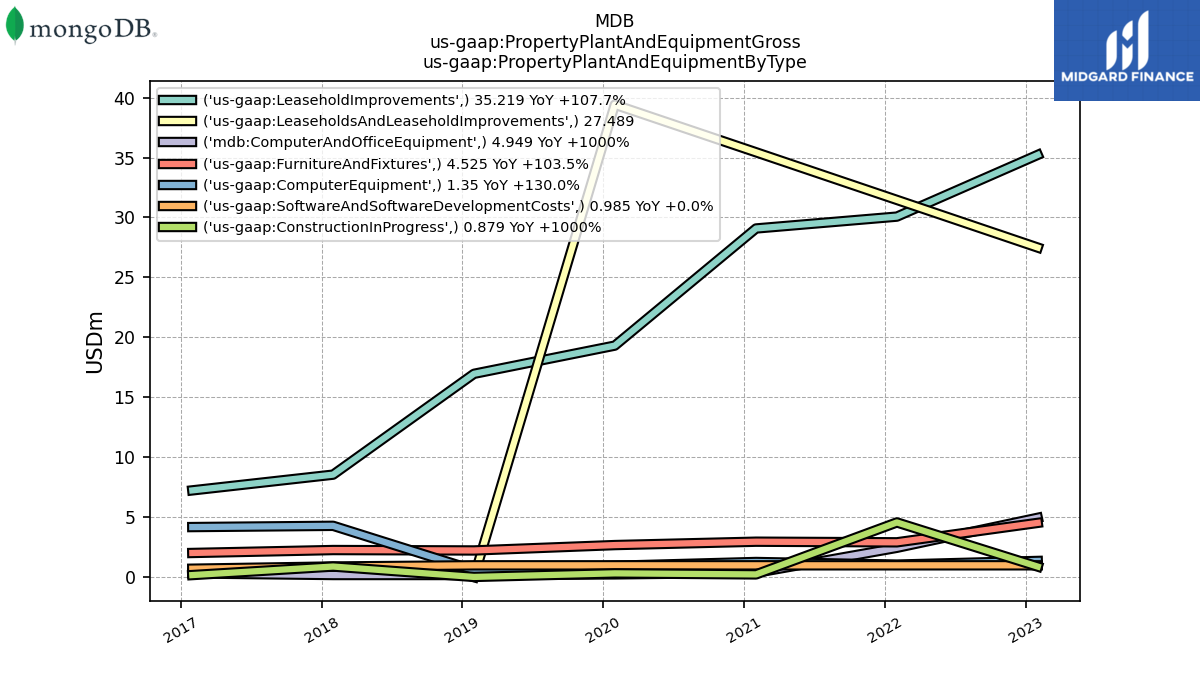
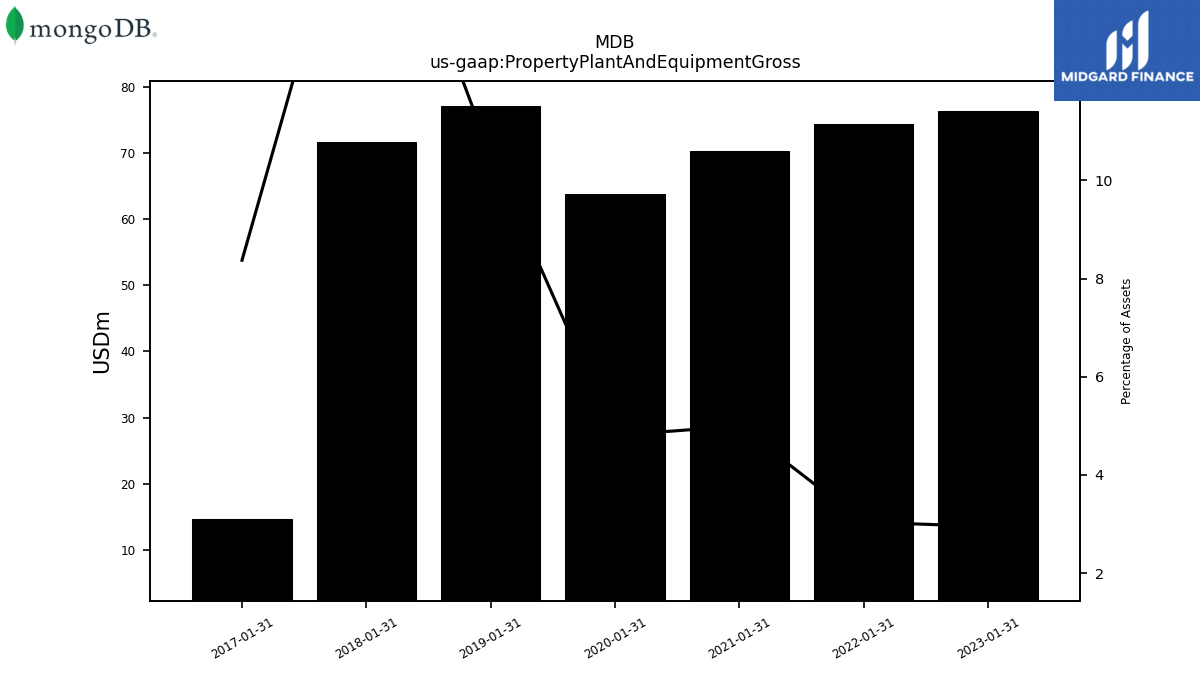
| Property Plant And Equipment Gross | NA | NA | NA | 76.36 | NA | NA | NA | 74.44 | NA | NA | NA | 70.31 | NA | NA | NA | 63.87 | NA | NA | NA | 77.11 | NA | NA | NA | 71.74 | NA | NA | NA | 14.61 | NA | |
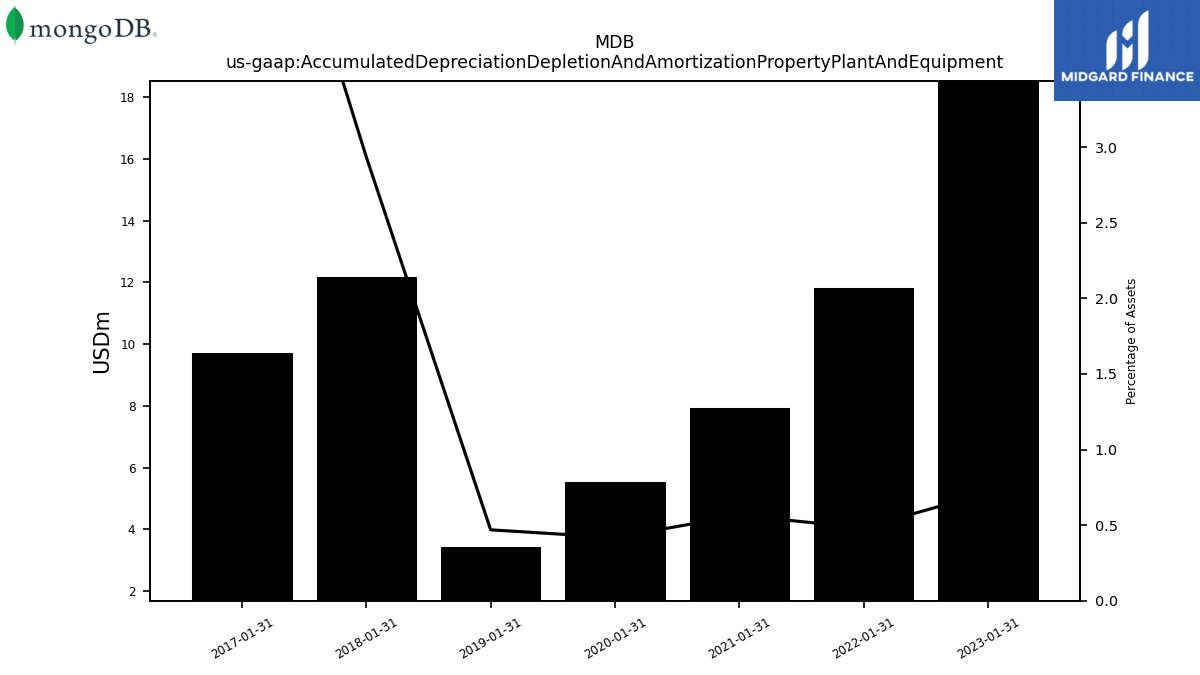
| Accumulated Depreciation Depletion And Amortization Property Plant And Equipment | NA | NA | NA | 18.52 | NA | NA | NA | 11.82 | NA | NA | NA | 7.95 | NA | NA | NA | 5.55 | NA | NA | NA | 3.44 | NA | NA | NA | 12.18 | NA | NA | NA | 9.73 | NA | |
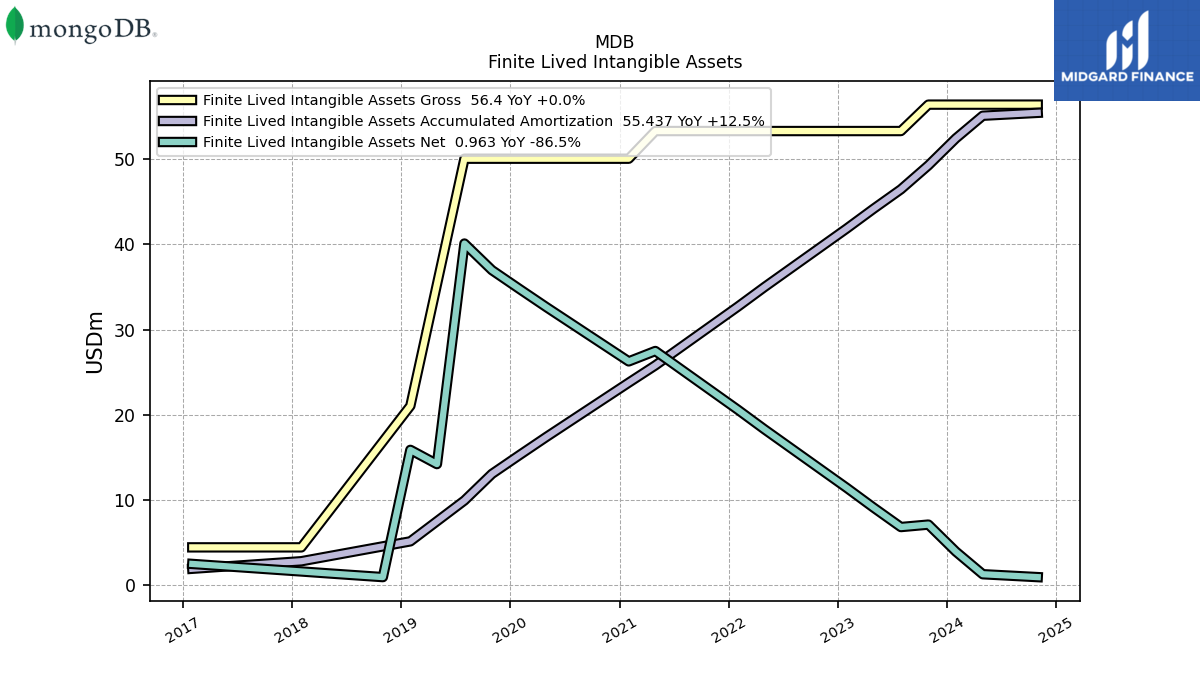
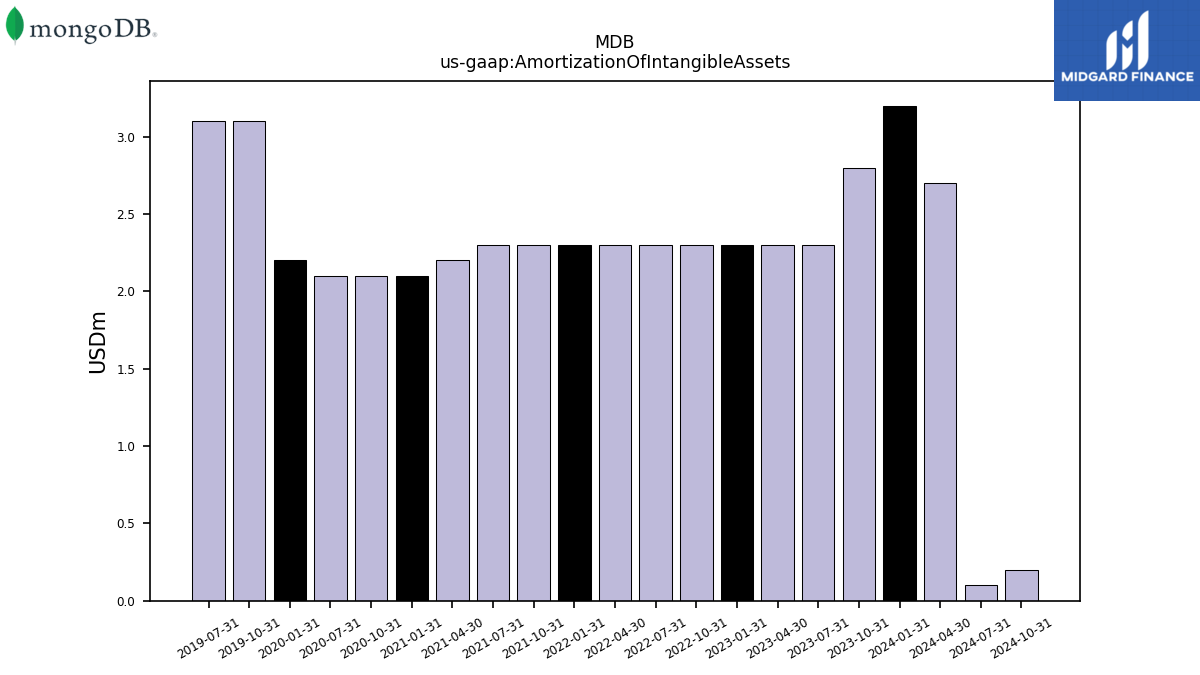
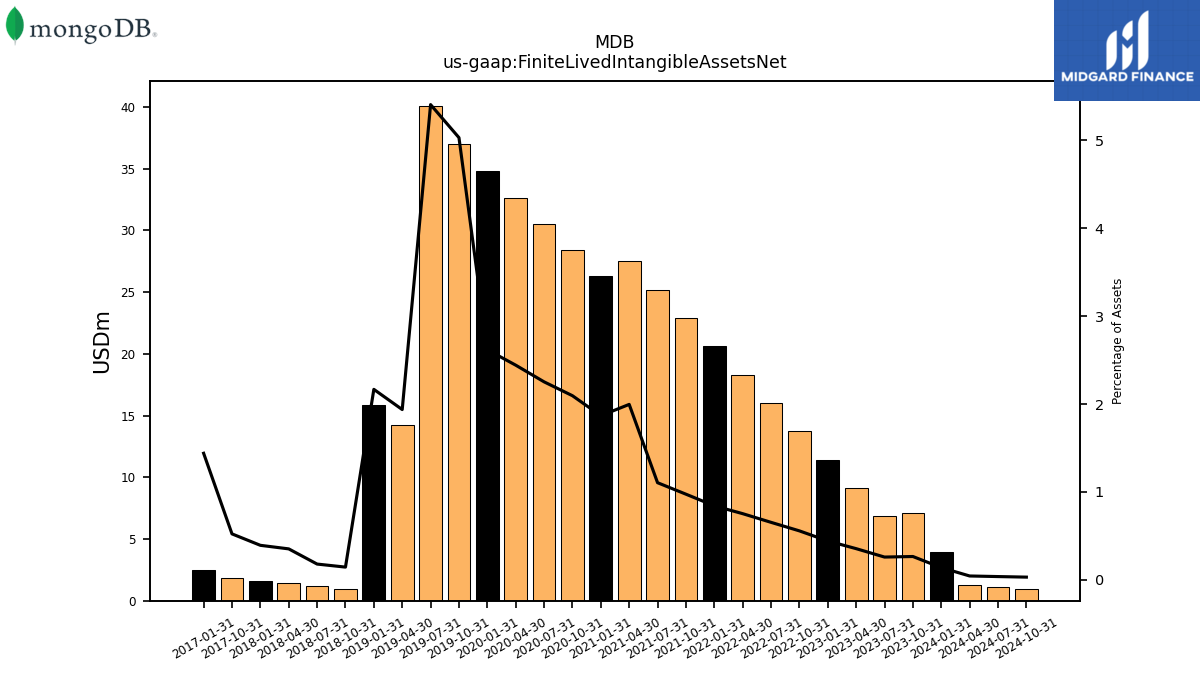
| Amortization Of Intangible Assets | 2.80 | 2.30 | 2.30 | 2.30 | 2.30 | 2.30 | 2.30 | 2.30 | 2.30 | 2.30 | 2.20 | 2.10 | 2.10 | 2.10 | NA | 2.20 | 3.10 | 3.10 | NA | NA | NA | NA | NA | NA | NA | NA | NA | NA | NA | |
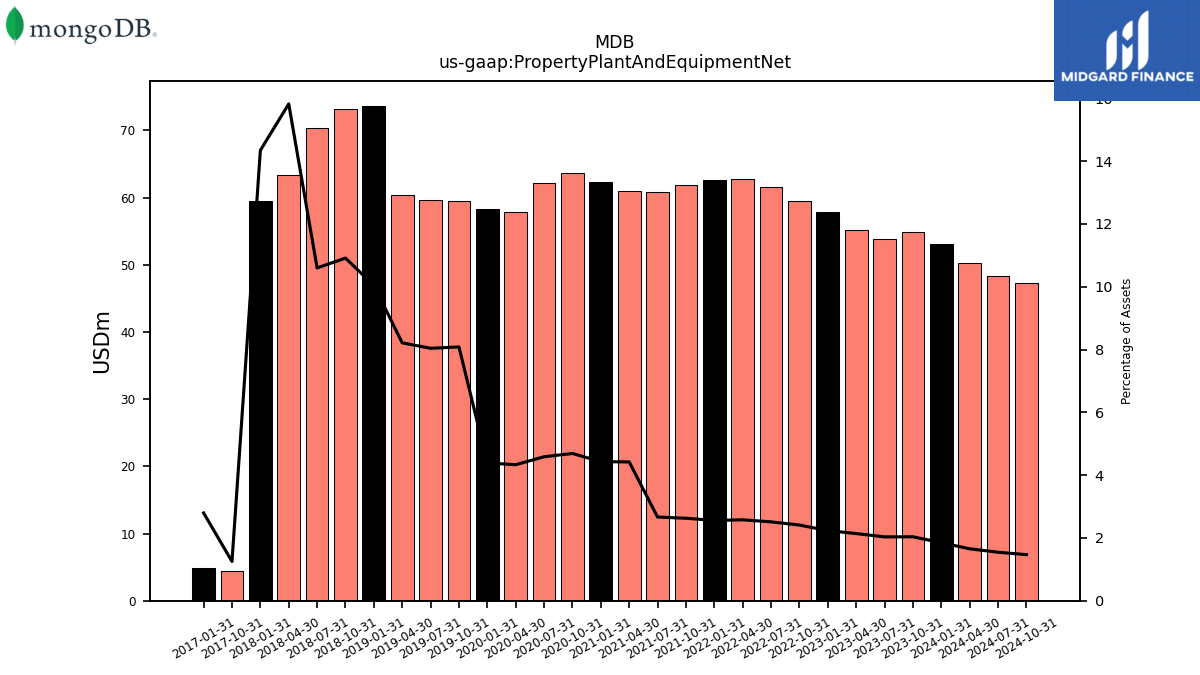
| Property Plant And Equipment Net | 54.89 | 53.87 | 55.21 | 57.84 | 59.49 | 61.60 | 62.76 | 62.62 | 61.80 | 60.83 | 60.91 | 62.36 | 63.59 | 62.15 | 57.91 | 58.32 | 59.42 | 59.63 | 60.31 | 73.66 | 73.19 | 70.37 | 63.34 | 59.56 | 4.43 | NA | NA | 4.88 | NA | |
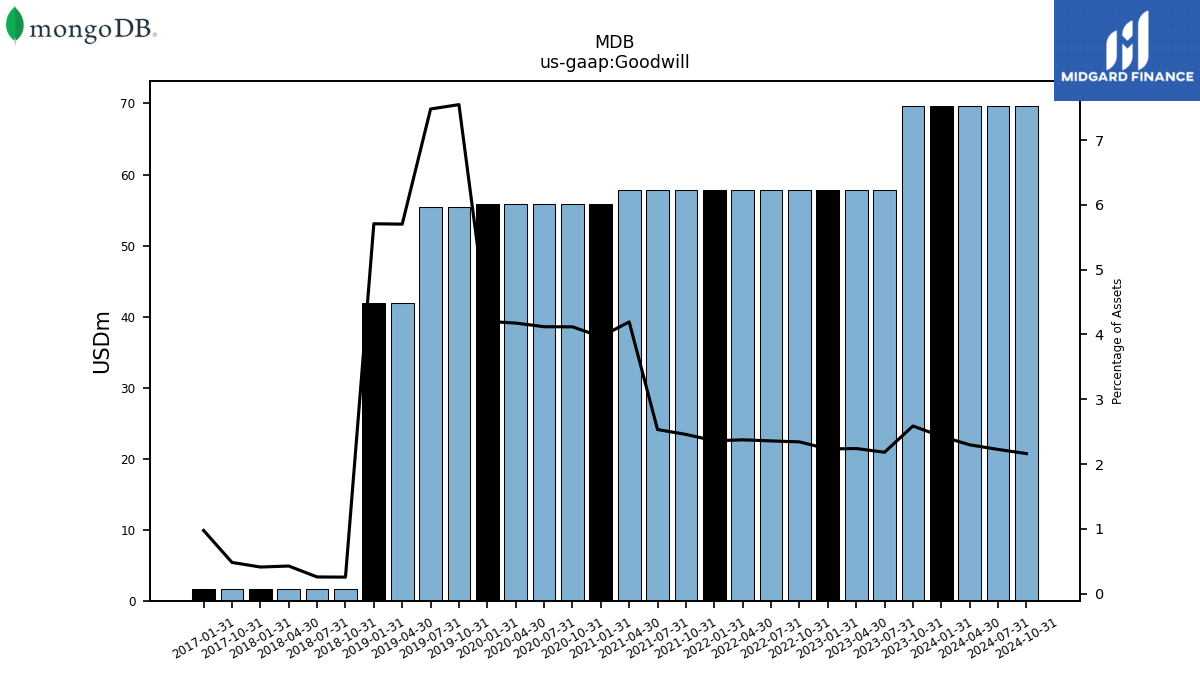
| Goodwill | 69.68 | 57.78 | 57.78 | 57.78 | 57.78 | 57.78 | 57.77 | 57.77 | 57.77 | 57.77 | 57.77 | 55.83 | 55.83 | 55.83 | 55.83 | 55.83 | 55.48 | 55.48 | 41.88 | 41.88 | 1.70 | 1.70 | 1.70 | 1.70 | 1.70 | NA | NA | 1.70 | NA | |
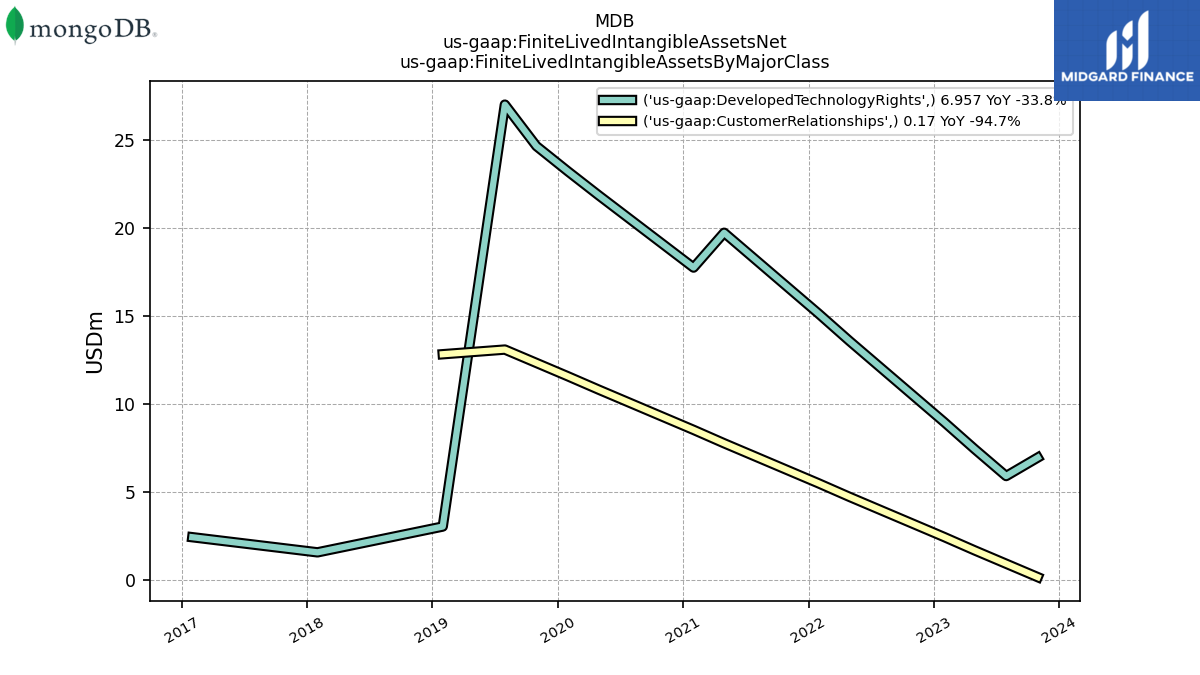
| Finite Lived Intangible Assets Net | 7.13 | 6.84 | 9.13 | 11.43 | 13.72 | 16.02 | 18.31 | 20.61 | 22.90 | 25.20 | 27.49 | 26.27 | 28.40 | 30.52 | 32.65 | 34.78 | 36.98 | 40.10 | 14.22 | 15.89 | 0.96 | 1.19 | 1.41 | 1.63 | 1.85 | NA | NA | 2.51 | NA | |
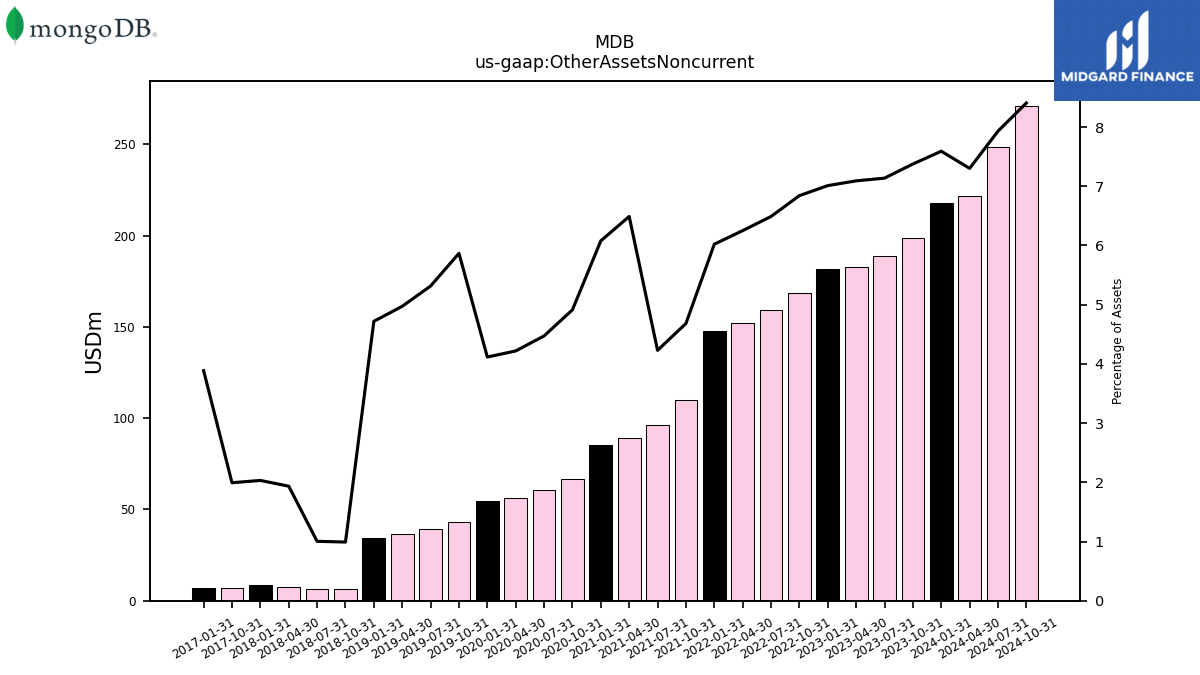
| Other Assets Noncurrent | 198.71 | 189.01 | 182.99 | 181.50 | 168.80 | 159.10 | 152.17 | 147.49 | 110.11 | 96.49 | 89.41 | 85.56 | 66.62 | 60.61 | 56.40 | 54.68 | 43.12 | 39.41 | 36.51 | 34.61 | 6.65 | 6.67 | 7.74 | 8.44 | 7.06 | NA | NA | 6.78 | NA |
| 2023-10-31 | 2023-07-31 | 2023-04-30 | 2023-01-31 | 2022-10-31 | 2022-07-31 | 2022-04-30 | 2022-01-31 | 2021-10-31 | 2021-07-31 | 2021-04-30 | 2021-01-31 | 2020-10-31 | 2020-07-31 | 2020-04-30 | 2020-01-31 | 2019-10-31 | 2019-07-31 | 2019-04-30 | 2019-01-31 | 2018-10-31 | 2018-07-31 | 2018-04-30 | 2018-01-31 | 2017-10-31 | 2017-07-31 | 2017-04-30 | 2017-01-31 | 2016-10-31 | ||
|---|---|---|---|---|---|---|---|---|---|---|---|---|---|---|---|---|---|---|---|---|---|---|---|---|---|---|---|---|---|---|
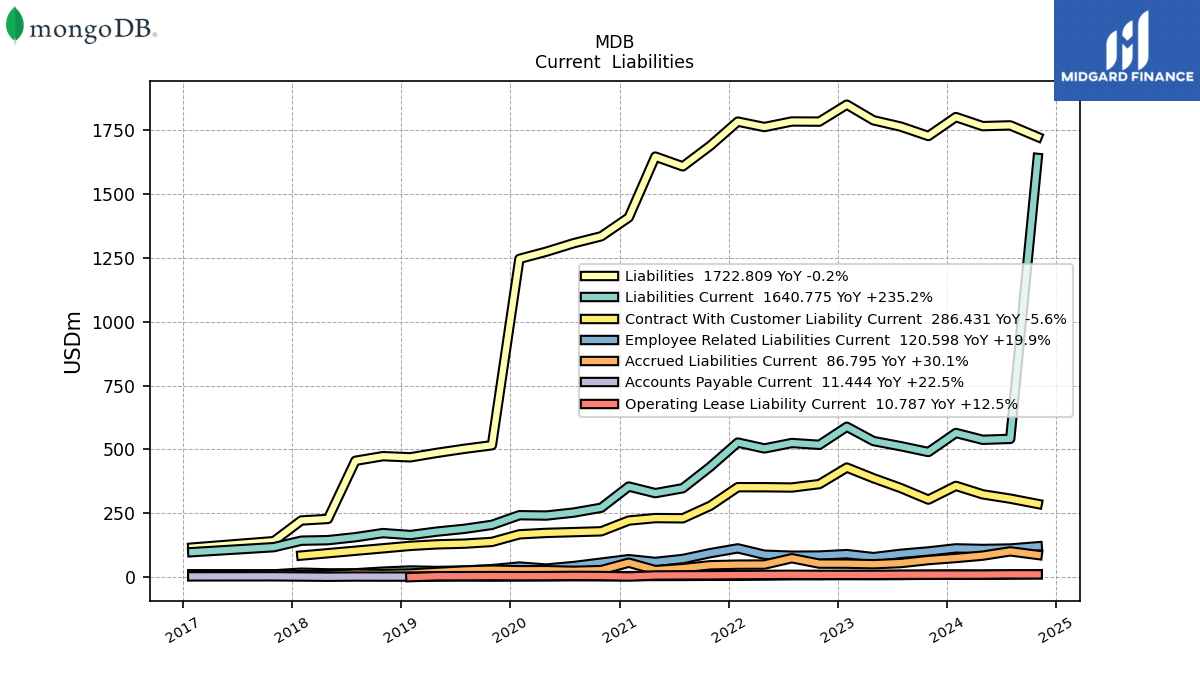
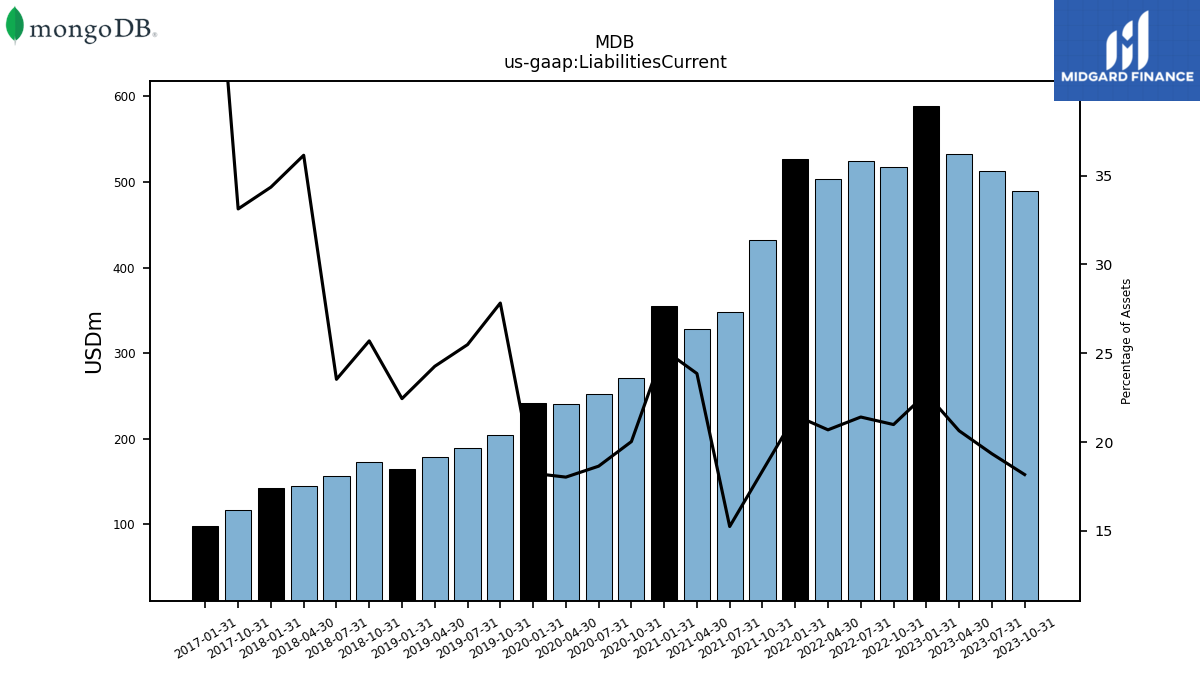
| Liabilities Current | 489.56 | 512.30 | 532.57 | 588.51 | 517.81 | 524.90 | 503.72 | 526.74 | 432.20 | 347.90 | 328.68 | 354.54 | 271.54 | 252.66 | 241.02 | 242.38 | 204.52 | 189.00 | 178.17 | 164.64 | 172.34 | 156.24 | 144.66 | 142.62 | 117.25 | NA | NA | 97.79 | NA | |
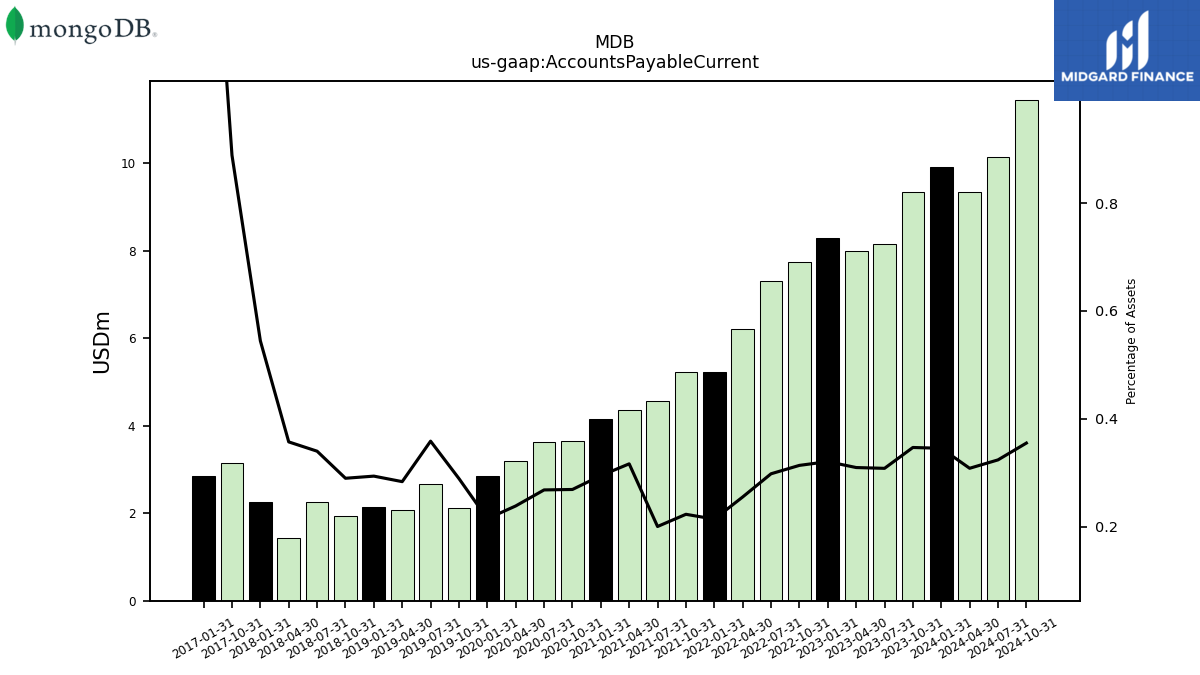
| Accounts Payable Current | 9.34 | 8.16 | 7.99 | 8.29 | 7.73 | 7.30 | 6.20 | 5.23 | 5.24 | 4.56 | 4.36 | 4.14 | 3.64 | 3.63 | 3.18 | 2.85 | 2.12 | 2.66 | 2.08 | 2.15 | 1.94 | 2.26 | 1.43 | 2.26 | 3.15 | NA | NA | 2.84 | NA | |
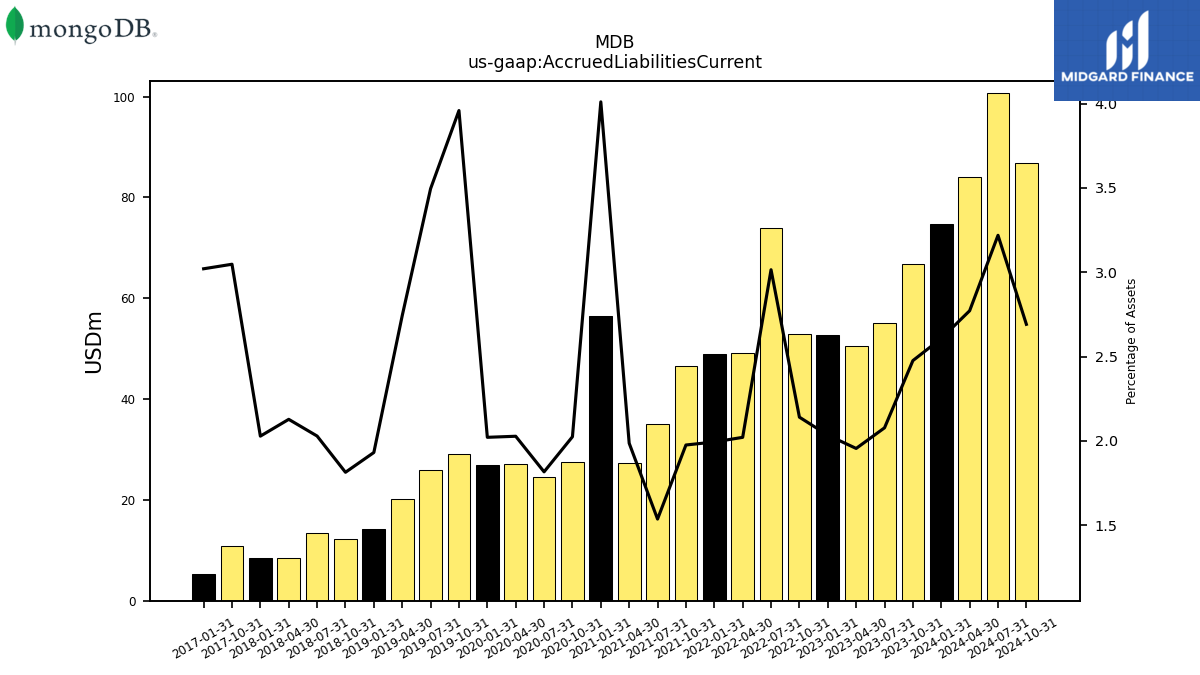
| Accrued Liabilities Current | 66.72 | 55.03 | 50.47 | 52.67 | 52.83 | 73.92 | 49.22 | 48.85 | 46.47 | 35.07 | 27.37 | 56.44 | 27.46 | 24.62 | 27.11 | 26.86 | 29.09 | 25.92 | 20.14 | 14.17 | 12.17 | 13.47 | 8.52 | 8.42 | 10.79 | NA | NA | 5.27 | NA | |
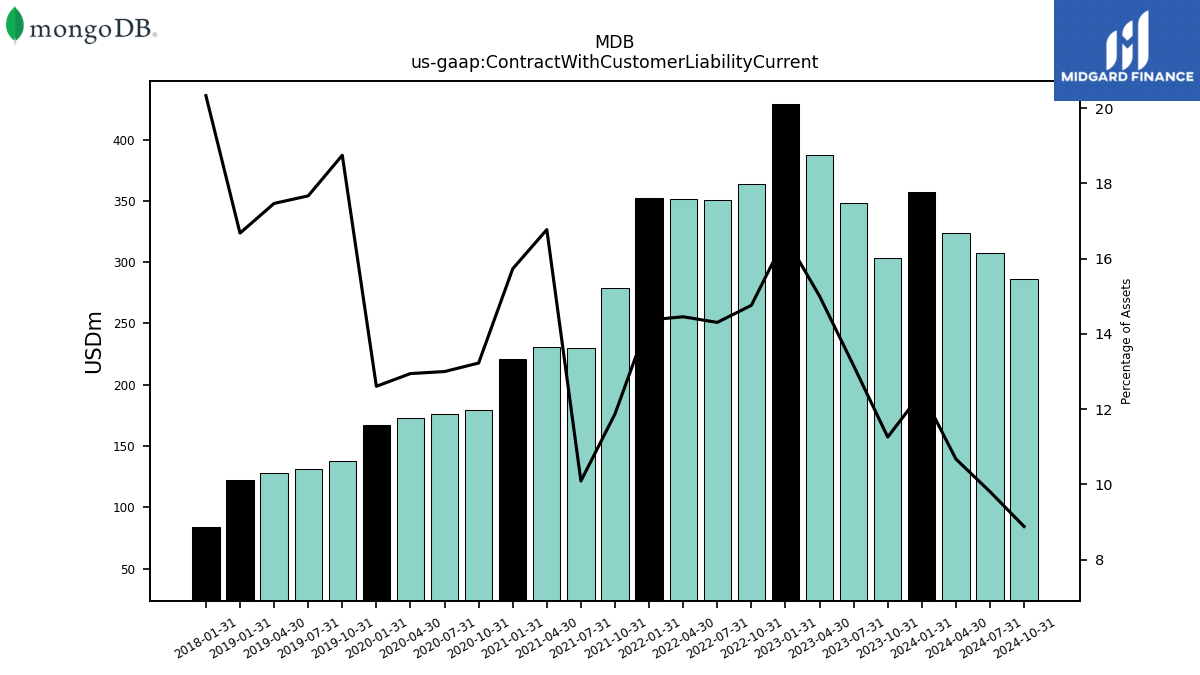
| Contract With Customer Liability Current | 303.32 | 348.36 | 387.21 | 428.75 | 364.16 | 350.71 | 351.91 | 352.00 | 279.24 | 230.22 | 231.04 | 221.40 | 179.32 | 176.16 | 173.07 | 167.50 | 137.79 | 131.02 | 128.25 | 122.33 | NA | NA | NA | 84.42 | NA | NA | NA | NA | NA |
| 2023-10-31 | 2023-07-31 | 2023-04-30 | 2023-01-31 | 2022-10-31 | 2022-07-31 | 2022-04-30 | 2022-01-31 | 2021-10-31 | 2021-07-31 | 2021-04-30 | 2021-01-31 | 2020-10-31 | 2020-07-31 | 2020-04-30 | 2020-01-31 | 2019-10-31 | 2019-07-31 | 2019-04-30 | 2019-01-31 | 2018-10-31 | 2018-07-31 | 2018-04-30 | 2018-01-31 | 2017-10-31 | 2017-07-31 | 2017-04-30 | 2017-01-31 | 2016-10-31 | ||
|---|---|---|---|---|---|---|---|---|---|---|---|---|---|---|---|---|---|---|---|---|---|---|---|---|---|---|---|---|---|---|
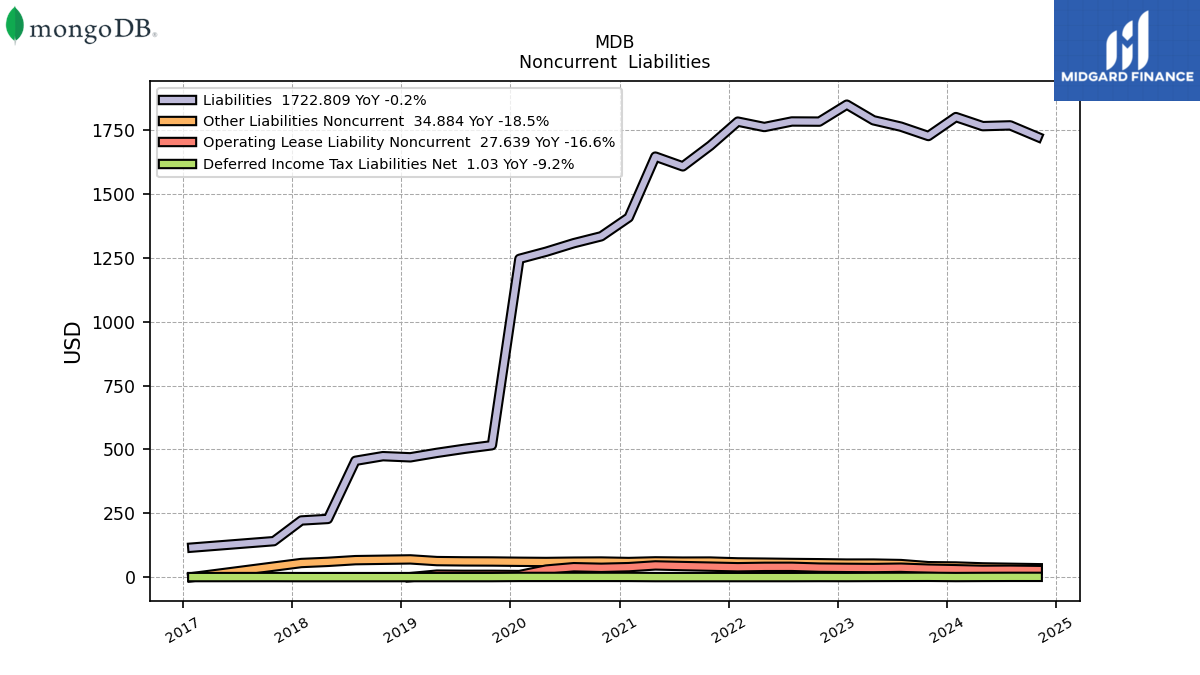
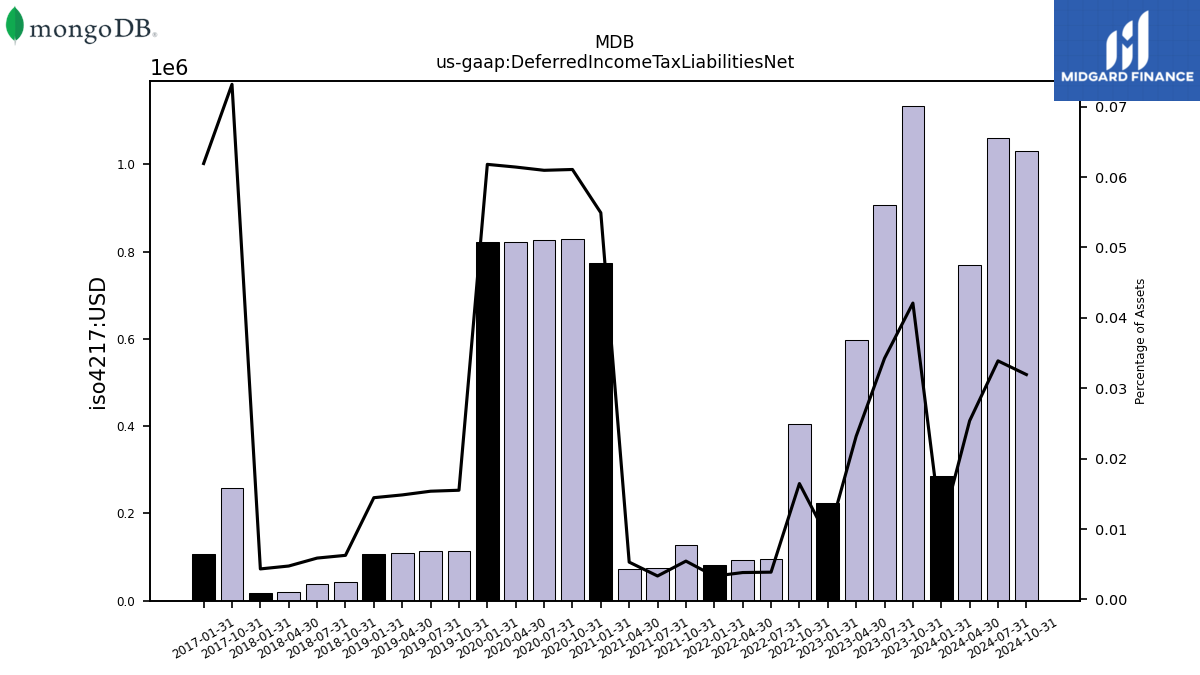
| Deferred Income Tax Liabilities Net | 1.13 | 0.91 | 0.60 | 0.23 | 0.41 | 0.10 | 0.09 | 0.08 | 0.13 | 0.08 | 0.07 | 0.77 | 0.83 | 0.83 | 0.82 | 0.82 | 0.11 | 0.11 | 0.11 | 0.11 | 0.04 | 0.04 | 0.02 | 0.02 | 0.26 | NA | NA | 0.11 | NA | |
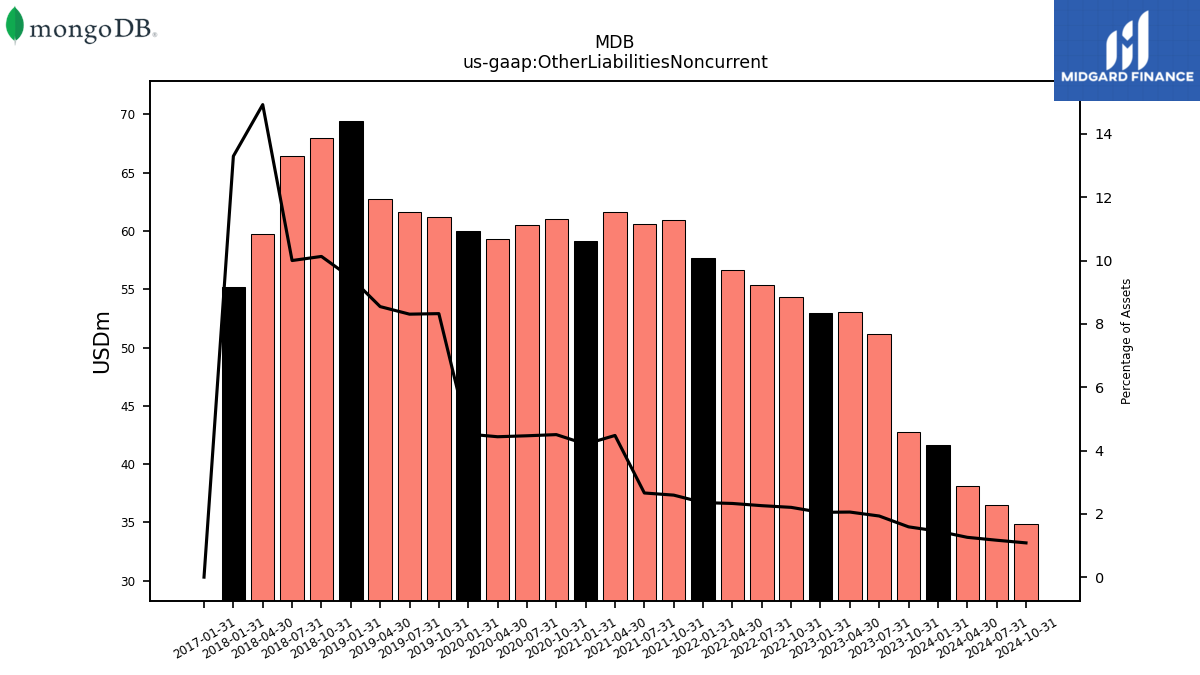
| Other Liabilities Noncurrent | 42.79 | 51.13 | 53.05 | 52.98 | 54.37 | 55.34 | 56.65 | 57.66 | 60.92 | 60.64 | 61.65 | 59.13 | 61.04 | 60.51 | 59.29 | 60.03 | 61.18 | 61.60 | 62.75 | 69.40 | 67.94 | 66.40 | 59.74 | 55.21 | NA | NA | NA | 0.00 | NA | |
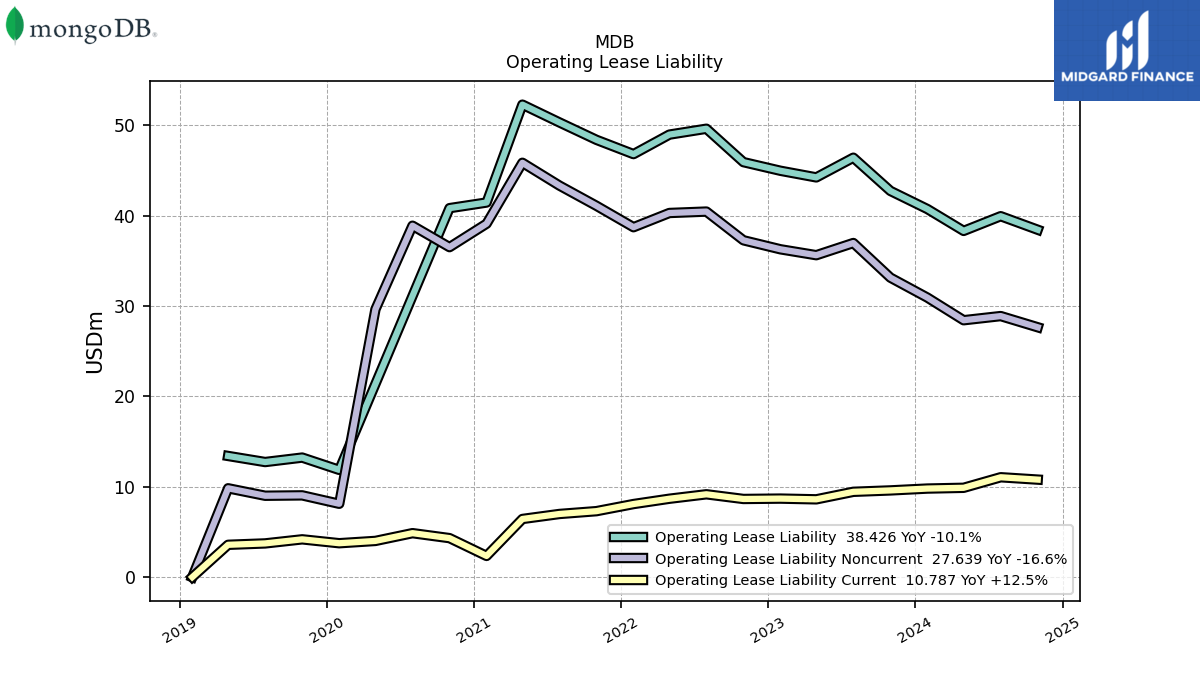
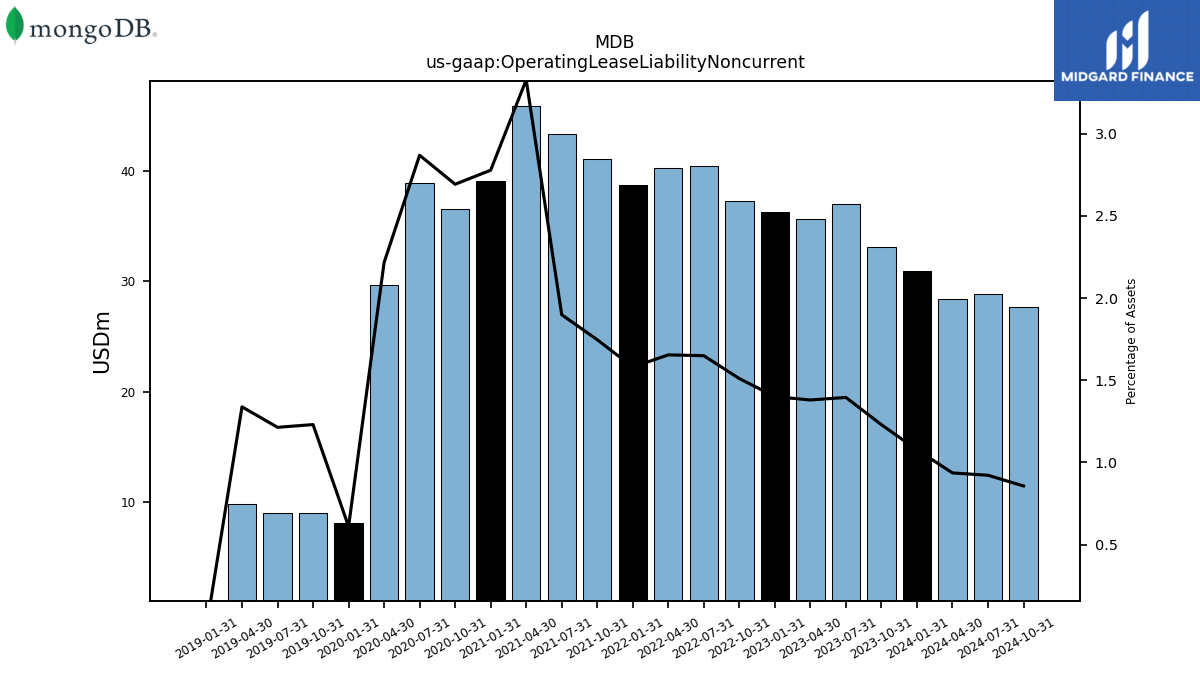
| Operating Lease Liability Noncurrent | 33.13 | 36.96 | 35.61 | 36.26 | 37.26 | 40.44 | 40.28 | 38.71 | 41.07 | 43.31 | 45.84 | 39.09 | 36.50 | 38.87 | 29.62 | 8.11 | 9.04 | 9.00 | 9.83 | 0.00 | NA | NA | NA | NA | NA | NA | NA | NA | NA |
| 2023-10-31 | 2023-07-31 | 2023-04-30 | 2023-01-31 | 2022-10-31 | 2022-07-31 | 2022-04-30 | 2022-01-31 | 2021-10-31 | 2021-07-31 | 2021-04-30 | 2021-01-31 | 2020-10-31 | 2020-07-31 | 2020-04-30 | 2020-01-31 | 2019-10-31 | 2019-07-31 | 2019-04-30 | 2019-01-31 | 2018-10-31 | 2018-07-31 | 2018-04-30 | 2018-01-31 | 2017-10-31 | 2017-07-31 | 2017-04-30 | 2017-01-31 | 2016-10-31 | ||
|---|---|---|---|---|---|---|---|---|---|---|---|---|---|---|---|---|---|---|---|---|---|---|---|---|---|---|---|---|---|---|
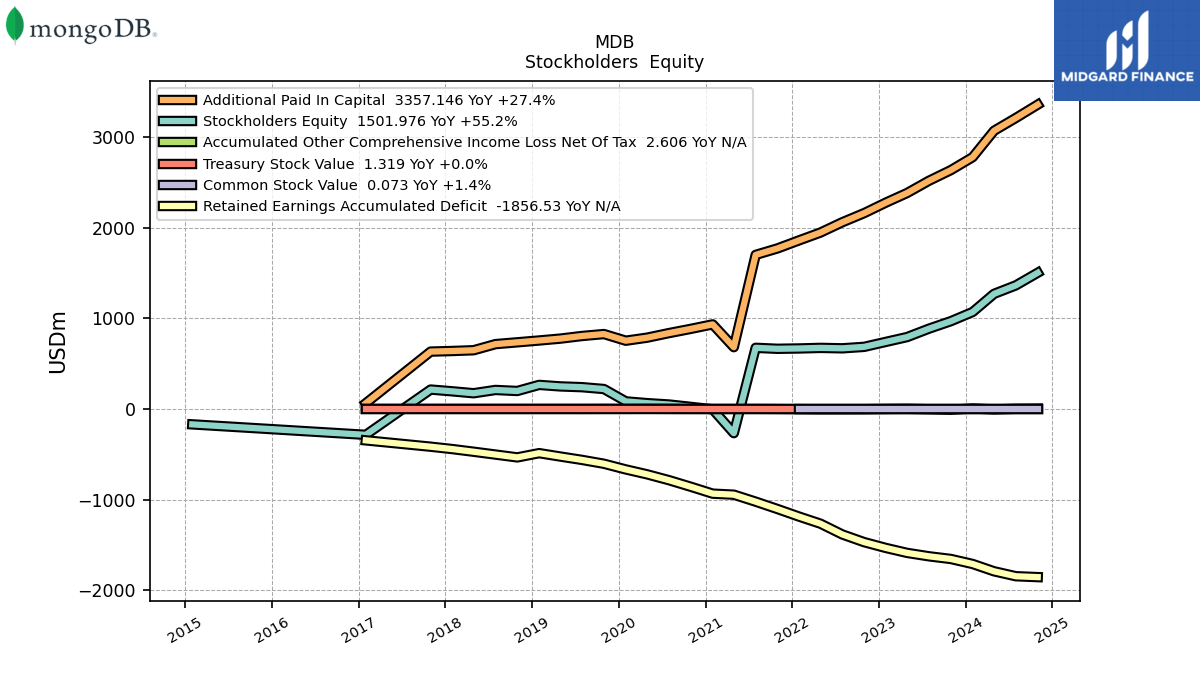
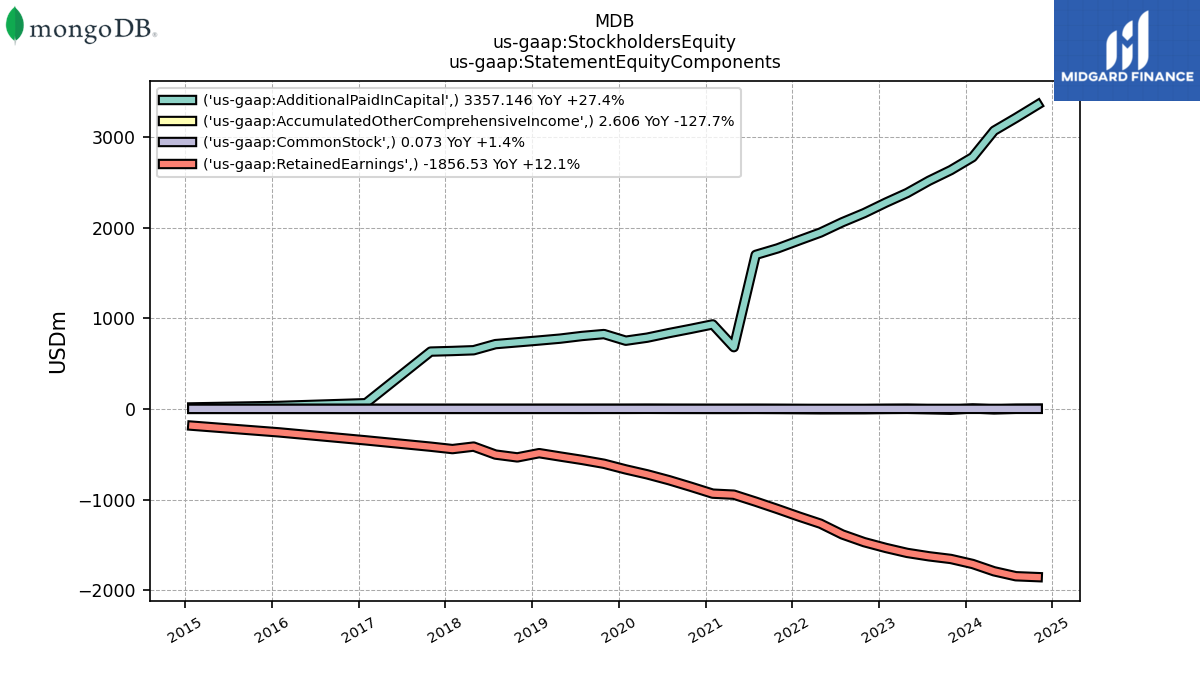
| Stockholders Equity | 967.54 | 885.09 | 792.43 | 739.51 | 684.28 | 668.17 | 672.88 | 666.70 | 662.90 | 673.72 | -268.36 | -5.03 | 21.80 | 48.15 | 63.04 | 82.86 | 218.84 | 239.34 | 247.87 | 264.57 | 197.25 | 208.62 | 172.51 | 193.49 | 213.19 | NA | NA | -286.51 | NA | |
| Common Stock Value | 0.07 | 0.07 | 0.07 | 0.07 | 0.07 | 0.07 | 0.07 | 0.07 | NA | NA | NA | NA | NA | NA | NA | NA | NA | NA | NA | NA | NA | NA | NA | NA | NA | NA | NA | NA | NA | |
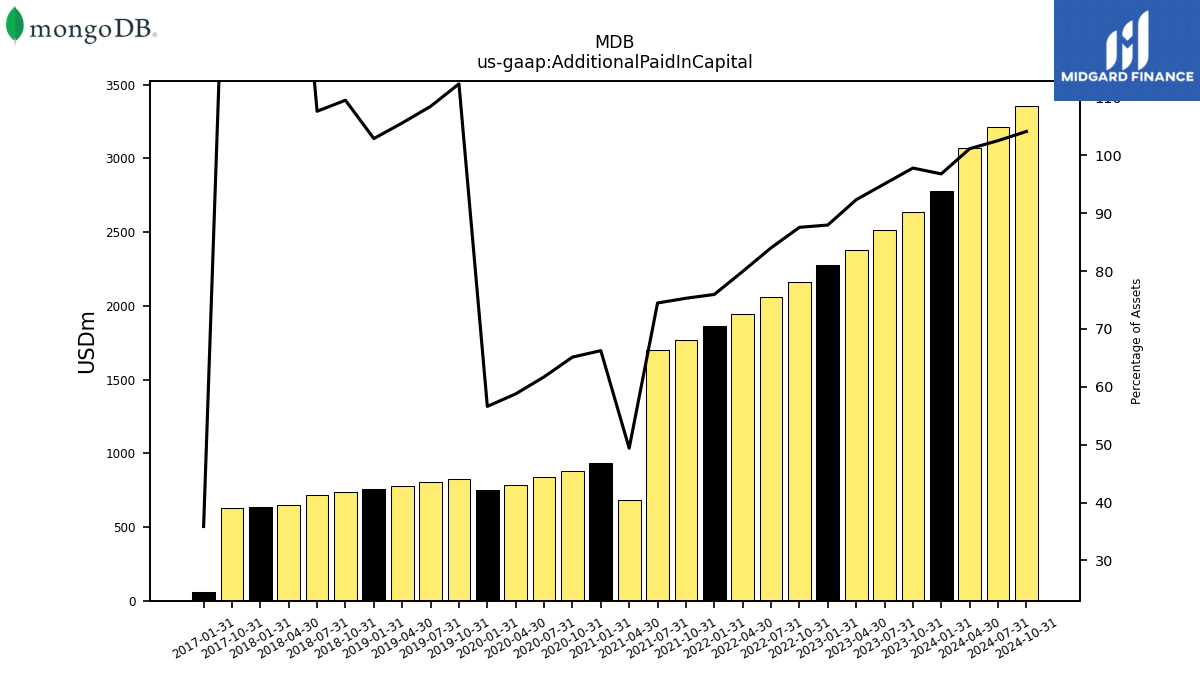
| Additional Paid In Capital | 2634.38 | 2517.25 | 2382.12 | 2276.69 | 2159.96 | 2059.41 | 1945.74 | 1860.51 | 1770.63 | 1699.15 | 680.41 | 932.33 | 883.00 | 836.29 | 785.73 | 752.13 | 825.58 | 804.22 | 775.18 | 754.61 | 734.38 | 714.40 | 646.97 | 638.68 | 632.05 | NA | NA | 62.56 | NA | |
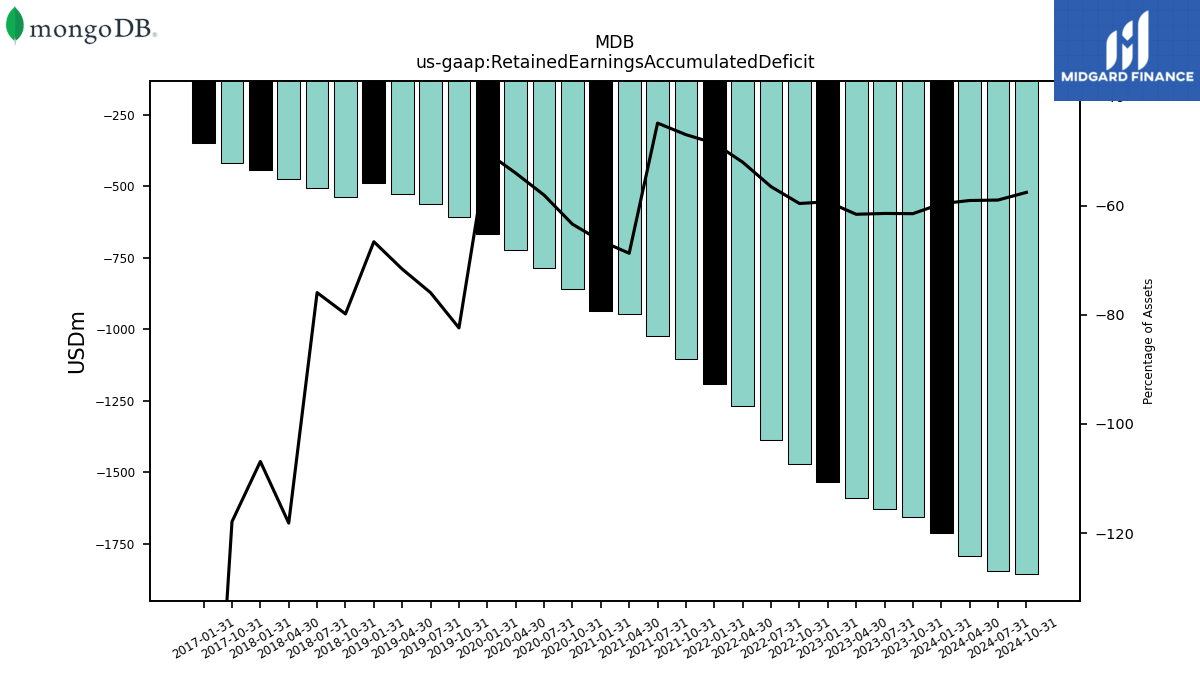
| Retained Earnings Accumulated Deficit | -1656.17 | -1626.88 | -1589.28 | -1535.03 | -1470.63 | -1385.79 | -1266.93 | -1189.63 | -1105.19 | -1023.89 | -946.76 | -935.40 | -859.60 | -786.95 | -722.43 | -668.23 | -605.67 | -563.29 | -525.95 | -488.61 | -535.49 | -504.17 | -472.92 | -443.76 | -417.39 | NA | NA | -347.40 | NA | |
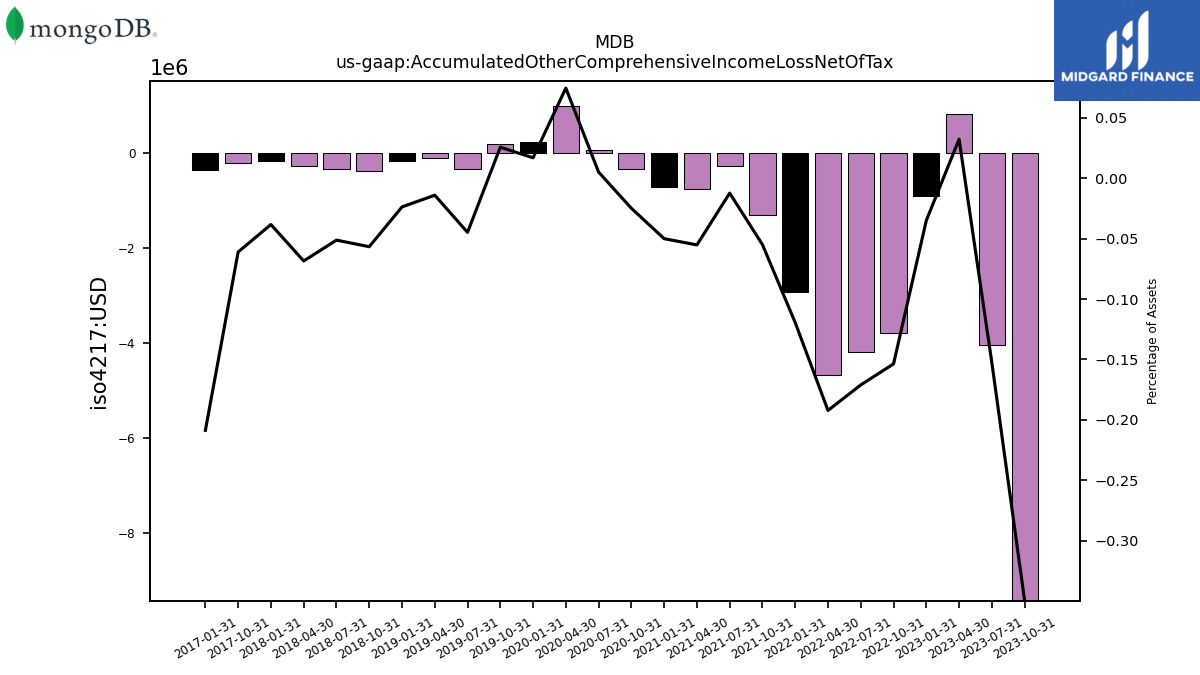
| Accumulated Other Comprehensive Income Loss Net Of Tax | -9.42 | -4.04 | 0.83 | -0.91 | -3.79 | -4.19 | -4.68 | -2.93 | -1.29 | -0.28 | -0.76 | -0.70 | -0.34 | 0.07 | 1.00 | 0.23 | 0.19 | -0.33 | -0.10 | -0.17 | -0.38 | -0.34 | -0.27 | -0.16 | -0.22 | NA | NA | -0.36 | NA | |
| Adjustments To Additional Paid In Capital Sharebased Compensation Requisite Service Period Recognition Value | 115.83 | 113.31 | 103.95 | NA | 99.20 | 96.55 | 83.57 | 182.36 | 69.62 | 57.70 | 50.91 | NA | 39.95 | 37.52 | 30.57 | NA | 19.37 | 17.66 | 14.01 | 10.55 | 10.26 | 9.01 | 7.51 | 6.17 | NA | NA | NA | NA | NA |
| 2023-10-31 | 2023-07-31 | 2023-04-30 | 2023-01-31 | 2022-10-31 | 2022-07-31 | 2022-04-30 | 2022-01-31 | 2021-10-31 | 2021-07-31 | 2021-04-30 | 2021-01-31 | 2020-10-31 | 2020-07-31 | 2020-04-30 | 2020-01-31 | 2019-10-31 | 2019-07-31 | 2019-04-30 | 2019-01-31 | 2018-10-31 | 2018-07-31 | 2018-04-30 | 2018-01-31 | 2017-10-31 | 2017-07-31 | 2017-04-30 | 2017-01-31 | 2016-10-31 | ||
|---|---|---|---|---|---|---|---|---|---|---|---|---|---|---|---|---|---|---|---|---|---|---|---|---|---|---|---|---|---|---|
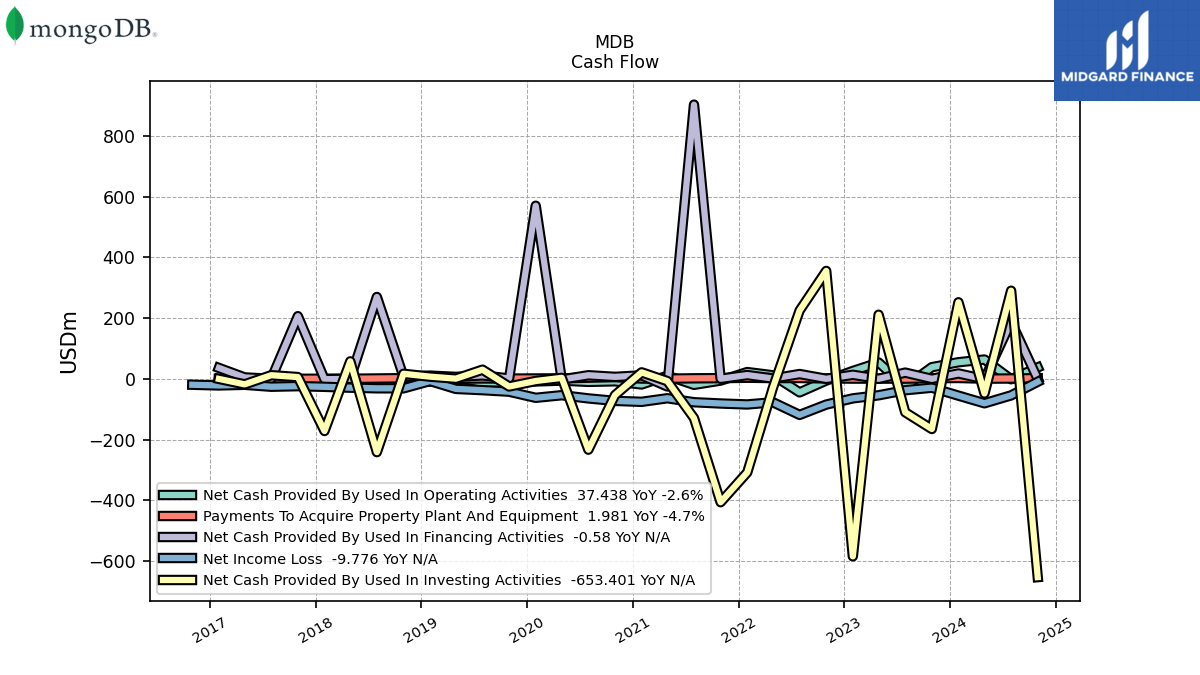
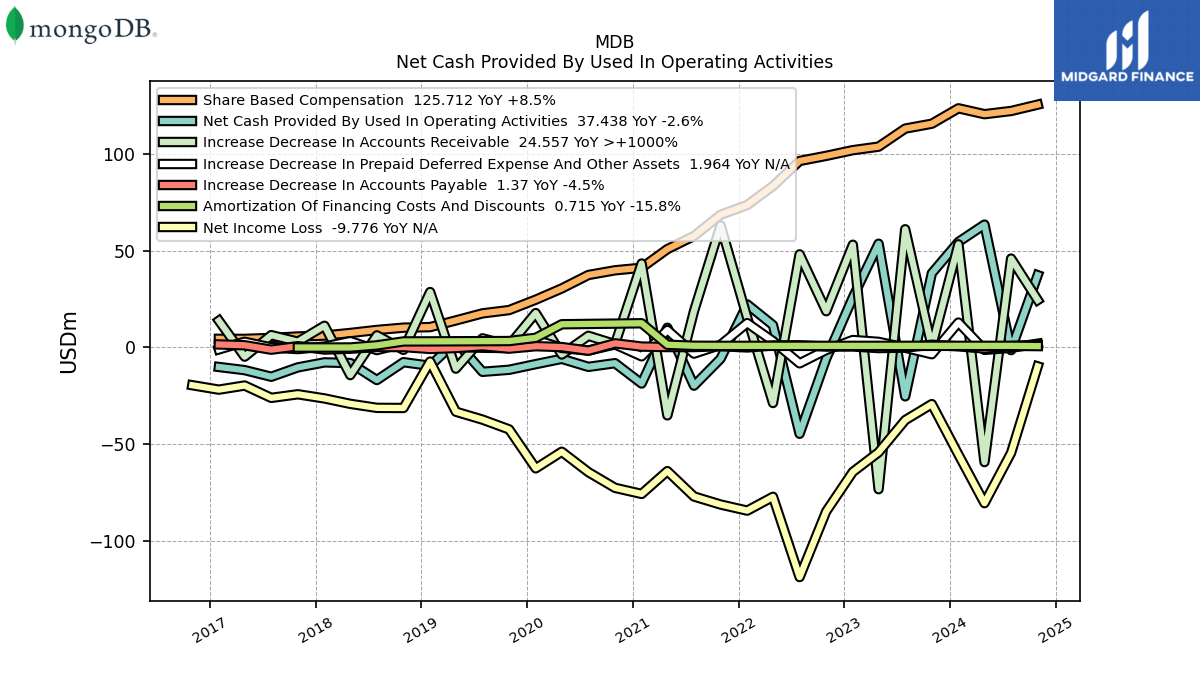
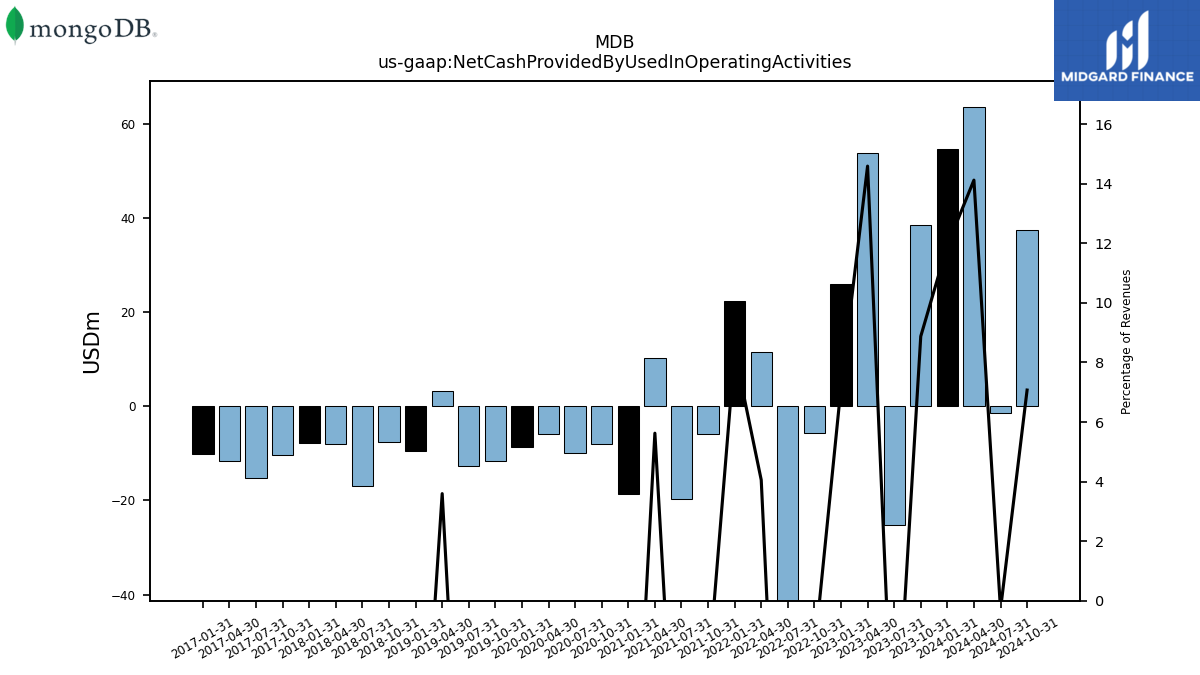
| Net Cash Provided By Used In Operating Activities | 38.42 | -25.30 | 53.73 | 25.87 | -5.74 | -44.67 | 11.57 | 22.31 | -5.79 | -19.76 | 10.22 | -18.64 | -8.12 | -10.03 | -5.88 | -8.62 | -11.54 | -12.59 | 3.21 | -9.48 | -7.61 | -16.85 | -8.05 | -7.71 | -10.30 | -15.15 | -11.72 | -10.09 | NA | |
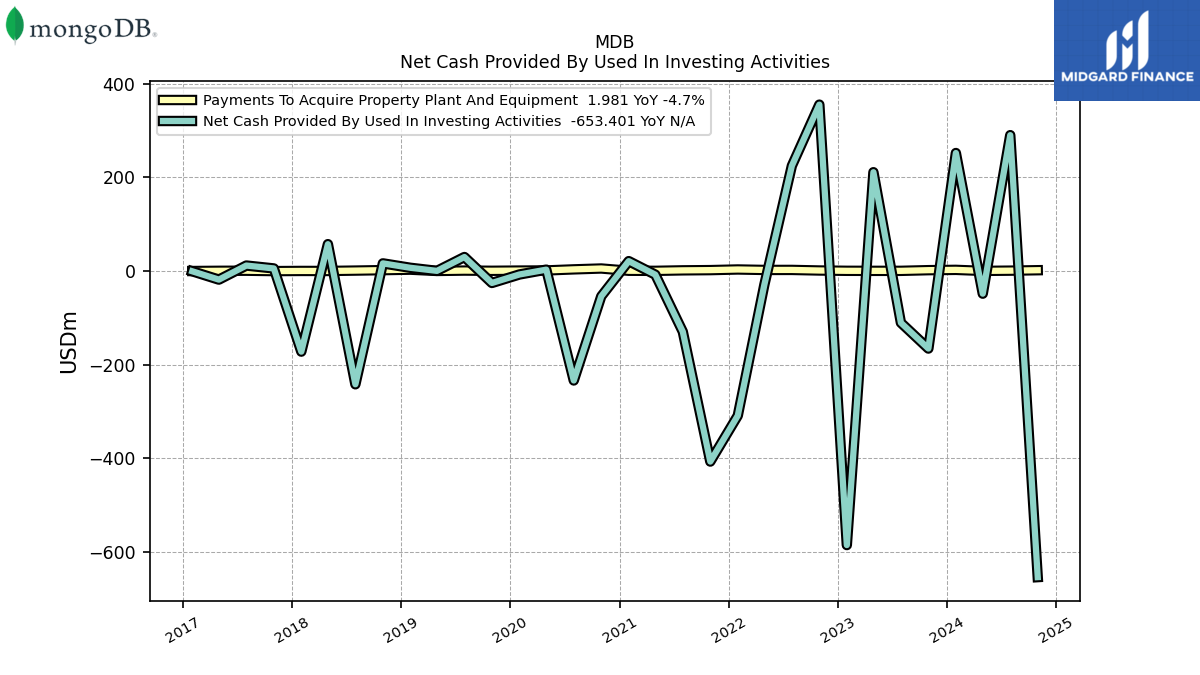
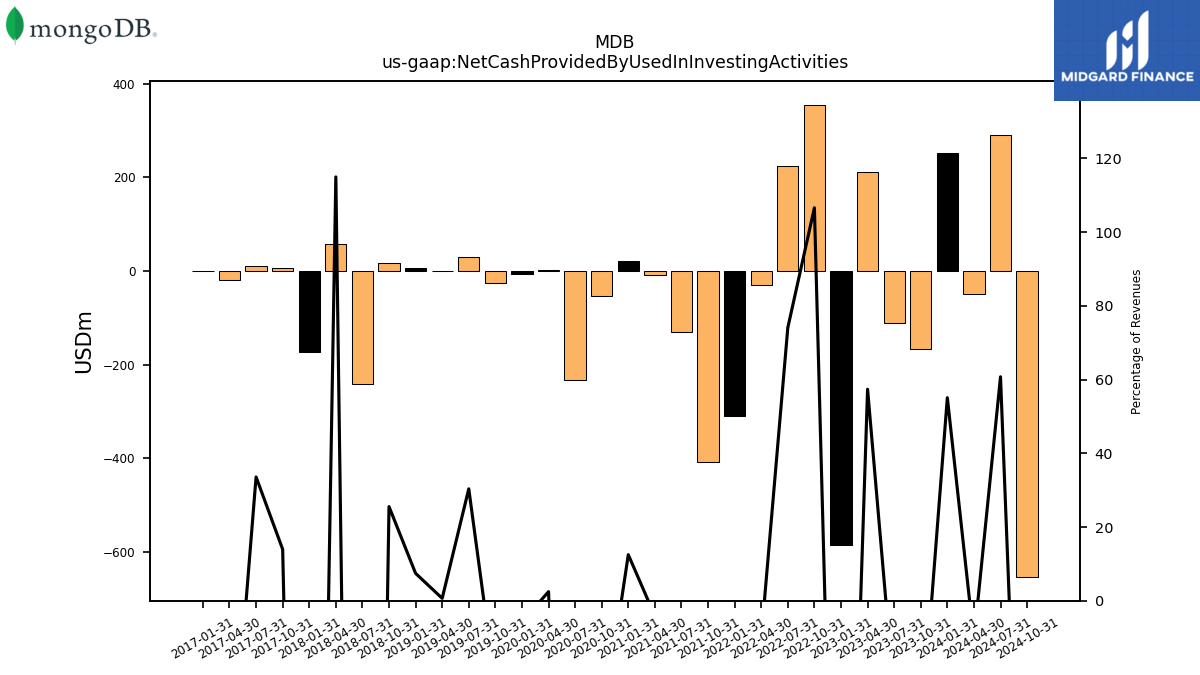
| Net Cash Provided By Used In Investing Activities | -165.33 | -110.19 | 211.28 | -585.00 | 355.58 | 224.92 | -28.80 | -308.56 | -406.65 | -129.41 | -7.51 | 21.36 | -53.71 | -233.51 | 3.21 | -7.14 | -25.26 | 30.16 | 0.59 | 7.16 | 16.59 | -241.66 | 57.63 | -171.92 | 5.79 | 11.95 | -18.10 | -0.28 | NA | |
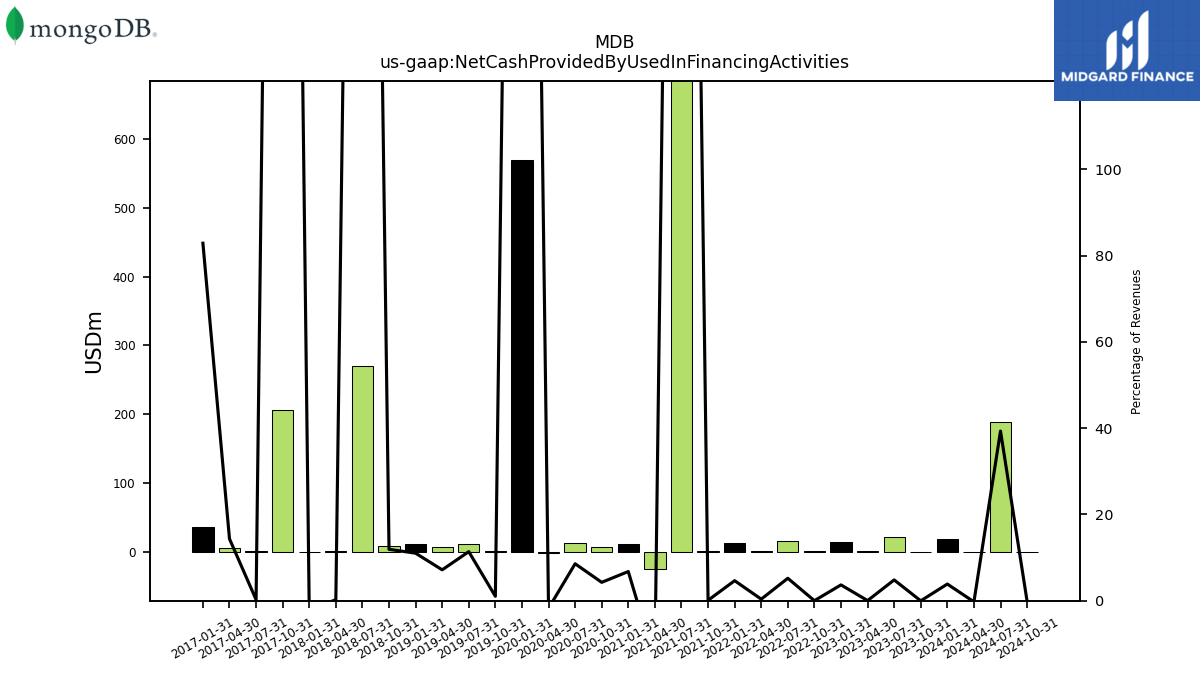
| Net Cash Provided By Used In Financing Activities | -0.08 | 20.46 | 0.13 | 13.27 | 0.05 | 15.82 | 1.06 | 12.40 | 0.23 | 903.52 | -25.25 | 11.58 | 6.44 | 11.86 | -2.29 | 570.39 | 1.13 | 11.31 | 6.41 | 10.61 | 7.75 | 269.74 | 0.14 | -1.31 | 206.47 | 0.09 | 4.65 | 35.95 | NA |
| 2023-10-31 | 2023-07-31 | 2023-04-30 | 2023-01-31 | 2022-10-31 | 2022-07-31 | 2022-04-30 | 2022-01-31 | 2021-10-31 | 2021-07-31 | 2021-04-30 | 2021-01-31 | 2020-10-31 | 2020-07-31 | 2020-04-30 | 2020-01-31 | 2019-10-31 | 2019-07-31 | 2019-04-30 | 2019-01-31 | 2018-10-31 | 2018-07-31 | 2018-04-30 | 2018-01-31 | 2017-10-31 | 2017-07-31 | 2017-04-30 | 2017-01-31 | 2016-10-31 | ||
|---|---|---|---|---|---|---|---|---|---|---|---|---|---|---|---|---|---|---|---|---|---|---|---|---|---|---|---|---|---|---|
| Net Cash Provided By Used In Operating Activities | 38.42 | -25.30 | 53.73 | 25.87 | -5.74 | -44.67 | 11.57 | 22.31 | -5.79 | -19.76 | 10.22 | -18.64 | -8.12 | -10.03 | -5.88 | -8.62 | -11.54 | -12.59 | 3.21 | -9.48 | -7.61 | -16.85 | -8.05 | -7.71 | -10.30 | -15.15 | -11.72 | -10.09 | NA | |
| Net Income Loss | -29.30 | -37.60 | -54.25 | -64.40 | -84.84 | -118.86 | -77.29 | -84.45 | -81.29 | -77.13 | -63.99 | -75.80 | -72.65 | -64.53 | -53.97 | -62.56 | -42.38 | -37.34 | -33.24 | -7.28 | -31.32 | -31.25 | -29.16 | -26.37 | -24.22 | -26.08 | -19.69 | -21.82 | -19.54 | |
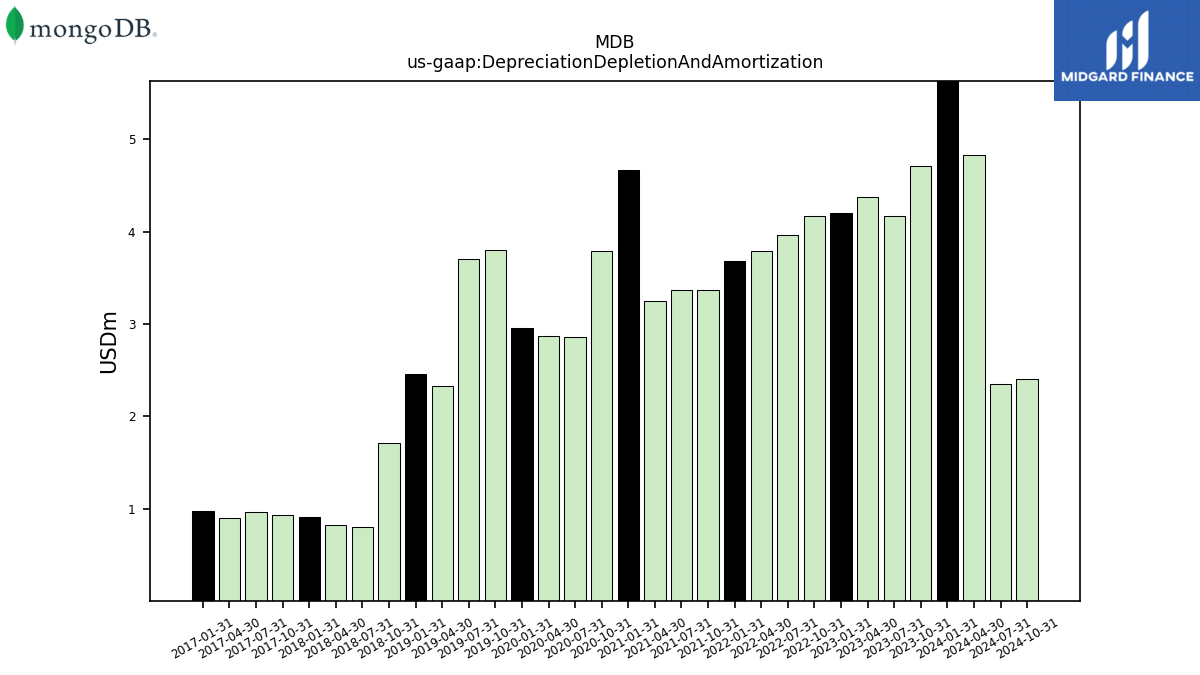
| Depreciation Depletion And Amortization | 4.71 | 4.17 | 4.37 | 4.20 | 4.17 | 3.96 | 3.79 | 3.68 | 3.37 | 3.37 | 3.25 | 4.66 | 3.79 | 2.86 | 2.86 | 2.96 | 3.79 | 3.71 | 2.32 | 2.46 | 1.71 | 0.81 | 0.82 | 0.91 | 0.93 | 0.96 | 0.90 | 0.97 | NA | |
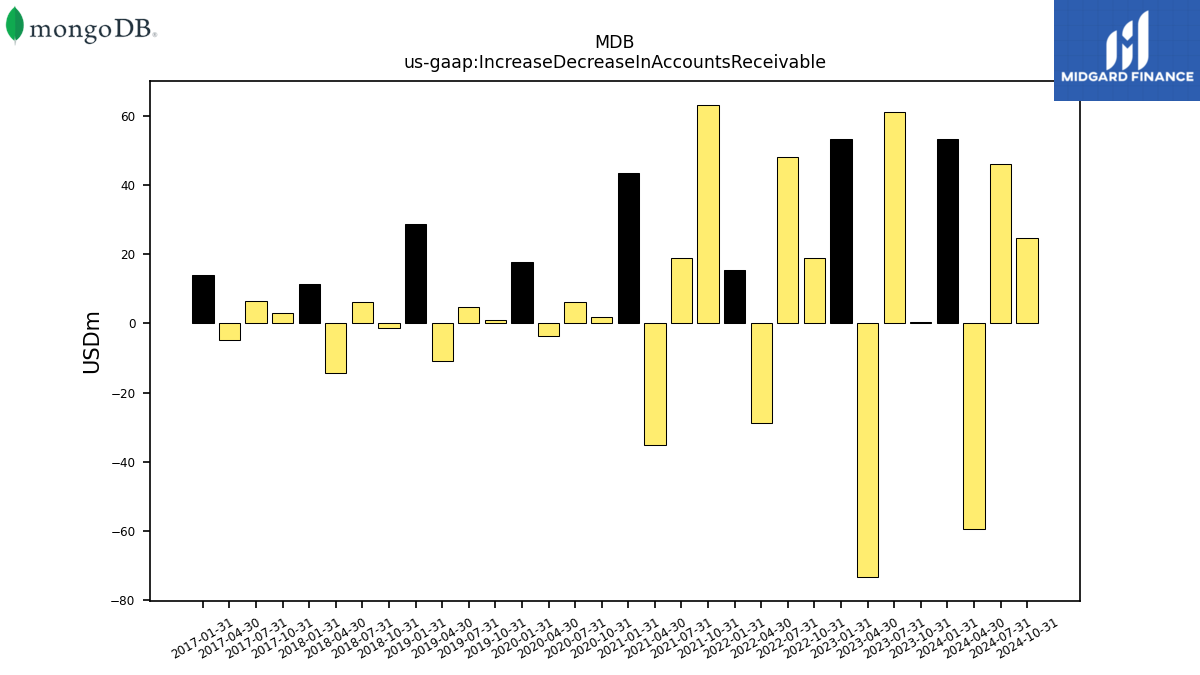
| Increase Decrease In Accounts Receivable | 0.40 | 61.21 | -73.36 | 53.19 | 18.78 | 48.22 | -28.74 | 15.38 | 63.22 | 18.82 | -35.15 | 43.48 | 1.75 | 6.04 | -3.64 | 17.82 | 1.10 | 4.74 | -10.96 | 28.71 | -1.24 | 6.28 | -14.31 | 11.25 | 3.01 | 6.40 | -4.75 | 13.86 | NA | |
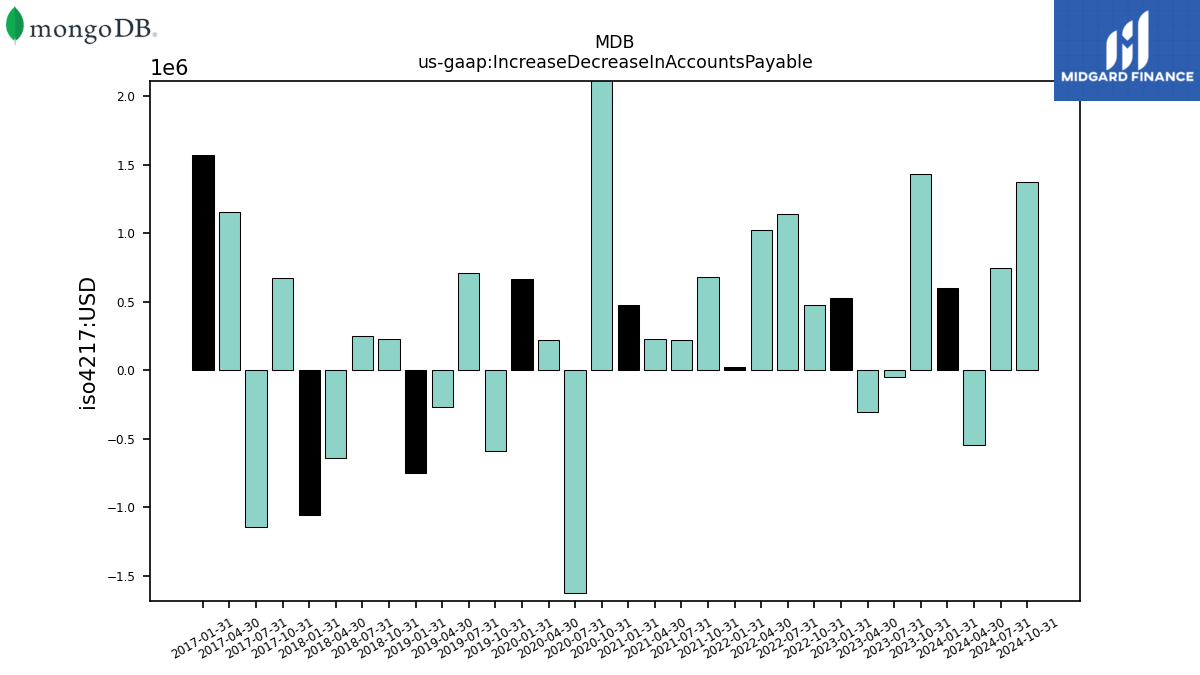
| Increase Decrease In Accounts Payable | 1.43 | -0.05 | -0.30 | 0.53 | 0.47 | 1.14 | 1.02 | 0.02 | 0.68 | 0.22 | 0.22 | 0.47 | 2.15 | -1.63 | 0.22 | 0.67 | -0.59 | 0.71 | -0.27 | -0.75 | 0.23 | 0.24 | -0.64 | -1.06 | 0.68 | -1.14 | 1.15 | 1.57 | NA | |
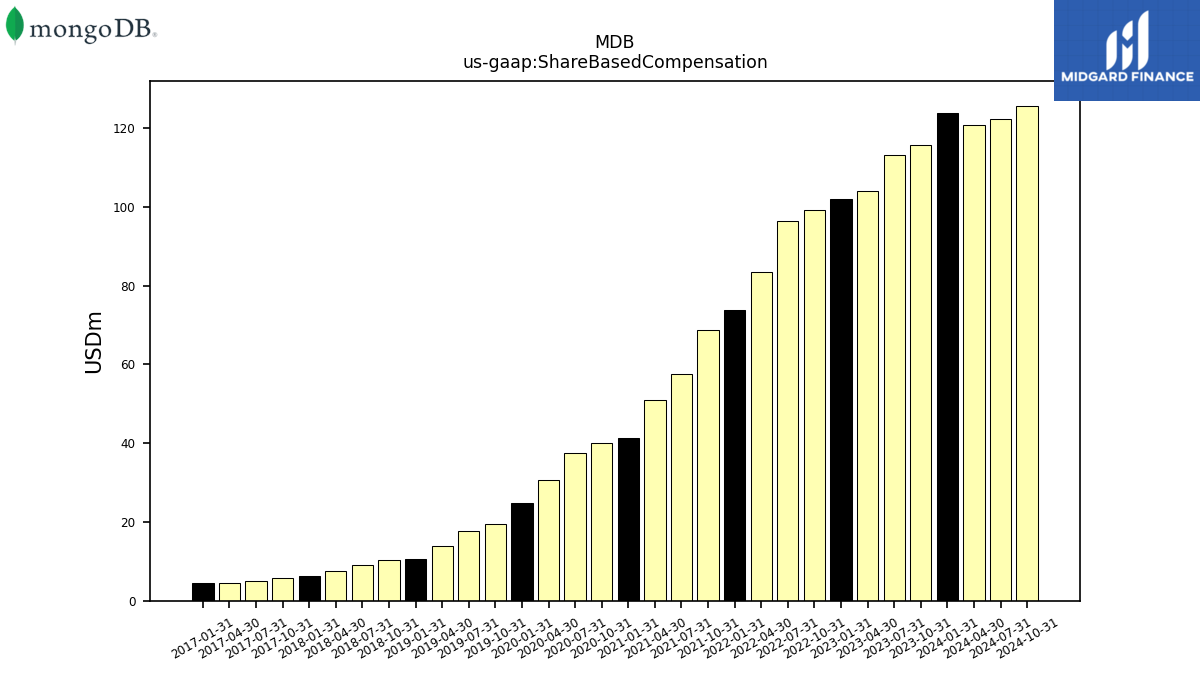
| Share Based Compensation | 115.83 | 113.31 | 103.95 | 102.14 | 99.20 | 96.55 | 83.57 | 73.74 | 68.71 | 57.70 | 50.91 | 41.27 | 39.95 | 37.52 | 30.57 | 24.74 | 19.37 | 17.66 | 14.01 | 10.55 | 10.26 | 9.08 | 7.51 | 6.17 | 5.70 | 4.92 | 4.45 | 4.49 | NA |
| 2023-10-31 | 2023-07-31 | 2023-04-30 | 2023-01-31 | 2022-10-31 | 2022-07-31 | 2022-04-30 | 2022-01-31 | 2021-10-31 | 2021-07-31 | 2021-04-30 | 2021-01-31 | 2020-10-31 | 2020-07-31 | 2020-04-30 | 2020-01-31 | 2019-10-31 | 2019-07-31 | 2019-04-30 | 2019-01-31 | 2018-10-31 | 2018-07-31 | 2018-04-30 | 2018-01-31 | 2017-10-31 | 2017-07-31 | 2017-04-30 | 2017-01-31 | 2016-10-31 | ||
|---|---|---|---|---|---|---|---|---|---|---|---|---|---|---|---|---|---|---|---|---|---|---|---|---|---|---|---|---|---|---|
| Net Cash Provided By Used In Investing Activities | -165.33 | -110.19 | 211.28 | -585.00 | 355.58 | 224.92 | -28.80 | -308.56 | -406.65 | -129.41 | -7.51 | 21.36 | -53.71 | -233.51 | 3.21 | -7.14 | -25.26 | 30.16 | 0.59 | 7.16 | 16.59 | -241.66 | 57.63 | -171.92 | 5.79 | 11.95 | -18.10 | -0.28 | NA | |
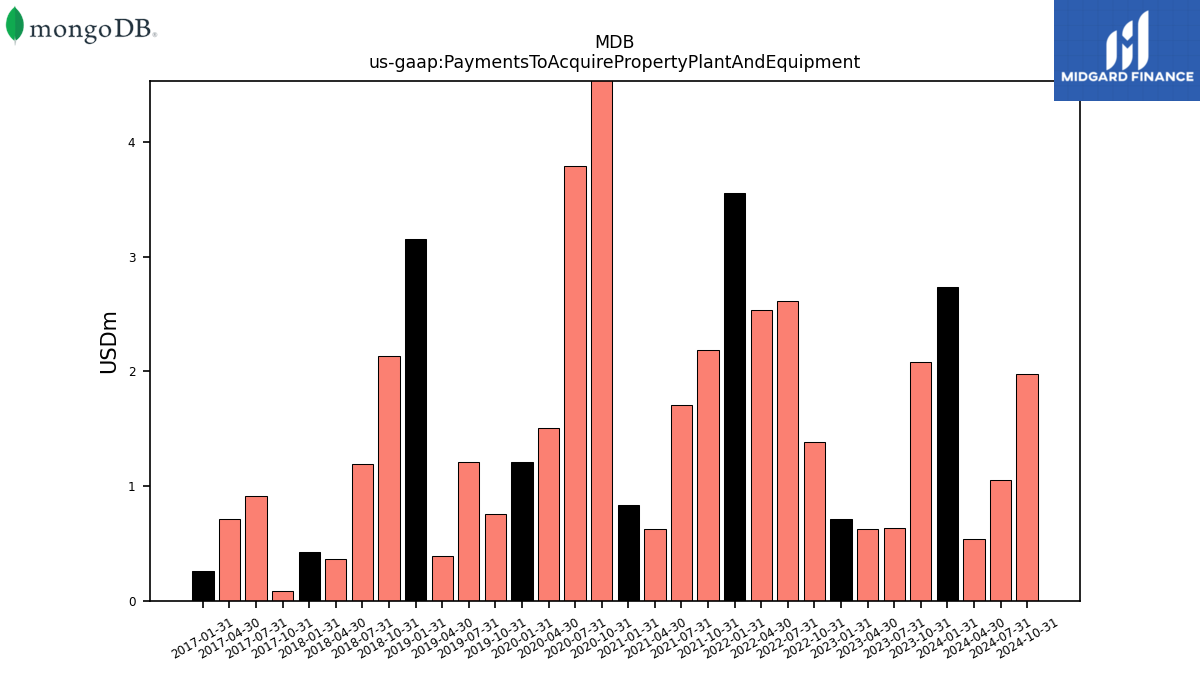
| Payments To Acquire Property Plant And Equipment | 2.08 | 0.64 | 0.62 | 0.71 | 1.38 | 2.61 | 2.54 | 3.56 | 2.18 | 1.71 | 0.63 | 0.83 | 5.65 | 3.79 | 1.50 | 1.21 | 0.75 | 1.21 | 0.39 | 3.15 | 2.14 | 1.19 | 0.37 | 0.42 | 0.09 | 0.91 | 0.71 | 0.26 | NA |
| 2023-10-31 | 2023-07-31 | 2023-04-30 | 2023-01-31 | 2022-10-31 | 2022-07-31 | 2022-04-30 | 2022-01-31 | 2021-10-31 | 2021-07-31 | 2021-04-30 | 2021-01-31 | 2020-10-31 | 2020-07-31 | 2020-04-30 | 2020-01-31 | 2019-10-31 | 2019-07-31 | 2019-04-30 | 2019-01-31 | 2018-10-31 | 2018-07-31 | 2018-04-30 | 2018-01-31 | 2017-10-31 | 2017-07-31 | 2017-04-30 | 2017-01-31 | 2016-10-31 | ||
|---|---|---|---|---|---|---|---|---|---|---|---|---|---|---|---|---|---|---|---|---|---|---|---|---|---|---|---|---|---|---|
| Net Cash Provided By Used In Financing Activities | -0.08 | 20.46 | 0.13 | 13.27 | 0.05 | 15.82 | 1.06 | 12.40 | 0.23 | 903.52 | -25.25 | 11.58 | 6.44 | 11.86 | -2.29 | 570.39 | 1.13 | 11.31 | 6.41 | 10.61 | 7.75 | 269.74 | 0.14 | -1.31 | 206.47 | 0.09 | 4.65 | 35.95 | NA |
| 2023-10-31 | 2023-07-31 | 2023-04-30 | 2023-01-31 | 2022-10-31 | 2022-07-31 | 2022-04-30 | 2022-01-31 | 2021-10-31 | 2021-07-31 | 2021-04-30 | 2021-01-31 | 2020-10-31 | 2020-07-31 | 2020-04-30 | 2020-01-31 | 2019-10-31 | 2019-07-31 | 2019-04-30 | 2019-01-31 | 2018-10-31 | 2018-07-31 | 2018-04-30 | 2018-01-31 | 2017-10-31 | 2017-07-31 | 2017-04-30 | 2017-01-31 | 2016-10-31 | ||
|---|---|---|---|---|---|---|---|---|---|---|---|---|---|---|---|---|---|---|---|---|---|---|---|---|---|---|---|---|---|---|
| Revenues | 432.94 | 423.79 | 368.28 | 361.31 | 333.62 | 303.66 | 285.45 | 266.49 | 226.89 | 198.75 | 181.65 | 171.00 | 150.77 | 138.28 | 130.33 | 123.52 | 109.44 | 99.37 | 89.39 | 96.32 | 64.98 | 59.61 | 50.14 | 56.55 | 41.49 | 35.60 | 32.39 | 43.38 | 26.30 | |
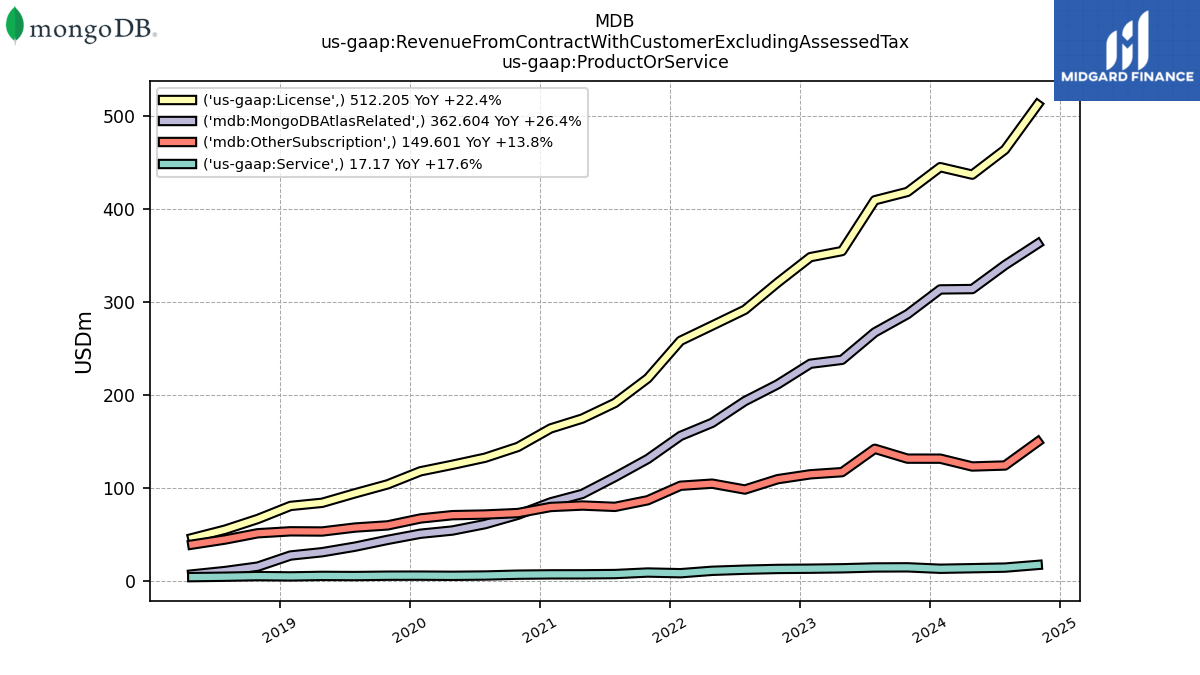
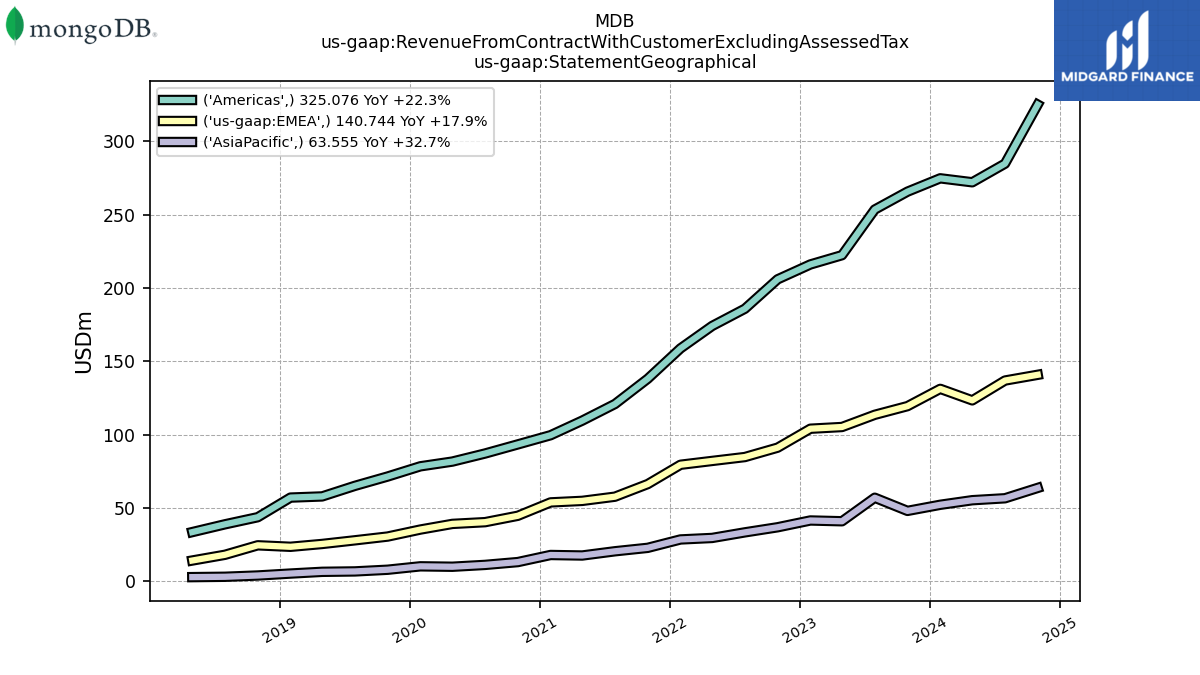
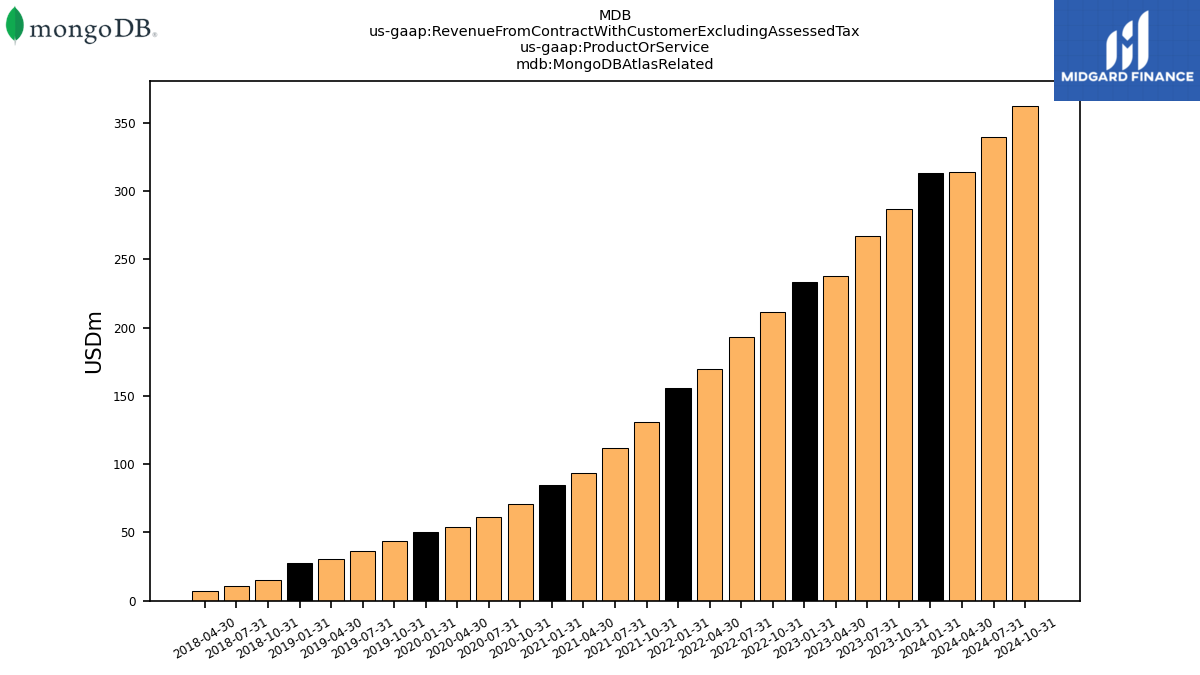
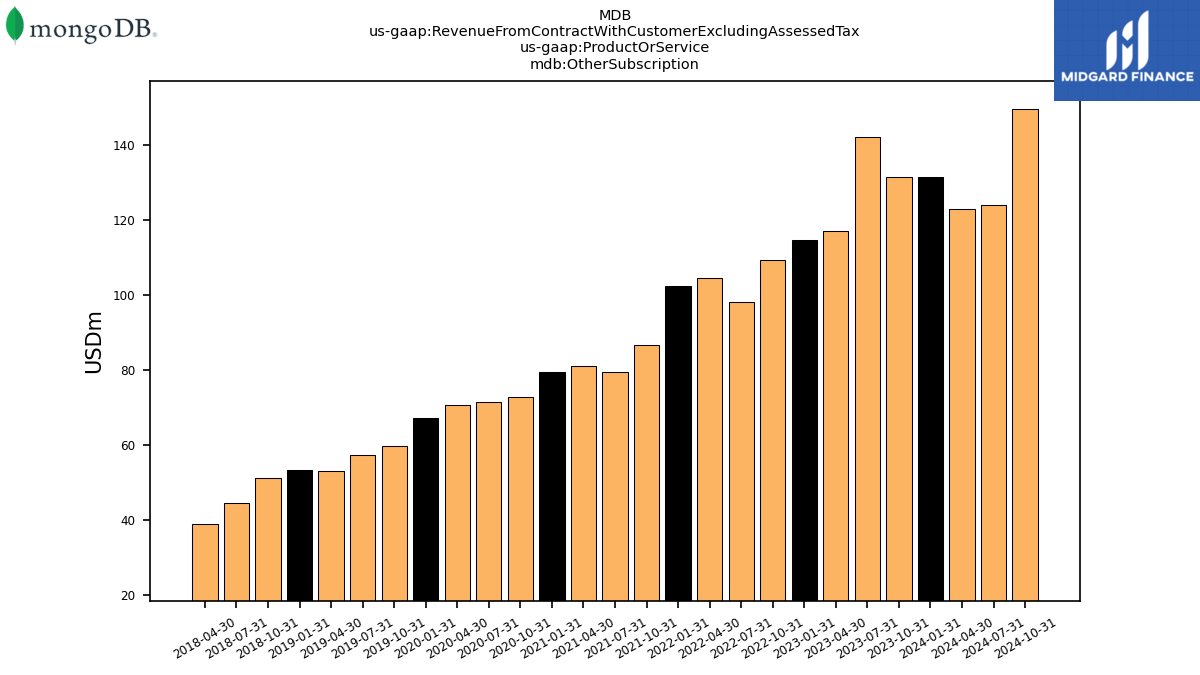
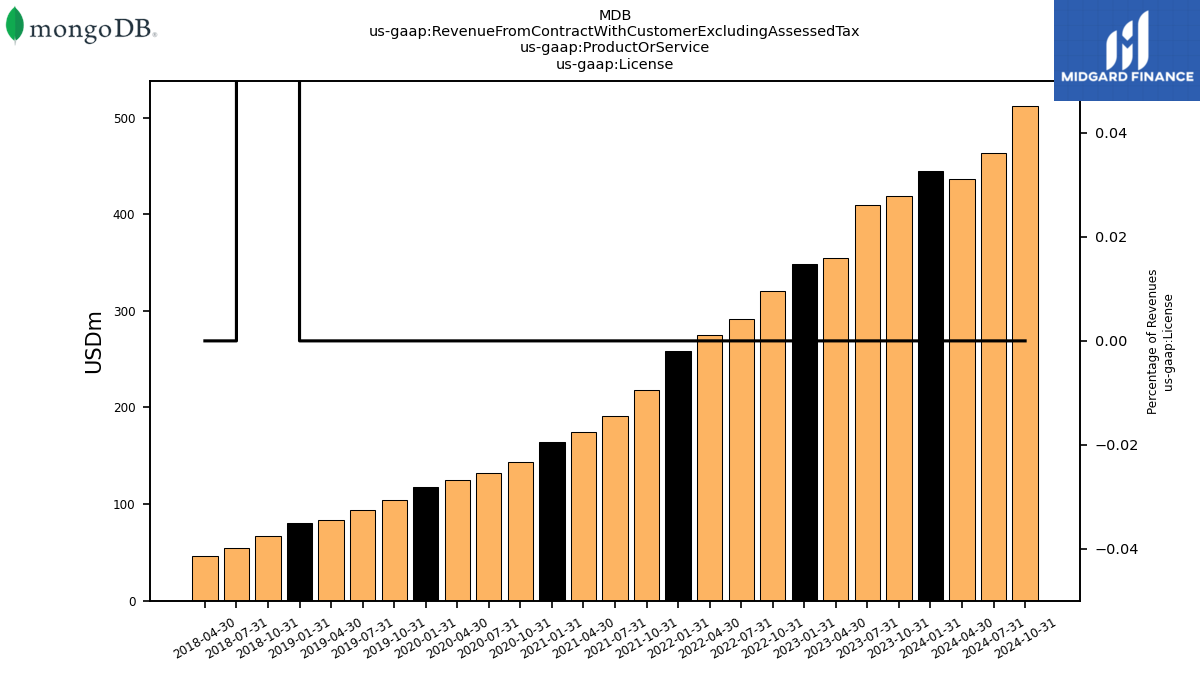
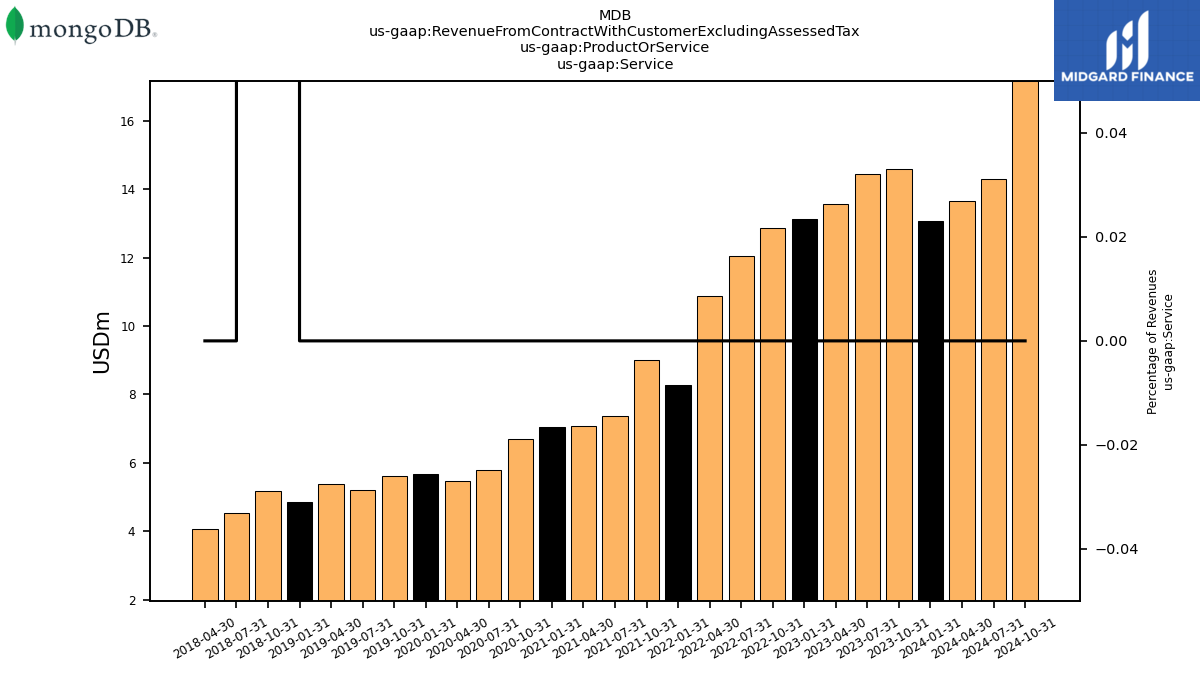
| Revenue From Contract With Customer Excluding Assessed Tax | 432.94 | 423.79 | 368.28 | 361.31 | 333.62 | 303.66 | 285.45 | 266.49 | 226.89 | 198.75 | 181.65 | 171.00 | 150.77 | 138.28 | 130.33 | 123.52 | 109.44 | 99.37 | 89.39 | 85.48 | 71.78 | 59.61 | 50.14 | 56.55 | 41.49 | 35.60 | 32.39 | 43.38 | 26.30 | |
| Mongo D B Atlas Related | 286.86 | 267.26 | 237.76 | 233.54 | 211.38 | 193.35 | 170.00 | 155.90 | 131.12 | 111.76 | 93.51 | 84.45 | 71.11 | 61.07 | 54.17 | 50.73 | 44.13 | 36.79 | 30.86 | 27.30 | 15.38 | 10.61 | 6.96 | NA | NA | NA | NA | NA | NA | |
| Other Subscription | 131.48 | 142.08 | 116.96 | 114.64 | 109.38 | 98.25 | 104.59 | 102.33 | 86.75 | 79.62 | 81.06 | 79.50 | 72.96 | 71.40 | 70.69 | 67.12 | 59.69 | 57.37 | 53.13 | 53.34 | 51.23 | 44.48 | 39.11 | NA | NA | NA | NA | NA | NA | |
| License | 418.34 | 409.33 | 354.71 | 348.18 | 320.76 | 291.61 | 274.58 | 258.23 | 217.87 | 191.38 | 174.57 | 163.95 | 144.07 | 132.48 | 124.86 | 117.85 | 103.83 | 94.16 | 83.99 | 80.63 | 66.60 | 55.09 | 46.07 | NA | NA | NA | NA | NA | NA | |
| Service | 14.60 | 14.46 | 13.57 | 13.13 | 12.87 | 12.05 | 10.87 | 8.27 | 9.02 | 7.37 | 7.08 | 7.05 | 6.70 | 5.80 | 5.47 | 5.67 | 5.61 | 5.21 | 5.39 | 4.85 | 5.18 | 4.53 | 4.07 | NA | NA | NA | NA | NA | NA | |
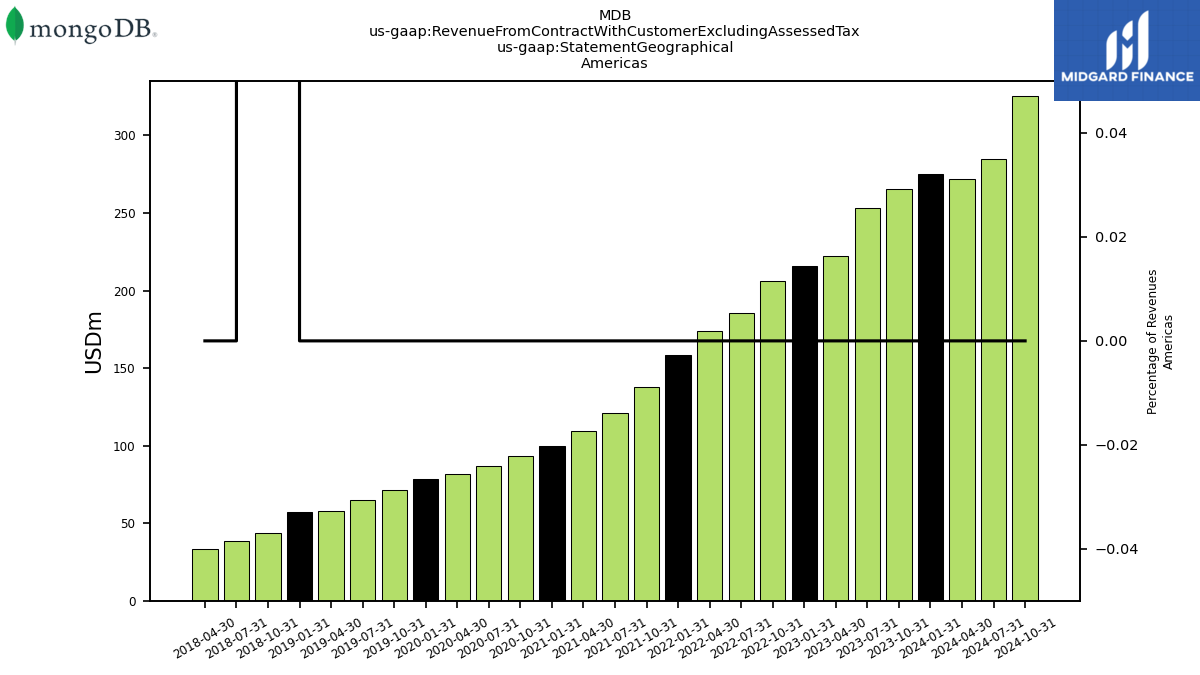
| 265.70 | 253.49 | 222.35 | 216.02 | 205.89 | 185.80 | 174.06 | 158.74 | 138.04 | 120.83 | 109.48 | 99.52 | 93.25 | 87.04 | 81.54 | 78.30 | 71.33 | 64.97 | 57.76 | 56.96 | 43.57 | 38.74 | 33.42 | NA | NA | NA | NA | NA | NA | ||
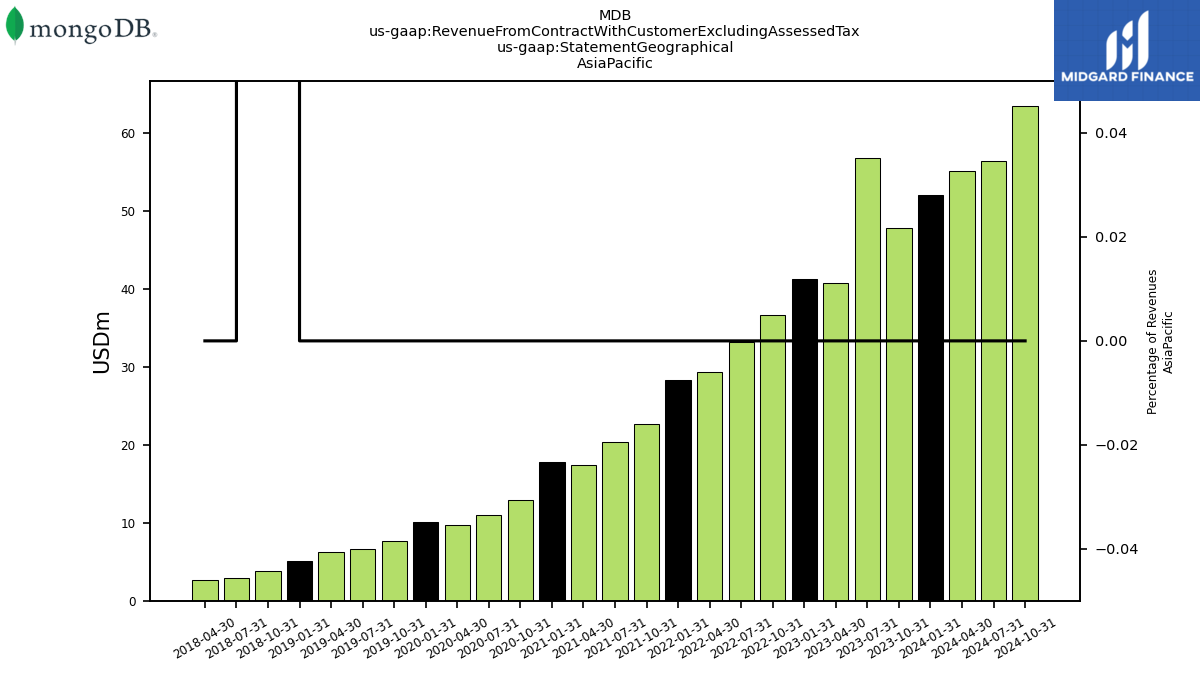
| 47.88 | 56.86 | 40.81 | 41.34 | 36.71 | 33.24 | 29.42 | 28.40 | 22.67 | 20.34 | 17.45 | 17.80 | 12.96 | 11.04 | 9.78 | 10.06 | 7.74 | 6.59 | 6.31 | 5.13 | 3.81 | 2.94 | 2.69 | NA | NA | NA | NA | NA | NA | ||
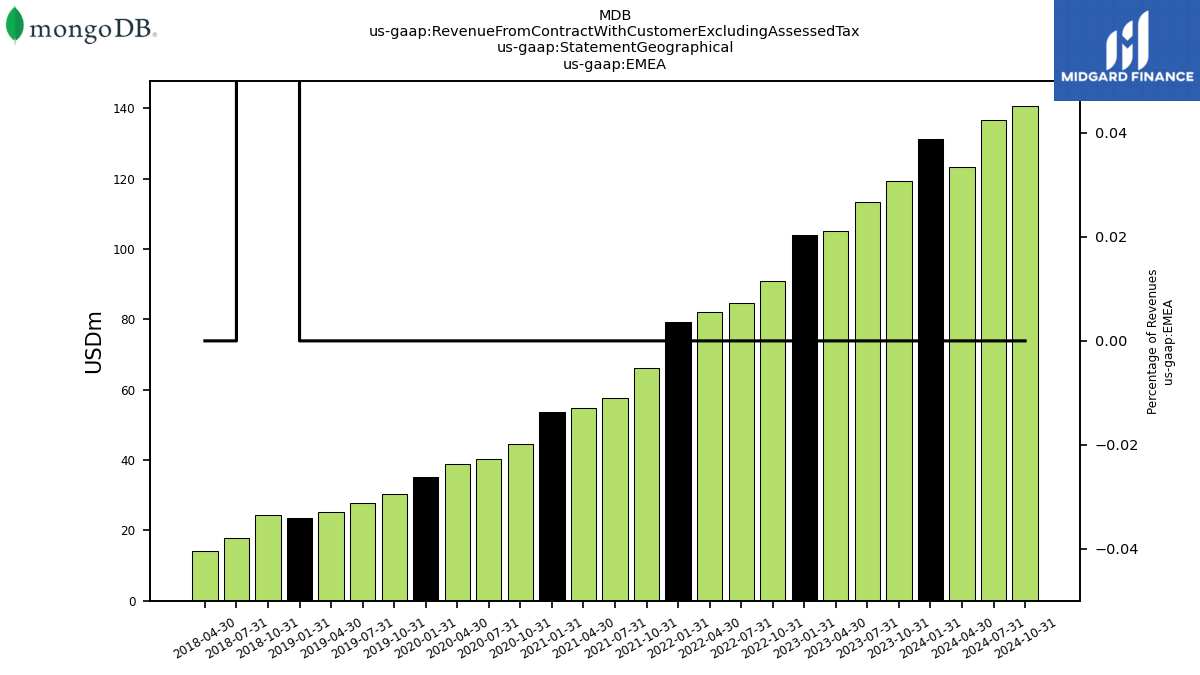
| EMEA | 119.36 | 113.45 | 105.12 | 103.95 | 91.02 | 84.63 | 81.97 | 79.36 | 66.18 | 57.58 | 54.73 | 53.69 | 44.55 | 40.20 | 39.01 | 35.16 | 30.37 | 27.81 | 25.32 | 23.39 | 24.41 | 17.94 | 14.02 | NA | NA | NA | NA | NA | NA |