
| 2022-12-31 | 2022-09-30 | 2022-06-30 | 2022-03-31 | 2021-12-31 | 2021-09-30 | 2021-06-30 | 2021-03-31 | 2020-12-31 | 2020-09-30 | 2020-06-30 | 2020-03-31 | 2019-12-31 | 2019-09-30 | 2019-06-30 | 2019-03-31 | 2018-12-31 | 2018-09-30 | 2018-06-30 | 2018-03-31 | 2017-12-31 | 2017-09-30 | 2017-06-30 | 2017-03-31 | ||
|---|---|---|---|---|---|---|---|---|---|---|---|---|---|---|---|---|---|---|---|---|---|---|---|---|---|
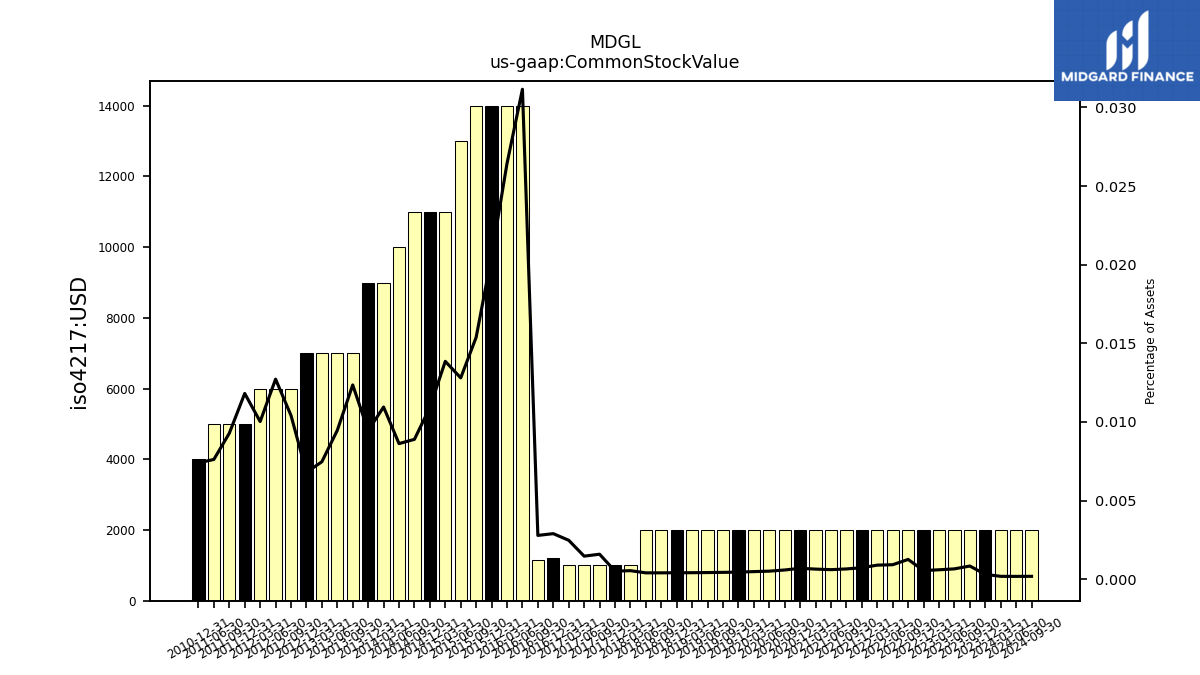
| Common Stock Value | 0.00 | 0.00 | 0.00 | 0.00 | 0.00 | 0.00 | 0.00 | 0.00 | 0.00 | 0.00 | 0.00 | 0.00 | 0.00 | 0.00 | 0.00 | 0.00 | 0.00 | 0.00 | 0.00 | 0.00 | 0.00 | 0.00 | 0.00 | 0.00 | |
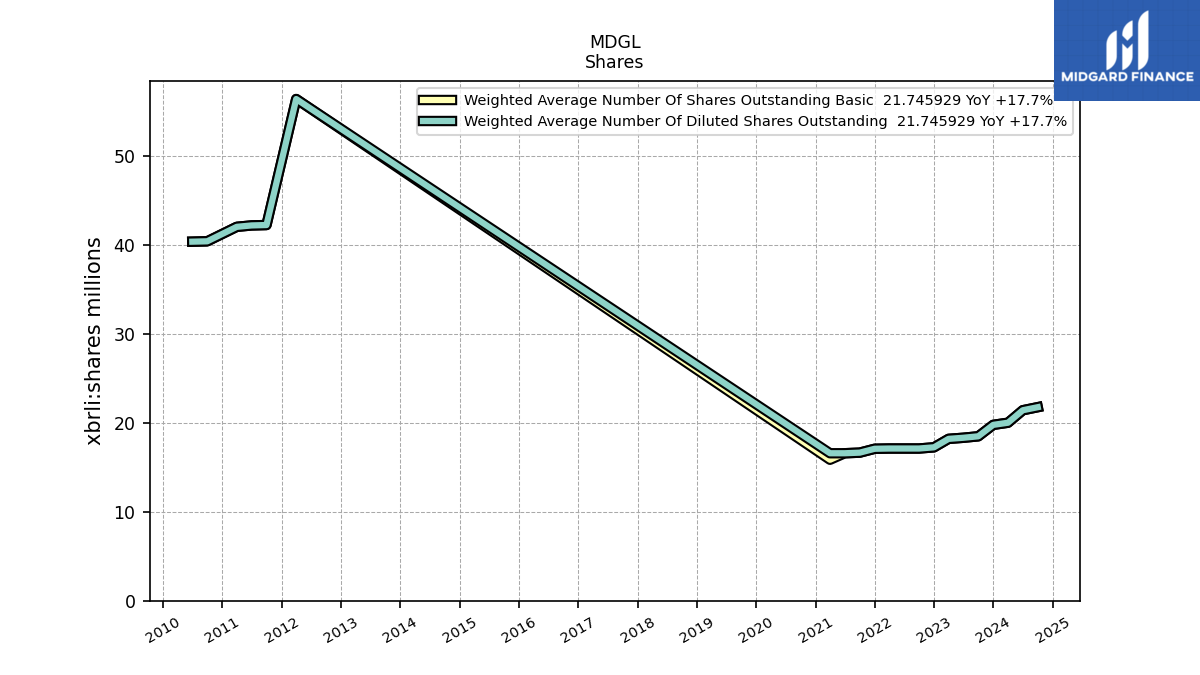
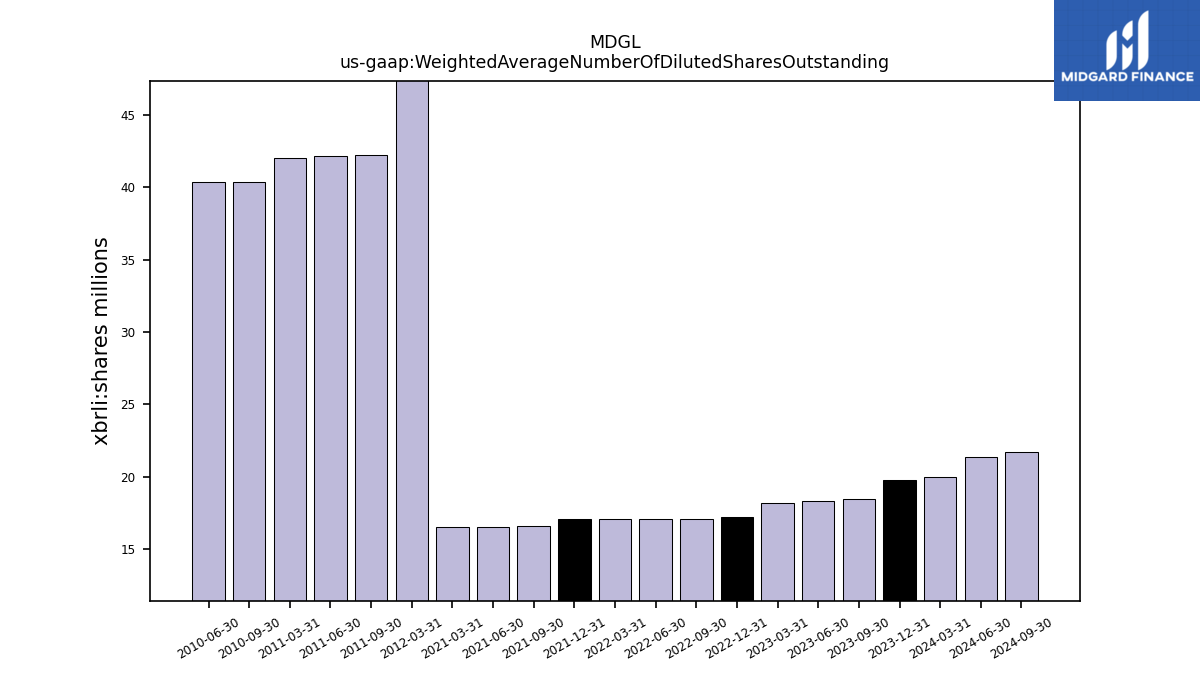
| Weighted Average Number Of Diluted Shares Outstanding | 17.24 | 17.10 | 17.10 | 17.10 | 17.07 | 16.64 | 16.57 | 16.57 | NA | NA | NA | NA | NA | NA | NA | NA | NA | NA | NA | NA | NA | NA | NA | NA | |
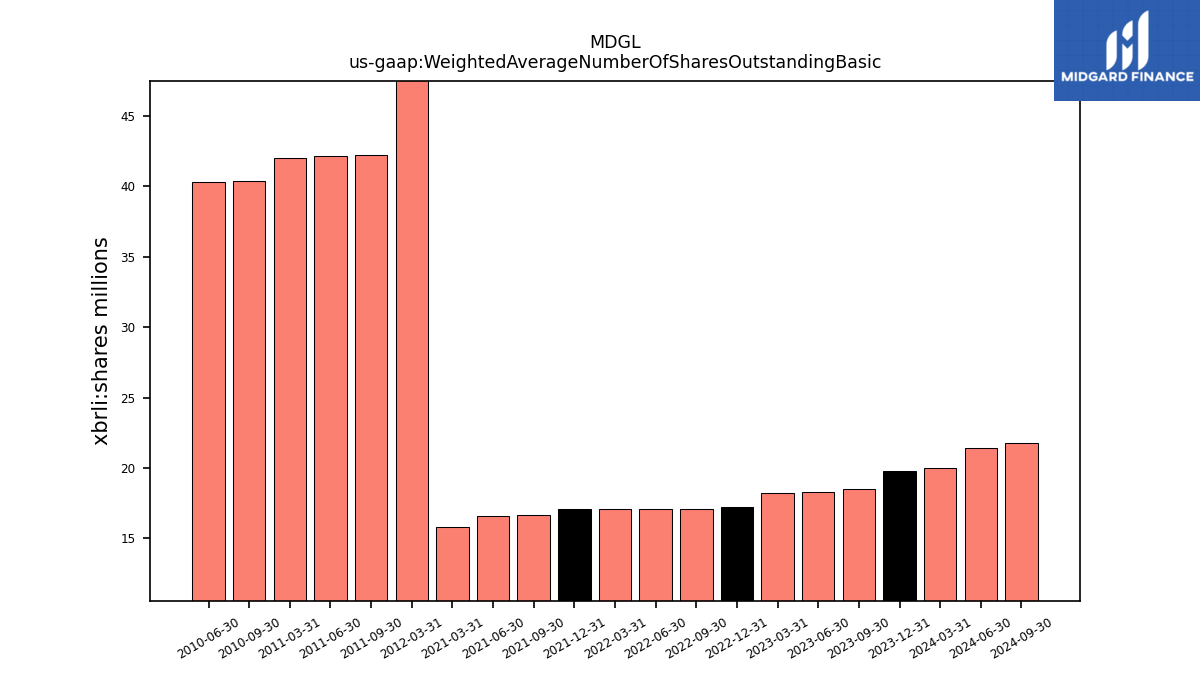
| Weighted Average Number Of Shares Outstanding Basic | 17.24 | 17.10 | 17.10 | 17.10 | 17.07 | 16.64 | 16.57 | 15.84 | NA | NA | NA | NA | NA | NA | NA | NA | NA | NA | NA | NA | NA | NA | NA | NA | |
| Weighted Average Number Of Share Outstanding Basic And Diluted | NA | NA | NA | 17.10 | 17.07 | 16.64 | 16.57 | 15.84 | 15.48 | 15.45 | 15.43 | 15.43 | 15.43 | 15.42 | 15.37 | 15.36 | 15.35 | 15.31 | 14.38 | 14.13 | 12.60 | 12.38 | 12.04 | 11.96 | |
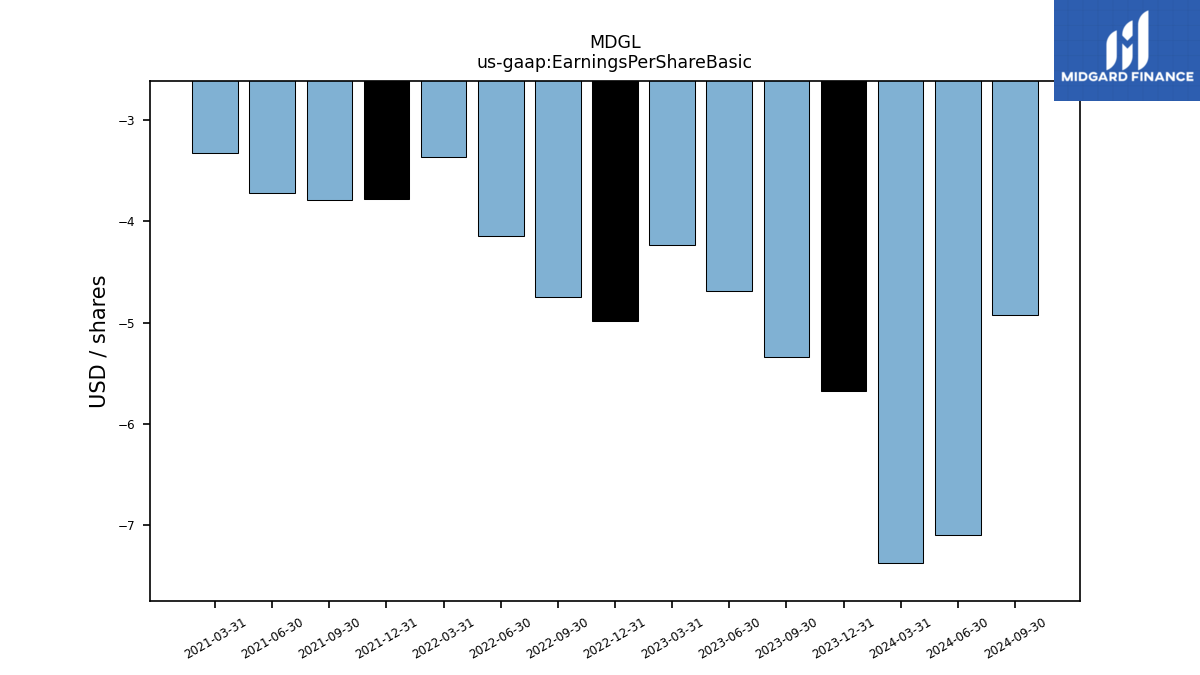
| Earnings Per Share Basic | -4.98 | -4.75 | -4.14 | -3.36 | -3.78 | -3.79 | -3.72 | -3.32 | NA | NA | NA | NA | NA | NA | NA | NA | NA | NA | NA | NA | NA | NA | NA | NA | |
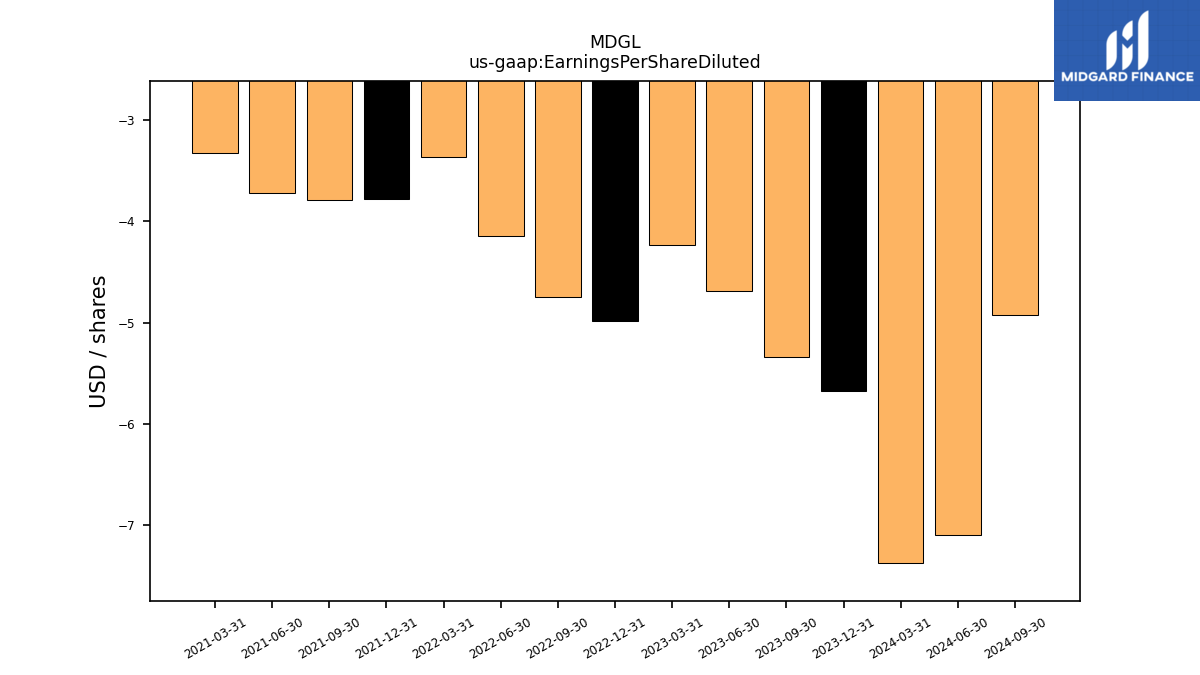
| Earnings Per Share Diluted | -4.98 | -4.75 | -4.14 | -3.36 | -3.78 | -3.79 | -3.72 | -3.32 | NA | NA | NA | NA | NA | NA | NA | NA | NA | NA | NA | NA | NA | NA | NA | NA | |
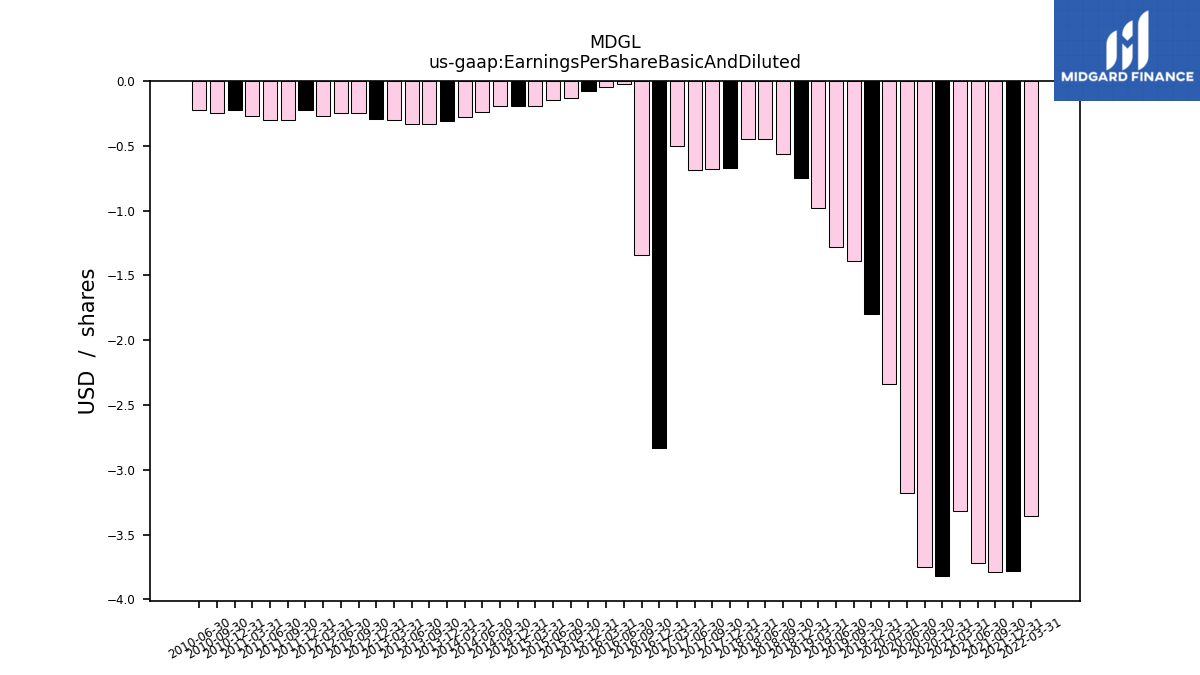
| Earnings Per Share Basic And Diluted | NA | NA | NA | -3.36 | -3.78 | -3.79 | -3.72 | -3.32 | -3.82 | -3.75 | -3.18 | -2.34 | -1.80 | -1.39 | -1.28 | -0.98 | -0.75 | -0.56 | -0.45 | -0.45 | -0.67 | -0.68 | -0.69 | -0.50 |
| 2022-12-31 | 2022-09-30 | 2022-06-30 | 2022-03-31 | 2021-12-31 | 2021-09-30 | 2021-06-30 | 2021-03-31 | 2020-12-31 | 2020-09-30 | 2020-06-30 | 2020-03-31 | 2019-12-31 | 2019-09-30 | 2019-06-30 | 2019-03-31 | 2018-12-31 | 2018-09-30 | 2018-06-30 | 2018-03-31 | 2017-12-31 | 2017-09-30 | 2017-06-30 | 2017-03-31 | ||
|---|---|---|---|---|---|---|---|---|---|---|---|---|---|---|---|---|---|---|---|---|---|---|---|---|---|
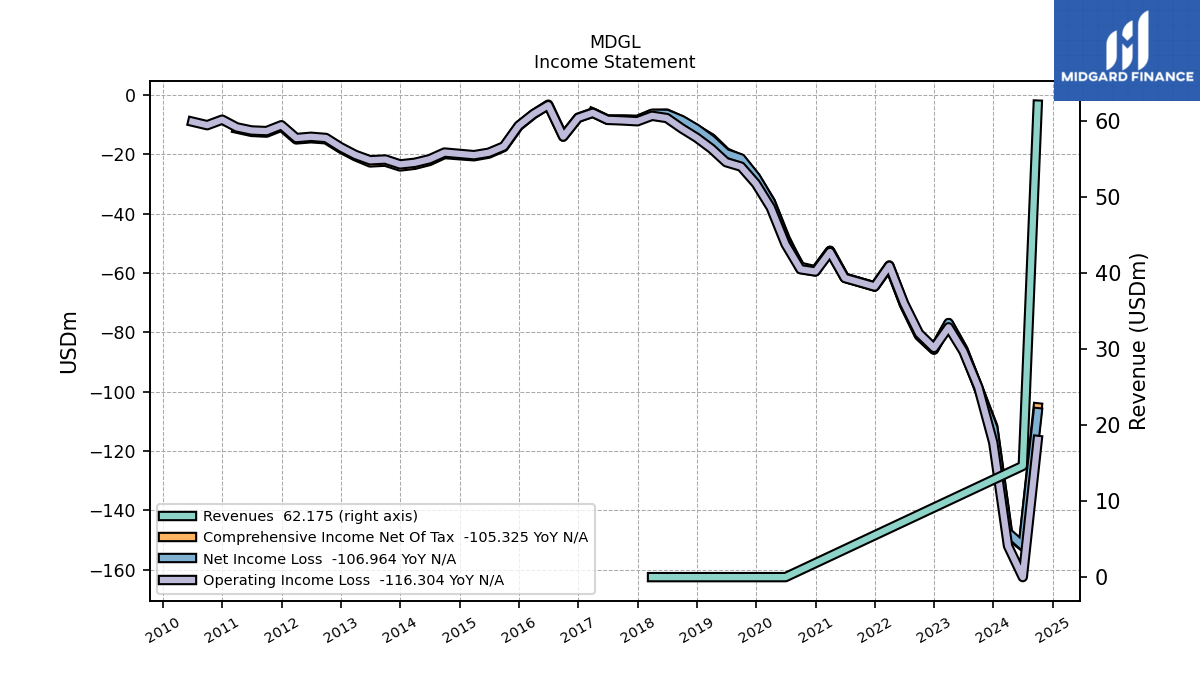
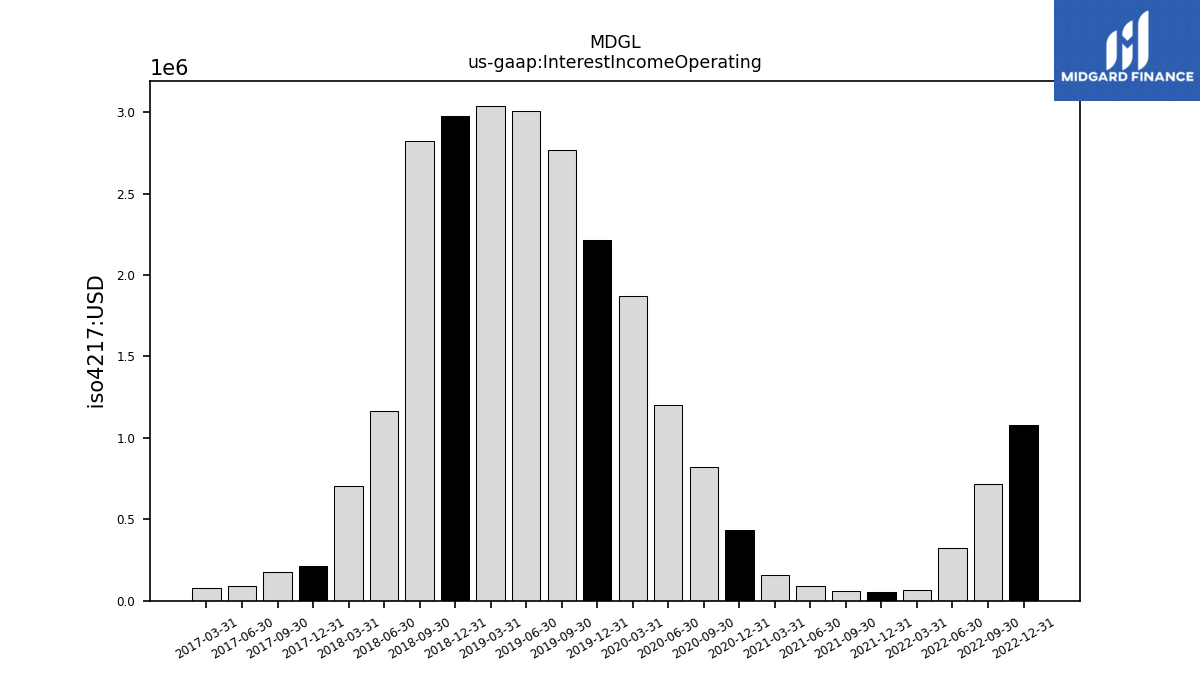
| Interest Income Operating | 1.08 | 0.72 | 0.32 | 0.07 | 0.05 | 0.06 | 0.09 | 0.16 | 0.43 | 0.82 | 1.20 | 1.87 | 2.21 | 2.77 | 3.00 | 3.04 | 2.98 | 2.82 | 1.17 | 0.70 | 0.22 | 0.17 | 0.09 | 0.08 | |
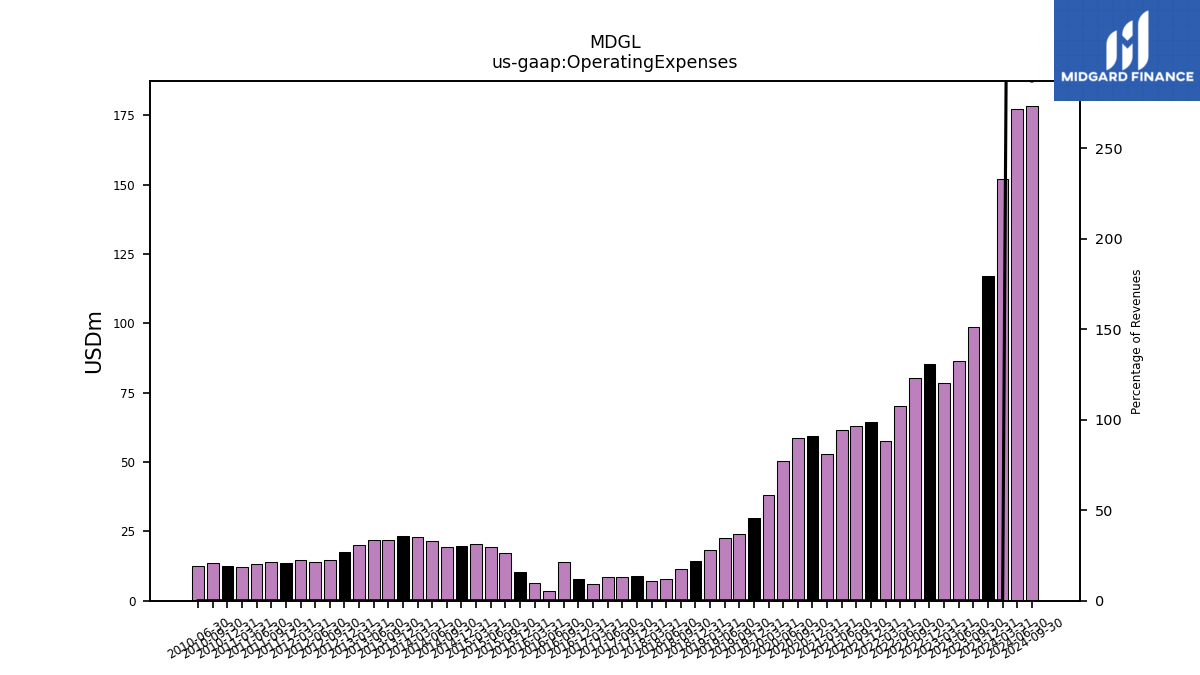
| Operating Expenses | 85.30 | 80.41 | 70.27 | 57.59 | 64.60 | 63.16 | 61.74 | 52.98 | 59.55 | 58.79 | 50.33 | 38.01 | 29.95 | 24.20 | 22.70 | 18.12 | 14.45 | 11.33 | 7.83 | 7.07 | 8.91 | 8.64 | 8.44 | 6.08 | |
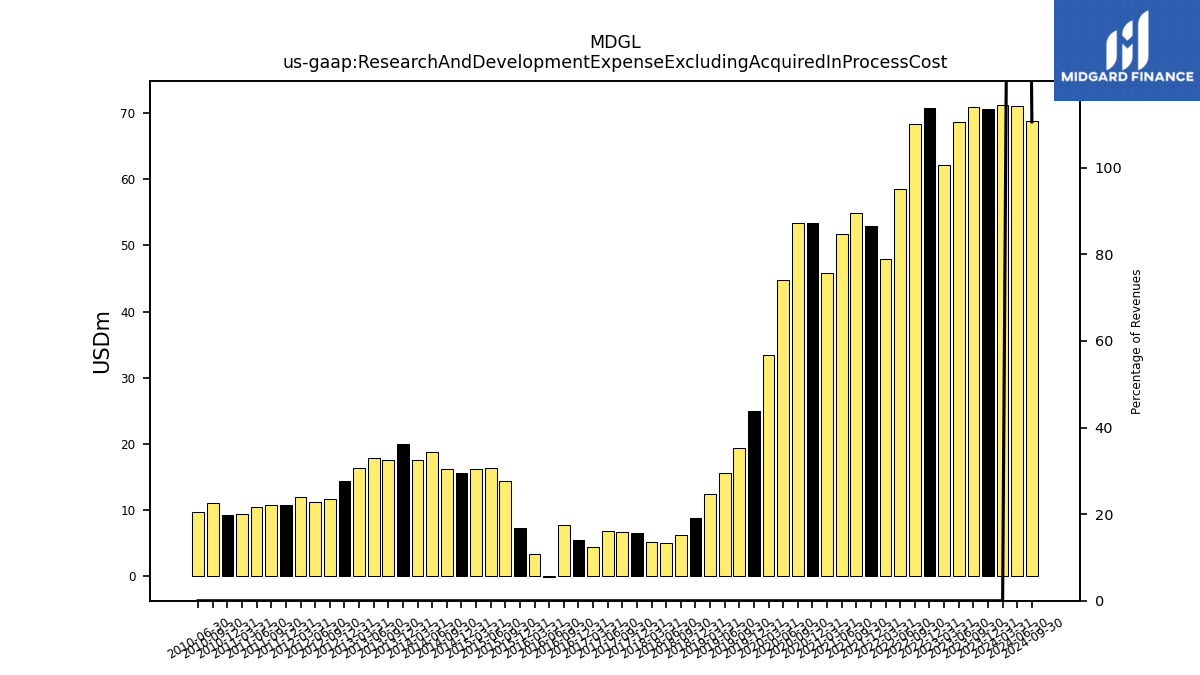
| Research And Development Expense Excluding Acquired In Process Cost | 70.74 | 68.27 | 58.50 | 47.93 | 52.89 | 54.87 | 51.63 | 45.77 | 53.43 | 53.29 | 44.69 | 33.40 | 24.91 | 19.45 | 15.59 | 12.37 | 8.87 | 6.21 | 5.11 | 5.20 | 6.51 | 6.68 | 6.82 | 4.38 | |
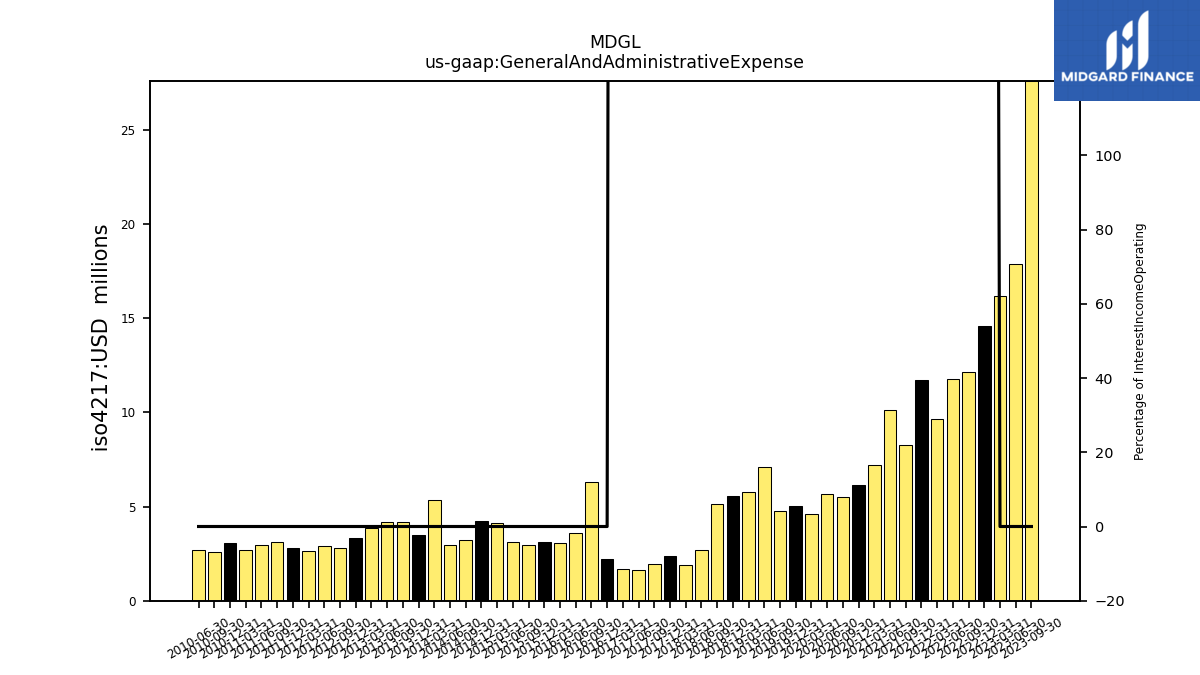
| General And Administrative Expense | 14.56 | 12.14 | 11.77 | 9.66 | 11.71 | 8.29 | 10.11 | 7.21 | 6.13 | 5.49 | 5.64 | 4.61 | 5.04 | 4.75 | 7.11 | 5.75 | 5.58 | 5.12 | 2.72 | 1.87 | 2.40 | 1.96 | 1.62 | 1.70 | |
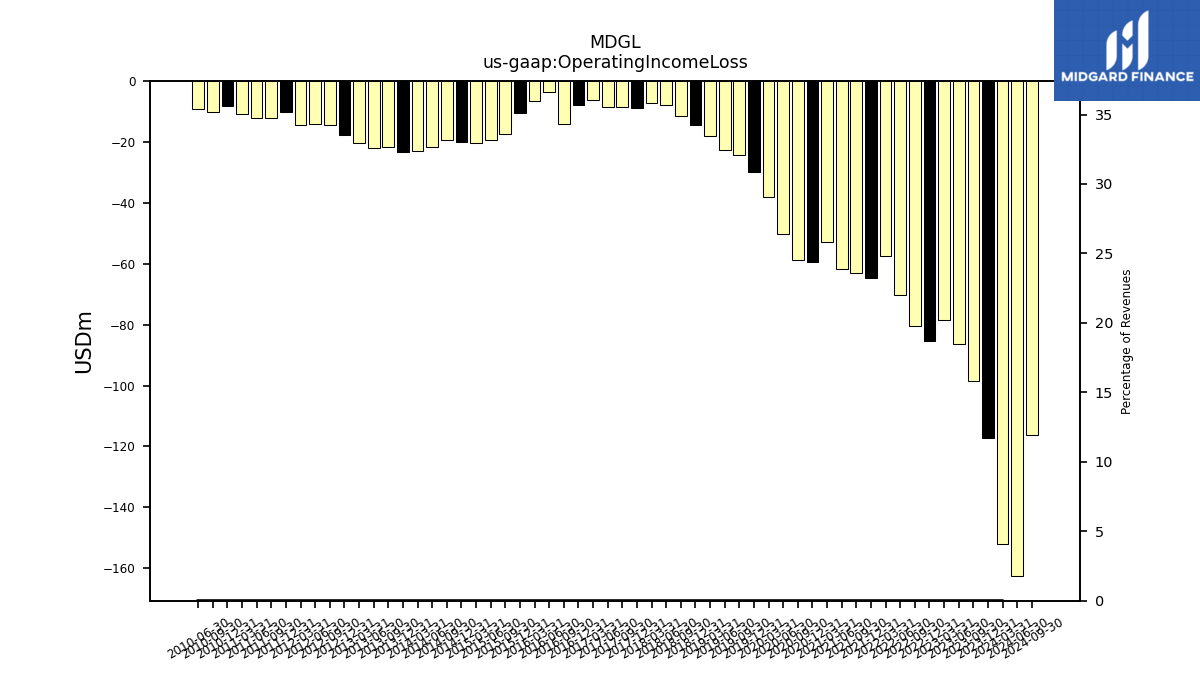
| Operating Income Loss | -85.30 | -80.41 | -70.27 | -57.59 | -64.60 | -63.16 | -61.74 | -52.98 | -59.55 | -58.79 | -50.33 | -38.01 | -29.95 | -24.20 | -22.70 | -18.12 | -14.45 | -11.33 | -7.83 | -7.07 | -8.91 | -8.64 | -8.44 | -6.08 | |
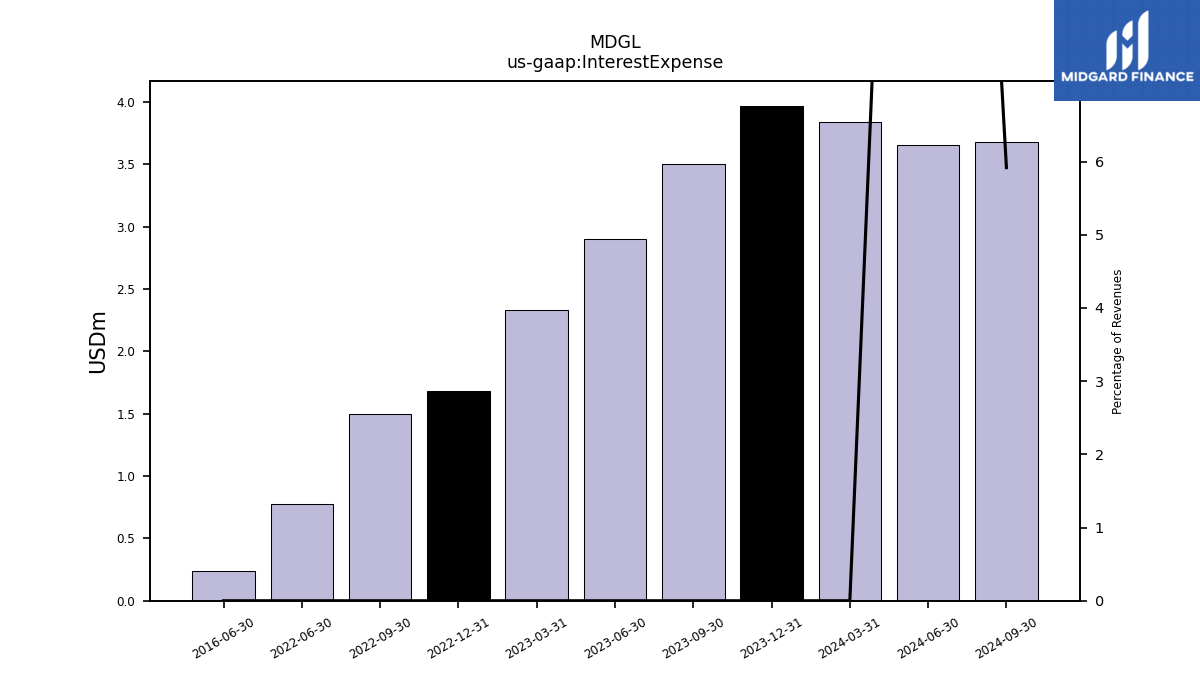
| Interest Expense | 1.68 | 1.50 | 0.78 | NA | NA | NA | NA | NA | NA | NA | NA | NA | NA | NA | NA | NA | NA | NA | NA | NA | NA | NA | NA | NA | |
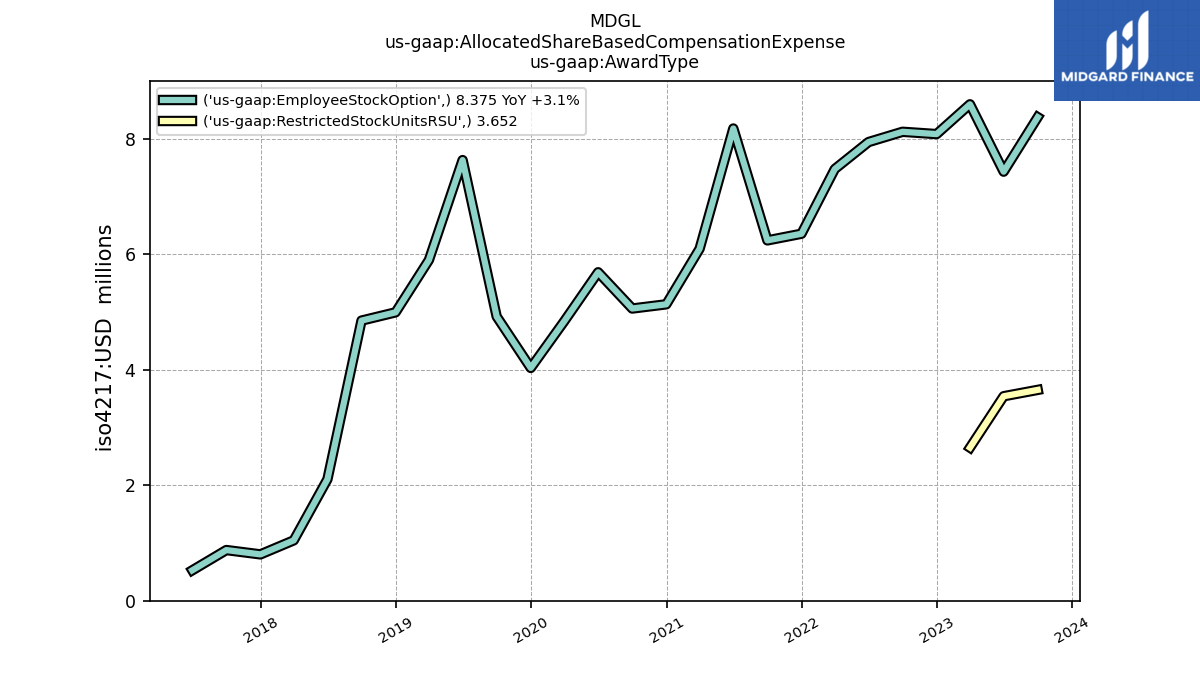
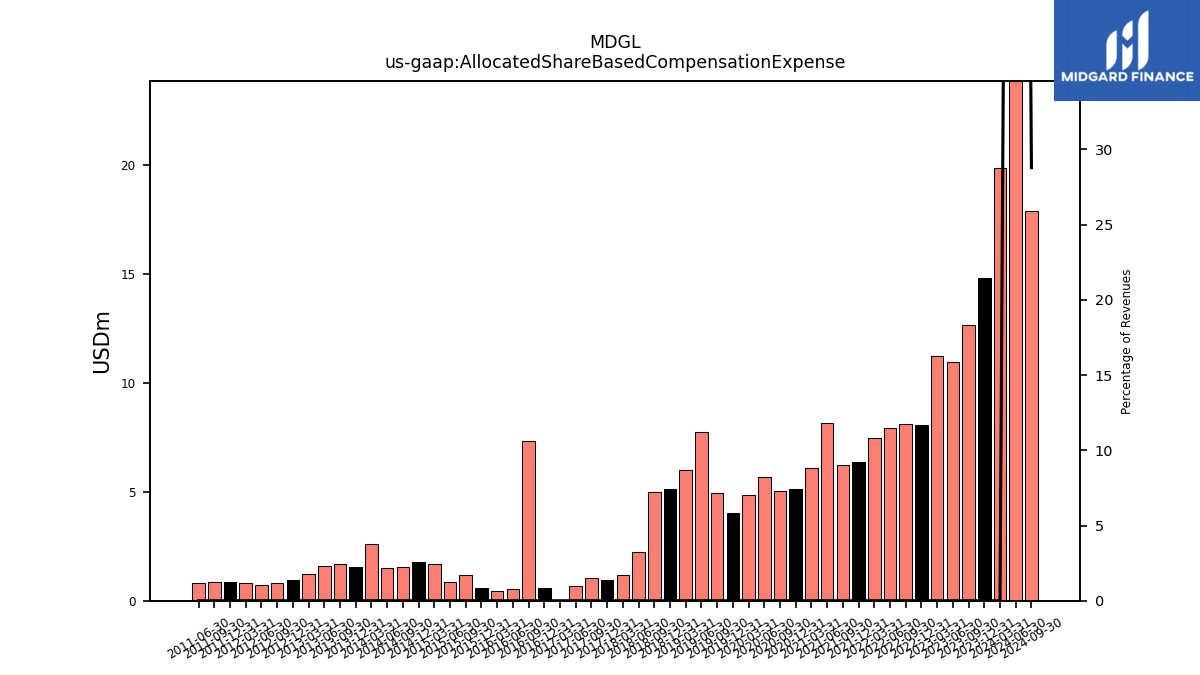
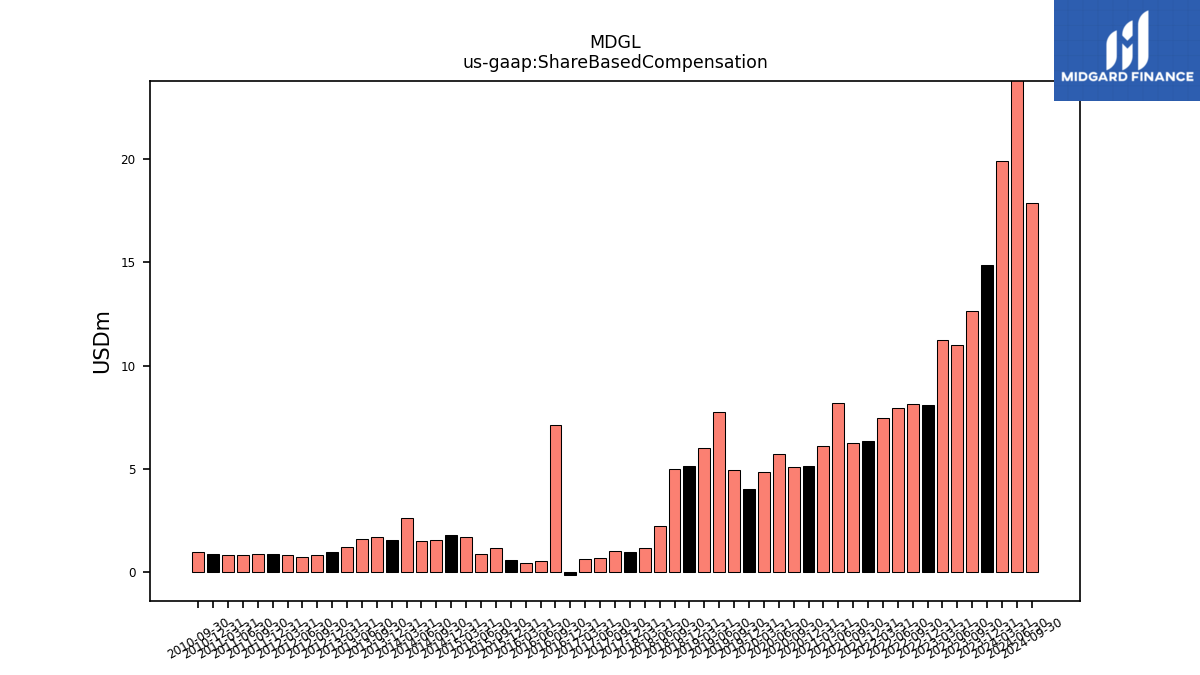
| Allocated Share Based Compensation Expense | 8.08 | 8.12 | 7.94 | 7.48 | 6.36 | 6.24 | 8.18 | 6.10 | 5.13 | 5.06 | 5.69 | 4.85 | 4.03 | 4.95 | 7.75 | 6.02 | 5.12 | 4.98 | 2.23 | 1.17 | 0.95 | 1.03 | 0.68 | 0.00 | |
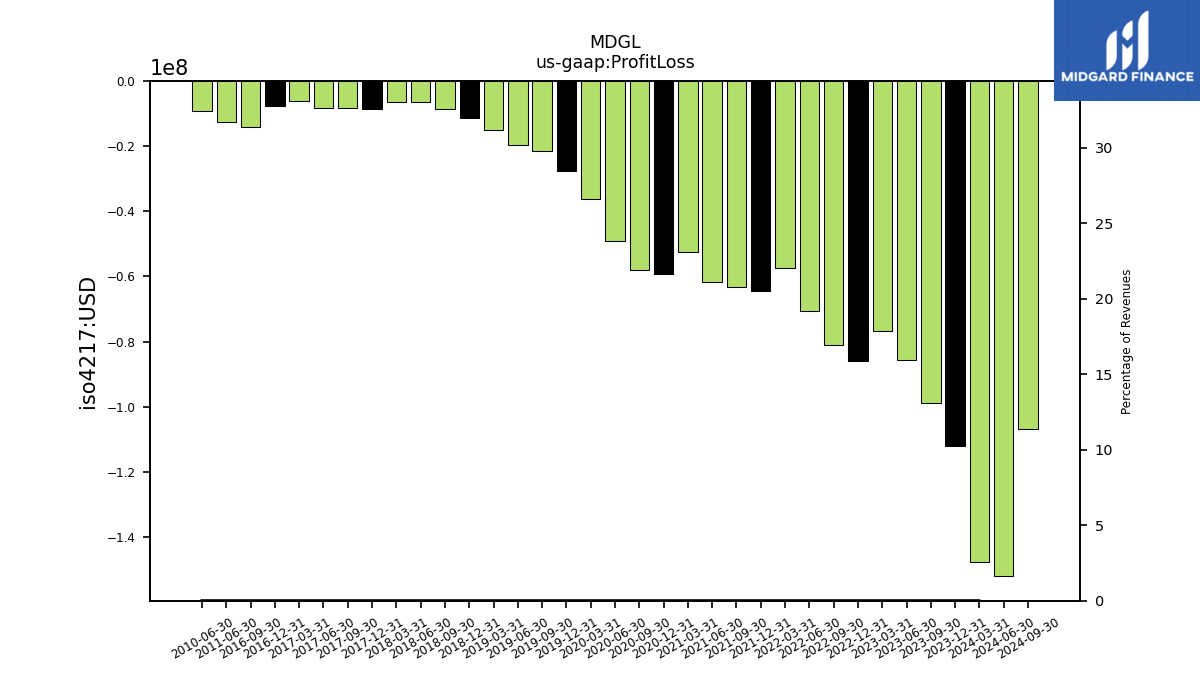
| Profit Loss | -85.91 | -81.20 | -70.73 | -57.52 | -64.55 | -63.10 | -61.65 | -52.55 | -59.12 | -57.96 | -49.02 | -36.13 | -27.74 | -21.43 | -19.70 | -15.08 | -11.47 | -8.51 | -6.46 | -6.36 | -8.45 | -8.36 | -8.35 | -6.00 | |
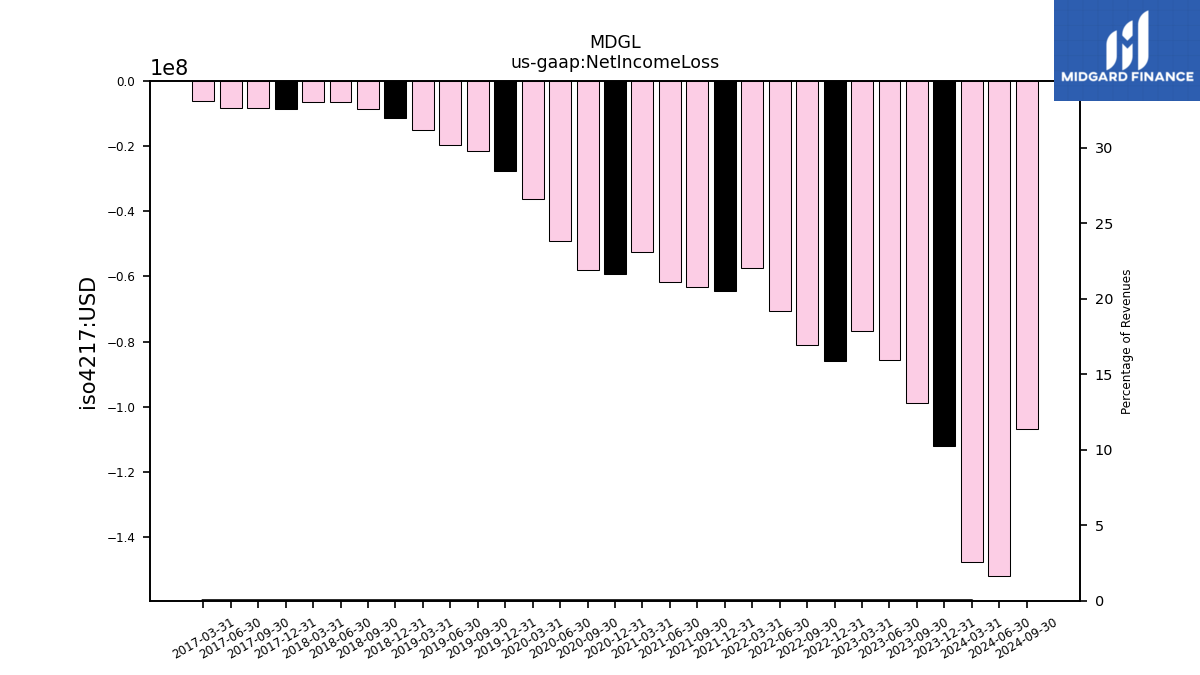
| Net Income Loss | -85.91 | -81.20 | -70.73 | -57.52 | -64.55 | -63.10 | -61.65 | -52.55 | -59.12 | -57.96 | -49.02 | -36.13 | -27.74 | -21.43 | -19.70 | -15.08 | -11.47 | -8.51 | -6.46 | -6.36 | -8.45 | -8.36 | -8.35 | -6.00 | |
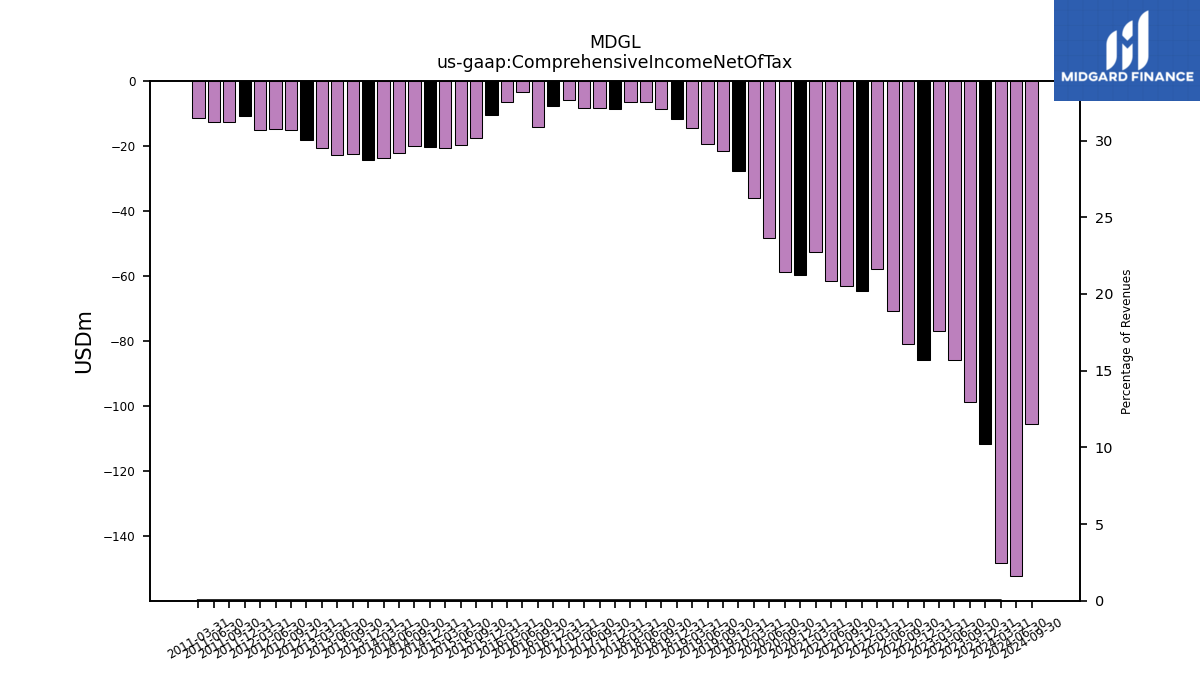
| Comprehensive Income Net Of Tax | -85.70 | -80.99 | -70.78 | -57.84 | -64.63 | -63.11 | -61.62 | -52.61 | -59.50 | -58.62 | -48.36 | -35.94 | -27.82 | -21.62 | -19.39 | -14.58 | -11.65 | -8.61 | -6.33 | -6.51 | -8.52 | -8.35 | -8.38 | -5.96 |
| 2022-12-31 | 2022-09-30 | 2022-06-30 | 2022-03-31 | 2021-12-31 | 2021-09-30 | 2021-06-30 | 2021-03-31 | 2020-12-31 | 2020-09-30 | 2020-06-30 | 2020-03-31 | 2019-12-31 | 2019-09-30 | 2019-06-30 | 2019-03-31 | 2018-12-31 | 2018-09-30 | 2018-06-30 | 2018-03-31 | 2017-12-31 | 2017-09-30 | 2017-06-30 | 2017-03-31 | ||
|---|---|---|---|---|---|---|---|---|---|---|---|---|---|---|---|---|---|---|---|---|---|---|---|---|---|
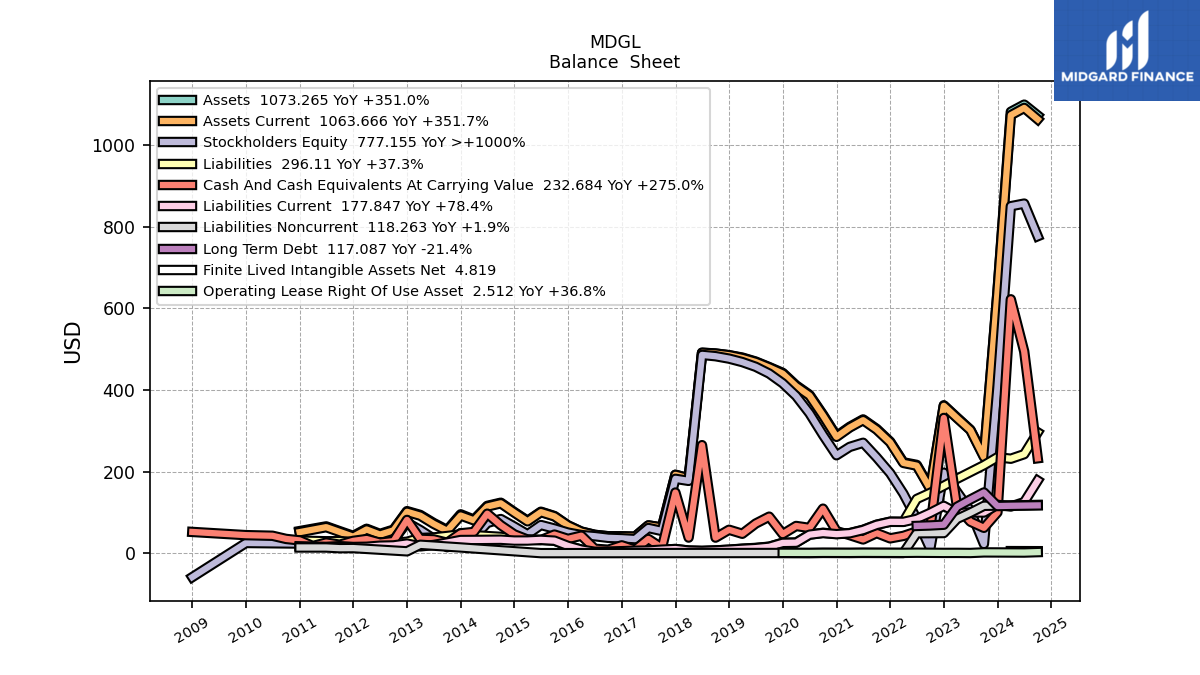
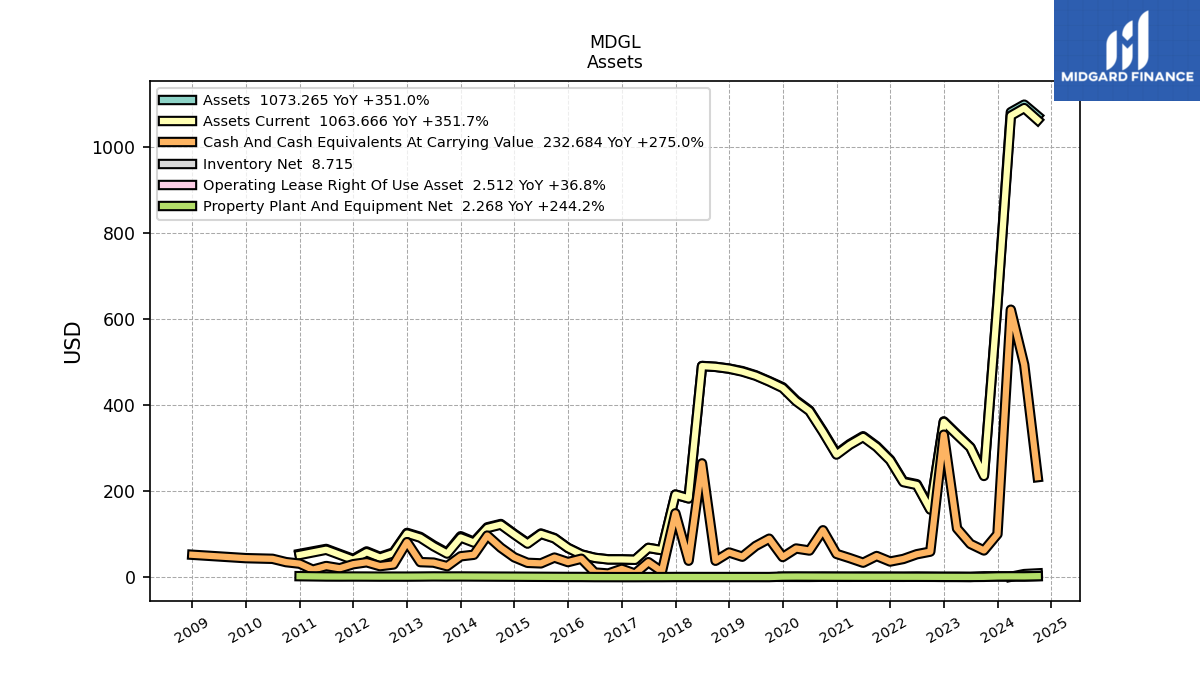
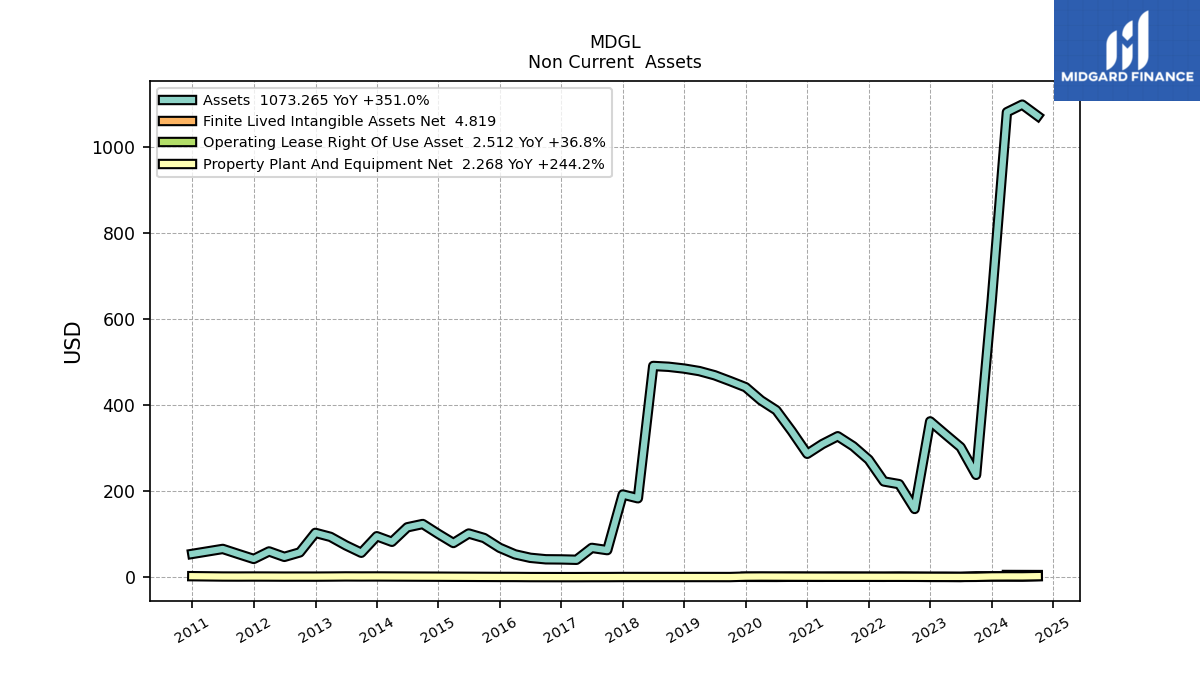
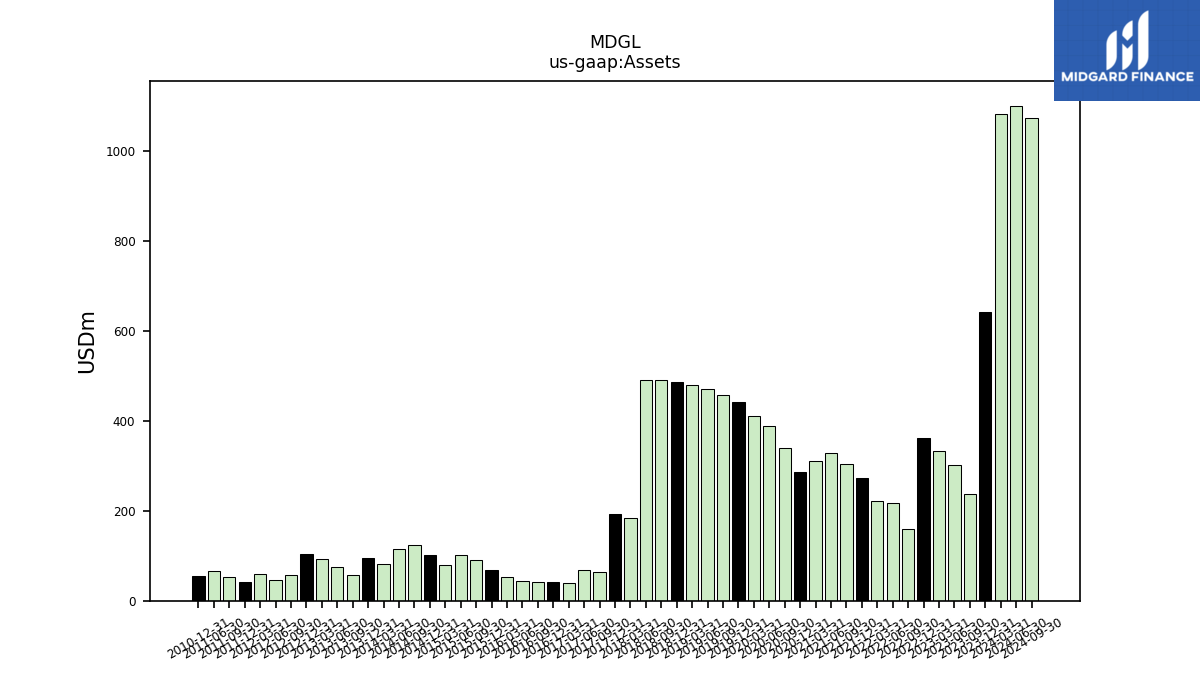
| Assets | 362.57 | 158.64 | 216.39 | 222.66 | 273.33 | 304.70 | 327.95 | 309.73 | 287.00 | 339.62 | 388.39 | 411.46 | 442.06 | 456.25 | 469.82 | 479.56 | 485.43 | 489.55 | 491.53 | 183.48 | 192.31 | 62.83 | 68.07 | 40.36 | |
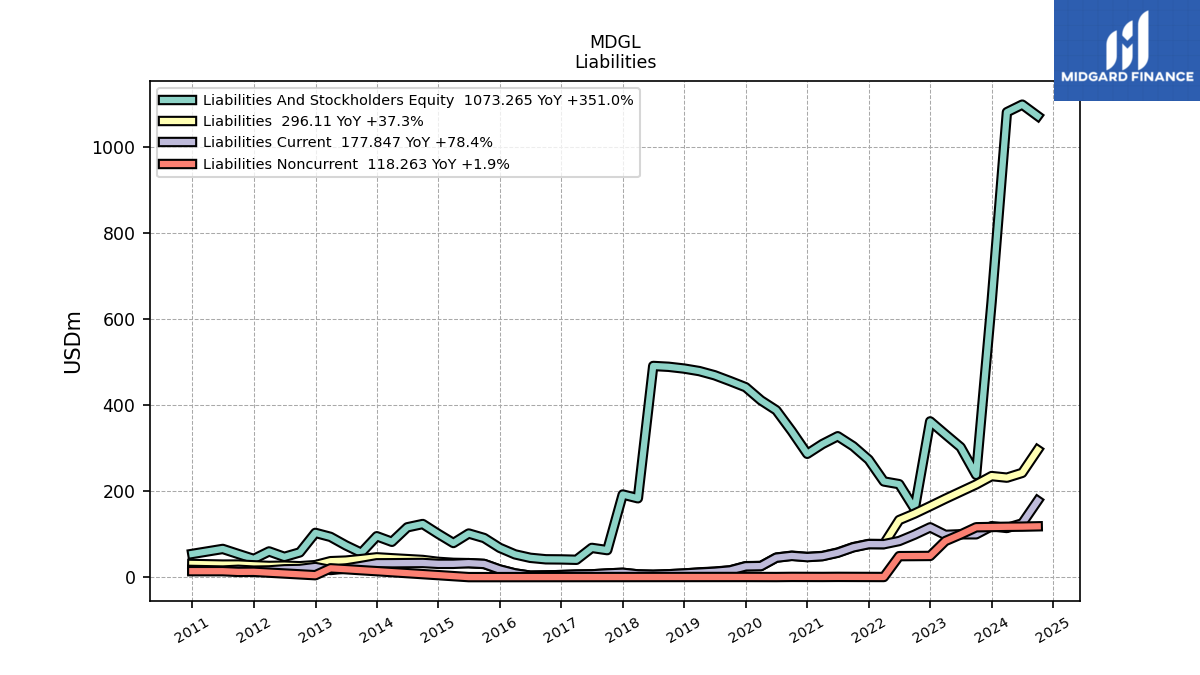
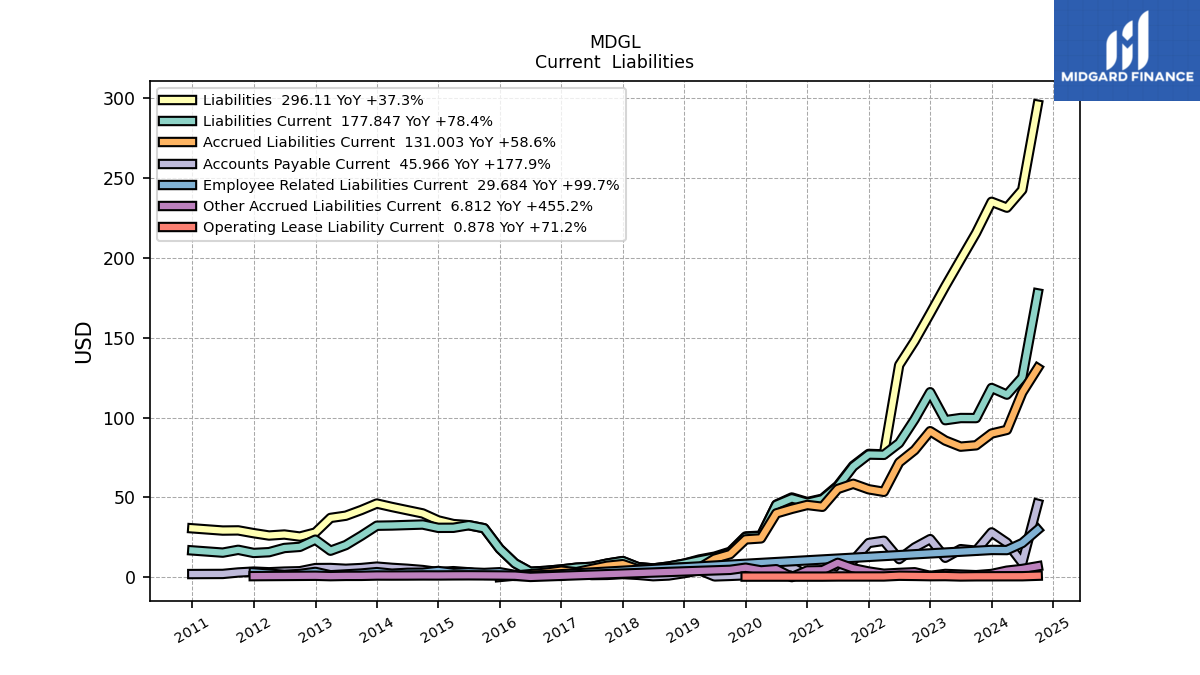
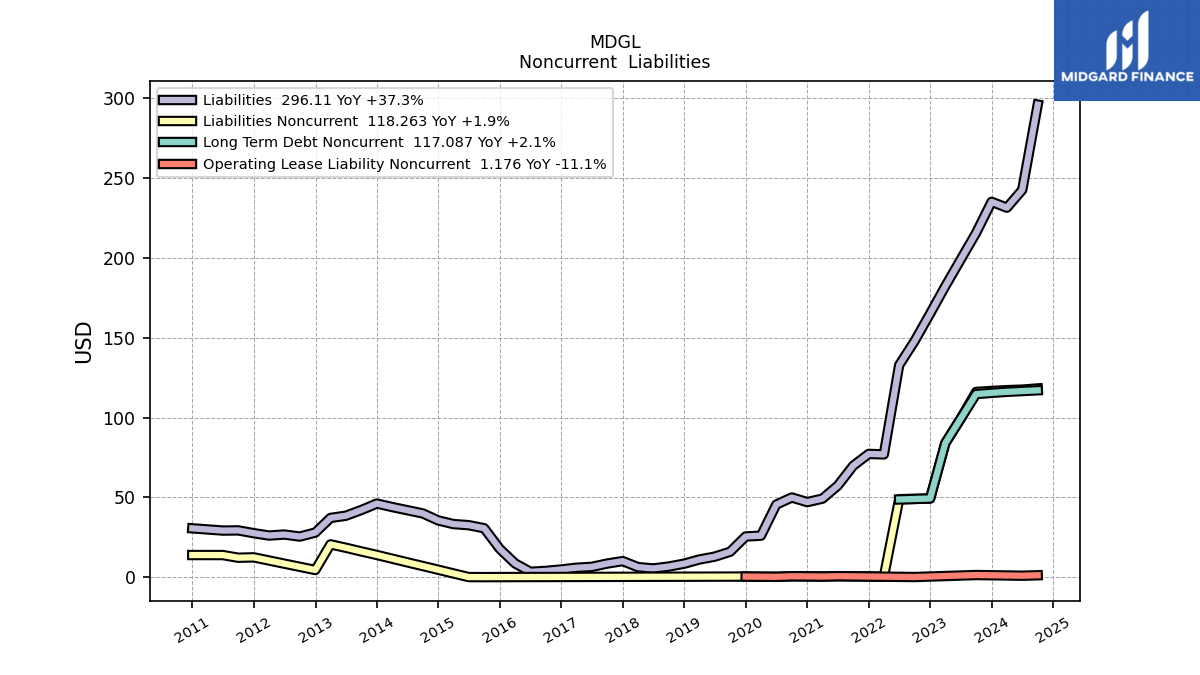
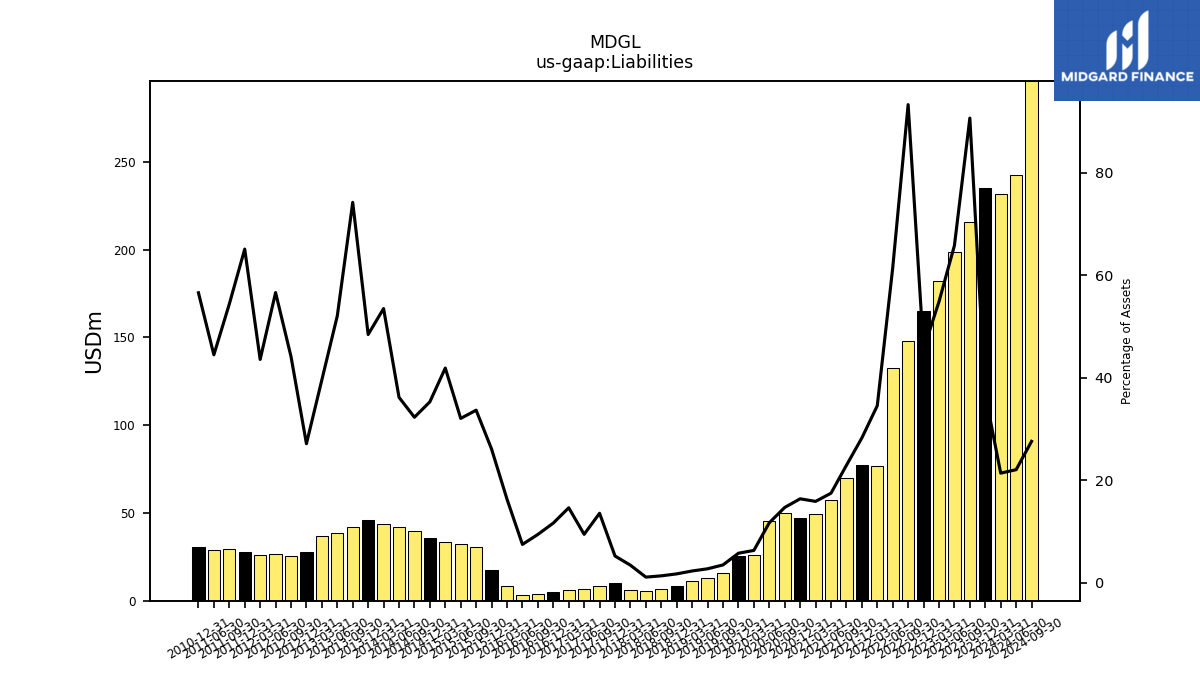
| Liabilities | 165.18 | 147.97 | 132.86 | 76.92 | 77.22 | 69.82 | 57.30 | 49.18 | 47.02 | 49.91 | 45.47 | 25.98 | 25.49 | 15.90 | 12.84 | 11.05 | 8.44 | 6.64 | 5.44 | 6.29 | 10.05 | 8.52 | 6.44 | 5.91 | |
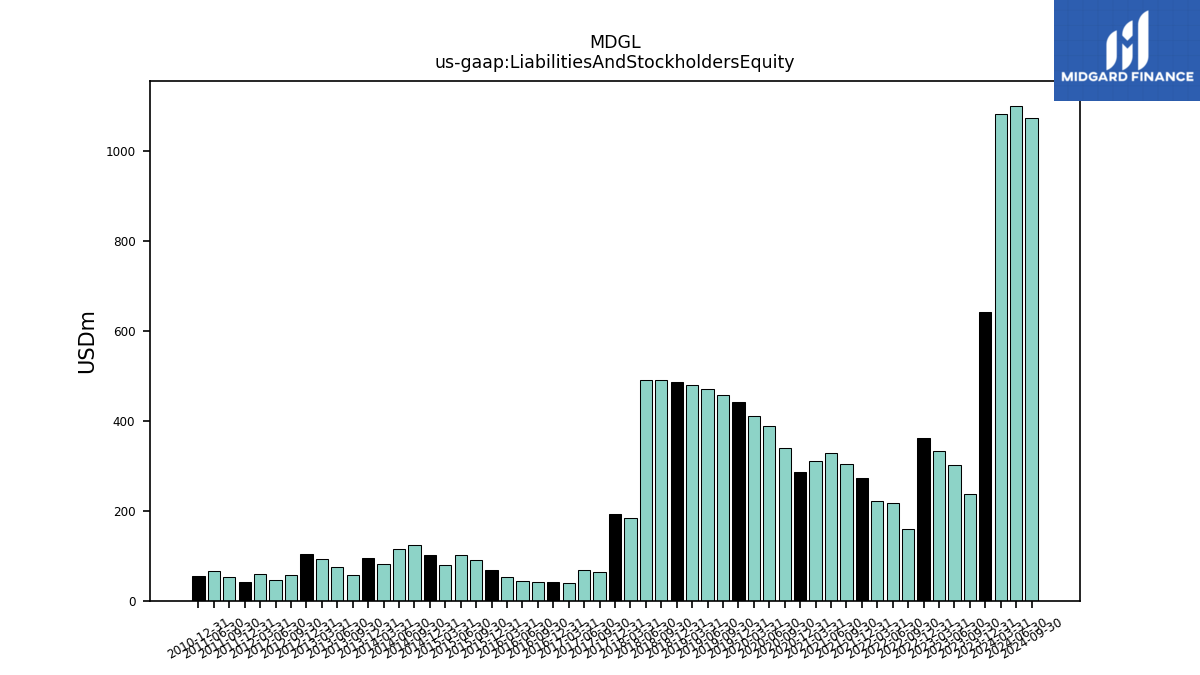
| Liabilities And Stockholders Equity | 362.57 | 158.64 | 216.39 | 222.66 | 273.33 | 304.70 | 327.95 | 309.73 | 287.00 | 339.62 | 388.39 | 411.46 | 442.06 | 456.25 | 469.82 | 479.56 | 485.43 | 489.55 | 491.53 | 183.48 | 192.31 | 62.83 | 68.07 | 40.36 | |
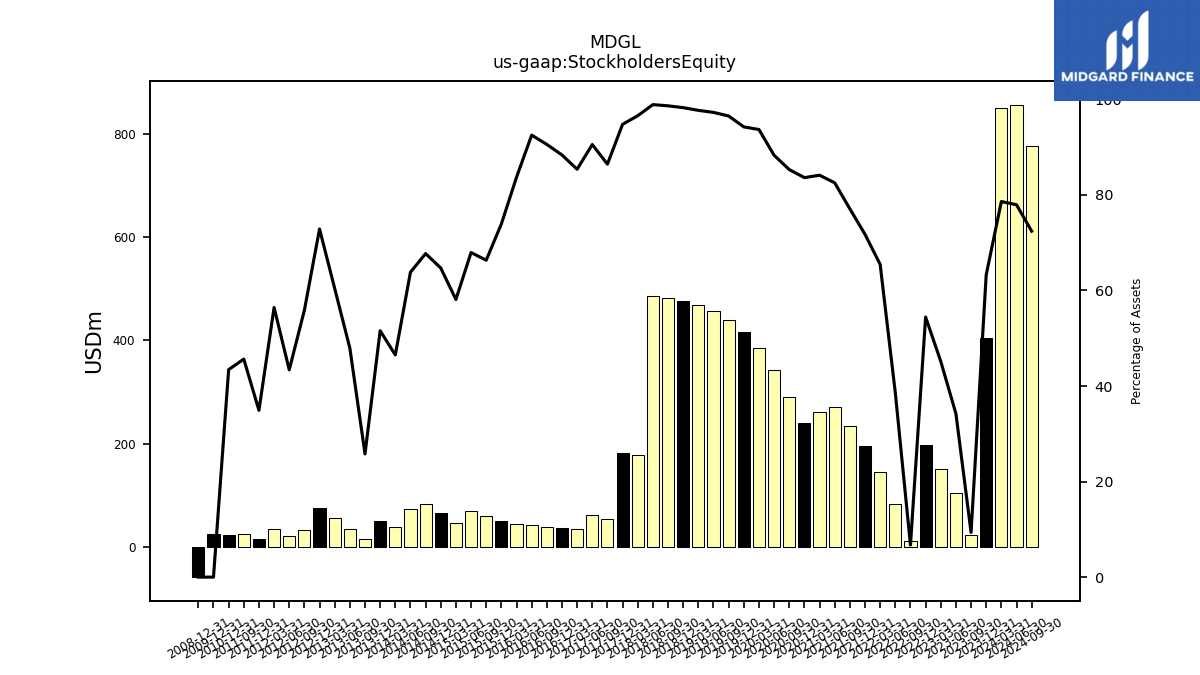
| Stockholders Equity | 197.39 | 10.67 | 83.53 | 145.74 | 196.11 | 234.88 | 270.65 | 260.55 | 239.97 | 289.70 | 342.92 | 385.48 | 416.56 | 440.35 | 456.99 | 468.51 | 476.98 | 482.91 | 486.09 | 177.18 | 182.26 | 54.31 | 61.63 | 34.45 |
| 2022-12-31 | 2022-09-30 | 2022-06-30 | 2022-03-31 | 2021-12-31 | 2021-09-30 | 2021-06-30 | 2021-03-31 | 2020-12-31 | 2020-09-30 | 2020-06-30 | 2020-03-31 | 2019-12-31 | 2019-09-30 | 2019-06-30 | 2019-03-31 | 2018-12-31 | 2018-09-30 | 2018-06-30 | 2018-03-31 | 2017-12-31 | 2017-09-30 | 2017-06-30 | 2017-03-31 | ||
|---|---|---|---|---|---|---|---|---|---|---|---|---|---|---|---|---|---|---|---|---|---|---|---|---|---|
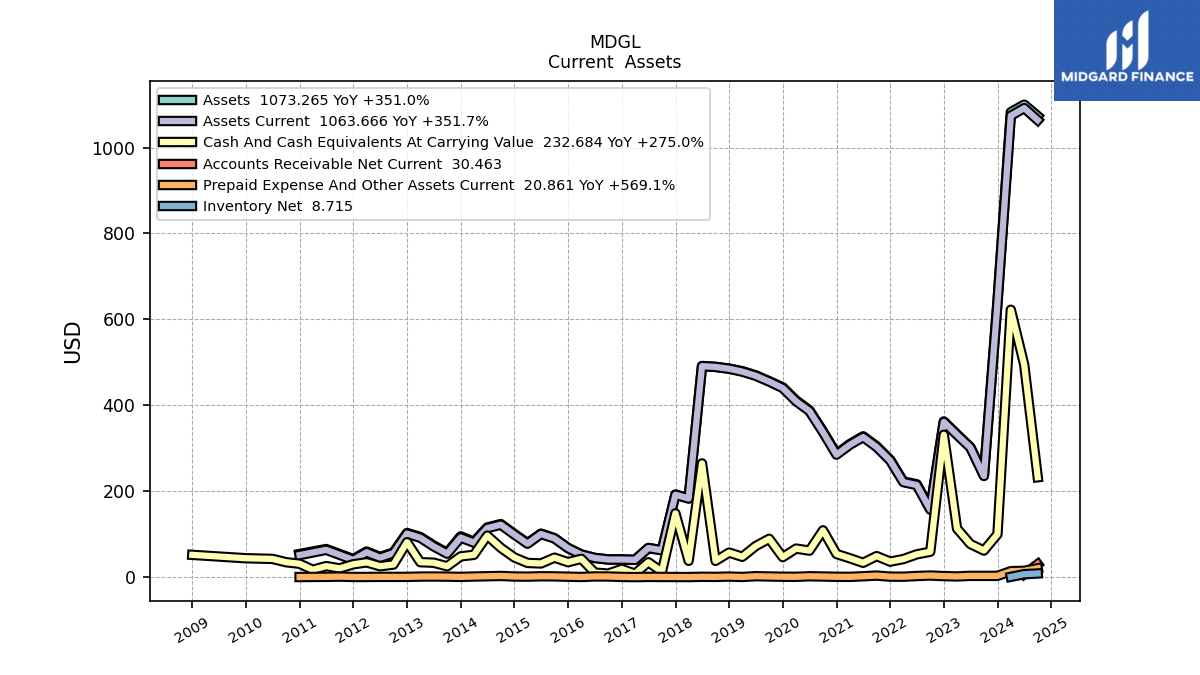
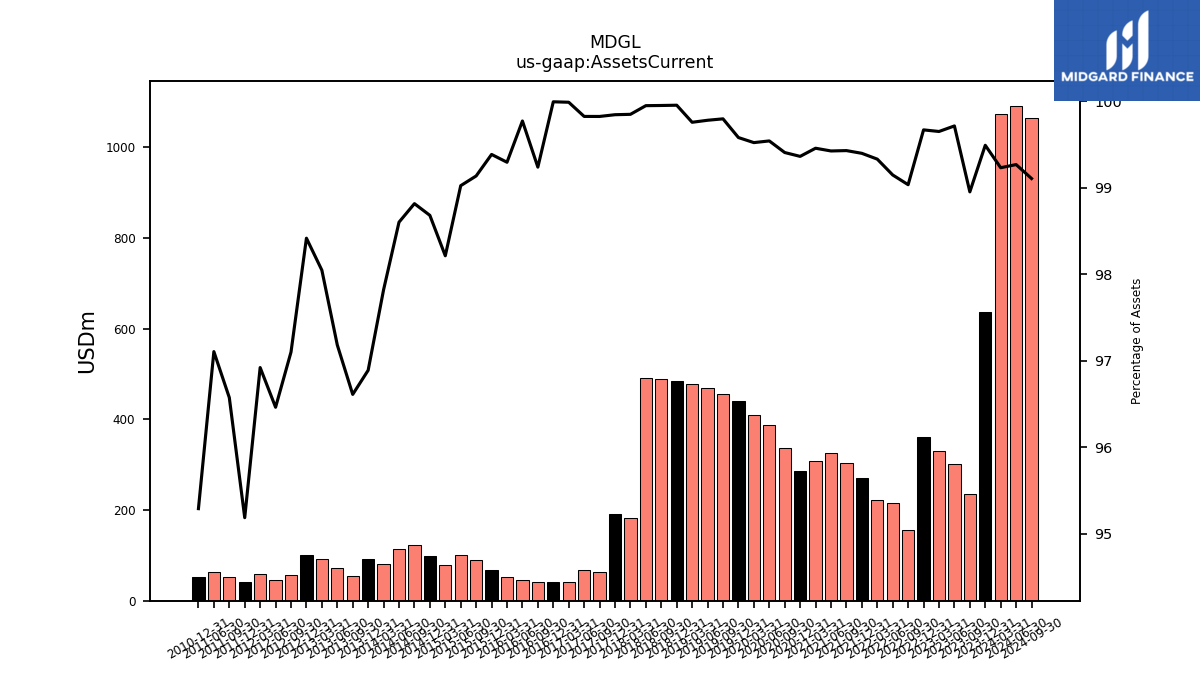
| Assets Current | 361.37 | 157.11 | 214.55 | 221.17 | 271.68 | 302.96 | 326.07 | 308.05 | 285.16 | 337.60 | 386.60 | 409.49 | 440.20 | 455.32 | 468.79 | 478.39 | 485.20 | 489.31 | 491.27 | 183.20 | 192.01 | 62.72 | 67.95 | 40.35 | |
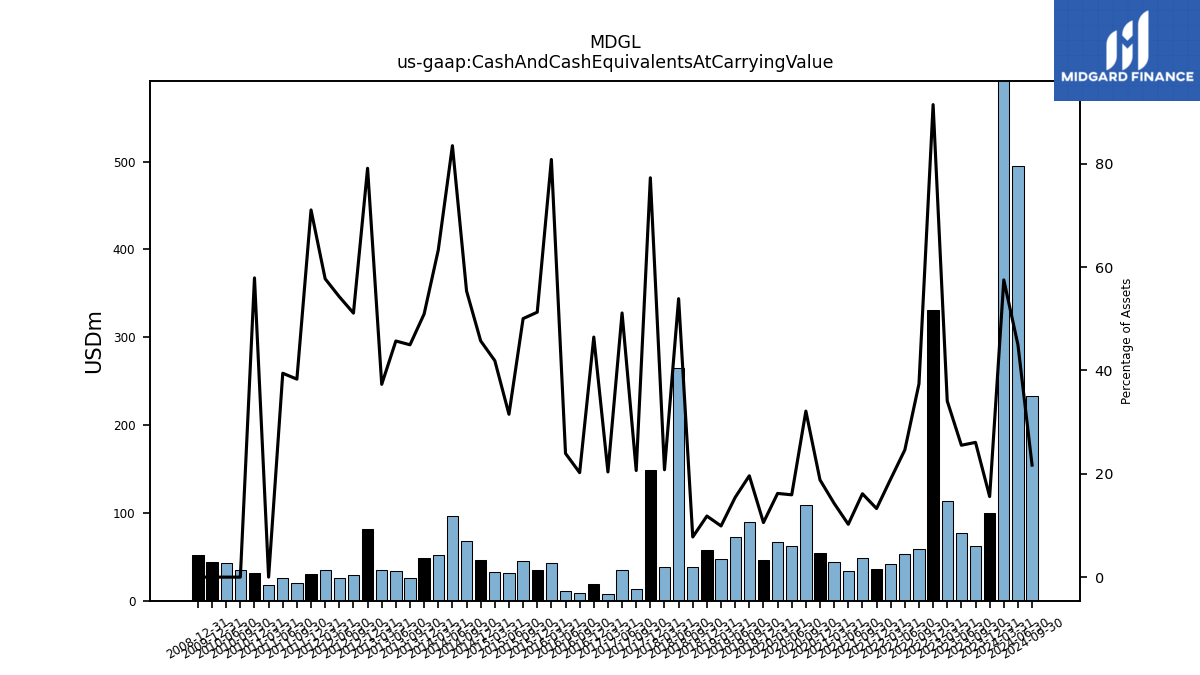
| Cash And Cash Equivalents At Carrying Value | 331.55 | 59.34 | 53.27 | 42.28 | 36.27 | 49.17 | 33.54 | 44.20 | 54.00 | 109.12 | 61.87 | 66.65 | 46.70 | 89.49 | 72.51 | 47.49 | 57.38 | 38.05 | 264.86 | 38.12 | 148.63 | 12.96 | 34.80 | 8.21 | |
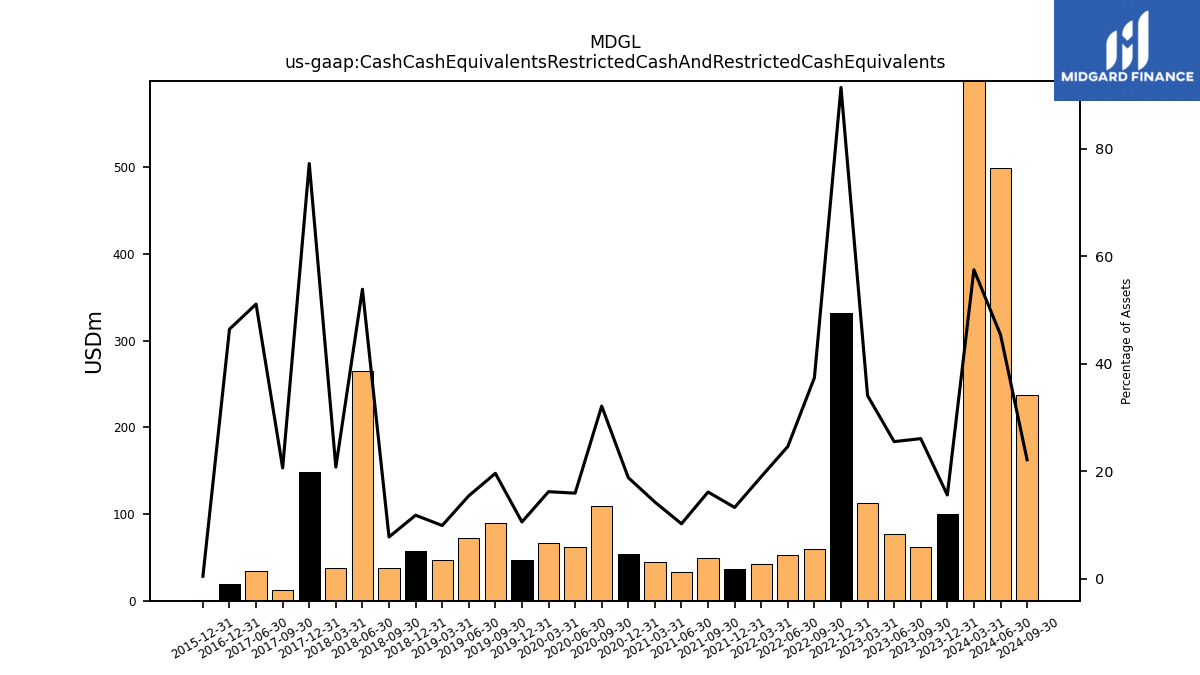
| Cash Cash Equivalents Restricted Cash And Restricted Cash Equivalents | 331.55 | 59.34 | 53.27 | 42.28 | 36.27 | 49.17 | 33.54 | 44.20 | 54.00 | 109.12 | 61.87 | 66.65 | 46.70 | 89.49 | 72.51 | 47.49 | 57.38 | 38.05 | 264.86 | 38.12 | 148.63 | 12.96 | 34.80 | NA | |
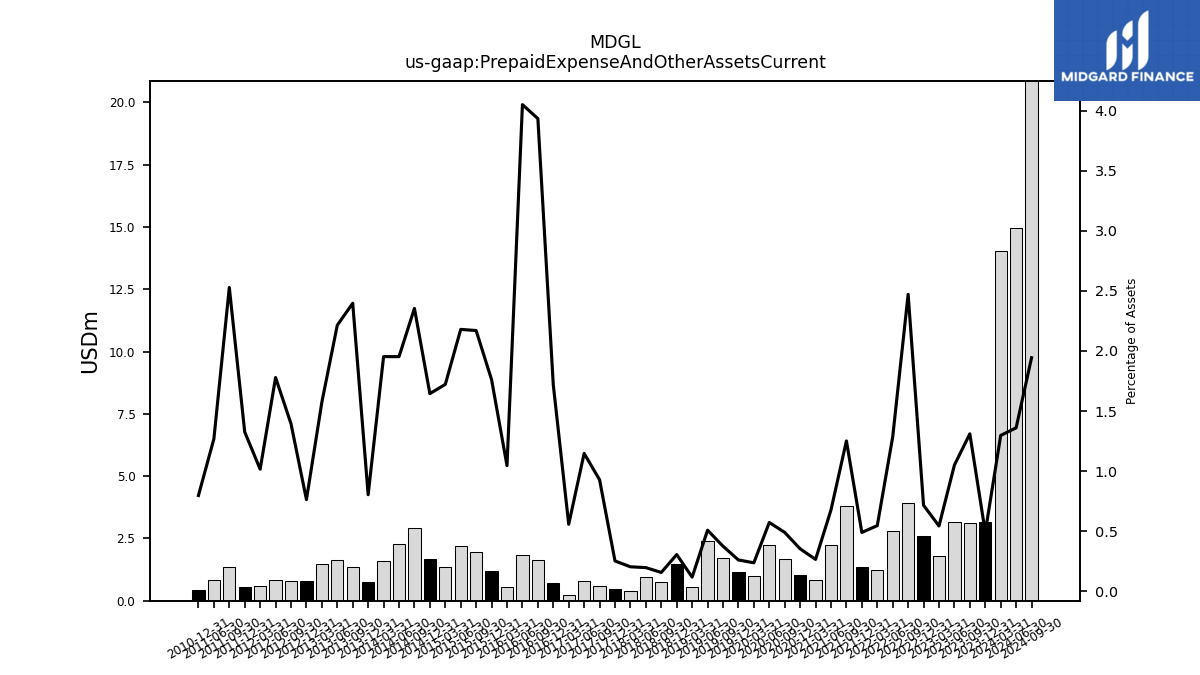
| Prepaid Expense And Other Assets Current | 2.60 | 3.92 | 2.78 | 1.22 | 1.34 | 3.81 | 2.22 | 0.82 | 1.01 | 1.66 | 2.22 | 0.98 | 1.15 | 1.71 | 2.39 | 0.56 | 1.48 | 0.77 | 0.97 | 0.37 | 0.48 | 0.58 | 0.78 | 0.23 |
| 2022-12-31 | 2022-09-30 | 2022-06-30 | 2022-03-31 | 2021-12-31 | 2021-09-30 | 2021-06-30 | 2021-03-31 | 2020-12-31 | 2020-09-30 | 2020-06-30 | 2020-03-31 | 2019-12-31 | 2019-09-30 | 2019-06-30 | 2019-03-31 | 2018-12-31 | 2018-09-30 | 2018-06-30 | 2018-03-31 | 2017-12-31 | 2017-09-30 | 2017-06-30 | 2017-03-31 | ||
|---|---|---|---|---|---|---|---|---|---|---|---|---|---|---|---|---|---|---|---|---|---|---|---|---|---|
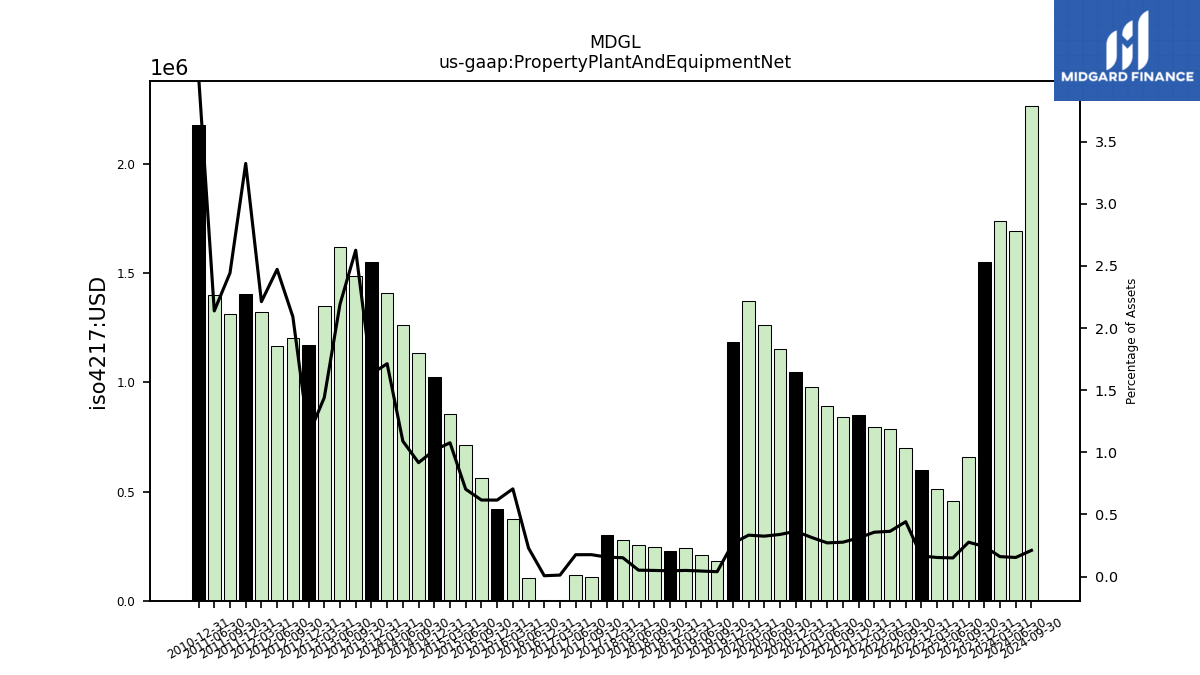
| Property Plant And Equipment Net | 0.60 | 0.70 | 0.79 | 0.80 | 0.85 | 0.84 | 0.89 | 0.98 | 1.05 | 1.15 | 1.26 | 1.37 | 1.18 | 0.18 | 0.21 | 0.24 | 0.23 | 0.24 | 0.26 | 0.28 | 0.30 | 0.11 | 0.12 | 0.01 |
| 2022-12-31 | 2022-09-30 | 2022-06-30 | 2022-03-31 | 2021-12-31 | 2021-09-30 | 2021-06-30 | 2021-03-31 | 2020-12-31 | 2020-09-30 | 2020-06-30 | 2020-03-31 | 2019-12-31 | 2019-09-30 | 2019-06-30 | 2019-03-31 | 2018-12-31 | 2018-09-30 | 2018-06-30 | 2018-03-31 | 2017-12-31 | 2017-09-30 | 2017-06-30 | 2017-03-31 | ||
|---|---|---|---|---|---|---|---|---|---|---|---|---|---|---|---|---|---|---|---|---|---|---|---|---|---|
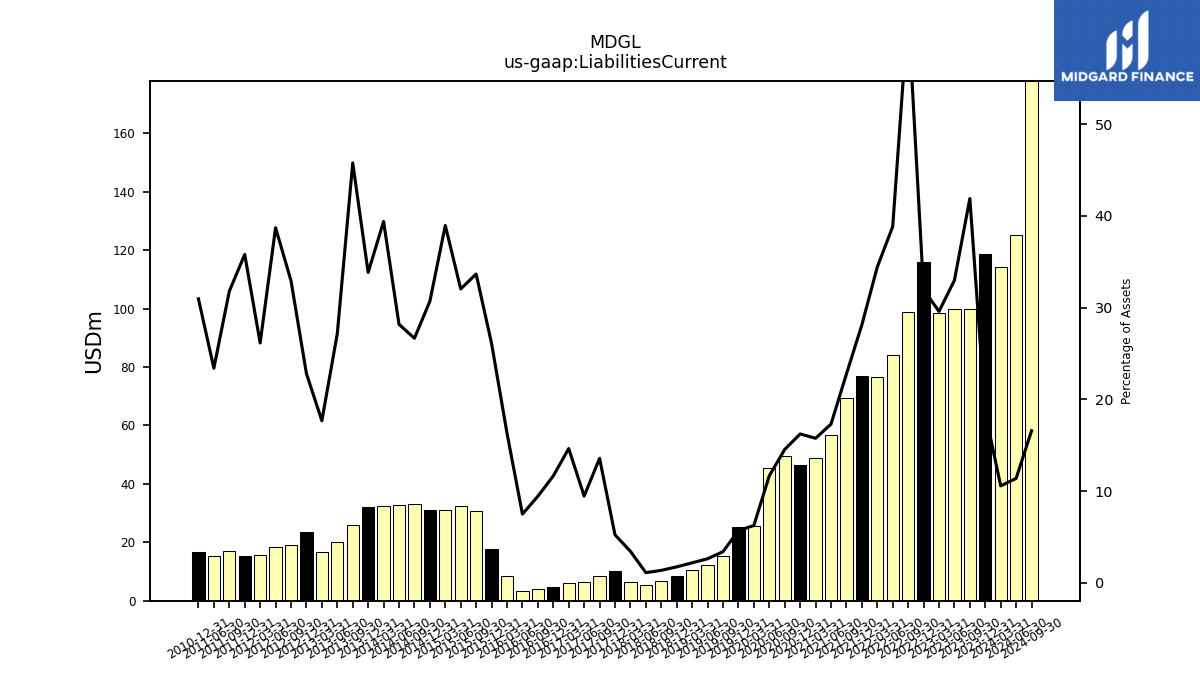
| Liabilities Current | 115.89 | 98.92 | 84.01 | 76.64 | 76.84 | 69.33 | 56.71 | 48.79 | 46.56 | 49.37 | 45.27 | 25.70 | 25.13 | 15.46 | 12.32 | 10.46 | 8.44 | 6.64 | 5.44 | 6.29 | 10.05 | 8.52 | 6.44 | 5.91 | |
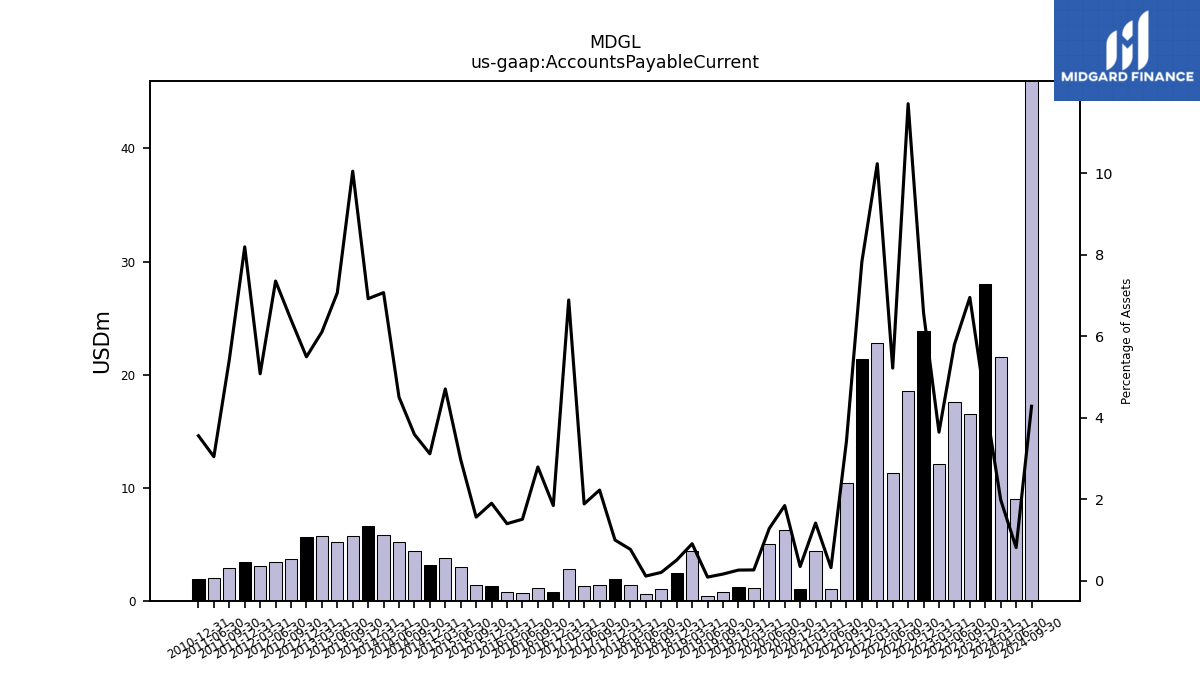
| Accounts Payable Current | 23.83 | 18.56 | 11.29 | 22.78 | 21.38 | 10.42 | 1.07 | 4.40 | 1.02 | 6.28 | 5.00 | 1.11 | 1.18 | 0.77 | 0.45 | 4.38 | 2.49 | 1.03 | 0.59 | 1.42 | 1.93 | 1.40 | 1.28 | 2.78 | |
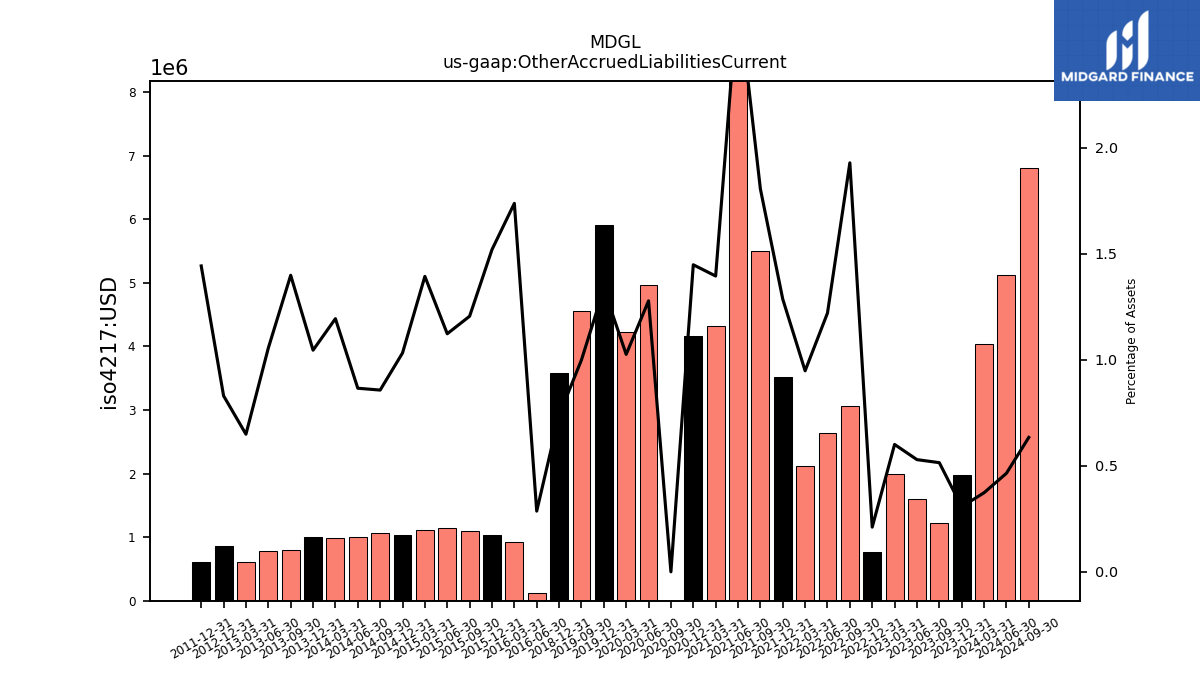
| Other Accrued Liabilities Current | 0.77 | 3.06 | 2.64 | 2.11 | 3.52 | 5.51 | 8.95 | 4.32 | 4.16 | 0.00 | 4.97 | 4.22 | 5.91 | 4.56 | NA | NA | 3.59 | NA | NA | NA | NA | NA | NA | NA | |
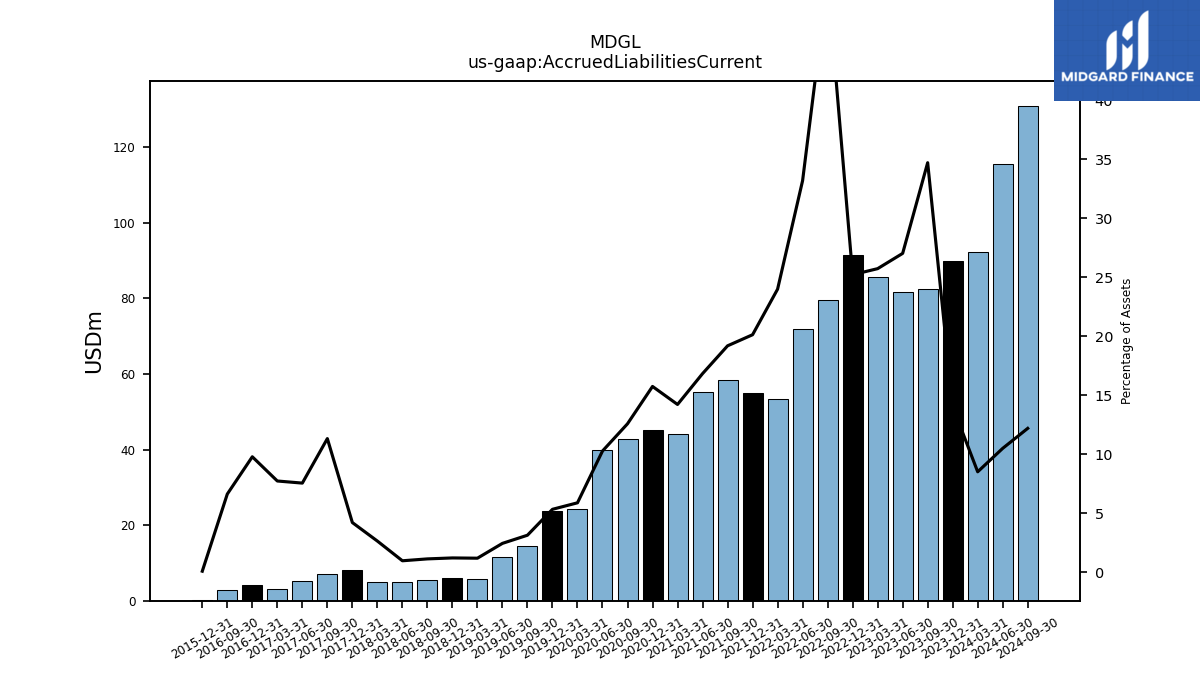
| Accrued Liabilities Current | 91.46 | 79.60 | 71.84 | 53.44 | 55.05 | 58.50 | 55.24 | 44.08 | 45.22 | 42.77 | 39.95 | 24.27 | 23.64 | 14.38 | 11.56 | 5.78 | 5.96 | 5.61 | 4.85 | 4.87 | 8.12 | 7.12 | 5.15 | 3.13 |
| 2022-12-31 | 2022-09-30 | 2022-06-30 | 2022-03-31 | 2021-12-31 | 2021-09-30 | 2021-06-30 | 2021-03-31 | 2020-12-31 | 2020-09-30 | 2020-06-30 | 2020-03-31 | 2019-12-31 | 2019-09-30 | 2019-06-30 | 2019-03-31 | 2018-12-31 | 2018-09-30 | 2018-06-30 | 2018-03-31 | 2017-12-31 | 2017-09-30 | 2017-06-30 | 2017-03-31 | ||
|---|---|---|---|---|---|---|---|---|---|---|---|---|---|---|---|---|---|---|---|---|---|---|---|---|---|
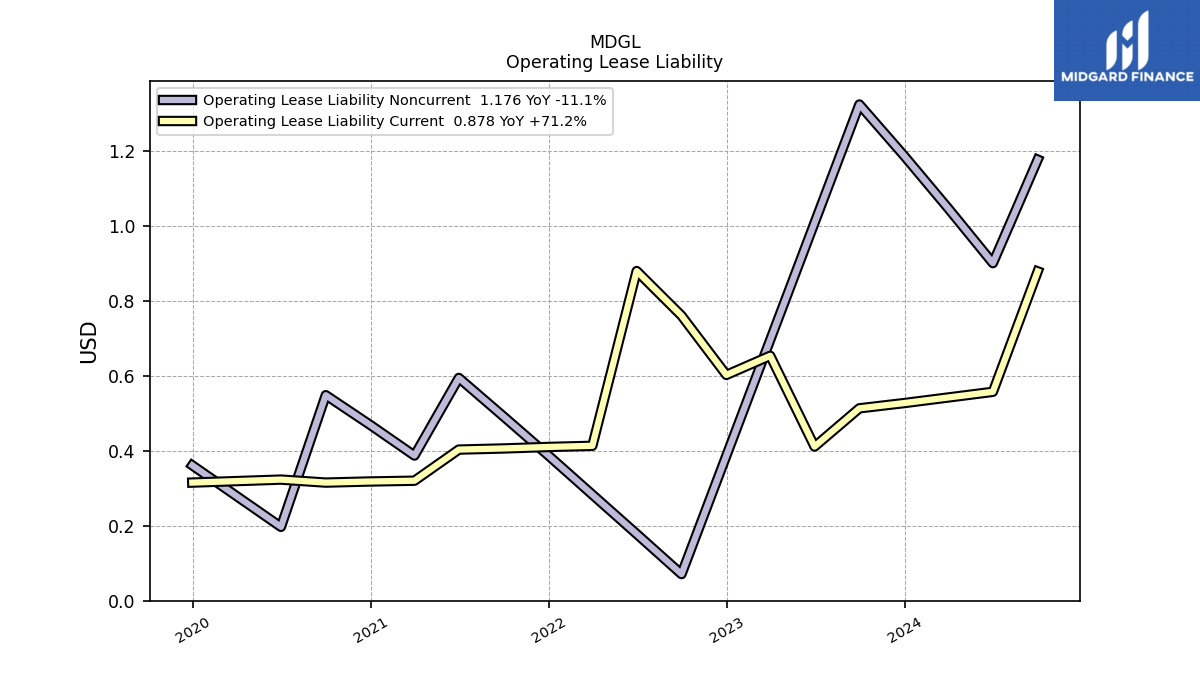
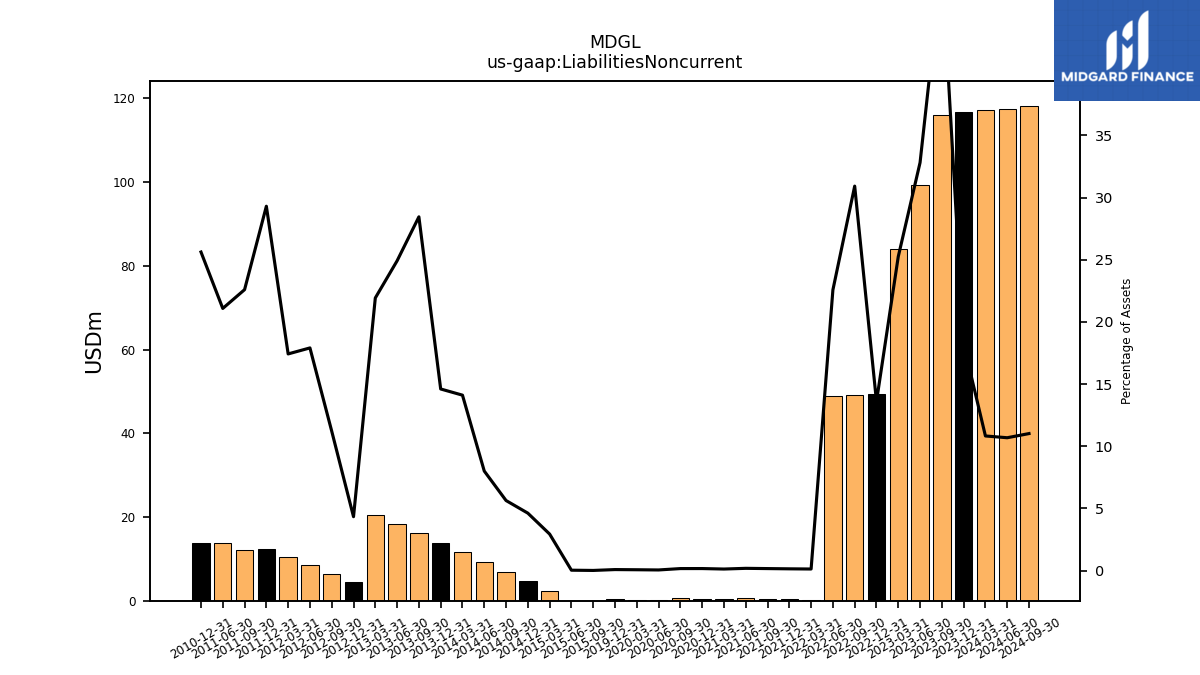
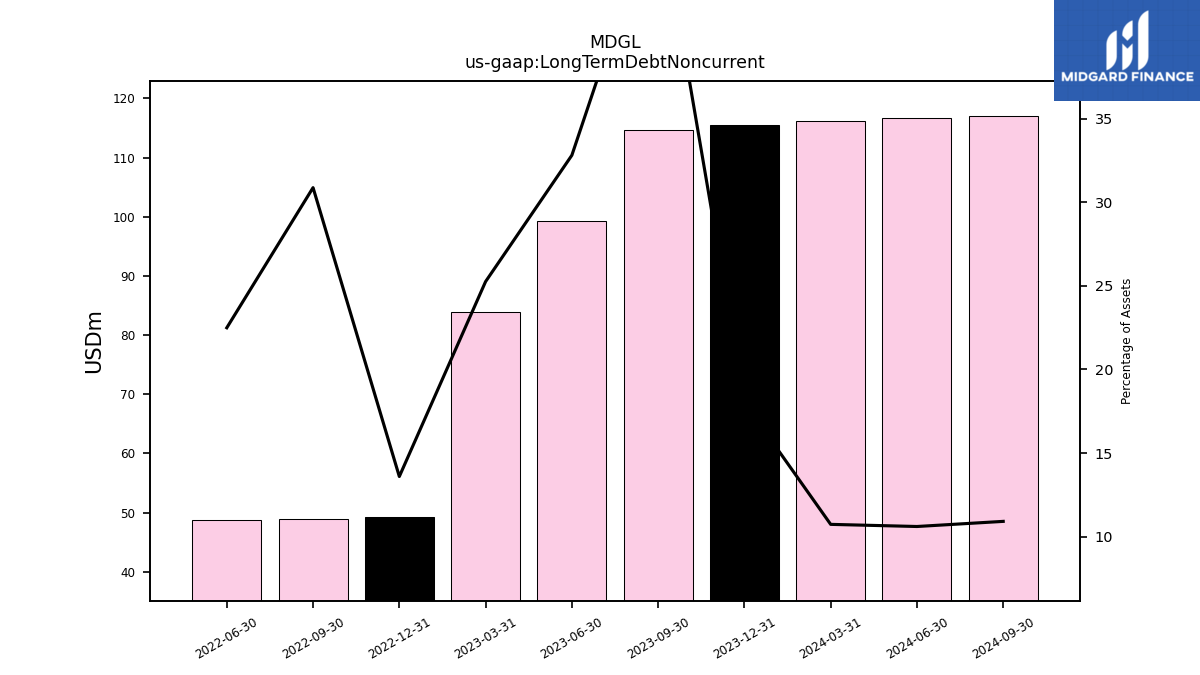
| Liabilities Noncurrent | 49.29 | 49.05 | 48.85 | 0.28 | 0.39 | 0.49 | 0.59 | 0.39 | 0.47 | 0.55 | 0.20 | 0.28 | 0.36 | NA | NA | NA | NA | NA | NA | NA | NA | NA | NA | NA | |
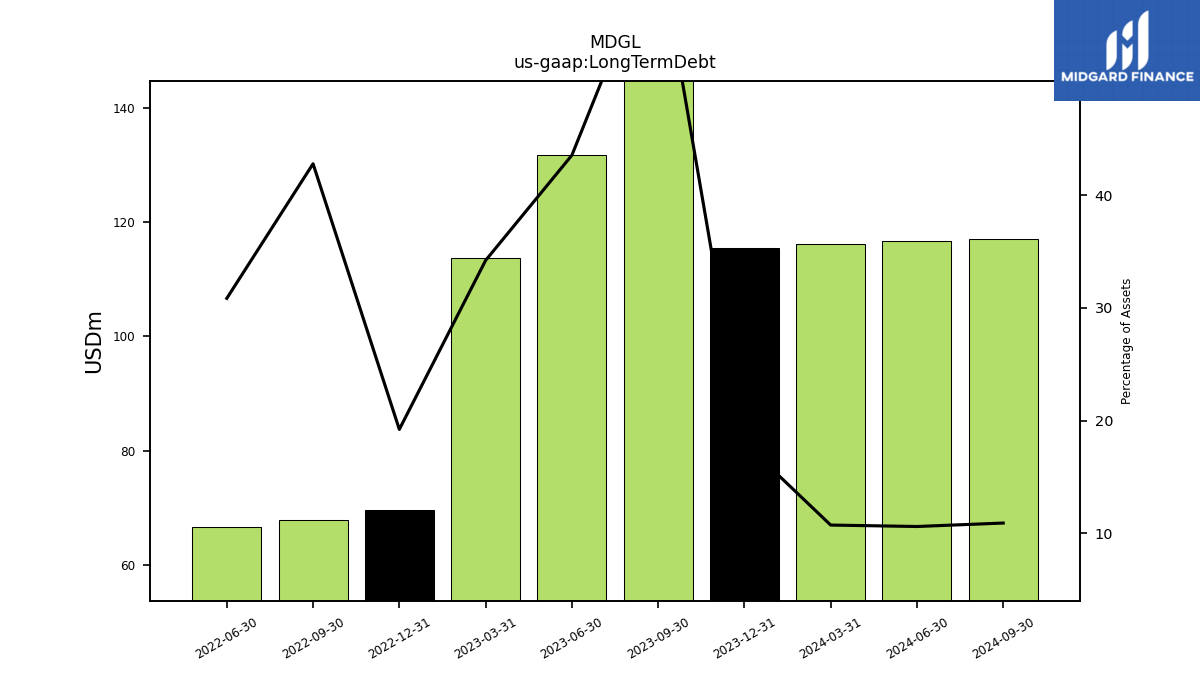
| Long Term Debt | 69.67 | 67.86 | 66.73 | NA | NA | NA | NA | NA | NA | NA | NA | NA | NA | NA | NA | NA | NA | NA | NA | NA | NA | NA | NA | NA | |
| Long Term Debt Noncurrent | 49.29 | 48.98 | 48.67 | NA | NA | NA | NA | NA | NA | NA | NA | NA | NA | NA | NA | NA | NA | NA | NA | NA | NA | NA | NA | NA | |
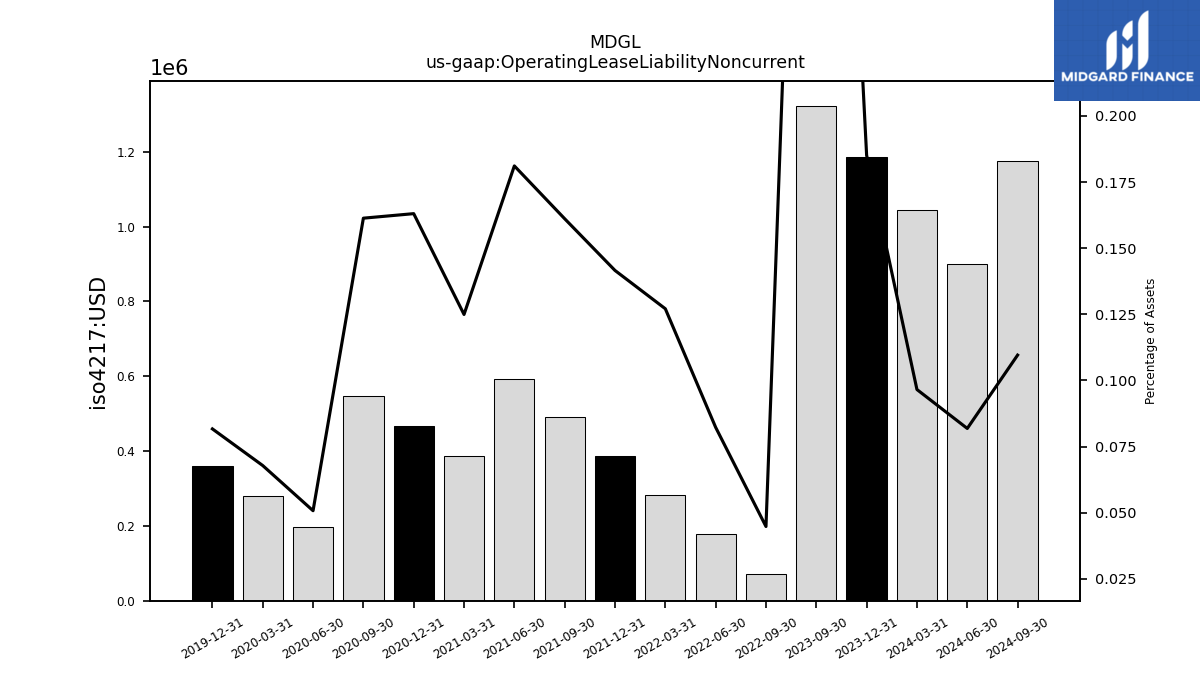
| Operating Lease Liability Noncurrent | NA | 0.07 | 0.18 | 0.28 | 0.39 | 0.49 | 0.59 | 0.39 | 0.47 | 0.55 | 0.20 | 0.28 | 0.36 | NA | NA | NA | NA | NA | NA | NA | NA | NA | NA | NA |
| 2022-12-31 | 2022-09-30 | 2022-06-30 | 2022-03-31 | 2021-12-31 | 2021-09-30 | 2021-06-30 | 2021-03-31 | 2020-12-31 | 2020-09-30 | 2020-06-30 | 2020-03-31 | 2019-12-31 | 2019-09-30 | 2019-06-30 | 2019-03-31 | 2018-12-31 | 2018-09-30 | 2018-06-30 | 2018-03-31 | 2017-12-31 | 2017-09-30 | 2017-06-30 | 2017-03-31 | ||
|---|---|---|---|---|---|---|---|---|---|---|---|---|---|---|---|---|---|---|---|---|---|---|---|---|---|
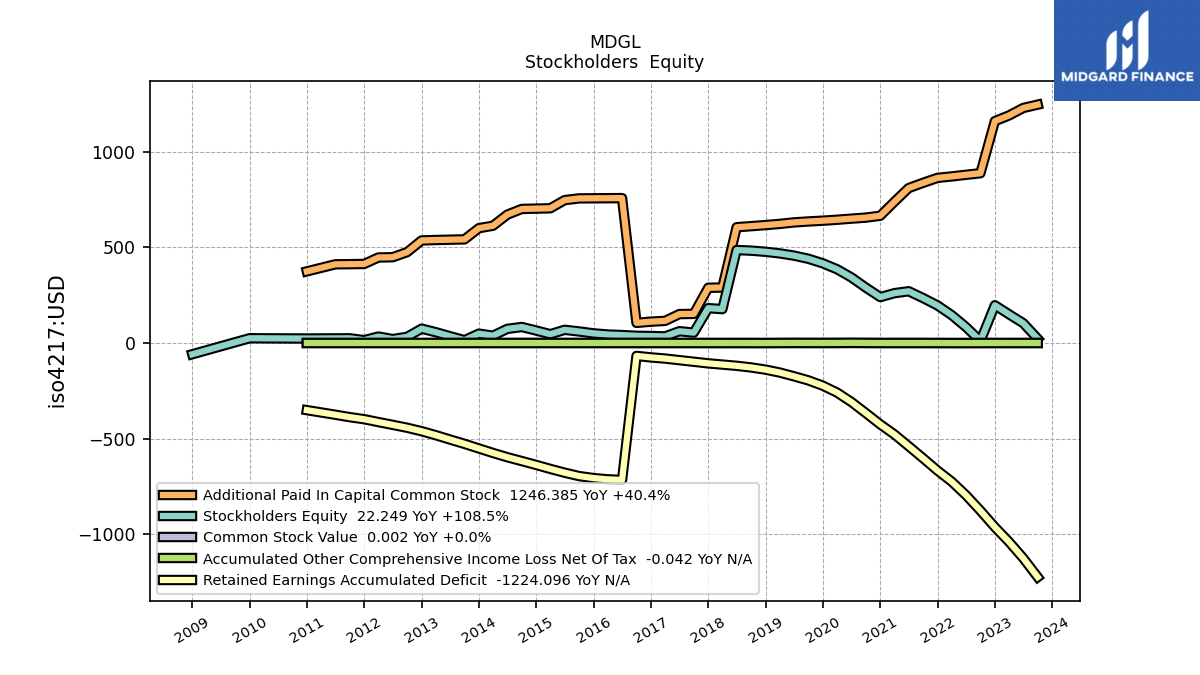
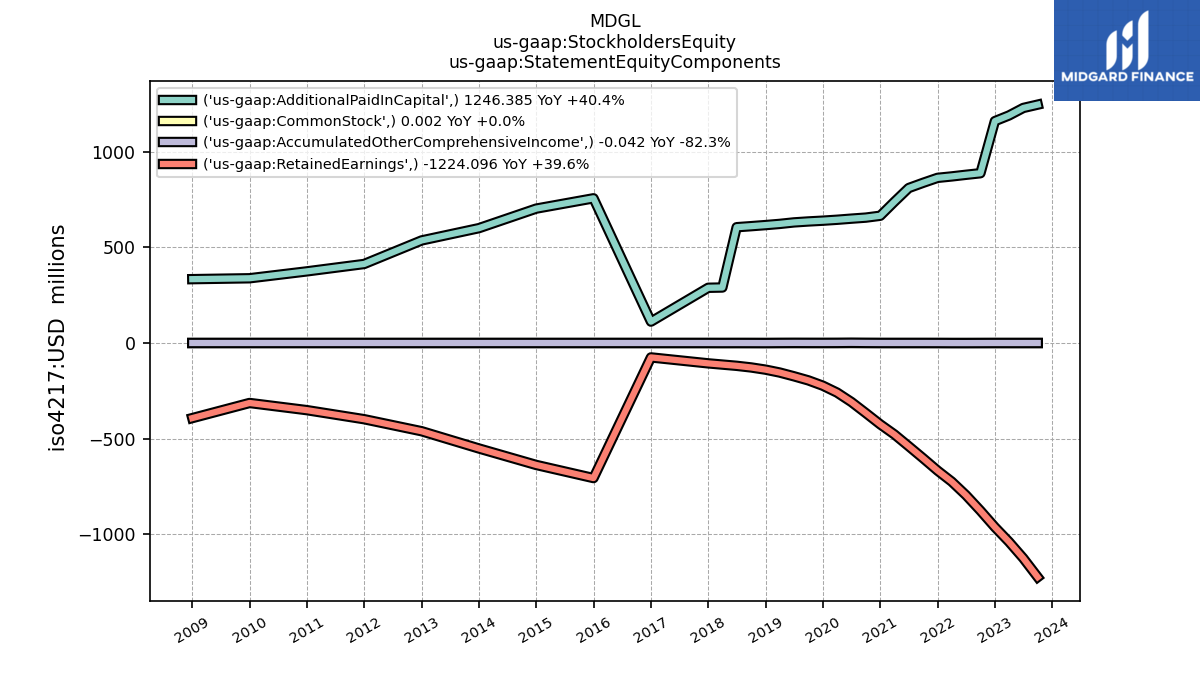
| Stockholders Equity | 197.39 | 10.67 | 83.53 | 145.74 | 196.11 | 234.88 | 270.65 | 260.55 | 239.97 | 289.70 | 342.92 | 385.48 | 416.56 | 440.35 | 456.99 | 468.51 | 476.98 | 482.91 | 486.09 | 177.18 | 182.26 | 54.31 | 61.63 | 34.45 | |
| Common Stock Value | 0.00 | 0.00 | 0.00 | 0.00 | 0.00 | 0.00 | 0.00 | 0.00 | 0.00 | 0.00 | 0.00 | 0.00 | 0.00 | 0.00 | 0.00 | 0.00 | 0.00 | 0.00 | 0.00 | 0.00 | 0.00 | 0.00 | 0.00 | 0.00 | |
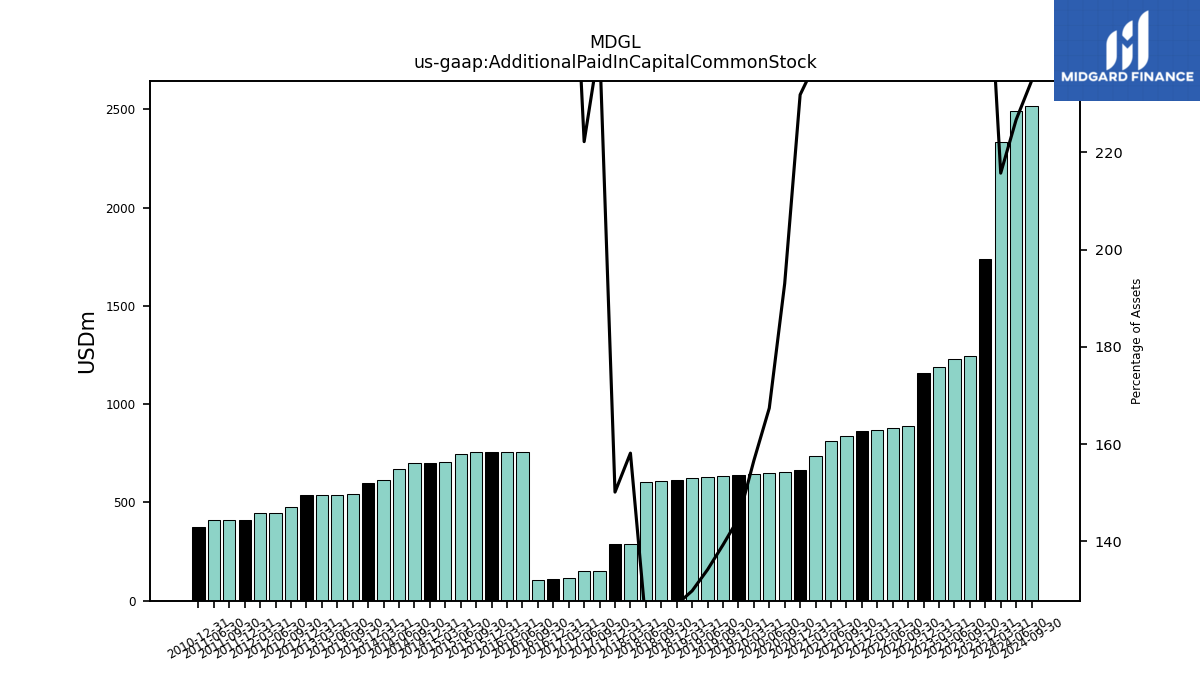
| Additional Paid In Capital Common Stock | 1160.08 | 887.66 | 879.54 | 870.97 | 863.50 | 837.64 | 810.29 | 738.58 | 665.38 | 655.62 | 650.21 | 644.41 | 639.57 | 635.53 | 630.55 | 622.68 | 616.57 | 610.85 | 605.42 | 290.18 | 288.75 | 152.28 | 151.25 | 115.69 | |
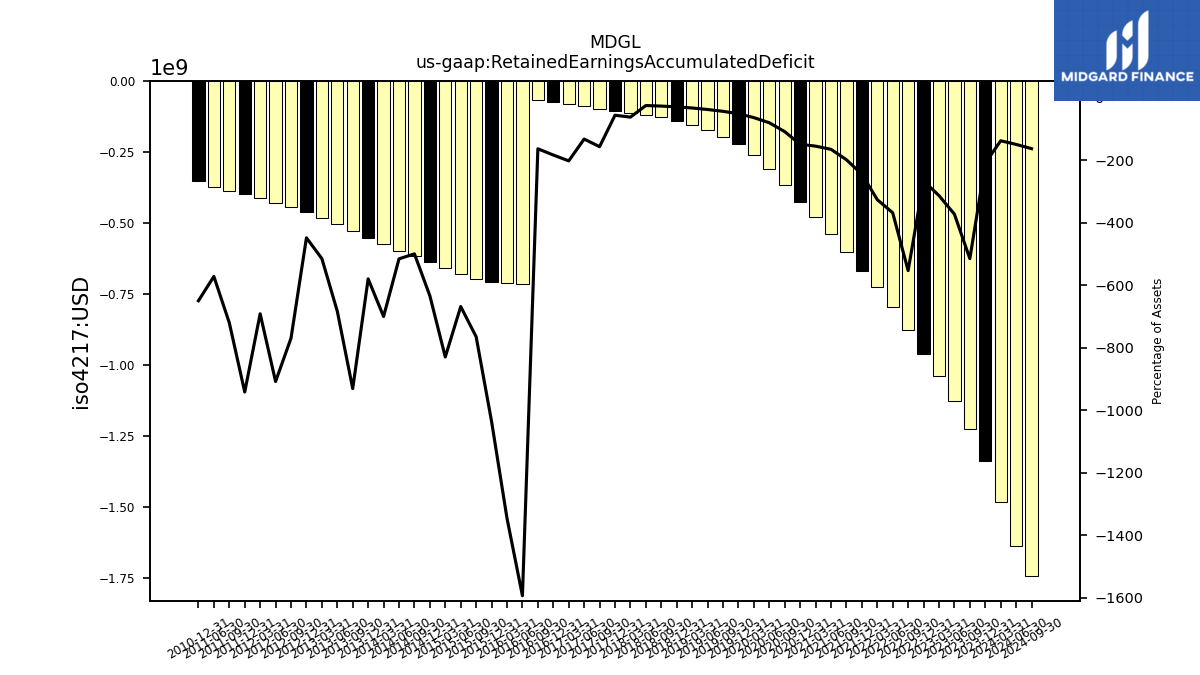
| Retained Earnings Accumulated Deficit | -962.66 | -876.75 | -795.56 | -724.83 | -667.31 | -602.76 | -539.66 | -478.01 | -425.46 | -366.34 | -308.38 | -259.36 | -223.22 | -195.48 | -174.05 | -154.35 | -139.27 | -127.80 | -119.28 | -112.83 | -106.46 | -98.02 | -89.65 | -81.31 | |
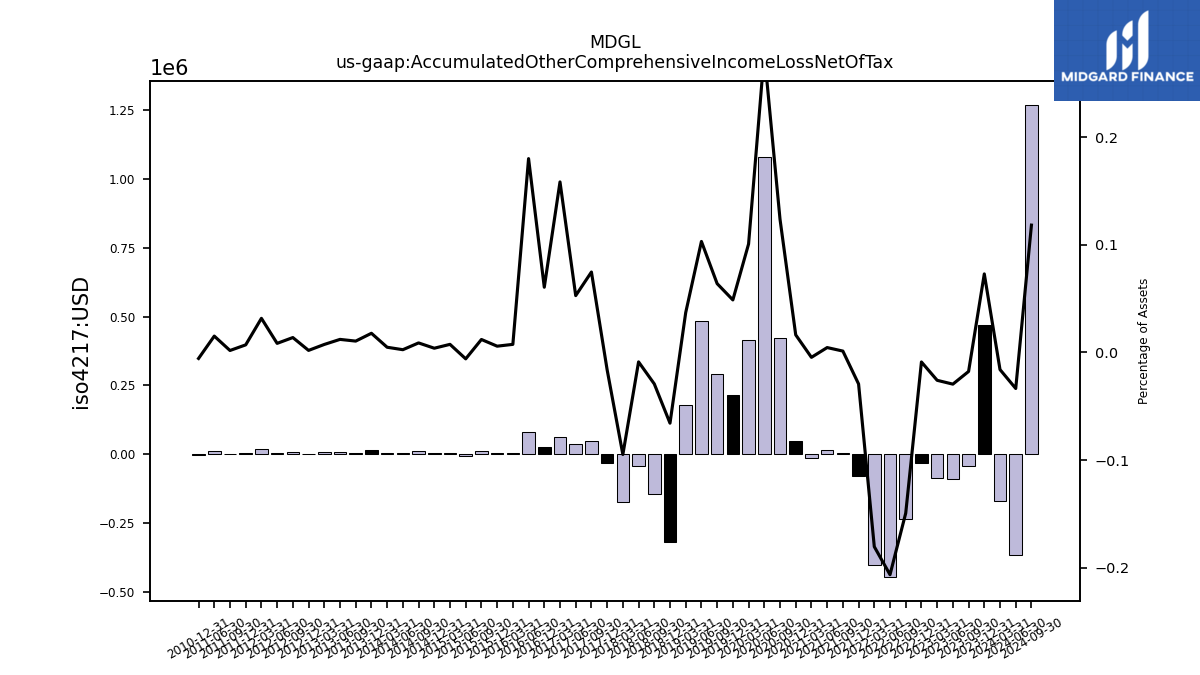
| Accumulated Other Comprehensive Income Loss Net Of Tax | -0.03 | -0.24 | -0.45 | -0.40 | -0.08 | 0.00 | 0.01 | -0.01 | 0.05 | 0.42 | 1.08 | 0.41 | 0.22 | 0.29 | 0.48 | 0.18 | -0.32 | -0.14 | -0.04 | -0.17 | -0.03 | 0.05 | 0.04 | 0.06 |
| 2022-12-31 | 2022-09-30 | 2022-06-30 | 2022-03-31 | 2021-12-31 | 2021-09-30 | 2021-06-30 | 2021-03-31 | 2020-12-31 | 2020-09-30 | 2020-06-30 | 2020-03-31 | 2019-12-31 | 2019-09-30 | 2019-06-30 | 2019-03-31 | 2018-12-31 | 2018-09-30 | 2018-06-30 | 2018-03-31 | 2017-12-31 | 2017-09-30 | 2017-06-30 | 2017-03-31 | ||
|---|---|---|---|---|---|---|---|---|---|---|---|---|---|---|---|---|---|---|---|---|---|---|---|---|---|
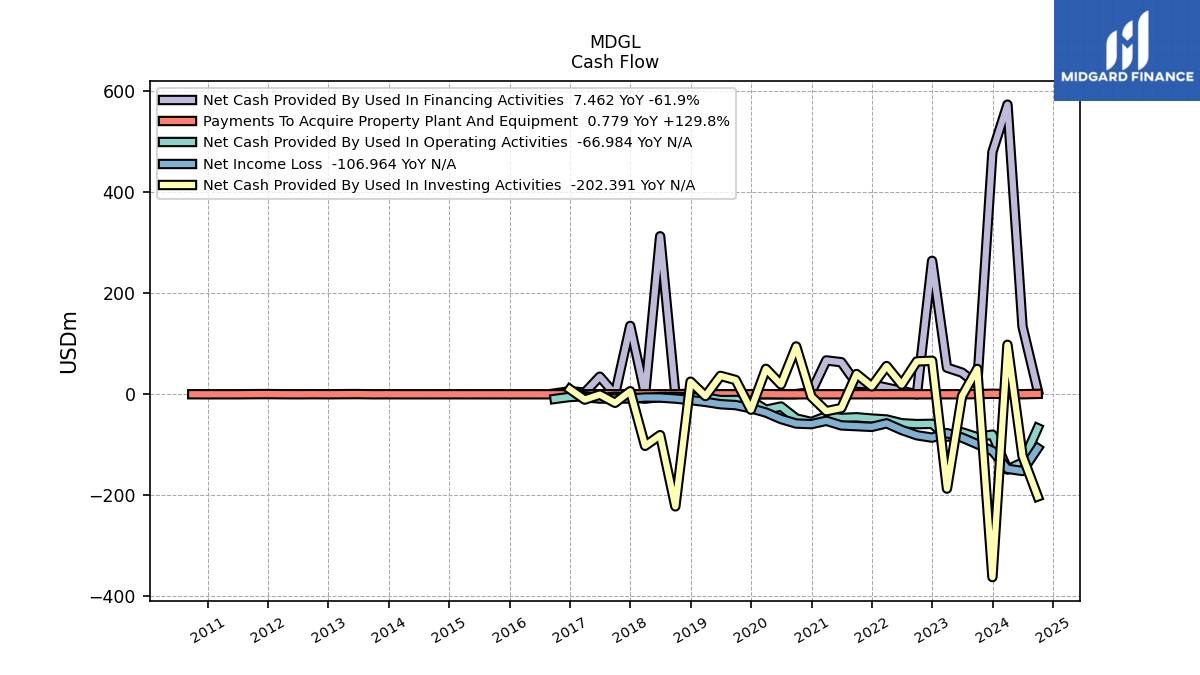
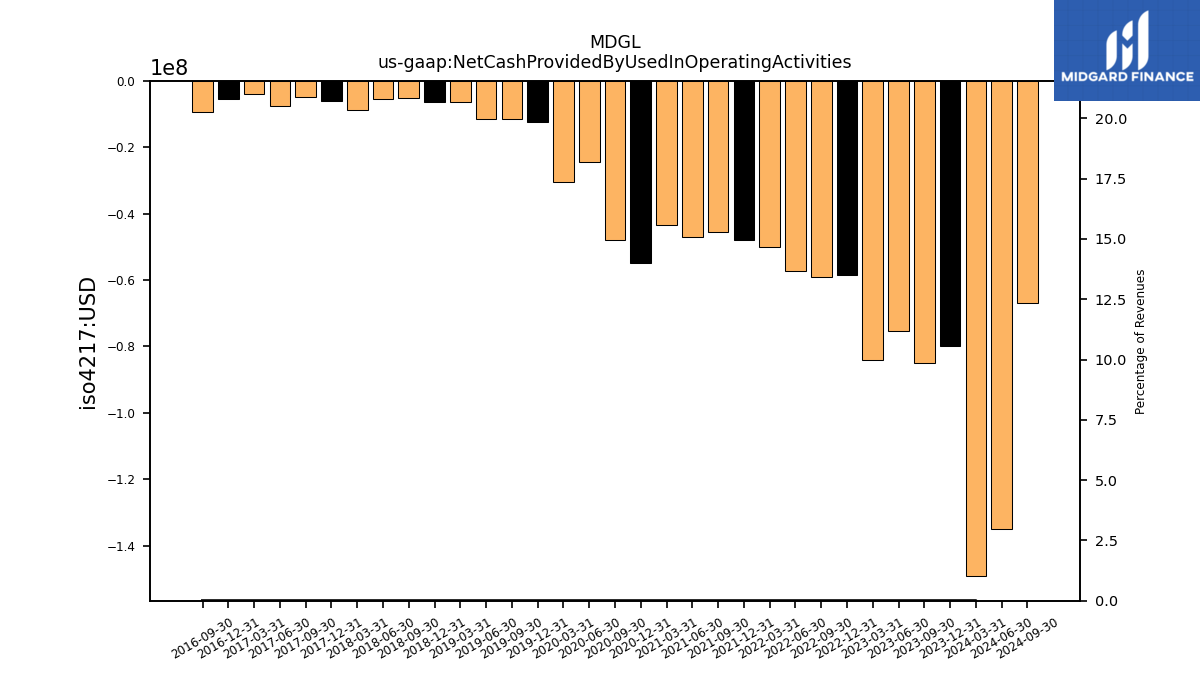
| Net Cash Provided By Used In Operating Activities | -58.52 | -59.07 | -57.36 | -49.91 | -48.05 | -45.56 | -46.88 | -43.43 | -54.95 | -47.85 | -24.26 | -30.51 | -12.28 | -11.32 | -11.54 | -6.48 | -6.26 | -5.24 | -5.36 | -8.64 | -5.95 | -4.95 | -7.65 | -3.77 | |
| Net Cash Provided By Used In Investing Activities | 66.39 | 65.14 | 19.24 | 55.93 | 15.64 | 40.09 | -27.32 | -33.46 | -4.80 | 94.75 | 19.36 | 50.46 | -30.51 | 28.27 | 36.44 | -3.49 | 24.99 | -222.03 | -80.91 | -102.12 | 6.08 | -16.89 | -0.65 | -10.56 | |
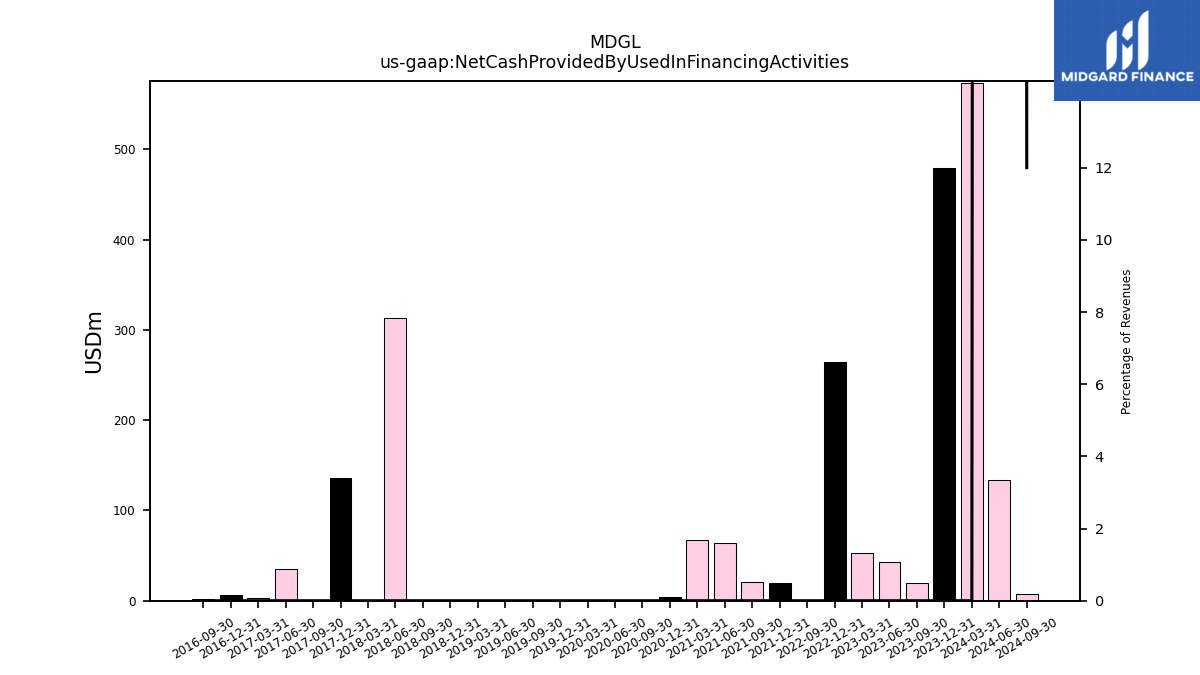
| Net Cash Provided By Used In Financing Activities | 264.34 | 0.00 | NA | NA | 19.50 | 21.10 | 63.54 | 67.09 | 4.63 | 0.35 | 0.11 | 0.00 | 0.00 | 0.04 | 0.12 | 0.08 | 0.61 | 0.45 | 313.01 | 0.27 | 135.53 | 0.00 | 34.88 | 3.40 |
| 2022-12-31 | 2022-09-30 | 2022-06-30 | 2022-03-31 | 2021-12-31 | 2021-09-30 | 2021-06-30 | 2021-03-31 | 2020-12-31 | 2020-09-30 | 2020-06-30 | 2020-03-31 | 2019-12-31 | 2019-09-30 | 2019-06-30 | 2019-03-31 | 2018-12-31 | 2018-09-30 | 2018-06-30 | 2018-03-31 | 2017-12-31 | 2017-09-30 | 2017-06-30 | 2017-03-31 | ||
|---|---|---|---|---|---|---|---|---|---|---|---|---|---|---|---|---|---|---|---|---|---|---|---|---|---|
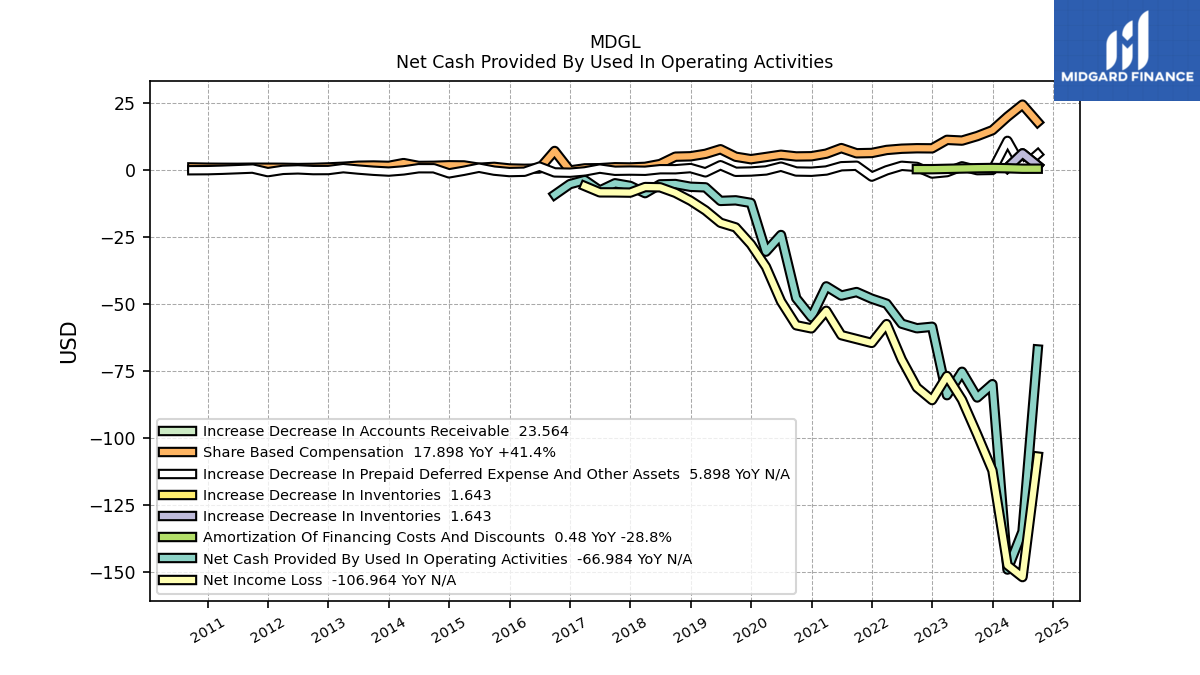
| Net Cash Provided By Used In Operating Activities | -58.52 | -59.07 | -57.36 | -49.91 | -48.05 | -45.56 | -46.88 | -43.43 | -54.95 | -47.85 | -24.26 | -30.51 | -12.28 | -11.32 | -11.54 | -6.48 | -6.26 | -5.24 | -5.36 | -8.64 | -5.95 | -4.95 | -7.65 | -3.77 | |
| Net Income Loss | -85.91 | -81.20 | -70.73 | -57.52 | -64.55 | -63.10 | -61.65 | -52.55 | -59.12 | -57.96 | -49.02 | -36.13 | -27.74 | -21.43 | -19.70 | -15.08 | -11.47 | -8.51 | -6.46 | -6.36 | -8.45 | -8.36 | -8.35 | -6.00 | |
| Profit Loss | -85.91 | -81.20 | -70.73 | -57.52 | -64.55 | -63.10 | -61.65 | -52.55 | -59.12 | -57.96 | -49.02 | -36.13 | -27.74 | -21.43 | -19.70 | -15.08 | -11.47 | -8.51 | -6.46 | -6.36 | -8.45 | -8.36 | -8.35 | -6.00 | |
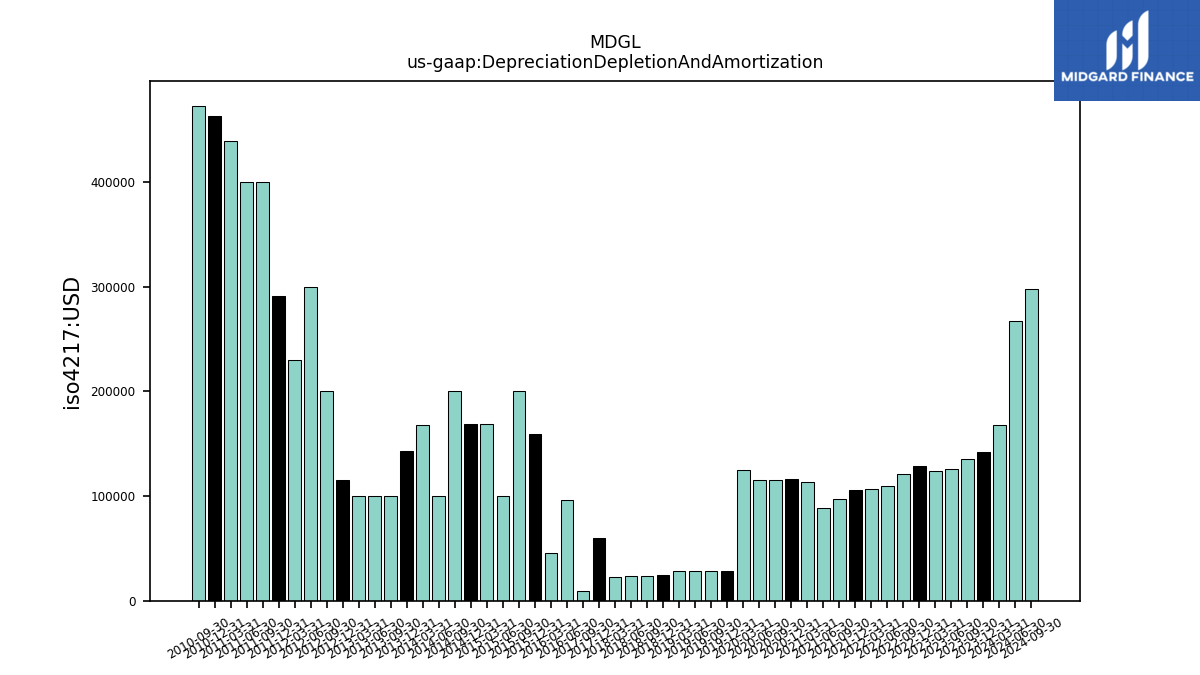
| Depreciation Depletion And Amortization | 0.13 | 0.12 | 0.11 | 0.11 | 0.11 | 0.10 | 0.09 | 0.11 | 0.12 | 0.12 | 0.12 | 0.12 | 0.03 | 0.03 | 0.03 | 0.03 | 0.03 | 0.02 | 0.02 | 0.02 | 0.06 | 0.01 | NA | NA | |
| Share Based Compensation | 8.08 | 8.12 | 7.94 | 7.48 | 6.36 | 6.24 | 8.18 | 6.10 | 5.13 | 5.06 | 5.69 | 4.85 | 4.03 | 4.95 | 7.75 | 6.02 | 5.12 | 4.98 | 2.23 | 1.17 | 0.95 | 1.03 | 0.68 | 0.60 |
| 2022-12-31 | 2022-09-30 | 2022-06-30 | 2022-03-31 | 2021-12-31 | 2021-09-30 | 2021-06-30 | 2021-03-31 | 2020-12-31 | 2020-09-30 | 2020-06-30 | 2020-03-31 | 2019-12-31 | 2019-09-30 | 2019-06-30 | 2019-03-31 | 2018-12-31 | 2018-09-30 | 2018-06-30 | 2018-03-31 | 2017-12-31 | 2017-09-30 | 2017-06-30 | 2017-03-31 | ||
|---|---|---|---|---|---|---|---|---|---|---|---|---|---|---|---|---|---|---|---|---|---|---|---|---|---|
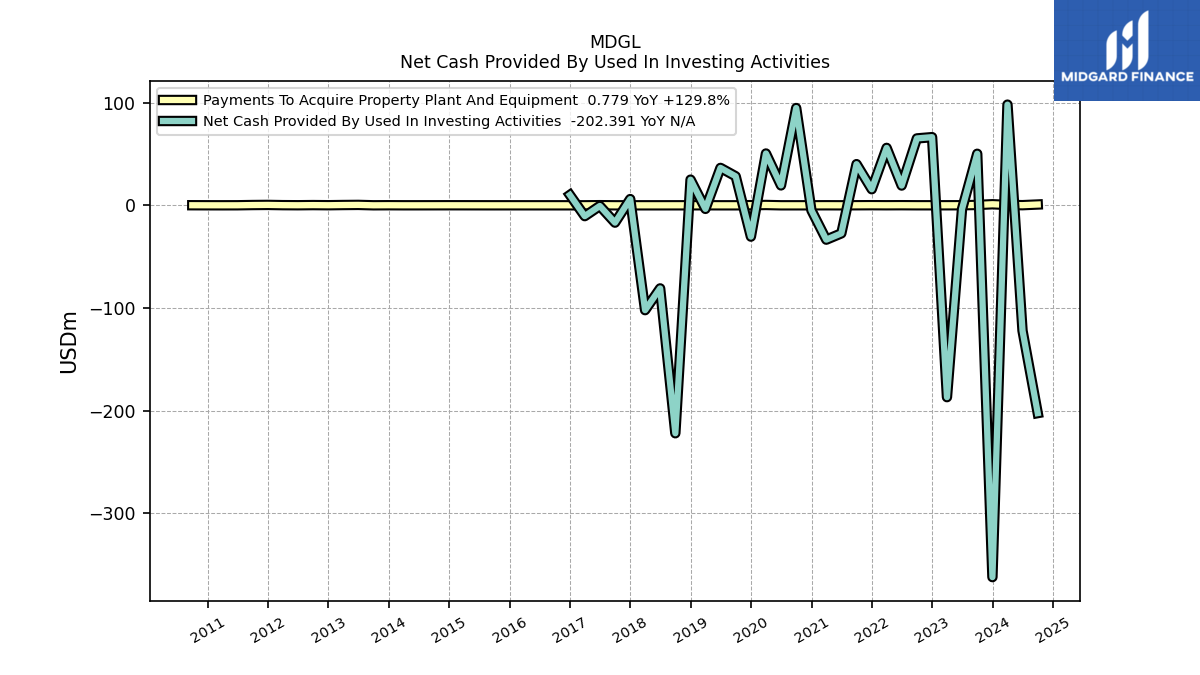
| Net Cash Provided By Used In Investing Activities | 66.39 | 65.14 | 19.24 | 55.93 | 15.64 | 40.09 | -27.32 | -33.46 | -4.80 | 94.75 | 19.36 | 50.46 | -30.51 | 28.27 | 36.44 | -3.49 | 24.99 | -222.03 | -80.91 | -102.12 | 6.08 | -16.89 | -0.65 | -10.56 | |
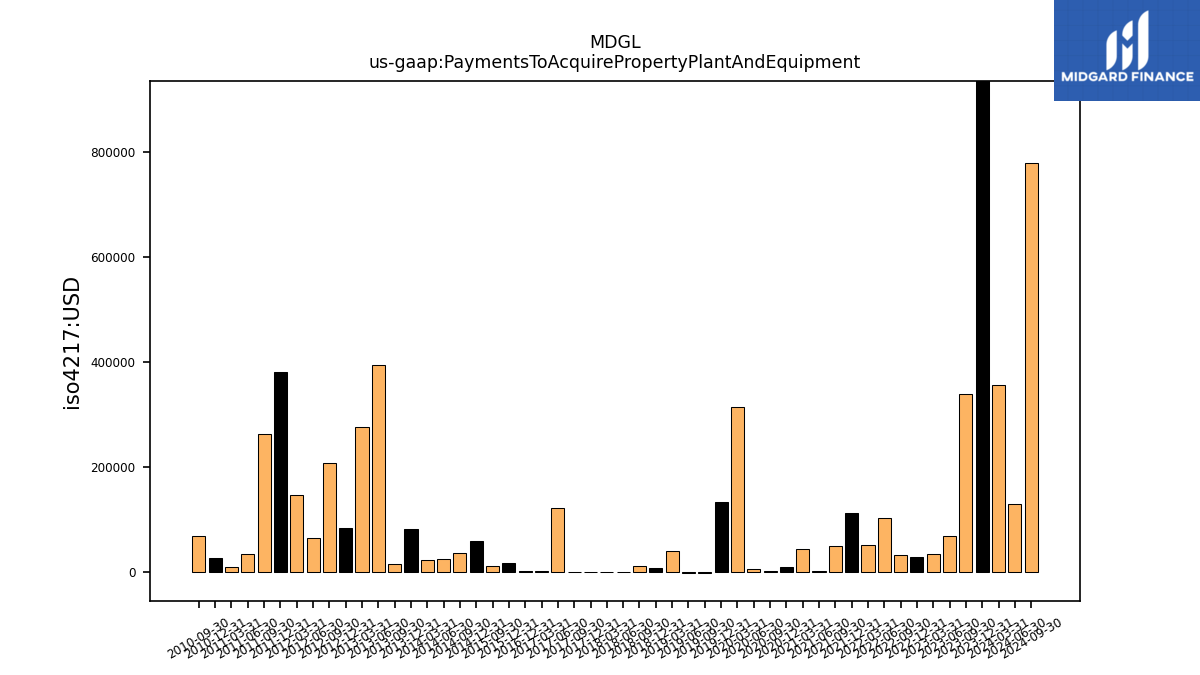
| Payments To Acquire Property Plant And Equipment | 0.03 | 0.03 | 0.10 | 0.05 | 0.11 | 0.05 | 0.00 | 0.04 | 0.01 | 0.00 | 0.01 | 0.31 | 0.13 | -0.00 | -0.00 | 0.04 | 0.01 | 0.01 | 0.00 | 0.00 | 0.00 | 0.00 | 0.12 | 0.00 |
| 2022-12-31 | 2022-09-30 | 2022-06-30 | 2022-03-31 | 2021-12-31 | 2021-09-30 | 2021-06-30 | 2021-03-31 | 2020-12-31 | 2020-09-30 | 2020-06-30 | 2020-03-31 | 2019-12-31 | 2019-09-30 | 2019-06-30 | 2019-03-31 | 2018-12-31 | 2018-09-30 | 2018-06-30 | 2018-03-31 | 2017-12-31 | 2017-09-30 | 2017-06-30 | 2017-03-31 | ||
|---|---|---|---|---|---|---|---|---|---|---|---|---|---|---|---|---|---|---|---|---|---|---|---|---|---|
| Net Cash Provided By Used In Financing Activities | 264.34 | 0.00 | NA | NA | 19.50 | 21.10 | 63.54 | 67.09 | 4.63 | 0.35 | 0.11 | 0.00 | 0.00 | 0.04 | 0.12 | 0.08 | 0.61 | 0.45 | 313.01 | 0.27 | 135.53 | 0.00 | 34.88 | 3.40 |
| 2022-12-31 | 2022-09-30 | 2022-06-30 | 2022-03-31 | 2021-12-31 | 2021-09-30 | 2021-06-30 | 2021-03-31 | 2020-12-31 | 2020-09-30 | 2020-06-30 | 2020-03-31 | 2019-12-31 | 2019-09-30 | 2019-06-30 | 2019-03-31 | 2018-12-31 | 2018-09-30 | 2018-06-30 | 2018-03-31 | 2017-12-31 | 2017-09-30 | 2017-06-30 | 2017-03-31 | ||
|---|---|---|---|---|---|---|---|---|---|---|---|---|---|---|---|---|---|---|---|---|---|---|---|---|---|
| Interest Income Operating | 1.08 | 0.72 | 0.32 | 0.07 | 0.05 | 0.06 | 0.09 | 0.16 | 0.43 | 0.82 | 1.20 | 1.87 | 2.21 | 2.77 | 3.00 | 3.04 | 2.98 | 2.82 | 1.17 | 0.70 | 0.22 | 0.17 | 0.09 | 0.08 |
