
| 2023-03-31 | 2022-12-31 | 2022-09-30 | 2022-06-30 | 2022-03-31 | 2021-12-31 | 2021-09-30 | 2021-06-30 | 2021-03-31 | 2020-12-31 | 2020-09-30 | 2020-06-30 | 2020-03-31 | 2019-12-31 | 2019-09-30 | 2019-06-30 | 2019-03-31 | 2018-12-31 | 2018-09-30 | 2018-06-30 | 2018-03-31 | 2017-12-31 | 2017-09-30 | 2017-06-30 | 2017-03-31 | 2016-12-31 | 2016-09-30 | 2016-06-30 | 2016-03-31 | 2015-12-31 | 2015-09-30 | 2015-06-30 | 2015-03-31 | 2014-12-31 | 2014-09-30 | 2014-06-30 | 2014-03-31 | 2013-12-31 | 2013-09-30 | 2013-06-30 | 2013-03-31 | 2012-12-31 | 2012-09-30 | 2012-06-30 | 2012-03-31 | 2011-12-31 | 2011-09-30 | 2011-06-30 | 2011-03-31 | 2010-12-31 | 2010-09-30 | 2010-06-30 | ||
|---|---|---|---|---|---|---|---|---|---|---|---|---|---|---|---|---|---|---|---|---|---|---|---|---|---|---|---|---|---|---|---|---|---|---|---|---|---|---|---|---|---|---|---|---|---|---|---|---|---|---|---|---|---|
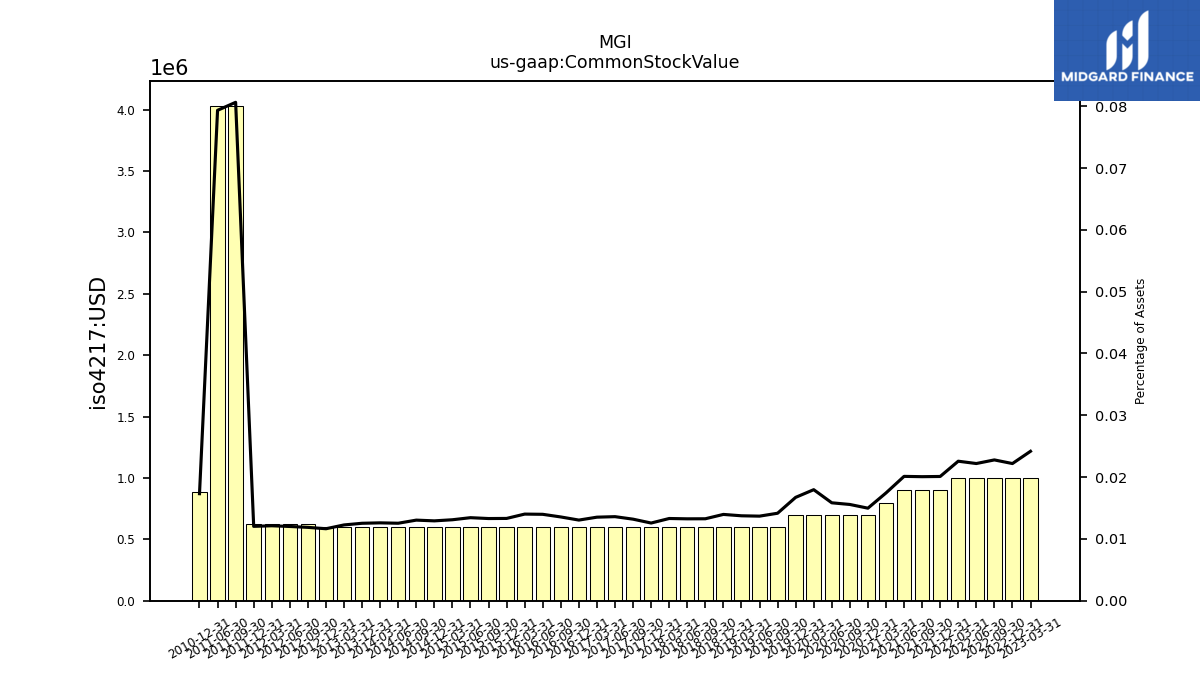
| Common Stock Value | 1.00 | 1.00 | 1.00 | 1.00 | 1.00 | 0.90 | 0.90 | 0.90 | 0.80 | 0.70 | 0.70 | 0.70 | 0.70 | 0.70 | 0.60 | 0.60 | 0.60 | 0.60 | 0.60 | 0.60 | 0.60 | 0.60 | 0.60 | 0.60 | 0.60 | 0.60 | 0.60 | 0.60 | 0.60 | 0.60 | 0.60 | 0.60 | 0.60 | 0.60 | 0.60 | 0.60 | 0.60 | 0.60 | NA | NA | 0.60 | 0.60 | 0.62 | 0.62 | 0.62 | 0.62 | 4.03 | 4.03 | NA | 0.89 | NA | NA | |
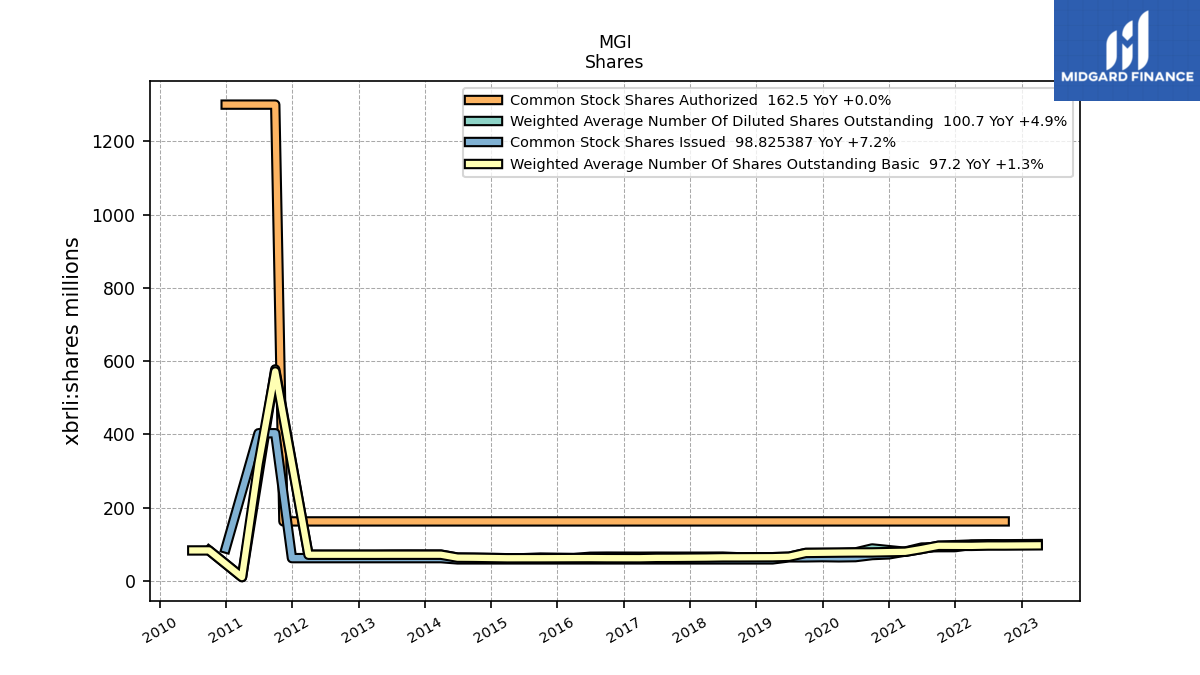
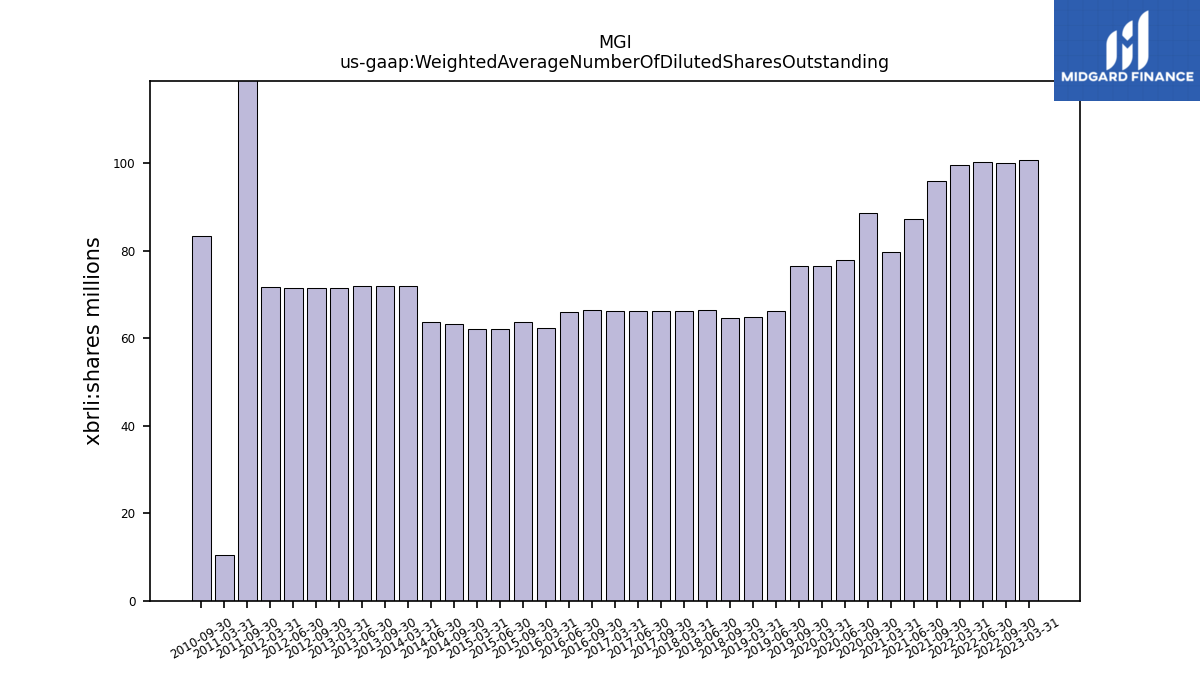
| Weighted Average Number Of Diluted Shares Outstanding | 100.70 | NA | 100.10 | 100.20 | 99.50 | NA | 96.00 | 87.20 | 79.60 | NA | 88.70 | 77.80 | 76.40 | NA | 76.40 | 66.10 | 64.80 | NA | 64.50 | 66.40 | 66.20 | NA | 66.20 | 66.30 | 66.10 | NA | 66.40 | 66.00 | 62.40 | NA | 63.80 | 62.10 | 62.00 | NA | 63.30 | 63.80 | 71.90 | NA | 72.00 | 71.80 | 71.50 | NA | 71.51 | 71.50 | 71.65 | NA | 577.41 | NA | 10.46 | NA | 83.34 | NA | |
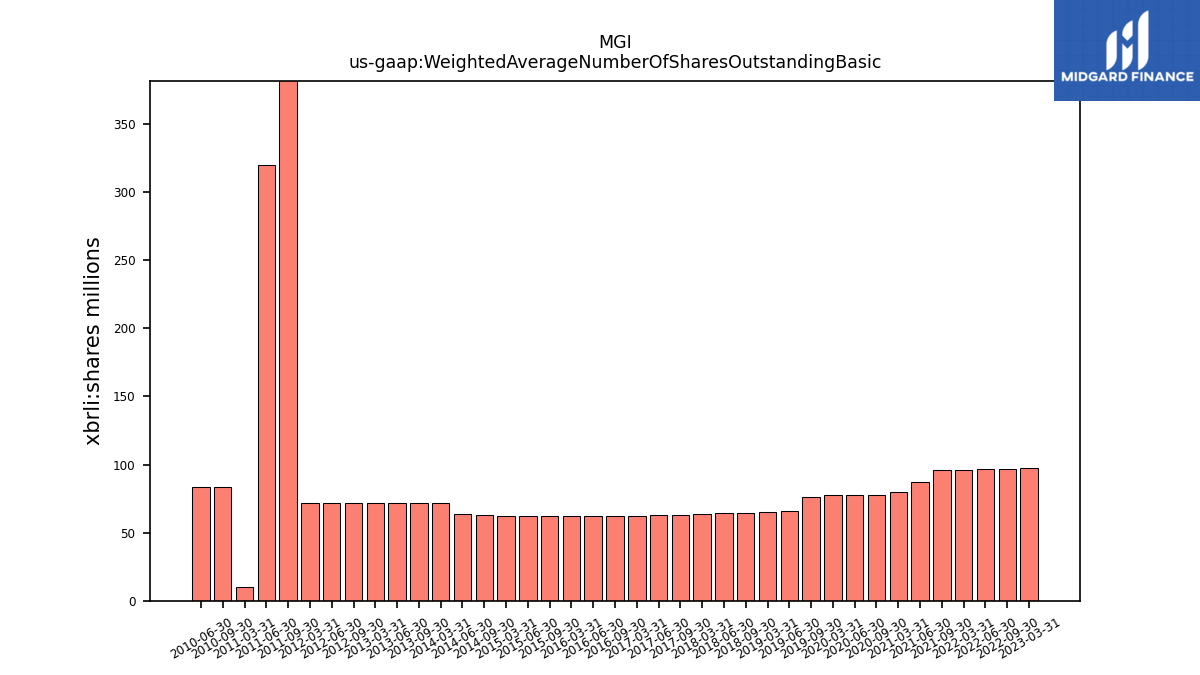
| Weighted Average Number Of Shares Outstanding Basic | 97.20 | NA | 96.60 | 96.60 | 95.70 | NA | 96.00 | 87.20 | 79.60 | NA | 77.90 | 77.80 | 77.40 | NA | 76.40 | 66.10 | 64.80 | NA | 64.50 | 64.50 | 63.80 | NA | 63.10 | 63.00 | 62.10 | NA | 62.20 | 62.50 | 62.40 | NA | 62.10 | 62.10 | 62.00 | NA | 63.30 | 63.60 | 71.60 | NA | 71.60 | 71.60 | 71.50 | NA | 71.51 | 71.50 | 71.49 | NA | 571.82 | 319.67 | 10.46 | NA | 83.34 | 83.27 | |
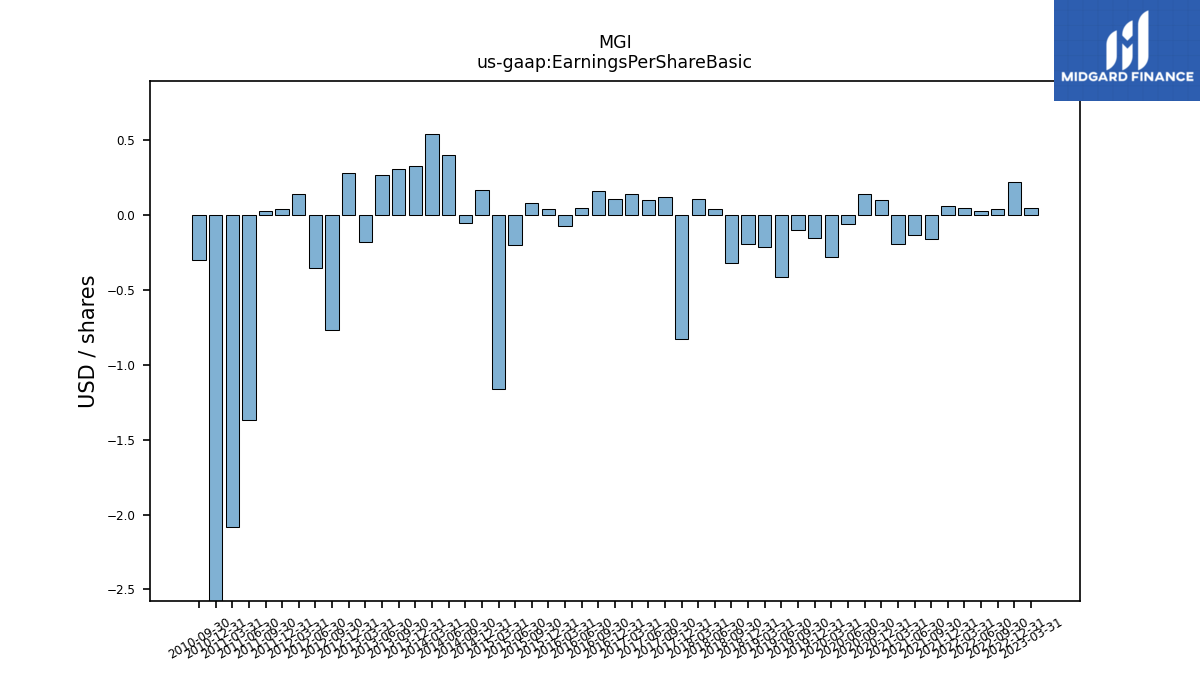
| Earnings Per Share Basic | 0.05 | 0.22 | 0.04 | 0.03 | 0.05 | 0.06 | -0.16 | -0.13 | -0.19 | 0.10 | 0.14 | -0.06 | -0.28 | -0.15 | -0.10 | -0.41 | -0.21 | -0.19 | -0.32 | 0.04 | 0.11 | -0.83 | 0.12 | 0.10 | 0.14 | 0.11 | 0.16 | 0.05 | -0.07 | 0.04 | 0.08 | -0.20 | -1.16 | 0.17 | -0.05 | 0.40 | 0.54 | 0.33 | 0.31 | 0.27 | -0.18 | 0.28 | -0.77 | -0.35 | 0.14 | 0.04 | 0.03 | -1.37 | -2.08 | -7.91 | -0.30 | NA | |
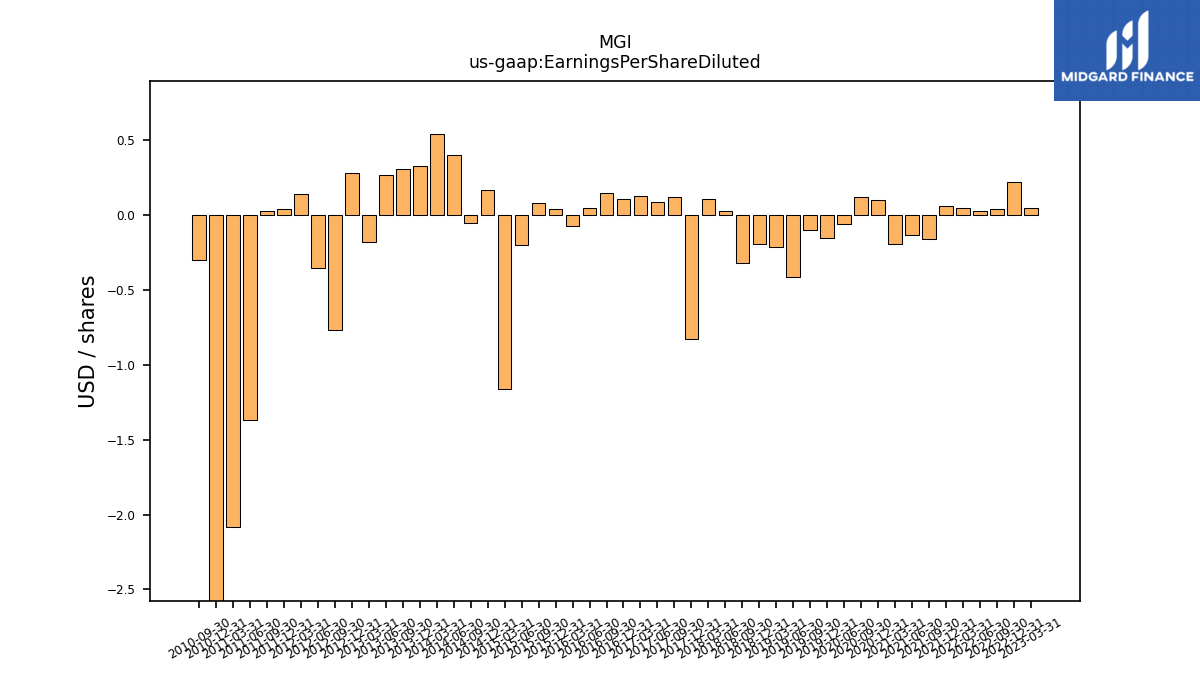
| Earnings Per Share Diluted | 0.05 | 0.22 | 0.04 | 0.03 | 0.05 | 0.06 | -0.16 | -0.13 | -0.19 | 0.10 | 0.12 | -0.06 | NA | -0.15 | -0.10 | -0.41 | -0.21 | -0.19 | -0.32 | 0.03 | 0.11 | -0.83 | 0.12 | 0.09 | 0.13 | 0.11 | 0.15 | 0.05 | -0.07 | 0.04 | 0.08 | -0.20 | -1.16 | 0.17 | -0.05 | 0.40 | 0.54 | 0.33 | 0.31 | 0.27 | -0.18 | 0.28 | -0.77 | -0.35 | 0.14 | 0.04 | 0.03 | -1.37 | -2.08 | -7.91 | -0.30 | NA |
| 2023-03-31 | 2022-12-31 | 2022-09-30 | 2022-06-30 | 2022-03-31 | 2021-12-31 | 2021-09-30 | 2021-06-30 | 2021-03-31 | 2020-12-31 | 2020-09-30 | 2020-06-30 | 2020-03-31 | 2019-12-31 | 2019-09-30 | 2019-06-30 | 2019-03-31 | 2018-12-31 | 2018-09-30 | 2018-06-30 | 2018-03-31 | 2017-12-31 | 2017-09-30 | 2017-06-30 | 2017-03-31 | 2016-12-31 | 2016-09-30 | 2016-06-30 | 2016-03-31 | 2015-12-31 | 2015-09-30 | 2015-06-30 | 2015-03-31 | 2014-12-31 | 2014-09-30 | 2014-06-30 | 2014-03-31 | 2013-12-31 | 2013-09-30 | 2013-06-30 | 2013-03-31 | 2012-12-31 | 2012-09-30 | 2012-06-30 | 2012-03-31 | 2011-12-31 | 2011-09-30 | 2011-06-30 | 2011-03-31 | 2010-12-31 | 2010-09-30 | 2010-06-30 | ||
|---|---|---|---|---|---|---|---|---|---|---|---|---|---|---|---|---|---|---|---|---|---|---|---|---|---|---|---|---|---|---|---|---|---|---|---|---|---|---|---|---|---|---|---|---|---|---|---|---|---|---|---|---|---|
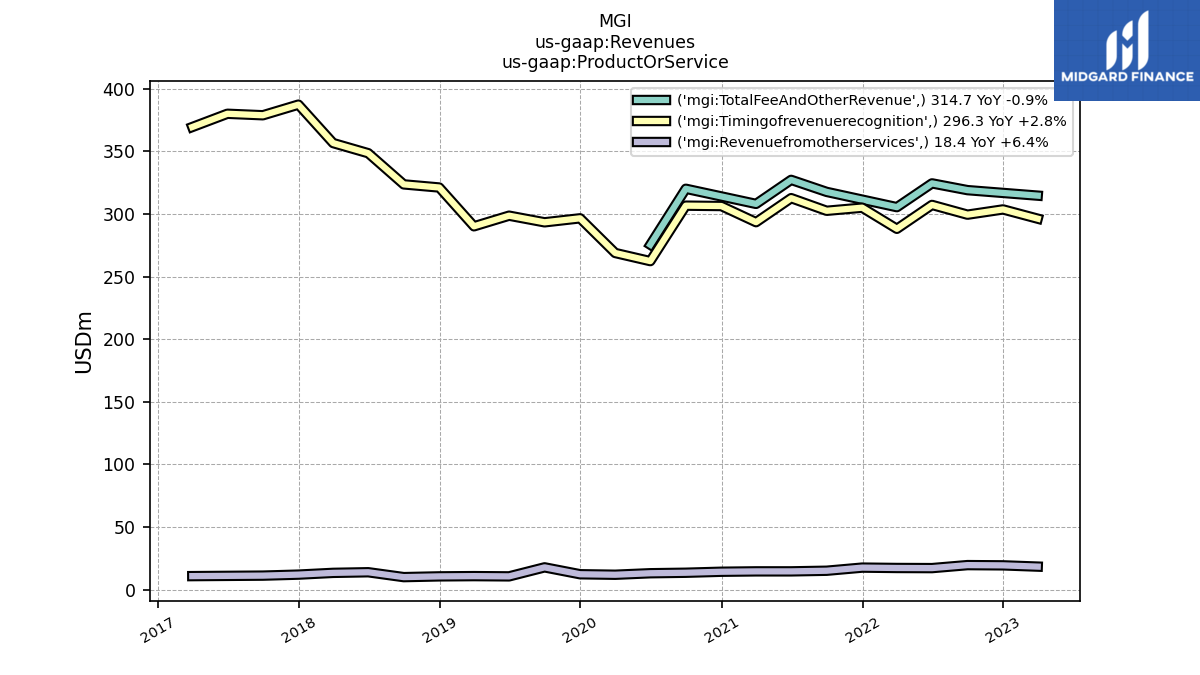
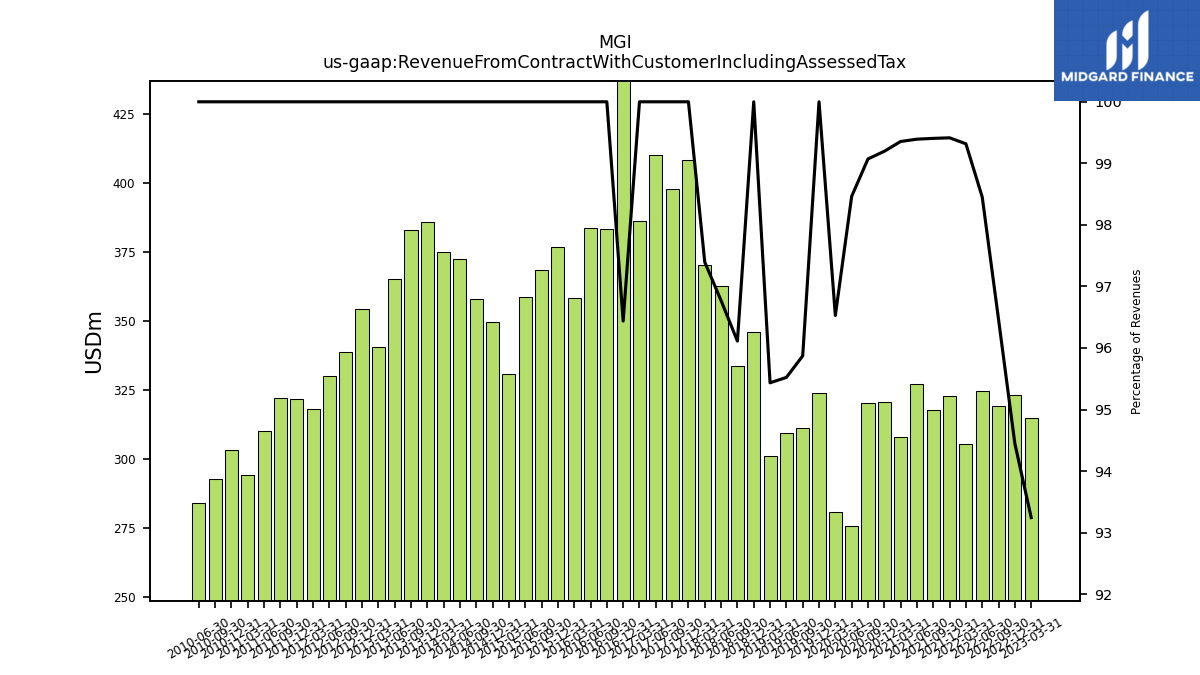
| Revenue From Contract With Customer Including Assessed Tax | 314.70 | 323.10 | 319.10 | 324.50 | 305.50 | 322.70 | 317.70 | 327.30 | 308.10 | 320.70 | 320.20 | 275.50 | 280.80 | 323.70 | 311.20 | 309.30 | 301.00 | 345.80 | 333.70 | 362.50 | 370.10 | 408.20 | 397.80 | 410.00 | 386.10 | 487.20 | 383.10 | 383.70 | 358.40 | 376.70 | 368.60 | 358.80 | 330.60 | 349.60 | 358.00 | 372.40 | 374.90 | 385.80 | 383.00 | 365.10 | 340.50 | 354.40 | 338.55 | 330.14 | 318.10 | 321.80 | 321.95 | 309.95 | 294.02 | 303.37 | 292.89 | 283.90 | |
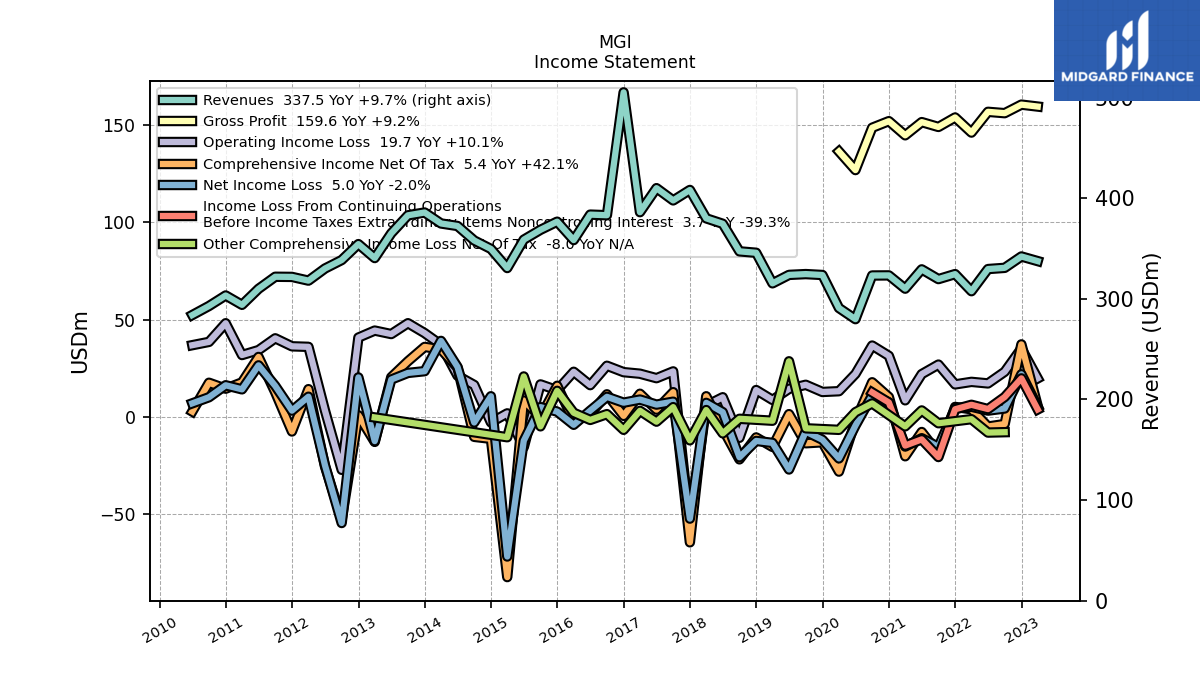
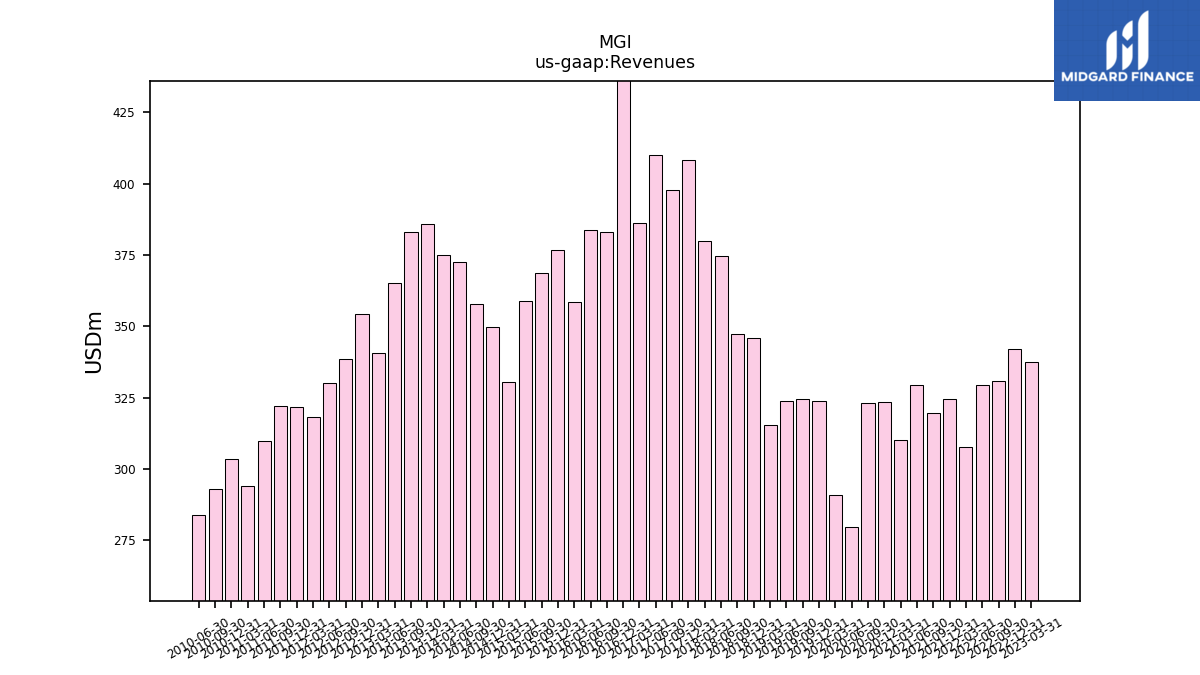
| Revenues | 337.50 | 342.10 | 330.80 | 329.60 | 307.60 | 324.60 | 319.60 | 329.30 | 310.10 | 323.30 | 323.20 | 279.80 | 290.90 | 323.70 | 324.60 | 323.80 | 315.40 | 345.80 | 347.20 | 374.60 | 380.00 | 408.20 | 397.80 | 410.00 | 386.10 | 505.20 | 383.10 | 383.70 | 358.40 | 376.70 | 368.60 | 358.80 | 330.60 | 349.60 | 358.00 | 372.40 | 374.90 | 385.80 | 383.00 | 365.10 | 340.50 | 354.40 | 338.55 | 330.14 | 318.10 | 321.80 | 321.95 | 309.95 | 294.02 | 303.37 | 292.89 | 283.90 | |
| Cost Of Revenue | 177.90 | 181.50 | 174.60 | 172.70 | 161.40 | 170.60 | 170.50 | 177.70 | 165.30 | 171.20 | 174.50 | 152.90 | 154.40 | 167.70 | 165.80 | 167.80 | 160.90 | 176.60 | 179.70 | 190.40 | 185.50 | 196.00 | 192.70 | 196.20 | 187.30 | 288.50 | 170.80 | 173.50 | 162.80 | 170.40 | 168.90 | 163.40 | 153.50 | 159.50 | 164.20 | 171.70 | 171.00 | 175.40 | 178.70 | 169.70 | 154.40 | 158.27 | 152.47 | 146.78 | 142.00 | 142.02 | 141.11 | 135.67 | NA | NA | NA | NA | |
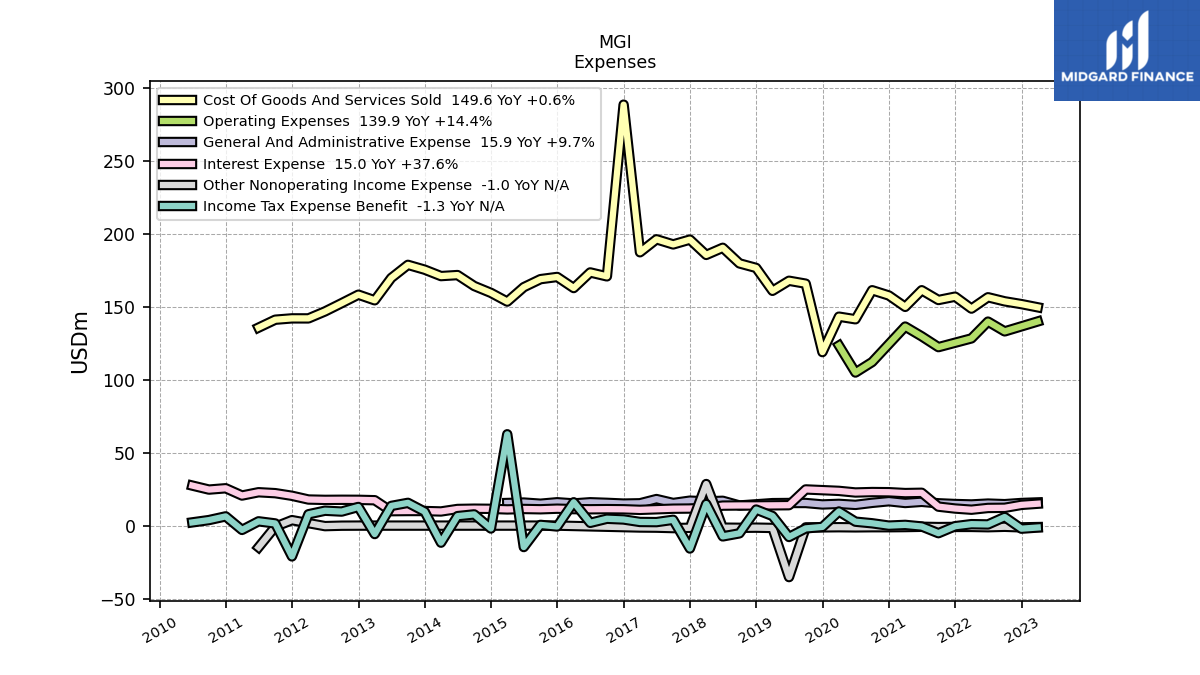
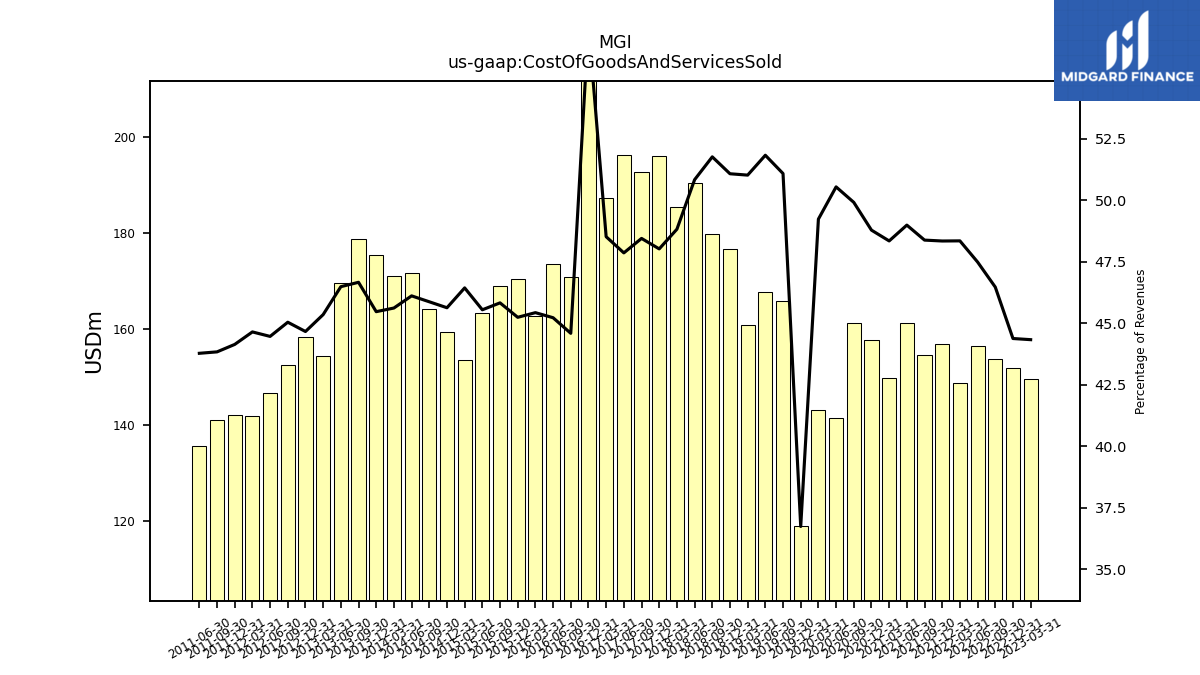
| Cost Of Goods And Services Sold | 149.60 | 151.80 | 153.70 | 156.50 | 148.70 | 156.90 | 154.60 | 161.30 | 149.90 | 157.70 | 161.30 | 141.40 | 143.20 | 118.90 | 165.80 | 167.80 | 160.90 | 176.60 | 179.70 | 190.40 | 185.50 | 196.00 | 192.70 | 196.20 | 187.30 | 288.50 | 170.80 | 173.50 | 162.80 | 170.40 | 168.90 | 163.40 | 153.50 | 159.50 | 164.20 | 171.70 | 171.00 | 175.40 | 178.70 | 169.70 | 154.40 | 158.27 | 152.47 | 146.78 | 142.00 | 142.02 | 141.11 | 135.67 | NA | NA | NA | NA | |
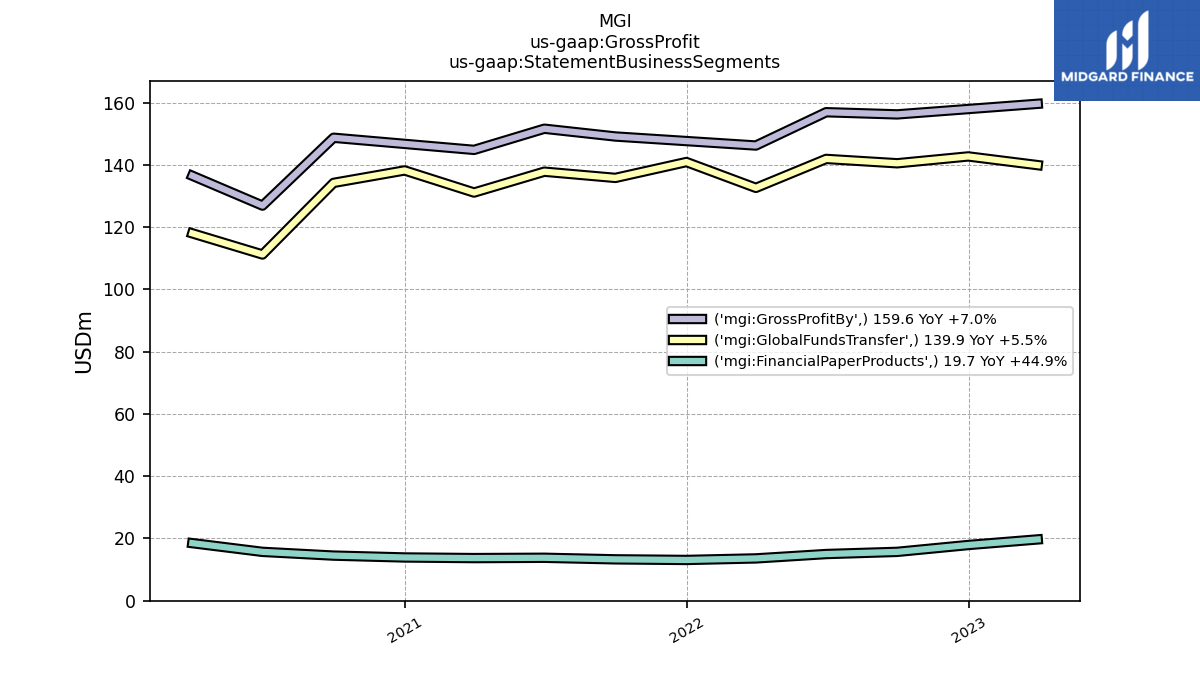
| Gross Profit | 159.60 | 160.60 | 156.20 | 156.90 | 146.20 | 154.00 | 149.10 | 151.60 | 144.80 | 152.10 | 148.70 | 126.90 | 136.50 | NA | NA | NA | NA | NA | NA | NA | NA | NA | NA | NA | NA | NA | NA | NA | NA | NA | NA | NA | NA | NA | NA | NA | NA | NA | NA | NA | NA | NA | NA | NA | NA | NA | NA | NA | NA | NA | NA | NA | |
| Operating Expenses | 139.90 | NA | 133.10 | 139.80 | 128.30 | NA | 122.30 | 129.70 | 136.40 | NA | 112.10 | 104.90 | 123.40 | NA | NA | NA | NA | NA | NA | NA | NA | NA | NA | NA | NA | NA | NA | NA | NA | NA | NA | NA | NA | NA | NA | NA | NA | NA | NA | NA | NA | NA | NA | NA | NA | NA | NA | NA | NA | NA | NA | NA | |
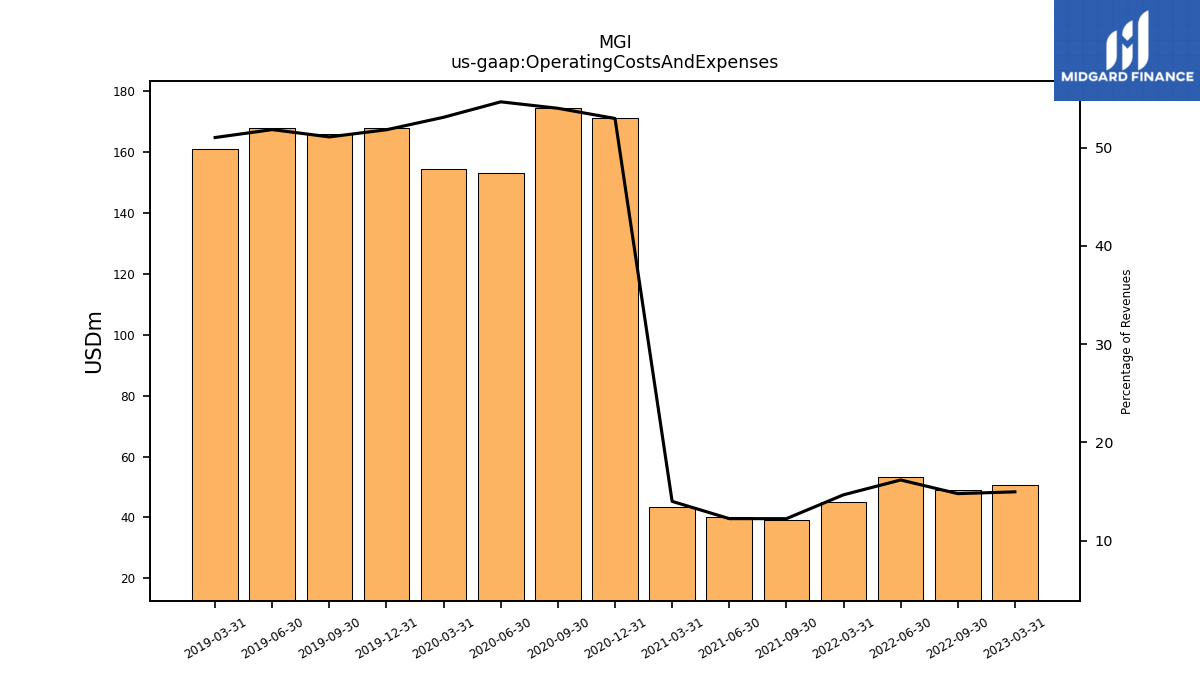
| Operating Costs And Expenses | 50.50 | NA | 48.90 | 53.30 | 45.10 | NA | 39.10 | 40.30 | 43.40 | 171.20 | 174.50 | 152.90 | 154.40 | 167.70 | 165.80 | 167.80 | 160.90 | NA | NA | NA | NA | NA | NA | NA | NA | NA | NA | NA | NA | NA | NA | NA | NA | NA | NA | NA | NA | NA | NA | NA | NA | NA | NA | NA | NA | NA | NA | NA | NA | NA | NA | NA | |
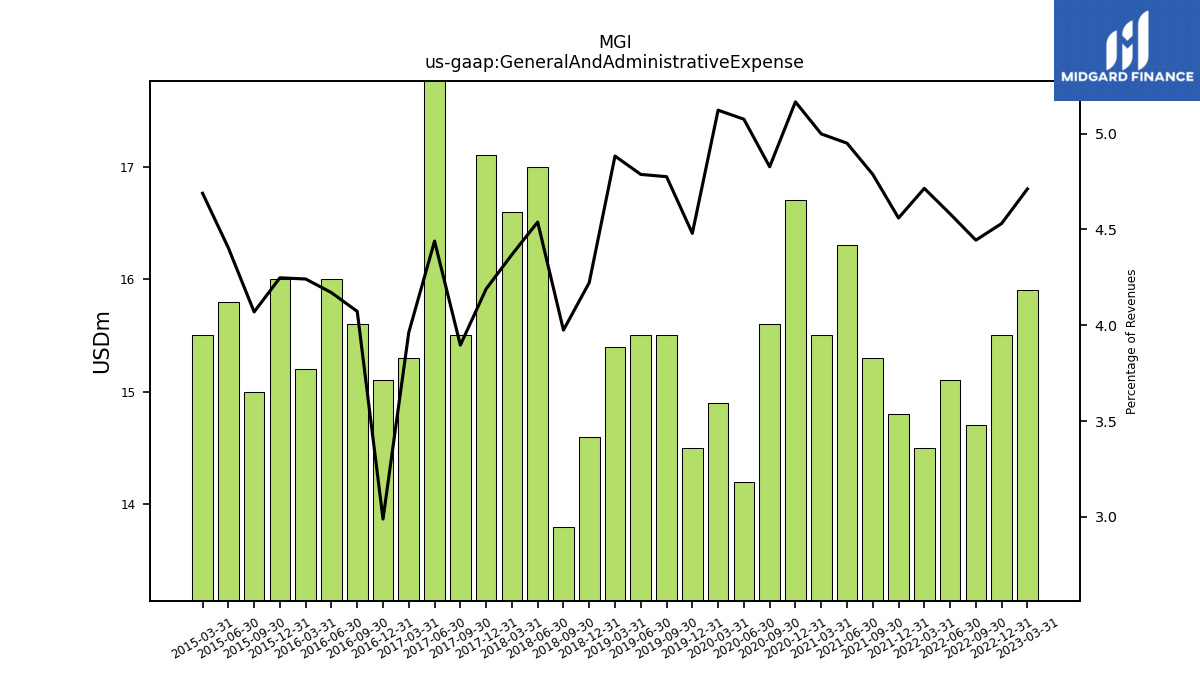
| General And Administrative Expense | 15.90 | 15.50 | 14.70 | 15.10 | 14.50 | 14.80 | 15.30 | 16.30 | 15.50 | 16.70 | 15.60 | 14.20 | 14.90 | 14.50 | 15.50 | 15.50 | 15.40 | 14.60 | 13.80 | 17.00 | 16.60 | 17.10 | 15.50 | 18.20 | 15.30 | 15.10 | 15.60 | 16.00 | 15.20 | 16.00 | 15.00 | 15.80 | 15.50 | NA | NA | NA | NA | NA | NA | NA | NA | NA | NA | NA | NA | NA | NA | NA | NA | NA | NA | NA | |
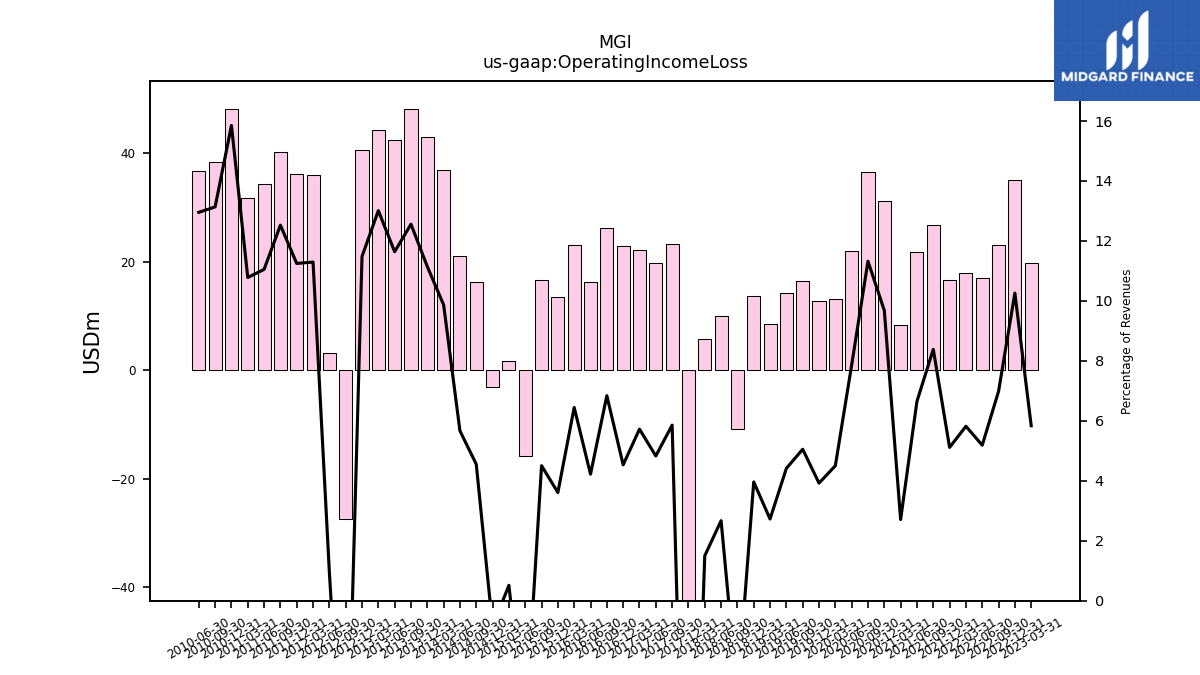
| Operating Income Loss | 19.70 | 35.10 | 23.10 | 17.10 | 17.90 | 16.60 | 26.80 | 21.90 | 8.40 | 31.30 | 36.60 | 22.00 | 13.10 | 12.70 | 16.40 | 14.30 | 8.60 | 13.70 | -10.90 | 10.00 | 5.70 | -56.50 | 23.30 | 19.80 | 22.10 | 22.90 | 26.20 | 16.20 | 23.10 | 13.60 | 16.60 | -15.70 | 1.70 | -3.00 | 16.30 | 21.10 | 37.00 | 43.00 | 48.10 | 42.50 | 44.30 | 40.70 | -27.37 | 3.13 | 35.93 | 36.20 | 40.33 | 34.26 | 31.70 | 48.08 | 38.47 | 36.78 | |
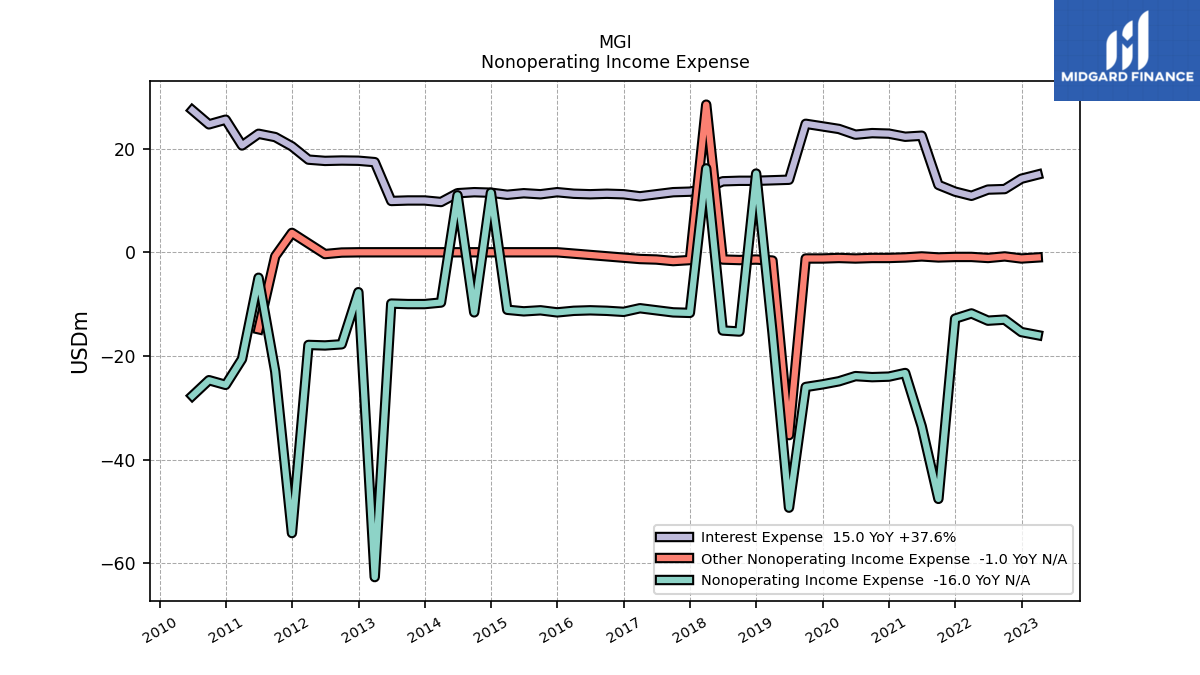
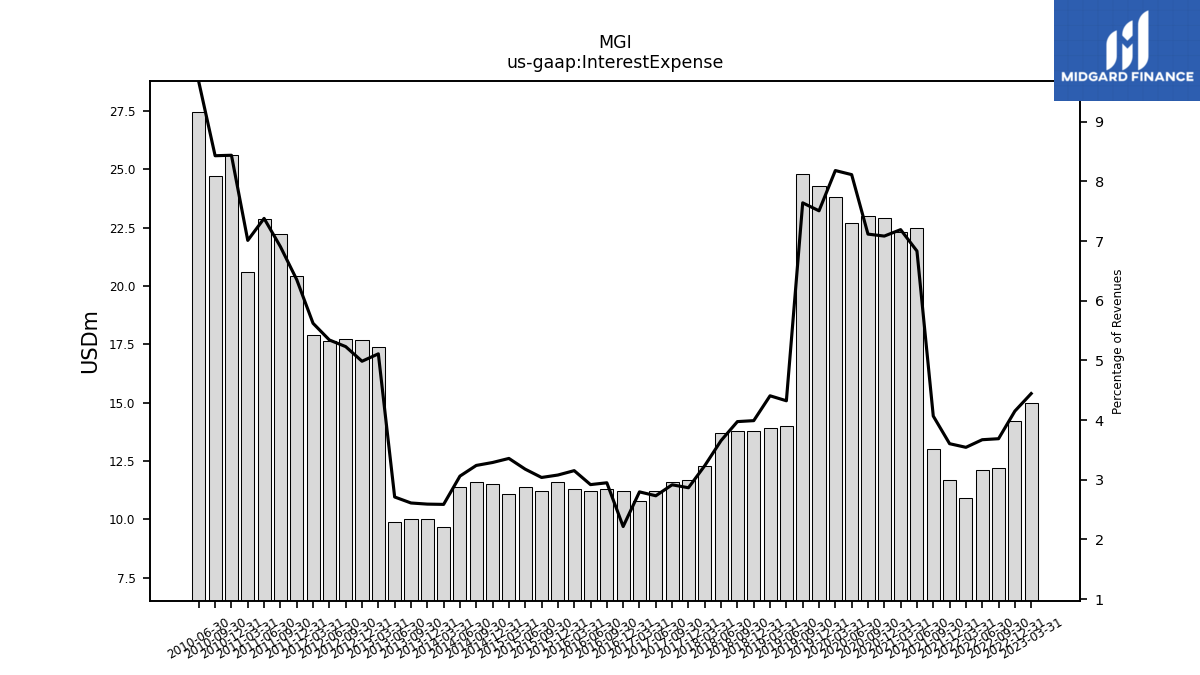
| Interest Expense | 15.00 | 14.20 | 12.20 | 12.10 | 10.90 | 11.70 | 13.00 | 22.50 | 22.30 | 22.90 | 23.00 | 22.70 | 23.80 | 24.30 | 24.80 | 14.00 | 13.90 | 13.80 | 13.80 | 13.70 | 12.30 | 11.70 | 11.60 | 11.20 | 10.80 | 11.20 | 11.30 | 11.20 | 11.30 | 11.60 | 11.20 | 11.40 | 11.10 | 11.50 | 11.60 | 11.40 | 9.70 | 10.00 | 10.00 | 9.90 | 17.40 | 17.67 | 17.71 | 17.64 | 17.88 | 20.45 | 22.23 | 22.87 | 20.61 | 25.60 | 24.69 | 27.44 | |
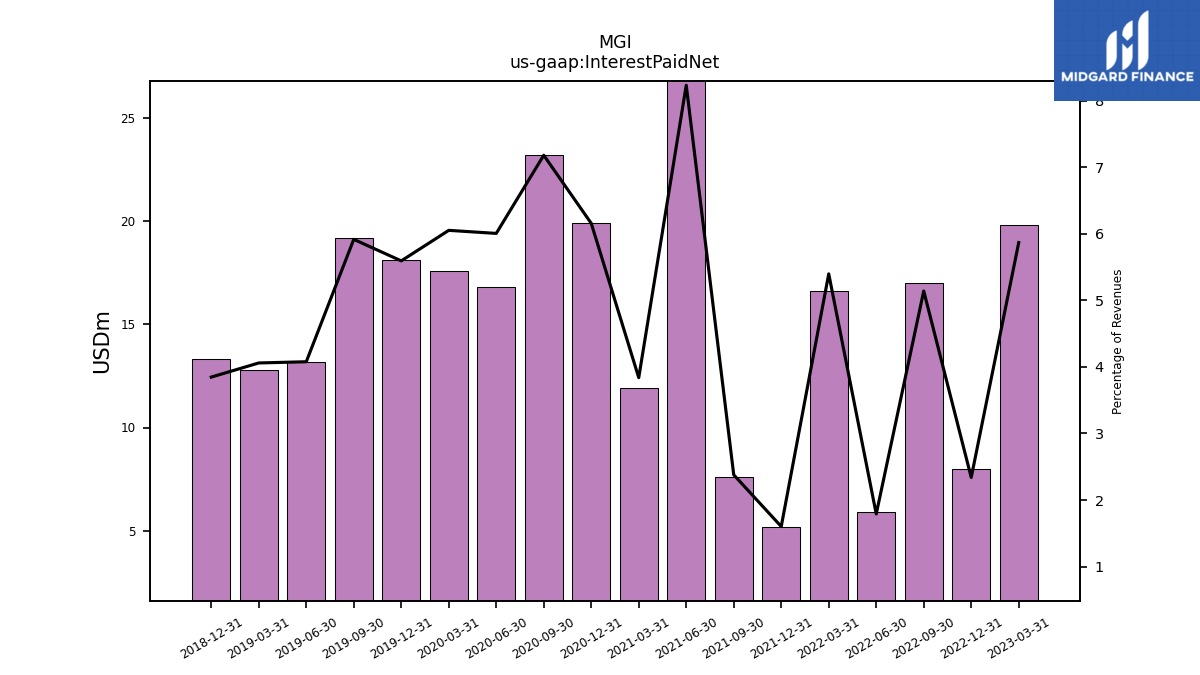
| Interest Paid Net | 19.80 | 8.00 | 17.00 | 5.90 | 16.60 | 5.20 | 7.60 | 27.10 | 11.90 | 19.90 | 23.20 | 16.80 | 17.60 | 18.10 | 19.20 | 13.20 | 12.80 | 13.30 | NA | NA | NA | NA | NA | NA | NA | NA | NA | NA | NA | NA | NA | NA | NA | NA | NA | NA | NA | NA | NA | NA | NA | NA | NA | NA | NA | NA | NA | NA | NA | NA | NA | NA | |
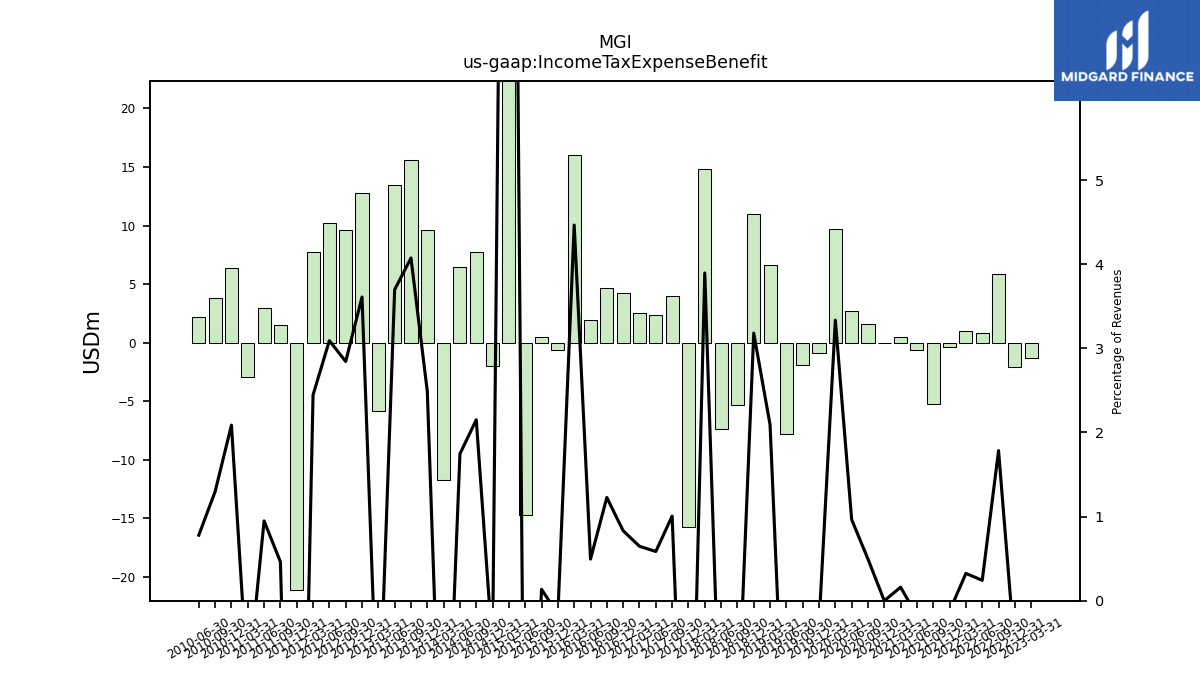
| Income Tax Expense Benefit | -1.30 | -2.10 | 5.90 | 0.80 | 1.00 | -0.40 | -5.20 | -0.60 | 0.50 | 0.00 | 1.60 | 2.70 | 9.70 | -0.90 | -1.90 | -7.80 | 6.60 | 11.00 | -5.30 | -7.40 | 14.80 | -15.70 | 4.00 | 2.40 | 2.50 | 4.20 | 4.70 | 1.90 | 16.00 | -0.60 | 0.50 | -14.70 | 62.60 | -2.00 | 7.70 | 6.50 | -11.70 | 9.60 | 15.60 | 13.50 | -5.80 | 12.79 | 9.63 | 10.21 | 7.78 | -21.11 | 1.49 | 2.94 | -2.96 | 6.33 | 3.80 | 2.21 | |
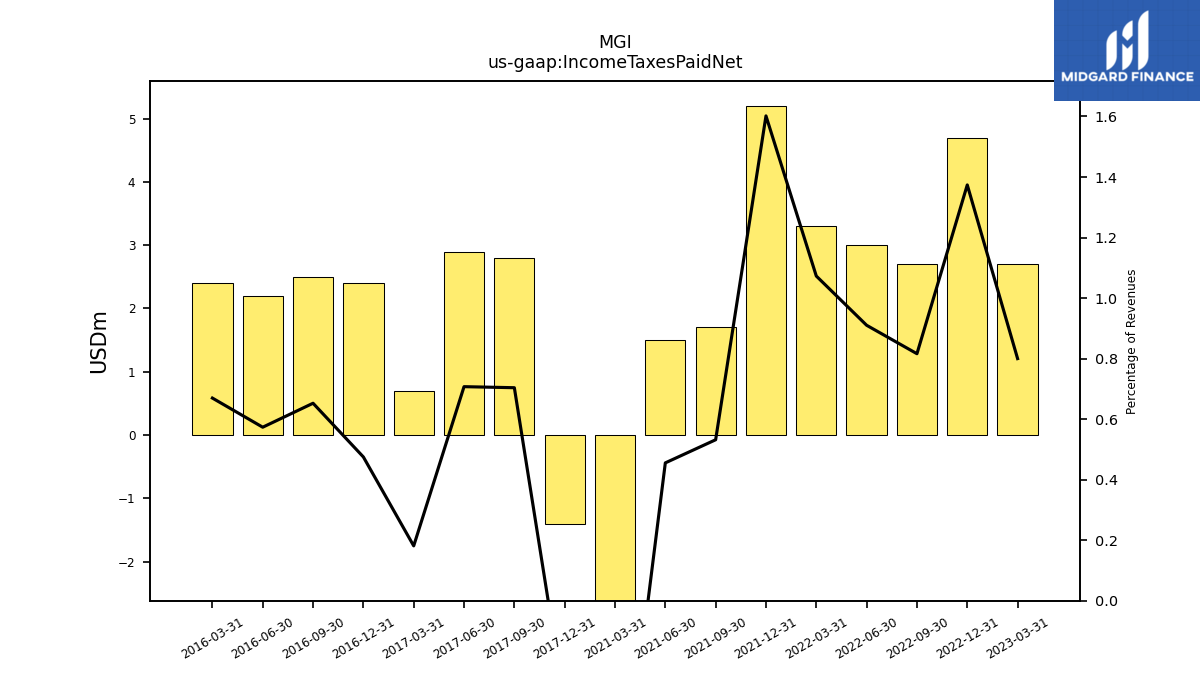
| Income Taxes Paid Net | 2.70 | 4.70 | 2.70 | 3.00 | 3.30 | 5.20 | 1.70 | 1.50 | -2.70 | NA | NA | NA | NA | NA | NA | NA | NA | NA | NA | NA | NA | -1.40 | 2.80 | 2.90 | 0.70 | 2.40 | 2.50 | 2.20 | 2.40 | NA | NA | NA | NA | NA | NA | NA | NA | NA | NA | NA | NA | NA | NA | NA | NA | NA | NA | NA | NA | NA | NA | NA | |
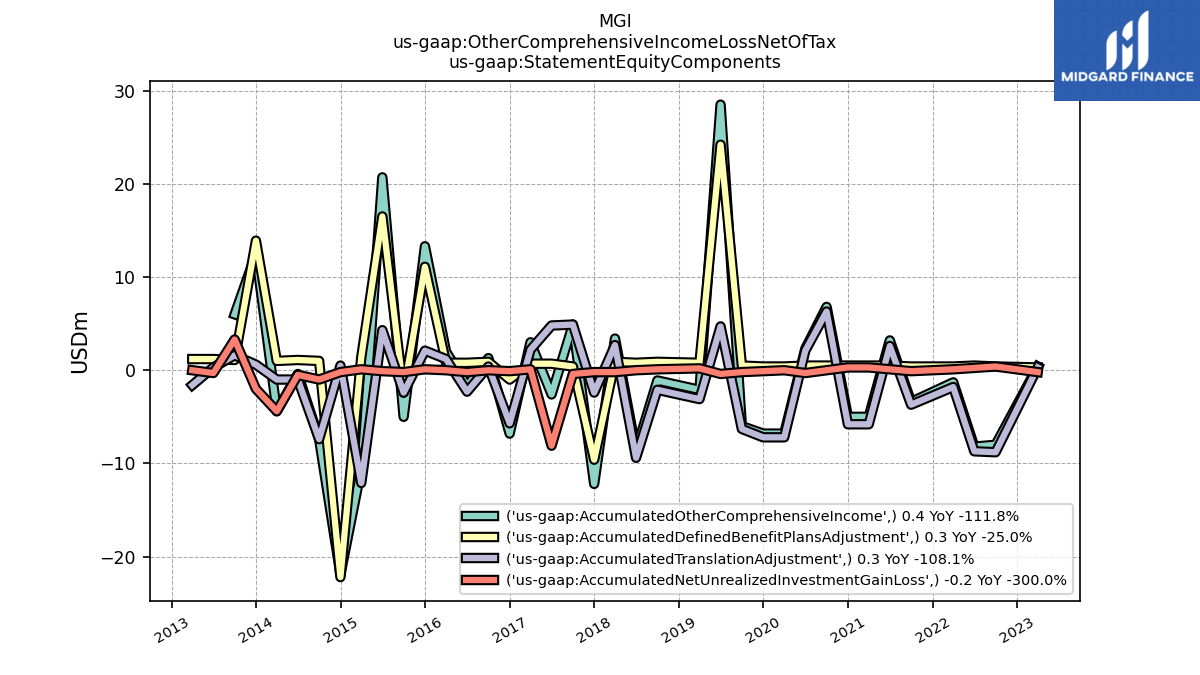
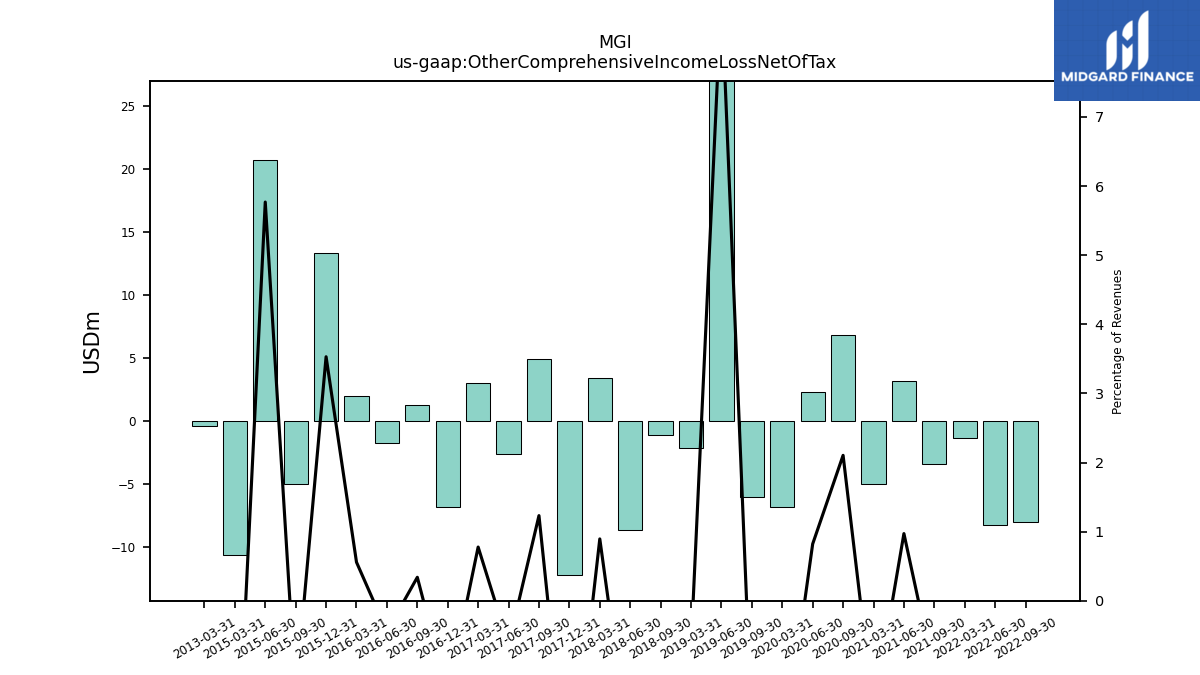
| Other Comprehensive Income Loss Net Of Tax | NA | NA | -8.00 | -8.20 | -1.30 | NA | -3.40 | 3.20 | -5.00 | NA | 6.80 | 2.30 | -6.80 | NA | -6.00 | 28.50 | -2.10 | NA | -1.10 | -8.60 | 3.40 | -12.20 | 4.90 | -2.60 | 3.00 | -6.80 | 1.30 | -1.70 | 2.00 | 13.30 | -5.00 | 20.70 | -10.60 | NA | NA | NA | NA | NA | NA | NA | -0.40 | NA | NA | NA | NA | NA | NA | NA | NA | NA | NA | NA | |
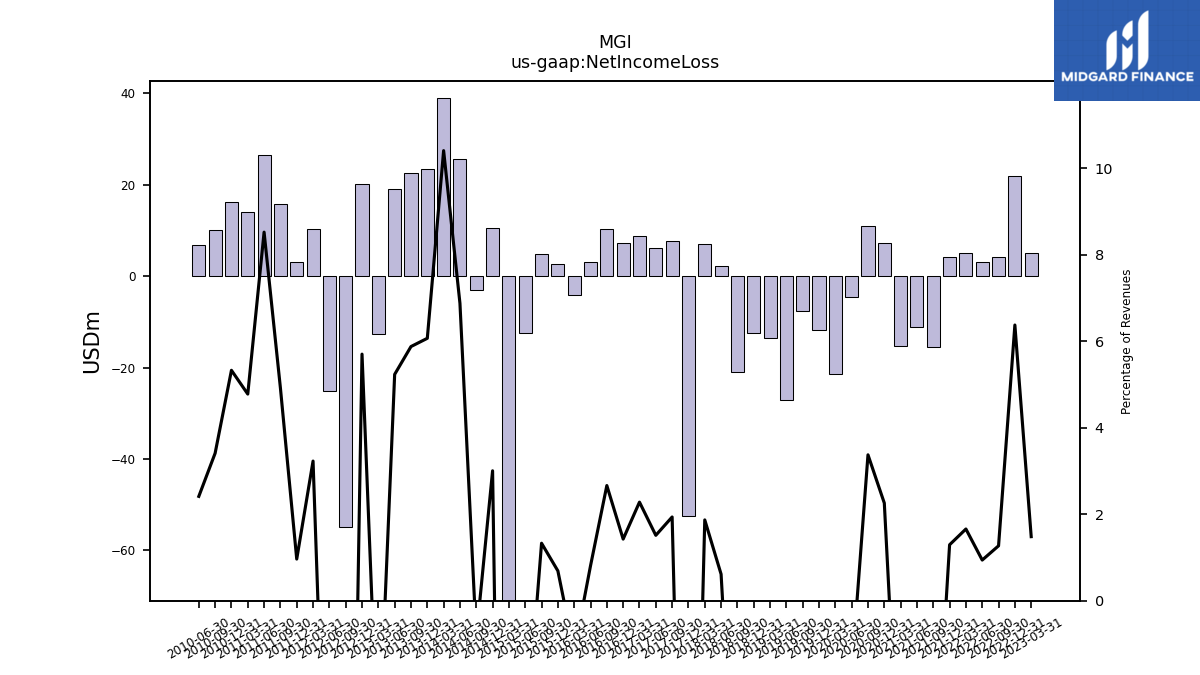
| Net Income Loss | 5.00 | 21.80 | 4.20 | 3.10 | 5.10 | 4.20 | -15.60 | -11.10 | -15.40 | 7.30 | 10.90 | -4.60 | -21.50 | -11.90 | -7.70 | -27.20 | -13.50 | -12.50 | -20.90 | 2.30 | 7.10 | -52.50 | 7.70 | 6.20 | 8.80 | 7.20 | 10.20 | 3.10 | -4.20 | 2.60 | 4.90 | -12.40 | -72.00 | 10.50 | -3.00 | 25.60 | 39.00 | 23.40 | 22.50 | 19.10 | -12.60 | 20.20 | -54.76 | -25.06 | 10.27 | 3.10 | 15.83 | 26.40 | 14.04 | 16.16 | 9.98 | 6.85 | |
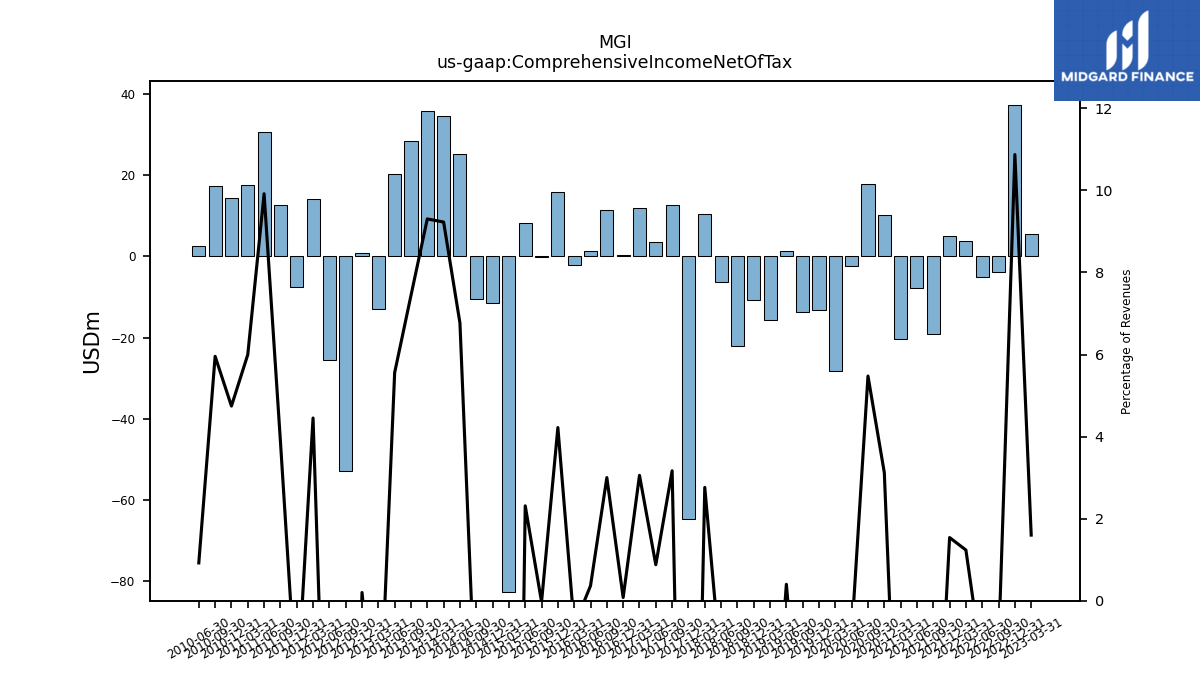
| Comprehensive Income Net Of Tax | 5.40 | 37.20 | -3.80 | -5.10 | 3.80 | 5.00 | -19.00 | -7.90 | -20.40 | 10.10 | 17.70 | -2.30 | -28.30 | -13.20 | -13.70 | 1.30 | -15.60 | -10.70 | -22.00 | -6.30 | 10.50 | -64.70 | 12.60 | 3.60 | 11.80 | 0.40 | 11.50 | 1.40 | -2.20 | 15.90 | -0.10 | 8.30 | -82.60 | -11.40 | -10.40 | 25.20 | 34.60 | 35.90 | 28.50 | 20.30 | -13.00 | 0.71 | -52.90 | -25.58 | 14.17 | -7.65 | 12.53 | 30.75 | 17.63 | 14.39 | 17.45 | 2.62 |
| 2023-03-31 | 2022-12-31 | 2022-09-30 | 2022-06-30 | 2022-03-31 | 2021-12-31 | 2021-09-30 | 2021-06-30 | 2021-03-31 | 2020-12-31 | 2020-09-30 | 2020-06-30 | 2020-03-31 | 2019-12-31 | 2019-09-30 | 2019-06-30 | 2019-03-31 | 2018-12-31 | 2018-09-30 | 2018-06-30 | 2018-03-31 | 2017-12-31 | 2017-09-30 | 2017-06-30 | 2017-03-31 | 2016-12-31 | 2016-09-30 | 2016-06-30 | 2016-03-31 | 2015-12-31 | 2015-09-30 | 2015-06-30 | 2015-03-31 | 2014-12-31 | 2014-09-30 | 2014-06-30 | 2014-03-31 | 2013-12-31 | 2013-09-30 | 2013-06-30 | 2013-03-31 | 2012-12-31 | 2012-09-30 | 2012-06-30 | 2012-03-31 | 2011-12-31 | 2011-09-30 | 2011-06-30 | 2011-03-31 | 2010-12-31 | 2010-09-30 | 2010-06-30 | ||
|---|---|---|---|---|---|---|---|---|---|---|---|---|---|---|---|---|---|---|---|---|---|---|---|---|---|---|---|---|---|---|---|---|---|---|---|---|---|---|---|---|---|---|---|---|---|---|---|---|---|---|---|---|---|
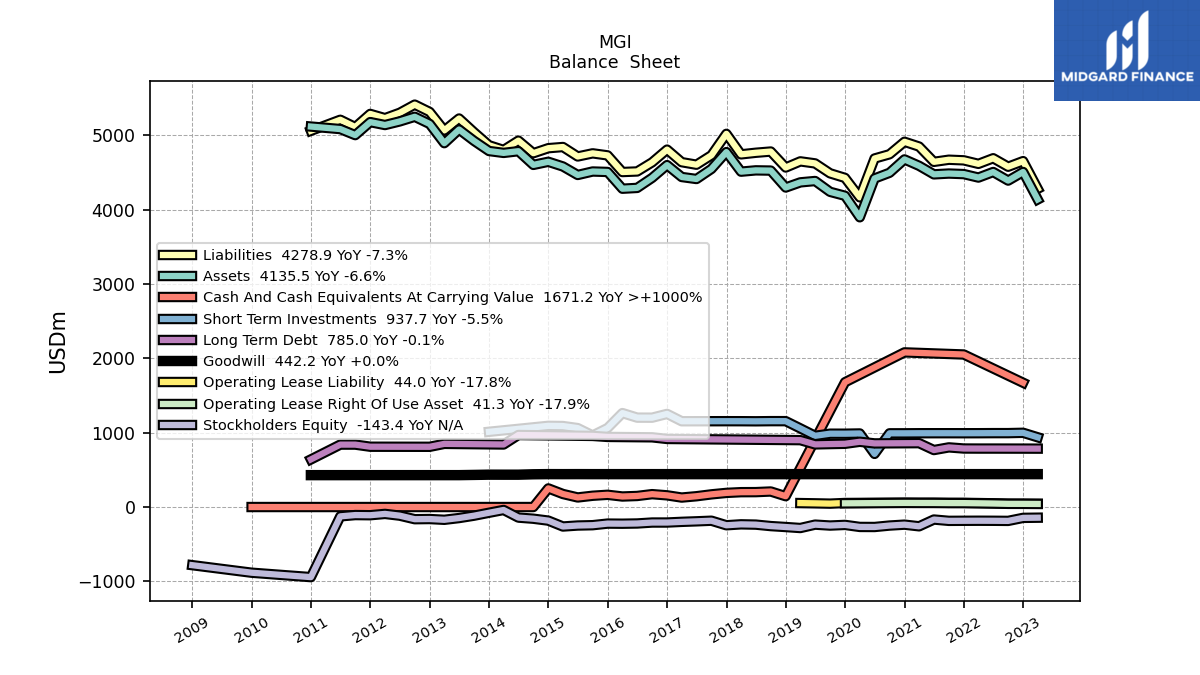
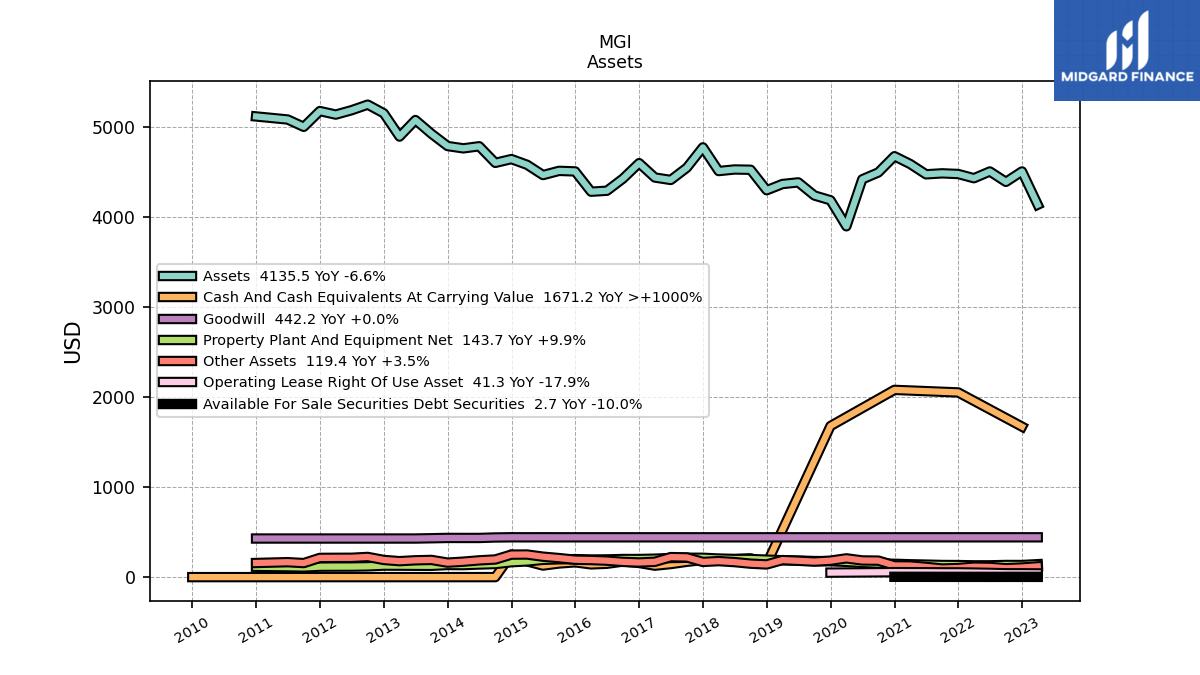
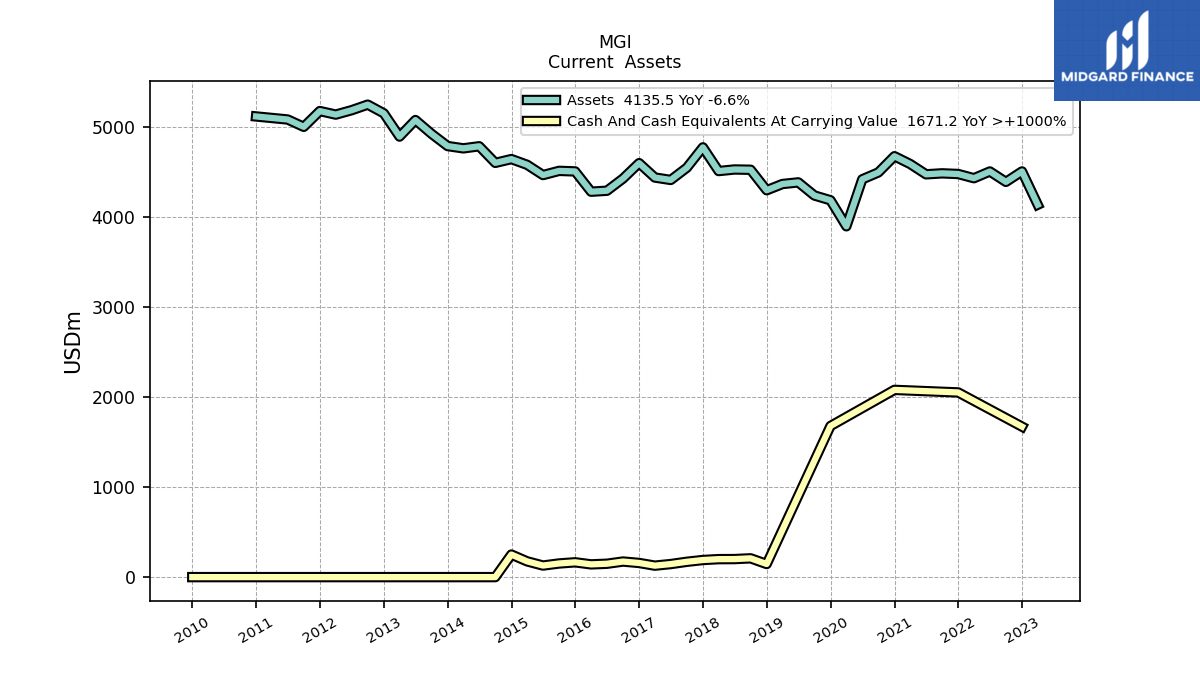
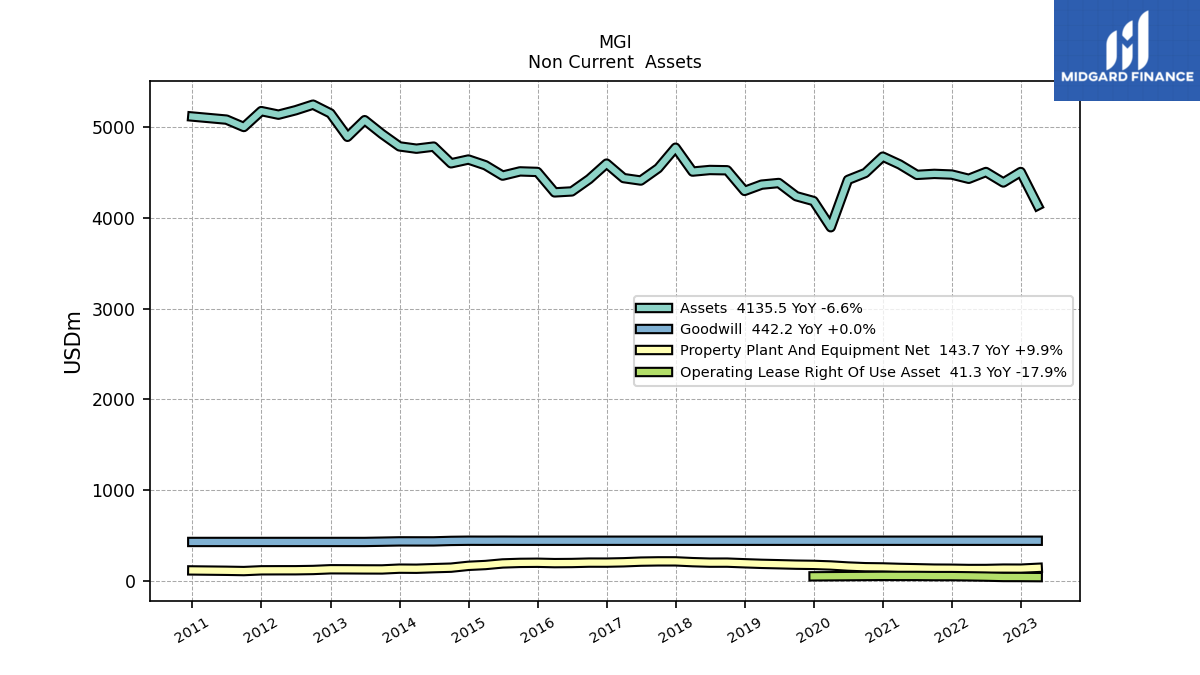
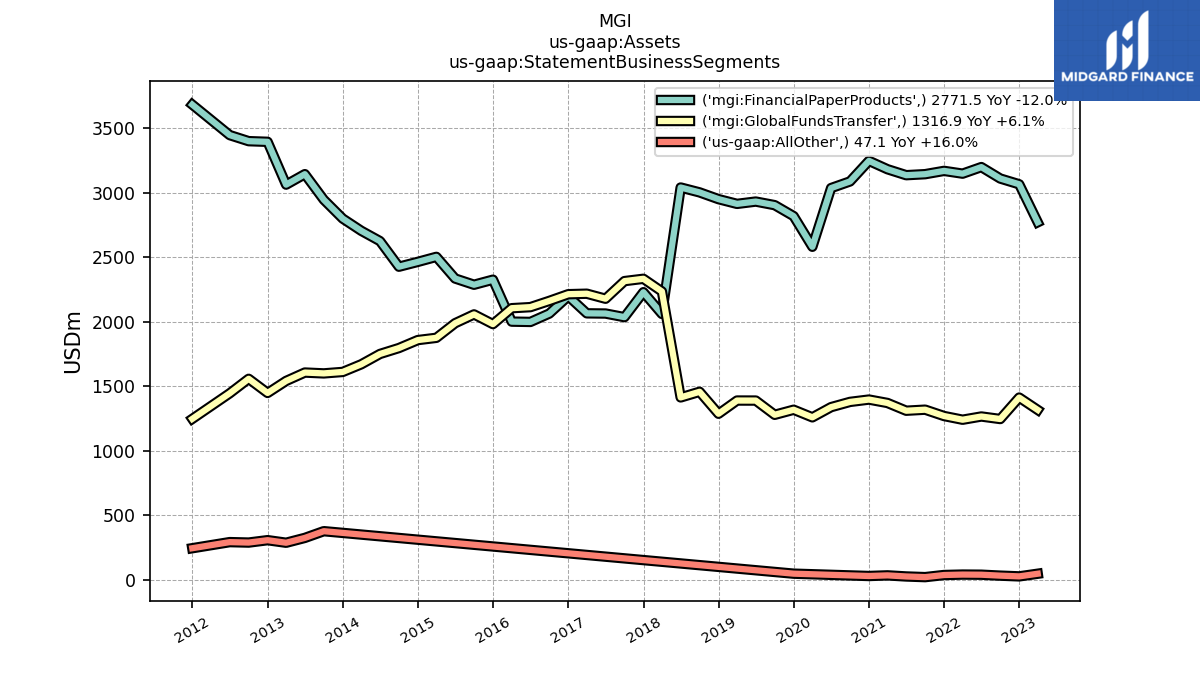
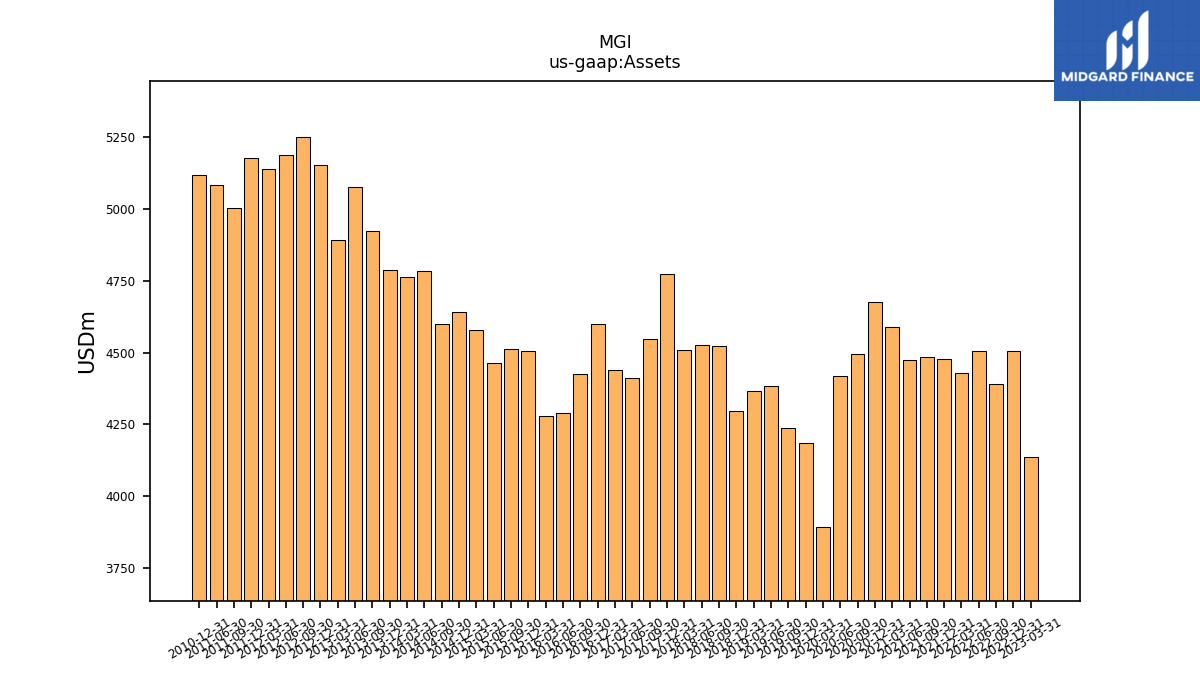
| Assets | 4135.50 | 4505.20 | 4389.10 | 4504.70 | 4429.80 | 4476.50 | 4483.90 | 4473.00 | 4587.60 | 4674.10 | 4494.00 | 4417.80 | 3895.70 | 4185.00 | 4238.00 | 4383.60 | 4365.30 | 4296.10 | 4523.70 | 4526.80 | 4509.20 | 4772.50 | 4546.10 | 4410.40 | 4437.50 | 4597.40 | 4426.10 | 4290.80 | 4280.00 | 4505.20 | 4511.40 | 4464.60 | 4578.90 | 4642.20 | 4600.20 | 4784.50 | 4761.40 | 4786.90 | 4923.20 | 5075.80 | 4892.00 | 5150.60 | 5246.99 | 5185.06 | 5136.18 | 5175.58 | 5000.32 | 5081.77 | NA | 5115.74 | NA | NA | |
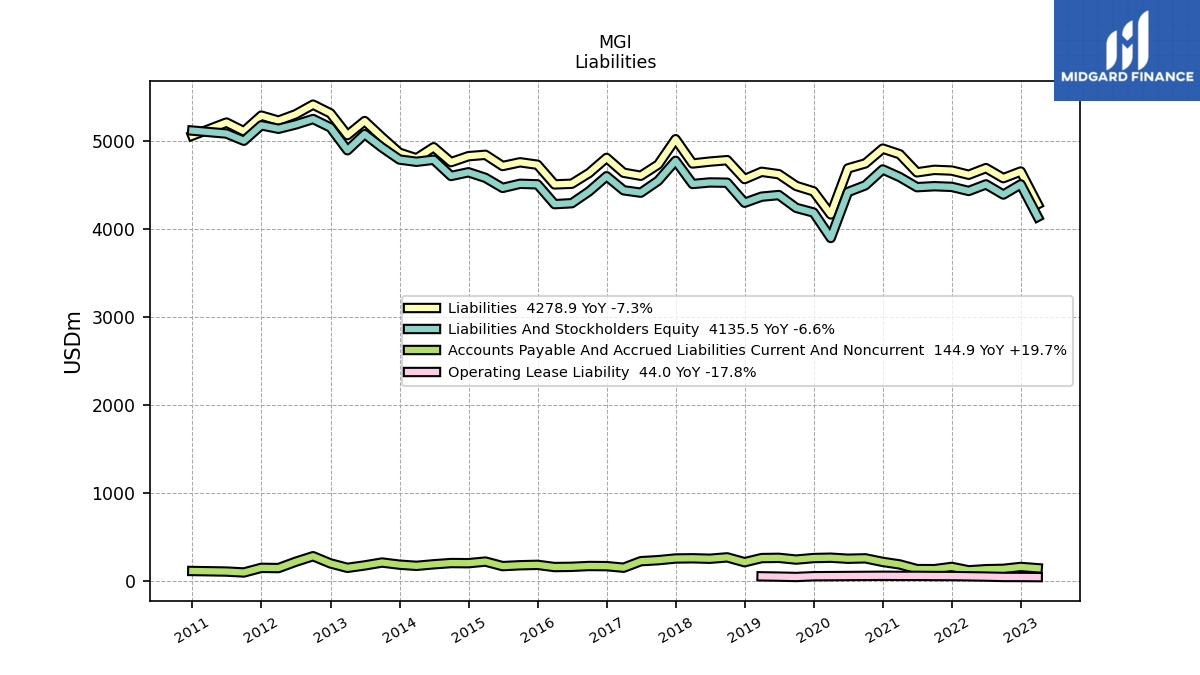
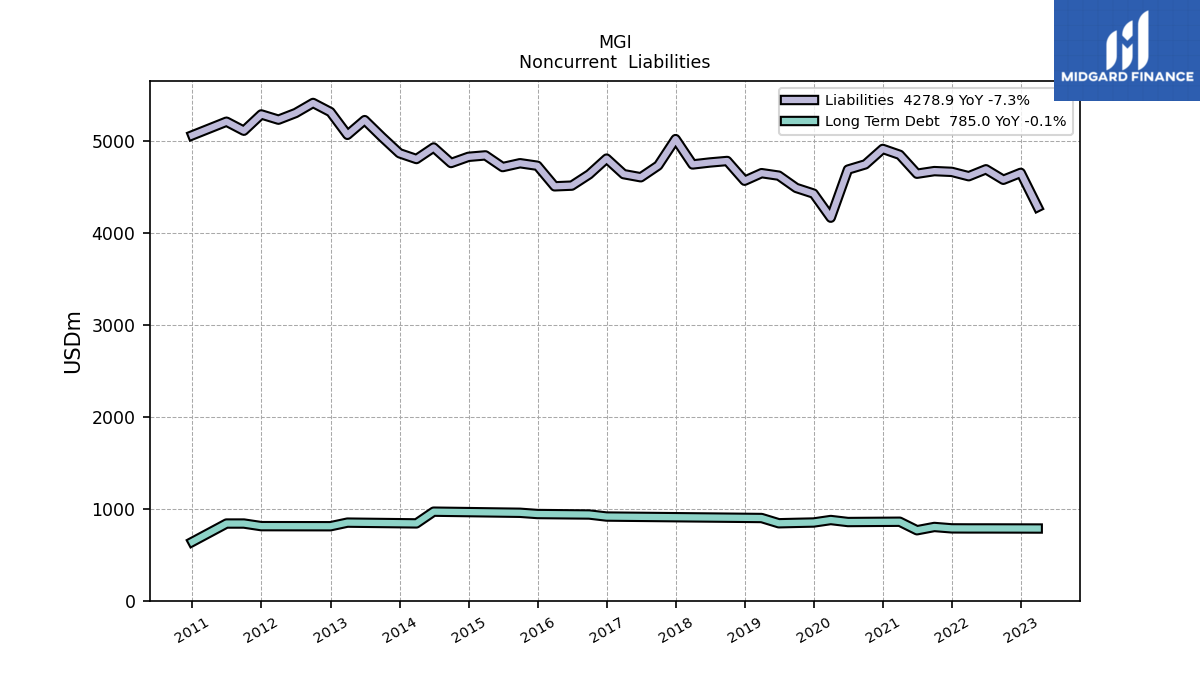
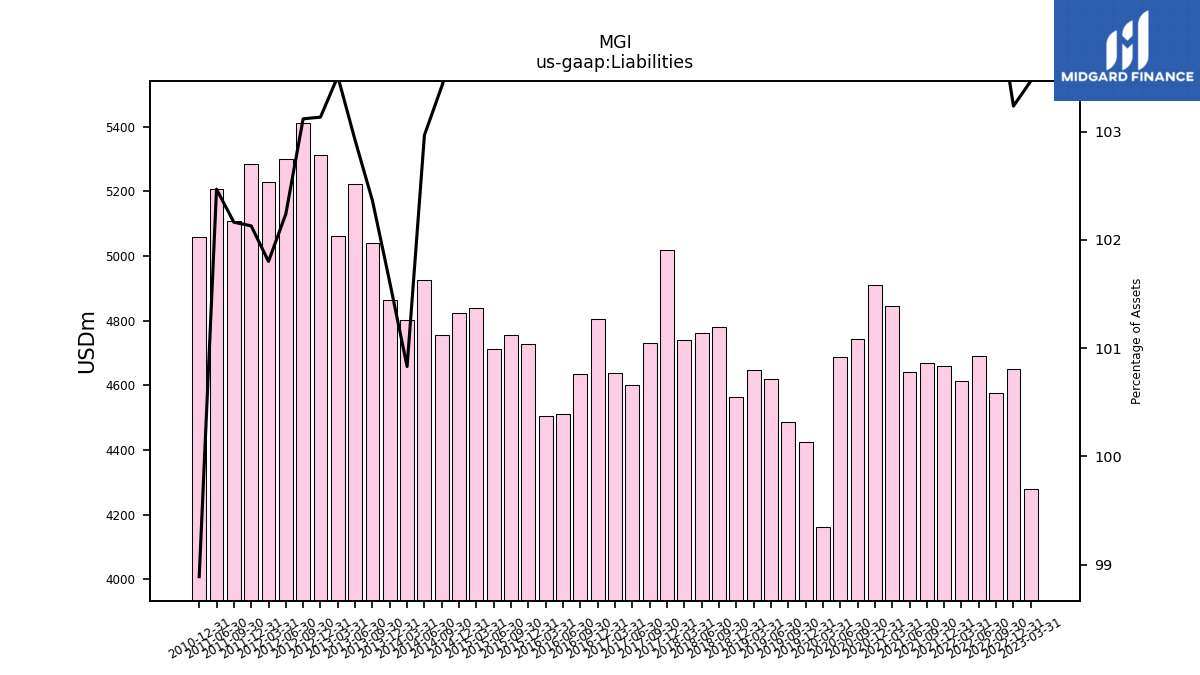
| Liabilities | 4278.90 | 4651.00 | 4575.50 | 4689.60 | 4614.10 | 4661.50 | 4669.80 | 4641.20 | 4846.80 | 4911.10 | 4743.10 | 4686.30 | 4163.40 | 4425.40 | 4487.00 | 4620.30 | 4647.60 | 4564.90 | 4779.90 | 4763.40 | 4741.90 | 5017.80 | 4730.10 | 4602.60 | 4636.80 | 4805.80 | 4634.60 | 4512.00 | 4504.30 | 4728.00 | 4755.60 | 4713.30 | 4840.70 | 4824.90 | 4757.40 | 4926.50 | 4800.90 | 4863.90 | 5039.50 | 5224.00 | 5063.70 | 5312.00 | 5410.61 | 5301.16 | 5228.66 | 5285.78 | 5108.48 | 5207.19 | NA | 5058.86 | NA | NA | |
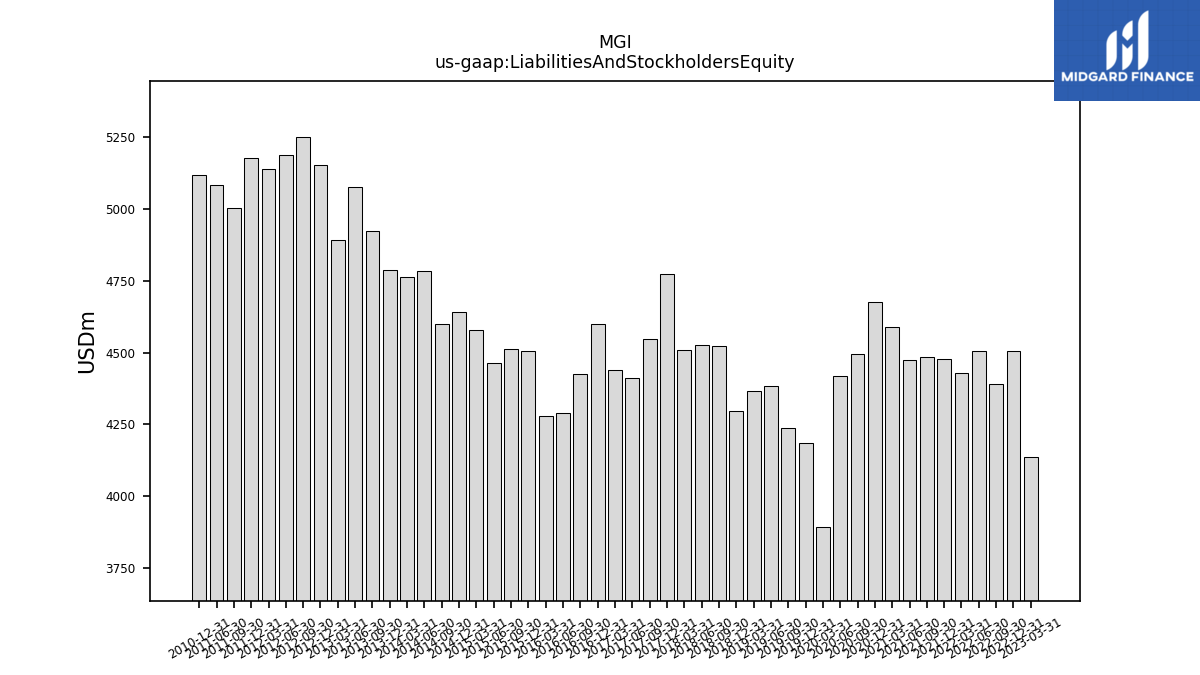
| Liabilities And Stockholders Equity | 4135.50 | 4505.20 | 4389.10 | 4504.70 | 4429.80 | 4476.50 | 4483.90 | 4473.00 | 4587.60 | 4674.10 | 4494.00 | 4417.80 | 3895.70 | 4185.00 | 4238.00 | 4383.60 | 4365.30 | 4296.10 | 4523.70 | 4526.80 | 4509.20 | 4772.50 | 4546.10 | 4410.40 | 4437.50 | 4597.40 | 4426.10 | 4290.80 | 4280.00 | 4505.20 | 4511.40 | 4464.60 | 4578.90 | 4642.20 | 4600.20 | 4784.50 | 4761.40 | 4786.90 | 4923.20 | 5075.80 | 4892.00 | 5150.60 | 5246.99 | 5185.06 | 5136.18 | 5175.58 | 5000.32 | 5081.77 | NA | 5115.74 | NA | NA | |
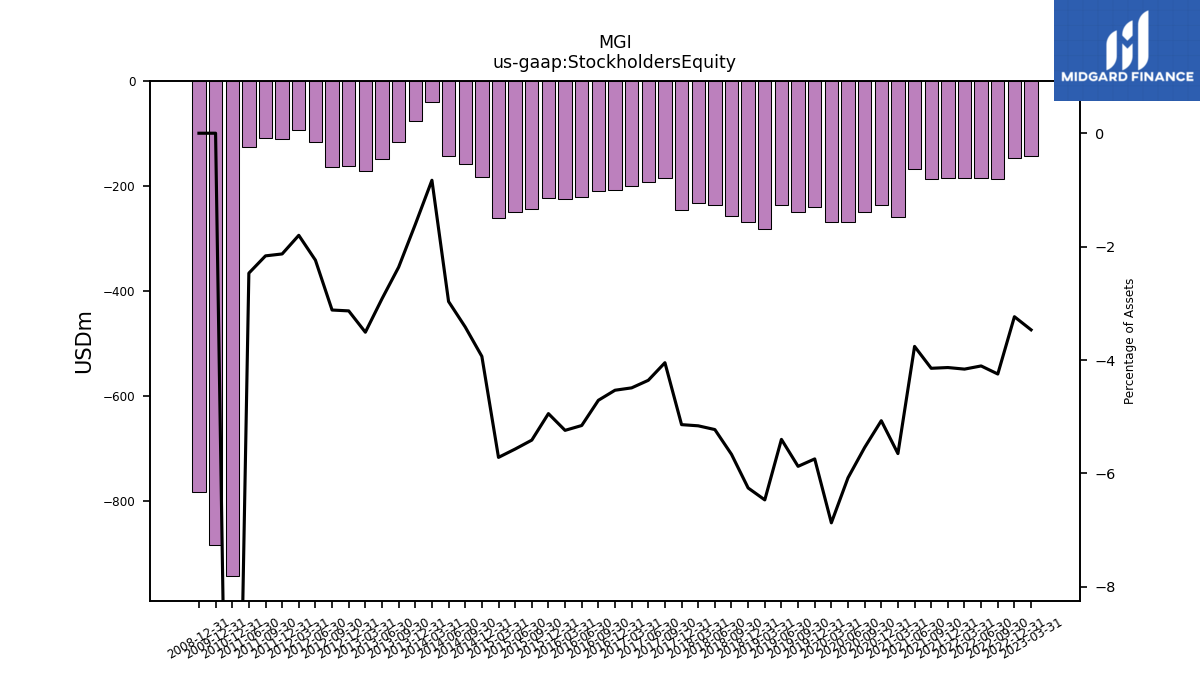
| Stockholders Equity | -143.40 | -145.80 | -186.40 | -184.90 | -184.30 | -185.00 | -185.90 | -168.20 | -259.20 | -237.00 | -249.10 | -268.50 | -267.70 | -240.40 | -249.00 | -236.70 | -282.30 | -268.80 | -256.20 | -236.60 | -232.70 | -245.30 | -184.00 | -192.20 | -199.30 | -208.40 | -208.50 | -221.20 | -224.30 | -222.80 | -244.20 | -248.70 | -261.80 | -182.70 | -157.20 | -142.00 | -39.50 | -77.00 | -116.30 | -148.20 | -171.70 | -161.40 | -163.61 | -116.10 | -92.49 | -110.20 | -108.16 | -125.42 | NA | -942.48 | NA | NA |
| 2023-03-31 | 2022-12-31 | 2022-09-30 | 2022-06-30 | 2022-03-31 | 2021-12-31 | 2021-09-30 | 2021-06-30 | 2021-03-31 | 2020-12-31 | 2020-09-30 | 2020-06-30 | 2020-03-31 | 2019-12-31 | 2019-09-30 | 2019-06-30 | 2019-03-31 | 2018-12-31 | 2018-09-30 | 2018-06-30 | 2018-03-31 | 2017-12-31 | 2017-09-30 | 2017-06-30 | 2017-03-31 | 2016-12-31 | 2016-09-30 | 2016-06-30 | 2016-03-31 | 2015-12-31 | 2015-09-30 | 2015-06-30 | 2015-03-31 | 2014-12-31 | 2014-09-30 | 2014-06-30 | 2014-03-31 | 2013-12-31 | 2013-09-30 | 2013-06-30 | 2013-03-31 | 2012-12-31 | 2012-09-30 | 2012-06-30 | 2012-03-31 | 2011-12-31 | 2011-09-30 | 2011-06-30 | 2011-03-31 | 2010-12-31 | 2010-09-30 | 2010-06-30 | ||
|---|---|---|---|---|---|---|---|---|---|---|---|---|---|---|---|---|---|---|---|---|---|---|---|---|---|---|---|---|---|---|---|---|---|---|---|---|---|---|---|---|---|---|---|---|---|---|---|---|---|---|---|---|---|
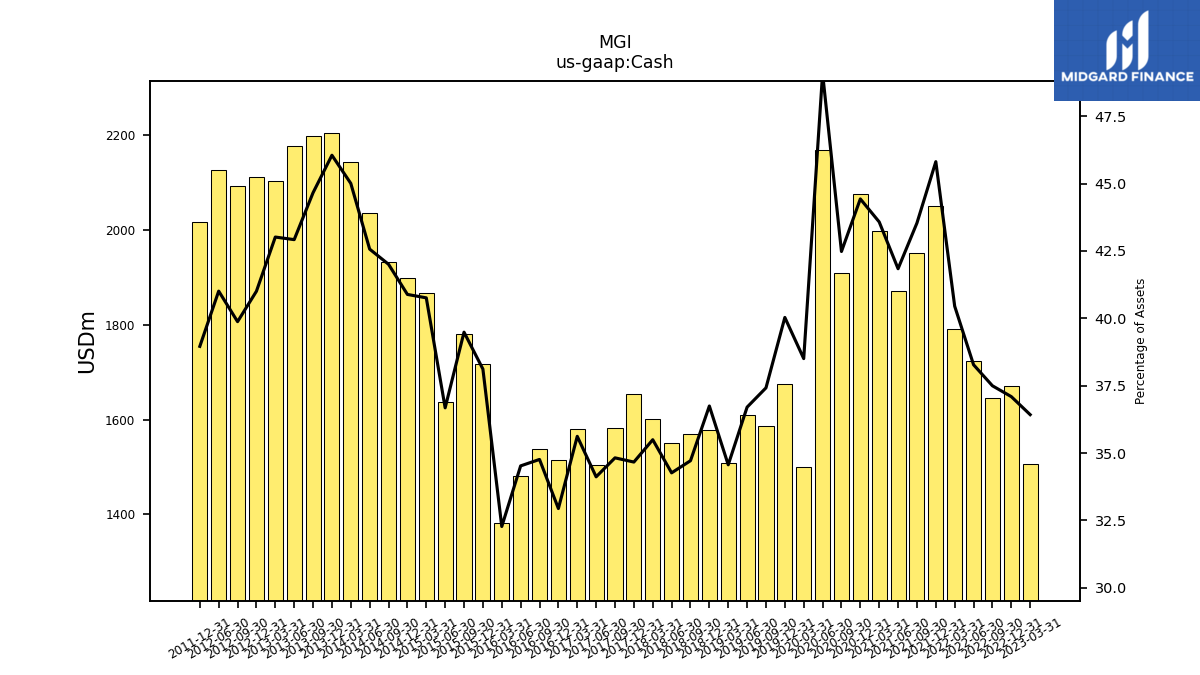
| Cash | 1506.40 | 1671.20 | 1645.80 | 1724.30 | 1791.90 | 2050.90 | 1952.20 | 1871.60 | 1999.20 | 2076.80 | 1909.10 | 2168.90 | 1500.10 | 1675.40 | 1585.90 | 1609.00 | 1508.90 | 1578.70 | 1570.50 | 1551.20 | 1600.60 | 1654.50 | 1583.10 | 1504.80 | 1580.70 | 1514.50 | 1538.70 | 1481.40 | 1381.40 | 1717.30 | 1781.40 | 1637.60 | 1866.40 | 1898.10 | 1932.40 | 2036.70 | 2143.00 | 2204.50 | 2198.80 | 2178.60 | 2104.40 | 2112.10 | 2092.37 | 2126.44 | NA | 2016.45 | NA | NA | NA | NA | NA | NA | |
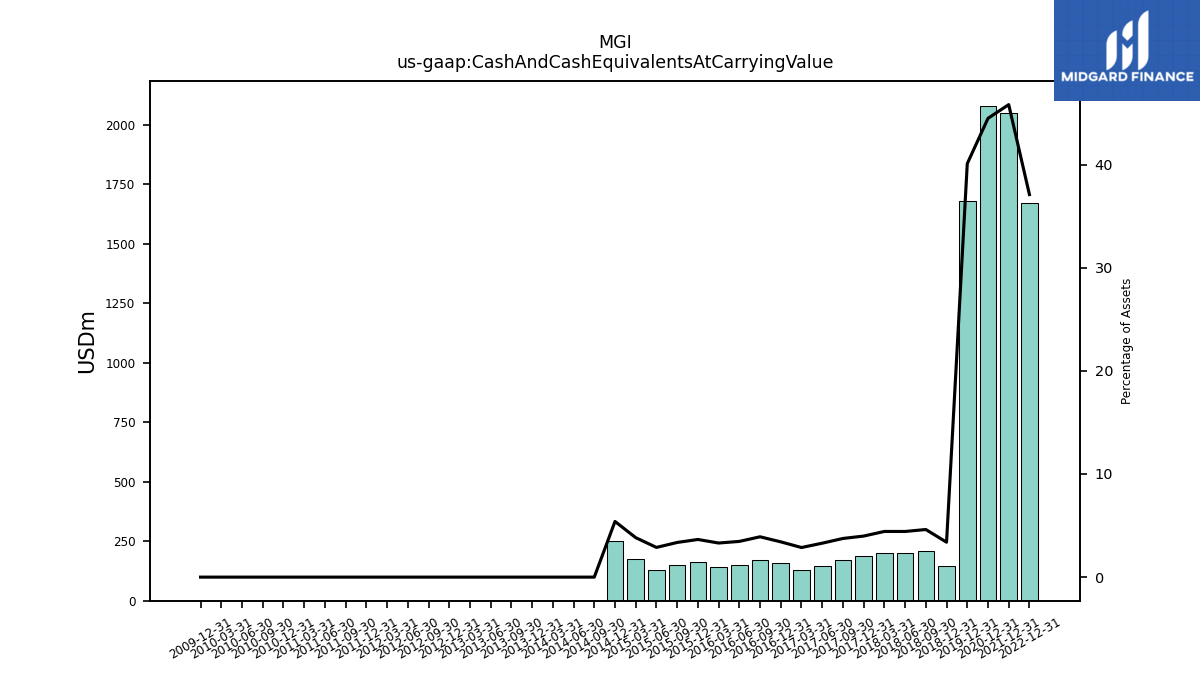
| Cash And Cash Equivalents At Carrying Value | NA | 1671.20 | NA | NA | NA | 2050.90 | NA | NA | NA | 2079.30 | NA | NA | NA | 1677.90 | NA | NA | NA | 145.50 | 208.80 | 200.40 | 199.70 | 190.00 | 170.40 | 145.10 | 127.40 | 157.20 | 173.10 | 148.60 | 141.50 | 164.50 | 151.60 | 128.60 | 175.20 | 250.60 | 0.00 | 0.00 | 0.00 | 0.00 | 0.00 | 0.00 | 0.00 | 0.00 | 0.00 | 0.00 | 0.00 | 0.00 | 0.00 | 0.00 | 0.00 | 0.00 | 0.00 | 0.00 | |
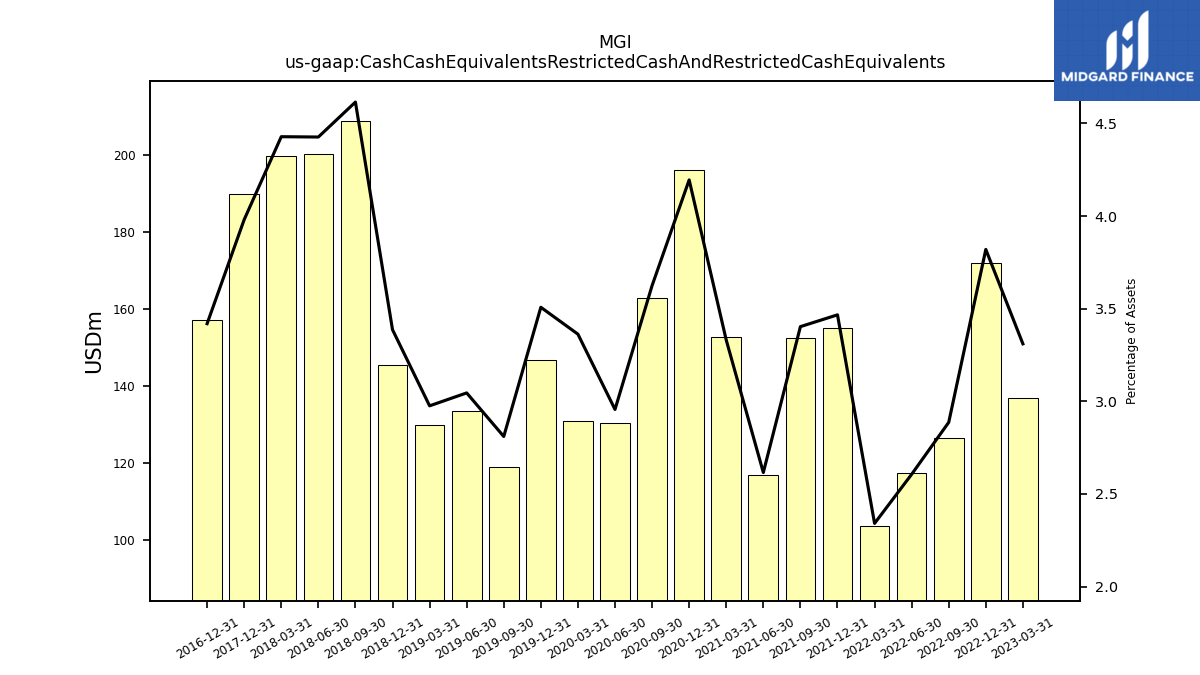
| Cash Cash Equivalents Restricted Cash And Restricted Cash Equivalents | 136.90 | 172.10 | 126.70 | 117.40 | 103.70 | 155.20 | 152.60 | 117.00 | 152.80 | 196.10 | 162.90 | 130.60 | 131.00 | 146.80 | 119.10 | 133.50 | 129.90 | 145.50 | 208.80 | 200.40 | 199.70 | 190.00 | NA | NA | NA | 157.20 | NA | NA | NA | NA | NA | NA | NA | NA | NA | NA | NA | NA | NA | NA | NA | NA | NA | NA | NA | NA | NA | NA | NA | NA | NA | NA | |
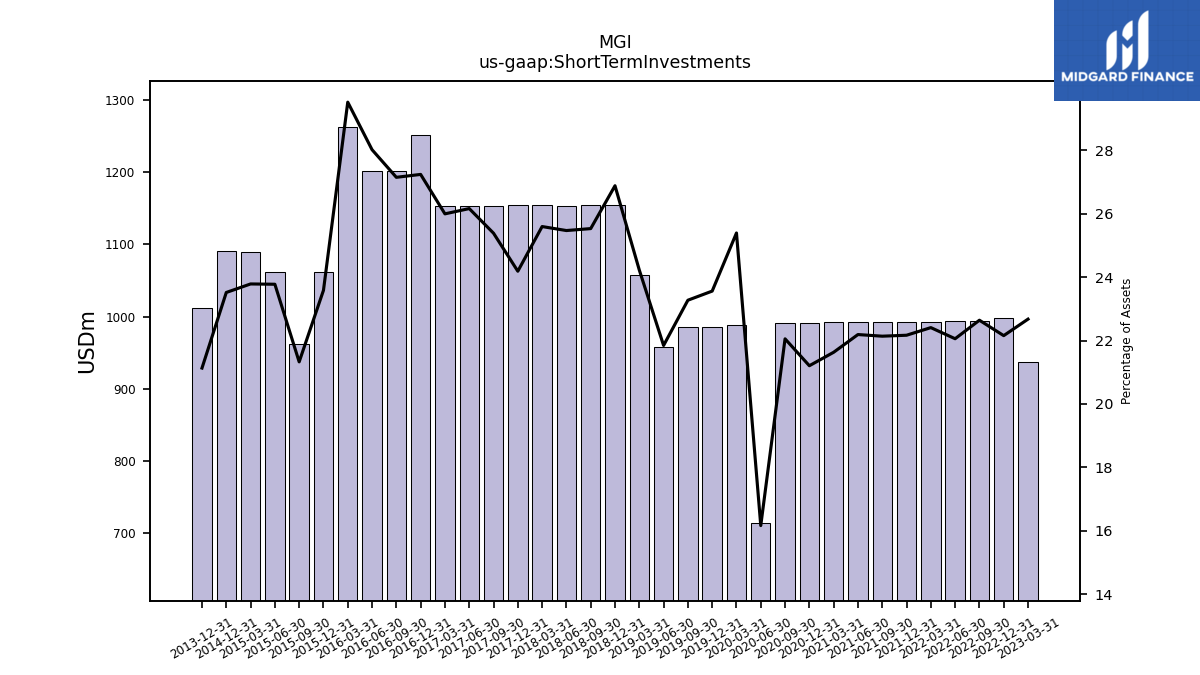
| Short Term Investments | 937.70 | 998.10 | 993.70 | 993.60 | 992.60 | 992.30 | 992.60 | 992.50 | 992.30 | 991.20 | 991.10 | 714.30 | 989.10 | 985.90 | 986.20 | 957.60 | 1057.40 | 1154.70 | 1154.80 | 1152.80 | 1154.00 | 1154.20 | 1153.90 | 1153.70 | 1153.40 | 1252.10 | 1201.40 | 1202.00 | 1263.10 | 1062.40 | 962.20 | 1061.40 | 1089.00 | 1091.60 | NA | NA | NA | 1011.60 | NA | NA | NA | NA | NA | NA | NA | NA | NA | NA | NA | NA | NA | NA | |
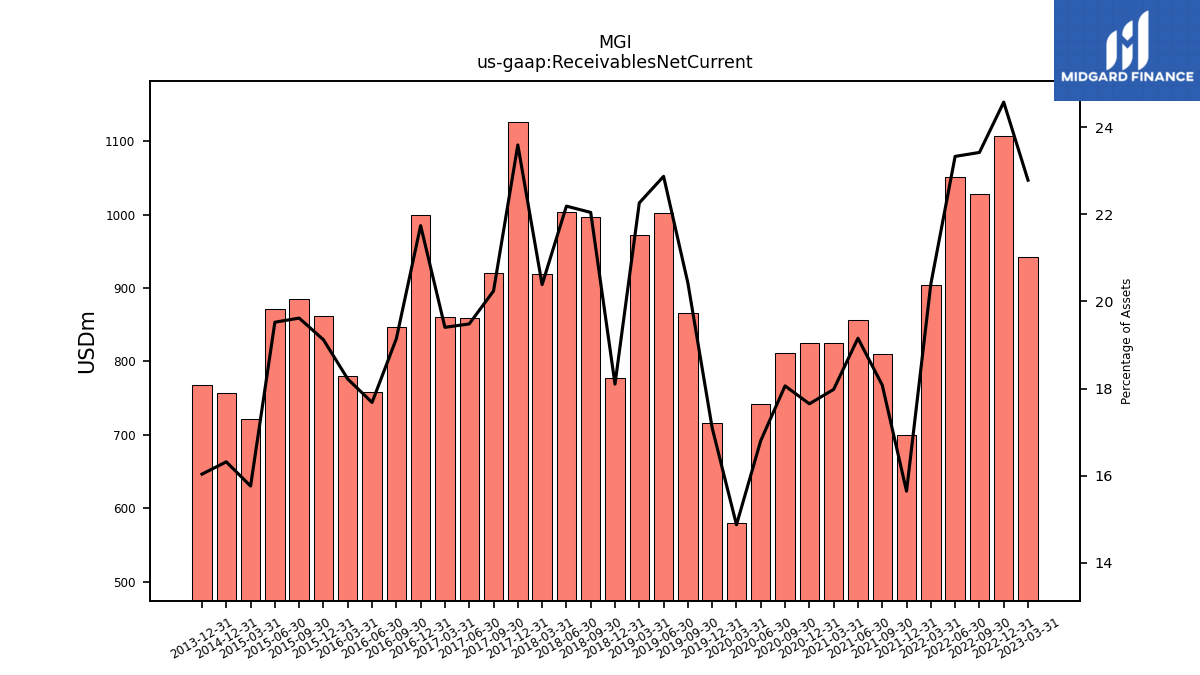
| Receivables Net Current | 942.10 | 1107.00 | 1027.80 | 1050.80 | 903.60 | 700.40 | 810.70 | 856.80 | 824.90 | 825.00 | 811.70 | 742.50 | 579.50 | 715.50 | 865.50 | 1002.50 | 971.70 | 777.70 | 997.10 | 1004.30 | 919.20 | 1125.80 | 920.10 | 859.30 | 861.10 | 999.40 | 847.40 | 758.70 | 779.80 | 861.40 | 885.00 | 871.60 | 721.80 | 757.60 | NA | NA | NA | 767.70 | NA | NA | NA | NA | NA | NA | NA | NA | NA | NA | NA | NA | NA | NA | |
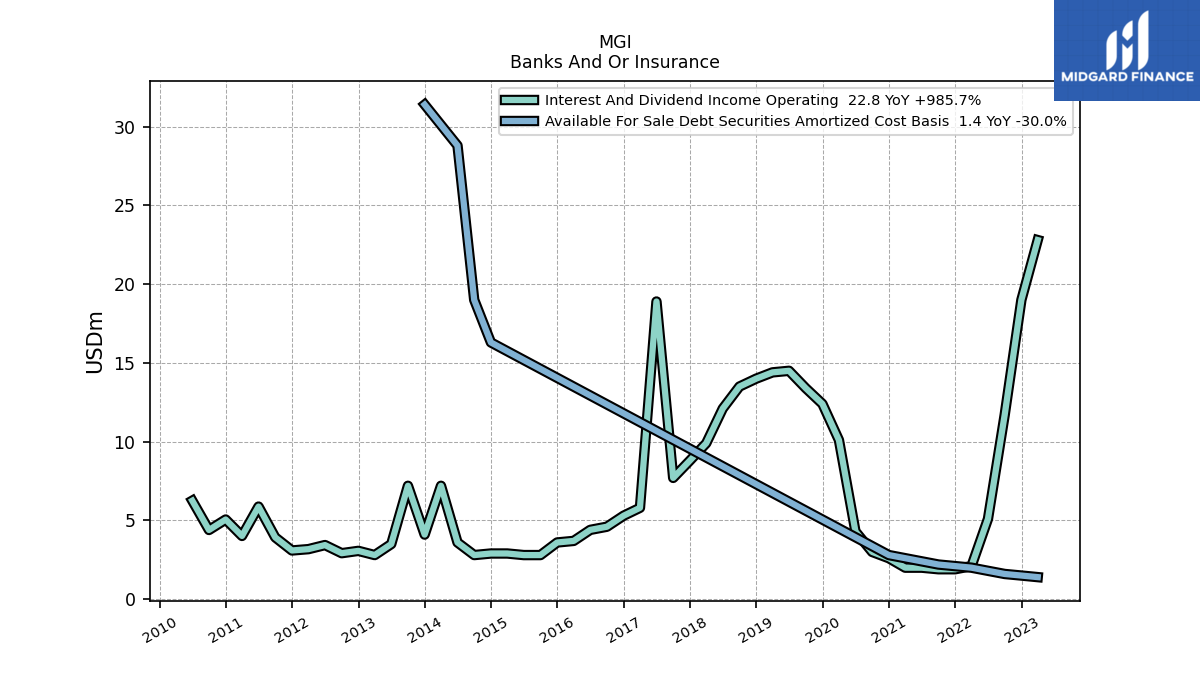
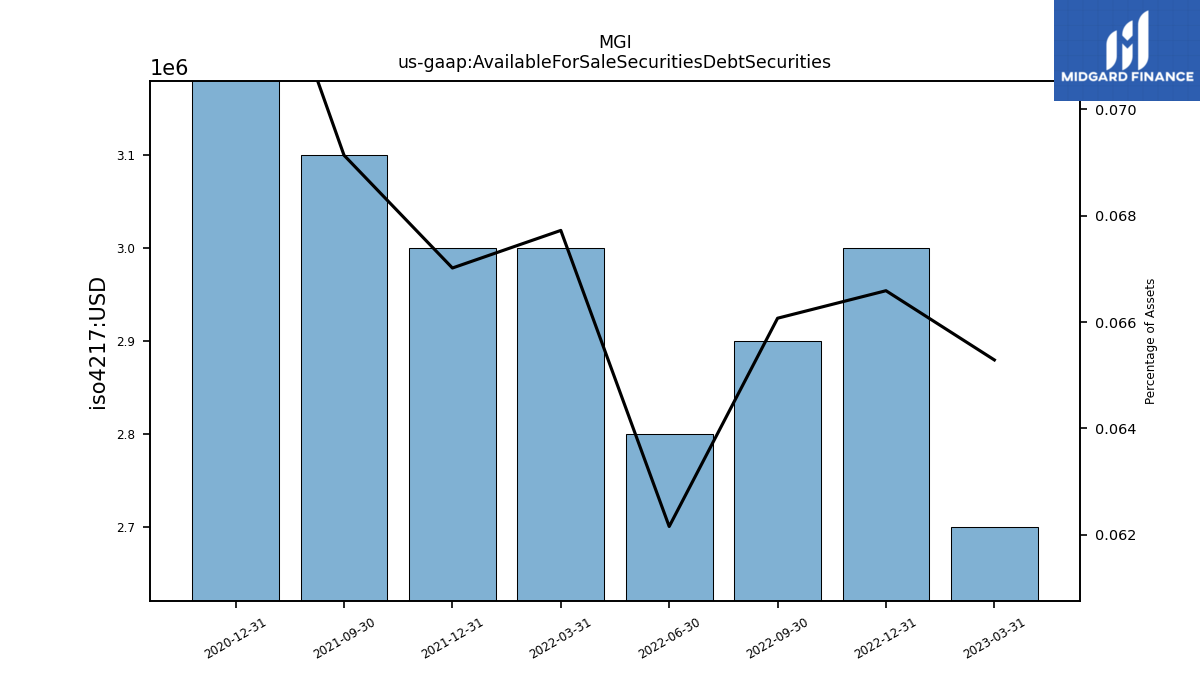
| Available For Sale Securities Debt Securities | 2.70 | 3.00 | 2.90 | 2.80 | 3.00 | 3.00 | 3.10 | NA | NA | 3.50 | NA | NA | NA | NA | NA | NA | NA | NA | NA | NA | NA | NA | NA | NA | NA | NA | NA | NA | NA | NA | NA | NA | NA | NA | NA | NA | NA | NA | NA | NA | NA | NA | NA | NA | NA | NA | NA | NA | NA | NA | NA | NA |
| 2023-03-31 | 2022-12-31 | 2022-09-30 | 2022-06-30 | 2022-03-31 | 2021-12-31 | 2021-09-30 | 2021-06-30 | 2021-03-31 | 2020-12-31 | 2020-09-30 | 2020-06-30 | 2020-03-31 | 2019-12-31 | 2019-09-30 | 2019-06-30 | 2019-03-31 | 2018-12-31 | 2018-09-30 | 2018-06-30 | 2018-03-31 | 2017-12-31 | 2017-09-30 | 2017-06-30 | 2017-03-31 | 2016-12-31 | 2016-09-30 | 2016-06-30 | 2016-03-31 | 2015-12-31 | 2015-09-30 | 2015-06-30 | 2015-03-31 | 2014-12-31 | 2014-09-30 | 2014-06-30 | 2014-03-31 | 2013-12-31 | 2013-09-30 | 2013-06-30 | 2013-03-31 | 2012-12-31 | 2012-09-30 | 2012-06-30 | 2012-03-31 | 2011-12-31 | 2011-09-30 | 2011-06-30 | 2011-03-31 | 2010-12-31 | 2010-09-30 | 2010-06-30 | ||
|---|---|---|---|---|---|---|---|---|---|---|---|---|---|---|---|---|---|---|---|---|---|---|---|---|---|---|---|---|---|---|---|---|---|---|---|---|---|---|---|---|---|---|---|---|---|---|---|---|---|---|---|---|---|
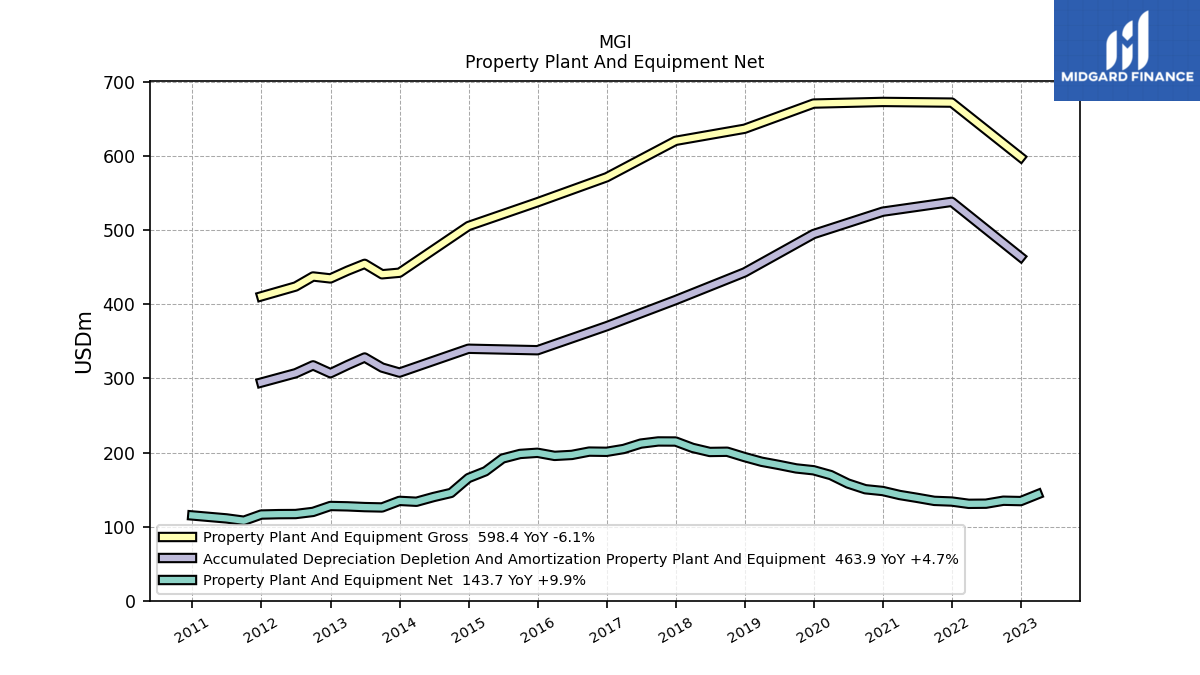
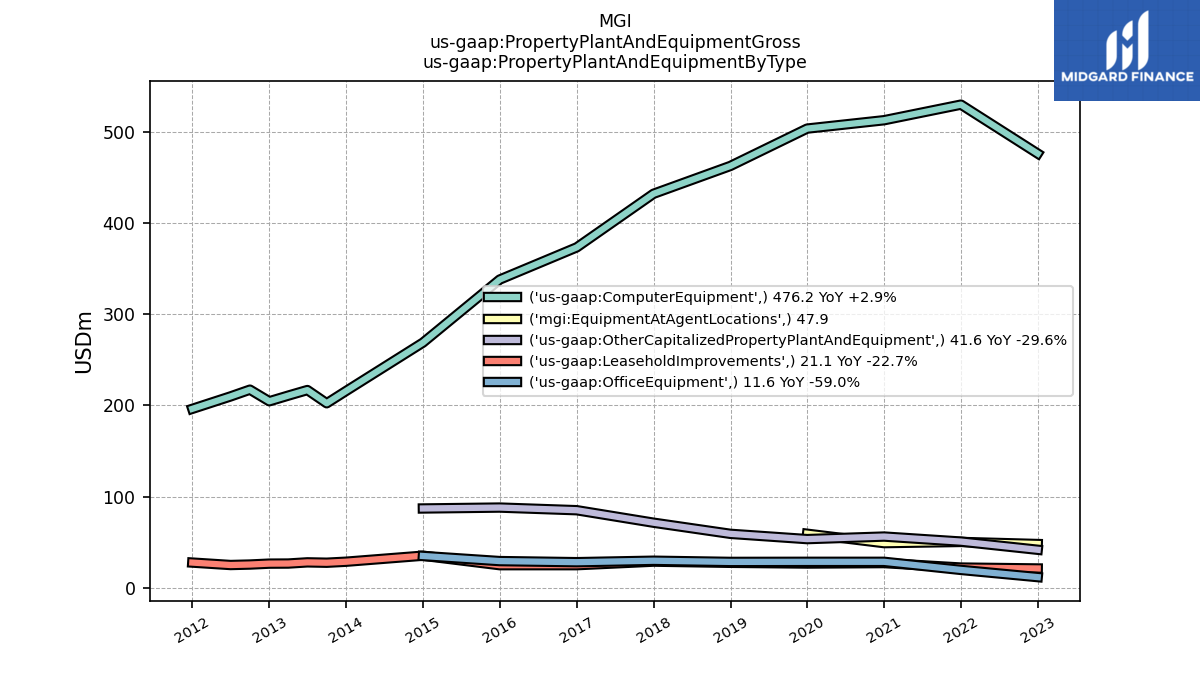
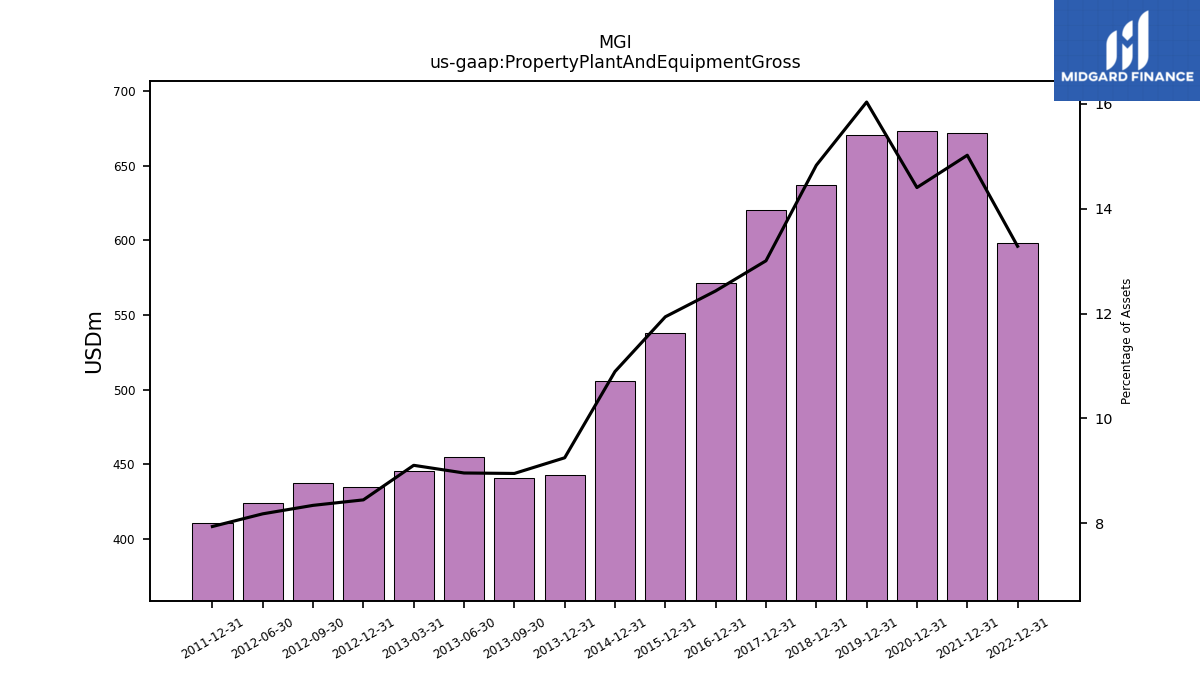
| Property Plant And Equipment Gross | NA | 598.40 | NA | NA | NA | 672.30 | NA | NA | NA | 673.20 | NA | NA | NA | 671.00 | NA | NA | NA | 637.00 | NA | NA | NA | 620.70 | NA | NA | NA | 571.50 | NA | NA | NA | 537.80 | NA | NA | NA | 505.70 | NA | NA | NA | 442.70 | 440.60 | 454.70 | 445.40 | 435.00 | 437.64 | 424.10 | NA | 410.82 | NA | NA | NA | NA | NA | NA | |
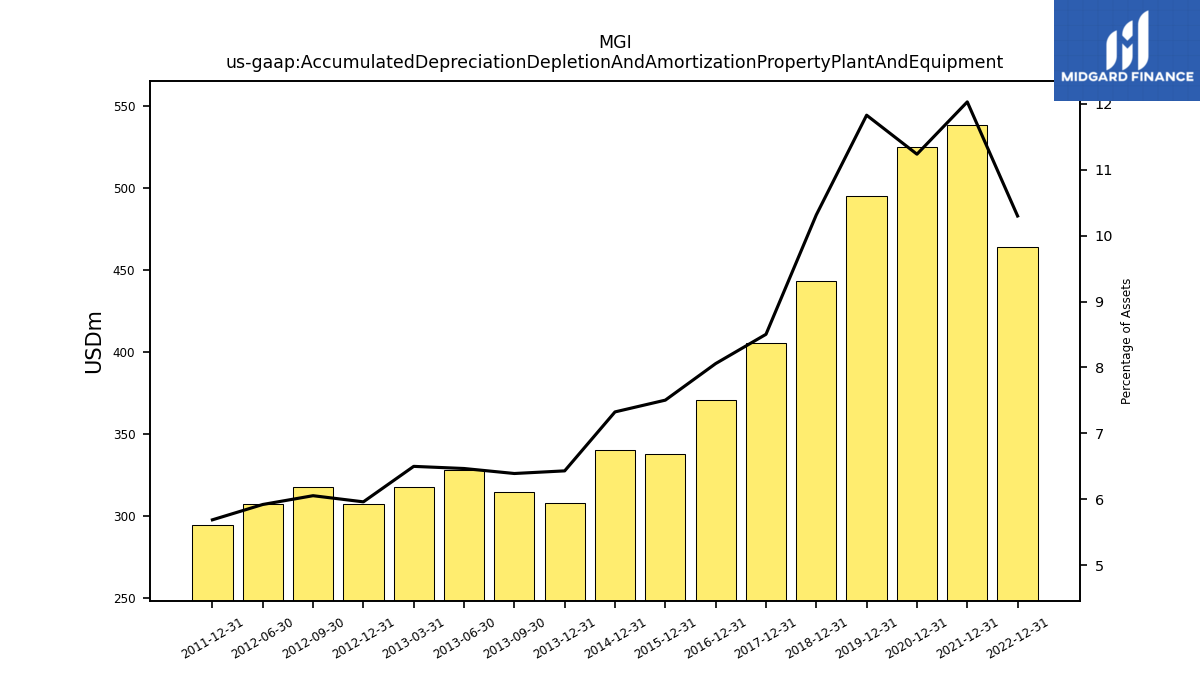
| Accumulated Depreciation Depletion And Amortization Property Plant And Equipment | NA | 463.90 | NA | NA | NA | 538.40 | NA | NA | NA | 525.10 | NA | NA | NA | 494.90 | NA | NA | NA | 443.10 | NA | NA | NA | 405.80 | NA | NA | NA | 370.50 | NA | NA | NA | 338.10 | NA | NA | NA | 340.10 | NA | NA | NA | 307.90 | 314.70 | 328.30 | 318.00 | 307.10 | 317.74 | 307.07 | NA | 294.48 | NA | NA | NA | NA | NA | NA | |
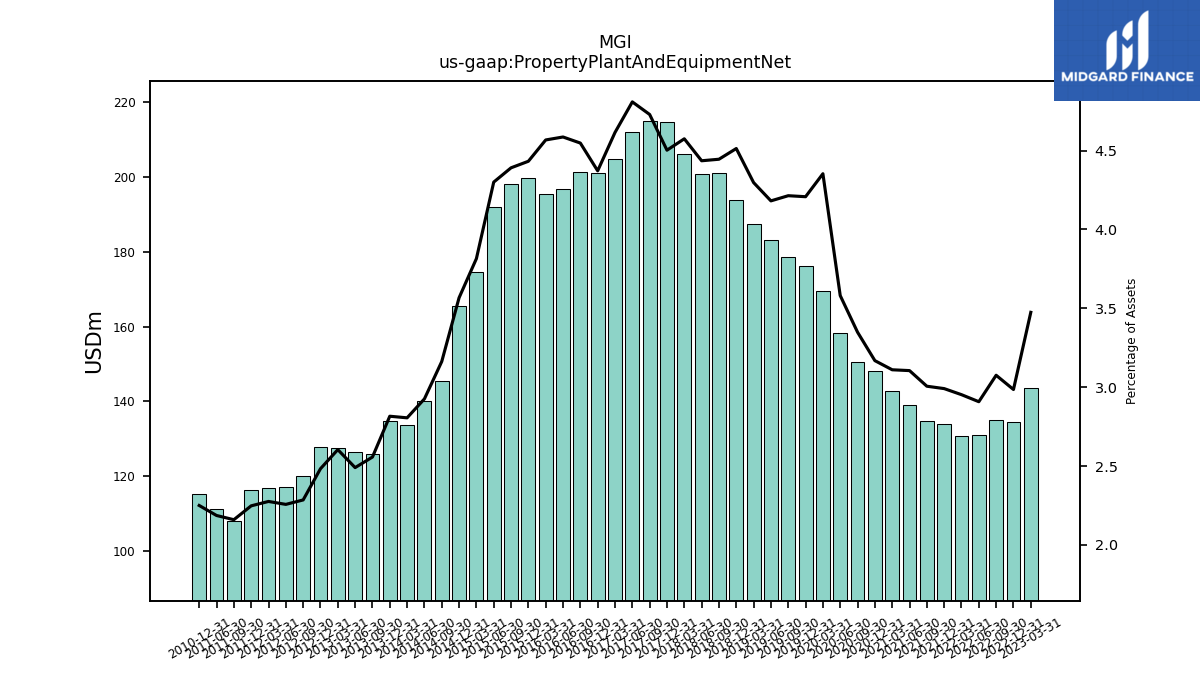
| Property Plant And Equipment Net | 143.70 | 134.50 | 135.00 | 131.00 | 130.80 | 133.90 | 134.80 | 138.90 | 142.70 | 148.10 | 150.50 | 158.20 | 169.60 | 176.10 | 178.60 | 183.30 | 187.60 | 193.90 | 201.10 | 200.80 | 206.30 | 214.90 | 215.00 | 212.10 | 204.80 | 201.00 | 201.30 | 196.80 | 195.50 | 199.70 | 198.10 | 192.00 | 174.70 | 165.60 | 145.50 | 140.00 | 133.60 | 134.80 | 125.90 | 126.40 | 127.40 | 127.90 | 119.91 | 117.03 | 116.88 | 116.34 | 108.00 | 111.12 | NA | 115.11 | NA | NA | |
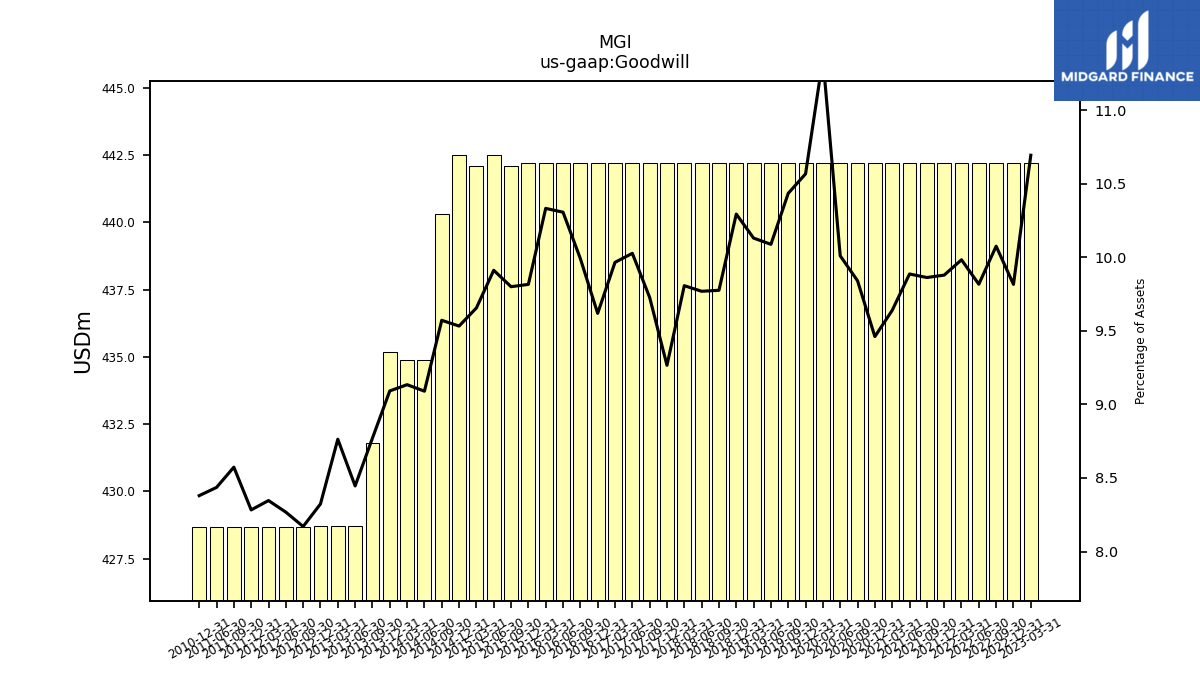
| Goodwill | 442.20 | 442.20 | 442.20 | 442.20 | 442.20 | 442.20 | 442.20 | 442.20 | 442.20 | 442.20 | 442.20 | 442.20 | 442.20 | 442.20 | 442.20 | 442.20 | 442.20 | 442.20 | 442.20 | 442.20 | 442.20 | 442.20 | 442.20 | 442.20 | 442.20 | 442.20 | 442.20 | 442.20 | 442.20 | 442.20 | 442.10 | 442.50 | 442.10 | 442.50 | 440.30 | 434.90 | 434.90 | 435.20 | 431.80 | 428.70 | 428.70 | 428.70 | 428.69 | 428.69 | 428.69 | 428.69 | 428.69 | 428.69 | NA | 428.69 | NA | NA | |
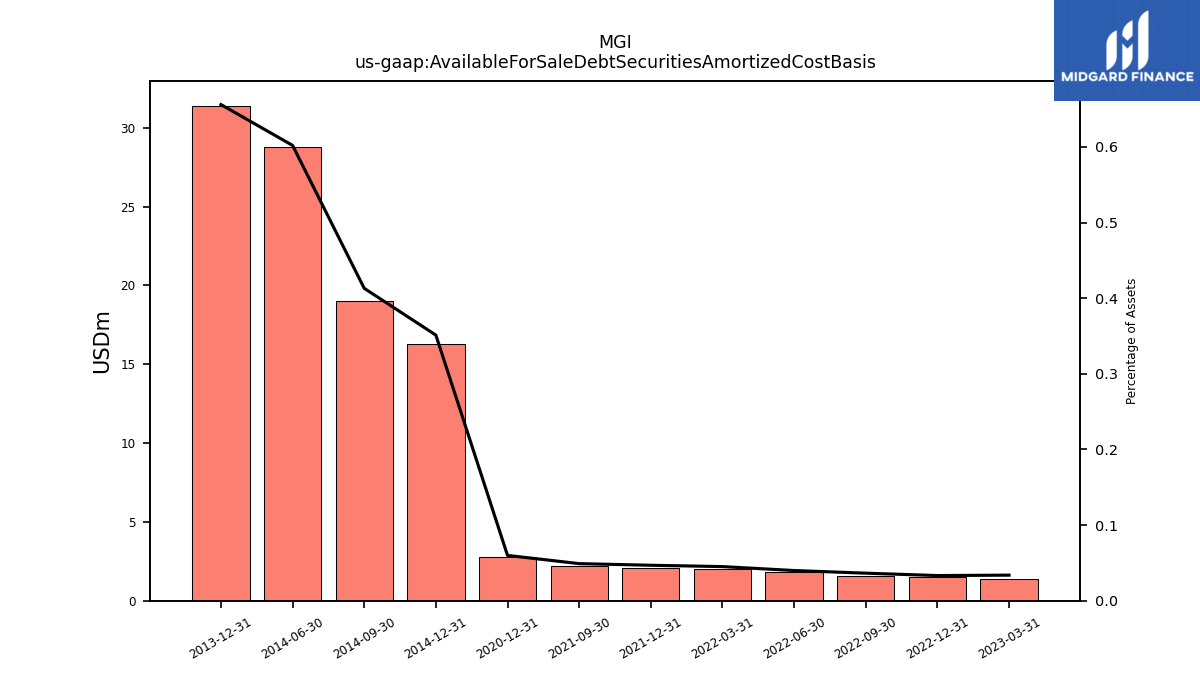
| Available For Sale Debt Securities Amortized Cost Basis | 1.40 | 1.50 | 1.60 | 1.80 | 2.00 | 2.10 | 2.20 | NA | NA | 2.80 | NA | NA | NA | NA | NA | NA | NA | NA | NA | NA | NA | NA | NA | NA | NA | NA | NA | NA | NA | NA | NA | NA | NA | 16.30 | 19.00 | 28.80 | NA | 31.40 | NA | NA | NA | NA | NA | NA | NA | NA | NA | NA | NA | NA | NA | NA |
| 2023-03-31 | 2022-12-31 | 2022-09-30 | 2022-06-30 | 2022-03-31 | 2021-12-31 | 2021-09-30 | 2021-06-30 | 2021-03-31 | 2020-12-31 | 2020-09-30 | 2020-06-30 | 2020-03-31 | 2019-12-31 | 2019-09-30 | 2019-06-30 | 2019-03-31 | 2018-12-31 | 2018-09-30 | 2018-06-30 | 2018-03-31 | 2017-12-31 | 2017-09-30 | 2017-06-30 | 2017-03-31 | 2016-12-31 | 2016-09-30 | 2016-06-30 | 2016-03-31 | 2015-12-31 | 2015-09-30 | 2015-06-30 | 2015-03-31 | 2014-12-31 | 2014-09-30 | 2014-06-30 | 2014-03-31 | 2013-12-31 | 2013-09-30 | 2013-06-30 | 2013-03-31 | 2012-12-31 | 2012-09-30 | 2012-06-30 | 2012-03-31 | 2011-12-31 | 2011-09-30 | 2011-06-30 | 2011-03-31 | 2010-12-31 | 2010-09-30 | 2010-06-30 | ||
|---|---|---|---|---|---|---|---|---|---|---|---|---|---|---|---|---|---|---|---|---|---|---|---|---|---|---|---|---|---|---|---|---|---|---|---|---|---|---|---|---|---|---|---|---|---|---|---|---|---|---|---|---|---|
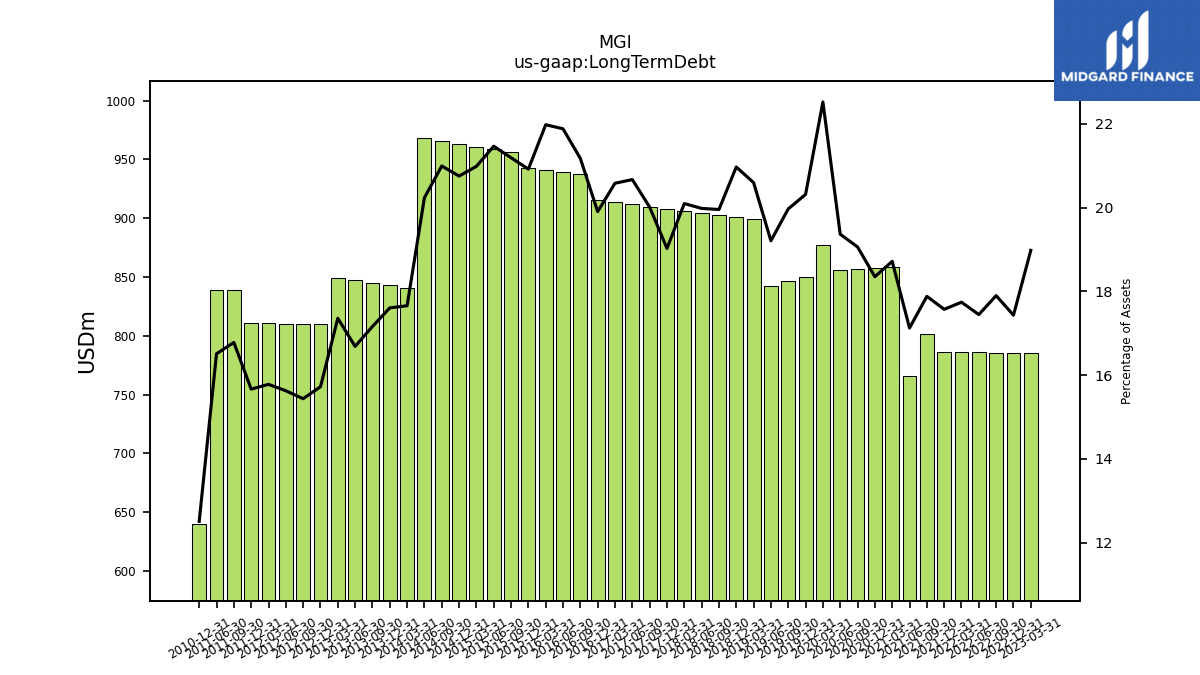
| Long Term Debt | 785.00 | 785.40 | 785.70 | 786.00 | 786.00 | 786.70 | 801.90 | 766.10 | 858.80 | 857.80 | 856.70 | 855.60 | 877.50 | 850.30 | 846.40 | 842.10 | 899.20 | 901.00 | 902.80 | 904.60 | 906.30 | 908.10 | 909.90 | 911.70 | 913.40 | 915.20 | 937.30 | 939.00 | 940.80 | 942.60 | 956.10 | 958.50 | 961.00 | 963.50 | 965.90 | 968.30 | 840.80 | 842.90 | 845.00 | 847.10 | 849.20 | 809.90 | 810.11 | 810.37 | 810.62 | 810.89 | 839.20 | 839.17 | NA | 639.95 | NA | NA |
| 2023-03-31 | 2022-12-31 | 2022-09-30 | 2022-06-30 | 2022-03-31 | 2021-12-31 | 2021-09-30 | 2021-06-30 | 2021-03-31 | 2020-12-31 | 2020-09-30 | 2020-06-30 | 2020-03-31 | 2019-12-31 | 2019-09-30 | 2019-06-30 | 2019-03-31 | 2018-12-31 | 2018-09-30 | 2018-06-30 | 2018-03-31 | 2017-12-31 | 2017-09-30 | 2017-06-30 | 2017-03-31 | 2016-12-31 | 2016-09-30 | 2016-06-30 | 2016-03-31 | 2015-12-31 | 2015-09-30 | 2015-06-30 | 2015-03-31 | 2014-12-31 | 2014-09-30 | 2014-06-30 | 2014-03-31 | 2013-12-31 | 2013-09-30 | 2013-06-30 | 2013-03-31 | 2012-12-31 | 2012-09-30 | 2012-06-30 | 2012-03-31 | 2011-12-31 | 2011-09-30 | 2011-06-30 | 2011-03-31 | 2010-12-31 | 2010-09-30 | 2010-06-30 | ||
|---|---|---|---|---|---|---|---|---|---|---|---|---|---|---|---|---|---|---|---|---|---|---|---|---|---|---|---|---|---|---|---|---|---|---|---|---|---|---|---|---|---|---|---|---|---|---|---|---|---|---|---|---|---|
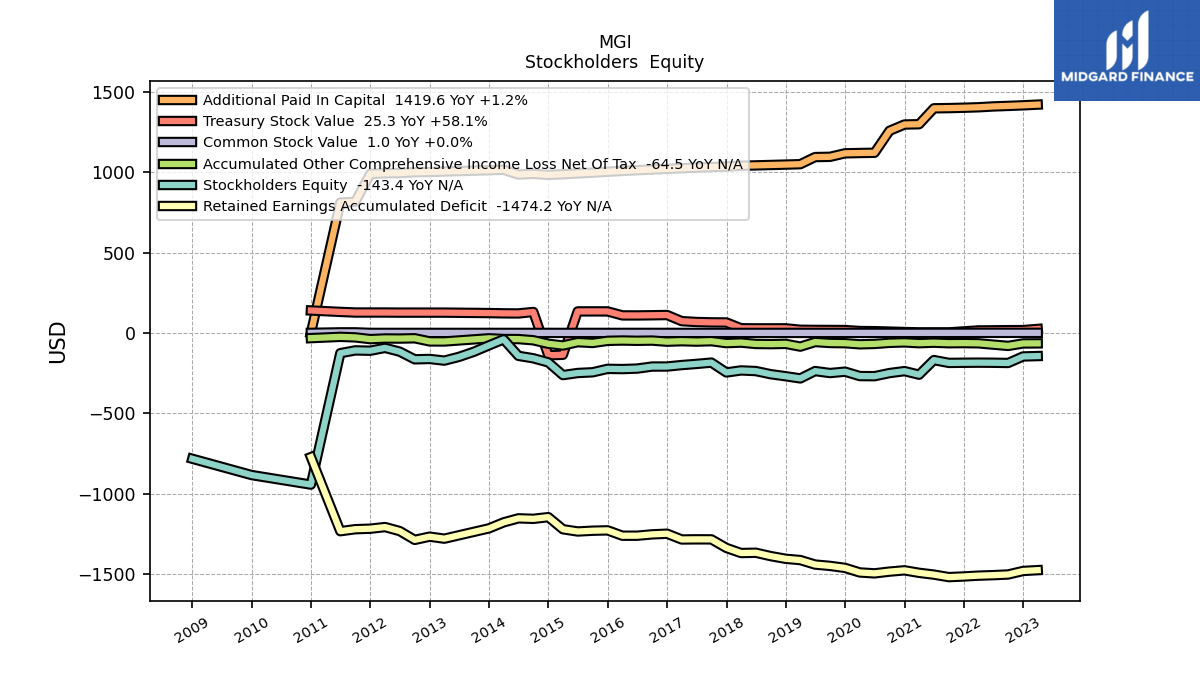
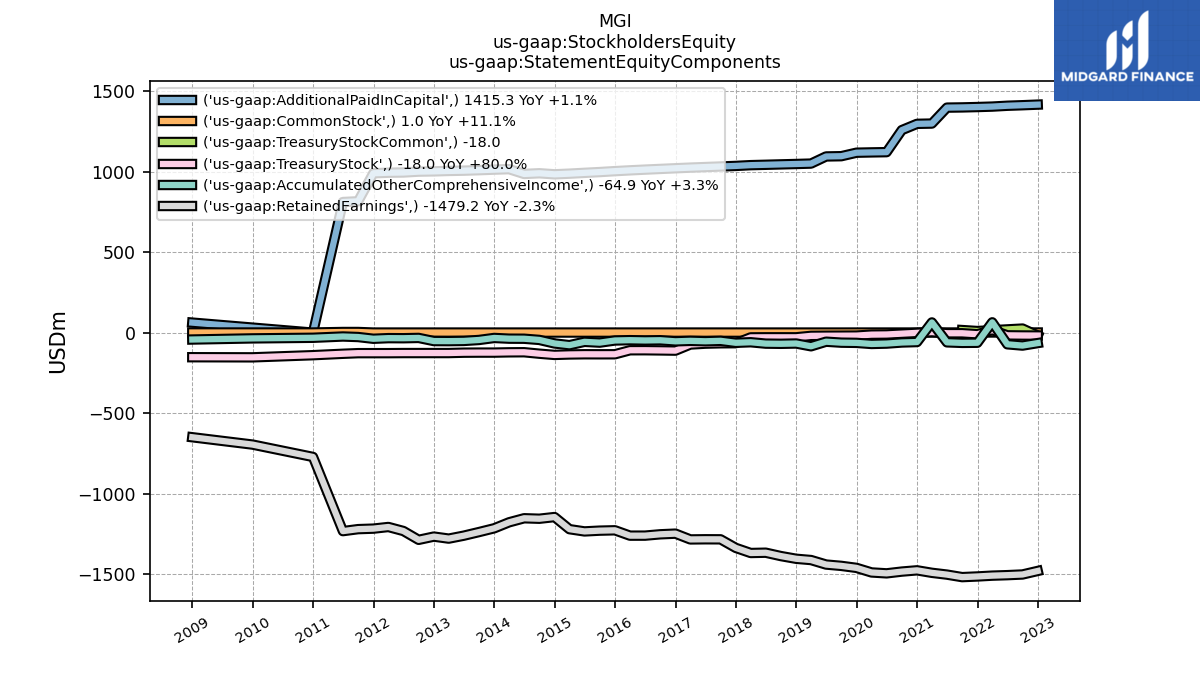
| Stockholders Equity | -143.40 | -145.80 | -186.40 | -184.90 | -184.30 | -185.00 | -185.90 | -168.20 | -259.20 | -237.00 | -249.10 | -268.50 | -267.70 | -240.40 | -249.00 | -236.70 | -282.30 | -268.80 | -256.20 | -236.60 | -232.70 | -245.30 | -184.00 | -192.20 | -199.30 | -208.40 | -208.50 | -221.20 | -224.30 | -222.80 | -244.20 | -248.70 | -261.80 | -182.70 | -157.20 | -142.00 | -39.50 | -77.00 | -116.30 | -148.20 | -171.70 | -161.40 | -163.61 | -116.10 | -92.49 | -110.20 | -108.16 | -125.42 | NA | -942.48 | NA | NA | |
| Common Stock Value | 1.00 | 1.00 | 1.00 | 1.00 | 1.00 | 0.90 | 0.90 | 0.90 | 0.80 | 0.70 | 0.70 | 0.70 | 0.70 | 0.70 | 0.60 | 0.60 | 0.60 | 0.60 | 0.60 | 0.60 | 0.60 | 0.60 | 0.60 | 0.60 | 0.60 | 0.60 | 0.60 | 0.60 | 0.60 | 0.60 | 0.60 | 0.60 | 0.60 | 0.60 | 0.60 | 0.60 | 0.60 | 0.60 | NA | NA | 0.60 | 0.60 | 0.62 | 0.62 | 0.62 | 0.62 | 4.03 | 4.03 | NA | 0.89 | NA | NA | |
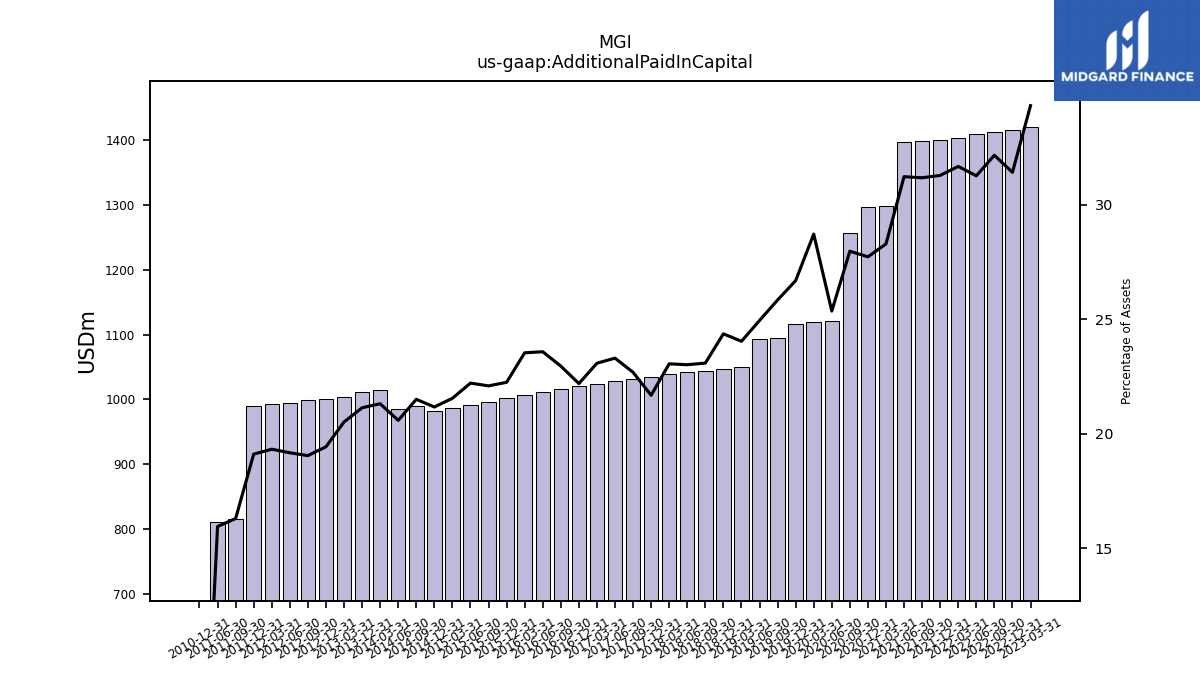
| Additional Paid In Capital | 1419.60 | 1415.30 | 1411.60 | 1408.30 | 1403.10 | 1400.30 | 1398.00 | 1396.70 | 1297.80 | 1296.00 | 1257.10 | 1120.30 | 1118.80 | 1116.90 | 1095.20 | 1093.60 | 1049.40 | 1046.80 | 1044.40 | 1041.90 | 1039.60 | 1034.80 | 1031.30 | 1027.80 | 1024.30 | 1020.30 | 1016.10 | 1011.90 | 1007.40 | 1002.40 | 996.70 | 991.80 | 986.80 | 982.80 | 989.30 | 985.00 | 1014.80 | 1011.80 | NA | NA | 1003.70 | 1001.00 | 999.46 | 994.08 | 992.71 | 989.19 | 815.14 | 810.74 | NA | 0.00 | NA | NA | |
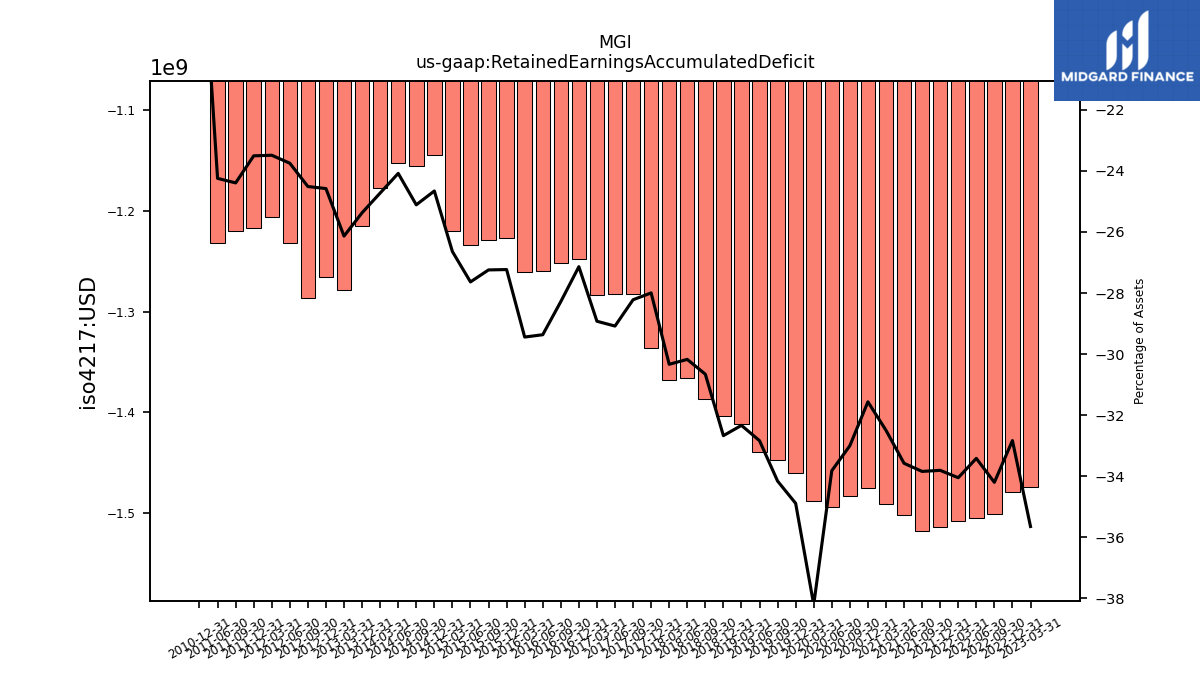
| Retained Earnings Accumulated Deficit | -1474.20 | -1479.20 | -1501.10 | -1505.30 | -1508.30 | -1513.40 | -1517.50 | -1501.90 | -1490.80 | -1475.30 | -1483.10 | -1494.10 | -1488.50 | -1460.10 | -1447.70 | -1439.40 | -1411.50 | -1403.60 | -1386.90 | -1365.90 | -1367.80 | -1336.10 | -1282.90 | -1282.60 | -1283.50 | -1247.60 | -1251.70 | -1260.00 | -1260.10 | -1226.80 | -1229.00 | -1233.80 | -1219.90 | -1144.60 | -1155.10 | -1152.10 | -1177.20 | -1214.40 | NA | NA | -1278.50 | -1265.90 | -1286.07 | -1231.30 | -1206.29 | -1216.54 | -1219.67 | -1231.99 | NA | -771.54 | NA | NA | |
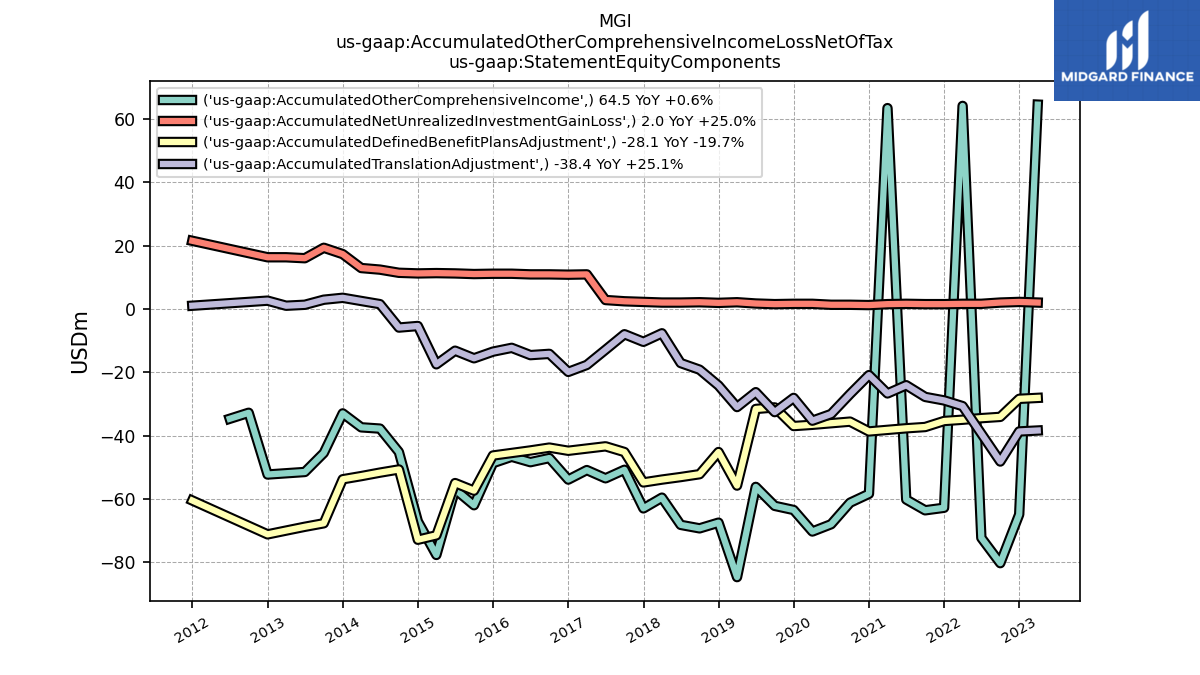
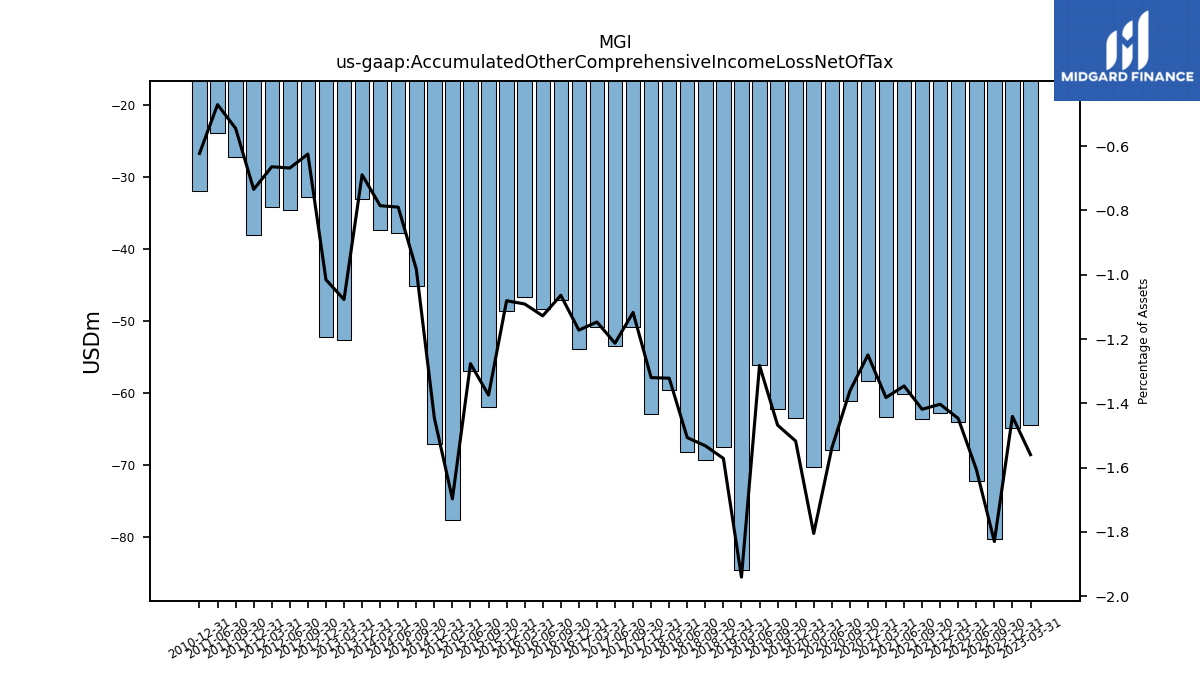
| Accumulated Other Comprehensive Income Loss Net Of Tax | -64.50 | -64.90 | -80.30 | -72.30 | -64.10 | -62.80 | -63.60 | -60.20 | -63.40 | -58.40 | -61.20 | -68.00 | -70.30 | -63.50 | -62.20 | -56.20 | -84.70 | -67.50 | -69.30 | -68.20 | -59.60 | -63.00 | -50.80 | -53.50 | -50.90 | -53.90 | -47.10 | -48.40 | -46.70 | -48.70 | -62.00 | -57.00 | -77.70 | -67.10 | -45.20 | -37.80 | -37.40 | -33.00 | NA | NA | -52.70 | -52.30 | -32.79 | -34.66 | -34.13 | -38.03 | -27.26 | -23.95 | NA | -31.88 | NA | NA | |
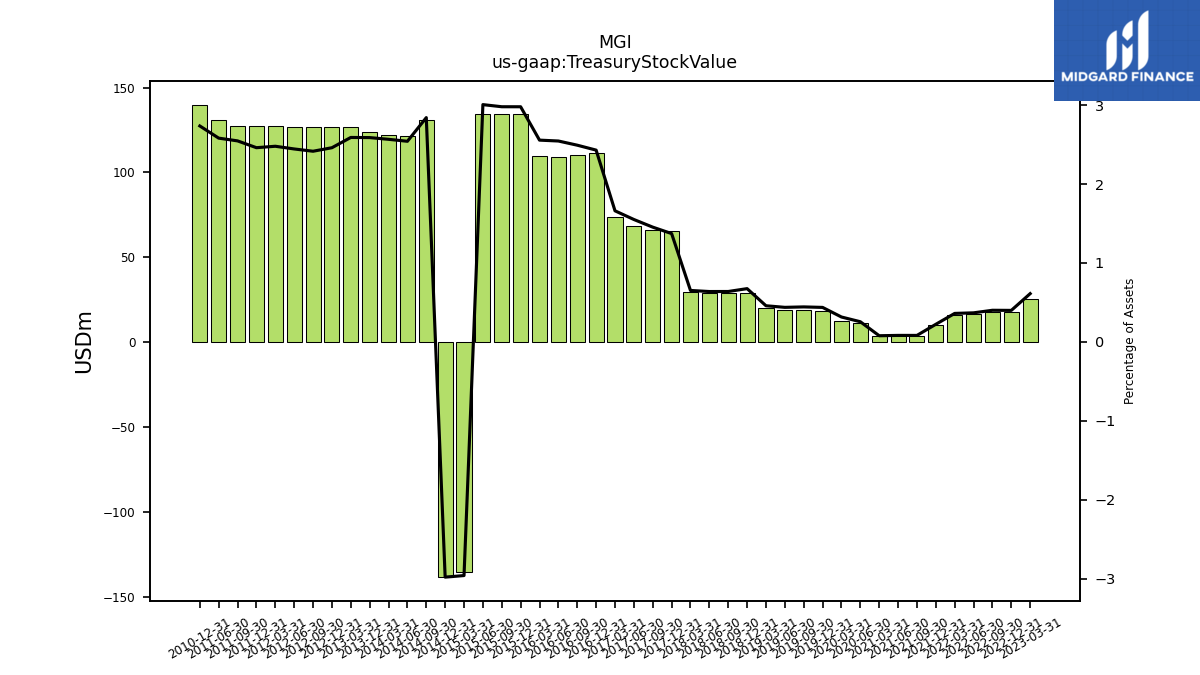
| Treasury Stock Value | 25.30 | 18.00 | 17.60 | 16.60 | 16.00 | 10.00 | 3.70 | 3.70 | 3.60 | NA | NA | 11.30 | 12.30 | 18.30 | 18.80 | 19.20 | 20.00 | 29.00 | 28.90 | 28.90 | 29.40 | 65.50 | 66.10 | 68.40 | 73.70 | 111.70 | 110.30 | 109.20 | 109.40 | 134.20 | 134.40 | 134.20 | -135.50 | -138.30 | 130.70 | 121.60 | 122.20 | 123.90 | NA | NA | 126.70 | 126.70 | 126.74 | 126.74 | 127.30 | 127.34 | 127.33 | 131.18 | NA | 139.94 | NA | NA |
| 2023-03-31 | 2022-12-31 | 2022-09-30 | 2022-06-30 | 2022-03-31 | 2021-12-31 | 2021-09-30 | 2021-06-30 | 2021-03-31 | 2020-12-31 | 2020-09-30 | 2020-06-30 | 2020-03-31 | 2019-12-31 | 2019-09-30 | 2019-06-30 | 2019-03-31 | 2018-12-31 | 2018-09-30 | 2018-06-30 | 2018-03-31 | 2017-12-31 | 2017-09-30 | 2017-06-30 | 2017-03-31 | 2016-12-31 | 2016-09-30 | 2016-06-30 | 2016-03-31 | 2015-12-31 | 2015-09-30 | 2015-06-30 | 2015-03-31 | 2014-12-31 | 2014-09-30 | 2014-06-30 | 2014-03-31 | 2013-12-31 | 2013-09-30 | 2013-06-30 | 2013-03-31 | 2012-12-31 | 2012-09-30 | 2012-06-30 | 2012-03-31 | 2011-12-31 | 2011-09-30 | 2011-06-30 | 2011-03-31 | 2010-12-31 | 2010-09-30 | 2010-06-30 | ||
|---|---|---|---|---|---|---|---|---|---|---|---|---|---|---|---|---|---|---|---|---|---|---|---|---|---|---|---|---|---|---|---|---|---|---|---|---|---|---|---|---|---|---|---|---|---|---|---|---|---|---|---|---|---|
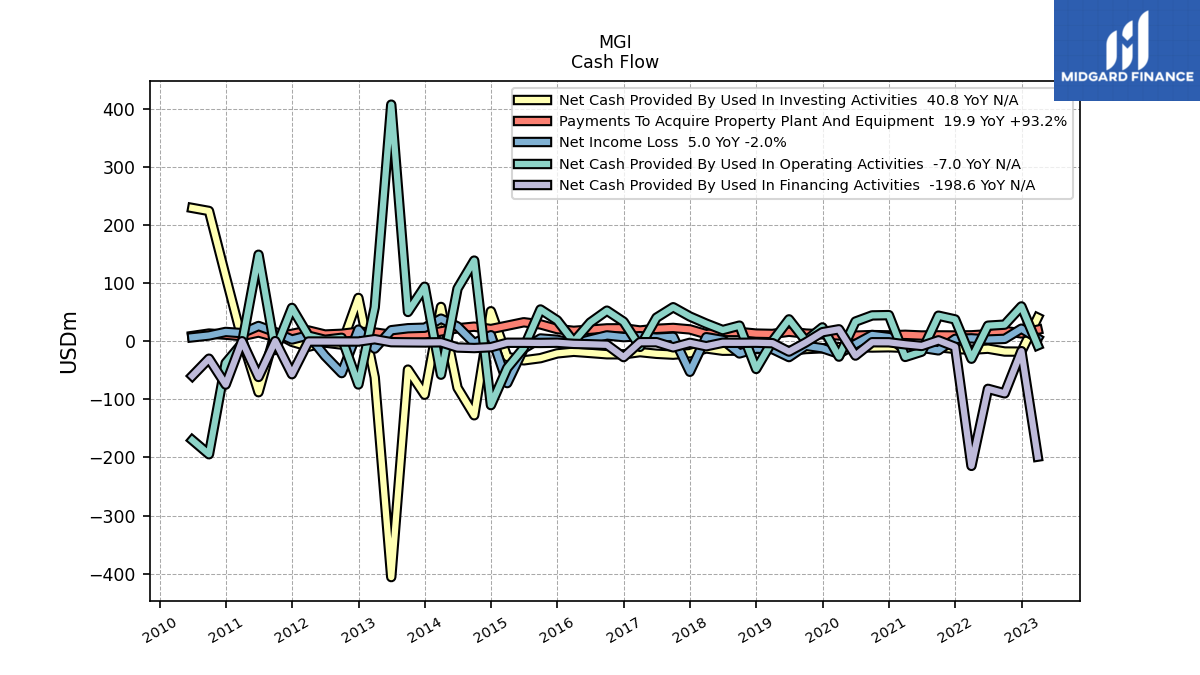
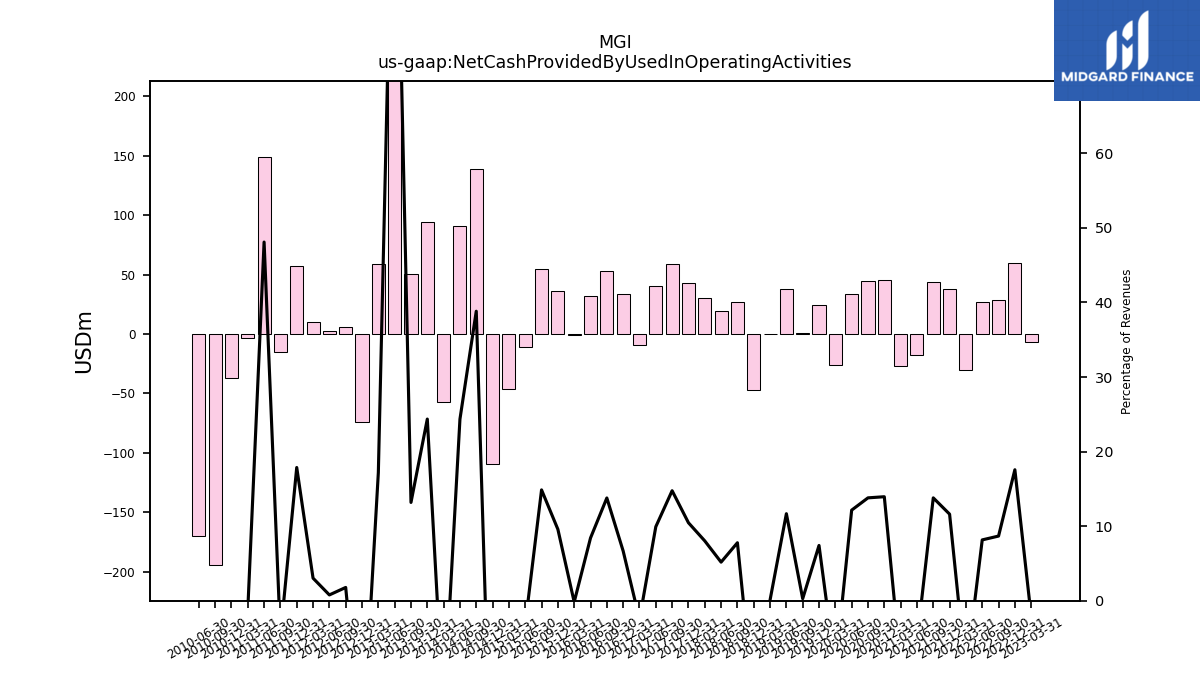
| Net Cash Provided By Used In Operating Activities | -7.00 | 60.10 | 28.70 | 26.90 | -30.00 | 37.70 | 44.10 | -17.80 | -26.90 | 45.10 | 44.60 | 34.00 | -26.40 | 24.00 | 0.90 | 37.80 | 0.30 | -47.60 | 27.00 | 19.40 | 30.50 | 42.70 | 58.70 | 40.70 | -9.60 | 33.70 | 52.80 | 32.30 | -0.60 | 36.10 | 54.80 | -11.30 | -46.00 | -109.90 | 139.00 | 90.70 | -57.50 | 94.00 | 50.50 | 407.50 | 58.50 | -74.36 | 6.04 | 2.58 | 9.64 | 57.51 | -15.03 | 149.10 | -3.73 | -37.38 | -194.52 | -170.04 | |
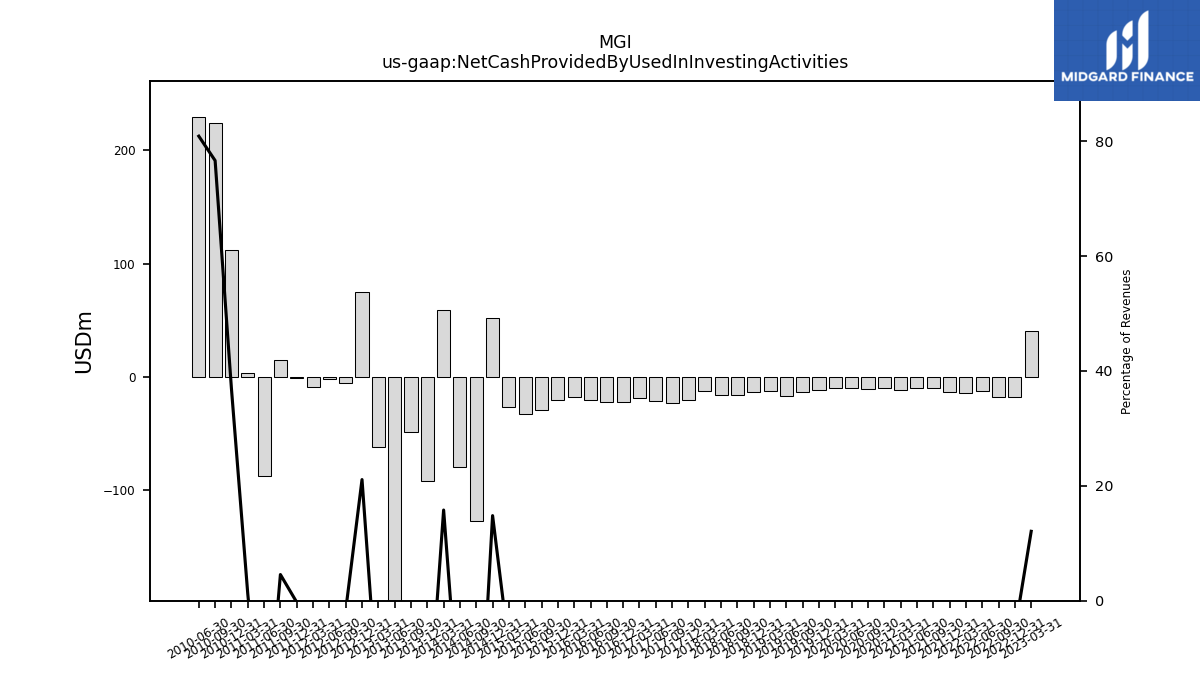
| Net Cash Provided By Used In Investing Activities | 40.80 | -17.80 | -17.60 | -12.70 | -14.50 | -13.10 | -10.20 | -10.00 | -11.20 | -10.20 | -10.70 | -9.80 | -10.10 | -12.00 | -13.30 | -16.50 | -12.70 | -13.30 | -16.00 | -16.20 | -12.30 | -20.50 | -23.00 | -21.50 | -18.60 | -22.40 | -22.30 | -20.10 | -18.00 | -20.80 | -29.00 | -32.80 | -26.90 | 51.80 | -127.40 | -80.00 | 59.20 | -92.00 | -48.70 | -406.00 | -62.10 | 74.75 | -5.67 | -2.21 | -9.28 | -0.83 | 14.68 | -87.71 | 3.55 | 111.97 | 224.42 | 229.59 | |
| Net Cash Provided By Used In Financing Activities | -198.60 | -16.90 | -89.60 | -81.80 | -214.50 | -9.50 | 1.70 | -8.00 | -5.20 | -1.70 | -1.60 | -24.60 | 20.70 | 15.70 | -2.00 | -17.70 | -3.20 | -2.40 | -2.60 | -2.50 | -8.50 | -2.60 | -10.40 | -1.50 | -1.60 | -27.20 | -6.00 | -5.10 | -4.40 | -2.40 | -2.80 | -2.50 | -2.50 | -10.10 | -11.60 | -10.70 | -1.70 | -2.00 | -1.80 | -1.50 | 3.60 | -0.40 | -0.38 | -0.37 | -0.35 | -56.67 | 0.35 | -61.38 | 0.18 | -74.58 | -29.90 | -59.56 |
| 2023-03-31 | 2022-12-31 | 2022-09-30 | 2022-06-30 | 2022-03-31 | 2021-12-31 | 2021-09-30 | 2021-06-30 | 2021-03-31 | 2020-12-31 | 2020-09-30 | 2020-06-30 | 2020-03-31 | 2019-12-31 | 2019-09-30 | 2019-06-30 | 2019-03-31 | 2018-12-31 | 2018-09-30 | 2018-06-30 | 2018-03-31 | 2017-12-31 | 2017-09-30 | 2017-06-30 | 2017-03-31 | 2016-12-31 | 2016-09-30 | 2016-06-30 | 2016-03-31 | 2015-12-31 | 2015-09-30 | 2015-06-30 | 2015-03-31 | 2014-12-31 | 2014-09-30 | 2014-06-30 | 2014-03-31 | 2013-12-31 | 2013-09-30 | 2013-06-30 | 2013-03-31 | 2012-12-31 | 2012-09-30 | 2012-06-30 | 2012-03-31 | 2011-12-31 | 2011-09-30 | 2011-06-30 | 2011-03-31 | 2010-12-31 | 2010-09-30 | 2010-06-30 | ||
|---|---|---|---|---|---|---|---|---|---|---|---|---|---|---|---|---|---|---|---|---|---|---|---|---|---|---|---|---|---|---|---|---|---|---|---|---|---|---|---|---|---|---|---|---|---|---|---|---|---|---|---|---|---|
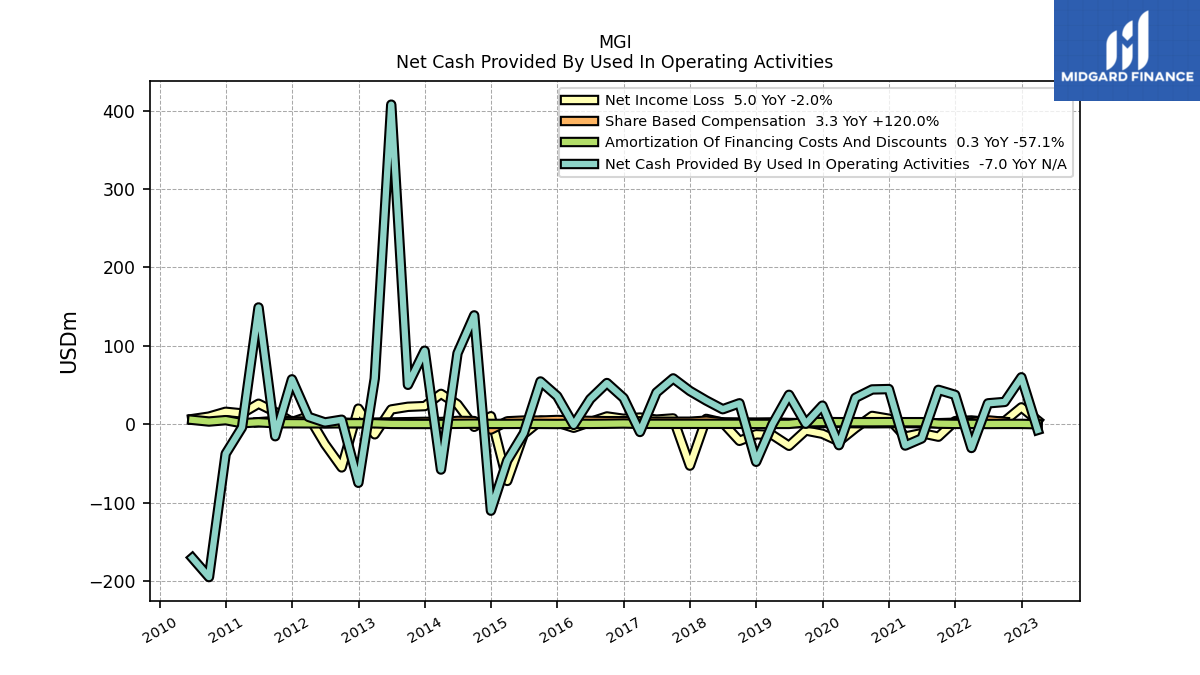
| Net Cash Provided By Used In Operating Activities | -7.00 | 60.10 | 28.70 | 26.90 | -30.00 | 37.70 | 44.10 | -17.80 | -26.90 | 45.10 | 44.60 | 34.00 | -26.40 | 24.00 | 0.90 | 37.80 | 0.30 | -47.60 | 27.00 | 19.40 | 30.50 | 42.70 | 58.70 | 40.70 | -9.60 | 33.70 | 52.80 | 32.30 | -0.60 | 36.10 | 54.80 | -11.30 | -46.00 | -109.90 | 139.00 | 90.70 | -57.50 | 94.00 | 50.50 | 407.50 | 58.50 | -74.36 | 6.04 | 2.58 | 9.64 | 57.51 | -15.03 | 149.10 | -3.73 | -37.38 | -194.52 | -170.04 | |
| Net Income Loss | 5.00 | 21.80 | 4.20 | 3.10 | 5.10 | 4.20 | -15.60 | -11.10 | -15.40 | 7.30 | 10.90 | -4.60 | -21.50 | -11.90 | -7.70 | -27.20 | -13.50 | -12.50 | -20.90 | 2.30 | 7.10 | -52.50 | 7.70 | 6.20 | 8.80 | 7.20 | 10.20 | 3.10 | -4.20 | 2.60 | 4.90 | -12.40 | -72.00 | 10.50 | -3.00 | 25.60 | 39.00 | 23.40 | 22.50 | 19.10 | -12.60 | 20.20 | -54.76 | -25.06 | 10.27 | 3.10 | 15.83 | 26.40 | 14.04 | 16.16 | 9.98 | 6.85 | |
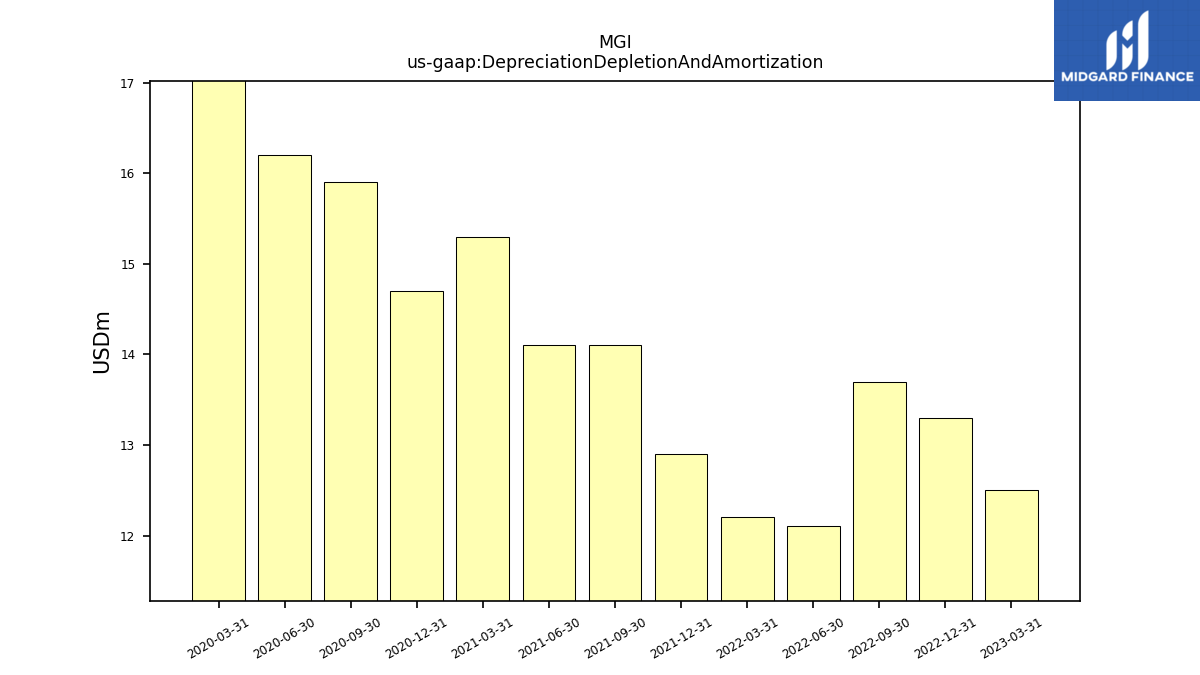
| Depreciation Depletion And Amortization | 12.50 | 13.30 | 13.70 | 12.10 | 12.20 | 12.90 | 14.10 | 14.10 | 15.30 | 14.70 | 15.90 | 16.20 | 17.10 | NA | NA | NA | NA | NA | NA | NA | NA | NA | NA | NA | NA | NA | NA | NA | NA | NA | NA | NA | NA | NA | NA | NA | NA | NA | NA | NA | NA | NA | NA | NA | NA | NA | NA | NA | NA | NA | NA | NA | |
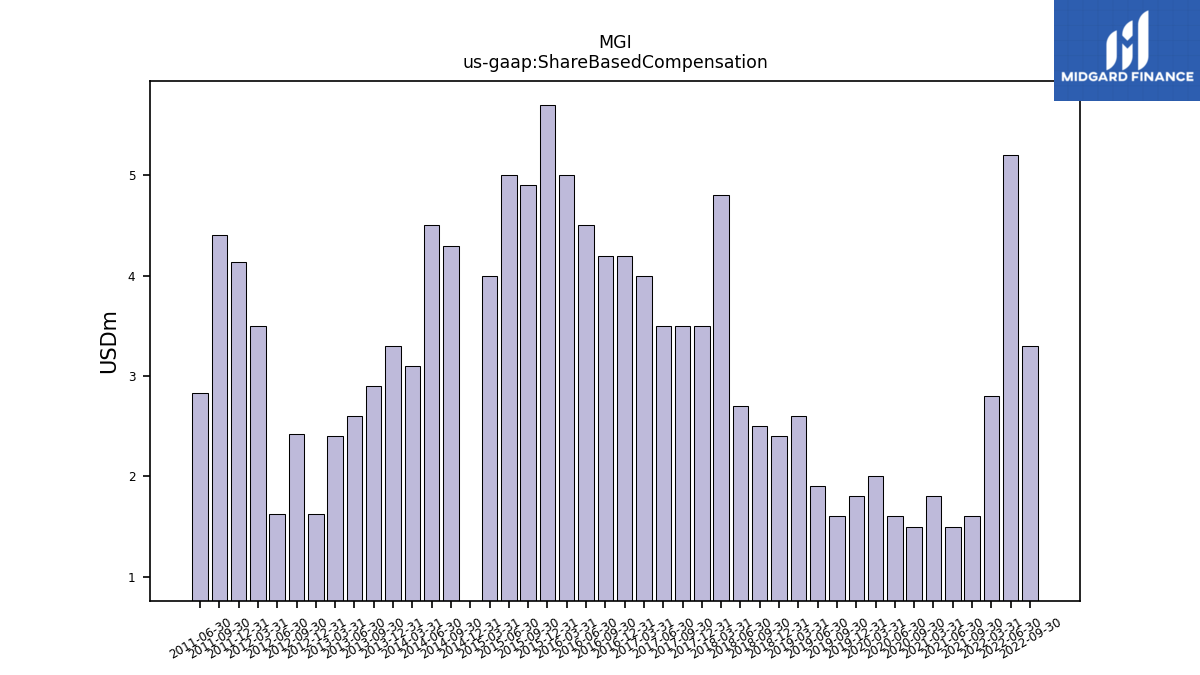
| Share Based Compensation | NA | NA | 3.30 | 5.20 | 2.80 | NA | 1.60 | 1.50 | 1.80 | NA | 1.50 | 1.60 | 2.00 | 1.80 | 1.60 | 1.90 | 2.60 | 2.40 | 2.50 | 2.70 | 4.80 | 3.50 | 3.50 | 3.50 | 4.00 | 4.20 | 4.20 | 4.50 | 5.00 | 5.70 | 4.90 | 5.00 | 4.00 | -6.50 | 4.30 | 4.50 | 3.10 | 3.30 | 2.90 | 2.60 | 2.40 | 1.62 | 2.42 | 1.63 | 3.50 | 4.13 | 4.40 | 2.83 | NA | NA | NA | NA |
| 2023-03-31 | 2022-12-31 | 2022-09-30 | 2022-06-30 | 2022-03-31 | 2021-12-31 | 2021-09-30 | 2021-06-30 | 2021-03-31 | 2020-12-31 | 2020-09-30 | 2020-06-30 | 2020-03-31 | 2019-12-31 | 2019-09-30 | 2019-06-30 | 2019-03-31 | 2018-12-31 | 2018-09-30 | 2018-06-30 | 2018-03-31 | 2017-12-31 | 2017-09-30 | 2017-06-30 | 2017-03-31 | 2016-12-31 | 2016-09-30 | 2016-06-30 | 2016-03-31 | 2015-12-31 | 2015-09-30 | 2015-06-30 | 2015-03-31 | 2014-12-31 | 2014-09-30 | 2014-06-30 | 2014-03-31 | 2013-12-31 | 2013-09-30 | 2013-06-30 | 2013-03-31 | 2012-12-31 | 2012-09-30 | 2012-06-30 | 2012-03-31 | 2011-12-31 | 2011-09-30 | 2011-06-30 | 2011-03-31 | 2010-12-31 | 2010-09-30 | 2010-06-30 | ||
|---|---|---|---|---|---|---|---|---|---|---|---|---|---|---|---|---|---|---|---|---|---|---|---|---|---|---|---|---|---|---|---|---|---|---|---|---|---|---|---|---|---|---|---|---|---|---|---|---|---|---|---|---|---|
| Net Cash Provided By Used In Investing Activities | 40.80 | -17.80 | -17.60 | -12.70 | -14.50 | -13.10 | -10.20 | -10.00 | -11.20 | -10.20 | -10.70 | -9.80 | -10.10 | -12.00 | -13.30 | -16.50 | -12.70 | -13.30 | -16.00 | -16.20 | -12.30 | -20.50 | -23.00 | -21.50 | -18.60 | -22.40 | -22.30 | -20.10 | -18.00 | -20.80 | -29.00 | -32.80 | -26.90 | 51.80 | -127.40 | -80.00 | 59.20 | -92.00 | -48.70 | -406.00 | -62.10 | 74.75 | -5.67 | -2.21 | -9.28 | -0.83 | 14.68 | -87.71 | 3.55 | 111.97 | 224.42 | 229.59 | |
| Payments To Acquire Property Plant And Equipment | 19.90 | 13.60 | 17.80 | 12.10 | 10.30 | 10.00 | 10.20 | 10.00 | 11.20 | 10.20 | 10.70 | 9.80 | 10.10 | 12.00 | 13.30 | 16.50 | 12.70 | 13.30 | 16.00 | 16.20 | 12.30 | 20.50 | 23.00 | 21.50 | 18.60 | 22.40 | 22.30 | 20.10 | 18.00 | 21.10 | 29.10 | 32.80 | 26.90 | 21.10 | 25.20 | 22.40 | 17.10 | 11.60 | 10.80 | 11.20 | 15.20 | 16.39 | 12.92 | 11.66 | 18.63 | 12.79 | 7.24 | 15.22 | 8.97 | 11.37 | 13.35 | 9.15 | |
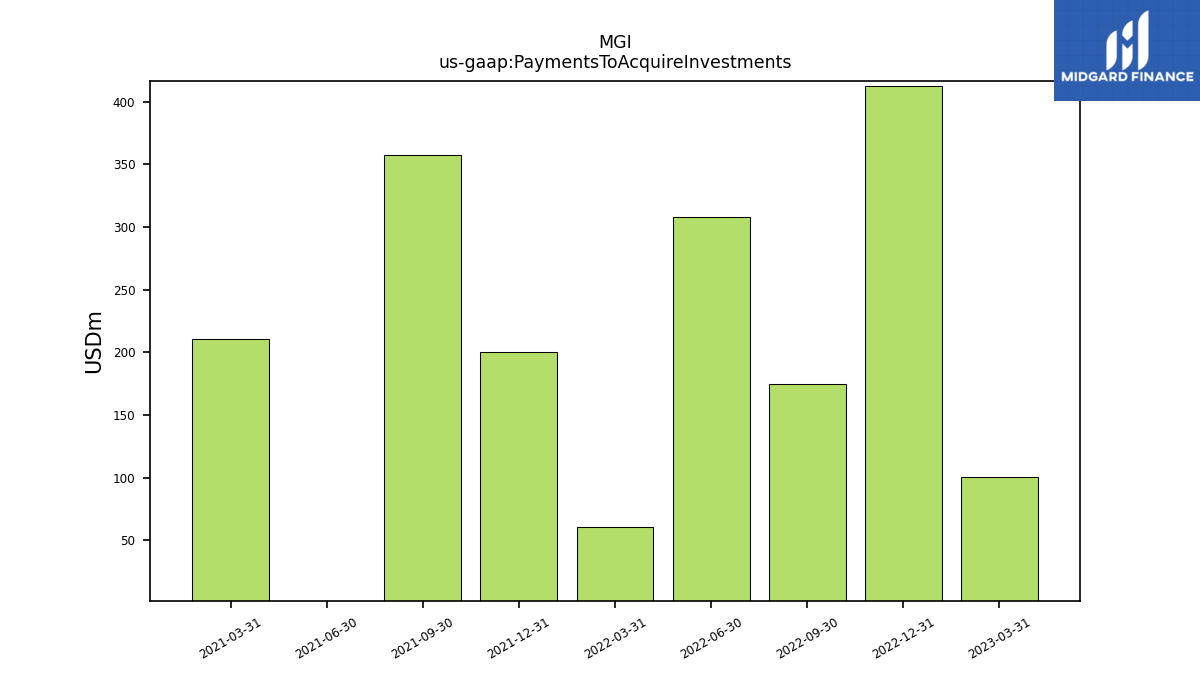
| Payments To Acquire Investments | 100.40 | 412.30 | 175.00 | 308.10 | 61.00 | 200.00 | 357.20 | 0.00 | 210.80 | NA | NA | NA | NA | NA | NA | NA | NA | NA | NA | NA | NA | NA | NA | NA | NA | NA | NA | NA | NA | NA | NA | NA | NA | NA | NA | NA | NA | NA | NA | NA | NA | NA | NA | NA | NA | NA | NA | NA | NA | NA | NA | NA |
| 2023-03-31 | 2022-12-31 | 2022-09-30 | 2022-06-30 | 2022-03-31 | 2021-12-31 | 2021-09-30 | 2021-06-30 | 2021-03-31 | 2020-12-31 | 2020-09-30 | 2020-06-30 | 2020-03-31 | 2019-12-31 | 2019-09-30 | 2019-06-30 | 2019-03-31 | 2018-12-31 | 2018-09-30 | 2018-06-30 | 2018-03-31 | 2017-12-31 | 2017-09-30 | 2017-06-30 | 2017-03-31 | 2016-12-31 | 2016-09-30 | 2016-06-30 | 2016-03-31 | 2015-12-31 | 2015-09-30 | 2015-06-30 | 2015-03-31 | 2014-12-31 | 2014-09-30 | 2014-06-30 | 2014-03-31 | 2013-12-31 | 2013-09-30 | 2013-06-30 | 2013-03-31 | 2012-12-31 | 2012-09-30 | 2012-06-30 | 2012-03-31 | 2011-12-31 | 2011-09-30 | 2011-06-30 | 2011-03-31 | 2010-12-31 | 2010-09-30 | 2010-06-30 | ||
|---|---|---|---|---|---|---|---|---|---|---|---|---|---|---|---|---|---|---|---|---|---|---|---|---|---|---|---|---|---|---|---|---|---|---|---|---|---|---|---|---|---|---|---|---|---|---|---|---|---|---|---|---|---|
| Net Cash Provided By Used In Financing Activities | -198.60 | -16.90 | -89.60 | -81.80 | -214.50 | -9.50 | 1.70 | -8.00 | -5.20 | -1.70 | -1.60 | -24.60 | 20.70 | 15.70 | -2.00 | -17.70 | -3.20 | -2.40 | -2.60 | -2.50 | -8.50 | -2.60 | -10.40 | -1.50 | -1.60 | -27.20 | -6.00 | -5.10 | -4.40 | -2.40 | -2.80 | -2.50 | -2.50 | -10.10 | -11.60 | -10.70 | -1.70 | -2.00 | -1.80 | -1.50 | 3.60 | -0.40 | -0.38 | -0.37 | -0.35 | -56.67 | 0.35 | -61.38 | 0.18 | -74.58 | -29.90 | -59.56 |
| 2023-03-31 | 2022-12-31 | 2022-09-30 | 2022-06-30 | 2022-03-31 | 2021-12-31 | 2021-09-30 | 2021-06-30 | 2021-03-31 | 2020-12-31 | 2020-09-30 | 2020-06-30 | 2020-03-31 | 2019-12-31 | 2019-09-30 | 2019-06-30 | 2019-03-31 | 2018-12-31 | 2018-09-30 | 2018-06-30 | 2018-03-31 | 2017-12-31 | 2017-09-30 | 2017-06-30 | 2017-03-31 | 2016-12-31 | 2016-09-30 | 2016-06-30 | 2016-03-31 | 2015-12-31 | 2015-09-30 | 2015-06-30 | 2015-03-31 | 2014-12-31 | 2014-09-30 | 2014-06-30 | 2014-03-31 | 2013-12-31 | 2013-09-30 | 2013-06-30 | 2013-03-31 | 2012-12-31 | 2012-09-30 | 2012-06-30 | 2012-03-31 | 2011-12-31 | 2011-09-30 | 2011-06-30 | 2011-03-31 | 2010-12-31 | 2010-09-30 | 2010-06-30 | ||
|---|---|---|---|---|---|---|---|---|---|---|---|---|---|---|---|---|---|---|---|---|---|---|---|---|---|---|---|---|---|---|---|---|---|---|---|---|---|---|---|---|---|---|---|---|---|---|---|---|---|---|---|---|---|
| Revenues | 337.50 | 342.10 | 330.80 | 329.60 | 307.60 | 324.60 | 319.60 | 329.30 | 310.10 | 323.30 | 323.20 | 279.80 | 290.90 | 323.70 | 324.60 | 323.80 | 315.40 | 345.80 | 347.20 | 374.60 | 380.00 | 408.20 | 397.80 | 410.00 | 386.10 | 505.20 | 383.10 | 383.70 | 358.40 | 376.70 | 368.60 | 358.80 | 330.60 | 349.60 | 358.00 | 372.40 | 374.90 | 385.80 | 383.00 | 365.10 | 340.50 | 354.40 | 338.55 | 330.14 | 318.10 | 321.80 | 321.95 | 309.95 | 294.02 | 303.37 | 292.89 | 283.90 | |
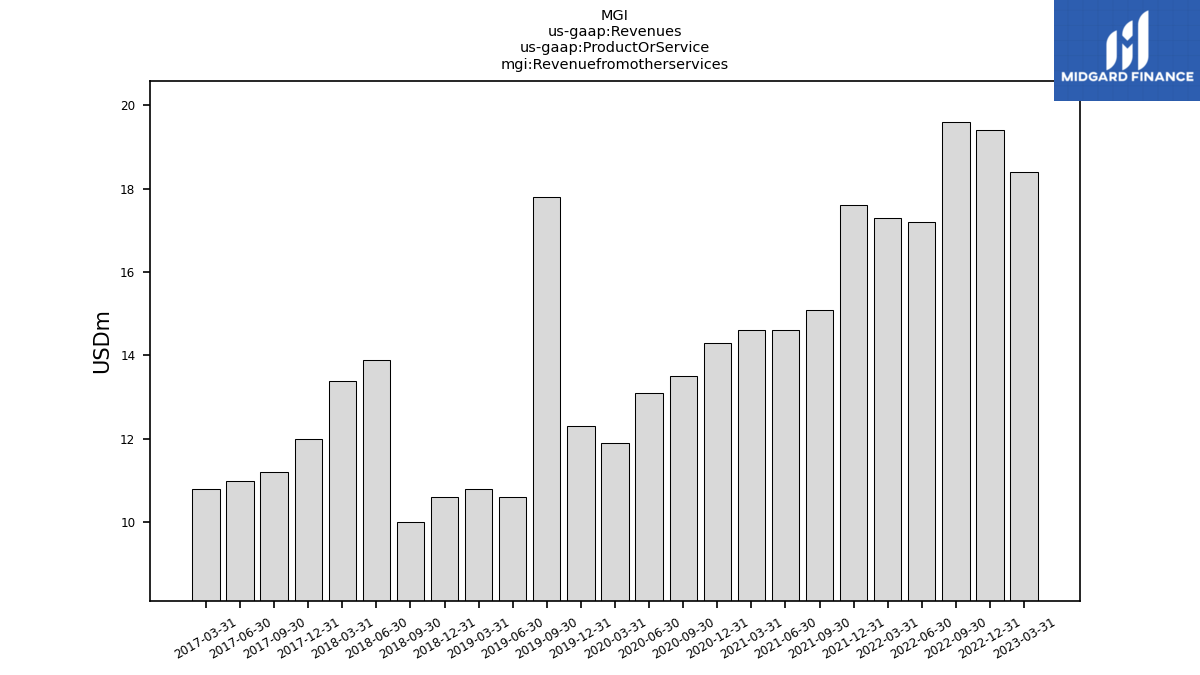
| Revenuefromotherservices | 18.40 | 19.40 | 19.60 | 17.20 | 17.30 | 17.60 | 15.10 | 14.60 | 14.60 | 14.30 | 13.50 | 13.10 | 11.90 | 12.30 | 17.80 | 10.60 | 10.80 | 10.60 | 10.00 | 13.90 | 13.40 | 12.00 | 11.20 | 11.00 | 10.80 | NA | NA | NA | NA | NA | NA | NA | NA | NA | NA | NA | NA | NA | NA | NA | NA | NA | NA | NA | NA | NA | NA | NA | NA | NA | NA | NA | |
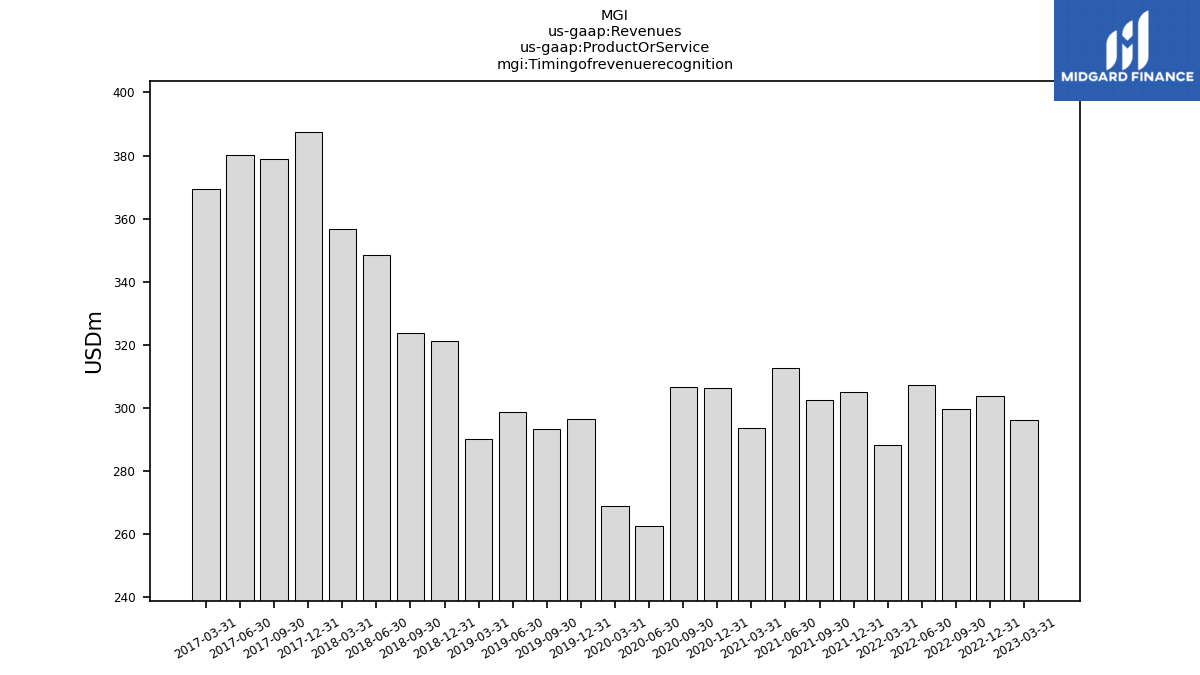
| Timingofrevenuerecognition | 296.30 | 303.70 | 299.50 | 307.30 | 288.20 | 305.10 | 302.60 | 312.70 | 293.50 | 306.40 | 306.70 | 262.40 | 268.90 | 296.60 | 293.40 | 298.70 | 290.20 | 321.20 | 323.70 | 348.60 | 356.70 | 387.40 | 378.90 | 380.10 | 369.50 | NA | NA | NA | NA | NA | NA | NA | NA | NA | NA | NA | NA | NA | NA | NA | NA | NA | NA | NA | NA | NA | NA | NA | NA | NA | NA | NA | |
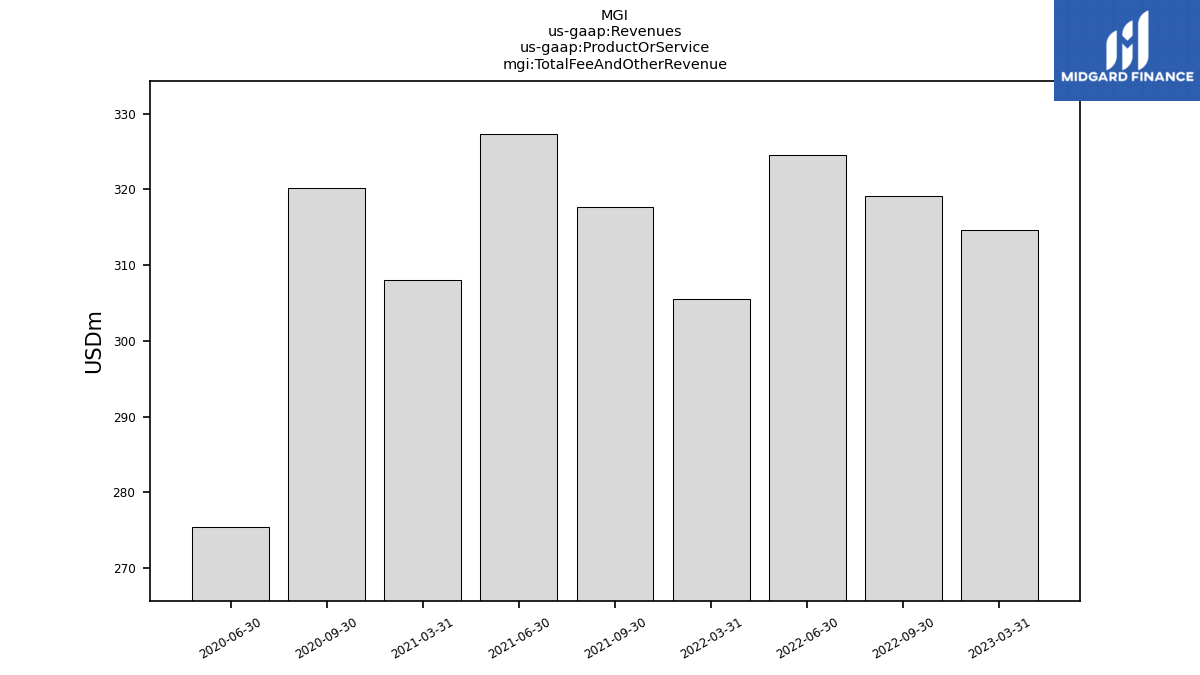
| Total Fee And Other Revenue | 314.70 | NA | 319.10 | 324.50 | 305.50 | NA | 317.70 | 327.30 | 308.10 | NA | 320.20 | 275.50 | NA | NA | NA | NA | NA | NA | NA | NA | NA | NA | NA | NA | NA | NA | NA | NA | NA | NA | NA | NA | NA | NA | NA | NA | NA | NA | NA | NA | NA | NA | NA | NA | NA | NA | NA | NA | NA | NA | NA | NA | |
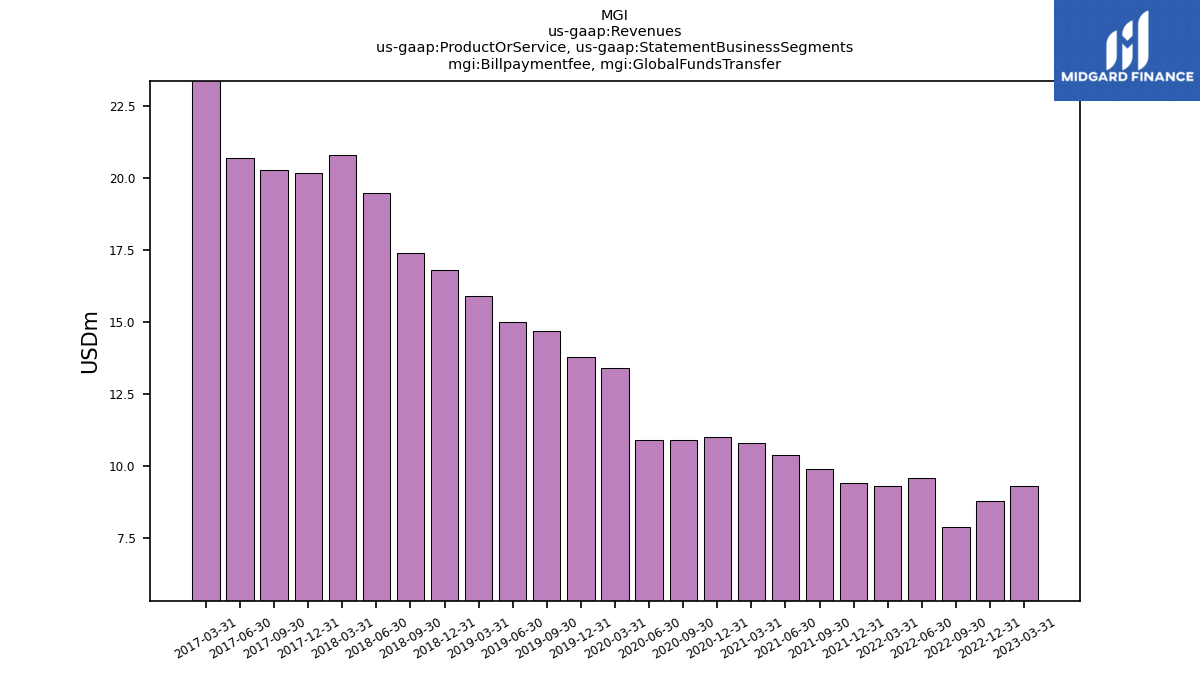
| Billpaymentfee, Global Funds Transfer | 9.30 | 8.80 | 7.90 | 9.60 | 9.30 | 9.40 | 9.90 | 10.40 | 10.80 | 11.00 | 10.90 | 10.90 | 13.40 | 13.80 | 14.70 | 15.00 | 15.90 | 16.80 | 17.40 | 19.50 | 20.80 | 20.20 | 20.30 | 20.70 | 25.10 | NA | NA | NA | NA | NA | NA | NA | NA | NA | NA | NA | NA | NA | NA | NA | NA | NA | NA | NA | NA | NA | NA | NA | NA | NA | NA | NA | |
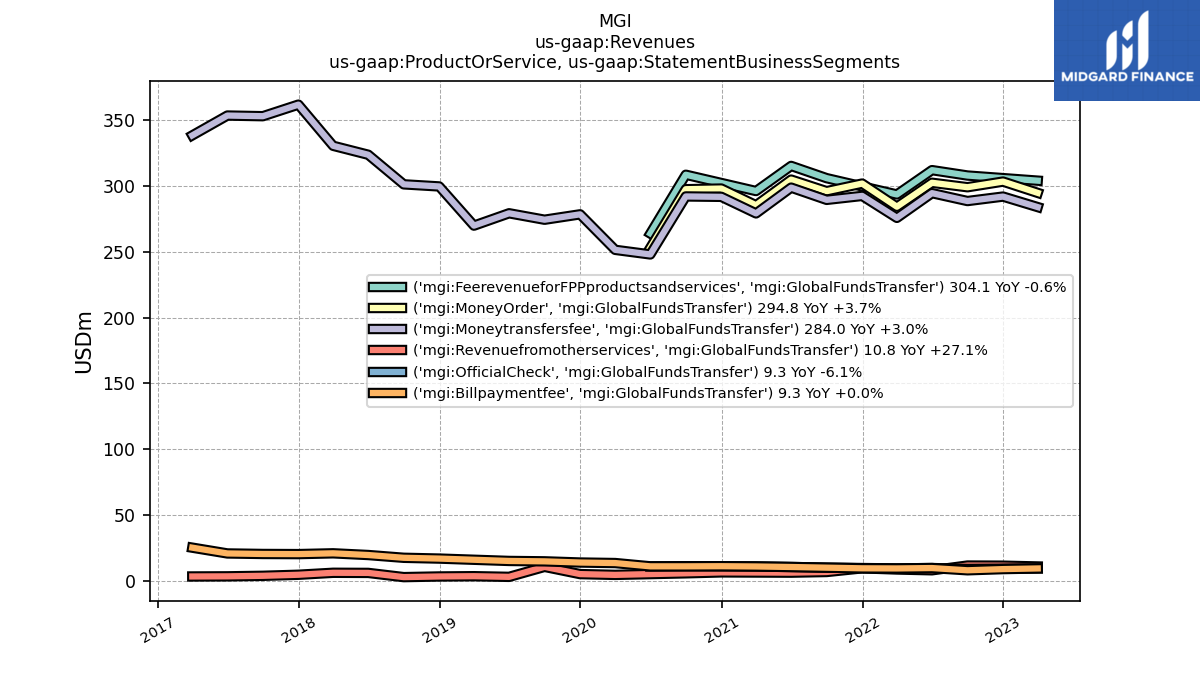
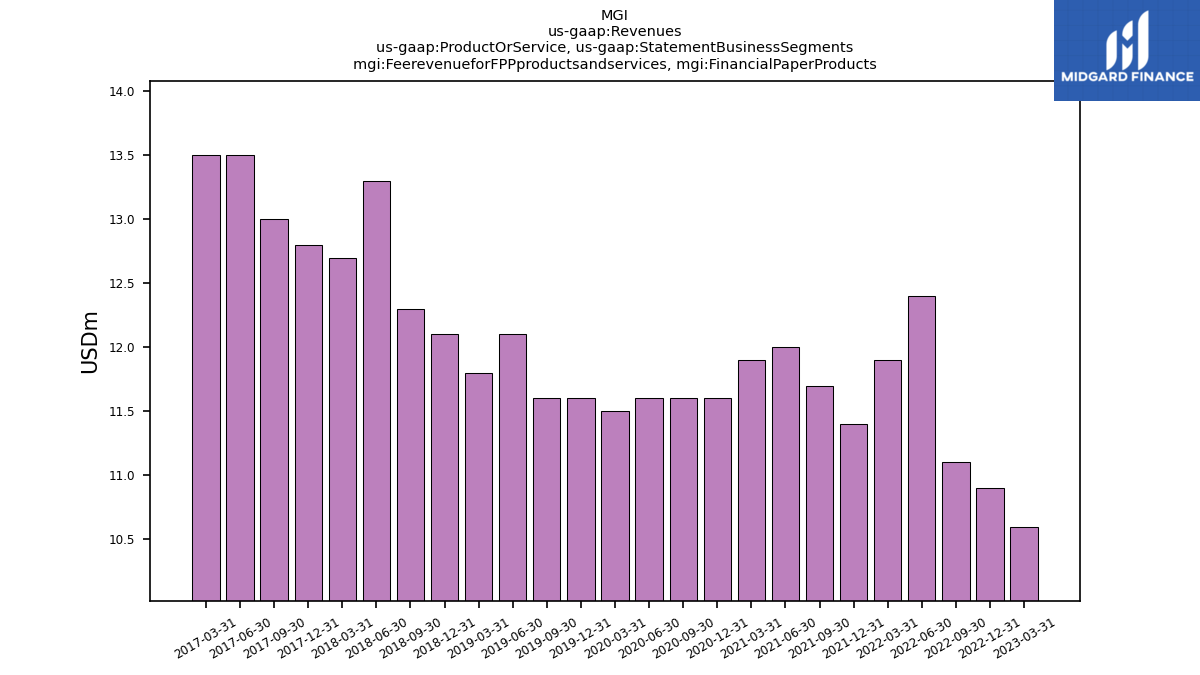
| Feerevenuefor F P Pproductsandservices, Financial Paper Products | 10.60 | 10.90 | 11.10 | 12.40 | 11.90 | 11.40 | 11.70 | 12.00 | 11.90 | 11.60 | 11.60 | 11.60 | 11.50 | 11.60 | 11.60 | 12.10 | 11.80 | 12.10 | 12.30 | 13.30 | 12.70 | 12.80 | 13.00 | 13.50 | 13.50 | NA | NA | NA | NA | NA | NA | NA | NA | NA | NA | NA | NA | NA | NA | NA | NA | NA | NA | NA | NA | NA | NA | NA | NA | NA | NA | NA | |
| Feerevenuefor F P Pproductsandservices, Global Funds Transfer | 304.10 | NA | 308.00 | 312.10 | 293.60 | NA | 306.00 | 315.30 | 296.20 | NA | 308.60 | 263.90 | NA | NA | NA | NA | NA | NA | NA | NA | NA | NA | NA | NA | NA | NA | NA | NA | NA | NA | NA | NA | NA | NA | NA | NA | NA | NA | NA | NA | NA | NA | NA | NA | NA | NA | NA | NA | NA | NA | NA | NA | |
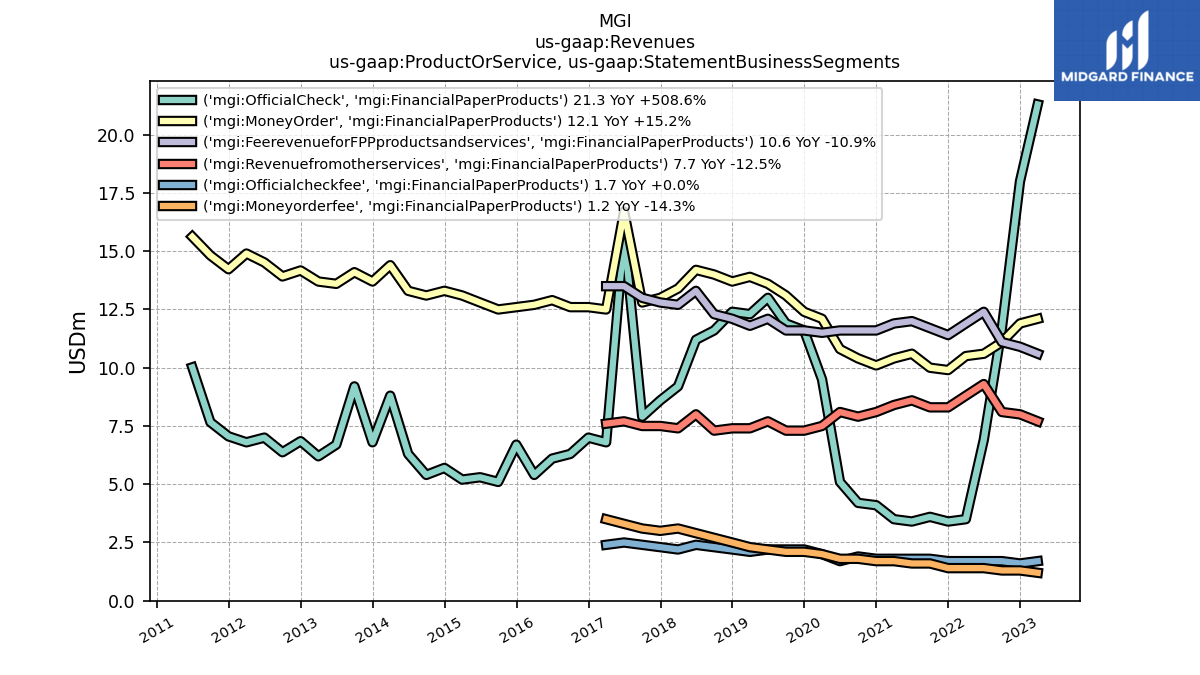
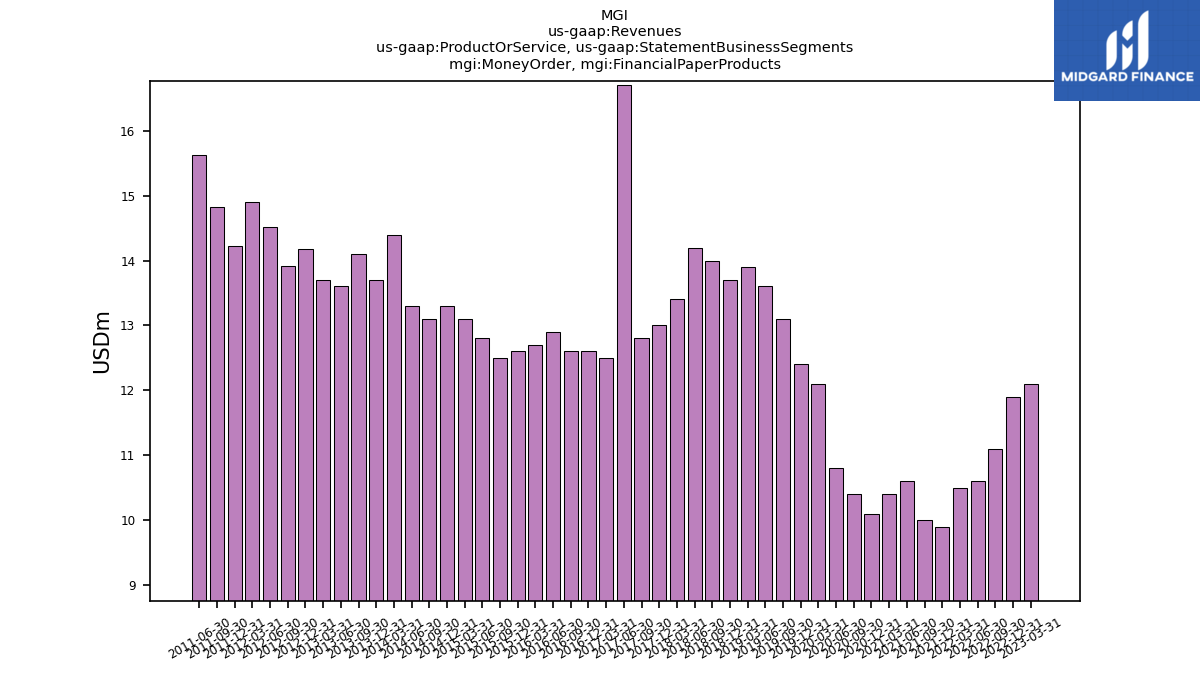
| Money Order, Financial Paper Products | 12.10 | 11.90 | 11.10 | 10.60 | 10.50 | 9.90 | 10.00 | 10.60 | 10.40 | 10.10 | 10.40 | 10.80 | 12.10 | 12.40 | 13.10 | 13.60 | 13.90 | 13.70 | 14.00 | 14.20 | 13.40 | 13.00 | 12.80 | 16.70 | 12.50 | 12.60 | 12.60 | 12.90 | 12.70 | 12.60 | 12.50 | 12.80 | 13.10 | 13.30 | 13.10 | 13.30 | 14.40 | 13.70 | 14.10 | 13.60 | 13.70 | 14.17 | 13.92 | 14.52 | 14.90 | 14.23 | 14.82 | 15.62 | NA | NA | NA | NA | |
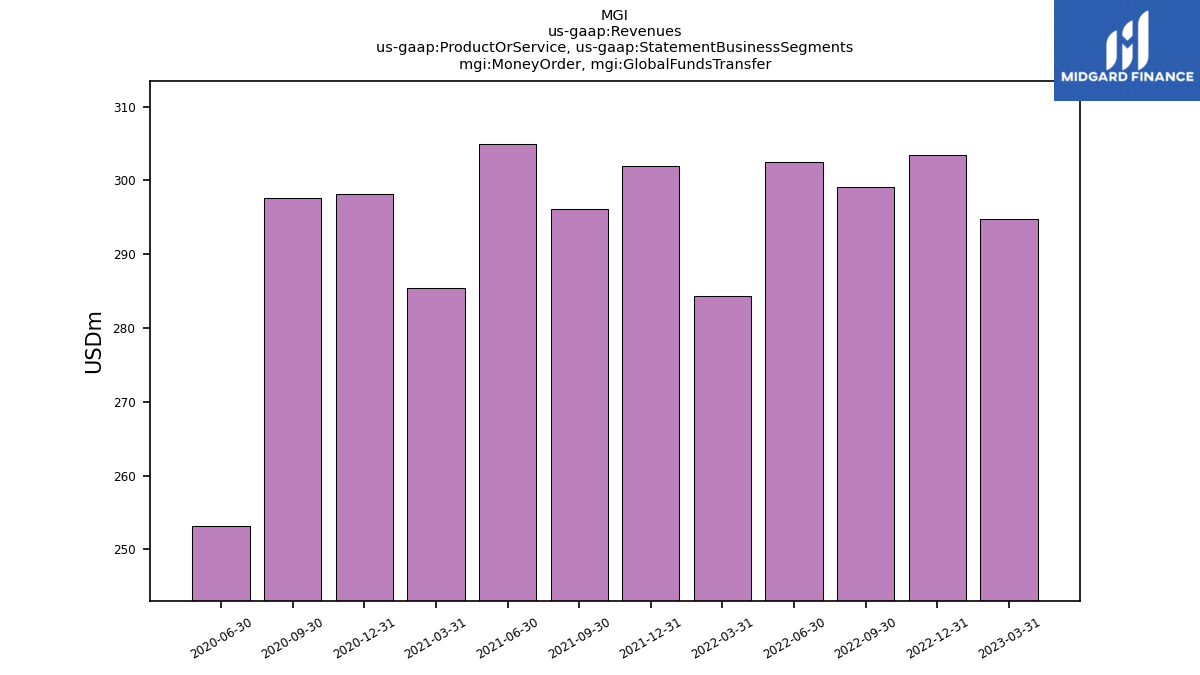
| Money Order, Global Funds Transfer | 294.80 | 303.40 | 299.10 | 302.50 | 284.30 | 301.90 | 296.10 | 304.90 | 285.40 | 298.10 | 297.60 | 253.10 | NA | NA | NA | NA | NA | NA | NA | NA | NA | NA | NA | NA | NA | NA | NA | NA | NA | NA | NA | NA | NA | NA | NA | NA | NA | NA | NA | NA | NA | NA | NA | NA | NA | NA | NA | NA | NA | NA | NA | NA | |
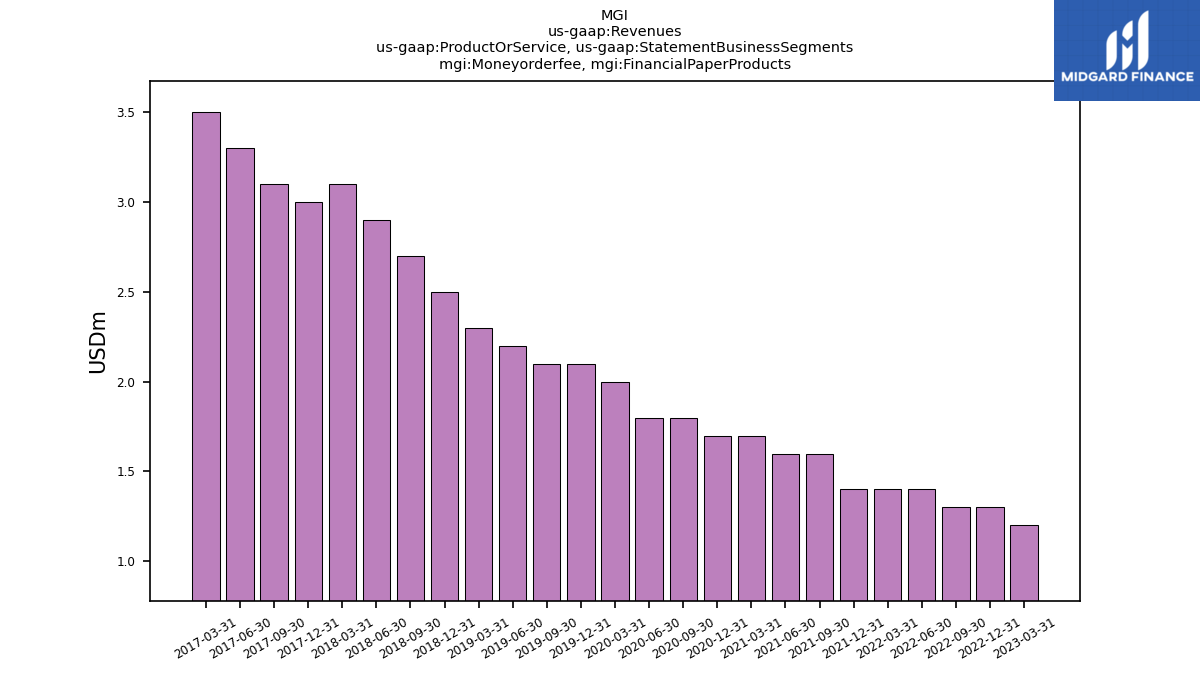
| Moneyorderfee, Financial Paper Products | 1.20 | 1.30 | 1.30 | 1.40 | 1.40 | 1.40 | 1.60 | 1.60 | 1.70 | 1.70 | 1.80 | 1.80 | 2.00 | 2.10 | 2.10 | 2.20 | 2.30 | 2.50 | 2.70 | 2.90 | 3.10 | 3.00 | 3.10 | 3.30 | 3.50 | NA | NA | NA | NA | NA | NA | NA | NA | NA | NA | NA | NA | NA | NA | NA | NA | NA | NA | NA | NA | NA | NA | NA | NA | NA | NA | NA | |
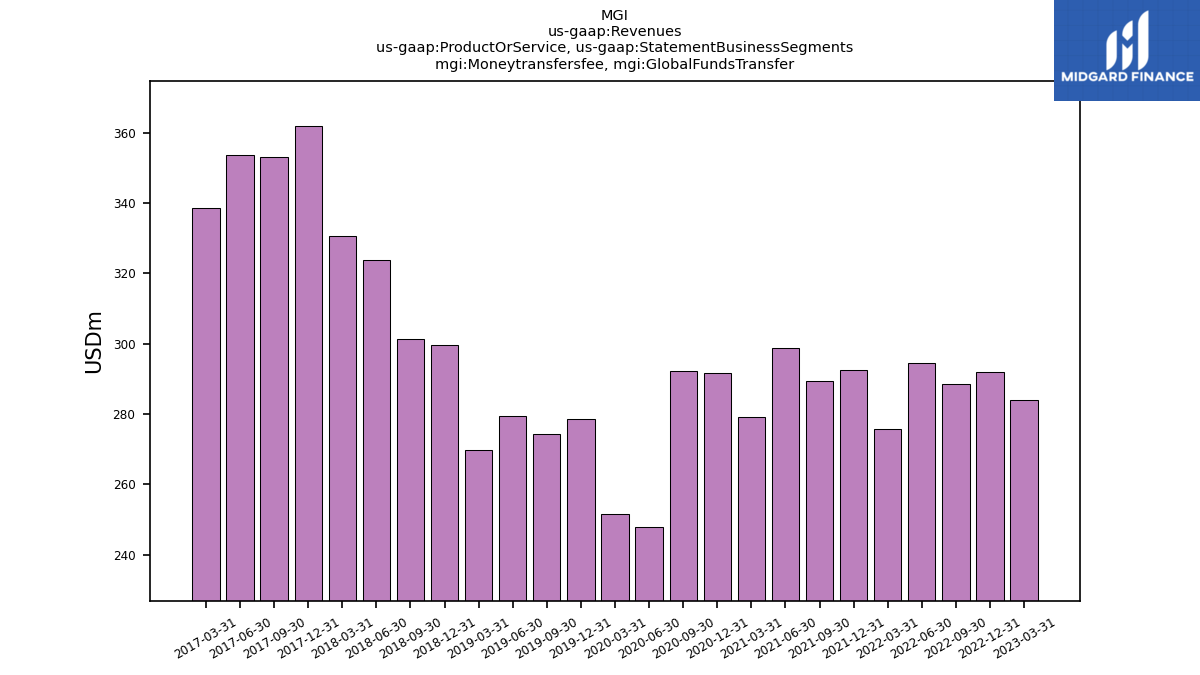
| Moneytransfersfee, Global Funds Transfer | 284.00 | 292.00 | 288.60 | 294.60 | 275.80 | 292.50 | 289.50 | 298.80 | 279.20 | 291.80 | 292.10 | 248.00 | 251.50 | 278.50 | 274.40 | 279.30 | 269.90 | 299.70 | 301.30 | 323.80 | 330.60 | 361.90 | 353.10 | 353.60 | 338.50 | NA | NA | NA | NA | NA | NA | NA | NA | NA | NA | NA | NA | NA | NA | NA | NA | NA | NA | NA | NA | NA | NA | NA | NA | NA | NA | NA | |
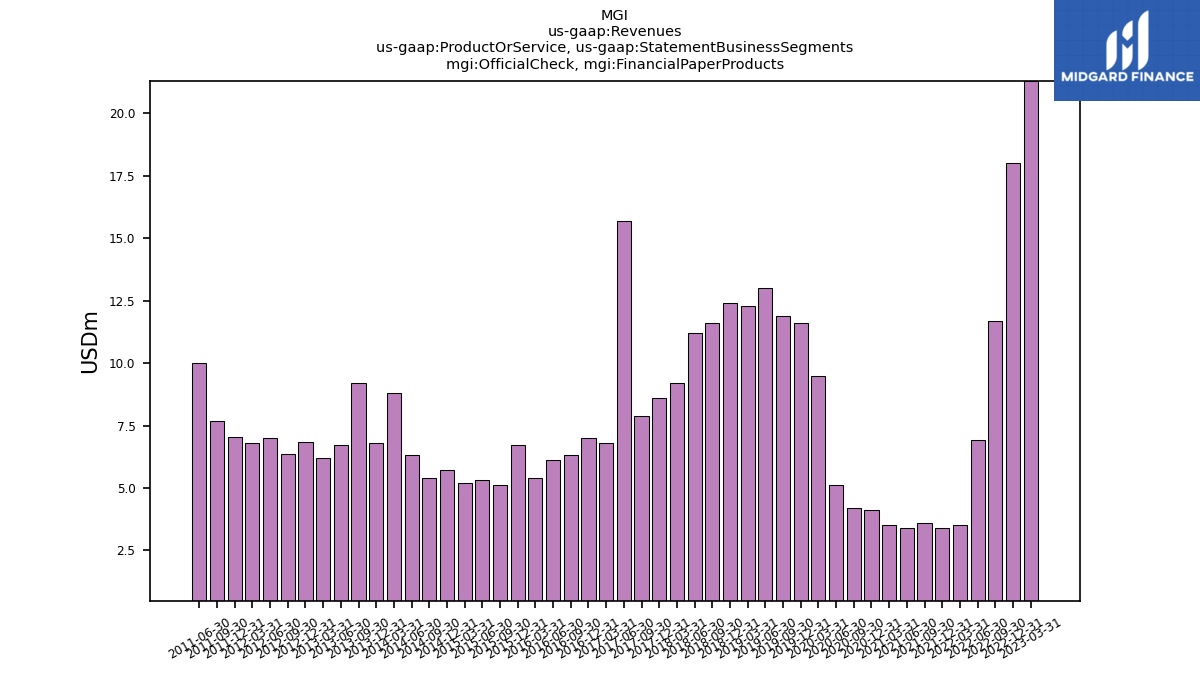
| Official Check, Financial Paper Products | 21.30 | 18.00 | 11.70 | 6.90 | 3.50 | 3.40 | 3.60 | 3.40 | 3.50 | 4.10 | 4.20 | 5.10 | 9.50 | 11.60 | 11.90 | 13.00 | 12.30 | 12.40 | 11.60 | 11.20 | 9.20 | 8.60 | 7.90 | 15.70 | 6.80 | 7.00 | 6.30 | 6.10 | 5.40 | 6.70 | 5.10 | 5.30 | 5.20 | 5.70 | 5.40 | 6.30 | 8.80 | 6.80 | 9.20 | 6.70 | 6.20 | 6.85 | 6.37 | 7.00 | 6.80 | 7.05 | 7.66 | 10.02 | NA | NA | NA | NA | |
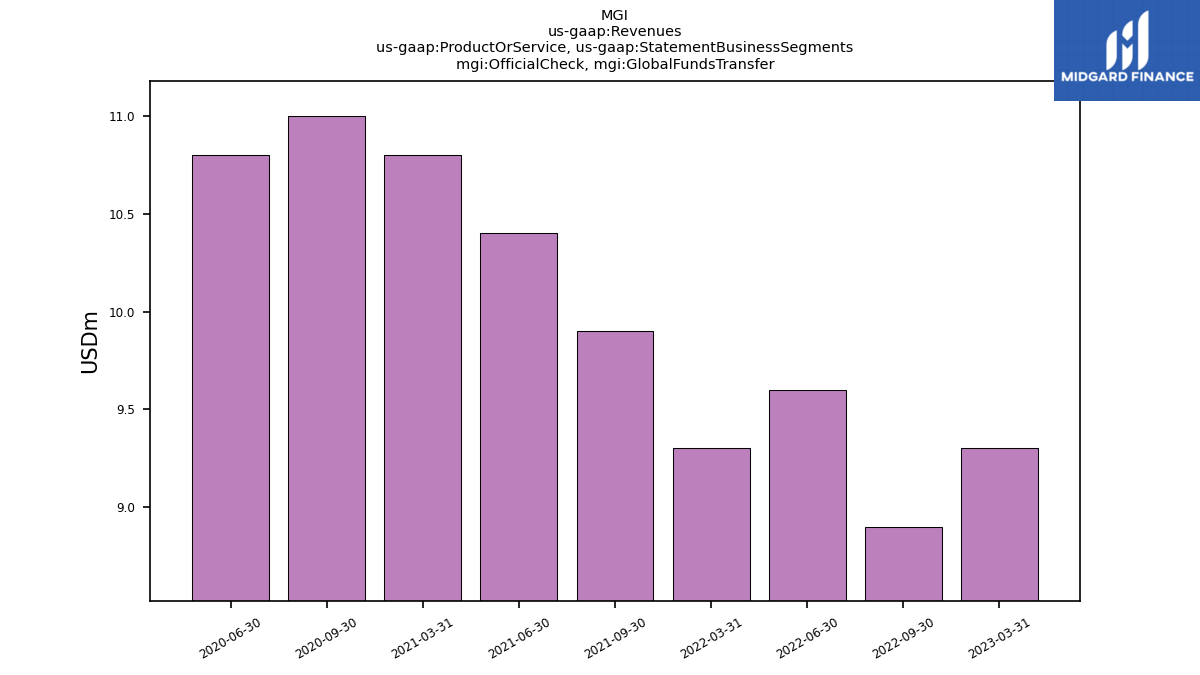
| Official Check, Global Funds Transfer | 9.30 | NA | 8.90 | 9.60 | 9.30 | NA | 9.90 | 10.40 | 10.80 | NA | 11.00 | 10.80 | NA | NA | NA | NA | NA | NA | NA | NA | NA | NA | NA | NA | NA | NA | NA | NA | NA | NA | NA | NA | NA | NA | NA | NA | NA | NA | NA | NA | NA | NA | NA | NA | NA | NA | NA | NA | NA | NA | NA | NA | |
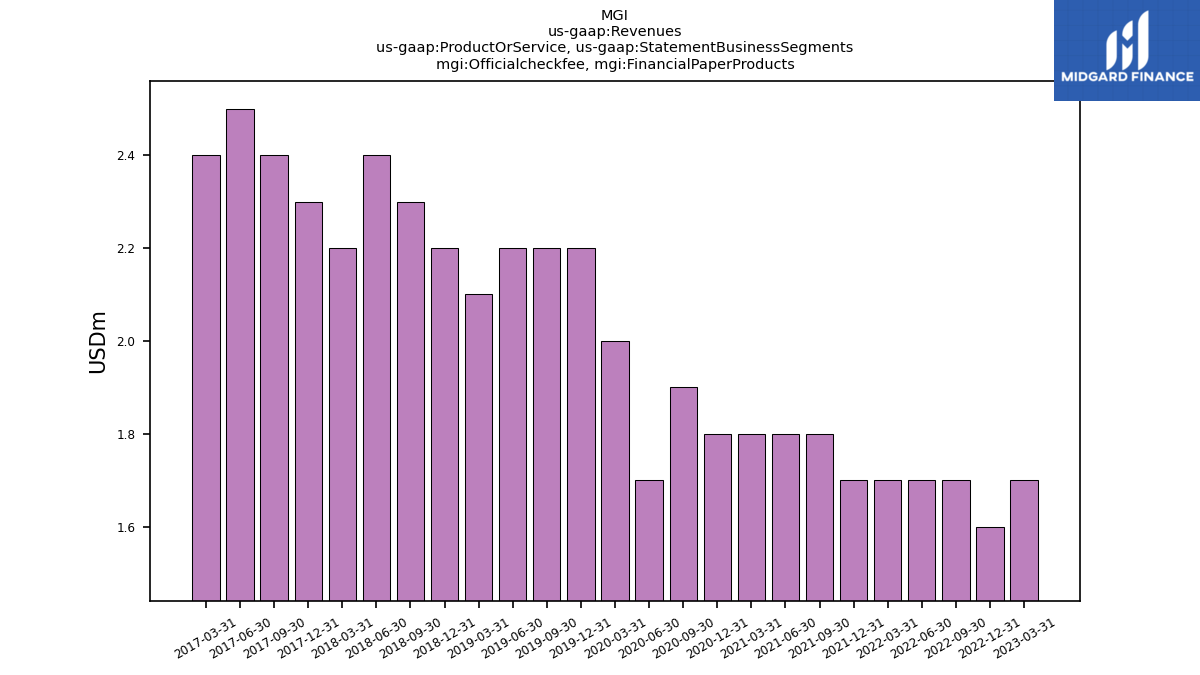
| Officialcheckfee, Financial Paper Products | 1.70 | 1.60 | 1.70 | 1.70 | 1.70 | 1.70 | 1.80 | 1.80 | 1.80 | 1.80 | 1.90 | 1.70 | 2.00 | 2.20 | 2.20 | 2.20 | 2.10 | 2.20 | 2.30 | 2.40 | 2.20 | 2.30 | 2.40 | 2.50 | 2.40 | NA | NA | NA | NA | NA | NA | NA | NA | NA | NA | NA | NA | NA | NA | NA | NA | NA | NA | NA | NA | NA | NA | NA | NA | NA | NA | NA | |
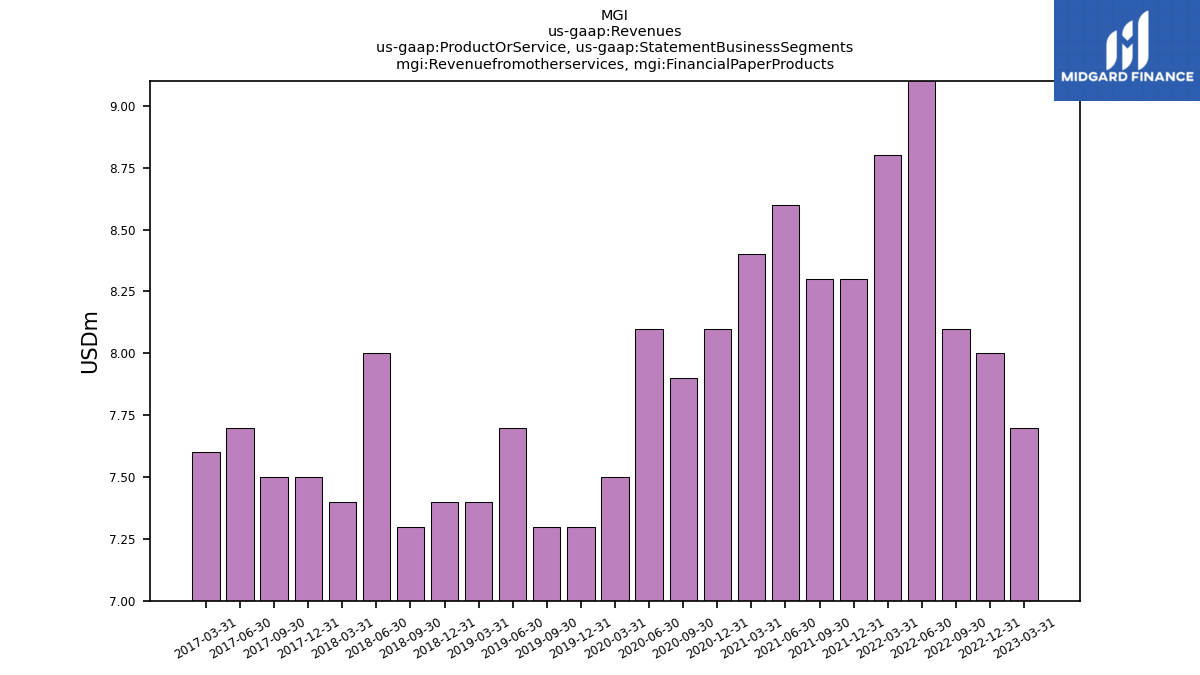
| Revenuefromotherservices, Financial Paper Products | 7.70 | 8.00 | 8.10 | 9.30 | 8.80 | 8.30 | 8.30 | 8.60 | 8.40 | 8.10 | 7.90 | 8.10 | 7.50 | 7.30 | 7.30 | 7.70 | 7.40 | 7.40 | 7.30 | 8.00 | 7.40 | 7.50 | 7.50 | 7.70 | 7.60 | NA | NA | NA | NA | NA | NA | NA | NA | NA | NA | NA | NA | NA | NA | NA | NA | NA | NA | NA | NA | NA | NA | NA | NA | NA | NA | NA | |
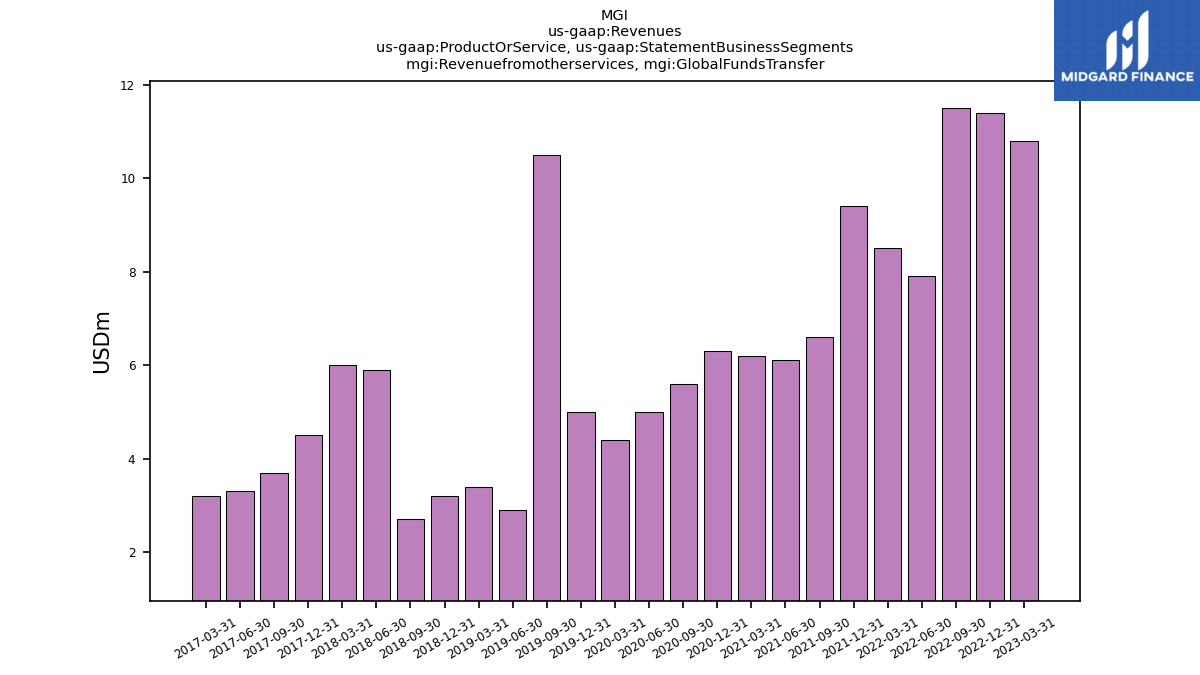
| Revenuefromotherservices, Global Funds Transfer | 10.80 | 11.40 | 11.50 | 7.90 | 8.50 | 9.40 | 6.60 | 6.10 | 6.20 | 6.30 | 5.60 | 5.00 | 4.40 | 5.00 | 10.50 | 2.90 | 3.40 | 3.20 | 2.70 | 5.90 | 6.00 | 4.50 | 3.70 | 3.30 | 3.20 | NA | NA | NA | NA | NA | NA | NA | NA | NA | NA | NA | NA | NA | NA | NA | NA | NA | NA | NA | NA | NA | NA | NA | NA | NA | NA | NA | |
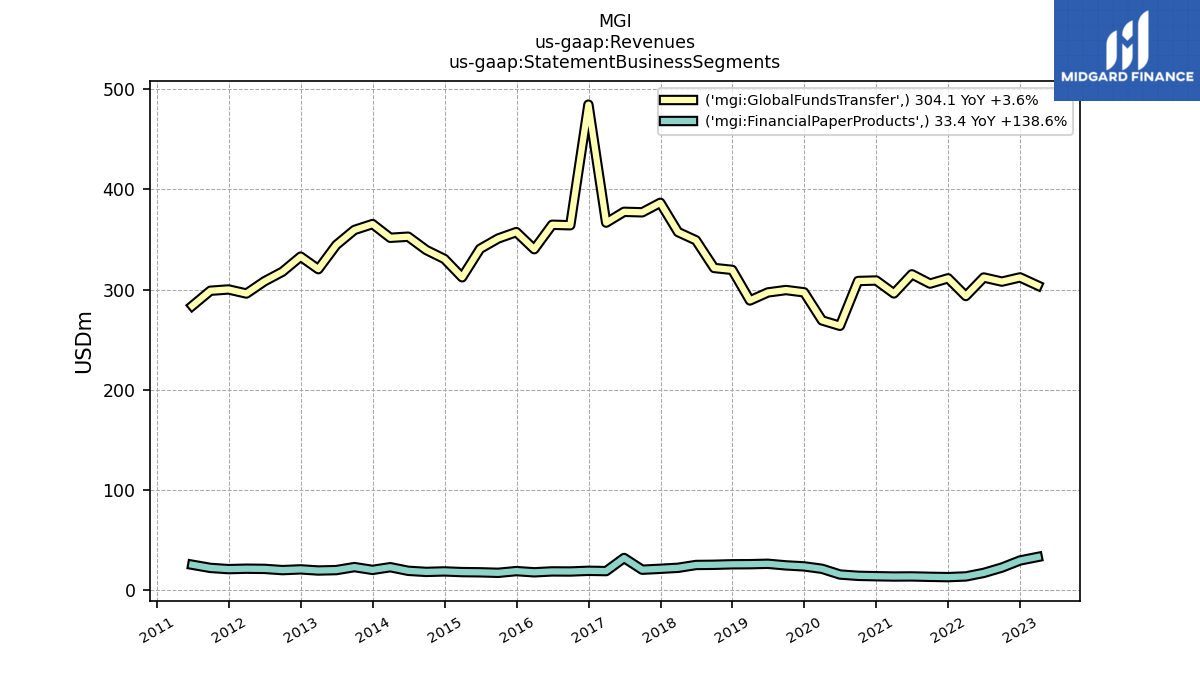
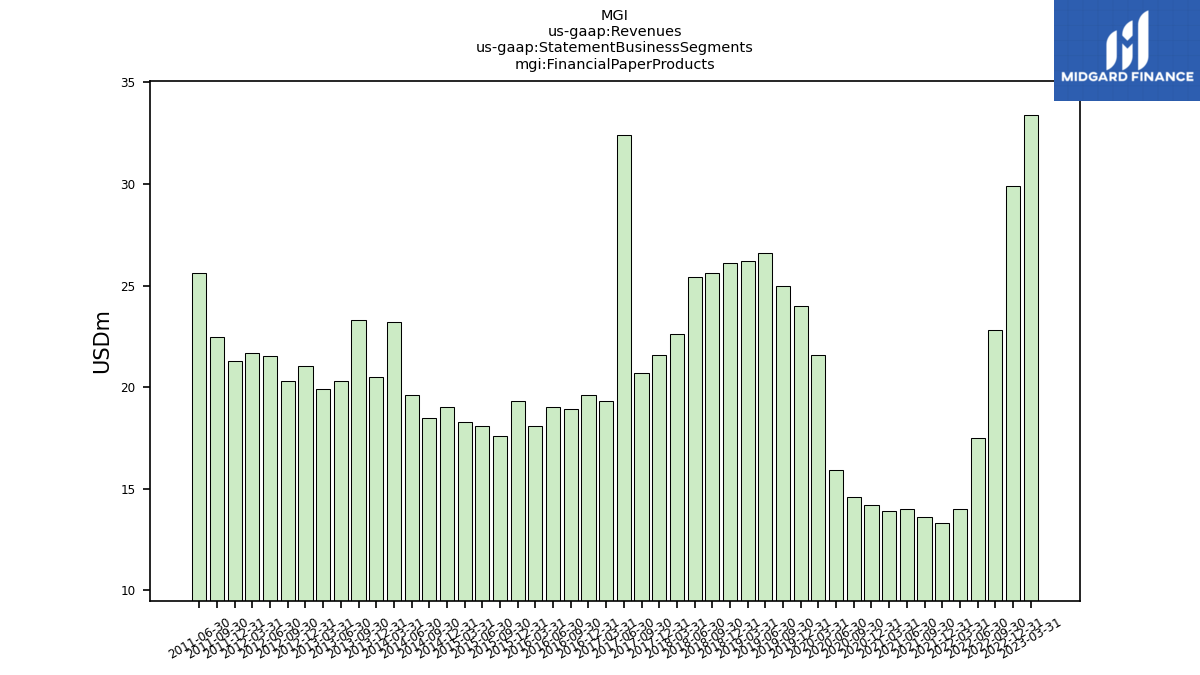
| Financial Paper Products | 33.40 | 29.90 | 22.80 | 17.50 | 14.00 | 13.30 | 13.60 | 14.00 | 13.90 | 14.20 | 14.60 | 15.90 | 21.60 | 24.00 | 25.00 | 26.60 | 26.20 | 26.10 | 25.60 | 25.40 | 22.60 | 21.60 | 20.70 | 32.40 | 19.30 | 19.60 | 18.90 | 19.00 | 18.10 | 19.30 | 17.60 | 18.10 | 18.30 | 19.00 | 18.50 | 19.60 | 23.20 | 20.50 | 23.30 | 20.30 | 19.90 | 21.02 | 20.29 | 21.52 | 21.70 | 21.28 | 22.48 | 25.64 | NA | NA | NA | NA | |
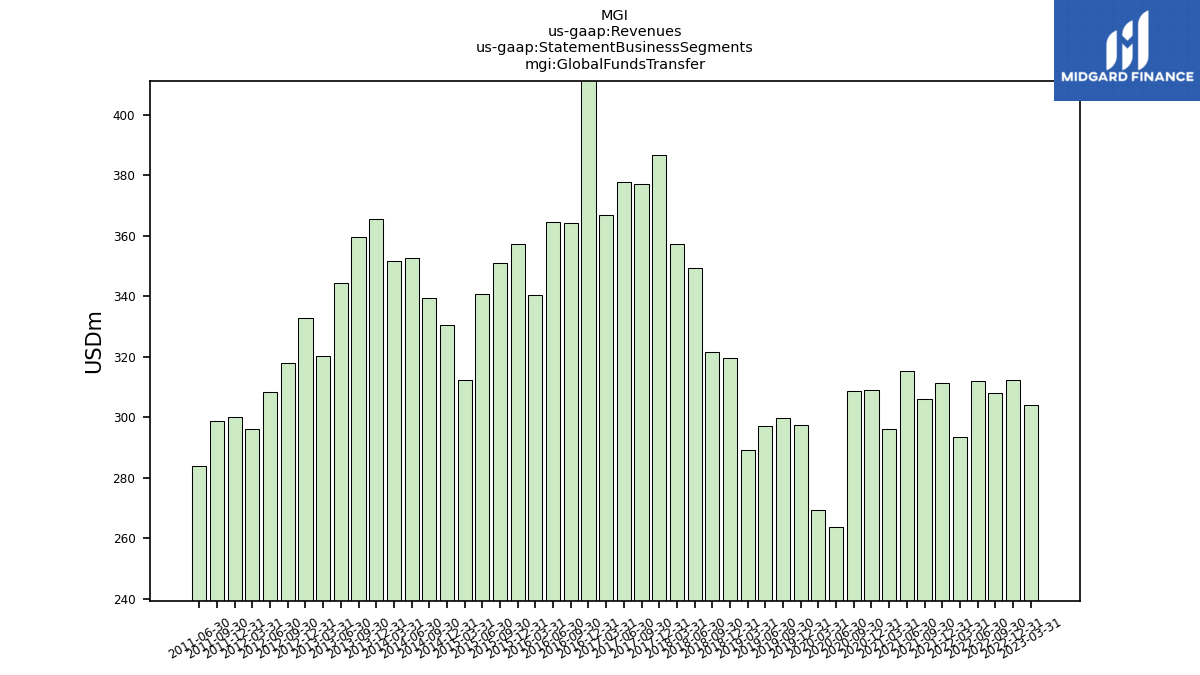
| Global Funds Transfer | 304.10 | 312.20 | 308.00 | 312.10 | 293.60 | 311.30 | 306.00 | 315.30 | 296.20 | 309.10 | 308.60 | 263.90 | 269.30 | 297.30 | 299.60 | 297.20 | 289.20 | 319.70 | 321.60 | 349.20 | 357.40 | 386.60 | 377.10 | 377.60 | 366.80 | 484.50 | 364.20 | 364.70 | 340.30 | 357.40 | 351.00 | 340.70 | 312.30 | 330.60 | 339.50 | 352.80 | 351.70 | 365.40 | 359.50 | 344.50 | 320.40 | 332.91 | 317.88 | 308.27 | 296.10 | 300.19 | 298.89 | 283.84 | NA | NA | NA | NA | |
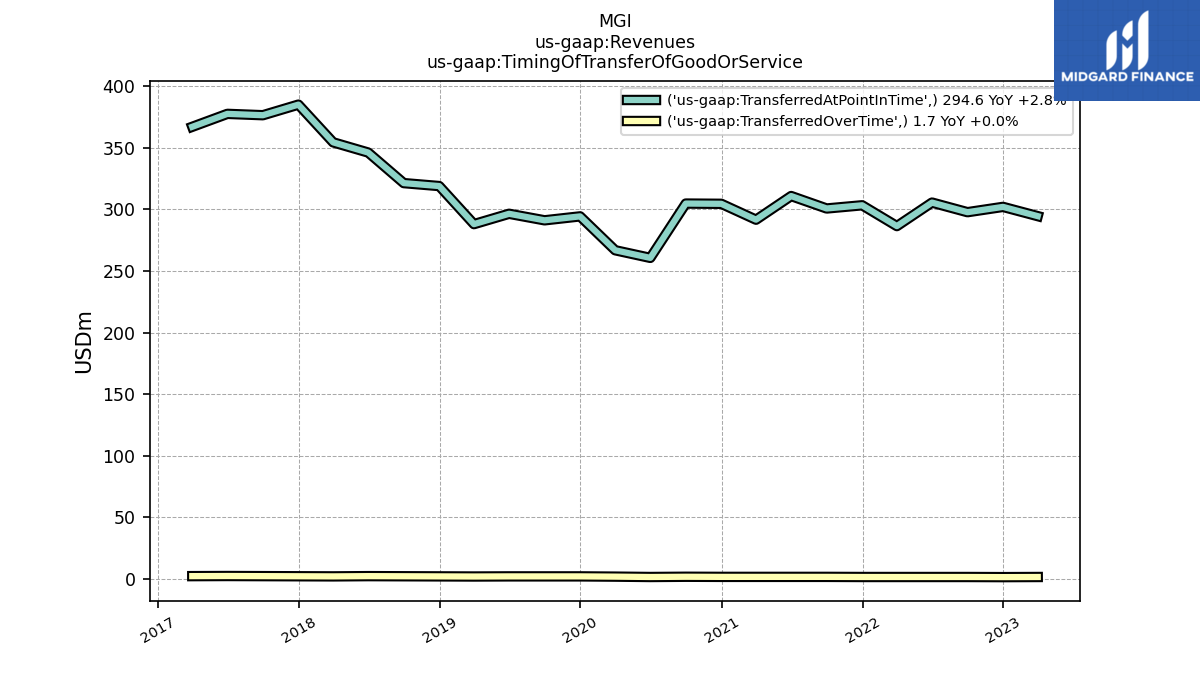
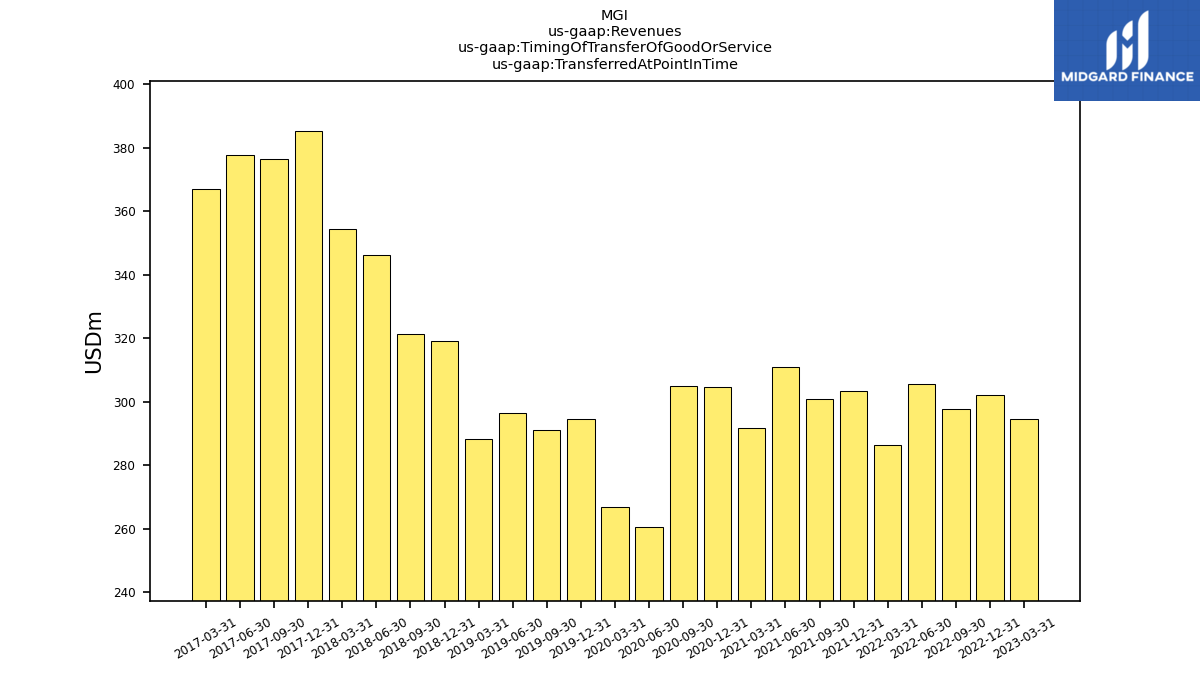
| Transferred At Point In Time | 294.60 | 302.10 | 297.80 | 305.60 | 286.50 | 303.40 | 300.80 | 310.90 | 291.70 | 304.60 | 304.80 | 260.70 | 266.90 | 294.40 | 291.20 | 296.50 | 288.10 | 319.00 | 321.40 | 346.20 | 354.50 | 385.10 | 376.50 | 377.60 | 367.10 | NA | NA | NA | NA | NA | NA | NA | NA | NA | NA | NA | NA | NA | NA | NA | NA | NA | NA | NA | NA | NA | NA | NA | NA | NA | NA | NA | |
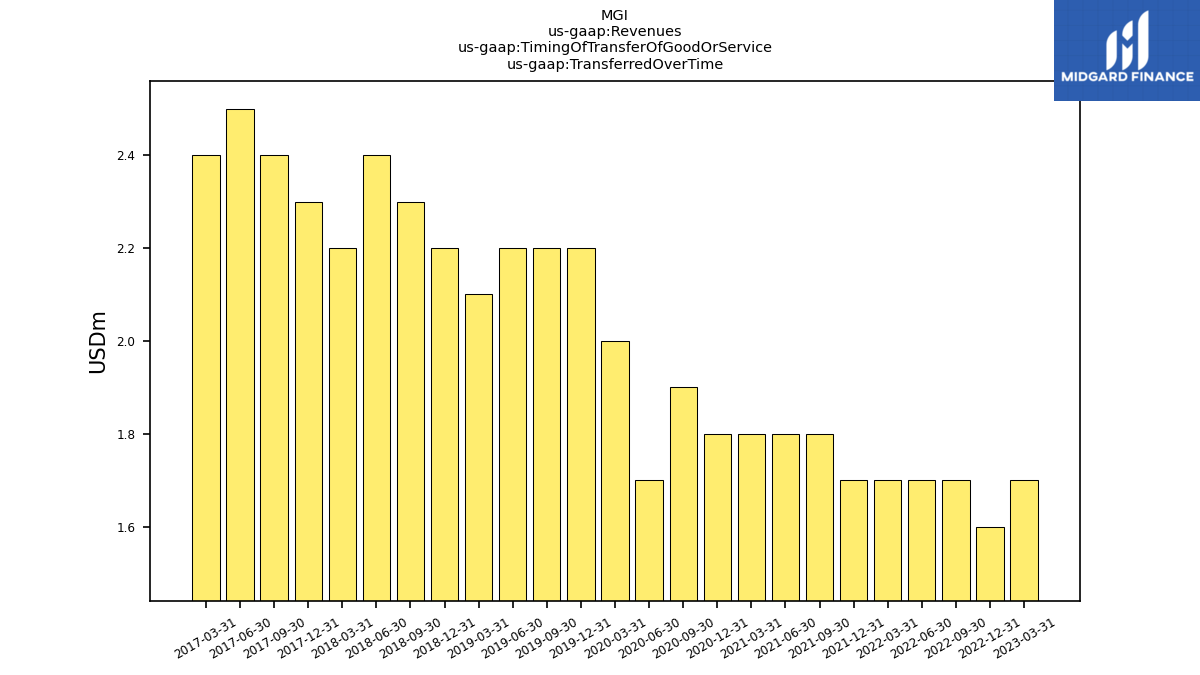
| Transferred Over Time | 1.70 | 1.60 | 1.70 | 1.70 | 1.70 | 1.70 | 1.80 | 1.80 | 1.80 | 1.80 | 1.90 | 1.70 | 2.00 | 2.20 | 2.20 | 2.20 | 2.10 | 2.20 | 2.30 | 2.40 | 2.20 | 2.30 | 2.40 | 2.50 | 2.40 | NA | NA | NA | NA | NA | NA | NA | NA | NA | NA | NA | NA | NA | NA | NA | NA | NA | NA | NA | NA | NA | NA | NA | NA | NA | NA | NA | |
| Revenue From Contract With Customer Including Assessed Tax | 314.70 | 323.10 | 319.10 | 324.50 | 305.50 | 322.70 | 317.70 | 327.30 | 308.10 | 320.70 | 320.20 | 275.50 | 280.80 | 323.70 | 311.20 | 309.30 | 301.00 | 345.80 | 333.70 | 362.50 | 370.10 | 408.20 | 397.80 | 410.00 | 386.10 | 487.20 | 383.10 | 383.70 | 358.40 | 376.70 | 368.60 | 358.80 | 330.60 | 349.60 | 358.00 | 372.40 | 374.90 | 385.80 | 383.00 | 365.10 | 340.50 | 354.40 | 338.55 | 330.14 | 318.10 | 321.80 | 321.95 | 309.95 | 294.02 | 303.37 | 292.89 | 283.90 |


