
| 2023-12-02 | 2023-09-02 | 2023-06-03 | 2023-03-04 | 2022-12-03 | 2022-09-03 | 2022-05-28 | 2022-02-26 | 2021-11-27 | 2021-08-28 | 2021-05-29 | 2021-02-27 | 2020-11-28 | 2020-08-29 | 2020-05-30 | 2020-02-29 | 2019-11-30 | 2019-08-31 | 2019-06-01 | 2019-03-02 | 2018-12-01 | 2018-09-01 | 2018-06-02 | 2018-03-03 | 2017-12-02 | 2017-09-02 | 2017-06-03 | 2017-03-04 | 2016-12-03 | 2016-09-03 | 2016-05-28 | 2016-02-27 | 2015-11-28 | 2015-08-29 | 2015-05-30 | 2015-02-28 | 2014-11-29 | 2014-08-30 | 2014-05-31 | 2014-03-01 | 2013-11-30 | 2013-08-31 | 2013-06-01 | 2013-03-02 | 2012-12-01 | 2012-09-01 | 2012-06-02 | 2012-03-03 | 2011-12-03 | 2011-09-03 | 2011-05-28 | 2011-02-26 | 2010-11-27 | 2010-08-28 | 2010-05-29 | 2010-02-27 | 2009-11-28 | 2009-08-29 | ||
|---|---|---|---|---|---|---|---|---|---|---|---|---|---|---|---|---|---|---|---|---|---|---|---|---|---|---|---|---|---|---|---|---|---|---|---|---|---|---|---|---|---|---|---|---|---|---|---|---|---|---|---|---|---|---|---|---|---|---|---|
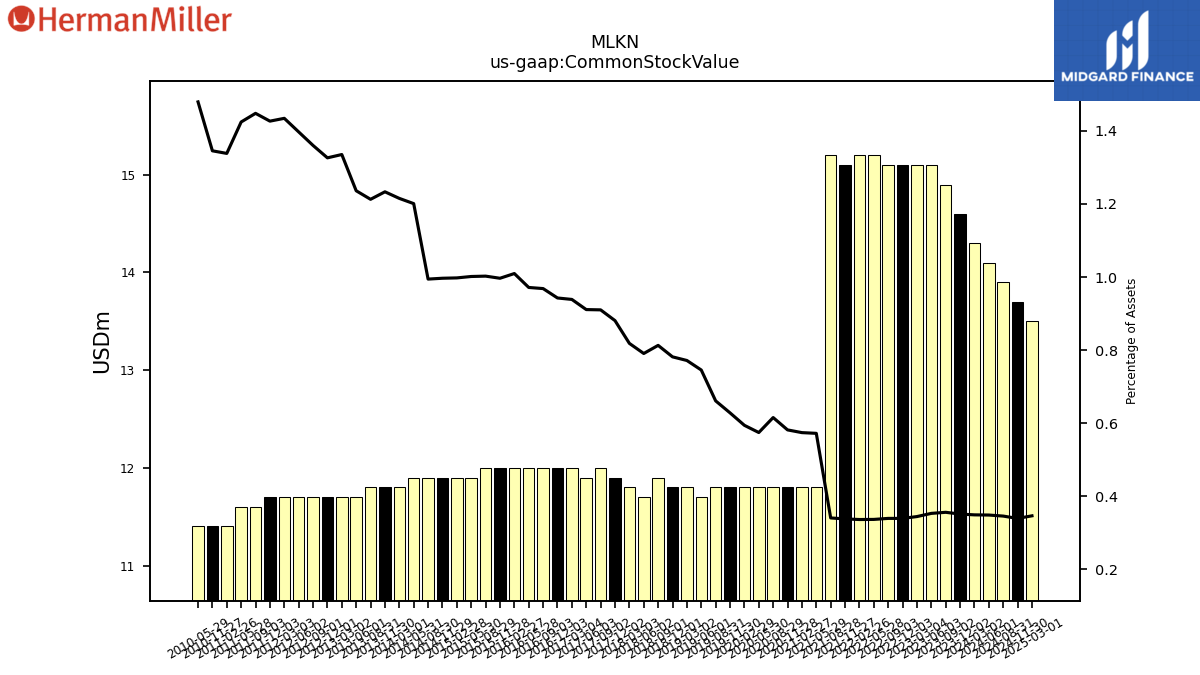
| Common Stock Value | 14.60 | 14.90 | 15.10 | 15.10 | 15.10 | 15.10 | 15.20 | 15.20 | 15.10 | 15.20 | 11.80 | 11.80 | 11.80 | 11.80 | 11.80 | 11.80 | 11.80 | 11.80 | 11.70 | 11.80 | 11.80 | 11.90 | 11.70 | 11.80 | 11.90 | 12.00 | 11.90 | 12.00 | 12.00 | 12.00 | 12.00 | 12.00 | 12.00 | 12.00 | 11.90 | 11.90 | 11.90 | 11.90 | 11.90 | 11.80 | 11.80 | 11.80 | 11.70 | 11.70 | 11.70 | 11.70 | 11.70 | 11.70 | 11.70 | 11.60 | 11.60 | 11.40 | 11.40 | NA | 11.40 | NA | NA | NA | |
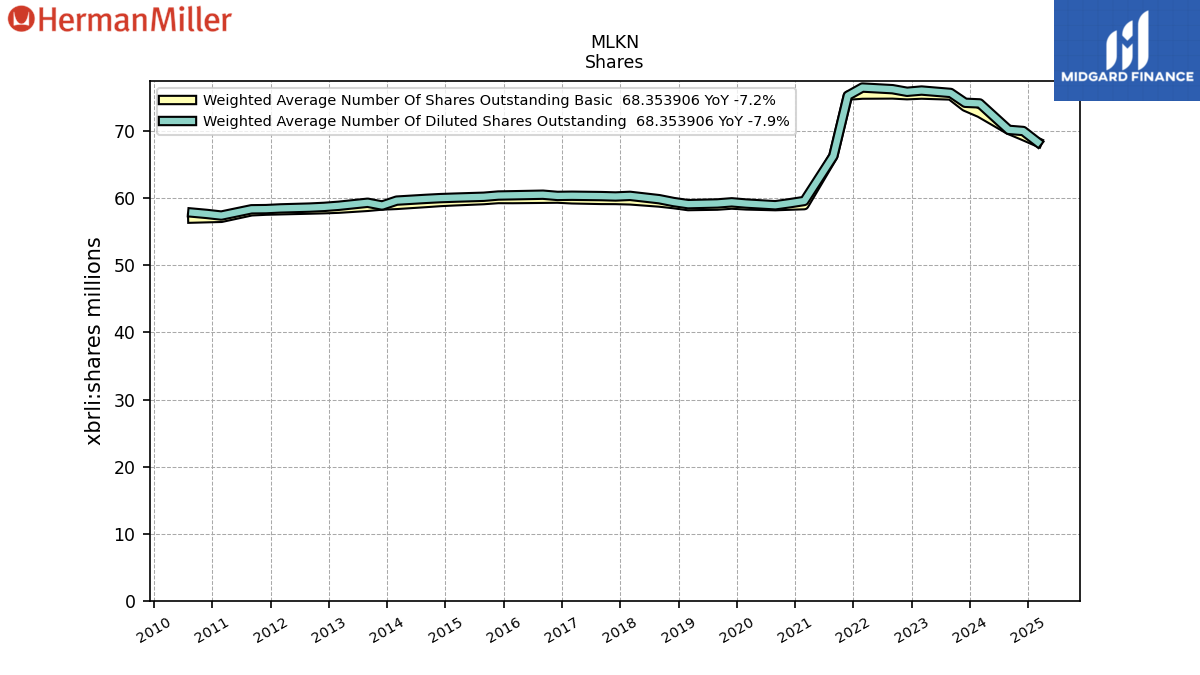
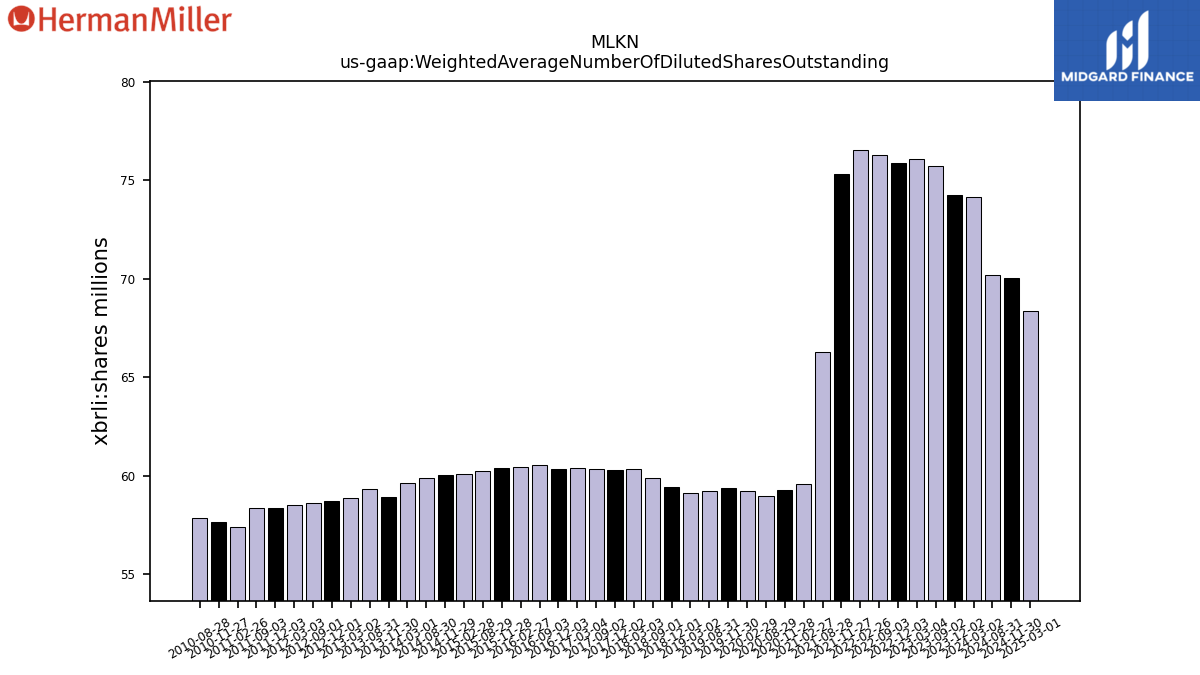
| Weighted Average Number Of Diluted Shares Outstanding | 74.24 | 75.71 | NA | 76.07 | 75.88 | 76.27 | NA | 76.51 | 75.30 | 66.30 | NA | 59.60 | 59.27 | 58.96 | NA | 59.22 | 59.40 | 59.23 | NA | 59.13 | 59.44 | 59.87 | NA | 60.36 | 60.27 | 60.33 | NA | 60.38 | 60.35 | 60.54 | NA | 60.45 | 60.41 | 60.23 | NA | 60.10 | 60.02 | 59.91 | NA | 59.65 | 58.92 | 59.34 | NA | 58.88 | 58.72 | 58.62 | NA | 58.49 | 58.39 | 58.36 | NA | 57.43 | 57.67 | 57.87 | NA | NA | NA | NA | |
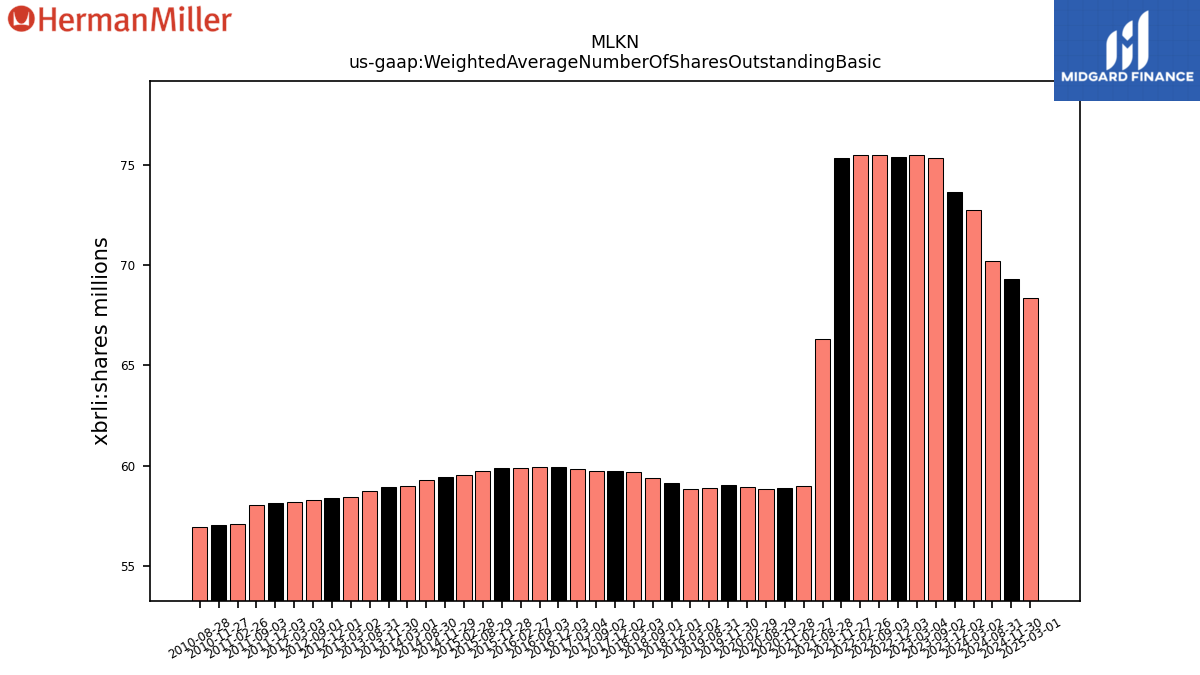
| Weighted Average Number Of Shares Outstanding Basic | 73.66 | 75.33 | NA | 75.46 | 75.37 | 75.48 | NA | 75.46 | 75.30 | 66.30 | NA | 58.98 | 58.91 | 58.83 | NA | 58.94 | 59.06 | 58.91 | NA | 58.84 | 59.13 | 59.37 | NA | 59.69 | 59.75 | 59.76 | NA | 59.85 | 59.95 | 59.93 | NA | 59.89 | 59.89 | 59.73 | NA | 59.55 | 59.45 | 59.30 | NA | 59.01 | 58.92 | 58.73 | NA | 58.45 | 58.37 | 58.32 | NA | 58.22 | 58.16 | 58.06 | NA | 57.09 | 57.03 | 56.98 | NA | NA | NA | NA | |
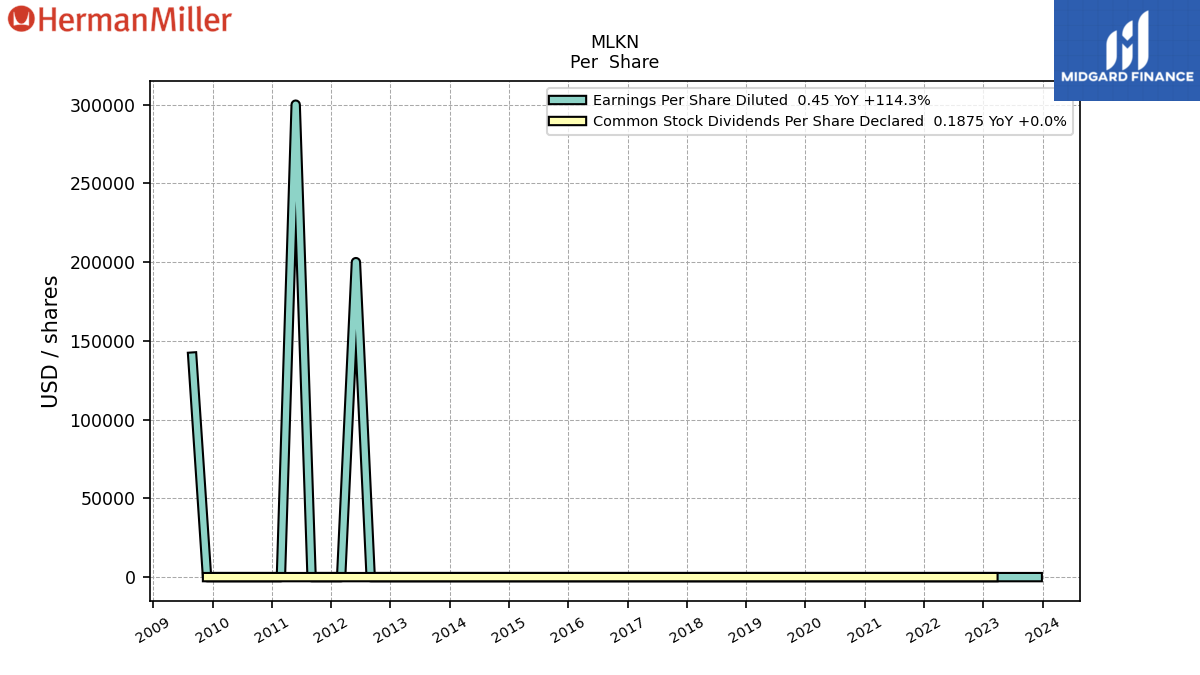
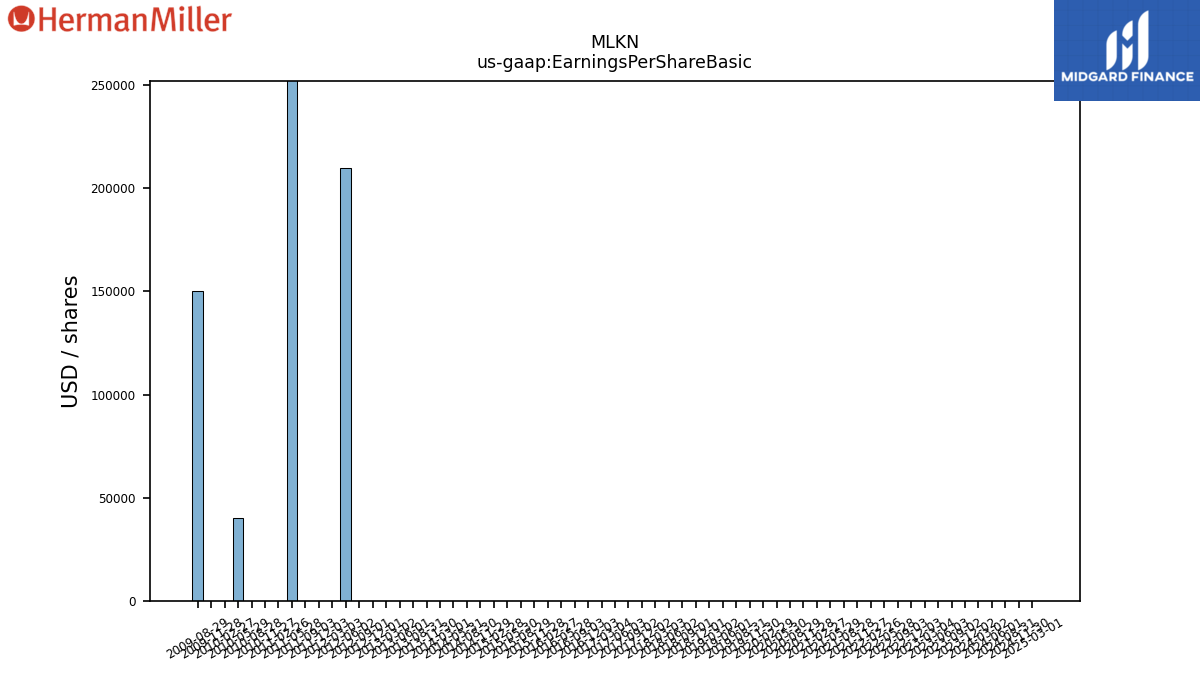
| Earnings Per Share Basic | 0.45 | 0.22 | 0.00 | 0.01 | 0.21 | 0.34 | 0.28 | 0.17 | -0.05 | -0.93 | 0.12 | 0.70 | 0.87 | 1.24 | -2.95 | 0.64 | 1.33 | 0.82 | 0.78 | 0.67 | 0.66 | 0.60 | 0.53 | 0.50 | 0.56 | 0.55 | 0.56 | 0.38 | 0.53 | 0.61 | 0.68 | 0.46 | 0.58 | 0.56 | 0.39 | 0.35 | 0.47 | 0.43 | 0.28 | 0.33 | -1.37 | 0.38 | 0.00 | 0.28 | 0.14 | 0.34 | 210000.00 | 0.26 | 0.41 | 0.42 | 300000.00 | 0.35 | 0.31 | 0.28 | 40000.00 | 0.15 | 0.17 | 150000.00 | |
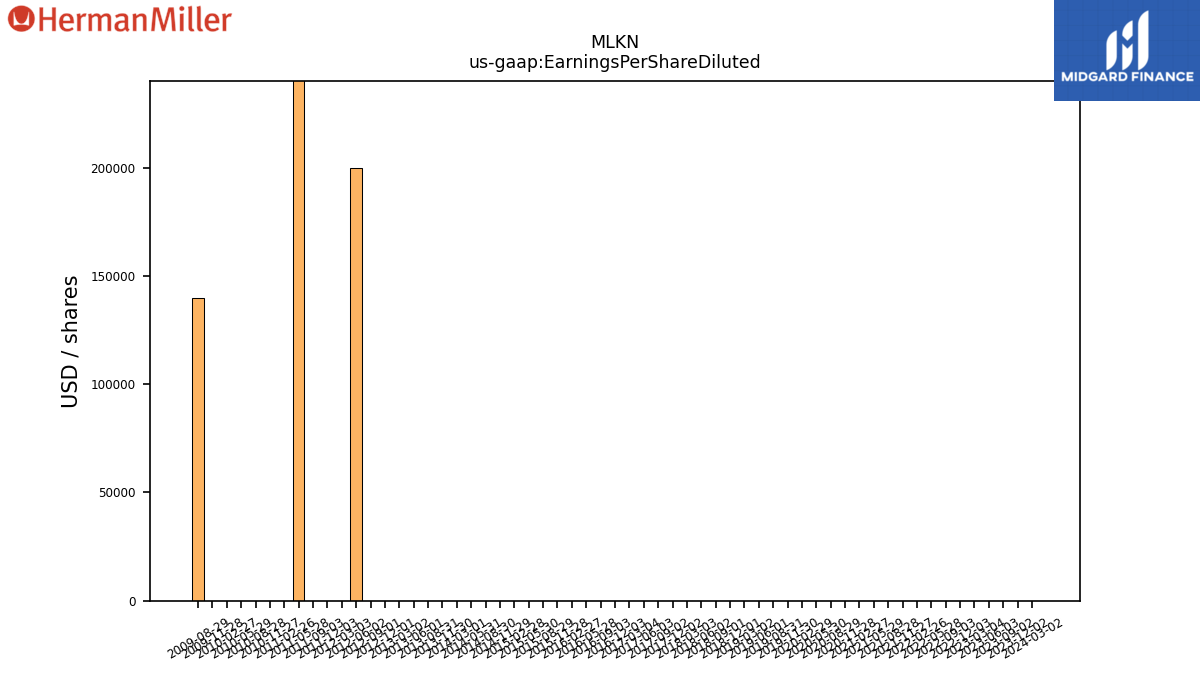
| Earnings Per Share Diluted | 0.45 | 0.22 | -0.01 | 0.01 | 0.21 | 0.34 | 0.28 | 0.16 | -0.05 | -0.93 | 0.12 | 0.70 | 0.87 | 1.24 | -2.95 | 0.64 | 1.32 | 0.81 | 0.78 | 0.66 | 0.66 | 0.60 | 0.53 | 0.49 | 0.55 | 0.55 | 0.55 | 0.37 | 0.53 | 0.60 | 0.67 | 0.46 | 0.57 | 0.56 | 0.39 | 0.35 | 0.46 | 0.42 | 0.28 | 0.33 | -1.37 | 0.38 | 0.00 | 0.28 | 0.14 | 0.34 | 200000.00 | 0.26 | 0.41 | 0.42 | 300000.00 | 0.29 | 0.26 | 0.22 | 0.00 | 0.12 | 0.17 | 140000.00 |
| 2023-12-02 | 2023-09-02 | 2023-06-03 | 2023-03-04 | 2022-12-03 | 2022-09-03 | 2022-05-28 | 2022-02-26 | 2021-11-27 | 2021-08-28 | 2021-05-29 | 2021-02-27 | 2020-11-28 | 2020-08-29 | 2020-05-30 | 2020-02-29 | 2019-11-30 | 2019-08-31 | 2019-06-01 | 2019-03-02 | 2018-12-01 | 2018-09-01 | 2018-06-02 | 2018-03-03 | 2017-12-02 | 2017-09-02 | 2017-06-03 | 2017-03-04 | 2016-12-03 | 2016-09-03 | 2016-05-28 | 2016-02-27 | 2015-11-28 | 2015-08-29 | 2015-05-30 | 2015-02-28 | 2014-11-29 | 2014-08-30 | 2014-05-31 | 2014-03-01 | 2013-11-30 | 2013-08-31 | 2013-06-01 | 2013-03-02 | 2012-12-01 | 2012-09-01 | 2012-06-02 | 2012-03-03 | 2011-12-03 | 2011-09-03 | 2011-05-28 | 2011-02-26 | 2010-11-27 | 2010-08-28 | 2010-05-29 | 2010-02-27 | 2009-11-28 | 2009-08-29 | ||
|---|---|---|---|---|---|---|---|---|---|---|---|---|---|---|---|---|---|---|---|---|---|---|---|---|---|---|---|---|---|---|---|---|---|---|---|---|---|---|---|---|---|---|---|---|---|---|---|---|---|---|---|---|---|---|---|---|---|---|---|
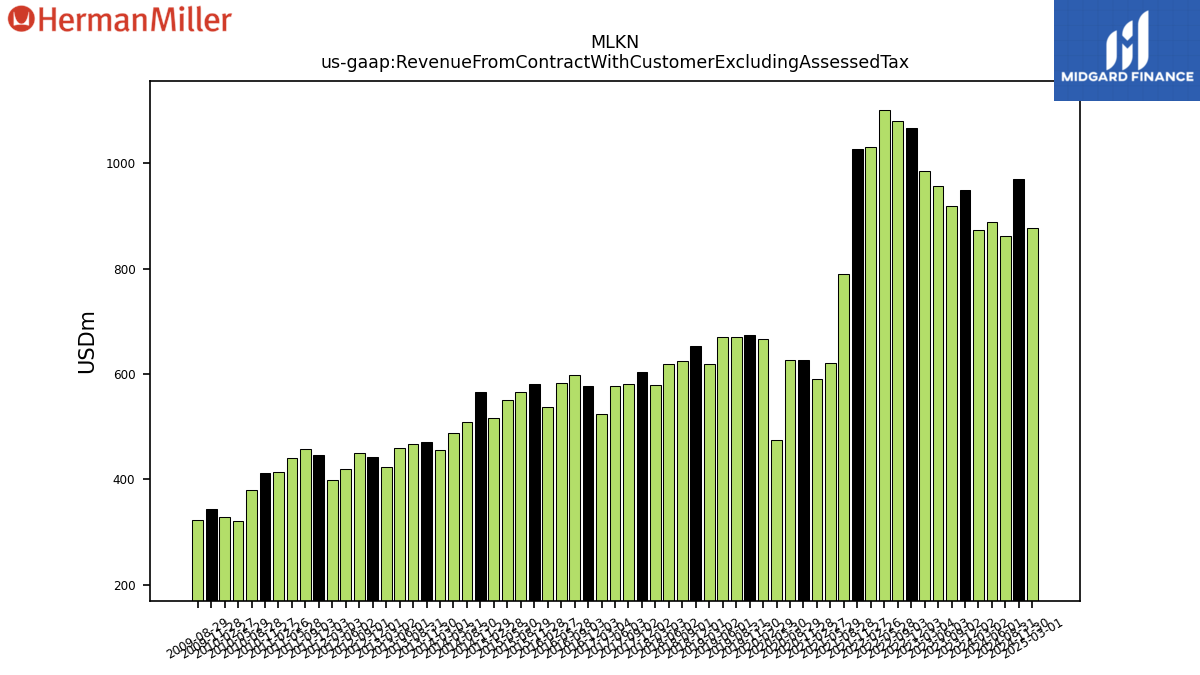
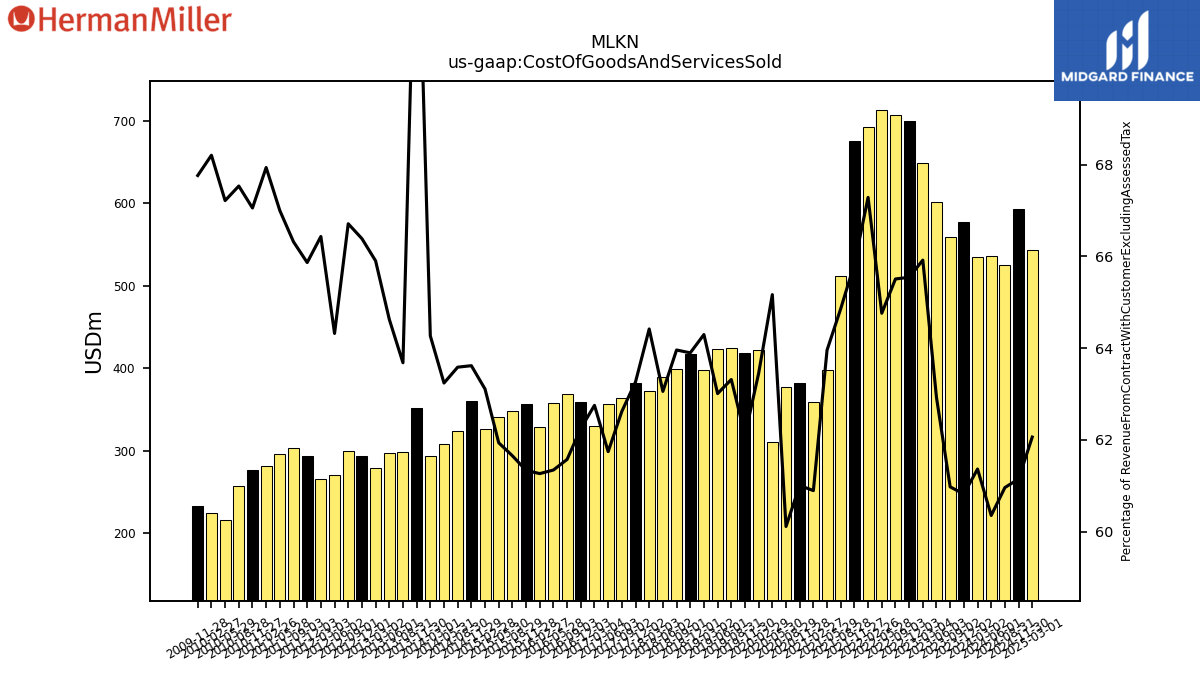
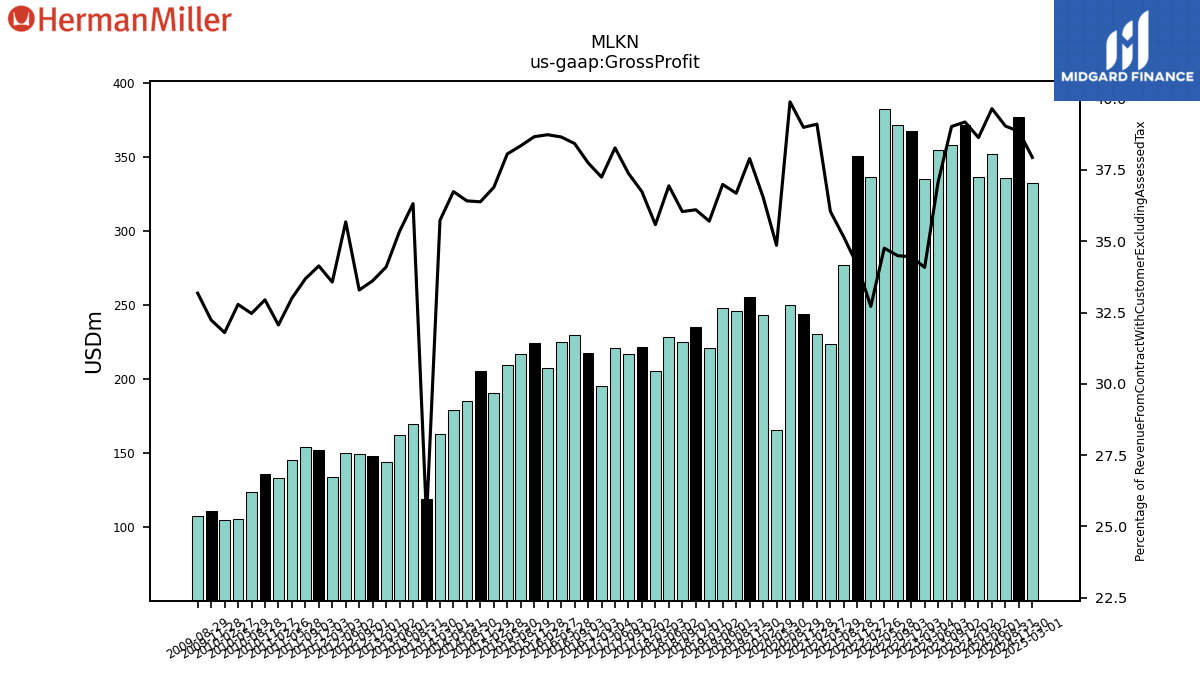
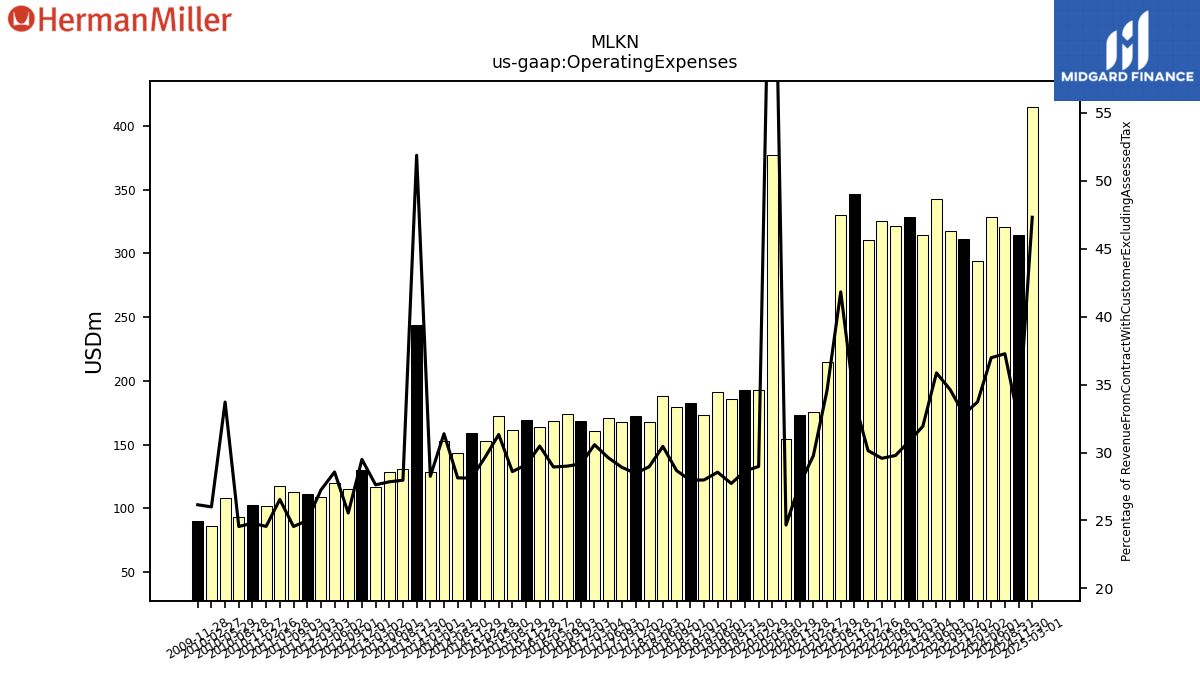
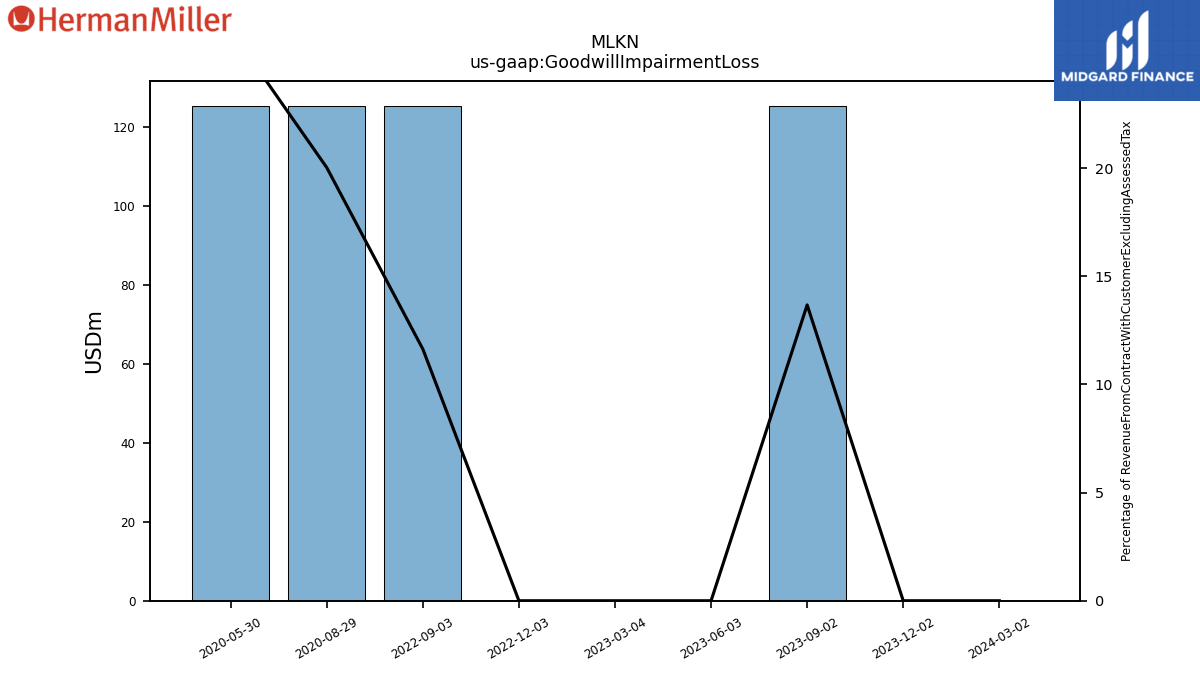
| Revenue From Contract With Customer Excluding Assessed Tax | 949.50 | 917.70 | 956.70 | 984.70 | 1066.90 | 1078.80 | 1100.50 | 1029.50 | 1026.30 | 789.70 | 621.50 | 590.50 | 626.30 | 626.80 | 475.70 | 665.70 | 674.20 | 670.90 | 671.00 | 619.00 | 652.60 | 624.60 | 618.00 | 578.40 | 604.60 | 580.30 | 577.20 | 524.90 | 577.50 | 598.60 | 582.60 | 536.50 | 580.40 | 565.40 | 550.70 | 516.40 | 565.40 | 509.70 | 487.50 | 455.90 | 470.50 | 468.10 | 460.00 | 423.50 | 441.80 | 449.70 | 420.70 | 399.80 | 445.60 | 458.10 | 441.50 | 414.80 | 412.20 | 380.70 | 321.50 | 329.60 | 343.70 | 324.00 | |
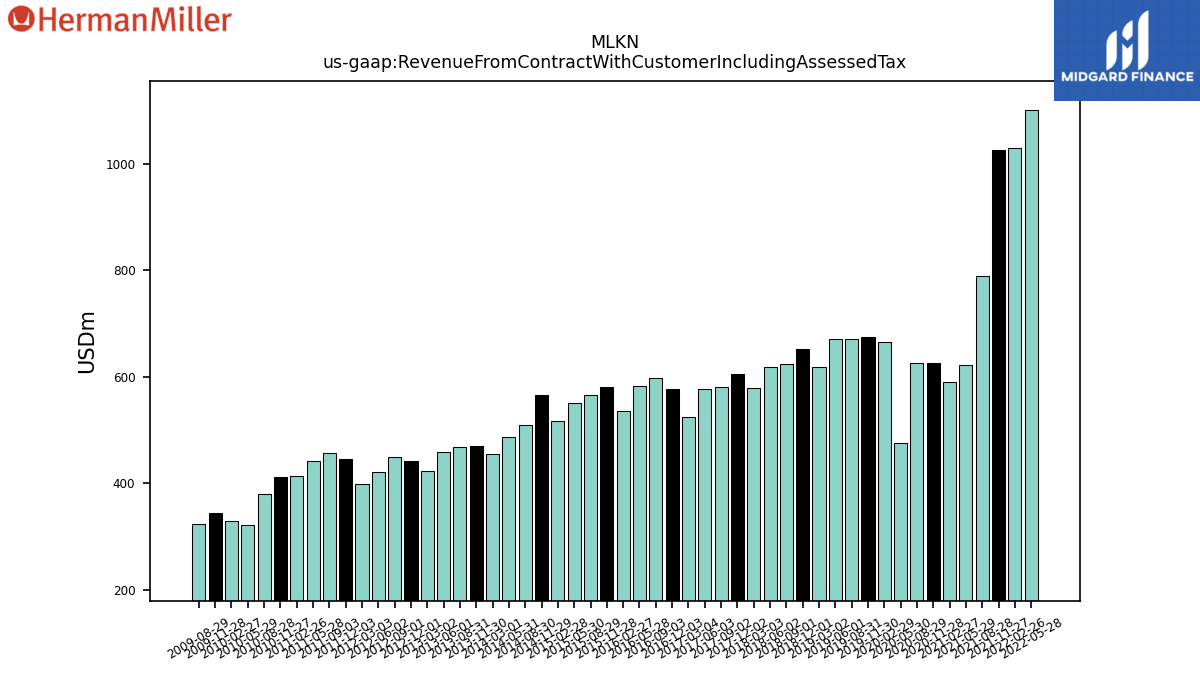
| Revenue From Contract With Customer Including Assessed Tax | NA | NA | NA | NA | NA | NA | 1100.50 | 1029.50 | 1026.30 | 789.70 | 621.50 | 590.50 | 626.30 | 626.80 | 475.70 | 665.70 | 674.20 | 670.90 | 671.00 | 619.00 | 652.60 | 624.60 | 618.00 | 578.40 | 604.60 | 580.30 | 577.20 | 524.90 | 577.50 | 598.60 | 582.60 | 536.50 | 580.40 | 565.40 | 550.70 | 516.40 | 565.40 | 509.70 | 487.50 | 455.90 | 470.50 | 468.10 | 460.00 | 423.50 | 441.80 | 449.70 | 420.70 | 399.80 | 445.60 | 458.10 | 441.50 | 414.80 | 412.20 | 380.70 | 321.50 | 329.60 | 343.70 | 324.00 | |
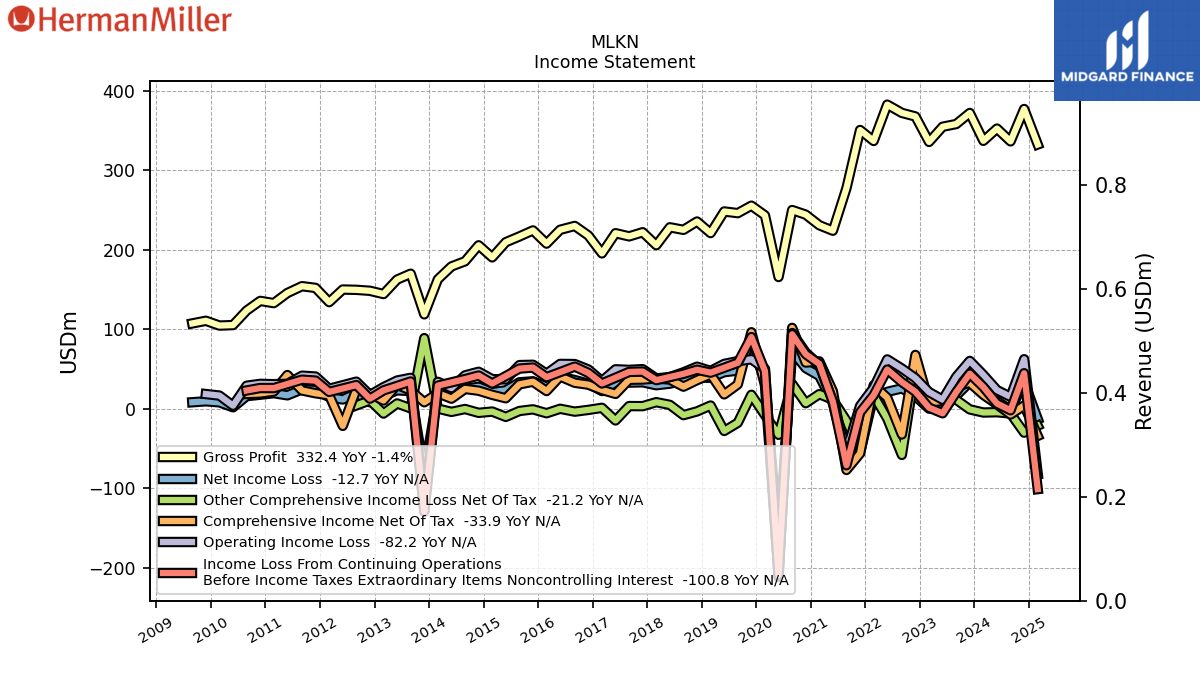
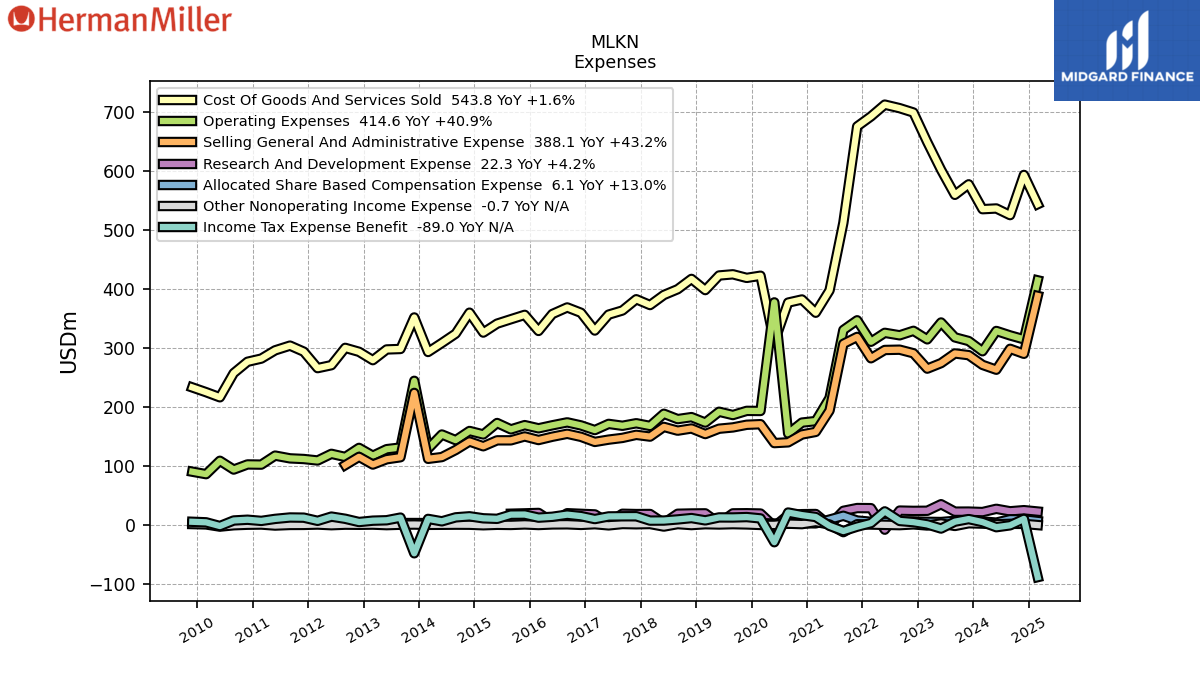
| Cost Of Goods And Services Sold | 577.50 | 559.60 | 602.00 | 649.10 | 699.30 | 706.70 | 712.70 | 692.70 | 675.70 | 512.20 | 397.50 | 359.60 | 382.10 | 376.80 | 310.00 | 422.40 | 418.70 | 424.80 | 422.80 | 398.00 | 417.00 | 399.50 | 389.70 | 372.60 | 382.50 | 363.40 | 356.40 | 329.40 | 359.50 | 368.60 | 357.40 | 328.70 | 356.00 | 348.60 | 341.10 | 325.90 | 359.70 | 324.10 | 308.30 | 293.00 | 351.60 | 298.10 | 297.30 | 279.10 | 293.30 | 300.00 | 270.60 | 265.60 | 293.50 | 303.80 | 295.80 | 281.80 | 276.40 | 257.10 | 216.10 | 224.80 | 232.90 | NA | |
| Gross Profit | 372.00 | 358.10 | 354.70 | 335.60 | 367.60 | 372.10 | 382.50 | 336.80 | 350.60 | 277.50 | 224.00 | 230.90 | 244.20 | 250.00 | 165.80 | 243.30 | 255.50 | 246.10 | 248.20 | 221.00 | 235.60 | 225.10 | 228.30 | 205.80 | 222.10 | 216.90 | 220.90 | 195.50 | 218.00 | 230.00 | 225.20 | 207.80 | 224.40 | 216.80 | 209.60 | 190.50 | 205.70 | 185.60 | 179.10 | 162.90 | 118.90 | 170.00 | 162.60 | 144.40 | 148.50 | 149.70 | 150.10 | 134.20 | 152.10 | 154.30 | 145.70 | 133.00 | 135.80 | 123.60 | 105.40 | 104.80 | 110.80 | 107.50 | |
| Operating Expenses | 311.60 | 317.80 | 343.10 | 314.40 | 328.90 | 321.30 | 325.50 | 310.30 | 346.80 | 330.30 | 214.90 | 175.80 | 173.20 | 154.60 | 377.20 | 192.90 | 193.10 | 186.00 | 191.60 | 173.20 | 182.50 | 179.10 | 188.20 | 167.50 | 172.10 | 167.80 | 171.00 | 160.50 | 168.40 | 173.60 | 168.60 | 163.50 | 168.90 | 161.70 | 172.50 | 153.10 | 159.00 | 143.40 | 153.00 | 128.80 | 244.10 | 130.90 | 128.10 | 117.00 | 130.30 | 114.90 | 120.20 | 108.90 | 111.40 | 112.50 | 117.20 | 101.90 | 102.20 | 93.50 | 108.40 | 85.70 | 89.90 | NA | |
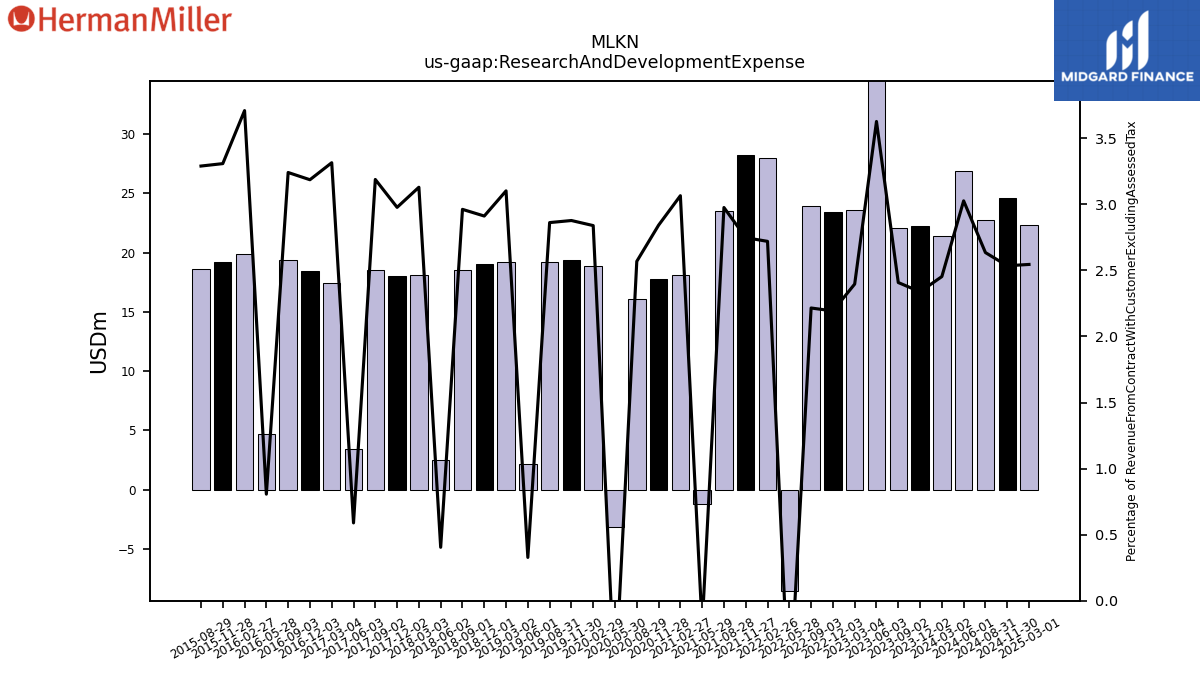
| Research And Development Expense | 22.20 | 22.10 | 34.70 | 23.60 | 23.40 | 23.90 | -8.50 | 28.00 | 28.20 | 23.50 | -1.20 | 18.10 | 17.80 | 16.10 | -3.10 | 18.90 | 19.40 | 19.20 | 2.20 | 19.20 | 19.00 | 18.50 | 2.50 | 18.10 | 18.00 | 18.50 | 3.40 | 17.40 | 18.40 | 19.40 | 4.70 | 19.90 | 19.20 | 18.60 | NA | NA | NA | NA | NA | NA | NA | NA | NA | NA | NA | NA | NA | NA | NA | NA | NA | NA | NA | NA | NA | NA | NA | NA | |
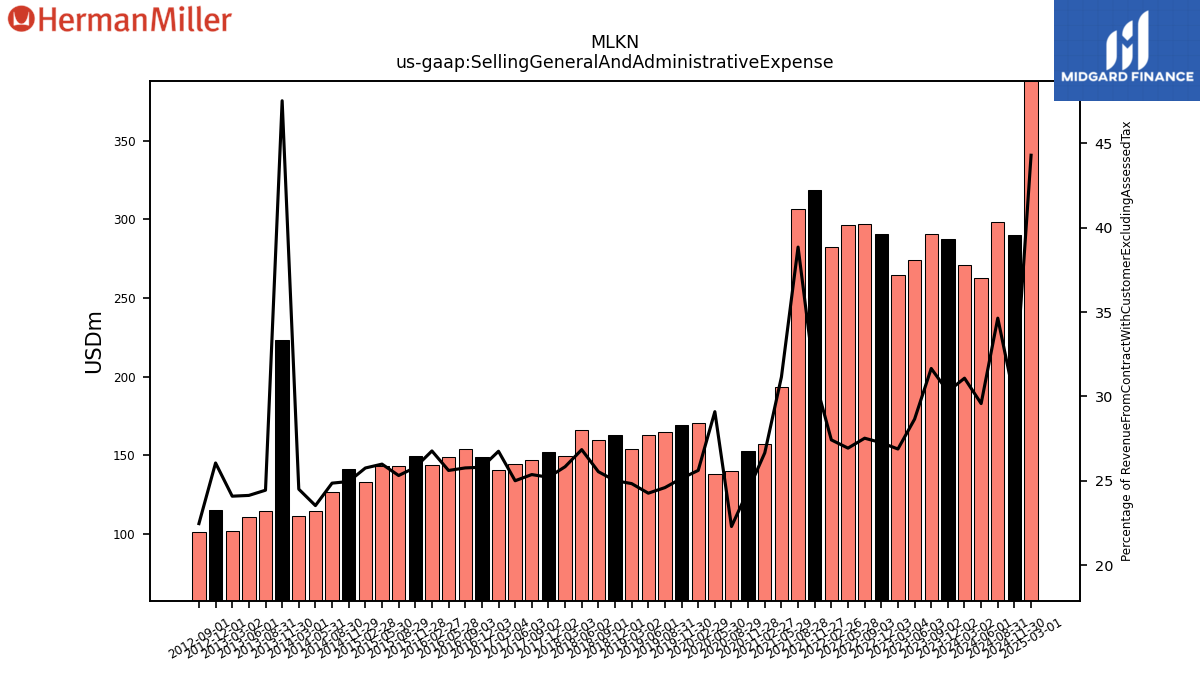
| Selling General And Administrative Expense | 287.60 | 290.50 | 274.10 | 264.70 | 290.80 | 296.90 | 296.40 | 282.30 | 318.60 | 306.80 | 193.60 | 157.40 | 153.00 | 139.70 | 138.40 | 170.50 | 169.50 | 165.00 | 162.80 | 153.70 | 163.20 | 159.50 | 165.90 | 149.40 | 152.40 | 147.20 | 144.30 | 140.40 | 149.00 | 154.20 | 149.20 | 143.60 | 149.70 | 143.10 | 143.10 | 133.00 | 141.10 | 126.70 | 114.70 | 111.70 | 223.60 | 114.40 | 111.00 | 102.00 | 115.10 | 101.00 | NA | NA | NA | NA | NA | NA | NA | NA | NA | NA | NA | NA | |
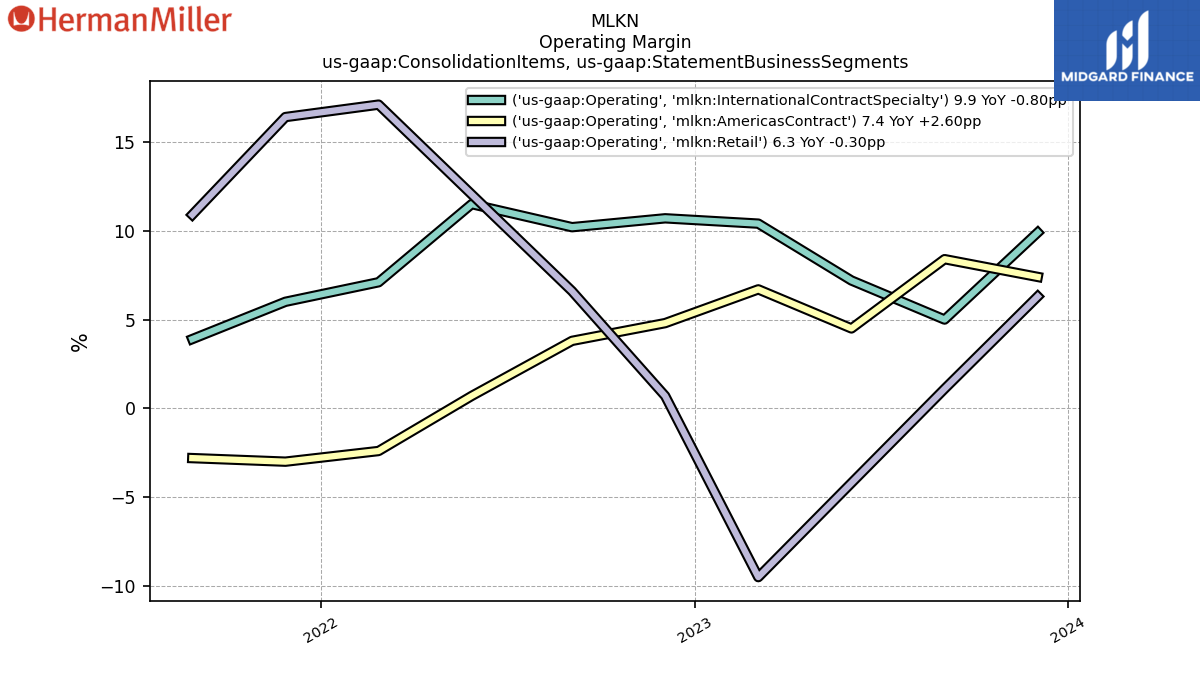
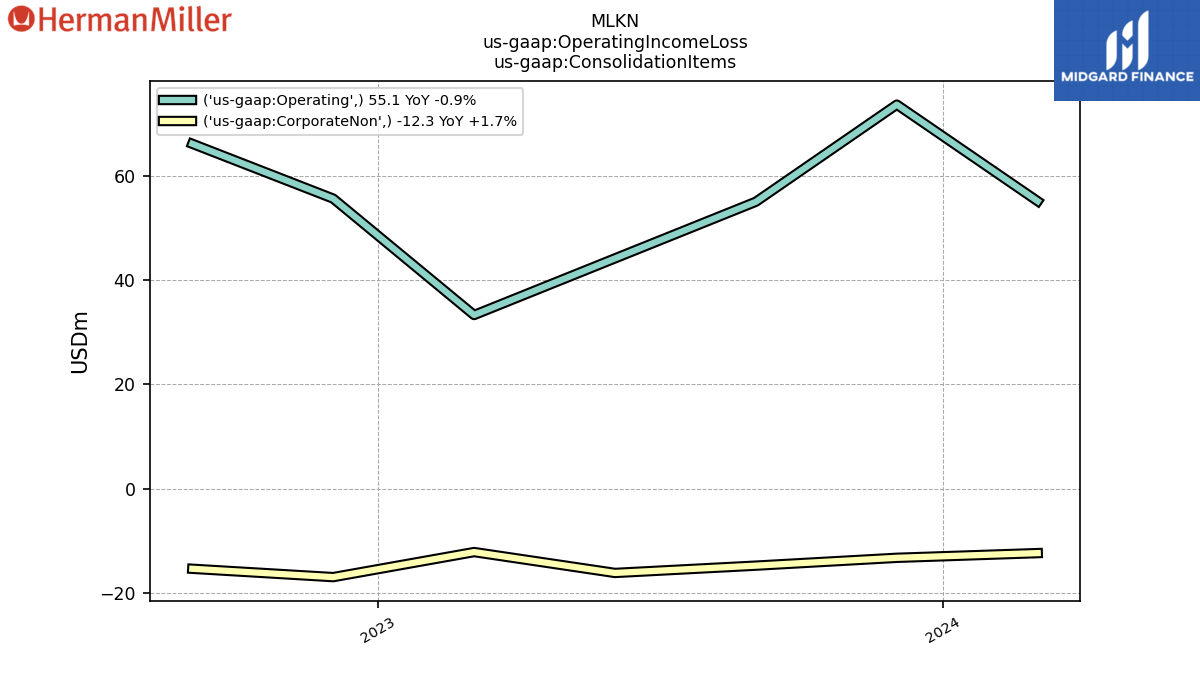
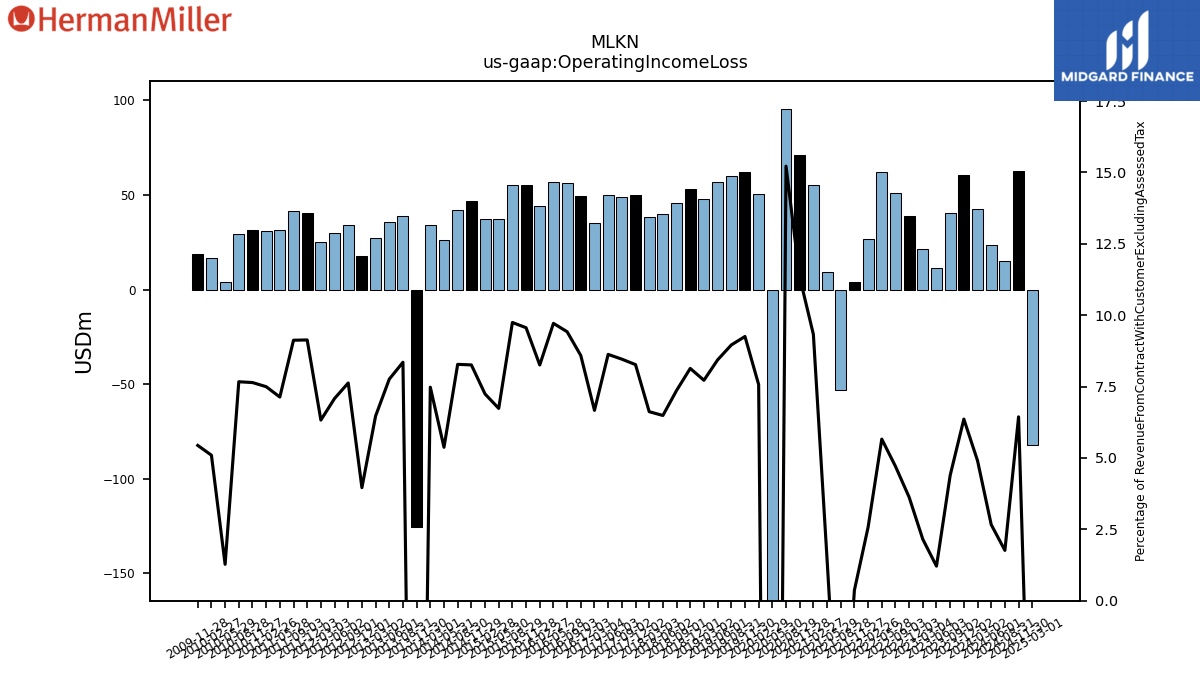
| Operating Income Loss | 60.40 | 40.30 | 11.60 | 21.20 | 38.70 | 50.80 | 62.30 | 26.50 | 3.80 | -52.80 | 9.10 | 55.10 | 71.00 | 95.40 | -211.40 | 50.40 | 62.40 | 60.10 | 56.60 | 47.80 | 53.10 | 46.00 | 40.10 | 38.30 | 50.00 | 49.10 | 49.80 | 35.00 | 49.60 | 56.40 | 56.60 | 44.30 | 55.50 | 55.10 | 37.10 | 37.40 | 46.70 | 42.20 | 26.20 | 34.10 | -125.20 | 39.10 | 35.70 | 27.40 | 17.50 | 34.30 | 29.80 | 25.30 | 40.70 | 41.80 | 31.50 | 31.10 | 31.50 | 29.20 | 4.10 | 16.80 | 18.70 | NA | |
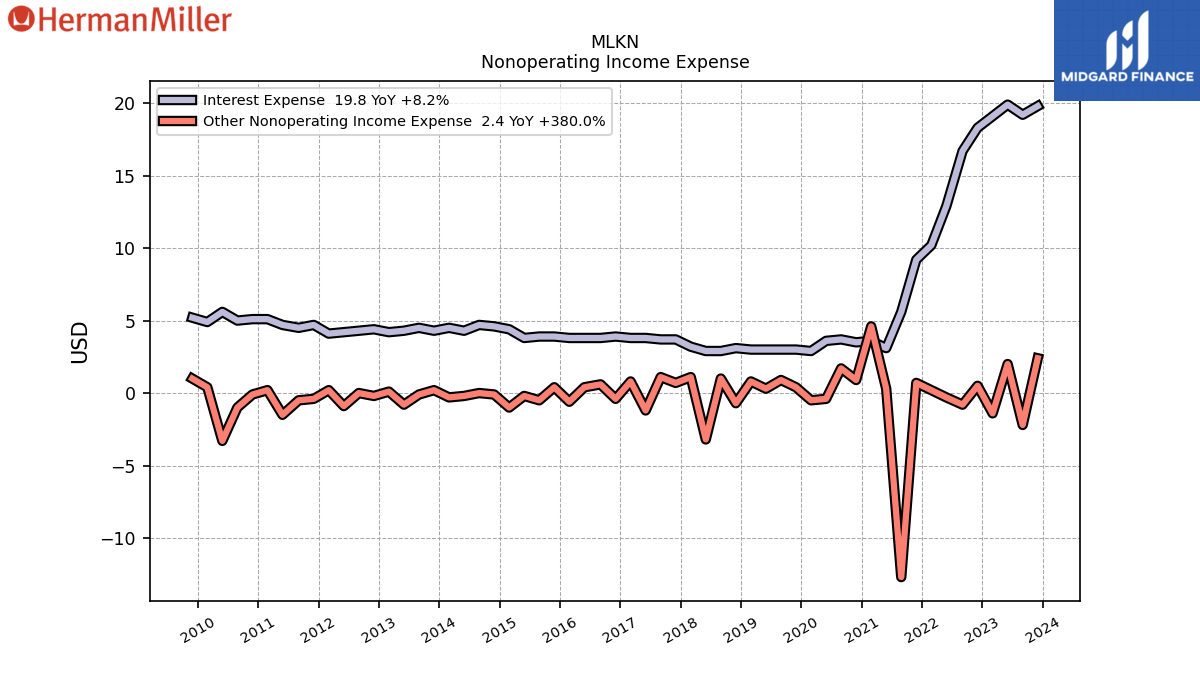
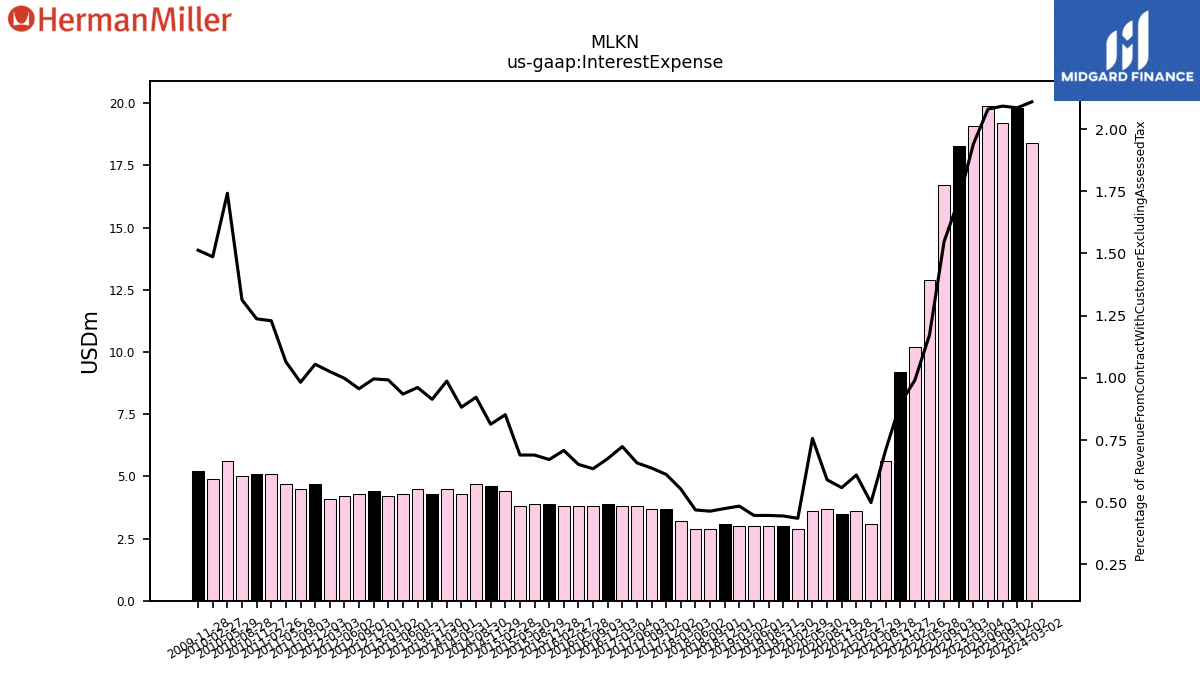
| Interest Expense | 19.80 | 19.20 | 19.90 | 19.10 | 18.30 | 16.70 | 12.90 | 10.20 | 9.20 | 5.60 | 3.10 | 3.60 | 3.50 | 3.70 | 3.60 | 2.90 | 3.00 | 3.00 | 3.00 | 3.00 | 3.10 | 2.90 | 2.90 | 3.20 | 3.70 | 3.70 | 3.80 | 3.80 | 3.90 | 3.80 | 3.80 | 3.80 | 3.90 | 3.90 | 3.80 | 4.40 | 4.60 | 4.70 | 4.30 | 4.50 | 4.30 | 4.50 | 4.30 | 4.20 | 4.40 | 4.30 | 4.20 | 4.10 | 4.70 | 4.50 | 4.70 | 5.10 | 5.10 | 5.00 | 5.60 | 4.90 | 5.20 | NA | |
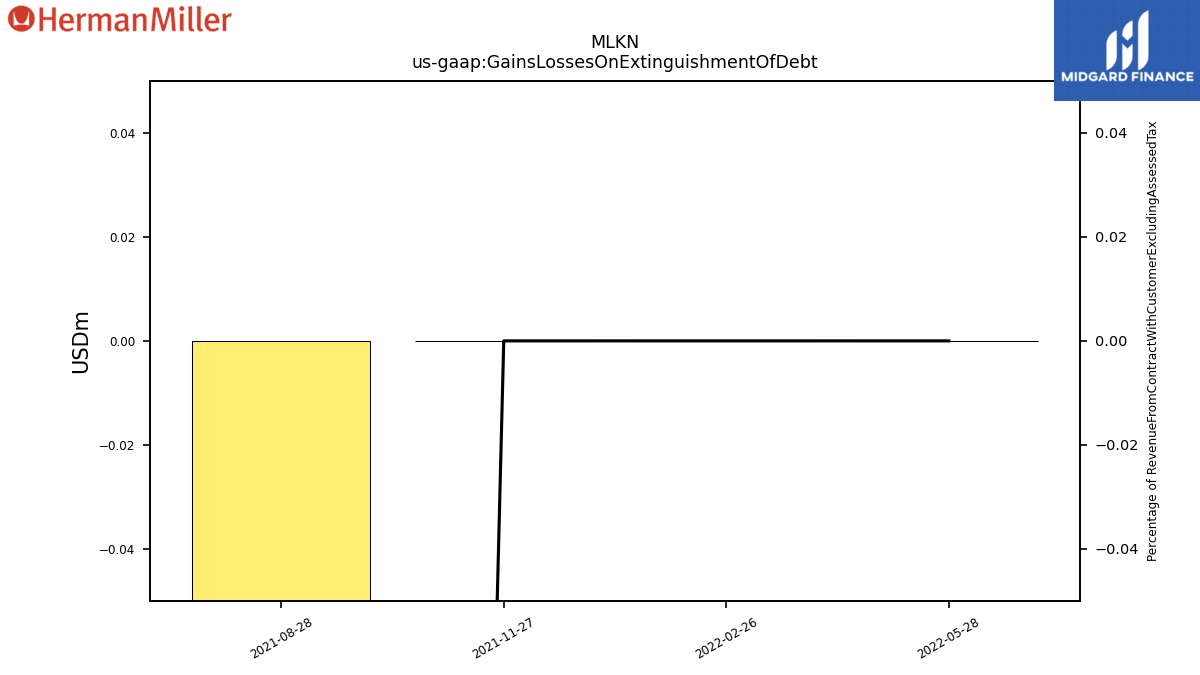
| Gains Losses On Extinguishment Of Debt | NA | NA | NA | NA | NA | NA | 0.00 | 0.00 | 0.00 | -13.40 | NA | NA | NA | NA | NA | NA | NA | NA | NA | NA | NA | NA | NA | NA | NA | NA | NA | NA | NA | NA | NA | NA | NA | NA | NA | NA | NA | NA | NA | NA | NA | NA | NA | NA | NA | NA | NA | NA | NA | NA | NA | NA | NA | NA | NA | NA | NA | NA | |
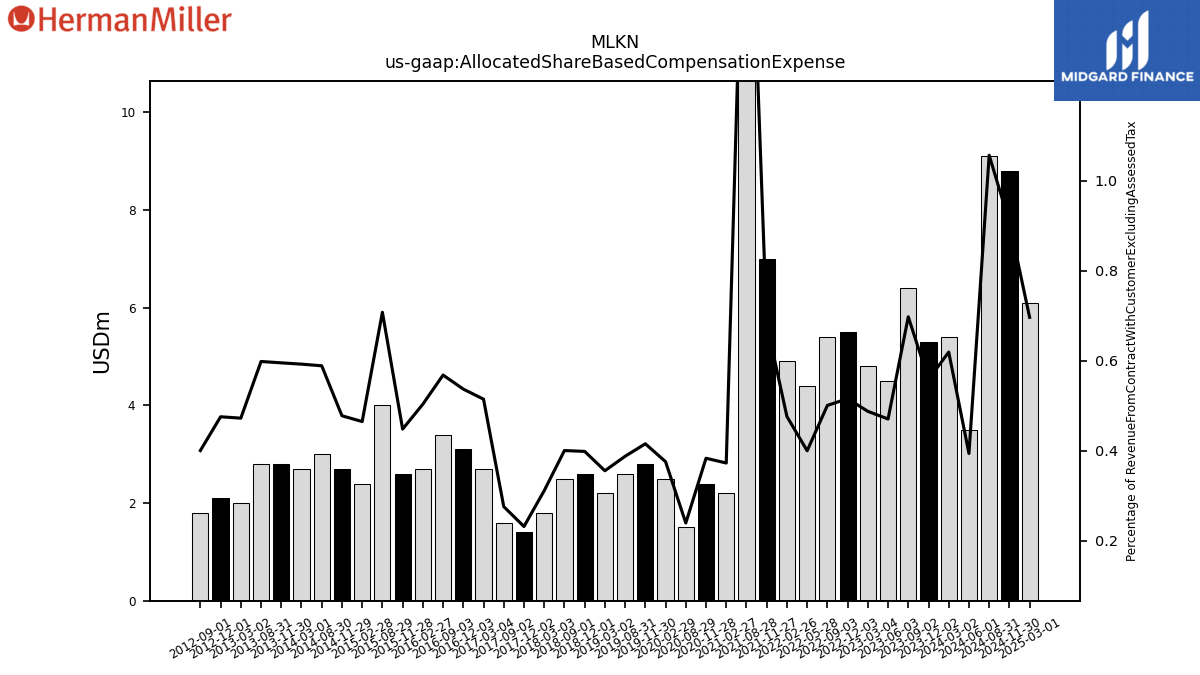
| Allocated Share Based Compensation Expense | 5.30 | 6.40 | NA | 4.80 | 5.50 | 5.40 | NA | 4.90 | 7.00 | 15.10 | NA | 2.20 | 2.40 | 1.50 | NA | 2.50 | 2.80 | 2.60 | NA | 2.20 | 2.60 | 2.50 | NA | 1.80 | 1.40 | 1.60 | NA | 2.70 | 3.10 | 3.40 | NA | 2.70 | 2.60 | 4.00 | NA | 2.40 | 2.70 | 3.00 | NA | 2.70 | 2.80 | 2.80 | NA | 2.00 | 2.10 | 1.80 | NA | NA | NA | NA | NA | NA | NA | NA | NA | NA | NA | NA | |
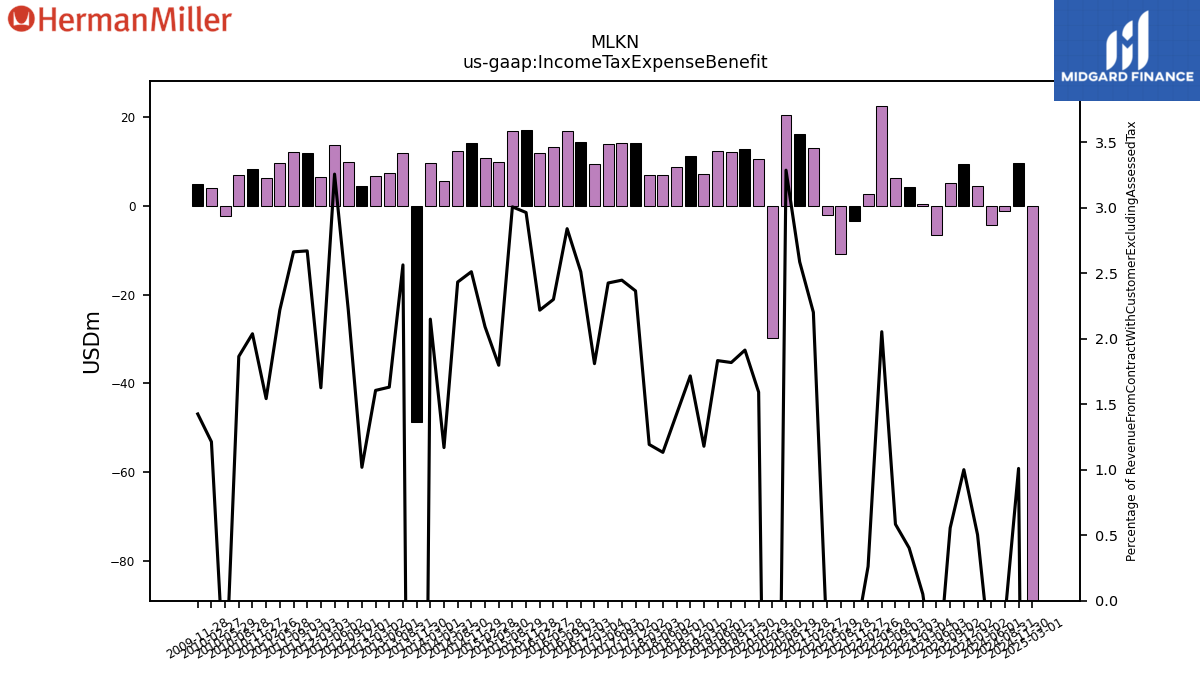
| Income Tax Expense Benefit | 9.50 | 5.10 | -6.60 | 0.50 | 4.30 | 6.30 | 22.60 | 2.70 | -3.40 | -10.80 | -2.00 | 13.00 | 16.20 | 20.60 | -29.80 | 10.60 | 12.90 | 12.20 | 12.30 | 7.30 | 11.20 | 8.90 | 7.00 | 6.90 | 14.30 | 14.20 | 14.00 | 9.50 | 14.50 | 17.00 | 13.40 | 11.90 | 17.20 | 17.00 | 9.90 | 10.80 | 14.20 | 12.40 | 5.70 | 9.80 | -48.60 | 12.00 | 7.50 | 6.80 | 4.50 | 10.00 | 13.70 | 6.50 | 11.90 | 12.20 | 9.80 | 6.40 | 8.40 | 7.10 | -2.30 | 4.00 | 4.90 | NA | |
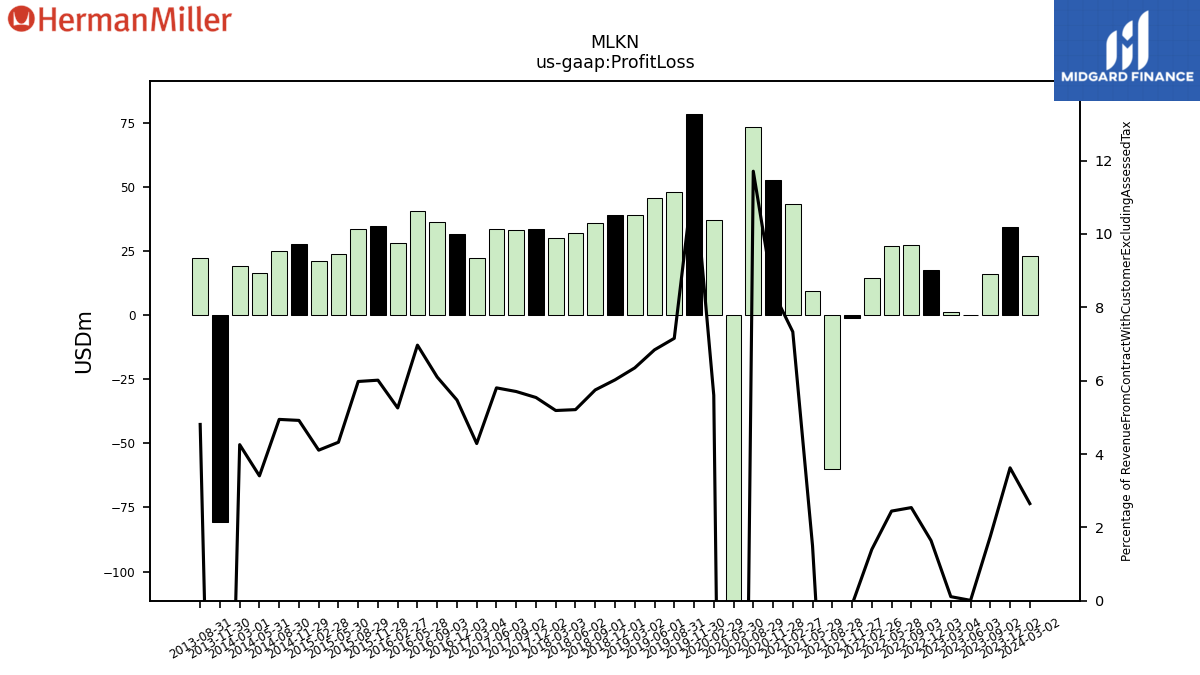
| Profit Loss | 34.40 | 16.10 | 0.10 | 1.10 | 17.50 | 27.40 | 26.90 | 14.40 | -1.10 | -59.90 | 9.30 | 43.30 | 52.80 | 73.40 | -178.30 | 37.30 | 78.60 | 48.00 | 45.90 | 39.30 | 39.30 | 35.90 | 32.20 | 30.00 | 33.50 | 33.10 | 33.50 | 22.50 | 31.60 | 36.50 | 40.60 | 28.20 | 34.90 | 33.80 | 23.80 | 21.20 | 27.80 | 25.20 | 16.60 | 19.40 | -80.60 | 22.50 | NA | NA | NA | NA | NA | NA | NA | NA | NA | NA | NA | NA | NA | NA | NA | NA | |
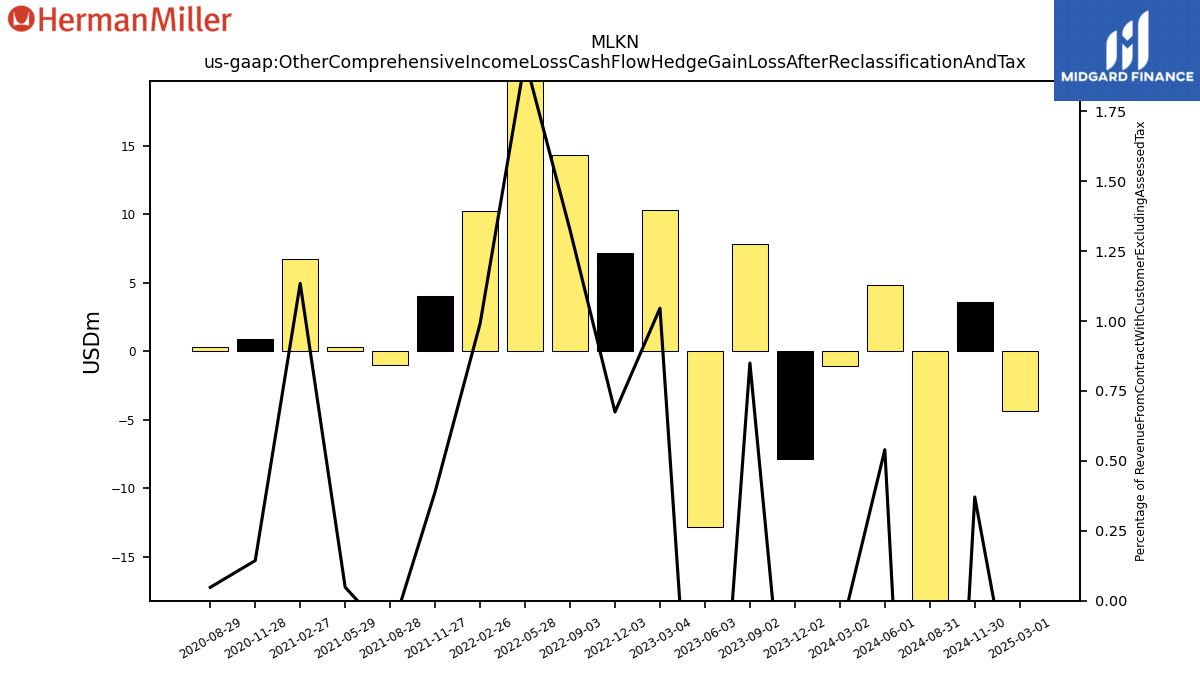
| Other Comprehensive Income Loss Cash Flow Hedge Gain Loss After Reclassification And Tax | -7.90 | 7.80 | -12.80 | 10.30 | 7.20 | 14.30 | 21.30 | 10.20 | 4.00 | -1.00 | 0.30 | 6.70 | 0.90 | 0.30 | NA | NA | NA | NA | NA | NA | NA | NA | NA | NA | NA | NA | NA | NA | NA | NA | NA | NA | NA | NA | NA | NA | NA | NA | NA | NA | NA | NA | NA | NA | NA | NA | NA | NA | NA | NA | NA | NA | NA | NA | NA | NA | NA | NA | |
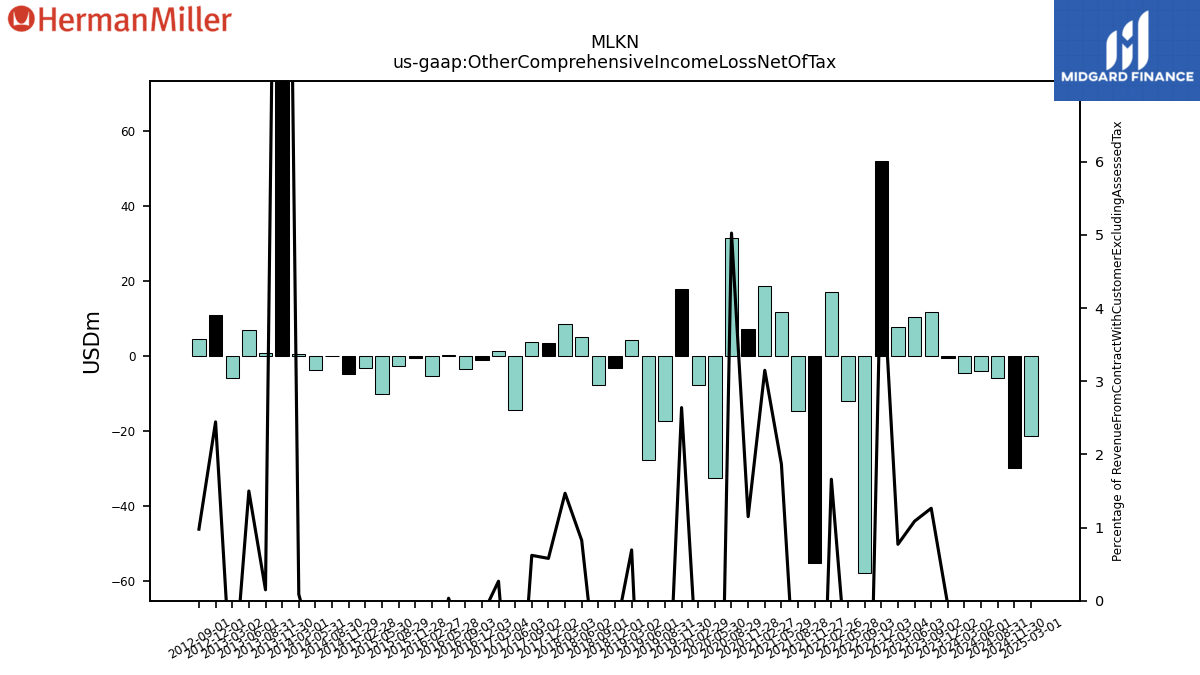
| Other Comprehensive Income Loss Net Of Tax | -0.60 | 11.60 | 10.40 | 7.60 | 51.80 | -57.80 | -12.10 | 17.10 | -55.10 | -14.70 | 11.60 | 18.60 | 7.20 | 31.50 | -32.50 | -7.80 | 17.80 | -17.40 | -27.70 | 4.30 | -3.10 | -7.80 | 5.10 | 8.50 | 3.50 | 3.60 | -14.50 | 1.40 | -1.20 | -3.40 | 0.20 | -5.40 | -0.50 | -2.60 | -10.00 | -3.30 | -4.90 | -0.10 | -3.70 | 0.40 | 89.00 | 0.70 | 6.90 | -5.80 | 10.80 | 4.40 | NA | NA | NA | NA | NA | NA | NA | NA | NA | NA | NA | NA | |
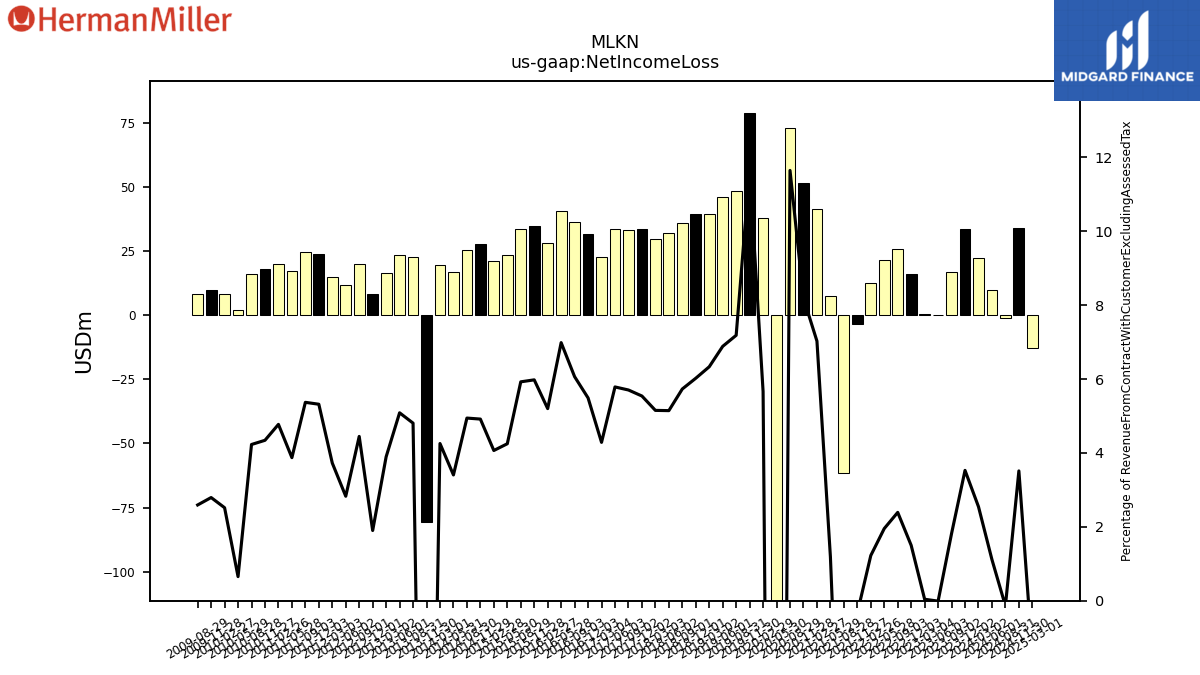
| Net Income Loss | 33.50 | 16.70 | -0.10 | 0.40 | 16.00 | 25.80 | 21.50 | 12.60 | -3.40 | -61.50 | 7.40 | 41.50 | 51.30 | 73.00 | -173.70 | 37.70 | 78.60 | 48.20 | 46.20 | 39.20 | 39.30 | 35.80 | 31.80 | 29.80 | 33.50 | 33.10 | 33.40 | 22.50 | 31.70 | 36.30 | 40.70 | 27.90 | 34.70 | 33.50 | 23.40 | 21.00 | 27.80 | 25.20 | 16.60 | 19.40 | -80.60 | 22.50 | 23.40 | 16.50 | 8.40 | 20.00 | 11.90 | 14.90 | 23.70 | 24.60 | 17.10 | 19.80 | 17.90 | 16.10 | 2.10 | 8.30 | 9.60 | 8.40 | |
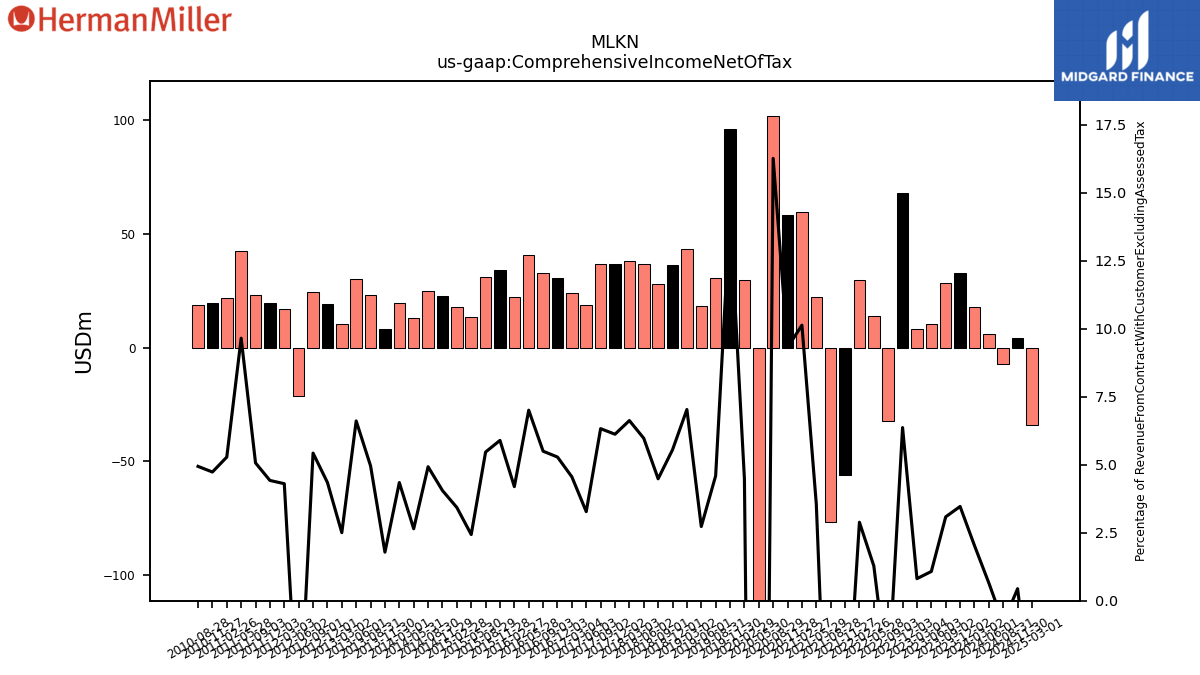
| Comprehensive Income Net Of Tax | 32.90 | 28.30 | 10.30 | 8.00 | 67.90 | -32.10 | 14.10 | 29.70 | -56.00 | -76.70 | 22.10 | 59.80 | 58.30 | 101.90 | -206.10 | 29.90 | 96.40 | 30.80 | 18.30 | 43.50 | 36.20 | 28.00 | 36.90 | 38.30 | 37.00 | 36.70 | 18.90 | 23.90 | 30.50 | 32.90 | 40.80 | 22.50 | 34.20 | 30.90 | 13.40 | 17.70 | 22.90 | 25.10 | 12.90 | 19.80 | 8.40 | 23.20 | 30.40 | 10.60 | 19.20 | 24.40 | -21.30 | 17.20 | 19.70 | 23.20 | 42.60 | 21.90 | 19.50 | 18.80 | NA | NA | NA | NA | |
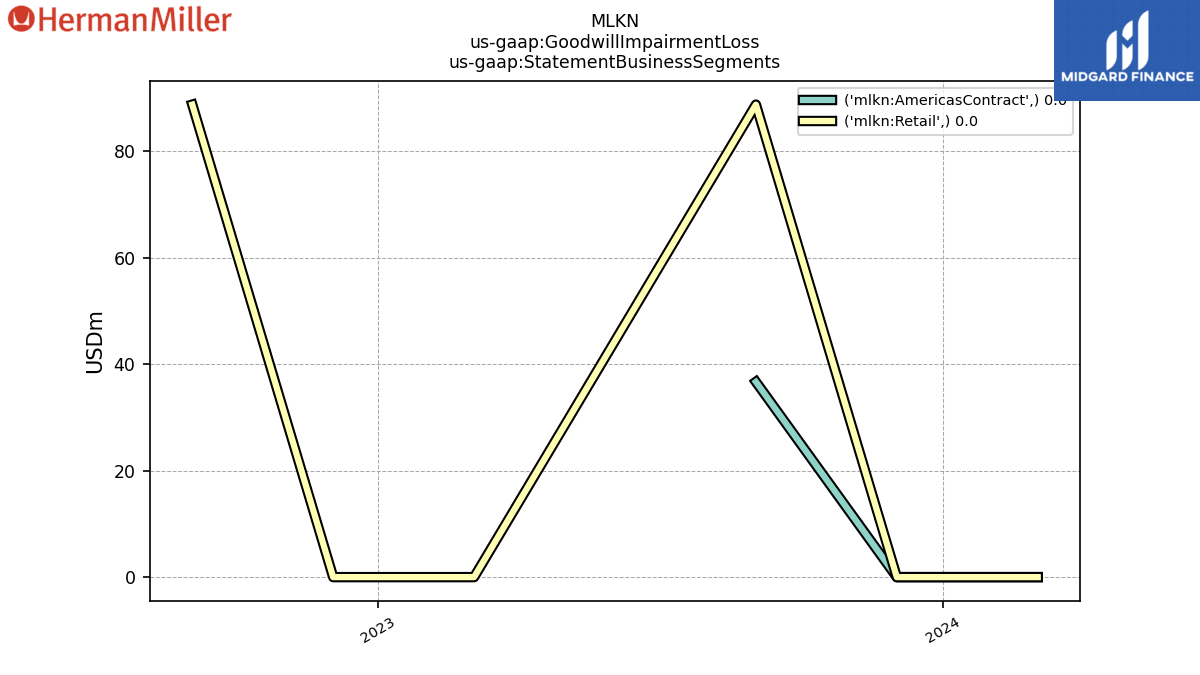
| Goodwill Impairment Loss | 0.00 | 125.50 | 0.00 | 0.00 | 0.00 | 125.50 | NA | NA | NA | NA | NA | NA | NA | 125.50 | 125.50 | NA | NA | NA | NA | NA | NA | NA | NA | NA | NA | NA | NA | NA | NA | NA | NA | NA | NA | NA | NA | NA | NA | NA | NA | NA | NA | NA | NA | NA | NA | NA | NA | NA | NA | NA | NA | NA | NA | NA | NA | NA | NA | NA |
| 2023-12-02 | 2023-09-02 | 2023-06-03 | 2023-03-04 | 2022-12-03 | 2022-09-03 | 2022-05-28 | 2022-02-26 | 2021-11-27 | 2021-08-28 | 2021-05-29 | 2021-02-27 | 2020-11-28 | 2020-08-29 | 2020-05-30 | 2020-02-29 | 2019-11-30 | 2019-08-31 | 2019-06-01 | 2019-03-02 | 2018-12-01 | 2018-09-01 | 2018-06-02 | 2018-03-03 | 2017-12-02 | 2017-09-02 | 2017-06-03 | 2017-03-04 | 2016-12-03 | 2016-09-03 | 2016-05-28 | 2016-02-27 | 2015-11-28 | 2015-08-29 | 2015-05-30 | 2015-02-28 | 2014-11-29 | 2014-08-30 | 2014-05-31 | 2014-03-01 | 2013-11-30 | 2013-08-31 | 2013-06-01 | 2013-03-02 | 2012-12-01 | 2012-09-01 | 2012-06-02 | 2012-03-03 | 2011-12-03 | 2011-09-03 | 2011-05-28 | 2011-02-26 | 2010-11-27 | 2010-08-28 | 2010-05-29 | 2010-02-27 | 2009-11-28 | 2009-08-29 | ||
|---|---|---|---|---|---|---|---|---|---|---|---|---|---|---|---|---|---|---|---|---|---|---|---|---|---|---|---|---|---|---|---|---|---|---|---|---|---|---|---|---|---|---|---|---|---|---|---|---|---|---|---|---|---|---|---|---|---|---|---|
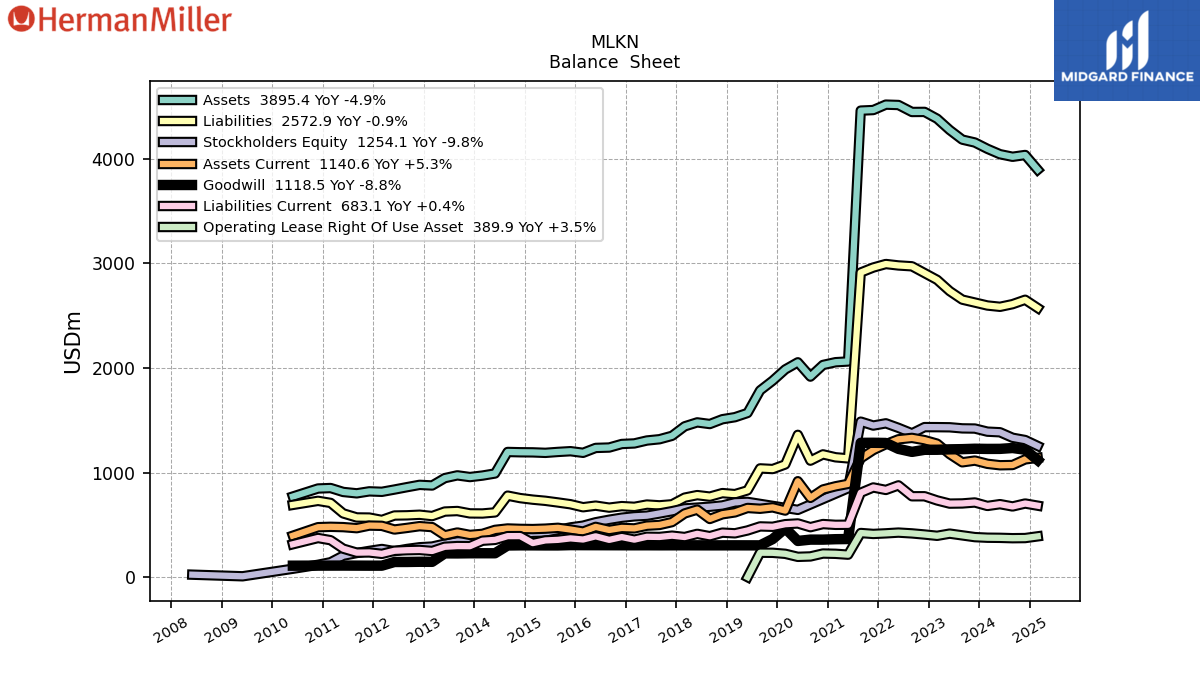
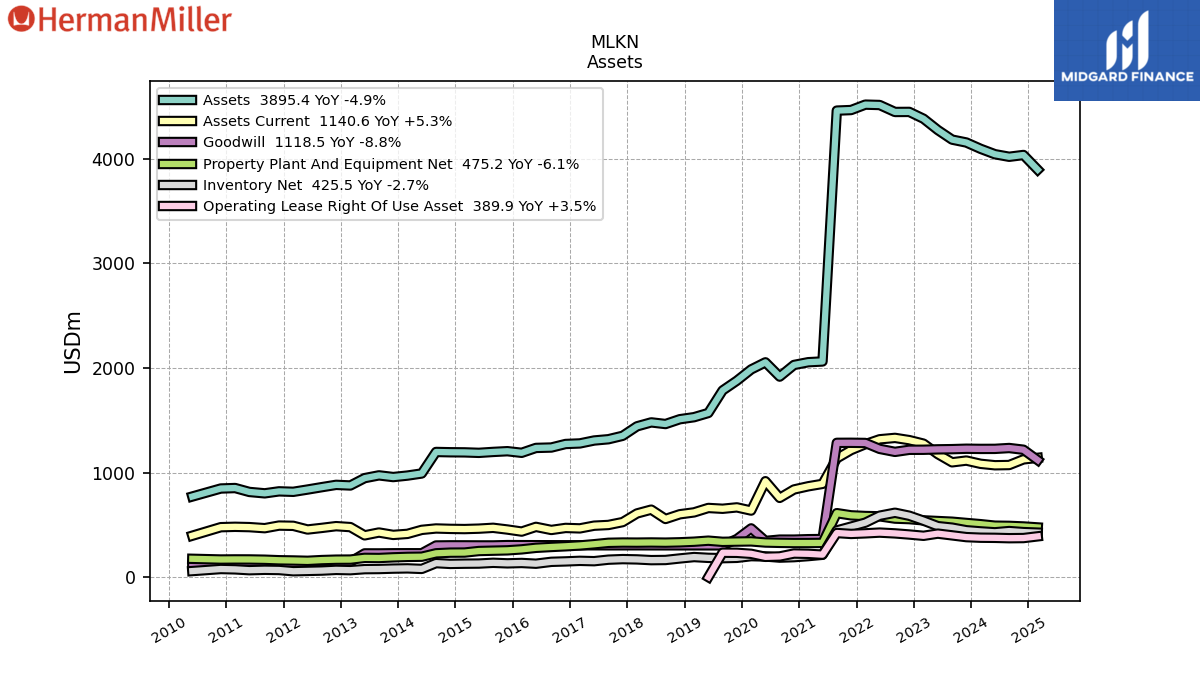
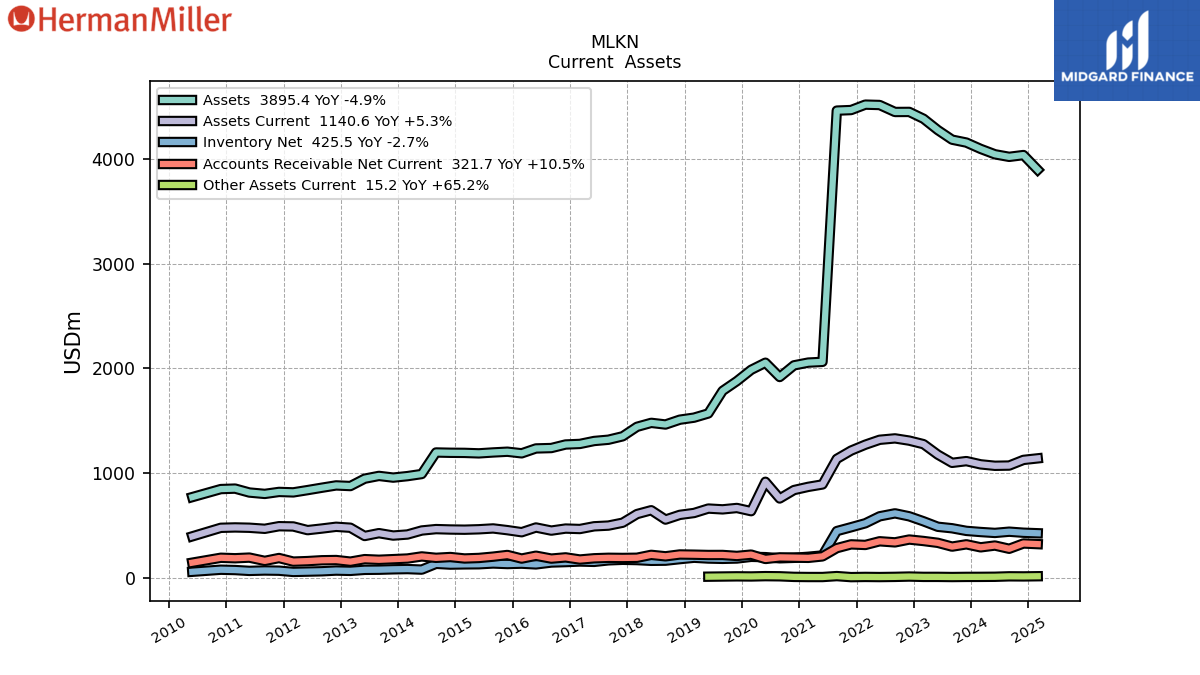
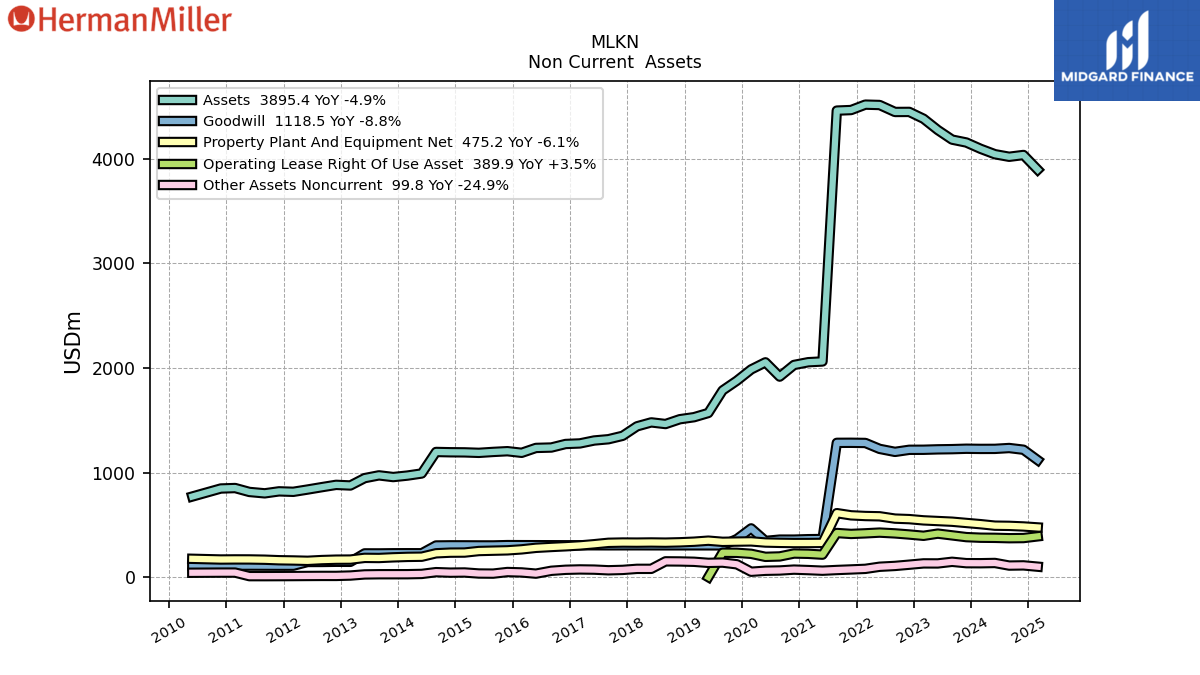
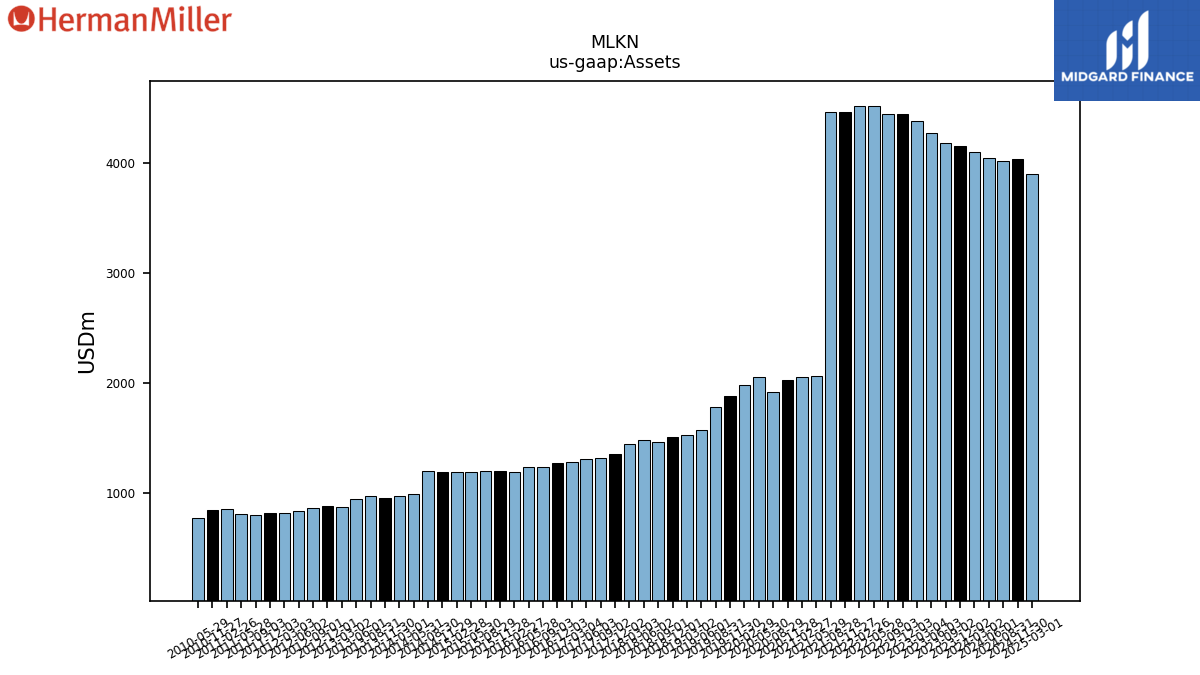
| Assets | 4155.50 | 4183.20 | 4274.80 | 4382.80 | 4448.10 | 4447.40 | 4514.00 | 4517.70 | 4465.90 | 4460.50 | 2061.90 | 2054.90 | 2028.50 | 1917.10 | 2053.90 | 1985.80 | 1878.00 | 1784.80 | 1569.30 | 1529.20 | 1509.70 | 1463.70 | 1479.50 | 1441.70 | 1351.10 | 1318.40 | 1306.30 | 1278.30 | 1272.90 | 1239.10 | 1235.20 | 1188.60 | 1204.00 | 1197.00 | 1188.20 | 1192.80 | 1193.90 | 1196.70 | 990.90 | 971.00 | 956.80 | 973.00 | 946.50 | 876.20 | 882.20 | 860.20 | 837.40 | 815.70 | 820.10 | 801.10 | 814.40 | 851.80 | 847.30 | NA | 770.60 | NA | NA | NA | |
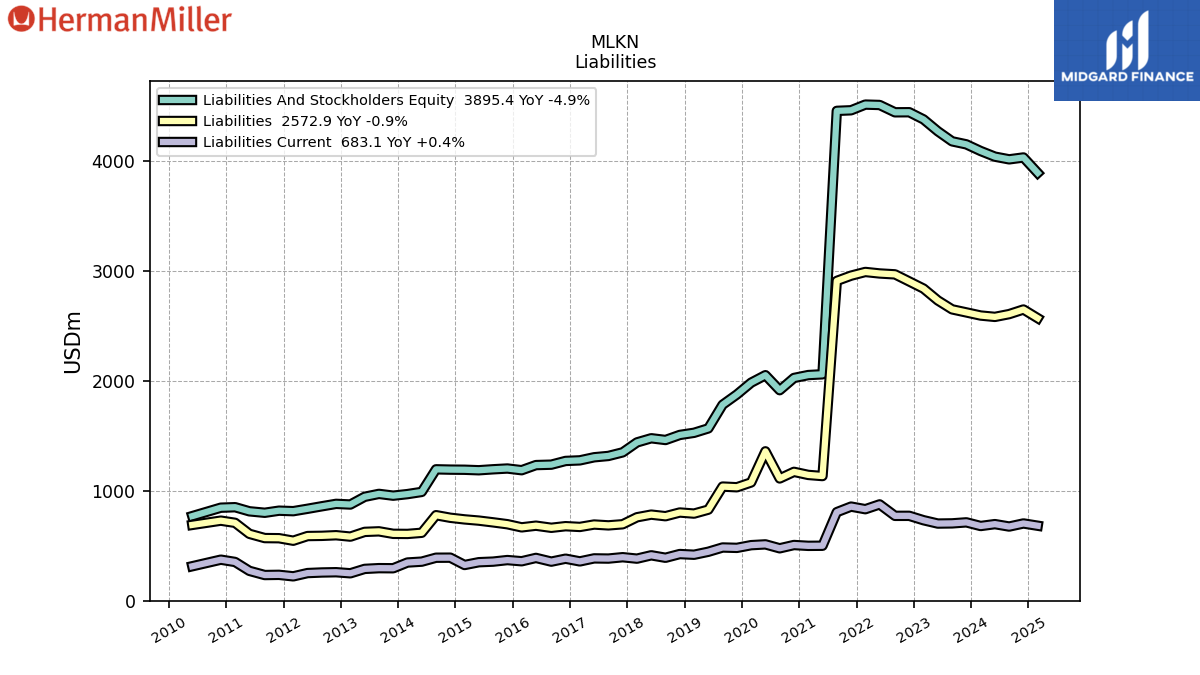
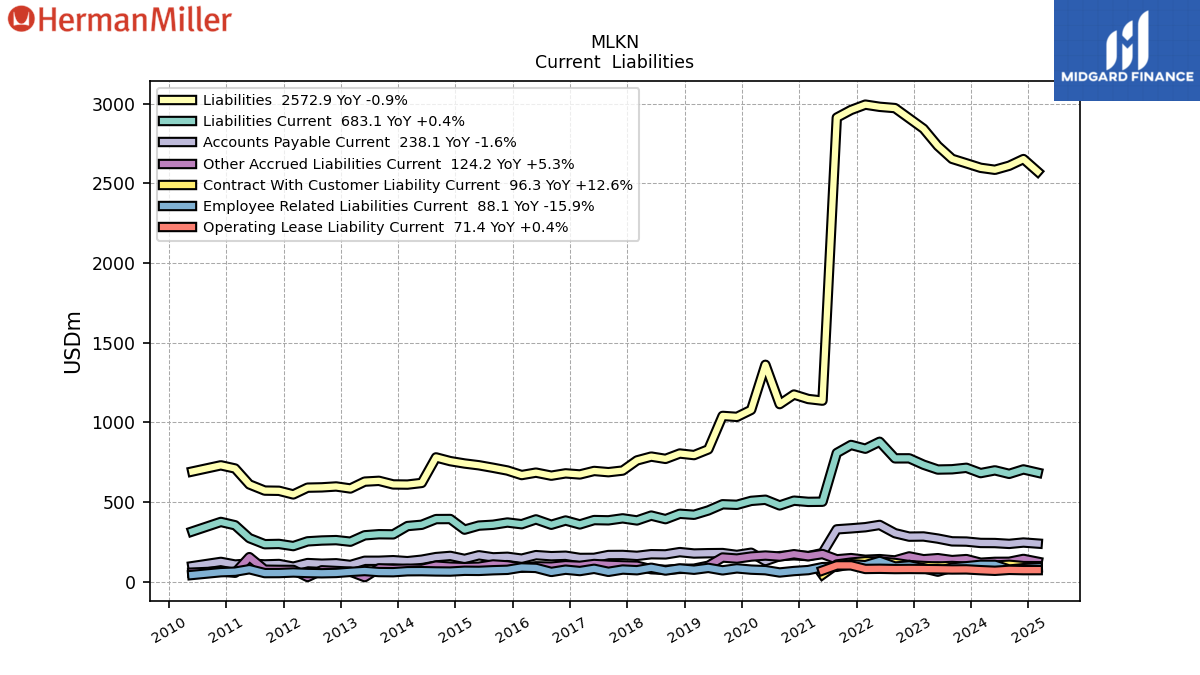
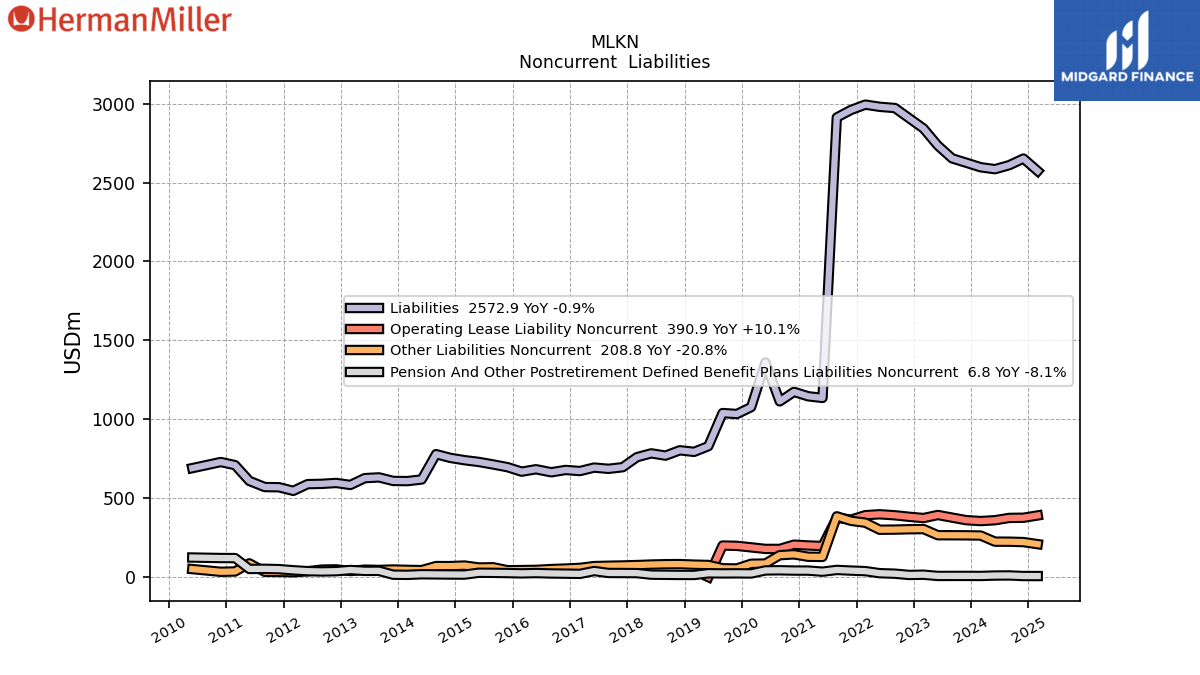
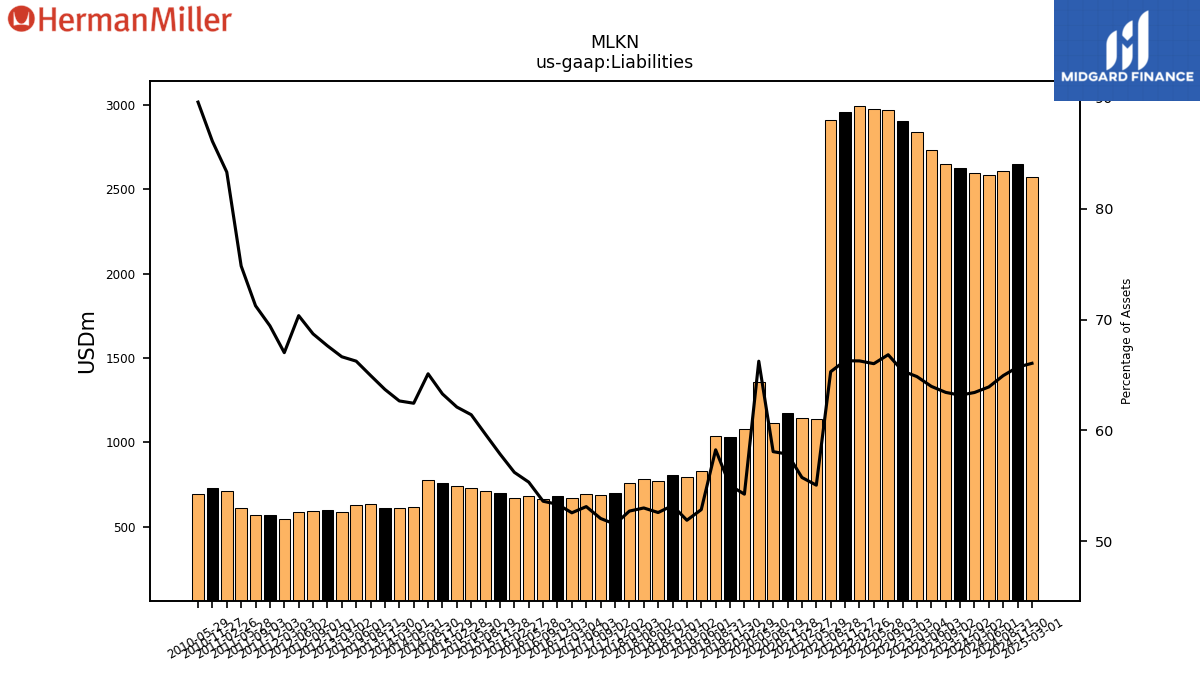
| Liabilities | 2625.30 | 2653.30 | 2734.60 | 2842.30 | 2907.20 | 2971.90 | 2980.00 | 2993.70 | 2960.10 | 2912.30 | 1135.30 | 1145.70 | 1173.70 | 1113.50 | 1360.50 | 1077.30 | 1033.40 | 1039.60 | 829.50 | 793.60 | 803.50 | 769.80 | 784.20 | 760.10 | 696.40 | 686.30 | 694.00 | 672.00 | 678.90 | 664.30 | 683.50 | 668.20 | 696.80 | 713.80 | 729.70 | 740.80 | 755.60 | 779.10 | 618.80 | 608.40 | 609.40 | 632.00 | 627.00 | 583.90 | 596.60 | 591.00 | 589.10 | 546.60 | 569.40 | 570.70 | 609.40 | 709.50 | 729.30 | NA | 690.50 | NA | NA | NA | |
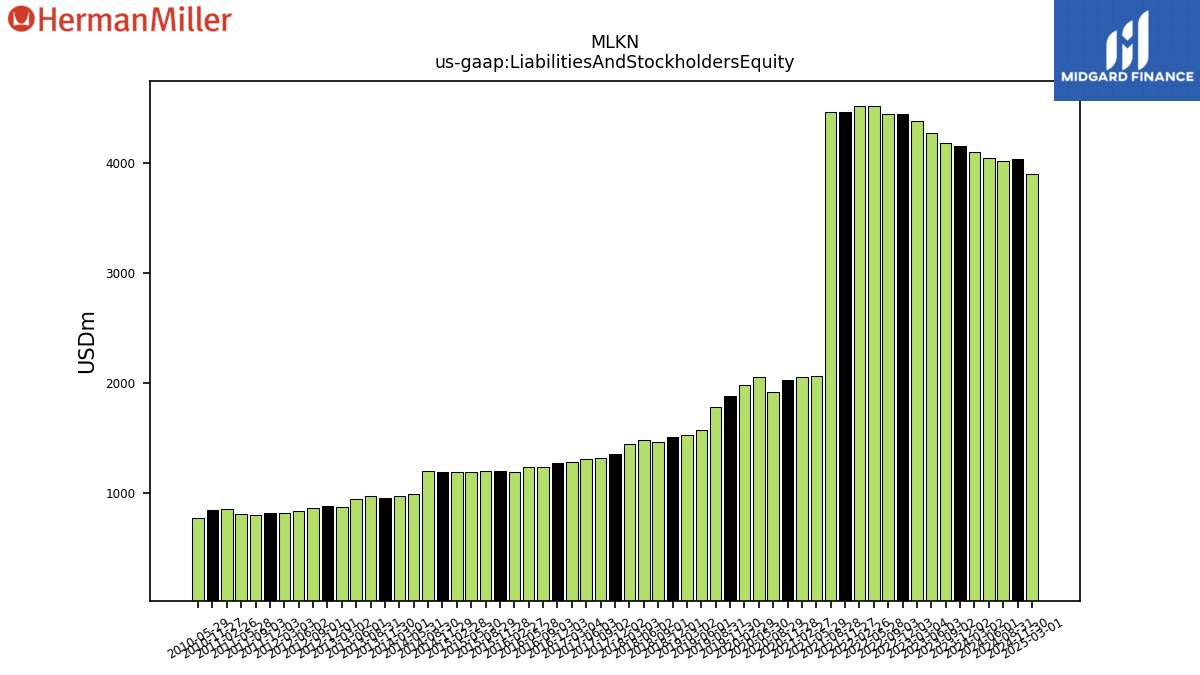
| Liabilities And Stockholders Equity | 4155.50 | 4183.20 | 4274.80 | 4382.80 | 4448.10 | 4447.40 | 4514.00 | 4517.70 | 4465.90 | 4460.50 | 2061.90 | 2054.90 | 2028.50 | 1917.10 | 2053.90 | 1985.80 | 1878.00 | 1784.80 | 1569.30 | 1529.20 | 1509.70 | 1463.70 | 1479.50 | 1441.70 | 1351.10 | 1318.40 | 1306.30 | 1278.30 | 1272.90 | 1239.10 | 1235.20 | 1188.60 | 1204.00 | 1197.00 | 1188.20 | 1192.80 | 1193.90 | 1196.70 | 990.90 | 971.00 | 956.80 | 973.00 | 946.50 | 876.20 | 882.20 | 860.20 | 837.40 | 815.70 | 820.10 | 801.10 | 814.40 | 851.80 | 847.30 | NA | 770.60 | NA | NA | NA | |
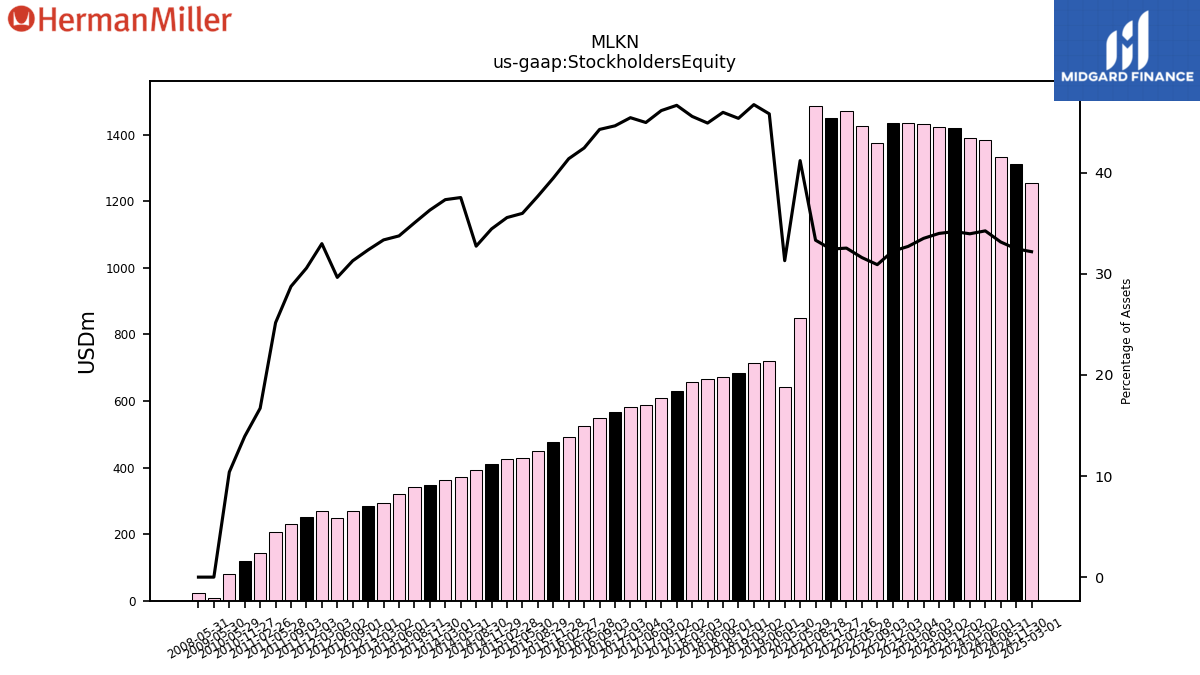
| Stockholders Equity | 1420.60 | 1422.30 | 1432.60 | 1433.90 | 1434.30 | 1374.80 | 1427.10 | 1470.50 | 1449.20 | 1486.70 | 849.60 | NA | NA | NA | 643.00 | NA | NA | NA | 719.20 | 714.80 | 685.20 | 673.00 | 664.60 | 657.10 | 630.60 | 608.50 | 587.50 | 581.00 | 568.30 | 548.80 | 524.40 | 492.00 | 475.30 | 451.10 | 427.60 | 424.30 | 411.30 | 391.80 | 372.10 | 362.60 | 347.40 | 341.00 | 319.50 | 292.30 | 285.60 | 269.20 | 248.30 | 269.10 | 250.70 | 230.40 | 205.00 | 142.30 | 118.00 | NA | 80.10 | NA | NA | NA |
| 2023-12-02 | 2023-09-02 | 2023-06-03 | 2023-03-04 | 2022-12-03 | 2022-09-03 | 2022-05-28 | 2022-02-26 | 2021-11-27 | 2021-08-28 | 2021-05-29 | 2021-02-27 | 2020-11-28 | 2020-08-29 | 2020-05-30 | 2020-02-29 | 2019-11-30 | 2019-08-31 | 2019-06-01 | 2019-03-02 | 2018-12-01 | 2018-09-01 | 2018-06-02 | 2018-03-03 | 2017-12-02 | 2017-09-02 | 2017-06-03 | 2017-03-04 | 2016-12-03 | 2016-09-03 | 2016-05-28 | 2016-02-27 | 2015-11-28 | 2015-08-29 | 2015-05-30 | 2015-02-28 | 2014-11-29 | 2014-08-30 | 2014-05-31 | 2014-03-01 | 2013-11-30 | 2013-08-31 | 2013-06-01 | 2013-03-02 | 2012-12-01 | 2012-09-01 | 2012-06-02 | 2012-03-03 | 2011-12-03 | 2011-09-03 | 2011-05-28 | 2011-02-26 | 2010-11-27 | 2010-08-28 | 2010-05-29 | 2010-02-27 | 2009-11-28 | 2009-08-29 | ||
|---|---|---|---|---|---|---|---|---|---|---|---|---|---|---|---|---|---|---|---|---|---|---|---|---|---|---|---|---|---|---|---|---|---|---|---|---|---|---|---|---|---|---|---|---|---|---|---|---|---|---|---|---|---|---|---|---|---|---|---|
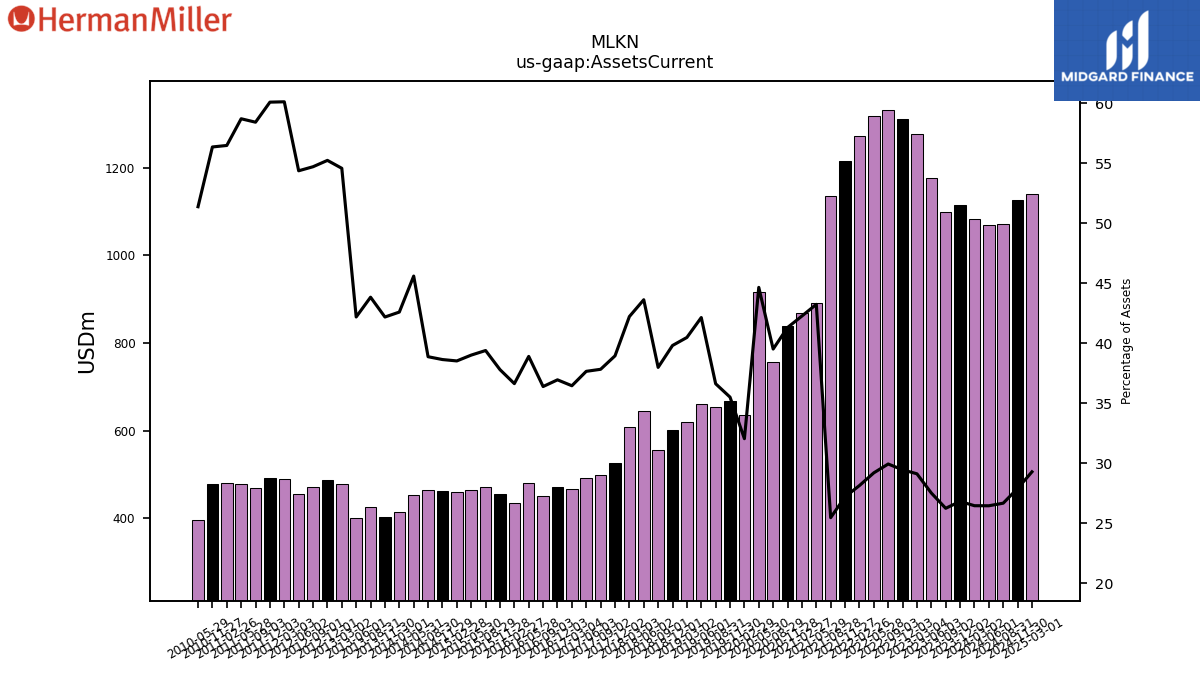
| Assets Current | 1114.30 | 1097.70 | 1176.20 | 1276.10 | 1309.90 | 1331.20 | 1317.90 | 1271.10 | 1214.60 | 1135.70 | 891.50 | 868.50 | 837.90 | 757.50 | 917.10 | 636.30 | 666.80 | 653.60 | 661.30 | 619.00 | 601.00 | 556.00 | 645.40 | 608.70 | 526.20 | 498.70 | 491.90 | 466.00 | 470.30 | 450.90 | 480.50 | 435.40 | 455.10 | 471.50 | 463.50 | 459.50 | 461.30 | 465.20 | 451.80 | 413.60 | 403.60 | 426.50 | 399.30 | 478.20 | 487.30 | 470.60 | 455.30 | 490.40 | 492.80 | 468.00 | 478.10 | 481.10 | 477.50 | NA | 395.90 | NA | NA | NA | |
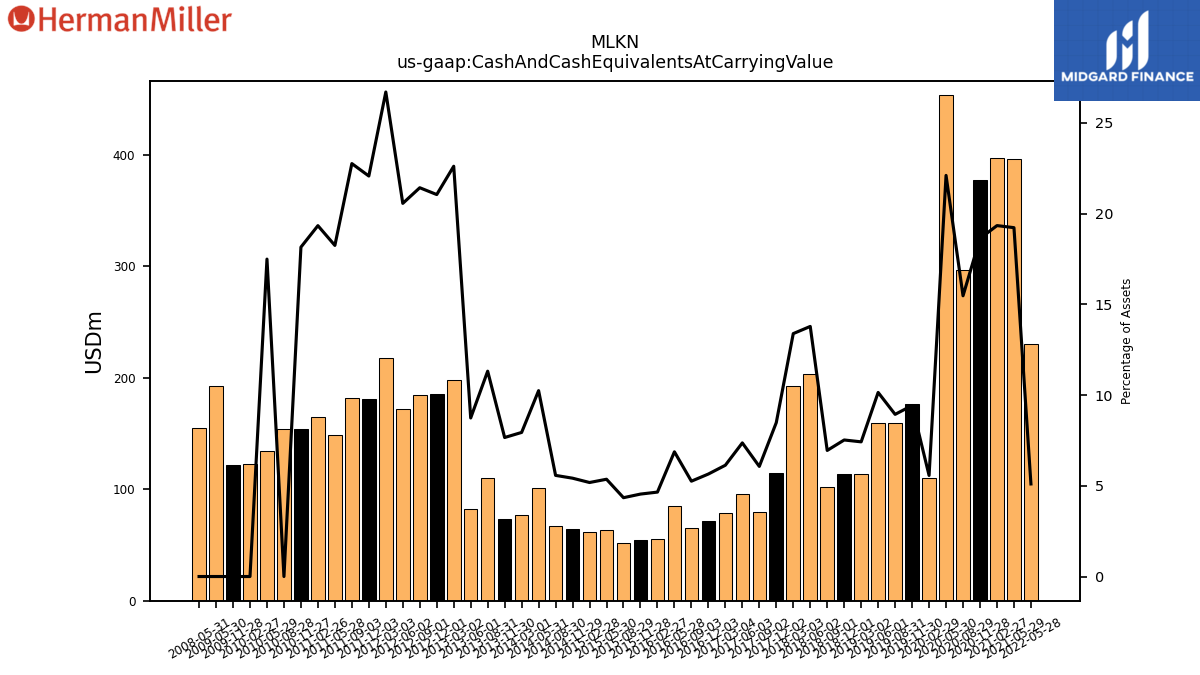
| Cash And Cash Equivalents At Carrying Value | NA | NA | NA | NA | NA | NA | 230.30 | NA | NA | NA | 396.40 | 397.40 | 377.90 | 296.60 | 454.00 | 110.60 | 177.00 | 159.50 | 159.20 | 113.50 | 113.60 | 101.70 | 203.90 | 193.00 | 114.60 | 80.00 | 96.20 | 78.40 | 71.90 | 65.10 | 84.90 | 55.30 | 54.70 | 52.00 | 63.70 | 61.80 | 64.70 | 66.70 | 101.50 | 77.10 | 73.30 | 110.10 | 82.70 | 198.10 | 185.70 | 184.30 | 172.20 | 217.80 | 181.00 | 182.30 | 148.60 | 164.70 | 153.80 | 153.80 | 134.80 | 123.10 | 121.70 | NA | |
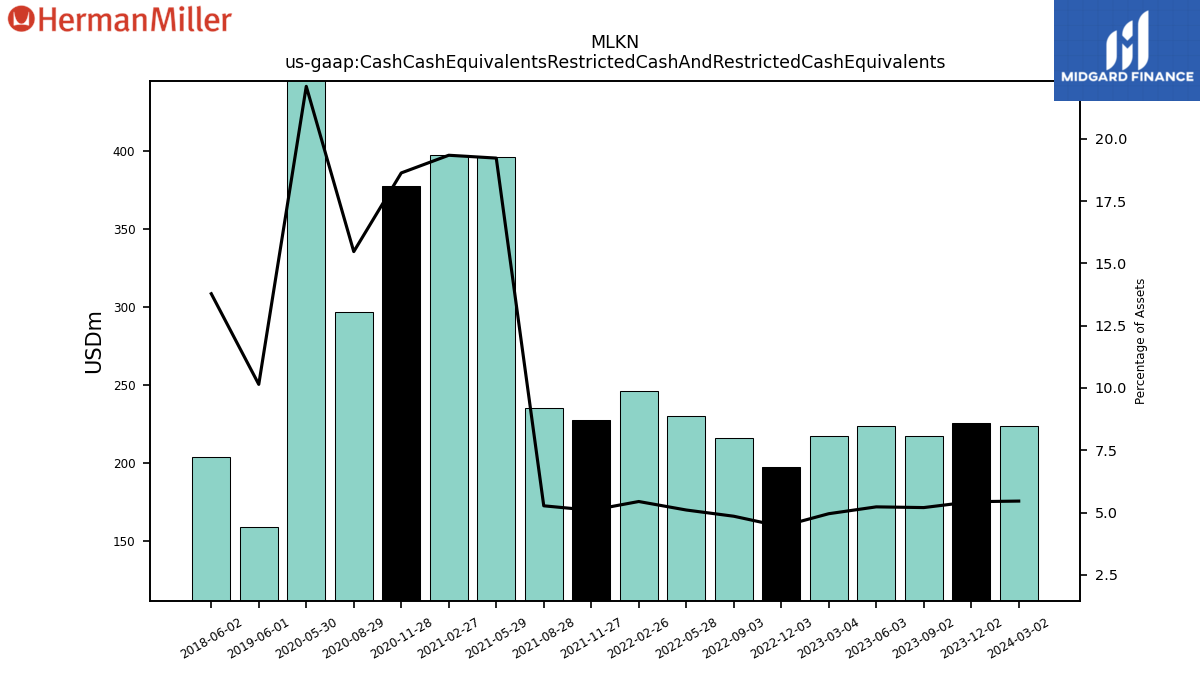
| Cash Cash Equivalents Restricted Cash And Restricted Cash Equivalents | 225.80 | 217.50 | 223.50 | 217.10 | 197.50 | 215.80 | 230.30 | 245.90 | 227.30 | 235.10 | 396.40 | 397.40 | 377.90 | 296.60 | 454.00 | NA | NA | NA | 159.20 | NA | NA | NA | 203.90 | NA | NA | NA | NA | NA | NA | NA | NA | NA | NA | NA | NA | NA | NA | NA | NA | NA | NA | NA | NA | NA | NA | NA | NA | NA | NA | NA | NA | NA | NA | NA | NA | NA | NA | NA | |
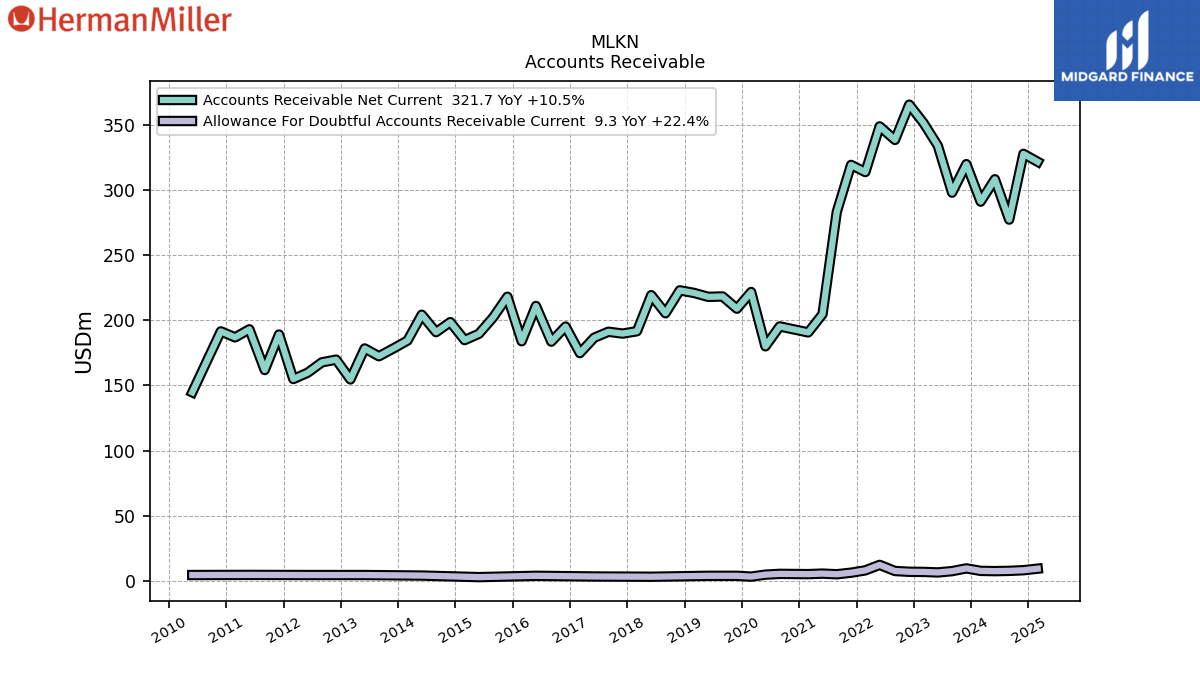
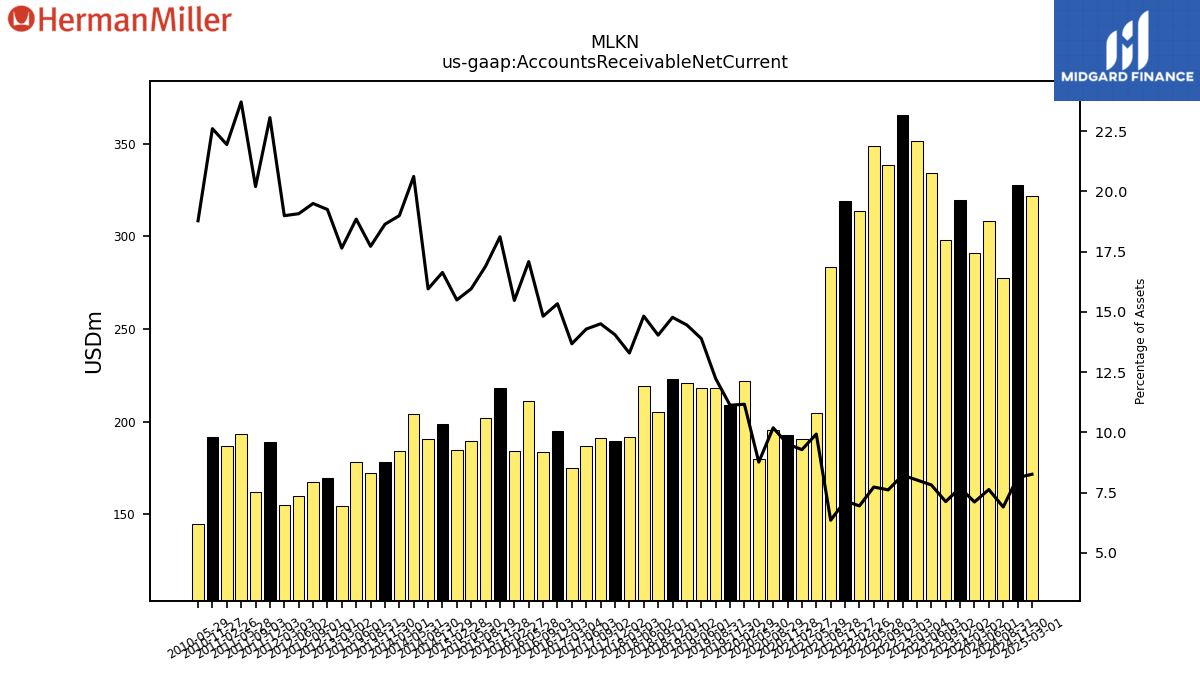
| Accounts Receivable Net Current | 319.90 | 298.00 | 334.10 | 351.50 | 365.60 | 338.50 | 348.90 | 313.80 | 319.30 | 283.30 | 204.70 | 190.70 | 193.00 | 195.30 | 180.00 | 221.70 | 208.90 | 218.30 | 218.00 | 221.00 | 223.00 | 205.40 | 219.30 | 191.60 | 189.80 | 191.20 | 186.60 | 174.80 | 195.20 | 183.60 | 211.00 | 183.90 | 218.10 | 202.20 | 189.60 | 184.80 | 198.60 | 190.90 | 204.30 | 184.40 | 178.30 | 172.40 | 178.40 | 154.60 | 169.80 | 167.70 | 159.70 | 154.90 | 189.10 | 161.80 | 193.10 | 186.90 | 191.50 | NA | 144.70 | NA | NA | NA | |
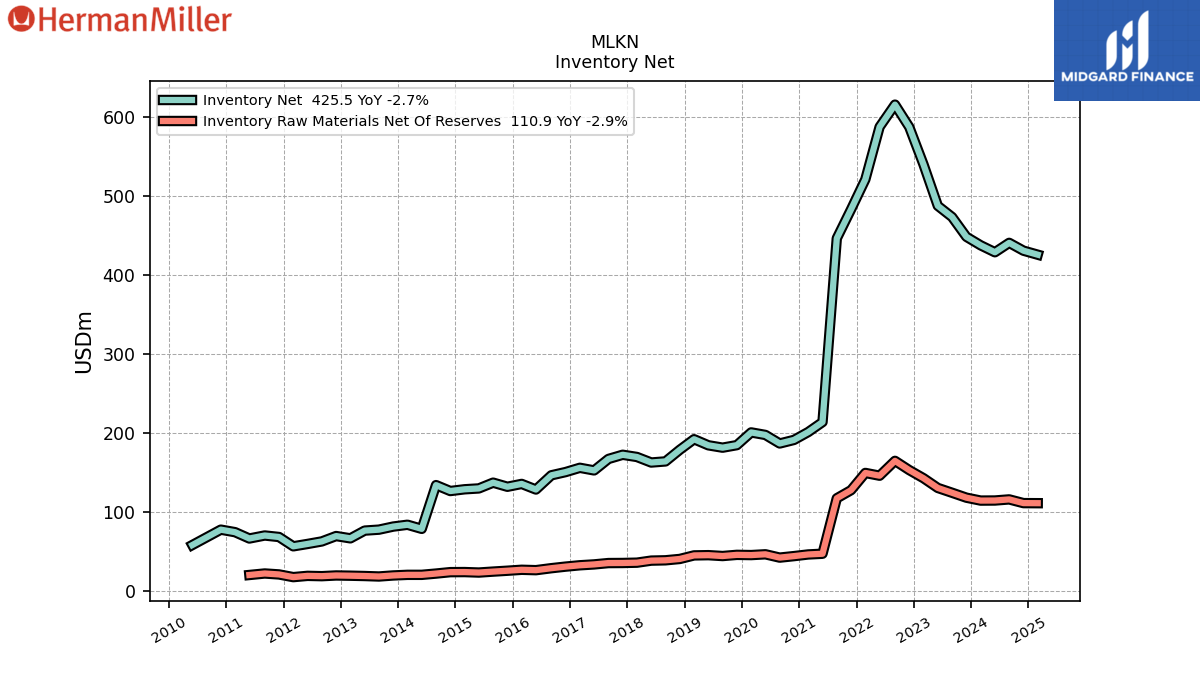
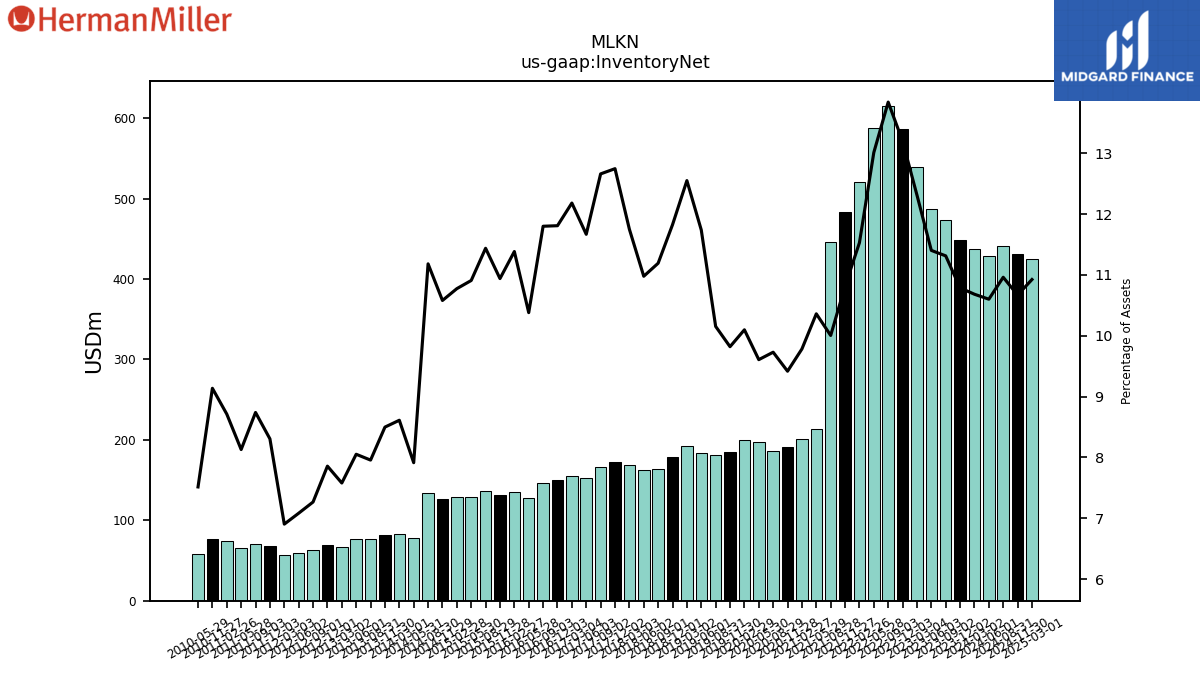
| Inventory Net | 448.20 | 473.20 | 487.40 | 539.60 | 587.10 | 615.50 | 587.30 | 520.80 | 482.90 | 446.20 | 213.60 | 201.00 | 191.00 | 186.50 | 197.30 | 200.50 | 184.40 | 181.20 | 184.20 | 191.90 | 178.50 | 163.80 | 162.40 | 169.40 | 172.20 | 166.90 | 152.40 | 155.70 | 150.30 | 146.20 | 128.20 | 135.30 | 131.70 | 136.90 | 129.60 | 128.50 | 126.30 | 133.80 | 78.40 | 83.60 | 81.30 | 77.40 | 76.20 | 66.40 | 69.30 | 62.50 | 59.30 | 56.30 | 68.10 | 70.00 | 66.20 | 74.20 | 77.40 | NA | 57.90 | NA | NA | NA | |
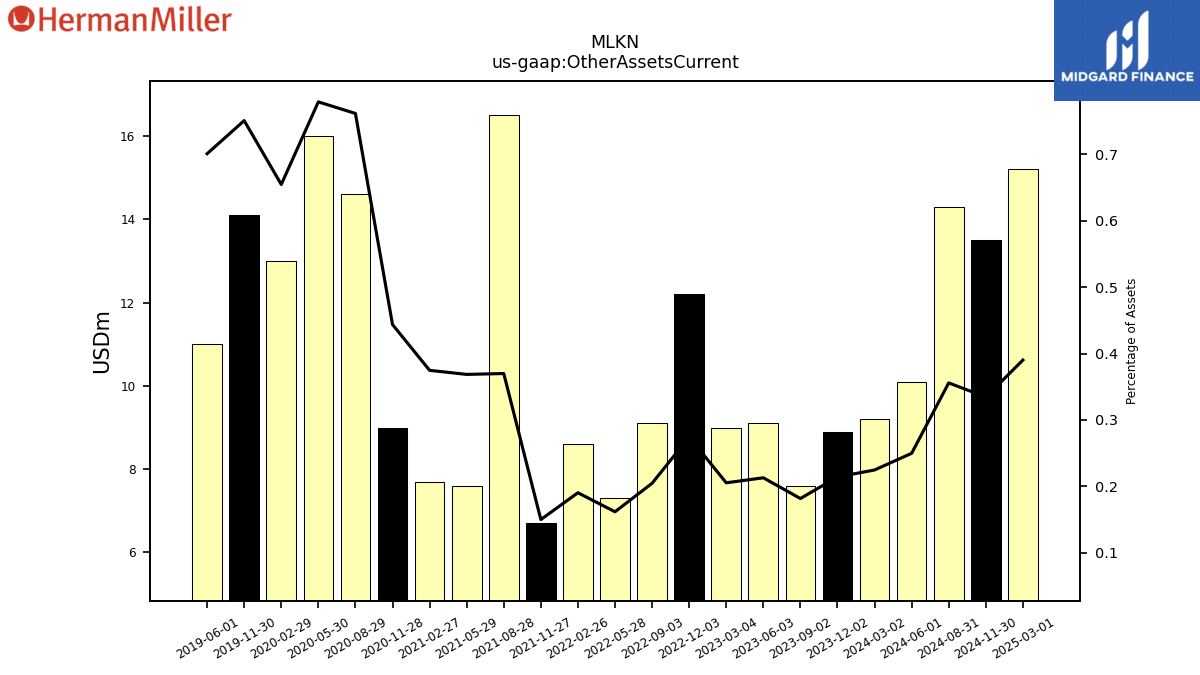
| Other Assets Current | 8.90 | 7.60 | 9.10 | 9.00 | 12.20 | 9.10 | 7.30 | 8.60 | 6.70 | 16.50 | 7.60 | 7.70 | 9.00 | 14.60 | 16.00 | 13.00 | 14.10 | NA | 11.00 | NA | NA | NA | NA | NA | NA | NA | NA | NA | NA | NA | NA | NA | NA | NA | NA | NA | NA | NA | NA | NA | NA | NA | NA | NA | NA | NA | NA | NA | NA | NA | NA | NA | NA | NA | NA | NA | NA | NA |
| 2023-12-02 | 2023-09-02 | 2023-06-03 | 2023-03-04 | 2022-12-03 | 2022-09-03 | 2022-05-28 | 2022-02-26 | 2021-11-27 | 2021-08-28 | 2021-05-29 | 2021-02-27 | 2020-11-28 | 2020-08-29 | 2020-05-30 | 2020-02-29 | 2019-11-30 | 2019-08-31 | 2019-06-01 | 2019-03-02 | 2018-12-01 | 2018-09-01 | 2018-06-02 | 2018-03-03 | 2017-12-02 | 2017-09-02 | 2017-06-03 | 2017-03-04 | 2016-12-03 | 2016-09-03 | 2016-05-28 | 2016-02-27 | 2015-11-28 | 2015-08-29 | 2015-05-30 | 2015-02-28 | 2014-11-29 | 2014-08-30 | 2014-05-31 | 2014-03-01 | 2013-11-30 | 2013-08-31 | 2013-06-01 | 2013-03-02 | 2012-12-01 | 2012-09-01 | 2012-06-02 | 2012-03-03 | 2011-12-03 | 2011-09-03 | 2011-05-28 | 2011-02-26 | 2010-11-27 | 2010-08-28 | 2010-05-29 | 2010-02-27 | 2009-11-28 | 2009-08-29 | ||
|---|---|---|---|---|---|---|---|---|---|---|---|---|---|---|---|---|---|---|---|---|---|---|---|---|---|---|---|---|---|---|---|---|---|---|---|---|---|---|---|---|---|---|---|---|---|---|---|---|---|---|---|---|---|---|---|---|---|---|---|
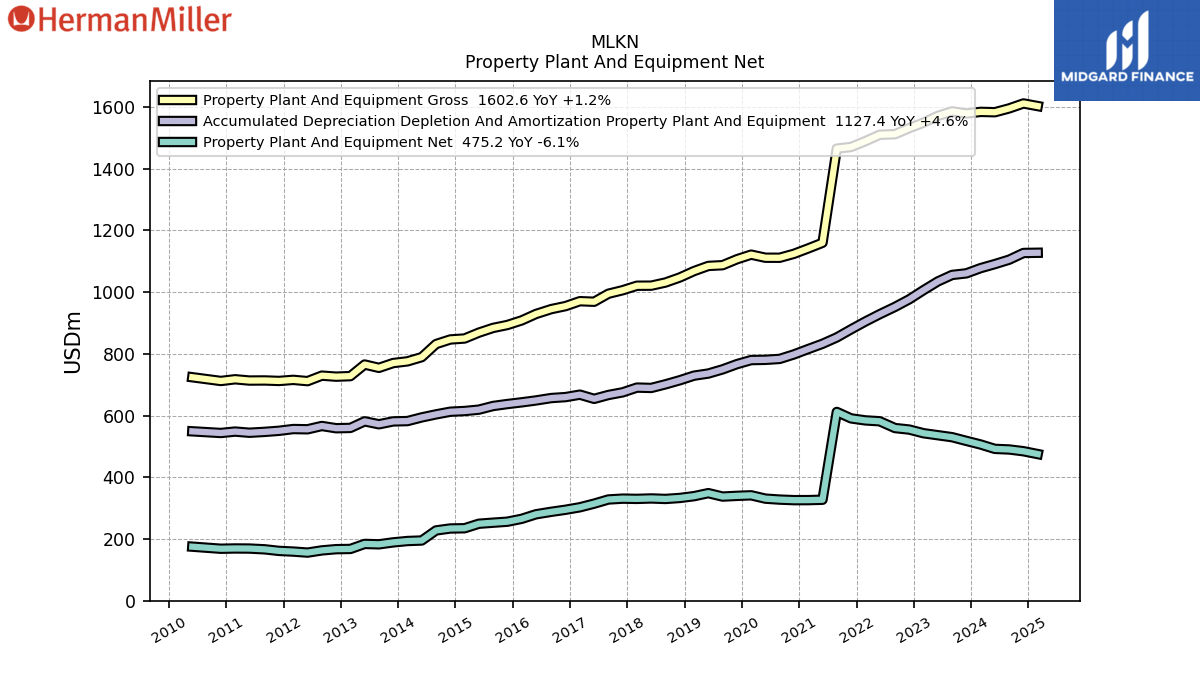
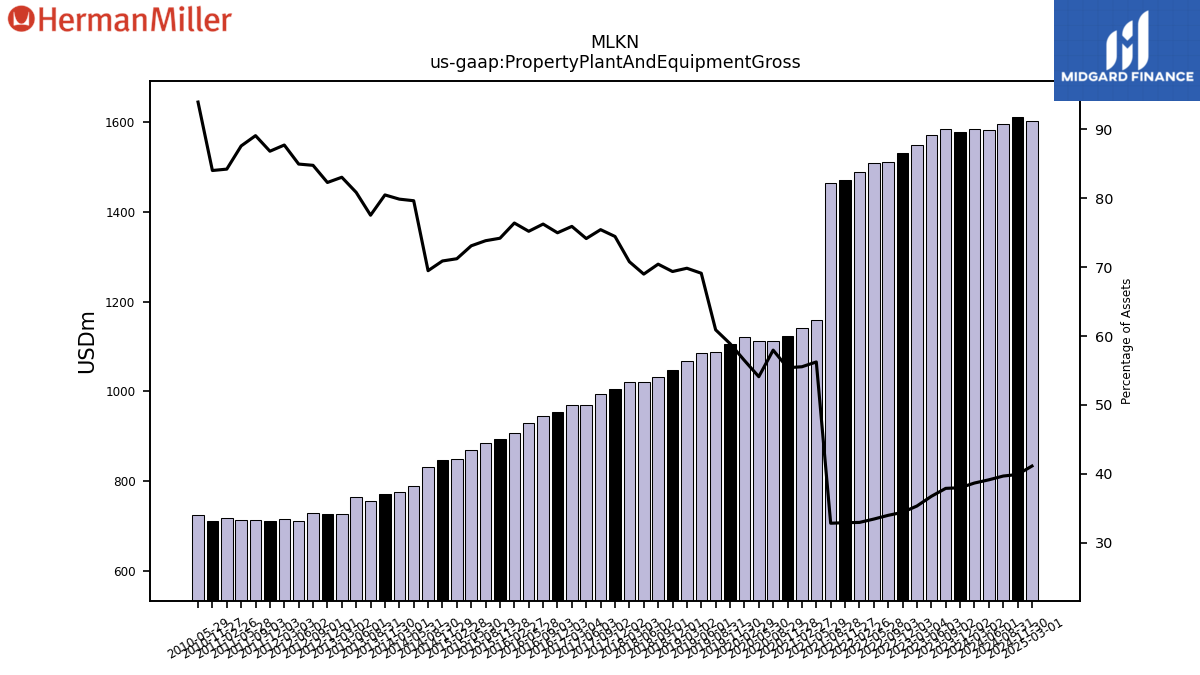
| Property Plant And Equipment Gross | 1578.60 | 1585.40 | 1570.70 | 1548.90 | 1531.20 | 1511.50 | 1509.70 | 1488.90 | 1470.10 | 1464.80 | 1159.70 | 1141.50 | 1124.00 | 1111.20 | 1111.30 | 1121.30 | 1106.30 | 1087.10 | 1084.70 | 1068.10 | 1047.30 | 1031.00 | 1020.80 | 1020.60 | 1006.00 | 994.70 | 968.70 | 970.50 | 954.60 | 944.90 | 929.00 | 908.20 | 893.40 | 883.90 | 868.60 | 849.60 | 846.50 | 831.60 | 789.20 | 775.60 | 770.10 | 754.50 | 765.30 | 727.70 | 726.00 | 729.30 | 711.50 | 715.60 | 712.10 | 713.70 | 713.40 | 717.50 | 712.00 | NA | 724.10 | NA | NA | NA | |
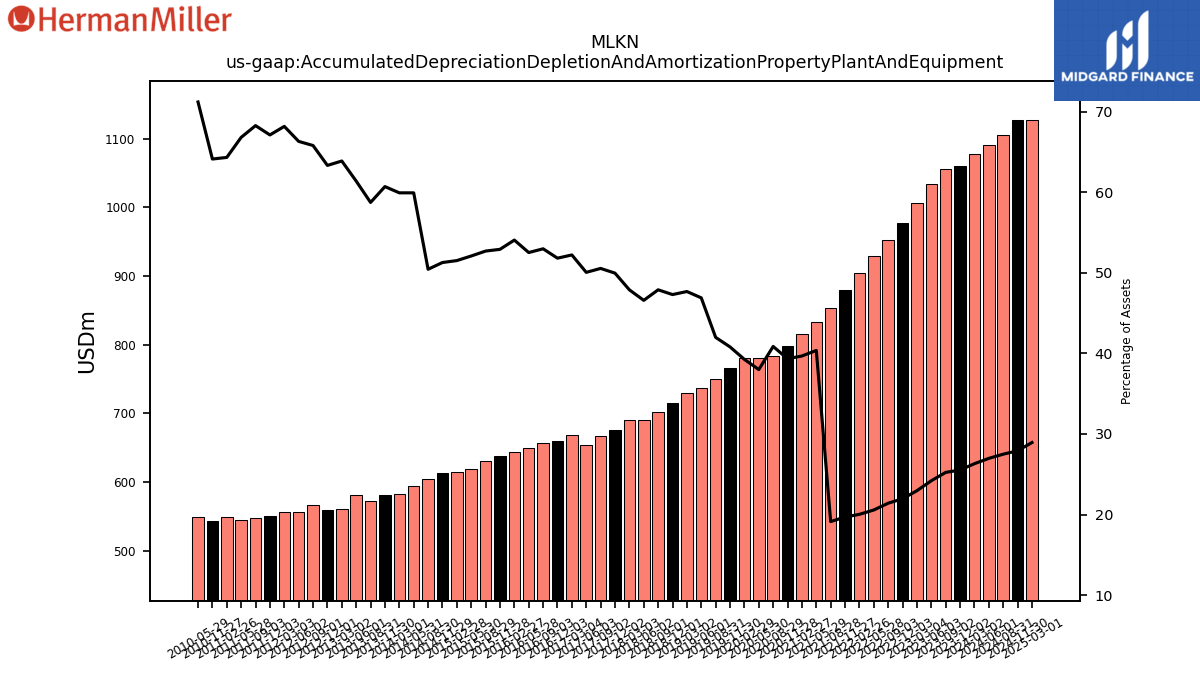
| Accumulated Depreciation Depletion And Amortization Property Plant And Equipment | 1060.70 | 1055.50 | 1034.40 | 1006.20 | 976.60 | 952.00 | 928.20 | 904.60 | 879.30 | 853.10 | 832.50 | 815.50 | 798.10 | 783.50 | 780.50 | 779.70 | 766.50 | 749.60 | 736.10 | 729.30 | 714.30 | 701.20 | 689.40 | 690.60 | 675.20 | 666.60 | 654.10 | 667.70 | 659.80 | 656.70 | 648.90 | 642.80 | 637.30 | 631.00 | 619.10 | 614.70 | 612.40 | 603.80 | 594.00 | 582.10 | 581.00 | 571.70 | 581.20 | 559.90 | 558.90 | 566.20 | 555.50 | 556.30 | 550.60 | 547.10 | 544.30 | 548.10 | 543.50 | NA | 548.90 | NA | NA | NA | |
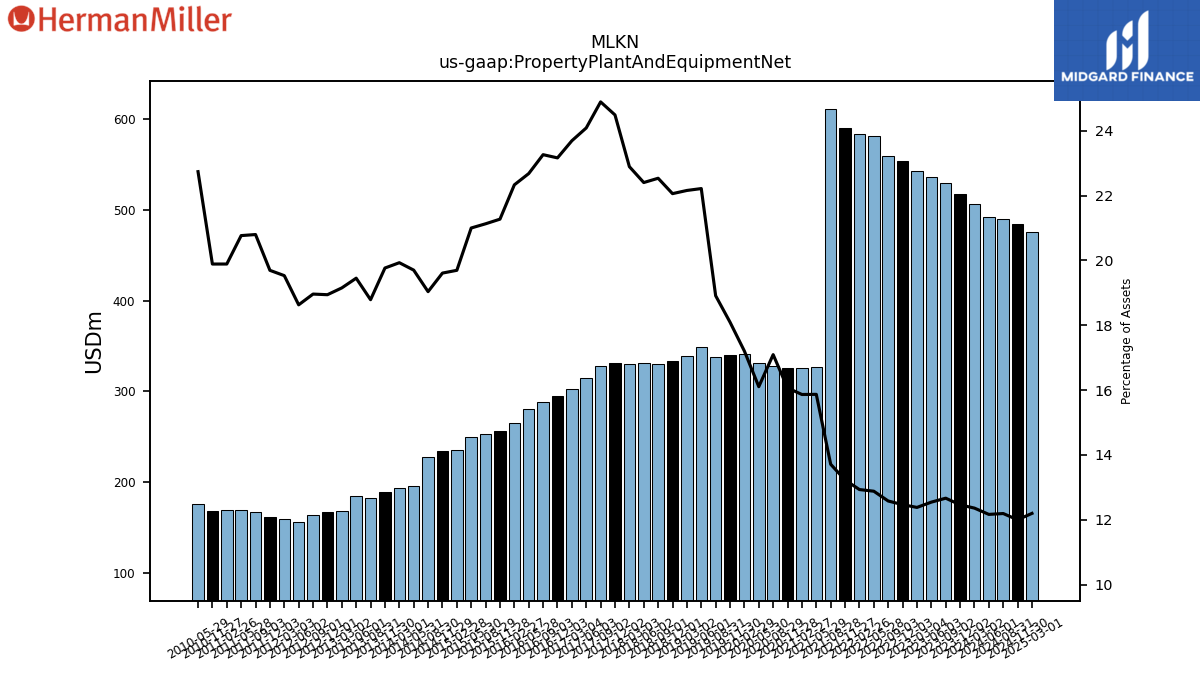
| Property Plant And Equipment Net | 517.90 | 529.90 | 536.30 | 542.70 | 554.60 | 559.50 | 581.50 | 584.30 | 590.80 | 611.70 | 327.20 | 326.00 | 325.90 | 327.70 | 330.80 | 341.60 | 339.80 | 337.50 | 348.60 | 338.80 | 333.00 | 329.80 | 331.40 | 330.00 | 330.80 | 328.10 | 314.60 | 302.80 | 294.80 | 288.20 | 280.10 | 265.40 | 256.10 | 252.90 | 249.50 | 234.90 | 234.10 | 227.80 | 195.20 | 193.50 | 189.10 | 182.80 | 184.10 | 167.80 | 167.10 | 163.10 | 156.00 | 159.30 | 161.50 | 166.60 | 169.10 | 169.40 | 168.50 | NA | 175.20 | NA | NA | NA | |
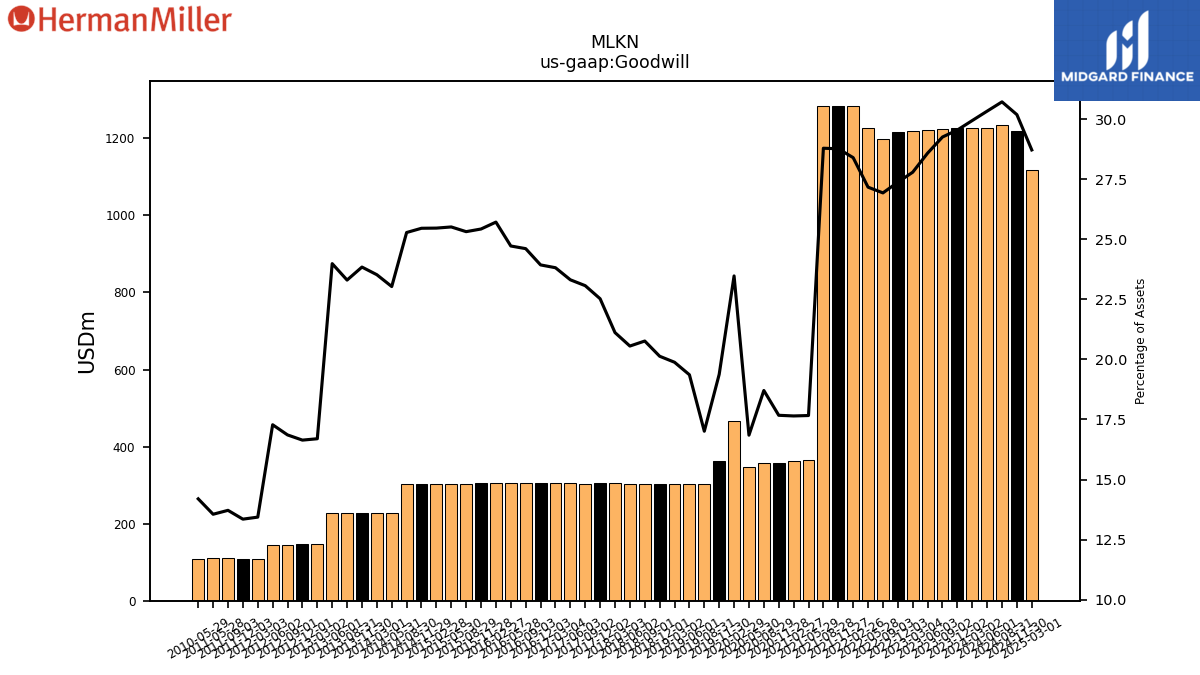
| Goodwill | 1227.60 | 1223.60 | 1221.70 | 1217.80 | 1217.40 | 1197.50 | 1226.20 | 1282.70 | 1284.50 | 1283.90 | 364.20 | 362.60 | 358.50 | 358.60 | 346.00 | 466.10 | 363.90 | 303.60 | 303.80 | 304.00 | 303.90 | 303.90 | 304.10 | 304.40 | 304.30 | 304.10 | 304.50 | 304.40 | 304.60 | 304.90 | 305.30 | 305.60 | 306.10 | 303.00 | 303.10 | 303.70 | 303.90 | 302.50 | 228.20 | 228.40 | 228.10 | 226.70 | 227.00 | 146.30 | 146.80 | 145.00 | 144.70 | 109.60 | 109.50 | 109.90 | 110.40 | NA | NA | NA | 109.40 | NA | NA | NA | |
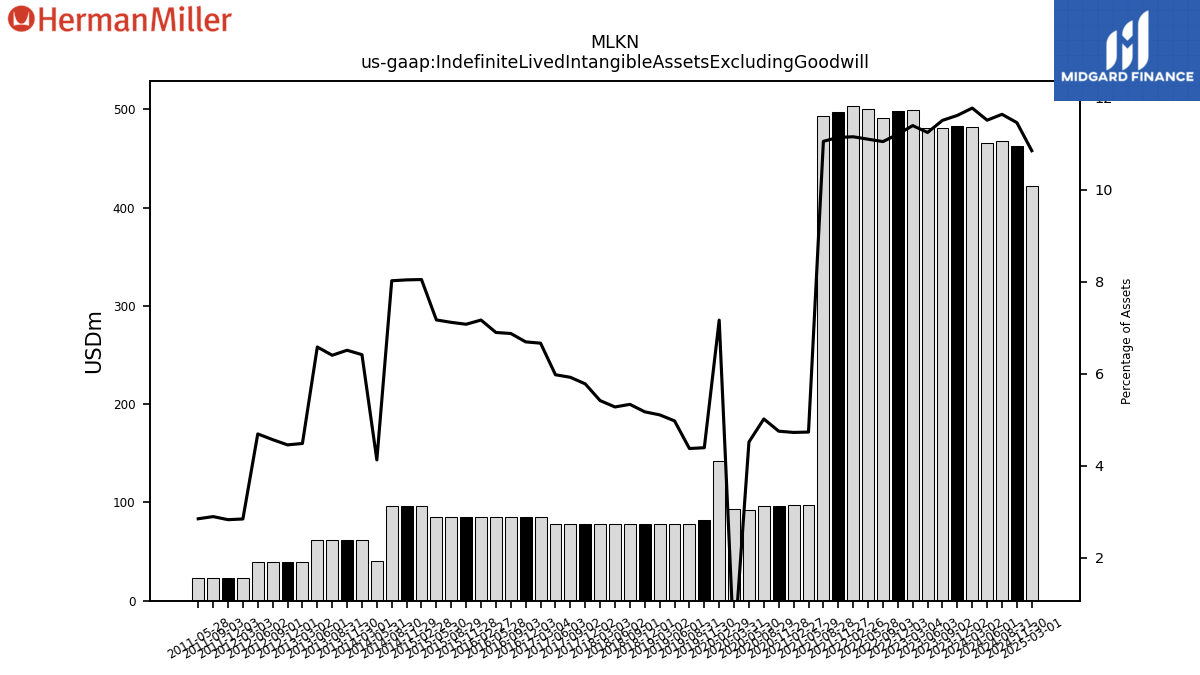
| Indefinite Lived Intangible Assets Excluding Goodwill | 482.70 | 481.40 | 480.70 | 499.40 | 498.50 | 491.30 | 501.00 | 503.80 | 497.40 | 493.00 | 97.60 | 97.10 | 96.40 | 96.20 | 92.80 | 142.30 | 82.50 | 78.10 | 78.10 | 78.10 | 78.10 | 78.10 | 78.10 | 78.10 | 78.10 | 78.10 | 78.10 | 85.20 | 85.20 | 85.20 | 85.20 | 85.20 | 85.20 | 85.20 | 85.20 | 96.00 | 96.00 | 96.00 | 40.90 | 62.30 | 62.30 | 62.30 | 62.30 | 39.30 | 39.30 | 39.30 | 39.30 | 23.20 | 23.20 | 23.20 | 23.20 | NA | NA | NA | NA | NA | NA | NA | |
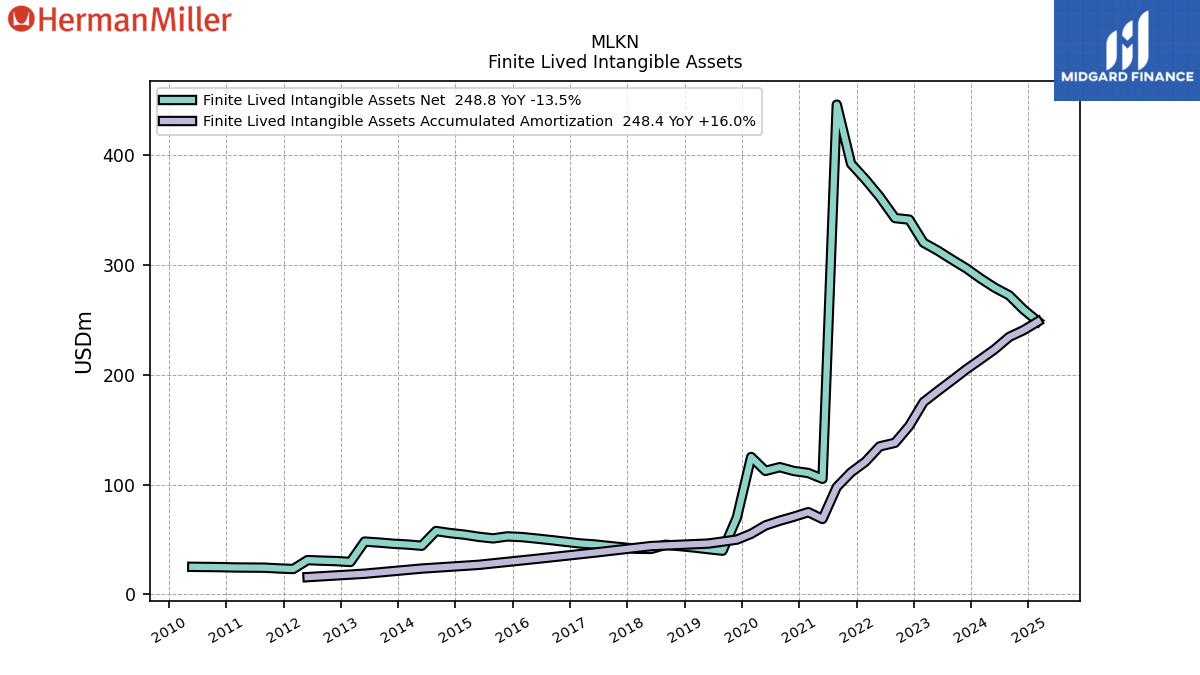
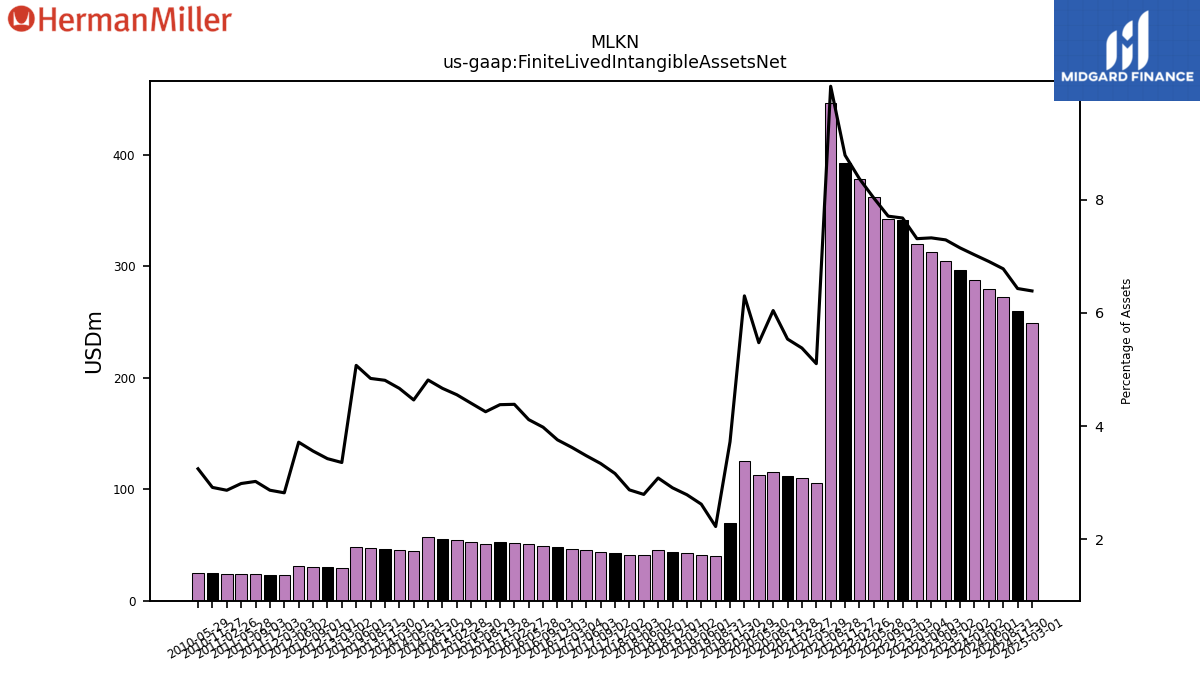
| Finite Lived Intangible Assets Net | 297.00 | 304.90 | 313.10 | 320.40 | 341.40 | 342.80 | 362.40 | 378.10 | 392.30 | 446.20 | 105.20 | 110.50 | 112.30 | 115.80 | 112.40 | 125.10 | 69.90 | 39.70 | 41.10 | 42.60 | 43.90 | 45.10 | 41.30 | 41.40 | 42.70 | 44.00 | 45.40 | 46.30 | 47.80 | 49.30 | 50.80 | 52.10 | 52.70 | 50.90 | 52.30 | 54.30 | 55.70 | 57.60 | 44.20 | 45.30 | 46.00 | 47.10 | 48.00 | 29.40 | 30.20 | 30.60 | 31.10 | 23.00 | 23.50 | 24.20 | 24.30 | 24.40 | 24.70 | NA | 25.00 | NA | NA | NA | |
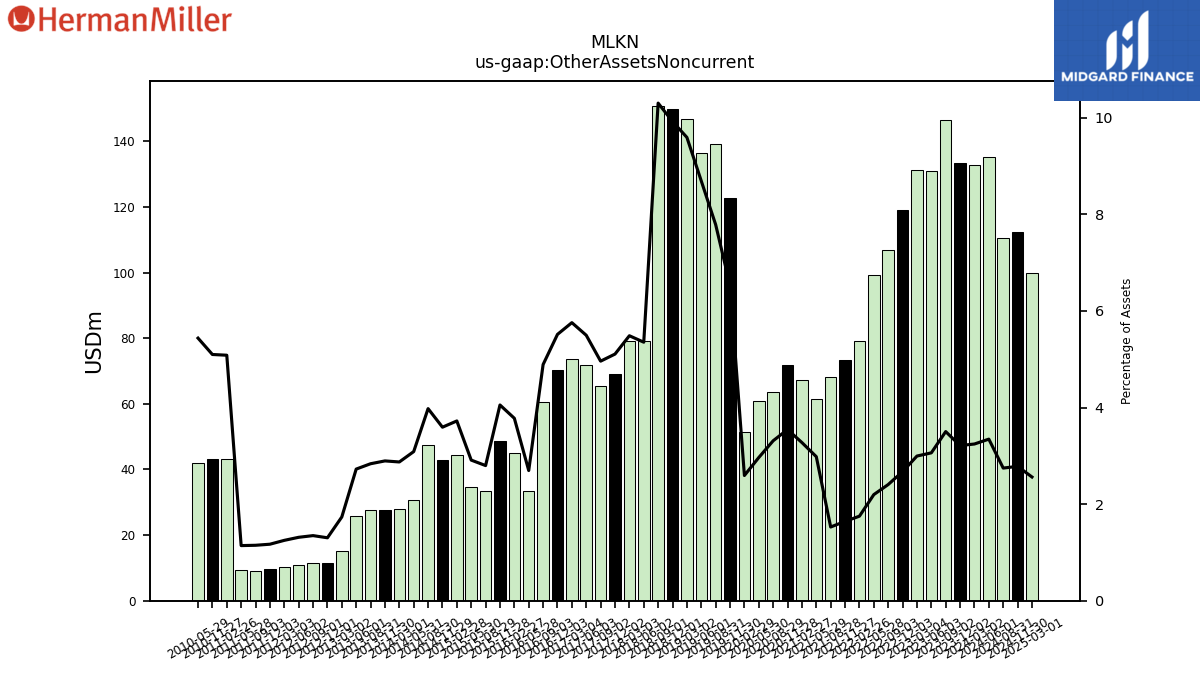
| Other Assets Noncurrent | 133.50 | 146.50 | 130.90 | 131.30 | 118.90 | 107.00 | 99.20 | 79.10 | 73.40 | 68.10 | 61.50 | 67.30 | 71.90 | 63.50 | 60.90 | 51.50 | 122.60 | 139.00 | 136.40 | 146.70 | 149.80 | 150.80 | 79.20 | 79.10 | 69.00 | 65.40 | 71.80 | 73.60 | 70.20 | 60.60 | 33.30 | 44.90 | 48.80 | 33.50 | 34.60 | 44.40 | 42.90 | 47.60 | 30.60 | 27.90 | 27.70 | 27.60 | 25.80 | 15.20 | 11.50 | 11.60 | 11.00 | 10.20 | 9.60 | 9.20 | 9.30 | 43.30 | 43.20 | NA | 41.90 | NA | NA | NA |
| 2023-12-02 | 2023-09-02 | 2023-06-03 | 2023-03-04 | 2022-12-03 | 2022-09-03 | 2022-05-28 | 2022-02-26 | 2021-11-27 | 2021-08-28 | 2021-05-29 | 2021-02-27 | 2020-11-28 | 2020-08-29 | 2020-05-30 | 2020-02-29 | 2019-11-30 | 2019-08-31 | 2019-06-01 | 2019-03-02 | 2018-12-01 | 2018-09-01 | 2018-06-02 | 2018-03-03 | 2017-12-02 | 2017-09-02 | 2017-06-03 | 2017-03-04 | 2016-12-03 | 2016-09-03 | 2016-05-28 | 2016-02-27 | 2015-11-28 | 2015-08-29 | 2015-05-30 | 2015-02-28 | 2014-11-29 | 2014-08-30 | 2014-05-31 | 2014-03-01 | 2013-11-30 | 2013-08-31 | 2013-06-01 | 2013-03-02 | 2012-12-01 | 2012-09-01 | 2012-06-02 | 2012-03-03 | 2011-12-03 | 2011-09-03 | 2011-05-28 | 2011-02-26 | 2010-11-27 | 2010-08-28 | 2010-05-29 | 2010-02-27 | 2009-11-28 | 2009-08-29 | ||
|---|---|---|---|---|---|---|---|---|---|---|---|---|---|---|---|---|---|---|---|---|---|---|---|---|---|---|---|---|---|---|---|---|---|---|---|---|---|---|---|---|---|---|---|---|---|---|---|---|---|---|---|---|---|---|---|---|---|---|---|
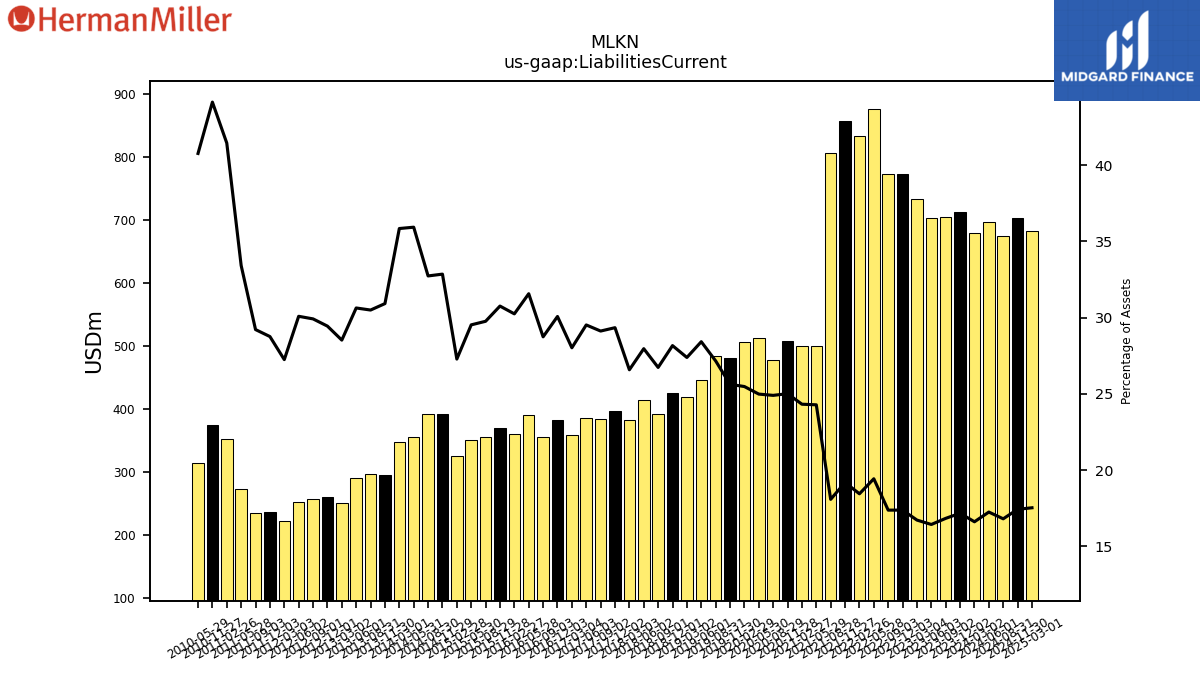
| Liabilities Current | 713.80 | 704.50 | 702.80 | 733.20 | 773.20 | 773.00 | 877.40 | 833.60 | 857.30 | 806.80 | 500.80 | 499.90 | 507.50 | 477.50 | 513.30 | 506.10 | 481.40 | 484.90 | 446.10 | 418.90 | 425.30 | 391.40 | 413.80 | 383.30 | 396.50 | 384.00 | 385.70 | 358.30 | 382.90 | 356.20 | 390.00 | 359.60 | 370.40 | 356.30 | 350.90 | 325.50 | 392.30 | 391.80 | 356.10 | 348.10 | 295.90 | 296.80 | 290.00 | 250.00 | 259.80 | 257.40 | 252.00 | 222.30 | 235.90 | 234.10 | 272.20 | 353.10 | 374.00 | NA | 314.20 | NA | NA | NA | |
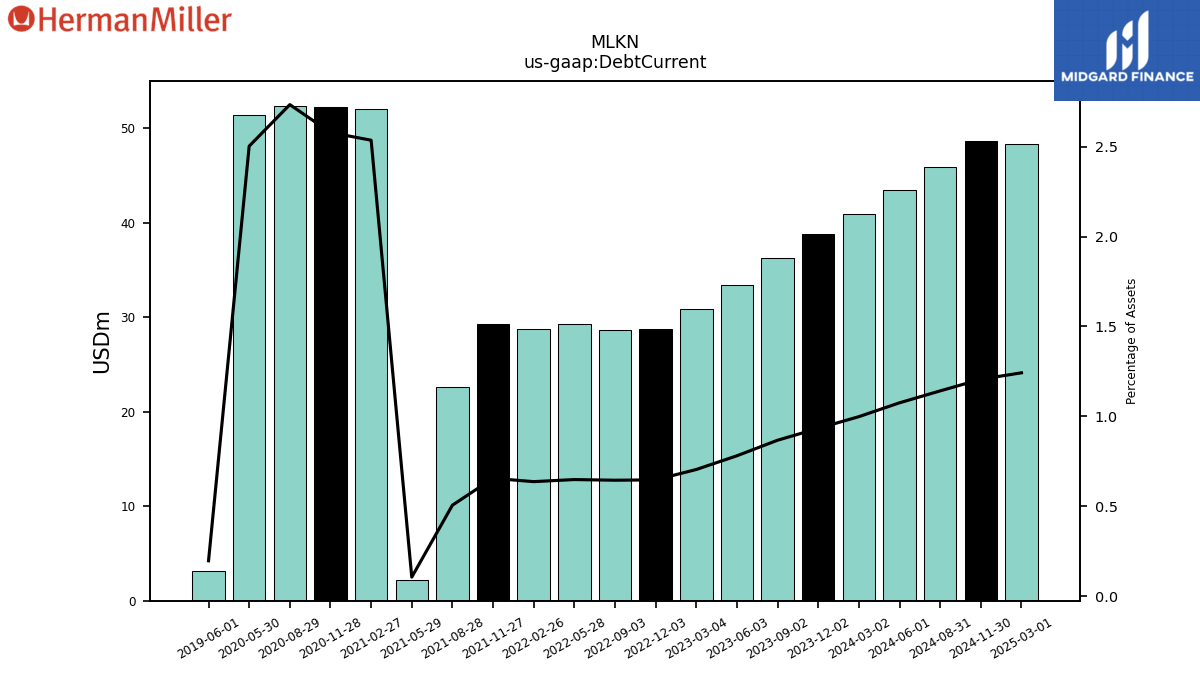
| Debt Current | 38.80 | 36.30 | 33.40 | 30.90 | 28.80 | 28.70 | 29.30 | 28.80 | 29.30 | 22.60 | 2.20 | 52.10 | 52.30 | 52.40 | 51.40 | NA | NA | NA | 3.10 | NA | NA | NA | NA | NA | NA | NA | NA | NA | NA | NA | NA | NA | NA | NA | NA | NA | NA | NA | NA | NA | NA | NA | NA | NA | NA | NA | NA | NA | NA | NA | NA | NA | NA | NA | NA | NA | NA | NA | |
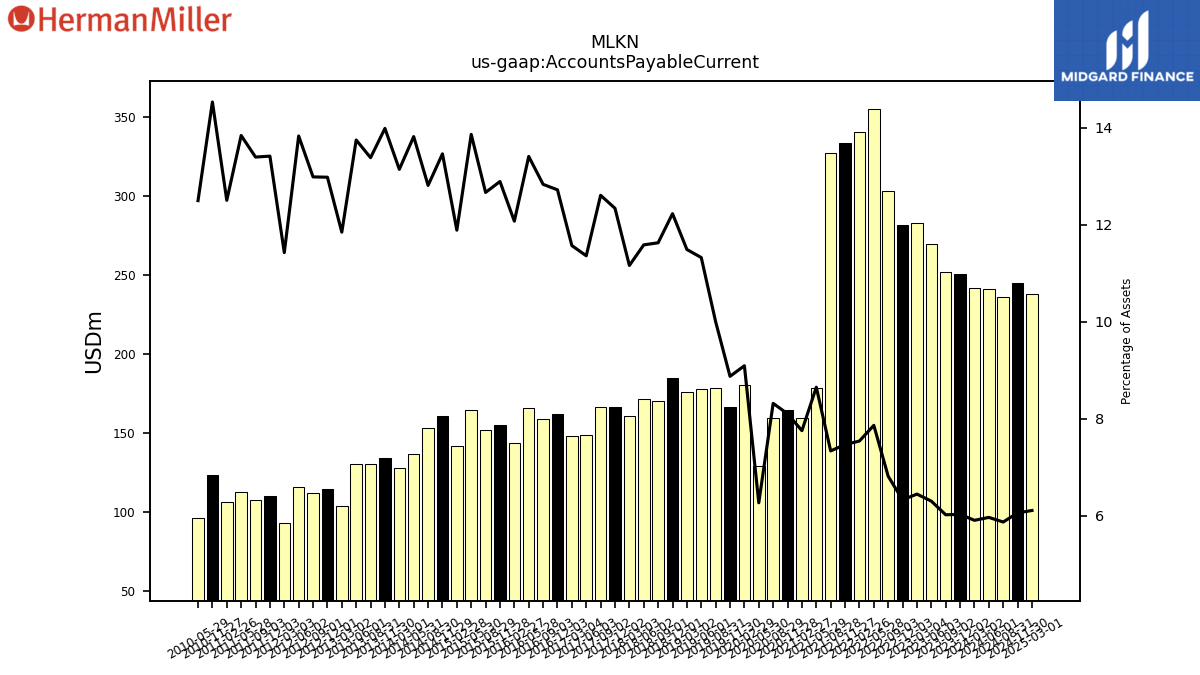
| Accounts Payable Current | 250.70 | 252.00 | 269.50 | 282.70 | 281.60 | 303.20 | 355.10 | 340.80 | 333.60 | 327.40 | 178.40 | 159.40 | 164.40 | 159.50 | 128.80 | 180.60 | 166.70 | 178.50 | 177.70 | 175.70 | 184.60 | 170.20 | 171.40 | 160.90 | 166.70 | 166.20 | 148.40 | 147.90 | 161.90 | 159.00 | 165.60 | 143.50 | 155.20 | 151.60 | 164.70 | 141.80 | 160.70 | 153.30 | 136.90 | 127.60 | 133.80 | 130.20 | 130.10 | 103.80 | 114.50 | 111.70 | 115.80 | 93.20 | 110.00 | 107.30 | 112.70 | 106.50 | 123.10 | NA | 96.30 | NA | NA | NA | |
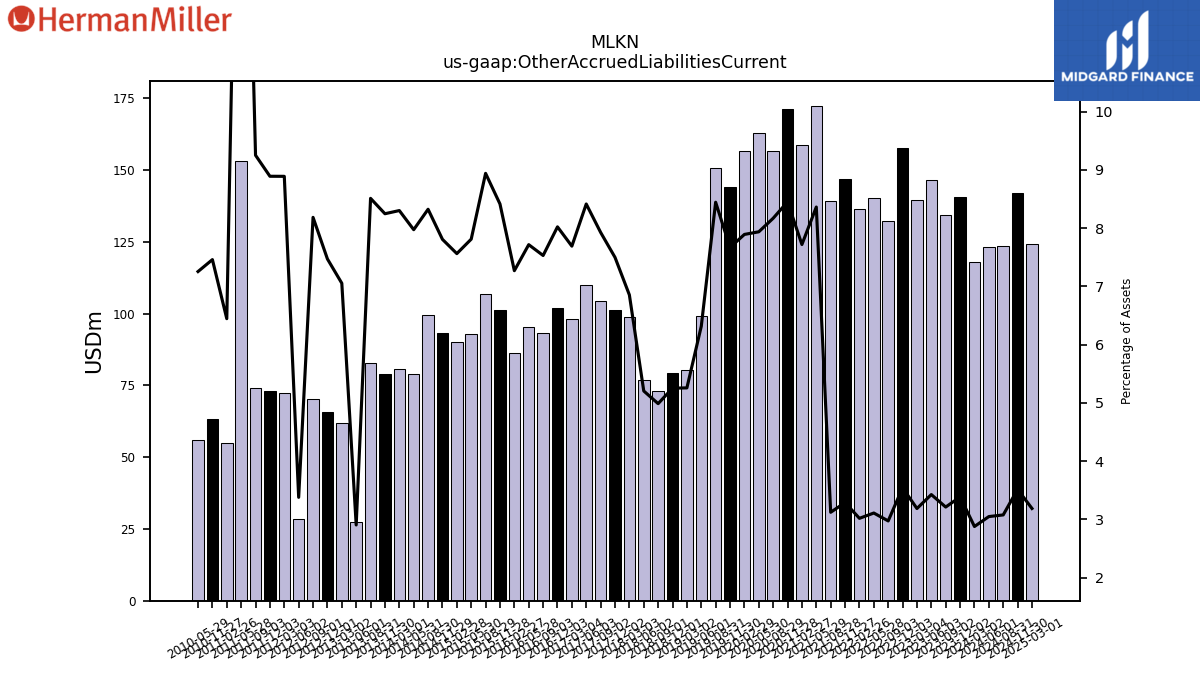
| Other Accrued Liabilities Current | 140.70 | 134.40 | 146.50 | 139.70 | 157.60 | 132.30 | 140.40 | 136.40 | 146.90 | 139.30 | 172.40 | 158.60 | 171.40 | 156.60 | 163.00 | 156.70 | 144.00 | 150.70 | 99.10 | 80.40 | 79.30 | 73.00 | 77.00 | 98.80 | 101.30 | 104.50 | 109.90 | 98.30 | 102.10 | 93.30 | 95.30 | 86.40 | 101.30 | 107.00 | 92.80 | 90.20 | 93.20 | 99.60 | 79.00 | 80.60 | 78.90 | 82.80 | 27.50 | 61.80 | 65.90 | 70.40 | 28.30 | 72.50 | 72.90 | 74.10 | 153.10 | 54.90 | 63.20 | NA | 55.90 | NA | NA | NA | |
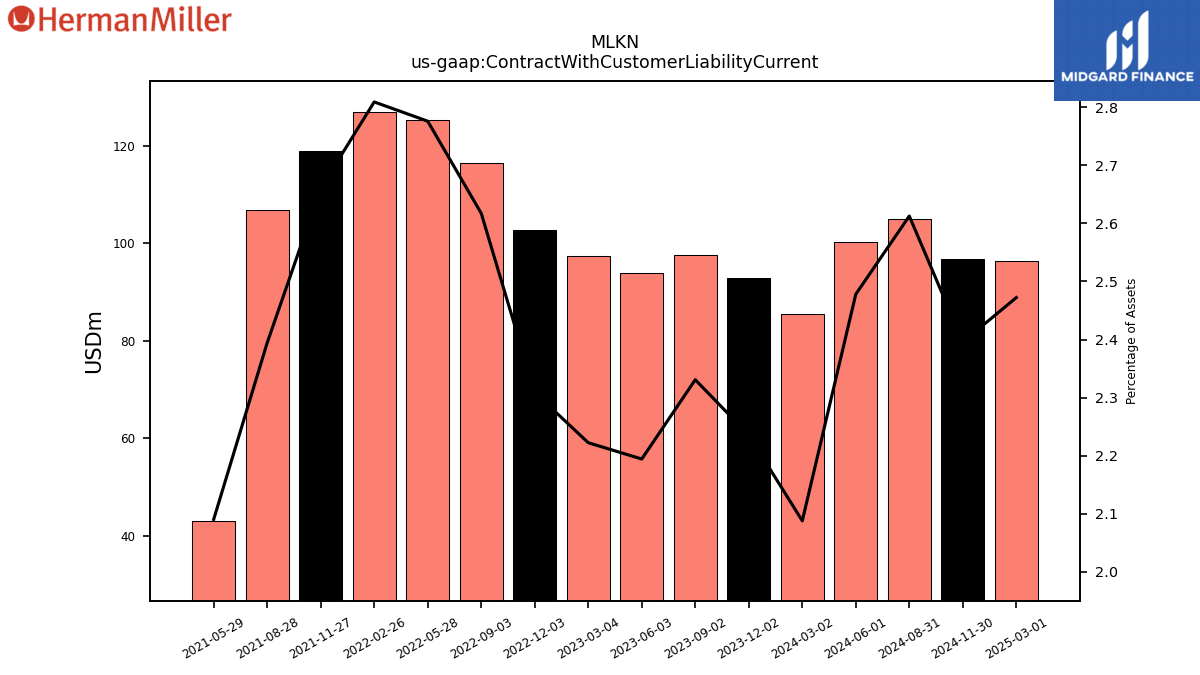
| Contract With Customer Liability Current | 92.90 | 97.50 | 93.80 | 97.40 | 102.70 | 116.40 | 125.30 | 126.90 | 118.80 | 106.80 | 43.10 | NA | NA | NA | NA | NA | NA | NA | NA | NA | NA | NA | NA | NA | NA | NA | NA | NA | NA | NA | NA | NA | NA | NA | NA | NA | NA | NA | NA | NA | NA | NA | NA | NA | NA | NA | NA | NA | NA | NA | NA | NA | NA | NA | NA | NA | NA | NA |
| 2023-12-02 | 2023-09-02 | 2023-06-03 | 2023-03-04 | 2022-12-03 | 2022-09-03 | 2022-05-28 | 2022-02-26 | 2021-11-27 | 2021-08-28 | 2021-05-29 | 2021-02-27 | 2020-11-28 | 2020-08-29 | 2020-05-30 | 2020-02-29 | 2019-11-30 | 2019-08-31 | 2019-06-01 | 2019-03-02 | 2018-12-01 | 2018-09-01 | 2018-06-02 | 2018-03-03 | 2017-12-02 | 2017-09-02 | 2017-06-03 | 2017-03-04 | 2016-12-03 | 2016-09-03 | 2016-05-28 | 2016-02-27 | 2015-11-28 | 2015-08-29 | 2015-05-30 | 2015-02-28 | 2014-11-29 | 2014-08-30 | 2014-05-31 | 2014-03-01 | 2013-11-30 | 2013-08-31 | 2013-06-01 | 2013-03-02 | 2012-12-01 | 2012-09-01 | 2012-06-02 | 2012-03-03 | 2011-12-03 | 2011-09-03 | 2011-05-28 | 2011-02-26 | 2010-11-27 | 2010-08-28 | 2010-05-29 | 2010-02-27 | 2009-11-28 | 2009-08-29 | ||
|---|---|---|---|---|---|---|---|---|---|---|---|---|---|---|---|---|---|---|---|---|---|---|---|---|---|---|---|---|---|---|---|---|---|---|---|---|---|---|---|---|---|---|---|---|---|---|---|---|---|---|---|---|---|---|---|---|---|---|---|
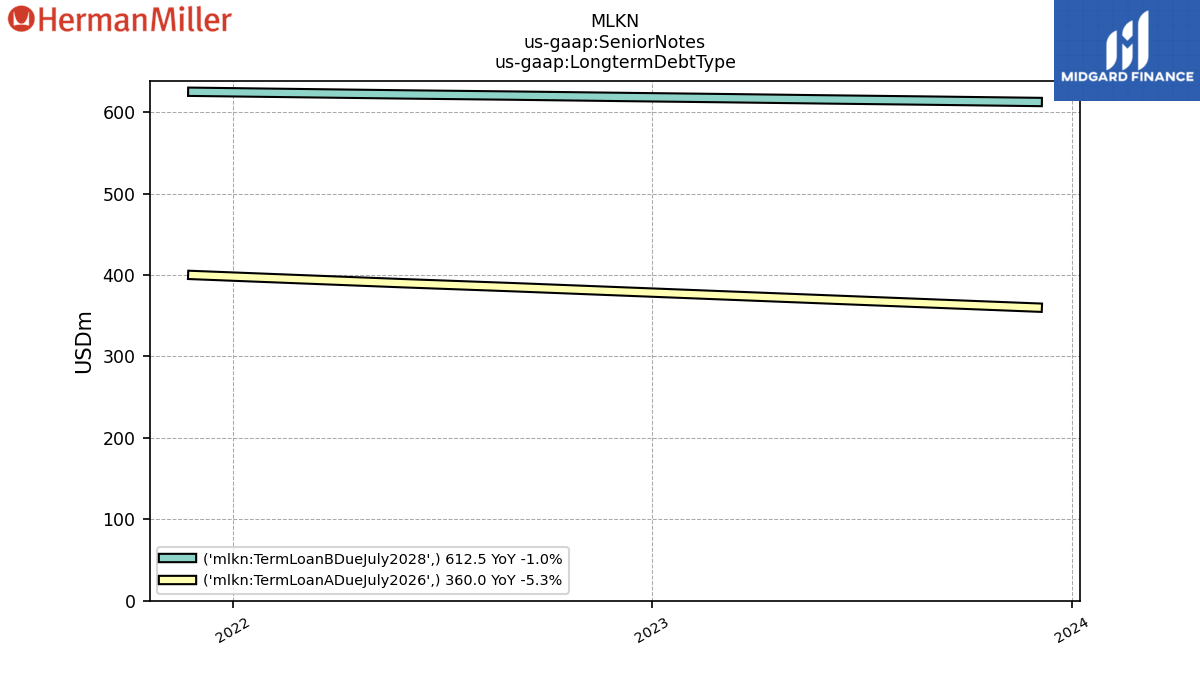
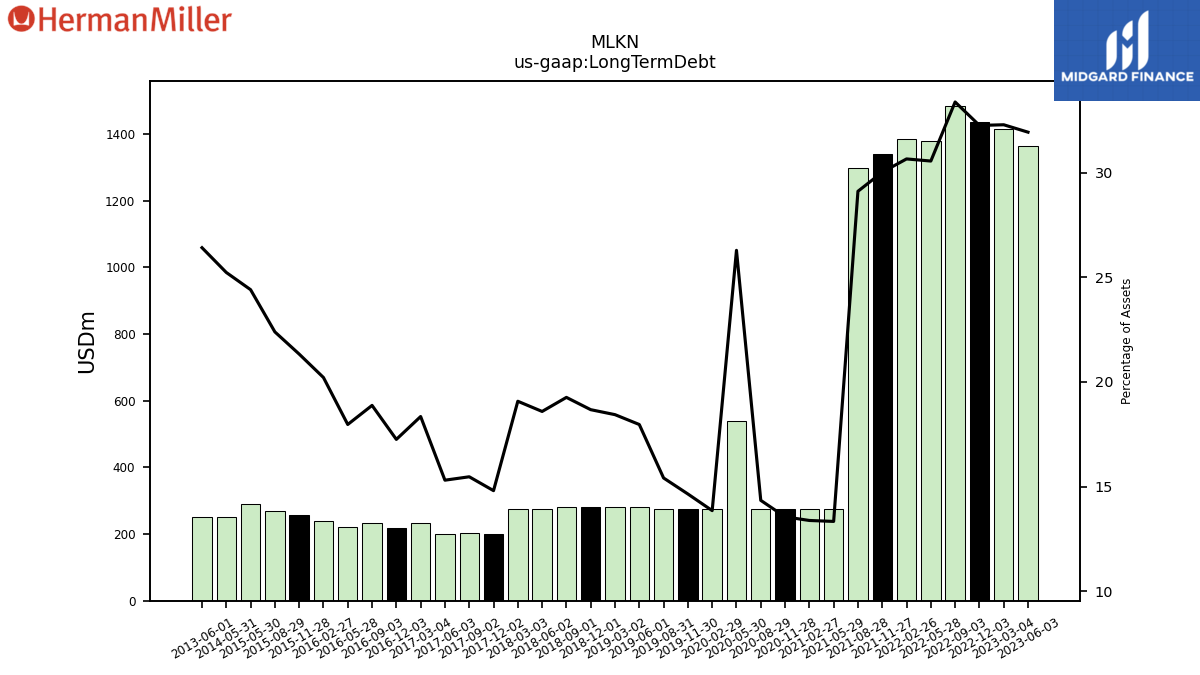
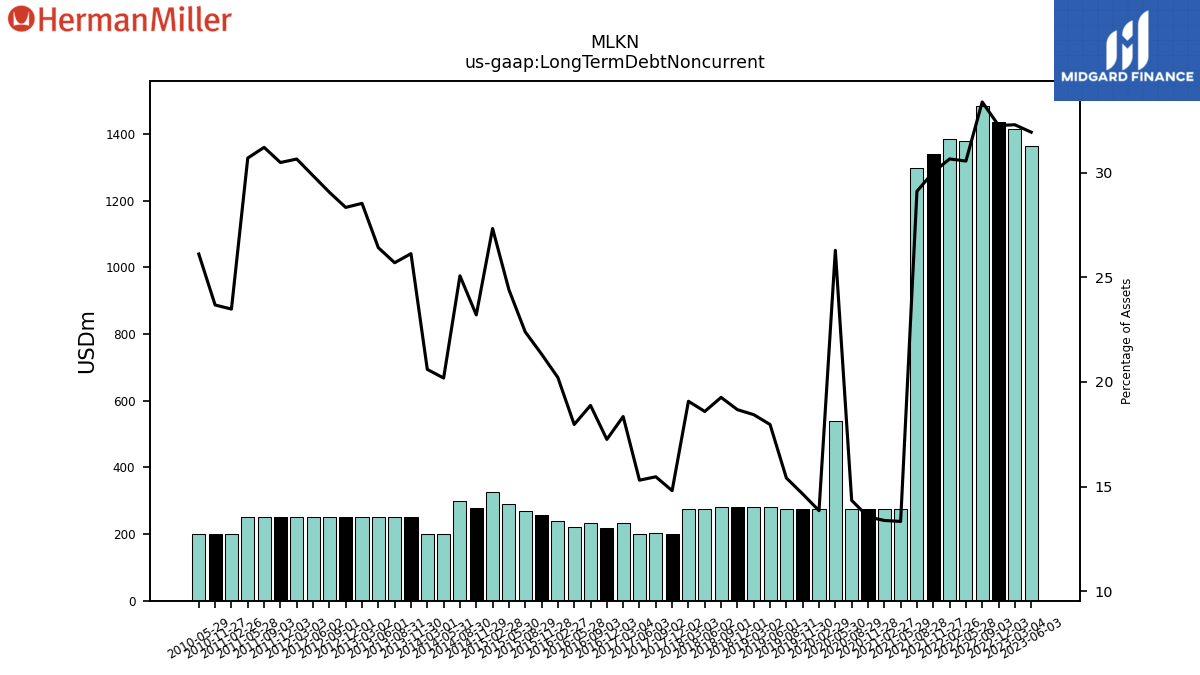
| Long Term Debt | NA | NA | 1365.10 | 1415.10 | 1434.80 | 1484.40 | 1379.20 | 1384.90 | 1340.70 | 1298.40 | 274.90 | 274.90 | 274.90 | 274.90 | 539.90 | 275.00 | 275.00 | 275.00 | 281.90 | 281.90 | 281.90 | 281.90 | 275.00 | 275.00 | 200.00 | 203.90 | 199.90 | 234.50 | 219.60 | 233.90 | 221.90 | 240.20 | 256.80 | 268.00 | 290.00 | NA | NA | NA | 250.00 | NA | NA | NA | 250.00 | NA | NA | NA | NA | NA | NA | NA | NA | NA | NA | NA | NA | NA | NA | NA | |
| Long Term Debt Noncurrent | NA | NA | 1365.10 | 1415.10 | 1434.80 | 1484.40 | 1379.20 | 1384.90 | 1340.70 | 1298.40 | 274.90 | 274.90 | 274.90 | 274.90 | 539.90 | 275.00 | 275.00 | 275.00 | 281.90 | 281.90 | 281.90 | 281.90 | 275.00 | 275.00 | 200.00 | 203.90 | 199.90 | 234.50 | 219.60 | 233.90 | 221.90 | 240.20 | 256.80 | 268.00 | 290.00 | 326.00 | 277.00 | 300.00 | 200.00 | 200.00 | 250.00 | 250.00 | 250.00 | 250.00 | 250.00 | 250.00 | 250.00 | 250.00 | 250.00 | 250.00 | 250.00 | 200.00 | 200.60 | NA | 201.20 | NA | NA | NA | |
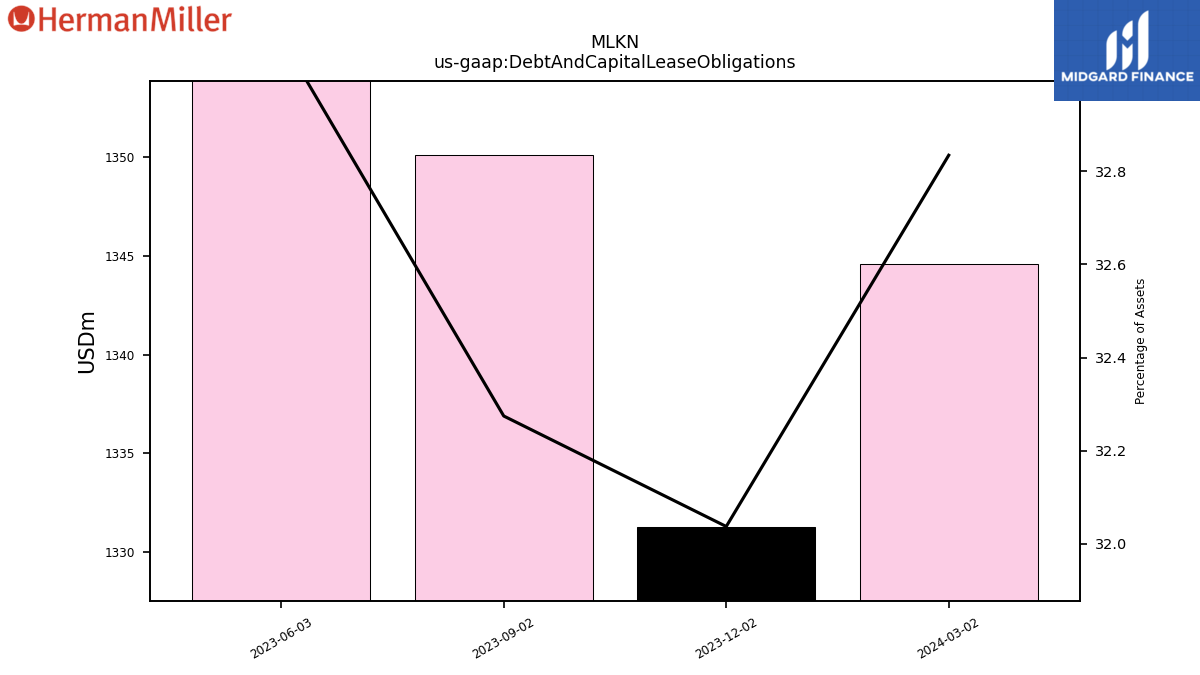
| Debt And Capital Lease Obligations | 1331.30 | 1350.10 | 1414.40 | NA | NA | NA | NA | NA | NA | NA | NA | NA | NA | NA | NA | NA | NA | NA | NA | NA | NA | NA | NA | NA | NA | NA | NA | NA | NA | NA | NA | NA | NA | NA | NA | NA | NA | NA | NA | NA | NA | NA | NA | NA | NA | NA | NA | NA | NA | NA | NA | NA | NA | NA | NA | NA | NA | NA | |
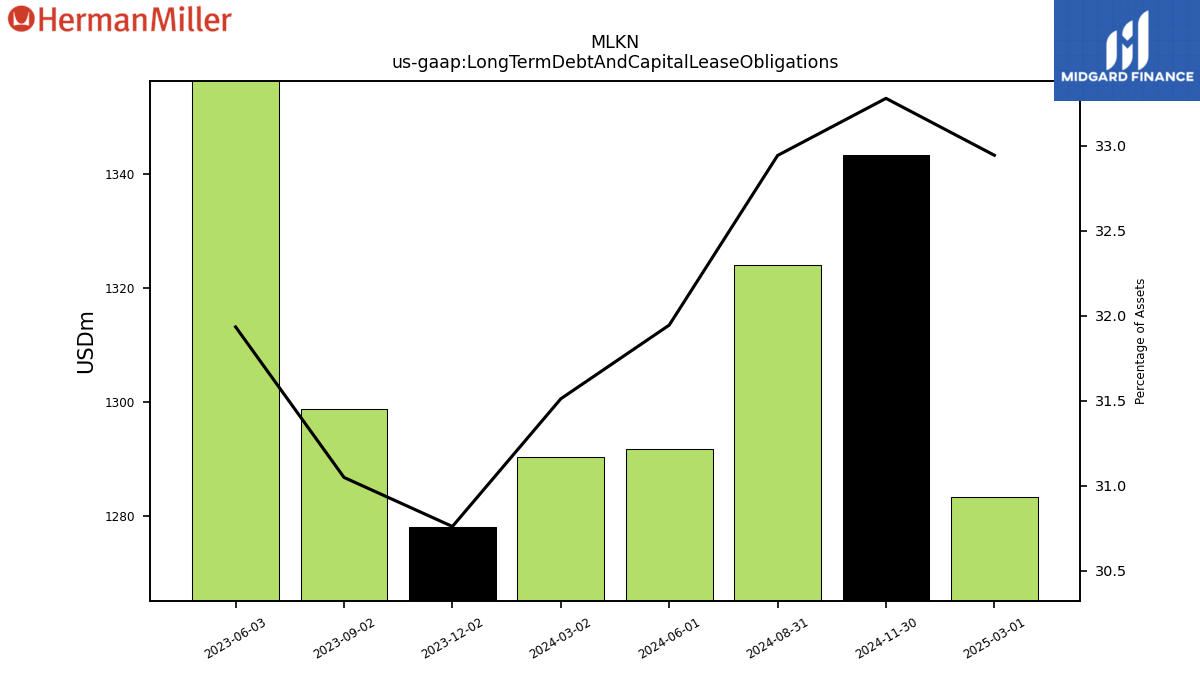
| Long Term Debt And Capital Lease Obligations | 1278.20 | 1298.80 | 1365.10 | NA | NA | NA | NA | NA | NA | NA | NA | NA | NA | NA | NA | NA | NA | NA | NA | NA | NA | NA | NA | NA | NA | NA | NA | NA | NA | NA | NA | NA | NA | NA | NA | NA | NA | NA | NA | NA | NA | NA | NA | NA | NA | NA | NA | NA | NA | NA | NA | NA | NA | NA | NA | NA | NA | NA | |
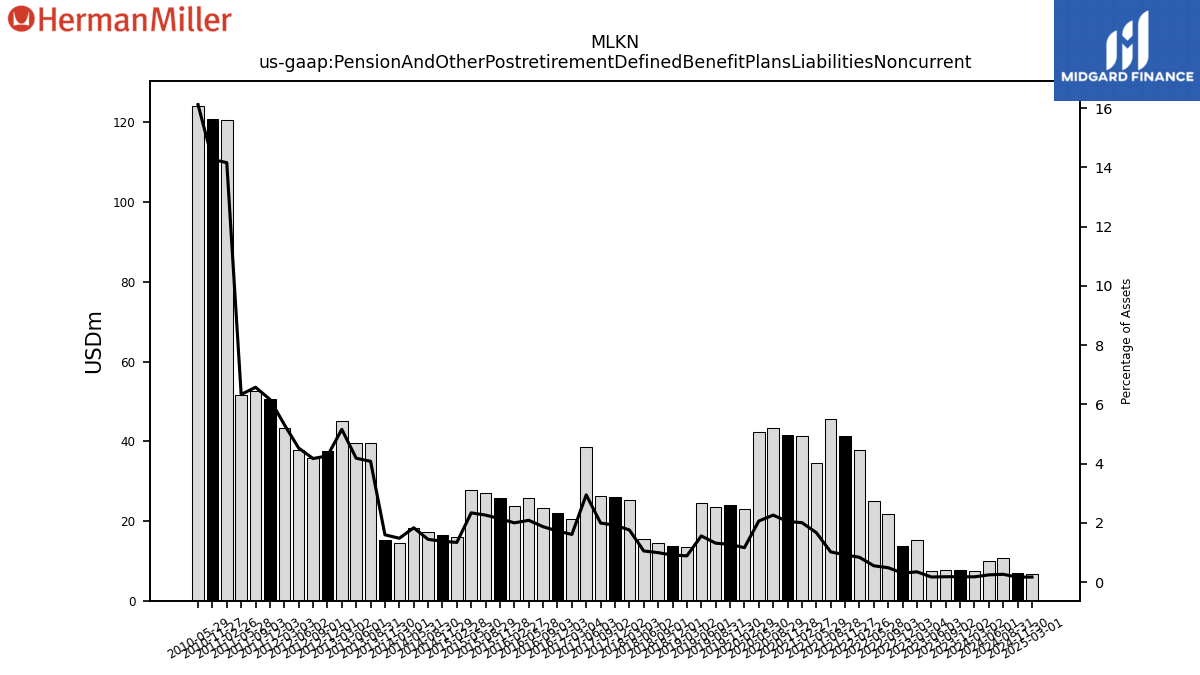
| Pension And Other Postretirement Defined Benefit Plans Liabilities Noncurrent | 7.70 | 7.70 | 7.50 | 15.30 | 13.70 | 21.70 | 25.00 | 37.90 | 41.30 | 45.60 | 34.50 | 41.30 | 41.50 | 43.40 | 42.40 | 23.10 | 24.00 | 23.50 | 24.50 | 13.60 | 13.80 | 14.60 | 15.60 | 25.40 | 26.00 | 26.30 | 38.50 | 20.60 | 22.00 | 23.20 | 25.80 | 23.80 | 25.80 | 27.10 | 27.80 | 16.00 | 16.50 | 17.30 | 18.20 | 14.40 | 15.30 | 39.70 | 39.60 | 45.20 | 37.60 | 35.90 | 37.90 | 43.40 | 50.60 | 52.70 | 51.60 | 120.60 | 120.90 | NA | 124.20 | NA | NA | NA | |
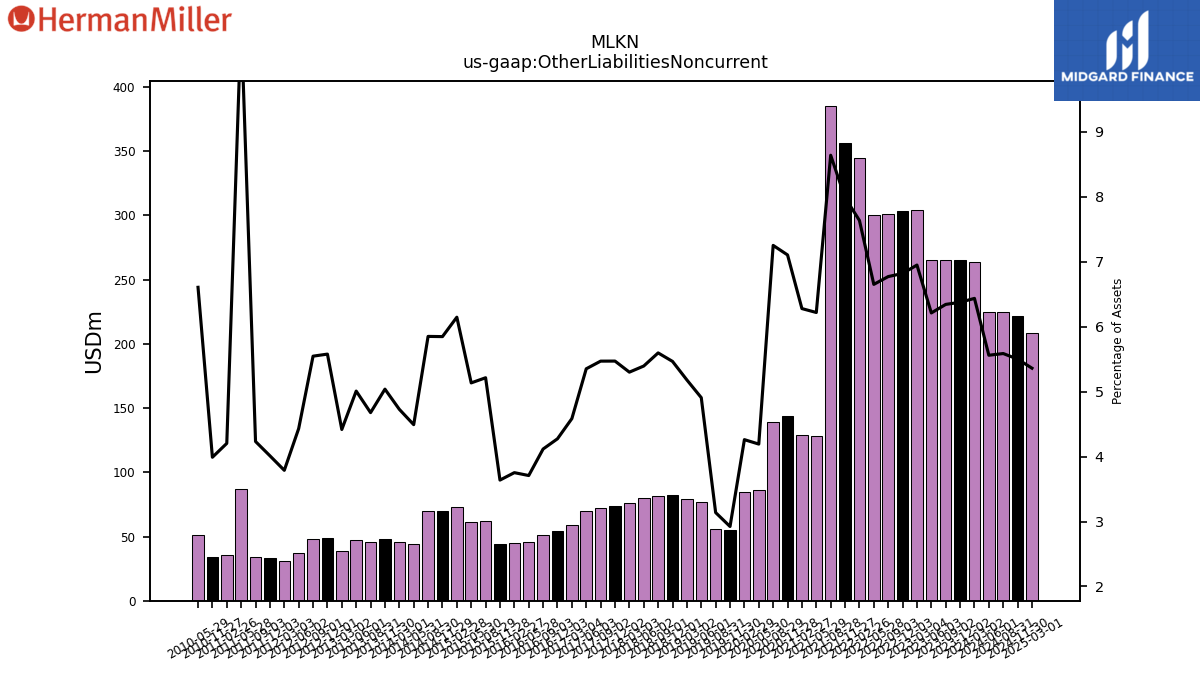
| Other Liabilities Noncurrent | 264.90 | 265.30 | 265.50 | 304.50 | 303.30 | 301.10 | 300.20 | 344.90 | 356.60 | 385.30 | 128.20 | 129.00 | 144.10 | 139.00 | 86.10 | 84.60 | 54.90 | 56.00 | 77.00 | 79.20 | 82.50 | 81.90 | 79.80 | 76.40 | 73.90 | 72.10 | 69.90 | 58.60 | 54.40 | 51.00 | 45.80 | 44.60 | 43.80 | 62.40 | 61.00 | 73.30 | 69.80 | 70.00 | 44.50 | 45.90 | 48.20 | 45.50 | 47.40 | 38.70 | 49.20 | 47.70 | 37.10 | 30.90 | 32.90 | 33.90 | 87.20 | 35.80 | 33.80 | NA | 50.90 | NA | NA | NA | |
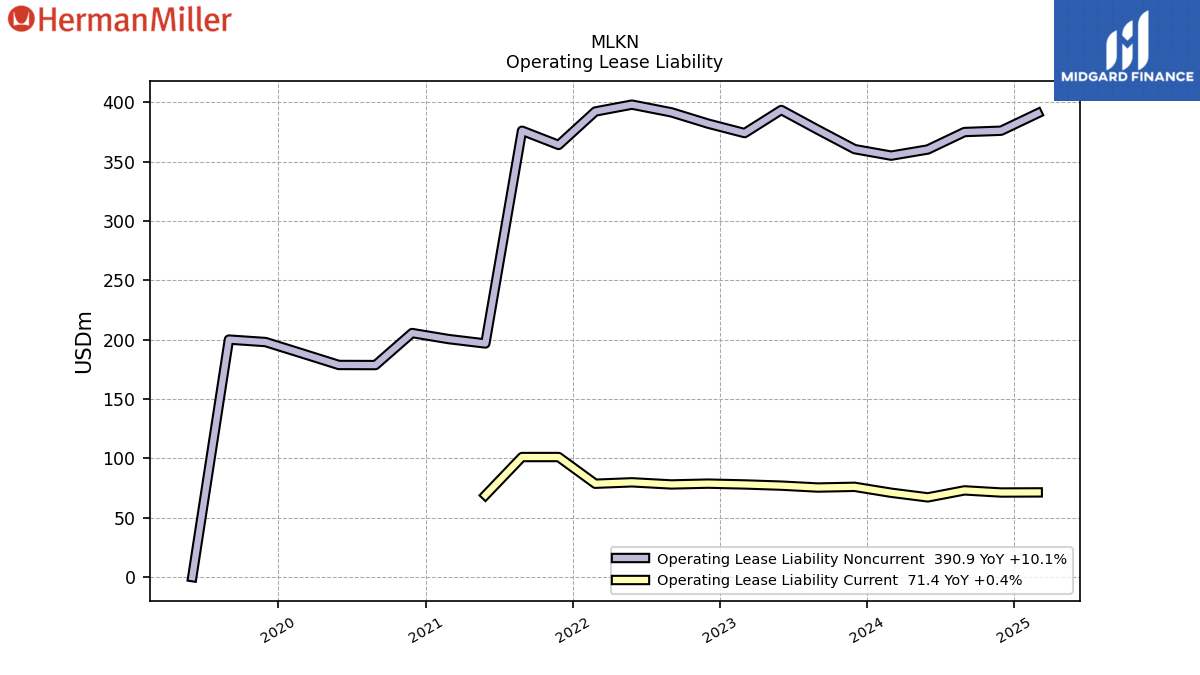
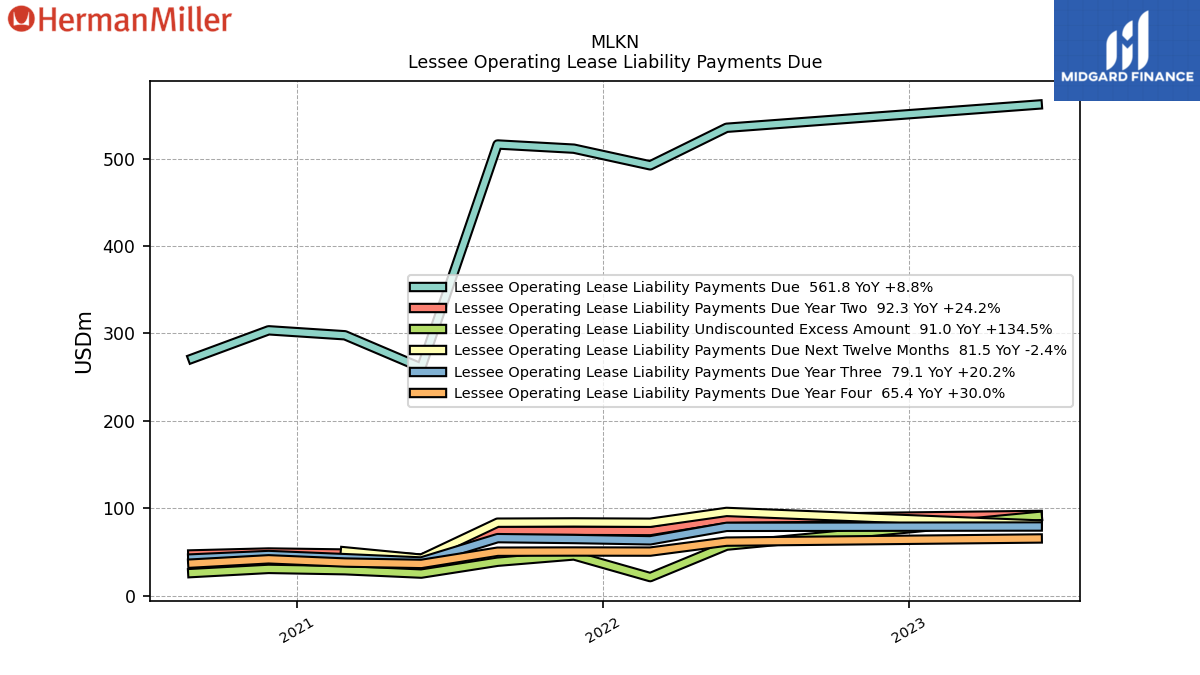
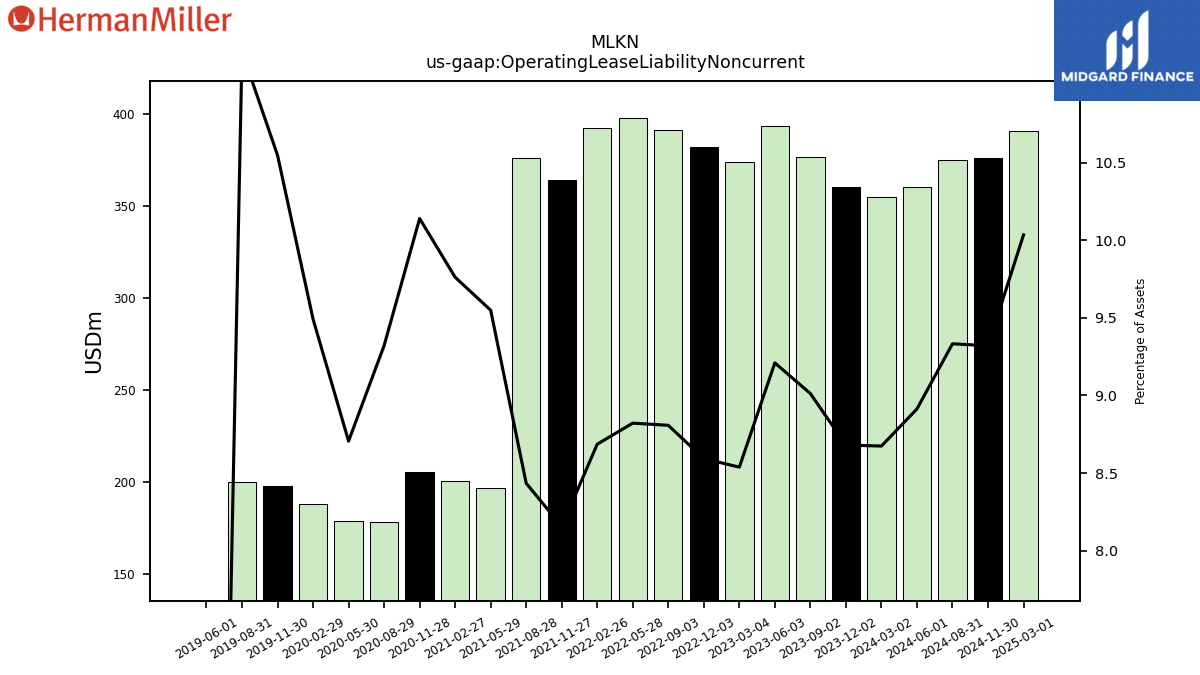
| Operating Lease Liability Noncurrent | 360.70 | 377.00 | 393.70 | 374.20 | 382.20 | 391.70 | 398.20 | 392.40 | 364.20 | 376.20 | 196.90 | 200.60 | 205.70 | 178.70 | 178.80 | 188.50 | 198.10 | 200.20 | 0.00 | NA | NA | NA | NA | NA | NA | NA | NA | NA | NA | NA | NA | NA | NA | NA | NA | NA | NA | NA | NA | NA | NA | NA | NA | NA | NA | NA | NA | NA | NA | NA | NA | NA | NA | NA | NA | NA | NA | NA |
| 2023-12-02 | 2023-09-02 | 2023-06-03 | 2023-03-04 | 2022-12-03 | 2022-09-03 | 2022-05-28 | 2022-02-26 | 2021-11-27 | 2021-08-28 | 2021-05-29 | 2021-02-27 | 2020-11-28 | 2020-08-29 | 2020-05-30 | 2020-02-29 | 2019-11-30 | 2019-08-31 | 2019-06-01 | 2019-03-02 | 2018-12-01 | 2018-09-01 | 2018-06-02 | 2018-03-03 | 2017-12-02 | 2017-09-02 | 2017-06-03 | 2017-03-04 | 2016-12-03 | 2016-09-03 | 2016-05-28 | 2016-02-27 | 2015-11-28 | 2015-08-29 | 2015-05-30 | 2015-02-28 | 2014-11-29 | 2014-08-30 | 2014-05-31 | 2014-03-01 | 2013-11-30 | 2013-08-31 | 2013-06-01 | 2013-03-02 | 2012-12-01 | 2012-09-01 | 2012-06-02 | 2012-03-03 | 2011-12-03 | 2011-09-03 | 2011-05-28 | 2011-02-26 | 2010-11-27 | 2010-08-28 | 2010-05-29 | 2010-02-27 | 2009-11-28 | 2009-08-29 | ||
|---|---|---|---|---|---|---|---|---|---|---|---|---|---|---|---|---|---|---|---|---|---|---|---|---|---|---|---|---|---|---|---|---|---|---|---|---|---|---|---|---|---|---|---|---|---|---|---|---|---|---|---|---|---|---|---|---|---|---|---|
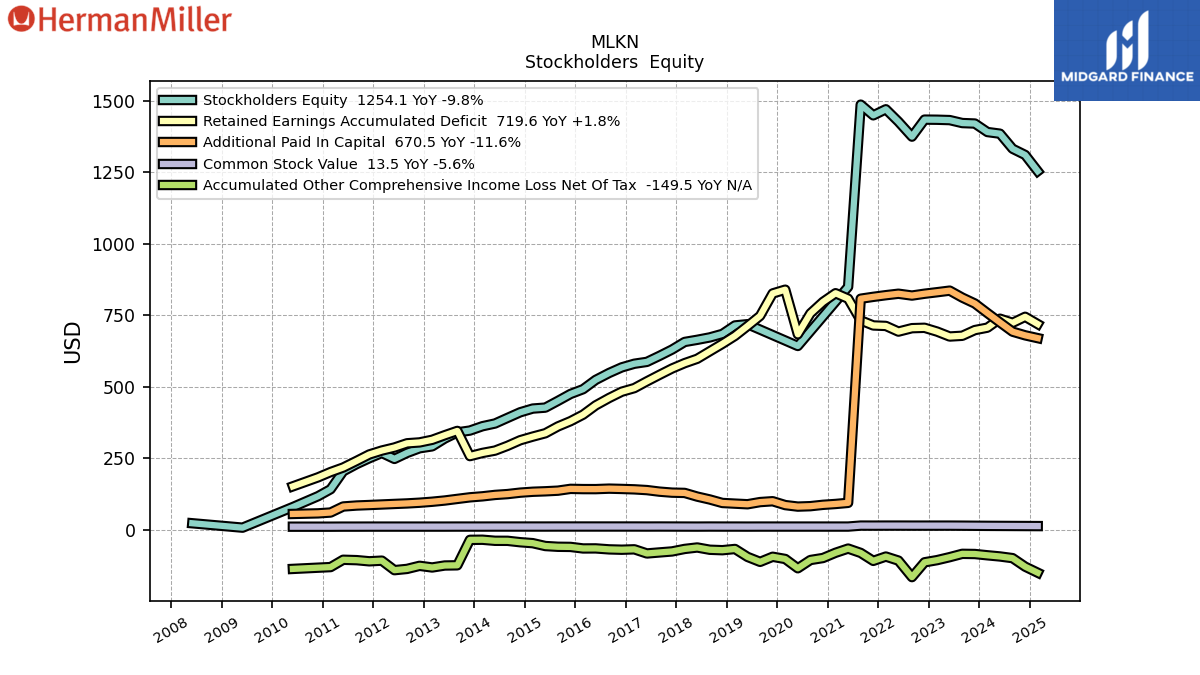
| Stockholders Equity | 1420.60 | 1422.30 | 1432.60 | 1433.90 | 1434.30 | 1374.80 | 1427.10 | 1470.50 | 1449.20 | 1486.70 | 849.60 | NA | NA | NA | 643.00 | NA | NA | NA | 719.20 | 714.80 | 685.20 | 673.00 | 664.60 | 657.10 | 630.60 | 608.50 | 587.50 | 581.00 | 568.30 | 548.80 | 524.40 | 492.00 | 475.30 | 451.10 | 427.60 | 424.30 | 411.30 | 391.80 | 372.10 | 362.60 | 347.40 | 341.00 | 319.50 | 292.30 | 285.60 | 269.20 | 248.30 | 269.10 | 250.70 | 230.40 | 205.00 | 142.30 | 118.00 | NA | 80.10 | NA | NA | NA | |
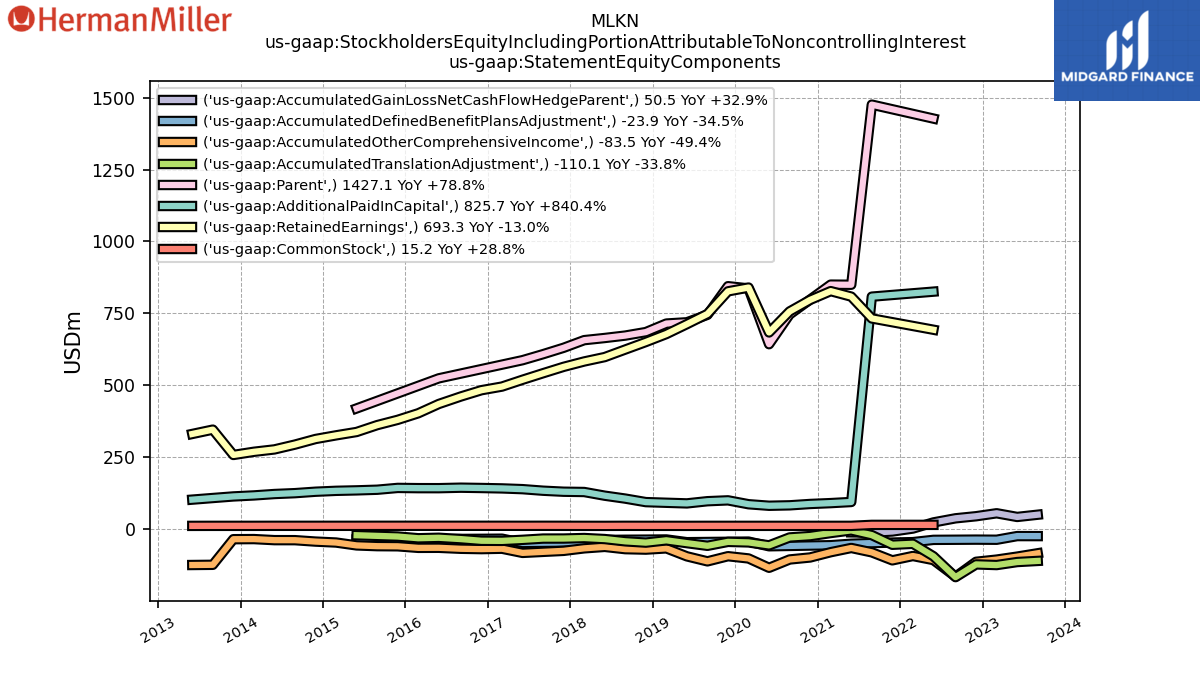
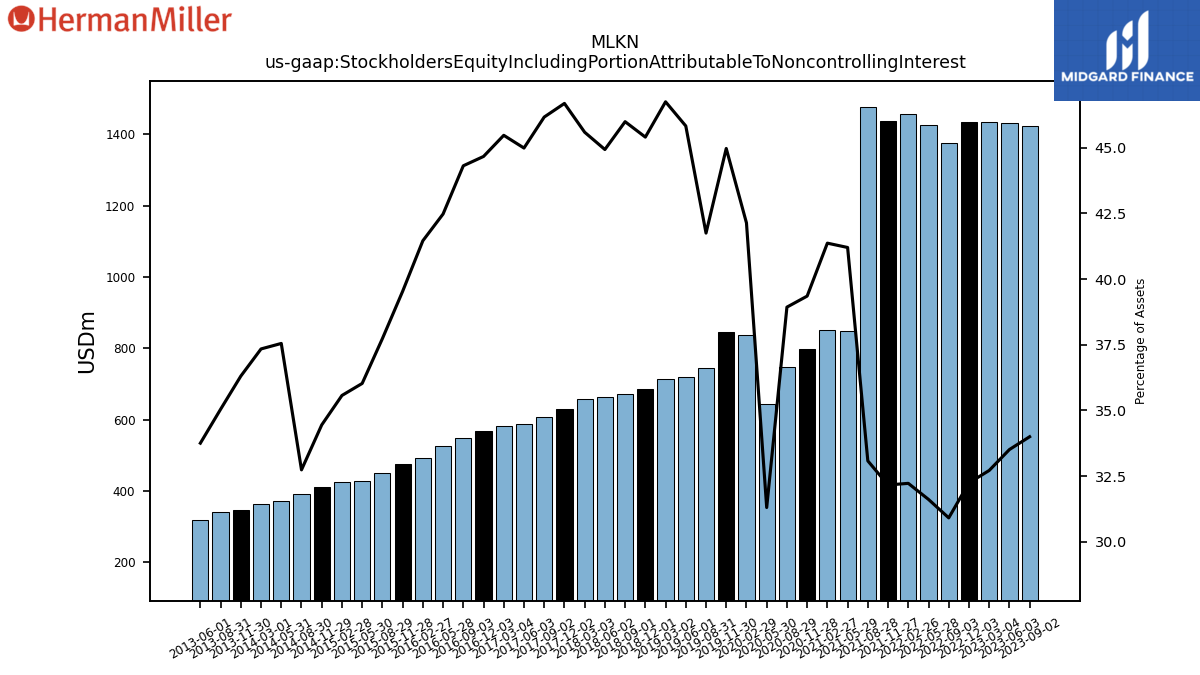
| Stockholders Equity Including Portion Attributable To Noncontrolling Interest | NA | 1422.30 | 1432.60 | 1433.90 | 1434.30 | 1374.80 | 1427.10 | 1455.90 | 1436.40 | 1475.60 | 849.60 | 850.10 | 798.30 | 746.40 | 643.00 | 836.80 | 844.60 | 745.20 | 719.20 | 714.90 | 685.50 | 673.20 | 664.80 | 657.30 | 630.80 | 608.70 | 587.70 | 581.30 | 568.60 | 549.10 | 524.70 | 492.80 | 476.00 | 451.70 | 428.10 | 424.30 | 411.30 | 391.80 | 372.10 | 362.60 | 347.40 | 341.00 | 319.50 | NA | NA | NA | NA | NA | NA | NA | NA | NA | NA | NA | NA | NA | NA | NA | |
| Common Stock Value | 14.60 | 14.90 | 15.10 | 15.10 | 15.10 | 15.10 | 15.20 | 15.20 | 15.10 | 15.20 | 11.80 | 11.80 | 11.80 | 11.80 | 11.80 | 11.80 | 11.80 | 11.80 | 11.70 | 11.80 | 11.80 | 11.90 | 11.70 | 11.80 | 11.90 | 12.00 | 11.90 | 12.00 | 12.00 | 12.00 | 12.00 | 12.00 | 12.00 | 12.00 | 11.90 | 11.90 | 11.90 | 11.90 | 11.90 | 11.80 | 11.80 | 11.80 | 11.70 | 11.70 | 11.70 | 11.70 | 11.70 | 11.70 | 11.70 | 11.60 | 11.60 | 11.40 | 11.40 | NA | 11.40 | NA | NA | NA | |
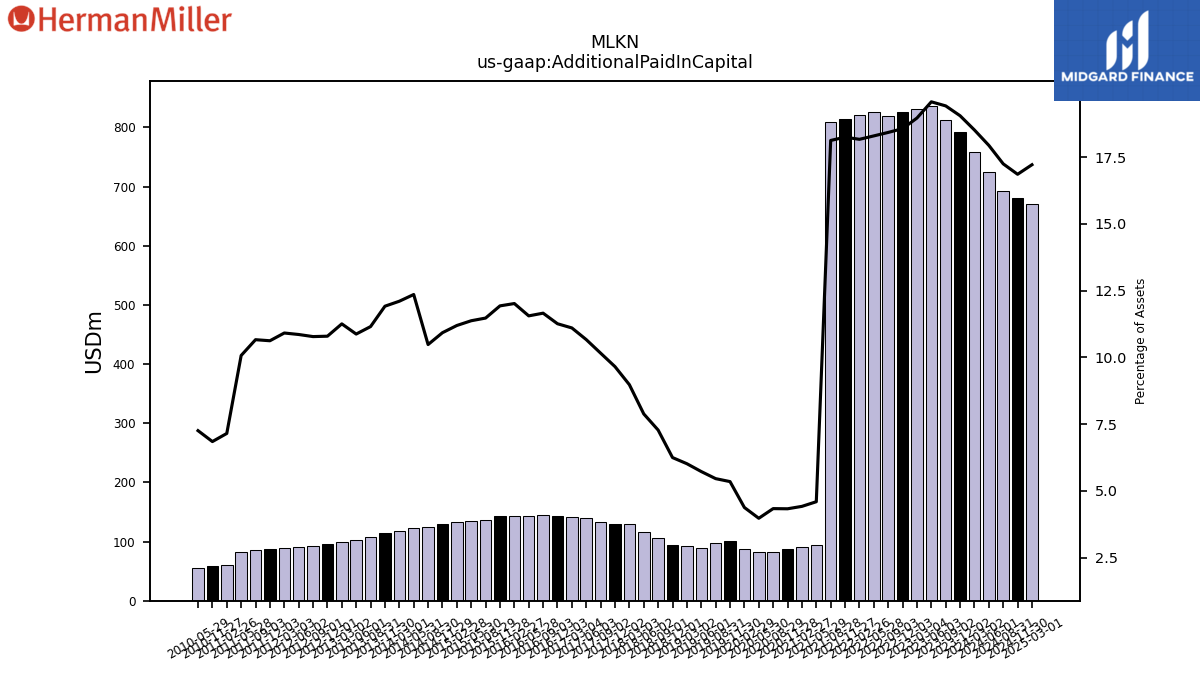
| Additional Paid In Capital | 791.50 | 812.20 | 836.50 | 831.00 | 825.70 | 819.30 | 825.70 | 820.60 | 814.80 | 808.30 | 94.70 | 90.80 | 87.80 | 83.10 | 81.60 | 86.90 | 100.40 | 97.40 | 89.80 | 92.00 | 94.30 | 106.50 | 116.60 | 129.40 | 130.40 | 133.90 | 139.30 | 141.90 | 143.30 | 144.40 | 142.70 | 142.80 | 143.60 | 137.30 | 135.10 | 133.50 | 130.40 | 125.40 | 122.40 | 117.50 | 114.00 | 108.50 | 102.90 | 98.60 | 95.20 | 92.70 | 90.90 | 89.00 | 87.10 | 85.40 | 82.00 | 60.90 | 58.00 | NA | 55.90 | NA | NA | NA | |
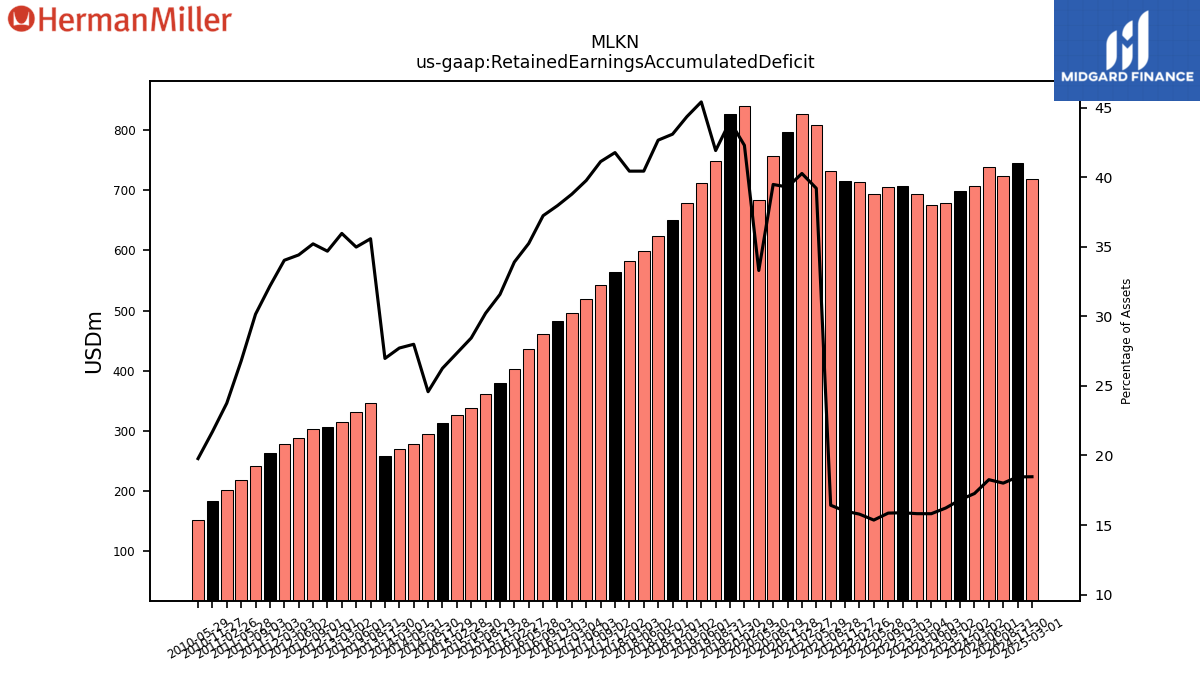
| Retained Earnings Accumulated Deficit | 698.60 | 678.70 | 676.10 | 693.30 | 706.60 | 705.30 | 693.30 | 713.10 | 714.80 | 732.60 | 808.40 | 827.50 | 797.10 | 756.90 | 683.90 | 839.90 | 826.70 | 748.20 | 712.70 | 678.30 | 650.60 | 624.50 | 598.30 | 583.00 | 564.40 | 542.20 | 519.50 | 495.80 | 483.20 | 461.40 | 435.30 | 403.00 | 380.20 | 361.80 | 338.00 | 326.30 | 313.60 | 294.20 | 277.40 | 269.20 | 258.10 | 346.20 | 331.10 | 315.10 | 306.00 | 302.90 | 288.20 | 277.60 | 263.90 | 241.60 | 218.20 | 202.40 | 183.90 | NA | 152.40 | NA | NA | NA | |
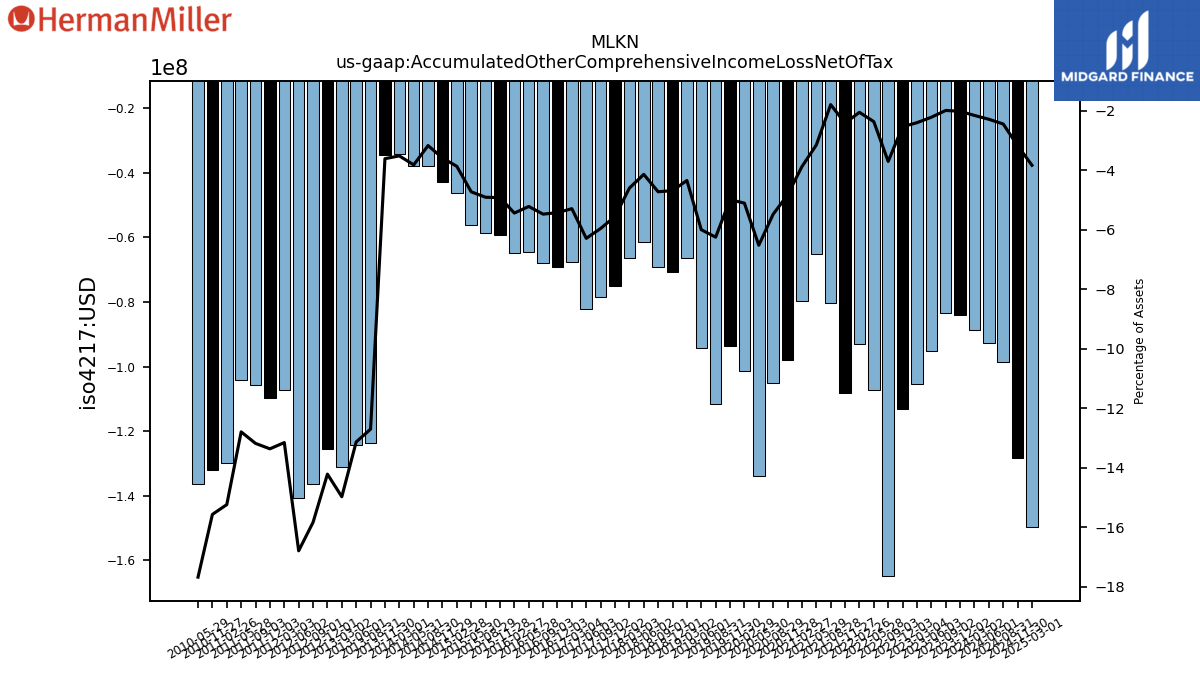
| Accumulated Other Comprehensive Income Loss Net Of Tax | -84.10 | -83.50 | -95.10 | -105.50 | -113.10 | -164.90 | -107.10 | -93.00 | -108.10 | -80.30 | -65.10 | -79.80 | -98.10 | -105.10 | -134.00 | -101.50 | -93.70 | -111.60 | -94.20 | -66.50 | -70.80 | -69.20 | -61.30 | -66.40 | -75.10 | -78.60 | -82.20 | -67.70 | -69.10 | -67.90 | -64.50 | -64.70 | -59.30 | -58.80 | -56.20 | -46.20 | -42.90 | -38.00 | -37.90 | -34.20 | -34.60 | -123.60 | -124.30 | -131.20 | -125.40 | -136.20 | -140.60 | -107.30 | -109.60 | -105.60 | -104.20 | -129.80 | -131.90 | NA | -136.20 | NA | NA | NA | |
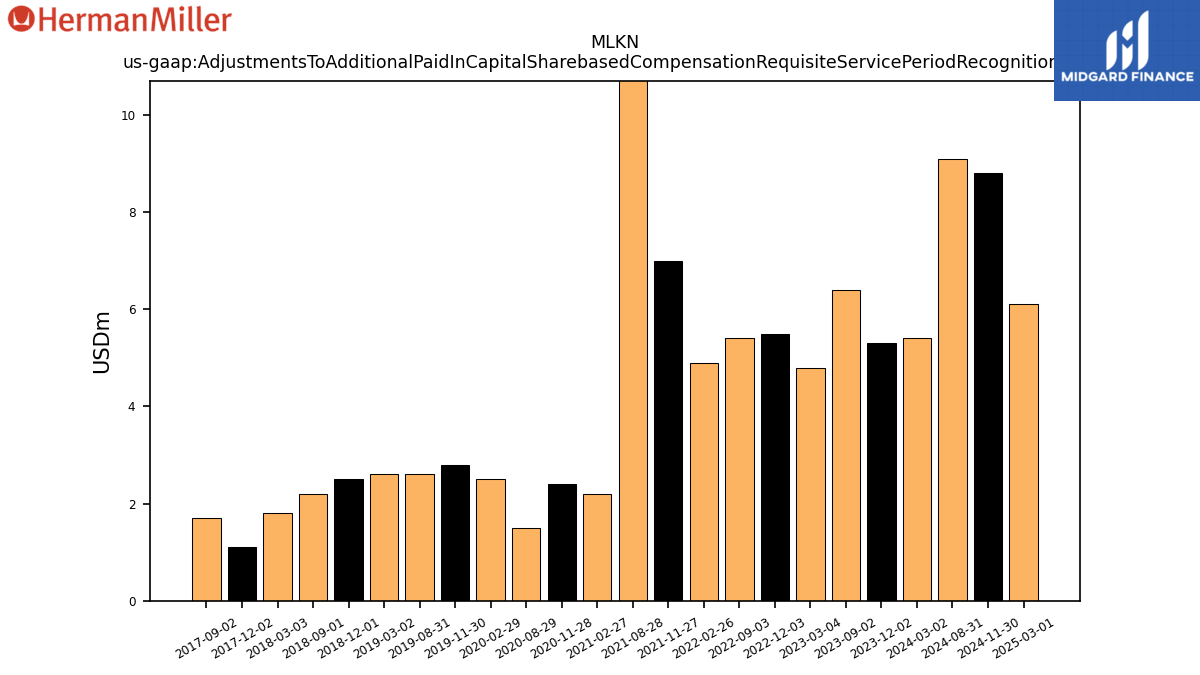
| Adjustments To Additional Paid In Capital Sharebased Compensation Requisite Service Period Recognition Value | 5.30 | 6.40 | NA | 4.80 | 5.50 | 5.40 | NA | 4.90 | 7.00 | 15.10 | NA | 2.20 | 2.40 | 1.50 | NA | 2.50 | 2.80 | 2.60 | NA | 2.60 | 2.50 | 2.20 | NA | 1.80 | 1.10 | 1.70 | NA | NA | NA | NA | NA | NA | NA | NA | NA | NA | NA | NA | NA | NA | NA | NA | NA | NA | NA | NA | NA | NA | NA | NA | NA | NA | NA | NA | NA | NA | NA | NA |
| 2023-12-02 | 2023-09-02 | 2023-06-03 | 2023-03-04 | 2022-12-03 | 2022-09-03 | 2022-05-28 | 2022-02-26 | 2021-11-27 | 2021-08-28 | 2021-05-29 | 2021-02-27 | 2020-11-28 | 2020-08-29 | 2020-05-30 | 2020-02-29 | 2019-11-30 | 2019-08-31 | 2019-06-01 | 2019-03-02 | 2018-12-01 | 2018-09-01 | 2018-06-02 | 2018-03-03 | 2017-12-02 | 2017-09-02 | 2017-06-03 | 2017-03-04 | 2016-12-03 | 2016-09-03 | 2016-05-28 | 2016-02-27 | 2015-11-28 | 2015-08-29 | 2015-05-30 | 2015-02-28 | 2014-11-29 | 2014-08-30 | 2014-05-31 | 2014-03-01 | 2013-11-30 | 2013-08-31 | 2013-06-01 | 2013-03-02 | 2012-12-01 | 2012-09-01 | 2012-06-02 | 2012-03-03 | 2011-12-03 | 2011-09-03 | 2011-05-28 | 2011-02-26 | 2010-11-27 | 2010-08-28 | 2010-05-29 | 2010-02-27 | 2009-11-28 | 2009-08-29 | ||
|---|---|---|---|---|---|---|---|---|---|---|---|---|---|---|---|---|---|---|---|---|---|---|---|---|---|---|---|---|---|---|---|---|---|---|---|---|---|---|---|---|---|---|---|---|---|---|---|---|---|---|---|---|---|---|---|---|---|---|---|
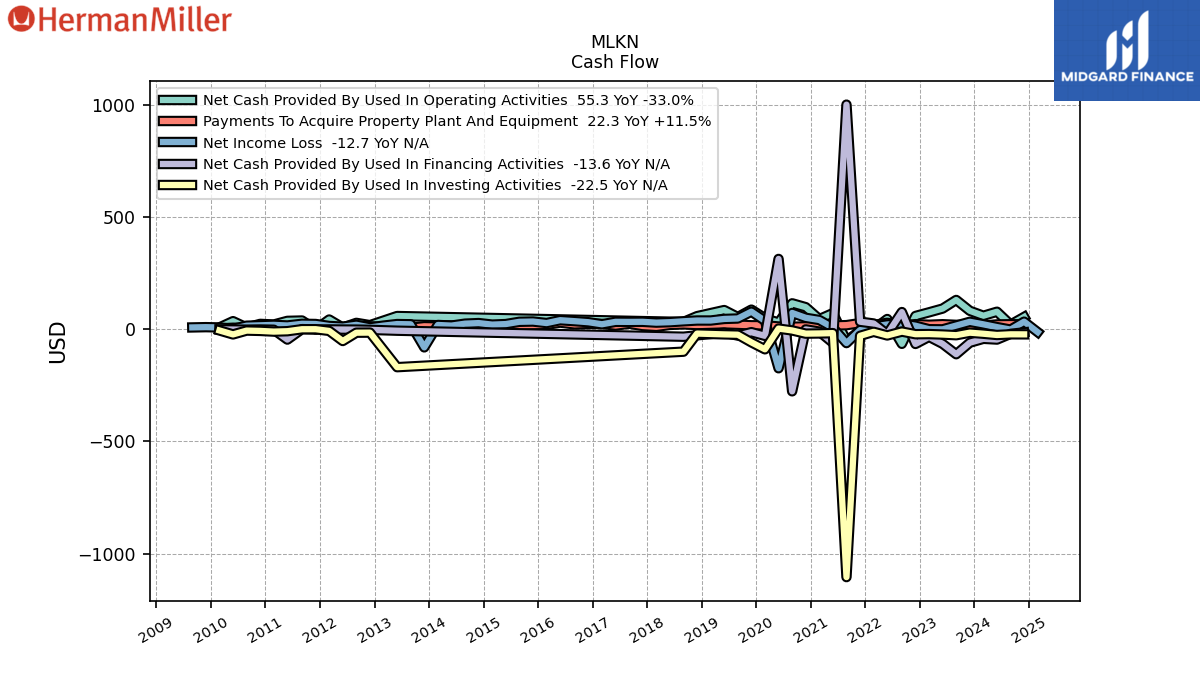
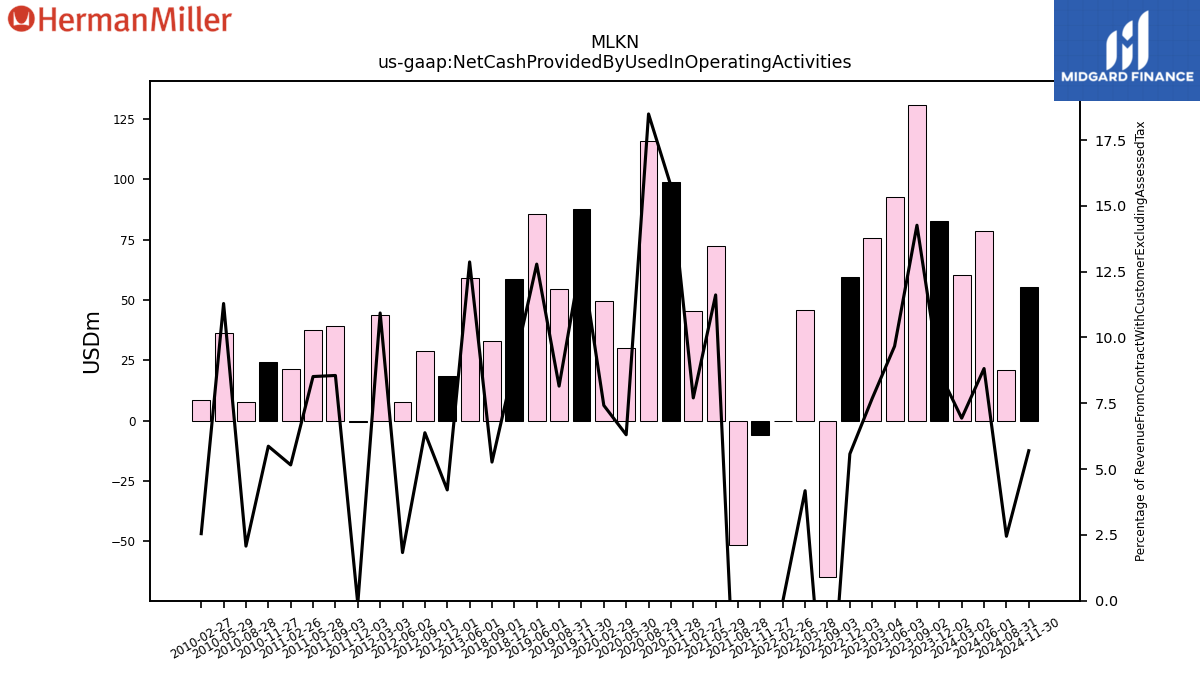
| Net Cash Provided By Used In Operating Activities | 82.50 | 130.90 | 92.50 | 75.70 | 59.50 | -64.80 | 46.00 | -0.30 | -5.90 | -51.70 | 72.20 | 45.50 | 98.70 | 115.90 | 30.00 | 49.40 | 87.70 | 54.70 | 85.80 | NA | 58.60 | 32.90 | NA | NA | NA | NA | NA | NA | NA | NA | NA | NA | NA | NA | NA | NA | NA | NA | NA | NA | NA | NA | 59.20 | NA | 18.60 | 28.70 | 7.70 | 43.70 | -0.50 | 39.20 | 37.60 | 21.40 | 24.20 | 7.90 | 36.30 | 8.40 | NA | NA | |
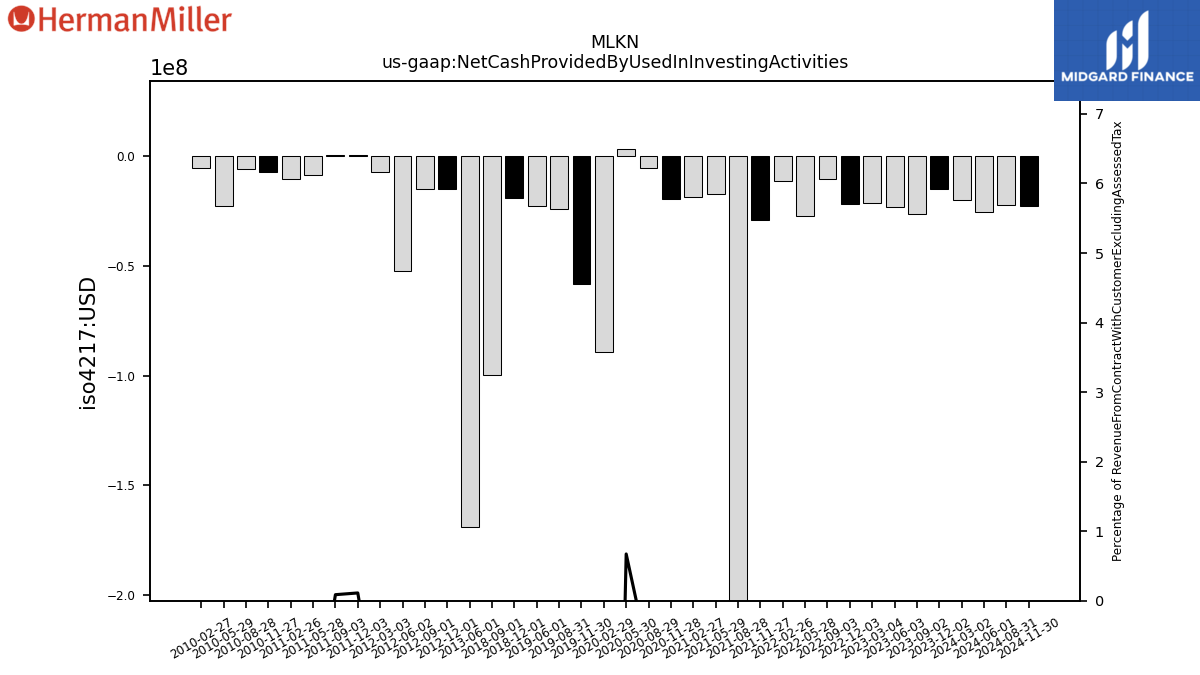
| Net Cash Provided By Used In Investing Activities | -15.00 | -26.30 | -23.30 | -21.20 | -21.80 | -10.20 | -27.40 | -11.20 | -29.10 | -1104.70 | -17.00 | -18.50 | -19.30 | -5.10 | 3.20 | -89.20 | -58.10 | -24.00 | -22.60 | NA | -19.00 | -99.70 | NA | NA | NA | NA | NA | NA | NA | NA | NA | NA | NA | NA | NA | NA | NA | NA | NA | NA | NA | NA | -168.80 | NA | -14.70 | -15.10 | -52.20 | -7.10 | 0.50 | 0.40 | -8.40 | -10.20 | -7.10 | -5.70 | -22.80 | -5.10 | NA | NA | |
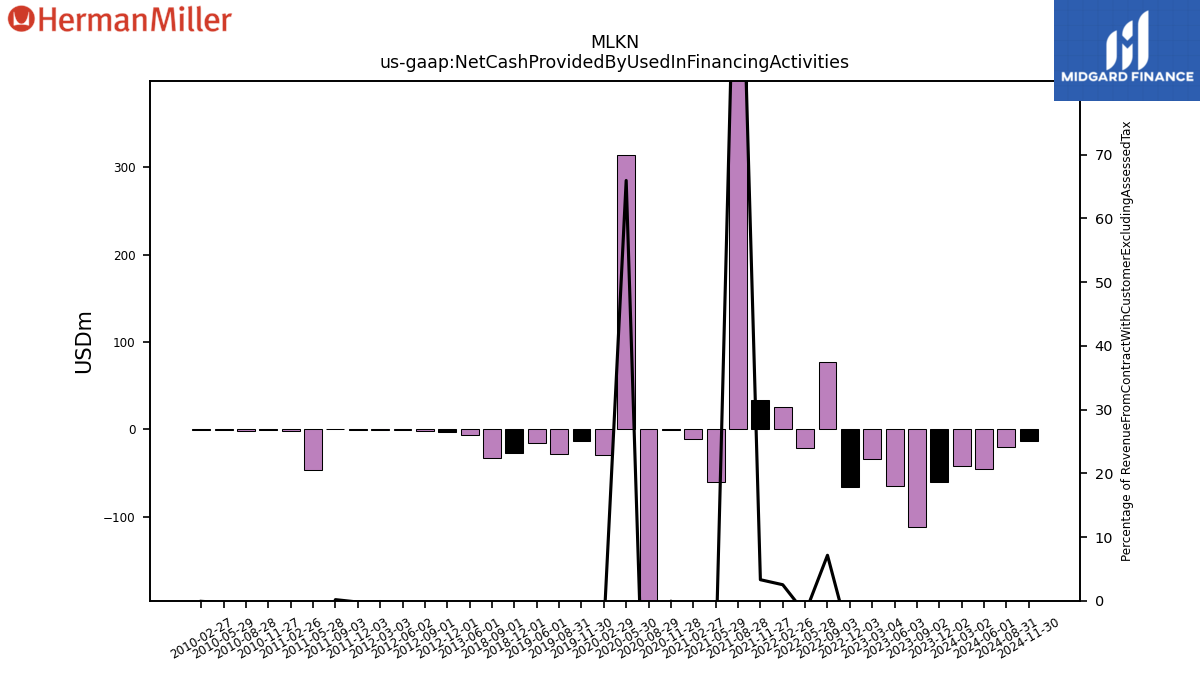
| Net Cash Provided By Used In Financing Activities | -59.70 | -111.10 | -64.70 | -33.70 | -65.40 | 77.00 | -21.50 | 25.90 | 33.90 | 1001.60 | -60.40 | -10.40 | -0.40 | -276.50 | 313.80 | -29.20 | -12.70 | -27.90 | -15.30 | NA | -26.80 | -33.00 | NA | NA | NA | NA | NA | NA | NA | NA | NA | NA | NA | NA | NA | NA | NA | NA | NA | NA | NA | NA | -6.20 | NA | -2.40 | -1.30 | -1.00 | -0.50 | -0.90 | 0.80 | -45.90 | -1.90 | -0.80 | -1.60 | -1.00 | -0.30 | NA | NA |
| 2023-12-02 | 2023-09-02 | 2023-06-03 | 2023-03-04 | 2022-12-03 | 2022-09-03 | 2022-05-28 | 2022-02-26 | 2021-11-27 | 2021-08-28 | 2021-05-29 | 2021-02-27 | 2020-11-28 | 2020-08-29 | 2020-05-30 | 2020-02-29 | 2019-11-30 | 2019-08-31 | 2019-06-01 | 2019-03-02 | 2018-12-01 | 2018-09-01 | 2018-06-02 | 2018-03-03 | 2017-12-02 | 2017-09-02 | 2017-06-03 | 2017-03-04 | 2016-12-03 | 2016-09-03 | 2016-05-28 | 2016-02-27 | 2015-11-28 | 2015-08-29 | 2015-05-30 | 2015-02-28 | 2014-11-29 | 2014-08-30 | 2014-05-31 | 2014-03-01 | 2013-11-30 | 2013-08-31 | 2013-06-01 | 2013-03-02 | 2012-12-01 | 2012-09-01 | 2012-06-02 | 2012-03-03 | 2011-12-03 | 2011-09-03 | 2011-05-28 | 2011-02-26 | 2010-11-27 | 2010-08-28 | 2010-05-29 | 2010-02-27 | 2009-11-28 | 2009-08-29 | ||
|---|---|---|---|---|---|---|---|---|---|---|---|---|---|---|---|---|---|---|---|---|---|---|---|---|---|---|---|---|---|---|---|---|---|---|---|---|---|---|---|---|---|---|---|---|---|---|---|---|---|---|---|---|---|---|---|---|---|---|---|
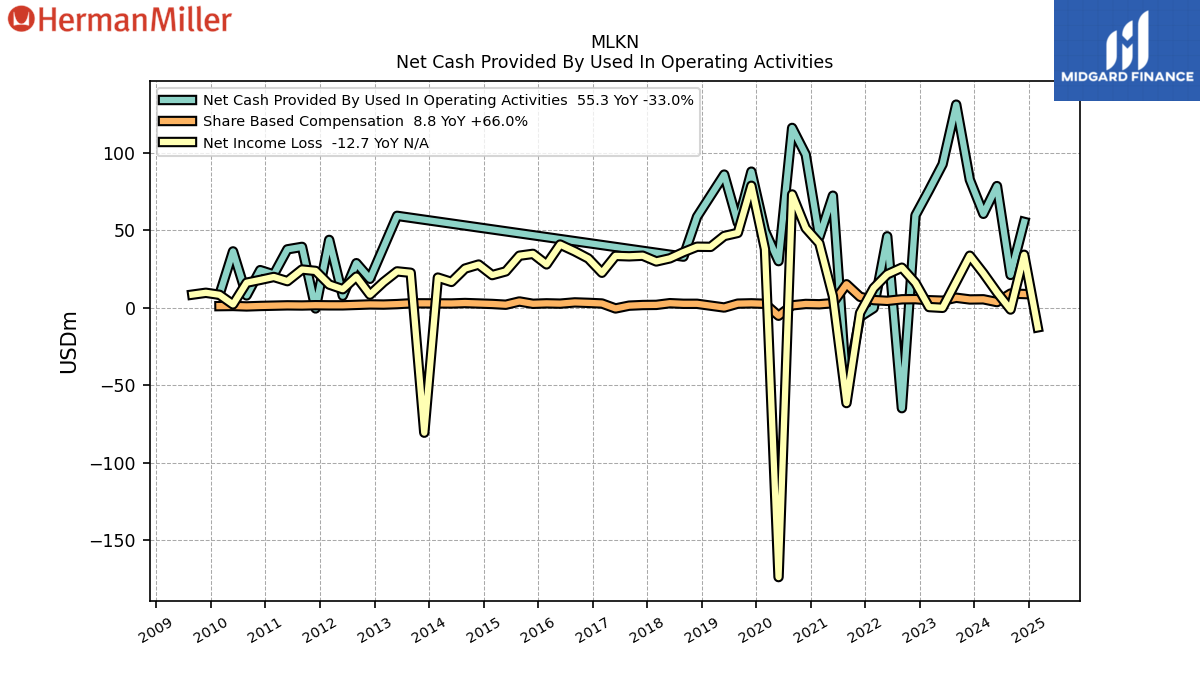
| Net Cash Provided By Used In Operating Activities | 82.50 | 130.90 | 92.50 | 75.70 | 59.50 | -64.80 | 46.00 | -0.30 | -5.90 | -51.70 | 72.20 | 45.50 | 98.70 | 115.90 | 30.00 | 49.40 | 87.70 | 54.70 | 85.80 | NA | 58.60 | 32.90 | NA | NA | NA | NA | NA | NA | NA | NA | NA | NA | NA | NA | NA | NA | NA | NA | NA | NA | NA | NA | 59.20 | NA | 18.60 | 28.70 | 7.70 | 43.70 | -0.50 | 39.20 | 37.60 | 21.40 | 24.20 | 7.90 | 36.30 | 8.40 | NA | NA | |
| Net Income Loss | 33.50 | 16.70 | -0.10 | 0.40 | 16.00 | 25.80 | 21.50 | 12.60 | -3.40 | -61.50 | 7.40 | 41.50 | 51.30 | 73.00 | -173.70 | 37.70 | 78.60 | 48.20 | 46.20 | 39.20 | 39.30 | 35.80 | 31.80 | 29.80 | 33.50 | 33.10 | 33.40 | 22.50 | 31.70 | 36.30 | 40.70 | 27.90 | 34.70 | 33.50 | 23.40 | 21.00 | 27.80 | 25.20 | 16.60 | 19.40 | -80.60 | 22.50 | 23.40 | 16.50 | 8.40 | 20.00 | 11.90 | 14.90 | 23.70 | 24.60 | 17.10 | 19.80 | 17.90 | 16.10 | 2.10 | 8.30 | 9.60 | 8.40 | |
| Profit Loss | 34.40 | 16.10 | 0.10 | 1.10 | 17.50 | 27.40 | 26.90 | 14.40 | -1.10 | -59.90 | 9.30 | 43.30 | 52.80 | 73.40 | -178.30 | 37.30 | 78.60 | 48.00 | 45.90 | 39.30 | 39.30 | 35.90 | 32.20 | 30.00 | 33.50 | 33.10 | 33.50 | 22.50 | 31.60 | 36.50 | 40.60 | 28.20 | 34.90 | 33.80 | 23.80 | 21.20 | 27.80 | 25.20 | 16.60 | 19.40 | -80.60 | 22.50 | NA | NA | NA | NA | NA | NA | NA | NA | NA | NA | NA | NA | NA | NA | NA | NA | |
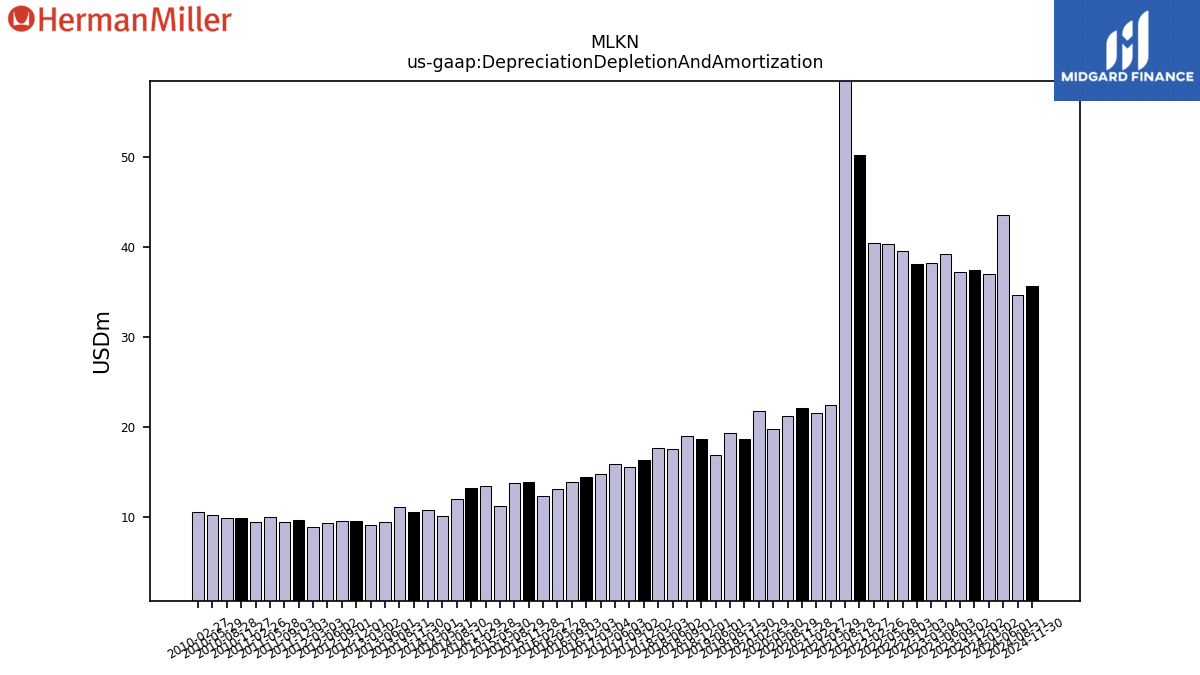
| Depreciation Depletion And Amortization | 37.40 | 37.20 | 39.20 | 38.20 | 38.10 | 39.60 | 40.30 | 40.40 | 50.20 | 59.70 | 22.40 | 21.50 | 22.10 | 21.20 | 19.80 | 21.80 | 18.60 | 19.30 | 16.80 | NA | 18.60 | 19.00 | 17.50 | 17.60 | 16.30 | 15.50 | 15.90 | 14.70 | 14.40 | 13.90 | 13.10 | 12.30 | 13.90 | 13.70 | 11.20 | 13.40 | 13.20 | 12.00 | 10.10 | 10.70 | 10.50 | 11.10 | 9.40 | 9.10 | 9.50 | 9.50 | 9.30 | 8.90 | 9.60 | 9.40 | 10.00 | 9.40 | 9.80 | 9.90 | 10.20 | 10.50 | NA | NA | |
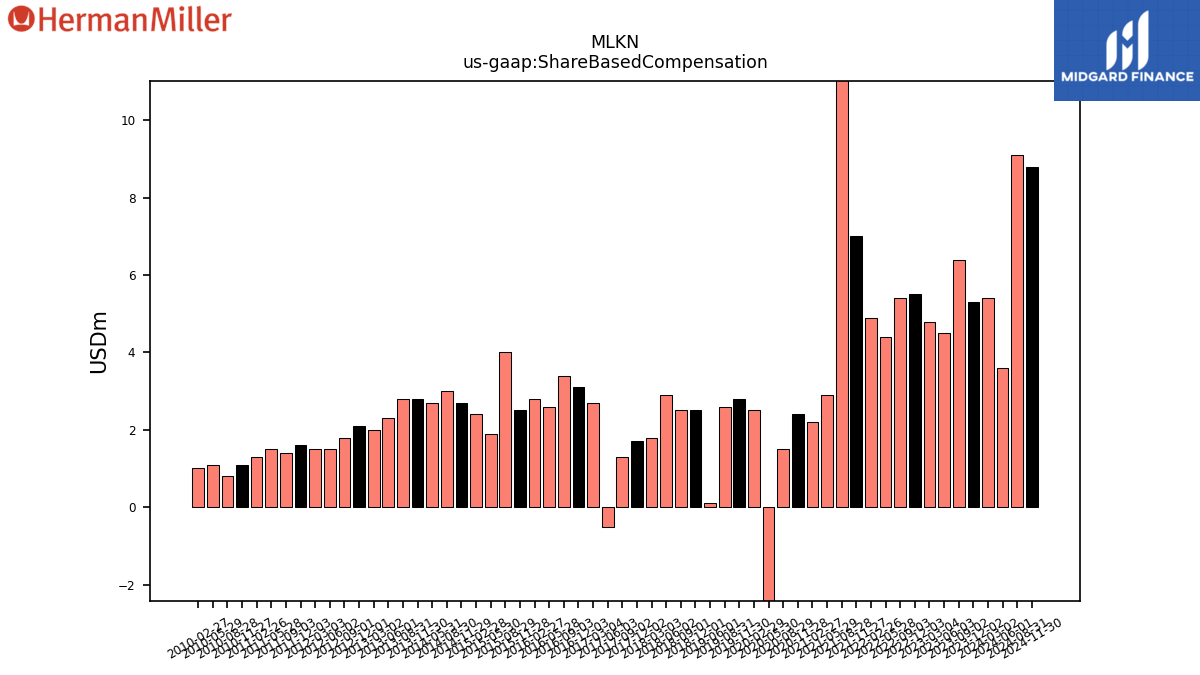
| Share Based Compensation | 5.30 | 6.40 | 4.50 | 4.80 | 5.50 | 5.40 | 4.40 | 4.90 | 7.00 | 15.10 | 2.90 | 2.20 | 2.40 | 1.50 | -5.20 | 2.50 | 2.80 | 2.60 | 0.10 | NA | 2.50 | 2.50 | 2.90 | 1.80 | 1.70 | 1.30 | -0.50 | 2.70 | 3.10 | 3.40 | 2.60 | 2.80 | 2.50 | 4.00 | 1.90 | 2.40 | 2.70 | 3.00 | 2.70 | NA | 2.80 | 2.80 | 2.30 | 2.00 | 2.10 | 1.80 | 1.50 | 1.50 | 1.60 | 1.40 | 1.50 | 1.30 | 1.10 | 0.80 | 1.10 | 1.00 | NA | NA |
| 2023-12-02 | 2023-09-02 | 2023-06-03 | 2023-03-04 | 2022-12-03 | 2022-09-03 | 2022-05-28 | 2022-02-26 | 2021-11-27 | 2021-08-28 | 2021-05-29 | 2021-02-27 | 2020-11-28 | 2020-08-29 | 2020-05-30 | 2020-02-29 | 2019-11-30 | 2019-08-31 | 2019-06-01 | 2019-03-02 | 2018-12-01 | 2018-09-01 | 2018-06-02 | 2018-03-03 | 2017-12-02 | 2017-09-02 | 2017-06-03 | 2017-03-04 | 2016-12-03 | 2016-09-03 | 2016-05-28 | 2016-02-27 | 2015-11-28 | 2015-08-29 | 2015-05-30 | 2015-02-28 | 2014-11-29 | 2014-08-30 | 2014-05-31 | 2014-03-01 | 2013-11-30 | 2013-08-31 | 2013-06-01 | 2013-03-02 | 2012-12-01 | 2012-09-01 | 2012-06-02 | 2012-03-03 | 2011-12-03 | 2011-09-03 | 2011-05-28 | 2011-02-26 | 2010-11-27 | 2010-08-28 | 2010-05-29 | 2010-02-27 | 2009-11-28 | 2009-08-29 | ||
|---|---|---|---|---|---|---|---|---|---|---|---|---|---|---|---|---|---|---|---|---|---|---|---|---|---|---|---|---|---|---|---|---|---|---|---|---|---|---|---|---|---|---|---|---|---|---|---|---|---|---|---|---|---|---|---|---|---|---|---|
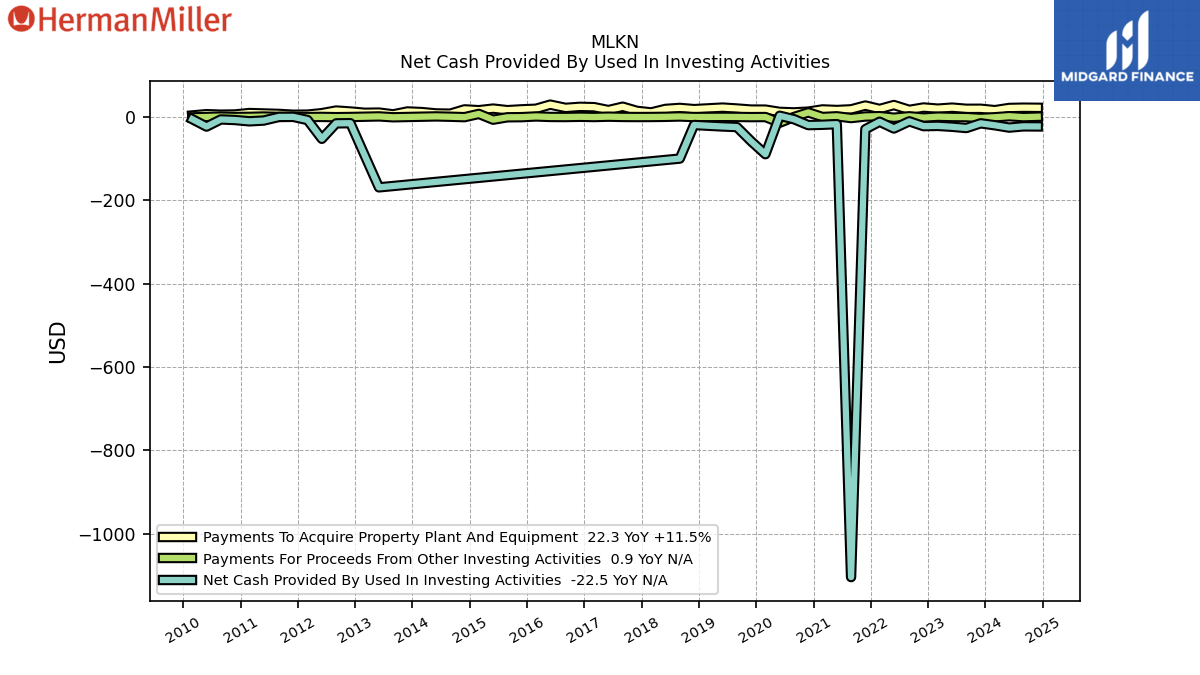
| Net Cash Provided By Used In Investing Activities | -15.00 | -26.30 | -23.30 | -21.20 | -21.80 | -10.20 | -27.40 | -11.20 | -29.10 | -1104.70 | -17.00 | -18.50 | -19.30 | -5.10 | 3.20 | -89.20 | -58.10 | -24.00 | -22.60 | NA | -19.00 | -99.70 | NA | NA | NA | NA | NA | NA | NA | NA | NA | NA | NA | NA | NA | NA | NA | NA | NA | NA | NA | NA | -168.80 | NA | -14.70 | -15.10 | -52.20 | -7.10 | 0.50 | 0.40 | -8.40 | -10.20 | -7.10 | -5.70 | -22.80 | -5.10 | NA | NA | |
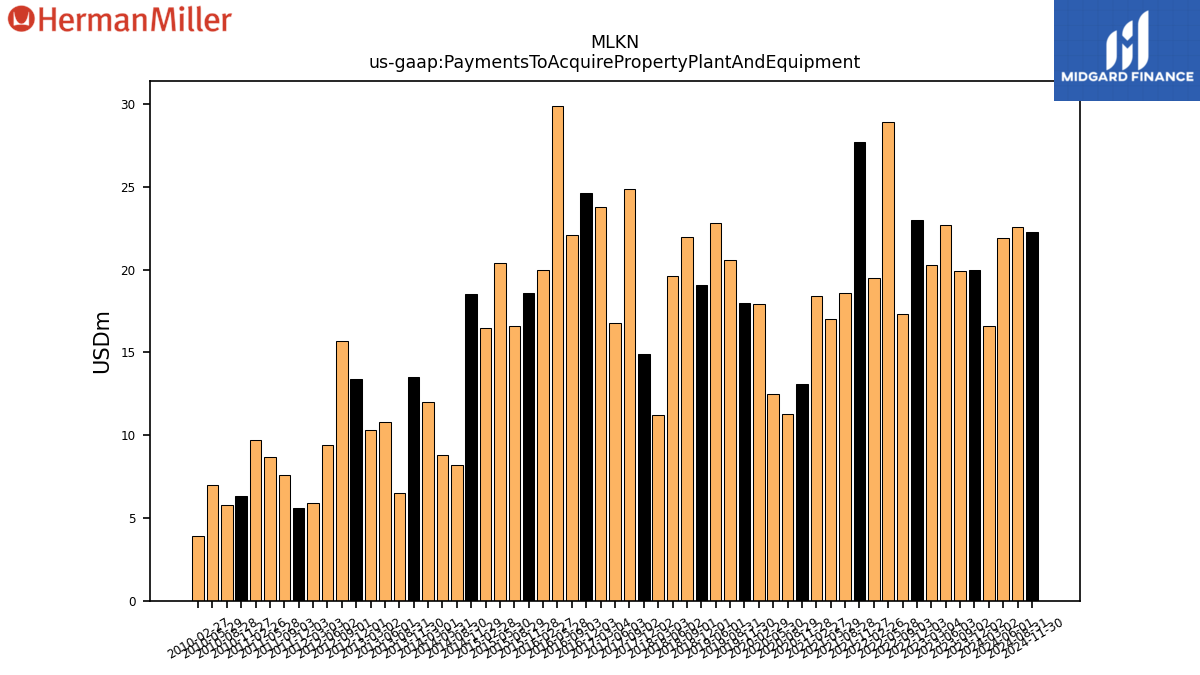
| Payments To Acquire Property Plant And Equipment | 20.00 | 19.90 | 22.70 | 20.30 | 23.00 | 17.30 | 28.90 | 19.50 | 27.70 | 18.60 | 17.00 | 18.40 | 13.10 | 11.30 | 12.50 | 17.90 | 18.00 | 20.60 | 22.80 | NA | 19.10 | 22.00 | 19.60 | 11.20 | 14.90 | 24.90 | 16.80 | 23.80 | 24.60 | 22.10 | 29.90 | 20.00 | 18.60 | 16.60 | 20.40 | 16.50 | 18.50 | 8.20 | 8.80 | 12.00 | 13.50 | 6.50 | 10.80 | 10.30 | 13.40 | 15.70 | 9.40 | 5.90 | 5.60 | 7.60 | 8.70 | 9.70 | 6.30 | 5.80 | 7.00 | 3.90 | NA | NA |
| 2023-12-02 | 2023-09-02 | 2023-06-03 | 2023-03-04 | 2022-12-03 | 2022-09-03 | 2022-05-28 | 2022-02-26 | 2021-11-27 | 2021-08-28 | 2021-05-29 | 2021-02-27 | 2020-11-28 | 2020-08-29 | 2020-05-30 | 2020-02-29 | 2019-11-30 | 2019-08-31 | 2019-06-01 | 2019-03-02 | 2018-12-01 | 2018-09-01 | 2018-06-02 | 2018-03-03 | 2017-12-02 | 2017-09-02 | 2017-06-03 | 2017-03-04 | 2016-12-03 | 2016-09-03 | 2016-05-28 | 2016-02-27 | 2015-11-28 | 2015-08-29 | 2015-05-30 | 2015-02-28 | 2014-11-29 | 2014-08-30 | 2014-05-31 | 2014-03-01 | 2013-11-30 | 2013-08-31 | 2013-06-01 | 2013-03-02 | 2012-12-01 | 2012-09-01 | 2012-06-02 | 2012-03-03 | 2011-12-03 | 2011-09-03 | 2011-05-28 | 2011-02-26 | 2010-11-27 | 2010-08-28 | 2010-05-29 | 2010-02-27 | 2009-11-28 | 2009-08-29 | ||
|---|---|---|---|---|---|---|---|---|---|---|---|---|---|---|---|---|---|---|---|---|---|---|---|---|---|---|---|---|---|---|---|---|---|---|---|---|---|---|---|---|---|---|---|---|---|---|---|---|---|---|---|---|---|---|---|---|---|---|---|
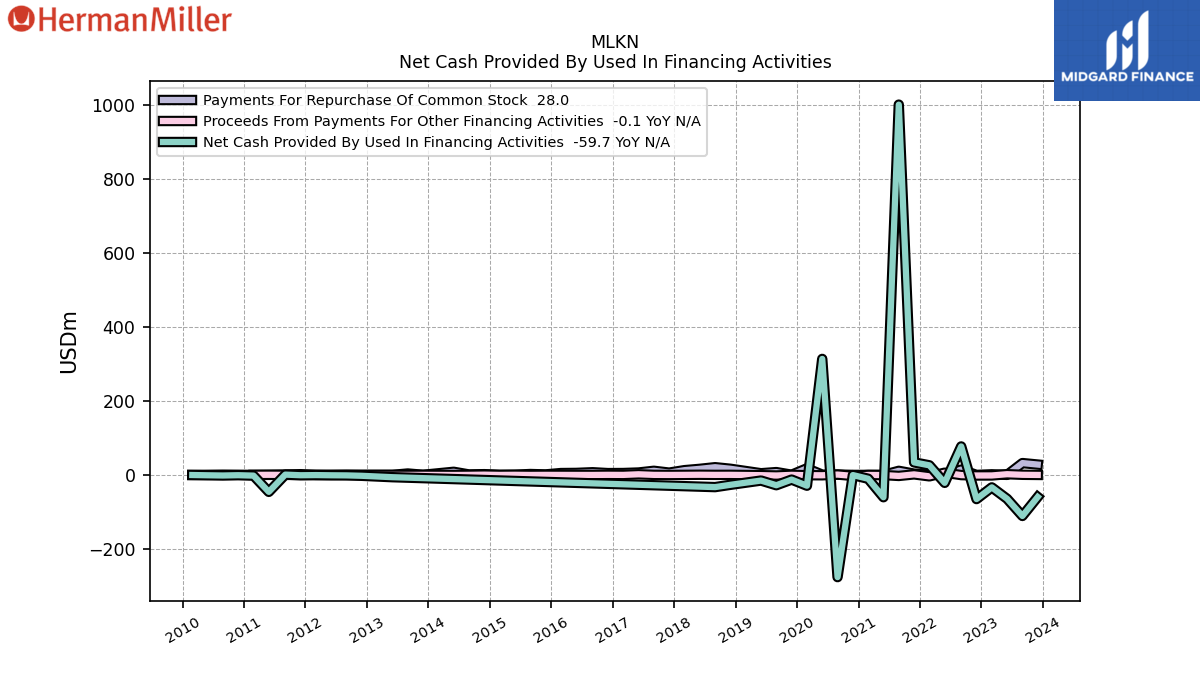
| Net Cash Provided By Used In Financing Activities | -59.70 | -111.10 | -64.70 | -33.70 | -65.40 | 77.00 | -21.50 | 25.90 | 33.90 | 1001.60 | -60.40 | -10.40 | -0.40 | -276.50 | 313.80 | -29.20 | -12.70 | -27.90 | -15.30 | NA | -26.80 | -33.00 | NA | NA | NA | NA | NA | NA | NA | NA | NA | NA | NA | NA | NA | NA | NA | NA | NA | NA | NA | NA | -6.20 | NA | -2.40 | -1.30 | -1.00 | -0.50 | -0.90 | 0.80 | -45.90 | -1.90 | -0.80 | -1.60 | -1.00 | -0.30 | NA | NA | |
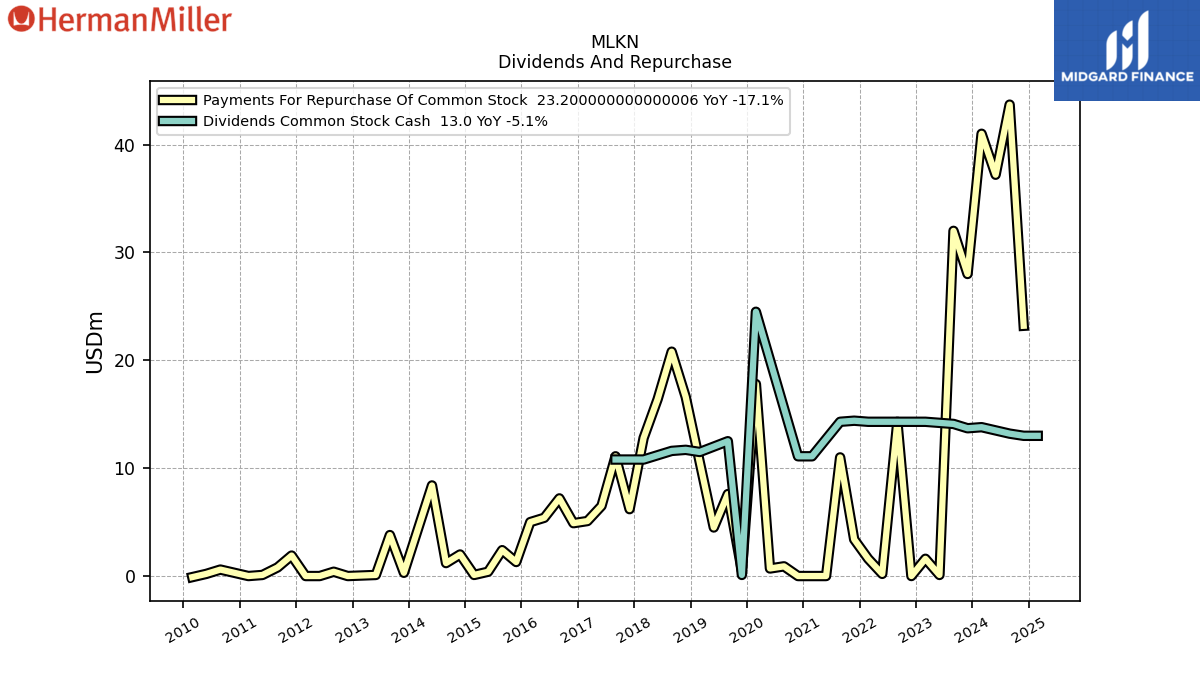
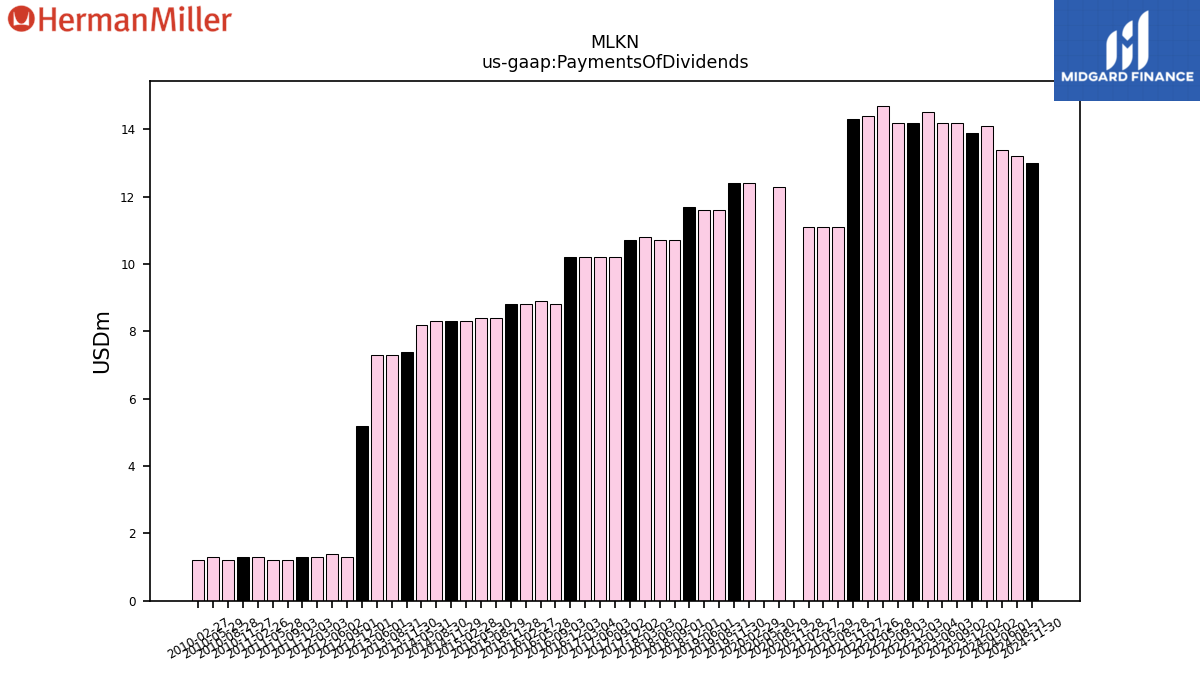
| Payments Of Dividends | 13.90 | 14.20 | 14.20 | 14.50 | 14.20 | 14.20 | 14.70 | 14.40 | 14.30 | 11.10 | 11.10 | 11.10 | 0.00 | 12.30 | 0.00 | 12.40 | 12.40 | 11.60 | 11.60 | NA | 11.70 | 10.70 | 10.70 | 10.80 | 10.70 | 10.20 | 10.20 | 10.20 | 10.20 | 8.80 | 8.90 | 8.80 | 8.80 | 8.40 | 8.40 | 8.30 | 8.30 | 8.30 | 8.20 | NA | 7.40 | 7.30 | 7.30 | NA | 5.20 | 1.30 | 1.40 | 1.30 | 1.30 | 1.20 | 1.20 | 1.30 | 1.30 | 1.20 | 1.30 | 1.20 | NA | NA | |
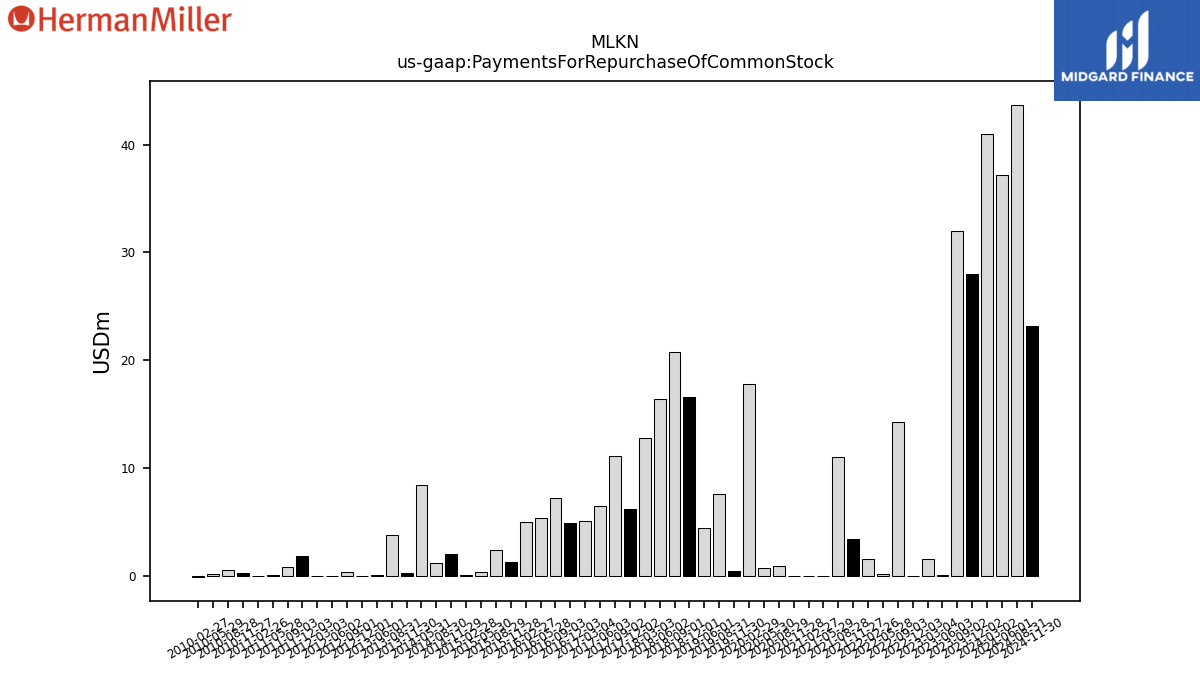
| Payments For Repurchase Of Common Stock | 28.00 | 32.00 | 0.10 | 1.60 | 0.00 | 14.30 | 0.20 | 1.60 | 3.40 | 11.00 | 0.00 | 0.00 | 0.00 | 0.90 | 0.70 | 17.80 | 0.50 | 7.60 | 4.50 | NA | 16.60 | 20.80 | 16.40 | 12.80 | 6.20 | 11.10 | 6.50 | 5.10 | 4.90 | 7.20 | 5.40 | 5.00 | 1.30 | 2.40 | 0.40 | 0.10 | 2.00 | 1.20 | 8.40 | NA | 0.30 | 3.80 | 0.10 | NA | 0.00 | 0.40 | 0.00 | 0.00 | 1.90 | 0.80 | 0.10 | 0.00 | 0.30 | 0.60 | 0.20 | -0.10 | NA | NA |
| 2023-12-02 | 2023-09-02 | 2023-06-03 | 2023-03-04 | 2022-12-03 | 2022-09-03 | 2022-05-28 | 2022-02-26 | 2021-11-27 | 2021-08-28 | 2021-05-29 | 2021-02-27 | 2020-11-28 | 2020-08-29 | 2020-05-30 | 2020-02-29 | 2019-11-30 | 2019-08-31 | 2019-06-01 | 2019-03-02 | 2018-12-01 | 2018-09-01 | 2018-06-02 | 2018-03-03 | 2017-12-02 | 2017-09-02 | 2017-06-03 | 2017-03-04 | 2016-12-03 | 2016-09-03 | 2016-05-28 | 2016-02-27 | 2015-11-28 | 2015-08-29 | 2015-05-30 | 2015-02-28 | 2014-11-29 | 2014-08-30 | 2014-05-31 | 2014-03-01 | 2013-11-30 | 2013-08-31 | 2013-06-01 | 2013-03-02 | 2012-12-01 | 2012-09-01 | 2012-06-02 | 2012-03-03 | 2011-12-03 | 2011-09-03 | 2011-05-28 | 2011-02-26 | 2010-11-27 | 2010-08-28 | 2010-05-29 | 2010-02-27 | 2009-11-28 | 2009-08-29 | ||
|---|---|---|---|---|---|---|---|---|---|---|---|---|---|---|---|---|---|---|---|---|---|---|---|---|---|---|---|---|---|---|---|---|---|---|---|---|---|---|---|---|---|---|---|---|---|---|---|---|---|---|---|---|---|---|---|---|---|---|---|
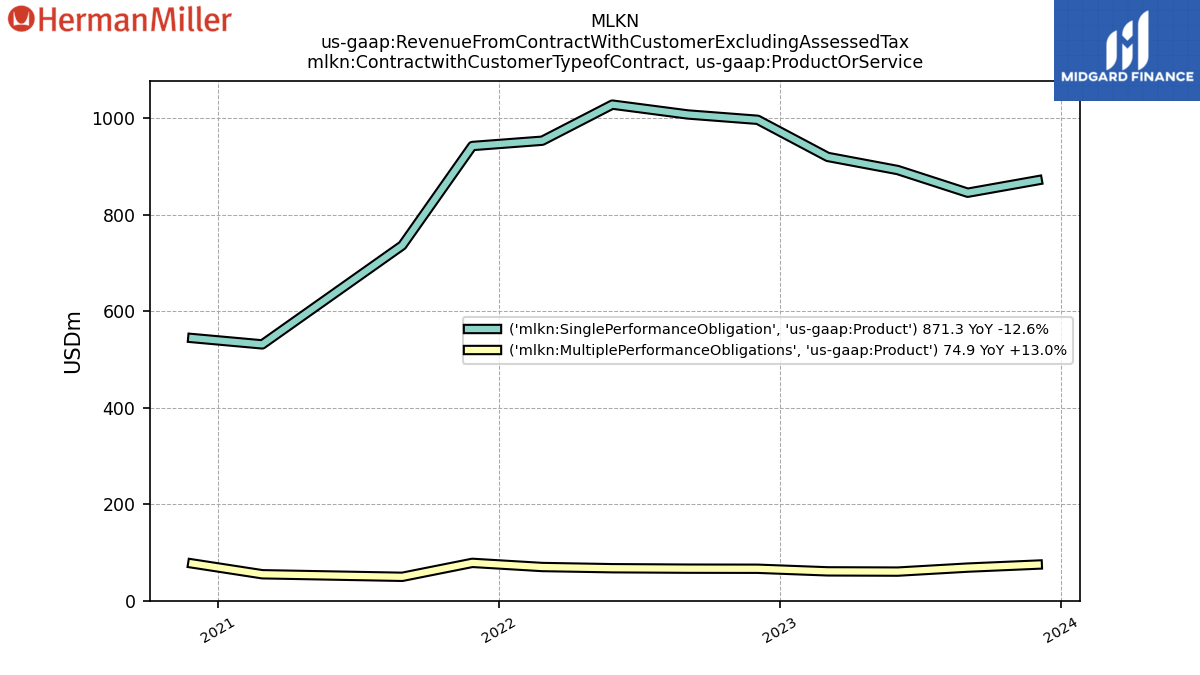
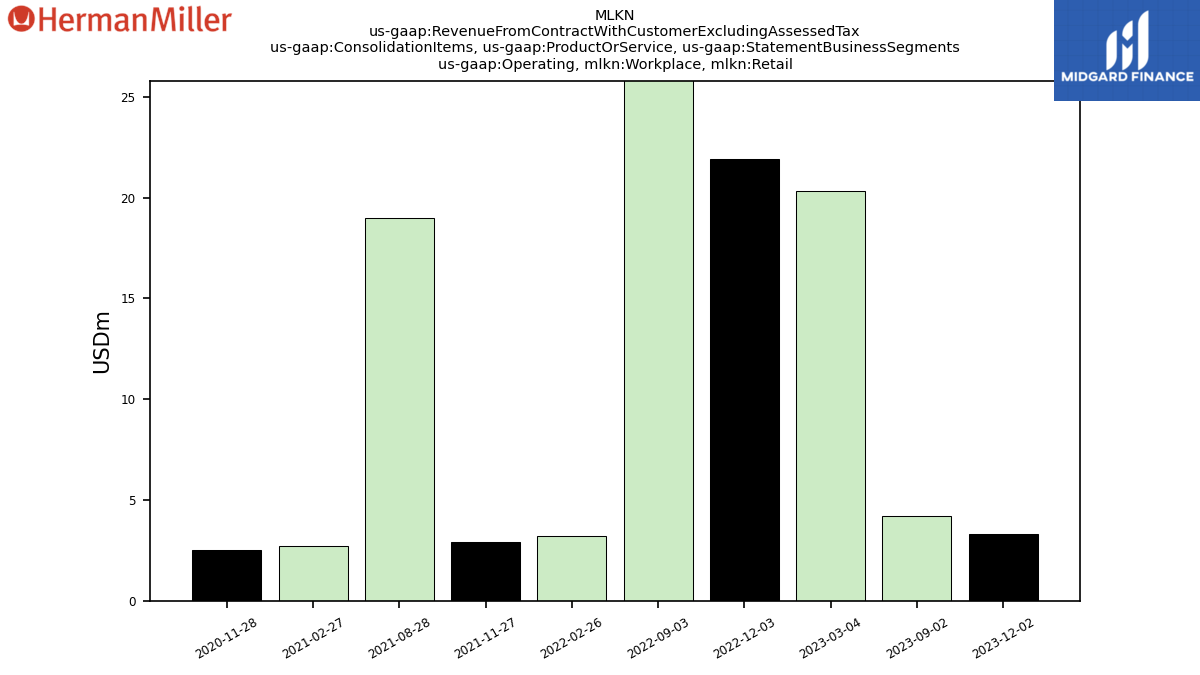
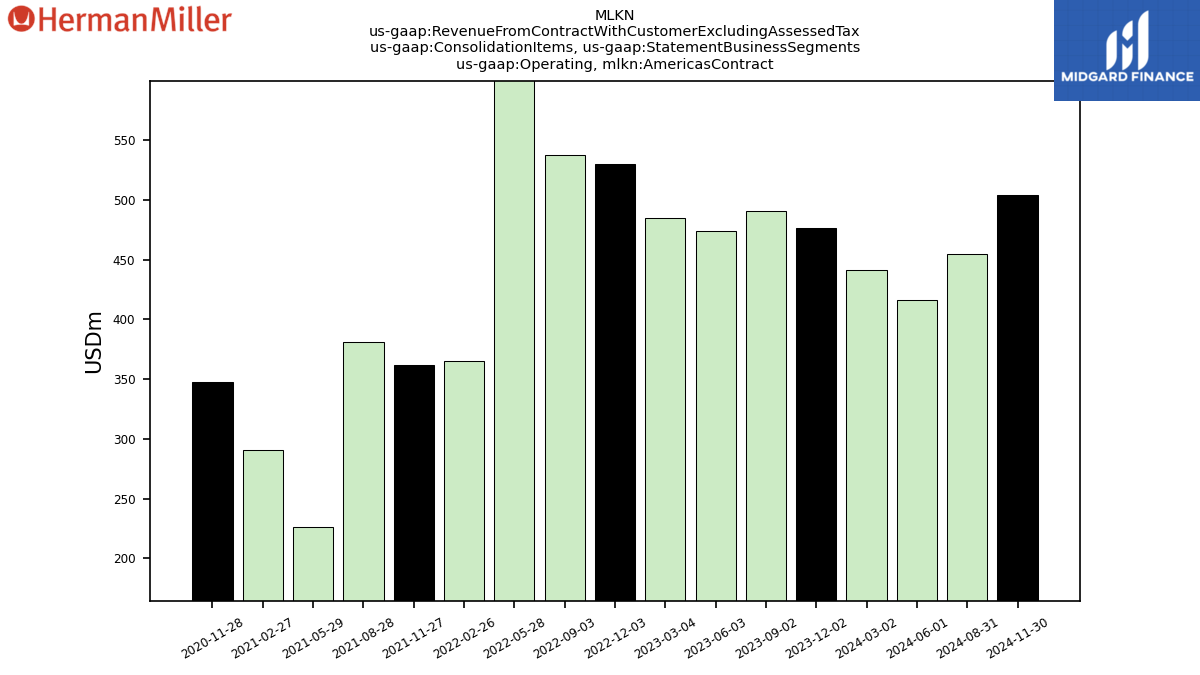
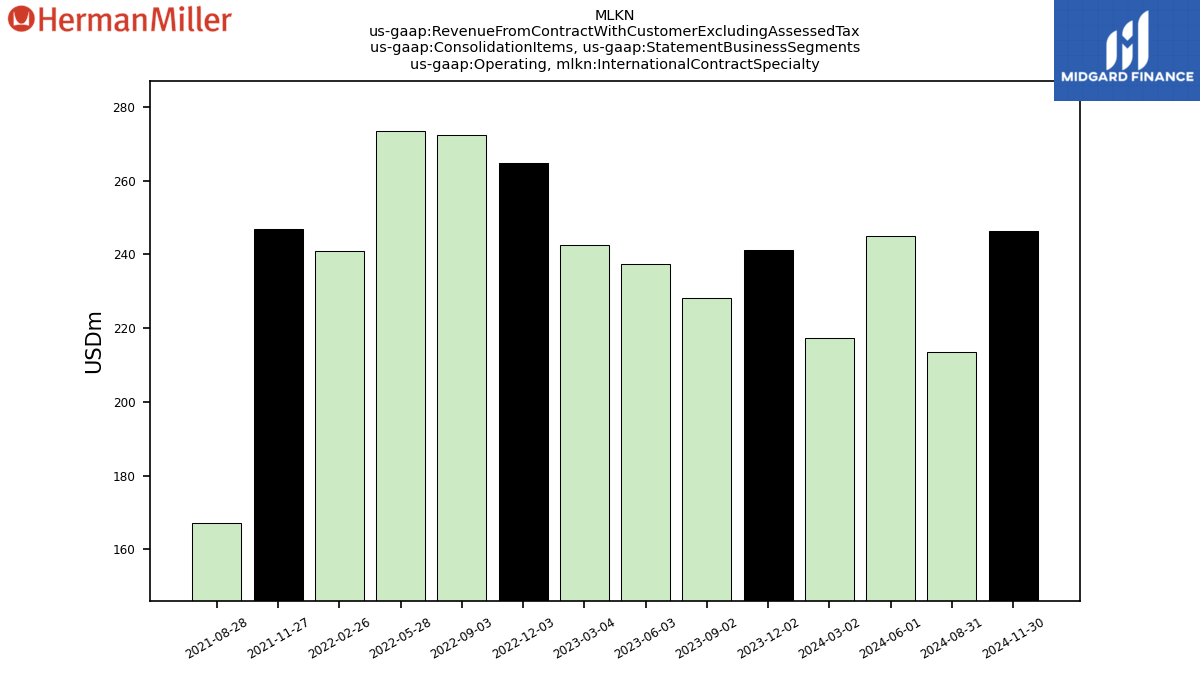
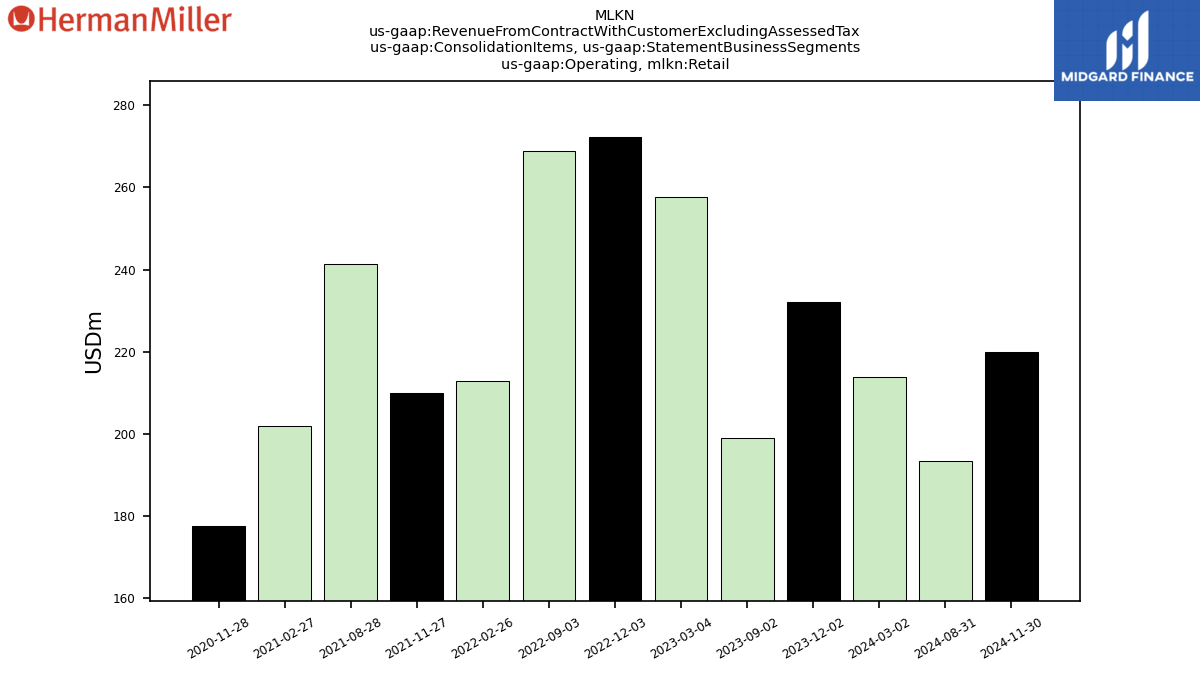
| Revenue From Contract With Customer Excluding Assessed Tax | 949.50 | 917.70 | 956.70 | 984.70 | 1066.90 | 1078.80 | 1100.50 | 1029.50 | 1026.30 | 789.70 | 621.50 | 590.50 | 626.30 | 626.80 | 475.70 | 665.70 | 674.20 | 670.90 | 671.00 | 619.00 | 652.60 | 624.60 | 618.00 | 578.40 | 604.60 | 580.30 | 577.20 | 524.90 | 577.50 | 598.60 | 582.60 | 536.50 | 580.40 | 565.40 | 550.70 | 516.40 | 565.40 | 509.70 | 487.50 | 455.90 | 470.50 | 468.10 | 460.00 | 423.50 | 441.80 | 449.70 | 420.70 | 399.80 | 445.60 | 458.10 | 441.50 | 414.80 | 412.20 | 380.70 | 321.50 | 329.60 | 343.70 | 324.00 | |
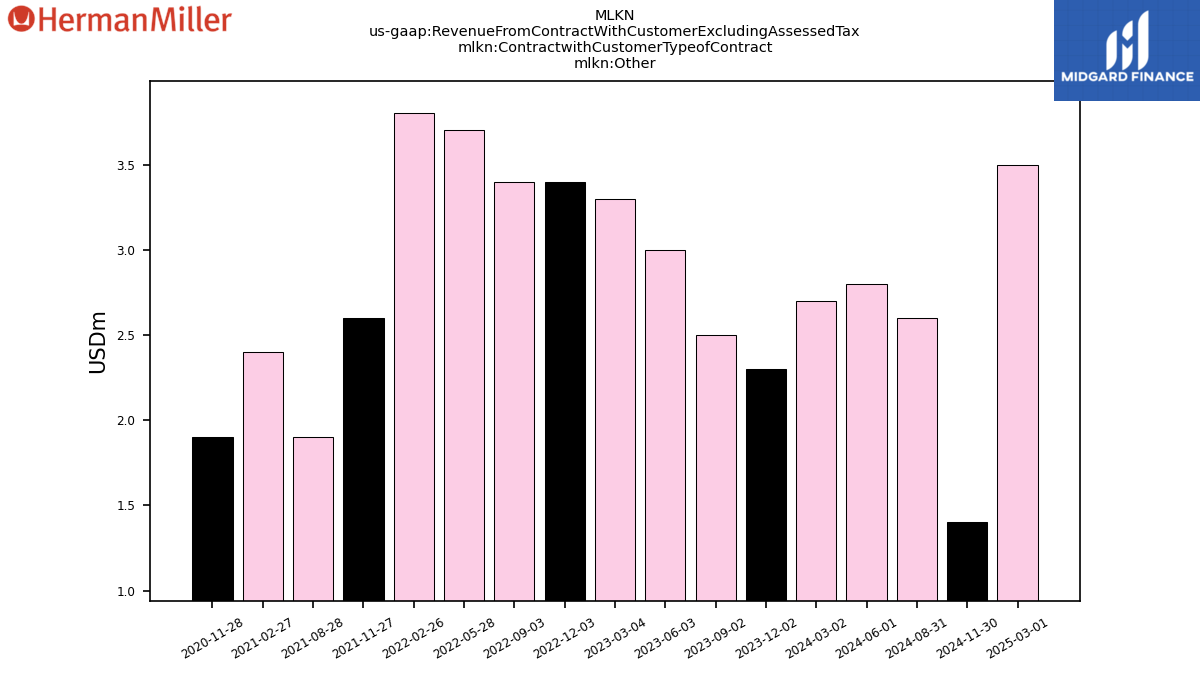
| Other | 2.30 | 2.50 | 3.00 | 3.30 | 3.40 | 3.40 | 3.70 | 3.80 | 2.60 | 1.90 | NA | 2.40 | 1.90 | NA | NA | NA | NA | NA | NA | NA | NA | NA | NA | NA | NA | NA | NA | NA | NA | NA | NA | NA | NA | NA | NA | NA | NA | NA | NA | NA | NA | NA | NA | NA | NA | NA | NA | NA | NA | NA | NA | NA | NA | NA | NA | NA | NA | NA | |
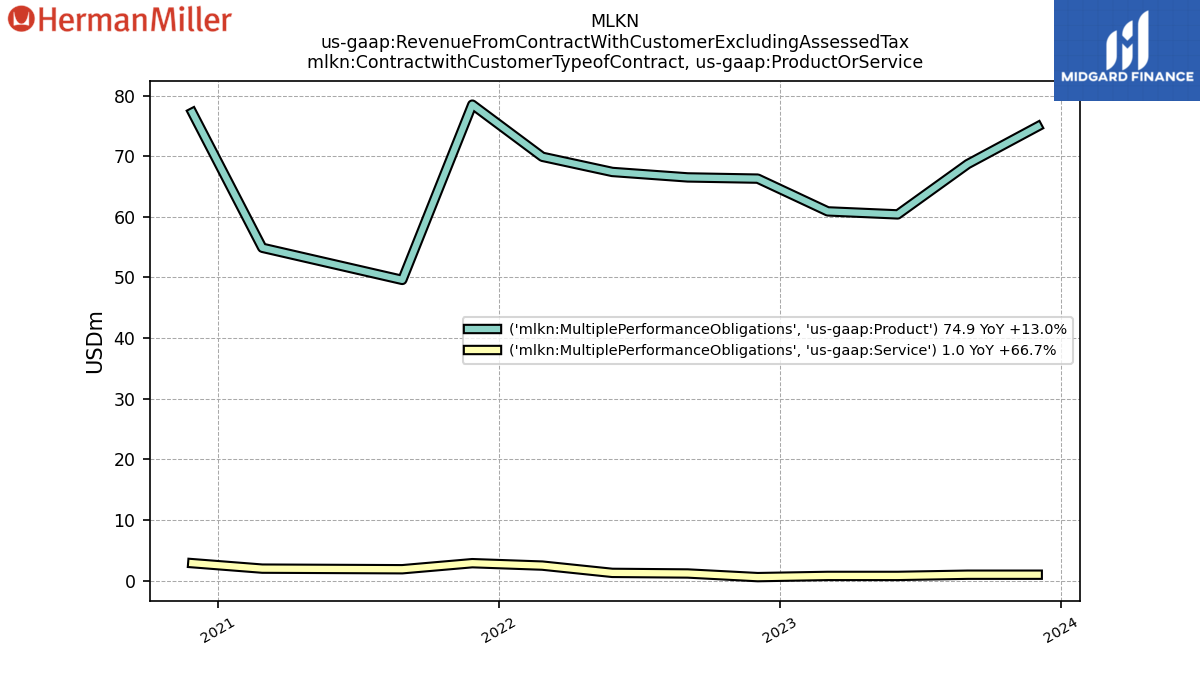
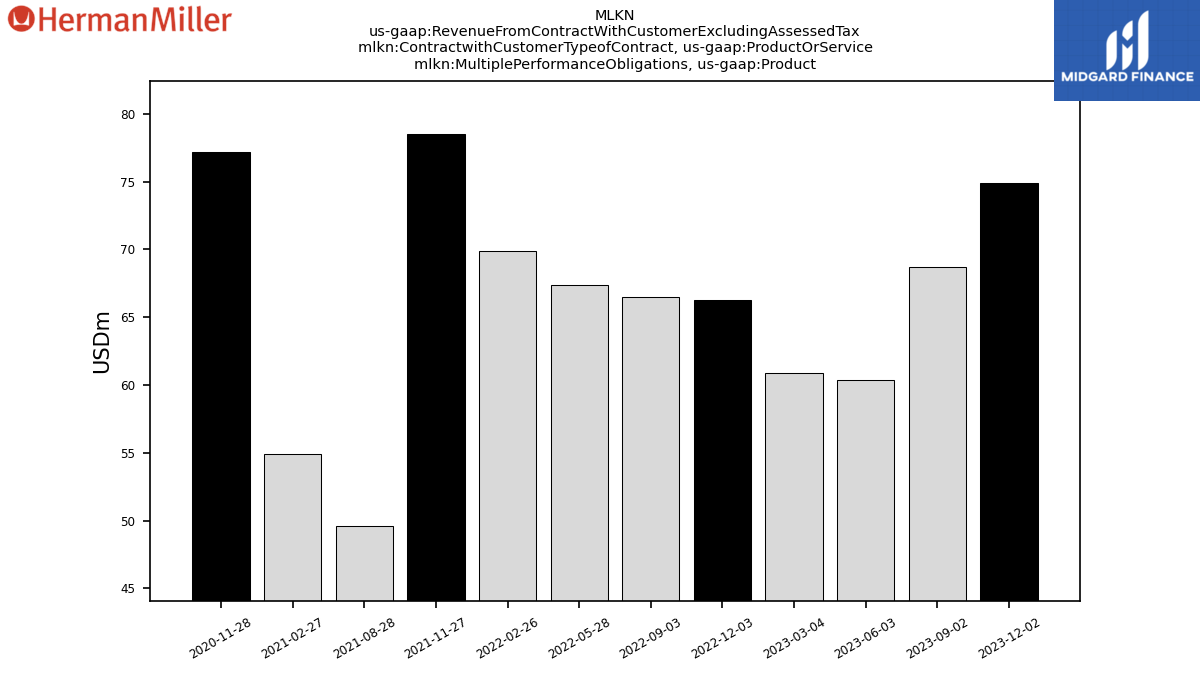
| Multiple Performance Obligations, Product | 74.90 | 68.70 | 60.40 | 60.90 | 66.30 | 66.50 | 67.40 | 69.90 | 78.50 | 49.60 | NA | 54.90 | 77.20 | NA | NA | NA | NA | NA | NA | NA | NA | NA | NA | NA | NA | NA | NA | NA | NA | NA | NA | NA | NA | NA | NA | NA | NA | NA | NA | NA | NA | NA | NA | NA | NA | NA | NA | NA | NA | NA | NA | NA | NA | NA | NA | NA | NA | NA | |
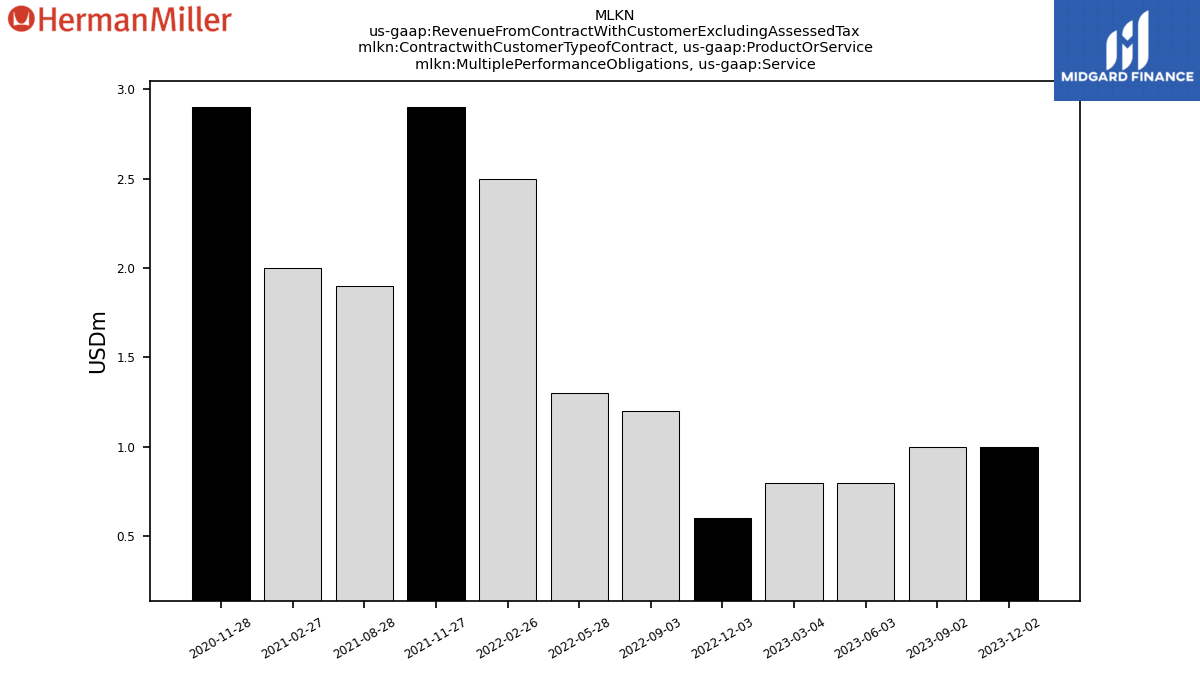
| Multiple Performance Obligations, Service | 1.00 | 1.00 | 0.80 | 0.80 | 0.60 | 1.20 | 1.30 | 2.50 | 2.90 | 1.90 | NA | 2.00 | 2.90 | NA | NA | NA | NA | NA | NA | NA | NA | NA | NA | NA | NA | NA | NA | NA | NA | NA | NA | NA | NA | NA | NA | NA | NA | NA | NA | NA | NA | NA | NA | NA | NA | NA | NA | NA | NA | NA | NA | NA | NA | NA | NA | NA | NA | NA | |
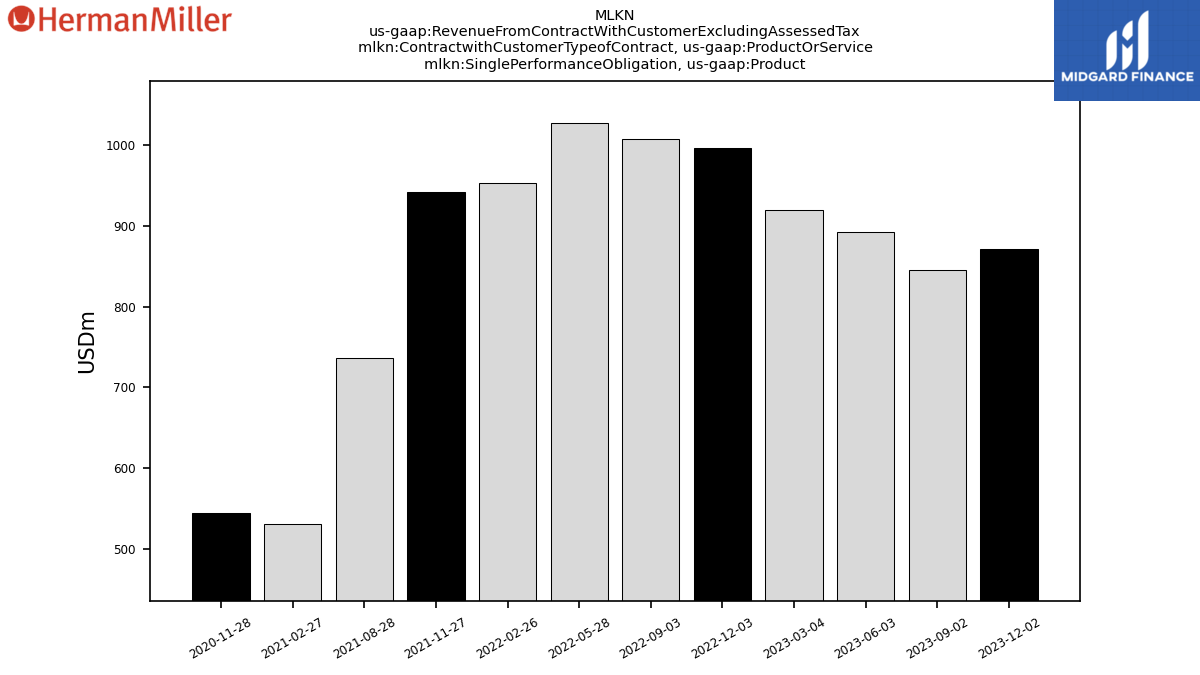
| Single Performance Obligation, Product | 871.30 | 845.50 | 892.50 | 919.70 | 996.60 | 1007.70 | 1028.10 | 953.30 | 942.30 | 736.30 | NA | 531.20 | 544.30 | NA | NA | NA | NA | NA | NA | NA | NA | NA | NA | NA | NA | NA | NA | NA | NA | NA | NA | NA | NA | NA | NA | NA | NA | NA | NA | NA | NA | NA | NA | NA | NA | NA | NA | NA | NA | NA | NA | NA | NA | NA | NA | NA | NA | NA | |
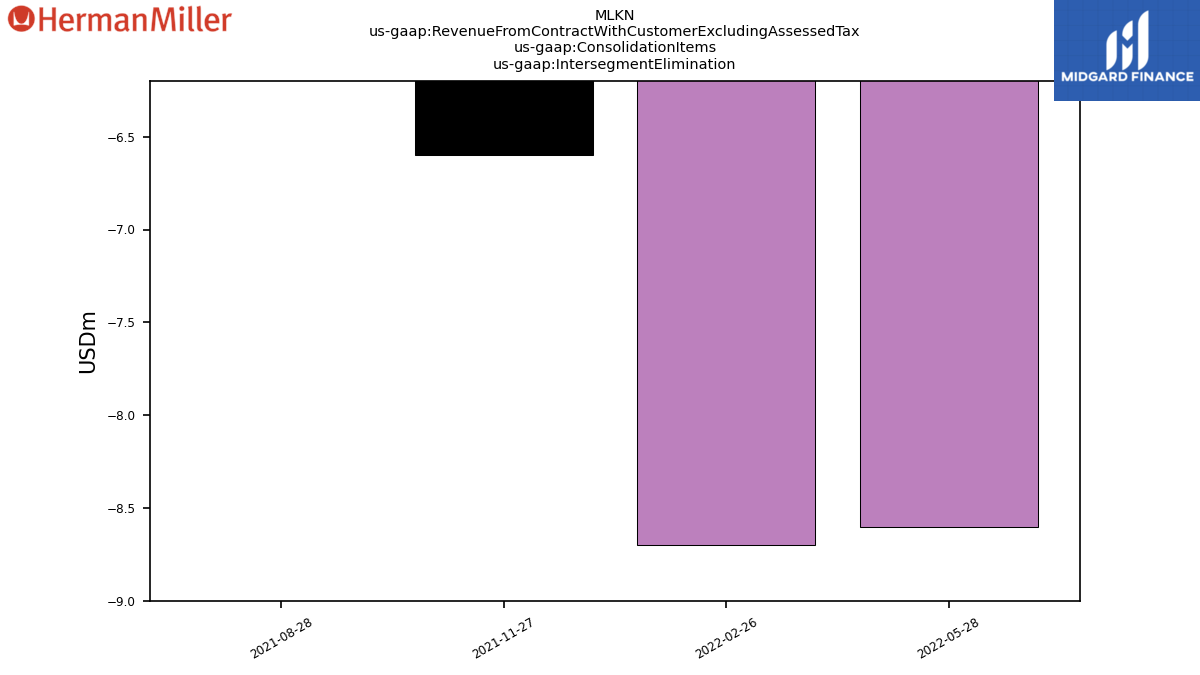
| Intersegment Elimination | NA | NA | NA | NA | NA | NA | -8.60 | -8.70 | -6.60 | -3.60 | NA | NA | NA | NA | NA | NA | NA | NA | NA | NA | NA | NA | NA | NA | NA | NA | NA | NA | NA | NA | NA | NA | NA | NA | NA | NA | NA | NA | NA | NA | NA | NA | NA | NA | NA | NA | NA | NA | NA | NA | NA | NA | NA | NA | NA | NA | NA | NA | |
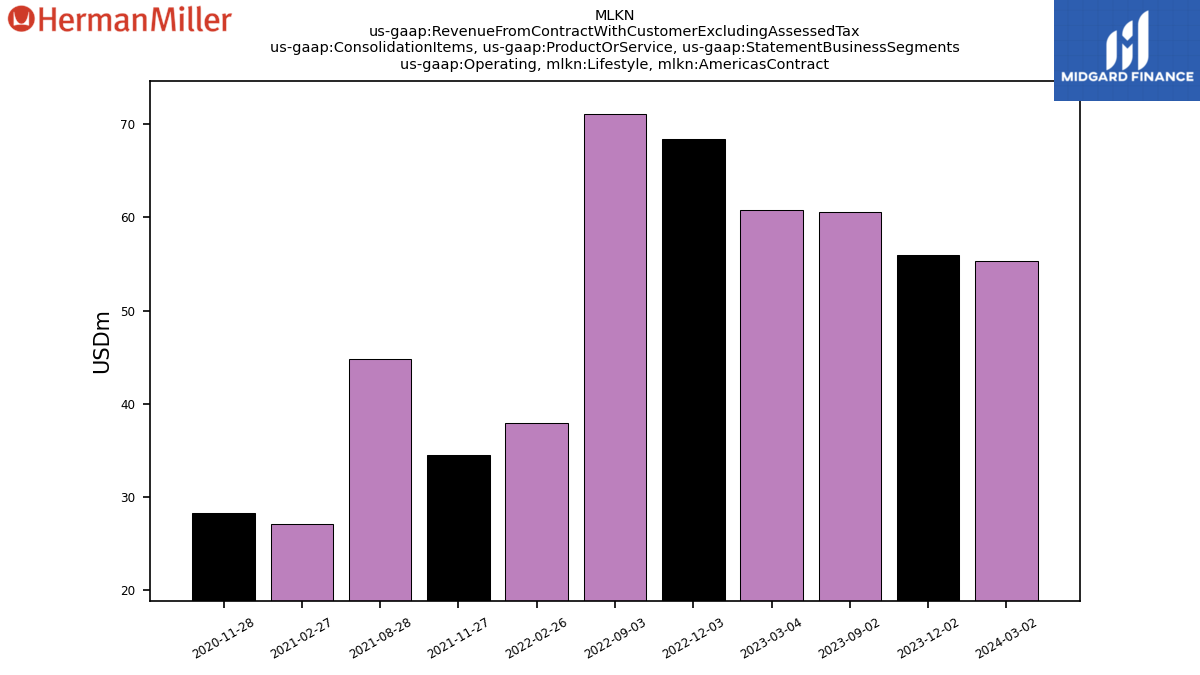
| Operating, Lifestyle, Americas Contract | 56.00 | 60.60 | NA | 60.80 | 68.40 | 71.10 | NA | 37.90 | 34.50 | 44.80 | NA | 27.10 | 28.30 | NA | NA | NA | NA | NA | NA | NA | NA | NA | NA | NA | NA | NA | NA | NA | NA | NA | NA | NA | NA | NA | NA | NA | NA | NA | NA | NA | NA | NA | NA | NA | NA | NA | NA | NA | NA | NA | NA | NA | NA | NA | NA | NA | NA | NA | |
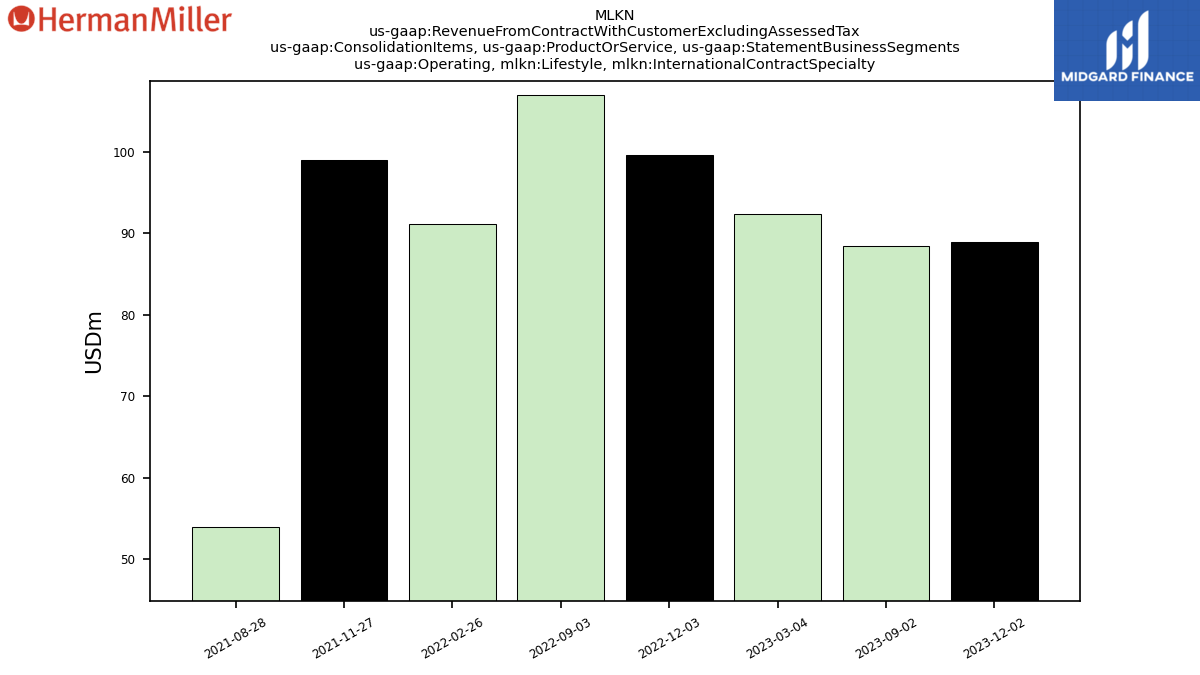
| Operating, Lifestyle, International Contract Specialty | 88.90 | 88.40 | NA | 92.40 | 99.60 | 107.00 | NA | 91.20 | 99.00 | 54.00 | NA | NA | NA | NA | NA | NA | NA | NA | NA | NA | NA | NA | NA | NA | NA | NA | NA | NA | NA | NA | NA | NA | NA | NA | NA | NA | NA | NA | NA | NA | NA | NA | NA | NA | NA | NA | NA | NA | NA | NA | NA | NA | NA | NA | NA | NA | NA | NA | |
| Operating, Lifestyle, Retail | 172.90 | 152.50 | NA | 177.20 | 198.80 | 189.80 | NA | 145.40 | 146.40 | 158.50 | NA | 123.50 | 111.10 | NA | NA | NA | NA | NA | NA | NA | NA | NA | NA | NA | NA | NA | NA | NA | NA | NA | NA | NA | NA | NA | NA | NA | NA | NA | NA | NA | NA | NA | NA | NA | NA | NA | NA | NA | NA | NA | NA | NA | NA | NA | NA | NA | NA | NA | |
| Operating, Other Products, Americas Contract | 5.00 | 2.30 | NA | 7.50 | 4.20 | 8.70 | NA | 32.70 | 33.00 | 10.20 | NA | 28.00 | 33.30 | NA | NA | NA | NA | NA | NA | NA | NA | NA | NA | NA | NA | NA | NA | NA | NA | NA | NA | NA | NA | NA | NA | NA | NA | NA | NA | NA | NA | NA | NA | NA | NA | NA | NA | NA | NA | NA | NA | NA | NA | NA | NA | NA | NA | NA | |
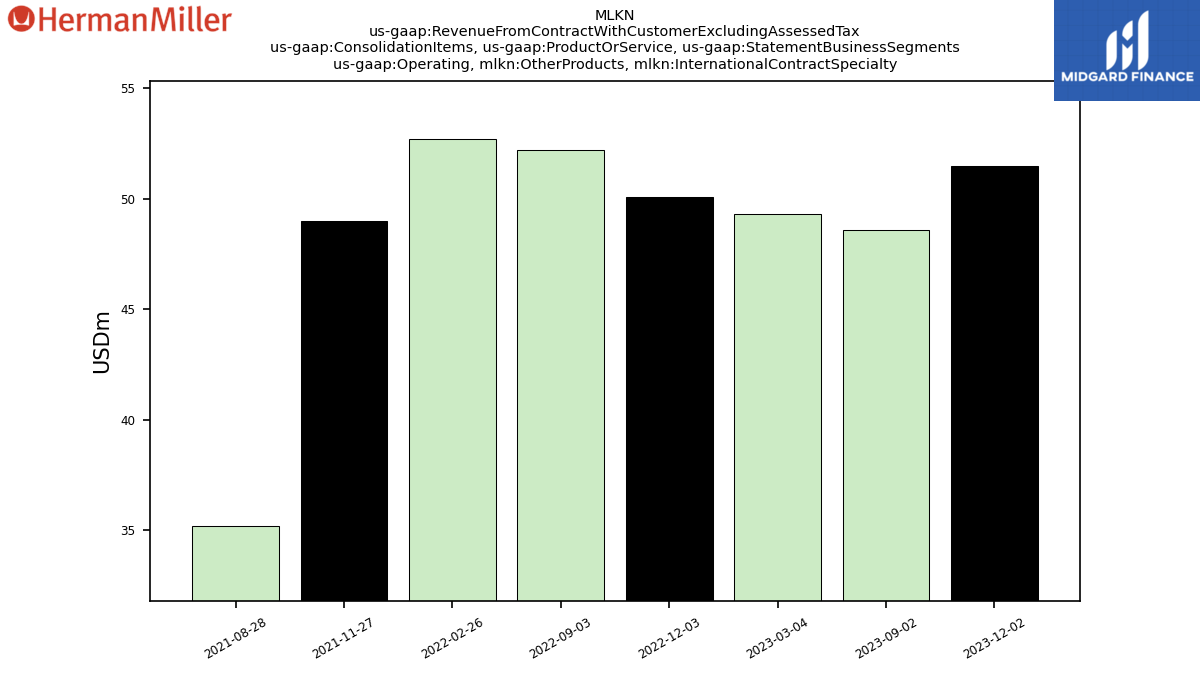
| Operating, Other Products, International Contract Specialty | 51.50 | 48.60 | NA | 49.30 | 50.10 | 52.20 | NA | 52.70 | 49.00 | 35.20 | NA | NA | NA | NA | NA | NA | NA | NA | NA | NA | NA | NA | NA | NA | NA | NA | NA | NA | NA | NA | NA | NA | NA | NA | NA | NA | NA | NA | NA | NA | NA | NA | NA | NA | NA | NA | NA | NA | NA | NA | NA | NA | NA | NA | NA | NA | NA | NA | |
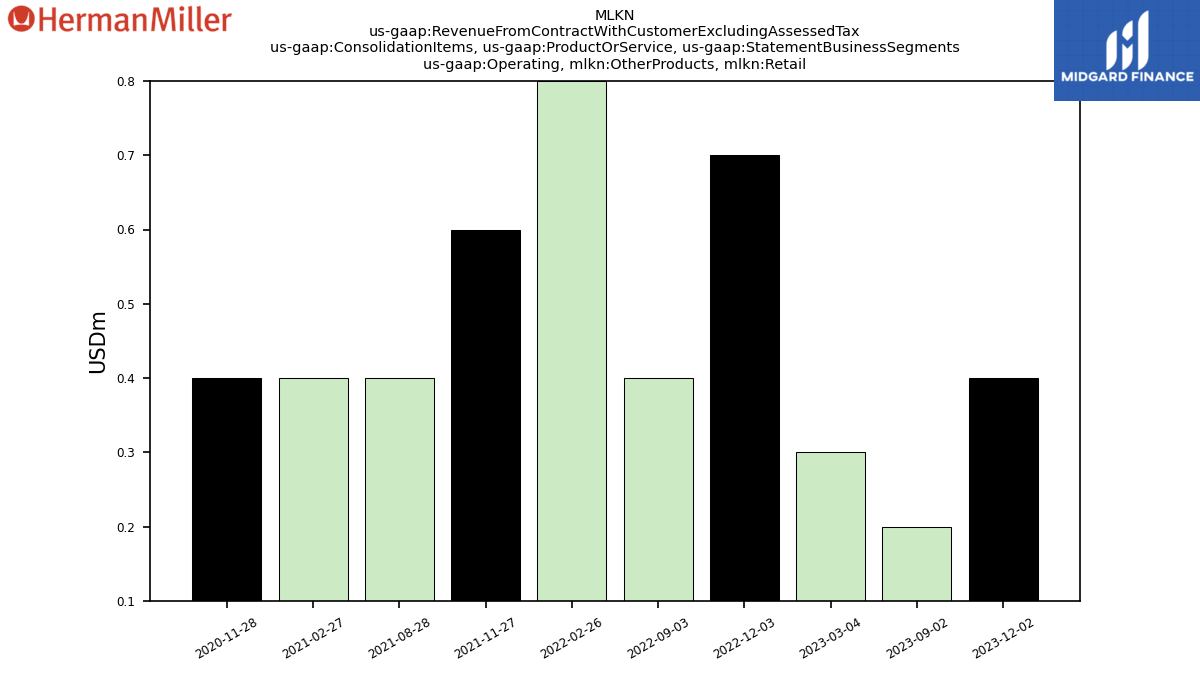
| Operating, Other Products, Retail | 0.40 | 0.20 | NA | 0.30 | 0.70 | 0.40 | NA | 0.80 | 0.60 | 0.40 | NA | 0.40 | 0.40 | NA | NA | NA | NA | NA | NA | NA | NA | NA | NA | NA | NA | NA | NA | NA | NA | NA | NA | NA | NA | NA | NA | NA | NA | NA | NA | NA | NA | NA | NA | NA | NA | NA | NA | NA | NA | NA | NA | NA | NA | NA | NA | NA | NA | NA | |
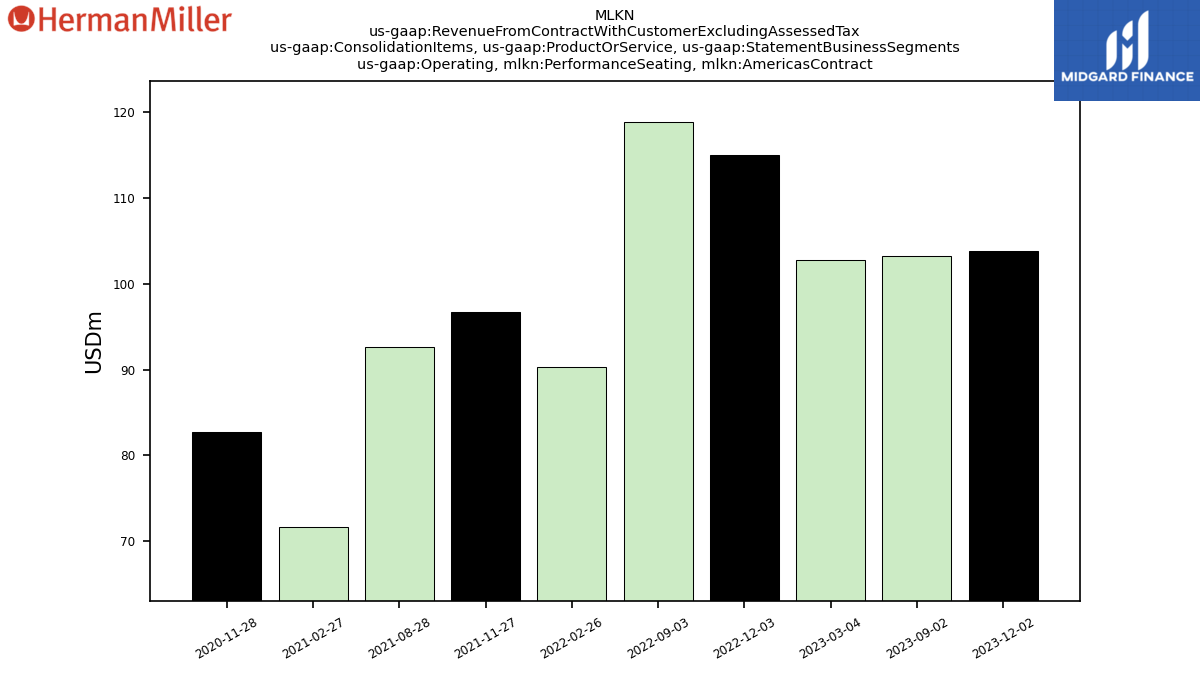
| Operating, Performance Seating, Americas Contract | 103.80 | 103.30 | NA | 102.80 | 115.00 | 118.90 | NA | 90.30 | 96.70 | 92.60 | NA | 71.70 | 82.70 | NA | NA | NA | NA | NA | NA | NA | NA | NA | NA | NA | NA | NA | NA | NA | NA | NA | NA | NA | NA | NA | NA | NA | NA | NA | NA | NA | NA | NA | NA | NA | NA | NA | NA | NA | NA | NA | NA | NA | NA | NA | NA | NA | NA | NA | |
| Operating, Performance Seating, International Contract Specialty | 64.30 | 52.60 | NA | 63.30 | 65.70 | 68.90 | NA | 62.00 | 58.50 | 49.70 | NA | NA | NA | NA | NA | NA | NA | NA | NA | NA | NA | NA | NA | NA | NA | NA | NA | NA | NA | NA | NA | NA | NA | NA | NA | NA | NA | NA | NA | NA | NA | NA | NA | NA | NA | NA | NA | NA | NA | NA | NA | NA | NA | NA | NA | NA | NA | NA | |
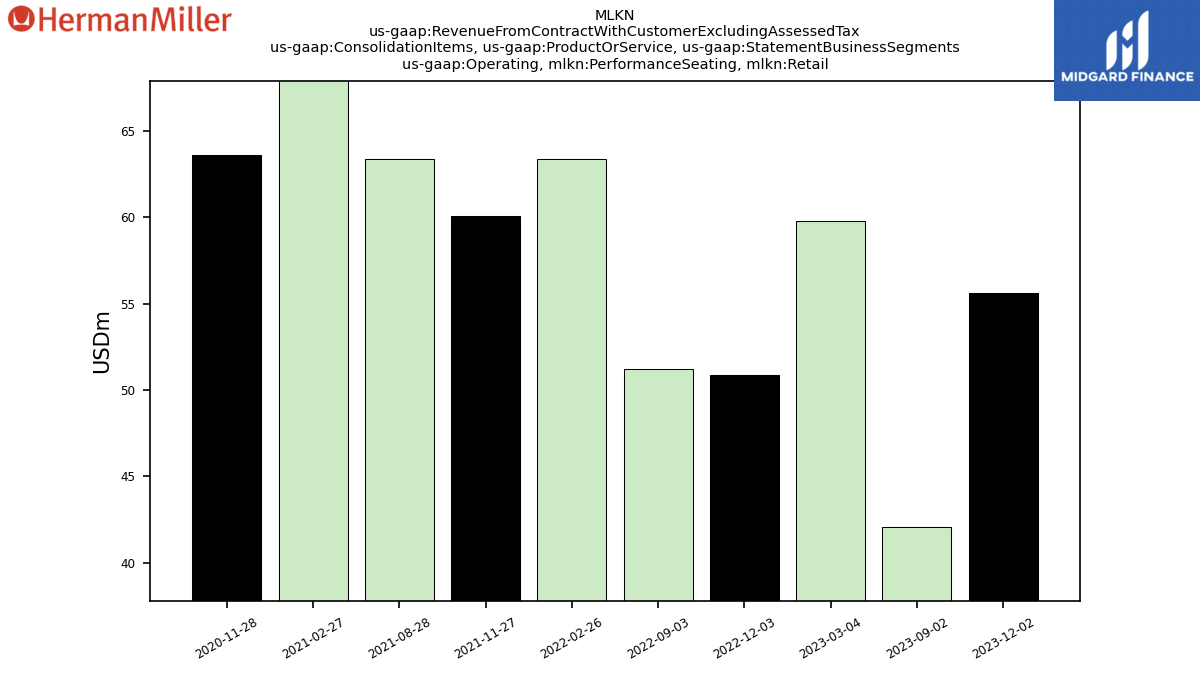
| Operating, Performance Seating, Retail | 55.60 | 42.10 | NA | 59.80 | 50.90 | 51.20 | NA | 63.40 | 60.10 | 63.40 | NA | 75.20 | 63.60 | NA | NA | NA | NA | NA | NA | NA | NA | NA | NA | NA | NA | NA | NA | NA | NA | NA | NA | NA | NA | NA | NA | NA | NA | NA | NA | NA | NA | NA | NA | NA | NA | NA | NA | NA | NA | NA | NA | NA | NA | NA | NA | NA | NA | NA | |
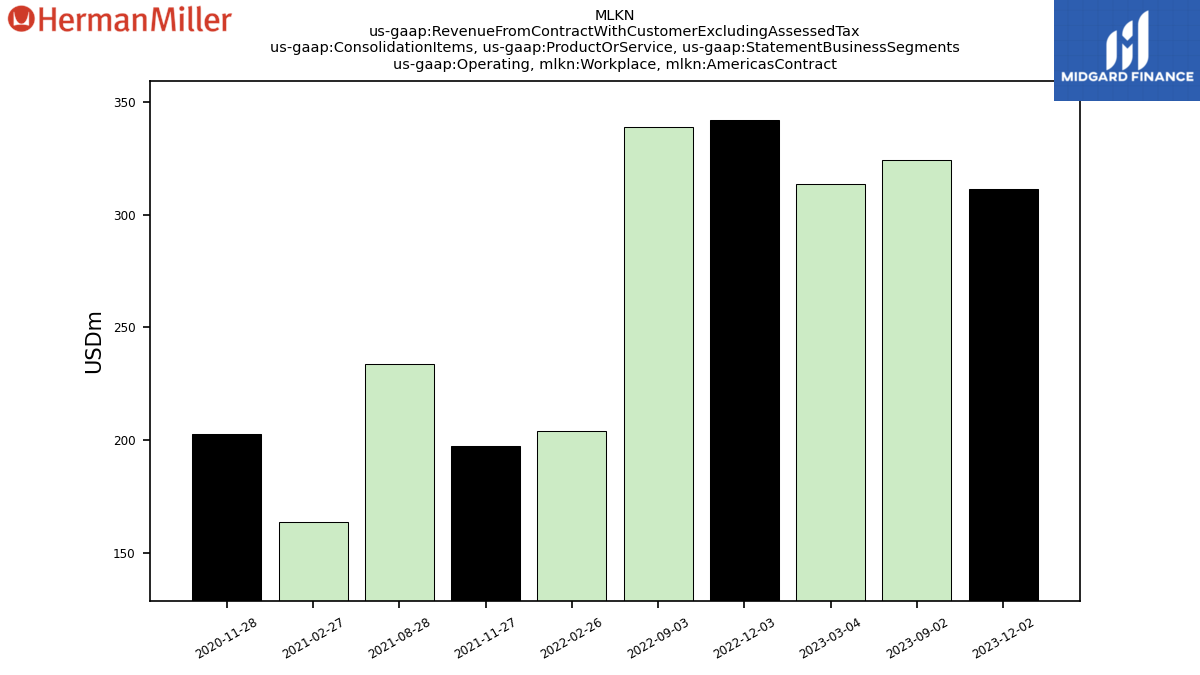
| Operating, Workplace, Americas Contract | 311.30 | 324.20 | NA | 313.50 | 342.10 | 338.70 | NA | 204.20 | 197.30 | 233.70 | NA | 163.90 | 202.90 | NA | NA | NA | NA | NA | NA | NA | NA | NA | NA | NA | NA | NA | NA | NA | NA | NA | NA | NA | NA | NA | NA | NA | NA | NA | NA | NA | NA | NA | NA | NA | NA | NA | NA | NA | NA | NA | NA | NA | NA | NA | NA | NA | NA | NA | |
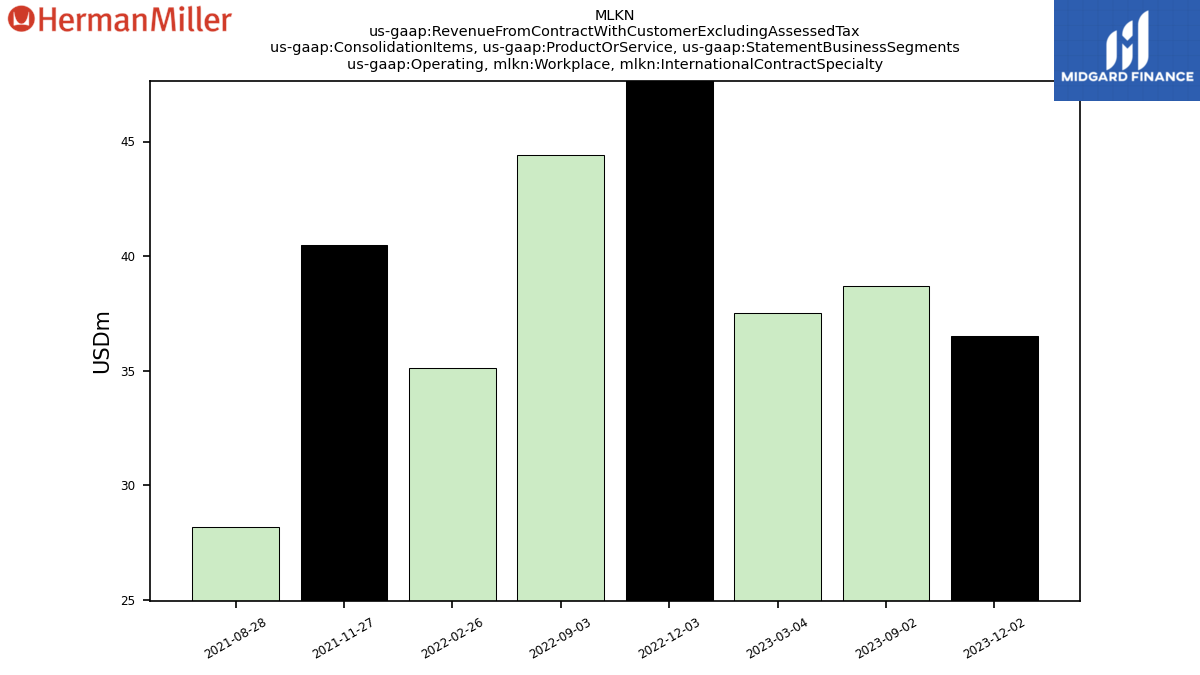
| Operating, Workplace, International Contract Specialty | 36.50 | 38.70 | NA | 37.50 | 49.50 | 44.40 | NA | 35.10 | 40.50 | 28.20 | NA | NA | NA | NA | NA | NA | NA | NA | NA | NA | NA | NA | NA | NA | NA | NA | NA | NA | NA | NA | NA | NA | NA | NA | NA | NA | NA | NA | NA | NA | NA | NA | NA | NA | NA | NA | NA | NA | NA | NA | NA | NA | NA | NA | NA | NA | NA | NA | |
| Operating, Workplace, Retail | 3.30 | 4.20 | NA | 20.30 | 21.90 | 27.50 | NA | 3.20 | 2.90 | 19.00 | NA | 2.70 | 2.50 | NA | NA | NA | NA | NA | NA | NA | NA | NA | NA | NA | NA | NA | NA | NA | NA | NA | NA | NA | NA | NA | NA | NA | NA | NA | NA | NA | NA | NA | NA | NA | NA | NA | NA | NA | NA | NA | NA | NA | NA | NA | NA | NA | NA | NA | |
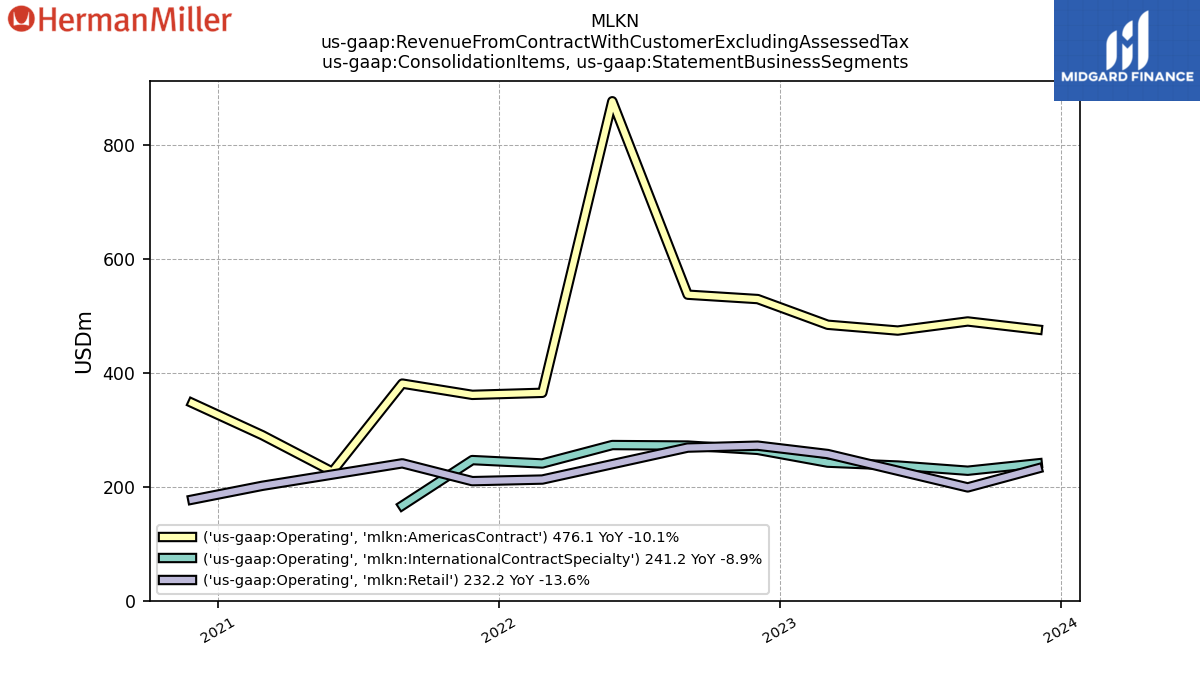
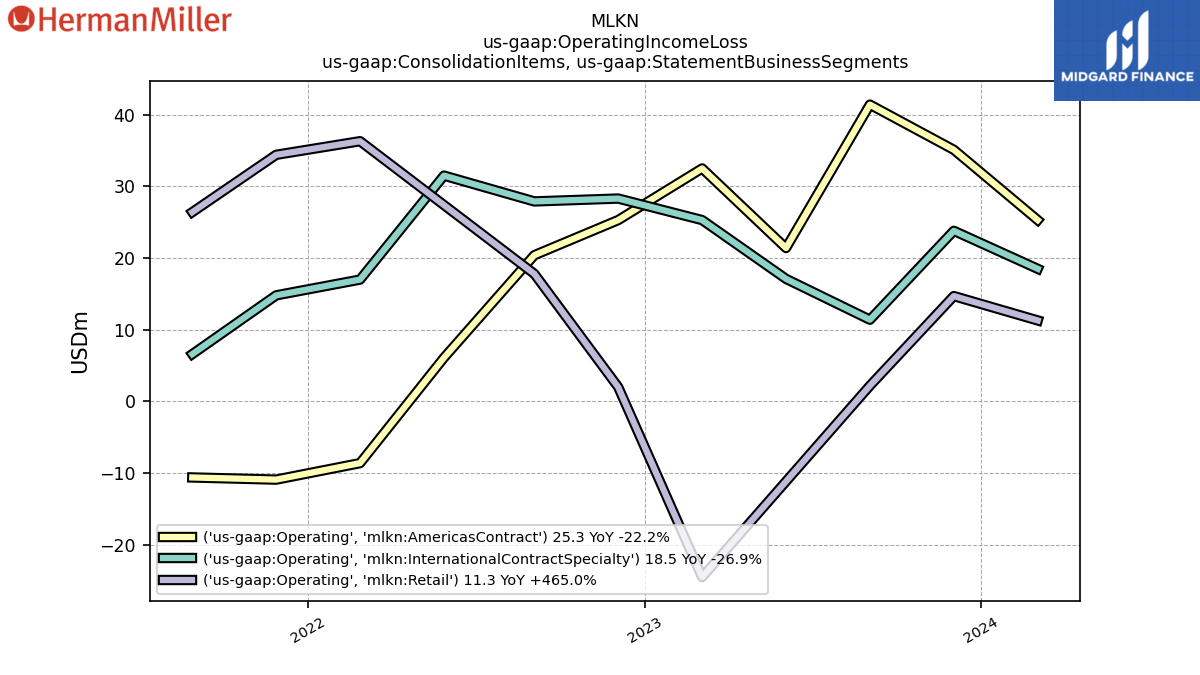
| Operating, Americas Contract | 476.10 | 490.40 | 474.40 | 484.60 | 529.70 | 537.40 | 877.10 | 365.10 | 361.50 | 381.30 | 226.60 | 290.70 | 347.20 | NA | NA | NA | NA | NA | NA | NA | NA | NA | NA | NA | NA | NA | NA | NA | NA | NA | NA | NA | NA | NA | NA | NA | NA | NA | NA | NA | NA | NA | NA | NA | NA | NA | NA | NA | NA | NA | NA | NA | NA | NA | NA | NA | NA | NA | |
| Operating, International Contract Specialty | 241.20 | 228.30 | 237.40 | 242.50 | 264.90 | 272.50 | 273.40 | 241.00 | 247.00 | 167.10 | NA | NA | NA | NA | NA | NA | NA | NA | NA | NA | NA | NA | NA | NA | NA | NA | NA | NA | NA | NA | NA | NA | NA | NA | NA | NA | NA | NA | NA | NA | NA | NA | NA | NA | NA | NA | NA | NA | NA | NA | NA | NA | NA | NA | NA | NA | NA | NA | |
| Operating, Retail | 232.20 | 199.00 | NA | 257.60 | 272.30 | 268.90 | NA | 212.80 | 210.00 | 241.30 | NA | 201.80 | 177.60 | NA | NA | NA | NA | NA | NA | NA | NA | NA | NA | NA | NA | NA | NA | NA | NA | NA | NA | NA | NA | NA | NA | NA | NA | NA | NA | NA | NA | NA | NA | NA | NA | NA | NA | NA | NA | NA | NA | NA | NA | NA | NA | NA | NA | NA | |
| Revenue From Contract With Customer Including Assessed Tax | NA | NA | NA | NA | NA | NA | 1100.50 | 1029.50 | 1026.30 | 789.70 | 621.50 | 590.50 | 626.30 | 626.80 | 475.70 | 665.70 | 674.20 | 670.90 | 671.00 | 619.00 | 652.60 | 624.60 | 618.00 | 578.40 | 604.60 | 580.30 | 577.20 | 524.90 | 577.50 | 598.60 | 582.60 | 536.50 | 580.40 | 565.40 | 550.70 | 516.40 | 565.40 | 509.70 | 487.50 | 455.90 | 470.50 | 468.10 | 460.00 | 423.50 | 441.80 | 449.70 | 420.70 | 399.80 | 445.60 | 458.10 | 441.50 | 414.80 | 412.20 | 380.70 | 321.50 | 329.60 | 343.70 | 324.00 |


