

| 2023-06-30 | 2023-03-31 | 2022-12-31 | 2022-09-30 | 2022-06-30 | 2022-03-31 | 2021-12-31 | 2021-09-30 | 2021-06-30 | 2021-03-31 | 2020-12-31 | 2020-09-30 | 2020-06-30 | 2020-03-31 | 2019-12-31 | 2019-09-30 | 2019-06-30 | 2019-03-31 | 2018-12-31 | 2018-09-30 | 2018-06-30 | 2018-03-31 | 2017-12-31 | 2017-09-30 | 2017-06-30 | 2017-03-31 | 2016-12-31 | 2016-09-30 | 2016-06-30 | 2016-03-31 | 2015-12-31 | 2015-09-30 | 2015-06-30 | 2015-03-31 | 2014-12-31 | 2014-09-30 | 2014-06-30 | 2014-03-31 | 2013-12-31 | 2013-09-30 | 2013-06-30 | 2013-03-31 | 2012-12-31 | 2012-09-30 | 2012-06-30 | 2012-03-31 | 2011-12-31 | 2011-09-30 | 2011-06-30 | 2011-03-31 | 2010-12-31 | 2010-09-30 | 2010-06-30 | 2010-03-31 | ||
|---|---|---|---|---|---|---|---|---|---|---|---|---|---|---|---|---|---|---|---|---|---|---|---|---|---|---|---|---|---|---|---|---|---|---|---|---|---|---|---|---|---|---|---|---|---|---|---|---|---|---|---|---|---|---|---|
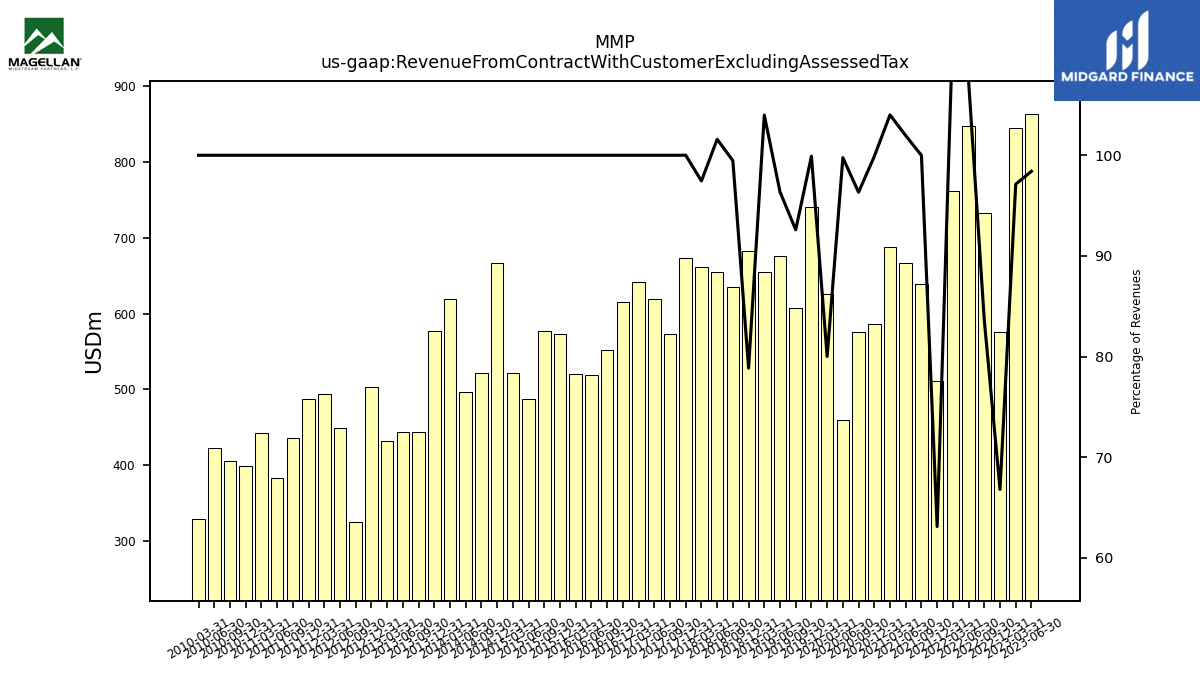
| Revenue From Contract With Customer Excluding Assessed Tax | 863.20 | 844.70 | 575.10 | 732.40 | 847.10 | 761.10 | 510.76 | 638.95 | 666.41 | 687.57 | 585.66 | 576.25 | 459.28 | 626.28 | 740.00 | 607.96 | 676.19 | 654.07 | 682.55 | 634.58 | 654.33 | 661.44 | 673.30 | 572.85 | 619.44 | 642.07 | 614.91 | 551.78 | 518.90 | 519.82 | 573.05 | 577.23 | 487.54 | 522.09 | 667.07 | 521.60 | 496.45 | 618.61 | 577.44 | 443.83 | 443.91 | 432.42 | 503.19 | 325.87 | 449.53 | 493.48 | 486.93 | 435.51 | 383.33 | 442.90 | 398.49 | 406.20 | 423.06 | 329.69 | |
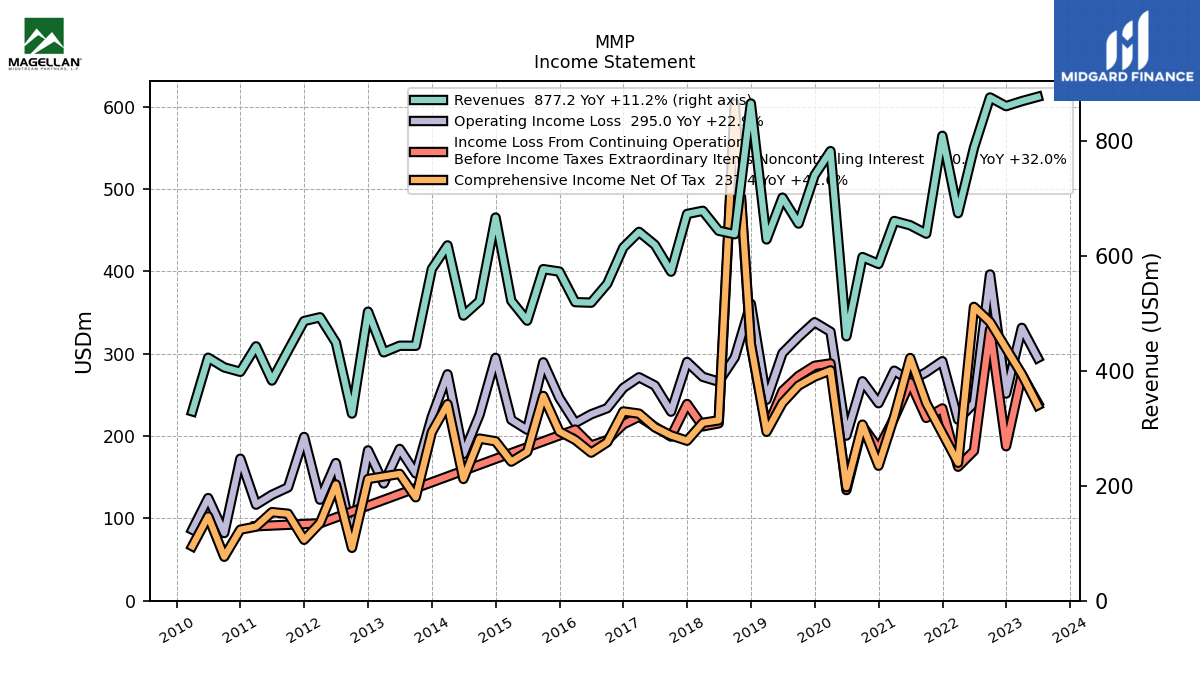
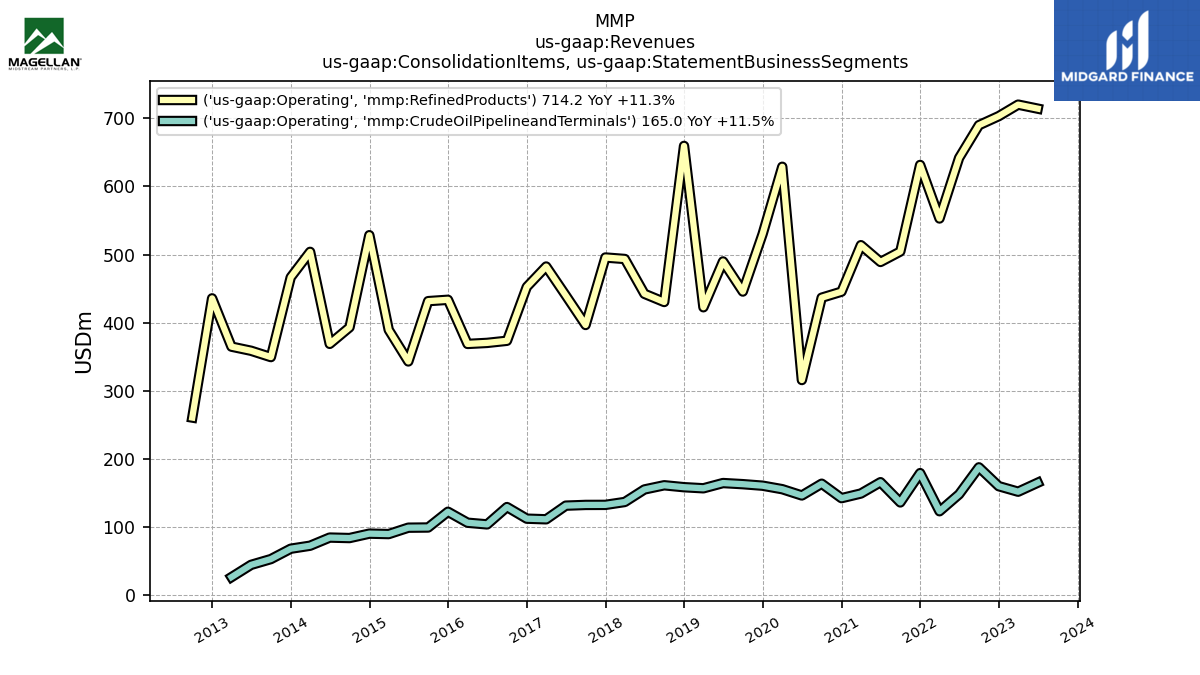
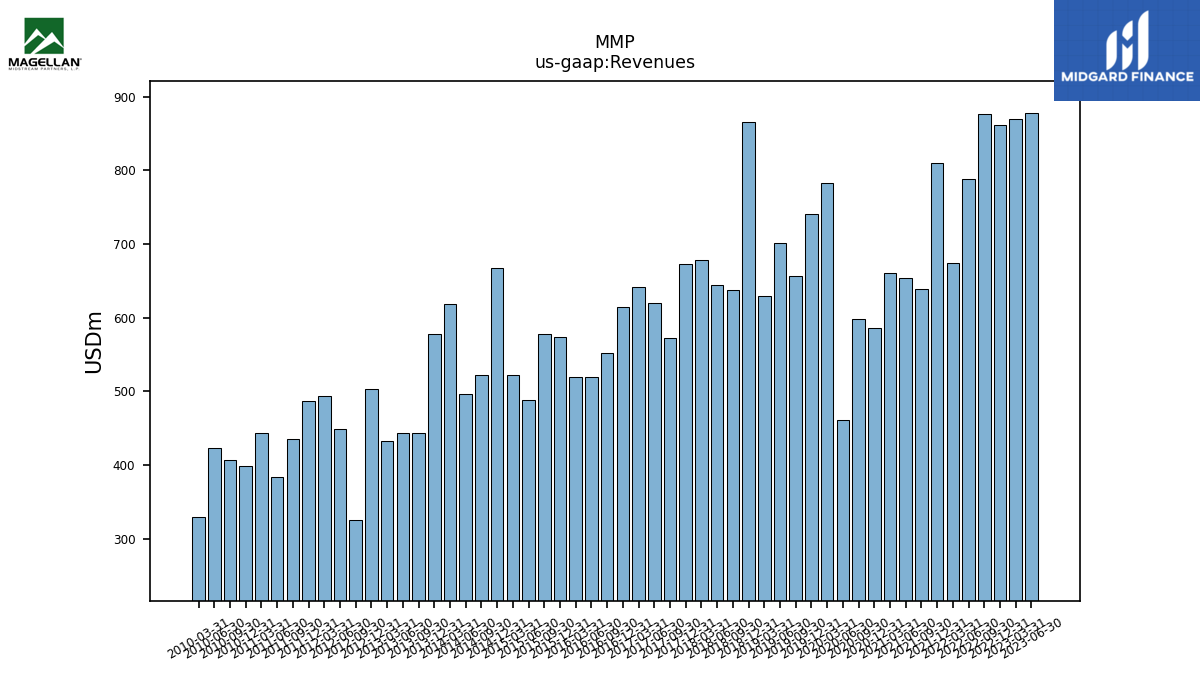
| Revenues | 877.20 | 869.70 | 861.00 | 876.10 | 788.60 | 674.70 | 809.33 | 639.05 | 653.64 | 661.07 | 586.32 | 598.26 | 460.41 | 782.81 | 740.68 | 656.60 | 701.70 | 628.93 | 865.68 | 638.02 | 644.09 | 678.78 | 673.30 | 572.85 | 619.44 | 642.07 | 614.91 | 551.78 | 518.90 | 519.82 | 573.05 | 577.23 | 487.54 | 522.09 | 667.07 | 521.60 | 496.45 | 618.61 | 577.44 | 443.83 | 443.91 | 432.42 | 503.19 | 325.87 | 449.53 | 493.48 | 486.93 | 435.51 | 383.33 | 442.90 | 398.49 | 406.20 | 423.06 | 329.69 | |
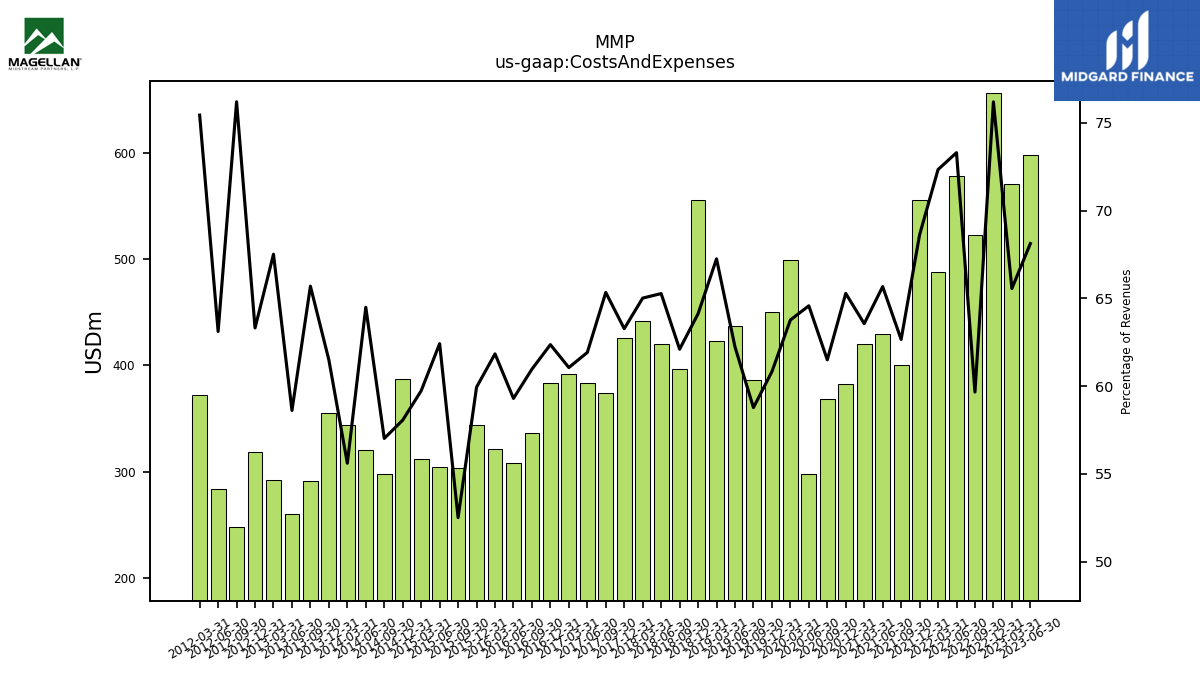
| Costs And Expenses | 597.60 | 570.20 | 656.10 | 522.70 | 578.10 | 488.10 | 555.40 | 400.44 | 429.26 | 420.18 | 382.78 | 367.94 | 297.32 | 499.19 | 450.51 | 385.93 | 436.72 | 422.99 | 555.11 | 396.24 | 420.43 | 441.32 | 426.04 | 374.30 | 383.56 | 392.05 | 383.49 | 336.41 | 307.71 | 321.45 | 343.50 | 303.08 | 304.32 | 311.87 | 387.31 | 297.41 | 320.18 | 343.98 | 355.08 | 291.59 | 260.19 | 291.97 | 318.60 | 248.33 | 283.72 | 372.32 | NA | NA | NA | NA | NA | NA | NA | NA | |
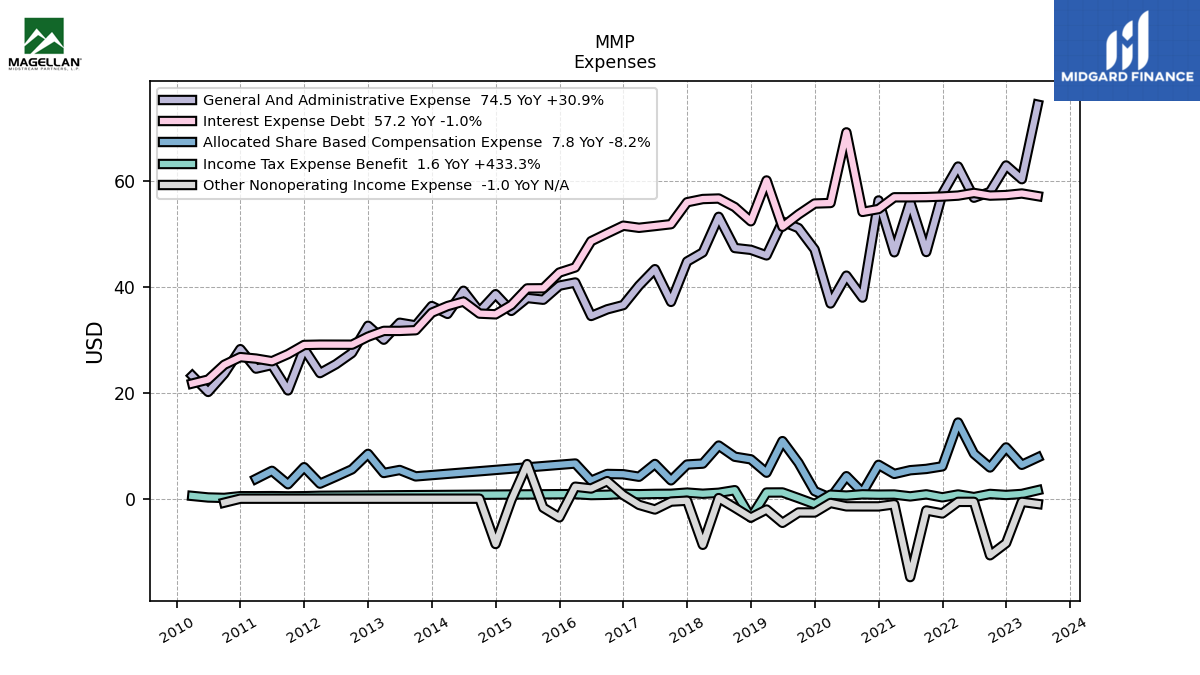
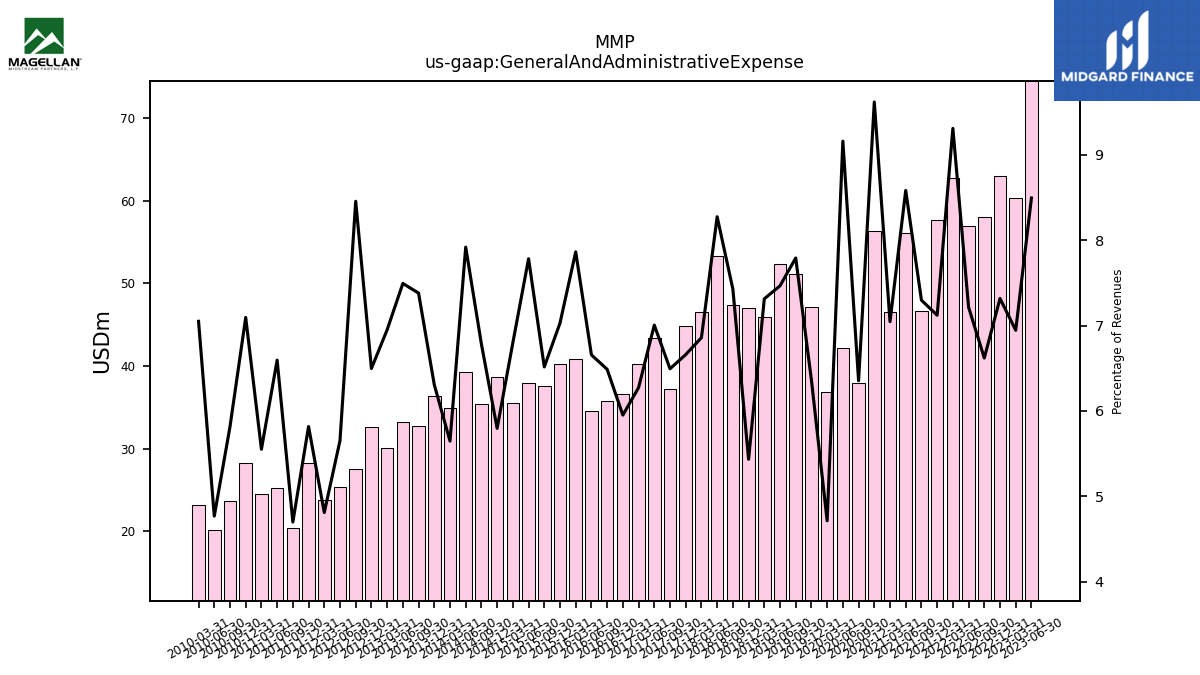
| General And Administrative Expense | 74.50 | 60.40 | 63.00 | 58.00 | 56.90 | 62.80 | 57.63 | 46.63 | 56.09 | 46.58 | 56.39 | 38.02 | 42.17 | 36.91 | 47.12 | 51.16 | 52.38 | 45.99 | 47.05 | 47.39 | 53.29 | 46.56 | 44.84 | 37.20 | 43.39 | 40.28 | 36.60 | 35.80 | 34.54 | 40.87 | 40.28 | 37.61 | 37.94 | 35.50 | 38.67 | 35.38 | 39.31 | 34.94 | 36.42 | 32.76 | 33.26 | 30.06 | 32.69 | 27.55 | 25.41 | 23.74 | 28.33 | 20.47 | 25.28 | 24.59 | 28.27 | 23.62 | 20.18 | 23.24 | |
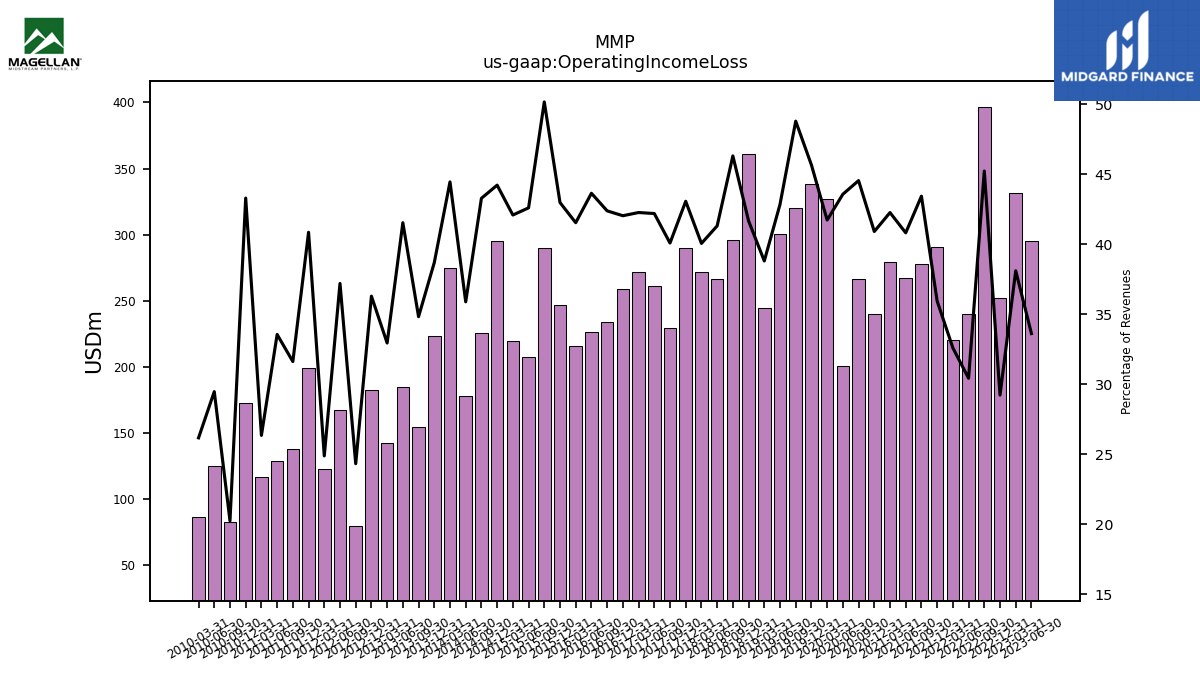
| Operating Income Loss | 295.00 | 331.50 | 251.70 | 396.40 | 240.00 | 220.00 | 290.99 | 277.67 | 266.88 | 279.48 | 239.95 | 266.60 | 200.69 | 326.77 | 338.34 | 320.48 | 300.74 | 244.15 | 360.85 | 295.57 | 266.17 | 271.99 | 290.08 | 229.70 | 261.46 | 271.47 | 258.58 | 233.95 | 226.53 | 216.00 | 246.38 | 289.67 | 207.76 | 219.81 | 295.09 | 225.84 | 178.22 | 275.09 | 223.47 | 154.62 | 184.46 | 142.50 | 182.68 | 79.28 | 167.28 | 122.81 | 199.00 | 137.75 | 128.67 | 116.72 | 172.60 | 82.25 | 124.72 | 86.31 | |
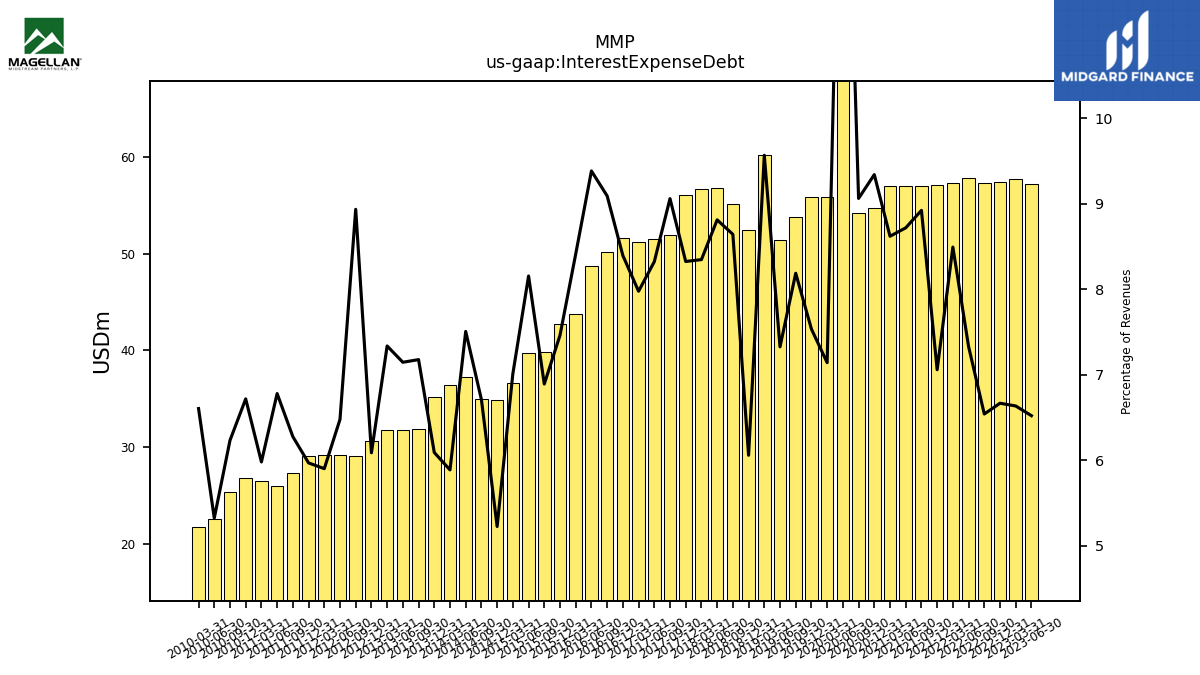
| Interest Expense Debt | 57.20 | 57.70 | 57.40 | 57.30 | 57.80 | 57.30 | 57.12 | 57.02 | 56.98 | 56.98 | 54.76 | 54.21 | 69.26 | 55.90 | 55.80 | 53.75 | 51.41 | 60.17 | 52.44 | 55.13 | 56.75 | 56.65 | 56.05 | 51.90 | 51.55 | 51.21 | 51.61 | 50.16 | 48.69 | 43.72 | 42.75 | 39.78 | 39.76 | 36.61 | 34.85 | 34.99 | 37.27 | 36.42 | 35.17 | 31.85 | 31.72 | 31.72 | 30.63 | 29.11 | 29.12 | 29.12 | 29.06 | 27.33 | 25.99 | 26.49 | 26.77 | 25.32 | 22.52 | 21.77 | |
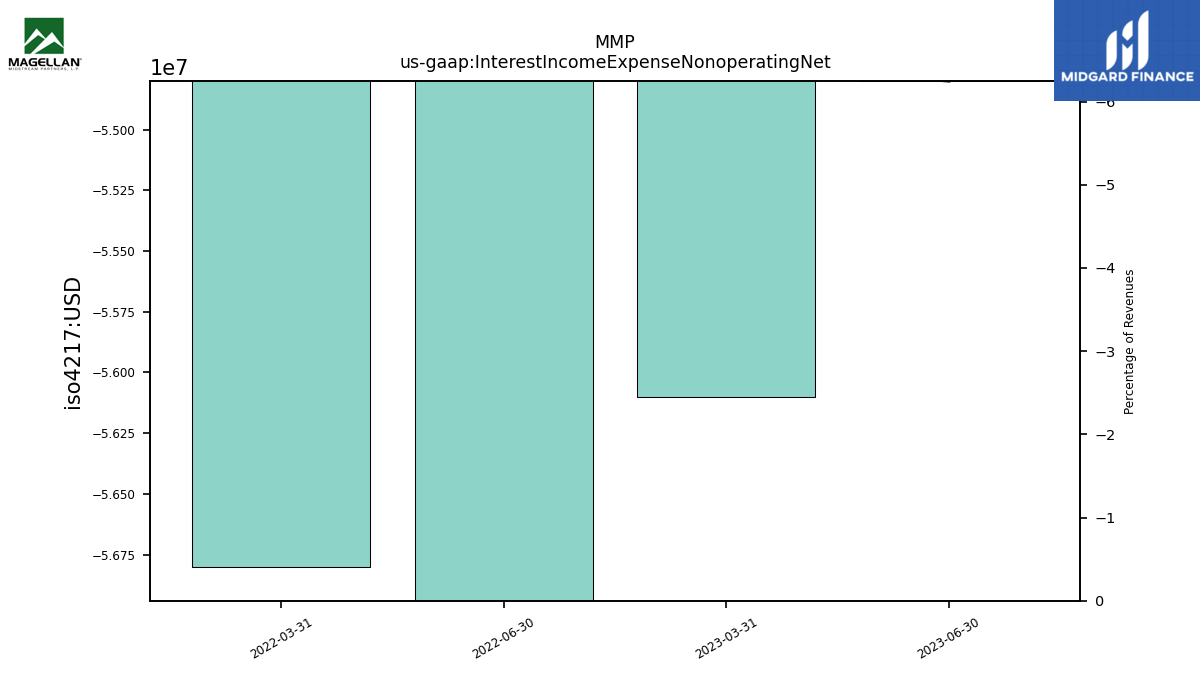
| Interest Income Expense Nonoperating Net | -54.80 | -56.10 | NA | NA | -57.30 | -56.80 | NA | NA | NA | NA | NA | NA | NA | NA | NA | NA | NA | NA | NA | NA | NA | NA | NA | NA | NA | NA | NA | NA | NA | NA | NA | NA | NA | NA | NA | NA | NA | NA | NA | NA | NA | NA | NA | NA | NA | NA | NA | NA | NA | NA | NA | NA | NA | NA | |
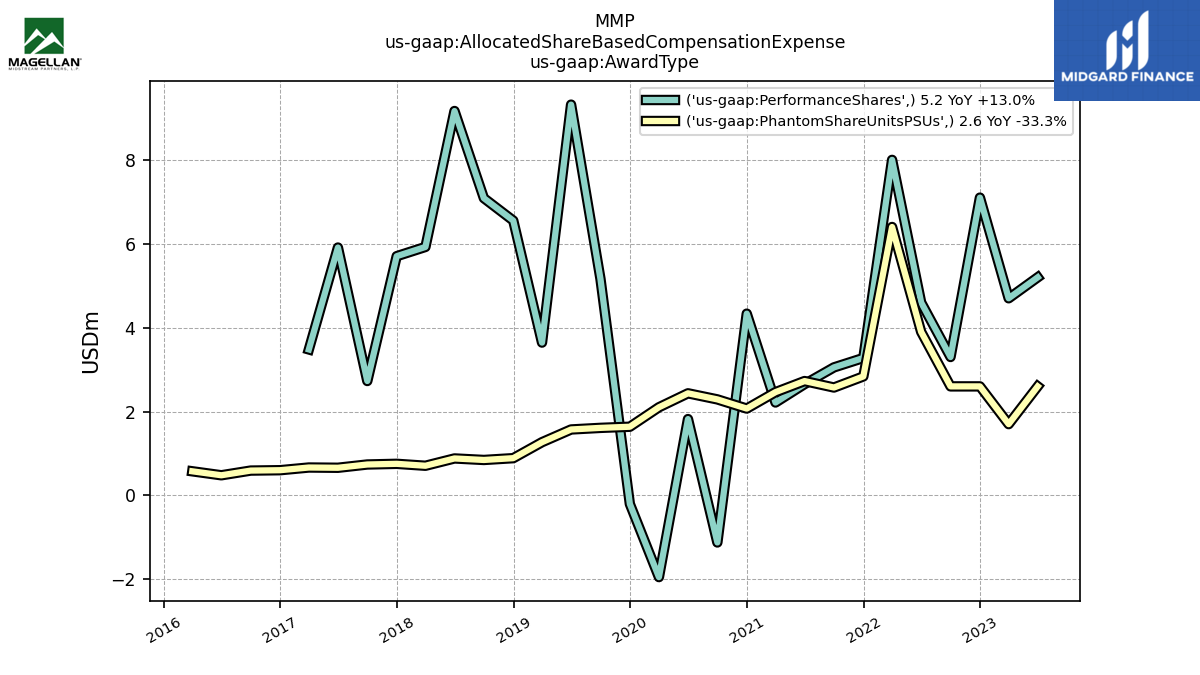
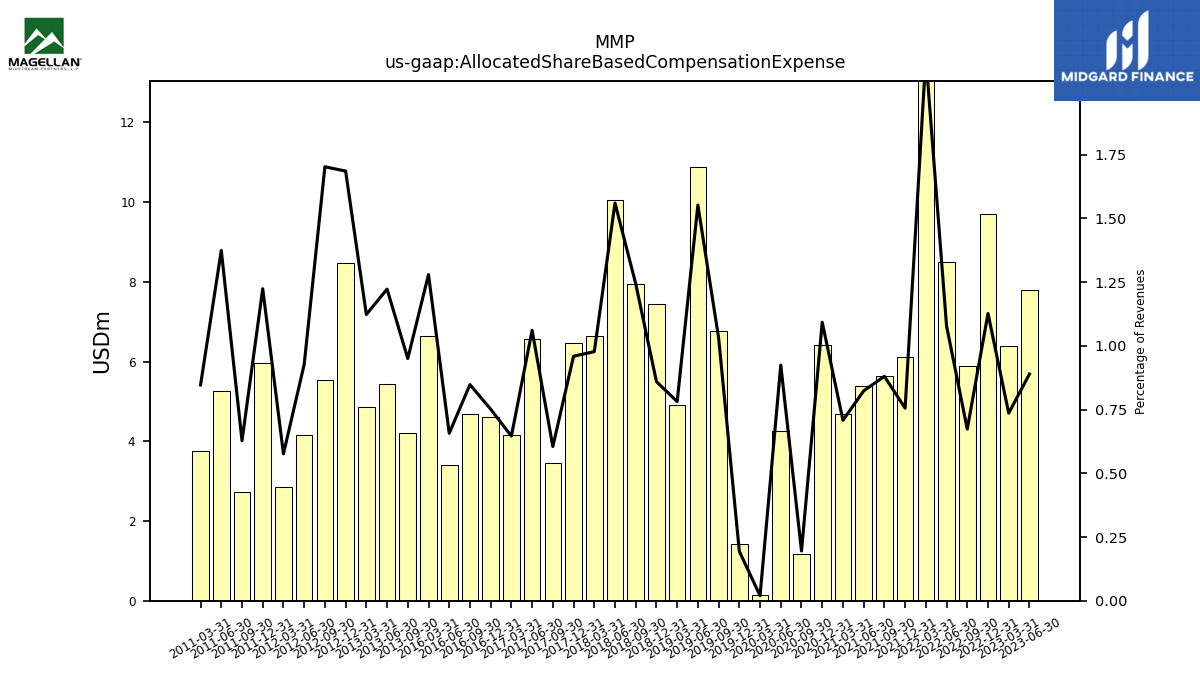
| Allocated Share Based Compensation Expense | 7.80 | 6.40 | 9.70 | 5.90 | 8.50 | 14.40 | 6.11 | 5.63 | 5.38 | 4.68 | 6.41 | 1.17 | 4.26 | 0.15 | 1.44 | 6.77 | 10.89 | 4.91 | 7.44 | 7.93 | 10.05 | 6.63 | 6.46 | 3.47 | 6.57 | 4.15 | 4.62 | 4.68 | 3.41 | 6.65 | NA | NA | NA | NA | NA | NA | NA | NA | NA | 4.22 | 5.43 | 4.86 | 8.48 | 5.55 | 4.17 | 2.84 | 5.96 | 2.73 | 5.27 | 3.75 | NA | NA | NA | NA | |
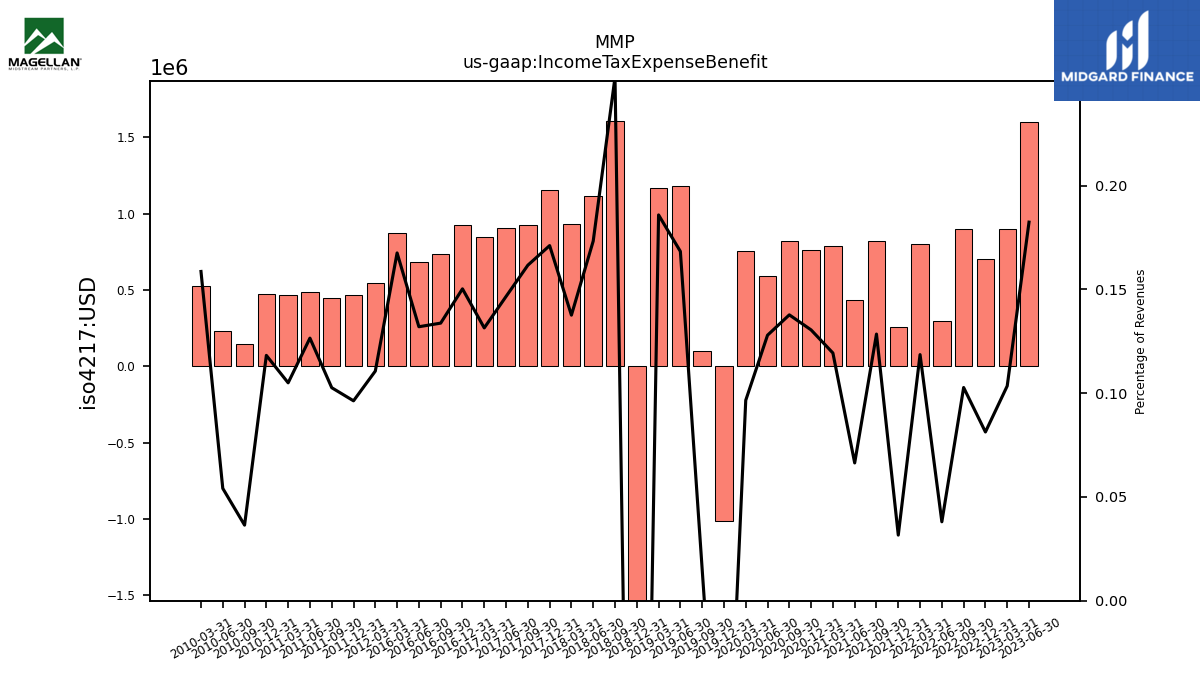
| Income Tax Expense Benefit | 1.60 | 0.90 | 0.70 | 0.90 | 0.30 | 0.80 | 0.26 | 0.82 | 0.43 | 0.79 | 0.77 | 0.82 | 0.59 | 0.76 | -1.01 | 0.10 | 1.18 | 1.17 | -3.59 | 1.61 | 1.12 | 0.93 | 1.15 | 0.93 | 0.91 | 0.84 | 0.92 | 0.74 | 0.69 | 0.87 | NA | NA | NA | NA | NA | NA | NA | NA | NA | NA | NA | NA | NA | NA | NA | 0.55 | 0.47 | 0.45 | 0.48 | 0.47 | 0.47 | 0.15 | 0.23 | 0.52 | |
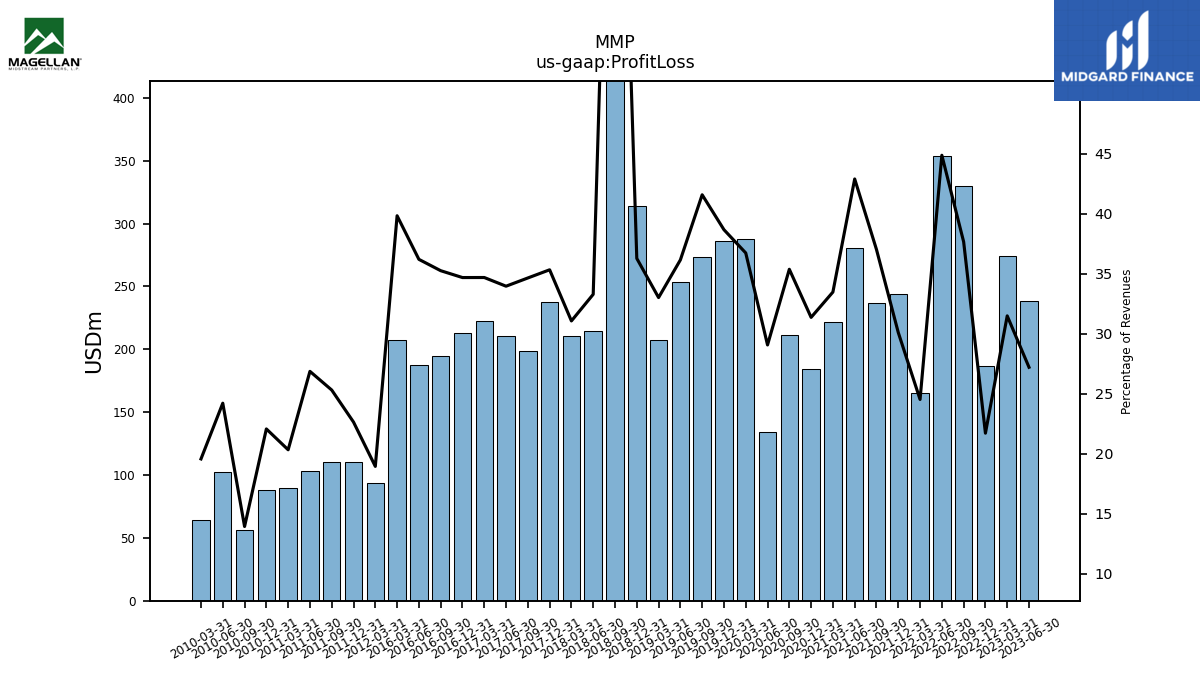
| Profit Loss | 238.70 | 273.90 | 187.00 | 330.00 | 353.90 | 165.50 | 243.67 | 236.60 | 280.42 | 221.32 | 183.92 | 211.64 | 133.84 | 287.56 | 286.44 | 273.04 | 253.70 | 207.66 | 314.07 | 594.53 | 214.41 | 210.91 | 237.90 | 198.50 | 210.40 | 222.74 | 213.29 | 194.55 | 187.86 | 207.07 | NA | NA | NA | NA | NA | NA | NA | NA | NA | NA | NA | NA | NA | NA | NA | 93.52 | 110.26 | 110.24 | 103.00 | 90.06 | 87.96 | 56.64 | 102.45 | 64.53 | |
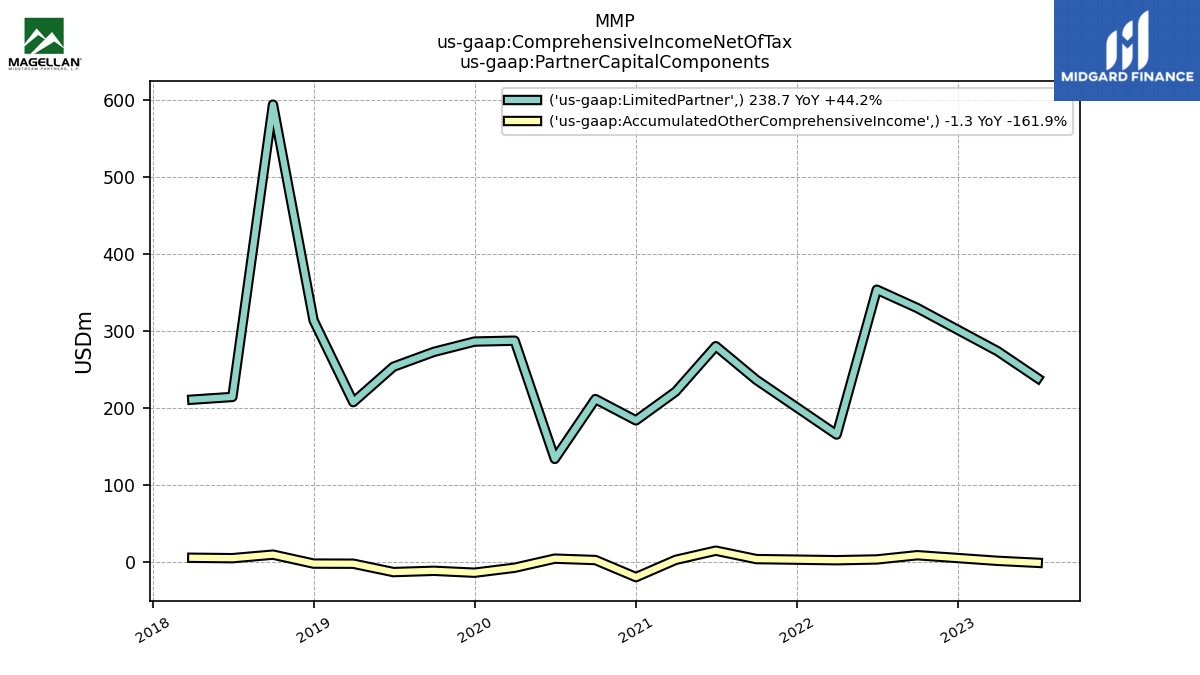
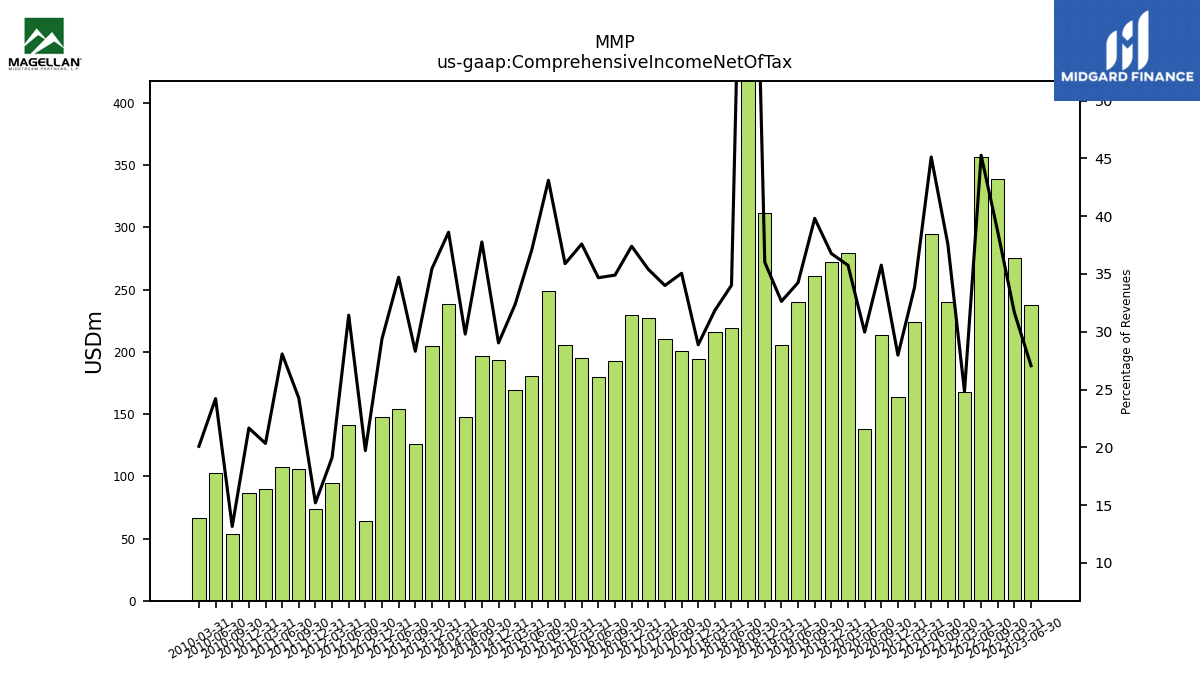
| Comprehensive Income Net Of Tax | 237.40 | 275.20 | NA | 338.60 | 357.00 | 167.60 | NA | 240.17 | 294.92 | 223.85 | 164.03 | 213.96 | 137.99 | 279.87 | 272.31 | 261.36 | 240.37 | 205.22 | 311.78 | 603.89 | 219.16 | 216.19 | 194.42 | 200.82 | 210.63 | 227.32 | 229.96 | 192.57 | 179.93 | 195.41 | 205.67 | 248.82 | 180.81 | 169.01 | 193.70 | 197.00 | 147.94 | 238.84 | 204.77 | 125.67 | 154.10 | NA | 147.89 | 64.28 | 141.31 | 94.33 | 74.02 | 105.69 | 107.65 | 90.10 | 86.35 | 53.44 | 102.44 | 66.25 |
| 2023-06-30 | 2023-03-31 | 2022-12-31 | 2022-09-30 | 2022-06-30 | 2022-03-31 | 2021-12-31 | 2021-09-30 | 2021-06-30 | 2021-03-31 | 2020-12-31 | 2020-09-30 | 2020-06-30 | 2020-03-31 | 2019-12-31 | 2019-09-30 | 2019-06-30 | 2019-03-31 | 2018-12-31 | 2018-09-30 | 2018-06-30 | 2018-03-31 | 2017-12-31 | 2017-09-30 | 2017-06-30 | 2017-03-31 | 2016-12-31 | 2016-09-30 | 2016-06-30 | 2016-03-31 | 2015-12-31 | 2015-09-30 | 2015-06-30 | 2015-03-31 | 2014-12-31 | 2014-09-30 | 2014-06-30 | 2014-03-31 | 2013-12-31 | 2013-09-30 | 2013-06-30 | 2013-03-31 | 2012-12-31 | 2012-09-30 | 2012-06-30 | 2012-03-31 | 2011-12-31 | 2011-09-30 | 2011-06-30 | 2011-03-31 | 2010-12-31 | 2010-09-30 | 2010-06-30 | 2010-03-31 | ||
|---|---|---|---|---|---|---|---|---|---|---|---|---|---|---|---|---|---|---|---|---|---|---|---|---|---|---|---|---|---|---|---|---|---|---|---|---|---|---|---|---|---|---|---|---|---|---|---|---|---|---|---|---|---|---|---|
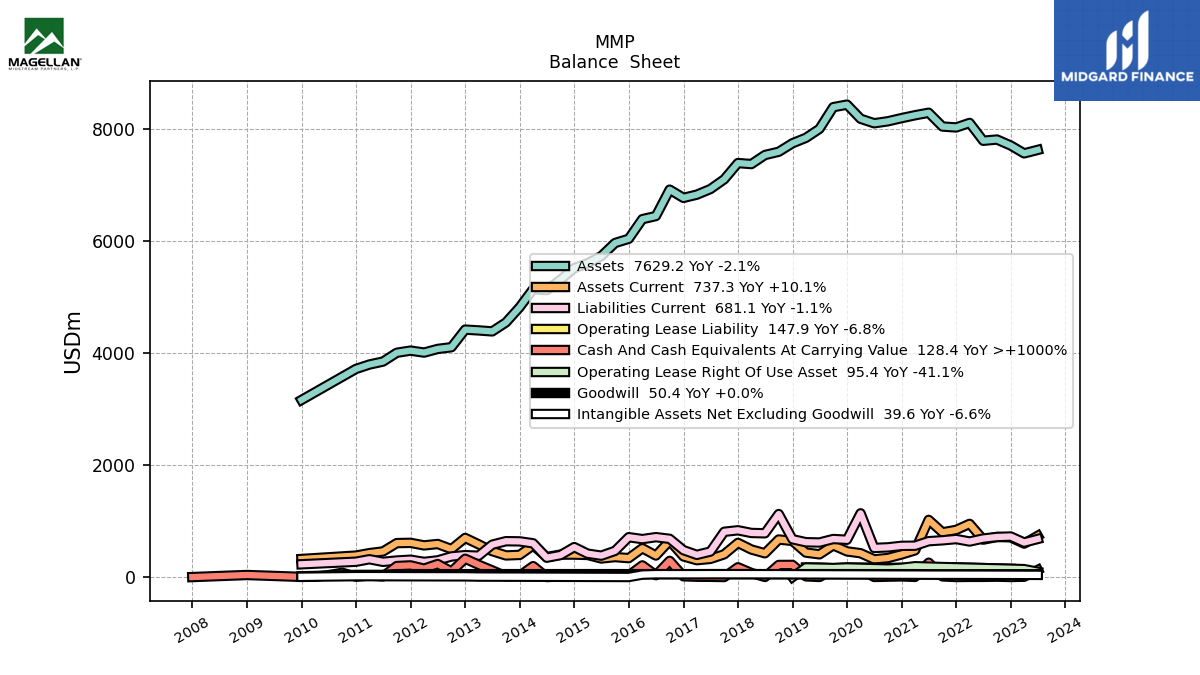
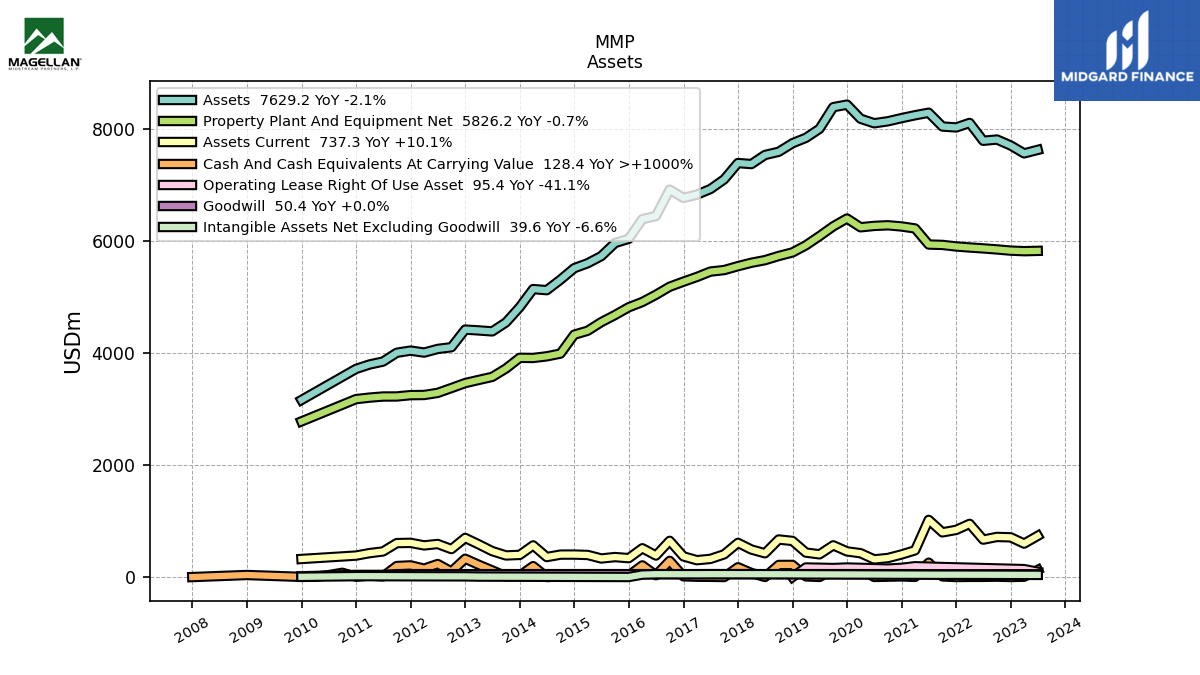
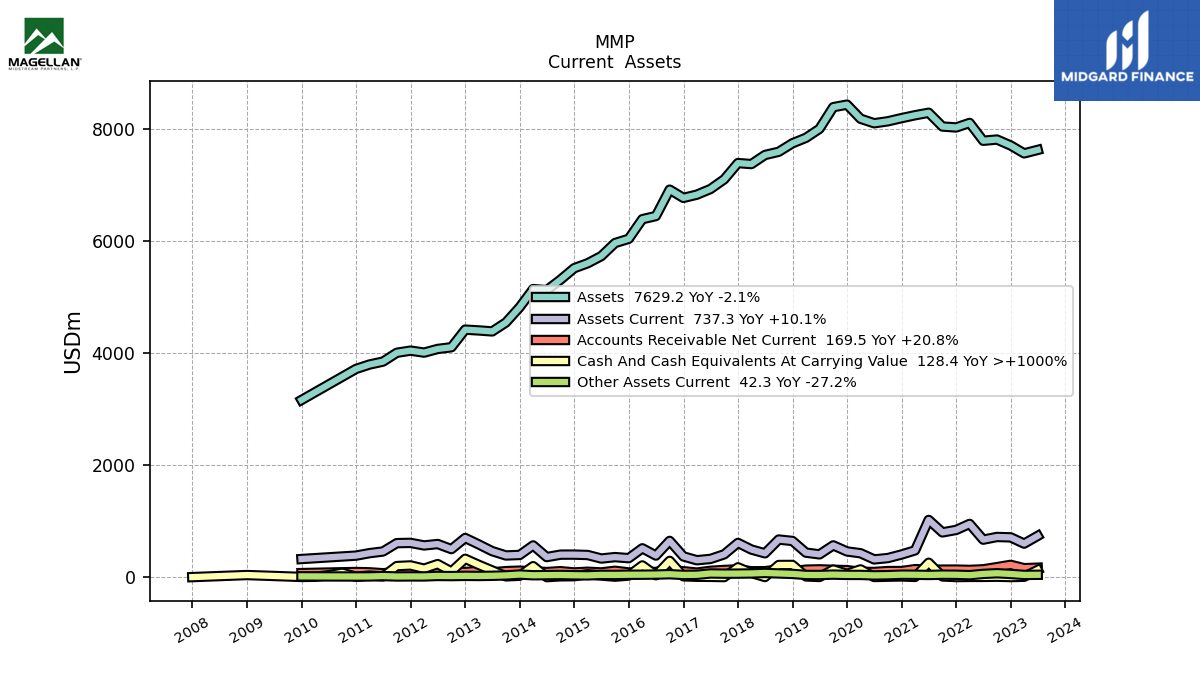
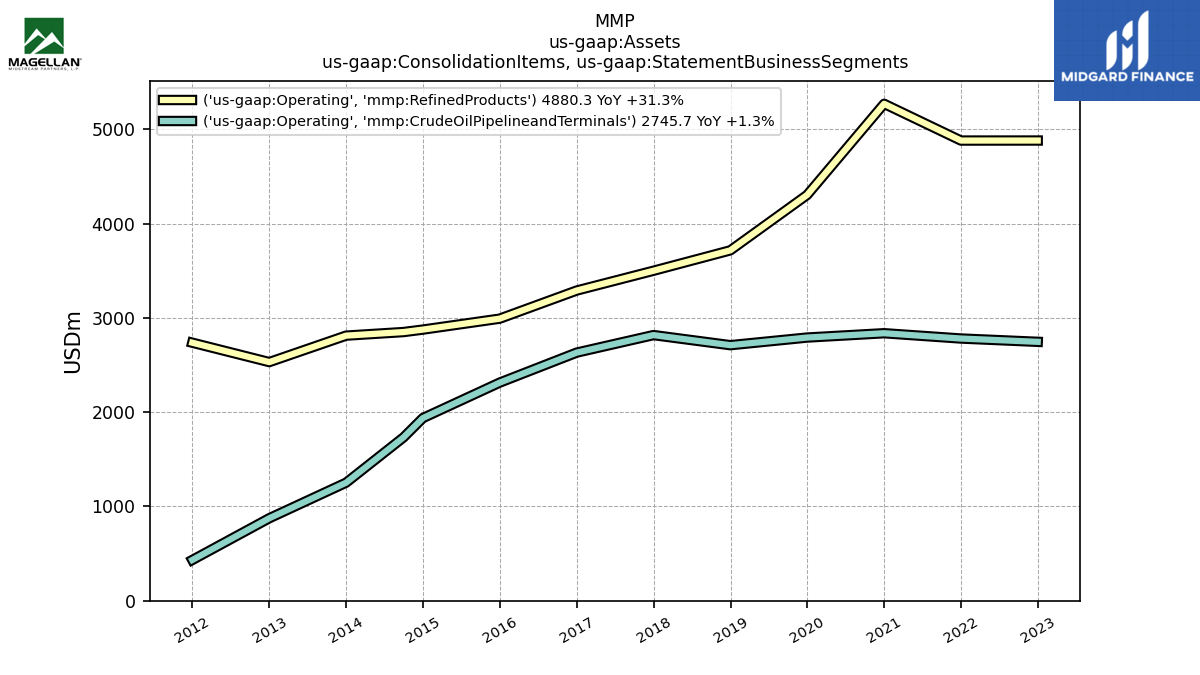
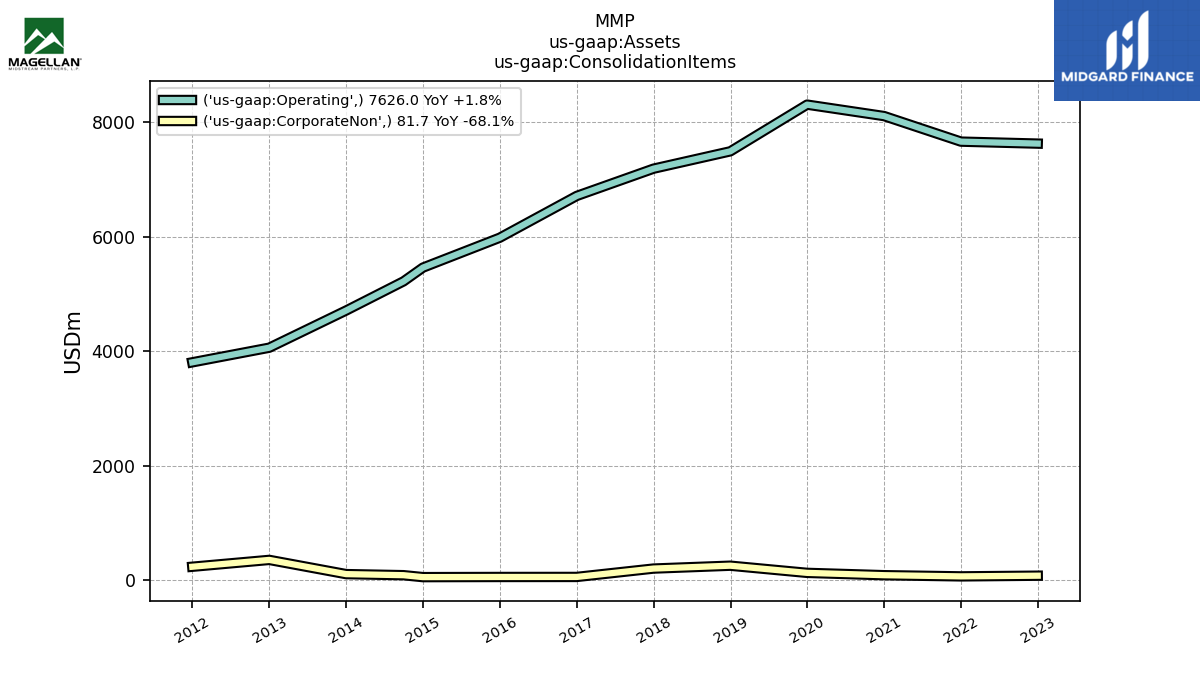
| Assets | 7629.20 | 7567.10 | 7707.70 | 7814.30 | 7792.40 | 8111.00 | 8030.00 | 8046.66 | 8292.66 | 8248.23 | 8196.98 | 8140.20 | 8104.99 | 8185.31 | 8437.73 | 8392.19 | 8005.44 | 7844.55 | 7747.54 | 7595.67 | 7538.30 | 7376.05 | 7394.38 | 7103.45 | 6930.72 | 6829.88 | 6772.07 | 6919.78 | 6448.20 | 6392.31 | 6041.57 | 5966.18 | 5732.06 | 5605.12 | 5517.28 | 5311.40 | 5124.26 | 5143.78 | 4820.81 | 4548.01 | 4388.07 | 4405.71 | 4420.07 | 4105.36 | 4074.99 | 4009.79 | 4045.00 | 4006.70 | 3849.16 | 3796.84 | 3717.90 | NA | NA | NA | |
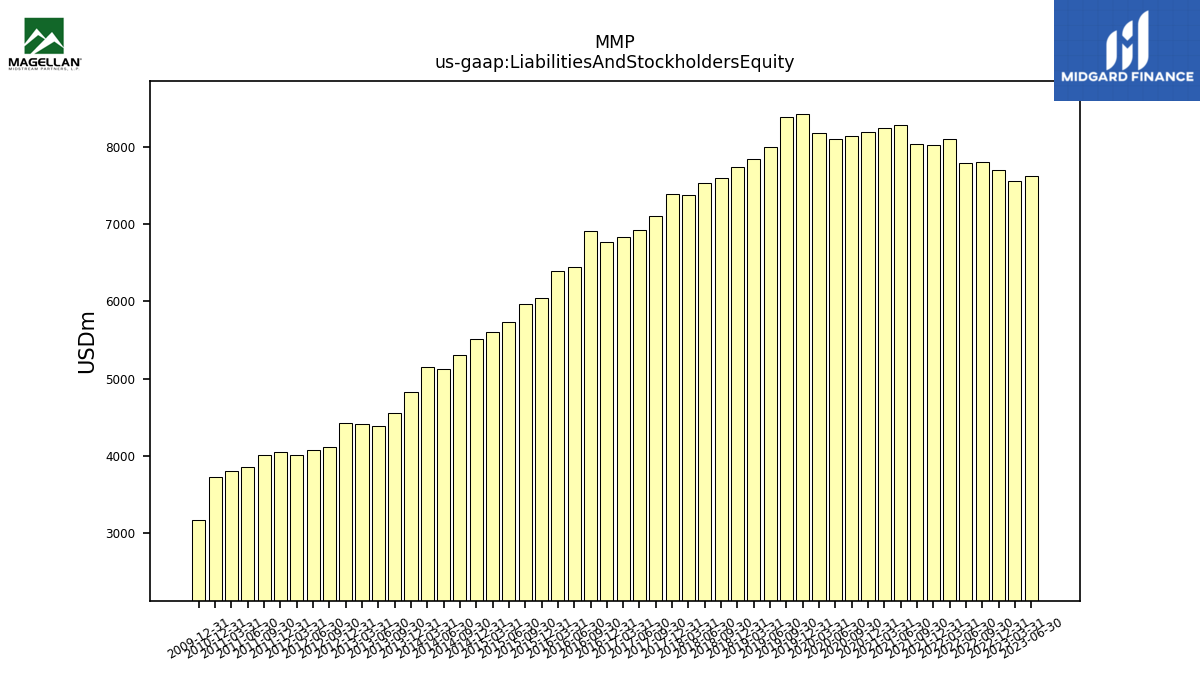
| Liabilities And Stockholders Equity | 7629.20 | 7567.10 | 7707.70 | 7814.30 | 7792.40 | 8111.00 | 8030.00 | 8046.66 | 8292.66 | 8248.23 | 8196.98 | 8140.20 | 8104.99 | 8185.31 | 8437.73 | 8392.19 | 8005.44 | 7844.55 | 7747.54 | 7595.67 | 7538.30 | 7376.05 | 7394.38 | 7103.45 | 6930.72 | 6829.88 | 6772.07 | 6919.78 | 6448.20 | 6392.31 | 6041.57 | 5966.18 | 5732.06 | 5605.12 | 5517.28 | 5311.40 | 5124.26 | 5143.78 | 4820.81 | 4548.01 | 4388.07 | 4405.71 | 4420.07 | 4105.36 | 4074.99 | 4009.79 | 4045.00 | 4006.70 | 3849.16 | 3796.84 | 3717.90 | NA | NA | NA |
| 2023-06-30 | 2023-03-31 | 2022-12-31 | 2022-09-30 | 2022-06-30 | 2022-03-31 | 2021-12-31 | 2021-09-30 | 2021-06-30 | 2021-03-31 | 2020-12-31 | 2020-09-30 | 2020-06-30 | 2020-03-31 | 2019-12-31 | 2019-09-30 | 2019-06-30 | 2019-03-31 | 2018-12-31 | 2018-09-30 | 2018-06-30 | 2018-03-31 | 2017-12-31 | 2017-09-30 | 2017-06-30 | 2017-03-31 | 2016-12-31 | 2016-09-30 | 2016-06-30 | 2016-03-31 | 2015-12-31 | 2015-09-30 | 2015-06-30 | 2015-03-31 | 2014-12-31 | 2014-09-30 | 2014-06-30 | 2014-03-31 | 2013-12-31 | 2013-09-30 | 2013-06-30 | 2013-03-31 | 2012-12-31 | 2012-09-30 | 2012-06-30 | 2012-03-31 | 2011-12-31 | 2011-09-30 | 2011-06-30 | 2011-03-31 | 2010-12-31 | 2010-09-30 | 2010-06-30 | 2010-03-31 | ||
|---|---|---|---|---|---|---|---|---|---|---|---|---|---|---|---|---|---|---|---|---|---|---|---|---|---|---|---|---|---|---|---|---|---|---|---|---|---|---|---|---|---|---|---|---|---|---|---|---|---|---|---|---|---|---|---|
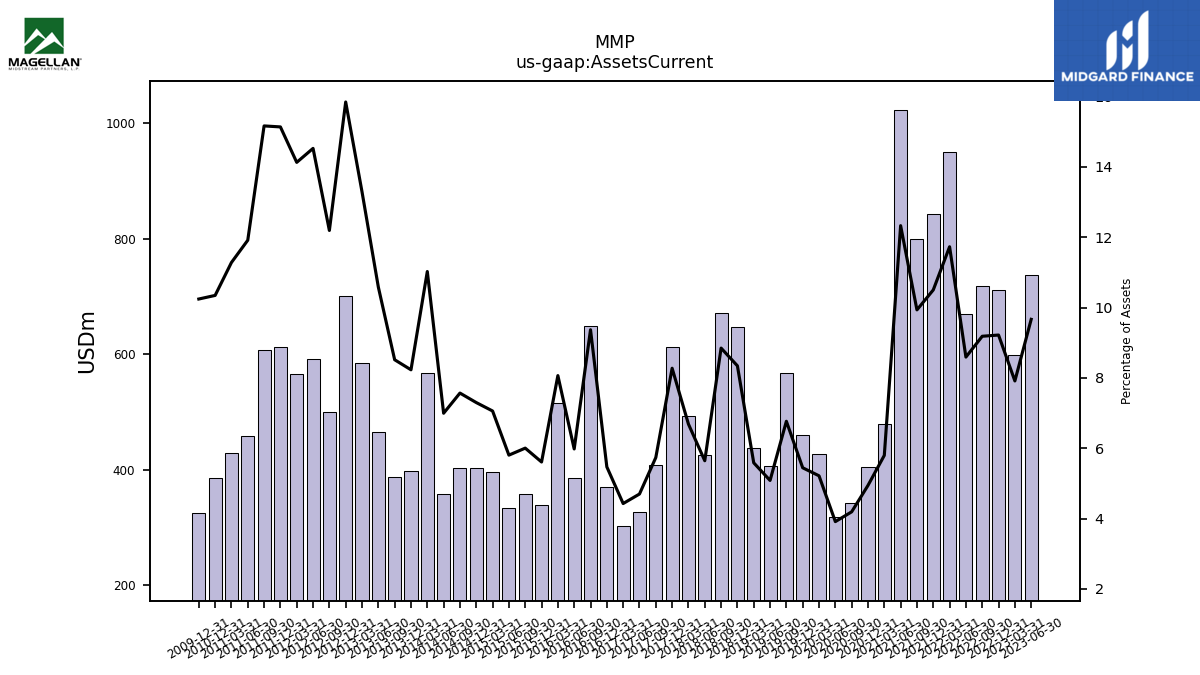
| Assets Current | 737.30 | 598.80 | 710.50 | 717.60 | 669.50 | 951.20 | 843.20 | 799.30 | 1022.27 | 478.14 | 405.19 | 341.24 | 317.24 | 426.99 | 459.41 | 567.84 | 407.02 | 438.19 | 646.34 | 672.01 | 425.54 | 493.19 | 611.84 | 407.43 | 325.66 | 302.43 | 370.39 | 648.27 | 385.58 | 515.53 | 338.85 | 358.16 | 332.70 | 395.65 | 402.67 | 401.98 | 358.46 | 567.04 | 396.73 | 387.28 | 464.32 | 585.50 | 700.28 | 500.47 | 591.85 | 566.45 | 612.19 | 607.52 | 458.57 | 428.28 | 384.58 | NA | NA | NA | |
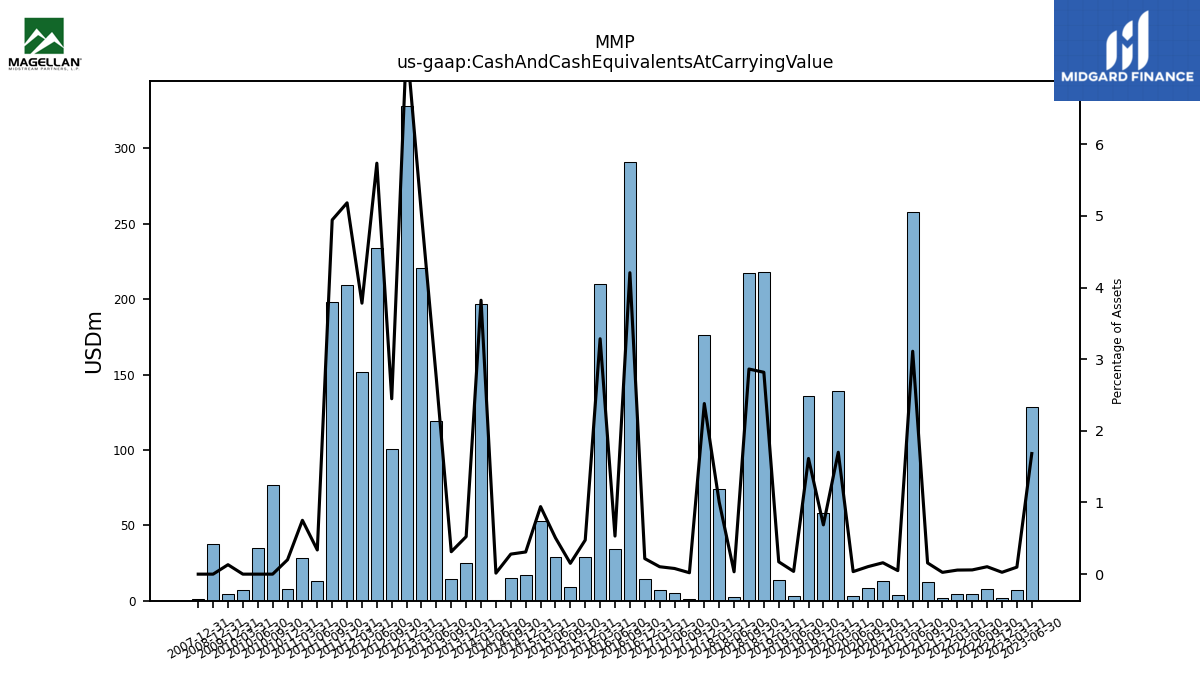
| Cash And Cash Equivalents At Carrying Value | 128.40 | 7.40 | 2.00 | 8.10 | 4.60 | 4.60 | 2.00 | 12.59 | 257.97 | 4.07 | 13.04 | 8.54 | 2.86 | 139.25 | 58.03 | 135.49 | 3.07 | 13.50 | 218.28 | 217.42 | 2.47 | 74.20 | 176.07 | 1.38 | 5.47 | 7.05 | 14.70 | 291.10 | 34.26 | 209.99 | 28.73 | 9.01 | 29.03 | 52.81 | 17.06 | 14.85 | 0.73 | 196.63 | 25.23 | 14.23 | 119.49 | 221.00 | 328.28 | 100.49 | 233.72 | 151.64 | 209.62 | 198.06 | 12.99 | 28.53 | 7.48 | 77.02 | 35.09 | 6.92 | |
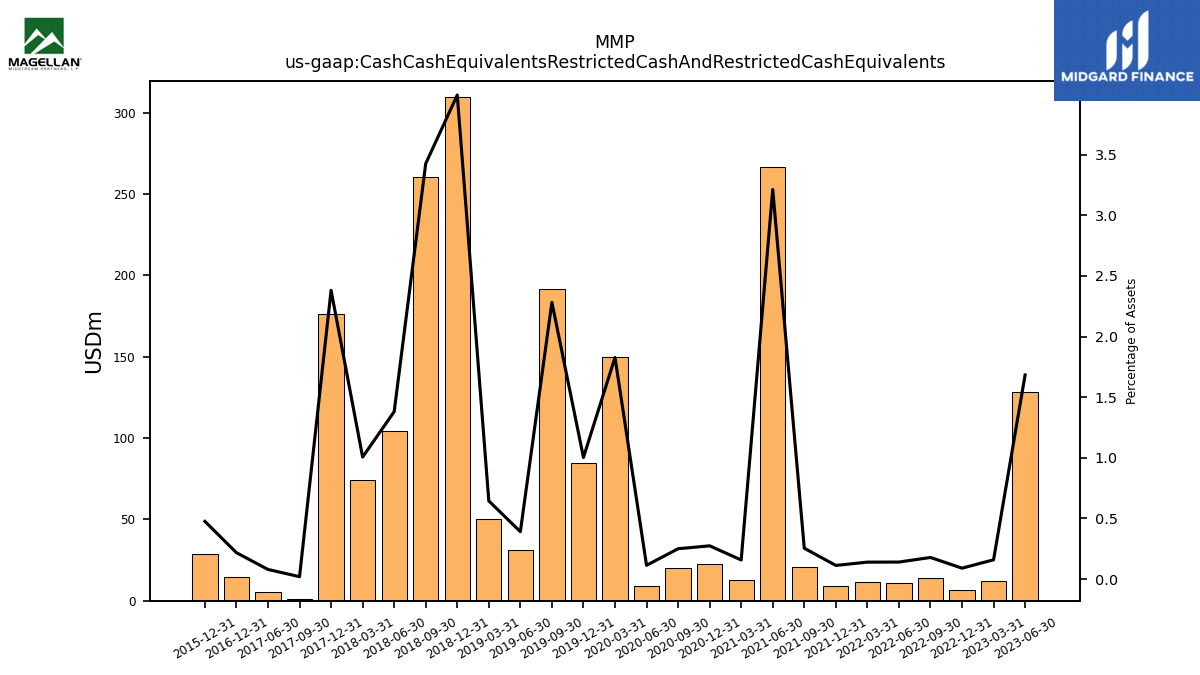
| Cash Cash Equivalents Restricted Cash And Restricted Cash Equivalents | 128.40 | 12.00 | 6.90 | 13.90 | 10.90 | 11.30 | 9.00 | 20.44 | 266.38 | 12.95 | 22.45 | 20.33 | 9.16 | 149.56 | 84.60 | 191.49 | 31.25 | 50.53 | 309.26 | 260.23 | 104.06 | 74.20 | 176.07 | 1.38 | 5.47 | NA | 14.70 | NA | NA | NA | 28.73 | NA | NA | NA | NA | NA | NA | NA | NA | NA | NA | NA | NA | NA | NA | NA | NA | NA | NA | NA | NA | NA | NA | NA | |
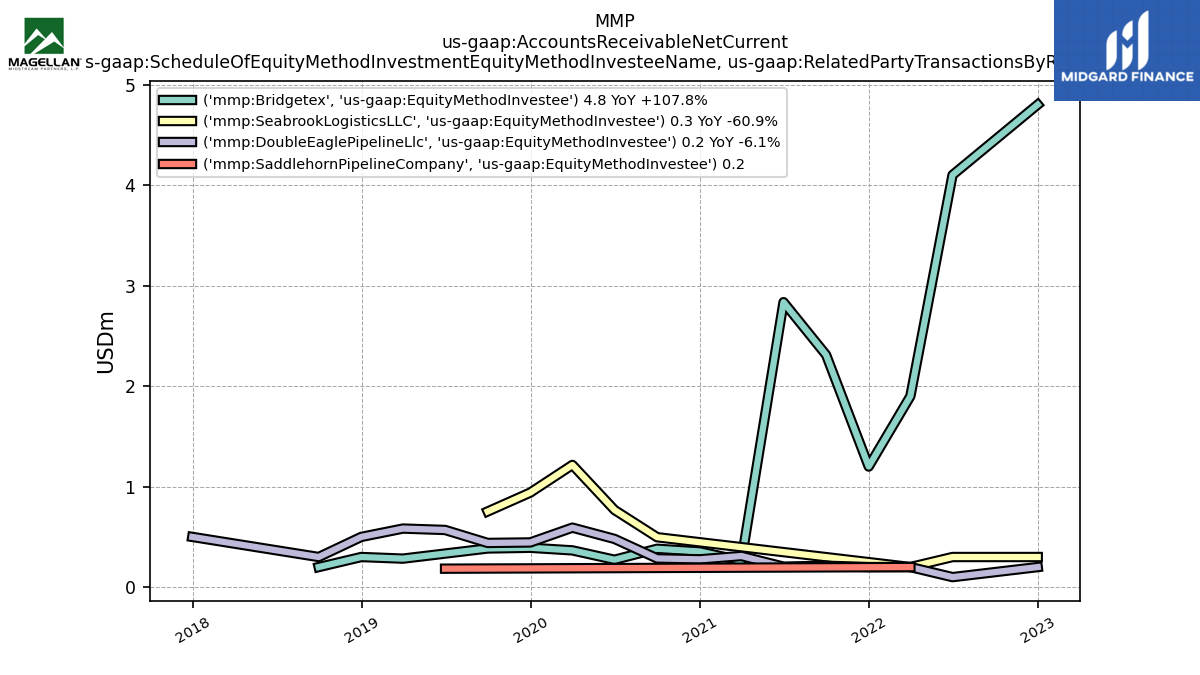
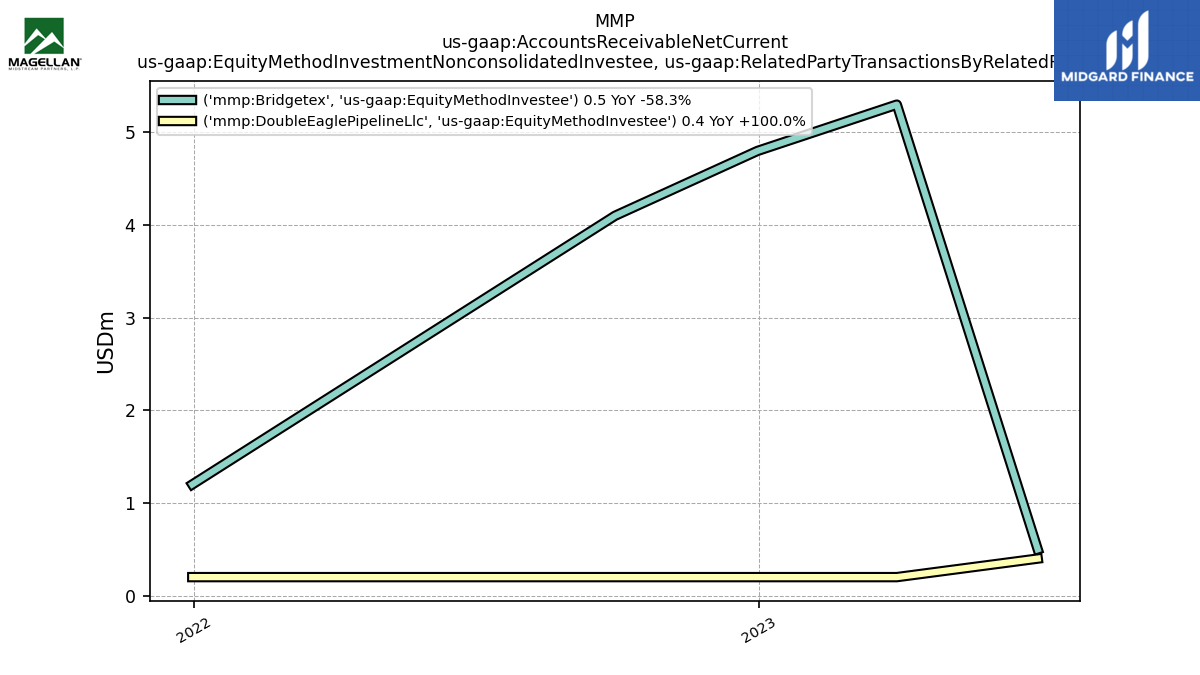
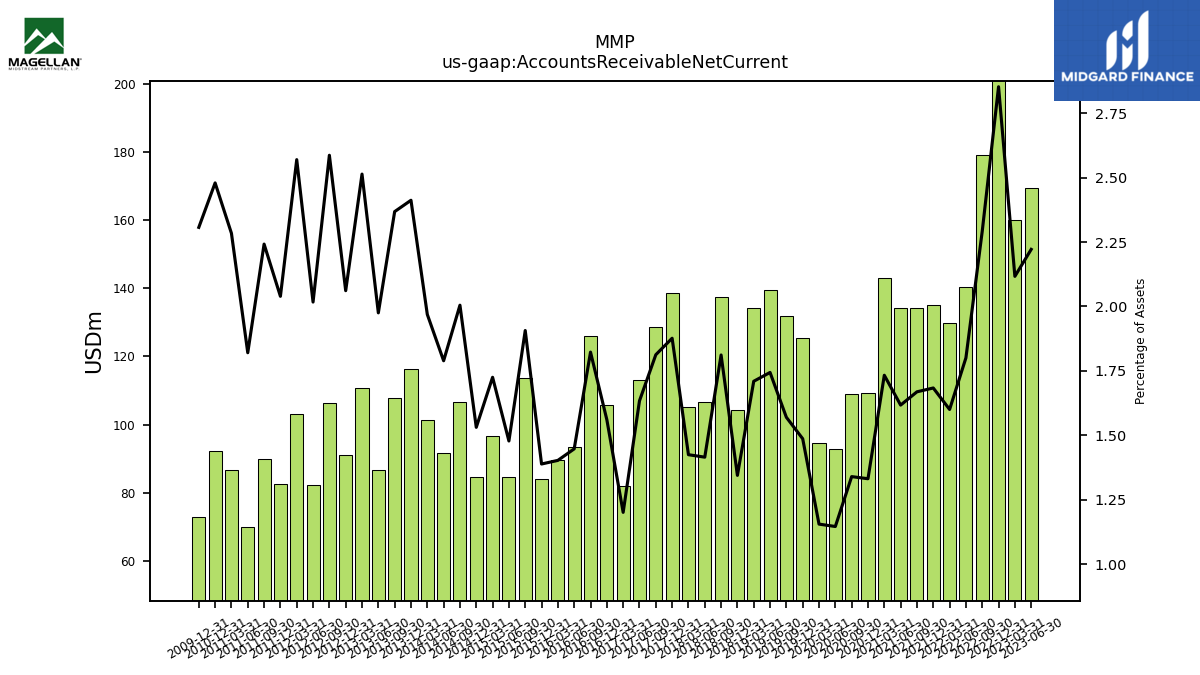
| Accounts Receivable Net Current | 169.50 | 160.20 | 219.90 | 179.10 | 140.30 | 129.80 | 135.20 | 134.28 | 134.12 | 142.95 | 109.14 | 109.05 | 92.88 | 94.56 | 125.44 | 131.75 | 139.61 | 134.12 | 104.16 | 137.62 | 106.68 | 105.09 | 138.78 | 128.76 | 113.23 | 82.02 | 105.69 | 126.14 | 93.33 | 89.66 | 83.89 | 113.76 | 84.72 | 96.70 | 84.47 | 106.50 | 91.69 | 101.29 | 116.30 | 107.71 | 86.68 | 110.76 | 91.11 | 106.21 | 82.20 | 103.05 | 82.50 | 89.84 | 70.07 | 86.73 | 92.19 | NA | NA | NA | |
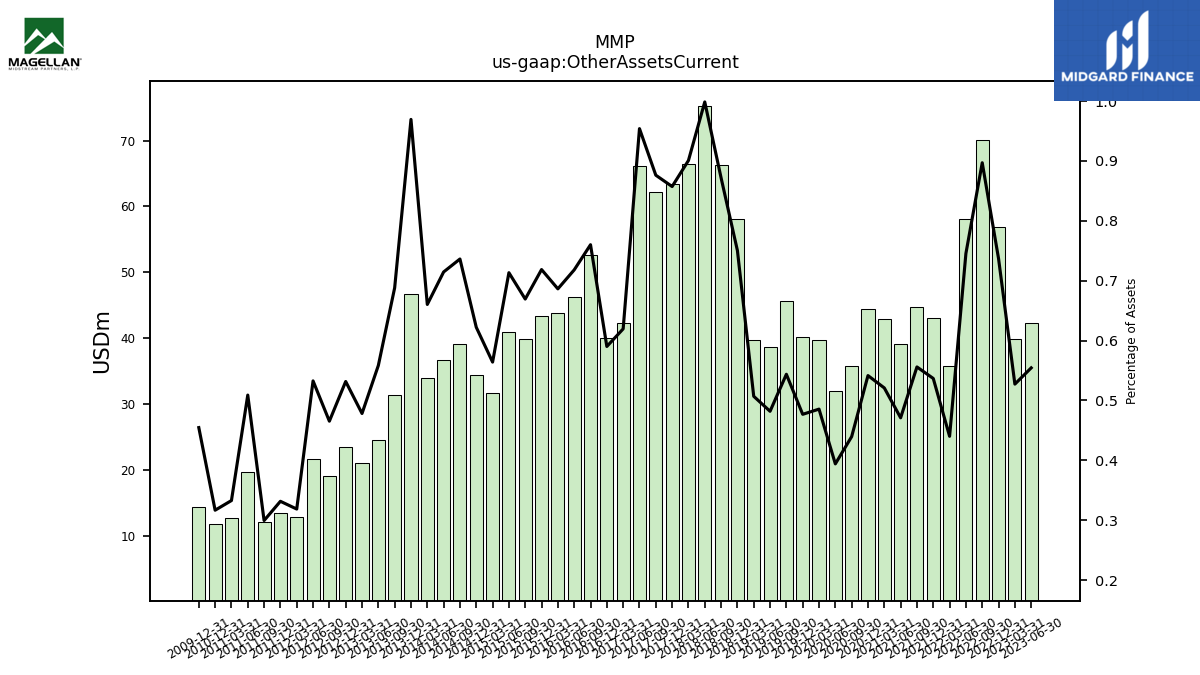
| Other Assets Current | 42.30 | 39.90 | 56.80 | 70.10 | 58.10 | 35.70 | 43.10 | 44.74 | 39.06 | 42.97 | 44.39 | 35.79 | 31.94 | 39.74 | 40.24 | 45.63 | 38.58 | 39.77 | 58.14 | 66.22 | 75.28 | 66.45 | 63.40 | 62.25 | 66.12 | 42.32 | 39.97 | 52.60 | 46.30 | 43.88 | 43.42 | 39.94 | 40.89 | 31.62 | 34.33 | 39.11 | 36.62 | 33.97 | 46.73 | 31.30 | 24.50 | 21.07 | 23.50 | 19.11 | 21.71 | 12.78 | 13.41 | 12.00 | 19.59 | 12.64 | 11.77 | NA | NA | NA |
| 2023-06-30 | 2023-03-31 | 2022-12-31 | 2022-09-30 | 2022-06-30 | 2022-03-31 | 2021-12-31 | 2021-09-30 | 2021-06-30 | 2021-03-31 | 2020-12-31 | 2020-09-30 | 2020-06-30 | 2020-03-31 | 2019-12-31 | 2019-09-30 | 2019-06-30 | 2019-03-31 | 2018-12-31 | 2018-09-30 | 2018-06-30 | 2018-03-31 | 2017-12-31 | 2017-09-30 | 2017-06-30 | 2017-03-31 | 2016-12-31 | 2016-09-30 | 2016-06-30 | 2016-03-31 | 2015-12-31 | 2015-09-30 | 2015-06-30 | 2015-03-31 | 2014-12-31 | 2014-09-30 | 2014-06-30 | 2014-03-31 | 2013-12-31 | 2013-09-30 | 2013-06-30 | 2013-03-31 | 2012-12-31 | 2012-09-30 | 2012-06-30 | 2012-03-31 | 2011-12-31 | 2011-09-30 | 2011-06-30 | 2011-03-31 | 2010-12-31 | 2010-09-30 | 2010-06-30 | 2010-03-31 | ||
|---|---|---|---|---|---|---|---|---|---|---|---|---|---|---|---|---|---|---|---|---|---|---|---|---|---|---|---|---|---|---|---|---|---|---|---|---|---|---|---|---|---|---|---|---|---|---|---|---|---|---|---|---|---|---|---|
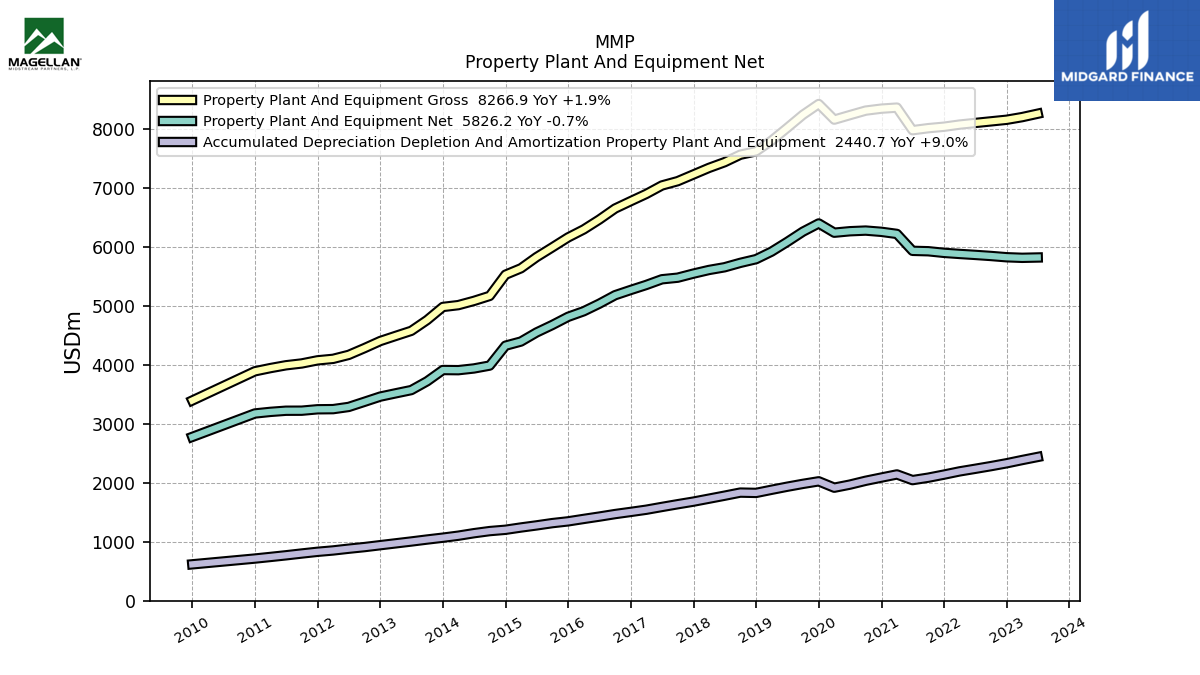
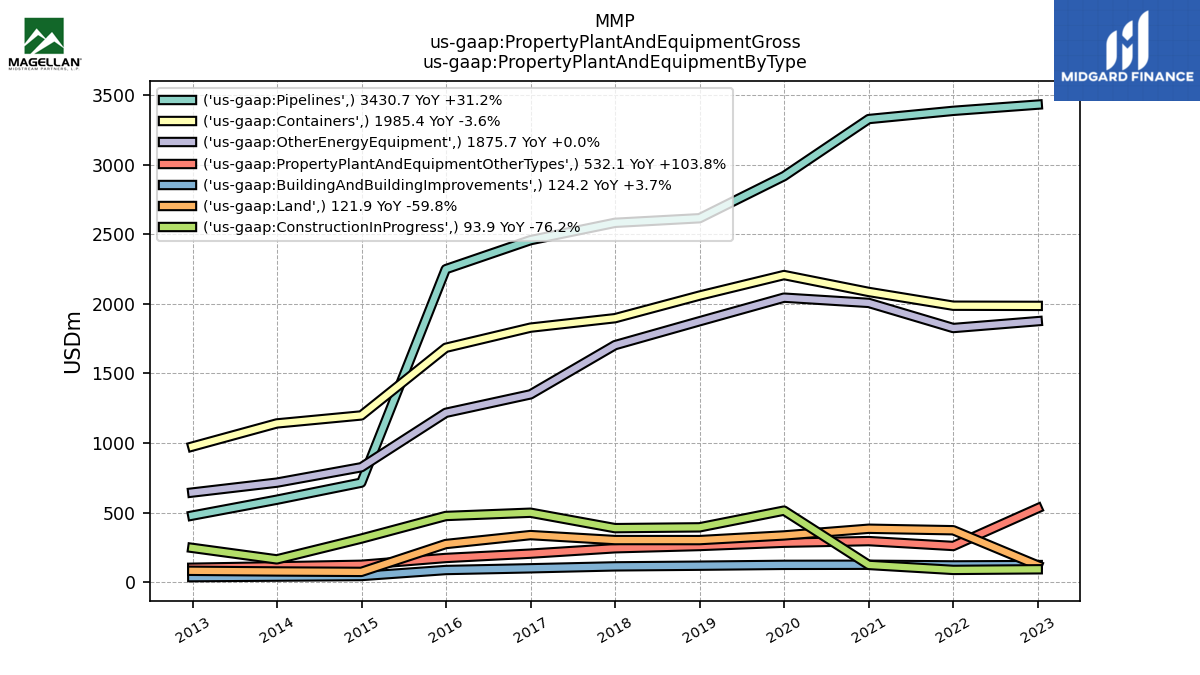
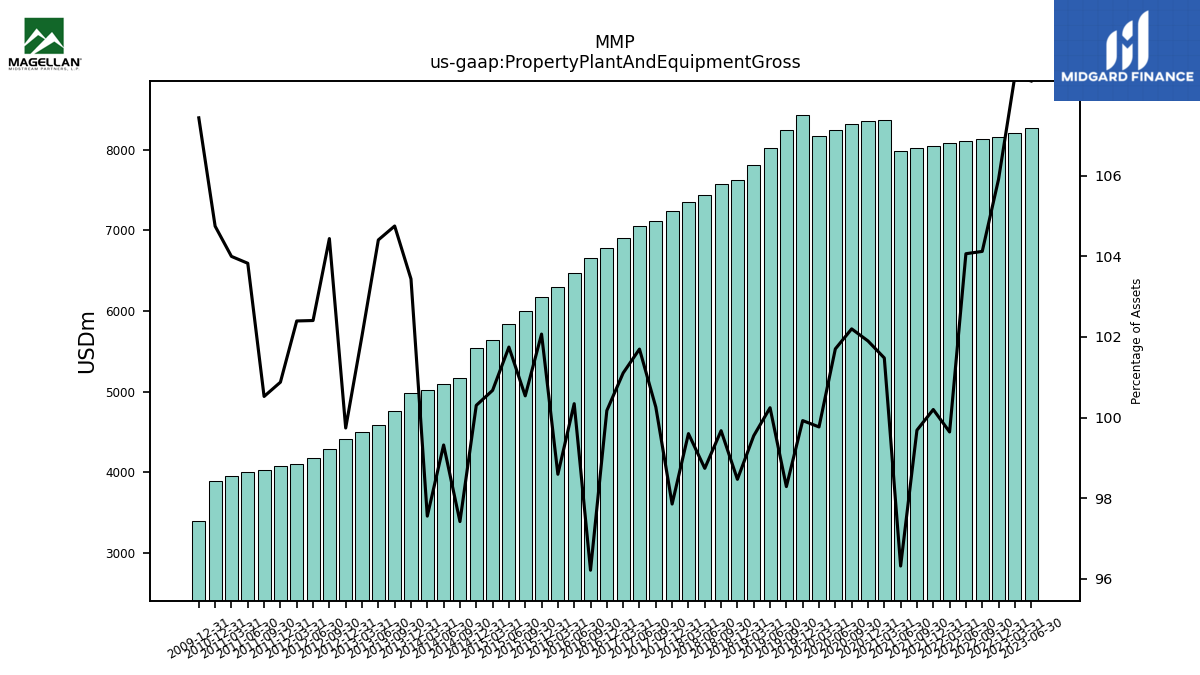
| Property Plant And Equipment Gross | 8266.90 | 8208.80 | 8163.90 | 8136.70 | 8109.40 | 8081.90 | 8045.90 | 8021.35 | 7986.74 | 8370.21 | 8352.83 | 8319.40 | 8243.11 | 8166.12 | 8431.23 | 8248.18 | 8024.85 | 7808.95 | 7628.59 | 7570.76 | 7443.10 | 7346.49 | 7235.47 | 7121.86 | 7048.50 | 6905.37 | 6783.74 | 6657.31 | 6470.36 | 6302.20 | 6166.77 | 5998.28 | 5832.34 | 5642.90 | 5533.94 | 5174.11 | 5089.28 | 5017.79 | 4986.75 | 4764.32 | 4581.60 | 4495.23 | 4408.55 | 4287.81 | 4173.15 | 4105.95 | 4080.48 | 4027.64 | 3996.61 | 3948.78 | 3894.61 | NA | NA | NA | |
| Accumulated Depreciation Depletion And Amortization Property Plant And Equipment | 2440.70 | 2388.20 | 2333.60 | 2284.80 | 2239.30 | 2195.40 | 2141.20 | 2088.99 | 2047.56 | 2143.84 | 2091.13 | 2036.35 | 1971.27 | 1919.01 | 2027.19 | 1983.69 | 1935.30 | 1883.36 | 1830.41 | 1835.82 | 1783.04 | 1732.49 | 1682.63 | 1638.35 | 1592.04 | 1545.00 | 1508.00 | 1471.26 | 1428.43 | 1388.69 | 1347.54 | 1317.63 | 1278.87 | 1243.31 | 1204.60 | 1182.36 | 1146.55 | 1104.19 | 1070.49 | 1039.14 | 1005.77 | 974.35 | 943.25 | 910.85 | 883.47 | 853.66 | 830.76 | 801.71 | 771.35 | 743.17 | 716.05 | NA | NA | NA | |
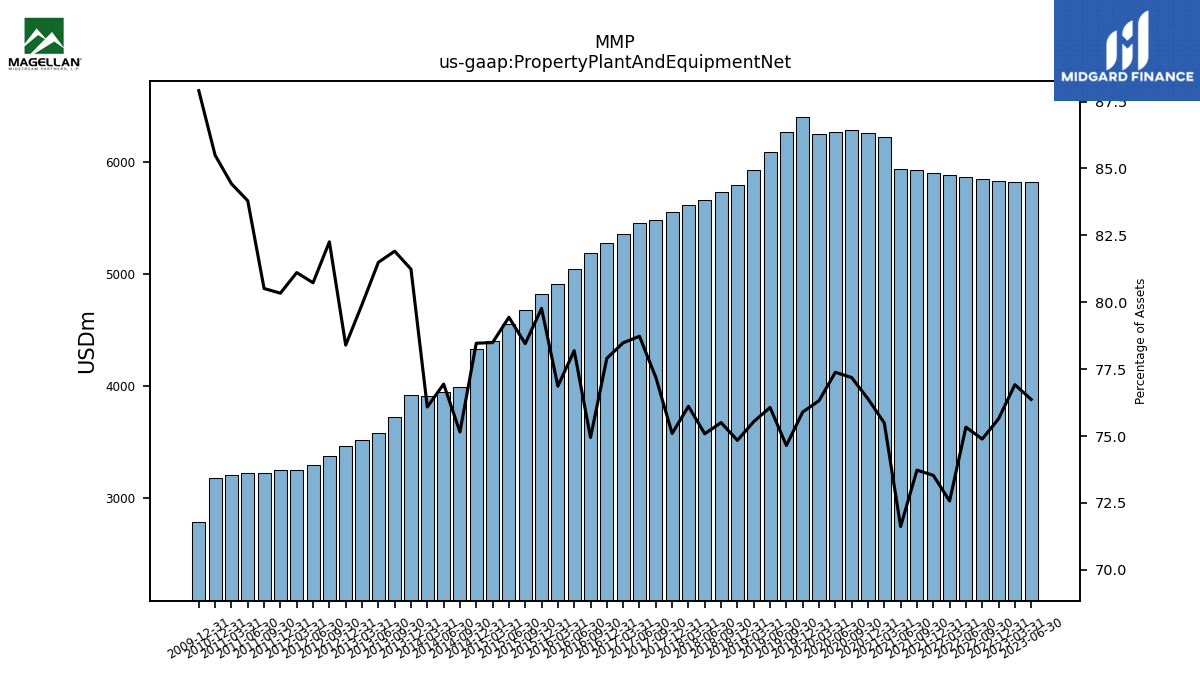
| Property Plant And Equipment Net | 5826.20 | 5820.60 | 5830.30 | 5851.90 | 5870.10 | 5886.50 | 5904.70 | 5932.36 | 5939.18 | 6226.37 | 6261.69 | 6283.05 | 6271.84 | 6247.11 | 6404.03 | 6264.49 | 6089.54 | 5925.59 | 5798.18 | 5734.94 | 5660.06 | 5614.01 | 5552.84 | 5483.51 | 5456.47 | 5360.37 | 5275.74 | 5186.04 | 5041.93 | 4913.51 | 4819.23 | 4680.65 | 4553.47 | 4399.59 | 4329.33 | 3991.75 | 3942.73 | 3913.59 | 3916.26 | 3725.19 | 3575.84 | 3520.89 | 3465.30 | 3376.96 | 3289.68 | 3252.29 | 3249.72 | 3225.93 | 3225.26 | 3205.61 | 3178.56 | NA | NA | NA | |
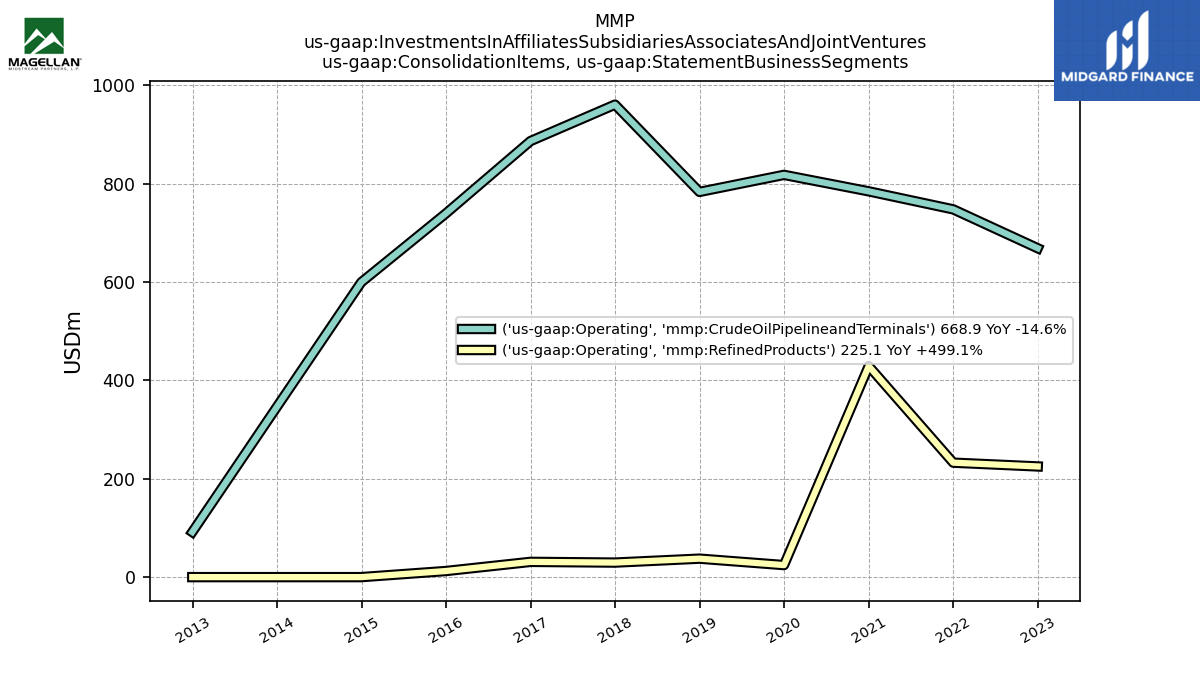
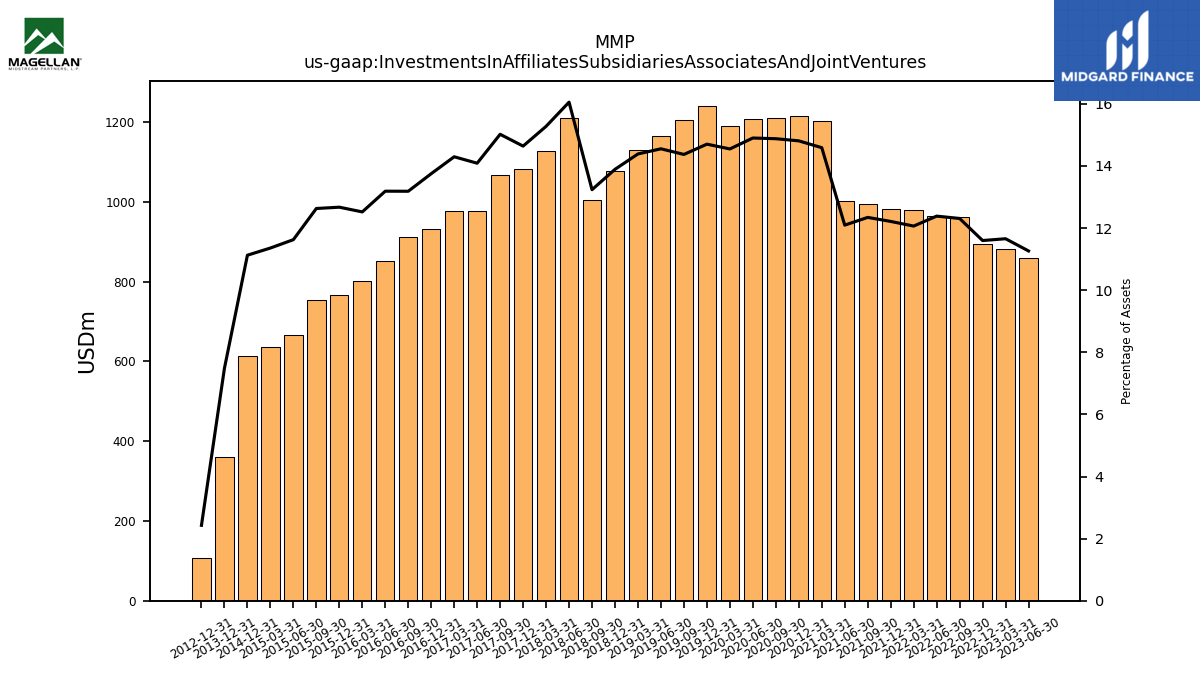
| Investments In Affiliates Subsidiaries Associates And Joint Ventures | 859.30 | 882.10 | 894.00 | 961.90 | 965.10 | 978.60 | 980.80 | 993.29 | 1002.99 | 1203.34 | 1213.86 | 1211.08 | 1207.67 | 1190.80 | 1240.55 | 1206.04 | 1165.03 | 1128.63 | 1076.31 | 1005.39 | 1210.26 | 1126.77 | 1082.51 | 1066.94 | 976.46 | 976.42 | 931.25 | 912.42 | 850.40 | 800.38 | 765.63 | 753.57 | 666.45 | 636.62 | 613.87 | NA | NA | NA | 360.85 | NA | NA | NA | 107.36 | NA | NA | NA | NA | NA | NA | NA | NA | NA | NA | NA | |
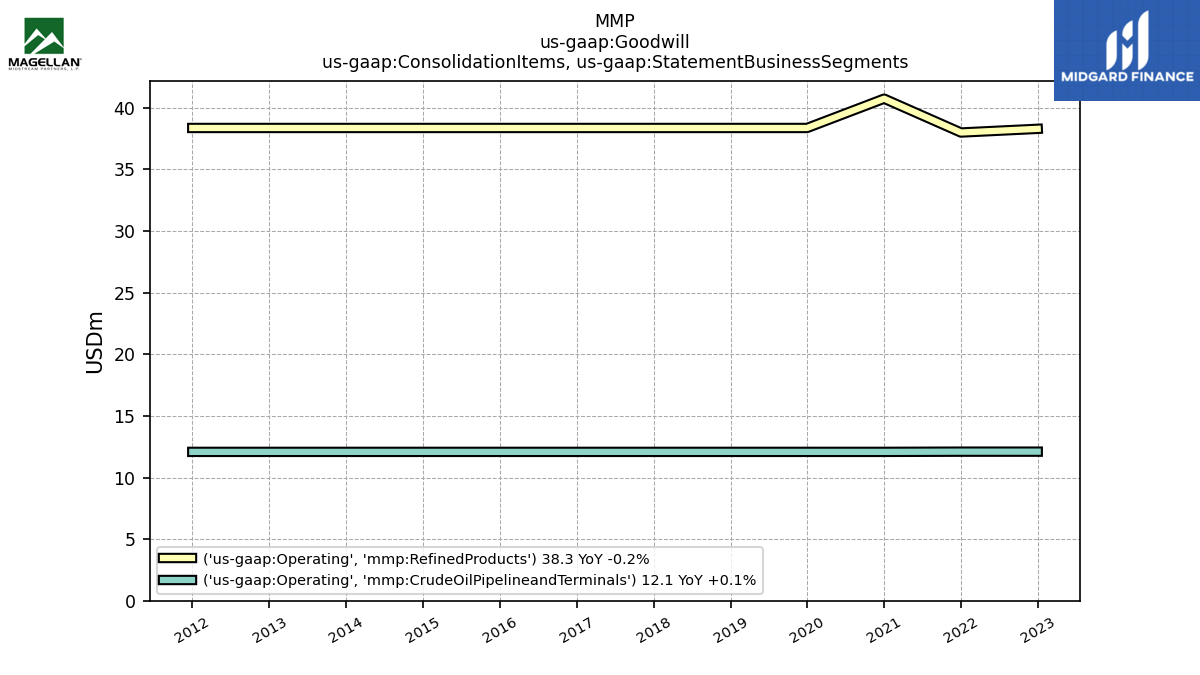
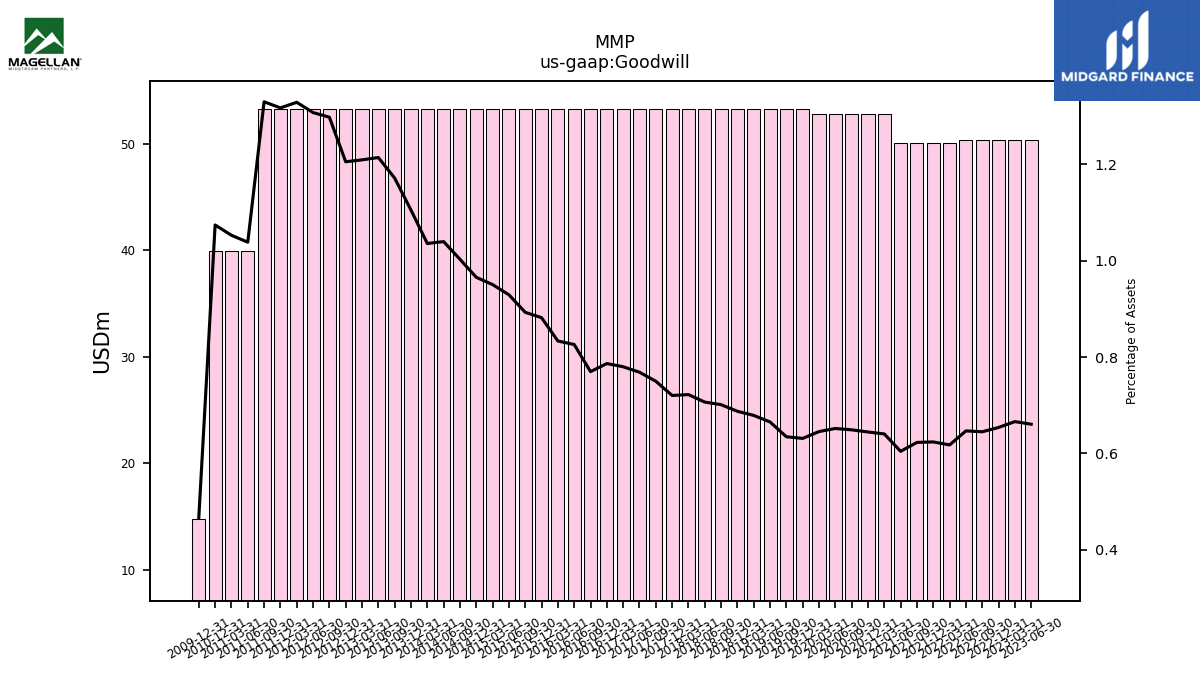
| Goodwill | 50.40 | 50.40 | 50.40 | 50.40 | 50.40 | 50.10 | 50.10 | 50.12 | 50.12 | 52.83 | 52.83 | 52.83 | 52.83 | 52.83 | 53.26 | 53.26 | 53.26 | 53.26 | 53.26 | 53.26 | 53.26 | 53.26 | 53.26 | 53.26 | 53.26 | 53.26 | 53.26 | 53.26 | 53.26 | 53.26 | 53.26 | 53.26 | 53.26 | 53.26 | 53.26 | 53.26 | 53.26 | 53.26 | 53.26 | 53.26 | 53.26 | 53.26 | 53.26 | 53.26 | 53.26 | 53.26 | 53.26 | 53.26 | 39.96 | 39.96 | 39.92 | NA | NA | NA | |
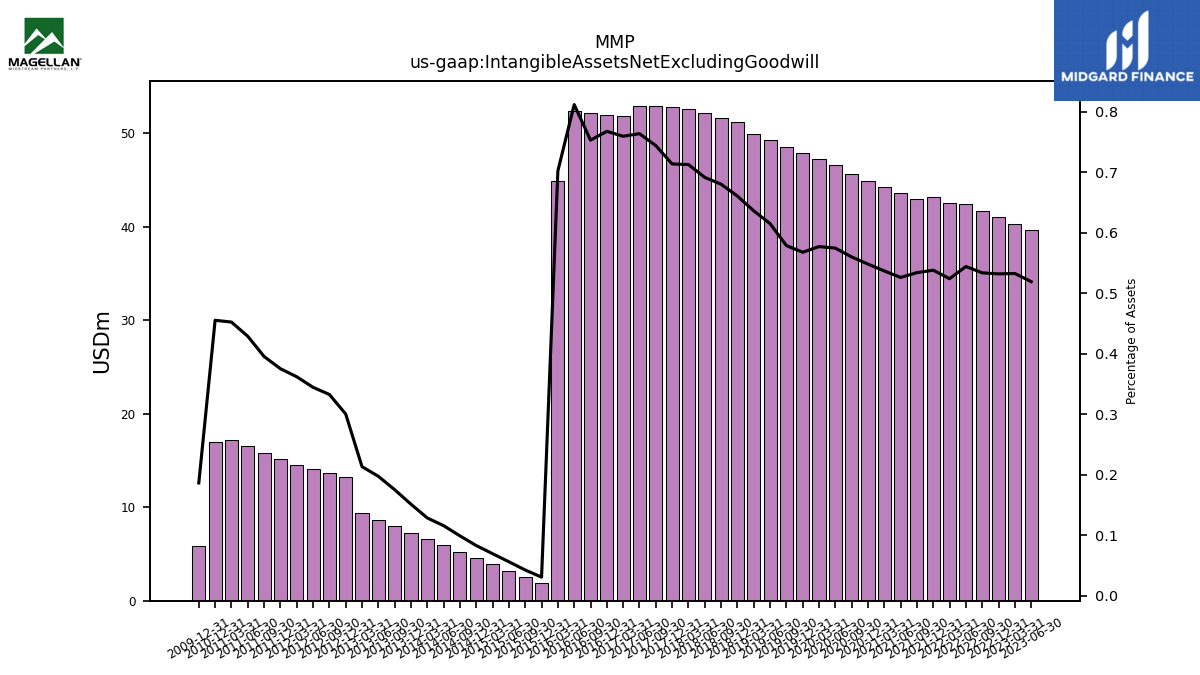
| Intangible Assets Net Excluding Goodwill | 39.60 | 40.30 | 41.00 | 41.70 | 42.40 | 42.50 | 43.20 | 42.97 | 43.62 | 44.27 | 44.92 | 45.58 | 46.56 | 47.23 | 47.90 | 48.56 | 49.23 | 49.90 | 51.17 | 51.66 | 52.12 | 52.56 | 52.76 | 52.84 | 52.92 | 51.87 | 51.98 | 52.10 | 52.34 | 44.88 | 1.86 | 2.54 | 3.21 | 3.89 | 4.57 | 5.25 | 5.93 | 6.61 | 7.29 | 7.97 | 8.66 | 9.40 | 13.27 | 13.65 | 14.04 | 14.51 | 15.18 | 15.84 | 16.51 | 17.17 | 16.92 | NA | NA | NA | |
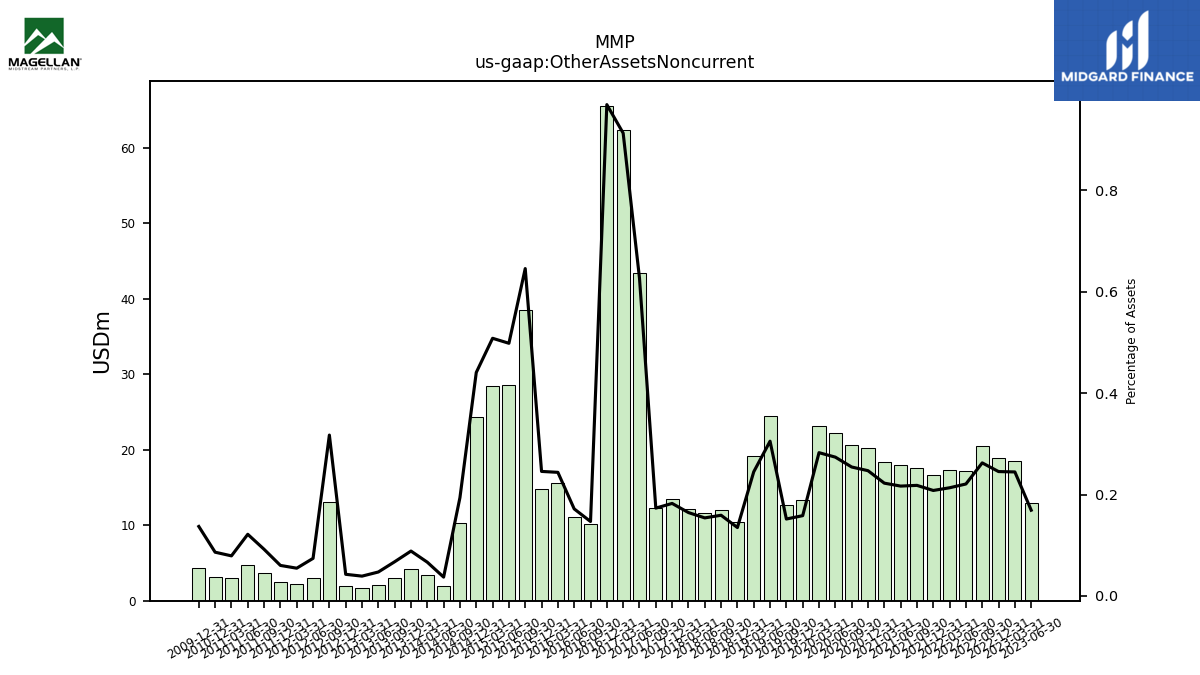
| Other Assets Noncurrent | 12.90 | 18.50 | 18.90 | 20.50 | 17.20 | 17.30 | 16.70 | 17.54 | 17.96 | 18.34 | 20.24 | 20.69 | 22.18 | 23.12 | 13.36 | 12.73 | 24.42 | 19.20 | 10.45 | 12.09 | 11.60 | 12.13 | 13.49 | 12.30 | 43.43 | 62.30 | 65.58 | 10.16 | 11.07 | 15.58 | 14.83 | 38.50 | 28.55 | 28.47 | 24.30 | 10.30 | 1.91 | 3.43 | 4.27 | 3.07 | 2.08 | 1.73 | 1.89 | 13.02 | 3.02 | 2.20 | 2.44 | 3.69 | 4.68 | 3.00 | 3.21 | NA | NA | NA |
| 2023-06-30 | 2023-03-31 | 2022-12-31 | 2022-09-30 | 2022-06-30 | 2022-03-31 | 2021-12-31 | 2021-09-30 | 2021-06-30 | 2021-03-31 | 2020-12-31 | 2020-09-30 | 2020-06-30 | 2020-03-31 | 2019-12-31 | 2019-09-30 | 2019-06-30 | 2019-03-31 | 2018-12-31 | 2018-09-30 | 2018-06-30 | 2018-03-31 | 2017-12-31 | 2017-09-30 | 2017-06-30 | 2017-03-31 | 2016-12-31 | 2016-09-30 | 2016-06-30 | 2016-03-31 | 2015-12-31 | 2015-09-30 | 2015-06-30 | 2015-03-31 | 2014-12-31 | 2014-09-30 | 2014-06-30 | 2014-03-31 | 2013-12-31 | 2013-09-30 | 2013-06-30 | 2013-03-31 | 2012-12-31 | 2012-09-30 | 2012-06-30 | 2012-03-31 | 2011-12-31 | 2011-09-30 | 2011-06-30 | 2011-03-31 | 2010-12-31 | 2010-09-30 | 2010-06-30 | 2010-03-31 | ||
|---|---|---|---|---|---|---|---|---|---|---|---|---|---|---|---|---|---|---|---|---|---|---|---|---|---|---|---|---|---|---|---|---|---|---|---|---|---|---|---|---|---|---|---|---|---|---|---|---|---|---|---|---|---|---|---|
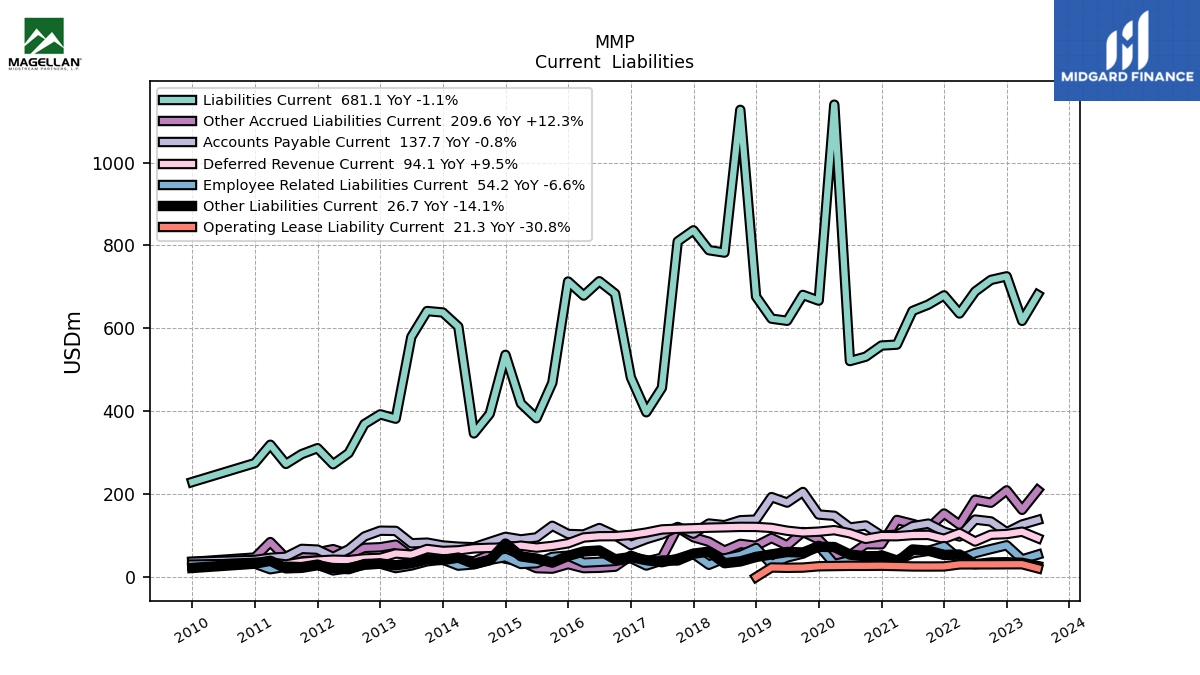
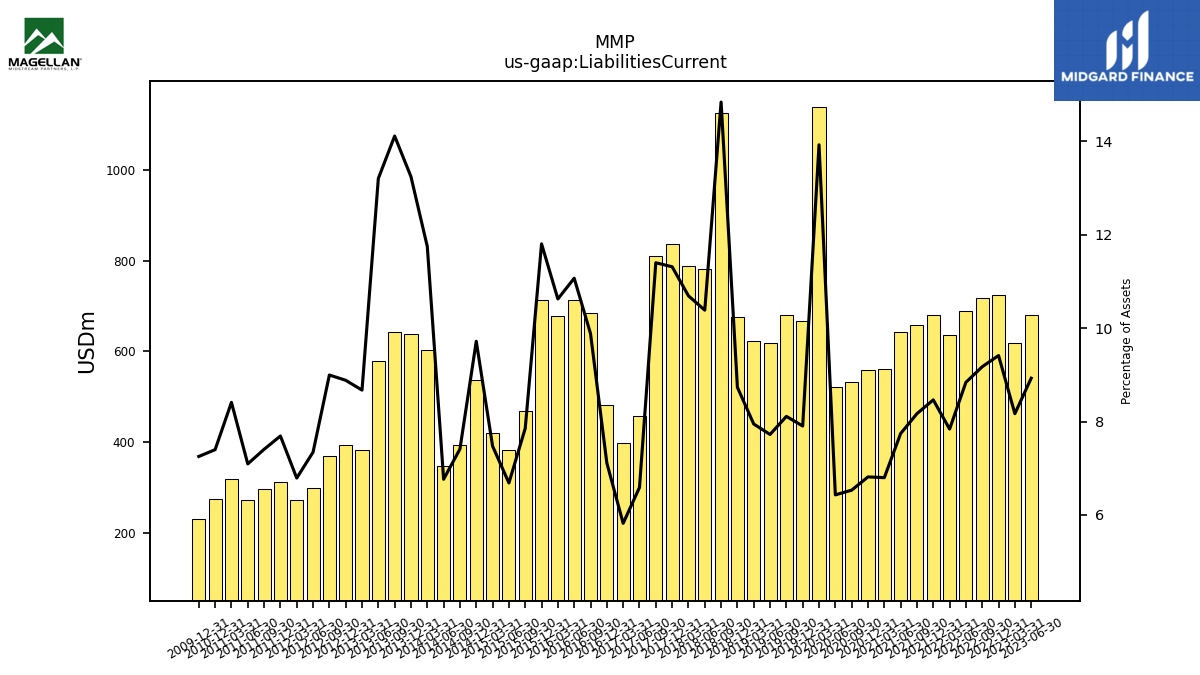
| Liabilities Current | 681.10 | 618.10 | 725.50 | 716.80 | 688.80 | 635.80 | 679.60 | 657.29 | 642.02 | 560.76 | 558.57 | 531.62 | 521.15 | 1139.64 | 666.88 | 680.64 | 618.27 | 623.37 | 676.56 | 1127.06 | 782.74 | 788.54 | 836.51 | 809.71 | 456.57 | 397.60 | 481.66 | 683.85 | 713.66 | 679.09 | 713.07 | 468.56 | 383.20 | 418.89 | 536.15 | 393.65 | 346.63 | 604.15 | 638.28 | 641.76 | 579.36 | 382.07 | 392.62 | 369.29 | 299.27 | 272.26 | 311.06 | 296.69 | 273.01 | 319.31 | 275.05 | NA | NA | NA | |
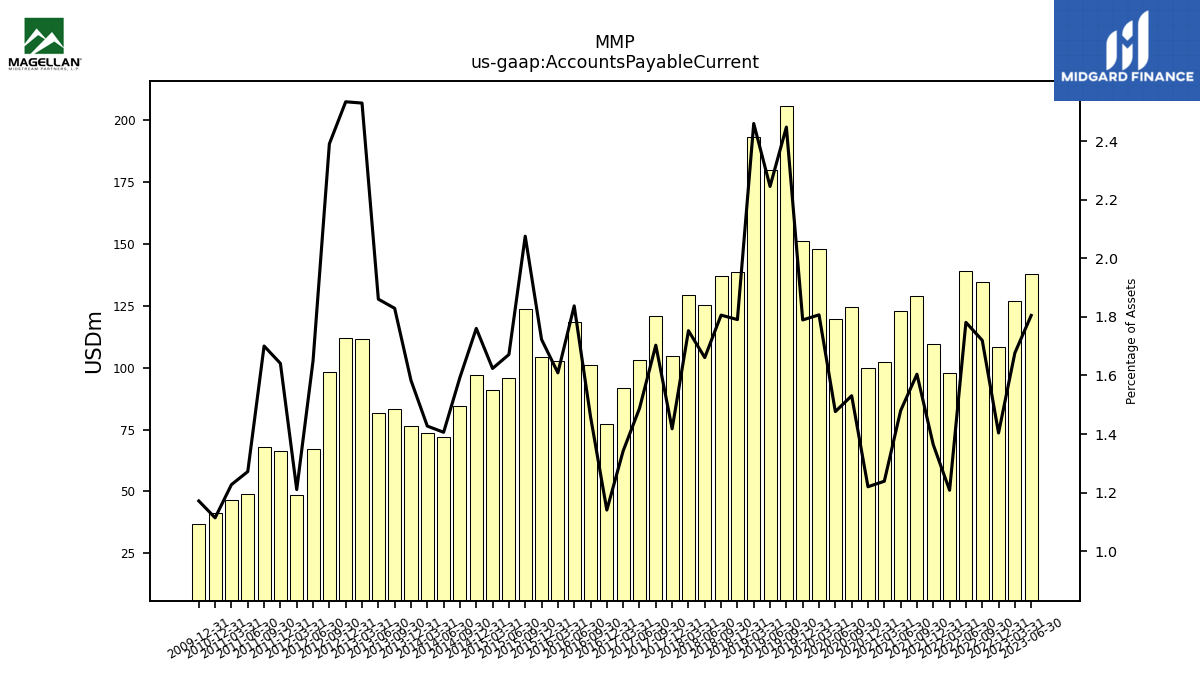
| Accounts Payable Current | 137.70 | 126.90 | 108.20 | 134.40 | 138.80 | 98.00 | 109.50 | 129.09 | 122.71 | 102.20 | 100.02 | 124.61 | 119.68 | 147.89 | 150.99 | 205.41 | 179.73 | 192.97 | 138.74 | 137.17 | 125.22 | 129.28 | 104.85 | 120.99 | 103.10 | 91.69 | 77.25 | 101.01 | 118.48 | 102.86 | 104.09 | 123.81 | 95.81 | 91.02 | 97.13 | 84.64 | 72.05 | 73.42 | 76.33 | 83.19 | 81.64 | 111.45 | 112.00 | 98.14 | 67.23 | 48.54 | 66.38 | 68.13 | 48.96 | 46.60 | 41.42 | NA | NA | NA | |
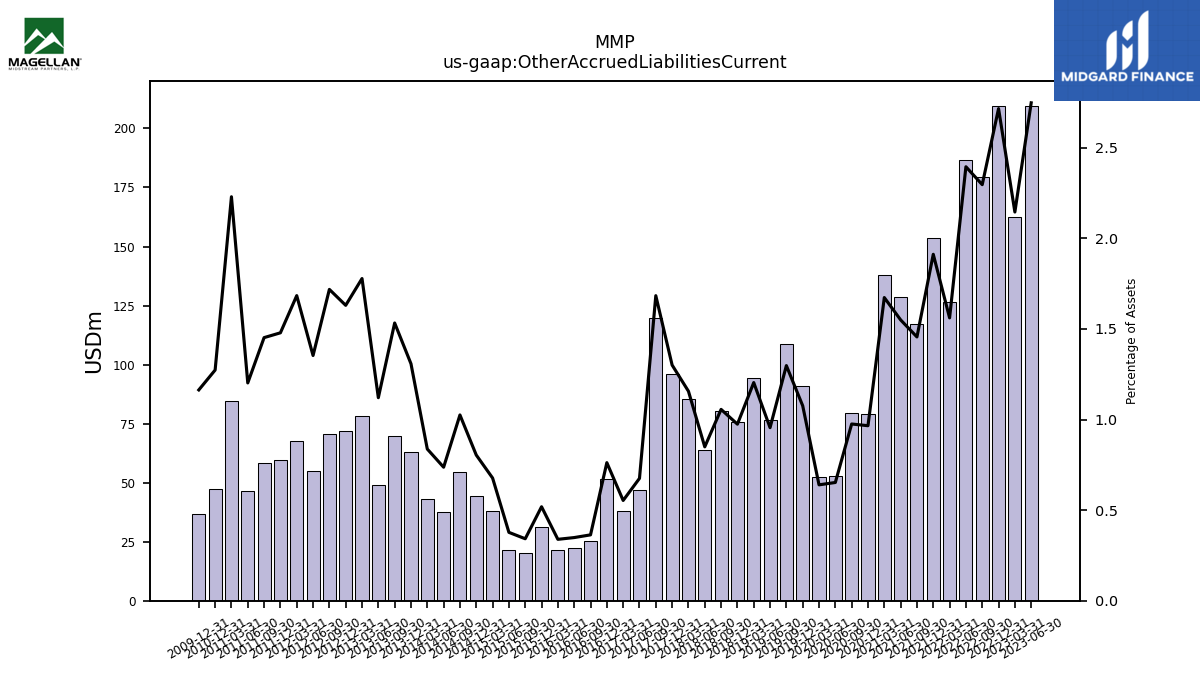
| Other Accrued Liabilities Current | 209.60 | 162.30 | 209.30 | 179.40 | 186.60 | 126.60 | 153.50 | 117.13 | 128.51 | 137.98 | 79.17 | 79.39 | 52.89 | 52.35 | 90.79 | 108.88 | 76.46 | 94.43 | 75.48 | 80.19 | 64.02 | 85.27 | 96.16 | 119.57 | 46.80 | 37.79 | 51.60 | 25.16 | 22.48 | 21.66 | 31.34 | 20.41 | 21.63 | 37.95 | 44.35 | 54.45 | 37.76 | 43.05 | 63.03 | 69.70 | 49.16 | 78.32 | 72.05 | 70.53 | 55.14 | 67.50 | 59.80 | 58.17 | 46.26 | 84.64 | 47.32 | NA | NA | NA | |
| Other Liabilities Current | 26.70 | 34.50 | 35.90 | 35.40 | 31.10 | 54.50 | 53.50 | 63.74 | 66.68 | 35.92 | 50.78 | 50.26 | 54.35 | 72.56 | 73.20 | 59.50 | 60.57 | 54.82 | 48.66 | 37.87 | 33.60 | 61.54 | 56.54 | 44.06 | 36.02 | 40.86 | 48.43 | 43.06 | 64.23 | 61.89 | 51.10 | 34.93 | 44.67 | 50.13 | 80.93 | 40.61 | 31.92 | 47.11 | 41.15 | 43.08 | 33.59 | 28.63 | 32.84 | 31.52 | 19.14 | 21.36 | 28.73 | 22.42 | 21.12 | 39.48 | 32.43 | NA | NA | NA |
| 2023-06-30 | 2023-03-31 | 2022-12-31 | 2022-09-30 | 2022-06-30 | 2022-03-31 | 2021-12-31 | 2021-09-30 | 2021-06-30 | 2021-03-31 | 2020-12-31 | 2020-09-30 | 2020-06-30 | 2020-03-31 | 2019-12-31 | 2019-09-30 | 2019-06-30 | 2019-03-31 | 2018-12-31 | 2018-09-30 | 2018-06-30 | 2018-03-31 | 2017-12-31 | 2017-09-30 | 2017-06-30 | 2017-03-31 | 2016-12-31 | 2016-09-30 | 2016-06-30 | 2016-03-31 | 2015-12-31 | 2015-09-30 | 2015-06-30 | 2015-03-31 | 2014-12-31 | 2014-09-30 | 2014-06-30 | 2014-03-31 | 2013-12-31 | 2013-09-30 | 2013-06-30 | 2013-03-31 | 2012-12-31 | 2012-09-30 | 2012-06-30 | 2012-03-31 | 2011-12-31 | 2011-09-30 | 2011-06-30 | 2011-03-31 | 2010-12-31 | 2010-09-30 | 2010-06-30 | 2010-03-31 | ||
|---|---|---|---|---|---|---|---|---|---|---|---|---|---|---|---|---|---|---|---|---|---|---|---|---|---|---|---|---|---|---|---|---|---|---|---|---|---|---|---|---|---|---|---|---|---|---|---|---|---|---|---|---|---|---|---|
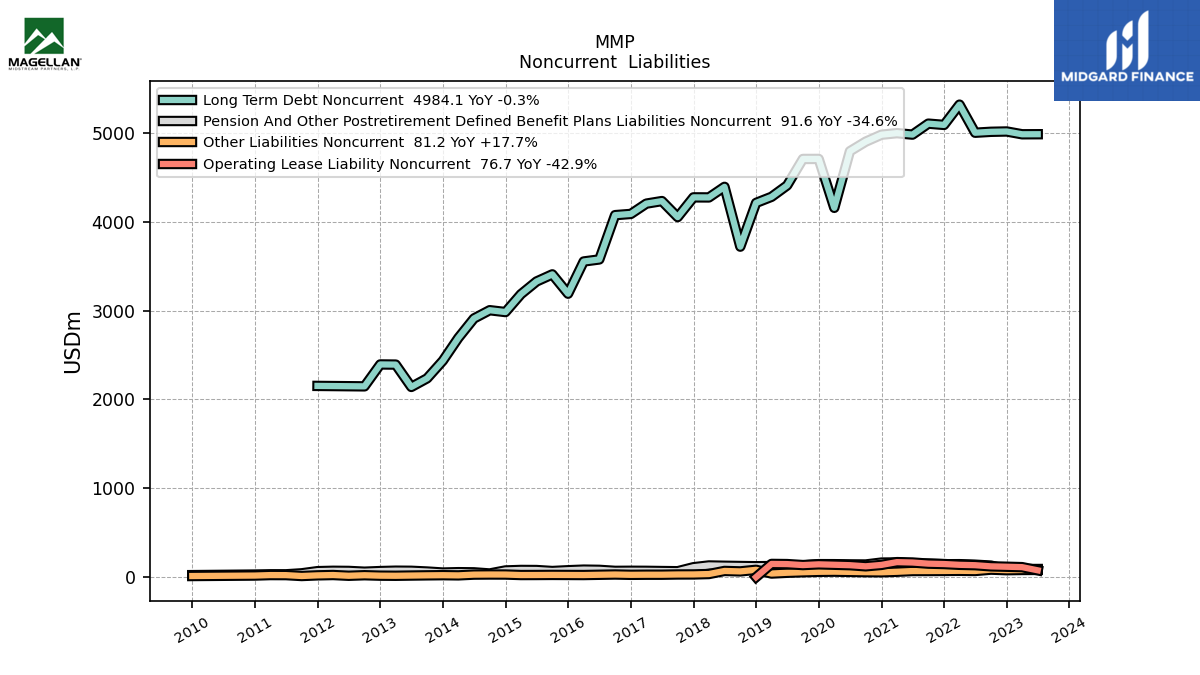
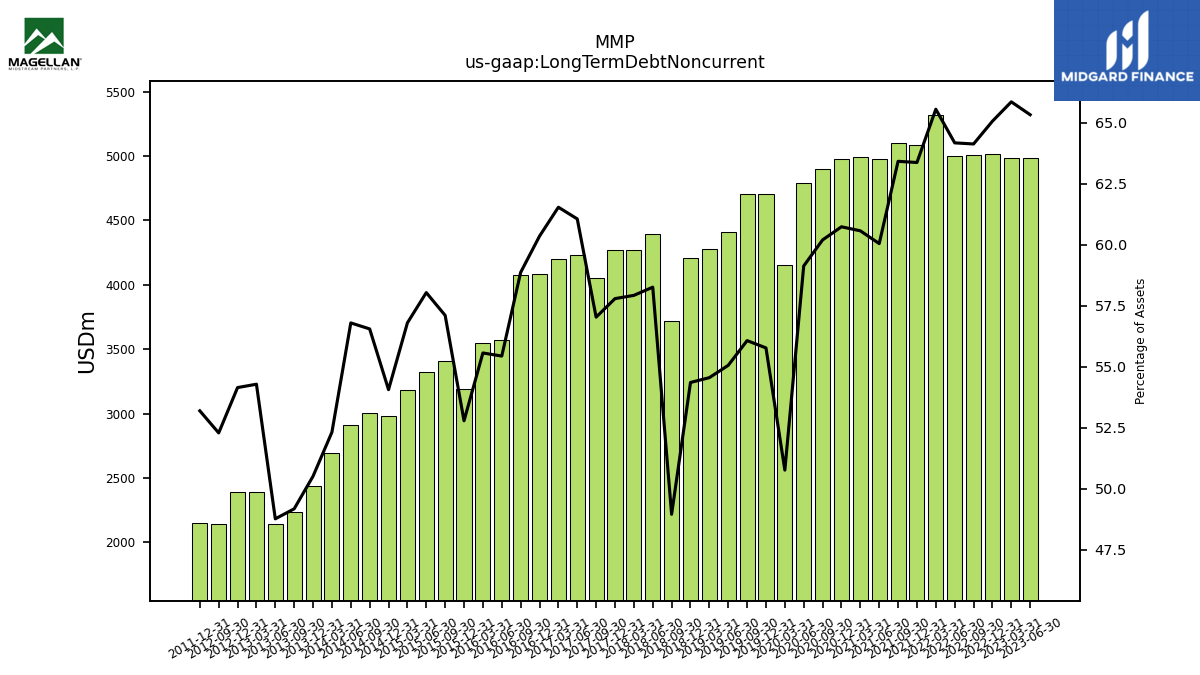
| Long Term Debt Noncurrent | 4984.10 | 4983.50 | 5015.00 | 5011.40 | 5000.90 | 5317.20 | 5088.80 | 5103.23 | 4979.69 | 4996.14 | 4978.69 | 4900.31 | 4792.65 | 4155.44 | 4706.07 | 4705.77 | 4407.79 | 4279.68 | 4211.38 | 3718.61 | 4392.03 | 4272.75 | 4273.52 | 4051.41 | 4231.91 | 4203.08 | 4087.19 | 4073.50 | 3574.90 | 3552.03 | 3189.29 | 3407.11 | 3326.94 | 3183.75 | 2982.89 | 3003.71 | 2910.50 | 2691.29 | 2435.32 | 2236.76 | 2140.08 | 2391.72 | 2393.41 | 2146.75 | NA | NA | 2151.78 | NA | NA | NA | NA | NA | NA | NA | |
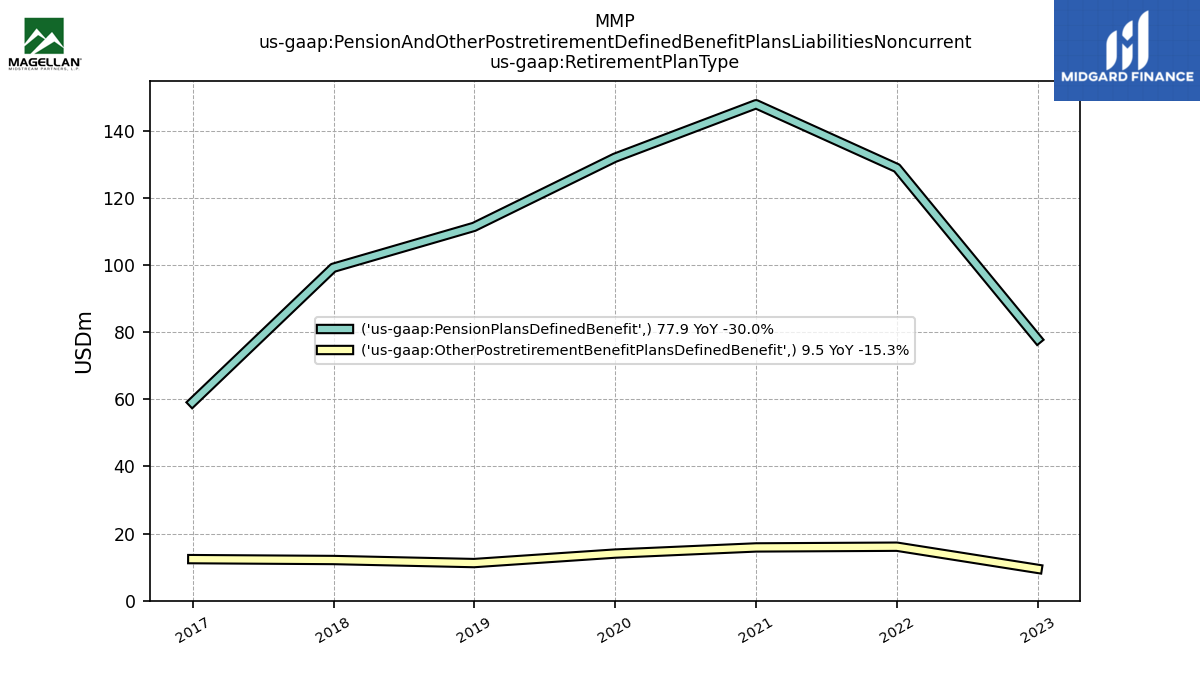
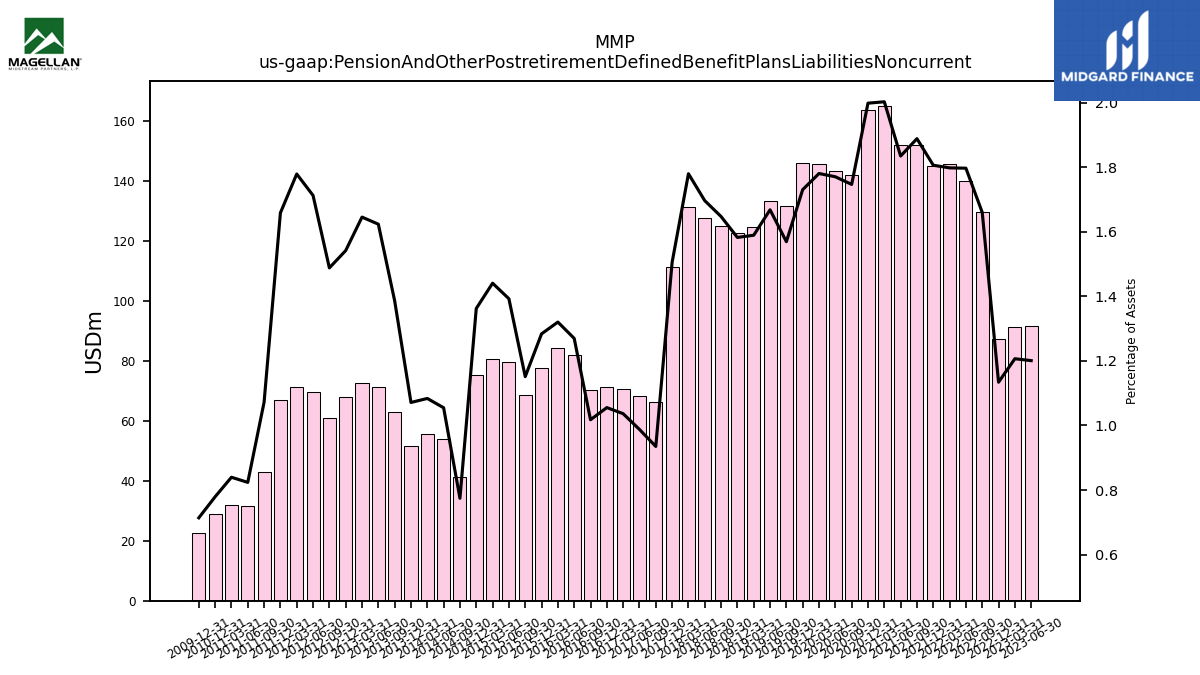
| Pension And Other Postretirement Defined Benefit Plans Liabilities Noncurrent | 91.60 | 91.30 | 87.40 | 129.70 | 140.00 | 145.80 | 145.00 | 151.92 | 152.11 | 165.15 | 163.78 | 142.15 | 143.46 | 145.71 | 145.99 | 131.68 | 133.51 | 124.65 | 122.58 | 125.09 | 127.85 | 131.25 | 111.31 | 66.41 | 68.44 | 70.78 | 71.46 | 70.42 | 81.86 | 84.39 | 77.55 | 68.68 | 79.81 | 80.74 | 75.16 | 41.13 | 54.05 | 55.74 | 51.64 | 63.04 | 71.23 | 72.48 | 68.13 | 61.08 | 69.77 | 71.32 | 67.08 | 42.94 | 31.70 | 31.88 | 28.96 | NA | NA | NA | |
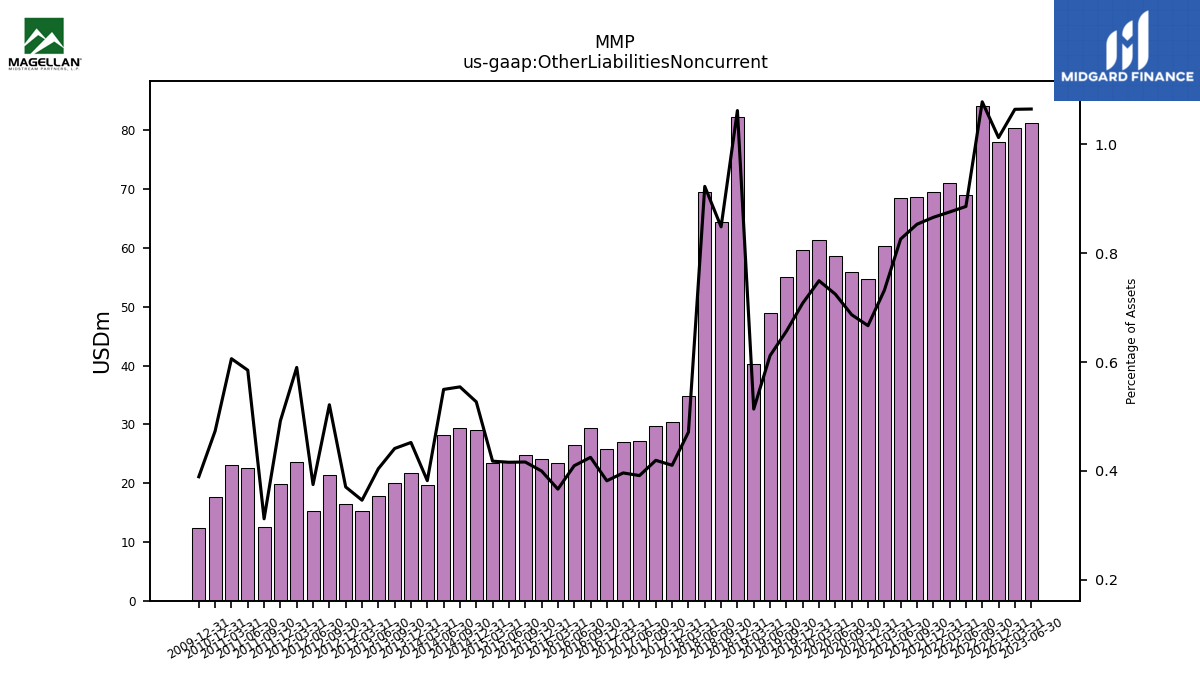
| Other Liabilities Noncurrent | 81.20 | 80.50 | 78.00 | 84.20 | 69.00 | 71.00 | 69.50 | 68.62 | 68.47 | 60.33 | 54.65 | 55.90 | 58.72 | 61.32 | 59.73 | 55.09 | 48.97 | 40.30 | 82.24 | 64.42 | 69.53 | 34.76 | 30.35 | 29.80 | 27.14 | 27.07 | 25.87 | 29.41 | 26.41 | 23.44 | 24.16 | 24.85 | 23.84 | 23.43 | 29.07 | 29.44 | 28.17 | 19.66 | 21.80 | 20.07 | 17.73 | 15.26 | 16.38 | 21.41 | 15.28 | 23.66 | 19.91 | 12.51 | 22.52 | 23.01 | 17.60 | NA | NA | NA | |
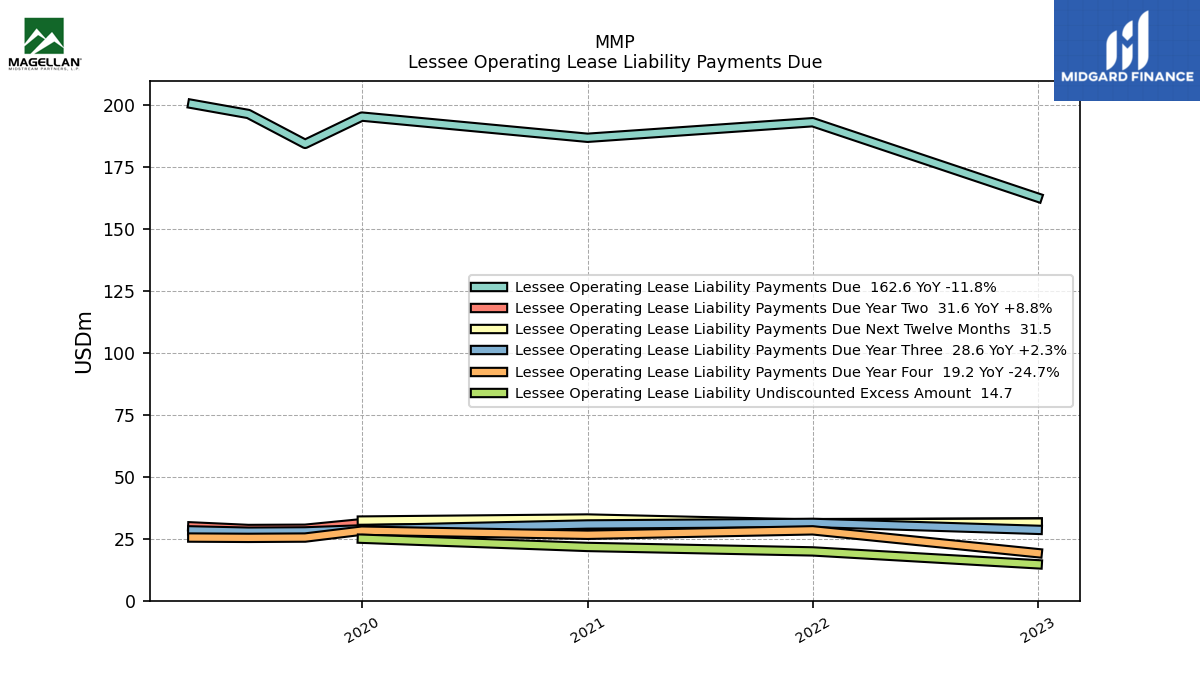
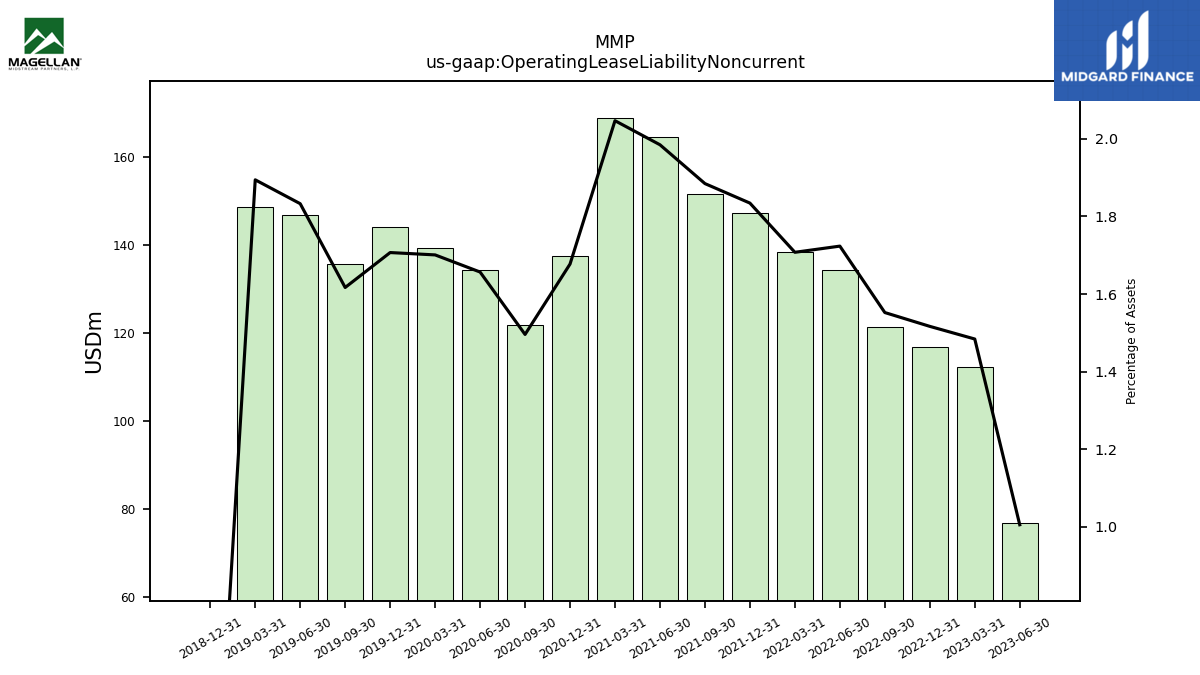
| Operating Lease Liability Noncurrent | 76.70 | 112.30 | 116.90 | 121.30 | 134.30 | 138.50 | 147.30 | 151.65 | 164.58 | 168.82 | 137.48 | 121.76 | 134.27 | 139.22 | 144.02 | 135.69 | 146.73 | 148.60 | 0.00 | NA | NA | NA | NA | NA | NA | NA | NA | NA | NA | NA | NA | NA | NA | NA | NA | NA | NA | NA | NA | NA | NA | NA | NA | NA | NA | NA | NA | NA | NA | NA | NA | NA | NA | NA |
| 2023-06-30 | 2023-03-31 | 2022-12-31 | 2022-09-30 | 2022-06-30 | 2022-03-31 | 2021-12-31 | 2021-09-30 | 2021-06-30 | 2021-03-31 | 2020-12-31 | 2020-09-30 | 2020-06-30 | 2020-03-31 | 2019-12-31 | 2019-09-30 | 2019-06-30 | 2019-03-31 | 2018-12-31 | 2018-09-30 | 2018-06-30 | 2018-03-31 | 2017-12-31 | 2017-09-30 | 2017-06-30 | 2017-03-31 | 2016-12-31 | 2016-09-30 | 2016-06-30 | 2016-03-31 | 2015-12-31 | 2015-09-30 | 2015-06-30 | 2015-03-31 | 2014-12-31 | 2014-09-30 | 2014-06-30 | 2014-03-31 | 2013-12-31 | 2013-09-30 | 2013-06-30 | 2013-03-31 | 2012-12-31 | 2012-09-30 | 2012-06-30 | 2012-03-31 | 2011-12-31 | 2011-09-30 | 2011-06-30 | 2011-03-31 | 2010-12-31 | 2010-09-30 | 2010-06-30 | 2010-03-31 | ||
|---|---|---|---|---|---|---|---|---|---|---|---|---|---|---|---|---|---|---|---|---|---|---|---|---|---|---|---|---|---|---|---|---|---|---|---|---|---|---|---|---|---|---|---|---|---|---|---|---|---|---|---|---|---|---|---|
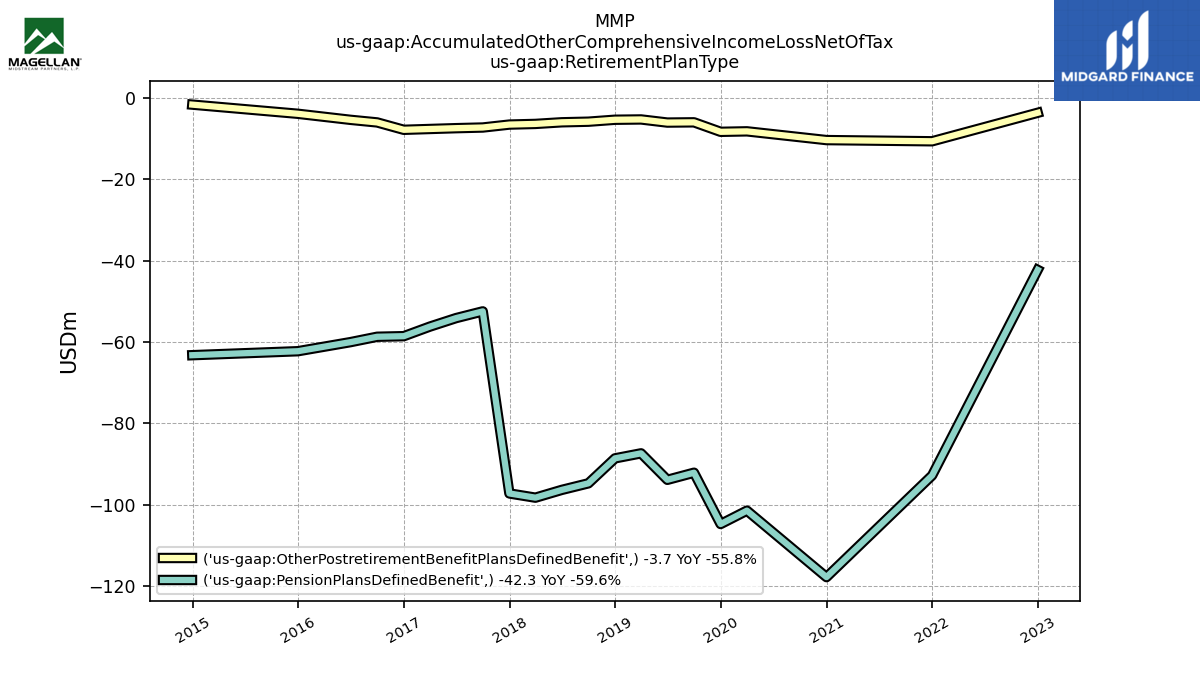
| Accumulated Other Comprehensive Income Loss Net Of Tax | -93.90 | -92.60 | -93.90 | -141.20 | -149.80 | -152.90 | -155.00 | -162.58 | -166.15 | -180.66 | -183.19 | -163.30 | -165.63 | -169.77 | -162.08 | -147.94 | -136.27 | -122.94 | -120.49 | -118.20 | -127.55 | -132.30 | -137.58 | -94.10 | -96.42 | -96.66 | -101.24 | -117.91 | -115.94 | -108.01 | -96.35 | -94.89 | -92.74 | -96.16 | -81.54 | -23.16 | -21.53 | -23.21 | -19.50 | -34.26 | -34.31 | -34.77 | -35.06 | -29.15 | -42.90 | -46.39 | -47.20 | -10.96 | -6.41 | -11.06 | -11.10 | NA | NA | NA | |
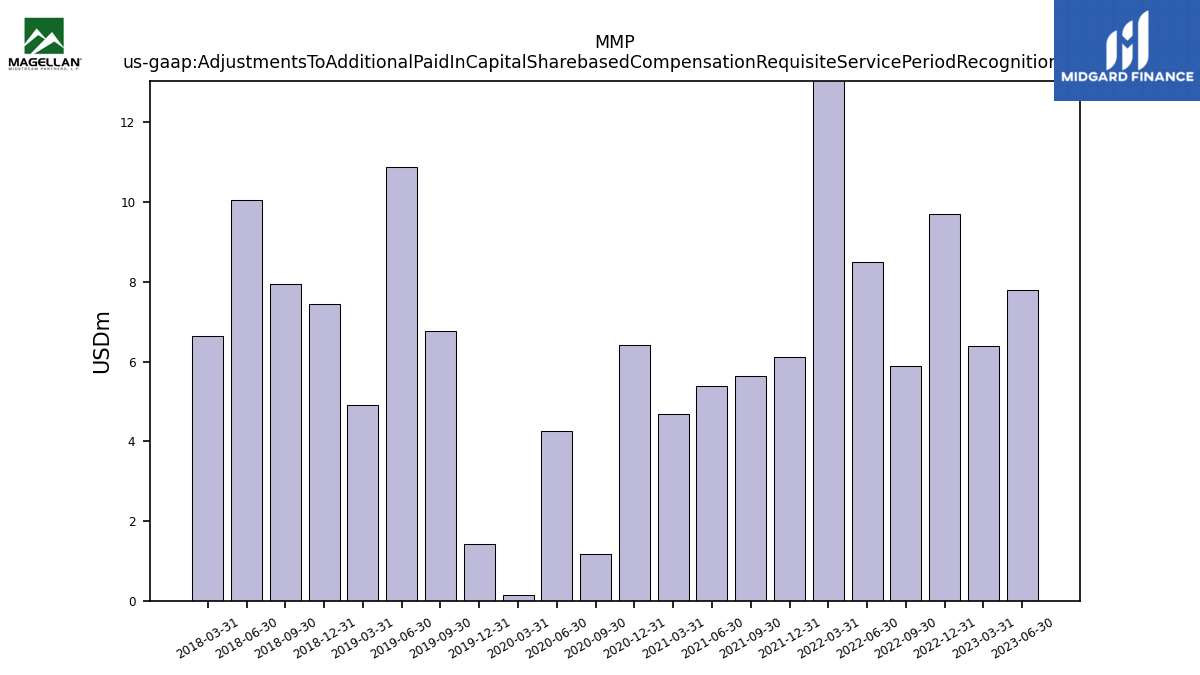
| Adjustments To Additional Paid In Capital Sharebased Compensation Requisite Service Period Recognition Value | 7.80 | 6.40 | 9.70 | 5.90 | 8.50 | 14.40 | 6.11 | 5.63 | 5.38 | 4.68 | 6.41 | 1.17 | 4.26 | 0.15 | 1.44 | 6.77 | 10.89 | 4.91 | 7.44 | 7.93 | 10.05 | 6.63 | NA | NA | NA | NA | NA | NA | NA | NA | NA | NA | NA | NA | NA | NA | NA | NA | NA | NA | NA | NA | NA | NA | NA | NA | NA | NA | NA | NA | NA | NA | NA | NA |
| 2023-06-30 | 2023-03-31 | 2022-12-31 | 2022-09-30 | 2022-06-30 | 2022-03-31 | 2021-12-31 | 2021-09-30 | 2021-06-30 | 2021-03-31 | 2020-12-31 | 2020-09-30 | 2020-06-30 | 2020-03-31 | 2019-12-31 | 2019-09-30 | 2019-06-30 | 2019-03-31 | 2018-12-31 | 2018-09-30 | 2018-06-30 | 2018-03-31 | 2017-12-31 | 2017-09-30 | 2017-06-30 | 2017-03-31 | 2016-12-31 | 2016-09-30 | 2016-06-30 | 2016-03-31 | 2015-12-31 | 2015-09-30 | 2015-06-30 | 2015-03-31 | 2014-12-31 | 2014-09-30 | 2014-06-30 | 2014-03-31 | 2013-12-31 | 2013-09-30 | 2013-06-30 | 2013-03-31 | 2012-12-31 | 2012-09-30 | 2012-06-30 | 2012-03-31 | 2011-12-31 | 2011-09-30 | 2011-06-30 | 2011-03-31 | 2010-12-31 | 2010-09-30 | 2010-06-30 | 2010-03-31 | ||
|---|---|---|---|---|---|---|---|---|---|---|---|---|---|---|---|---|---|---|---|---|---|---|---|---|---|---|---|---|---|---|---|---|---|---|---|---|---|---|---|---|---|---|---|---|---|---|---|---|---|---|---|---|---|---|---|
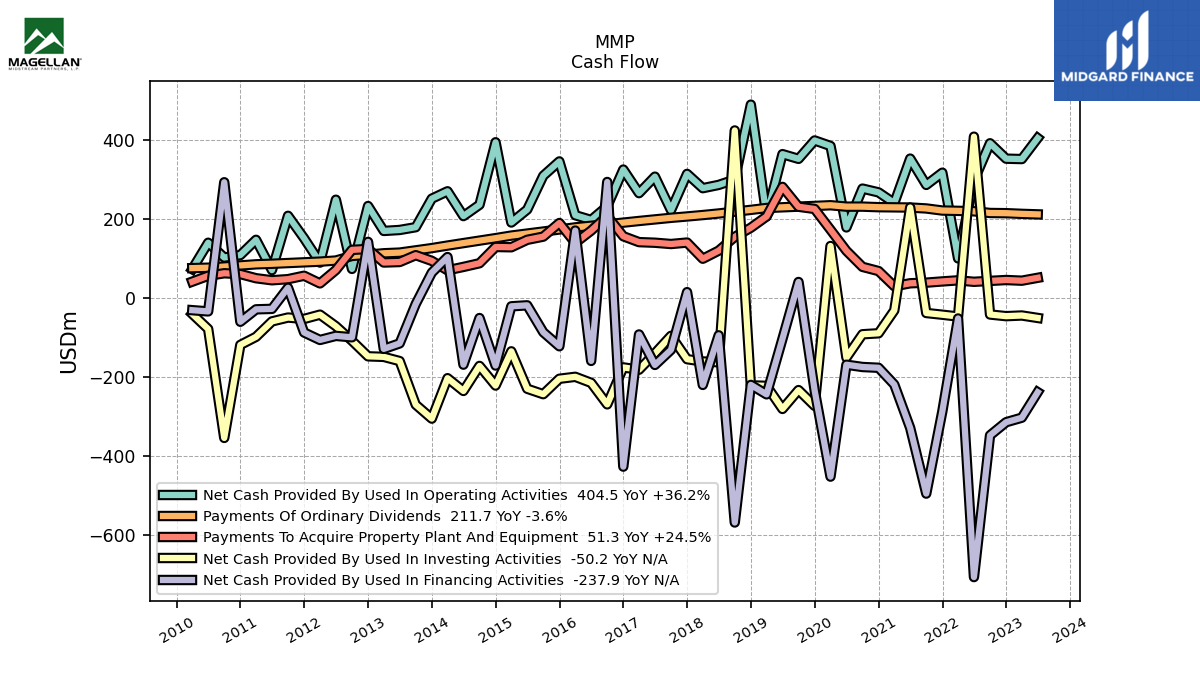
| Net Cash Provided By Used In Operating Activities | 404.50 | 351.50 | 352.50 | 391.50 | 296.90 | 100.40 | 317.12 | 286.12 | 352.72 | 240.24 | 267.27 | 276.85 | 178.63 | 384.62 | 398.58 | 352.04 | 364.00 | 206.56 | 489.17 | 299.71 | 286.16 | 277.90 | 314.11 | 222.16 | 307.08 | 265.33 | 325.05 | 231.93 | 197.50 | 209.57 | 345.59 | 309.29 | 223.74 | 191.08 | 393.99 | 235.96 | 207.28 | 270.07 | 251.46 | 179.23 | 172.23 | 169.78 | 232.85 | 73.76 | 248.75 | 89.74 | 151.18 | 208.09 | 70.67 | 147.38 | 108.77 | 102.59 | 139.97 | 73.34 | |
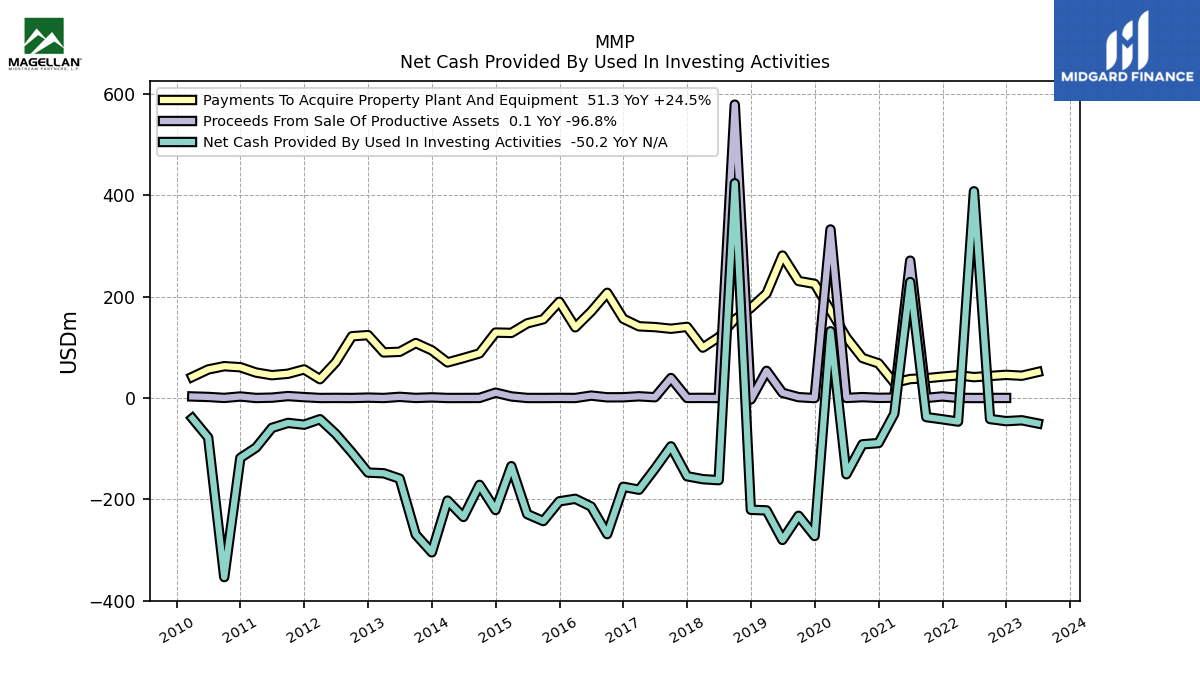
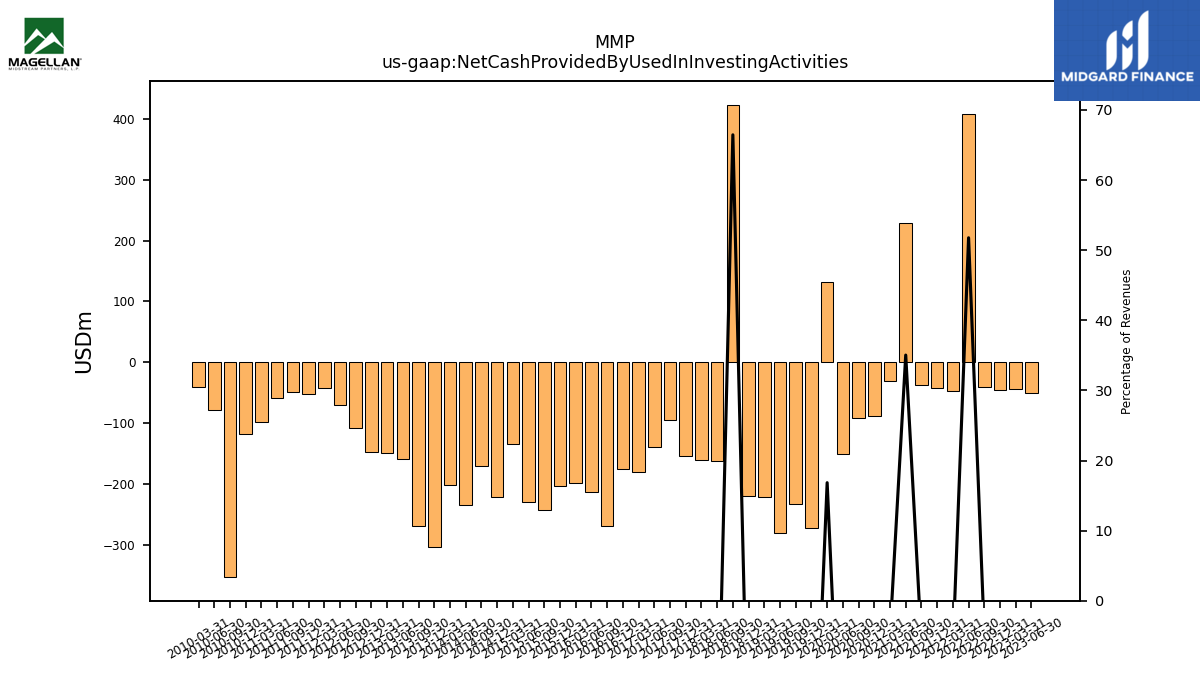
| Net Cash Provided By Used In Investing Activities | -50.20 | -44.00 | -45.70 | -41.50 | 408.20 | -46.60 | -42.04 | -37.69 | 229.00 | -31.16 | -88.98 | -91.46 | -150.60 | 131.79 | -272.50 | -232.57 | -280.28 | -221.89 | -220.69 | 423.93 | -162.26 | -160.23 | -154.48 | -95.41 | -139.64 | -181.10 | -175.25 | -268.74 | -214.34 | -199.03 | -203.98 | -242.98 | -229.25 | -134.57 | -221.18 | -171.48 | -234.84 | -202.48 | -304.75 | -269.48 | -159.20 | -148.62 | -147.25 | -107.86 | -71.11 | -41.86 | -52.69 | -49.16 | -58.97 | -97.92 | -118.36 | -353.63 | -78.11 | -40.05 | |
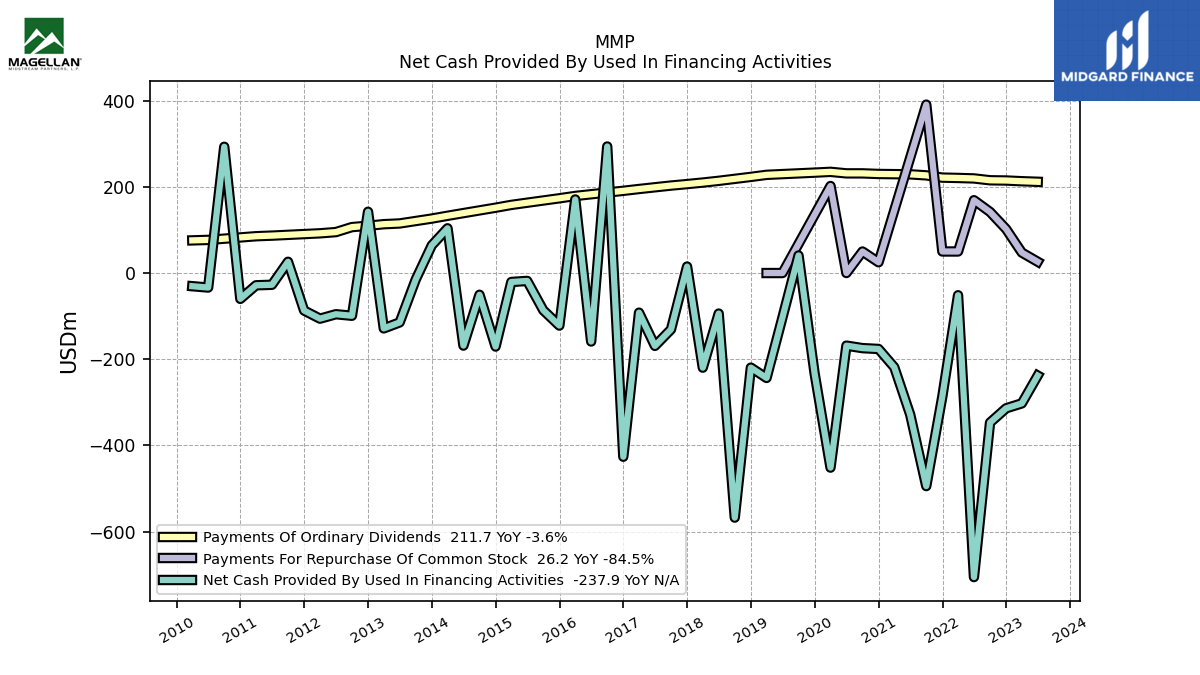
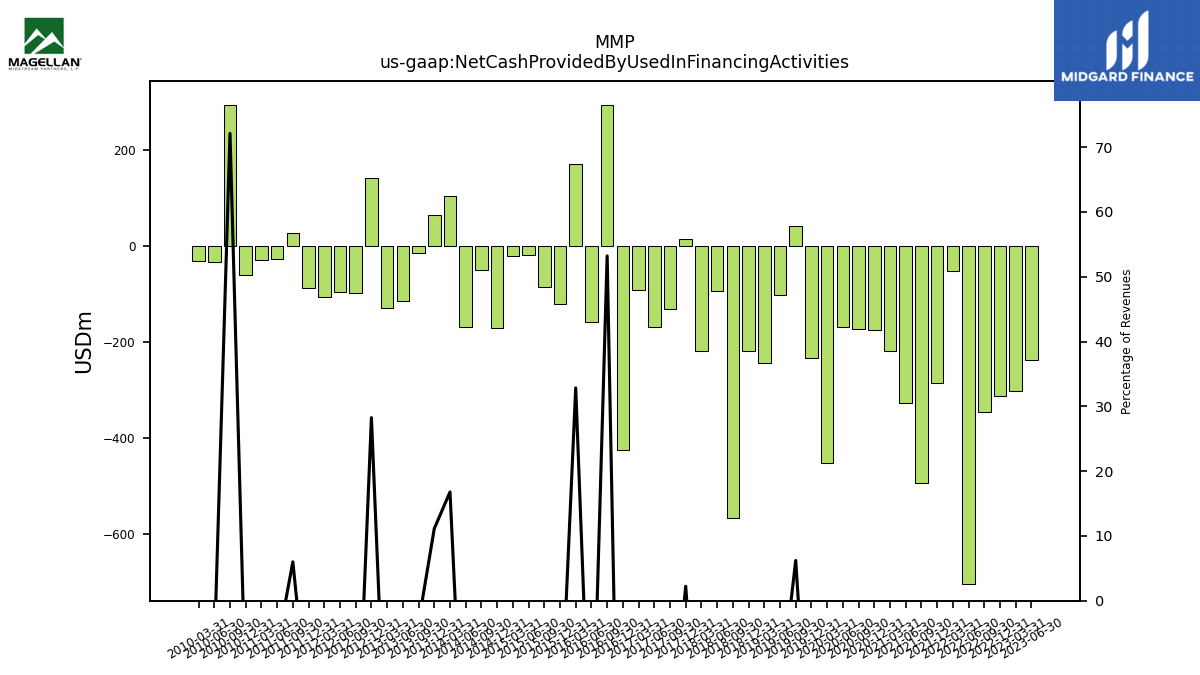
| Net Cash Provided By Used In Financing Activities | -237.90 | -302.40 | -313.80 | -347.00 | -705.50 | -51.50 | -286.47 | -494.37 | -328.29 | -218.57 | -176.18 | -174.21 | -168.44 | -451.46 | -232.97 | 40.78 | -103.01 | -243.39 | -219.44 | -567.47 | -94.05 | -219.54 | 15.06 | -130.84 | -169.03 | -91.87 | -426.19 | 293.65 | -158.89 | 170.72 | -121.89 | -86.33 | -18.27 | -20.77 | -170.59 | -50.36 | -168.34 | 103.80 | 64.30 | -15.02 | -114.54 | -128.44 | 142.19 | -99.12 | -95.56 | -105.86 | -86.94 | 26.15 | -27.25 | -28.41 | -59.94 | 292.97 | -33.67 | -30.54 |
| 2023-06-30 | 2023-03-31 | 2022-12-31 | 2022-09-30 | 2022-06-30 | 2022-03-31 | 2021-12-31 | 2021-09-30 | 2021-06-30 | 2021-03-31 | 2020-12-31 | 2020-09-30 | 2020-06-30 | 2020-03-31 | 2019-12-31 | 2019-09-30 | 2019-06-30 | 2019-03-31 | 2018-12-31 | 2018-09-30 | 2018-06-30 | 2018-03-31 | 2017-12-31 | 2017-09-30 | 2017-06-30 | 2017-03-31 | 2016-12-31 | 2016-09-30 | 2016-06-30 | 2016-03-31 | 2015-12-31 | 2015-09-30 | 2015-06-30 | 2015-03-31 | 2014-12-31 | 2014-09-30 | 2014-06-30 | 2014-03-31 | 2013-12-31 | 2013-09-30 | 2013-06-30 | 2013-03-31 | 2012-12-31 | 2012-09-30 | 2012-06-30 | 2012-03-31 | 2011-12-31 | 2011-09-30 | 2011-06-30 | 2011-03-31 | 2010-12-31 | 2010-09-30 | 2010-06-30 | 2010-03-31 | ||
|---|---|---|---|---|---|---|---|---|---|---|---|---|---|---|---|---|---|---|---|---|---|---|---|---|---|---|---|---|---|---|---|---|---|---|---|---|---|---|---|---|---|---|---|---|---|---|---|---|---|---|---|---|---|---|---|
| Net Cash Provided By Used In Operating Activities | 404.50 | 351.50 | 352.50 | 391.50 | 296.90 | 100.40 | 317.12 | 286.12 | 352.72 | 240.24 | 267.27 | 276.85 | 178.63 | 384.62 | 398.58 | 352.04 | 364.00 | 206.56 | 489.17 | 299.71 | 286.16 | 277.90 | 314.11 | 222.16 | 307.08 | 265.33 | 325.05 | 231.93 | 197.50 | 209.57 | 345.59 | 309.29 | 223.74 | 191.08 | 393.99 | 235.96 | 207.28 | 270.07 | 251.46 | 179.23 | 172.23 | 169.78 | 232.85 | 73.76 | 248.75 | 89.74 | 151.18 | 208.09 | 70.67 | 147.38 | 108.77 | 102.59 | 139.97 | 73.34 | |
| Profit Loss | 238.70 | 273.90 | 187.00 | 330.00 | 353.90 | 165.50 | 243.67 | 236.60 | 280.42 | 221.32 | 183.92 | 211.64 | 133.84 | 287.56 | 286.44 | 273.04 | 253.70 | 207.66 | 314.07 | 594.53 | 214.41 | 210.91 | 237.90 | 198.50 | 210.40 | 222.74 | 213.29 | 194.55 | 187.86 | 207.07 | NA | NA | NA | NA | NA | NA | NA | NA | NA | NA | NA | NA | NA | NA | NA | 93.52 | 110.26 | 110.24 | 103.00 | 90.06 | 87.96 | 56.64 | 102.45 | 64.53 | |
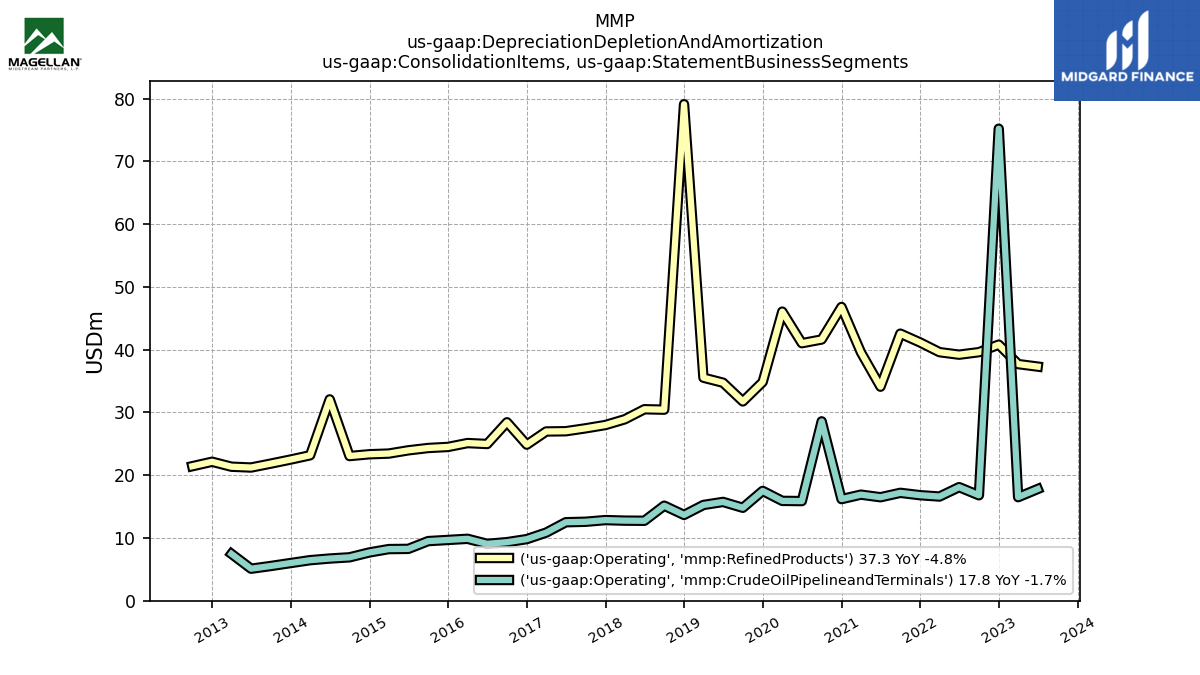
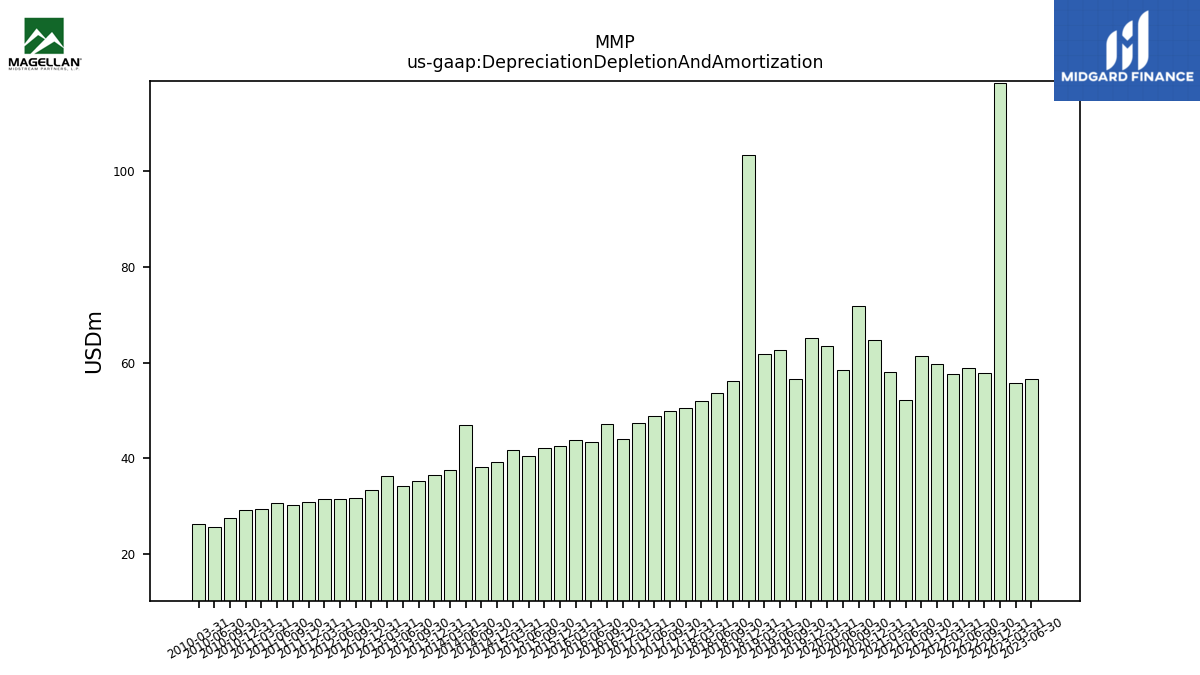
| Depreciation Depletion And Amortization | 56.60 | 55.80 | 118.40 | 57.90 | 58.80 | 57.70 | 59.60 | 61.40 | 52.26 | 58.13 | 64.78 | 71.82 | 58.54 | 63.53 | 65.11 | 56.63 | 62.53 | 61.87 | 103.35 | 56.23 | 53.62 | 51.88 | 50.53 | 49.91 | 48.90 | 47.30 | 44.01 | 47.08 | 43.30 | 43.75 | 42.63 | 42.04 | 40.44 | 41.70 | 39.28 | 38.05 | 46.90 | 37.51 | 36.44 | 35.27 | 34.19 | 36.33 | 33.32 | 31.69 | 31.49 | 31.51 | 30.92 | 30.23 | 30.66 | 29.36 | 29.21 | 27.40 | 25.71 | 26.34 | |
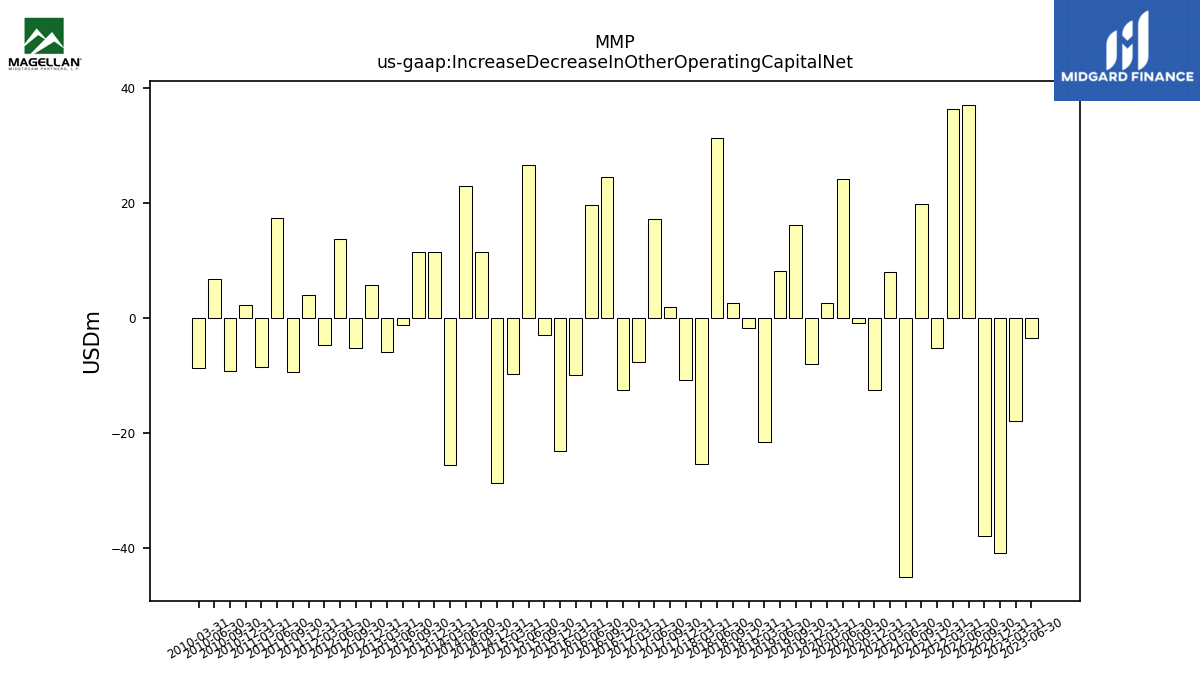
| Increase Decrease In Other Operating Capital Net | -3.50 | -17.90 | -40.80 | -38.00 | 37.10 | 36.30 | -5.29 | 19.87 | -45.08 | 8.00 | -12.51 | -0.84 | 24.09 | 2.54 | -8.06 | 16.24 | 8.09 | -21.58 | -1.78 | 2.63 | 31.26 | -25.41 | -10.80 | 1.98 | 17.14 | -7.62 | -12.47 | 24.56 | 19.57 | -9.90 | -23.07 | -2.91 | 26.55 | -9.83 | -28.67 | 11.49 | 22.89 | -25.59 | 11.52 | 11.44 | -1.17 | -5.92 | 5.73 | -5.25 | 13.76 | -4.73 | 4.02 | -9.45 | 17.44 | -8.54 | 2.17 | -9.16 | 6.71 | -8.72 | |
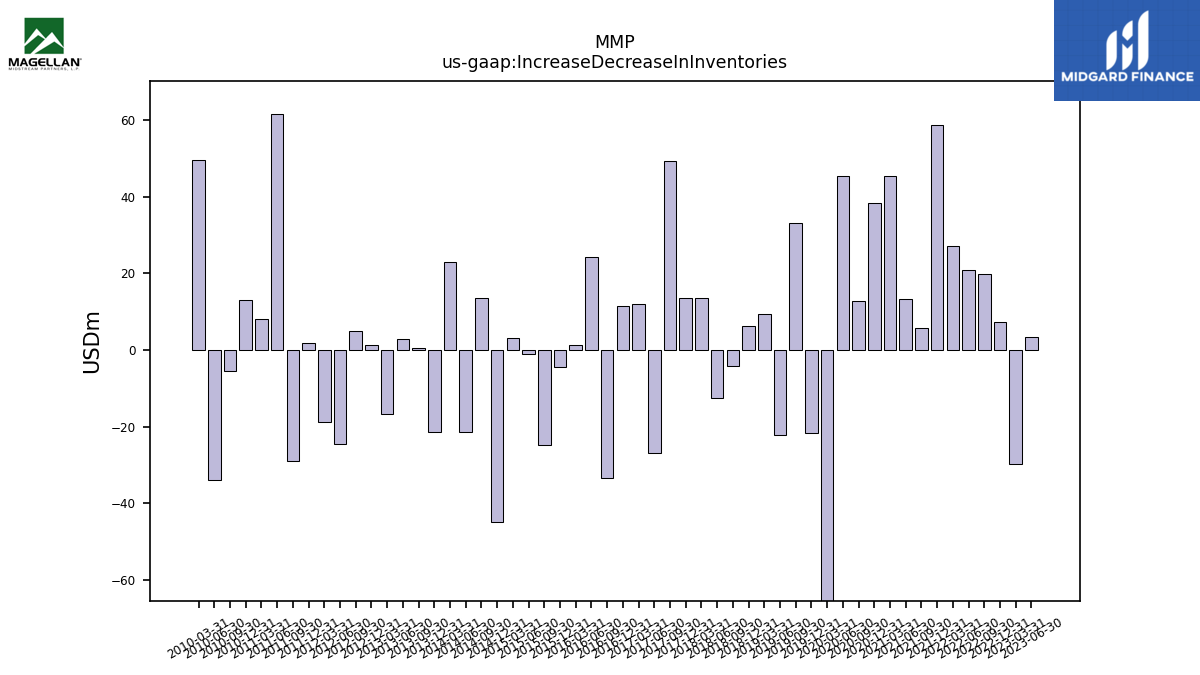
| Increase Decrease In Inventories | 3.50 | -29.60 | 7.40 | 19.80 | 20.80 | 27.10 | 58.54 | 5.66 | 13.32 | 45.38 | 38.36 | 12.65 | 45.23 | -112.01 | -21.55 | 33.05 | -22.14 | 9.31 | 6.37 | -4.21 | -12.41 | 13.64 | 13.58 | 49.31 | -26.98 | 12.05 | 11.37 | -33.42 | 24.34 | 1.22 | -4.31 | -24.74 | -1.03 | 3.19 | -44.71 | 13.53 | -21.29 | 23.01 | -21.26 | 0.58 | 2.75 | -16.74 | 1.17 | 5.05 | -24.50 | -18.69 | 1.74 | -28.88 | 61.44 | 8.15 | 13.13 | -5.53 | -33.84 | 49.64 | |
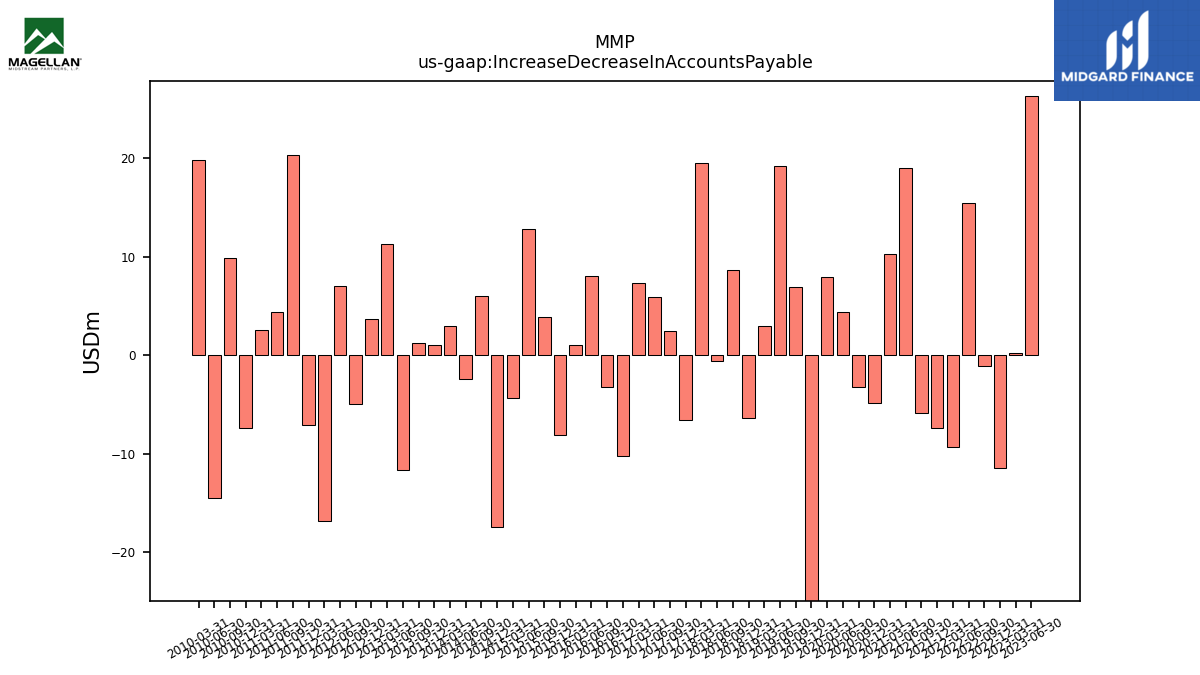
| Increase Decrease In Accounts Payable | 26.30 | 0.20 | -11.50 | -1.10 | 15.40 | -9.30 | -7.41 | -5.85 | 19.02 | 10.23 | -4.82 | -3.27 | 4.39 | 7.93 | -30.25 | 6.90 | 19.20 | 2.91 | -6.35 | 8.65 | -0.61 | 19.46 | -6.62 | 2.44 | 5.86 | 7.28 | -10.27 | -3.27 | 8.07 | 1.05 | -8.12 | 3.82 | 12.76 | -4.35 | -17.40 | 6.00 | -2.47 | 2.96 | 1.05 | 1.28 | -11.63 | 11.31 | 3.67 | -4.96 | 6.98 | -16.86 | -7.07 | 20.29 | 4.41 | 2.60 | -7.44 | 9.85 | -14.47 | 19.85 | |
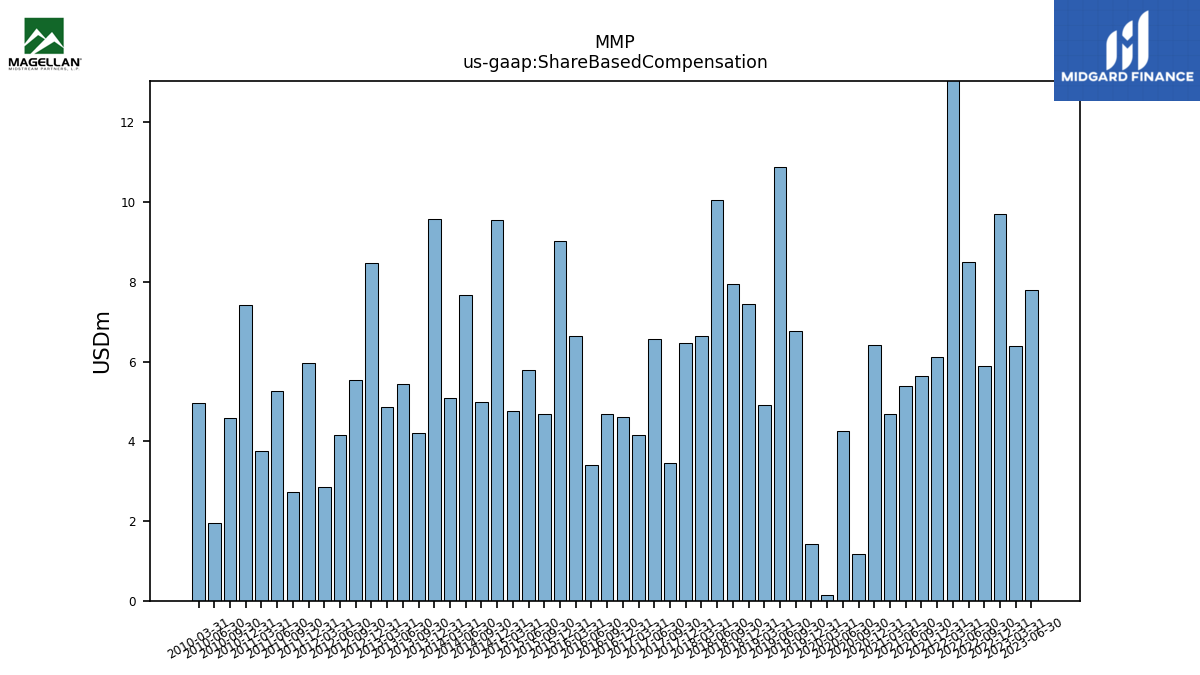
| Share Based Compensation | 7.80 | 6.40 | 9.70 | 5.90 | 8.50 | 14.40 | 6.11 | 5.63 | 5.38 | 4.68 | 6.41 | 1.17 | 4.26 | 0.15 | 1.44 | 6.77 | 10.89 | 4.91 | 7.44 | 7.93 | 10.05 | 6.63 | 6.46 | 3.47 | 6.57 | 4.15 | 4.62 | 4.68 | 3.41 | 6.65 | 9.02 | 4.69 | 5.79 | 4.75 | 9.55 | 4.98 | 7.67 | 5.09 | 9.58 | 4.22 | 5.43 | 4.86 | 8.48 | 5.55 | 4.17 | 2.84 | 5.96 | 2.73 | 5.27 | 3.75 | 7.42 | 4.57 | 1.95 | 4.96 |
| 2023-06-30 | 2023-03-31 | 2022-12-31 | 2022-09-30 | 2022-06-30 | 2022-03-31 | 2021-12-31 | 2021-09-30 | 2021-06-30 | 2021-03-31 | 2020-12-31 | 2020-09-30 | 2020-06-30 | 2020-03-31 | 2019-12-31 | 2019-09-30 | 2019-06-30 | 2019-03-31 | 2018-12-31 | 2018-09-30 | 2018-06-30 | 2018-03-31 | 2017-12-31 | 2017-09-30 | 2017-06-30 | 2017-03-31 | 2016-12-31 | 2016-09-30 | 2016-06-30 | 2016-03-31 | 2015-12-31 | 2015-09-30 | 2015-06-30 | 2015-03-31 | 2014-12-31 | 2014-09-30 | 2014-06-30 | 2014-03-31 | 2013-12-31 | 2013-09-30 | 2013-06-30 | 2013-03-31 | 2012-12-31 | 2012-09-30 | 2012-06-30 | 2012-03-31 | 2011-12-31 | 2011-09-30 | 2011-06-30 | 2011-03-31 | 2010-12-31 | 2010-09-30 | 2010-06-30 | 2010-03-31 | ||
|---|---|---|---|---|---|---|---|---|---|---|---|---|---|---|---|---|---|---|---|---|---|---|---|---|---|---|---|---|---|---|---|---|---|---|---|---|---|---|---|---|---|---|---|---|---|---|---|---|---|---|---|---|---|---|---|
| Net Cash Provided By Used In Investing Activities | -50.20 | -44.00 | -45.70 | -41.50 | 408.20 | -46.60 | -42.04 | -37.69 | 229.00 | -31.16 | -88.98 | -91.46 | -150.60 | 131.79 | -272.50 | -232.57 | -280.28 | -221.89 | -220.69 | 423.93 | -162.26 | -160.23 | -154.48 | -95.41 | -139.64 | -181.10 | -175.25 | -268.74 | -214.34 | -199.03 | -203.98 | -242.98 | -229.25 | -134.57 | -221.18 | -171.48 | -234.84 | -202.48 | -304.75 | -269.48 | -159.20 | -148.62 | -147.25 | -107.86 | -71.11 | -41.86 | -52.69 | -49.16 | -58.97 | -97.92 | -118.36 | -353.63 | -78.11 | -40.05 | |
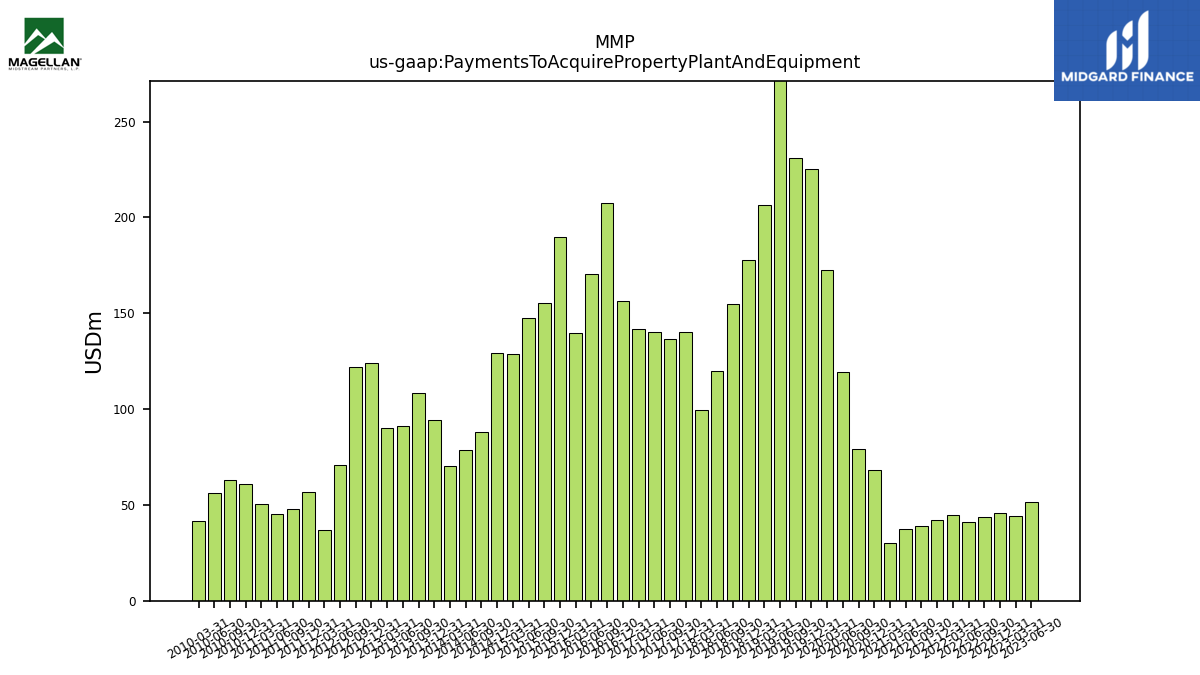
| Payments To Acquire Property Plant And Equipment | 51.30 | 44.00 | 45.70 | 43.50 | 41.20 | 44.90 | 42.14 | 39.05 | 37.45 | 29.95 | 68.40 | 78.95 | 119.55 | 172.67 | 225.38 | 230.94 | 281.23 | 206.44 | 177.94 | 154.88 | 119.97 | 99.47 | 140.43 | 136.74 | 139.99 | 141.51 | 156.35 | 207.68 | 170.61 | 139.52 | 189.89 | 155.41 | 147.33 | 128.52 | 129.21 | 88.10 | 78.84 | 70.30 | 94.09 | 108.50 | 91.22 | 89.95 | 124.15 | 121.92 | 70.96 | 37.14 | 56.50 | 47.89 | 45.05 | 50.22 | 60.73 | 62.81 | 56.33 | 41.55 |
| 2023-06-30 | 2023-03-31 | 2022-12-31 | 2022-09-30 | 2022-06-30 | 2022-03-31 | 2021-12-31 | 2021-09-30 | 2021-06-30 | 2021-03-31 | 2020-12-31 | 2020-09-30 | 2020-06-30 | 2020-03-31 | 2019-12-31 | 2019-09-30 | 2019-06-30 | 2019-03-31 | 2018-12-31 | 2018-09-30 | 2018-06-30 | 2018-03-31 | 2017-12-31 | 2017-09-30 | 2017-06-30 | 2017-03-31 | 2016-12-31 | 2016-09-30 | 2016-06-30 | 2016-03-31 | 2015-12-31 | 2015-09-30 | 2015-06-30 | 2015-03-31 | 2014-12-31 | 2014-09-30 | 2014-06-30 | 2014-03-31 | 2013-12-31 | 2013-09-30 | 2013-06-30 | 2013-03-31 | 2012-12-31 | 2012-09-30 | 2012-06-30 | 2012-03-31 | 2011-12-31 | 2011-09-30 | 2011-06-30 | 2011-03-31 | 2010-12-31 | 2010-09-30 | 2010-06-30 | 2010-03-31 | ||
|---|---|---|---|---|---|---|---|---|---|---|---|---|---|---|---|---|---|---|---|---|---|---|---|---|---|---|---|---|---|---|---|---|---|---|---|---|---|---|---|---|---|---|---|---|---|---|---|---|---|---|---|---|---|---|---|
| Net Cash Provided By Used In Financing Activities | -237.90 | -302.40 | -313.80 | -347.00 | -705.50 | -51.50 | -286.47 | -494.37 | -328.29 | -218.57 | -176.18 | -174.21 | -168.44 | -451.46 | -232.97 | 40.78 | -103.01 | -243.39 | -219.44 | -567.47 | -94.05 | -219.54 | 15.06 | -130.84 | -169.03 | -91.87 | -426.19 | 293.65 | -158.89 | 170.72 | -121.89 | -86.33 | -18.27 | -20.77 | -170.59 | -50.36 | -168.34 | 103.80 | 64.30 | -15.02 | -114.54 | -128.44 | 142.19 | -99.12 | -95.56 | -105.86 | -86.94 | 26.15 | -27.25 | -28.41 | -59.94 | 292.97 | -33.67 | -30.54 | |
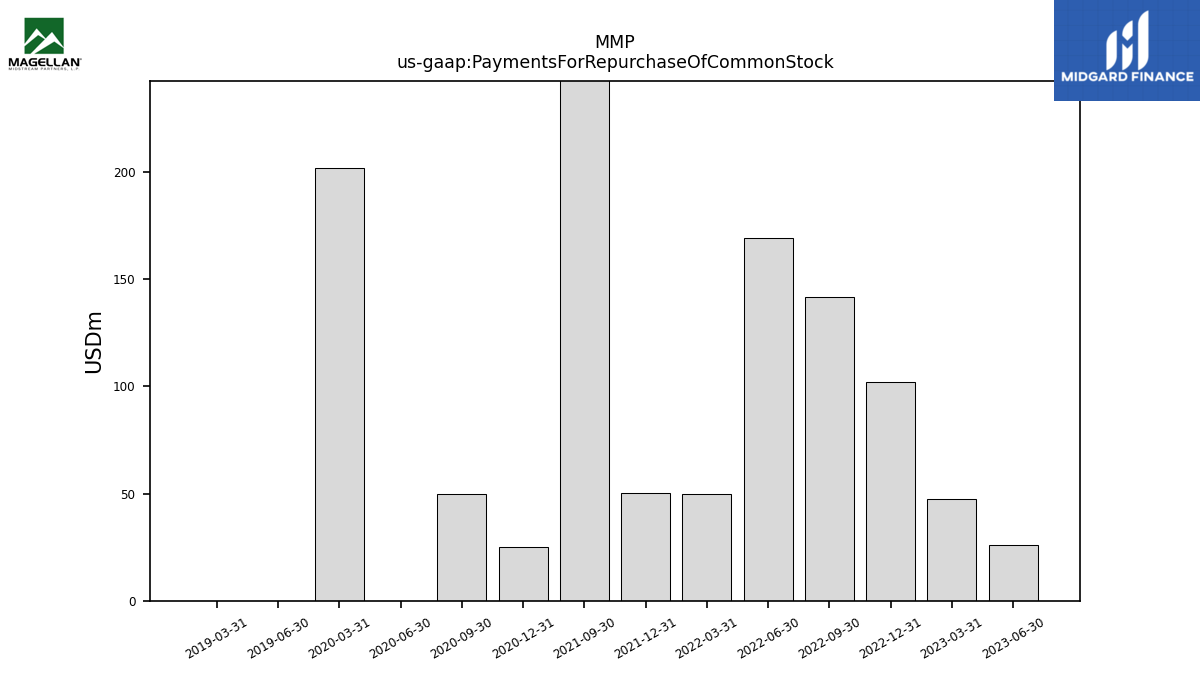
| Payments For Repurchase Of Common Stock | 26.20 | 47.50 | 102.10 | 141.80 | 169.00 | 50.00 | 50.04 | 390.74 | NA | NA | 24.99 | 49.97 | 0.00 | 201.98 | NA | NA | 0.00 | 0.00 | NA | NA | NA | NA | NA | NA | NA | NA | NA | NA | NA | NA | NA | NA | NA | NA | NA | NA | NA | NA | NA | NA | NA | NA | NA | NA | NA | NA | NA | NA | NA | NA | NA | NA | NA | NA |
| 2023-06-30 | 2023-03-31 | 2022-12-31 | 2022-09-30 | 2022-06-30 | 2022-03-31 | 2021-12-31 | 2021-09-30 | 2021-06-30 | 2021-03-31 | 2020-12-31 | 2020-09-30 | 2020-06-30 | 2020-03-31 | 2019-12-31 | 2019-09-30 | 2019-06-30 | 2019-03-31 | 2018-12-31 | 2018-09-30 | 2018-06-30 | 2018-03-31 | 2017-12-31 | 2017-09-30 | 2017-06-30 | 2017-03-31 | 2016-12-31 | 2016-09-30 | 2016-06-30 | 2016-03-31 | 2015-12-31 | 2015-09-30 | 2015-06-30 | 2015-03-31 | 2014-12-31 | 2014-09-30 | 2014-06-30 | 2014-03-31 | 2013-12-31 | 2013-09-30 | 2013-06-30 | 2013-03-31 | 2012-12-31 | 2012-09-30 | 2012-06-30 | 2012-03-31 | 2011-12-31 | 2011-09-30 | 2011-06-30 | 2011-03-31 | 2010-12-31 | 2010-09-30 | 2010-06-30 | 2010-03-31 | ||
|---|---|---|---|---|---|---|---|---|---|---|---|---|---|---|---|---|---|---|---|---|---|---|---|---|---|---|---|---|---|---|---|---|---|---|---|---|---|---|---|---|---|---|---|---|---|---|---|---|---|---|---|---|---|---|---|
| Revenues | 877.20 | 869.70 | 861.00 | 876.10 | 788.60 | 674.70 | 809.33 | 639.05 | 653.64 | 661.07 | 586.32 | 598.26 | 460.41 | 782.81 | 740.68 | 656.60 | 701.70 | 628.93 | 865.68 | 638.02 | 644.09 | 678.78 | 673.30 | 572.85 | 619.44 | 642.07 | 614.91 | 551.78 | 518.90 | 519.82 | 573.05 | 577.23 | 487.54 | 522.09 | 667.07 | 521.60 | 496.45 | 618.61 | 577.44 | 443.83 | 443.91 | 432.42 | 503.19 | 325.87 | 449.53 | 493.48 | 486.93 | 435.51 | 383.33 | 442.90 | 398.49 | 406.20 | 423.06 | 329.69 | |
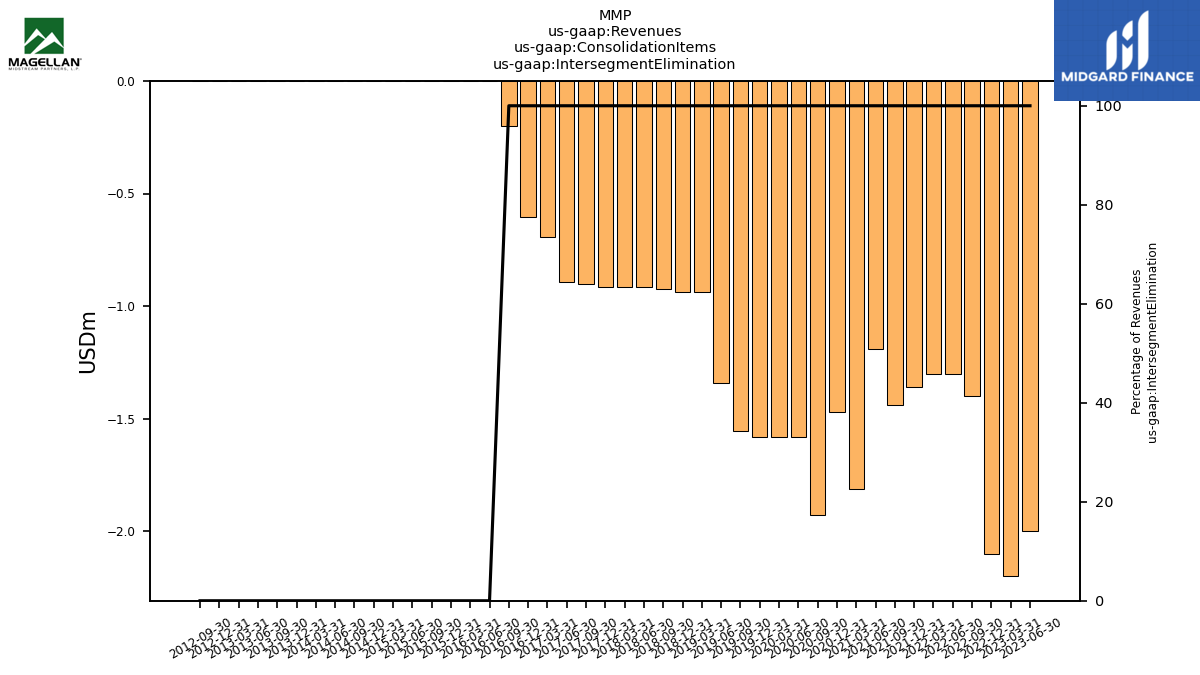
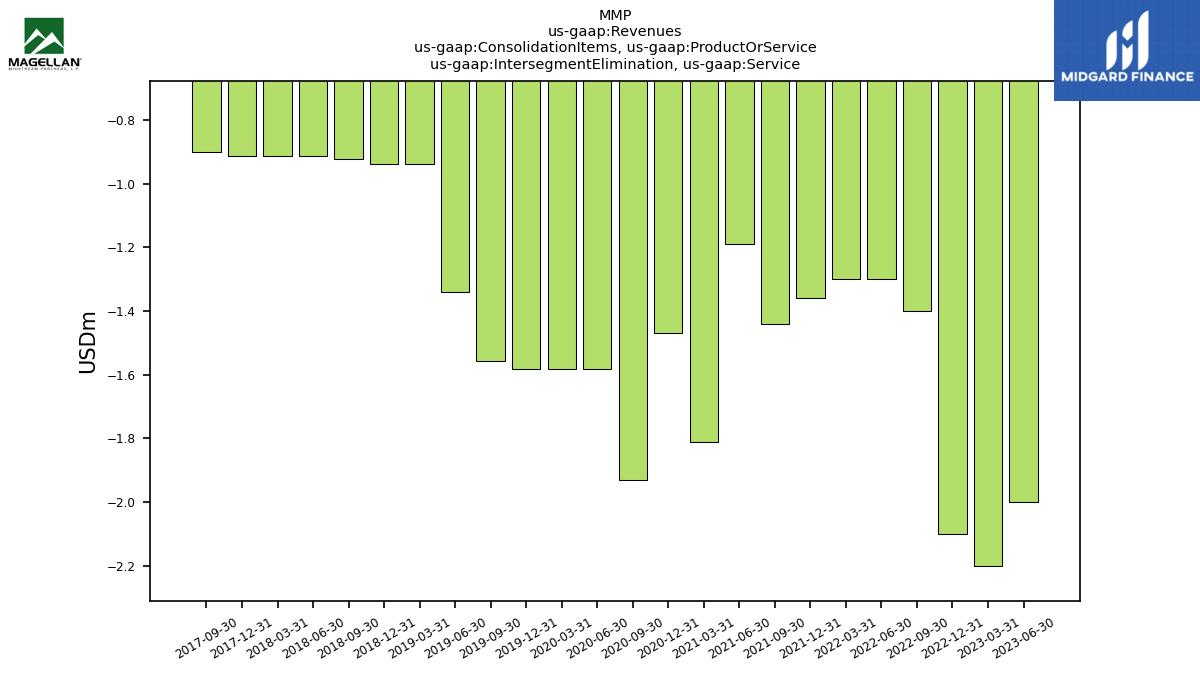
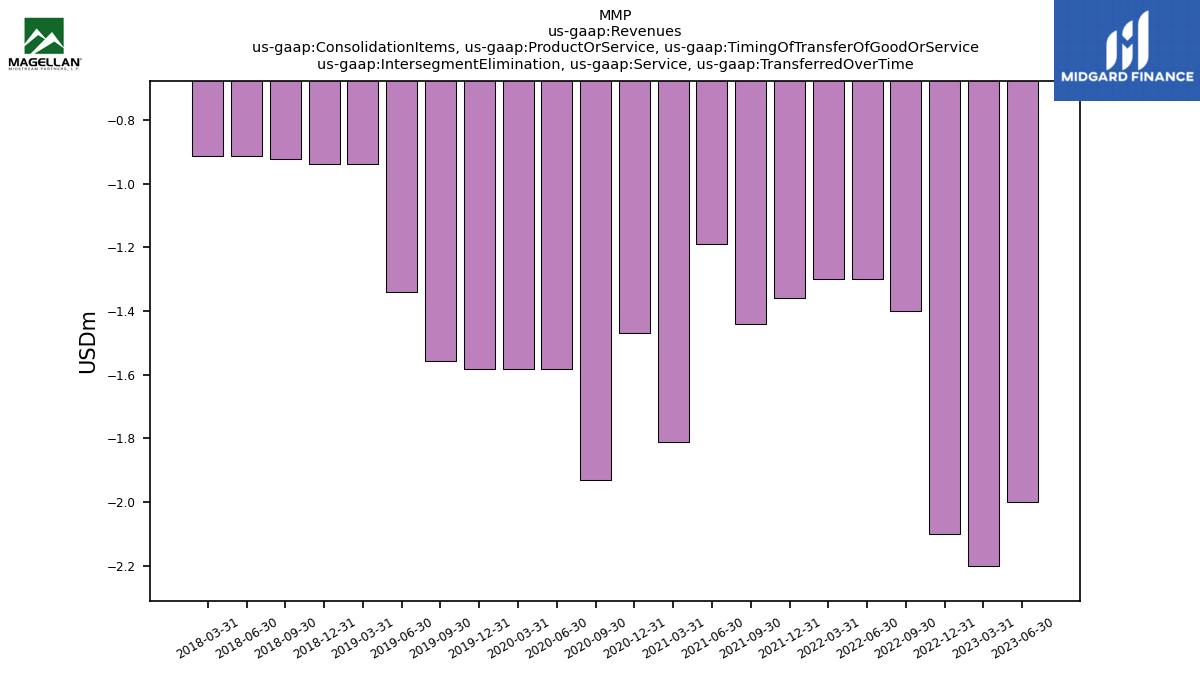
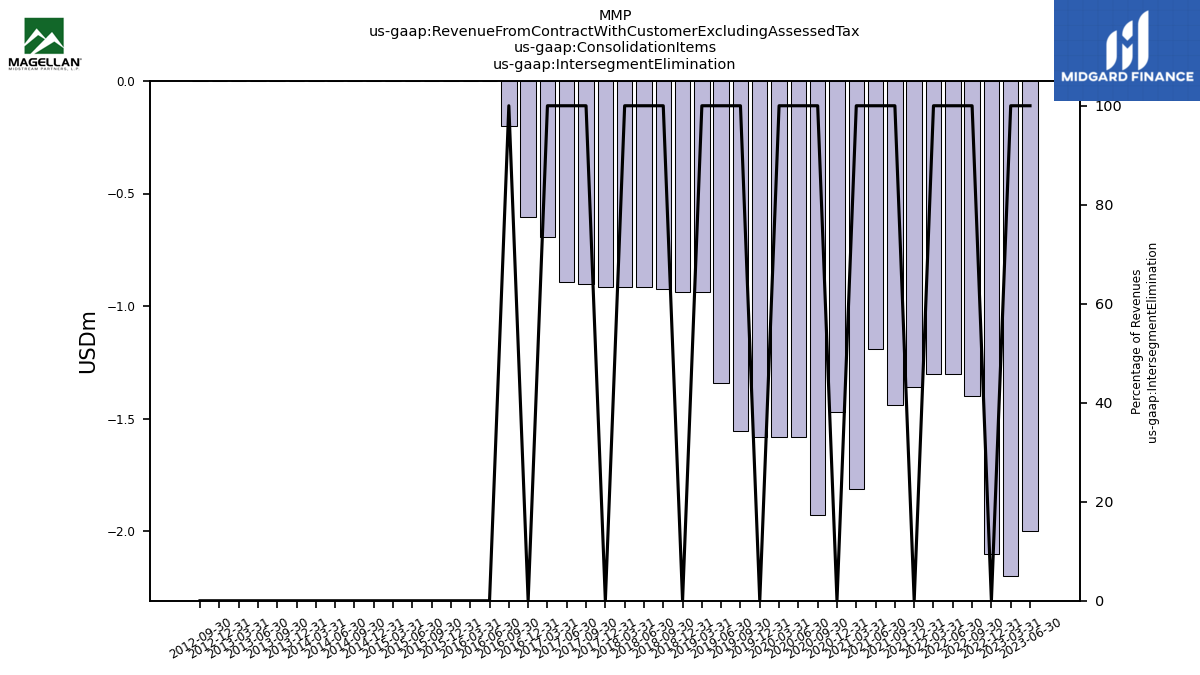
| Intersegment Elimination | -2.00 | -2.20 | -2.10 | -1.40 | -1.30 | -1.30 | -1.36 | -1.44 | -1.19 | -1.81 | -1.47 | -1.93 | -1.58 | -1.58 | -1.58 | -1.56 | -1.34 | -0.94 | -0.94 | -0.92 | -0.92 | -0.92 | -0.92 | -0.90 | -0.89 | -0.69 | -0.61 | -0.20 | 0.00 | 0.00 | 0.00 | 0.00 | 0.00 | 0.00 | 0.00 | 0.00 | 0.00 | 0.00 | 0.00 | 0.00 | 0.00 | 0.00 | 0.00 | 0.00 | NA | NA | NA | NA | NA | NA | NA | NA | NA | NA | |
| Intersegment Elimination, Service | -2.00 | -2.20 | -2.10 | -1.40 | -1.30 | -1.30 | -1.36 | -1.44 | -1.19 | -1.81 | -1.47 | -1.93 | -1.58 | -1.58 | -1.58 | -1.56 | -1.34 | -0.94 | -0.94 | -0.92 | -0.92 | -0.92 | -0.92 | -0.90 | NA | NA | NA | NA | NA | NA | NA | NA | NA | NA | NA | NA | NA | NA | NA | NA | NA | NA | NA | NA | NA | NA | NA | NA | NA | NA | NA | NA | NA | NA | |
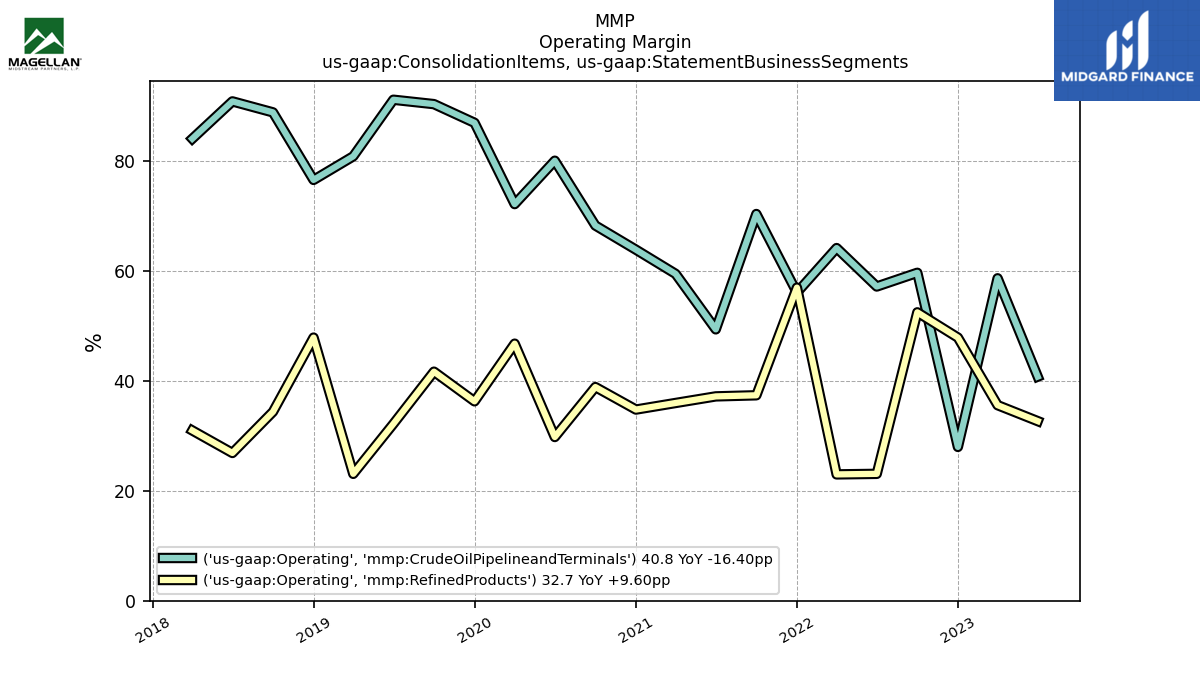
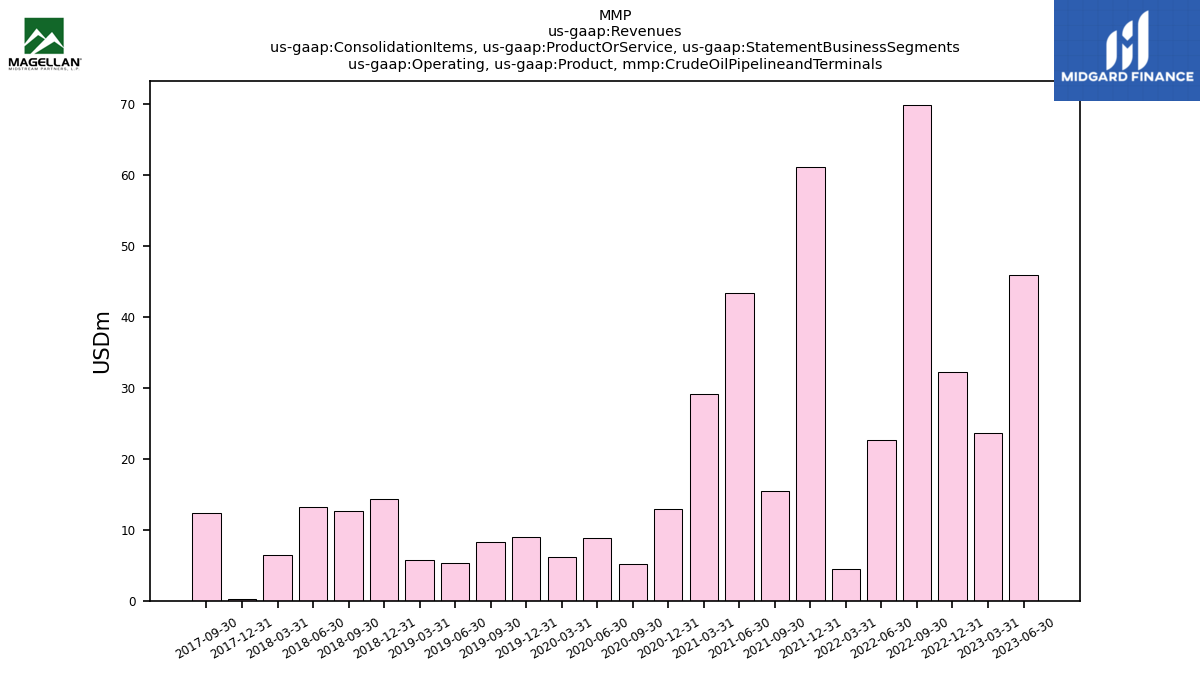
| Operating, Product, Crude Oil Pipelineand Terminals | 45.90 | 23.60 | 32.20 | 69.90 | 22.70 | 4.50 | 61.08 | 15.46 | 43.39 | 29.17 | 12.95 | 5.19 | 8.81 | 6.13 | 8.93 | 8.34 | 5.29 | 5.71 | 14.38 | 12.67 | 13.28 | 6.44 | 0.18 | 12.37 | NA | NA | NA | NA | NA | NA | NA | NA | NA | NA | NA | NA | NA | NA | NA | NA | NA | NA | NA | NA | NA | NA | NA | NA | NA | NA | NA | NA | NA | NA | |
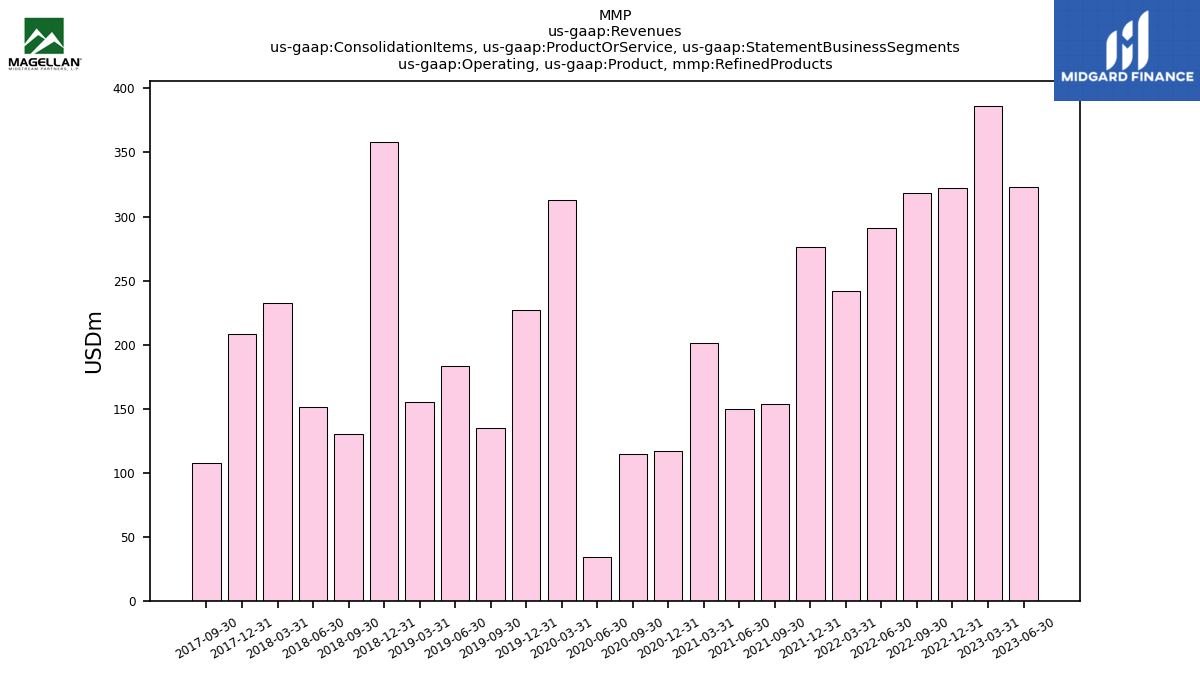
| Operating, Product, Refined Products | 322.80 | 386.50 | 322.20 | 318.30 | 291.00 | 241.60 | 276.35 | 153.35 | 149.68 | 201.43 | 116.93 | 114.25 | 34.46 | 312.99 | 226.64 | 134.75 | 183.21 | 155.16 | 358.51 | 129.93 | 150.93 | 232.77 | 208.07 | 107.17 | NA | NA | NA | NA | NA | NA | NA | NA | NA | NA | NA | NA | NA | NA | NA | NA | NA | NA | NA | NA | NA | NA | NA | NA | NA | NA | NA | NA | NA | NA | |
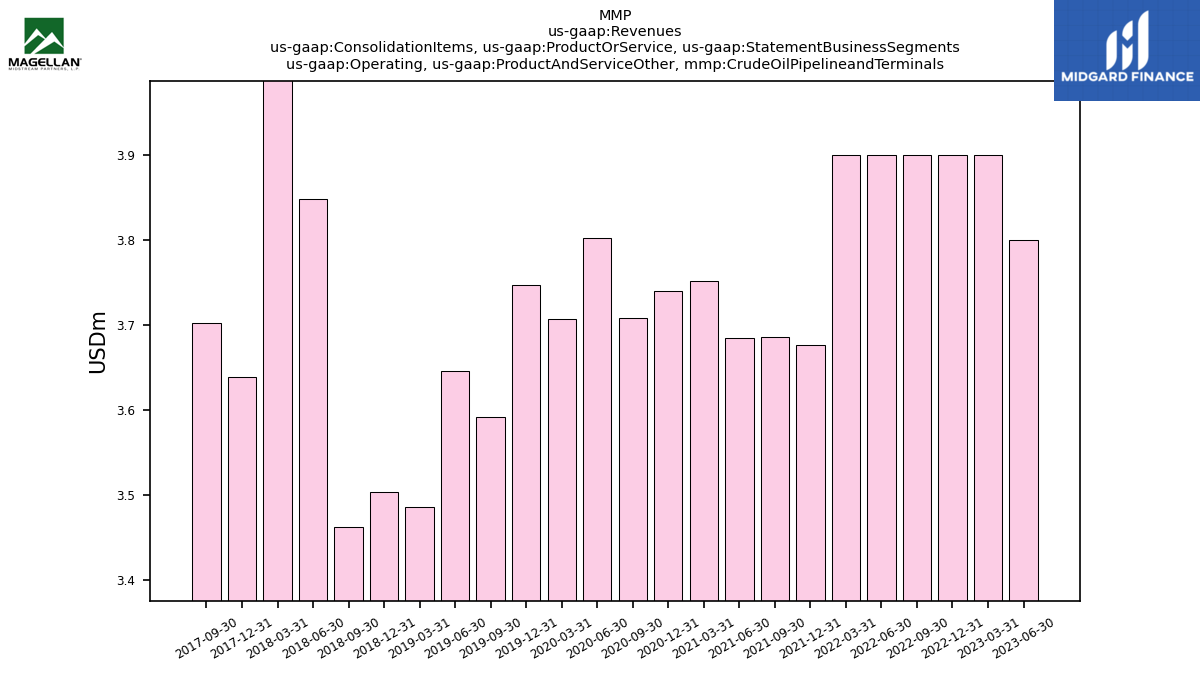
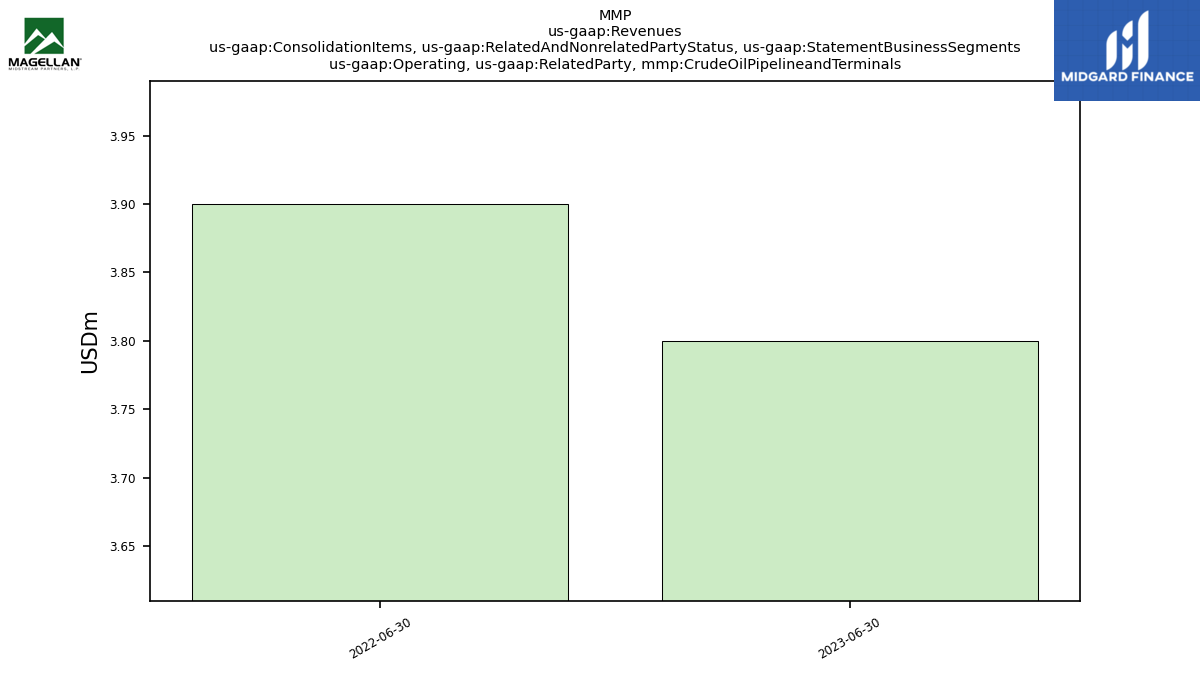
| Operating, Product And Service Other, Crude Oil Pipelineand Terminals | 3.80 | 3.90 | 3.90 | 3.90 | 3.90 | 3.90 | 3.68 | 3.69 | 3.69 | 3.75 | 3.74 | 3.71 | 3.80 | 3.71 | 3.75 | 3.59 | 3.65 | 3.49 | 3.50 | 3.46 | 3.85 | 4.02 | 3.64 | 3.70 | NA | NA | NA | NA | NA | NA | NA | NA | NA | NA | NA | NA | NA | NA | NA | NA | NA | NA | NA | NA | NA | NA | NA | NA | NA | NA | NA | NA | NA | NA | |
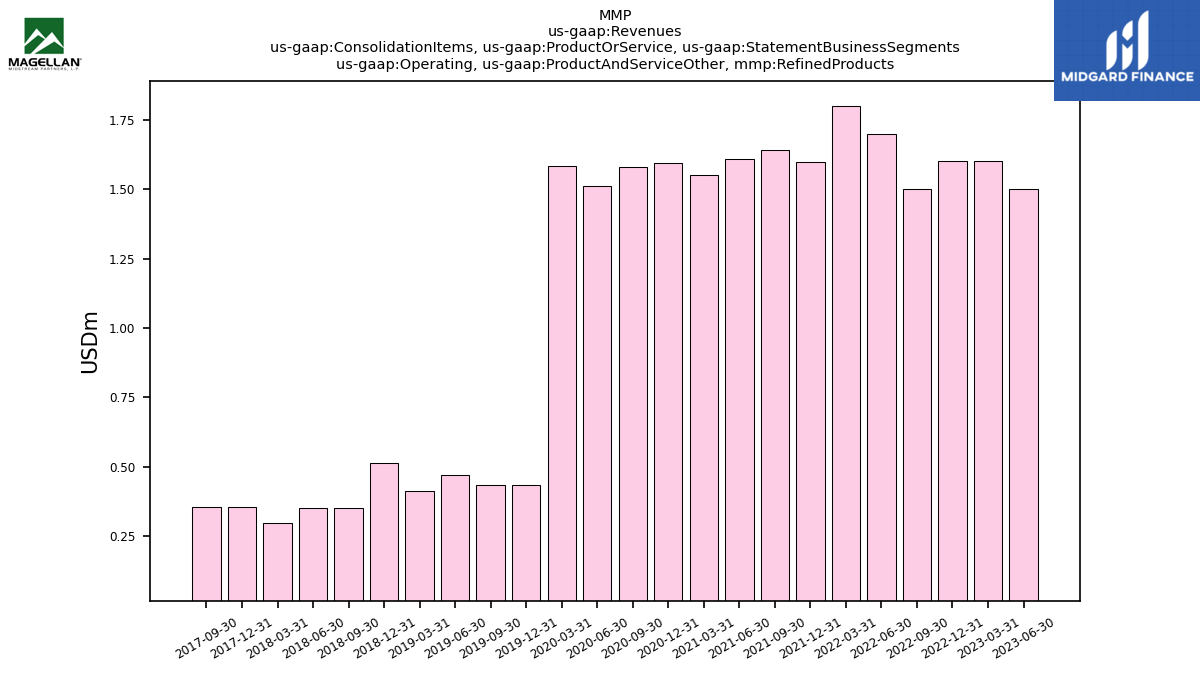
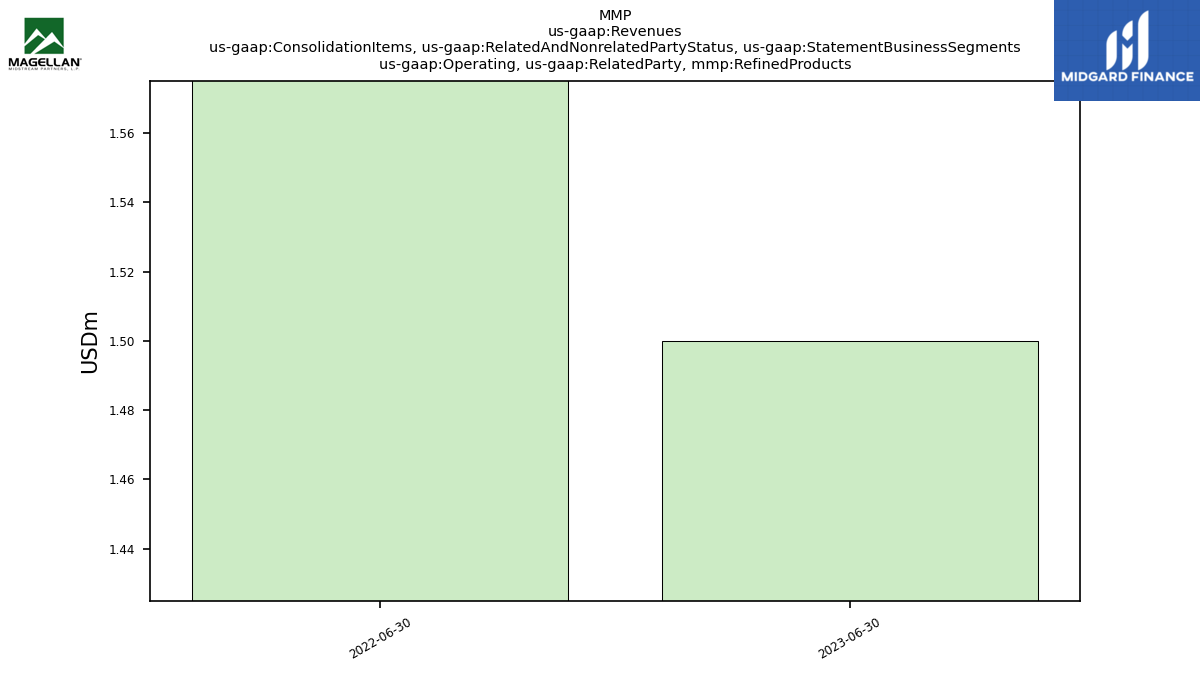
| Operating, Product And Service Other, Refined Products | 1.50 | 1.60 | 1.60 | 1.50 | 1.70 | 1.80 | 1.60 | 1.64 | 1.61 | 1.55 | 1.59 | 1.58 | 1.51 | 1.58 | 0.43 | 0.43 | 0.47 | 0.41 | 0.51 | 0.35 | 0.35 | 0.30 | 0.35 | 0.35 | NA | NA | NA | NA | NA | NA | NA | NA | NA | NA | NA | NA | NA | NA | NA | NA | NA | NA | NA | NA | NA | NA | NA | NA | NA | NA | NA | NA | NA | NA | |
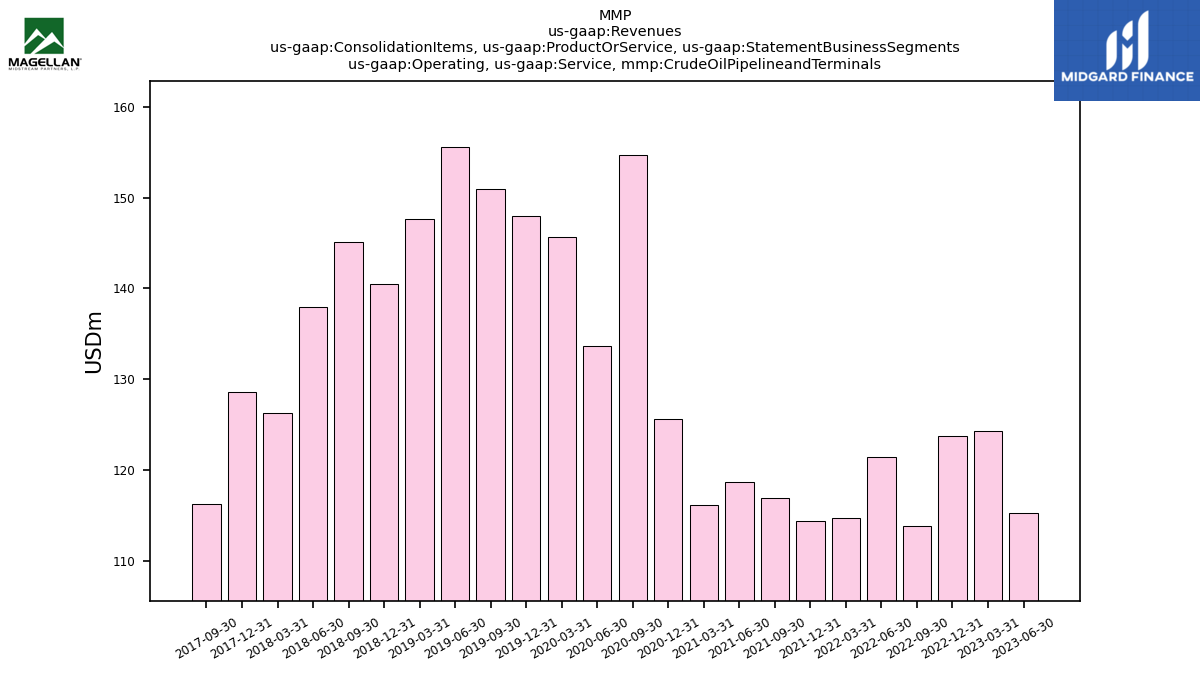
| Operating, Service, Crude Oil Pipelineand Terminals | 115.30 | 124.30 | 123.80 | 113.80 | 121.40 | 114.70 | 114.38 | 116.92 | 118.68 | 116.21 | 125.62 | 154.65 | 133.64 | 145.66 | 147.94 | 150.93 | 155.57 | 147.61 | 140.52 | 145.12 | 137.95 | 126.26 | 128.64 | 116.31 | NA | NA | NA | NA | NA | NA | NA | NA | NA | NA | NA | NA | NA | NA | NA | NA | NA | NA | NA | NA | NA | NA | NA | NA | NA | NA | NA | NA | NA | NA | |
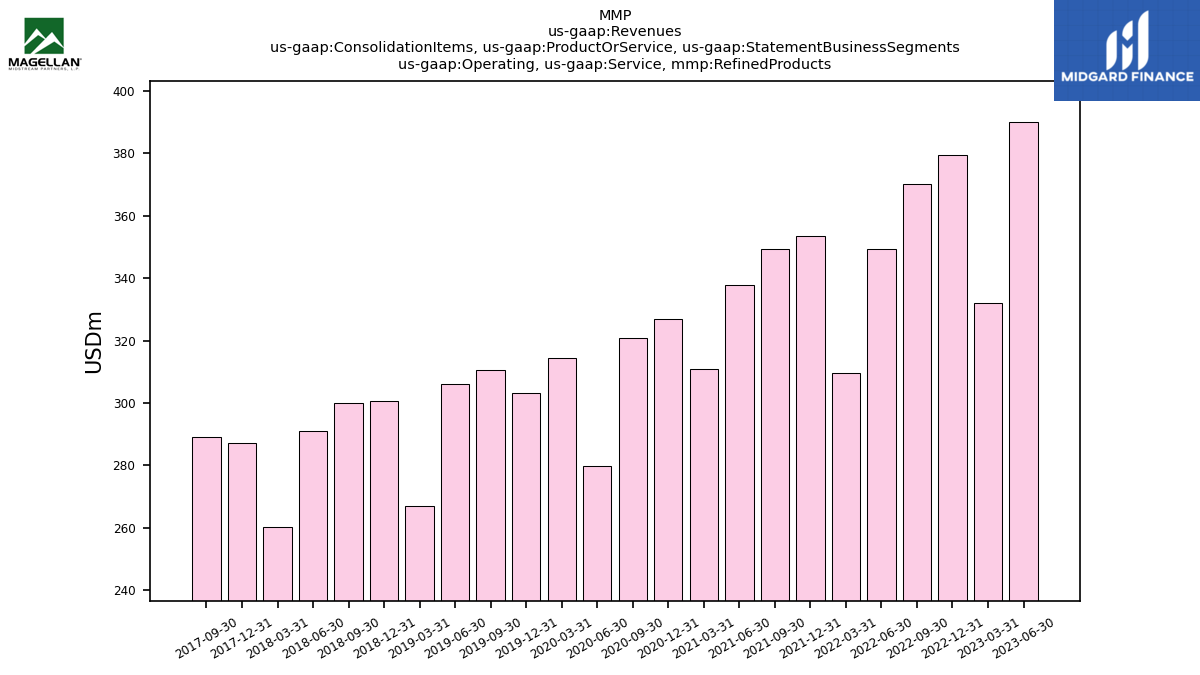
| Operating, Service, Refined Products | 389.90 | 332.00 | 379.40 | 370.10 | 349.20 | 309.50 | 353.61 | 349.43 | 337.78 | 310.77 | 326.96 | 320.81 | 279.76 | 314.32 | 303.26 | 310.48 | 306.21 | 267.00 | 300.49 | 300.03 | 291.06 | 260.39 | 287.22 | 289.03 | NA | NA | NA | NA | NA | NA | NA | NA | NA | NA | NA | NA | NA | NA | NA | NA | NA | NA | NA | NA | NA | NA | NA | NA | NA | NA | NA | NA | NA | NA | |
| Operating, Ancillary Services, Crude Oil Pipelineand Terminals, Transferred Over Time | 4.30 | 3.30 | 3.60 | 3.30 | 3.50 | 7.90 | 6.68 | 7.67 | 7.61 | 7.95 | 6.19 | 6.83 | 12.11 | 7.84 | 7.47 | 7.16 | 6.61 | 6.02 | 6.08 | 6.28 | 8.20 | 5.04 | NA | NA | NA | NA | NA | NA | NA | NA | NA | NA | NA | NA | NA | NA | NA | NA | NA | NA | NA | NA | NA | NA | NA | NA | NA | NA | NA | NA | NA | NA | NA | NA | |
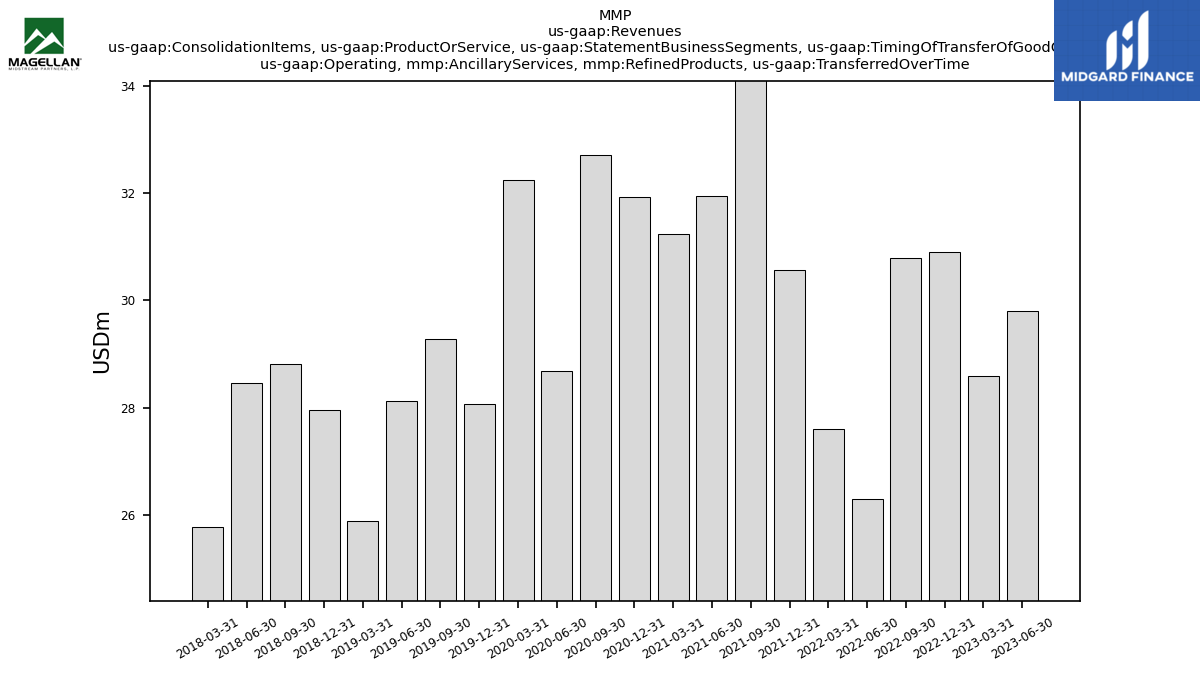
| Operating, Ancillary Services, Refined Products, Transferred Over Time | 29.80 | 28.60 | 30.90 | 30.80 | 26.30 | 27.60 | 30.56 | 34.16 | 31.94 | 31.25 | 31.93 | 32.71 | 28.68 | 32.24 | 28.08 | 29.28 | 28.13 | 25.90 | 27.95 | 28.81 | 28.46 | 25.79 | NA | NA | NA | NA | NA | NA | NA | NA | NA | NA | NA | NA | NA | NA | NA | NA | NA | NA | NA | NA | NA | NA | NA | NA | NA | NA | NA | NA | NA | NA | NA | NA | |
| Operating, Lease Revenue, Crude Oil Pipelineand Terminals, Transferred Over Time | 14.10 | 19.70 | 20.30 | 20.00 | 18.40 | 18.50 | 19.88 | 19.60 | 18.37 | 17.84 | 19.48 | 19.14 | 18.79 | 19.31 | 19.23 | 19.36 | 17.73 | 16.86 | 15.89 | 16.13 | 16.46 | 12.11 | NA | NA | NA | NA | NA | NA | NA | NA | NA | NA | NA | NA | NA | NA | NA | NA | NA | NA | NA | NA | NA | NA | NA | NA | NA | NA | NA | NA | NA | NA | NA | NA | |
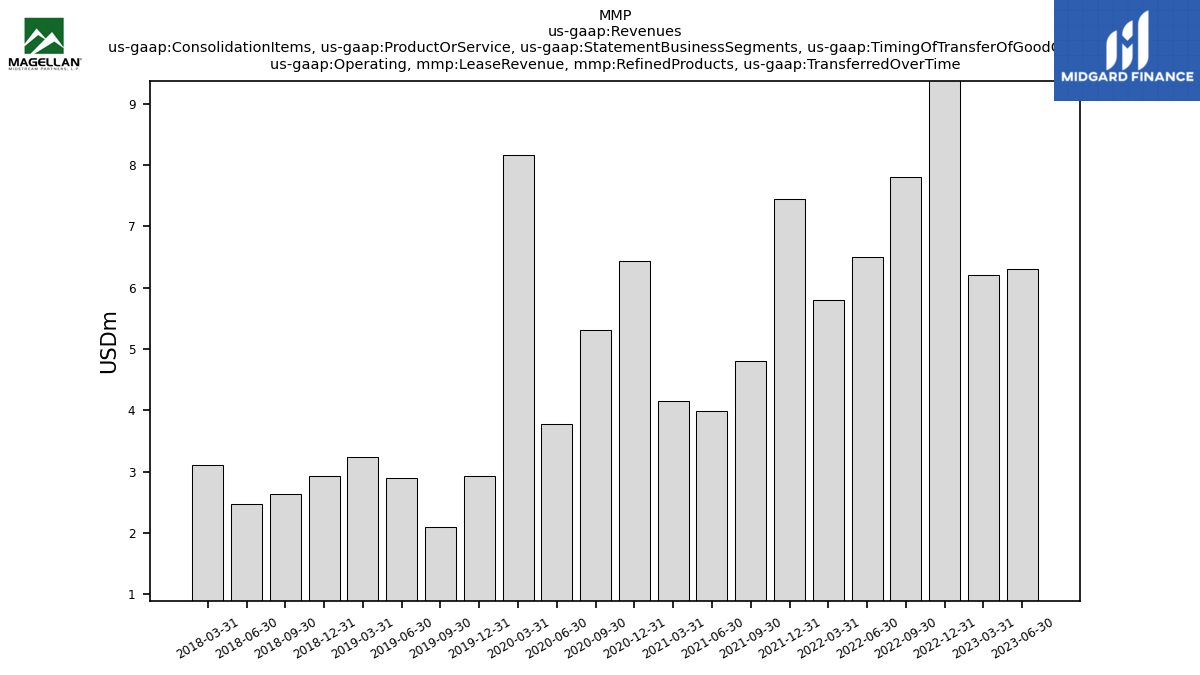
| Operating, Lease Revenue, Refined Products, Transferred Over Time | 6.30 | 6.20 | 10.00 | 7.80 | 6.50 | 5.80 | 7.45 | 4.80 | 4.00 | 4.15 | 6.43 | 5.32 | 3.77 | 8.16 | 2.93 | 2.10 | 2.89 | 3.25 | 2.93 | 2.64 | 2.47 | 3.11 | NA | NA | NA | NA | NA | NA | NA | NA | NA | NA | NA | NA | NA | NA | NA | NA | NA | NA | NA | NA | NA | NA | NA | NA | NA | NA | NA | NA | NA | NA | NA | NA | |
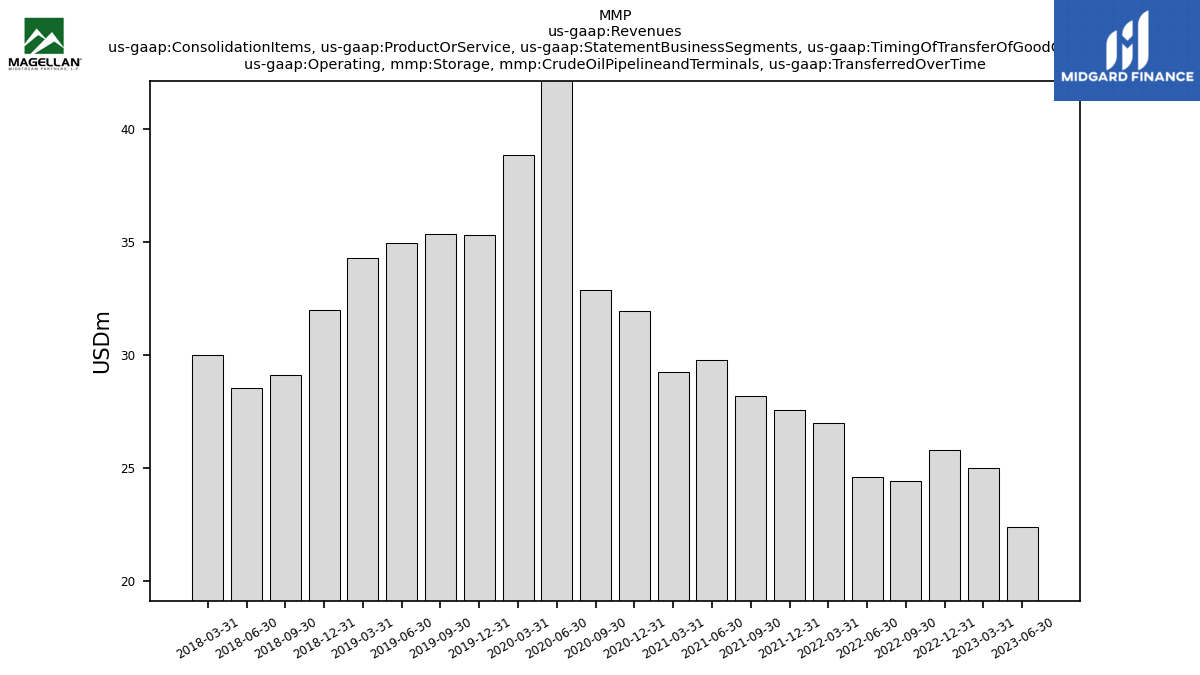
| Operating, Storage, Crude Oil Pipelineand Terminals, Transferred Over Time | 22.40 | 25.00 | 25.80 | 24.40 | 24.60 | 27.00 | 27.56 | 28.20 | 29.78 | 29.26 | 31.95 | 32.88 | 44.71 | 38.85 | 35.33 | 35.37 | 34.97 | 34.32 | 31.99 | 29.09 | 28.54 | 29.99 | NA | NA | NA | NA | NA | NA | NA | NA | NA | NA | NA | NA | NA | NA | NA | NA | NA | NA | NA | NA | NA | NA | NA | NA | NA | NA | NA | NA | NA | NA | NA | NA | |
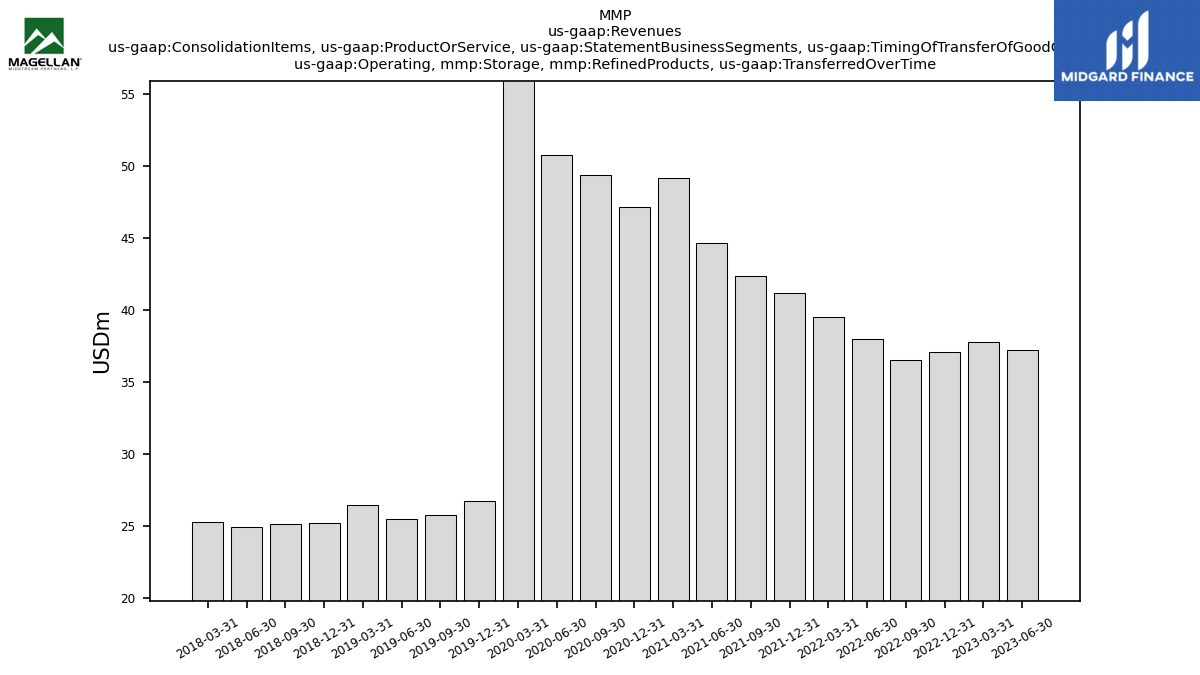
| Operating, Storage, Refined Products, Transferred Over Time | 37.20 | 37.80 | 37.10 | 36.50 | 38.00 | 39.50 | 41.16 | 42.32 | 44.61 | 49.16 | 47.16 | 49.37 | 50.73 | 57.53 | 26.73 | 25.79 | 25.47 | 26.44 | 25.21 | 25.14 | 24.97 | 25.25 | NA | NA | NA | NA | NA | NA | NA | NA | NA | NA | NA | NA | NA | NA | NA | NA | NA | NA | NA | NA | NA | NA | NA | NA | NA | NA | NA | NA | NA | NA | NA | NA | |
| Operating, Terminalling, Crude Oil Pipelineand Terminals, Transferred Over Time | 14.20 | 18.00 | 14.30 | 16.20 | 12.80 | 6.30 | 4.38 | 3.28 | 3.22 | 6.12 | 6.76 | 5.65 | 0.48 | 2.54 | 4.68 | 3.18 | 4.72 | 5.25 | 3.84 | 2.53 | 0.00 | 0.00 | NA | NA | NA | NA | NA | NA | NA | NA | NA | NA | NA | NA | NA | NA | NA | NA | NA | NA | NA | NA | NA | NA | NA | NA | NA | NA | NA | NA | NA | NA | NA | NA | |
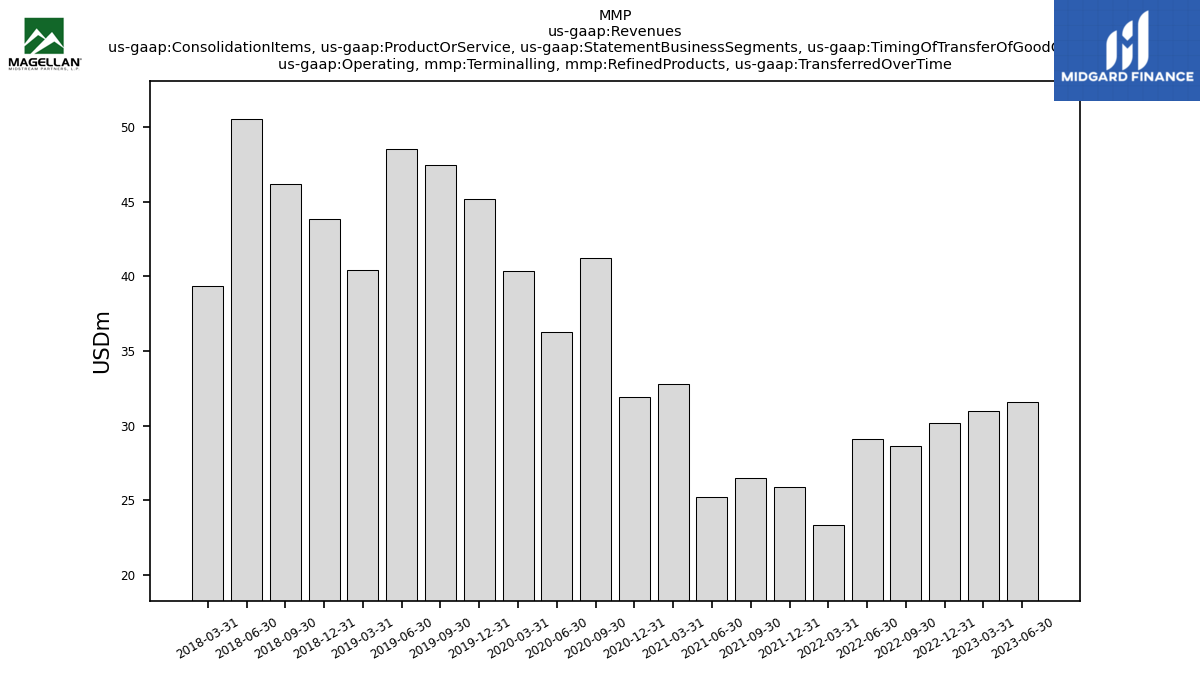
| Operating, Terminalling, Refined Products, Transferred Over Time | 31.60 | 31.00 | 30.20 | 28.60 | 29.10 | 23.30 | 25.88 | 26.47 | 25.20 | 32.79 | 31.94 | 41.23 | 36.30 | 40.39 | 45.16 | 47.48 | 48.55 | 40.40 | 43.86 | 46.21 | 50.57 | 39.35 | NA | NA | NA | NA | NA | NA | NA | NA | NA | NA | NA | NA | NA | NA | NA | NA | NA | NA | NA | NA | NA | NA | NA | NA | NA | NA | NA | NA | NA | NA | NA | NA | |
| Operating, Transportation, Crude Oil Pipelineand Terminals, Transferred Over Time | 60.30 | 58.30 | 59.80 | 49.90 | 62.10 | 55.00 | 55.88 | 58.17 | 59.70 | 55.05 | 61.24 | 90.16 | 57.55 | 77.11 | 81.23 | 85.86 | 91.53 | 85.16 | 82.73 | 91.09 | 84.75 | 79.12 | NA | NA | NA | NA | NA | NA | NA | NA | NA | NA | NA | NA | NA | NA | NA | NA | NA | NA | NA | NA | NA | NA | NA | NA | NA | NA | NA | NA | NA | NA | NA | NA | |
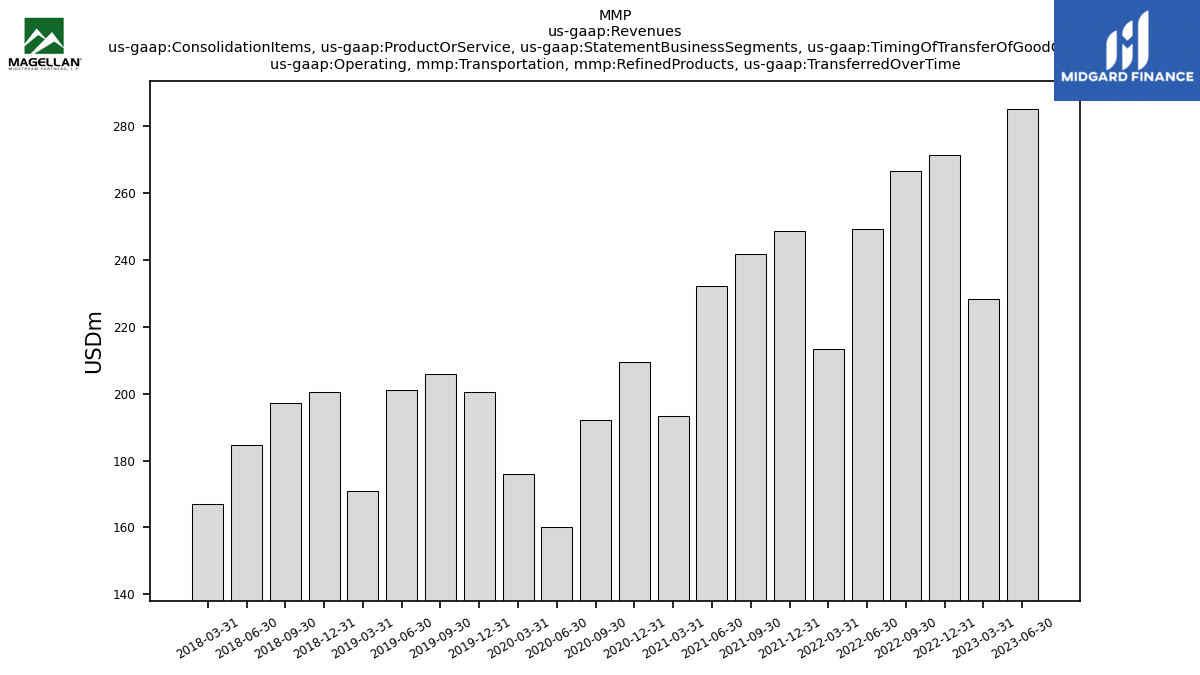
| Operating, Transportation, Refined Products, Transferred Over Time | 285.00 | 228.40 | 271.20 | 266.40 | 249.30 | 213.30 | 248.55 | 241.69 | 232.04 | 193.43 | 209.50 | 192.19 | 160.28 | 176.00 | 200.37 | 205.82 | 201.17 | 171.03 | 200.53 | 197.24 | 184.60 | 166.90 | NA | NA | NA | NA | NA | NA | NA | NA | NA | NA | NA | NA | NA | NA | NA | NA | NA | NA | NA | NA | NA | NA | NA | NA | NA | NA | NA | NA | NA | NA | NA | NA | |
| Operating, Product, Crude Oil Pipelineand Terminals, Transferred At Point In Time | 45.90 | 23.60 | 32.20 | 69.90 | 22.70 | 4.50 | 61.08 | 15.46 | 43.39 | 29.17 | 12.95 | 5.19 | 8.81 | 6.13 | 8.93 | 8.34 | 5.29 | 5.71 | 14.38 | 12.67 | 13.28 | 6.44 | NA | NA | NA | NA | NA | NA | NA | NA | NA | NA | NA | NA | NA | NA | NA | NA | NA | NA | NA | NA | NA | NA | NA | NA | NA | NA | NA | NA | NA | NA | NA | NA | |
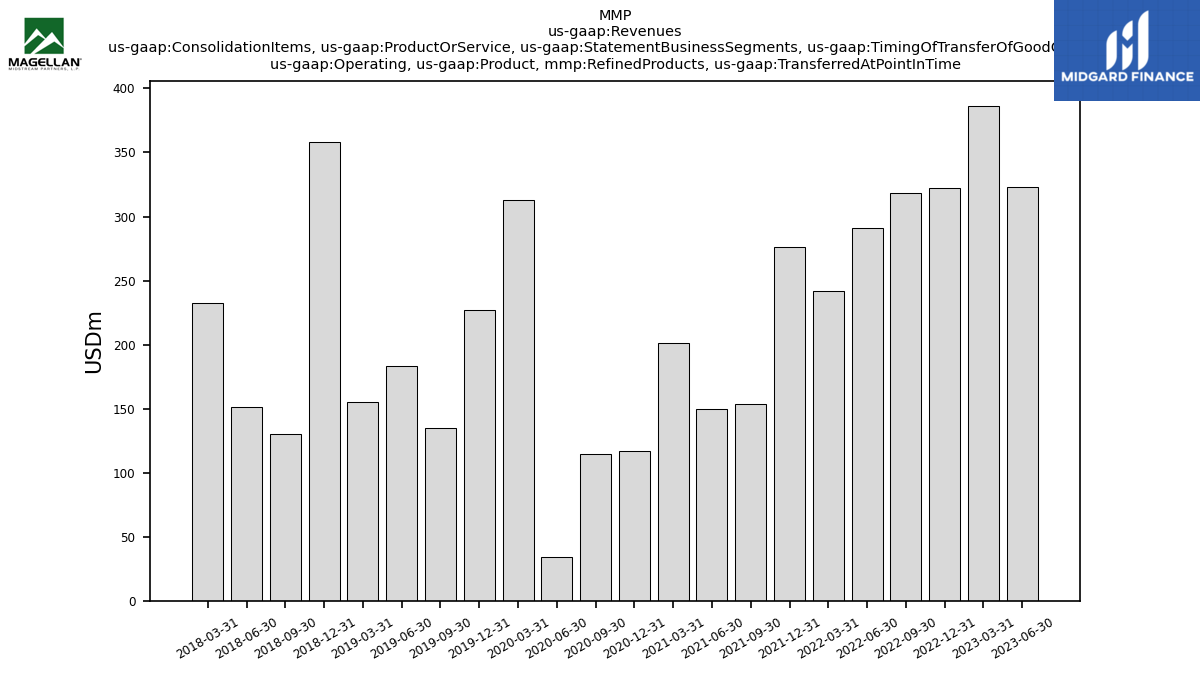
| Operating, Product, Refined Products, Transferred At Point In Time | 322.80 | 386.50 | 322.20 | 318.30 | 291.00 | 241.60 | 276.35 | 153.35 | 149.68 | 201.43 | 116.93 | 114.25 | 34.46 | 312.99 | 226.64 | 134.75 | 183.21 | 155.16 | 358.51 | 129.93 | 150.93 | 232.77 | NA | NA | NA | NA | NA | NA | NA | NA | NA | NA | NA | NA | NA | NA | NA | NA | NA | NA | NA | NA | NA | NA | NA | NA | NA | NA | NA | NA | NA | NA | NA | NA | |
| Operating, Service, Crude Oil Pipelineand Terminals, Transferred Over Time | 115.30 | 124.30 | 123.80 | 113.80 | 121.40 | 114.70 | 114.38 | 116.92 | 118.68 | 116.21 | 125.62 | 154.65 | 133.64 | 145.66 | 147.94 | 150.93 | 155.57 | 147.61 | 140.52 | 145.12 | 137.95 | 126.26 | NA | NA | NA | NA | NA | NA | NA | NA | NA | NA | NA | NA | NA | NA | NA | NA | NA | NA | NA | NA | NA | NA | NA | NA | NA | NA | NA | NA | NA | NA | NA | NA | |
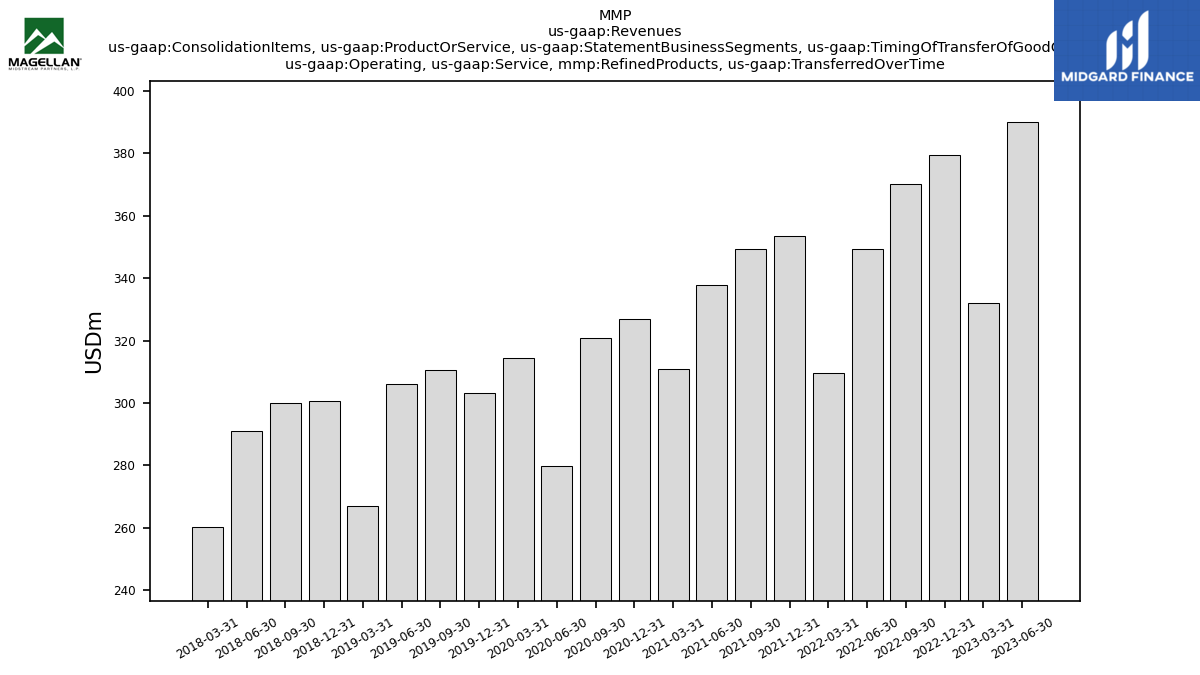
| Operating, Service, Refined Products, Transferred Over Time | 389.90 | 332.00 | 379.40 | 370.10 | 349.20 | 309.50 | 353.61 | 349.43 | 337.78 | 310.77 | 326.96 | 320.81 | 279.76 | 314.32 | 303.26 | 310.48 | 306.21 | 267.00 | 300.49 | 300.03 | 291.06 | 260.39 | NA | NA | NA | NA | NA | NA | NA | NA | NA | NA | NA | NA | NA | NA | NA | NA | NA | NA | NA | NA | NA | NA | NA | NA | NA | NA | NA | NA | NA | NA | NA | NA | |
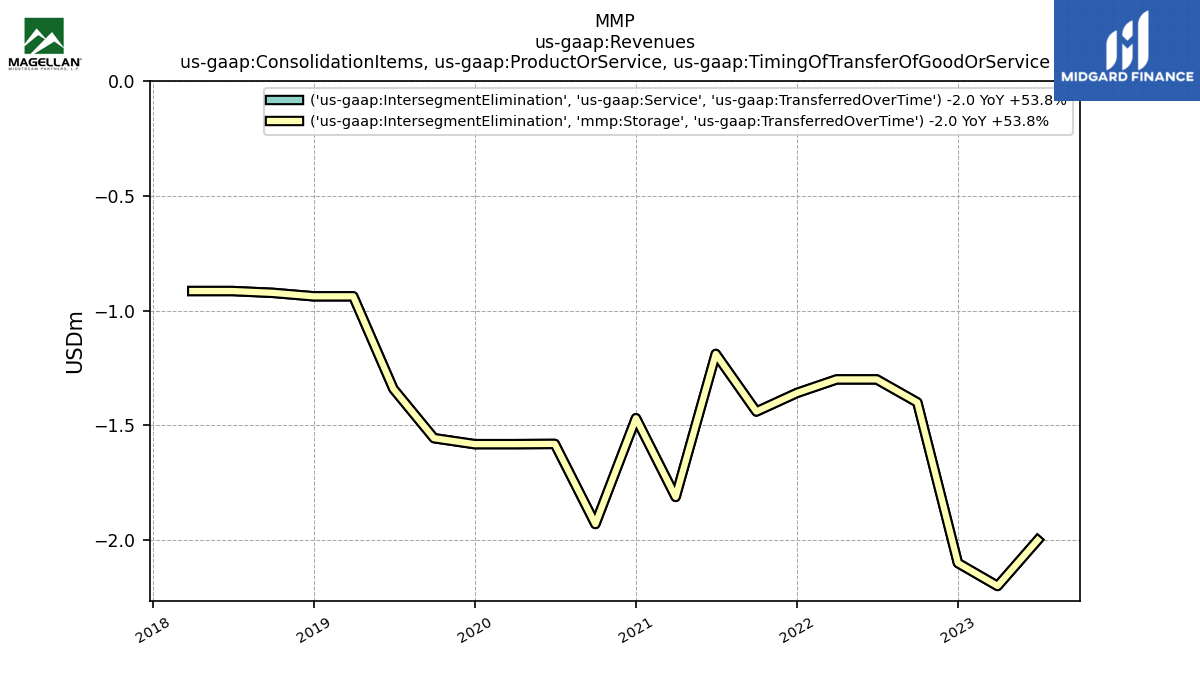
| Intersegment Elimination, Storage, Transferred Over Time | -2.00 | -2.20 | -2.10 | -1.40 | -1.30 | -1.30 | -1.36 | -1.44 | -1.19 | -1.81 | -1.47 | -1.93 | -1.58 | -1.58 | -1.58 | -1.56 | -1.34 | -0.94 | -0.94 | -0.92 | -0.92 | -0.92 | NA | NA | NA | NA | NA | NA | NA | NA | NA | NA | NA | NA | NA | NA | NA | NA | NA | NA | NA | NA | NA | NA | NA | NA | NA | NA | NA | NA | NA | NA | NA | NA | |
| Intersegment Elimination, Service, Transferred Over Time | -2.00 | -2.20 | -2.10 | -1.40 | -1.30 | -1.30 | -1.36 | -1.44 | -1.19 | -1.81 | -1.47 | -1.93 | -1.58 | -1.58 | -1.58 | -1.56 | -1.34 | -0.94 | -0.94 | -0.92 | -0.92 | -0.92 | NA | NA | NA | NA | NA | NA | NA | NA | NA | NA | NA | NA | NA | NA | NA | NA | NA | NA | NA | NA | NA | NA | NA | NA | NA | NA | NA | NA | NA | NA | NA | NA | |
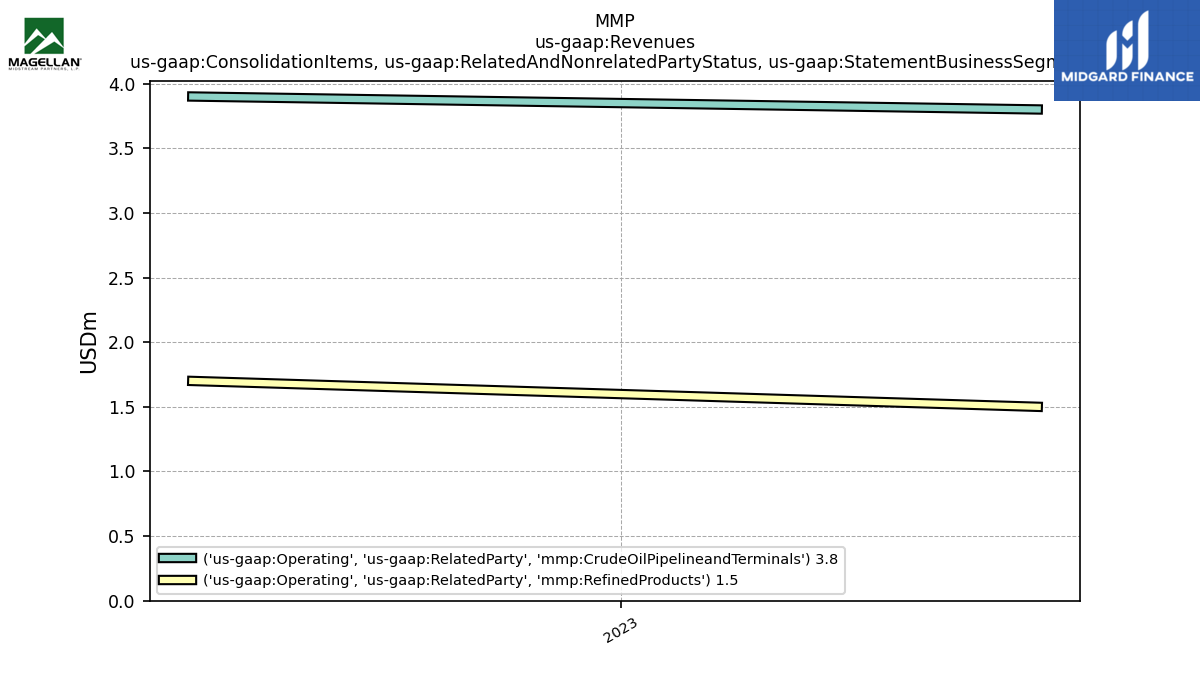
| Operating, Related Party, Crude Oil Pipelineand Terminals | 3.80 | NA | NA | NA | 3.90 | NA | NA | NA | NA | NA | NA | NA | NA | NA | NA | NA | NA | NA | NA | NA | NA | NA | NA | NA | NA | NA | NA | NA | NA | NA | NA | NA | NA | NA | NA | NA | NA | NA | NA | NA | NA | NA | NA | NA | NA | NA | NA | NA | NA | NA | NA | NA | NA | NA | |
| Operating, Related Party, Refined Products | 1.50 | NA | NA | NA | 1.70 | NA | NA | NA | NA | NA | NA | NA | NA | NA | NA | NA | NA | NA | NA | NA | NA | NA | NA | NA | NA | NA | NA | NA | NA | NA | NA | NA | NA | NA | NA | NA | NA | NA | NA | NA | NA | NA | NA | NA | NA | NA | NA | NA | NA | NA | NA | NA | NA | NA | |
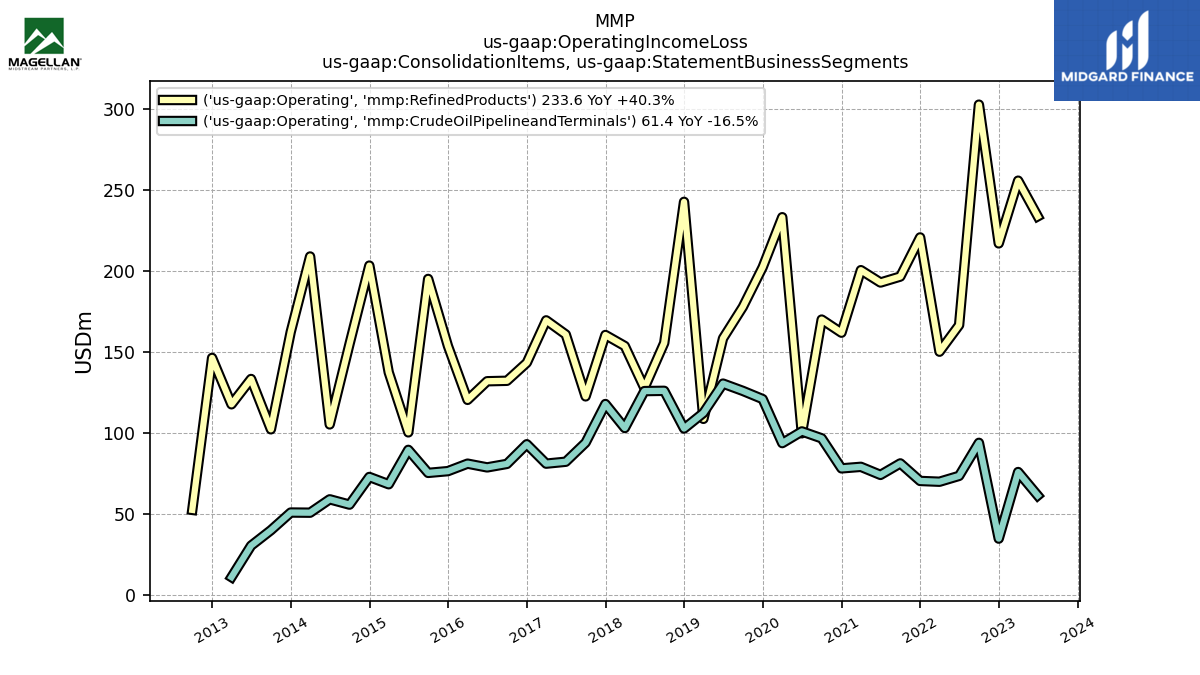
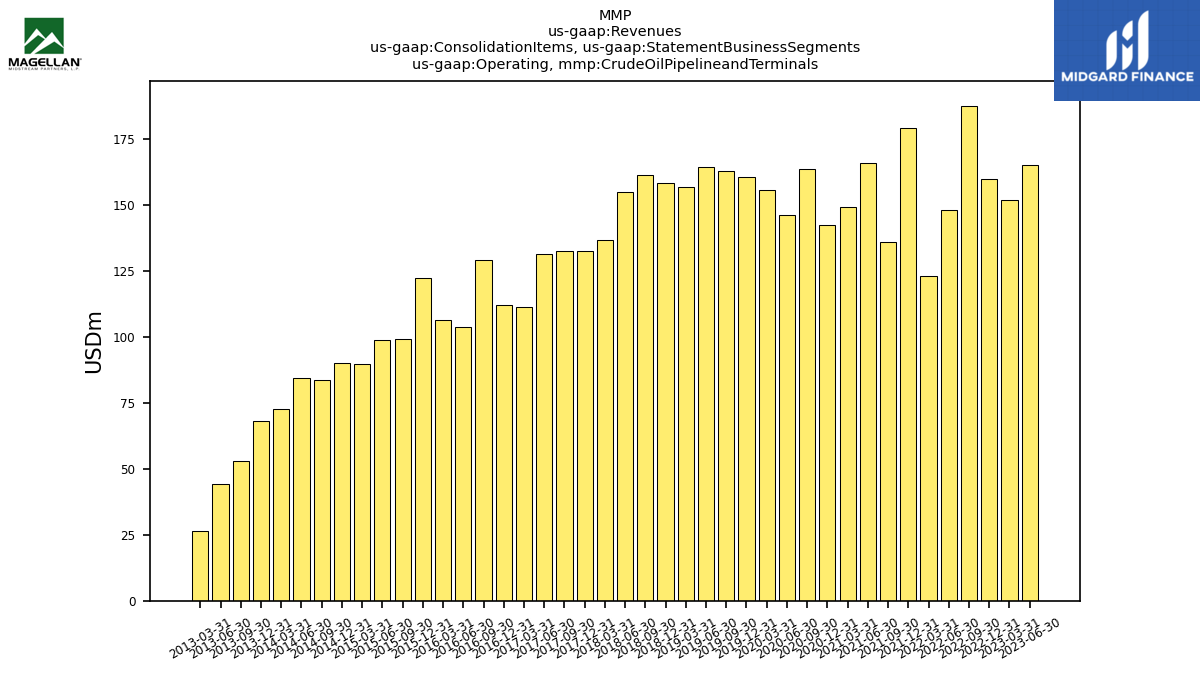
| Operating, Crude Oil Pipelineand Terminals | 165.00 | 151.80 | 159.90 | 187.60 | 148.00 | 123.10 | 179.14 | 136.07 | 165.76 | 149.14 | 142.31 | 163.55 | 146.25 | 155.50 | 160.62 | 162.86 | 164.51 | 156.81 | 158.40 | 161.25 | 155.08 | 136.71 | 132.46 | 132.38 | 131.33 | 111.29 | 112.21 | 129.28 | 103.80 | 106.25 | 122.39 | 99.24 | 98.97 | 89.59 | 90.23 | 83.74 | 84.46 | 72.50 | 68.10 | 52.89 | 44.40 | 26.39 | NA | NA | NA | NA | NA | NA | NA | NA | NA | NA | NA | NA | |
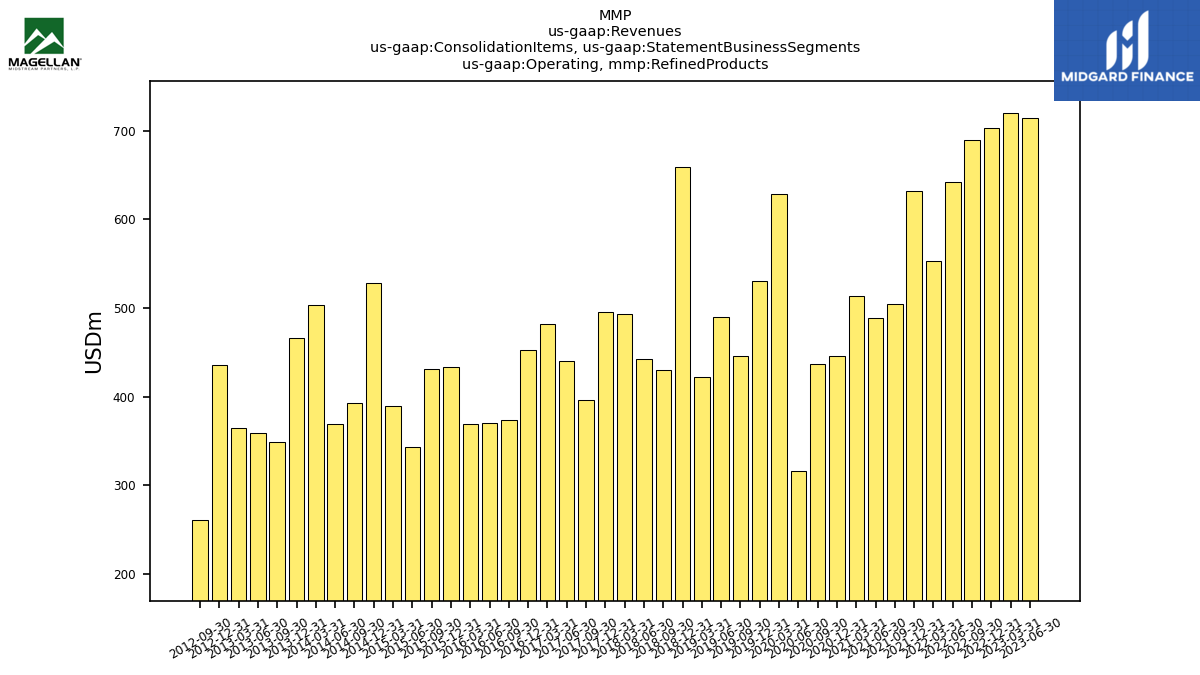
| Operating, Refined Products | 714.20 | 720.10 | 703.20 | 689.90 | 641.90 | 552.90 | 631.55 | 504.43 | 489.07 | 513.75 | 445.48 | 436.64 | 315.74 | 628.89 | 530.34 | 445.67 | 489.90 | 422.57 | 659.51 | 430.31 | 442.35 | 493.46 | 495.65 | 396.56 | 439.96 | 482.40 | 452.48 | 373.39 | 370.28 | 368.75 | 433.58 | 431.58 | 343.03 | 389.42 | 528.42 | 393.11 | 368.82 | 503.95 | 466.50 | 349.41 | 358.72 | 364.77 | 435.70 | 260.66 | NA | NA | NA | NA | NA | NA | NA | NA | NA | NA | |
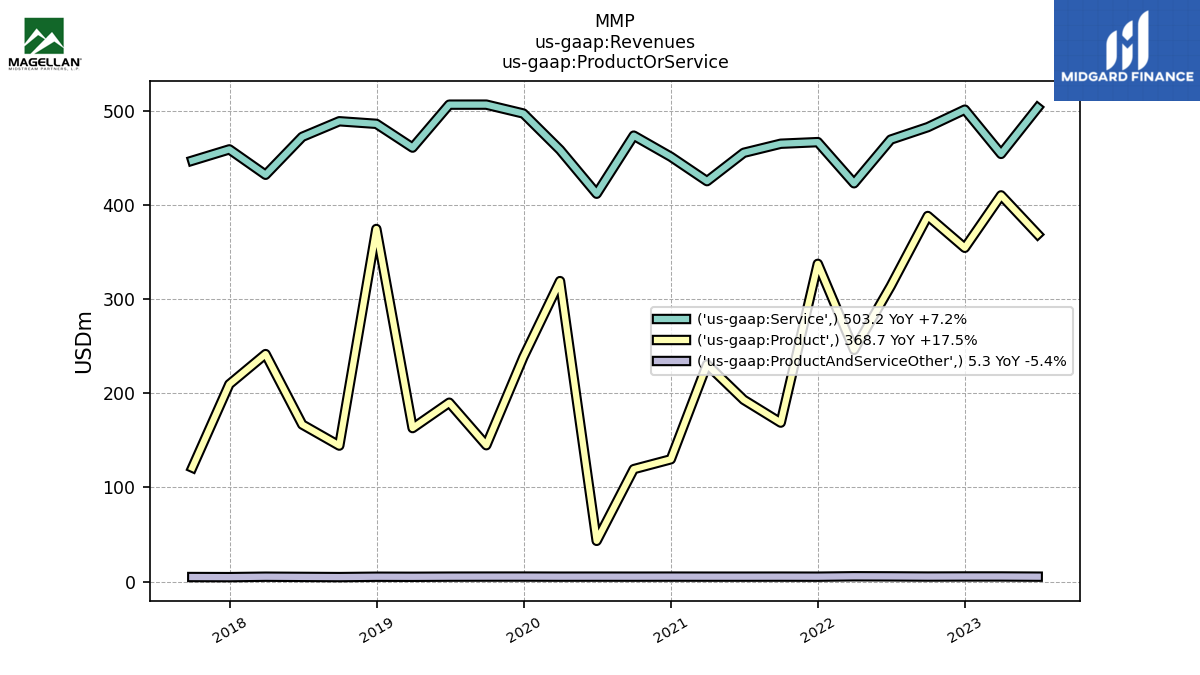
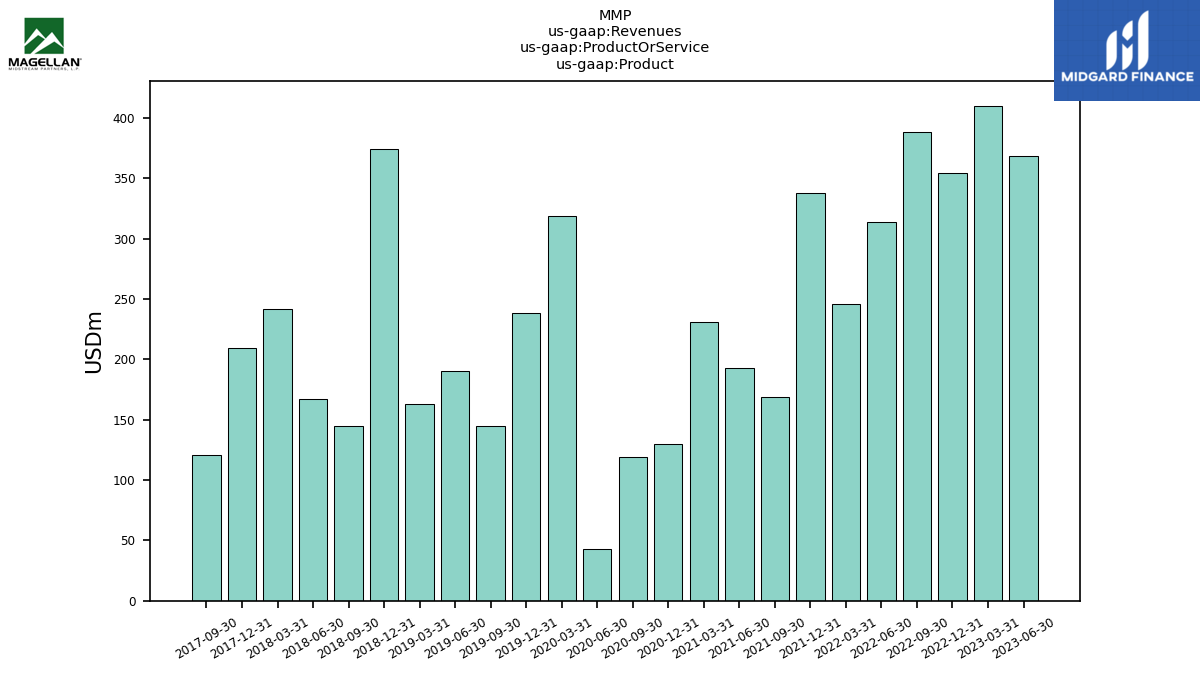
| Product | 368.70 | 410.10 | 354.40 | 388.20 | 313.70 | 246.10 | 337.43 | 168.81 | 193.07 | 230.60 | 129.88 | 119.44 | 43.28 | 319.12 | 238.30 | 144.81 | 189.99 | 163.00 | 374.43 | 144.40 | 166.80 | 241.59 | 209.57 | 121.01 | NA | NA | NA | NA | NA | NA | NA | NA | NA | NA | NA | NA | NA | NA | NA | NA | NA | NA | NA | NA | NA | NA | NA | NA | NA | NA | NA | NA | NA | NA | |
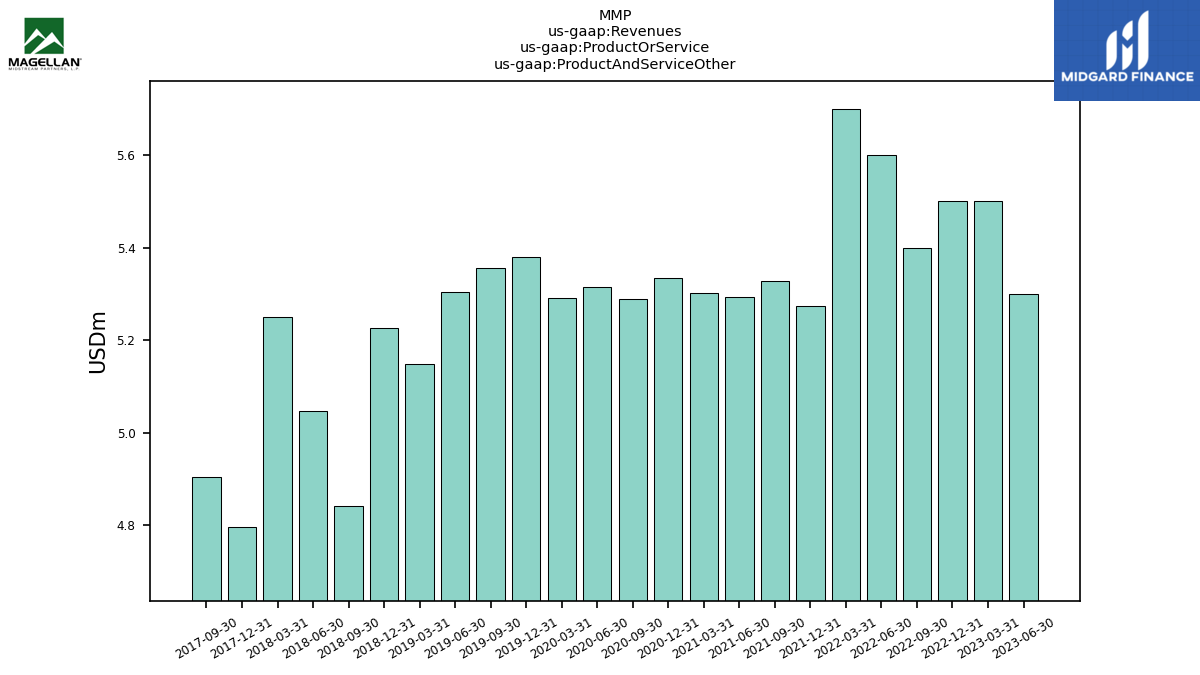
| Product And Service Other | 5.30 | 5.50 | 5.50 | 5.40 | 5.60 | 5.70 | 5.28 | 5.33 | 5.29 | 5.30 | 5.33 | 5.29 | 5.32 | 5.29 | 5.38 | 5.36 | 5.30 | 5.15 | 5.23 | 4.84 | 5.05 | 5.25 | 4.80 | 4.90 | NA | NA | NA | NA | NA | NA | NA | NA | NA | NA | NA | NA | NA | NA | NA | NA | NA | NA | NA | NA | NA | NA | NA | NA | NA | NA | NA | NA | NA | NA | |
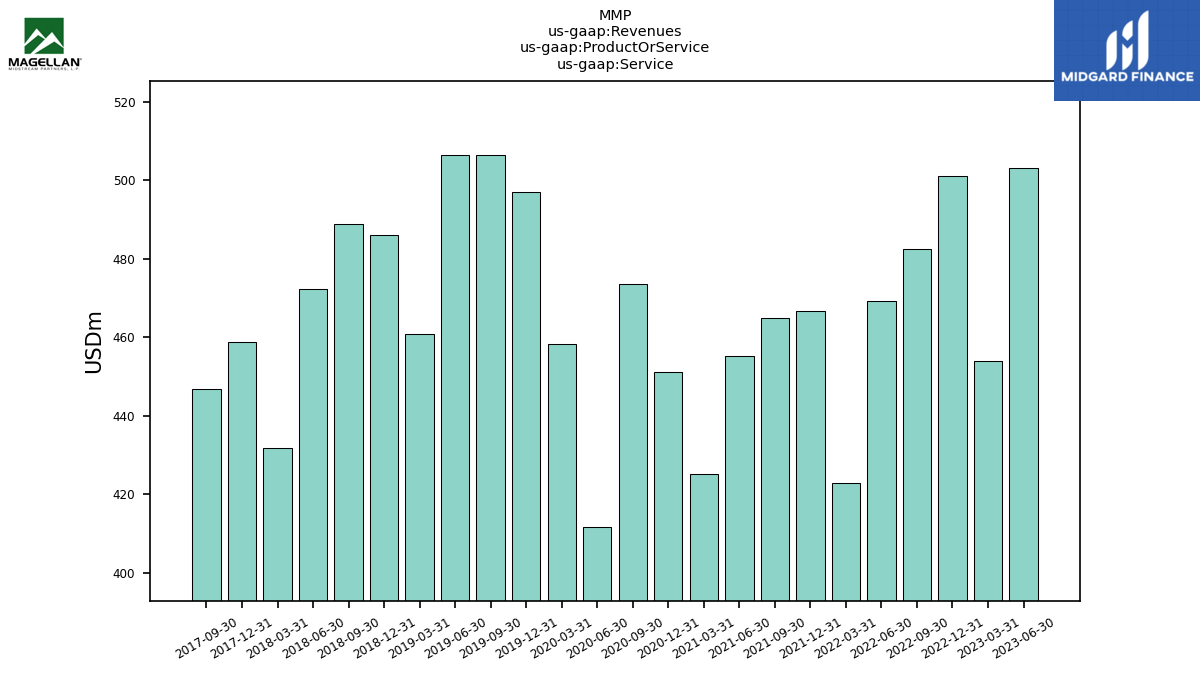
| Service | 503.20 | 454.10 | 501.10 | 482.50 | 469.30 | 422.90 | 466.63 | 464.91 | 455.28 | 425.17 | 451.11 | 473.53 | 411.81 | 458.39 | 497.00 | 506.43 | 506.40 | 460.79 | 486.03 | 488.77 | 472.25 | 431.94 | 458.93 | 446.94 | NA | NA | NA | NA | NA | NA | NA | NA | NA | NA | NA | NA | NA | NA | NA | NA | NA | NA | NA | NA | NA | NA | NA | NA | NA | NA | NA | NA | NA | NA | |
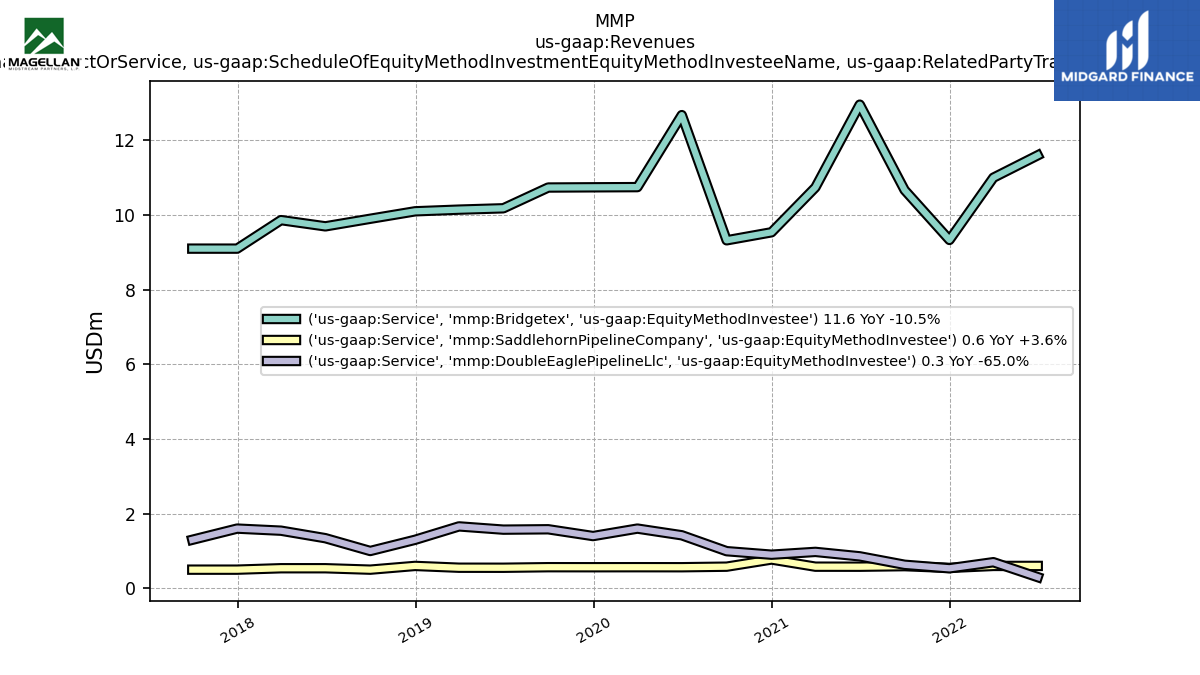
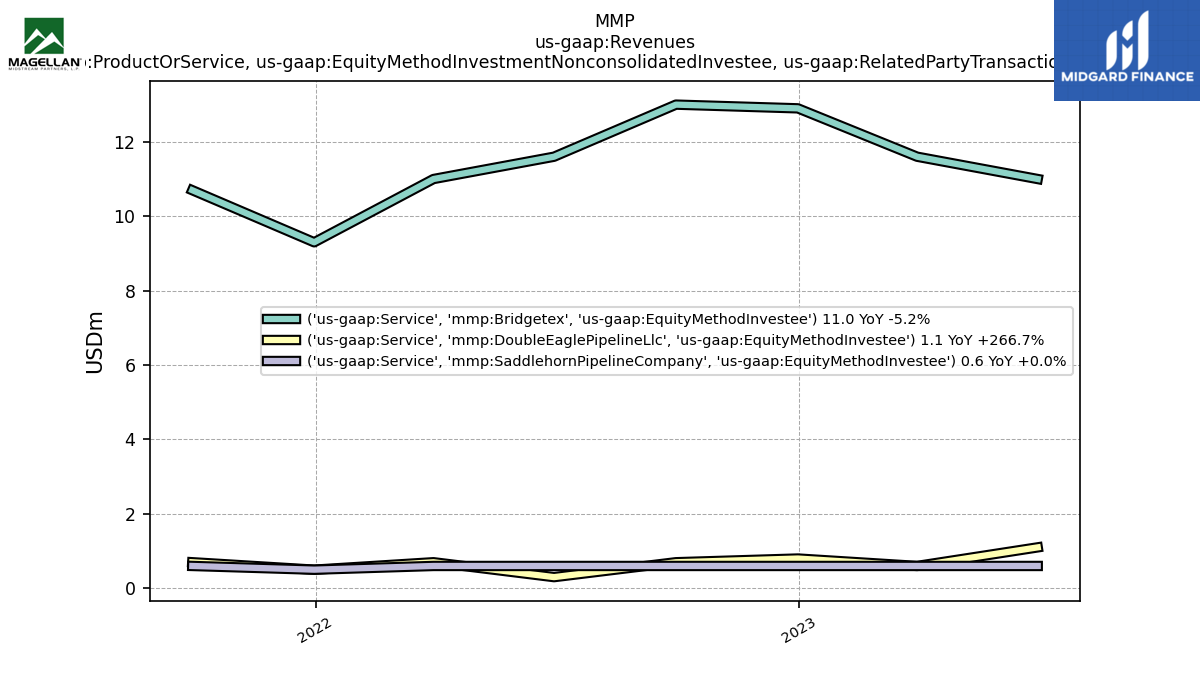
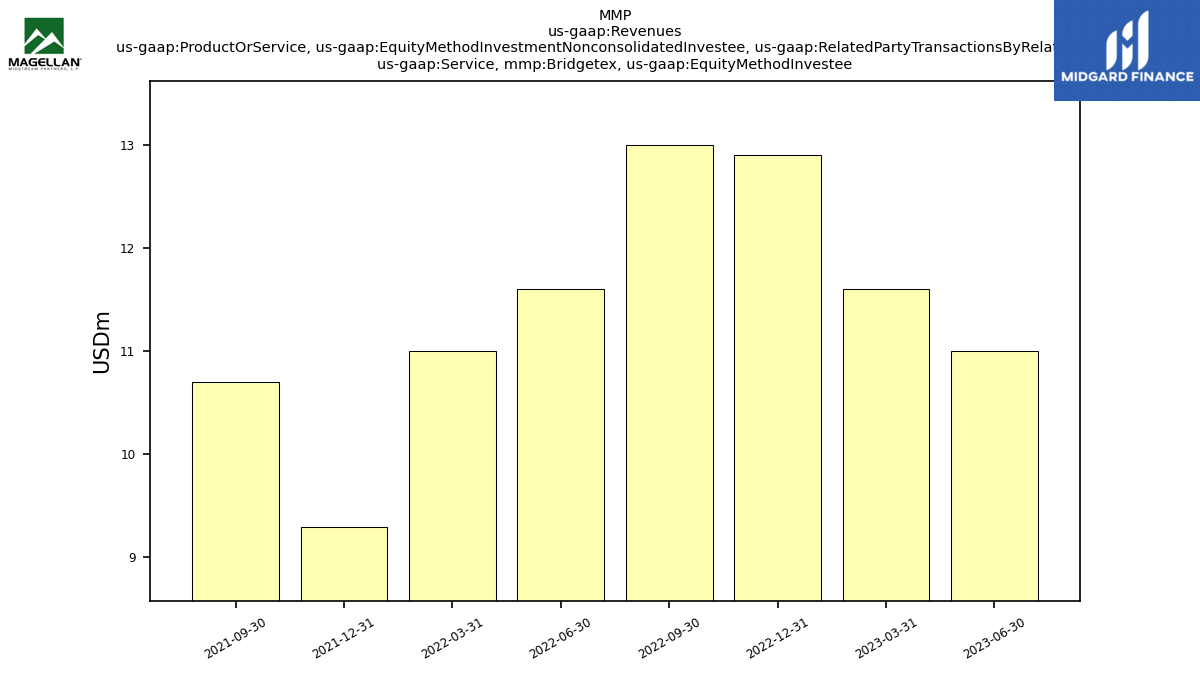
| Service, Bridgetex, Equity Method Investee | 11.00 | 11.60 | 12.90 | 13.00 | 11.60 | 11.00 | 9.30 | 10.70 | NA | NA | NA | NA | NA | NA | NA | NA | NA | NA | NA | NA | NA | NA | NA | NA | NA | NA | NA | NA | NA | NA | NA | NA | NA | NA | NA | NA | NA | NA | NA | NA | NA | NA | NA | NA | NA | NA | NA | NA | NA | NA | NA | NA | NA | NA | |
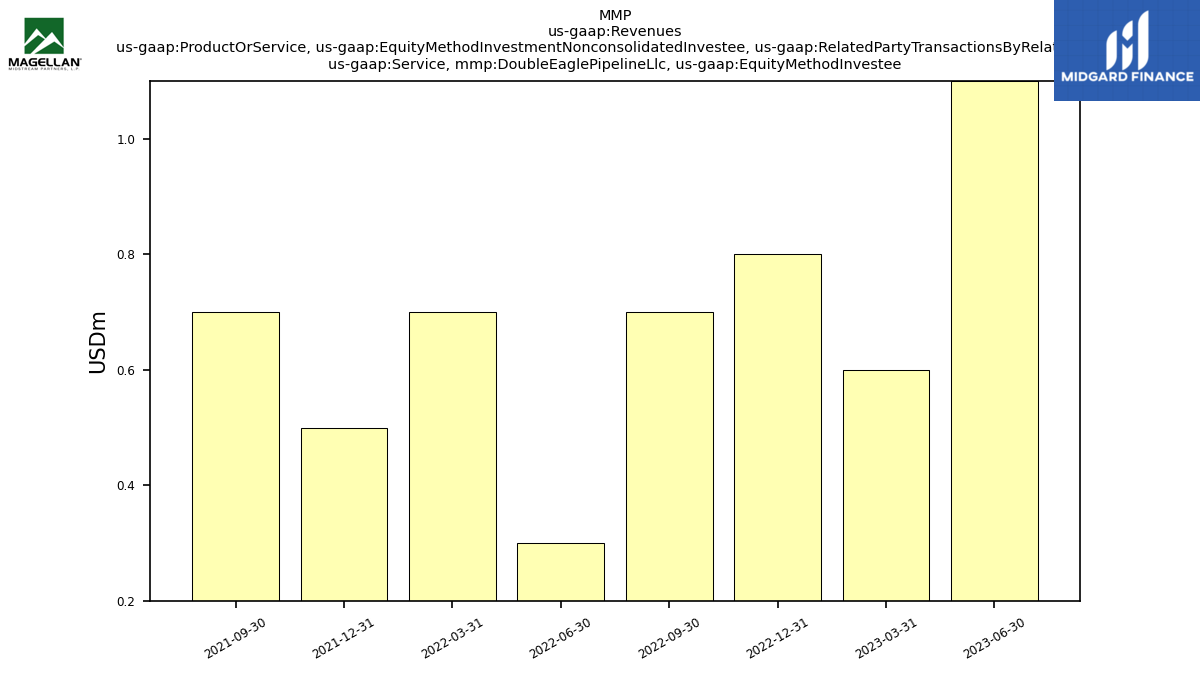
| Service, Double Eagle Pipeline Llc, Equity Method Investee | 1.10 | 0.60 | 0.80 | 0.70 | 0.30 | 0.70 | 0.50 | 0.70 | NA | NA | NA | NA | NA | NA | NA | NA | NA | NA | NA | NA | NA | NA | NA | NA | NA | NA | NA | NA | NA | NA | NA | NA | NA | NA | NA | NA | NA | NA | NA | NA | NA | NA | NA | NA | NA | NA | NA | NA | NA | NA | NA | NA | NA | NA | |
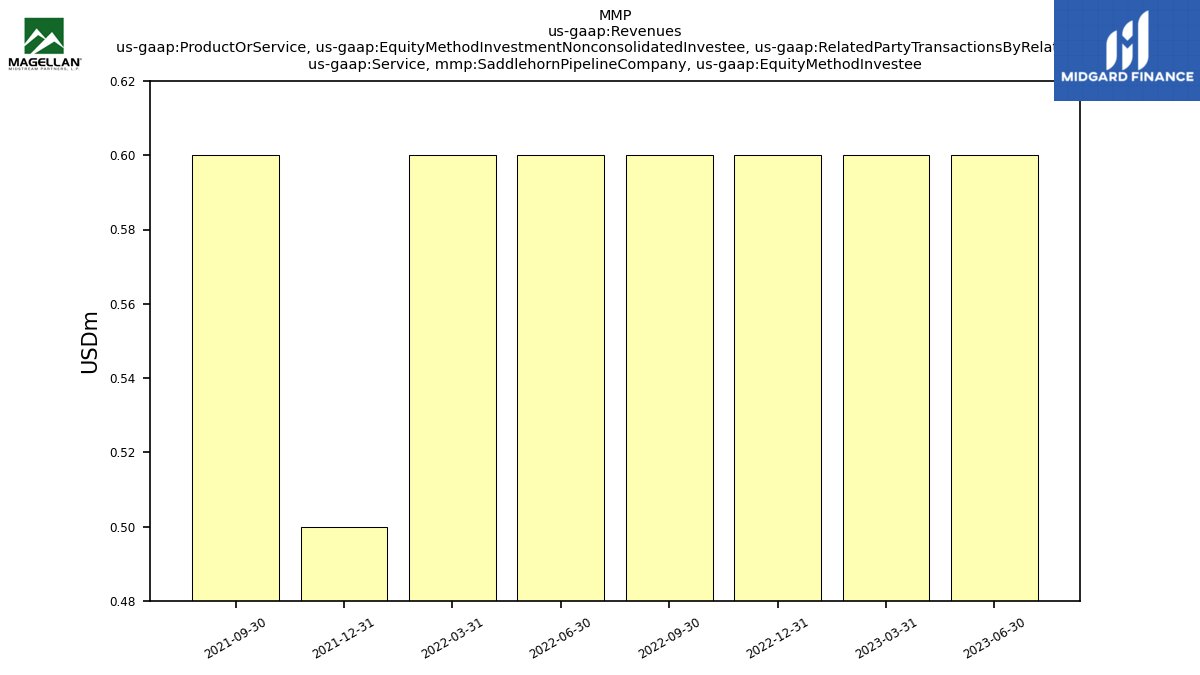
| Service, Saddlehorn Pipeline Company, Equity Method Investee | 0.60 | 0.60 | 0.60 | 0.60 | 0.60 | 0.60 | 0.50 | 0.60 | NA | NA | NA | NA | NA | NA | NA | NA | NA | NA | NA | NA | NA | NA | NA | NA | NA | NA | NA | NA | NA | NA | NA | NA | NA | NA | NA | NA | NA | NA | NA | NA | NA | NA | NA | NA | NA | NA | NA | NA | NA | NA | NA | NA | NA | NA | |
| Service, Related Party, Methvin Company,, Transferred Over Time | 20.90 | NA | NA | NA | 14.90 | NA | NA | NA | NA | NA | NA | NA | NA | NA | NA | NA | NA | NA | NA | NA | NA | NA | NA | NA | NA | NA | NA | NA | NA | NA | NA | NA | NA | NA | NA | NA | NA | NA | NA | NA | NA | NA | NA | NA | NA | NA | NA | NA | NA | NA | NA | NA | NA | NA | |
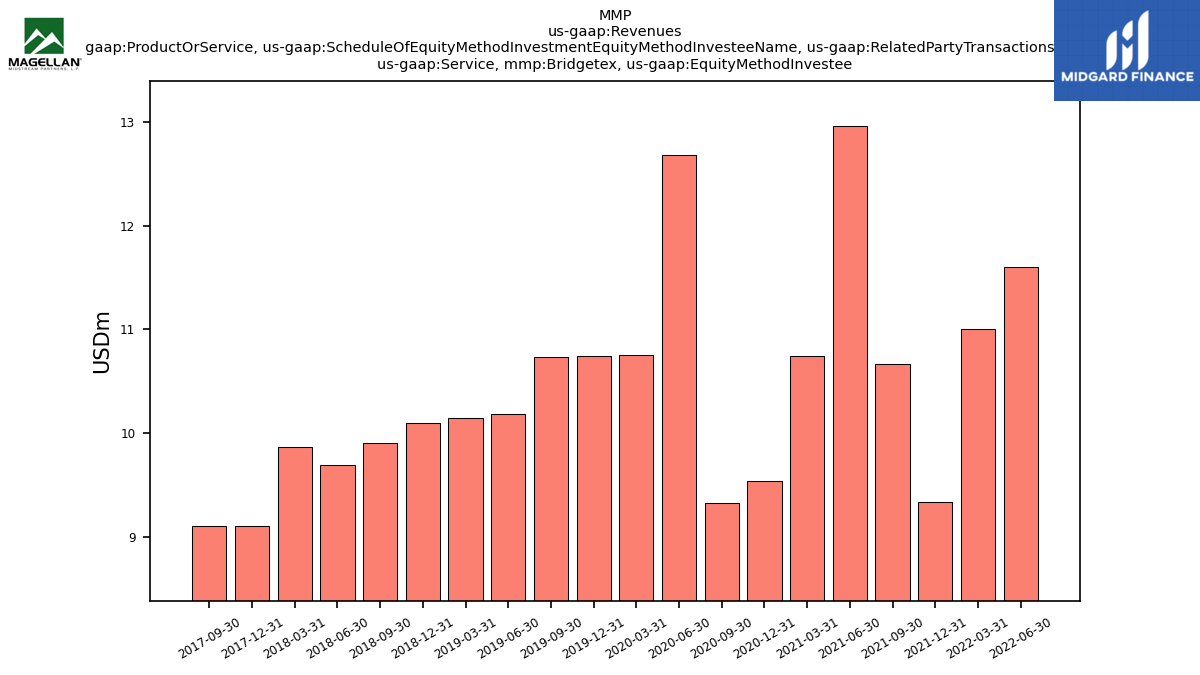
| Service, Bridgetex, Equity Method Investee | NA | NA | NA | NA | 11.60 | 11.00 | 9.33 | 10.67 | 12.96 | 10.74 | 9.54 | 9.32 | 12.68 | 10.75 | 10.74 | 10.74 | 10.18 | 10.14 | 10.10 | 9.90 | 9.70 | 9.86 | 9.10 | 9.10 | NA | NA | NA | NA | NA | NA | NA | NA | NA | NA | NA | NA | NA | NA | NA | NA | NA | NA | NA | NA | NA | NA | NA | NA | NA | NA | NA | NA | NA | NA | |
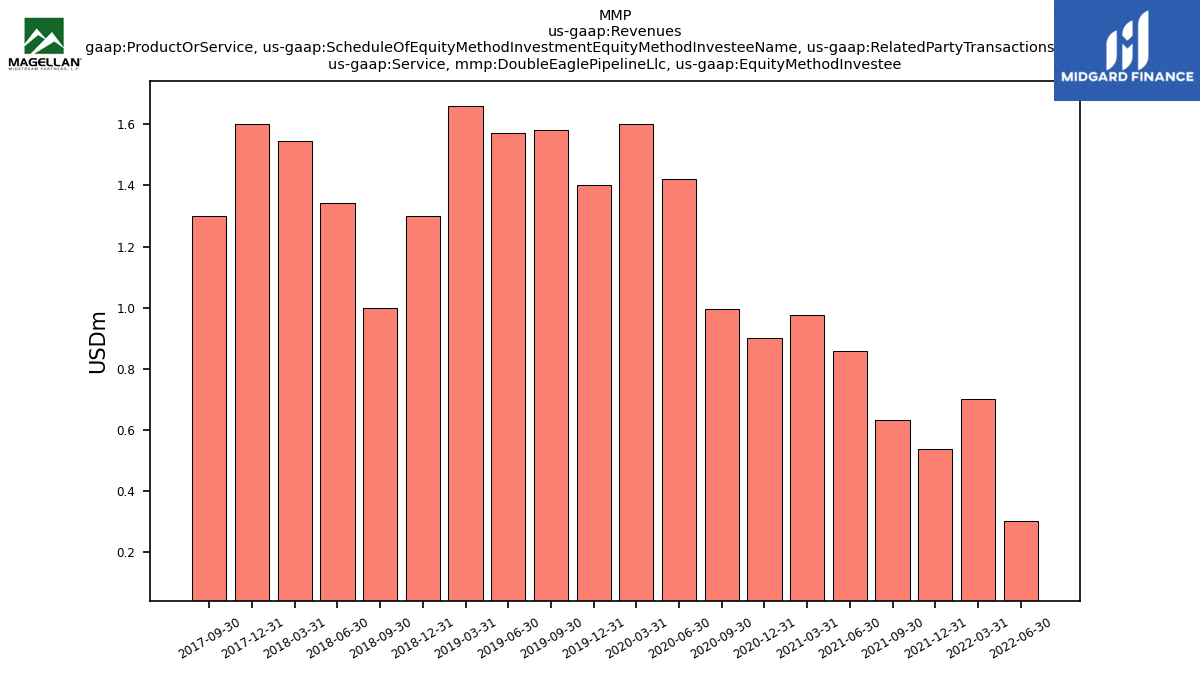
| Service, Double Eagle Pipeline Llc, Equity Method Investee | NA | NA | NA | NA | 0.30 | 0.70 | 0.54 | 0.63 | 0.86 | 0.98 | 0.90 | 0.99 | 1.42 | 1.60 | 1.40 | 1.58 | 1.57 | 1.66 | 1.30 | 1.00 | 1.34 | 1.54 | 1.60 | 1.30 | NA | NA | NA | NA | NA | NA | NA | NA | NA | NA | NA | NA | NA | NA | NA | NA | NA | NA | NA | NA | NA | NA | NA | NA | NA | NA | NA | NA | NA | NA | |
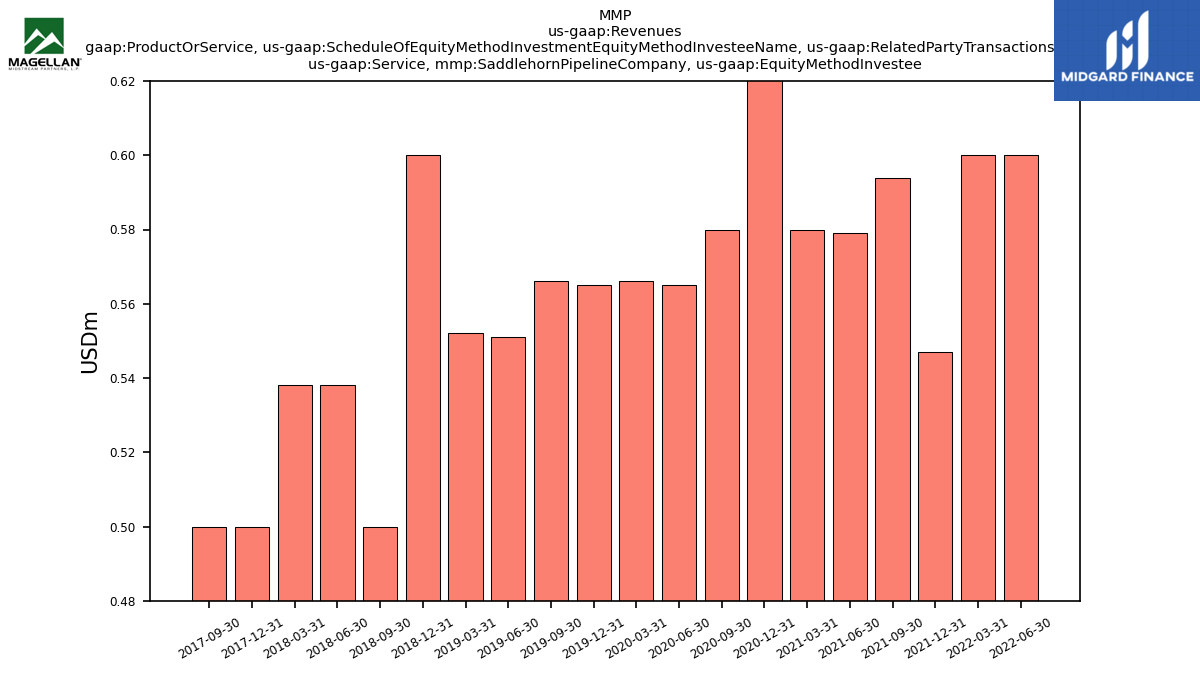
| Service, Saddlehorn Pipeline Company, Equity Method Investee | NA | NA | NA | NA | 0.60 | 0.60 | 0.55 | 0.59 | 0.58 | 0.58 | 0.77 | 0.58 | 0.56 | 0.57 | 0.56 | 0.57 | 0.55 | 0.55 | 0.60 | 0.50 | 0.54 | 0.54 | 0.50 | 0.50 | NA | NA | NA | NA | NA | NA | NA | NA | NA | NA | NA | NA | NA | NA | NA | NA | NA | NA | NA | NA | NA | NA | NA | NA | NA | NA | NA | NA | NA | NA | |
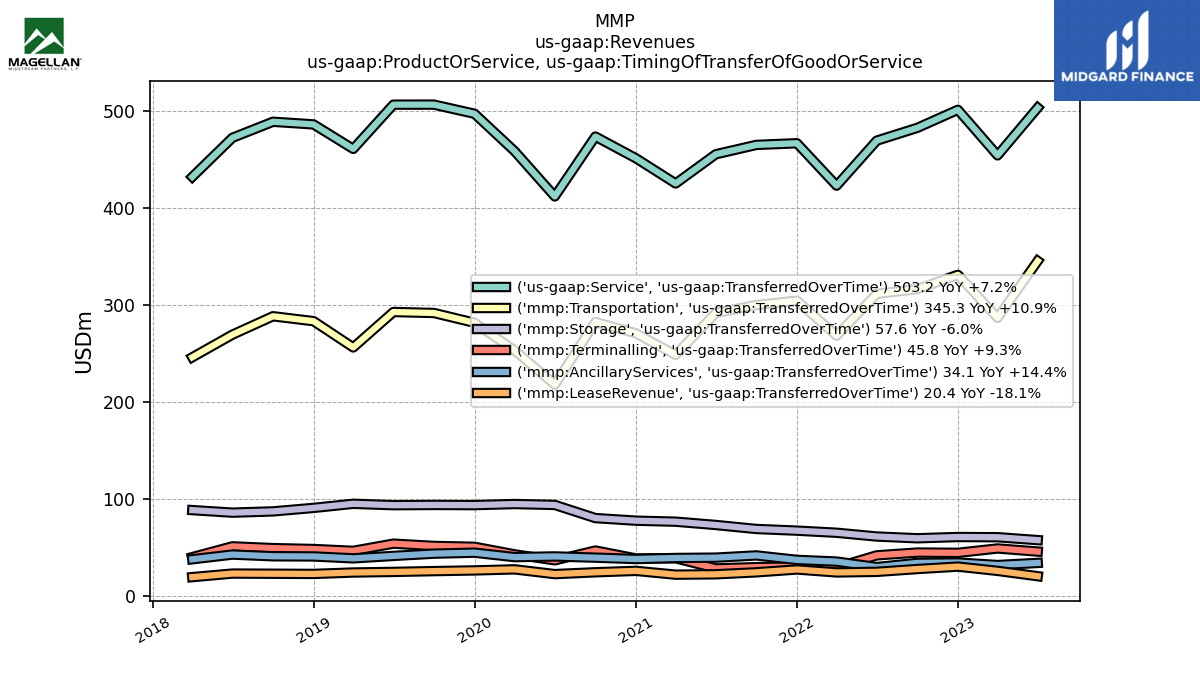
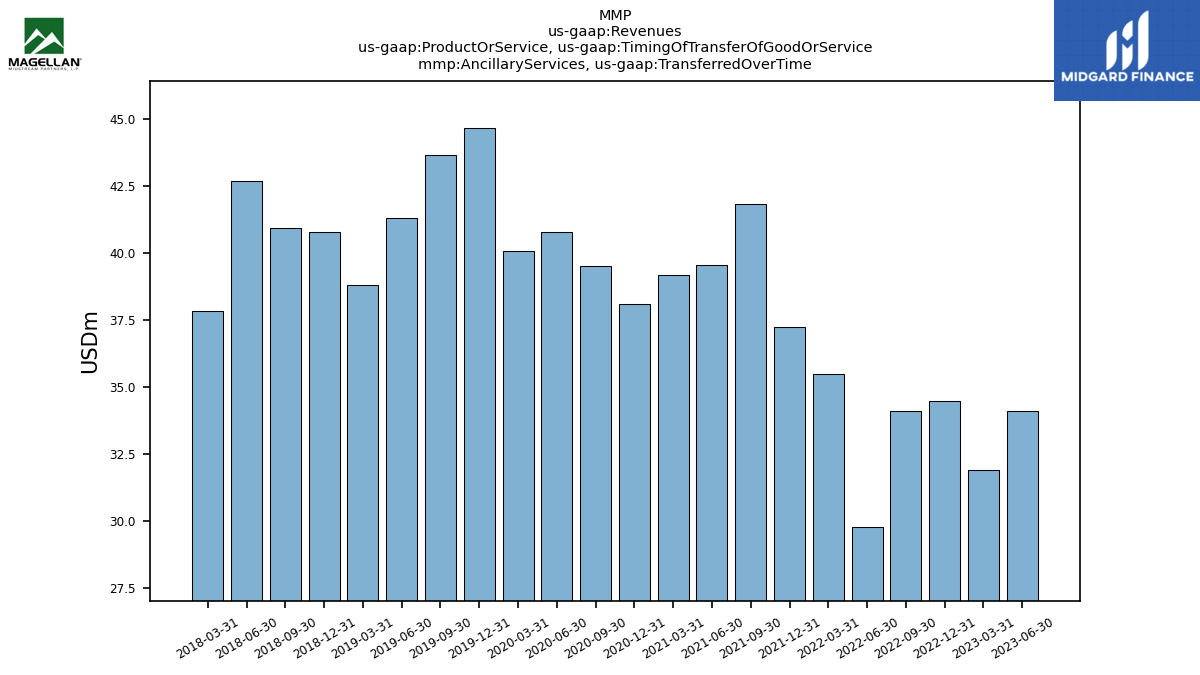
| Ancillary Services, Transferred Over Time | 34.10 | 31.90 | 34.50 | 34.10 | 29.80 | 35.50 | 37.24 | 41.82 | 39.55 | 39.19 | 38.12 | 39.53 | 40.78 | 40.09 | 44.66 | 43.65 | 41.32 | 38.80 | 40.78 | 40.94 | 42.70 | 37.86 | NA | NA | NA | NA | NA | NA | NA | NA | NA | NA | NA | NA | NA | NA | NA | NA | NA | NA | NA | NA | NA | NA | NA | NA | NA | NA | NA | NA | NA | NA | NA | NA | |
| Lease Revenue, Transferred Over Time | 20.40 | 25.90 | 30.30 | 27.80 | 24.90 | 24.30 | 27.34 | 24.41 | 22.37 | 21.99 | 25.91 | 24.46 | 22.56 | 27.47 | 26.36 | 25.66 | 24.82 | 24.23 | 22.76 | 22.96 | 23.13 | 19.46 | NA | NA | NA | NA | NA | NA | NA | NA | NA | NA | NA | NA | NA | NA | NA | NA | NA | NA | NA | NA | NA | NA | NA | NA | NA | NA | NA | NA | NA | NA | NA | NA | |
| Storage, Transferred Over Time | 57.60 | 60.60 | 60.80 | 59.50 | 61.30 | 65.20 | 67.37 | 69.08 | 73.19 | 76.61 | 77.63 | 80.31 | 93.85 | 94.80 | 93.66 | 93.83 | 93.59 | 95.04 | 90.80 | 87.20 | 85.91 | 88.53 | NA | NA | NA | NA | NA | NA | NA | NA | NA | NA | NA | NA | NA | NA | NA | NA | NA | NA | NA | NA | NA | NA | NA | NA | NA | NA | NA | NA | NA | NA | NA | NA | |
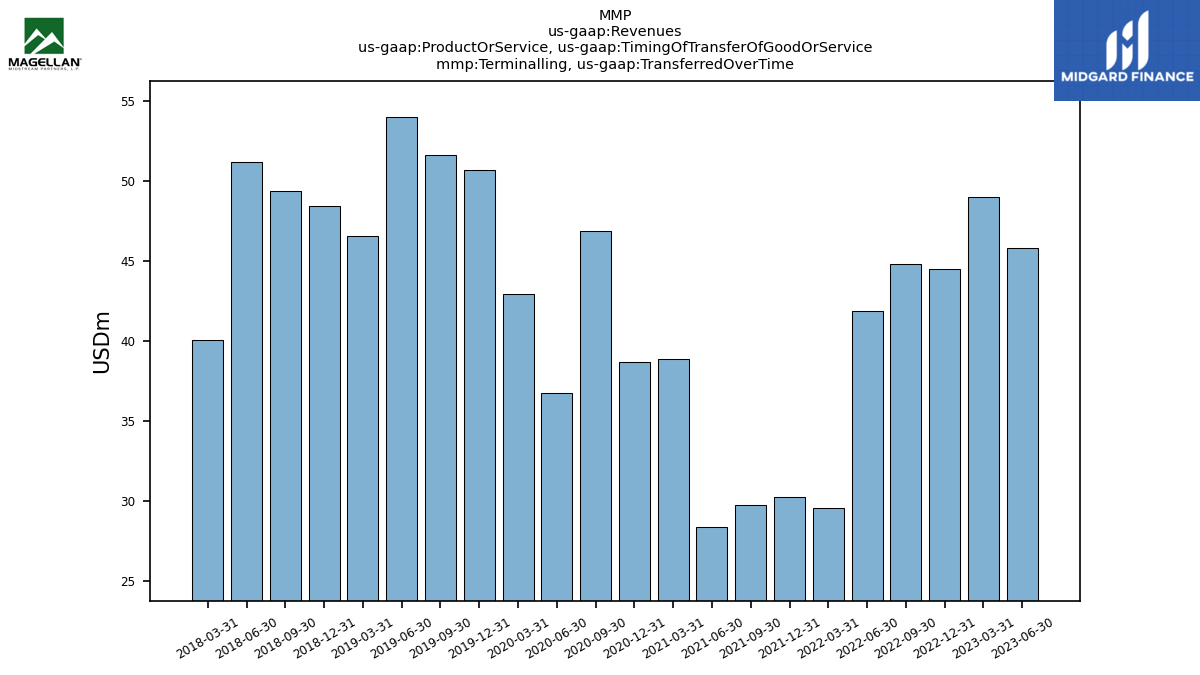
| Terminalling, Transferred Over Time | 45.80 | 49.00 | 44.50 | 44.80 | 41.90 | 29.60 | 30.26 | 29.75 | 28.42 | 38.91 | 38.70 | 46.88 | 36.78 | 42.92 | 50.72 | 51.60 | 53.97 | 46.54 | 48.43 | 49.36 | 51.17 | 40.06 | NA | NA | NA | NA | NA | NA | NA | NA | NA | NA | NA | NA | NA | NA | NA | NA | NA | NA | NA | NA | NA | NA | NA | NA | NA | NA | NA | NA | NA | NA | NA | NA | |
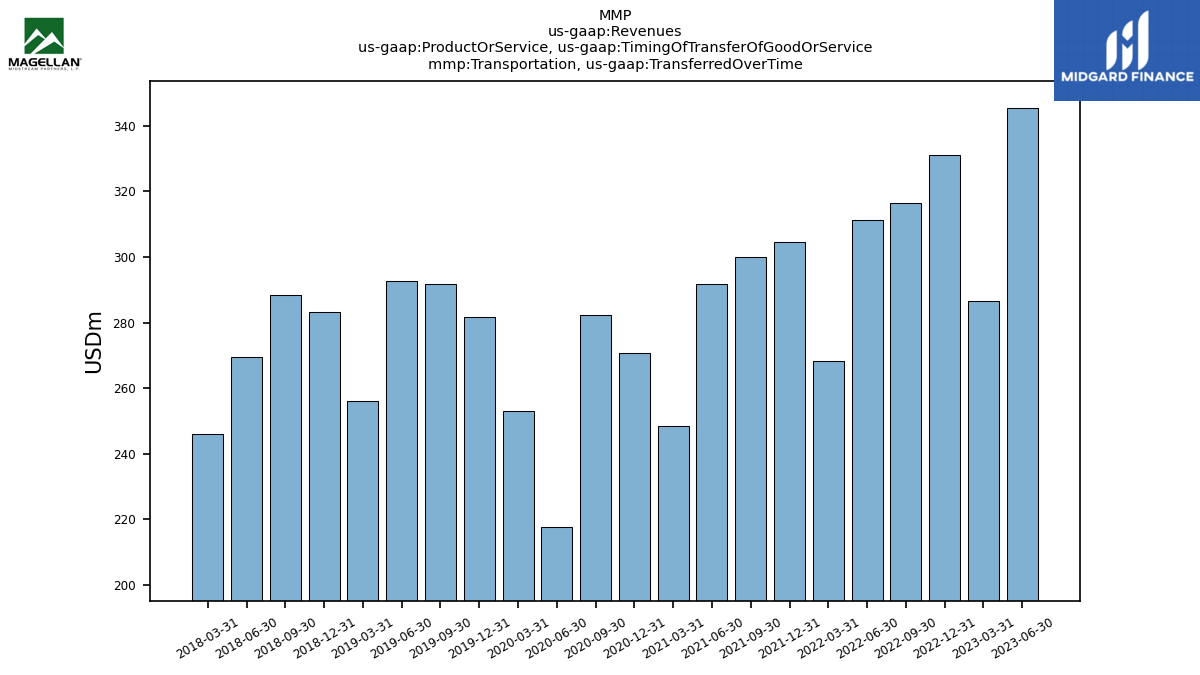
| Transportation, Transferred Over Time | 345.30 | 286.70 | 331.00 | 316.30 | 311.40 | 268.30 | 304.43 | 299.86 | 291.74 | 248.47 | 270.74 | 282.35 | 217.83 | 253.12 | 281.60 | 291.68 | 292.71 | 256.19 | 283.26 | 288.32 | 269.35 | 246.03 | NA | NA | NA | NA | NA | NA | NA | NA | NA | NA | NA | NA | NA | NA | NA | NA | NA | NA | NA | NA | NA | NA | NA | NA | NA | NA | NA | NA | NA | NA | NA | NA | |
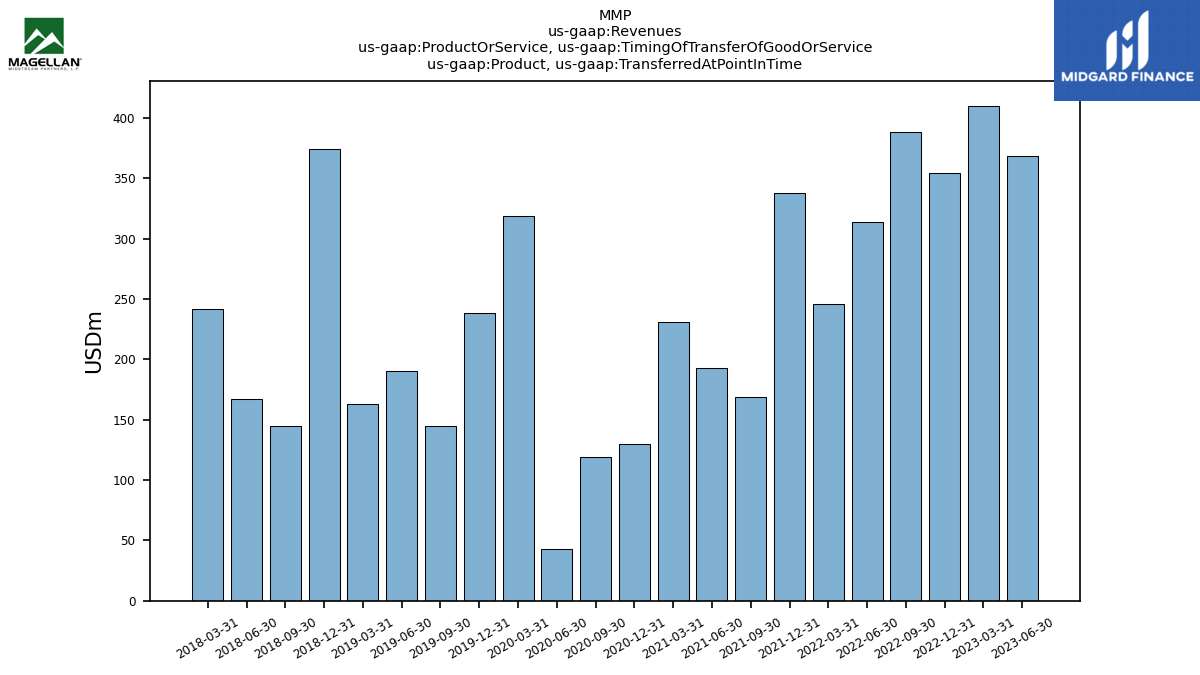
| Product, Transferred At Point In Time | 368.70 | 410.10 | 354.40 | 388.20 | 313.70 | 246.10 | 337.43 | 168.81 | 193.07 | 230.60 | 129.88 | 119.44 | 43.28 | 319.12 | 238.30 | 144.81 | 189.99 | 163.00 | 374.43 | 144.40 | 166.80 | 241.59 | NA | NA | NA | NA | NA | NA | NA | NA | NA | NA | NA | NA | NA | NA | NA | NA | NA | NA | NA | NA | NA | NA | NA | NA | NA | NA | NA | NA | NA | NA | NA | NA | |
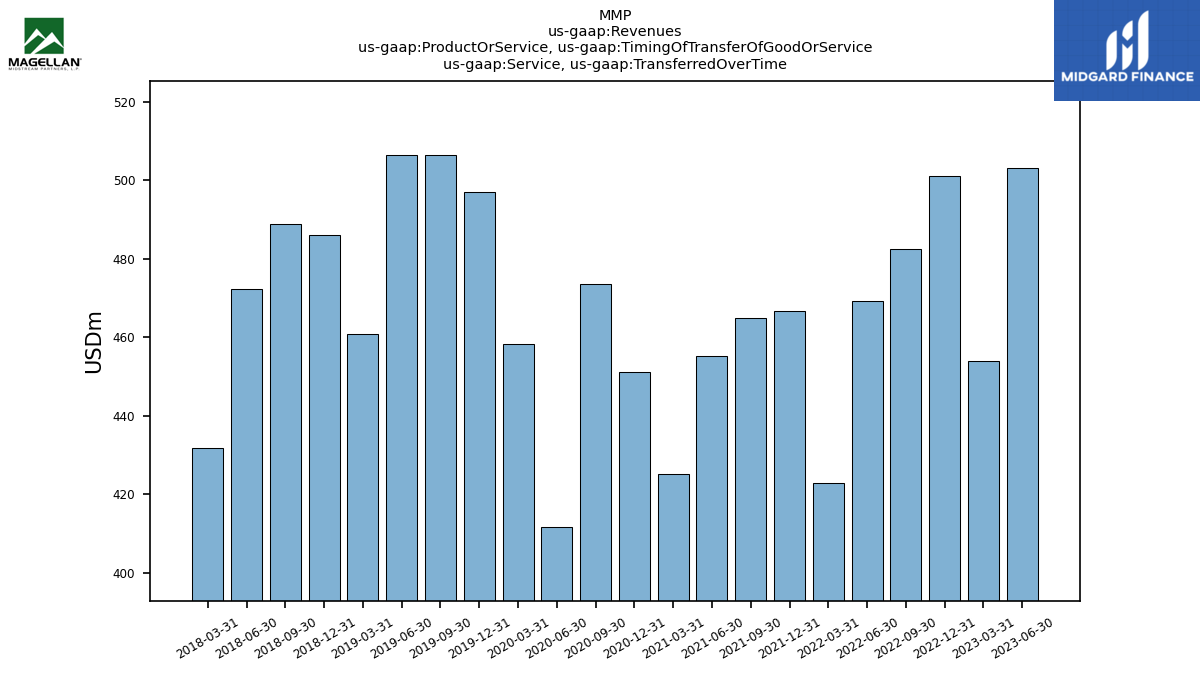
| Service, Transferred Over Time | 503.20 | 454.10 | 501.10 | 482.50 | 469.30 | 422.90 | 466.63 | 464.91 | 455.28 | 425.17 | 451.11 | 473.53 | 411.81 | 458.39 | 497.00 | 506.43 | 506.40 | 460.79 | 486.03 | 488.77 | 472.25 | 431.94 | NA | NA | NA | NA | NA | NA | NA | NA | NA | NA | NA | NA | NA | NA | NA | NA | NA | NA | NA | NA | NA | NA | NA | NA | NA | NA | NA | NA | NA | NA | NA | NA | |
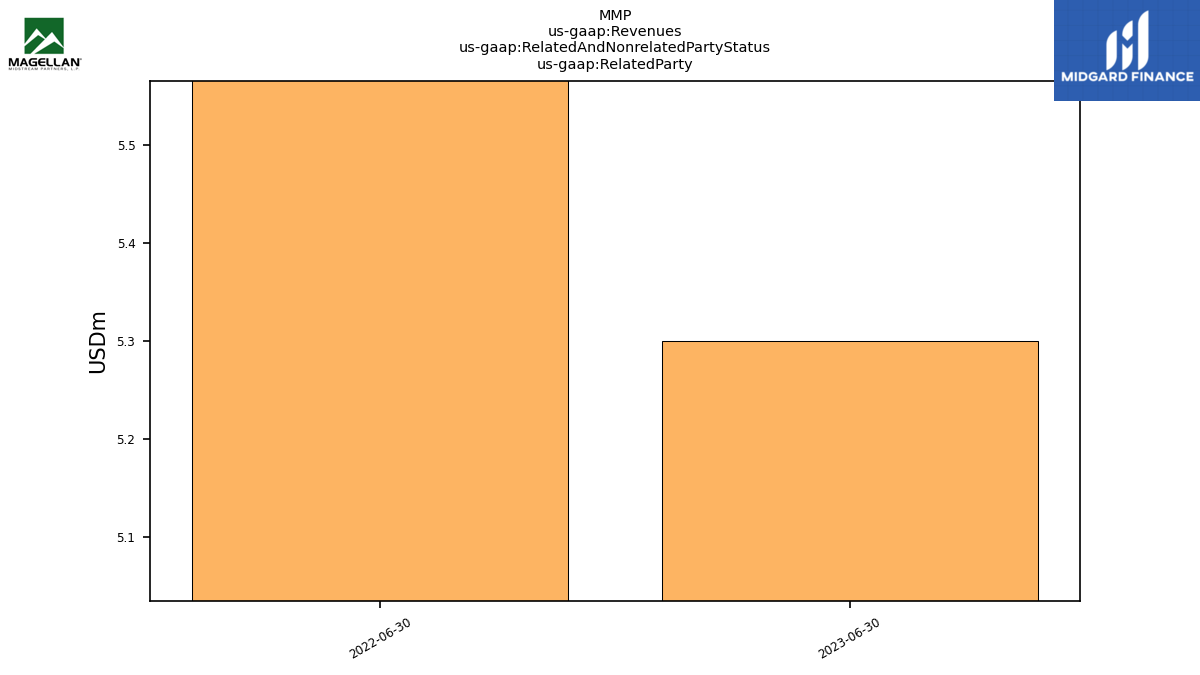
| Related Party | 5.30 | NA | NA | NA | 5.60 | NA | NA | NA | NA | NA | NA | NA | NA | NA | NA | NA | NA | NA | NA | NA | NA | NA | NA | NA | NA | NA | NA | NA | NA | NA | NA | NA | NA | NA | NA | NA | NA | NA | NA | NA | NA | NA | NA | NA | NA | NA | NA | NA | NA | NA | NA | NA | NA | NA | |
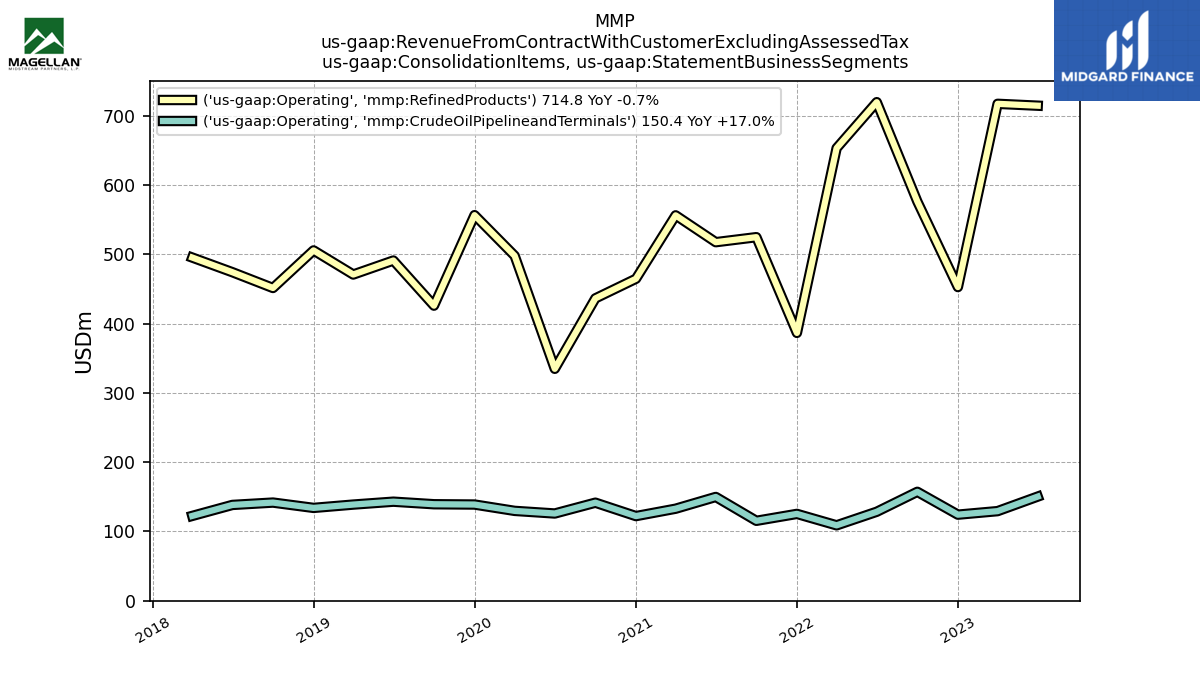
| Revenue From Contract With Customer Excluding Assessed Tax | 863.20 | 844.70 | 575.10 | 732.40 | 847.10 | 761.10 | 510.76 | 638.95 | 666.41 | 687.57 | 585.66 | 576.25 | 459.28 | 626.28 | 740.00 | 607.96 | 676.19 | 654.07 | 682.55 | 634.58 | 654.33 | 661.44 | 673.30 | 572.85 | 619.44 | 642.07 | 614.91 | 551.78 | 518.90 | 519.82 | 573.05 | 577.23 | 487.54 | 522.09 | 667.07 | 521.60 | 496.45 | 618.61 | 577.44 | 443.83 | 443.91 | 432.42 | 503.19 | 325.87 | 449.53 | 493.48 | 486.93 | 435.51 | 383.33 | 442.90 | 398.49 | 406.20 | 423.06 | 329.69 | |
| Intersegment Elimination | -2.00 | -2.20 | -2.10 | -1.40 | -1.30 | -1.30 | -1.36 | -1.44 | -1.19 | -1.81 | -1.47 | -1.93 | -1.58 | -1.58 | -1.58 | -1.56 | -1.34 | -0.94 | -0.94 | -0.92 | -0.92 | -0.92 | -0.92 | -0.90 | -0.89 | -0.69 | -0.61 | -0.20 | 0.00 | 0.00 | 0.00 | 0.00 | 0.00 | 0.00 | 0.00 | 0.00 | 0.00 | 0.00 | 0.00 | 0.00 | 0.00 | 0.00 | 0.00 | 0.00 | NA | NA | NA | NA | NA | NA | NA | NA | NA | NA | |
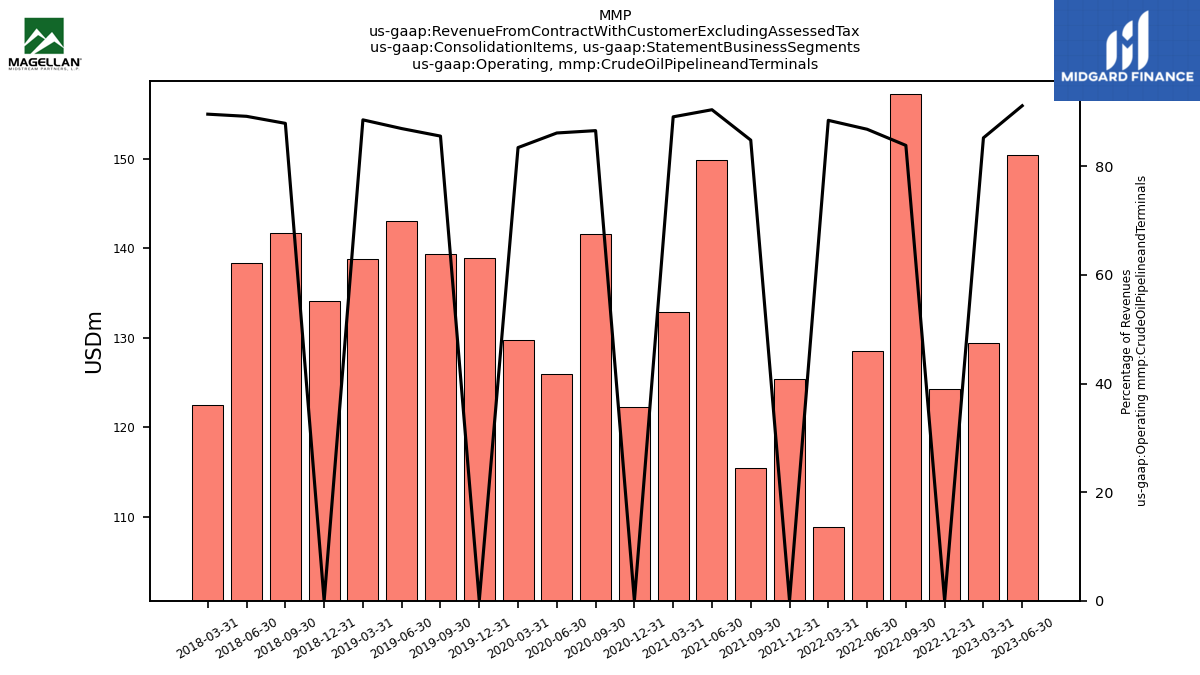
| Operating, Crude Oil Pipelineand Terminals | 150.40 | 129.40 | 124.30 | 157.30 | 128.50 | 108.90 | 125.41 | 115.42 | 149.88 | 132.90 | 122.23 | 141.59 | 125.98 | 129.76 | 138.92 | 139.35 | 143.04 | 138.86 | 134.06 | 141.75 | 138.34 | 122.50 | NA | NA | NA | NA | NA | NA | NA | NA | NA | NA | NA | NA | NA | NA | NA | NA | NA | NA | NA | NA | NA | NA | NA | NA | NA | NA | NA | NA | NA | NA | NA | NA | |
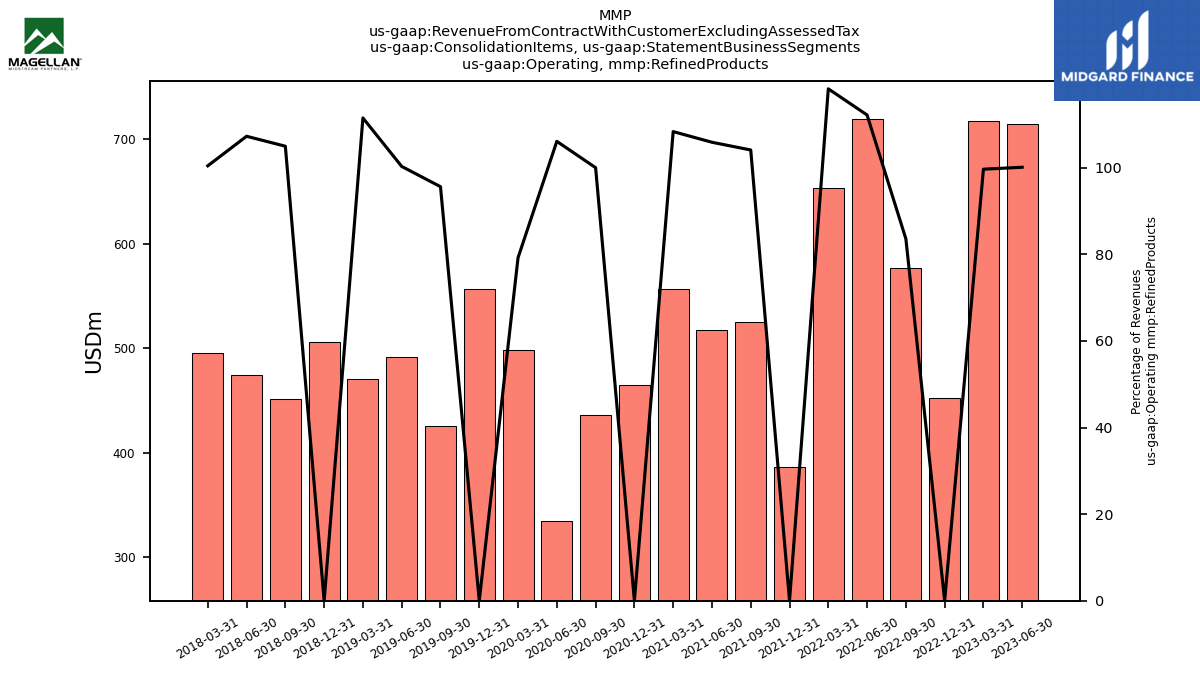
| Operating, Refined Products | 714.80 | 717.50 | 452.90 | 576.50 | 719.90 | 653.50 | 386.70 | 524.97 | 517.72 | 556.49 | 464.90 | 436.60 | 334.89 | 498.10 | 556.76 | 426.07 | 491.25 | 471.02 | 505.87 | 451.57 | 474.37 | 495.52 | NA | NA | NA | NA | NA | NA | NA | NA | NA | NA | NA | NA | NA | NA | NA | NA | NA | NA | NA | NA | NA | NA | NA | NA | NA | NA | NA | NA | NA | NA | NA | NA |


