
| 2023-12-31 | 2023-09-30 | 2023-06-30 | 2023-03-31 | 2022-12-31 | 2022-09-30 | 2022-06-30 | 2022-03-31 | 2021-12-31 | 2021-09-30 | 2021-06-30 | 2021-03-31 | 2020-12-31 | 2020-09-30 | 2020-06-30 | 2020-03-31 | 2019-12-31 | 2019-09-30 | 2019-06-30 | 2019-03-31 | 2018-12-31 | 2018-09-30 | 2018-06-30 | 2018-03-31 | 2017-12-31 | 2017-09-30 | 2017-06-30 | 2017-03-31 | 2016-12-31 | 2016-09-30 | 2016-06-30 | 2016-03-31 | 2015-12-31 | 2015-09-30 | 2015-06-30 | 2015-03-31 | 2014-12-31 | 2014-09-30 | 2014-06-30 | 2014-03-31 | 2013-12-31 | 2013-09-30 | 2013-06-30 | 2013-03-31 | 2012-12-31 | 2012-09-30 | 2012-06-30 | 2012-03-31 | 2011-12-31 | 2011-09-30 | 2011-06-30 | 2011-03-31 | 2010-12-31 | 2010-09-30 | 2010-06-30 | 2010-03-31 | ||
|---|---|---|---|---|---|---|---|---|---|---|---|---|---|---|---|---|---|---|---|---|---|---|---|---|---|---|---|---|---|---|---|---|---|---|---|---|---|---|---|---|---|---|---|---|---|---|---|---|---|---|---|---|---|---|---|---|---|
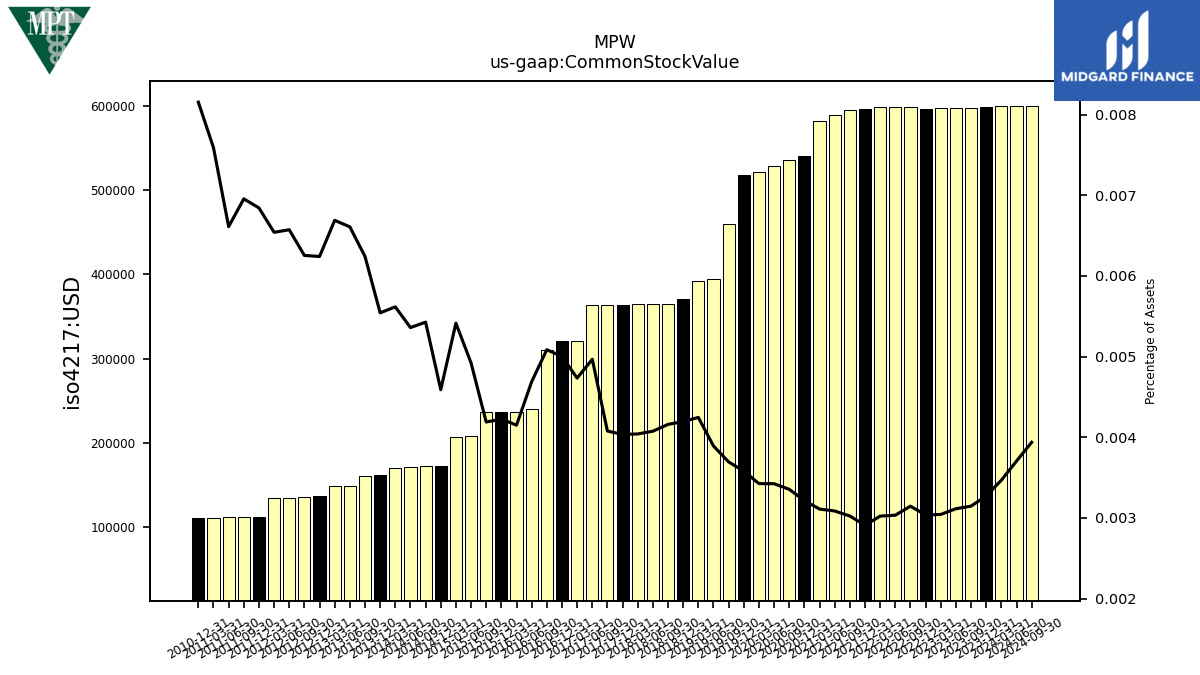
| Common Stock Value | 0.60 | 0.60 | 0.60 | 0.60 | 0.60 | 0.60 | 0.60 | 0.60 | 0.60 | 0.60 | 0.59 | 0.58 | 0.54 | 0.54 | 0.53 | 0.52 | 0.52 | 0.46 | 0.39 | 0.39 | 0.37 | 0.36 | 0.36 | 0.36 | 0.36 | 0.36 | 0.36 | 0.32 | 0.32 | 0.31 | 0.24 | 0.24 | 0.24 | 0.24 | 0.21 | 0.21 | 0.17 | 0.17 | 0.17 | 0.17 | 0.16 | 0.16 | 0.15 | 0.15 | 0.14 | 0.14 | 0.13 | 0.13 | 0.11 | 0.11 | 0.11 | 0.11 | 0.11 | NA | NA | NA | |
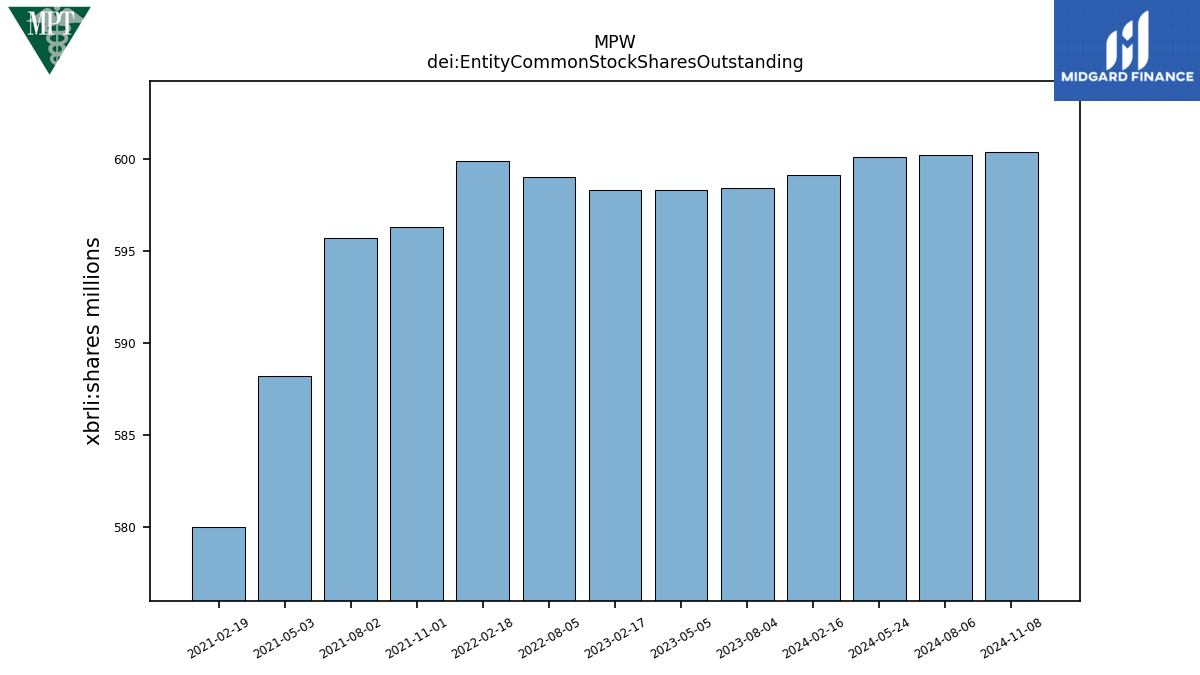
| dei: Entity Common Stock Shares Outstanding | NA | NA | NA | NA | NA | NA | NA | NA | NA | NA | NA | NA | NA | NA | NA | NA | NA | NA | NA | NA | NA | NA | NA | NA | NA | NA | NA | NA | NA | NA | NA | NA | NA | NA | NA | NA | NA | NA | NA | NA | NA | NA | NA | NA | NA | NA | NA | NA | NA | NA | NA | NA | NA | NA | NA | NA | |
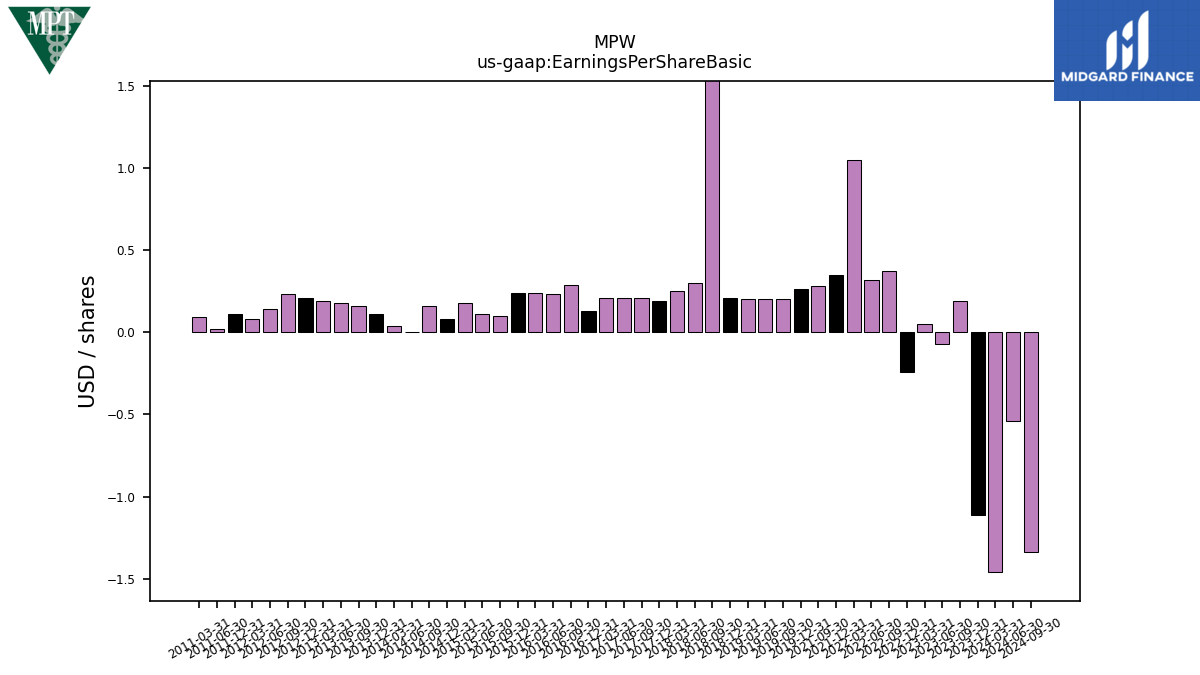
| Earnings Per Share Basic | -1.11 | 0.19 | -0.07 | 0.05 | -0.24 | 0.37 | 0.32 | 1.05 | 0.35 | 0.28 | NA | NA | NA | NA | NA | NA | 0.26 | 0.20 | 0.20 | 0.20 | 0.21 | 2.01 | 0.30 | 0.25 | 0.19 | 0.21 | 0.21 | 0.21 | 0.13 | 0.29 | 0.23 | 0.24 | 0.24 | 0.10 | 0.11 | 0.18 | 0.08 | 0.16 | 0.00 | 0.04 | 0.11 | 0.16 | 0.18 | 0.19 | 0.21 | 0.23 | 0.14 | 0.08 | 0.11 | NA | 0.02 | 0.09 | NA | NA | NA | NA | |
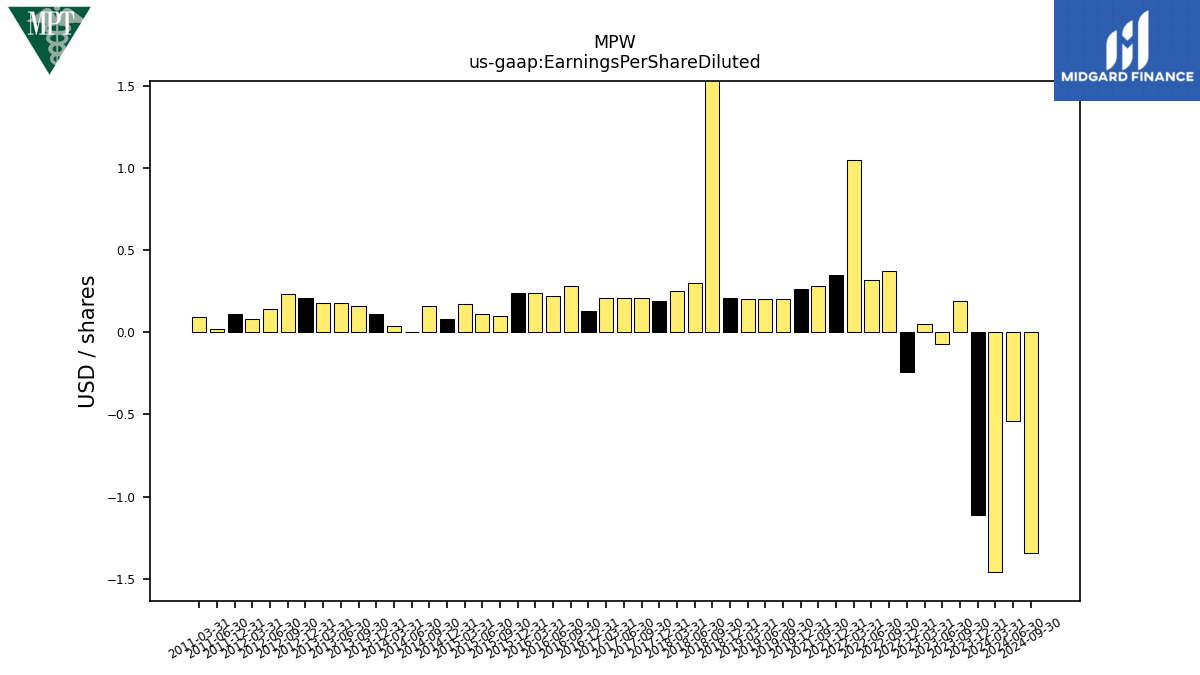
| Earnings Per Share Diluted | -1.11 | 0.19 | -0.07 | 0.05 | -0.24 | 0.37 | 0.32 | 1.05 | 0.35 | 0.28 | NA | NA | NA | NA | NA | NA | 0.26 | 0.20 | 0.20 | 0.20 | 0.21 | 2.00 | 0.30 | 0.25 | 0.19 | 0.21 | 0.21 | 0.21 | 0.13 | 0.28 | 0.22 | 0.24 | 0.24 | 0.10 | 0.11 | 0.17 | 0.08 | 0.16 | 0.00 | 0.04 | 0.11 | 0.16 | 0.18 | 0.18 | 0.21 | 0.23 | 0.14 | 0.08 | 0.11 | NA | 0.02 | 0.09 | NA | NA | NA | NA |
| 2023-12-31 | 2023-09-30 | 2023-06-30 | 2023-03-31 | 2022-12-31 | 2022-09-30 | 2022-06-30 | 2022-03-31 | 2021-12-31 | 2021-09-30 | 2021-06-30 | 2021-03-31 | 2020-12-31 | 2020-09-30 | 2020-06-30 | 2020-03-31 | 2019-12-31 | 2019-09-30 | 2019-06-30 | 2019-03-31 | 2018-12-31 | 2018-09-30 | 2018-06-30 | 2018-03-31 | 2017-12-31 | 2017-09-30 | 2017-06-30 | 2017-03-31 | 2016-12-31 | 2016-09-30 | 2016-06-30 | 2016-03-31 | 2015-12-31 | 2015-09-30 | 2015-06-30 | 2015-03-31 | 2014-12-31 | 2014-09-30 | 2014-06-30 | 2014-03-31 | 2013-12-31 | 2013-09-30 | 2013-06-30 | 2013-03-31 | 2012-12-31 | 2012-09-30 | 2012-06-30 | 2012-03-31 | 2011-12-31 | 2011-09-30 | 2011-06-30 | 2011-03-31 | 2010-12-31 | 2010-09-30 | 2010-06-30 | 2010-03-31 | ||
|---|---|---|---|---|---|---|---|---|---|---|---|---|---|---|---|---|---|---|---|---|---|---|---|---|---|---|---|---|---|---|---|---|---|---|---|---|---|---|---|---|---|---|---|---|---|---|---|---|---|---|---|---|---|---|---|---|---|
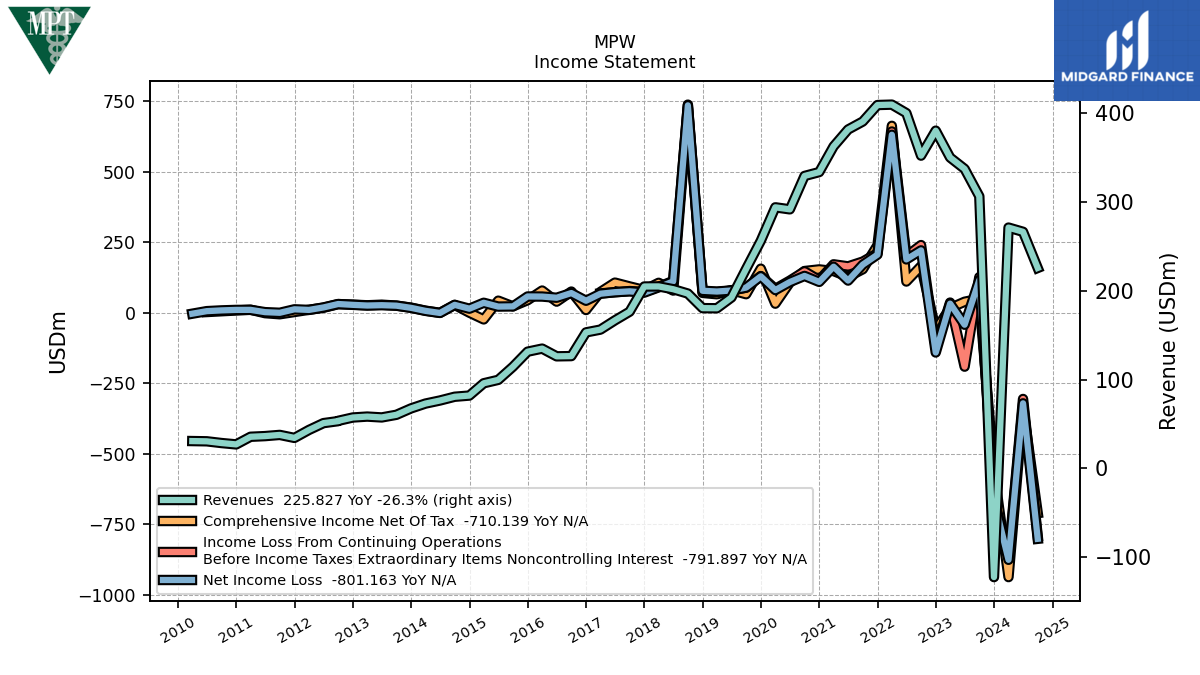
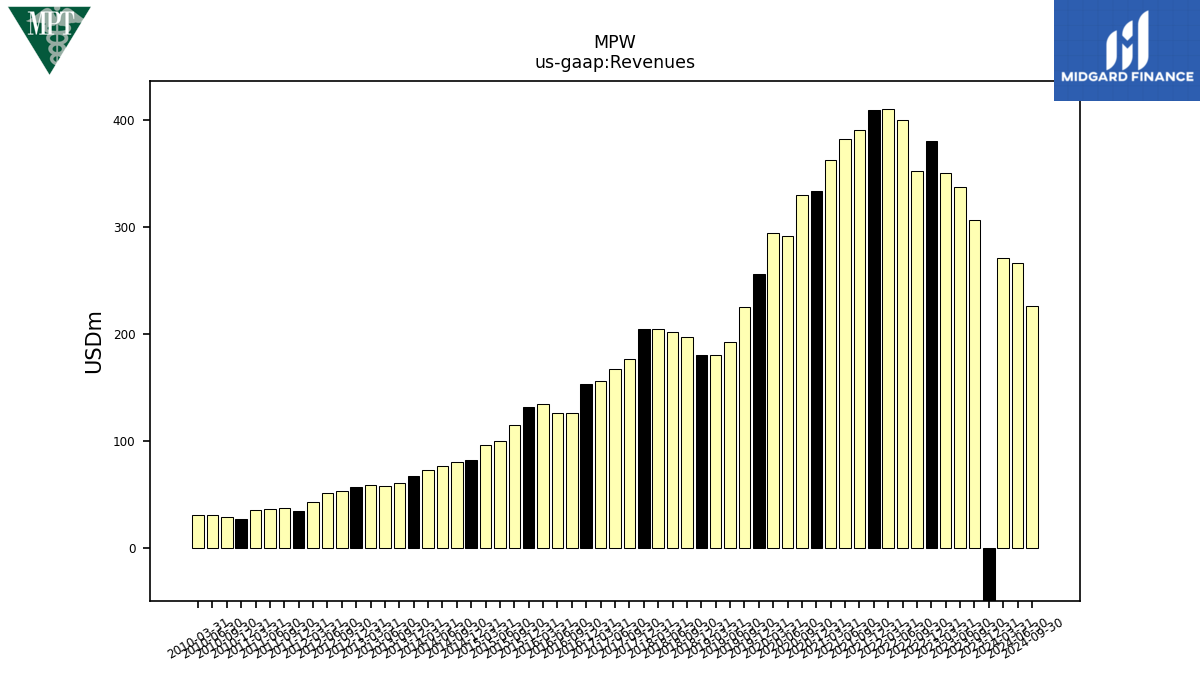
| Revenues | -122.38 | 306.58 | 337.39 | 350.21 | 380.49 | 352.34 | 400.23 | 409.80 | 409.33 | 390.78 | 381.79 | 362.76 | 333.81 | 329.46 | 291.84 | 294.13 | 256.44 | 224.76 | 192.55 | 180.45 | 180.58 | 197.00 | 201.90 | 205.05 | 204.96 | 176.58 | 166.81 | 156.40 | 153.28 | 126.56 | 126.30 | 135.00 | 131.55 | 114.57 | 99.80 | 95.96 | 82.11 | 80.78 | 76.56 | 73.09 | 67.68 | 60.46 | 57.47 | 58.44 | 57.41 | 53.31 | 51.07 | 43.39 | 34.42 | 37.79 | 36.45 | 35.70 | 27.10 | 28.64 | 30.59 | 30.86 | |
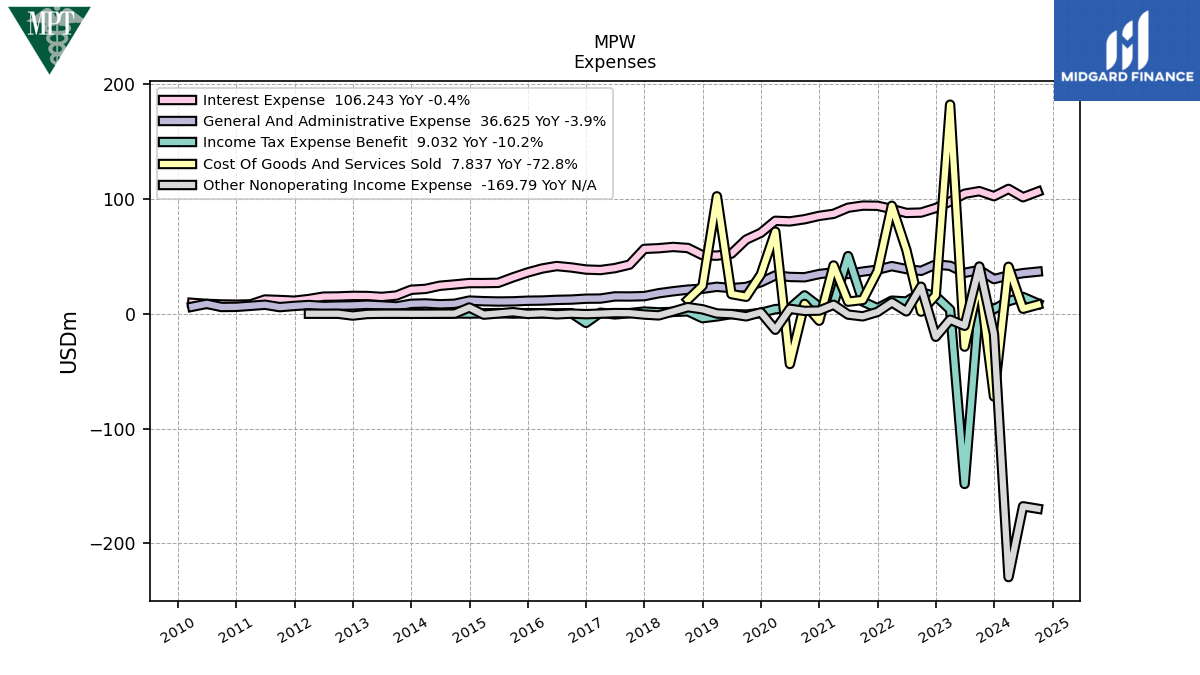
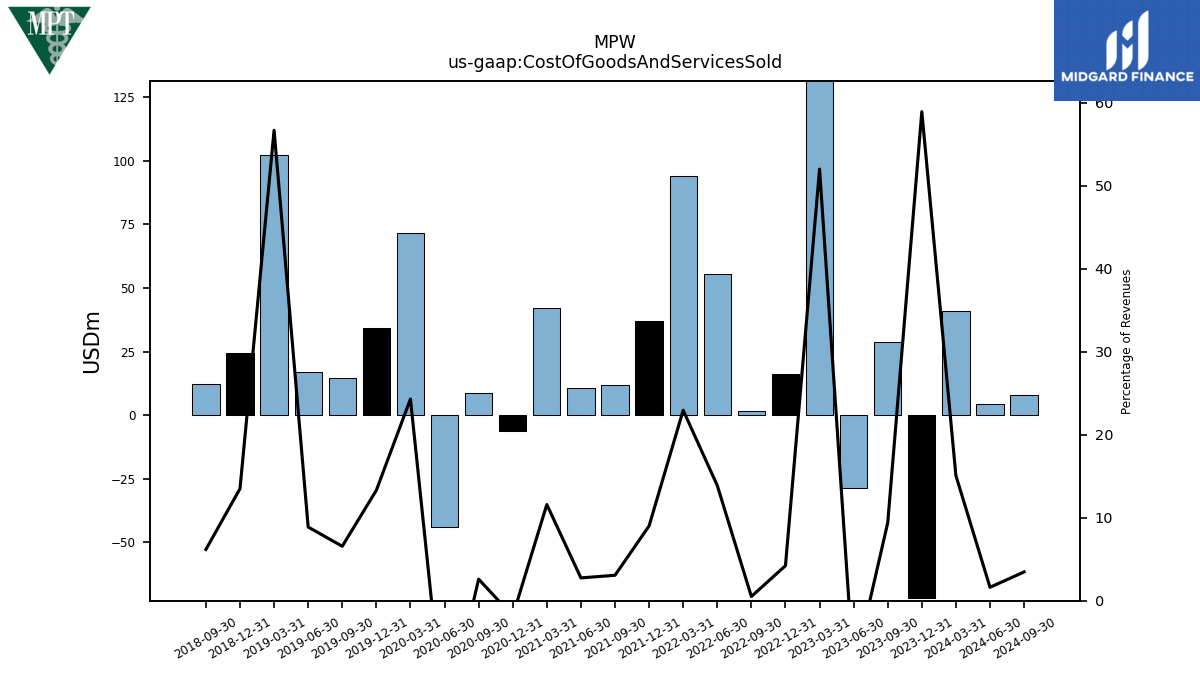
| Cost Of Goods And Services Sold | -72.08 | 28.77 | -28.67 | 182.06 | 16.05 | 1.81 | 55.56 | 93.99 | 36.91 | 11.99 | 10.50 | 42.04 | -6.11 | 8.58 | -43.80 | 71.47 | 34.13 | 14.75 | 17.09 | 102.24 | 24.38 | 12.18 | NA | NA | NA | NA | NA | NA | NA | NA | NA | NA | NA | NA | NA | NA | NA | NA | NA | NA | NA | NA | NA | NA | NA | NA | NA | NA | NA | NA | NA | NA | NA | NA | NA | NA | |
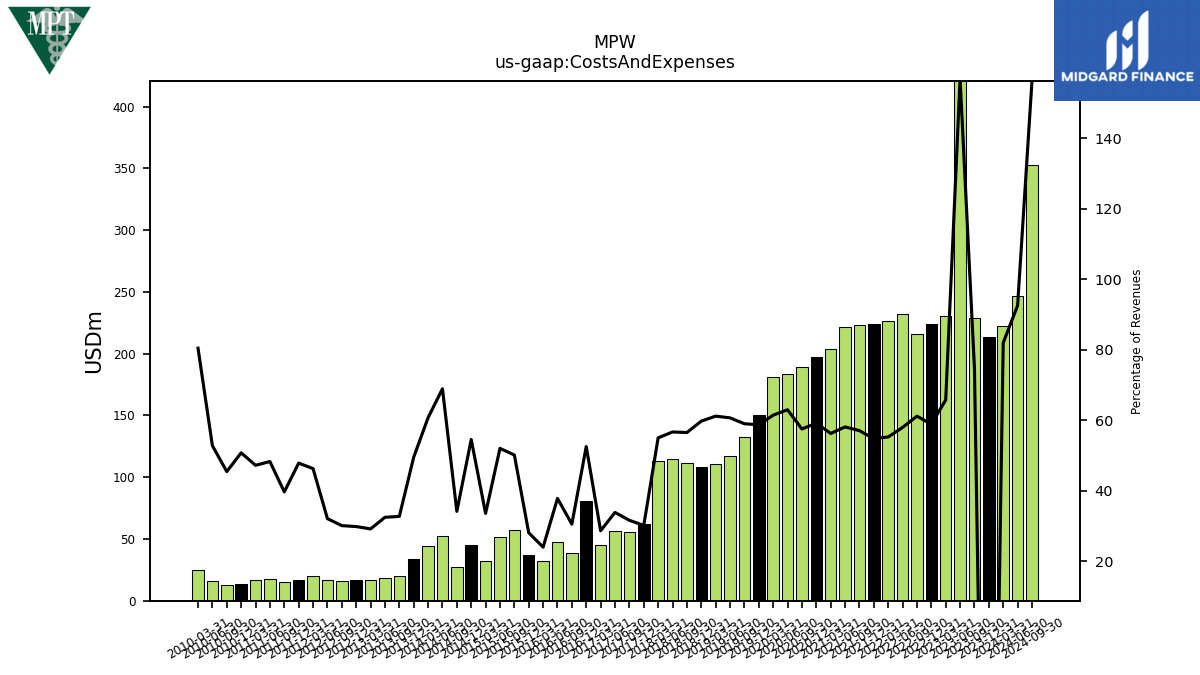
| Costs And Expenses | 213.08 | 229.10 | 529.15 | 230.35 | 224.09 | 215.53 | 232.06 | 226.52 | 224.34 | 222.99 | 221.90 | 204.14 | 197.64 | 189.54 | 183.84 | 180.78 | 150.59 | 132.68 | 116.86 | 110.42 | 107.92 | 111.37 | 114.47 | 112.83 | 61.88 | 55.88 | 56.53 | 44.87 | 80.56 | 38.69 | 47.80 | 32.45 | 36.98 | 57.47 | 51.94 | 32.25 | 44.80 | 27.61 | 52.78 | 44.40 | 33.53 | 19.81 | 18.68 | 17.07 | 17.15 | 16.17 | 16.40 | 20.09 | 16.47 | 15.01 | 17.61 | 16.87 | 13.76 | 13.02 | 16.16 | 24.82 | |
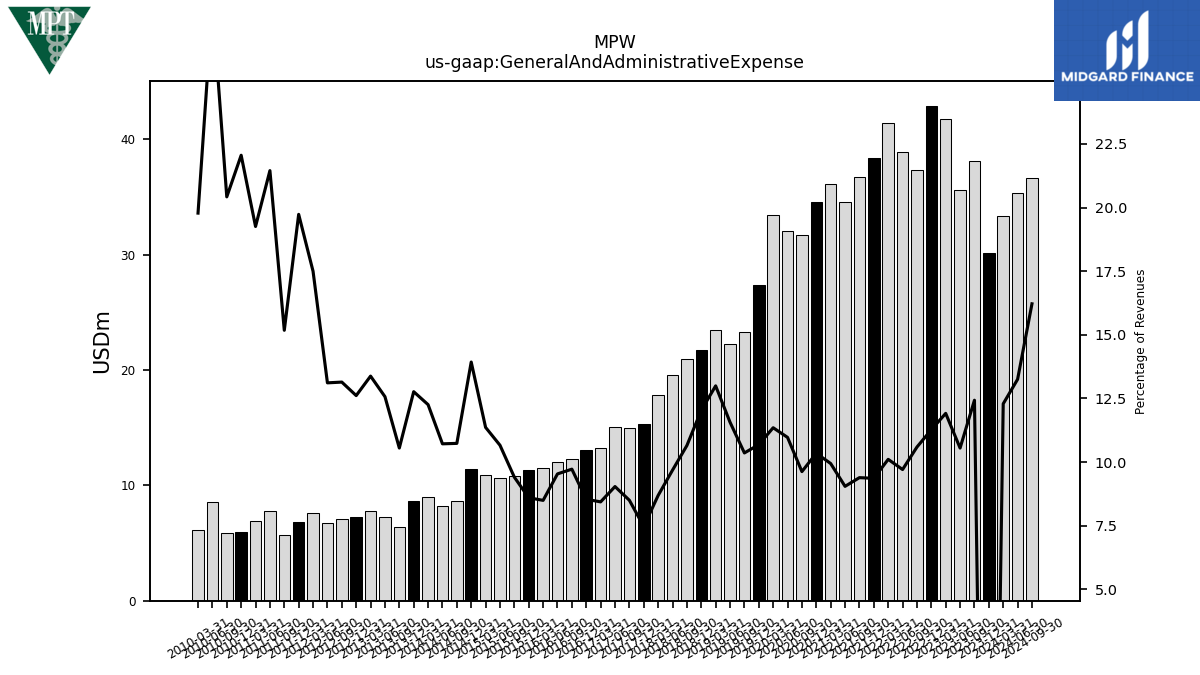
| General And Administrative Expense | 30.15 | 38.11 | 35.60 | 41.72 | 42.89 | 37.32 | 38.86 | 41.42 | 38.33 | 36.69 | 34.55 | 36.07 | 34.54 | 31.72 | 32.02 | 33.38 | 27.40 | 23.29 | 22.27 | 23.45 | 21.73 | 20.98 | 19.55 | 17.82 | 15.31 | 15.01 | 15.08 | 13.20 | 13.09 | 12.30 | 12.04 | 11.47 | 11.31 | 10.78 | 10.64 | 10.90 | 11.44 | 8.67 | 8.21 | 8.96 | 8.64 | 6.38 | 7.22 | 7.82 | 7.24 | 7.05 | 6.70 | 7.59 | 6.79 | 5.74 | 7.82 | 6.87 | 5.98 | 5.85 | 8.58 | 6.10 | |
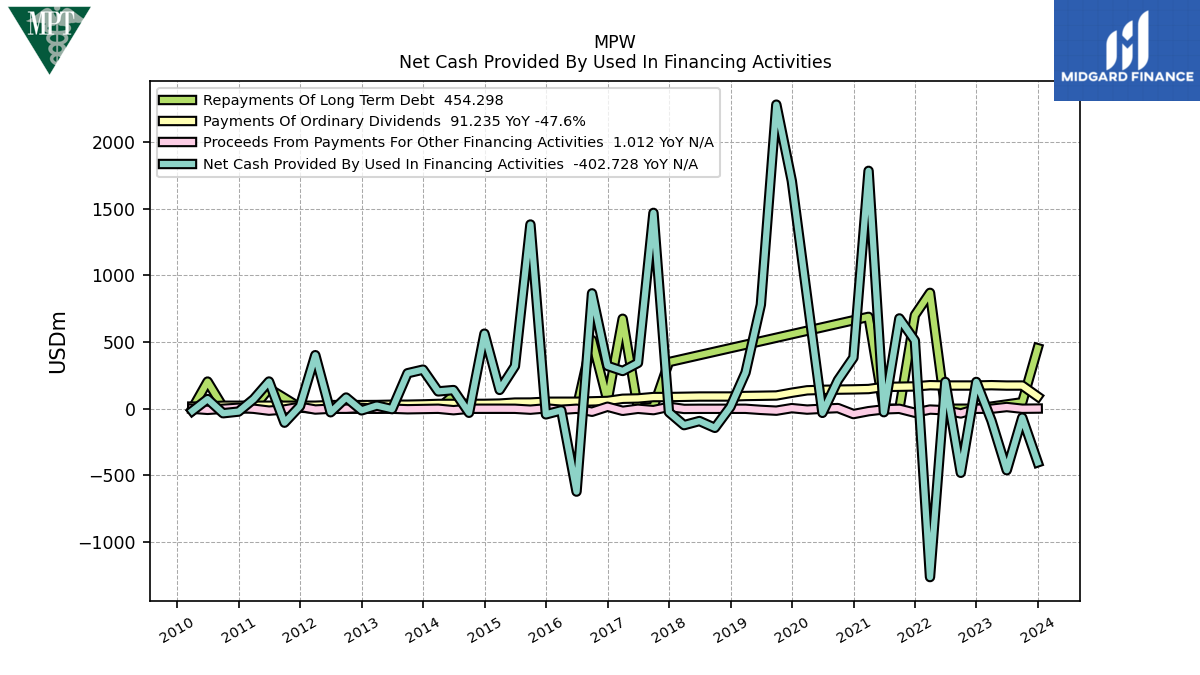
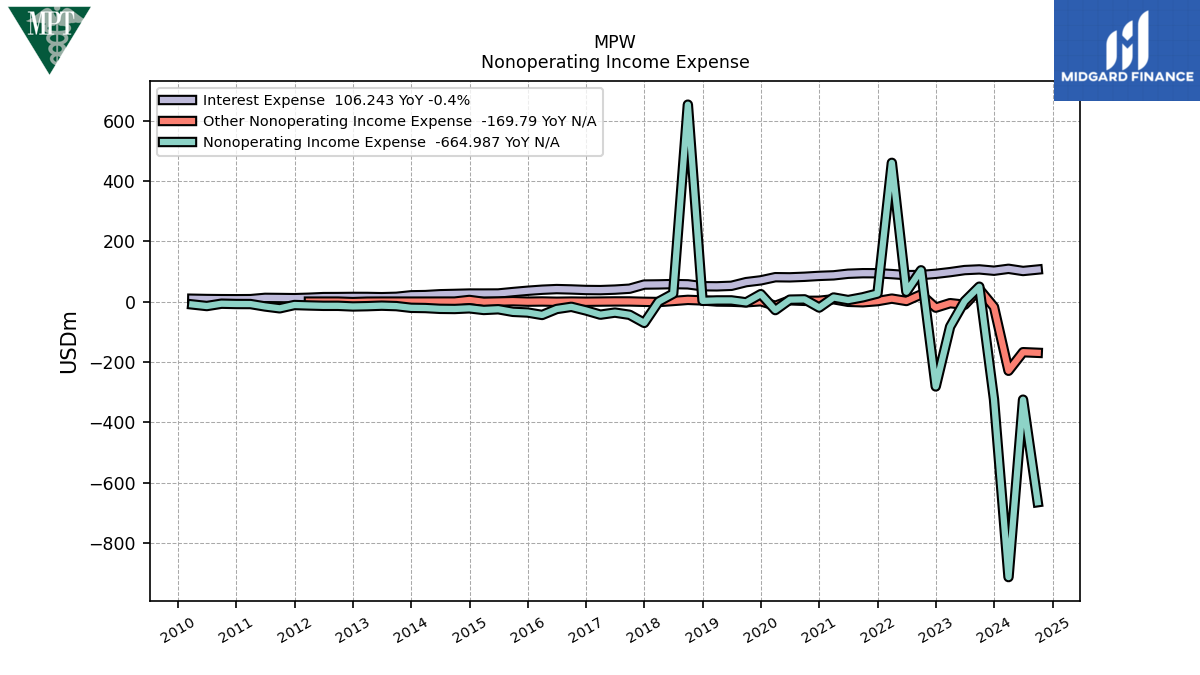
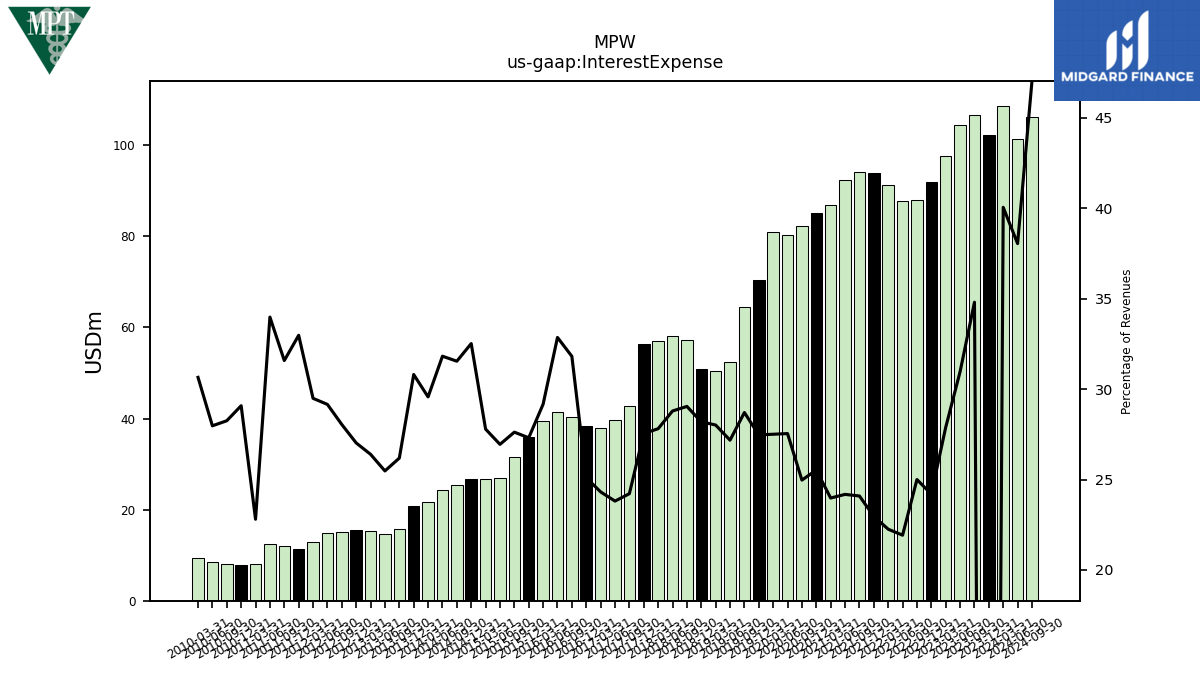
| Interest Expense | 102.34 | 106.71 | 104.47 | 97.65 | 92.05 | 88.08 | 87.73 | 91.18 | 93.98 | 94.13 | 92.31 | 86.97 | 85.19 | 82.26 | 80.38 | 80.90 | 70.43 | 64.52 | 52.33 | 50.55 | 50.91 | 57.22 | 58.13 | 57.02 | 56.46 | 42.76 | 39.71 | 38.03 | 38.47 | 40.26 | 41.50 | 39.37 | 35.92 | 31.64 | 26.89 | 26.67 | 26.70 | 25.48 | 24.36 | 21.61 | 20.85 | 15.83 | 14.64 | 15.42 | 15.51 | 15.05 | 14.89 | 12.80 | 11.35 | 11.94 | 12.39 | 8.14 | 7.88 | 8.09 | 8.56 | 9.46 | |
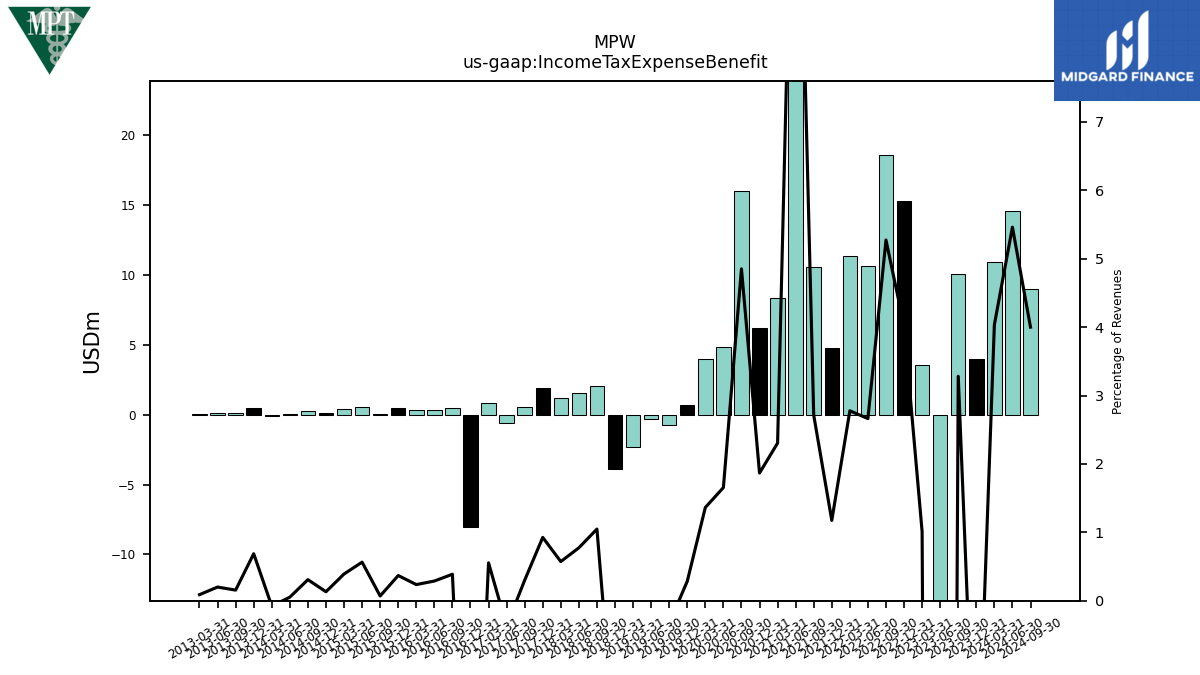
| Income Tax Expense Benefit | 3.98 | 10.06 | -148.26 | 3.54 | 15.29 | 18.58 | 10.66 | 11.38 | 4.81 | 10.60 | 50.18 | 8.36 | 6.23 | 15.98 | 4.83 | 4.01 | 0.73 | -0.74 | -0.27 | -2.33 | -3.88 | 2.06 | 1.56 | 1.18 | 1.90 | 0.53 | -0.61 | 0.87 | -8.00 | 0.49 | 0.36 | 0.32 | 0.48 | 0.08 | 0.56 | 0.38 | 0.11 | 0.25 | 0.04 | -0.06 | 0.47 | 0.09 | 0.12 | 0.05 | NA | NA | NA | NA | NA | NA | NA | NA | NA | NA | NA | NA | |
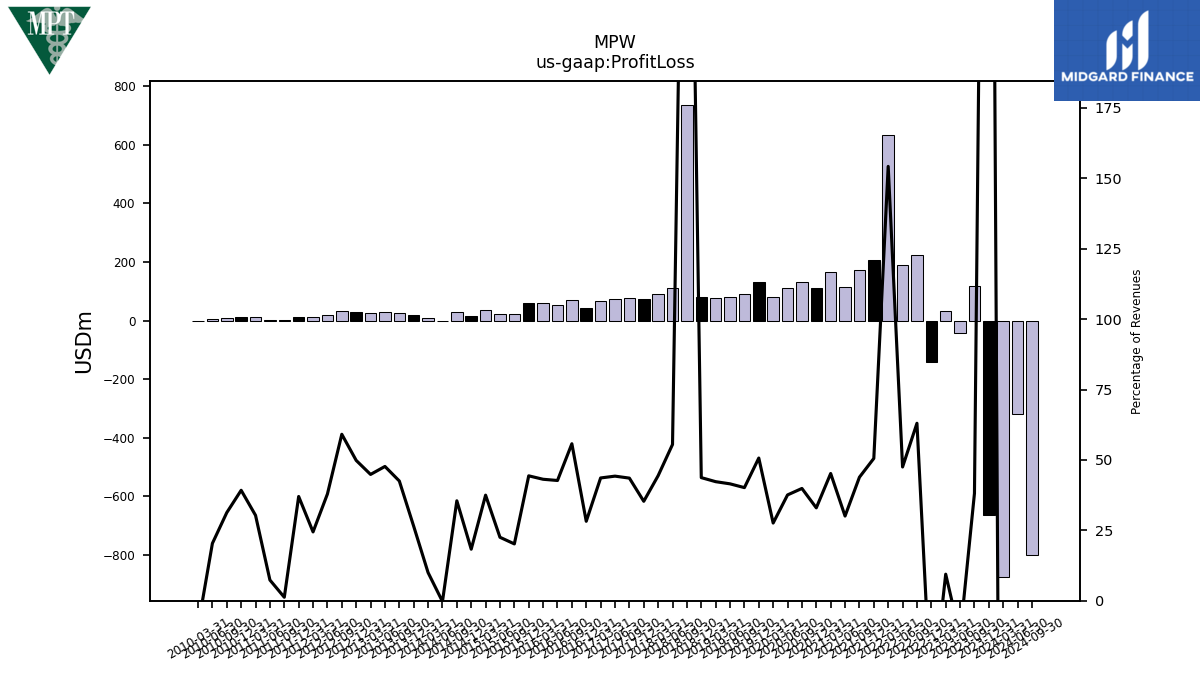
| Profit Loss | -663.58 | 116.89 | -42.43 | 33.03 | -140.21 | 222.02 | 190.06 | 631.95 | 206.84 | 171.40 | 114.82 | 163.88 | 110.11 | 131.36 | 109.65 | 81.16 | 129.92 | 90.27 | 79.92 | 76.29 | 78.94 | 736.48 | 112.02 | 91.04 | 72.38 | 76.88 | 73.80 | 68.19 | 43.24 | 70.54 | 53.92 | 58.23 | 58.34 | 23.12 | 22.49 | 35.98 | 15.03 | 28.66 | -0.20 | 7.31 | 17.90 | 25.70 | 27.41 | 26.21 | 28.60 | 31.51 | 19.36 | 10.61 | 12.74 | 0.47 | 2.68 | 10.82 | 10.63 | 8.96 | 6.23 | -2.81 | |
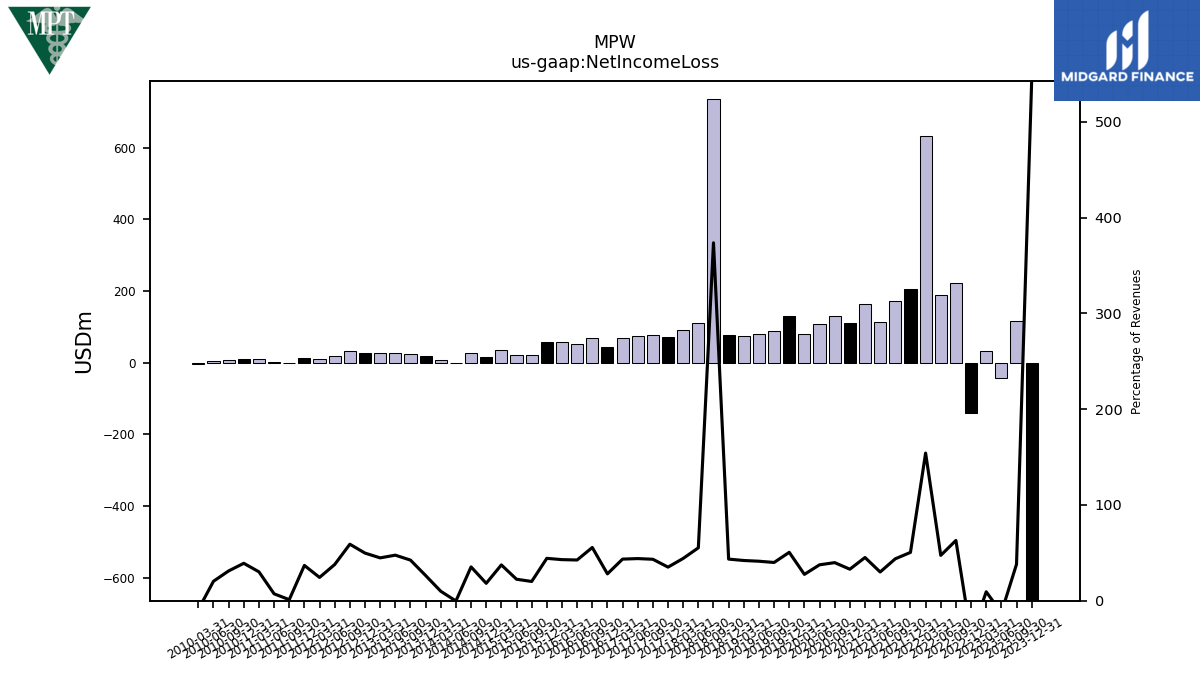
| Net Income Loss | -663.94 | 116.71 | -42.04 | 32.79 | -140.47 | 221.79 | 189.60 | 631.68 | 206.54 | 171.14 | 114.56 | 163.78 | 109.88 | 131.11 | 109.47 | 80.99 | 129.64 | 89.79 | 79.44 | 75.82 | 78.48 | 736.03 | 111.57 | 90.60 | 71.94 | 76.46 | 73.42 | 67.97 | 43.04 | 70.36 | 53.72 | 57.93 | 58.24 | 23.06 | 22.41 | 35.90 | 14.95 | 28.54 | -0.20 | 7.24 | 17.84 | 25.65 | 27.35 | 26.16 | 28.56 | 31.46 | 19.32 | 10.56 | 12.69 | 0.42 | 2.64 | 10.78 | 10.59 | 8.92 | 6.22 | -2.82 | |
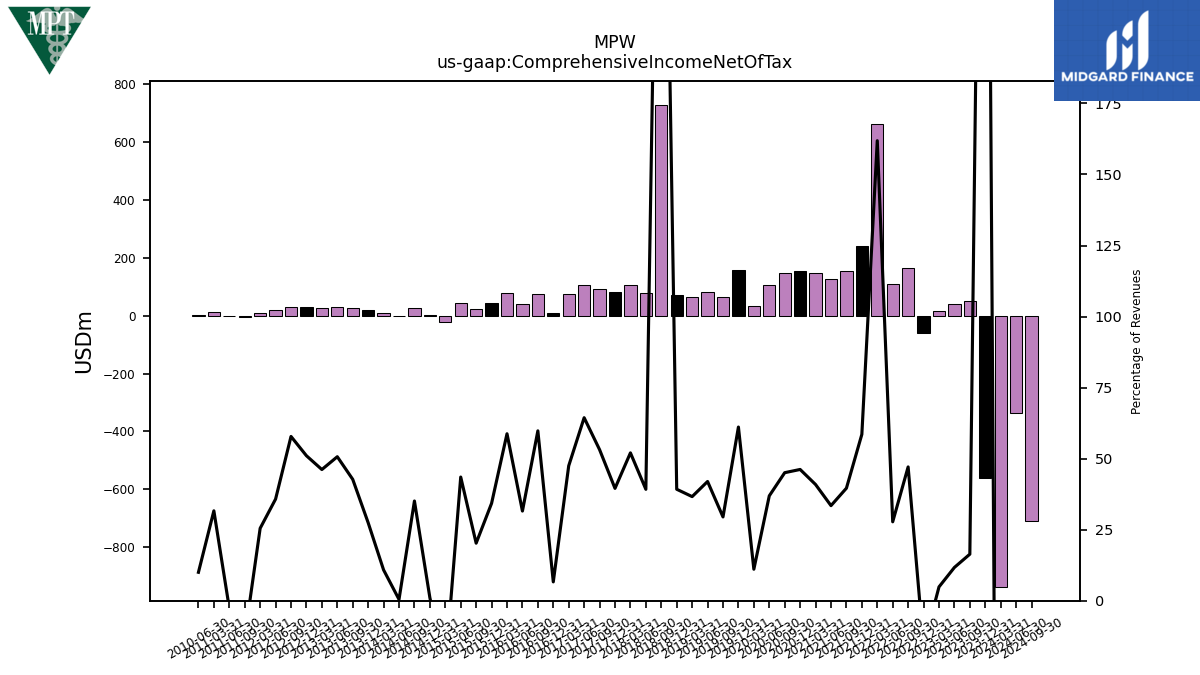
| Comprehensive Income Net Of Tax | -561.66 | 50.25 | 39.56 | 17.06 | -60.36 | 165.92 | 111.18 | 663.40 | 239.65 | 154.79 | 127.79 | 148.39 | 154.21 | 148.47 | 107.73 | 32.62 | 156.75 | 66.30 | 80.80 | 66.13 | 70.85 | 727.82 | 79.17 | 106.69 | 81.06 | 93.89 | 107.44 | 74.26 | 10.17 | 75.66 | 39.87 | 79.33 | 45.08 | 23.21 | 43.44 | -23.11 | 0.91 | 28.35 | 0.36 | 7.93 | 18.59 | 25.83 | 29.13 | 26.98 | 29.29 | 31.02 | 18.27 | 11.06 | NA | -4.85 | -0.95 | 11.30 | NA | NA | 3.06 | NA |
| 2023-12-31 | 2023-09-30 | 2023-06-30 | 2023-03-31 | 2022-12-31 | 2022-09-30 | 2022-06-30 | 2022-03-31 | 2021-12-31 | 2021-09-30 | 2021-06-30 | 2021-03-31 | 2020-12-31 | 2020-09-30 | 2020-06-30 | 2020-03-31 | 2019-12-31 | 2019-09-30 | 2019-06-30 | 2019-03-31 | 2018-12-31 | 2018-09-30 | 2018-06-30 | 2018-03-31 | 2017-12-31 | 2017-09-30 | 2017-06-30 | 2017-03-31 | 2016-12-31 | 2016-09-30 | 2016-06-30 | 2016-03-31 | 2015-12-31 | 2015-09-30 | 2015-06-30 | 2015-03-31 | 2014-12-31 | 2014-09-30 | 2014-06-30 | 2014-03-31 | 2013-12-31 | 2013-09-30 | 2013-06-30 | 2013-03-31 | 2012-12-31 | 2012-09-30 | 2012-06-30 | 2012-03-31 | 2011-12-31 | 2011-09-30 | 2011-06-30 | 2011-03-31 | 2010-12-31 | 2010-09-30 | 2010-06-30 | 2010-03-31 | ||
|---|---|---|---|---|---|---|---|---|---|---|---|---|---|---|---|---|---|---|---|---|---|---|---|---|---|---|---|---|---|---|---|---|---|---|---|---|---|---|---|---|---|---|---|---|---|---|---|---|---|---|---|---|---|---|---|---|---|
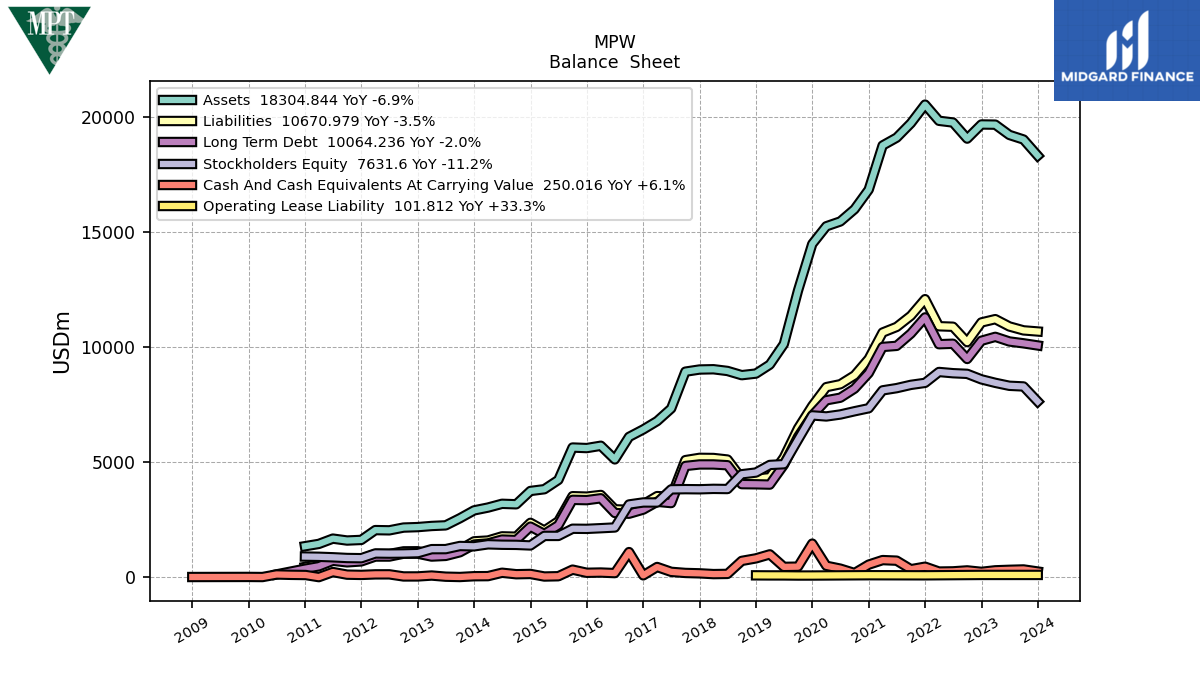
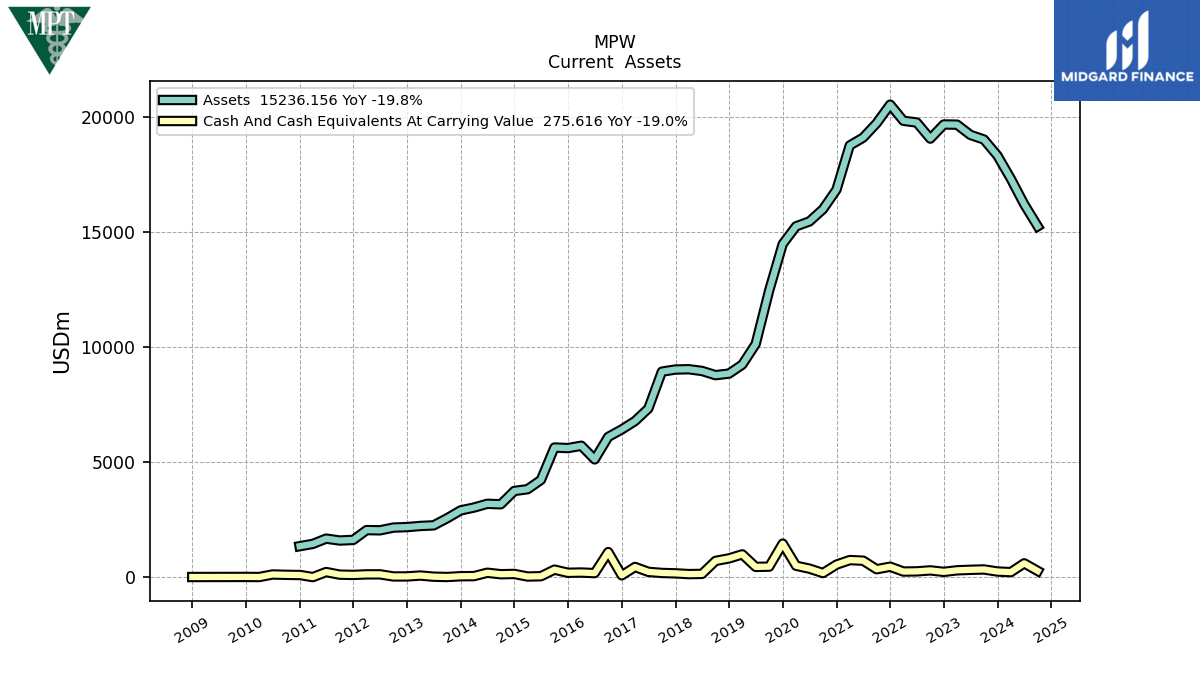
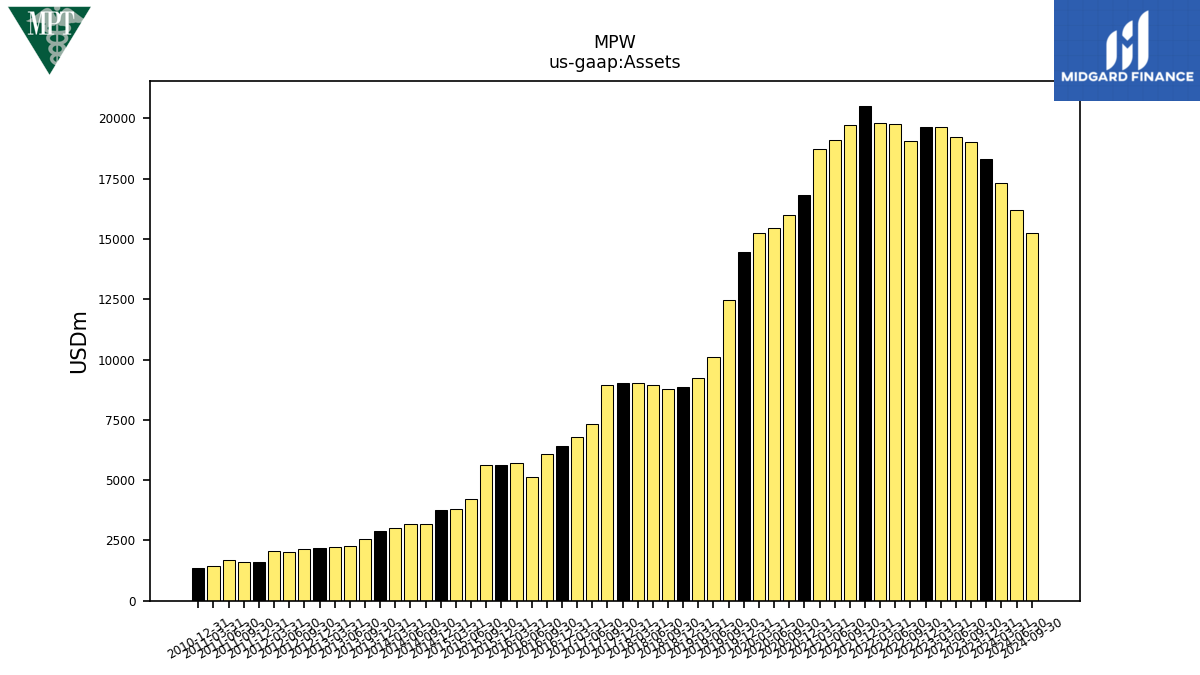
| Assets | 18304.84 | 19004.88 | 19204.38 | 19650.16 | 19658.00 | 19043.42 | 19743.08 | 19817.83 | 20519.80 | 19711.99 | 19086.15 | 18745.67 | 16829.01 | 15978.42 | 15448.07 | 15238.09 | 14467.33 | 12452.15 | 10123.21 | 9231.45 | 8843.64 | 8774.52 | 8956.82 | 9031.84 | 9020.29 | 8927.04 | 7327.84 | 6780.73 | 6418.54 | 6095.34 | 5117.93 | 5710.40 | 5609.35 | 5633.32 | 4226.12 | 3823.05 | 3747.34 | 3169.14 | 3190.04 | 3026.59 | 2904.57 | 2563.15 | 2254.48 | 2227.20 | 2178.89 | 2158.40 | 2038.53 | 2048.46 | 1621.87 | 1595.69 | 1678.72 | 1449.09 | 1348.81 | NA | NA | NA | |
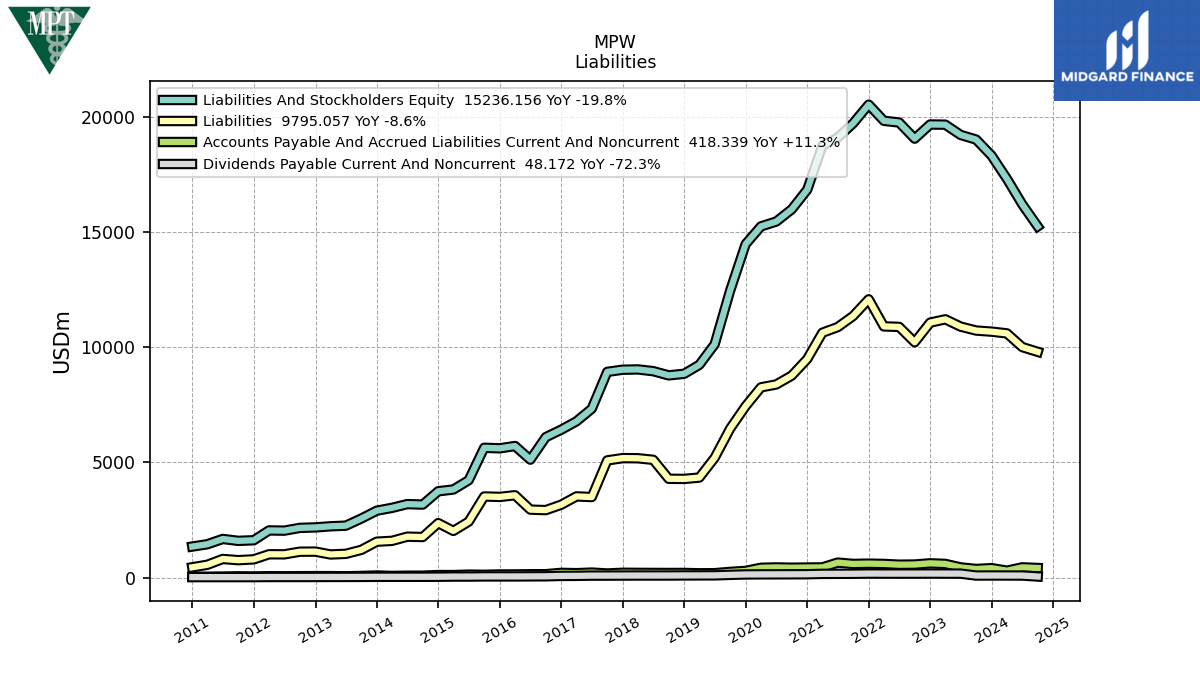
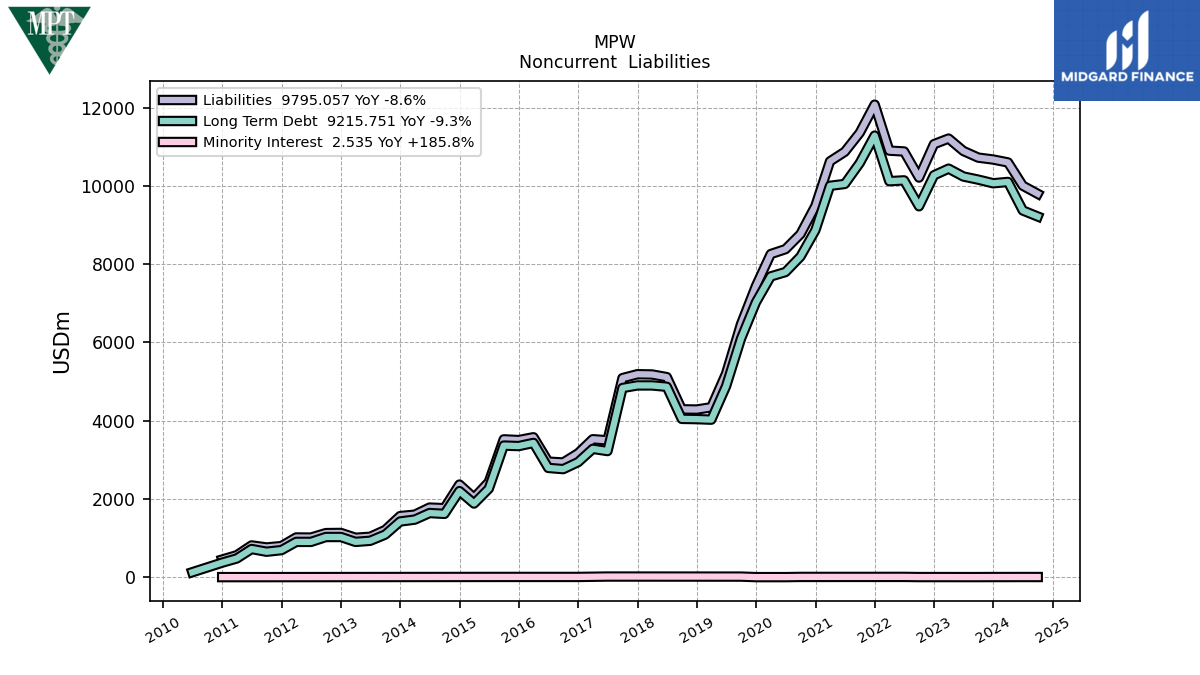
| Liabilities | 10670.98 | 10719.47 | 10889.66 | 11206.90 | 11063.59 | 10210.17 | 10877.21 | 10898.48 | 12074.13 | 11353.25 | 10869.07 | 10625.47 | 9485.16 | 8765.54 | 8380.79 | 8255.58 | 7439.18 | 6465.34 | 5199.58 | 4340.98 | 4282.70 | 4288.01 | 5111.37 | 5178.65 | 5185.08 | 5085.84 | 3495.63 | 3524.16 | 3165.31 | 2929.37 | 2950.70 | 3574.25 | 3502.09 | 3520.72 | 2430.25 | 2027.35 | 2365.29 | 1762.03 | 1777.09 | 1595.61 | 1560.36 | 1204.58 | 1031.64 | 1005.62 | 1129.07 | 1125.24 | 1010.95 | 1013.72 | 793.06 | 758.02 | 810.02 | 558.82 | 449.24 | NA | NA | NA | |
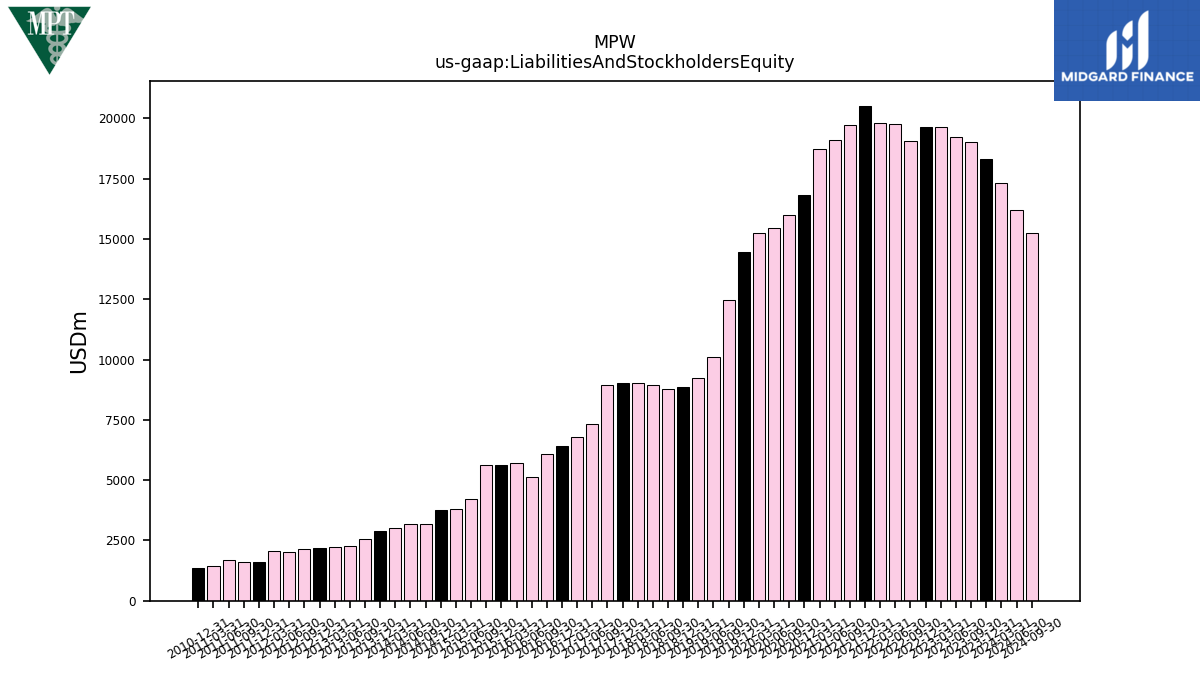
| Liabilities And Stockholders Equity | 18304.84 | 19004.88 | 19204.38 | 19650.16 | 19658.00 | 19043.42 | 19743.08 | 19817.83 | 20519.80 | 19711.99 | 19086.15 | 18745.67 | 16829.01 | 15978.42 | 15448.07 | 15238.09 | 14467.33 | 12452.15 | 10123.21 | 9231.45 | 8843.64 | 8774.52 | 8956.82 | 9031.84 | 9020.29 | 8927.04 | 7327.84 | 6780.73 | 6418.54 | 6095.34 | 5117.93 | 5710.40 | 5609.35 | 5633.32 | 4226.12 | 3823.05 | 3747.34 | 3169.14 | 3190.04 | 3026.59 | 2904.57 | 2563.15 | 2254.48 | 2227.20 | 2178.89 | 2158.40 | 2038.53 | 2048.46 | 1621.87 | 1595.69 | 1678.72 | 1449.09 | 1348.81 | NA | NA | NA | |
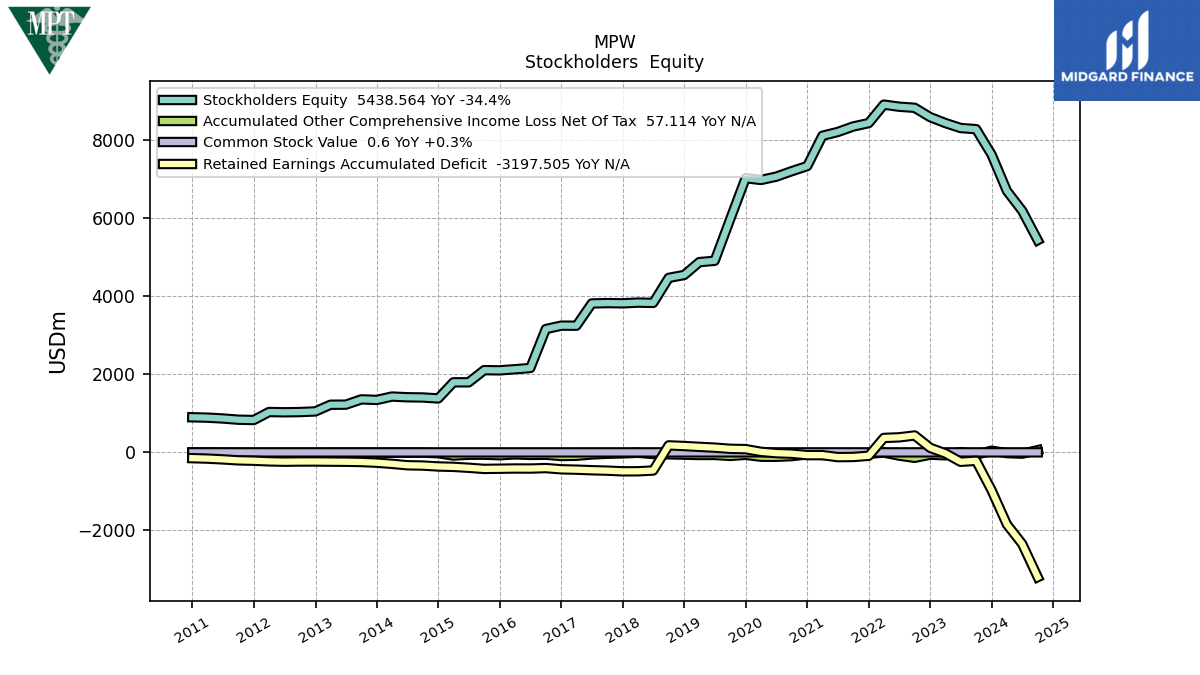
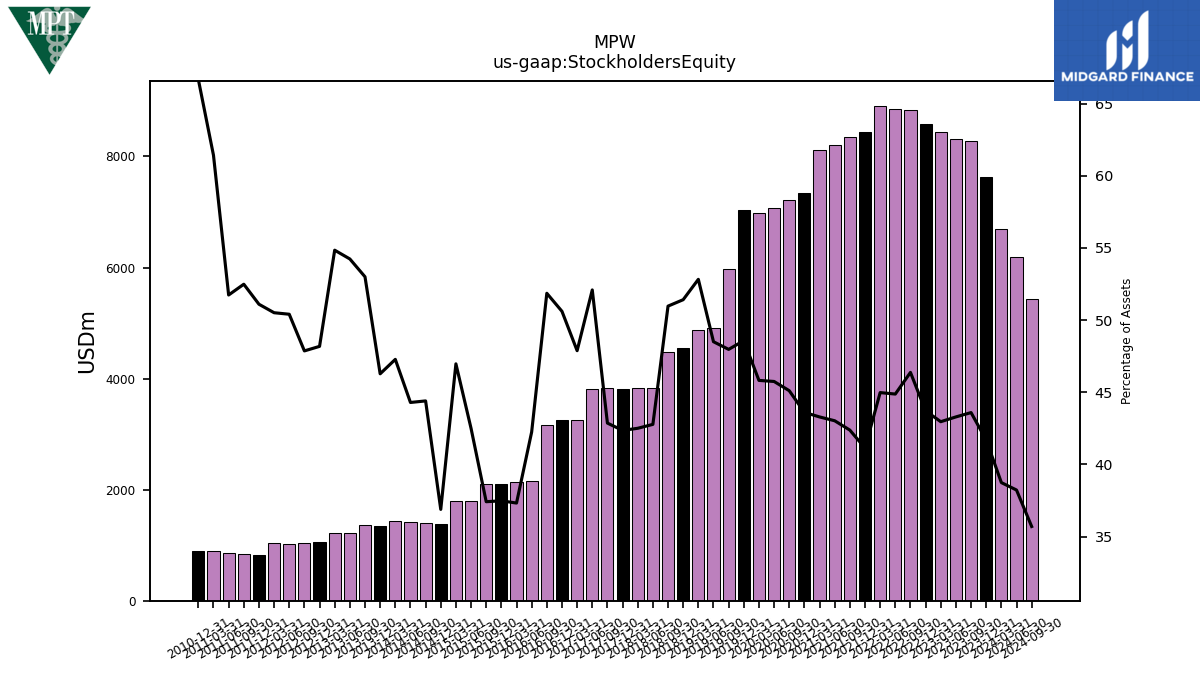
| Stockholders Equity | 7631.60 | 8284.53 | 8313.81 | 8441.68 | 8592.84 | 8831.78 | 8859.83 | 8913.45 | 8440.19 | 8353.33 | 8211.74 | 8114.98 | 7338.53 | 7207.64 | 7067.17 | 6982.40 | 7028.05 | 5973.54 | 4910.17 | 4876.82 | 4547.11 | 4472.49 | 3831.25 | 3838.80 | 3820.63 | 3826.44 | 3817.31 | 3246.78 | 3248.38 | 3161.05 | 2162.26 | 2131.11 | 2102.27 | 2107.60 | 1795.88 | 1795.70 | 1382.05 | 1407.11 | 1412.95 | 1430.98 | 1344.21 | 1358.57 | 1222.84 | 1221.57 | 1049.81 | 1033.16 | 1027.58 | 1034.75 | 828.82 | 837.56 | 868.60 | 890.16 | 899.46 | NA | NA | NA |
| 2023-12-31 | 2023-09-30 | 2023-06-30 | 2023-03-31 | 2022-12-31 | 2022-09-30 | 2022-06-30 | 2022-03-31 | 2021-12-31 | 2021-09-30 | 2021-06-30 | 2021-03-31 | 2020-12-31 | 2020-09-30 | 2020-06-30 | 2020-03-31 | 2019-12-31 | 2019-09-30 | 2019-06-30 | 2019-03-31 | 2018-12-31 | 2018-09-30 | 2018-06-30 | 2018-03-31 | 2017-12-31 | 2017-09-30 | 2017-06-30 | 2017-03-31 | 2016-12-31 | 2016-09-30 | 2016-06-30 | 2016-03-31 | 2015-12-31 | 2015-09-30 | 2015-06-30 | 2015-03-31 | 2014-12-31 | 2014-09-30 | 2014-06-30 | 2014-03-31 | 2013-12-31 | 2013-09-30 | 2013-06-30 | 2013-03-31 | 2012-12-31 | 2012-09-30 | 2012-06-30 | 2012-03-31 | 2011-12-31 | 2011-09-30 | 2011-06-30 | 2011-03-31 | 2010-12-31 | 2010-09-30 | 2010-06-30 | 2010-03-31 | ||
|---|---|---|---|---|---|---|---|---|---|---|---|---|---|---|---|---|---|---|---|---|---|---|---|---|---|---|---|---|---|---|---|---|---|---|---|---|---|---|---|---|---|---|---|---|---|---|---|---|---|---|---|---|---|---|---|---|---|
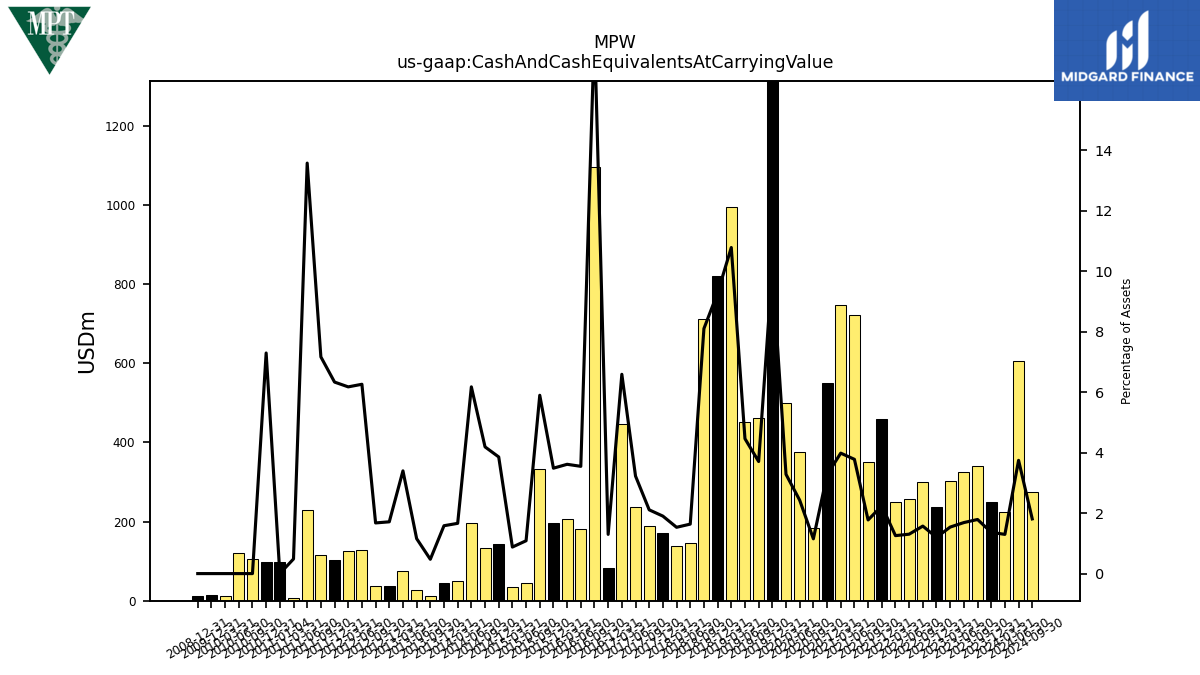
| Cash And Cash Equivalents At Carrying Value | 250.02 | 340.06 | 324.05 | 302.32 | 235.67 | 299.17 | 257.27 | 248.85 | 459.23 | 349.65 | 721.32 | 746.75 | 549.88 | 183.79 | 374.96 | 500.21 | 1462.29 | 461.62 | 451.65 | 995.55 | 820.87 | 710.97 | 146.57 | 138.31 | 171.47 | 188.22 | 236.36 | 446.95 | 83.24 | 1094.92 | 181.56 | 206.41 | 195.54 | 332.24 | 45.90 | 33.55 | 144.54 | 132.81 | 197.02 | 50.31 | 45.98 | 12.12 | 26.07 | 75.67 | 37.31 | 36.16 | 127.64 | 126.50 | 102.73 | 114.37 | 227.91 | 7.01 | 98.41 | 106.48 | 121.64 | 10.80 | |
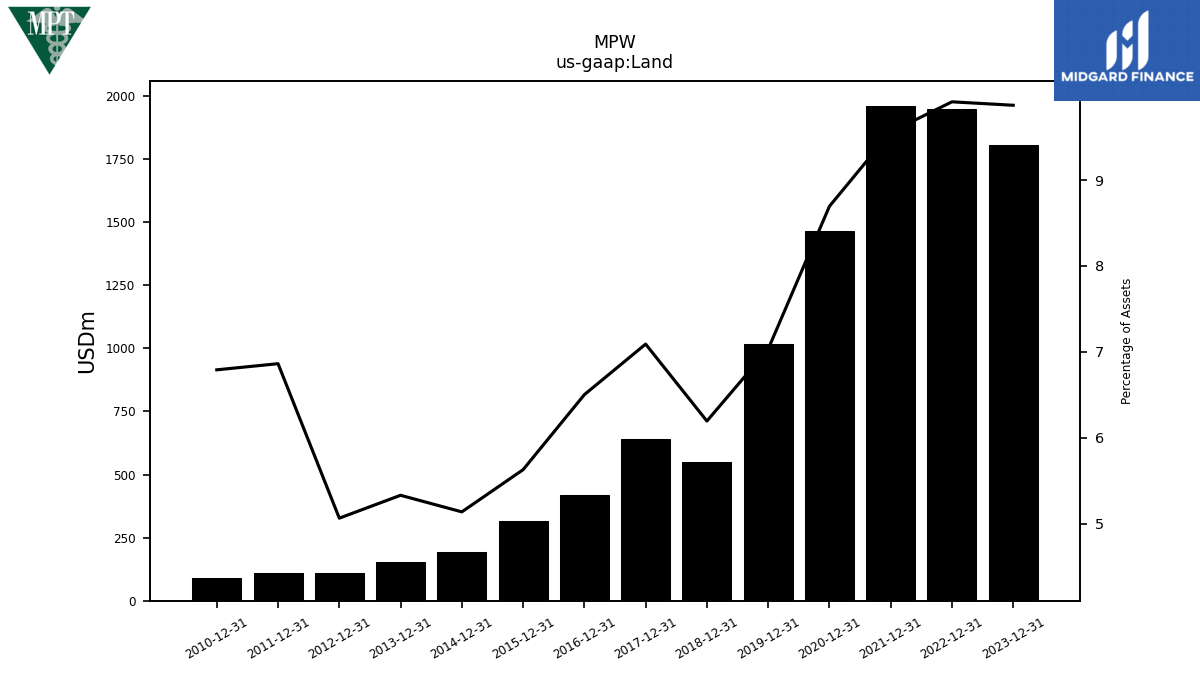
| Land | 1806.77 | NA | NA | NA | 1948.22 | NA | NA | NA | 1961.48 | NA | NA | NA | 1463.20 | NA | NA | NA | 1017.40 | NA | NA | NA | 547.89 | NA | NA | NA | 639.63 | NA | NA | NA | 417.37 | NA | NA | NA | 315.79 | NA | NA | NA | 192.55 | NA | NA | NA | 154.86 | NA | NA | NA | 110.36 | NA | NA | NA | 111.31 | NA | NA | NA | 91.60 | NA | NA | NA |
| 2023-12-31 | 2023-09-30 | 2023-06-30 | 2023-03-31 | 2022-12-31 | 2022-09-30 | 2022-06-30 | 2022-03-31 | 2021-12-31 | 2021-09-30 | 2021-06-30 | 2021-03-31 | 2020-12-31 | 2020-09-30 | 2020-06-30 | 2020-03-31 | 2019-12-31 | 2019-09-30 | 2019-06-30 | 2019-03-31 | 2018-12-31 | 2018-09-30 | 2018-06-30 | 2018-03-31 | 2017-12-31 | 2017-09-30 | 2017-06-30 | 2017-03-31 | 2016-12-31 | 2016-09-30 | 2016-06-30 | 2016-03-31 | 2015-12-31 | 2015-09-30 | 2015-06-30 | 2015-03-31 | 2014-12-31 | 2014-09-30 | 2014-06-30 | 2014-03-31 | 2013-12-31 | 2013-09-30 | 2013-06-30 | 2013-03-31 | 2012-12-31 | 2012-09-30 | 2012-06-30 | 2012-03-31 | 2011-12-31 | 2011-09-30 | 2011-06-30 | 2011-03-31 | 2010-12-31 | 2010-09-30 | 2010-06-30 | 2010-03-31 | ||
|---|---|---|---|---|---|---|---|---|---|---|---|---|---|---|---|---|---|---|---|---|---|---|---|---|---|---|---|---|---|---|---|---|---|---|---|---|---|---|---|---|---|---|---|---|---|---|---|---|---|---|---|---|---|---|---|---|---|
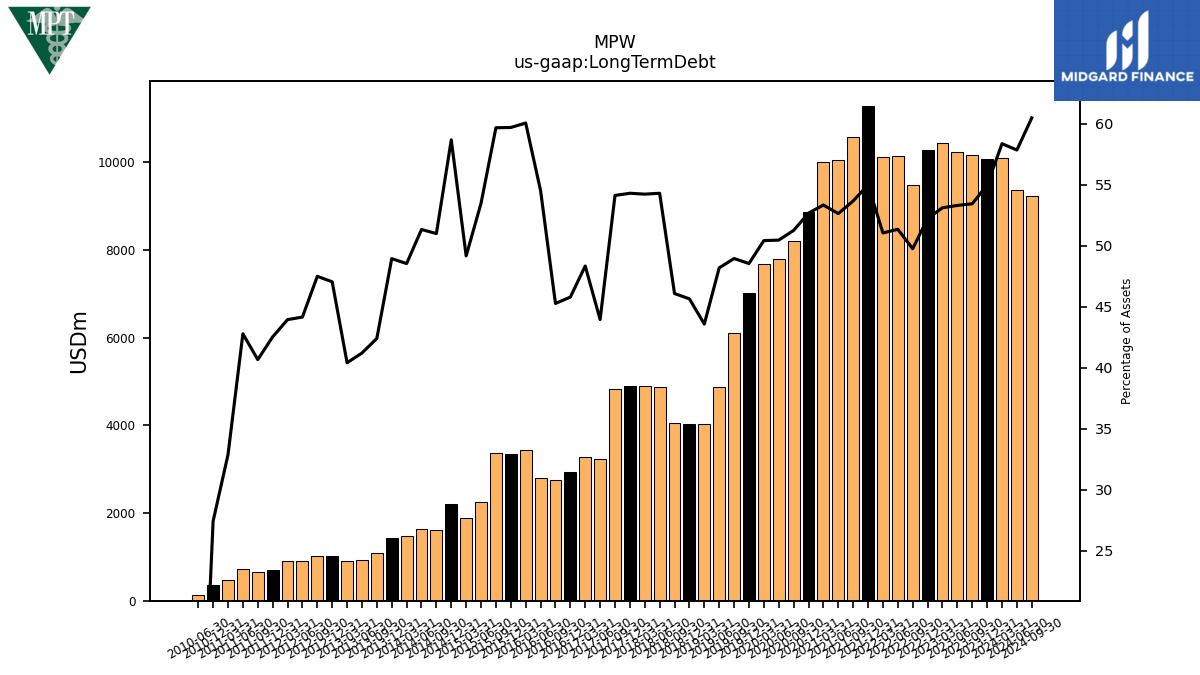
| Long Term Debt | 10064.24 | 10157.08 | 10237.56 | 10438.15 | 10268.41 | 9476.14 | 10138.77 | 10117.99 | 11282.77 | 10581.02 | 10047.11 | 9999.54 | 8865.46 | 8190.67 | 7795.89 | 7684.29 | 7023.68 | 6096.23 | 4878.31 | 4023.57 | 4037.39 | 4043.85 | 4864.26 | 4898.36 | 4898.67 | 4832.26 | 3221.05 | 3277.99 | 2939.29 | 2759.63 | 2790.67 | 3429.93 | 3348.74 | 3361.86 | 2260.52 | 1879.89 | 2199.13 | 1616.37 | 1637.66 | 1469.26 | 1421.68 | 1086.97 | 929.07 | 900.13 | 1025.16 | 1025.18 | 900.20 | 900.23 | 689.85 | 649.01 | 718.31 | 476.35 | 369.97 | NA | 125.00 | NA | |
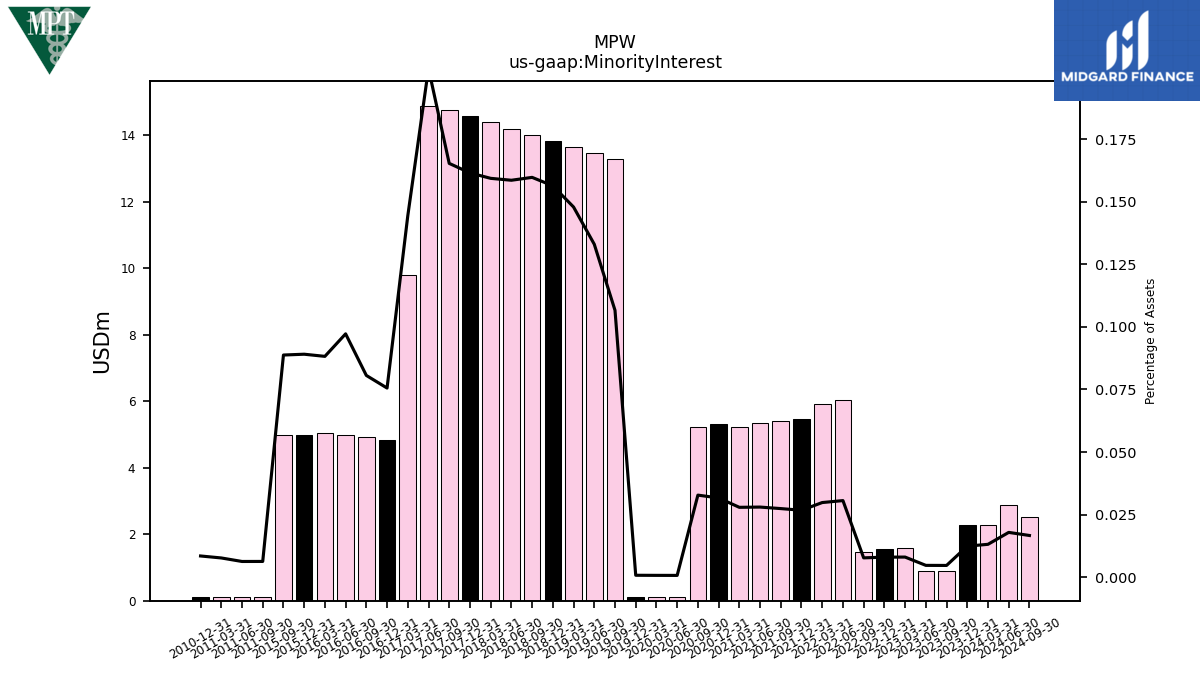
| Minority Interest | 2.27 | 0.89 | 0.90 | 1.57 | 1.57 | 1.47 | 6.04 | 5.91 | 5.48 | 5.40 | 5.34 | 5.23 | 5.33 | 5.24 | 0.11 | 0.11 | 0.11 | 13.28 | 13.47 | 13.65 | 13.83 | 14.02 | 14.21 | 14.39 | 14.57 | 14.76 | 14.89 | 9.79 | 4.85 | 4.91 | 4.98 | 5.04 | 5.00 | 5.00 | NA | NA | NA | NA | NA | NA | NA | NA | NA | NA | NA | NA | NA | NA | NA | 0.10 | 0.10 | 0.11 | 0.11 | NA | NA | NA |
| 2023-12-31 | 2023-09-30 | 2023-06-30 | 2023-03-31 | 2022-12-31 | 2022-09-30 | 2022-06-30 | 2022-03-31 | 2021-12-31 | 2021-09-30 | 2021-06-30 | 2021-03-31 | 2020-12-31 | 2020-09-30 | 2020-06-30 | 2020-03-31 | 2019-12-31 | 2019-09-30 | 2019-06-30 | 2019-03-31 | 2018-12-31 | 2018-09-30 | 2018-06-30 | 2018-03-31 | 2017-12-31 | 2017-09-30 | 2017-06-30 | 2017-03-31 | 2016-12-31 | 2016-09-30 | 2016-06-30 | 2016-03-31 | 2015-12-31 | 2015-09-30 | 2015-06-30 | 2015-03-31 | 2014-12-31 | 2014-09-30 | 2014-06-30 | 2014-03-31 | 2013-12-31 | 2013-09-30 | 2013-06-30 | 2013-03-31 | 2012-12-31 | 2012-09-30 | 2012-06-30 | 2012-03-31 | 2011-12-31 | 2011-09-30 | 2011-06-30 | 2011-03-31 | 2010-12-31 | 2010-09-30 | 2010-06-30 | 2010-03-31 | ||
|---|---|---|---|---|---|---|---|---|---|---|---|---|---|---|---|---|---|---|---|---|---|---|---|---|---|---|---|---|---|---|---|---|---|---|---|---|---|---|---|---|---|---|---|---|---|---|---|---|---|---|---|---|---|---|---|---|---|
| Stockholders Equity | 7631.60 | 8284.53 | 8313.81 | 8441.68 | 8592.84 | 8831.78 | 8859.83 | 8913.45 | 8440.19 | 8353.33 | 8211.74 | 8114.98 | 7338.53 | 7207.64 | 7067.17 | 6982.40 | 7028.05 | 5973.54 | 4910.17 | 4876.82 | 4547.11 | 4472.49 | 3831.25 | 3838.80 | 3820.63 | 3826.44 | 3817.31 | 3246.78 | 3248.38 | 3161.05 | 2162.26 | 2131.11 | 2102.27 | 2107.60 | 1795.88 | 1795.70 | 1382.05 | 1407.11 | 1412.95 | 1430.98 | 1344.21 | 1358.57 | 1222.84 | 1221.57 | 1049.81 | 1033.16 | 1027.58 | 1034.75 | 828.82 | 837.56 | 868.60 | 890.16 | 899.46 | NA | NA | NA | |
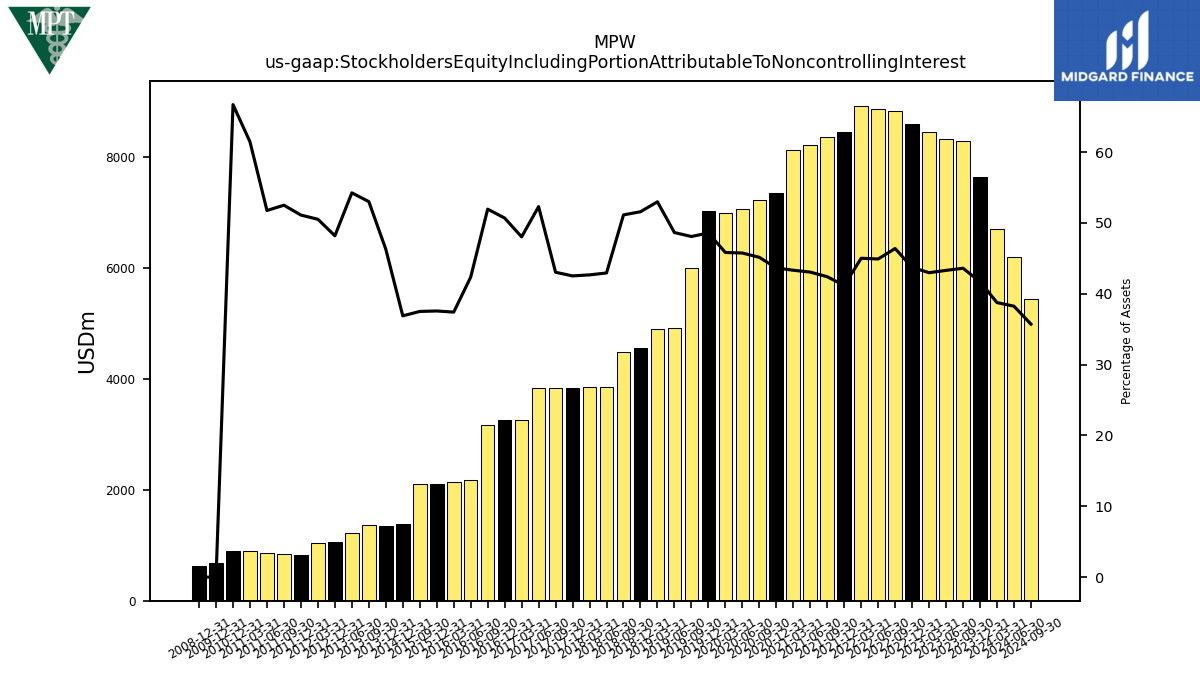
| Stockholders Equity Including Portion Attributable To Noncontrolling Interest | 7633.86 | 8285.42 | 8314.71 | 8443.25 | 8594.41 | 8833.25 | 8865.87 | 8919.36 | 8445.67 | 8358.73 | 8217.08 | 8120.21 | 7343.86 | 7212.88 | 7067.28 | 6982.51 | 7028.15 | 5986.82 | 4923.64 | 4890.48 | 4560.94 | 4486.51 | 3845.45 | 3853.19 | 3835.20 | 3841.20 | 3832.20 | 3256.57 | 3253.23 | 3165.97 | 2167.24 | 2136.15 | 2107.26 | 2112.60 | NA | NA | 1382.05 | NA | NA | NA | 1344.21 | 1358.57 | 1222.84 | NA | 1049.81 | NA | NA | 1034.75 | 828.82 | 837.66 | 868.70 | 890.27 | 899.58 | NA | NA | NA | |
| Common Stock Value | 0.60 | 0.60 | 0.60 | 0.60 | 0.60 | 0.60 | 0.60 | 0.60 | 0.60 | 0.60 | 0.59 | 0.58 | 0.54 | 0.54 | 0.53 | 0.52 | 0.52 | 0.46 | 0.39 | 0.39 | 0.37 | 0.36 | 0.36 | 0.36 | 0.36 | 0.36 | 0.36 | 0.32 | 0.32 | 0.31 | 0.24 | 0.24 | 0.24 | 0.24 | 0.21 | 0.21 | 0.17 | 0.17 | 0.17 | 0.17 | 0.16 | 0.16 | 0.15 | 0.15 | 0.14 | 0.14 | 0.13 | 0.13 | 0.11 | 0.11 | 0.11 | 0.11 | 0.11 | NA | NA | NA | |
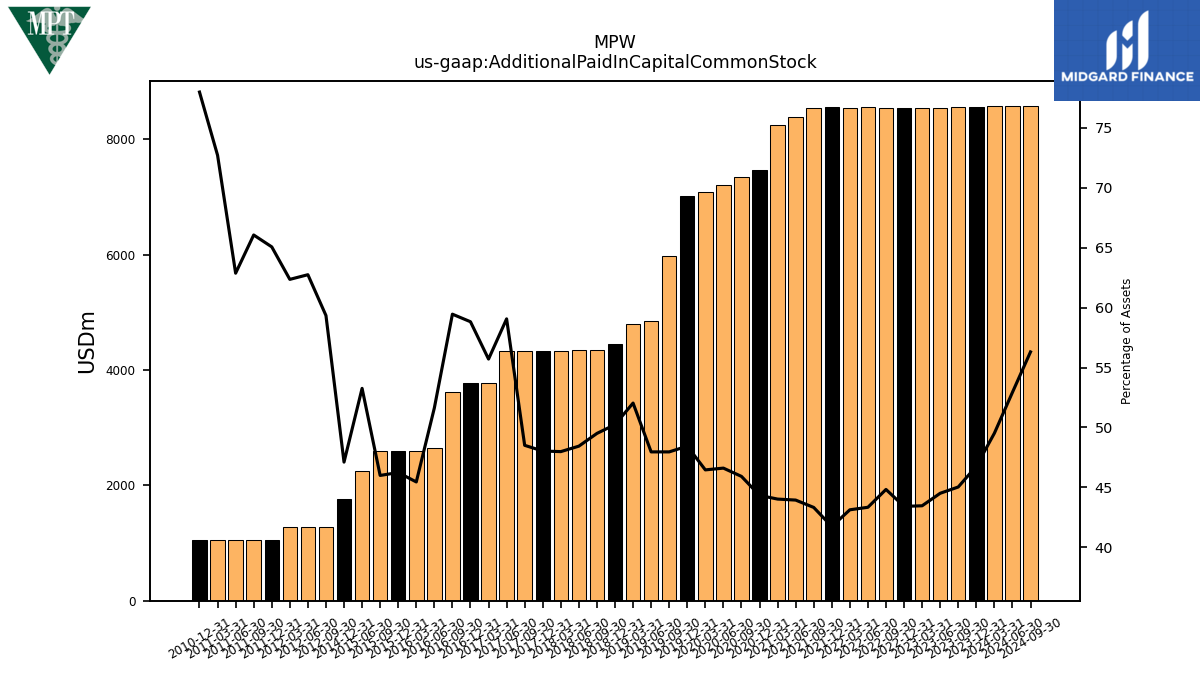
| Additional Paid In Capital Common Stock | 8560.31 | 8558.77 | 8547.83 | 8541.41 | 8535.14 | 8537.15 | 8557.12 | 8547.89 | 8564.79 | 8541.09 | 8387.06 | 8252.97 | 7461.50 | 7337.15 | 7200.20 | 7079.91 | 7008.20 | 5972.34 | 4855.31 | 4803.67 | 4442.95 | 4343.77 | 4338.80 | 4333.97 | 4333.03 | 4330.49 | 4327.73 | 3777.16 | 3775.34 | 3623.67 | 2642.28 | 2595.72 | 2593.83 | 2591.23 | 2250.89 | NA | 1765.38 | NA | NA | NA | NA | NA | NA | NA | NA | 1280.77 | 1279.03 | 1277.28 | 1055.26 | 1054.04 | 1055.39 | 1053.59 | 1051.79 | NA | NA | NA | |
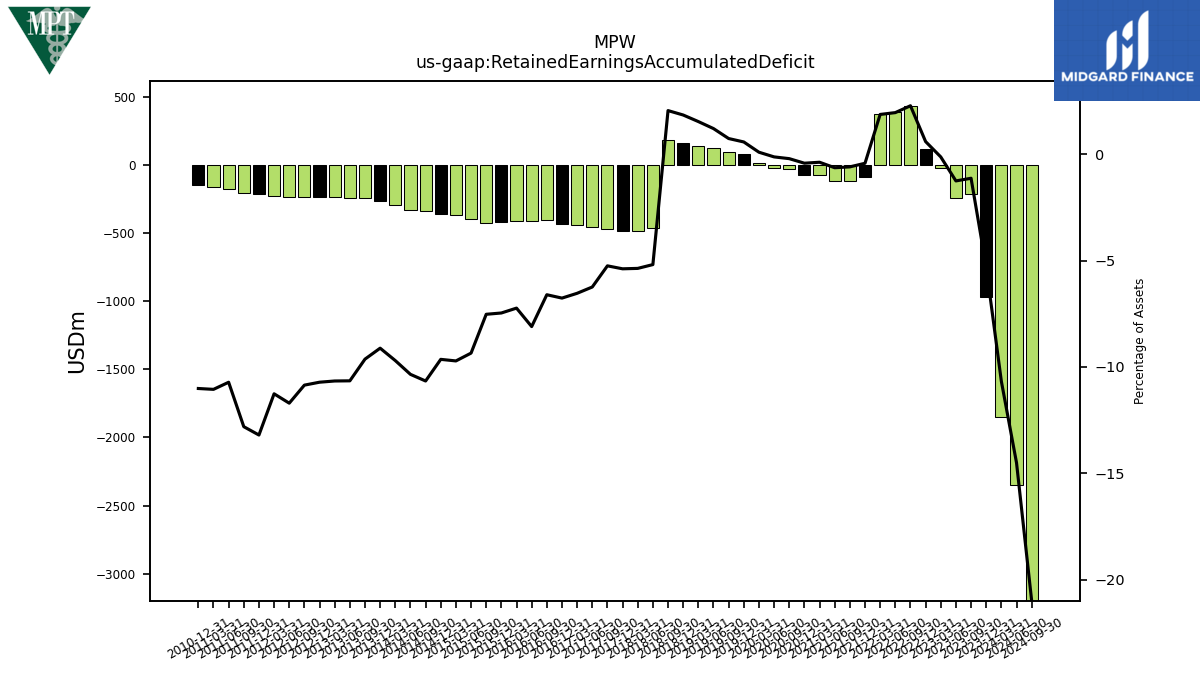
| Retained Earnings Accumulated Deficit | -971.81 | -215.06 | -241.30 | -25.41 | 116.28 | 433.34 | 385.55 | 369.97 | -87.69 | -117.73 | -121.64 | -71.07 | -71.41 | -33.62 | -19.77 | 14.03 | 83.01 | 91.53 | 121.77 | 141.43 | 162.77 | 179.70 | -464.78 | -484.80 | -485.93 | -468.47 | -457.42 | -443.31 | -434.11 | -402.63 | -414.66 | -413.11 | -418.65 | -423.87 | -395.08 | -371.46 | -361.33 | -337.82 | -330.07 | -293.60 | -264.80 | -246.87 | -240.13 | -237.40 | -233.49 | -234.26 | -238.54 | -230.68 | -214.06 | -204.34 | -179.93 | -160.15 | -148.53 | NA | NA | NA | |
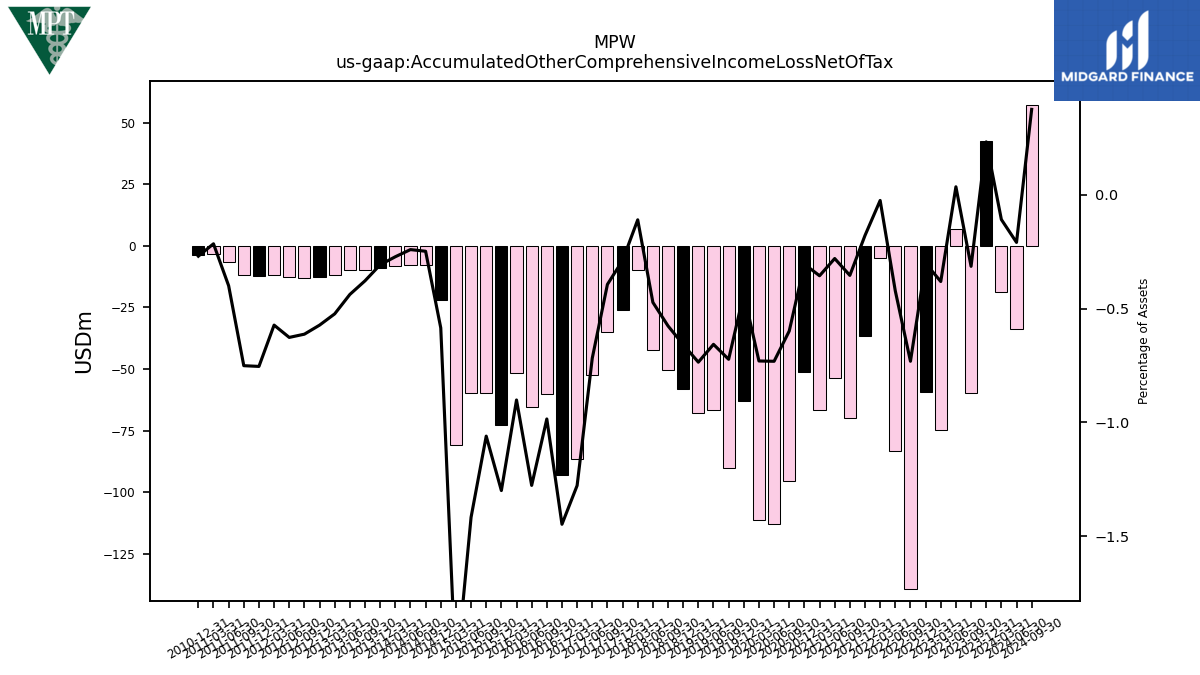
| Accumulated Other Comprehensive Income Loss Net Of Tax | 42.50 | -59.78 | 6.68 | -74.92 | -59.18 | -139.30 | -83.43 | -5.01 | -36.73 | -69.84 | -53.50 | -66.72 | -51.32 | -95.65 | -113.01 | -111.28 | -62.91 | -90.02 | -66.53 | -67.89 | -58.20 | -50.57 | -42.35 | -9.96 | -26.05 | -35.16 | -52.59 | -86.61 | -92.90 | -60.04 | -65.34 | -51.48 | -72.88 | -59.73 | -59.88 | -80.92 | -21.91 | -7.87 | -7.69 | -8.25 | -8.94 | -9.69 | -9.88 | -11.65 | -12.48 | -13.22 | -12.78 | -11.73 | -12.23 | -11.98 | -6.71 | -3.12 | -3.64 | NA | NA | NA | |
| Minority Interest | 2.27 | 0.89 | 0.90 | 1.57 | 1.57 | 1.47 | 6.04 | 5.91 | 5.48 | 5.40 | 5.34 | 5.23 | 5.33 | 5.24 | 0.11 | 0.11 | 0.11 | 13.28 | 13.47 | 13.65 | 13.83 | 14.02 | 14.21 | 14.39 | 14.57 | 14.76 | 14.89 | 9.79 | 4.85 | 4.91 | 4.98 | 5.04 | 5.00 | 5.00 | NA | NA | NA | NA | NA | NA | NA | NA | NA | NA | NA | NA | NA | NA | NA | 0.10 | 0.10 | 0.11 | 0.11 | NA | NA | NA |
| 2023-12-31 | 2023-09-30 | 2023-06-30 | 2023-03-31 | 2022-12-31 | 2022-09-30 | 2022-06-30 | 2022-03-31 | 2021-12-31 | 2021-09-30 | 2021-06-30 | 2021-03-31 | 2020-12-31 | 2020-09-30 | 2020-06-30 | 2020-03-31 | 2019-12-31 | 2019-09-30 | 2019-06-30 | 2019-03-31 | 2018-12-31 | 2018-09-30 | 2018-06-30 | 2018-03-31 | 2017-12-31 | 2017-09-30 | 2017-06-30 | 2017-03-31 | 2016-12-31 | 2016-09-30 | 2016-06-30 | 2016-03-31 | 2015-12-31 | 2015-09-30 | 2015-06-30 | 2015-03-31 | 2014-12-31 | 2014-09-30 | 2014-06-30 | 2014-03-31 | 2013-12-31 | 2013-09-30 | 2013-06-30 | 2013-03-31 | 2012-12-31 | 2012-09-30 | 2012-06-30 | 2012-03-31 | 2011-12-31 | 2011-09-30 | 2011-06-30 | 2011-03-31 | 2010-12-31 | 2010-09-30 | 2010-06-30 | 2010-03-31 | ||
|---|---|---|---|---|---|---|---|---|---|---|---|---|---|---|---|---|---|---|---|---|---|---|---|---|---|---|---|---|---|---|---|---|---|---|---|---|---|---|---|---|---|---|---|---|---|---|---|---|---|---|---|---|---|---|---|---|---|
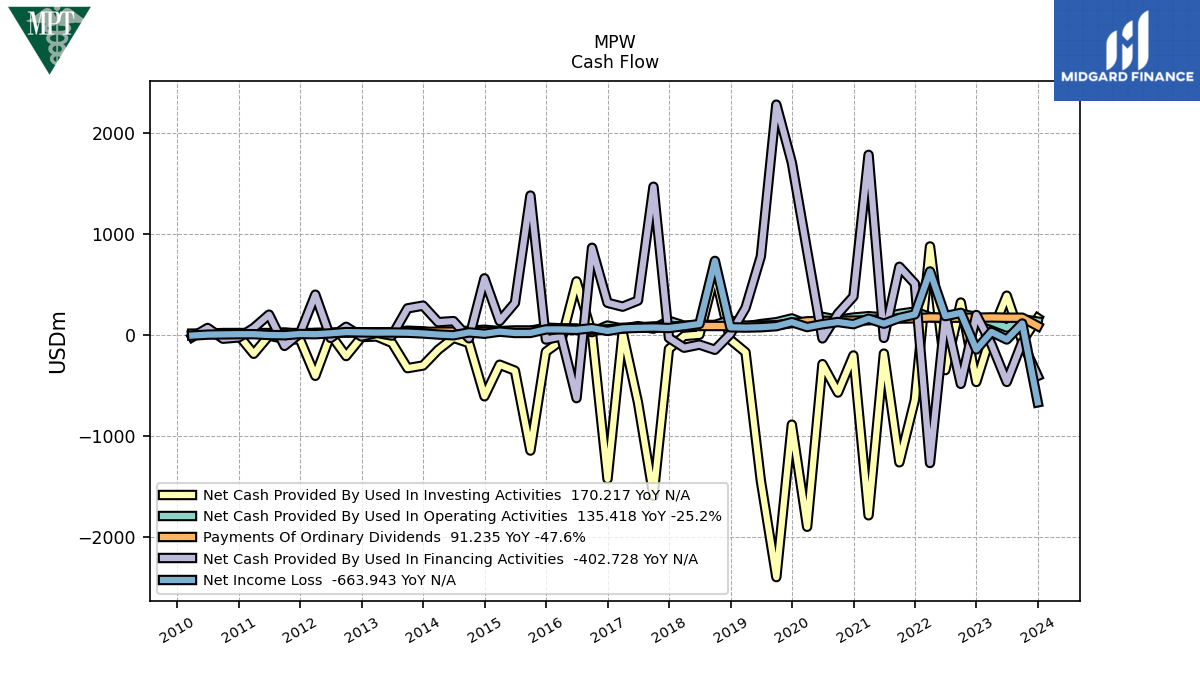
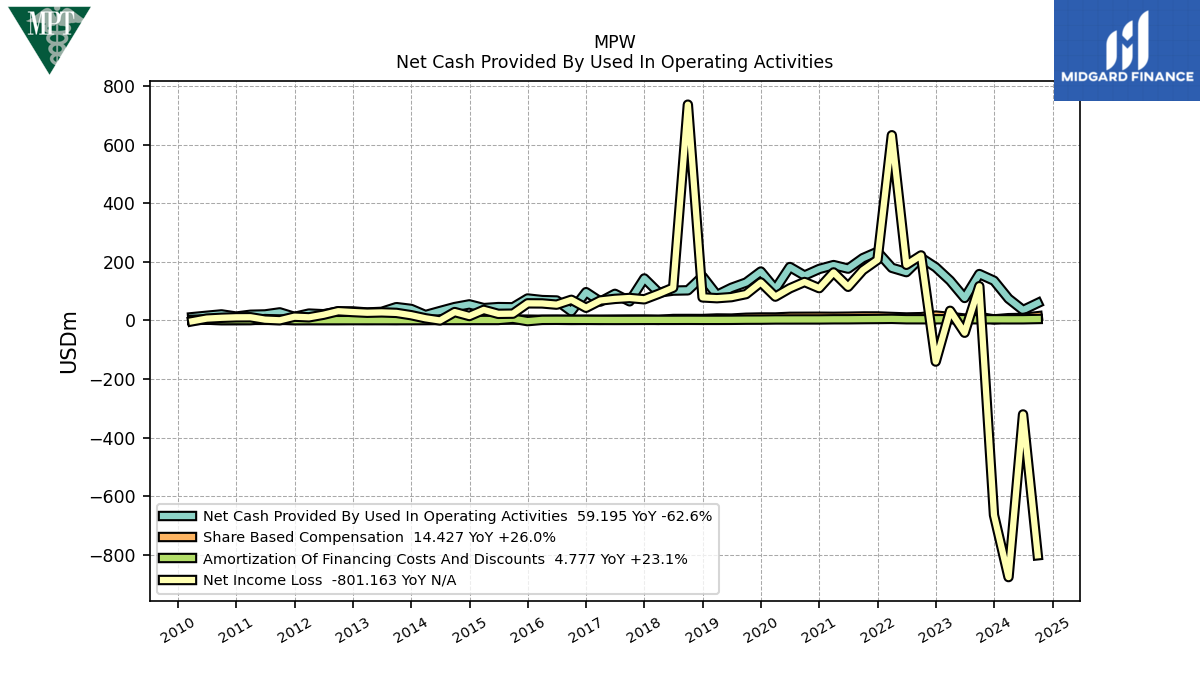
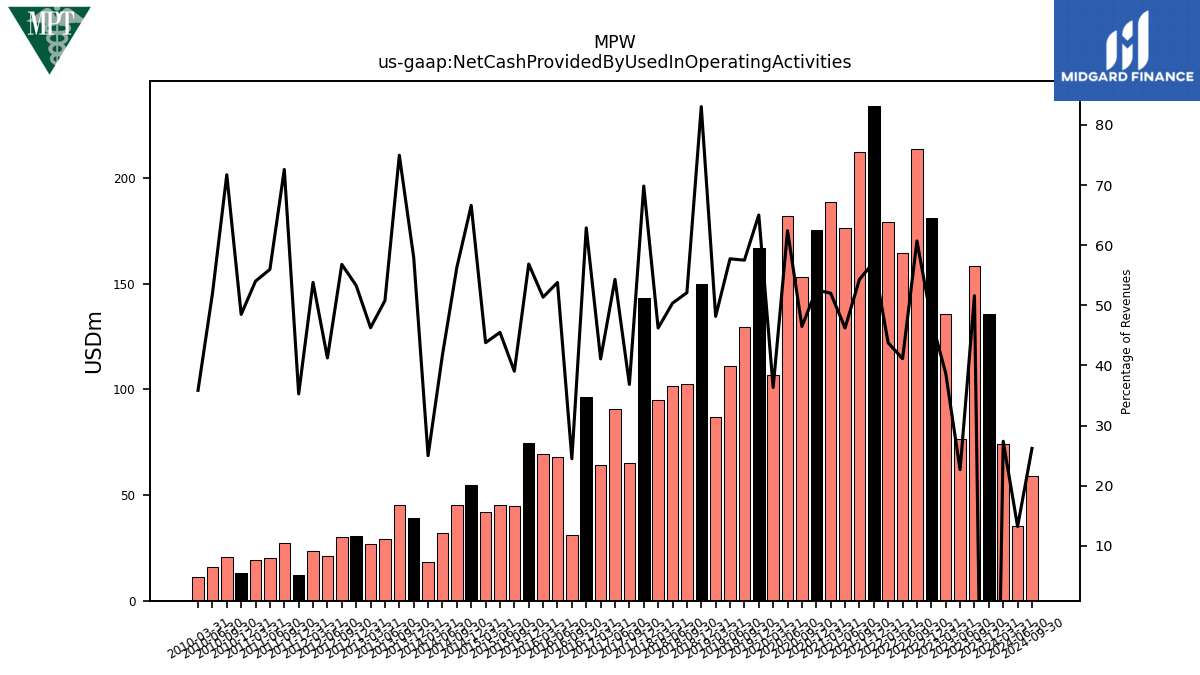
| Net Cash Provided By Used In Operating Activities | 135.42 | 158.19 | 76.53 | 135.65 | 181.09 | 213.90 | 164.63 | 179.39 | 234.17 | 212.23 | 176.53 | 188.73 | 175.42 | 153.15 | 182.15 | 106.91 | 166.74 | 129.27 | 111.18 | 86.92 | 149.97 | 102.64 | 101.68 | 94.80 | 143.16 | 65.06 | 90.61 | 64.27 | 96.39 | 31.00 | 67.95 | 69.34 | 74.81 | 44.74 | 45.42 | 42.03 | 54.70 | 45.49 | 31.97 | 18.28 | 39.24 | 45.32 | 29.19 | 27.05 | 30.60 | 30.29 | 21.07 | 23.35 | 12.14 | 27.44 | 20.41 | 19.29 | 13.14 | 20.54 | 15.88 | 11.07 | |
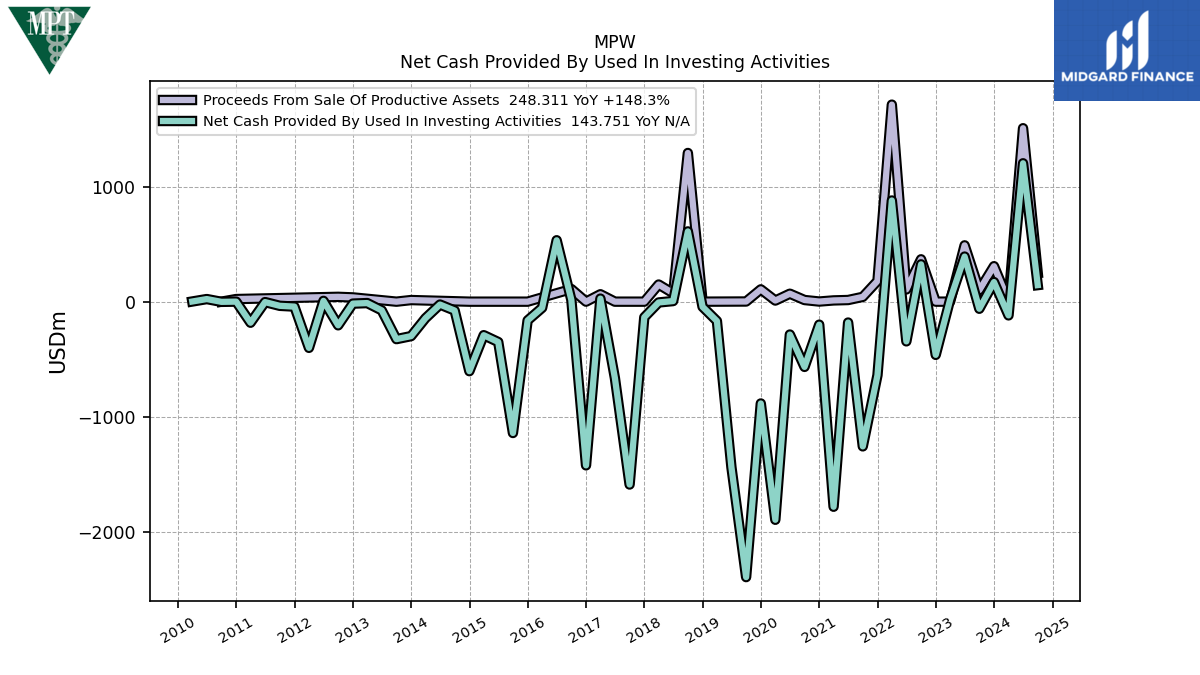
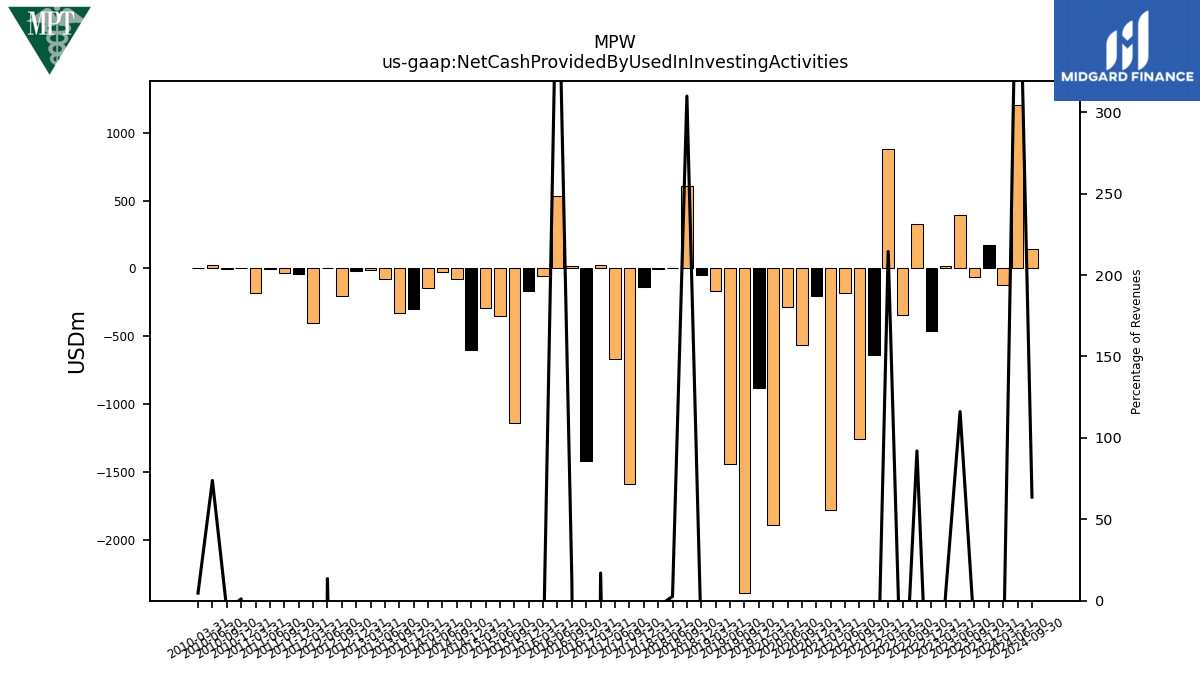
| Net Cash Provided By Used In Investing Activities | 170.22 | -61.66 | 391.82 | 17.18 | -462.25 | 324.18 | -344.91 | 879.03 | -638.48 | -1257.10 | -181.26 | -1781.56 | -199.77 | -566.73 | -285.49 | -1894.79 | -884.23 | -2392.82 | -1438.92 | -167.99 | -44.64 | 610.47 | 5.29 | -6.94 | -135.61 | -1588.52 | -664.50 | 26.56 | -1422.07 | 15.42 | 533.45 | -53.35 | -163.13 | -1140.99 | -350.46 | -291.05 | -603.97 | -77.12 | -25.09 | -143.84 | -299.31 | -325.50 | -75.53 | -12.24 | -17.02 | -205.62 | 6.93 | -401.41 | -42.91 | -35.99 | -3.71 | -183.02 | 0.30 | -1.57 | 22.60 | 1.45 | |
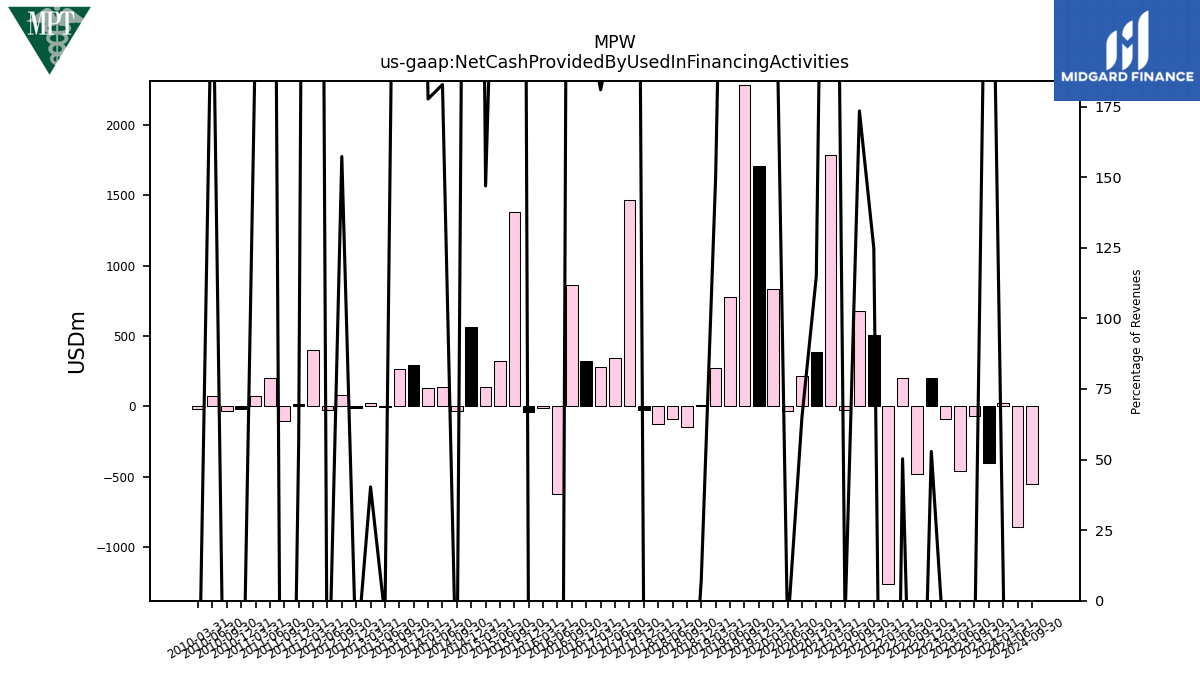
| Net Cash Provided By Used In Financing Activities | -402.73 | -66.66 | -461.82 | -89.12 | 201.17 | -480.97 | 201.09 | -1263.82 | 510.97 | 677.73 | -26.29 | 1785.19 | 383.31 | 213.77 | -31.23 | 835.22 | 1708.90 | 2281.94 | 780.33 | 270.71 | 13.49 | -143.60 | -92.42 | -123.34 | -26.08 | 1469.77 | 343.60 | 282.98 | 321.29 | 865.77 | -622.22 | -12.28 | -42.47 | 1382.41 | 319.76 | 140.99 | 563.39 | -30.64 | 139.93 | 129.88 | 293.31 | 266.23 | -3.26 | 23.55 | -12.43 | 83.86 | -26.86 | 401.83 | 19.13 | -104.99 | 204.20 | 72.33 | -21.52 | -34.13 | 72.36 | -17.03 |
| 2023-12-31 | 2023-09-30 | 2023-06-30 | 2023-03-31 | 2022-12-31 | 2022-09-30 | 2022-06-30 | 2022-03-31 | 2021-12-31 | 2021-09-30 | 2021-06-30 | 2021-03-31 | 2020-12-31 | 2020-09-30 | 2020-06-30 | 2020-03-31 | 2019-12-31 | 2019-09-30 | 2019-06-30 | 2019-03-31 | 2018-12-31 | 2018-09-30 | 2018-06-30 | 2018-03-31 | 2017-12-31 | 2017-09-30 | 2017-06-30 | 2017-03-31 | 2016-12-31 | 2016-09-30 | 2016-06-30 | 2016-03-31 | 2015-12-31 | 2015-09-30 | 2015-06-30 | 2015-03-31 | 2014-12-31 | 2014-09-30 | 2014-06-30 | 2014-03-31 | 2013-12-31 | 2013-09-30 | 2013-06-30 | 2013-03-31 | 2012-12-31 | 2012-09-30 | 2012-06-30 | 2012-03-31 | 2011-12-31 | 2011-09-30 | 2011-06-30 | 2011-03-31 | 2010-12-31 | 2010-09-30 | 2010-06-30 | 2010-03-31 | ||
|---|---|---|---|---|---|---|---|---|---|---|---|---|---|---|---|---|---|---|---|---|---|---|---|---|---|---|---|---|---|---|---|---|---|---|---|---|---|---|---|---|---|---|---|---|---|---|---|---|---|---|---|---|---|---|---|---|---|
| Net Cash Provided By Used In Operating Activities | 135.42 | 158.19 | 76.53 | 135.65 | 181.09 | 213.90 | 164.63 | 179.39 | 234.17 | 212.23 | 176.53 | 188.73 | 175.42 | 153.15 | 182.15 | 106.91 | 166.74 | 129.27 | 111.18 | 86.92 | 149.97 | 102.64 | 101.68 | 94.80 | 143.16 | 65.06 | 90.61 | 64.27 | 96.39 | 31.00 | 67.95 | 69.34 | 74.81 | 44.74 | 45.42 | 42.03 | 54.70 | 45.49 | 31.97 | 18.28 | 39.24 | 45.32 | 29.19 | 27.05 | 30.60 | 30.29 | 21.07 | 23.35 | 12.14 | 27.44 | 20.41 | 19.29 | 13.14 | 20.54 | 15.88 | 11.07 | |
| Net Income Loss | -663.94 | 116.71 | -42.04 | 32.79 | -140.47 | 221.79 | 189.60 | 631.68 | 206.54 | 171.14 | 114.56 | 163.78 | 109.88 | 131.11 | 109.47 | 80.99 | 129.64 | 89.79 | 79.44 | 75.82 | 78.48 | 736.03 | 111.57 | 90.60 | 71.94 | 76.46 | 73.42 | 67.97 | 43.04 | 70.36 | 53.72 | 57.93 | 58.24 | 23.06 | 22.41 | 35.90 | 14.95 | 28.54 | -0.20 | 7.24 | 17.84 | 25.65 | 27.35 | 26.16 | 28.56 | 31.46 | 19.32 | 10.56 | 12.69 | 0.42 | 2.64 | 10.78 | 10.59 | 8.92 | 6.22 | -2.82 | |
| Profit Loss | -663.58 | 116.89 | -42.43 | 33.03 | -140.21 | 222.02 | 190.06 | 631.95 | 206.84 | 171.40 | 114.82 | 163.88 | 110.11 | 131.36 | 109.65 | 81.16 | 129.92 | 90.27 | 79.92 | 76.29 | 78.94 | 736.48 | 112.02 | 91.04 | 72.38 | 76.88 | 73.80 | 68.19 | 43.24 | 70.54 | 53.92 | 58.23 | 58.34 | 23.12 | 22.49 | 35.98 | 15.03 | 28.66 | -0.20 | 7.31 | 17.90 | 25.70 | 27.41 | 26.21 | 28.60 | 31.51 | 19.36 | 10.61 | 12.74 | 0.47 | 2.68 | 10.82 | 10.63 | 8.96 | 6.23 | -2.81 | |
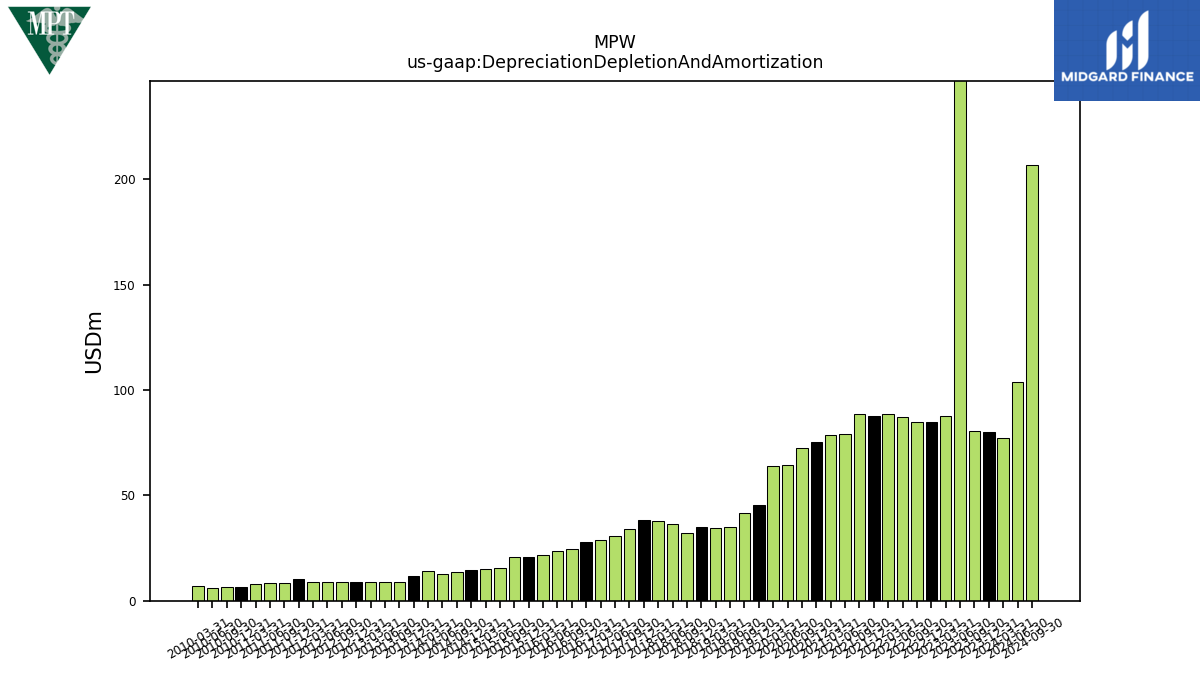
| Depreciation Depletion And Amortization | 79.93 | 80.65 | 367.97 | 87.59 | 84.86 | 84.64 | 87.32 | 88.76 | 87.66 | 88.44 | 79.07 | 78.61 | 75.15 | 72.59 | 64.38 | 63.83 | 45.51 | 41.64 | 34.76 | 34.67 | 34.98 | 32.07 | 36.58 | 37.86 | 38.17 | 33.98 | 30.87 | 28.95 | 27.88 | 24.55 | 23.48 | 21.69 | 20.68 | 20.59 | 15.49 | 15.07 | 14.76 | 13.69 | 12.74 | 13.97 | 11.82 | 9.07 | 9.00 | 8.93 | 8.69 | 8.96 | 9.03 | 8.91 | 10.22 | 8.62 | 8.54 | 8.08 | 6.68 | 6.45 | 6.14 | 7.04 | |
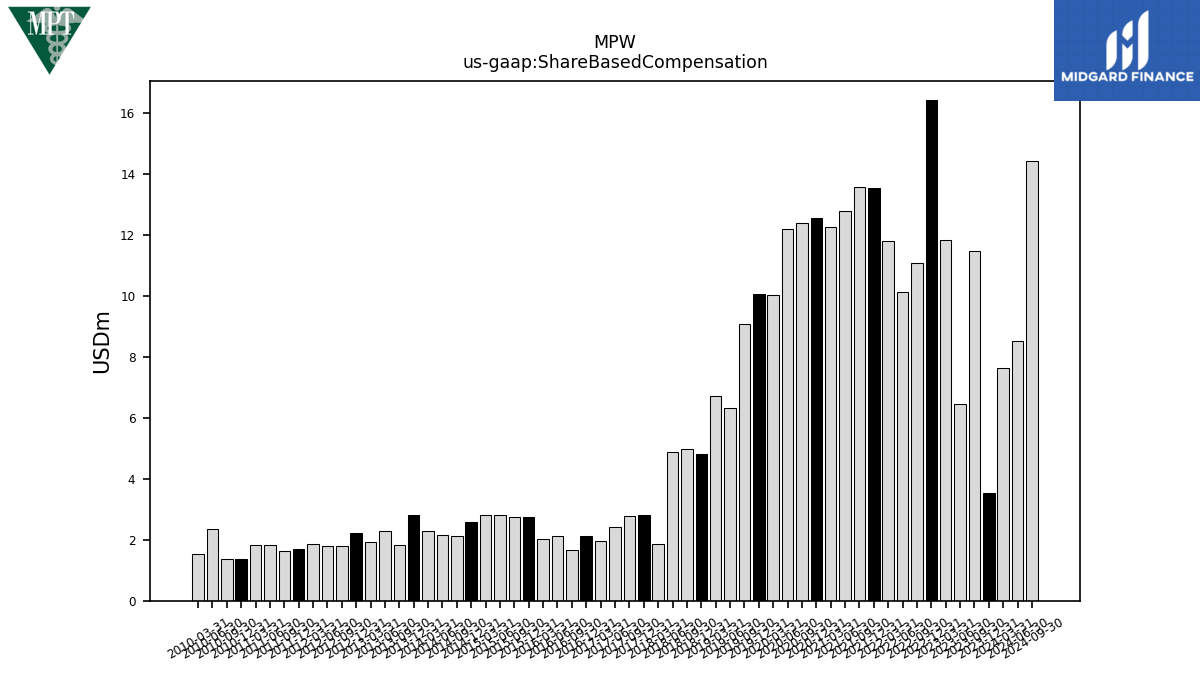
| Share Based Compensation | 3.53 | 11.45 | 6.44 | 11.83 | 16.42 | 11.09 | 10.11 | 11.80 | 13.52 | 13.55 | 12.77 | 12.26 | 12.55 | 12.37 | 12.19 | 10.04 | 10.07 | 9.09 | 6.32 | 6.71 | 4.81 | 4.97 | 4.87 | 1.86 | 2.80 | 2.77 | 2.41 | 1.97 | 2.11 | 1.68 | 2.13 | 2.02 | 2.74 | 2.74 | 2.82 | 2.83 | 2.59 | 2.14 | 2.15 | 2.29 | 2.81 | 1.81 | 2.29 | 1.92 | 2.21 | 1.79 | 1.78 | 1.86 | 1.69 | 1.63 | 1.82 | 1.84 | 1.37 | 1.37 | 2.35 | 1.53 |
| 2023-12-31 | 2023-09-30 | 2023-06-30 | 2023-03-31 | 2022-12-31 | 2022-09-30 | 2022-06-30 | 2022-03-31 | 2021-12-31 | 2021-09-30 | 2021-06-30 | 2021-03-31 | 2020-12-31 | 2020-09-30 | 2020-06-30 | 2020-03-31 | 2019-12-31 | 2019-09-30 | 2019-06-30 | 2019-03-31 | 2018-12-31 | 2018-09-30 | 2018-06-30 | 2018-03-31 | 2017-12-31 | 2017-09-30 | 2017-06-30 | 2017-03-31 | 2016-12-31 | 2016-09-30 | 2016-06-30 | 2016-03-31 | 2015-12-31 | 2015-09-30 | 2015-06-30 | 2015-03-31 | 2014-12-31 | 2014-09-30 | 2014-06-30 | 2014-03-31 | 2013-12-31 | 2013-09-30 | 2013-06-30 | 2013-03-31 | 2012-12-31 | 2012-09-30 | 2012-06-30 | 2012-03-31 | 2011-12-31 | 2011-09-30 | 2011-06-30 | 2011-03-31 | 2010-12-31 | 2010-09-30 | 2010-06-30 | 2010-03-31 | ||
|---|---|---|---|---|---|---|---|---|---|---|---|---|---|---|---|---|---|---|---|---|---|---|---|---|---|---|---|---|---|---|---|---|---|---|---|---|---|---|---|---|---|---|---|---|---|---|---|---|---|---|---|---|---|---|---|---|---|
| Net Cash Provided By Used In Investing Activities | 170.22 | -61.66 | 391.82 | 17.18 | -462.25 | 324.18 | -344.91 | 879.03 | -638.48 | -1257.10 | -181.26 | -1781.56 | -199.77 | -566.73 | -285.49 | -1894.79 | -884.23 | -2392.82 | -1438.92 | -167.99 | -44.64 | 610.47 | 5.29 | -6.94 | -135.61 | -1588.52 | -664.50 | 26.56 | -1422.07 | 15.42 | 533.45 | -53.35 | -163.13 | -1140.99 | -350.46 | -291.05 | -603.97 | -77.12 | -25.09 | -143.84 | -299.31 | -325.50 | -75.53 | -12.24 | -17.02 | -205.62 | 6.93 | -401.41 | -42.91 | -35.99 | -3.71 | -183.02 | 0.30 | -1.57 | 22.60 | 1.45 |
| 2023-12-31 | 2023-09-30 | 2023-06-30 | 2023-03-31 | 2022-12-31 | 2022-09-30 | 2022-06-30 | 2022-03-31 | 2021-12-31 | 2021-09-30 | 2021-06-30 | 2021-03-31 | 2020-12-31 | 2020-09-30 | 2020-06-30 | 2020-03-31 | 2019-12-31 | 2019-09-30 | 2019-06-30 | 2019-03-31 | 2018-12-31 | 2018-09-30 | 2018-06-30 | 2018-03-31 | 2017-12-31 | 2017-09-30 | 2017-06-30 | 2017-03-31 | 2016-12-31 | 2016-09-30 | 2016-06-30 | 2016-03-31 | 2015-12-31 | 2015-09-30 | 2015-06-30 | 2015-03-31 | 2014-12-31 | 2014-09-30 | 2014-06-30 | 2014-03-31 | 2013-12-31 | 2013-09-30 | 2013-06-30 | 2013-03-31 | 2012-12-31 | 2012-09-30 | 2012-06-30 | 2012-03-31 | 2011-12-31 | 2011-09-30 | 2011-06-30 | 2011-03-31 | 2010-12-31 | 2010-09-30 | 2010-06-30 | 2010-03-31 | ||
|---|---|---|---|---|---|---|---|---|---|---|---|---|---|---|---|---|---|---|---|---|---|---|---|---|---|---|---|---|---|---|---|---|---|---|---|---|---|---|---|---|---|---|---|---|---|---|---|---|---|---|---|---|---|---|---|---|---|
| Net Cash Provided By Used In Financing Activities | -402.73 | -66.66 | -461.82 | -89.12 | 201.17 | -480.97 | 201.09 | -1263.82 | 510.97 | 677.73 | -26.29 | 1785.19 | 383.31 | 213.77 | -31.23 | 835.22 | 1708.90 | 2281.94 | 780.33 | 270.71 | 13.49 | -143.60 | -92.42 | -123.34 | -26.08 | 1469.77 | 343.60 | 282.98 | 321.29 | 865.77 | -622.22 | -12.28 | -42.47 | 1382.41 | 319.76 | 140.99 | 563.39 | -30.64 | 139.93 | 129.88 | 293.31 | 266.23 | -3.26 | 23.55 | -12.43 | 83.86 | -26.86 | 401.83 | 19.13 | -104.99 | 204.20 | 72.33 | -21.52 | -34.13 | 72.36 | -17.03 |
| 2023-12-31 | 2023-09-30 | 2023-06-30 | 2023-03-31 | 2022-12-31 | 2022-09-30 | 2022-06-30 | 2022-03-31 | 2021-12-31 | 2021-09-30 | 2021-06-30 | 2021-03-31 | 2020-12-31 | 2020-09-30 | 2020-06-30 | 2020-03-31 | 2019-12-31 | 2019-09-30 | 2019-06-30 | 2019-03-31 | 2018-12-31 | 2018-09-30 | 2018-06-30 | 2018-03-31 | 2017-12-31 | 2017-09-30 | 2017-06-30 | 2017-03-31 | 2016-12-31 | 2016-09-30 | 2016-06-30 | 2016-03-31 | 2015-12-31 | 2015-09-30 | 2015-06-30 | 2015-03-31 | 2014-12-31 | 2014-09-30 | 2014-06-30 | 2014-03-31 | 2013-12-31 | 2013-09-30 | 2013-06-30 | 2013-03-31 | 2012-12-31 | 2012-09-30 | 2012-06-30 | 2012-03-31 | 2011-12-31 | 2011-09-30 | 2011-06-30 | 2011-03-31 | 2010-12-31 | 2010-09-30 | 2010-06-30 | 2010-03-31 | ||
|---|---|---|---|---|---|---|---|---|---|---|---|---|---|---|---|---|---|---|---|---|---|---|---|---|---|---|---|---|---|---|---|---|---|---|---|---|---|---|---|---|---|---|---|---|---|---|---|---|---|---|---|---|---|---|---|---|---|
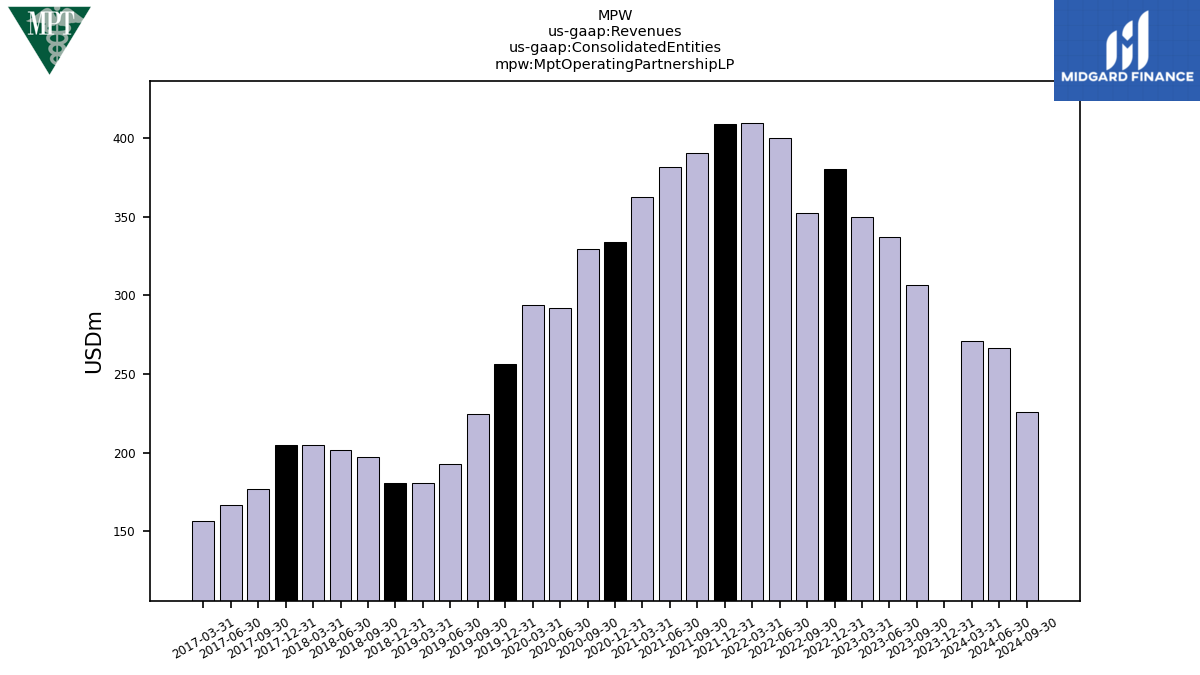
| Revenues | -122.38 | 306.58 | 337.39 | 350.21 | 380.49 | 352.34 | 400.23 | 409.80 | 409.33 | 390.78 | 381.79 | 362.76 | 333.81 | 329.46 | 291.84 | 294.13 | 256.44 | 224.76 | 192.55 | 180.45 | 180.58 | 197.00 | 201.90 | 205.05 | 204.96 | 176.58 | 166.81 | 156.40 | 153.28 | 126.56 | 126.30 | 135.00 | 131.55 | 114.57 | 99.80 | 95.96 | 82.11 | 80.78 | 76.56 | 73.09 | 67.68 | 60.46 | 57.47 | 58.44 | 57.41 | 53.31 | 51.07 | 43.39 | 34.42 | 37.79 | 36.45 | 35.70 | 27.10 | 28.64 | 30.59 | 30.86 | |
| Mpt Operating Partnership L P | -122.38 | 306.58 | 337.39 | 350.21 | 380.49 | 352.34 | 400.23 | 409.80 | 409.33 | 390.78 | 381.79 | 362.76 | 333.81 | 329.46 | 291.84 | 294.13 | 256.44 | 224.76 | 192.55 | 180.45 | 180.58 | 197.00 | 201.90 | 205.05 | 204.96 | 176.58 | 166.81 | 156.40 | NA | NA | NA | NA | NA | NA | NA | NA | NA | NA | NA | NA | NA | NA | NA | NA | NA | NA | NA | NA | NA | NA | NA | NA | NA | NA | NA | NA | |
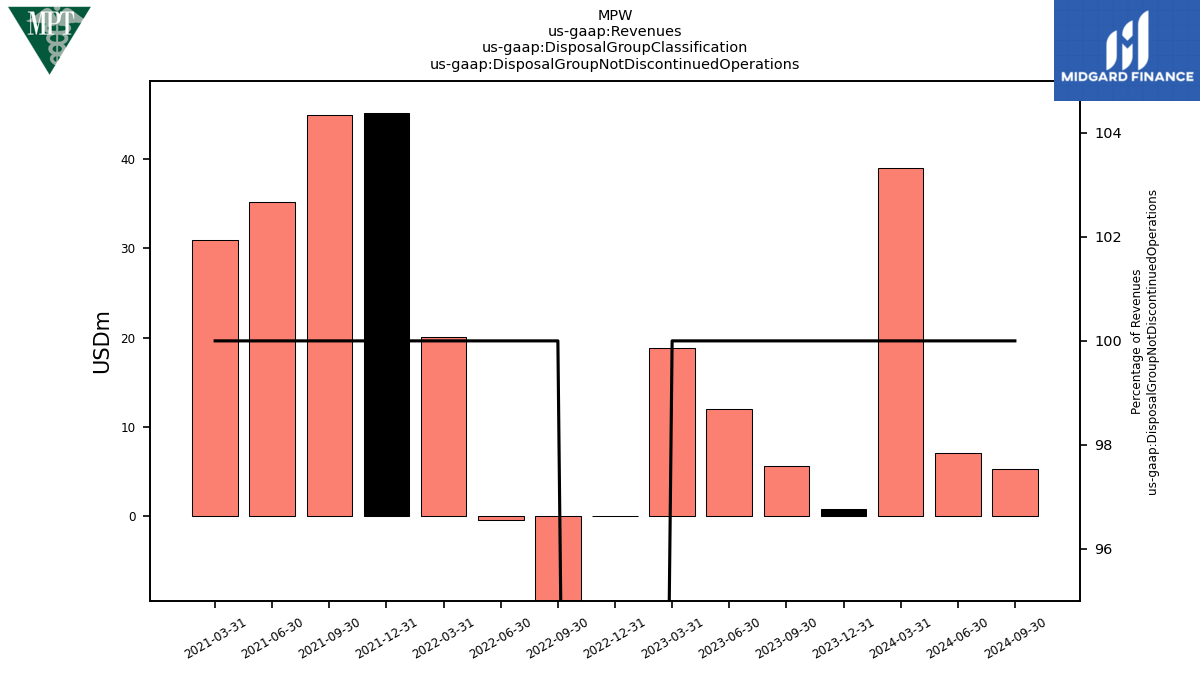
| Disposal Group Not Discontinued Operations | 0.77 | 5.63 | 12.05 | 18.88 | 0.00 | -27.03 | -0.40 | 20.09 | 45.16 | 44.96 | 35.22 | 30.99 | NA | NA | NA | NA | NA | NA | NA | NA | NA | NA | NA | NA | NA | NA | NA | NA | NA | NA | NA | NA | NA | NA | NA | NA | NA | NA | NA | NA | NA | NA | NA | NA | NA | NA | NA | NA | NA | NA | NA | NA | NA | NA | NA | NA | |
| , Prospect | 11.00 | NA | NA | NA | NA | NA | NA | NA | NA | NA | NA | NA | NA | NA | NA | NA | NA | NA | NA | NA | NA | NA | NA | NA | NA | NA | NA | NA | NA | NA | NA | NA | NA | NA | NA | NA | NA | NA | NA | NA | NA | NA | NA | NA | NA | NA | NA | NA | NA | NA | NA | NA | NA | NA | NA | NA |

