
| 2023-12-31 | 2023-09-30 | 2023-06-30 | 2023-03-31 | 2022-12-31 | 2022-09-30 | 2022-06-30 | 2022-03-31 | 2021-12-31 | 2021-09-30 | 2021-06-30 | 2021-03-31 | 2020-12-31 | 2020-09-30 | 2020-06-30 | 2020-03-31 | 2019-12-31 | 2019-09-30 | 2019-06-30 | 2019-03-31 | 2018-12-31 | 2018-09-30 | 2018-06-30 | 2018-03-31 | 2017-12-31 | 2017-09-30 | 2017-06-30 | 2017-03-31 | 2016-12-31 | 2016-09-30 | 2016-06-30 | 2016-03-31 | 2015-12-31 | 2015-09-30 | 2015-06-30 | 2015-03-31 | 2014-12-31 | 2014-09-30 | 2014-06-30 | 2014-03-31 | 2013-12-31 | 2013-09-30 | 2013-06-30 | 2013-03-31 | 2012-12-31 | 2012-09-30 | 2012-06-30 | 2012-03-31 | 2011-12-31 | 2011-09-30 | 2011-06-30 | 2011-03-31 | 2010-12-31 | 2010-11-30 | 2010-08-31 | 2010-05-31 | 2010-02-28 | 2009-12-31 | ||
|---|---|---|---|---|---|---|---|---|---|---|---|---|---|---|---|---|---|---|---|---|---|---|---|---|---|---|---|---|---|---|---|---|---|---|---|---|---|---|---|---|---|---|---|---|---|---|---|---|---|---|---|---|---|---|---|---|---|---|---|
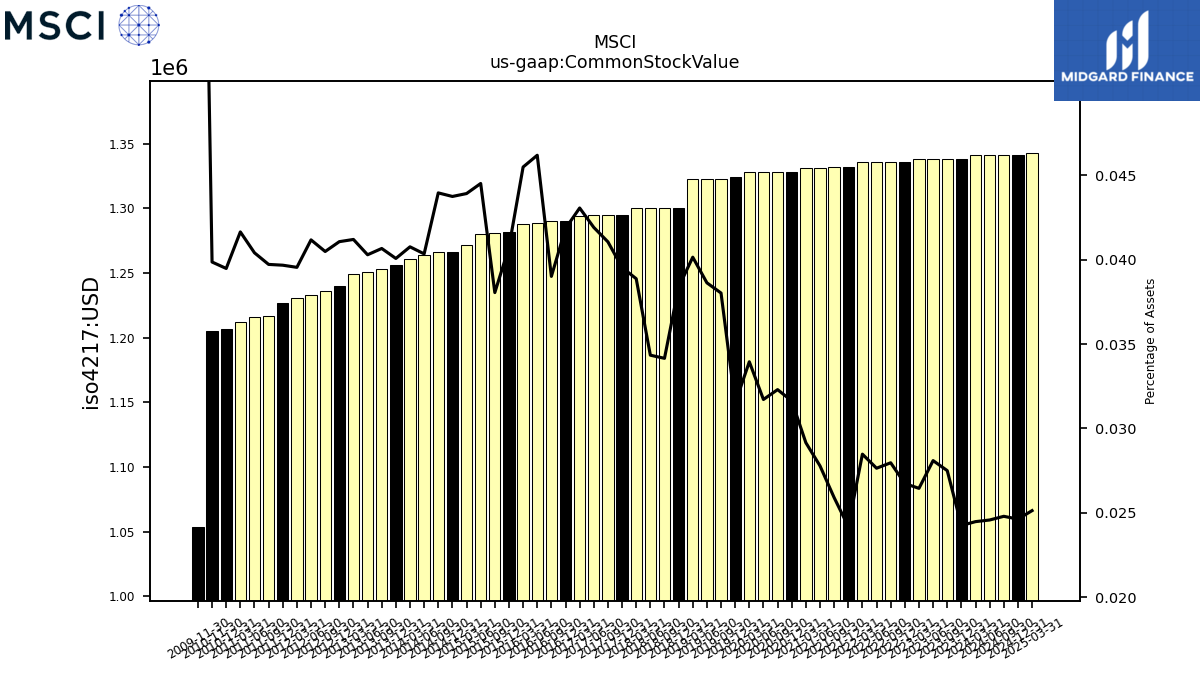
| Common Stock Value | 1.34 | 1.34 | 1.34 | 1.34 | 1.34 | 1.34 | 1.34 | 1.34 | 1.33 | 1.33 | 1.33 | 1.33 | 1.33 | 1.33 | 1.33 | 1.33 | 1.32 | 1.32 | 1.32 | 1.32 | 1.30 | 1.30 | 1.30 | 1.30 | 1.29 | 1.29 | 1.29 | 1.29 | 1.29 | 1.29 | 1.29 | 1.29 | 1.28 | 1.28 | 1.28 | 1.27 | 1.27 | 1.27 | 1.26 | 1.26 | 1.26 | 1.25 | 1.25 | 1.25 | 1.24 | 1.24 | 1.23 | 1.23 | 1.23 | 1.22 | 1.22 | 1.21 | 1.21 | 1.21 | NA | NA | NA | NA | |
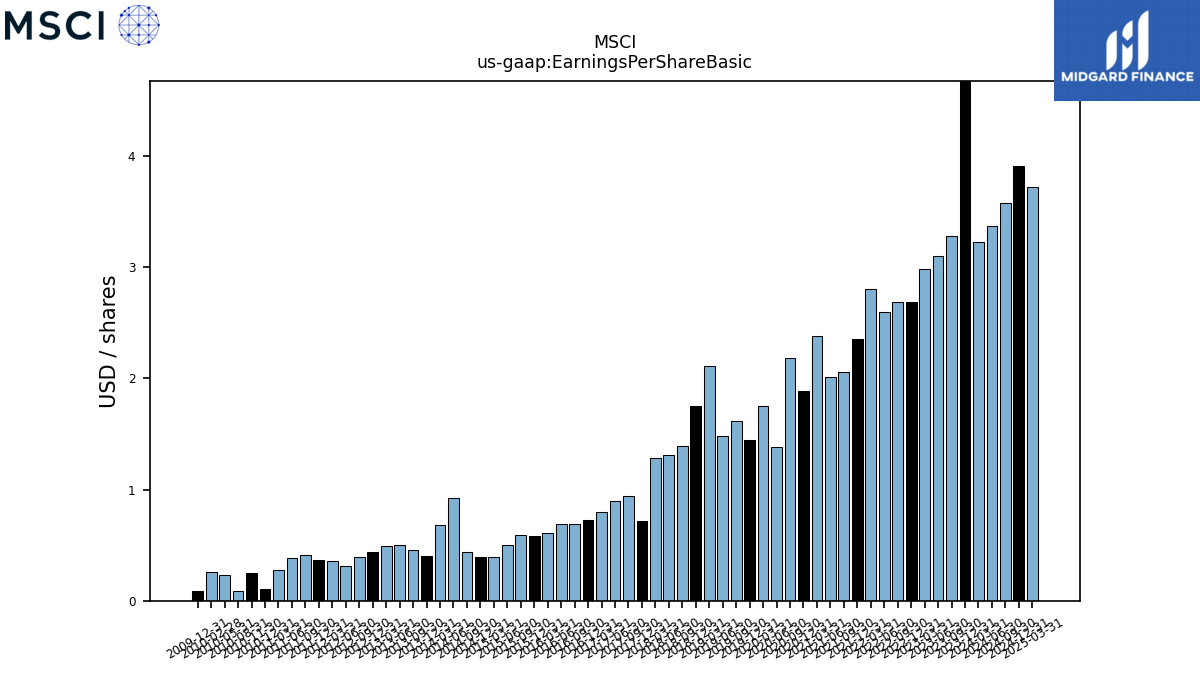
| Earnings Per Share Basic | 5.09 | 3.28 | 3.10 | 2.98 | 2.69 | 2.69 | 2.60 | 2.80 | 2.35 | 2.06 | 2.01 | 2.38 | 1.89 | 2.18 | 1.38 | 1.75 | 1.45 | 1.62 | 1.48 | 2.11 | 1.75 | 1.39 | 1.31 | 1.28 | 0.72 | 0.94 | 0.90 | 0.80 | 0.73 | 0.69 | 0.69 | 0.61 | 0.58 | 0.59 | 0.50 | 0.39 | 0.39 | 0.44 | 0.92 | 0.68 | 0.40 | 0.46 | 0.50 | 0.49 | 0.44 | 0.39 | 0.31 | 0.36 | 0.37 | 0.41 | 0.38 | 0.28 | 0.11 | 0.25 | 0.09 | 0.23 | 0.26 | 0.09 | |
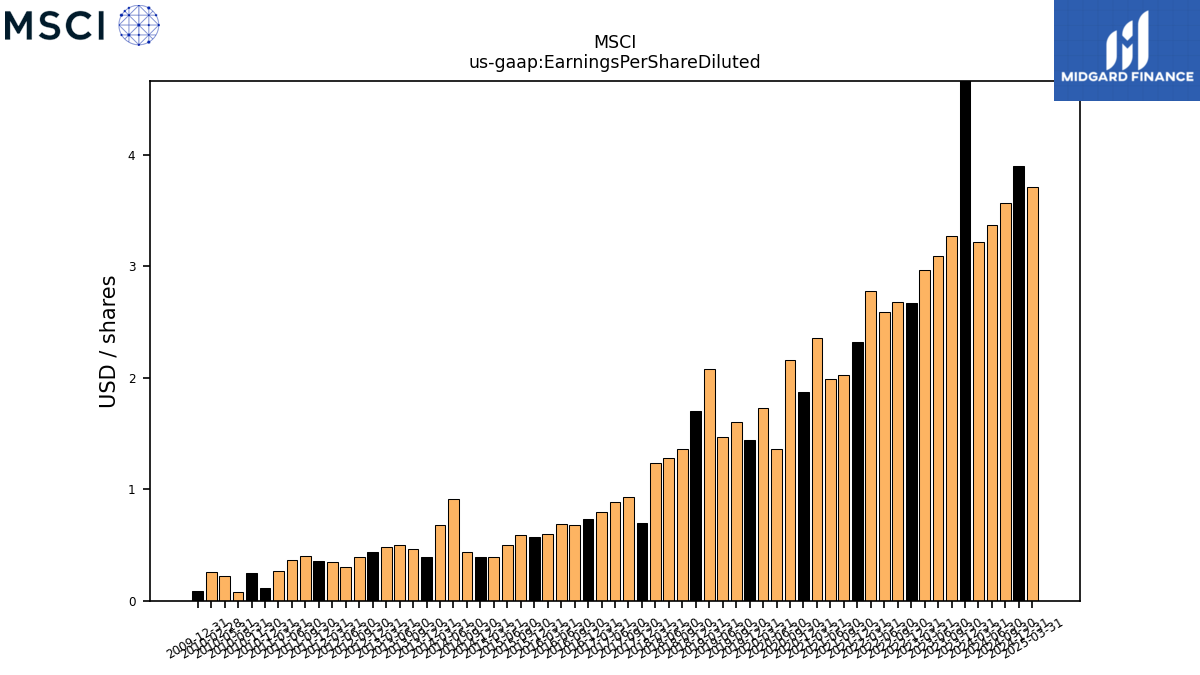
| Earnings Per Share Diluted | 5.07 | 3.27 | 3.09 | 2.97 | 2.67 | 2.68 | 2.59 | 2.78 | 2.32 | 2.03 | 1.99 | 2.36 | 1.87 | 2.16 | 1.36 | 1.73 | 1.44 | 1.60 | 1.47 | 2.08 | 1.70 | 1.36 | 1.28 | 1.24 | 0.70 | 0.93 | 0.89 | 0.80 | 0.73 | 0.68 | 0.69 | 0.60 | 0.57 | 0.59 | 0.50 | 0.39 | 0.39 | 0.44 | 0.91 | 0.68 | 0.39 | 0.46 | 0.50 | 0.48 | 0.44 | 0.39 | 0.30 | 0.35 | 0.36 | 0.40 | 0.37 | 0.27 | 0.11 | 0.25 | 0.08 | 0.22 | 0.26 | 0.09 |
| 2023-12-31 | 2023-09-30 | 2023-06-30 | 2023-03-31 | 2022-12-31 | 2022-09-30 | 2022-06-30 | 2022-03-31 | 2021-12-31 | 2021-09-30 | 2021-06-30 | 2021-03-31 | 2020-12-31 | 2020-09-30 | 2020-06-30 | 2020-03-31 | 2019-12-31 | 2019-09-30 | 2019-06-30 | 2019-03-31 | 2018-12-31 | 2018-09-30 | 2018-06-30 | 2018-03-31 | 2017-12-31 | 2017-09-30 | 2017-06-30 | 2017-03-31 | 2016-12-31 | 2016-09-30 | 2016-06-30 | 2016-03-31 | 2015-12-31 | 2015-09-30 | 2015-06-30 | 2015-03-31 | 2014-12-31 | 2014-09-30 | 2014-06-30 | 2014-03-31 | 2013-12-31 | 2013-09-30 | 2013-06-30 | 2013-03-31 | 2012-12-31 | 2012-09-30 | 2012-06-30 | 2012-03-31 | 2011-12-31 | 2011-09-30 | 2011-06-30 | 2011-03-31 | 2010-12-31 | 2010-11-30 | 2010-08-31 | 2010-05-31 | 2010-02-28 | 2009-12-31 | ||
|---|---|---|---|---|---|---|---|---|---|---|---|---|---|---|---|---|---|---|---|---|---|---|---|---|---|---|---|---|---|---|---|---|---|---|---|---|---|---|---|---|---|---|---|---|---|---|---|---|---|---|---|---|---|---|---|---|---|---|---|
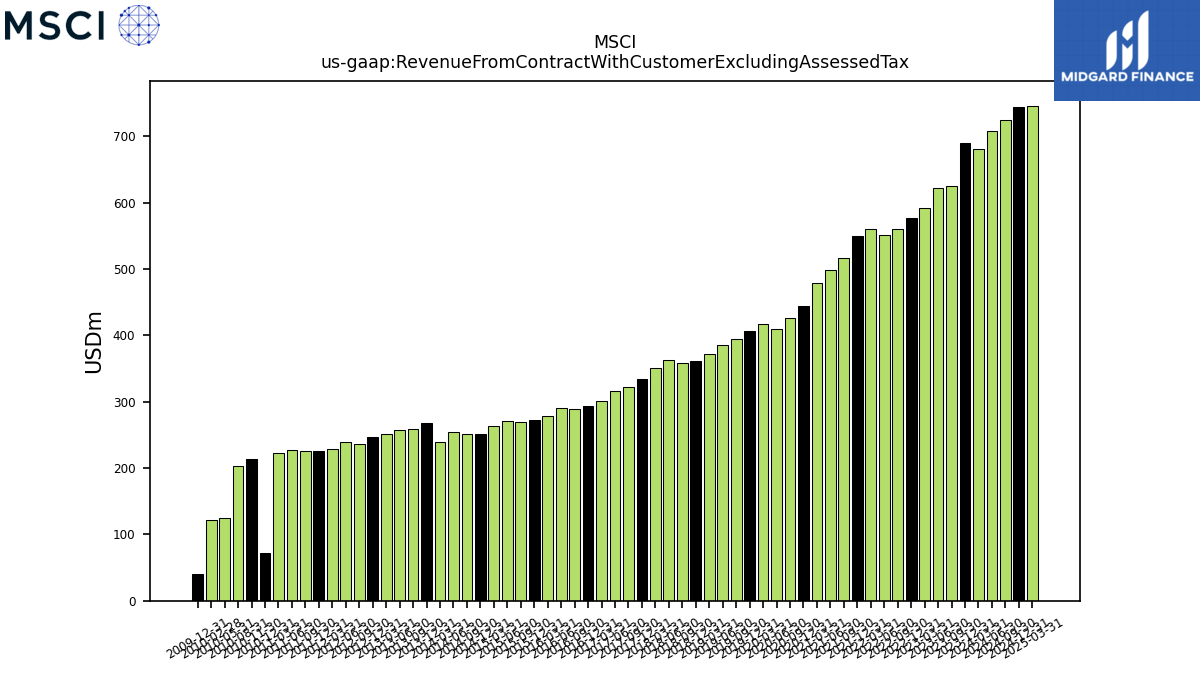
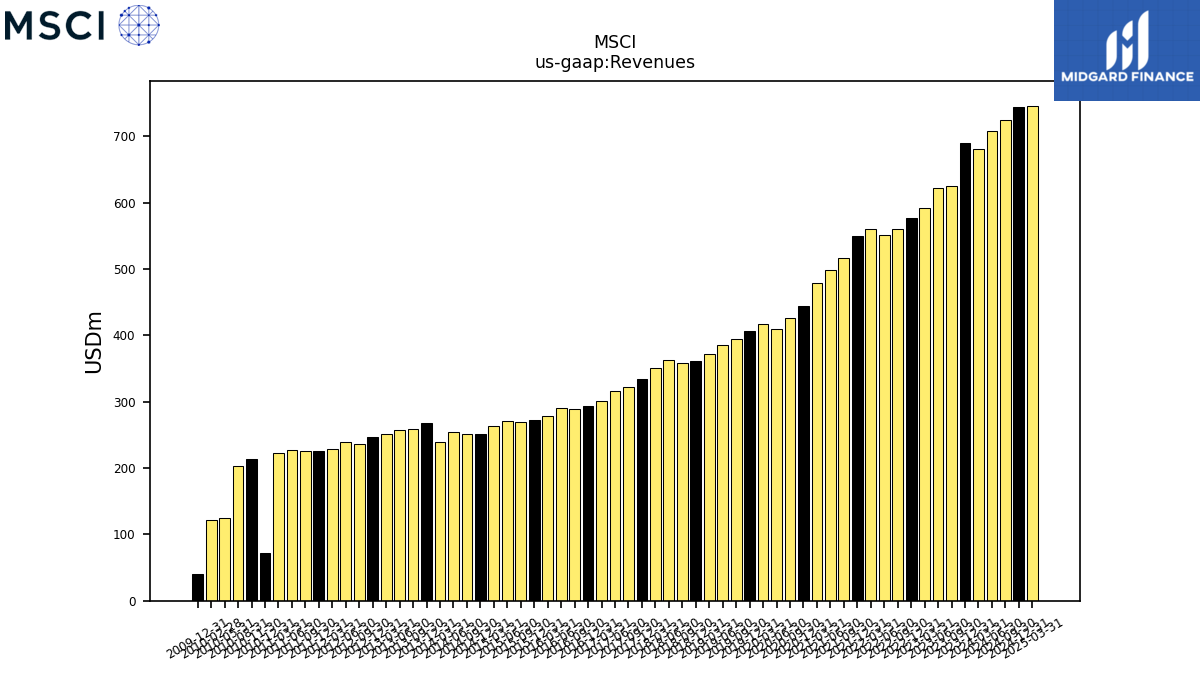
| Revenue From Contract With Customer Excluding Assessed Tax | 690.11 | 625.44 | 621.16 | 592.22 | 576.21 | 560.64 | 551.81 | 559.95 | 549.84 | 517.10 | 498.18 | 478.42 | 443.66 | 425.33 | 409.62 | 416.78 | 406.61 | 394.25 | 385.56 | 371.38 | 361.69 | 357.93 | 363.05 | 351.32 | 334.78 | 322.10 | 316.09 | 301.21 | 292.81 | 288.43 | 290.60 | 278.83 | 272.89 | 268.77 | 270.58 | 262.77 | 251.10 | 251.66 | 254.23 | 239.69 | 267.62 | 258.24 | 257.90 | 251.91 | 247.08 | 235.44 | 238.56 | 229.05 | 226.13 | 225.03 | 226.48 | 223.30 | 72.52 | 213.32 | 202.73 | 125.17 | 121.68 | 40.49 | |
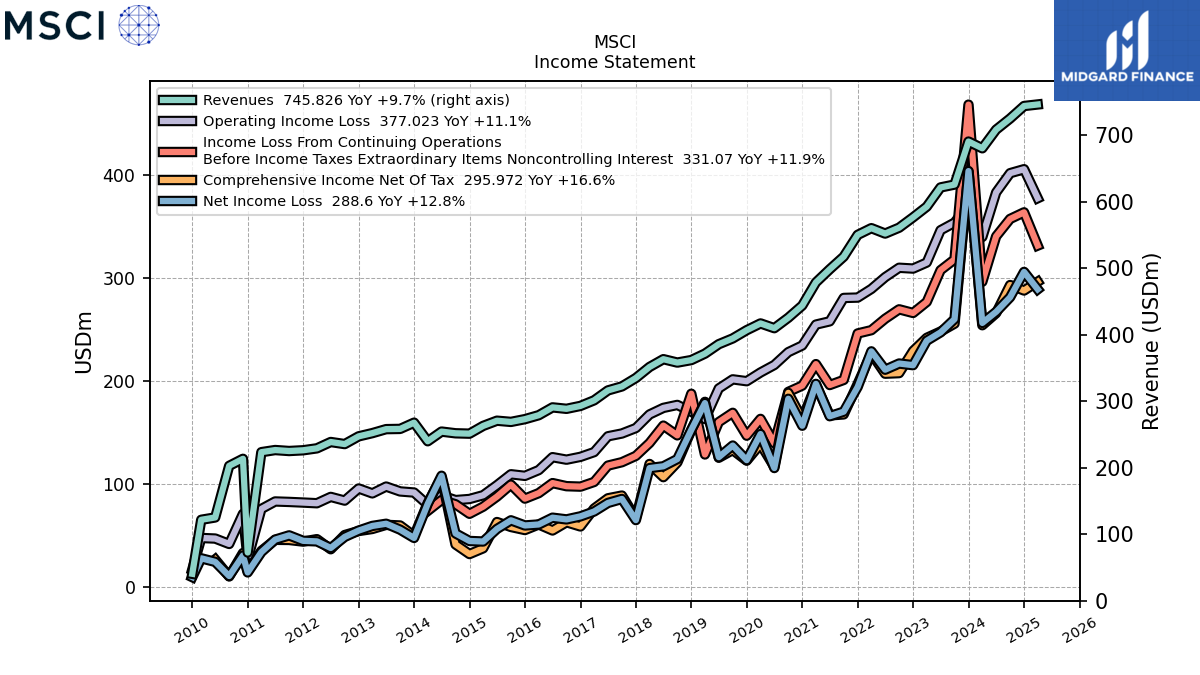
| Revenues | 690.11 | 625.44 | 621.16 | 592.22 | 576.21 | 560.64 | 551.81 | 559.95 | 549.84 | 517.10 | 498.18 | 478.42 | 443.66 | 425.33 | 409.62 | 416.78 | 406.61 | 394.25 | 385.56 | 371.38 | 361.69 | 357.93 | 363.05 | 351.32 | 334.78 | 322.10 | 316.09 | 301.21 | 292.81 | 288.43 | 290.60 | 278.83 | 272.89 | 268.77 | 270.58 | 262.77 | 251.10 | 251.66 | 254.23 | 239.69 | 267.62 | 258.24 | 257.90 | 251.91 | 247.08 | 235.44 | 238.56 | 229.05 | 226.13 | 225.03 | 226.48 | 223.30 | 72.52 | 213.32 | 202.73 | 125.17 | 121.68 | 40.49 | |
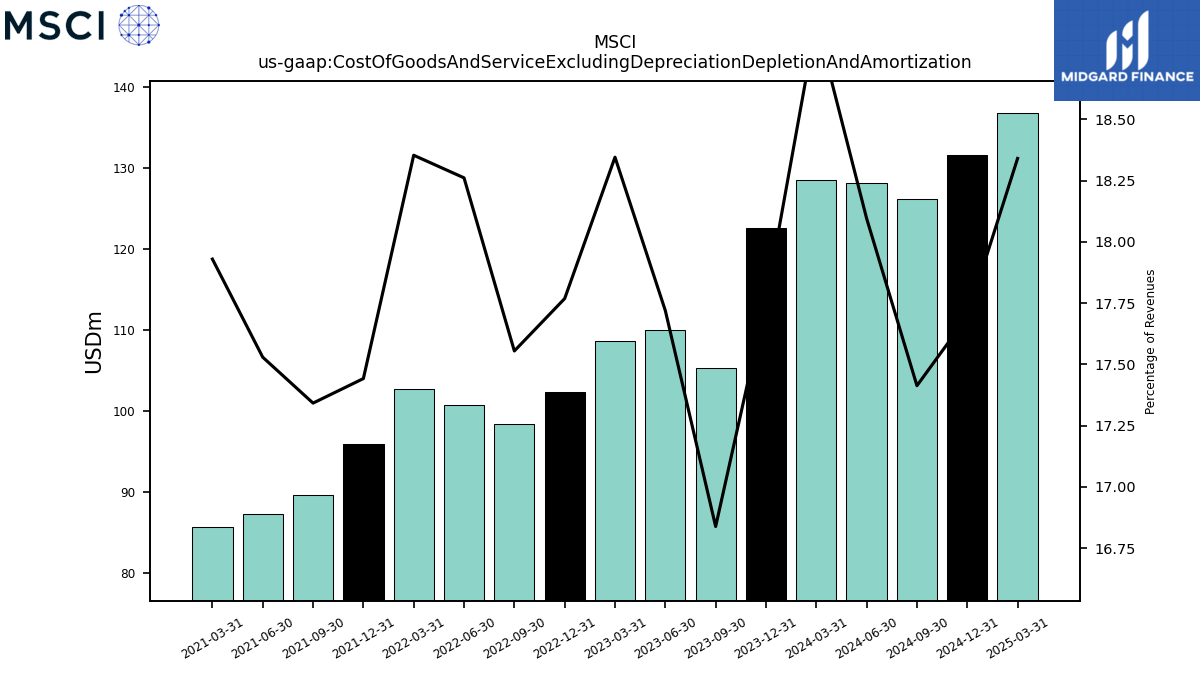
| Cost Of Goods And Service Excluding Depreciation Depletion And Amortization | 122.56 | 105.31 | 110.07 | 108.65 | 102.38 | 98.42 | 100.77 | 102.77 | 95.90 | 89.67 | 87.33 | 85.78 | NA | NA | NA | NA | NA | NA | NA | NA | NA | NA | NA | NA | NA | NA | NA | NA | NA | NA | NA | NA | NA | NA | NA | NA | NA | NA | NA | NA | NA | NA | NA | NA | NA | NA | NA | NA | NA | NA | NA | NA | NA | NA | NA | NA | NA | NA | |
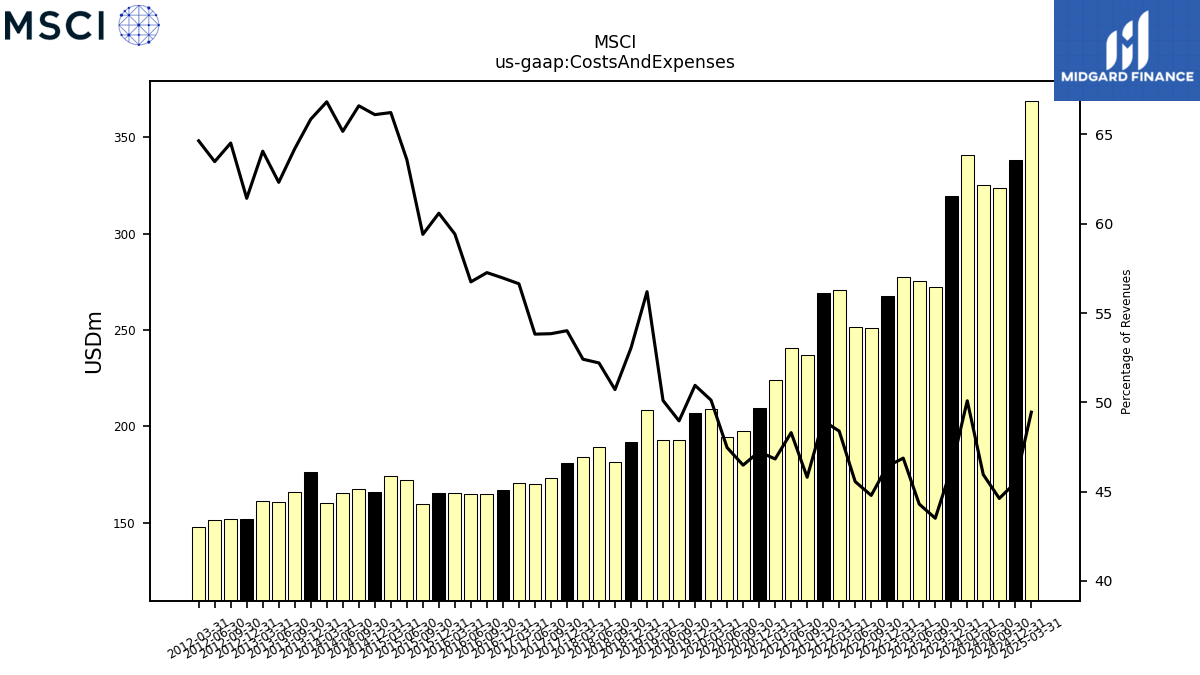
| Costs And Expenses | 319.36 | 272.13 | 275.20 | 277.62 | 267.46 | 251.11 | 251.43 | 270.97 | 269.25 | 236.87 | 240.65 | 224.05 | 209.58 | 197.71 | 194.44 | 208.90 | 207.18 | 193.03 | 193.18 | 208.71 | 191.87 | 181.53 | 189.53 | 184.15 | 180.82 | 173.43 | 170.12 | 170.60 | 166.80 | 165.17 | 164.91 | 165.69 | 165.35 | 159.67 | 172.07 | 174.03 | 166.01 | 167.62 | 165.69 | 160.18 | 176.25 | 165.80 | 160.73 | 161.38 | 151.77 | 151.91 | 151.44 | 148.07 | NA | NA | NA | NA | NA | NA | NA | NA | NA | NA | |
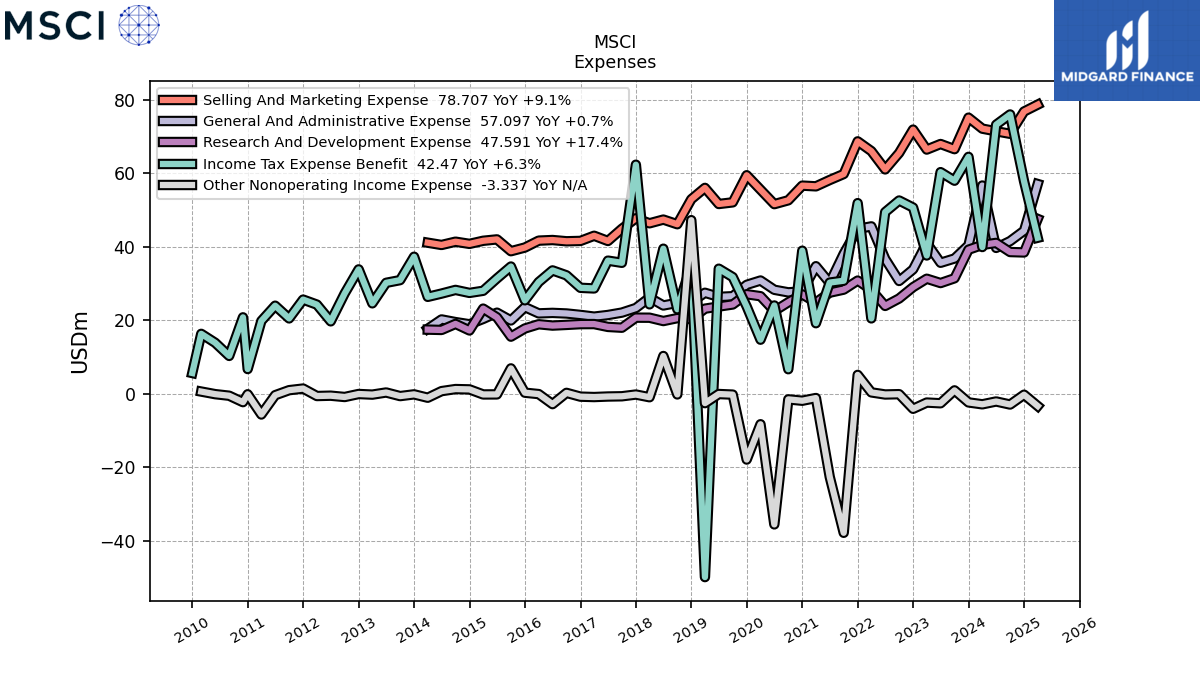
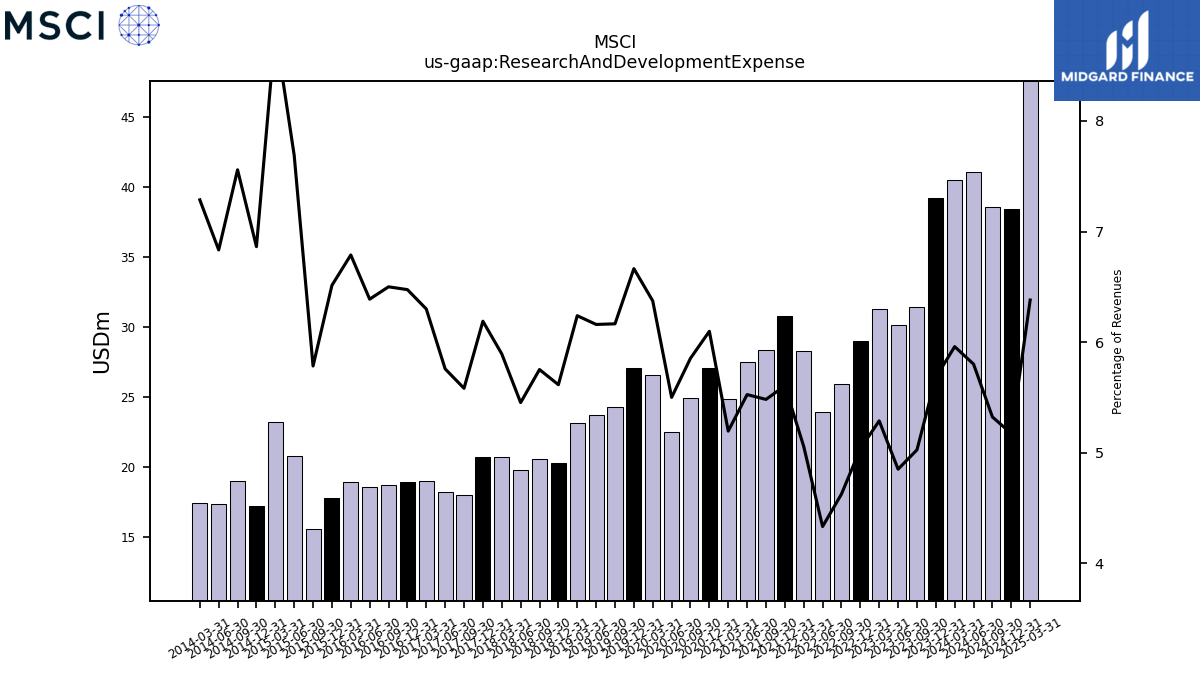
| Research And Development Expense | 39.22 | 31.44 | 30.14 | 31.32 | 29.03 | 25.94 | 23.92 | 28.32 | 30.82 | 28.35 | 27.53 | 24.86 | 27.06 | 24.90 | 22.53 | 26.56 | 27.10 | 24.31 | 23.75 | 23.17 | 20.31 | 20.59 | 19.80 | 20.71 | 20.72 | 17.98 | 18.20 | 18.98 | 18.96 | 18.75 | 18.57 | 18.93 | 17.78 | 15.55 | 20.81 | 23.19 | 17.23 | 19.02 | 17.37 | 17.46 | NA | NA | NA | NA | NA | NA | NA | NA | NA | NA | NA | NA | NA | NA | NA | NA | NA | NA | |
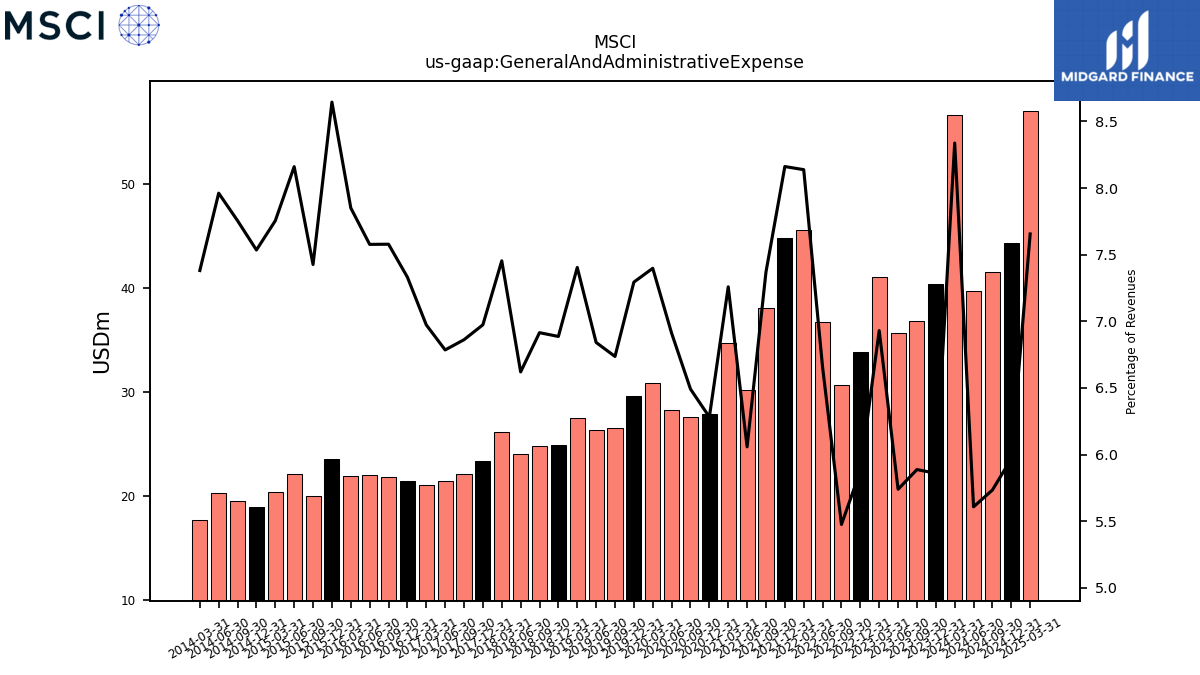
| General And Administrative Expense | 40.44 | 36.83 | 35.66 | 41.04 | 33.86 | 30.70 | 36.72 | 45.57 | 44.87 | 38.11 | 30.18 | 34.73 | 27.87 | 27.61 | 28.31 | 30.83 | 29.66 | 26.56 | 26.38 | 27.50 | 24.91 | 24.75 | 24.04 | 26.19 | 23.35 | 22.10 | 21.45 | 21.00 | 21.47 | 21.86 | 22.02 | 21.89 | 23.59 | 19.96 | 22.08 | 20.38 | 18.92 | 19.52 | 20.24 | 17.69 | NA | NA | NA | NA | NA | NA | NA | NA | NA | NA | NA | NA | NA | NA | NA | NA | NA | NA | |
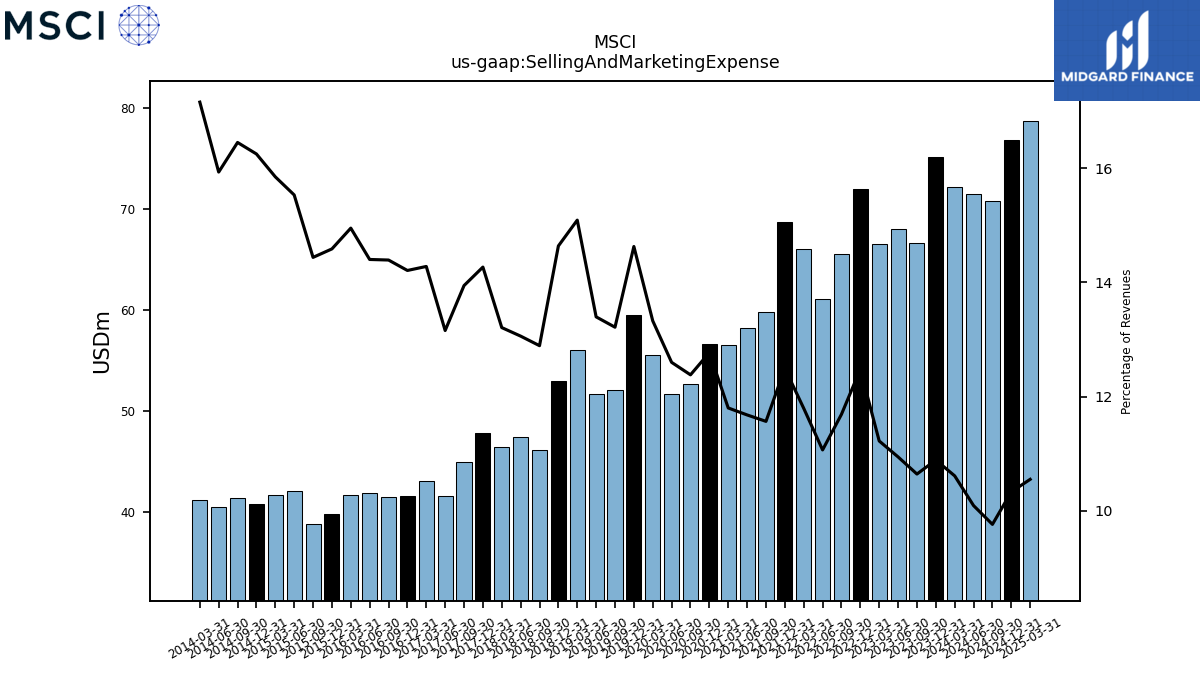
| Selling And Marketing Expense | 75.16 | 66.58 | 67.99 | 66.47 | 71.91 | 65.55 | 61.07 | 66.05 | 68.71 | 59.82 | 58.19 | 56.47 | 56.66 | 52.67 | 51.62 | 55.55 | 59.49 | 52.11 | 51.66 | 56.05 | 52.95 | 46.15 | 47.42 | 46.41 | 47.77 | 44.92 | 41.59 | 43.01 | 41.61 | 41.51 | 41.85 | 41.69 | 39.81 | 38.81 | 42.03 | 41.65 | 40.80 | 41.40 | 40.51 | 41.13 | NA | NA | NA | NA | NA | NA | NA | NA | NA | NA | NA | NA | NA | NA | NA | NA | NA | NA | |
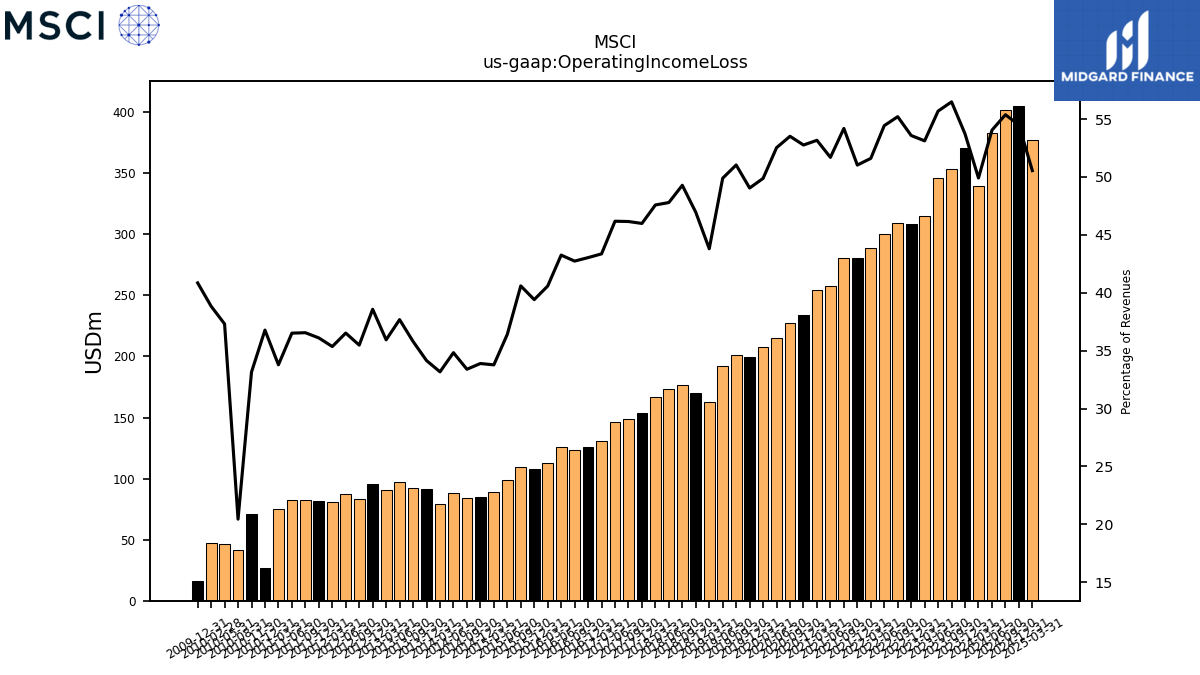
| Operating Income Loss | 370.75 | 353.31 | 345.95 | 314.60 | 308.75 | 309.53 | 300.38 | 288.98 | 280.59 | 280.23 | 257.53 | 254.38 | 234.09 | 227.62 | 215.18 | 207.88 | 199.43 | 201.22 | 192.38 | 162.68 | 169.82 | 176.40 | 173.51 | 167.17 | 153.96 | 148.66 | 145.97 | 130.60 | 126.01 | 123.26 | 125.69 | 113.14 | 107.54 | 109.10 | 98.51 | 88.74 | 85.09 | 84.04 | 88.53 | 79.50 | 91.37 | 92.44 | 97.17 | 90.53 | 95.31 | 83.53 | 87.12 | 80.98 | 81.63 | 82.25 | 82.69 | 75.43 | 26.67 | 70.72 | 41.45 | 46.70 | 47.26 | 16.54 | |
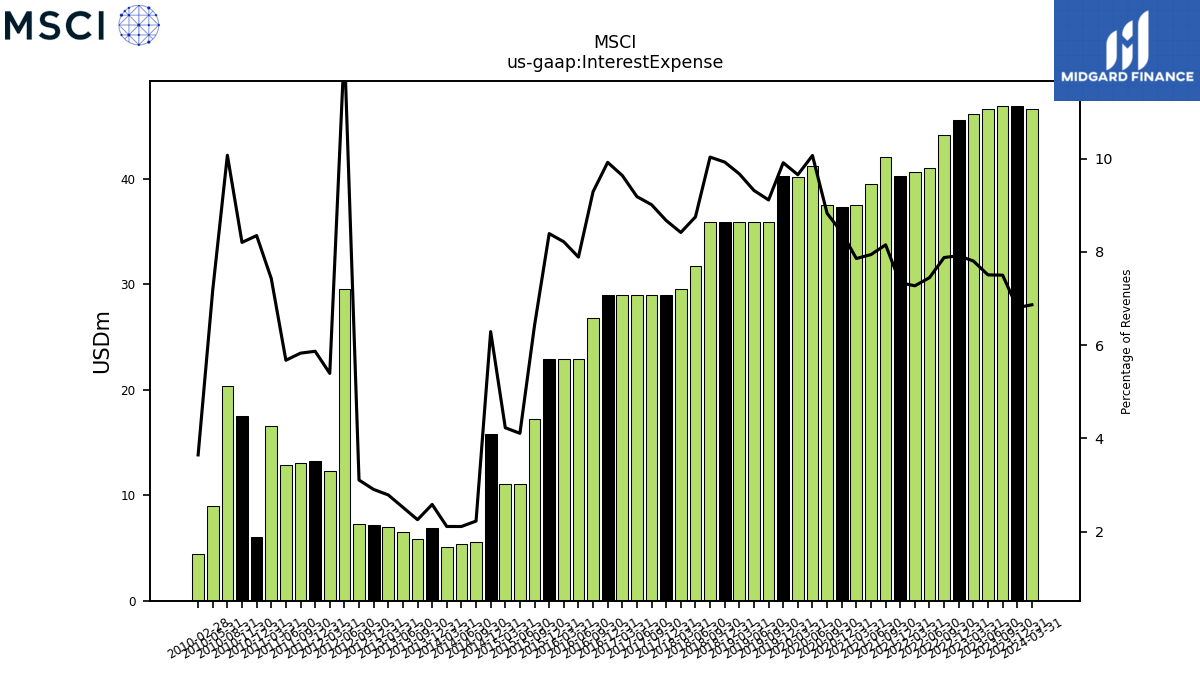
| Interest Expense | 46.95 | 46.90 | 46.62 | 46.21 | 45.61 | 44.16 | 41.09 | 40.71 | 40.34 | 42.14 | 39.56 | 37.58 | 37.33 | 37.54 | 41.23 | 40.23 | 40.29 | 35.92 | 35.91 | 35.91 | 35.89 | 35.90 | 31.76 | 29.56 | 29.03 | 29.02 | 29.03 | 29.02 | 29.04 | 26.79 | 22.92 | 22.90 | 22.90 | 17.27 | 11.12 | 11.11 | 15.79 | 5.60 | 5.37 | 5.06 | 6.91 | 5.83 | 6.50 | 7.02 | 7.18 | 7.31 | 29.58 | 12.36 | 13.27 | 13.11 | 12.85 | 16.59 | 6.05 | 17.50 | 20.41 | 8.99 | 4.44 | NA | |
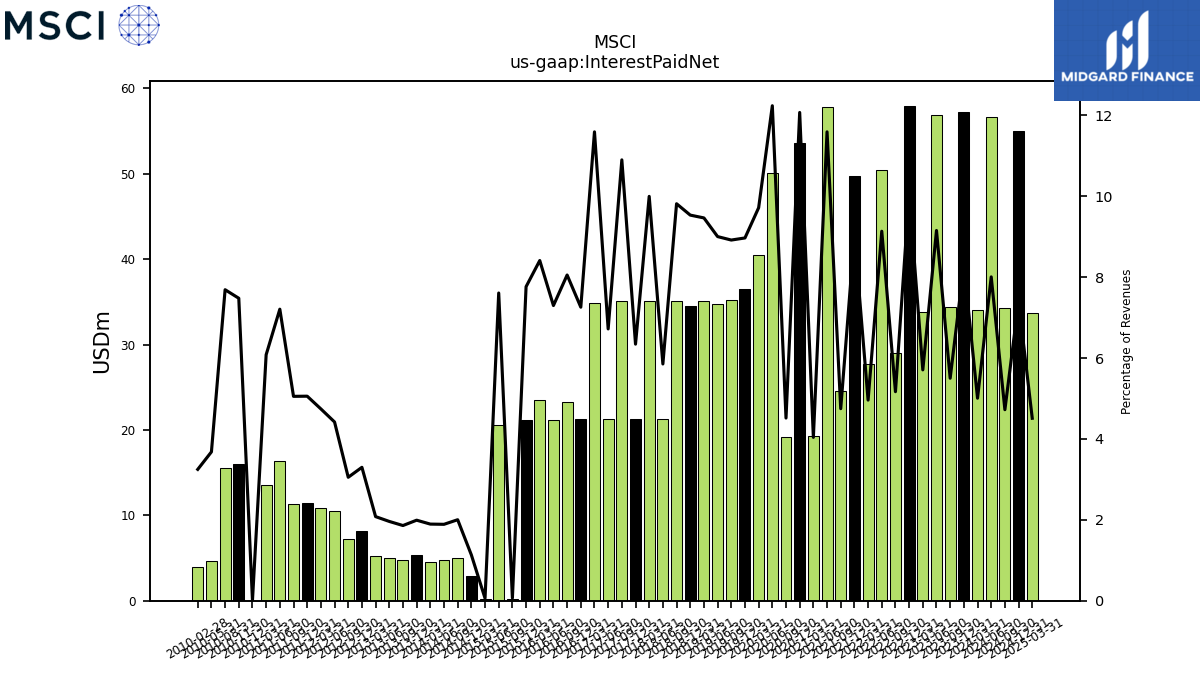
| Interest Paid Net | 57.24 | 34.41 | 56.86 | 33.80 | 57.95 | 28.98 | 50.41 | 27.78 | 49.70 | 24.55 | 57.75 | 19.33 | 53.56 | 19.21 | 50.13 | 40.49 | 36.47 | 35.16 | 34.71 | 35.15 | 34.48 | 35.13 | 21.25 | 35.12 | 21.24 | 35.11 | 21.24 | 34.92 | 21.25 | 23.23 | 21.21 | 23.45 | 21.19 | 0.17 | 20.59 | 0.16 | 2.85 | 5.04 | 4.80 | 4.54 | 5.33 | 4.80 | 5.06 | 5.24 | 8.15 | 7.19 | 10.54 | 10.86 | 11.44 | 11.37 | 16.32 | 13.58 | 0.01 | 15.95 | 15.59 | 4.61 | 3.95 | NA | |
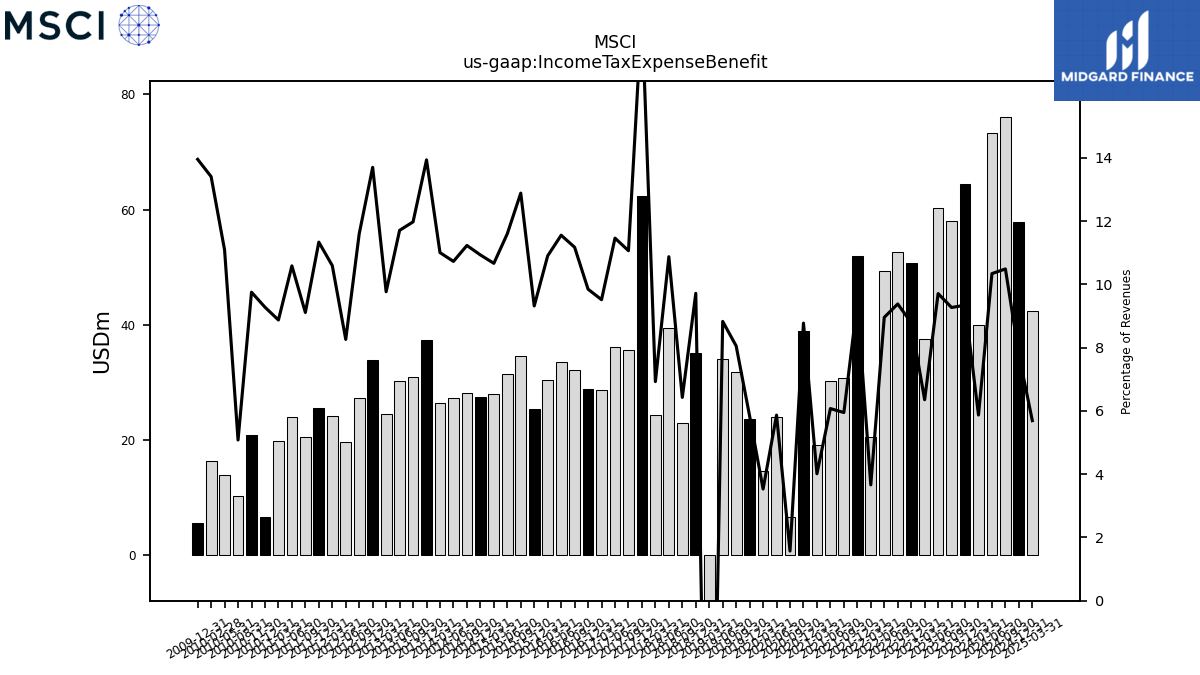
| Income Tax Expense Benefit | 64.50 | 58.00 | 60.33 | 37.64 | 50.69 | 52.61 | 49.45 | 20.52 | 51.90 | 30.77 | 30.27 | 19.21 | 38.95 | 6.68 | 24.04 | 14.72 | 23.75 | 31.77 | 34.05 | -49.90 | 35.16 | 23.01 | 39.49 | 24.35 | 62.36 | 35.65 | 36.24 | 28.67 | 28.84 | 32.24 | 33.59 | 30.41 | 25.44 | 34.64 | 31.40 | 28.04 | 27.46 | 28.27 | 27.28 | 26.39 | 37.31 | 30.94 | 30.21 | 24.61 | 33.86 | 27.32 | 19.71 | 24.27 | 25.64 | 20.51 | 23.98 | 19.82 | 6.73 | 20.81 | 10.30 | 13.88 | 16.32 | 5.65 | |
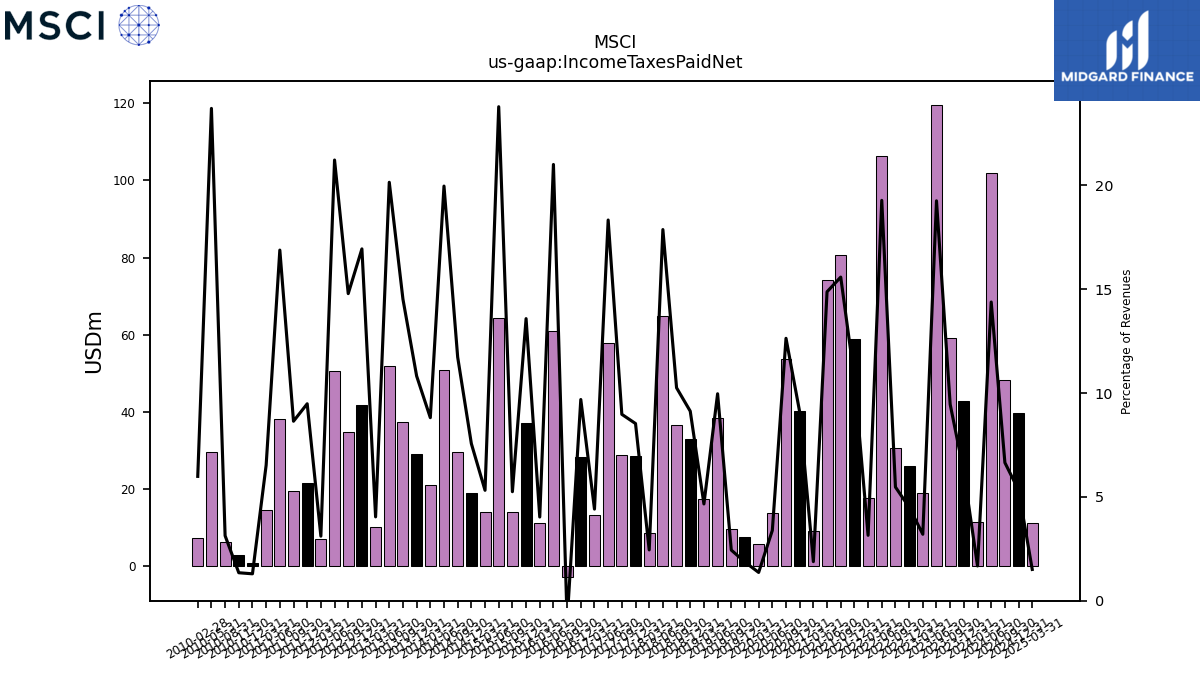
| Income Taxes Paid Net | 42.73 | 59.16 | 119.62 | 18.96 | 25.96 | 30.69 | 106.39 | 17.64 | 58.89 | 80.59 | 74.12 | 9.01 | 40.34 | 53.75 | 13.88 | 5.68 | 7.57 | 9.62 | 38.43 | 17.31 | 33.02 | 36.70 | 64.89 | 8.60 | 28.57 | 28.91 | 57.95 | 13.29 | 28.37 | -2.82 | 61.05 | 11.24 | 37.07 | 14.11 | 64.37 | 13.98 | 19.00 | 29.52 | 50.77 | 21.13 | 28.96 | 37.50 | 51.97 | 10.18 | 41.86 | 34.82 | 50.63 | 7.12 | 21.45 | 19.45 | 38.24 | 14.58 | 0.94 | 2.88 | 6.35 | 29.68 | 7.29 | NA | |
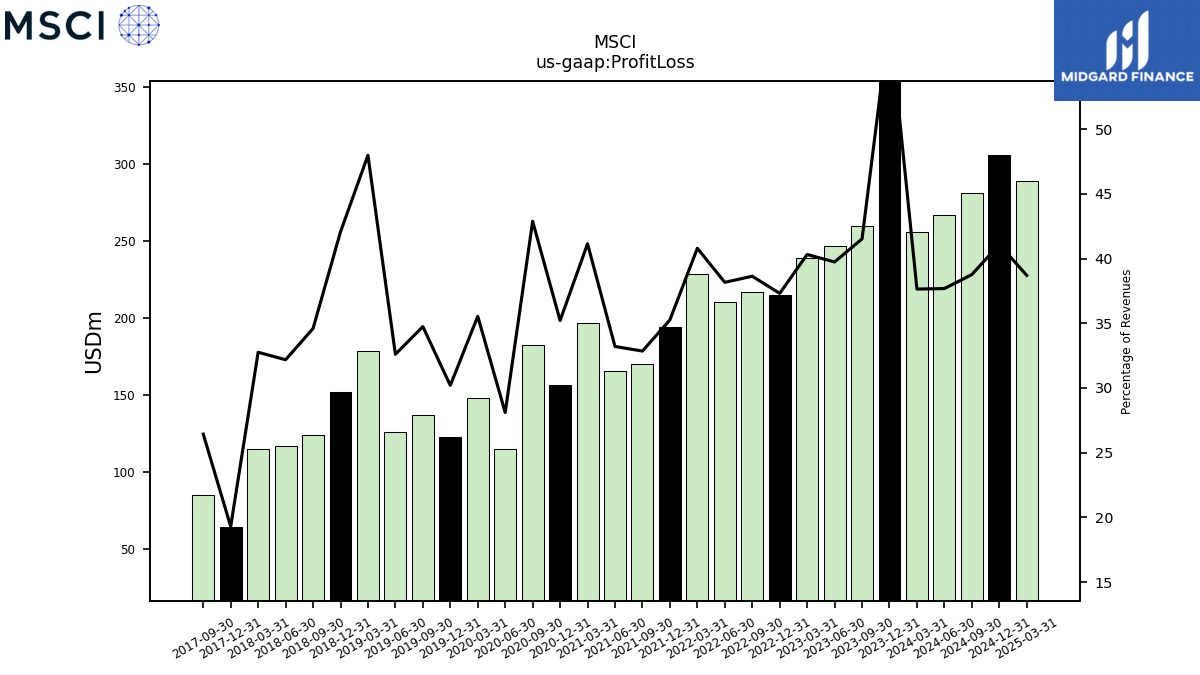
| Profit Loss | 403.38 | 259.66 | 246.82 | 238.73 | 214.97 | 216.59 | 210.59 | 228.42 | 193.87 | 169.88 | 165.42 | 196.82 | 156.22 | 182.36 | 115.12 | 148.12 | 122.78 | 136.98 | 125.69 | 178.19 | 152.13 | 123.83 | 116.83 | 115.09 | 64.60 | 85.15 | NA | NA | NA | NA | NA | NA | NA | NA | NA | NA | NA | NA | NA | NA | NA | NA | NA | NA | NA | NA | NA | NA | NA | NA | NA | NA | NA | NA | NA | NA | NA | NA | |
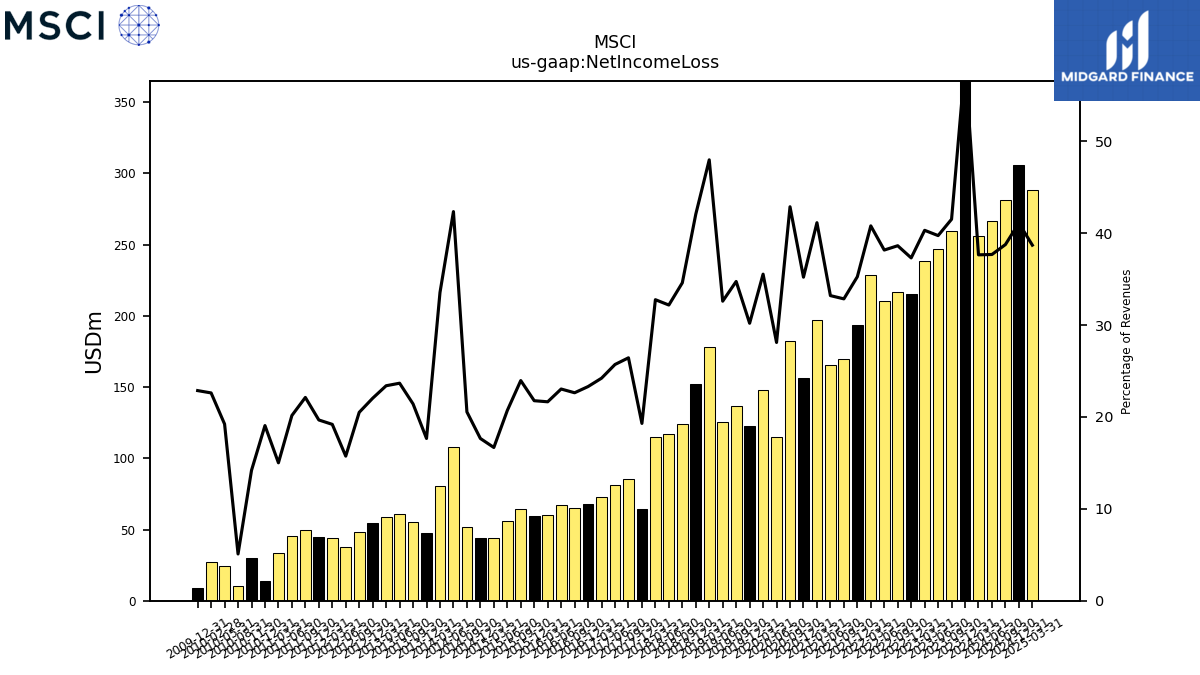
| Net Income Loss | 403.38 | 259.66 | 246.82 | 238.73 | 214.97 | 216.59 | 210.59 | 228.42 | 193.87 | 169.88 | 165.42 | 196.82 | 156.22 | 182.36 | 115.12 | 148.12 | 122.78 | 136.98 | 125.69 | 178.19 | 152.13 | 123.83 | 116.83 | 115.09 | 64.60 | 85.15 | 81.27 | 72.95 | 68.25 | 65.28 | 66.96 | 60.37 | 59.41 | 64.40 | 56.02 | 43.83 | 44.34 | 51.71 | 107.66 | 80.40 | 47.26 | 55.31 | 61.05 | 58.94 | 54.45 | 48.27 | 37.55 | 43.97 | 44.49 | 49.79 | 45.66 | 33.52 | 13.82 | 30.27 | 10.32 | 24.07 | 27.52 | 9.26 | |
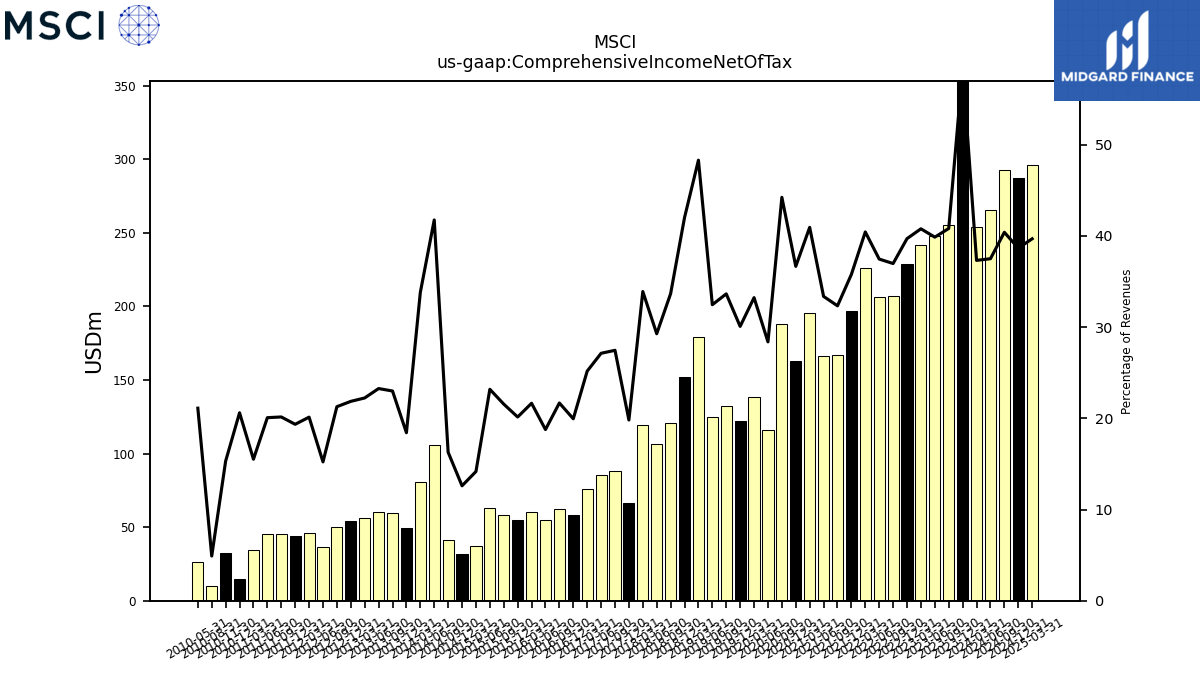
| Comprehensive Income Net Of Tax | 403.05 | 255.28 | 247.62 | 241.50 | 228.77 | 207.28 | 206.70 | 226.40 | 196.75 | 167.21 | 166.23 | 195.86 | 162.65 | 188.13 | 116.26 | 138.50 | 122.30 | 132.64 | 125.13 | 179.39 | 151.94 | 120.51 | 106.28 | 119.10 | 66.34 | 88.44 | 85.76 | 75.83 | 58.42 | 62.54 | 54.54 | 60.37 | 54.98 | 57.94 | 62.73 | 37.23 | 31.64 | 40.98 | 106.14 | 81.03 | 49.31 | 59.38 | 60.00 | 56.01 | 54.01 | 50.09 | 36.32 | 46.11 | 43.75 | 45.34 | 45.46 | 34.65 | 14.95 | 32.67 | 9.93 | 26.43 | NA | NA |
| 2023-12-31 | 2023-09-30 | 2023-06-30 | 2023-03-31 | 2022-12-31 | 2022-09-30 | 2022-06-30 | 2022-03-31 | 2021-12-31 | 2021-09-30 | 2021-06-30 | 2021-03-31 | 2020-12-31 | 2020-09-30 | 2020-06-30 | 2020-03-31 | 2019-12-31 | 2019-09-30 | 2019-06-30 | 2019-03-31 | 2018-12-31 | 2018-09-30 | 2018-06-30 | 2018-03-31 | 2017-12-31 | 2017-09-30 | 2017-06-30 | 2017-03-31 | 2016-12-31 | 2016-09-30 | 2016-06-30 | 2016-03-31 | 2015-12-31 | 2015-09-30 | 2015-06-30 | 2015-03-31 | 2014-12-31 | 2014-09-30 | 2014-06-30 | 2014-03-31 | 2013-12-31 | 2013-09-30 | 2013-06-30 | 2013-03-31 | 2012-12-31 | 2012-09-30 | 2012-06-30 | 2012-03-31 | 2011-12-31 | 2011-09-30 | 2011-06-30 | 2011-03-31 | 2010-12-31 | 2010-11-30 | 2010-08-31 | 2010-05-31 | 2010-02-28 | 2009-12-31 | ||
|---|---|---|---|---|---|---|---|---|---|---|---|---|---|---|---|---|---|---|---|---|---|---|---|---|---|---|---|---|---|---|---|---|---|---|---|---|---|---|---|---|---|---|---|---|---|---|---|---|---|---|---|---|---|---|---|---|---|---|---|
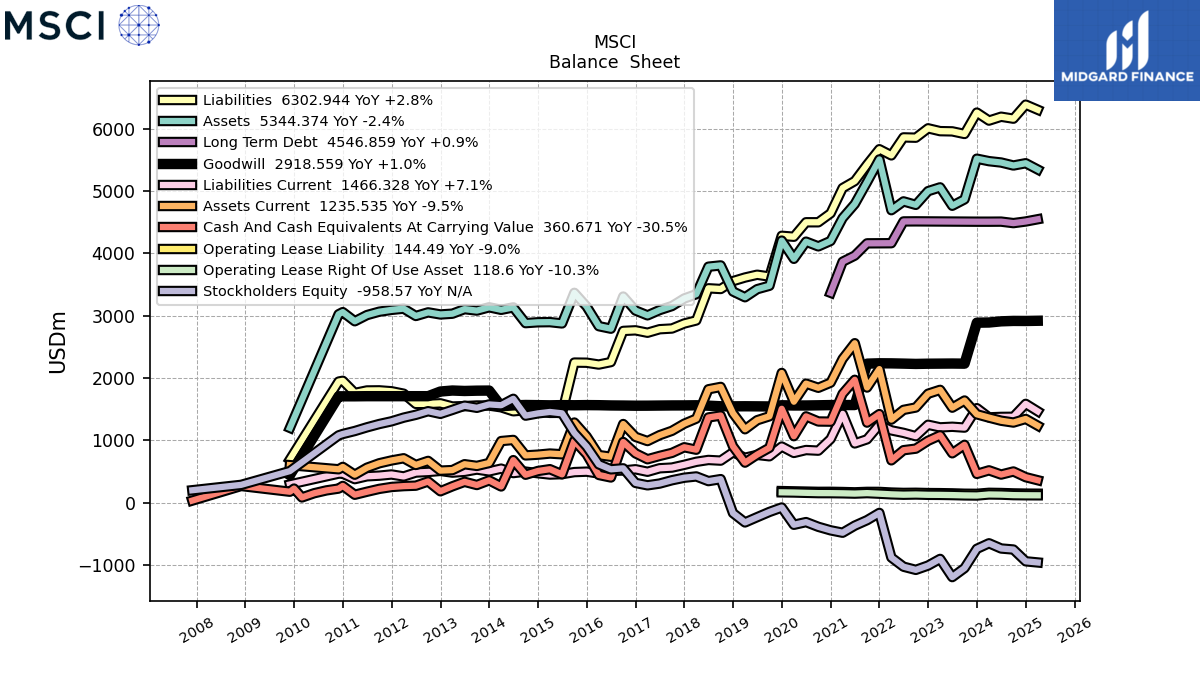
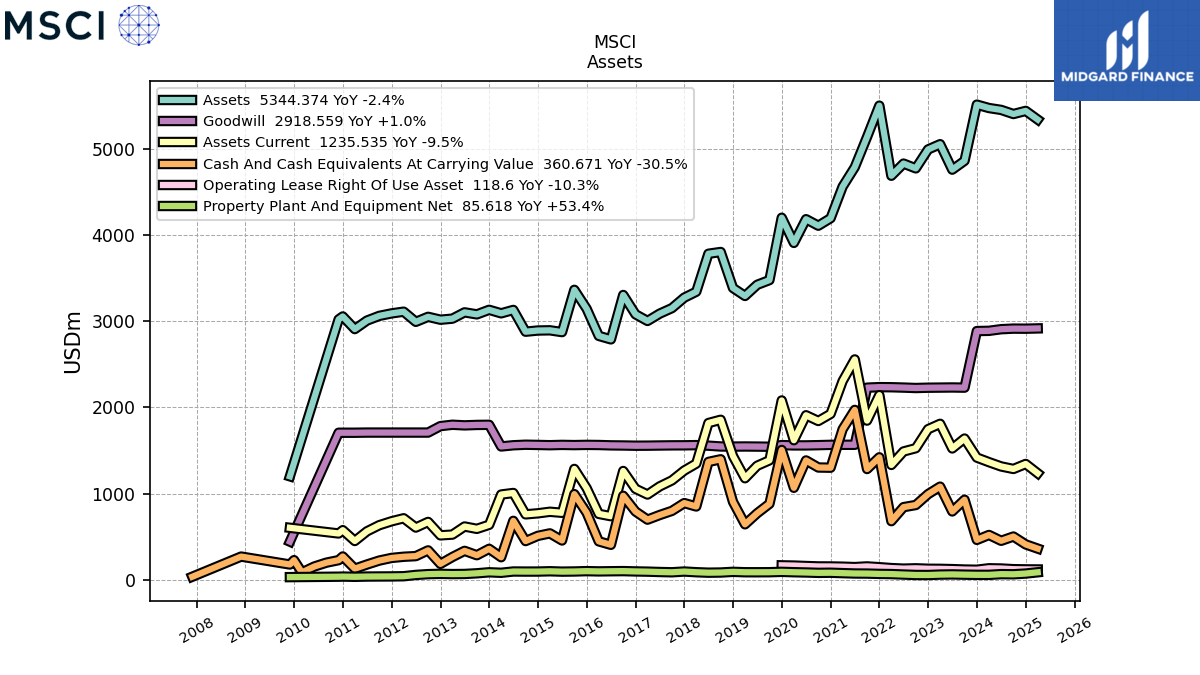
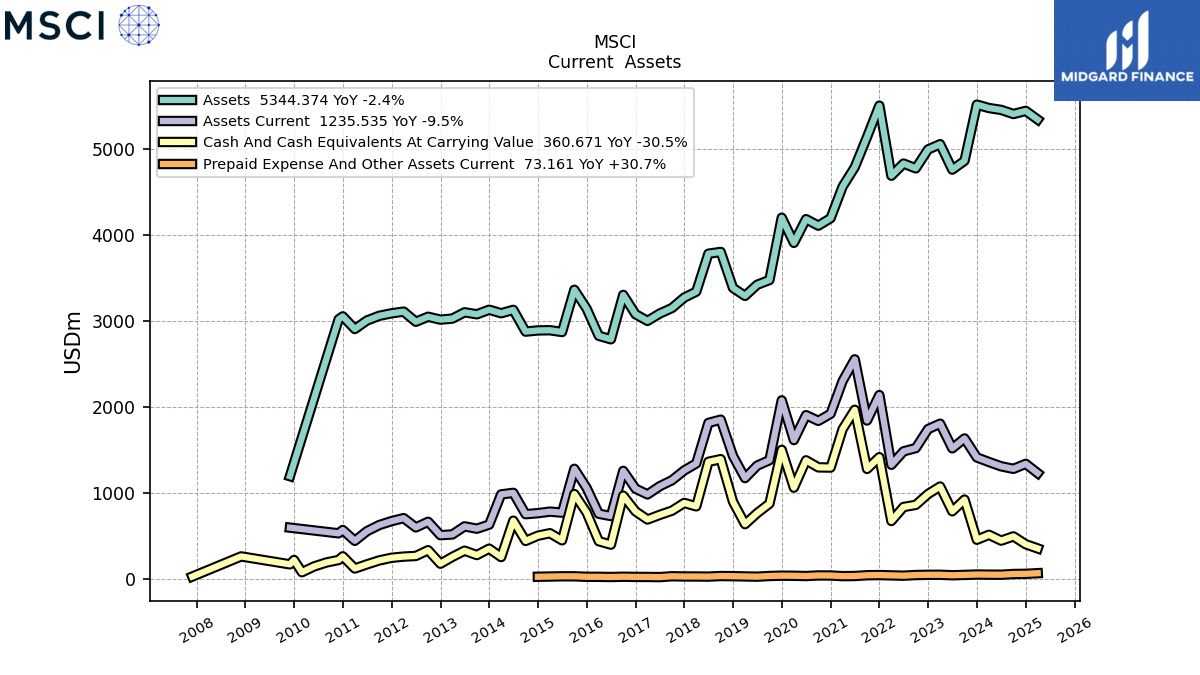
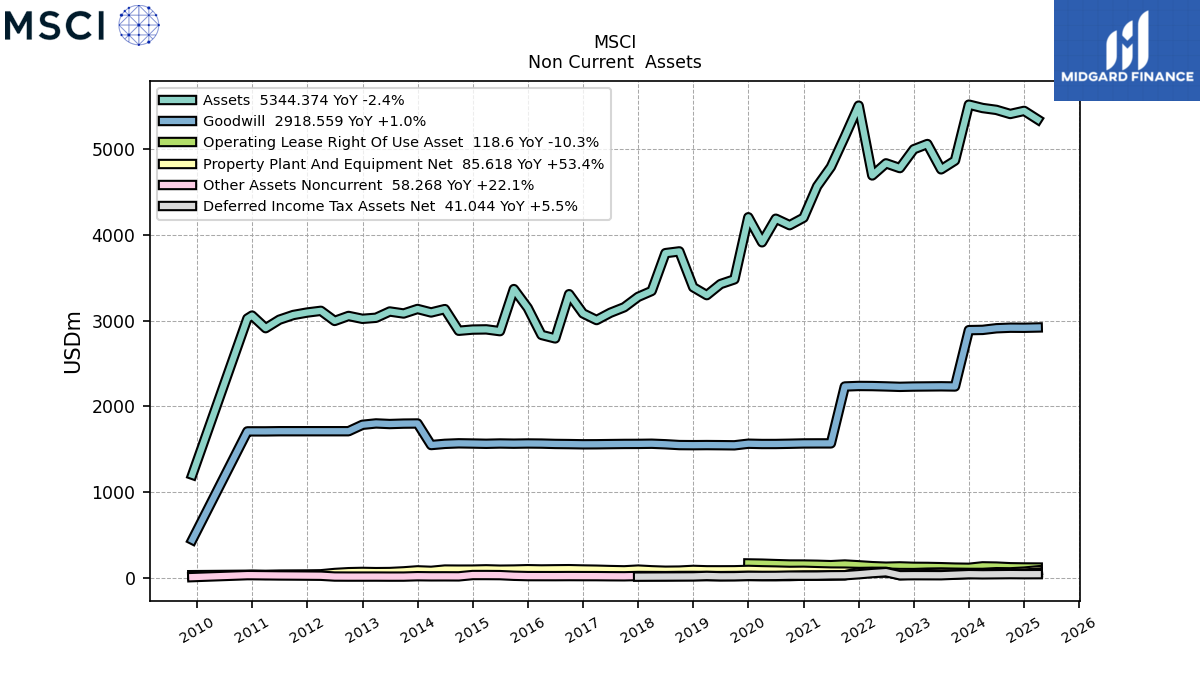
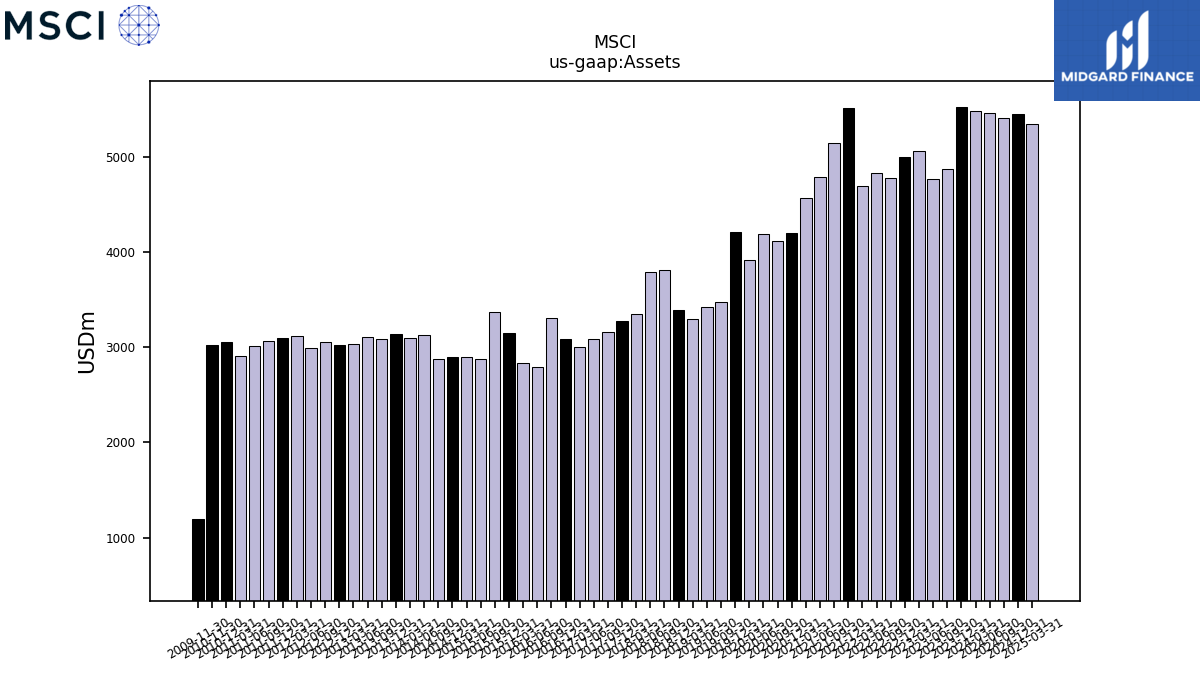
| Assets | 5518.22 | 4865.49 | 4762.83 | 5058.70 | 4997.53 | 4777.53 | 4833.35 | 4691.83 | 5506.70 | 5142.67 | 4791.08 | 4565.53 | 4198.65 | 4111.72 | 4187.42 | 3911.80 | 4204.44 | 3479.74 | 3425.09 | 3295.57 | 3387.95 | 3806.41 | 3785.80 | 3344.49 | 3275.67 | 3154.47 | 3090.10 | 3005.14 | 3082.58 | 3307.08 | 2790.99 | 2831.63 | 3146.99 | 3366.79 | 2875.63 | 2896.53 | 2894.18 | 2880.28 | 3133.24 | 3093.82 | 3134.54 | 3081.59 | 3105.10 | 3031.86 | 3019.64 | 3053.19 | 2994.89 | 3113.05 | 3093.00 | 3064.21 | 3009.59 | 2910.48 | 3057.48 | 3023.17 | NA | NA | NA | NA | |
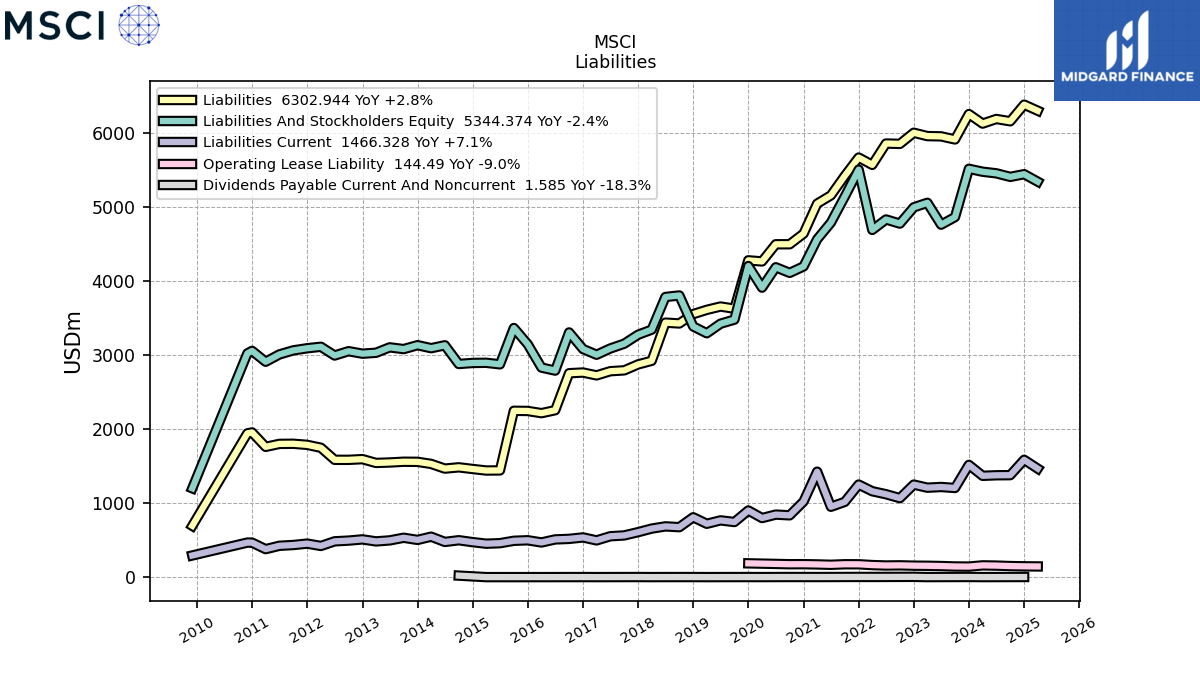
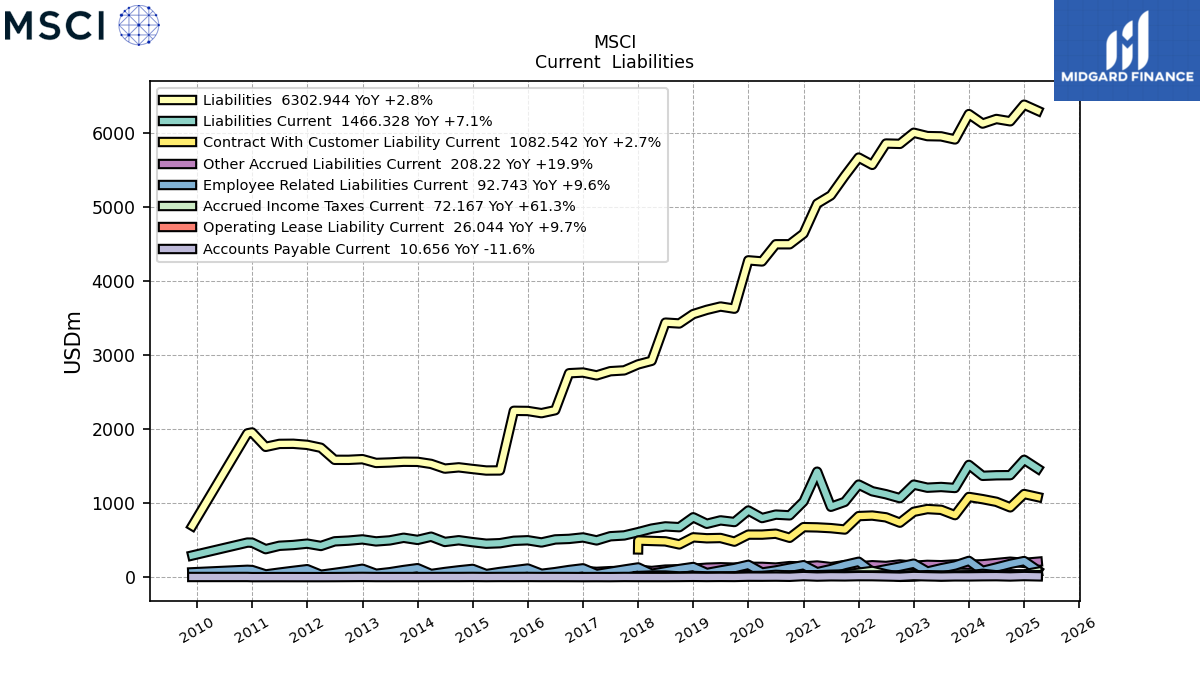
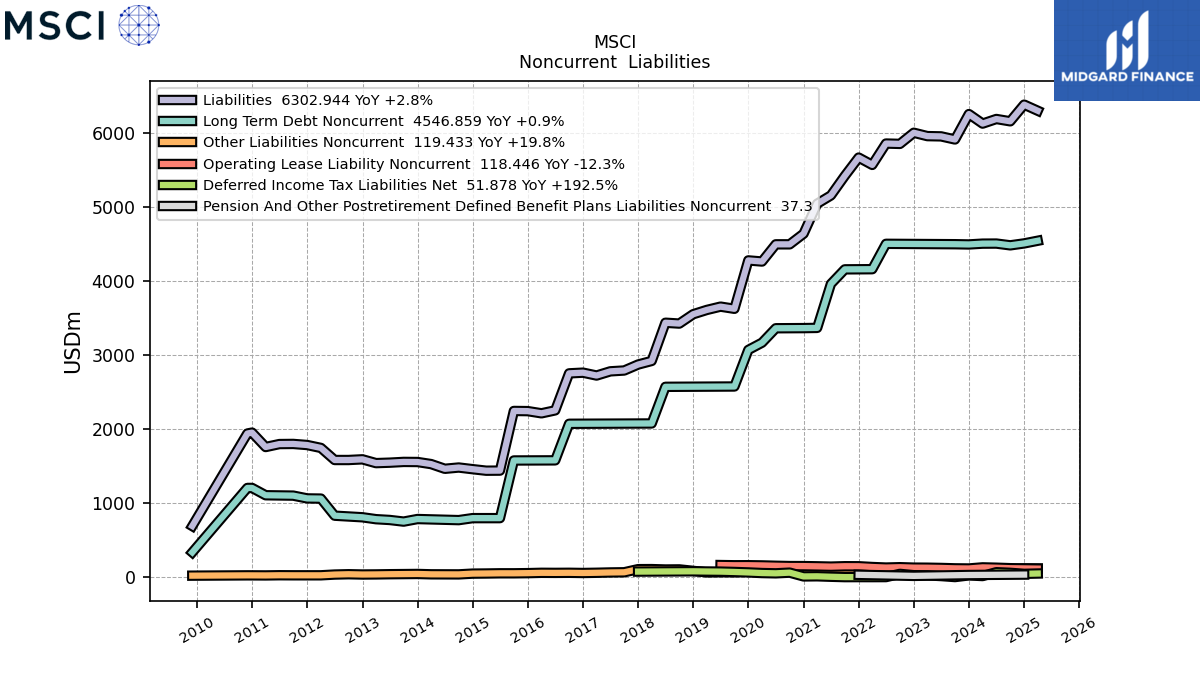
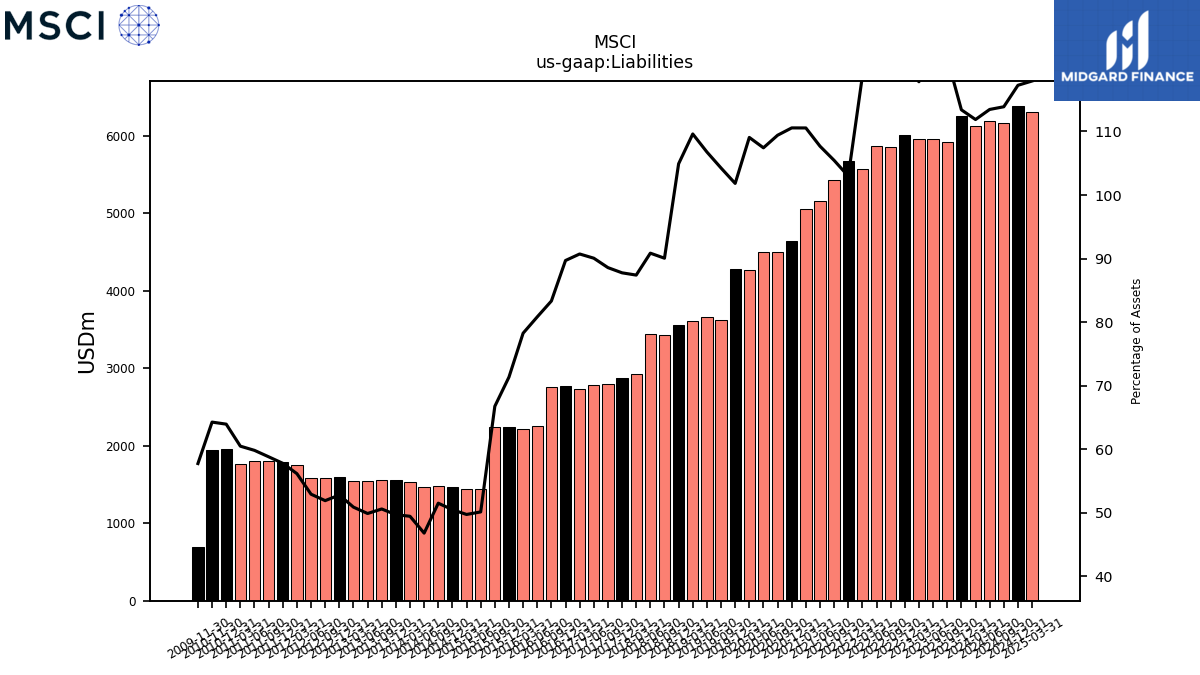
| Liabilities | 6257.98 | 5914.59 | 5956.50 | 5960.06 | 6005.46 | 5854.92 | 5859.80 | 5571.02 | 5670.17 | 5422.69 | 5158.88 | 5047.11 | 4641.88 | 4498.31 | 4498.35 | 4266.13 | 4281.15 | 3627.60 | 3656.89 | 3612.07 | 3554.45 | 3427.96 | 3439.38 | 2923.12 | 2874.66 | 2794.16 | 2782.90 | 2726.30 | 2764.97 | 2755.57 | 2255.83 | 2215.98 | 2245.50 | 2247.69 | 1441.91 | 1440.83 | 1461.34 | 1483.74 | 1466.56 | 1530.09 | 1558.17 | 1559.44 | 1549.27 | 1543.12 | 1594.41 | 1585.13 | 1585.23 | 1748.44 | 1787.56 | 1802.27 | 1800.54 | 1760.46 | 1955.31 | 1943.05 | NA | NA | NA | NA | |
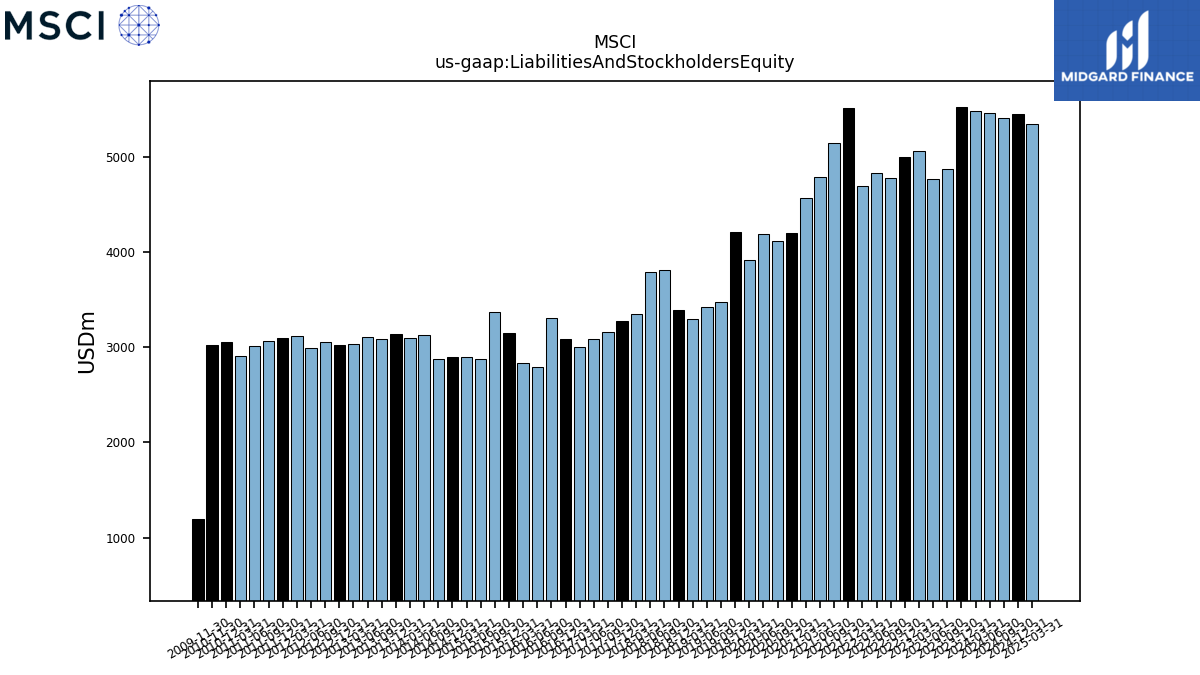
| Liabilities And Stockholders Equity | 5518.22 | 4865.49 | 4762.83 | 5058.70 | 4997.53 | 4777.53 | 4833.35 | 4691.83 | 5506.70 | 5142.67 | 4791.08 | 4565.53 | 4198.65 | 4111.72 | 4187.42 | 3911.80 | 4204.44 | 3479.74 | 3425.09 | 3295.57 | 3387.95 | 3806.41 | 3785.80 | 3344.49 | 3275.67 | 3154.47 | 3090.10 | 3005.14 | 3082.58 | 3307.08 | 2790.99 | 2831.63 | 3146.99 | 3366.79 | 2875.63 | 2896.53 | 2894.18 | 2880.28 | 3133.24 | 3093.82 | 3134.54 | 3081.59 | 3105.10 | 3031.86 | 3019.64 | 3053.19 | 2994.89 | 3113.05 | 3093.00 | 3064.21 | 3009.59 | 2910.48 | 3057.48 | 3023.17 | NA | NA | NA | NA | |
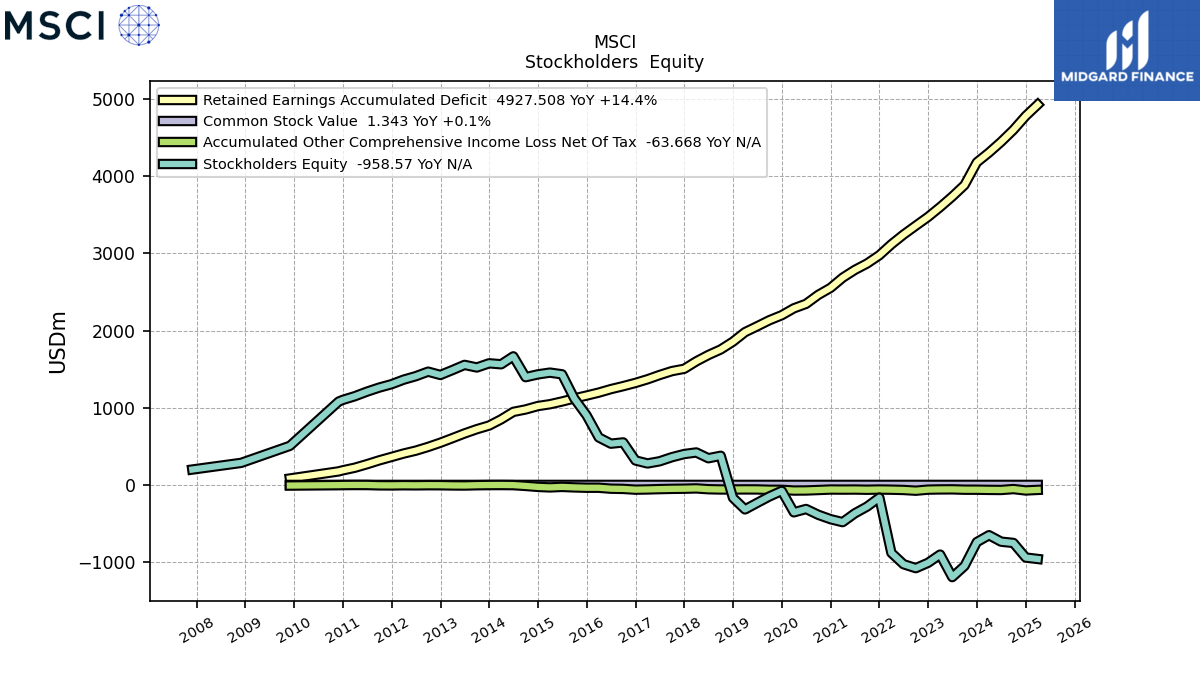
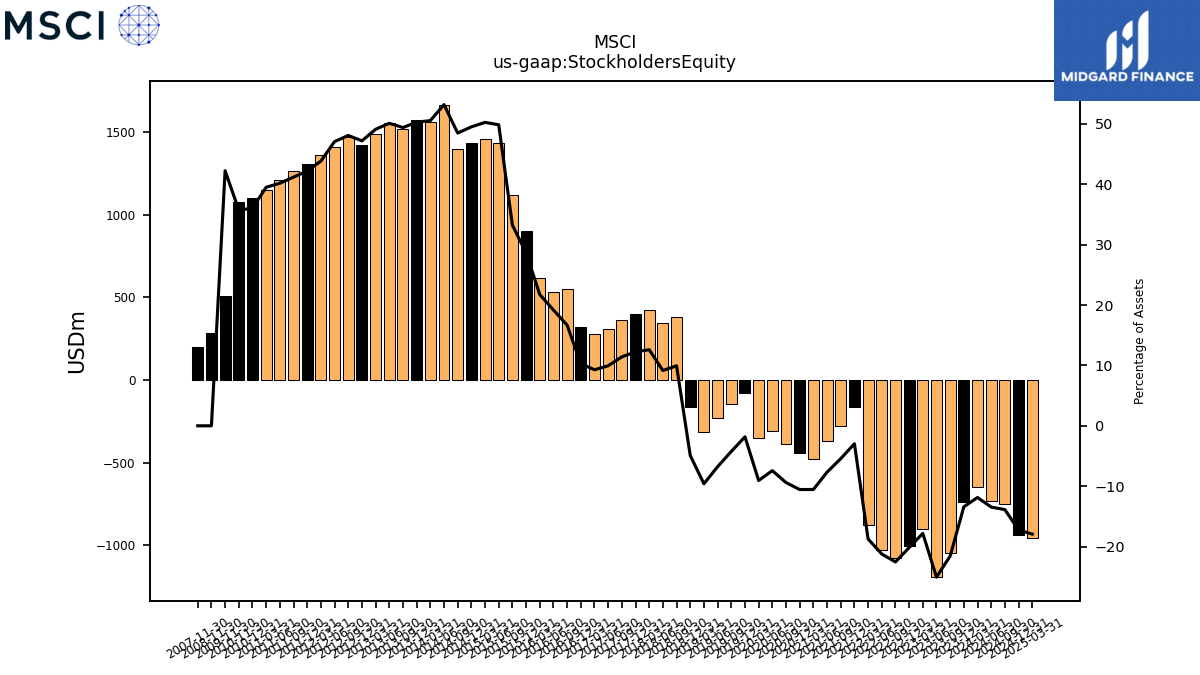
| Stockholders Equity | -739.76 | -1049.10 | -1193.67 | -901.36 | -1007.92 | -1077.39 | -1026.45 | -879.19 | -163.47 | -280.02 | -367.81 | -481.58 | -443.23 | -386.59 | -310.93 | -354.33 | -76.71 | -147.86 | -231.80 | -316.51 | -166.49 | 378.44 | 346.42 | 421.37 | 401.01 | 360.31 | 307.20 | 278.84 | 317.61 | 551.52 | 535.15 | 615.66 | 901.49 | 1119.11 | 1433.71 | 1455.70 | 1432.83 | 1396.53 | 1666.68 | 1563.73 | 1576.36 | 1522.15 | 1555.83 | 1488.74 | 1425.23 | 1468.06 | 1409.66 | 1364.60 | 1305.43 | 1261.95 | 1209.05 | 1150.02 | 1102.17 | 1080.12 | NA | NA | NA | NA |
| 2023-12-31 | 2023-09-30 | 2023-06-30 | 2023-03-31 | 2022-12-31 | 2022-09-30 | 2022-06-30 | 2022-03-31 | 2021-12-31 | 2021-09-30 | 2021-06-30 | 2021-03-31 | 2020-12-31 | 2020-09-30 | 2020-06-30 | 2020-03-31 | 2019-12-31 | 2019-09-30 | 2019-06-30 | 2019-03-31 | 2018-12-31 | 2018-09-30 | 2018-06-30 | 2018-03-31 | 2017-12-31 | 2017-09-30 | 2017-06-30 | 2017-03-31 | 2016-12-31 | 2016-09-30 | 2016-06-30 | 2016-03-31 | 2015-12-31 | 2015-09-30 | 2015-06-30 | 2015-03-31 | 2014-12-31 | 2014-09-30 | 2014-06-30 | 2014-03-31 | 2013-12-31 | 2013-09-30 | 2013-06-30 | 2013-03-31 | 2012-12-31 | 2012-09-30 | 2012-06-30 | 2012-03-31 | 2011-12-31 | 2011-09-30 | 2011-06-30 | 2011-03-31 | 2010-12-31 | 2010-11-30 | 2010-08-31 | 2010-05-31 | 2010-02-28 | 2009-12-31 | ||
|---|---|---|---|---|---|---|---|---|---|---|---|---|---|---|---|---|---|---|---|---|---|---|---|---|---|---|---|---|---|---|---|---|---|---|---|---|---|---|---|---|---|---|---|---|---|---|---|---|---|---|---|---|---|---|---|---|---|---|---|
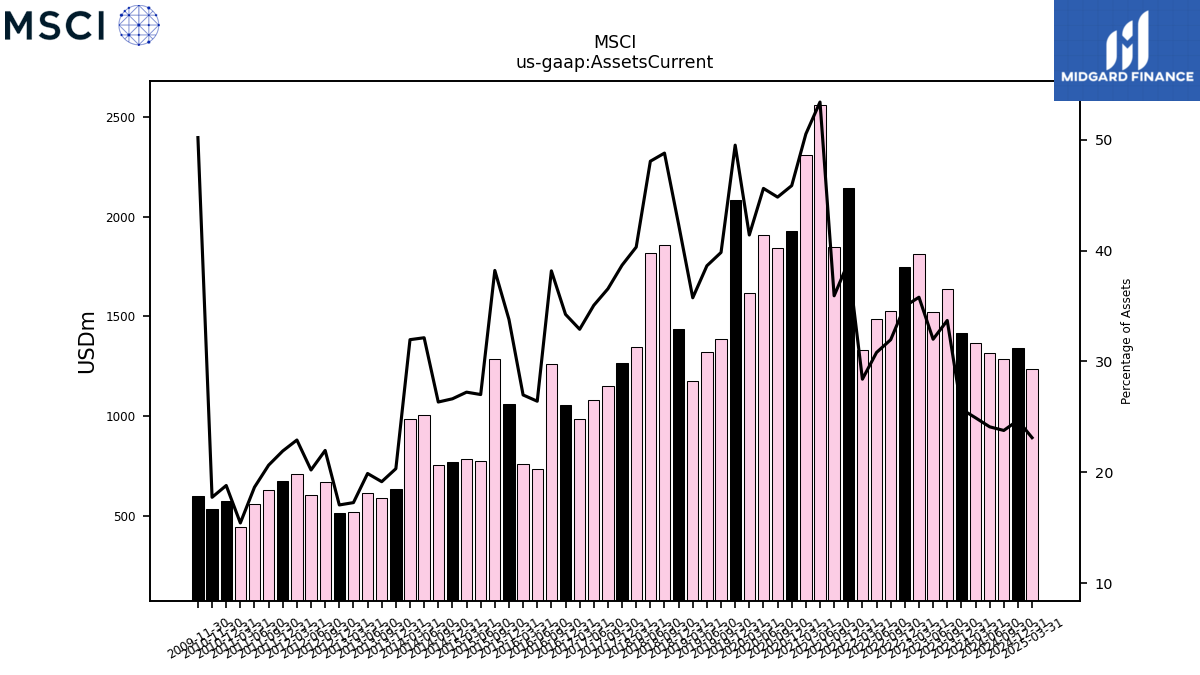
| Assets Current | 1418.15 | 1639.33 | 1524.18 | 1810.57 | 1747.97 | 1526.91 | 1489.08 | 1332.42 | 2143.41 | 1847.35 | 2558.54 | 2306.64 | 1925.60 | 1843.09 | 1909.87 | 1619.77 | 2081.78 | 1386.09 | 1323.08 | 1177.93 | 1435.09 | 1857.35 | 1819.49 | 1348.36 | 1267.13 | 1153.08 | 1083.44 | 988.65 | 1055.67 | 1262.36 | 737.06 | 763.81 | 1063.27 | 1286.36 | 776.78 | 788.63 | 770.63 | 758.59 | 1006.89 | 988.86 | 637.03 | 590.10 | 617.52 | 523.33 | 514.84 | 670.78 | 605.10 | 713.13 | 677.94 | 632.44 | 561.32 | 448.97 | 574.96 | 536.28 | NA | NA | NA | NA | |
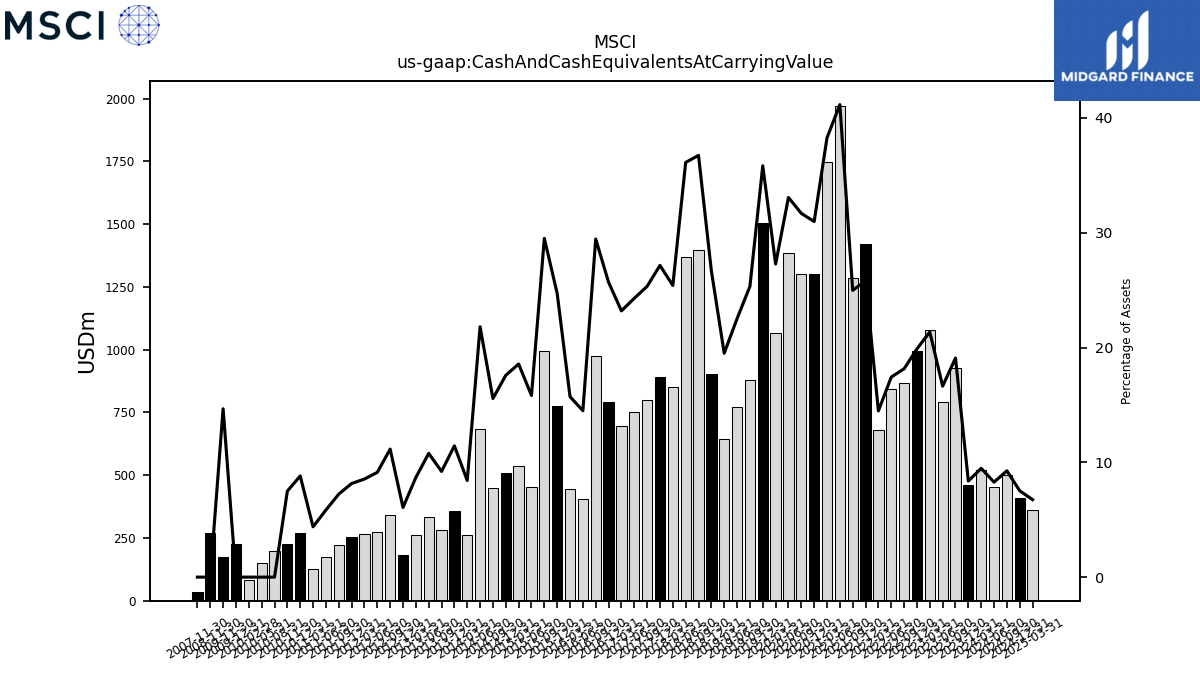
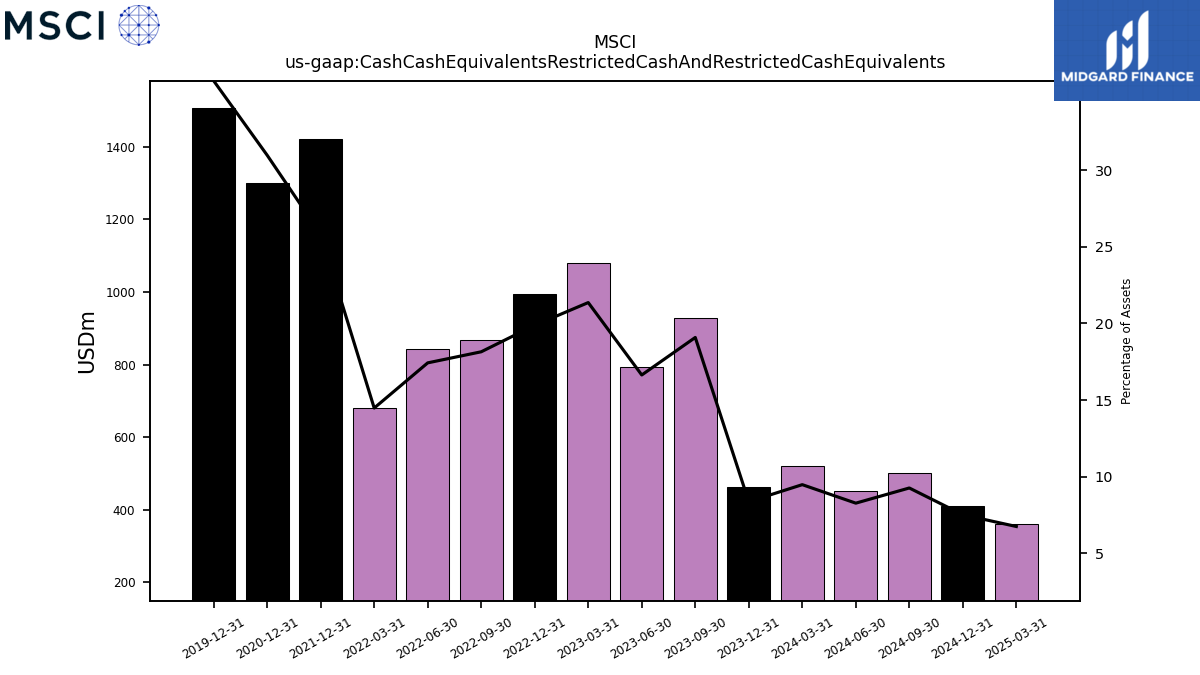
| Cash And Cash Equivalents At Carrying Value | 461.69 | 928.55 | 792.33 | 1080.61 | 993.56 | 867.11 | 842.30 | 679.32 | 1421.45 | 1284.66 | 1972.00 | 1747.15 | 1300.52 | 1302.86 | 1384.98 | 1066.86 | 1506.57 | 881.15 | 771.12 | 642.78 | 904.18 | 1398.40 | 1367.60 | 849.83 | 889.50 | 799.01 | 750.58 | 696.97 | 791.83 | 974.06 | 404.61 | 445.01 | 777.71 | 993.49 | 455.02 | 537.75 | 508.80 | 448.19 | 683.24 | 260.45 | 358.43 | 283.75 | 334.70 | 263.03 | 183.31 | 340.46 | 273.31 | 266.02 | 252.21 | 221.57 | 175.90 | 127.64 | 269.42 | 226.57 | 197.74 | 152.15 | 84.35 | 226.57 | |
| Cash Cash Equivalents Restricted Cash And Restricted Cash Equivalents | 461.69 | 928.55 | 792.33 | 1080.61 | 993.56 | 867.11 | 842.30 | 679.32 | 1421.45 | NA | NA | NA | 1300.52 | NA | NA | NA | 1506.57 | NA | NA | NA | NA | NA | NA | NA | NA | NA | NA | NA | NA | NA | NA | NA | NA | NA | NA | NA | NA | NA | NA | NA | NA | NA | NA | NA | NA | NA | NA | NA | NA | NA | NA | NA | NA | NA | NA | NA | NA | NA | |
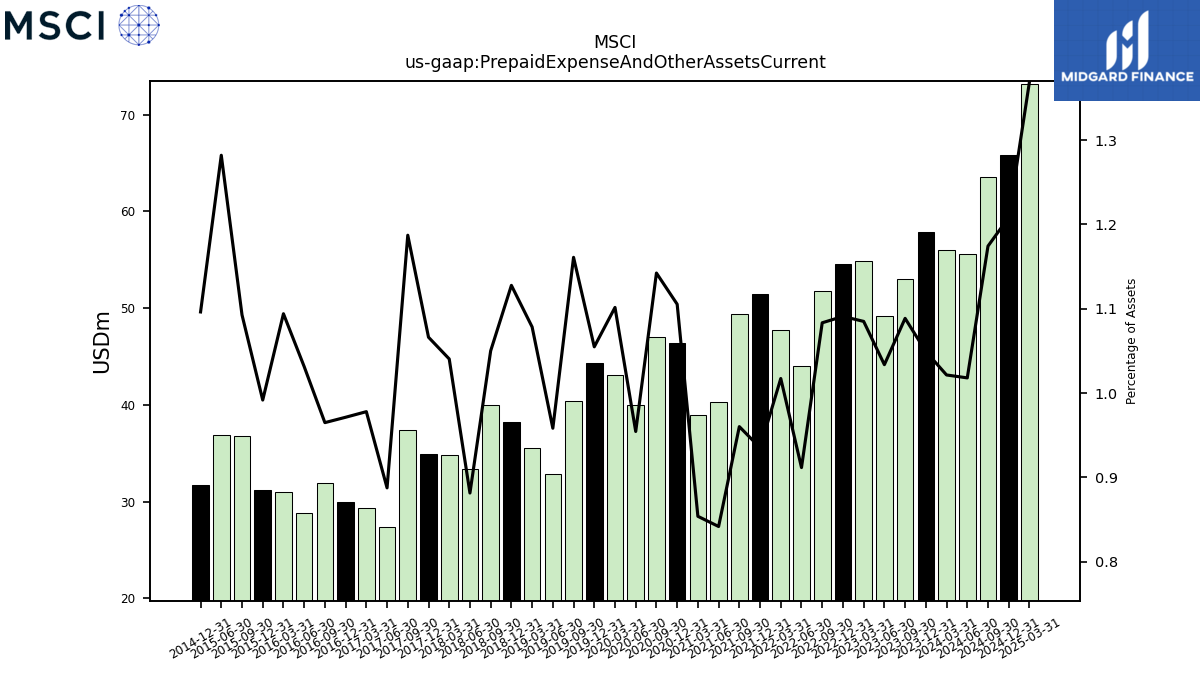
| Prepaid Expense And Other Assets Current | 57.90 | 52.97 | 49.23 | 54.89 | 54.52 | 51.76 | 44.07 | 47.73 | 51.50 | 49.38 | 40.33 | 38.99 | 46.41 | 46.97 | 39.97 | 43.09 | 44.35 | 40.40 | 32.82 | 35.54 | 38.21 | 39.97 | 33.37 | 34.80 | 34.93 | 37.45 | 27.43 | 29.39 | 29.94 | 31.91 | 28.79 | 30.98 | 31.21 | 36.79 | 36.87 | NA | 31.73 | NA | NA | NA | NA | NA | NA | NA | NA | NA | NA | NA | NA | NA | NA | NA | NA | NA | NA | NA | NA | NA | |
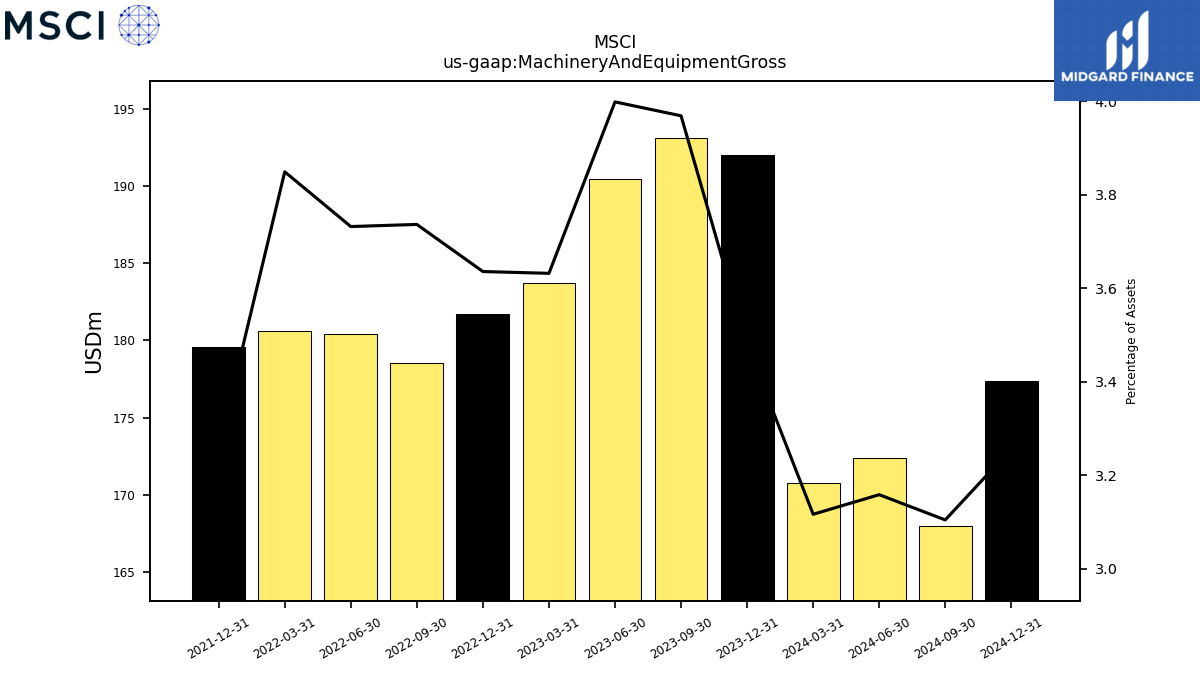
| Machinery And Equipment Gross | 192.01 | 193.11 | 190.45 | 183.74 | 181.71 | 178.52 | 180.39 | 180.60 | 179.56 | NA | NA | NA | NA | NA | NA | NA | NA | NA | NA | NA | NA | NA | NA | NA | NA | NA | NA | NA | NA | NA | NA | NA | NA | NA | NA | NA | NA | NA | NA | NA | NA | NA | NA | NA | NA | NA | NA | NA | NA | NA | NA | NA | NA | NA | NA | NA | NA | NA |
| 2023-12-31 | 2023-09-30 | 2023-06-30 | 2023-03-31 | 2022-12-31 | 2022-09-30 | 2022-06-30 | 2022-03-31 | 2021-12-31 | 2021-09-30 | 2021-06-30 | 2021-03-31 | 2020-12-31 | 2020-09-30 | 2020-06-30 | 2020-03-31 | 2019-12-31 | 2019-09-30 | 2019-06-30 | 2019-03-31 | 2018-12-31 | 2018-09-30 | 2018-06-30 | 2018-03-31 | 2017-12-31 | 2017-09-30 | 2017-06-30 | 2017-03-31 | 2016-12-31 | 2016-09-30 | 2016-06-30 | 2016-03-31 | 2015-12-31 | 2015-09-30 | 2015-06-30 | 2015-03-31 | 2014-12-31 | 2014-09-30 | 2014-06-30 | 2014-03-31 | 2013-12-31 | 2013-09-30 | 2013-06-30 | 2013-03-31 | 2012-12-31 | 2012-09-30 | 2012-06-30 | 2012-03-31 | 2011-12-31 | 2011-09-30 | 2011-06-30 | 2011-03-31 | 2010-12-31 | 2010-11-30 | 2010-08-31 | 2010-05-31 | 2010-02-28 | 2009-12-31 | ||
|---|---|---|---|---|---|---|---|---|---|---|---|---|---|---|---|---|---|---|---|---|---|---|---|---|---|---|---|---|---|---|---|---|---|---|---|---|---|---|---|---|---|---|---|---|---|---|---|---|---|---|---|---|---|---|---|---|---|---|---|
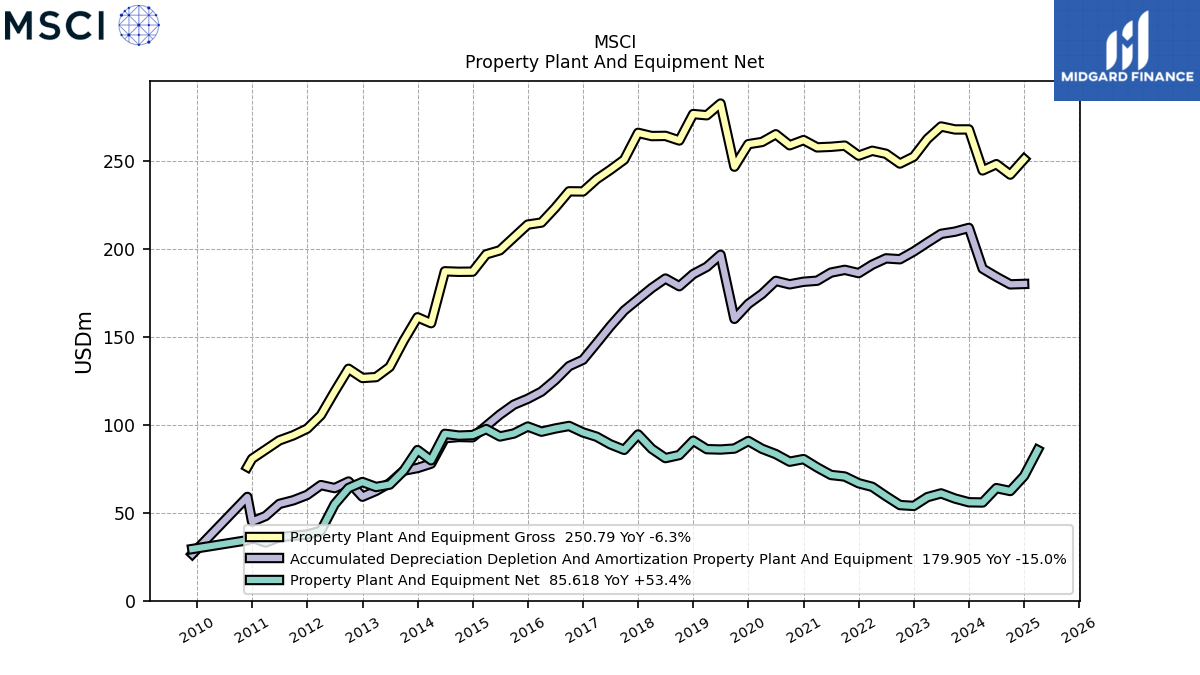
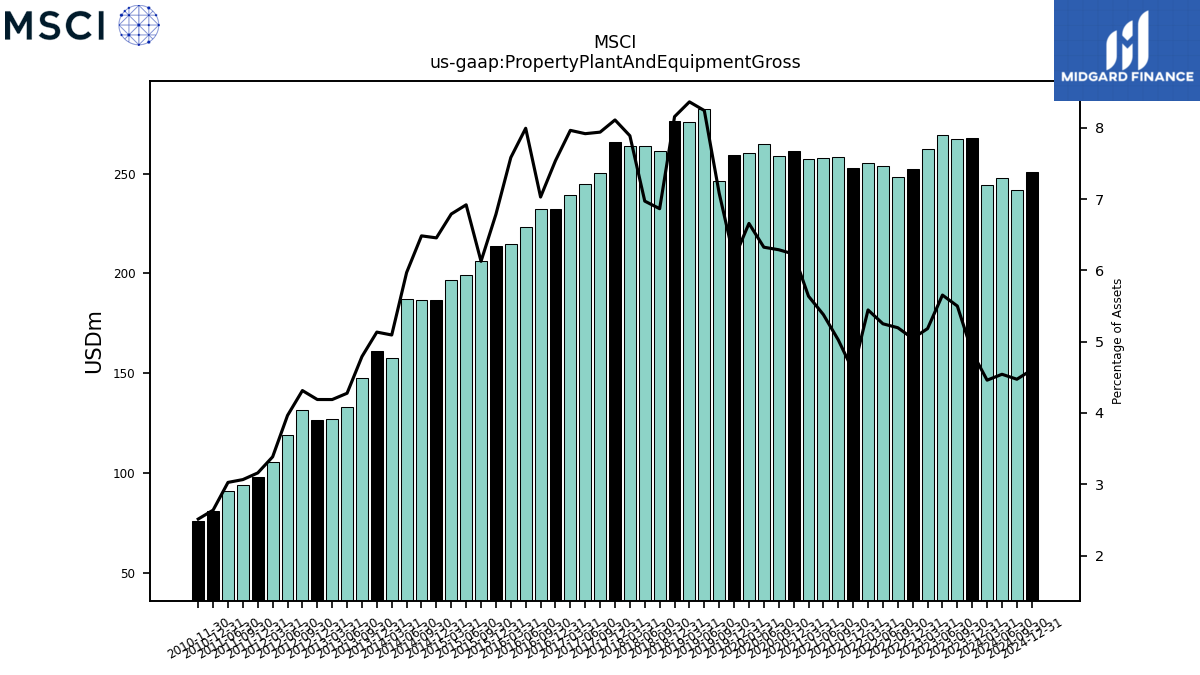
| Property Plant And Equipment Gross | 267.66 | 267.63 | 269.31 | 262.24 | 252.20 | 248.26 | 253.82 | 255.52 | 252.76 | 258.45 | 257.78 | 257.45 | 261.60 | 258.65 | 264.90 | 260.51 | 259.28 | 246.49 | 282.36 | 275.69 | 276.38 | 261.36 | 263.98 | 263.87 | 265.72 | 250.48 | 244.71 | 239.38 | 232.43 | 232.50 | 223.13 | 214.76 | 213.61 | 206.33 | 199.02 | 196.73 | 186.88 | 186.80 | 187.08 | 157.61 | 160.96 | 147.66 | 132.81 | 127.00 | 126.50 | 131.73 | 118.77 | 105.39 | 97.71 | 93.94 | 91.07 | NA | 80.63 | 75.94 | NA | NA | NA | NA | |
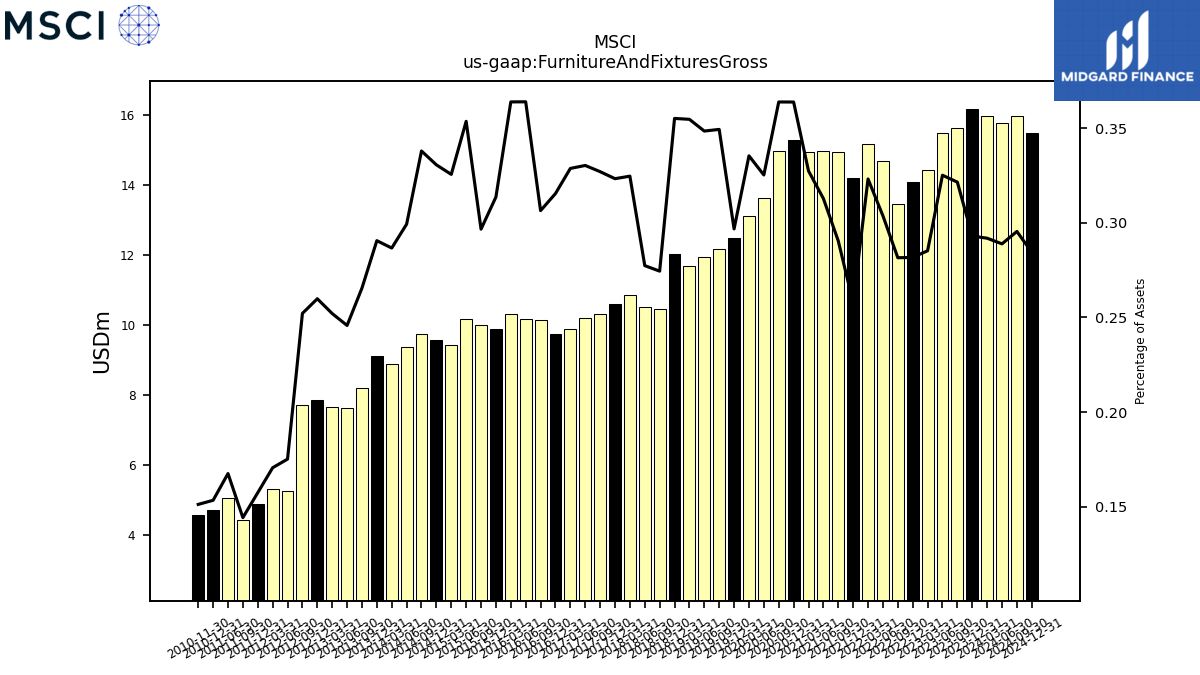
| Furniture And Fixtures Gross | 16.17 | 15.64 | 15.49 | 14.43 | 14.08 | 13.45 | 14.68 | 15.16 | 14.19 | 14.94 | 14.99 | 14.95 | 15.28 | 14.96 | 13.62 | 13.12 | 12.48 | 12.16 | 11.94 | 11.69 | 12.03 | 10.45 | 10.50 | 10.86 | 10.59 | 10.32 | 10.21 | 9.88 | 9.72 | 10.13 | 10.16 | 10.30 | 9.87 | 9.99 | 10.17 | 9.43 | 9.57 | 9.73 | 9.38 | 8.87 | 9.11 | 8.18 | 7.63 | 7.64 | 7.85 | 7.70 | 5.25 | 5.31 | 4.87 | 4.42 | 5.04 | NA | 4.69 | 4.57 | NA | NA | NA | NA | |
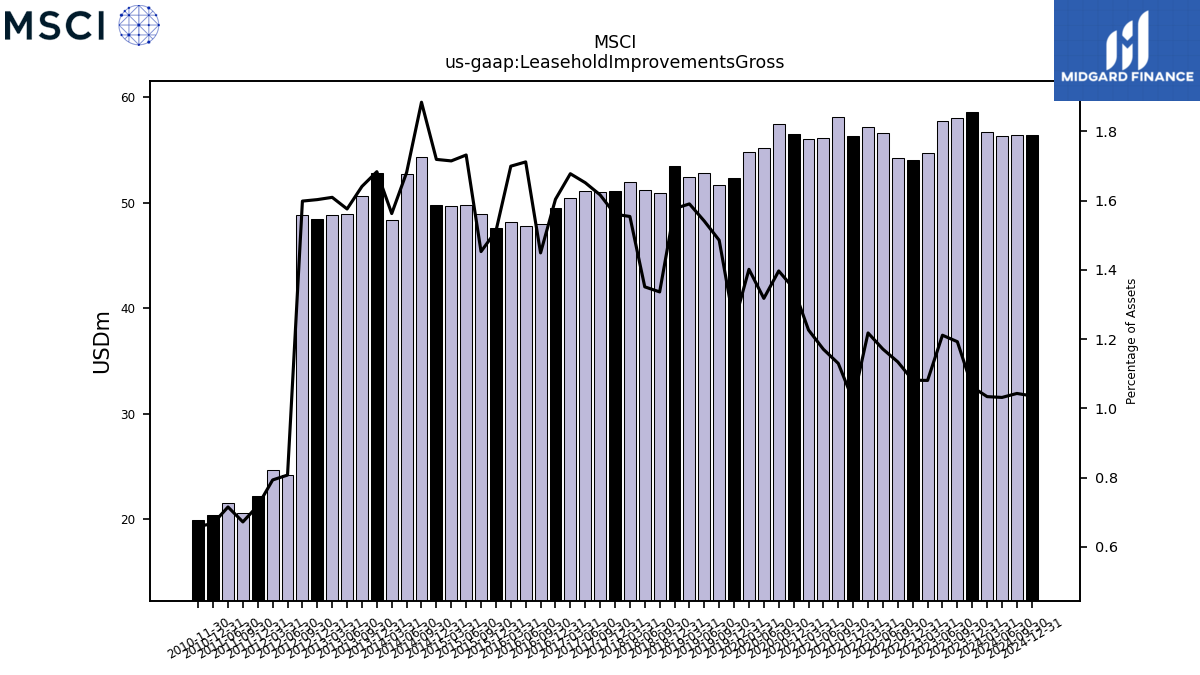
| Leasehold Improvements Gross | 58.58 | 58.02 | 57.69 | 54.66 | 54.04 | 54.18 | 56.60 | 57.14 | 56.31 | 58.10 | 56.09 | 55.99 | 56.54 | 57.44 | 55.18 | 54.83 | 52.34 | 51.70 | 52.78 | 52.42 | 53.43 | 50.87 | 51.15 | 51.98 | 51.13 | 51.00 | 51.05 | 50.42 | 49.44 | 47.92 | 47.78 | 48.13 | 47.58 | 48.92 | 49.80 | 49.67 | 49.76 | 54.28 | 52.68 | 48.35 | 52.78 | 50.57 | 48.94 | 48.80 | 48.41 | 48.81 | 24.17 | 24.69 | 22.22 | 20.59 | 21.52 | NA | 20.40 | 19.91 | NA | NA | NA | NA | |
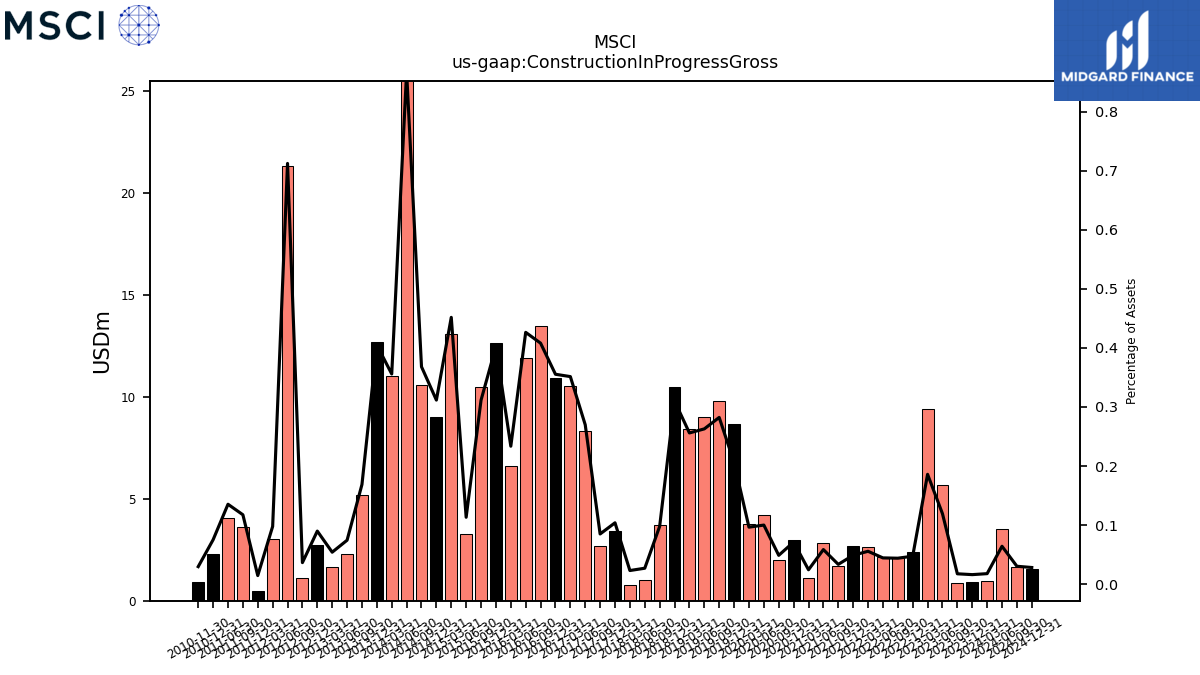
| Construction In Progress Gross | 0.90 | 0.86 | 5.69 | 9.41 | 2.37 | 2.10 | 2.15 | 2.62 | 2.70 | 1.73 | 2.81 | 1.12 | 3.00 | 2.01 | 4.19 | 3.78 | 8.67 | 9.82 | 9.01 | 8.44 | 10.51 | 3.73 | 1.03 | 0.78 | 3.41 | 2.68 | 8.34 | 10.56 | 10.95 | 13.49 | 11.90 | 6.61 | 12.66 | 10.49 | 3.26 | 13.08 | 9.02 | 10.60 | 27.17 | 11.01 | 12.69 | 5.20 | 2.31 | 1.64 | 2.72 | 1.12 | 21.33 | 3.05 | 0.45 | 3.60 | 4.07 | NA | 2.30 | 0.90 | NA | NA | NA | NA | |
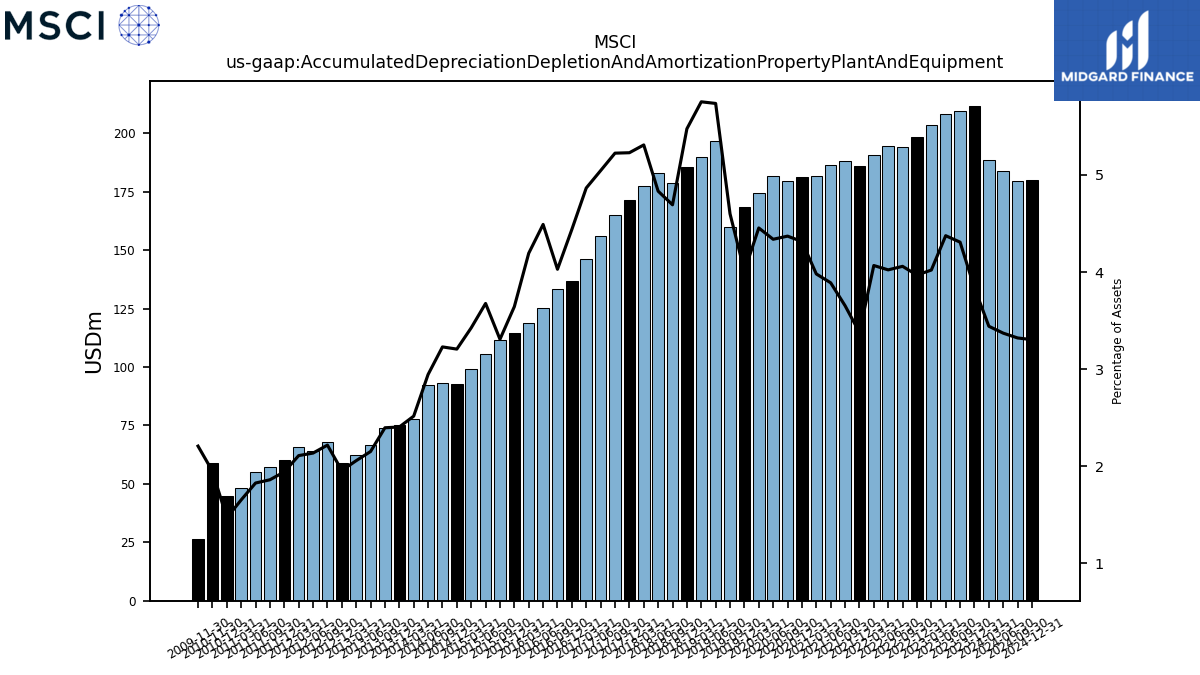
| Accumulated Depreciation Depletion And Amortization Property Plant And Equipment | 211.74 | 209.60 | 208.35 | 203.40 | 198.35 | 193.92 | 194.43 | 190.84 | 186.04 | 187.91 | 186.34 | 181.74 | 181.15 | 179.68 | 181.63 | 174.24 | 168.57 | 160.07 | 196.48 | 189.60 | 185.50 | 178.62 | 182.98 | 177.56 | 171.28 | 164.80 | 155.88 | 146.22 | 136.84 | 133.24 | 125.33 | 118.75 | 114.68 | 111.37 | 105.73 | 99.23 | 92.81 | 93.01 | 92.28 | 77.85 | 75.37 | 73.86 | 66.82 | 62.39 | 59.08 | 67.72 | 63.97 | 65.68 | 60.09 | 57.03 | 55.00 | 48.12 | 44.91 | 58.96 | NA | NA | NA | NA | |
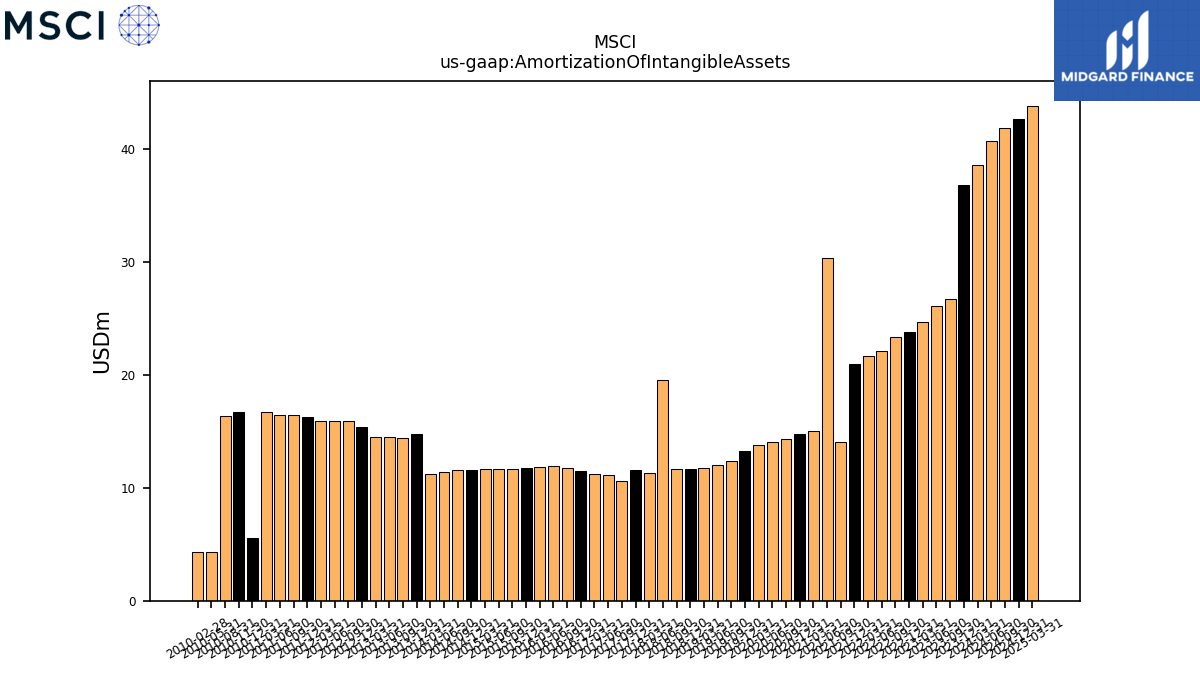
| Amortization Of Intangible Assets | 36.89 | 26.72 | 26.15 | 24.67 | 23.80 | 23.38 | 22.18 | 21.72 | 21.02 | 14.11 | 30.40 | 15.07 | 14.77 | 14.33 | 14.06 | 13.78 | 13.24 | 12.36 | 12.01 | 11.79 | 11.63 | 11.68 | 19.54 | 11.34 | 11.56 | 10.61 | 11.12 | 11.25 | 11.50 | 11.75 | 11.94 | 11.84 | 11.80 | 11.71 | 11.70 | 11.70 | 11.59 | 11.57 | 11.44 | 11.27 | 14.76 | 14.45 | 14.51 | 14.49 | 15.42 | 15.96 | 15.96 | 15.96 | 16.27 | 16.42 | 16.42 | 16.69 | 5.56 | 16.69 | 16.35 | 4.28 | 4.28 | NA | |
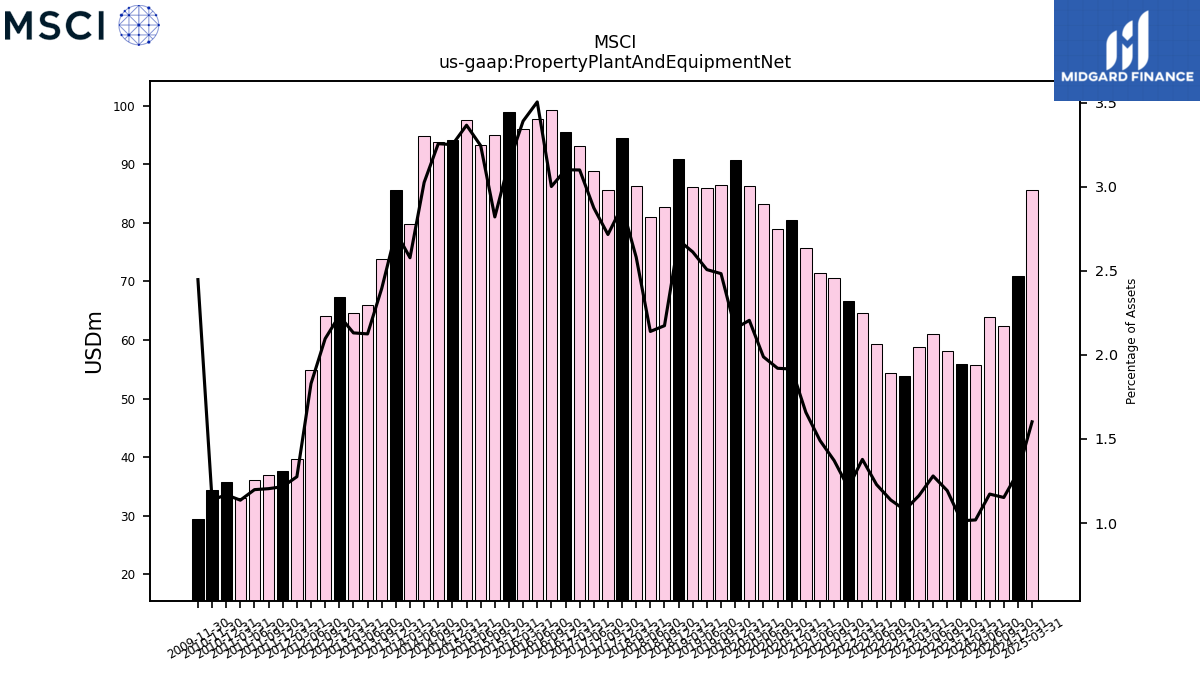
| Property Plant And Equipment Net | 55.92 | 58.04 | 60.97 | 58.84 | 53.85 | 54.34 | 59.39 | 64.68 | 66.72 | 70.54 | 71.43 | 75.71 | 80.45 | 78.97 | 83.26 | 86.28 | 90.71 | 86.42 | 85.88 | 86.09 | 90.88 | 82.75 | 81.00 | 86.31 | 94.44 | 85.68 | 88.83 | 93.16 | 95.58 | 99.26 | 97.81 | 96.01 | 98.93 | 94.96 | 93.29 | 97.50 | 94.07 | 93.79 | 94.80 | 79.76 | 85.59 | 73.81 | 65.98 | 64.61 | 67.42 | 64.01 | 54.79 | 39.71 | 37.62 | 36.91 | 36.08 | 33.06 | 35.72 | 34.37 | NA | NA | NA | NA | |
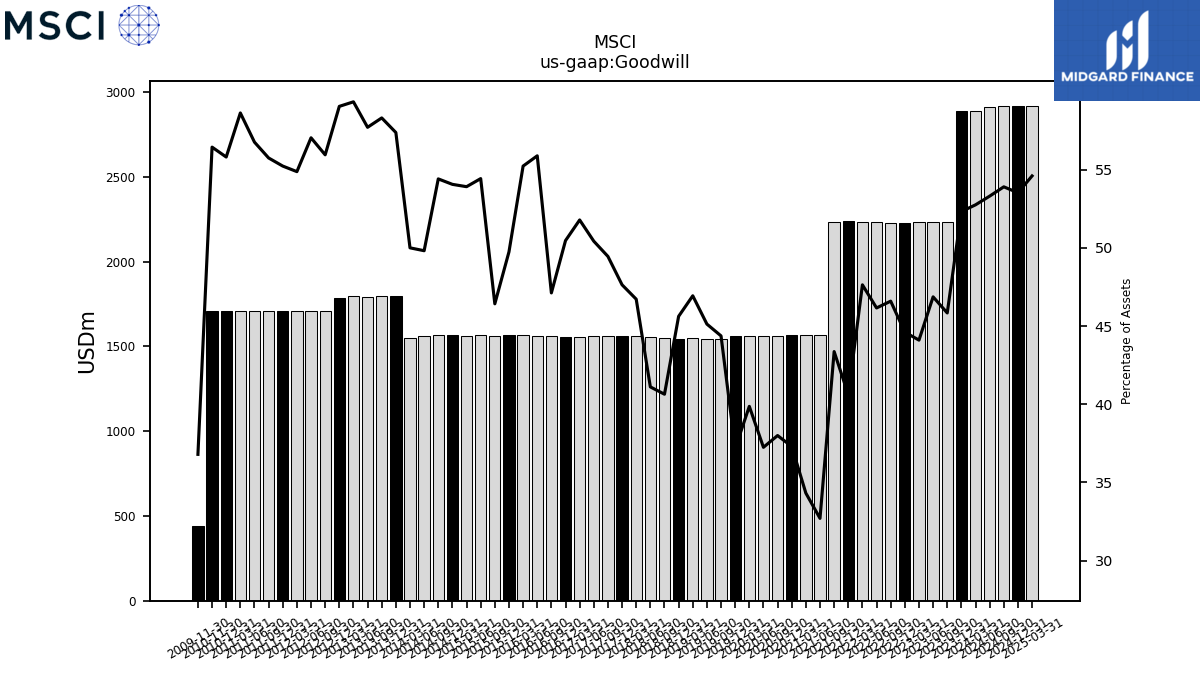
| Goodwill | 2887.69 | 2230.39 | 2232.46 | 2231.04 | 2229.67 | 2226.14 | 2231.15 | 2235.20 | 2236.39 | 2230.40 | 1566.61 | 1566.54 | 1566.02 | 1562.38 | 1559.57 | 1559.42 | 1562.87 | 1544.08 | 1545.72 | 1546.96 | 1545.76 | 1547.00 | 1556.35 | 1562.66 | 1560.62 | 1560.17 | 1558.43 | 1556.45 | 1555.85 | 1558.43 | 1560.08 | 1564.19 | 1565.62 | 1563.09 | 1565.45 | 1561.85 | 1564.90 | 1567.44 | 1561.12 | 1547.17 | 1798.82 | 1797.22 | 1792.31 | 1799.45 | 1783.41 | 1708.59 | 1708.59 | 1708.59 | 1708.59 | 1708.59 | 1708.59 | 1706.67 | 1706.67 | 1706.67 | NA | NA | NA | NA | |
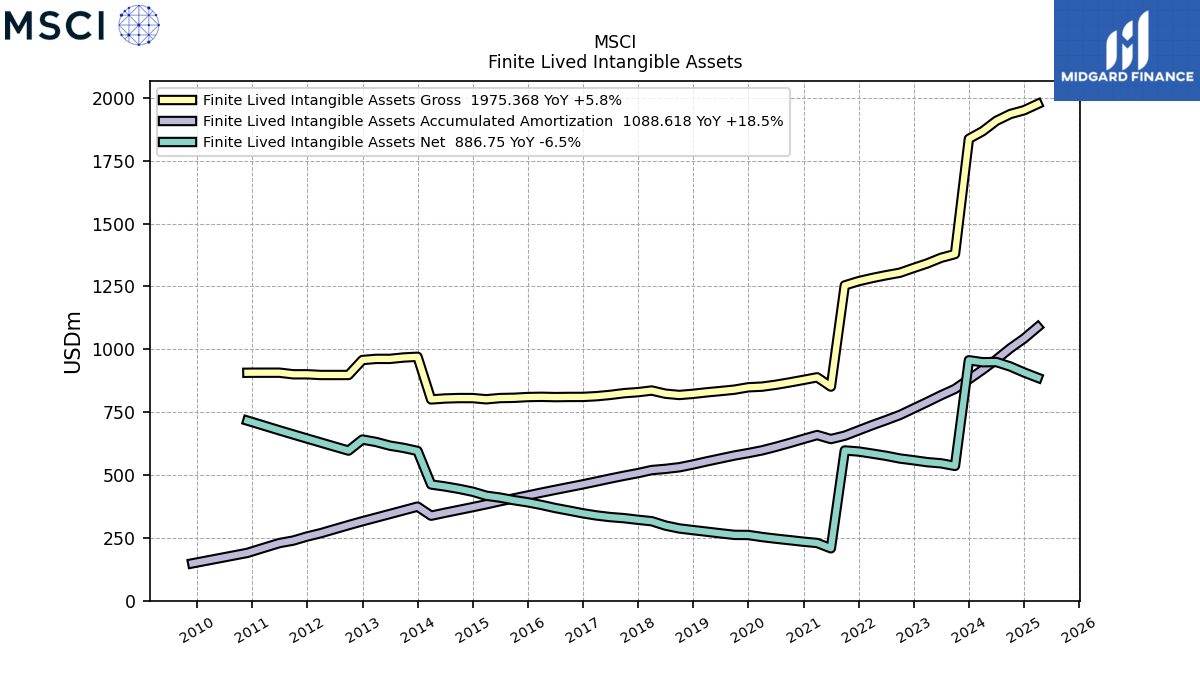
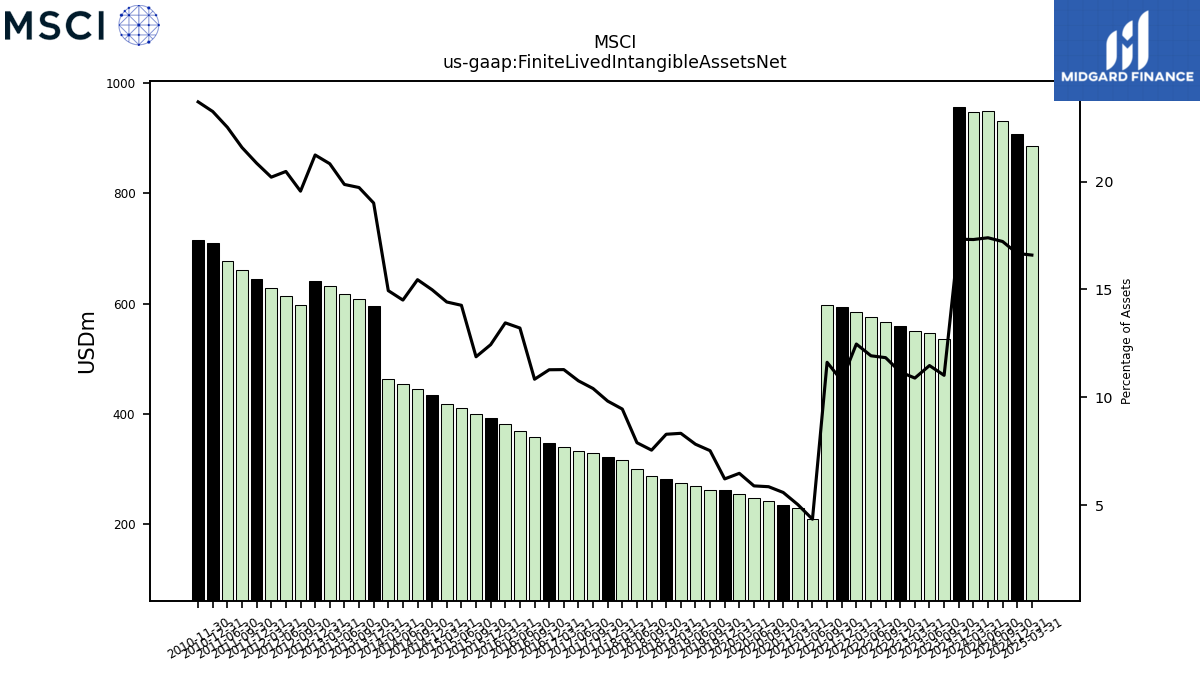
| Finite Lived Intangible Assets Net | 956.23 | 536.13 | 546.42 | 551.01 | 558.52 | 565.58 | 576.36 | 585.06 | 593.34 | 597.64 | 208.47 | 229.59 | 234.75 | 240.86 | 246.87 | 253.40 | 261.49 | 261.94 | 268.09 | 274.58 | 280.80 | 287.44 | 298.97 | 316.26 | 321.84 | 328.33 | 332.62 | 339.11 | 347.64 | 358.43 | 368.71 | 380.86 | 391.49 | 399.94 | 410.20 | 417.61 | 433.63 | 445.03 | 454.52 | 462.35 | 595.71 | 607.77 | 616.83 | 631.38 | 641.07 | 597.00 | 612.96 | 628.92 | 644.88 | 661.15 | 677.57 | NA | 710.69 | 716.25 | NA | NA | NA | NA | |
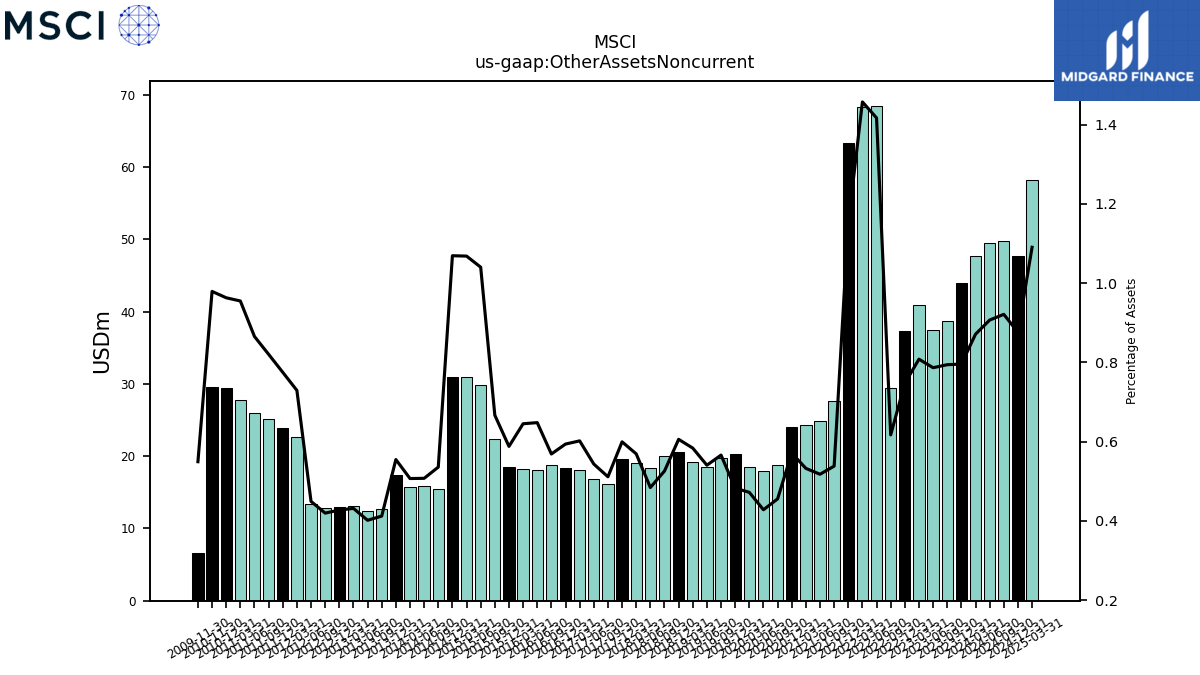
| Other Assets Noncurrent | 43.90 | 38.63 | 37.45 | 40.87 | 37.34 | 29.47 | 68.47 | 68.36 | 63.38 | 27.67 | 24.80 | 24.31 | 23.98 | 18.72 | 17.92 | 18.46 | 20.28 | 19.69 | 18.51 | 19.23 | 20.52 | 20.01 | 18.33 | 19.03 | 19.63 | 16.12 | 16.79 | 18.08 | 18.30 | 18.81 | 18.08 | 18.26 | 18.50 | 22.44 | 29.91 | 30.93 | 30.94 | 15.43 | 15.89 | 15.68 | 17.39 | 12.70 | 12.46 | 13.08 | 12.90 | 12.81 | 13.45 | 22.70 | 23.96 | 25.13 | 26.04 | 27.79 | 29.44 | 29.59 | NA | NA | NA | NA |
| 2023-12-31 | 2023-09-30 | 2023-06-30 | 2023-03-31 | 2022-12-31 | 2022-09-30 | 2022-06-30 | 2022-03-31 | 2021-12-31 | 2021-09-30 | 2021-06-30 | 2021-03-31 | 2020-12-31 | 2020-09-30 | 2020-06-30 | 2020-03-31 | 2019-12-31 | 2019-09-30 | 2019-06-30 | 2019-03-31 | 2018-12-31 | 2018-09-30 | 2018-06-30 | 2018-03-31 | 2017-12-31 | 2017-09-30 | 2017-06-30 | 2017-03-31 | 2016-12-31 | 2016-09-30 | 2016-06-30 | 2016-03-31 | 2015-12-31 | 2015-09-30 | 2015-06-30 | 2015-03-31 | 2014-12-31 | 2014-09-30 | 2014-06-30 | 2014-03-31 | 2013-12-31 | 2013-09-30 | 2013-06-30 | 2013-03-31 | 2012-12-31 | 2012-09-30 | 2012-06-30 | 2012-03-31 | 2011-12-31 | 2011-09-30 | 2011-06-30 | 2011-03-31 | 2010-12-31 | 2010-11-30 | 2010-08-31 | 2010-05-31 | 2010-02-28 | 2009-12-31 | ||
|---|---|---|---|---|---|---|---|---|---|---|---|---|---|---|---|---|---|---|---|---|---|---|---|---|---|---|---|---|---|---|---|---|---|---|---|---|---|---|---|---|---|---|---|---|---|---|---|---|---|---|---|---|---|---|---|---|---|---|---|
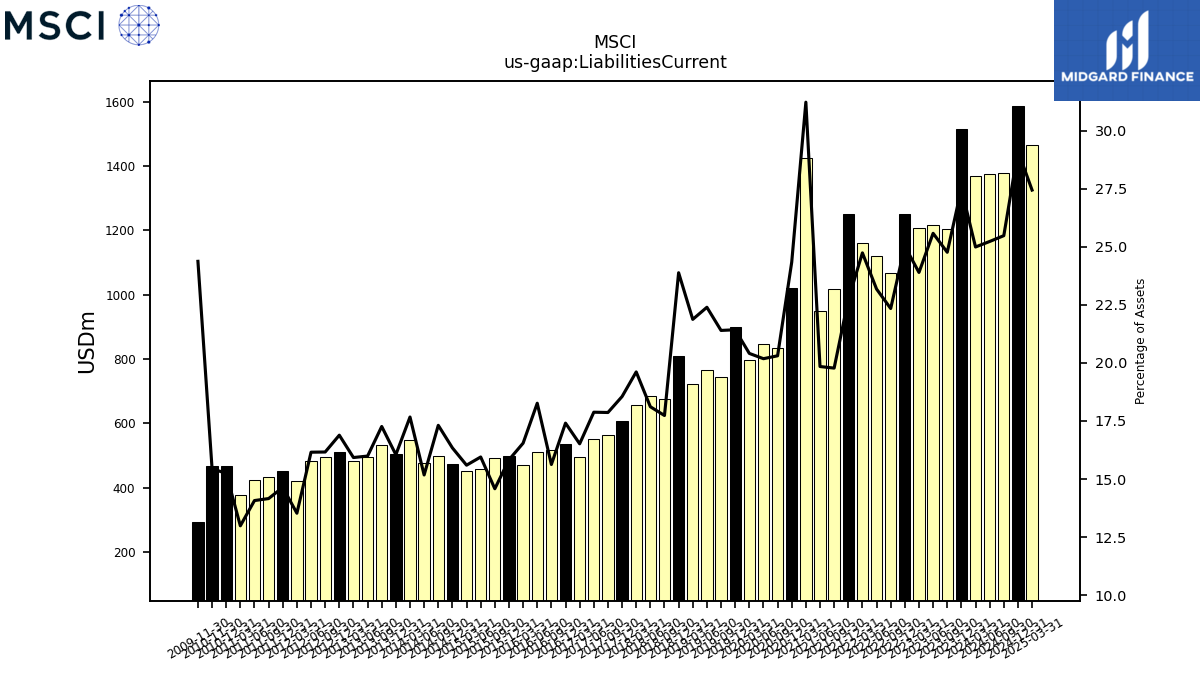
| Liabilities Current | 1517.03 | 1204.64 | 1218.12 | 1208.59 | 1250.53 | 1067.25 | 1120.28 | 1160.43 | 1250.94 | 1016.93 | 950.67 | 1425.33 | 1021.77 | 834.85 | 845.00 | 798.28 | 900.79 | 744.52 | 766.96 | 720.80 | 809.01 | 675.05 | 685.68 | 655.88 | 607.67 | 563.52 | 552.40 | 496.35 | 536.57 | 516.78 | 509.70 | 468.47 | 498.12 | 490.96 | 458.63 | 451.76 | 472.91 | 498.64 | 475.49 | 546.65 | 503.04 | 531.95 | 496.47 | 482.85 | 509.94 | 493.50 | 483.83 | 421.19 | 452.81 | 433.89 | 423.57 | 378.02 | 466.08 | 466.92 | NA | NA | NA | NA | |
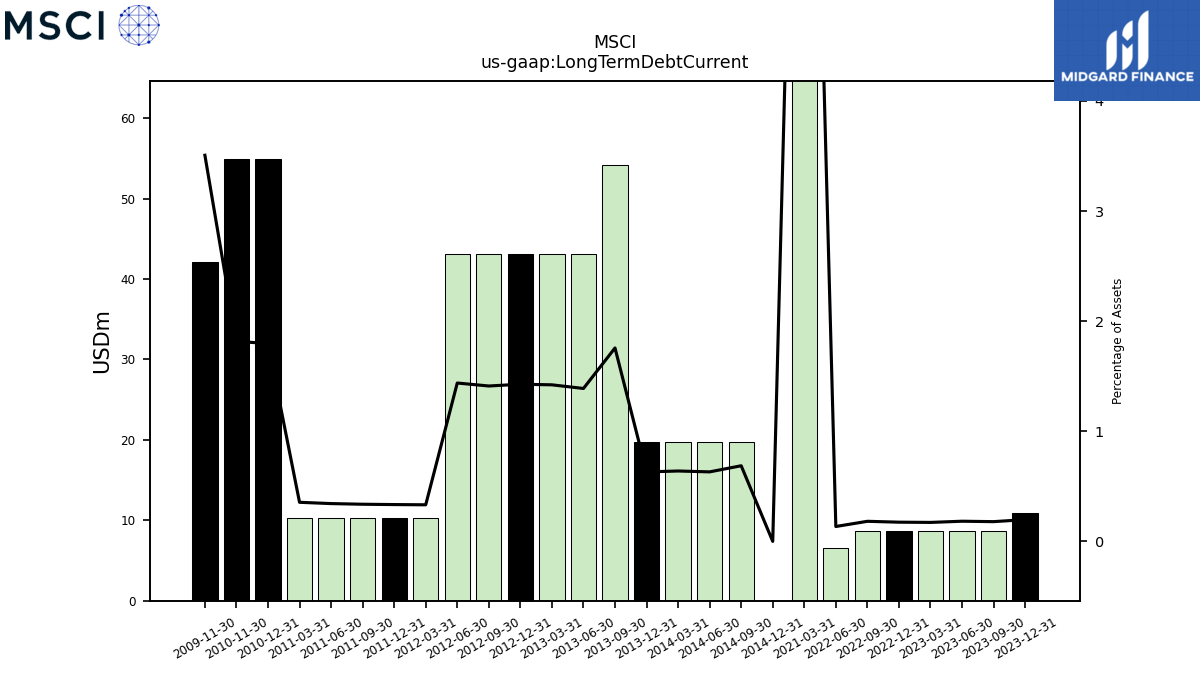
| Long Term Debt Current | 10.90 | 8.72 | 8.72 | 8.71 | 8.71 | 8.71 | 6.53 | NA | NA | NA | NA | 496.43 | NA | NA | NA | NA | NA | NA | NA | NA | NA | NA | NA | NA | NA | NA | NA | NA | NA | NA | NA | NA | NA | NA | NA | NA | 0.00 | 19.78 | 19.78 | 19.77 | 19.77 | 54.13 | 43.12 | 43.11 | 43.09 | 43.08 | 43.07 | 10.34 | 10.34 | 10.33 | 10.33 | 10.33 | 54.93 | 54.92 | NA | NA | NA | NA | |
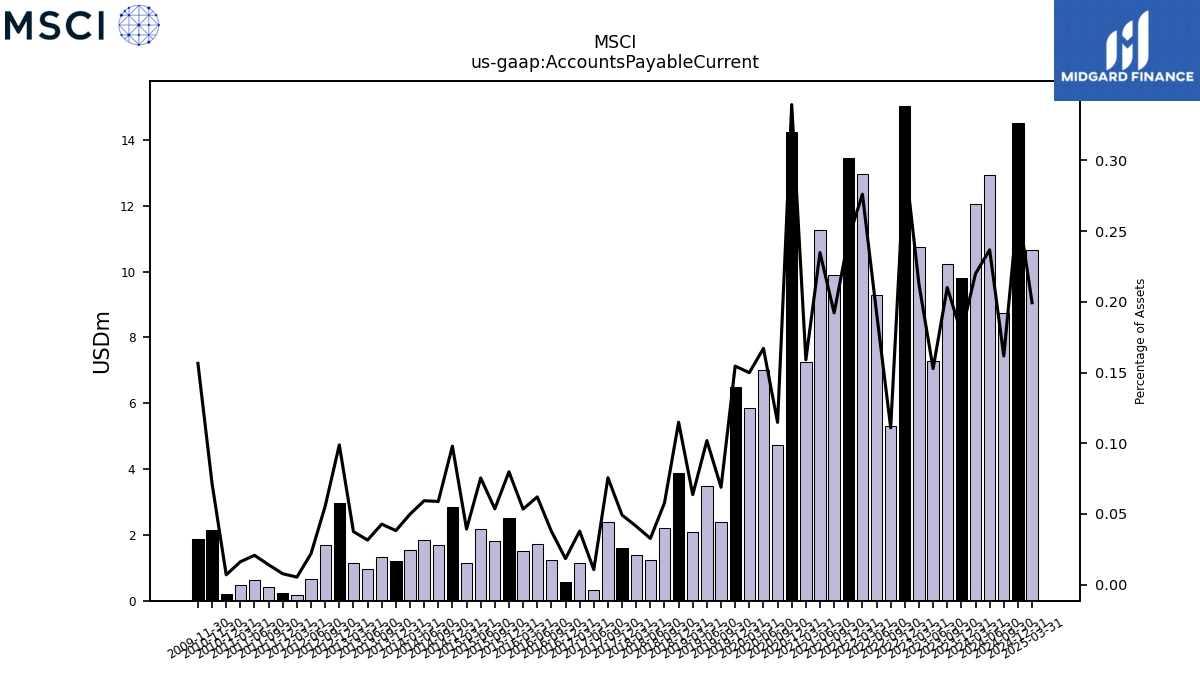
| Accounts Payable Current | 9.81 | 10.22 | 7.28 | 10.75 | 15.04 | 5.30 | 9.29 | 12.96 | 13.45 | 9.88 | 11.25 | 7.26 | 14.25 | 4.72 | 7.00 | 5.86 | 6.50 | 2.40 | 3.49 | 2.10 | 3.89 | 2.20 | 1.24 | 1.38 | 1.61 | 2.38 | 0.33 | 1.14 | 0.57 | 1.25 | 1.73 | 1.51 | 2.51 | 1.81 | 2.17 | 1.14 | 2.83 | 1.70 | 1.86 | 1.54 | 1.20 | 1.32 | 0.98 | 1.14 | 2.98 | 1.69 | 0.66 | 0.17 | 0.24 | 0.43 | 0.62 | 0.47 | 0.21 | 2.16 | NA | NA | NA | NA | |
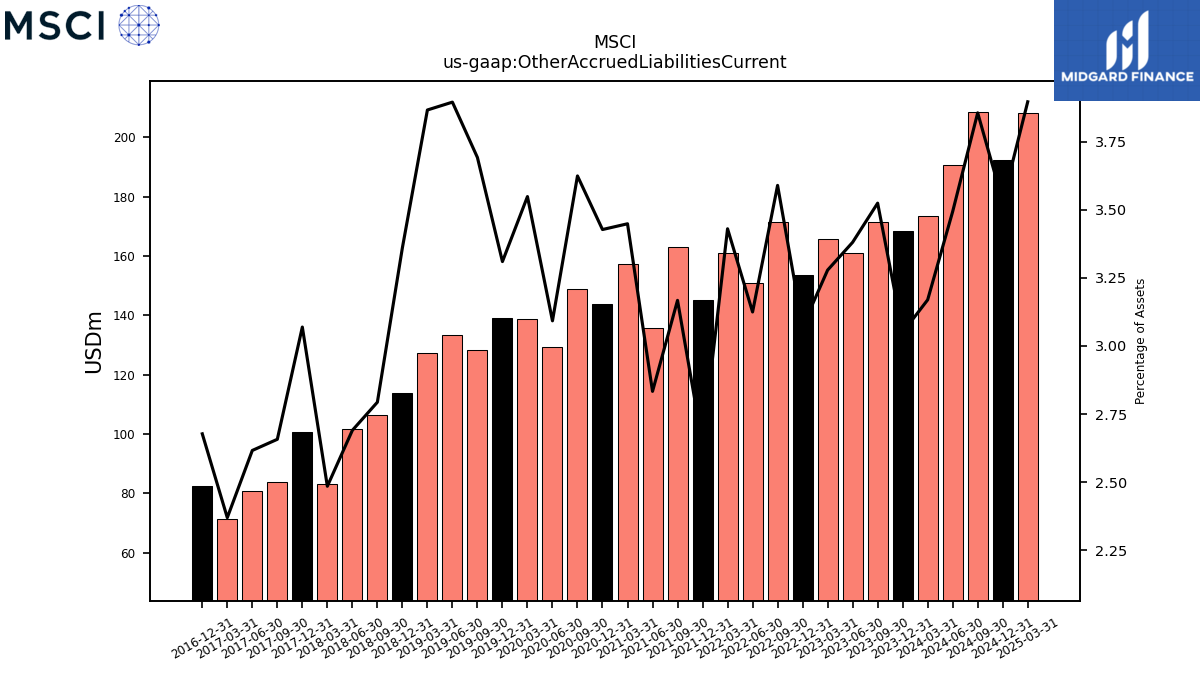
| Other Accrued Liabilities Current | 168.28 | 171.46 | 161.00 | 165.84 | 153.46 | 171.48 | 151.02 | 160.93 | 145.30 | 162.88 | 135.74 | 157.43 | 143.89 | 149.00 | 129.48 | 138.80 | 139.15 | 128.46 | 133.40 | 127.41 | 113.84 | 106.33 | 101.84 | 83.11 | 100.54 | 83.82 | 80.84 | 71.21 | 82.53 | NA | NA | NA | NA | NA | NA | NA | NA | NA | NA | NA | NA | NA | NA | NA | NA | NA | NA | NA | NA | NA | NA | NA | NA | NA | NA | NA | NA | NA | |
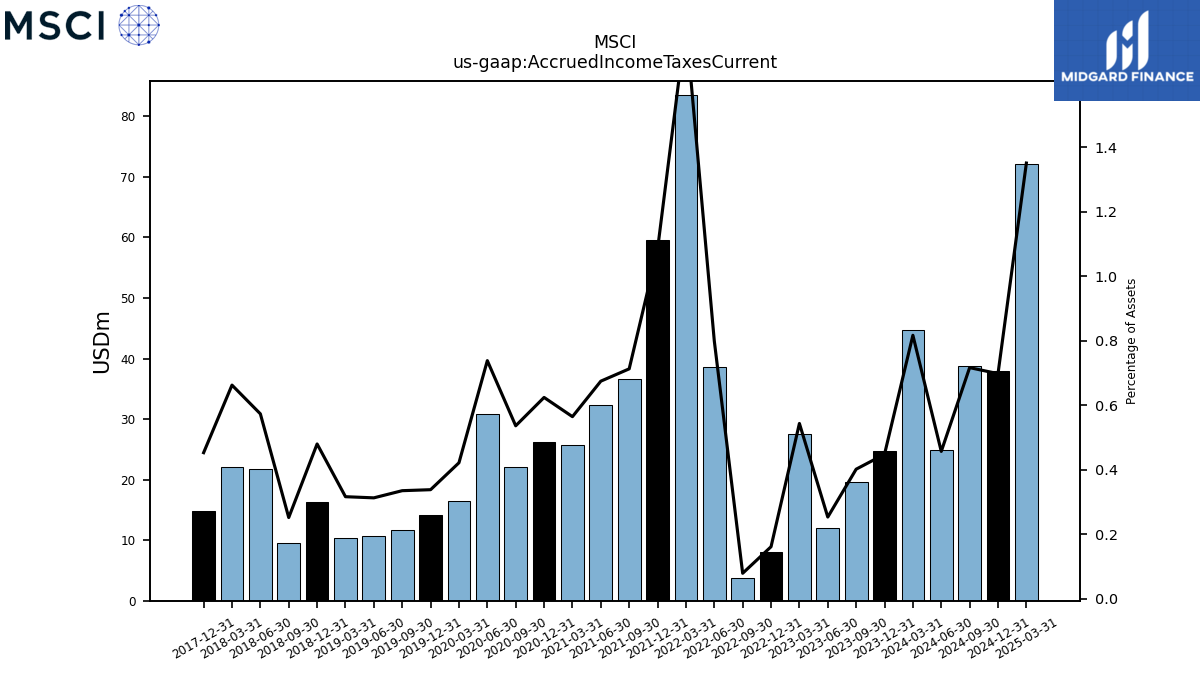
| Accrued Income Taxes Current | 24.71 | 19.54 | 12.06 | 27.48 | 8.06 | 3.77 | 38.62 | 83.59 | 59.63 | 36.64 | 32.31 | 25.76 | 26.20 | 22.04 | 30.90 | 16.49 | 14.21 | 11.65 | 10.71 | 10.42 | 16.25 | 9.58 | 21.69 | 22.14 | 14.83 | NA | NA | NA | NA | NA | NA | NA | NA | NA | NA | NA | NA | NA | NA | NA | NA | NA | NA | NA | NA | NA | NA | NA | NA | NA | NA | NA | NA | NA | NA | NA | NA | NA | |
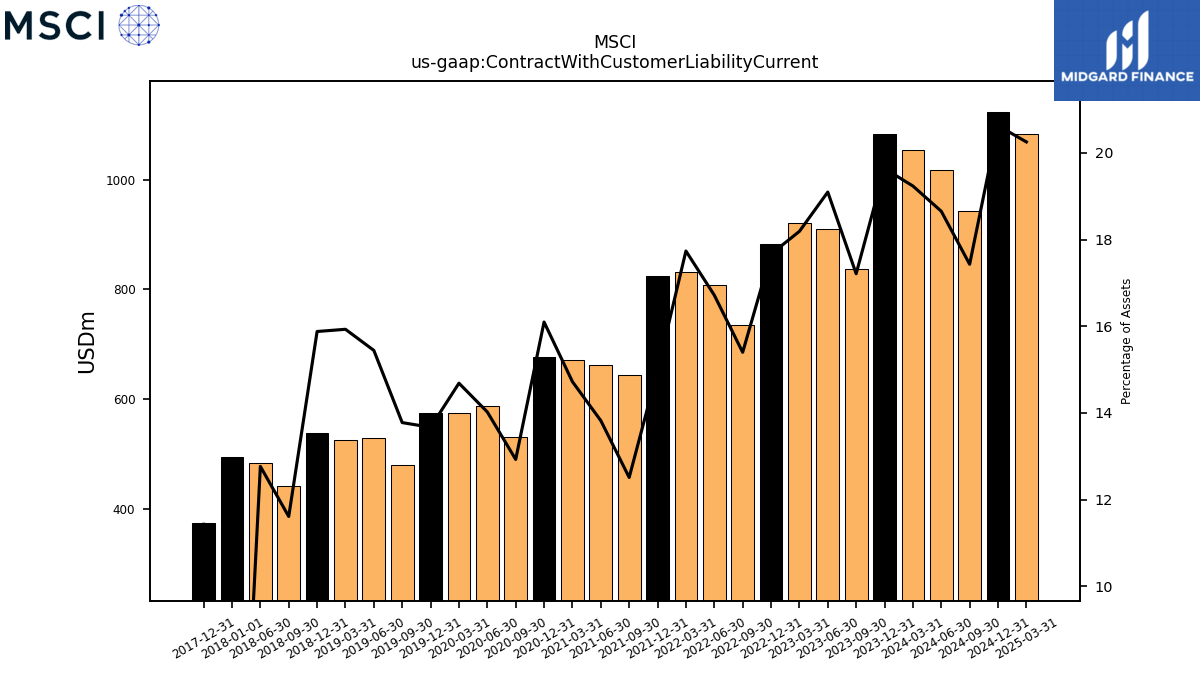
| Contract With Customer Liability Current | 1083.86 | 837.48 | 909.62 | 920.25 | 882.89 | 735.71 | 808.02 | 832.20 | 824.91 | 643.35 | 662.17 | 672.05 | 675.87 | 531.49 | 587.11 | 574.47 | 574.66 | 479.37 | 528.92 | 524.99 | 537.98 | 441.88 | 483.23 | NA | 374.37 | NA | NA | NA | NA | NA | NA | NA | NA | NA | NA | NA | NA | NA | NA | NA | NA | NA | NA | NA | NA | NA | NA | NA | NA | NA | NA | NA | NA | NA | NA | NA | NA | NA |
| 2023-12-31 | 2023-09-30 | 2023-06-30 | 2023-03-31 | 2022-12-31 | 2022-09-30 | 2022-06-30 | 2022-03-31 | 2021-12-31 | 2021-09-30 | 2021-06-30 | 2021-03-31 | 2020-12-31 | 2020-09-30 | 2020-06-30 | 2020-03-31 | 2019-12-31 | 2019-09-30 | 2019-06-30 | 2019-03-31 | 2018-12-31 | 2018-09-30 | 2018-06-30 | 2018-03-31 | 2017-12-31 | 2017-09-30 | 2017-06-30 | 2017-03-31 | 2016-12-31 | 2016-09-30 | 2016-06-30 | 2016-03-31 | 2015-12-31 | 2015-09-30 | 2015-06-30 | 2015-03-31 | 2014-12-31 | 2014-09-30 | 2014-06-30 | 2014-03-31 | 2013-12-31 | 2013-09-30 | 2013-06-30 | 2013-03-31 | 2012-12-31 | 2012-09-30 | 2012-06-30 | 2012-03-31 | 2011-12-31 | 2011-09-30 | 2011-06-30 | 2011-03-31 | 2010-12-31 | 2010-11-30 | 2010-08-31 | 2010-05-31 | 2010-02-28 | 2009-12-31 | ||
|---|---|---|---|---|---|---|---|---|---|---|---|---|---|---|---|---|---|---|---|---|---|---|---|---|---|---|---|---|---|---|---|---|---|---|---|---|---|---|---|---|---|---|---|---|---|---|---|---|---|---|---|---|---|---|---|---|---|---|---|
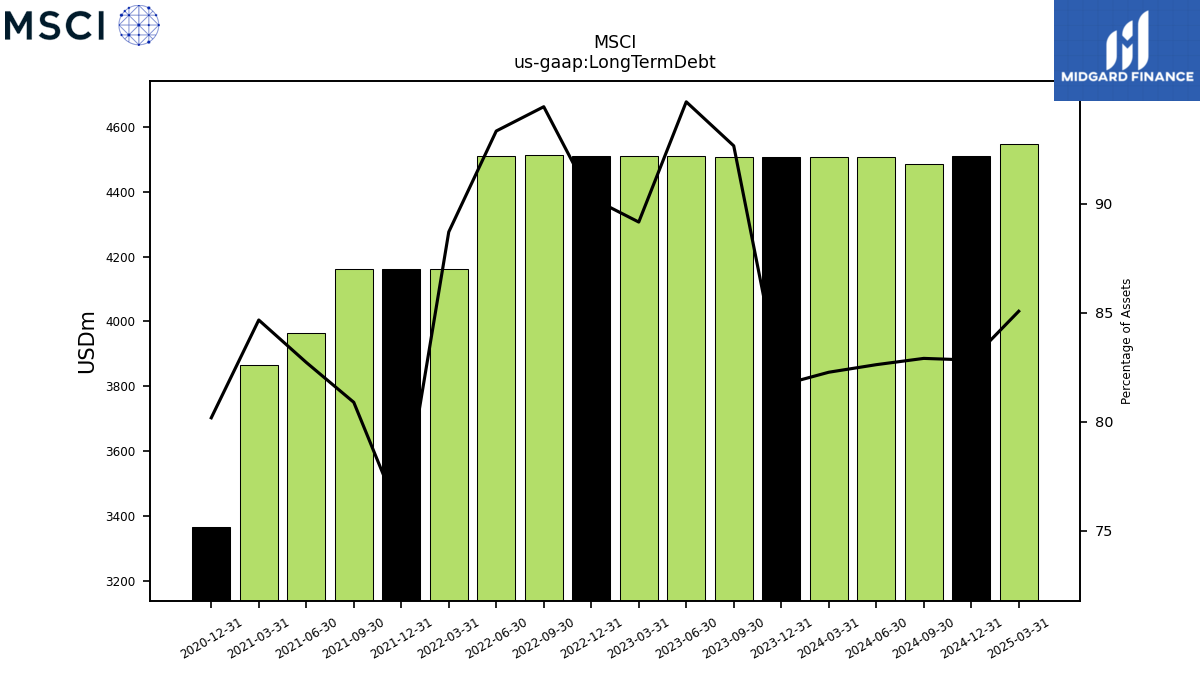
| Long Term Debt | 4507.73 | 4508.78 | 4509.84 | 4510.89 | 4511.95 | 4513.00 | 4511.87 | 4162.47 | 4161.42 | 4160.38 | 3963.62 | 3865.89 | 3366.78 | NA | NA | NA | NA | NA | NA | NA | NA | NA | NA | NA | NA | NA | NA | NA | NA | NA | NA | NA | NA | NA | NA | NA | NA | NA | NA | NA | NA | NA | NA | NA | NA | NA | NA | NA | NA | NA | NA | NA | NA | NA | NA | NA | NA | NA | |
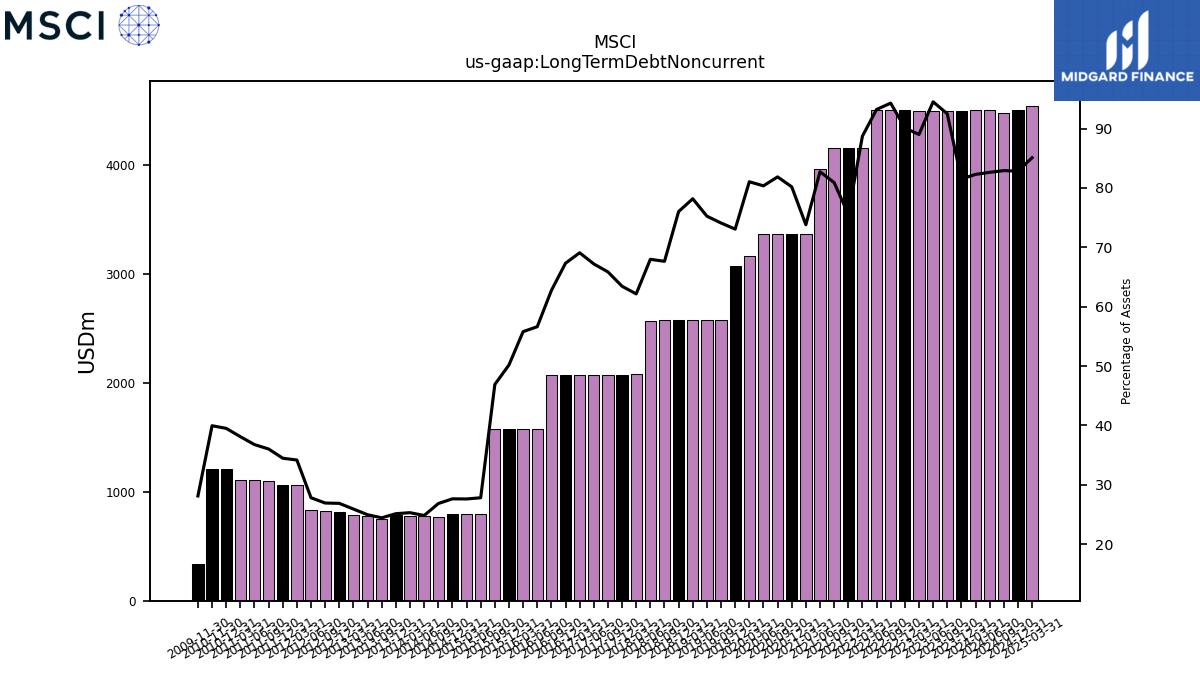
| Long Term Debt Noncurrent | 4496.83 | 4500.06 | 4501.12 | 4502.18 | 4503.23 | 4504.29 | 4505.34 | 4162.47 | 4161.42 | 4160.38 | 3963.62 | 3369.47 | 3366.78 | 3365.78 | 3364.79 | 3170.06 | 3071.93 | 2578.16 | 2577.27 | 2576.39 | 2575.50 | 2574.62 | 2573.73 | 2078.82 | 2078.09 | 2077.37 | 2076.65 | 2075.92 | 2075.20 | 2074.48 | 1580.52 | 1579.96 | 1579.40 | 1578.85 | 800.00 | 800.00 | 800.00 | 773.17 | 778.12 | 783.07 | 788.01 | 753.28 | 775.07 | 785.86 | 811.62 | 822.40 | 833.17 | 1063.96 | 1066.55 | 1104.12 | 1106.70 | 1109.28 | 1207.97 | 1207.88 | NA | NA | NA | NA | |
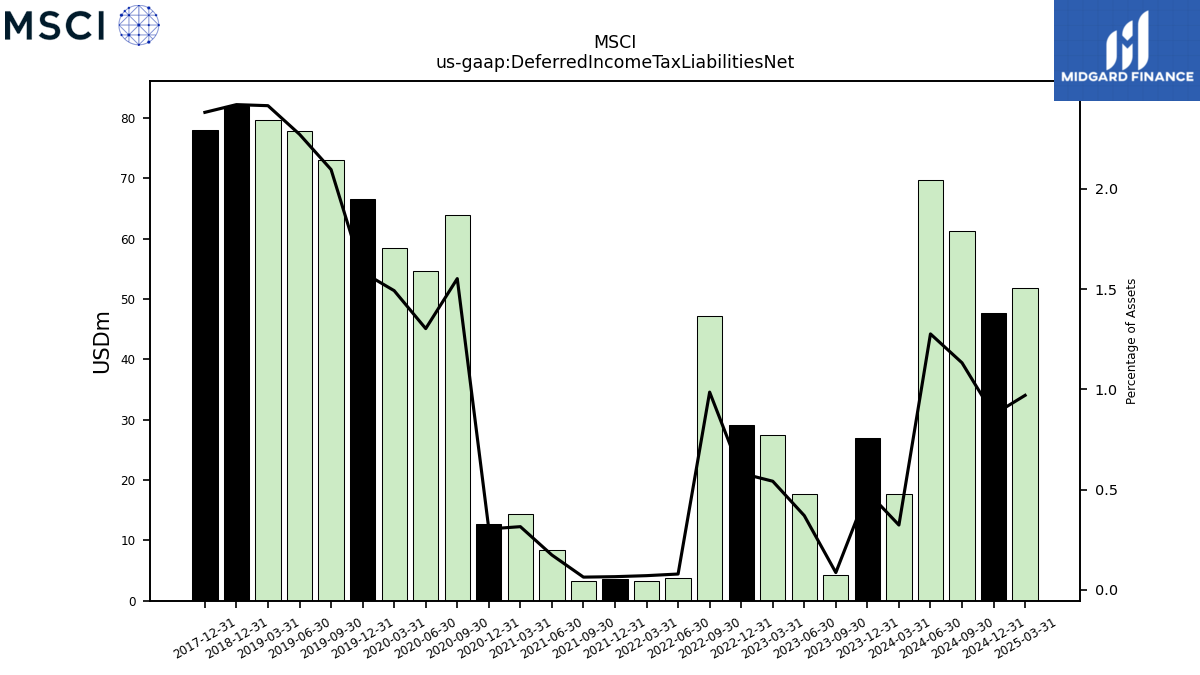
| Deferred Income Tax Liabilities Net | 27.03 | 4.22 | 17.66 | 27.43 | 29.10 | 47.14 | 3.84 | 3.35 | 3.65 | 3.29 | 8.35 | 14.41 | 12.77 | 63.84 | 54.58 | 58.39 | 66.64 | 72.96 | 77.84 | 79.60 | 82.01 | NA | NA | NA | 78.03 | NA | NA | NA | NA | NA | NA | NA | NA | NA | NA | NA | NA | NA | NA | NA | NA | NA | NA | NA | NA | NA | NA | NA | NA | NA | NA | NA | NA | NA | NA | NA | NA | NA | |
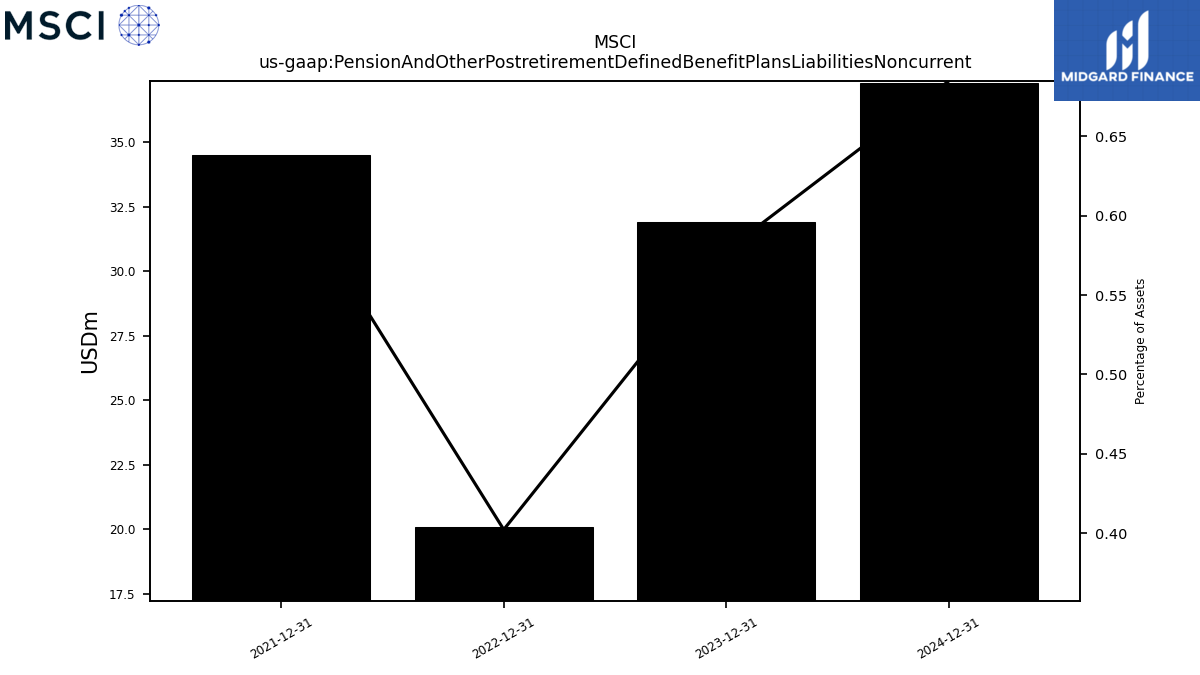
| Pension And Other Postretirement Defined Benefit Plans Liabilities Noncurrent | 31.90 | NA | NA | NA | 20.10 | NA | NA | NA | 34.50 | NA | NA | NA | NA | NA | NA | NA | NA | NA | NA | NA | NA | NA | NA | NA | NA | NA | NA | NA | NA | NA | NA | NA | NA | NA | NA | NA | NA | NA | NA | NA | NA | NA | NA | NA | NA | NA | NA | NA | NA | NA | NA | NA | NA | NA | NA | NA | NA | NA | |
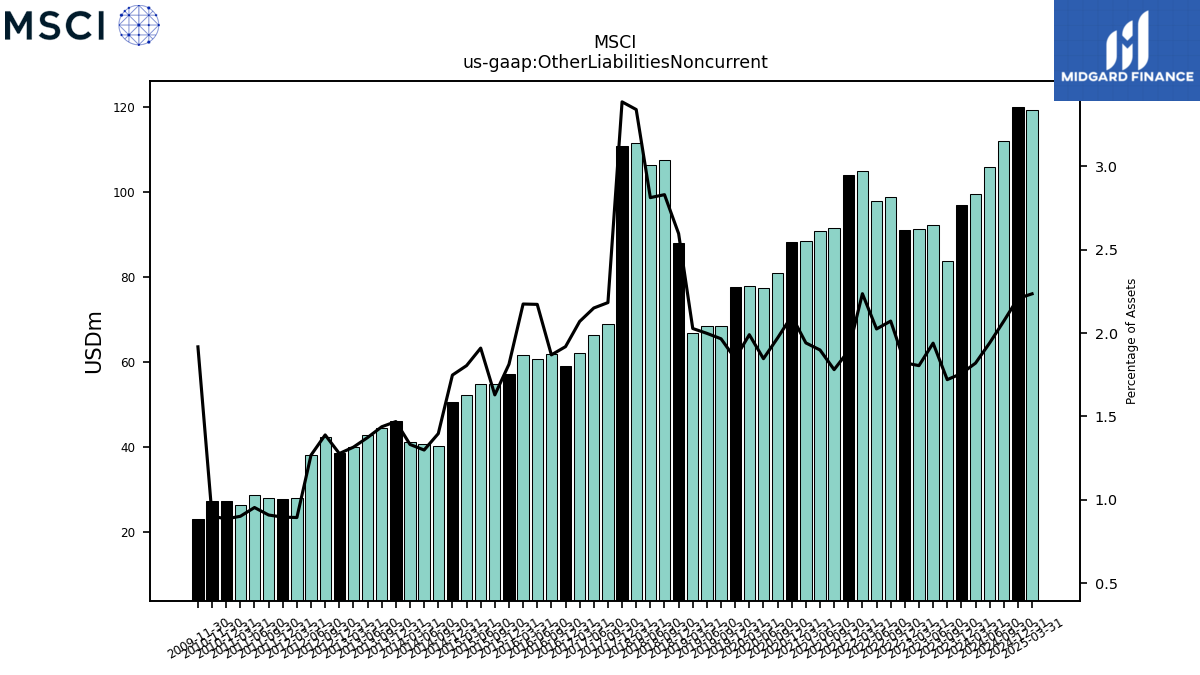
| Other Liabilities Noncurrent | 96.97 | 83.72 | 92.37 | 91.29 | 91.03 | 98.97 | 97.84 | 104.89 | 104.13 | 91.58 | 90.96 | 88.61 | 88.22 | 81.01 | 77.31 | 77.85 | 77.66 | 68.39 | 68.43 | 66.80 | 87.93 | 107.67 | 106.42 | 111.66 | 110.86 | 68.84 | 66.43 | 62.18 | 59.13 | 61.81 | 60.61 | 61.55 | 57.04 | 54.86 | 54.92 | 52.27 | 50.59 | 40.25 | 40.71 | 41.23 | 46.07 | 44.33 | 42.67 | 39.91 | 38.59 | 42.43 | 38.00 | 27.86 | 27.75 | 27.88 | 28.74 | 26.26 | 27.11 | 27.30 | NA | NA | NA | NA | |
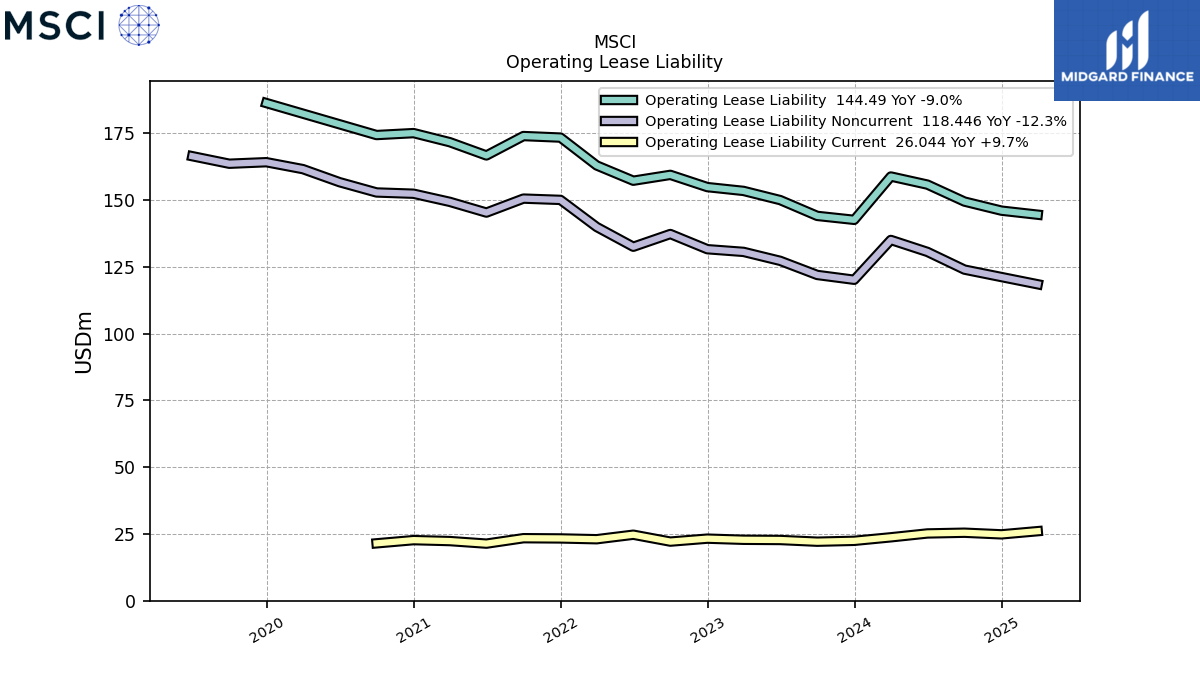
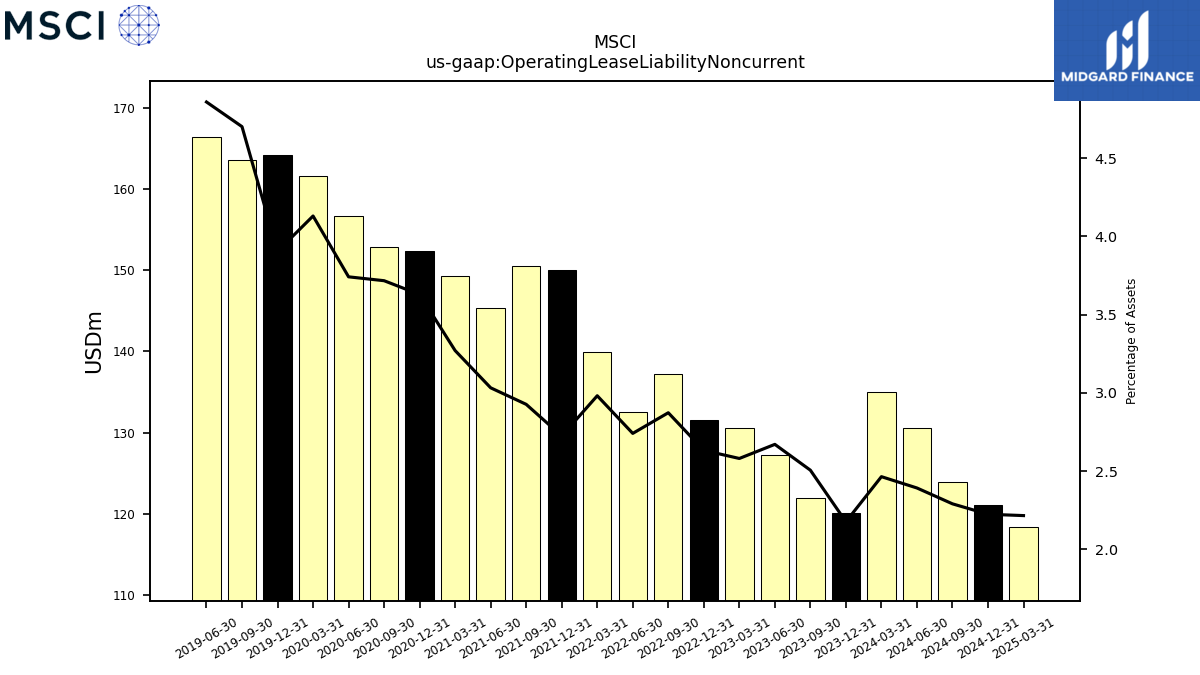
| Operating Lease Liability Noncurrent | 120.13 | 121.94 | 127.22 | 130.57 | 131.57 | 137.26 | 132.49 | 139.90 | 150.03 | 150.52 | 145.28 | 149.30 | 152.34 | 152.81 | 156.66 | 161.55 | 164.14 | 163.57 | 166.39 | NA | NA | NA | NA | NA | NA | NA | NA | NA | NA | NA | NA | NA | NA | NA | NA | NA | NA | NA | NA | NA | NA | NA | NA | NA | NA | NA | NA | NA | NA | NA | NA | NA | NA | NA | NA | NA | NA | NA |
| 2023-12-31 | 2023-09-30 | 2023-06-30 | 2023-03-31 | 2022-12-31 | 2022-09-30 | 2022-06-30 | 2022-03-31 | 2021-12-31 | 2021-09-30 | 2021-06-30 | 2021-03-31 | 2020-12-31 | 2020-09-30 | 2020-06-30 | 2020-03-31 | 2019-12-31 | 2019-09-30 | 2019-06-30 | 2019-03-31 | 2018-12-31 | 2018-09-30 | 2018-06-30 | 2018-03-31 | 2017-12-31 | 2017-09-30 | 2017-06-30 | 2017-03-31 | 2016-12-31 | 2016-09-30 | 2016-06-30 | 2016-03-31 | 2015-12-31 | 2015-09-30 | 2015-06-30 | 2015-03-31 | 2014-12-31 | 2014-09-30 | 2014-06-30 | 2014-03-31 | 2013-12-31 | 2013-09-30 | 2013-06-30 | 2013-03-31 | 2012-12-31 | 2012-09-30 | 2012-06-30 | 2012-03-31 | 2011-12-31 | 2011-09-30 | 2011-06-30 | 2011-03-31 | 2010-12-31 | 2010-11-30 | 2010-08-31 | 2010-05-31 | 2010-02-28 | 2009-12-31 | ||
|---|---|---|---|---|---|---|---|---|---|---|---|---|---|---|---|---|---|---|---|---|---|---|---|---|---|---|---|---|---|---|---|---|---|---|---|---|---|---|---|---|---|---|---|---|---|---|---|---|---|---|---|---|---|---|---|---|---|---|---|
| Stockholders Equity | -739.76 | -1049.10 | -1193.67 | -901.36 | -1007.92 | -1077.39 | -1026.45 | -879.19 | -163.47 | -280.02 | -367.81 | -481.58 | -443.23 | -386.59 | -310.93 | -354.33 | -76.71 | -147.86 | -231.80 | -316.51 | -166.49 | 378.44 | 346.42 | 421.37 | 401.01 | 360.31 | 307.20 | 278.84 | 317.61 | 551.52 | 535.15 | 615.66 | 901.49 | 1119.11 | 1433.71 | 1455.70 | 1432.83 | 1396.53 | 1666.68 | 1563.73 | 1576.36 | 1522.15 | 1555.83 | 1488.74 | 1425.23 | 1468.06 | 1409.66 | 1364.60 | 1305.43 | 1261.95 | 1209.05 | 1150.02 | 1102.17 | 1080.12 | NA | NA | NA | NA | |
| Common Stock Value | 1.34 | 1.34 | 1.34 | 1.34 | 1.34 | 1.34 | 1.34 | 1.34 | 1.33 | 1.33 | 1.33 | 1.33 | 1.33 | 1.33 | 1.33 | 1.33 | 1.32 | 1.32 | 1.32 | 1.32 | 1.30 | 1.30 | 1.30 | 1.30 | 1.29 | 1.29 | 1.29 | 1.29 | 1.29 | 1.29 | 1.29 | 1.29 | 1.28 | 1.28 | 1.28 | 1.27 | 1.27 | 1.27 | 1.26 | 1.26 | 1.26 | 1.25 | 1.25 | 1.25 | 1.24 | 1.24 | 1.23 | 1.23 | 1.23 | 1.22 | 1.22 | 1.21 | 1.21 | 1.21 | NA | NA | NA | NA | |
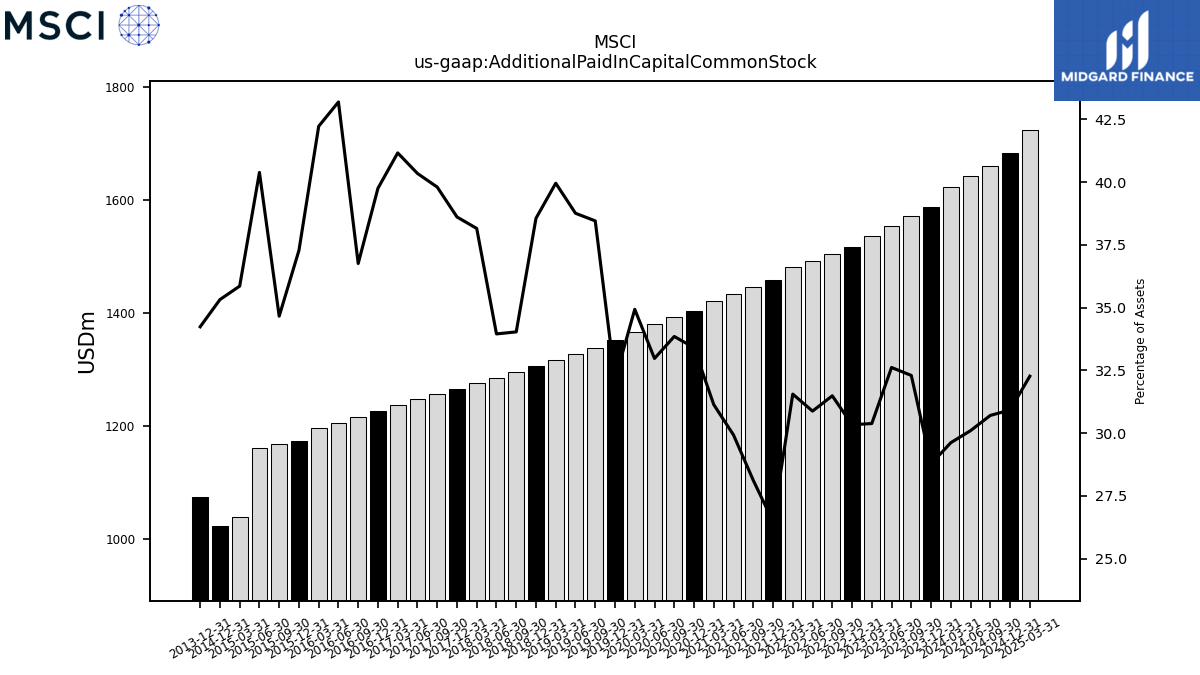
| Additional Paid In Capital Common Stock | 1587.67 | 1571.44 | 1553.37 | 1536.91 | 1515.87 | 1504.27 | 1492.33 | 1480.45 | 1457.62 | 1446.00 | 1433.72 | 1421.44 | 1402.54 | 1391.84 | 1380.77 | 1366.44 | 1351.03 | 1338.19 | 1327.60 | 1316.84 | 1306.43 | 1295.45 | 1285.38 | 1276.11 | 1264.85 | 1255.62 | 1246.78 | 1237.11 | 1225.57 | 1215.66 | 1205.59 | 1195.74 | 1173.18 | 1166.89 | 1161.41 | 1038.63 | 1022.22 | NA | NA | NA | 1073.16 | NA | NA | NA | NA | NA | NA | NA | NA | NA | NA | NA | NA | NA | NA | NA | NA | NA | |
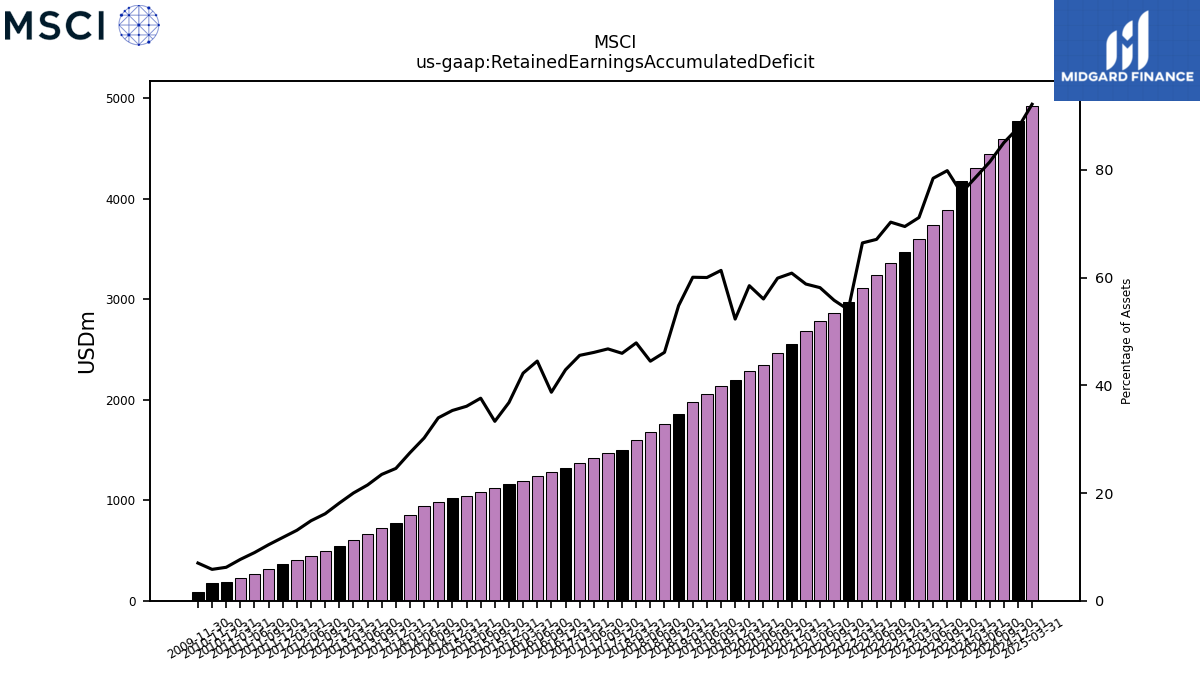
| Retained Earnings Accumulated Deficit | 4179.68 | 3886.19 | 3736.38 | 3599.93 | 3473.19 | 3358.89 | 3243.65 | 3117.66 | 2976.52 | 2869.13 | 2785.73 | 2685.17 | 2554.30 | 2463.11 | 2346.58 | 2288.82 | 2199.29 | 2134.69 | 2055.88 | 1979.80 | 1856.95 | 1755.73 | 1684.16 | 1601.58 | 1505.20 | 1475.35 | 1424.96 | 1369.41 | 1322.22 | 1280.50 | 1242.15 | 1196.78 | 1158.46 | 1121.86 | 1081.67 | 1046.10 | 1022.70 | 978.36 | 947.03 | 850.65 | 770.26 | 723.00 | 667.69 | 606.64 | 547.70 | 493.25 | 444.97 | 407.43 | 363.46 | 318.98 | 269.19 | 223.53 | 190.01 | 176.18 | NA | NA | NA | NA | |
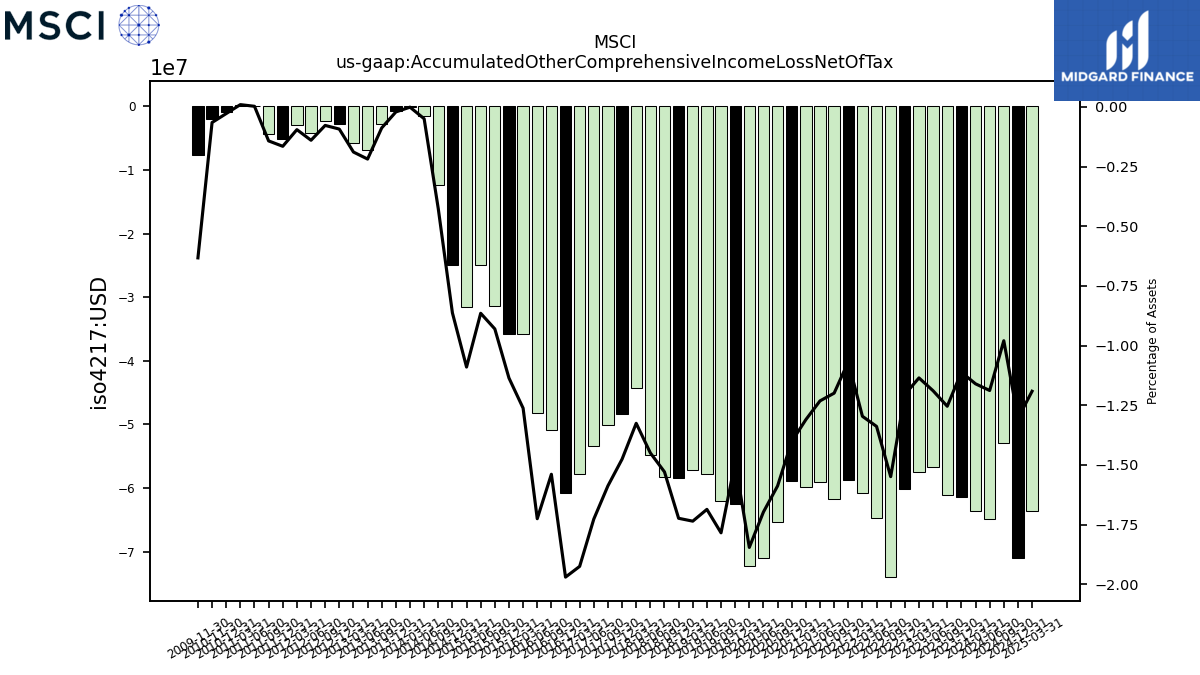
| Accumulated Other Comprehensive Income Loss Net Of Tax | -61.35 | -61.02 | -56.65 | -57.44 | -60.21 | -74.01 | -64.70 | -60.82 | -58.80 | -61.67 | -59.01 | -59.82 | -58.86 | -65.30 | -71.07 | -72.20 | -62.58 | -62.10 | -57.76 | -57.20 | -58.40 | -58.21 | -54.88 | -44.34 | -48.35 | -50.08 | -53.37 | -57.86 | -60.73 | -50.90 | -48.16 | -35.74 | -35.74 | -31.32 | -24.86 | -31.57 | -24.97 | -12.28 | -1.54 | -0.02 | -0.65 | -2.70 | -6.78 | -5.72 | -2.80 | -2.36 | -4.18 | -2.95 | -5.09 | -4.36 | 0.09 | 0.29 | -0.84 | -1.97 | NA | NA | NA | NA |
| 2023-12-31 | 2023-09-30 | 2023-06-30 | 2023-03-31 | 2022-12-31 | 2022-09-30 | 2022-06-30 | 2022-03-31 | 2021-12-31 | 2021-09-30 | 2021-06-30 | 2021-03-31 | 2020-12-31 | 2020-09-30 | 2020-06-30 | 2020-03-31 | 2019-12-31 | 2019-09-30 | 2019-06-30 | 2019-03-31 | 2018-12-31 | 2018-09-30 | 2018-06-30 | 2018-03-31 | 2017-12-31 | 2017-09-30 | 2017-06-30 | 2017-03-31 | 2016-12-31 | 2016-09-30 | 2016-06-30 | 2016-03-31 | 2015-12-31 | 2015-09-30 | 2015-06-30 | 2015-03-31 | 2014-12-31 | 2014-09-30 | 2014-06-30 | 2014-03-31 | 2013-12-31 | 2013-09-30 | 2013-06-30 | 2013-03-31 | 2012-12-31 | 2012-09-30 | 2012-06-30 | 2012-03-31 | 2011-12-31 | 2011-09-30 | 2011-06-30 | 2011-03-31 | 2010-12-31 | 2010-11-30 | 2010-08-31 | 2010-05-31 | 2010-02-28 | 2009-12-31 | ||
|---|---|---|---|---|---|---|---|---|---|---|---|---|---|---|---|---|---|---|---|---|---|---|---|---|---|---|---|---|---|---|---|---|---|---|---|---|---|---|---|---|---|---|---|---|---|---|---|---|---|---|---|---|---|---|---|---|---|---|---|
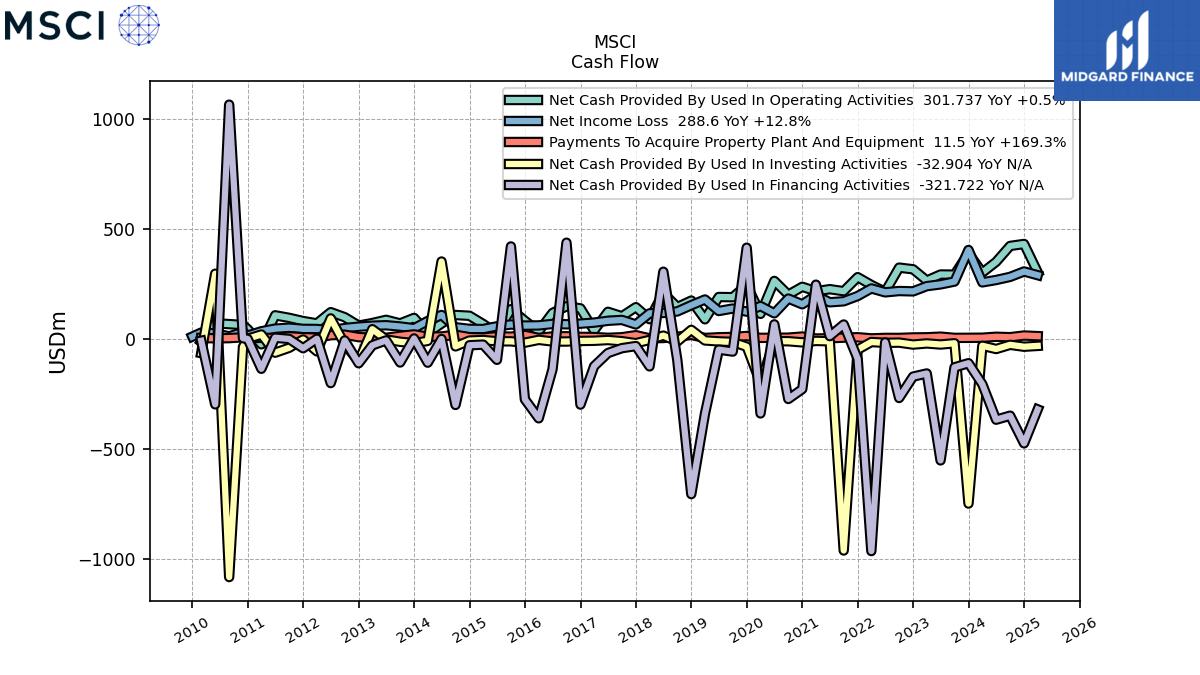
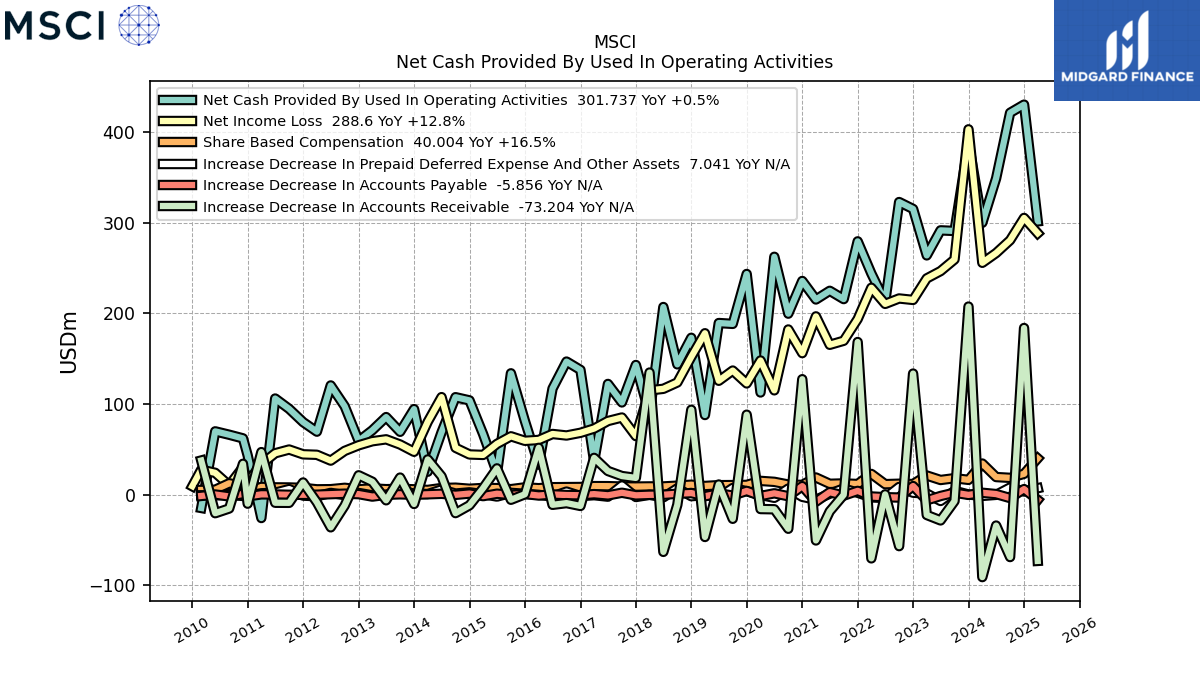
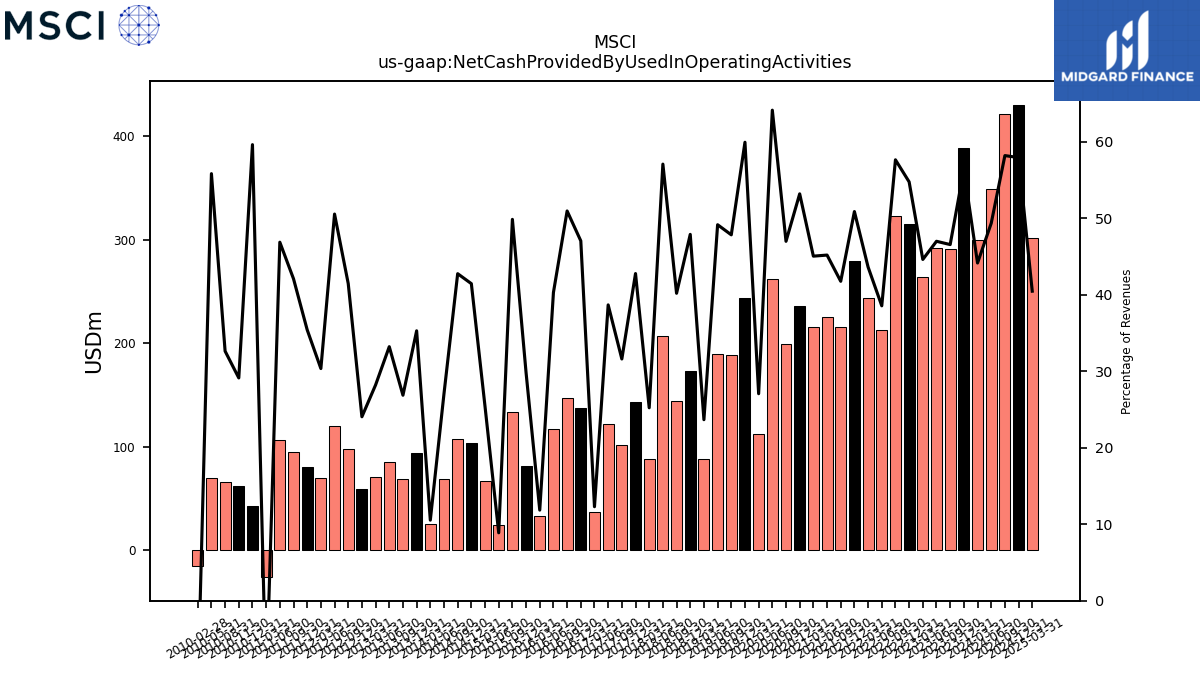
| Net Cash Provided By Used In Operating Activities | 388.95 | 291.13 | 291.80 | 264.14 | 315.43 | 323.07 | 212.69 | 244.18 | 279.66 | 215.89 | 225.06 | 215.46 | 235.93 | 199.79 | 262.62 | 112.77 | 243.64 | 188.53 | 189.47 | 87.88 | 173.18 | 143.82 | 207.16 | 88.60 | 143.15 | 101.77 | 122.22 | 37.02 | 137.71 | 146.92 | 117.08 | 33.03 | 81.32 | 133.96 | 24.03 | 66.68 | 104.05 | 107.57 | 68.80 | 25.25 | 94.41 | 69.36 | 85.63 | 71.05 | 59.41 | 97.60 | 120.56 | 69.51 | 80.07 | 94.68 | 106.12 | -25.88 | 43.23 | 62.12 | 66.13 | 69.86 | -14.76 | NA | |
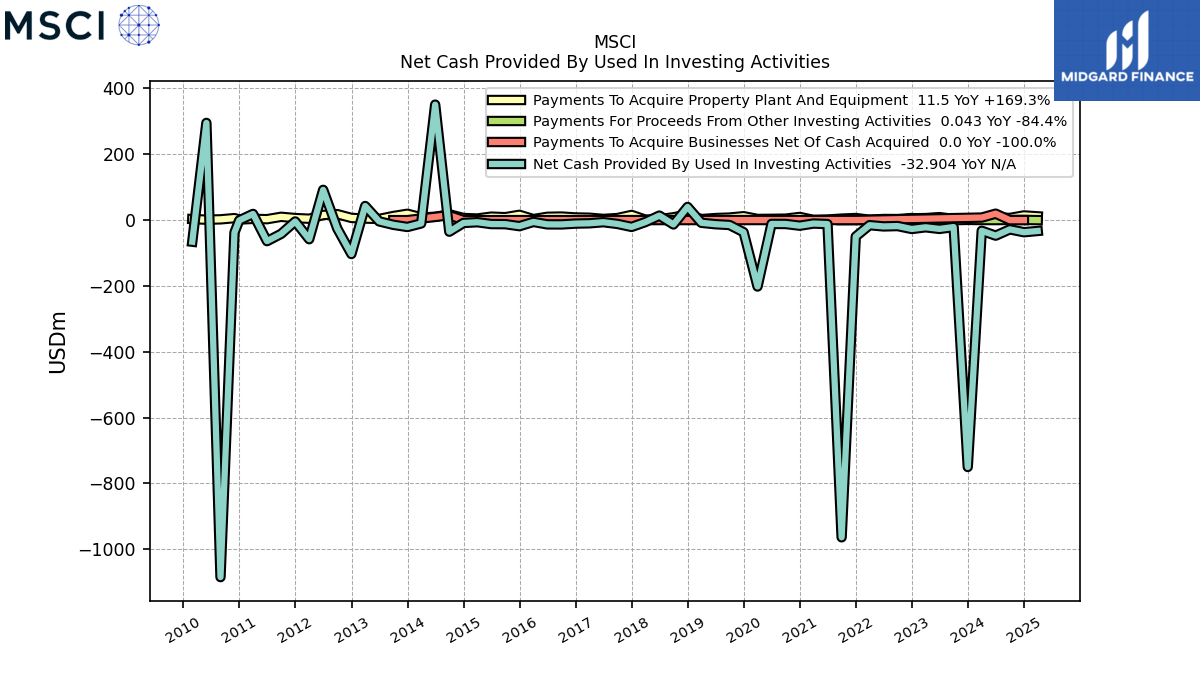
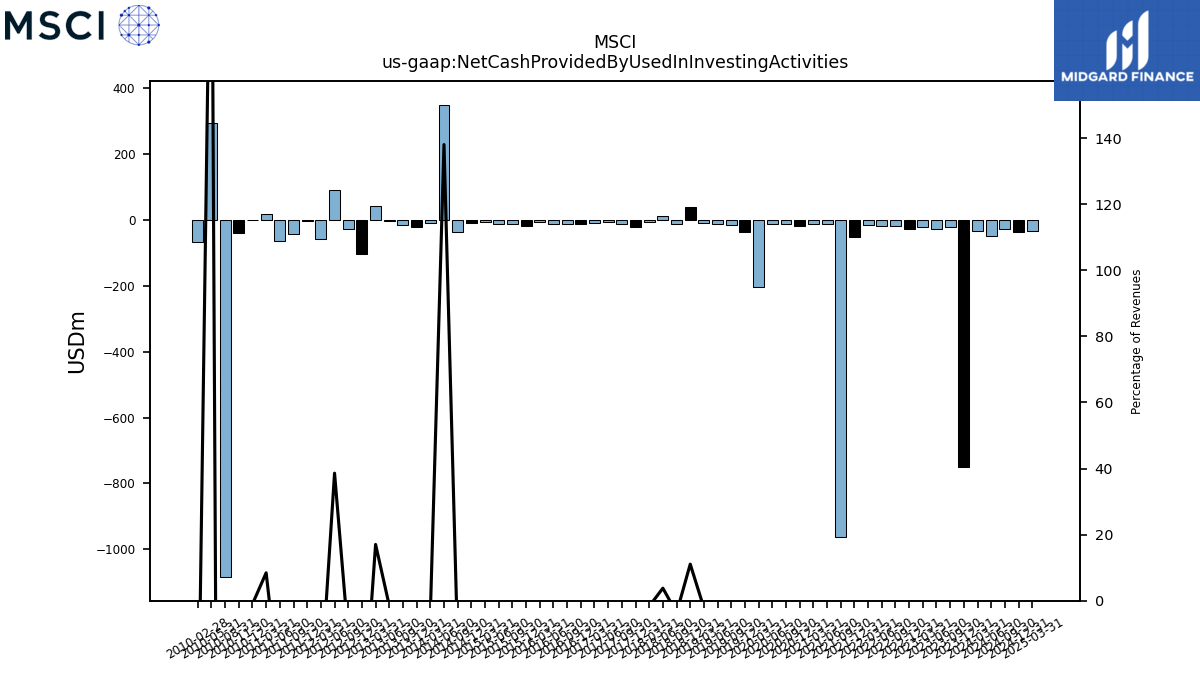
| Net Cash Provided By Used In Investing Activities | -749.97 | -20.98 | -26.67 | -21.76 | -26.92 | -18.00 | -19.10 | -15.31 | -49.83 | -963.56 | -11.96 | -10.36 | -16.89 | -11.72 | -11.54 | -201.64 | -36.65 | -14.77 | -12.39 | -8.14 | 40.04 | -13.10 | 13.80 | -5.87 | -20.60 | -11.55 | -6.26 | -9.63 | -10.54 | -13.07 | -12.90 | -5.52 | -18.33 | -12.25 | -11.96 | -6.32 | -8.66 | -35.15 | 350.91 | -10.05 | -20.81 | -14.21 | -3.79 | 42.93 | -102.97 | -25.55 | 92.08 | -57.93 | -3.98 | -41.66 | -63.85 | 18.88 | -0.71 | -37.65 | -1084.49 | 295.40 | -65.54 | NA | |
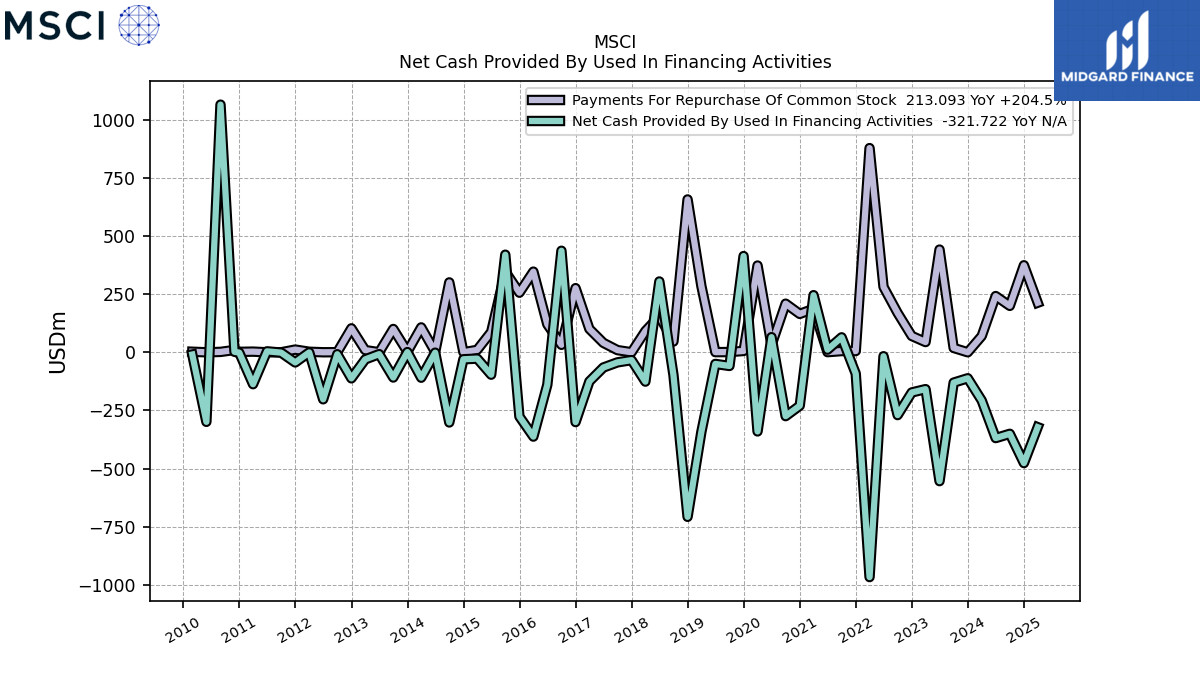
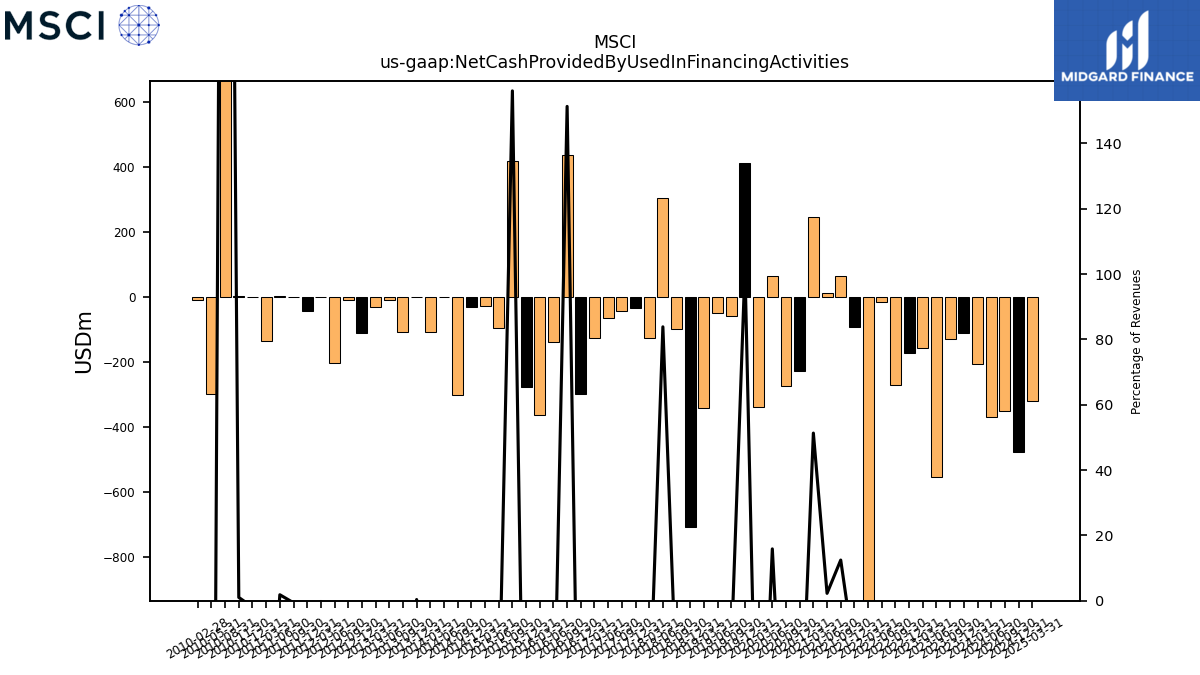
| Net Cash Provided By Used In Financing Activities | -111.57 | -130.31 | -553.76 | -158.29 | -172.55 | -269.89 | -16.82 | -966.12 | -91.74 | 64.39 | 11.32 | 245.54 | -229.55 | -274.43 | 65.03 | -340.08 | 413.65 | -58.77 | -49.91 | -341.63 | -707.08 | -97.76 | 304.42 | -126.06 | -33.67 | -43.25 | -65.40 | -125.23 | -300.00 | 436.43 | -139.40 | -362.31 | -276.08 | 419.45 | -96.28 | -27.14 | -29.95 | -301.53 | -1.51 | -109.34 | 1.01 | -108.50 | -7.90 | -30.46 | -112.05 | -8.31 | -202.10 | -0.52 | -43.64 | -1.38 | 4.16 | -137.13 | -1.40 | 2.17 | 1064.30 | -298.91 | -9.50 | NA |
| 2023-12-31 | 2023-09-30 | 2023-06-30 | 2023-03-31 | 2022-12-31 | 2022-09-30 | 2022-06-30 | 2022-03-31 | 2021-12-31 | 2021-09-30 | 2021-06-30 | 2021-03-31 | 2020-12-31 | 2020-09-30 | 2020-06-30 | 2020-03-31 | 2019-12-31 | 2019-09-30 | 2019-06-30 | 2019-03-31 | 2018-12-31 | 2018-09-30 | 2018-06-30 | 2018-03-31 | 2017-12-31 | 2017-09-30 | 2017-06-30 | 2017-03-31 | 2016-12-31 | 2016-09-30 | 2016-06-30 | 2016-03-31 | 2015-12-31 | 2015-09-30 | 2015-06-30 | 2015-03-31 | 2014-12-31 | 2014-09-30 | 2014-06-30 | 2014-03-31 | 2013-12-31 | 2013-09-30 | 2013-06-30 | 2013-03-31 | 2012-12-31 | 2012-09-30 | 2012-06-30 | 2012-03-31 | 2011-12-31 | 2011-09-30 | 2011-06-30 | 2011-03-31 | 2010-12-31 | 2010-11-30 | 2010-08-31 | 2010-05-31 | 2010-02-28 | 2009-12-31 | ||
|---|---|---|---|---|---|---|---|---|---|---|---|---|---|---|---|---|---|---|---|---|---|---|---|---|---|---|---|---|---|---|---|---|---|---|---|---|---|---|---|---|---|---|---|---|---|---|---|---|---|---|---|---|---|---|---|---|---|---|---|
| Net Cash Provided By Used In Operating Activities | 388.95 | 291.13 | 291.80 | 264.14 | 315.43 | 323.07 | 212.69 | 244.18 | 279.66 | 215.89 | 225.06 | 215.46 | 235.93 | 199.79 | 262.62 | 112.77 | 243.64 | 188.53 | 189.47 | 87.88 | 173.18 | 143.82 | 207.16 | 88.60 | 143.15 | 101.77 | 122.22 | 37.02 | 137.71 | 146.92 | 117.08 | 33.03 | 81.32 | 133.96 | 24.03 | 66.68 | 104.05 | 107.57 | 68.80 | 25.25 | 94.41 | 69.36 | 85.63 | 71.05 | 59.41 | 97.60 | 120.56 | 69.51 | 80.07 | 94.68 | 106.12 | -25.88 | 43.23 | 62.12 | 66.13 | 69.86 | -14.76 | NA | |
| Net Income Loss | 403.38 | 259.66 | 246.82 | 238.73 | 214.97 | 216.59 | 210.59 | 228.42 | 193.87 | 169.88 | 165.42 | 196.82 | 156.22 | 182.36 | 115.12 | 148.12 | 122.78 | 136.98 | 125.69 | 178.19 | 152.13 | 123.83 | 116.83 | 115.09 | 64.60 | 85.15 | 81.27 | 72.95 | 68.25 | 65.28 | 66.96 | 60.37 | 59.41 | 64.40 | 56.02 | 43.83 | 44.34 | 51.71 | 107.66 | 80.40 | 47.26 | 55.31 | 61.05 | 58.94 | 54.45 | 48.27 | 37.55 | 43.97 | 44.49 | 49.79 | 45.66 | 33.52 | 13.82 | 30.27 | 10.32 | 24.07 | 27.52 | 9.26 | |
| Profit Loss | 403.38 | 259.66 | 246.82 | 238.73 | 214.97 | 216.59 | 210.59 | 228.42 | 193.87 | 169.88 | 165.42 | 196.82 | 156.22 | 182.36 | 115.12 | 148.12 | 122.78 | 136.98 | 125.69 | 178.19 | 152.13 | 123.83 | 116.83 | 115.09 | 64.60 | 85.15 | NA | NA | NA | NA | NA | NA | NA | NA | NA | NA | NA | NA | NA | NA | NA | NA | NA | NA | NA | NA | NA | NA | NA | NA | NA | NA | NA | NA | NA | NA | NA | NA | |
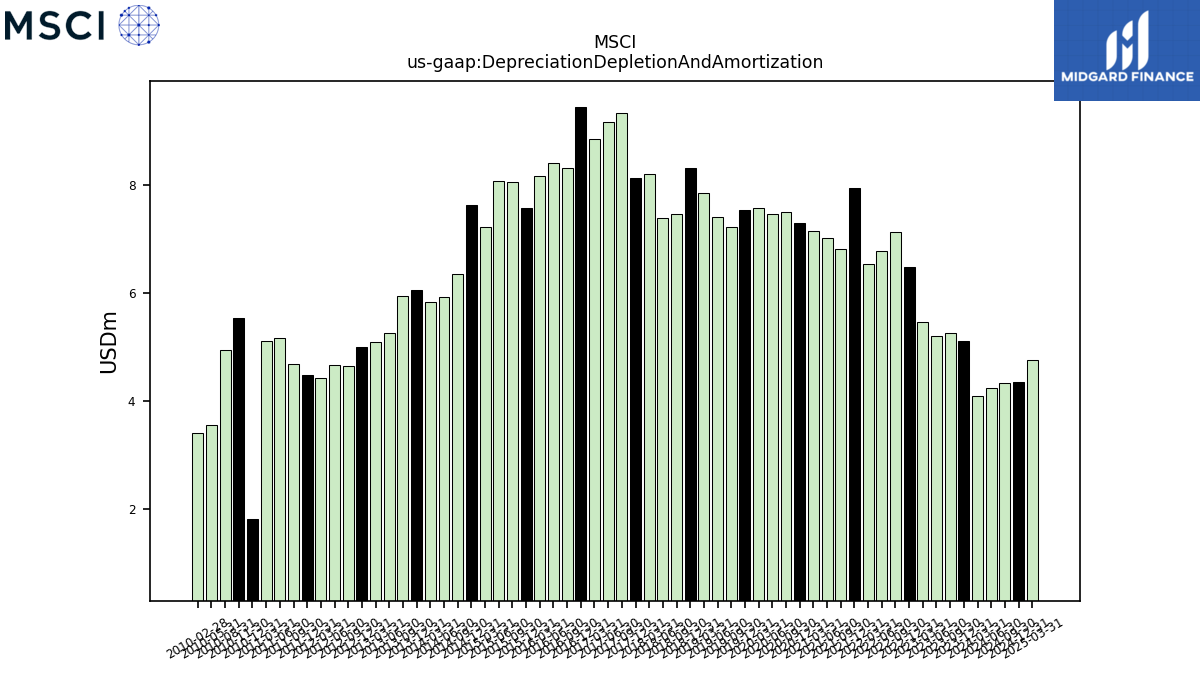
| Depreciation Depletion And Amortization | 5.10 | 5.25 | 5.20 | 5.46 | 6.47 | 7.13 | 6.76 | 6.53 | 7.93 | 6.81 | 7.02 | 7.14 | 7.28 | 7.49 | 7.46 | 7.57 | 7.54 | 7.21 | 7.41 | 7.85 | 8.31 | 7.45 | 7.38 | 8.21 | 8.12 | 9.32 | 9.16 | 8.84 | 9.45 | 8.31 | 8.39 | 8.17 | 7.57 | 8.05 | 8.06 | 7.21 | 7.62 | 6.34 | 5.92 | 5.83 | 6.04 | 5.93 | 5.25 | 5.08 | 4.99 | 4.63 | 4.66 | 4.42 | 4.48 | 4.67 | 5.17 | 5.11 | 1.80 | 5.53 | 4.93 | 3.56 | 3.39 | NA | |
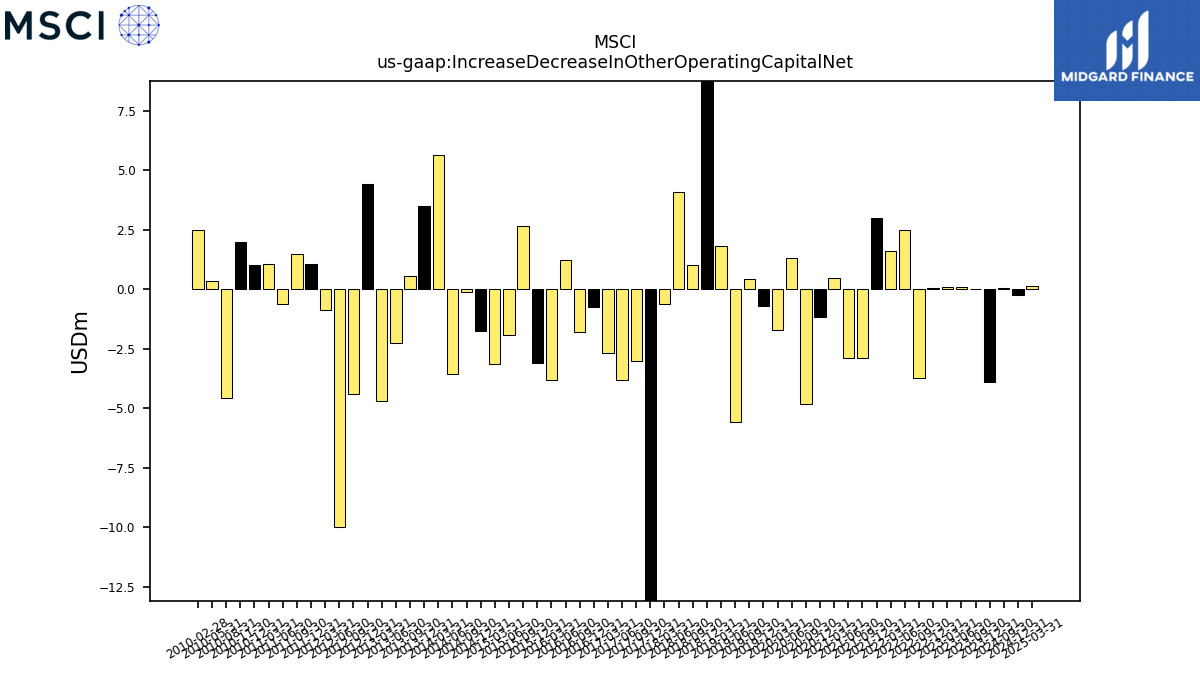
| Increase Decrease In Other Operating Capital Net | -3.88 | 0.03 | 0.11 | 0.08 | 0.04 | -3.73 | 2.51 | 1.62 | 3.01 | -2.87 | -2.87 | 0.46 | -1.16 | -4.84 | 1.31 | -1.73 | -0.71 | 0.43 | -5.58 | 1.81 | 18.48 | 1.02 | 4.10 | -0.61 | -37.84 | -3.03 | -3.83 | -2.68 | -0.73 | -1.80 | 1.25 | -3.83 | -3.12 | 2.65 | -1.93 | -3.16 | -1.75 | -0.12 | -3.56 | 5.63 | 3.51 | 0.54 | -2.27 | -4.71 | 4.42 | -4.40 | -9.97 | -0.88 | 1.08 | 1.48 | -0.61 | 1.08 | 1.03 | 1.98 | -4.57 | 0.34 | 2.49 | NA | |
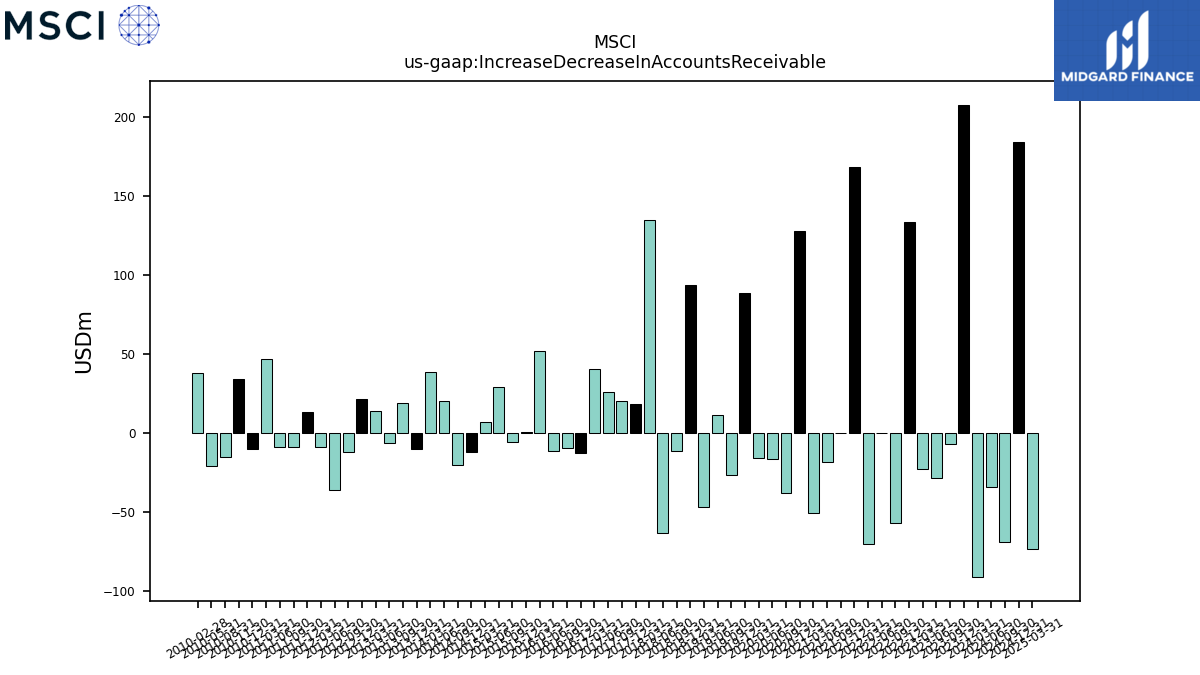
| Increase Decrease In Accounts Receivable | 207.66 | -7.15 | -28.50 | -22.49 | 133.67 | -56.91 | 0.29 | -70.42 | 168.53 | -0.20 | -18.49 | -50.63 | 127.45 | -37.72 | -16.20 | -15.93 | 88.25 | -26.72 | 11.19 | -46.80 | 93.69 | -11.30 | -63.25 | 134.80 | 18.43 | 20.51 | 26.08 | 40.58 | -12.53 | -9.36 | -11.28 | 51.66 | 0.42 | -5.70 | 29.00 | 7.18 | -11.81 | -20.45 | 20.20 | 38.88 | -10.35 | 18.83 | -6.28 | 14.21 | 21.35 | -12.11 | -36.14 | -8.57 | 13.40 | -9.07 | -8.99 | 46.95 | -10.03 | 34.05 | -15.34 | -20.54 | 37.68 | NA | |
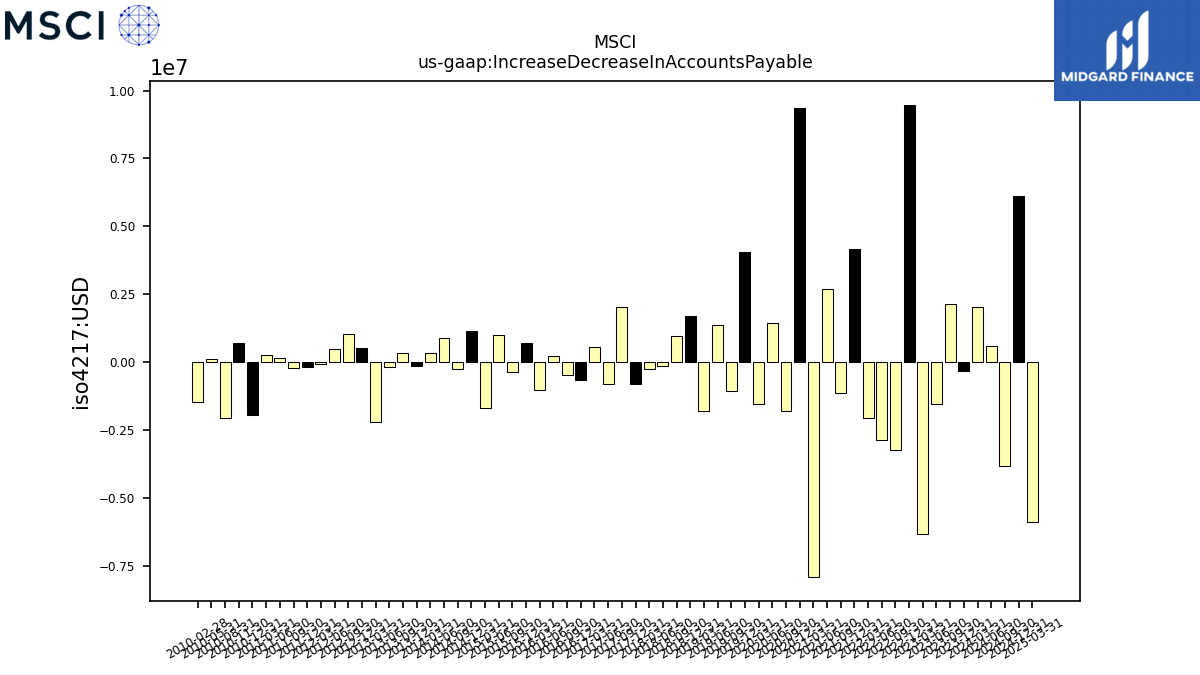
| Increase Decrease In Accounts Payable | -0.33 | 2.13 | -1.52 | -6.33 | 9.48 | -3.24 | -2.85 | -2.06 | 4.15 | -1.14 | 2.69 | -7.90 | 9.36 | -1.78 | 1.44 | -1.54 | 4.07 | -1.07 | 1.38 | -1.79 | 1.70 | 0.97 | -0.14 | -0.23 | -0.78 | 2.05 | -0.81 | 0.56 | -0.65 | -0.47 | 0.22 | -1.01 | 0.71 | -0.34 | 1.01 | -1.68 | 1.16 | -0.26 | 0.88 | 0.35 | -0.13 | 0.33 | -0.16 | -2.18 | 0.53 | 1.03 | 0.48 | -0.07 | -0.18 | -0.20 | 0.16 | 0.27 | -1.95 | 0.72 | -2.03 | 0.13 | -1.47 | NA | |
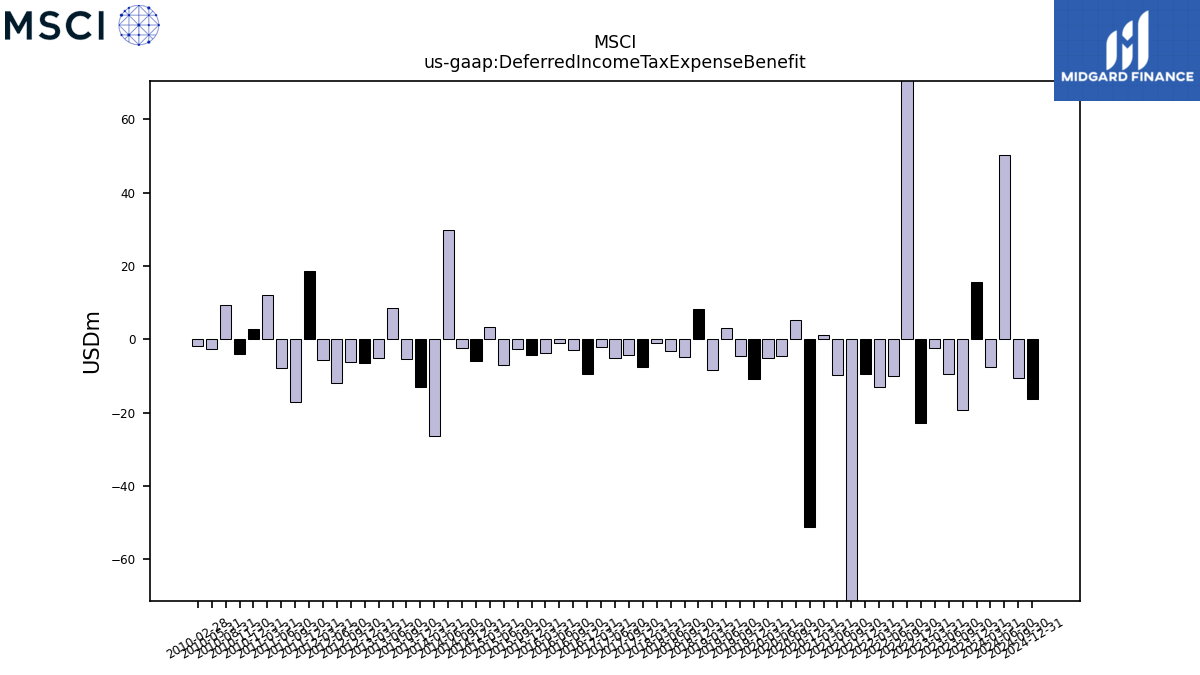
| Deferred Income Tax Expense Benefit | 15.71 | -19.21 | -9.51 | -2.25 | -22.89 | 82.15 | -9.87 | -12.96 | -9.53 | -93.35 | -9.63 | 1.14 | -51.02 | 5.22 | -4.68 | -5.17 | -10.92 | -4.54 | 3.09 | -8.40 | 8.33 | -4.83 | -3.18 | -1.10 | -7.45 | -4.37 | -5.04 | -2.04 | -9.33 | -2.88 | -0.99 | -3.77 | -4.19 | -2.55 | -6.97 | 3.43 | -5.96 | -2.48 | 29.75 | -26.27 | -12.94 | -5.48 | 8.50 | -5.14 | -6.49 | -6.18 | -11.83 | -5.69 | 18.57 | -17.18 | -7.84 | 12.06 | 2.85 | -3.94 | 9.44 | -2.67 | -1.92 | NA | |
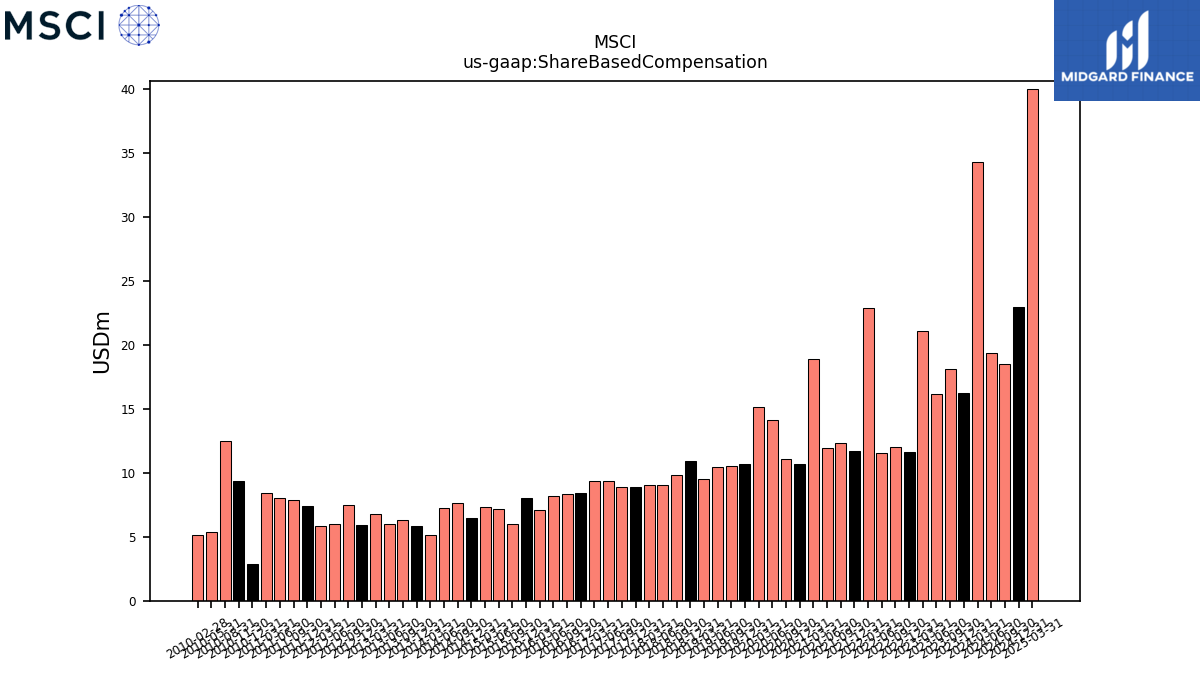
| Share Based Compensation | 16.28 | 18.14 | 16.14 | 21.09 | 11.66 | 12.01 | 11.56 | 22.86 | 11.70 | 12.36 | 11.95 | 18.91 | 10.71 | 11.12 | 14.10 | 15.16 | 10.71 | 10.52 | 10.43 | 9.54 | 10.96 | 9.87 | 9.02 | 9.05 | 8.91 | 8.93 | 9.34 | 9.39 | 8.41 | 8.32 | 8.19 | 7.08 | 8.01 | 6.01 | 7.19 | 7.35 | 6.47 | 7.66 | 7.29 | 5.17 | 5.85 | 6.32 | 6.02 | 6.81 | 5.91 | 7.50 | 6.00 | 5.84 | 7.40 | 7.90 | 8.00 | 8.45 | 2.84 | 9.34 | 12.50 | 5.40 | 5.12 | NA | |
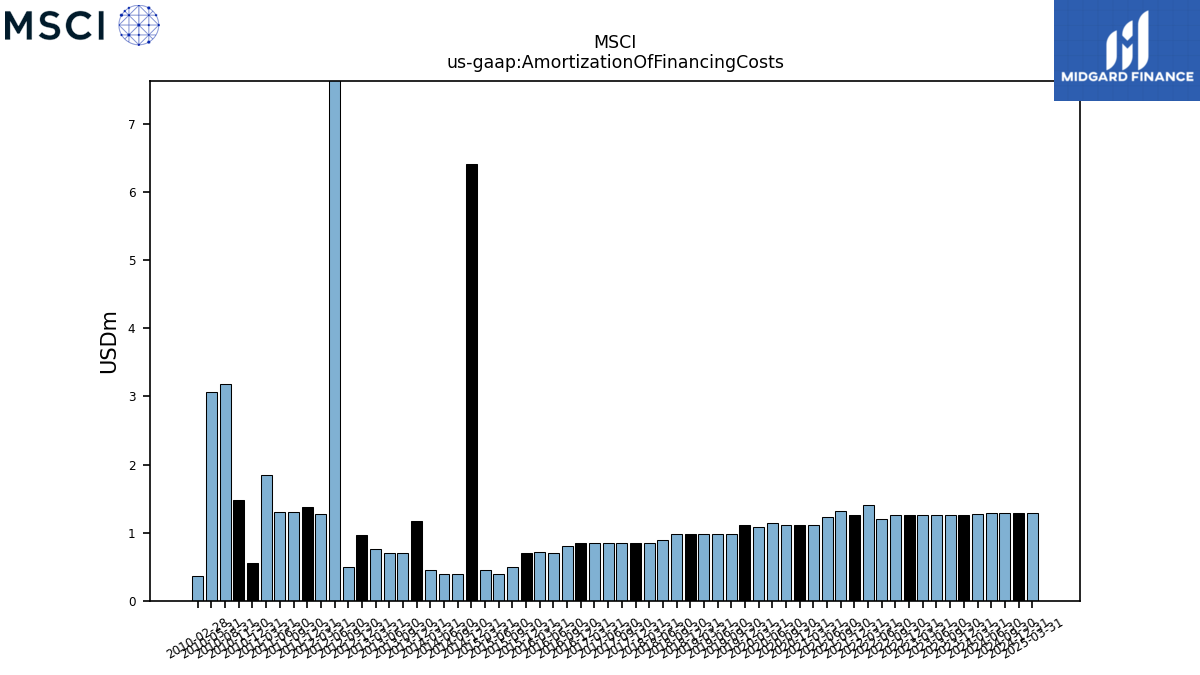
| Amortization Of Financing Costs | 1.26 | 1.26 | 1.26 | 1.26 | 1.26 | 1.26 | 1.20 | 1.40 | 1.26 | 1.32 | 1.23 | 1.11 | 1.11 | 1.11 | 1.14 | 1.09 | 1.12 | 0.99 | 0.98 | 0.99 | 0.98 | 0.99 | 0.90 | 0.85 | 0.85 | 0.85 | 0.85 | 0.85 | 0.85 | 0.80 | 0.70 | 0.71 | 0.71 | 0.50 | 0.40 | 0.45 | 6.42 | 0.40 | 0.40 | 0.45 | 1.17 | 0.70 | 0.70 | 0.76 | 0.97 | 0.50 | 15.30 | 1.27 | 1.37 | 1.30 | 1.30 | 1.85 | 0.55 | 1.48 | 3.18 | 3.07 | 0.36 | NA |
| 2023-12-31 | 2023-09-30 | 2023-06-30 | 2023-03-31 | 2022-12-31 | 2022-09-30 | 2022-06-30 | 2022-03-31 | 2021-12-31 | 2021-09-30 | 2021-06-30 | 2021-03-31 | 2020-12-31 | 2020-09-30 | 2020-06-30 | 2020-03-31 | 2019-12-31 | 2019-09-30 | 2019-06-30 | 2019-03-31 | 2018-12-31 | 2018-09-30 | 2018-06-30 | 2018-03-31 | 2017-12-31 | 2017-09-30 | 2017-06-30 | 2017-03-31 | 2016-12-31 | 2016-09-30 | 2016-06-30 | 2016-03-31 | 2015-12-31 | 2015-09-30 | 2015-06-30 | 2015-03-31 | 2014-12-31 | 2014-09-30 | 2014-06-30 | 2014-03-31 | 2013-12-31 | 2013-09-30 | 2013-06-30 | 2013-03-31 | 2012-12-31 | 2012-09-30 | 2012-06-30 | 2012-03-31 | 2011-12-31 | 2011-09-30 | 2011-06-30 | 2011-03-31 | 2010-12-31 | 2010-11-30 | 2010-08-31 | 2010-05-31 | 2010-02-28 | 2009-12-31 | ||
|---|---|---|---|---|---|---|---|---|---|---|---|---|---|---|---|---|---|---|---|---|---|---|---|---|---|---|---|---|---|---|---|---|---|---|---|---|---|---|---|---|---|---|---|---|---|---|---|---|---|---|---|---|---|---|---|---|---|---|---|
| Net Cash Provided By Used In Investing Activities | -749.97 | -20.98 | -26.67 | -21.76 | -26.92 | -18.00 | -19.10 | -15.31 | -49.83 | -963.56 | -11.96 | -10.36 | -16.89 | -11.72 | -11.54 | -201.64 | -36.65 | -14.77 | -12.39 | -8.14 | 40.04 | -13.10 | 13.80 | -5.87 | -20.60 | -11.55 | -6.26 | -9.63 | -10.54 | -13.07 | -12.90 | -5.52 | -18.33 | -12.25 | -11.96 | -6.32 | -8.66 | -35.15 | 350.91 | -10.05 | -20.81 | -14.21 | -3.79 | 42.93 | -102.97 | -25.55 | 92.08 | -57.93 | -3.98 | -41.66 | -63.85 | 18.88 | -0.71 | -37.65 | -1084.49 | 295.40 | -65.54 | NA | |
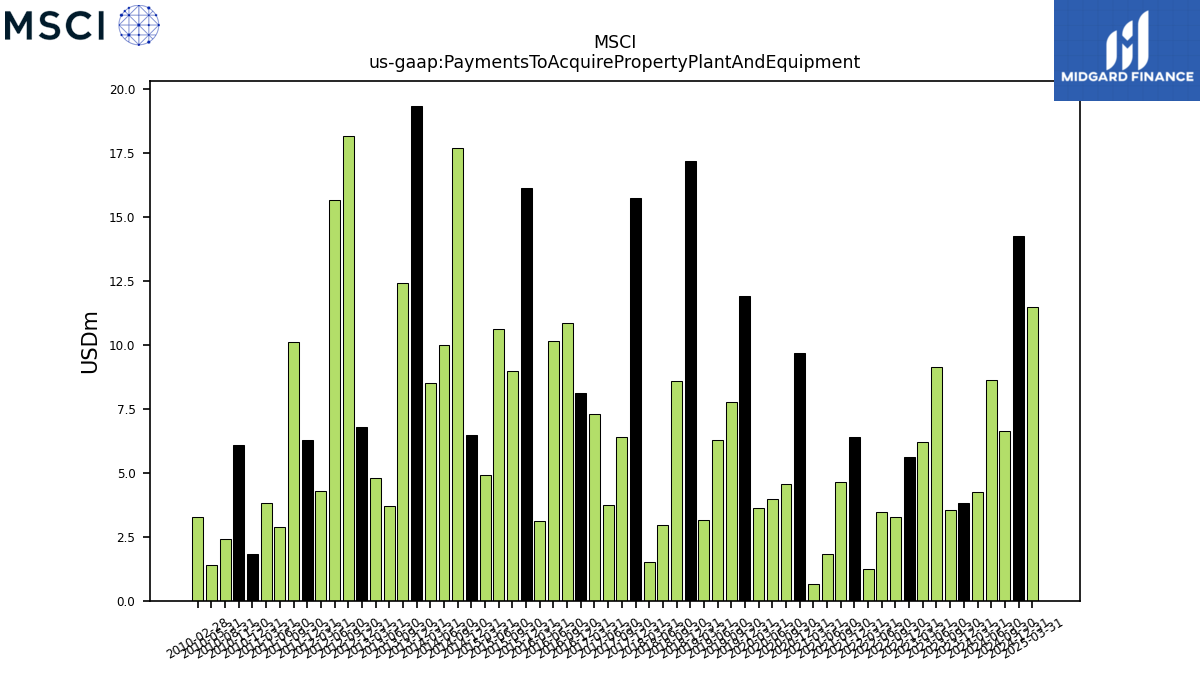
| Payments To Acquire Property Plant And Equipment | 3.81 | 3.56 | 9.15 | 6.22 | 5.61 | 3.27 | 3.48 | 1.25 | 6.39 | 4.65 | 1.81 | 0.66 | 9.67 | 4.55 | 3.98 | 3.61 | 11.90 | 7.78 | 6.28 | 3.16 | 17.19 | 8.59 | 2.97 | 1.51 | 15.74 | 6.39 | 3.73 | 7.32 | 8.14 | 10.87 | 10.14 | 3.13 | 16.13 | 8.97 | 10.62 | 4.93 | 6.49 | 17.69 | 9.98 | 8.50 | 19.36 | 12.41 | 3.69 | 4.80 | 6.78 | 18.16 | 15.65 | 4.29 | 6.27 | 10.11 | 2.90 | 3.83 | 1.81 | 6.09 | 2.40 | 1.41 | 3.29 | NA |
| 2023-12-31 | 2023-09-30 | 2023-06-30 | 2023-03-31 | 2022-12-31 | 2022-09-30 | 2022-06-30 | 2022-03-31 | 2021-12-31 | 2021-09-30 | 2021-06-30 | 2021-03-31 | 2020-12-31 | 2020-09-30 | 2020-06-30 | 2020-03-31 | 2019-12-31 | 2019-09-30 | 2019-06-30 | 2019-03-31 | 2018-12-31 | 2018-09-30 | 2018-06-30 | 2018-03-31 | 2017-12-31 | 2017-09-30 | 2017-06-30 | 2017-03-31 | 2016-12-31 | 2016-09-30 | 2016-06-30 | 2016-03-31 | 2015-12-31 | 2015-09-30 | 2015-06-30 | 2015-03-31 | 2014-12-31 | 2014-09-30 | 2014-06-30 | 2014-03-31 | 2013-12-31 | 2013-09-30 | 2013-06-30 | 2013-03-31 | 2012-12-31 | 2012-09-30 | 2012-06-30 | 2012-03-31 | 2011-12-31 | 2011-09-30 | 2011-06-30 | 2011-03-31 | 2010-12-31 | 2010-11-30 | 2010-08-31 | 2010-05-31 | 2010-02-28 | 2009-12-31 | ||
|---|---|---|---|---|---|---|---|---|---|---|---|---|---|---|---|---|---|---|---|---|---|---|---|---|---|---|---|---|---|---|---|---|---|---|---|---|---|---|---|---|---|---|---|---|---|---|---|---|---|---|---|---|---|---|---|---|---|---|---|
| Net Cash Provided By Used In Financing Activities | -111.57 | -130.31 | -553.76 | -158.29 | -172.55 | -269.89 | -16.82 | -966.12 | -91.74 | 64.39 | 11.32 | 245.54 | -229.55 | -274.43 | 65.03 | -340.08 | 413.65 | -58.77 | -49.91 | -341.63 | -707.08 | -97.76 | 304.42 | -126.06 | -33.67 | -43.25 | -65.40 | -125.23 | -300.00 | 436.43 | -139.40 | -362.31 | -276.08 | 419.45 | -96.28 | -27.14 | -29.95 | -301.53 | -1.51 | -109.34 | 1.01 | -108.50 | -7.90 | -30.46 | -112.05 | -8.31 | -202.10 | -0.52 | -43.64 | -1.38 | 4.16 | -137.13 | -1.40 | 2.17 | 1064.30 | -298.91 | -9.50 | NA | |
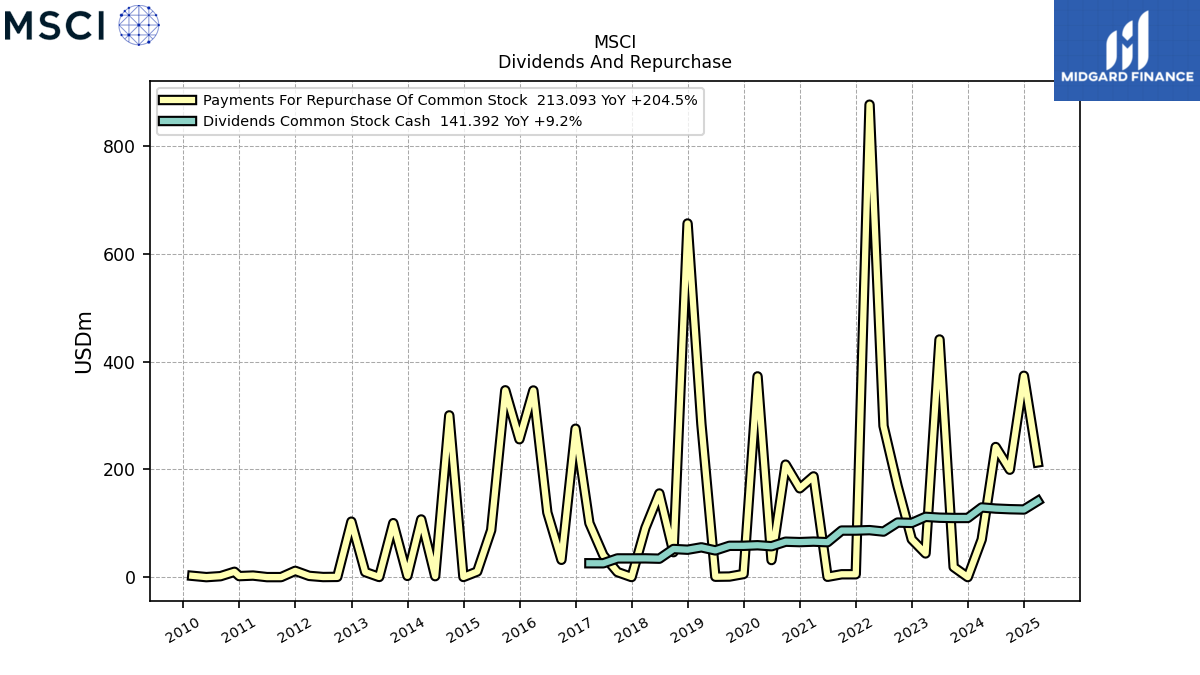
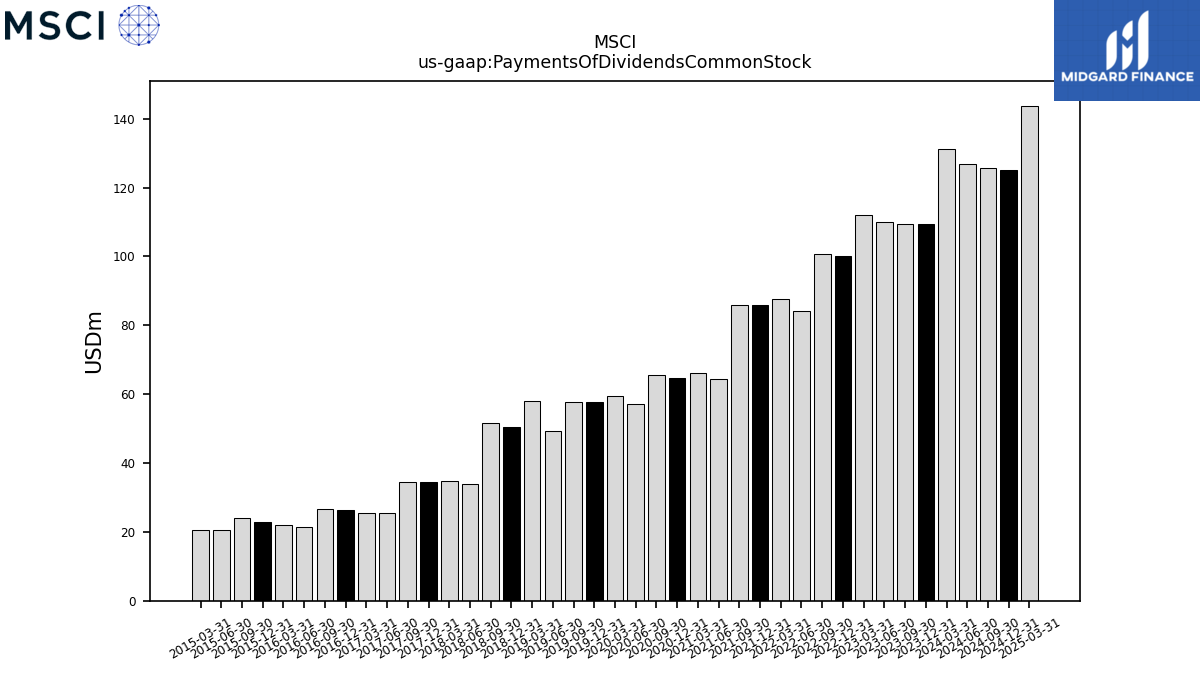
| Payments Of Dividends Common Stock | 109.35 | 109.38 | 110.11 | 112.14 | 100.16 | 100.82 | 84.17 | 87.77 | 85.95 | 85.94 | 64.47 | 66.09 | 64.60 | 65.43 | 57.03 | 59.38 | 57.84 | 57.85 | 49.34 | 57.90 | 50.41 | 51.73 | 33.92 | 34.88 | 34.41 | 34.39 | 25.43 | 25.49 | 26.26 | 26.65 | 21.39 | 21.89 | 22.75 | 24.15 | 20.44 | 20.41 | NA | NA | NA | NA | NA | NA | NA | NA | NA | NA | NA | NA | NA | NA | NA | NA | NA | NA | NA | NA | NA | NA | |
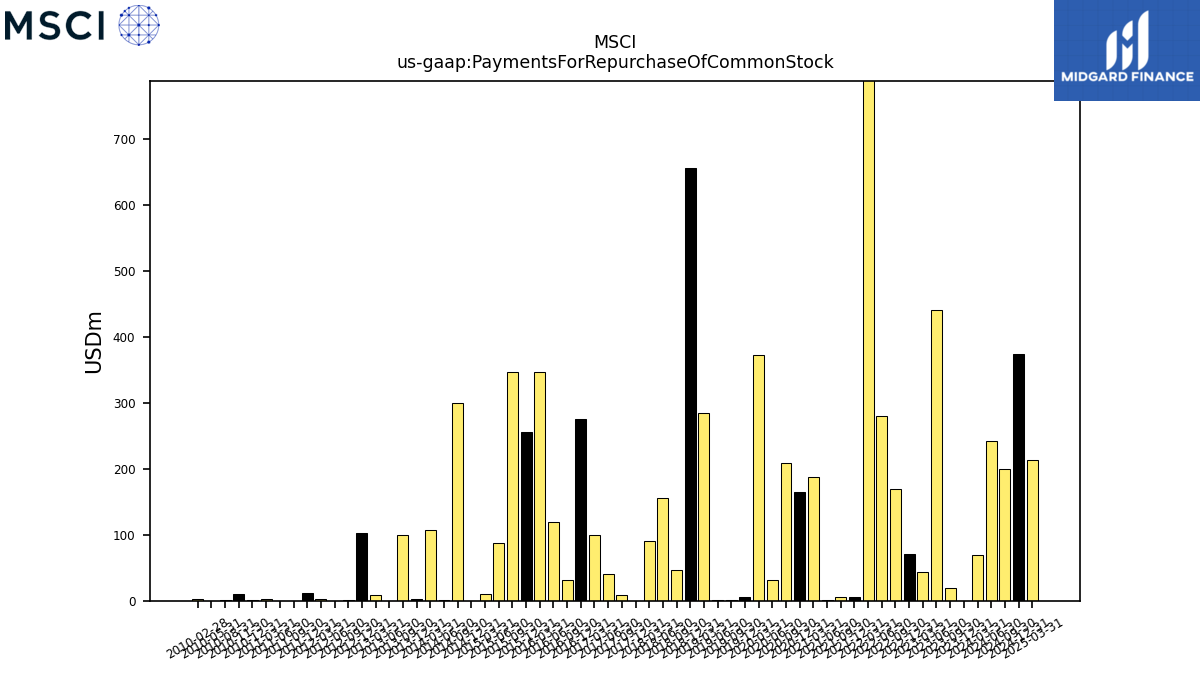
| Payments For Repurchase Of Common Stock | 0.03 | 18.74 | 441.46 | 43.96 | 70.21 | 168.78 | 280.86 | 877.66 | 5.31 | 5.29 | 0.62 | 187.15 | 164.95 | 209.00 | 31.67 | 372.89 | 5.79 | 1.08 | 0.74 | 284.47 | 656.92 | 46.27 | 155.42 | 91.28 | 0.11 | 9.37 | 40.62 | 100.36 | 275.70 | 32.12 | 120.03 | 346.71 | 256.07 | 347.07 | 87.22 | 10.35 | 0.26 | 300.49 | 1.74 | 107.16 | 2.25 | 100.29 | 0.24 | 9.40 | 103.06 | 0.44 | 0.17 | 2.31 | 11.69 | 0.03 | 0.02 | 2.90 | 1.88 | 9.94 | 1.76 | 0.00 | 2.45 | NA |
| 2023-12-31 | 2023-09-30 | 2023-06-30 | 2023-03-31 | 2022-12-31 | 2022-09-30 | 2022-06-30 | 2022-03-31 | 2021-12-31 | 2021-09-30 | 2021-06-30 | 2021-03-31 | 2020-12-31 | 2020-09-30 | 2020-06-30 | 2020-03-31 | 2019-12-31 | 2019-09-30 | 2019-06-30 | 2019-03-31 | 2018-12-31 | 2018-09-30 | 2018-06-30 | 2018-03-31 | 2017-12-31 | 2017-09-30 | 2017-06-30 | 2017-03-31 | 2016-12-31 | 2016-09-30 | 2016-06-30 | 2016-03-31 | 2015-12-31 | 2015-09-30 | 2015-06-30 | 2015-03-31 | 2014-12-31 | 2014-09-30 | 2014-06-30 | 2014-03-31 | 2013-12-31 | 2013-09-30 | 2013-06-30 | 2013-03-31 | 2012-12-31 | 2012-09-30 | 2012-06-30 | 2012-03-31 | 2011-12-31 | 2011-09-30 | 2011-06-30 | 2011-03-31 | 2010-12-31 | 2010-11-30 | 2010-08-31 | 2010-05-31 | 2010-02-28 | 2009-12-31 | ||
|---|---|---|---|---|---|---|---|---|---|---|---|---|---|---|---|---|---|---|---|---|---|---|---|---|---|---|---|---|---|---|---|---|---|---|---|---|---|---|---|---|---|---|---|---|---|---|---|---|---|---|---|---|---|---|---|---|---|---|---|
| Revenues | 690.11 | 625.44 | 621.16 | 592.22 | 576.21 | 560.64 | 551.81 | 559.95 | 549.84 | 517.10 | 498.18 | 478.42 | 443.66 | 425.33 | 409.62 | 416.78 | 406.61 | 394.25 | 385.56 | 371.38 | 361.69 | 357.93 | 363.05 | 351.32 | 334.78 | 322.10 | 316.09 | 301.21 | 292.81 | 288.43 | 290.60 | 278.83 | 272.89 | 268.77 | 270.58 | 262.77 | 251.10 | 251.66 | 254.23 | 239.69 | 267.62 | 258.24 | 257.90 | 251.91 | 247.08 | 235.44 | 238.56 | 229.05 | 226.13 | 225.03 | 226.48 | 223.30 | 72.52 | 213.32 | 202.73 | 125.17 | 121.68 | 40.49 | |
| Revenue From Contract With Customer Excluding Assessed Tax | 690.11 | 625.44 | 621.16 | 592.22 | 576.21 | 560.64 | 551.81 | 559.95 | 549.84 | 517.10 | 498.18 | 478.42 | 443.66 | 425.33 | 409.62 | 416.78 | 406.61 | 394.25 | 385.56 | 371.38 | 361.69 | 357.93 | 363.05 | 351.32 | 334.78 | 322.10 | 316.09 | 301.21 | 292.81 | 288.43 | 290.60 | 278.83 | 272.89 | 268.77 | 270.58 | 262.77 | 251.10 | 251.66 | 254.23 | 239.69 | 267.62 | 258.24 | 257.90 | 251.91 | 247.08 | 235.44 | 238.56 | 229.05 | 226.13 | 225.03 | 226.48 | 223.30 | 72.52 | 213.32 | 202.73 | 125.17 | 121.68 | 40.49 | |
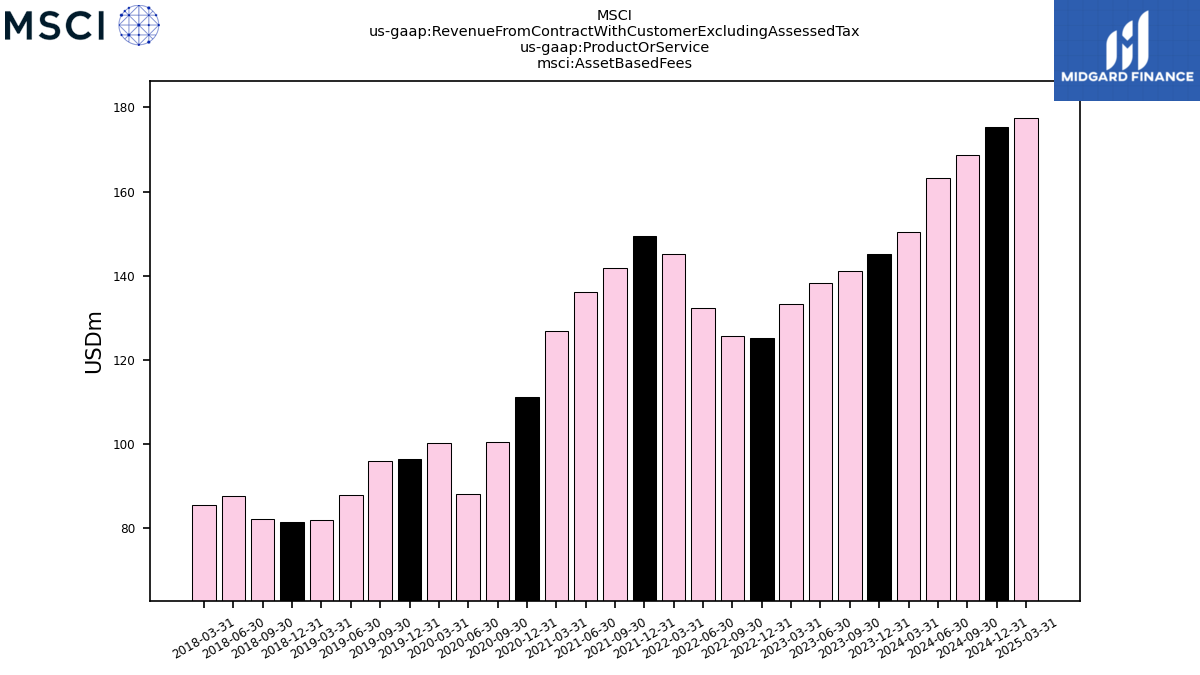
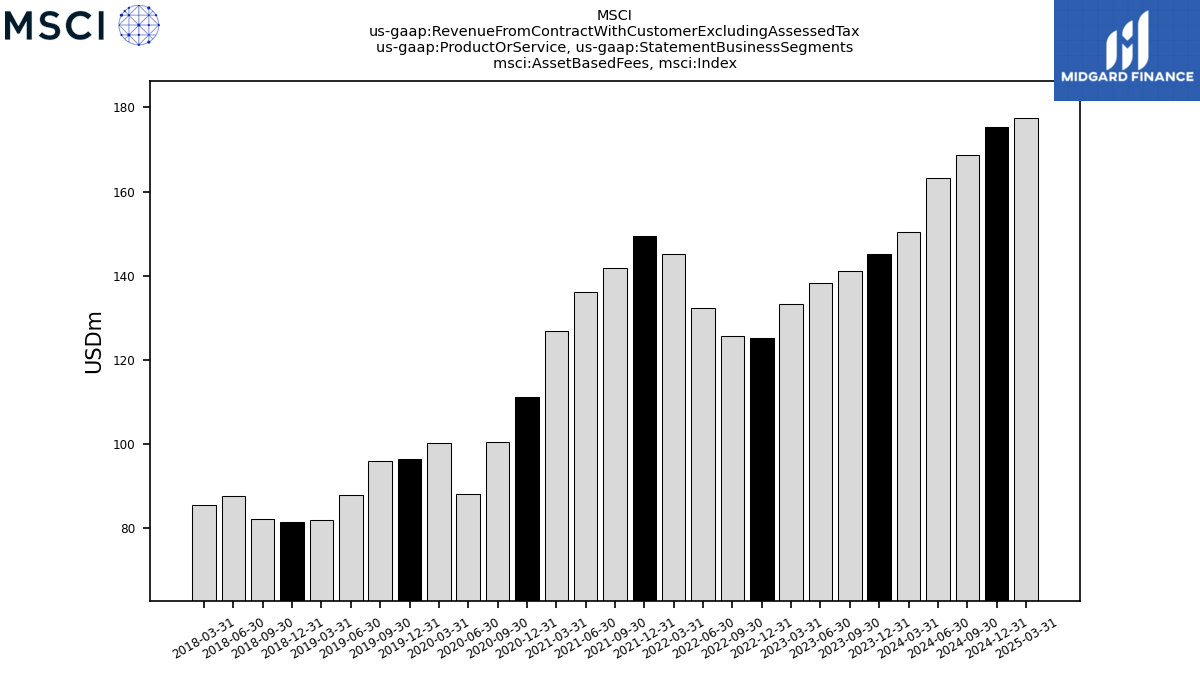
| Asset Based Fees | 145.15 | 141.07 | 138.16 | 133.13 | 125.24 | 125.62 | 132.22 | 145.05 | 149.40 | 141.75 | 136.14 | 126.71 | 111.13 | 100.37 | 88.08 | 100.20 | 96.37 | 96.01 | 87.73 | 81.81 | 81.44 | 82.01 | 87.64 | 85.48 | NA | NA | NA | NA | NA | NA | NA | NA | NA | NA | NA | NA | NA | NA | NA | NA | NA | NA | NA | NA | NA | NA | NA | NA | NA | NA | NA | NA | NA | NA | NA | NA | NA | NA | |
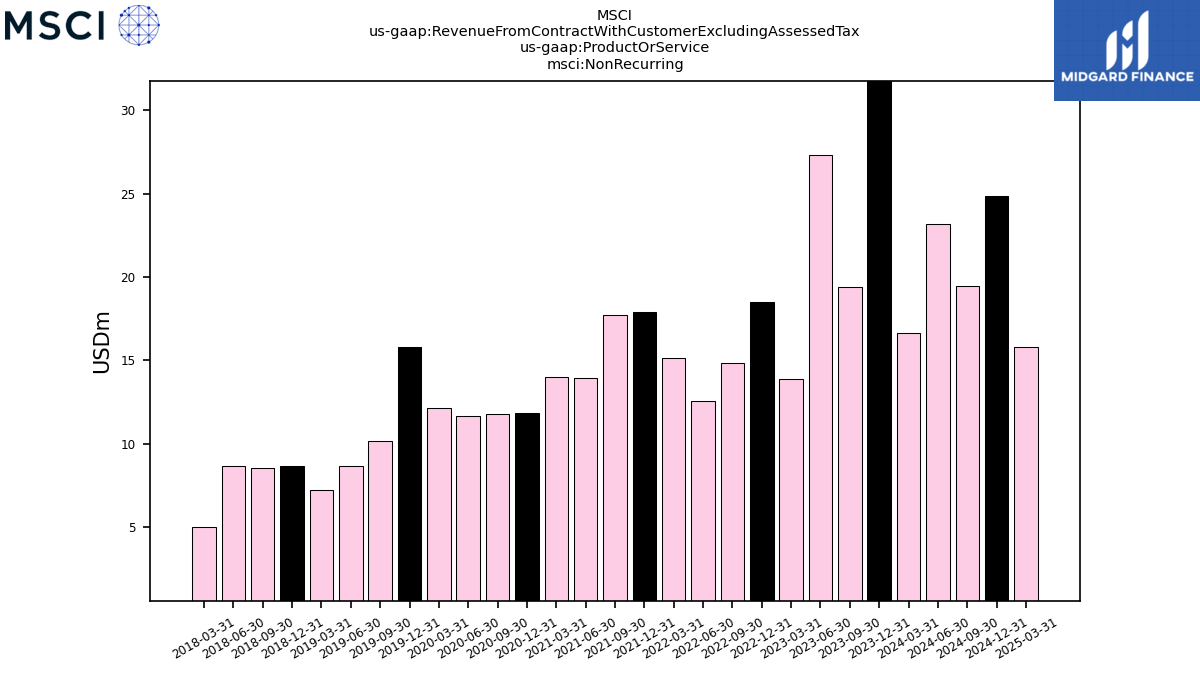
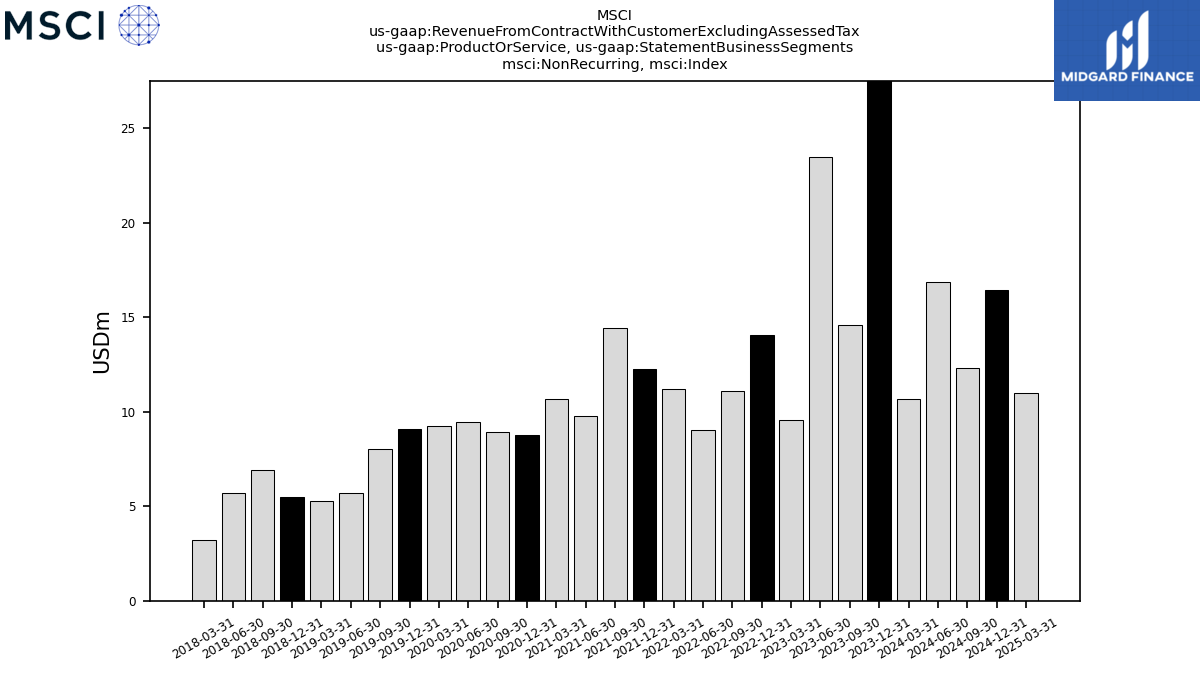
| Non Recurring | 39.60 | 19.38 | 27.30 | 13.85 | 18.47 | 14.80 | 12.54 | 15.13 | 17.91 | 17.71 | 13.91 | 13.98 | 11.86 | 11.77 | 11.66 | 12.16 | 15.81 | 10.13 | 8.68 | 7.21 | 8.64 | 8.55 | 8.67 | 5.02 | NA | NA | NA | NA | NA | NA | NA | NA | NA | NA | NA | NA | NA | NA | NA | NA | NA | NA | NA | NA | NA | NA | NA | NA | NA | NA | NA | NA | NA | NA | NA | NA | NA | NA | |
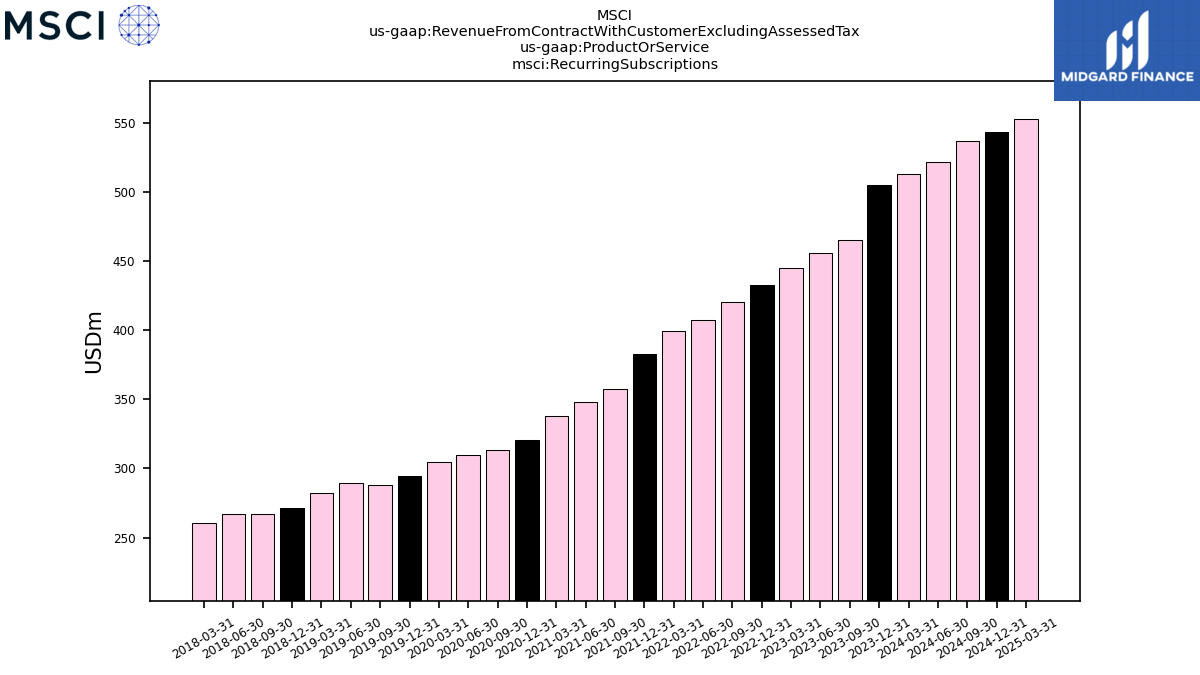
| Recurring Subscriptions | 505.35 | 465.00 | 455.69 | 445.25 | 432.50 | 420.22 | 407.05 | 399.76 | 382.54 | 357.64 | 348.13 | 337.73 | 320.68 | 313.19 | 309.88 | 304.43 | 294.42 | 288.11 | 289.15 | 282.36 | 271.61 | 267.38 | 266.74 | 260.81 | NA | NA | NA | NA | NA | NA | NA | NA | NA | NA | NA | NA | NA | NA | NA | NA | NA | NA | NA | NA | NA | NA | NA | NA | NA | NA | NA | NA | NA | NA | NA | NA | NA | NA | |
| Asset Based Fees, Index | 145.15 | 141.07 | 138.16 | 133.13 | 125.24 | 125.62 | 132.22 | 145.05 | 149.40 | 141.75 | 136.14 | 126.71 | 111.13 | 100.37 | 88.08 | 100.20 | 96.37 | 96.01 | 87.73 | 81.81 | 81.44 | 82.01 | 87.64 | 85.48 | NA | NA | NA | NA | NA | NA | NA | NA | NA | NA | NA | NA | NA | NA | NA | NA | NA | NA | NA | NA | NA | NA | NA | NA | NA | NA | NA | NA | NA | NA | NA | NA | NA | NA | |
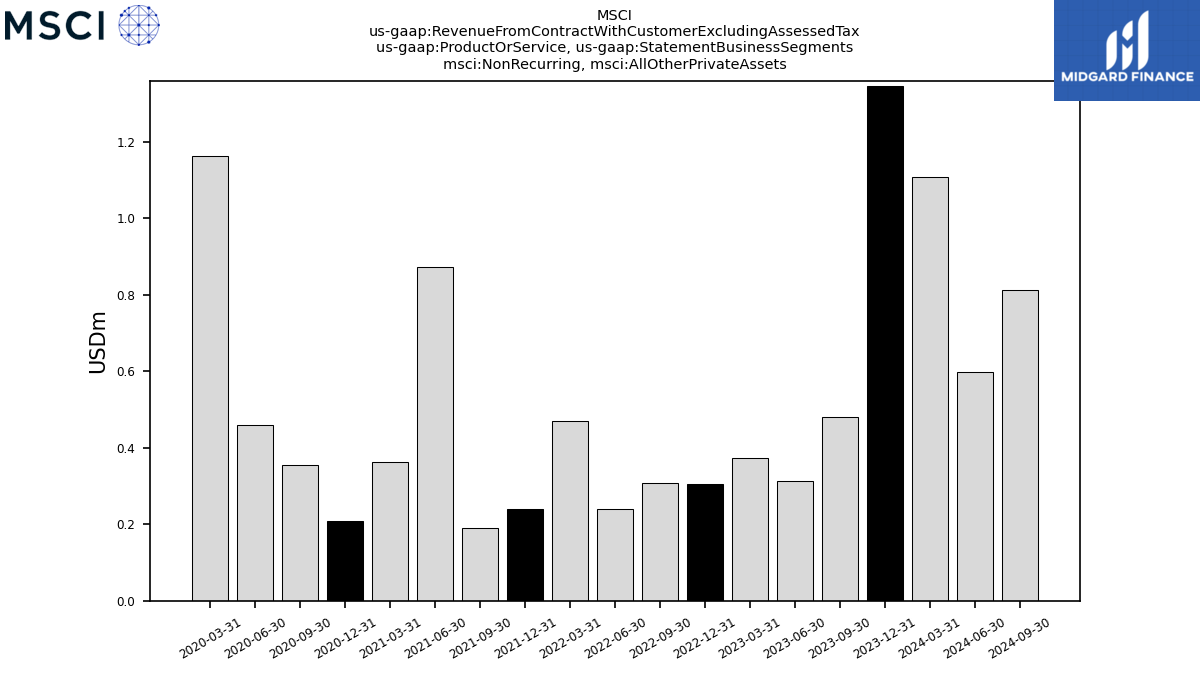
| Non Recurring, All Other Private Assets | 1.35 | 0.48 | 0.31 | 0.37 | 0.30 | 0.31 | 0.24 | 0.47 | 0.24 | 0.19 | 0.87 | 0.36 | 0.21 | 0.35 | 0.46 | 1.16 | NA | NA | NA | NA | NA | NA | NA | NA | NA | NA | NA | NA | NA | NA | NA | NA | NA | NA | NA | NA | NA | NA | NA | NA | NA | NA | NA | NA | NA | NA | NA | NA | NA | NA | NA | NA | NA | NA | NA | NA | NA | NA | |
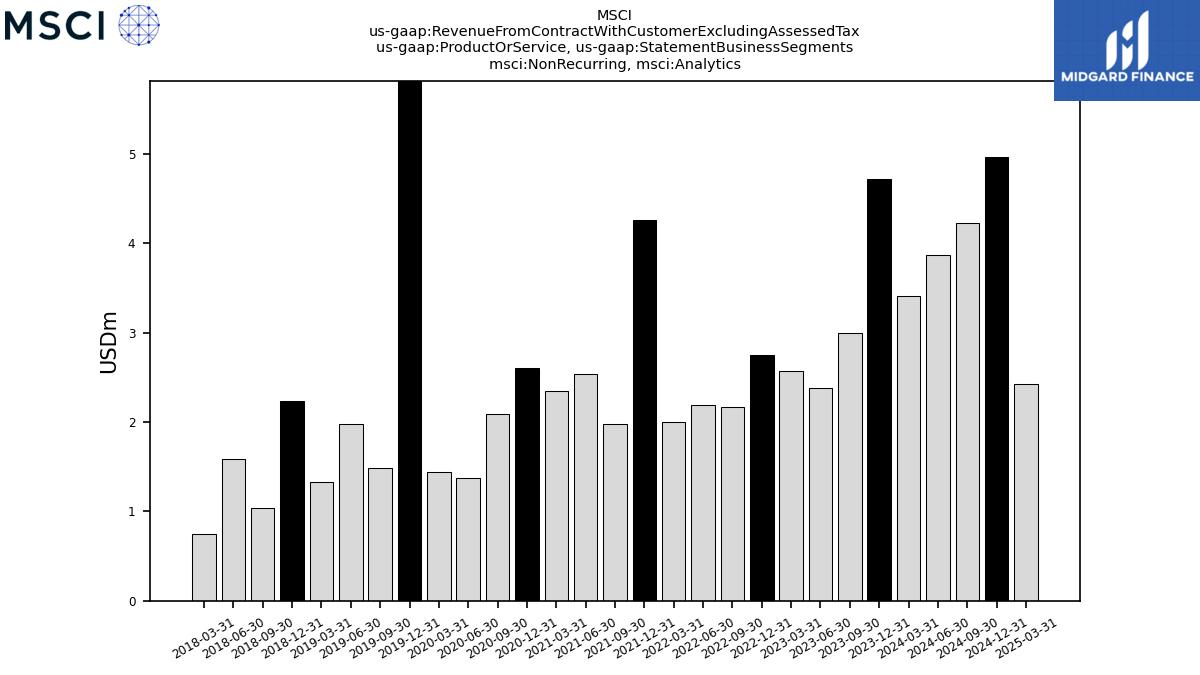
| Non Recurring, Analytics | 4.72 | 3.00 | 2.38 | 2.57 | 2.75 | 2.16 | 2.19 | 2.00 | 4.26 | 1.98 | 2.53 | 2.35 | 2.60 | 2.09 | 1.37 | 1.44 | 5.85 | 1.48 | 1.98 | 1.32 | 2.23 | 1.04 | 1.59 | 0.74 | NA | NA | NA | NA | NA | NA | NA | NA | NA | NA | NA | NA | NA | NA | NA | NA | NA | NA | NA | NA | NA | NA | NA | NA | NA | NA | NA | NA | NA | NA | NA | NA | NA | NA | |
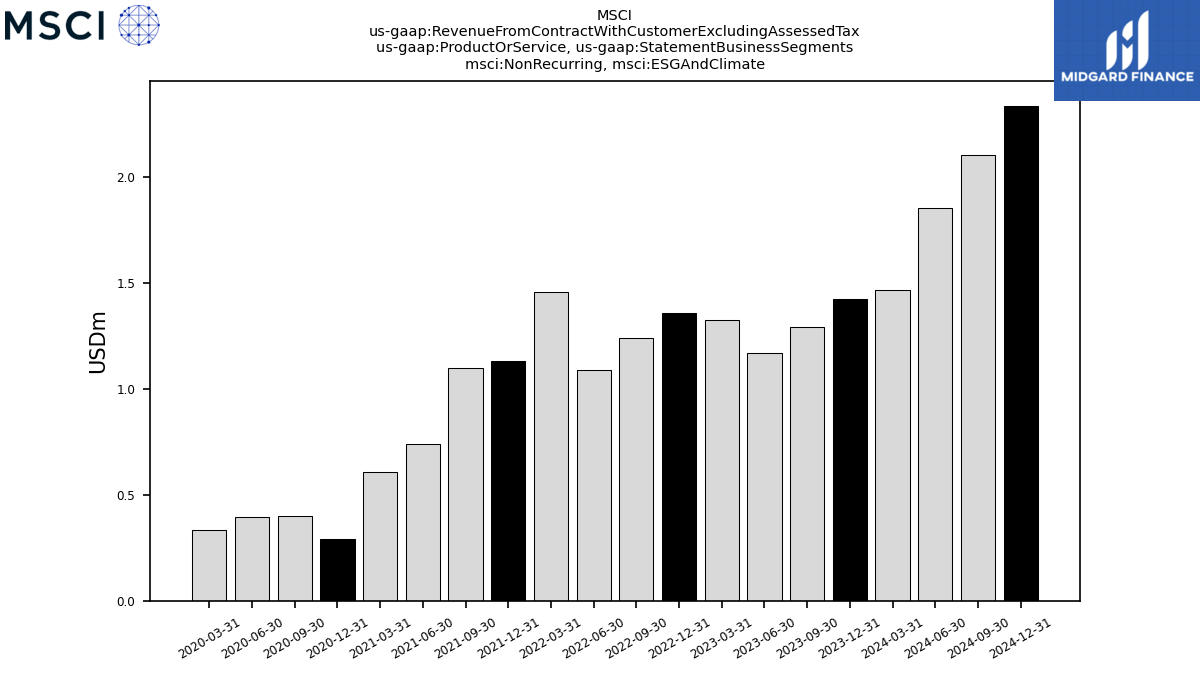
| Non Recurring, E S G And Climate | 1.43 | 1.29 | 1.17 | 1.33 | 1.36 | 1.24 | 1.09 | 1.46 | 1.13 | 1.10 | 0.74 | 0.61 | 0.29 | 0.40 | 0.39 | 0.33 | NA | NA | NA | NA | NA | NA | NA | NA | NA | NA | NA | NA | NA | NA | NA | NA | NA | NA | NA | NA | NA | NA | NA | NA | NA | NA | NA | NA | NA | NA | NA | NA | NA | NA | NA | NA | NA | NA | NA | NA | NA | NA | |
| Non Recurring, Index | 32.11 | 14.60 | 23.44 | 9.58 | 14.05 | 11.09 | 9.02 | 11.21 | 12.27 | 14.45 | 9.76 | 10.67 | 8.75 | 8.93 | 9.43 | 9.22 | 9.07 | 8.01 | 5.67 | 5.29 | 5.50 | 6.90 | 5.67 | 3.23 | NA | NA | NA | NA | NA | NA | NA | NA | NA | NA | NA | NA | NA | NA | NA | NA | NA | NA | NA | NA | NA | NA | NA | NA | NA | NA | NA | NA | NA | NA | NA | NA | NA | NA | |
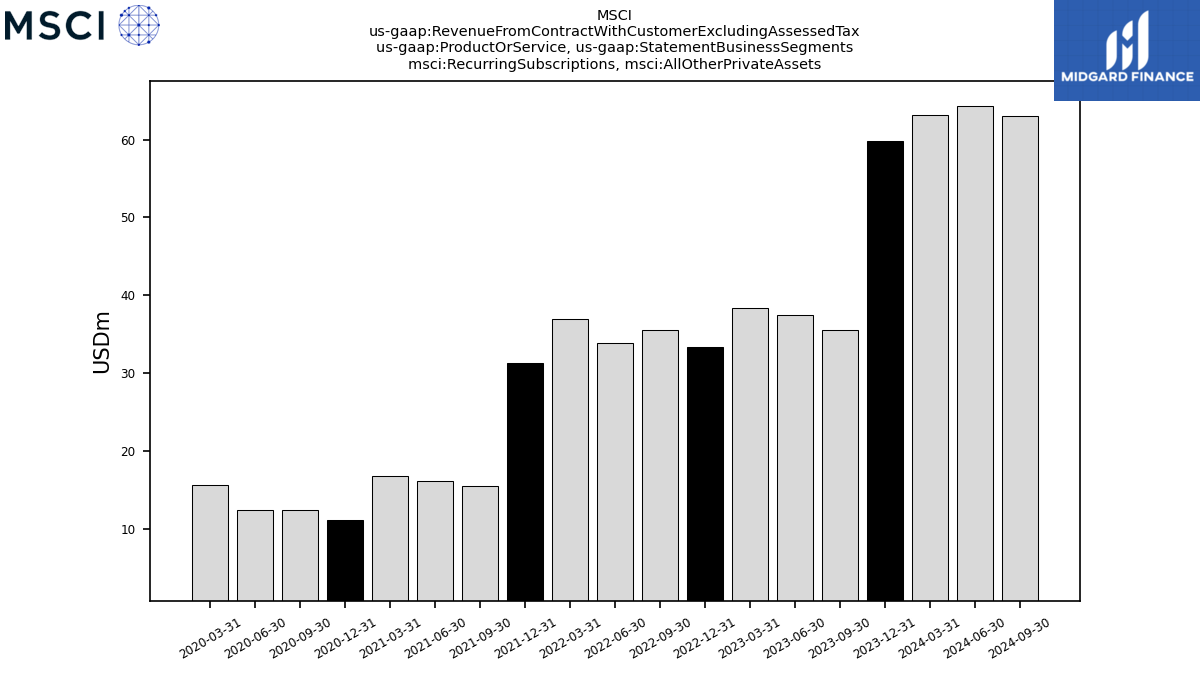
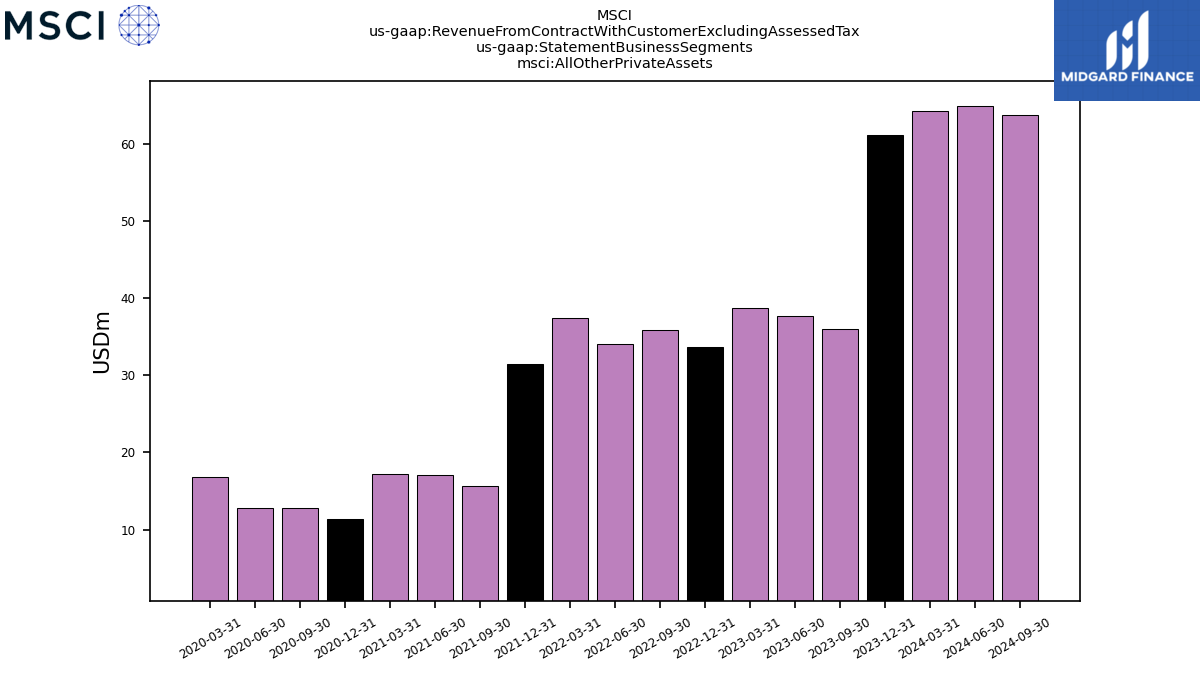
| Recurring Subscriptions, All Other Private Assets | 59.77 | 35.53 | 37.43 | 38.33 | 33.37 | 35.58 | 33.80 | 36.89 | 31.27 | 15.42 | 16.13 | 16.80 | 11.13 | 12.40 | 12.38 | 15.62 | NA | NA | NA | NA | NA | NA | NA | NA | NA | NA | NA | NA | NA | NA | NA | NA | NA | NA | NA | NA | NA | NA | NA | NA | NA | NA | NA | NA | NA | NA | NA | NA | NA | NA | NA | NA | NA | NA | NA | NA | NA | NA | |
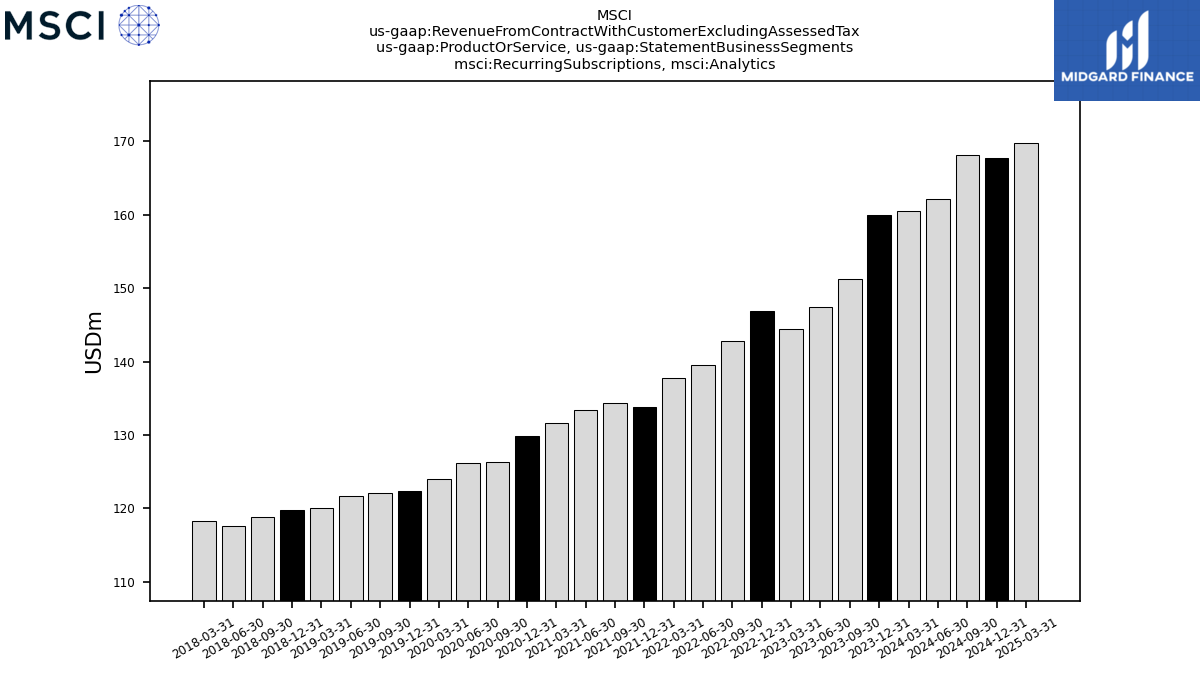
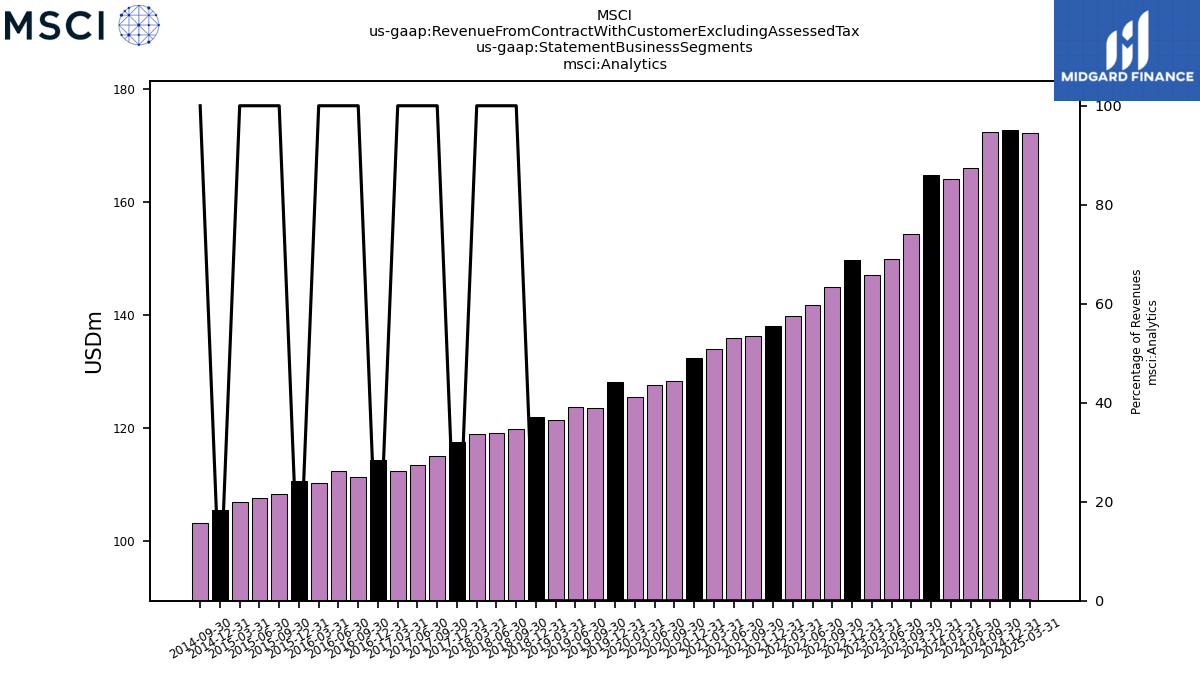
| Recurring Subscriptions, Analytics | 160.01 | 151.27 | 147.50 | 144.50 | 146.96 | 142.75 | 139.50 | 137.80 | 133.82 | 134.32 | 133.37 | 131.67 | 129.80 | 126.25 | 126.19 | 124.06 | 122.35 | 122.12 | 121.70 | 120.11 | 119.70 | 118.86 | 117.53 | 118.24 | NA | NA | NA | NA | NA | NA | NA | NA | NA | NA | NA | NA | NA | NA | NA | NA | NA | NA | NA | NA | NA | NA | NA | NA | NA | NA | NA | NA | NA | NA | NA | NA | NA | NA | |
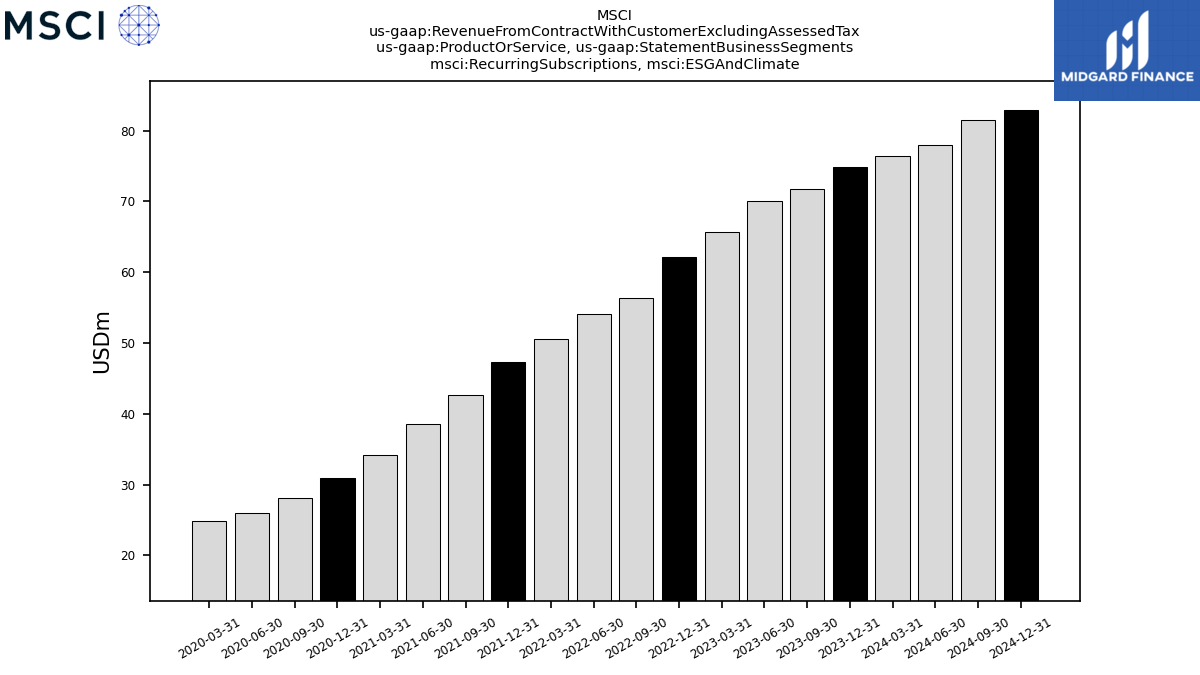
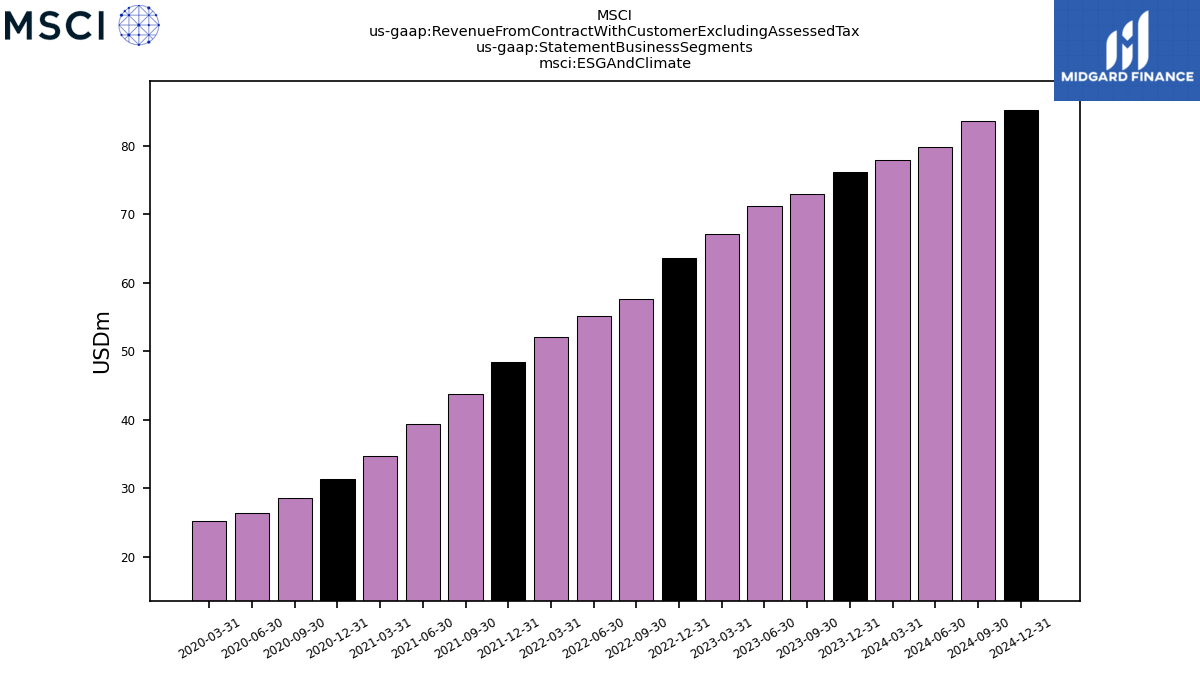
| Recurring Subscriptions, E S G And Climate | 74.83 | 71.74 | 70.05 | 65.73 | 62.20 | 56.35 | 54.04 | 50.57 | 47.31 | 42.59 | 38.57 | 34.14 | 30.98 | 28.15 | 25.91 | 24.90 | NA | NA | NA | NA | NA | NA | NA | NA | NA | NA | NA | NA | NA | NA | NA | NA | NA | NA | NA | NA | NA | NA | NA | NA | NA | NA | NA | NA | NA | NA | NA | NA | NA | NA | NA | NA | NA | NA | NA | NA | NA | NA | |
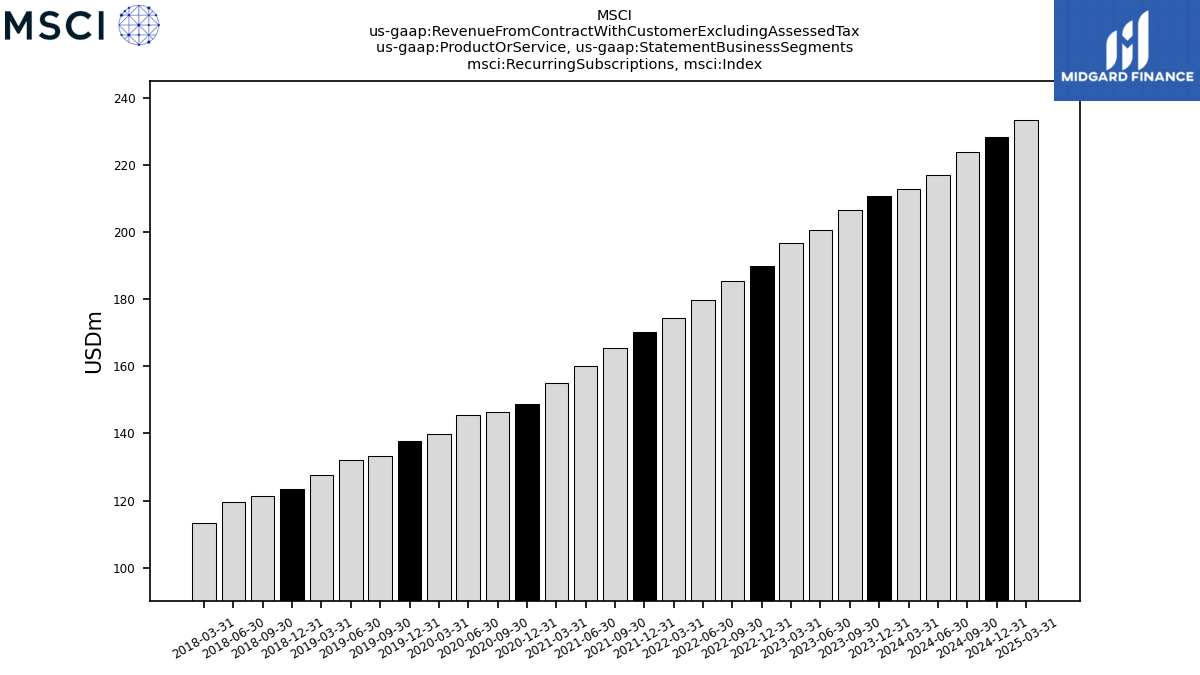
| Recurring Subscriptions, Index | 210.74 | 206.45 | 200.71 | 196.68 | 189.97 | 185.53 | 179.71 | 174.50 | 170.14 | 165.31 | 160.06 | 155.12 | 148.76 | 146.39 | 145.40 | 139.84 | 137.75 | 133.40 | 132.15 | 127.67 | 123.50 | 121.28 | 119.63 | 113.20 | NA | NA | NA | NA | NA | NA | NA | NA | NA | NA | NA | NA | NA | NA | NA | NA | NA | NA | NA | NA | NA | NA | NA | NA | NA | NA | NA | NA | NA | NA | NA | NA | NA | NA | |
| All Other Private Assets | 61.12 | 36.01 | 37.74 | 38.71 | 33.68 | 35.89 | 34.05 | 37.36 | 31.51 | 15.61 | 17.01 | 17.16 | 11.34 | 12.75 | 12.84 | 16.78 | NA | NA | NA | NA | NA | NA | NA | NA | NA | NA | NA | NA | NA | NA | NA | NA | NA | NA | NA | NA | NA | NA | NA | NA | NA | NA | NA | NA | NA | NA | NA | NA | NA | NA | NA | NA | NA | NA | NA | NA | NA | NA | |
| Analytics | 164.74 | 154.27 | 149.88 | 147.07 | 149.71 | 144.91 | 141.68 | 139.80 | 138.08 | 136.30 | 135.90 | 134.02 | 132.40 | 128.34 | 127.56 | 125.51 | 128.21 | 123.60 | 123.68 | 121.44 | 121.94 | 119.90 | 119.12 | 118.99 | 117.51 | 114.97 | 113.37 | 112.42 | 114.41 | 111.29 | 112.39 | 110.26 | 110.67 | 108.34 | 107.57 | 106.84 | 105.42 | 103.25 | NA | NA | NA | NA | NA | NA | NA | NA | NA | NA | NA | NA | NA | NA | NA | NA | NA | NA | NA | NA | |
| E S G And Climate | 76.25 | 73.04 | 71.22 | 67.06 | 63.56 | 57.59 | 55.13 | 52.03 | 48.44 | 43.69 | 39.31 | 34.75 | 31.28 | 28.55 | 26.30 | 25.23 | NA | NA | NA | NA | NA | NA | NA | NA | NA | NA | NA | NA | NA | NA | NA | NA | NA | NA | NA | NA | NA | NA | NA | NA | NA | NA | NA | NA | NA | NA | NA | NA | NA | NA | NA | NA | NA | NA | NA | NA | NA | NA | |
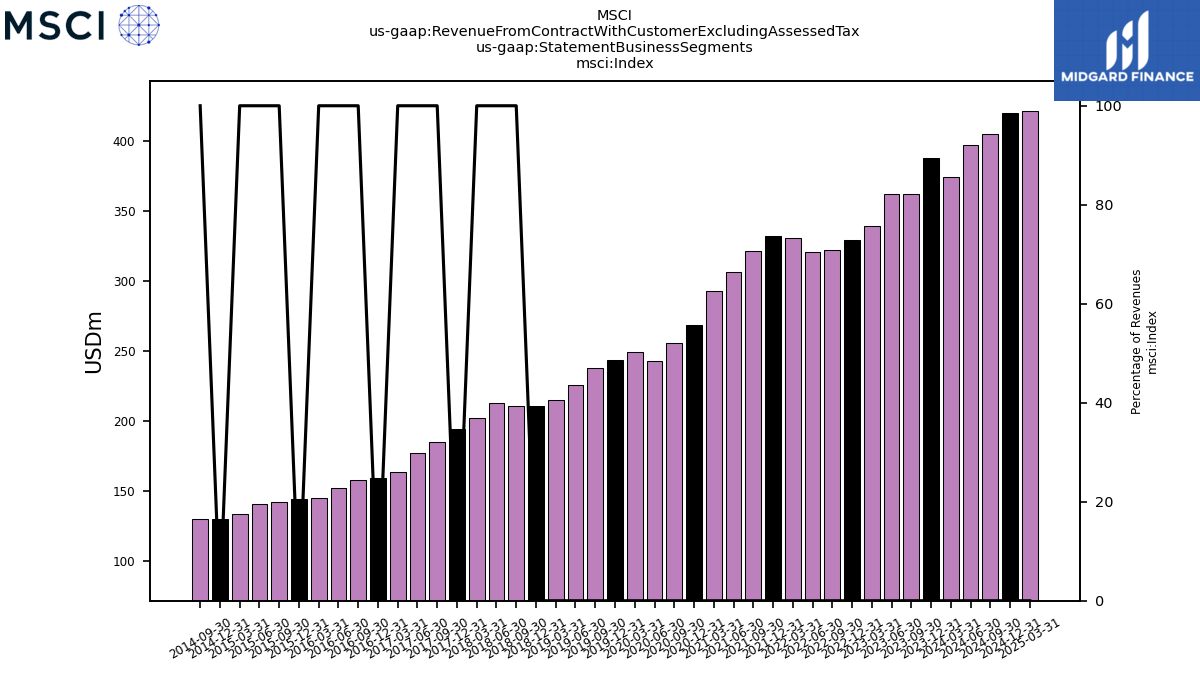
| Index | 388.00 | 362.12 | 362.32 | 339.38 | 329.26 | 322.24 | 320.95 | 330.76 | 331.81 | 321.50 | 305.96 | 292.49 | 268.64 | 255.69 | 242.91 | 249.26 | 243.19 | 237.43 | 225.55 | 214.77 | 210.43 | 210.19 | 212.93 | 201.91 | 193.77 | 184.59 | 177.16 | 163.44 | 159.07 | 157.75 | 152.12 | 144.61 | 143.70 | 141.58 | 140.13 | 133.55 | 129.46 | 129.87 | NA | NA | NA | NA | NA | NA | NA | NA | NA | NA | NA | NA | NA | NA | NA | NA | NA | NA | NA | NA | |
| 331.69 | 274.33 | 284.01 | 265.95 | 263.64 | 257.65 | 253.37 | 255.82 | 248.14 | 235.82 | 221.81 | 216.86 | 205.61 | 198.25 | 192.71 | 198.80 | 198.87 | 193.03 | 190.04 | 182.17 | 178.61 | 182.53 | 179.55 | 179.72 | 175.36 | 171.12 | 167.29 | NA | NA | NA | NA | NA | NA | NA | NA | NA | NA | NA | NA | NA | NA | NA | NA | NA | NA | NA | NA | NA | NA | NA | NA | NA | NA | NA | NA | NA | NA | NA | ||
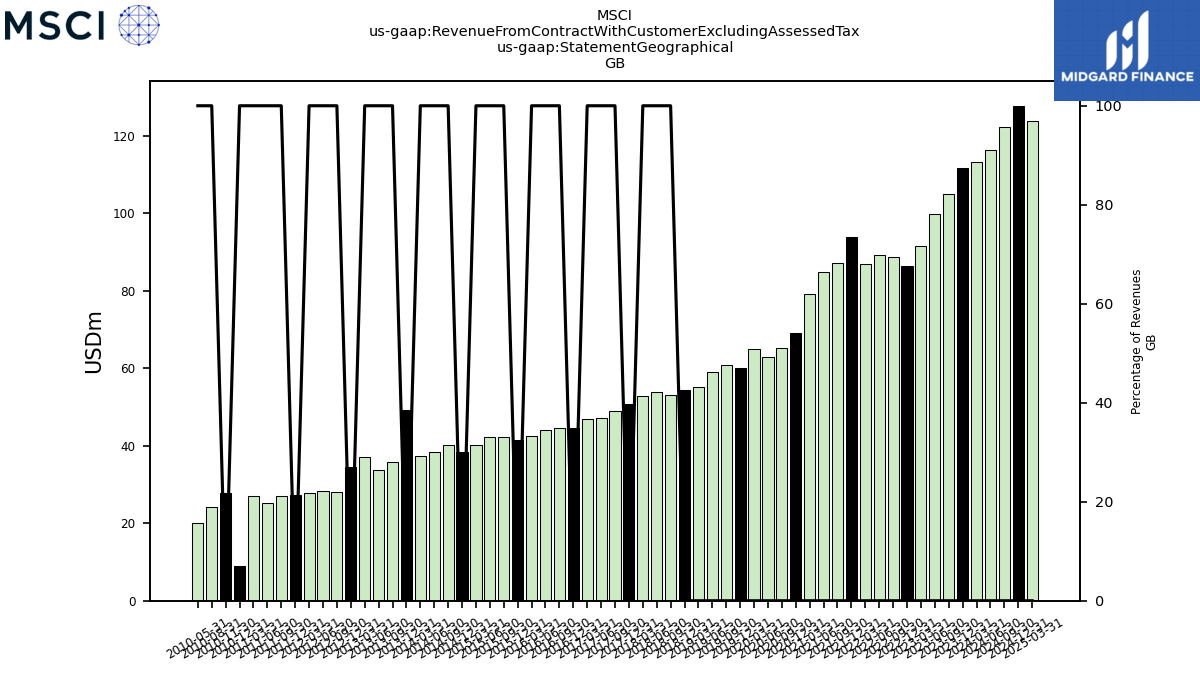
| 111.70 | 105.04 | 99.69 | 91.66 | 86.37 | 88.68 | 89.19 | 86.99 | 93.99 | 87.10 | 84.80 | 79.08 | 69.15 | 65.16 | 62.83 | 65.06 | 59.94 | 60.86 | 58.92 | 55.21 | 54.51 | 53.00 | 53.77 | 52.93 | 50.69 | 48.88 | 47.24 | 47.02 | 44.47 | 44.69 | 43.98 | 42.61 | 41.37 | 42.25 | 42.16 | 40.24 | 38.35 | 40.10 | 38.38 | 37.48 | 49.23 | 35.76 | 33.71 | 37.04 | 34.49 | 28.13 | 28.38 | 27.83 | 27.28 | 26.96 | 25.35 | 27.05 | 8.95 | 27.76 | 24.27 | 20.13 | NA | NA | ||
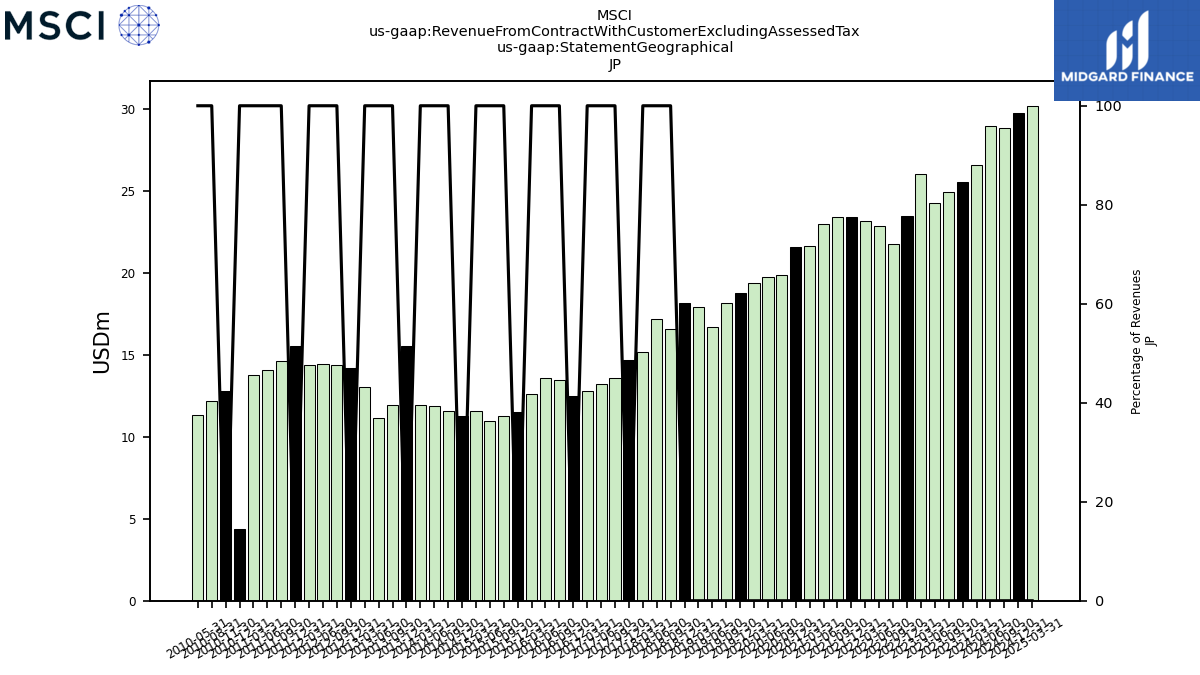
| 25.57 | 24.96 | 24.29 | 26.02 | 23.45 | 21.78 | 22.84 | 23.19 | 23.40 | 23.38 | 22.99 | 21.64 | 21.59 | 19.89 | 19.73 | 19.39 | 18.79 | 18.17 | 16.72 | 17.95 | 18.16 | 16.57 | 17.19 | 15.18 | 14.71 | 13.58 | 13.24 | 12.83 | 12.48 | 13.48 | 13.56 | 12.64 | 11.53 | 11.28 | 10.96 | 11.60 | 11.26 | 11.57 | 11.85 | 11.96 | 15.54 | 11.92 | 11.12 | 13.04 | 14.20 | 14.40 | 14.44 | 14.38 | 15.54 | 14.65 | 14.07 | 13.75 | 4.36 | 12.78 | 12.18 | 11.30 | NA | NA | ||
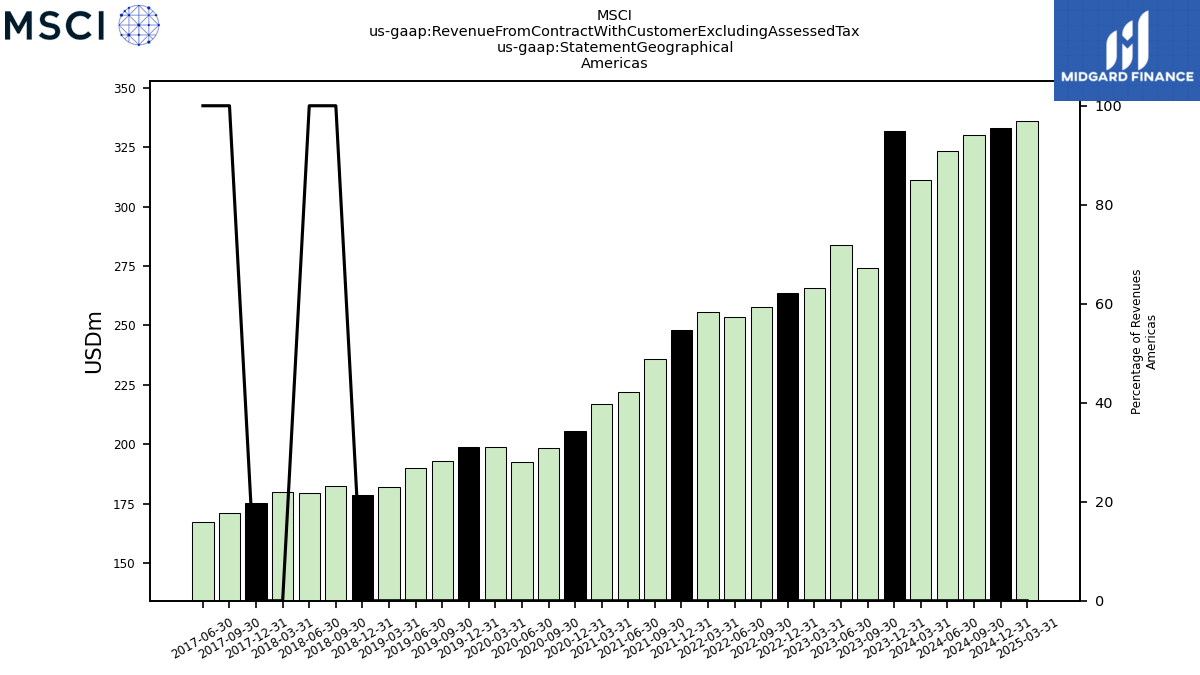
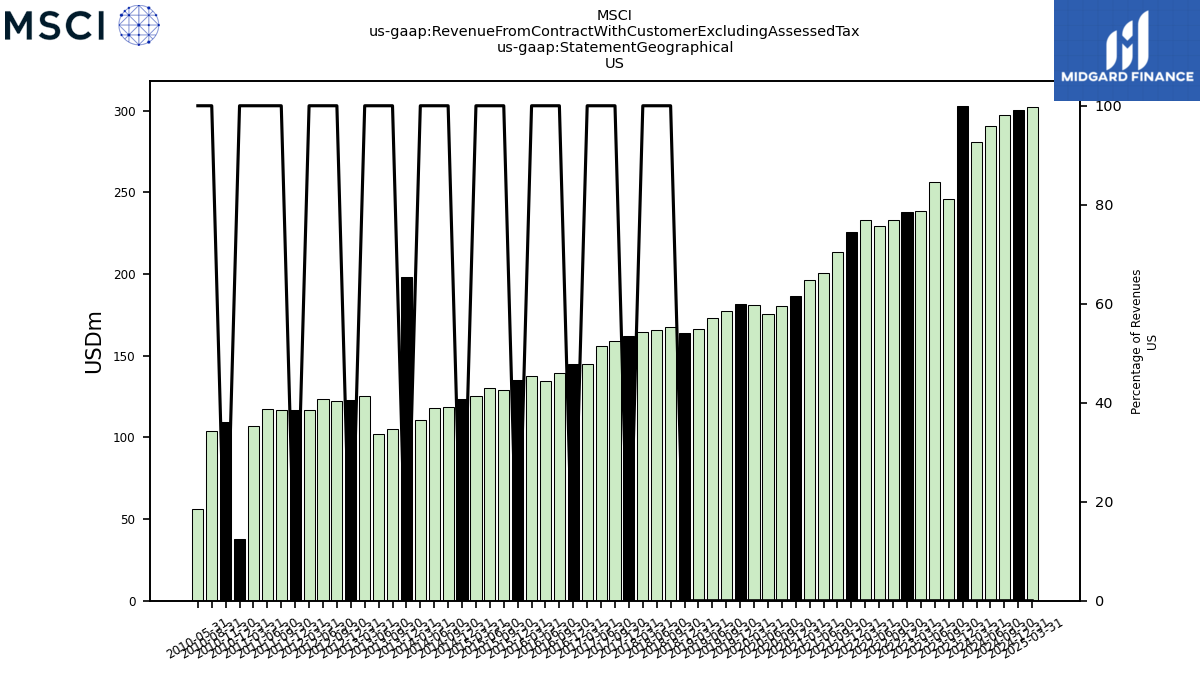
| US | 303.08 | 246.09 | 256.43 | 238.42 | 238.18 | 233.20 | 229.73 | 233.36 | 225.65 | 213.76 | 200.78 | 196.69 | 186.89 | 180.21 | 175.82 | 181.05 | 181.54 | 177.15 | 173.23 | 166.19 | 164.07 | 167.41 | 166.02 | 164.84 | 162.17 | 159.12 | 156.00 | 144.84 | 145.04 | 139.38 | 134.72 | 137.65 | 134.99 | 128.77 | 130.06 | 125.62 | 123.37 | 118.72 | 118.23 | 110.83 | 198.05 | 104.92 | 102.16 | 125.30 | 123.14 | 122.20 | 123.26 | 117.00 | 116.98 | 116.51 | 117.39 | 106.72 | 37.88 | 109.27 | 104.07 | 56.28 | NA | NA | |
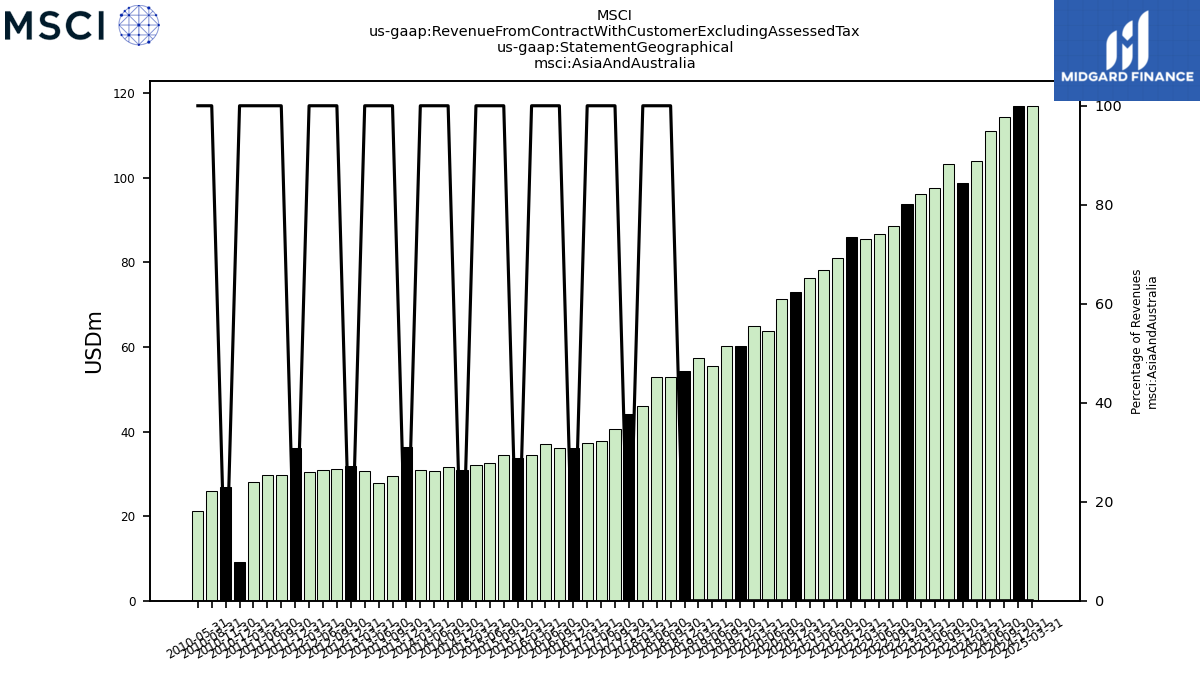
| Asia And Australia | 98.68 | 103.25 | 97.61 | 96.29 | 93.87 | 88.70 | 86.73 | 85.56 | 86.03 | 81.08 | 78.31 | 76.29 | 73.03 | 71.39 | 63.87 | 64.99 | 60.32 | 60.34 | 55.51 | 57.37 | 54.32 | 52.80 | 53.02 | 45.98 | 44.11 | 40.53 | 37.77 | 37.39 | 36.17 | 36.14 | 37.08 | 34.55 | 33.71 | 34.37 | 32.61 | 32.13 | 30.97 | 31.60 | 30.76 | 30.82 | 36.27 | 29.52 | 27.82 | 30.75 | 31.93 | 31.06 | 30.89 | 30.43 | 36.22 | 29.75 | 29.76 | 28.19 | 9.19 | 26.96 | 26.04 | 21.26 | NA | NA | |
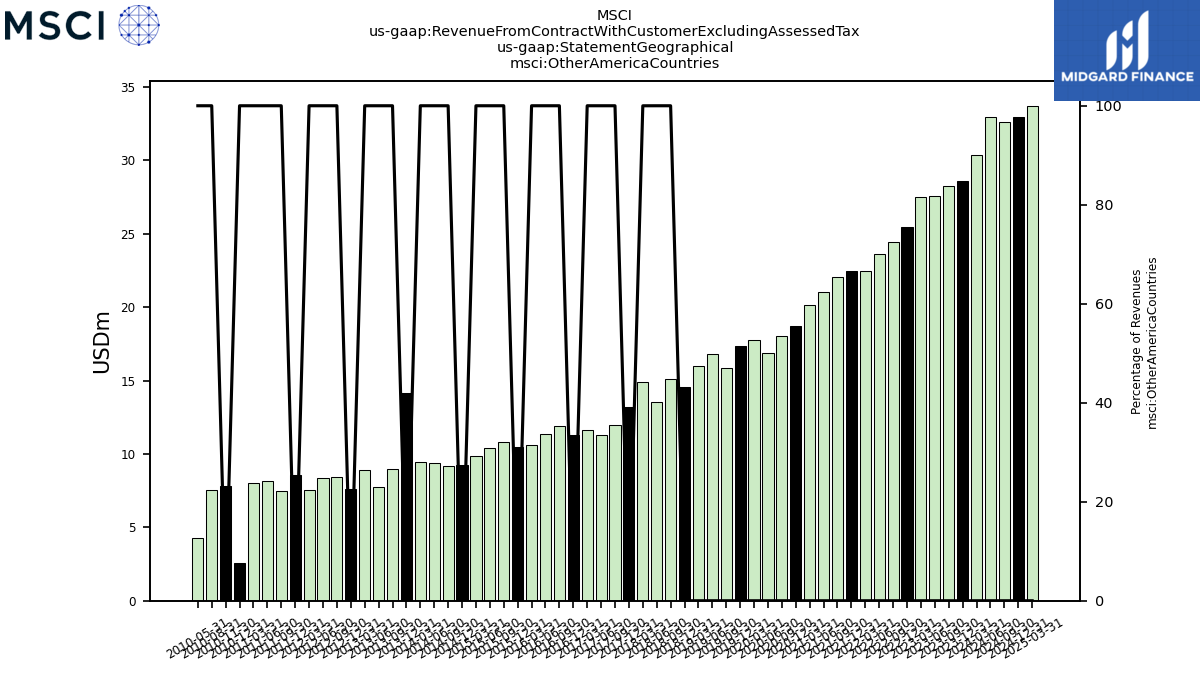
| Other America Countries | 28.61 | 28.24 | 27.57 | 27.54 | 25.46 | 24.45 | 23.64 | 22.47 | 22.48 | 22.06 | 21.03 | 20.17 | 18.72 | 18.04 | 16.89 | 17.76 | 17.33 | 15.88 | 16.81 | 15.98 | 14.54 | 15.12 | 13.53 | 14.88 | 13.19 | 12.00 | 11.30 | 11.65 | 11.31 | 11.91 | 11.39 | 10.58 | 10.51 | 10.82 | 10.38 | 9.86 | 9.23 | 9.17 | 9.36 | 9.43 | 14.12 | 8.99 | 7.77 | 8.91 | 7.62 | 8.42 | 8.37 | 7.52 | 8.57 | 7.45 | 8.14 | 8.03 | 2.58 | 7.82 | 7.58 | 4.29 | NA | NA | |
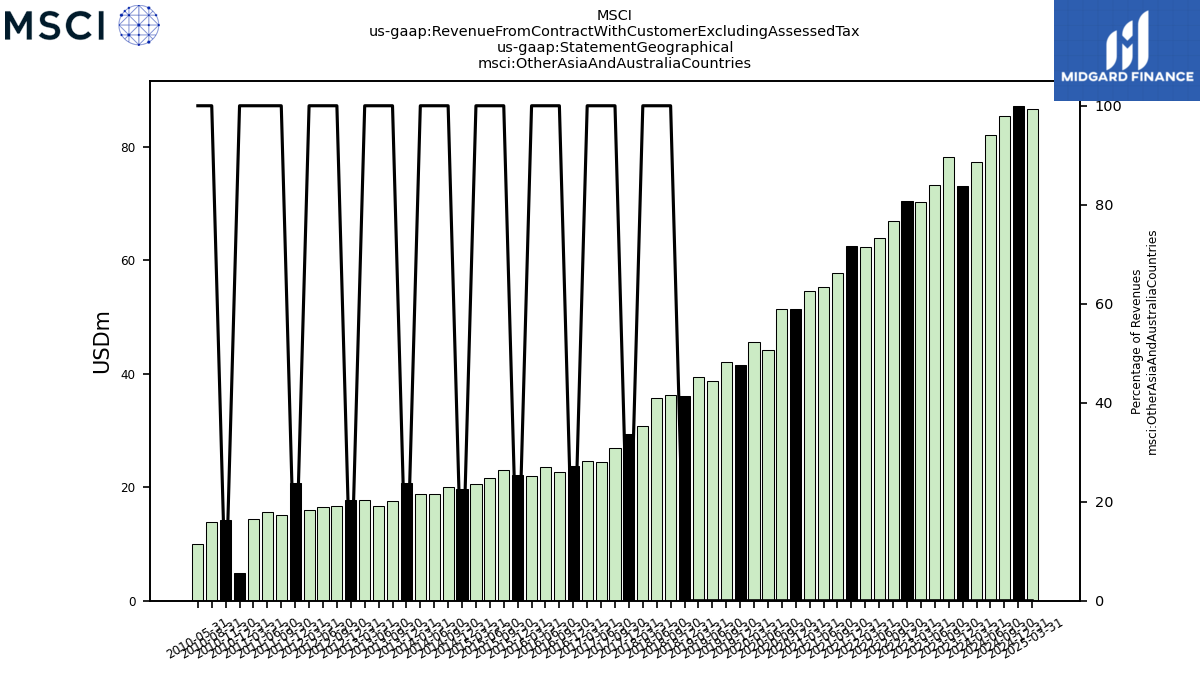
| Other Asia And Australia Countries | 73.12 | 78.29 | 73.32 | 70.27 | 70.43 | 66.92 | 63.89 | 62.37 | 62.63 | 57.70 | 55.32 | 54.64 | 51.44 | 51.51 | 44.15 | 45.60 | 41.53 | 42.17 | 38.79 | 39.42 | 36.16 | 36.23 | 35.83 | 30.80 | 29.40 | 26.95 | 24.53 | 24.56 | 23.69 | 22.67 | 23.52 | 21.91 | 22.18 | 23.09 | 21.66 | 20.53 | 19.71 | 20.02 | 18.90 | 18.86 | 20.73 | 17.60 | 16.70 | 17.71 | 17.73 | 16.66 | 16.46 | 16.05 | 20.68 | 15.09 | 15.69 | 14.44 | 4.83 | 14.18 | 13.86 | 9.95 | NA | NA | |
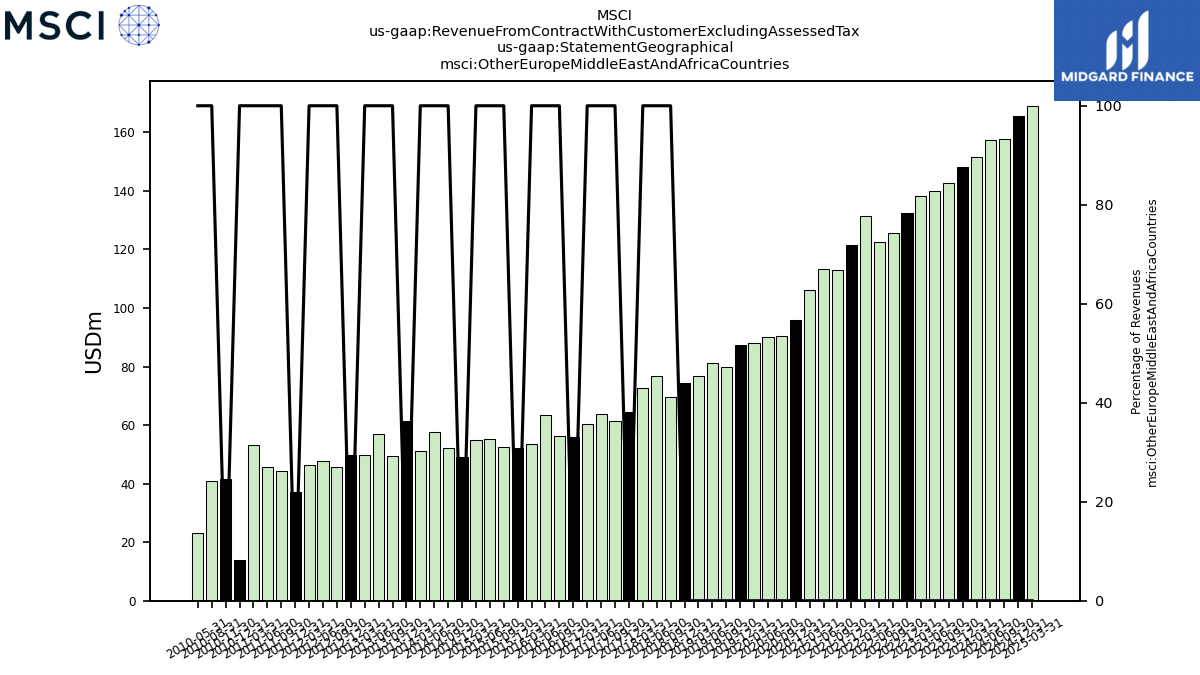
| Other Europe Middle East And Africa Countries | 148.04 | 142.83 | 139.85 | 138.32 | 132.32 | 125.61 | 122.52 | 131.57 | 121.69 | 113.10 | 113.26 | 106.19 | 95.87 | 90.54 | 90.21 | 87.93 | 87.48 | 80.02 | 81.09 | 76.64 | 74.25 | 69.60 | 76.71 | 72.69 | 64.61 | 61.57 | 63.79 | 60.30 | 55.82 | 56.32 | 63.44 | 53.44 | 52.32 | 52.56 | 55.38 | 54.93 | 49.20 | 52.07 | 57.50 | 51.13 | 61.49 | 49.42 | 56.97 | 49.91 | 49.91 | 45.64 | 47.65 | 46.27 | 37.08 | 44.36 | 45.84 | 53.32 | 13.92 | 41.51 | 40.78 | 23.22 | NA | NA | |
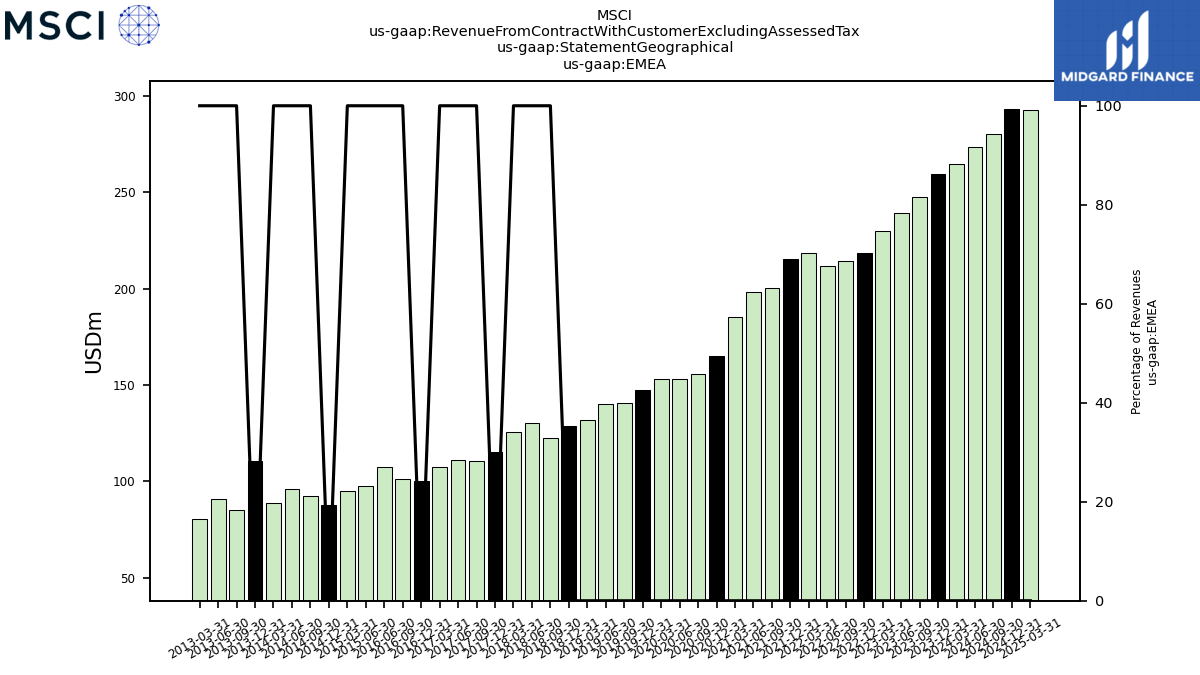
| EMEA | 259.74 | 247.86 | 239.54 | 229.98 | 218.69 | 214.29 | 211.70 | 218.56 | 215.68 | 200.20 | 198.06 | 185.28 | 165.02 | 155.69 | 153.03 | 152.99 | 147.42 | 140.88 | 140.01 | 131.84 | 128.76 | 122.60 | 130.48 | 125.62 | 115.30 | 110.44 | 111.02 | 107.33 | 100.29 | 101.01 | 107.41 | NA | NA | NA | 97.53 | 95.17 | 87.55 | 92.17 | 95.88 | 88.60 | 110.72 | 85.18 | 90.68 | 80.46 | NA | NA | NA | NA | NA | NA | NA | NA | NA | NA | NA | NA | NA | NA |