
| 2023-12-31 | 2023-09-30 | 2023-06-30 | 2023-03-31 | 2022-12-31 | 2022-09-30 | 2022-06-30 | 2022-03-31 | 2021-12-31 | 2021-09-30 | 2021-06-30 | 2021-03-31 | 2020-12-31 | 2020-09-30 | 2020-06-30 | 2020-03-31 | 2019-12-31 | 2019-09-30 | 2019-06-30 | 2019-03-31 | 2018-12-31 | 2018-09-30 | 2018-06-30 | 2018-03-31 | 2017-12-31 | 2017-09-30 | 2017-06-30 | 2017-03-31 | 2016-12-31 | 2016-09-30 | 2016-06-30 | 2016-03-31 | 2015-12-31 | 2015-09-30 | 2015-06-30 | 2015-03-31 | 2014-12-31 | 2014-09-30 | 2014-06-30 | 2014-03-31 | 2013-12-31 | 2013-09-30 | 2013-06-30 | 2013-03-31 | 2012-12-31 | 2012-09-30 | 2012-06-30 | 2012-03-31 | 2011-12-31 | 2011-09-30 | 2011-06-30 | 2011-03-31 | 2010-12-31 | 2010-09-30 | 2010-06-30 | ||
|---|---|---|---|---|---|---|---|---|---|---|---|---|---|---|---|---|---|---|---|---|---|---|---|---|---|---|---|---|---|---|---|---|---|---|---|---|---|---|---|---|---|---|---|---|---|---|---|---|---|---|---|---|---|---|---|---|
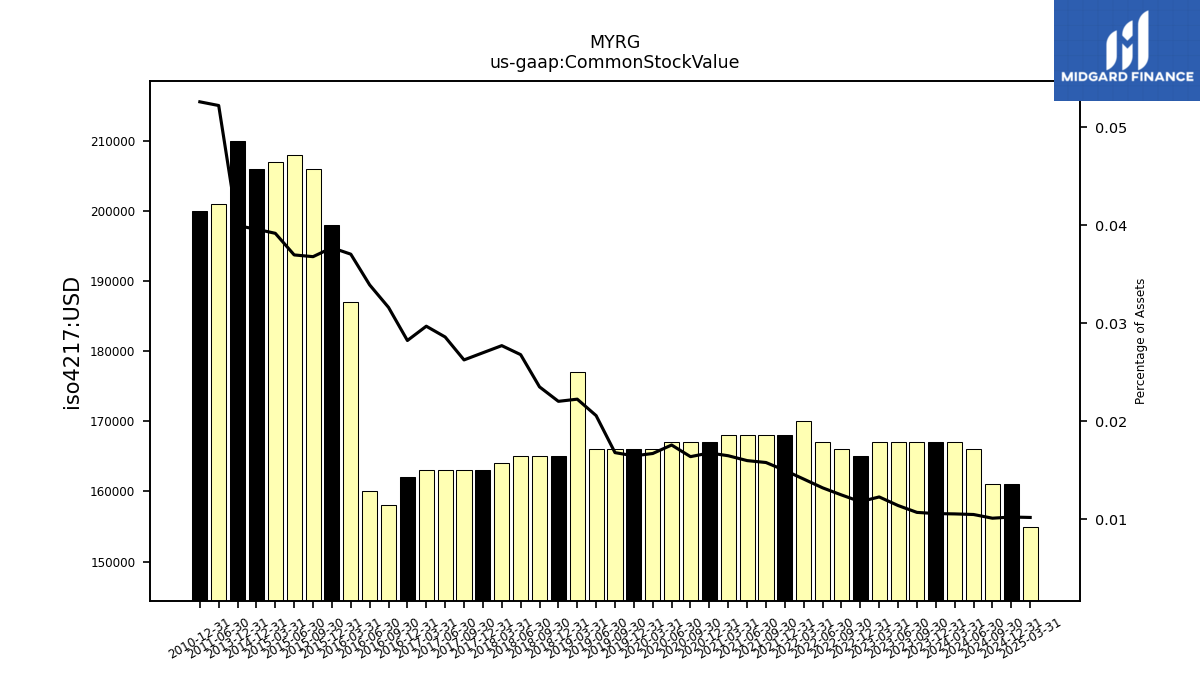
| Common Stock Value | 0.17 | 0.17 | 0.17 | 0.17 | 0.17 | 0.17 | 0.17 | 0.17 | 0.17 | 0.17 | 0.17 | 0.17 | 0.17 | 0.17 | 0.17 | 0.17 | 0.17 | 0.17 | 0.17 | 0.18 | 0.17 | 0.17 | 0.17 | 0.16 | 0.16 | 0.16 | 0.16 | 0.16 | 0.16 | 0.16 | 0.16 | 0.19 | 0.20 | 0.21 | 0.21 | 0.21 | 0.21 | NA | NA | NA | 0.21 | NA | NA | NA | NA | NA | NA | NA | NA | NA | 0.20 | NA | 0.20 | NA | NA | |
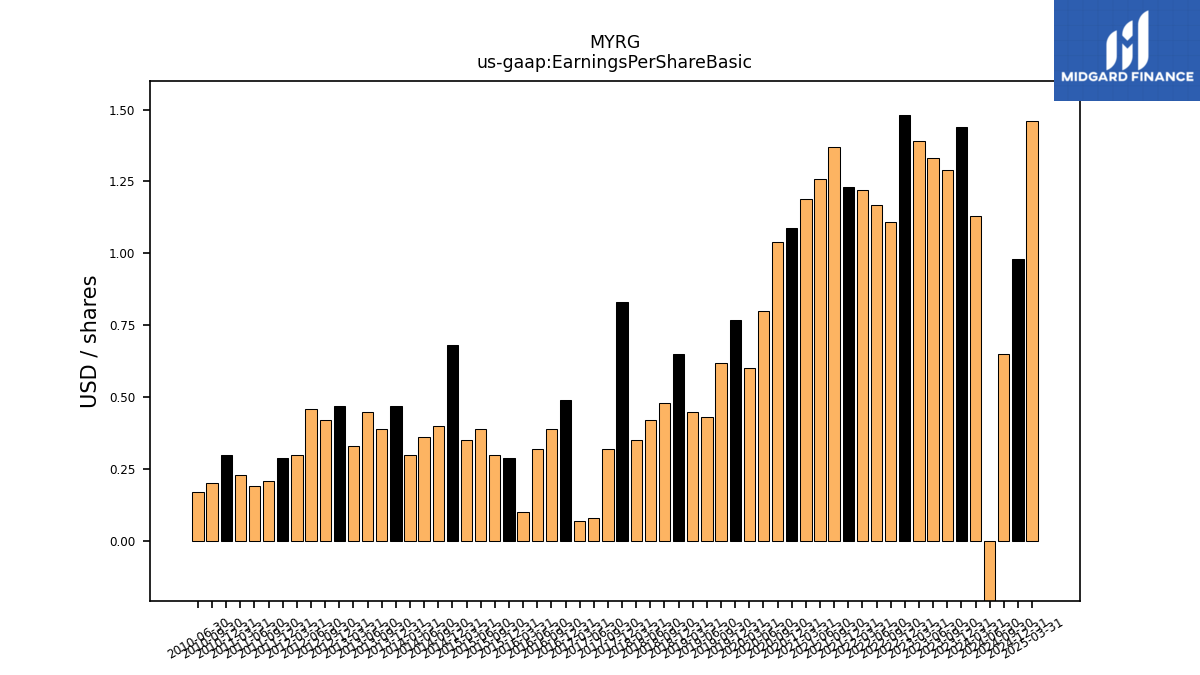
| Earnings Per Share Basic | 1.44 | 1.29 | 1.33 | 1.39 | 1.48 | 1.11 | 1.17 | 1.22 | 1.23 | 1.37 | 1.26 | 1.19 | 1.09 | 1.04 | 0.80 | 0.60 | 0.77 | 0.62 | 0.43 | 0.45 | 0.65 | 0.48 | 0.42 | 0.35 | 0.83 | 0.32 | 0.08 | 0.07 | 0.49 | 0.39 | 0.32 | 0.10 | 0.29 | 0.30 | 0.39 | 0.35 | 0.68 | 0.40 | 0.36 | 0.30 | 0.47 | 0.39 | 0.45 | 0.33 | 0.47 | 0.42 | 0.46 | 0.30 | 0.29 | 0.21 | 0.19 | 0.23 | 0.30 | 0.20 | 0.17 | |
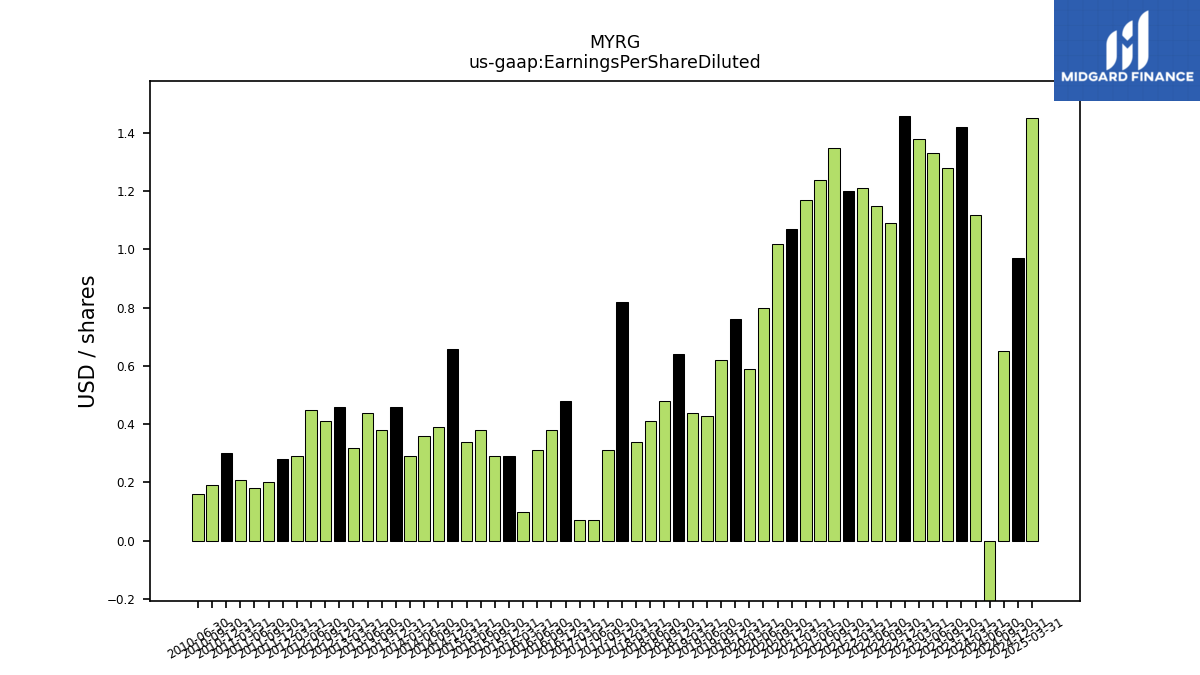
| Earnings Per Share Diluted | 1.42 | 1.28 | 1.33 | 1.38 | 1.46 | 1.09 | 1.15 | 1.21 | 1.20 | 1.35 | 1.24 | 1.17 | 1.07 | 1.02 | 0.80 | 0.59 | 0.76 | 0.62 | 0.43 | 0.44 | 0.64 | 0.48 | 0.41 | 0.34 | 0.82 | 0.31 | 0.07 | 0.07 | 0.48 | 0.38 | 0.31 | 0.10 | 0.29 | 0.29 | 0.38 | 0.34 | 0.66 | 0.39 | 0.36 | 0.29 | 0.46 | 0.38 | 0.44 | 0.32 | 0.46 | 0.41 | 0.45 | 0.29 | 0.28 | 0.20 | 0.18 | 0.21 | 0.30 | 0.19 | 0.16 |
| 2023-12-31 | 2023-09-30 | 2023-06-30 | 2023-03-31 | 2022-12-31 | 2022-09-30 | 2022-06-30 | 2022-03-31 | 2021-12-31 | 2021-09-30 | 2021-06-30 | 2021-03-31 | 2020-12-31 | 2020-09-30 | 2020-06-30 | 2020-03-31 | 2019-12-31 | 2019-09-30 | 2019-06-30 | 2019-03-31 | 2018-12-31 | 2018-09-30 | 2018-06-30 | 2018-03-31 | 2017-12-31 | 2017-09-30 | 2017-06-30 | 2017-03-31 | 2016-12-31 | 2016-09-30 | 2016-06-30 | 2016-03-31 | 2015-12-31 | 2015-09-30 | 2015-06-30 | 2015-03-31 | 2014-12-31 | 2014-09-30 | 2014-06-30 | 2014-03-31 | 2013-12-31 | 2013-09-30 | 2013-06-30 | 2013-03-31 | 2012-12-31 | 2012-09-30 | 2012-06-30 | 2012-03-31 | 2011-12-31 | 2011-09-30 | 2011-06-30 | 2011-03-31 | 2010-12-31 | 2010-09-30 | 2010-06-30 | ||
|---|---|---|---|---|---|---|---|---|---|---|---|---|---|---|---|---|---|---|---|---|---|---|---|---|---|---|---|---|---|---|---|---|---|---|---|---|---|---|---|---|---|---|---|---|---|---|---|---|---|---|---|---|---|---|---|---|
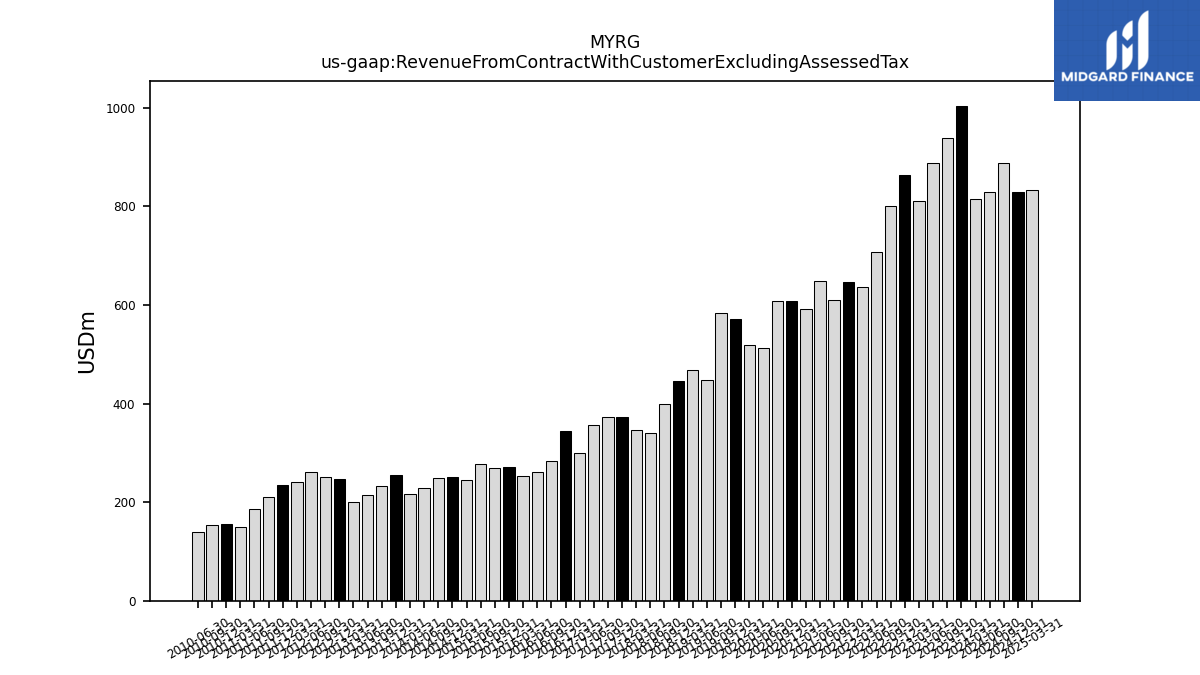
| Revenue From Contract With Customer Excluding Assessed Tax | 1004.20 | 939.48 | 888.62 | 811.62 | 863.96 | 799.85 | 708.11 | 636.62 | 646.05 | 610.18 | 649.57 | 592.49 | 607.97 | 607.90 | 513.05 | 518.47 | 571.08 | 583.21 | 448.78 | 468.09 | 446.35 | 399.54 | 339.68 | 345.61 | 373.50 | 373.50 | 356.19 | 300.13 | 343.66 | 283.26 | 261.93 | 253.63 | 271.18 | 269.86 | 276.49 | 244.15 | 250.98 | 248.47 | 228.88 | 215.64 | 254.58 | 232.89 | 213.92 | 201.34 | 247.76 | 250.56 | 260.41 | 240.23 | 234.26 | 210.49 | 185.31 | 150.29 | 155.14 | 152.77 | 140.28 | |
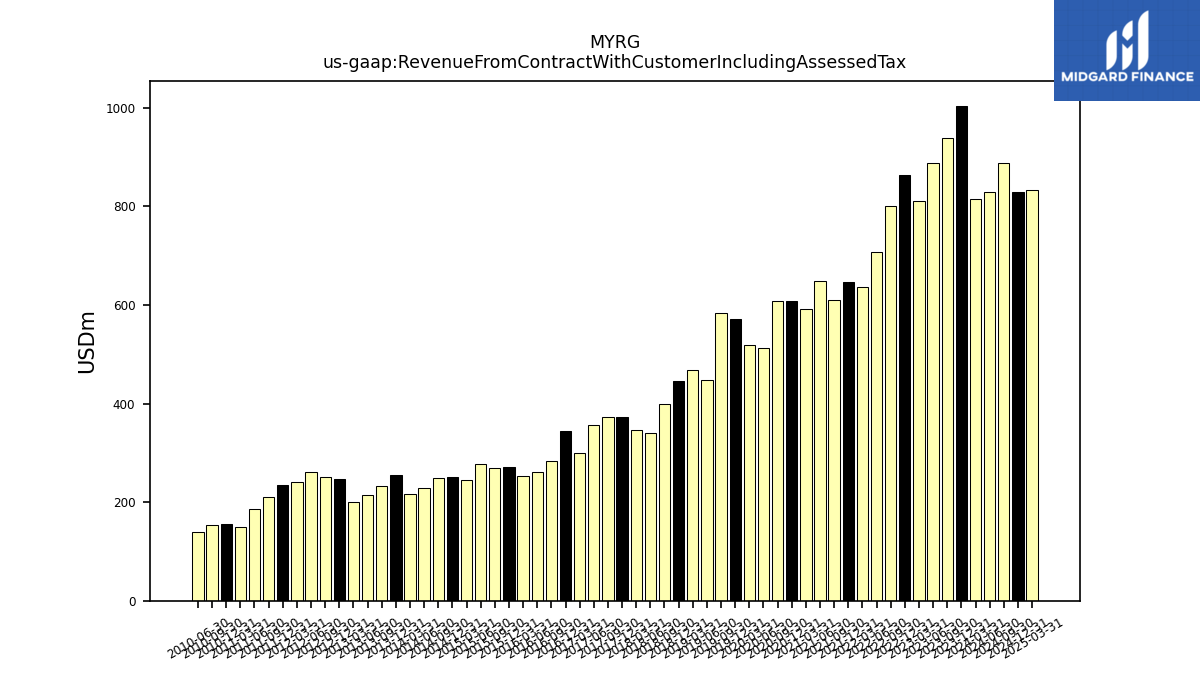
| Revenue From Contract With Customer Including Assessed Tax | 1004.20 | 939.48 | 888.62 | 811.62 | 863.96 | 799.85 | 708.11 | 636.62 | 646.05 | 610.18 | 649.57 | 592.49 | 607.97 | 607.90 | 513.05 | 518.47 | 571.08 | 583.21 | 448.78 | 468.09 | 446.35 | 399.54 | 339.68 | 345.61 | 373.50 | 373.50 | 356.19 | 300.13 | 343.66 | 283.26 | 261.93 | 253.63 | 271.18 | 269.86 | 276.49 | 244.15 | 250.98 | 248.47 | 228.88 | 215.64 | 254.58 | 232.89 | 213.92 | 201.34 | 247.76 | 250.56 | 260.41 | 240.23 | 234.26 | 210.49 | 185.31 | 150.29 | 155.14 | 152.77 | 140.28 | |
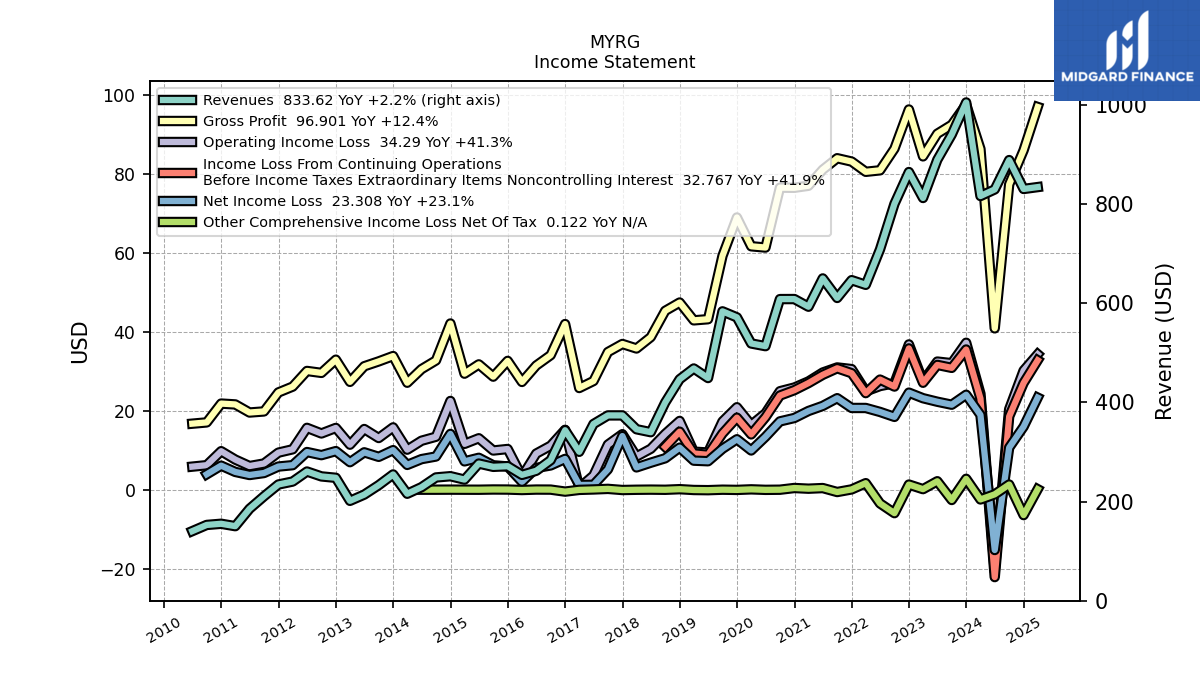
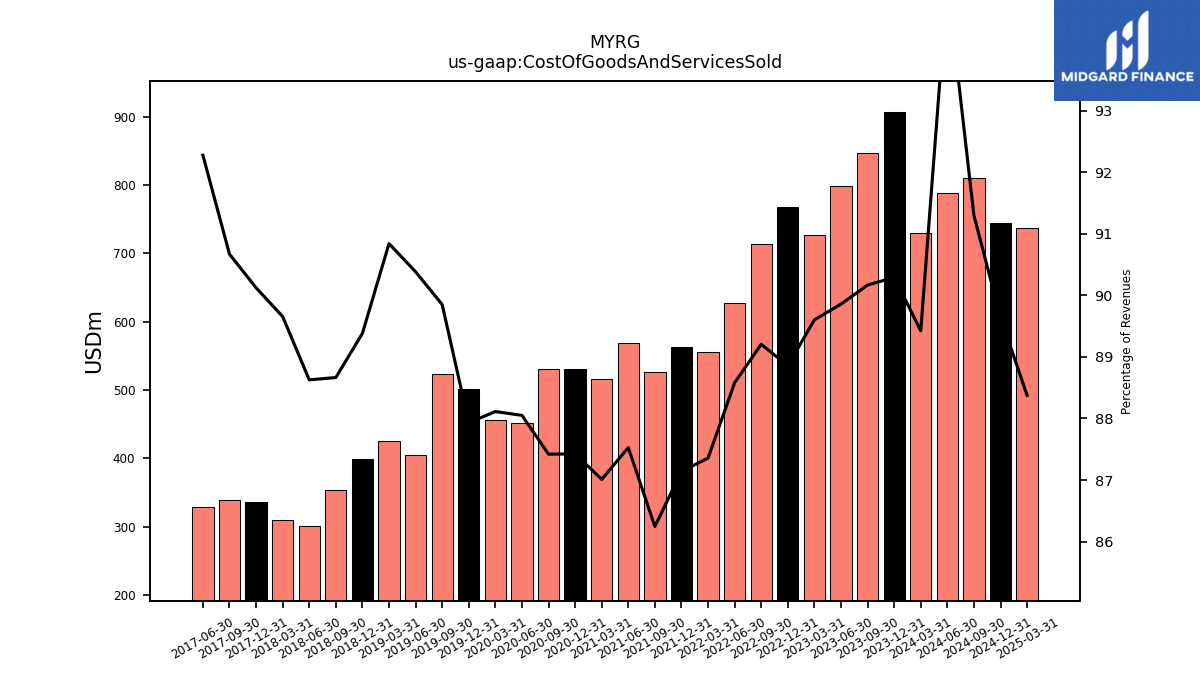
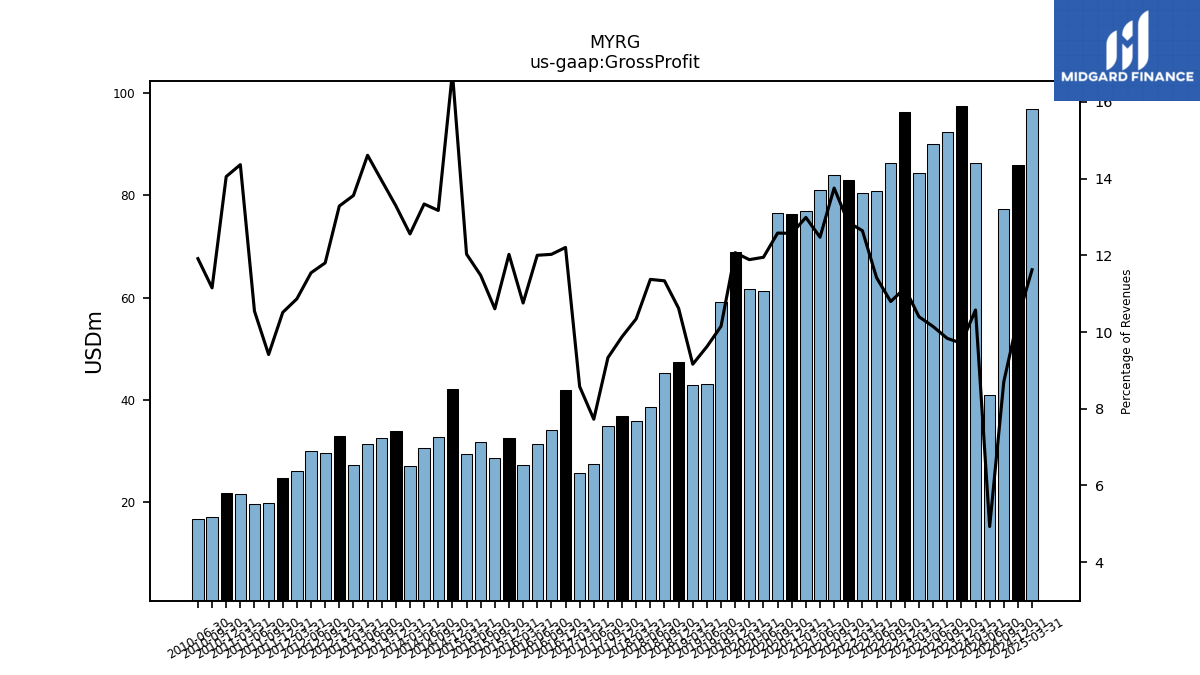
| Revenues | 1004.20 | 939.48 | 888.62 | 811.62 | 863.96 | 799.85 | 708.11 | 636.62 | 646.05 | 610.18 | 649.57 | 592.49 | 607.97 | 607.90 | 513.05 | 518.47 | 571.08 | 583.21 | 448.78 | 468.09 | 446.35 | 399.54 | 339.68 | 345.61 | 373.50 | 373.50 | 356.19 | 300.13 | 343.66 | 283.26 | 261.93 | 253.63 | 271.18 | 269.86 | 276.49 | 244.15 | 250.98 | 248.47 | 228.88 | 215.64 | 254.58 | 232.89 | 213.92 | 201.34 | 247.76 | 250.56 | 260.41 | 240.23 | 234.26 | 210.49 | 185.31 | 150.29 | 155.14 | 152.77 | 140.28 | |
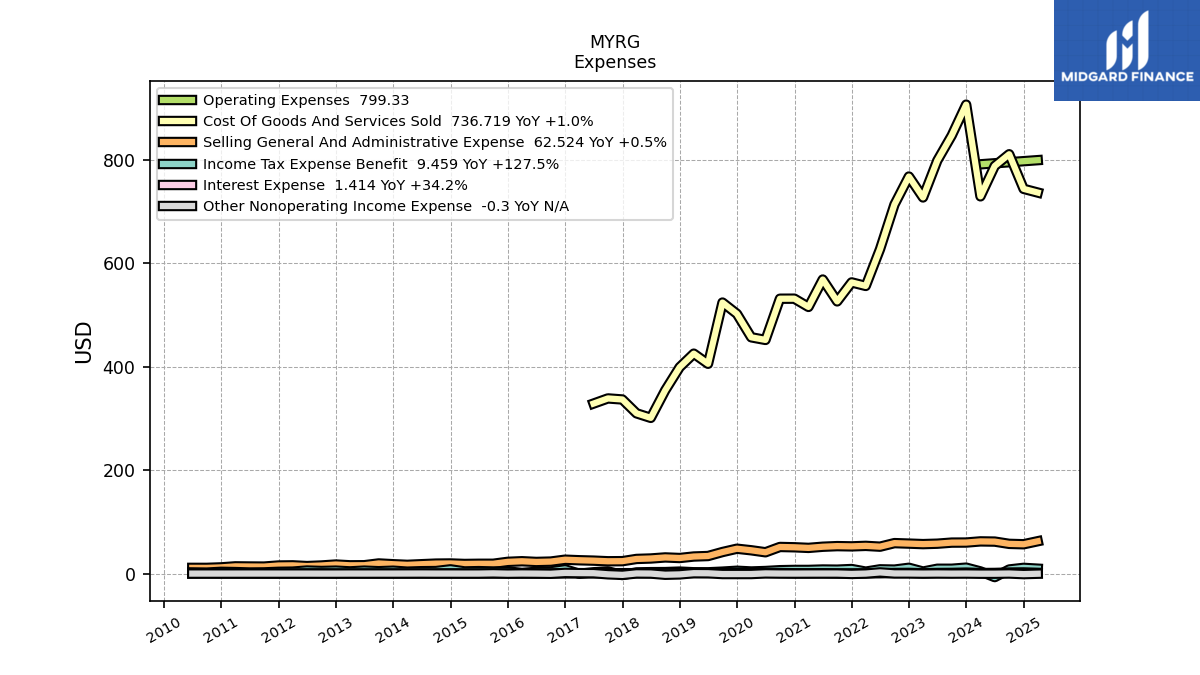
| Cost Of Goods And Services Sold | 906.70 | 847.09 | 798.49 | 727.22 | 767.69 | 713.50 | 627.25 | 556.14 | 562.97 | 526.26 | 568.55 | 515.53 | 531.53 | 531.43 | 451.75 | 456.84 | 502.15 | 524.02 | 405.61 | 425.22 | 398.95 | 354.25 | 301.05 | 309.86 | 336.61 | 338.65 | 328.67 | NA | NA | NA | NA | NA | NA | NA | NA | NA | NA | NA | NA | NA | NA | NA | NA | NA | NA | NA | NA | NA | NA | NA | NA | NA | NA | NA | NA | |
| Gross Profit | 97.50 | 92.38 | 90.13 | 84.39 | 96.27 | 86.35 | 80.86 | 80.48 | 83.08 | 83.92 | 81.02 | 76.95 | 76.44 | 76.47 | 61.30 | 61.63 | 68.92 | 59.20 | 43.16 | 42.88 | 47.39 | 45.29 | 38.63 | 35.75 | 36.89 | 34.85 | 27.52 | 25.74 | 41.94 | 34.06 | 31.43 | 27.28 | 32.61 | 28.62 | 31.74 | 29.37 | 42.08 | 32.72 | 30.53 | 27.08 | 33.84 | 32.48 | 31.25 | 27.30 | 32.92 | 29.57 | 30.06 | 26.10 | 24.62 | 19.81 | 19.54 | 21.59 | 21.80 | 17.04 | 16.71 | |
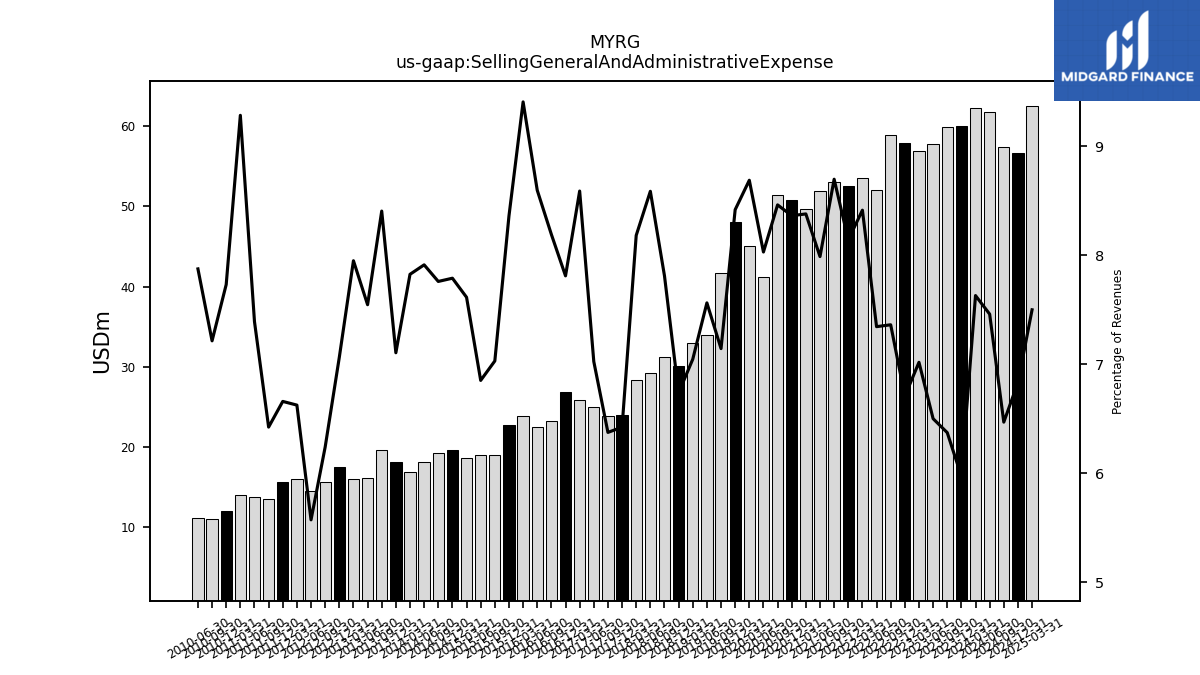
| Selling General And Administrative Expense | 59.99 | 59.88 | 57.77 | 56.96 | 57.95 | 58.89 | 52.02 | 53.56 | 52.60 | 53.07 | 51.89 | 49.65 | 50.85 | 51.44 | 41.20 | 45.05 | 48.08 | 41.67 | 33.94 | 32.99 | 30.08 | 31.21 | 29.17 | 28.28 | 23.99 | 23.81 | 25.02 | 25.78 | 26.84 | 23.20 | 22.52 | 23.86 | 22.67 | 18.97 | 18.95 | 18.59 | 19.55 | 19.28 | 18.11 | 16.88 | 18.09 | 19.58 | 16.14 | 16.01 | 17.50 | 15.64 | 14.52 | 15.92 | 15.60 | 13.52 | 13.70 | 13.95 | 11.99 | 11.02 | 11.05 | |
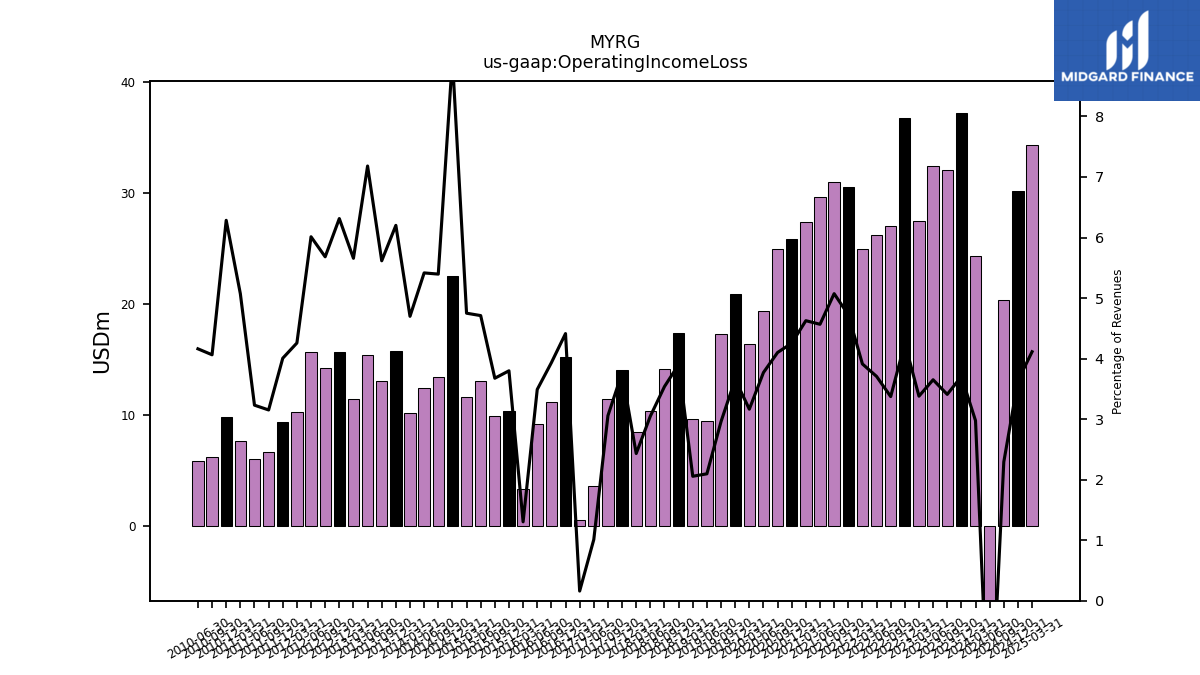
| Operating Income Loss | 37.20 | 32.03 | 32.44 | 27.43 | 36.78 | 26.98 | 26.25 | 24.90 | 30.53 | 30.95 | 29.66 | 27.41 | 25.87 | 24.93 | 19.34 | 16.41 | 20.88 | 17.26 | 9.41 | 9.63 | 17.41 | 14.14 | 10.36 | 8.41 | 14.06 | 11.42 | 3.60 | 0.48 | 15.17 | 11.14 | 9.14 | 3.31 | 10.30 | 9.92 | 13.02 | 11.60 | 22.47 | 13.41 | 12.39 | 10.13 | 15.79 | 13.08 | 15.36 | 11.39 | 15.64 | 14.24 | 15.66 | 10.23 | 9.38 | 6.63 | 5.99 | 7.62 | 9.75 | 6.21 | 5.84 | |
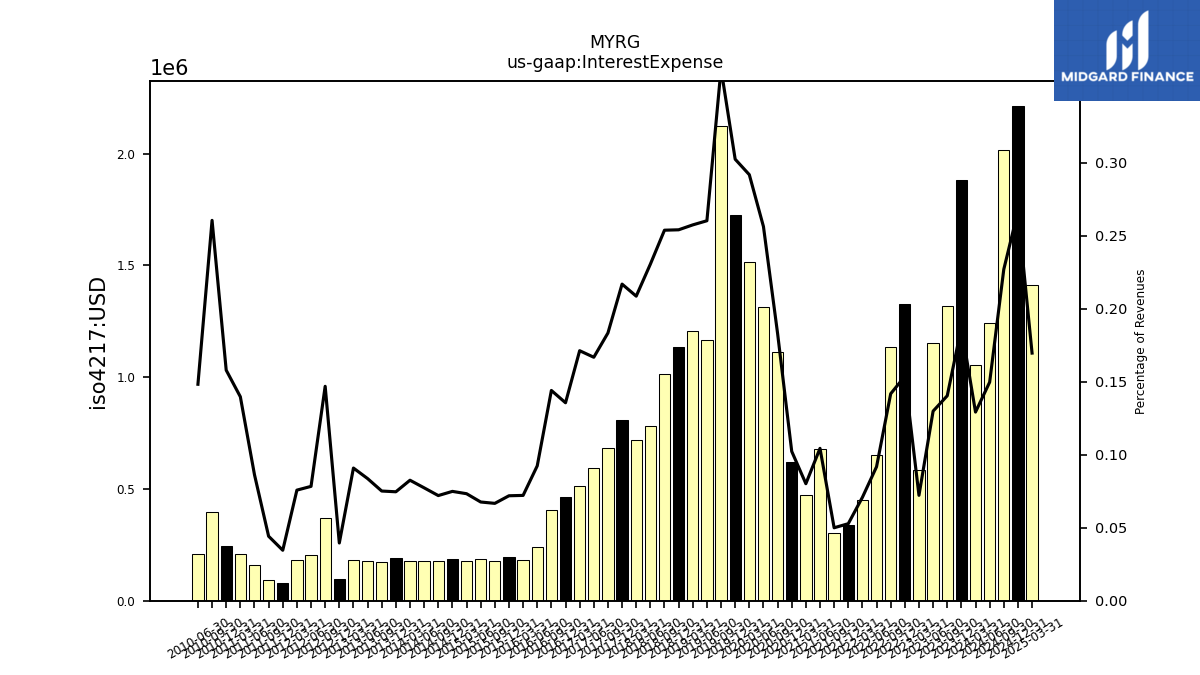
| Interest Expense | 1.88 | 1.32 | 1.15 | 0.59 | 1.33 | 1.13 | 0.65 | 0.45 | 0.34 | 0.30 | 0.68 | 0.47 | 0.62 | 1.11 | 1.31 | 1.51 | 1.73 | 2.12 | 1.17 | 1.21 | 1.13 | 1.01 | 0.78 | 0.72 | 0.81 | 0.69 | 0.59 | 0.51 | 0.47 | 0.41 | 0.24 | 0.18 | 0.20 | 0.18 | 0.19 | 0.18 | 0.19 | 0.18 | 0.18 | 0.18 | 0.19 | 0.17 | 0.18 | 0.18 | 0.10 | 0.37 | 0.20 | 0.18 | 0.08 | 0.09 | 0.16 | 0.21 | 0.24 | 0.40 | 0.21 | |
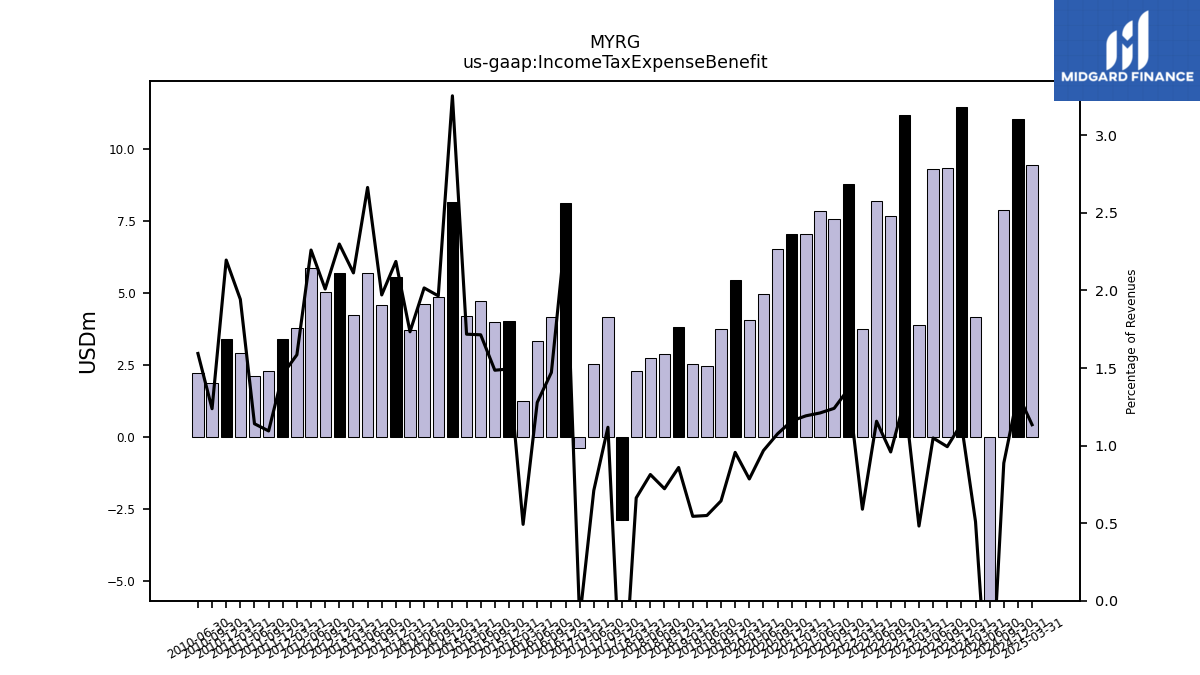
| Income Tax Expense Benefit | 11.45 | 9.33 | 9.32 | 3.91 | 11.20 | 7.67 | 8.19 | 3.76 | 8.81 | 7.57 | 7.86 | 7.06 | 7.05 | 6.54 | 4.97 | 4.07 | 5.46 | 3.75 | 2.47 | 2.55 | 3.83 | 2.88 | 2.76 | 2.29 | -2.86 | 4.18 | 2.53 | -0.36 | 8.15 | 4.17 | 3.35 | 1.25 | 4.05 | 4.01 | 4.74 | 4.20 | 8.17 | 4.88 | 4.62 | 3.74 | 5.57 | 4.59 | 5.70 | 4.25 | 5.70 | 5.04 | 5.89 | 3.81 | 3.42 | 2.30 | 2.11 | 2.92 | 3.41 | 1.89 | 2.24 | |
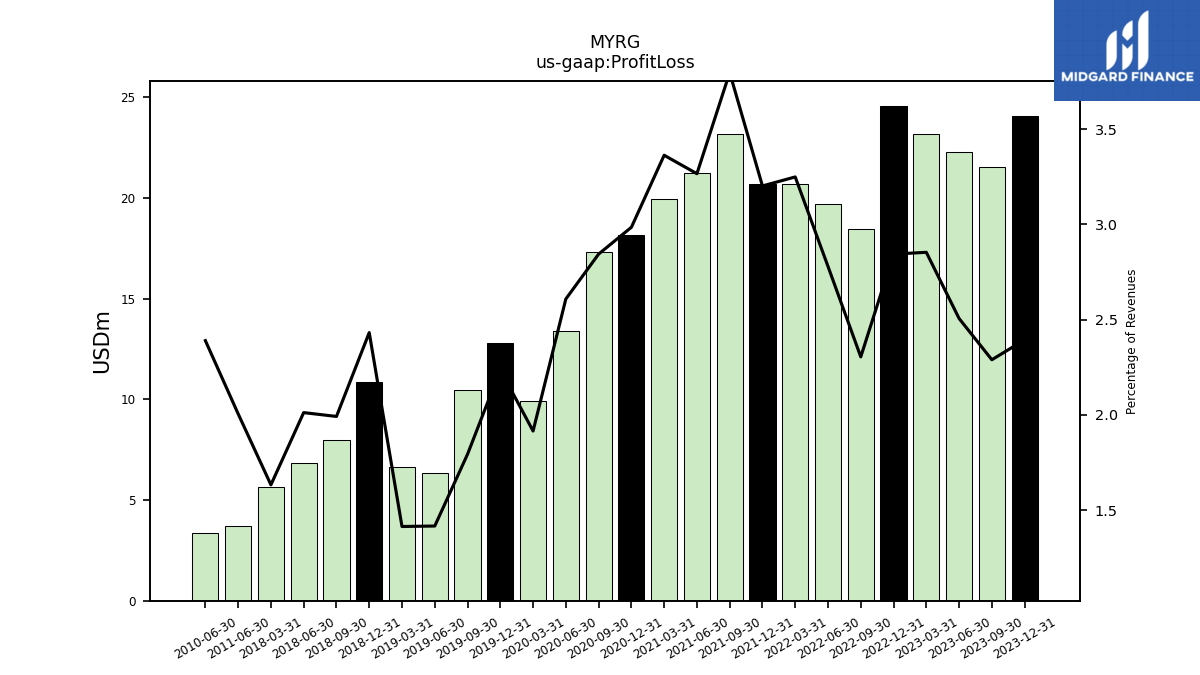
| Profit Loss | 24.04 | 21.51 | 22.27 | 23.16 | 24.57 | 18.44 | 19.68 | 20.69 | 20.69 | 23.17 | 21.22 | 19.93 | 18.15 | 17.29 | 13.38 | 9.93 | 12.78 | 10.46 | 6.36 | 6.62 | 10.86 | 7.96 | 6.83 | 5.64 | NA | NA | NA | NA | NA | NA | NA | NA | NA | NA | NA | NA | NA | NA | NA | NA | NA | NA | NA | NA | NA | NA | NA | NA | NA | NA | 3.72 | NA | NA | NA | 3.35 | |
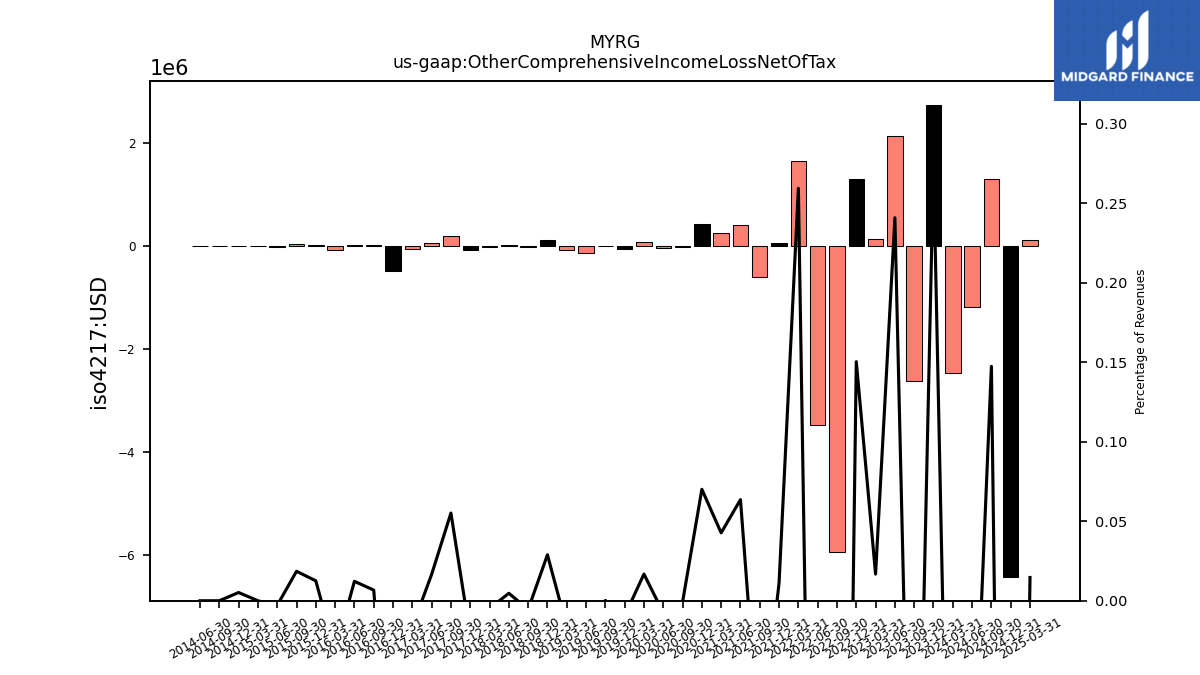
| Other Comprehensive Income Loss Net Of Tax | 2.75 | -2.61 | 2.14 | 0.14 | 1.30 | -5.95 | -3.48 | 1.65 | 0.07 | -0.59 | 0.41 | 0.25 | 0.43 | -0.01 | -0.04 | 0.09 | -0.05 | 0.00 | -0.12 | -0.08 | 0.13 | -0.02 | 0.02 | -0.02 | -0.08 | 0.21 | 0.06 | -0.05 | -0.48 | 0.02 | 0.03 | -0.08 | 0.03 | 0.05 | -0.01 | 0.00 | 0.01 | 0.00 | 0.00 | NA | NA | NA | NA | NA | NA | NA | NA | NA | NA | NA | NA | NA | NA | NA | NA | |
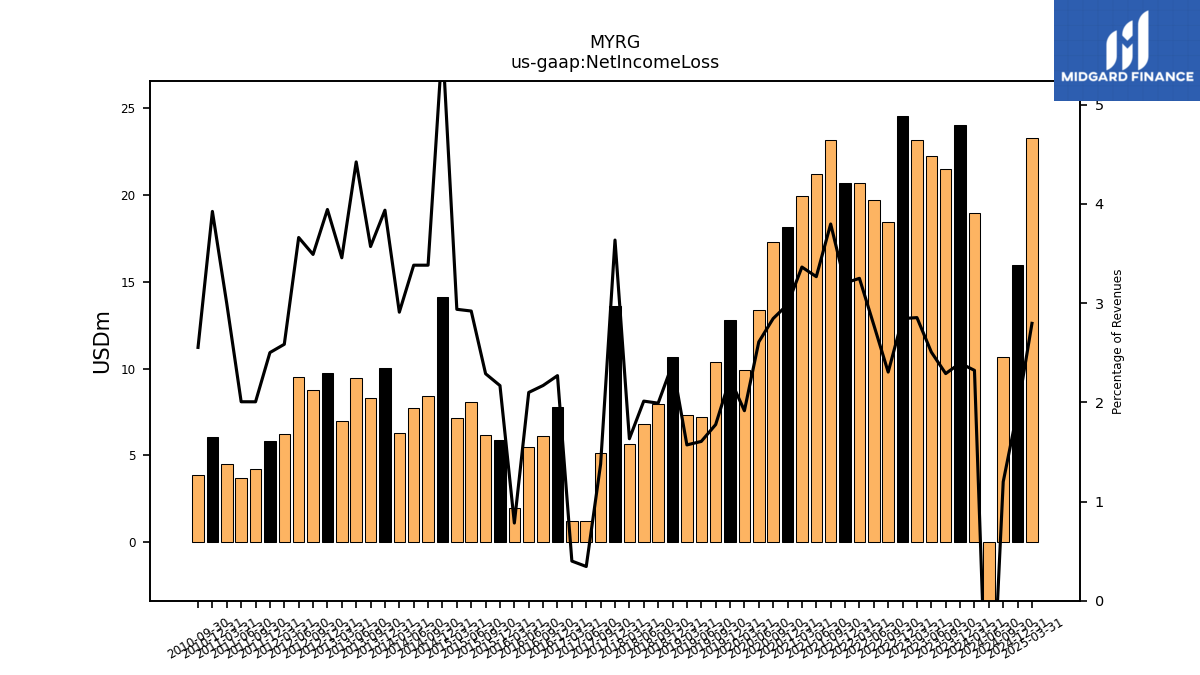
| Net Income Loss | 24.04 | 21.51 | 22.27 | 23.16 | 24.57 | 18.44 | 19.68 | 20.69 | 20.69 | 23.17 | 21.22 | 19.93 | 18.15 | 17.29 | 13.38 | 9.93 | 12.78 | 10.36 | 7.21 | 7.35 | 10.65 | 7.96 | 6.83 | 5.64 | 13.58 | 5.14 | 1.23 | 1.20 | 7.80 | 6.15 | 5.50 | 1.99 | 5.88 | 6.17 | 8.07 | 7.17 | 14.13 | 8.40 | 7.74 | 6.27 | 10.02 | 8.31 | 9.46 | 6.96 | 9.77 | 8.75 | 9.54 | 6.21 | 5.86 | 4.22 | 3.72 | 4.50 | 6.09 | 3.90 | NA |
| 2023-12-31 | 2023-09-30 | 2023-06-30 | 2023-03-31 | 2022-12-31 | 2022-09-30 | 2022-06-30 | 2022-03-31 | 2021-12-31 | 2021-09-30 | 2021-06-30 | 2021-03-31 | 2020-12-31 | 2020-09-30 | 2020-06-30 | 2020-03-31 | 2019-12-31 | 2019-09-30 | 2019-06-30 | 2019-03-31 | 2018-12-31 | 2018-09-30 | 2018-06-30 | 2018-03-31 | 2017-12-31 | 2017-09-30 | 2017-06-30 | 2017-03-31 | 2016-12-31 | 2016-09-30 | 2016-06-30 | 2016-03-31 | 2015-12-31 | 2015-09-30 | 2015-06-30 | 2015-03-31 | 2014-12-31 | 2014-09-30 | 2014-06-30 | 2014-03-31 | 2013-12-31 | 2013-09-30 | 2013-06-30 | 2013-03-31 | 2012-12-31 | 2012-09-30 | 2012-06-30 | 2012-03-31 | 2011-12-31 | 2011-09-30 | 2011-06-30 | 2011-03-31 | 2010-12-31 | 2010-09-30 | 2010-06-30 | ||
|---|---|---|---|---|---|---|---|---|---|---|---|---|---|---|---|---|---|---|---|---|---|---|---|---|---|---|---|---|---|---|---|---|---|---|---|---|---|---|---|---|---|---|---|---|---|---|---|---|---|---|---|---|---|---|---|---|
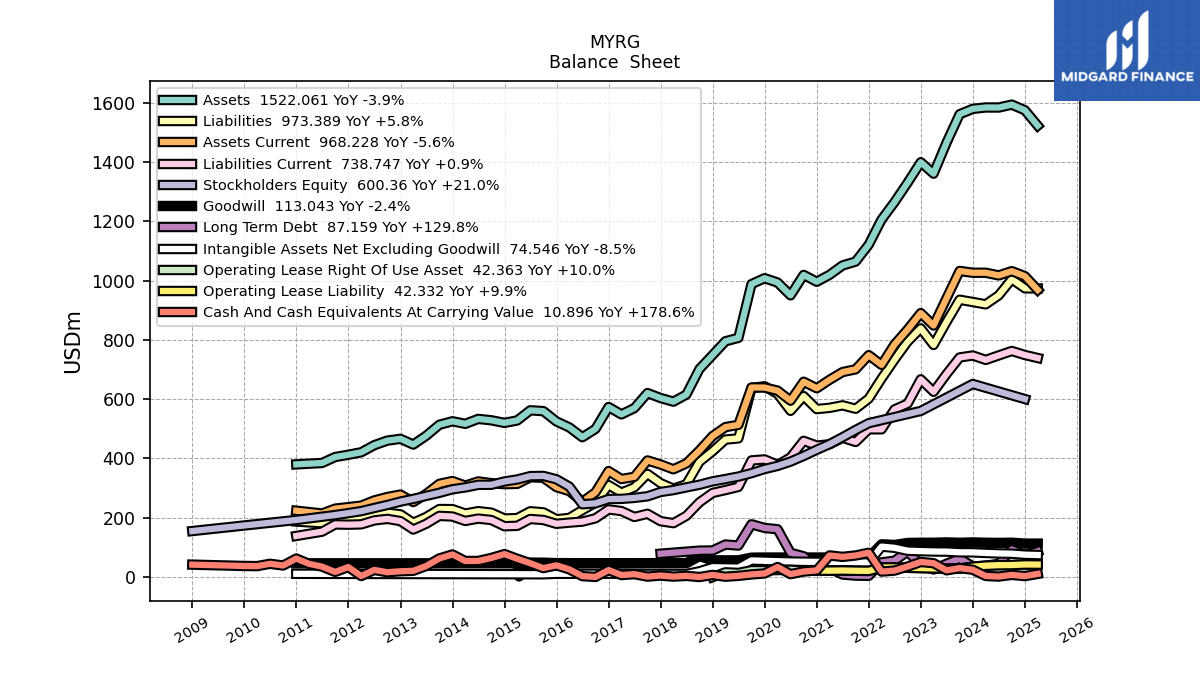
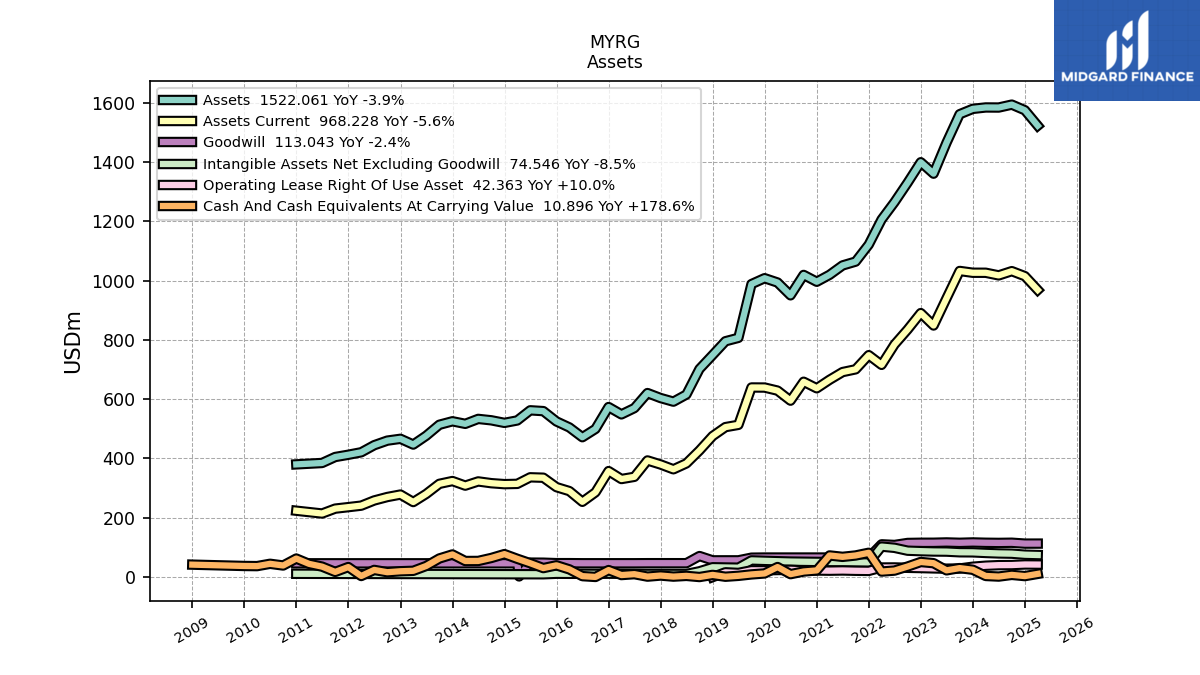
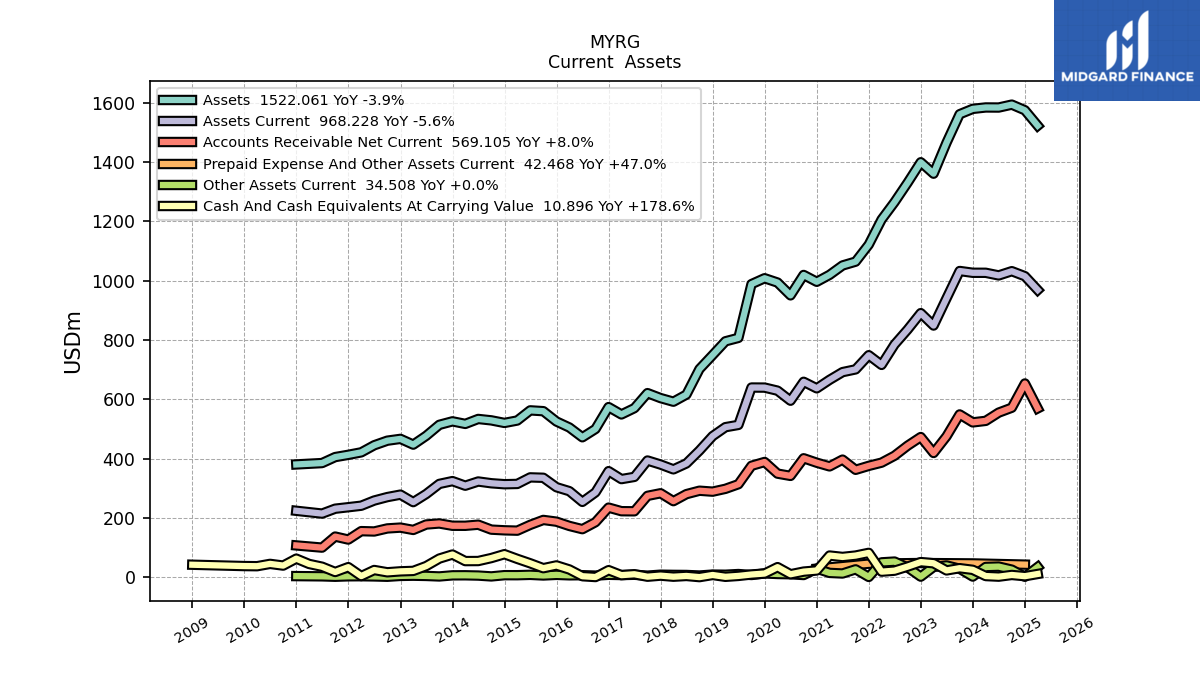
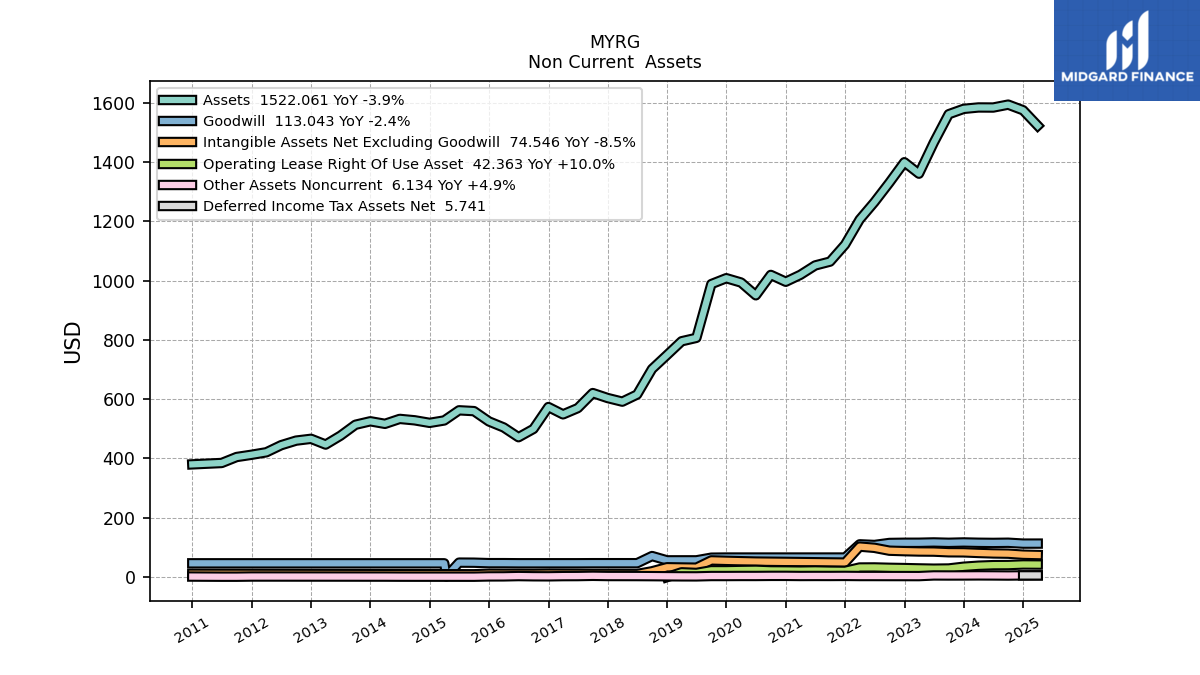
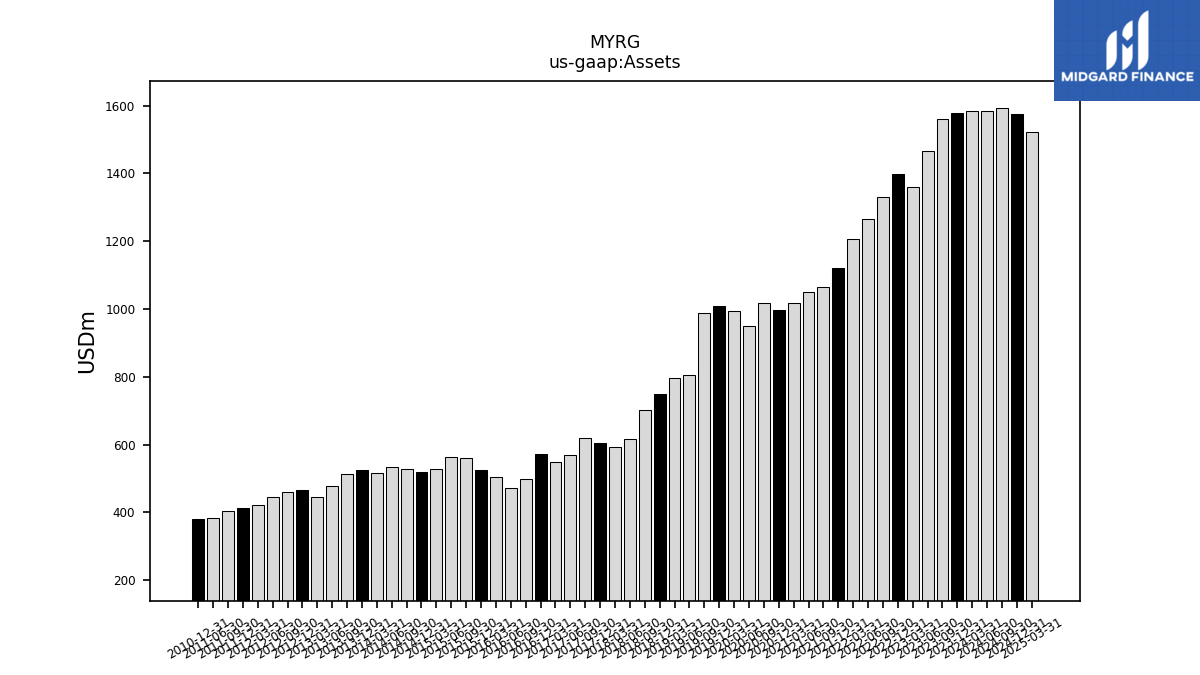
| Assets | 1578.75 | 1560.73 | 1464.80 | 1360.24 | 1398.86 | 1329.96 | 1264.37 | 1205.58 | 1121.09 | 1063.83 | 1050.83 | 1019.25 | 995.86 | 1018.91 | 950.09 | 993.25 | 1007.87 | 988.01 | 806.70 | 795.22 | 748.75 | 701.70 | 615.59 | 591.59 | 603.79 | 620.60 | 569.86 | 548.71 | 573.50 | 499.61 | 471.68 | 504.60 | 524.92 | 559.71 | 562.43 | 528.22 | 520.09 | 528.70 | 533.46 | 516.78 | 525.42 | 513.69 | 476.77 | 446.89 | 466.35 | 460.25 | 444.77 | 420.93 | 412.57 | 404.96 | 384.81 | NA | 380.15 | NA | NA | |
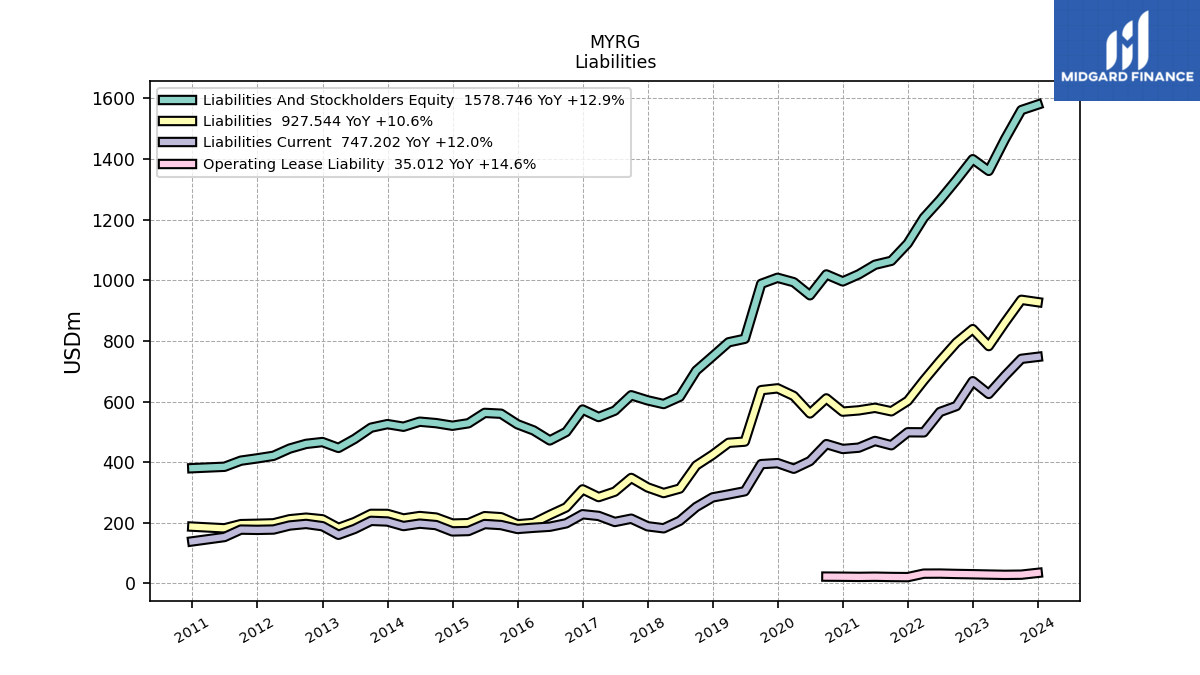
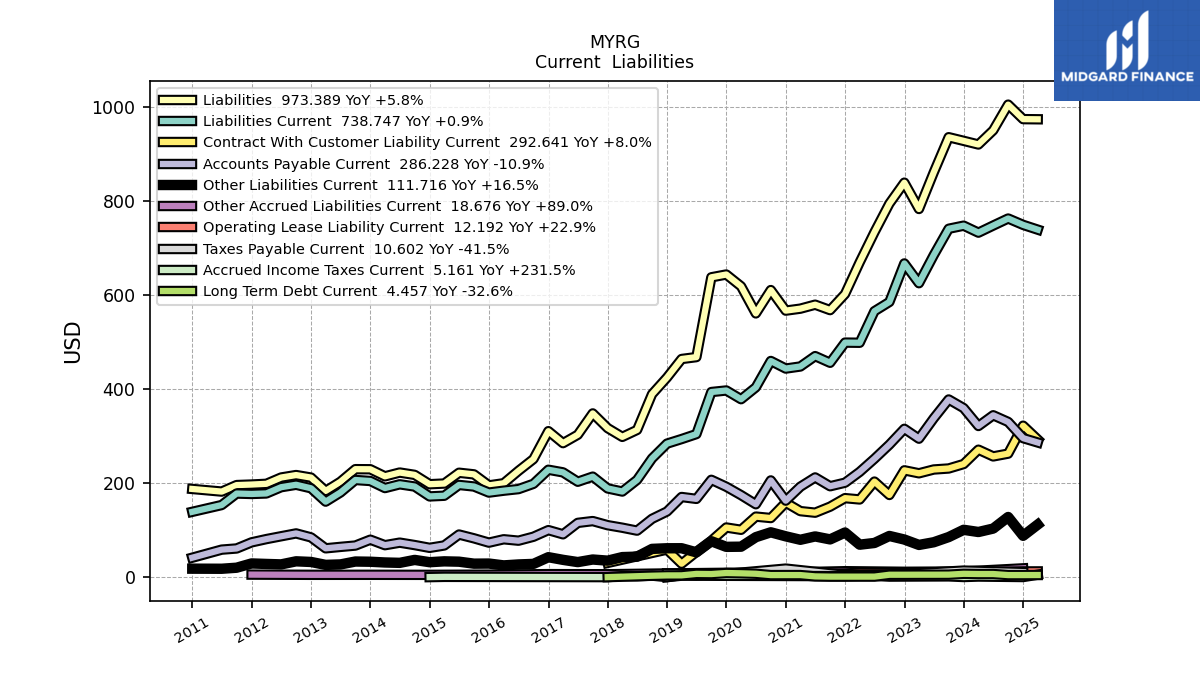
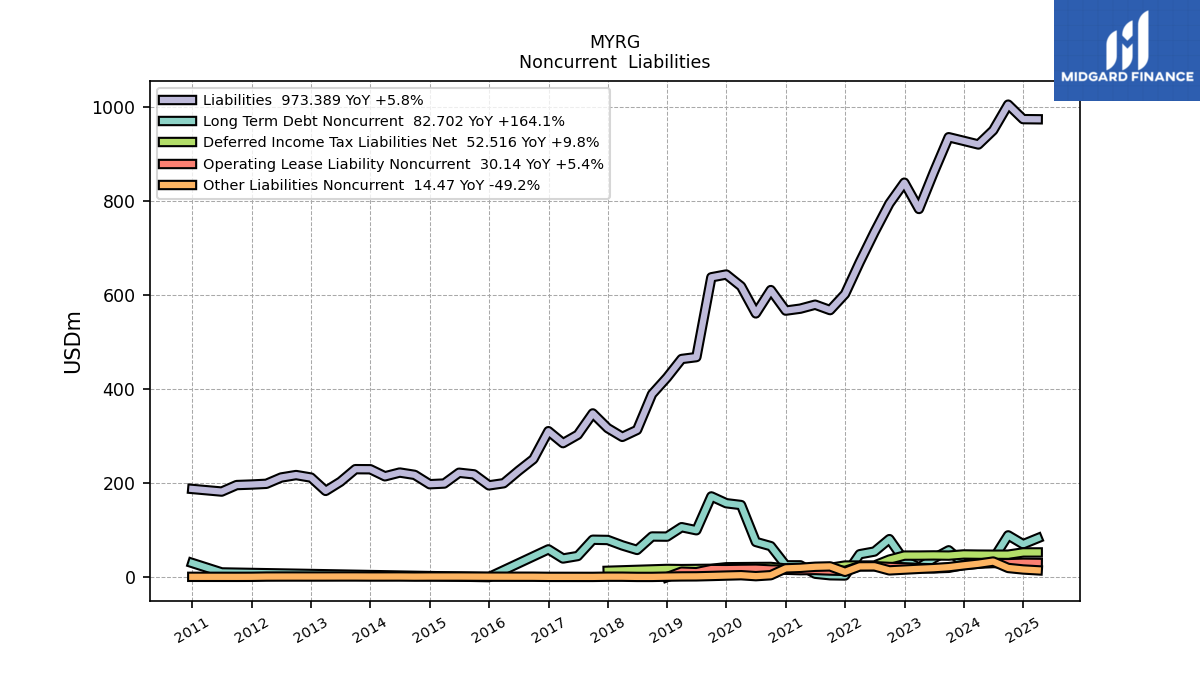
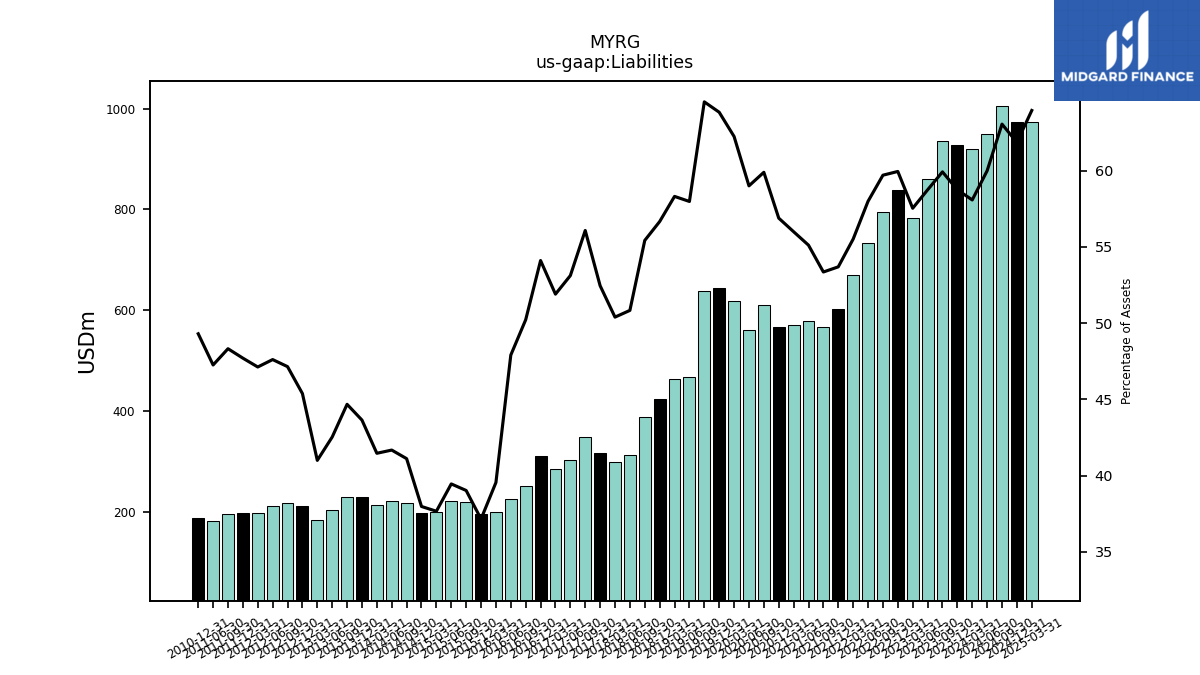
| Liabilities | 927.54 | 935.27 | 860.50 | 782.67 | 838.66 | 794.08 | 733.29 | 669.30 | 601.99 | 567.65 | 579.20 | 570.78 | 566.57 | 610.31 | 560.64 | 618.26 | 643.40 | 637.44 | 467.76 | 463.74 | 424.29 | 388.95 | 312.97 | 298.16 | 316.75 | 348.04 | 302.73 | 284.81 | 310.32 | 250.94 | 225.99 | 199.59 | 195.04 | 218.45 | 221.94 | 198.97 | 197.53 | 217.39 | 222.35 | 214.31 | 229.33 | 229.52 | 202.79 | 183.25 | 211.66 | 217.02 | 211.78 | 198.38 | 196.83 | 195.71 | 181.87 | NA | 187.44 | NA | NA | |
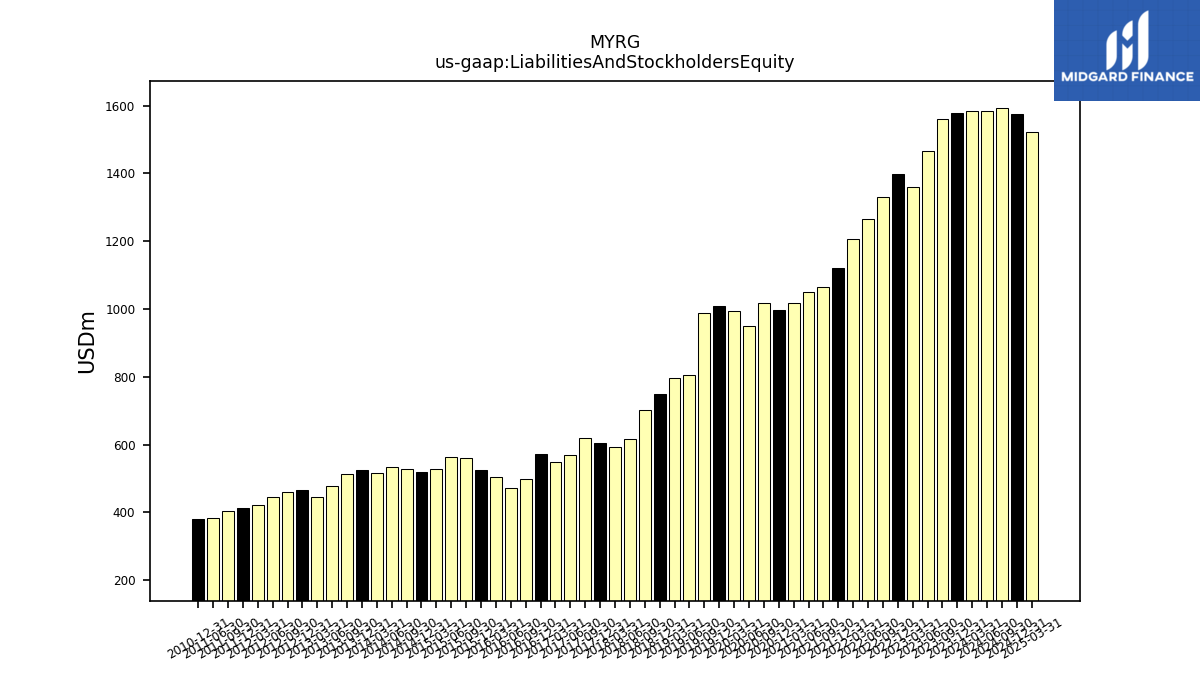
| Liabilities And Stockholders Equity | 1578.75 | 1560.73 | 1464.80 | 1360.24 | 1398.86 | 1329.96 | 1264.37 | 1205.58 | 1121.09 | 1063.83 | 1050.83 | 1019.25 | 995.86 | 1018.91 | 950.09 | 993.25 | 1007.87 | 988.01 | 806.70 | 795.22 | 748.75 | 701.70 | 615.59 | 591.59 | 603.79 | 620.60 | 569.86 | 548.71 | 573.50 | 499.61 | 471.68 | 504.60 | 524.92 | 559.71 | 562.43 | 528.22 | 520.09 | 528.70 | 533.46 | 516.78 | 525.42 | 513.69 | 476.77 | 446.89 | 466.35 | 460.25 | 444.77 | 420.93 | 412.57 | 404.96 | 384.81 | NA | 380.15 | NA | NA |
| 2023-12-31 | 2023-09-30 | 2023-06-30 | 2023-03-31 | 2022-12-31 | 2022-09-30 | 2022-06-30 | 2022-03-31 | 2021-12-31 | 2021-09-30 | 2021-06-30 | 2021-03-31 | 2020-12-31 | 2020-09-30 | 2020-06-30 | 2020-03-31 | 2019-12-31 | 2019-09-30 | 2019-06-30 | 2019-03-31 | 2018-12-31 | 2018-09-30 | 2018-06-30 | 2018-03-31 | 2017-12-31 | 2017-09-30 | 2017-06-30 | 2017-03-31 | 2016-12-31 | 2016-09-30 | 2016-06-30 | 2016-03-31 | 2015-12-31 | 2015-09-30 | 2015-06-30 | 2015-03-31 | 2014-12-31 | 2014-09-30 | 2014-06-30 | 2014-03-31 | 2013-12-31 | 2013-09-30 | 2013-06-30 | 2013-03-31 | 2012-12-31 | 2012-09-30 | 2012-06-30 | 2012-03-31 | 2011-12-31 | 2011-09-30 | 2011-06-30 | 2011-03-31 | 2010-12-31 | 2010-09-30 | 2010-06-30 | ||
|---|---|---|---|---|---|---|---|---|---|---|---|---|---|---|---|---|---|---|---|---|---|---|---|---|---|---|---|---|---|---|---|---|---|---|---|---|---|---|---|---|---|---|---|---|---|---|---|---|---|---|---|---|---|---|---|---|
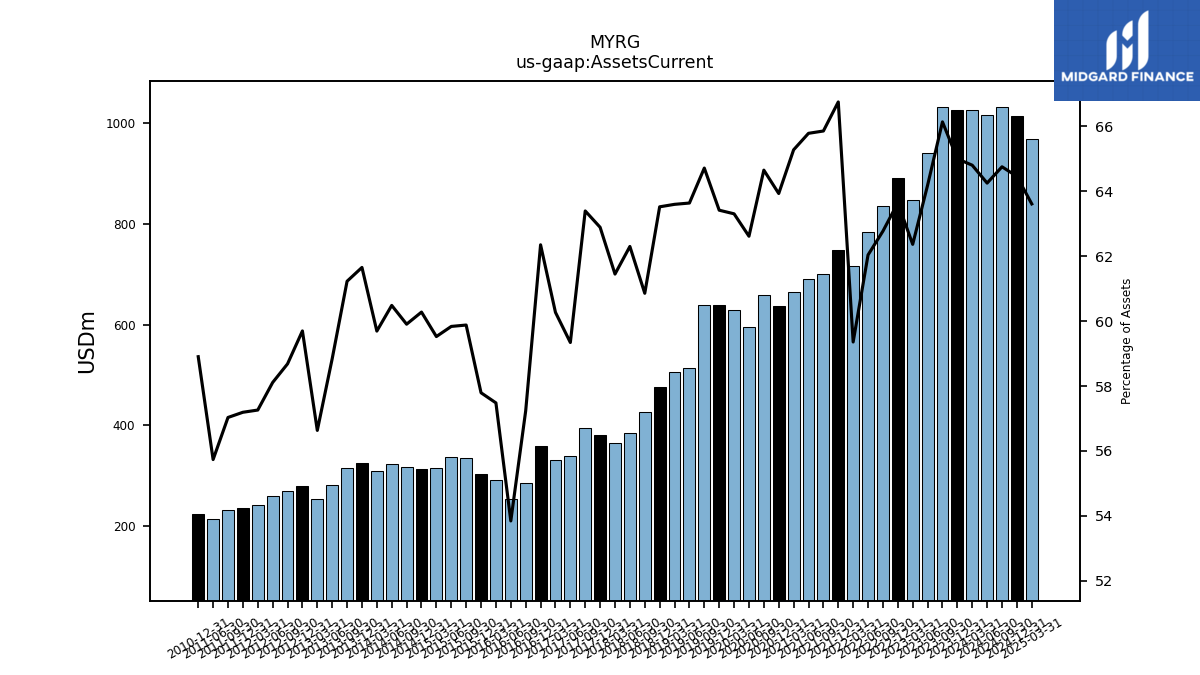
| Assets Current | 1026.24 | 1032.28 | 940.20 | 848.34 | 890.29 | 834.86 | 784.41 | 715.60 | 748.39 | 700.63 | 691.33 | 665.37 | 636.68 | 658.76 | 594.92 | 628.80 | 639.18 | 639.41 | 513.38 | 505.76 | 475.63 | 427.05 | 383.52 | 363.54 | 379.74 | 393.43 | 338.16 | 330.71 | 357.59 | 285.95 | 253.96 | 290.05 | 303.37 | 335.15 | 336.54 | 314.42 | 313.50 | 316.72 | 322.66 | 308.49 | 323.95 | 314.53 | 280.54 | 253.08 | 278.40 | 270.09 | 258.45 | 241.02 | 235.95 | 230.95 | 214.47 | NA | 223.92 | NA | NA | |
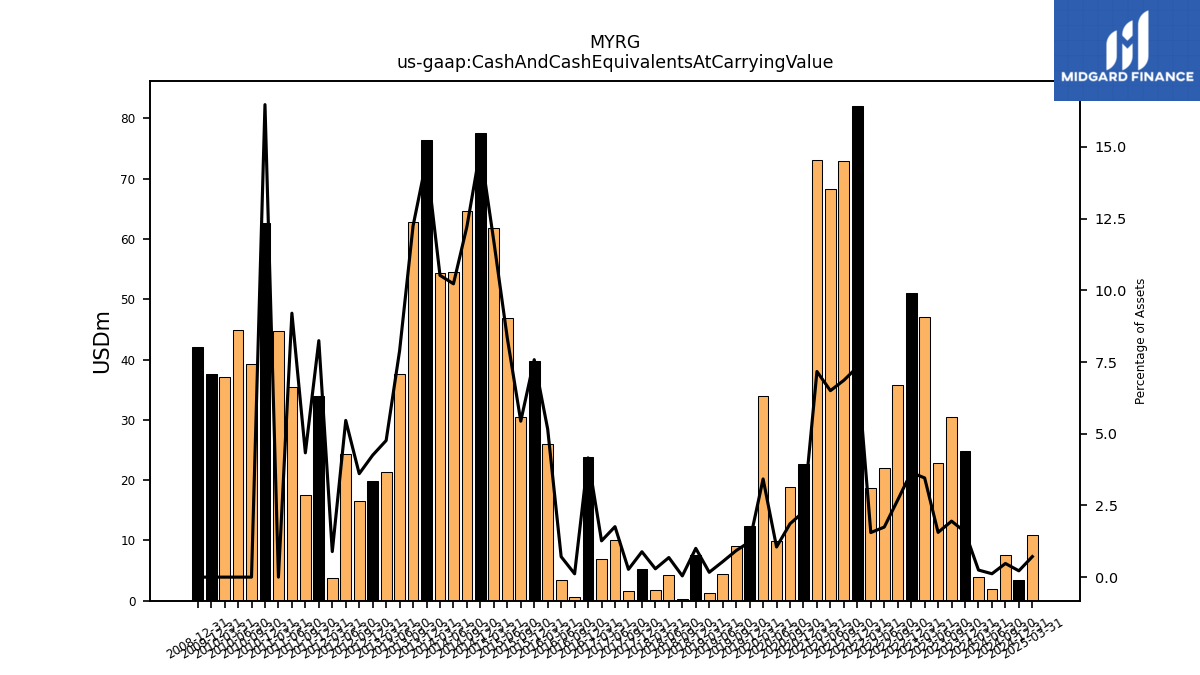
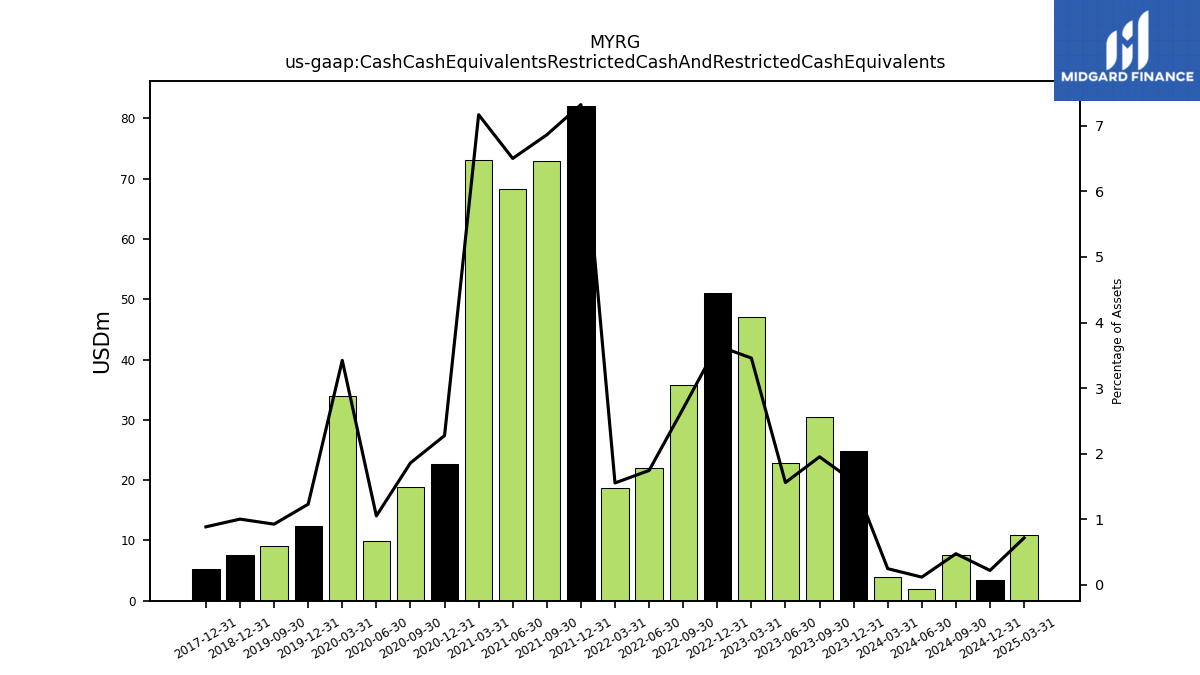
| Cash And Cash Equivalents At Carrying Value | 24.90 | 30.47 | 22.85 | 47.04 | 51.04 | 35.77 | 22.06 | 18.73 | 82.09 | 73.01 | 68.32 | 73.07 | 22.67 | 18.95 | 9.99 | 34.00 | 12.40 | 9.14 | 4.36 | 1.34 | 7.51 | 0.30 | 4.20 | 1.72 | 5.34 | 1.68 | 10.03 | 6.94 | 23.85 | 0.58 | 3.36 | 26.04 | 39.80 | 30.43 | 46.88 | 61.83 | 77.64 | 64.61 | 54.55 | 54.38 | 76.45 | 62.89 | 37.63 | 21.28 | 19.82 | 16.60 | 24.30 | 3.75 | 34.01 | 17.55 | 35.41 | 44.71 | 62.62 | 39.18 | 44.94 | |
| Cash Cash Equivalents Restricted Cash And Restricted Cash Equivalents | 24.90 | 30.47 | 22.85 | 47.04 | 51.04 | 35.77 | 22.06 | 18.73 | 82.09 | 73.01 | 68.32 | 73.07 | 22.67 | 18.95 | 9.99 | 34.00 | 12.40 | 9.14 | NA | NA | 7.51 | NA | NA | NA | 5.34 | NA | NA | NA | NA | NA | NA | NA | NA | NA | NA | NA | NA | NA | NA | NA | NA | NA | NA | NA | NA | NA | NA | NA | NA | NA | NA | NA | NA | NA | NA | |
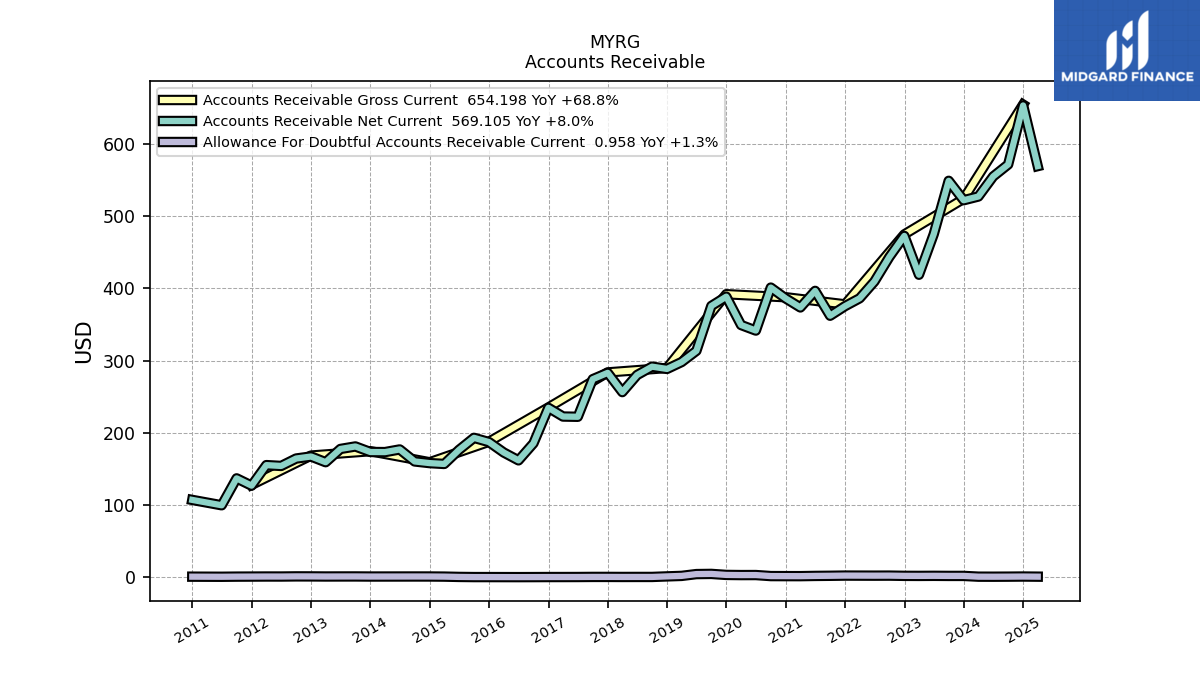
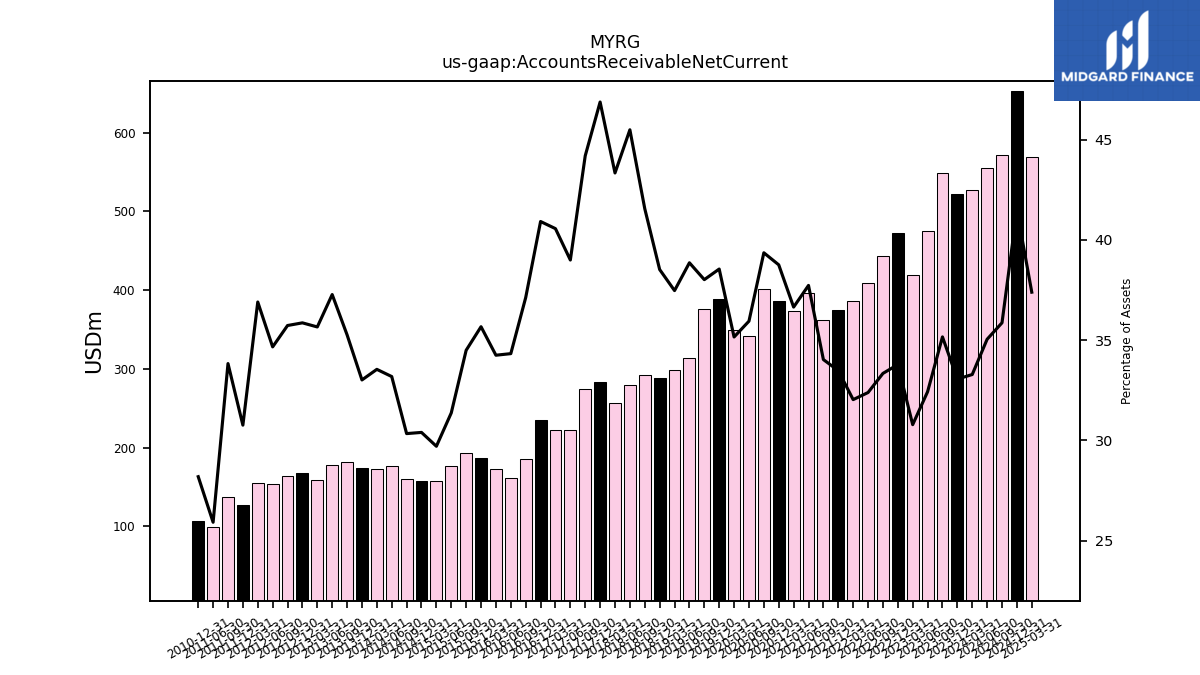
| Accounts Receivable Net Current | 521.89 | 548.77 | 474.98 | 418.76 | 472.54 | 443.41 | 409.50 | 386.19 | 375.35 | 362.03 | 396.45 | 373.52 | 385.94 | 401.00 | 341.51 | 349.19 | 388.48 | 375.60 | 313.45 | 297.97 | 288.43 | 291.58 | 280.02 | 256.36 | 283.01 | 274.25 | 222.21 | 222.55 | 234.64 | 185.45 | 161.91 | 172.81 | 187.24 | 193.06 | 176.45 | 156.92 | 158.10 | 160.41 | 177.02 | 173.34 | 173.47 | 181.15 | 177.70 | 159.35 | 167.24 | 164.44 | 154.17 | 155.33 | 126.91 | 137.00 | 99.74 | NA | 107.17 | NA | NA | |
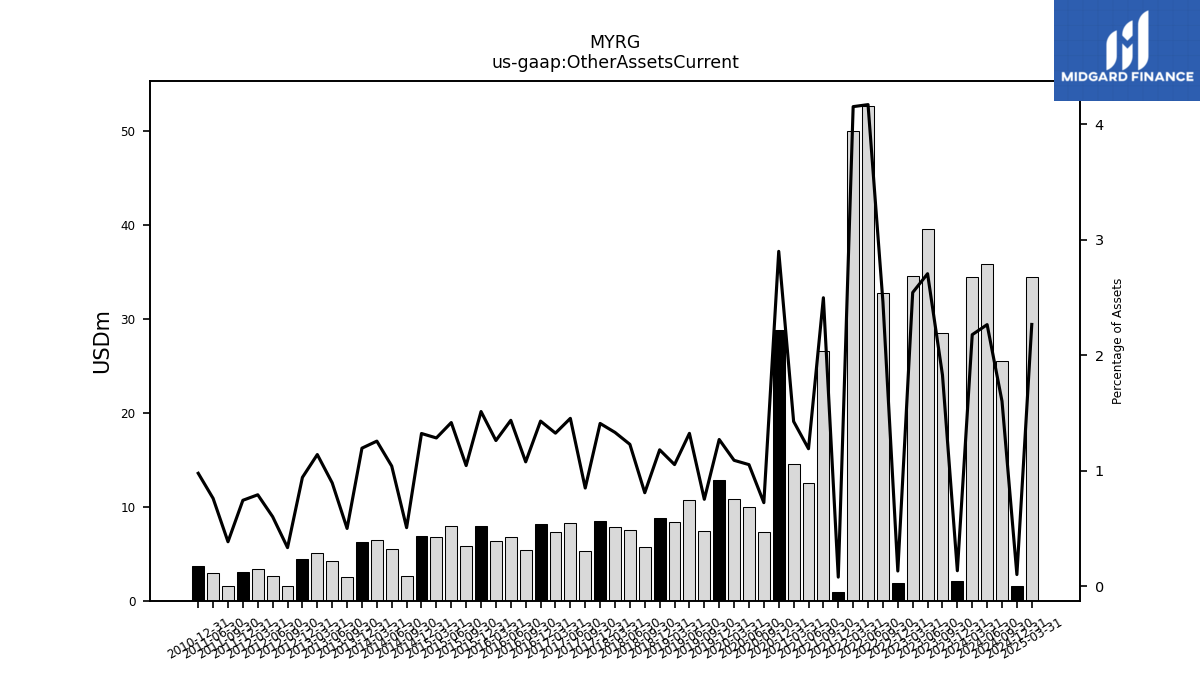
| Other Assets Current | 2.12 | 28.56 | 39.64 | 34.60 | 1.85 | 32.75 | 52.73 | 50.07 | 0.89 | 26.58 | 12.52 | 14.55 | 28.88 | 7.38 | 10.01 | 10.83 | 12.81 | 7.44 | 10.68 | 8.38 | 8.85 | 5.68 | 7.57 | 7.88 | 8.51 | 5.28 | 8.29 | 7.28 | 8.20 | 5.38 | 6.78 | 6.37 | 7.94 | 5.85 | 7.97 | 6.78 | 6.88 | 2.68 | 5.55 | 6.50 | 6.28 | 2.57 | 4.27 | 5.10 | 4.40 | 1.54 | 2.68 | 3.33 | 3.07 | 1.56 | 2.93 | NA | 3.72 | NA | NA | |
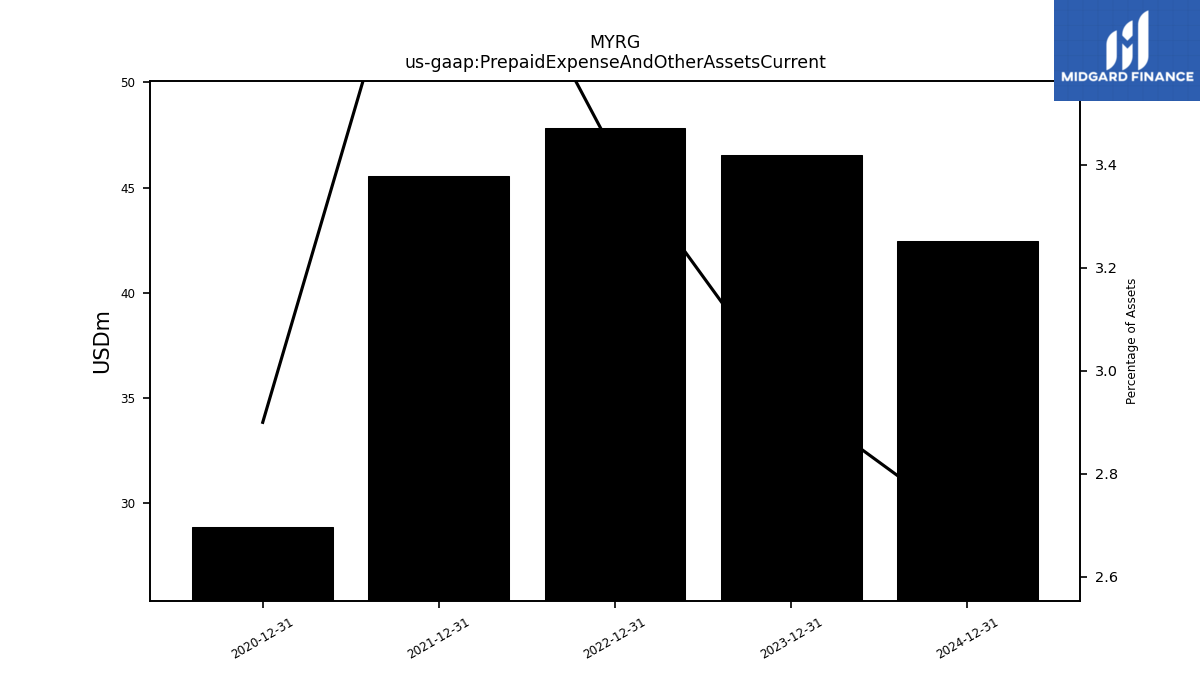
| Prepaid Expense And Other Assets Current | 46.53 | NA | NA | NA | 47.82 | NA | NA | NA | 45.56 | NA | NA | NA | 28.88 | NA | NA | NA | NA | NA | NA | NA | NA | NA | NA | NA | NA | NA | NA | NA | NA | NA | NA | NA | NA | NA | NA | NA | NA | NA | NA | NA | NA | NA | NA | NA | NA | NA | NA | NA | NA | NA | NA | NA | NA | NA | NA |
| 2023-12-31 | 2023-09-30 | 2023-06-30 | 2023-03-31 | 2022-12-31 | 2022-09-30 | 2022-06-30 | 2022-03-31 | 2021-12-31 | 2021-09-30 | 2021-06-30 | 2021-03-31 | 2020-12-31 | 2020-09-30 | 2020-06-30 | 2020-03-31 | 2019-12-31 | 2019-09-30 | 2019-06-30 | 2019-03-31 | 2018-12-31 | 2018-09-30 | 2018-06-30 | 2018-03-31 | 2017-12-31 | 2017-09-30 | 2017-06-30 | 2017-03-31 | 2016-12-31 | 2016-09-30 | 2016-06-30 | 2016-03-31 | 2015-12-31 | 2015-09-30 | 2015-06-30 | 2015-03-31 | 2014-12-31 | 2014-09-30 | 2014-06-30 | 2014-03-31 | 2013-12-31 | 2013-09-30 | 2013-06-30 | 2013-03-31 | 2012-12-31 | 2012-09-30 | 2012-06-30 | 2012-03-31 | 2011-12-31 | 2011-09-30 | 2011-06-30 | 2011-03-31 | 2010-12-31 | 2010-09-30 | 2010-06-30 | ||
|---|---|---|---|---|---|---|---|---|---|---|---|---|---|---|---|---|---|---|---|---|---|---|---|---|---|---|---|---|---|---|---|---|---|---|---|---|---|---|---|---|---|---|---|---|---|---|---|---|---|---|---|---|---|---|---|---|
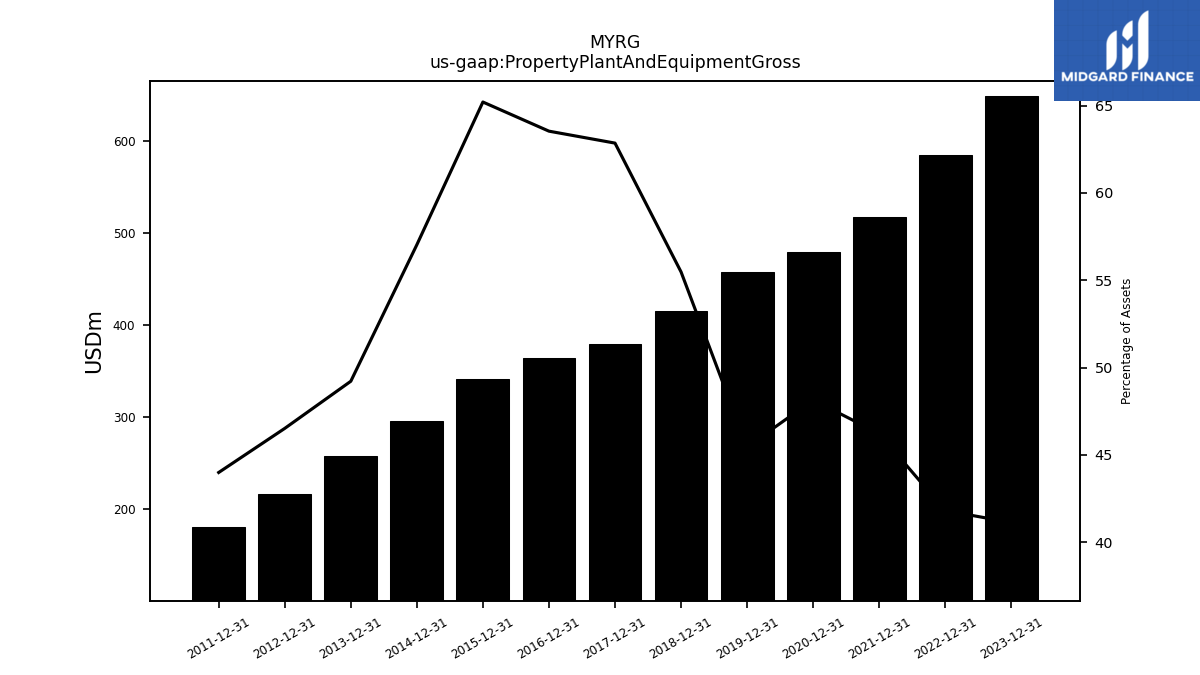
| Property Plant And Equipment Gross | 649.44 | NA | NA | NA | 584.93 | NA | NA | NA | 518.22 | NA | NA | NA | 479.48 | NA | NA | NA | 458.21 | NA | NA | NA | 415.39 | NA | NA | NA | 379.48 | NA | NA | NA | 364.36 | NA | NA | NA | 342.25 | NA | NA | NA | 296.61 | NA | NA | NA | 258.61 | NA | NA | NA | 216.95 | NA | NA | NA | 181.52 | NA | NA | NA | NA | NA | NA | |
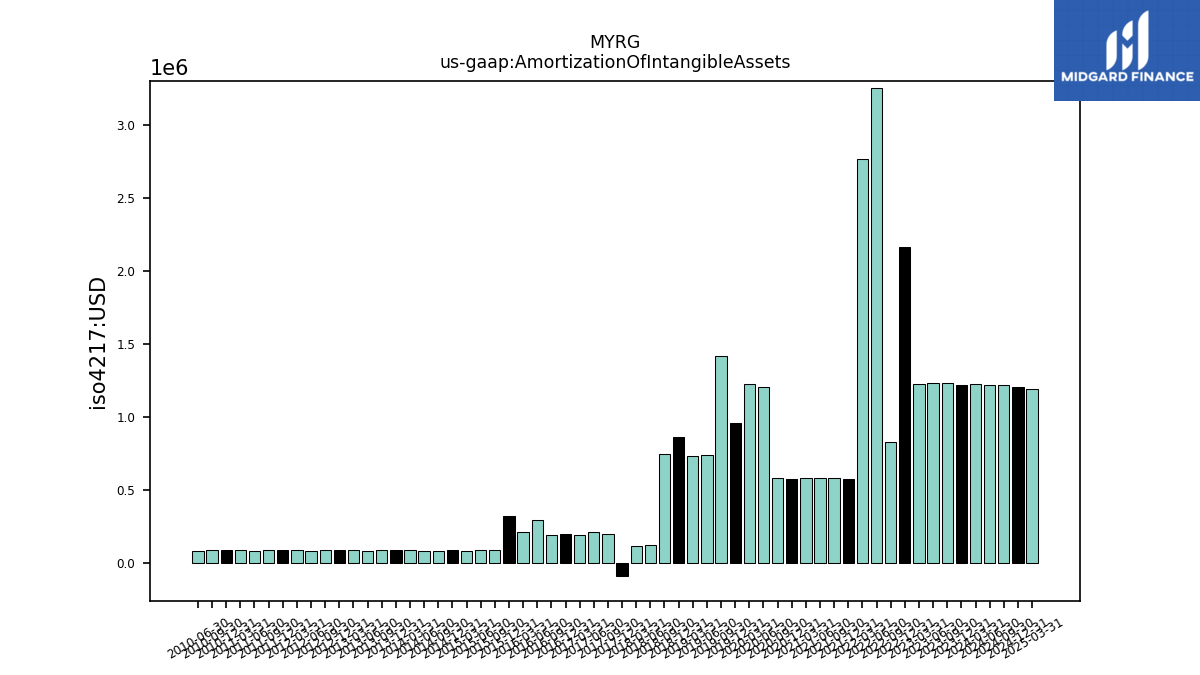
| Amortization Of Intangible Assets | 1.22 | 1.23 | 1.23 | 1.23 | 2.16 | 0.83 | 3.25 | 2.77 | 0.58 | 0.58 | 0.58 | 0.58 | 0.58 | 0.58 | 1.20 | 1.23 | 0.96 | 1.42 | 0.73 | 0.73 | 0.86 | 0.74 | 0.12 | 0.12 | -0.09 | 0.20 | 0.21 | 0.19 | 0.20 | 0.19 | 0.29 | 0.21 | 0.32 | 0.08 | 0.08 | 0.08 | 0.08 | 0.08 | 0.08 | 0.08 | 0.08 | 0.08 | 0.08 | 0.08 | 0.08 | 0.08 | 0.08 | 0.08 | 0.08 | 0.08 | 0.08 | 0.08 | 0.08 | 0.08 | 0.08 | |
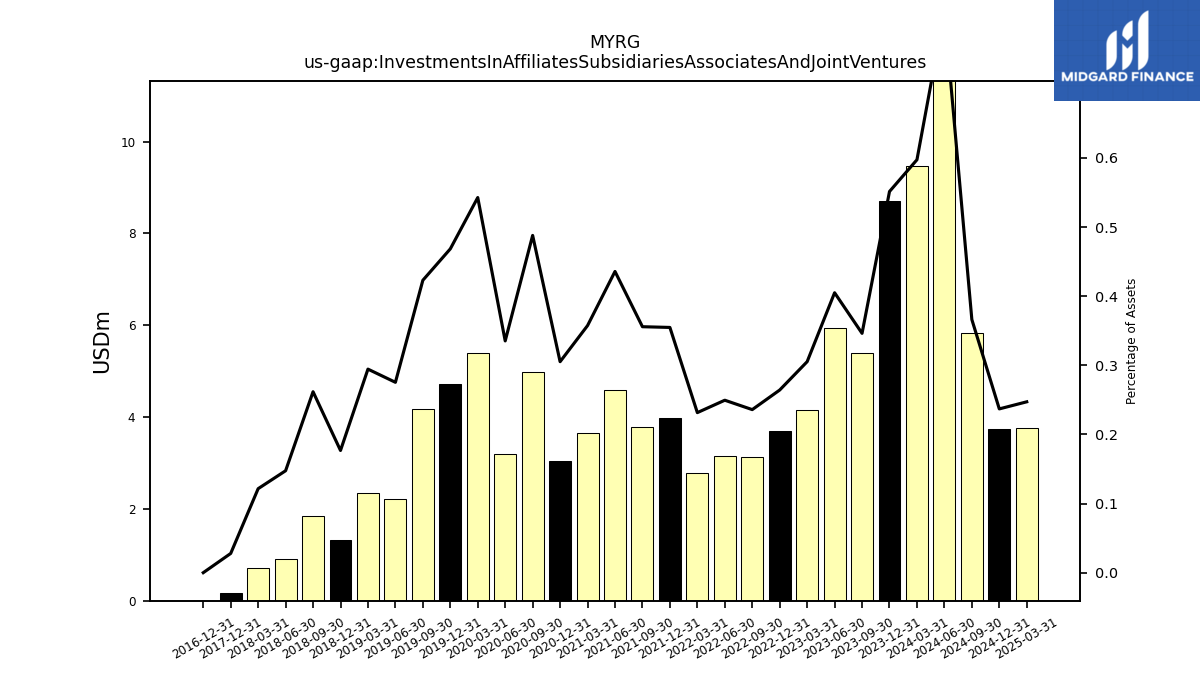
| Investments In Affiliates Subsidiaries Associates And Joint Ventures | 8.71 | 5.41 | 5.93 | 4.15 | 3.70 | 3.14 | 3.15 | 2.79 | 3.98 | 3.79 | 4.58 | 3.64 | 3.04 | 4.97 | 3.19 | 5.39 | 4.72 | 4.18 | 2.22 | 2.34 | 1.32 | 1.84 | 0.91 | 0.72 | 0.17 | NA | NA | NA | 0.00 | NA | NA | NA | NA | NA | NA | NA | NA | NA | NA | NA | NA | NA | NA | NA | NA | NA | NA | NA | NA | NA | NA | NA | NA | NA | NA | |
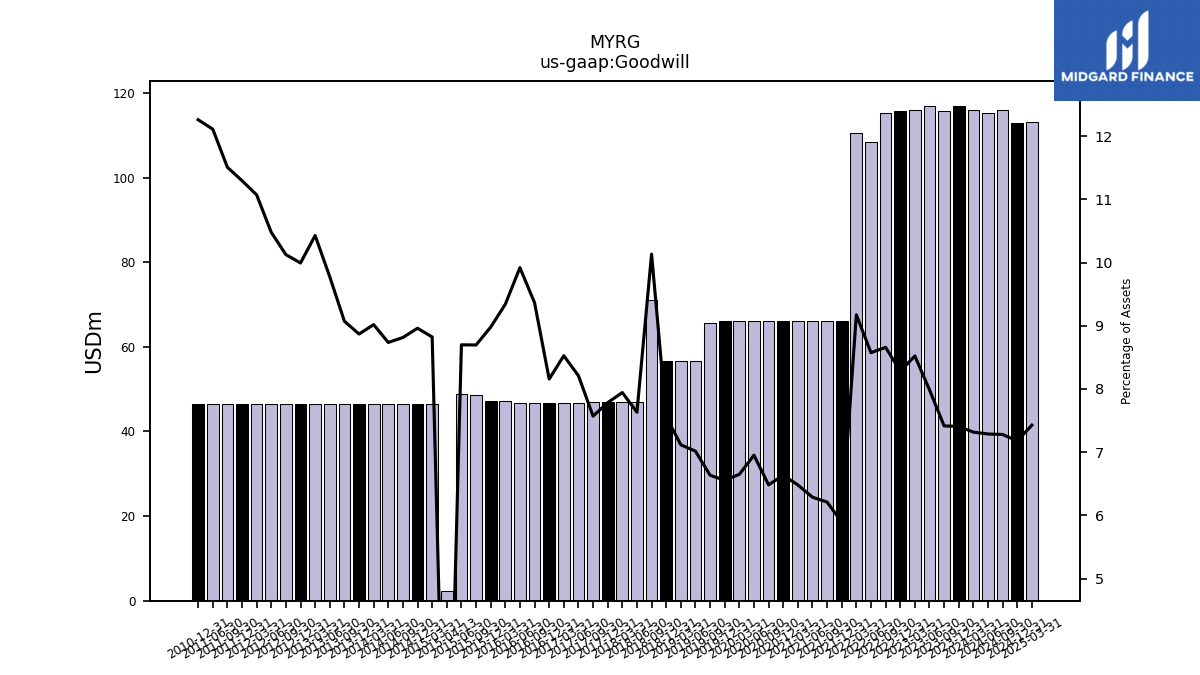
| Goodwill | 116.95 | 115.73 | 116.98 | 115.91 | 115.85 | 115.15 | 108.41 | 110.59 | 66.06 | 66.06 | 66.07 | 66.07 | 66.06 | 66.06 | 66.05 | 66.04 | 66.06 | 65.56 | 56.60 | 56.59 | 56.59 | 71.10 | 46.98 | 46.99 | 46.99 | 46.98 | 46.78 | 46.78 | 46.78 | 46.78 | 46.78 | 47.12 | 47.12 | 48.67 | 48.92 | 46.60 | 46.60 | 46.60 | 46.60 | 46.60 | 46.60 | 46.60 | 46.60 | 46.60 | 46.60 | 46.60 | 46.60 | 46.60 | 46.60 | 46.60 | 46.60 | NA | 46.60 | NA | NA | |
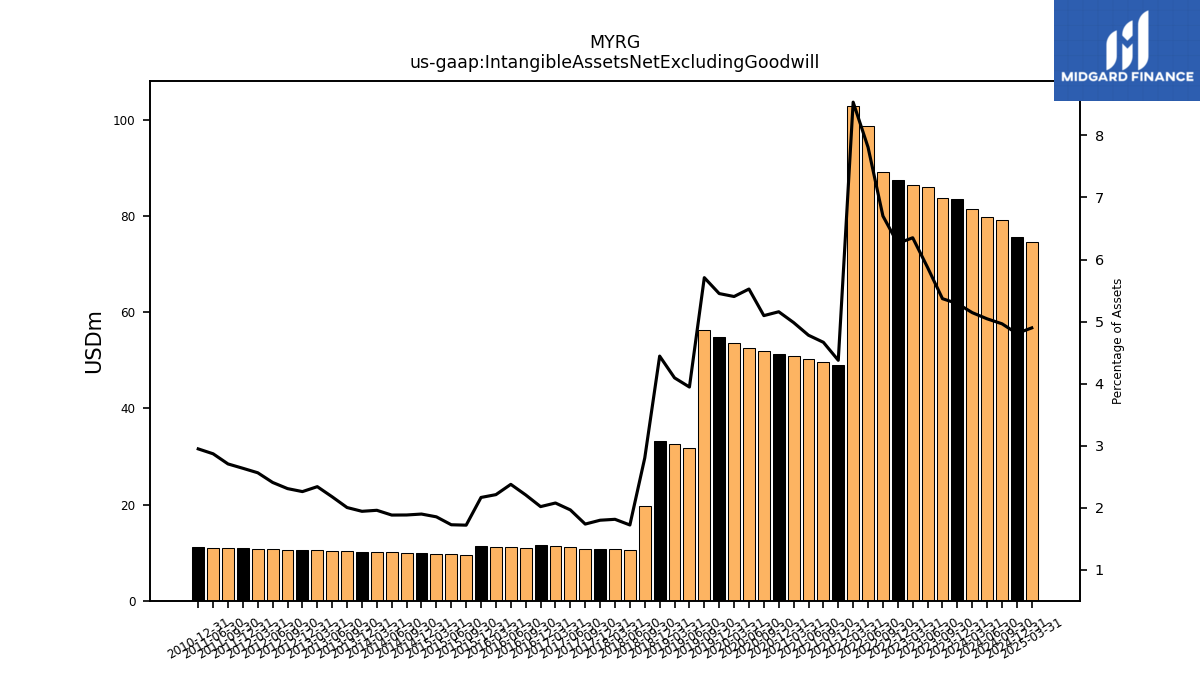
| Intangible Assets Net Excluding Goodwill | 83.52 | 83.79 | 86.01 | 86.39 | 87.56 | 89.12 | 98.75 | 102.92 | 49.05 | 49.63 | 50.22 | 50.79 | 51.37 | 51.92 | 52.49 | 53.67 | 54.94 | 56.39 | 31.82 | 32.54 | 33.27 | 19.66 | 10.59 | 10.72 | 10.85 | 10.77 | 11.19 | 11.38 | 11.57 | 11.02 | 11.21 | 11.15 | 11.36 | 9.61 | 9.70 | 9.78 | 9.87 | 9.95 | 10.03 | 10.12 | 10.20 | 10.28 | 10.37 | 10.45 | 10.53 | 10.62 | 10.70 | 10.79 | 10.87 | 10.95 | 11.04 | NA | 11.20 | NA | NA | |
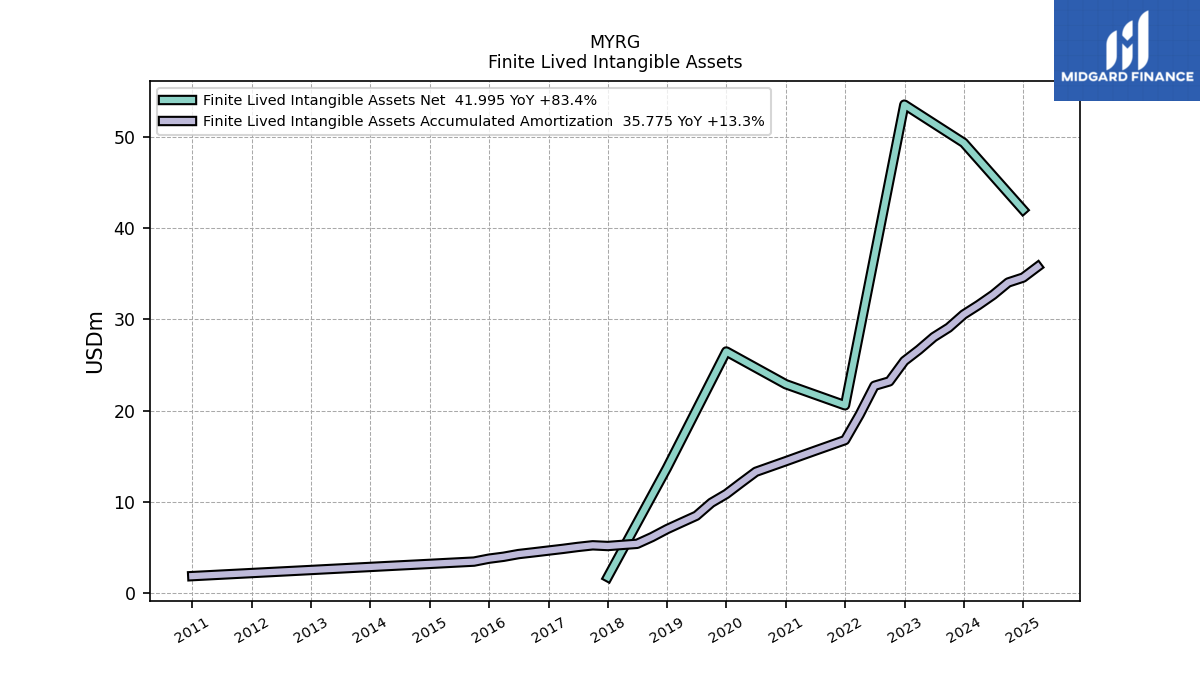
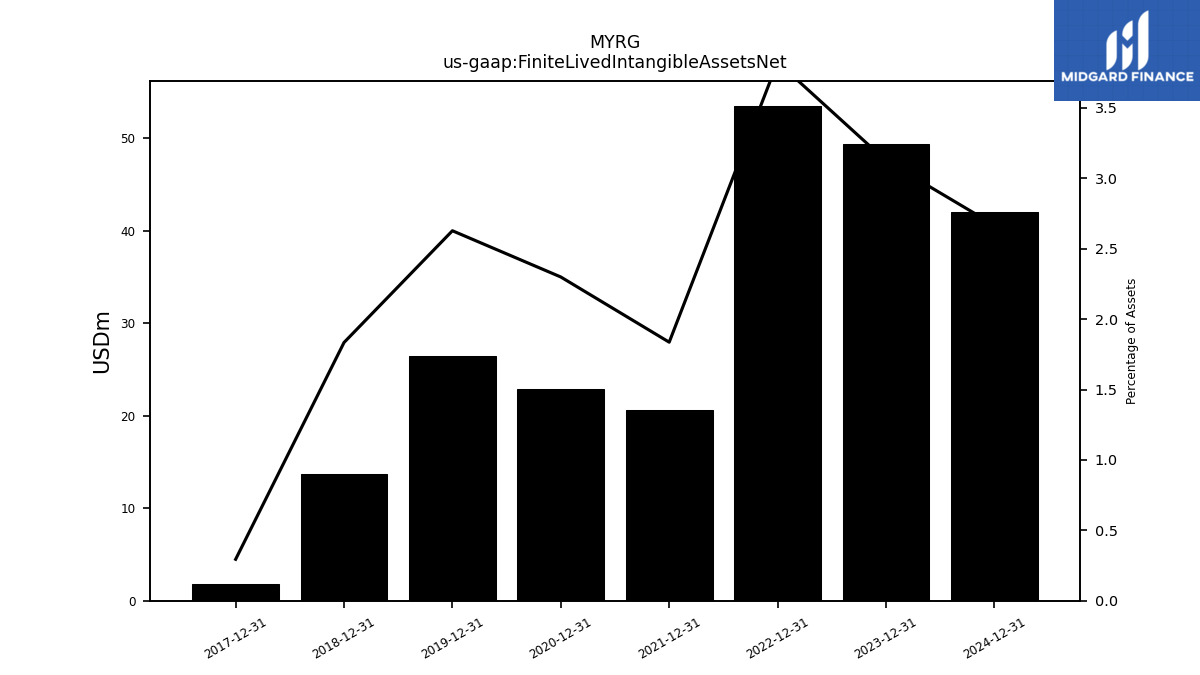
| Finite Lived Intangible Assets Net | 49.34 | NA | NA | NA | 53.51 | NA | NA | NA | 20.59 | NA | NA | NA | 22.90 | NA | NA | NA | 26.48 | NA | NA | NA | 13.73 | NA | NA | NA | 1.78 | NA | NA | NA | NA | NA | NA | NA | NA | NA | NA | NA | NA | NA | NA | NA | NA | NA | NA | NA | NA | NA | NA | NA | NA | NA | NA | NA | NA | NA | NA | |
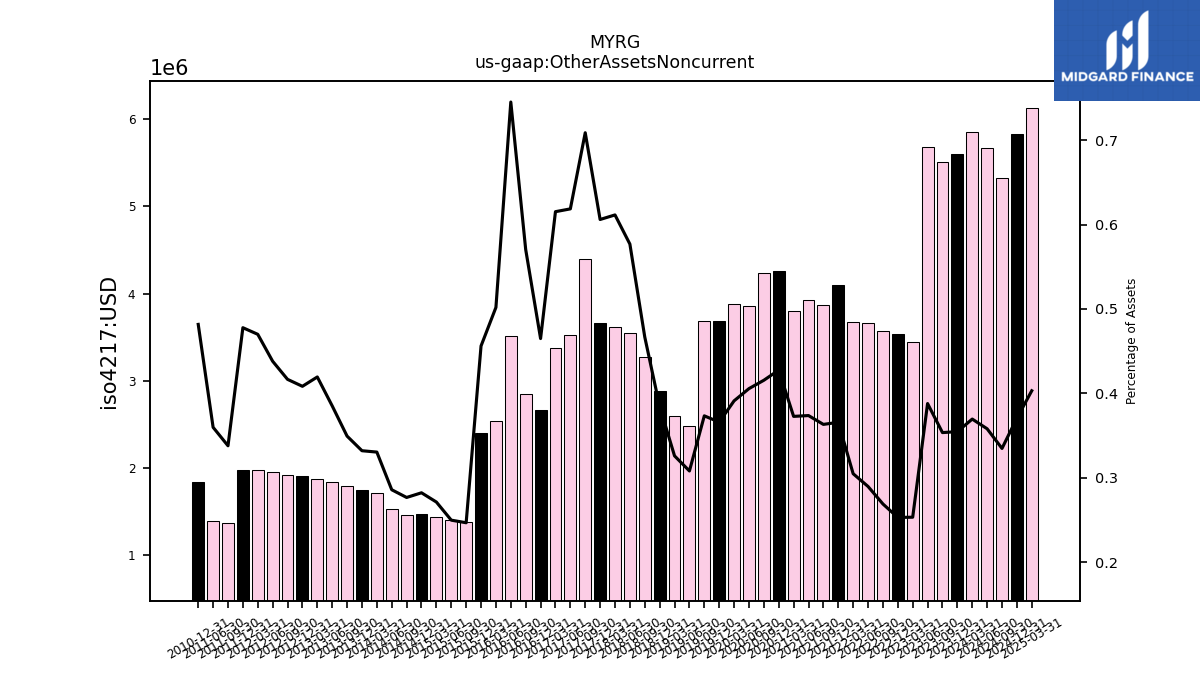
| Other Assets Noncurrent | 5.60 | 5.52 | 5.68 | 3.44 | 3.54 | 3.58 | 3.66 | 3.67 | 4.10 | 3.86 | 3.93 | 3.80 | 4.26 | 4.23 | 3.85 | 3.88 | 3.69 | 3.69 | 2.48 | 2.59 | 2.88 | 3.27 | 3.55 | 3.62 | 3.66 | 4.40 | 3.52 | 3.38 | 2.67 | 2.85 | 3.52 | 2.53 | 2.39 | 1.38 | 1.40 | 1.43 | 1.47 | 1.46 | 1.52 | 1.71 | 1.74 | 1.79 | 1.84 | 1.87 | 1.90 | 1.92 | 1.95 | 1.98 | 1.97 | 1.37 | 1.38 | NA | 1.83 | NA | NA |
| 2023-12-31 | 2023-09-30 | 2023-06-30 | 2023-03-31 | 2022-12-31 | 2022-09-30 | 2022-06-30 | 2022-03-31 | 2021-12-31 | 2021-09-30 | 2021-06-30 | 2021-03-31 | 2020-12-31 | 2020-09-30 | 2020-06-30 | 2020-03-31 | 2019-12-31 | 2019-09-30 | 2019-06-30 | 2019-03-31 | 2018-12-31 | 2018-09-30 | 2018-06-30 | 2018-03-31 | 2017-12-31 | 2017-09-30 | 2017-06-30 | 2017-03-31 | 2016-12-31 | 2016-09-30 | 2016-06-30 | 2016-03-31 | 2015-12-31 | 2015-09-30 | 2015-06-30 | 2015-03-31 | 2014-12-31 | 2014-09-30 | 2014-06-30 | 2014-03-31 | 2013-12-31 | 2013-09-30 | 2013-06-30 | 2013-03-31 | 2012-12-31 | 2012-09-30 | 2012-06-30 | 2012-03-31 | 2011-12-31 | 2011-09-30 | 2011-06-30 | 2011-03-31 | 2010-12-31 | 2010-09-30 | 2010-06-30 | ||
|---|---|---|---|---|---|---|---|---|---|---|---|---|---|---|---|---|---|---|---|---|---|---|---|---|---|---|---|---|---|---|---|---|---|---|---|---|---|---|---|---|---|---|---|---|---|---|---|---|---|---|---|---|---|---|---|---|
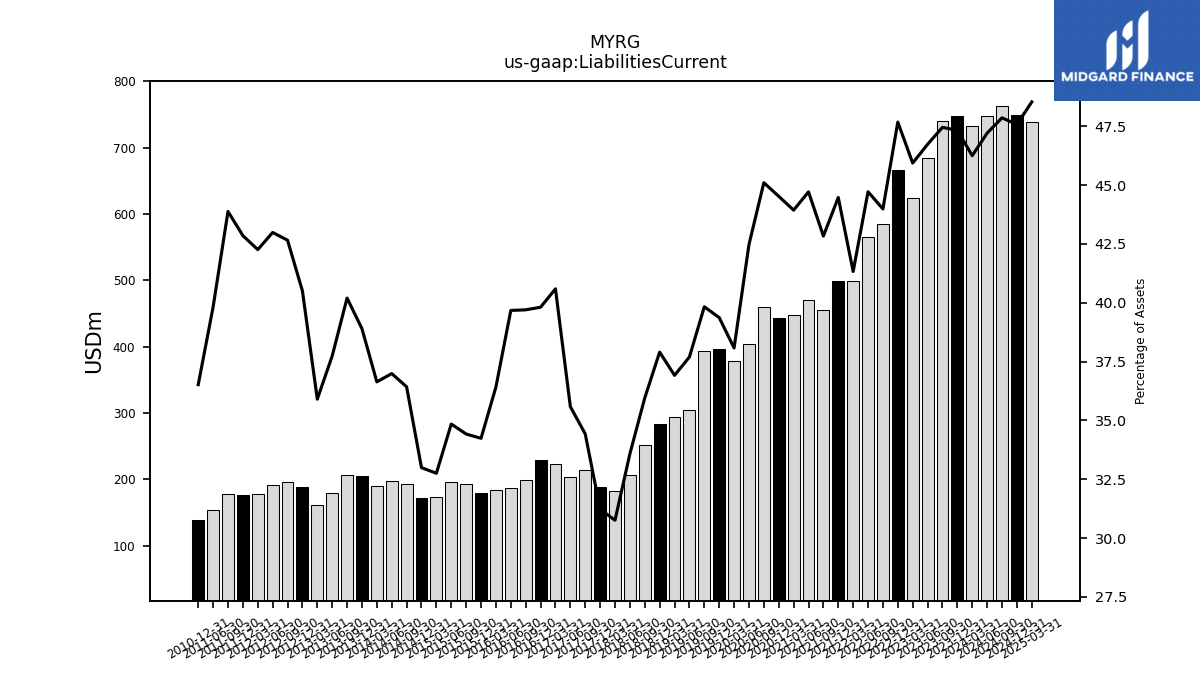
| Liabilities Current | 747.20 | 740.65 | 684.56 | 624.85 | 666.96 | 585.01 | 565.41 | 498.26 | 498.60 | 455.70 | 469.88 | 447.82 | 443.40 | 459.55 | 403.53 | 378.24 | 396.81 | 393.52 | 304.10 | 293.56 | 283.81 | 252.30 | 206.72 | 181.96 | 188.56 | 213.66 | 202.79 | 222.73 | 228.31 | 198.35 | 187.14 | 183.77 | 179.74 | 192.66 | 195.98 | 173.02 | 171.59 | 192.59 | 197.34 | 189.34 | 204.38 | 206.50 | 179.93 | 160.45 | 188.89 | 196.34 | 191.19 | 177.88 | 176.80 | 177.69 | 153.24 | NA | 138.83 | NA | NA | |
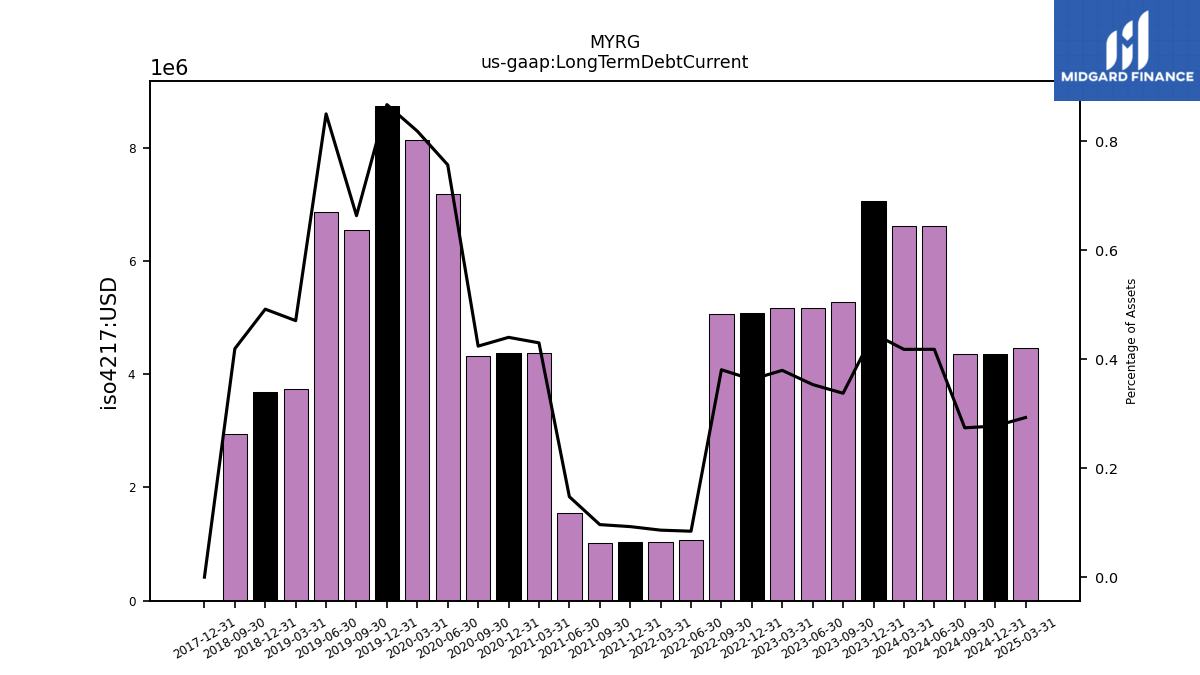
| Long Term Debt Current | 7.05 | 5.26 | 5.17 | 5.16 | 5.07 | 5.06 | 1.06 | 1.04 | 1.04 | 1.02 | 1.55 | 4.38 | 4.38 | 4.32 | 7.19 | 8.13 | 8.74 | 6.55 | 6.86 | 3.74 | 3.68 | 2.94 | NA | NA | 0.00 | NA | NA | NA | NA | NA | NA | NA | NA | NA | NA | NA | NA | NA | NA | NA | NA | NA | NA | NA | NA | NA | NA | NA | NA | NA | NA | NA | NA | NA | NA | |
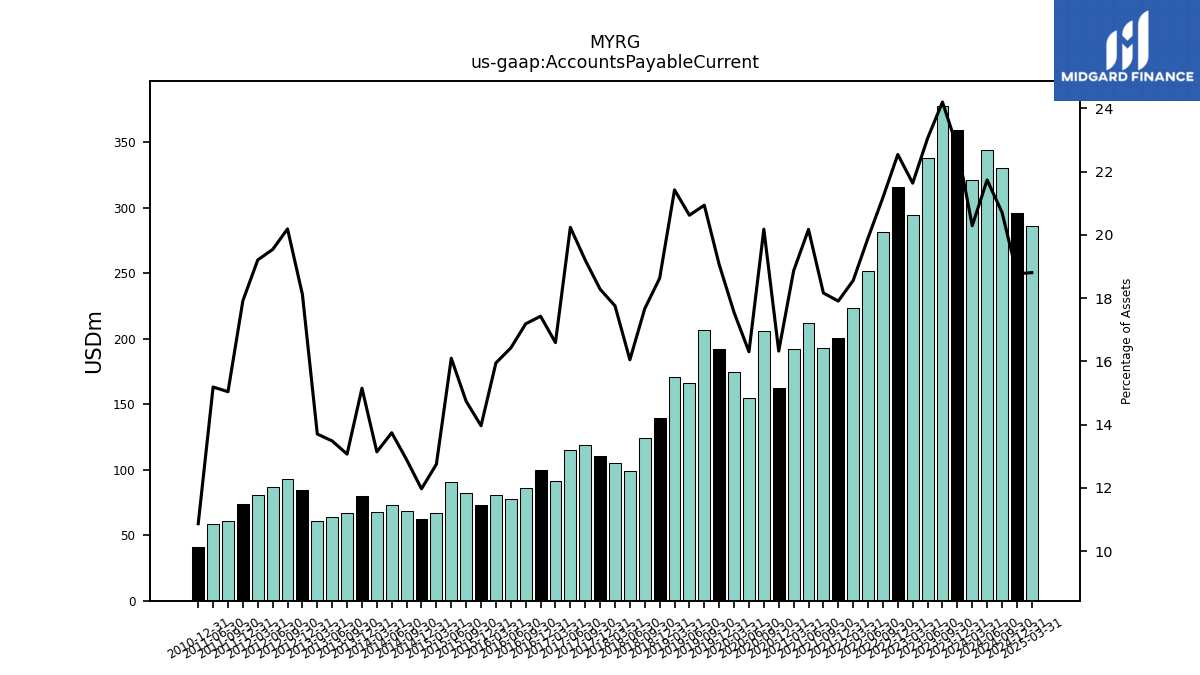
| Accounts Payable Current | 359.36 | 377.69 | 337.70 | 294.31 | 315.32 | 281.71 | 251.65 | 223.70 | 200.74 | 193.22 | 211.97 | 192.24 | 162.58 | 205.60 | 154.90 | 174.28 | 192.11 | 206.88 | 166.35 | 170.35 | 139.48 | 123.98 | 98.80 | 105.04 | 110.38 | 119.17 | 115.32 | 91.05 | 99.94 | 85.87 | 77.47 | 80.48 | 73.30 | 82.49 | 90.54 | 67.33 | 62.25 | 68.15 | 73.31 | 67.90 | 79.61 | 67.12 | 64.28 | 61.23 | 84.48 | 92.92 | 86.90 | 80.85 | 73.92 | 60.91 | 58.45 | NA | 41.31 | NA | NA | |
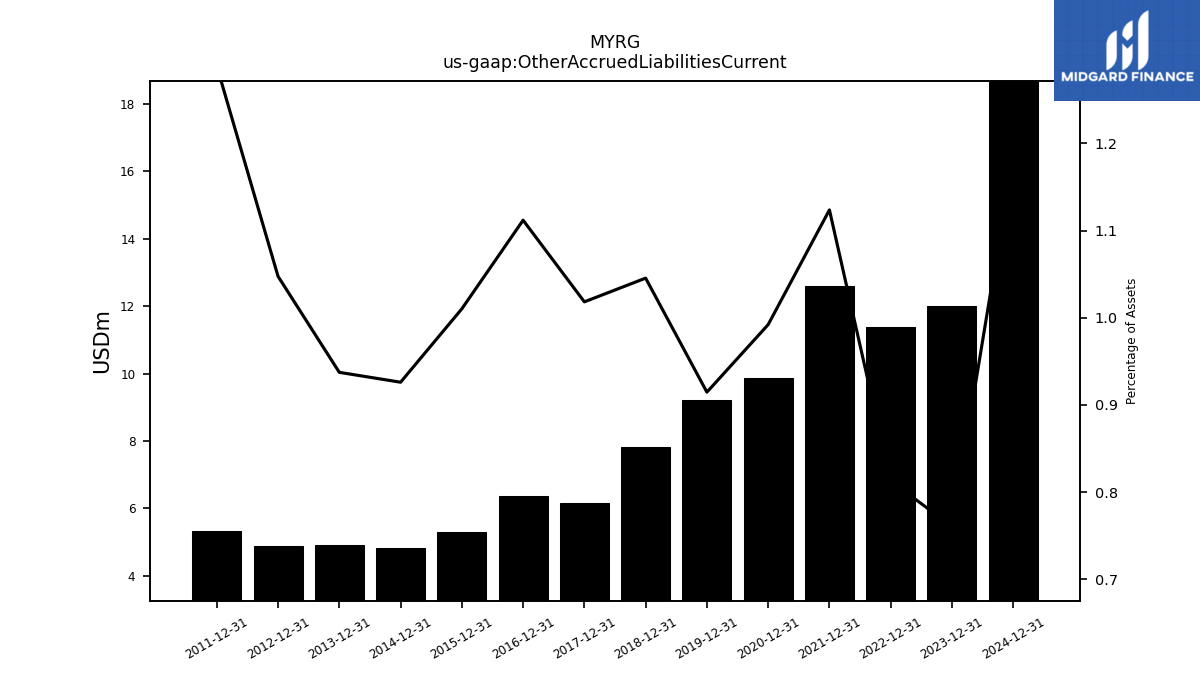
| Other Accrued Liabilities Current | 12.01 | NA | NA | NA | 11.37 | NA | NA | NA | 12.60 | NA | NA | NA | 9.88 | NA | NA | NA | 9.22 | NA | NA | NA | 7.83 | NA | NA | NA | 6.15 | NA | NA | NA | 6.38 | NA | NA | NA | 5.30 | NA | NA | NA | 4.82 | NA | NA | NA | 4.92 | NA | NA | NA | 4.88 | NA | NA | NA | 5.32 | NA | NA | NA | NA | NA | NA | |
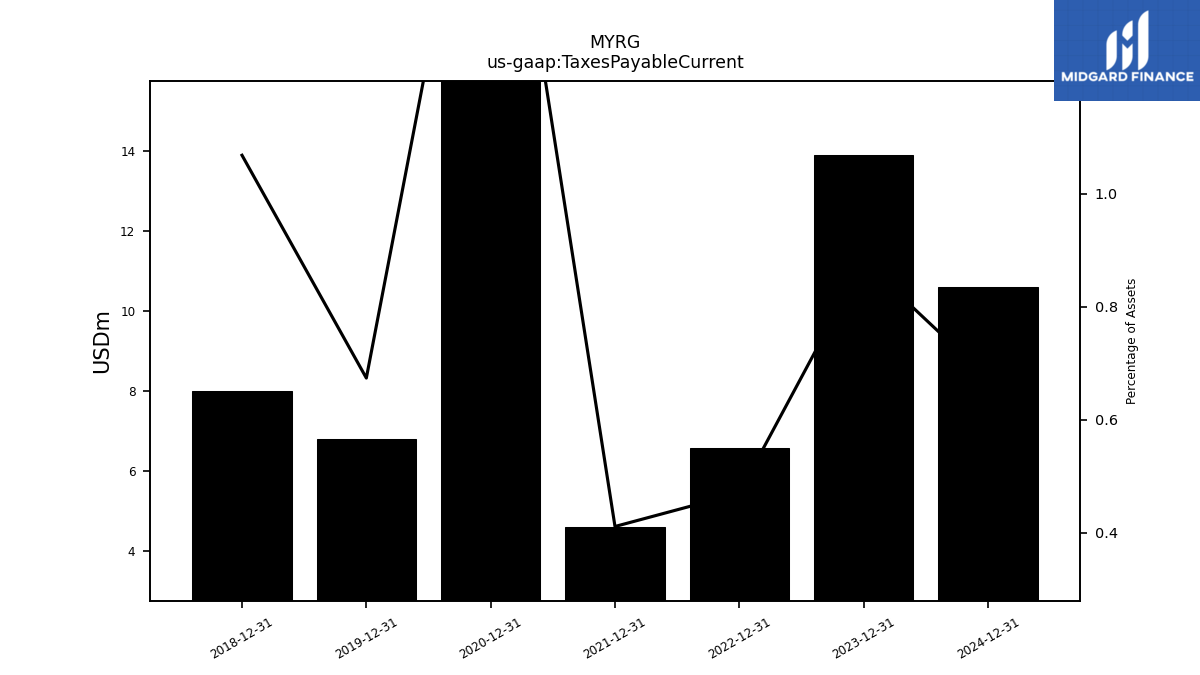
| Taxes Payable Current | 13.90 | NA | NA | NA | 6.57 | NA | NA | NA | 4.61 | NA | NA | NA | 18.13 | NA | NA | NA | 6.79 | NA | NA | NA | 8.00 | NA | NA | NA | NA | NA | NA | NA | NA | NA | NA | NA | NA | NA | NA | NA | NA | NA | NA | NA | NA | NA | NA | NA | NA | NA | NA | NA | NA | NA | NA | NA | NA | NA | NA | |
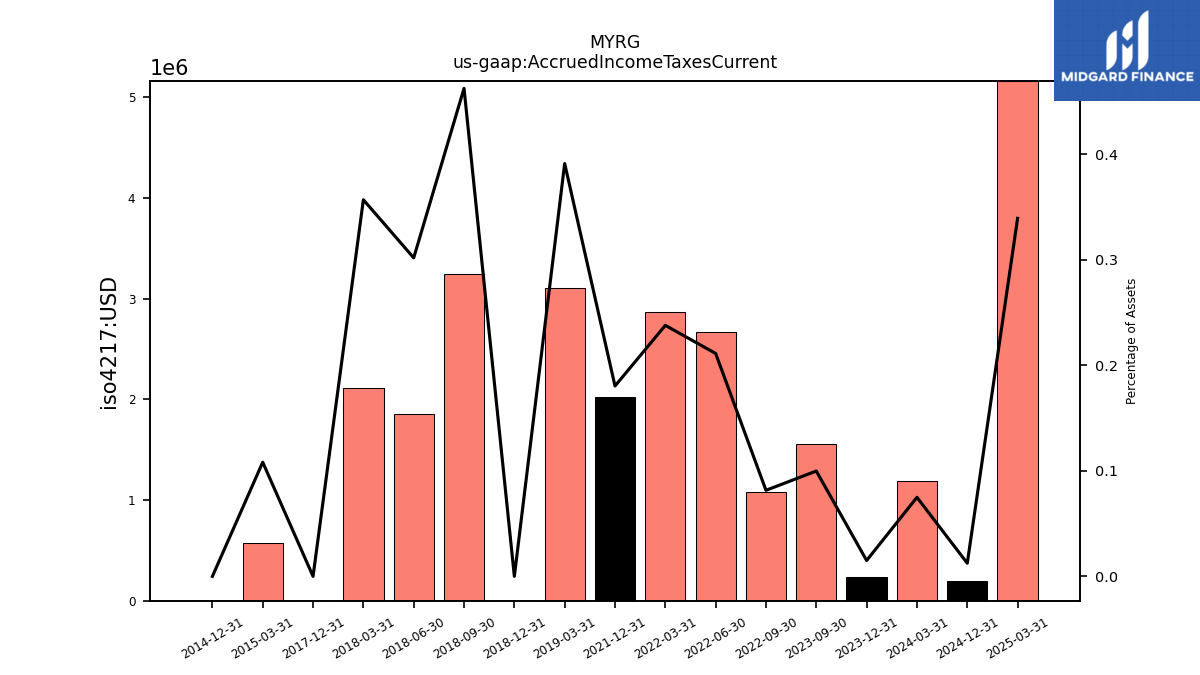
| Accrued Income Taxes Current | 0.24 | 1.56 | NA | NA | NA | 1.08 | 2.67 | 2.87 | 2.02 | NA | NA | NA | NA | NA | NA | NA | NA | NA | NA | 3.11 | 0.00 | 3.24 | 1.86 | 2.11 | 0.00 | NA | NA | NA | NA | NA | NA | NA | NA | NA | NA | 0.57 | 0.00 | NA | NA | NA | NA | NA | NA | NA | NA | NA | NA | NA | NA | NA | NA | NA | NA | NA | NA | |
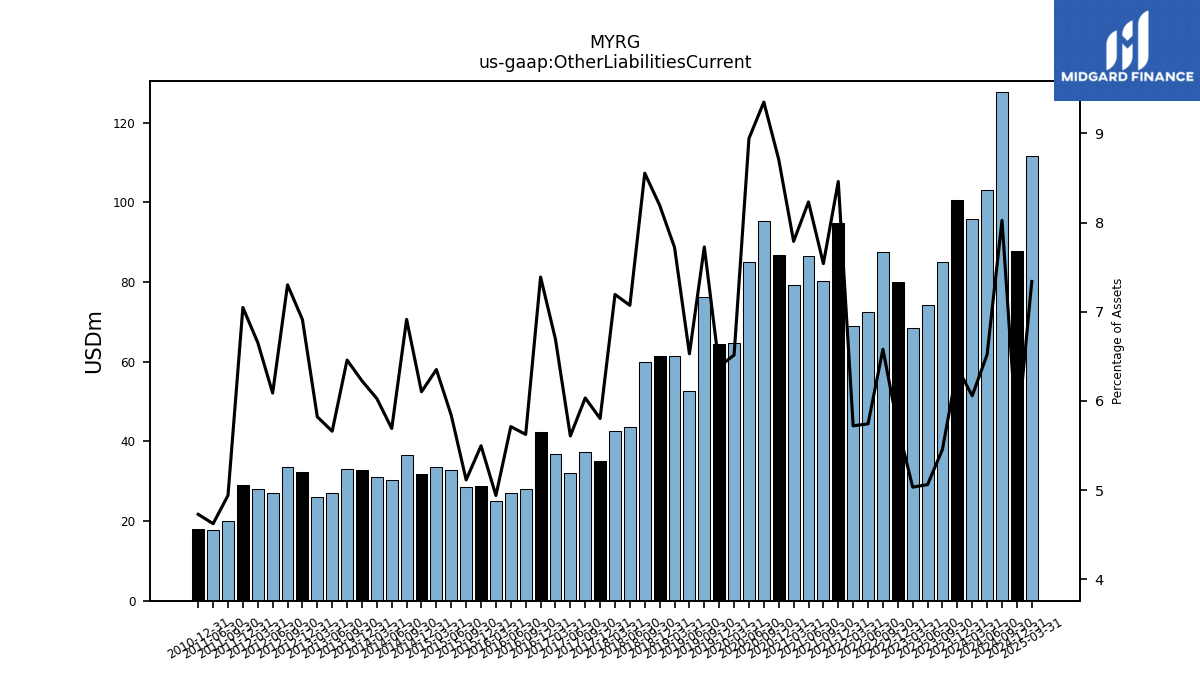
| Other Liabilities Current | 100.59 | 85.18 | 74.15 | 68.46 | 79.92 | 87.51 | 72.61 | 68.97 | 94.86 | 80.22 | 86.51 | 79.40 | 86.72 | 95.29 | 84.98 | 64.71 | 64.36 | 76.35 | 52.67 | 61.41 | 61.36 | 60.03 | 43.54 | 42.56 | 35.04 | 37.44 | 31.96 | 36.72 | 42.38 | 28.10 | 26.94 | 24.93 | 28.86 | 28.63 | 32.84 | 33.55 | 31.74 | 36.56 | 30.36 | 31.15 | 32.71 | 33.18 | 26.99 | 26.02 | 32.24 | 33.61 | 27.08 | 28.01 | 29.08 | 20.01 | 17.79 | NA | 17.97 | NA | NA | |
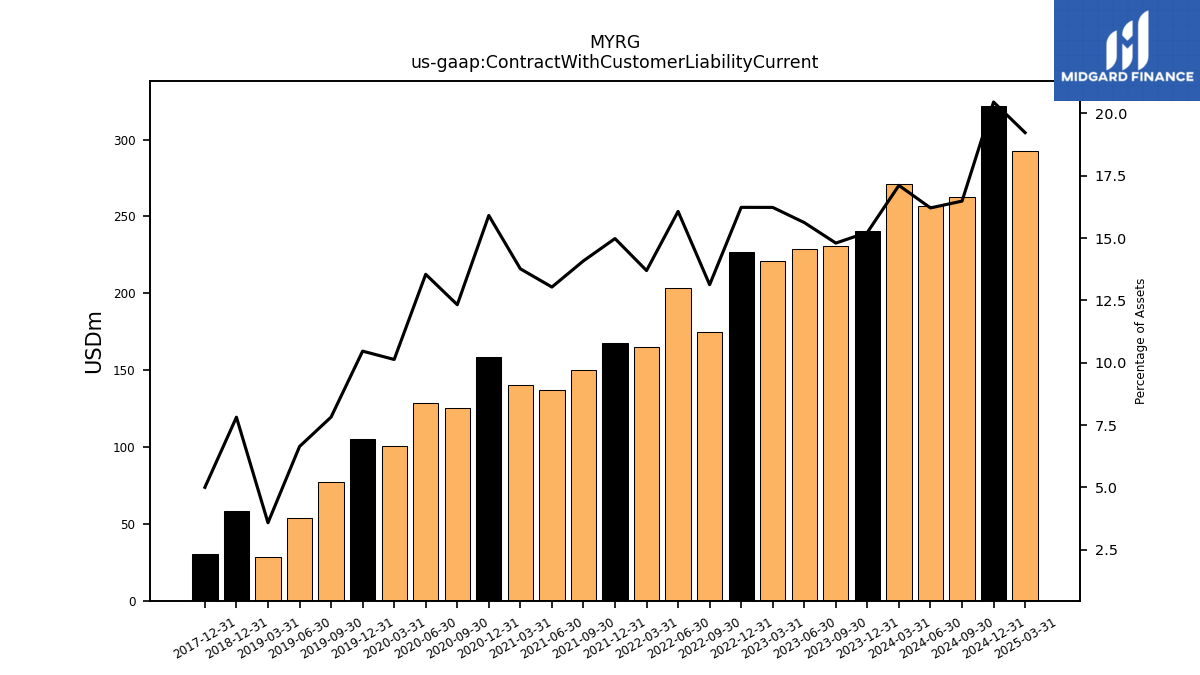
| Contract With Customer Liability Current | 240.41 | 230.97 | 228.82 | 220.75 | 227.06 | 174.63 | 203.16 | 165.13 | 167.93 | 149.85 | 136.99 | 140.31 | 158.40 | 125.61 | 128.70 | 100.64 | 105.49 | 77.29 | 53.58 | 28.52 | 58.53 | NA | NA | NA | 30.22 | NA | NA | NA | NA | NA | NA | NA | NA | NA | NA | NA | NA | NA | NA | NA | NA | NA | NA | NA | NA | NA | NA | NA | NA | NA | NA | NA | NA | NA | NA |
| 2023-12-31 | 2023-09-30 | 2023-06-30 | 2023-03-31 | 2022-12-31 | 2022-09-30 | 2022-06-30 | 2022-03-31 | 2021-12-31 | 2021-09-30 | 2021-06-30 | 2021-03-31 | 2020-12-31 | 2020-09-30 | 2020-06-30 | 2020-03-31 | 2019-12-31 | 2019-09-30 | 2019-06-30 | 2019-03-31 | 2018-12-31 | 2018-09-30 | 2018-06-30 | 2018-03-31 | 2017-12-31 | 2017-09-30 | 2017-06-30 | 2017-03-31 | 2016-12-31 | 2016-09-30 | 2016-06-30 | 2016-03-31 | 2015-12-31 | 2015-09-30 | 2015-06-30 | 2015-03-31 | 2014-12-31 | 2014-09-30 | 2014-06-30 | 2014-03-31 | 2013-12-31 | 2013-09-30 | 2013-06-30 | 2013-03-31 | 2012-12-31 | 2012-09-30 | 2012-06-30 | 2012-03-31 | 2011-12-31 | 2011-09-30 | 2011-06-30 | 2011-03-31 | 2010-12-31 | 2010-09-30 | 2010-06-30 | ||
|---|---|---|---|---|---|---|---|---|---|---|---|---|---|---|---|---|---|---|---|---|---|---|---|---|---|---|---|---|---|---|---|---|---|---|---|---|---|---|---|---|---|---|---|---|---|---|---|---|---|---|---|---|---|---|---|---|
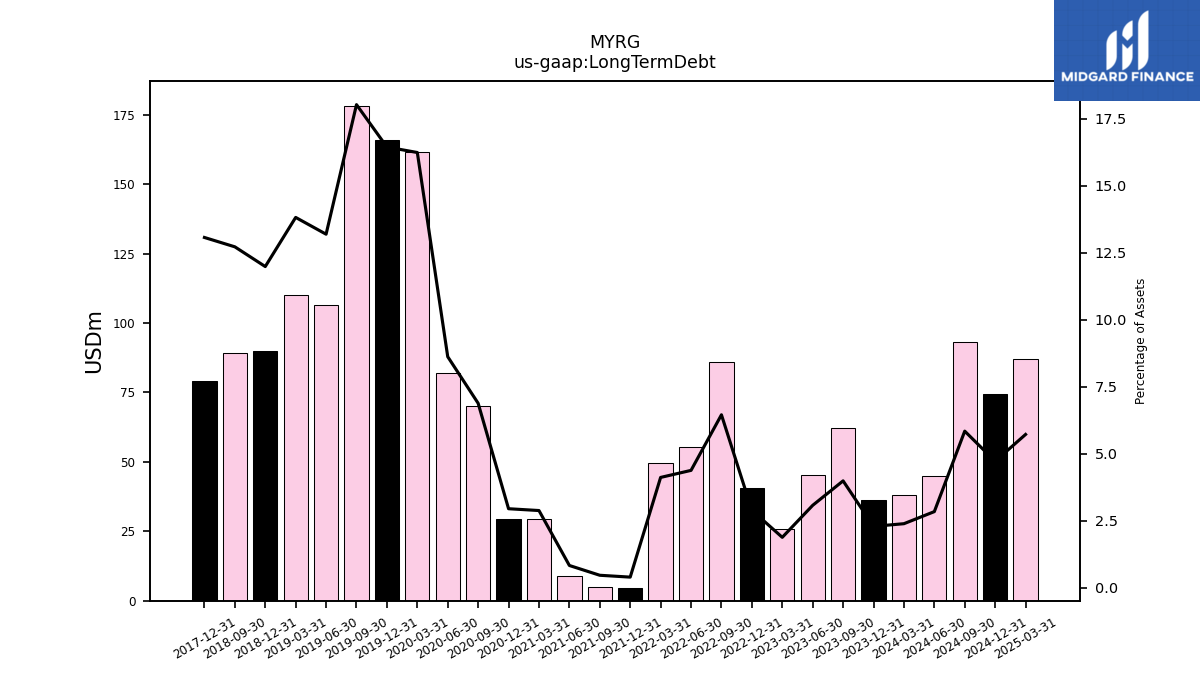
| Long Term Debt | 36.24 | 62.34 | 45.12 | 25.66 | 40.55 | 85.91 | 55.45 | 49.70 | 4.50 | 5.01 | 8.79 | 29.42 | 29.42 | 70.19 | 81.97 | 161.38 | 165.82 | 178.19 | 106.48 | 109.95 | 89.79 | 89.31 | NA | NA | 78.96 | NA | NA | NA | NA | NA | NA | NA | NA | NA | NA | NA | NA | NA | NA | NA | NA | NA | NA | NA | NA | NA | NA | NA | NA | NA | NA | NA | NA | NA | NA | |
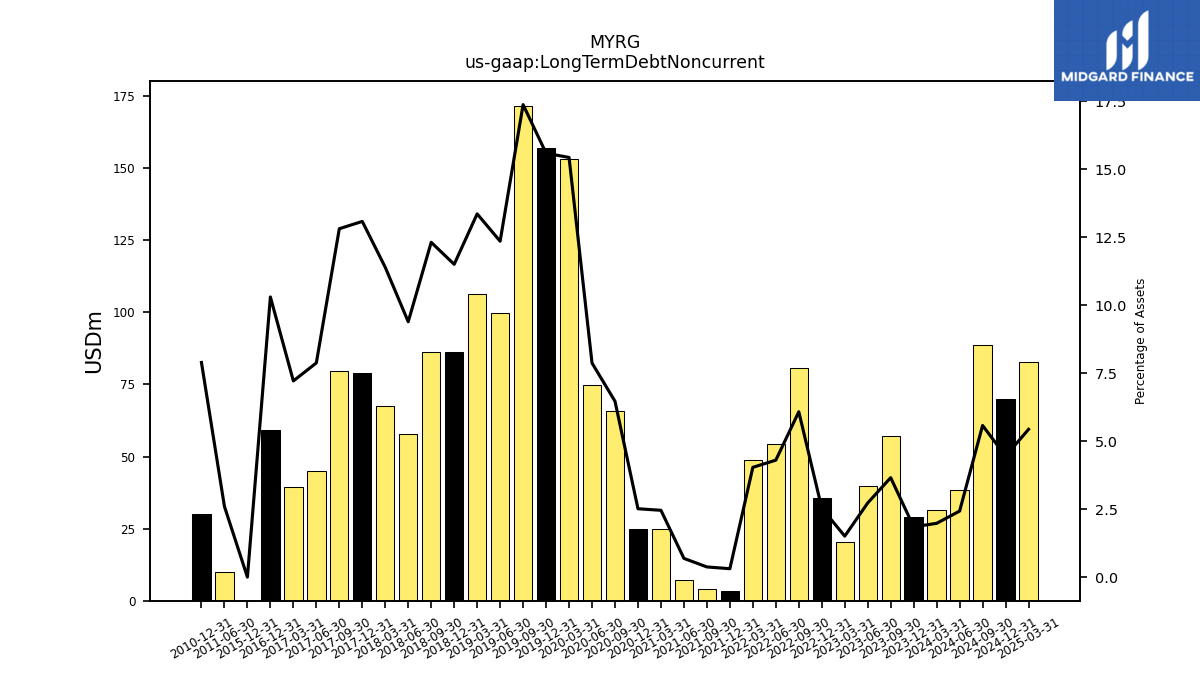
| Long Term Debt Noncurrent | 29.19 | 57.07 | 39.95 | 20.50 | 35.48 | 80.85 | 54.38 | 48.66 | 3.46 | 3.99 | 7.24 | 25.04 | 25.04 | 65.88 | 74.78 | 153.26 | 157.09 | 171.64 | 99.62 | 106.20 | 86.11 | 86.37 | 57.80 | 67.38 | 78.96 | 79.50 | 44.88 | 39.58 | 59.07 | NA | NA | NA | 0.00 | NA | NA | NA | NA | NA | NA | NA | NA | NA | NA | NA | NA | NA | NA | NA | NA | NA | 10.00 | NA | 30.00 | NA | NA | |
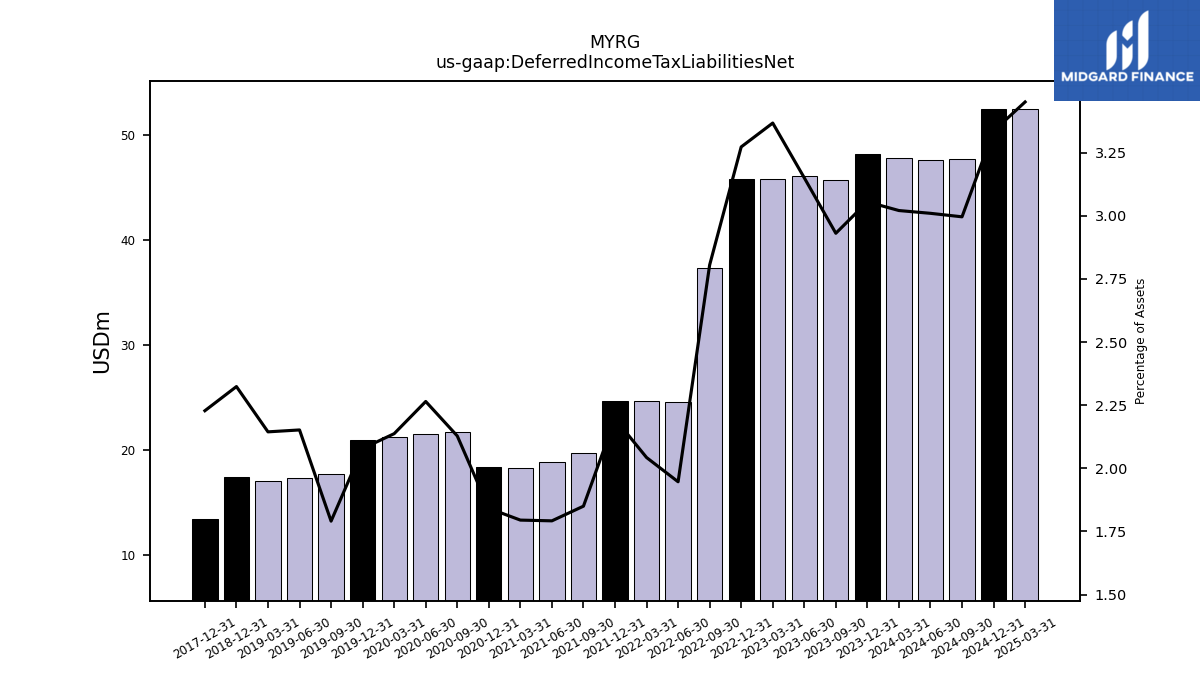
| Deferred Income Tax Liabilities Net | 48.23 | 45.74 | 46.14 | 45.80 | 45.77 | 37.30 | 24.61 | 24.63 | 24.62 | 19.68 | 18.83 | 18.30 | 18.34 | 21.68 | 21.52 | 21.23 | 20.95 | 17.69 | 17.36 | 17.05 | 17.40 | NA | NA | NA | 13.45 | NA | NA | NA | NA | NA | NA | NA | NA | NA | NA | NA | NA | NA | NA | NA | NA | NA | NA | NA | NA | NA | NA | NA | NA | NA | NA | NA | NA | NA | NA | |
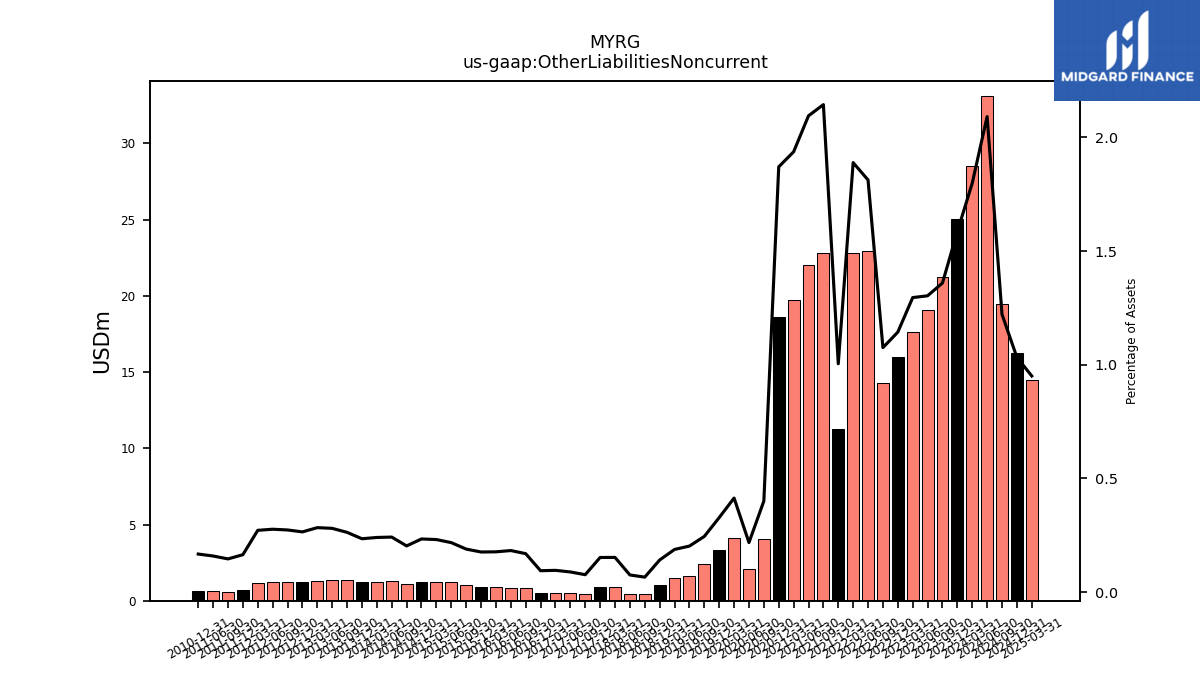
| Other Liabilities Noncurrent | 25.04 | 21.22 | 19.09 | 17.62 | 16.00 | 14.30 | 22.92 | 22.78 | 11.26 | 22.81 | 22.02 | 19.74 | 18.63 | 4.08 | 2.07 | 4.11 | 3.30 | 2.42 | 1.63 | 1.49 | 1.06 | 0.46 | 0.46 | 0.90 | 0.92 | 0.47 | 0.51 | 0.53 | 0.54 | 0.84 | 0.86 | 0.89 | 0.93 | 1.06 | 1.22 | 1.22 | 1.22 | 1.07 | 1.29 | 1.24 | 1.23 | 1.35 | 1.34 | 1.27 | 1.24 | 1.26 | 1.23 | 1.14 | 0.68 | 0.59 | 0.61 | NA | 0.64 | NA | NA | |
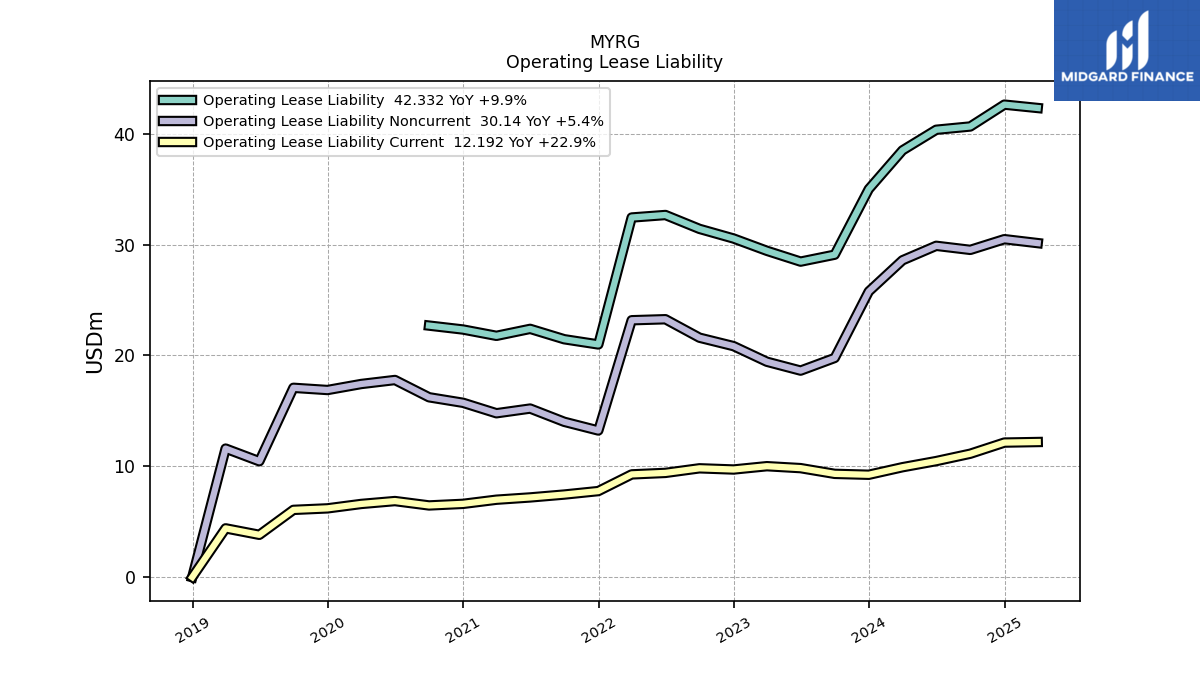
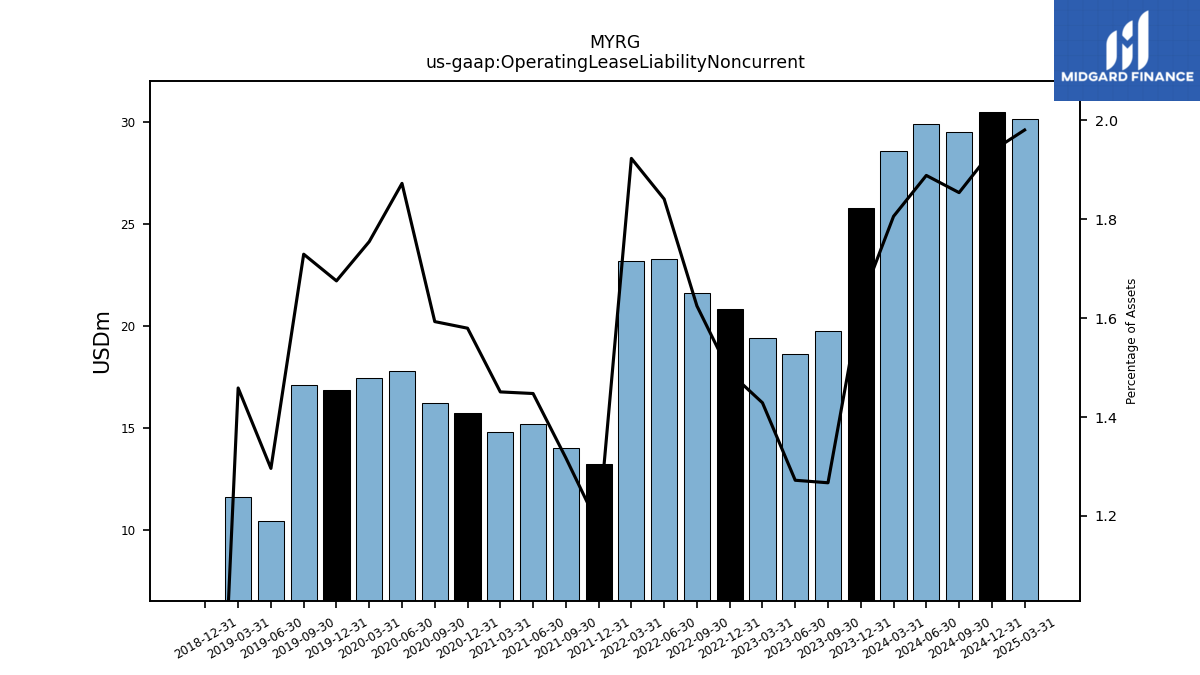
| Operating Lease Liability Noncurrent | 25.77 | 19.78 | 18.64 | 19.43 | 20.84 | 21.61 | 23.27 | 23.18 | 13.23 | 14.02 | 15.21 | 14.79 | 15.73 | 16.23 | 17.79 | 17.43 | 16.88 | 17.08 | 10.46 | 11.60 | 0.00 | NA | NA | NA | NA | NA | NA | NA | NA | NA | NA | NA | NA | NA | NA | NA | NA | NA | NA | NA | NA | NA | NA | NA | NA | NA | NA | NA | NA | NA | NA | NA | NA | NA | NA |
| 2023-12-31 | 2023-09-30 | 2023-06-30 | 2023-03-31 | 2022-12-31 | 2022-09-30 | 2022-06-30 | 2022-03-31 | 2021-12-31 | 2021-09-30 | 2021-06-30 | 2021-03-31 | 2020-12-31 | 2020-09-30 | 2020-06-30 | 2020-03-31 | 2019-12-31 | 2019-09-30 | 2019-06-30 | 2019-03-31 | 2018-12-31 | 2018-09-30 | 2018-06-30 | 2018-03-31 | 2017-12-31 | 2017-09-30 | 2017-06-30 | 2017-03-31 | 2016-12-31 | 2016-09-30 | 2016-06-30 | 2016-03-31 | 2015-12-31 | 2015-09-30 | 2015-06-30 | 2015-03-31 | 2014-12-31 | 2014-09-30 | 2014-06-30 | 2014-03-31 | 2013-12-31 | 2013-09-30 | 2013-06-30 | 2013-03-31 | 2012-12-31 | 2012-09-30 | 2012-06-30 | 2012-03-31 | 2011-12-31 | 2011-09-30 | 2011-06-30 | 2011-03-31 | 2010-12-31 | 2010-09-30 | 2010-06-30 | ||
|---|---|---|---|---|---|---|---|---|---|---|---|---|---|---|---|---|---|---|---|---|---|---|---|---|---|---|---|---|---|---|---|---|---|---|---|---|---|---|---|---|---|---|---|---|---|---|---|---|---|---|---|---|---|---|---|---|
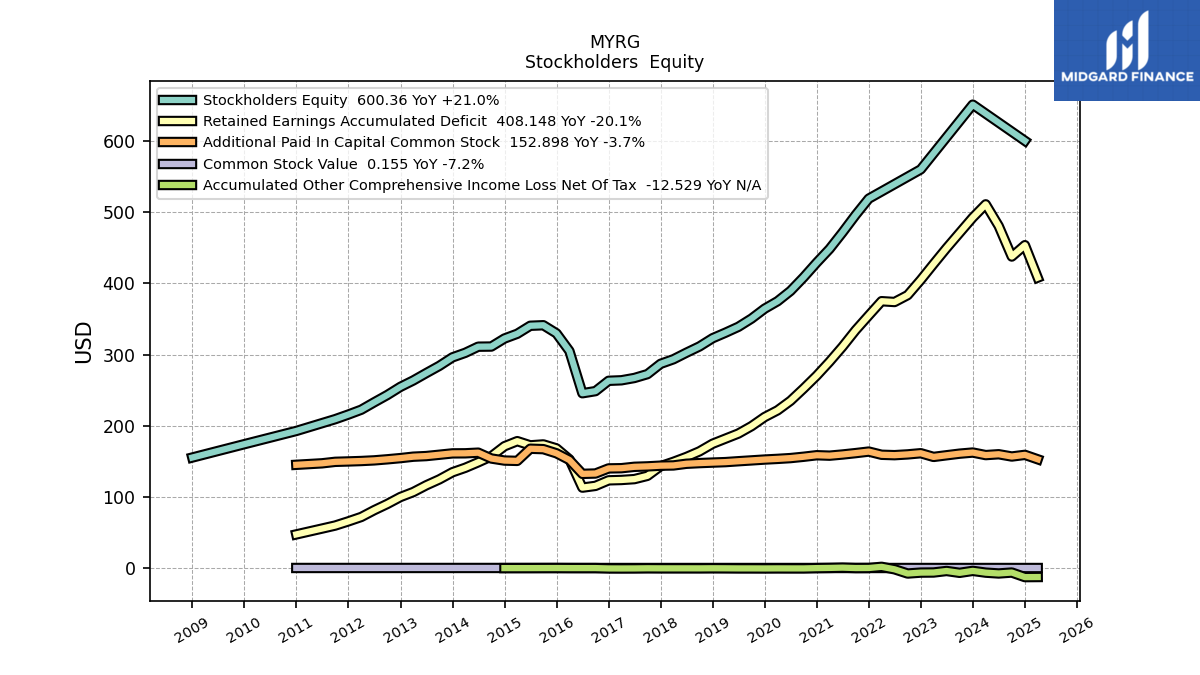
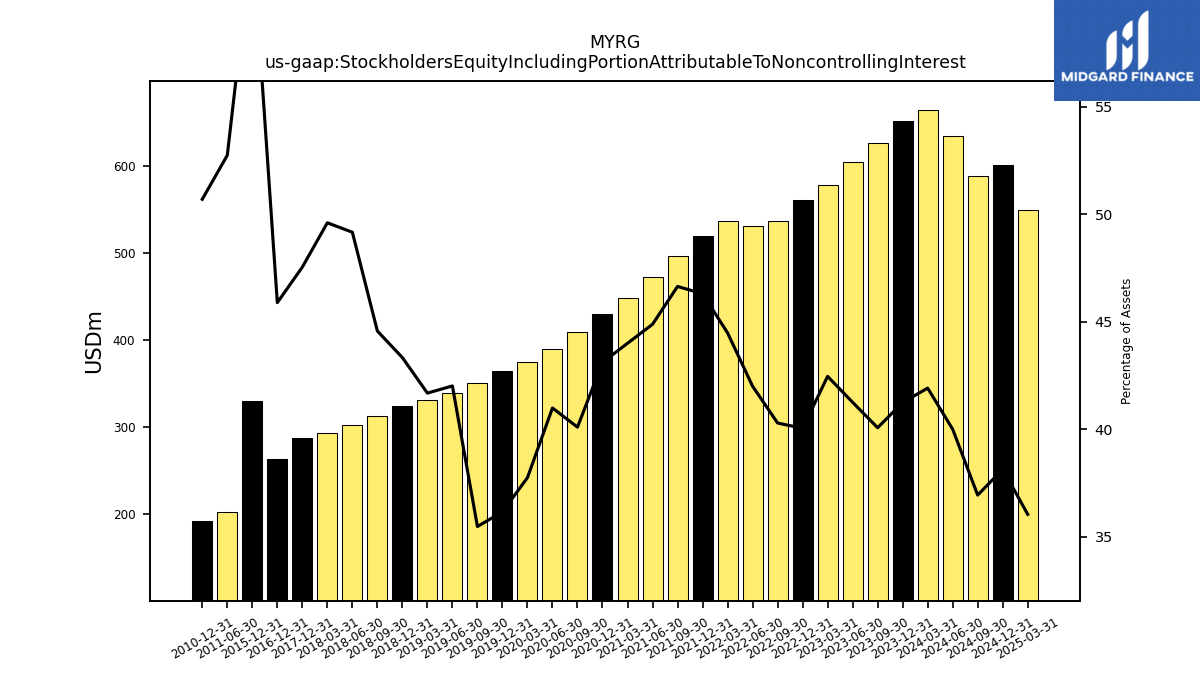
| Stockholders Equity Including Portion Attributable To Noncontrolling Interest | 651.20 | 625.46 | 604.30 | 577.57 | 560.20 | 535.88 | 531.08 | 536.28 | 519.10 | 496.18 | 471.63 | 448.46 | 429.29 | 408.60 | 389.45 | 374.99 | 364.48 | 350.57 | 338.94 | 331.47 | 324.46 | 312.75 | 302.63 | 293.43 | 287.04 | NA | NA | NA | 263.17 | NA | NA | NA | 329.88 | NA | NA | NA | NA | NA | NA | NA | NA | NA | NA | NA | NA | NA | NA | NA | NA | NA | 202.95 | NA | 192.71 | NA | NA | |
| Common Stock Value | 0.17 | 0.17 | 0.17 | 0.17 | 0.17 | 0.17 | 0.17 | 0.17 | 0.17 | 0.17 | 0.17 | 0.17 | 0.17 | 0.17 | 0.17 | 0.17 | 0.17 | 0.17 | 0.17 | 0.18 | 0.17 | 0.17 | 0.17 | 0.16 | 0.16 | 0.16 | 0.16 | 0.16 | 0.16 | 0.16 | 0.16 | 0.19 | 0.20 | 0.21 | 0.21 | 0.21 | 0.21 | NA | NA | NA | 0.21 | NA | NA | NA | NA | NA | NA | NA | NA | NA | 0.20 | NA | 0.20 | NA | NA | |
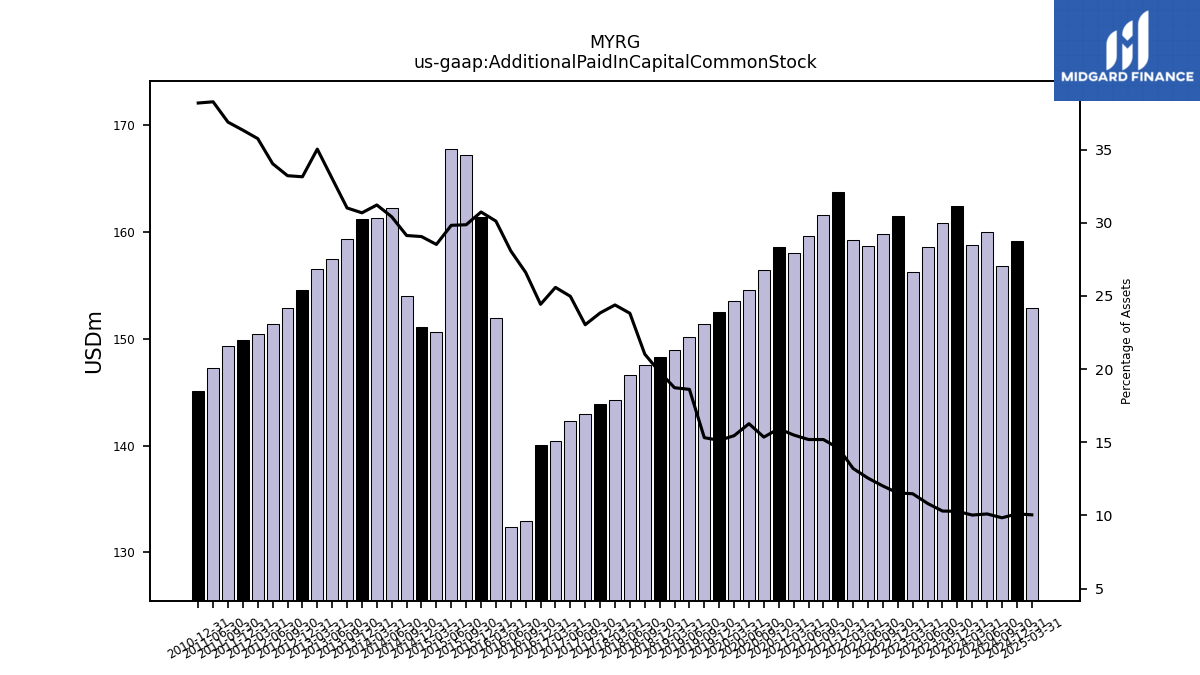
| Additional Paid In Capital Common Stock | 162.39 | 160.81 | 158.56 | 156.23 | 161.43 | 159.78 | 158.69 | 159.26 | 163.75 | 161.59 | 159.62 | 158.00 | 158.62 | 156.46 | 154.59 | 153.48 | 152.53 | 151.35 | 150.18 | 148.94 | 148.28 | 147.54 | 146.61 | 144.26 | 143.93 | 142.95 | 142.33 | 140.39 | 140.10 | 132.92 | 132.43 | 151.95 | 161.34 | 167.15 | 167.75 | 150.65 | 151.12 | 154.01 | 162.21 | 161.31 | 161.20 | 159.30 | 157.43 | 156.56 | 154.56 | 152.88 | 151.38 | 150.48 | 149.88 | 149.33 | 147.25 | NA | 145.15 | NA | NA | |
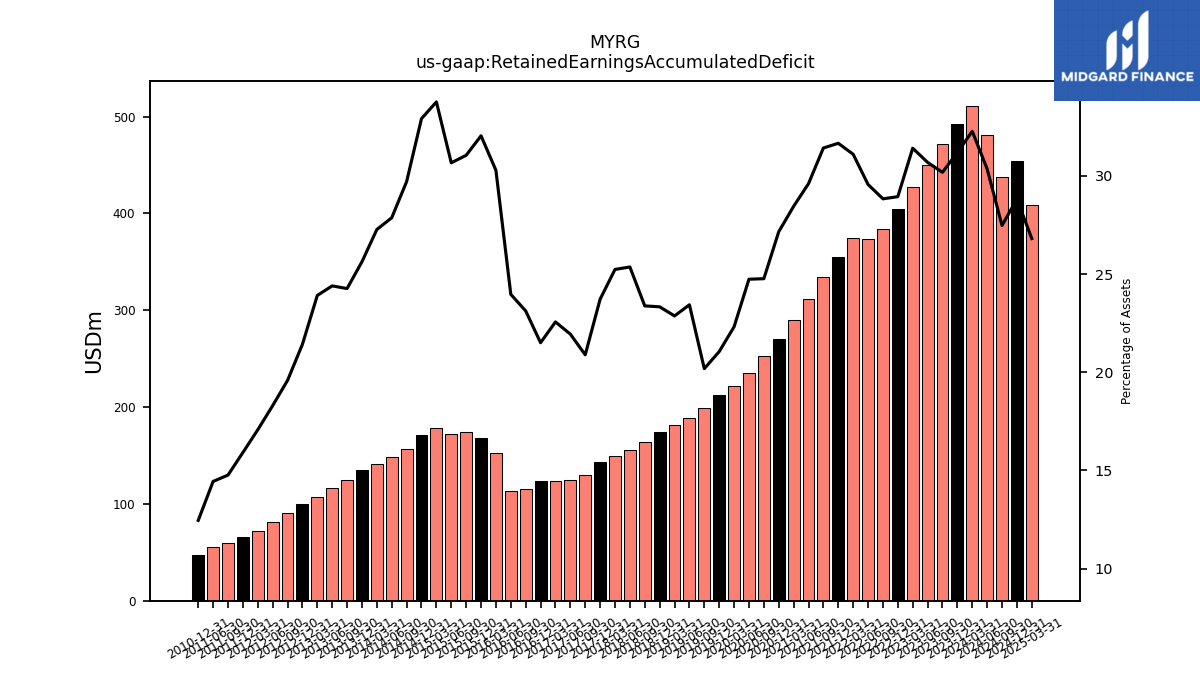
| Retained Earnings Accumulated Deficit | 492.53 | 471.11 | 449.60 | 427.33 | 404.91 | 383.53 | 373.88 | 375.03 | 355.01 | 334.31 | 311.14 | 290.02 | 270.48 | 252.38 | 235.08 | 221.70 | 212.22 | 199.44 | 189.09 | 181.88 | 174.74 | 164.09 | 156.15 | 149.32 | 143.24 | 129.66 | 125.06 | 123.83 | 123.34 | 115.55 | 113.06 | 152.85 | 168.22 | 173.81 | 172.50 | 178.40 | 171.22 | 157.10 | 148.69 | 140.95 | 134.68 | 124.66 | 116.34 | 106.88 | 99.92 | 90.15 | 81.40 | 71.87 | 65.66 | 59.80 | 55.58 | NA | 47.36 | NA | NA | |
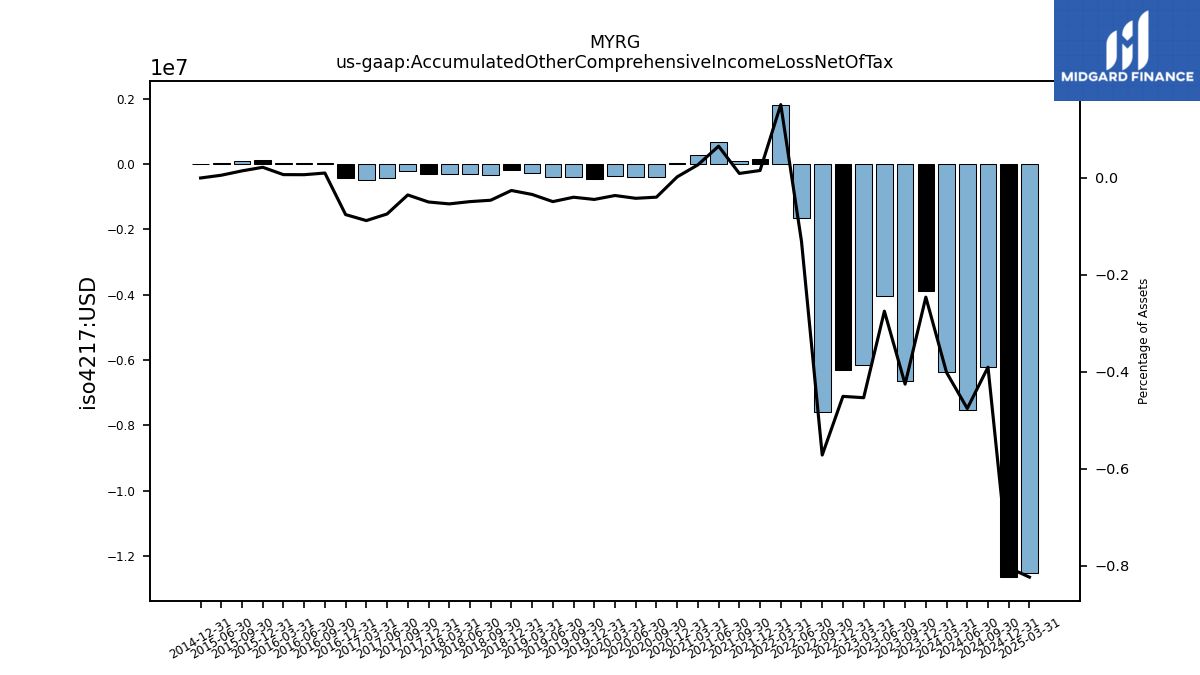
| Accumulated Other Comprehensive Income Loss Net Of Tax | -3.88 | -6.63 | -4.02 | -6.16 | -6.30 | -7.60 | -1.65 | 1.82 | 0.17 | 0.10 | 0.69 | 0.28 | 0.02 | -0.40 | -0.40 | -0.36 | -0.45 | -0.39 | -0.39 | -0.27 | -0.19 | -0.32 | -0.30 | -0.32 | -0.30 | -0.22 | -0.42 | -0.48 | -0.43 | 0.05 | 0.03 | 0.04 | 0.12 | 0.08 | 0.03 | NA | 0.00 | NA | NA | NA | NA | NA | NA | NA | NA | NA | NA | NA | NA | NA | NA | NA | NA | NA | NA |
| 2023-12-31 | 2023-09-30 | 2023-06-30 | 2023-03-31 | 2022-12-31 | 2022-09-30 | 2022-06-30 | 2022-03-31 | 2021-12-31 | 2021-09-30 | 2021-06-30 | 2021-03-31 | 2020-12-31 | 2020-09-30 | 2020-06-30 | 2020-03-31 | 2019-12-31 | 2019-09-30 | 2019-06-30 | 2019-03-31 | 2018-12-31 | 2018-09-30 | 2018-06-30 | 2018-03-31 | 2017-12-31 | 2017-09-30 | 2017-06-30 | 2017-03-31 | 2016-12-31 | 2016-09-30 | 2016-06-30 | 2016-03-31 | 2015-12-31 | 2015-09-30 | 2015-06-30 | 2015-03-31 | 2014-12-31 | 2014-09-30 | 2014-06-30 | 2014-03-31 | 2013-12-31 | 2013-09-30 | 2013-06-30 | 2013-03-31 | 2012-12-31 | 2012-09-30 | 2012-06-30 | 2012-03-31 | 2011-12-31 | 2011-09-30 | 2011-06-30 | 2011-03-31 | 2010-12-31 | 2010-09-30 | 2010-06-30 | ||
|---|---|---|---|---|---|---|---|---|---|---|---|---|---|---|---|---|---|---|---|---|---|---|---|---|---|---|---|---|---|---|---|---|---|---|---|---|---|---|---|---|---|---|---|---|---|---|---|---|---|---|---|---|---|---|---|---|
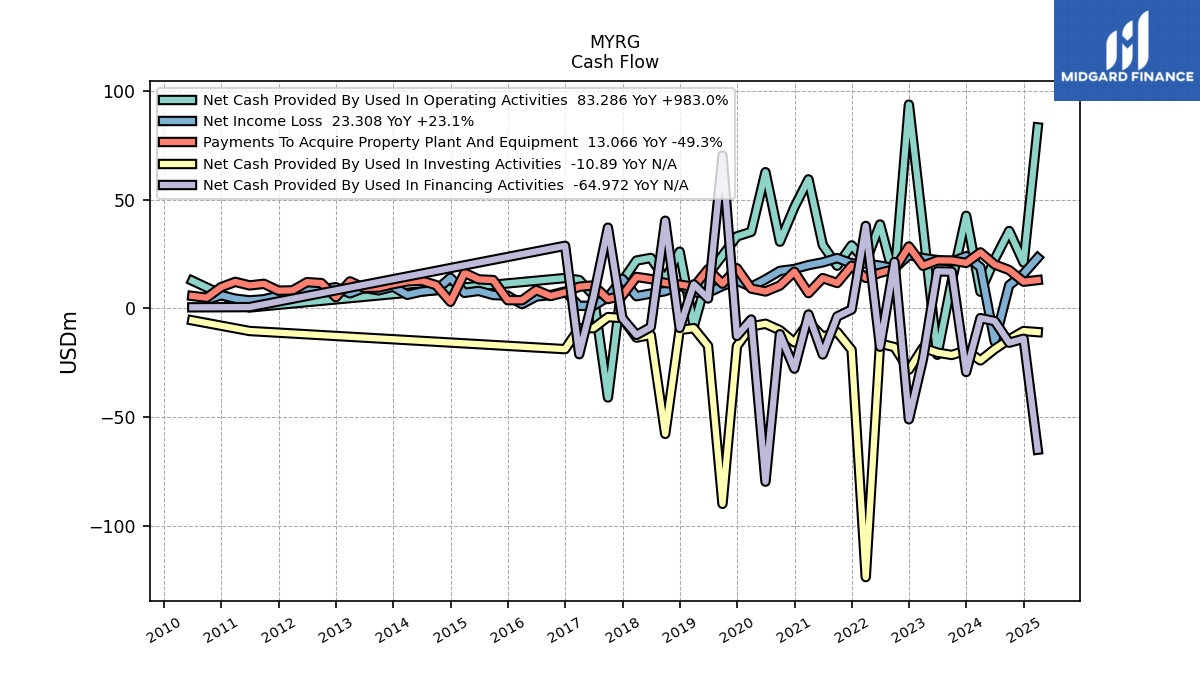
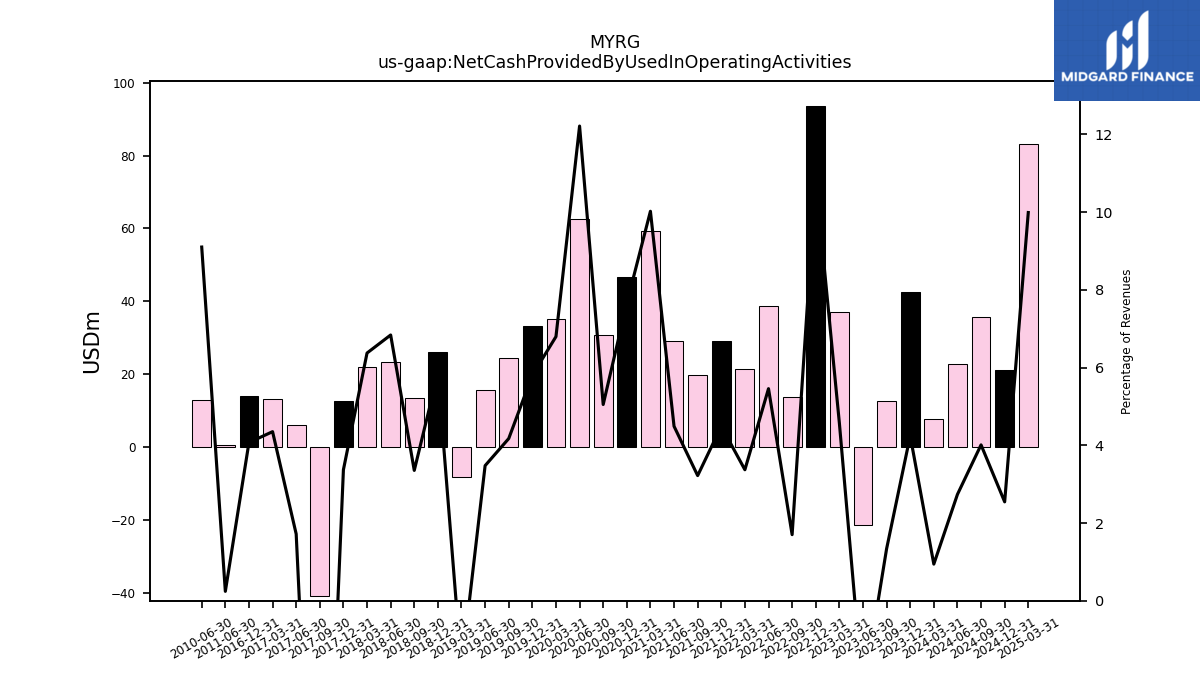
| Net Cash Provided By Used In Operating Activities | 42.62 | 12.55 | -21.31 | 37.16 | 93.76 | 13.61 | 38.65 | 21.47 | 29.01 | 19.65 | 29.17 | 59.39 | 46.54 | 30.70 | 62.68 | 35.24 | 33.15 | 24.35 | 15.60 | -8.21 | 26.12 | 13.40 | 23.23 | 22.03 | 12.59 | -40.97 | 6.12 | 13.06 | 13.99 | NA | NA | NA | NA | NA | NA | NA | NA | NA | NA | NA | NA | NA | NA | NA | NA | NA | NA | NA | NA | NA | 0.45 | NA | NA | NA | 12.77 | |
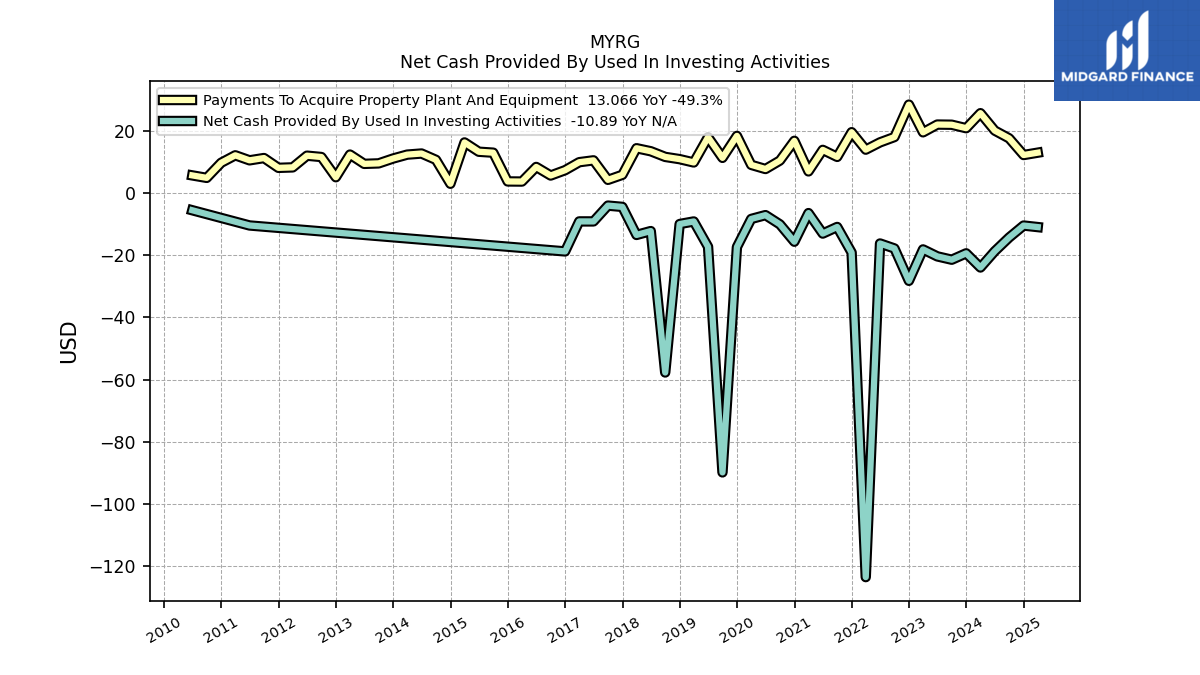
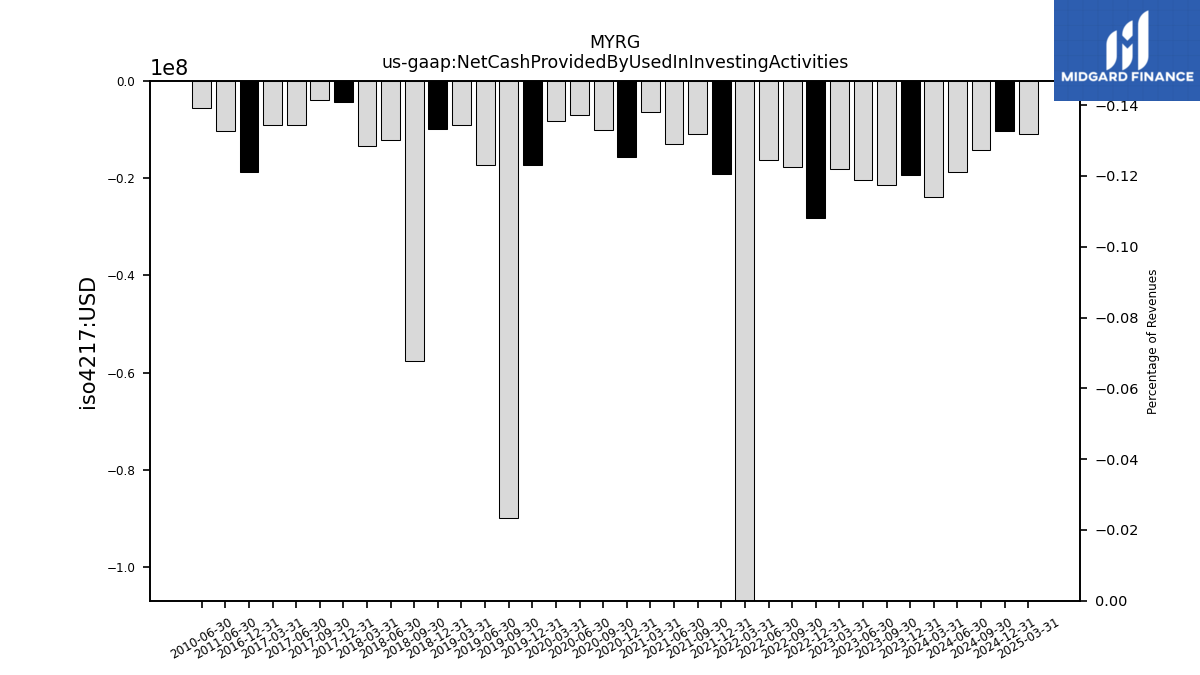
| Net Cash Provided By Used In Investing Activities | -19.34 | -21.39 | -20.32 | -18.08 | -28.19 | -17.77 | -16.17 | -123.59 | -19.09 | -10.85 | -12.98 | -6.38 | -15.60 | -10.02 | -7.04 | -8.27 | -17.32 | -89.87 | -17.22 | -9.08 | -9.90 | -57.71 | -12.17 | -13.42 | -4.39 | -3.98 | -9.07 | -9.06 | -18.72 | NA | NA | NA | NA | NA | NA | NA | NA | NA | NA | NA | NA | NA | NA | NA | NA | NA | NA | NA | NA | NA | -10.37 | NA | NA | NA | -5.47 | |
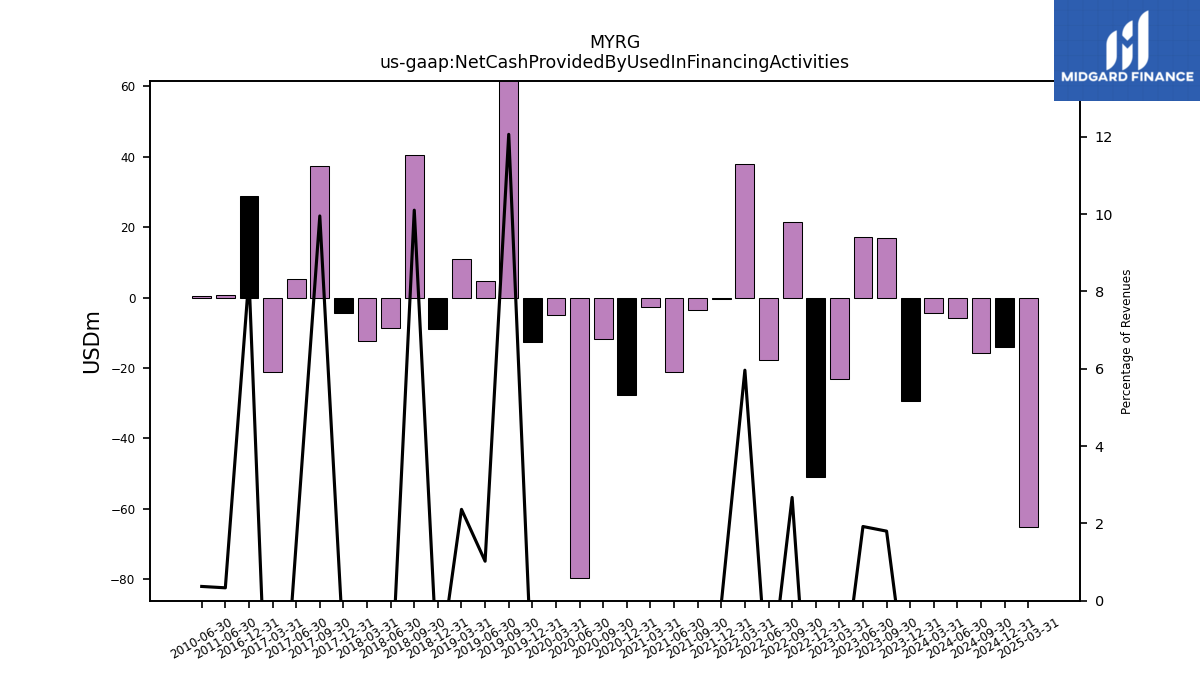
| Net Cash Provided By Used In Financing Activities | -29.24 | 16.92 | 17.06 | -23.11 | -51.00 | 21.37 | -17.62 | 37.97 | -0.49 | -3.68 | -21.15 | -2.77 | -27.69 | -11.84 | -79.69 | -5.07 | -12.66 | 70.36 | 4.59 | 11.06 | -8.97 | 40.37 | -8.55 | -12.20 | -4.53 | 37.18 | 5.30 | -21.06 | 28.82 | NA | NA | NA | NA | NA | NA | NA | NA | NA | NA | NA | NA | NA | NA | NA | NA | NA | NA | NA | NA | NA | 0.62 | NA | NA | NA | 0.52 |
| 2023-12-31 | 2023-09-30 | 2023-06-30 | 2023-03-31 | 2022-12-31 | 2022-09-30 | 2022-06-30 | 2022-03-31 | 2021-12-31 | 2021-09-30 | 2021-06-30 | 2021-03-31 | 2020-12-31 | 2020-09-30 | 2020-06-30 | 2020-03-31 | 2019-12-31 | 2019-09-30 | 2019-06-30 | 2019-03-31 | 2018-12-31 | 2018-09-30 | 2018-06-30 | 2018-03-31 | 2017-12-31 | 2017-09-30 | 2017-06-30 | 2017-03-31 | 2016-12-31 | 2016-09-30 | 2016-06-30 | 2016-03-31 | 2015-12-31 | 2015-09-30 | 2015-06-30 | 2015-03-31 | 2014-12-31 | 2014-09-30 | 2014-06-30 | 2014-03-31 | 2013-12-31 | 2013-09-30 | 2013-06-30 | 2013-03-31 | 2012-12-31 | 2012-09-30 | 2012-06-30 | 2012-03-31 | 2011-12-31 | 2011-09-30 | 2011-06-30 | 2011-03-31 | 2010-12-31 | 2010-09-30 | 2010-06-30 | ||
|---|---|---|---|---|---|---|---|---|---|---|---|---|---|---|---|---|---|---|---|---|---|---|---|---|---|---|---|---|---|---|---|---|---|---|---|---|---|---|---|---|---|---|---|---|---|---|---|---|---|---|---|---|---|---|---|---|
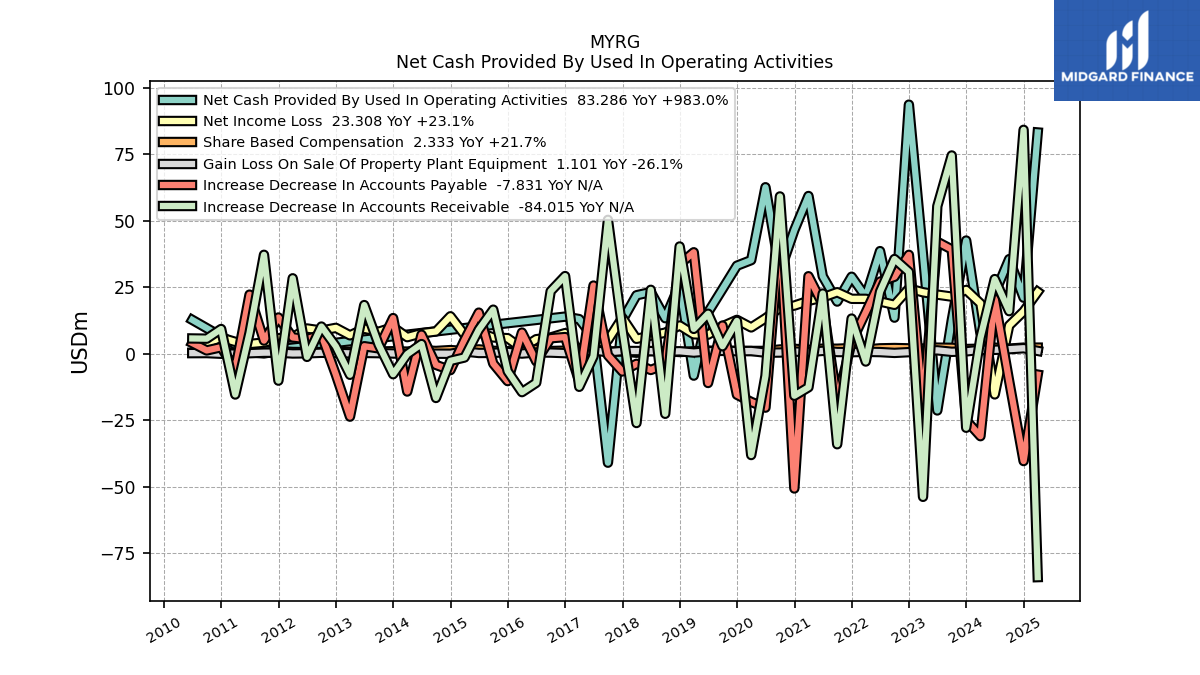
| Net Cash Provided By Used In Operating Activities | 42.62 | 12.55 | -21.31 | 37.16 | 93.76 | 13.61 | 38.65 | 21.47 | 29.01 | 19.65 | 29.17 | 59.39 | 46.54 | 30.70 | 62.68 | 35.24 | 33.15 | 24.35 | 15.60 | -8.21 | 26.12 | 13.40 | 23.23 | 22.03 | 12.59 | -40.97 | 6.12 | 13.06 | 13.99 | NA | NA | NA | NA | NA | NA | NA | NA | NA | NA | NA | NA | NA | NA | NA | NA | NA | NA | NA | NA | NA | 0.45 | NA | NA | NA | 12.77 | |
| Net Income Loss | 24.04 | 21.51 | 22.27 | 23.16 | 24.57 | 18.44 | 19.68 | 20.69 | 20.69 | 23.17 | 21.22 | 19.93 | 18.15 | 17.29 | 13.38 | 9.93 | 12.78 | 10.36 | 7.21 | 7.35 | 10.65 | 7.96 | 6.83 | 5.64 | 13.58 | 5.14 | 1.23 | 1.20 | 7.80 | 6.15 | 5.50 | 1.99 | 5.88 | 6.17 | 8.07 | 7.17 | 14.13 | 8.40 | 7.74 | 6.27 | 10.02 | 8.31 | 9.46 | 6.96 | 9.77 | 8.75 | 9.54 | 6.21 | 5.86 | 4.22 | 3.72 | 4.50 | 6.09 | 3.90 | NA | |
| Profit Loss | 24.04 | 21.51 | 22.27 | 23.16 | 24.57 | 18.44 | 19.68 | 20.69 | 20.69 | 23.17 | 21.22 | 19.93 | 18.15 | 17.29 | 13.38 | 9.93 | 12.78 | 10.46 | 6.36 | 6.62 | 10.86 | 7.96 | 6.83 | 5.64 | NA | NA | NA | NA | NA | NA | NA | NA | NA | NA | NA | NA | NA | NA | NA | NA | NA | NA | NA | NA | NA | NA | NA | NA | NA | NA | 3.72 | NA | NA | NA | 3.35 | |
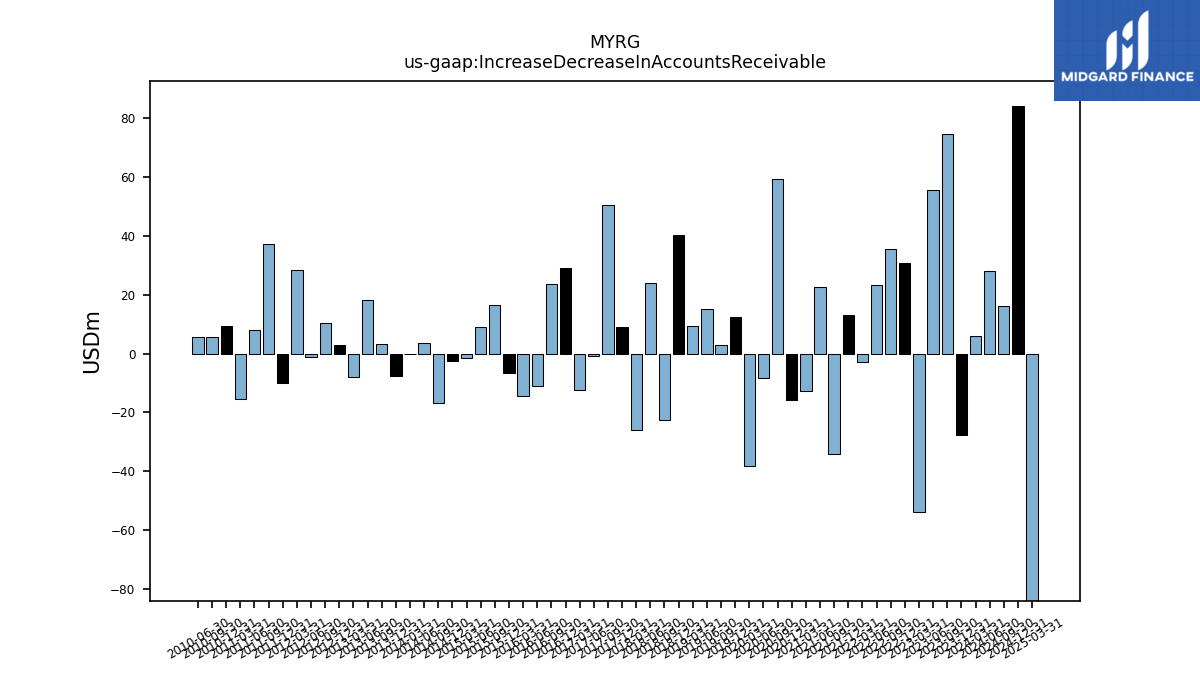
| Increase Decrease In Accounts Receivable | -27.82 | 74.64 | 55.53 | -53.82 | 30.81 | 35.67 | 23.36 | -2.90 | 13.27 | -34.03 | 22.69 | -12.59 | -15.77 | 59.22 | -8.26 | -38.09 | 12.38 | 2.86 | 15.09 | 9.38 | 40.39 | -22.57 | 24.09 | -26.04 | 9.13 | 50.41 | -0.93 | -12.42 | 29.25 | 23.54 | -10.89 | -14.42 | -6.54 | 16.62 | 9.07 | -1.39 | -2.64 | -16.62 | 3.68 | -0.12 | -7.68 | 3.45 | 18.35 | -7.89 | 2.80 | 10.27 | -1.16 | 28.42 | -10.09 | 37.26 | 7.89 | -15.32 | 9.34 | 5.70 | 5.78 | |
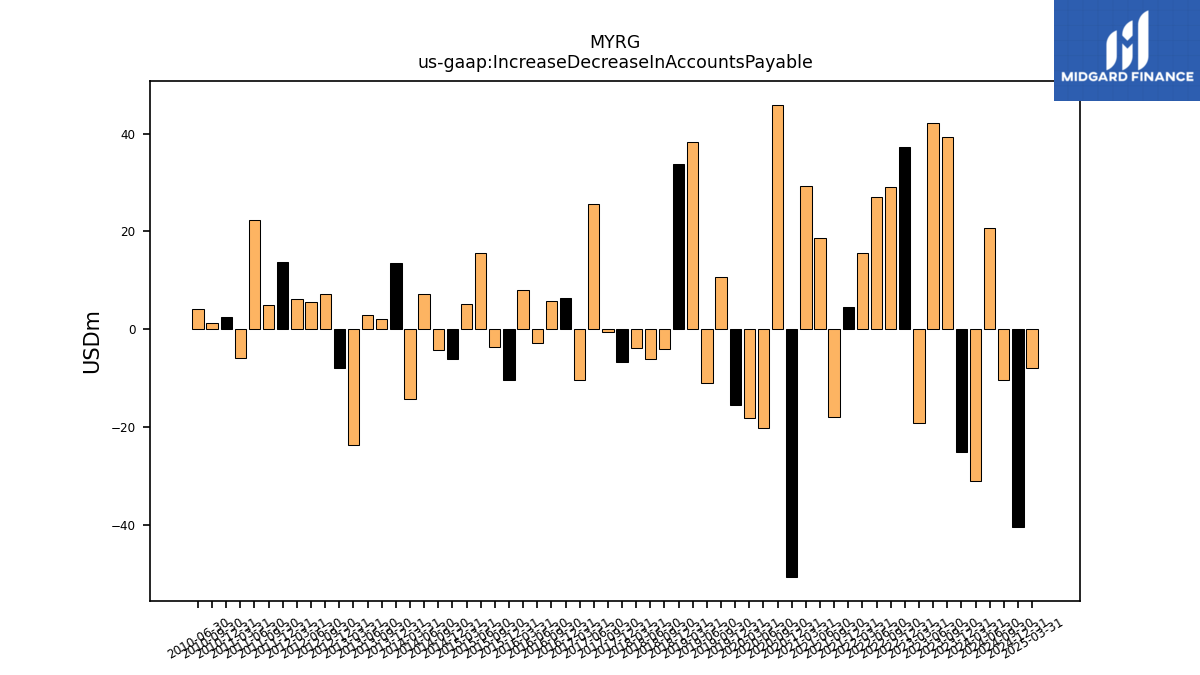
| Increase Decrease In Accounts Payable | -25.03 | 39.27 | 42.15 | -19.14 | 37.25 | 29.00 | 27.15 | 15.61 | 4.47 | -17.90 | 18.57 | 29.20 | -50.67 | 45.94 | -20.25 | -18.09 | -15.38 | 10.63 | -10.98 | 38.22 | 33.73 | -3.94 | -6.08 | -3.77 | -6.65 | -0.55 | 25.69 | -10.33 | 6.30 | 5.86 | -2.84 | 8.00 | -10.27 | -3.67 | 15.50 | 5.19 | -6.14 | -4.17 | 7.20 | -14.20 | 13.46 | 2.04 | 2.87 | -23.65 | -7.83 | 7.18 | 5.54 | 6.18 | 13.67 | 4.97 | 22.27 | -5.86 | 2.50 | 1.27 | 4.06 | |
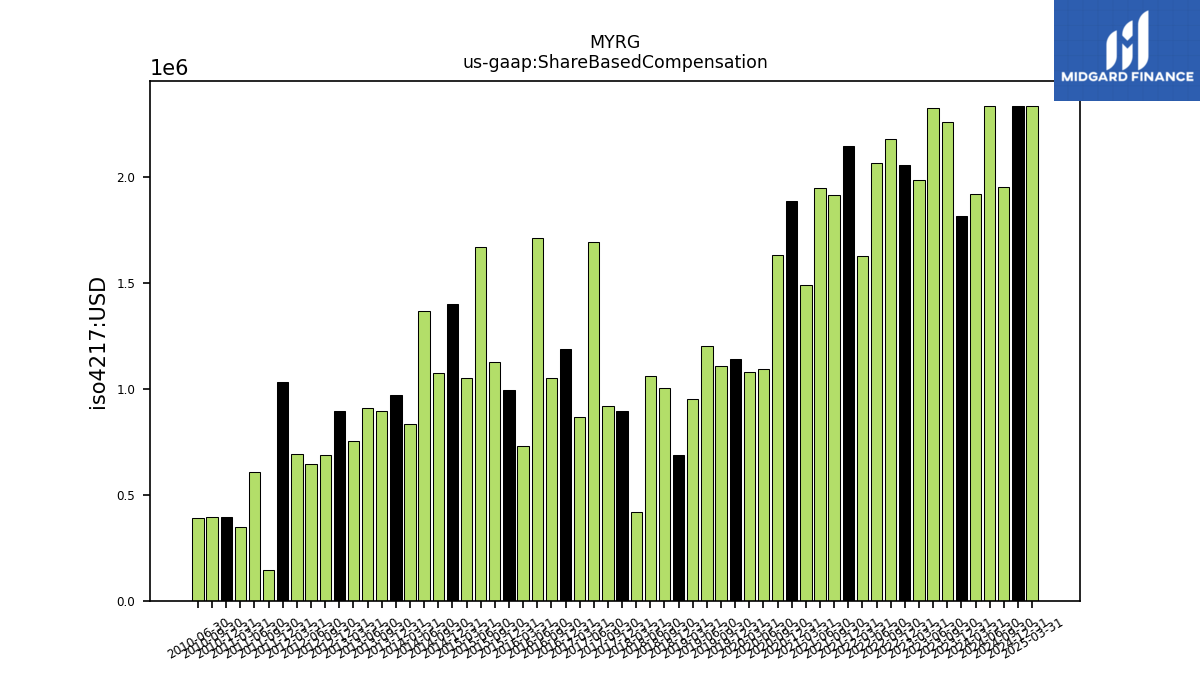
| Share Based Compensation | 1.81 | 2.26 | 2.32 | 1.98 | 2.06 | 2.18 | 2.06 | 1.62 | 2.15 | 1.92 | 1.95 | 1.49 | 1.88 | 1.63 | 1.09 | 1.08 | 1.14 | 1.11 | 1.20 | 0.95 | 0.69 | 1.00 | 1.06 | 0.42 | 0.90 | 0.92 | 1.69 | 0.87 | 1.19 | 1.05 | 1.71 | 0.73 | 0.99 | 1.13 | 1.67 | 1.05 | 1.40 | 1.07 | 1.36 | 0.83 | 0.97 | 0.89 | 0.91 | 0.75 | 0.89 | 0.69 | 0.65 | 0.69 | 1.03 | 0.15 | 0.61 | 0.35 | 0.39 | 0.39 | 0.39 |
| 2023-12-31 | 2023-09-30 | 2023-06-30 | 2023-03-31 | 2022-12-31 | 2022-09-30 | 2022-06-30 | 2022-03-31 | 2021-12-31 | 2021-09-30 | 2021-06-30 | 2021-03-31 | 2020-12-31 | 2020-09-30 | 2020-06-30 | 2020-03-31 | 2019-12-31 | 2019-09-30 | 2019-06-30 | 2019-03-31 | 2018-12-31 | 2018-09-30 | 2018-06-30 | 2018-03-31 | 2017-12-31 | 2017-09-30 | 2017-06-30 | 2017-03-31 | 2016-12-31 | 2016-09-30 | 2016-06-30 | 2016-03-31 | 2015-12-31 | 2015-09-30 | 2015-06-30 | 2015-03-31 | 2014-12-31 | 2014-09-30 | 2014-06-30 | 2014-03-31 | 2013-12-31 | 2013-09-30 | 2013-06-30 | 2013-03-31 | 2012-12-31 | 2012-09-30 | 2012-06-30 | 2012-03-31 | 2011-12-31 | 2011-09-30 | 2011-06-30 | 2011-03-31 | 2010-12-31 | 2010-09-30 | 2010-06-30 | ||
|---|---|---|---|---|---|---|---|---|---|---|---|---|---|---|---|---|---|---|---|---|---|---|---|---|---|---|---|---|---|---|---|---|---|---|---|---|---|---|---|---|---|---|---|---|---|---|---|---|---|---|---|---|---|---|---|---|
| Net Cash Provided By Used In Investing Activities | -19.34 | -21.39 | -20.32 | -18.08 | -28.19 | -17.77 | -16.17 | -123.59 | -19.09 | -10.85 | -12.98 | -6.38 | -15.60 | -10.02 | -7.04 | -8.27 | -17.32 | -89.87 | -17.22 | -9.08 | -9.90 | -57.71 | -12.17 | -13.42 | -4.39 | -3.98 | -9.07 | -9.06 | -18.72 | NA | NA | NA | NA | NA | NA | NA | NA | NA | NA | NA | NA | NA | NA | NA | NA | NA | NA | NA | NA | NA | -10.37 | NA | NA | NA | -5.47 | |
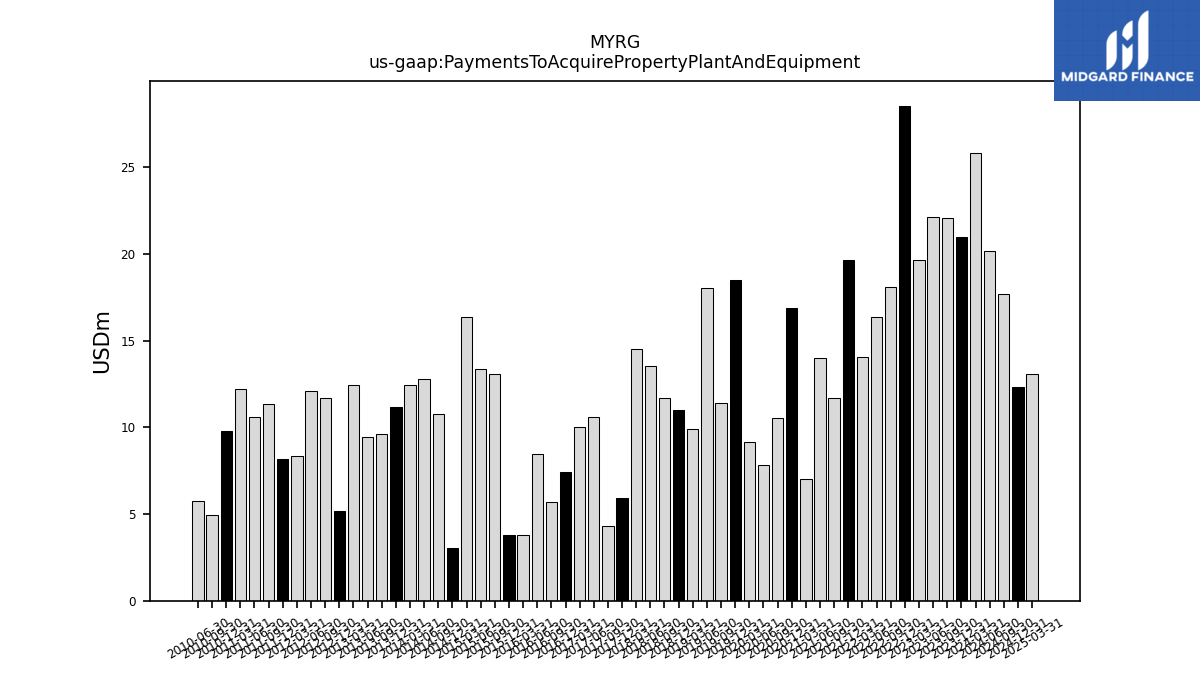
| Payments To Acquire Property Plant And Equipment | 20.95 | 22.06 | 22.11 | 19.61 | 28.53 | 18.10 | 16.38 | 14.04 | 19.66 | 11.70 | 13.97 | 7.03 | 16.89 | 10.53 | 7.80 | 9.14 | 18.47 | 11.39 | 18.05 | 9.91 | 10.98 | 11.70 | 13.52 | 14.50 | 5.93 | 4.31 | 10.60 | 10.00 | 7.42 | 5.71 | 8.47 | 3.77 | 3.80 | 13.06 | 13.37 | 16.36 | 3.05 | 10.76 | 12.79 | 12.44 | 11.19 | 9.62 | 9.46 | 12.46 | 5.16 | 11.66 | 12.10 | 8.33 | 8.18 | 11.34 | 10.60 | 12.22 | 9.81 | 4.95 | 5.75 |
| 2023-12-31 | 2023-09-30 | 2023-06-30 | 2023-03-31 | 2022-12-31 | 2022-09-30 | 2022-06-30 | 2022-03-31 | 2021-12-31 | 2021-09-30 | 2021-06-30 | 2021-03-31 | 2020-12-31 | 2020-09-30 | 2020-06-30 | 2020-03-31 | 2019-12-31 | 2019-09-30 | 2019-06-30 | 2019-03-31 | 2018-12-31 | 2018-09-30 | 2018-06-30 | 2018-03-31 | 2017-12-31 | 2017-09-30 | 2017-06-30 | 2017-03-31 | 2016-12-31 | 2016-09-30 | 2016-06-30 | 2016-03-31 | 2015-12-31 | 2015-09-30 | 2015-06-30 | 2015-03-31 | 2014-12-31 | 2014-09-30 | 2014-06-30 | 2014-03-31 | 2013-12-31 | 2013-09-30 | 2013-06-30 | 2013-03-31 | 2012-12-31 | 2012-09-30 | 2012-06-30 | 2012-03-31 | 2011-12-31 | 2011-09-30 | 2011-06-30 | 2011-03-31 | 2010-12-31 | 2010-09-30 | 2010-06-30 | ||
|---|---|---|---|---|---|---|---|---|---|---|---|---|---|---|---|---|---|---|---|---|---|---|---|---|---|---|---|---|---|---|---|---|---|---|---|---|---|---|---|---|---|---|---|---|---|---|---|---|---|---|---|---|---|---|---|---|
| Net Cash Provided By Used In Financing Activities | -29.24 | 16.92 | 17.06 | -23.11 | -51.00 | 21.37 | -17.62 | 37.97 | -0.49 | -3.68 | -21.15 | -2.77 | -27.69 | -11.84 | -79.69 | -5.07 | -12.66 | 70.36 | 4.59 | 11.06 | -8.97 | 40.37 | -8.55 | -12.20 | -4.53 | 37.18 | 5.30 | -21.06 | 28.82 | NA | NA | NA | NA | NA | NA | NA | NA | NA | NA | NA | NA | NA | NA | NA | NA | NA | NA | NA | NA | NA | 0.62 | NA | NA | NA | 0.52 |
| 2023-12-31 | 2023-09-30 | 2023-06-30 | 2023-03-31 | 2022-12-31 | 2022-09-30 | 2022-06-30 | 2022-03-31 | 2021-12-31 | 2021-09-30 | 2021-06-30 | 2021-03-31 | 2020-12-31 | 2020-09-30 | 2020-06-30 | 2020-03-31 | 2019-12-31 | 2019-09-30 | 2019-06-30 | 2019-03-31 | 2018-12-31 | 2018-09-30 | 2018-06-30 | 2018-03-31 | 2017-12-31 | 2017-09-30 | 2017-06-30 | 2017-03-31 | 2016-12-31 | 2016-09-30 | 2016-06-30 | 2016-03-31 | 2015-12-31 | 2015-09-30 | 2015-06-30 | 2015-03-31 | 2014-12-31 | 2014-09-30 | 2014-06-30 | 2014-03-31 | 2013-12-31 | 2013-09-30 | 2013-06-30 | 2013-03-31 | 2012-12-31 | 2012-09-30 | 2012-06-30 | 2012-03-31 | 2011-12-31 | 2011-09-30 | 2011-06-30 | 2011-03-31 | 2010-12-31 | 2010-09-30 | 2010-06-30 | ||
|---|---|---|---|---|---|---|---|---|---|---|---|---|---|---|---|---|---|---|---|---|---|---|---|---|---|---|---|---|---|---|---|---|---|---|---|---|---|---|---|---|---|---|---|---|---|---|---|---|---|---|---|---|---|---|---|---|
| Revenues | 1004.20 | 939.48 | 888.62 | 811.62 | 863.96 | 799.85 | 708.11 | 636.62 | 646.05 | 610.18 | 649.57 | 592.49 | 607.97 | 607.90 | 513.05 | 518.47 | 571.08 | 583.21 | 448.78 | 468.09 | 446.35 | 399.54 | 339.68 | 345.61 | 373.50 | 373.50 | 356.19 | 300.13 | 343.66 | 283.26 | 261.93 | 253.63 | 271.18 | 269.86 | 276.49 | 244.15 | 250.98 | 248.47 | 228.88 | 215.64 | 254.58 | 232.89 | 213.92 | 201.34 | 247.76 | 250.56 | 260.41 | 240.23 | 234.26 | 210.49 | 185.31 | 150.29 | 155.14 | 152.77 | 140.28 | |
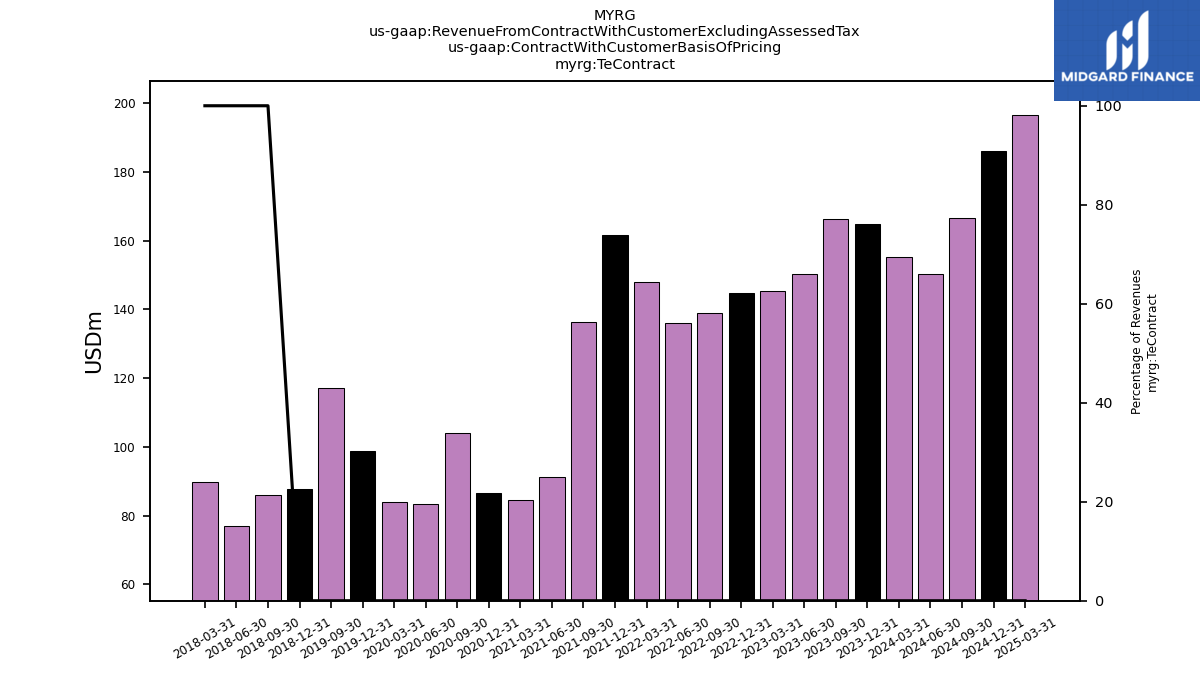
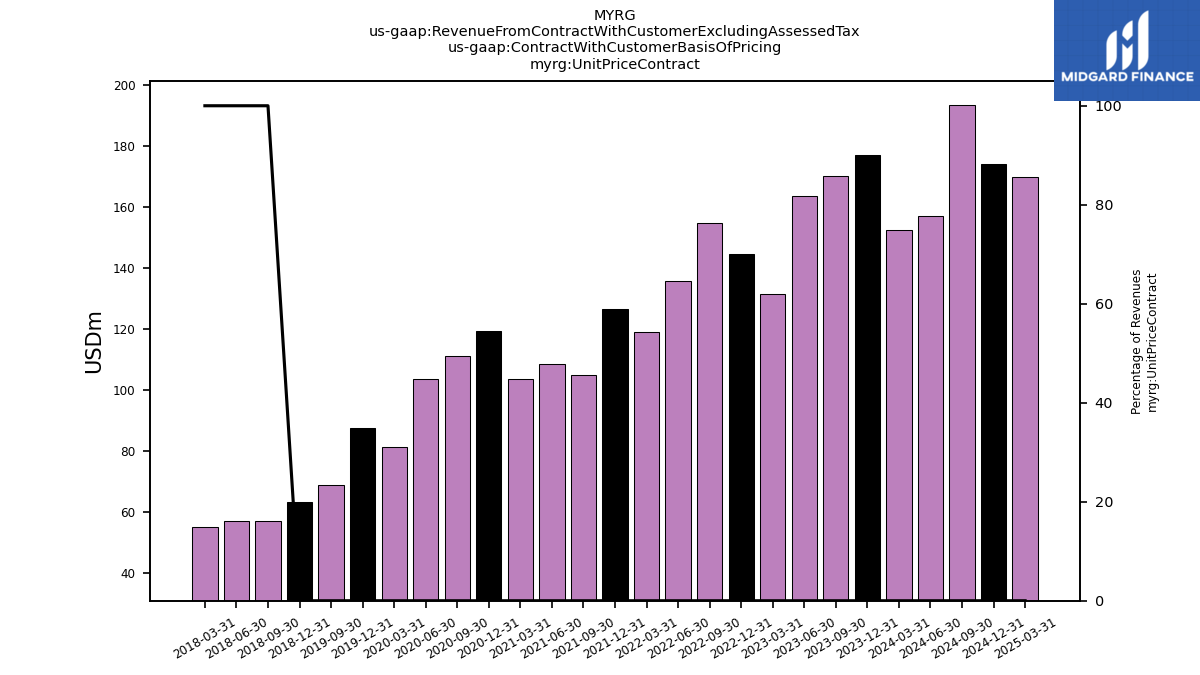
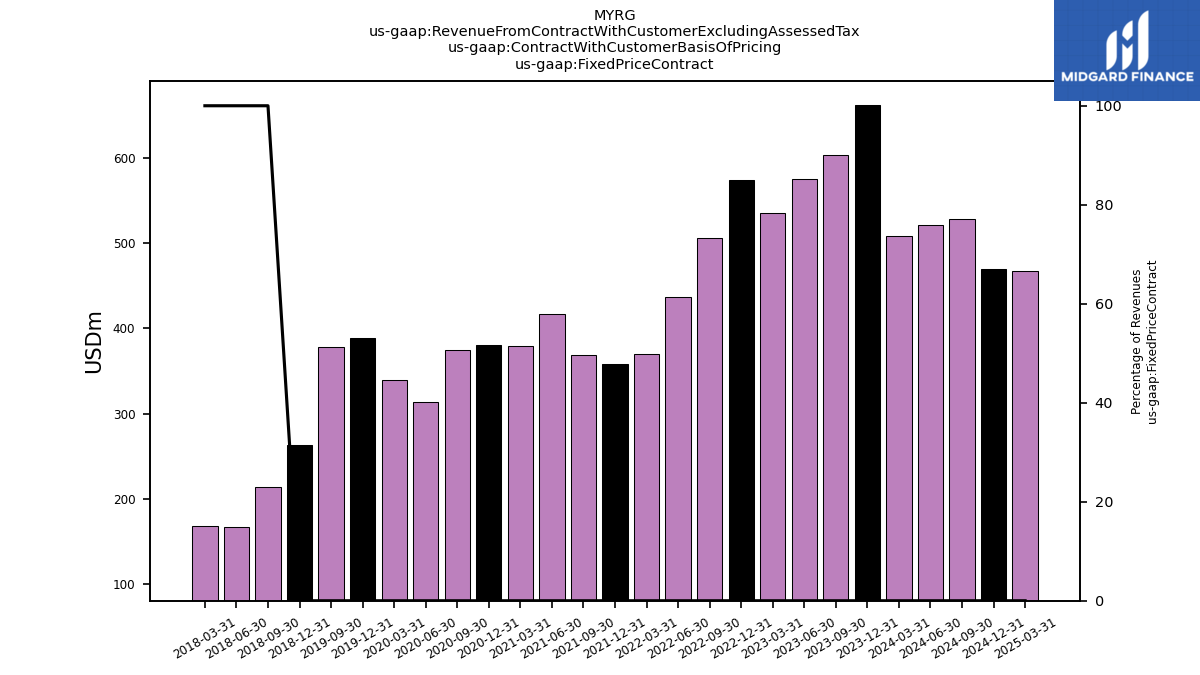
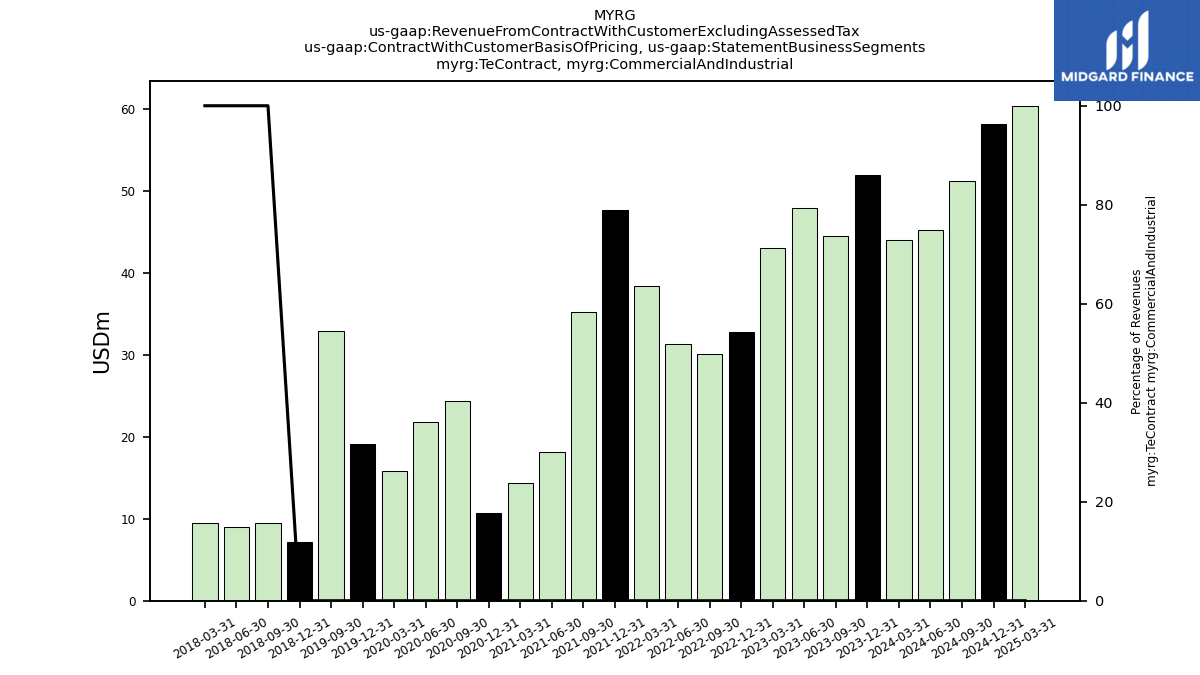
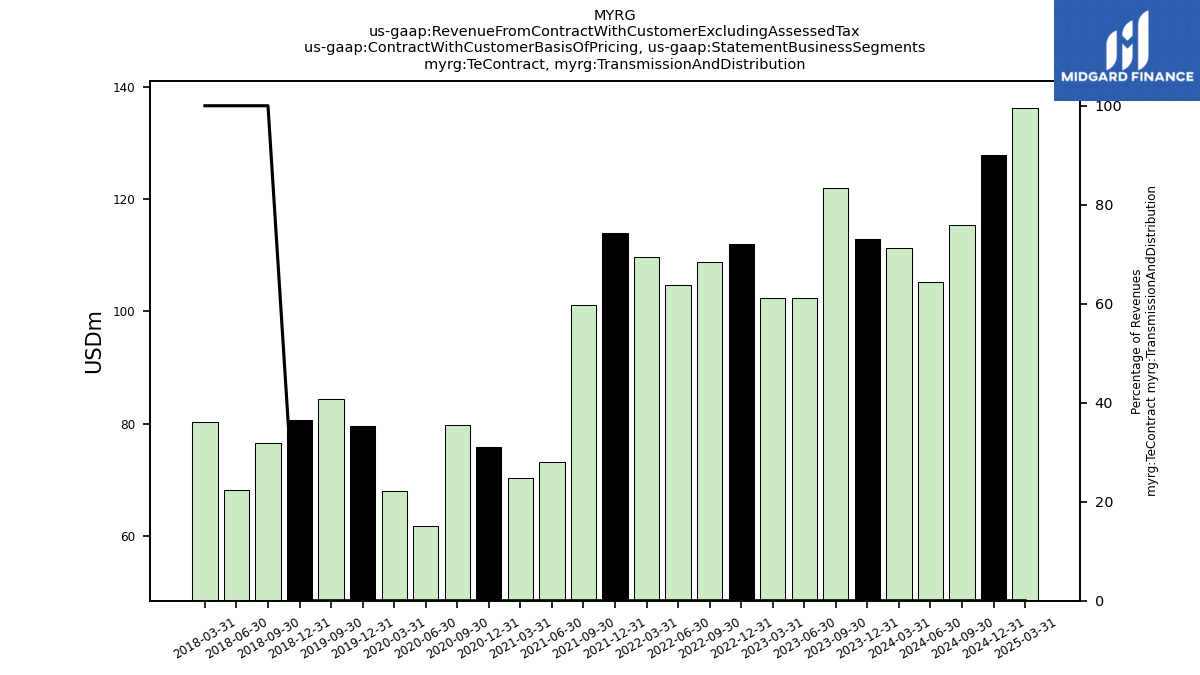
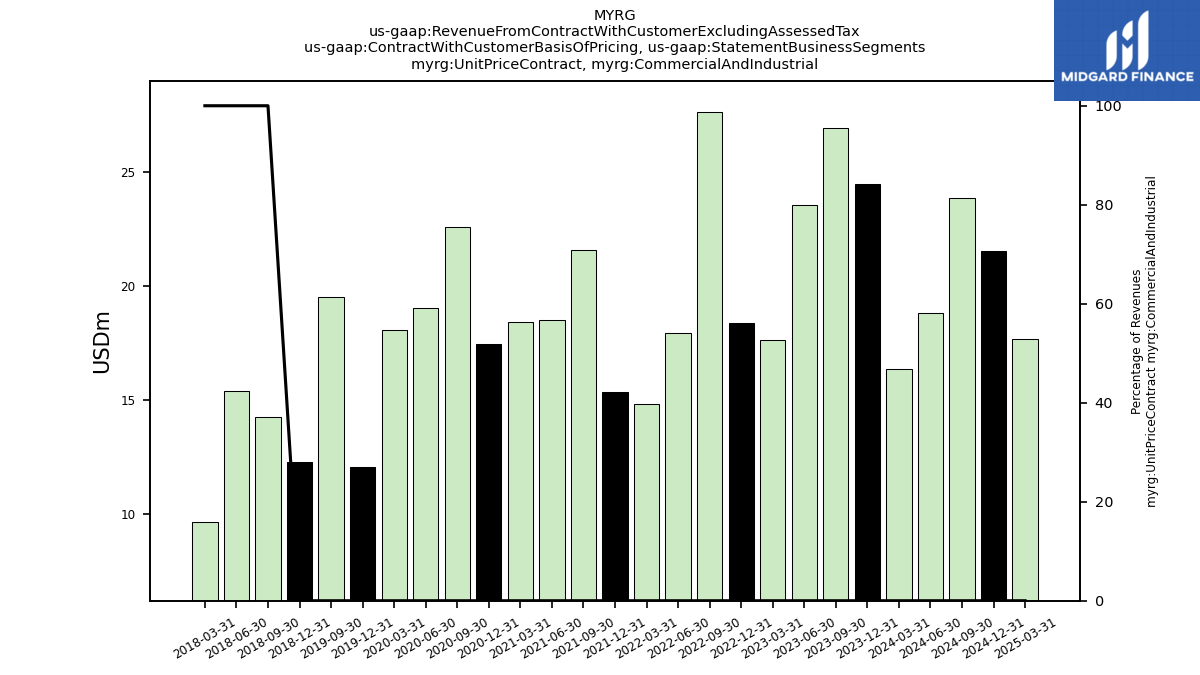
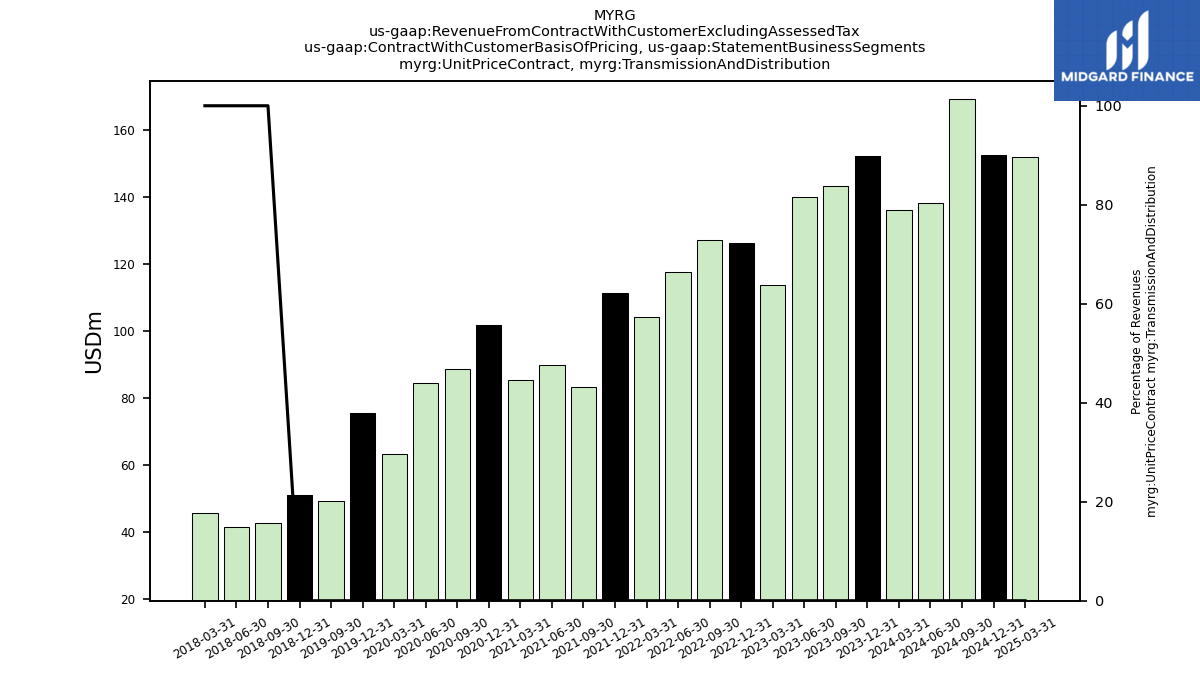
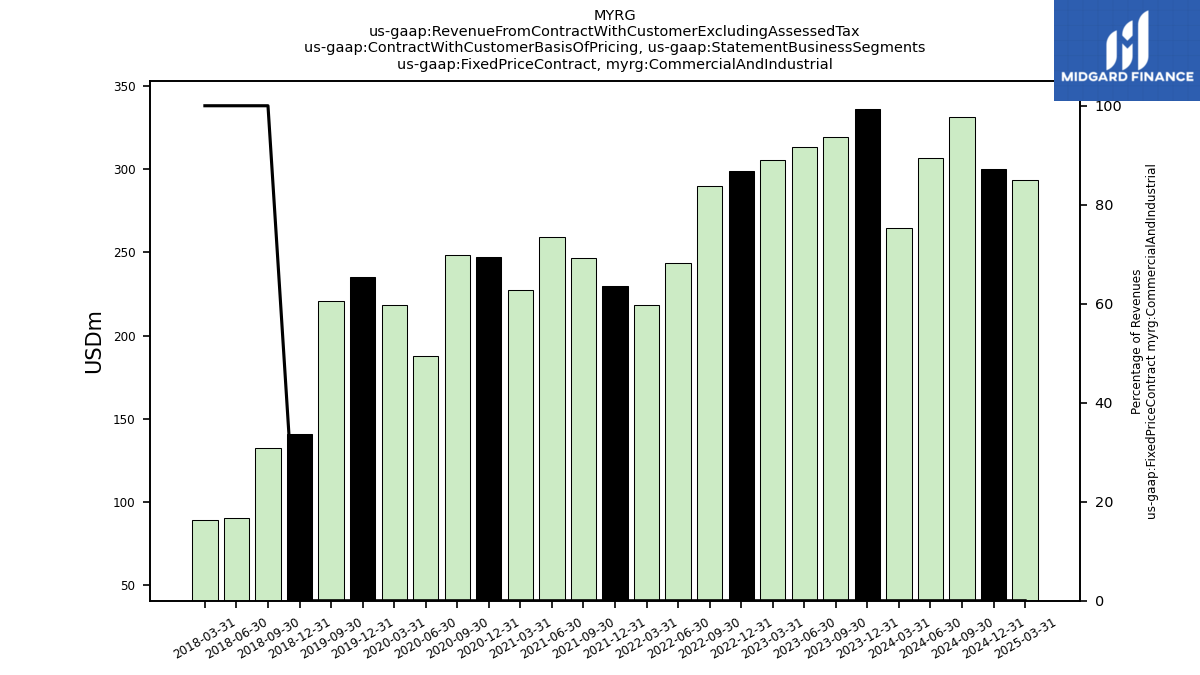
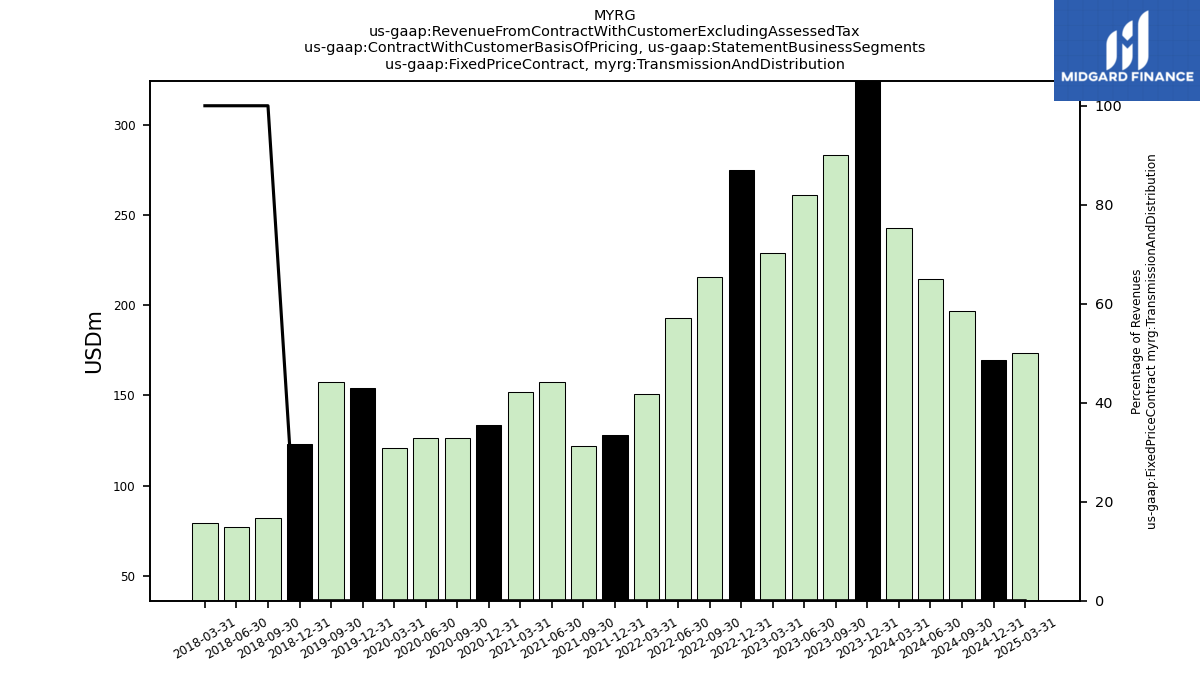
| Revenue From Contract With Customer Excluding Assessed Tax | 1004.20 | 939.48 | 888.62 | 811.62 | 863.96 | 799.85 | 708.11 | 636.62 | 646.05 | 610.18 | 649.57 | 592.49 | 607.97 | 607.90 | 513.05 | 518.47 | 571.08 | 583.21 | 448.78 | 468.09 | 446.35 | 399.54 | 339.68 | 345.61 | 373.50 | 373.50 | 356.19 | 300.13 | 343.66 | 283.26 | 261.93 | 253.63 | 271.18 | 269.86 | 276.49 | 244.15 | 250.98 | 248.47 | 228.88 | 215.64 | 254.58 | 232.89 | 213.92 | 201.34 | 247.76 | 250.56 | 260.41 | 240.23 | 234.26 | 210.49 | 185.31 | 150.29 | 155.14 | 152.77 | 140.28 | |
| Te Contract | 164.91 | 166.37 | 150.37 | 145.41 | 144.89 | 138.97 | 135.96 | 148.02 | 161.50 | 136.43 | 91.24 | 84.66 | 86.44 | 104.04 | 83.38 | 83.85 | 98.67 | 117.17 | NA | NA | 87.75 | 85.95 | 77.02 | 89.80 | NA | NA | NA | NA | NA | NA | NA | NA | NA | NA | NA | NA | NA | NA | NA | NA | NA | NA | NA | NA | NA | NA | NA | NA | NA | NA | NA | NA | NA | NA | NA | |
| Unit Price Contract | 176.85 | 170.12 | 163.49 | 131.35 | 144.61 | 154.72 | 135.54 | 119.12 | 126.57 | 104.77 | 108.44 | 103.70 | 119.24 | 111.17 | 103.68 | 81.39 | 87.55 | 68.91 | NA | NA | 63.40 | 57.01 | 57.04 | 55.33 | NA | NA | NA | NA | NA | NA | NA | NA | NA | NA | NA | NA | NA | NA | NA | NA | NA | NA | NA | NA | NA | NA | NA | NA | NA | NA | NA | NA | NA | NA | NA | |
| Fixed Price Contract | 662.44 | 602.99 | 574.76 | 534.86 | 574.46 | 506.16 | 436.62 | 369.48 | 357.98 | 368.99 | 416.66 | 379.64 | 380.80 | 374.98 | 314.01 | 339.54 | 389.04 | 378.23 | NA | NA | 263.68 | 214.50 | 167.67 | 168.59 | NA | NA | NA | NA | NA | NA | NA | NA | NA | NA | NA | NA | NA | NA | NA | NA | NA | NA | NA | NA | NA | NA | NA | NA | NA | NA | NA | NA | NA | NA | NA | |
| Te Contract, Commercial And Industrial | 51.99 | 44.44 | 47.91 | 43.03 | 32.80 | 30.16 | 31.27 | 38.39 | 47.61 | 35.27 | 18.14 | 14.38 | 10.68 | 24.32 | 21.75 | 15.80 | 19.18 | 32.87 | NA | NA | 7.11 | 9.43 | 8.94 | 9.46 | NA | NA | NA | NA | NA | NA | NA | NA | NA | NA | NA | NA | NA | NA | NA | NA | NA | NA | NA | NA | NA | NA | NA | NA | NA | NA | NA | NA | NA | NA | NA | |
| Te Contract, Transmission And Distribution | 112.92 | 121.94 | 102.46 | 102.38 | 112.09 | 108.81 | 104.69 | 109.63 | 113.89 | 101.16 | 73.10 | 70.28 | 75.76 | 79.71 | 61.63 | 68.05 | 79.50 | 84.30 | NA | NA | 80.64 | 76.52 | 68.07 | 80.34 | NA | NA | NA | NA | NA | NA | NA | NA | NA | NA | NA | NA | NA | NA | NA | NA | NA | NA | NA | NA | NA | NA | NA | NA | NA | NA | NA | NA | NA | NA | NA | |
| Unit Price Contract, Commercial And Industrial | 24.48 | 26.90 | 23.56 | 17.64 | 18.38 | 27.60 | 17.93 | 14.80 | 15.35 | 21.57 | 18.48 | 18.43 | 17.43 | 22.59 | 19.05 | 18.08 | 12.07 | 19.52 | NA | NA | 12.28 | 14.26 | 15.41 | 9.65 | NA | NA | NA | NA | NA | NA | NA | NA | NA | NA | NA | NA | NA | NA | NA | NA | NA | NA | NA | NA | NA | NA | NA | NA | NA | NA | NA | NA | NA | NA | NA | |
| Unit Price Contract, Transmission And Distribution | 152.37 | 143.22 | 139.93 | 113.71 | 126.22 | 127.12 | 117.61 | 104.32 | 111.22 | 83.20 | 89.95 | 85.27 | 101.81 | 88.58 | 84.63 | 63.31 | 75.47 | 49.39 | NA | NA | 51.12 | 42.75 | 41.63 | 45.68 | NA | NA | NA | NA | NA | NA | NA | NA | NA | NA | NA | NA | NA | NA | NA | NA | NA | NA | NA | NA | NA | NA | NA | NA | NA | NA | NA | NA | NA | NA | NA | |
| Fixed Price Contract, Commercial And Industrial | 336.19 | 319.55 | 313.41 | 305.62 | 299.09 | 290.08 | 243.68 | 218.58 | 229.79 | 246.80 | 259.22 | 227.71 | 247.34 | 248.60 | 187.66 | 218.54 | 235.04 | 220.87 | NA | NA | 140.70 | 132.44 | 90.44 | 89.16 | NA | NA | NA | NA | NA | NA | NA | NA | NA | NA | NA | NA | NA | NA | NA | NA | NA | NA | NA | NA | NA | NA | NA | NA | NA | NA | NA | NA | NA | NA | NA | |
| Fixed Price Contract, Transmission And Distribution | 326.25 | 283.44 | 261.35 | 229.23 | 275.37 | 216.08 | 192.93 | 150.90 | 128.19 | 122.19 | 157.44 | 151.93 | 133.46 | 126.39 | 126.35 | 121.00 | 154.00 | 157.36 | NA | NA | 122.98 | 82.06 | 77.23 | 79.44 | NA | NA | NA | NA | NA | NA | NA | NA | NA | NA | NA | NA | NA | NA | NA | NA | NA | NA | NA | NA | NA | NA | NA | NA | NA | NA | NA | NA | NA | NA | NA | |
| Market Type Distribution, Transmission And Distribution | 188.70 | 190.89 | 181.47 | 147.23 | 165.98 | 187.99 | 165.16 | 143.25 | 135.06 | 140.59 | 115.89 | 103.68 | 110.77 | 114.73 | 95.57 | 87.70 | 91.72 | 98.86 | NA | NA | 75.58 | 100.91 | 75.22 | 81.93 | NA | NA | NA | NA | NA | NA | NA | NA | NA | NA | NA | NA | NA | NA | NA | NA | NA | NA | NA | NA | NA | NA | NA | NA | NA | NA | NA | NA | NA | NA | NA | |
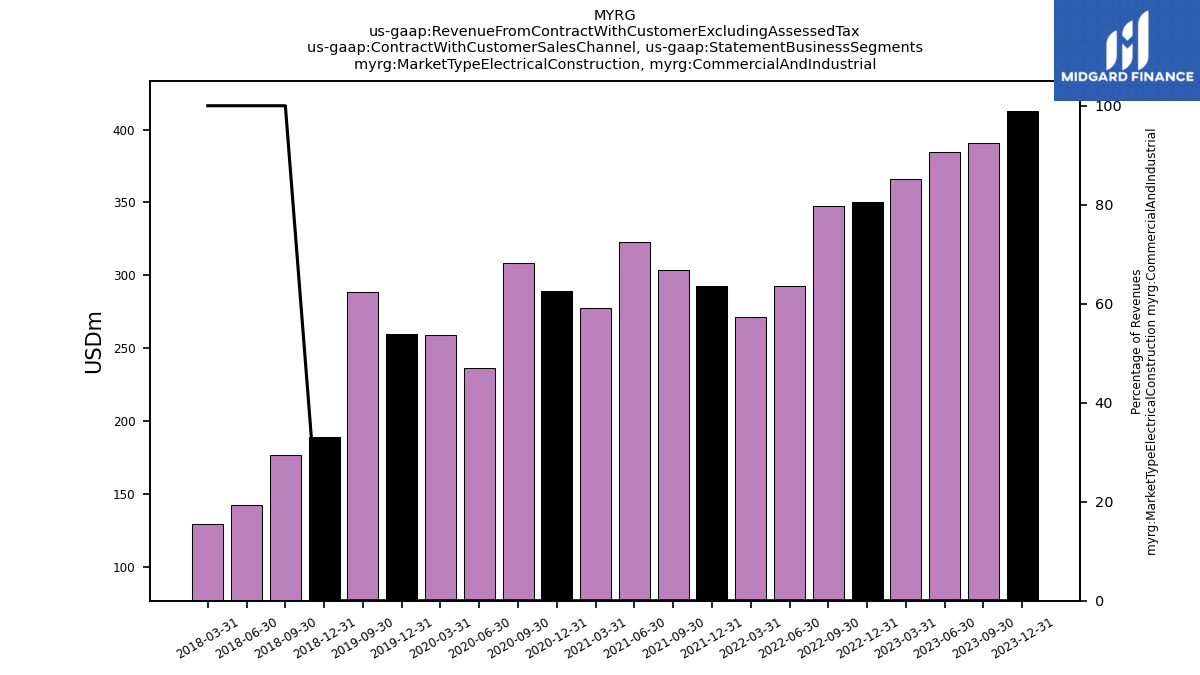
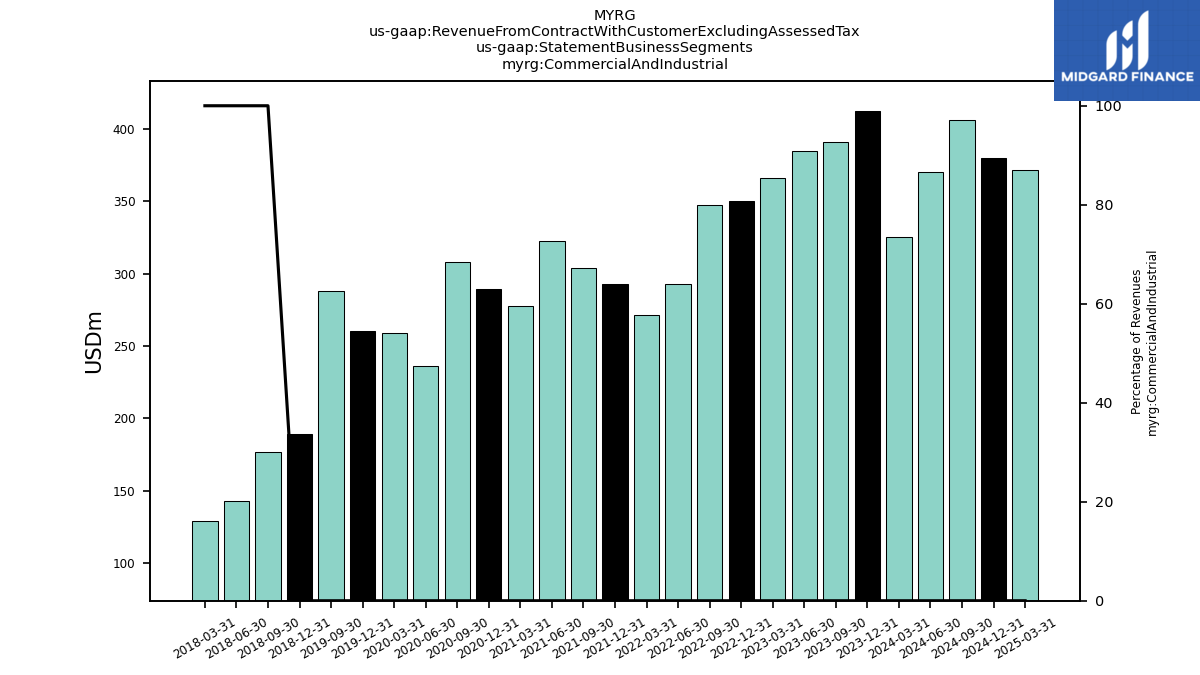
| Market Type Electrical Construction, Commercial And Industrial | 412.66 | 390.88 | 384.88 | 366.29 | 350.27 | 347.83 | 292.88 | 271.77 | 292.75 | 303.64 | 322.74 | 277.58 | 289.36 | 308.16 | 236.29 | 259.20 | 260.06 | 288.27 | NA | NA | 189.08 | 177.01 | 142.75 | 129.22 | NA | NA | NA | NA | NA | NA | NA | NA | NA | NA | NA | NA | NA | NA | NA | NA | NA | NA | NA | NA | NA | NA | NA | NA | NA | NA | NA | NA | NA | NA | NA | |
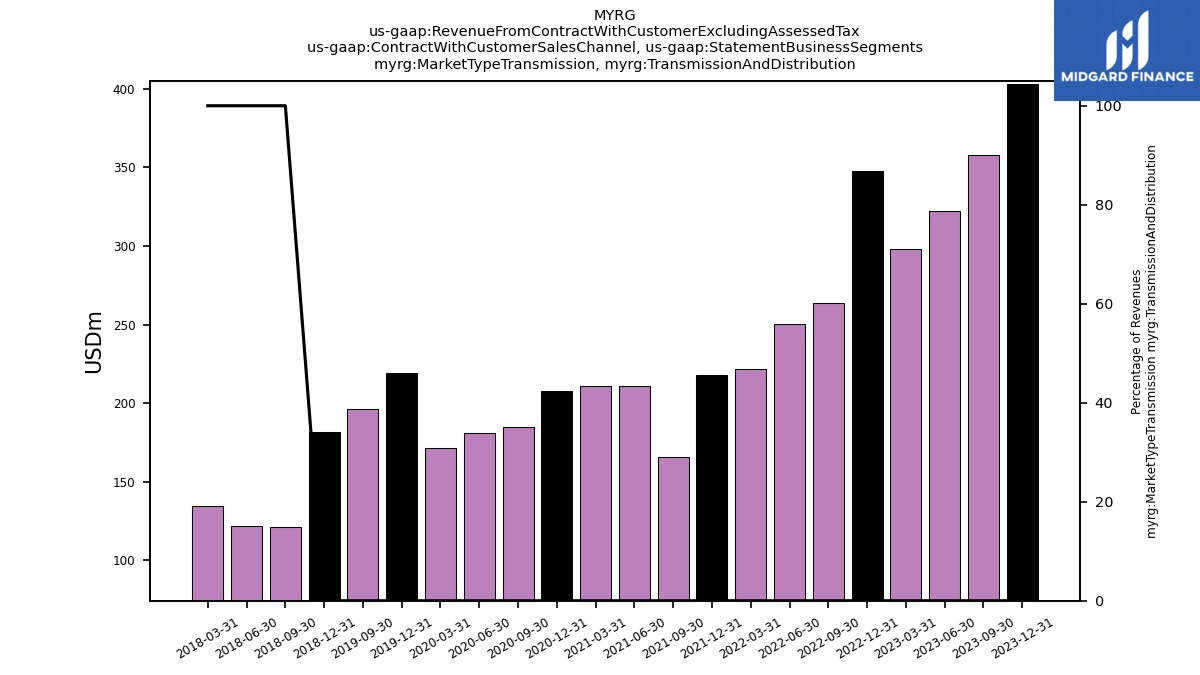
| Market Type Transmission, Transmission And Distribution | 402.85 | 357.71 | 322.27 | 298.10 | 347.71 | 264.02 | 250.08 | 221.61 | 218.24 | 165.95 | 210.95 | 211.23 | 207.84 | 185.01 | 181.19 | 171.57 | 219.29 | 196.08 | NA | NA | 181.69 | 121.62 | 121.71 | 134.45 | NA | NA | NA | NA | NA | NA | NA | NA | NA | NA | NA | NA | NA | NA | NA | NA | NA | NA | NA | NA | NA | NA | NA | NA | NA | NA | NA | NA | NA | NA | NA | |
| Commercial And Industrial | 412.66 | 390.88 | 384.88 | 366.29 | 350.27 | 347.83 | 292.88 | 271.77 | 292.75 | 303.64 | 322.74 | 277.58 | 289.36 | 308.16 | 236.29 | 259.20 | 260.06 | 288.27 | NA | NA | 189.08 | 177.01 | 142.75 | 129.22 | NA | NA | NA | NA | NA | NA | NA | NA | NA | NA | NA | NA | NA | NA | NA | NA | NA | NA | NA | NA | NA | NA | NA | NA | NA | NA | NA | NA | NA | NA | NA | |
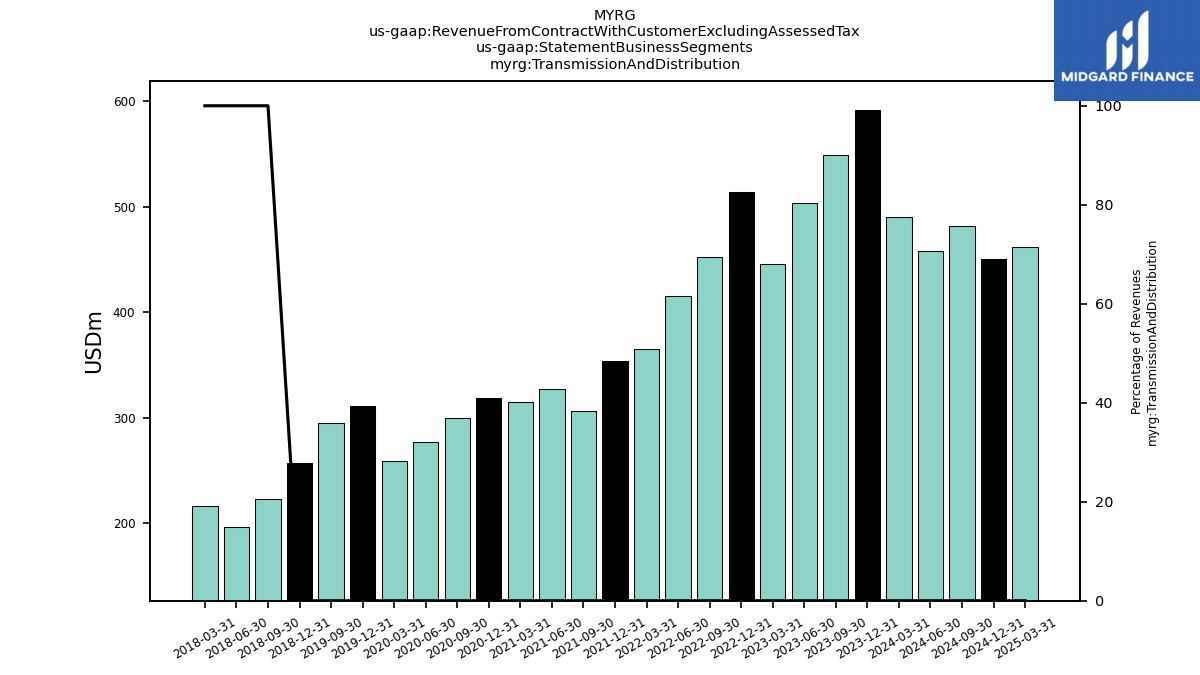
| Transmission And Distribution | 591.54 | 548.60 | 503.74 | 445.32 | 513.69 | 452.01 | 415.24 | 364.86 | 353.30 | 306.55 | 326.83 | 314.91 | 318.61 | 299.74 | 276.76 | 259.27 | 311.01 | 294.94 | NA | NA | 257.27 | 222.53 | 196.93 | 216.39 | NA | NA | NA | NA | NA | NA | NA | NA | NA | NA | NA | NA | NA | NA | NA | NA | NA | NA | NA | NA | NA | NA | NA | NA | NA | NA | NA | NA | NA | NA | NA | |
| Revenue From Contract With Customer Including Assessed Tax | 1004.20 | 939.48 | 888.62 | 811.62 | 863.96 | 799.85 | 708.11 | 636.62 | 646.05 | 610.18 | 649.57 | 592.49 | 607.97 | 607.90 | 513.05 | 518.47 | 571.08 | 583.21 | 448.78 | 468.09 | 446.35 | 399.54 | 339.68 | 345.61 | 373.50 | 373.50 | 356.19 | 300.13 | 343.66 | 283.26 | 261.93 | 253.63 | 271.18 | 269.86 | 276.49 | 244.15 | 250.98 | 248.47 | 228.88 | 215.64 | 254.58 | 232.89 | 213.92 | 201.34 | 247.76 | 250.56 | 260.41 | 240.23 | 234.26 | 210.49 | 185.31 | 150.29 | 155.14 | 152.77 | 140.28 |