
| 2024-01-31 | 2023-10-31 | 2023-07-31 | 2023-04-30 | 2023-01-31 | 2022-10-31 | 2022-07-31 | 2022-04-30 | 2022-01-31 | 2021-10-31 | 2021-07-31 | 2021-04-30 | 2021-01-31 | 2020-10-31 | 2020-07-31 | 2020-04-30 | 2020-01-31 | 2019-10-31 | 2019-07-31 | 2019-04-30 | 2019-01-31 | 2018-10-31 | 2018-07-31 | 2018-04-30 | 2018-01-31 | 2017-10-31 | 2017-07-31 | 2017-04-30 | 2017-01-31 | 2016-10-31 | 2016-07-31 | 2016-04-30 | 2016-01-31 | 2015-10-31 | 2015-07-31 | 2015-04-30 | 2015-01-31 | 2014-10-31 | 2014-07-31 | 2014-04-30 | 2014-01-31 | 2013-10-31 | 2013-07-31 | 2013-04-30 | 2013-01-31 | 2012-10-31 | 2012-07-31 | 2012-04-30 | 2012-01-31 | 2011-10-31 | 2011-07-31 | 2011-04-30 | 2011-01-31 | 2010-10-31 | 2010-07-31 | 2010-04-30 | 2010-01-31 | ||
|---|---|---|---|---|---|---|---|---|---|---|---|---|---|---|---|---|---|---|---|---|---|---|---|---|---|---|---|---|---|---|---|---|---|---|---|---|---|---|---|---|---|---|---|---|---|---|---|---|---|---|---|---|---|---|---|---|---|---|
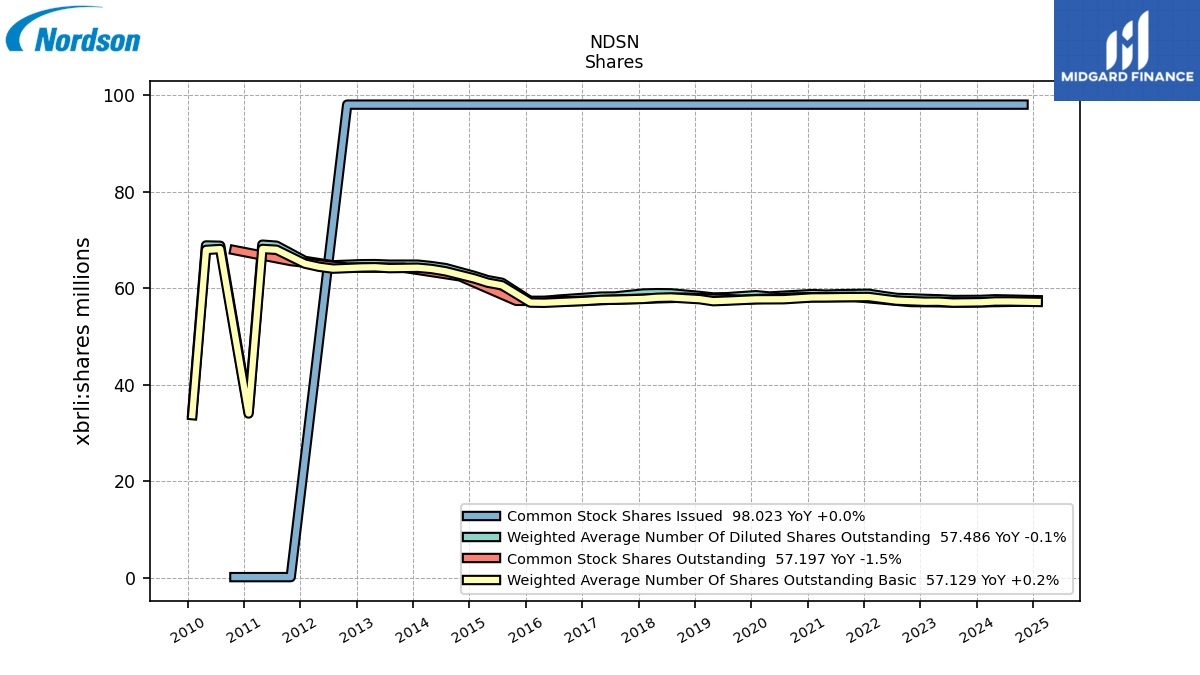
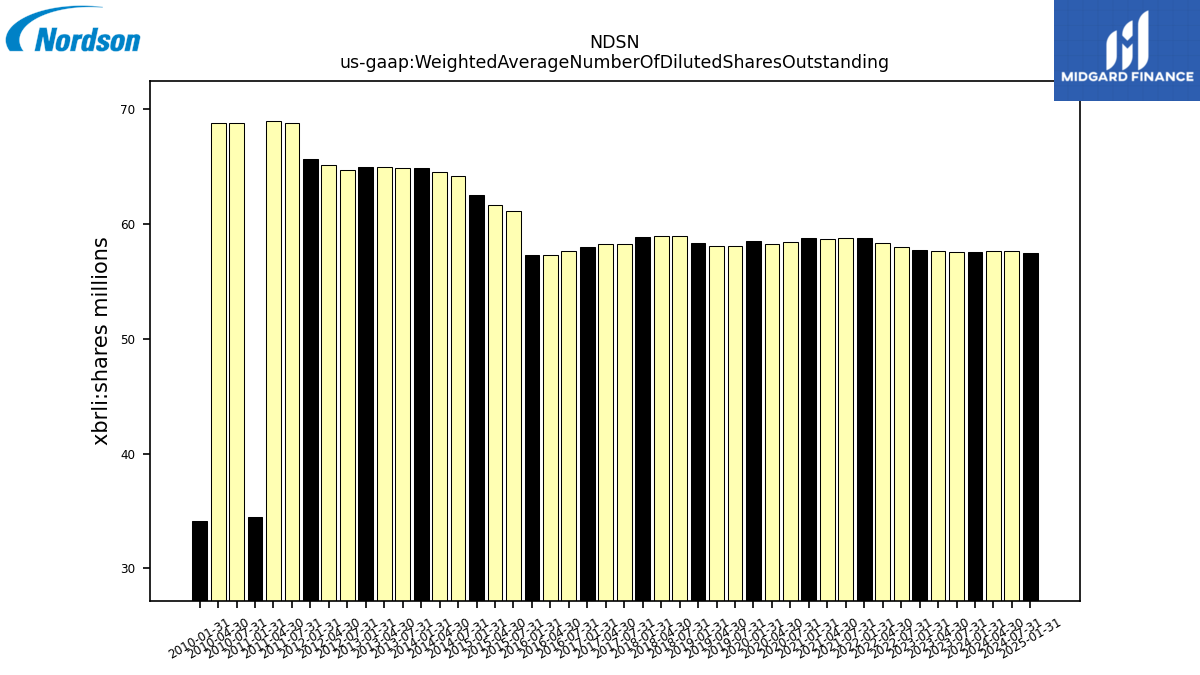
| Weighted Average Number Of Diluted Shares Outstanding | 57.55 | NA | 57.53 | 57.68 | 57.76 | NA | 57.97 | 58.38 | 58.82 | NA | 58.73 | 58.65 | 58.76 | NA | 58.43 | 58.26 | 58.52 | NA | 58.12 | 58.06 | 58.37 | NA | 58.91 | 58.95 | 58.87 | NA | 58.26 | 58.23 | 58.02 | NA | 57.62 | 57.33 | 57.30 | NA | 61.10 | 61.64 | 62.54 | NA | 64.14 | 64.56 | 64.86 | NA | 64.85 | 64.97 | 64.95 | NA | 64.72 | 65.18 | 65.63 | NA | 68.78 | 69.00 | 34.44 | NA | 68.77 | 68.84 | 34.12 | |
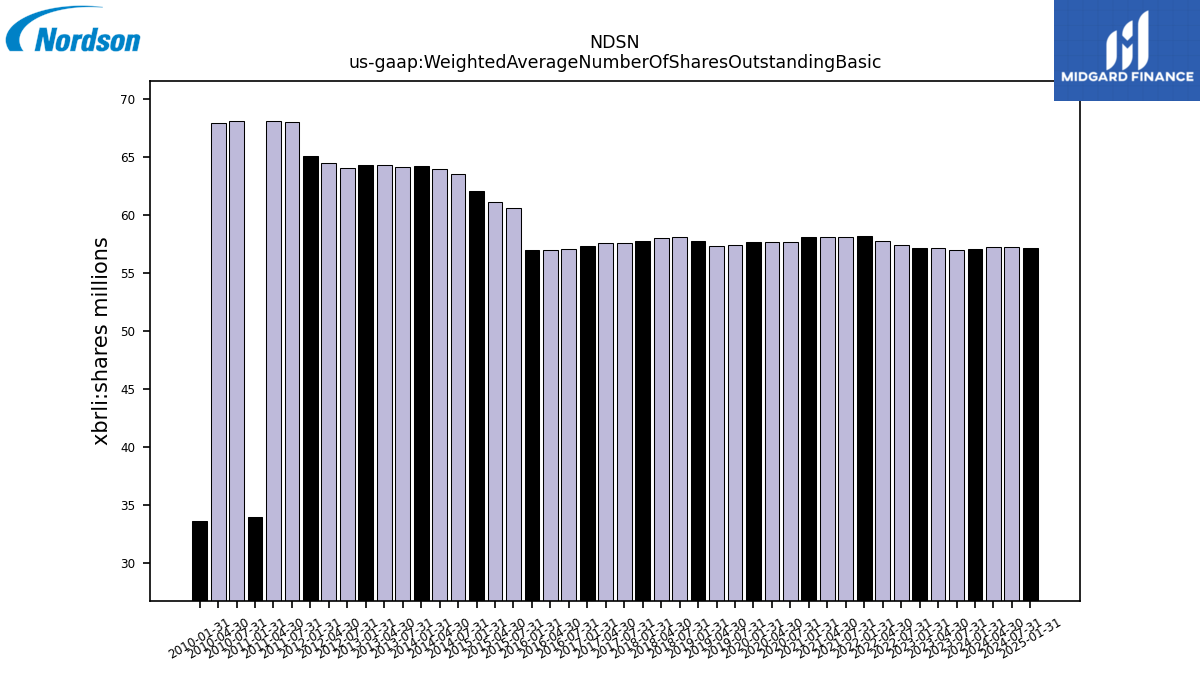
| Weighted Average Number Of Shares Outstanding Basic | 57.06 | NA | 56.99 | 57.18 | 57.17 | NA | 57.41 | 57.78 | 58.15 | NA | 58.11 | 58.07 | 58.06 | NA | 57.69 | 57.68 | 57.67 | NA | 57.40 | 57.29 | 57.70 | NA | 58.05 | 57.99 | 57.76 | NA | 57.59 | 57.55 | 57.35 | NA | 57.09 | 56.95 | 57.00 | NA | 60.58 | 61.12 | 62.01 | NA | 63.48 | 63.96 | 64.22 | NA | 64.14 | 64.32 | 64.27 | NA | 64.03 | 64.43 | 65.06 | NA | 67.94 | 68.11 | 34.01 | NA | 68.09 | 67.91 | 33.66 | |
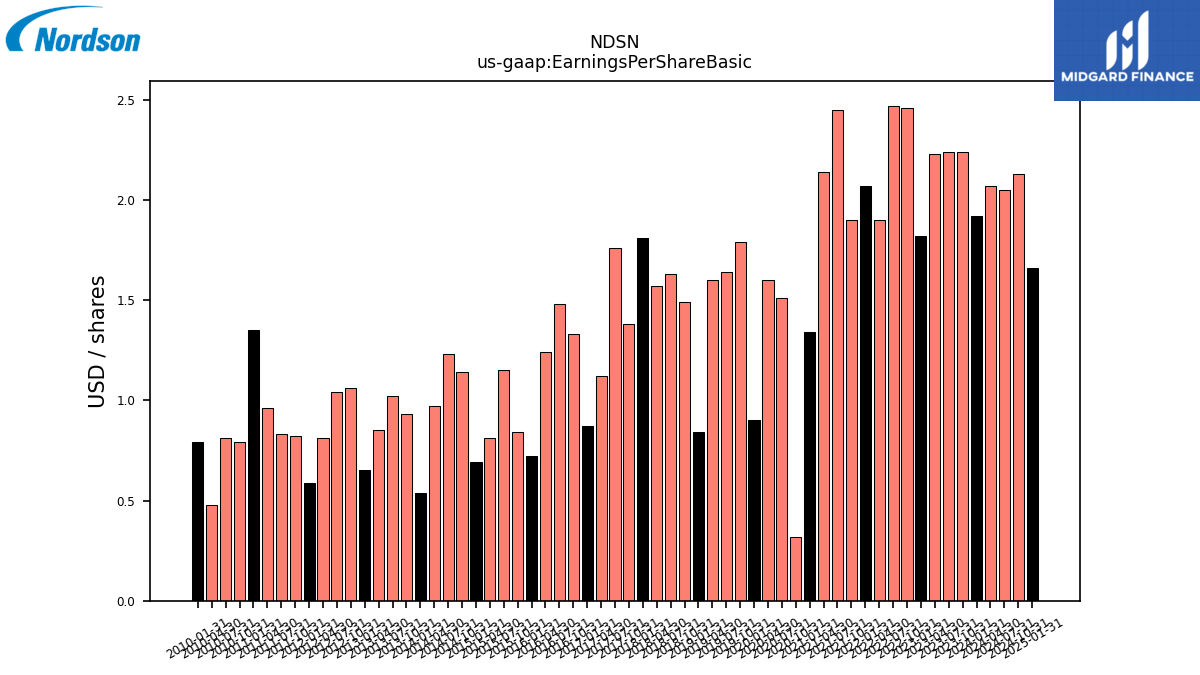
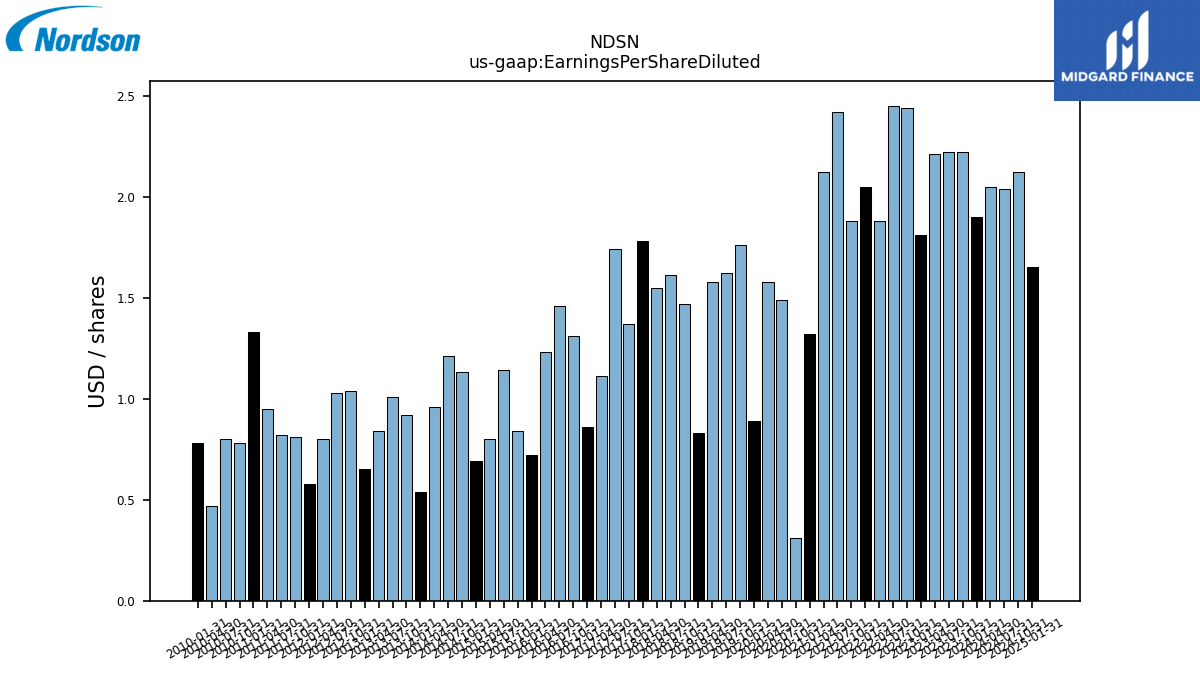
| Earnings Per Share Basic | 1.92 | 2.24 | 2.24 | 2.23 | 1.82 | 2.46 | 2.47 | 1.90 | 2.07 | 1.90 | 2.45 | 2.14 | 1.34 | 0.32 | 1.51 | 1.60 | 0.90 | 1.79 | 1.64 | 1.60 | 0.84 | 1.49 | 1.63 | 1.57 | 1.81 | 1.38 | 1.76 | 1.12 | 0.87 | 1.33 | 1.48 | 1.24 | 0.72 | 0.84 | 1.15 | 0.81 | 0.69 | 1.14 | 1.23 | 0.97 | 0.54 | 0.93 | 1.02 | 0.85 | 0.65 | 1.06 | 1.04 | 0.81 | 0.59 | 0.82 | 0.83 | 0.96 | 1.35 | 0.79 | 0.81 | 0.48 | 0.79 | |
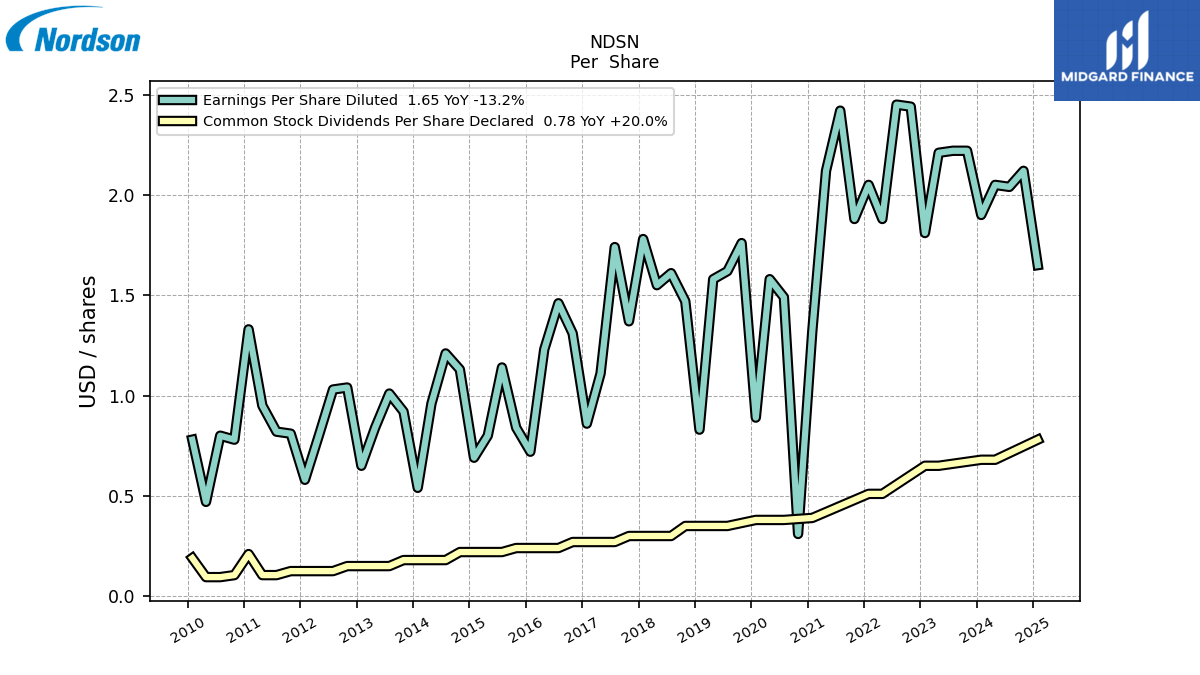
| Earnings Per Share Diluted | 1.90 | 2.22 | 2.22 | 2.21 | 1.81 | 2.44 | 2.45 | 1.88 | 2.05 | 1.88 | 2.42 | 2.12 | 1.32 | 0.31 | 1.49 | 1.58 | 0.89 | 1.76 | 1.62 | 1.58 | 0.83 | 1.47 | 1.61 | 1.55 | 1.78 | 1.37 | 1.74 | 1.11 | 0.86 | 1.31 | 1.46 | 1.23 | 0.72 | 0.84 | 1.14 | 0.80 | 0.69 | 1.13 | 1.21 | 0.96 | 0.54 | 0.92 | 1.01 | 0.84 | 0.65 | 1.04 | 1.03 | 0.80 | 0.58 | 0.81 | 0.82 | 0.95 | 1.33 | 0.78 | 0.80 | 0.47 | 0.78 |
| 2024-01-31 | 2023-10-31 | 2023-07-31 | 2023-04-30 | 2023-01-31 | 2022-10-31 | 2022-07-31 | 2022-04-30 | 2022-01-31 | 2021-10-31 | 2021-07-31 | 2021-04-30 | 2021-01-31 | 2020-10-31 | 2020-07-31 | 2020-04-30 | 2020-01-31 | 2019-10-31 | 2019-07-31 | 2019-04-30 | 2019-01-31 | 2018-10-31 | 2018-07-31 | 2018-04-30 | 2018-01-31 | 2017-10-31 | 2017-07-31 | 2017-04-30 | 2017-01-31 | 2016-10-31 | 2016-07-31 | 2016-04-30 | 2016-01-31 | 2015-10-31 | 2015-07-31 | 2015-04-30 | 2015-01-31 | 2014-10-31 | 2014-07-31 | 2014-04-30 | 2014-01-31 | 2013-10-31 | 2013-07-31 | 2013-04-30 | 2013-01-31 | 2012-10-31 | 2012-07-31 | 2012-04-30 | 2012-01-31 | 2011-10-31 | 2011-07-31 | 2011-04-30 | 2011-01-31 | 2010-10-31 | 2010-07-31 | 2010-04-30 | 2010-01-31 | ||
|---|---|---|---|---|---|---|---|---|---|---|---|---|---|---|---|---|---|---|---|---|---|---|---|---|---|---|---|---|---|---|---|---|---|---|---|---|---|---|---|---|---|---|---|---|---|---|---|---|---|---|---|---|---|---|---|---|---|---|
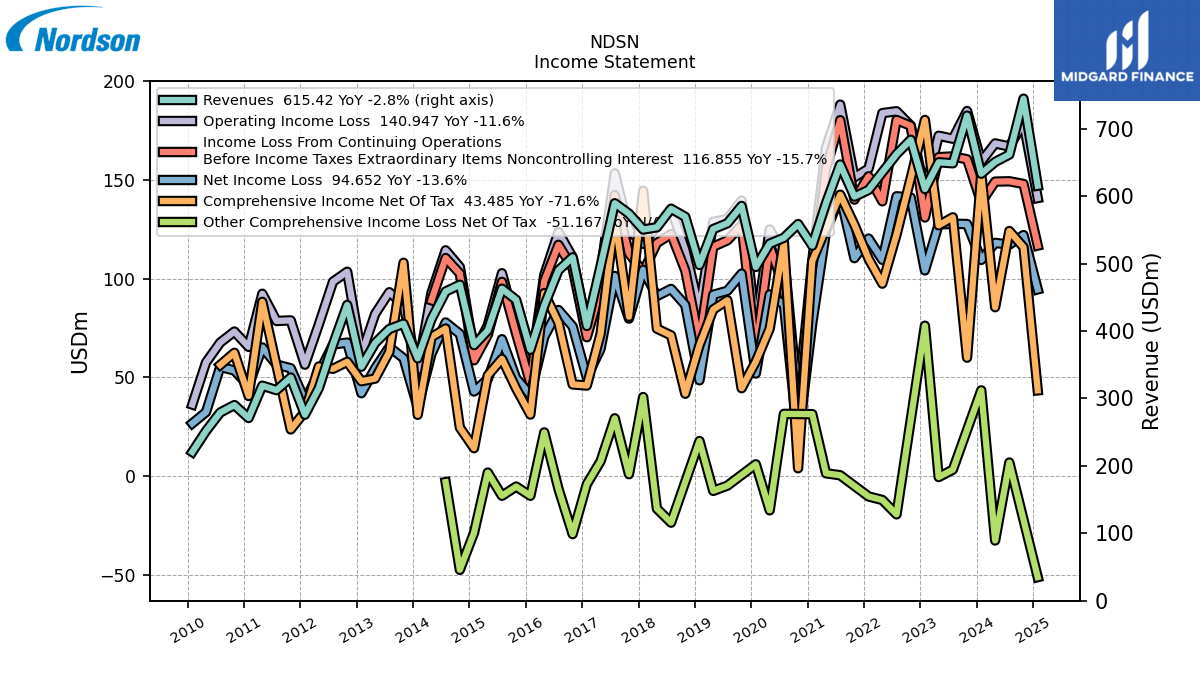
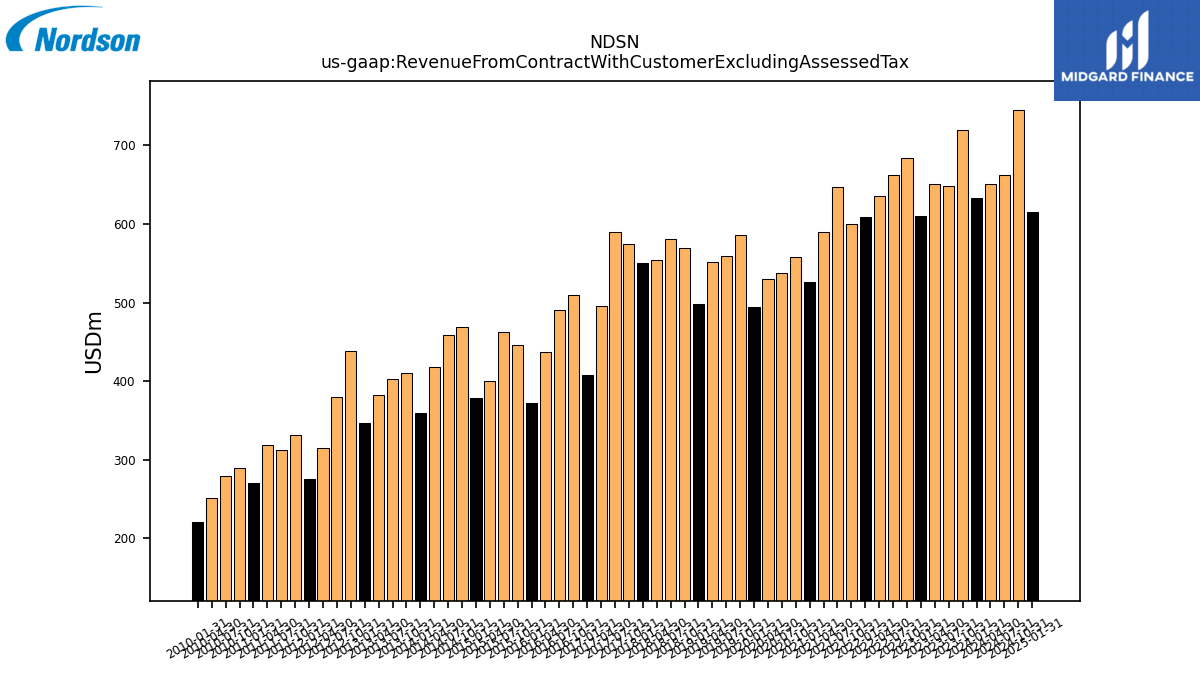
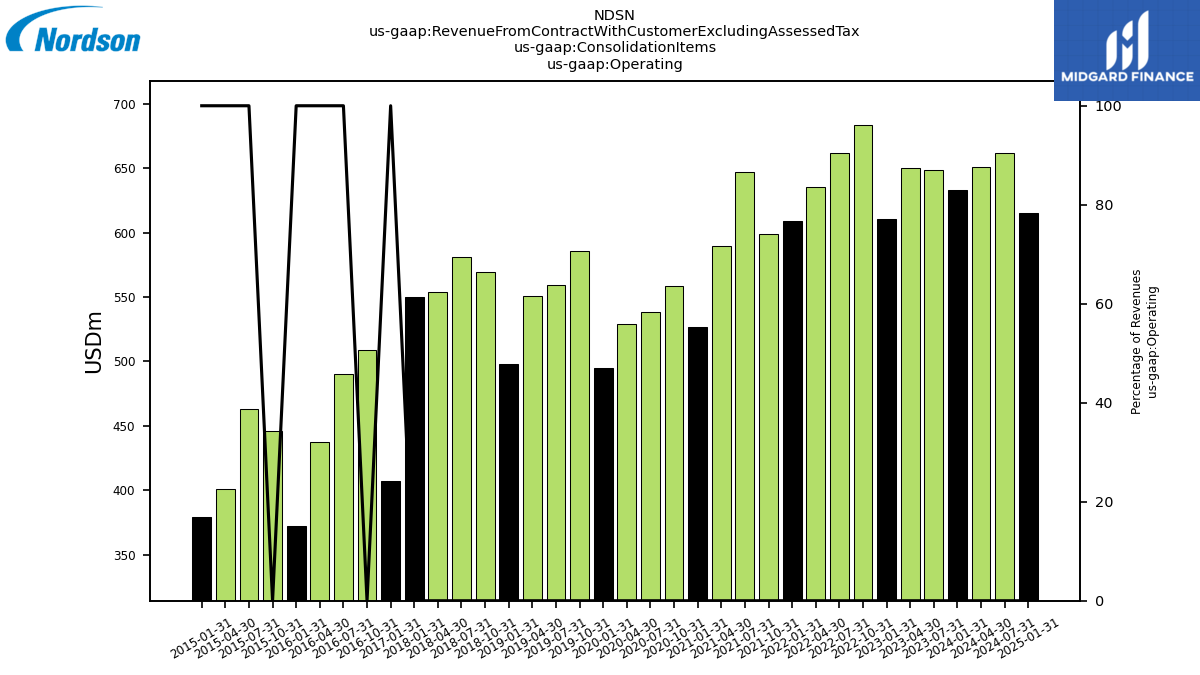
| Revenue From Contract With Customer Excluding Assessed Tax | 633.19 | 719.31 | 648.68 | 650.16 | 610.48 | 683.58 | 662.13 | 635.40 | 609.17 | 599.25 | 646.86 | 589.54 | 526.57 | 558.52 | 538.18 | 529.48 | 494.92 | 585.45 | 559.75 | 551.12 | 497.91 | 569.29 | 581.24 | 553.71 | 550.42 | 573.94 | 589.44 | 496.14 | 407.47 | 509.28 | 489.90 | 437.59 | 372.22 | 446.20 | 462.73 | 400.73 | 379.01 | 468.59 | 458.55 | 417.46 | 359.42 | 410.82 | 402.96 | 382.10 | 347.04 | 438.68 | 379.87 | 315.19 | 275.84 | 331.02 | 312.25 | 318.92 | 270.96 | 290.18 | 279.12 | 251.66 | 220.59 | |
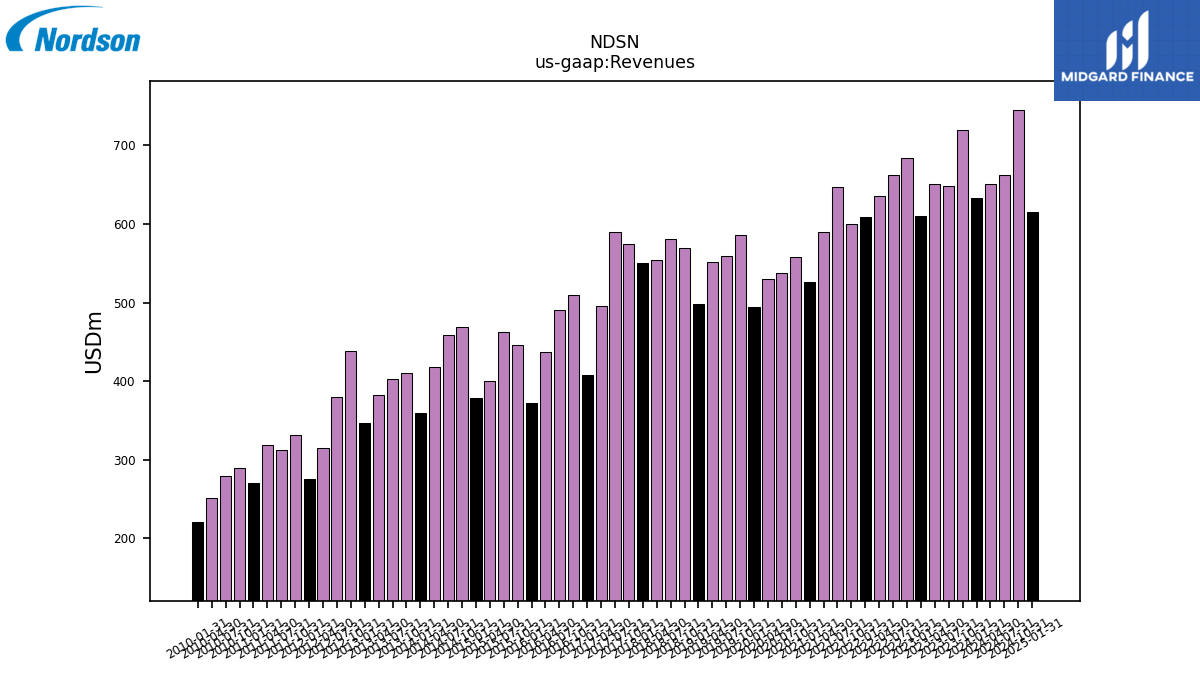
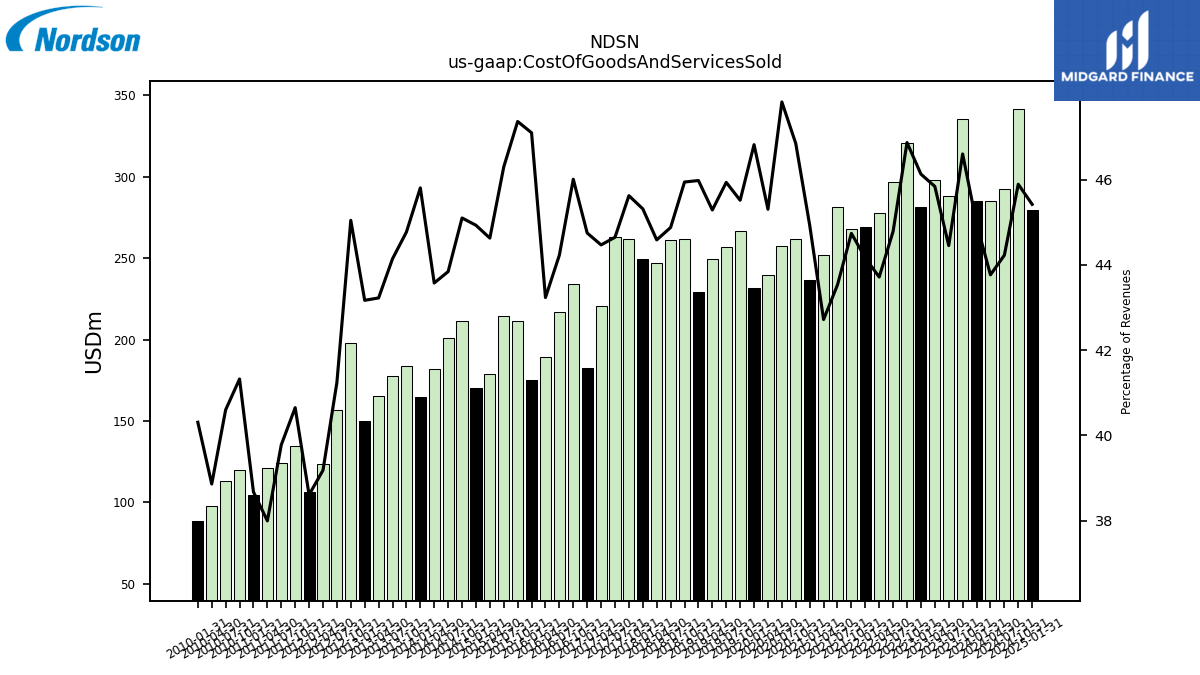
| Revenues | 633.19 | 719.31 | 648.68 | 650.16 | 610.48 | 683.58 | 662.13 | 635.40 | 609.17 | 599.25 | 646.86 | 589.54 | 526.57 | 558.52 | 538.18 | 529.48 | 494.92 | 585.45 | 559.75 | 551.12 | 497.91 | 569.29 | 581.24 | 553.71 | 550.42 | 573.94 | 589.44 | 496.14 | 407.47 | 509.28 | 489.90 | 437.59 | 372.22 | 446.20 | 462.73 | 400.73 | 379.01 | 468.59 | 458.55 | 417.46 | 359.42 | 410.82 | 402.96 | 382.10 | 347.04 | 438.68 | 379.87 | 315.19 | 275.84 | 331.02 | 312.25 | 318.92 | 270.96 | 290.18 | 279.12 | 251.66 | 220.59 | |
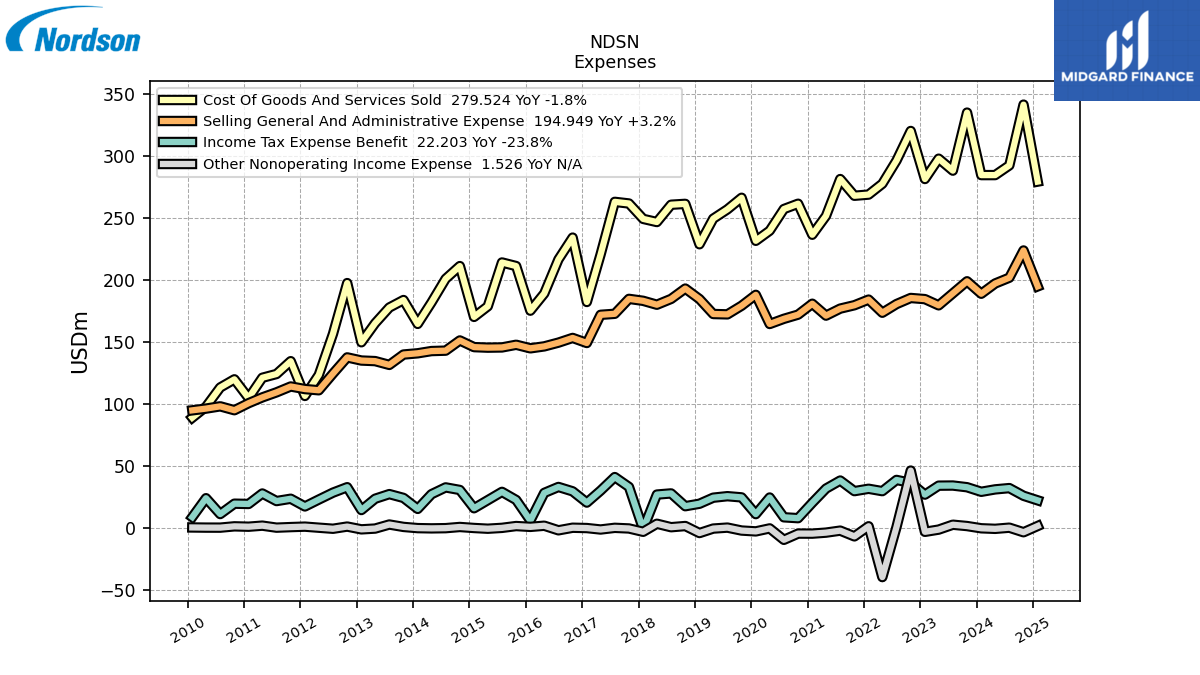
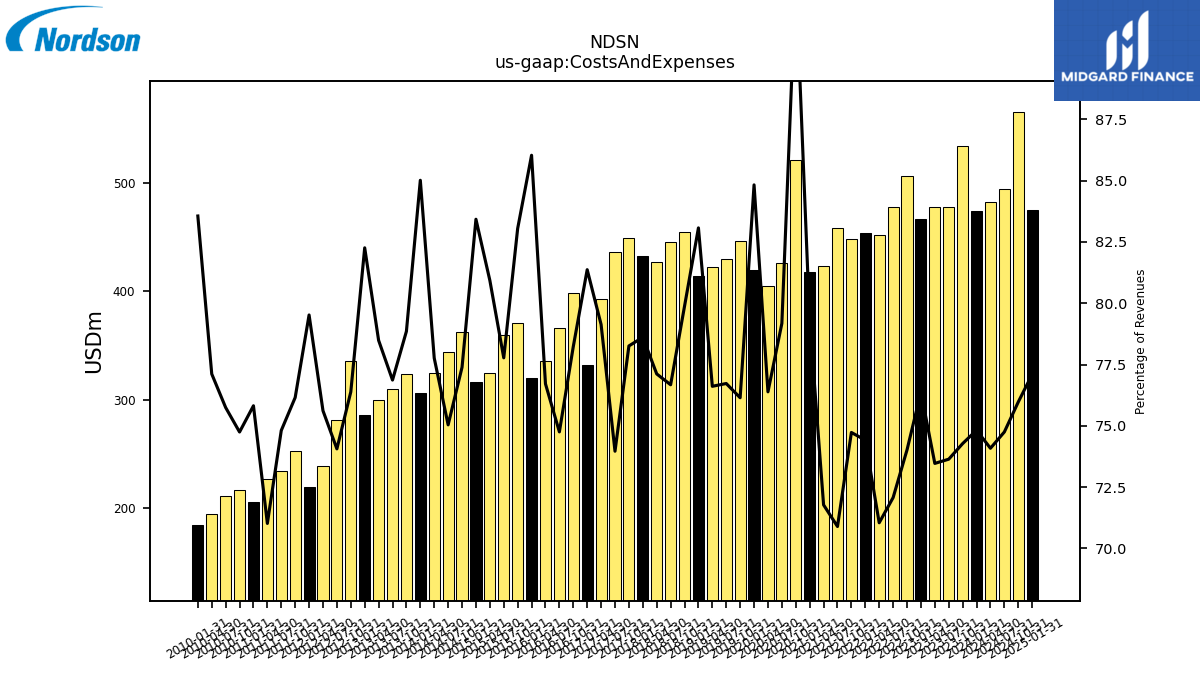
| Cost Of Goods And Services Sold | 284.77 | 335.22 | 288.36 | 298.04 | 281.61 | 320.40 | 296.54 | 277.77 | 269.03 | 268.10 | 281.59 | 251.84 | 236.61 | 261.66 | 257.37 | 239.88 | 231.72 | 266.48 | 257.12 | 249.59 | 228.93 | 261.56 | 260.85 | 246.88 | 249.42 | 261.85 | 263.17 | 220.62 | 182.33 | 234.32 | 216.68 | 189.19 | 175.31 | 211.34 | 214.24 | 178.84 | 170.29 | 211.34 | 201.04 | 181.91 | 164.64 | 183.92 | 177.88 | 165.16 | 149.81 | 197.60 | 156.66 | 123.50 | 106.49 | 134.56 | 124.20 | 121.17 | 104.79 | 119.91 | 113.32 | 97.79 | 88.91 | |
| Costs And Expenses | 473.76 | 534.27 | 477.68 | 477.66 | 466.26 | 505.97 | 477.21 | 451.43 | 453.31 | 447.81 | 458.58 | 423.15 | 417.54 | 521.16 | 426.13 | 404.45 | 419.82 | 445.79 | 429.47 | 422.22 | 413.63 | 454.74 | 445.67 | 427.00 | 432.70 | 449.15 | 435.97 | 392.61 | 331.55 | 398.42 | 366.21 | 335.69 | 320.24 | 370.55 | 359.88 | 324.31 | 316.19 | 362.63 | 344.10 | 324.63 | 305.56 | 323.95 | 309.74 | 299.90 | 285.48 | 335.08 | 281.33 | 238.34 | 219.35 | 252.08 | 233.60 | 226.50 | 205.44 | 216.90 | 211.43 | 194.07 | 184.32 | |
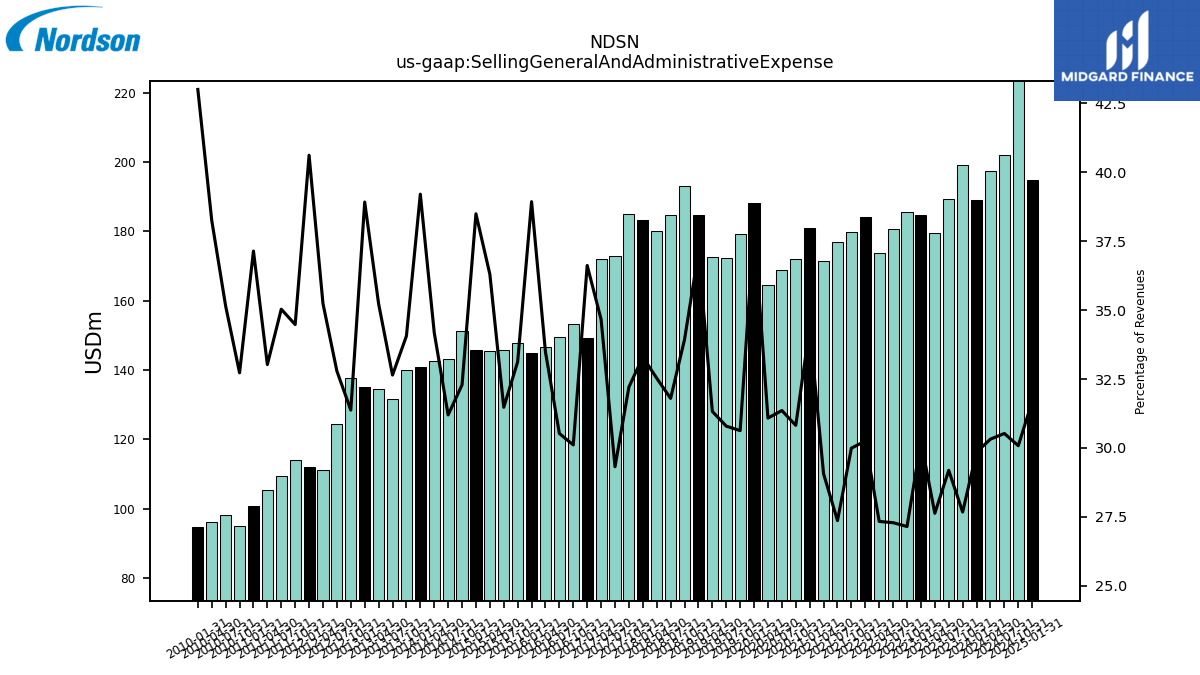
| Selling General And Administrative Expense | 188.99 | 199.05 | 189.32 | 179.62 | 184.65 | 185.57 | 180.67 | 173.66 | 184.27 | 179.72 | 177.00 | 171.31 | 180.94 | 172.13 | 168.75 | 164.57 | 188.10 | 179.31 | 172.35 | 172.63 | 184.69 | 193.19 | 184.82 | 180.12 | 183.28 | 184.86 | 172.80 | 171.98 | 149.22 | 153.33 | 149.53 | 146.50 | 144.93 | 147.80 | 145.64 | 145.48 | 145.90 | 151.30 | 143.06 | 142.72 | 140.92 | 139.93 | 131.54 | 134.62 | 135.08 | 137.62 | 124.56 | 111.06 | 112.05 | 114.12 | 109.39 | 105.32 | 100.65 | 94.96 | 98.11 | 96.28 | 94.87 | |
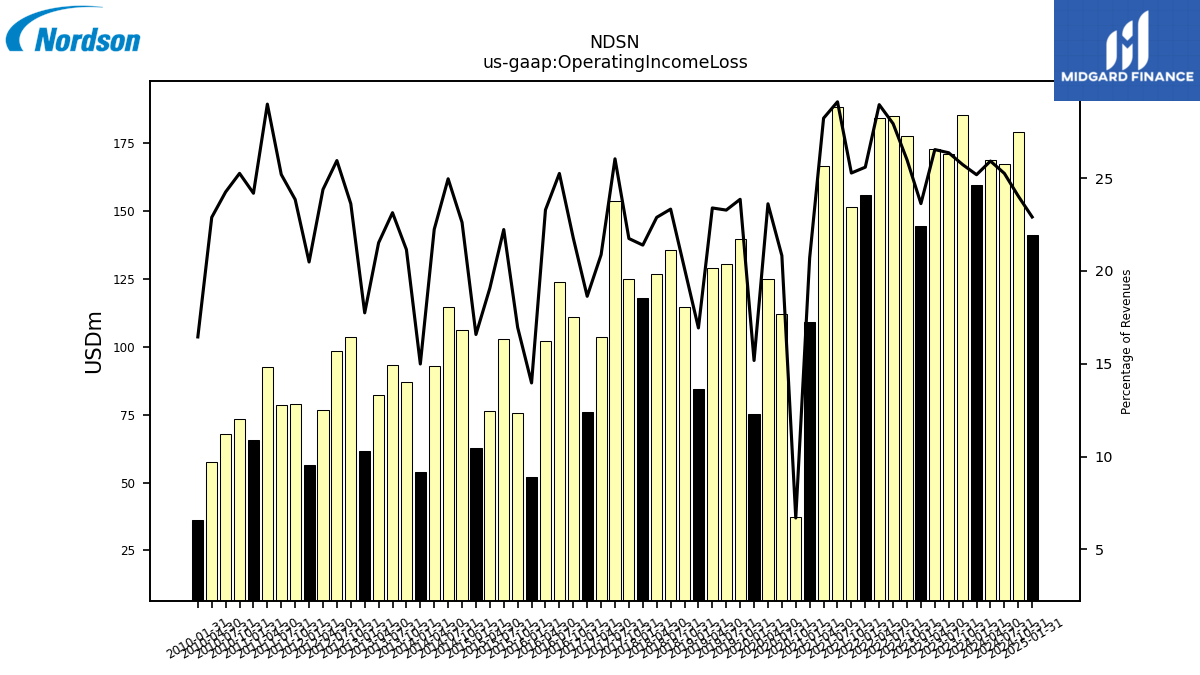
| Operating Income Loss | 159.44 | 185.04 | 171.00 | 172.51 | 144.22 | 177.61 | 184.92 | 183.97 | 155.86 | 151.44 | 188.28 | 166.39 | 109.03 | 37.37 | 112.06 | 125.03 | 75.09 | 139.66 | 130.28 | 128.90 | 84.28 | 114.55 | 135.58 | 126.70 | 117.72 | 124.79 | 153.47 | 103.53 | 75.92 | 110.86 | 123.69 | 101.90 | 51.98 | 75.65 | 102.85 | 76.41 | 62.82 | 105.96 | 114.45 | 92.83 | 53.86 | 86.87 | 93.22 | 82.20 | 61.56 | 103.60 | 98.54 | 76.86 | 56.49 | 78.94 | 78.66 | 92.43 | 65.52 | 73.28 | 67.69 | 57.59 | 36.27 | |
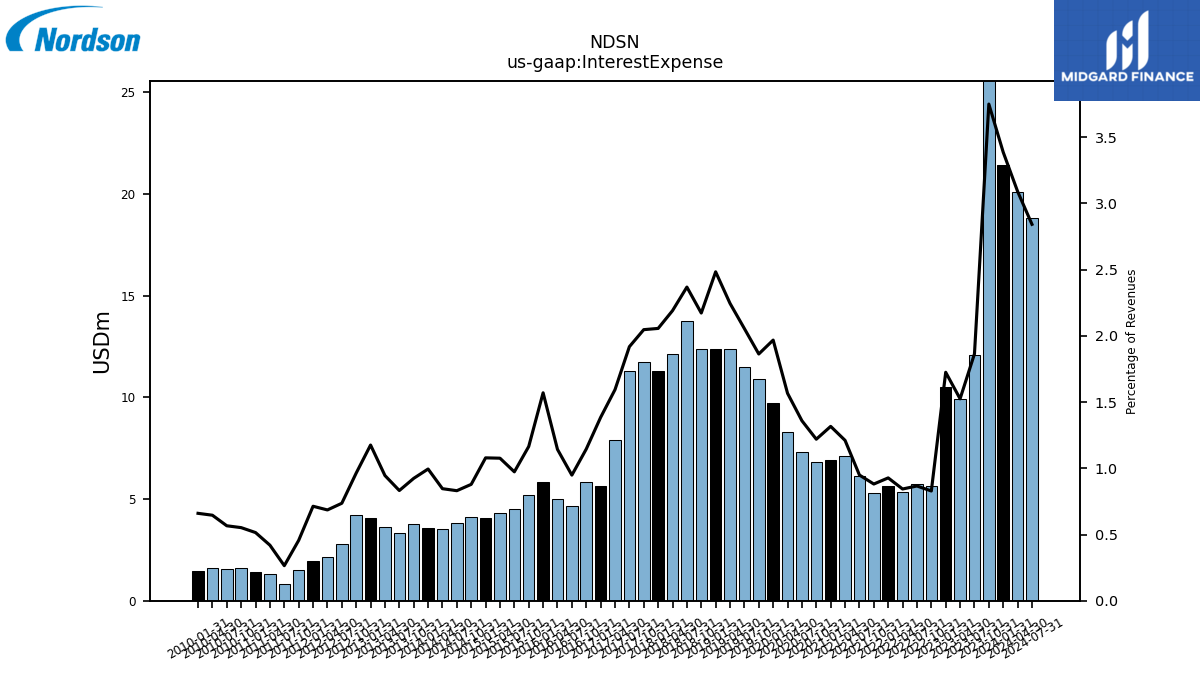
| Interest Expense | 21.44 | 26.97 | 12.09 | 9.91 | 10.53 | 5.67 | 5.74 | 5.36 | 5.65 | 5.28 | 6.14 | 7.14 | 6.93 | 6.81 | 7.31 | 8.29 | 9.74 | 10.91 | 11.50 | 12.37 | 12.37 | 12.37 | 13.77 | 12.13 | 11.32 | 11.75 | 11.31 | 7.91 | 5.64 | 5.83 | 4.65 | 5.00 | 5.84 | 5.20 | 4.50 | 4.31 | 4.09 | 4.12 | 3.81 | 3.53 | 3.58 | 3.80 | 3.35 | 3.61 | 4.08 | 4.23 | 2.80 | 2.16 | 1.97 | 1.51 | 0.83 | 1.34 | 1.40 | 1.60 | 1.58 | 1.62 | 1.46 | |
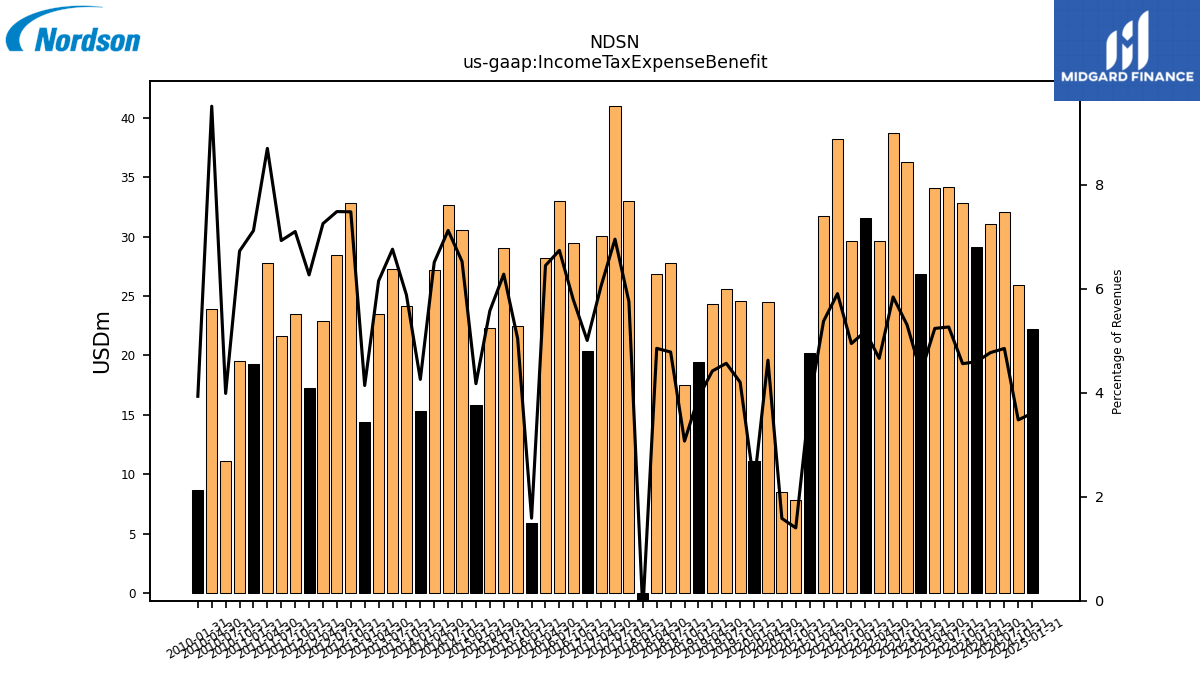
| Income Tax Expense Benefit | 29.13 | 32.80 | 34.16 | 34.06 | 26.82 | 36.29 | 38.69 | 29.63 | 31.56 | 29.65 | 38.22 | 31.71 | 20.23 | 7.83 | 8.53 | 24.51 | 11.09 | 24.61 | 25.57 | 24.36 | 19.48 | 17.49 | 27.81 | 26.88 | -1.04 | 33.03 | 41.00 | 30.05 | 20.41 | 29.50 | 33.02 | 28.22 | 5.91 | 22.50 | 29.07 | 22.35 | 15.83 | 30.59 | 32.67 | 27.18 | 15.31 | 24.17 | 27.25 | 23.51 | 14.37 | 32.82 | 28.44 | 22.87 | 17.29 | 23.51 | 21.64 | 27.75 | 19.29 | 19.52 | 11.13 | 23.94 | 8.68 | |
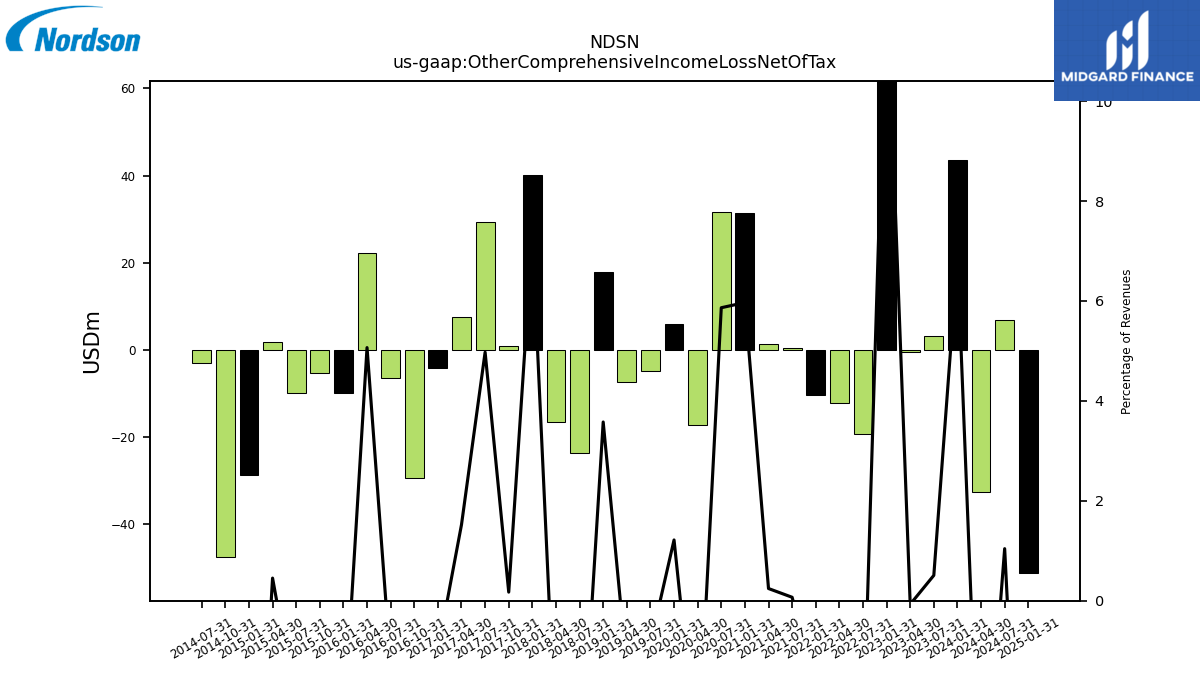
| Other Comprehensive Income Loss Net Of Tax | 43.48 | NA | 3.30 | -0.46 | 76.25 | NA | -19.37 | -12.08 | -10.30 | NA | 0.45 | 1.44 | 31.43 | NA | 31.56 | -17.33 | 6.02 | NA | -4.79 | -7.47 | 17.82 | NA | -23.57 | -16.47 | 40.09 | 0.99 | 29.32 | 7.56 | -4.06 | -29.38 | -6.41 | 22.17 | -9.95 | -5.26 | -9.96 | 1.82 | -28.70 | -47.48 | -3.05 | NA | NA | NA | NA | NA | NA | NA | NA | NA | NA | NA | NA | NA | NA | NA | NA | NA | NA | |
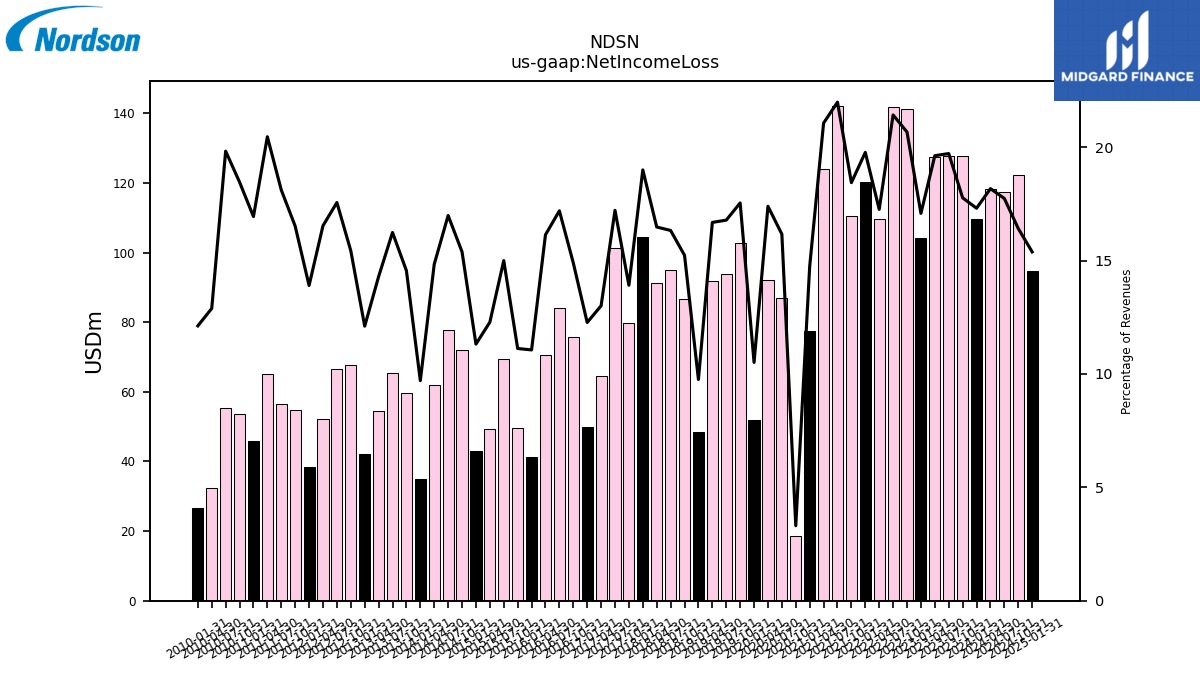
| Net Income Loss | 109.57 | 127.78 | 127.89 | 127.56 | 104.26 | 141.25 | 141.81 | 109.63 | 120.41 | 110.46 | 142.18 | 124.14 | 77.58 | 18.48 | 86.98 | 92.08 | 52.00 | 102.67 | 93.93 | 91.92 | 48.57 | 86.70 | 94.88 | 91.23 | 104.56 | 79.83 | 101.46 | 64.52 | 49.99 | 75.87 | 84.21 | 70.60 | 41.16 | 49.62 | 69.39 | 49.21 | 42.88 | 72.08 | 77.88 | 61.93 | 34.88 | 59.78 | 65.42 | 54.60 | 42.01 | 67.69 | 66.69 | 52.11 | 38.34 | 54.67 | 56.55 | 65.24 | 45.90 | 53.56 | 55.33 | 32.43 | 26.73 | |
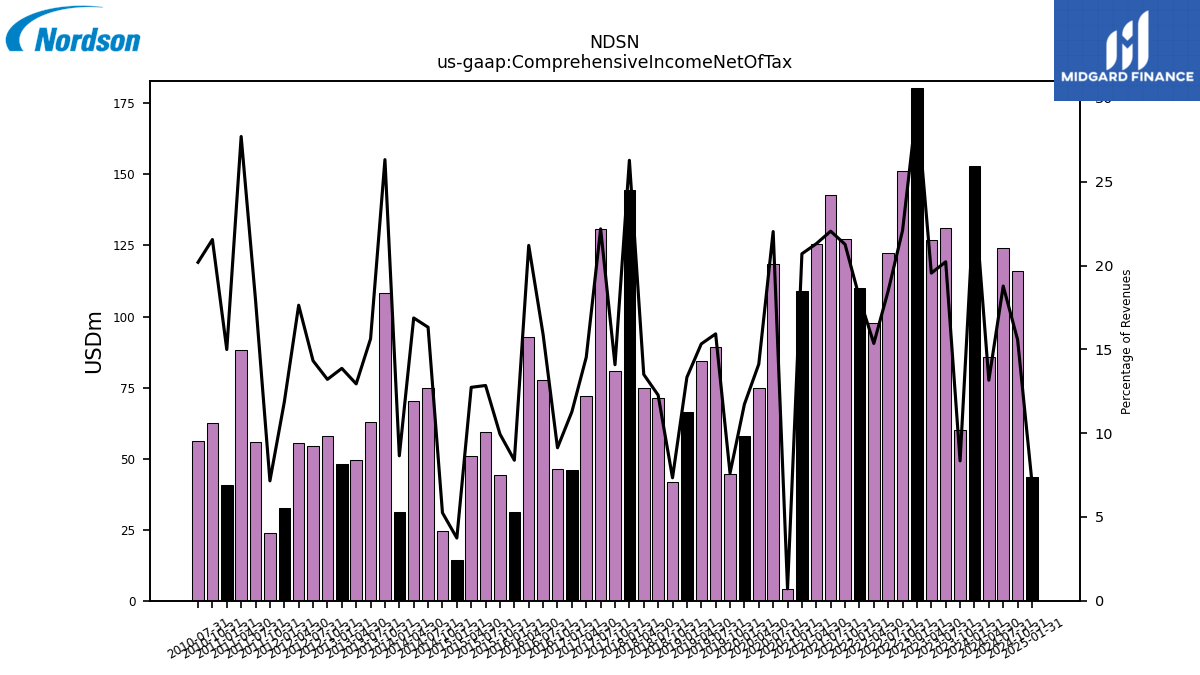
| Comprehensive Income Net Of Tax | 153.06 | 60.04 | 131.19 | 127.10 | 180.51 | 151.05 | 122.44 | 97.56 | 110.11 | 127.42 | 142.63 | 125.59 | 109.01 | 3.98 | 118.55 | 74.75 | 58.03 | 44.55 | 89.13 | 84.46 | 66.38 | 41.77 | 71.32 | 74.76 | 144.65 | 80.83 | 130.78 | 72.08 | 45.93 | 46.49 | 77.81 | 92.77 | 31.21 | 44.37 | 59.43 | 51.03 | 14.18 | 24.60 | 74.83 | 70.44 | 31.08 | 108.13 | 62.98 | 49.44 | 48.12 | 57.95 | 54.40 | 55.58 | 32.70 | 23.68 | 56.02 | 88.34 | 40.62 | 62.53 | 56.36 | NA | NA |
| 2024-01-31 | 2023-10-31 | 2023-07-31 | 2023-04-30 | 2023-01-31 | 2022-10-31 | 2022-07-31 | 2022-04-30 | 2022-01-31 | 2021-10-31 | 2021-07-31 | 2021-04-30 | 2021-01-31 | 2020-10-31 | 2020-07-31 | 2020-04-30 | 2020-01-31 | 2019-10-31 | 2019-07-31 | 2019-04-30 | 2019-01-31 | 2018-10-31 | 2018-07-31 | 2018-04-30 | 2018-01-31 | 2017-10-31 | 2017-07-31 | 2017-04-30 | 2017-01-31 | 2016-10-31 | 2016-07-31 | 2016-04-30 | 2016-01-31 | 2015-10-31 | 2015-07-31 | 2015-04-30 | 2015-01-31 | 2014-10-31 | 2014-07-31 | 2014-04-30 | 2014-01-31 | 2013-10-31 | 2013-07-31 | 2013-04-30 | 2013-01-31 | 2012-10-31 | 2012-07-31 | 2012-04-30 | 2012-01-31 | 2011-10-31 | 2011-07-31 | 2011-04-30 | 2011-01-31 | 2010-10-31 | 2010-07-31 | 2010-04-30 | 2010-01-31 | ||
|---|---|---|---|---|---|---|---|---|---|---|---|---|---|---|---|---|---|---|---|---|---|---|---|---|---|---|---|---|---|---|---|---|---|---|---|---|---|---|---|---|---|---|---|---|---|---|---|---|---|---|---|---|---|---|---|---|---|---|
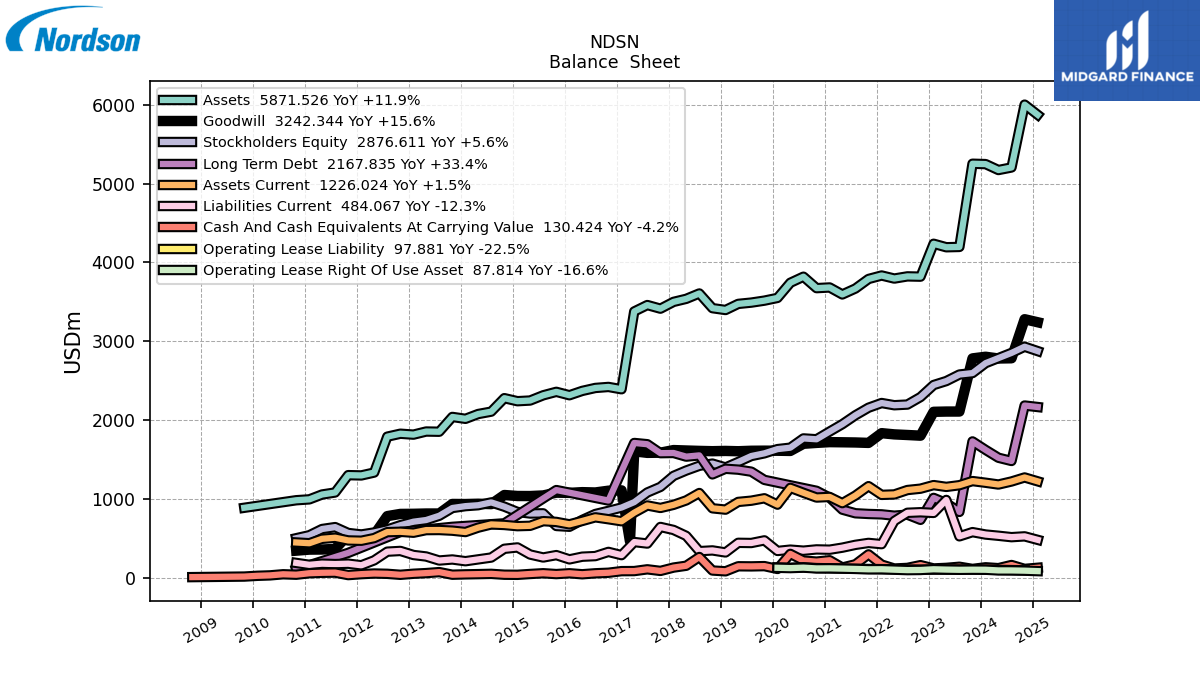
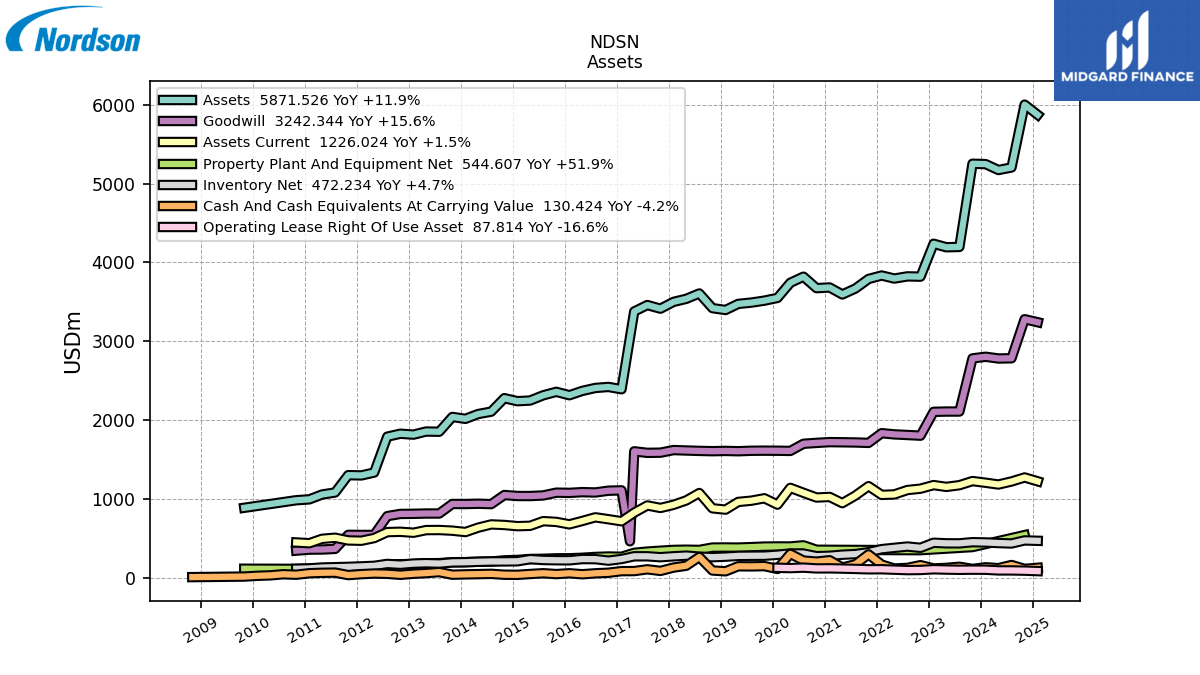
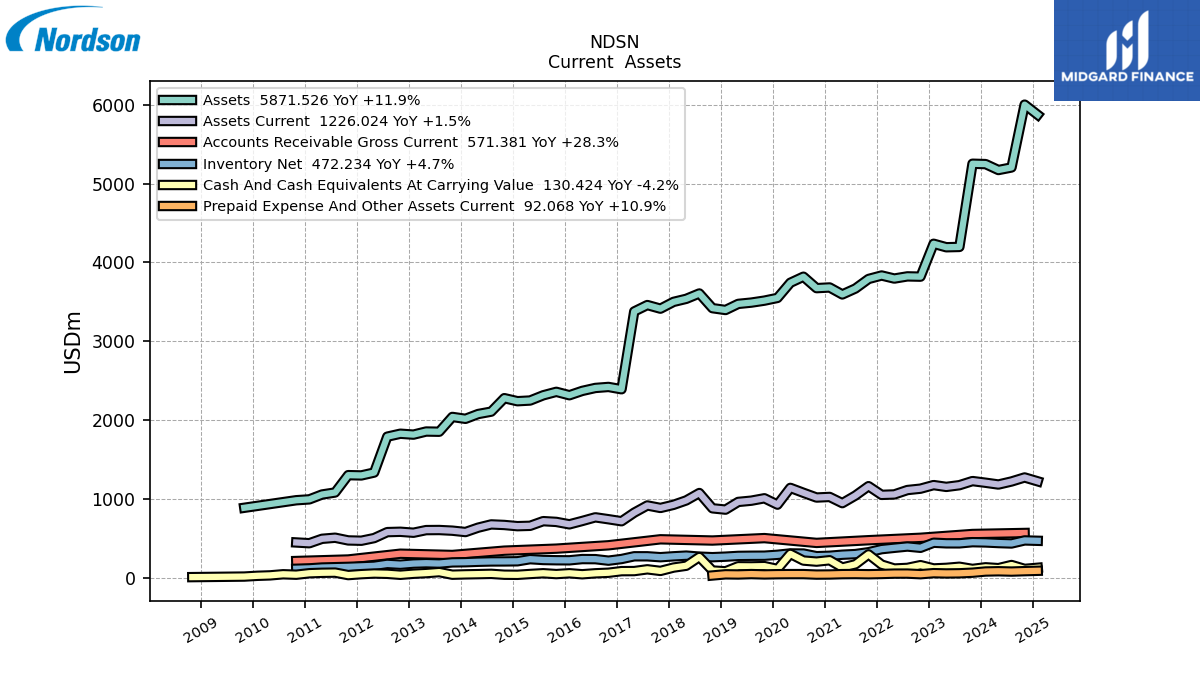
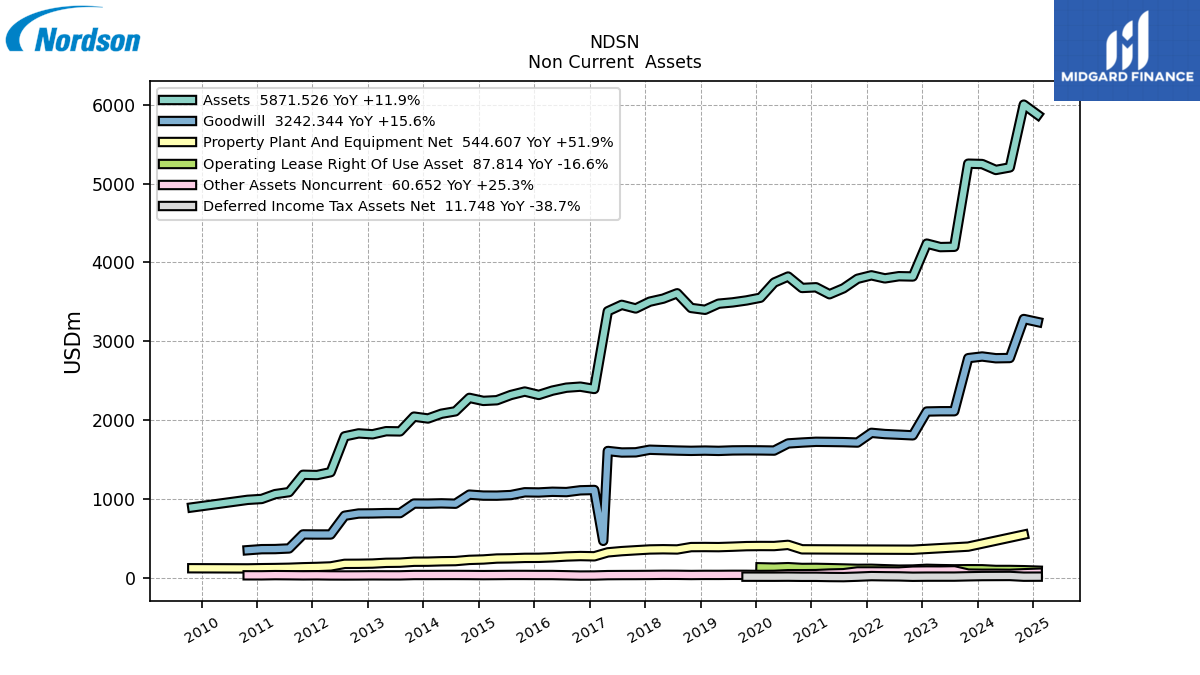
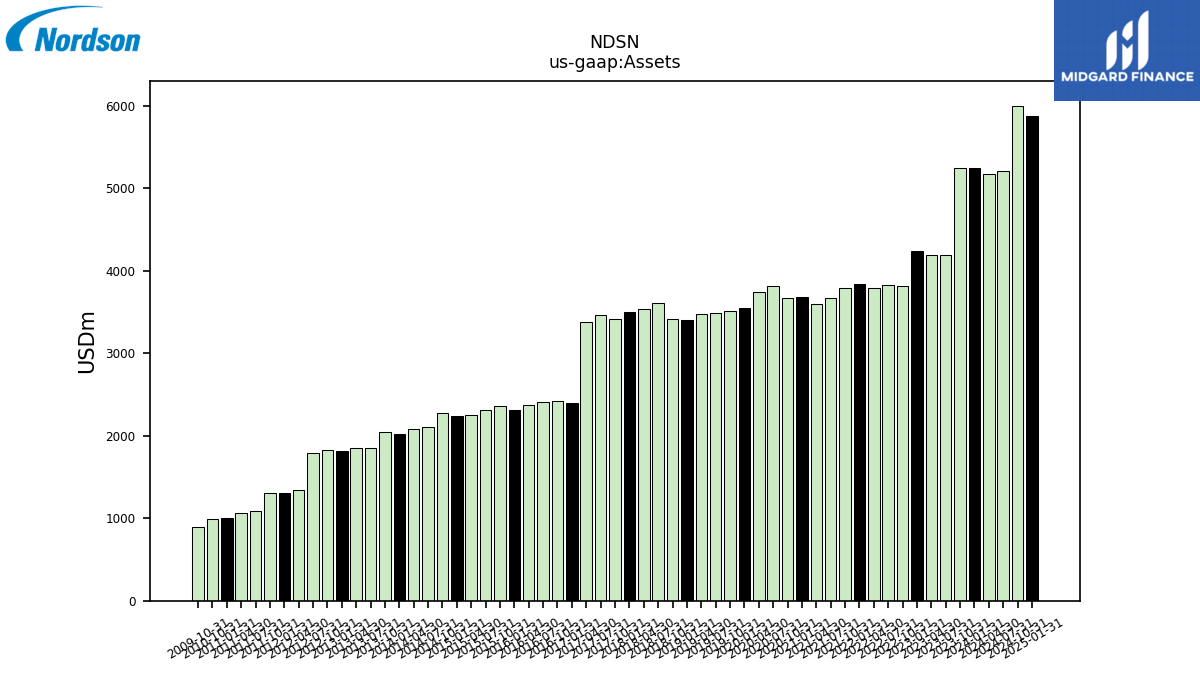
| Assets | 5247.08 | 5251.77 | 4197.03 | 4193.11 | 4237.42 | 3820.38 | 3823.82 | 3796.34 | 3834.99 | 3790.96 | 3670.08 | 3594.91 | 3683.40 | 3674.66 | 3819.96 | 3742.90 | 3550.87 | 3516.45 | 3491.54 | 3475.09 | 3397.75 | 3421.01 | 3607.39 | 3539.22 | 3500.64 | 3414.54 | 3460.52 | 3379.24 | 2393.02 | 2422.36 | 2409.53 | 2372.18 | 2317.24 | 2360.44 | 2316.36 | 2250.24 | 2241.70 | 2280.13 | 2109.45 | 2079.06 | 2018.32 | 2042.29 | 1854.68 | 1857.34 | 1817.98 | 1829.52 | 1792.20 | 1337.22 | 1300.83 | 1304.45 | 1084.44 | 1058.91 | 997.43 | 986.35 | NA | NA | NA | |
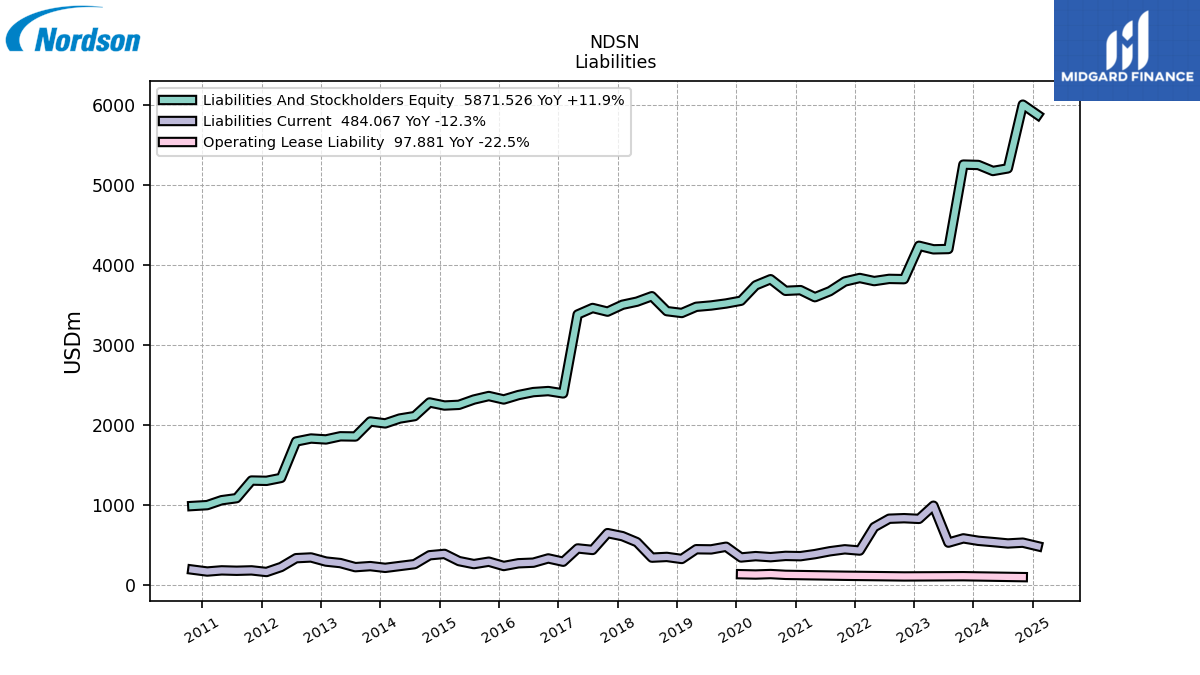
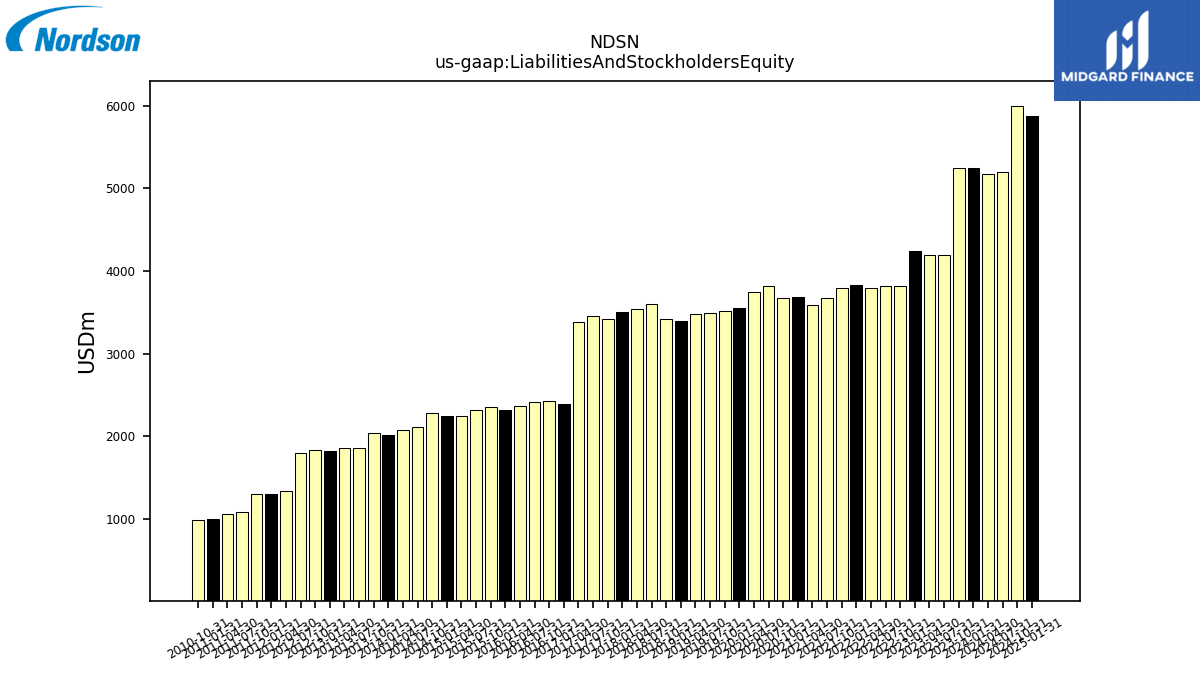
| Liabilities And Stockholders Equity | 5247.08 | 5251.77 | 4197.03 | 4193.11 | 4237.42 | 3820.38 | 3823.82 | 3796.34 | 3834.99 | 3790.96 | 3670.08 | 3594.91 | 3683.40 | 3674.66 | 3819.96 | 3742.90 | 3550.87 | 3516.45 | 3491.54 | 3475.09 | 3397.75 | 3421.01 | 3607.39 | 3539.22 | 3500.64 | 3414.54 | 3460.52 | 3379.24 | 2393.02 | 2422.36 | 2409.53 | 2372.18 | 2317.24 | 2360.44 | 2316.36 | 2250.24 | 2241.70 | 2280.13 | 2109.45 | 2079.06 | 2018.32 | 2042.29 | 1854.68 | 1857.34 | 1817.98 | 1829.52 | 1792.20 | 1337.22 | 1300.83 | 1304.45 | 1084.44 | 1058.91 | 997.43 | 986.35 | NA | NA | NA | |
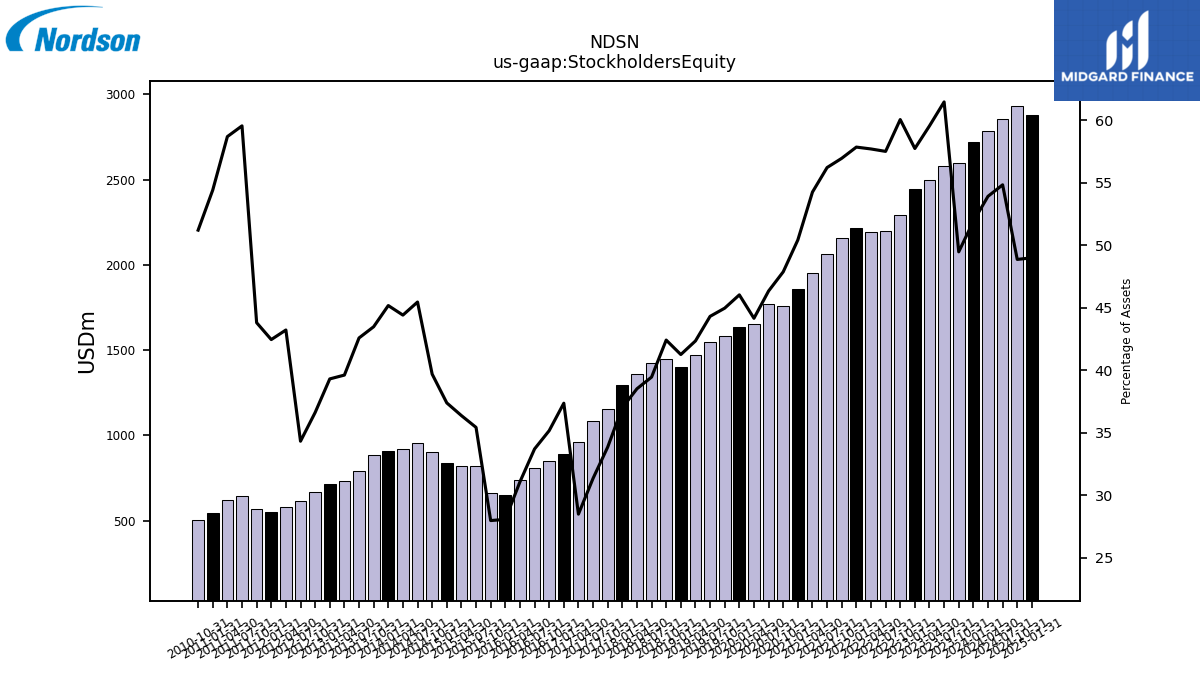
| Stockholders Equity | 2723.97 | 2598.06 | 2579.81 | 2497.00 | 2446.68 | 2294.38 | 2199.05 | 2190.62 | 2218.63 | 2159.13 | 2063.18 | 1950.36 | 1857.18 | 1758.99 | 1769.91 | 1652.49 | 1634.27 | 1581.05 | 1546.89 | 1471.26 | 1401.54 | 1450.74 | 1422.92 | 1362.91 | 1295.12 | 1155.49 | 1084.43 | 962.27 | 893.84 | 851.60 | 811.81 | 736.70 | 650.11 | 660.02 | 820.42 | 818.23 | 837.90 | 904.80 | 958.77 | 923.22 | 911.67 | 887.86 | 789.64 | 735.60 | 714.43 | 669.77 | 614.93 | 577.84 | 552.16 | 571.32 | 645.81 | 621.50 | 542.77 | 505.07 | NA | NA | NA |
| 2024-01-31 | 2023-10-31 | 2023-07-31 | 2023-04-30 | 2023-01-31 | 2022-10-31 | 2022-07-31 | 2022-04-30 | 2022-01-31 | 2021-10-31 | 2021-07-31 | 2021-04-30 | 2021-01-31 | 2020-10-31 | 2020-07-31 | 2020-04-30 | 2020-01-31 | 2019-10-31 | 2019-07-31 | 2019-04-30 | 2019-01-31 | 2018-10-31 | 2018-07-31 | 2018-04-30 | 2018-01-31 | 2017-10-31 | 2017-07-31 | 2017-04-30 | 2017-01-31 | 2016-10-31 | 2016-07-31 | 2016-04-30 | 2016-01-31 | 2015-10-31 | 2015-07-31 | 2015-04-30 | 2015-01-31 | 2014-10-31 | 2014-07-31 | 2014-04-30 | 2014-01-31 | 2013-10-31 | 2013-07-31 | 2013-04-30 | 2013-01-31 | 2012-10-31 | 2012-07-31 | 2012-04-30 | 2012-01-31 | 2011-10-31 | 2011-07-31 | 2011-04-30 | 2011-01-31 | 2010-10-31 | 2010-07-31 | 2010-04-30 | 2010-01-31 | ||
|---|---|---|---|---|---|---|---|---|---|---|---|---|---|---|---|---|---|---|---|---|---|---|---|---|---|---|---|---|---|---|---|---|---|---|---|---|---|---|---|---|---|---|---|---|---|---|---|---|---|---|---|---|---|---|---|---|---|---|
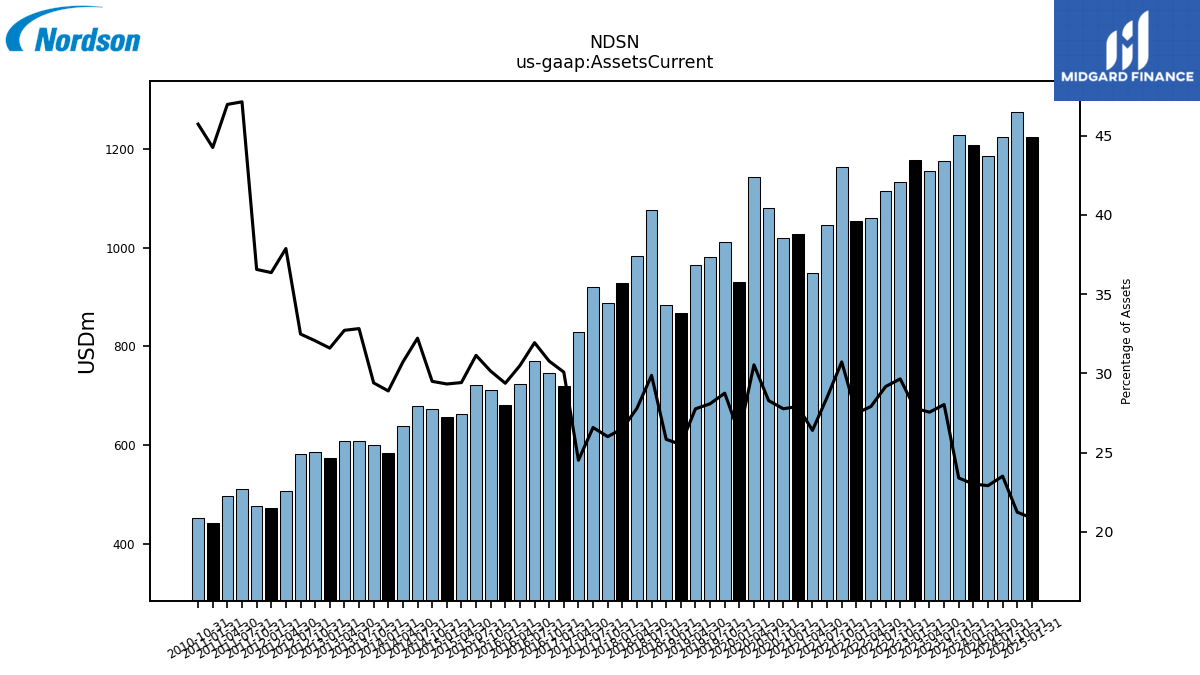
| Assets Current | 1208.11 | 1229.31 | 1176.92 | 1155.44 | 1178.42 | 1132.97 | 1115.61 | 1059.84 | 1054.23 | 1164.84 | 1045.76 | 949.42 | 1028.13 | 1020.61 | 1080.70 | 1143.28 | 930.32 | 1011.20 | 980.74 | 964.94 | 867.20 | 884.10 | 1077.82 | 984.02 | 928.03 | 888.37 | 920.16 | 828.85 | 719.95 | 745.58 | 769.65 | 723.47 | 680.87 | 711.59 | 721.36 | 662.14 | 657.65 | 672.68 | 679.79 | 638.75 | 583.26 | 600.57 | 608.88 | 607.75 | 574.47 | 586.62 | 582.25 | 506.53 | 473.02 | 476.96 | 511.16 | 497.38 | 441.43 | 451.03 | NA | NA | NA | |
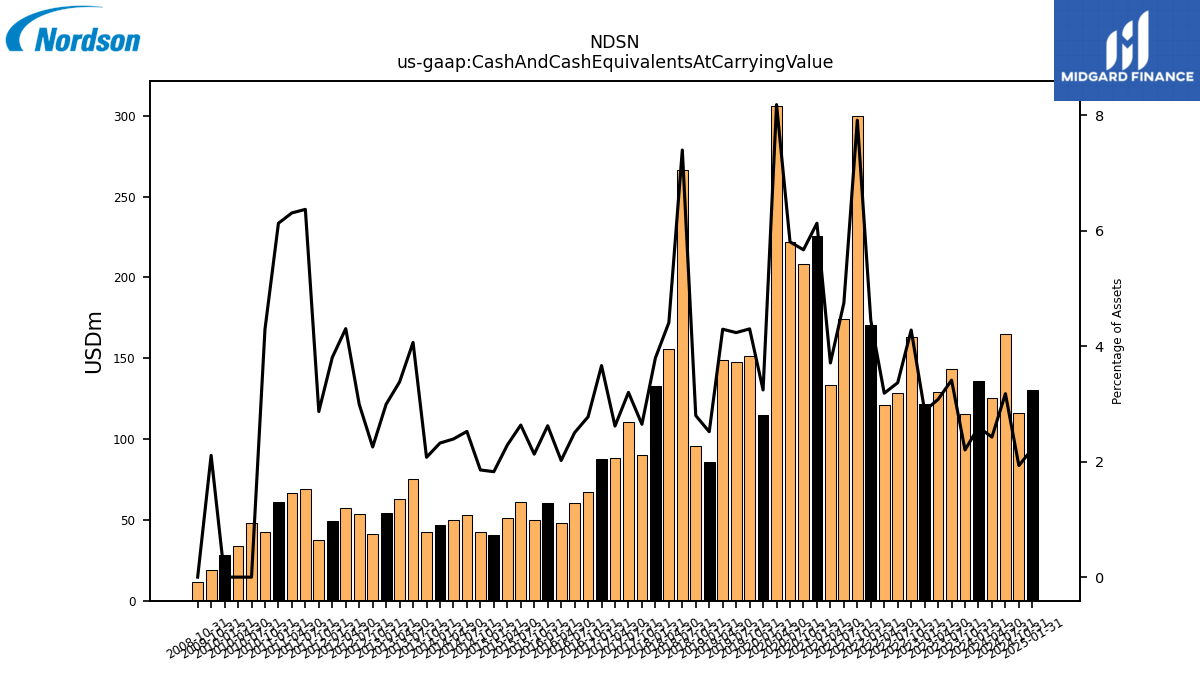
| Cash And Cash Equivalents At Carrying Value | 136.20 | 115.68 | 143.14 | 129.07 | 121.99 | 163.46 | 128.74 | 120.89 | 170.54 | 299.97 | 174.24 | 133.32 | 225.74 | 208.29 | 221.78 | 306.25 | 115.10 | 151.16 | 147.84 | 149.18 | 85.55 | 95.68 | 266.80 | 155.95 | 132.84 | 90.38 | 110.70 | 88.41 | 87.66 | 67.24 | 60.29 | 47.92 | 60.74 | 50.27 | 61.00 | 51.45 | 40.93 | 42.31 | 53.22 | 49.73 | 46.86 | 42.38 | 75.37 | 62.79 | 54.43 | 41.24 | 53.64 | 57.54 | 49.48 | 37.41 | 69.06 | 66.78 | 61.12 | 42.33 | 48.04 | 33.91 | 28.47 | |
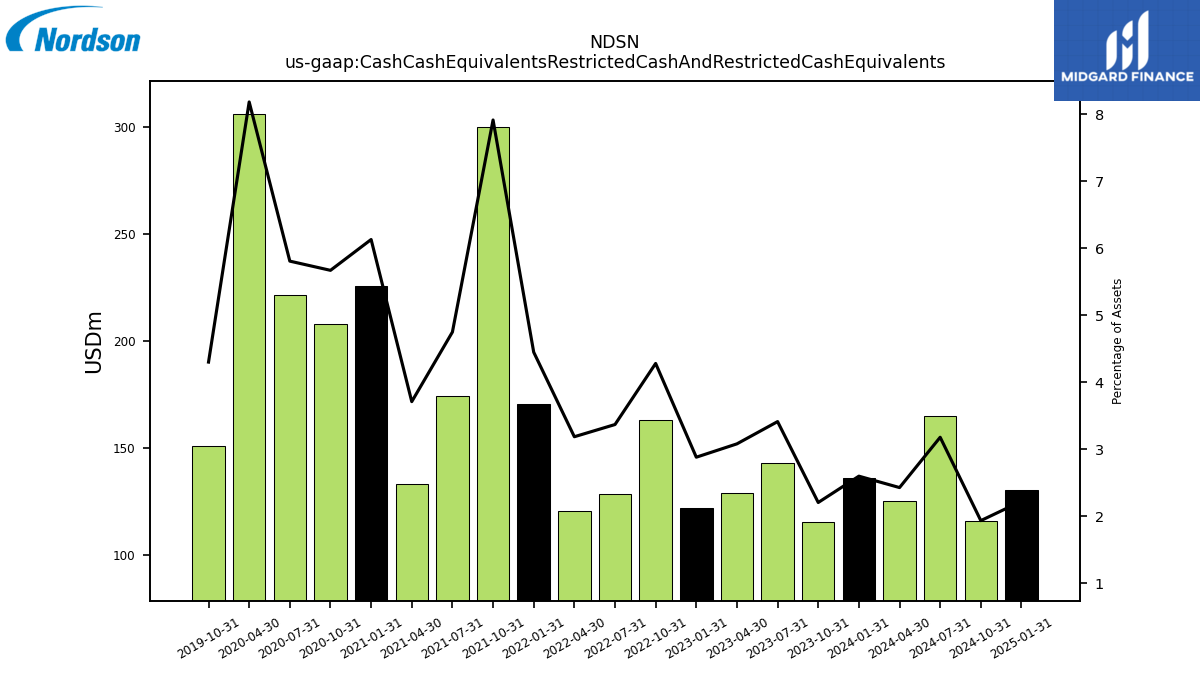
| Cash Cash Equivalents Restricted Cash And Restricted Cash Equivalents | 136.20 | 115.68 | 143.14 | 129.07 | 121.99 | 163.46 | 128.74 | 120.89 | 170.54 | 299.97 | 174.24 | 133.32 | 225.74 | 208.29 | 221.78 | 306.25 | NA | 151.16 | NA | NA | NA | NA | NA | NA | NA | NA | NA | NA | NA | NA | NA | NA | NA | NA | NA | NA | NA | NA | NA | NA | NA | NA | NA | NA | NA | NA | NA | NA | NA | NA | NA | NA | NA | NA | NA | NA | NA | |
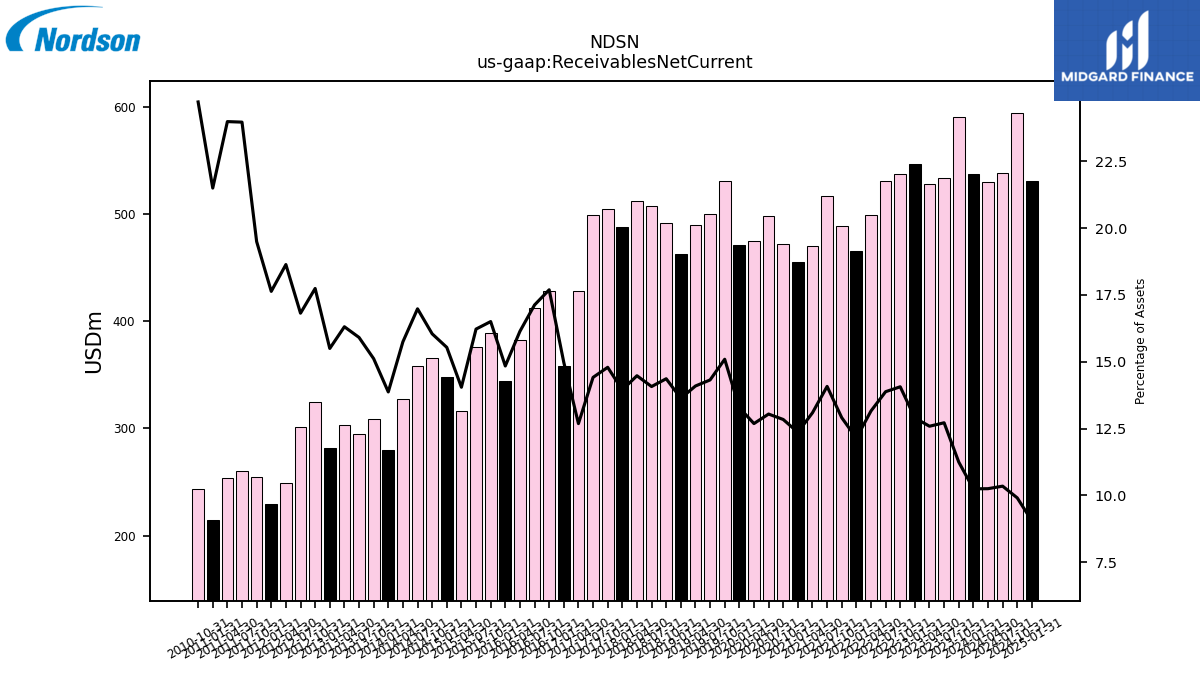
| Receivables Net Current | 537.70 | 590.89 | 533.79 | 527.85 | 546.65 | 537.31 | 530.76 | 499.54 | 465.72 | 489.39 | 516.68 | 470.62 | 455.38 | 471.87 | 498.28 | 474.91 | 471.63 | 530.76 | 499.98 | 489.75 | 463.23 | 491.42 | 507.68 | 512.39 | 488.28 | 505.09 | 498.85 | 428.73 | 358.37 | 428.56 | 412.61 | 382.81 | 343.93 | 389.55 | 375.75 | 316.09 | 348.32 | 365.84 | 358.19 | 327.39 | 279.98 | 308.71 | 295.07 | 302.91 | 281.73 | 324.56 | 301.37 | 249.18 | 229.37 | 254.31 | 259.85 | 253.94 | 214.40 | 243.79 | NA | NA | NA | |
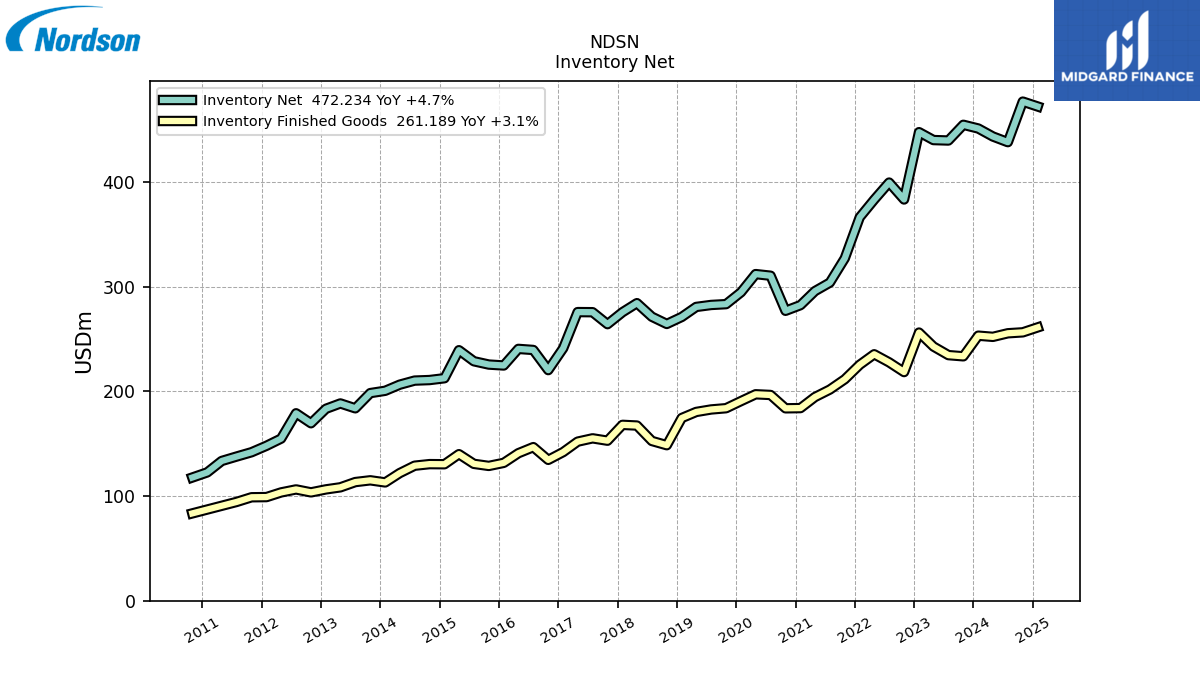
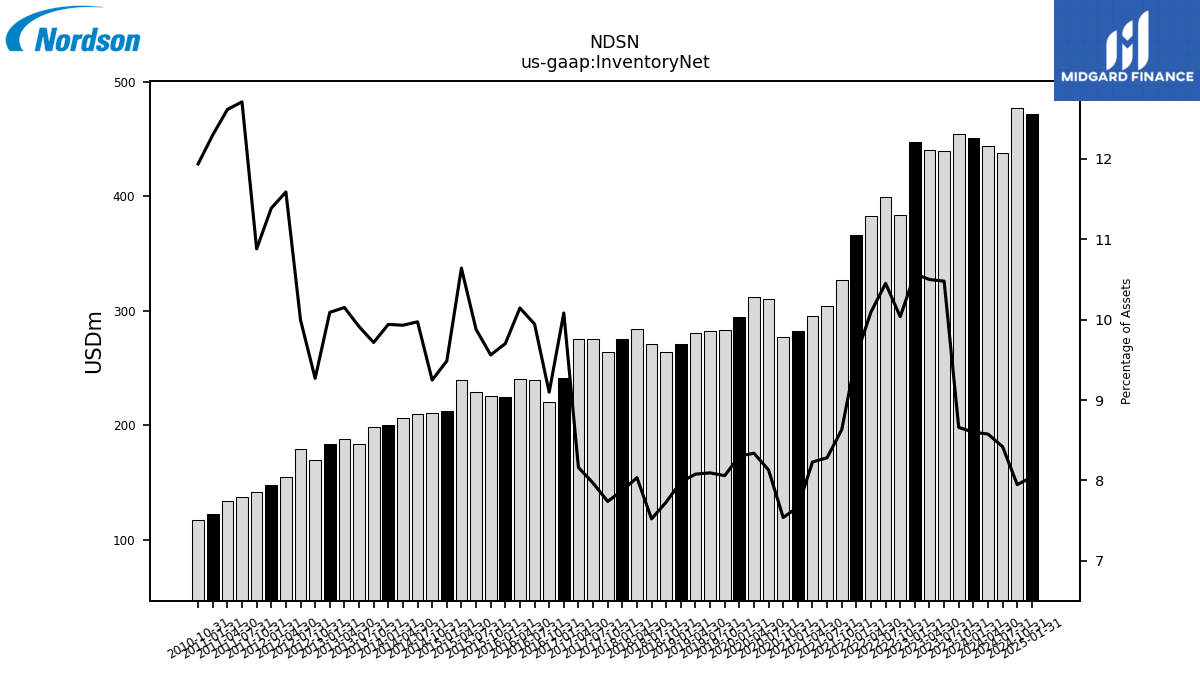
| Inventory Net | 451.22 | 454.77 | 439.74 | 440.18 | 447.73 | 383.40 | 399.58 | 383.21 | 366.38 | 327.19 | 303.98 | 295.84 | 282.44 | 277.03 | 310.56 | 312.12 | 294.77 | 283.40 | 282.61 | 280.73 | 271.16 | 264.48 | 271.36 | 284.36 | 275.69 | 264.27 | 275.70 | 275.81 | 241.26 | 220.36 | 239.61 | 240.65 | 224.79 | 225.67 | 228.83 | 239.41 | 212.61 | 210.87 | 210.35 | 206.44 | 200.62 | 198.40 | 183.85 | 188.52 | 183.41 | 169.59 | 179.14 | 154.93 | 148.08 | 141.91 | 137.79 | 133.54 | 122.63 | 117.72 | NA | NA | NA | |
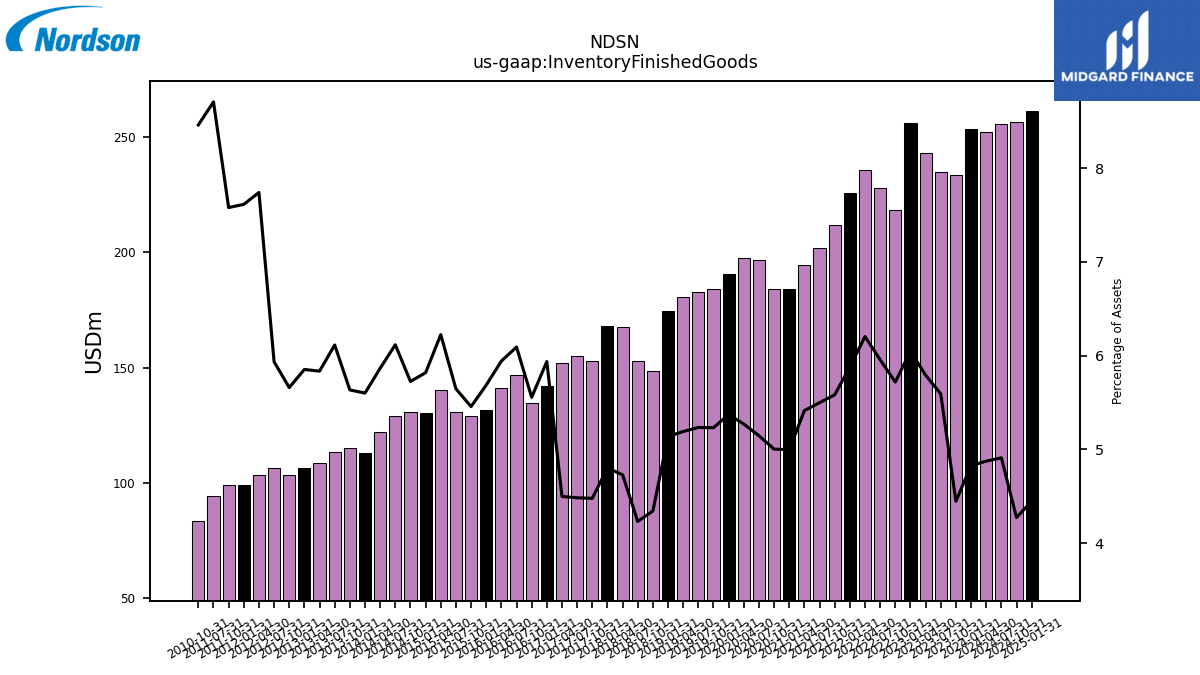
| Inventory Finished Goods | 253.28 | 233.55 | 234.69 | 242.90 | 256.24 | 218.49 | 227.77 | 235.51 | 225.52 | 211.63 | 201.81 | 194.62 | 184.06 | 183.86 | 196.61 | 197.28 | 190.77 | 183.97 | 182.77 | 180.39 | 174.60 | 148.62 | 152.67 | 167.40 | 168.07 | 152.92 | 155.19 | 152.03 | 142.07 | 134.60 | 146.79 | 140.97 | 131.76 | 128.82 | 130.81 | 140.06 | 130.43 | 130.54 | 129.03 | 121.95 | 113.05 | 115.08 | 113.40 | 108.38 | 106.41 | 103.55 | 106.38 | 103.51 | 99.04 | 98.88 | 94.41 | NA | NA | 83.46 | NA | NA | NA | |
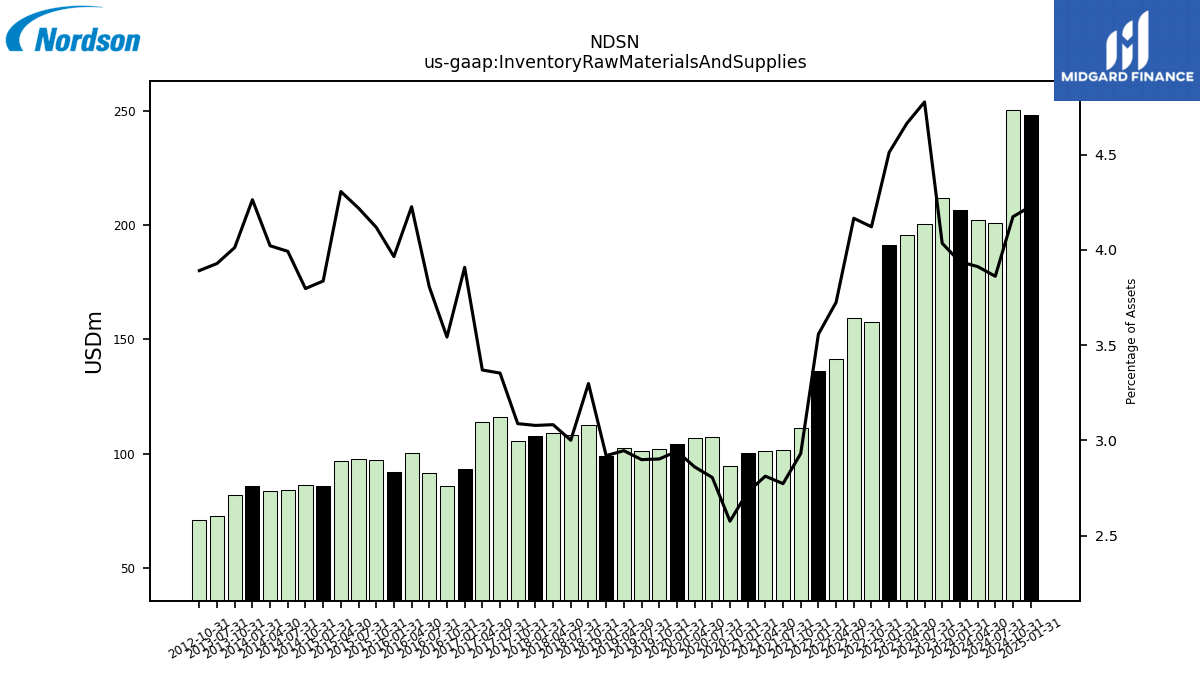
| Inventory Raw Materials And Supplies | 206.59 | 211.87 | 200.47 | 195.57 | 191.19 | 157.45 | 159.29 | 141.40 | 136.41 | 111.09 | 101.75 | 101.08 | 100.50 | 94.63 | 107.14 | 107.06 | 104.47 | 102.04 | 101.20 | 102.36 | 99.19 | 112.82 | 108.23 | 109.08 | 107.75 | 105.42 | 116.03 | 113.85 | 93.52 | 85.80 | 91.71 | 100.26 | 91.87 | 97.22 | 97.73 | 96.90 | 86.00 | 86.57 | 84.21 | 83.61 | 86.04 | 81.94 | 72.86 | NA | NA | 71.19 | NA | NA | NA | NA | NA | NA | NA | NA | NA | NA | NA | |
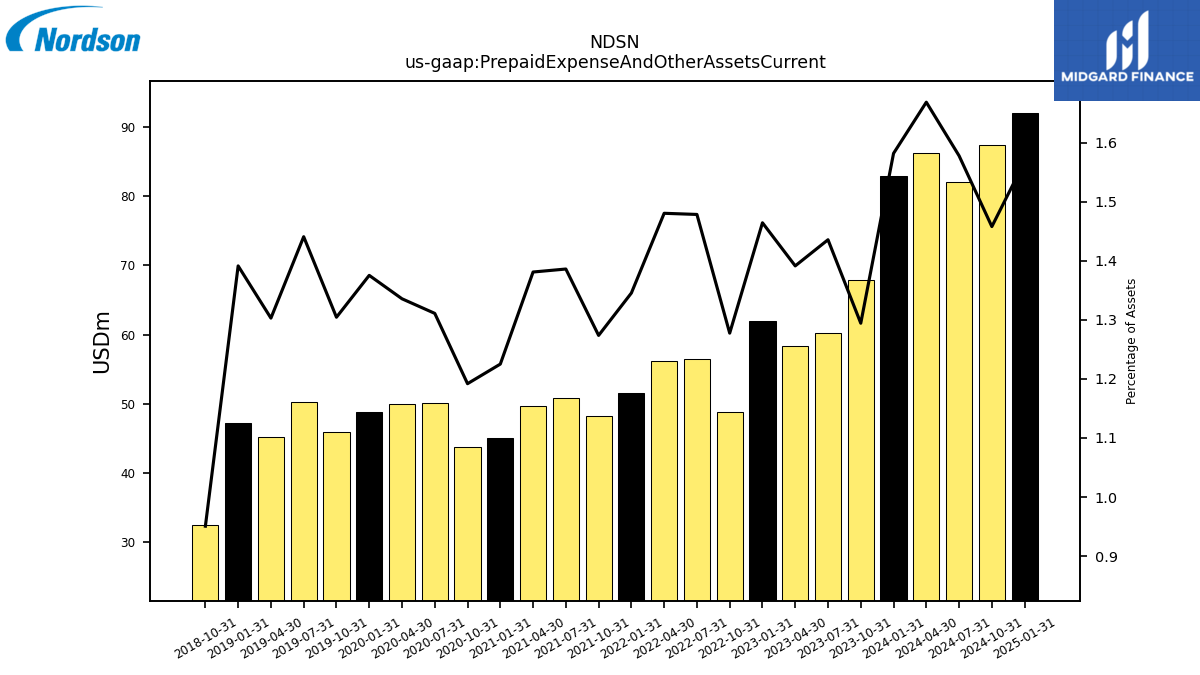
| Prepaid Expense And Other Assets Current | 82.99 | 67.97 | 60.25 | 58.34 | 62.05 | 48.80 | 56.53 | 56.20 | 51.59 | 48.28 | 50.87 | 49.64 | 45.12 | 43.80 | 50.08 | 49.99 | 48.83 | 45.87 | 50.30 | 45.28 | 47.27 | 32.52 | NA | NA | NA | NA | NA | NA | NA | NA | NA | NA | NA | NA | NA | NA | NA | NA | NA | NA | NA | NA | NA | NA | NA | NA | NA | NA | NA | NA | NA | NA | NA | NA | NA | NA | NA |
| 2024-01-31 | 2023-10-31 | 2023-07-31 | 2023-04-30 | 2023-01-31 | 2022-10-31 | 2022-07-31 | 2022-04-30 | 2022-01-31 | 2021-10-31 | 2021-07-31 | 2021-04-30 | 2021-01-31 | 2020-10-31 | 2020-07-31 | 2020-04-30 | 2020-01-31 | 2019-10-31 | 2019-07-31 | 2019-04-30 | 2019-01-31 | 2018-10-31 | 2018-07-31 | 2018-04-30 | 2018-01-31 | 2017-10-31 | 2017-07-31 | 2017-04-30 | 2017-01-31 | 2016-10-31 | 2016-07-31 | 2016-04-30 | 2016-01-31 | 2015-10-31 | 2015-07-31 | 2015-04-30 | 2015-01-31 | 2014-10-31 | 2014-07-31 | 2014-04-30 | 2014-01-31 | 2013-10-31 | 2013-07-31 | 2013-04-30 | 2013-01-31 | 2012-10-31 | 2012-07-31 | 2012-04-30 | 2012-01-31 | 2011-10-31 | 2011-07-31 | 2011-04-30 | 2011-01-31 | 2010-10-31 | 2010-07-31 | 2010-04-30 | 2010-01-31 | ||
|---|---|---|---|---|---|---|---|---|---|---|---|---|---|---|---|---|---|---|---|---|---|---|---|---|---|---|---|---|---|---|---|---|---|---|---|---|---|---|---|---|---|---|---|---|---|---|---|---|---|---|---|---|---|---|---|---|---|---|
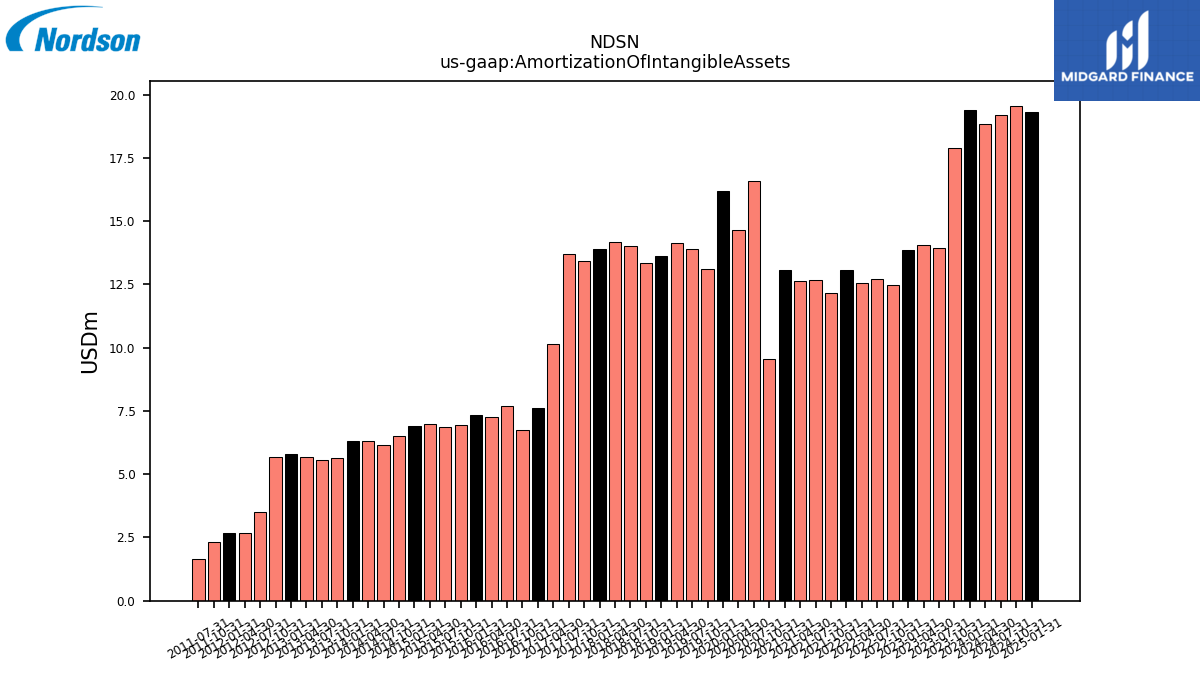
| Amortization Of Intangible Assets | 19.39 | 17.88 | 13.92 | 14.04 | 13.87 | 12.46 | 12.71 | 12.57 | 13.09 | 12.17 | 12.68 | 12.62 | 13.08 | 9.57 | 16.58 | 14.66 | 16.17 | 13.12 | 13.90 | 14.13 | 13.63 | 13.35 | 14.04 | 14.17 | 13.89 | 13.43 | 13.69 | 10.16 | 7.63 | 6.75 | 7.71 | 7.27 | 7.33 | 6.93 | 6.87 | 6.98 | 6.89 | 6.52 | 6.15 | 6.31 | 6.33 | 5.64 | 5.55 | 5.68 | 5.80 | 5.67 | 3.51 | 2.68 | 2.67 | 2.32 | 1.65 | NA | NA | NA | NA | NA | NA | |
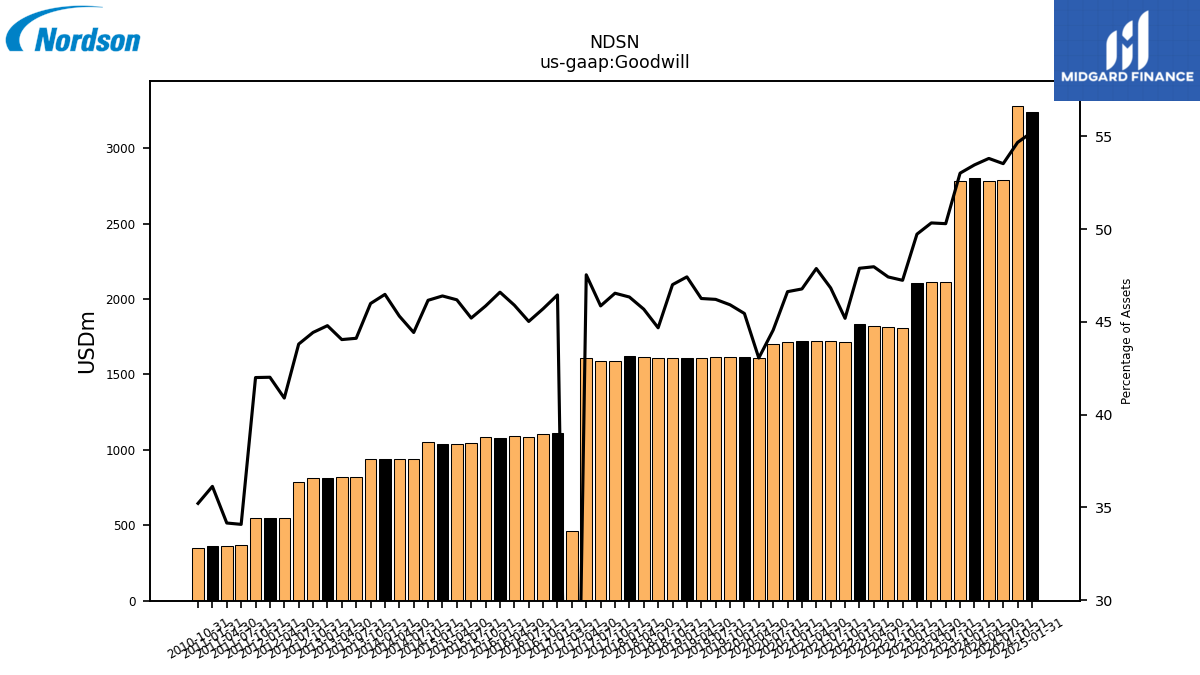
| Goodwill | 2805.09 | 2784.20 | 2110.78 | 2110.47 | 2107.11 | 1804.69 | 1813.23 | 1821.09 | 1836.48 | 1713.15 | 1718.57 | 1720.99 | 1722.82 | 1713.35 | 1701.91 | 1611.34 | 1613.87 | 1614.74 | 1613.48 | 1607.51 | 1611.35 | 1608.02 | 1611.73 | 1616.80 | 1622.12 | 1589.21 | 1586.95 | 1606.35 | 1111.57 | 1107.14 | 1084.81 | 1088.78 | 1079.80 | 1082.38 | 1047.09 | 1039.33 | 1040.05 | 1052.54 | 937.14 | 942.02 | 938.11 | 939.21 | 818.16 | 818.04 | 814.34 | 812.82 | 784.99 | 546.78 | 546.51 | 547.83 | 369.61 | 361.67 | 360.38 | 347.33 | NA | NA | NA | |
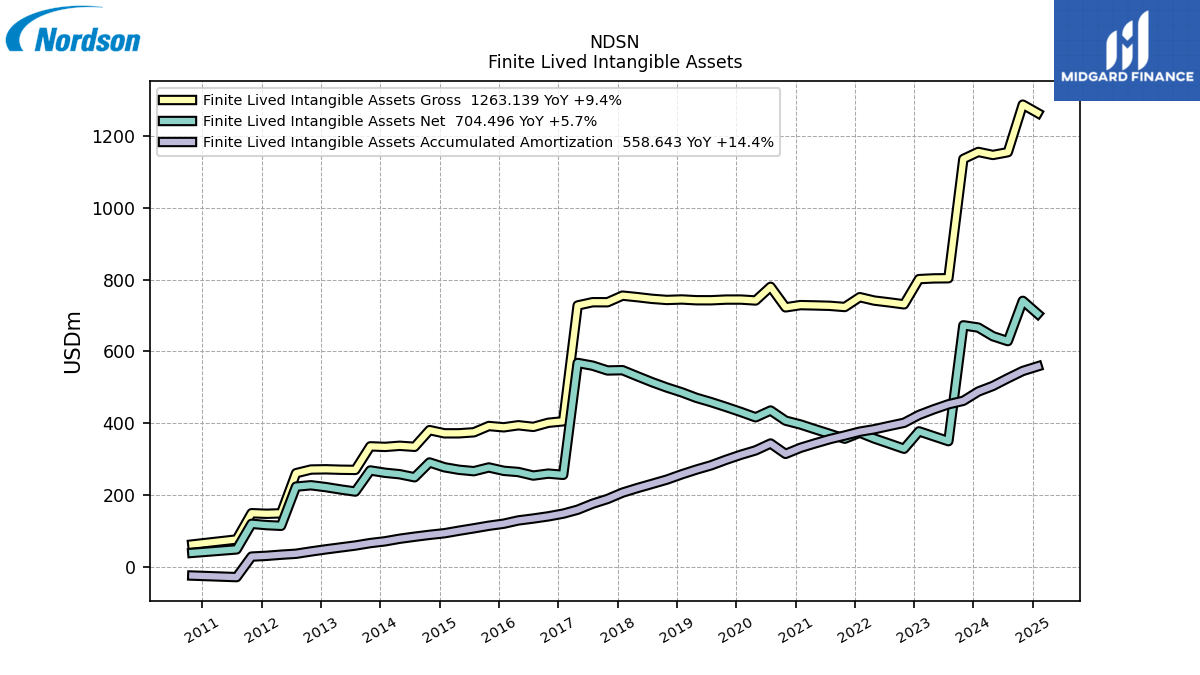
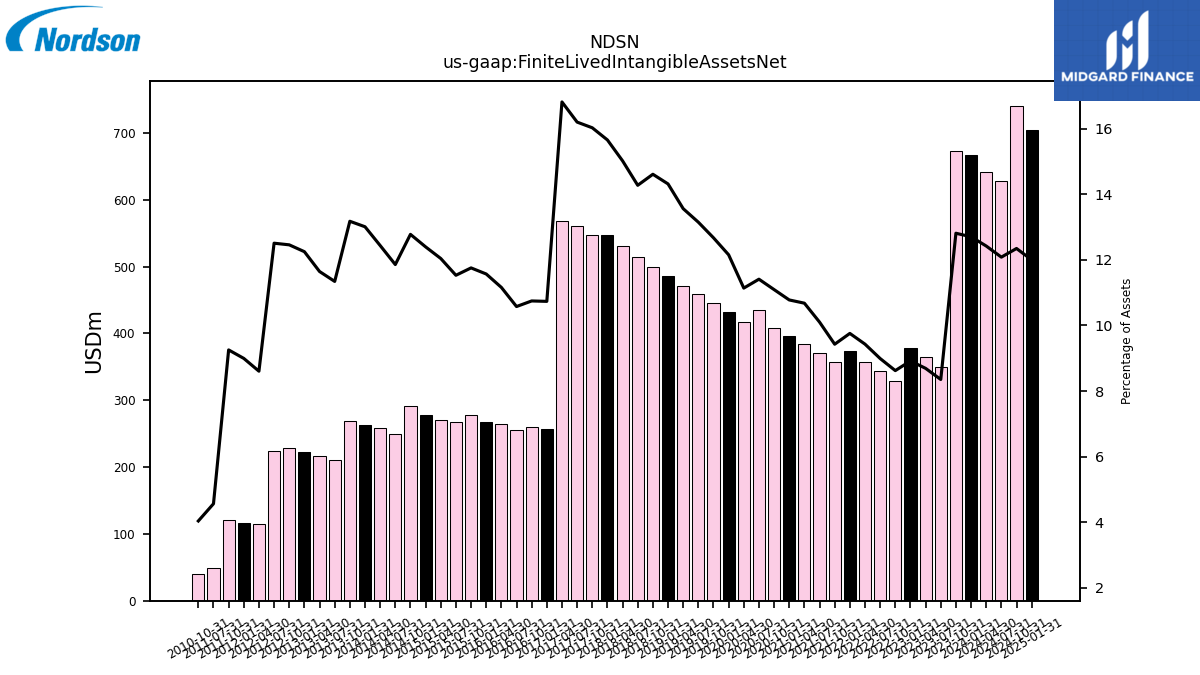
| Finite Lived Intangible Assets Net | 666.49 | 672.74 | 350.52 | 364.40 | 377.83 | 329.40 | 343.78 | 357.95 | 374.15 | 357.37 | 370.71 | 383.86 | 396.94 | 407.59 | 435.82 | 416.88 | 431.53 | 445.57 | 459.03 | 471.21 | 486.34 | 499.74 | 514.84 | 531.48 | 547.99 | 547.18 | 560.54 | 568.14 | 256.85 | 260.30 | 254.82 | 264.70 | 268.05 | 277.43 | 267.04 | 270.94 | 277.85 | 291.31 | 250.08 | 258.55 | 262.54 | 269.07 | 210.34 | 216.26 | 222.66 | 227.89 | 224.14 | 115.06 | 117.00 | 120.70 | 49.48 | NA | NA | 39.83 | NA | NA | NA | |
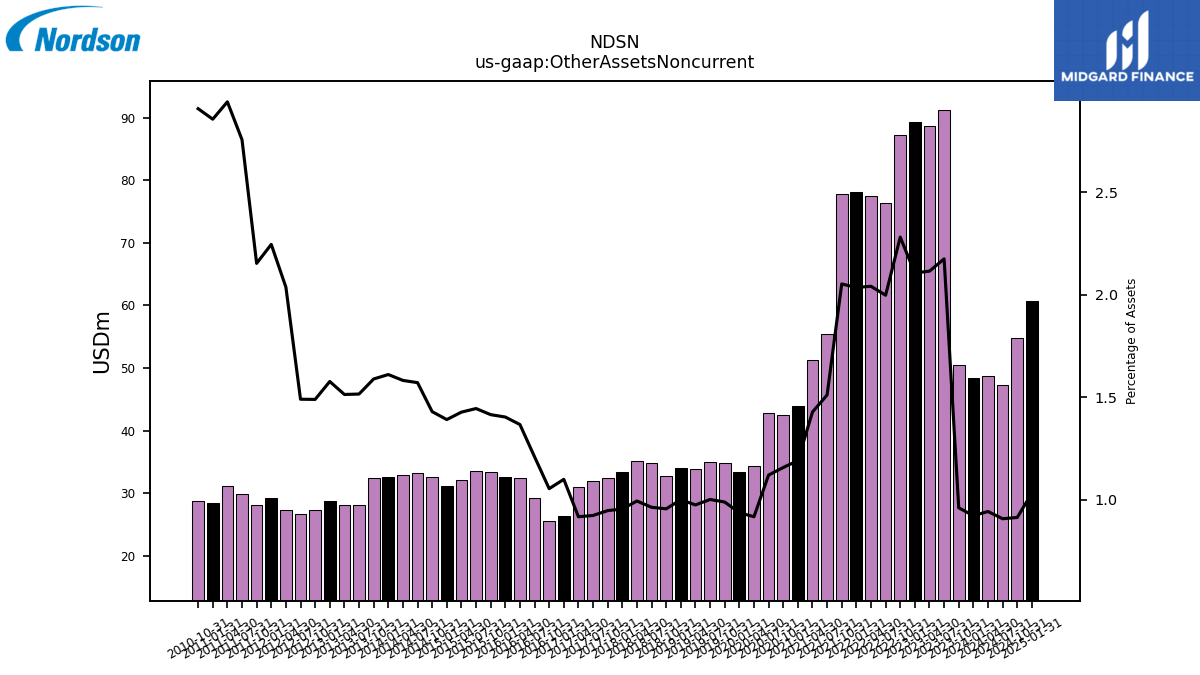
| Other Assets Noncurrent | 48.41 | 50.47 | 91.28 | 88.69 | 89.24 | 87.14 | 76.39 | 77.49 | 78.06 | 77.81 | 55.46 | 51.33 | 43.88 | 42.53 | 42.81 | 34.34 | 33.30 | 34.78 | 34.97 | 33.88 | 34.00 | 32.70 | 34.76 | 35.18 | 33.44 | 32.35 | 31.96 | 31.00 | 26.32 | 25.54 | 29.15 | 32.43 | 32.53 | 33.41 | 33.47 | 32.12 | 31.19 | 32.60 | 33.15 | 32.90 | 32.51 | 32.46 | 28.11 | 28.11 | 28.67 | 27.25 | 26.71 | 27.24 | 29.21 | 28.09 | 29.89 | 31.14 | 28.49 | 28.68 | NA | NA | NA |
| 2024-01-31 | 2023-10-31 | 2023-07-31 | 2023-04-30 | 2023-01-31 | 2022-10-31 | 2022-07-31 | 2022-04-30 | 2022-01-31 | 2021-10-31 | 2021-07-31 | 2021-04-30 | 2021-01-31 | 2020-10-31 | 2020-07-31 | 2020-04-30 | 2020-01-31 | 2019-10-31 | 2019-07-31 | 2019-04-30 | 2019-01-31 | 2018-10-31 | 2018-07-31 | 2018-04-30 | 2018-01-31 | 2017-10-31 | 2017-07-31 | 2017-04-30 | 2017-01-31 | 2016-10-31 | 2016-07-31 | 2016-04-30 | 2016-01-31 | 2015-10-31 | 2015-07-31 | 2015-04-30 | 2015-01-31 | 2014-10-31 | 2014-07-31 | 2014-04-30 | 2014-01-31 | 2013-10-31 | 2013-07-31 | 2013-04-30 | 2013-01-31 | 2012-10-31 | 2012-07-31 | 2012-04-30 | 2012-01-31 | 2011-10-31 | 2011-07-31 | 2011-04-30 | 2011-01-31 | 2010-10-31 | 2010-07-31 | 2010-04-30 | 2010-01-31 | ||
|---|---|---|---|---|---|---|---|---|---|---|---|---|---|---|---|---|---|---|---|---|---|---|---|---|---|---|---|---|---|---|---|---|---|---|---|---|---|---|---|---|---|---|---|---|---|---|---|---|---|---|---|---|---|---|---|---|---|---|
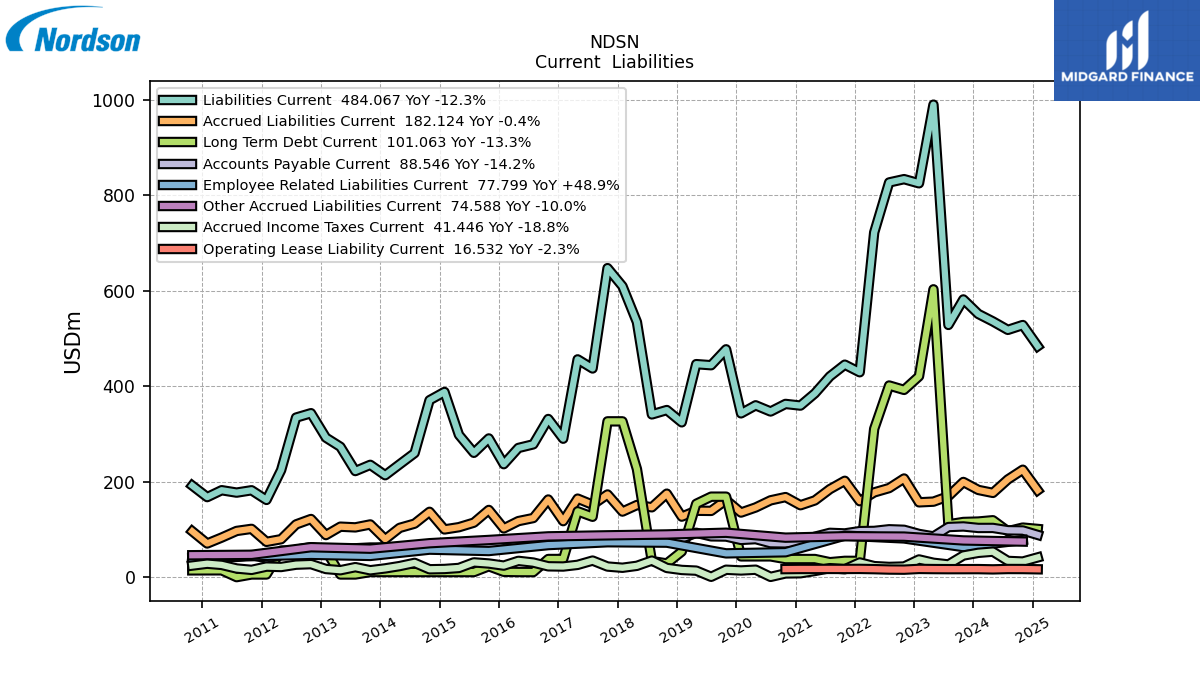
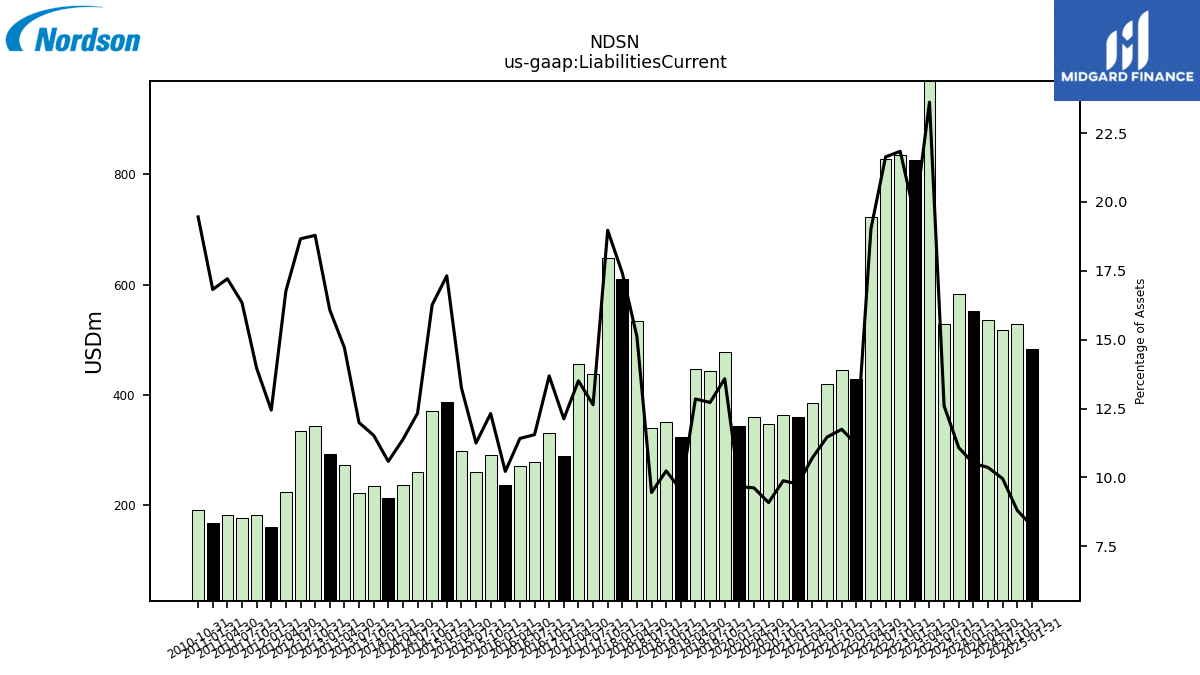
| Liabilities Current | 551.68 | 582.09 | 528.61 | 990.39 | 825.46 | 834.20 | 827.28 | 722.50 | 429.47 | 445.39 | 420.82 | 385.27 | 359.61 | 363.09 | 347.22 | 360.19 | 343.32 | 477.63 | 444.22 | 446.49 | 324.50 | 350.28 | 341.10 | 534.66 | 609.77 | 647.75 | 437.39 | 456.49 | 290.22 | 331.54 | 278.42 | 270.80 | 236.82 | 290.78 | 260.62 | 298.27 | 388.18 | 370.87 | 260.06 | 236.55 | 213.63 | 235.47 | 222.40 | 273.28 | 292.38 | 343.68 | 334.46 | 224.23 | 161.88 | 182.16 | 177.24 | 182.25 | 167.79 | 191.91 | NA | NA | NA | |
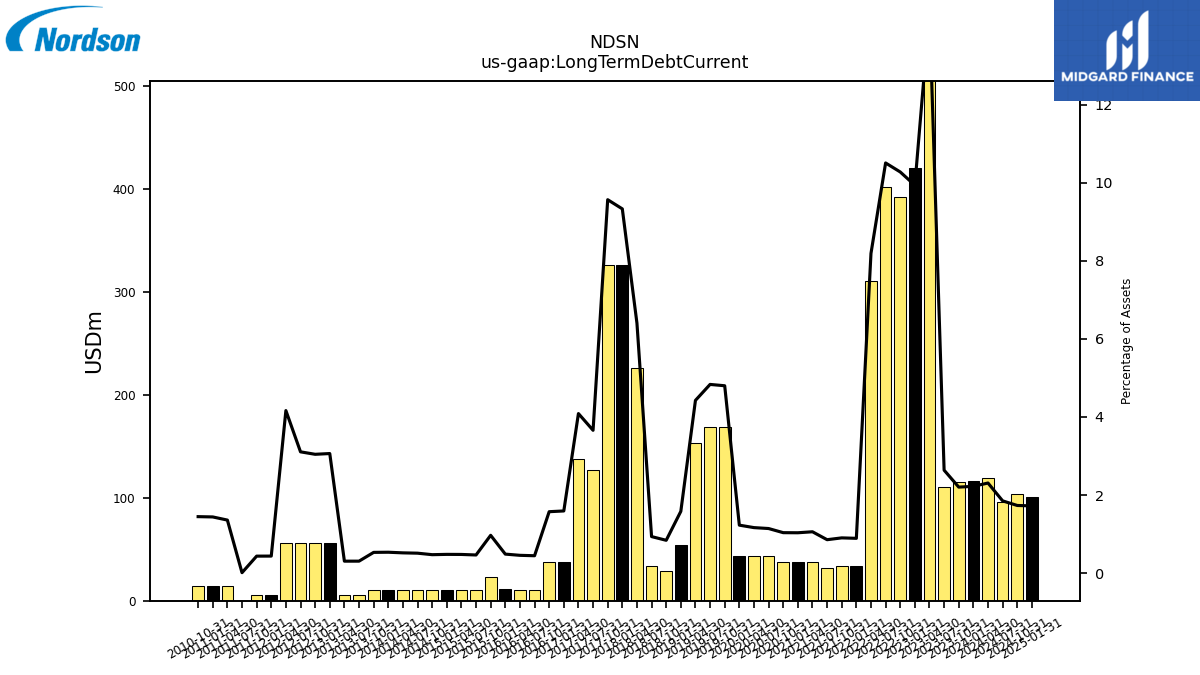
| Long Term Debt Current | 116.58 | 115.66 | 110.64 | 603.34 | 420.95 | 392.54 | 401.73 | 310.89 | 34.15 | 34.19 | 31.39 | 38.04 | 38.04 | 38.04 | 43.60 | 43.60 | 43.60 | 168.74 | 168.73 | 153.73 | 53.73 | 28.73 | 33.73 | 226.59 | 326.59 | 326.59 | 126.58 | 138.08 | 38.08 | 38.09 | 10.71 | 10.79 | 11.26 | 22.84 | 10.74 | 10.74 | 10.74 | 10.75 | 10.76 | 10.77 | 10.78 | 10.83 | 5.67 | 5.67 | 55.67 | 55.67 | 55.66 | 55.66 | 5.66 | 5.66 | 0.11 | 14.38 | 14.35 | 14.26 | NA | NA | NA | |
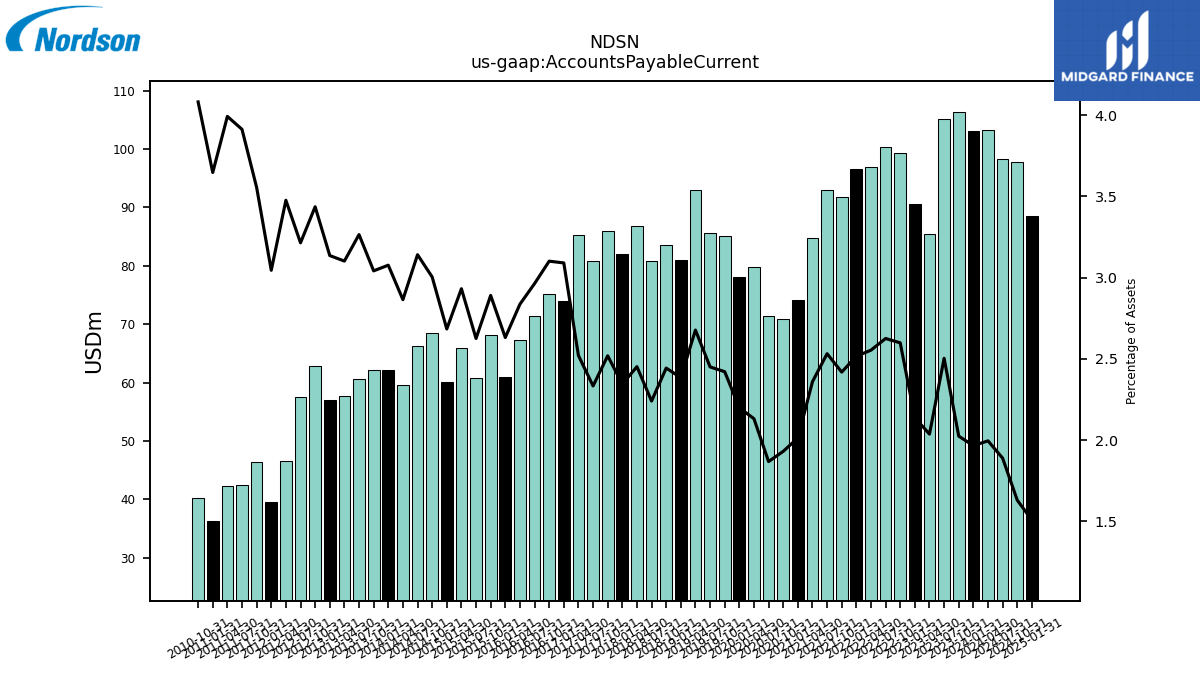
| Accounts Payable Current | 103.15 | 106.32 | 105.08 | 85.41 | 90.60 | 99.28 | 100.40 | 96.95 | 96.50 | 91.69 | 92.92 | 84.82 | 74.15 | 70.95 | 71.36 | 79.78 | 78.09 | 85.14 | 85.56 | 93.04 | 81.01 | 83.59 | 80.82 | 86.79 | 82.08 | 86.02 | 80.75 | 85.19 | 73.96 | 75.13 | 71.41 | 67.29 | 60.98 | 68.23 | 60.82 | 65.97 | 60.17 | 68.50 | 66.27 | 59.56 | 62.10 | 62.12 | 60.56 | 57.62 | 57.01 | 62.87 | 57.61 | 46.49 | 39.61 | 46.38 | 42.43 | 42.28 | 36.38 | 40.26 | NA | NA | NA | |
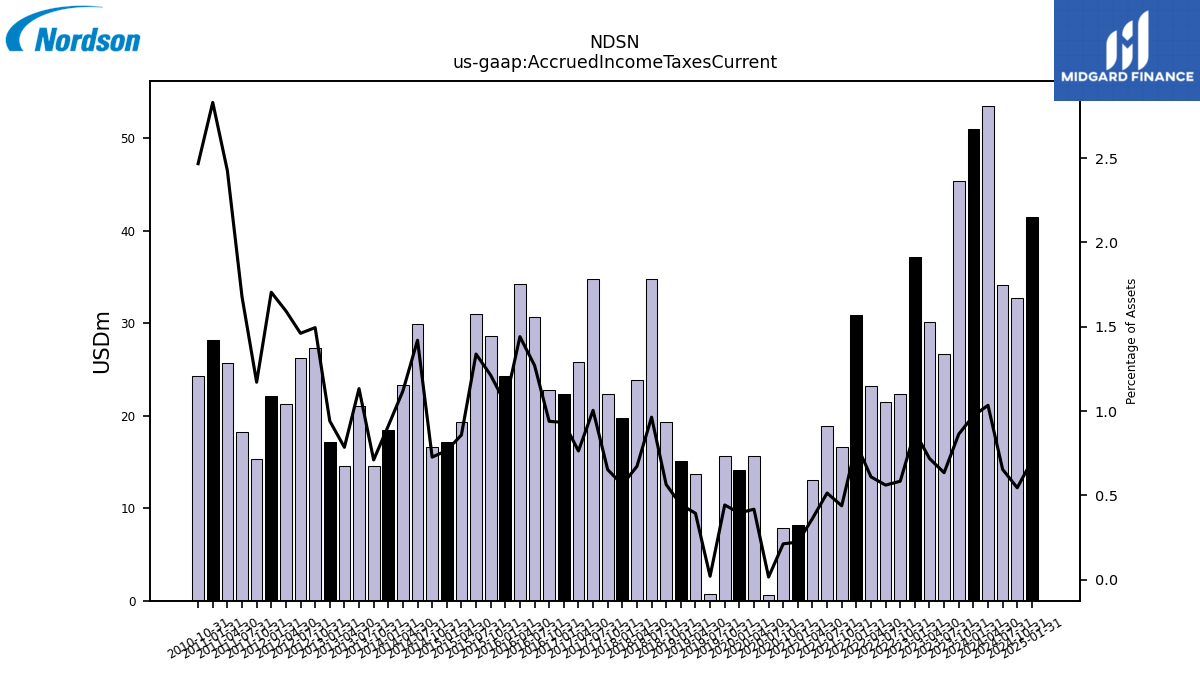
| Accrued Income Taxes Current | 51.02 | 45.36 | 26.66 | 30.16 | 37.16 | 22.33 | 21.47 | 23.18 | 30.86 | 16.64 | 18.88 | 13.07 | 8.24 | 7.84 | 0.64 | 15.66 | 14.09 | 15.60 | 0.74 | 13.71 | 15.14 | 19.32 | 34.78 | 23.81 | 19.75 | 22.31 | 34.77 | 25.82 | 22.34 | 22.76 | 30.63 | 34.20 | 24.26 | 28.64 | 31.00 | 19.33 | 17.18 | 16.59 | 29.96 | 23.28 | 18.42 | 14.52 | 21.02 | 14.59 | 17.12 | 27.35 | 26.19 | 21.32 | 22.18 | 15.28 | 18.21 | 25.69 | 28.23 | 24.34 | NA | NA | NA | |
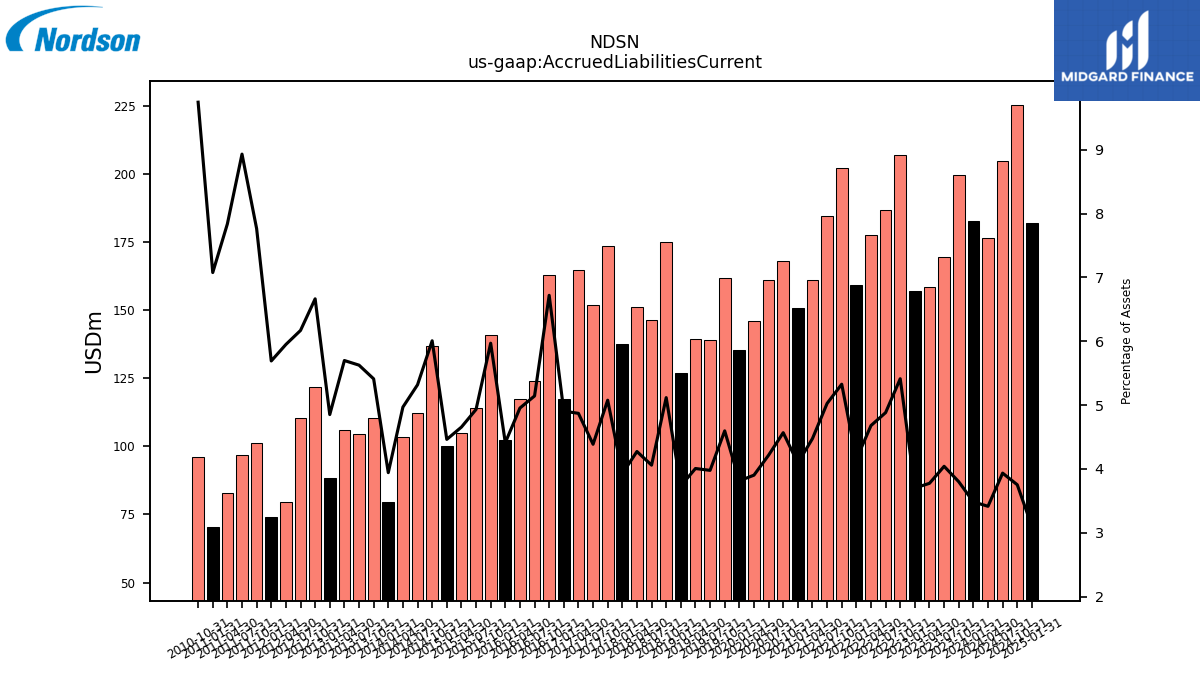
| Accrued Liabilities Current | 182.85 | 199.59 | 169.63 | 158.31 | 156.86 | 206.83 | 186.71 | 177.67 | 159.25 | 201.99 | 184.49 | 160.91 | 150.75 | 167.88 | 161.04 | 146.09 | 135.44 | 161.66 | 138.91 | 139.26 | 126.91 | 175.09 | 146.46 | 151.25 | 137.46 | 173.37 | 151.83 | 164.62 | 117.40 | 162.80 | 123.94 | 117.53 | 102.24 | 140.93 | 114.26 | 104.78 | 100.06 | 137.00 | 112.20 | 103.33 | 79.57 | 110.53 | 104.36 | 105.85 | 88.22 | 121.95 | 110.59 | 79.57 | 74.05 | 101.29 | 96.87 | 83.01 | 70.59 | 96.13 | NA | NA | NA |
| 2024-01-31 | 2023-10-31 | 2023-07-31 | 2023-04-30 | 2023-01-31 | 2022-10-31 | 2022-07-31 | 2022-04-30 | 2022-01-31 | 2021-10-31 | 2021-07-31 | 2021-04-30 | 2021-01-31 | 2020-10-31 | 2020-07-31 | 2020-04-30 | 2020-01-31 | 2019-10-31 | 2019-07-31 | 2019-04-30 | 2019-01-31 | 2018-10-31 | 2018-07-31 | 2018-04-30 | 2018-01-31 | 2017-10-31 | 2017-07-31 | 2017-04-30 | 2017-01-31 | 2016-10-31 | 2016-07-31 | 2016-04-30 | 2016-01-31 | 2015-10-31 | 2015-07-31 | 2015-04-30 | 2015-01-31 | 2014-10-31 | 2014-07-31 | 2014-04-30 | 2014-01-31 | 2013-10-31 | 2013-07-31 | 2013-04-30 | 2013-01-31 | 2012-10-31 | 2012-07-31 | 2012-04-30 | 2012-01-31 | 2011-10-31 | 2011-07-31 | 2011-04-30 | 2011-01-31 | 2010-10-31 | 2010-07-31 | 2010-04-30 | 2010-01-31 | ||
|---|---|---|---|---|---|---|---|---|---|---|---|---|---|---|---|---|---|---|---|---|---|---|---|---|---|---|---|---|---|---|---|---|---|---|---|---|---|---|---|---|---|---|---|---|---|---|---|---|---|---|---|---|---|---|---|---|---|---|
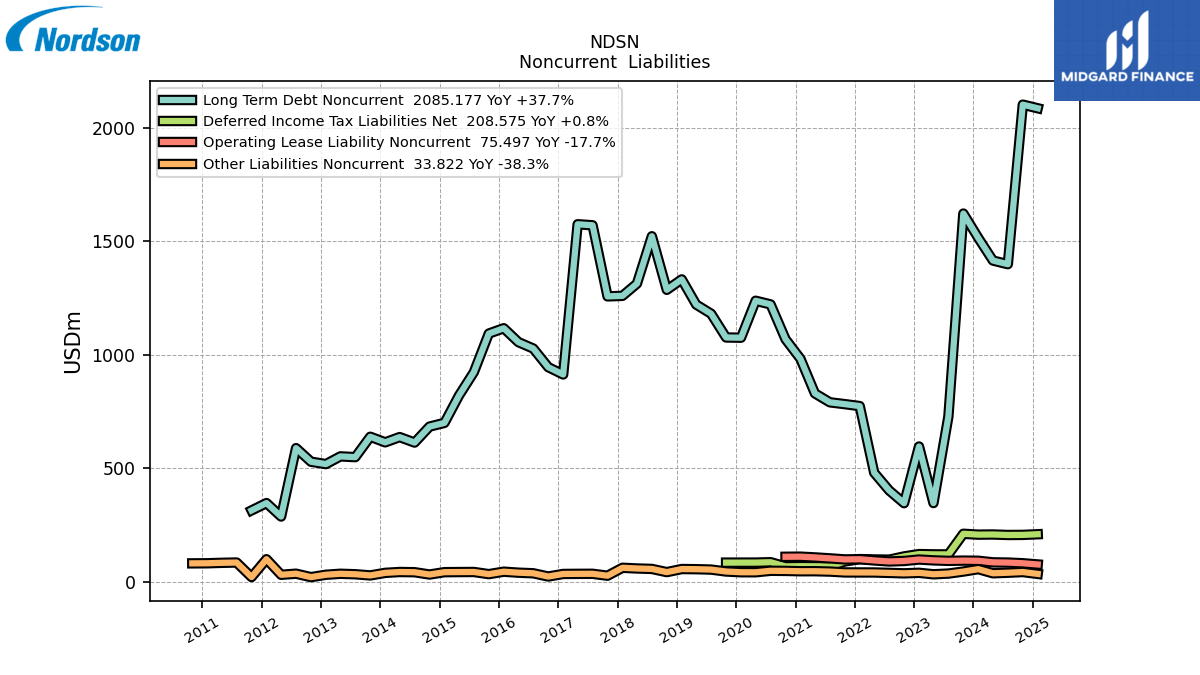
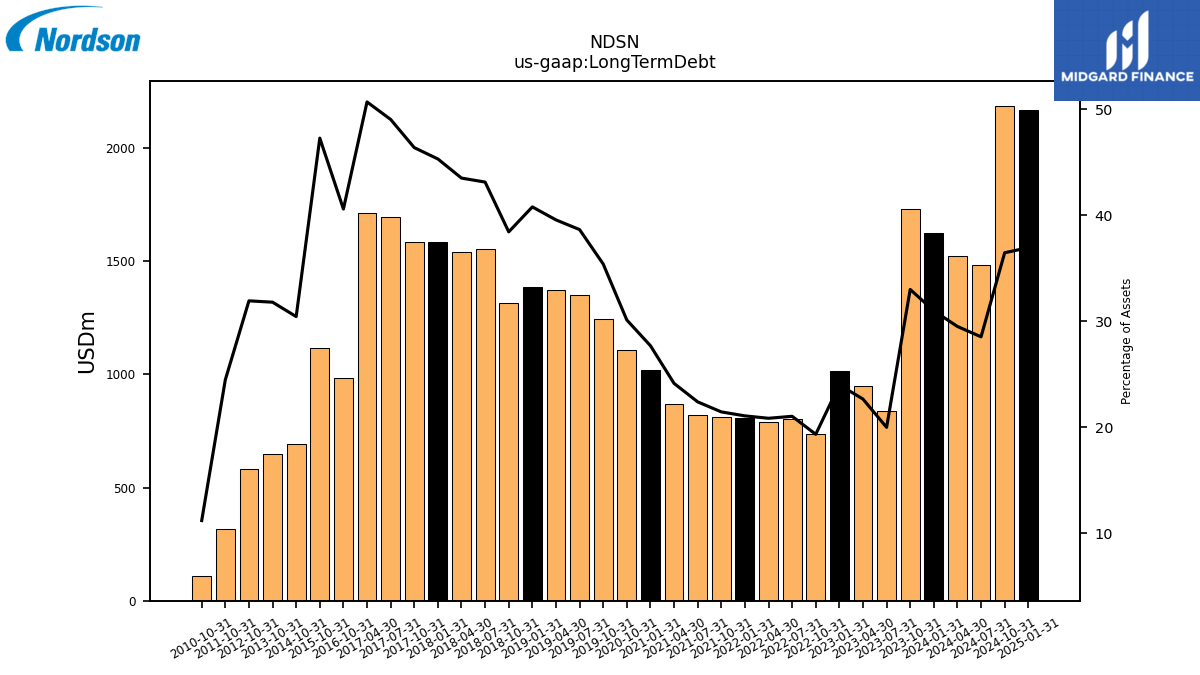
| Long Term Debt | 1624.51 | 1732.04 | 838.10 | 949.24 | 1016.11 | 737.86 | 803.43 | 790.60 | 807.34 | 812.35 | 821.12 | 867.09 | 1019.33 | 1105.99 | NA | NA | NA | 1244.14 | 1348.61 | 1374.12 | 1385.13 | 1314.09 | 1555.12 | 1539.05 | 1585.43 | 1582.98 | 1696.26 | 1712.27 | NA | 982.65 | NA | NA | NA | 1115.48 | NA | NA | NA | 693.62 | NA | NA | NA | 648.99 | NA | NA | NA | 583.71 | NA | NA | NA | 319.12 | NA | NA | NA | 110.26 | NA | NA | NA | |
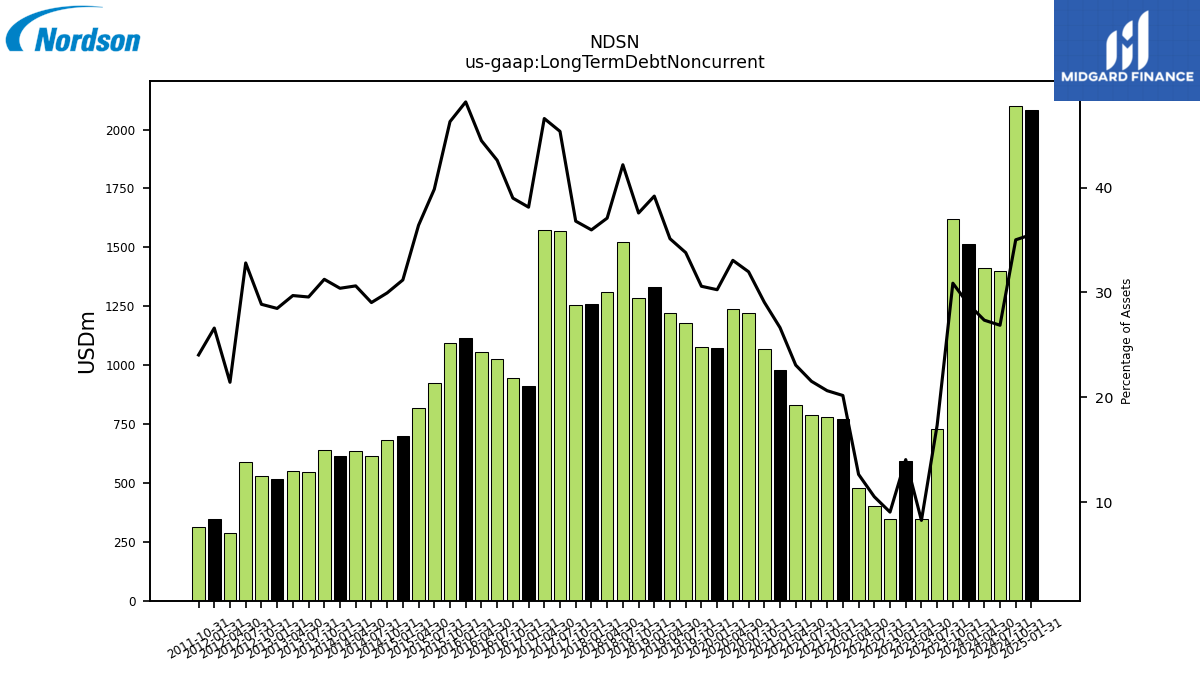
| Long Term Debt Noncurrent | 1513.87 | 1621.39 | 727.46 | 345.90 | 595.17 | 345.32 | 401.70 | 479.70 | 773.19 | 781.71 | 789.73 | 829.04 | 981.28 | 1067.95 | 1221.08 | 1237.22 | 1074.31 | 1075.40 | 1179.87 | 1220.39 | 1331.39 | 1285.36 | 1521.39 | 1312.46 | 1258.84 | 1256.40 | 1569.68 | 1574.19 | 912.40 | 944.55 | 1026.55 | 1054.98 | 1116.18 | 1092.64 | 922.73 | 819.20 | 699.13 | 682.87 | 612.36 | 636.59 | 613.40 | 638.16 | 548.23 | 551.56 | 517.56 | 528.04 | 587.98 | 286.48 | 345.93 | 313.46 | NA | NA | NA | NA | NA | NA | NA | |
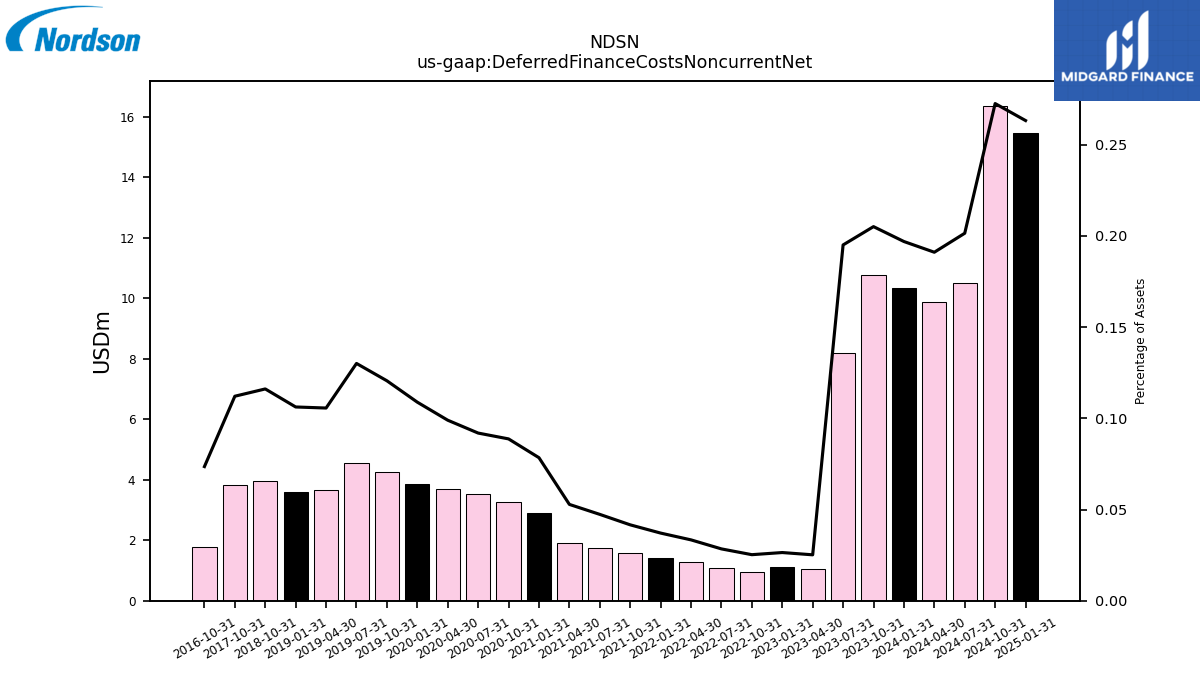
| Deferred Finance Costs Noncurrent Net | 10.34 | 10.77 | 8.19 | 1.06 | 1.12 | 0.96 | 1.09 | 1.27 | 1.42 | 1.58 | 1.74 | 1.90 | 2.89 | 3.26 | 3.51 | 3.71 | 3.87 | 4.24 | 4.54 | 3.67 | 3.61 | 3.97 | NA | NA | NA | 3.83 | NA | NA | NA | 1.78 | NA | NA | NA | NA | NA | NA | NA | NA | NA | NA | NA | NA | NA | NA | NA | NA | NA | NA | NA | NA | NA | NA | NA | NA | NA | NA | NA | |
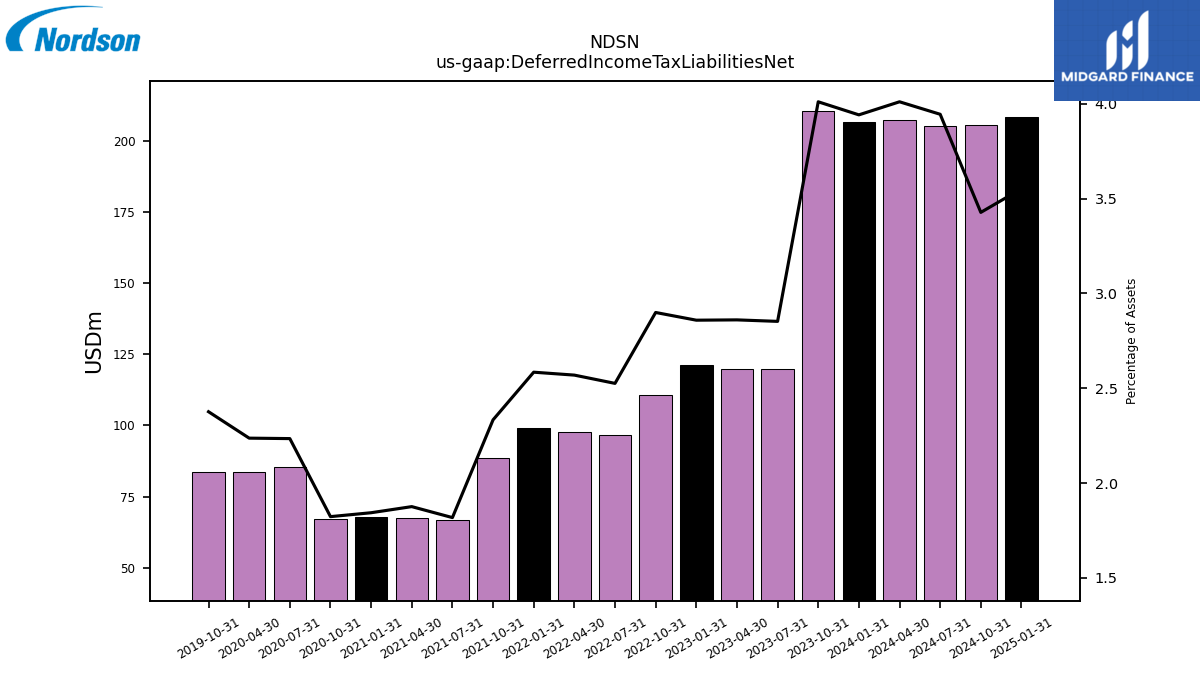
| Deferred Income Tax Liabilities Net | 206.83 | 210.64 | 119.73 | 119.95 | 121.15 | 110.78 | 96.58 | 97.55 | 99.13 | 88.47 | 66.73 | 67.44 | 67.91 | 67.00 | 85.36 | 83.73 | NA | 83.56 | NA | NA | NA | NA | NA | NA | NA | NA | NA | NA | NA | NA | NA | NA | NA | NA | NA | NA | NA | NA | NA | NA | NA | NA | NA | NA | NA | NA | NA | NA | NA | NA | NA | NA | NA | NA | NA | NA | NA | |
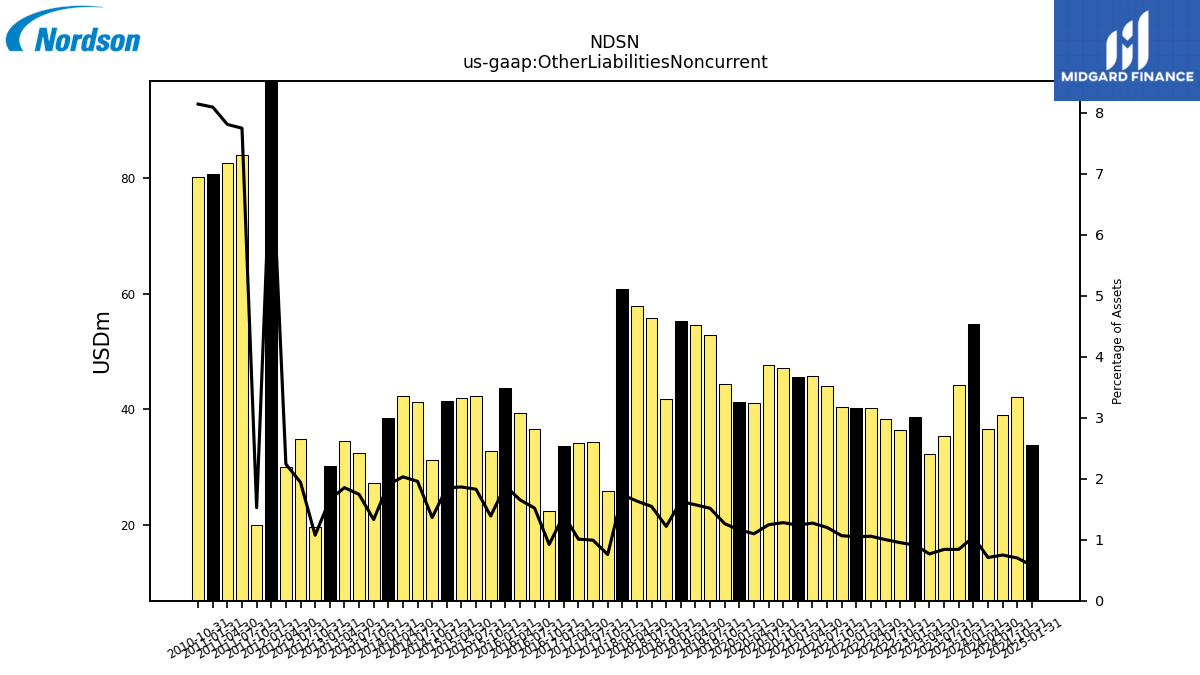
| Other Liabilities Noncurrent | 54.80 | 44.22 | 35.32 | 32.19 | 38.64 | 36.39 | 38.29 | 40.13 | 40.23 | 40.40 | 44.07 | 45.76 | 45.58 | 47.06 | 47.59 | 41.09 | 41.17 | 44.42 | 52.90 | 54.65 | 55.32 | 41.70 | 55.77 | 57.80 | 60.81 | 25.86 | 34.34 | 34.12 | 33.61 | 22.34 | 36.59 | 39.27 | 43.63 | 32.78 | 42.33 | 41.96 | 41.48 | 31.11 | 41.31 | 42.23 | 38.42 | 27.16 | 32.36 | 34.43 | 30.12 | 19.67 | 34.79 | 29.95 | 98.64 | 19.89 | 84.00 | 82.67 | 80.70 | 80.30 | NA | NA | NA | |
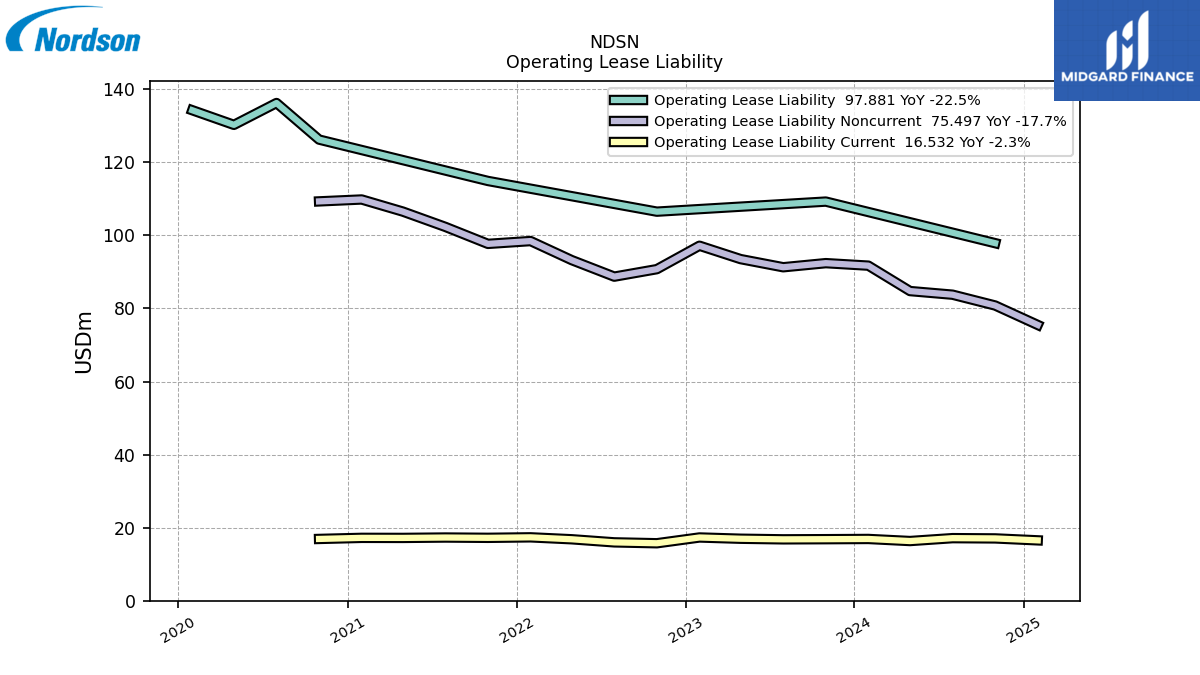
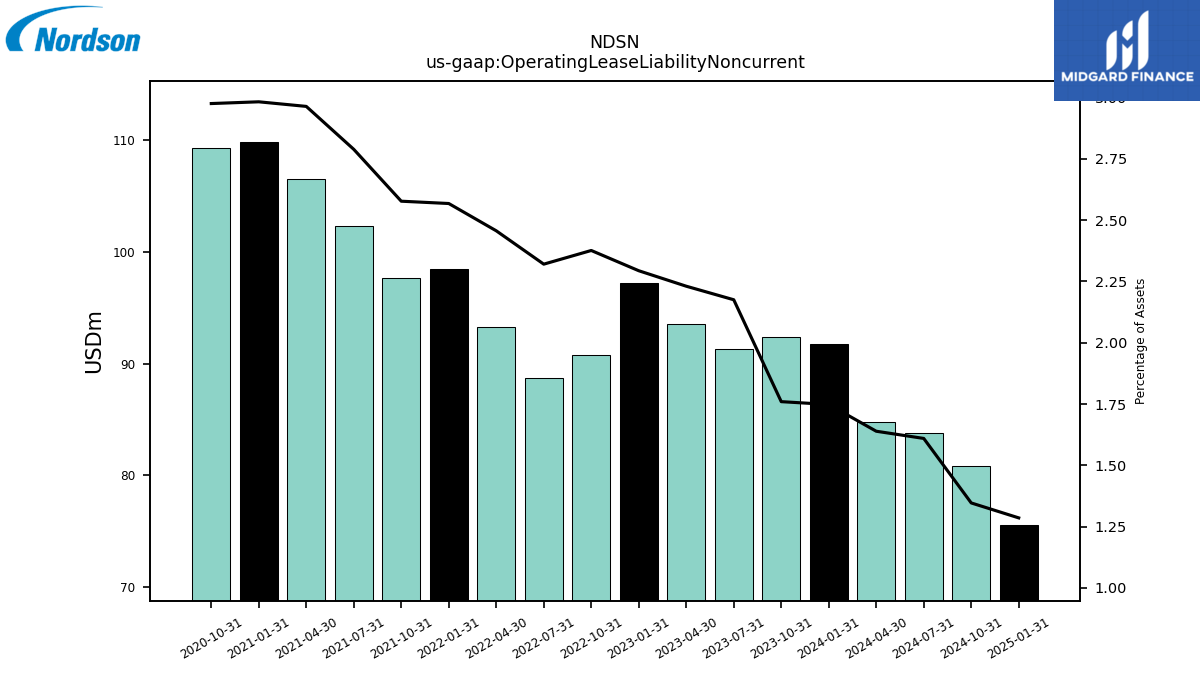
| Operating Lease Liability Noncurrent | 91.72 | 92.41 | 91.29 | 93.52 | 97.18 | 90.77 | 88.72 | 93.24 | 98.46 | 97.69 | 102.33 | 106.53 | 109.84 | 109.32 | NA | NA | NA | NA | NA | NA | NA | NA | NA | NA | NA | NA | NA | NA | NA | NA | NA | NA | NA | NA | NA | NA | NA | NA | NA | NA | NA | NA | NA | NA | NA | NA | NA | NA | NA | NA | NA | NA | NA | NA | NA | NA | NA |
| 2024-01-31 | 2023-10-31 | 2023-07-31 | 2023-04-30 | 2023-01-31 | 2022-10-31 | 2022-07-31 | 2022-04-30 | 2022-01-31 | 2021-10-31 | 2021-07-31 | 2021-04-30 | 2021-01-31 | 2020-10-31 | 2020-07-31 | 2020-04-30 | 2020-01-31 | 2019-10-31 | 2019-07-31 | 2019-04-30 | 2019-01-31 | 2018-10-31 | 2018-07-31 | 2018-04-30 | 2018-01-31 | 2017-10-31 | 2017-07-31 | 2017-04-30 | 2017-01-31 | 2016-10-31 | 2016-07-31 | 2016-04-30 | 2016-01-31 | 2015-10-31 | 2015-07-31 | 2015-04-30 | 2015-01-31 | 2014-10-31 | 2014-07-31 | 2014-04-30 | 2014-01-31 | 2013-10-31 | 2013-07-31 | 2013-04-30 | 2013-01-31 | 2012-10-31 | 2012-07-31 | 2012-04-30 | 2012-01-31 | 2011-10-31 | 2011-07-31 | 2011-04-30 | 2011-01-31 | 2010-10-31 | 2010-07-31 | 2010-04-30 | 2010-01-31 | ||
|---|---|---|---|---|---|---|---|---|---|---|---|---|---|---|---|---|---|---|---|---|---|---|---|---|---|---|---|---|---|---|---|---|---|---|---|---|---|---|---|---|---|---|---|---|---|---|---|---|---|---|---|---|---|---|---|---|---|---|
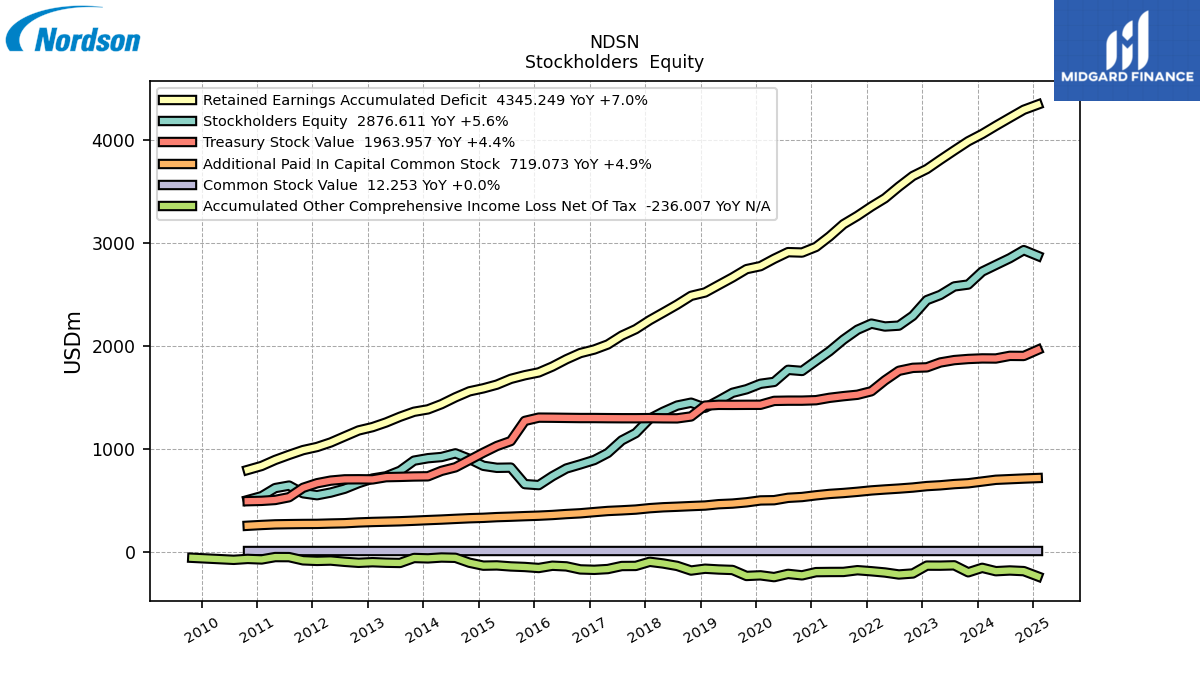
| Stockholders Equity | 2723.97 | 2598.06 | 2579.81 | 2497.00 | 2446.68 | 2294.38 | 2199.05 | 2190.62 | 2218.63 | 2159.13 | 2063.18 | 1950.36 | 1857.18 | 1758.99 | 1769.91 | 1652.49 | 1634.27 | 1581.05 | 1546.89 | 1471.26 | 1401.54 | 1450.74 | 1422.92 | 1362.91 | 1295.12 | 1155.49 | 1084.43 | 962.27 | 893.84 | 851.60 | 811.81 | 736.70 | 650.11 | 660.02 | 820.42 | 818.23 | 837.90 | 904.80 | 958.77 | 923.22 | 911.67 | 887.86 | 789.64 | 735.60 | 714.43 | 669.77 | 614.93 | 577.84 | 552.16 | 571.32 | 645.81 | 621.50 | 542.77 | 505.07 | NA | NA | NA | |
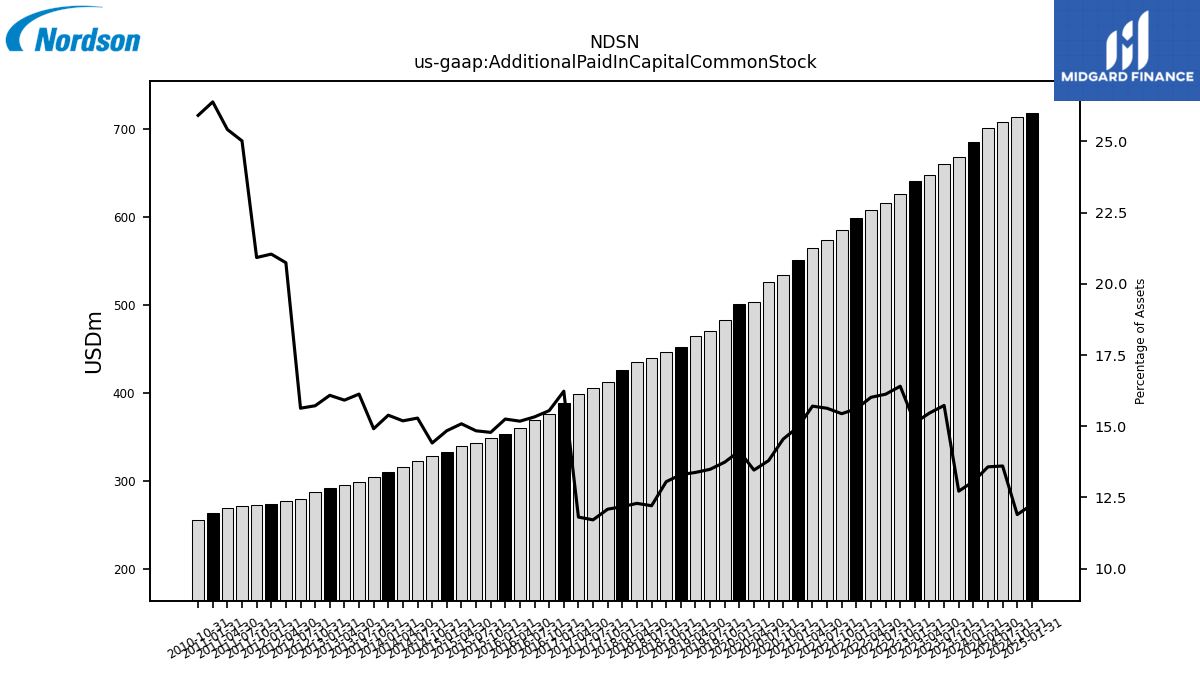
| Additional Paid In Capital Common Stock | 685.27 | 668.10 | 660.22 | 648.40 | 640.80 | 626.70 | 616.57 | 608.01 | 598.77 | 585.33 | 573.67 | 564.61 | 551.27 | 534.68 | 526.92 | 503.84 | 501.55 | 483.12 | 470.95 | 464.92 | 451.93 | 446.56 | 440.44 | 435.07 | 426.30 | 412.79 | 405.37 | 399.14 | 388.38 | 376.62 | 369.35 | 360.05 | 353.43 | 348.99 | 343.74 | 339.47 | 332.71 | 328.61 | 322.45 | 315.79 | 310.58 | 304.55 | 299.13 | 295.62 | 292.44 | 287.58 | 280.18 | 277.35 | 273.73 | 272.93 | 271.30 | 269.14 | 263.18 | 255.59 | NA | NA | NA | |
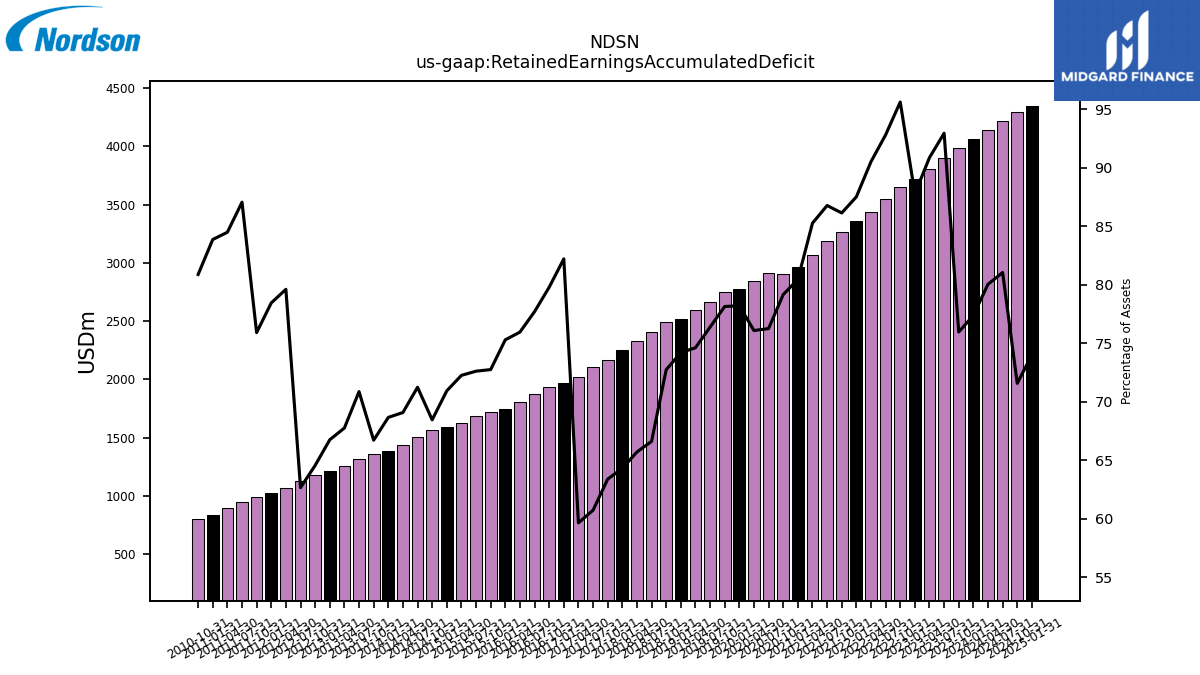
| Retained Earnings Accumulated Deficit | 4060.07 | 3989.35 | 3900.38 | 3809.58 | 3719.28 | 3652.22 | 3548.21 | 3435.77 | 3355.71 | 3265.03 | 3184.23 | 3064.73 | 2963.25 | 2908.74 | 2912.85 | 2847.76 | 2776.68 | 2747.65 | 2666.80 | 2592.95 | 2521.06 | 2488.38 | 2403.16 | 2325.69 | 2251.83 | 2164.60 | 2102.05 | 2016.15 | 1967.15 | 1932.63 | 1872.20 | 1801.67 | 1744.73 | 1717.23 | 1681.99 | 1625.95 | 1590.21 | 1560.97 | 1502.75 | 1436.29 | 1385.90 | 1362.58 | 1314.36 | 1258.55 | 1213.62 | 1181.24 | 1123.17 | 1064.48 | 1020.43 | 990.22 | 943.94 | 894.54 | 836.45 | 797.70 | NA | NA | NA | |
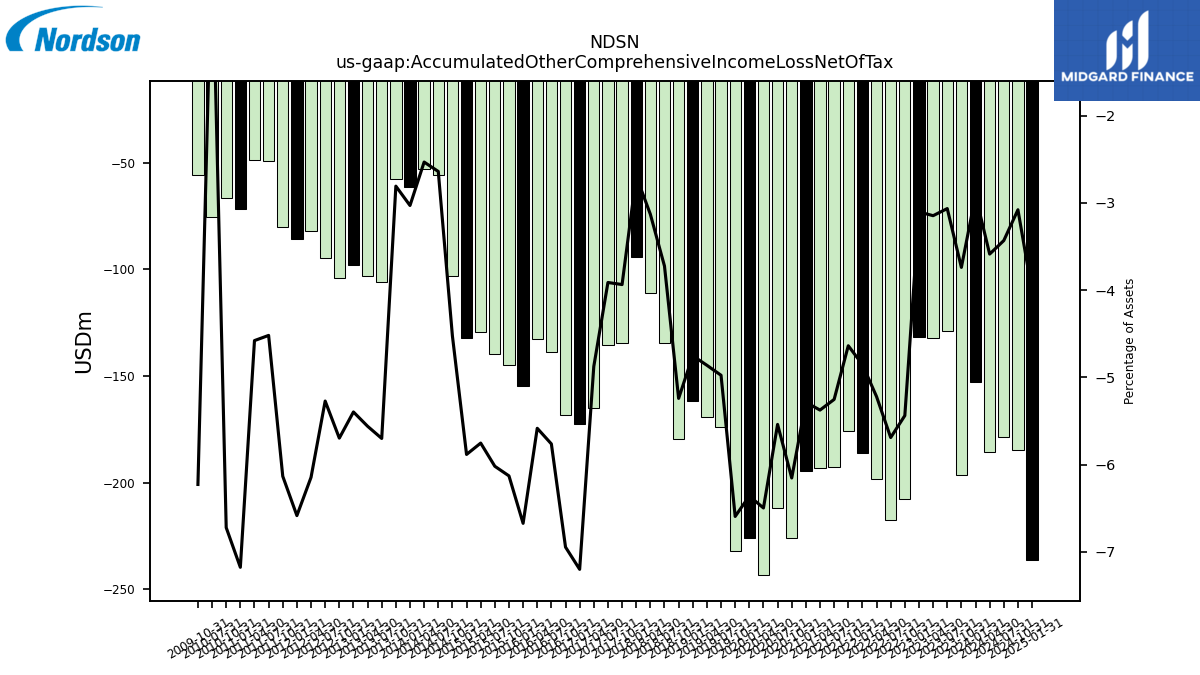
| Accumulated Other Comprehensive Income Loss Net Of Tax | -152.96 | -196.44 | -128.70 | -132.00 | -131.54 | -207.78 | -217.58 | -198.21 | -186.13 | -175.84 | -192.79 | -193.25 | -194.69 | -226.12 | -211.62 | -243.19 | -225.86 | -231.88 | -173.76 | -168.97 | -161.50 | -179.31 | -134.38 | -110.82 | -94.34 | -134.44 | -135.43 | -164.75 | -172.31 | -168.25 | -138.87 | -132.46 | -154.64 | -144.69 | -139.43 | -129.47 | -131.90 | -103.20 | -55.72 | -52.67 | -61.18 | -57.38 | -105.73 | -103.28 | -98.12 | -104.23 | -94.49 | -82.19 | -85.65 | -80.01 | -49.02 | -48.49 | -71.59 | -66.31 | -75.28 | NA | NA | |
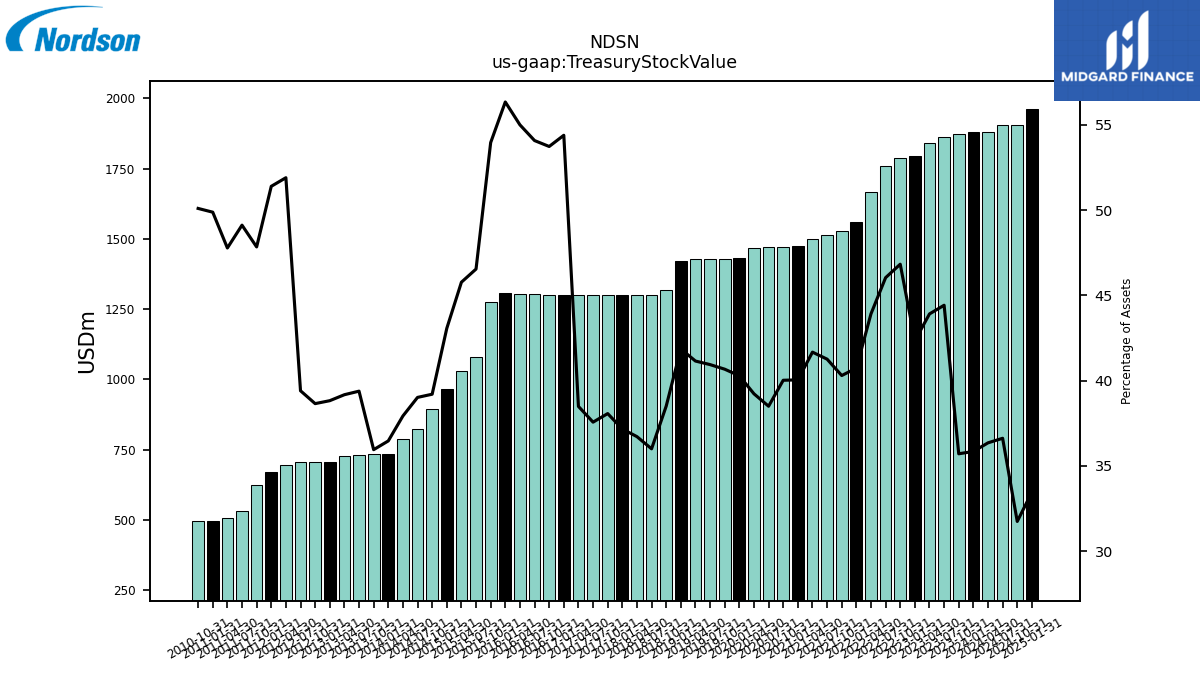
| Treasury Stock Value | 1880.67 | 1875.20 | 1864.35 | 1841.23 | 1794.11 | 1789.01 | 1760.40 | 1667.21 | 1561.98 | 1527.65 | 1514.18 | 1497.99 | 1474.90 | 1470.57 | 1470.49 | 1468.17 | 1430.36 | 1430.09 | 1429.35 | 1429.89 | 1422.20 | 1317.13 | 1298.56 | 1299.29 | 1300.92 | 1299.71 | 1299.82 | 1300.52 | 1301.63 | 1301.66 | 1303.12 | 1304.81 | 1305.68 | 1273.77 | 1078.13 | 1029.97 | 965.37 | 893.83 | 822.96 | 788.45 | 735.88 | 734.14 | 730.37 | 727.54 | 705.75 | 707.08 | 706.18 | 694.05 | 668.59 | 624.07 | 532.67 | 505.94 | 497.52 | 494.17 | NA | NA | NA | |
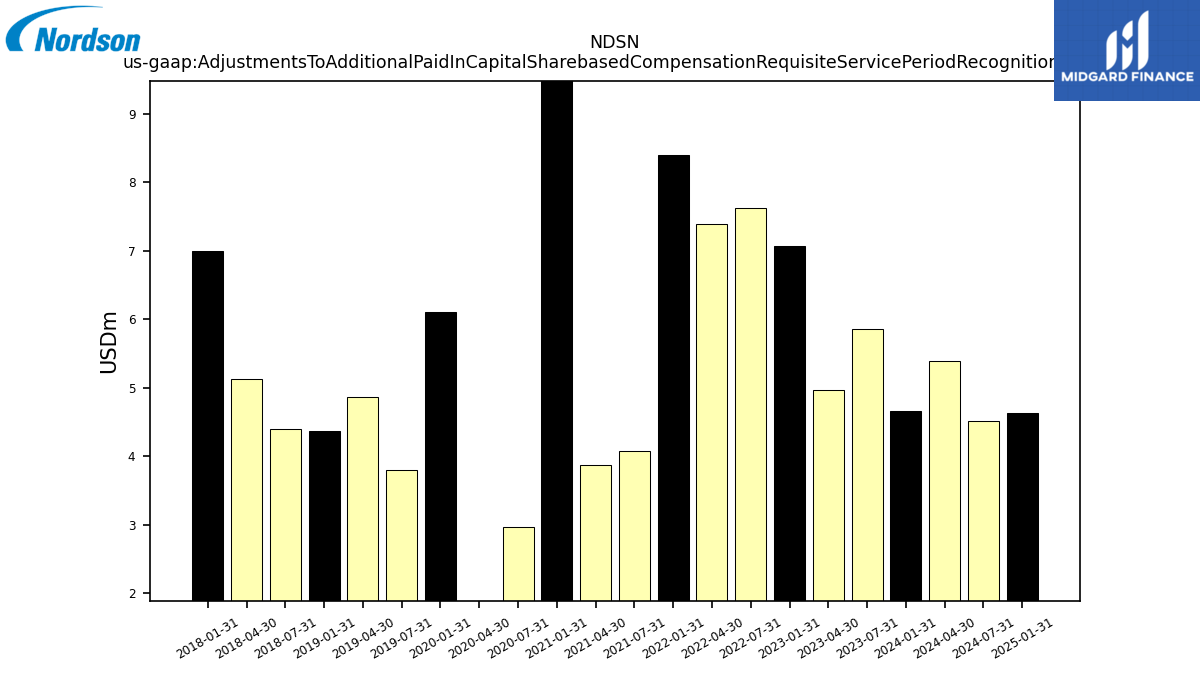
| Adjustments To Additional Paid In Capital Sharebased Compensation Requisite Service Period Recognition Value | 4.66 | NA | 5.86 | 4.97 | 7.07 | NA | 7.62 | 7.39 | 8.39 | NA | 4.08 | 3.88 | 10.12 | NA | 2.97 | -0.07 | 6.11 | NA | 3.79 | 4.87 | 4.36 | NA | 4.40 | 5.13 | 6.99 | NA | NA | NA | NA | NA | NA | NA | NA | NA | NA | NA | NA | NA | NA | NA | NA | NA | NA | NA | NA | NA | NA | NA | NA | NA | NA | NA | NA | NA | NA | NA | NA |
| 2024-01-31 | 2023-10-31 | 2023-07-31 | 2023-04-30 | 2023-01-31 | 2022-10-31 | 2022-07-31 | 2022-04-30 | 2022-01-31 | 2021-10-31 | 2021-07-31 | 2021-04-30 | 2021-01-31 | 2020-10-31 | 2020-07-31 | 2020-04-30 | 2020-01-31 | 2019-10-31 | 2019-07-31 | 2019-04-30 | 2019-01-31 | 2018-10-31 | 2018-07-31 | 2018-04-30 | 2018-01-31 | 2017-10-31 | 2017-07-31 | 2017-04-30 | 2017-01-31 | 2016-10-31 | 2016-07-31 | 2016-04-30 | 2016-01-31 | 2015-10-31 | 2015-07-31 | 2015-04-30 | 2015-01-31 | 2014-10-31 | 2014-07-31 | 2014-04-30 | 2014-01-31 | 2013-10-31 | 2013-07-31 | 2013-04-30 | 2013-01-31 | 2012-10-31 | 2012-07-31 | 2012-04-30 | 2012-01-31 | 2011-10-31 | 2011-07-31 | 2011-04-30 | 2011-01-31 | 2010-10-31 | 2010-07-31 | 2010-04-30 | 2010-01-31 | ||
|---|---|---|---|---|---|---|---|---|---|---|---|---|---|---|---|---|---|---|---|---|---|---|---|---|---|---|---|---|---|---|---|---|---|---|---|---|---|---|---|---|---|---|---|---|---|---|---|---|---|---|---|---|---|---|---|---|---|---|
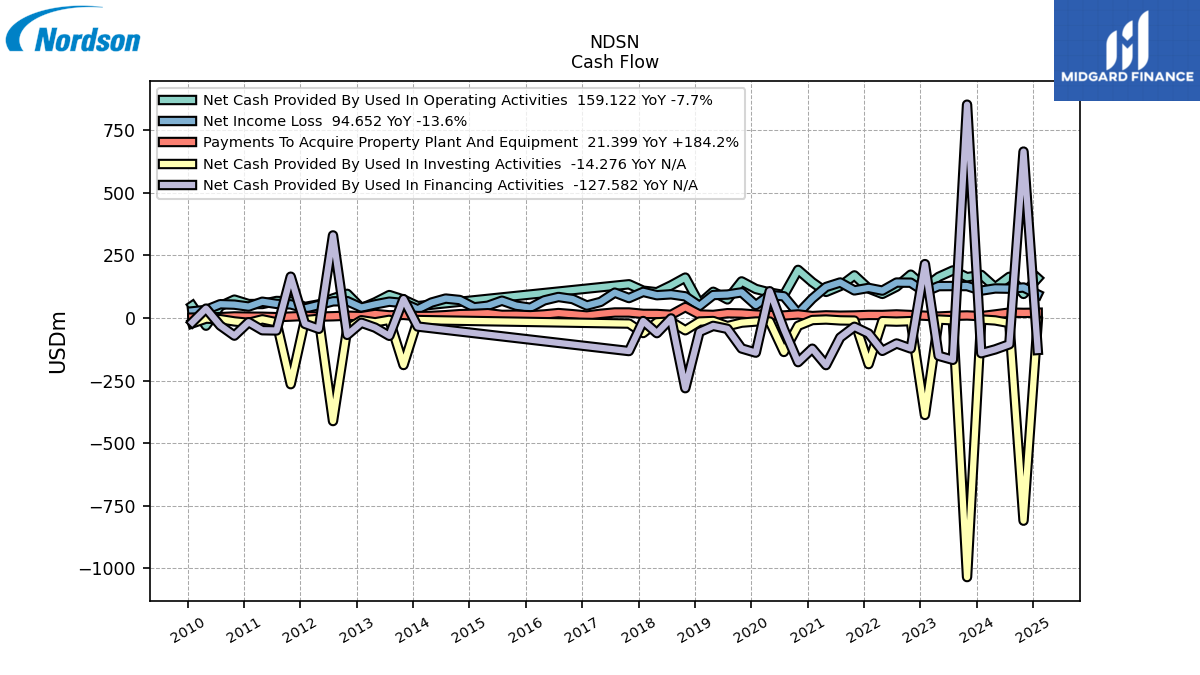
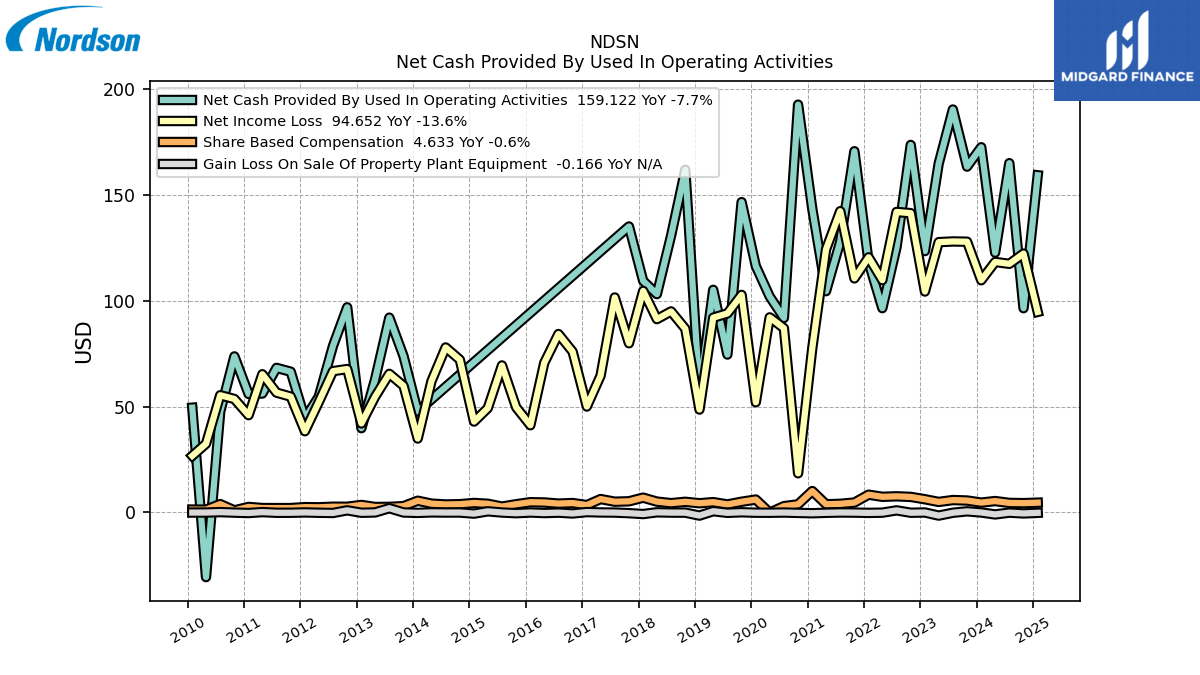
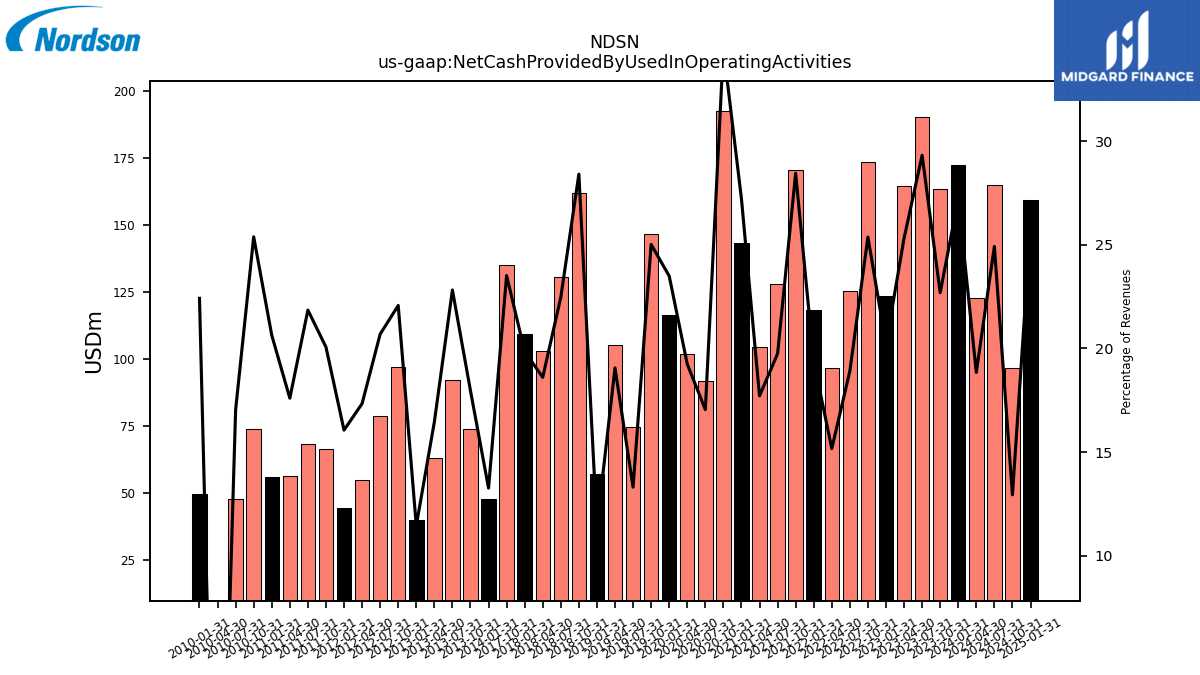
| Net Cash Provided By Used In Operating Activities | 172.36 | 163.21 | 190.17 | 164.57 | 123.34 | 173.44 | 125.19 | 96.41 | 118.09 | 170.47 | 127.74 | 104.42 | 143.29 | 192.46 | 91.78 | 101.90 | 116.28 | 146.46 | 74.52 | 105.06 | 56.85 | 161.71 | 130.62 | 103.03 | 109.28 | 134.96 | NA | NA | NA | NA | NA | NA | NA | NA | NA | NA | NA | NA | NA | NA | 47.69 | 73.79 | 91.95 | 62.87 | 39.76 | 96.82 | 78.61 | 54.66 | 44.31 | 66.44 | 68.23 | 56.14 | 55.92 | 73.66 | 47.59 | -30.51 | 49.45 | |
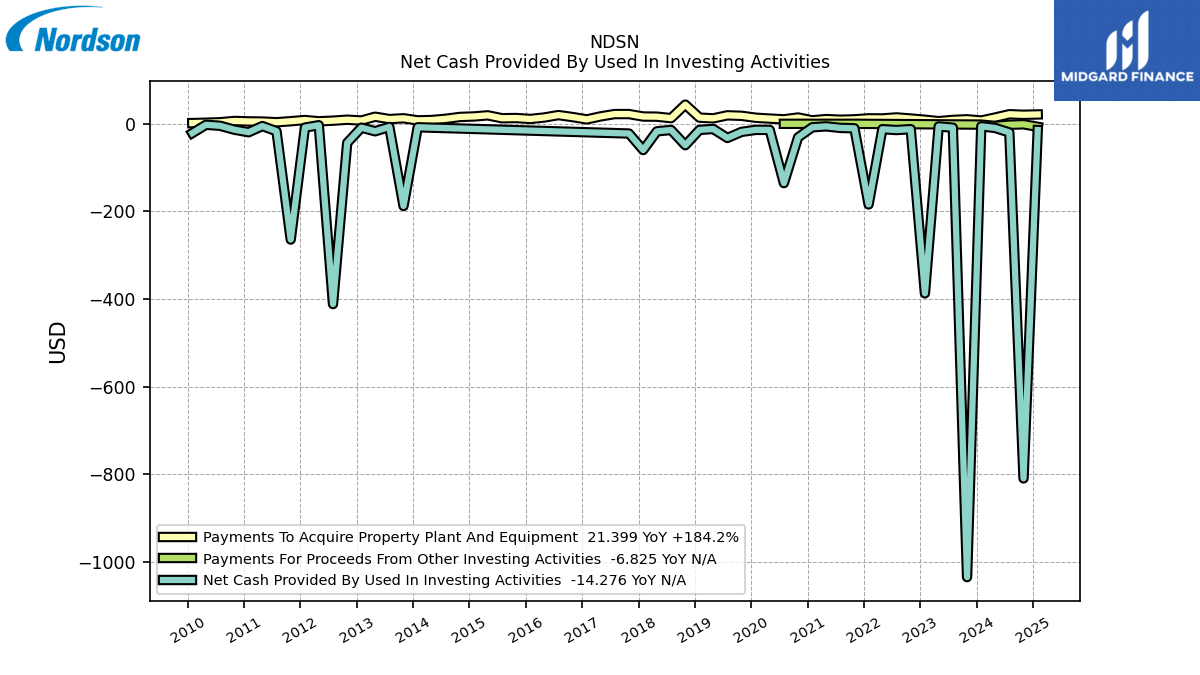
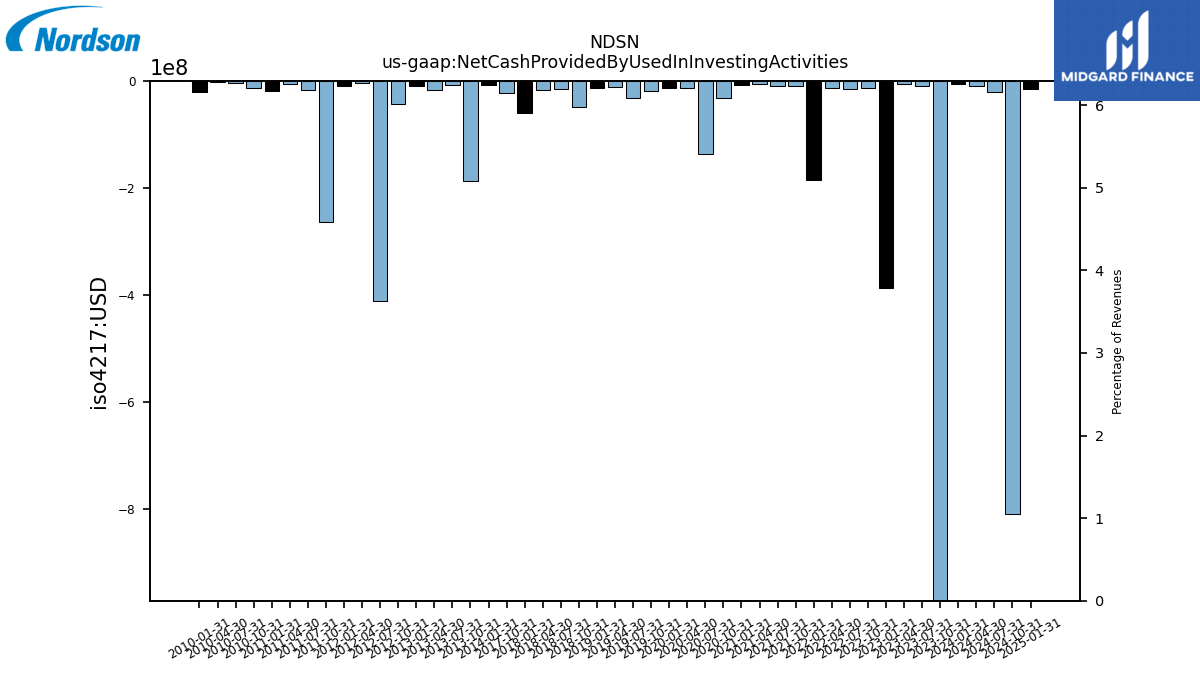
| Net Cash Provided By Used In Investing Activities | -5.72 | -1034.88 | -8.84 | -6.02 | -387.14 | -12.19 | -14.20 | -12.28 | -184.10 | -10.17 | -9.32 | -5.79 | -7.89 | -30.92 | -135.46 | -13.91 | -13.82 | -18.37 | -32.23 | -11.81 | -13.88 | -48.88 | -14.05 | -17.09 | -59.90 | -22.13 | NA | NA | NA | NA | NA | NA | NA | NA | NA | NA | NA | NA | NA | NA | -7.88 | -187.67 | -7.12 | -17.02 | -8.73 | -43.46 | -411.60 | -3.15 | -8.57 | -264.25 | -16.92 | -5.10 | -19.23 | -13.44 | -4.54 | -2.16 | -21.18 | |
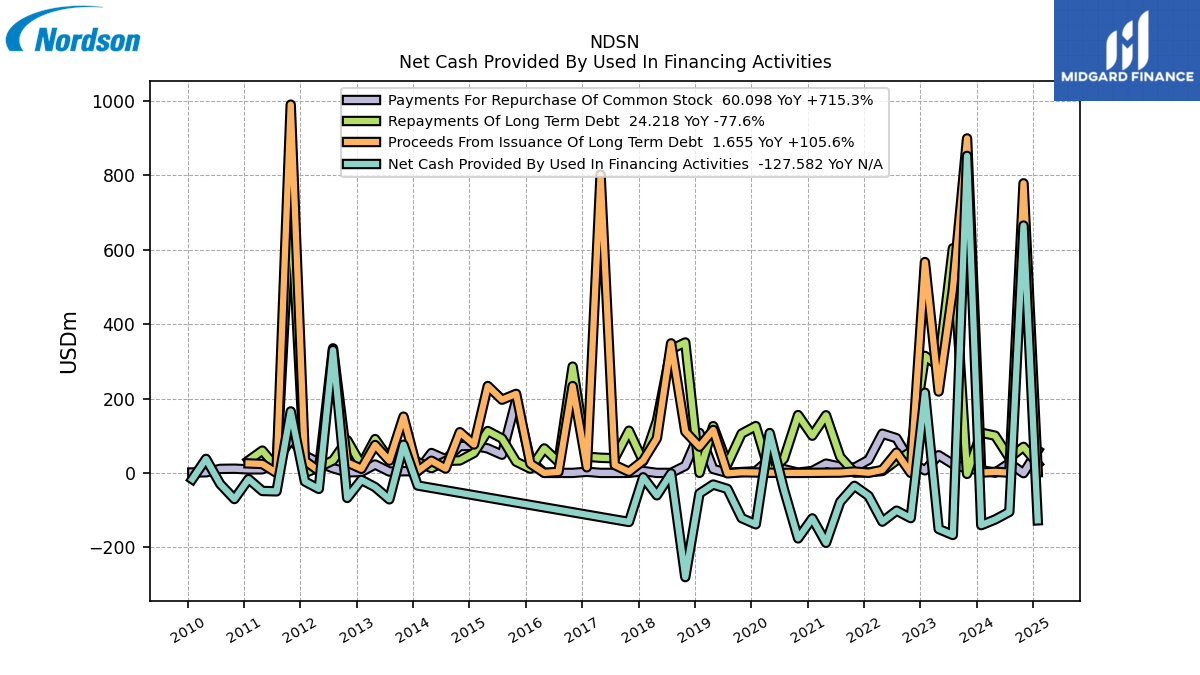
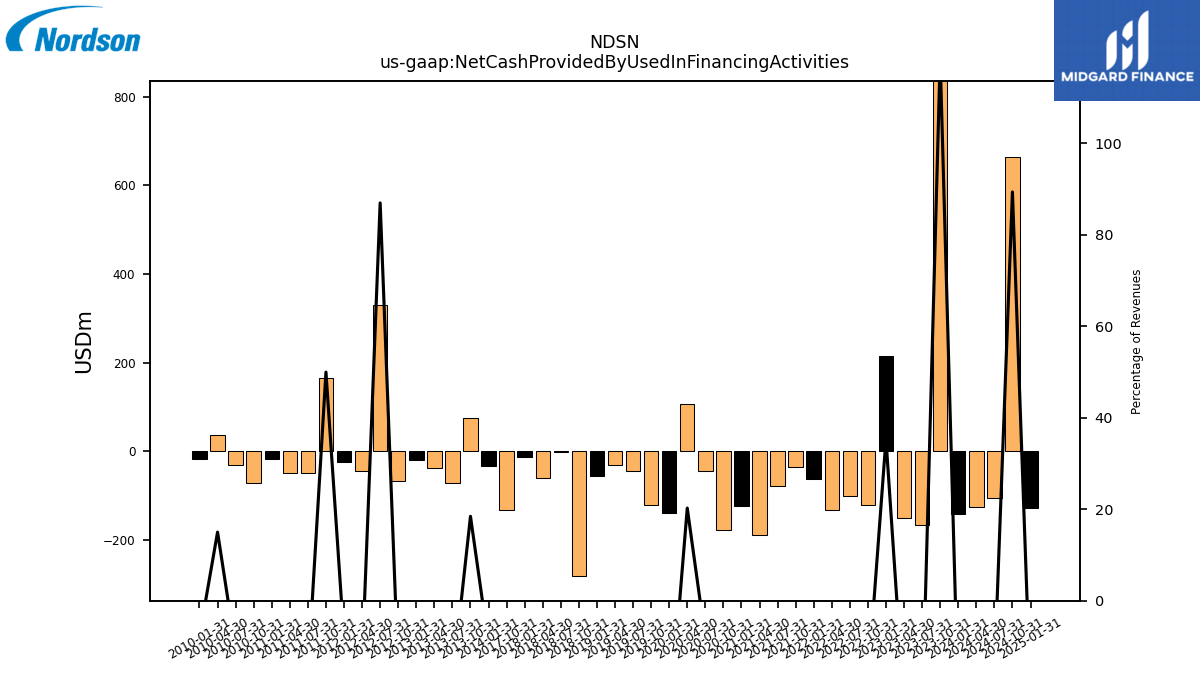
| Net Cash Provided By Used In Financing Activities | -140.49 | 852.59 | -166.90 | -150.87 | 215.69 | -121.59 | -101.48 | -131.03 | -61.90 | -34.79 | -77.79 | -188.06 | -122.28 | -176.12 | -44.42 | 107.23 | -138.22 | -121.47 | -43.05 | -31.26 | -55.30 | -280.23 | -1.36 | -60.30 | -11.80 | -131.89 | NA | NA | NA | NA | NA | NA | NA | NA | NA | NA | NA | NA | NA | NA | -33.95 | 75.79 | -71.15 | -38.25 | -18.82 | -67.31 | 330.26 | -43.03 | -23.11 | 165.38 | -49.62 | -48.56 | -16.50 | -70.25 | -29.84 | 37.75 | -16.94 |
| 2024-01-31 | 2023-10-31 | 2023-07-31 | 2023-04-30 | 2023-01-31 | 2022-10-31 | 2022-07-31 | 2022-04-30 | 2022-01-31 | 2021-10-31 | 2021-07-31 | 2021-04-30 | 2021-01-31 | 2020-10-31 | 2020-07-31 | 2020-04-30 | 2020-01-31 | 2019-10-31 | 2019-07-31 | 2019-04-30 | 2019-01-31 | 2018-10-31 | 2018-07-31 | 2018-04-30 | 2018-01-31 | 2017-10-31 | 2017-07-31 | 2017-04-30 | 2017-01-31 | 2016-10-31 | 2016-07-31 | 2016-04-30 | 2016-01-31 | 2015-10-31 | 2015-07-31 | 2015-04-30 | 2015-01-31 | 2014-10-31 | 2014-07-31 | 2014-04-30 | 2014-01-31 | 2013-10-31 | 2013-07-31 | 2013-04-30 | 2013-01-31 | 2012-10-31 | 2012-07-31 | 2012-04-30 | 2012-01-31 | 2011-10-31 | 2011-07-31 | 2011-04-30 | 2011-01-31 | 2010-10-31 | 2010-07-31 | 2010-04-30 | 2010-01-31 | ||
|---|---|---|---|---|---|---|---|---|---|---|---|---|---|---|---|---|---|---|---|---|---|---|---|---|---|---|---|---|---|---|---|---|---|---|---|---|---|---|---|---|---|---|---|---|---|---|---|---|---|---|---|---|---|---|---|---|---|---|
| Net Cash Provided By Used In Operating Activities | 172.36 | 163.21 | 190.17 | 164.57 | 123.34 | 173.44 | 125.19 | 96.41 | 118.09 | 170.47 | 127.74 | 104.42 | 143.29 | 192.46 | 91.78 | 101.90 | 116.28 | 146.46 | 74.52 | 105.06 | 56.85 | 161.71 | 130.62 | 103.03 | 109.28 | 134.96 | NA | NA | NA | NA | NA | NA | NA | NA | NA | NA | NA | NA | NA | NA | 47.69 | 73.79 | 91.95 | 62.87 | 39.76 | 96.82 | 78.61 | 54.66 | 44.31 | 66.44 | 68.23 | 56.14 | 55.92 | 73.66 | 47.59 | -30.51 | 49.45 | |
| Net Income Loss | 109.57 | 127.78 | 127.89 | 127.56 | 104.26 | 141.25 | 141.81 | 109.63 | 120.41 | 110.46 | 142.18 | 124.14 | 77.58 | 18.48 | 86.98 | 92.08 | 52.00 | 102.67 | 93.93 | 91.92 | 48.57 | 86.70 | 94.88 | 91.23 | 104.56 | 79.83 | 101.46 | 64.52 | 49.99 | 75.87 | 84.21 | 70.60 | 41.16 | 49.62 | 69.39 | 49.21 | 42.88 | 72.08 | 77.88 | 61.93 | 34.88 | 59.78 | 65.42 | 54.60 | 42.01 | 67.69 | 66.69 | 52.11 | 38.34 | 54.67 | 56.55 | 65.24 | 45.90 | 53.56 | 55.33 | 32.43 | 26.73 | |
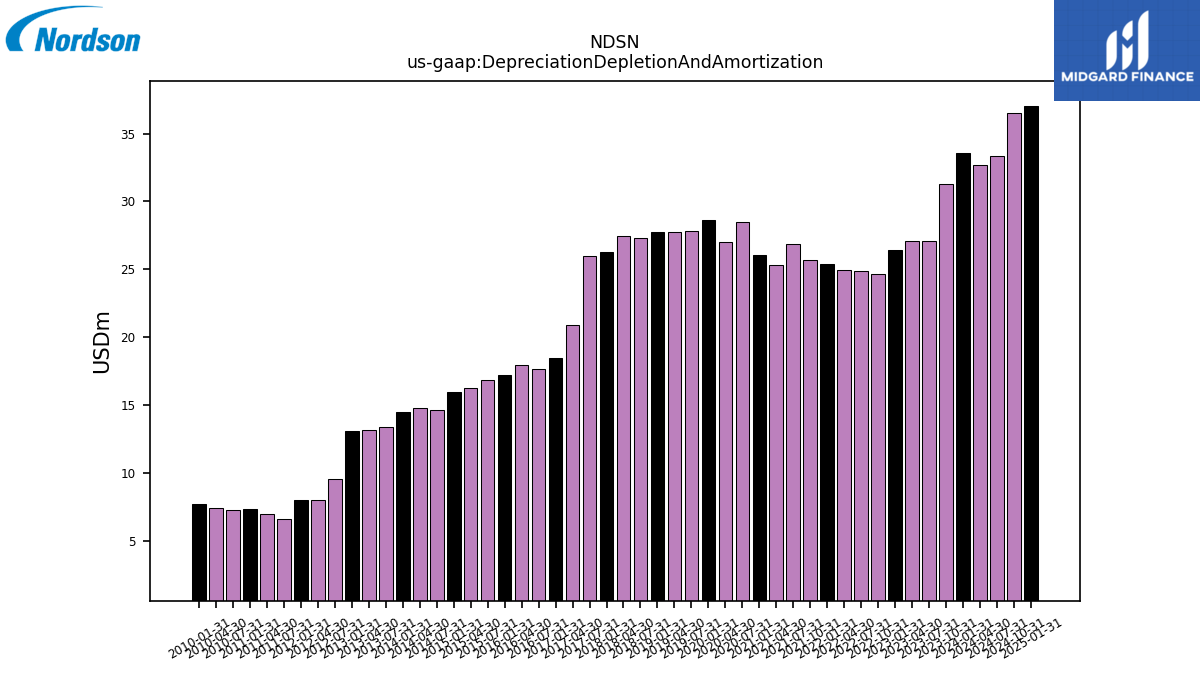
| Depreciation Depletion And Amortization | 33.54 | 31.26 | 27.10 | 27.10 | 26.43 | 24.68 | 24.89 | 24.96 | 25.39 | 25.65 | 26.90 | 25.32 | 26.02 | NA | 28.50 | 27.05 | 28.62 | NA | 27.84 | 27.74 | 27.75 | NA | 27.32 | 27.43 | 26.29 | NA | 25.95 | 20.91 | 18.50 | NA | 17.66 | 17.95 | 17.21 | NA | 16.85 | 16.24 | 15.98 | NA | 14.61 | 14.74 | 14.49 | NA | 13.37 | 13.14 | 13.05 | NA | 9.56 | 7.99 | 7.97 | NA | 6.56 | 6.93 | 7.32 | NA | 7.25 | 7.39 | 7.71 | |
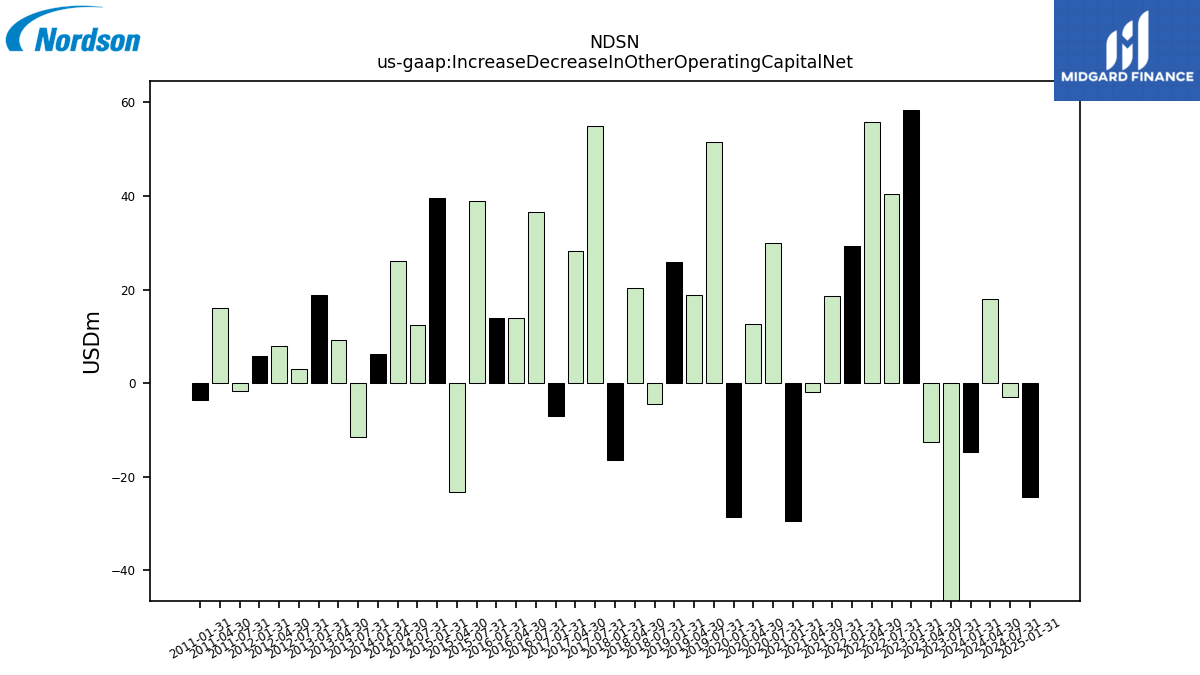
| Increase Decrease In Other Operating Capital Net | -14.61 | NA | -65.05 | -12.51 | 58.37 | NA | 40.50 | 55.85 | 29.22 | NA | 18.68 | -1.83 | -29.42 | NA | 29.95 | 12.56 | -28.49 | NA | 51.45 | 18.75 | 25.81 | NA | -4.48 | 20.32 | -16.33 | NA | 55.02 | 28.24 | -6.96 | NA | 36.65 | 14.01 | 13.83 | NA | 38.92 | -23.18 | 39.50 | NA | 12.39 | 26.10 | 6.26 | NA | -11.52 | 9.29 | 18.76 | NA | 3.00 | 7.84 | 5.78 | NA | -1.57 | 16.01 | -3.60 | NA | NA | NA | NA | |
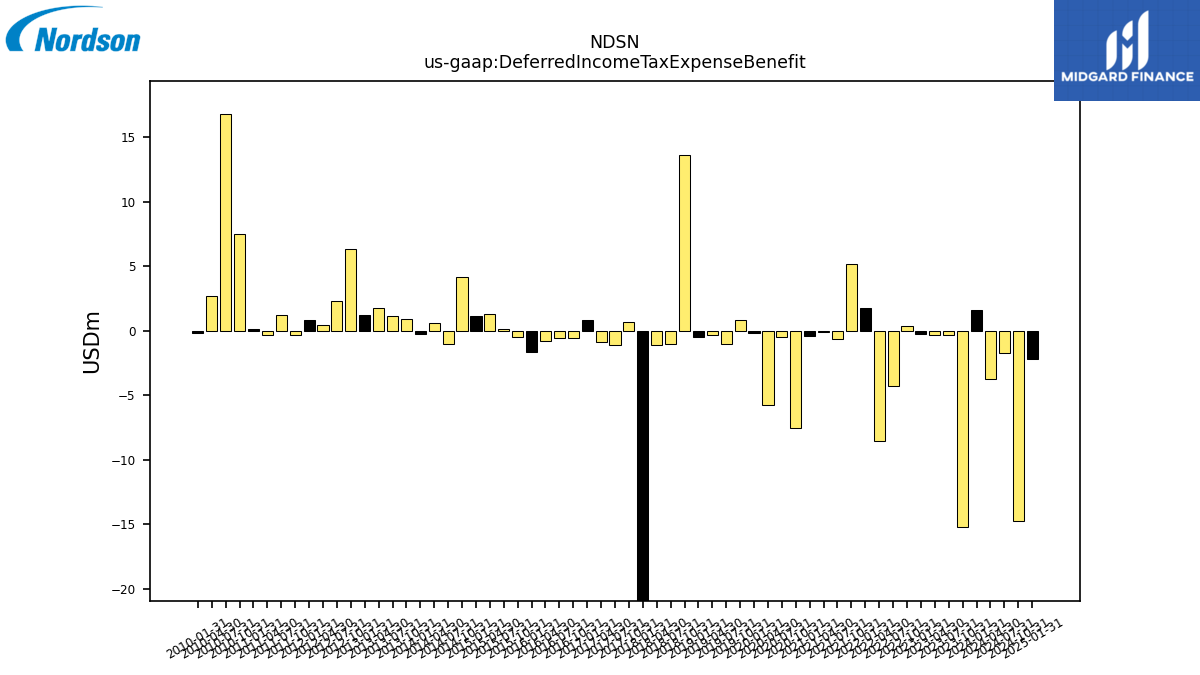
| Deferred Income Tax Expense Benefit | 1.64 | -15.19 | -0.32 | -0.34 | -0.28 | 0.36 | -4.31 | -8.57 | 1.78 | 5.18 | -0.62 | -0.12 | -0.37 | -7.55 | -0.47 | -5.75 | -0.18 | 0.81 | -1.00 | -0.34 | -0.48 | 13.61 | -1.03 | -1.10 | -45.43 | 0.69 | -1.12 | -0.85 | 0.81 | -0.55 | -0.60 | -0.80 | -1.66 | -0.48 | 0.15 | 1.29 | 1.13 | 4.20 | -1.06 | 0.59 | -0.23 | 0.94 | 1.16 | 1.79 | 1.23 | 6.32 | 2.28 | 0.44 | 0.80 | -0.31 | 1.24 | -0.32 | 0.11 | 7.52 | 16.78 | 2.73 | -0.20 | |
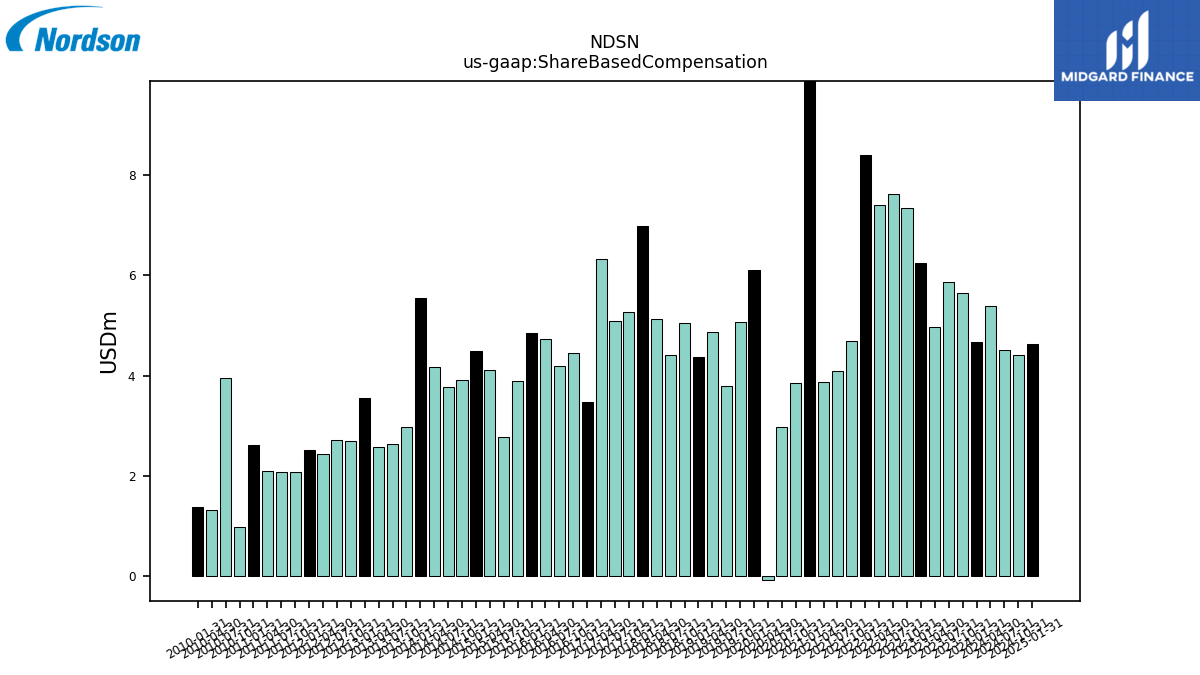
| Share Based Compensation | 4.66 | 5.64 | 5.86 | 4.97 | 6.24 | 7.34 | 7.62 | 7.39 | 8.39 | 4.68 | 4.08 | 3.88 | 10.12 | 3.85 | 2.97 | -0.07 | 6.11 | 5.07 | 3.79 | 4.87 | 4.36 | 5.04 | 4.40 | 5.13 | 6.99 | 5.28 | 5.08 | 6.33 | 3.48 | 4.45 | 4.19 | 4.72 | 4.85 | 3.89 | 2.78 | 4.11 | 4.48 | 3.91 | 3.78 | 4.17 | 5.54 | 2.98 | 2.64 | 2.58 | 3.56 | 2.69 | 2.72 | 2.44 | 2.52 | 2.08 | 2.07 | 2.09 | 2.61 | 0.99 | 3.95 | 1.32 | 1.38 |
| 2024-01-31 | 2023-10-31 | 2023-07-31 | 2023-04-30 | 2023-01-31 | 2022-10-31 | 2022-07-31 | 2022-04-30 | 2022-01-31 | 2021-10-31 | 2021-07-31 | 2021-04-30 | 2021-01-31 | 2020-10-31 | 2020-07-31 | 2020-04-30 | 2020-01-31 | 2019-10-31 | 2019-07-31 | 2019-04-30 | 2019-01-31 | 2018-10-31 | 2018-07-31 | 2018-04-30 | 2018-01-31 | 2017-10-31 | 2017-07-31 | 2017-04-30 | 2017-01-31 | 2016-10-31 | 2016-07-31 | 2016-04-30 | 2016-01-31 | 2015-10-31 | 2015-07-31 | 2015-04-30 | 2015-01-31 | 2014-10-31 | 2014-07-31 | 2014-04-30 | 2014-01-31 | 2013-10-31 | 2013-07-31 | 2013-04-30 | 2013-01-31 | 2012-10-31 | 2012-07-31 | 2012-04-30 | 2012-01-31 | 2011-10-31 | 2011-07-31 | 2011-04-30 | 2011-01-31 | 2010-10-31 | 2010-07-31 | 2010-04-30 | 2010-01-31 | ||
|---|---|---|---|---|---|---|---|---|---|---|---|---|---|---|---|---|---|---|---|---|---|---|---|---|---|---|---|---|---|---|---|---|---|---|---|---|---|---|---|---|---|---|---|---|---|---|---|---|---|---|---|---|---|---|---|---|---|---|
| Net Cash Provided By Used In Investing Activities | -5.72 | -1034.88 | -8.84 | -6.02 | -387.14 | -12.19 | -14.20 | -12.28 | -184.10 | -10.17 | -9.32 | -5.79 | -7.89 | -30.92 | -135.46 | -13.91 | -13.82 | -18.37 | -32.23 | -11.81 | -13.88 | -48.88 | -14.05 | -17.09 | -59.90 | -22.13 | NA | NA | NA | NA | NA | NA | NA | NA | NA | NA | NA | NA | NA | NA | -7.88 | -187.67 | -7.12 | -17.02 | -8.73 | -43.46 | -411.60 | -3.15 | -8.57 | -264.25 | -16.92 | -5.10 | -19.23 | -13.44 | -4.54 | -2.16 | -21.18 | |
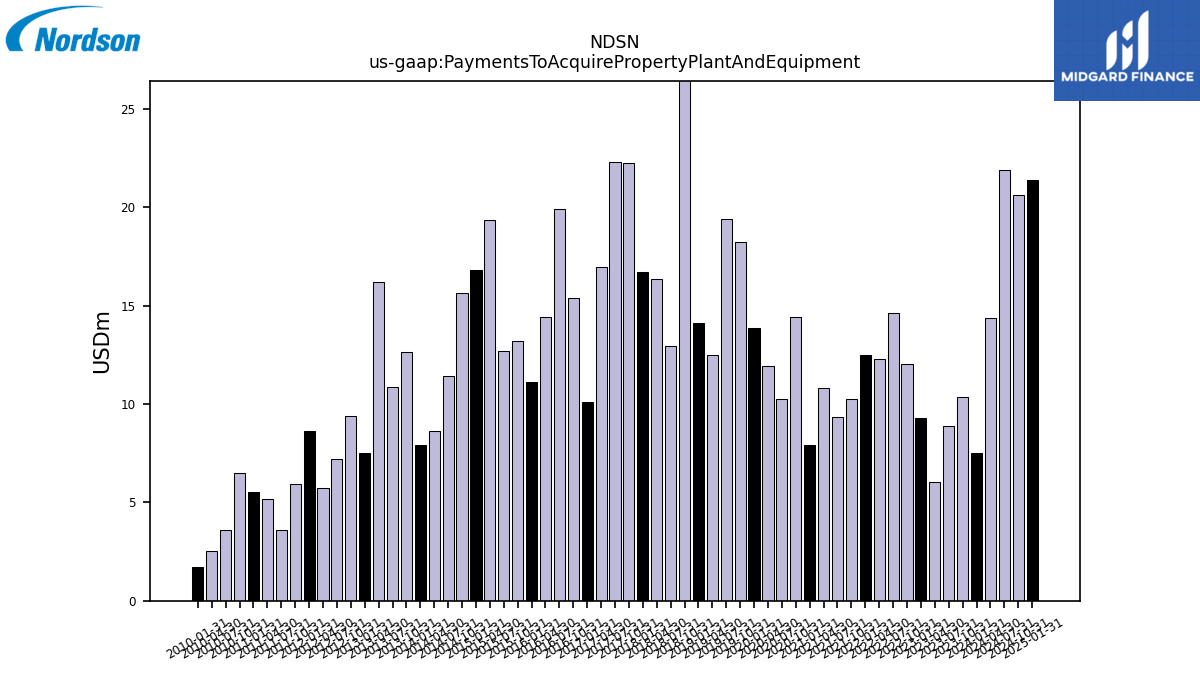
| Payments To Acquire Property Plant And Equipment | 7.53 | 10.34 | 8.89 | 6.05 | 9.30 | 12.05 | 14.60 | 12.29 | 12.49 | 10.23 | 9.33 | 10.83 | 7.92 | 14.44 | 10.26 | 11.95 | 13.88 | 18.24 | 19.40 | 12.48 | 14.12 | 43.82 | 12.92 | 16.37 | 16.68 | 22.23 | 22.30 | 16.95 | 10.08 | 15.40 | 19.93 | 14.43 | 11.09 | 13.19 | 12.71 | 19.36 | 16.82 | 15.64 | 11.44 | 8.60 | 7.89 | 12.65 | 10.86 | 16.19 | 7.52 | 9.41 | 7.18 | 5.73 | 8.64 | 5.93 | 3.59 | 5.18 | 5.53 | 6.50 | 3.58 | 2.52 | 1.72 |
| 2024-01-31 | 2023-10-31 | 2023-07-31 | 2023-04-30 | 2023-01-31 | 2022-10-31 | 2022-07-31 | 2022-04-30 | 2022-01-31 | 2021-10-31 | 2021-07-31 | 2021-04-30 | 2021-01-31 | 2020-10-31 | 2020-07-31 | 2020-04-30 | 2020-01-31 | 2019-10-31 | 2019-07-31 | 2019-04-30 | 2019-01-31 | 2018-10-31 | 2018-07-31 | 2018-04-30 | 2018-01-31 | 2017-10-31 | 2017-07-31 | 2017-04-30 | 2017-01-31 | 2016-10-31 | 2016-07-31 | 2016-04-30 | 2016-01-31 | 2015-10-31 | 2015-07-31 | 2015-04-30 | 2015-01-31 | 2014-10-31 | 2014-07-31 | 2014-04-30 | 2014-01-31 | 2013-10-31 | 2013-07-31 | 2013-04-30 | 2013-01-31 | 2012-10-31 | 2012-07-31 | 2012-04-30 | 2012-01-31 | 2011-10-31 | 2011-07-31 | 2011-04-30 | 2011-01-31 | 2010-10-31 | 2010-07-31 | 2010-04-30 | 2010-01-31 | ||
|---|---|---|---|---|---|---|---|---|---|---|---|---|---|---|---|---|---|---|---|---|---|---|---|---|---|---|---|---|---|---|---|---|---|---|---|---|---|---|---|---|---|---|---|---|---|---|---|---|---|---|---|---|---|---|---|---|---|---|
| Net Cash Provided By Used In Financing Activities | -140.49 | 852.59 | -166.90 | -150.87 | 215.69 | -121.59 | -101.48 | -131.03 | -61.90 | -34.79 | -77.79 | -188.06 | -122.28 | -176.12 | -44.42 | 107.23 | -138.22 | -121.47 | -43.05 | -31.26 | -55.30 | -280.23 | -1.36 | -60.30 | -11.80 | -131.89 | NA | NA | NA | NA | NA | NA | NA | NA | NA | NA | NA | NA | NA | NA | -33.95 | 75.79 | -71.15 | -38.25 | -18.82 | -67.31 | 330.26 | -43.03 | -23.11 | 165.38 | -49.62 | -48.56 | -16.50 | -70.25 | -29.84 | 37.75 | -16.94 | |
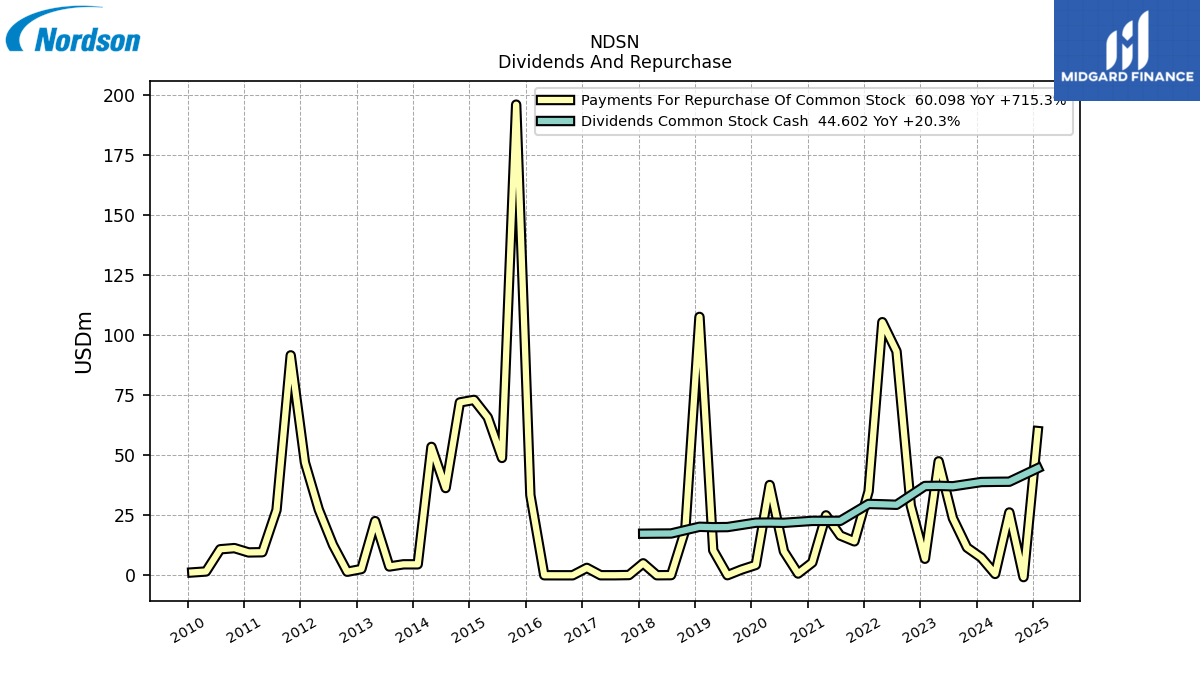
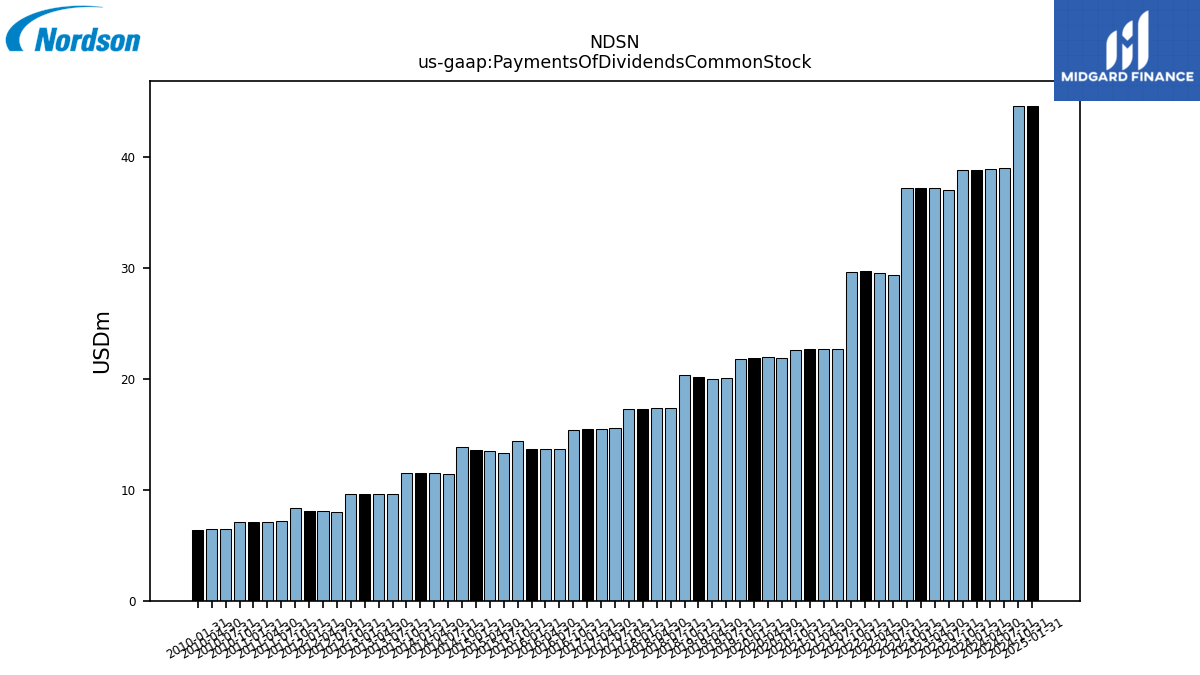
| Payments Of Dividends Common Stock | 38.85 | 38.81 | 37.08 | 37.26 | 37.20 | 37.24 | 29.37 | 29.58 | 29.72 | 29.66 | 22.68 | 22.67 | 22.67 | 22.61 | 21.86 | 21.96 | 21.91 | 21.82 | 20.09 | 20.03 | 20.21 | 20.33 | 17.41 | 17.38 | 17.32 | 17.29 | 15.55 | 15.52 | 15.47 | 15.43 | 13.69 | 13.66 | 13.65 | 14.38 | 13.35 | 13.48 | 13.63 | 13.87 | 11.42 | 11.54 | 11.56 | 11.55 | 9.62 | 9.67 | 9.64 | 9.62 | 8.00 | 8.06 | 8.13 | 8.40 | 7.15 | 7.15 | 7.14 | 7.12 | 6.48 | 6.44 | 6.40 | |
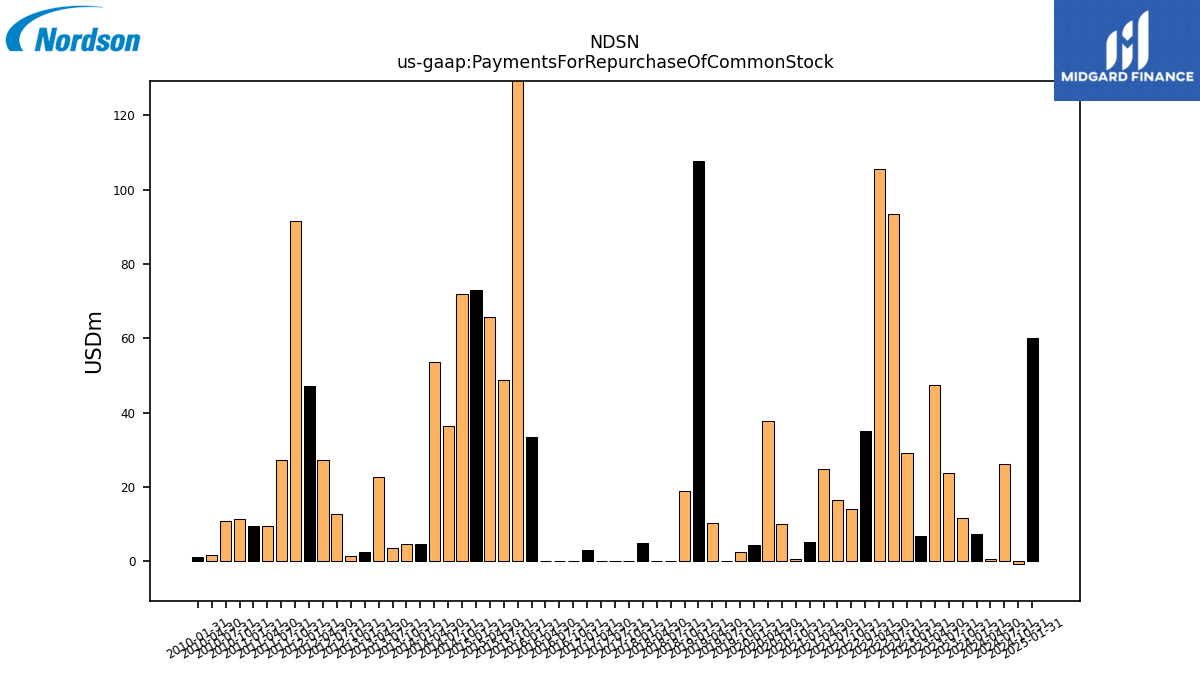
| Payments For Repurchase Of Common Stock | 7.37 | 11.54 | 23.80 | 47.49 | 6.88 | 29.10 | 93.30 | 105.46 | 35.00 | 14.13 | 16.57 | 24.96 | 5.31 | 0.72 | 9.97 | 37.62 | 4.31 | 2.39 | 0.04 | 10.42 | 107.67 | 18.95 | 0.06 | 0.02 | 4.99 | 0.10 | 0.02 | 0.02 | 3.08 | 0.00 | 0.00 | 0.01 | 33.41 | 196.10 | 48.89 | 65.78 | 73.08 | 72.02 | 36.34 | 53.50 | 4.56 | 4.57 | 3.66 | 22.58 | 2.59 | 1.47 | 12.63 | 27.33 | 47.02 | 91.65 | 27.21 | 9.61 | 9.52 | 11.32 | 10.84 | 1.58 | 1.19 |
| 2024-01-31 | 2023-10-31 | 2023-07-31 | 2023-04-30 | 2023-01-31 | 2022-10-31 | 2022-07-31 | 2022-04-30 | 2022-01-31 | 2021-10-31 | 2021-07-31 | 2021-04-30 | 2021-01-31 | 2020-10-31 | 2020-07-31 | 2020-04-30 | 2020-01-31 | 2019-10-31 | 2019-07-31 | 2019-04-30 | 2019-01-31 | 2018-10-31 | 2018-07-31 | 2018-04-30 | 2018-01-31 | 2017-10-31 | 2017-07-31 | 2017-04-30 | 2017-01-31 | 2016-10-31 | 2016-07-31 | 2016-04-30 | 2016-01-31 | 2015-10-31 | 2015-07-31 | 2015-04-30 | 2015-01-31 | 2014-10-31 | 2014-07-31 | 2014-04-30 | 2014-01-31 | 2013-10-31 | 2013-07-31 | 2013-04-30 | 2013-01-31 | 2012-10-31 | 2012-07-31 | 2012-04-30 | 2012-01-31 | 2011-10-31 | 2011-07-31 | 2011-04-30 | 2011-01-31 | 2010-10-31 | 2010-07-31 | 2010-04-30 | 2010-01-31 | ||
|---|---|---|---|---|---|---|---|---|---|---|---|---|---|---|---|---|---|---|---|---|---|---|---|---|---|---|---|---|---|---|---|---|---|---|---|---|---|---|---|---|---|---|---|---|---|---|---|---|---|---|---|---|---|---|---|---|---|---|
| Revenues | 633.19 | 719.31 | 648.68 | 650.16 | 610.48 | 683.58 | 662.13 | 635.40 | 609.17 | 599.25 | 646.86 | 589.54 | 526.57 | 558.52 | 538.18 | 529.48 | 494.92 | 585.45 | 559.75 | 551.12 | 497.91 | 569.29 | 581.24 | 553.71 | 550.42 | 573.94 | 589.44 | 496.14 | 407.47 | 509.28 | 489.90 | 437.59 | 372.22 | 446.20 | 462.73 | 400.73 | 379.01 | 468.59 | 458.55 | 417.46 | 359.42 | 410.82 | 402.96 | 382.10 | 347.04 | 438.68 | 379.87 | 315.19 | 275.84 | 331.02 | 312.25 | 318.92 | 270.96 | 290.18 | 279.12 | 251.66 | 220.59 | |
| Revenue From Contract With Customer Excluding Assessed Tax | 633.19 | 719.31 | 648.68 | 650.16 | 610.48 | 683.58 | 662.13 | 635.40 | 609.17 | 599.25 | 646.86 | 589.54 | 526.57 | 558.52 | 538.18 | 529.48 | 494.92 | 585.45 | 559.75 | 551.12 | 497.91 | 569.29 | 581.24 | 553.71 | 550.42 | 573.94 | 589.44 | 496.14 | 407.47 | 509.28 | 489.90 | 437.59 | 372.22 | 446.20 | 462.73 | 400.73 | 379.01 | 468.59 | 458.55 | 417.46 | 359.42 | 410.82 | 402.96 | 382.10 | 347.04 | 438.68 | 379.87 | 315.19 | 275.84 | 331.02 | 312.25 | 318.92 | 270.96 | 290.18 | 279.12 | 251.66 | 220.59 | |
| Operating | 633.19 | NA | 648.68 | 650.16 | 610.48 | 683.58 | 662.13 | 635.40 | 609.17 | 599.25 | 646.86 | 589.54 | 526.57 | 558.52 | 538.18 | 529.48 | 494.92 | 585.45 | 559.75 | 551.12 | 497.91 | 569.29 | 581.24 | 553.71 | 550.42 | NA | NA | NA | 407.47 | 509.28 | 489.90 | 437.59 | 372.22 | 446.20 | 462.73 | 400.73 | 379.01 | NA | NA | NA | NA | NA | NA | NA | NA | NA | NA | NA | NA | NA | NA | NA | NA | NA | NA | NA | NA | |
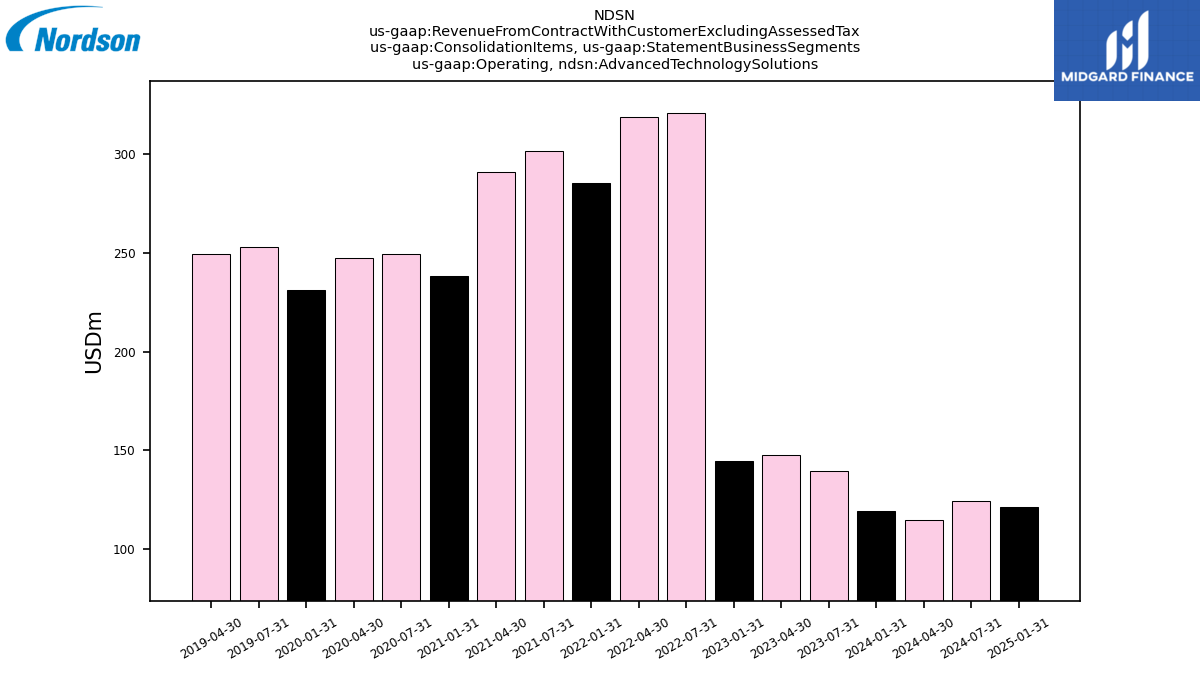
| Operating, Advanced Technology Solutions | 119.12 | NA | 139.55 | 147.83 | 144.64 | NA | 320.91 | 318.97 | 285.23 | NA | 301.41 | 290.76 | 238.15 | NA | 249.22 | 247.20 | 231.12 | NA | 253.10 | 249.29 | NA | NA | NA | NA | NA | NA | NA | NA | NA | NA | NA | NA | NA | NA | NA | NA | NA | NA | NA | NA | NA | NA | NA | NA | NA | NA | NA | NA | NA | NA | NA | NA | NA | NA | NA | NA | NA | |
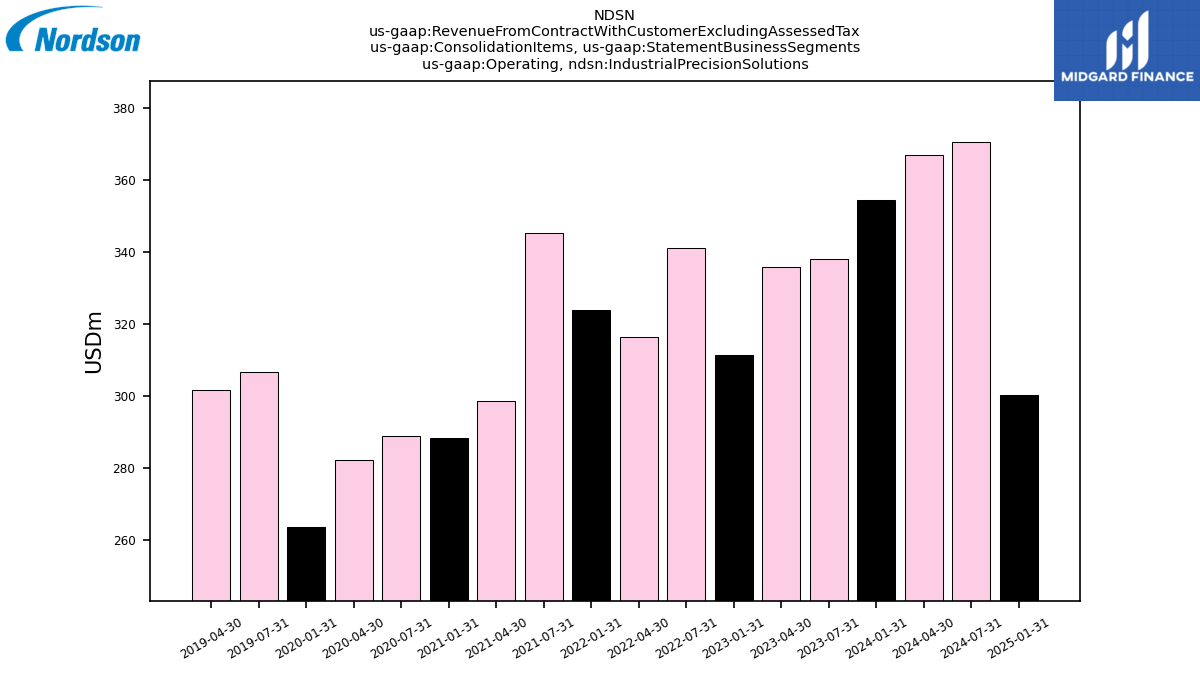
| Operating, Industrial Precision Solutions | 354.55 | NA | 338.26 | 335.81 | 311.55 | NA | 341.21 | 316.43 | 323.93 | NA | 345.45 | 298.77 | 288.42 | NA | 288.96 | 282.27 | 263.80 | NA | 306.65 | 301.82 | NA | NA | NA | NA | NA | NA | NA | NA | NA | NA | NA | NA | NA | NA | NA | NA | NA | NA | NA | NA | NA | NA | NA | NA | NA | NA | NA | NA | NA | NA | NA | NA | NA | NA | NA | NA | NA | |
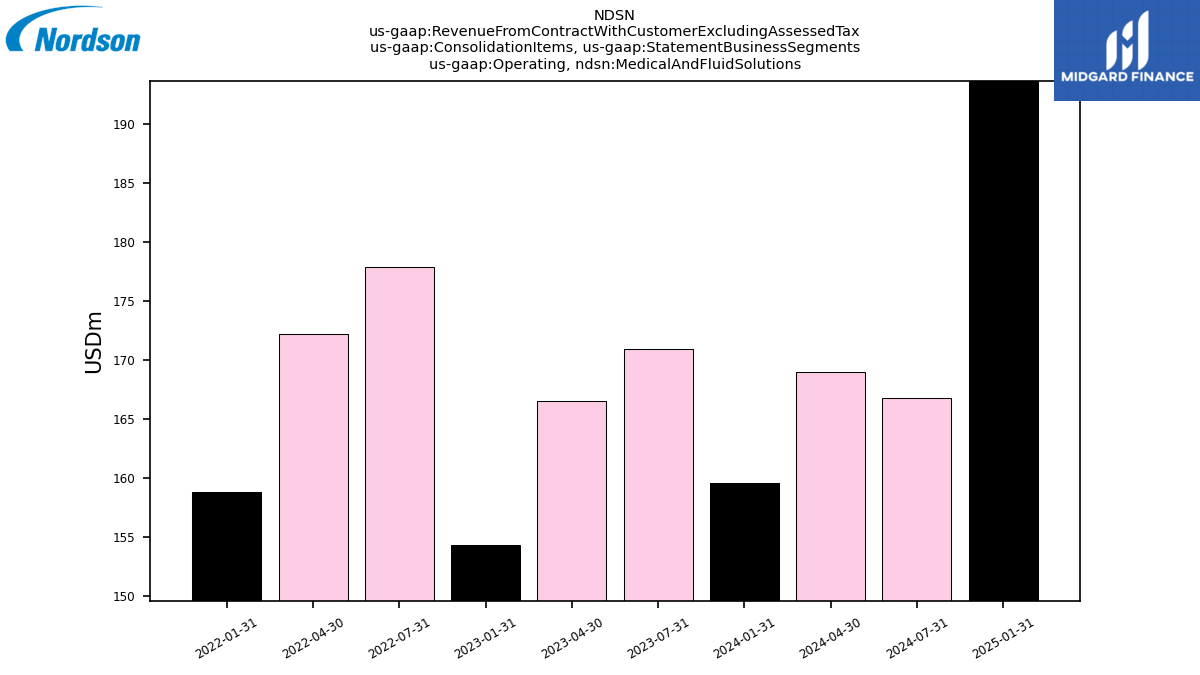
| Operating, Medical And Fluid Solutions | 159.53 | NA | 170.87 | 166.53 | 154.29 | NA | 177.84 | 172.21 | 158.78 | NA | NA | NA | NA | NA | NA | NA | NA | NA | NA | NA | NA | NA | NA | NA | NA | NA | NA | NA | NA | NA | NA | NA | NA | NA | NA | NA | NA | NA | NA | NA | NA | NA | NA | NA | NA | NA | NA | NA | NA | NA | NA | NA | NA | NA | NA | NA | NA | |
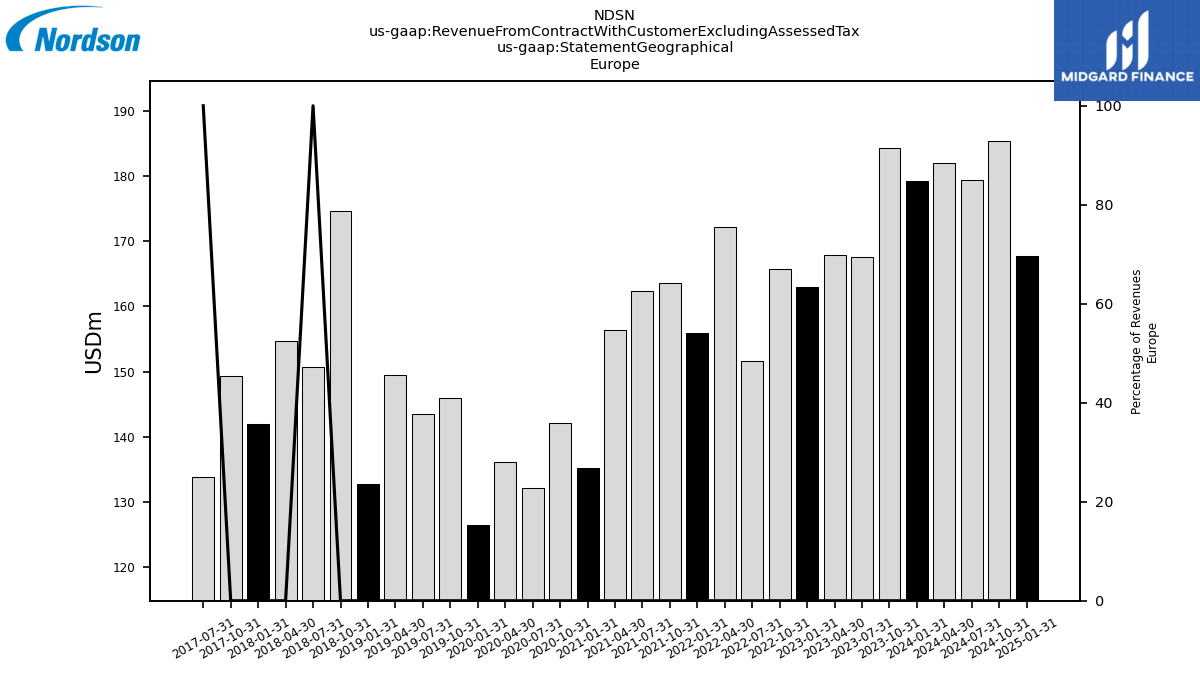
| 179.31 | 184.30 | 167.54 | 167.90 | 162.94 | 165.70 | 151.66 | 172.26 | 155.99 | 163.59 | 162.30 | 156.45 | 135.15 | 142.08 | 132.11 | 136.06 | 126.39 | 145.95 | 143.45 | 149.53 | 132.68 | 174.72 | 150.71 | 154.74 | 141.94 | 149.34 | 133.85 | NA | NA | NA | NA | NA | NA | NA | NA | NA | NA | NA | NA | NA | NA | NA | NA | NA | NA | NA | NA | NA | NA | NA | NA | NA | NA | NA | NA | NA | NA | ||
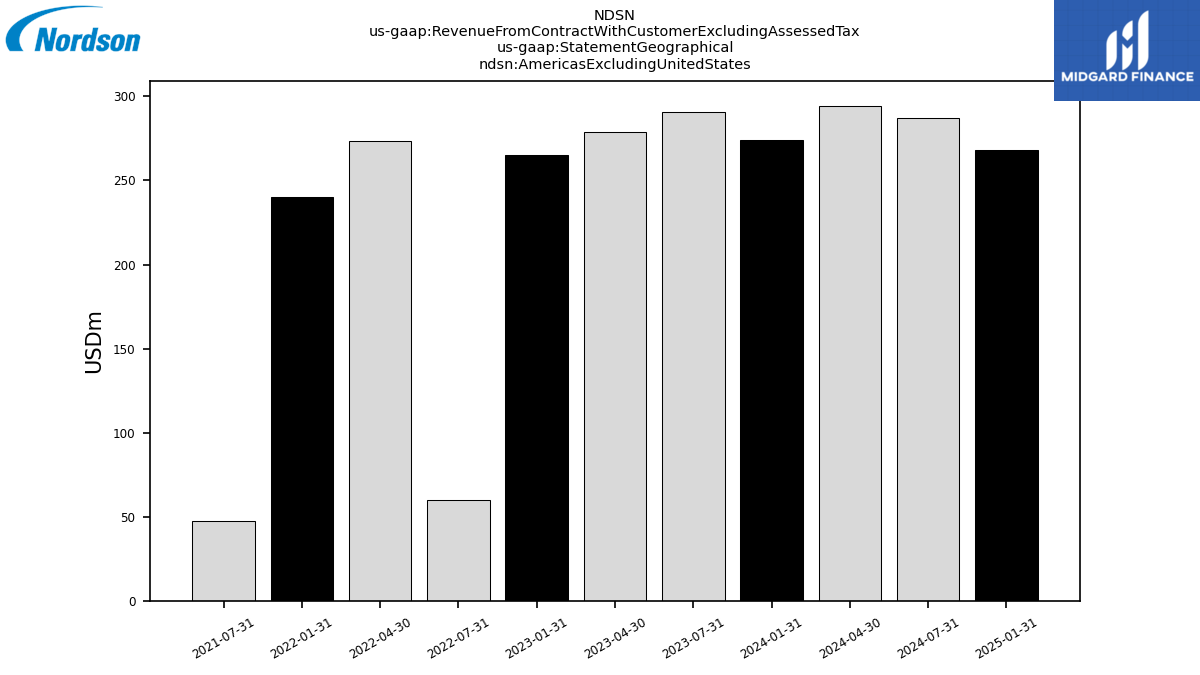
| Americas Excluding United States | 274.01 | NA | 290.51 | 278.73 | 264.88 | NA | 60.14 | 273.75 | 239.90 | NA | 47.72 | NA | NA | NA | NA | NA | NA | NA | NA | NA | NA | NA | NA | NA | NA | NA | NA | NA | NA | NA | NA | NA | NA | NA | NA | NA | NA | NA | NA | NA | NA | NA | NA | NA | NA | NA | NA | NA | NA | NA | NA | NA | NA | NA | NA | NA | NA | |
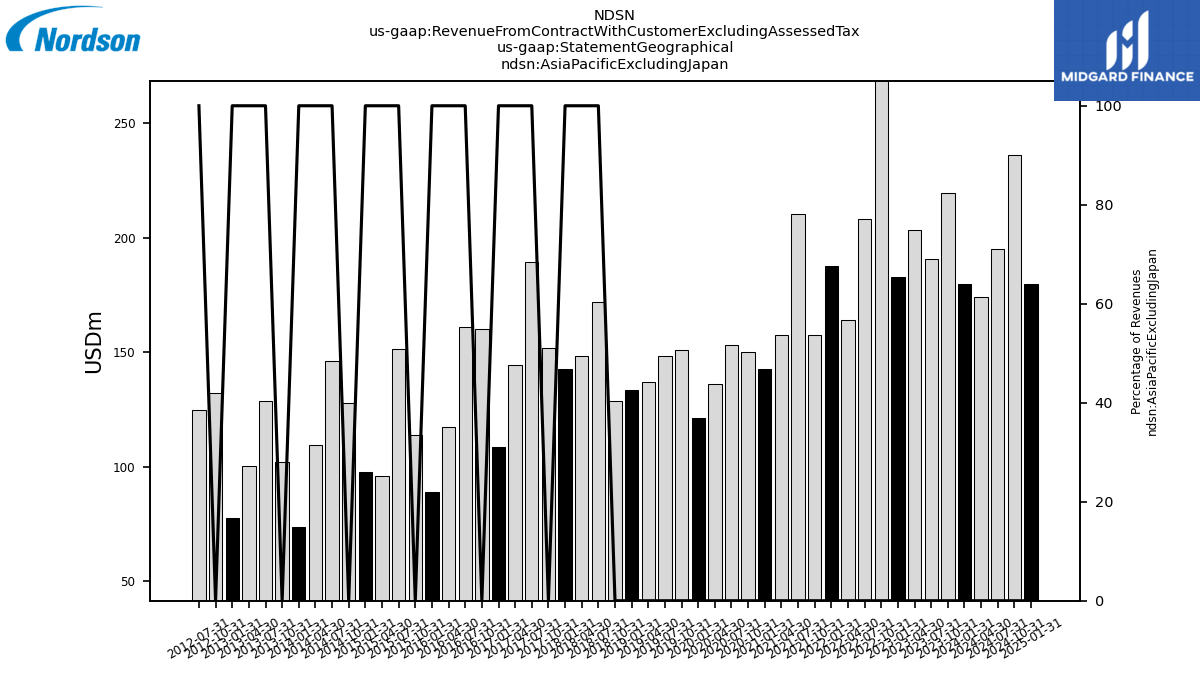
| Asia Pacific Excluding Japan | 179.87 | 219.38 | 190.63 | 203.53 | 182.66 | 288.22 | 208.18 | 163.95 | 187.72 | 157.43 | 210.37 | 157.40 | 142.85 | 150.04 | 153.07 | 136.24 | 121.39 | 150.94 | 148.31 | 137.18 | 133.40 | 128.71 | 171.74 | 148.16 | 142.51 | 151.77 | 189.56 | 144.39 | 108.57 | 159.94 | 161.01 | 117.45 | 88.90 | 113.91 | 151.28 | 96.07 | 97.82 | 127.73 | 146.32 | 109.68 | 73.93 | 102.10 | 128.55 | 100.33 | 77.82 | 132.10 | 124.98 | NA | NA | NA | NA | NA | NA | NA | NA | NA | NA |