
| 2023-09-30 | 2023-06-30 | 2023-03-31 | 2022-12-31 | 2022-09-30 | 2022-06-30 | 2022-03-31 | 2021-12-31 | 2021-09-30 | 2021-06-30 | 2021-03-31 | 2020-12-31 | 2020-09-30 | 2020-06-30 | 2020-03-31 | 2019-12-31 | 2019-09-30 | 2019-06-30 | 2019-03-31 | 2018-12-31 | 2018-09-30 | 2018-06-30 | 2018-03-31 | ||
|---|---|---|---|---|---|---|---|---|---|---|---|---|---|---|---|---|---|---|---|---|---|---|---|---|
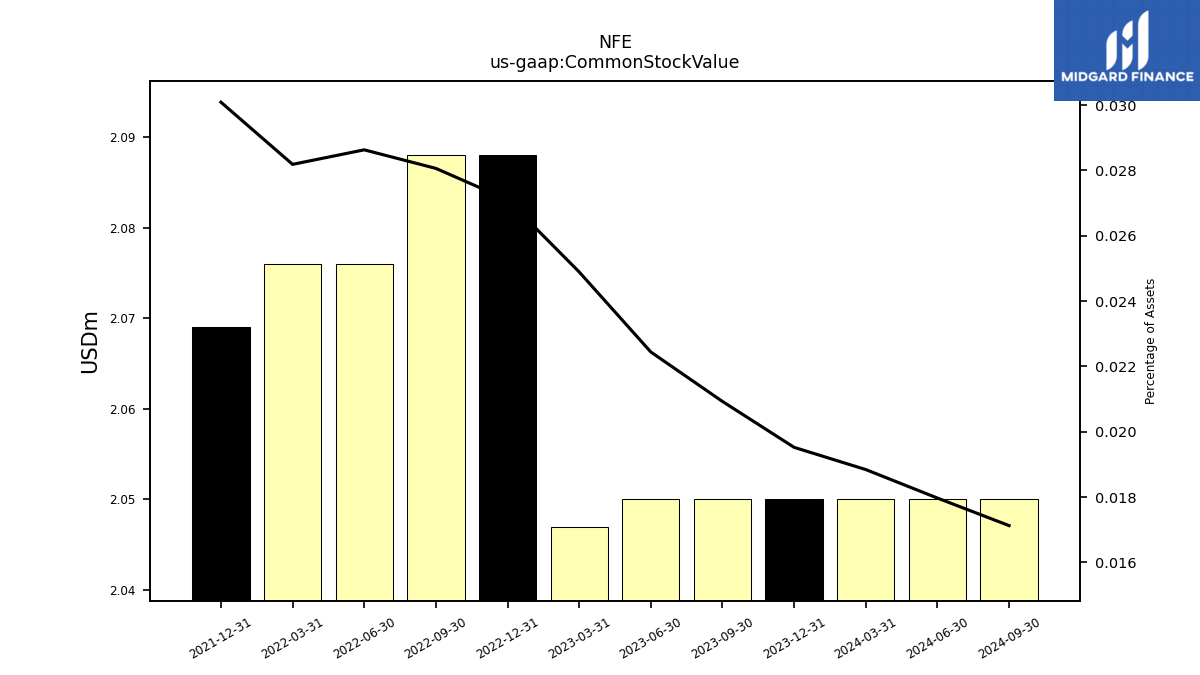
| Common Stock Value | 2.05 | 2.05 | 2.05 | 2.09 | 2.09 | 2.08 | 2.08 | 2.07 | NA | NA | NA | NA | NA | NA | NA | NA | NA | NA | NA | NA | NA | NA | NA | |
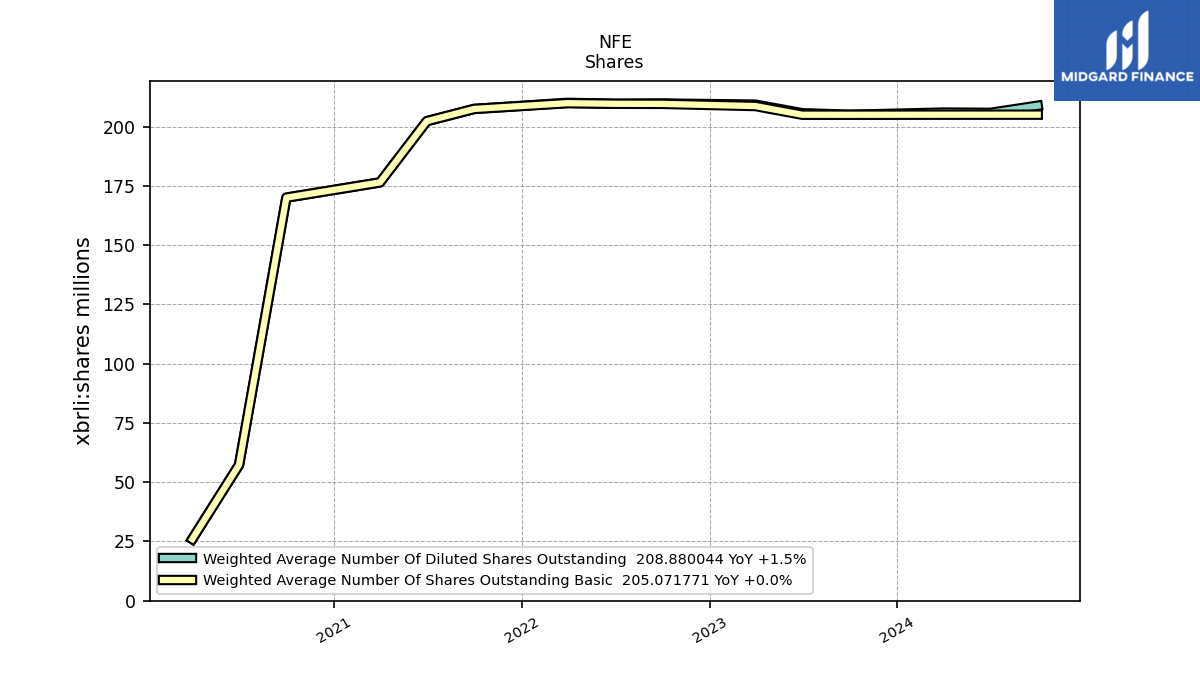
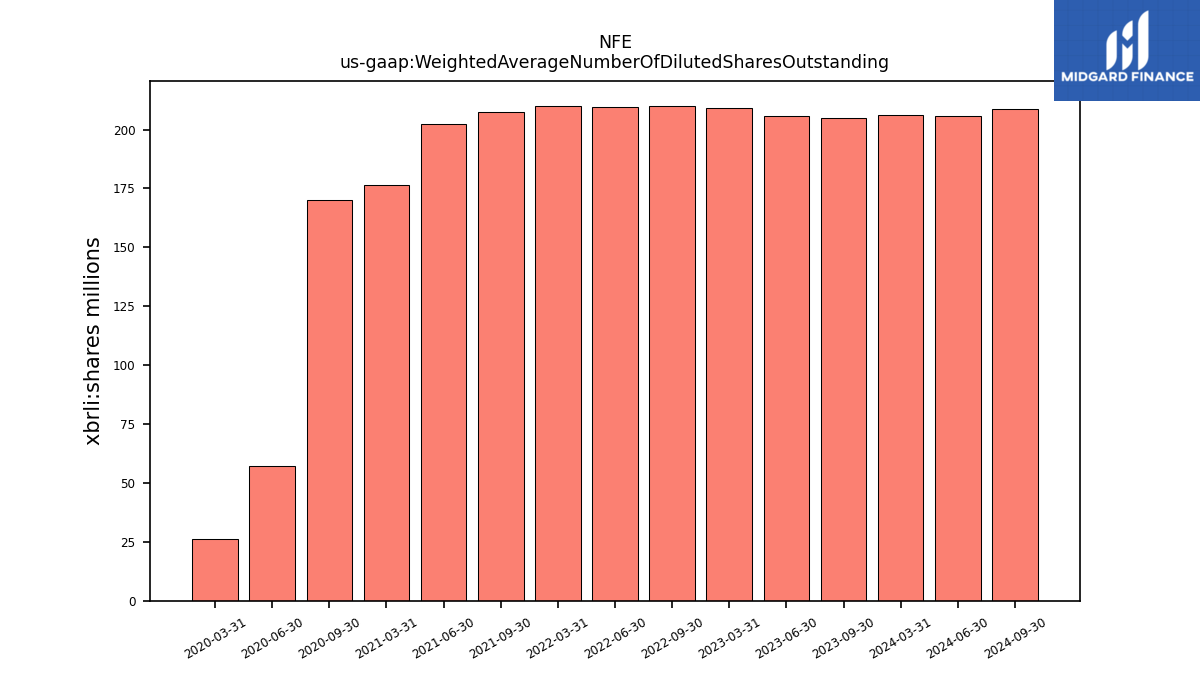
| Weighted Average Number Of Diluted Shares Outstanding | 205.03 | 205.71 | 209.33 | NA | 209.80 | 209.67 | 210.08 | NA | 207.50 | 202.33 | 176.50 | NA | 170.07 | 57.34 | 26.03 | NA | NA | NA | NA | NA | NA | NA | NA | |
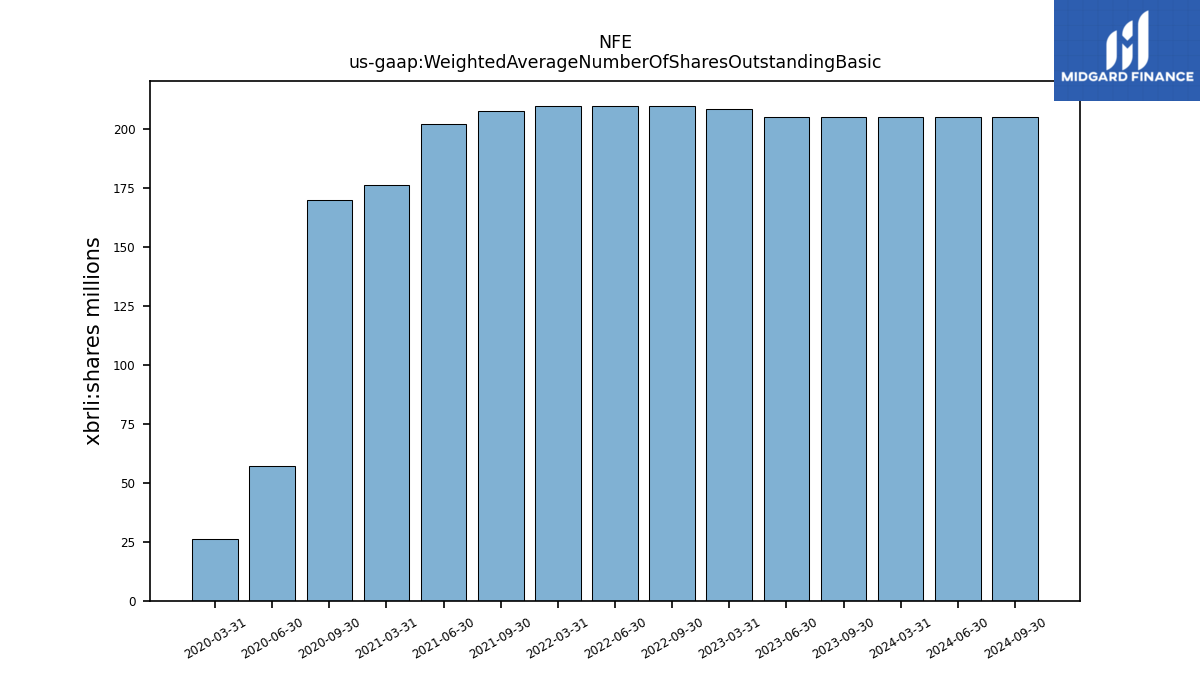
| Weighted Average Number Of Shares Outstanding Basic | 205.03 | 205.05 | 208.71 | NA | 209.63 | 209.67 | 209.93 | NA | 207.50 | 202.33 | 176.50 | NA | 170.07 | 57.34 | 26.03 | NA | NA | NA | NA | NA | NA | NA | NA | |
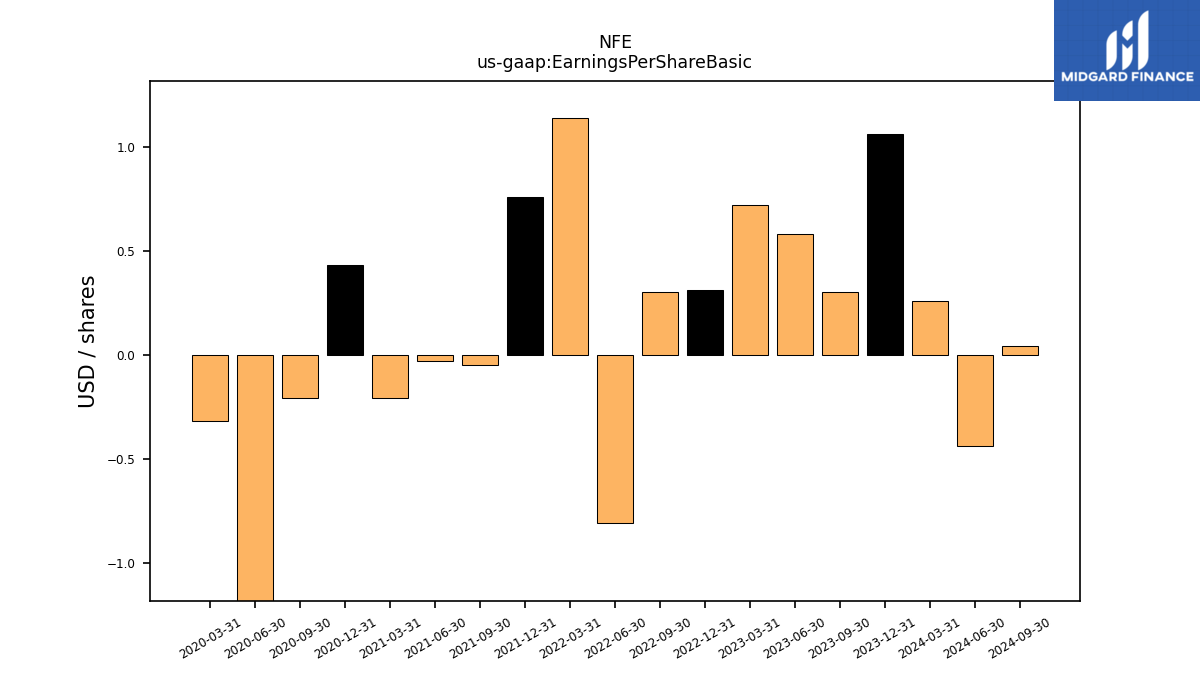
| Earnings Per Share Basic | 0.30 | 0.58 | 0.72 | 0.31 | 0.30 | -0.81 | 1.14 | 0.76 | -0.05 | -0.03 | -0.21 | 0.43 | -0.21 | -2.40 | -0.32 | NA | NA | NA | NA | NA | NA | NA | NA | |
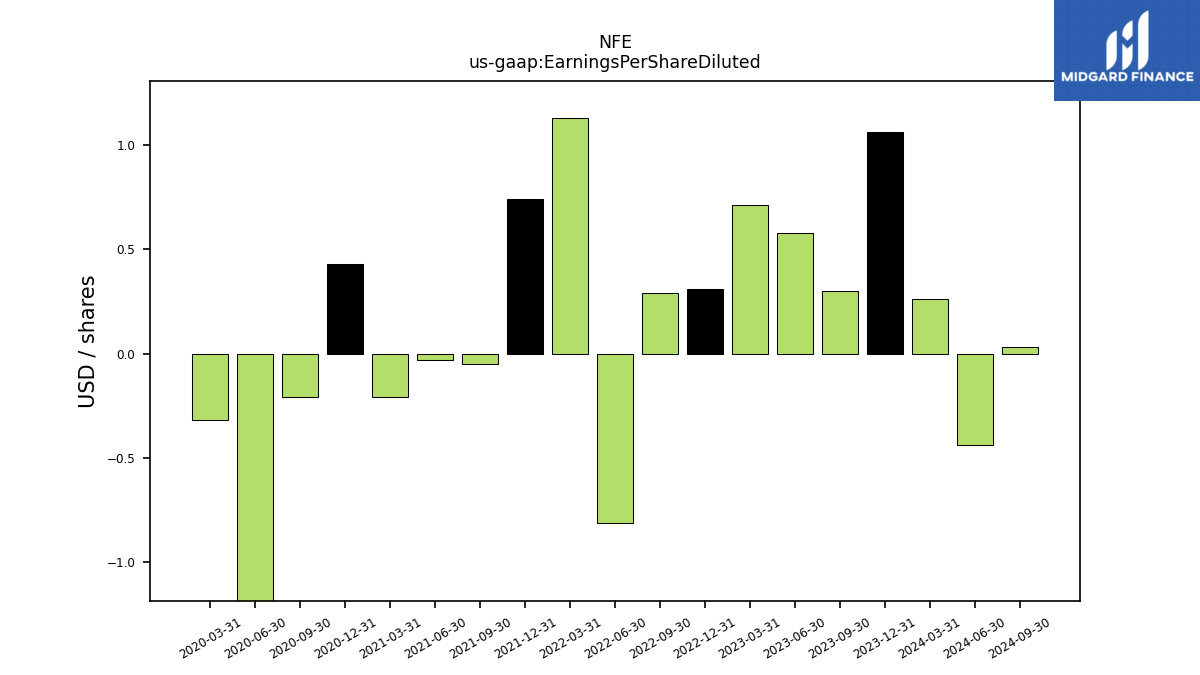
| Earnings Per Share Diluted | 0.30 | 0.58 | 0.71 | 0.31 | 0.29 | -0.81 | 1.13 | 0.74 | -0.05 | -0.03 | -0.21 | 0.43 | -0.21 | -2.40 | -0.32 | NA | NA | NA | NA | NA | NA | NA | NA |
| 2023-09-30 | 2023-06-30 | 2023-03-31 | 2022-12-31 | 2022-09-30 | 2022-06-30 | 2022-03-31 | 2021-12-31 | 2021-09-30 | 2021-06-30 | 2021-03-31 | 2020-12-31 | 2020-09-30 | 2020-06-30 | 2020-03-31 | 2019-12-31 | 2019-09-30 | 2019-06-30 | 2019-03-31 | 2018-12-31 | 2018-09-30 | 2018-06-30 | 2018-03-31 | ||
|---|---|---|---|---|---|---|---|---|---|---|---|---|---|---|---|---|---|---|---|---|---|---|---|---|
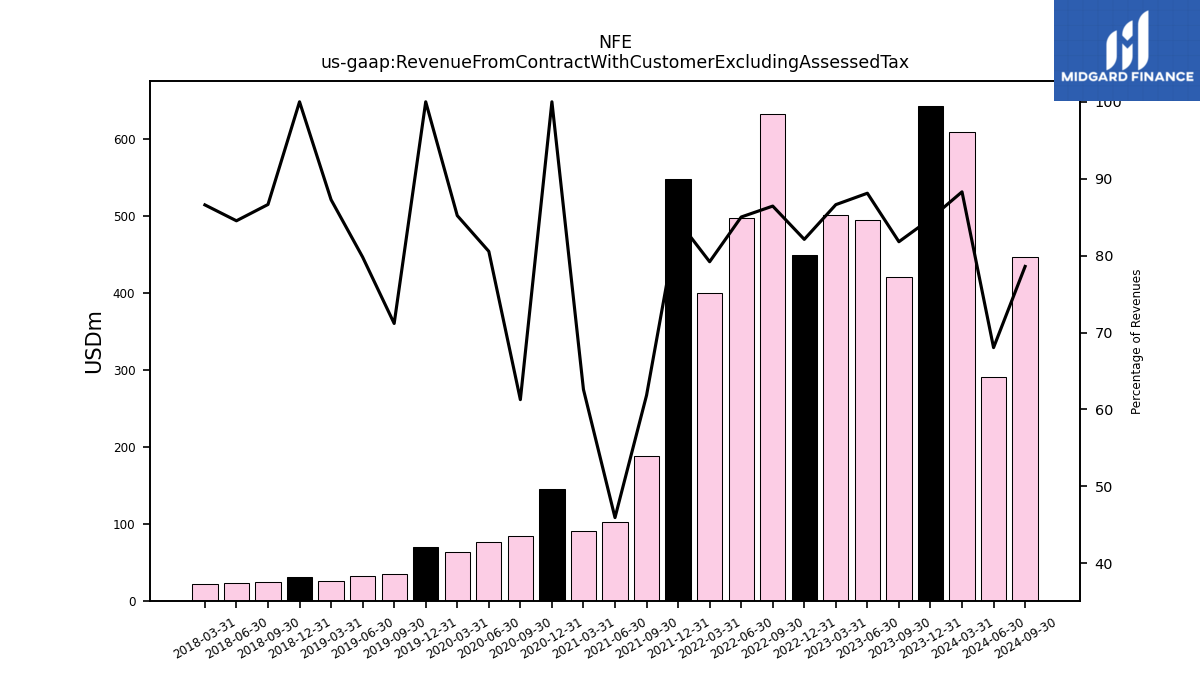
| Revenue From Contract With Customer Excluding Assessed Tax | 420.87 | 494.62 | 501.69 | 448.65 | 632.68 | 497.24 | 400.07 | 548.39 | 188.39 | 102.84 | 91.20 | 145.70 | 83.86 | 76.18 | 63.50 | 69.75 | 35.34 | 31.74 | 26.14 | 31.37 | 24.63 | 22.65 | 22.26 | |
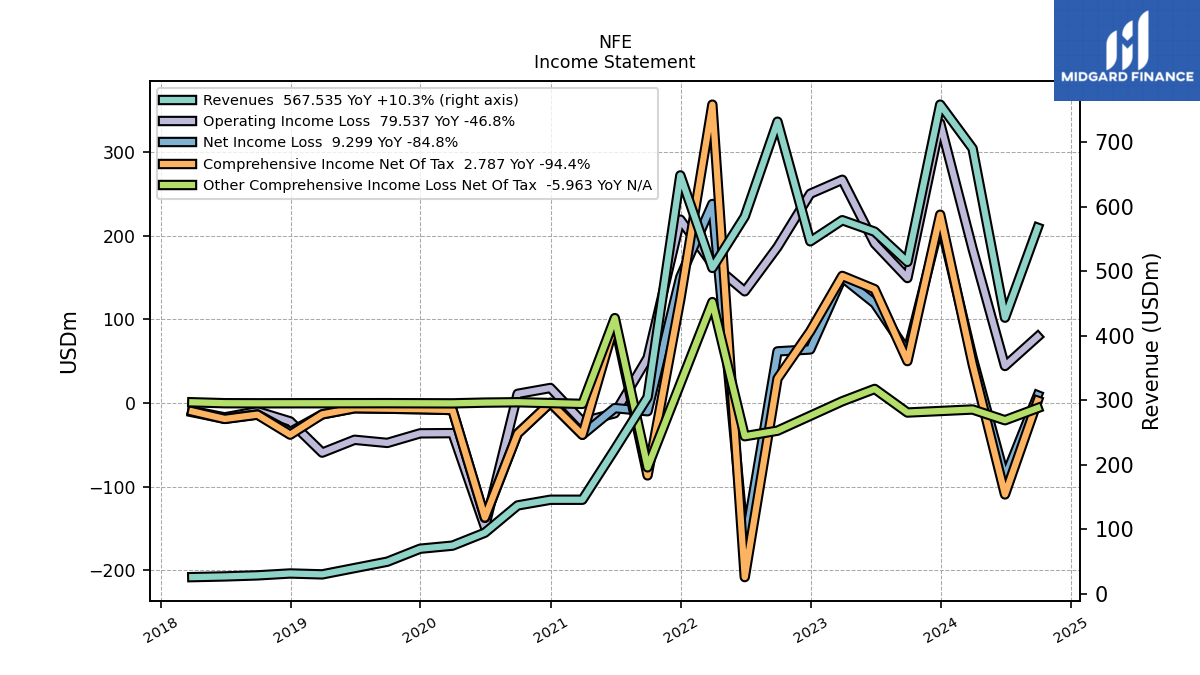
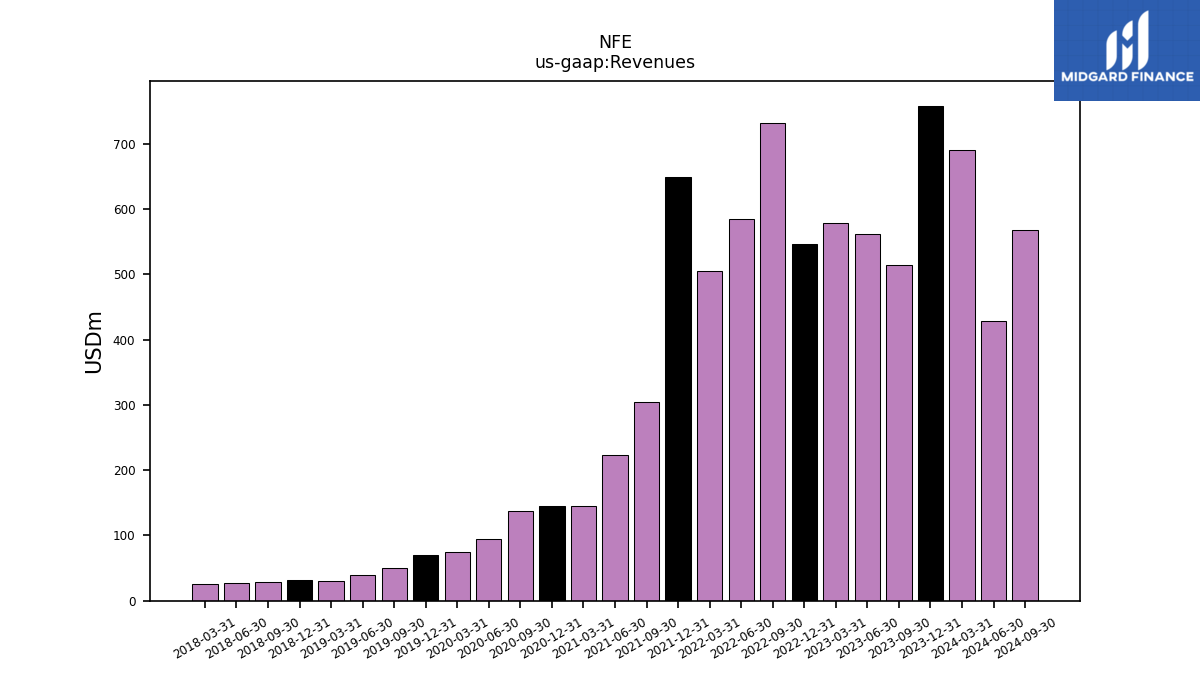
| Revenues | 514.46 | 561.35 | 579.13 | 546.37 | 731.93 | 584.86 | 505.12 | 648.63 | 304.66 | 223.84 | 145.68 | 145.70 | 136.86 | 94.57 | 74.53 | 69.75 | 49.66 | 39.77 | 29.95 | 31.37 | 28.42 | 26.80 | 25.71 | |
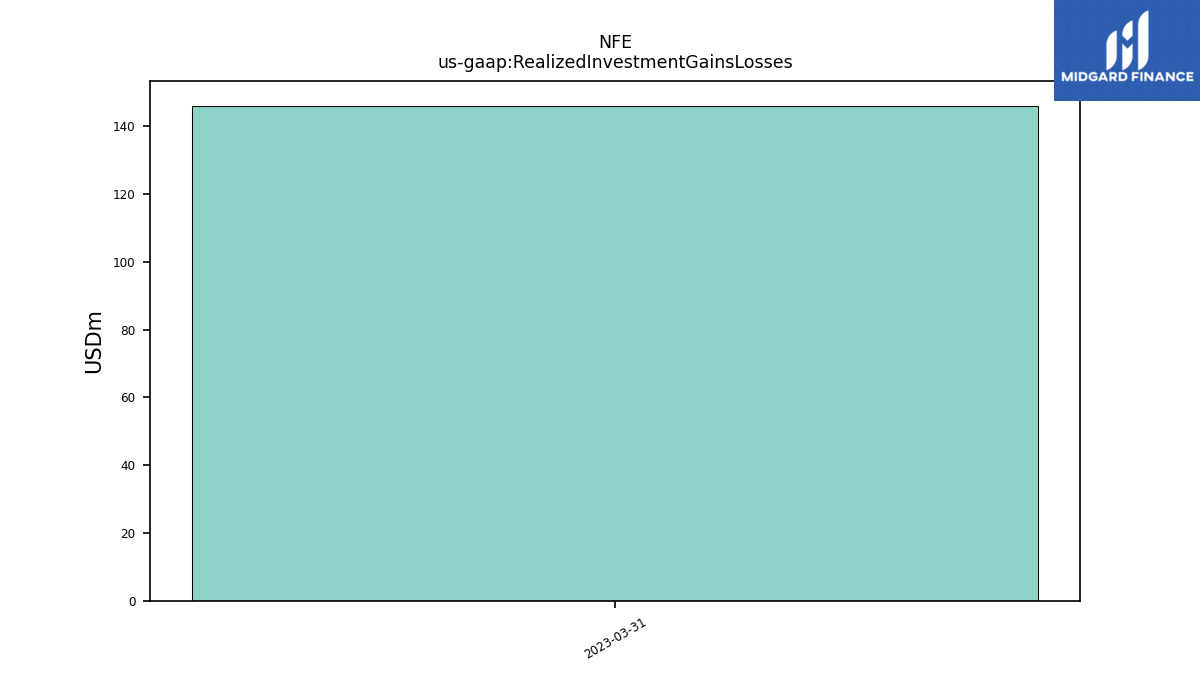
| Realized Investment Gains Losses | NA | NA | 146.11 | NA | NA | NA | NA | NA | NA | NA | NA | NA | NA | NA | NA | NA | NA | NA | NA | NA | NA | NA | NA | |
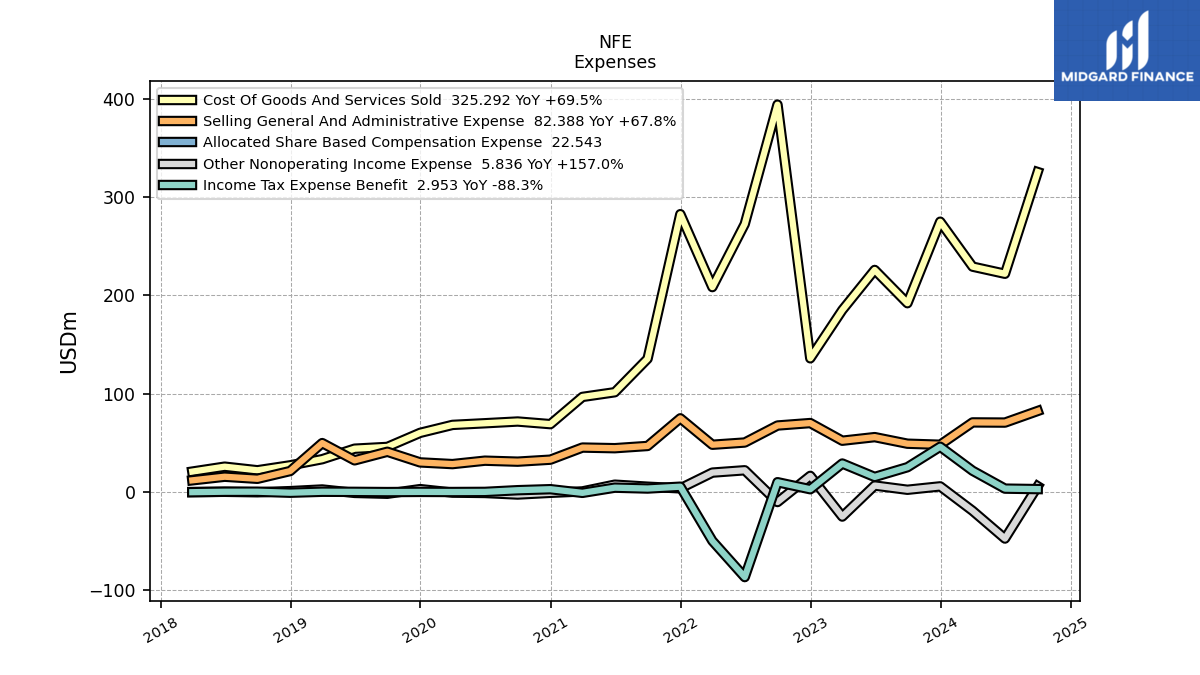
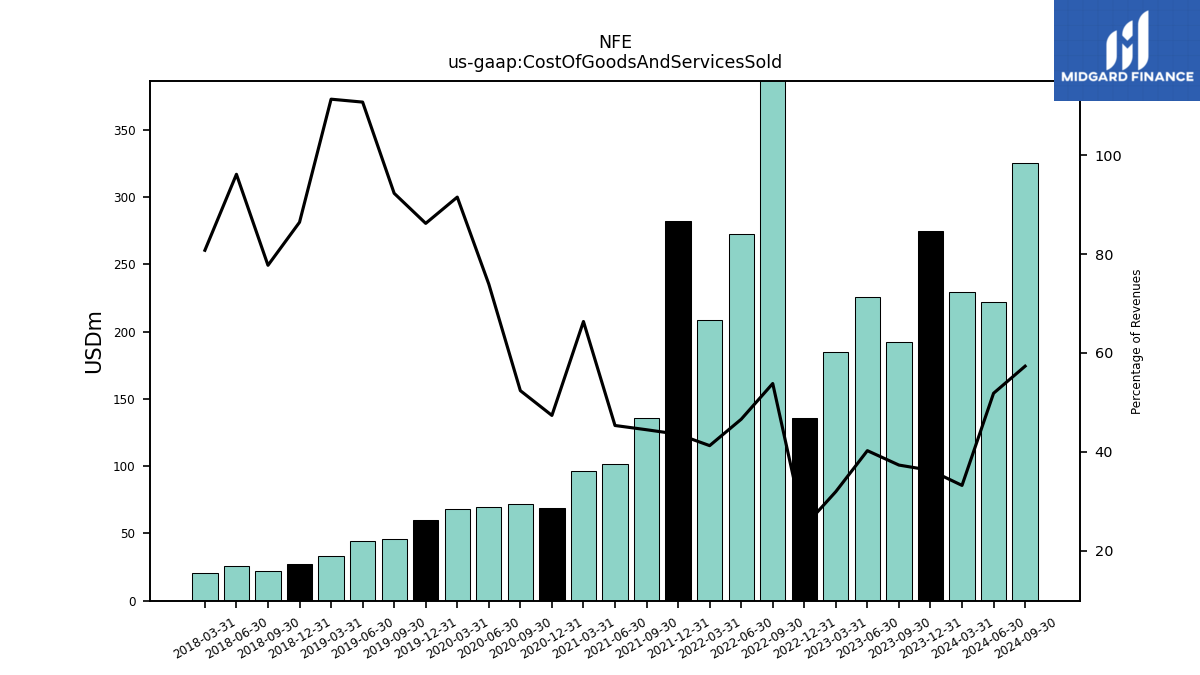
| Cost Of Goods And Services Sold | 191.92 | 225.77 | 184.94 | 135.90 | 393.83 | 272.40 | 208.30 | 282.48 | 135.43 | 101.43 | 96.67 | 68.99 | 71.67 | 69.90 | 68.22 | 60.13 | 45.83 | 44.04 | 33.35 | 27.12 | 22.09 | 25.77 | 20.77 | |
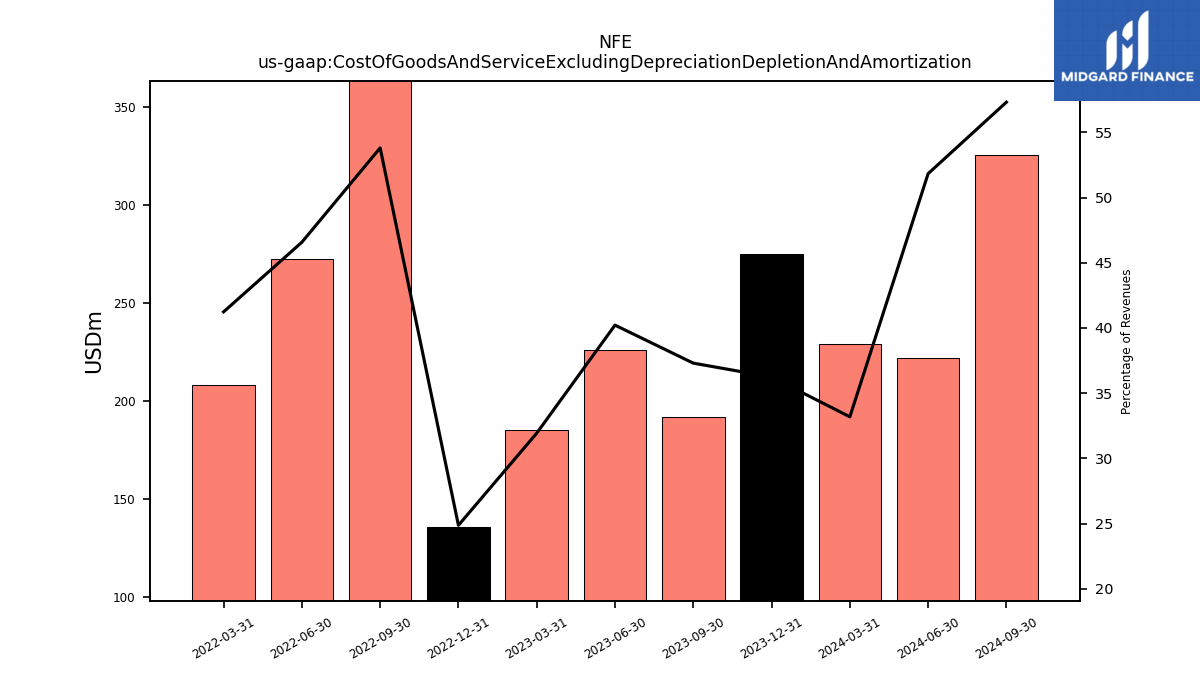
| Cost Of Goods And Service Excluding Depreciation Depletion And Amortization | 191.92 | 225.77 | 184.94 | 135.90 | 393.83 | 272.40 | 208.30 | NA | NA | NA | NA | NA | NA | NA | NA | NA | NA | NA | NA | NA | NA | NA | NA | |
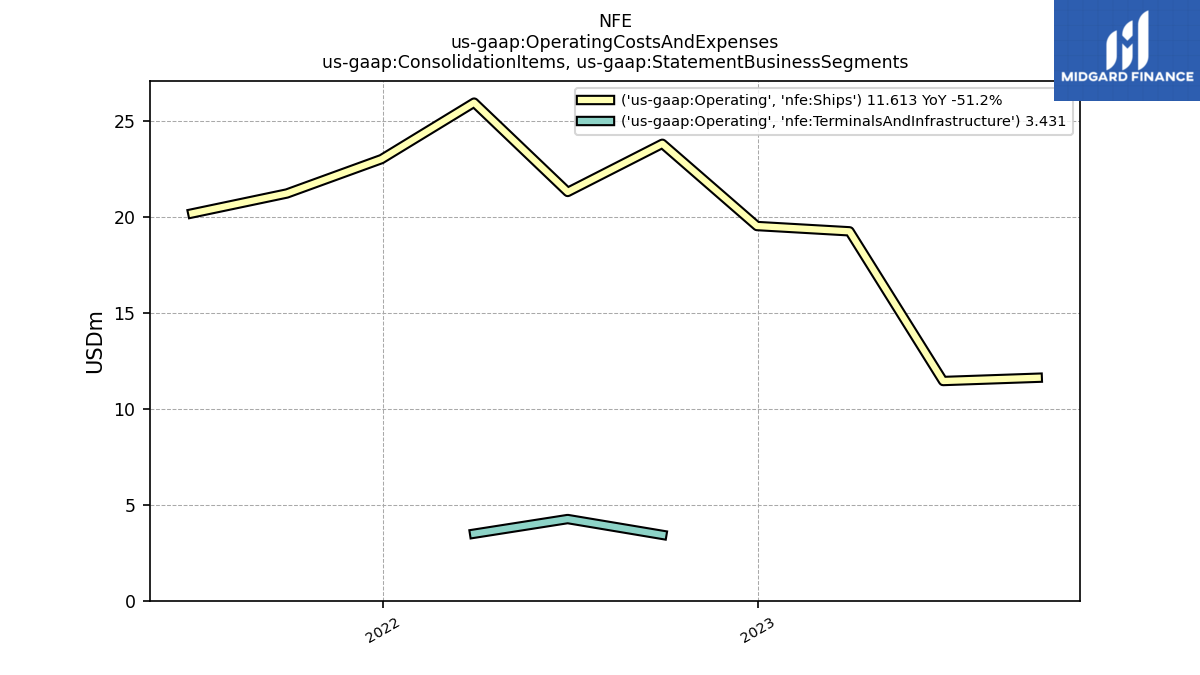
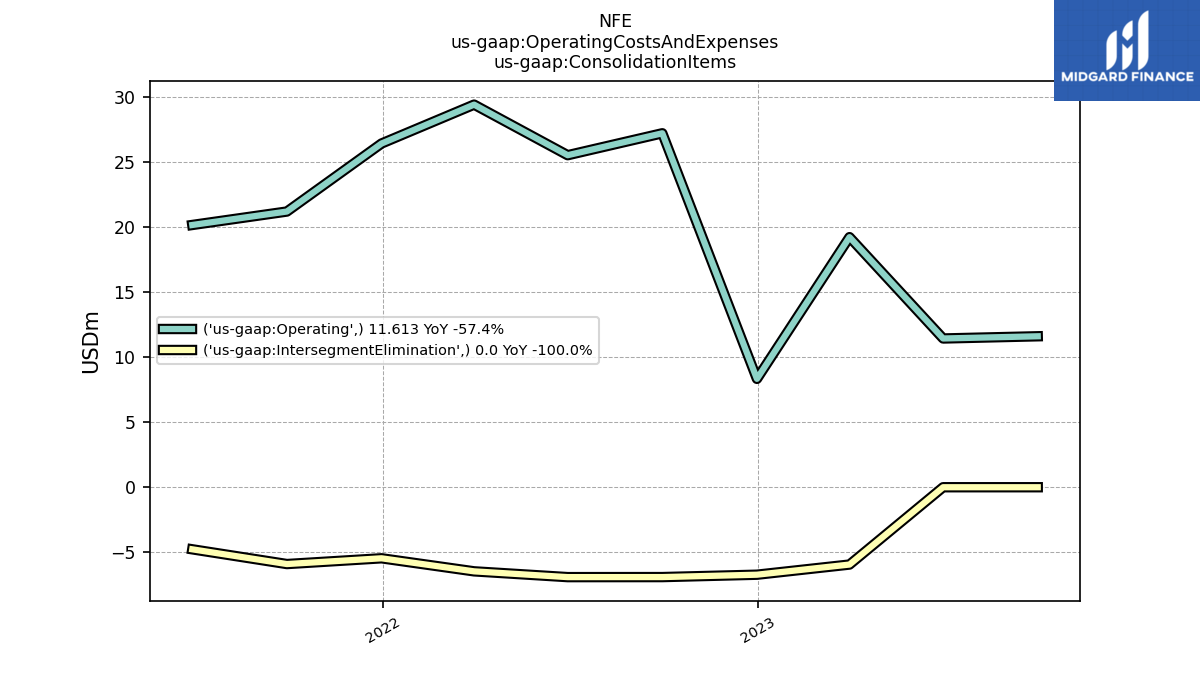
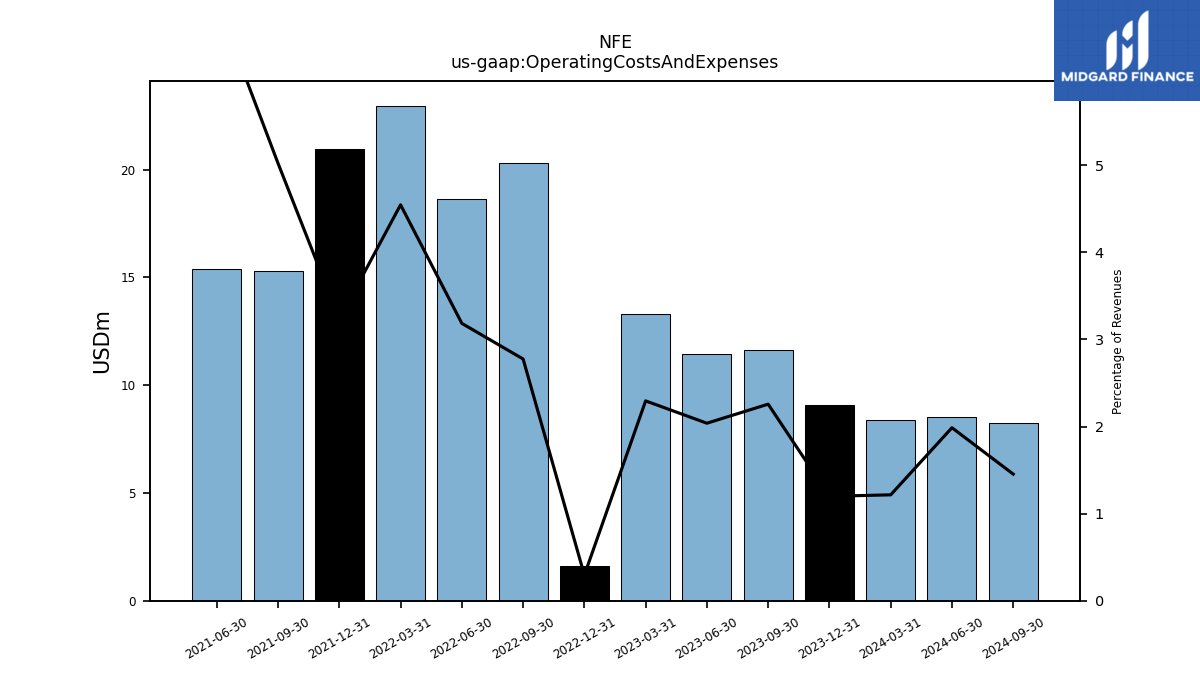
| Operating Costs And Expenses | 11.61 | 11.44 | 13.29 | 1.61 | 20.32 | 18.63 | 22.96 | 20.98 | 15.30 | 15.40 | NA | NA | NA | NA | NA | NA | NA | NA | NA | NA | NA | NA | NA | |
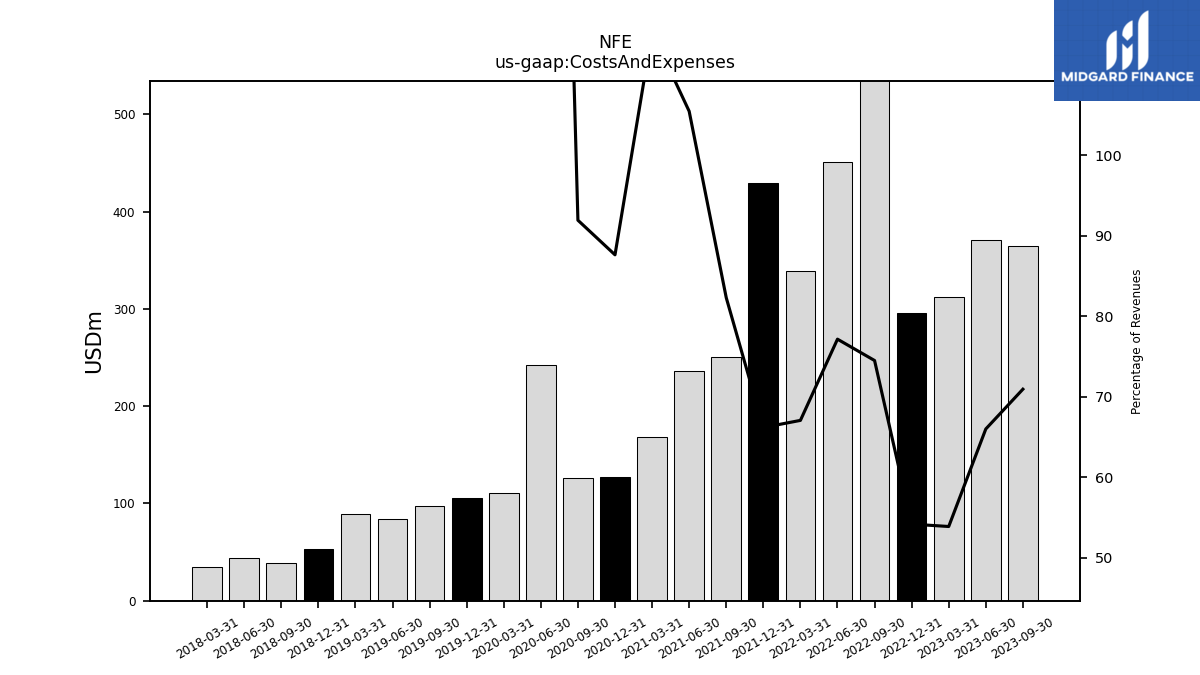
| Costs And Expenses | 364.87 | 370.38 | 311.91 | 295.88 | 545.20 | 451.16 | 338.66 | 429.14 | 250.72 | 236.08 | 167.99 | 127.67 | 125.81 | 242.77 | 110.53 | 106.00 | 97.38 | 83.72 | 89.29 | 53.33 | 38.35 | 43.94 | 35.17 | |
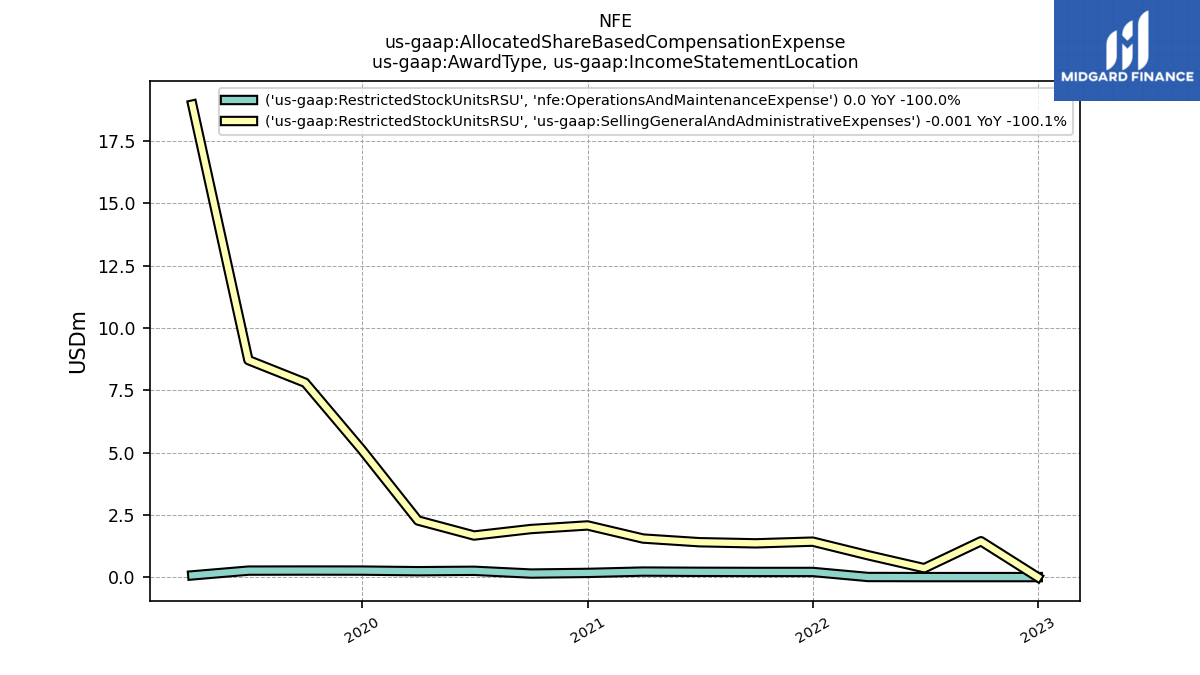
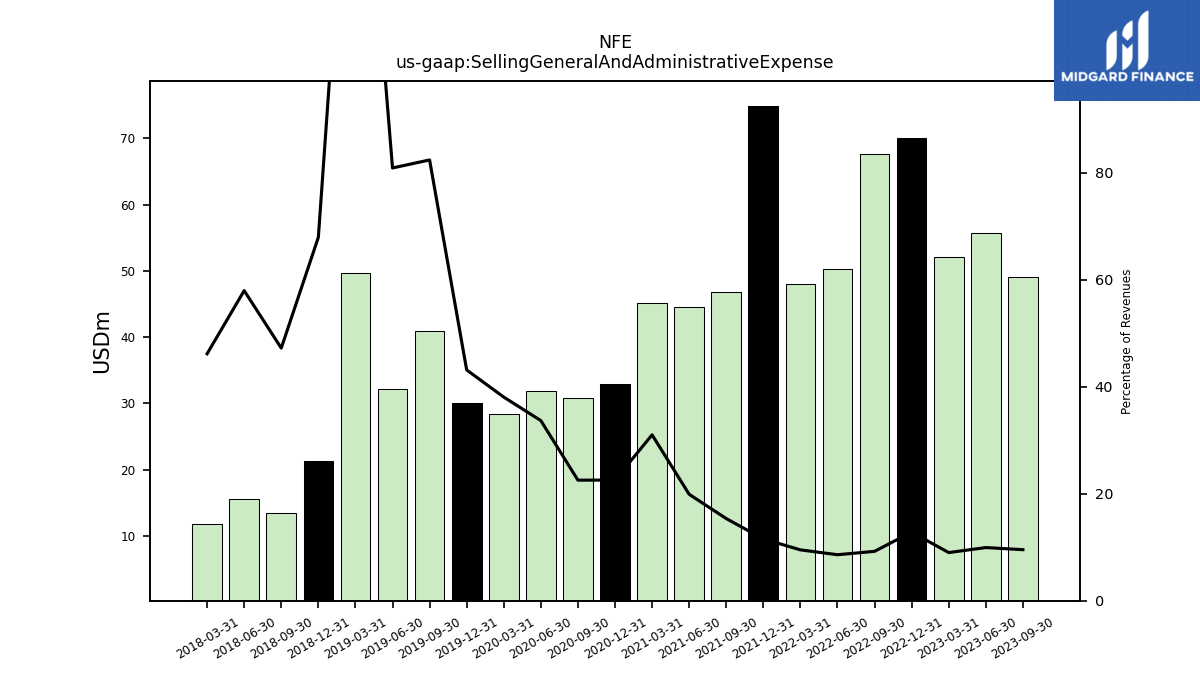
| Selling General And Administrative Expense | 49.11 | 55.80 | 52.14 | 70.10 | 67.60 | 50.31 | 48.04 | 74.93 | 46.80 | 44.54 | 45.18 | 32.87 | 30.85 | 31.85 | 28.37 | 30.09 | 40.91 | 32.17 | 49.75 | 21.31 | 13.42 | 15.54 | 11.87 | |
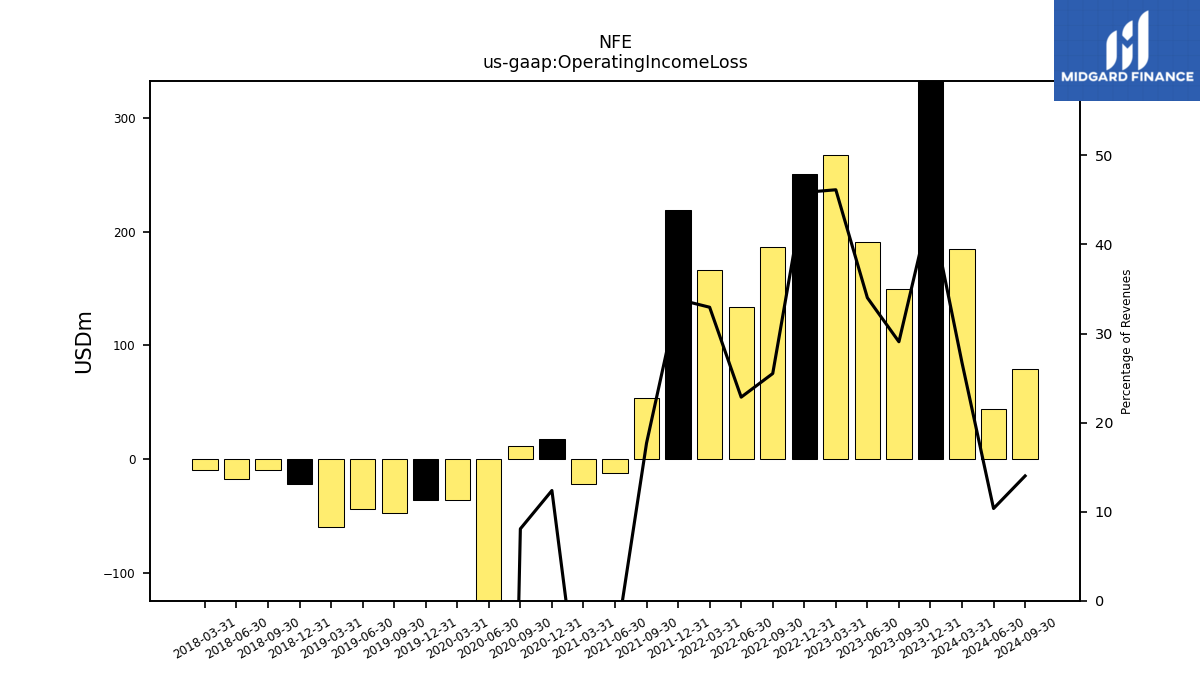
| Operating Income Loss | 149.59 | 190.97 | 267.22 | 250.49 | 186.74 | 133.69 | 166.46 | 219.49 | 53.94 | -12.24 | -22.31 | 18.03 | 11.05 | -148.21 | -36.00 | -36.25 | -47.73 | -43.96 | -59.34 | -21.96 | -9.92 | -17.14 | -9.46 | |
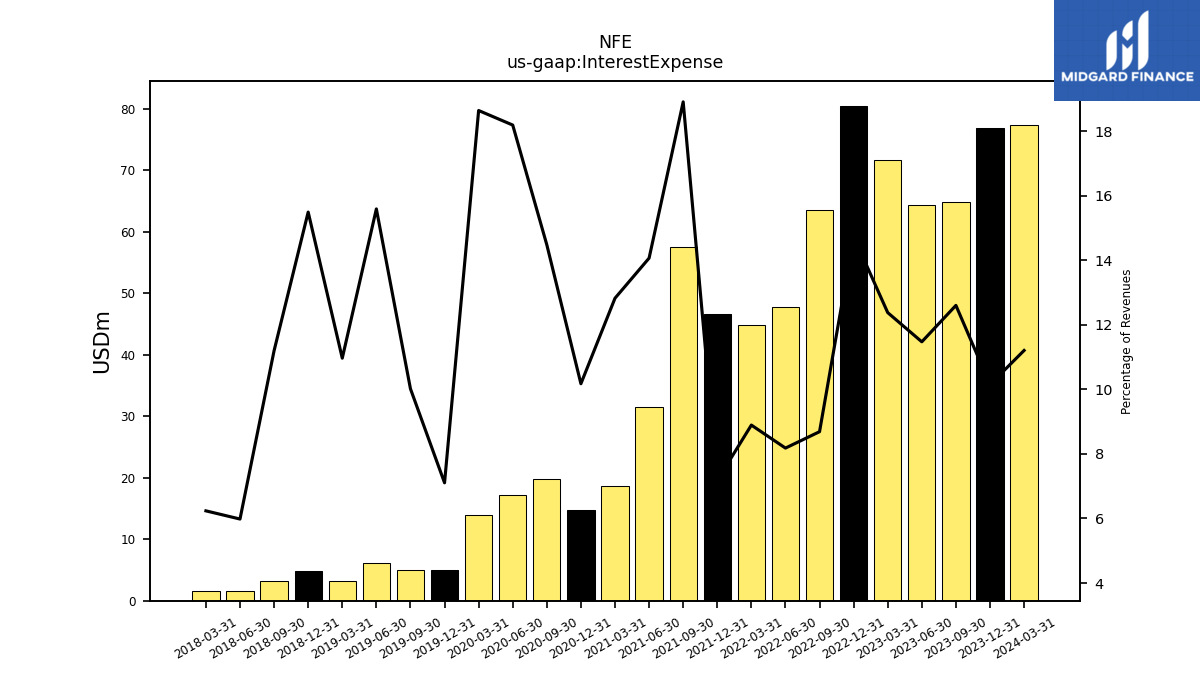
| Interest Expense | 64.82 | 64.40 | 71.67 | 80.52 | 63.59 | 47.84 | 44.92 | 46.57 | 57.59 | 31.48 | 18.68 | 14.82 | 19.81 | 17.20 | 13.89 | 4.96 | 4.97 | 6.20 | 3.28 | 4.86 | 3.18 | 1.60 | 1.60 | |
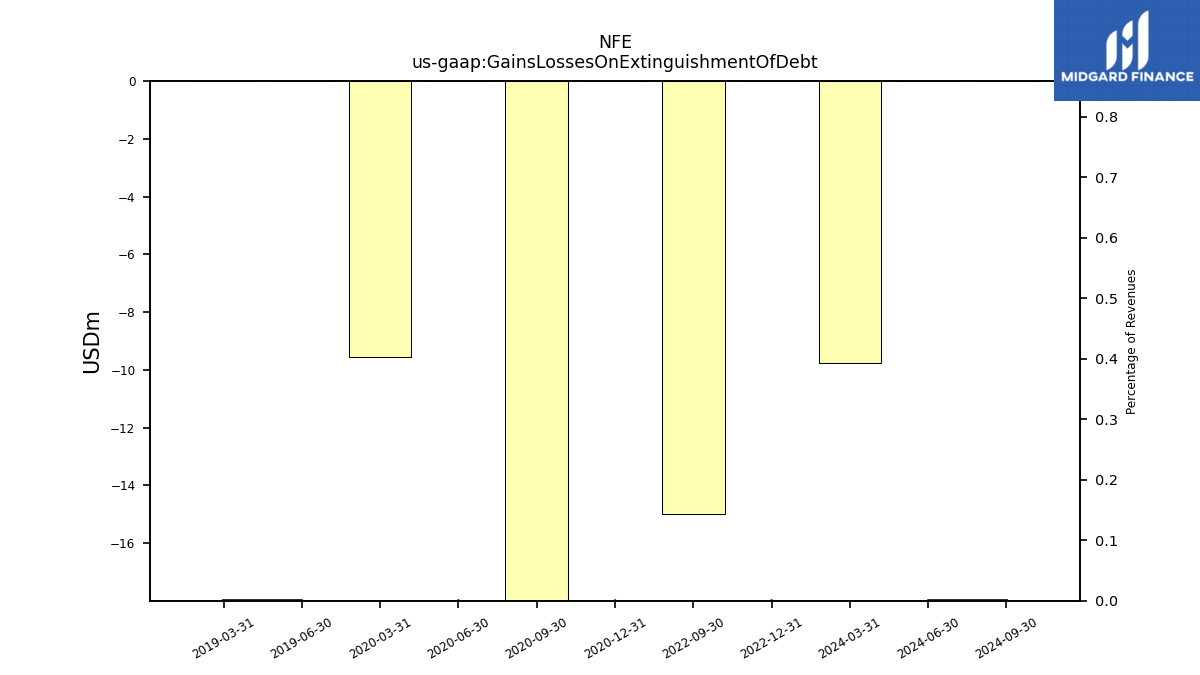
| Gains Losses On Extinguishment Of Debt | NA | NA | NA | 0.00 | -15.00 | NA | NA | NA | NA | NA | NA | 0.00 | -23.50 | 0.00 | -9.56 | NA | NA | 0.00 | 0.00 | NA | NA | NA | NA | |
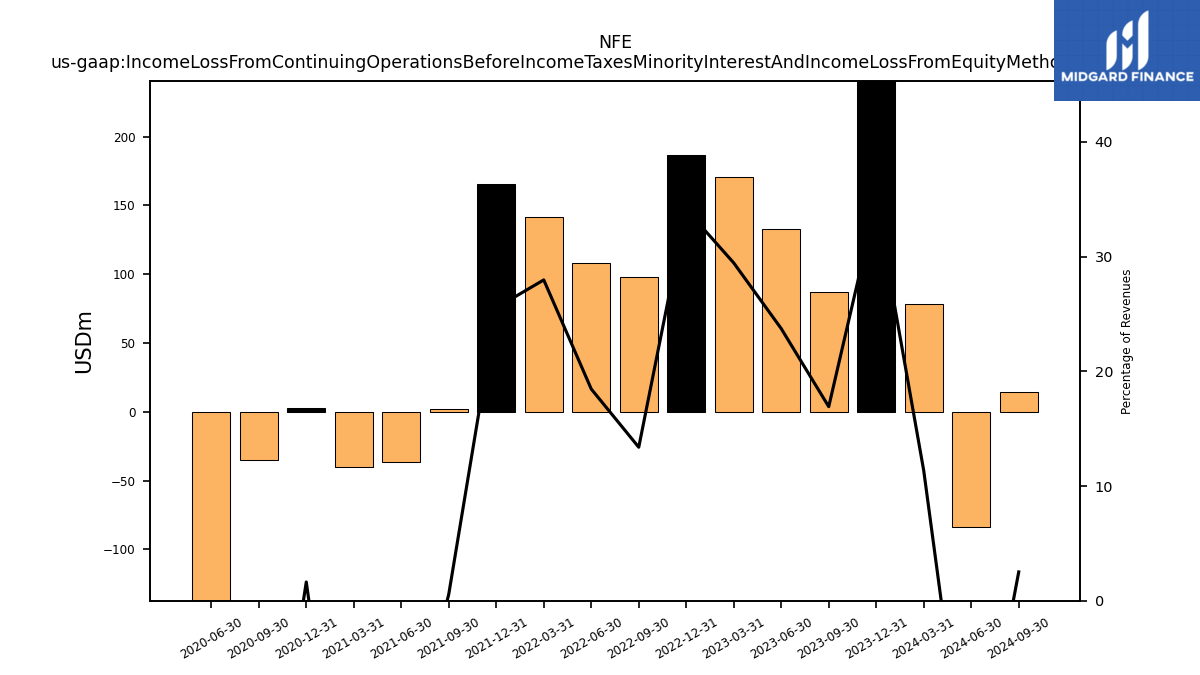
| Income Loss From Continuing Operations Before Income Taxes Minority Interest And Income Loss From Equity Method Investments | 87.04 | 133.15 | 170.55 | 186.41 | 97.94 | 107.96 | 141.26 | 165.64 | 1.74 | -36.27 | -40.39 | 2.38 | -34.83 | -166.40 | NA | NA | NA | NA | NA | NA | NA | NA | NA | |
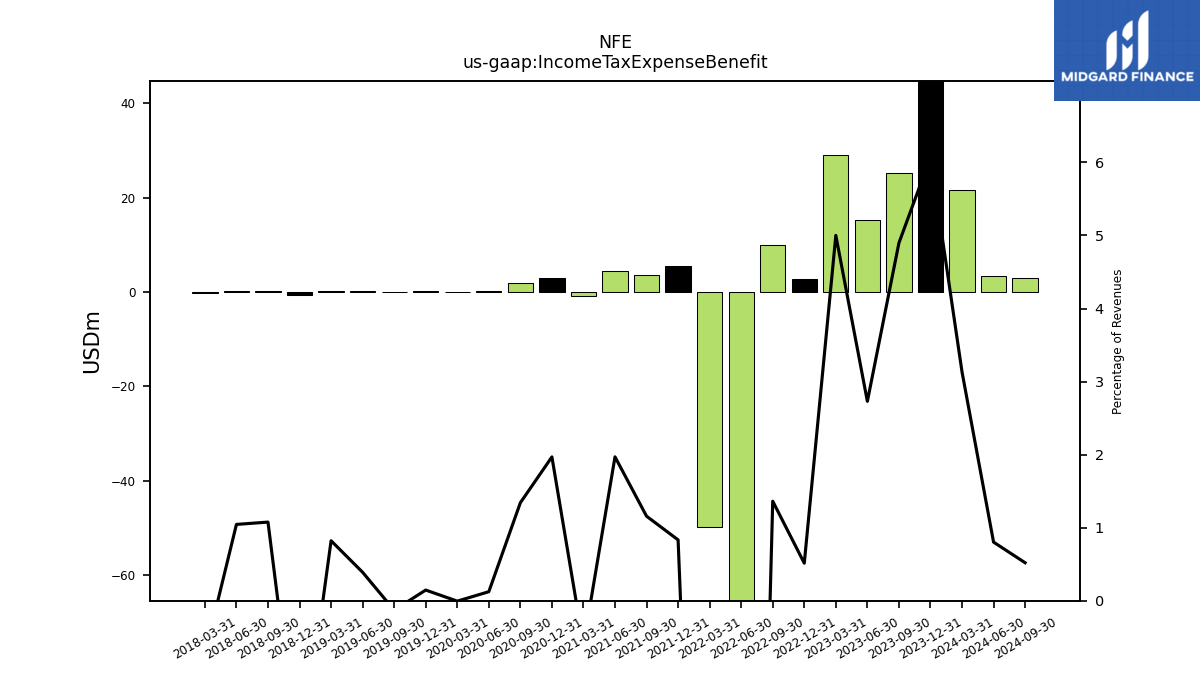
| Income Tax Expense Benefit | 25.19 | 15.32 | 28.96 | 2.81 | 9.97 | -86.54 | -49.68 | 5.40 | 3.53 | 4.41 | -0.88 | 2.87 | 1.84 | 0.12 | -0.00 | 0.10 | -0.06 | 0.15 | 0.25 | -0.74 | 0.31 | 0.28 | -0.19 | |
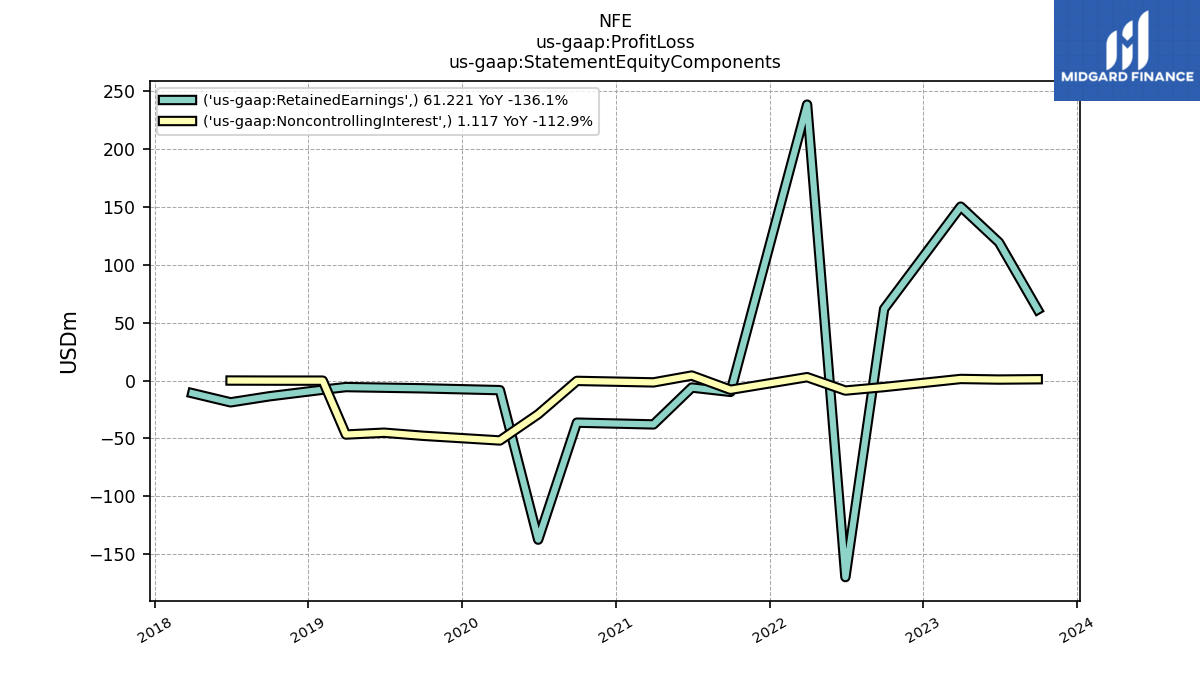
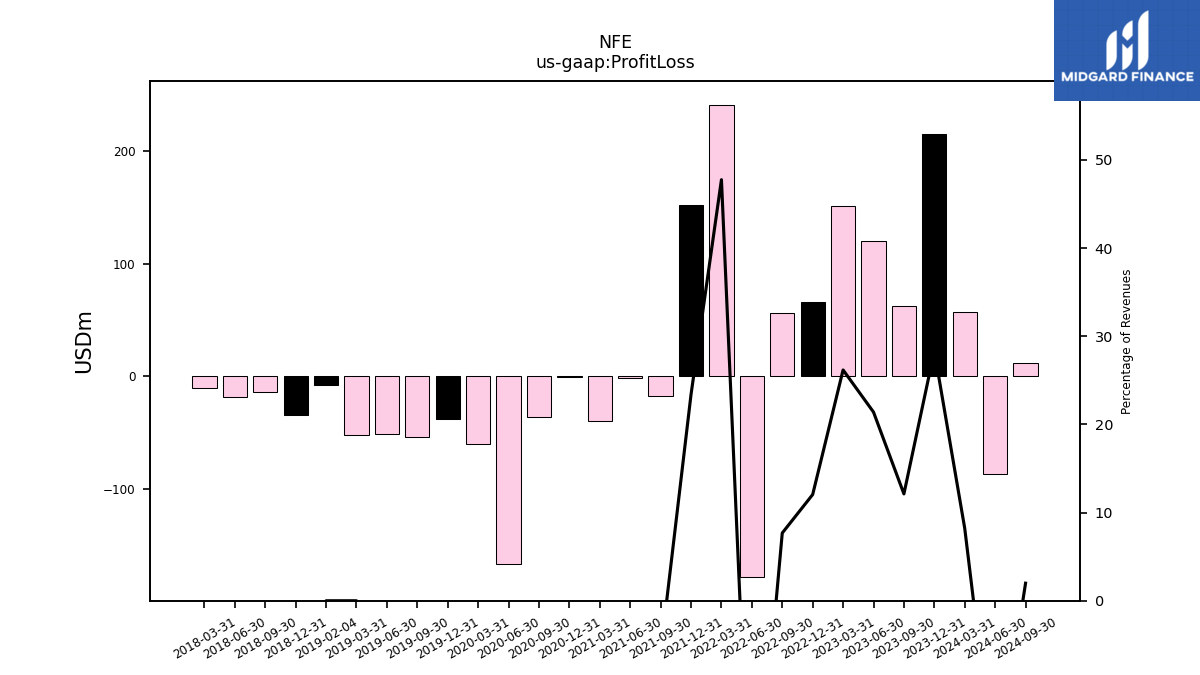
| Profit Loss | 62.34 | 120.10 | 151.57 | 65.81 | 56.23 | -178.43 | 241.18 | 151.72 | -17.77 | -1.73 | -39.51 | -0.48 | -36.67 | -166.52 | -60.05 | -38.37 | -54.42 | -51.23 | -52.29 | -34.76 | -13.68 | -18.82 | -10.91 | |
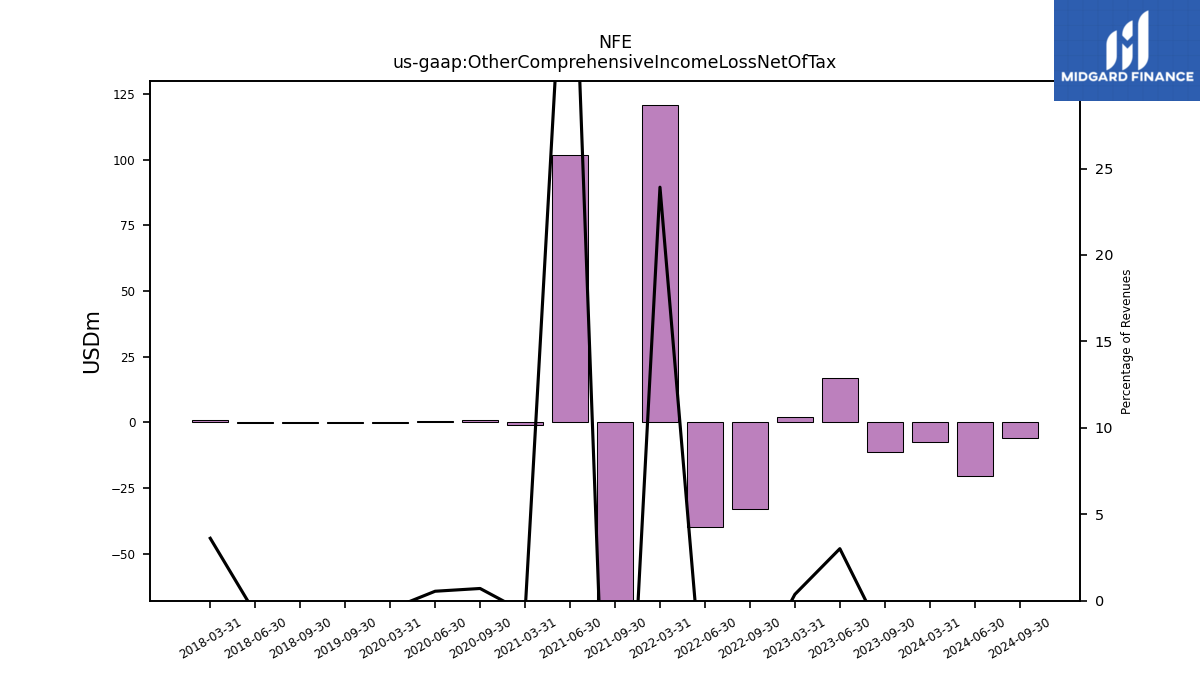
| Other Comprehensive Income Loss Net Of Tax | -11.36 | 16.91 | 2.14 | NA | -33.09 | -39.70 | 120.83 | NA | -77.00 | 101.69 | -1.00 | NA | 0.97 | 0.52 | -0.37 | NA | -0.14 | NA | NA | NA | -0.29 | -0.20 | 0.93 | |
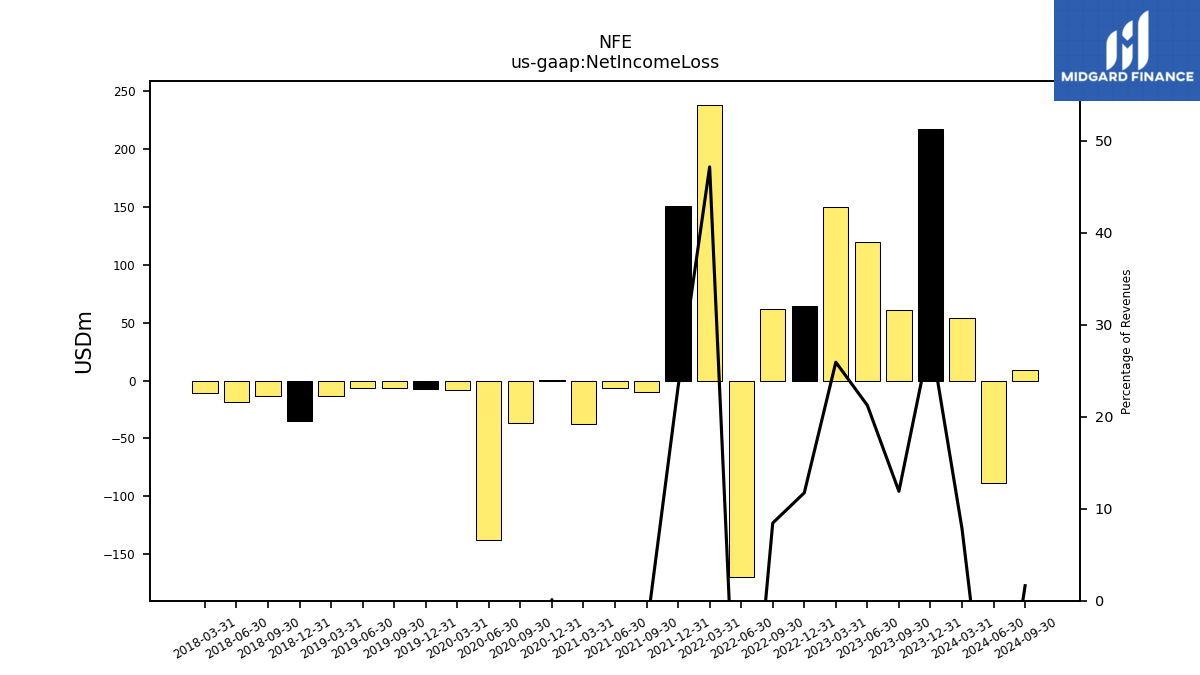
| Net Income Loss | 61.22 | 119.25 | 150.21 | 64.13 | 61.85 | -169.76 | 238.27 | 150.86 | -9.81 | -6.04 | -37.90 | 0.17 | -36.36 | -137.43 | -8.30 | -7.34 | -6.72 | -6.19 | -13.56 | -34.73 | -13.61 | -18.82 | -10.91 | |
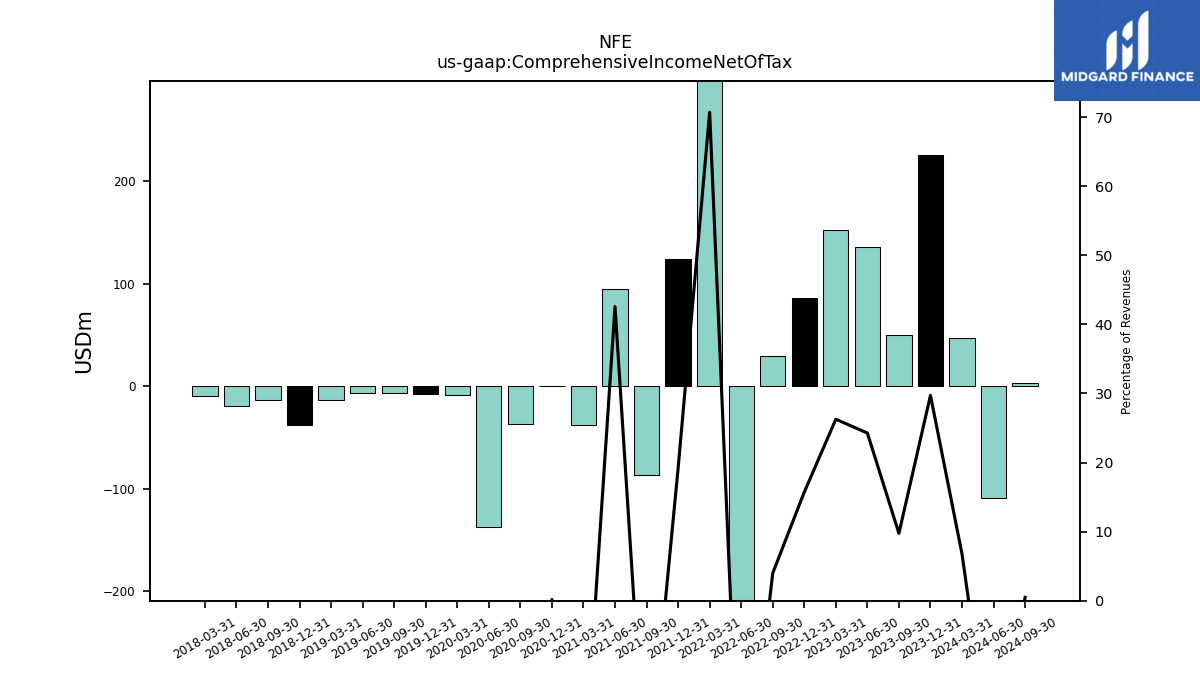
| Comprehensive Income Net Of Tax | 50.19 | 136.25 | 152.15 | 85.93 | 29.23 | -208.32 | 357.14 | 124.15 | -86.60 | 95.32 | -38.03 | 0.27 | -36.62 | -136.99 | -8.35 | -7.35 | -6.74 | -6.19 | -13.56 | -37.85 | -13.90 | -19.02 | -9.98 | |
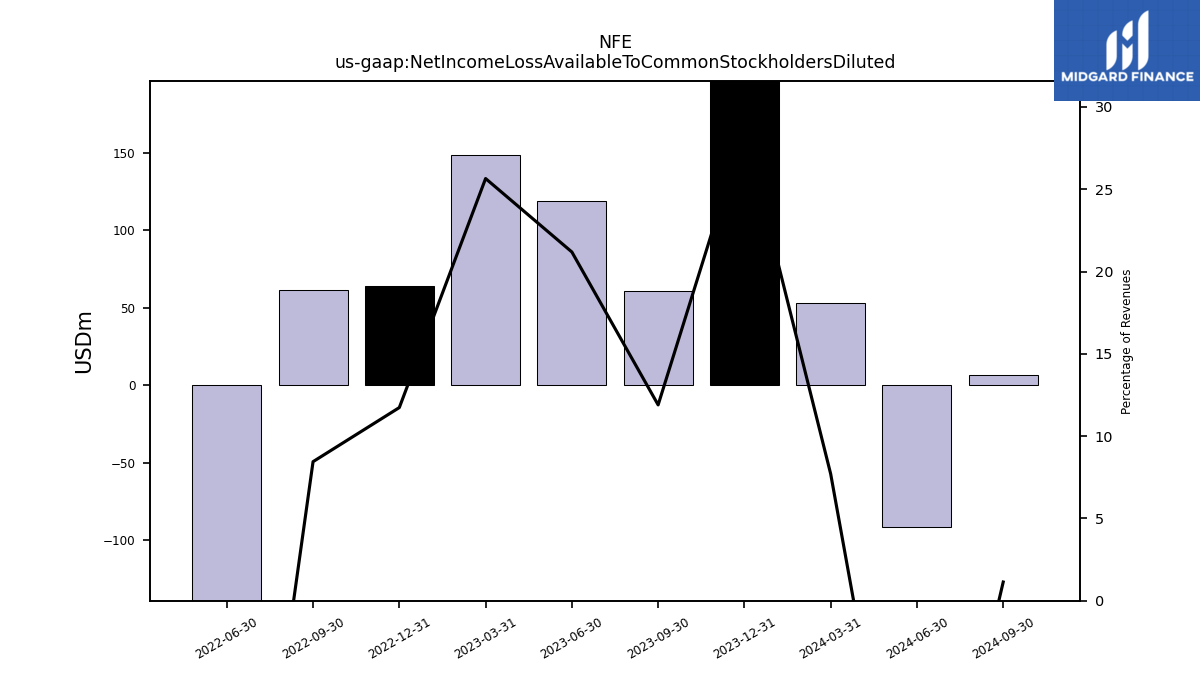
| Net Income Loss Available To Common Stockholders Diluted | 61.22 | 118.94 | NA | 64.13 | 61.85 | -169.76 | NA | NA | NA | NA | NA | NA | NA | NA | NA | NA | NA | NA | NA | NA | NA | NA | NA |
| 2023-09-30 | 2023-06-30 | 2023-03-31 | 2022-12-31 | 2022-09-30 | 2022-06-30 | 2022-03-31 | 2021-12-31 | 2021-09-30 | 2021-06-30 | 2021-03-31 | 2020-12-31 | 2020-09-30 | 2020-06-30 | 2020-03-31 | 2019-12-31 | 2019-09-30 | 2019-06-30 | 2019-03-31 | 2018-12-31 | 2018-09-30 | 2018-06-30 | 2018-03-31 | ||
|---|---|---|---|---|---|---|---|---|---|---|---|---|---|---|---|---|---|---|---|---|---|---|---|---|
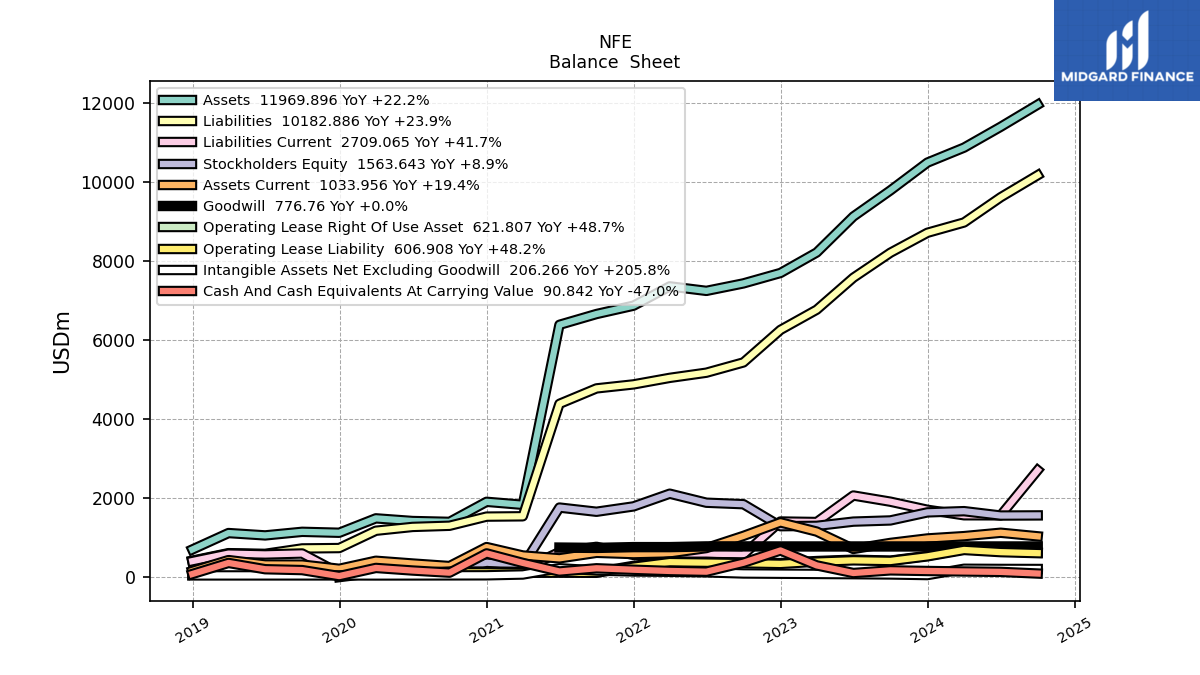
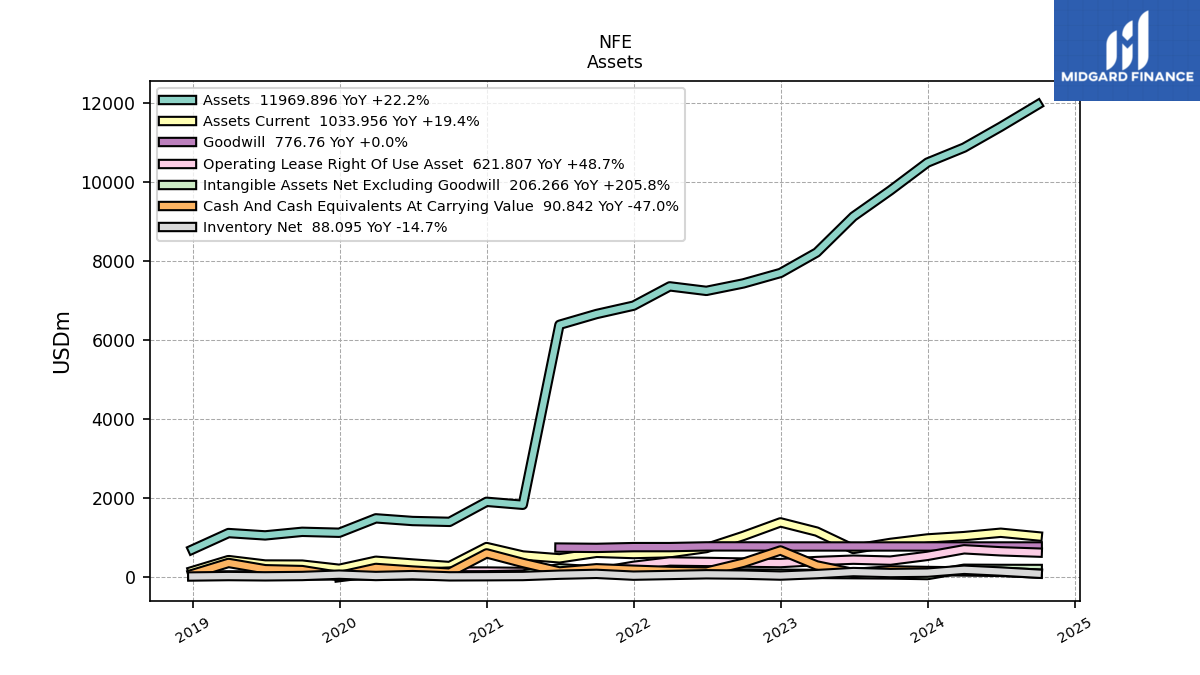
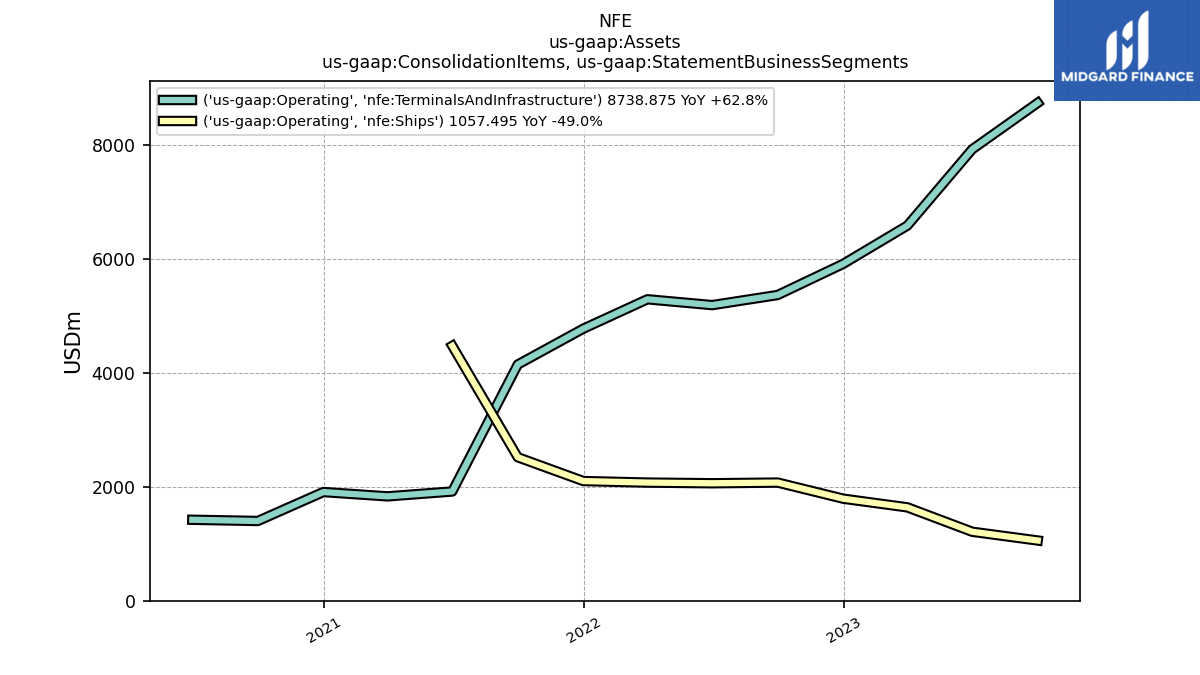
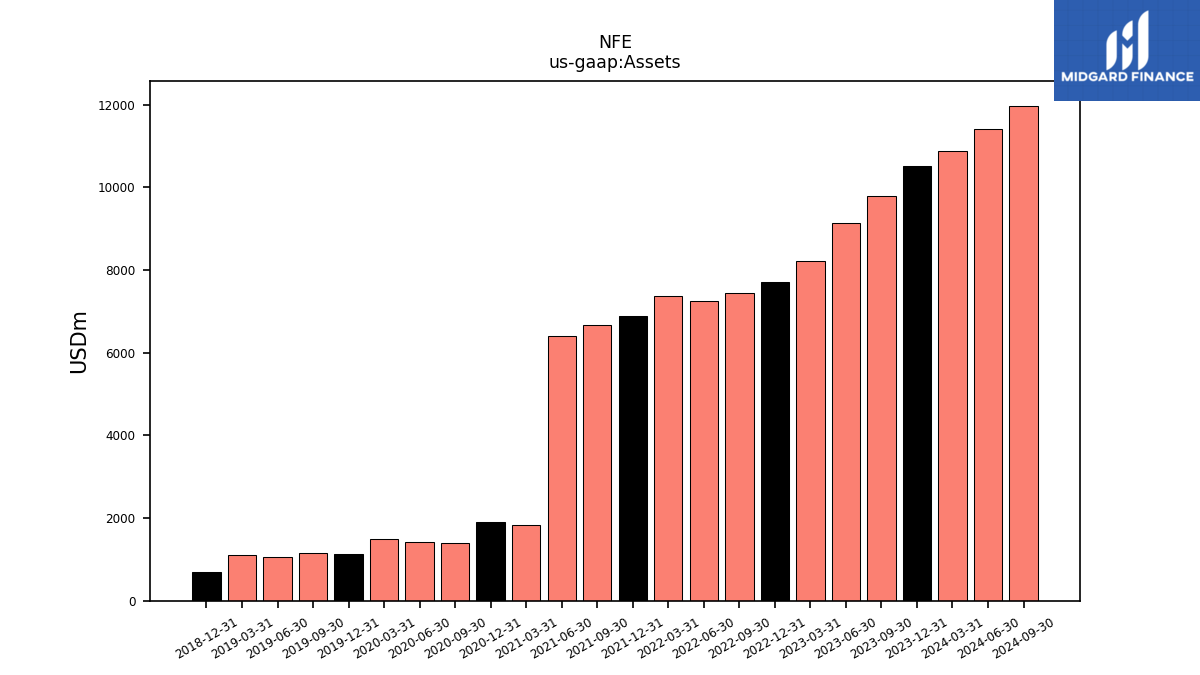
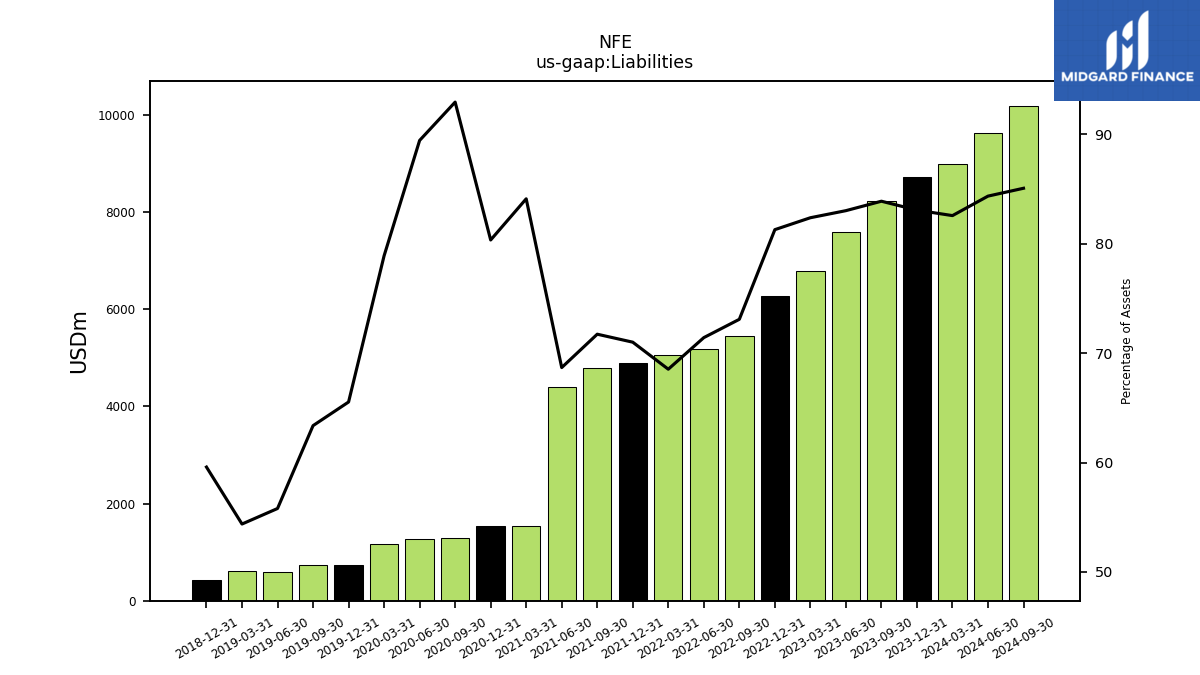
| Assets | 9796.37 | 9135.24 | 8223.75 | 7705.08 | 7440.98 | 7251.38 | 7365.81 | 6876.49 | 6665.09 | 6392.07 | 1832.11 | 1908.09 | 1399.81 | 1421.51 | 1489.12 | 1123.81 | 1147.78 | 1056.88 | 1116.62 | 699.40 | NA | NA | NA | |
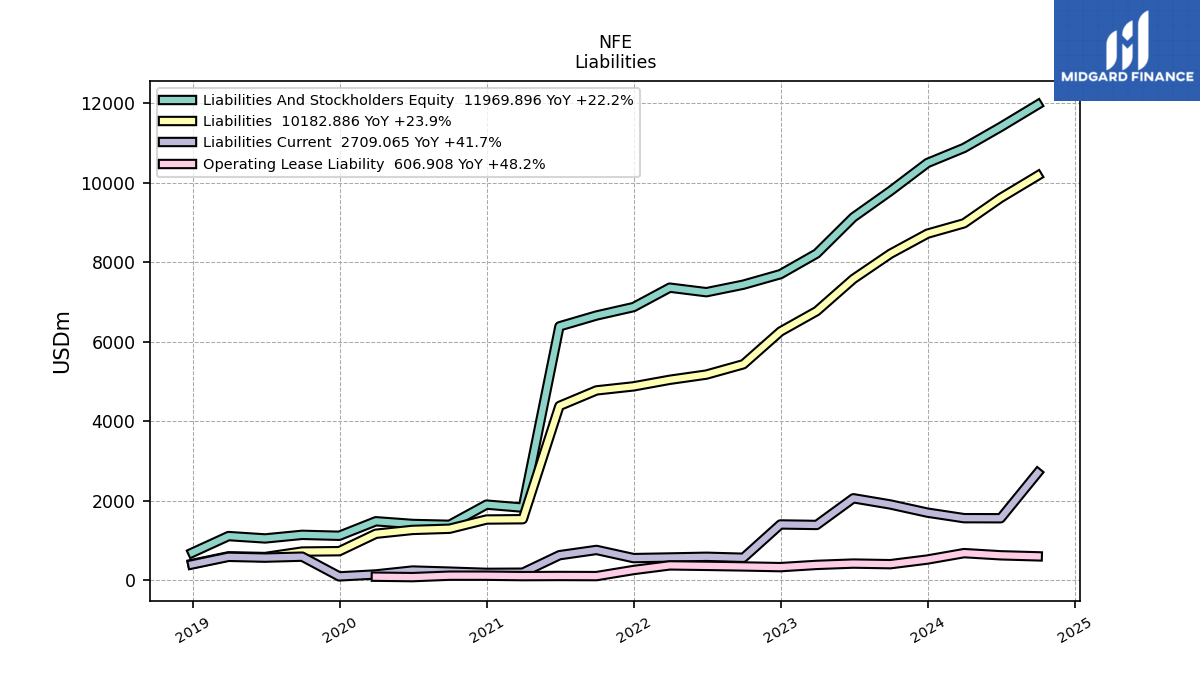
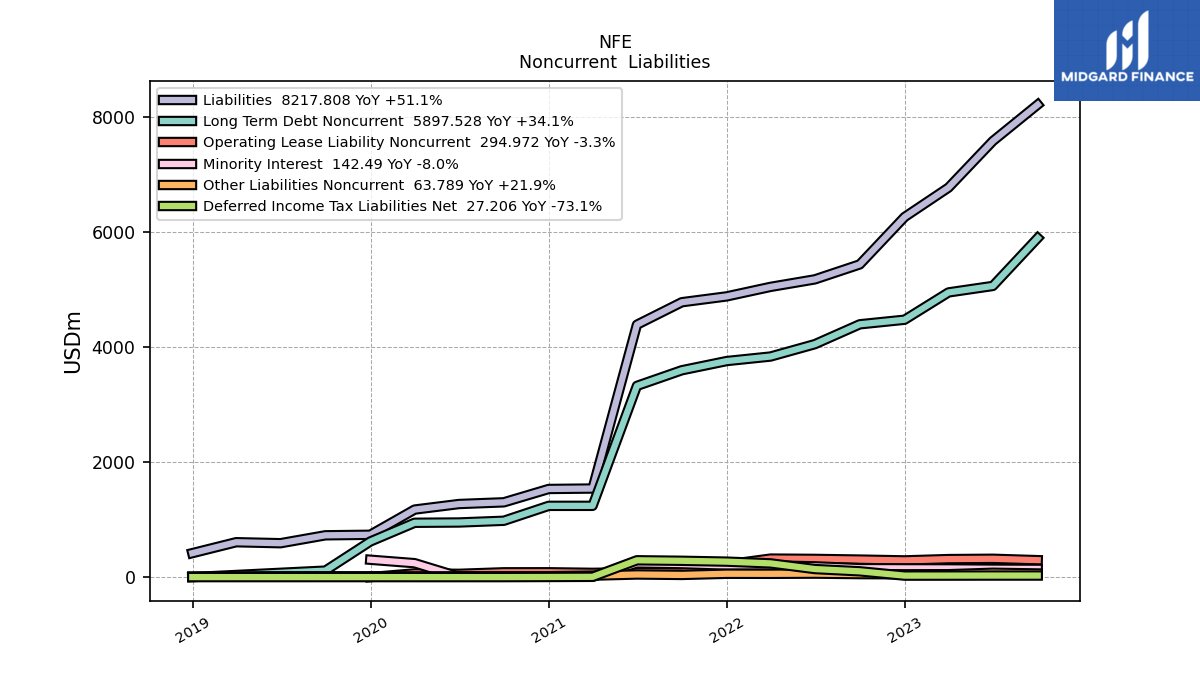
| Liabilities | 8217.81 | 7584.36 | 6774.42 | 6263.22 | 5438.79 | 5178.85 | 5047.90 | 4882.44 | 4780.94 | 4390.16 | 1540.93 | 1533.01 | 1301.08 | 1271.44 | 1174.92 | 736.49 | 727.38 | 589.74 | 607.22 | 416.75 | NA | NA | NA | |
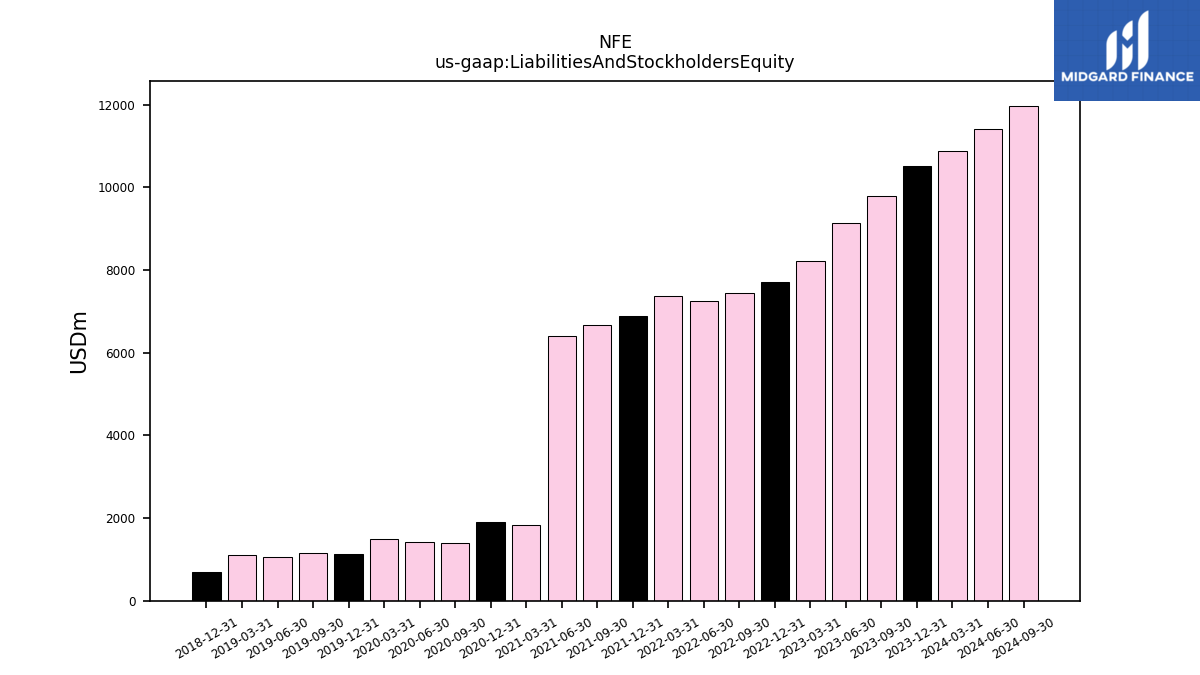
| Liabilities And Stockholders Equity | 9796.37 | 9135.24 | 8223.75 | 7705.08 | 7440.98 | 7251.38 | 7365.81 | 6876.49 | 6665.09 | 6392.07 | 1832.11 | 1908.09 | 1399.81 | 1421.51 | 1489.12 | 1123.81 | 1147.78 | 1056.88 | 1116.62 | 699.40 | NA | NA | NA | |
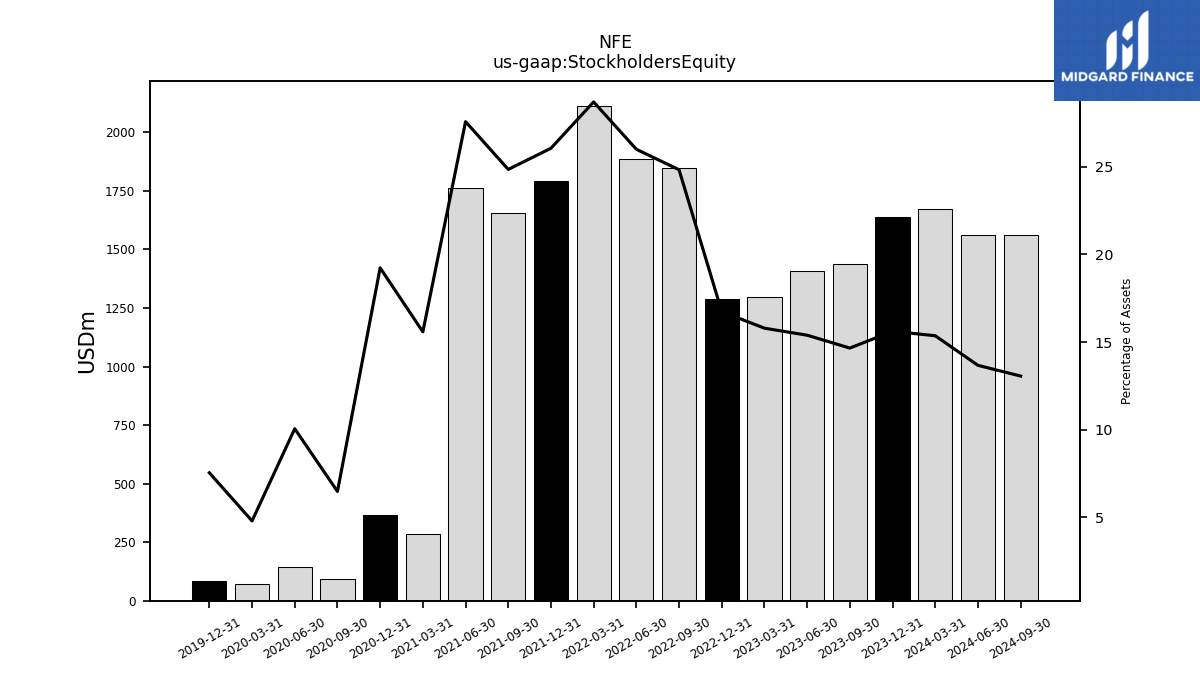
| Stockholders Equity | 1436.07 | 1406.16 | 1298.75 | 1289.82 | 1847.37 | 1885.03 | 2113.58 | 1791.58 | 1656.08 | 1762.35 | 285.53 | 366.96 | 90.74 | 143.00 | 71.52 | 84.81 | NA | NA | NA | NA | NA | NA | NA |
| 2023-09-30 | 2023-06-30 | 2023-03-31 | 2022-12-31 | 2022-09-30 | 2022-06-30 | 2022-03-31 | 2021-12-31 | 2021-09-30 | 2021-06-30 | 2021-03-31 | 2020-12-31 | 2020-09-30 | 2020-06-30 | 2020-03-31 | 2019-12-31 | 2019-09-30 | 2019-06-30 | 2019-03-31 | 2018-12-31 | 2018-09-30 | 2018-06-30 | 2018-03-31 | ||
|---|---|---|---|---|---|---|---|---|---|---|---|---|---|---|---|---|---|---|---|---|---|---|---|---|
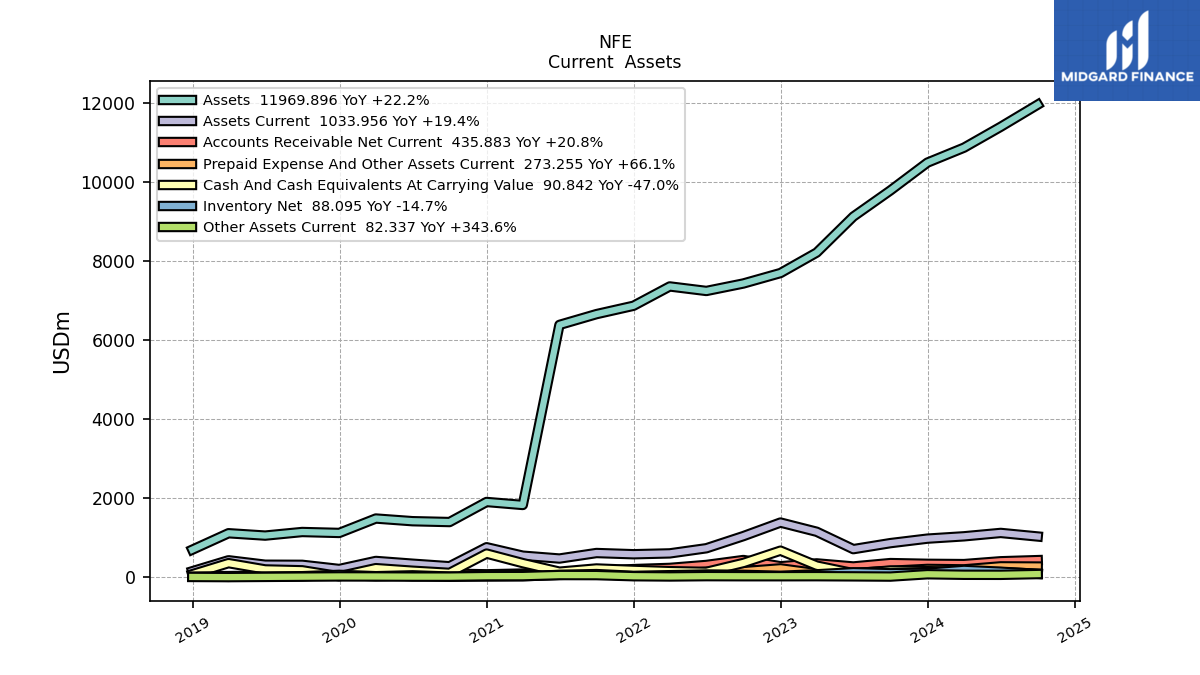
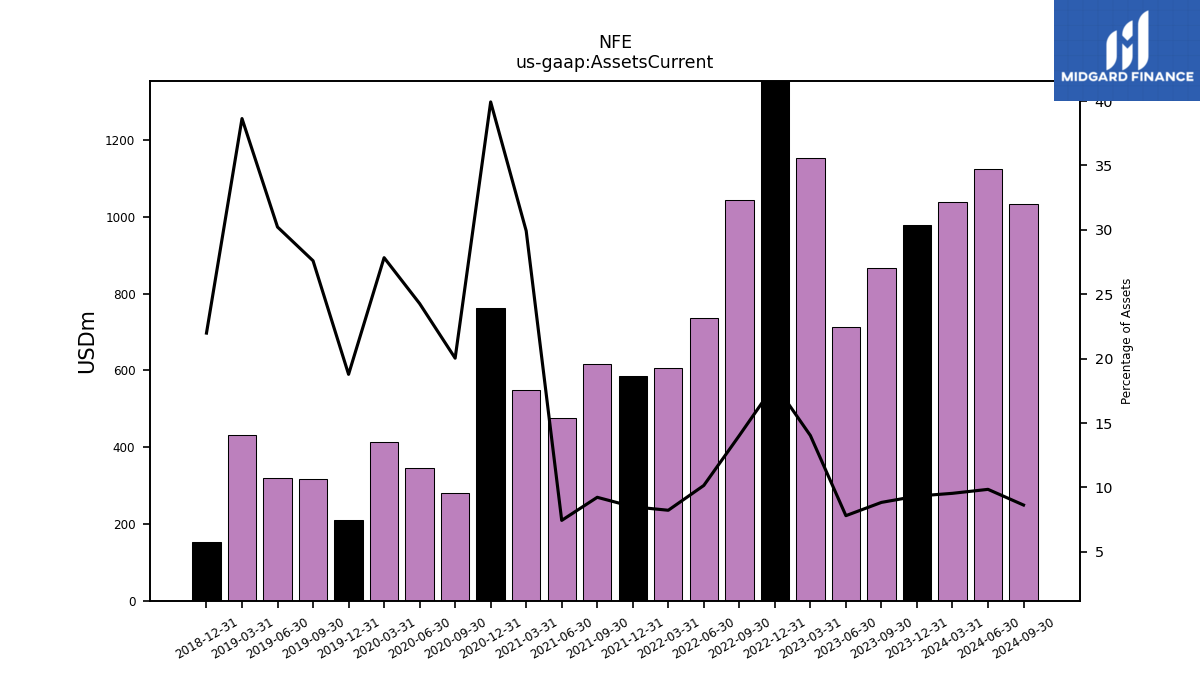
| Assets Current | 866.20 | 713.69 | 1154.14 | 1387.15 | 1044.56 | 736.63 | 606.33 | 584.87 | 615.72 | 475.95 | 548.21 | 762.01 | 280.52 | 345.16 | 414.61 | 211.12 | 316.83 | 319.42 | 431.50 | 153.78 | NA | NA | NA | |
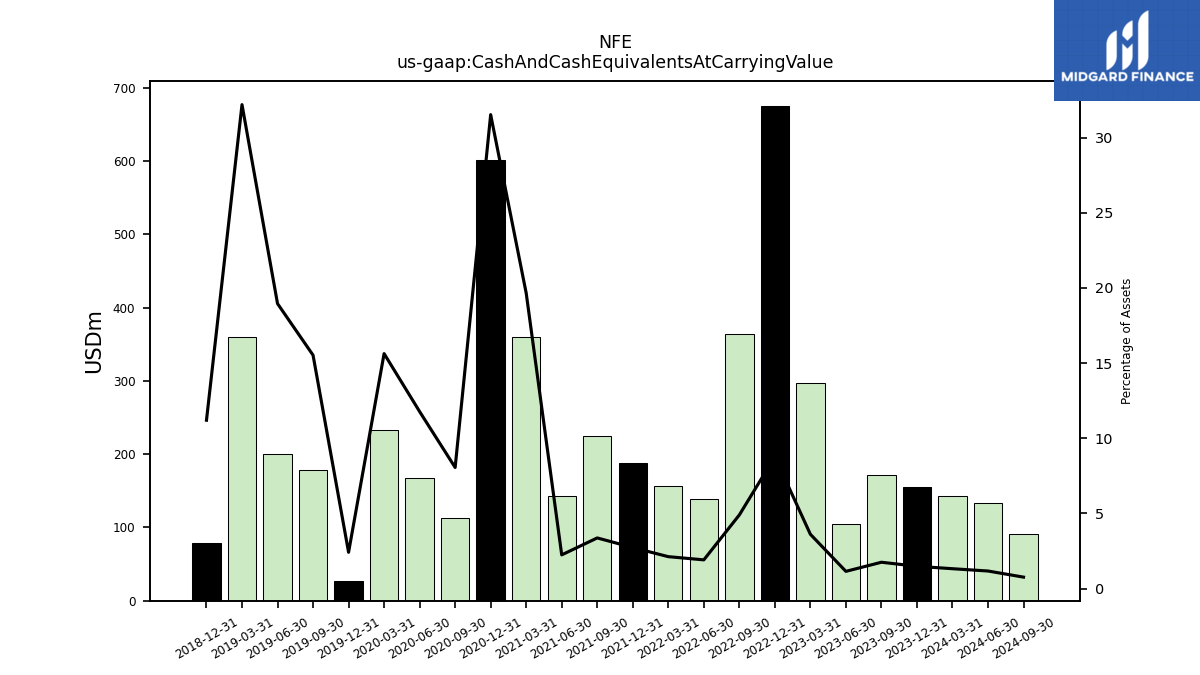
| Cash And Cash Equivalents At Carrying Value | 171.33 | 104.34 | 296.86 | 675.49 | 364.31 | 138.33 | 156.17 | 187.51 | 224.38 | 143.14 | 360.13 | 601.52 | 112.72 | 167.32 | 232.70 | 27.10 | 178.19 | 200.31 | 359.45 | 78.30 | NA | NA | NA | |
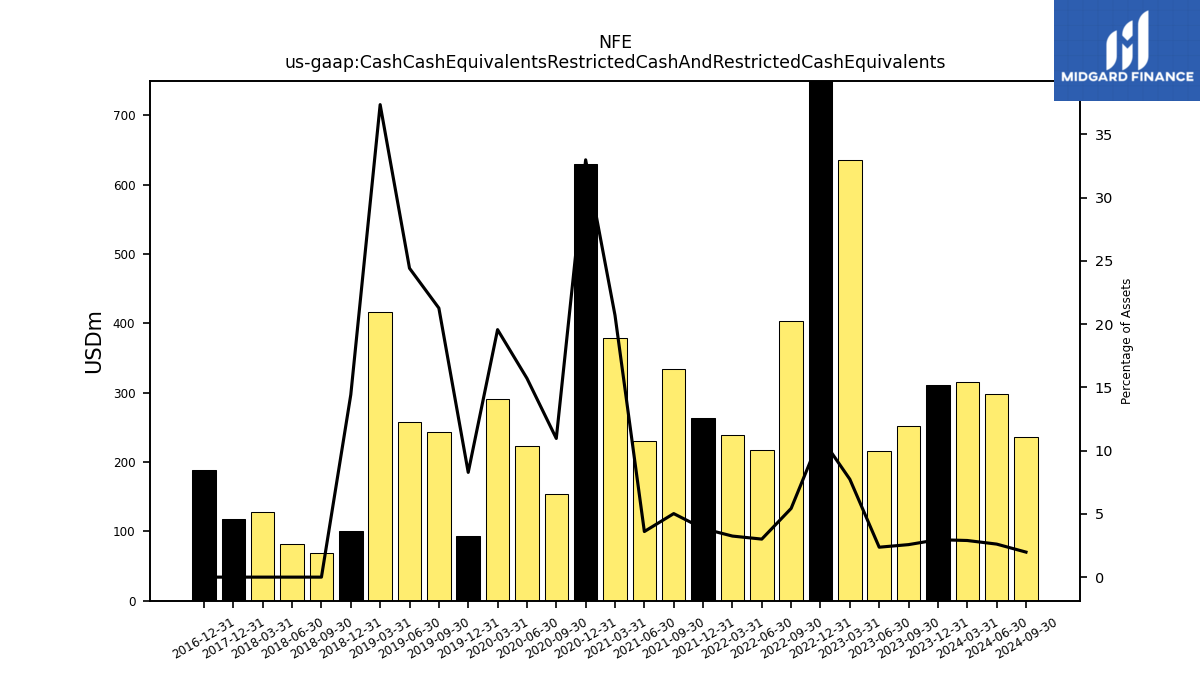
| Cash Cash Equivalents Restricted Cash And Restricted Cash Equivalents | 251.70 | 216.06 | 636.12 | 855.08 | 403.99 | 217.89 | 239.01 | 264.03 | 334.60 | 230.32 | 379.20 | 629.34 | 153.44 | 223.39 | 291.26 | 93.03 | 244.06 | 258.02 | 417.00 | 100.85 | 68.20 | 81.46 | 128.09 | |
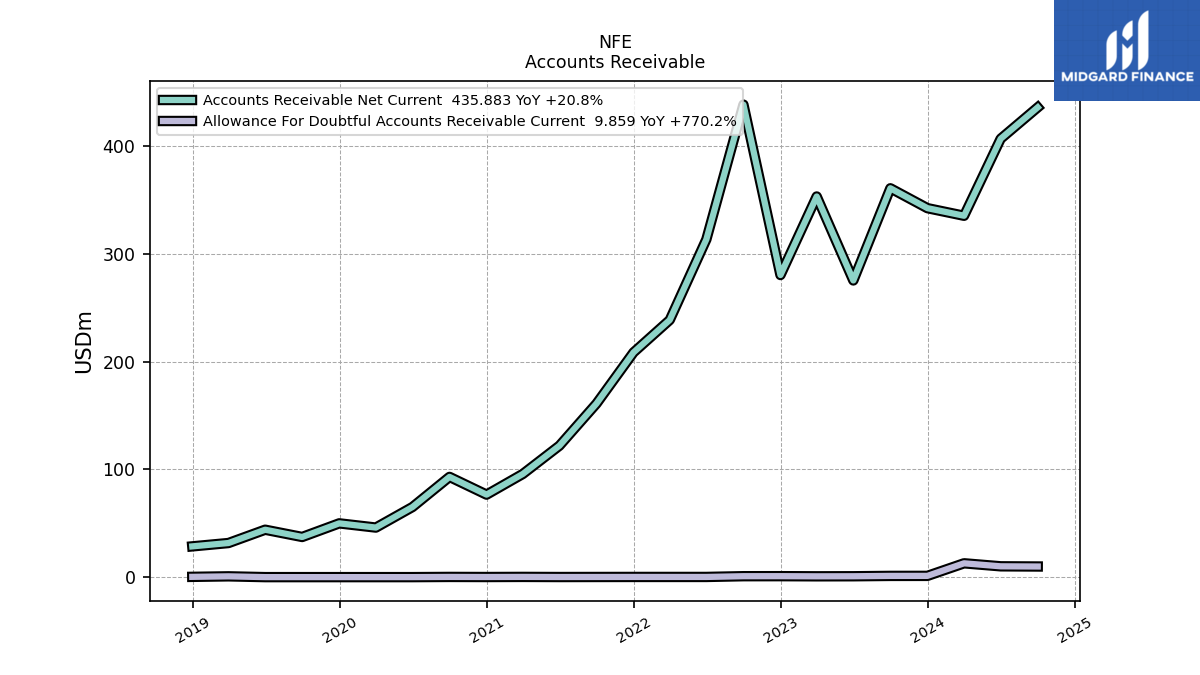
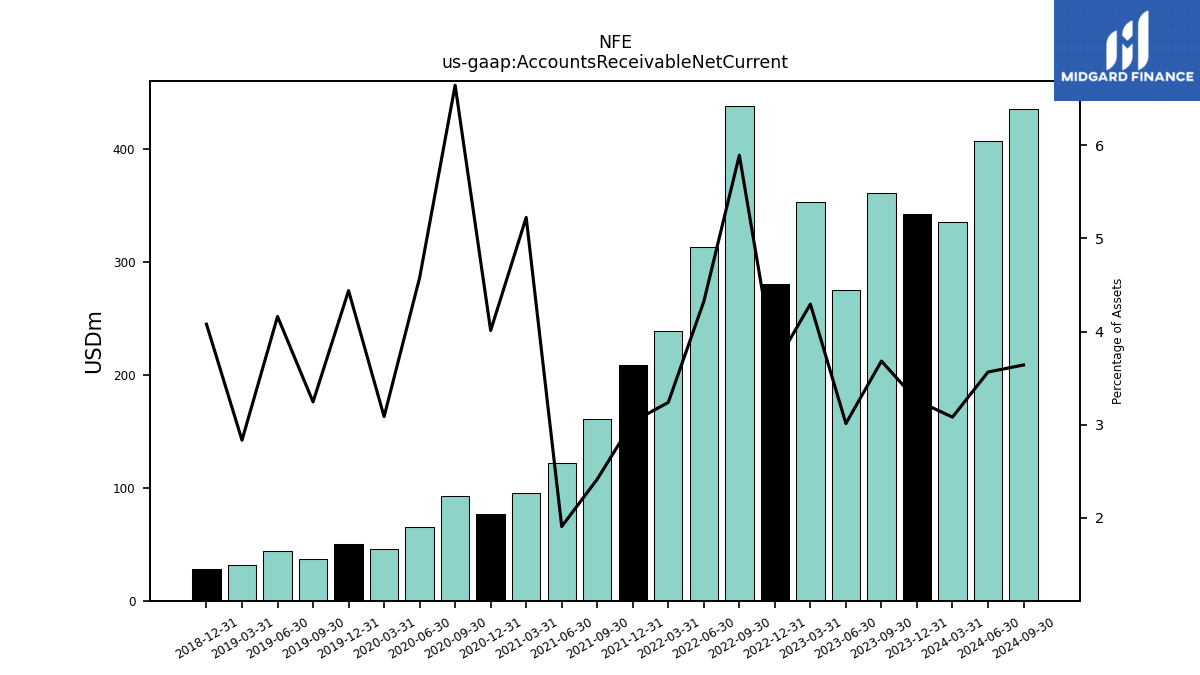
| Accounts Receivable Net Current | 360.82 | 275.29 | 353.19 | 280.31 | 438.44 | 313.46 | 238.61 | 208.50 | 161.01 | 121.96 | 95.73 | 76.54 | 93.00 | 65.07 | 45.98 | 49.89 | 37.25 | 43.99 | 31.65 | 28.53 | NA | NA | NA | |
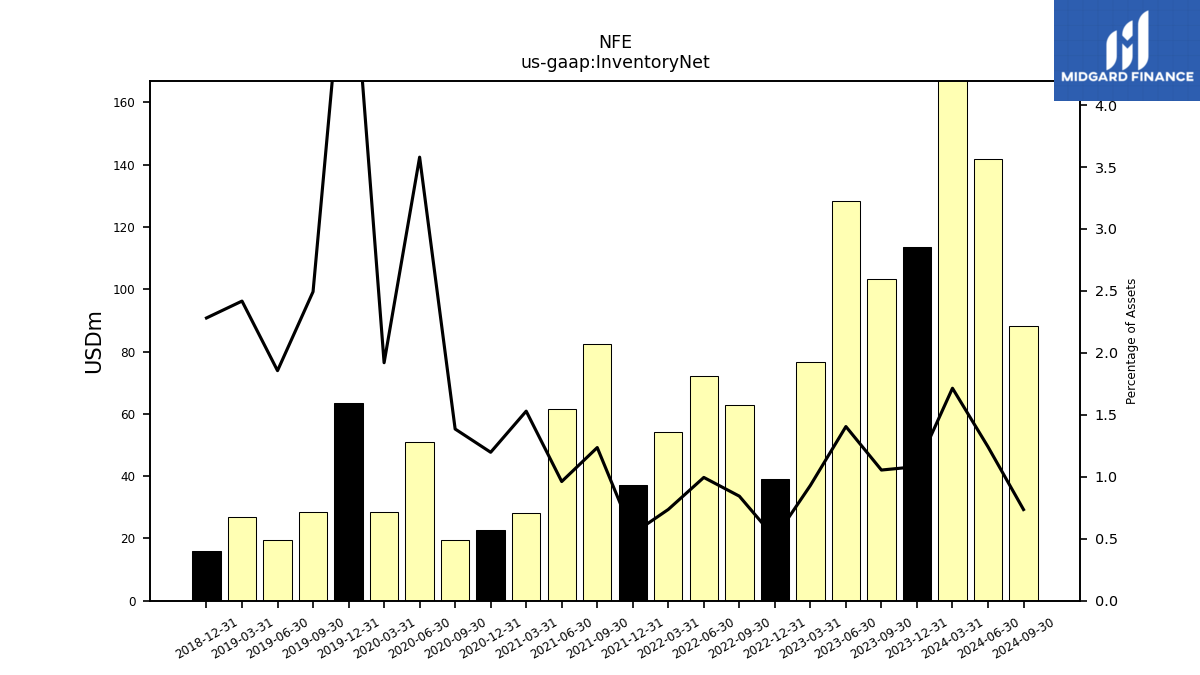
| Inventory Net | 103.33 | 128.41 | 76.54 | 39.07 | 62.80 | 72.15 | 54.27 | 37.18 | 82.39 | 61.49 | 28.03 | 22.86 | 19.40 | 50.88 | 28.60 | 63.43 | 28.62 | 19.62 | 27.00 | 15.96 | NA | NA | NA | |
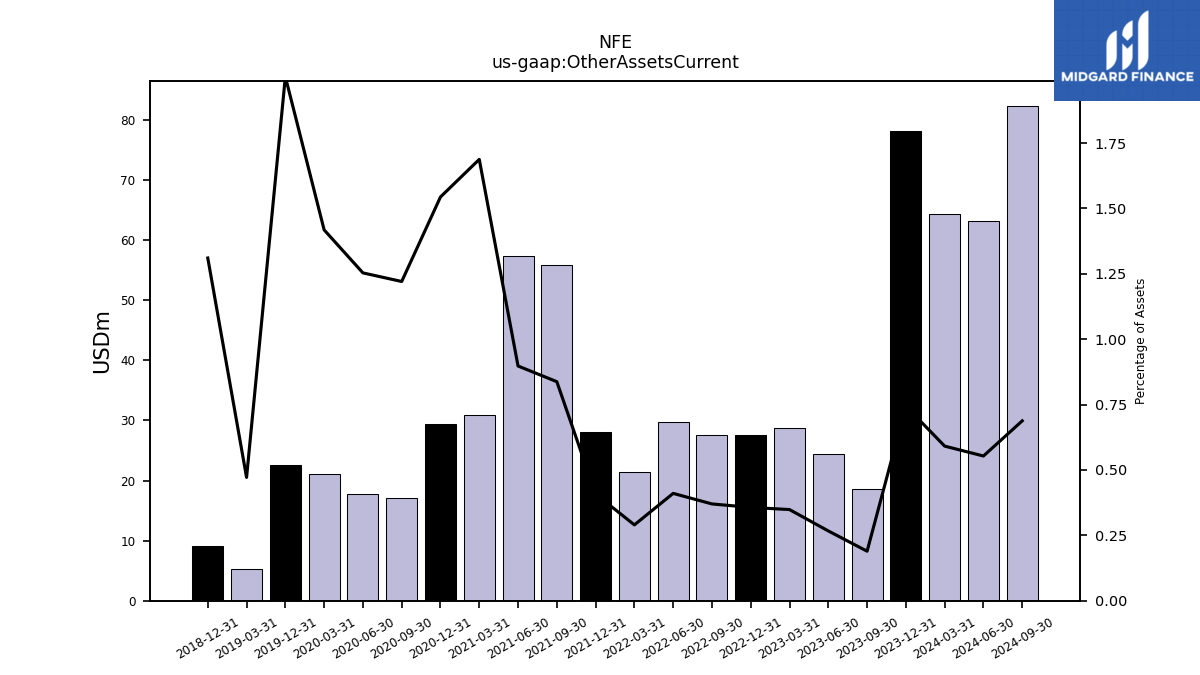
| Other Assets Current | 18.56 | 24.39 | 28.67 | 27.50 | 27.55 | 29.77 | 21.37 | 28.08 | 55.83 | 57.38 | 30.92 | 29.46 | 17.09 | 17.82 | 21.12 | 22.52 | NA | NA | 5.27 | 9.17 | NA | NA | NA | |
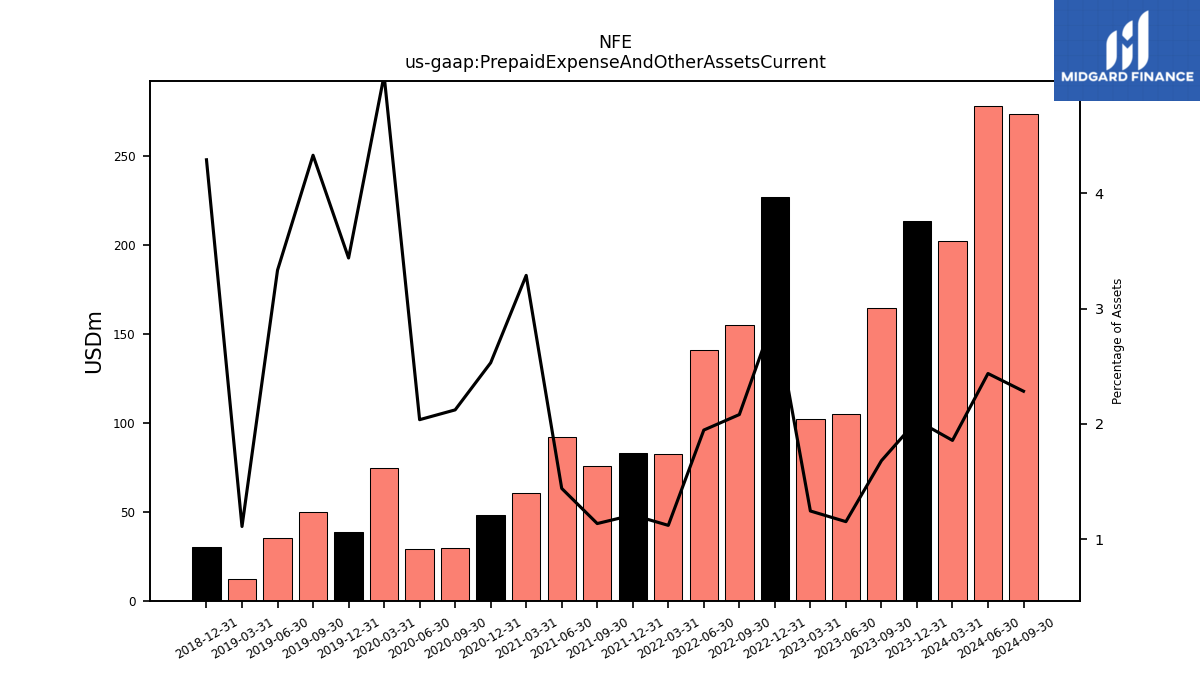
| Prepaid Expense And Other Assets Current | 164.56 | 105.13 | 102.25 | 226.88 | 154.80 | 141.09 | 82.39 | 83.11 | 75.60 | 92.01 | 60.24 | 48.27 | 29.69 | 28.94 | 74.83 | 38.65 | 49.71 | 35.23 | 12.38 | 30.02 | NA | NA | NA | |
| Equity Securities Fv Ni | NA | NA | NA | 17.81 | NA | NA | NA | 18.87 | 14.27 | NA | NA | 1.26 | 0.16 | 0.32 | 0.14 | 2.54 | NA | NA | NA | 3.66 | NA | NA | NA |
| 2023-09-30 | 2023-06-30 | 2023-03-31 | 2022-12-31 | 2022-09-30 | 2022-06-30 | 2022-03-31 | 2021-12-31 | 2021-09-30 | 2021-06-30 | 2021-03-31 | 2020-12-31 | 2020-09-30 | 2020-06-30 | 2020-03-31 | 2019-12-31 | 2019-09-30 | 2019-06-30 | 2019-03-31 | 2018-12-31 | 2018-09-30 | 2018-06-30 | 2018-03-31 | ||
|---|---|---|---|---|---|---|---|---|---|---|---|---|---|---|---|---|---|---|---|---|---|---|---|---|
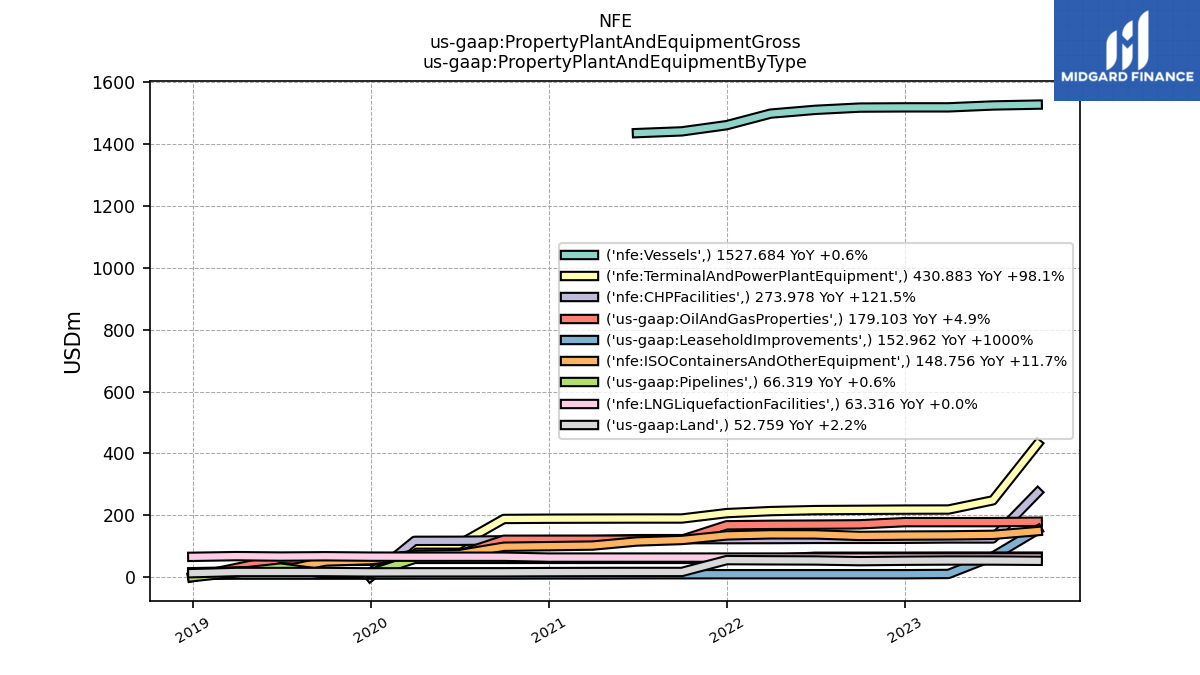
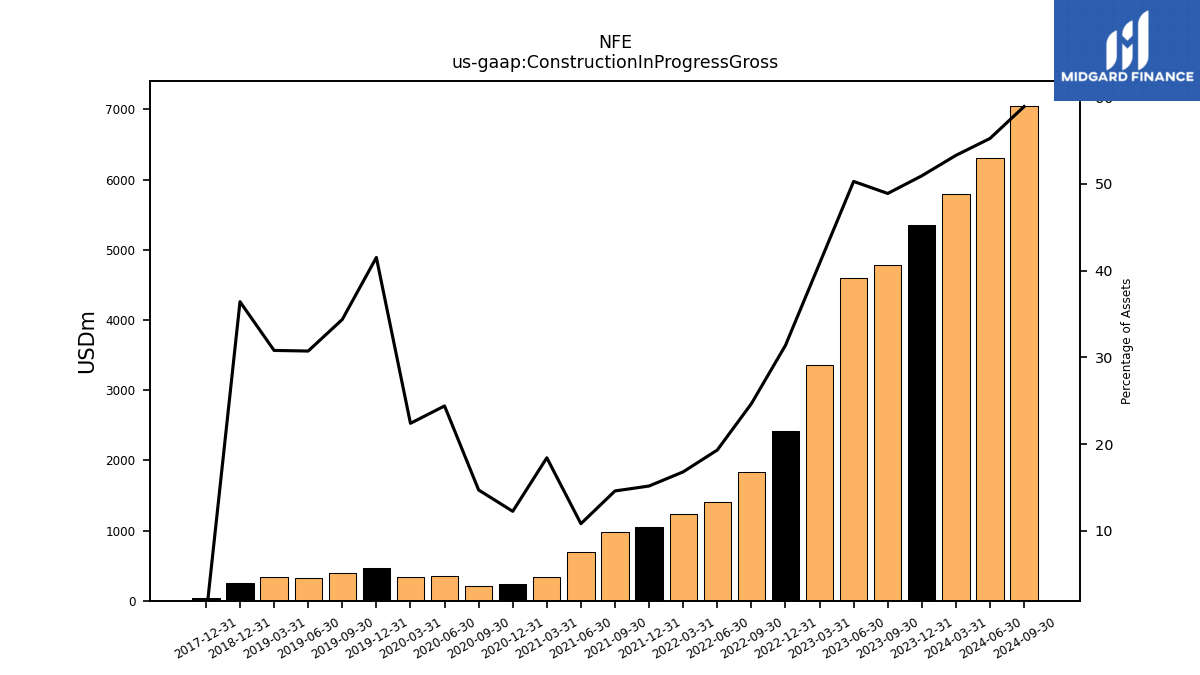
| Construction In Progress Gross | 4789.80 | 4593.13 | 3357.43 | 2418.61 | 1835.29 | 1401.47 | 1238.31 | 1043.88 | 973.88 | 692.75 | 337.69 | 234.04 | 206.11 | 346.95 | 333.65 | 466.59 | 394.52 | 324.83 | 343.96 | 254.70 | NA | NA | NA | |
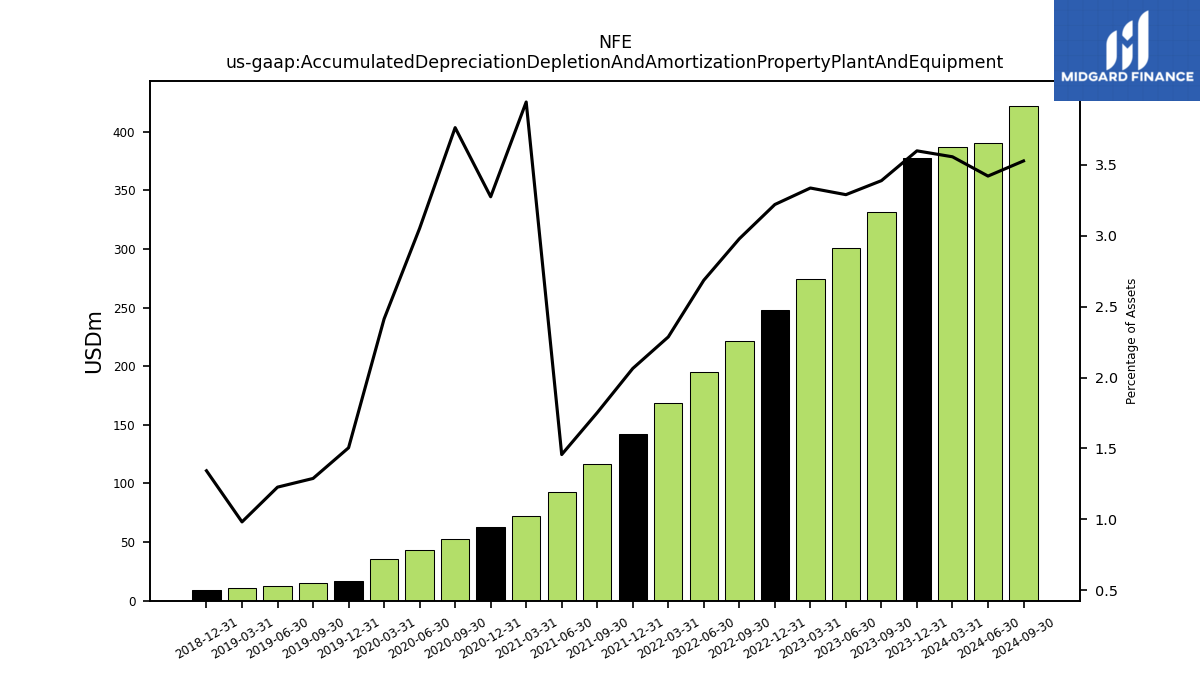
| Accumulated Depreciation Depletion And Amortization Property Plant And Equipment | 331.89 | 300.47 | 274.34 | 248.08 | 221.61 | 194.76 | 168.40 | 141.91 | 116.79 | 93.14 | 72.23 | 62.48 | 52.65 | 43.38 | 35.94 | 16.91 | 14.79 | 12.97 | 10.97 | 9.39 | NA | NA | NA | |
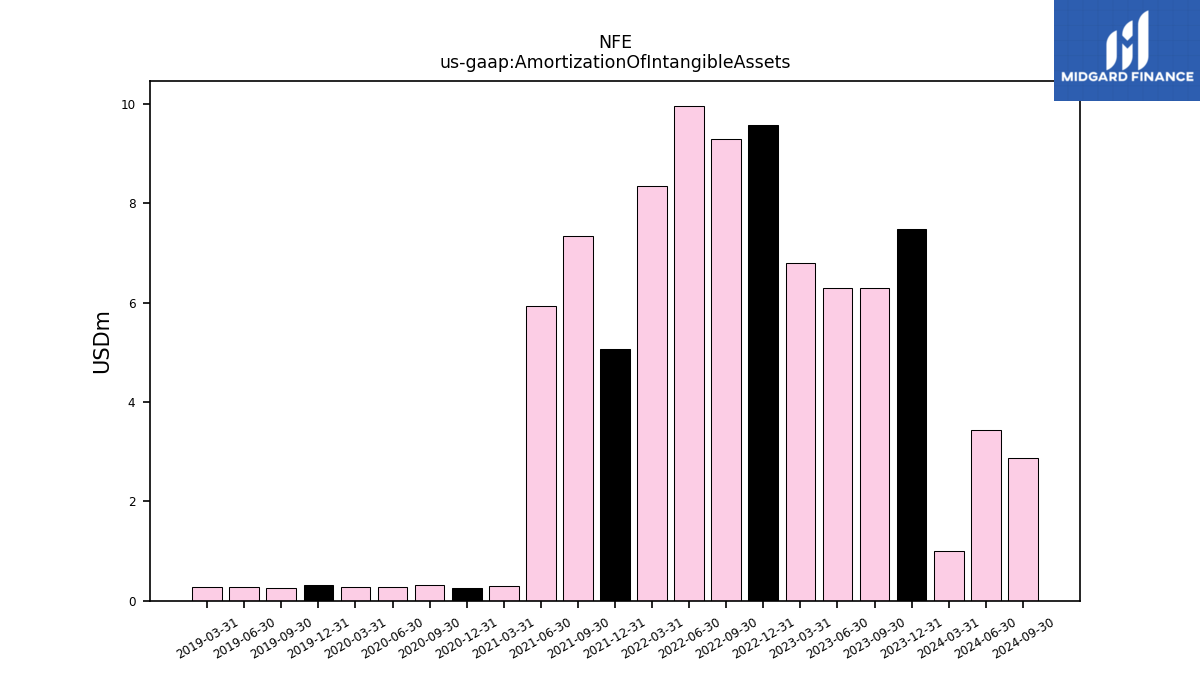
| Amortization Of Intangible Assets | 6.29 | 6.29 | 6.80 | 9.57 | 9.29 | 9.96 | 8.34 | 5.06 | 7.33 | 5.92 | 0.29 | 0.26 | 0.31 | 0.28 | 0.27 | 0.32 | 0.25 | 0.27 | 0.28 | NA | NA | NA | NA | |
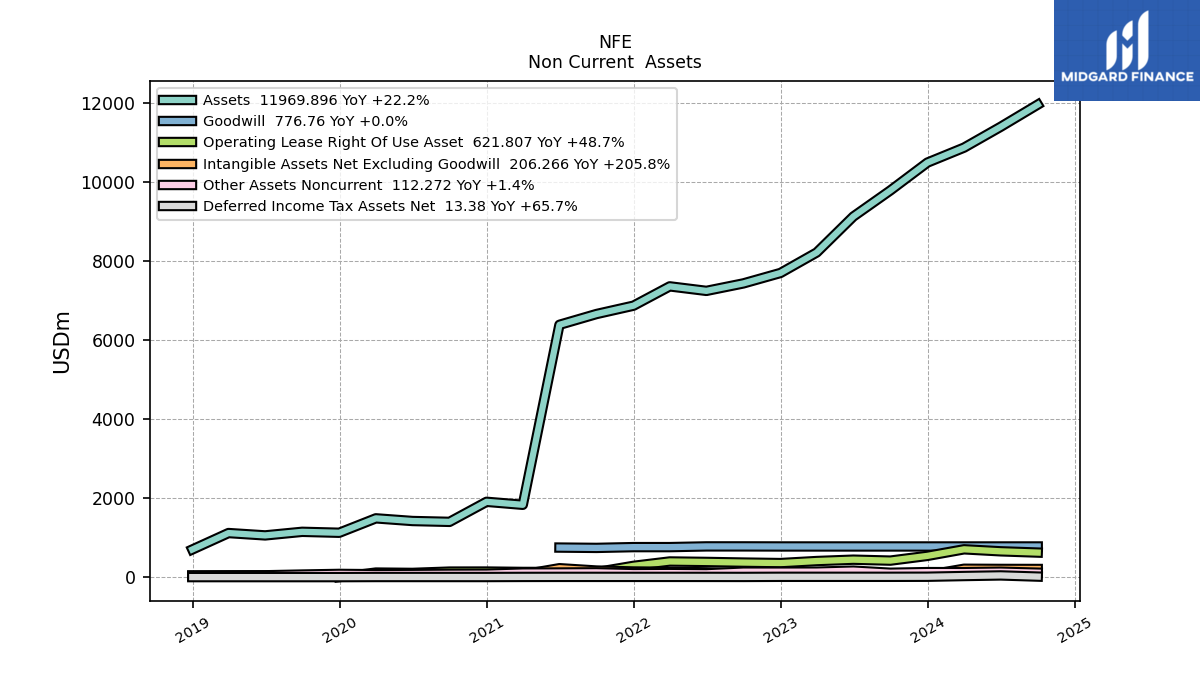
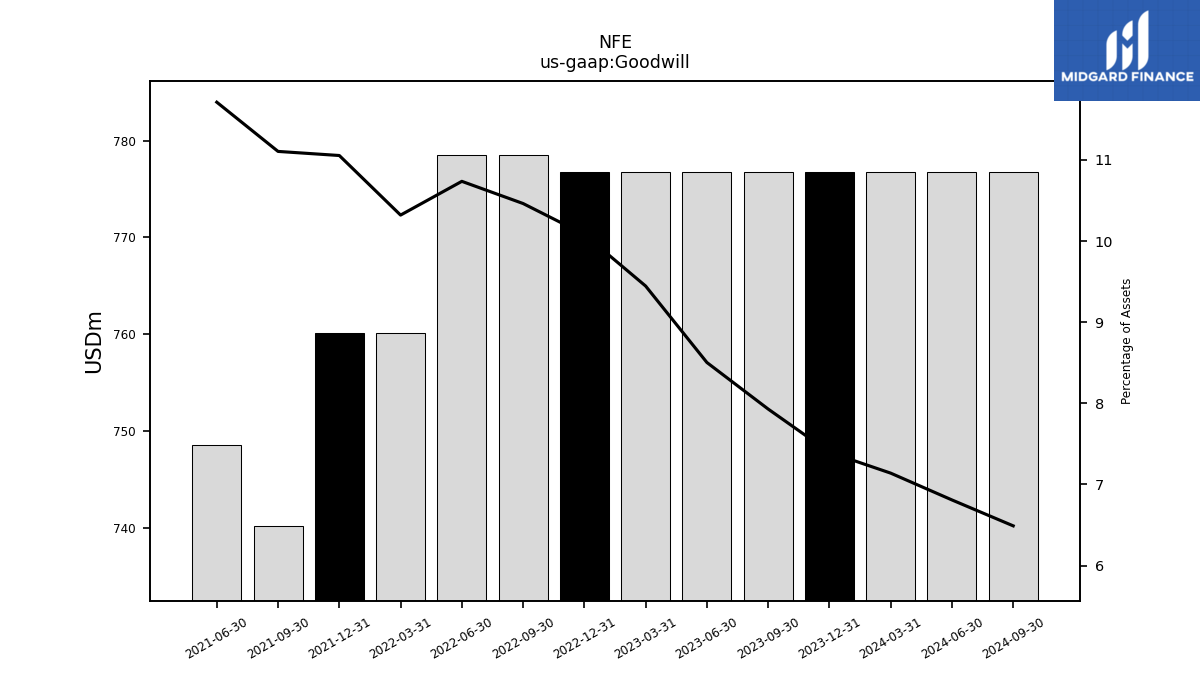
| Goodwill | 776.76 | 776.76 | 776.76 | 776.76 | 778.49 | 778.49 | 760.13 | 760.13 | 740.13 | 748.60 | NA | NA | NA | NA | NA | NA | NA | NA | NA | NA | NA | NA | NA | |
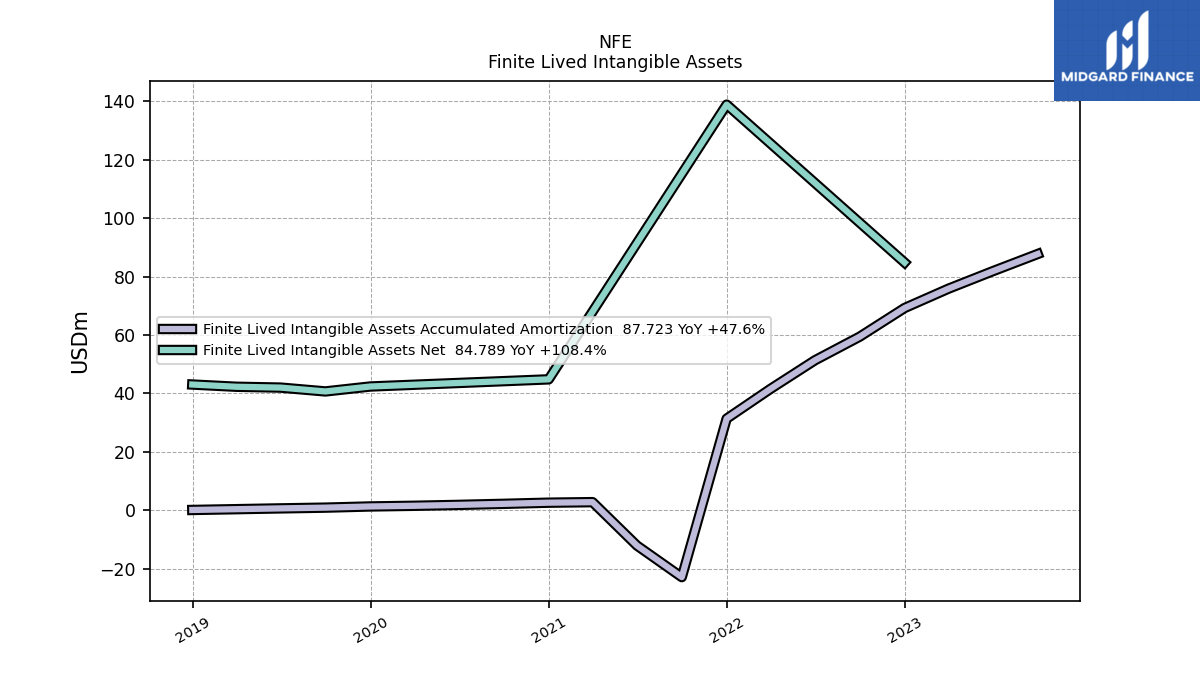
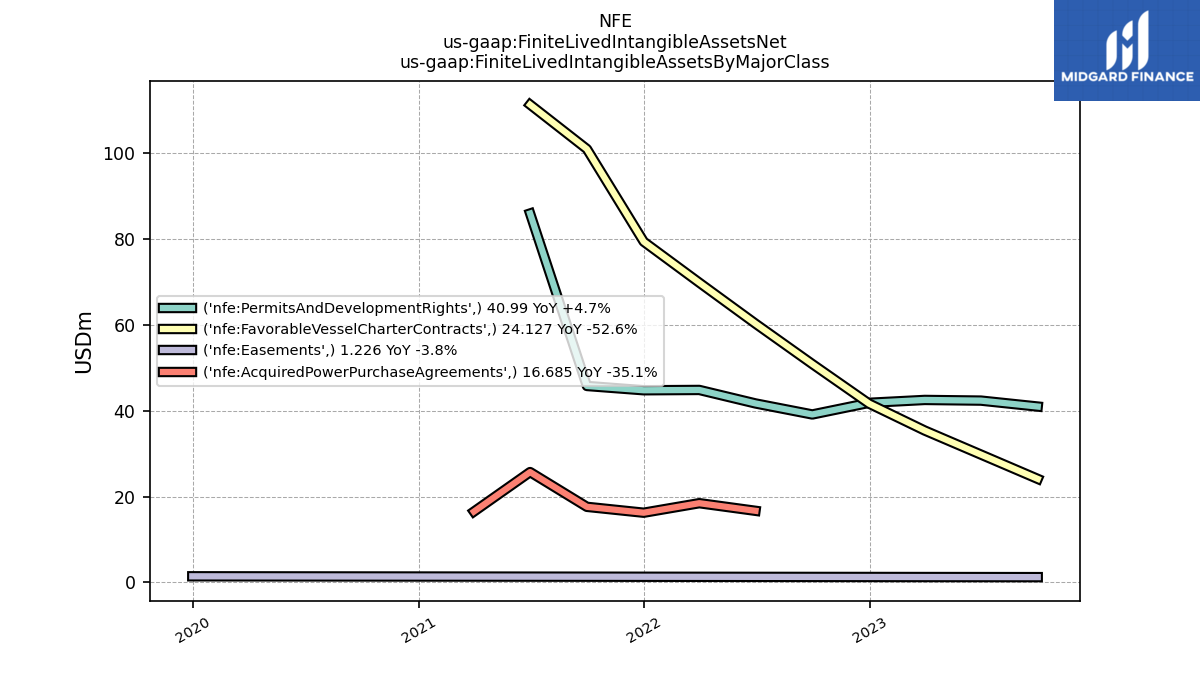
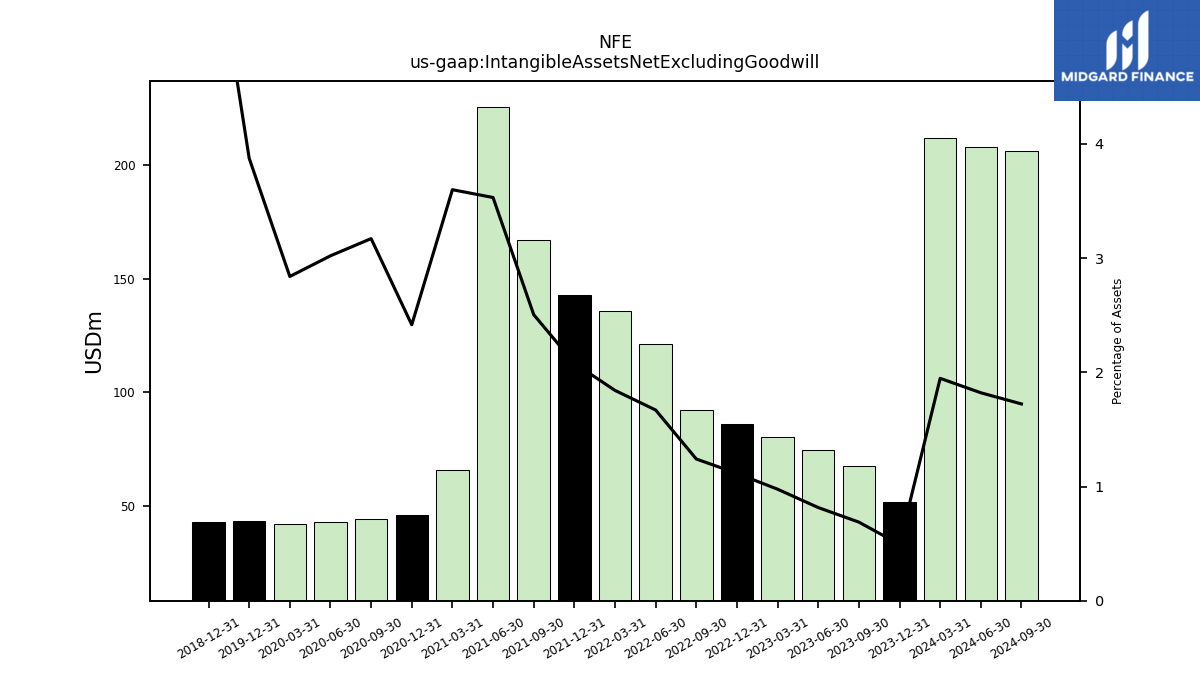
| Intangible Assets Net Excluding Goodwill | 67.44 | 74.54 | 80.31 | 85.90 | 92.34 | 121.09 | 135.65 | 142.94 | 166.96 | 225.67 | 65.93 | 46.10 | 44.38 | 42.93 | 42.28 | 43.54 | NA | NA | NA | 43.06 | NA | NA | NA | |
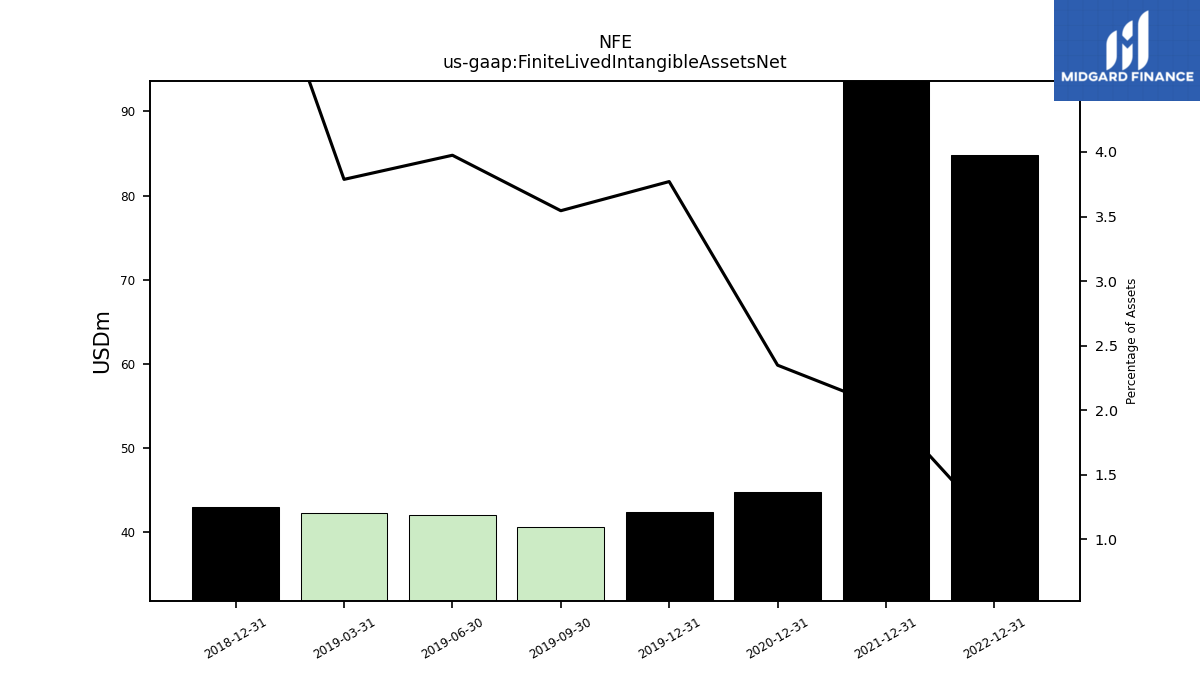
| Finite Lived Intangible Assets Net | NA | NA | NA | 84.79 | NA | NA | NA | 138.83 | NA | NA | NA | 44.83 | NA | NA | NA | 42.38 | 40.69 | 42.01 | 42.30 | 43.06 | NA | NA | NA | |
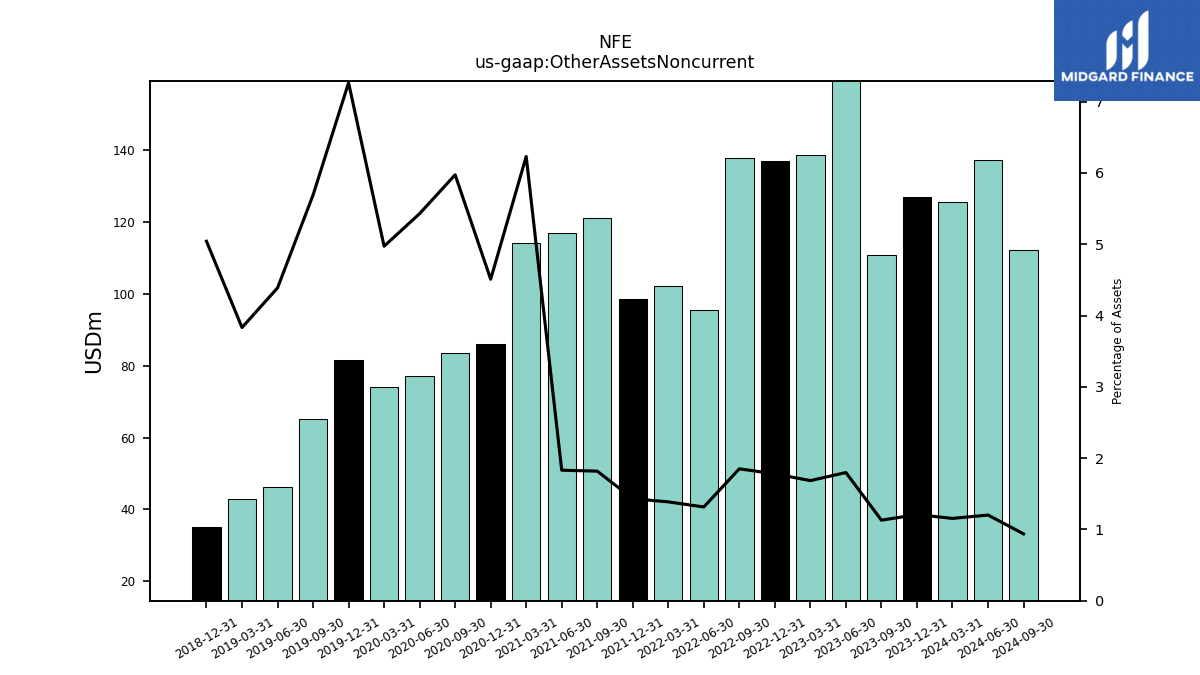
| Other Assets Noncurrent | 110.68 | 164.24 | 138.56 | 137.08 | 137.66 | 95.37 | 102.14 | 98.42 | 121.14 | 117.00 | 114.14 | 86.03 | 83.61 | 77.17 | 74.03 | 81.63 | 65.30 | 46.36 | 42.78 | 35.26 | NA | NA | NA | |
| Equity Securities Fv Ni | NA | NA | NA | 17.81 | NA | NA | NA | 18.87 | 14.27 | NA | NA | 1.26 | 0.16 | 0.32 | 0.14 | 2.54 | NA | NA | NA | 3.66 | NA | NA | NA |
| 2023-09-30 | 2023-06-30 | 2023-03-31 | 2022-12-31 | 2022-09-30 | 2022-06-30 | 2022-03-31 | 2021-12-31 | 2021-09-30 | 2021-06-30 | 2021-03-31 | 2020-12-31 | 2020-09-30 | 2020-06-30 | 2020-03-31 | 2019-12-31 | 2019-09-30 | 2019-06-30 | 2019-03-31 | 2018-12-31 | 2018-09-30 | 2018-06-30 | 2018-03-31 | ||
|---|---|---|---|---|---|---|---|---|---|---|---|---|---|---|---|---|---|---|---|---|---|---|---|---|
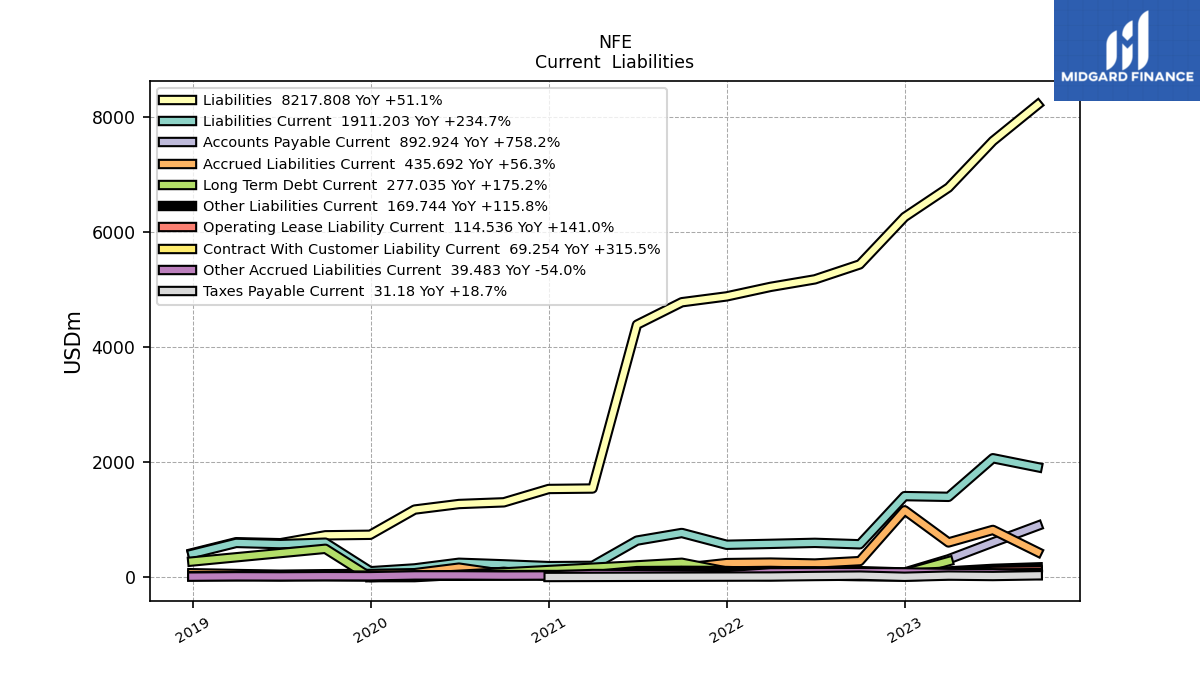
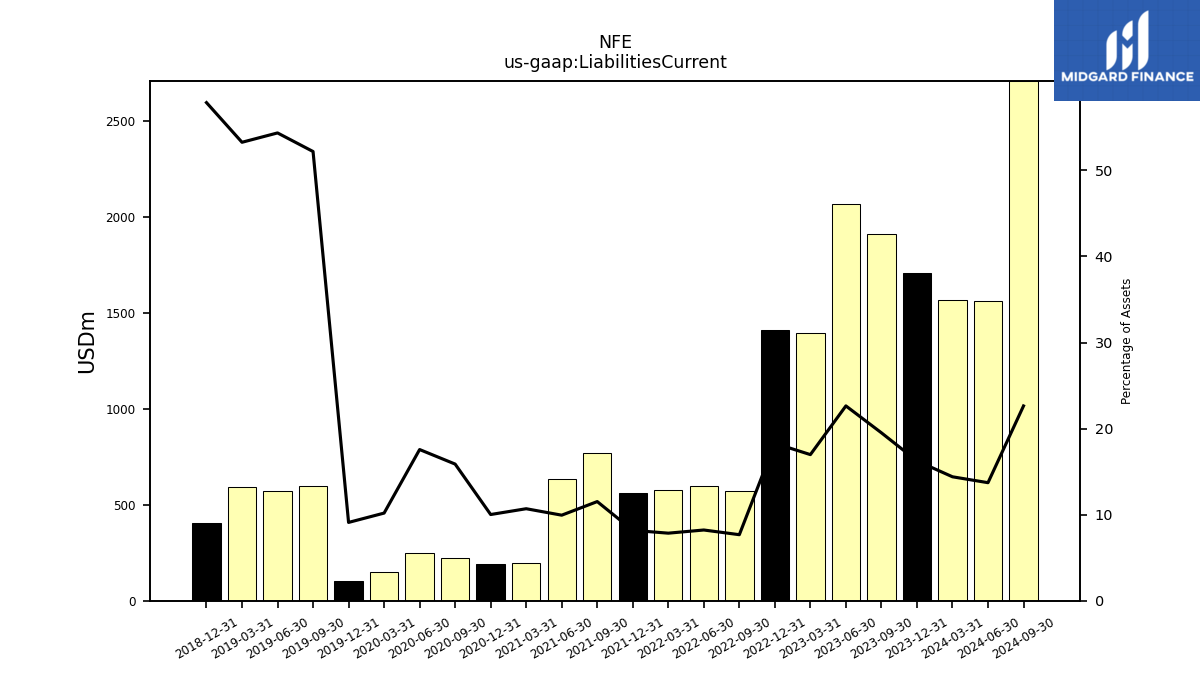
| Liabilities Current | 1911.20 | 2067.87 | 1396.18 | 1409.24 | 570.99 | 596.00 | 578.33 | 562.51 | 767.90 | 635.46 | 195.87 | 191.15 | 222.25 | 249.70 | 151.65 | 102.26 | 599.01 | 574.40 | 594.75 | 404.75 | NA | NA | NA | |
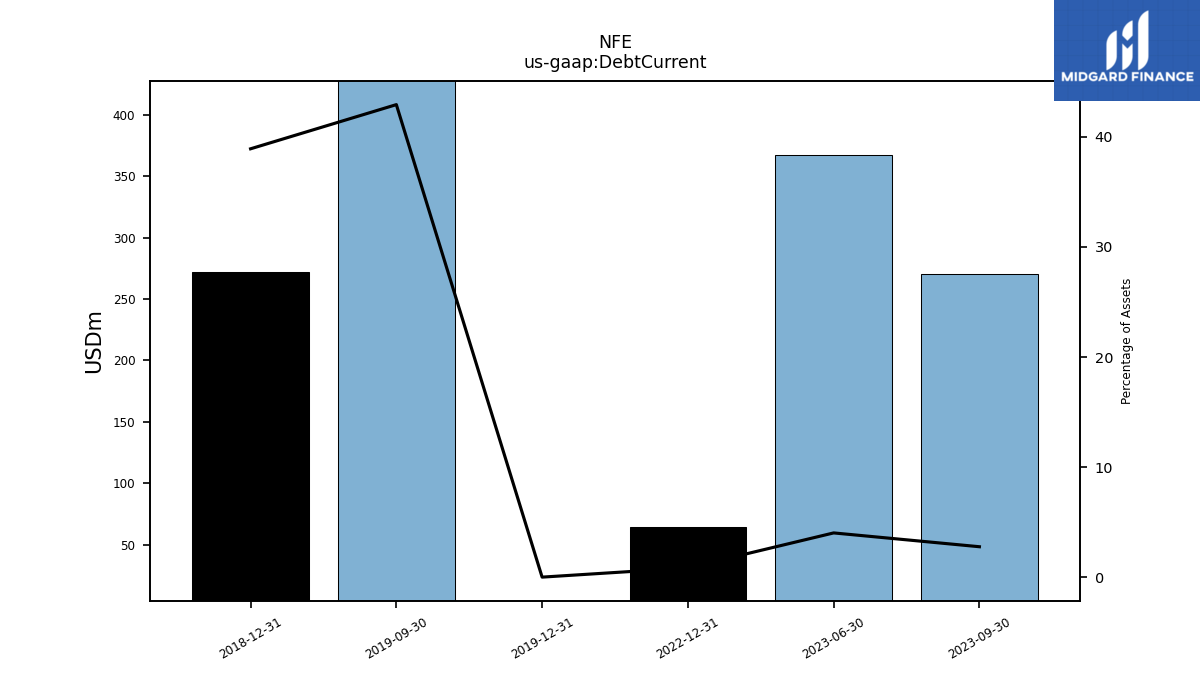
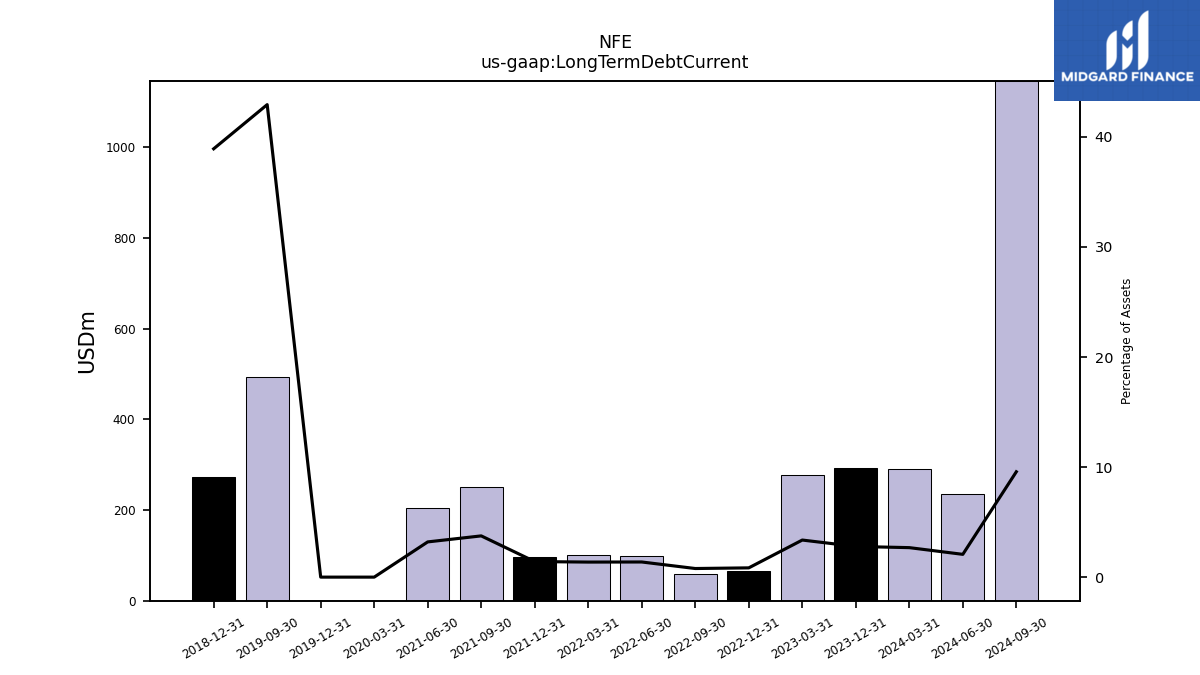
| Debt Current | 270.55 | 366.94 | NA | 64.82 | NA | NA | NA | NA | NA | NA | NA | NA | NA | NA | NA | 0.00 | 492.76 | NA | NA | 272.19 | NA | NA | NA | |
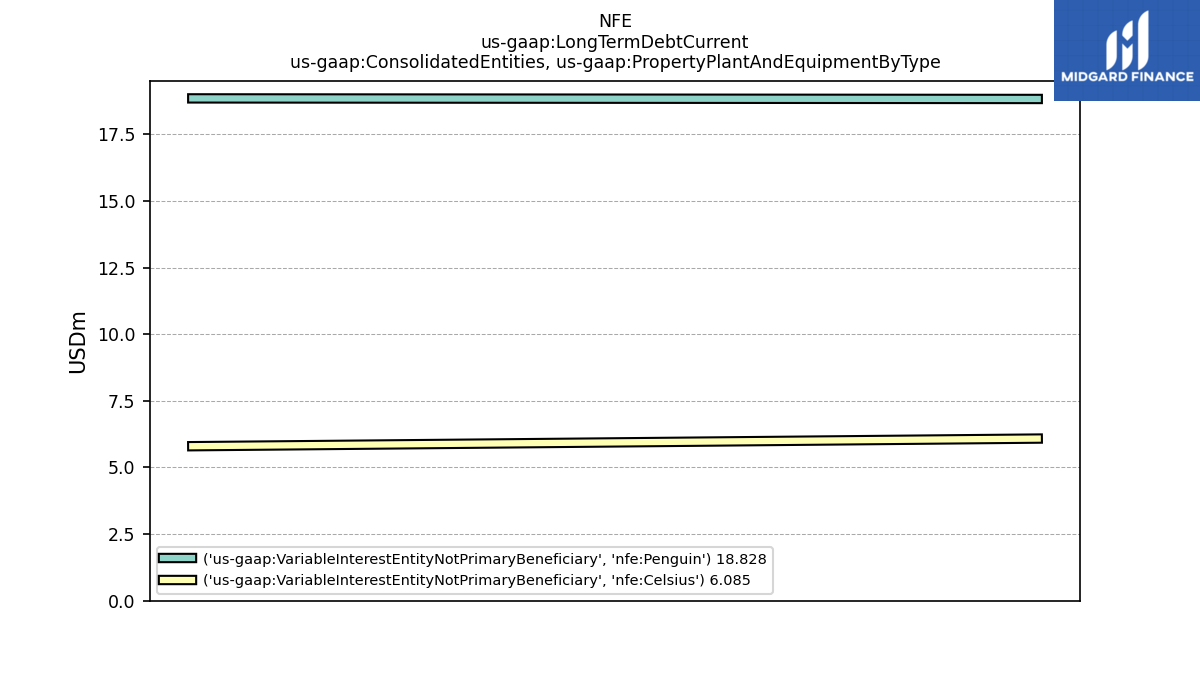
| Long Term Debt Current | NA | NA | 277.04 | 64.82 | 58.19 | 99.76 | 100.67 | 97.25 | 249.75 | 204.55 | NA | NA | NA | NA | 0.00 | 0.00 | 492.76 | NA | NA | 272.19 | NA | NA | NA | |
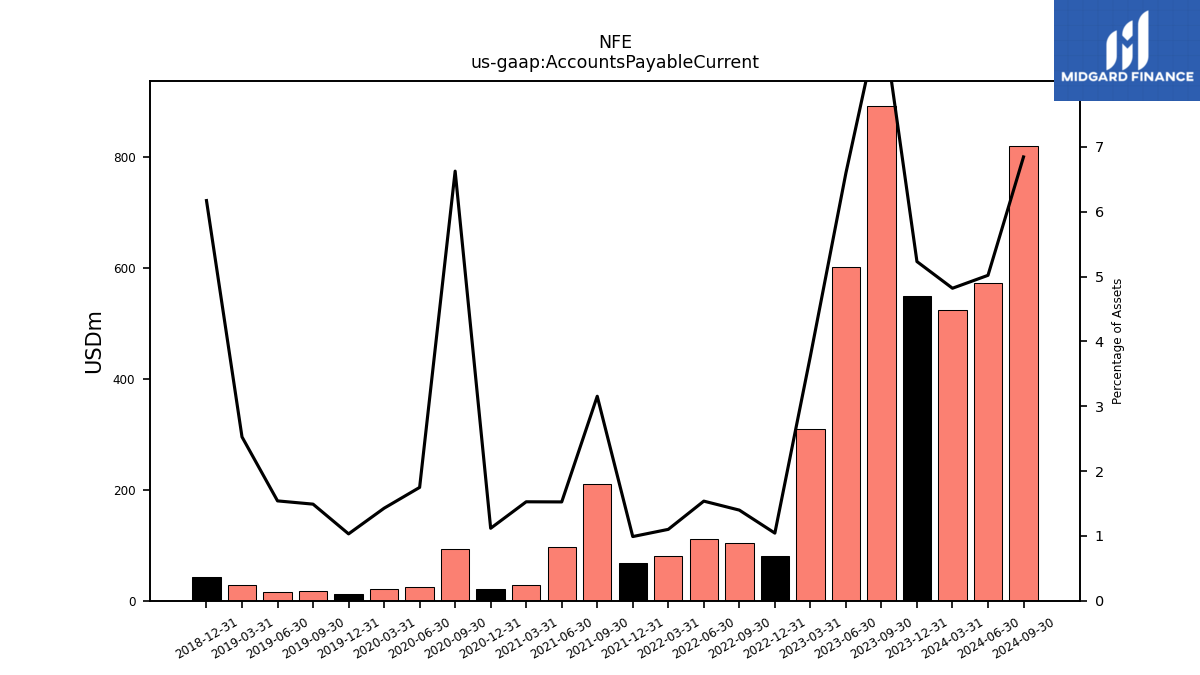
| Accounts Payable Current | 892.92 | 602.76 | 310.27 | 80.39 | 104.04 | 111.44 | 81.13 | 68.08 | 210.26 | 97.45 | 27.97 | 21.33 | 92.77 | 24.85 | 21.26 | 11.59 | 17.11 | 16.28 | 28.22 | 43.18 | NA | NA | NA | |
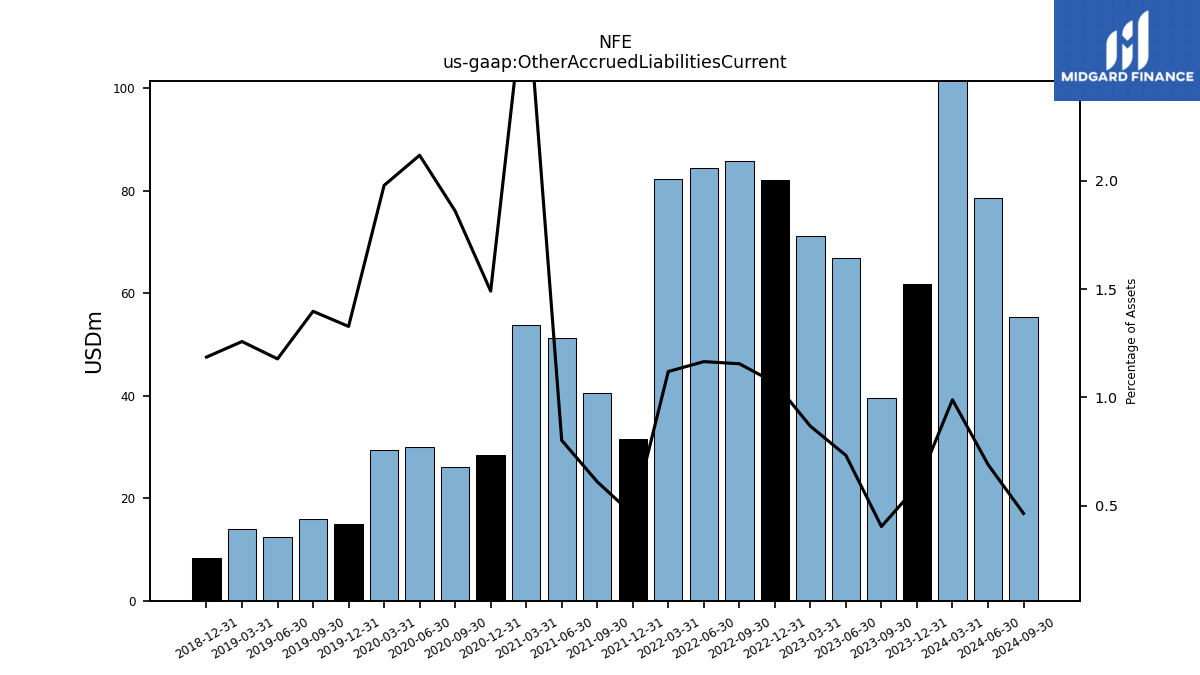
| Other Accrued Liabilities Current | 39.48 | 66.83 | 71.26 | 82.21 | 85.93 | 84.45 | 82.41 | 31.53 | 40.65 | 51.21 | 53.90 | 28.44 | 26.04 | 30.11 | 29.46 | 14.91 | 16.04 | 12.44 | 14.04 | 8.29 | NA | NA | NA | |
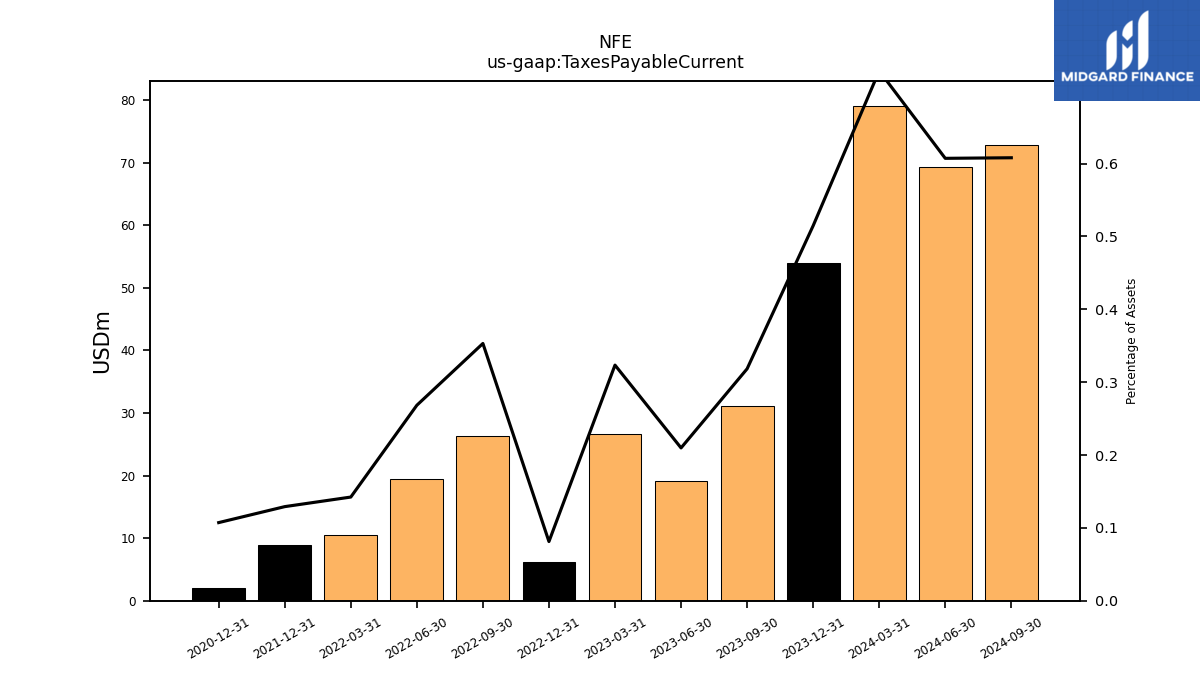
| Taxes Payable Current | 31.18 | 19.16 | 26.59 | 6.26 | 26.27 | 19.45 | 10.48 | 8.88 | NA | NA | NA | 2.05 | NA | NA | NA | NA | NA | NA | NA | NA | NA | NA | NA | |
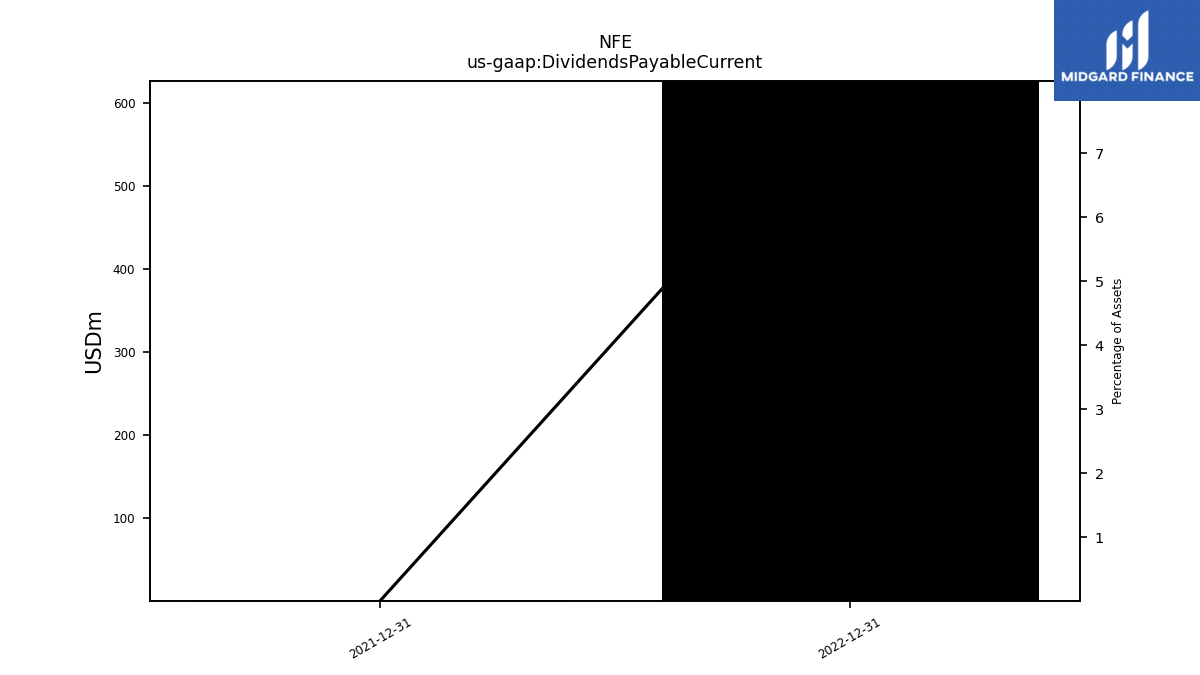
| Dividends Payable Current | NA | NA | NA | 626.31 | NA | NA | NA | 0.33 | NA | NA | NA | NA | NA | NA | NA | NA | NA | NA | NA | NA | NA | NA | NA | |
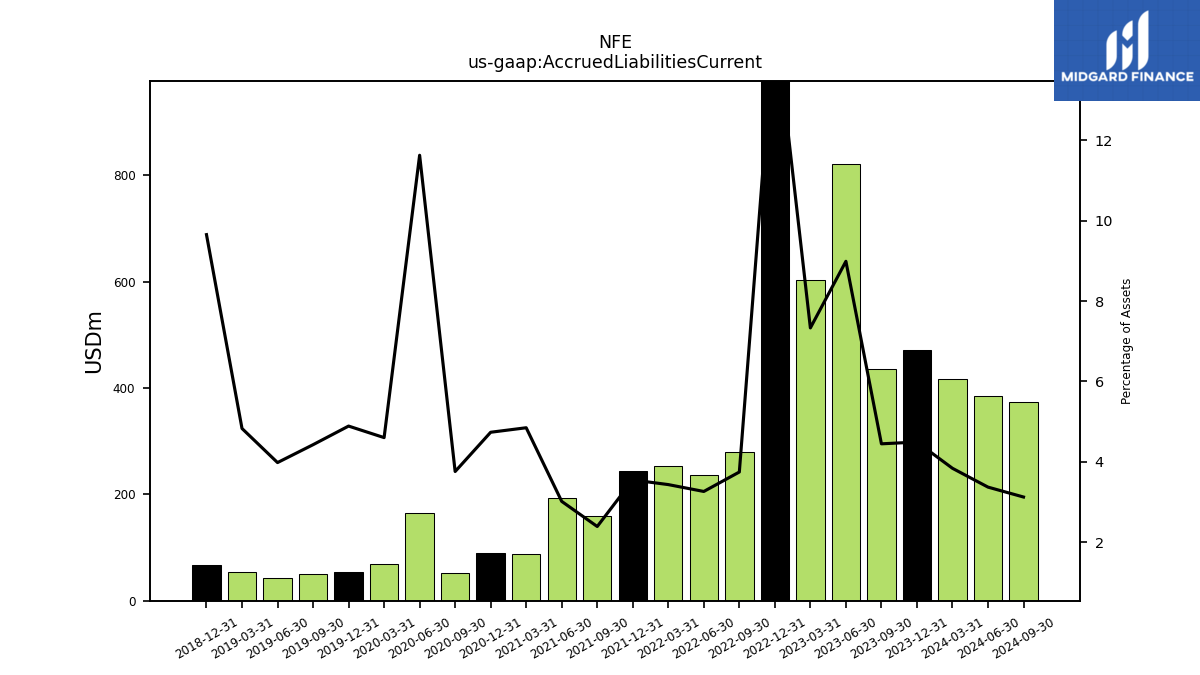
| Accrued Liabilities Current | 435.69 | 821.14 | 602.93 | 1162.41 | 278.73 | 236.53 | 252.86 | 244.03 | 159.30 | 192.72 | 88.81 | 90.35 | 52.61 | 165.29 | 68.53 | 54.94 | 50.80 | 42.07 | 53.92 | 67.51 | NA | NA | NA | |
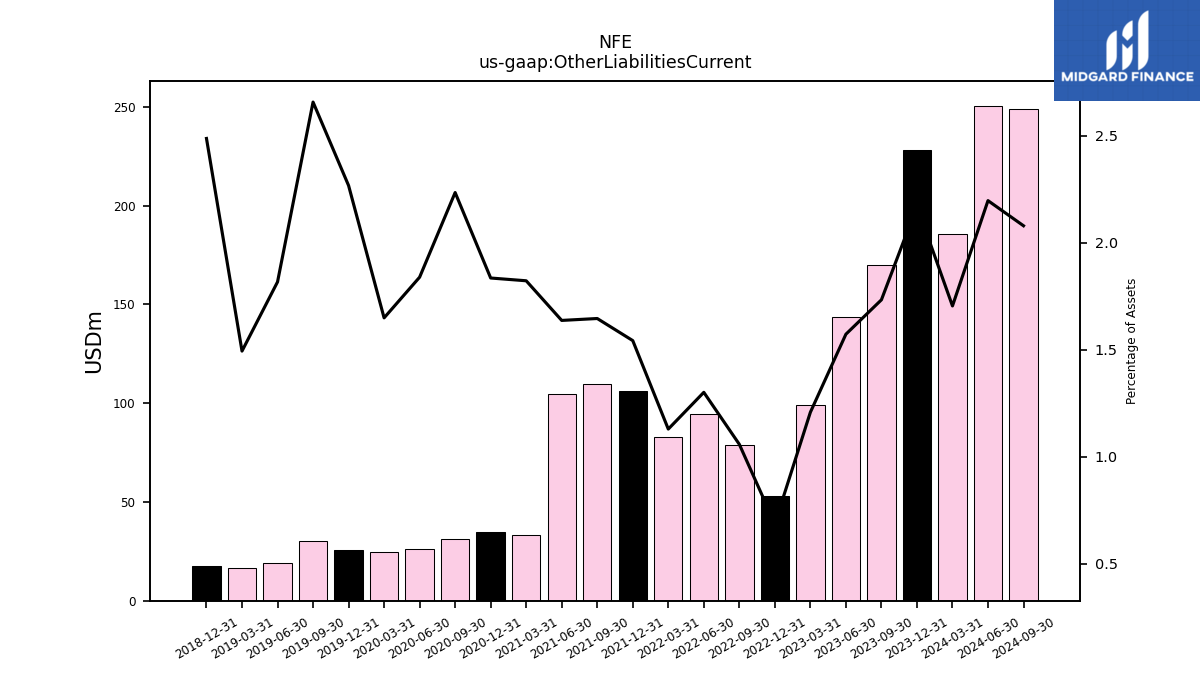
| Other Liabilities Current | 169.74 | 143.60 | 99.28 | 52.88 | 78.67 | 94.29 | 83.13 | 106.04 | 109.66 | 104.60 | 33.38 | 35.01 | 31.27 | 26.13 | 24.55 | 25.48 | 30.50 | 19.20 | 16.67 | 17.39 | NA | NA | NA | |
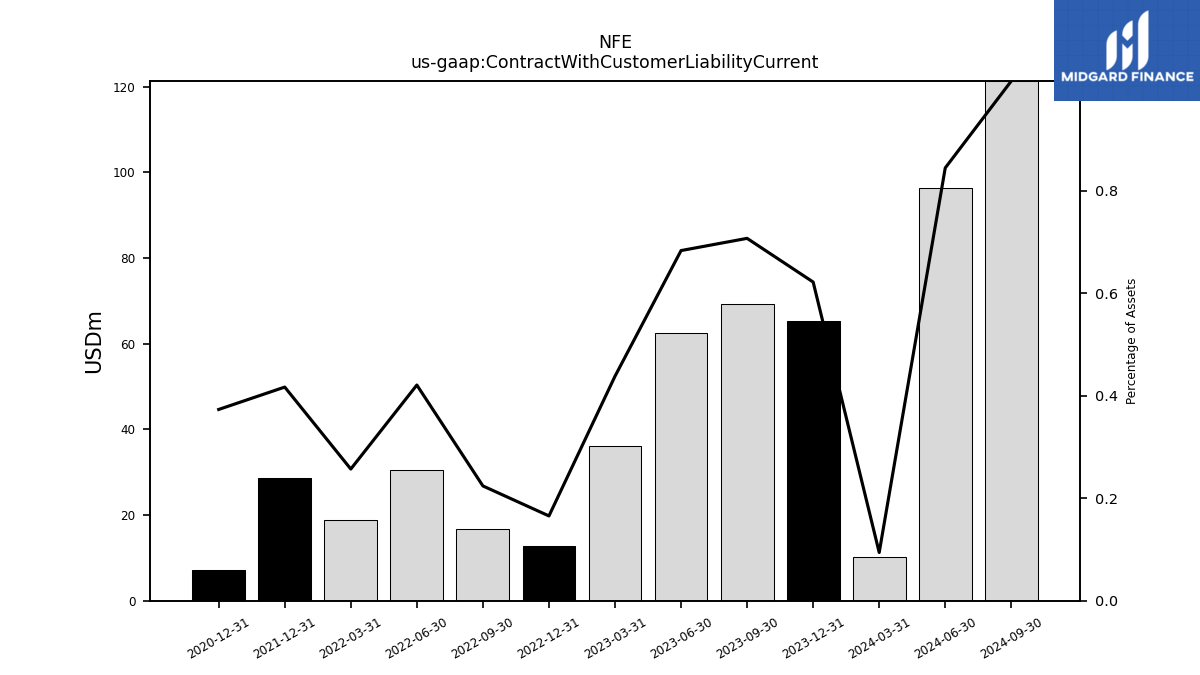
| Contract With Customer Liability Current | 69.25 | 62.40 | 36.02 | 12.75 | 16.67 | 30.52 | 18.93 | 28.66 | NA | NA | NA | 7.12 | NA | NA | NA | NA | NA | NA | NA | NA | NA | NA | NA |
| 2023-09-30 | 2023-06-30 | 2023-03-31 | 2022-12-31 | 2022-09-30 | 2022-06-30 | 2022-03-31 | 2021-12-31 | 2021-09-30 | 2021-06-30 | 2021-03-31 | 2020-12-31 | 2020-09-30 | 2020-06-30 | 2020-03-31 | 2019-12-31 | 2019-09-30 | 2019-06-30 | 2019-03-31 | 2018-12-31 | 2018-09-30 | 2018-06-30 | 2018-03-31 | ||
|---|---|---|---|---|---|---|---|---|---|---|---|---|---|---|---|---|---|---|---|---|---|---|---|---|
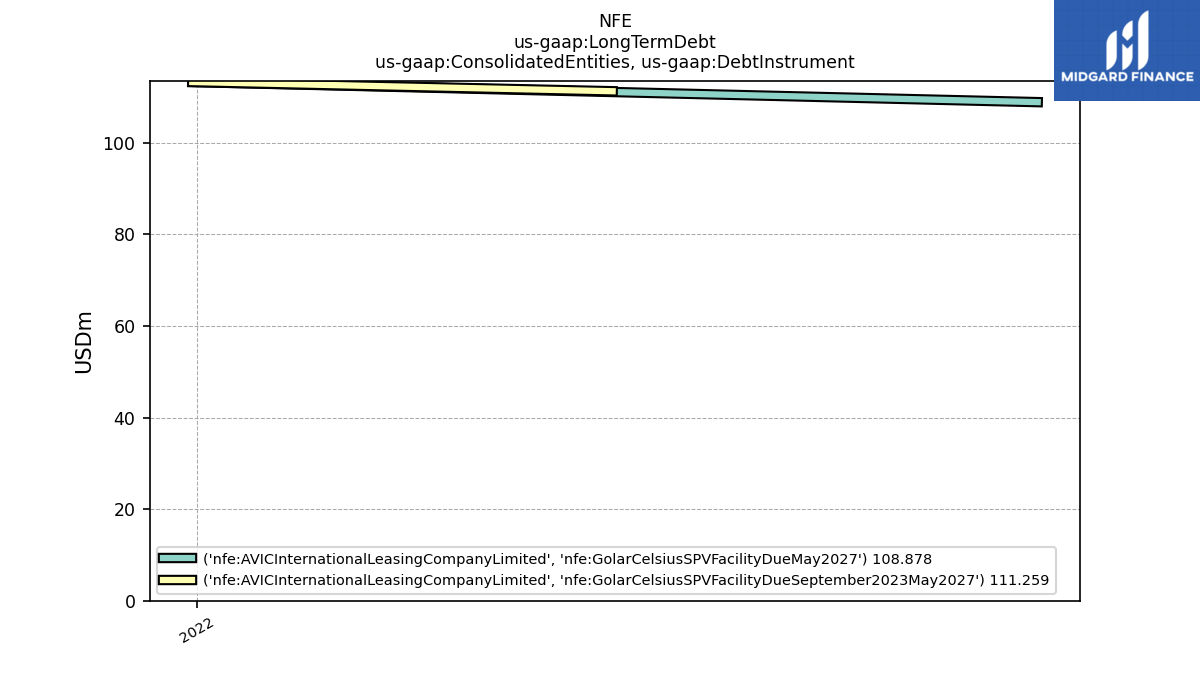
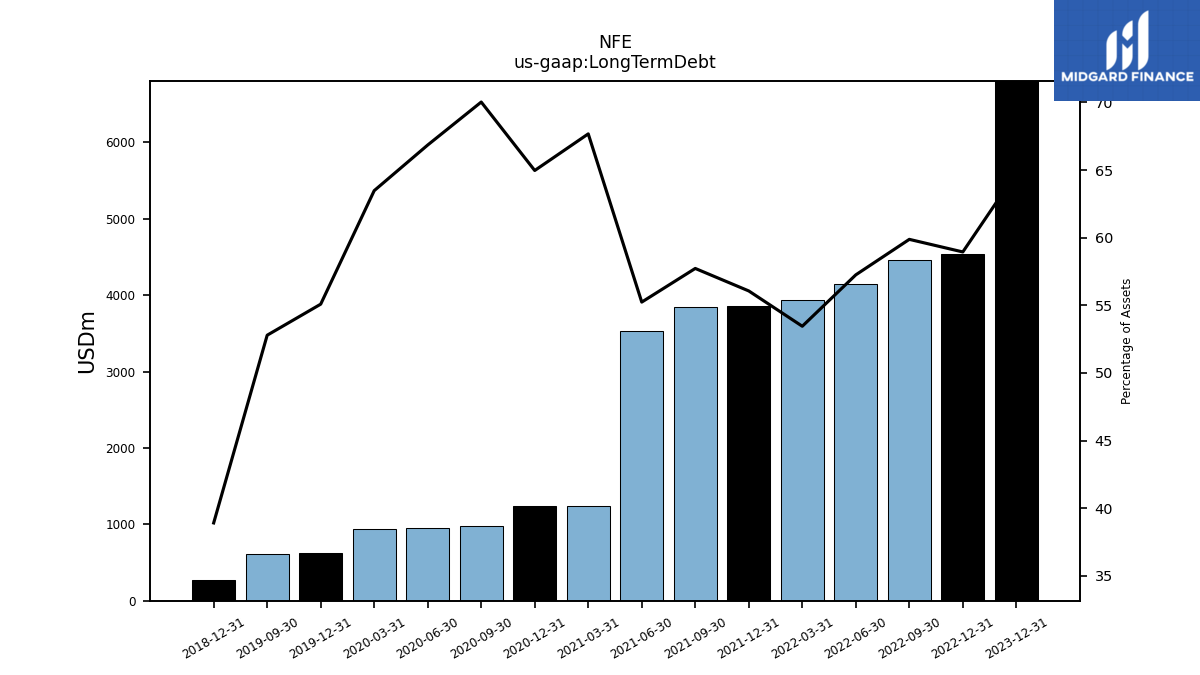
| Long Term Debt | NA | NA | NA | 4541.69 | 4455.29 | 4151.51 | 3937.28 | 3855.13 | 3847.41 | 3530.85 | 1239.80 | 1239.56 | 980.18 | 950.24 | 945.21 | 619.06 | 605.93 | NA | NA | 272.19 | NA | NA | NA | |
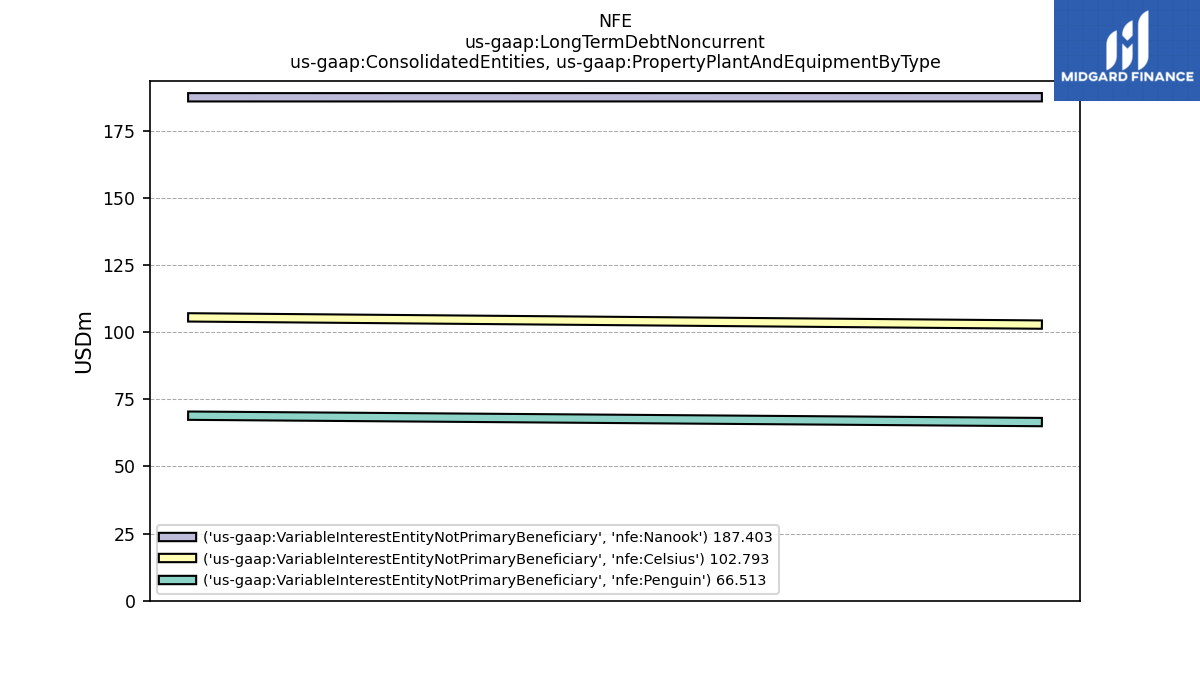
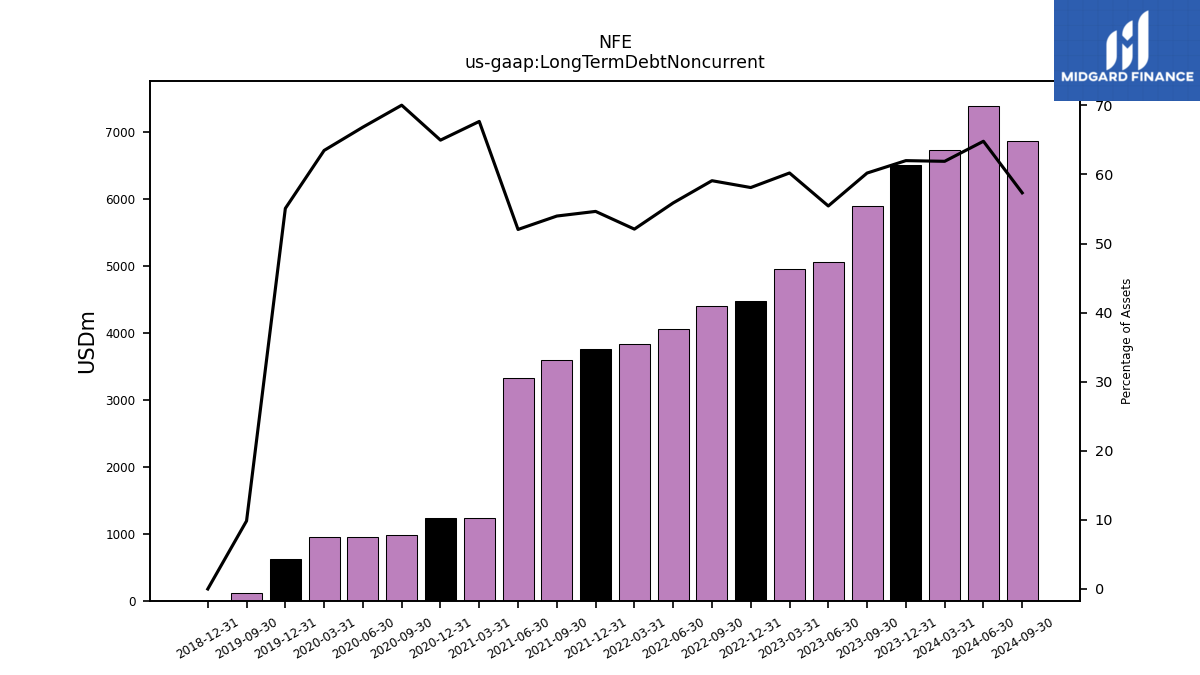
| Long Term Debt Noncurrent | 5897.53 | 5064.19 | 4951.55 | 4476.86 | 4397.10 | 4051.76 | 3836.61 | 3757.88 | 3597.66 | 3326.30 | 1239.80 | 1239.56 | 980.18 | 950.24 | 945.21 | 619.06 | 113.16 | NA | NA | 0.00 | NA | NA | NA | |
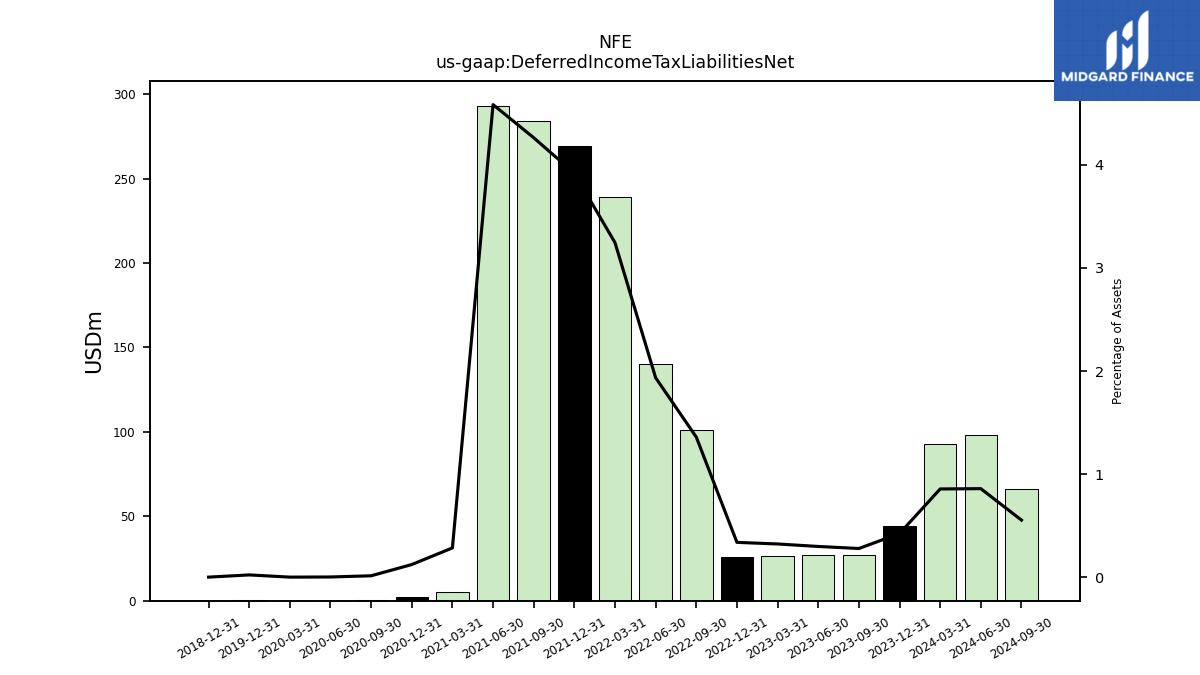
| Deferred Income Tax Liabilities Net | 27.21 | 27.19 | 26.45 | 25.99 | 101.11 | 140.29 | 239.06 | 269.51 | 284.18 | 293.07 | 5.19 | 2.33 | 0.18 | 0.02 | 0.00 | 0.24 | NA | NA | NA | 0.00 | NA | NA | NA | |
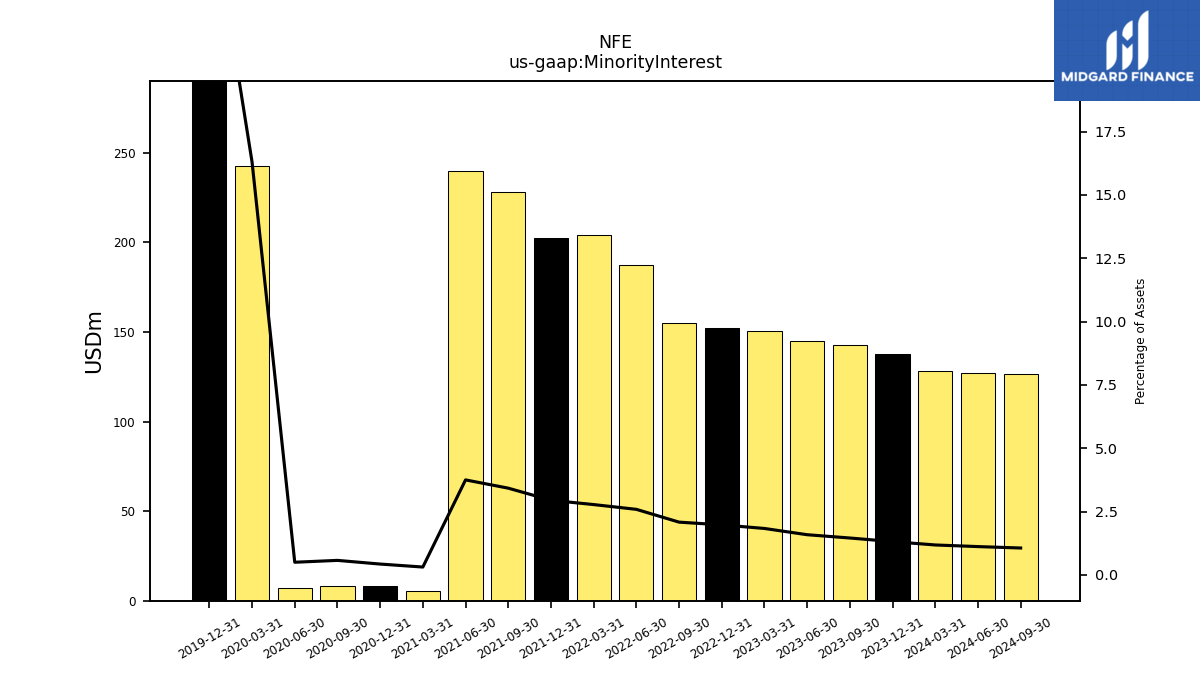
| Minority Interest | 142.49 | 144.71 | 150.57 | 152.04 | 154.82 | 187.50 | 204.33 | 202.48 | 228.07 | 239.57 | 5.65 | 8.13 | 8.00 | 7.07 | 242.67 | 302.52 | NA | NA | NA | NA | NA | NA | NA | |
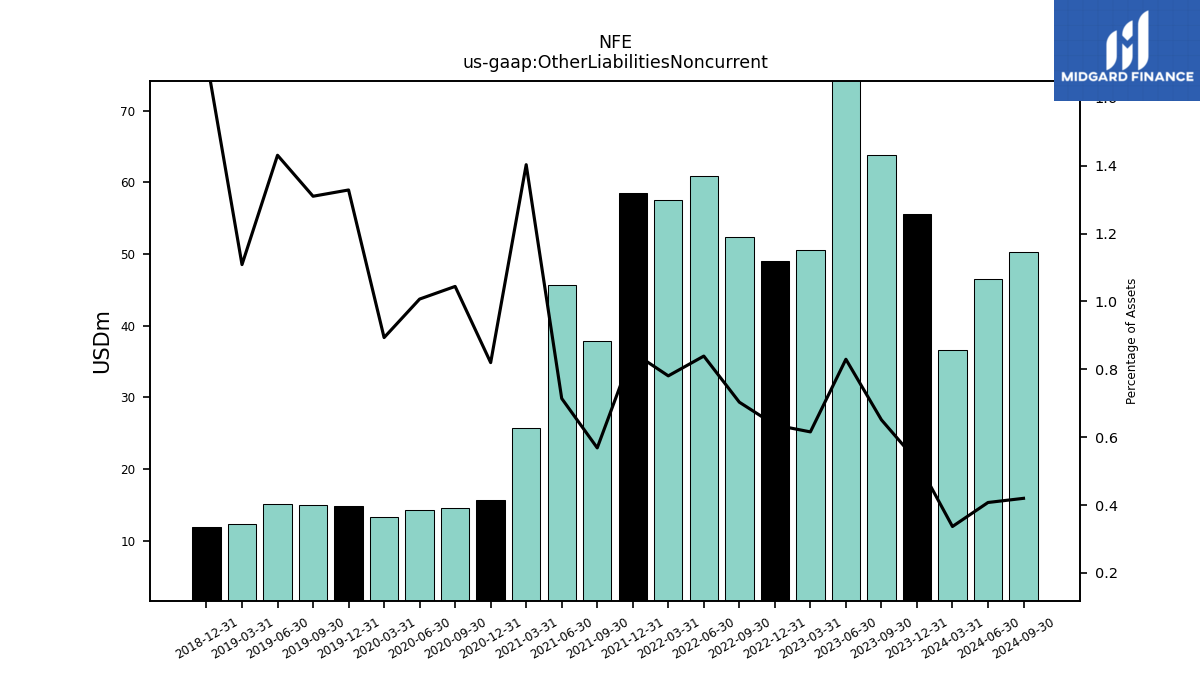
| Other Liabilities Noncurrent | 63.79 | 75.78 | 50.62 | 49.01 | 52.32 | 60.84 | 57.50 | 58.48 | 37.88 | 45.64 | 25.70 | 15.64 | 14.62 | 14.31 | 13.30 | 14.93 | 15.04 | 15.12 | 12.38 | 12.00 | NA | NA | NA | |
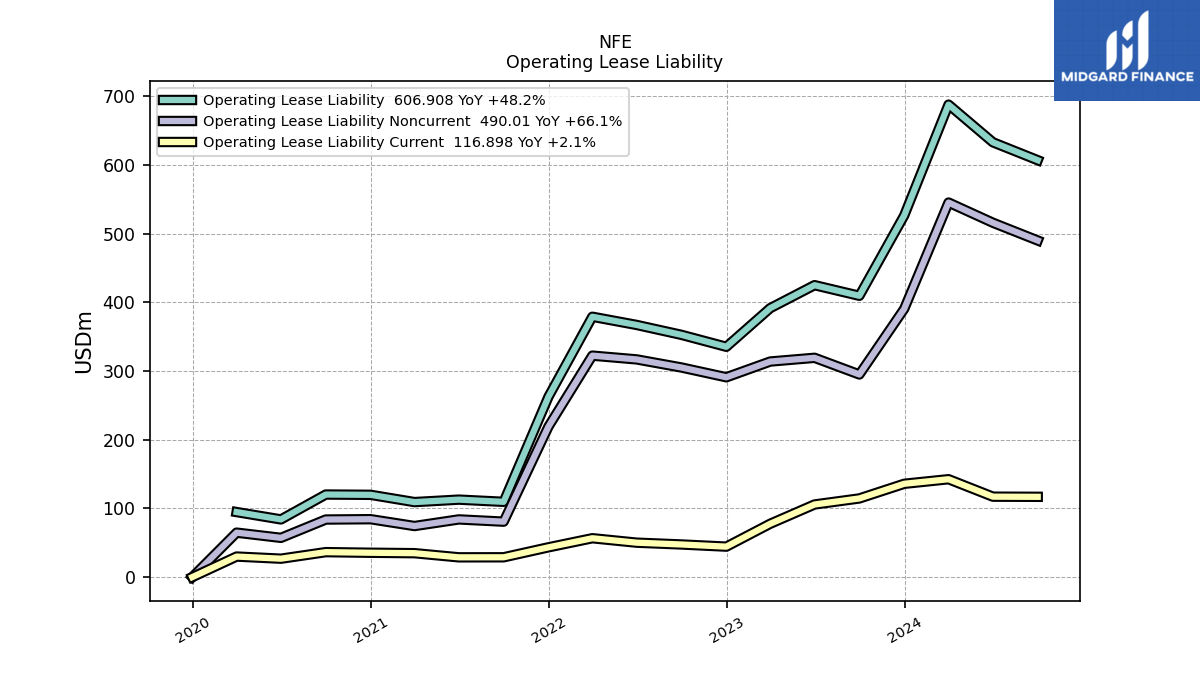
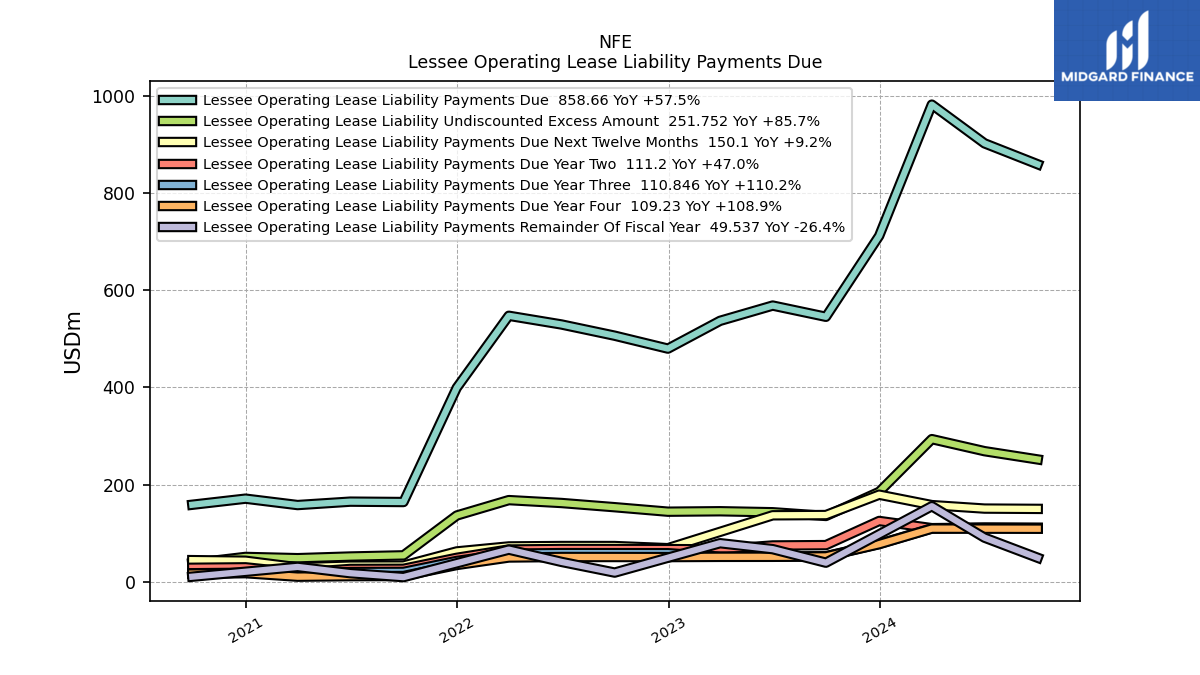
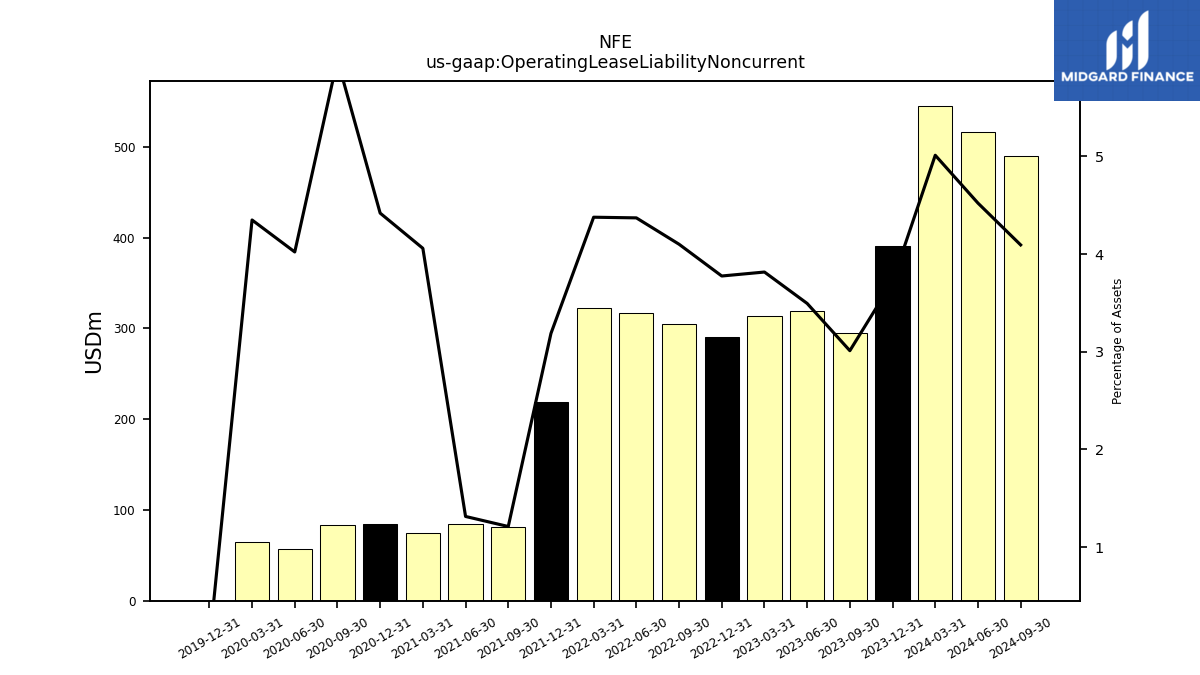
| Operating Lease Liability Noncurrent | 294.97 | 319.24 | 313.82 | 290.90 | 305.12 | 316.92 | 322.42 | 219.19 | 80.74 | 84.00 | 74.36 | 84.32 | 83.84 | 57.17 | 64.76 | 0.00 | NA | NA | NA | NA | NA | NA | NA |
| 2023-09-30 | 2023-06-30 | 2023-03-31 | 2022-12-31 | 2022-09-30 | 2022-06-30 | 2022-03-31 | 2021-12-31 | 2021-09-30 | 2021-06-30 | 2021-03-31 | 2020-12-31 | 2020-09-30 | 2020-06-30 | 2020-03-31 | 2019-12-31 | 2019-09-30 | 2019-06-30 | 2019-03-31 | 2018-12-31 | 2018-09-30 | 2018-06-30 | 2018-03-31 | ||
|---|---|---|---|---|---|---|---|---|---|---|---|---|---|---|---|---|---|---|---|---|---|---|---|---|
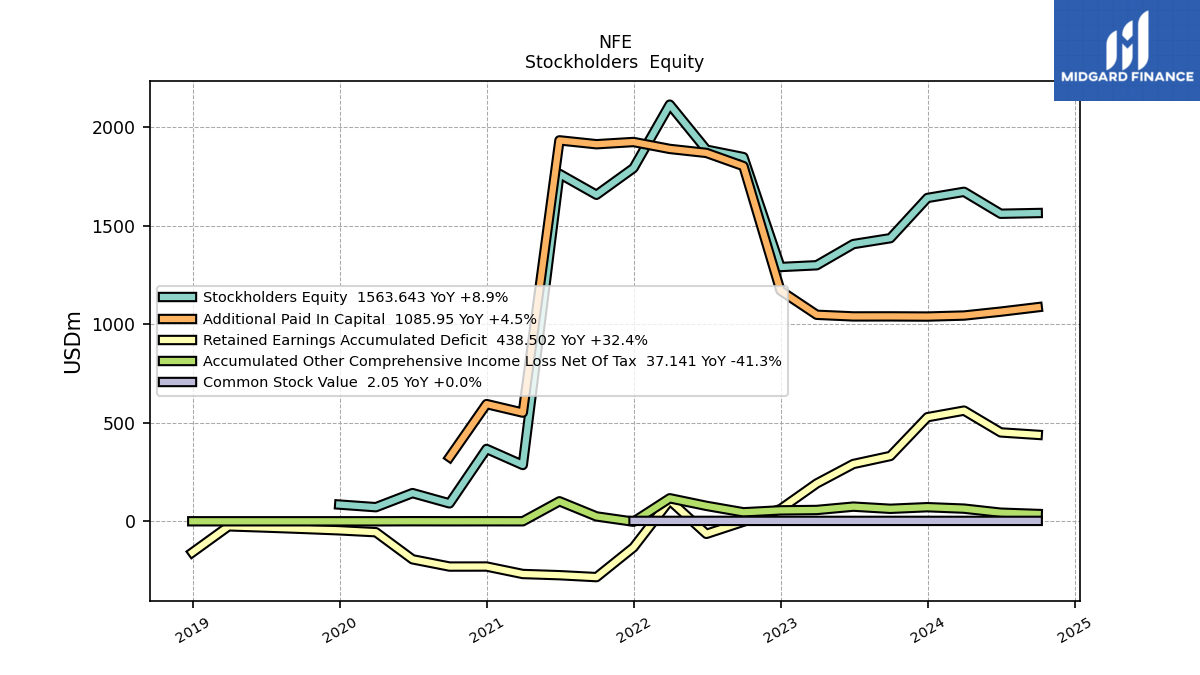
| Stockholders Equity | 1436.07 | 1406.16 | 1298.75 | 1289.82 | 1847.37 | 1885.03 | 2113.58 | 1791.58 | 1656.08 | 1762.35 | 285.53 | 366.96 | 90.74 | 143.00 | 71.52 | 84.81 | NA | NA | NA | NA | NA | NA | NA | |
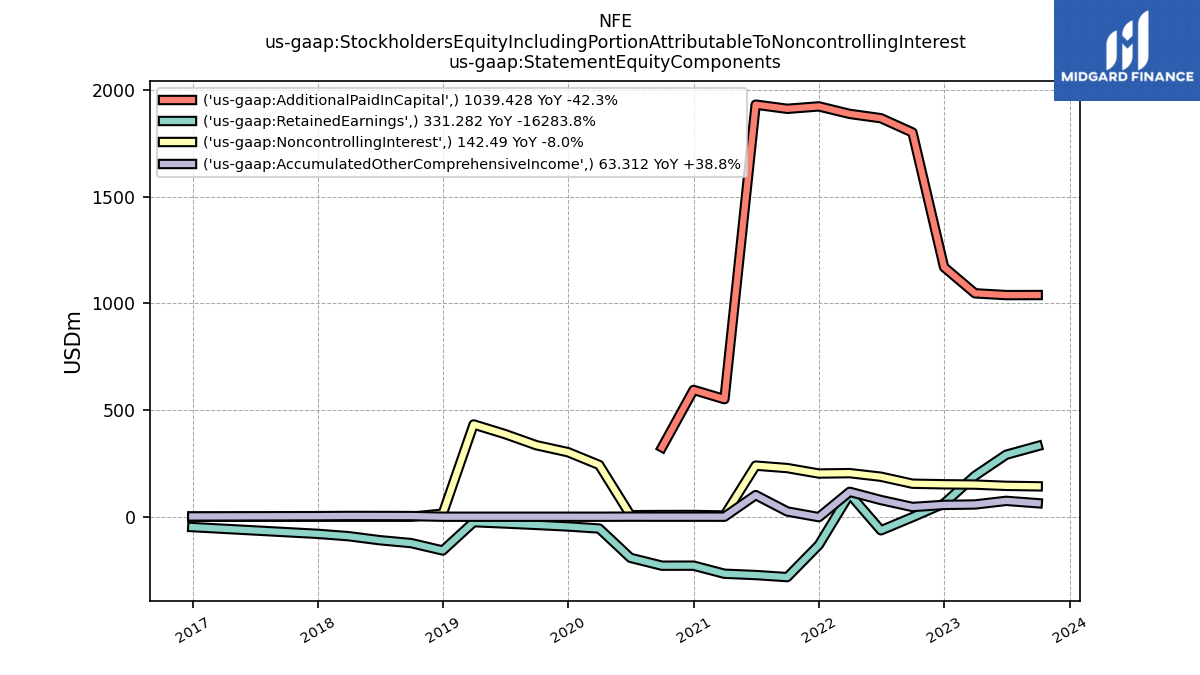
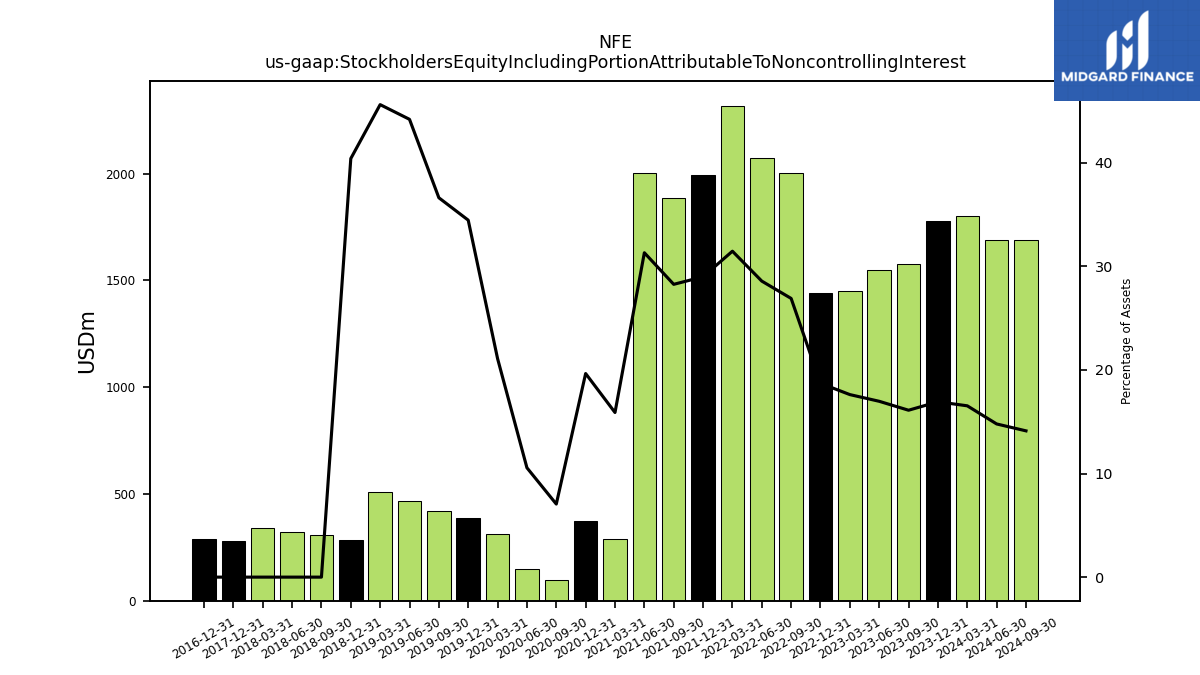
| Stockholders Equity Including Portion Attributable To Noncontrolling Interest | 1578.56 | 1550.88 | 1449.33 | 1441.86 | 2002.20 | 2072.53 | 2317.91 | 1994.05 | 1884.15 | 2001.92 | 291.18 | 375.09 | 98.74 | 150.07 | 314.19 | 387.32 | 420.40 | 467.14 | 509.40 | 282.65 | 306.08 | 320.06 | 339.08 | |
| Common Stock Value | 2.05 | 2.05 | 2.05 | 2.09 | 2.09 | 2.08 | 2.08 | 2.07 | NA | NA | NA | NA | NA | NA | NA | NA | NA | NA | NA | NA | NA | NA | NA | |
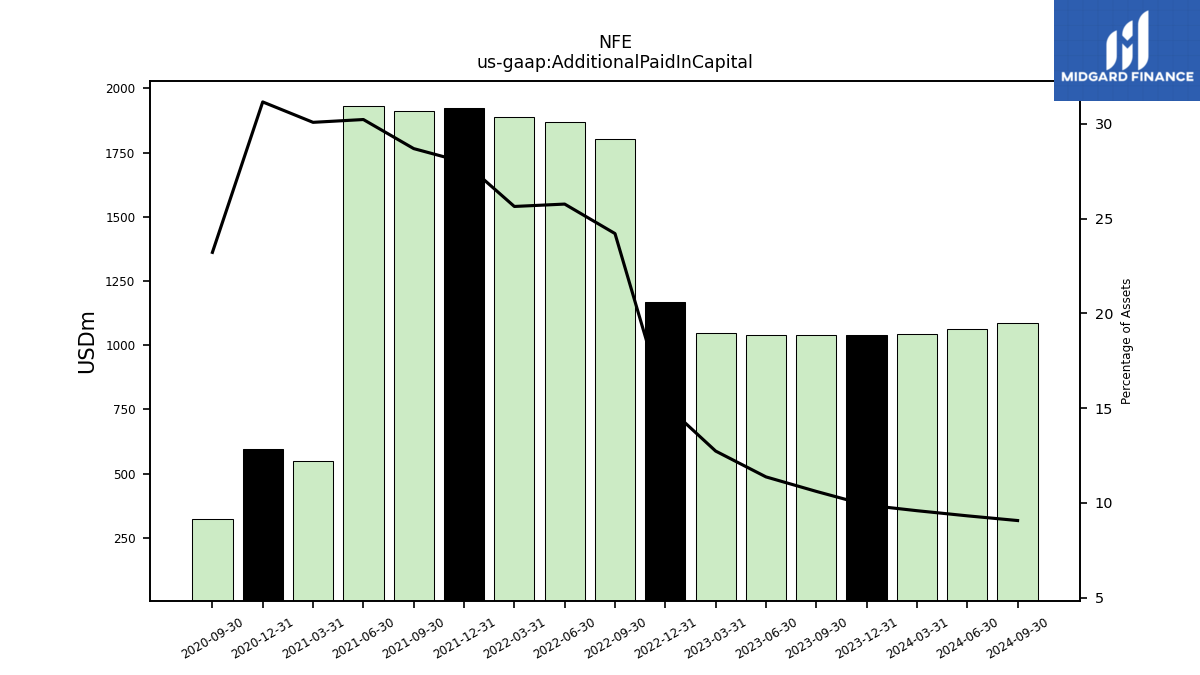
| Additional Paid In Capital | 1039.43 | 1039.20 | 1047.54 | 1170.25 | 1801.72 | 1868.62 | 1888.84 | 1923.99 | 1912.64 | 1932.32 | 551.13 | 594.53 | 325.05 | NA | NA | NA | NA | NA | NA | NA | NA | NA | NA | |
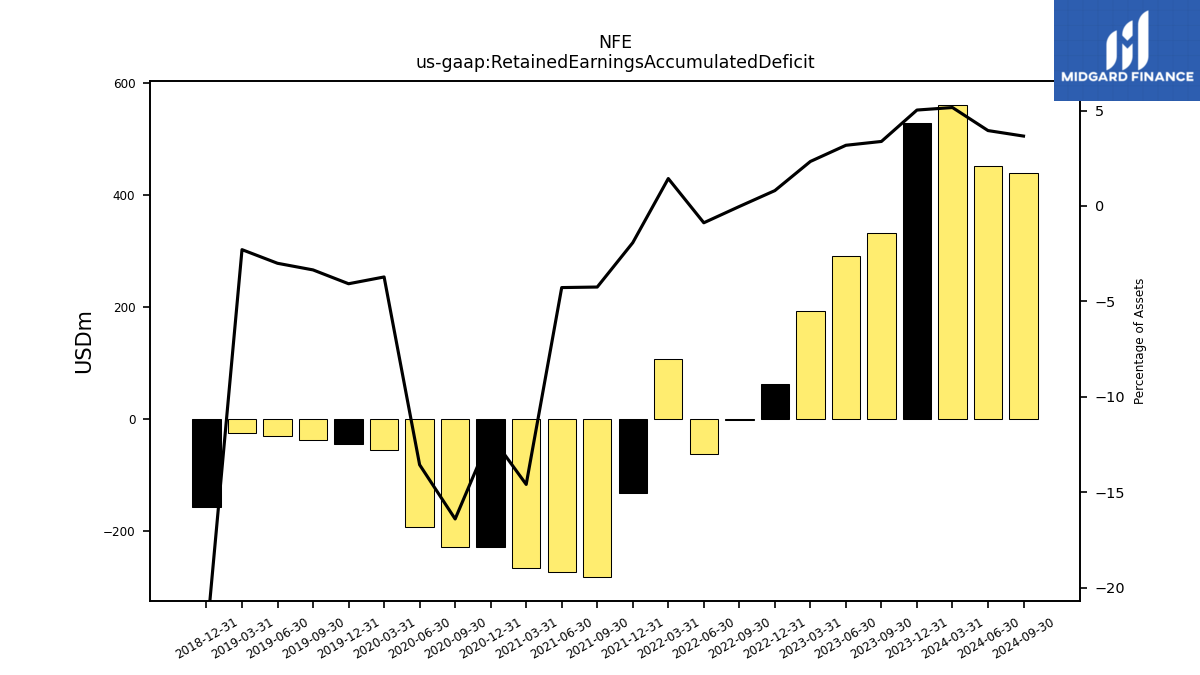
| Retained Earnings Accumulated Deficit | 331.28 | 290.56 | 191.82 | 62.08 | -2.05 | -63.90 | 105.87 | -132.40 | -283.26 | -273.45 | -267.41 | -229.50 | -229.67 | -192.85 | -55.43 | -45.82 | -38.48 | -31.76 | -25.57 | -158.42 | NA | NA | NA | |
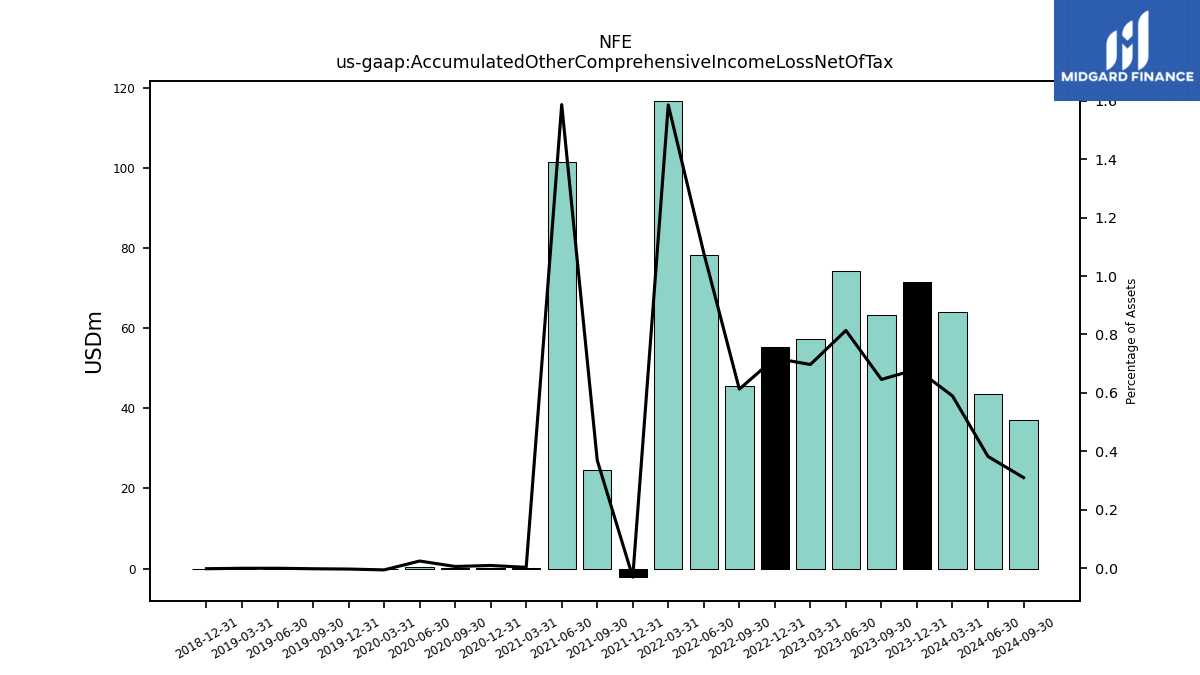
| Accumulated Other Comprehensive Income Loss Net Of Tax | 63.31 | 74.35 | 57.34 | 55.40 | 45.61 | 78.23 | 116.79 | -2.08 | 24.62 | 101.42 | 0.06 | 0.18 | 0.09 | 0.35 | -0.08 | -0.03 | -0.02 | 0.00 | 0.00 | -0.01 | NA | NA | NA | |
| Minority Interest | 142.49 | 144.71 | 150.57 | 152.04 | 154.82 | 187.50 | 204.33 | 202.48 | 228.07 | 239.57 | 5.65 | 8.13 | 8.00 | 7.07 | 242.67 | 302.52 | NA | NA | NA | NA | NA | NA | NA | |
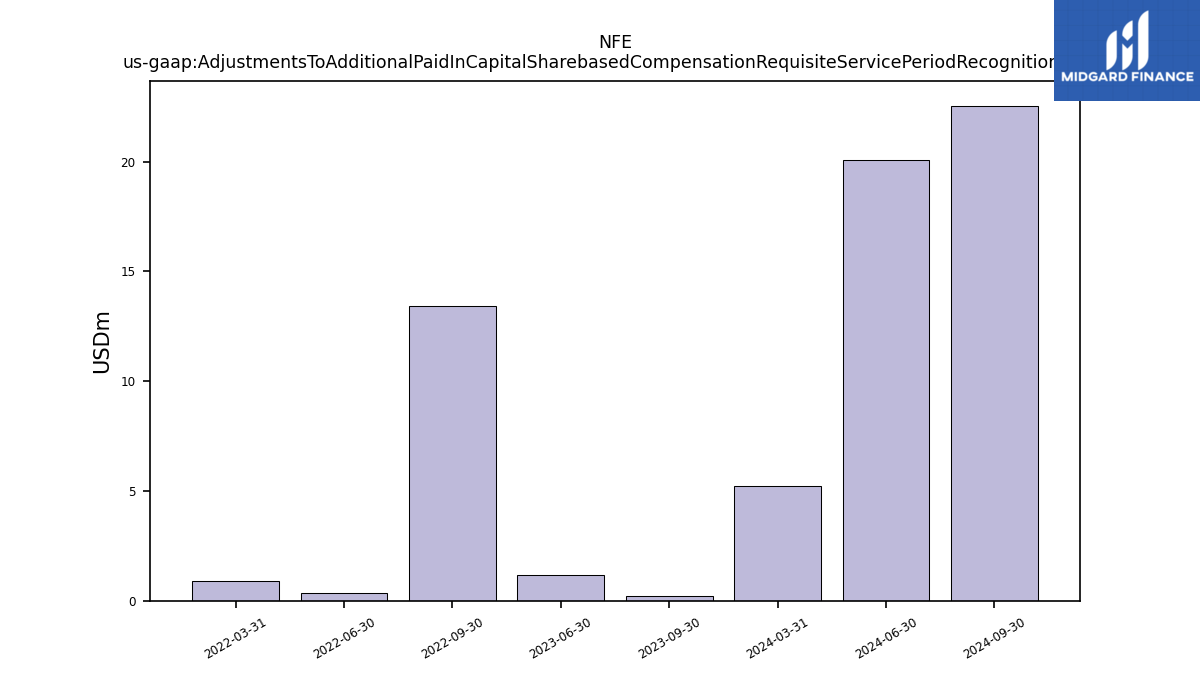
| Adjustments To Additional Paid In Capital Sharebased Compensation Requisite Service Period Recognition Value | 0.23 | 1.18 | NA | NA | 13.42 | 0.36 | 0.88 | NA | NA | NA | NA | NA | NA | NA | NA | NA | NA | NA | NA | NA | NA | NA | NA |
| 2023-09-30 | 2023-06-30 | 2023-03-31 | 2022-12-31 | 2022-09-30 | 2022-06-30 | 2022-03-31 | 2021-12-31 | 2021-09-30 | 2021-06-30 | 2021-03-31 | 2020-12-31 | 2020-09-30 | 2020-06-30 | 2020-03-31 | 2019-12-31 | 2019-09-30 | 2019-06-30 | 2019-03-31 | 2018-12-31 | 2018-09-30 | 2018-06-30 | 2018-03-31 | ||
|---|---|---|---|---|---|---|---|---|---|---|---|---|---|---|---|---|---|---|---|---|---|---|---|---|
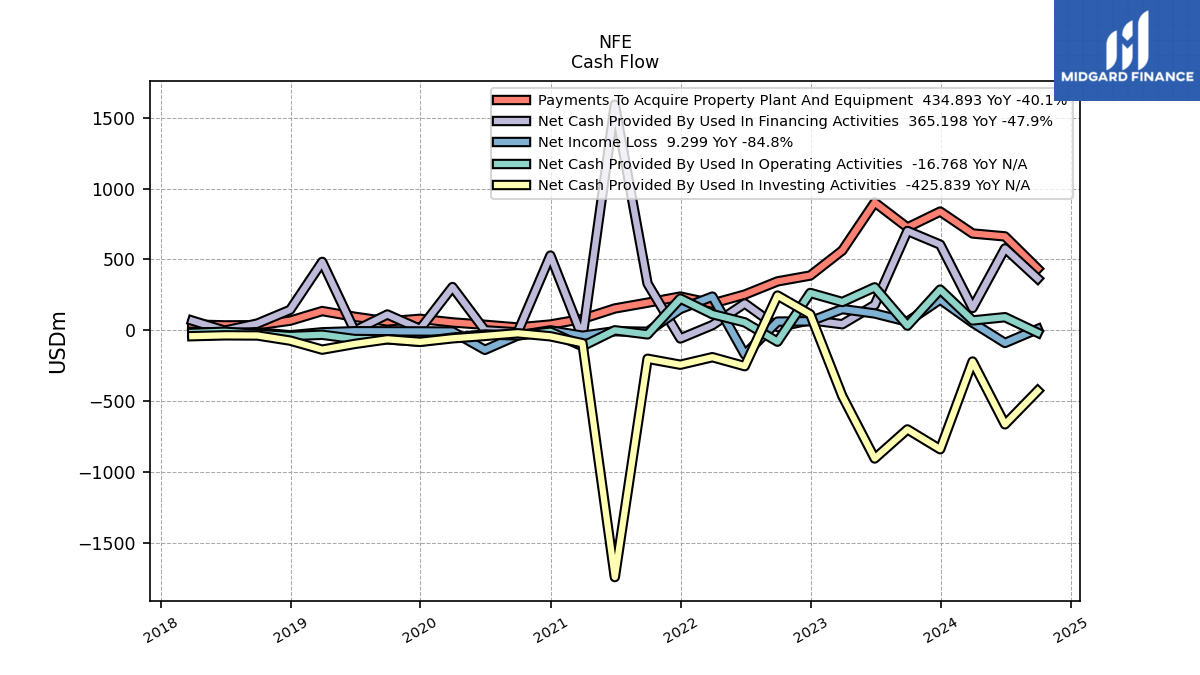
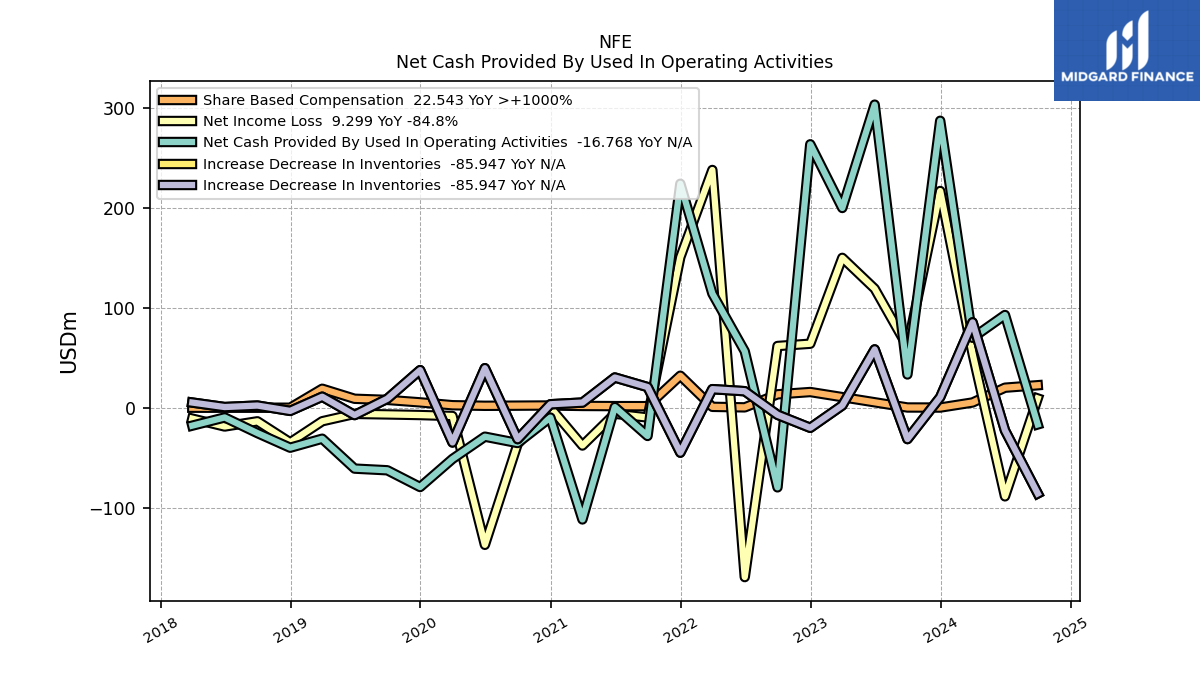
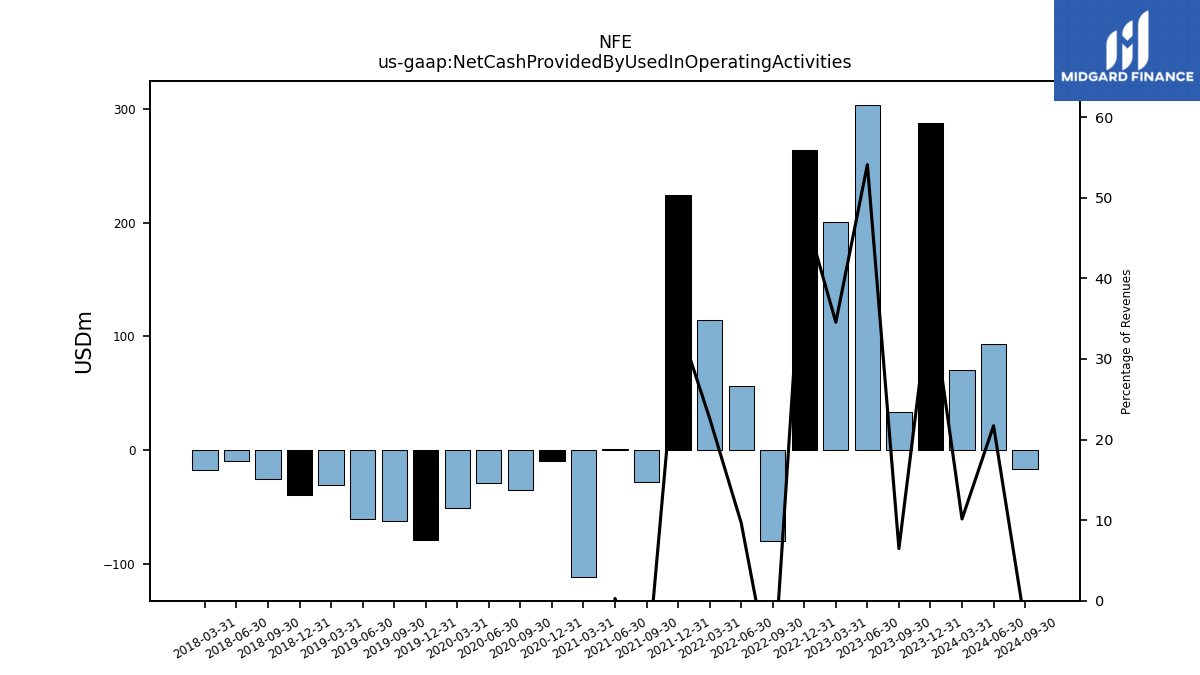
| Net Cash Provided By Used In Operating Activities | 33.31 | 303.74 | 200.14 | 264.01 | -79.83 | 56.55 | 114.38 | 224.46 | -28.34 | 0.63 | -111.99 | -9.86 | -35.39 | -29.01 | -51.31 | -79.50 | -62.69 | -61.02 | -31.05 | -40.07 | -25.44 | -9.75 | -17.97 | |
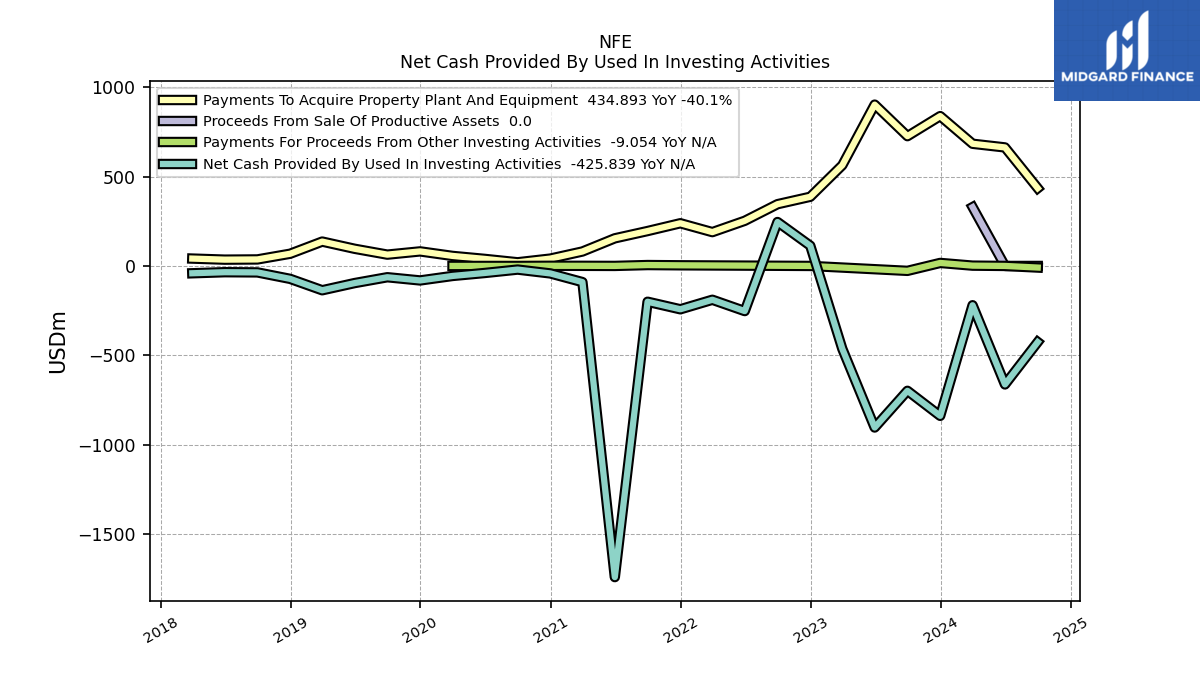
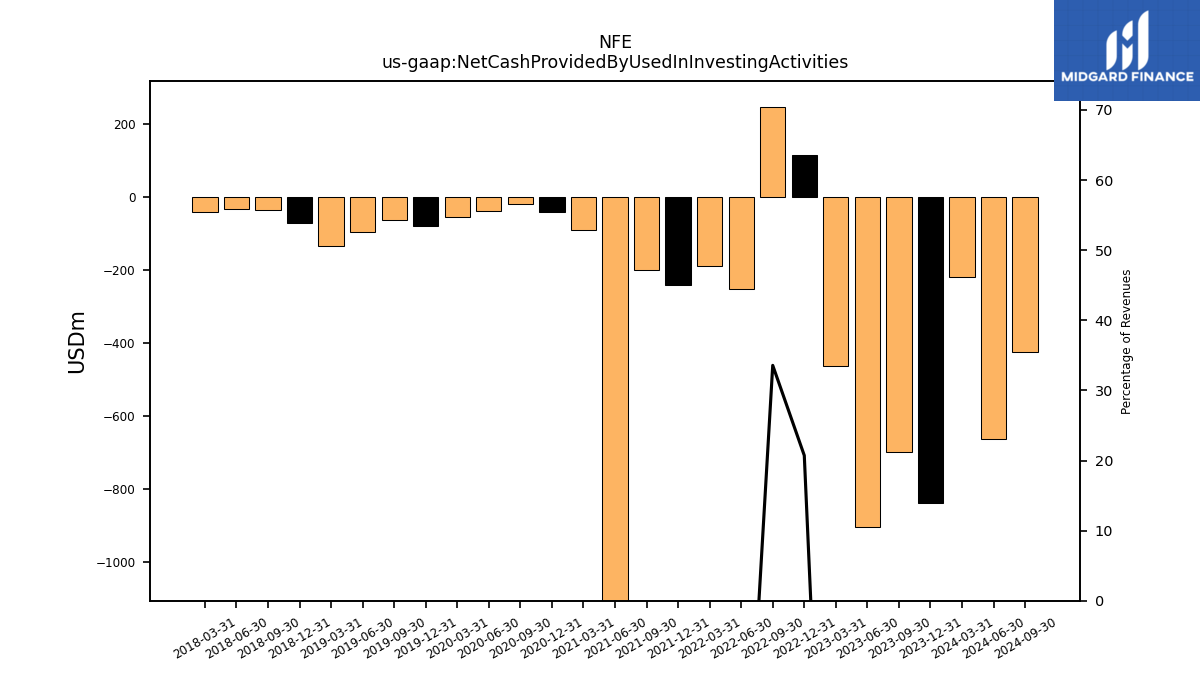
| Net Cash Provided By Used In Investing Activities | -698.47 | -903.82 | -463.27 | 113.23 | 245.75 | -252.49 | -189.22 | -242.40 | -200.22 | -1740.68 | -90.26 | -41.93 | -20.36 | -39.30 | -56.05 | -81.13 | -63.16 | -95.88 | -136.00 | -72.32 | -36.13 | -35.03 | -40.97 | |
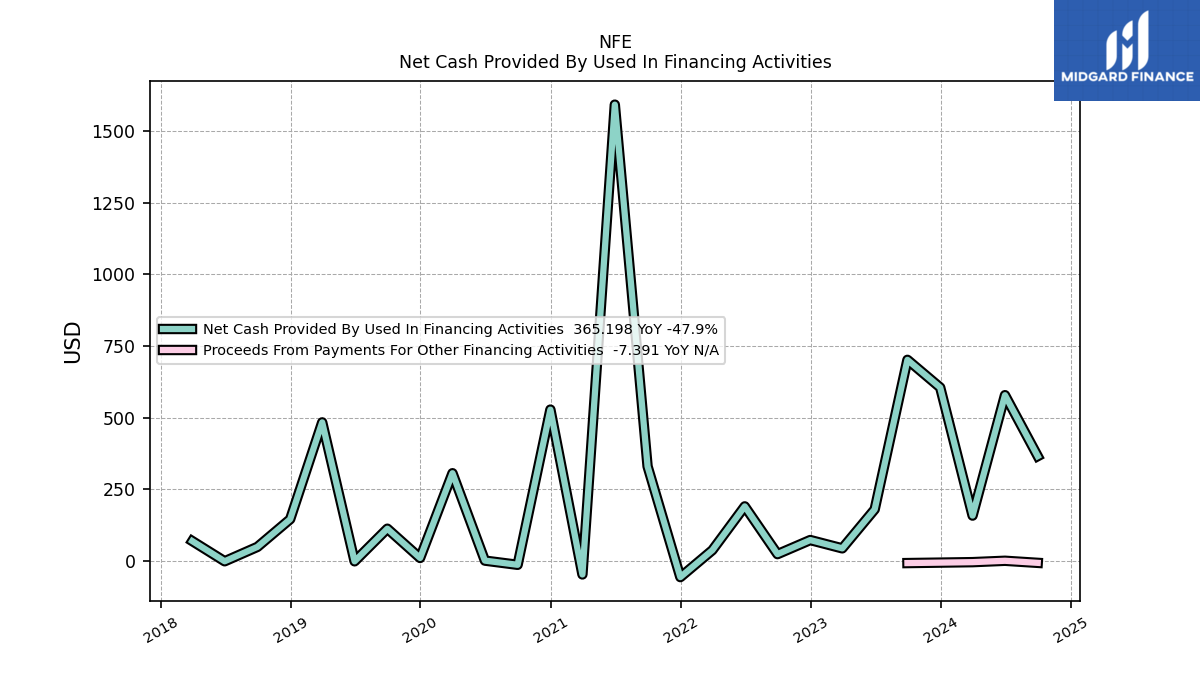
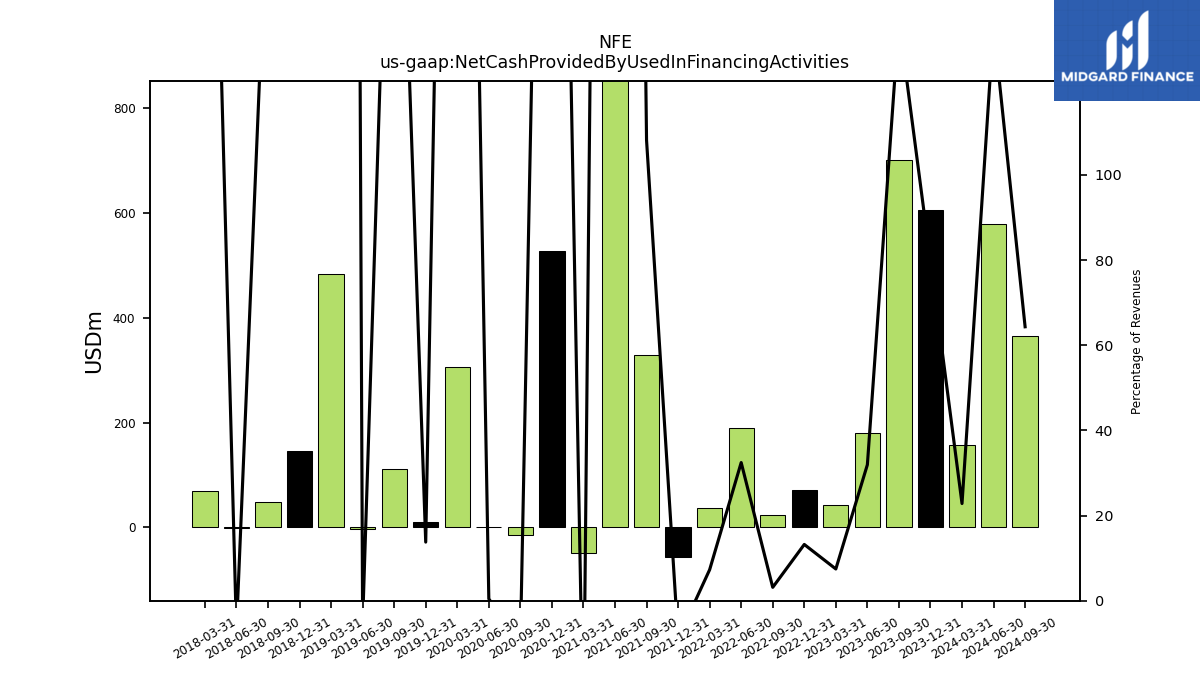
| Net Cash Provided By Used In Financing Activities | 701.49 | 179.36 | 43.22 | 72.25 | 23.06 | 189.82 | 36.84 | -57.20 | 329.56 | 1592.47 | -47.89 | 527.68 | -14.21 | 0.44 | 305.59 | 9.61 | 111.89 | -2.08 | 483.19 | 145.04 | 48.32 | -1.84 | 68.69 |
| 2023-09-30 | 2023-06-30 | 2023-03-31 | 2022-12-31 | 2022-09-30 | 2022-06-30 | 2022-03-31 | 2021-12-31 | 2021-09-30 | 2021-06-30 | 2021-03-31 | 2020-12-31 | 2020-09-30 | 2020-06-30 | 2020-03-31 | 2019-12-31 | 2019-09-30 | 2019-06-30 | 2019-03-31 | 2018-12-31 | 2018-09-30 | 2018-06-30 | 2018-03-31 | ||
|---|---|---|---|---|---|---|---|---|---|---|---|---|---|---|---|---|---|---|---|---|---|---|---|---|
| Net Cash Provided By Used In Operating Activities | 33.31 | 303.74 | 200.14 | 264.01 | -79.83 | 56.55 | 114.38 | 224.46 | -28.34 | 0.63 | -111.99 | -9.86 | -35.39 | -29.01 | -51.31 | -79.50 | -62.69 | -61.02 | -31.05 | -40.07 | -25.44 | -9.75 | -17.97 | |
| Net Income Loss | 61.22 | 119.25 | 150.21 | 64.13 | 61.85 | -169.76 | 238.27 | 150.86 | -9.81 | -6.04 | -37.90 | 0.17 | -36.36 | -137.43 | -8.30 | -7.34 | -6.72 | -6.19 | -13.56 | -34.73 | -13.61 | -18.82 | -10.91 | |
| Profit Loss | 62.34 | 120.10 | 151.57 | 65.81 | 56.23 | -178.43 | 241.18 | 151.72 | -17.77 | -1.73 | -39.51 | -0.48 | -36.67 | -166.52 | -60.05 | -38.37 | -54.42 | -51.23 | -52.29 | -34.76 | -13.68 | -18.82 | -10.91 | |
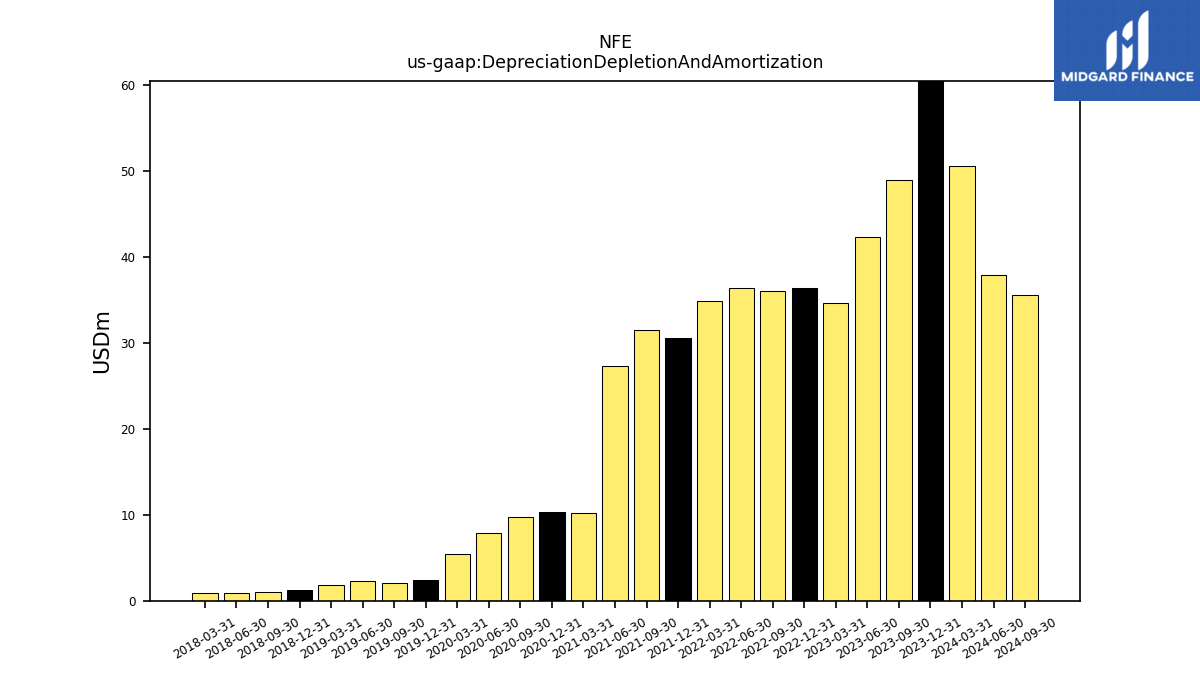
| Depreciation Depletion And Amortization | 48.90 | 42.34 | 34.61 | 36.40 | 36.01 | 36.32 | 34.85 | 30.57 | 31.51 | 27.30 | 10.16 | 10.28 | 9.70 | 7.84 | 5.48 | 2.44 | 2.09 | 2.26 | 1.85 | 1.26 | 1.01 | 0.91 | 0.86 | |
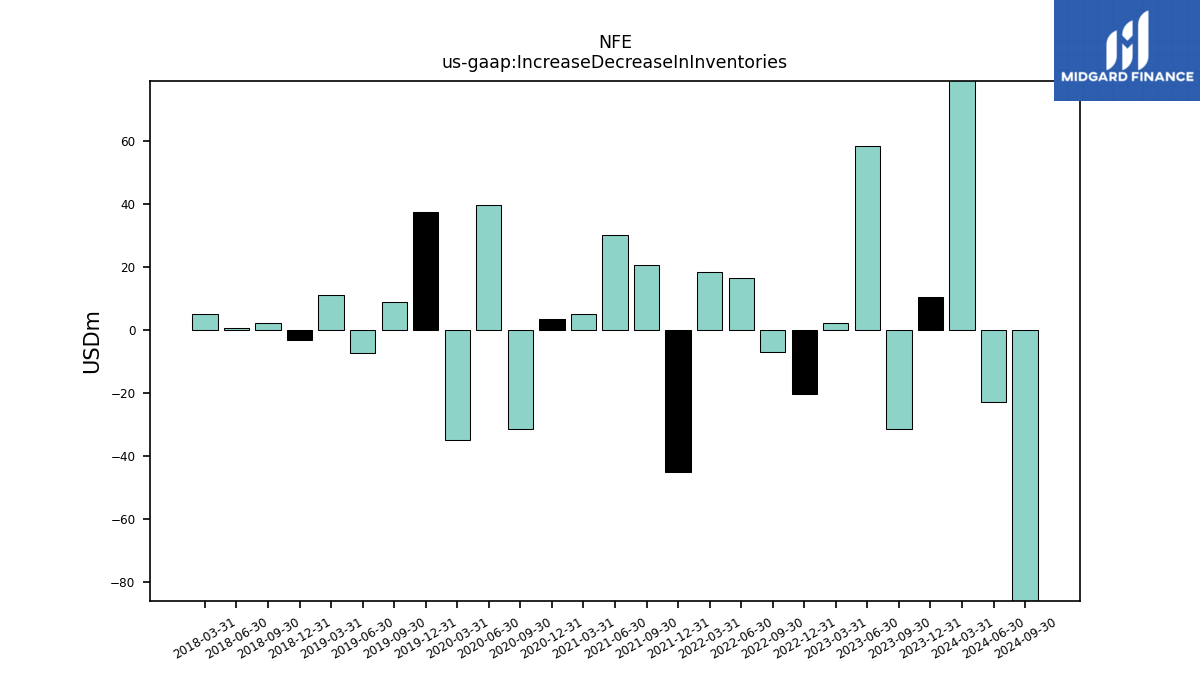
| Increase Decrease In Inventories | -31.47 | 58.44 | 2.27 | -20.14 | -7.09 | 16.55 | 18.62 | -45.02 | 20.71 | 30.29 | 5.17 | 3.46 | -31.48 | 39.62 | -34.83 | 37.68 | 9.00 | -7.38 | 11.04 | -3.19 | 2.16 | 0.66 | 5.18 | |
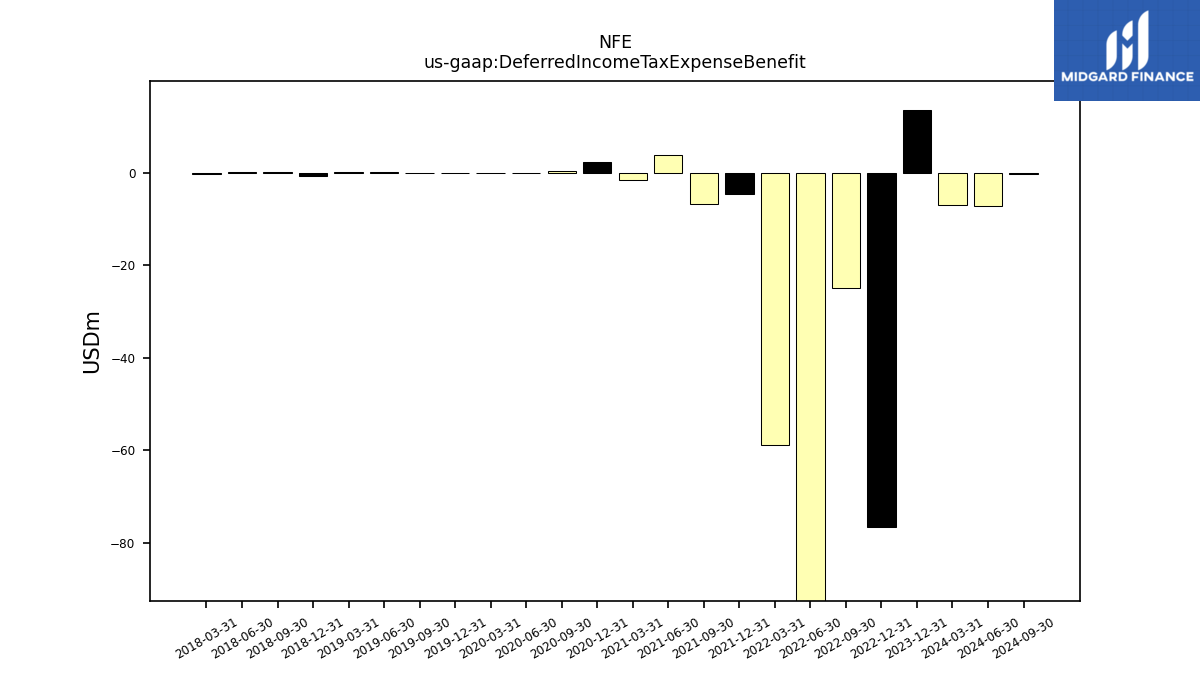
| Deferred Income Tax Expense Benefit | NA | NA | NA | -76.51 | -24.92 | -119.34 | -58.77 | -4.54 | -6.73 | 3.86 | -1.41 | 2.37 | 0.37 | 0.03 | -0.02 | 0.07 | -0.06 | 0.18 | 0.20 | -0.65 | 0.28 | 0.23 | -0.19 | |
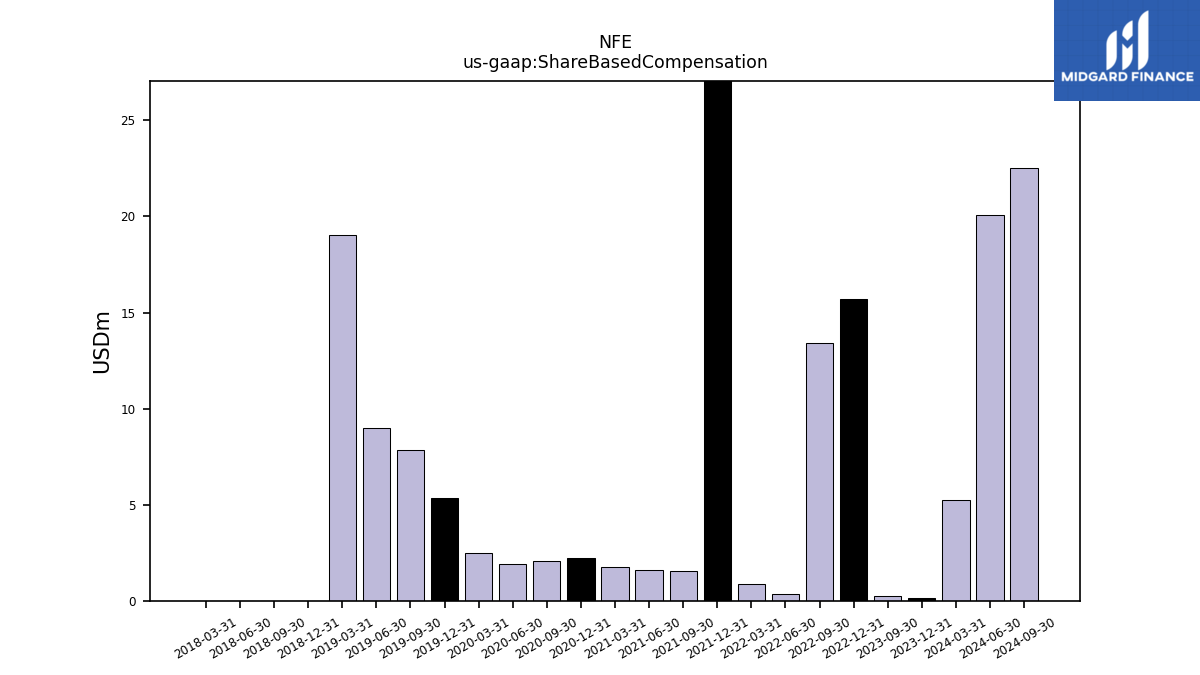
| Share Based Compensation | NA | NA | NA | 15.73 | 13.42 | 0.36 | 0.88 | 32.10 | 1.56 | 1.61 | 1.77 | 2.24 | 2.07 | 1.92 | 2.51 | 5.37 | 7.83 | 8.97 | 19.04 | 0.00 | 0.00 | 0.00 | 0.00 |
| 2023-09-30 | 2023-06-30 | 2023-03-31 | 2022-12-31 | 2022-09-30 | 2022-06-30 | 2022-03-31 | 2021-12-31 | 2021-09-30 | 2021-06-30 | 2021-03-31 | 2020-12-31 | 2020-09-30 | 2020-06-30 | 2020-03-31 | 2019-12-31 | 2019-09-30 | 2019-06-30 | 2019-03-31 | 2018-12-31 | 2018-09-30 | 2018-06-30 | 2018-03-31 | ||
|---|---|---|---|---|---|---|---|---|---|---|---|---|---|---|---|---|---|---|---|---|---|---|---|---|
| Net Cash Provided By Used In Investing Activities | -698.47 | -903.82 | -463.27 | 113.23 | 245.75 | -252.49 | -189.22 | -242.40 | -200.22 | -1740.68 | -90.26 | -41.93 | -20.36 | -39.30 | -56.05 | -81.13 | -63.16 | -95.88 | -136.00 | -72.32 | -36.13 | -35.03 | -40.97 | |
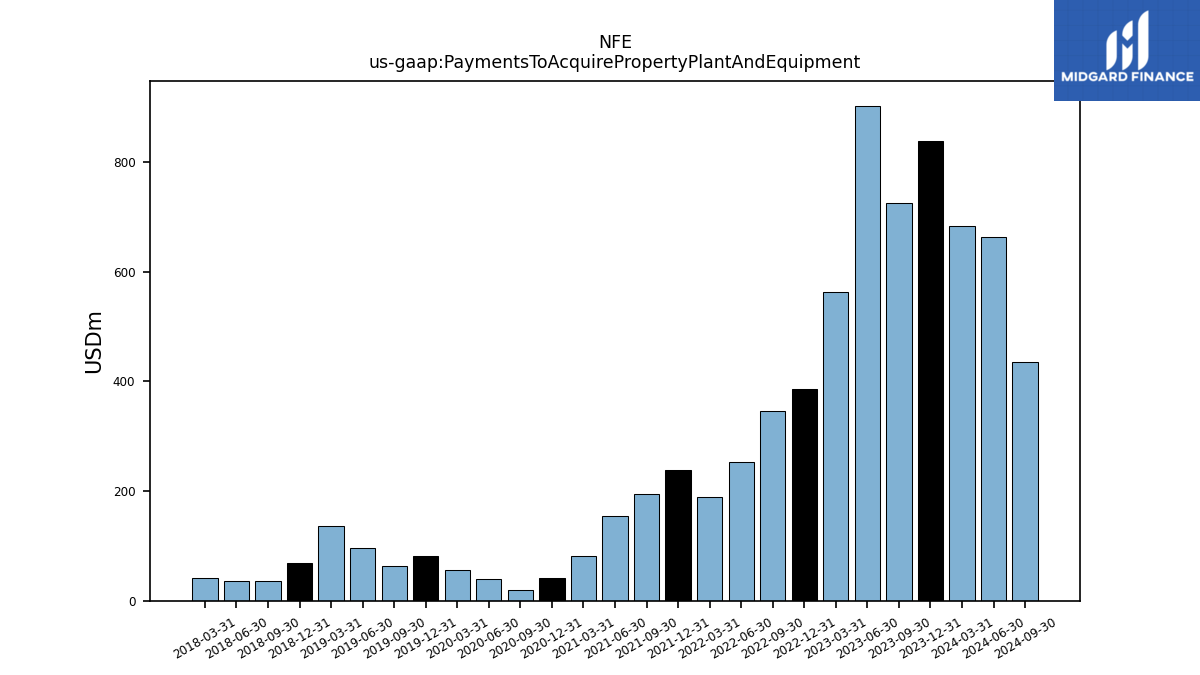
| Payments To Acquire Property Plant And Equipment | 725.96 | 902.37 | 563.27 | 386.84 | 345.46 | 252.49 | 189.22 | 238.80 | 195.22 | 154.51 | 80.81 | 41.15 | 20.42 | 39.32 | 56.10 | 81.42 | 63.29 | 96.07 | 136.28 | 68.29 | 36.41 | 35.24 | 41.21 |
| 2023-09-30 | 2023-06-30 | 2023-03-31 | 2022-12-31 | 2022-09-30 | 2022-06-30 | 2022-03-31 | 2021-12-31 | 2021-09-30 | 2021-06-30 | 2021-03-31 | 2020-12-31 | 2020-09-30 | 2020-06-30 | 2020-03-31 | 2019-12-31 | 2019-09-30 | 2019-06-30 | 2019-03-31 | 2018-12-31 | 2018-09-30 | 2018-06-30 | 2018-03-31 | ||
|---|---|---|---|---|---|---|---|---|---|---|---|---|---|---|---|---|---|---|---|---|---|---|---|---|
| Net Cash Provided By Used In Financing Activities | 701.49 | 179.36 | 43.22 | 72.25 | 23.06 | 189.82 | 36.84 | -57.20 | 329.56 | 1592.47 | -47.89 | 527.68 | -14.21 | 0.44 | 305.59 | 9.61 | 111.89 | -2.08 | 483.19 | 145.04 | 48.32 | -1.84 | 68.69 | |
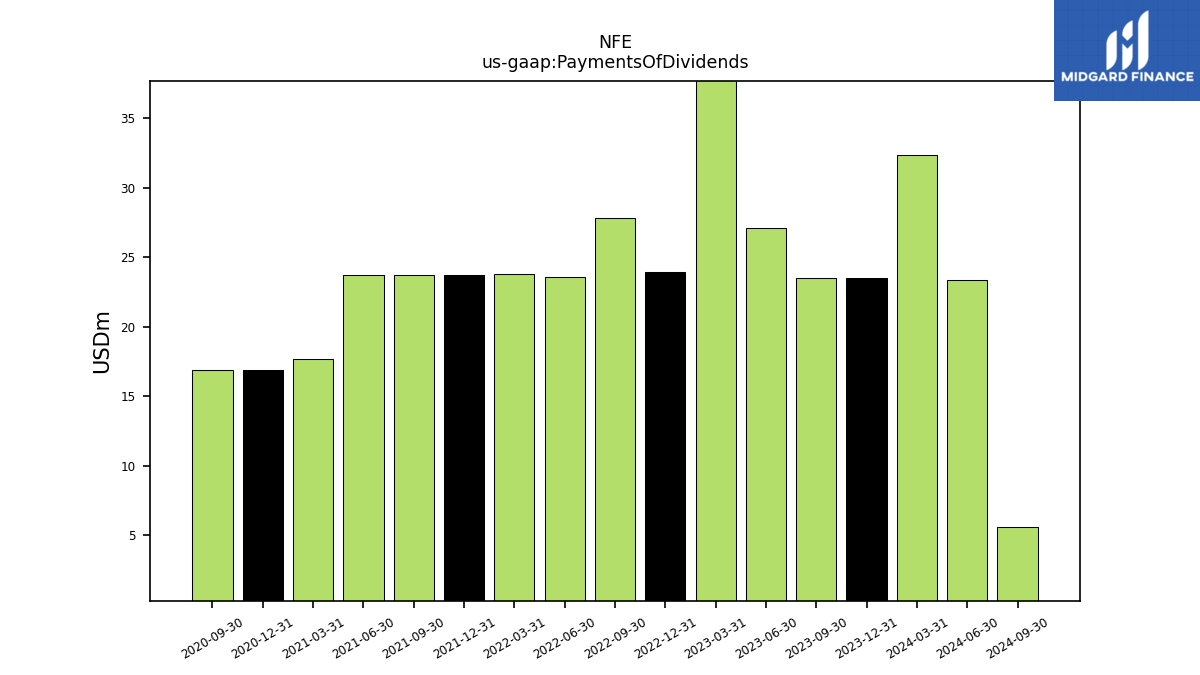
| Payments Of Dividends | 23.52 | 27.12 | 649.80 | 23.90 | 27.77 | 23.60 | 23.77 | 23.70 | 23.70 | 23.69 | 17.66 | 16.87 | 16.87 | NA | NA | NA | NA | NA | NA | NA | NA | NA | NA |
| 2023-09-30 | 2023-06-30 | 2023-03-31 | 2022-12-31 | 2022-09-30 | 2022-06-30 | 2022-03-31 | 2021-12-31 | 2021-09-30 | 2021-06-30 | 2021-03-31 | 2020-12-31 | 2020-09-30 | 2020-06-30 | 2020-03-31 | 2019-12-31 | 2019-09-30 | 2019-06-30 | 2019-03-31 | 2018-12-31 | 2018-09-30 | 2018-06-30 | 2018-03-31 | ||
|---|---|---|---|---|---|---|---|---|---|---|---|---|---|---|---|---|---|---|---|---|---|---|---|---|
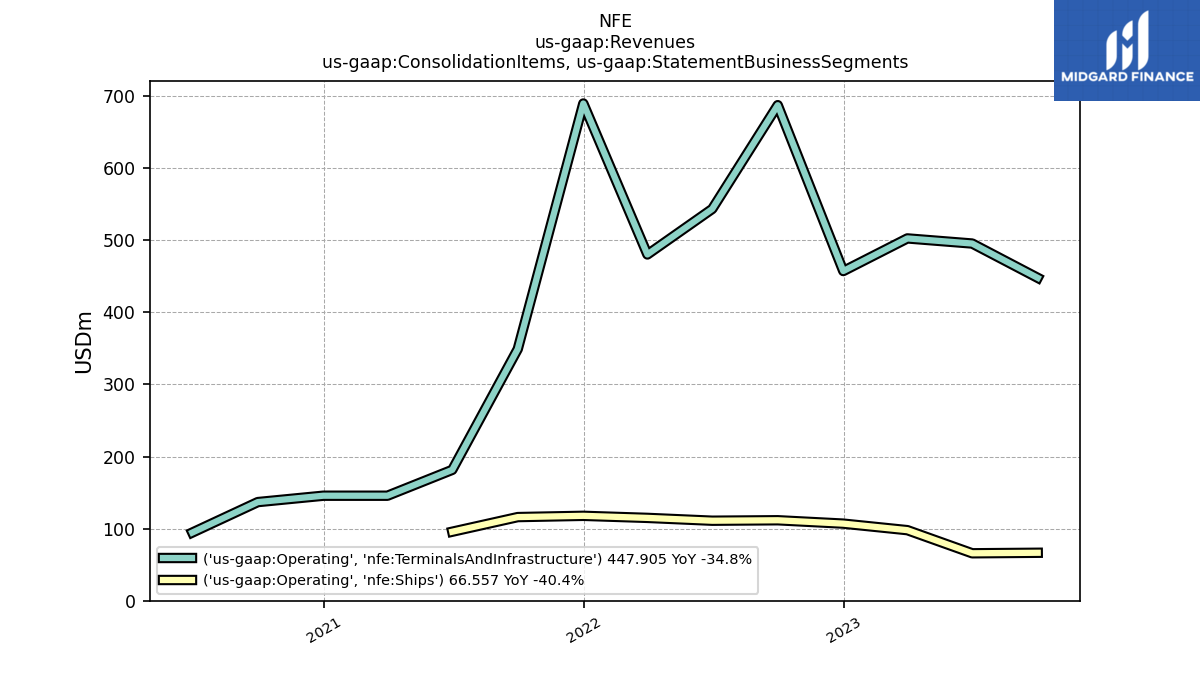
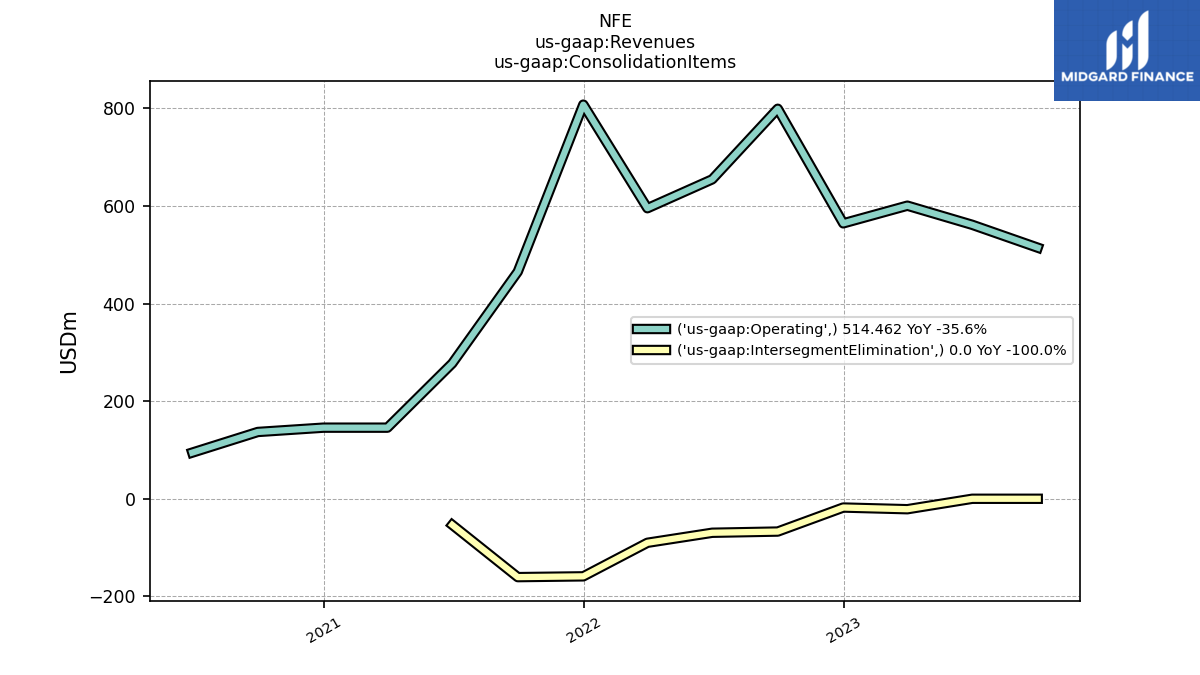
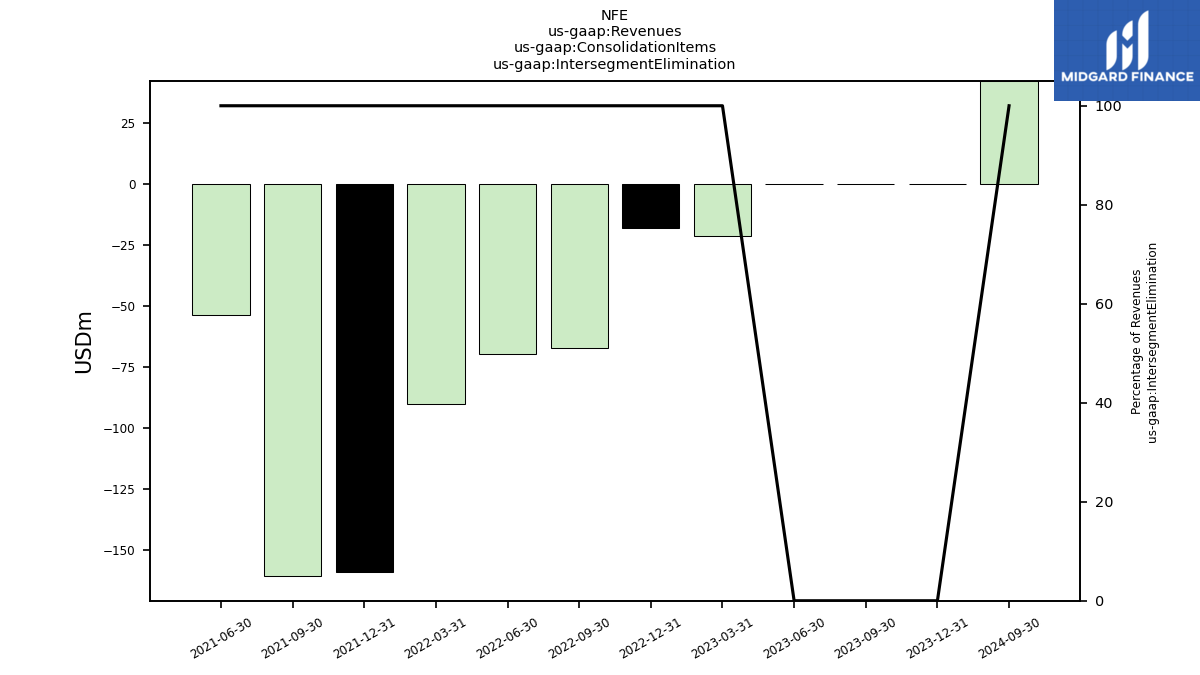
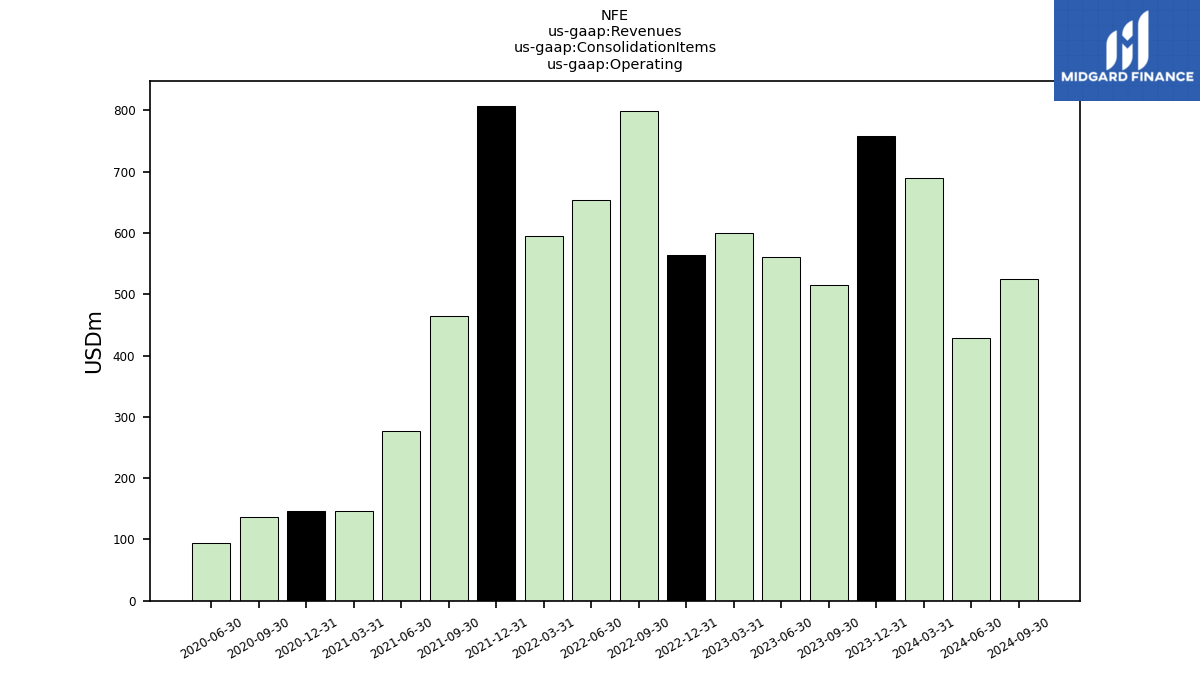
| Revenues | 514.46 | 561.35 | 579.13 | 546.37 | 731.93 | 584.86 | 505.12 | 648.63 | 304.66 | 223.84 | 145.68 | 145.70 | 136.86 | 94.57 | 74.53 | 69.75 | 49.66 | 39.77 | 29.95 | 31.37 | 28.42 | 26.80 | 25.71 | |
| Intersegment Elimination | 0.00 | 0.00 | -21.39 | -17.95 | -67.17 | -69.62 | -90.17 | -158.94 | -160.53 | -53.47 | NA | NA | NA | NA | NA | NA | NA | NA | NA | NA | NA | NA | NA | |
| Operating | 514.46 | 561.35 | 600.52 | 564.31 | 799.10 | 654.48 | 595.29 | 807.57 | 465.19 | 277.31 | 145.68 | 145.70 | 136.86 | 94.57 | NA | NA | NA | NA | NA | NA | NA | NA | NA | |
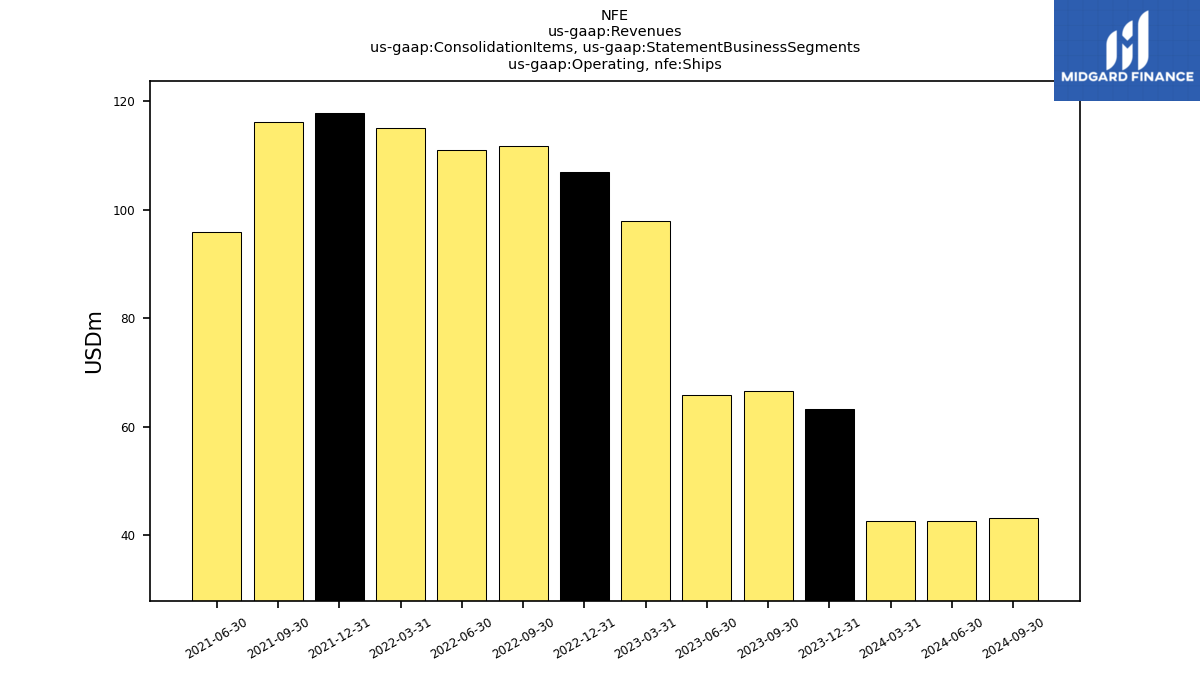
| Operating, Ships | 66.56 | 65.84 | 97.92 | 106.99 | 111.66 | 111.02 | 114.94 | 117.80 | 116.05 | 95.76 | NA | NA | NA | NA | NA | NA | NA | NA | NA | NA | NA | NA | NA | |
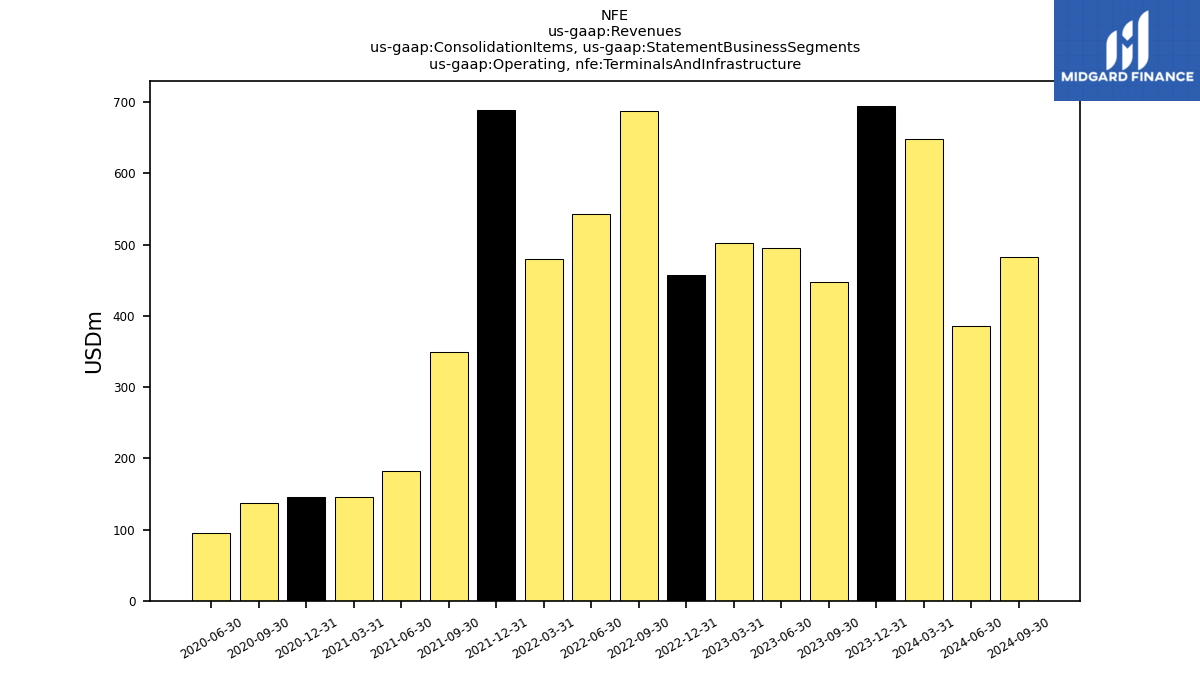
| Operating, Terminals And Infrastructure | 447.90 | 495.50 | 502.61 | 457.32 | 687.44 | 543.46 | 480.35 | 689.77 | 349.14 | 181.55 | 145.68 | 145.70 | 136.86 | 94.57 | NA | NA | NA | NA | NA | NA | NA | NA | NA | |
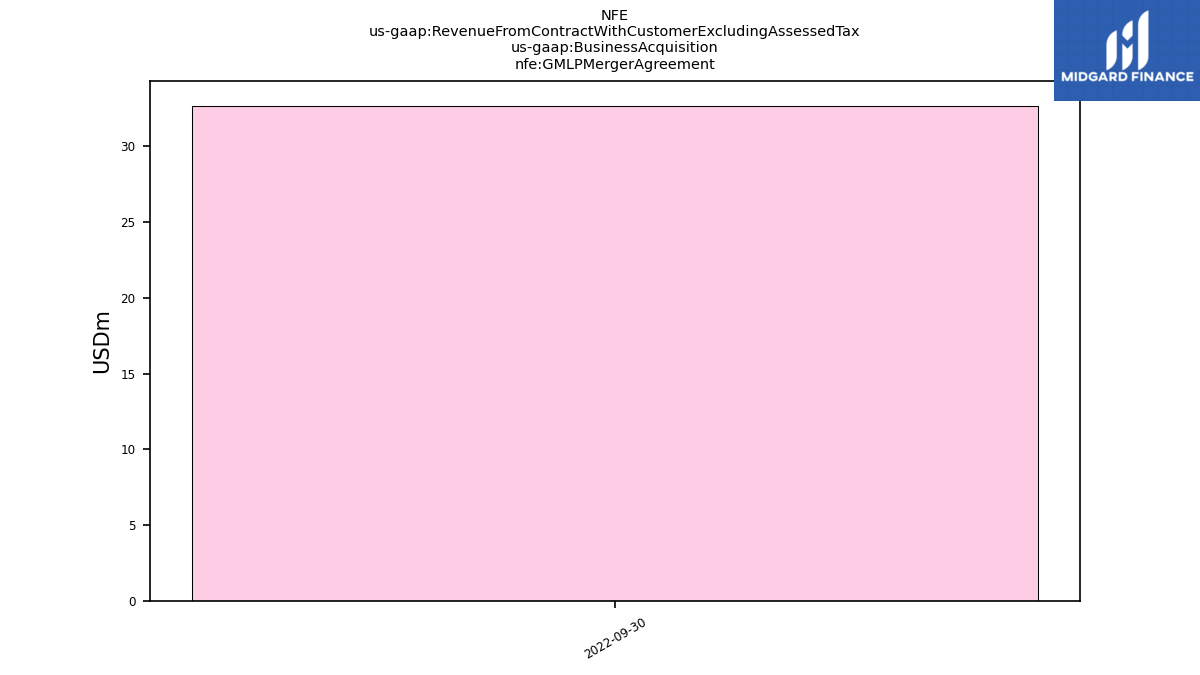
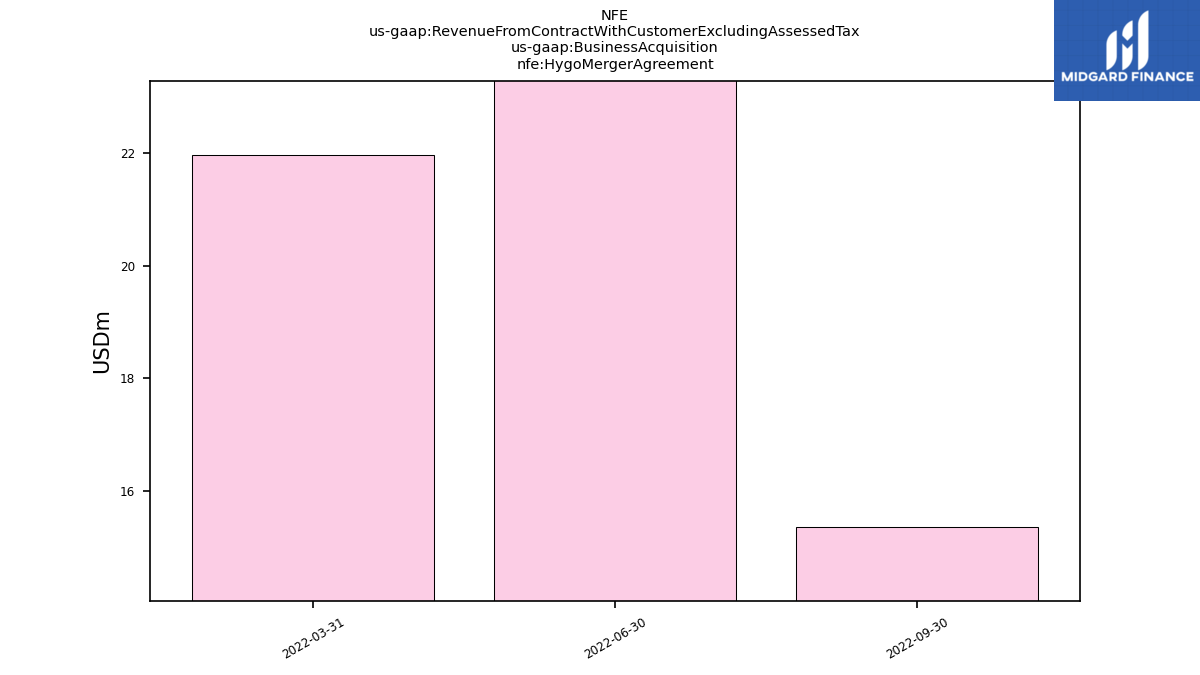
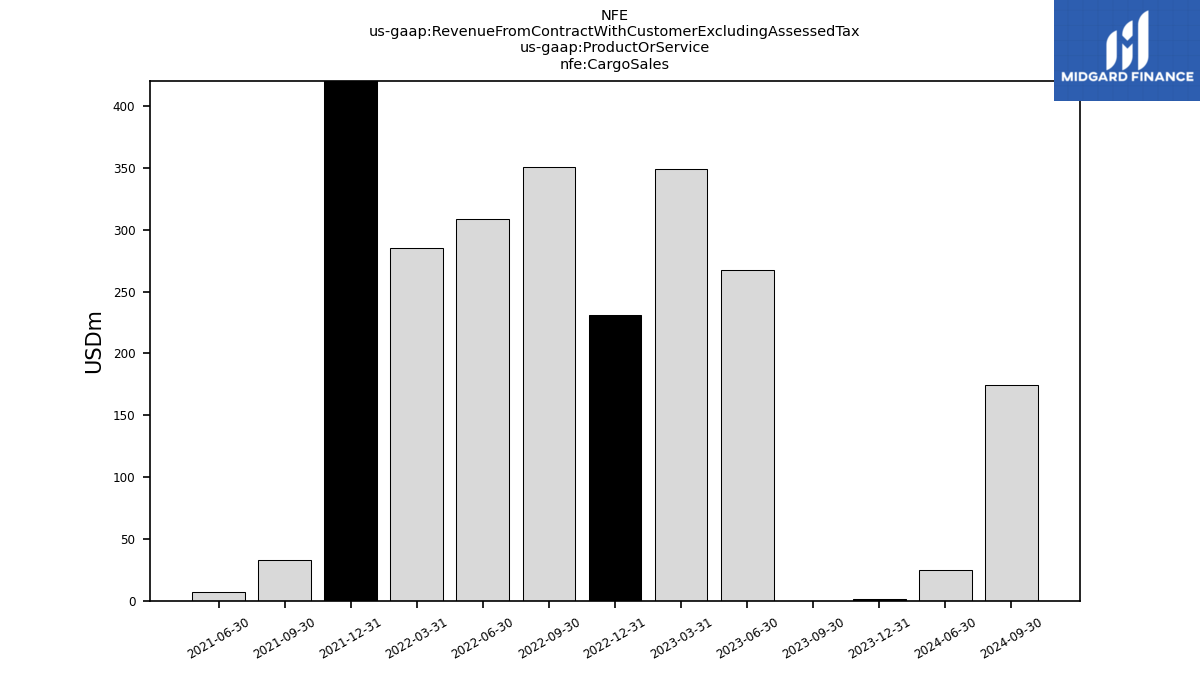
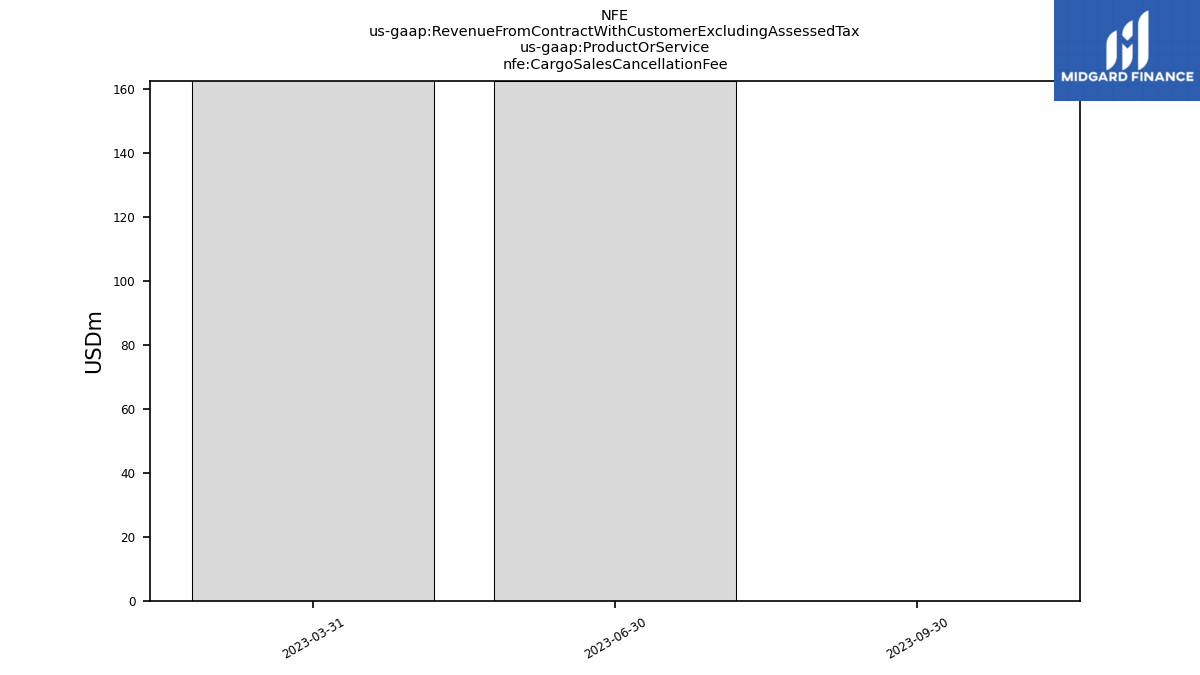
| Revenue From Contract With Customer Excluding Assessed Tax | 420.87 | 494.62 | 501.69 | 448.65 | 632.68 | 497.24 | 400.07 | 548.39 | 188.39 | 102.84 | 91.20 | 145.70 | 83.86 | 76.18 | 63.50 | 69.75 | 35.34 | 31.74 | 26.14 | 31.37 | 24.63 | 22.65 | 22.26 | |
| G M L P Merger Agreement | NA | NA | NA | NA | 32.68 | NA | NA | NA | NA | NA | NA | NA | NA | NA | NA | NA | NA | NA | NA | NA | NA | NA | NA | |
| Hygo Merger Agreement | NA | NA | NA | NA | 15.37 | 27.43 | 21.96 | NA | NA | NA | NA | NA | NA | NA | NA | NA | NA | NA | NA | NA | NA | NA | NA | |
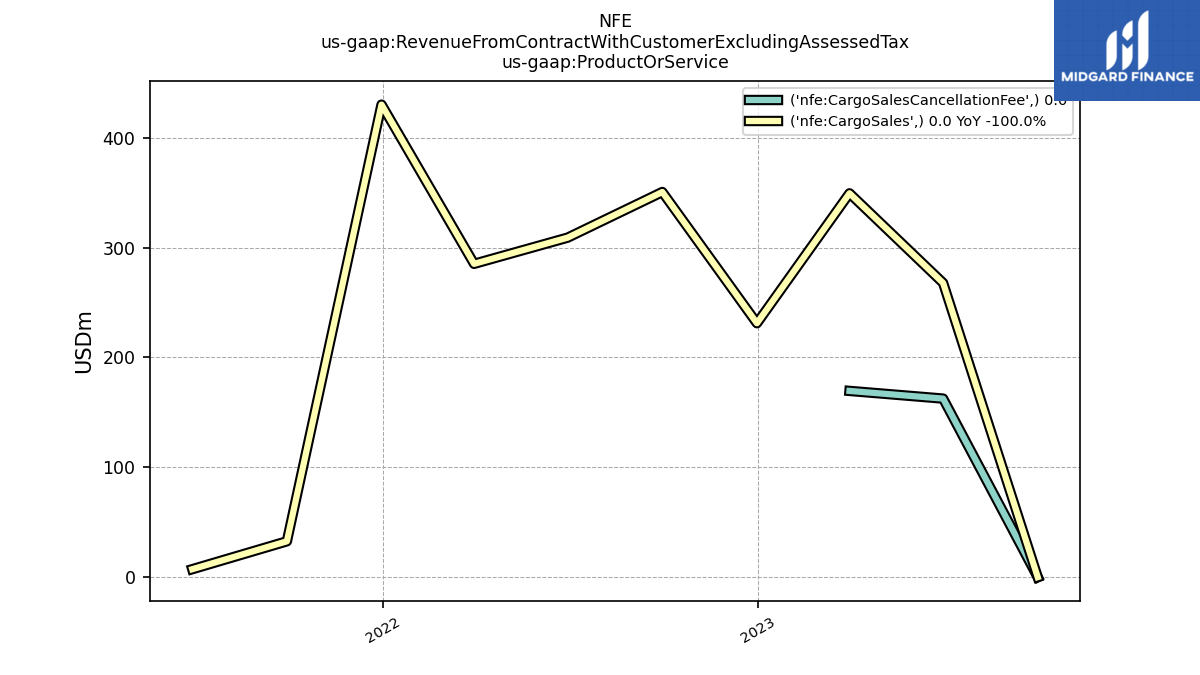
| Cargo Sales | 0.00 | 267.78 | 349.36 | 231.12 | 350.55 | 309.03 | 285.17 | 430.09 | 32.60 | 7.21 | NA | NA | NA | NA | NA | NA | NA | NA | NA | NA | NA | NA | NA | |
| Cargo Sales Cancellation Fee | 0.00 | 162.50 | 169.50 | NA | NA | NA | NA | NA | NA | NA | NA | NA | NA | NA | NA | NA | NA | NA | NA | NA | NA | NA | NA |


