
| 2023-09-30 | 2023-06-30 | 2023-03-31 | 2022-12-31 | 2022-09-30 | 2022-06-30 | 2022-03-31 | 2021-12-31 | 2021-09-30 | 2021-06-30 | 2021-03-31 | 2020-12-31 | 2020-09-30 | 2020-06-30 | 2020-03-31 | 2019-12-31 | 2019-09-30 | 2019-06-30 | 2019-03-31 | 2018-12-31 | 2018-09-30 | 2018-06-30 | 2018-03-31 | ||
|---|---|---|---|---|---|---|---|---|---|---|---|---|---|---|---|---|---|---|---|---|---|---|---|---|
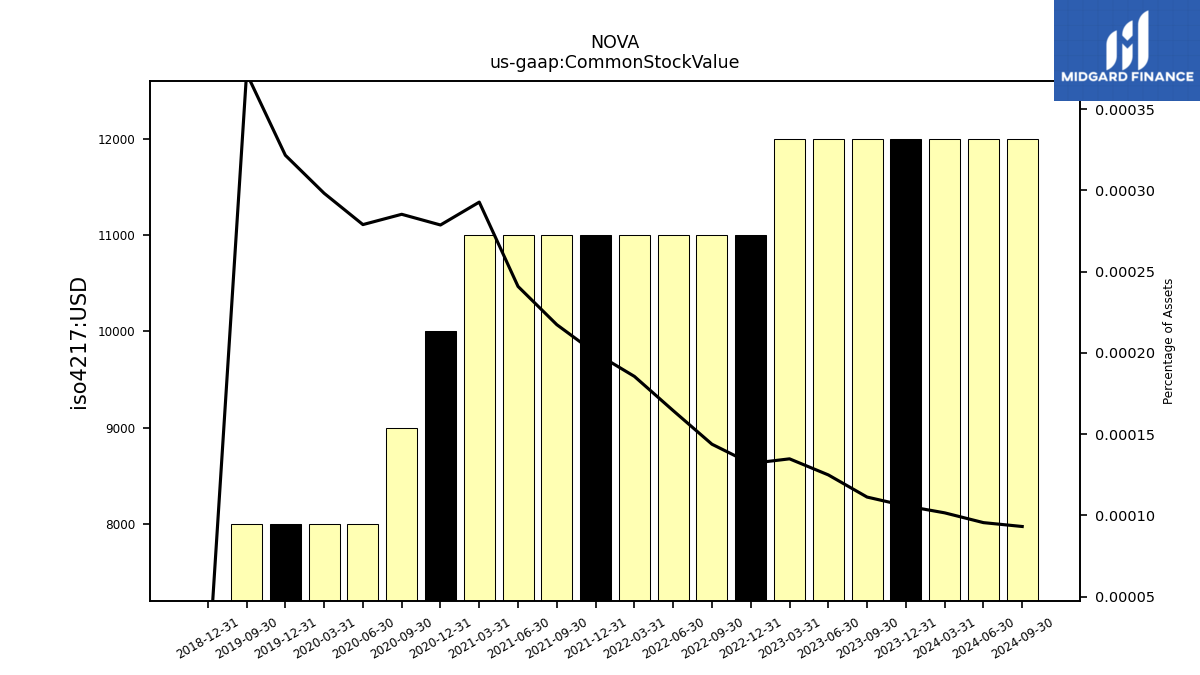
| Common Stock Value | 0.01 | 0.01 | 0.01 | 0.01 | 0.01 | 0.01 | 0.01 | 0.01 | 0.01 | 0.01 | 0.01 | 0.01 | 0.01 | 0.01 | 0.01 | 0.01 | 0.01 | NA | NA | 0.00 | NA | NA | NA | |
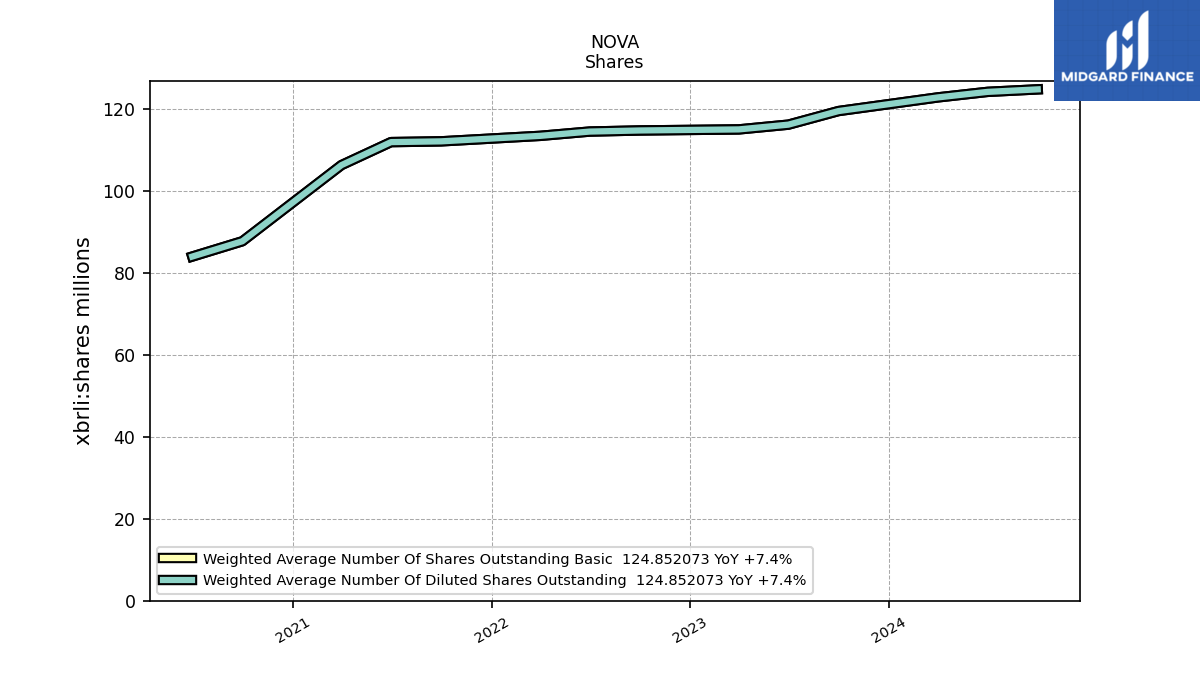
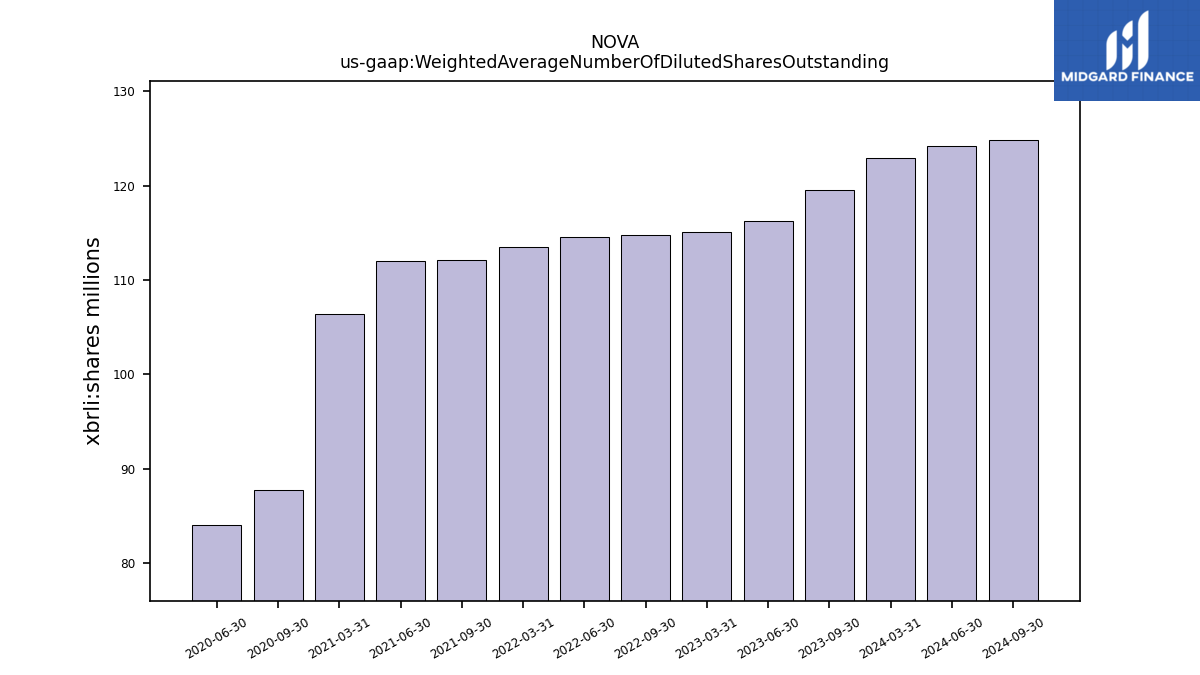
| Weighted Average Number Of Diluted Shares Outstanding | 119.55 | 116.24 | 115.07 | NA | 114.82 | 114.55 | 113.50 | NA | 112.16 | 111.97 | 106.36 | NA | 87.77 | 84.03 | NA | NA | NA | NA | NA | NA | NA | NA | NA | |
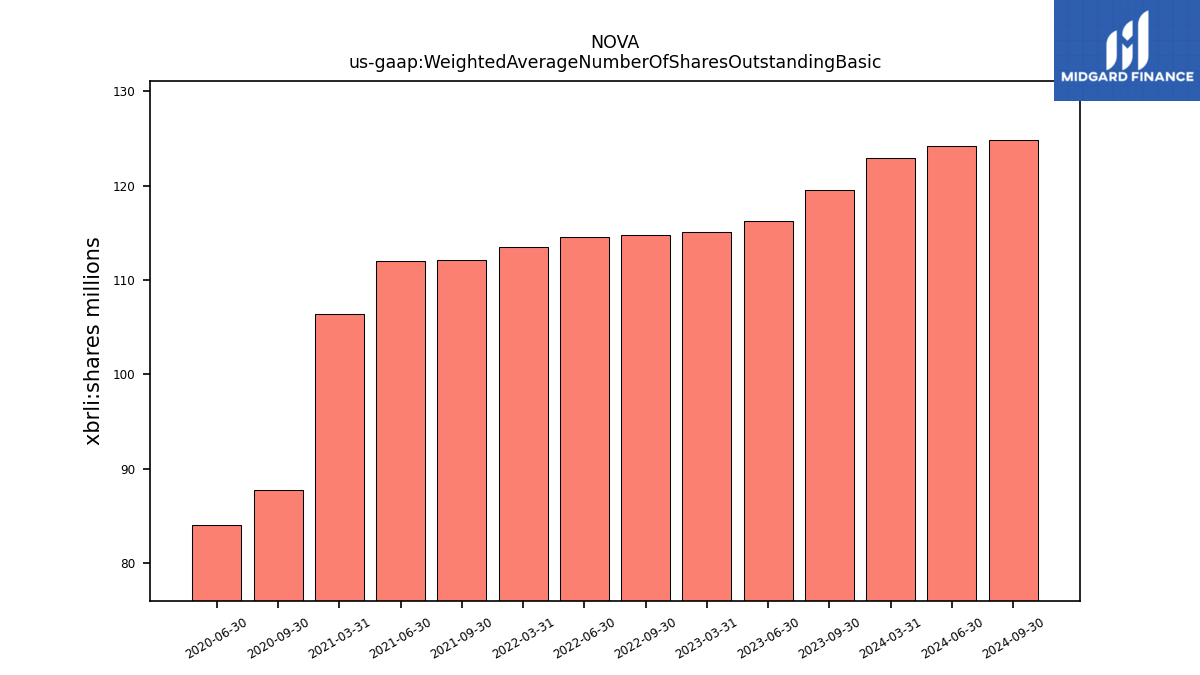
| Weighted Average Number Of Shares Outstanding Basic | 119.55 | 116.24 | 115.07 | NA | 114.82 | 114.55 | 113.50 | NA | 112.16 | 111.97 | 106.36 | NA | 87.77 | 84.03 | NA | NA | NA | NA | NA | NA | NA | NA | NA | |
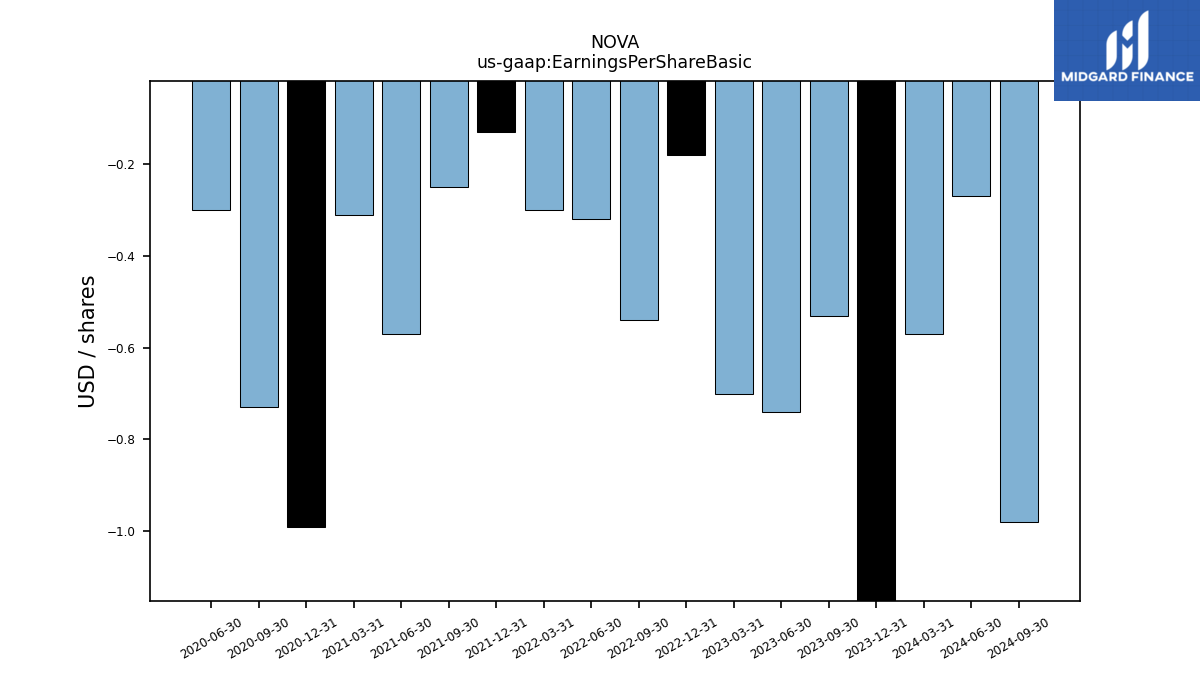
| Earnings Per Share Basic | -0.53 | -0.74 | -0.70 | -0.18 | -0.54 | -0.32 | -0.30 | -0.13 | -0.25 | -0.57 | -0.31 | -0.99 | -0.73 | -0.30 | NA | NA | NA | NA | NA | NA | NA | NA | NA | |
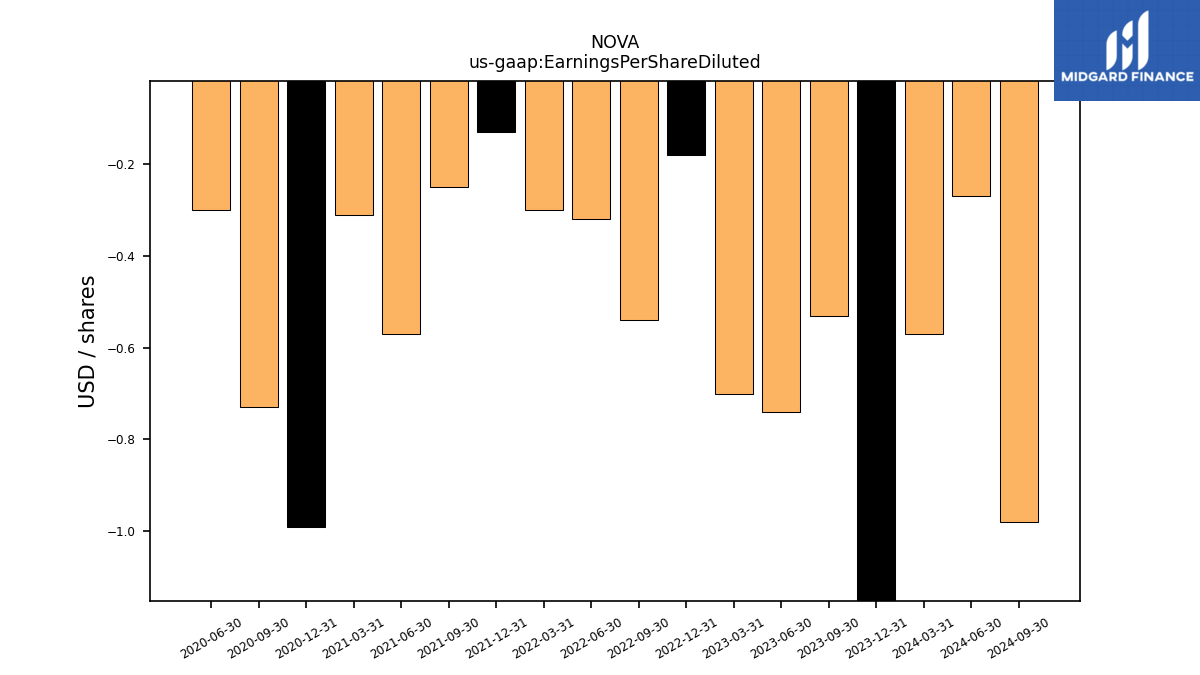
| Earnings Per Share Diluted | -0.53 | -0.74 | -0.70 | -0.18 | -0.54 | -0.32 | -0.30 | -0.13 | -0.25 | -0.57 | -0.31 | -0.99 | -0.73 | -0.30 | NA | NA | NA | NA | NA | NA | NA | NA | NA |
| 2023-09-30 | 2023-06-30 | 2023-03-31 | 2022-12-31 | 2022-09-30 | 2022-06-30 | 2022-03-31 | 2021-12-31 | 2021-09-30 | 2021-06-30 | 2021-03-31 | 2020-12-31 | 2020-09-30 | 2020-06-30 | 2020-03-31 | 2019-12-31 | 2019-09-30 | 2019-06-30 | 2019-03-31 | 2018-12-31 | 2018-09-30 | 2018-06-30 | 2018-03-31 | ||
|---|---|---|---|---|---|---|---|---|---|---|---|---|---|---|---|---|---|---|---|---|---|---|---|---|
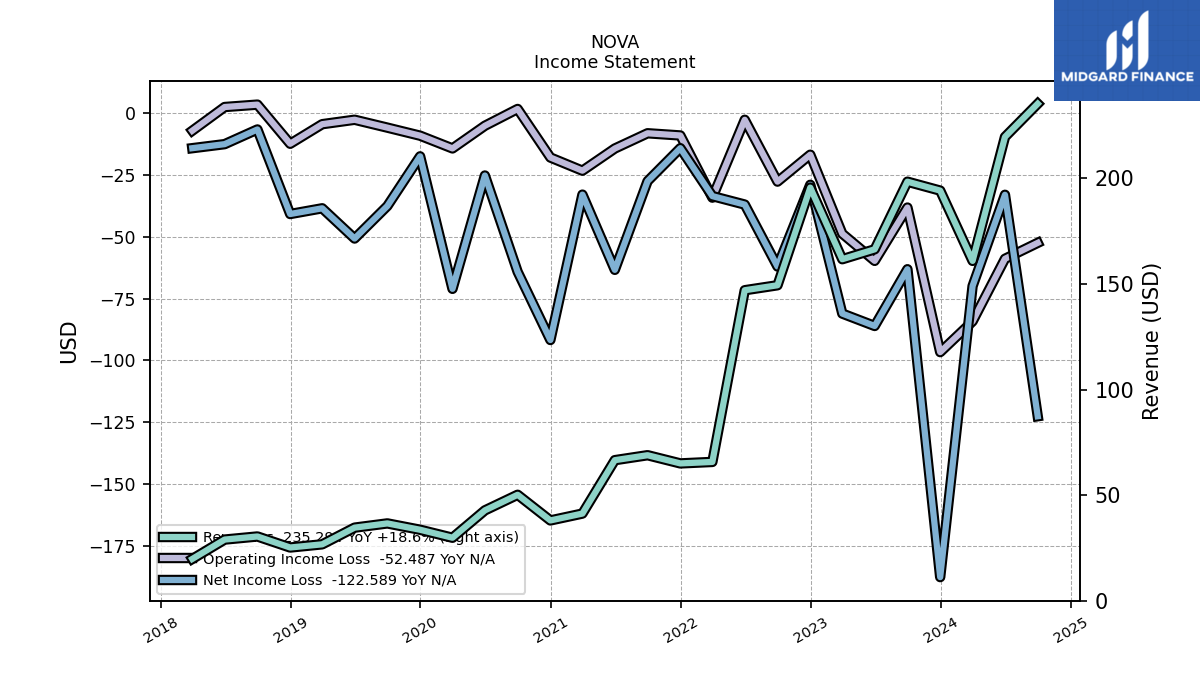
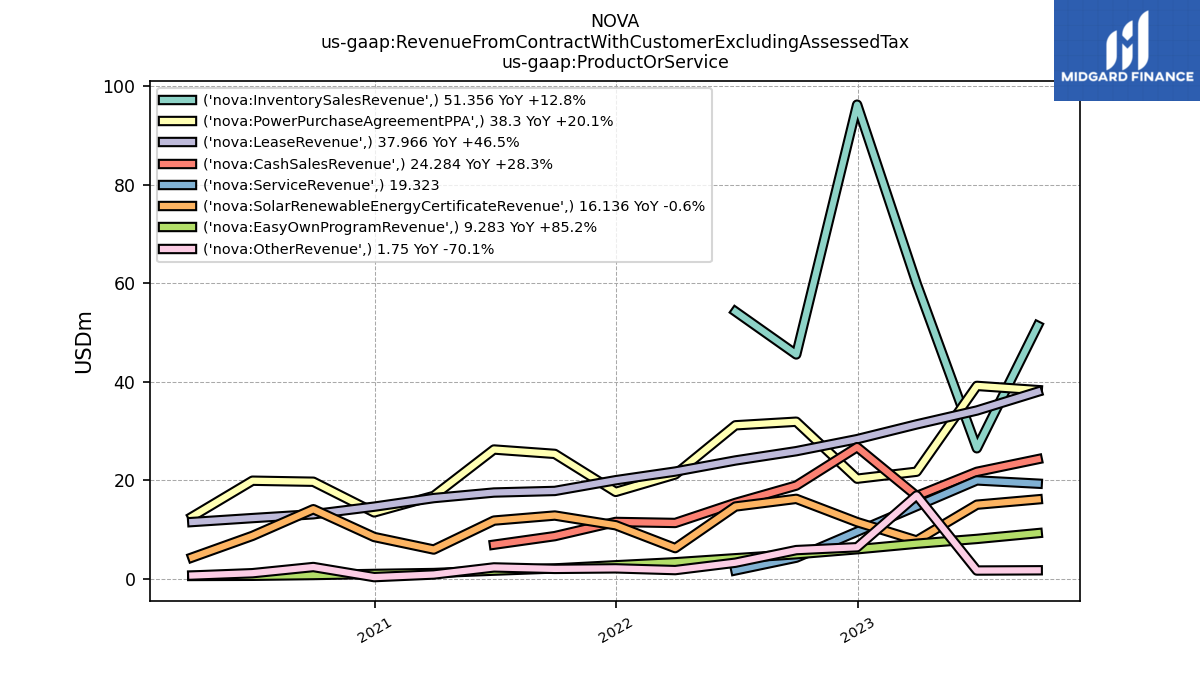
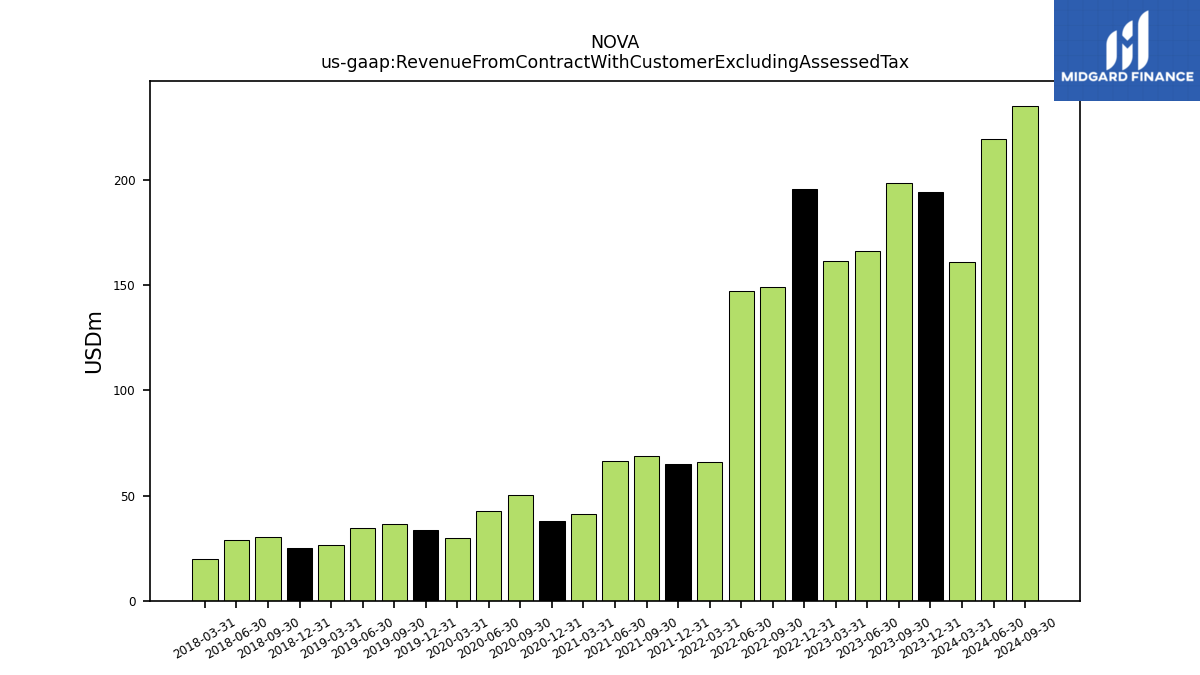
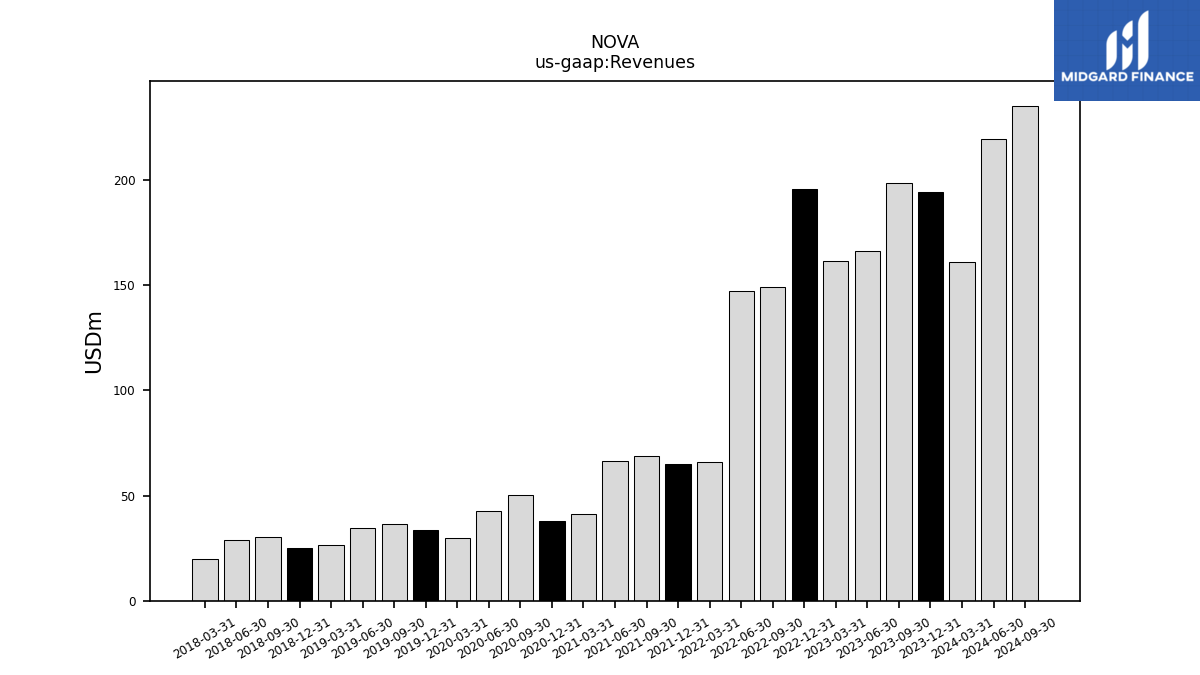
| Revenue From Contract With Customer Excluding Assessed Tax | 198.40 | 166.38 | 161.70 | 195.59 | 149.36 | 147.01 | 65.72 | 65.02 | 68.90 | 66.56 | 41.28 | 38.02 | 50.18 | 42.79 | 29.83 | 33.61 | 36.62 | 34.61 | 26.71 | 25.21 | 30.43 | 28.96 | 19.78 | |
| Revenues | 198.40 | 166.38 | 161.70 | 195.59 | 149.36 | 147.01 | 65.72 | 65.02 | 68.90 | 66.56 | 41.28 | 38.02 | 50.18 | 42.79 | 29.83 | 33.61 | 36.62 | 34.61 | 26.71 | 25.21 | 30.43 | 28.96 | 19.78 | |
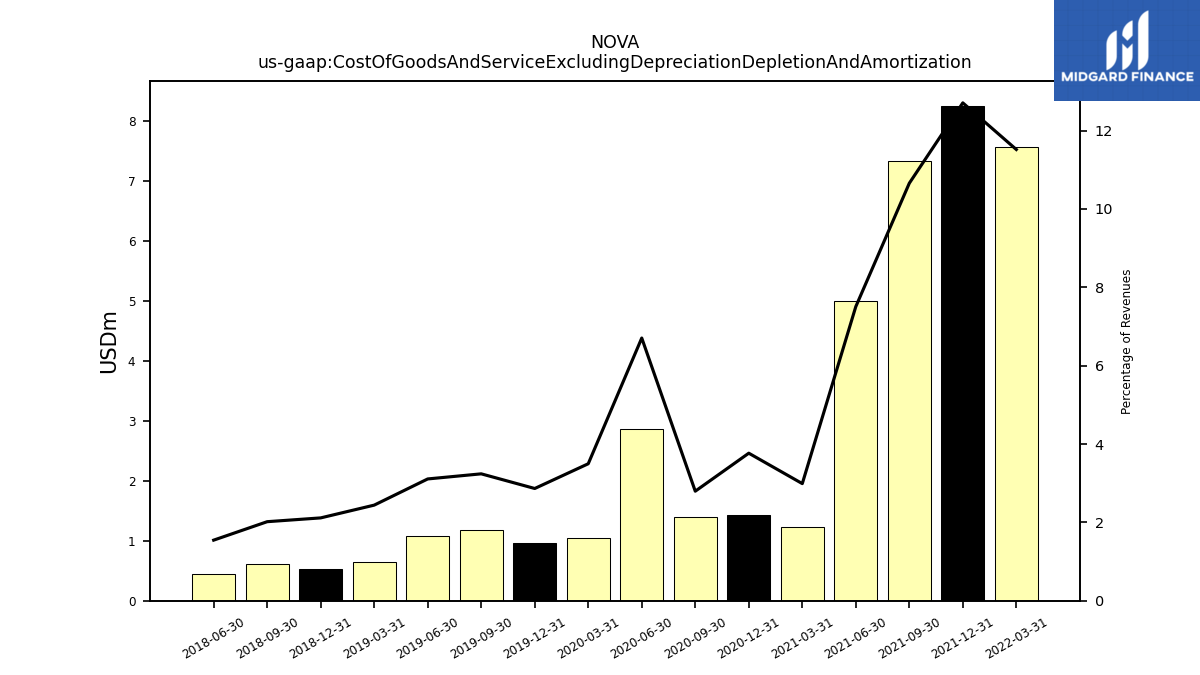
| Cost Of Goods And Service Excluding Depreciation Depletion And Amortization | NA | NA | NA | NA | NA | NA | 7.57 | 8.26 | 7.34 | 5.00 | 1.23 | 1.43 | 1.40 | 2.87 | 1.04 | 0.96 | 1.19 | 1.08 | 0.65 | 0.53 | 0.61 | 0.45 | NA | |
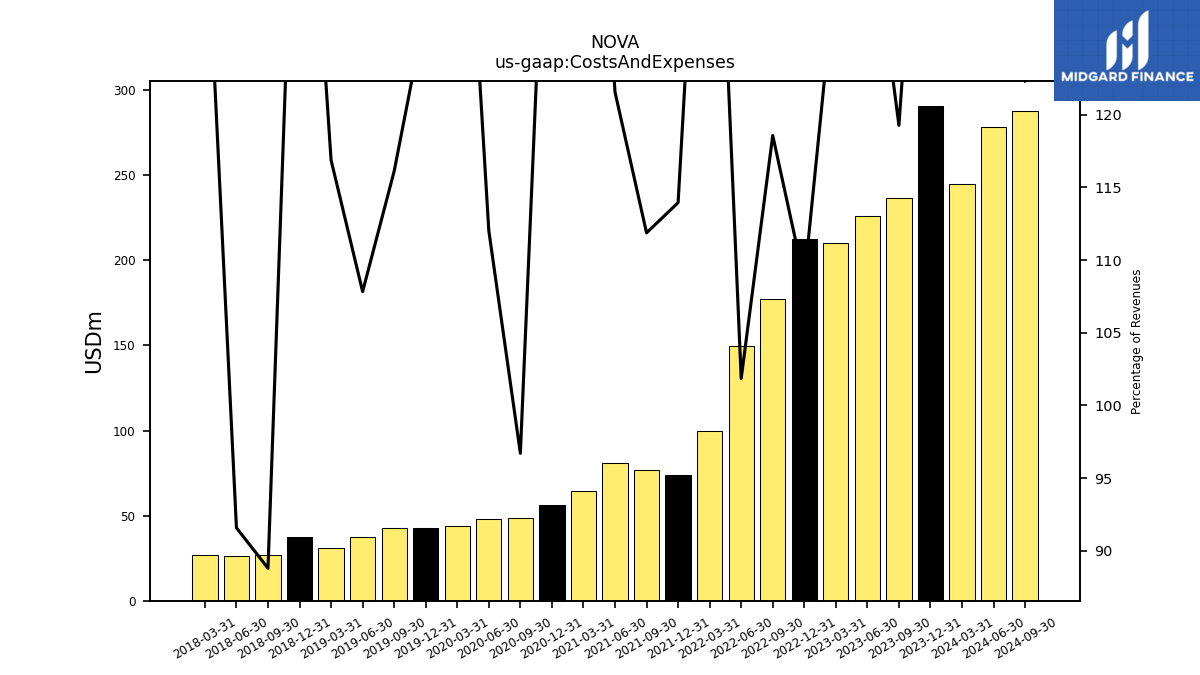
| Costs And Expenses | 236.61 | 226.15 | 210.48 | 212.44 | 177.09 | 149.74 | 99.93 | 74.08 | 77.08 | 80.90 | 64.58 | 56.00 | 48.53 | 47.93 | 44.13 | 42.77 | 42.51 | 37.32 | 31.22 | 37.62 | 27.02 | 26.53 | 26.94 | |
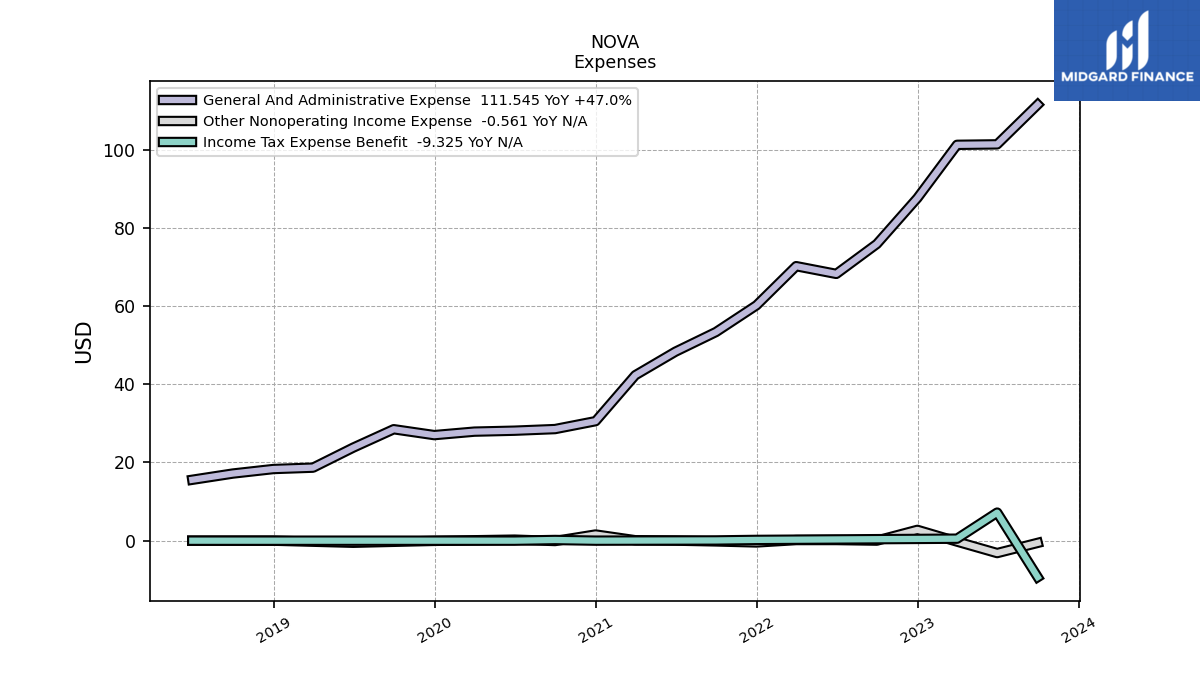
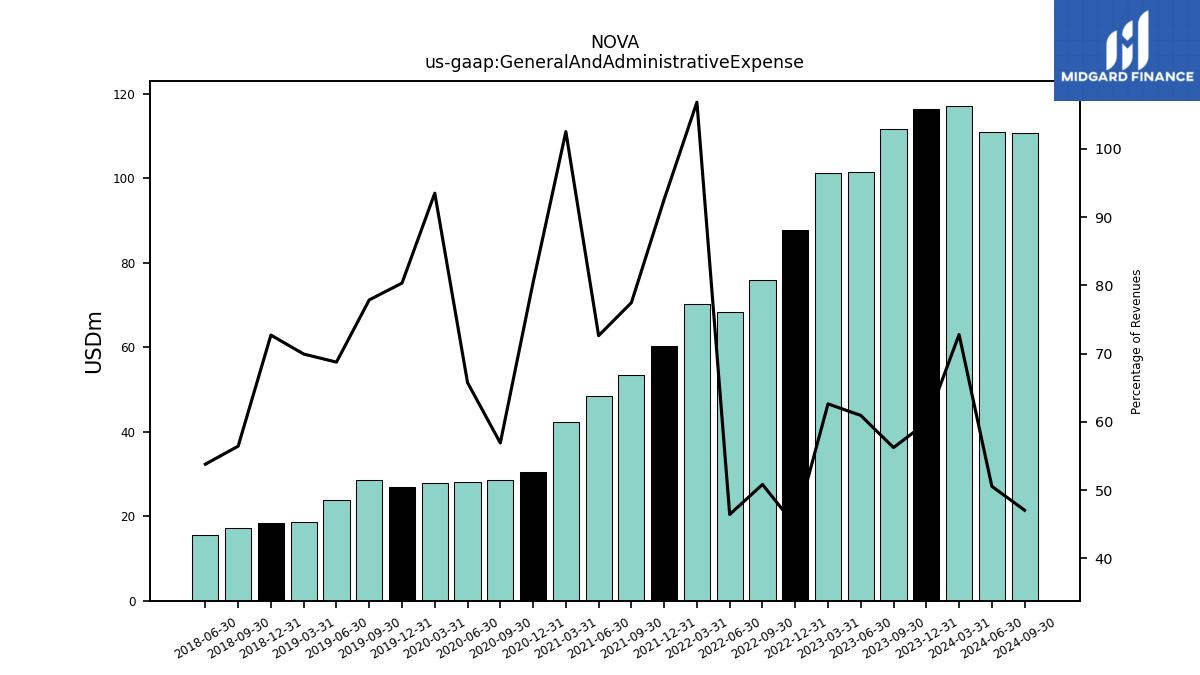
| General And Administrative Expense | 111.55 | 101.38 | 101.26 | 87.64 | 75.90 | 68.24 | 70.22 | 60.21 | 53.37 | 48.34 | 42.32 | 30.57 | 28.55 | 28.13 | 27.89 | 27.00 | 28.51 | 23.79 | 18.68 | 18.33 | 17.17 | 15.58 | NA | |
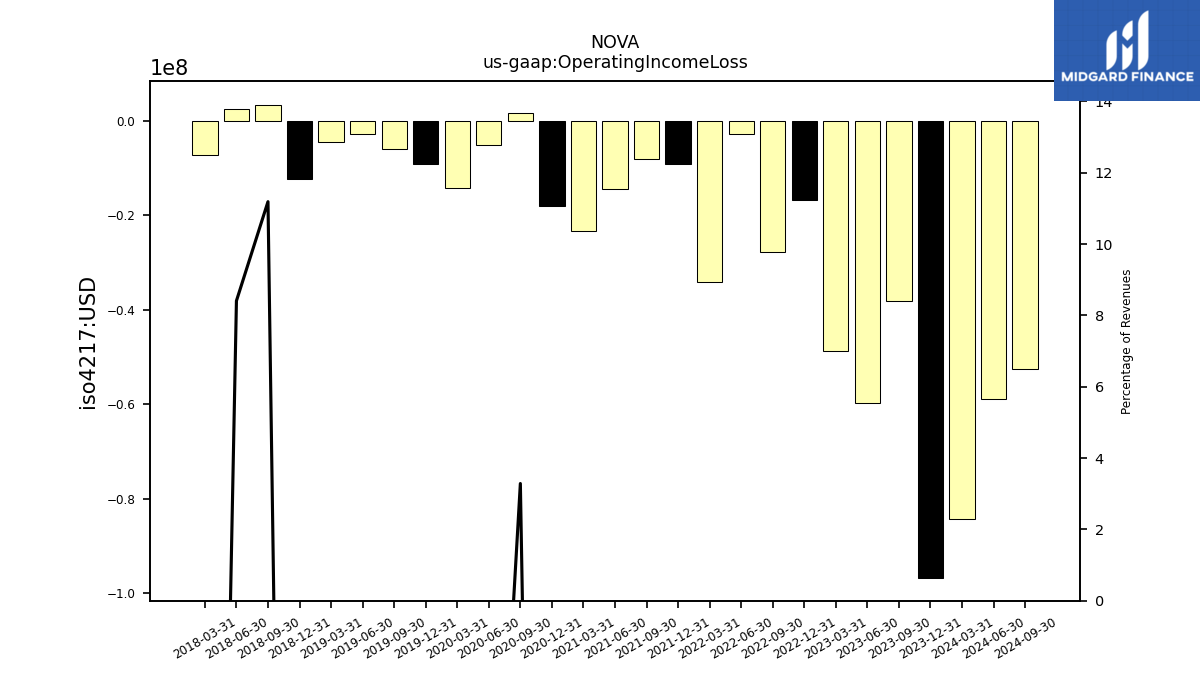
| Operating Income Loss | -38.22 | -59.77 | -48.78 | -16.85 | -27.72 | -2.73 | -34.21 | -9.06 | -8.18 | -14.34 | -23.31 | -17.98 | 1.65 | -5.14 | -14.31 | -9.15 | -5.90 | -2.71 | -4.51 | -12.42 | 3.40 | 2.44 | -7.15 | |
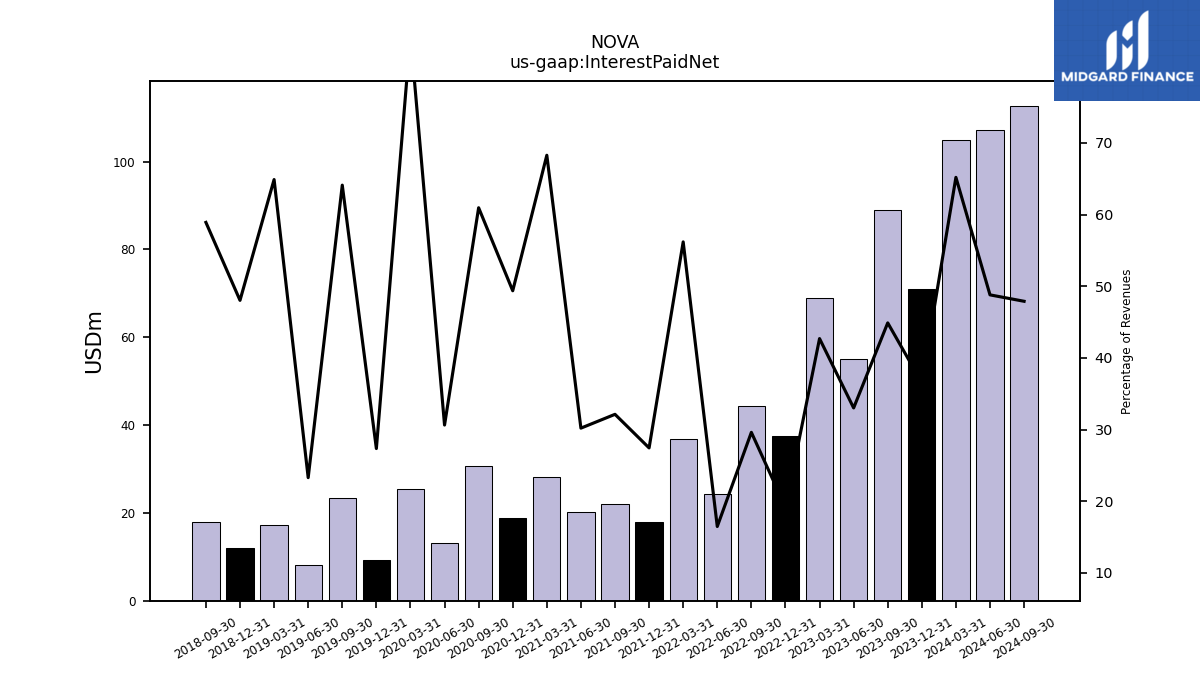
| Interest Paid Net | 89.05 | 54.93 | 69.03 | 37.49 | 44.23 | 24.22 | 36.93 | 17.84 | 22.14 | 20.10 | 28.18 | 18.77 | 30.58 | 13.11 | 25.37 | 9.19 | 23.47 | 8.06 | 17.33 | 12.11 | 17.92 | NA | NA | |
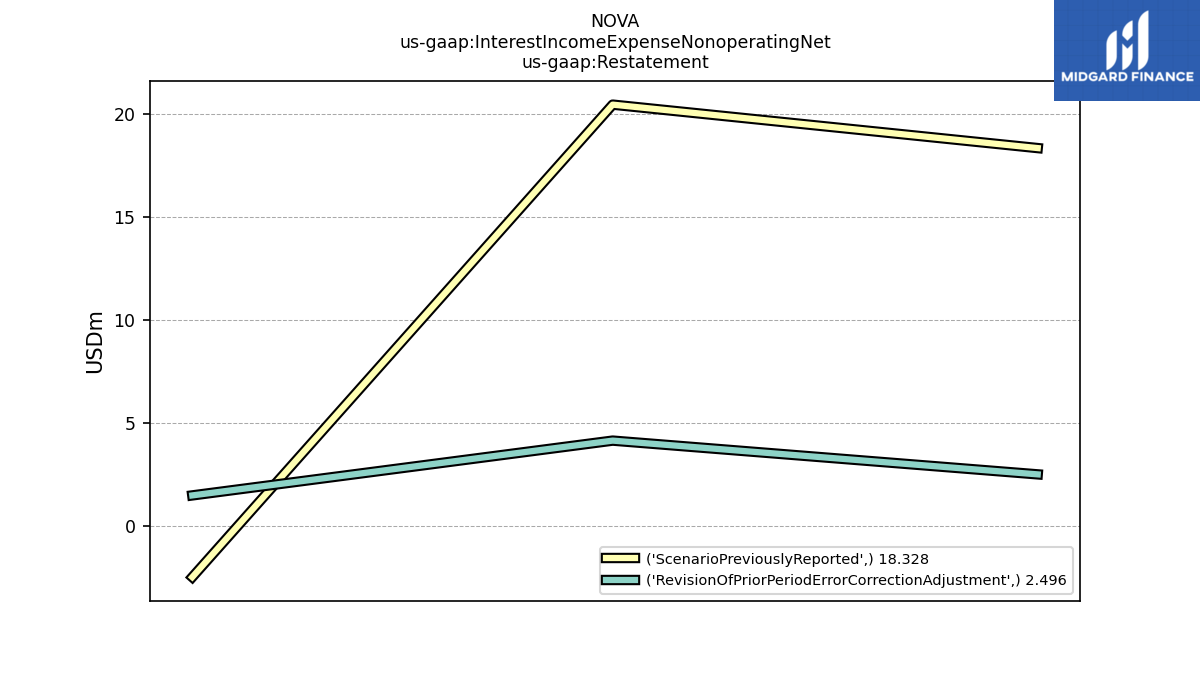
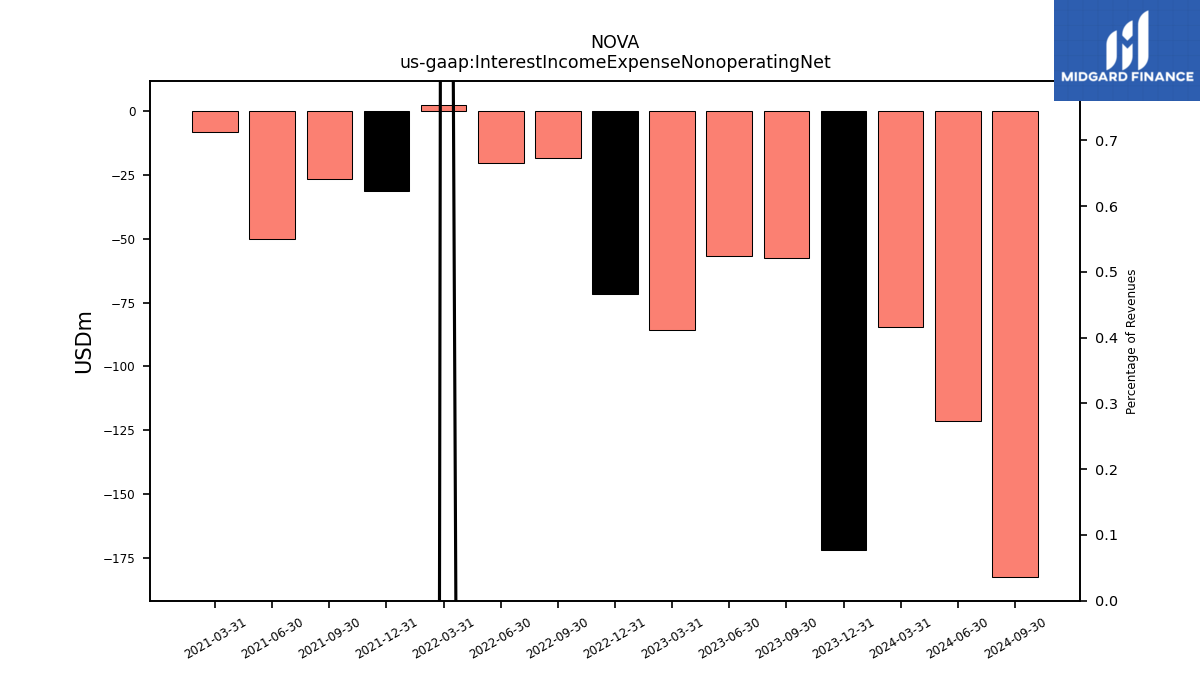
| Interest Income Expense Nonoperating Net | -57.60 | -56.95 | -85.61 | -71.50 | -18.33 | -20.44 | 2.49 | -31.50 | -26.59 | -50.11 | -8.05 | NA | NA | NA | NA | NA | NA | NA | NA | NA | NA | NA | NA | |
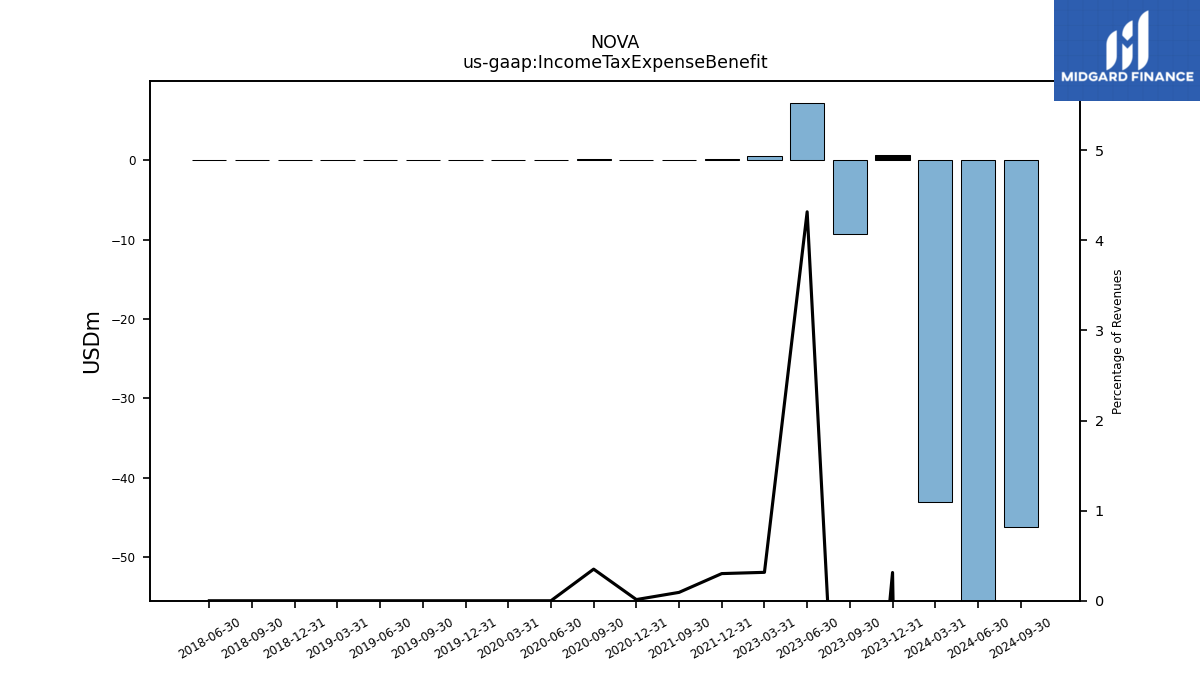
| Income Tax Expense Benefit | -9.32 | 7.18 | 0.51 | NA | NA | NA | NA | 0.20 | 0.06 | NA | NA | 0.01 | 0.18 | 0.00 | 0.00 | 0.00 | 0.00 | 0.00 | 0.00 | 0.00 | 0.00 | 0.00 | NA | |
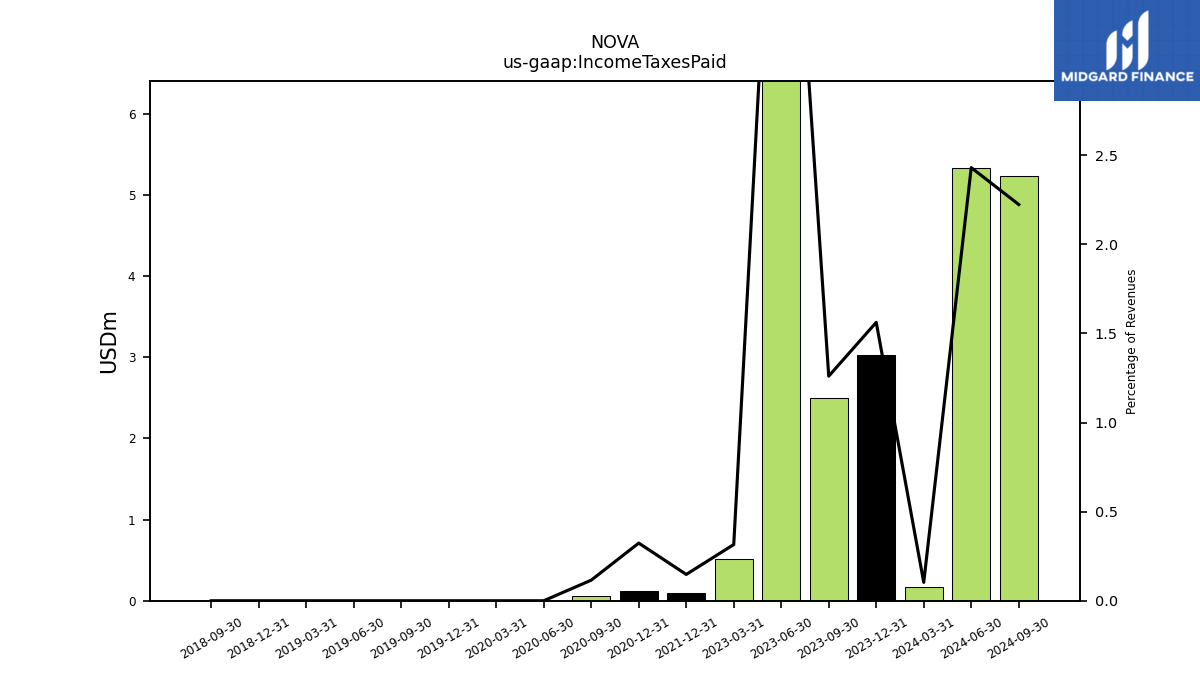
| Income Taxes Paid | 2.50 | 8.68 | 0.51 | NA | NA | NA | NA | 0.10 | NA | NA | NA | 0.12 | 0.06 | 0.00 | 0.00 | 0.00 | 0.00 | 0.00 | 0.00 | 0.00 | 0.00 | NA | NA | |
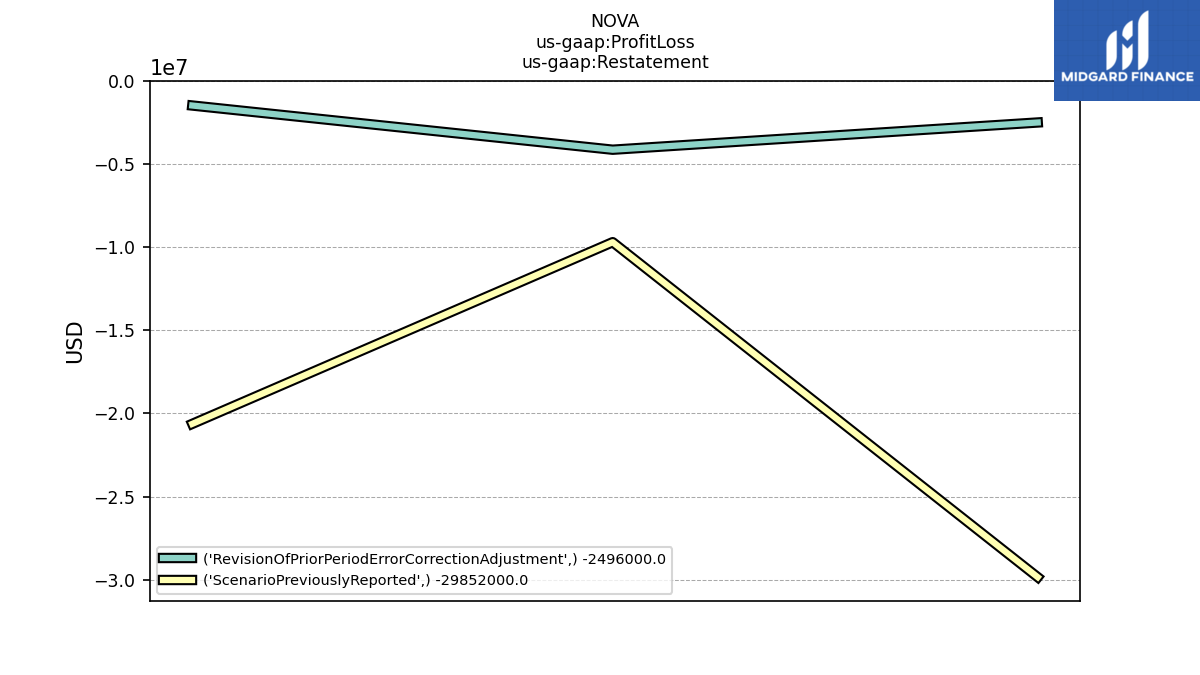
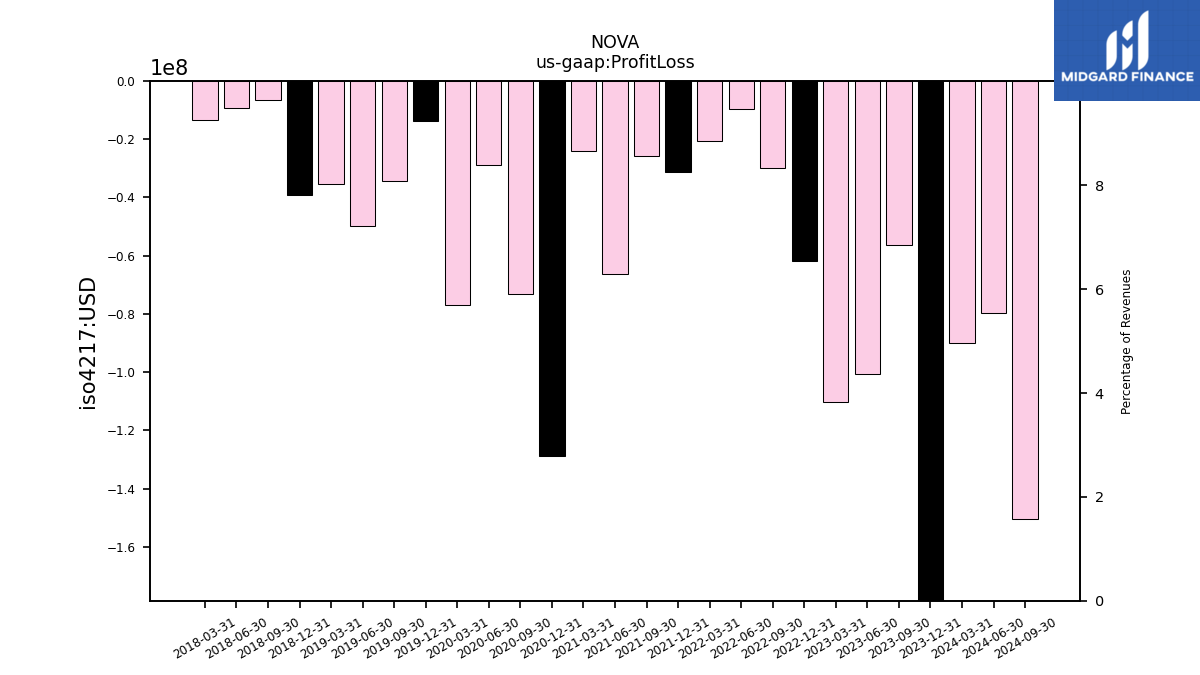
| Profit Loss | -56.46 | -100.78 | -110.35 | -61.99 | -29.85 | -9.70 | -20.63 | -31.25 | -25.92 | -66.27 | -24.06 | -128.79 | -73.29 | -28.73 | -77.00 | -13.76 | -34.37 | -49.81 | -35.50 | -39.10 | -6.65 | -9.22 | -13.44 | |
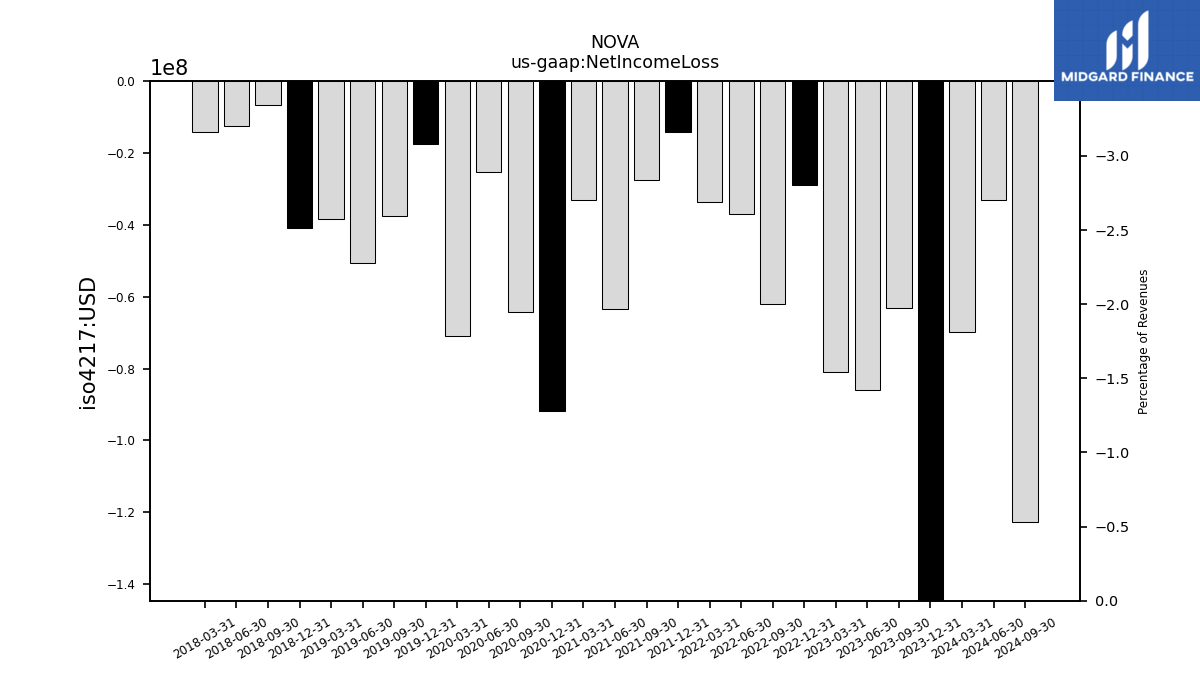
| Net Income Loss | -63.15 | -86.09 | -81.08 | -29.01 | -62.05 | -37.00 | -33.58 | -14.21 | -27.54 | -63.40 | -32.98 | -91.77 | -64.18 | -25.26 | -71.08 | -17.51 | -37.59 | -50.74 | -38.51 | -40.83 | -6.63 | -12.57 | -14.21 | |
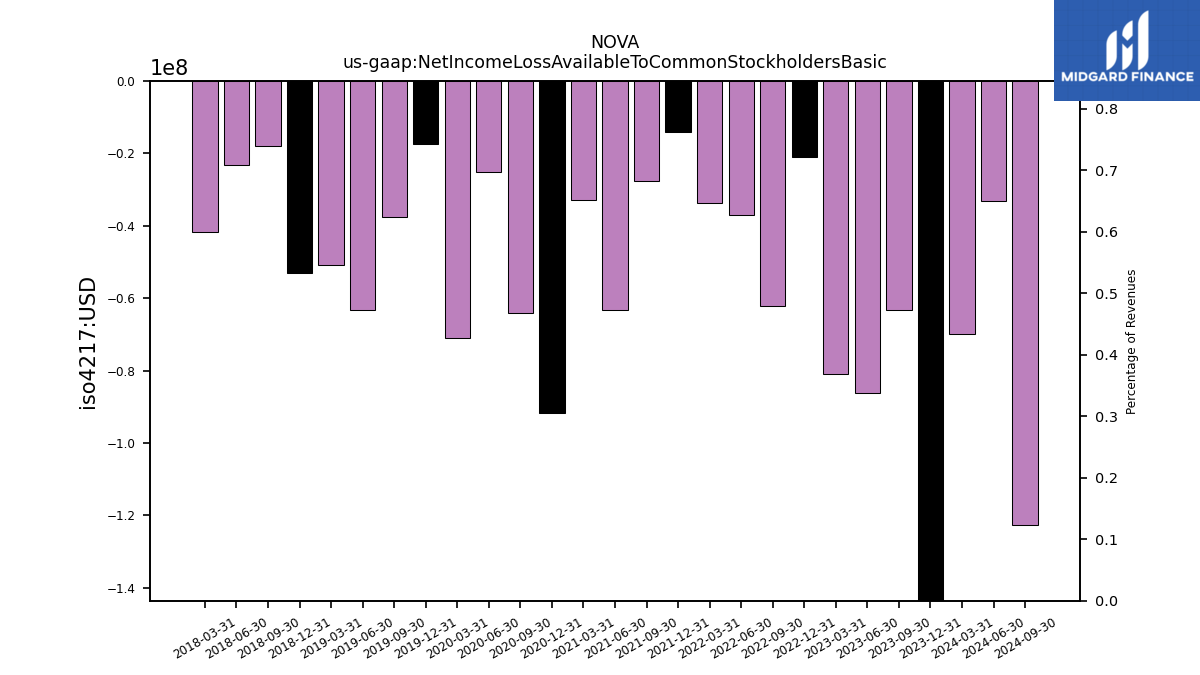
| Net Income Loss Available To Common Stockholders Basic | -63.15 | -86.09 | -81.08 | -20.90 | -62.05 | -37.00 | -33.58 | -14.21 | -27.54 | -63.40 | -32.98 | -91.77 | -64.18 | -25.26 | -71.08 | -17.51 | -37.59 | -63.26 | -50.72 | -53.02 | -17.86 | -23.27 | -41.72 | |
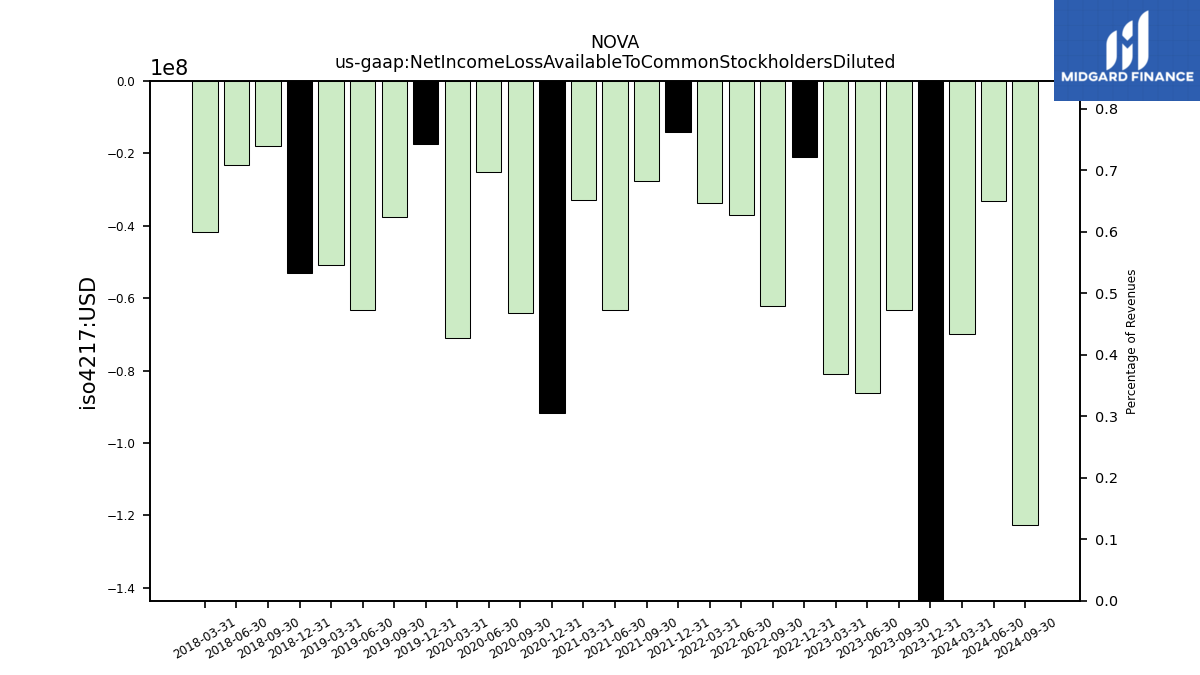
| Net Income Loss Available To Common Stockholders Diluted | -63.15 | -86.09 | -81.08 | -20.90 | -62.05 | -37.00 | -33.58 | -14.21 | -27.54 | -63.40 | -32.98 | -91.77 | -64.18 | -25.26 | -71.08 | -17.51 | -37.59 | -63.26 | -50.72 | -53.02 | -17.86 | -23.27 | -41.72 |
| 2023-09-30 | 2023-06-30 | 2023-03-31 | 2022-12-31 | 2022-09-30 | 2022-06-30 | 2022-03-31 | 2021-12-31 | 2021-09-30 | 2021-06-30 | 2021-03-31 | 2020-12-31 | 2020-09-30 | 2020-06-30 | 2020-03-31 | 2019-12-31 | 2019-09-30 | 2019-06-30 | 2019-03-31 | 2018-12-31 | 2018-09-30 | 2018-06-30 | 2018-03-31 | ||
|---|---|---|---|---|---|---|---|---|---|---|---|---|---|---|---|---|---|---|---|---|---|---|---|---|
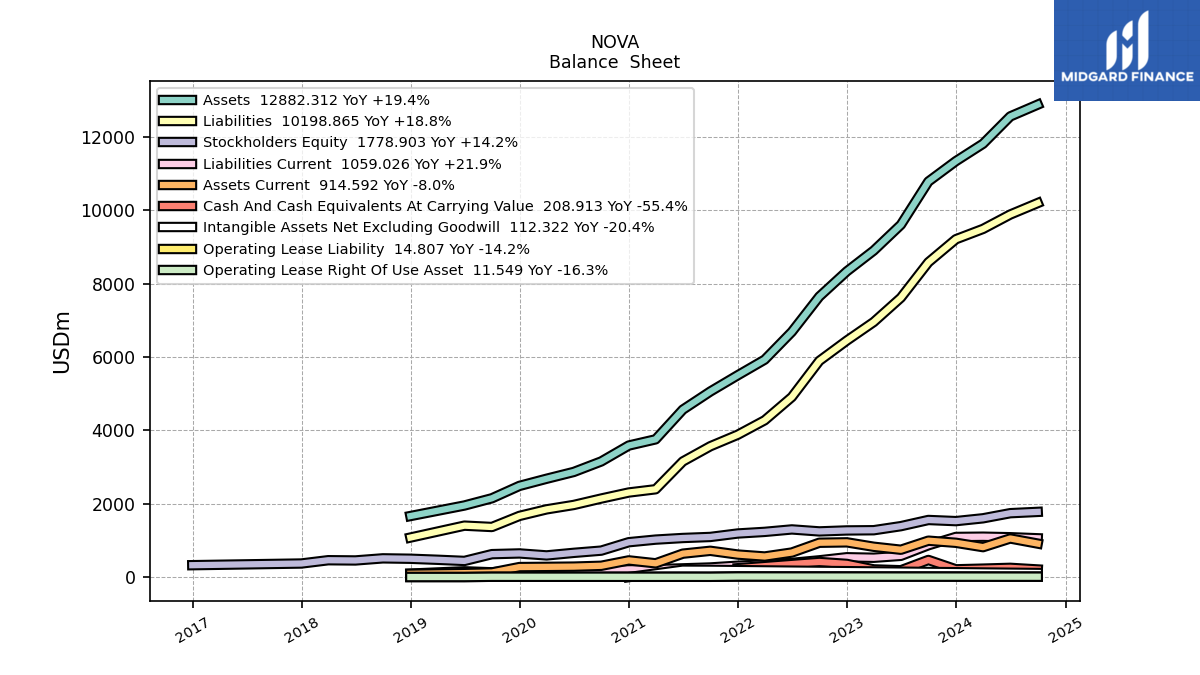
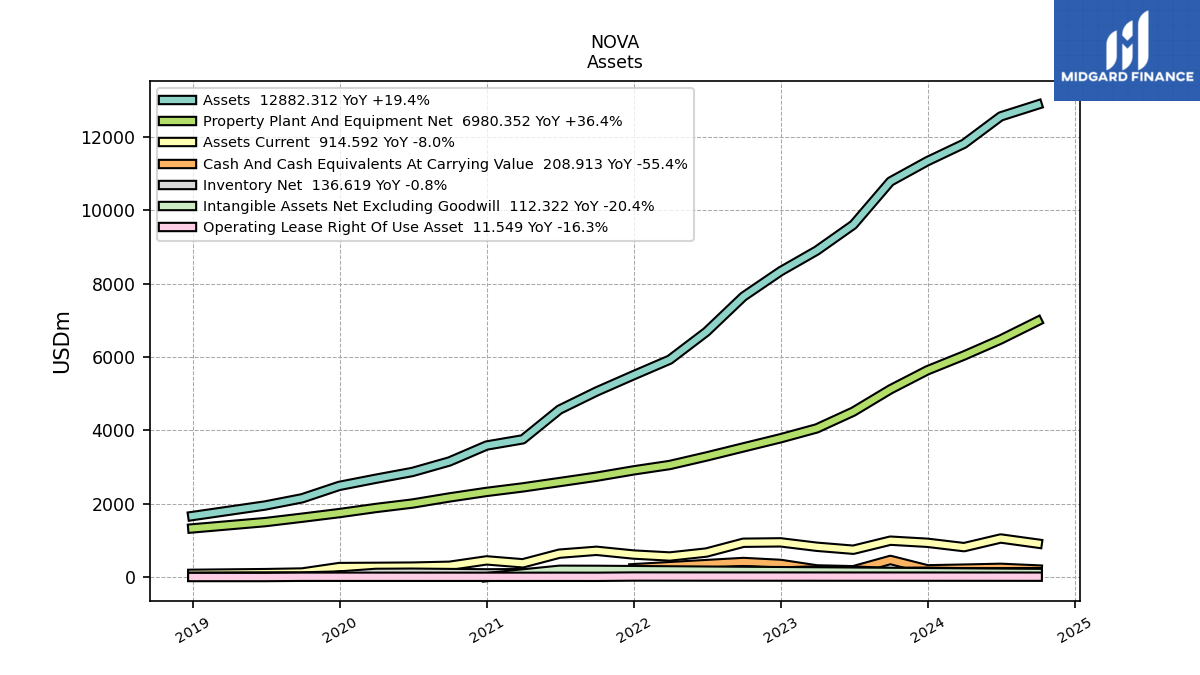
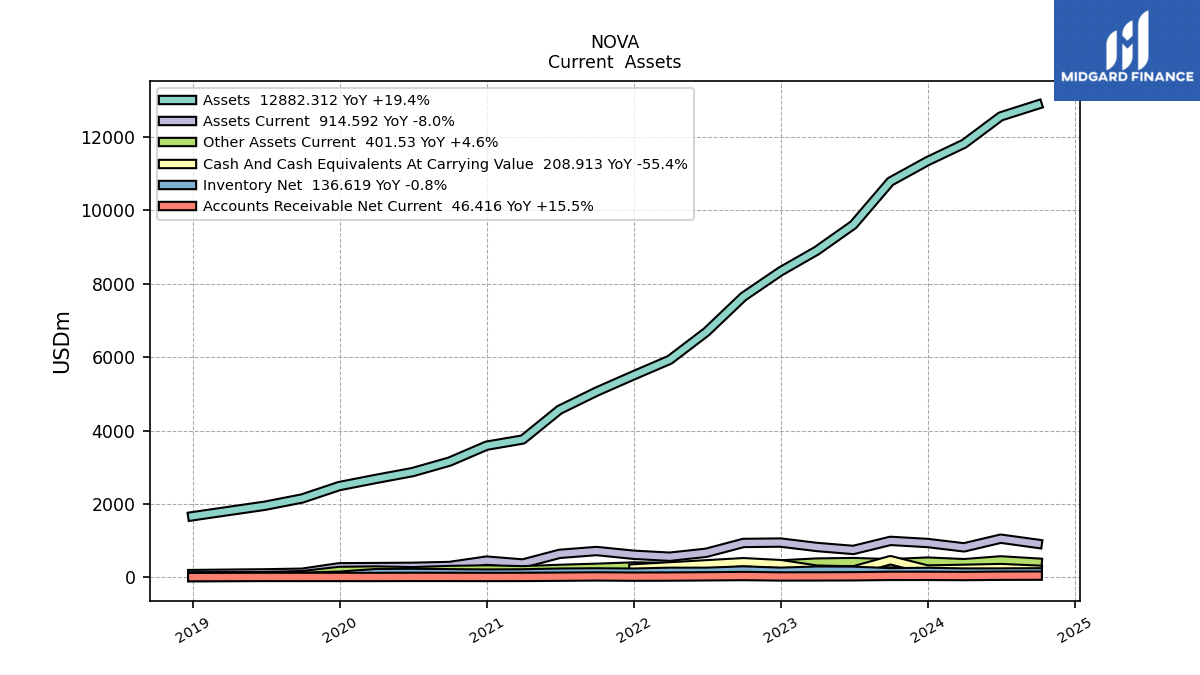
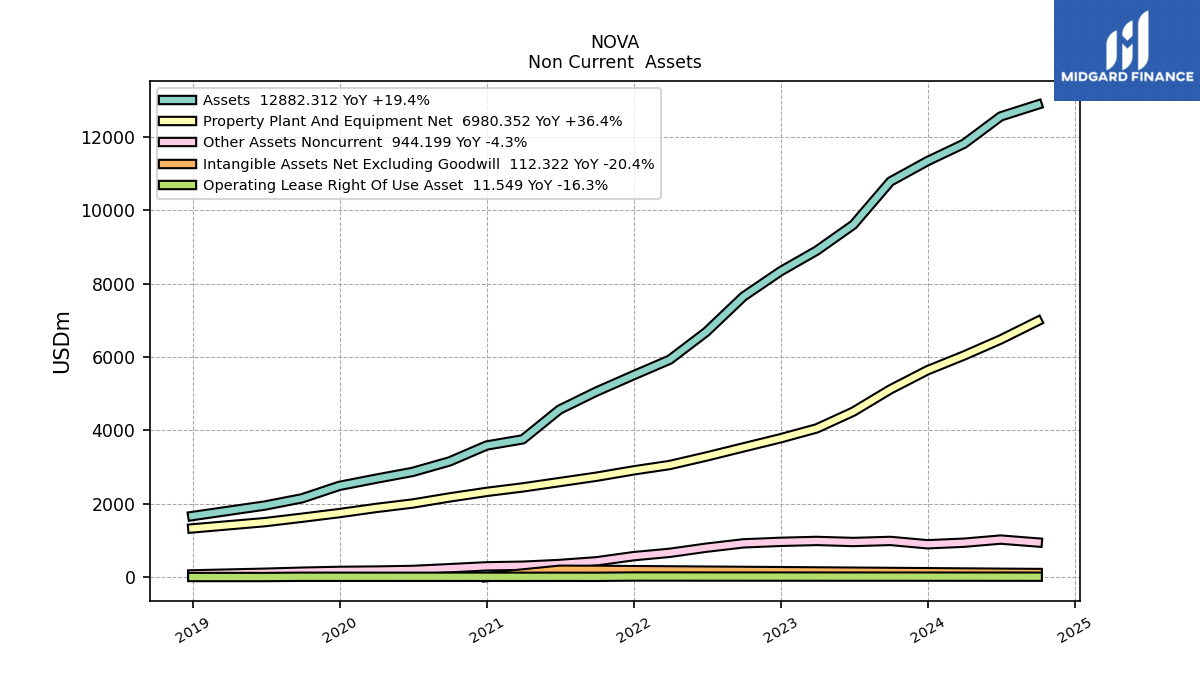
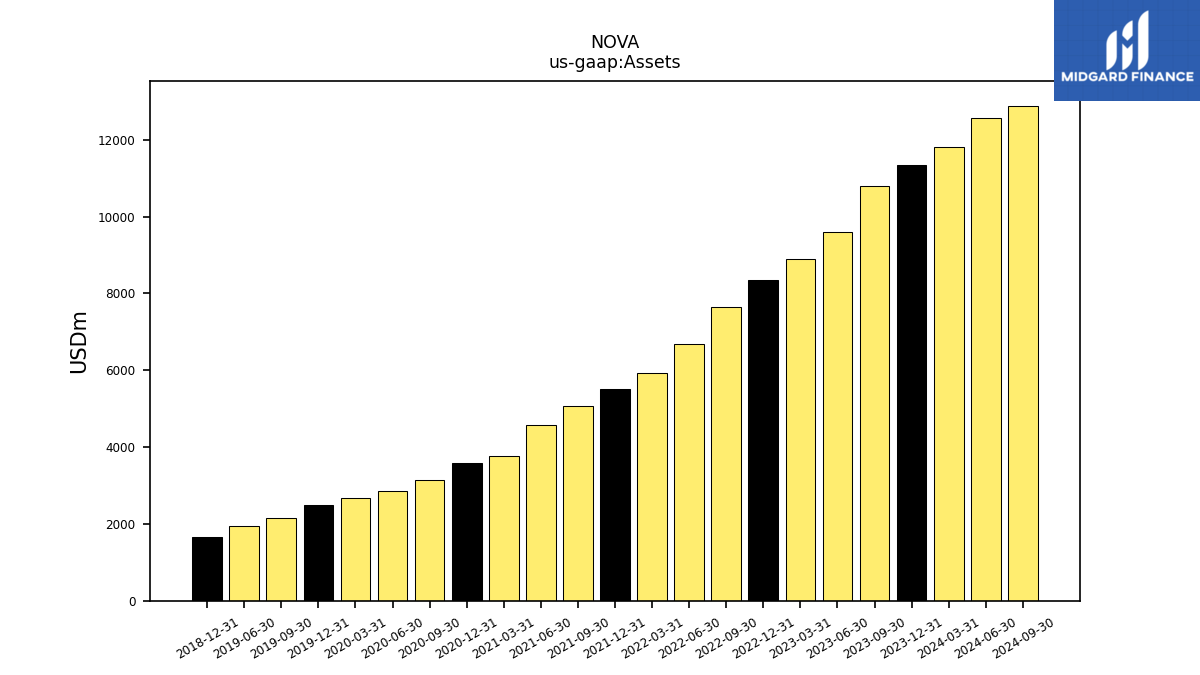
| Assets | 10785.31 | 9606.80 | 8902.21 | 8336.89 | 7649.73 | 6687.81 | 5928.45 | 5504.23 | 5060.41 | 4566.11 | 3756.61 | 3587.58 | 3154.29 | 2867.59 | 2682.18 | 2487.07 | 2149.79 | 1952.66 | NA | 1665.09 | NA | NA | NA | |
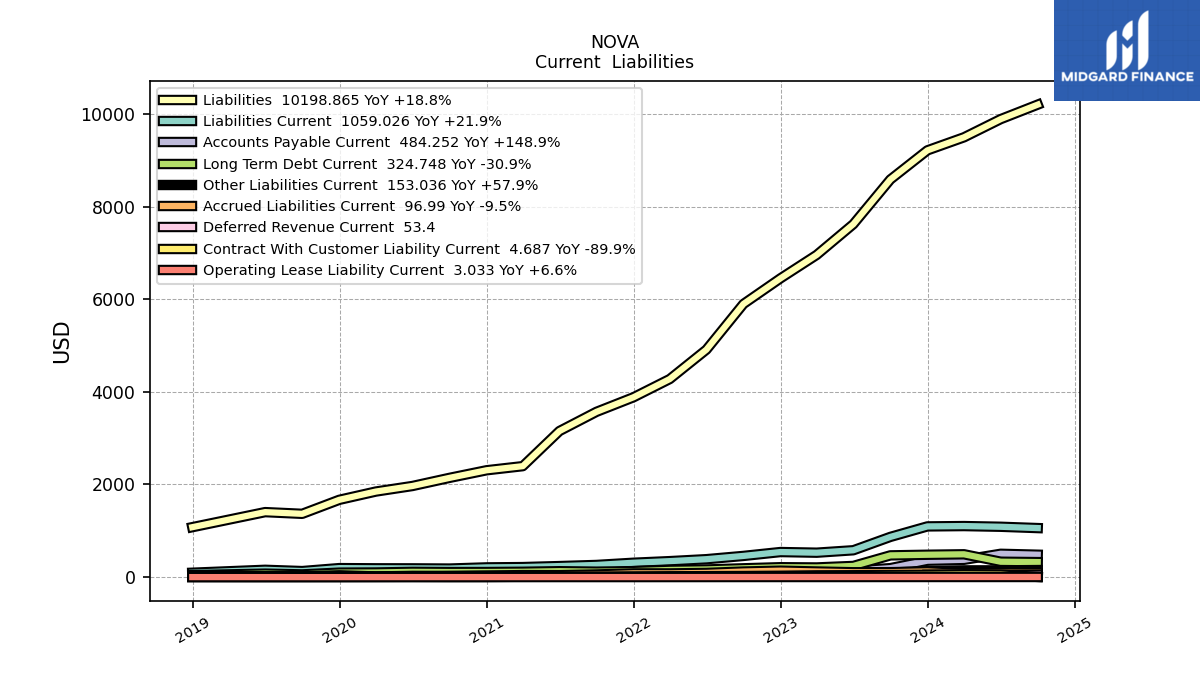
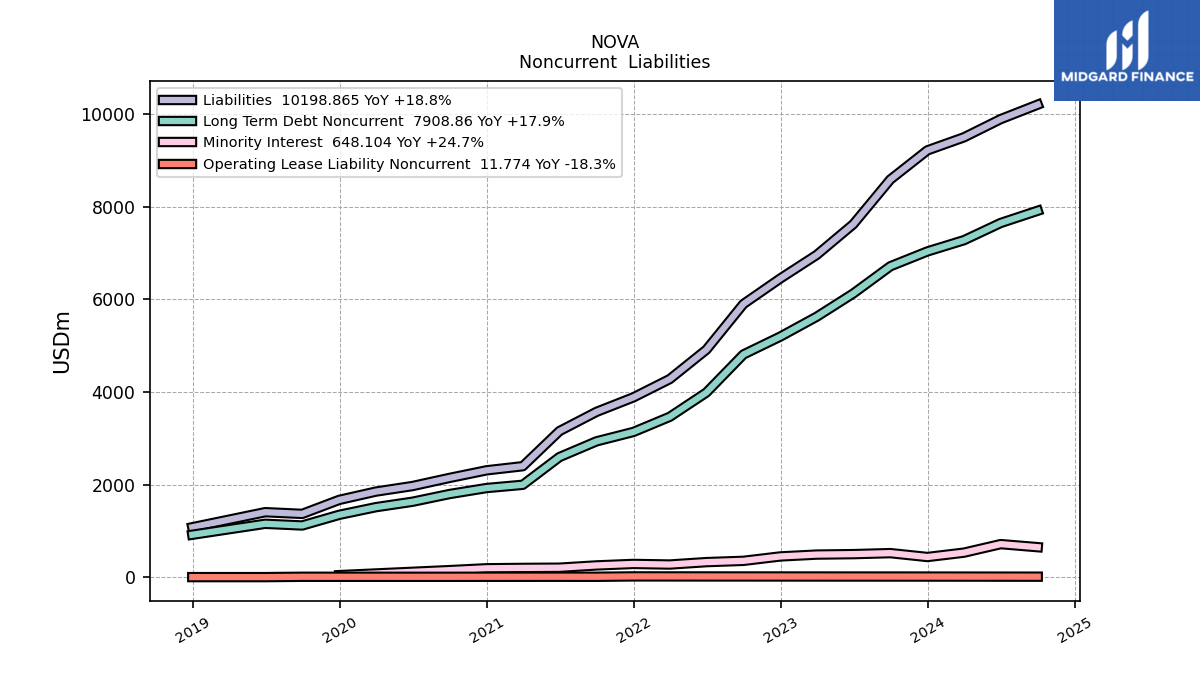
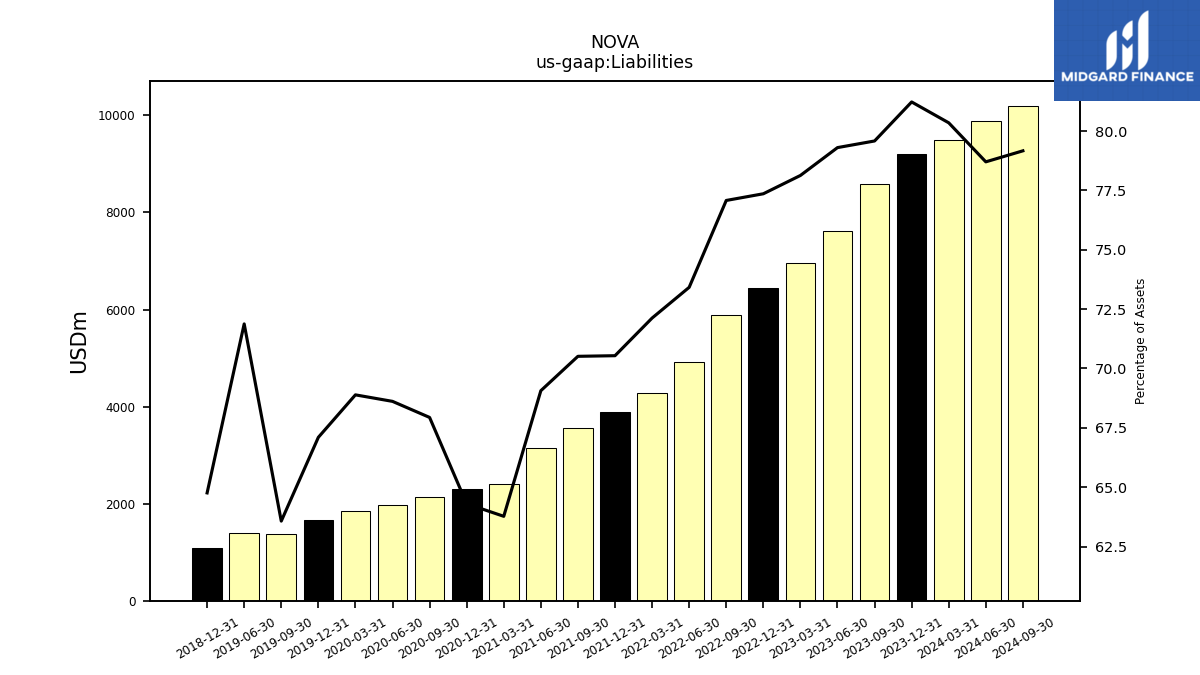
| Liabilities | 8583.43 | 7618.67 | 6955.44 | 6449.44 | 5896.31 | 4910.11 | 4275.84 | 3882.62 | 3568.24 | 3153.55 | 2395.70 | 2306.90 | 2142.97 | 1967.60 | 1847.73 | 1668.83 | 1366.65 | 1403.53 | NA | 1078.29 | NA | NA | NA | |
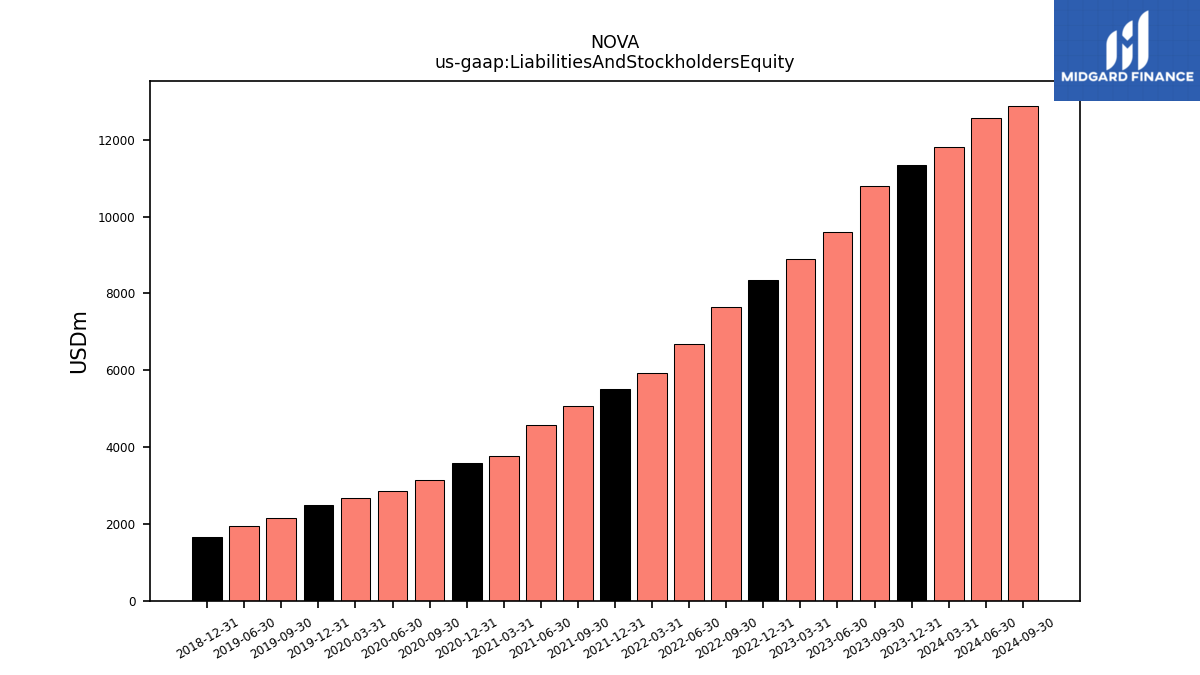
| Liabilities And Stockholders Equity | 10785.31 | 9606.80 | 8902.21 | 8336.89 | 7649.73 | 6687.81 | 5928.45 | 5504.23 | 5060.41 | 4566.11 | 3756.61 | 3587.58 | 3154.29 | 2867.59 | 2682.18 | 2487.07 | 2149.79 | 1952.66 | NA | 1665.09 | NA | NA | NA | |
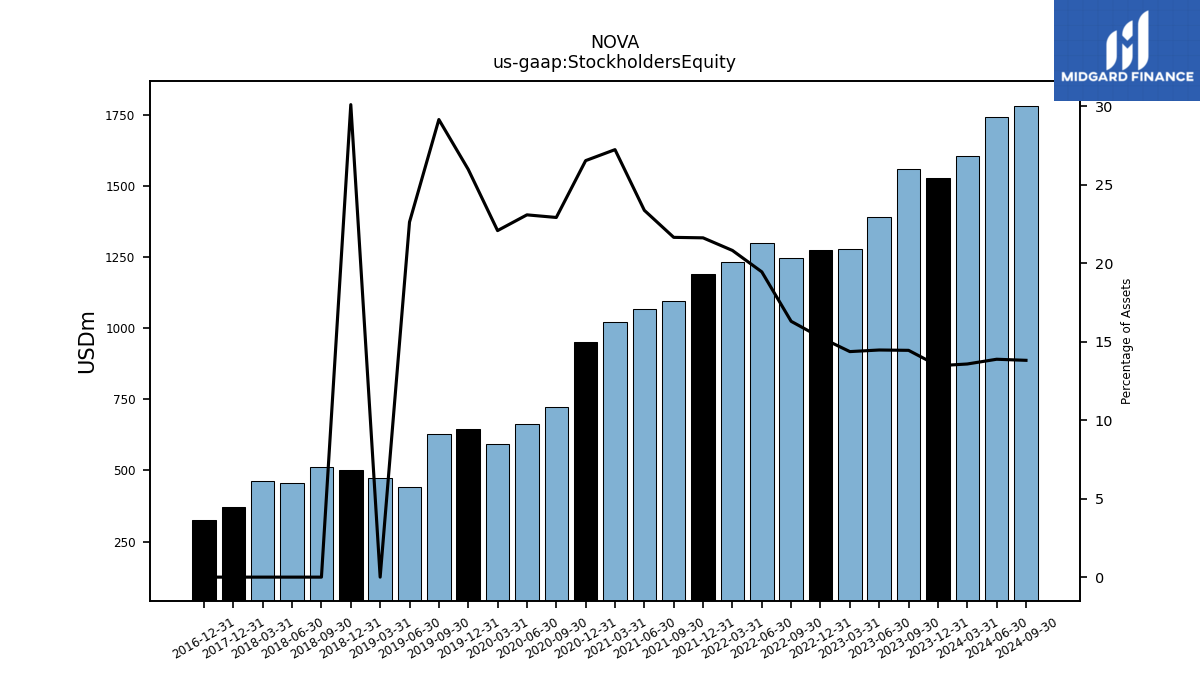
| Stockholders Equity | 1557.92 | 1389.78 | 1278.78 | 1273.08 | 1246.44 | 1300.44 | 1233.57 | 1189.49 | 1095.16 | 1066.73 | 1022.88 | 951.73 | 722.59 | 661.69 | 592.02 | 645.93 | 626.56 | 441.58 | 473.31 | 501.12 | 512.02 | 454.65 | 461.02 |
| 2023-09-30 | 2023-06-30 | 2023-03-31 | 2022-12-31 | 2022-09-30 | 2022-06-30 | 2022-03-31 | 2021-12-31 | 2021-09-30 | 2021-06-30 | 2021-03-31 | 2020-12-31 | 2020-09-30 | 2020-06-30 | 2020-03-31 | 2019-12-31 | 2019-09-30 | 2019-06-30 | 2019-03-31 | 2018-12-31 | 2018-09-30 | 2018-06-30 | 2018-03-31 | ||
|---|---|---|---|---|---|---|---|---|---|---|---|---|---|---|---|---|---|---|---|---|---|---|---|---|
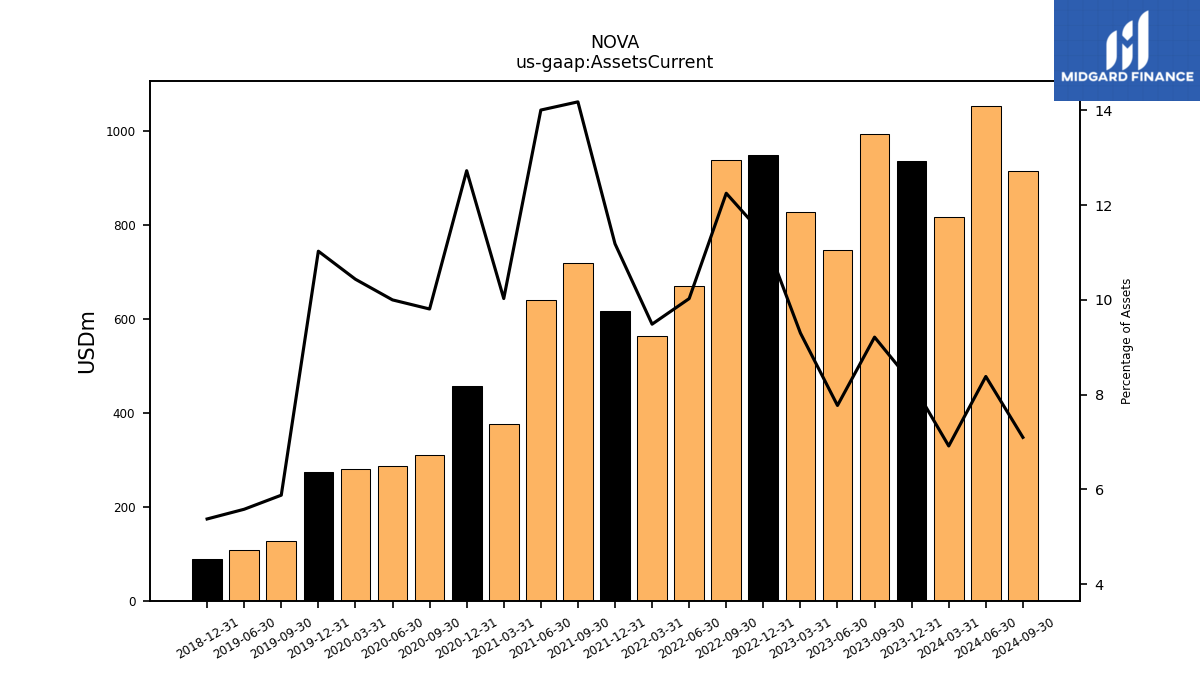
| Assets Current | 993.94 | 746.77 | 828.12 | 948.39 | 937.31 | 670.71 | 562.55 | 615.74 | 717.69 | 639.68 | 376.81 | 456.65 | 309.43 | 286.81 | 279.96 | 274.32 | 126.39 | 109.00 | NA | 89.53 | NA | NA | NA | |
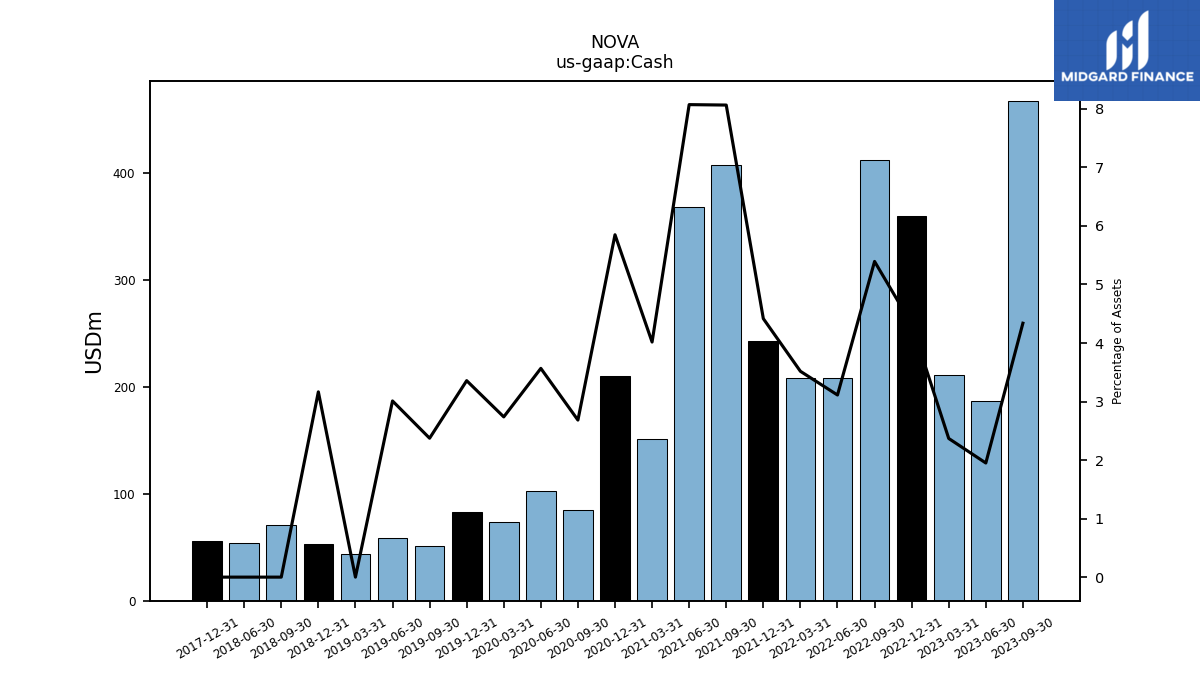
| Cash | 467.90 | 187.33 | 210.88 | 360.26 | 412.58 | 208.11 | 208.50 | 243.10 | 408.16 | 368.63 | 150.89 | 209.86 | 84.64 | 102.28 | 73.44 | 83.48 | 51.03 | 58.78 | 43.86 | 52.71 | 71.15 | 53.72 | NA | |
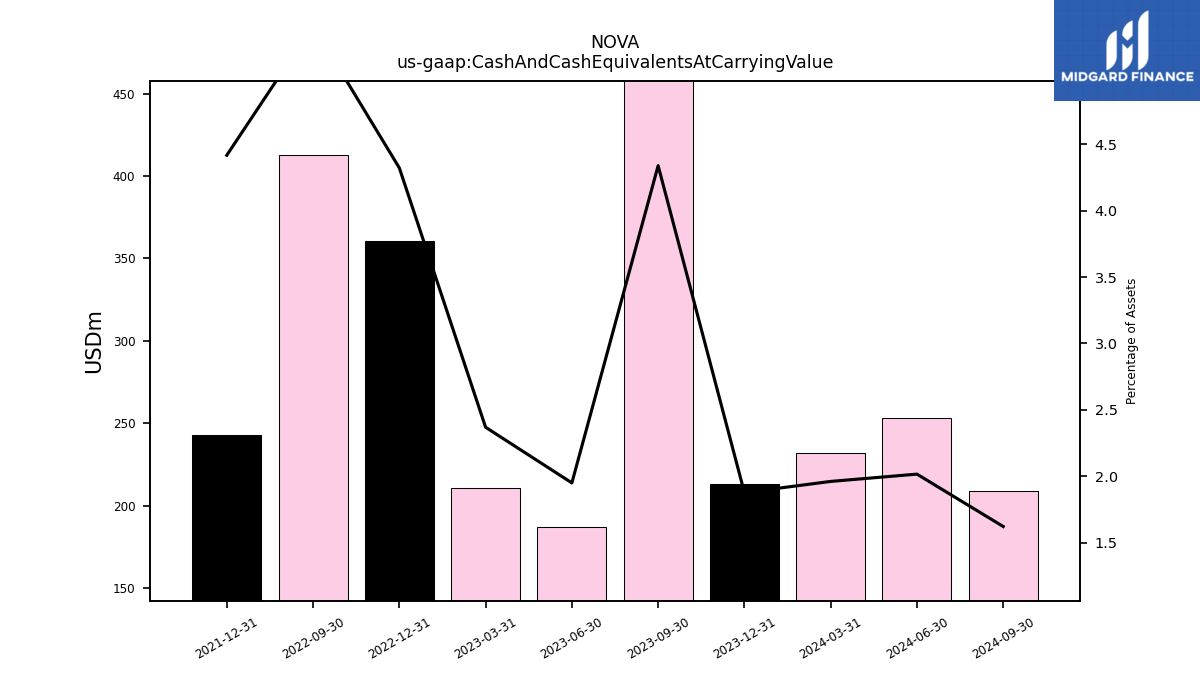
| Cash And Cash Equivalents At Carrying Value | 467.90 | 187.33 | 210.88 | 360.26 | 412.58 | NA | NA | 243.10 | NA | NA | NA | NA | NA | NA | NA | NA | NA | NA | NA | NA | NA | NA | NA | |
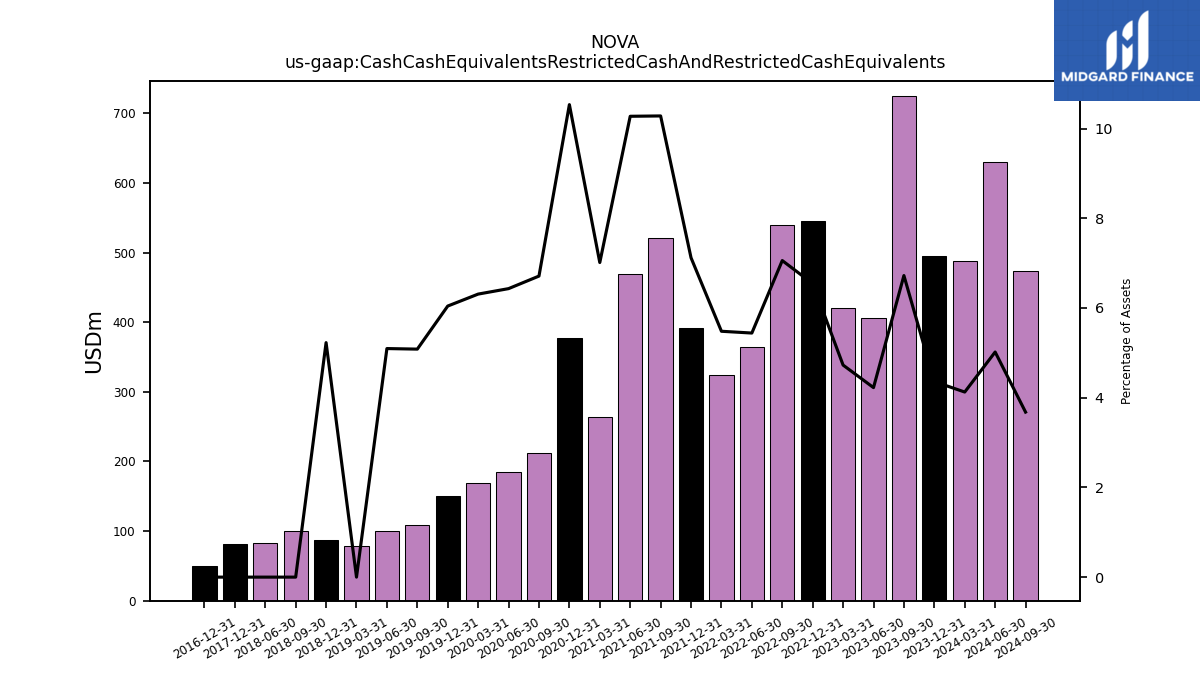
| Cash Cash Equivalents Restricted Cash And Restricted Cash Equivalents | 725.07 | 405.87 | 420.82 | 545.57 | 539.84 | 363.89 | 324.93 | 391.90 | 520.27 | 469.10 | 263.46 | 377.89 | 211.69 | 184.43 | 169.24 | 150.29 | 109.27 | 99.50 | 79.29 | 87.05 | 99.93 | 82.38 | NA | |
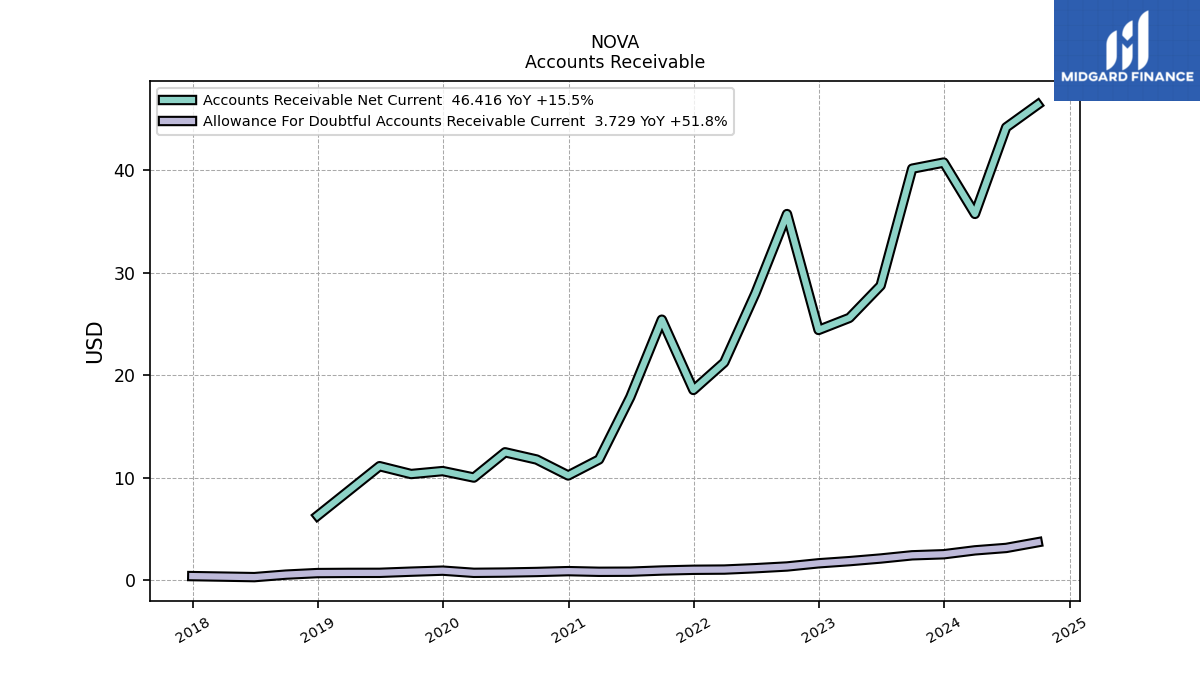
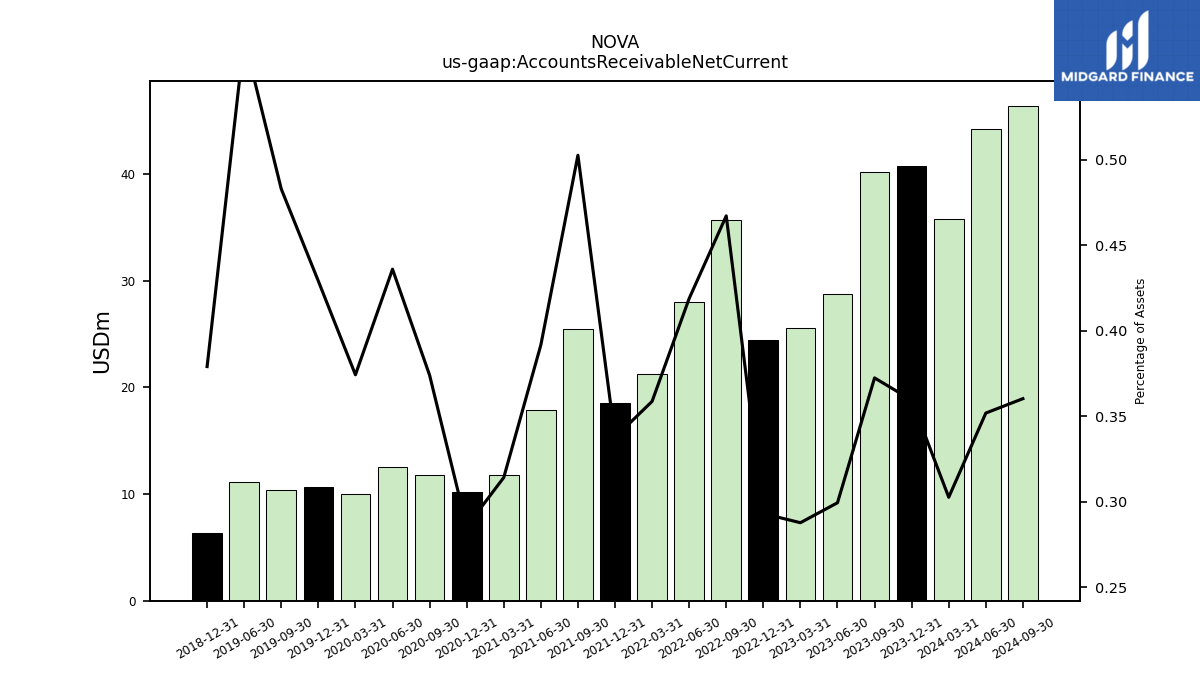
| Accounts Receivable Net Current | 40.17 | 28.76 | 25.61 | 24.43 | 35.74 | 28.02 | 21.27 | 18.58 | 25.44 | 17.89 | 11.80 | 10.24 | 11.80 | 12.50 | 10.04 | 10.67 | 10.38 | 11.15 | NA | 6.31 | NA | NA | NA | |
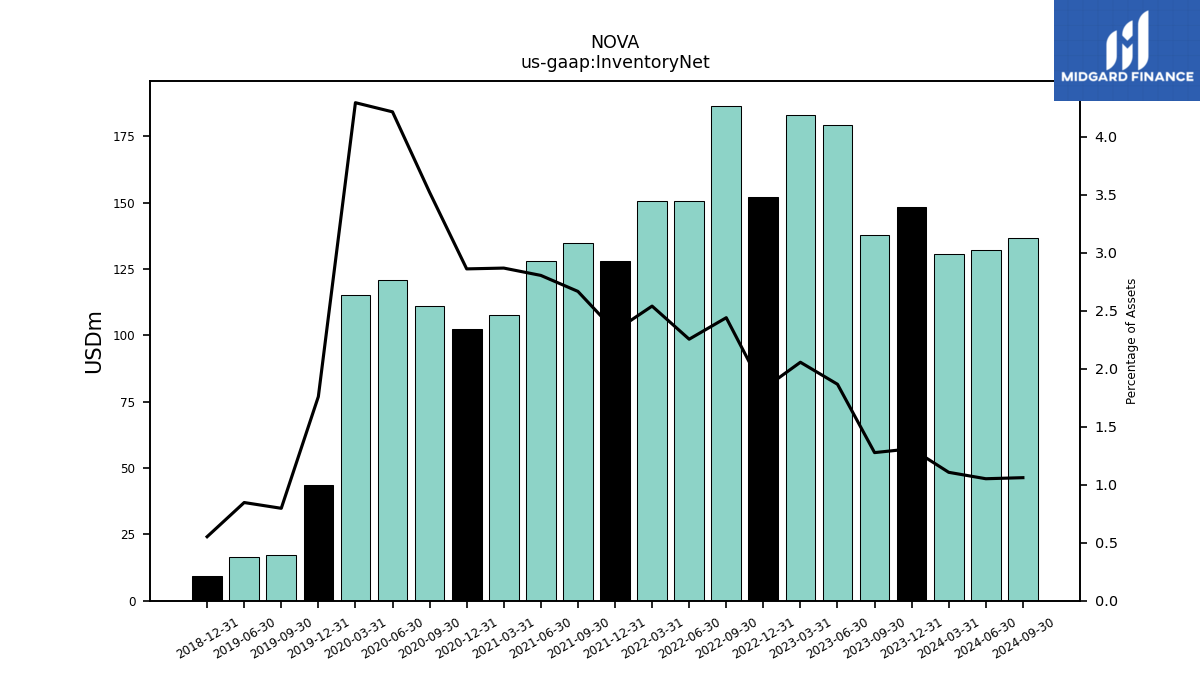
| Inventory Net | 137.67 | 179.21 | 182.95 | 152.11 | 186.57 | 150.72 | 150.52 | 127.95 | 134.89 | 128.00 | 107.68 | 102.59 | 111.01 | 120.80 | 115.11 | 43.75 | 17.12 | 16.53 | NA | 9.19 | NA | NA | NA | |
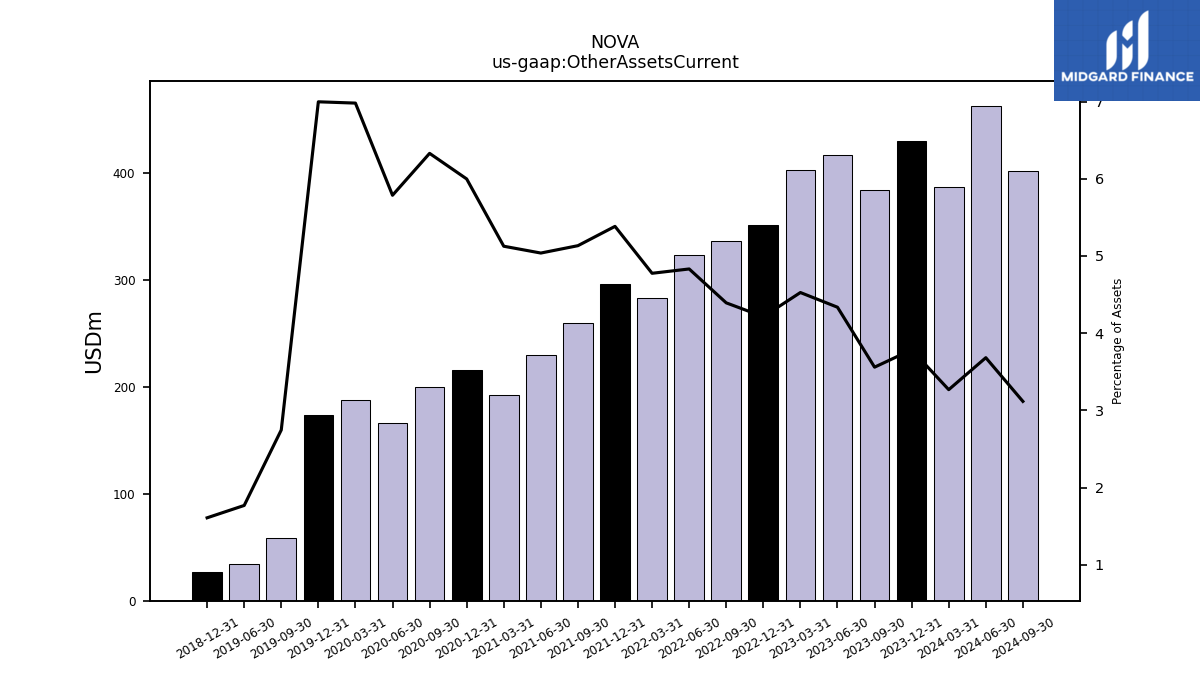
| Other Assets Current | 383.96 | 416.59 | 402.98 | 351.30 | 336.05 | 323.15 | 283.14 | 296.32 | 259.77 | 230.04 | 192.58 | 215.18 | 199.64 | 165.93 | 187.22 | 174.02 | 59.06 | 34.55 | NA | 26.79 | NA | NA | NA |
| 2023-09-30 | 2023-06-30 | 2023-03-31 | 2022-12-31 | 2022-09-30 | 2022-06-30 | 2022-03-31 | 2021-12-31 | 2021-09-30 | 2021-06-30 | 2021-03-31 | 2020-12-31 | 2020-09-30 | 2020-06-30 | 2020-03-31 | 2019-12-31 | 2019-09-30 | 2019-06-30 | 2019-03-31 | 2018-12-31 | 2018-09-30 | 2018-06-30 | 2018-03-31 | ||
|---|---|---|---|---|---|---|---|---|---|---|---|---|---|---|---|---|---|---|---|---|---|---|---|---|
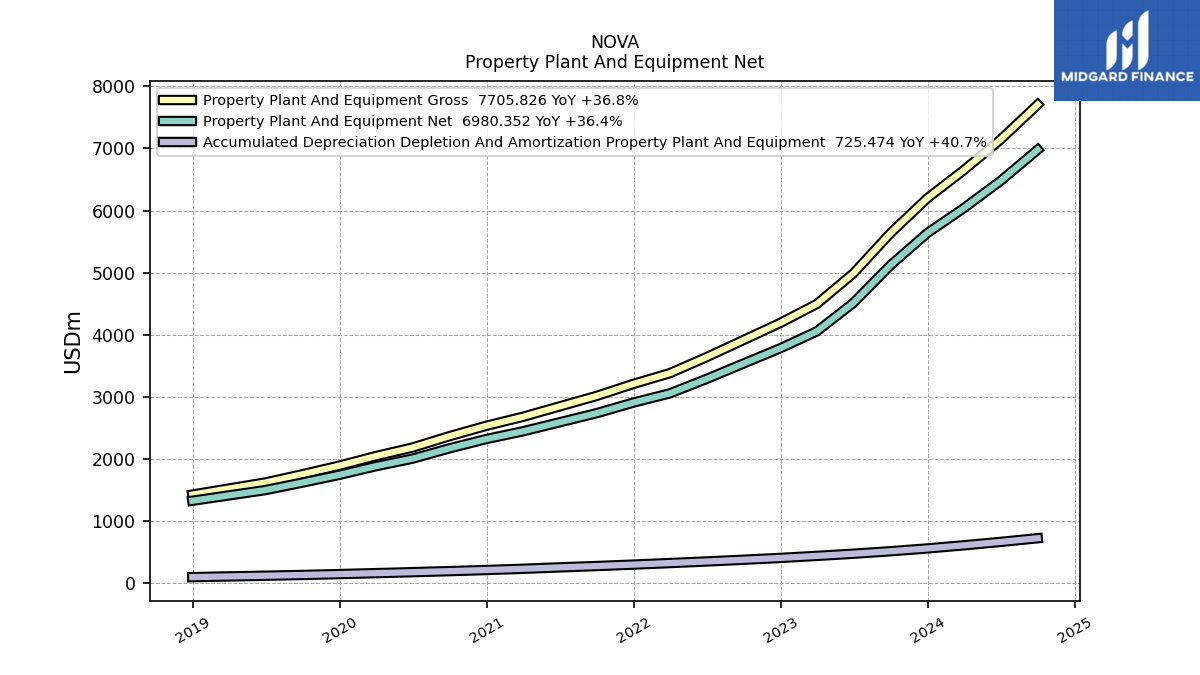
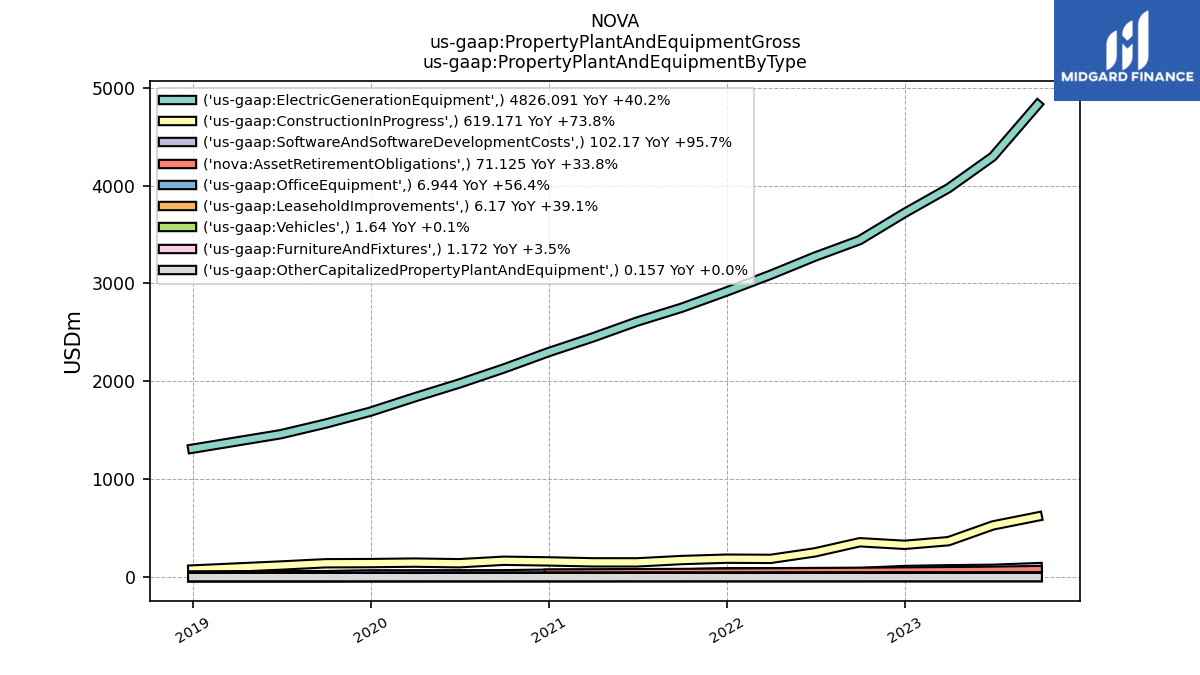
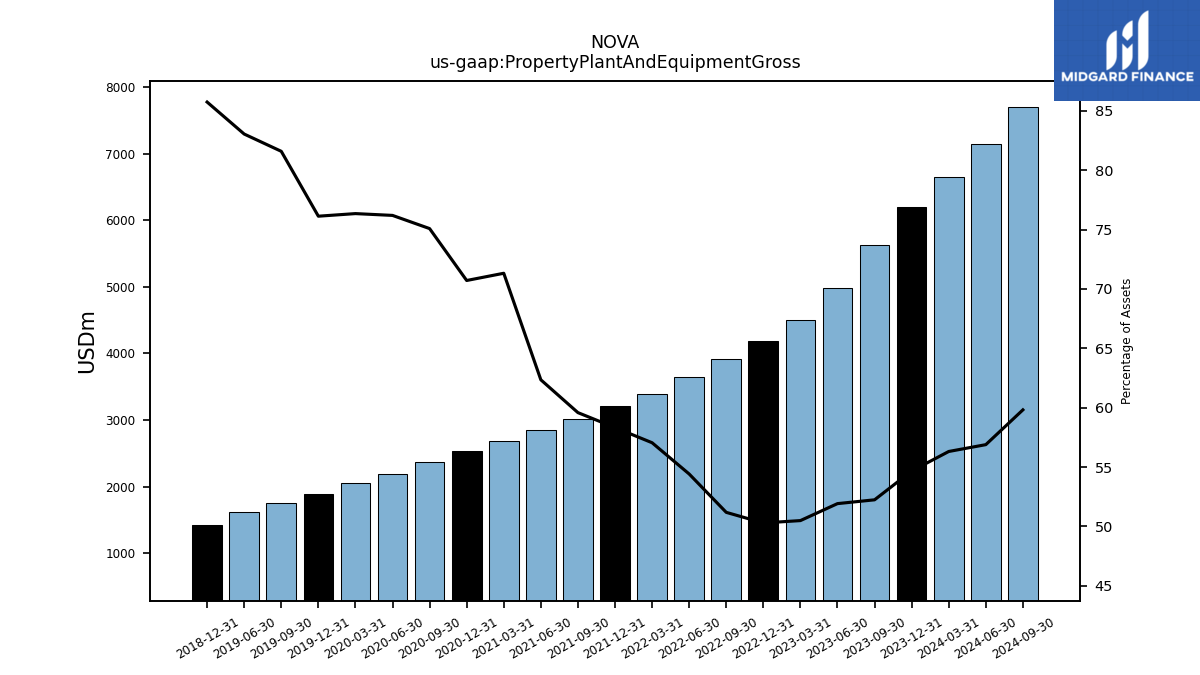
| Property Plant And Equipment Gross | 5634.64 | 4988.16 | 4495.11 | 4192.98 | 3915.73 | 3639.36 | 3382.17 | 3210.35 | 3015.23 | 2846.91 | 2679.14 | 2536.76 | 2368.24 | 2184.80 | 2047.60 | 1893.22 | 1753.91 | 1621.47 | NA | 1427.54 | NA | NA | NA | |
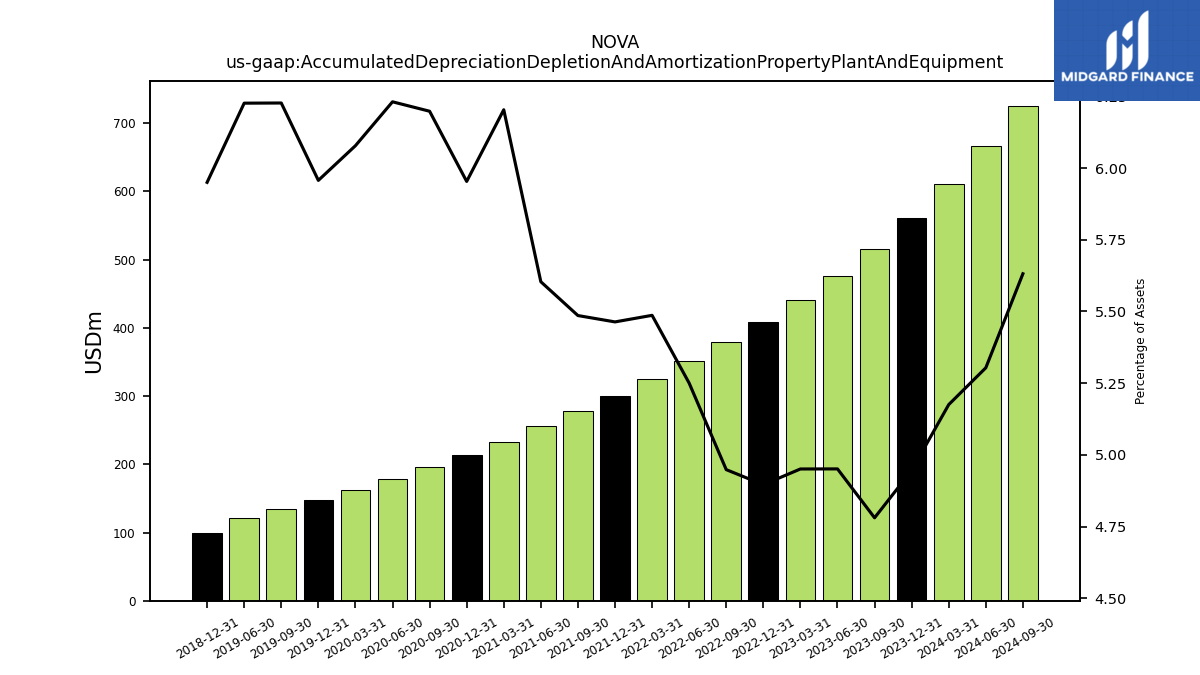
| Accumulated Depreciation Depletion And Amortization Property Plant And Equipment | 515.61 | 475.65 | 440.74 | 408.18 | 378.55 | 351.12 | 325.27 | 300.74 | 277.61 | 255.87 | 233.04 | 213.59 | 195.51 | 178.69 | 163.03 | 148.16 | 133.87 | 121.58 | NA | 99.08 | NA | NA | NA | |
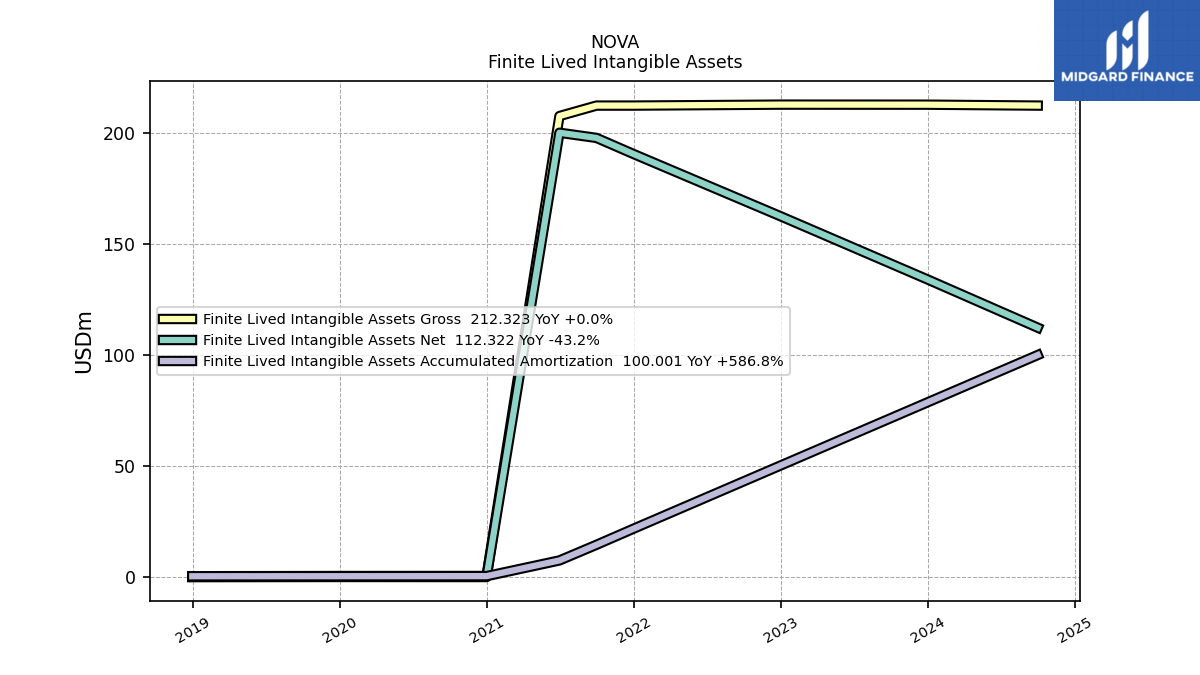
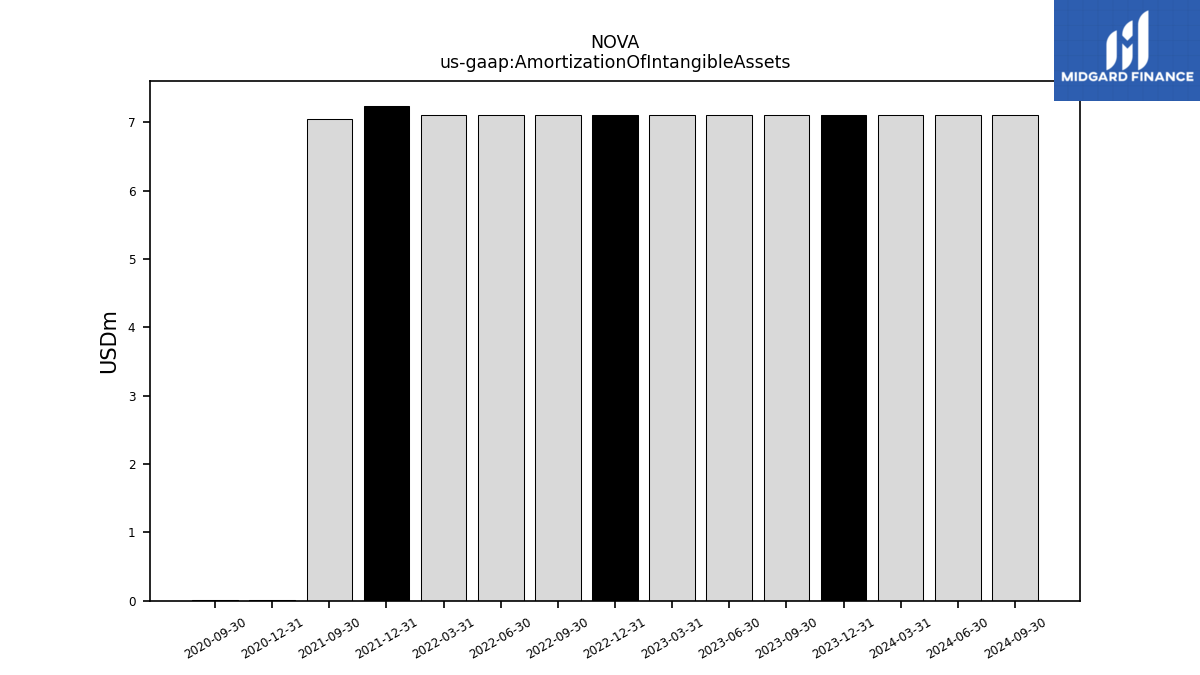
| Amortization Of Intangible Assets | 7.11 | 7.11 | 7.11 | 7.11 | 7.11 | 7.11 | 7.11 | 7.24 | 7.05 | NA | NA | 0.01 | 0.01 | NA | NA | NA | NA | NA | NA | NA | NA | NA | NA | |
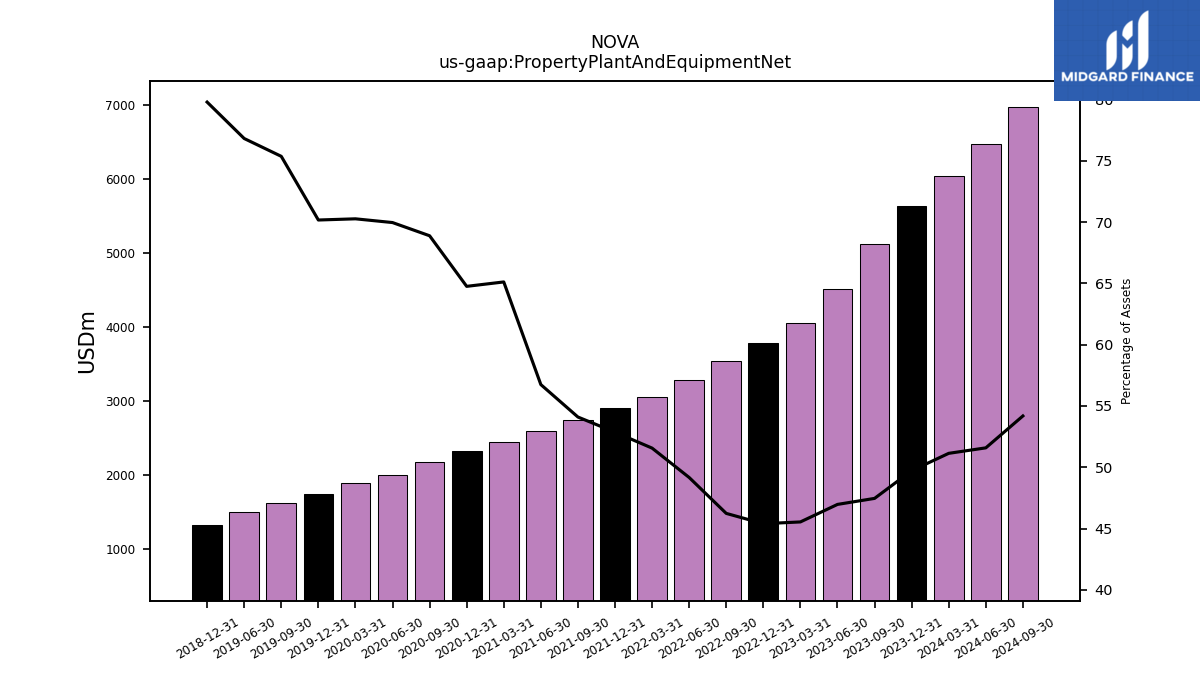
| Property Plant And Equipment Net | 5119.03 | 4512.51 | 4054.37 | 3784.80 | 3537.18 | 3288.23 | 3056.90 | 2909.61 | 2737.62 | 2591.04 | 2446.10 | 2323.17 | 2172.73 | 2006.12 | 1884.58 | 1745.06 | 1620.05 | 1499.89 | NA | 1328.46 | NA | NA | NA | |
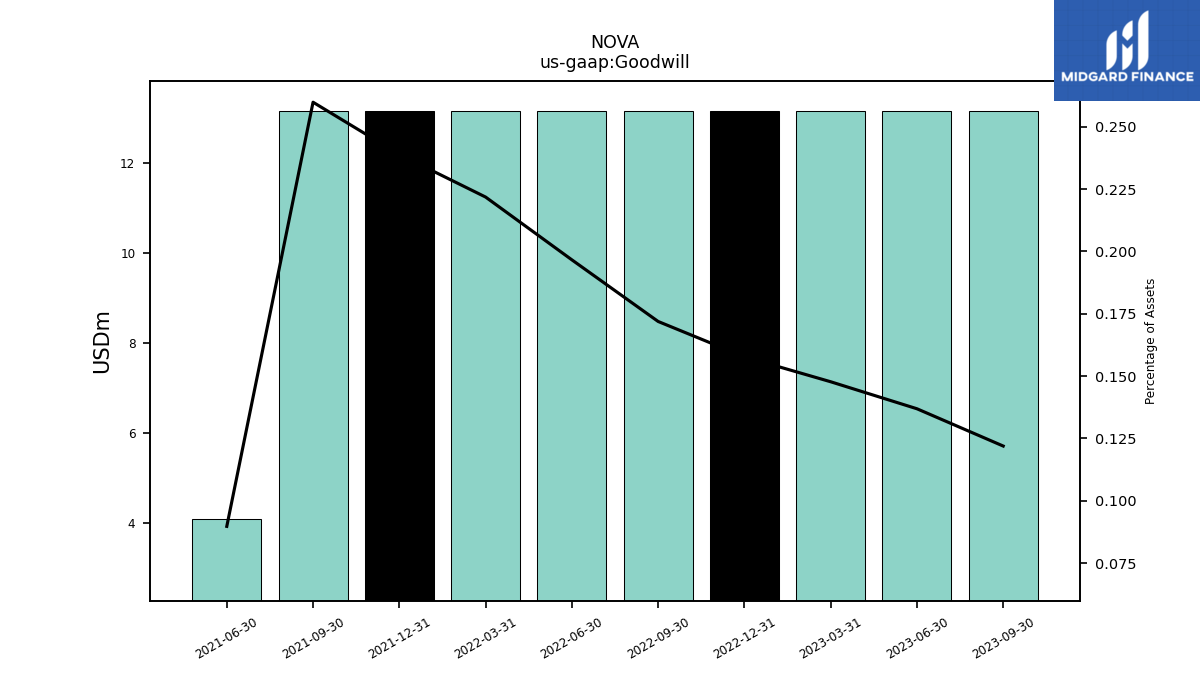
| Goodwill | 13.15 | 13.15 | 13.15 | 13.15 | 13.15 | 13.15 | 13.15 | 13.15 | 13.15 | 4.10 | NA | NA | NA | NA | NA | NA | NA | NA | NA | NA | NA | NA | NA | |
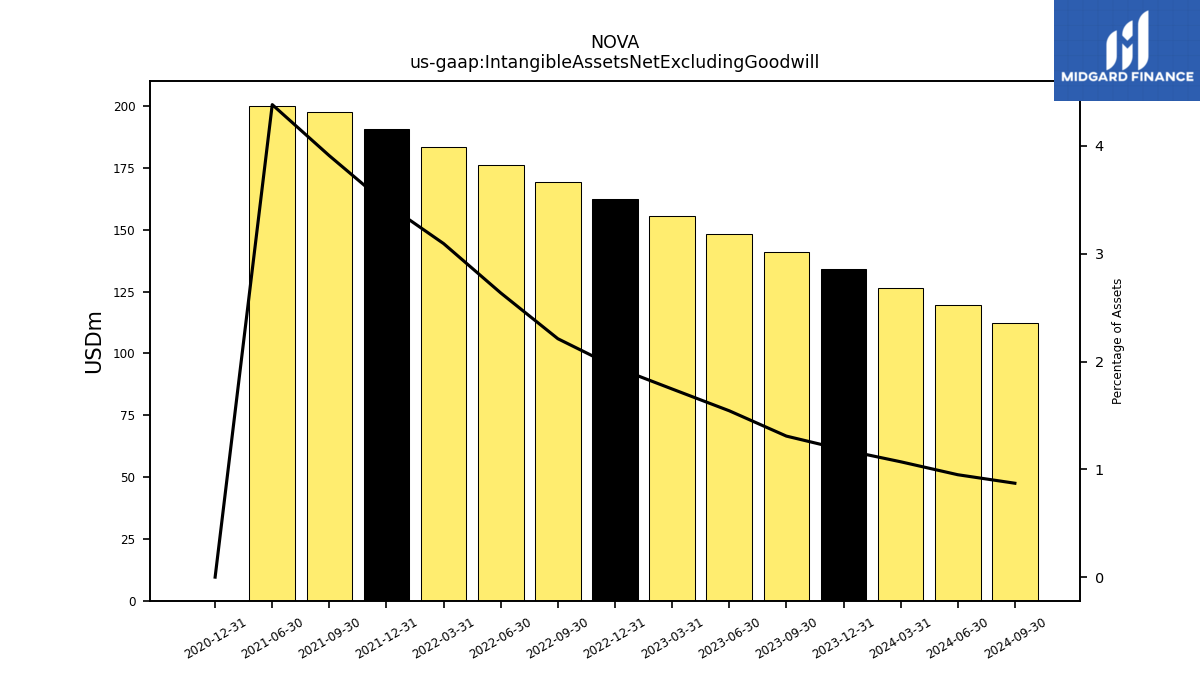
| Intangible Assets Net Excluding Goodwill | 141.18 | 148.29 | 155.40 | 162.51 | 169.19 | 176.30 | 183.41 | 190.52 | 197.76 | 200.10 | NA | 0.05 | NA | NA | NA | NA | NA | NA | NA | NA | NA | NA | NA | |
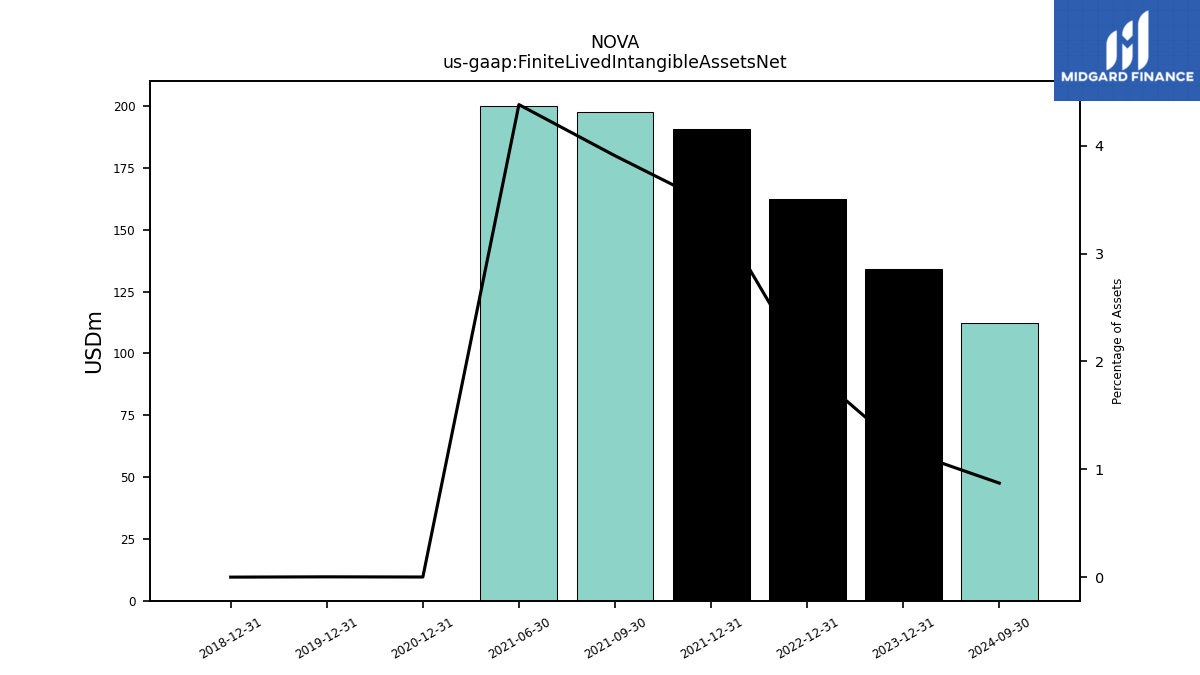
| Finite Lived Intangible Assets Net | NA | NA | NA | 162.51 | NA | NA | NA | 190.52 | 197.76 | 200.10 | NA | 0.04 | NA | NA | NA | 0.07 | NA | NA | NA | 0.00 | NA | NA | NA | |
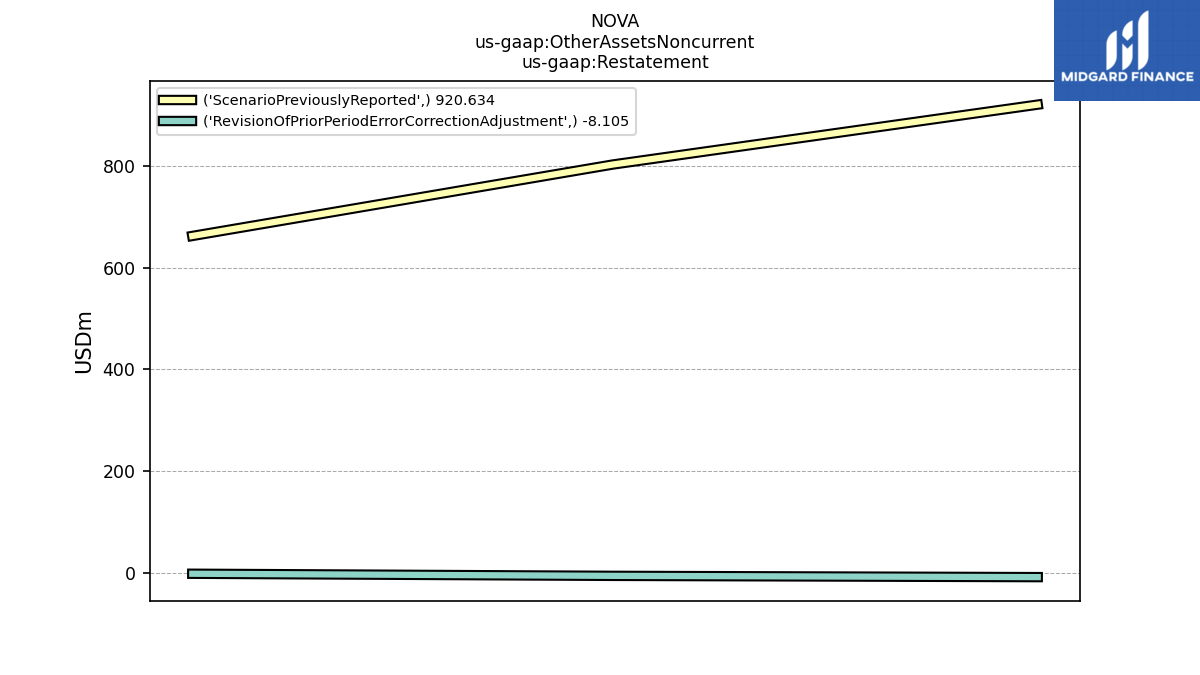
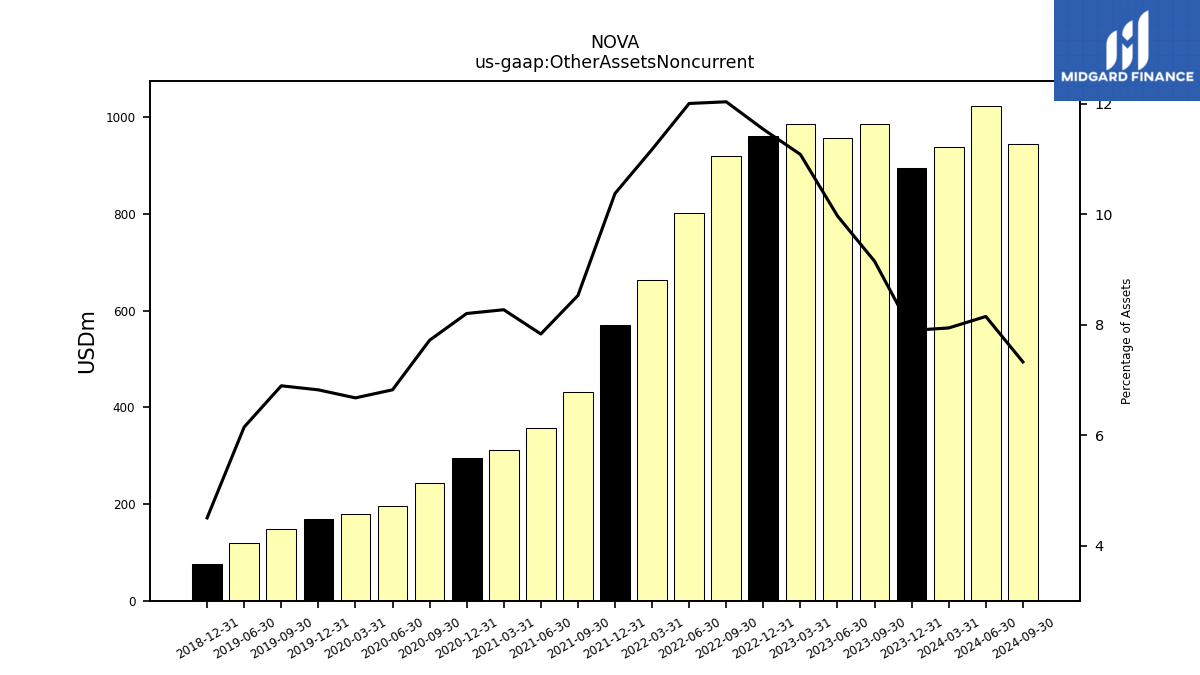
| Other Assets Noncurrent | 986.93 | 957.78 | 986.62 | 961.89 | 920.63 | 802.86 | 662.46 | 571.14 | 431.70 | 357.73 | 310.79 | 294.37 | 243.55 | 195.70 | 179.13 | 169.71 | 148.28 | 120.12 | NA | 75.06 | NA | NA | NA |
| 2023-09-30 | 2023-06-30 | 2023-03-31 | 2022-12-31 | 2022-09-30 | 2022-06-30 | 2022-03-31 | 2021-12-31 | 2021-09-30 | 2021-06-30 | 2021-03-31 | 2020-12-31 | 2020-09-30 | 2020-06-30 | 2020-03-31 | 2019-12-31 | 2019-09-30 | 2019-06-30 | 2019-03-31 | 2018-12-31 | 2018-09-30 | 2018-06-30 | 2018-03-31 | ||
|---|---|---|---|---|---|---|---|---|---|---|---|---|---|---|---|---|---|---|---|---|---|---|---|---|
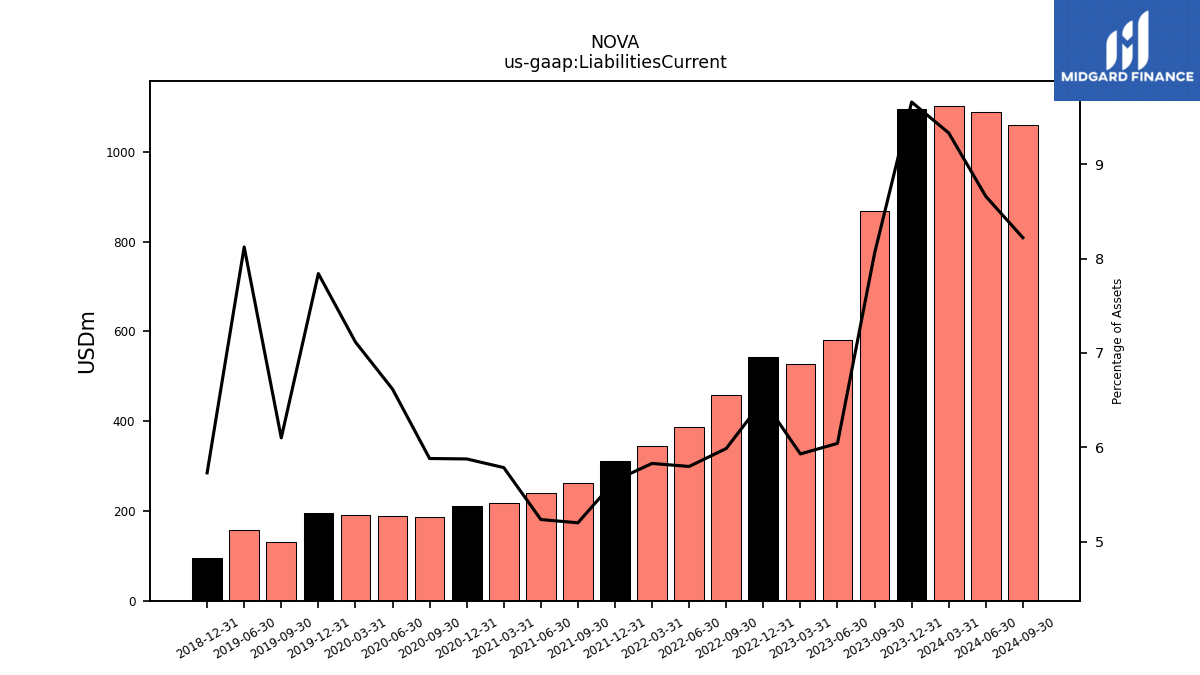
| Liabilities Current | 868.77 | 580.47 | 527.95 | 541.95 | 458.07 | 387.74 | 345.62 | 310.90 | 263.19 | 239.06 | 217.35 | 210.85 | 185.53 | 189.76 | 190.85 | 195.00 | 131.15 | 158.60 | NA | 95.40 | NA | NA | NA | |
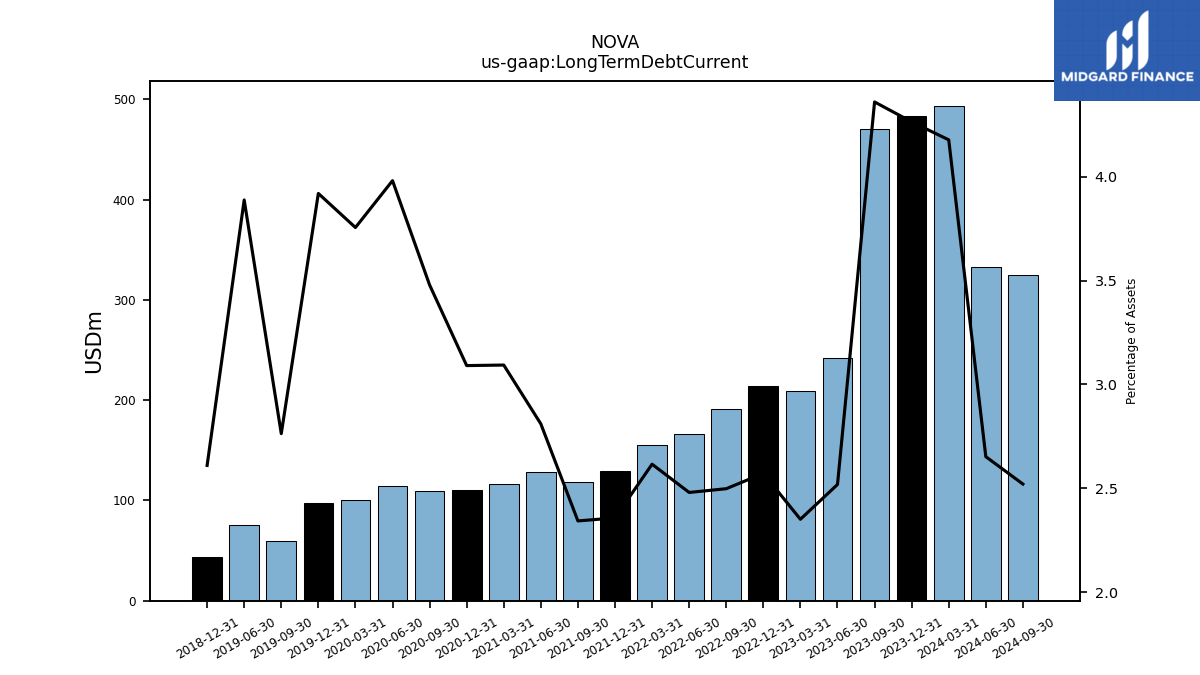
| Long Term Debt Current | 470.13 | 241.97 | 209.34 | 214.43 | 191.13 | 165.89 | 155.11 | 129.79 | 118.59 | 128.32 | 116.20 | 110.88 | 109.73 | 114.14 | 100.72 | 97.46 | 59.40 | 75.91 | NA | 43.47 | NA | NA | NA | |
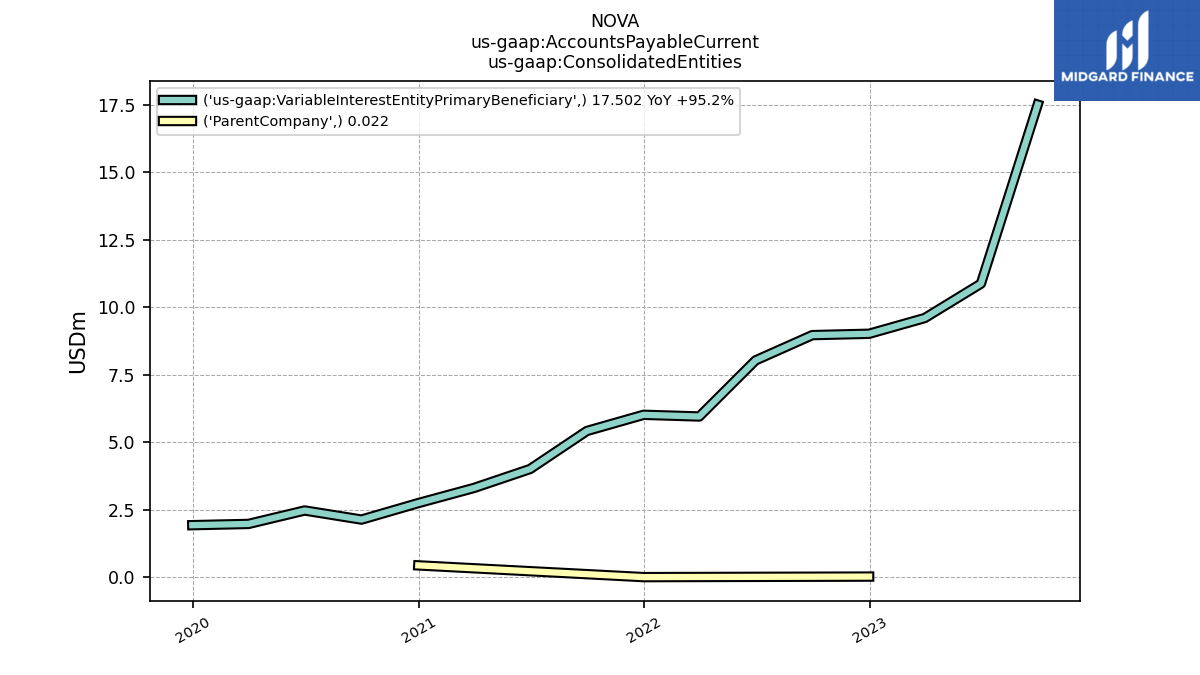
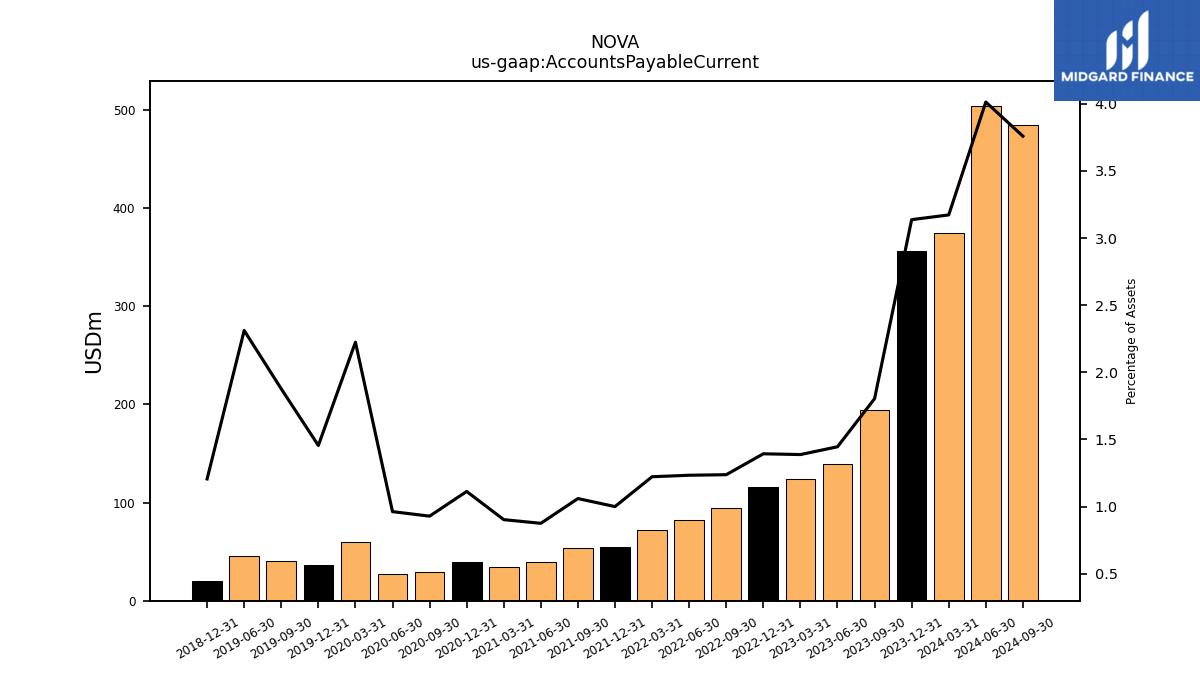
| Accounts Payable Current | 194.55 | 138.84 | 123.50 | 116.14 | 94.65 | 82.48 | 72.45 | 55.03 | 53.61 | 39.95 | 33.90 | 39.91 | 29.29 | 27.59 | 59.66 | 36.19 | 40.34 | 45.13 | NA | 20.07 | NA | NA | NA | |
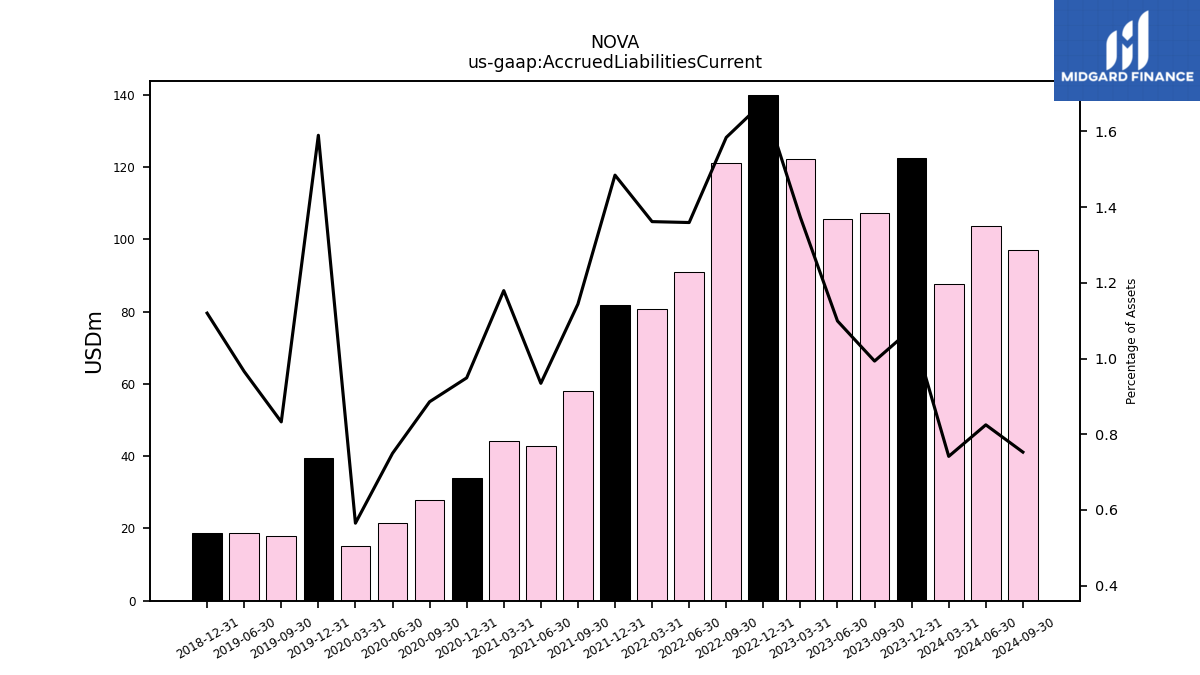
| Accrued Liabilities Current | 107.14 | 105.62 | 122.23 | 139.87 | 121.19 | 90.92 | 80.74 | 81.72 | 57.89 | 42.68 | 44.31 | 34.05 | 27.94 | 21.50 | 15.16 | 39.54 | 17.90 | 18.86 | NA | 18.65 | NA | NA | NA | |
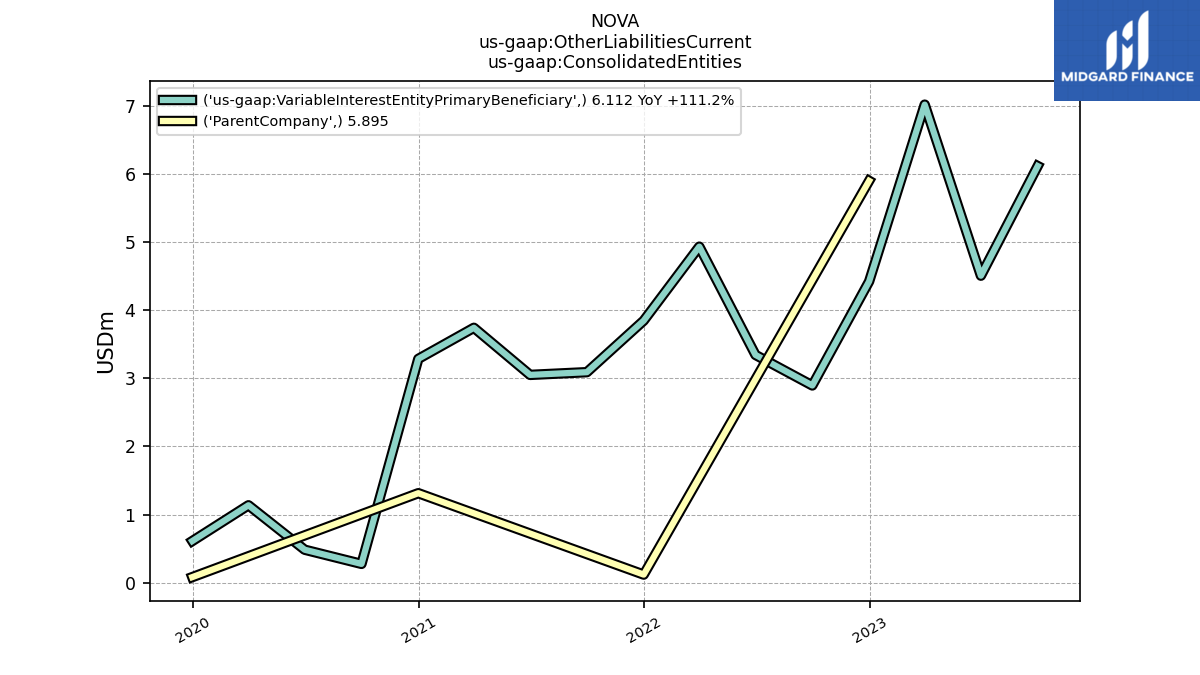
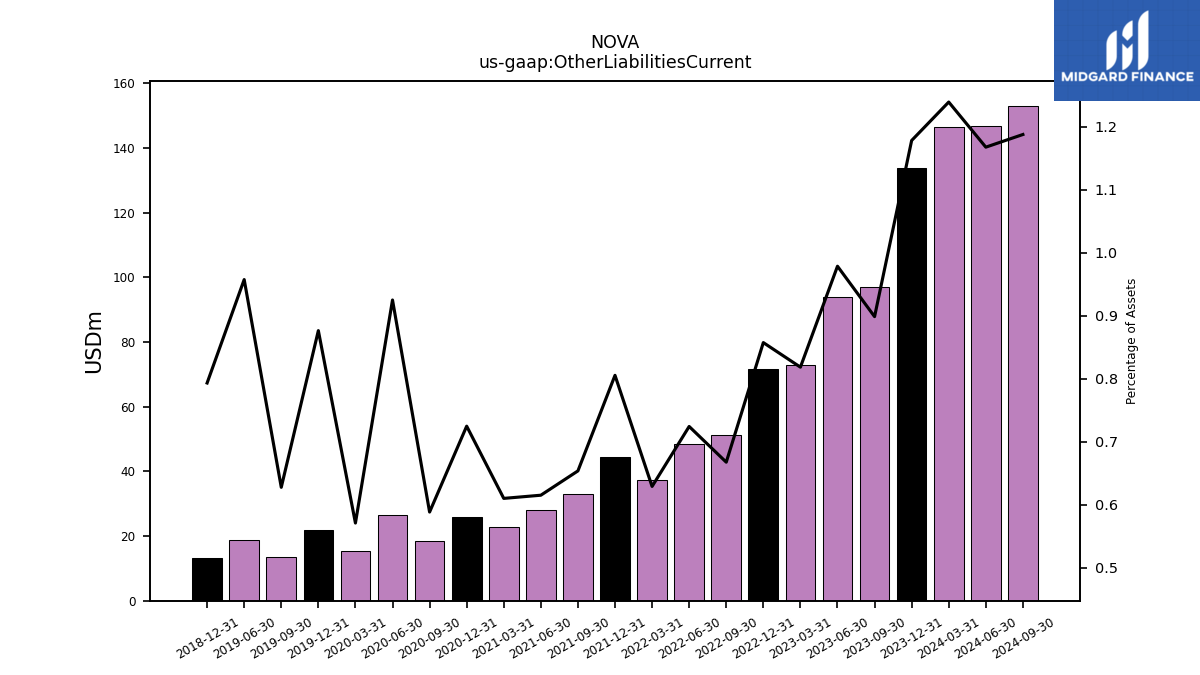
| Other Liabilities Current | 96.95 | 94.04 | 72.88 | 71.51 | 51.09 | 48.46 | 37.31 | 44.35 | 33.10 | 28.10 | 22.93 | 26.01 | 18.57 | 26.53 | 15.32 | 21.80 | 13.50 | 18.70 | NA | 13.21 | NA | NA | NA | |
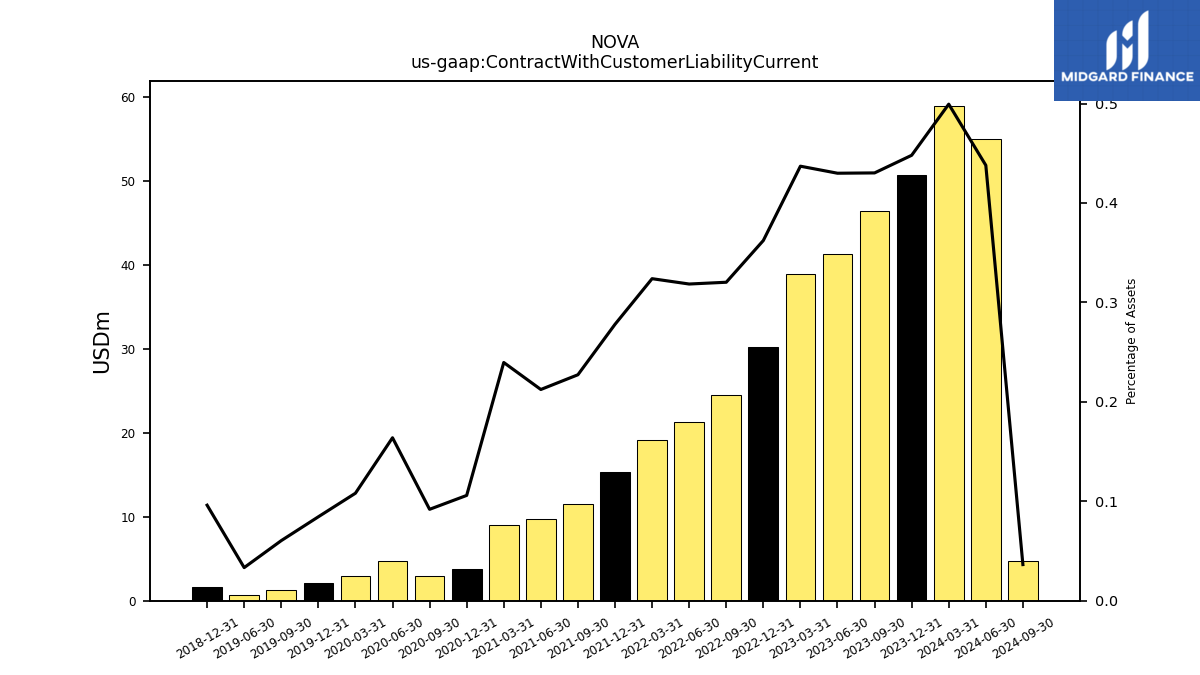
| Contract With Customer Liability Current | 46.40 | 41.30 | 38.90 | 30.20 | 24.50 | 21.30 | 19.20 | 15.30 | 11.50 | 9.70 | 9.00 | 3.80 | 2.90 | 4.70 | 2.90 | 2.10 | 1.30 | 0.65 | NA | 1.60 | NA | NA | NA |
| 2023-09-30 | 2023-06-30 | 2023-03-31 | 2022-12-31 | 2022-09-30 | 2022-06-30 | 2022-03-31 | 2021-12-31 | 2021-09-30 | 2021-06-30 | 2021-03-31 | 2020-12-31 | 2020-09-30 | 2020-06-30 | 2020-03-31 | 2019-12-31 | 2019-09-30 | 2019-06-30 | 2019-03-31 | 2018-12-31 | 2018-09-30 | 2018-06-30 | 2018-03-31 | ||
|---|---|---|---|---|---|---|---|---|---|---|---|---|---|---|---|---|---|---|---|---|---|---|---|---|
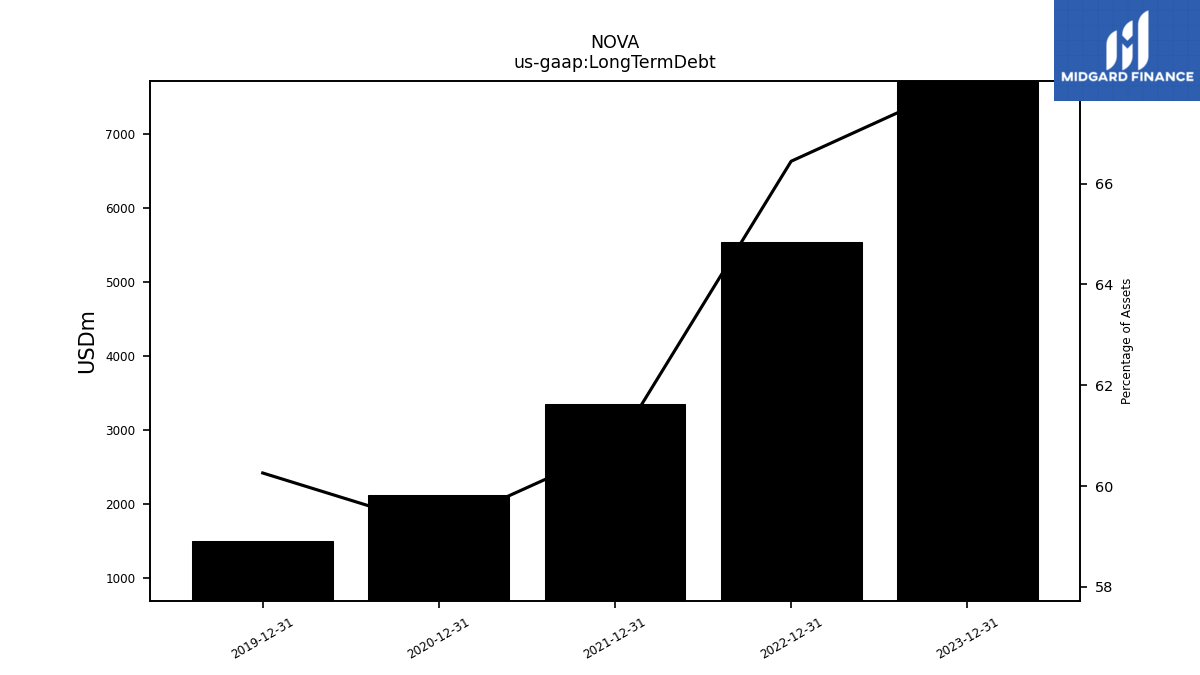
| Long Term Debt | NA | NA | NA | 5539.35 | NA | NA | NA | 3344.35 | NA | NA | NA | 2123.09 | NA | NA | NA | 1498.71 | NA | NA | NA | NA | NA | NA | NA | |
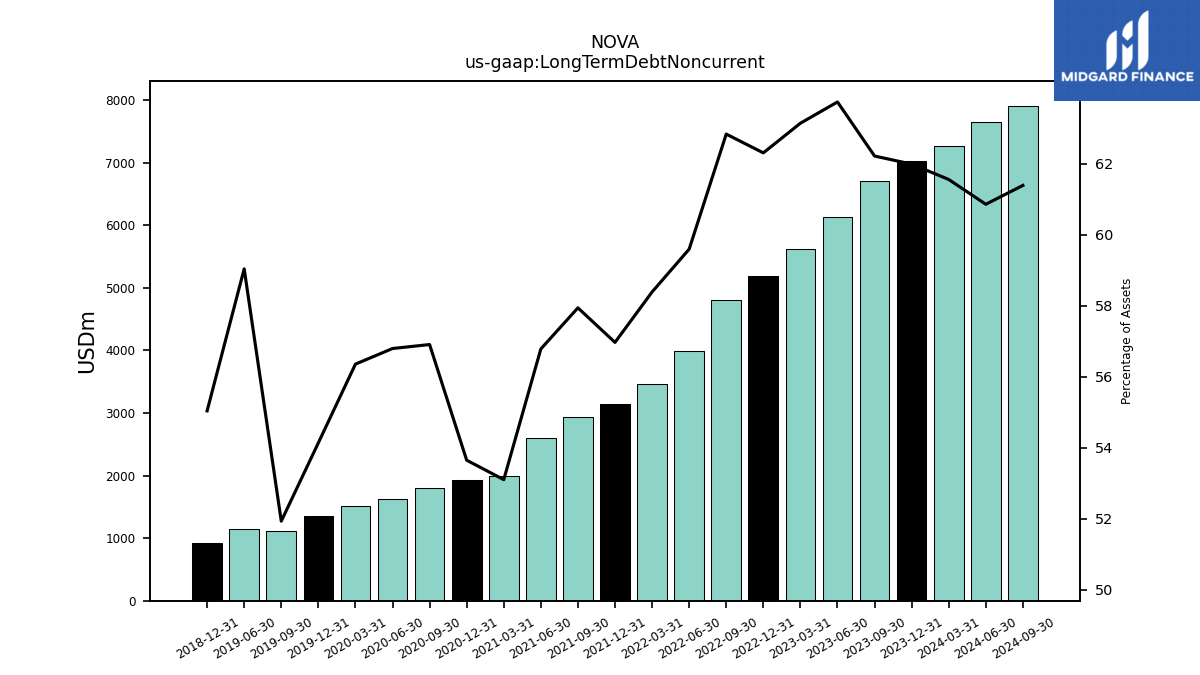
| Long Term Debt Noncurrent | 6710.73 | 6123.92 | 5621.44 | 5194.76 | 4807.11 | 3985.74 | 3461.61 | 3135.68 | 2932.12 | 2592.80 | 1994.73 | 1924.65 | 1795.04 | 1628.67 | 1511.56 | 1346.42 | 1116.37 | 1152.88 | NA | 916.43 | NA | NA | NA | |
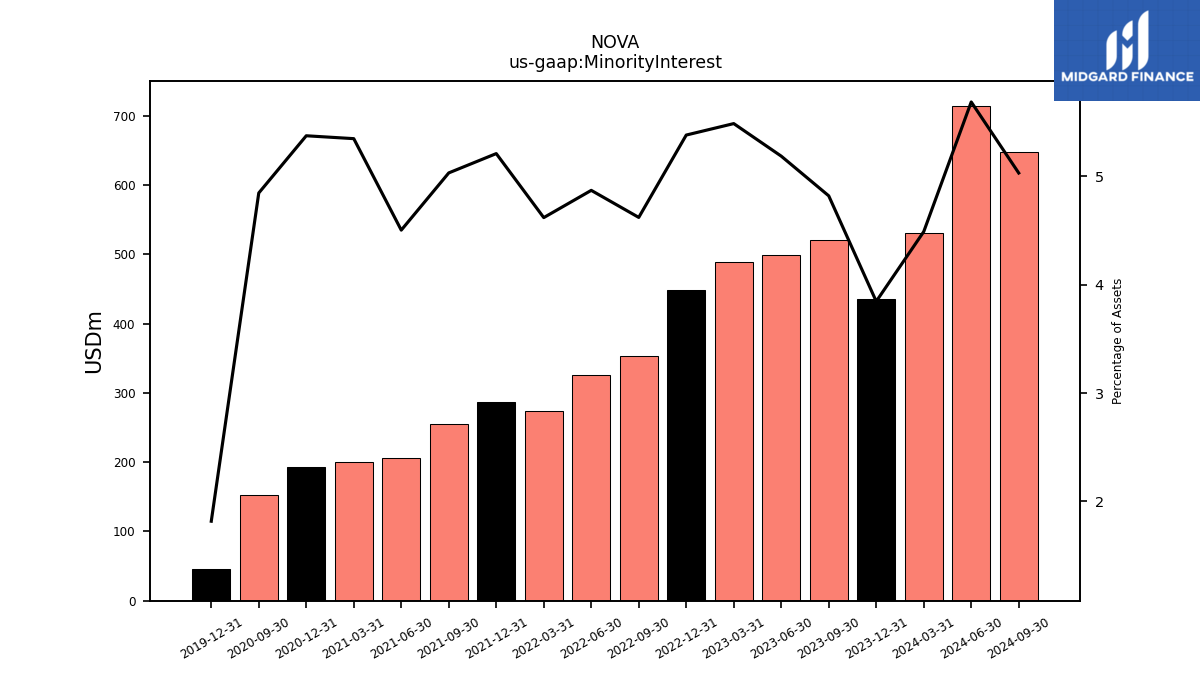
| Minority Interest | 519.88 | 498.27 | 488.49 | 448.64 | 353.50 | 325.75 | 273.85 | 286.78 | 254.64 | 205.64 | 200.91 | 192.83 | 152.88 | NA | NA | 45.18 | NA | NA | NA | NA | NA | NA | NA | |
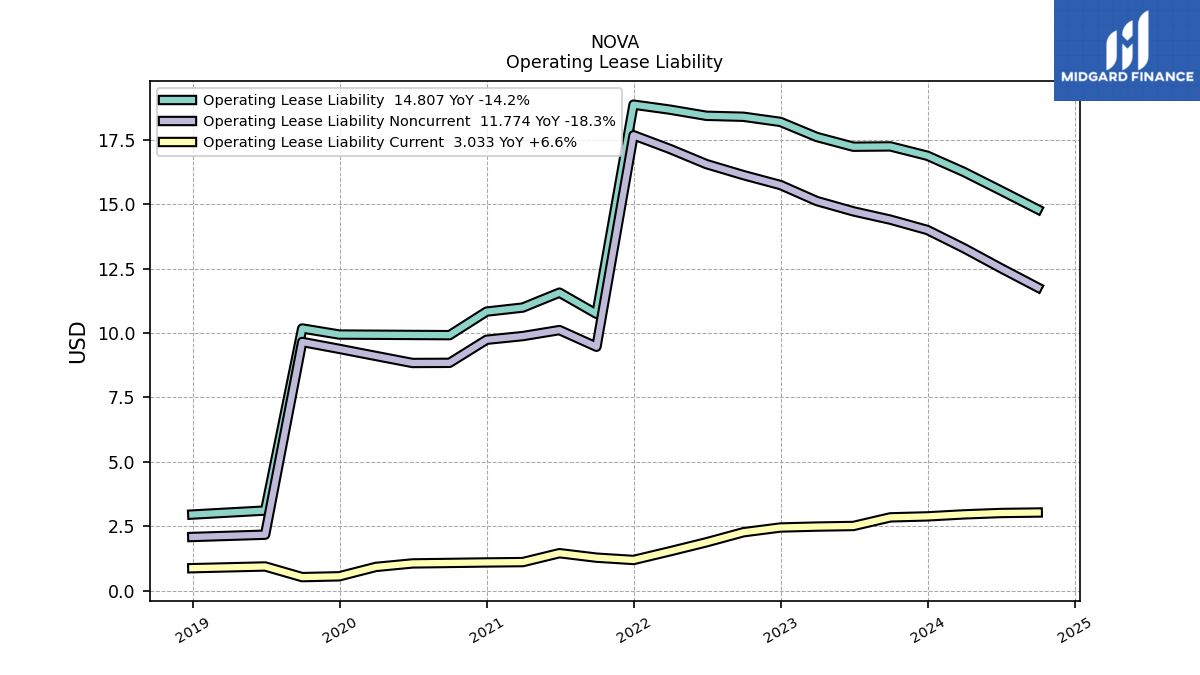
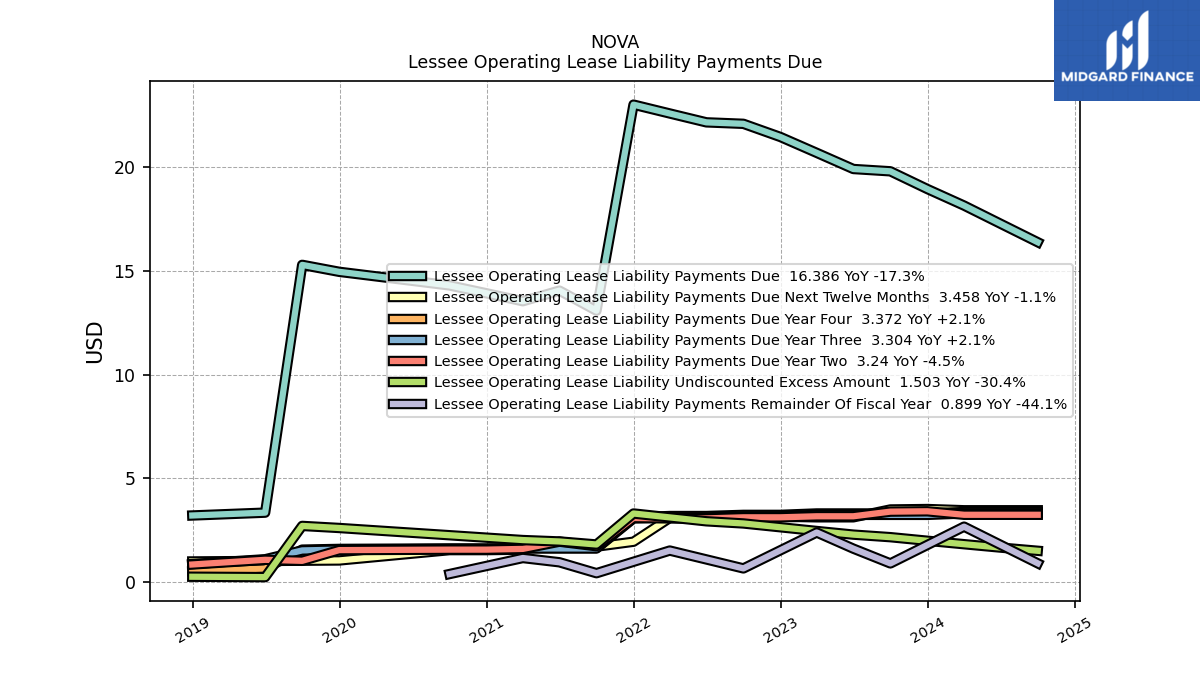
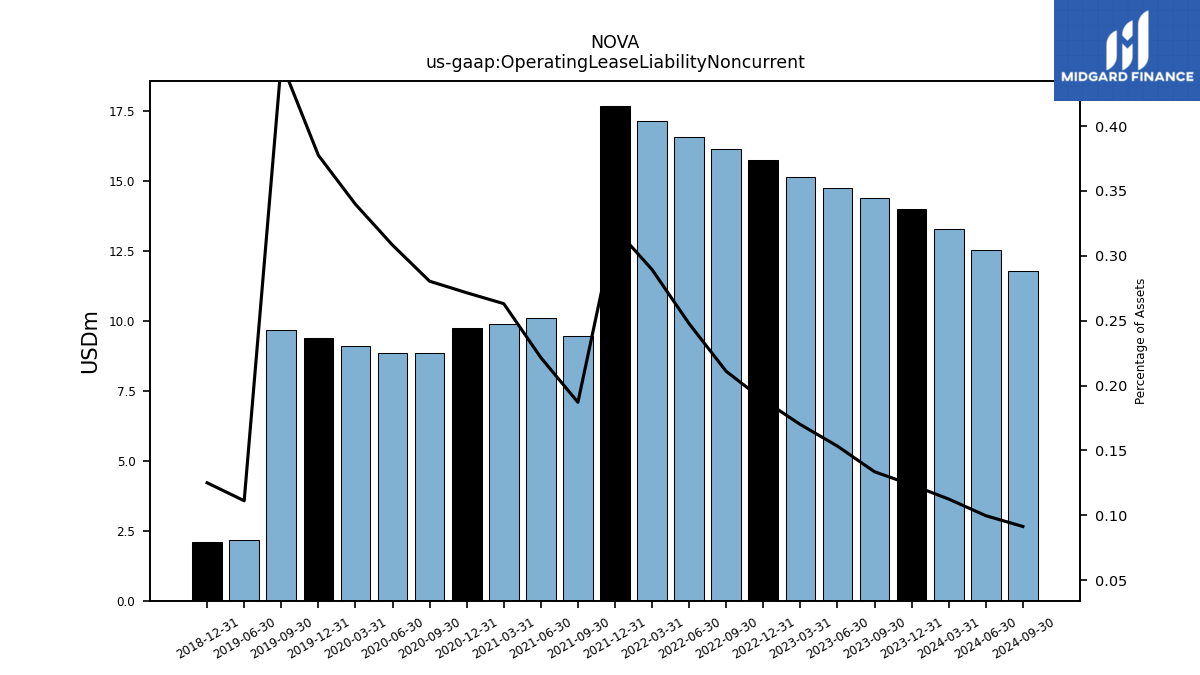
| Operating Lease Liability Noncurrent | 14.41 | 14.73 | 15.13 | 15.75 | 16.14 | 16.56 | 17.16 | 17.68 | 9.47 | 10.12 | 9.88 | 9.74 | 8.85 | 8.84 | 9.11 | 9.39 | 9.66 | 2.17 | NA | 2.08 | NA | NA | NA |
| 2023-09-30 | 2023-06-30 | 2023-03-31 | 2022-12-31 | 2022-09-30 | 2022-06-30 | 2022-03-31 | 2021-12-31 | 2021-09-30 | 2021-06-30 | 2021-03-31 | 2020-12-31 | 2020-09-30 | 2020-06-30 | 2020-03-31 | 2019-12-31 | 2019-09-30 | 2019-06-30 | 2019-03-31 | 2018-12-31 | 2018-09-30 | 2018-06-30 | 2018-03-31 | ||
|---|---|---|---|---|---|---|---|---|---|---|---|---|---|---|---|---|---|---|---|---|---|---|---|---|
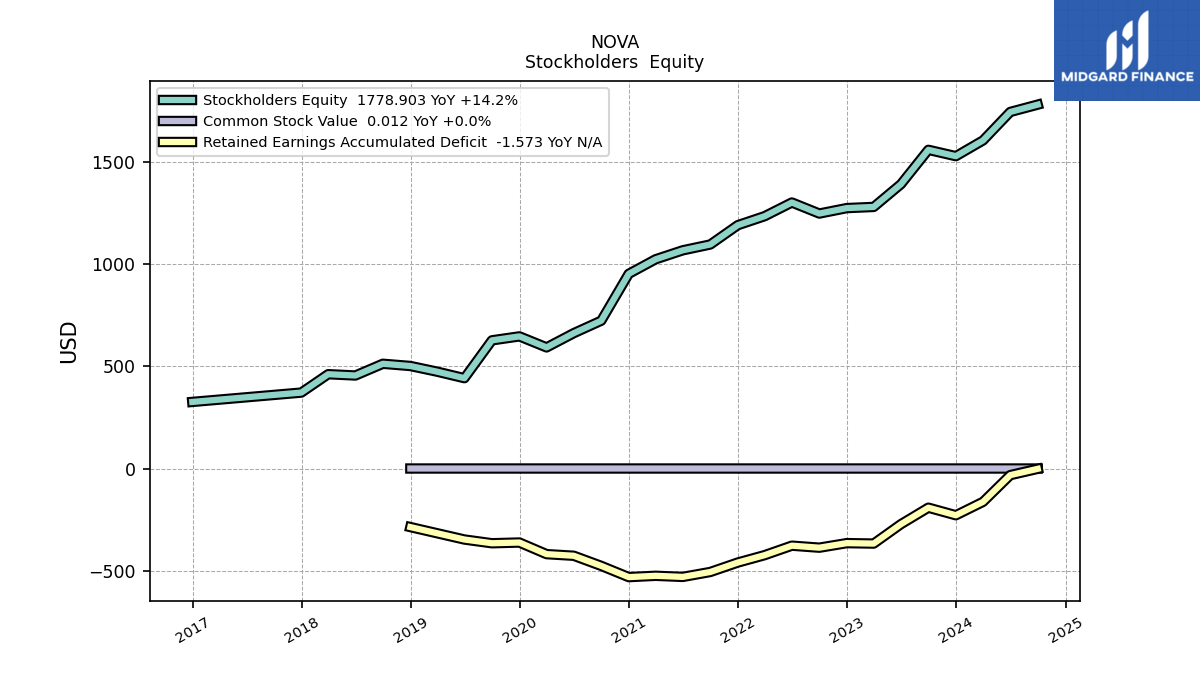
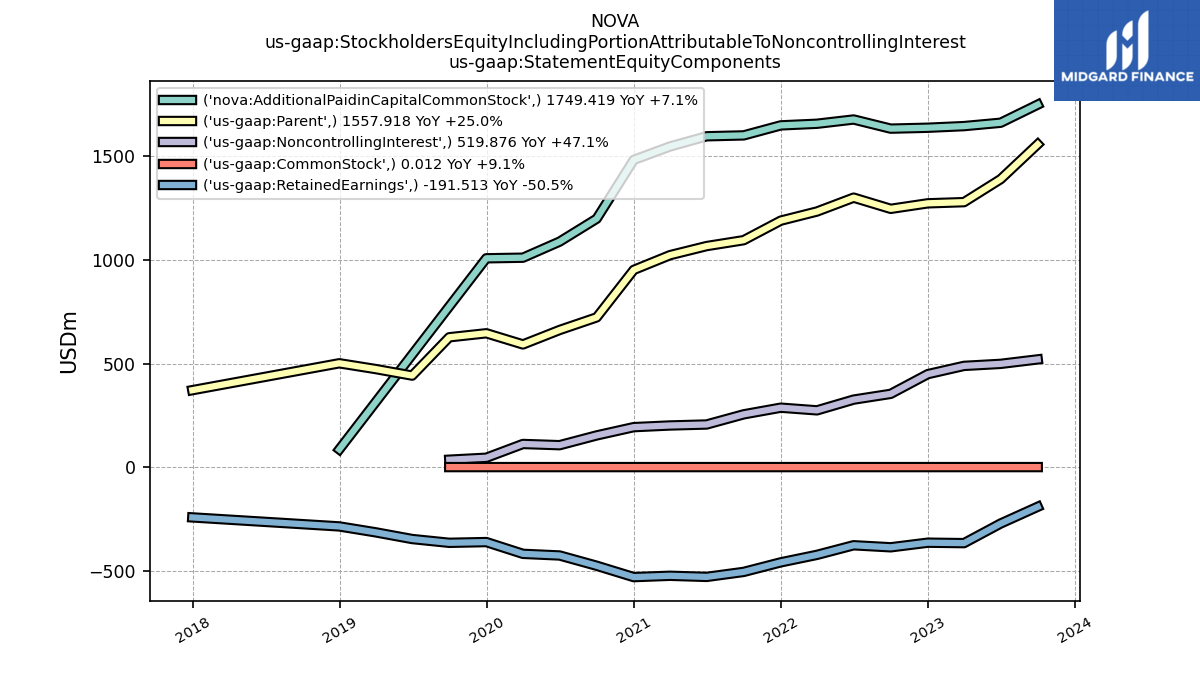
| Stockholders Equity | 1557.92 | 1389.78 | 1278.78 | 1273.08 | 1246.44 | 1300.44 | 1233.57 | 1189.49 | 1095.16 | 1066.73 | 1022.88 | 951.73 | 722.59 | 661.69 | 592.02 | 645.93 | 626.56 | 441.58 | 473.31 | 501.12 | 512.02 | 454.65 | 461.02 | |
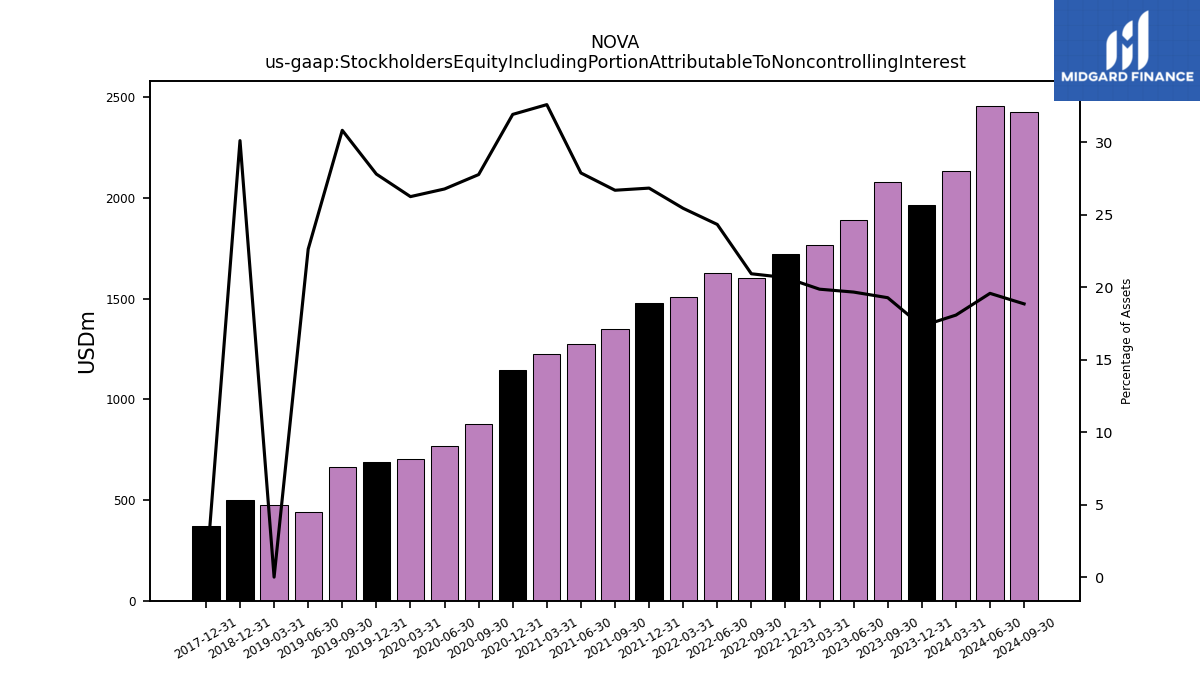
| Stockholders Equity Including Portion Attributable To Noncontrolling Interest | 2077.79 | 1888.04 | 1767.26 | 1721.71 | 1599.95 | 1626.19 | 1507.42 | 1476.28 | 1349.80 | 1272.38 | 1223.79 | 1144.56 | 875.47 | 767.42 | 703.66 | 691.11 | 662.27 | 441.58 | 473.31 | 501.12 | NA | NA | NA | |
| Common Stock Value | 0.01 | 0.01 | 0.01 | 0.01 | 0.01 | 0.01 | 0.01 | 0.01 | 0.01 | 0.01 | 0.01 | 0.01 | 0.01 | 0.01 | 0.01 | 0.01 | 0.01 | NA | NA | 0.00 | NA | NA | NA | |
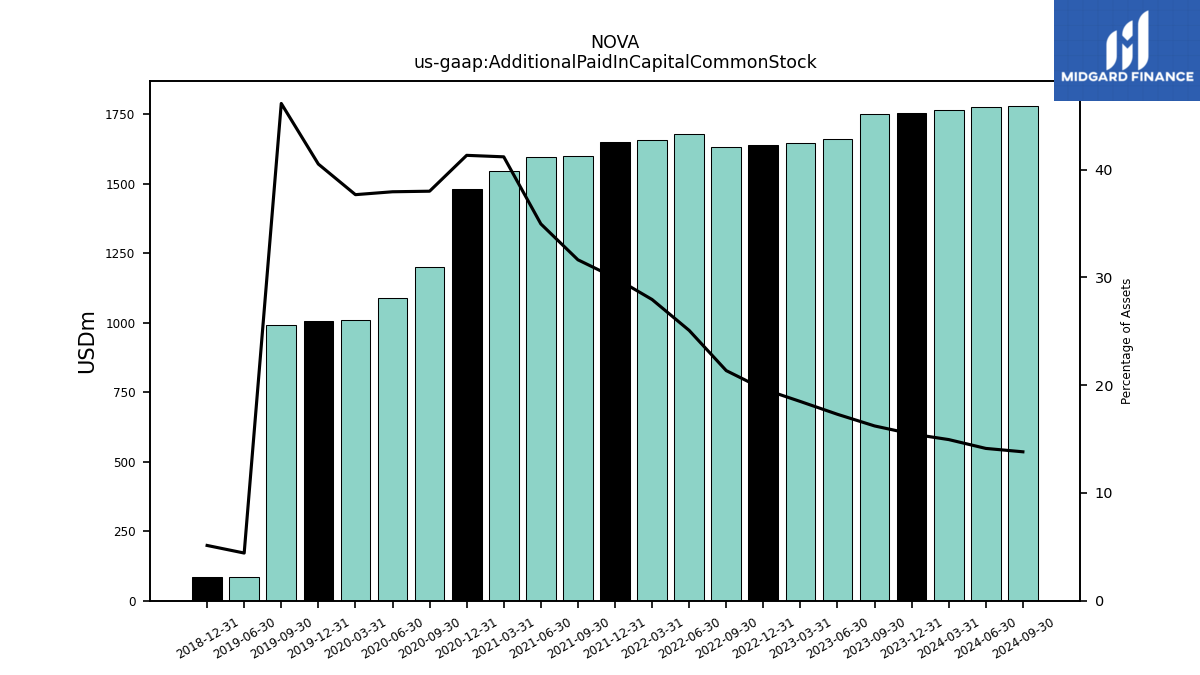
| Additional Paid In Capital Common Stock | 1749.42 | 1661.95 | 1645.74 | 1637.85 | 1633.51 | 1677.65 | 1657.09 | 1649.20 | 1600.94 | 1596.66 | 1547.38 | 1482.72 | 1198.68 | 1088.22 | 1010.65 | 1007.75 | 991.94 | 86.44 | NA | 85.44 | NA | NA | NA | |
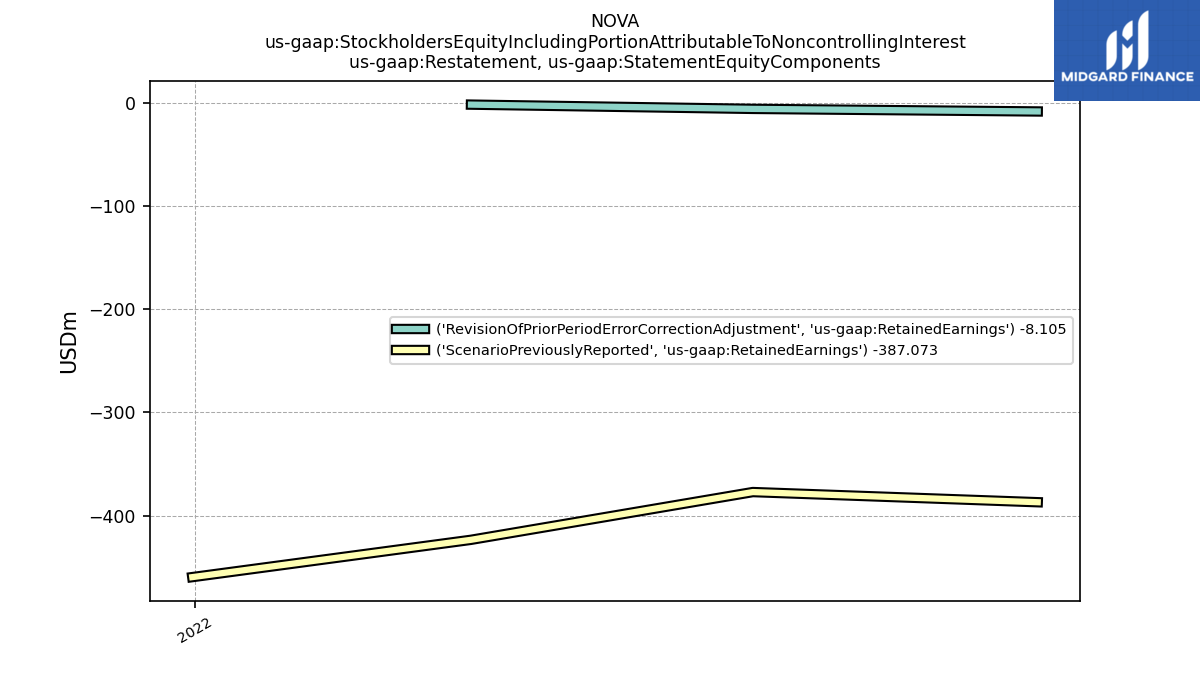
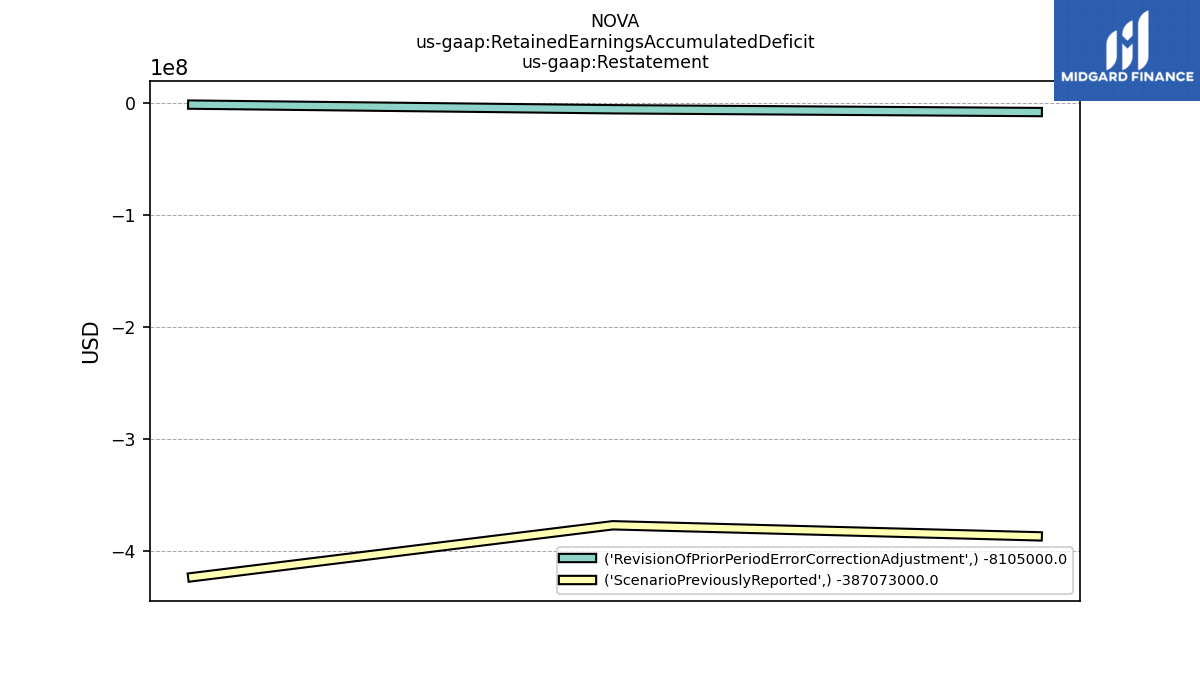
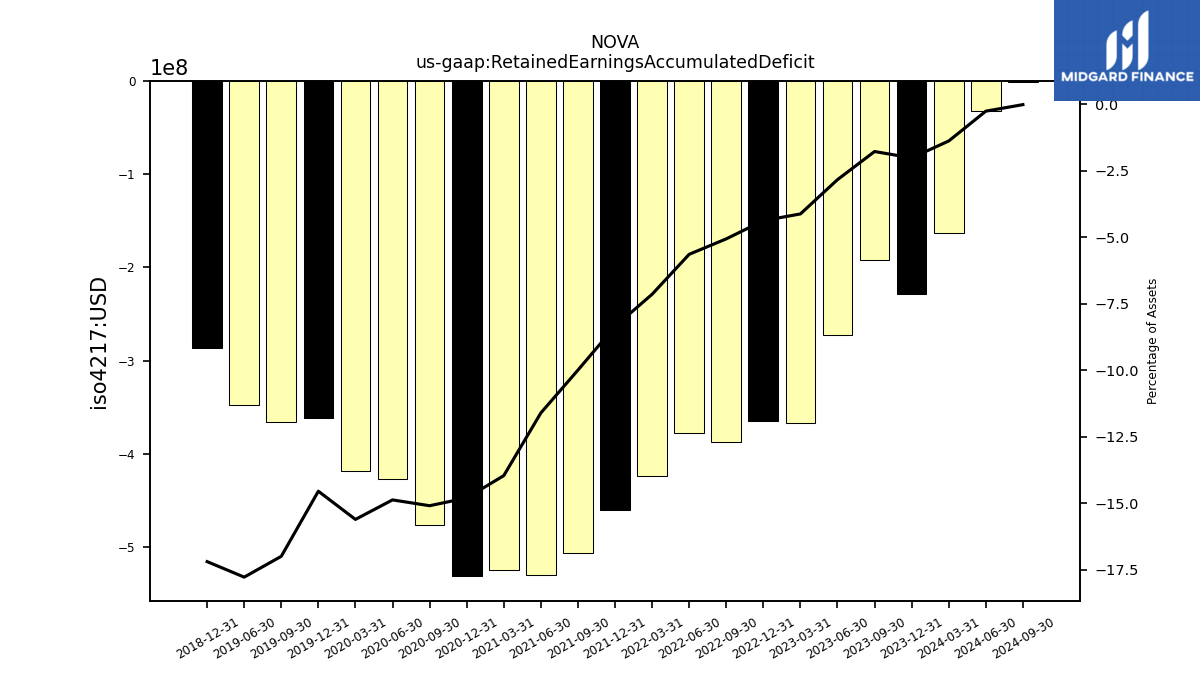
| Retained Earnings Accumulated Deficit | -191.51 | -272.19 | -366.97 | -364.78 | -387.07 | -377.22 | -423.53 | -459.71 | -505.79 | -529.94 | -524.51 | -531.00 | -476.10 | -426.54 | -418.64 | -361.82 | -365.38 | -347.15 | NA | -286.31 | NA | NA | NA | |
| Minority Interest | 519.88 | 498.27 | 488.49 | 448.64 | 353.50 | 325.75 | 273.85 | 286.78 | 254.64 | 205.64 | 200.91 | 192.83 | 152.88 | NA | NA | 45.18 | NA | NA | NA | NA | NA | NA | NA | |
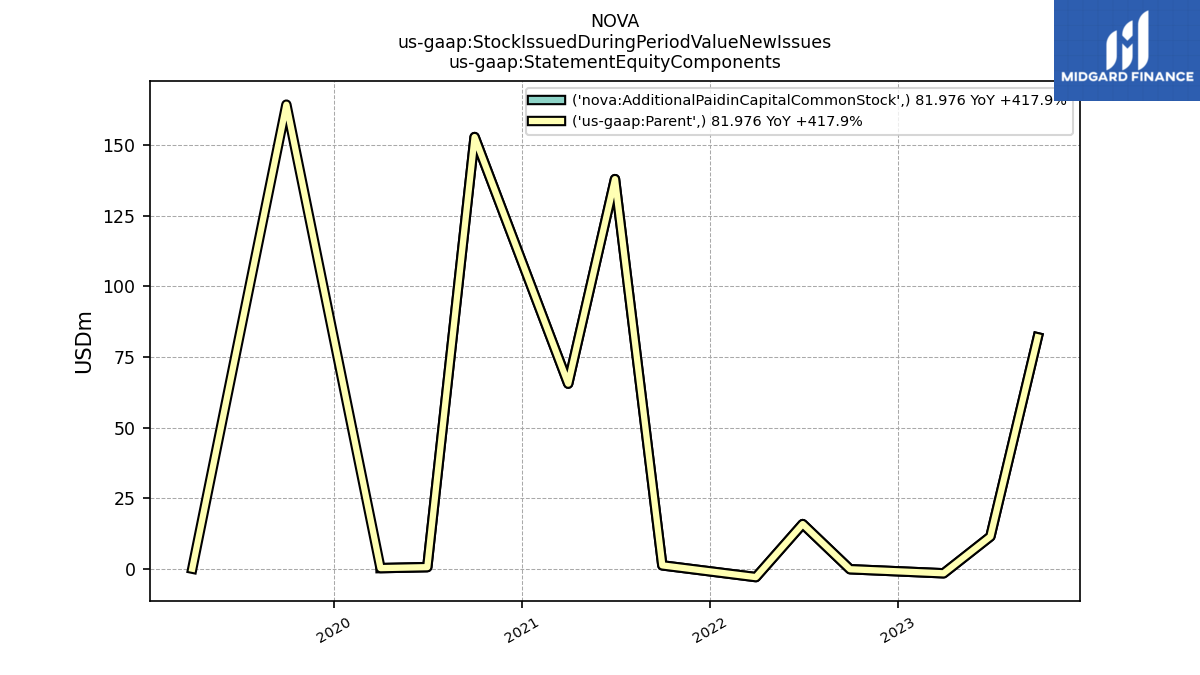
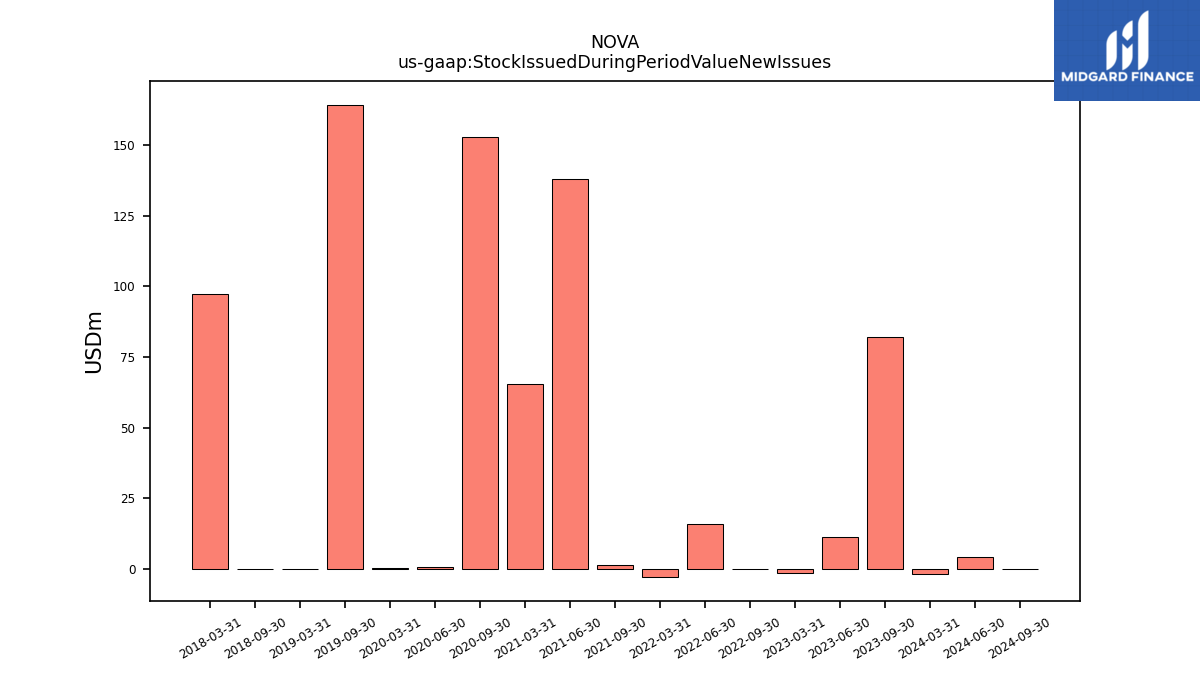
| Stock Issued During Period Value New Issues | 81.98 | 11.41 | -1.62 | NA | -0.18 | 15.83 | -2.98 | NA | 1.19 | 138.02 | 65.54 | NA | 152.92 | 0.56 | 0.21 | NA | 164.39 | NA | 0.00 | NA | -0.00 | NA | 97.33 | |
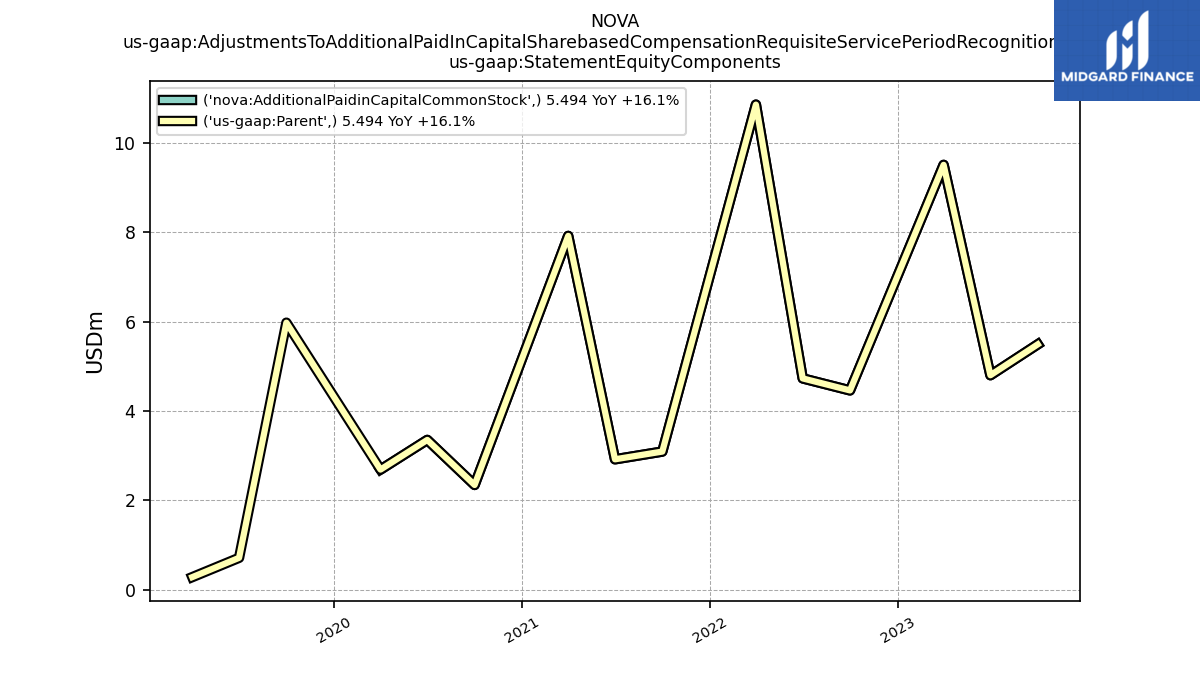
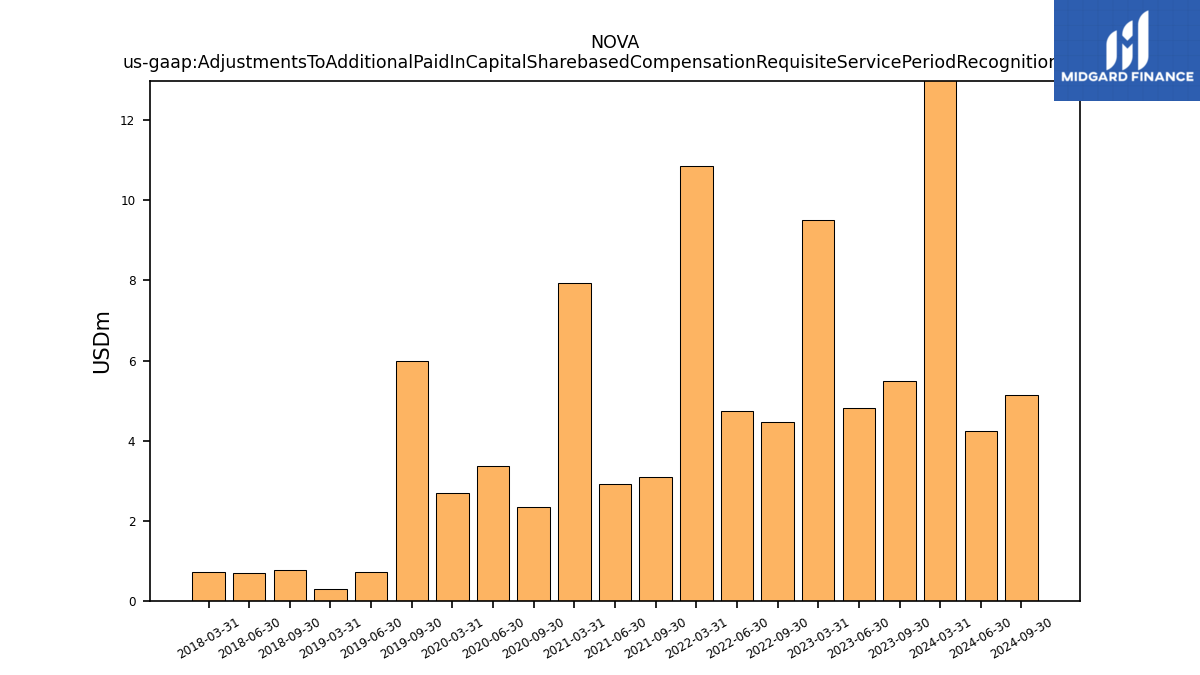
| Adjustments To Additional Paid In Capital Sharebased Compensation Requisite Service Period Recognition Value | 5.49 | 4.80 | 9.52 | NA | 4.46 | 4.73 | 10.86 | NA | 3.09 | 2.92 | 7.92 | NA | 2.35 | 3.35 | 2.69 | NA | 5.98 | 0.71 | 0.28 | NA | 0.77 | 0.68 | 0.73 | |
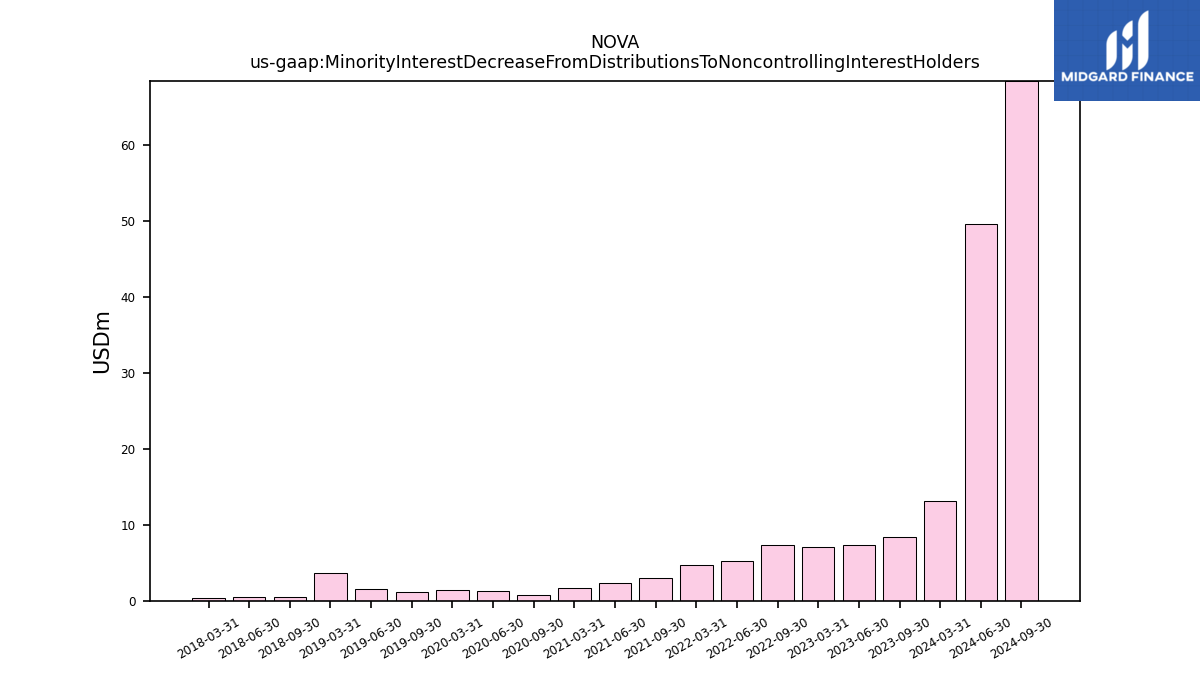
| Minority Interest Decrease From Distributions To Noncontrolling Interest Holders | 8.44 | 7.32 | 7.11 | NA | 7.31 | 5.24 | 4.73 | NA | 3.00 | 2.30 | 1.74 | NA | 0.77 | 1.23 | 1.37 | NA | 1.15 | 1.49 | 3.65 | NA | 0.53 | 0.45 | 0.34 |
| 2023-09-30 | 2023-06-30 | 2023-03-31 | 2022-12-31 | 2022-09-30 | 2022-06-30 | 2022-03-31 | 2021-12-31 | 2021-09-30 | 2021-06-30 | 2021-03-31 | 2020-12-31 | 2020-09-30 | 2020-06-30 | 2020-03-31 | 2019-12-31 | 2019-09-30 | 2019-06-30 | 2019-03-31 | 2018-12-31 | 2018-09-30 | 2018-06-30 | 2018-03-31 | ||
|---|---|---|---|---|---|---|---|---|---|---|---|---|---|---|---|---|---|---|---|---|---|---|---|---|
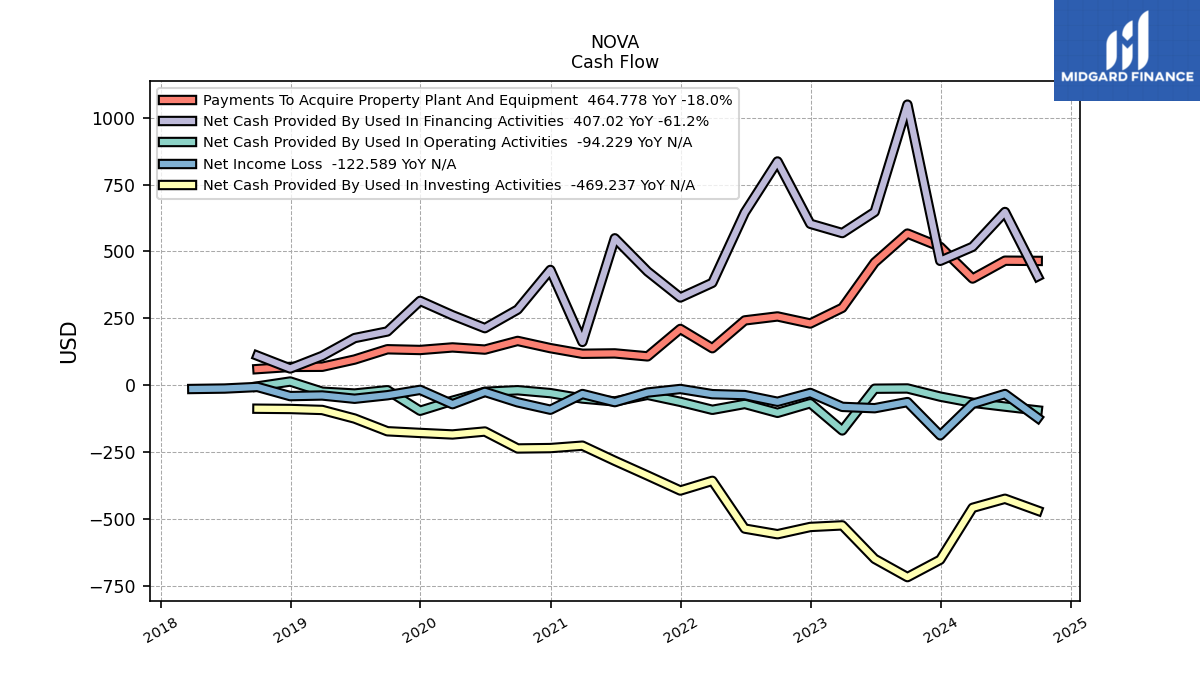
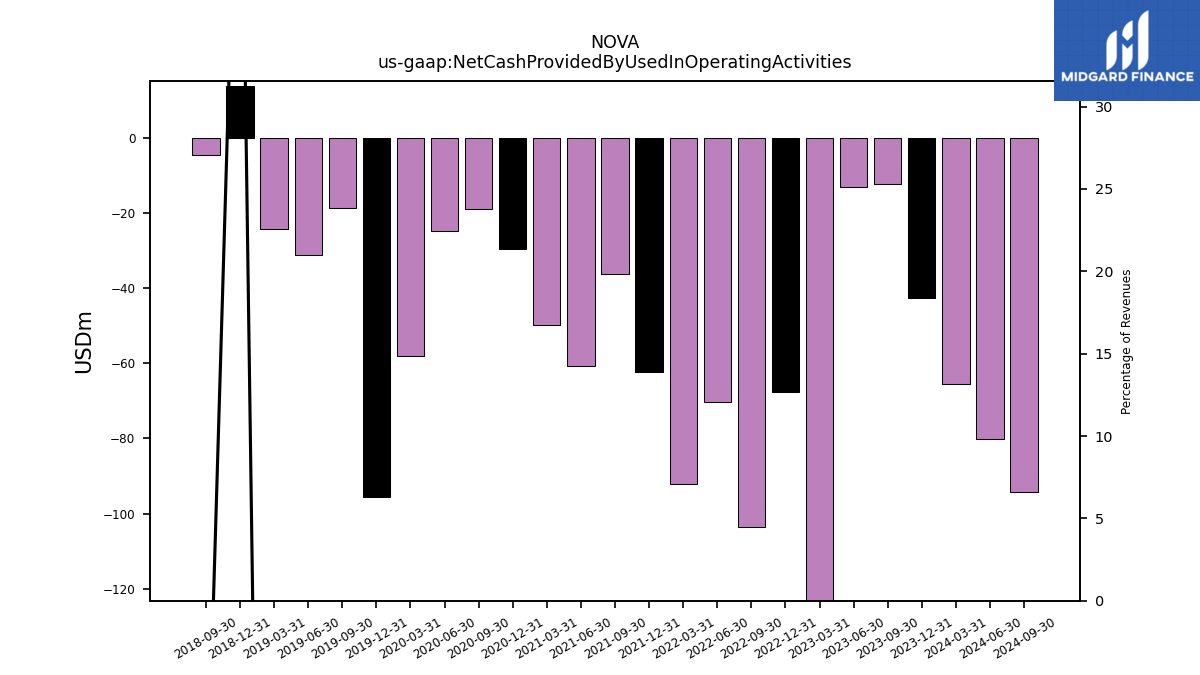
| Net Cash Provided By Used In Operating Activities | -12.25 | -13.21 | -169.33 | -67.63 | -103.45 | -70.21 | -92.13 | -62.38 | -36.16 | -60.78 | -49.91 | -29.67 | -18.87 | -24.82 | -58.11 | -95.72 | -18.84 | -31.26 | -24.43 | 13.67 | -4.68 | NA | NA | |
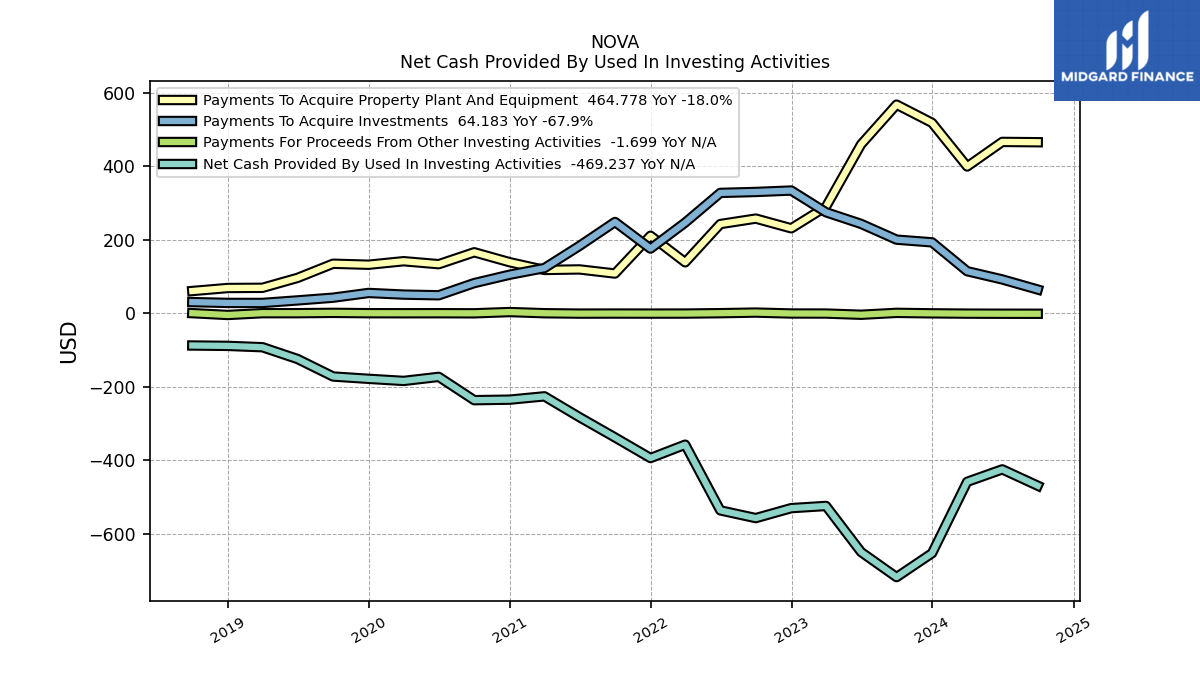
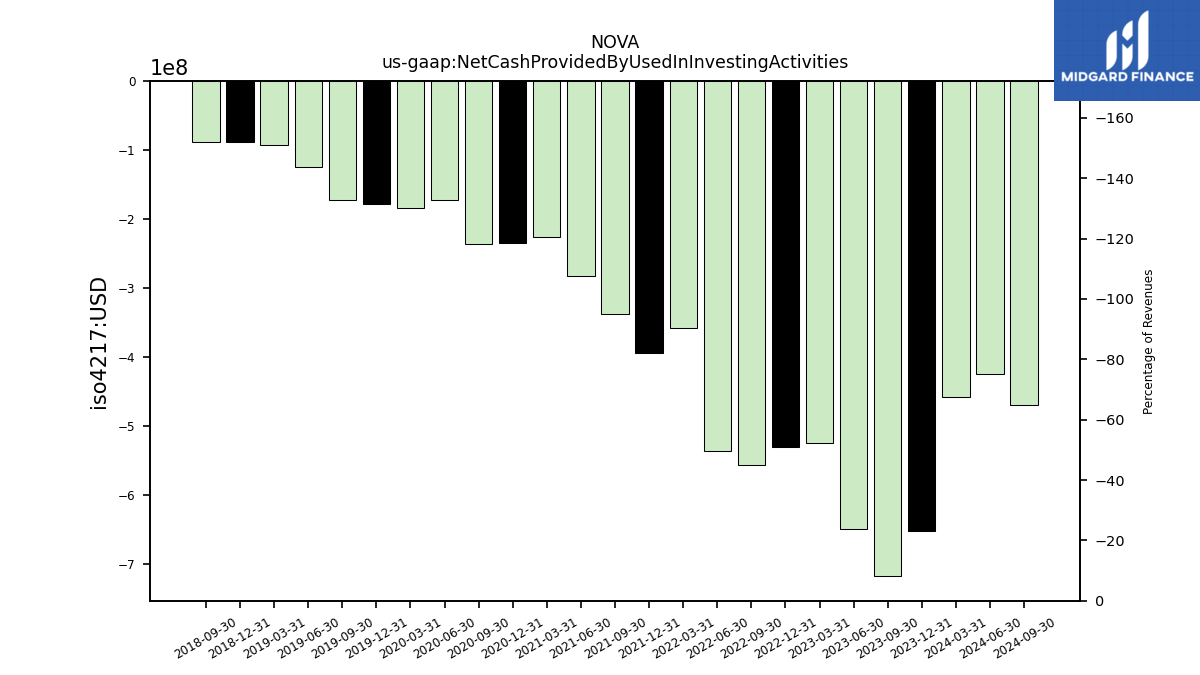
| Net Cash Provided By Used In Investing Activities | -717.85 | -649.63 | -524.29 | -530.25 | -557.36 | -536.34 | -357.65 | -394.04 | -337.99 | -282.98 | -226.21 | -235.24 | -236.68 | -173.28 | -184.31 | -178.62 | -172.29 | -124.73 | -92.68 | -89.02 | -87.99 | NA | NA | |
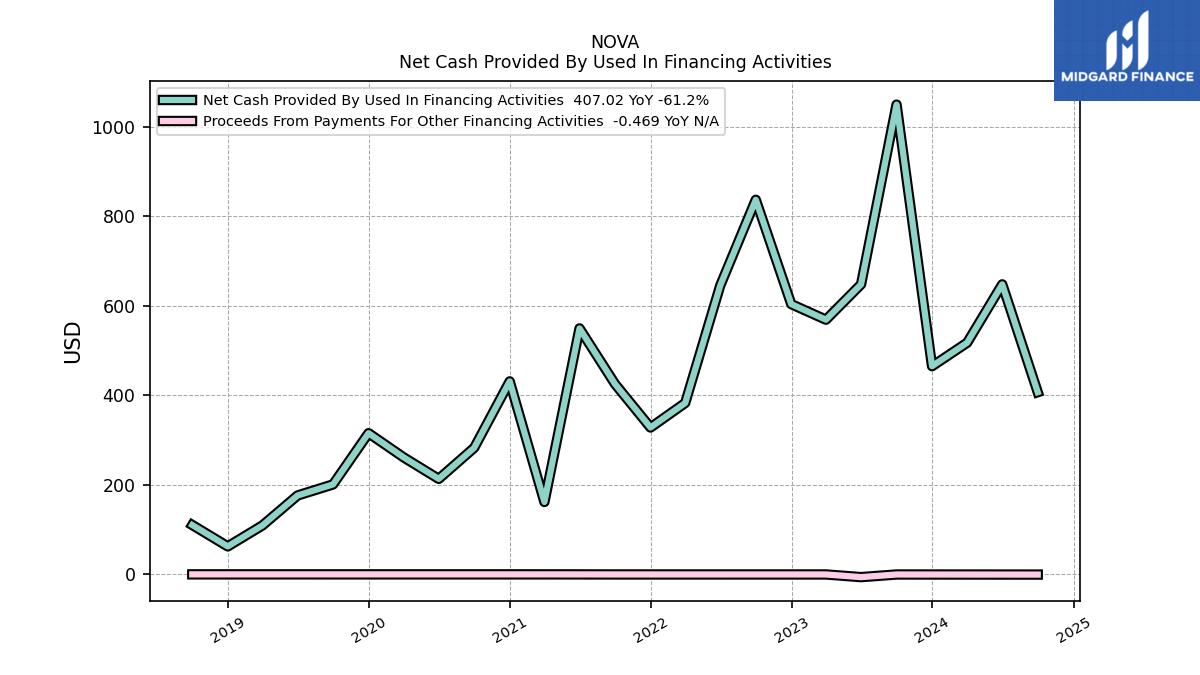
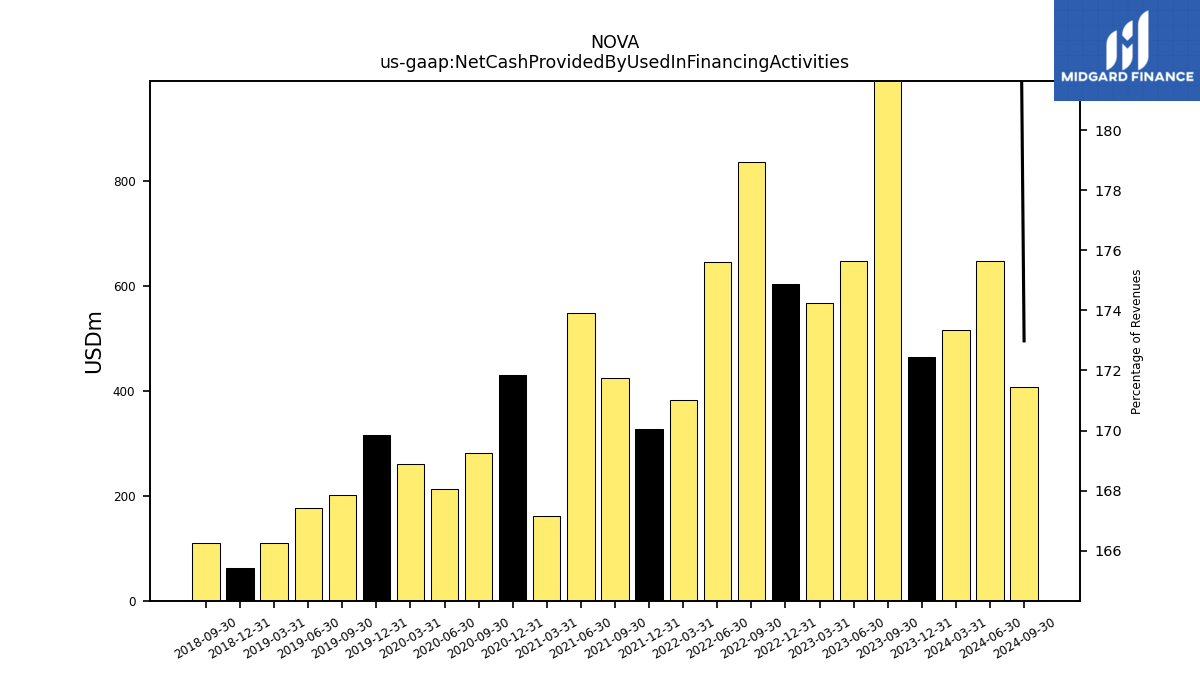
| Net Cash Provided By Used In Financing Activities | 1049.29 | 647.89 | 568.87 | 603.61 | 836.76 | 645.51 | 382.81 | 328.05 | 425.33 | 549.39 | 161.69 | 431.12 | 282.81 | 213.29 | 261.37 | 315.36 | 200.91 | 176.20 | 109.35 | 62.46 | 110.22 | NA | NA |
| 2023-09-30 | 2023-06-30 | 2023-03-31 | 2022-12-31 | 2022-09-30 | 2022-06-30 | 2022-03-31 | 2021-12-31 | 2021-09-30 | 2021-06-30 | 2021-03-31 | 2020-12-31 | 2020-09-30 | 2020-06-30 | 2020-03-31 | 2019-12-31 | 2019-09-30 | 2019-06-30 | 2019-03-31 | 2018-12-31 | 2018-09-30 | 2018-06-30 | 2018-03-31 | ||
|---|---|---|---|---|---|---|---|---|---|---|---|---|---|---|---|---|---|---|---|---|---|---|---|---|
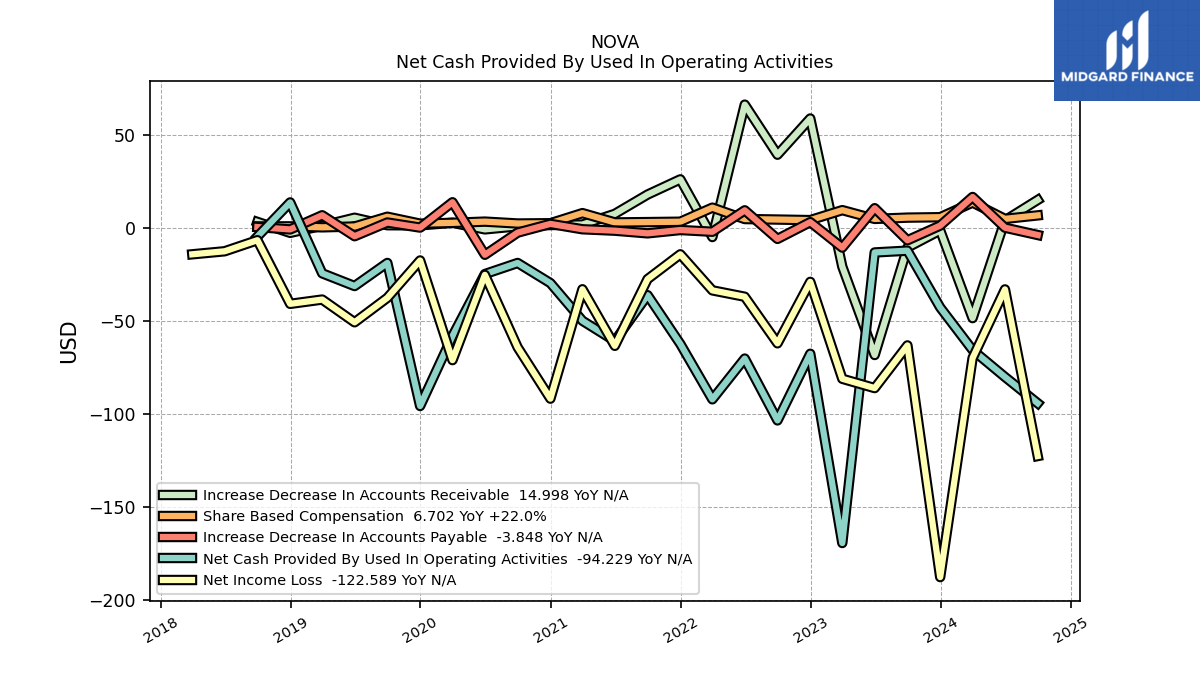
| Net Cash Provided By Used In Operating Activities | -12.25 | -13.21 | -169.33 | -67.63 | -103.45 | -70.21 | -92.13 | -62.38 | -36.16 | -60.78 | -49.91 | -29.67 | -18.87 | -24.82 | -58.11 | -95.72 | -18.84 | -31.26 | -24.43 | 13.67 | -4.68 | NA | NA | |
| Net Income Loss | -63.15 | -86.09 | -81.08 | -29.01 | -62.05 | -37.00 | -33.58 | -14.21 | -27.54 | -63.40 | -32.98 | -91.77 | -64.18 | -25.26 | -71.08 | -17.51 | -37.59 | -50.74 | -38.51 | -40.83 | -6.63 | -12.57 | -14.21 | |
| Profit Loss | -56.46 | -100.78 | -110.35 | -61.99 | -29.85 | -9.70 | -20.63 | -31.25 | -25.92 | -66.27 | -24.06 | -128.79 | -73.29 | -28.73 | -77.00 | -13.76 | -34.37 | -49.81 | -35.50 | -39.10 | -6.65 | -9.22 | -13.44 | |
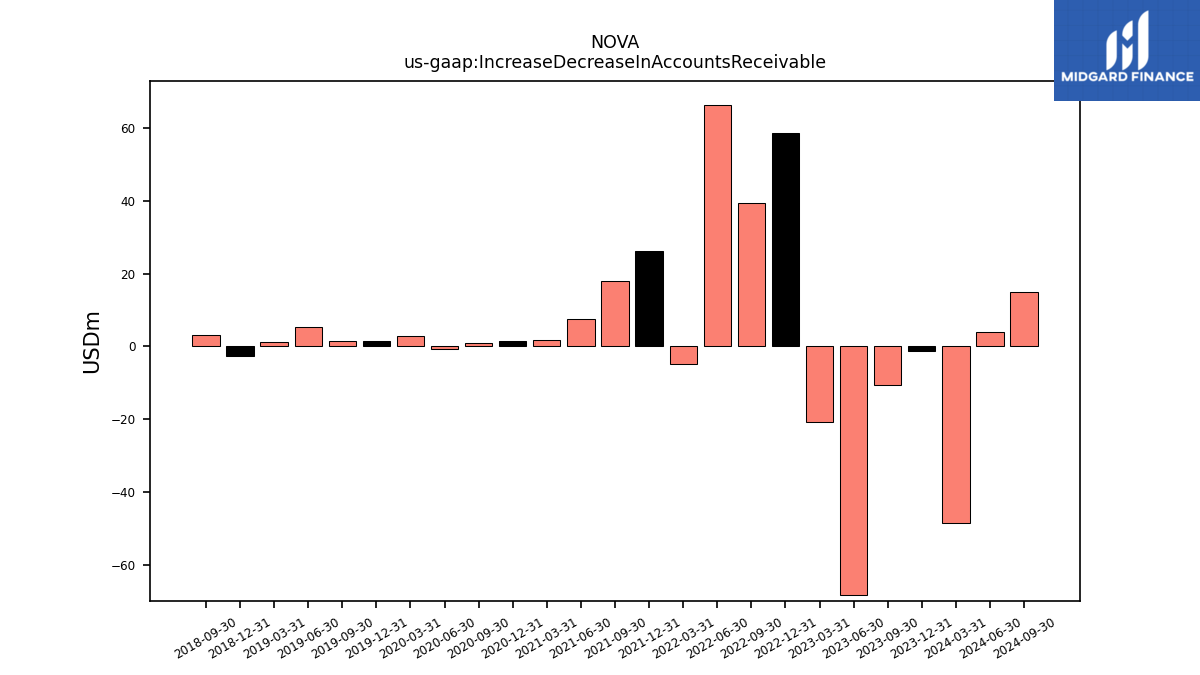
| Increase Decrease In Accounts Receivable | -10.60 | -68.32 | -20.84 | 58.76 | 39.29 | 66.20 | -4.96 | 26.07 | 17.89 | 7.53 | 1.77 | 1.51 | 0.84 | -0.81 | 2.75 | 1.34 | 1.41 | 5.43 | 1.17 | -2.69 | 3.19 | NA | NA | |
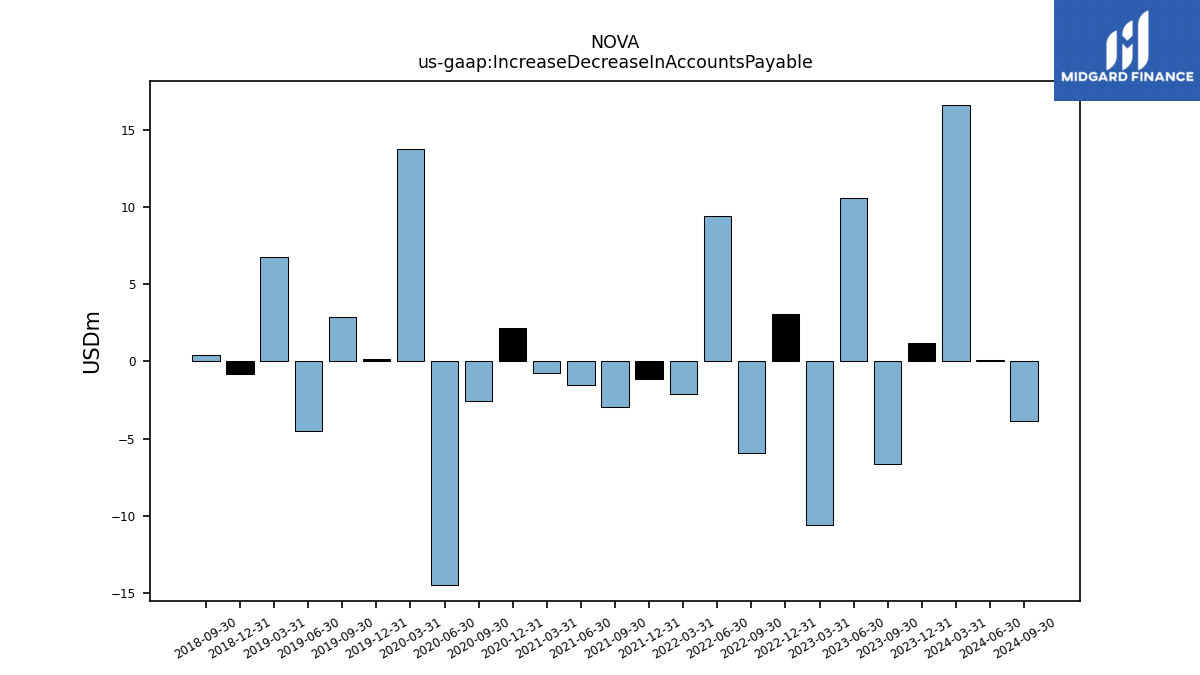
| Increase Decrease In Accounts Payable | -6.67 | 10.58 | -10.62 | 3.08 | -5.94 | 9.43 | -2.09 | -1.17 | -2.95 | -1.52 | -0.76 | 2.13 | -2.57 | -14.47 | 13.77 | 0.14 | 2.88 | -4.49 | 6.77 | -0.85 | 0.43 | NA | NA | |
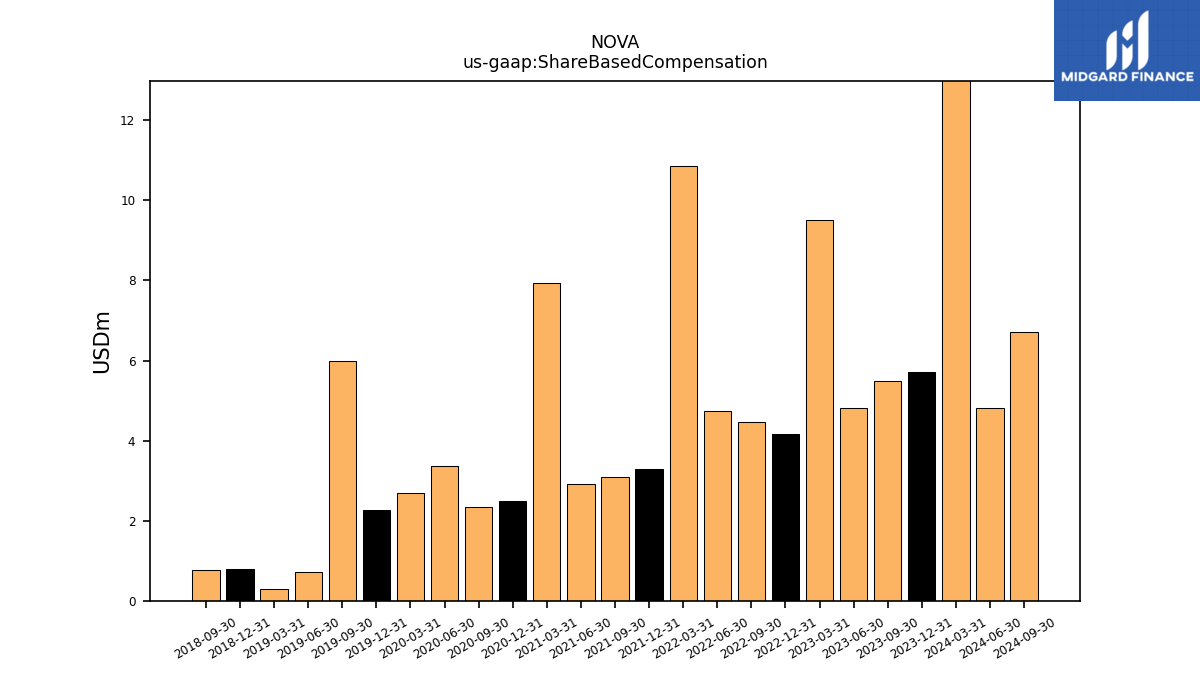
| Share Based Compensation | 5.49 | 4.80 | 9.52 | 4.16 | 4.46 | 4.73 | 10.86 | 3.30 | 3.09 | 2.92 | 7.92 | 2.48 | 2.35 | 3.35 | 2.69 | 2.26 | 5.98 | 0.71 | 0.28 | 0.80 | 0.77 | NA | NA | |
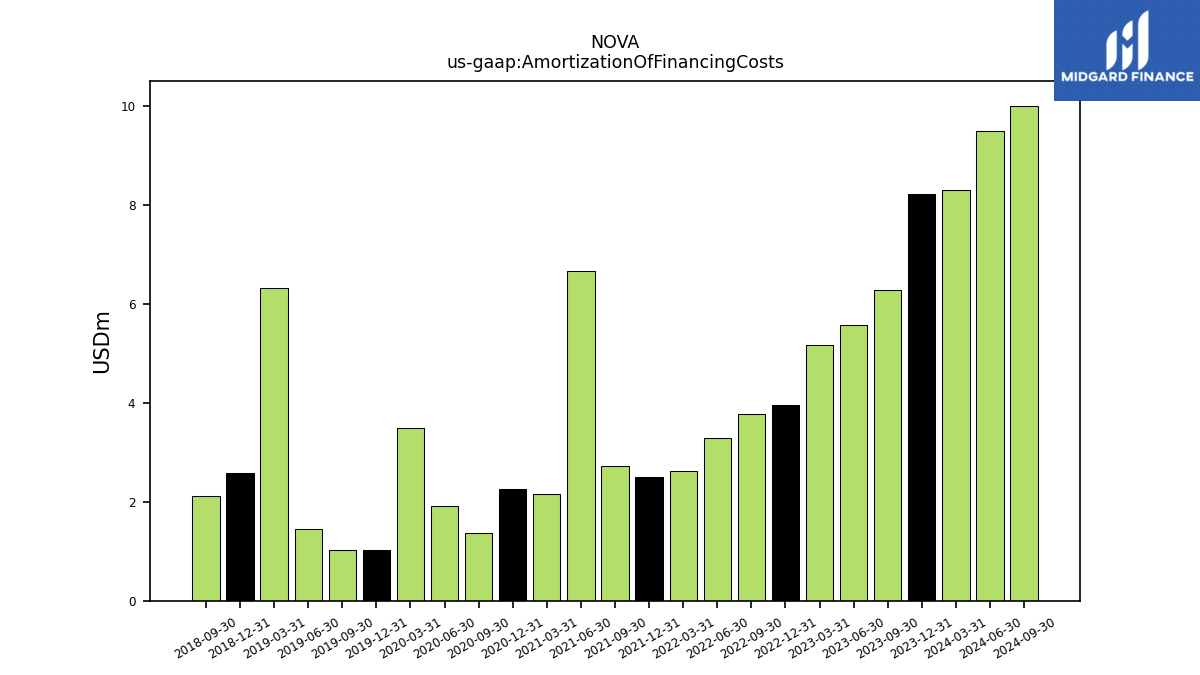
| Amortization Of Financing Costs | 6.27 | 5.56 | 5.17 | 3.95 | 3.77 | 3.29 | 2.63 | 2.49 | 2.72 | 6.67 | 2.16 | 2.25 | 1.37 | 1.92 | 3.49 | 1.03 | 1.02 | 1.45 | 6.32 | 2.59 | 2.12 | NA | NA |
| 2023-09-30 | 2023-06-30 | 2023-03-31 | 2022-12-31 | 2022-09-30 | 2022-06-30 | 2022-03-31 | 2021-12-31 | 2021-09-30 | 2021-06-30 | 2021-03-31 | 2020-12-31 | 2020-09-30 | 2020-06-30 | 2020-03-31 | 2019-12-31 | 2019-09-30 | 2019-06-30 | 2019-03-31 | 2018-12-31 | 2018-09-30 | 2018-06-30 | 2018-03-31 | ||
|---|---|---|---|---|---|---|---|---|---|---|---|---|---|---|---|---|---|---|---|---|---|---|---|---|
| Net Cash Provided By Used In Investing Activities | -717.85 | -649.63 | -524.29 | -530.25 | -557.36 | -536.34 | -357.65 | -394.04 | -337.99 | -282.98 | -226.21 | -235.24 | -236.68 | -173.28 | -184.31 | -178.62 | -172.29 | -124.73 | -92.68 | -89.02 | -87.99 | NA | NA | |
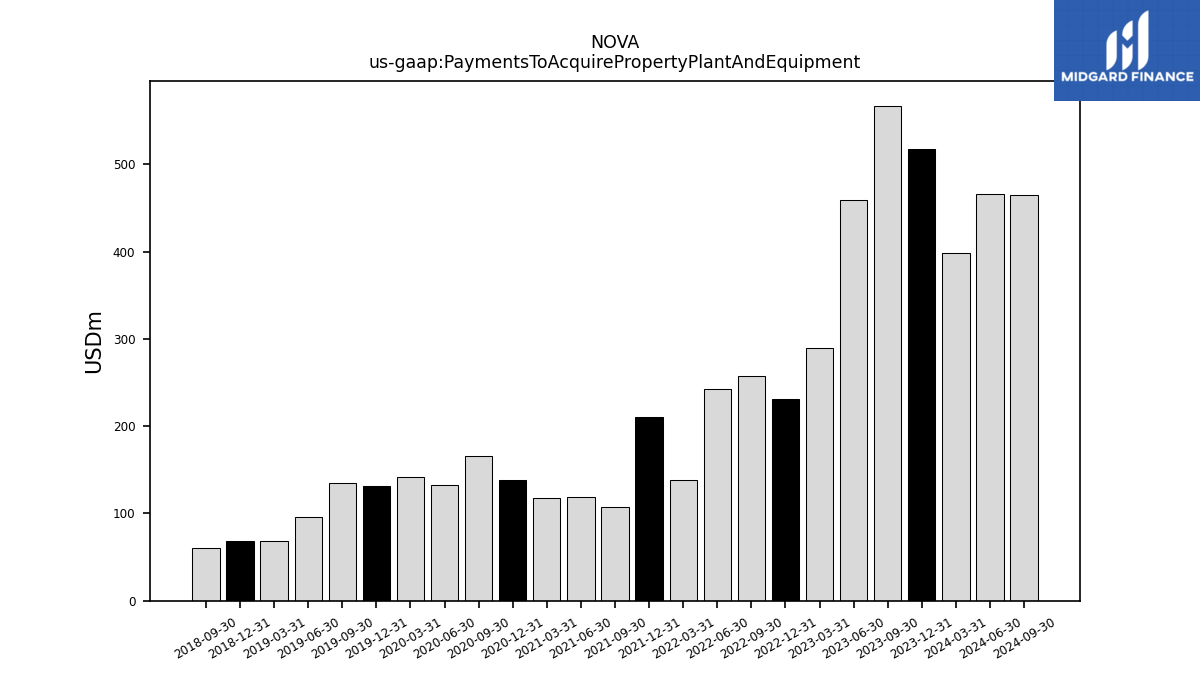
| Payments To Acquire Property Plant And Equipment | 567.04 | 458.86 | 289.30 | 230.65 | 257.12 | 242.25 | 138.18 | 210.50 | 107.70 | 118.89 | 117.46 | 138.51 | 165.52 | 133.10 | 141.23 | 131.62 | 134.40 | 95.89 | 68.90 | 68.36 | 60.19 | NA | NA | |
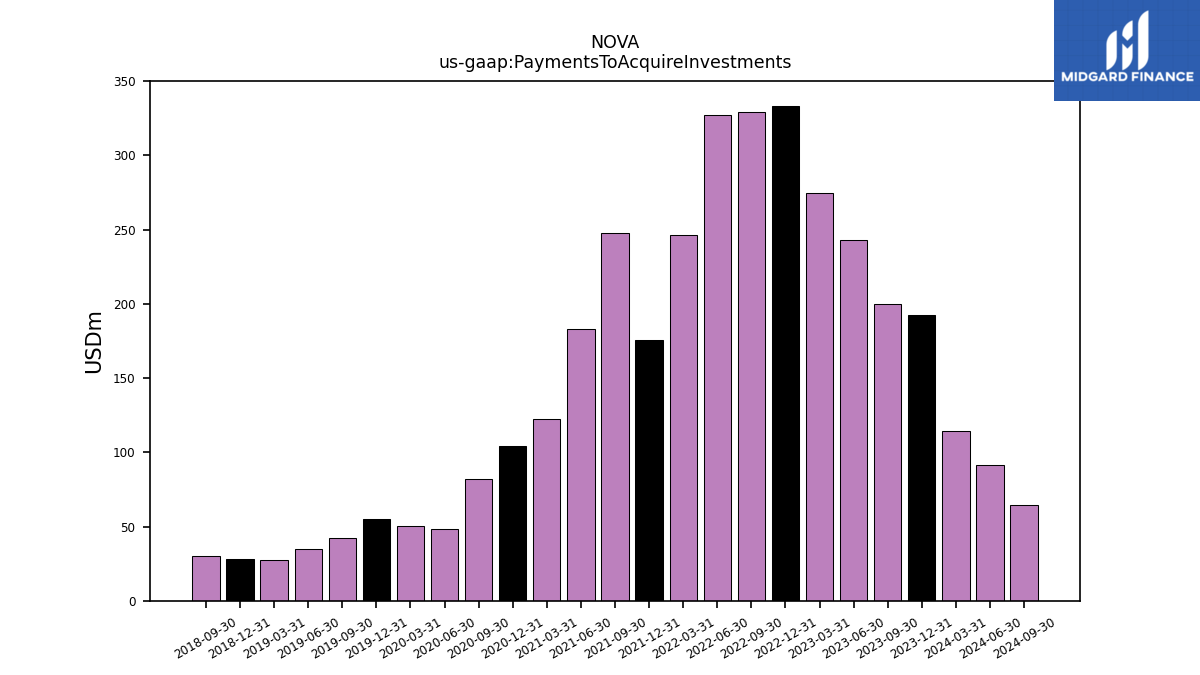
| Payments To Acquire Investments | 199.87 | 242.74 | 274.36 | 333.45 | 329.52 | 326.98 | 246.27 | 175.45 | 247.98 | 182.97 | 122.53 | 104.51 | 81.71 | 48.57 | 50.45 | 54.91 | 42.03 | 34.63 | 27.73 | 27.80 | 30.05 | NA | NA |
| 2023-09-30 | 2023-06-30 | 2023-03-31 | 2022-12-31 | 2022-09-30 | 2022-06-30 | 2022-03-31 | 2021-12-31 | 2021-09-30 | 2021-06-30 | 2021-03-31 | 2020-12-31 | 2020-09-30 | 2020-06-30 | 2020-03-31 | 2019-12-31 | 2019-09-30 | 2019-06-30 | 2019-03-31 | 2018-12-31 | 2018-09-30 | 2018-06-30 | 2018-03-31 | ||
|---|---|---|---|---|---|---|---|---|---|---|---|---|---|---|---|---|---|---|---|---|---|---|---|---|
| Net Cash Provided By Used In Financing Activities | 1049.29 | 647.89 | 568.87 | 603.61 | 836.76 | 645.51 | 382.81 | 328.05 | 425.33 | 549.39 | 161.69 | 431.12 | 282.81 | 213.29 | 261.37 | 315.36 | 200.91 | 176.20 | 109.35 | 62.46 | 110.22 | NA | NA |
| 2023-09-30 | 2023-06-30 | 2023-03-31 | 2022-12-31 | 2022-09-30 | 2022-06-30 | 2022-03-31 | 2021-12-31 | 2021-09-30 | 2021-06-30 | 2021-03-31 | 2020-12-31 | 2020-09-30 | 2020-06-30 | 2020-03-31 | 2019-12-31 | 2019-09-30 | 2019-06-30 | 2019-03-31 | 2018-12-31 | 2018-09-30 | 2018-06-30 | 2018-03-31 | ||
|---|---|---|---|---|---|---|---|---|---|---|---|---|---|---|---|---|---|---|---|---|---|---|---|---|
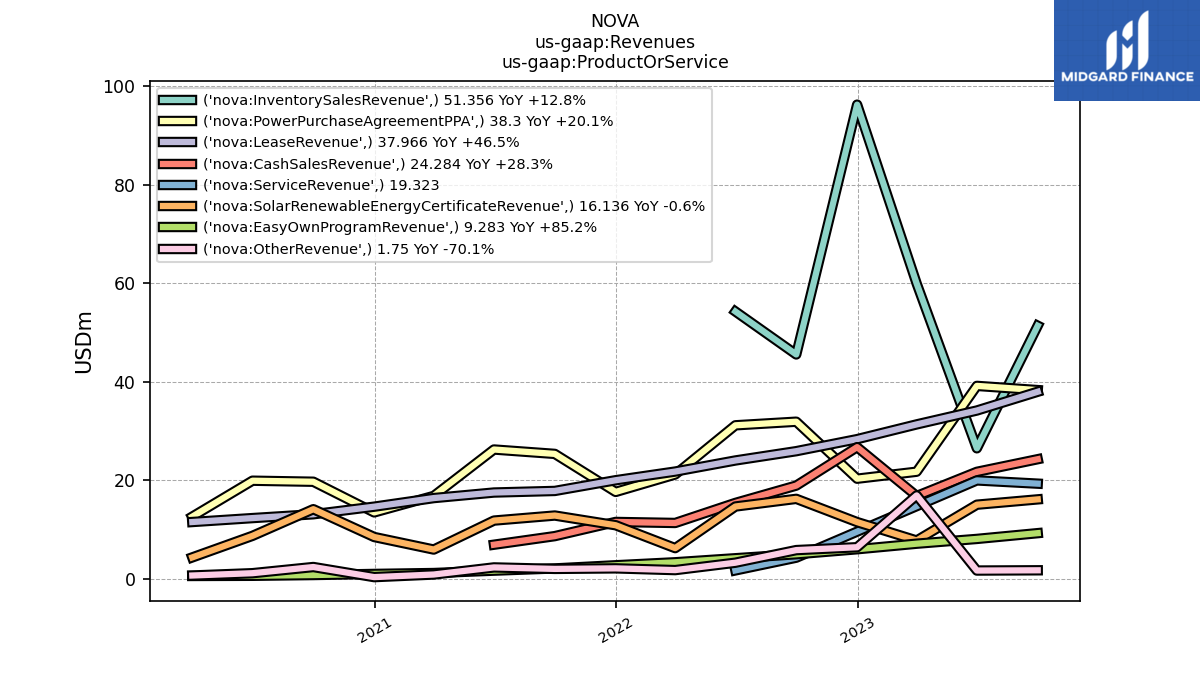
| Revenues | 198.40 | 166.38 | 161.70 | 195.59 | 149.36 | 147.01 | 65.72 | 65.02 | 68.90 | 66.56 | 41.28 | 38.02 | 50.18 | 42.79 | 29.83 | 33.61 | 36.62 | 34.61 | 26.71 | 25.21 | 30.43 | 28.96 | 19.78 | |
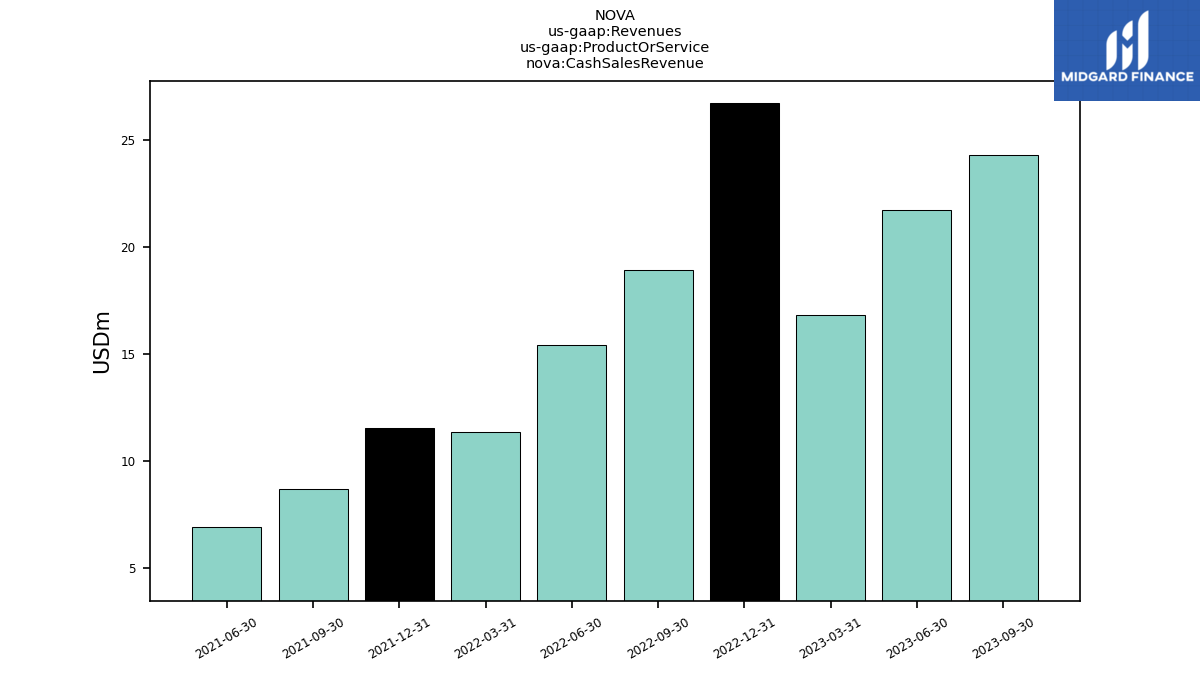
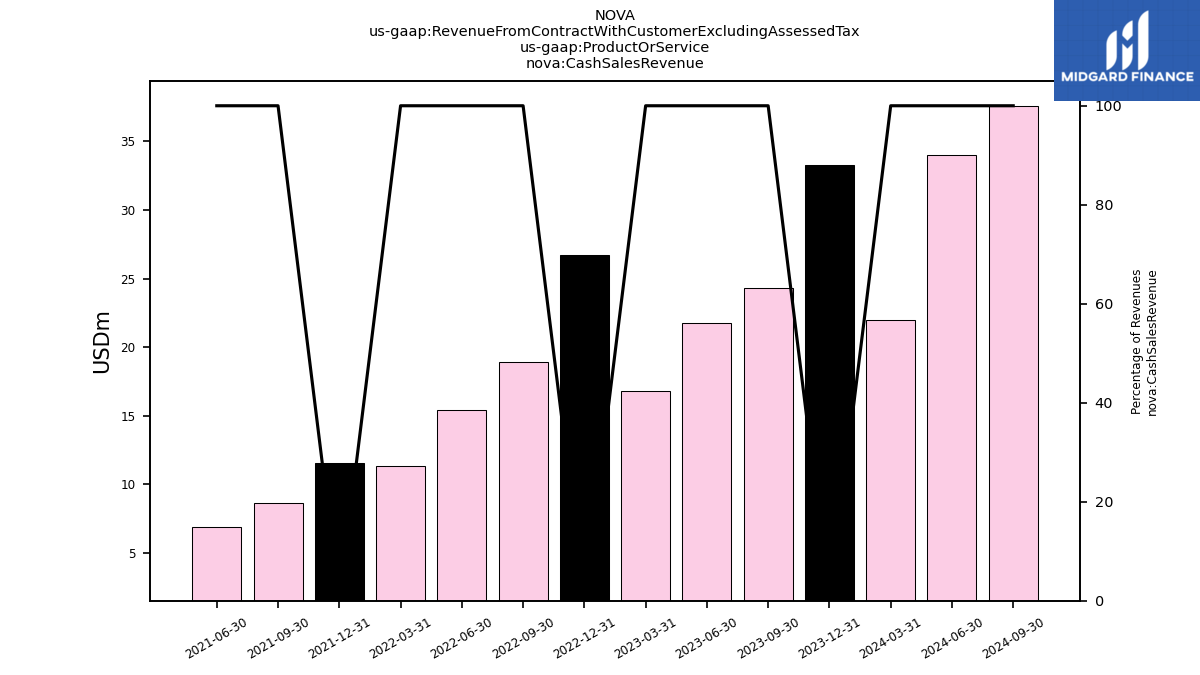
| Cash Sales Revenue | 24.28 | 21.72 | 16.82 | 26.73 | 18.93 | 15.41 | 11.35 | 11.56 | 8.68 | 6.94 | NA | NA | NA | NA | NA | NA | NA | NA | NA | NA | NA | NA | NA | |
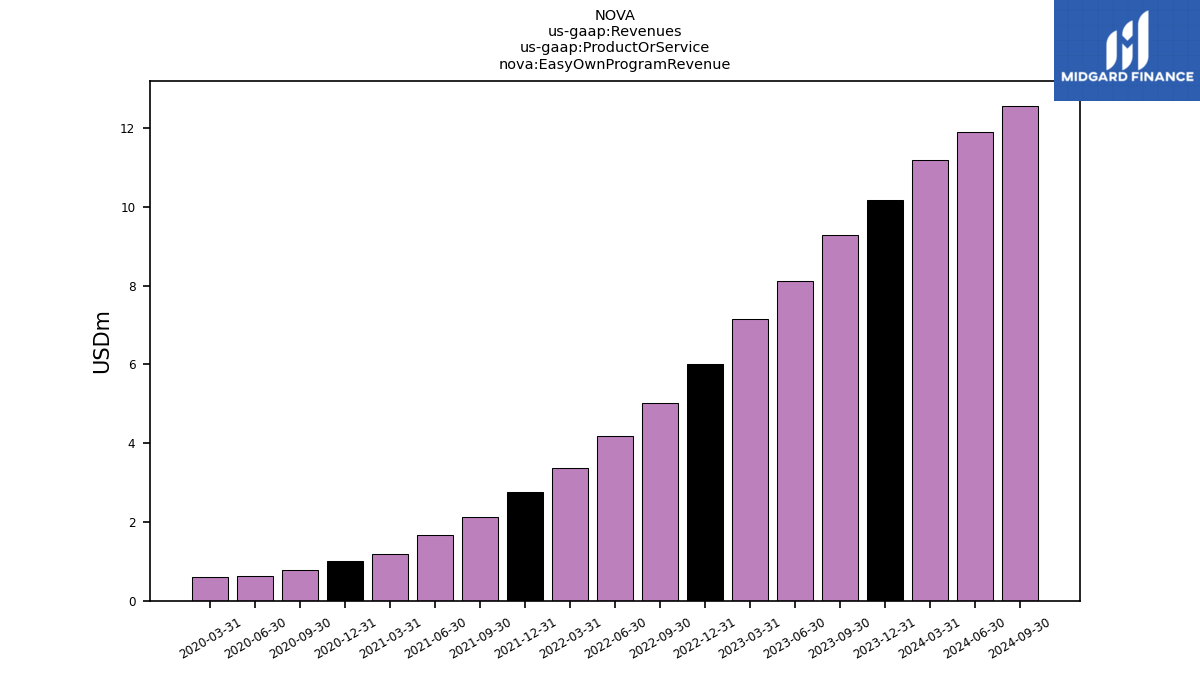
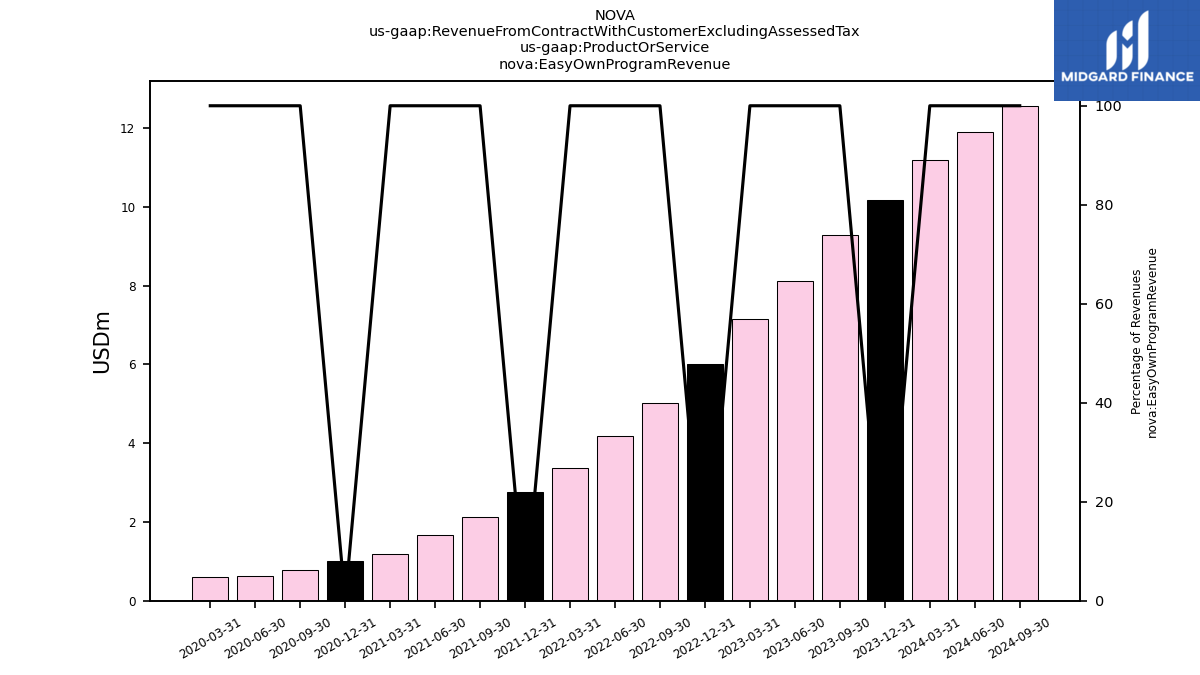
| Easy Own Program Revenue | 9.28 | 8.11 | 7.14 | 6.02 | 5.01 | 4.19 | 3.38 | 2.77 | 2.13 | 1.68 | 1.20 | 1.01 | 0.79 | 0.63 | 0.60 | NA | NA | NA | NA | NA | NA | NA | NA | |
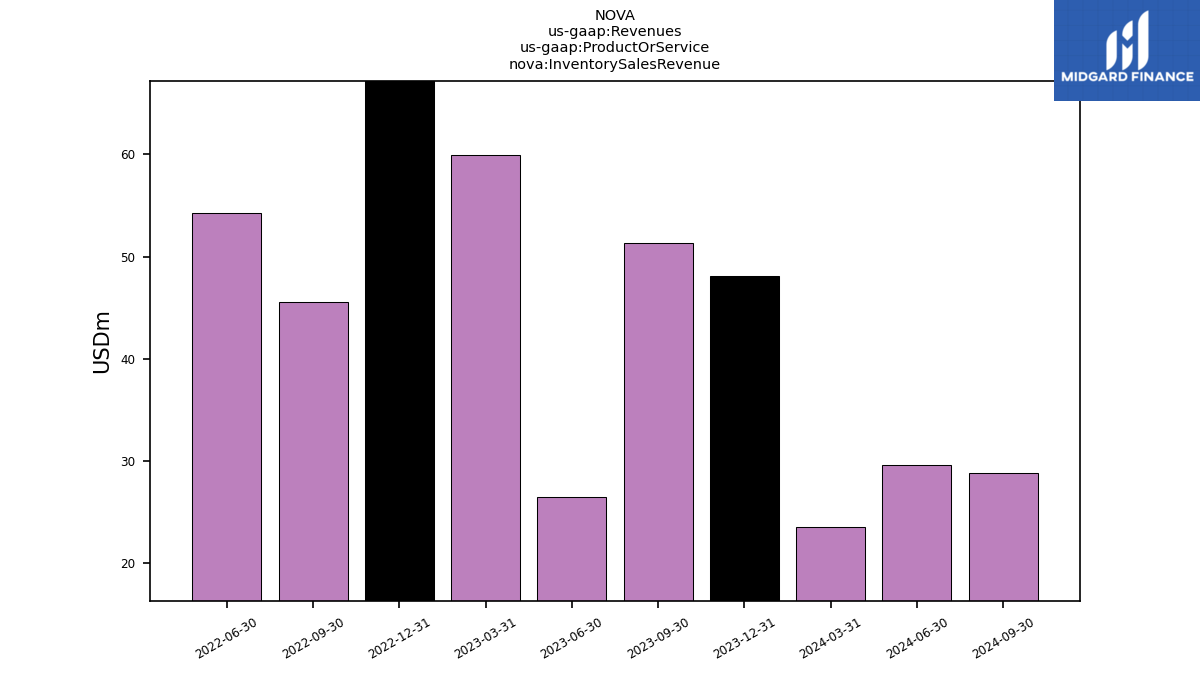
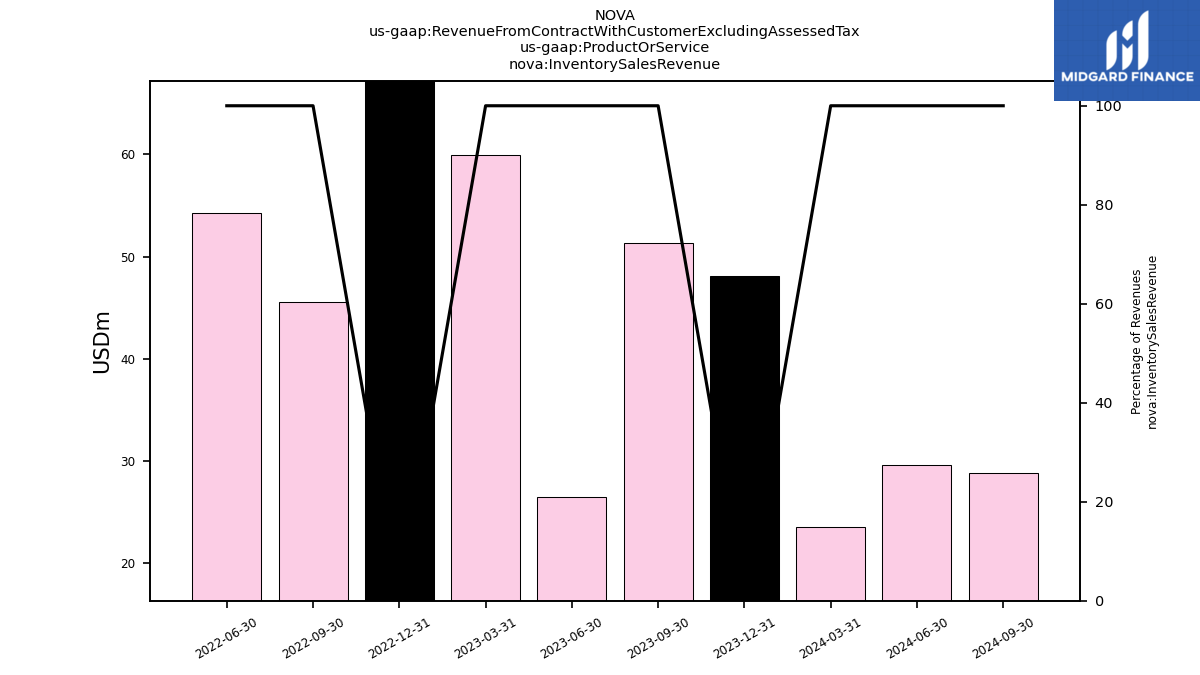
| Inventory Sales Revenue | 51.36 | 26.49 | 59.91 | 96.21 | 45.53 | 54.24 | NA | NA | NA | NA | NA | NA | NA | NA | NA | NA | NA | NA | NA | NA | NA | NA | NA | |
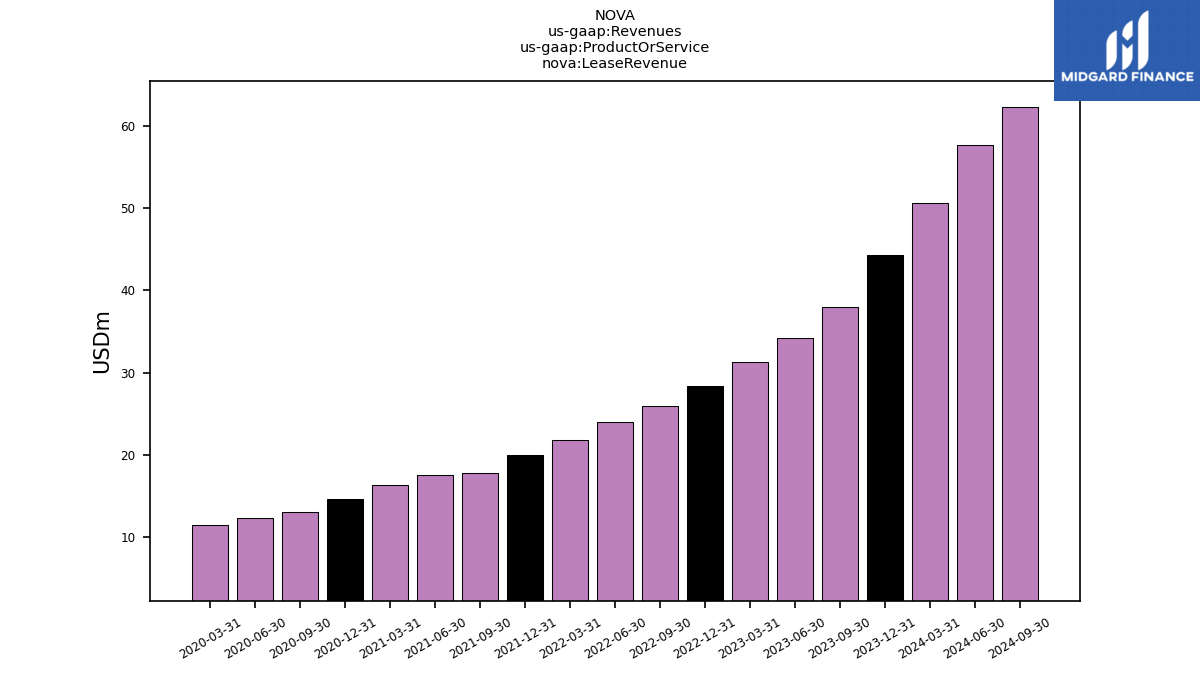
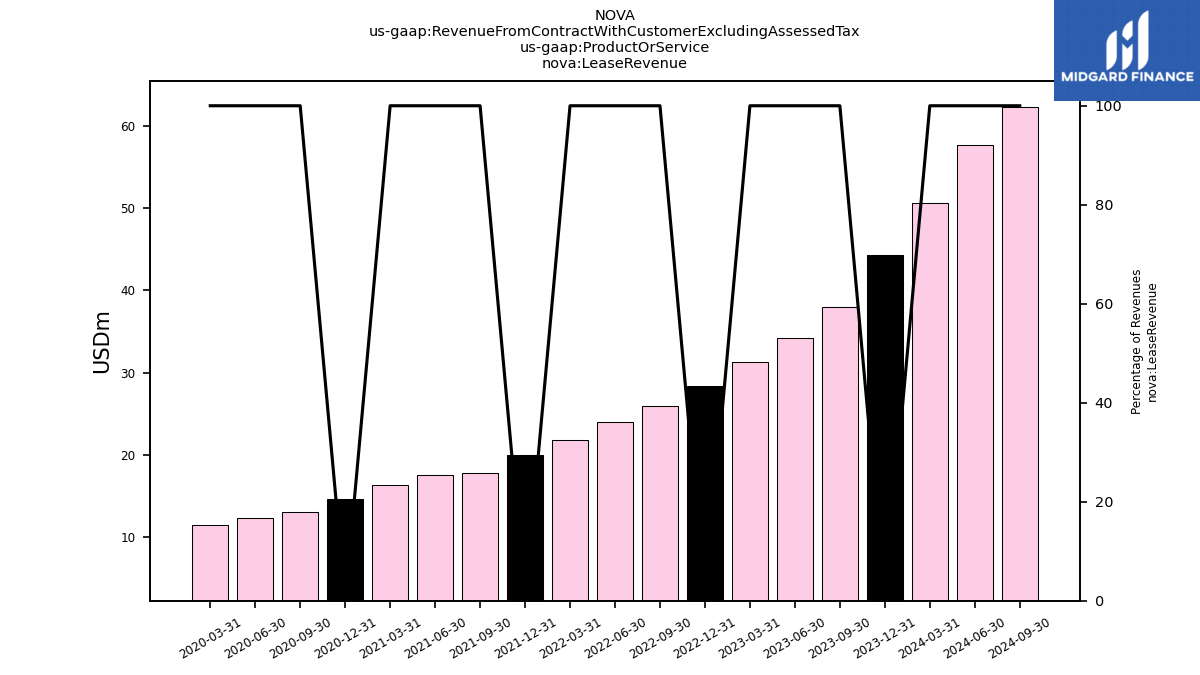
| Lease Revenue | 37.97 | 34.16 | 31.34 | 28.35 | 25.91 | 24.02 | 21.78 | 20.02 | 17.84 | 17.52 | 16.40 | 14.65 | 13.12 | 12.34 | 11.54 | NA | NA | NA | NA | NA | NA | NA | NA | |
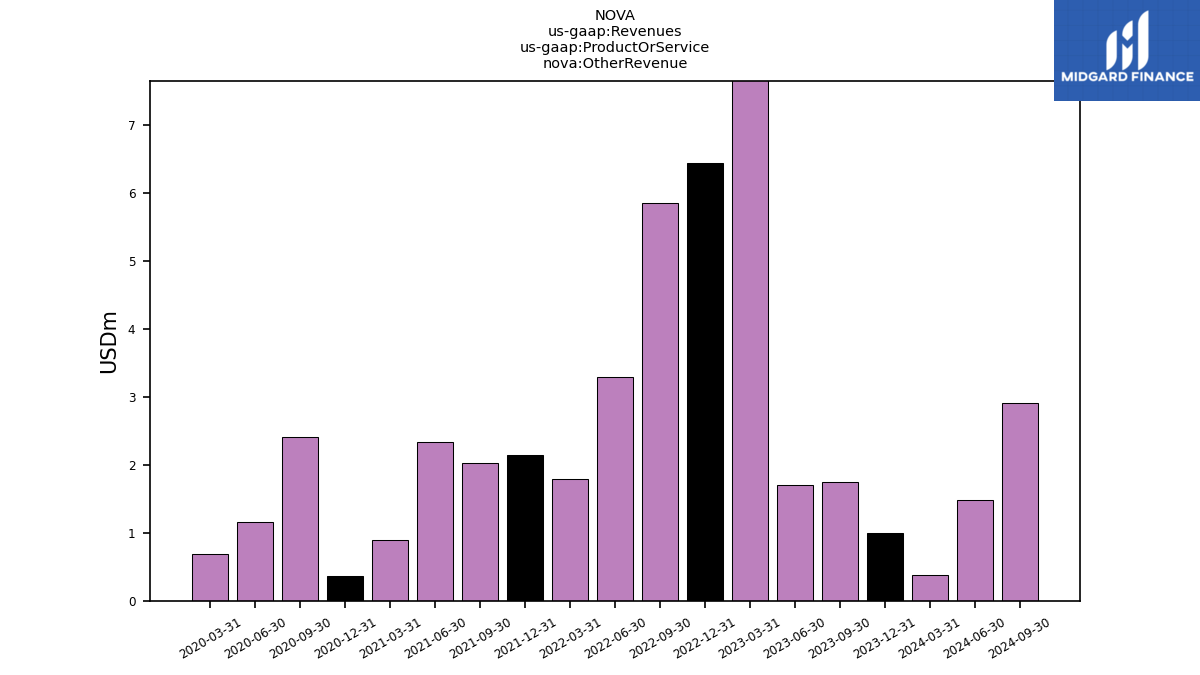
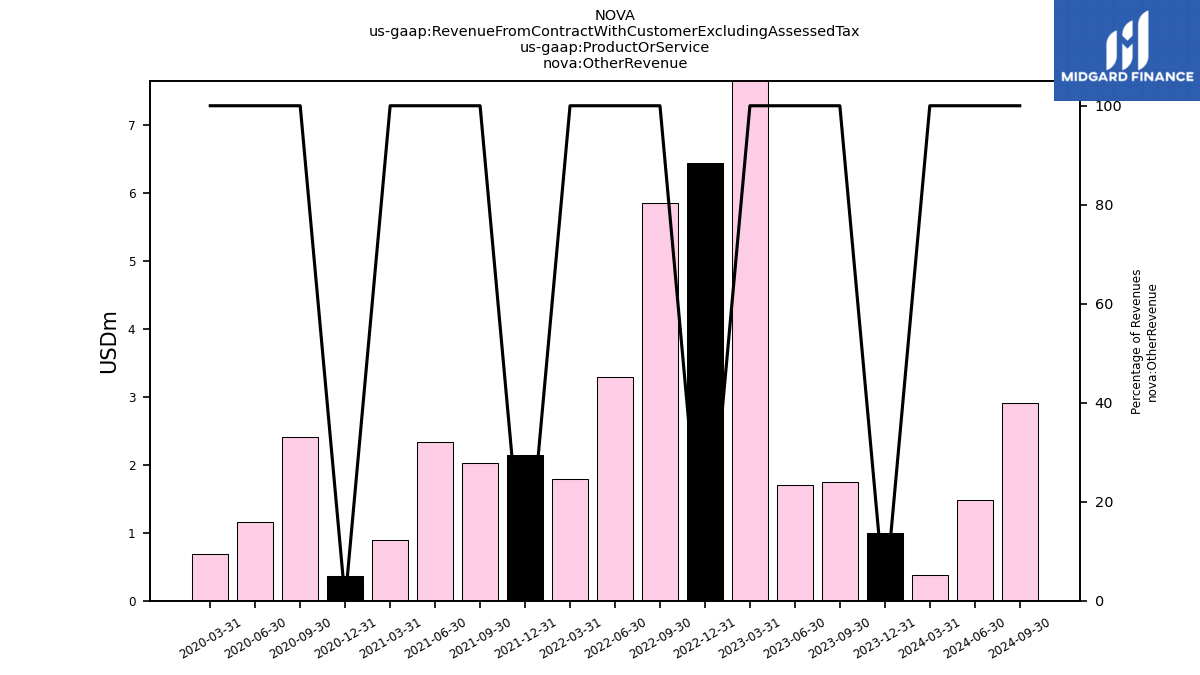
| Other Revenue | 1.75 | 1.70 | 16.94 | 6.43 | 5.85 | 3.29 | 1.79 | 2.14 | 2.03 | 2.33 | 0.89 | 0.36 | 2.41 | 1.16 | 0.69 | NA | NA | NA | NA | NA | NA | NA | NA | |
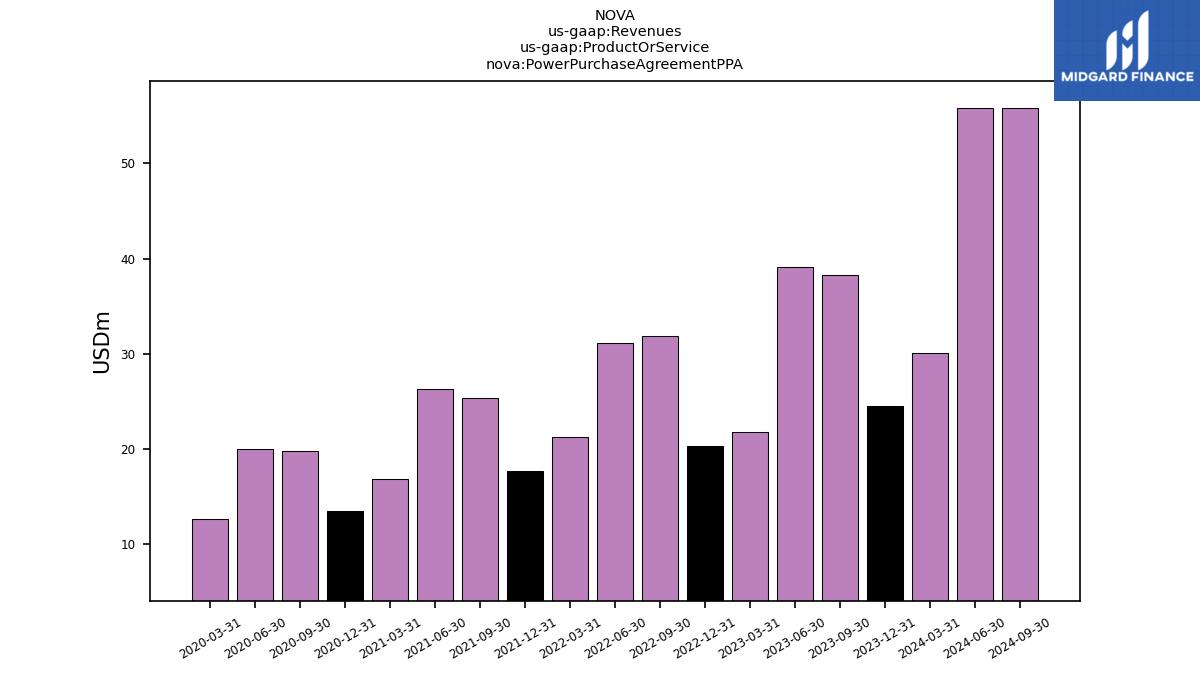
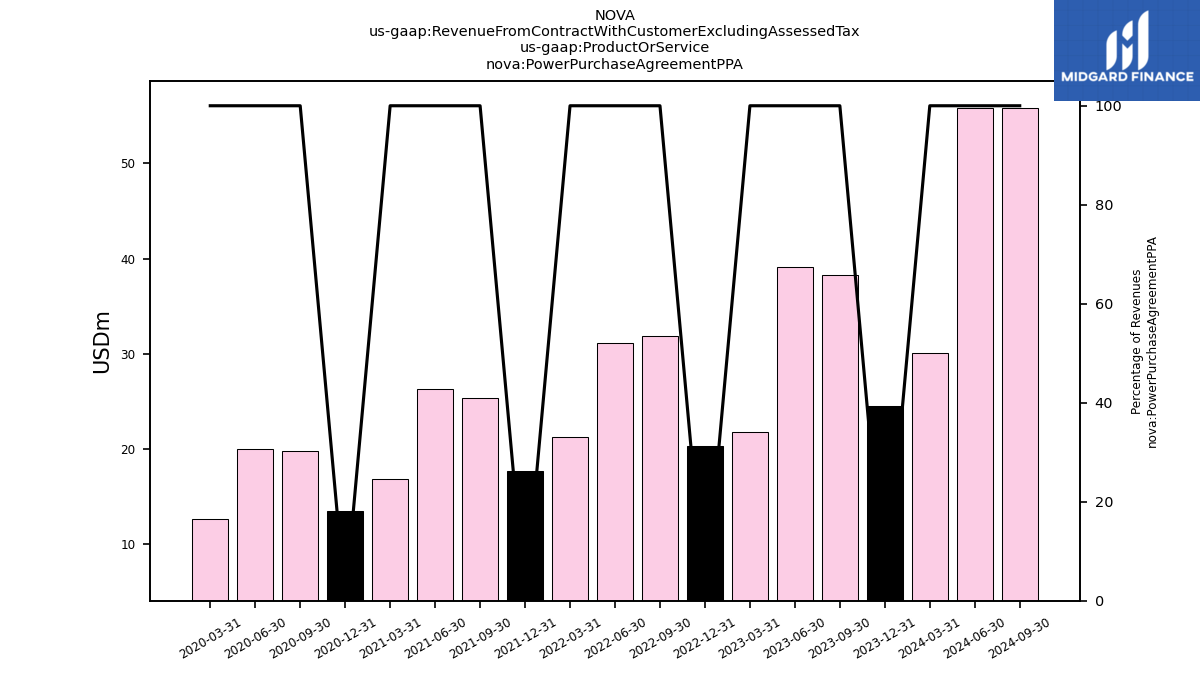
| Power Purchase Agreement P P A | 38.30 | 39.16 | 21.75 | 20.33 | 31.89 | 31.16 | 21.18 | 17.64 | 25.36 | 26.25 | 16.83 | 13.49 | 19.71 | 19.92 | 12.63 | NA | NA | NA | NA | NA | NA | NA | NA | |
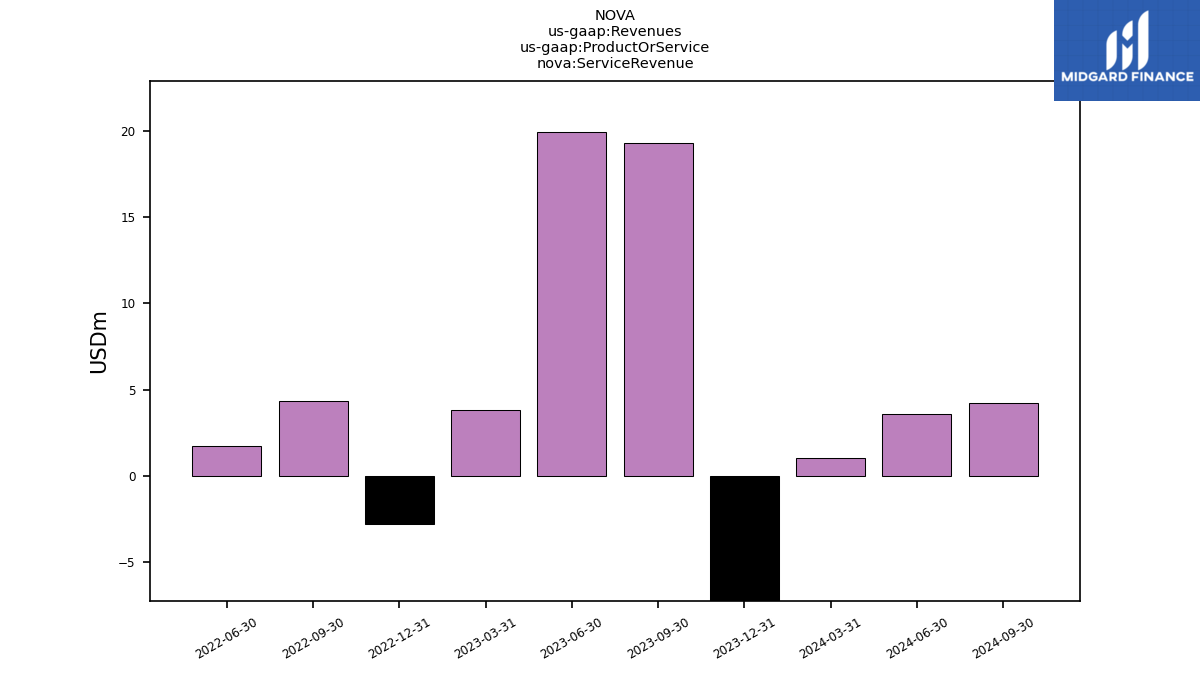
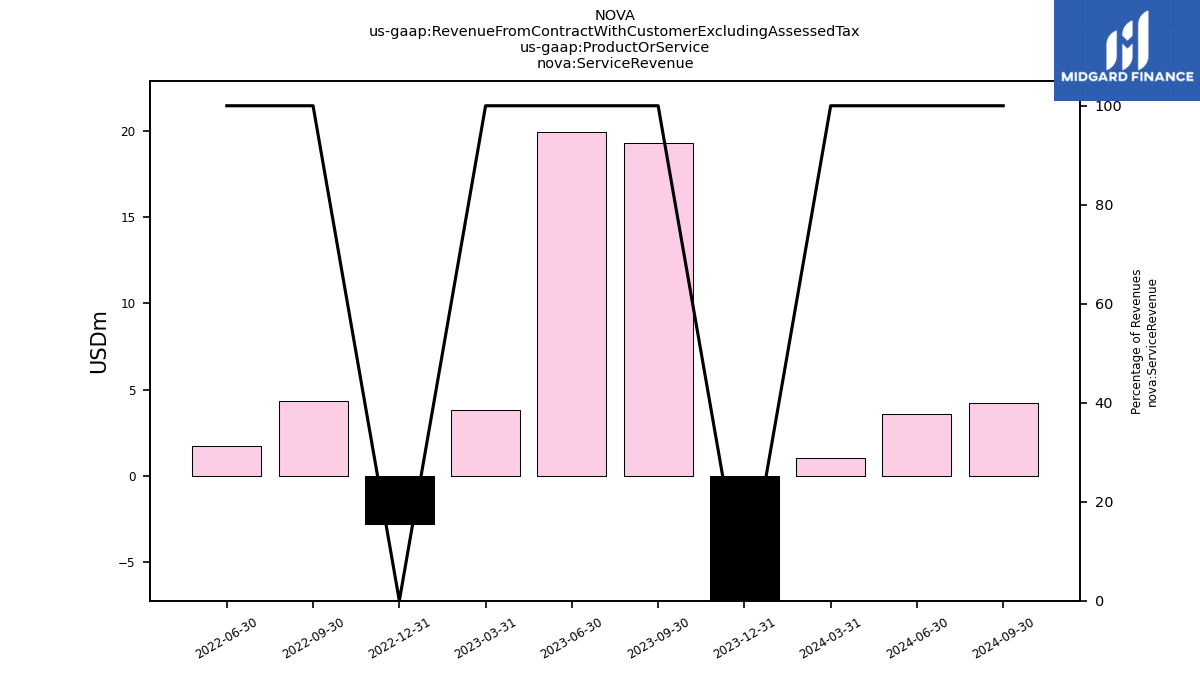
| Service Revenue | 19.32 | 19.98 | NA | NA | 4.31 | 1.73 | NA | NA | NA | NA | NA | NA | NA | NA | NA | NA | NA | NA | NA | NA | NA | NA | NA | |
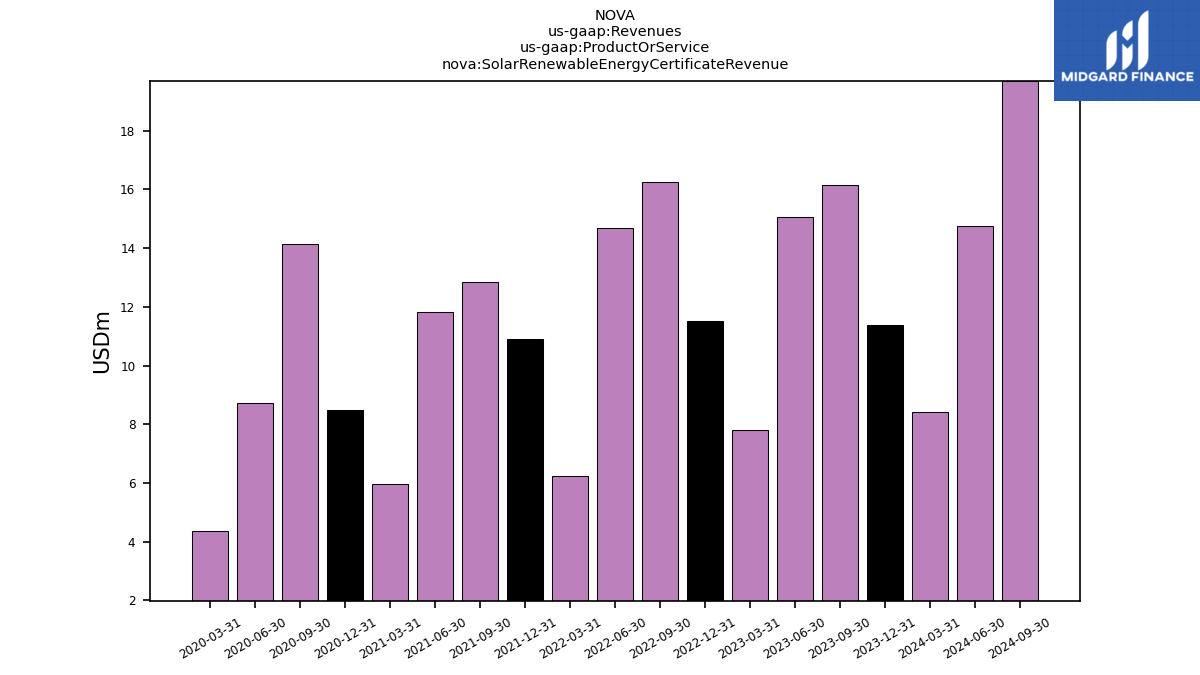
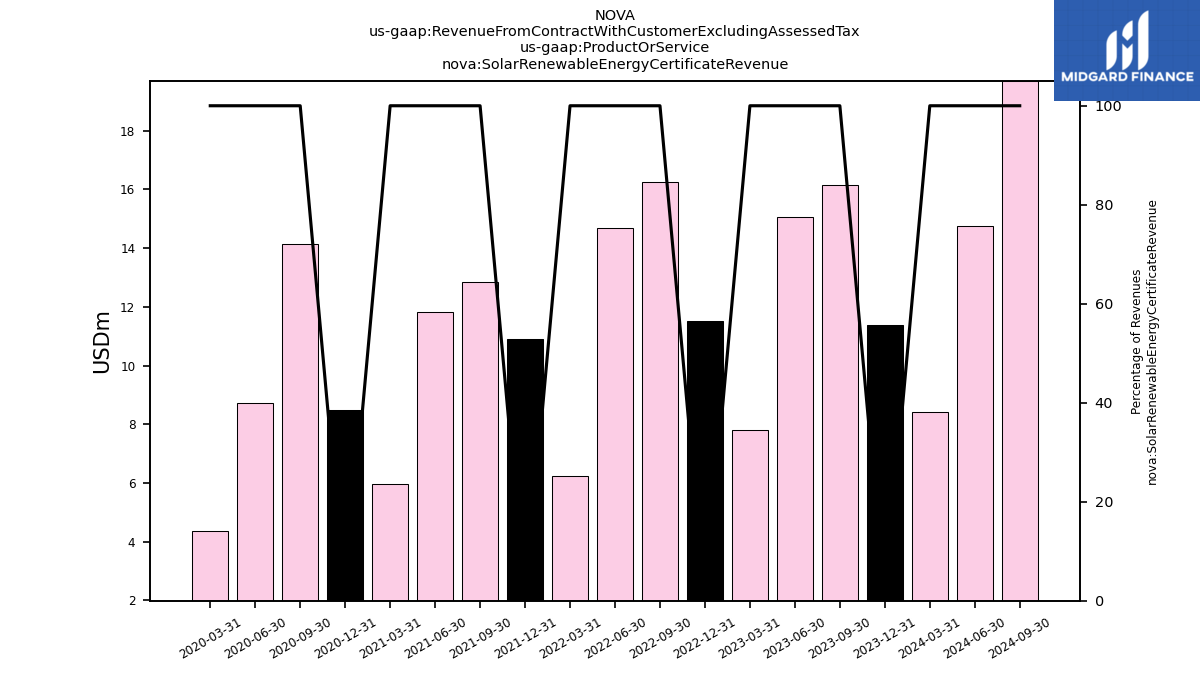
| Solar Renewable Energy Certificate Revenue | 16.14 | 15.05 | 7.79 | 11.53 | 16.24 | 14.69 | 6.24 | 10.89 | 12.86 | 11.83 | 5.96 | 8.50 | 14.15 | 8.73 | 4.36 | NA | NA | NA | NA | NA | NA | NA | NA | |
| Revenue From Contract With Customer Excluding Assessed Tax | 198.40 | 166.38 | 161.70 | 195.59 | 149.36 | 147.01 | 65.72 | 65.02 | 68.90 | 66.56 | 41.28 | 38.02 | 50.18 | 42.79 | 29.83 | 33.61 | 36.62 | 34.61 | 26.71 | 25.21 | 30.43 | 28.96 | 19.78 | |
| Cash Sales Revenue | 24.28 | 21.72 | 16.82 | 26.73 | 18.93 | 15.41 | 11.35 | 11.56 | 8.68 | 6.94 | NA | NA | NA | NA | NA | NA | NA | NA | NA | NA | NA | NA | NA | |
| Easy Own Program Revenue | 9.28 | 8.11 | 7.14 | 6.02 | 5.01 | 4.19 | 3.38 | 2.77 | 2.13 | 1.68 | 1.20 | 1.01 | 0.79 | 0.63 | 0.60 | NA | NA | NA | NA | NA | NA | NA | NA | |
| Inventory Sales Revenue | 51.36 | 26.49 | 59.91 | 96.21 | 45.53 | 54.24 | NA | NA | NA | NA | NA | NA | NA | NA | NA | NA | NA | NA | NA | NA | NA | NA | NA | |
| Lease Revenue | 37.97 | 34.16 | 31.34 | 28.35 | 25.91 | 24.02 | 21.78 | 20.02 | 17.84 | 17.52 | 16.40 | 14.65 | 13.12 | 12.34 | 11.54 | NA | NA | NA | NA | NA | NA | NA | NA | |
| Other Revenue | 1.75 | 1.70 | 16.94 | 6.43 | 5.85 | 3.29 | 1.79 | 2.14 | 2.03 | 2.33 | 0.89 | 0.36 | 2.41 | 1.16 | 0.69 | NA | NA | NA | NA | NA | NA | NA | NA | |
| Power Purchase Agreement P P A | 38.30 | 39.16 | 21.75 | 20.33 | 31.89 | 31.16 | 21.18 | 17.64 | 25.36 | 26.25 | 16.83 | 13.49 | 19.71 | 19.92 | 12.63 | NA | NA | NA | NA | NA | NA | NA | NA | |
| Service Revenue | 19.32 | 19.98 | NA | NA | 4.31 | 1.73 | NA | NA | NA | NA | NA | NA | NA | NA | NA | NA | NA | NA | NA | NA | NA | NA | NA | |
| Solar Renewable Energy Certificate Revenue | 16.14 | 15.05 | 7.79 | 11.53 | 16.24 | 14.69 | 6.24 | 10.89 | 12.86 | 11.83 | 5.96 | 8.50 | 14.15 | 8.73 | 4.36 | NA | NA | NA | NA | NA | NA | NA | NA |


