
| 2023-12-31 | 2023-09-30 | 2023-06-30 | 2023-03-31 | 2022-12-31 | 2022-09-30 | 2022-06-30 | 2022-03-31 | 2021-12-31 | 2021-09-30 | 2021-06-30 | 2021-03-31 | 2020-12-31 | 2020-09-30 | 2020-06-30 | 2020-03-31 | 2019-12-31 | 2019-09-30 | 2019-06-30 | 2019-03-31 | 2018-12-31 | 2018-09-30 | 2018-06-30 | 2018-03-31 | 2017-12-31 | 2017-09-30 | 2017-06-30 | 2017-03-31 | 2016-12-31 | 2016-09-30 | 2016-06-30 | 2016-03-31 | 2015-12-31 | 2015-09-30 | 2015-06-30 | 2015-03-31 | 2014-12-31 | 2014-09-30 | 2014-06-30 | 2014-03-31 | 2013-12-31 | 2013-09-30 | 2013-06-30 | 2013-03-31 | 2012-12-31 | 2012-09-30 | 2012-06-30 | 2012-03-31 | 2011-12-31 | 2011-09-30 | 2011-06-30 | 2011-03-31 | 2010-12-31 | 2010-09-30 | 2010-06-30 | 2010-03-31 | ||
|---|---|---|---|---|---|---|---|---|---|---|---|---|---|---|---|---|---|---|---|---|---|---|---|---|---|---|---|---|---|---|---|---|---|---|---|---|---|---|---|---|---|---|---|---|---|---|---|---|---|---|---|---|---|---|---|---|---|
| Earnings Per Share Basic | -0.24 | 0.40 | -0.89 | 1.80 | 6110000.00 | 1.29 | 1.59 | 0.78 | 4970000.00 | 1.34 | 1.42 | 0.87 | -0.39 | -0.96 | -0.31 | 10.62 | 0.14 | -0.08 | 1.16 | 0.63 | -1.07 | 1.17 | 0.47 | 0.59 | 1.60 | 22.98 | 0.42 | 0.30 | -0.14 | 0.28 | 0.17 | -2.15 | 0.30 | 0.52 | -1.66 | -0.07 | 0.16 | 0.36 | 0.36 | 0.06 | 0.25 | 0.27 | 0.39 | 0.41 | 0.28 | 0.54 | 0.50 | 0.67 | 0.12 | 0.70 | 0.59 | 0.74 | 0.31 | 0.24 | 2.22 | 4.89 | |
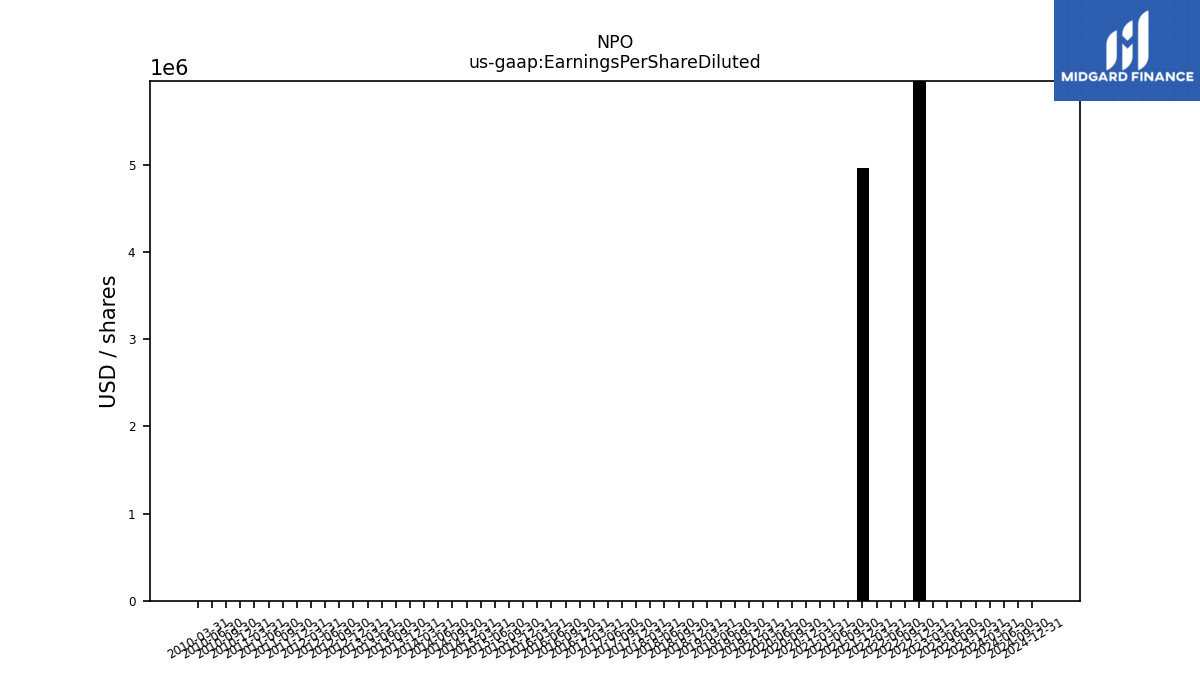
| Earnings Per Share Diluted | -0.24 | 0.39 | -0.89 | 1.79 | 6110000.00 | 1.29 | 1.59 | 0.77 | 4970000.00 | 1.33 | 1.41 | 0.87 | -0.39 | -0.96 | -0.31 | 10.59 | 0.14 | -0.08 | 1.15 | 0.63 | -1.07 | 1.16 | 0.47 | 0.58 | 1.57 | 22.49 | 0.41 | 0.30 | -0.14 | 0.28 | 0.17 | -2.15 | 0.30 | 0.51 | -1.66 | -0.07 | 0.15 | 0.33 | 0.32 | 0.05 | 0.22 | 0.23 | 0.35 | 0.39 | 0.27 | 0.53 | 0.47 | 0.64 | 0.12 | 0.66 | 0.56 | 0.71 | 0.30 | 0.24 | 2.20 | 4.83 | |
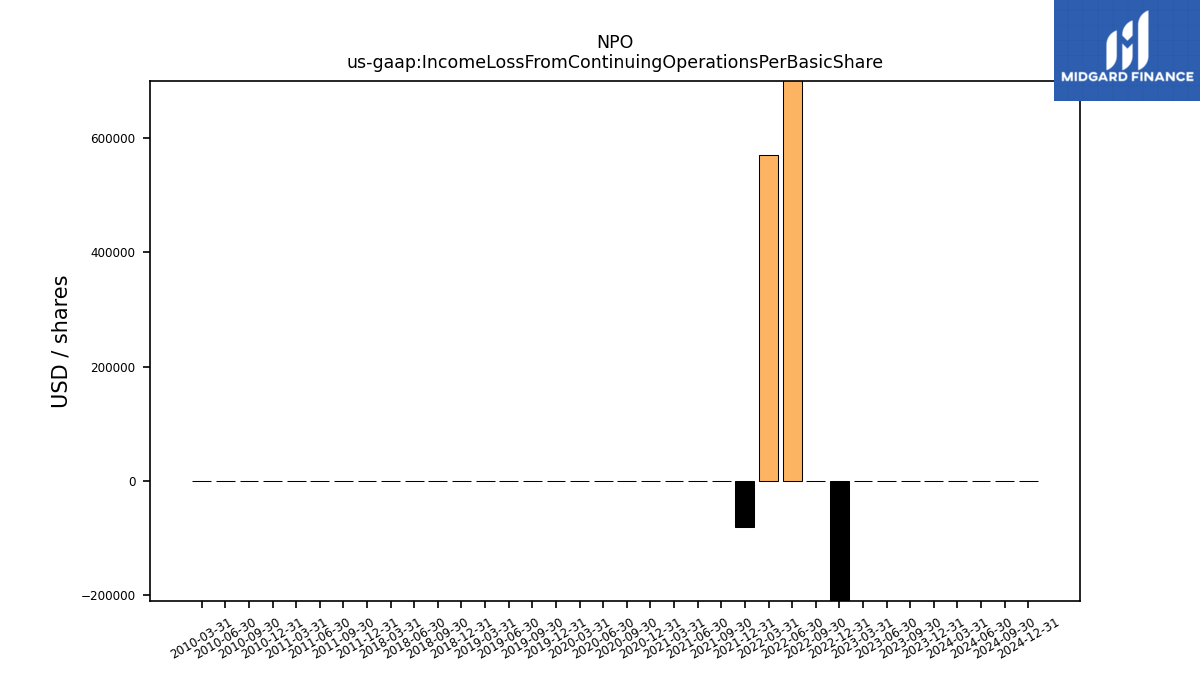
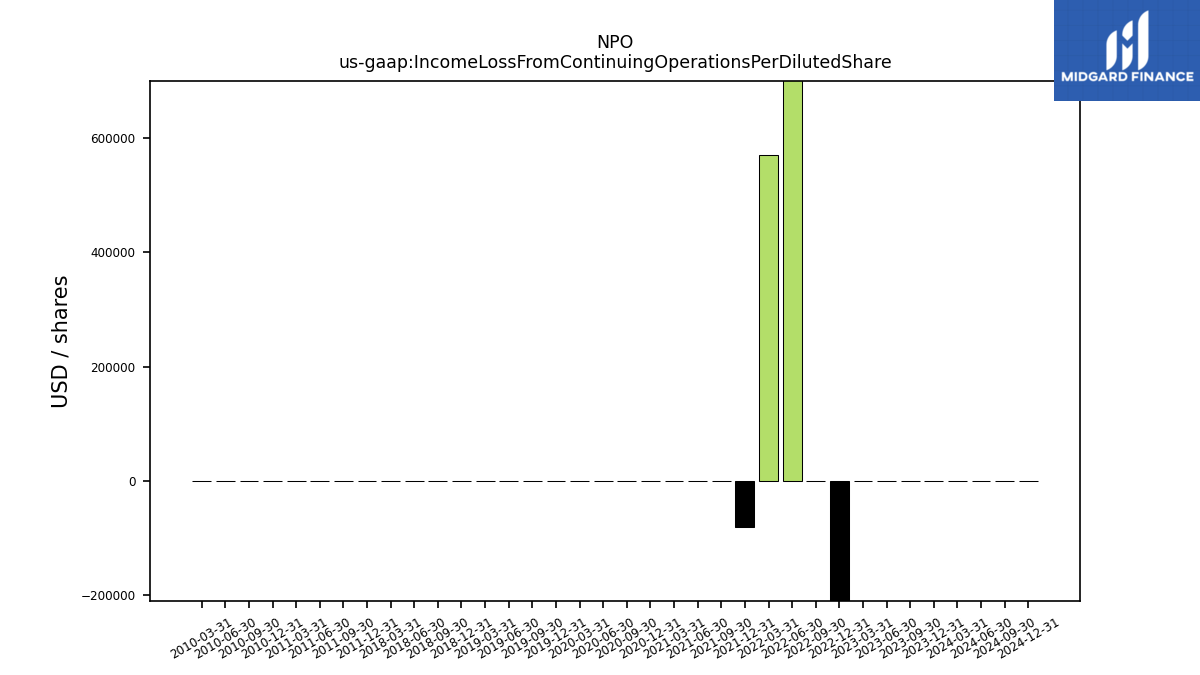
| Income Loss From Continuing Operations Per Basic Share | -0.00 | 0.00 | -0.00 | 0.00 | -2.76 | 0.00 | 1.25 | 0.57 | -0.08 | 0.00 | 0.00 | 0.00 | -0.00 | -0.00 | -0.00 | 0.00 | -0.00 | -0.00 | 0.00 | 0.00 | -0.00 | 0.00 | 0.00 | 0.00 | NA | NA | NA | NA | NA | NA | NA | NA | NA | NA | NA | NA | NA | NA | NA | NA | NA | NA | NA | NA | NA | NA | NA | NA | 0.00 | 0.00 | 0.00 | 0.00 | 0.00 | 0.00 | 0.00 | 0.00 | |
| Income Loss From Continuing Operations Per Diluted Share | -0.00 | 0.00 | -0.00 | 0.00 | -2.76 | 0.00 | 1.25 | 0.57 | -0.08 | 0.00 | 0.00 | 0.00 | -0.00 | -0.00 | -0.00 | 0.00 | -0.00 | -0.00 | 0.00 | 0.00 | -0.00 | 0.00 | 0.00 | 0.00 | NA | NA | NA | NA | NA | NA | NA | NA | NA | NA | NA | NA | NA | NA | NA | NA | NA | NA | NA | NA | NA | NA | NA | NA | 0.00 | 0.00 | 0.00 | 0.00 | 0.00 | 0.00 | 0.00 | 0.00 |
| 2023-12-31 | 2023-09-30 | 2023-06-30 | 2023-03-31 | 2022-12-31 | 2022-09-30 | 2022-06-30 | 2022-03-31 | 2021-12-31 | 2021-09-30 | 2021-06-30 | 2021-03-31 | 2020-12-31 | 2020-09-30 | 2020-06-30 | 2020-03-31 | 2019-12-31 | 2019-09-30 | 2019-06-30 | 2019-03-31 | 2018-12-31 | 2018-09-30 | 2018-06-30 | 2018-03-31 | 2017-12-31 | 2017-09-30 | 2017-06-30 | 2017-03-31 | 2016-12-31 | 2016-09-30 | 2016-06-30 | 2016-03-31 | 2015-12-31 | 2015-09-30 | 2015-06-30 | 2015-03-31 | 2014-12-31 | 2014-09-30 | 2014-06-30 | 2014-03-31 | 2013-12-31 | 2013-09-30 | 2013-06-30 | 2013-03-31 | 2012-12-31 | 2012-09-30 | 2012-06-30 | 2012-03-31 | 2011-12-31 | 2011-09-30 | 2011-06-30 | 2011-03-31 | 2010-12-31 | 2010-09-30 | 2010-06-30 | 2010-03-31 | ||
|---|---|---|---|---|---|---|---|---|---|---|---|---|---|---|---|---|---|---|---|---|---|---|---|---|---|---|---|---|---|---|---|---|---|---|---|---|---|---|---|---|---|---|---|---|---|---|---|---|---|---|---|---|---|---|---|---|---|
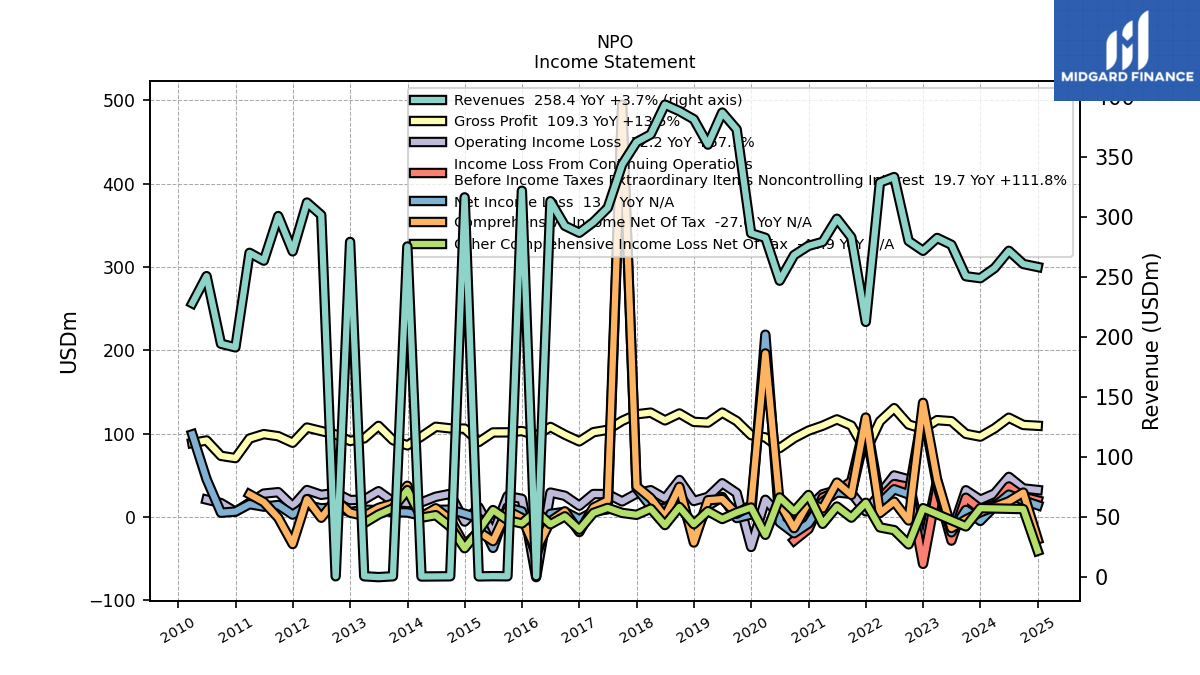
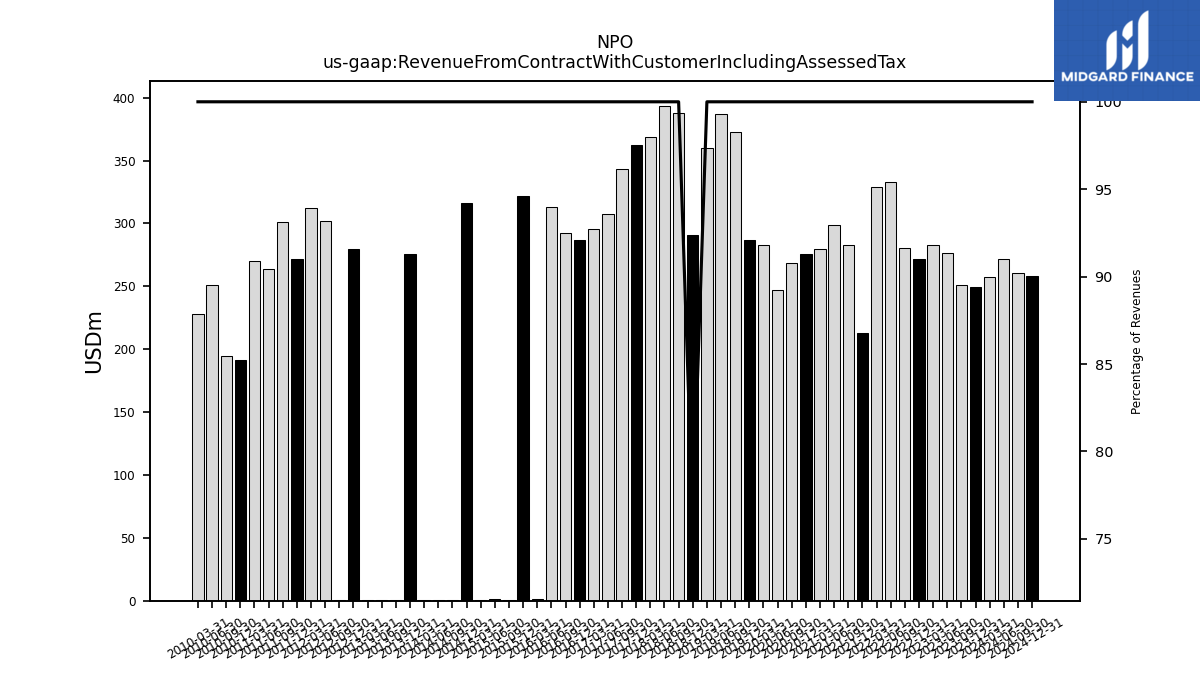
| Revenue From Contract With Customer Including Assessed Tax | 249.10 | 250.70 | 276.90 | 282.60 | 271.90 | 280.10 | 333.30 | 328.70 | 212.70 | 283.10 | 298.60 | 279.30 | 276.00 | 268.30 | 247.00 | 282.70 | 286.50 | 373.00 | 387.00 | 360.30 | 290.70 | 388.20 | 393.60 | 368.80 | 362.50 | 343.70 | 307.60 | 295.80 | 286.90 | 292.70 | 313.20 | 1.00 | 321.90 | 0.90 | 1.00 | 0.80 | 316.40 | 0.90 | 0.80 | 0.70 | 275.50 | 0.90 | 0.20 | 0.90 | 279.30 | 0.90 | 301.70 | 312.10 | 271.40 | 300.80 | 263.70 | 270.20 | 191.50 | 194.50 | 250.80 | 228.20 | |
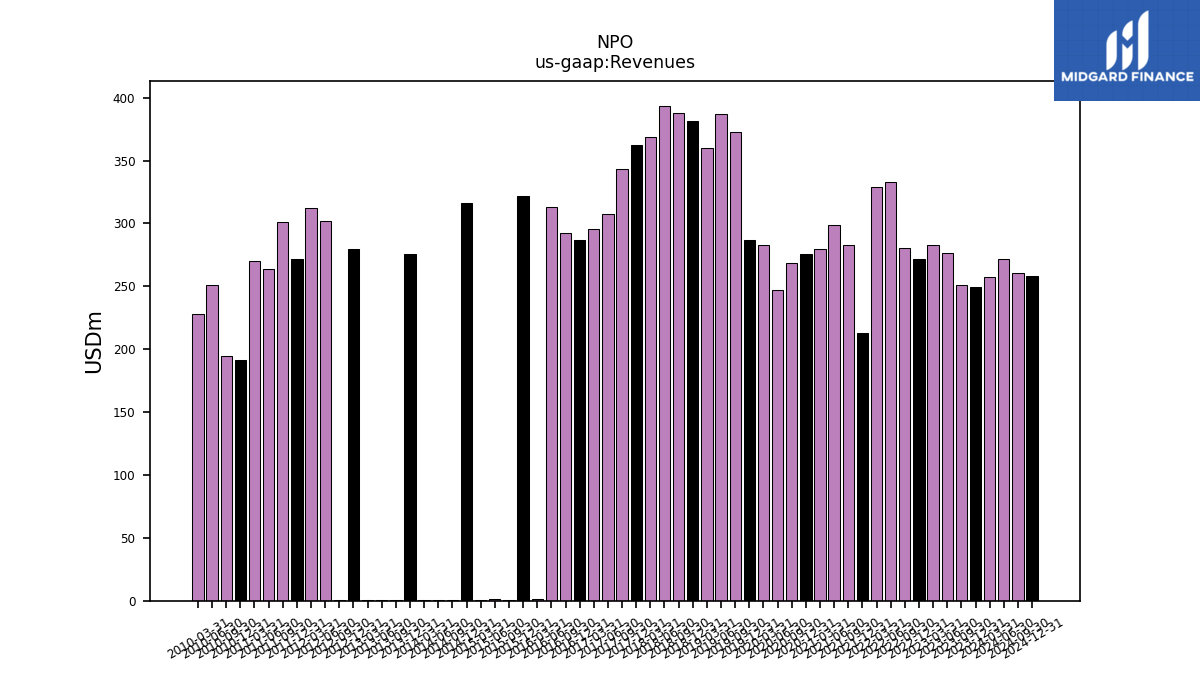
| Revenues | 249.10 | 250.70 | 276.90 | 282.60 | 271.90 | 280.10 | 333.30 | 328.70 | 212.70 | 283.10 | 298.60 | 279.30 | 276.00 | 268.30 | 247.00 | 282.70 | 286.50 | 373.00 | 387.00 | 360.30 | 381.40 | 388.20 | 393.60 | 368.80 | 362.50 | 343.70 | 307.60 | 295.80 | 286.90 | 292.70 | 313.20 | 1.00 | 321.90 | 0.90 | 1.00 | 0.80 | 316.40 | 0.90 | 0.80 | 0.70 | 275.50 | 0.90 | 0.20 | 0.90 | 279.30 | 0.90 | 301.70 | 312.10 | 271.40 | 300.80 | 263.70 | 270.20 | 191.50 | 194.50 | 250.80 | 228.20 | |
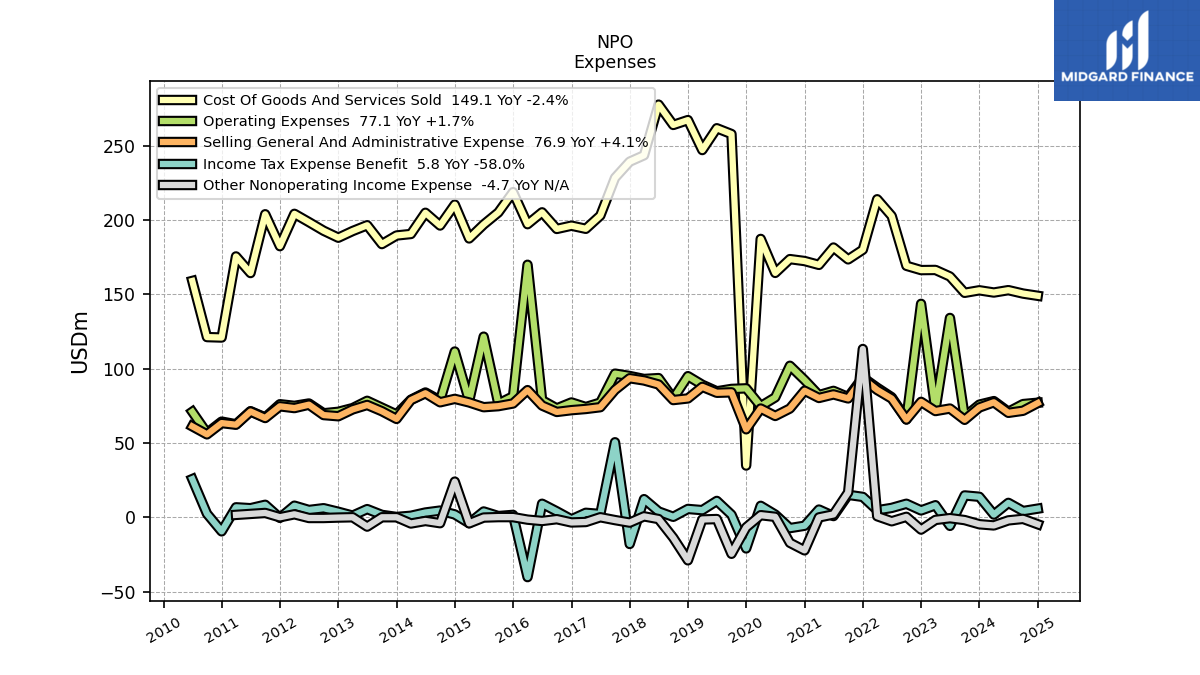
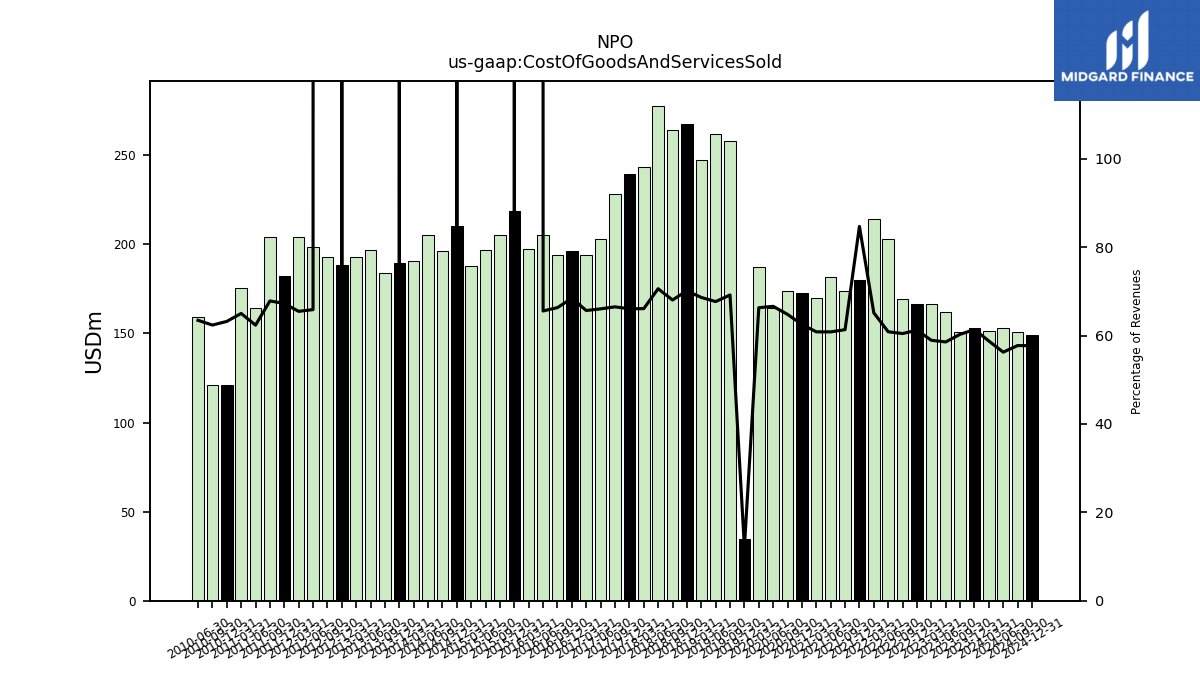
| Cost Of Goods And Services Sold | 152.80 | 151.10 | 162.10 | 166.50 | 166.40 | 169.30 | 202.80 | 214.10 | 180.10 | 173.60 | 181.60 | 169.90 | 172.50 | 173.80 | 164.50 | 187.40 | 34.80 | 258.00 | 261.90 | 247.20 | 267.40 | 264.10 | 277.80 | 243.70 | 239.40 | 228.50 | 203.10 | 194.20 | 196.30 | 194.10 | 205.30 | 197.30 | 218.90 | 205.20 | 197.10 | 187.70 | 210.50 | 196.40 | 205.00 | 190.70 | 189.70 | 183.90 | 196.60 | 192.70 | 188.20 | 192.90 | 198.70 | 204.30 | 182.50 | 204.00 | 164.40 | 175.60 | 121.00 | 121.30 | 159.10 | NA | |
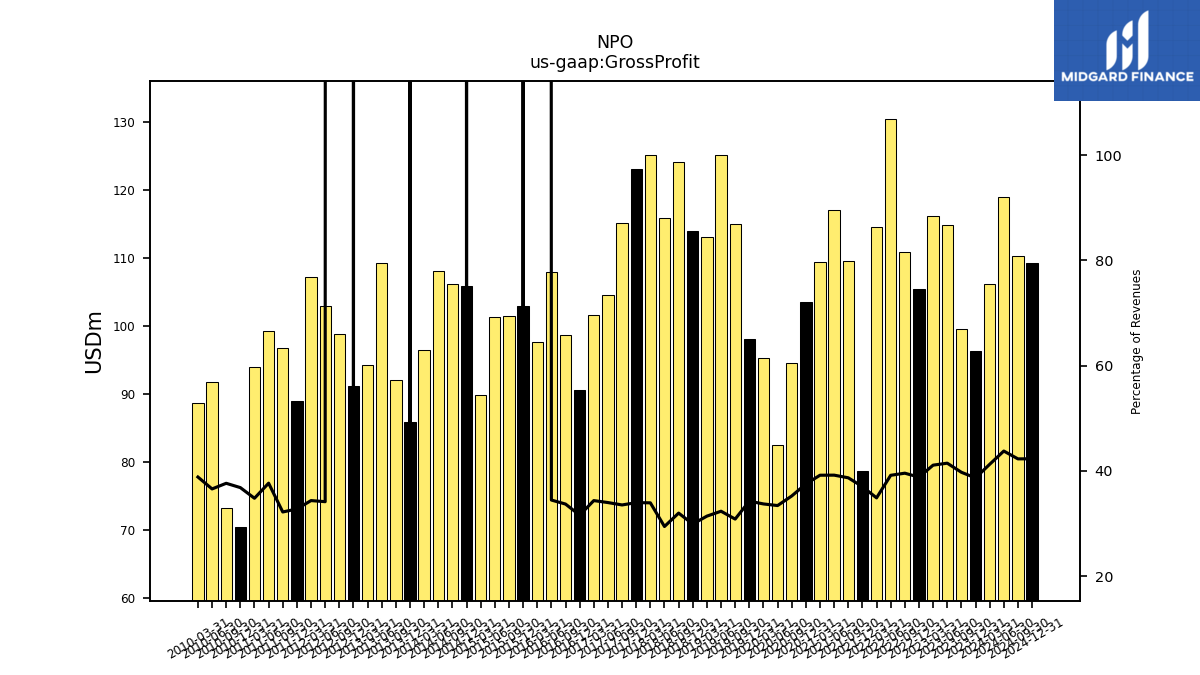
| Gross Profit | 96.30 | 99.60 | 114.80 | 116.10 | 105.50 | 110.80 | 130.50 | 114.60 | 78.70 | 109.50 | 117.00 | 109.40 | 103.50 | 94.50 | 82.50 | 95.30 | 98.10 | 115.00 | 125.10 | 113.10 | 114.00 | 124.10 | 115.80 | 125.10 | 123.10 | 115.20 | 104.50 | 101.60 | 90.60 | 98.60 | 107.90 | 97.60 | 103.00 | 101.40 | 101.30 | 89.80 | 105.90 | 106.20 | 108.10 | 96.50 | 85.80 | 92.10 | 109.20 | 94.20 | 91.10 | 98.80 | 103.00 | 107.20 | 88.90 | 96.80 | 99.30 | 94.00 | 70.50 | 73.20 | 91.70 | 88.60 | |
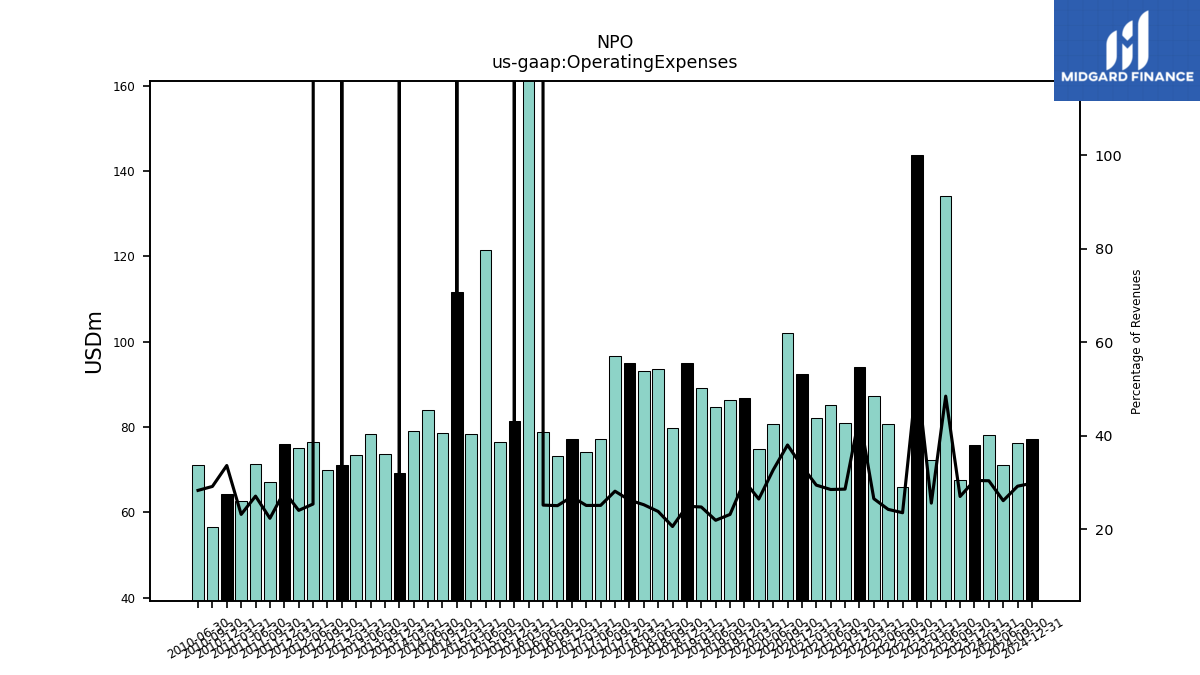
| Operating Expenses | 75.80 | 67.70 | 134.20 | 72.30 | 143.70 | 65.90 | 80.80 | 87.20 | 94.10 | 80.90 | 85.10 | 82.20 | 92.40 | 102.00 | 80.70 | 74.80 | 86.80 | 86.40 | 84.80 | 89.20 | 95.00 | 79.90 | 93.70 | 93.10 | 95.10 | 96.70 | 77.20 | 74.20 | 77.30 | 73.30 | 78.80 | 170.00 | 81.40 | 76.50 | 121.60 | 78.40 | 111.60 | 78.60 | 84.00 | 79.10 | 69.20 | 73.80 | 78.40 | 73.50 | 71.00 | 70.00 | 76.60 | 75.00 | 76.10 | 67.20 | 71.40 | 62.60 | 64.40 | 56.70 | 71.00 | NA | |
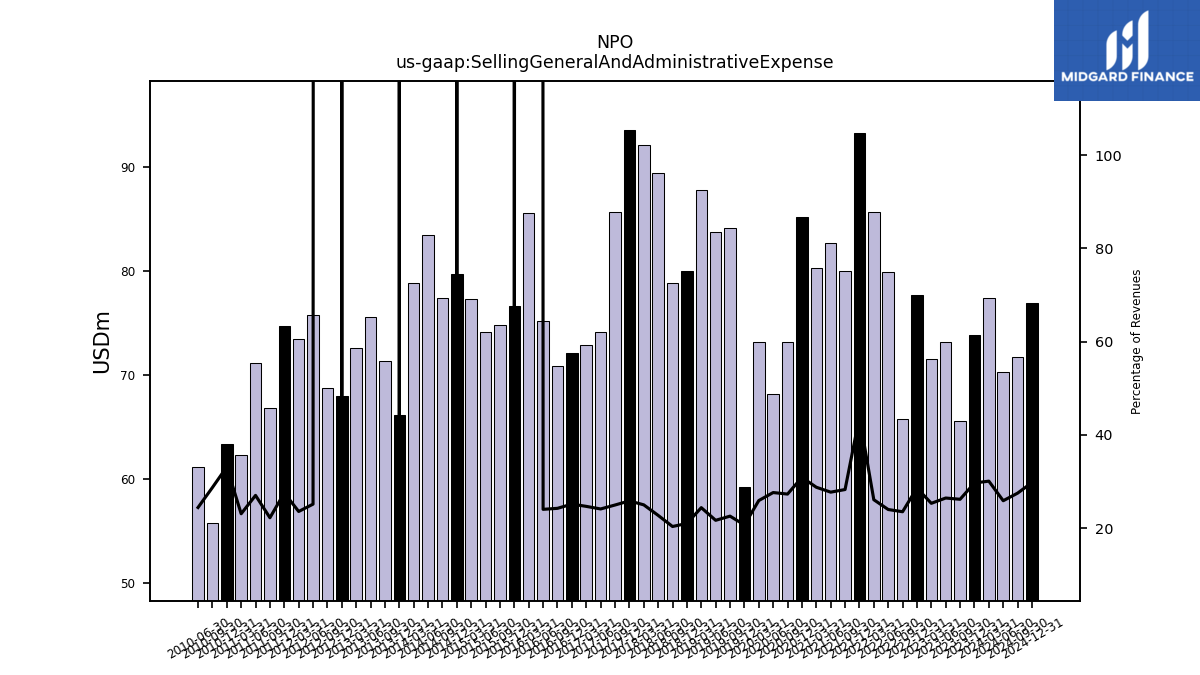
| Selling General And Administrative Expense | 73.90 | 65.60 | 73.20 | 71.50 | 77.70 | 65.80 | 79.90 | 85.70 | 93.30 | 80.00 | 82.70 | 80.30 | 85.20 | 73.20 | 68.20 | 73.20 | 59.20 | 84.10 | 83.80 | 87.80 | 80.00 | 78.90 | 89.40 | 92.10 | 93.60 | 85.70 | 74.10 | 72.90 | 72.10 | 70.90 | 75.20 | 85.60 | 76.60 | 74.80 | 74.10 | 77.30 | 79.70 | 77.40 | 83.50 | 78.90 | 66.20 | 71.40 | 75.60 | 72.60 | 68.00 | 68.80 | 75.80 | 73.50 | 74.70 | 66.80 | 71.20 | 62.30 | 63.40 | 55.80 | 61.20 | NA | |
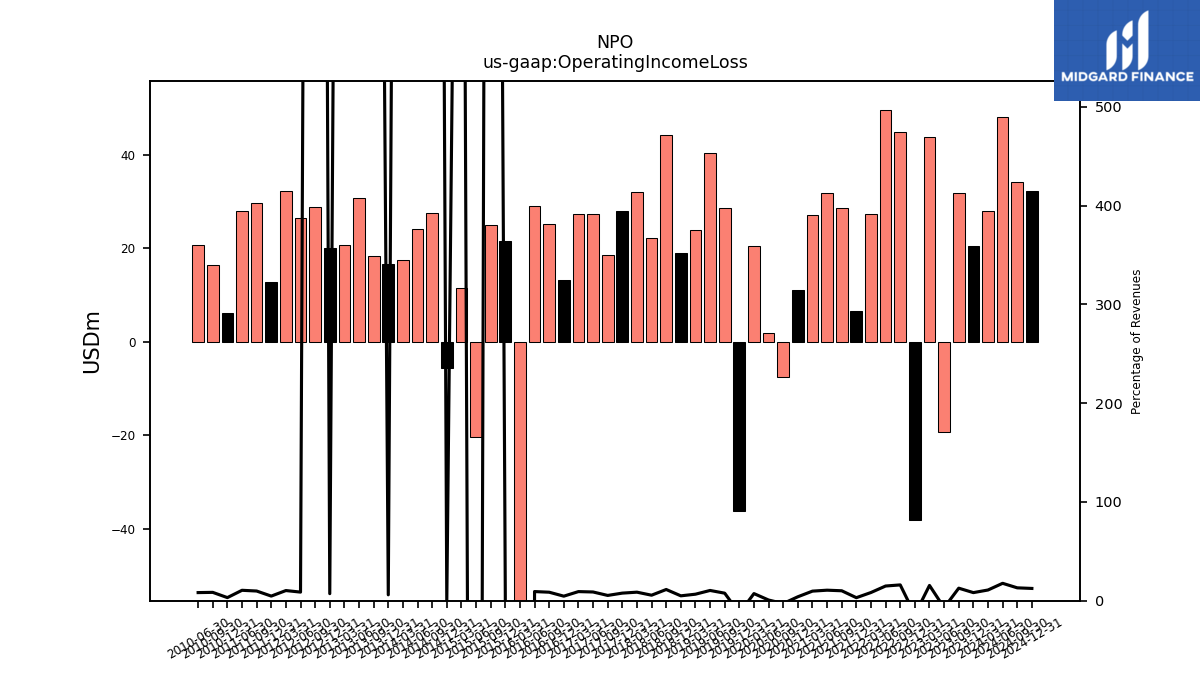
| Operating Income Loss | 20.50 | 31.90 | -19.40 | 43.80 | -38.20 | 44.90 | 49.70 | 27.40 | 6.60 | 28.60 | 31.90 | 27.20 | 11.10 | -7.50 | 1.80 | 20.50 | -36.20 | 28.60 | 40.30 | 23.90 | 19.00 | 44.20 | 22.10 | 32.00 | 28.00 | 18.50 | 27.30 | 27.40 | 13.30 | 25.30 | 29.10 | -72.40 | 21.60 | 24.90 | -20.30 | 11.40 | -5.70 | 27.60 | 24.10 | 17.40 | 16.60 | 18.30 | 30.80 | 20.70 | 20.10 | 28.80 | 26.40 | 32.20 | 12.80 | 29.60 | 27.90 | NA | 6.10 | 16.50 | 20.70 | NA | |
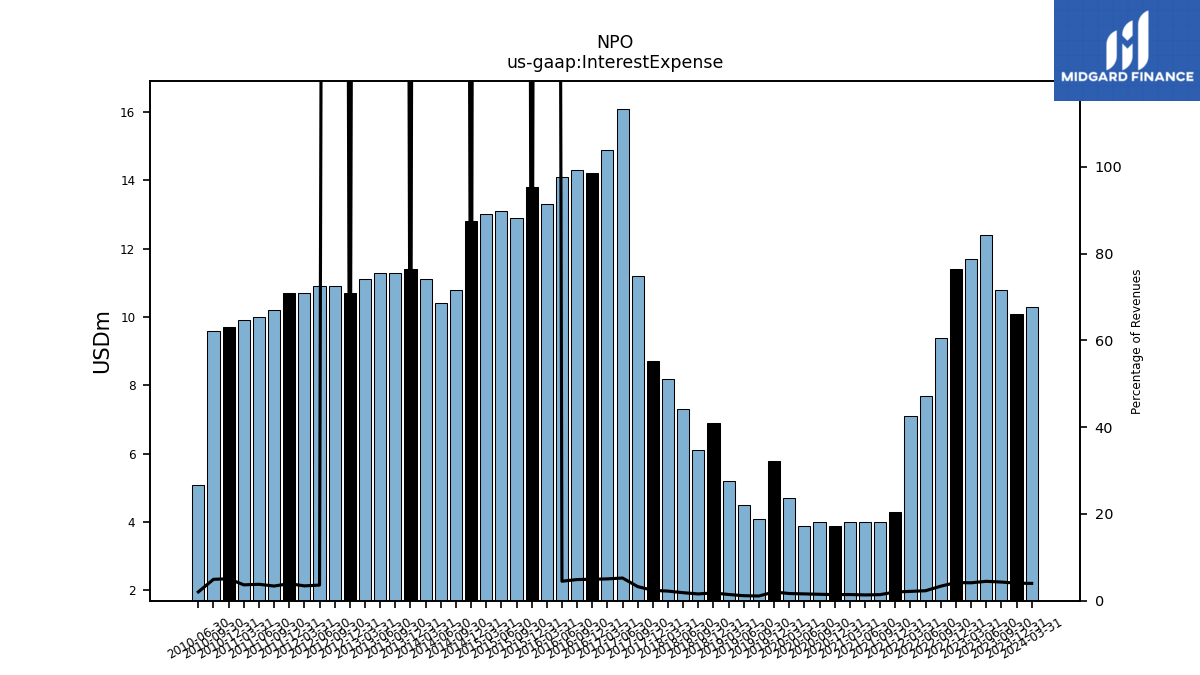
| Interest Expense | 10.10 | 10.80 | 12.40 | 11.70 | 11.40 | 9.40 | 7.70 | 7.10 | 4.30 | 4.00 | 4.00 | 4.00 | 3.90 | 4.00 | 3.90 | 4.70 | 5.80 | 4.10 | 4.50 | 5.20 | 6.90 | 6.10 | 7.30 | 8.20 | 8.70 | 11.20 | 16.10 | 14.90 | 14.20 | 14.30 | 14.10 | 13.30 | 13.80 | 12.90 | 13.10 | 13.00 | 12.80 | 10.80 | 10.40 | 11.10 | 11.40 | 11.30 | 11.30 | 11.10 | 10.70 | 10.90 | 10.90 | 10.70 | 10.70 | 10.20 | 10.00 | 9.90 | 9.70 | 9.60 | 5.10 | NA | |
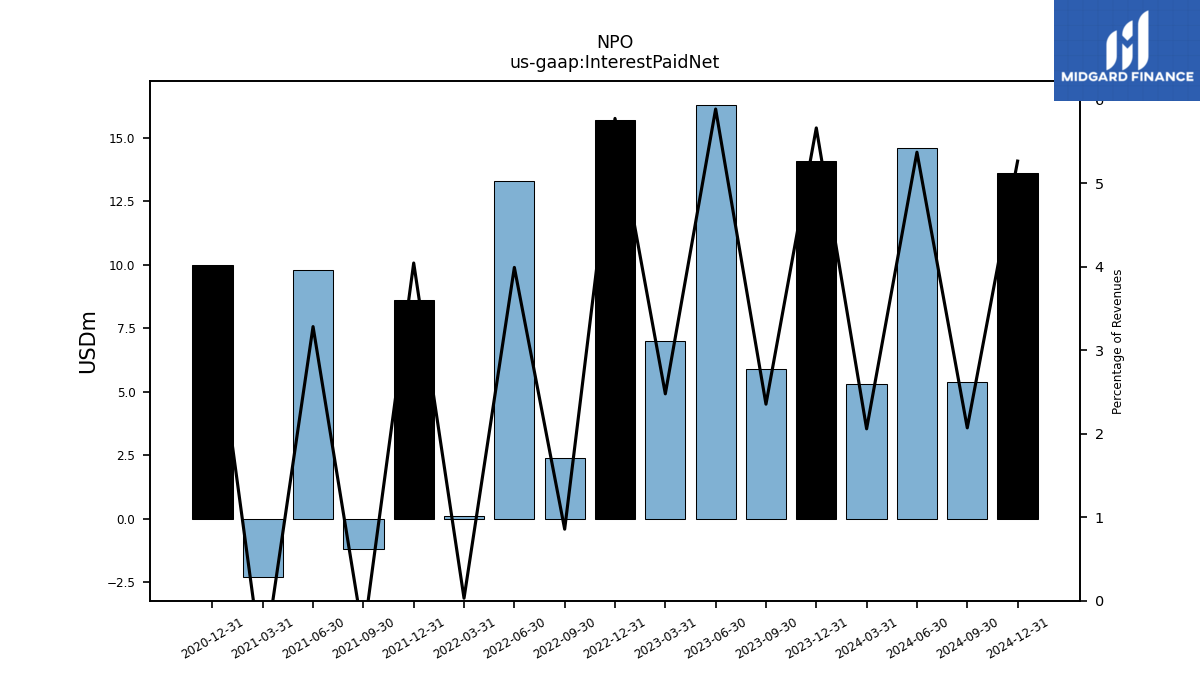
| Interest Paid Net | 14.10 | 5.90 | 16.30 | 7.00 | 15.70 | 2.40 | 13.30 | 0.10 | 8.60 | -1.20 | 9.80 | -2.30 | 10.00 | NA | NA | NA | NA | NA | NA | NA | NA | NA | NA | NA | NA | NA | NA | NA | NA | NA | NA | NA | NA | NA | NA | NA | NA | NA | NA | NA | NA | NA | NA | NA | NA | NA | NA | NA | NA | NA | NA | NA | NA | NA | NA | NA | |
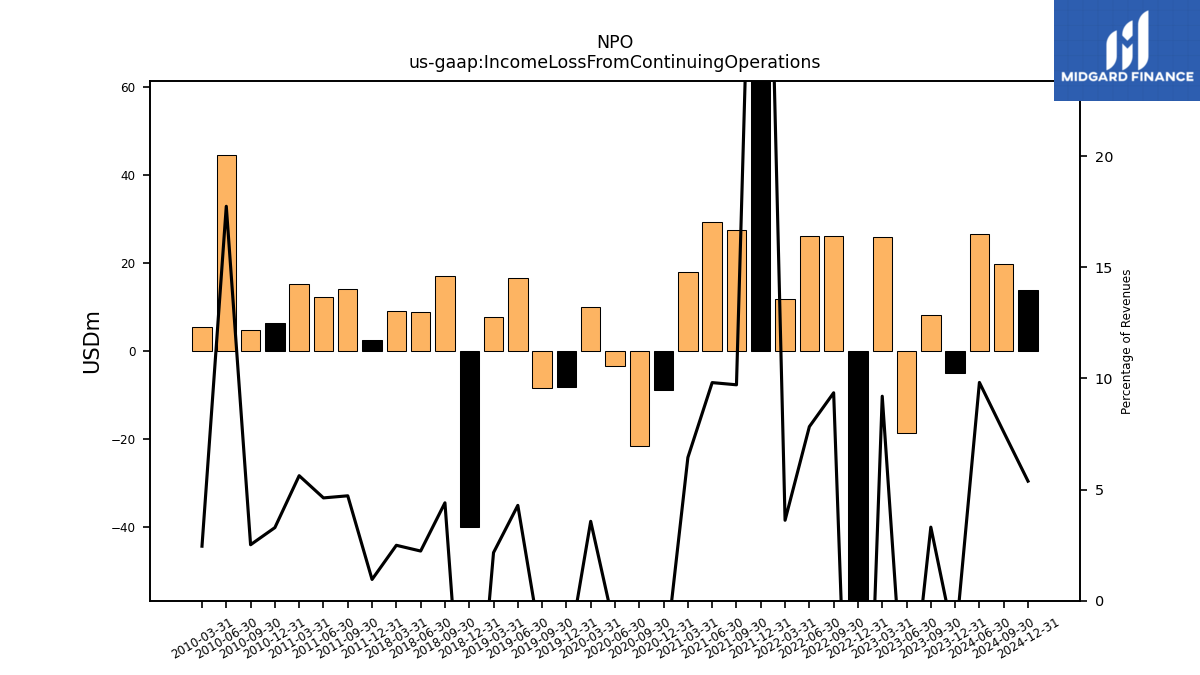
| Income Loss From Continuing Operations | -4.90 | 8.30 | -18.60 | 26.00 | -57.50 | 26.20 | 26.10 | 11.90 | 102.40 | 27.50 | 29.30 | 18.00 | -8.90 | -21.60 | -3.30 | 10.10 | -8.20 | -8.40 | 16.60 | 7.80 | -39.80 | 17.10 | 8.80 | 9.20 | NA | NA | NA | NA | NA | NA | NA | NA | NA | NA | NA | NA | NA | NA | NA | NA | NA | NA | NA | NA | NA | NA | NA | NA | 2.60 | 14.20 | 12.20 | 15.20 | 6.30 | 4.90 | 44.50 | 5.60 | |
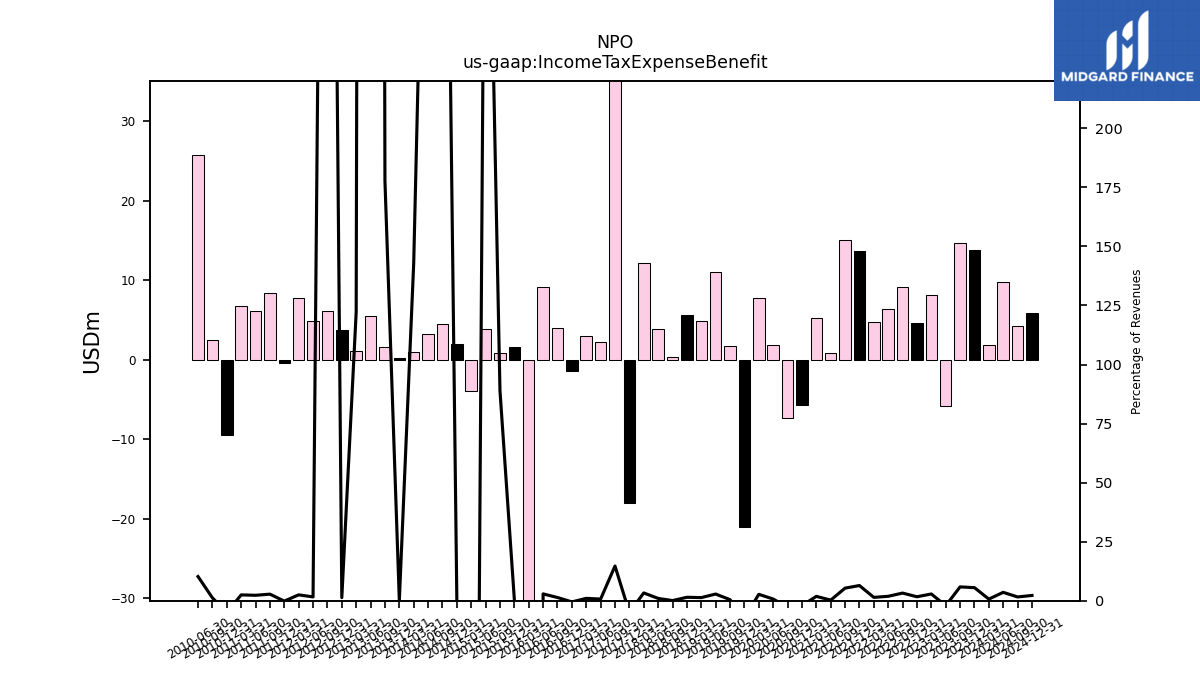
| Income Tax Expense Benefit | 13.80 | 14.70 | -5.80 | 8.10 | 4.60 | 9.10 | 6.30 | 4.70 | 13.70 | 15.10 | 0.80 | 5.20 | -5.70 | -7.30 | 1.80 | 7.70 | -21.00 | 1.70 | 11.00 | 4.80 | 5.60 | 0.30 | 3.90 | 12.20 | -18.00 | 50.50 | 2.20 | 3.00 | -1.40 | 4.00 | 9.10 | -40.30 | 1.60 | 0.80 | 3.90 | -4.00 | 1.90 | 4.50 | 3.20 | 1.00 | 0.20 | 1.60 | 5.50 | 1.10 | 3.70 | 6.10 | 4.90 | 7.80 | -0.40 | 8.40 | 6.10 | 6.70 | -9.50 | 2.40 | 25.70 | NA | |
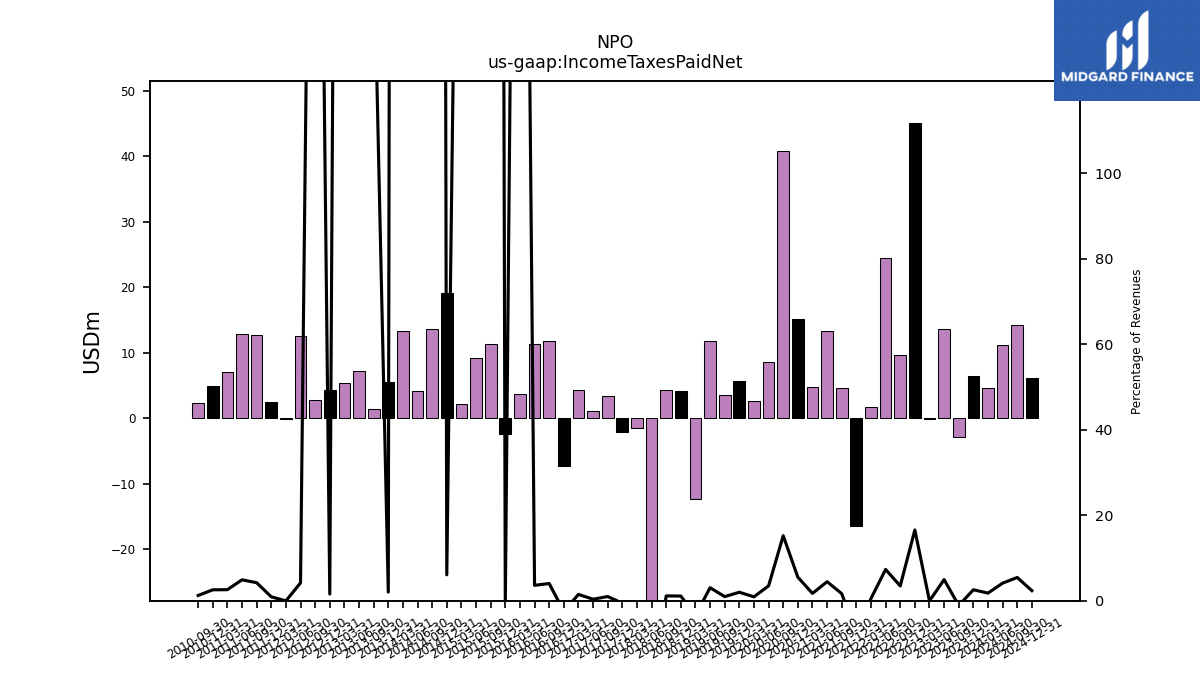
| Income Taxes Paid Net | 6.40 | -2.80 | 13.70 | -0.10 | 45.00 | 9.70 | 24.40 | 1.70 | -16.40 | 4.70 | 13.30 | 4.80 | 15.20 | 40.80 | 8.60 | 2.60 | 5.70 | 3.60 | 11.80 | -12.30 | 4.20 | 4.40 | -84.70 | -1.40 | -2.10 | 3.40 | 1.10 | 4.40 | -7.20 | 11.80 | 11.30 | 3.70 | -2.40 | 11.40 | 9.20 | 2.20 | 19.20 | 13.60 | 4.20 | 13.30 | 5.60 | 1.40 | 7.20 | 5.40 | 4.40 | 2.80 | 12.60 | -0.10 | 2.50 | 12.70 | 12.90 | 7.00 | 4.90 | 2.40 | NA | NA | |
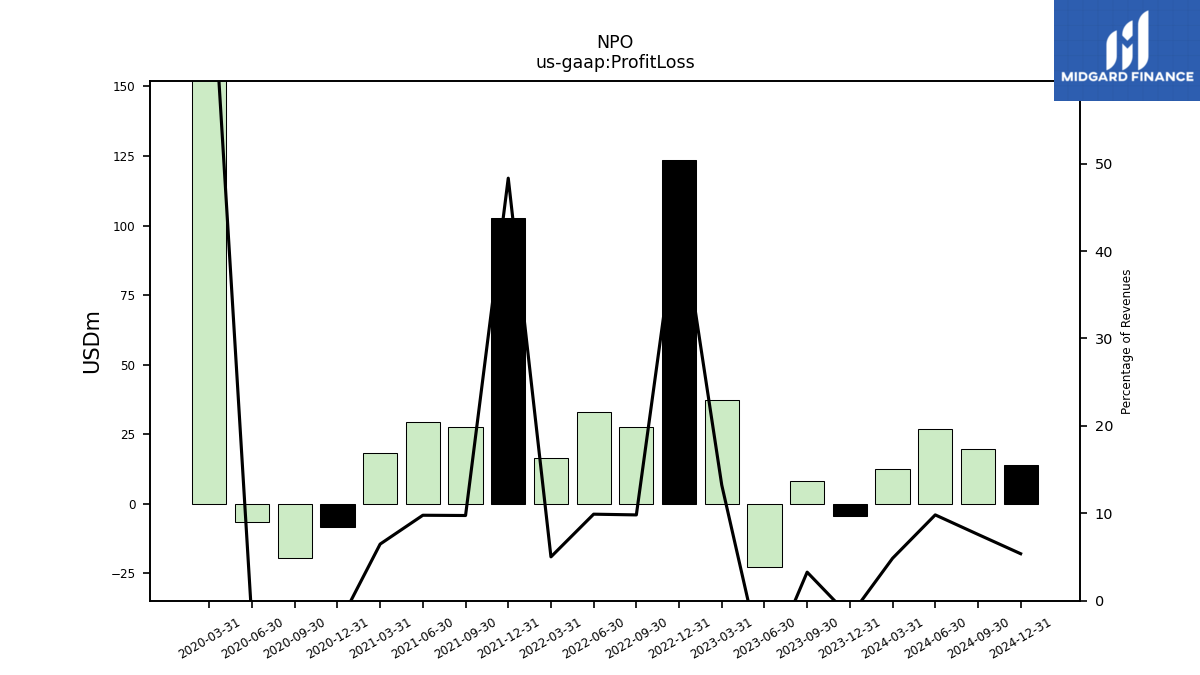
| Profit Loss | -4.50 | 8.20 | -22.80 | 37.40 | 123.40 | 27.50 | 33.00 | 16.50 | 102.80 | 27.60 | 29.20 | 18.10 | -8.20 | -19.40 | -6.40 | 218.80 | NA | NA | NA | NA | NA | NA | NA | NA | NA | NA | NA | NA | NA | NA | NA | NA | NA | NA | NA | NA | NA | NA | NA | NA | NA | NA | NA | NA | NA | NA | NA | NA | NA | NA | NA | NA | NA | NA | NA | NA | |
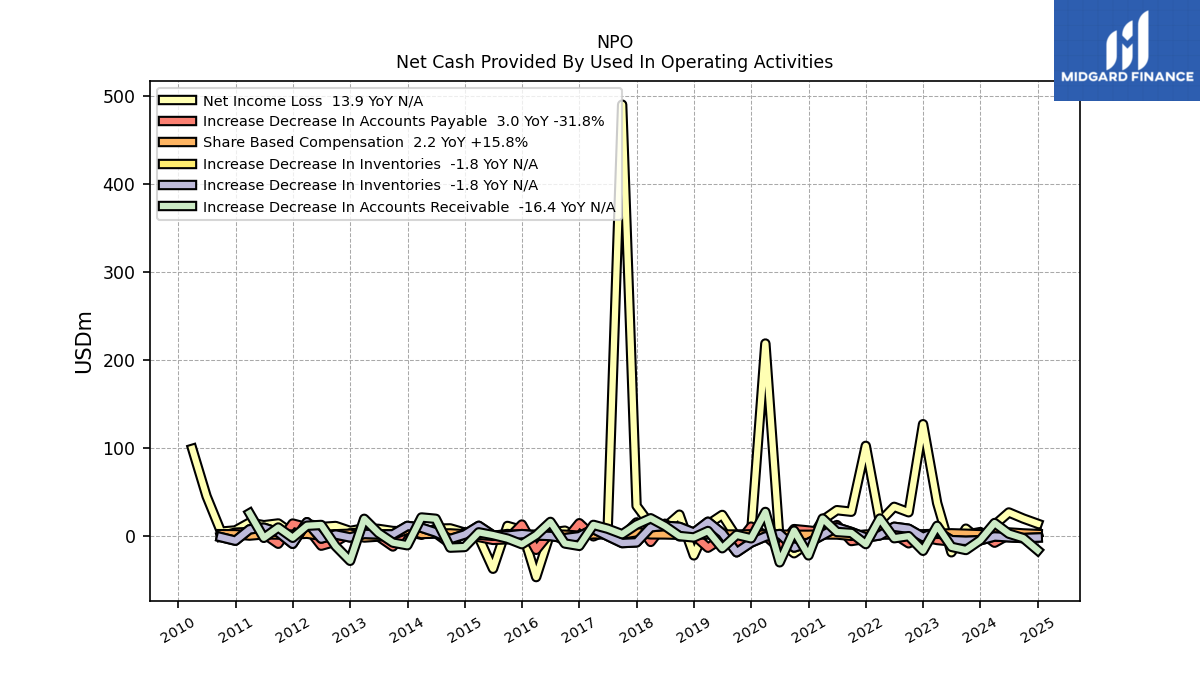
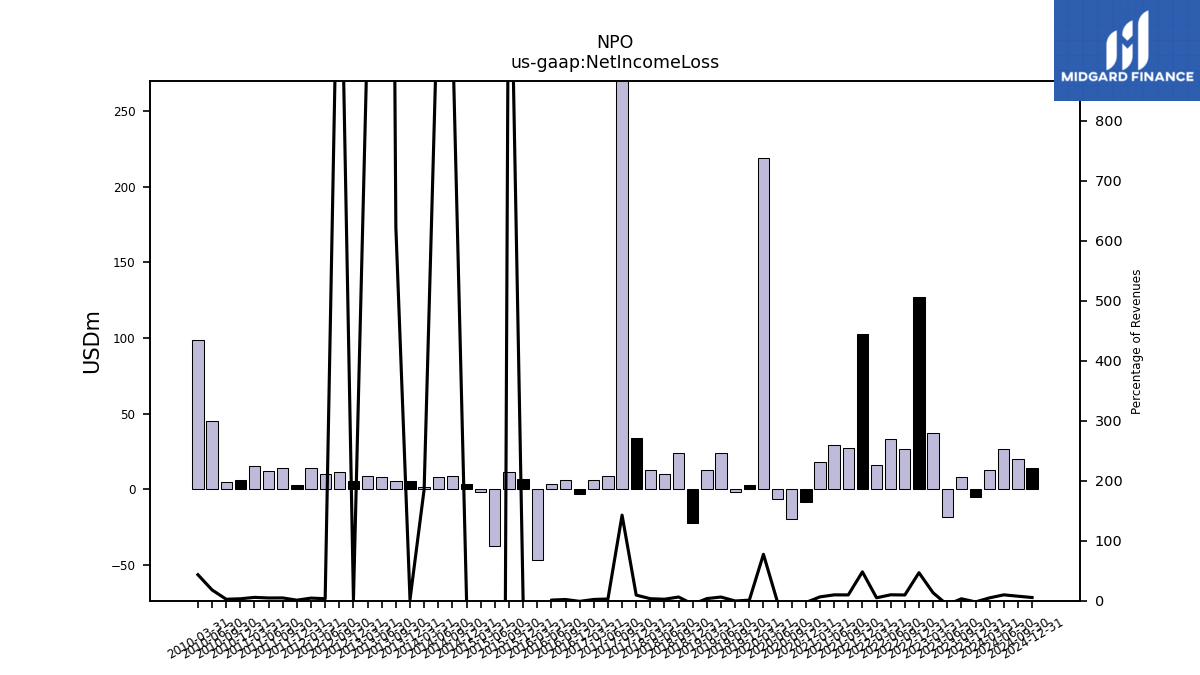
| Net Income Loss | -4.90 | 8.30 | -18.60 | 37.40 | 127.00 | 26.90 | 33.10 | 16.20 | 102.40 | 27.50 | 29.30 | 18.00 | -8.10 | -19.70 | -6.50 | 218.70 | 2.80 | -1.50 | 23.90 | 13.10 | -22.10 | 24.20 | 9.90 | 12.60 | 34.20 | 490.20 | 9.00 | 6.40 | -2.90 | 6.00 | 3.60 | -46.80 | 6.60 | 11.40 | -37.30 | -1.60 | 3.80 | 8.60 | 8.30 | 1.30 | 5.20 | 5.60 | 8.00 | 8.60 | 5.70 | 11.30 | 10.20 | 13.80 | 2.60 | 14.20 | 12.20 | 15.20 | 6.30 | 4.90 | 45.20 | 99.00 | |
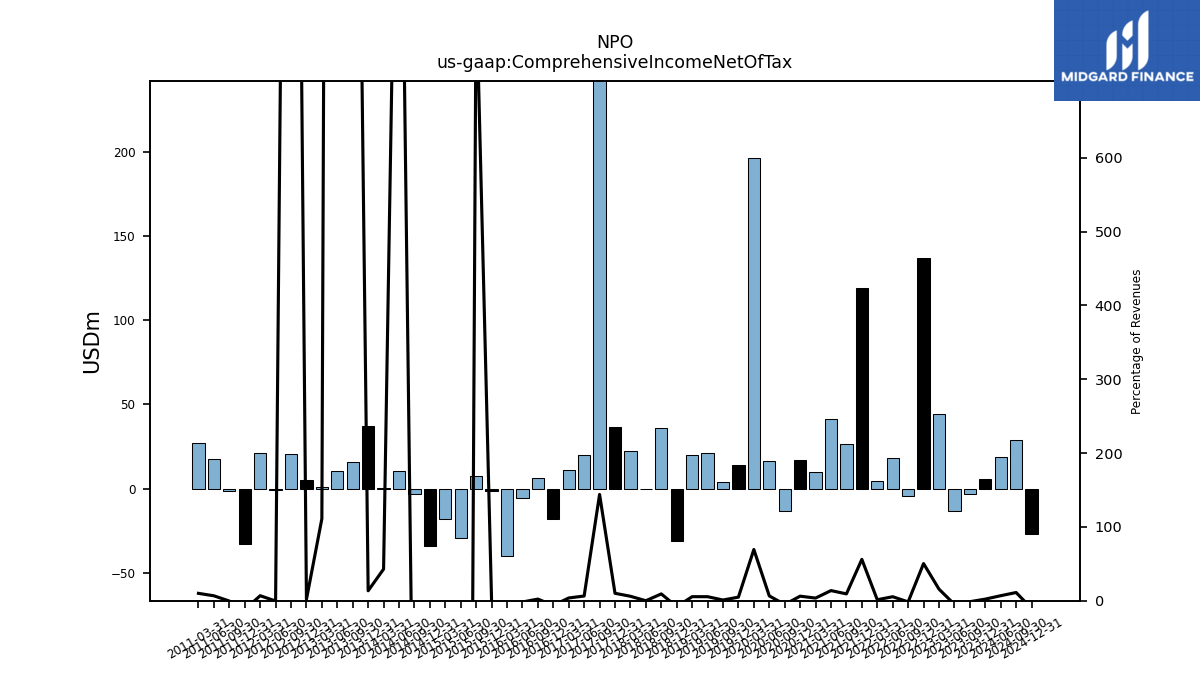
| Comprehensive Income Net Of Tax | 5.50 | -3.20 | -13.50 | 44.50 | 136.90 | -4.40 | 18.20 | 4.50 | 119.20 | 26.30 | 41.10 | 10.10 | 17.10 | -13.60 | 16.20 | 196.20 | 14.00 | 3.70 | 21.30 | 19.90 | -30.90 | 36.00 | 0.00 | 22.40 | 36.60 | 494.90 | 19.70 | 11.10 | -18.30 | 6.60 | -5.30 | -39.90 | -1.40 | 7.50 | -29.20 | -17.80 | -33.90 | -3.20 | 10.30 | 0.30 | 37.30 | 15.80 | 10.70 | 1.00 | 5.00 | 20.50 | -1.10 | 21.30 | -32.70 | -1.20 | 17.70 | 27.10 | NA | NA | NA | NA | |
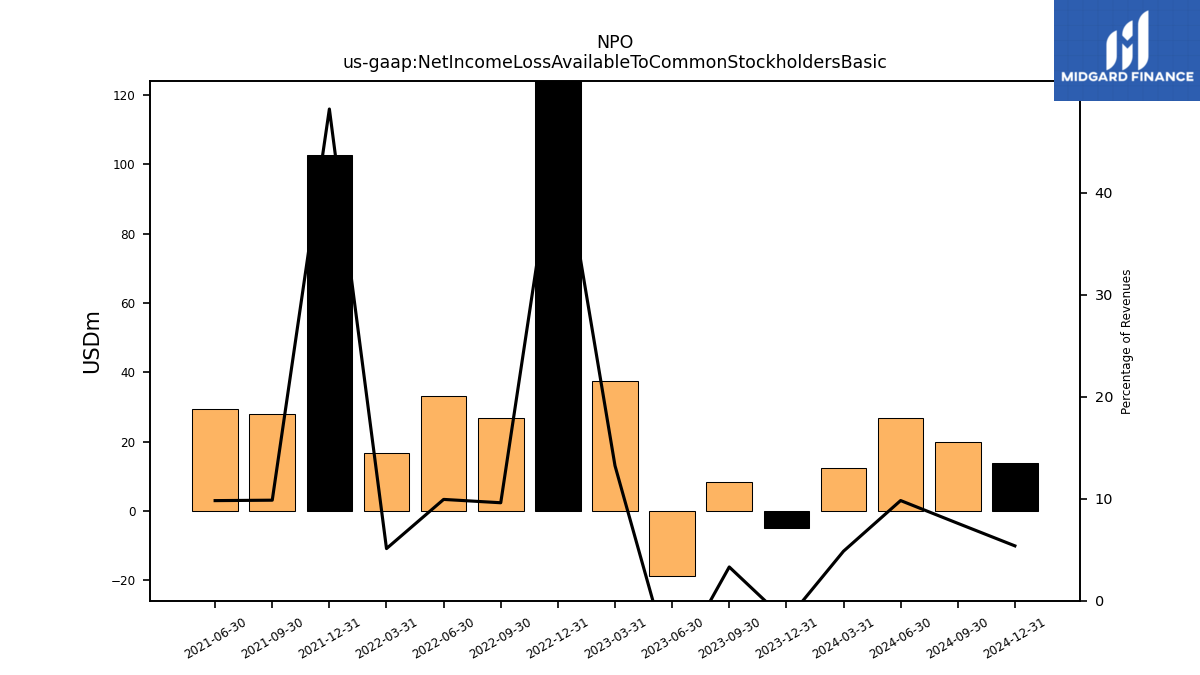
| Net Income Loss Available To Common Stockholders Basic | -4.90 | 8.30 | -18.60 | 37.40 | 127.00 | 26.90 | 33.10 | 16.80 | 102.50 | 27.90 | 29.30 | NA | NA | NA | NA | NA | NA | NA | NA | NA | NA | NA | NA | NA | NA | NA | NA | NA | NA | NA | NA | NA | NA | NA | NA | NA | NA | NA | NA | NA | NA | NA | NA | NA | NA | NA | NA | NA | NA | NA | NA | NA | NA | NA | NA | NA | |
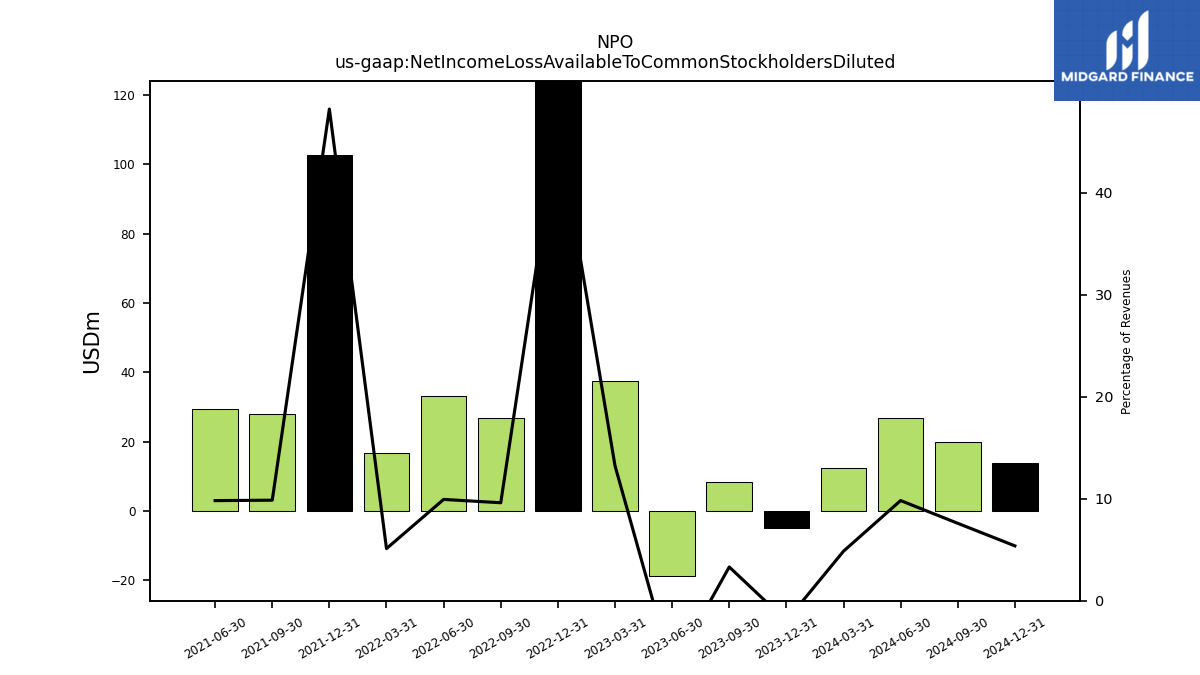
| Net Income Loss Available To Common Stockholders Diluted | -4.90 | 8.30 | -18.60 | 37.40 | 127.00 | 26.90 | 33.10 | 16.80 | 102.50 | 27.90 | 29.30 | NA | NA | NA | NA | NA | NA | NA | NA | NA | NA | NA | NA | NA | NA | NA | NA | NA | NA | NA | NA | NA | NA | NA | NA | NA | NA | NA | NA | NA | NA | NA | NA | NA | NA | NA | NA | NA | NA | NA | NA | NA | NA | NA | NA | NA | |
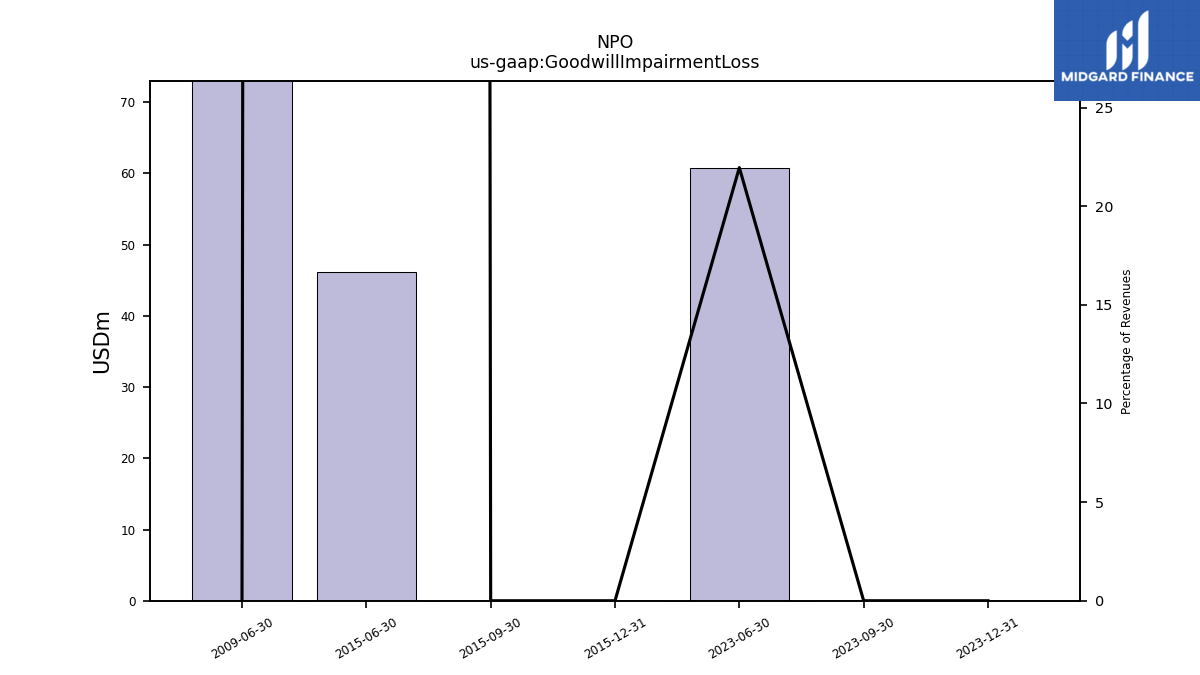
| Goodwill Impairment Loss | 0.00 | 0.00 | 60.80 | NA | NA | NA | NA | NA | NA | NA | NA | NA | NA | NA | NA | NA | NA | NA | NA | NA | NA | NA | NA | NA | NA | NA | NA | NA | NA | NA | NA | NA | 0.00 | 0.00 | 46.10 | NA | NA | NA | NA | NA | NA | NA | NA | NA | NA | NA | NA | NA | NA | NA | NA | NA | NA | NA | NA | NA |
| 2023-12-31 | 2023-09-30 | 2023-06-30 | 2023-03-31 | 2022-12-31 | 2022-09-30 | 2022-06-30 | 2022-03-31 | 2021-12-31 | 2021-09-30 | 2021-06-30 | 2021-03-31 | 2020-12-31 | 2020-09-30 | 2020-06-30 | 2020-03-31 | 2019-12-31 | 2019-09-30 | 2019-06-30 | 2019-03-31 | 2018-12-31 | 2018-09-30 | 2018-06-30 | 2018-03-31 | 2017-12-31 | 2017-09-30 | 2017-06-30 | 2017-03-31 | 2016-12-31 | 2016-09-30 | 2016-06-30 | 2016-03-31 | 2015-12-31 | 2015-09-30 | 2015-06-30 | 2015-03-31 | 2014-12-31 | 2014-09-30 | 2014-06-30 | 2014-03-31 | 2013-12-31 | 2013-09-30 | 2013-06-30 | 2013-03-31 | 2012-12-31 | 2012-09-30 | 2012-06-30 | 2012-03-31 | 2011-12-31 | 2011-09-30 | 2011-06-30 | 2011-03-31 | 2010-12-31 | 2010-09-30 | 2010-06-30 | 2010-03-31 | ||
|---|---|---|---|---|---|---|---|---|---|---|---|---|---|---|---|---|---|---|---|---|---|---|---|---|---|---|---|---|---|---|---|---|---|---|---|---|---|---|---|---|---|---|---|---|---|---|---|---|---|---|---|---|---|---|---|---|---|
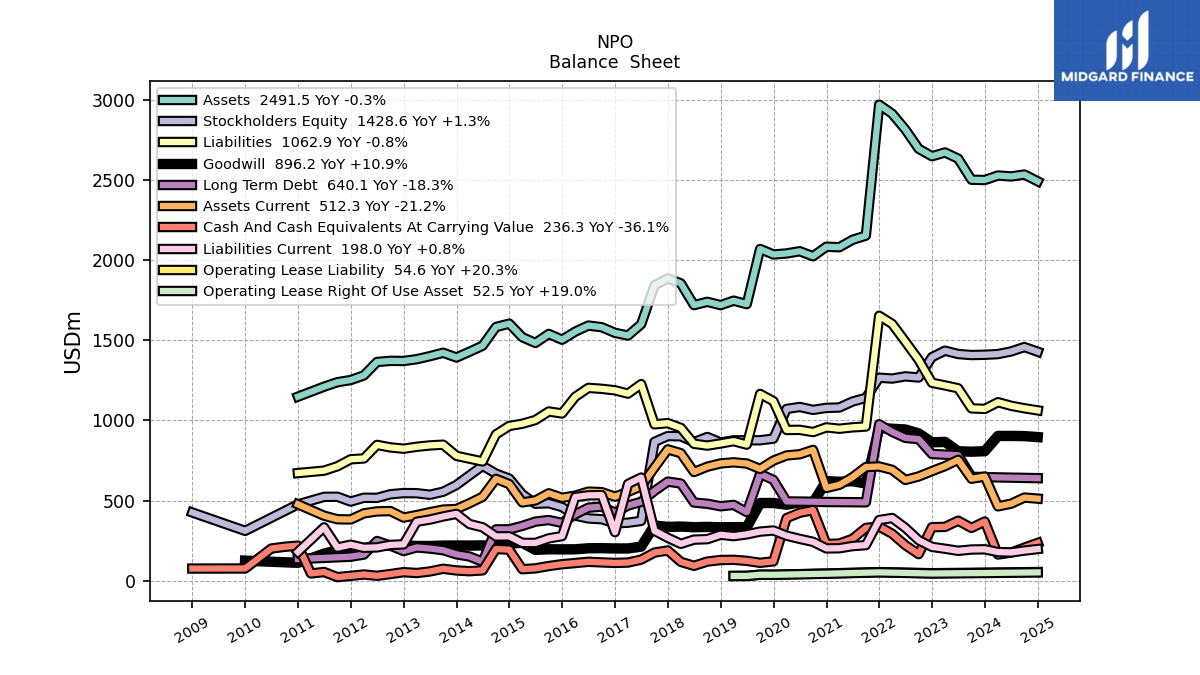
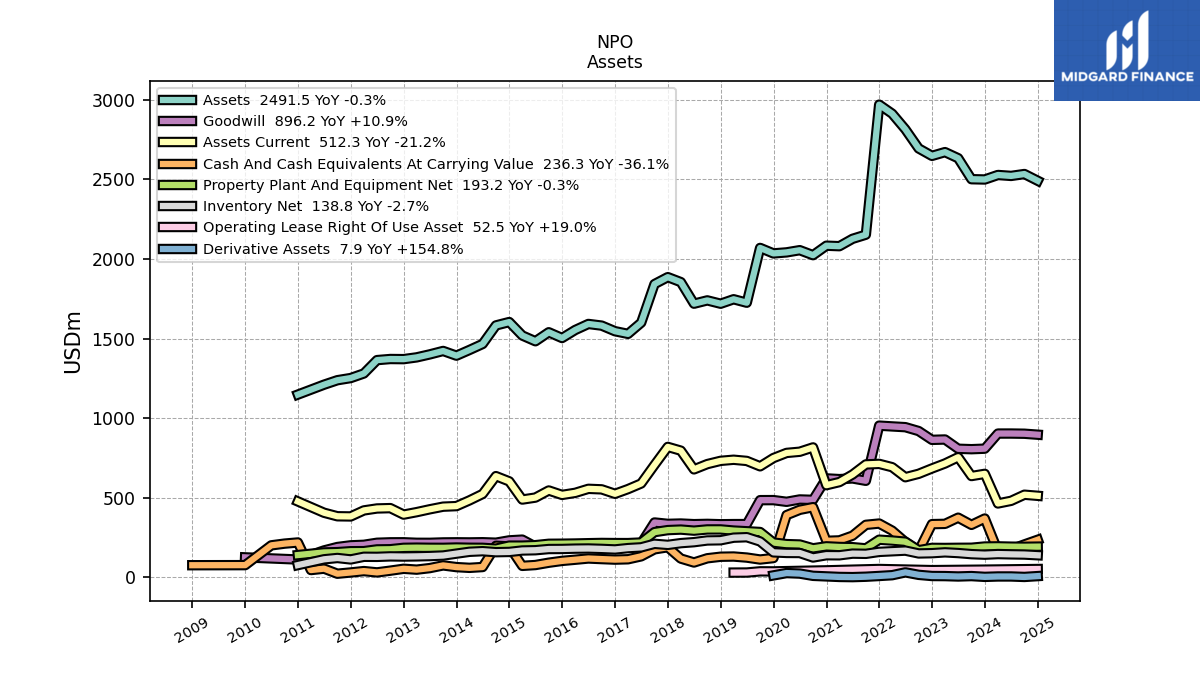
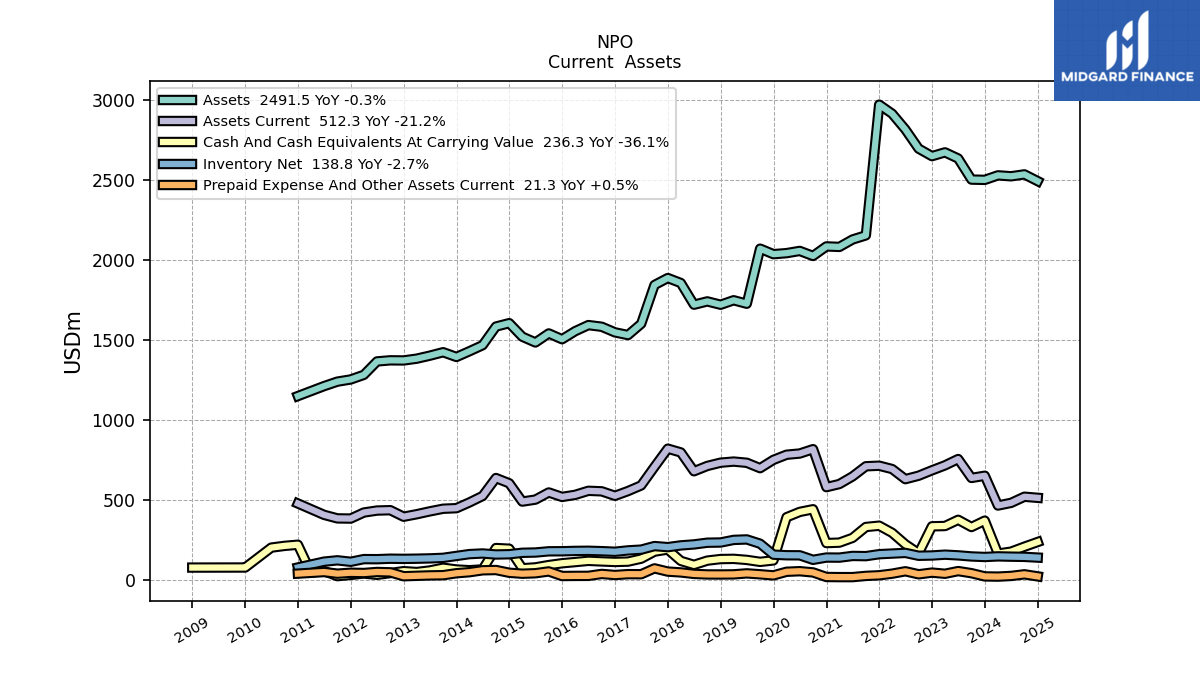
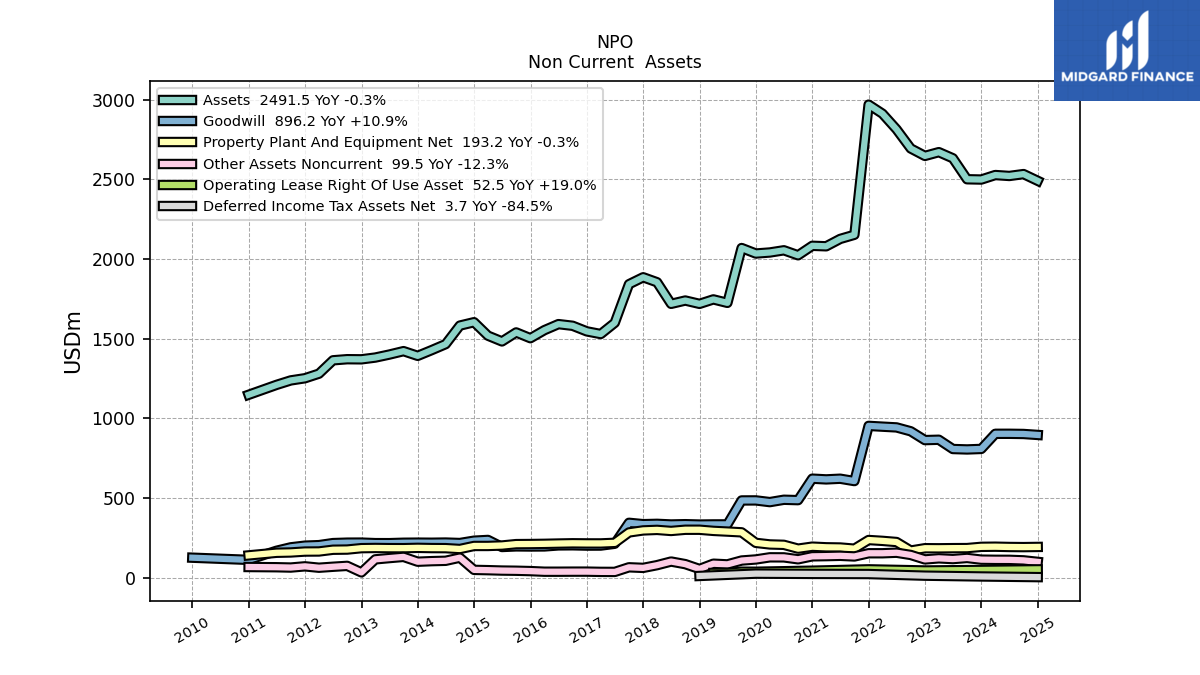
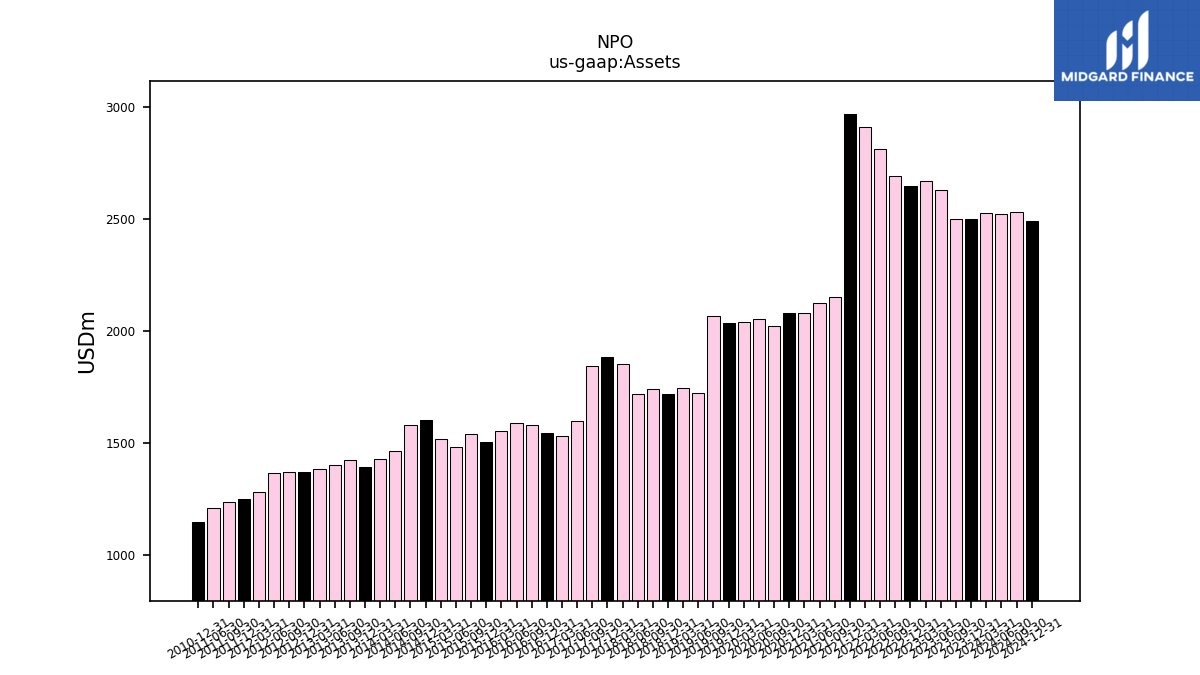
| Assets | 2499.50 | 2501.30 | 2633.10 | 2671.50 | 2647.80 | 2694.60 | 2814.70 | 2912.80 | 2969.80 | 2152.70 | 2126.80 | 2080.50 | 2083.60 | 2024.00 | 2055.40 | 2041.60 | 2035.10 | 2069.70 | 1725.30 | 1747.10 | 1719.10 | 1740.00 | 1719.20 | 1854.80 | 1886.10 | 1842.40 | 1600.10 | 1529.60 | 1546.40 | 1581.50 | 1591.90 | 1554.00 | 1498.80 | 1539.80 | 1483.30 | 1519.40 | 1604.00 | 1582.70 | 1466.20 | 1428.50 | 1392.70 | 1422.30 | 1400.80 | 1382.00 | 1370.90 | 1371.70 | 1364.80 | 1280.90 | 1252.10 | 1238.50 | 1210.50 | NA | 1148.30 | NA | NA | NA | |
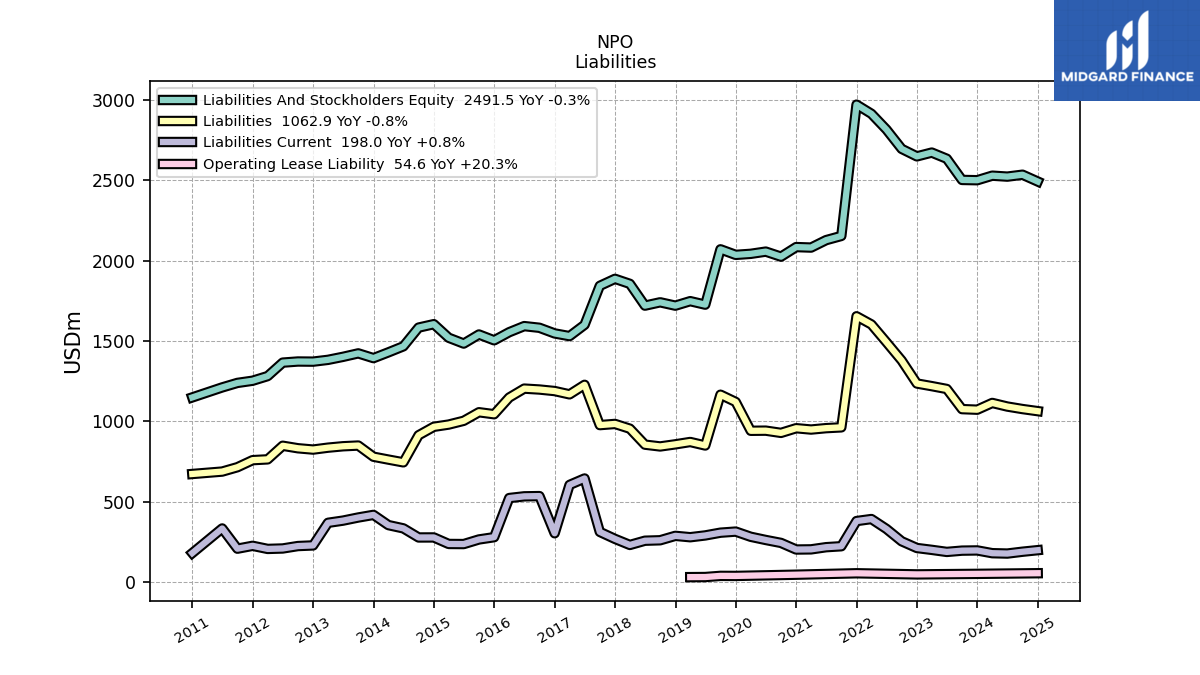
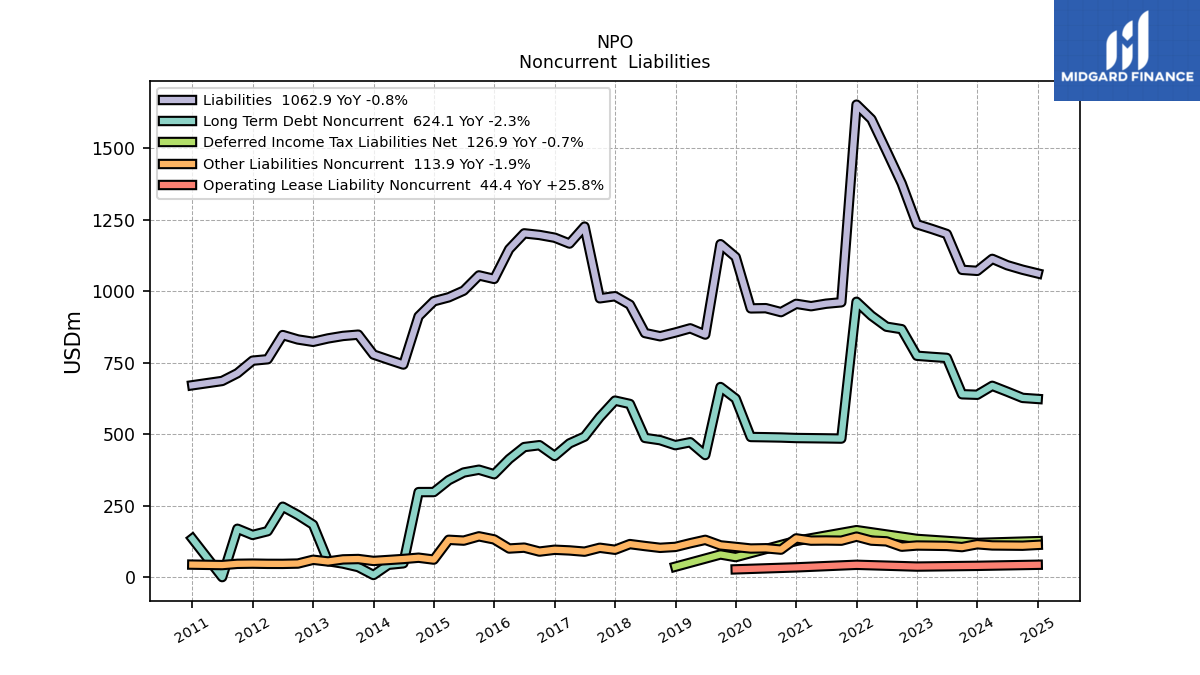
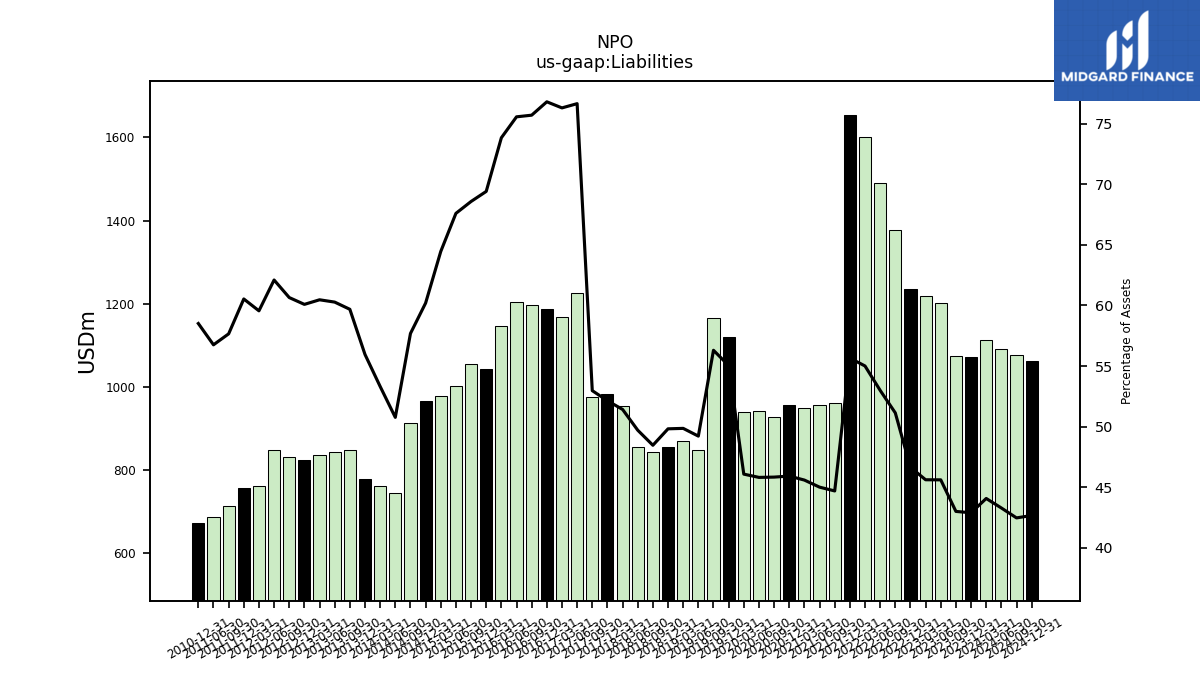
| Liabilities | 1071.90 | 1075.50 | 1200.80 | 1218.50 | 1234.80 | 1377.80 | 1491.60 | 1602.20 | 1653.10 | 962.00 | 957.10 | 948.40 | 956.70 | 927.60 | 941.50 | 940.70 | 1120.20 | 1165.30 | 849.10 | 871.00 | 856.40 | 843.20 | 854.50 | 953.70 | 983.30 | 975.90 | 1226.70 | 1167.30 | 1187.90 | 1197.40 | 1203.10 | 1147.60 | 1039.00 | 1056.10 | 1002.80 | 979.40 | 965.60 | 913.00 | 744.30 | 761.60 | 779.30 | 848.90 | 844.40 | 835.70 | 823.80 | 832.00 | 847.60 | 762.90 | 758.00 | 714.10 | 687.00 | NA | 671.90 | NA | NA | NA | |
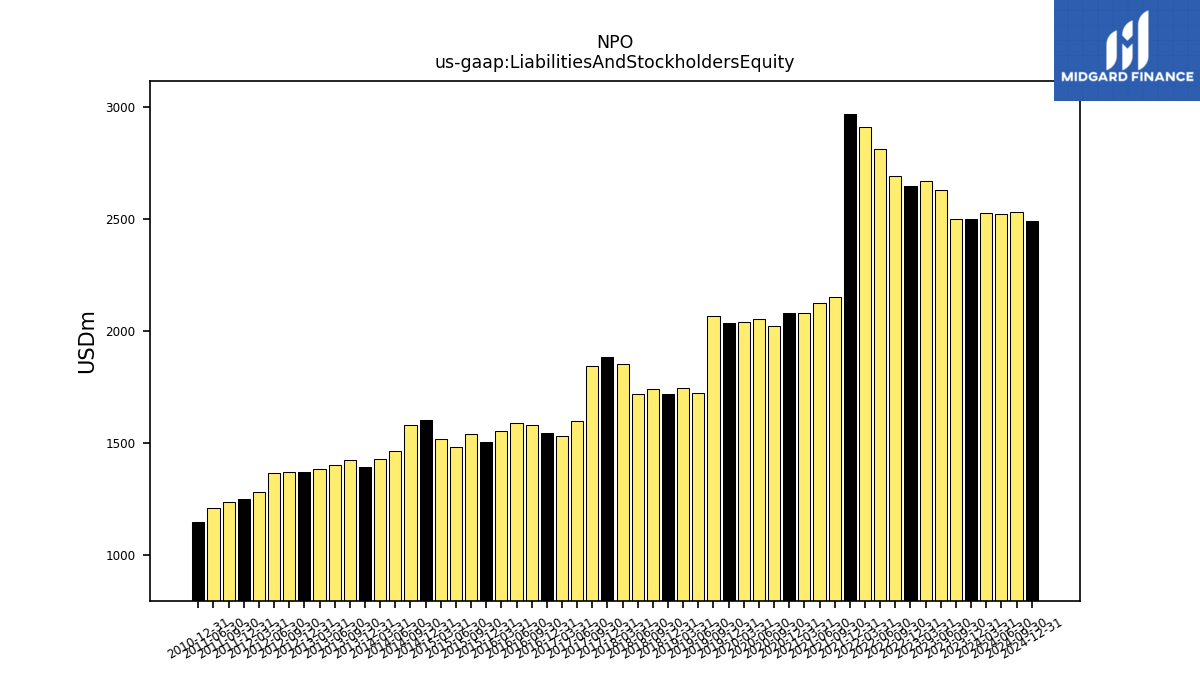
| Liabilities And Stockholders Equity | 2499.50 | 2501.30 | 2633.10 | 2671.50 | 2647.80 | 2694.60 | 2814.70 | 2912.80 | 2969.80 | 2152.70 | 2126.80 | 2080.50 | 2083.60 | 2024.00 | 2055.40 | 2041.60 | 2035.10 | 2069.70 | 1725.30 | 1747.10 | 1719.10 | 1740.00 | 1719.20 | 1854.80 | 1886.10 | 1842.40 | 1600.10 | 1529.60 | 1546.40 | 1581.50 | 1591.90 | 1554.00 | 1498.80 | 1539.80 | 1483.30 | 1519.40 | 1604.00 | 1582.70 | 1466.20 | 1428.50 | 1392.70 | 1422.30 | 1400.80 | 1382.00 | 1370.90 | 1371.70 | 1364.80 | 1280.90 | 1252.10 | 1238.50 | 1210.50 | NA | 1148.30 | NA | NA | NA | |
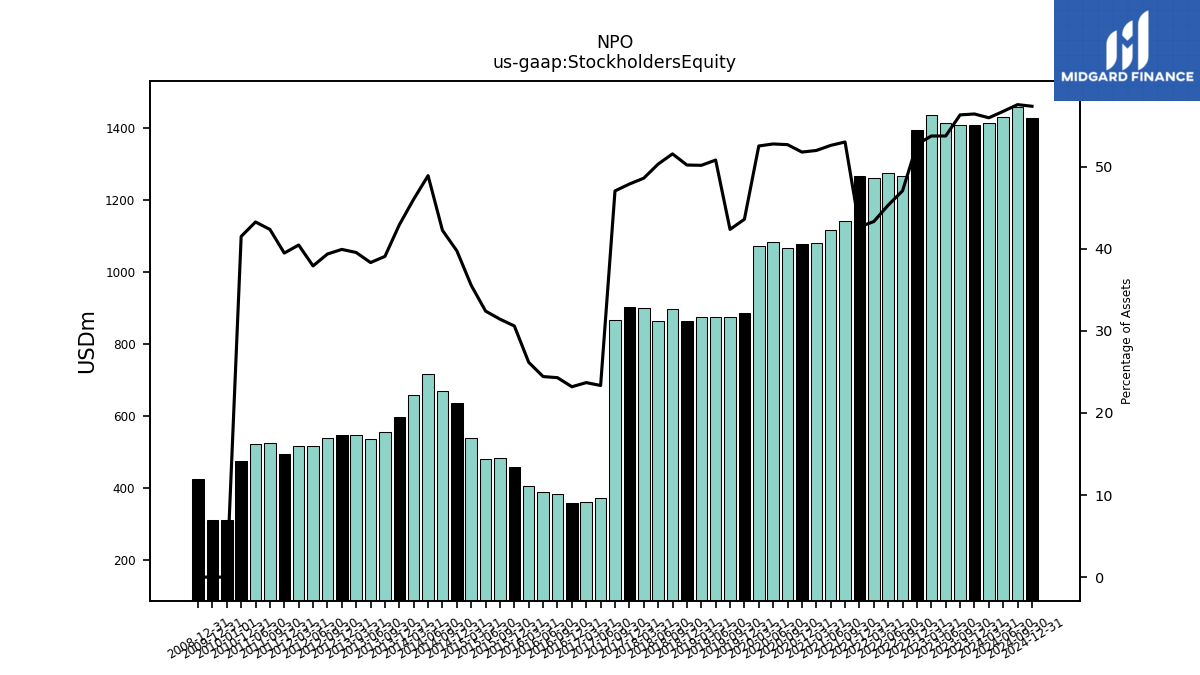
| Stockholders Equity | 1409.70 | 1407.90 | 1414.40 | 1435.10 | 1395.10 | 1267.80 | 1275.00 | 1261.30 | 1266.60 | 1140.70 | 1118.10 | 1080.90 | 1078.50 | 1065.90 | 1084.20 | 1071.90 | 886.90 | 876.40 | 876.20 | 876.10 | 862.70 | 896.80 | 864.70 | 901.10 | 902.80 | 866.50 | 373.40 | 362.30 | 358.50 | 384.10 | 388.80 | 406.40 | 459.80 | 483.70 | 480.50 | 539.90 | 637.40 | 668.40 | 716.80 | 657.50 | 597.50 | 555.50 | 536.60 | 546.30 | 547.10 | 539.70 | 517.20 | 518.00 | 494.10 | 524.40 | 523.50 | NA | 476.40 | NA | NA | NA |
| 2023-12-31 | 2023-09-30 | 2023-06-30 | 2023-03-31 | 2022-12-31 | 2022-09-30 | 2022-06-30 | 2022-03-31 | 2021-12-31 | 2021-09-30 | 2021-06-30 | 2021-03-31 | 2020-12-31 | 2020-09-30 | 2020-06-30 | 2020-03-31 | 2019-12-31 | 2019-09-30 | 2019-06-30 | 2019-03-31 | 2018-12-31 | 2018-09-30 | 2018-06-30 | 2018-03-31 | 2017-12-31 | 2017-09-30 | 2017-06-30 | 2017-03-31 | 2016-12-31 | 2016-09-30 | 2016-06-30 | 2016-03-31 | 2015-12-31 | 2015-09-30 | 2015-06-30 | 2015-03-31 | 2014-12-31 | 2014-09-30 | 2014-06-30 | 2014-03-31 | 2013-12-31 | 2013-09-30 | 2013-06-30 | 2013-03-31 | 2012-12-31 | 2012-09-30 | 2012-06-30 | 2012-03-31 | 2011-12-31 | 2011-09-30 | 2011-06-30 | 2011-03-31 | 2010-12-31 | 2010-09-30 | 2010-06-30 | 2010-03-31 | ||
|---|---|---|---|---|---|---|---|---|---|---|---|---|---|---|---|---|---|---|---|---|---|---|---|---|---|---|---|---|---|---|---|---|---|---|---|---|---|---|---|---|---|---|---|---|---|---|---|---|---|---|---|---|---|---|---|---|---|
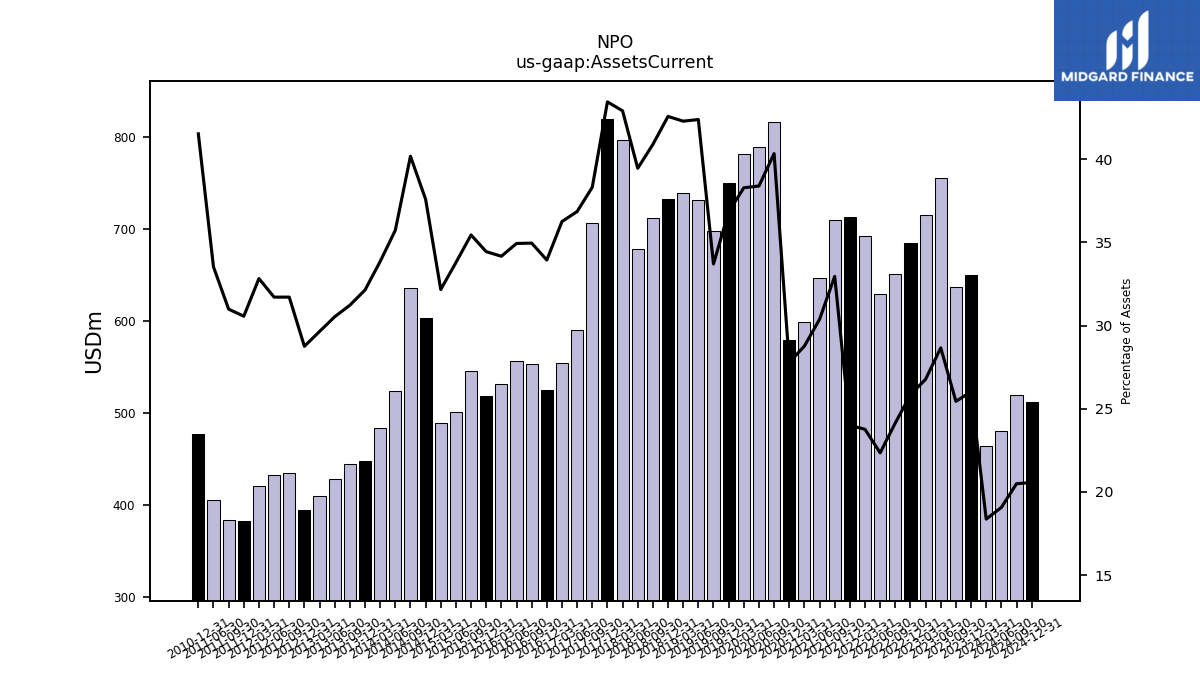
| Assets Current | 650.30 | 636.50 | 754.70 | 715.30 | 684.20 | 650.60 | 629.00 | 692.10 | 713.00 | 709.50 | 646.10 | 598.50 | 579.00 | 816.50 | 789.20 | 781.70 | 749.50 | 697.60 | 731.40 | 738.90 | 732.00 | 711.60 | 678.40 | 796.00 | 819.60 | 706.00 | 589.80 | 554.60 | 524.90 | 552.90 | 556.20 | 531.00 | 517.90 | 545.90 | 501.20 | 488.80 | 603.10 | 636.00 | 523.90 | 483.60 | 447.60 | 444.10 | 427.70 | 409.70 | 394.20 | 435.00 | 432.80 | 420.50 | 382.70 | 383.80 | 405.90 | NA | 476.90 | NA | NA | NA | |
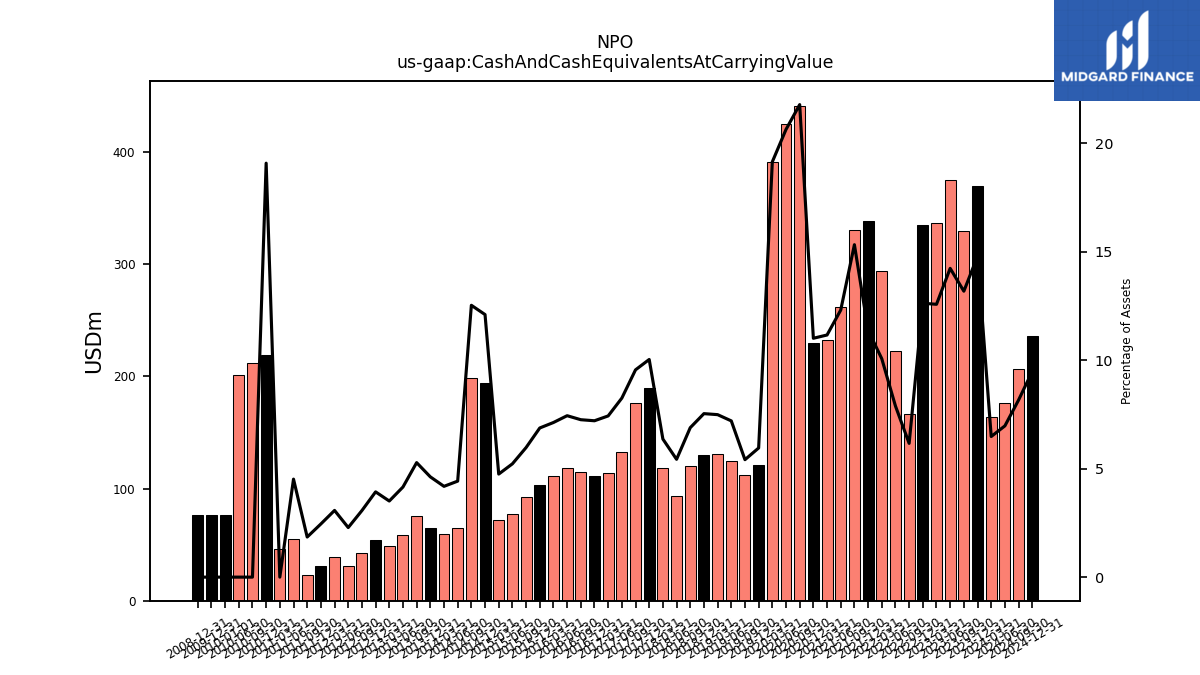
| Cash And Cash Equivalents At Carrying Value | 369.80 | 329.80 | 374.90 | 336.10 | 334.40 | 166.20 | 222.10 | 293.40 | 338.10 | 330.00 | 261.90 | 232.30 | 229.50 | 441.00 | 424.30 | 391.00 | 121.20 | 112.10 | 124.30 | 130.90 | 129.60 | 119.90 | 93.40 | 118.10 | 189.30 | 176.10 | 132.10 | 113.70 | 111.50 | 114.80 | 118.50 | 110.80 | 103.40 | 92.00 | 77.50 | 72.20 | 194.20 | 198.40 | 64.90 | 59.80 | 64.40 | 75.10 | 58.20 | 48.50 | 53.90 | 42.10 | 31.20 | 39.40 | 30.70 | 22.90 | 54.70 | 45.90 | 219.20 | 212.00 | 201.10 | NA | |
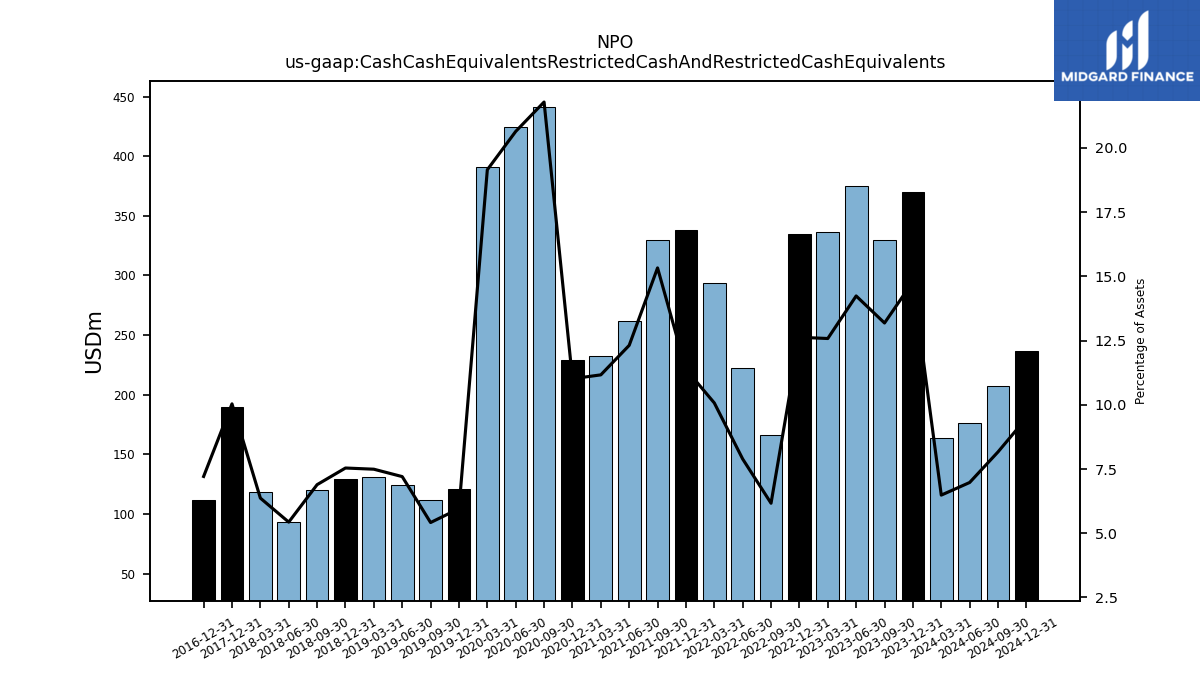
| Cash Cash Equivalents Restricted Cash And Restricted Cash Equivalents | 369.80 | 329.80 | 374.90 | 336.10 | 334.40 | 166.20 | 222.10 | 293.40 | 338.10 | 330.00 | 261.90 | 232.30 | 229.50 | 441.00 | 424.30 | 391.00 | 121.20 | 112.10 | 124.30 | 130.90 | 129.60 | 119.90 | 93.40 | 118.10 | 189.30 | NA | NA | NA | 111.50 | NA | NA | NA | NA | NA | NA | NA | NA | NA | NA | NA | NA | NA | NA | NA | NA | NA | NA | NA | NA | NA | NA | NA | NA | NA | NA | NA | |
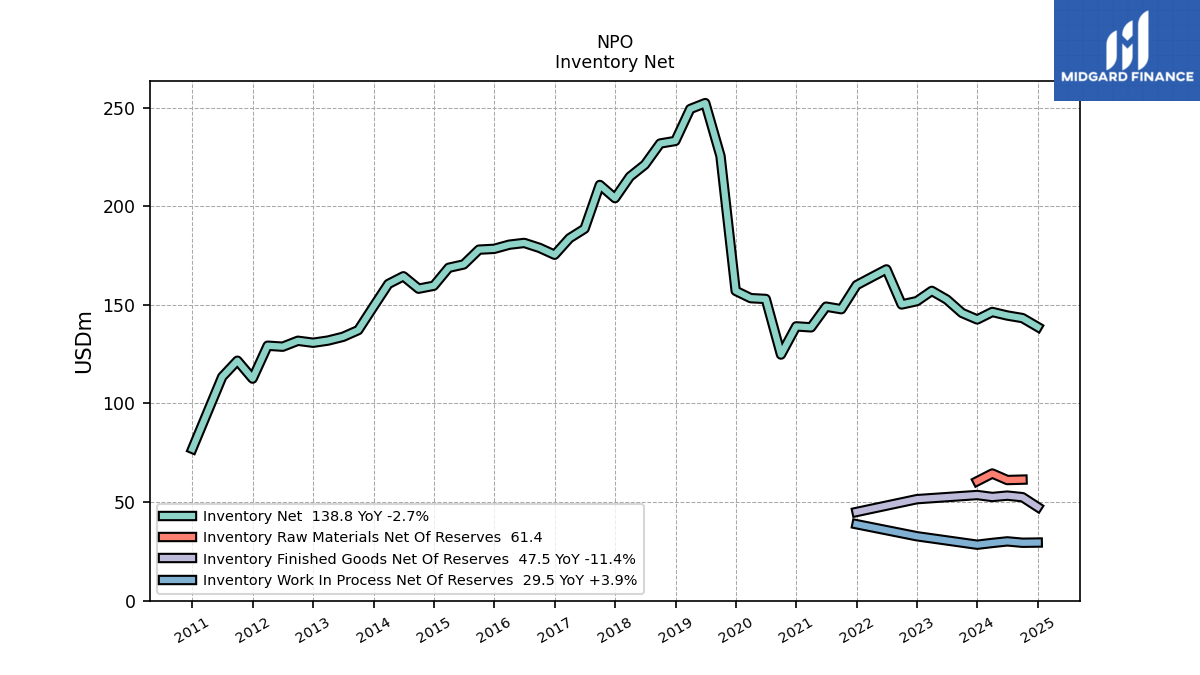
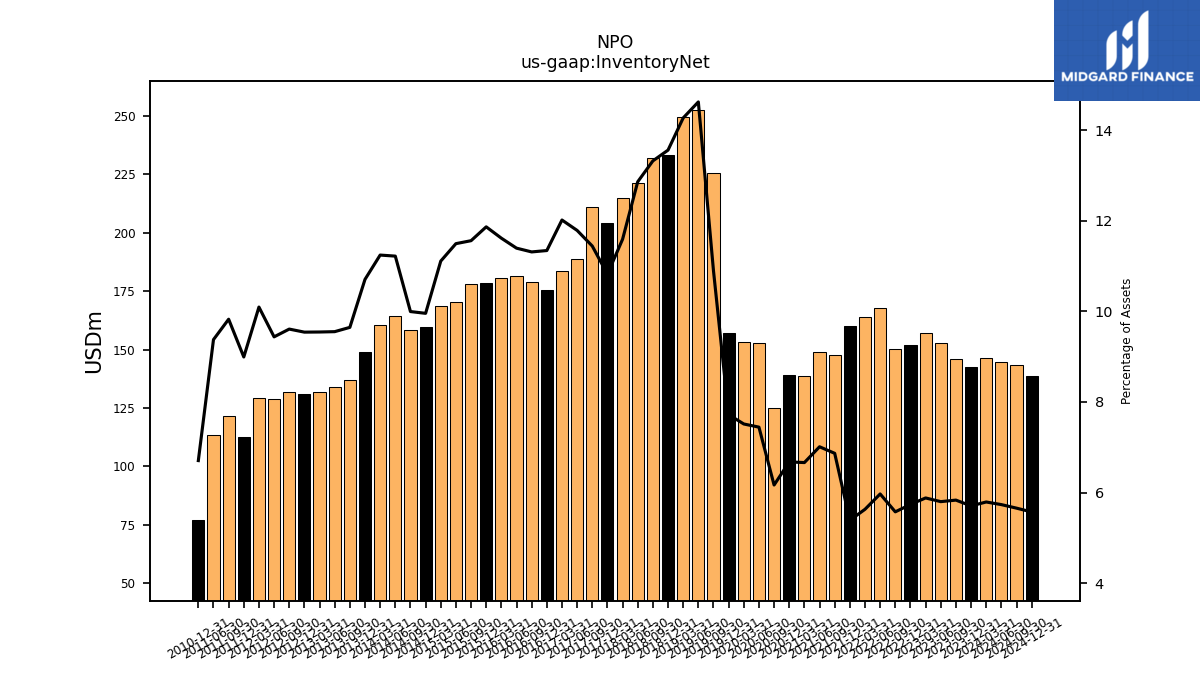
| Inventory Net | 142.60 | 145.90 | 152.70 | 157.10 | 151.90 | 150.20 | 168.00 | 164.00 | 160.00 | 147.80 | 149.10 | 138.60 | 139.10 | 124.80 | 153.00 | 153.40 | 157.10 | 225.50 | 252.30 | 249.30 | 233.10 | 231.80 | 221.10 | 215.00 | 204.10 | 210.80 | 188.60 | 183.80 | 175.40 | 178.90 | 181.40 | 180.50 | 178.40 | 178.00 | 170.50 | 168.80 | 159.70 | 158.20 | 164.50 | 160.60 | 149.10 | 137.20 | 133.80 | 131.90 | 130.80 | 131.80 | 128.80 | 129.30 | 112.60 | 121.70 | 113.50 | NA | 77.00 | NA | NA | NA | |
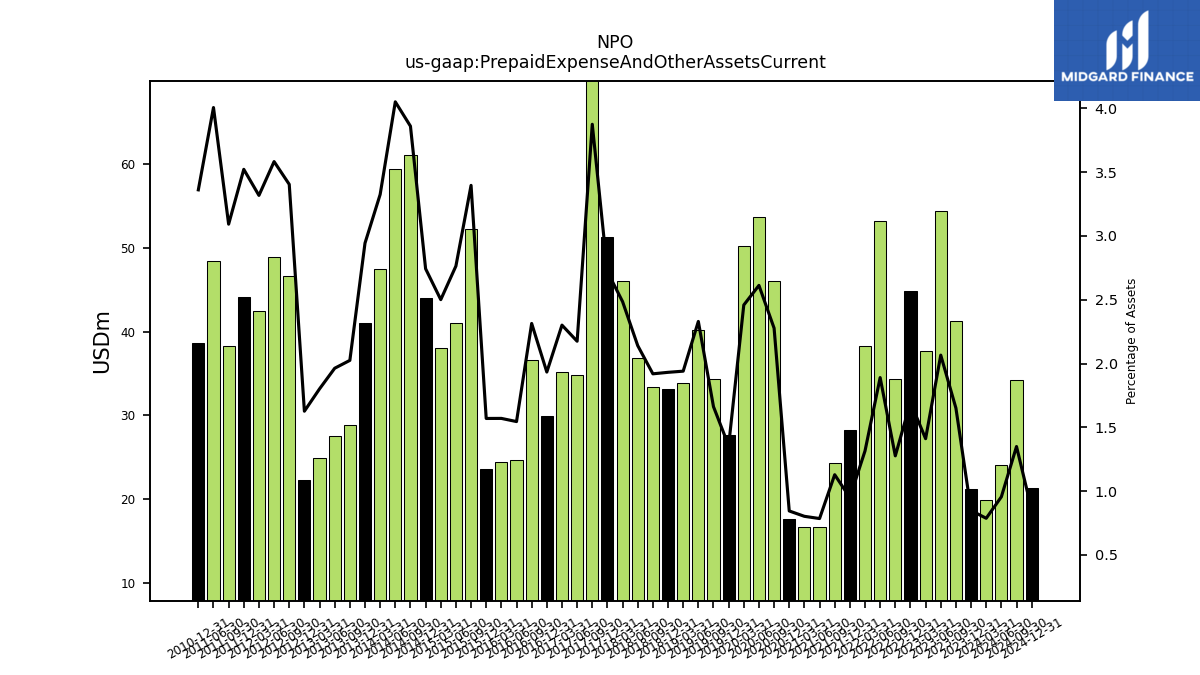
| Prepaid Expense And Other Assets Current | 21.20 | 41.30 | 54.40 | 37.70 | 44.90 | 34.40 | 53.20 | 38.30 | 28.20 | 24.30 | 16.70 | 16.70 | 17.60 | 46.10 | 53.70 | 50.20 | 27.60 | 34.40 | 40.20 | 33.90 | 33.20 | 33.40 | 36.80 | 46.10 | 51.30 | 71.40 | 34.80 | 35.20 | 29.90 | 36.60 | 24.60 | 24.40 | 23.60 | 52.30 | 41.00 | 38.00 | 44.00 | 61.10 | 59.40 | 47.50 | 41.00 | 28.80 | 27.50 | 24.90 | 22.30 | 46.70 | 48.90 | 42.50 | 44.10 | 38.30 | 48.50 | NA | 38.60 | NA | NA | NA |
| 2023-12-31 | 2023-09-30 | 2023-06-30 | 2023-03-31 | 2022-12-31 | 2022-09-30 | 2022-06-30 | 2022-03-31 | 2021-12-31 | 2021-09-30 | 2021-06-30 | 2021-03-31 | 2020-12-31 | 2020-09-30 | 2020-06-30 | 2020-03-31 | 2019-12-31 | 2019-09-30 | 2019-06-30 | 2019-03-31 | 2018-12-31 | 2018-09-30 | 2018-06-30 | 2018-03-31 | 2017-12-31 | 2017-09-30 | 2017-06-30 | 2017-03-31 | 2016-12-31 | 2016-09-30 | 2016-06-30 | 2016-03-31 | 2015-12-31 | 2015-09-30 | 2015-06-30 | 2015-03-31 | 2014-12-31 | 2014-09-30 | 2014-06-30 | 2014-03-31 | 2013-12-31 | 2013-09-30 | 2013-06-30 | 2013-03-31 | 2012-12-31 | 2012-09-30 | 2012-06-30 | 2012-03-31 | 2011-12-31 | 2011-09-30 | 2011-06-30 | 2011-03-31 | 2010-12-31 | 2010-09-30 | 2010-06-30 | 2010-03-31 | ||
|---|---|---|---|---|---|---|---|---|---|---|---|---|---|---|---|---|---|---|---|---|---|---|---|---|---|---|---|---|---|---|---|---|---|---|---|---|---|---|---|---|---|---|---|---|---|---|---|---|---|---|---|---|---|---|---|---|---|
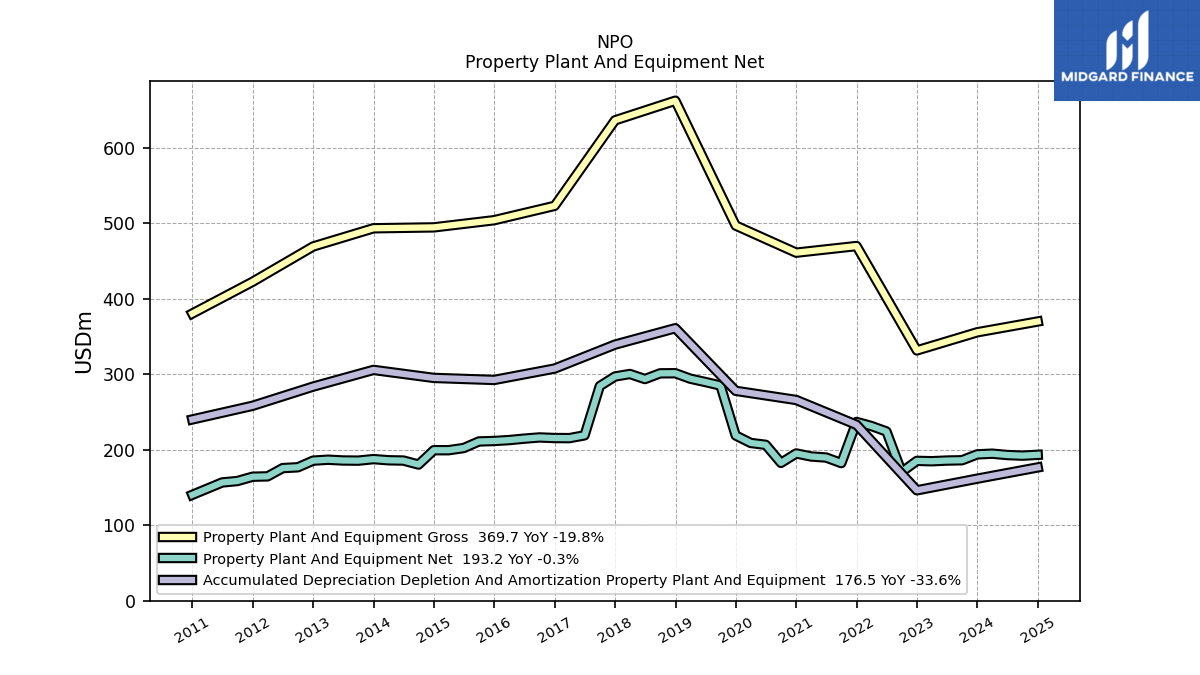
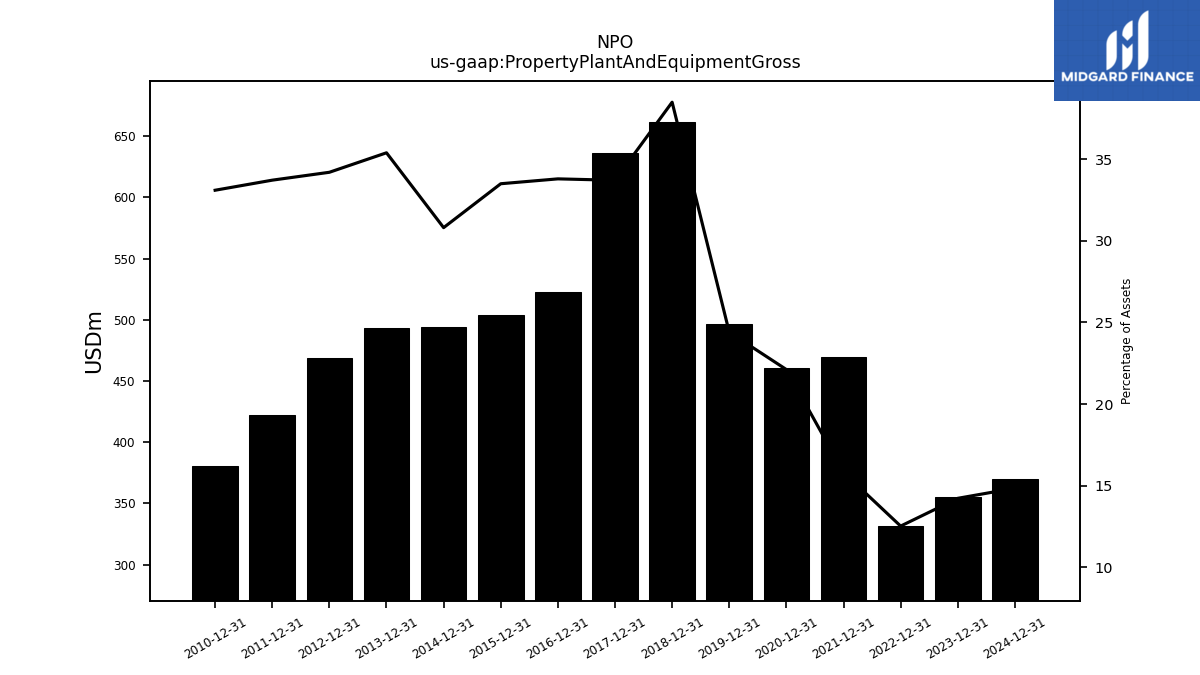
| Property Plant And Equipment Gross | 355.40 | NA | NA | NA | 331.40 | NA | NA | NA | 469.60 | NA | NA | NA | 460.80 | NA | NA | NA | 496.70 | NA | NA | NA | 662.00 | NA | NA | NA | 636.00 | NA | NA | NA | 522.80 | NA | NA | NA | 503.80 | NA | NA | NA | 494.30 | NA | NA | NA | 493.10 | NA | NA | NA | 469.00 | NA | NA | NA | 422.30 | NA | NA | NA | 380.20 | NA | NA | NA | |
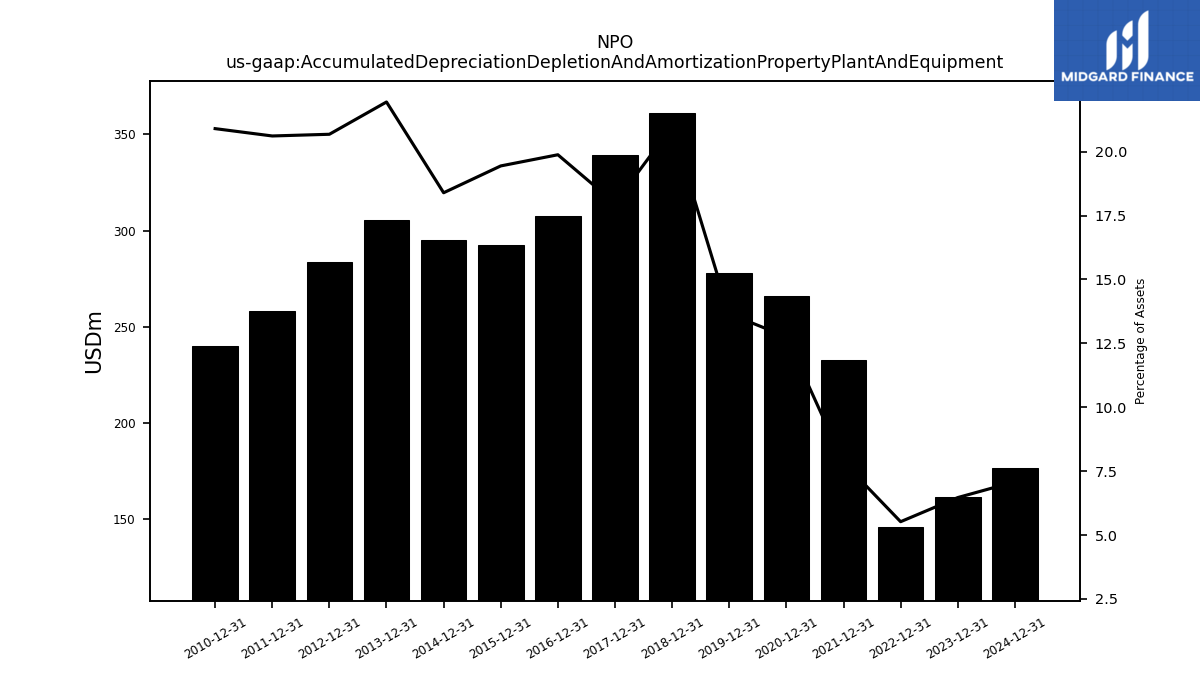
| Accumulated Depreciation Depletion And Amortization Property Plant And Equipment | 161.60 | NA | NA | NA | 146.20 | NA | NA | NA | 232.90 | NA | NA | NA | 265.80 | NA | NA | NA | 277.90 | NA | NA | NA | 360.80 | NA | NA | NA | 339.10 | NA | NA | NA | 307.40 | NA | NA | NA | 292.30 | NA | NA | NA | 295.00 | NA | NA | NA | 305.60 | NA | NA | NA | 283.50 | NA | NA | NA | 258.10 | NA | NA | NA | 240.00 | NA | NA | NA | |
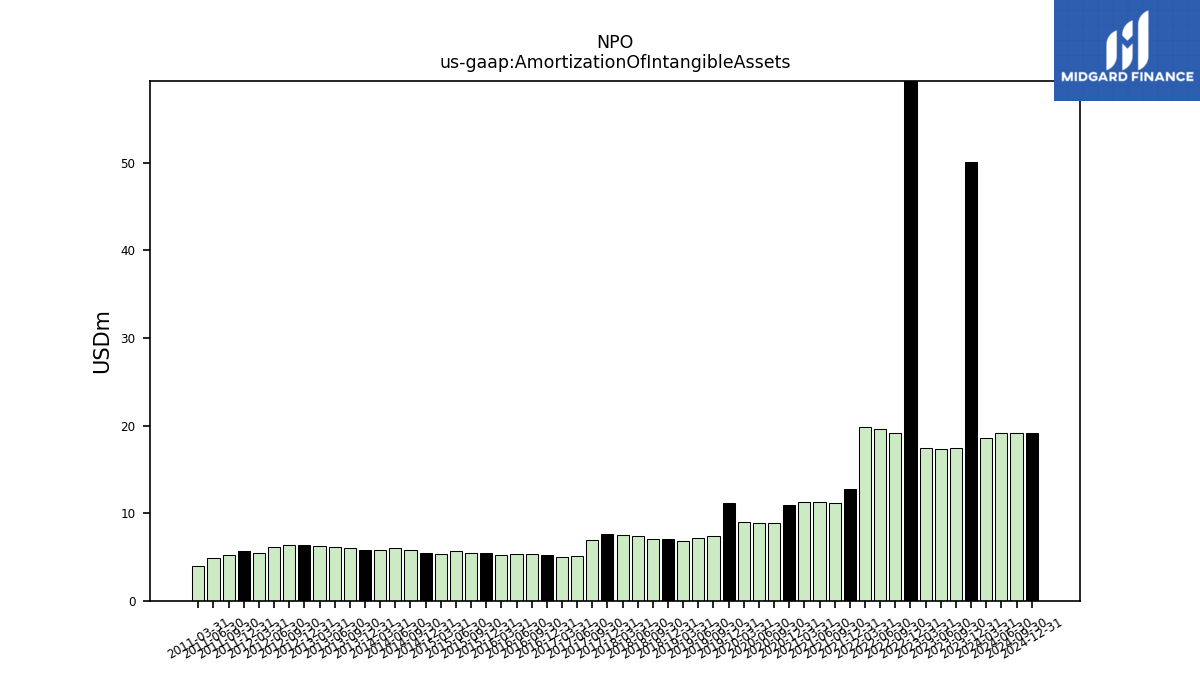
| Amortization Of Intangible Assets | 50.10 | 17.40 | 17.30 | 17.40 | 66.10 | 19.20 | 19.60 | 19.80 | 12.70 | 11.10 | 11.30 | 11.30 | 10.90 | 8.90 | 8.90 | 9.00 | 11.10 | 7.40 | 7.20 | 6.80 | 7.00 | 7.00 | 7.40 | 7.50 | 7.60 | 6.90 | 5.10 | 5.00 | 5.20 | 5.30 | 5.30 | 5.20 | 5.50 | 5.40 | 5.70 | 5.30 | 5.40 | 5.80 | 6.00 | 5.80 | 5.80 | 6.00 | 6.10 | 6.20 | 6.40 | 6.40 | 6.10 | 5.40 | 5.70 | 5.20 | 4.90 | 4.00 | NA | NA | NA | NA | |
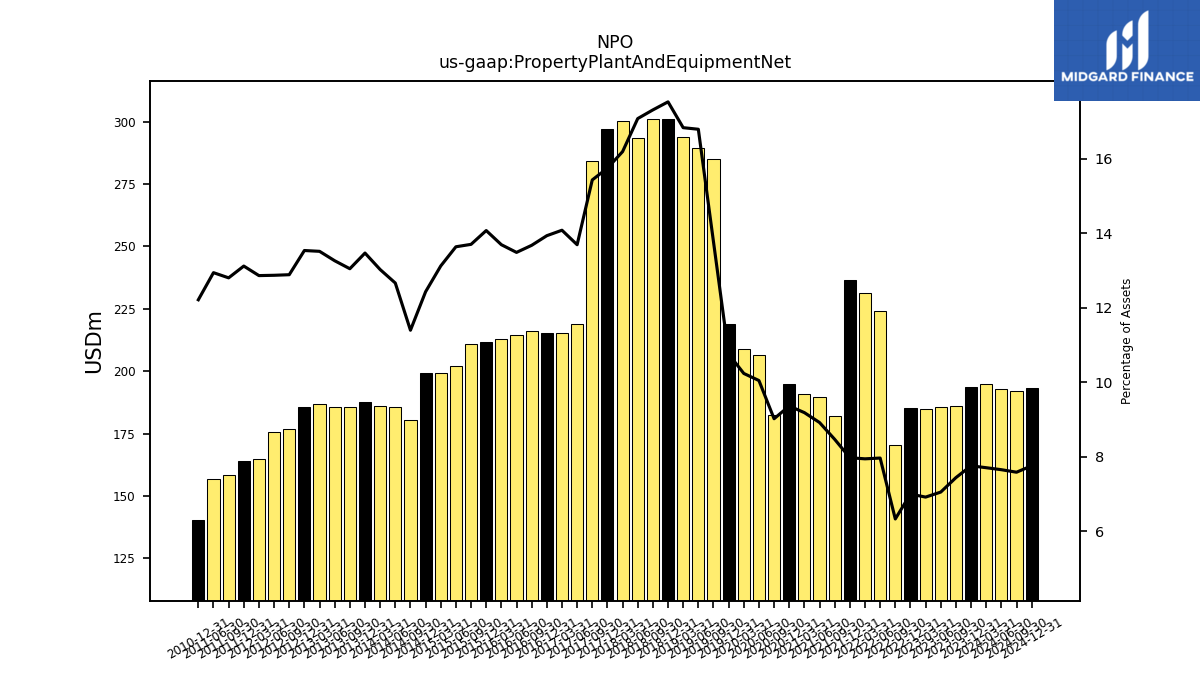
| Property Plant And Equipment Net | 193.80 | 186.00 | 185.60 | 184.70 | 185.20 | 170.50 | 224.10 | 231.30 | 236.70 | 182.20 | 189.60 | 191.00 | 195.00 | 182.50 | 206.40 | 208.90 | 218.80 | 284.90 | 289.60 | 294.00 | 301.20 | 301.10 | 293.50 | 300.20 | 296.90 | 284.20 | 219.00 | 215.30 | 215.40 | 216.20 | 214.60 | 212.70 | 211.50 | 210.90 | 202.20 | 199.30 | 199.30 | 180.30 | 185.60 | 186.00 | 187.50 | 185.50 | 185.70 | 186.70 | 185.50 | 176.70 | 175.60 | 164.70 | 164.20 | 158.50 | 156.60 | NA | 140.20 | NA | NA | NA | |
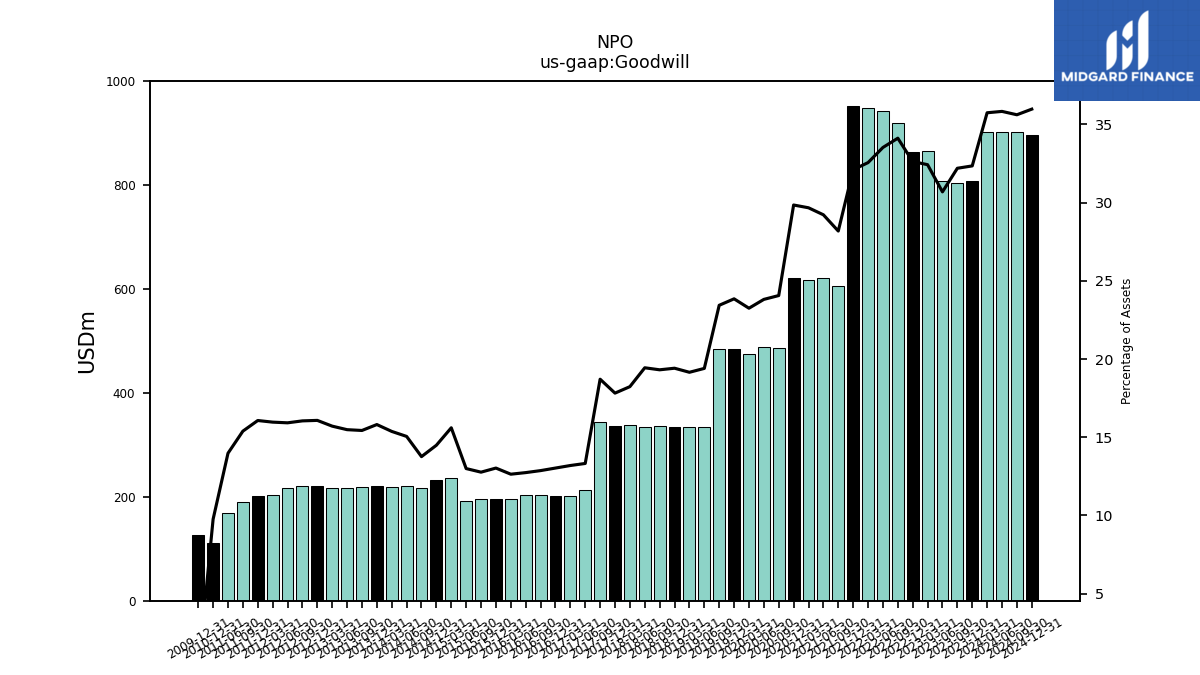
| Goodwill | 808.40 | 805.20 | 807.90 | 866.10 | 863.80 | 919.20 | 943.50 | 948.20 | 953.20 | 606.60 | 621.40 | 617.20 | 621.80 | 486.90 | 489.40 | 474.60 | 485.30 | 485.00 | 334.70 | 334.60 | 333.70 | 336.00 | 334.20 | 338.20 | 336.10 | 344.70 | 213.20 | 201.80 | 201.50 | 203.50 | 202.80 | 196.40 | 195.90 | 196.60 | 192.80 | 237.10 | 232.40 | 217.80 | 220.70 | 219.60 | 220.20 | 219.50 | 216.90 | 217.10 | 220.40 | 220.10 | 217.30 | 204.50 | 201.20 | 190.60 | 169.20 | NA | 112.10 | NA | NA | NA | |
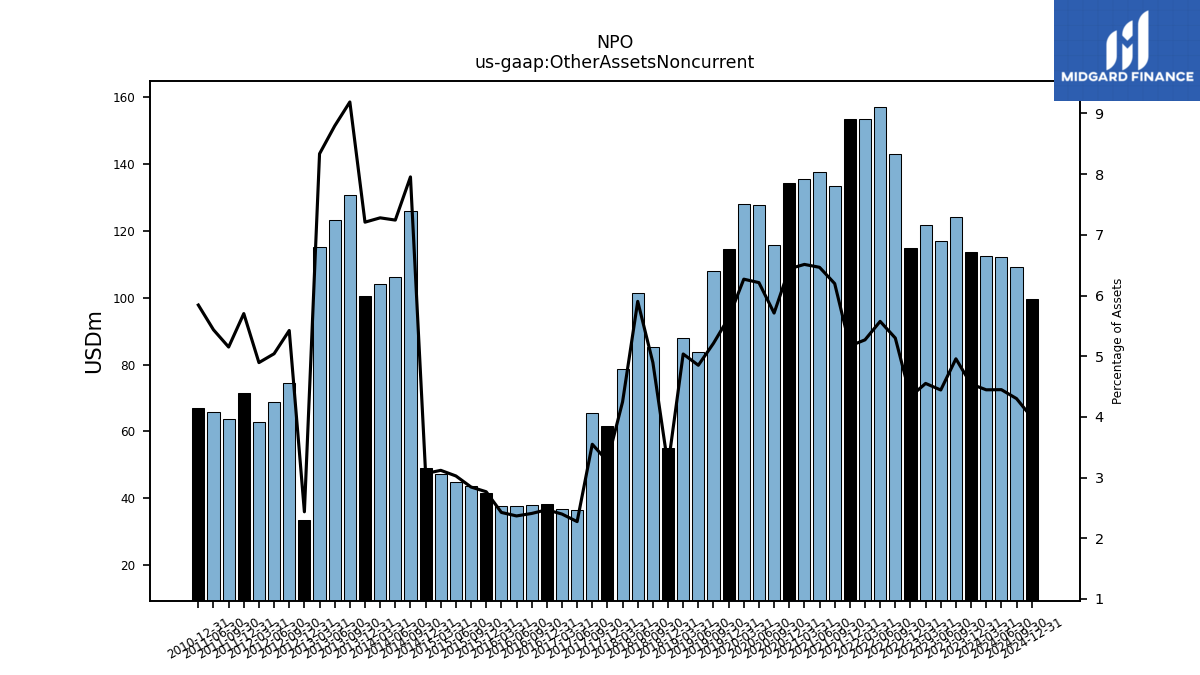
| Other Assets Noncurrent | 113.50 | 124.00 | 117.00 | 121.60 | 114.80 | 142.80 | 156.90 | 153.50 | 153.50 | 133.40 | 137.50 | 135.50 | 134.20 | 115.60 | 127.70 | 128.00 | 114.60 | 107.90 | 83.70 | 88.00 | 54.90 | 85.20 | 101.50 | 78.80 | 61.70 | 65.40 | 36.40 | 36.70 | 38.20 | 38.10 | 37.70 | 37.70 | 36.90 | 43.80 | 44.90 | 47.40 | 49.20 | 125.90 | 106.20 | 104.00 | 100.40 | 130.70 | 123.20 | 115.20 | 33.40 | 74.40 | 68.80 | 62.70 | 71.40 | 63.80 | 65.80 | NA | 67.10 | NA | NA | NA |
| 2023-12-31 | 2023-09-30 | 2023-06-30 | 2023-03-31 | 2022-12-31 | 2022-09-30 | 2022-06-30 | 2022-03-31 | 2021-12-31 | 2021-09-30 | 2021-06-30 | 2021-03-31 | 2020-12-31 | 2020-09-30 | 2020-06-30 | 2020-03-31 | 2019-12-31 | 2019-09-30 | 2019-06-30 | 2019-03-31 | 2018-12-31 | 2018-09-30 | 2018-06-30 | 2018-03-31 | 2017-12-31 | 2017-09-30 | 2017-06-30 | 2017-03-31 | 2016-12-31 | 2016-09-30 | 2016-06-30 | 2016-03-31 | 2015-12-31 | 2015-09-30 | 2015-06-30 | 2015-03-31 | 2014-12-31 | 2014-09-30 | 2014-06-30 | 2014-03-31 | 2013-12-31 | 2013-09-30 | 2013-06-30 | 2013-03-31 | 2012-12-31 | 2012-09-30 | 2012-06-30 | 2012-03-31 | 2011-12-31 | 2011-09-30 | 2011-06-30 | 2011-03-31 | 2010-12-31 | 2010-09-30 | 2010-06-30 | 2010-03-31 | ||
|---|---|---|---|---|---|---|---|---|---|---|---|---|---|---|---|---|---|---|---|---|---|---|---|---|---|---|---|---|---|---|---|---|---|---|---|---|---|---|---|---|---|---|---|---|---|---|---|---|---|---|---|---|---|---|---|---|---|
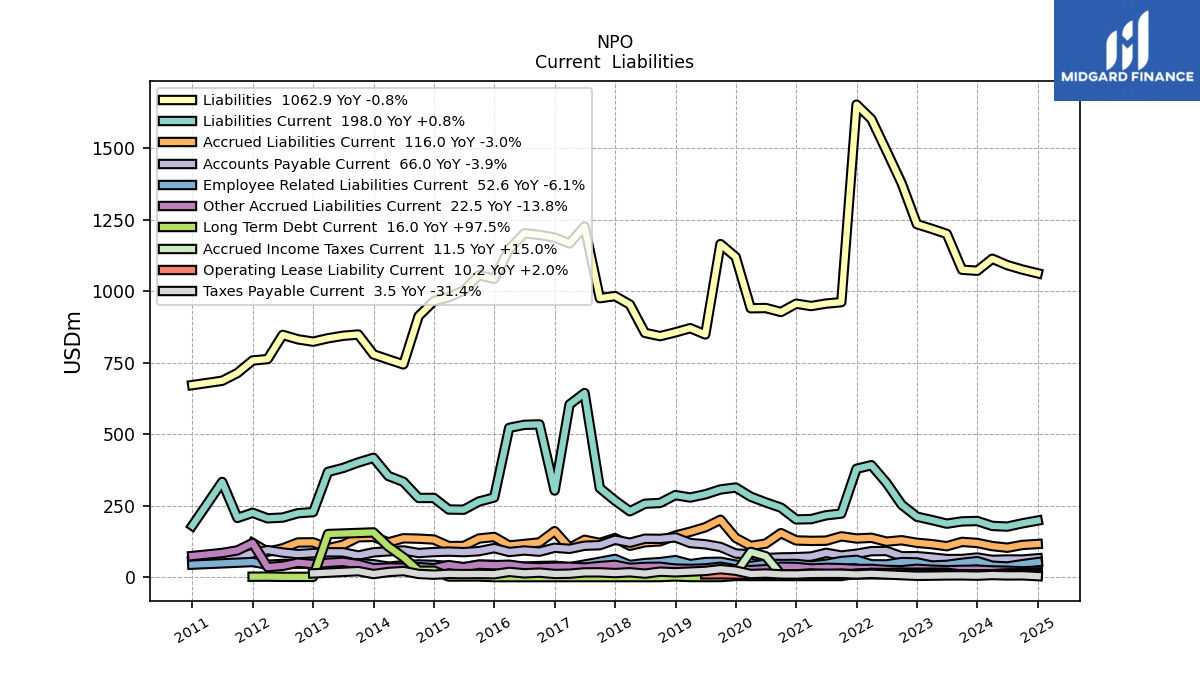
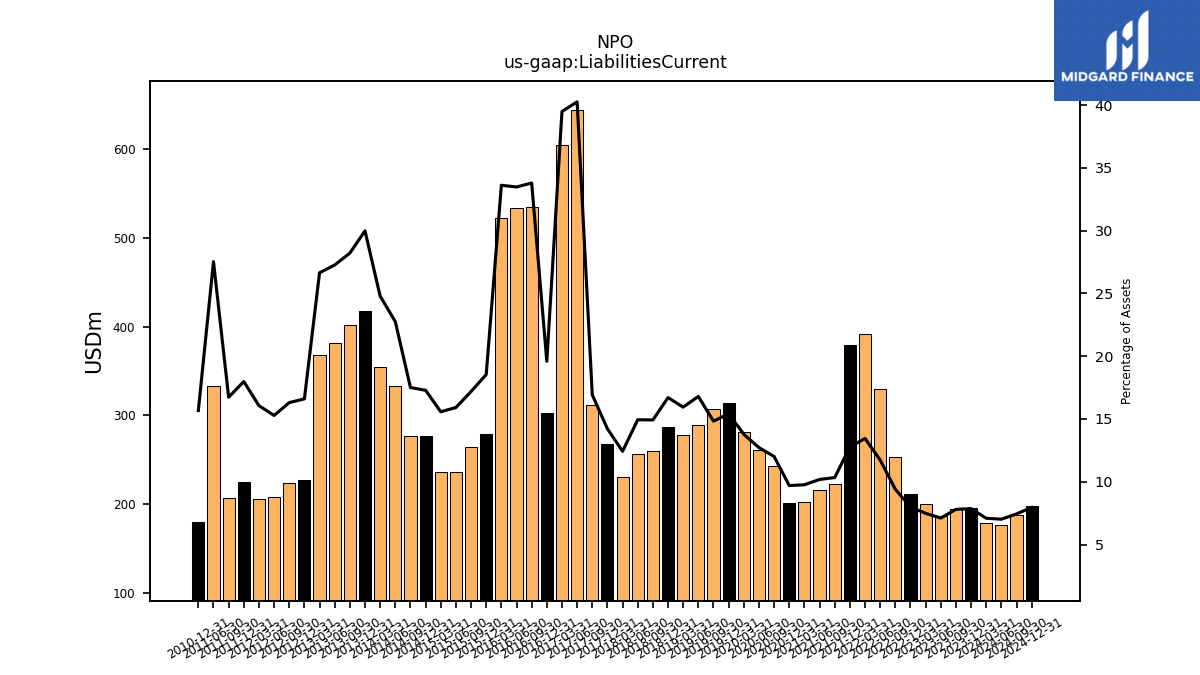
| Liabilities Current | 196.40 | 195.10 | 187.10 | 199.90 | 211.50 | 253.30 | 330.10 | 391.70 | 379.10 | 222.40 | 216.50 | 203.00 | 202.00 | 243.10 | 261.40 | 281.30 | 313.60 | 306.80 | 289.70 | 278.50 | 287.10 | 259.60 | 256.80 | 230.40 | 268.10 | 311.70 | 644.10 | 604.00 | 303.00 | 534.40 | 532.90 | 522.30 | 278.70 | 264.60 | 236.00 | 236.60 | 277.20 | 277.00 | 333.60 | 354.00 | 417.50 | 401.20 | 381.90 | 368.20 | 227.50 | 223.60 | 208.50 | 205.70 | 225.10 | 207.20 | 333.20 | NA | 179.90 | NA | NA | NA | |
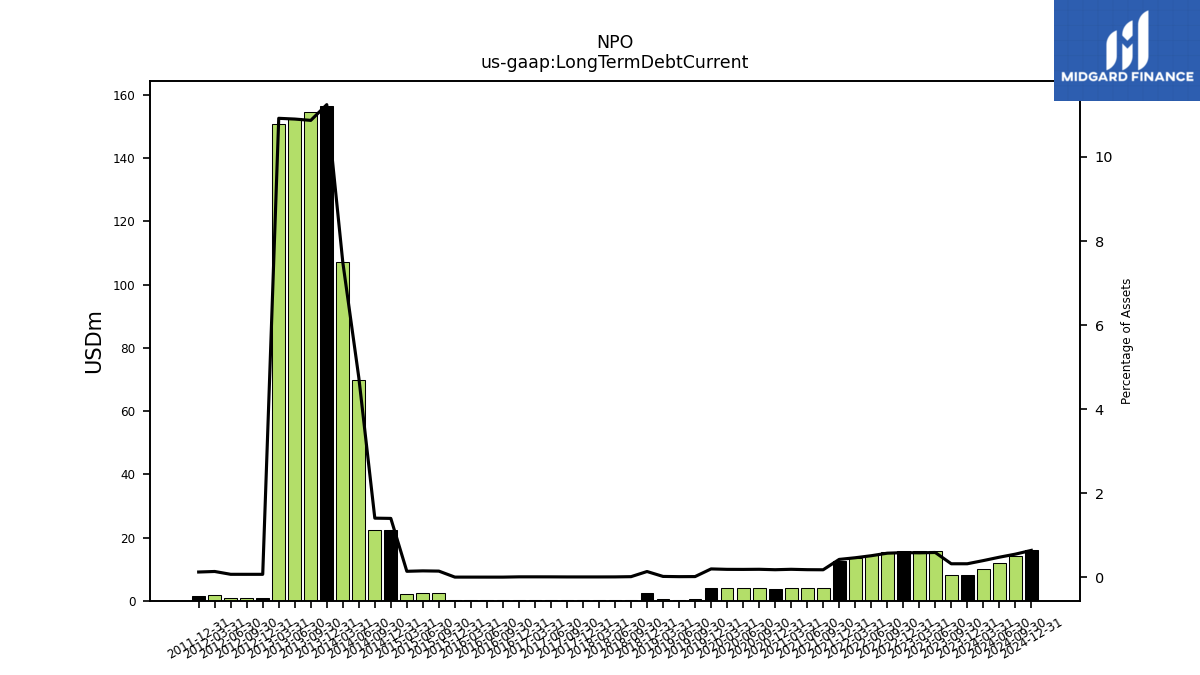
| Long Term Debt Current | 8.10 | 8.10 | 15.60 | 15.60 | 15.60 | 15.50 | 14.50 | 13.60 | 12.70 | 3.90 | 3.90 | 4.00 | 3.80 | 3.90 | 3.90 | 3.90 | 4.10 | 0.40 | 0.30 | 0.40 | 2.40 | 0.30 | 0.20 | 0.20 | 0.20 | 0.20 | 0.20 | 0.20 | 0.20 | 0.10 | 0.10 | 0.10 | 0.10 | 2.30 | 2.30 | 2.20 | 22.50 | 22.30 | 69.70 | 107.10 | 156.60 | 154.60 | 152.70 | 150.90 | 1.00 | 1.00 | 1.00 | 1.80 | 1.60 | NA | NA | NA | NA | NA | NA | NA | |
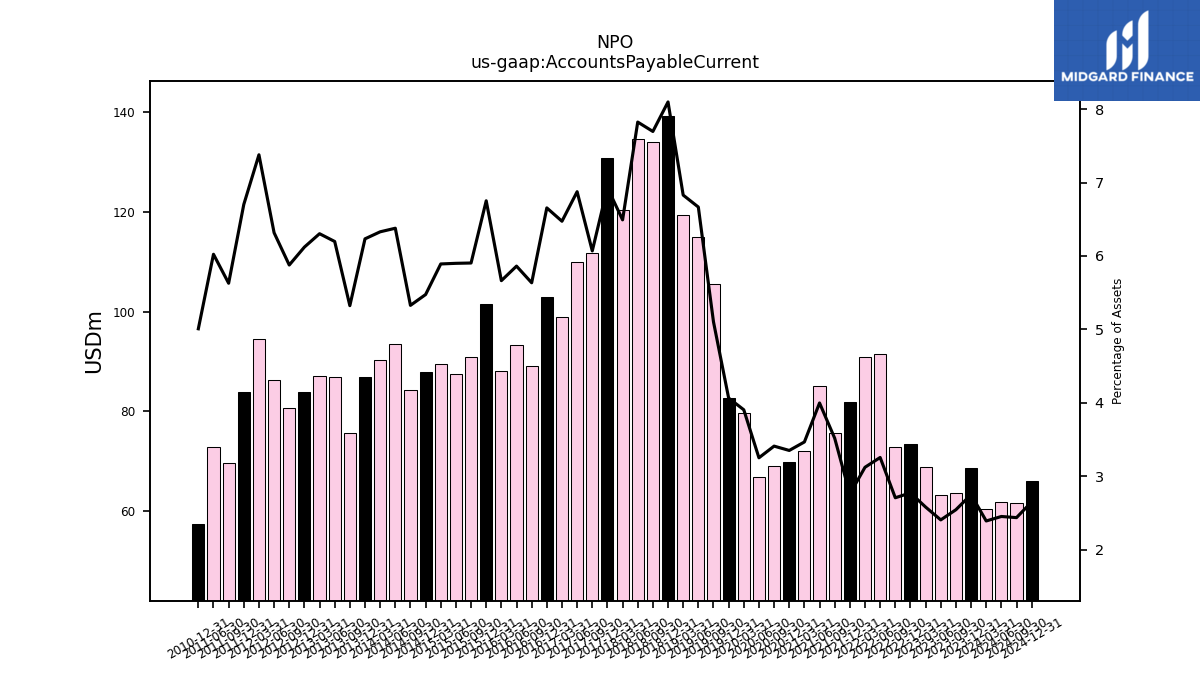
| Accounts Payable Current | 68.70 | 63.60 | 63.30 | 68.90 | 73.40 | 72.90 | 91.60 | 90.90 | 81.90 | 75.70 | 85.00 | 72.10 | 69.80 | 69.00 | 66.80 | 79.70 | 82.70 | 105.60 | 115.00 | 119.30 | 139.20 | 133.90 | 134.50 | 120.40 | 130.70 | 111.80 | 110.00 | 99.00 | 102.90 | 89.10 | 93.30 | 88.00 | 101.50 | 90.90 | 87.50 | 89.50 | 87.80 | 84.30 | 93.50 | 90.40 | 86.80 | 75.70 | 86.80 | 87.10 | 83.90 | 80.60 | 86.20 | 94.50 | 83.90 | 69.70 | 72.90 | NA | 57.50 | NA | NA | NA | |
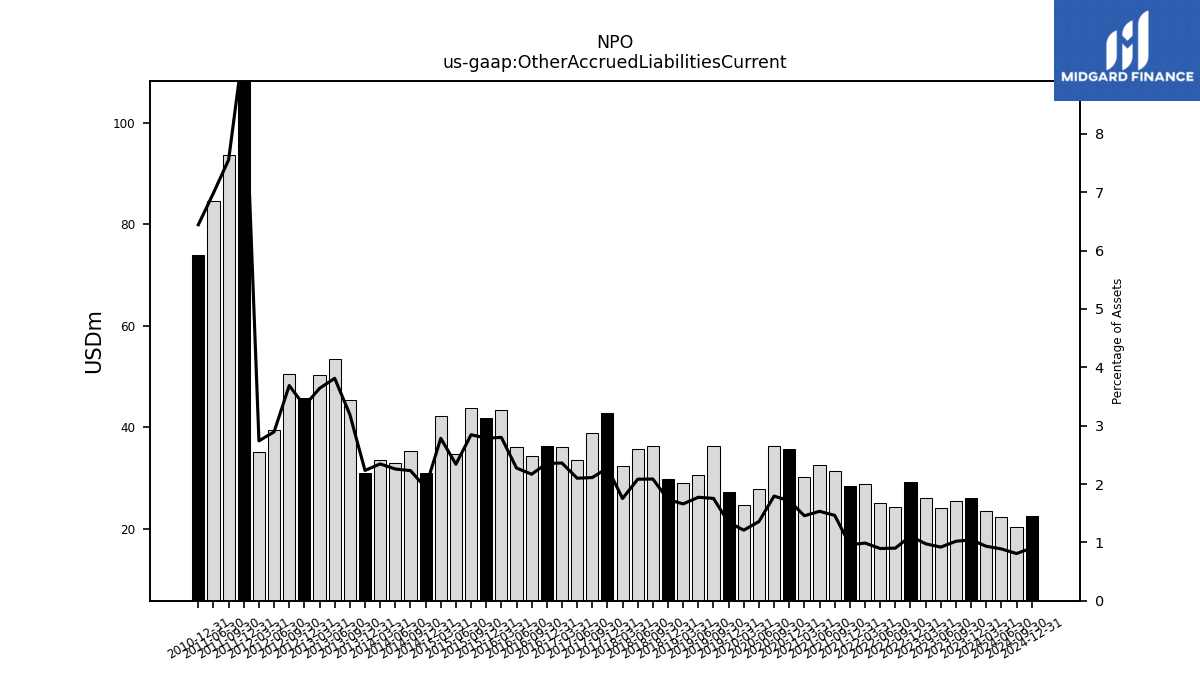
| Other Accrued Liabilities Current | 26.10 | 25.50 | 24.20 | 26.10 | 29.30 | 24.30 | 25.20 | 28.80 | 28.50 | 31.50 | 32.60 | 30.30 | 35.70 | 36.30 | 27.90 | 24.70 | 27.30 | 36.30 | 30.60 | 29.00 | 29.80 | 36.30 | 35.80 | 32.50 | 42.90 | 38.90 | 33.60 | 36.10 | 36.40 | 34.30 | 36.20 | 43.50 | 41.90 | 43.80 | 34.70 | 42.30 | 31.10 | 35.30 | 33.10 | 33.50 | 31.10 | 45.40 | 53.40 | 50.30 | 45.80 | 50.60 | 39.50 | 35.10 | 119.50 | 93.60 | 84.60 | NA | 74.00 | NA | NA | NA | |
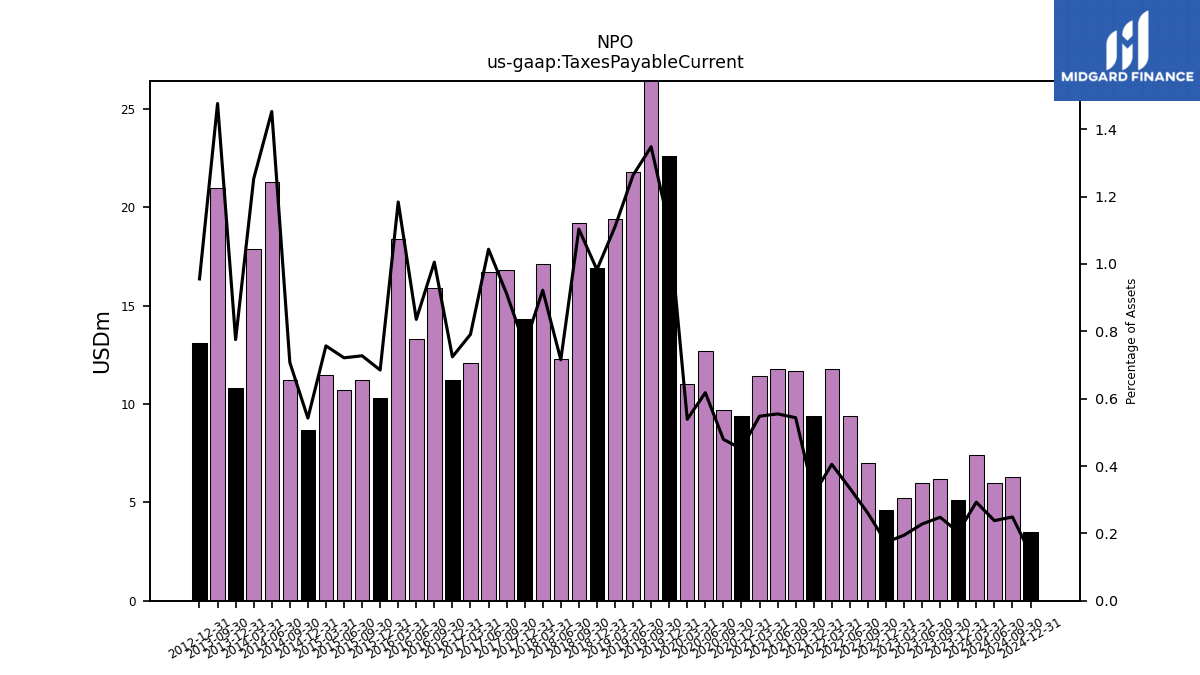
| Taxes Payable Current | 5.10 | 6.20 | 6.00 | 5.20 | 4.60 | 7.00 | 9.40 | 11.80 | 9.40 | 11.70 | 11.80 | 11.40 | 9.40 | 9.70 | 12.70 | 11.00 | 22.60 | 27.90 | 21.80 | 19.40 | 16.90 | 19.20 | 12.30 | 17.10 | 14.30 | 16.80 | 16.70 | 12.10 | 11.20 | 15.90 | 13.30 | 18.40 | 10.30 | 11.20 | 10.70 | 11.50 | 8.70 | 11.20 | 21.30 | 17.90 | 10.80 | 21.00 | NA | NA | 13.10 | NA | NA | NA | NA | NA | NA | NA | NA | NA | NA | NA | |
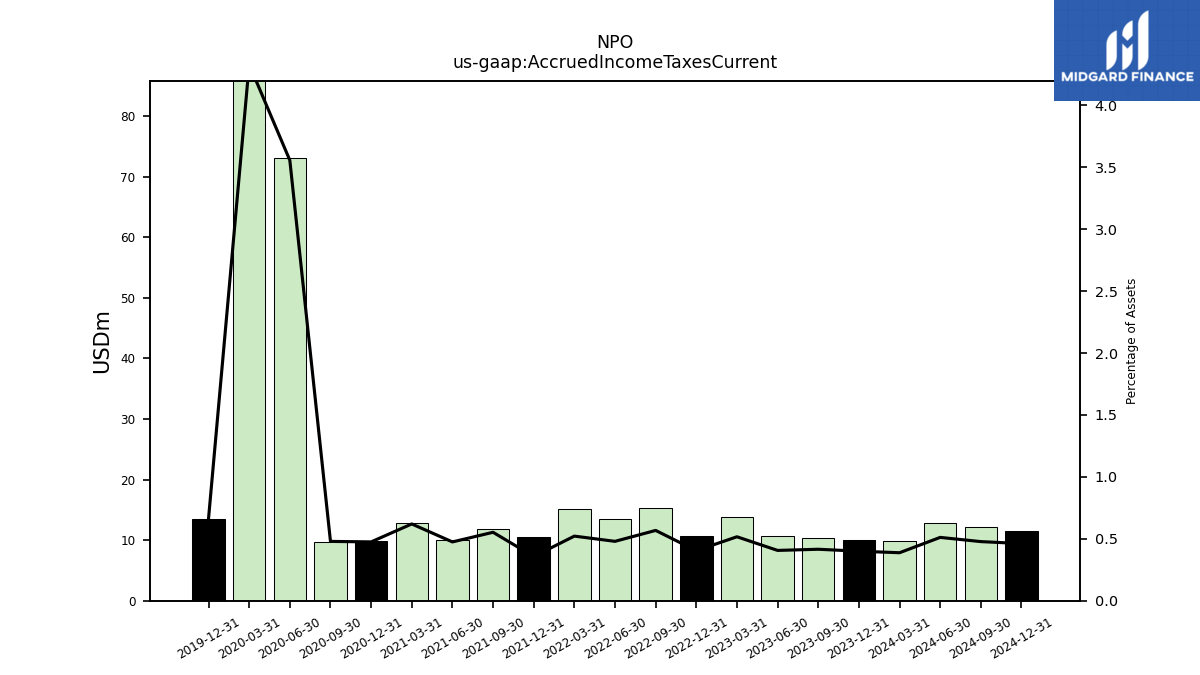
| Accrued Income Taxes Current | 10.00 | 10.40 | 10.70 | 13.80 | 10.70 | 15.30 | 13.50 | 15.20 | 10.60 | 11.90 | 10.10 | 12.90 | 9.90 | 9.70 | 73.10 | 88.40 | 13.50 | NA | NA | NA | NA | NA | NA | NA | NA | NA | NA | NA | NA | NA | NA | NA | NA | NA | NA | NA | NA | NA | NA | NA | NA | NA | NA | NA | NA | NA | NA | NA | NA | NA | NA | NA | NA | NA | NA | NA | |
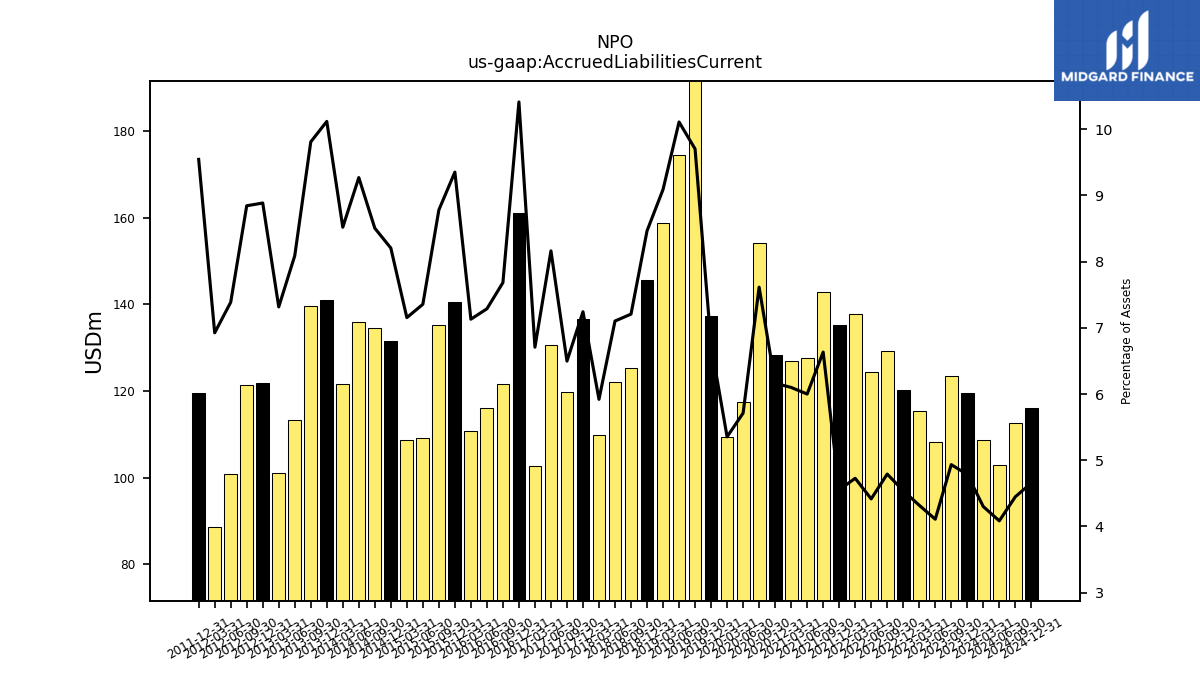
| Accrued Liabilities Current | 119.60 | 123.40 | 108.20 | 115.40 | 120.20 | 129.10 | 124.30 | 137.70 | 135.20 | 142.80 | 127.60 | 126.90 | 128.40 | 154.10 | 117.40 | 109.30 | 137.30 | 200.80 | 174.40 | 158.80 | 145.50 | 125.40 | 122.10 | 109.80 | 136.60 | 119.70 | 130.60 | 102.60 | 161.00 | 121.50 | 116.00 | 110.80 | 140.60 | 135.20 | 109.10 | 108.70 | 131.60 | 134.60 | 135.90 | 121.70 | 140.90 | 139.50 | 113.30 | 101.10 | 121.80 | 121.30 | 100.80 | 88.70 | 119.50 | NA | NA | NA | NA | NA | NA | NA |
| 2023-12-31 | 2023-09-30 | 2023-06-30 | 2023-03-31 | 2022-12-31 | 2022-09-30 | 2022-06-30 | 2022-03-31 | 2021-12-31 | 2021-09-30 | 2021-06-30 | 2021-03-31 | 2020-12-31 | 2020-09-30 | 2020-06-30 | 2020-03-31 | 2019-12-31 | 2019-09-30 | 2019-06-30 | 2019-03-31 | 2018-12-31 | 2018-09-30 | 2018-06-30 | 2018-03-31 | 2017-12-31 | 2017-09-30 | 2017-06-30 | 2017-03-31 | 2016-12-31 | 2016-09-30 | 2016-06-30 | 2016-03-31 | 2015-12-31 | 2015-09-30 | 2015-06-30 | 2015-03-31 | 2014-12-31 | 2014-09-30 | 2014-06-30 | 2014-03-31 | 2013-12-31 | 2013-09-30 | 2013-06-30 | 2013-03-31 | 2012-12-31 | 2012-09-30 | 2012-06-30 | 2012-03-31 | 2011-12-31 | 2011-09-30 | 2011-06-30 | 2011-03-31 | 2010-12-31 | 2010-09-30 | 2010-06-30 | 2010-03-31 | ||
|---|---|---|---|---|---|---|---|---|---|---|---|---|---|---|---|---|---|---|---|---|---|---|---|---|---|---|---|---|---|---|---|---|---|---|---|---|---|---|---|---|---|---|---|---|---|---|---|---|---|---|---|---|---|---|---|---|---|
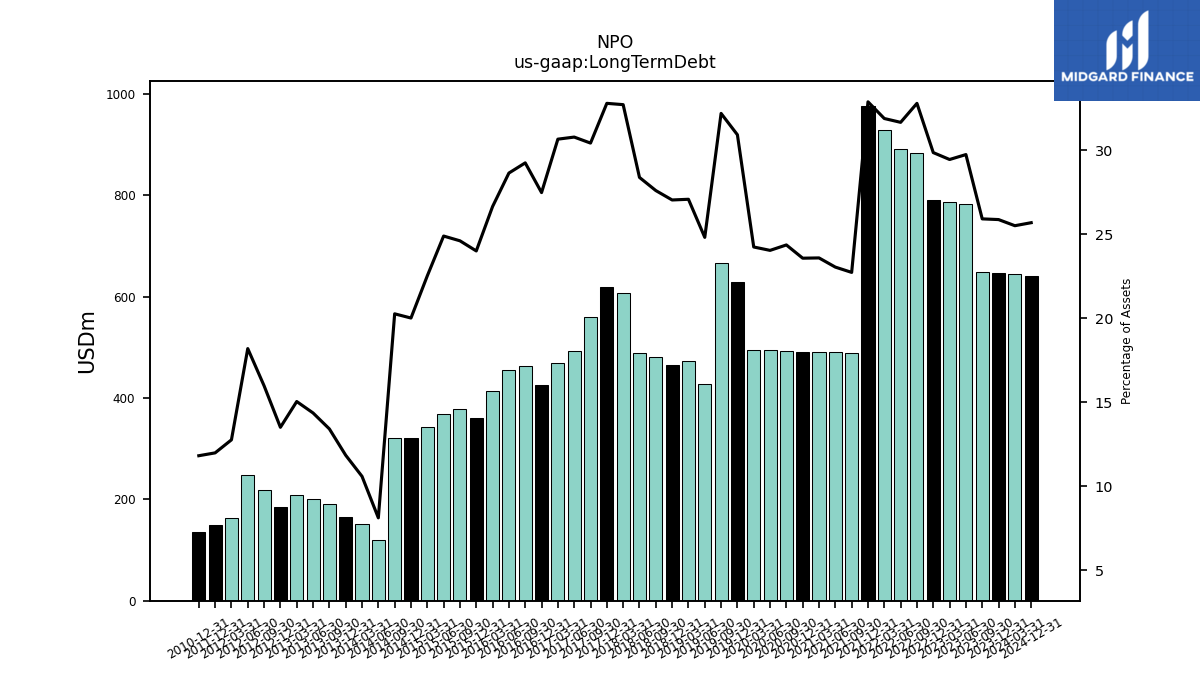
| Long Term Debt | 646.80 | 648.30 | 783.20 | 786.80 | 790.70 | 883.60 | 891.20 | 928.90 | 976.60 | 489.40 | 490.20 | 490.90 | 491.30 | 493.20 | 494.20 | 495.00 | 629.30 | 666.30 | 428.20 | 473.20 | 464.90 | 480.30 | 488.00 | 606.80 | 618.50 | 560.60 | 492.60 | 469.00 | 425.00 | 462.60 | 456.00 | 414.20 | 356.30 | 379.00 | 369.30 | 342.30 | 321.10 | 320.80 | 119.20 | 151.40 | 165.10 | 190.90 | 201.30 | 208.00 | 185.30 | 219.30 | 248.40 | 163.60 | 150.20 | NA | NA | NA | 135.80 | NA | NA | NA | |
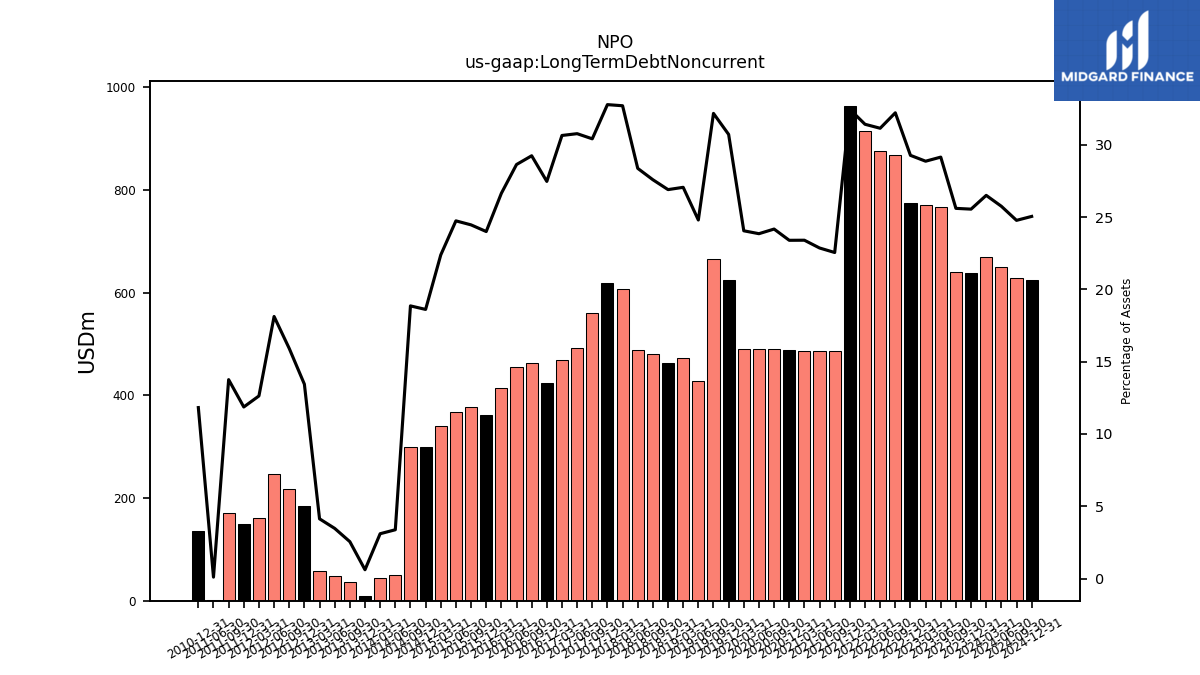
| Long Term Debt Noncurrent | 638.70 | 640.50 | 767.60 | 771.20 | 775.10 | 868.10 | 876.70 | 915.30 | 963.90 | 485.50 | 486.30 | 486.90 | 487.50 | 489.30 | 490.30 | 491.10 | 625.20 | 665.90 | 427.90 | 472.80 | 462.50 | 480.00 | 487.80 | 606.60 | 618.30 | 560.40 | 492.40 | 468.80 | 424.80 | 462.50 | 455.90 | 414.10 | 356.20 | 376.70 | 367.00 | 340.10 | 298.60 | 298.50 | 49.50 | 44.30 | 8.50 | 36.30 | 48.60 | 57.10 | 184.30 | 218.30 | 247.40 | 161.80 | 148.60 | 170.40 | 1.20 | NA | 135.80 | NA | NA | NA | |
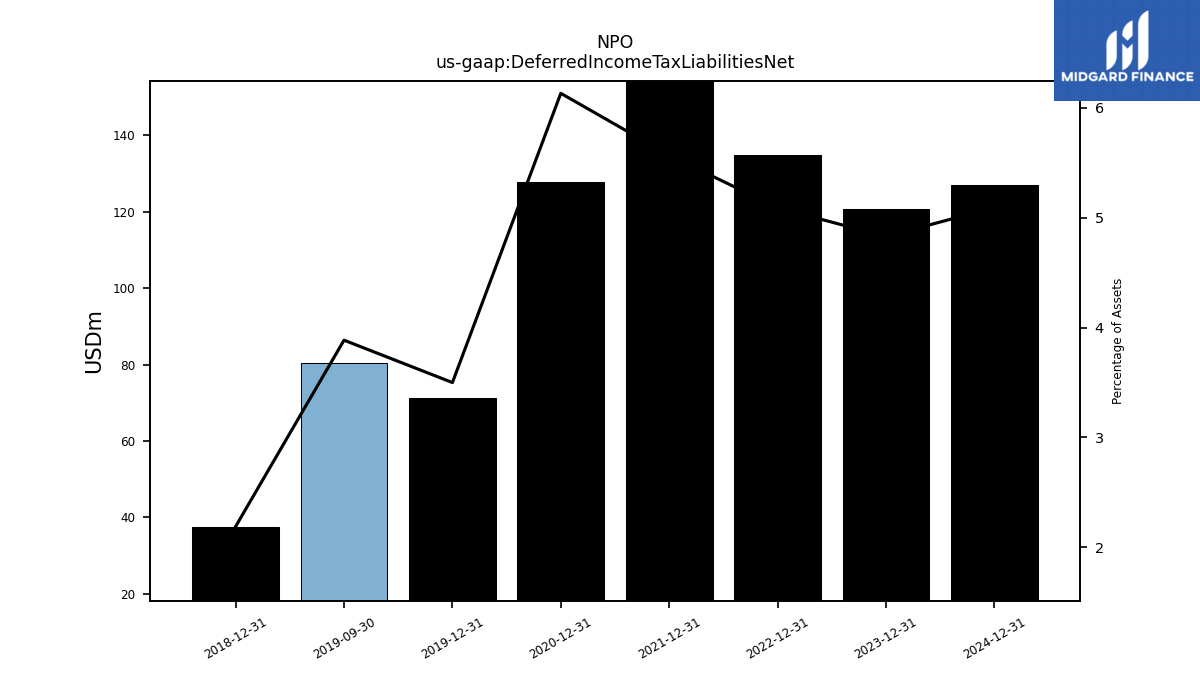
| Deferred Income Tax Liabilities Net | 120.70 | NA | NA | NA | 134.80 | NA | NA | NA | 165.40 | NA | NA | NA | 127.80 | NA | NA | NA | 71.20 | 80.40 | NA | NA | 37.60 | NA | NA | NA | NA | NA | NA | NA | NA | NA | NA | NA | NA | NA | NA | NA | NA | NA | NA | NA | NA | NA | NA | NA | NA | NA | NA | NA | NA | NA | NA | NA | NA | NA | NA | NA | |
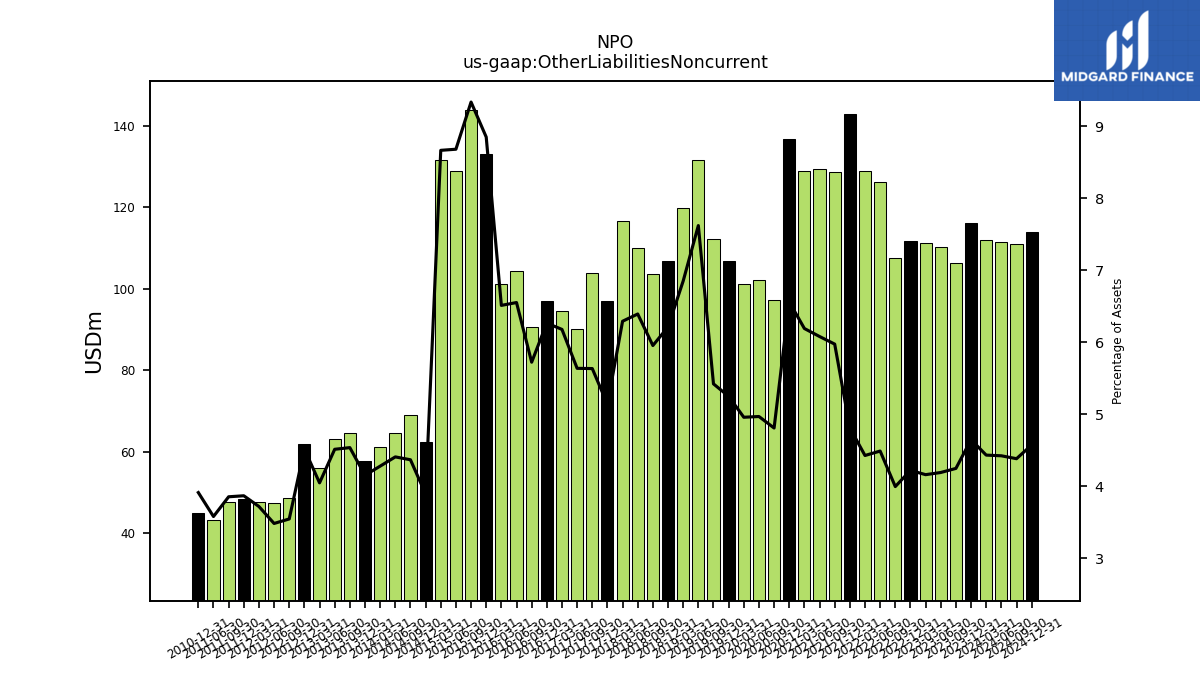
| Other Liabilities Noncurrent | 116.10 | 106.20 | 110.30 | 111.10 | 111.70 | 107.60 | 126.30 | 128.90 | 142.80 | 128.60 | 129.30 | 128.80 | 136.70 | 97.30 | 102.10 | 101.20 | 106.80 | 112.20 | 131.50 | 119.70 | 106.80 | 103.60 | 109.90 | 116.70 | 96.90 | 103.80 | 90.20 | 94.50 | 96.90 | 90.50 | 104.30 | 101.20 | 103.10 | 143.80 | 128.80 | 131.70 | 62.40 | 69.10 | 64.60 | 61.10 | 57.80 | 64.50 | 63.20 | 55.90 | 61.90 | 48.60 | 47.50 | 47.60 | 48.40 | 47.70 | 43.30 | NA | 44.90 | NA | NA | NA | |
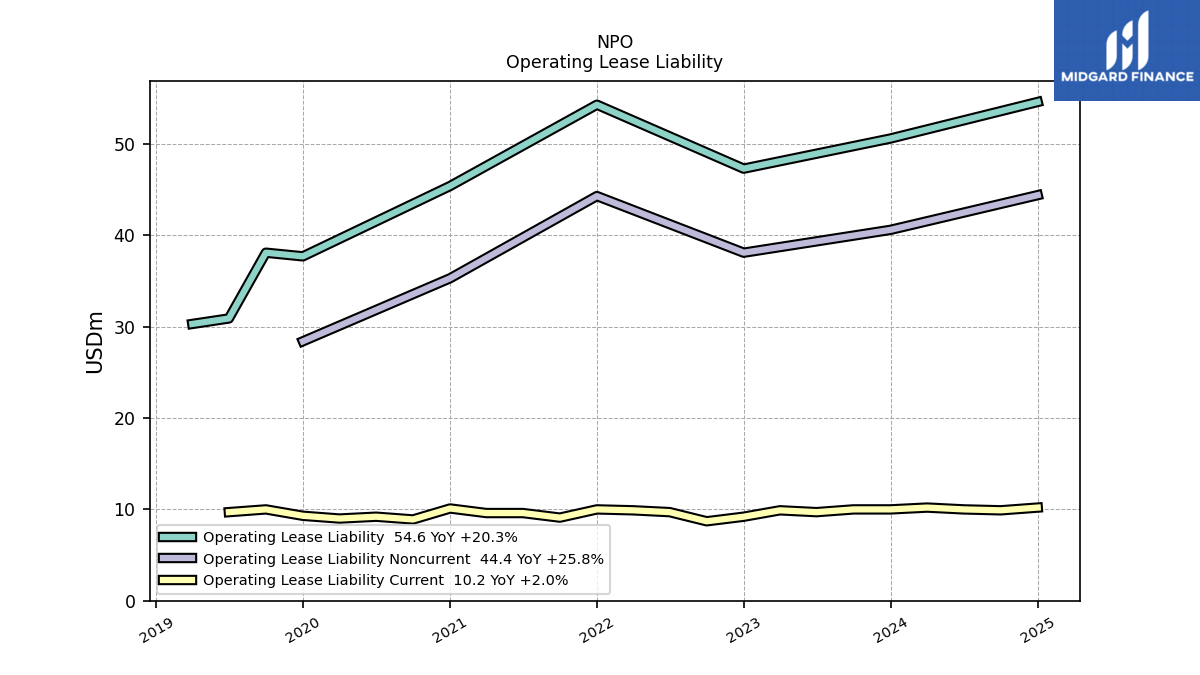
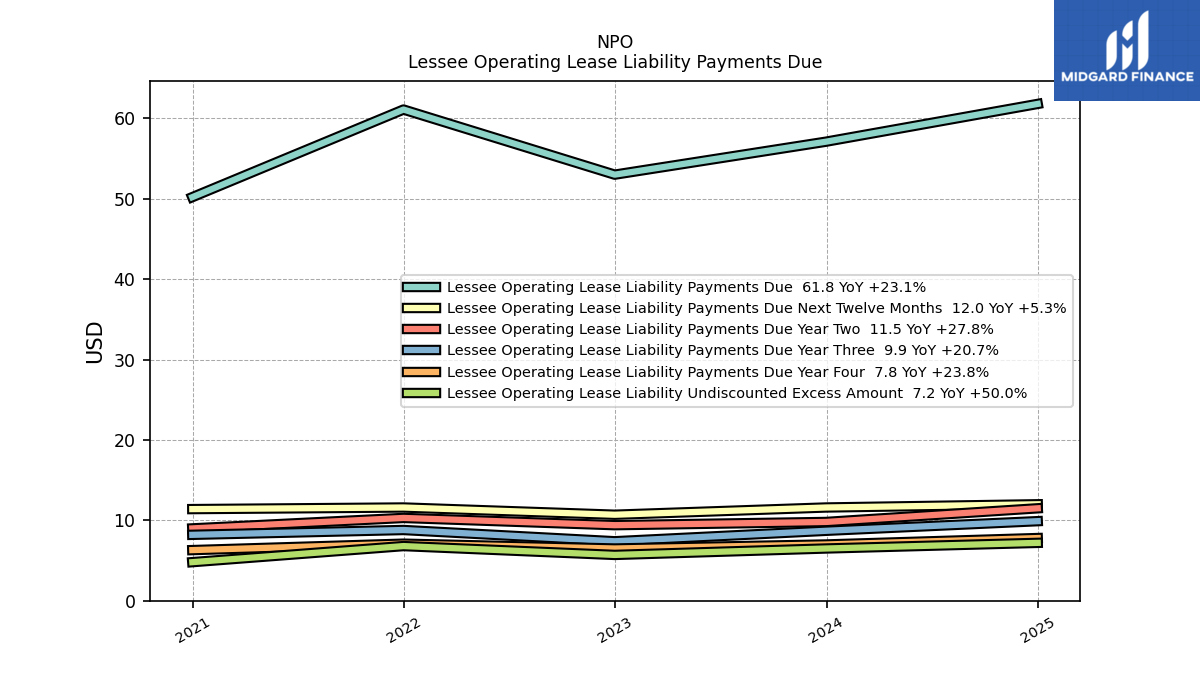
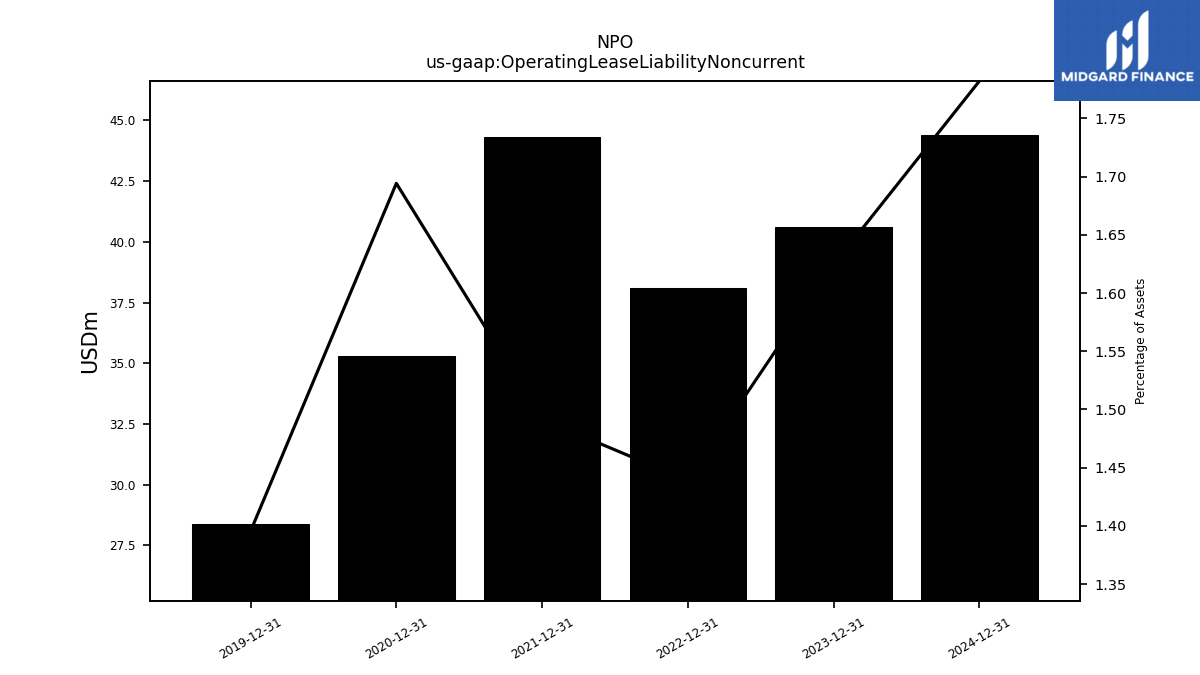
| Operating Lease Liability Noncurrent | 40.60 | NA | NA | NA | 38.10 | NA | NA | NA | 44.30 | NA | NA | NA | 35.30 | NA | NA | NA | 28.40 | NA | NA | NA | NA | NA | NA | NA | NA | NA | NA | NA | NA | NA | NA | NA | NA | NA | NA | NA | NA | NA | NA | NA | NA | NA | NA | NA | NA | NA | NA | NA | NA | NA | NA | NA | NA | NA | NA | NA |
| 2023-12-31 | 2023-09-30 | 2023-06-30 | 2023-03-31 | 2022-12-31 | 2022-09-30 | 2022-06-30 | 2022-03-31 | 2021-12-31 | 2021-09-30 | 2021-06-30 | 2021-03-31 | 2020-12-31 | 2020-09-30 | 2020-06-30 | 2020-03-31 | 2019-12-31 | 2019-09-30 | 2019-06-30 | 2019-03-31 | 2018-12-31 | 2018-09-30 | 2018-06-30 | 2018-03-31 | 2017-12-31 | 2017-09-30 | 2017-06-30 | 2017-03-31 | 2016-12-31 | 2016-09-30 | 2016-06-30 | 2016-03-31 | 2015-12-31 | 2015-09-30 | 2015-06-30 | 2015-03-31 | 2014-12-31 | 2014-09-30 | 2014-06-30 | 2014-03-31 | 2013-12-31 | 2013-09-30 | 2013-06-30 | 2013-03-31 | 2012-12-31 | 2012-09-30 | 2012-06-30 | 2012-03-31 | 2011-12-31 | 2011-09-30 | 2011-06-30 | 2011-03-31 | 2010-12-31 | 2010-09-30 | 2010-06-30 | 2010-03-31 | ||
|---|---|---|---|---|---|---|---|---|---|---|---|---|---|---|---|---|---|---|---|---|---|---|---|---|---|---|---|---|---|---|---|---|---|---|---|---|---|---|---|---|---|---|---|---|---|---|---|---|---|---|---|---|---|---|---|---|---|
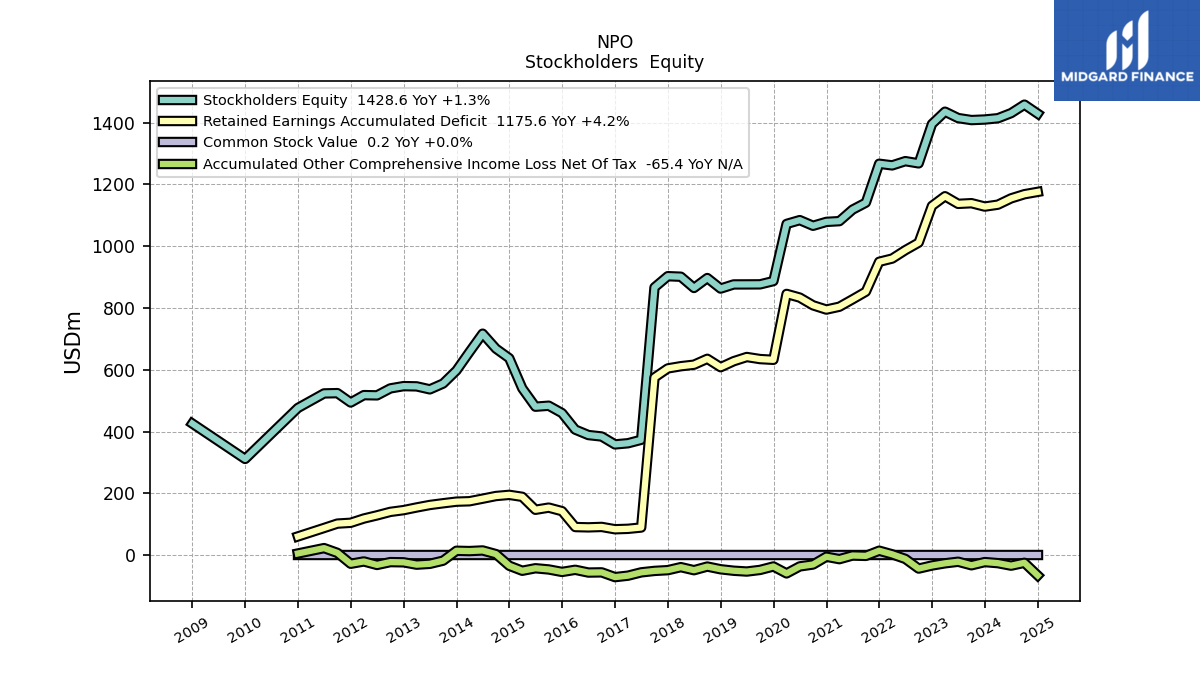
| Stockholders Equity | 1409.70 | 1407.90 | 1414.40 | 1435.10 | 1395.10 | 1267.80 | 1275.00 | 1261.30 | 1266.60 | 1140.70 | 1118.10 | 1080.90 | 1078.50 | 1065.90 | 1084.20 | 1071.90 | 886.90 | 876.40 | 876.20 | 876.10 | 862.70 | 896.80 | 864.70 | 901.10 | 902.80 | 866.50 | 373.40 | 362.30 | 358.50 | 384.10 | 388.80 | 406.40 | 459.80 | 483.70 | 480.50 | 539.90 | 637.40 | 668.40 | 716.80 | 657.50 | 597.50 | 555.50 | 536.60 | 546.30 | 547.10 | 539.70 | 517.20 | 518.00 | 494.10 | 524.40 | 523.50 | NA | 476.40 | NA | NA | NA | |
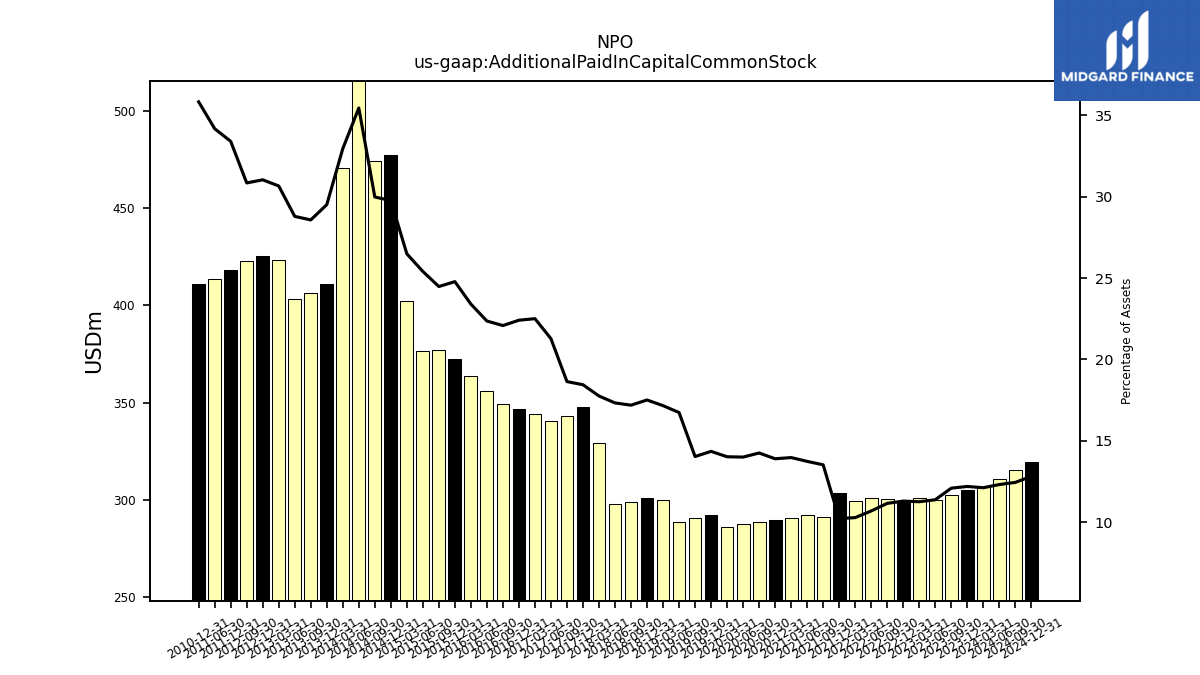
| Additional Paid In Capital Common Stock | 304.90 | 302.50 | 299.70 | 300.80 | 299.20 | 300.70 | 301.00 | 299.60 | 303.60 | 291.20 | 292.20 | 290.70 | 289.60 | 288.50 | 287.80 | 286.30 | 292.10 | 290.50 | 288.80 | 299.80 | 301.00 | 299.10 | 297.90 | 329.30 | 347.90 | 343.40 | 340.40 | 344.20 | 346.50 | 349.20 | 355.90 | 363.60 | 372.50 | 376.90 | 376.80 | 402.40 | 477.30 | 474.40 | 519.60 | 470.60 | 410.90 | 406.30 | 403.20 | 423.60 | 425.40 | 423.00 | NA | NA | 418.10 | NA | 413.60 | NA | 411.30 | NA | NA | NA | |
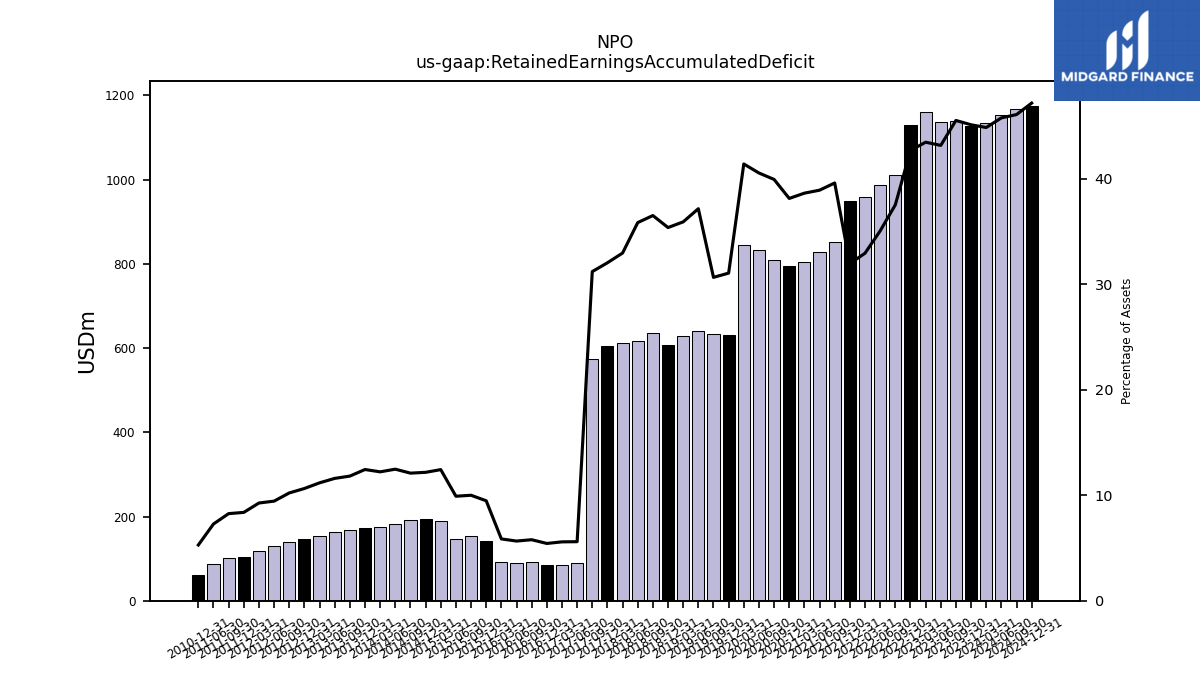
| Retained Earnings Accumulated Deficit | 1128.00 | 1139.00 | 1136.80 | 1161.50 | 1130.20 | 1011.40 | 987.00 | 959.80 | 949.40 | 852.70 | 827.90 | 804.00 | 794.80 | 808.50 | 833.60 | 845.50 | 632.20 | 634.60 | 641.30 | 627.60 | 608.30 | 635.50 | 616.40 | 611.50 | 604.40 | 575.00 | 89.60 | 85.40 | 84.00 | 91.50 | 90.10 | 91.10 | 142.50 | 154.00 | 147.00 | 188.90 | 195.30 | 191.50 | 182.90 | 174.60 | 173.30 | 168.10 | 162.50 | 154.50 | 145.90 | 140.20 | 128.90 | 118.70 | 104.90 | 102.30 | 88.10 | NA | 60.70 | NA | NA | NA | |
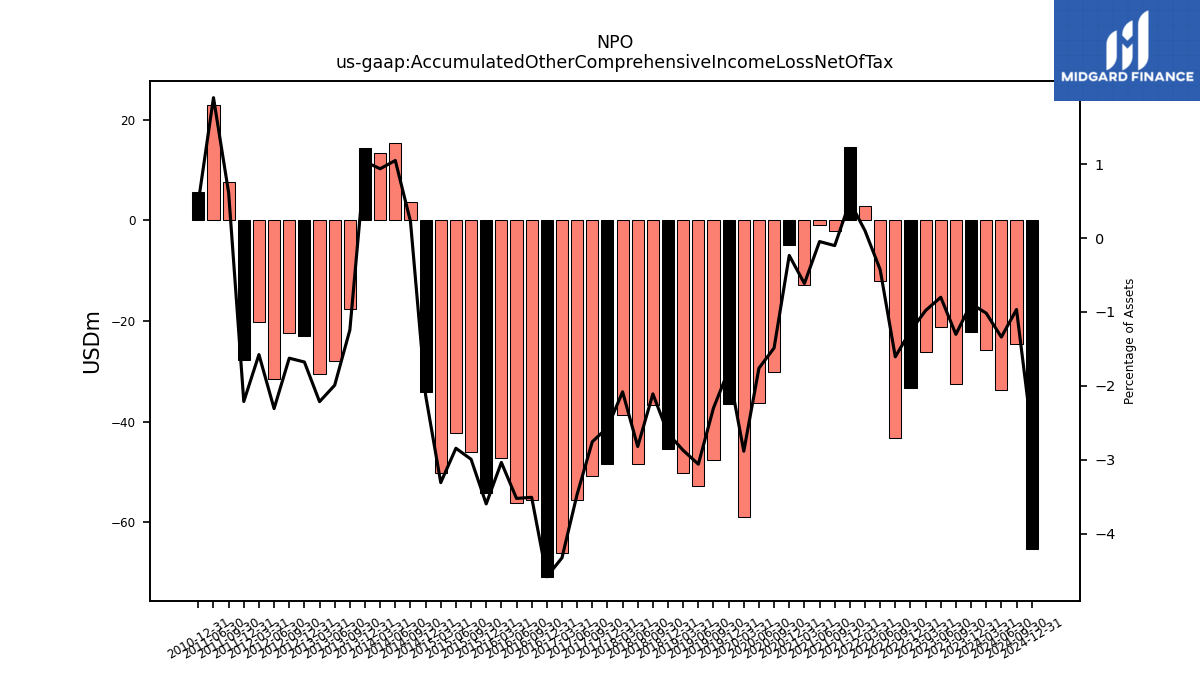
| Accumulated Other Comprehensive Income Loss Net Of Tax | -22.20 | -32.60 | -21.10 | -26.20 | -33.30 | -43.30 | -12.00 | 2.90 | 14.60 | -2.20 | -1.00 | -12.80 | -4.90 | -30.10 | -36.20 | -58.90 | -36.40 | -47.60 | -52.80 | -50.20 | -45.50 | -36.70 | -48.50 | -38.60 | -48.40 | -50.80 | -55.50 | -66.20 | -70.90 | -55.50 | -56.10 | -47.20 | -54.10 | -46.10 | -42.20 | -50.30 | -34.10 | 3.60 | 15.40 | 13.40 | 14.40 | -17.70 | -27.90 | -30.60 | -23.00 | -22.30 | -31.50 | -20.20 | -27.70 | 7.60 | 23.00 | NA | 5.60 | NA | NA | NA |
| 2023-12-31 | 2023-09-30 | 2023-06-30 | 2023-03-31 | 2022-12-31 | 2022-09-30 | 2022-06-30 | 2022-03-31 | 2021-12-31 | 2021-09-30 | 2021-06-30 | 2021-03-31 | 2020-12-31 | 2020-09-30 | 2020-06-30 | 2020-03-31 | 2019-12-31 | 2019-09-30 | 2019-06-30 | 2019-03-31 | 2018-12-31 | 2018-09-30 | 2018-06-30 | 2018-03-31 | 2017-12-31 | 2017-09-30 | 2017-06-30 | 2017-03-31 | 2016-12-31 | 2016-09-30 | 2016-06-30 | 2016-03-31 | 2015-12-31 | 2015-09-30 | 2015-06-30 | 2015-03-31 | 2014-12-31 | 2014-09-30 | 2014-06-30 | 2014-03-31 | 2013-12-31 | 2013-09-30 | 2013-06-30 | 2013-03-31 | 2012-12-31 | 2012-09-30 | 2012-06-30 | 2012-03-31 | 2011-12-31 | 2011-09-30 | 2011-06-30 | 2011-03-31 | 2010-12-31 | 2010-09-30 | 2010-06-30 | 2010-03-31 | ||
|---|---|---|---|---|---|---|---|---|---|---|---|---|---|---|---|---|---|---|---|---|---|---|---|---|---|---|---|---|---|---|---|---|---|---|---|---|---|---|---|---|---|---|---|---|---|---|---|---|---|---|---|---|---|---|---|---|---|
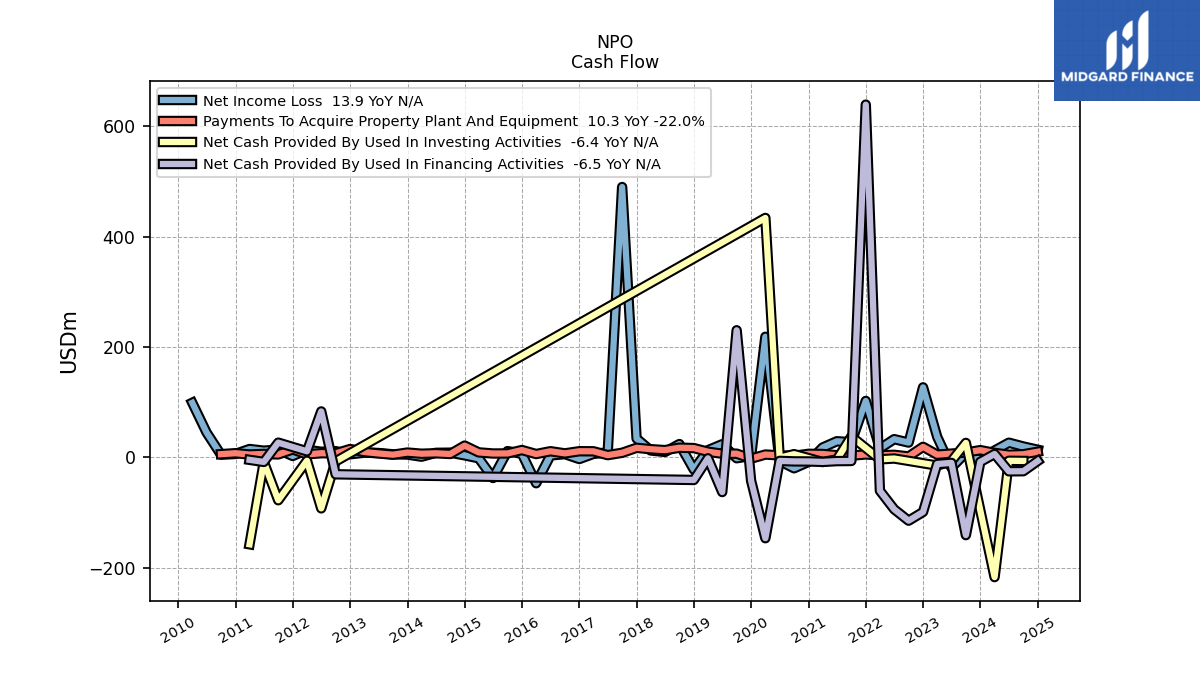
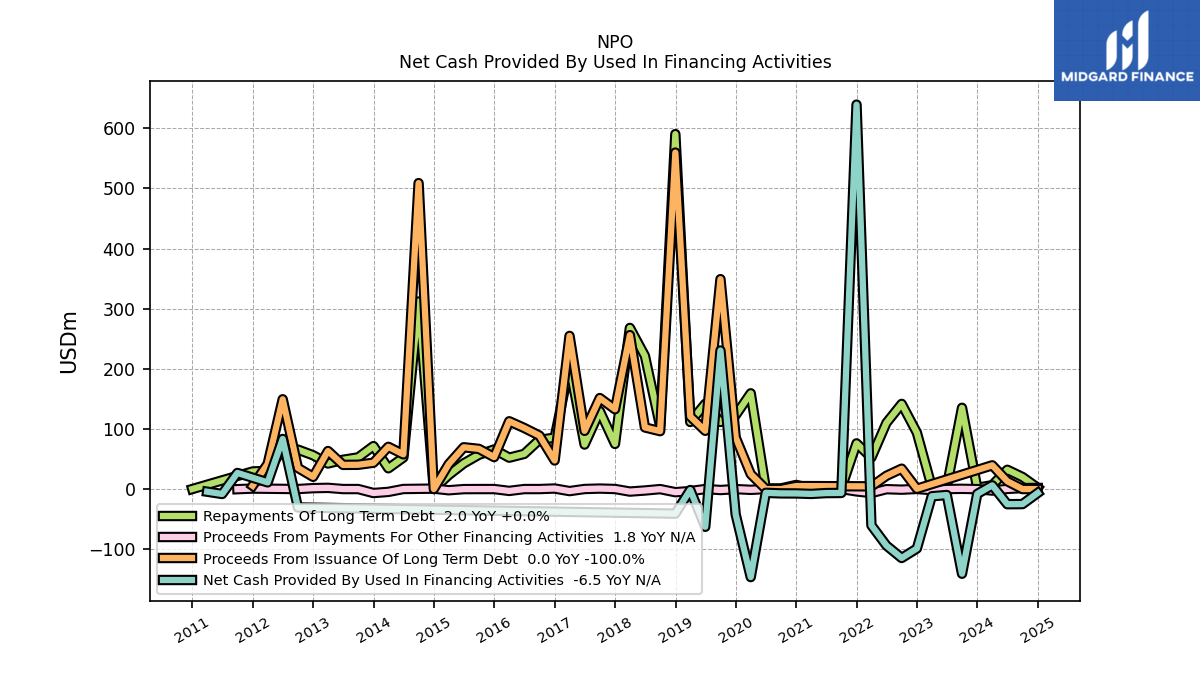
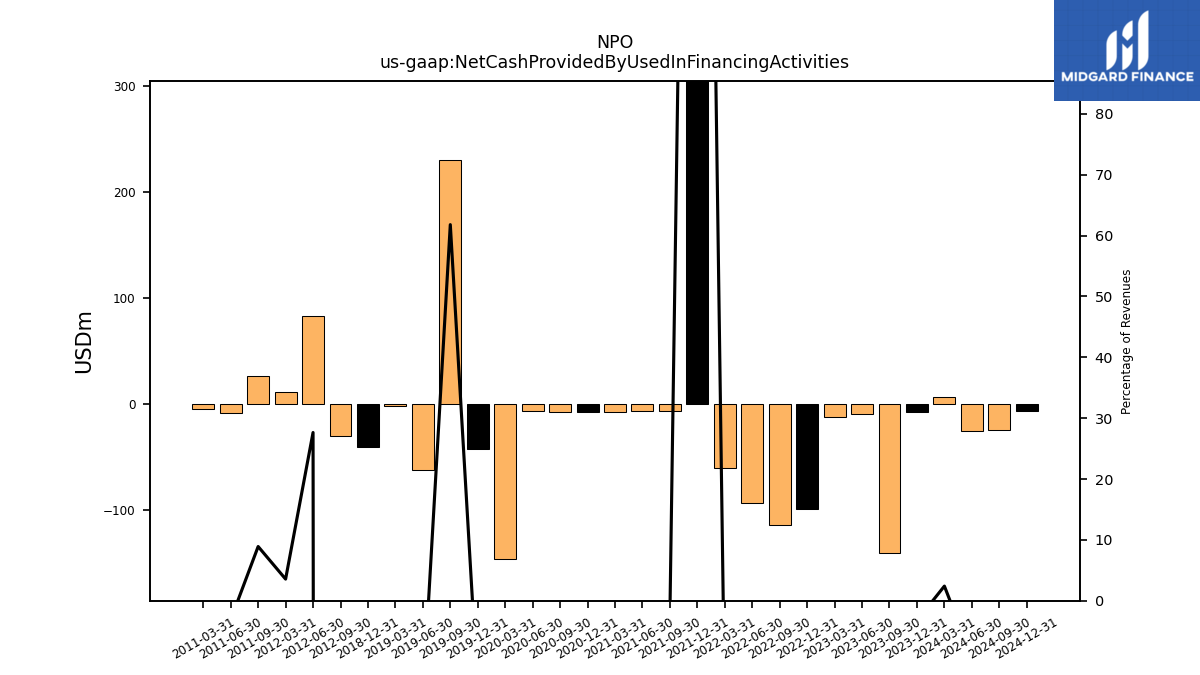
| Net Cash Provided By Used In Financing Activities | -8.10 | -140.90 | -9.90 | -12.00 | -98.90 | -114.70 | -94.00 | -60.40 | 639.50 | -6.50 | -6.70 | -8.10 | -7.30 | -7.20 | -6.30 | -146.50 | -42.30 | 230.50 | -62.80 | -1.60 | -40.90 | NA | NA | NA | NA | NA | NA | NA | NA | NA | NA | NA | NA | NA | NA | NA | NA | NA | NA | NA | NA | NA | NA | NA | NA | -30.60 | 83.40 | 11.10 | NA | 26.80 | -8.20 | -4.40 | NA | NA | NA | NA |
| 2023-12-31 | 2023-09-30 | 2023-06-30 | 2023-03-31 | 2022-12-31 | 2022-09-30 | 2022-06-30 | 2022-03-31 | 2021-12-31 | 2021-09-30 | 2021-06-30 | 2021-03-31 | 2020-12-31 | 2020-09-30 | 2020-06-30 | 2020-03-31 | 2019-12-31 | 2019-09-30 | 2019-06-30 | 2019-03-31 | 2018-12-31 | 2018-09-30 | 2018-06-30 | 2018-03-31 | 2017-12-31 | 2017-09-30 | 2017-06-30 | 2017-03-31 | 2016-12-31 | 2016-09-30 | 2016-06-30 | 2016-03-31 | 2015-12-31 | 2015-09-30 | 2015-06-30 | 2015-03-31 | 2014-12-31 | 2014-09-30 | 2014-06-30 | 2014-03-31 | 2013-12-31 | 2013-09-30 | 2013-06-30 | 2013-03-31 | 2012-12-31 | 2012-09-30 | 2012-06-30 | 2012-03-31 | 2011-12-31 | 2011-09-30 | 2011-06-30 | 2011-03-31 | 2010-12-31 | 2010-09-30 | 2010-06-30 | 2010-03-31 | ||
|---|---|---|---|---|---|---|---|---|---|---|---|---|---|---|---|---|---|---|---|---|---|---|---|---|---|---|---|---|---|---|---|---|---|---|---|---|---|---|---|---|---|---|---|---|---|---|---|---|---|---|---|---|---|---|---|---|---|
| Net Income Loss | -4.90 | 8.30 | -18.60 | 37.40 | 127.00 | 26.90 | 33.10 | 16.20 | 102.40 | 27.50 | 29.30 | 18.00 | -8.10 | -19.70 | -6.50 | 218.70 | 2.80 | -1.50 | 23.90 | 13.10 | -22.10 | 24.20 | 9.90 | 12.60 | 34.20 | 490.20 | 9.00 | 6.40 | -2.90 | 6.00 | 3.60 | -46.80 | 6.60 | 11.40 | -37.30 | -1.60 | 3.80 | 8.60 | 8.30 | 1.30 | 5.20 | 5.60 | 8.00 | 8.60 | 5.70 | 11.30 | 10.20 | 13.80 | 2.60 | 14.20 | 12.20 | 15.20 | 6.30 | 4.90 | 45.20 | 99.00 | |
| Profit Loss | -4.50 | 8.20 | -22.80 | 37.40 | 123.40 | 27.50 | 33.00 | 16.50 | 102.80 | 27.60 | 29.20 | 18.10 | -8.20 | -19.40 | -6.40 | 218.80 | NA | NA | NA | NA | NA | NA | NA | NA | NA | NA | NA | NA | NA | NA | NA | NA | NA | NA | NA | NA | NA | NA | NA | NA | NA | NA | NA | NA | NA | NA | NA | NA | NA | NA | NA | NA | NA | NA | NA | NA | |
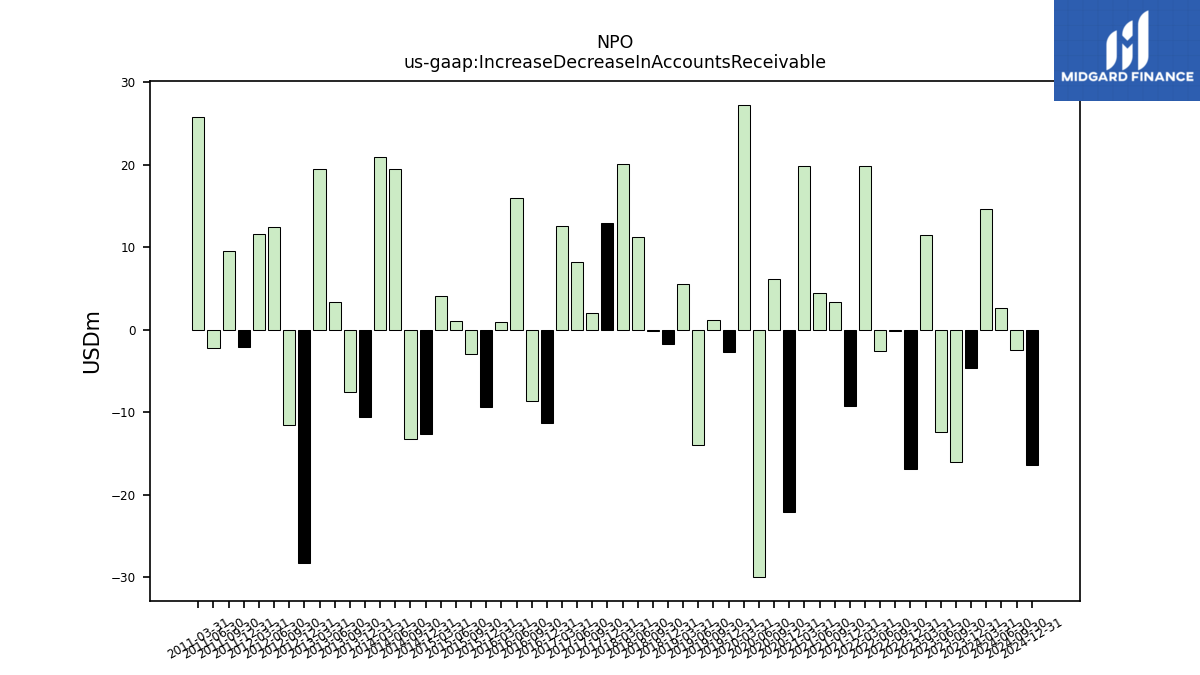
| Increase Decrease In Accounts Receivable | -4.70 | -16.00 | -12.40 | 11.50 | -16.90 | -0.20 | -2.60 | 19.80 | -9.30 | 3.40 | 4.50 | 19.80 | -22.10 | 6.10 | -30.00 | 27.30 | -2.70 | 1.20 | -14.00 | 5.60 | -1.70 | -0.10 | 11.30 | 20.10 | 12.90 | 2.00 | 8.20 | 12.60 | -11.30 | -8.60 | 16.00 | 0.90 | -9.40 | -3.00 | 1.00 | 4.10 | -12.60 | -13.30 | 19.50 | 21.00 | -10.60 | -7.60 | 3.40 | 19.50 | -28.30 | -11.60 | 12.50 | 11.60 | -2.10 | 9.60 | -2.20 | 25.80 | NA | NA | NA | NA | |
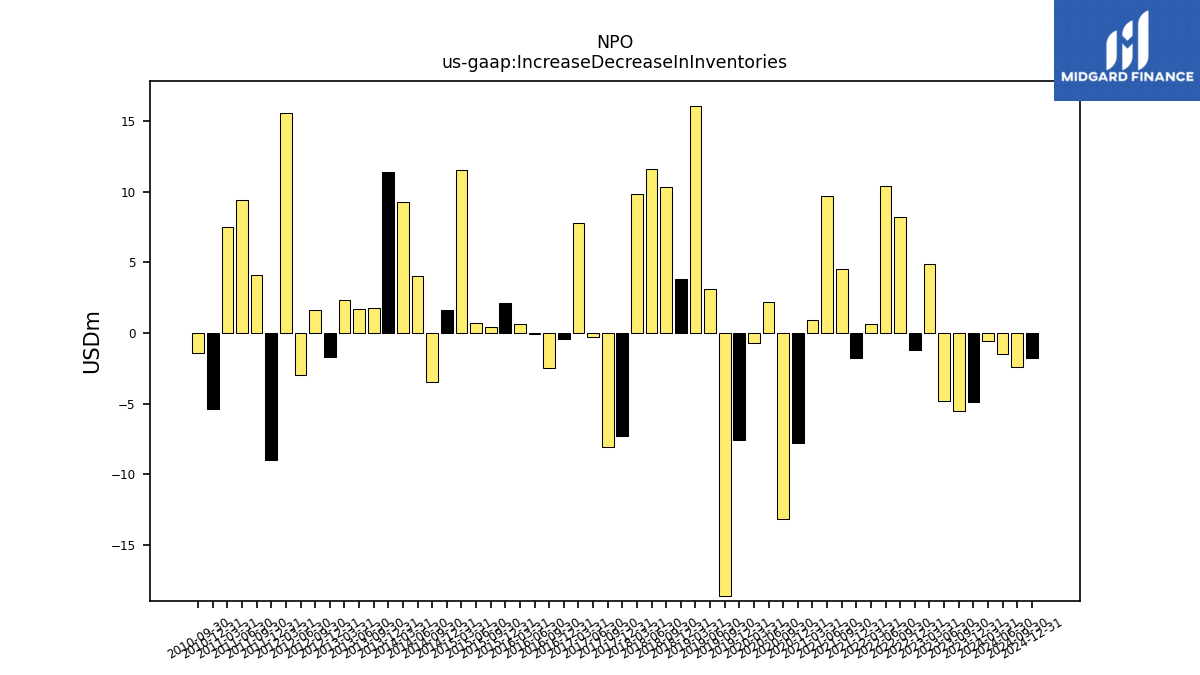
| Increase Decrease In Inventories | -4.90 | -5.50 | -4.80 | 4.90 | -1.20 | 8.20 | 10.40 | 0.60 | -1.80 | 4.50 | 9.70 | 0.90 | -7.80 | -13.20 | 2.20 | -0.70 | -7.60 | -18.60 | 3.10 | 16.10 | 3.80 | 10.30 | 11.60 | 9.80 | -7.30 | -8.10 | -0.30 | 7.80 | -0.40 | -2.50 | -0.10 | 0.60 | 2.10 | 0.40 | 0.70 | 11.50 | 1.60 | -3.50 | 4.00 | 9.30 | 11.40 | 1.80 | 1.70 | 2.30 | -1.70 | 1.60 | -3.00 | 15.60 | -9.00 | 4.10 | 9.40 | 7.50 | -5.40 | -1.40 | NA | NA | |
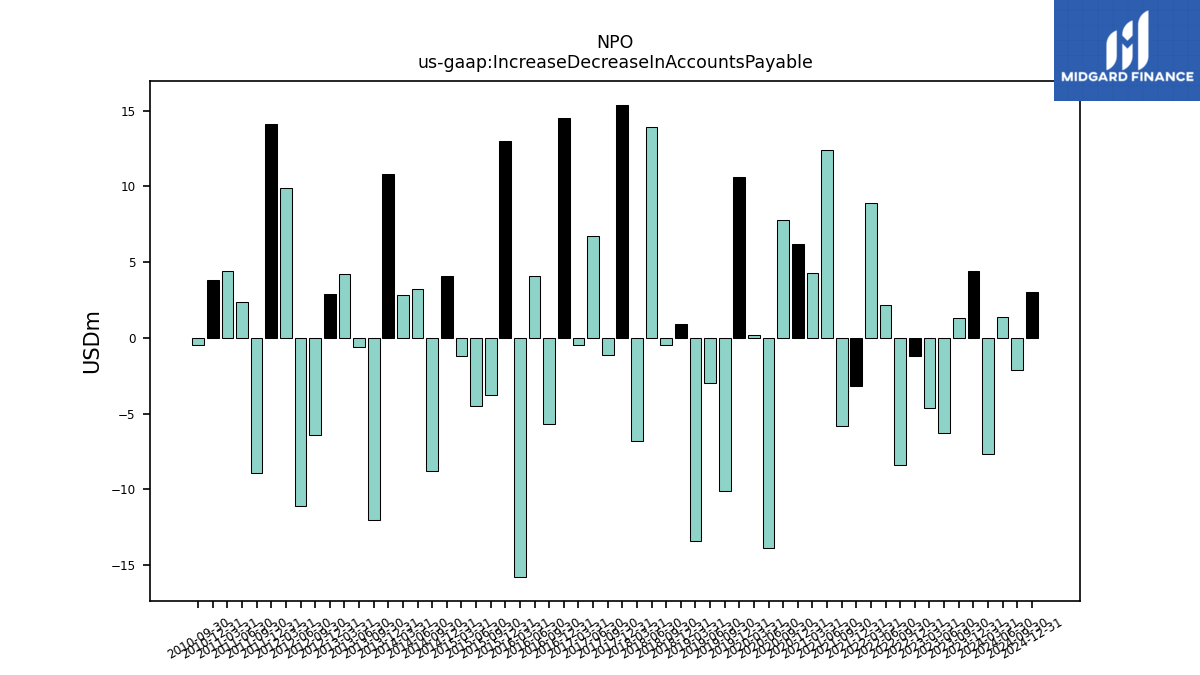
| Increase Decrease In Accounts Payable | 4.40 | 1.30 | -6.30 | -4.60 | -1.20 | -8.40 | 2.20 | 8.90 | -3.20 | -5.80 | 12.40 | 4.30 | 6.20 | 7.80 | -13.90 | 0.20 | 10.60 | -10.10 | -3.00 | -13.40 | 0.90 | -0.50 | 13.90 | -6.80 | 15.40 | -1.10 | 6.70 | -0.50 | 14.50 | -5.70 | 4.10 | -15.80 | 13.00 | -3.80 | -4.50 | -1.20 | 4.10 | -8.80 | 3.20 | 2.80 | 10.80 | -12.00 | -0.60 | 4.20 | 2.90 | -6.40 | -11.10 | 9.90 | 14.10 | -8.90 | 2.40 | 4.40 | 3.80 | -0.50 | NA | NA | |
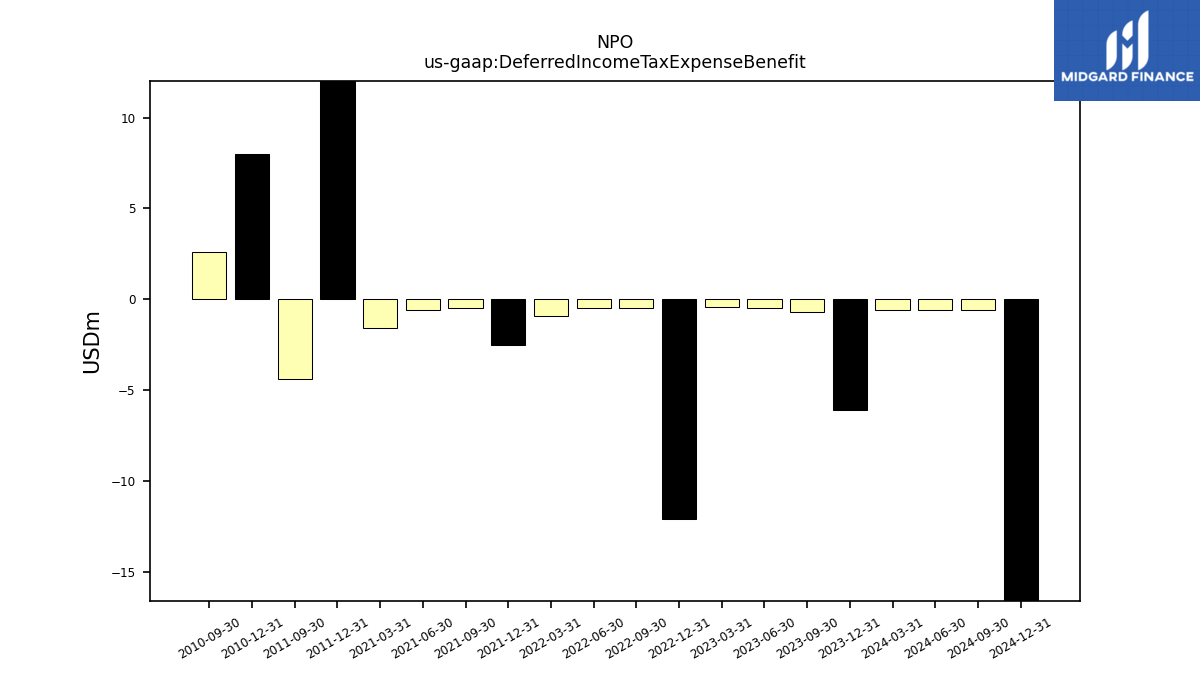
| Deferred Income Tax Expense Benefit | -6.10 | -0.70 | -0.50 | -0.40 | -12.10 | -0.50 | -0.50 | -0.90 | -2.50 | -0.50 | -0.60 | -1.60 | NA | NA | NA | NA | NA | NA | NA | NA | NA | NA | NA | NA | NA | NA | NA | NA | NA | NA | NA | NA | NA | NA | NA | NA | NA | NA | NA | NA | NA | NA | NA | NA | NA | NA | NA | NA | 15.80 | -4.40 | NA | NA | 8.00 | 2.60 | NA | NA | |
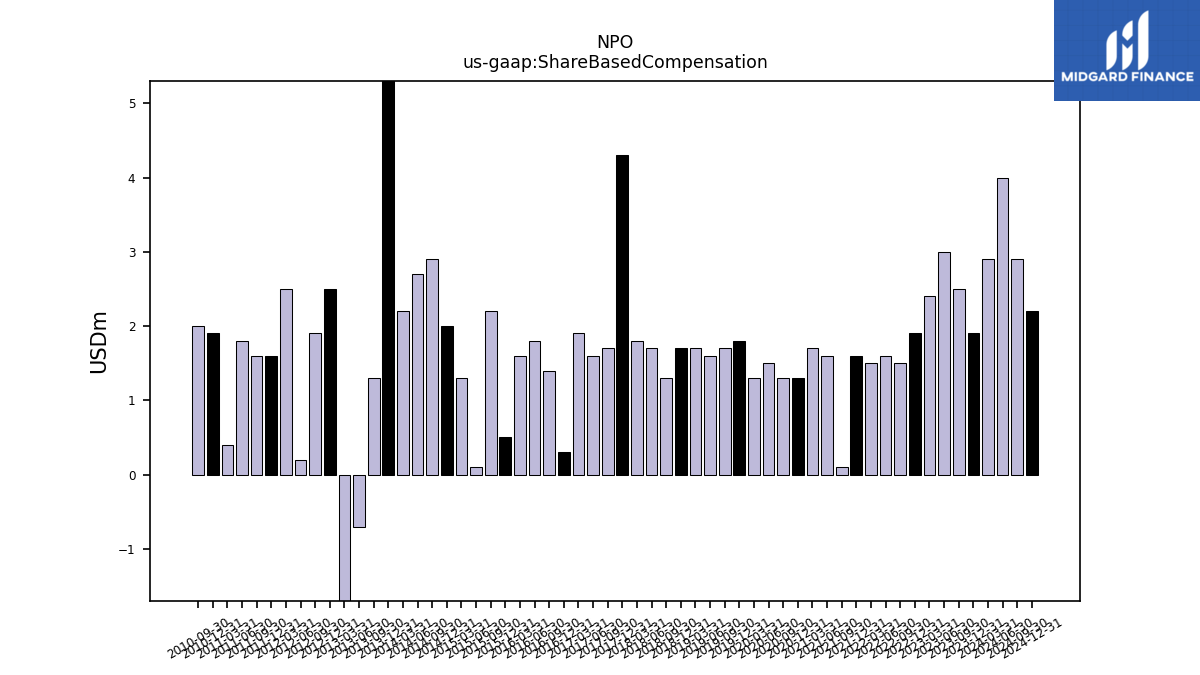
| Share Based Compensation | 1.90 | 2.50 | 3.00 | 2.40 | 1.90 | 1.50 | 1.60 | 1.50 | 1.60 | 0.10 | 1.60 | 1.70 | 1.30 | 1.30 | 1.50 | 1.30 | 1.80 | 1.70 | 1.60 | 1.70 | 1.70 | 1.30 | 1.70 | 1.80 | 4.30 | 1.70 | 1.60 | 1.90 | 0.30 | 1.40 | 1.80 | 1.60 | 0.50 | 2.20 | 0.10 | 1.30 | 2.00 | 2.90 | 2.70 | 2.20 | 7.20 | 1.30 | -0.70 | -1.80 | 2.50 | 1.90 | 0.20 | 2.50 | 1.60 | 1.60 | 1.80 | 0.40 | 1.90 | 2.00 | NA | NA |
| 2023-12-31 | 2023-09-30 | 2023-06-30 | 2023-03-31 | 2022-12-31 | 2022-09-30 | 2022-06-30 | 2022-03-31 | 2021-12-31 | 2021-09-30 | 2021-06-30 | 2021-03-31 | 2020-12-31 | 2020-09-30 | 2020-06-30 | 2020-03-31 | 2019-12-31 | 2019-09-30 | 2019-06-30 | 2019-03-31 | 2018-12-31 | 2018-09-30 | 2018-06-30 | 2018-03-31 | 2017-12-31 | 2017-09-30 | 2017-06-30 | 2017-03-31 | 2016-12-31 | 2016-09-30 | 2016-06-30 | 2016-03-31 | 2015-12-31 | 2015-09-30 | 2015-06-30 | 2015-03-31 | 2014-12-31 | 2014-09-30 | 2014-06-30 | 2014-03-31 | 2013-12-31 | 2013-09-30 | 2013-06-30 | 2013-03-31 | 2012-12-31 | 2012-09-30 | 2012-06-30 | 2012-03-31 | 2011-12-31 | 2011-09-30 | 2011-06-30 | 2011-03-31 | 2010-12-31 | 2010-09-30 | 2010-06-30 | 2010-03-31 | ||
|---|---|---|---|---|---|---|---|---|---|---|---|---|---|---|---|---|---|---|---|---|---|---|---|---|---|---|---|---|---|---|---|---|---|---|---|---|---|---|---|---|---|---|---|---|---|---|---|---|---|---|---|---|---|---|---|---|---|
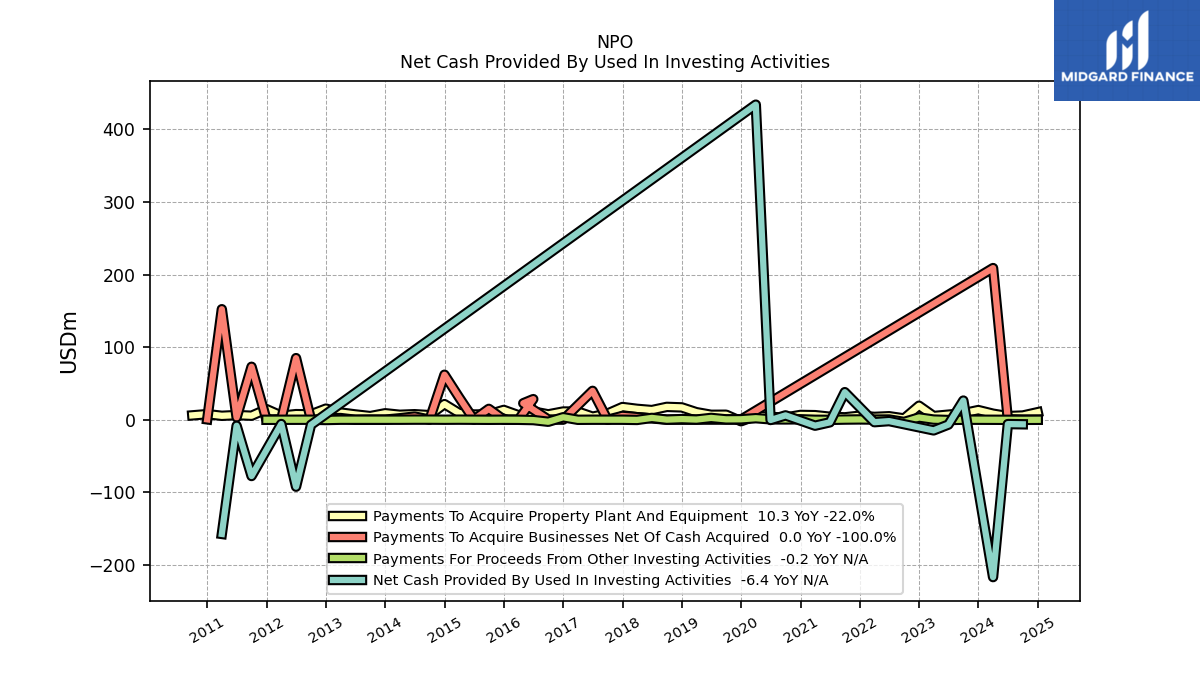
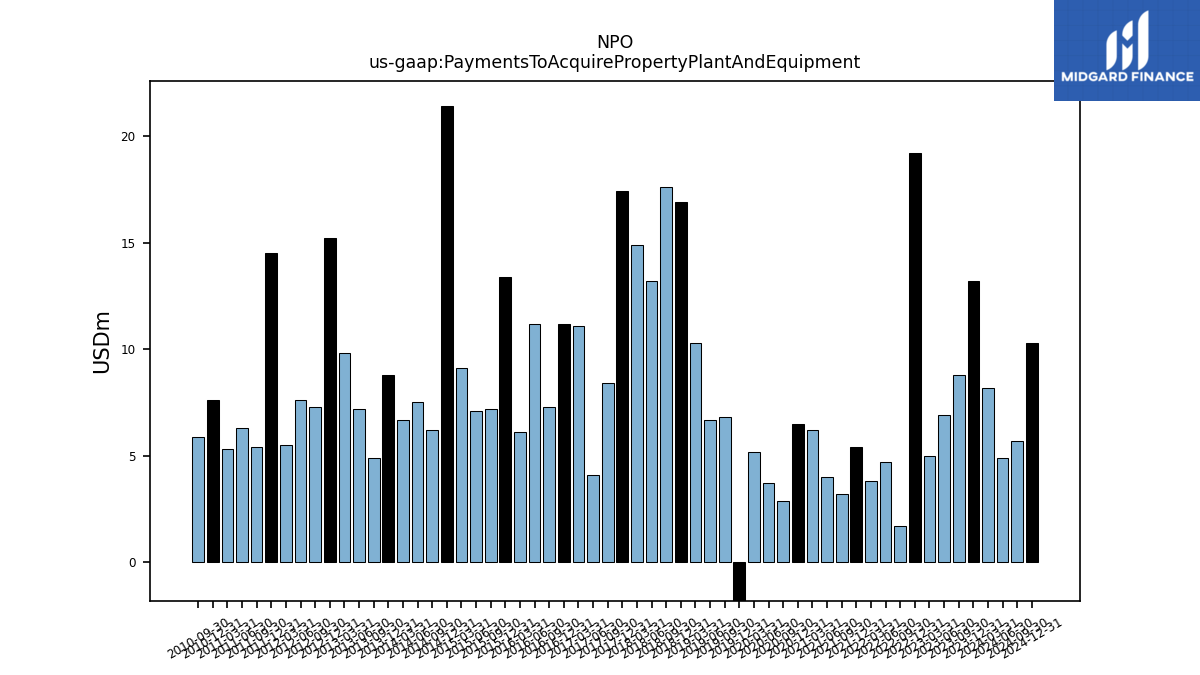
| Payments To Acquire Property Plant And Equipment | 13.20 | 8.80 | 6.90 | 5.00 | 19.20 | 1.70 | 4.70 | 3.80 | 5.40 | 3.20 | 4.00 | 6.20 | 6.50 | 2.90 | 3.70 | 5.20 | -2.20 | 6.80 | 6.70 | 10.30 | 16.90 | 17.60 | 13.20 | 14.90 | 17.40 | 8.40 | 4.10 | 11.10 | 11.20 | 7.30 | 11.20 | 6.10 | 13.40 | 7.20 | 7.10 | 9.10 | 21.40 | 6.20 | 7.50 | 6.70 | 8.80 | 4.90 | 7.20 | 9.80 | 15.20 | 7.30 | 7.60 | 5.50 | 14.50 | 5.40 | 6.30 | 5.30 | 7.60 | 5.90 | NA | NA | |
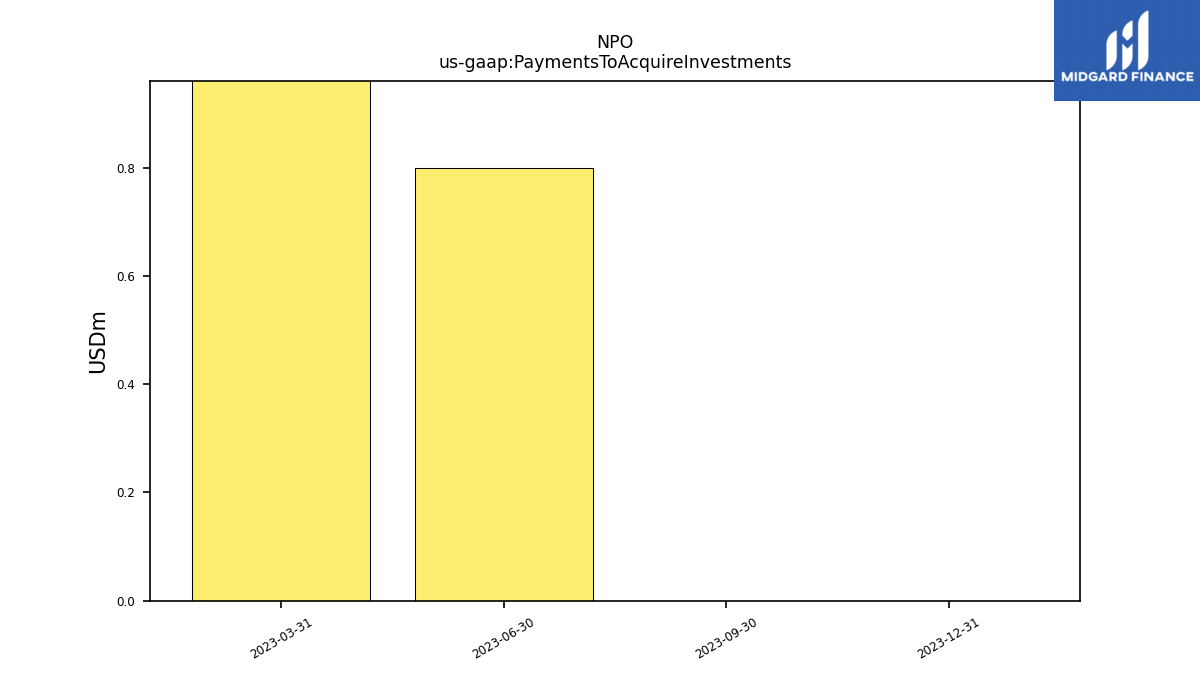
| Payments To Acquire Investments | 0.00 | 0.00 | 0.80 | 35.00 | NA | NA | NA | NA | NA | NA | NA | NA | NA | NA | NA | NA | NA | NA | NA | NA | NA | NA | NA | NA | NA | NA | NA | NA | NA | NA | NA | NA | NA | NA | NA | NA | NA | NA | NA | NA | NA | NA | NA | NA | NA | NA | NA | NA | NA | NA | NA | NA | NA | NA | NA | NA |
| 2023-12-31 | 2023-09-30 | 2023-06-30 | 2023-03-31 | 2022-12-31 | 2022-09-30 | 2022-06-30 | 2022-03-31 | 2021-12-31 | 2021-09-30 | 2021-06-30 | 2021-03-31 | 2020-12-31 | 2020-09-30 | 2020-06-30 | 2020-03-31 | 2019-12-31 | 2019-09-30 | 2019-06-30 | 2019-03-31 | 2018-12-31 | 2018-09-30 | 2018-06-30 | 2018-03-31 | 2017-12-31 | 2017-09-30 | 2017-06-30 | 2017-03-31 | 2016-12-31 | 2016-09-30 | 2016-06-30 | 2016-03-31 | 2015-12-31 | 2015-09-30 | 2015-06-30 | 2015-03-31 | 2014-12-31 | 2014-09-30 | 2014-06-30 | 2014-03-31 | 2013-12-31 | 2013-09-30 | 2013-06-30 | 2013-03-31 | 2012-12-31 | 2012-09-30 | 2012-06-30 | 2012-03-31 | 2011-12-31 | 2011-09-30 | 2011-06-30 | 2011-03-31 | 2010-12-31 | 2010-09-30 | 2010-06-30 | 2010-03-31 | ||
|---|---|---|---|---|---|---|---|---|---|---|---|---|---|---|---|---|---|---|---|---|---|---|---|---|---|---|---|---|---|---|---|---|---|---|---|---|---|---|---|---|---|---|---|---|---|---|---|---|---|---|---|---|---|---|---|---|---|
| Net Cash Provided By Used In Financing Activities | -8.10 | -140.90 | -9.90 | -12.00 | -98.90 | -114.70 | -94.00 | -60.40 | 639.50 | -6.50 | -6.70 | -8.10 | -7.30 | -7.20 | -6.30 | -146.50 | -42.30 | 230.50 | -62.80 | -1.60 | -40.90 | NA | NA | NA | NA | NA | NA | NA | NA | NA | NA | NA | NA | NA | NA | NA | NA | NA | NA | NA | NA | NA | NA | NA | NA | -30.60 | 83.40 | 11.10 | NA | 26.80 | -8.20 | -4.40 | NA | NA | NA | NA | |
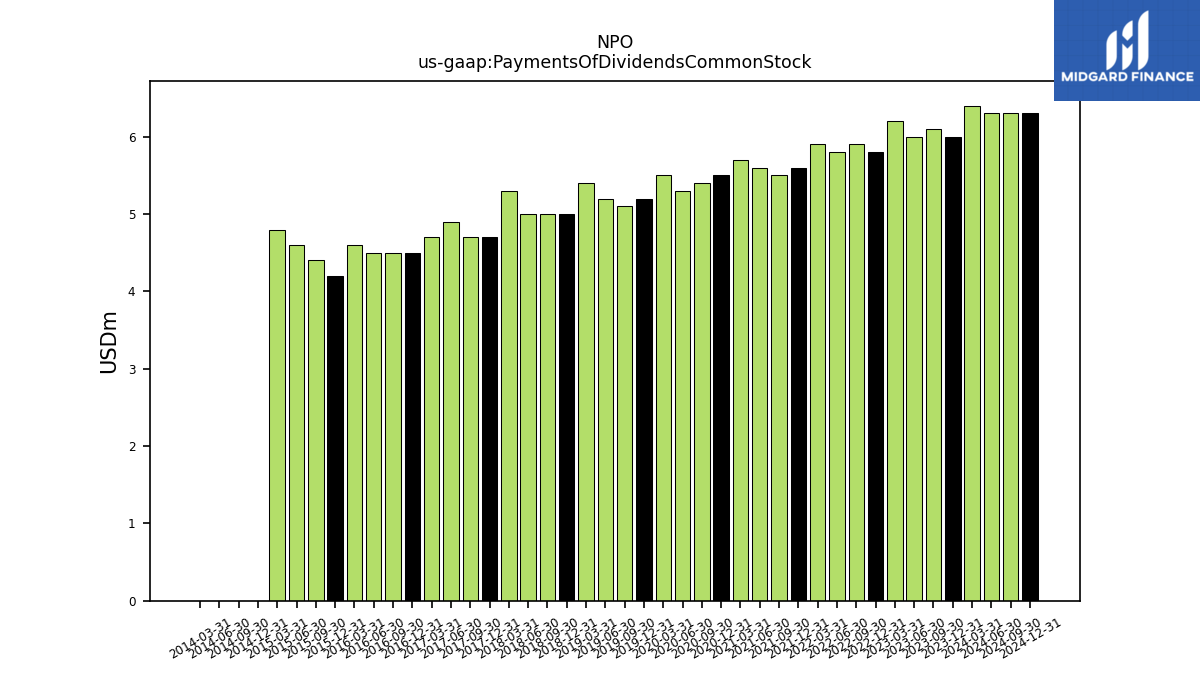
| Payments Of Dividends Common Stock | 6.00 | 6.10 | 6.00 | 6.20 | 5.80 | 5.90 | 5.80 | 5.90 | 5.60 | 5.50 | 5.60 | 5.70 | 5.50 | 5.40 | 5.30 | 5.50 | 5.20 | 5.10 | 5.20 | 5.40 | 5.00 | 5.00 | 5.00 | 5.30 | 4.70 | 4.70 | 4.90 | 4.70 | 4.50 | 4.50 | 4.50 | 4.60 | 4.20 | 4.40 | 4.60 | 4.80 | 0.00 | 0.00 | 0.00 | 0.00 | NA | NA | NA | NA | NA | NA | NA | NA | NA | NA | NA | NA | NA | NA | NA | NA |
| 2023-12-31 | 2023-09-30 | 2023-06-30 | 2023-03-31 | 2022-12-31 | 2022-09-30 | 2022-06-30 | 2022-03-31 | 2021-12-31 | 2021-09-30 | 2021-06-30 | 2021-03-31 | 2020-12-31 | 2020-09-30 | 2020-06-30 | 2020-03-31 | 2019-12-31 | 2019-09-30 | 2019-06-30 | 2019-03-31 | 2018-12-31 | 2018-09-30 | 2018-06-30 | 2018-03-31 | 2017-12-31 | 2017-09-30 | 2017-06-30 | 2017-03-31 | 2016-12-31 | 2016-09-30 | 2016-06-30 | 2016-03-31 | 2015-12-31 | 2015-09-30 | 2015-06-30 | 2015-03-31 | 2014-12-31 | 2014-09-30 | 2014-06-30 | 2014-03-31 | 2013-12-31 | 2013-09-30 | 2013-06-30 | 2013-03-31 | 2012-12-31 | 2012-09-30 | 2012-06-30 | 2012-03-31 | 2011-12-31 | 2011-09-30 | 2011-06-30 | 2011-03-31 | 2010-12-31 | 2010-09-30 | 2010-06-30 | 2010-03-31 | ||
|---|---|---|---|---|---|---|---|---|---|---|---|---|---|---|---|---|---|---|---|---|---|---|---|---|---|---|---|---|---|---|---|---|---|---|---|---|---|---|---|---|---|---|---|---|---|---|---|---|---|---|---|---|---|---|---|---|---|
| Revenues | 249.10 | 250.70 | 276.90 | 282.60 | 271.90 | 280.10 | 333.30 | 328.70 | 212.70 | 283.10 | 298.60 | 279.30 | 276.00 | 268.30 | 247.00 | 282.70 | 286.50 | 373.00 | 387.00 | 360.30 | 381.40 | 388.20 | 393.60 | 368.80 | 362.50 | 343.70 | 307.60 | 295.80 | 286.90 | 292.70 | 313.20 | 1.00 | 321.90 | 0.90 | 1.00 | 0.80 | 316.40 | 0.90 | 0.80 | 0.70 | 275.50 | 0.90 | 0.20 | 0.90 | 279.30 | 0.90 | 301.70 | 312.10 | 271.40 | 300.80 | 263.70 | 270.20 | 191.50 | 194.50 | 250.80 | 228.20 | |
| Revenue From Contract With Customer Including Assessed Tax | 249.10 | 250.70 | 276.90 | 282.60 | 271.90 | 280.10 | 333.30 | 328.70 | 212.70 | 283.10 | 298.60 | 279.30 | 276.00 | 268.30 | 247.00 | 282.70 | 286.50 | 373.00 | 387.00 | 360.30 | 290.70 | 388.20 | 393.60 | 368.80 | 362.50 | 343.70 | 307.60 | 295.80 | 286.90 | 292.70 | 313.20 | 1.00 | 321.90 | 0.90 | 1.00 | 0.80 | 316.40 | 0.90 | 0.80 | 0.70 | 275.50 | 0.90 | 0.20 | 0.90 | 279.30 | 0.90 | 301.70 | 312.10 | 271.40 | 300.80 | 263.70 | 270.20 | 191.50 | 194.50 | 250.80 | 228.20 |