
| 2023-12-30 | 2023-09-30 | 2023-07-01 | 2023-04-01 | 2022-12-31 | 2022-10-01 | 2022-07-02 | 2022-04-02 | 2022-01-01 | 2021-10-02 | 2021-07-03 | 2021-04-03 | 2021-01-02 | 2020-10-03 | 2020-06-27 | 2020-03-28 | 2019-12-28 | 2019-09-28 | 2019-06-29 | 2019-03-30 | 2018-12-29 | 2018-09-30 | 2018-09-29 | 2018-06-30 | 2018-03-31 | 2017-12-30 | 2017-09-30 | 2017-07-01 | 2017-04-01 | ||
|---|---|---|---|---|---|---|---|---|---|---|---|---|---|---|---|---|---|---|---|---|---|---|---|---|---|---|---|---|---|---|
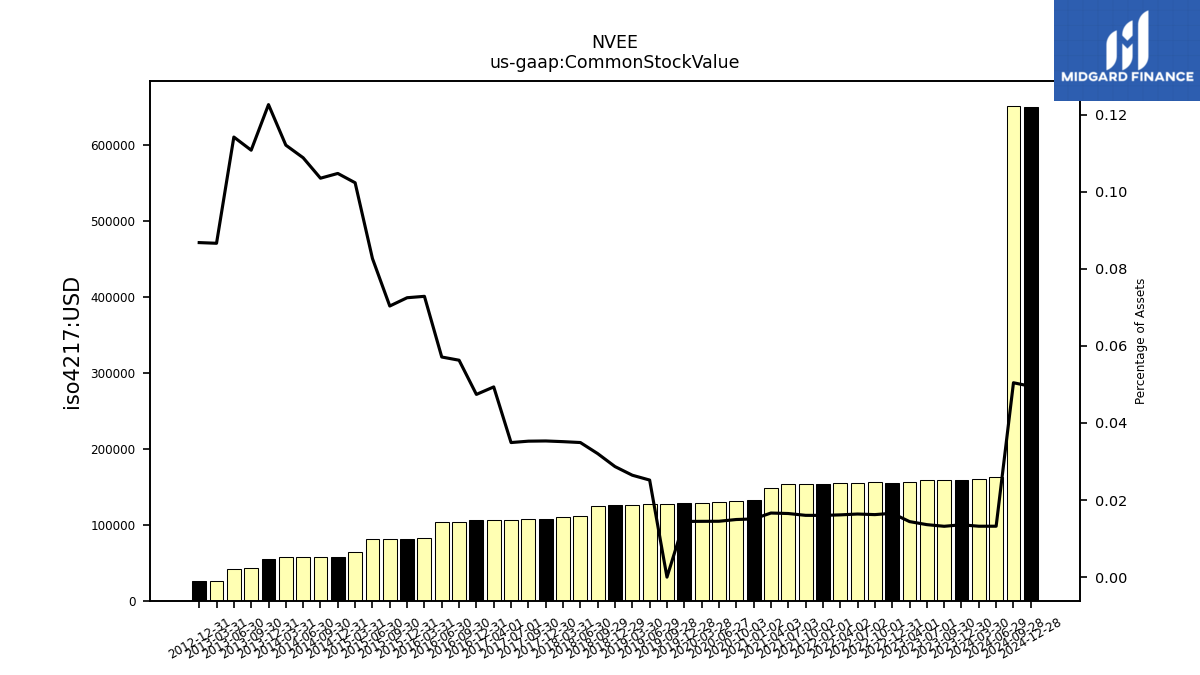
| Common Stock Value | 0.16 | 0.16 | 0.16 | 0.16 | 0.15 | 0.16 | 0.15 | 0.15 | 0.15 | 0.15 | 0.15 | 0.15 | 0.13 | 0.13 | 0.13 | 0.13 | 0.13 | 0.13 | 0.13 | 0.13 | 0.13 | NA | 0.12 | 0.11 | 0.11 | 0.11 | 0.11 | 0.11 | 0.11 | |
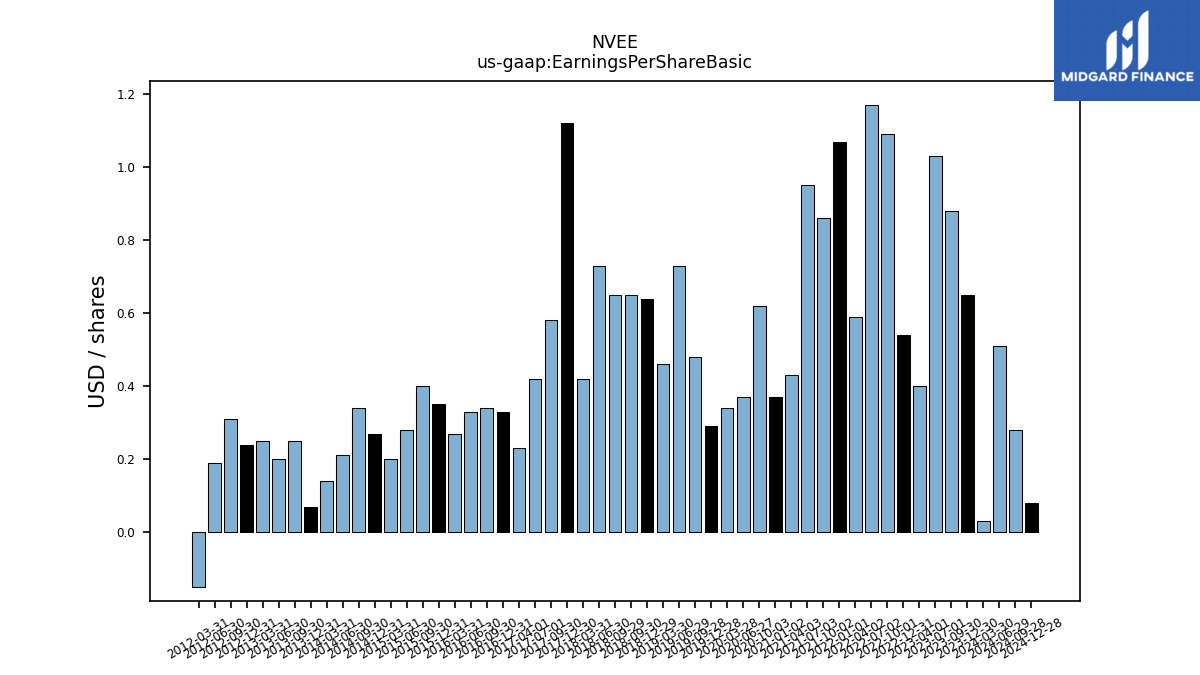
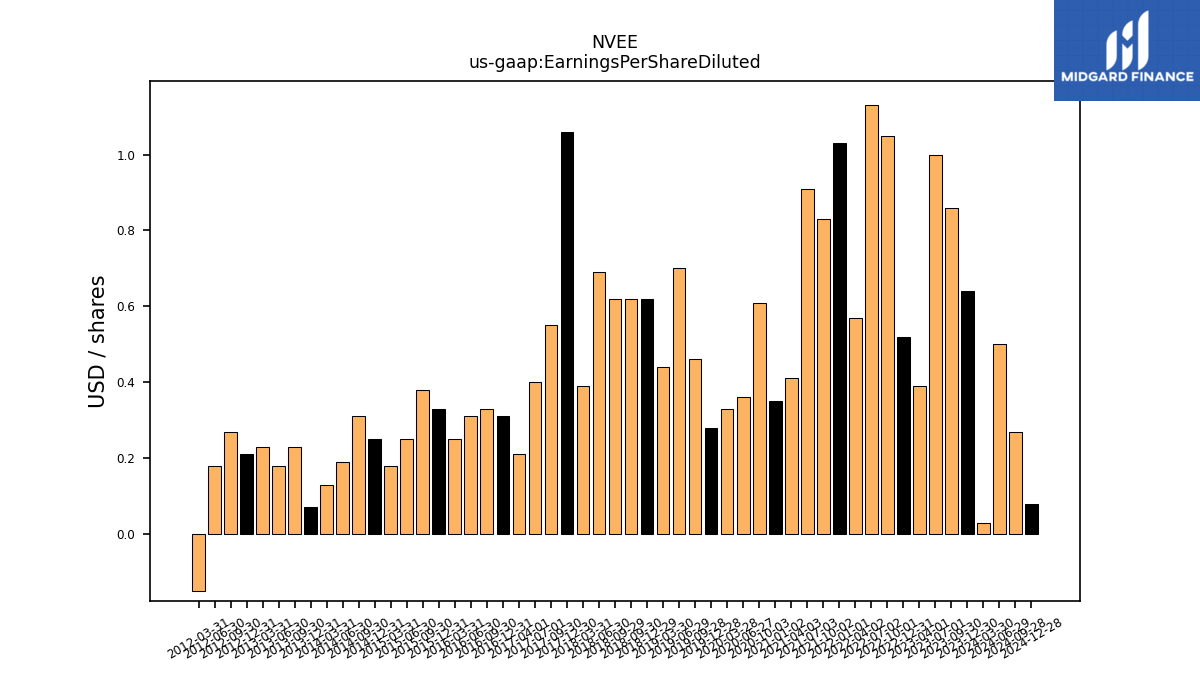
| Earnings Per Share Basic | 0.65 | 0.88 | 1.03 | 0.40 | 0.54 | 1.09 | 1.17 | 0.59 | 1.07 | 0.86 | 0.95 | 0.43 | 0.37 | 0.62 | 0.37 | 0.34 | 0.29 | 0.48 | 0.73 | 0.46 | 0.64 | 0.65 | 0.65 | 0.73 | 0.42 | 1.12 | 0.58 | 0.42 | 0.23 | |
| Earnings Per Share Diluted | 0.64 | 0.86 | 1.00 | 0.39 | 0.52 | 1.05 | 1.13 | 0.57 | 1.03 | 0.83 | 0.91 | 0.41 | 0.35 | 0.61 | 0.36 | 0.33 | 0.28 | 0.46 | 0.70 | 0.44 | 0.62 | 0.62 | 0.62 | 0.69 | 0.39 | 1.06 | 0.55 | 0.40 | 0.21 |
| 2023-12-30 | 2023-09-30 | 2023-07-01 | 2023-04-01 | 2022-12-31 | 2022-10-01 | 2022-07-02 | 2022-04-02 | 2022-01-01 | 2021-10-02 | 2021-07-03 | 2021-04-03 | 2021-01-02 | 2020-10-03 | 2020-06-27 | 2020-03-28 | 2019-12-28 | 2019-09-28 | 2019-06-29 | 2019-03-30 | 2018-12-29 | 2018-09-30 | 2018-09-29 | 2018-06-30 | 2018-03-31 | 2017-12-30 | 2017-09-30 | 2017-07-01 | 2017-04-01 | ||
|---|---|---|---|---|---|---|---|---|---|---|---|---|---|---|---|---|---|---|---|---|---|---|---|---|---|---|---|---|---|---|
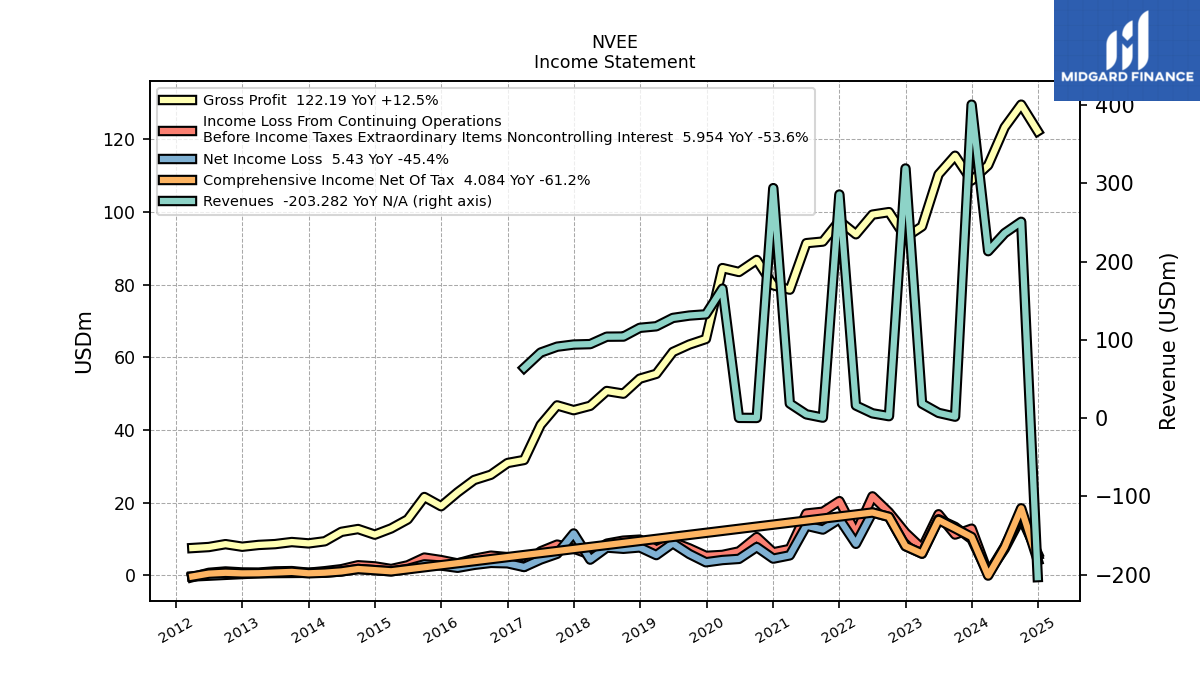
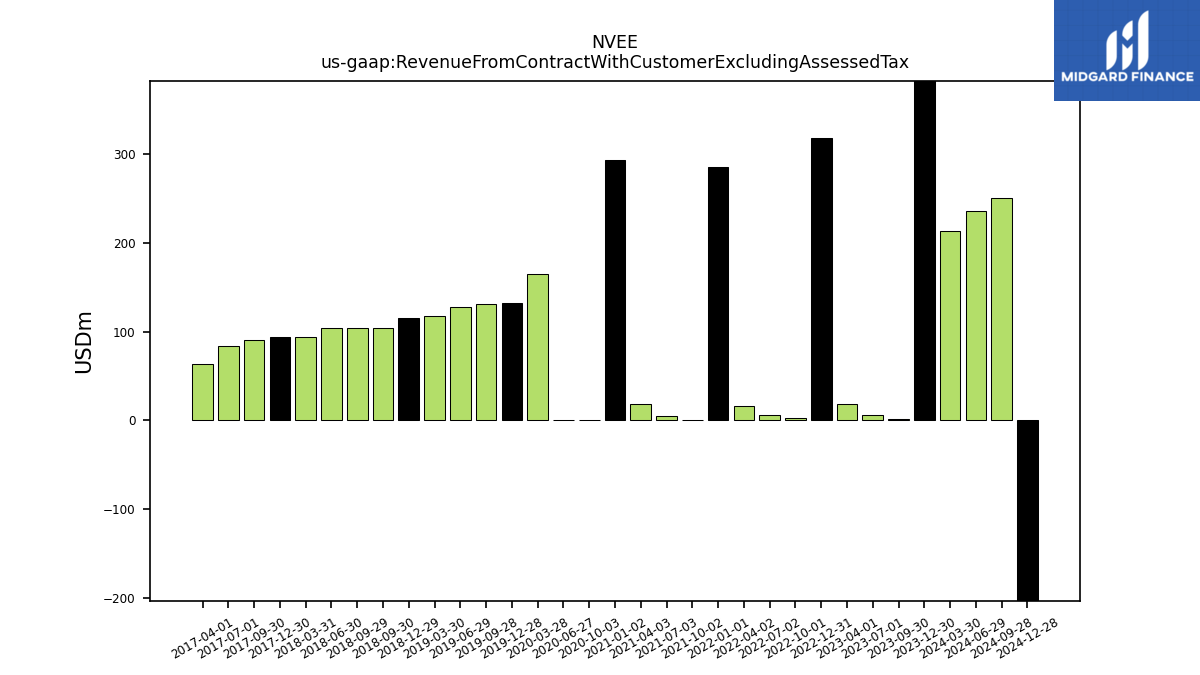
| Revenue From Contract With Customer Excluding Assessed Tax | 400.62 | 1.79 | 6.62 | 18.43 | 319.04 | 2.42 | 6.07 | 16.01 | 285.74 | 0.52 | 4.74 | 18.62 | 293.94 | 0.14 | 0.27 | 165.48 | 132.60 | 131.03 | 127.97 | 117.33 | 115.34 | 104.19 | 104.19 | 104.02 | 94.53 | 93.98 | 91.26 | 83.74 | 64.06 | |
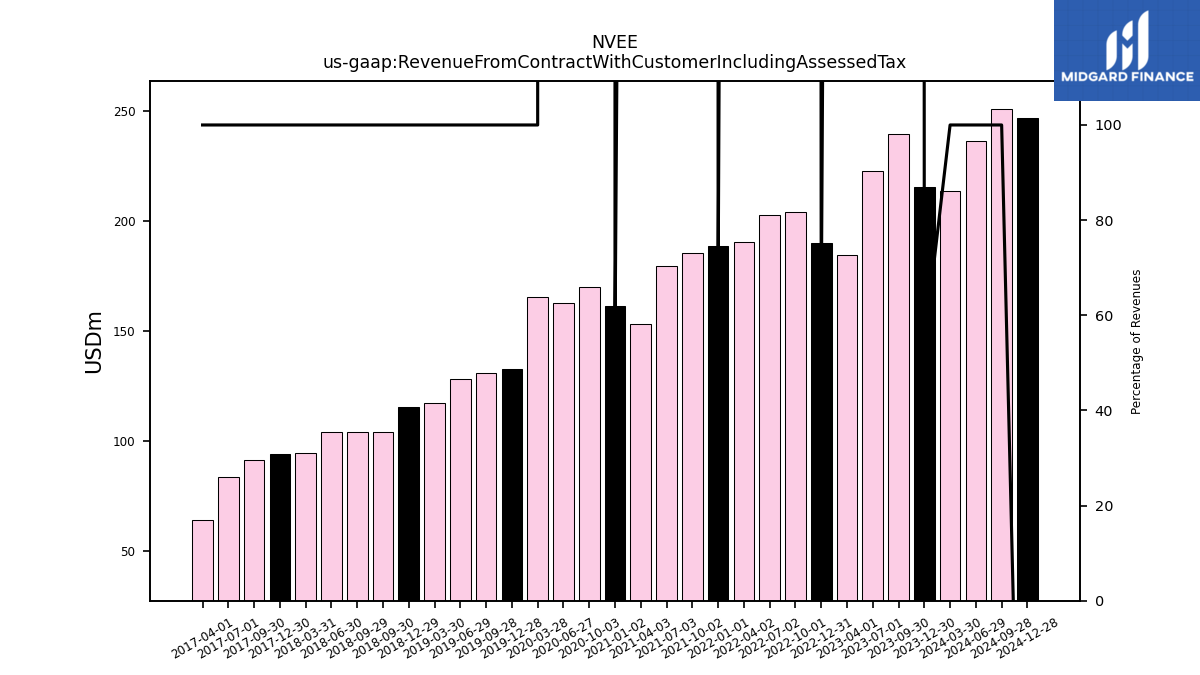
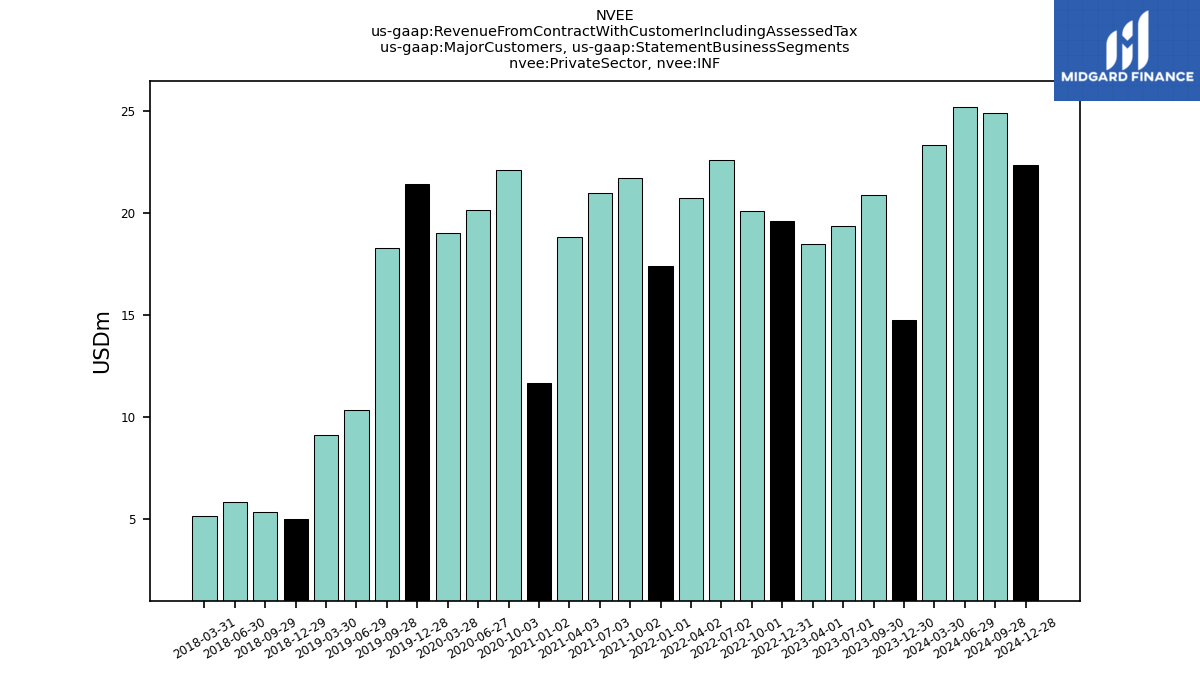
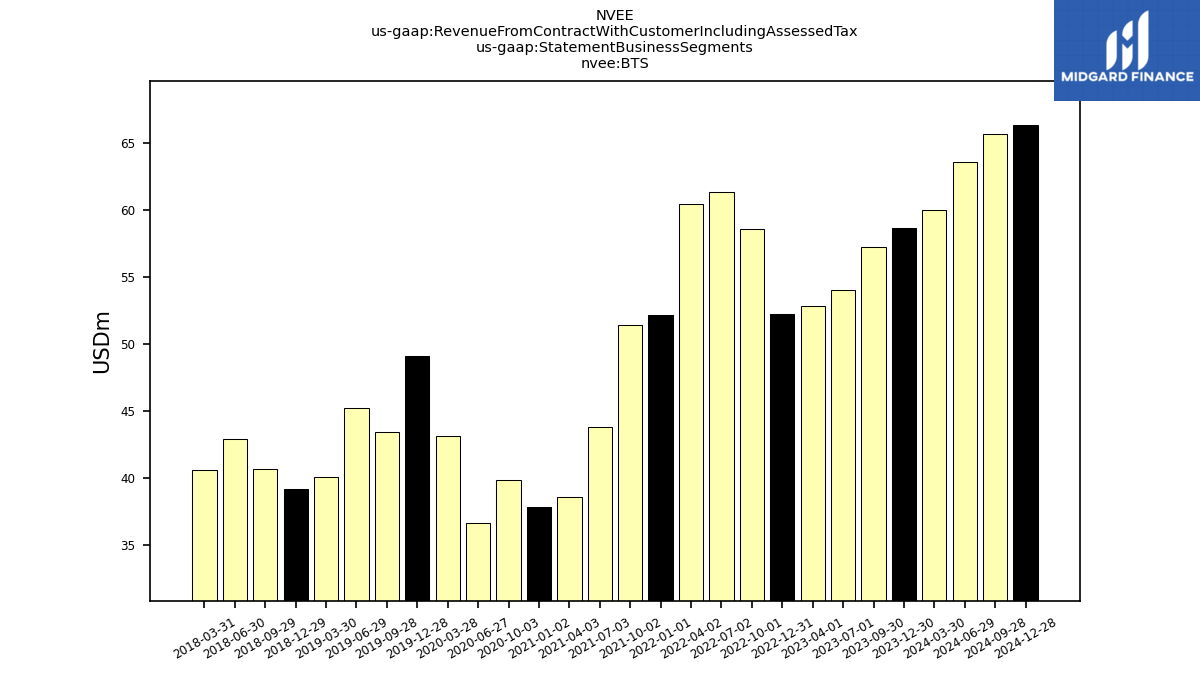
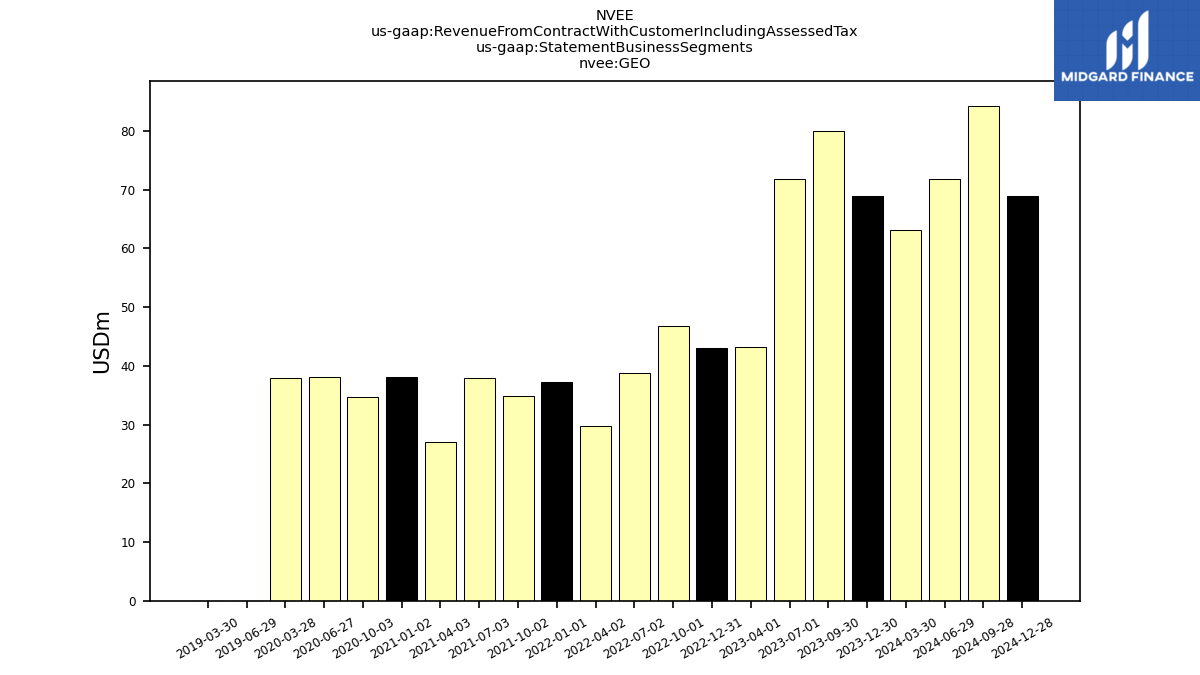
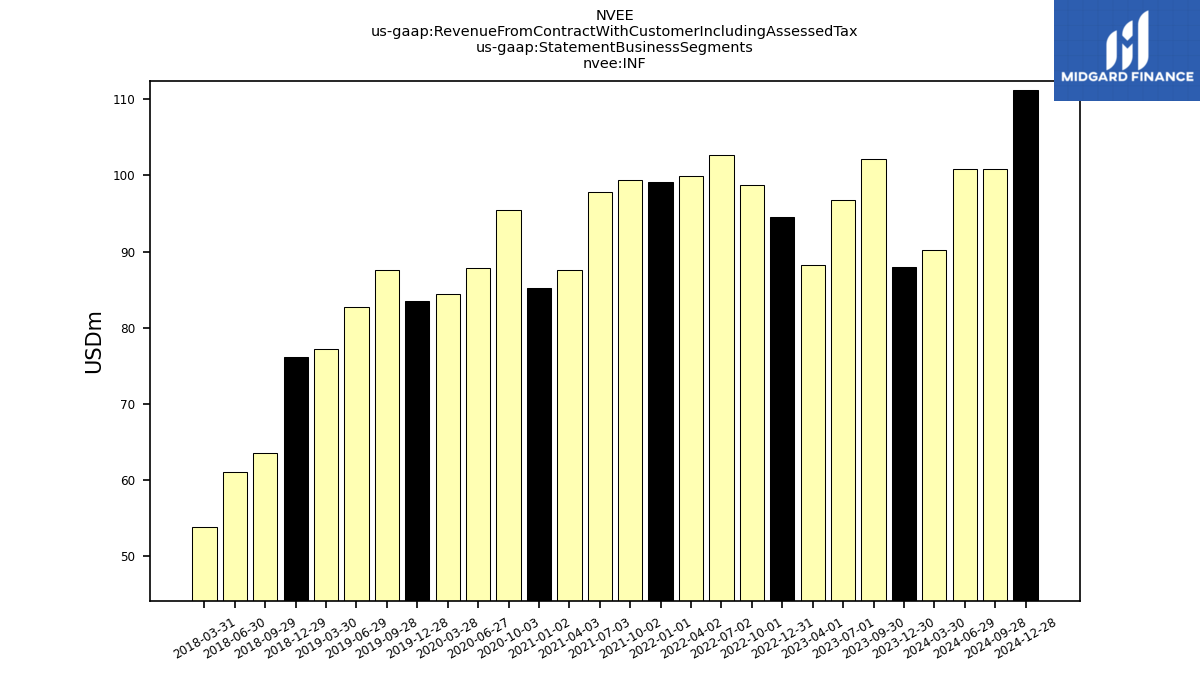
| Revenue From Contract With Customer Including Assessed Tax | 215.50 | 239.29 | 222.64 | 184.32 | 189.82 | 204.07 | 202.73 | 190.15 | 188.56 | 185.55 | 179.50 | 153.09 | 161.18 | 169.95 | 162.69 | 165.48 | 132.60 | 131.03 | 127.97 | 117.33 | 115.34 | 104.19 | 104.19 | 104.02 | 94.53 | 93.98 | 91.26 | 83.74 | 64.06 | |
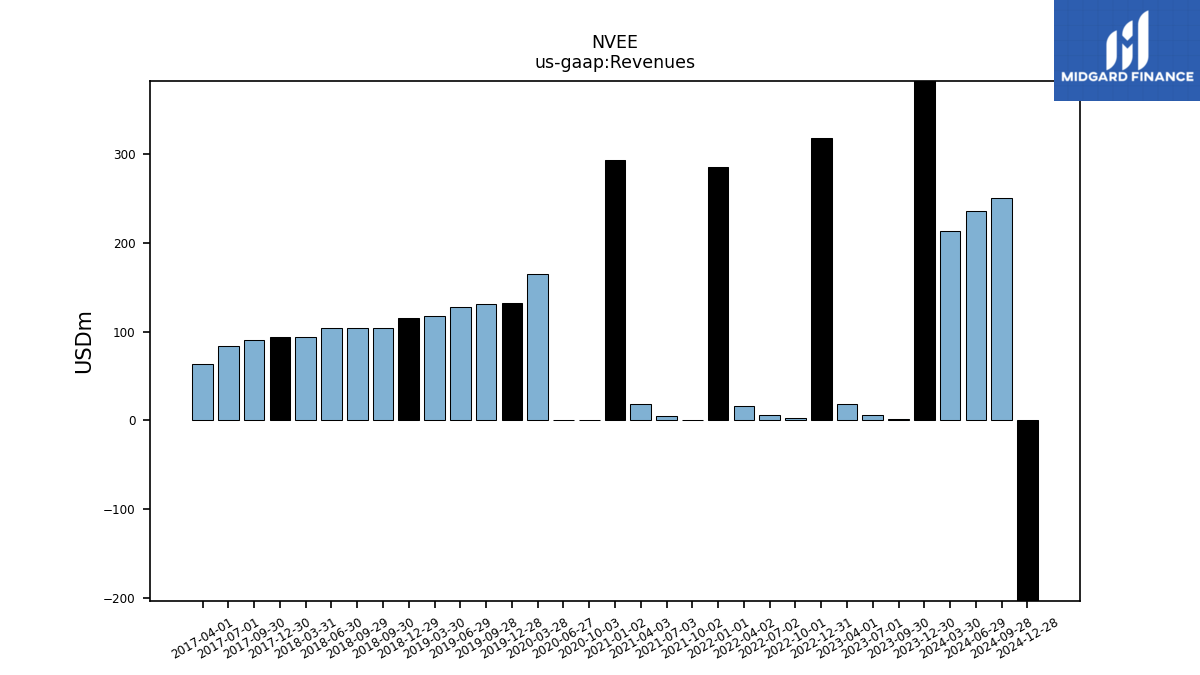
| Revenues | 400.62 | 1.79 | 6.62 | 18.43 | 319.04 | 2.42 | 6.07 | 16.01 | 285.74 | 0.52 | 4.74 | 18.62 | 293.94 | 0.14 | 0.27 | 165.48 | 132.60 | 131.03 | 127.97 | 117.33 | 115.34 | 104.19 | 104.19 | 104.02 | 94.53 | 93.98 | 91.26 | 83.74 | 64.06 | |
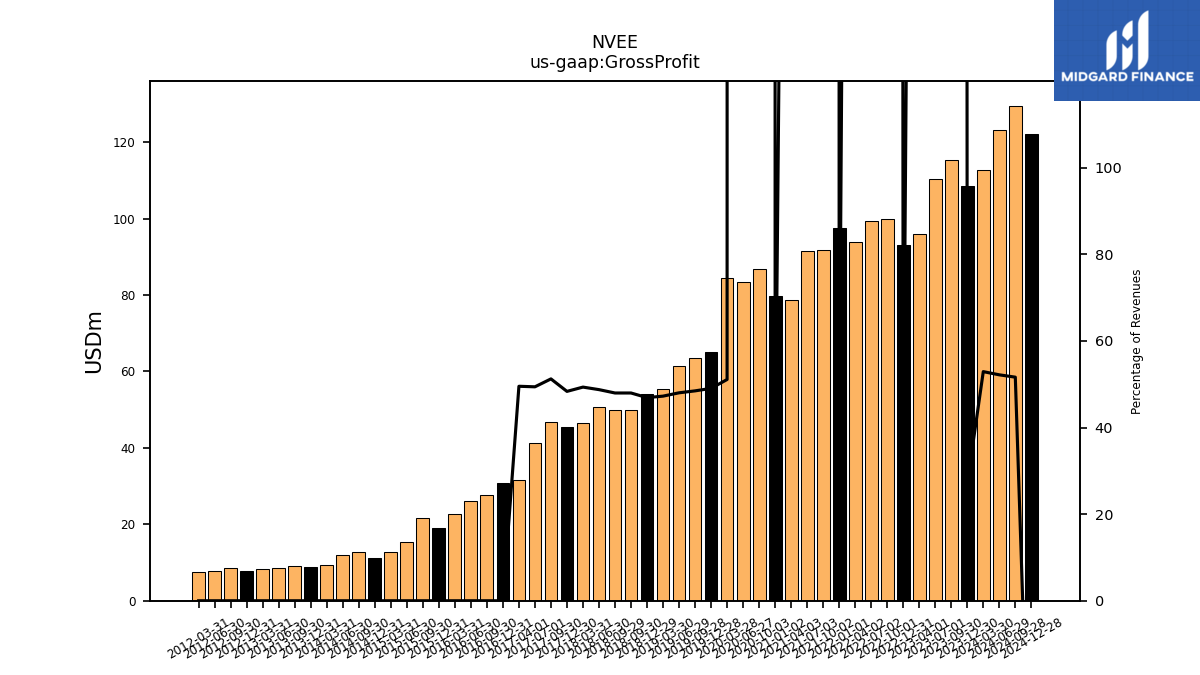
| Gross Profit | 108.62 | 115.44 | 110.30 | 96.00 | 92.97 | 99.94 | 99.24 | 93.83 | 97.51 | 91.83 | 91.39 | 78.59 | 79.79 | 86.76 | 83.45 | 84.53 | 65.02 | 63.50 | 61.44 | 55.43 | 54.10 | 49.97 | 49.97 | 50.70 | 46.63 | 45.43 | 46.75 | 41.36 | 31.72 | |
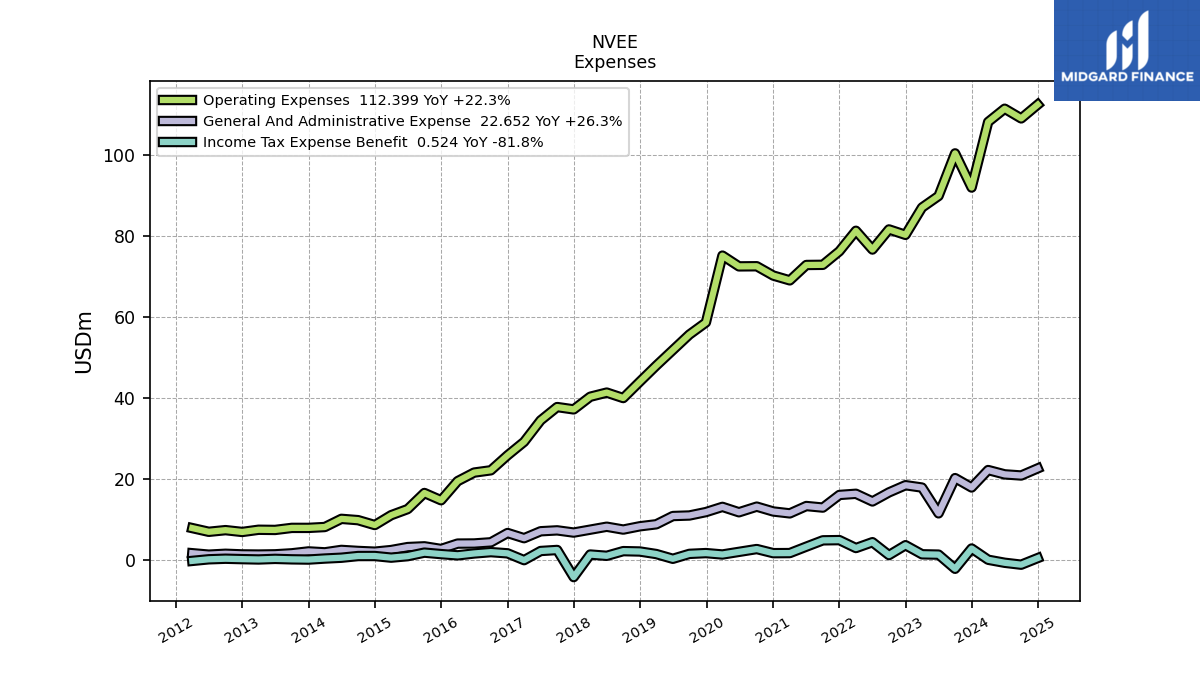
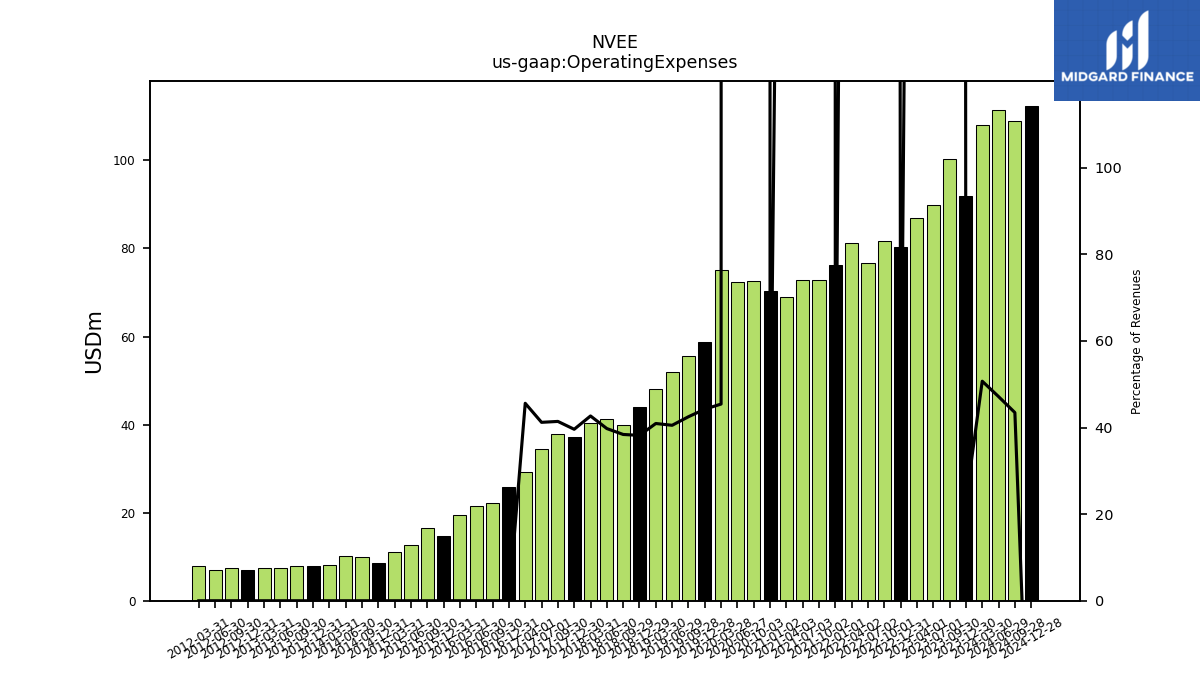
| Operating Expenses | 91.94 | 100.37 | 89.86 | 87.01 | 80.27 | 81.61 | 76.64 | 81.27 | 76.22 | 72.88 | 72.83 | 69.04 | 70.22 | 72.52 | 72.49 | 75.15 | 58.64 | 55.67 | 51.84 | 48.02 | 44.04 | NA | 40.00 | 41.35 | 40.33 | 37.20 | 37.79 | 34.49 | 29.20 | |
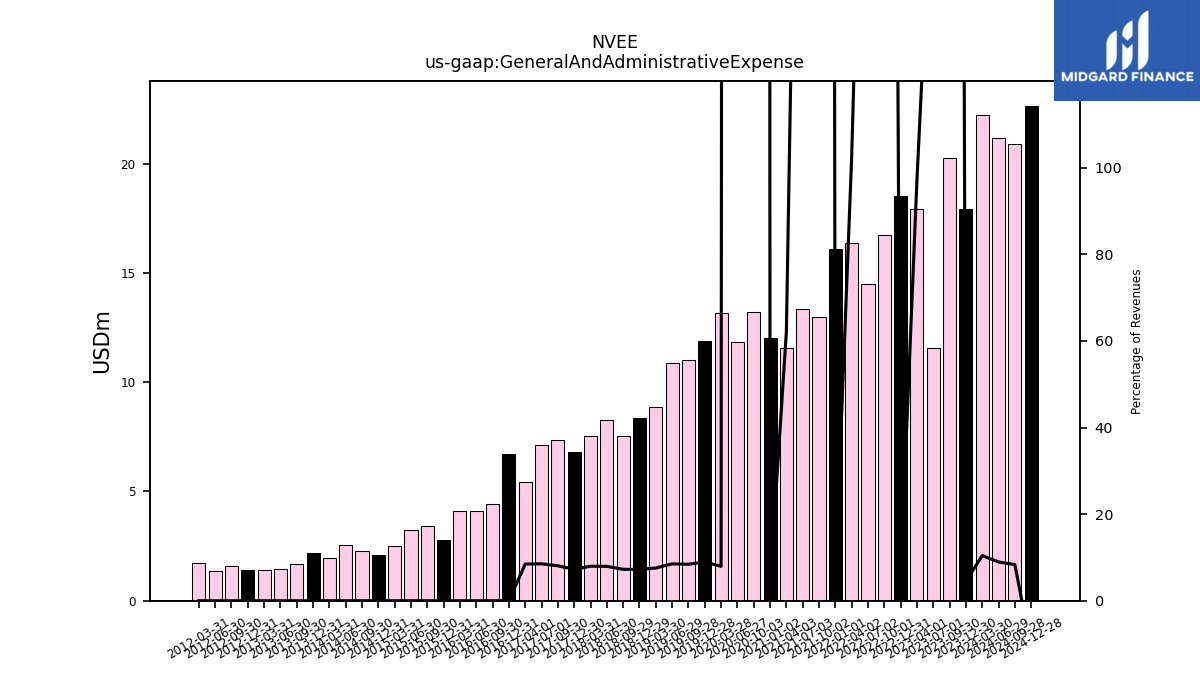
| General And Administrative Expense | 17.94 | 20.26 | 11.55 | 17.92 | 18.50 | 16.73 | 14.49 | 16.39 | 16.09 | 12.98 | 13.37 | 11.55 | 12.02 | 13.22 | 11.82 | 13.16 | 11.87 | 11.03 | 10.90 | 8.86 | 8.37 | NA | 7.56 | 8.26 | 7.53 | 6.82 | 7.36 | 7.14 | 5.43 | |
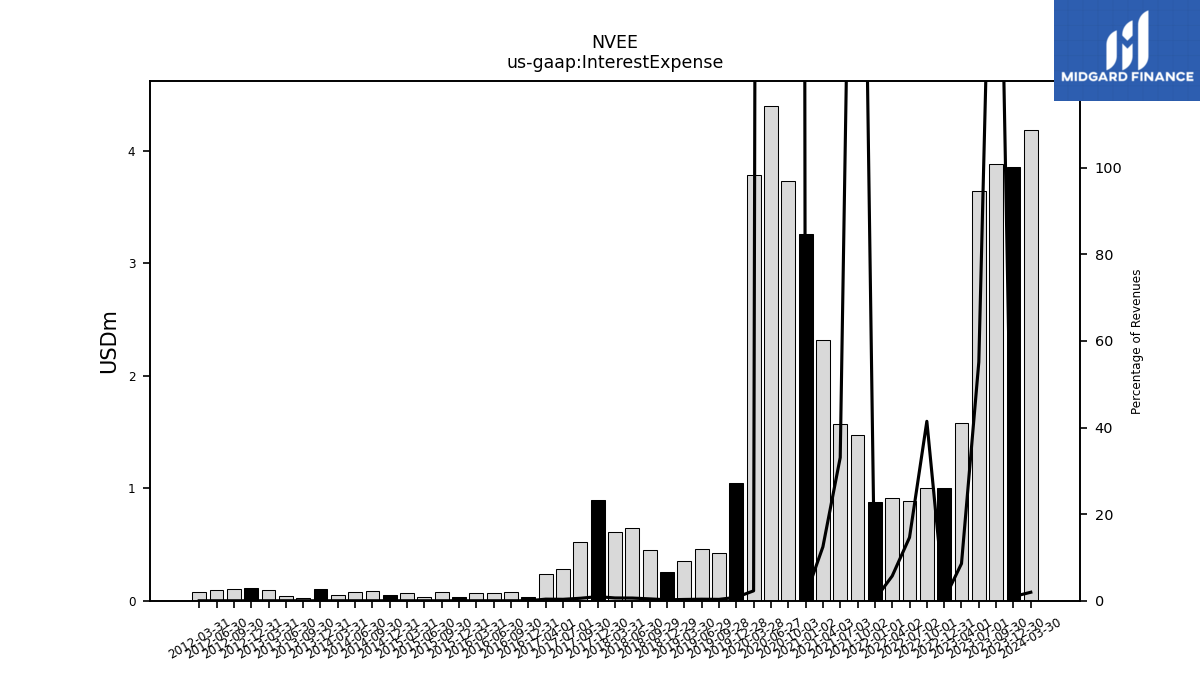
| Interest Expense | 3.86 | 3.88 | 3.65 | 1.58 | 1.00 | 1.00 | 0.89 | 0.91 | 0.88 | 1.48 | 1.57 | 2.32 | 3.26 | 3.73 | 4.40 | 3.79 | 1.04 | 0.42 | 0.46 | 0.35 | 0.25 | NA | 0.45 | 0.65 | 0.61 | 0.89 | 0.52 | 0.28 | 0.24 | |
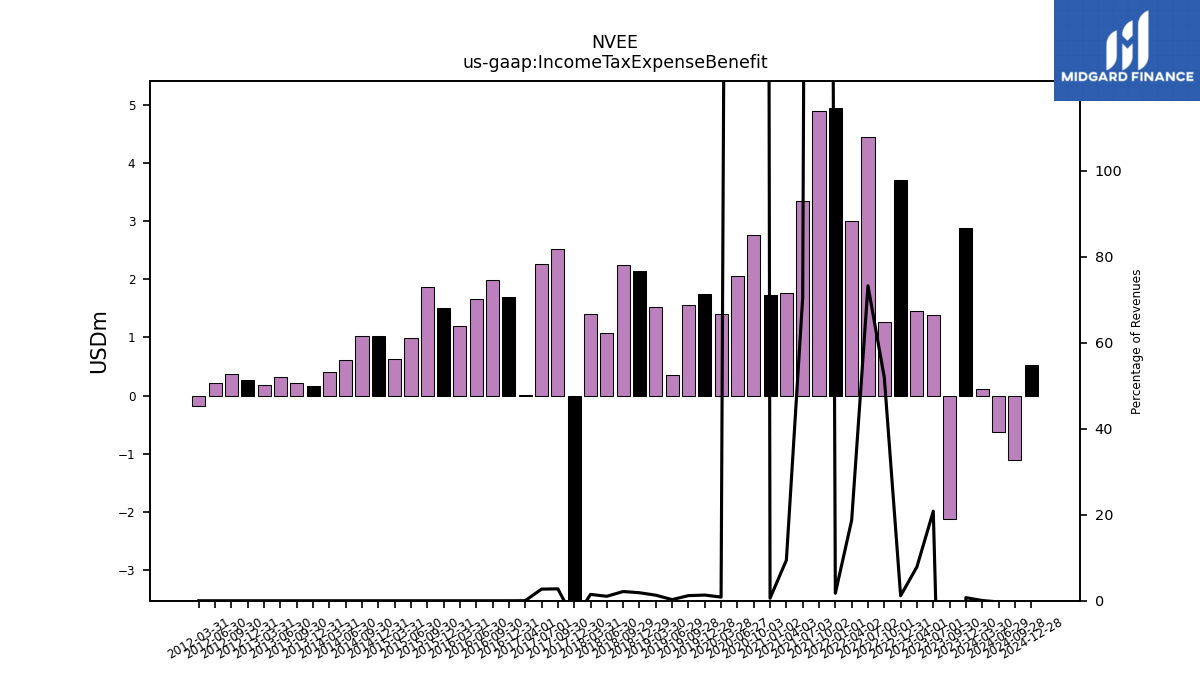
| Income Tax Expense Benefit | 2.89 | -2.12 | 1.38 | 1.46 | 3.70 | 1.26 | 4.45 | 3.00 | 4.95 | 4.90 | 3.35 | 1.76 | 1.74 | 2.75 | 2.06 | 1.41 | 1.75 | 1.56 | 0.35 | 1.52 | 2.15 | NA | 2.24 | 1.08 | 1.40 | -4.18 | 2.52 | 2.27 | 0.01 | |
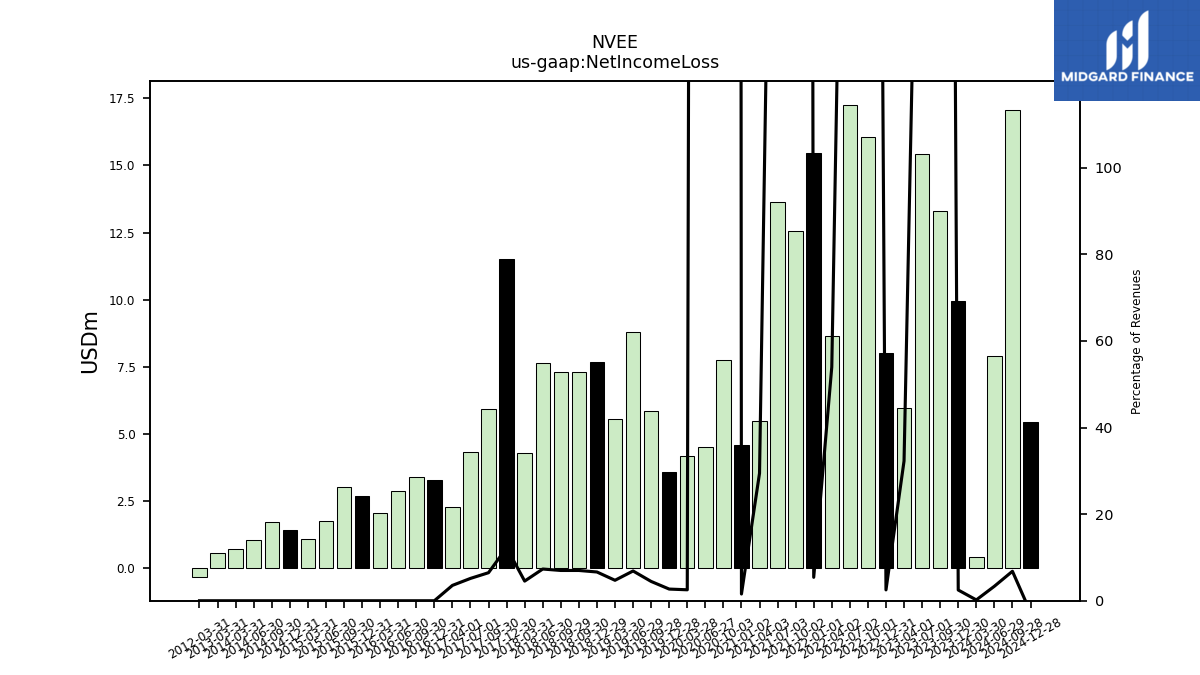
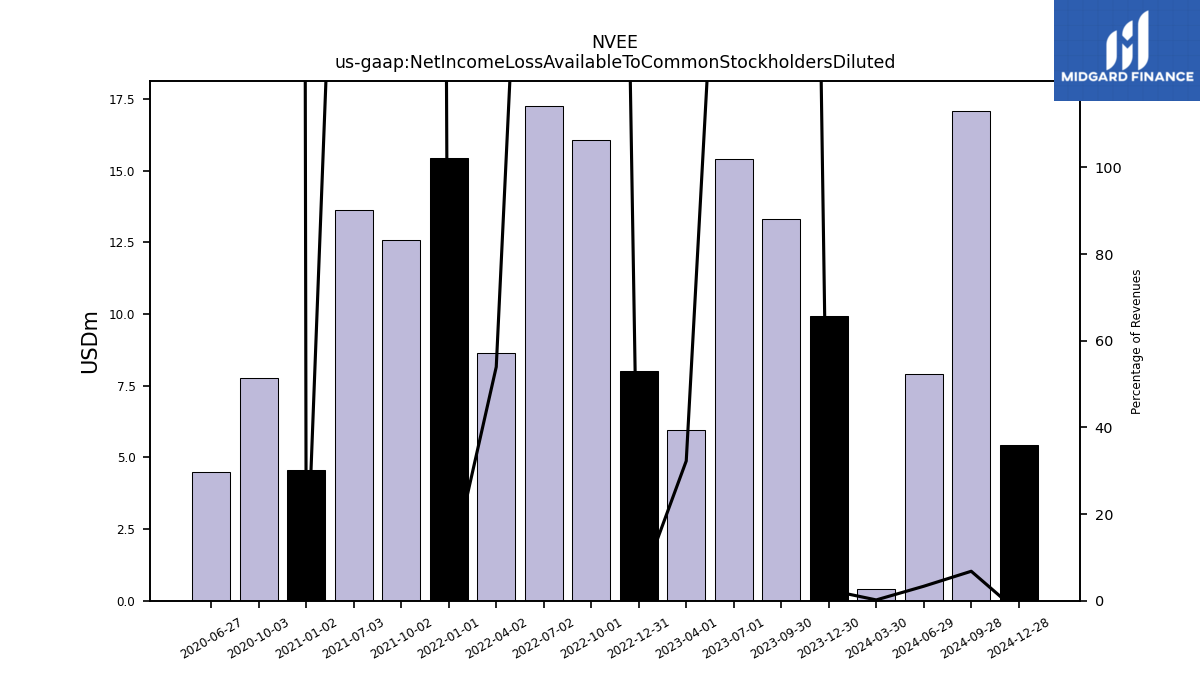
| Net Income Loss | 9.94 | 13.32 | 15.41 | 5.95 | 8.00 | 16.06 | 17.27 | 8.64 | 15.46 | 12.57 | 13.64 | 5.48 | 4.57 | 7.75 | 4.50 | 4.19 | 3.58 | 5.84 | 8.79 | 5.54 | 7.66 | 7.29 | 7.29 | 7.62 | 4.29 | 11.51 | 5.91 | 4.32 | 2.27 | |
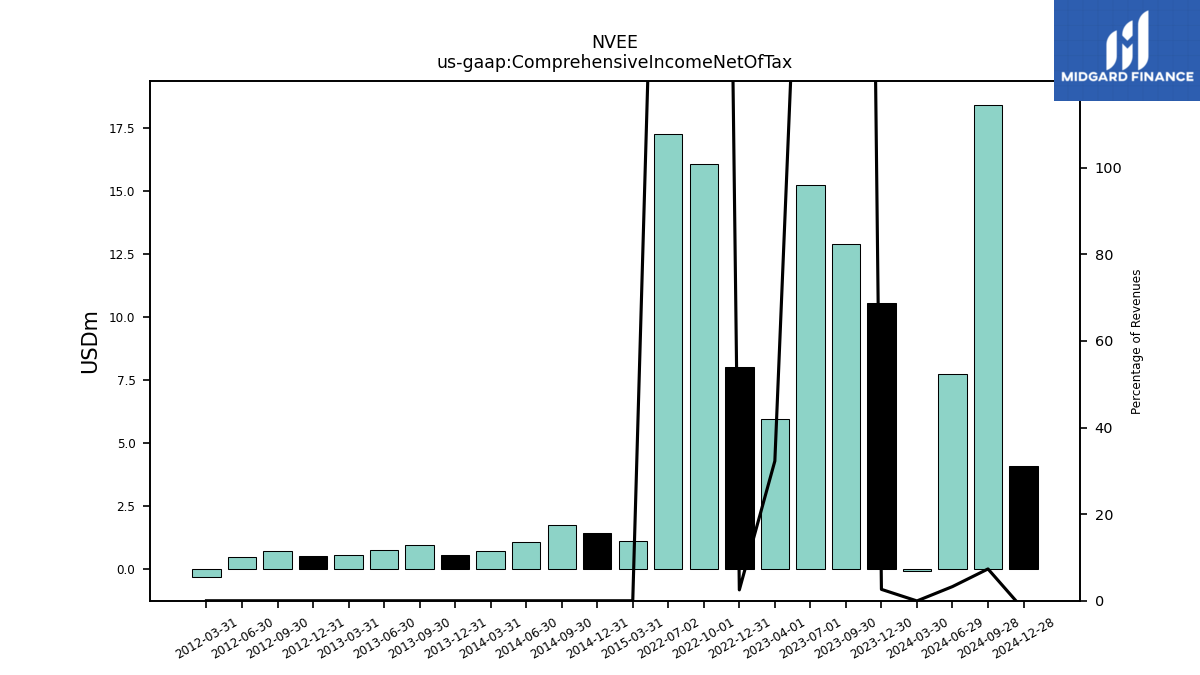
| Comprehensive Income Net Of Tax | 10.53 | 12.89 | 15.22 | NA | 8.00 | 16.06 | 17.27 | NA | NA | NA | NA | NA | NA | NA | NA | NA | NA | NA | NA | NA | NA | NA | NA | NA | NA | NA | NA | NA | NA | |
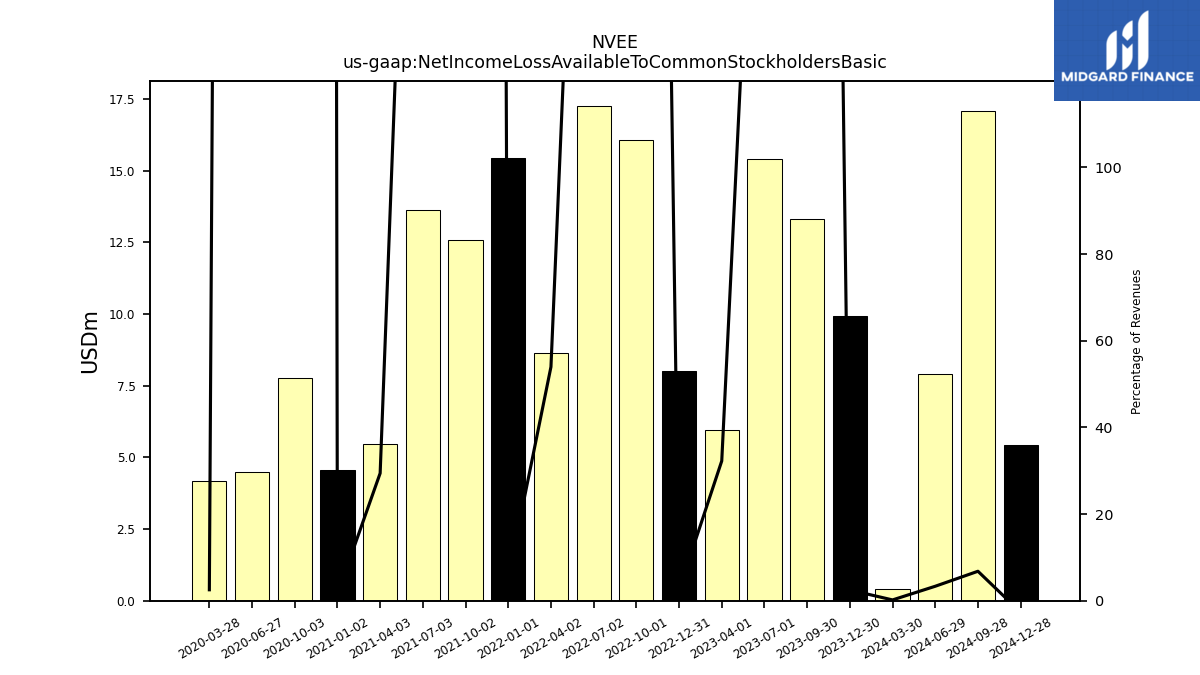
| Net Income Loss Available To Common Stockholders Basic | 9.94 | 13.32 | 15.41 | 5.95 | 8.00 | 16.06 | 17.27 | 8.64 | 15.46 | 12.57 | 13.64 | 5.48 | 4.57 | 7.75 | 4.50 | 4.19 | NA | NA | NA | NA | NA | NA | NA | NA | NA | NA | NA | NA | NA | |
| Net Income Loss Available To Common Stockholders Diluted | 9.94 | 13.32 | 15.41 | 5.95 | 8.00 | 16.06 | 17.27 | 8.64 | 15.46 | 12.57 | 13.64 | NA | 4.57 | 7.75 | 4.50 | NA | NA | NA | NA | NA | NA | NA | NA | NA | NA | NA | NA | NA | NA |
| 2023-12-30 | 2023-09-30 | 2023-07-01 | 2023-04-01 | 2022-12-31 | 2022-10-01 | 2022-07-02 | 2022-04-02 | 2022-01-01 | 2021-10-02 | 2021-07-03 | 2021-04-03 | 2021-01-02 | 2020-10-03 | 2020-06-27 | 2020-03-28 | 2019-12-28 | 2019-09-28 | 2019-06-29 | 2019-03-30 | 2018-12-29 | 2018-09-30 | 2018-09-29 | 2018-06-30 | 2018-03-31 | 2017-12-30 | 2017-09-30 | 2017-07-01 | 2017-04-01 | ||
|---|---|---|---|---|---|---|---|---|---|---|---|---|---|---|---|---|---|---|---|---|---|---|---|---|---|---|---|---|---|---|
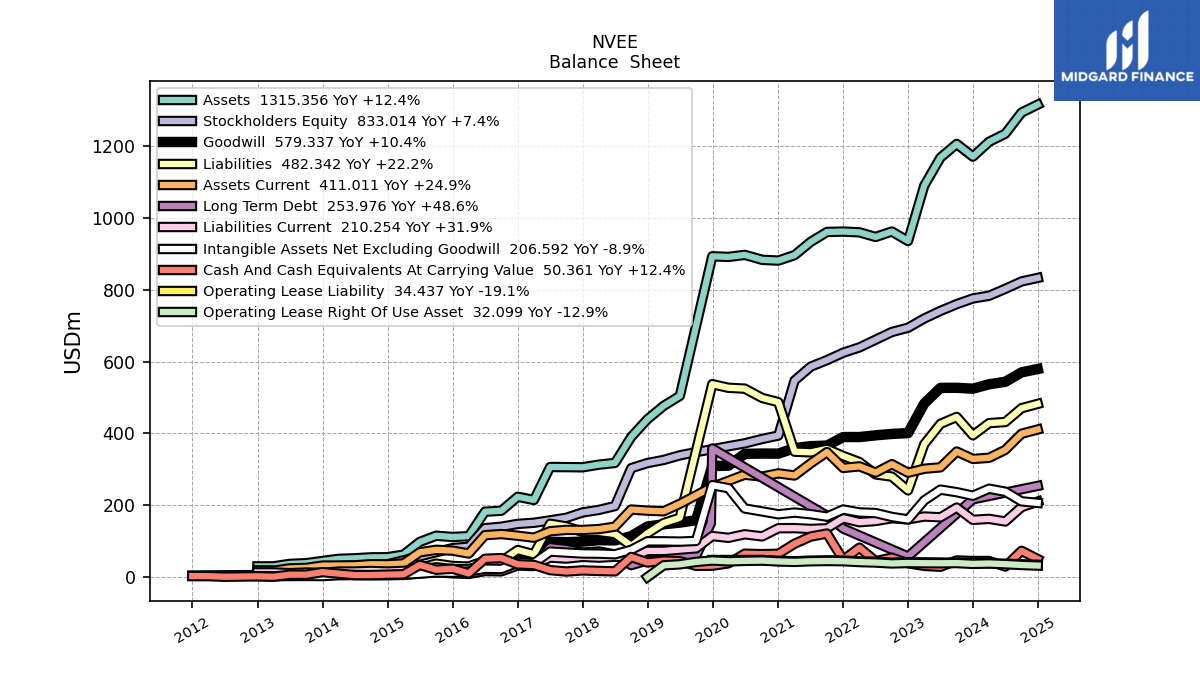
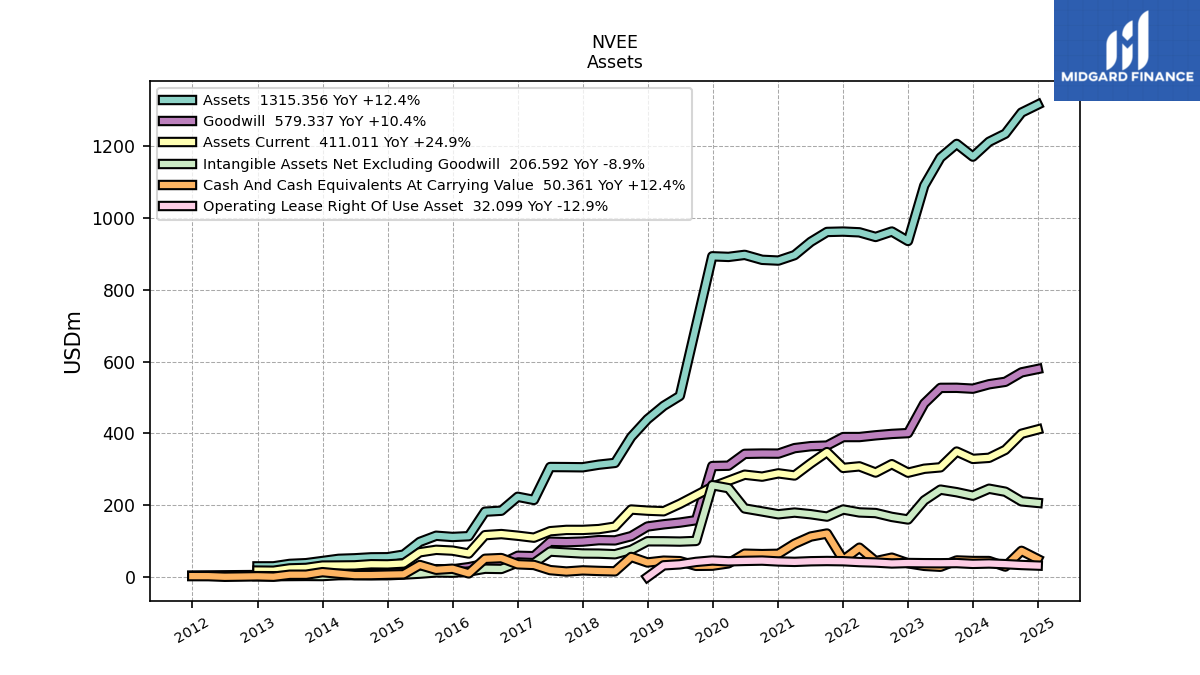
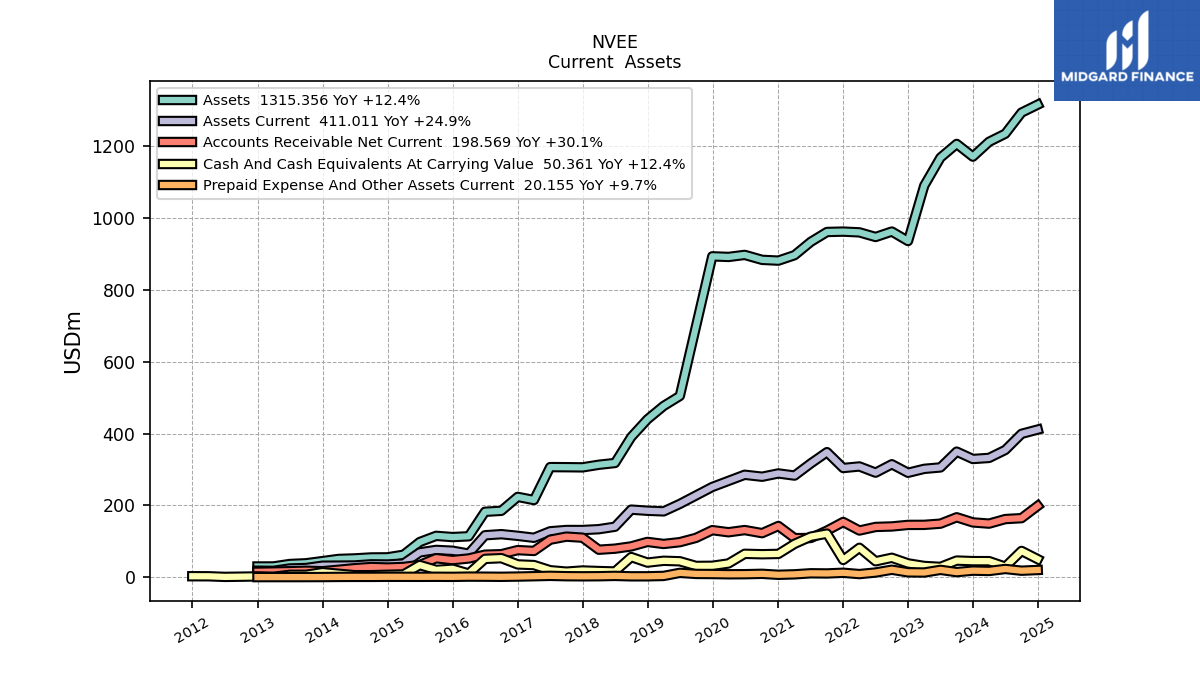
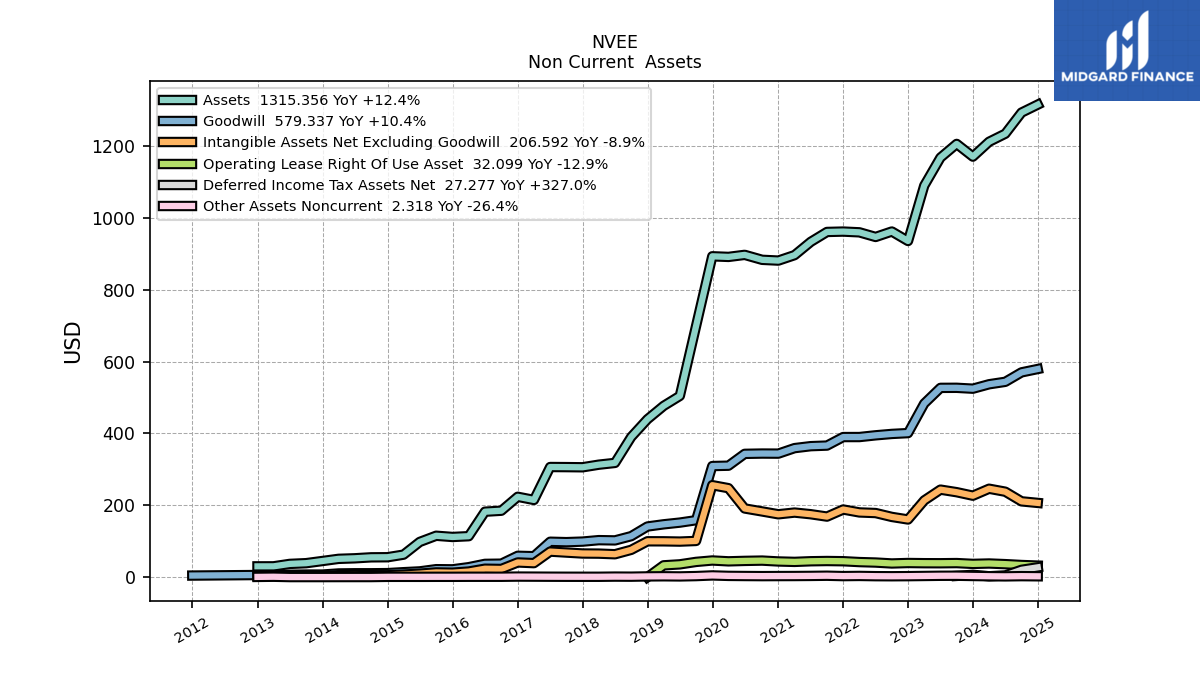
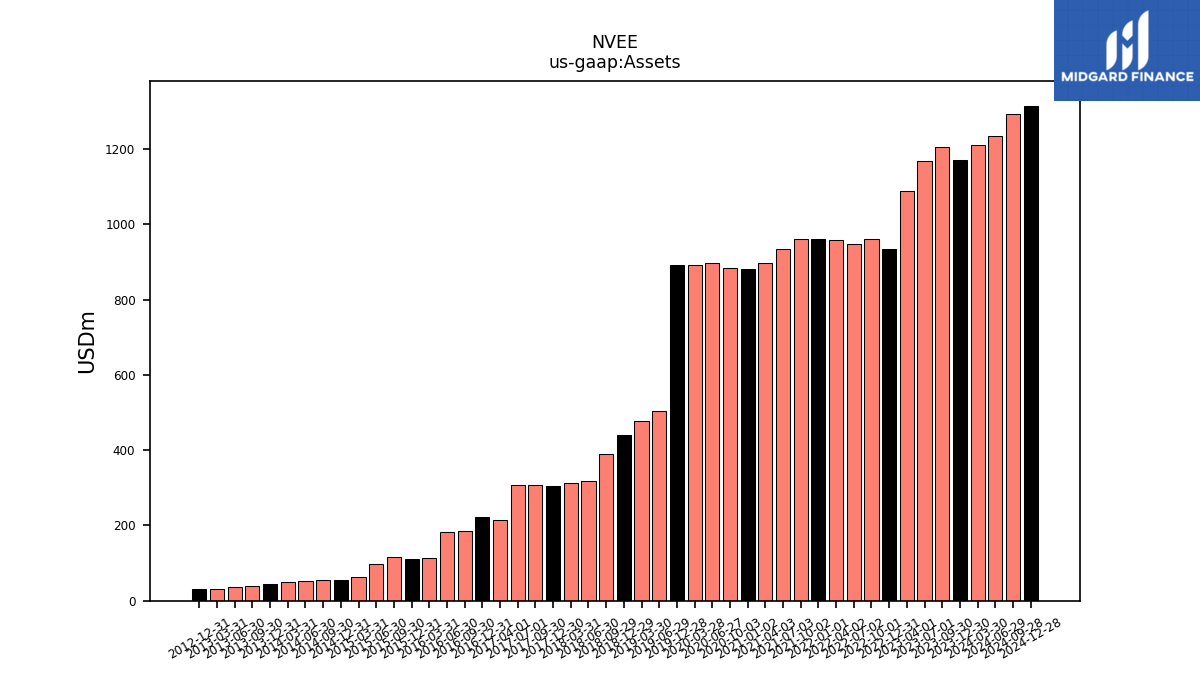
| Assets | 1170.59 | 1205.96 | 1167.83 | 1089.87 | 935.72 | 962.14 | 946.96 | 959.85 | 961.94 | 960.88 | 933.40 | 896.33 | 881.17 | 883.32 | 897.12 | 891.42 | 893.14 | NA | 504.45 | 476.70 | 439.42 | NA | 390.15 | 317.94 | 313.03 | 305.78 | 306.25 | 306.52 | 214.85 | |
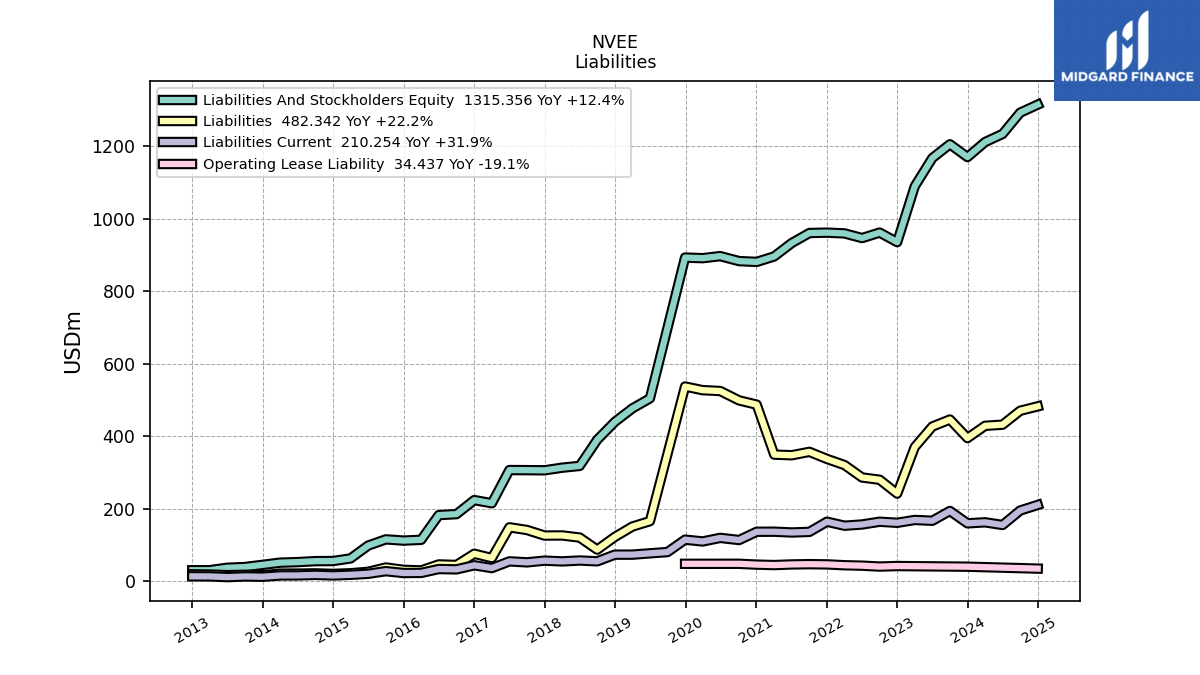
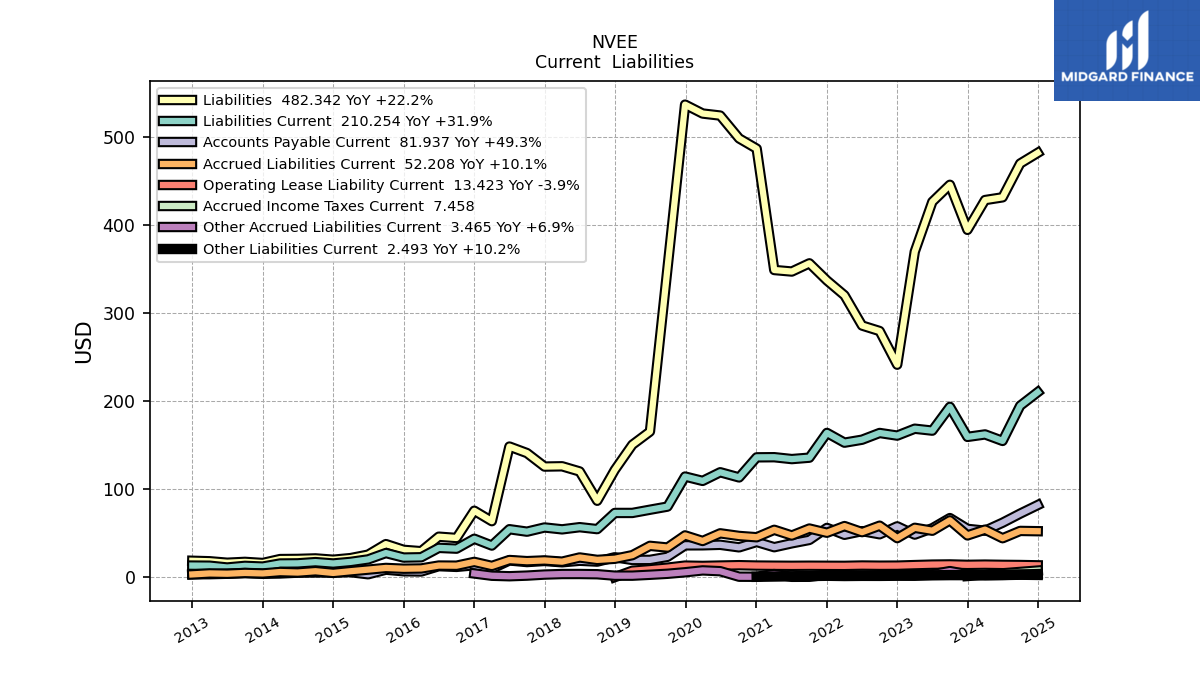
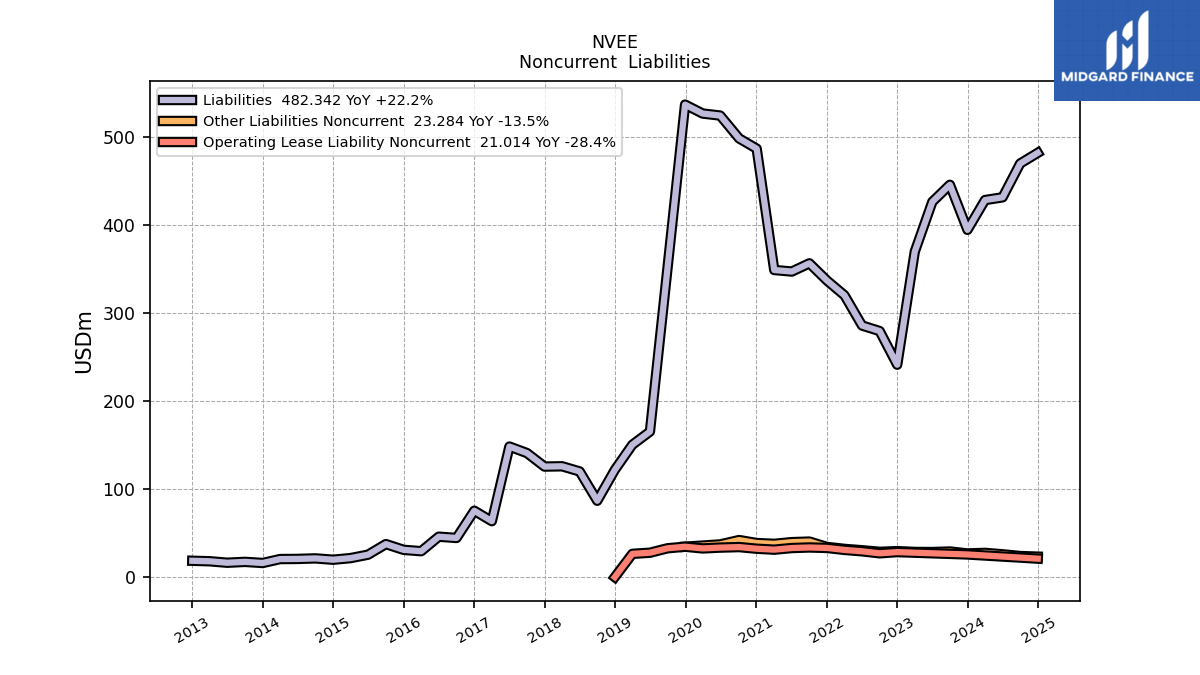
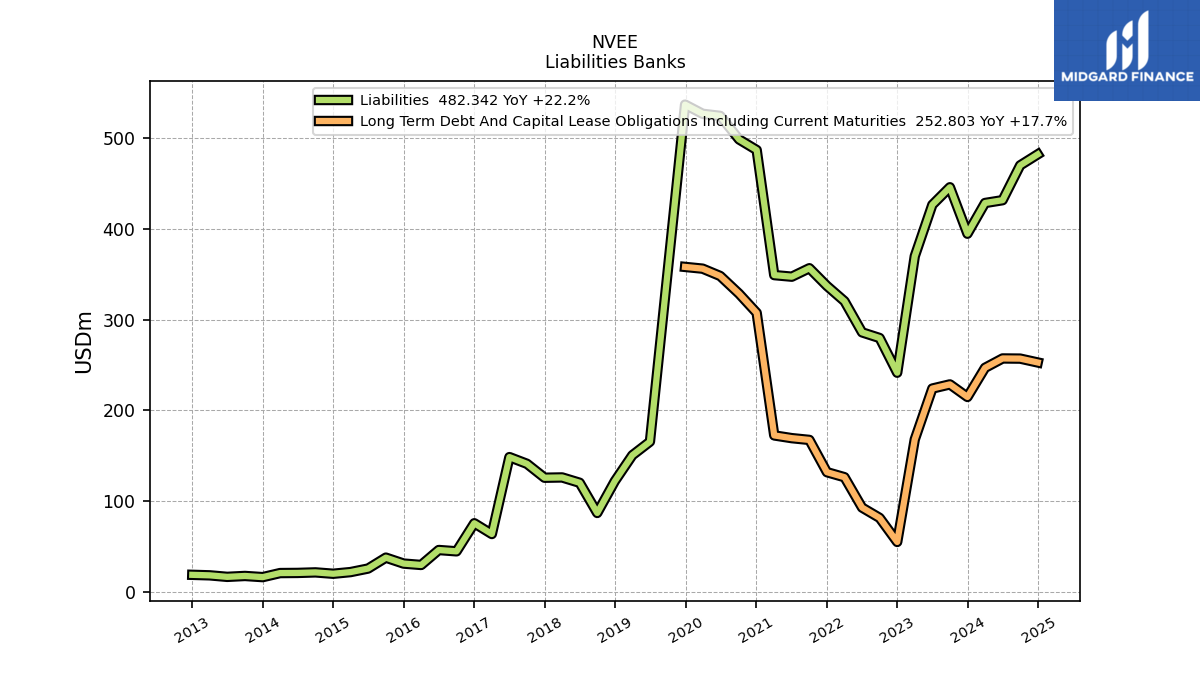
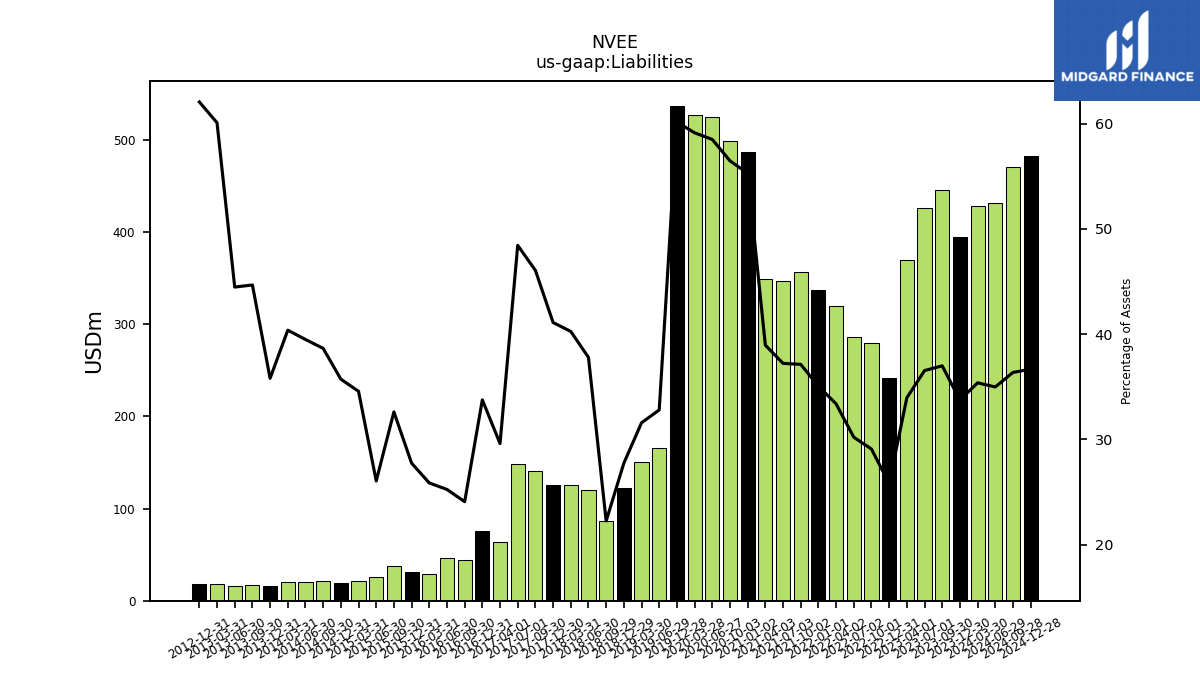
| Liabilities | 394.80 | 446.05 | 426.68 | 370.00 | 241.48 | 279.78 | 286.02 | 320.35 | 337.22 | 356.76 | 347.42 | 349.14 | 487.11 | 498.76 | 524.75 | 527.05 | 537.17 | NA | 165.45 | 150.53 | 121.88 | NA | 86.80 | 120.14 | 126.01 | 125.68 | 141.04 | 148.46 | 63.60 | |
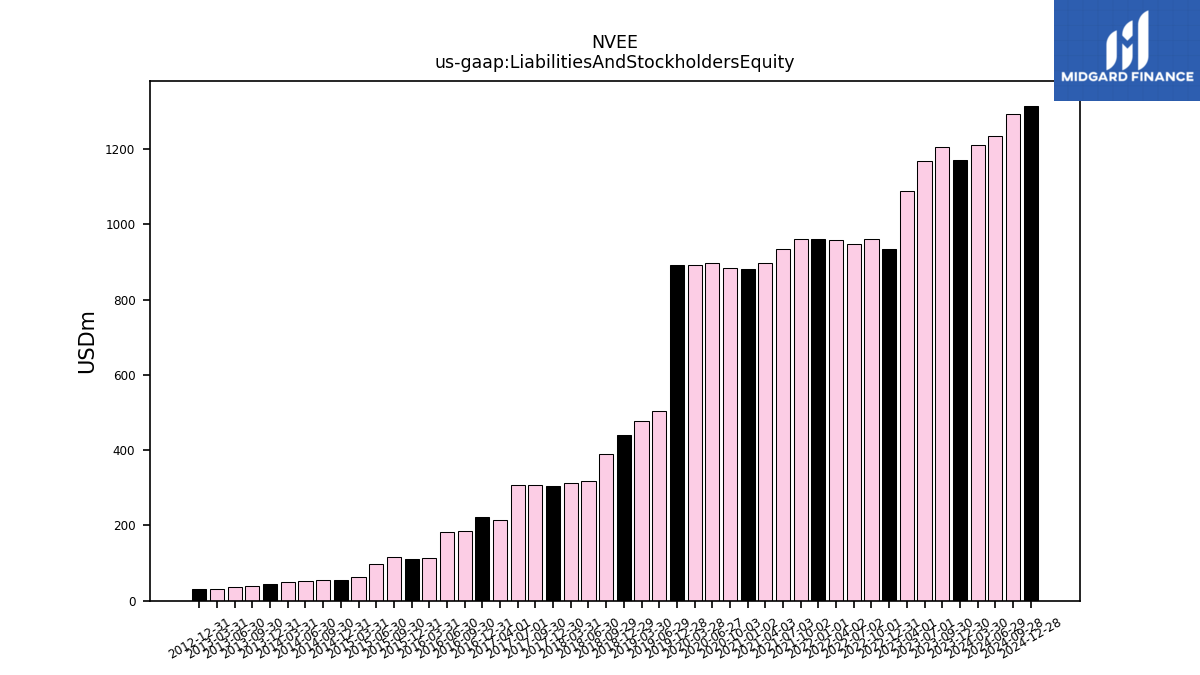
| Liabilities And Stockholders Equity | 1170.59 | 1205.96 | 1167.83 | 1089.87 | 935.72 | 962.14 | 946.96 | 959.85 | 961.94 | 960.88 | 933.40 | 896.33 | 881.17 | 883.32 | 897.12 | 891.42 | 893.14 | NA | 504.45 | 476.70 | 439.42 | NA | 390.15 | 317.94 | 313.03 | 305.78 | 306.25 | 306.52 | 214.85 | |
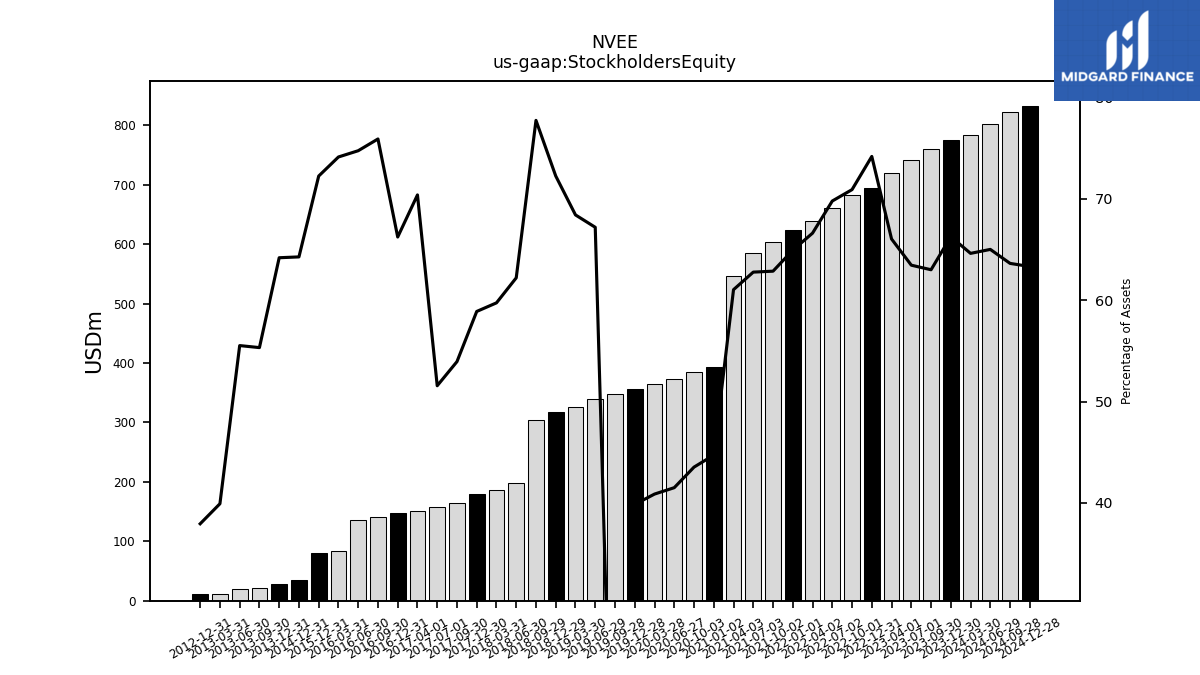
| Stockholders Equity | 775.79 | 759.92 | 741.15 | 719.87 | 694.24 | 682.36 | 660.94 | 639.50 | 624.72 | 604.12 | 585.99 | 547.19 | 394.07 | 384.56 | 372.37 | 364.37 | 355.96 | 348.07 | 339.00 | 326.17 | 317.54 | NA | 303.35 | 197.80 | 187.02 | 180.10 | 165.21 | 158.07 | 151.25 |
| 2023-12-30 | 2023-09-30 | 2023-07-01 | 2023-04-01 | 2022-12-31 | 2022-10-01 | 2022-07-02 | 2022-04-02 | 2022-01-01 | 2021-10-02 | 2021-07-03 | 2021-04-03 | 2021-01-02 | 2020-10-03 | 2020-06-27 | 2020-03-28 | 2019-12-28 | 2019-09-28 | 2019-06-29 | 2019-03-30 | 2018-12-29 | 2018-09-30 | 2018-09-29 | 2018-06-30 | 2018-03-31 | 2017-12-30 | 2017-09-30 | 2017-07-01 | 2017-04-01 | ||
|---|---|---|---|---|---|---|---|---|---|---|---|---|---|---|---|---|---|---|---|---|---|---|---|---|---|---|---|---|---|---|
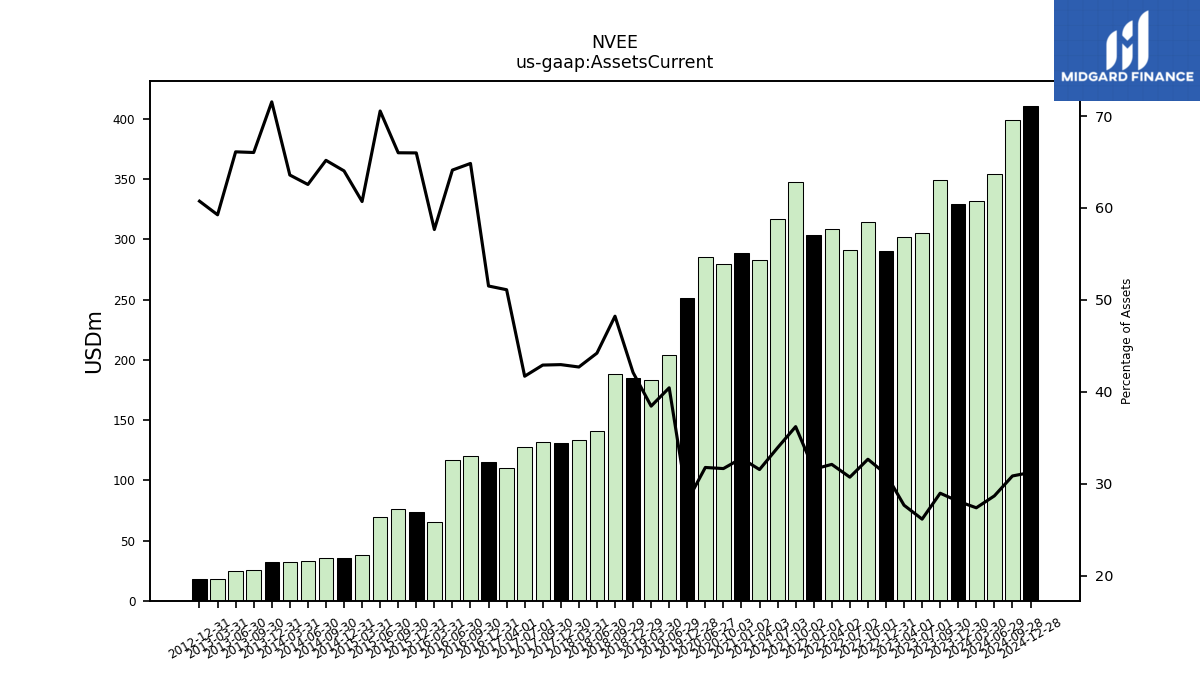
| Assets Current | 329.06 | 349.59 | 305.63 | 301.69 | 290.68 | 314.46 | 291.03 | 308.32 | 303.97 | 348.11 | 316.74 | 282.90 | 288.88 | 279.73 | 285.17 | NA | 251.20 | NA | 204.05 | 183.32 | 185.06 | NA | 188.18 | 140.59 | 133.70 | 131.39 | 131.45 | 127.84 | 109.81 | |
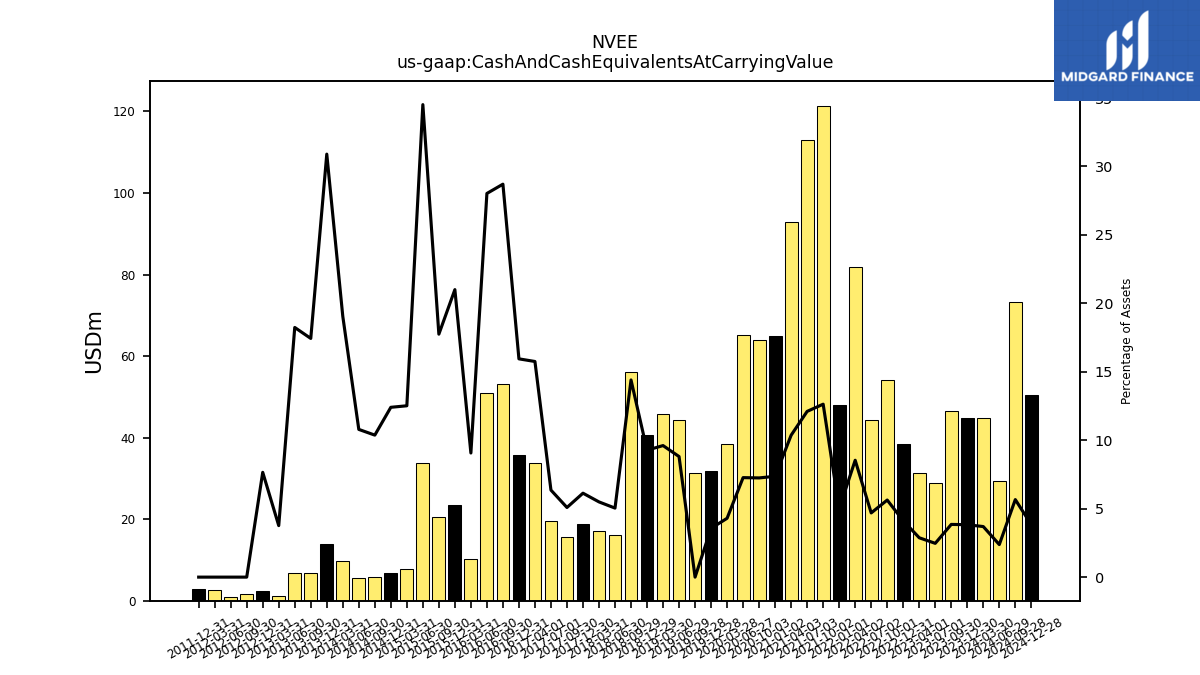
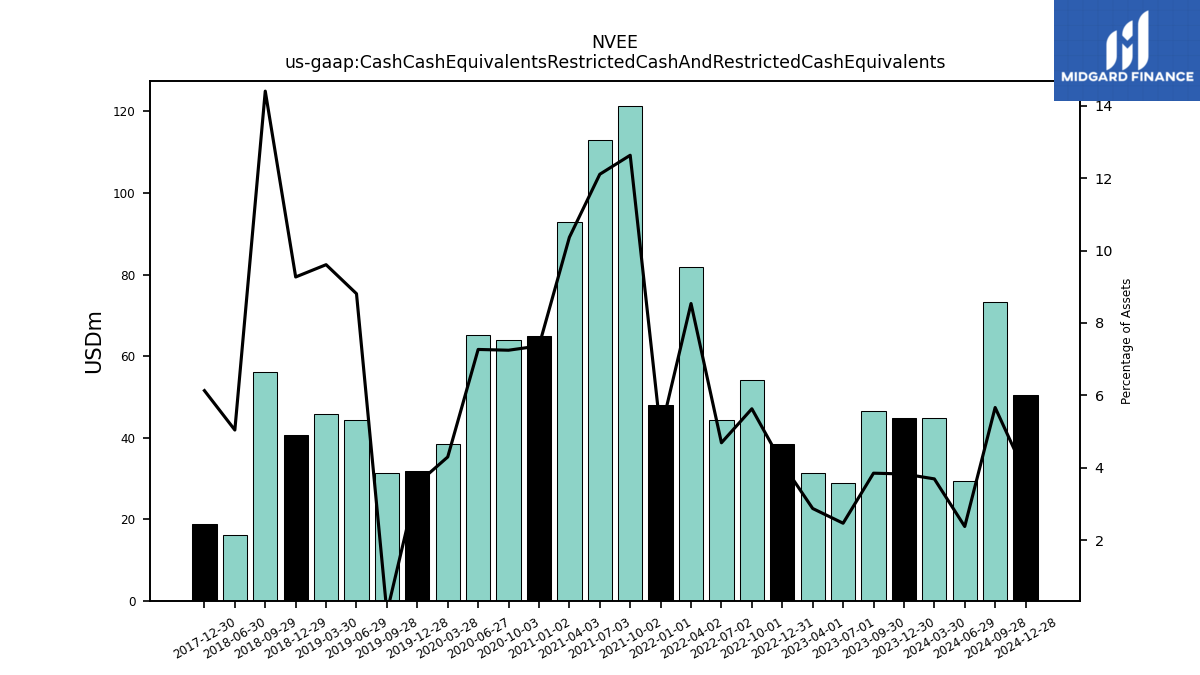
| Cash And Cash Equivalents At Carrying Value | 44.82 | 46.44 | 28.83 | 31.34 | 38.54 | 54.17 | 44.42 | 81.95 | 47.98 | 121.40 | 113.02 | 92.92 | 64.91 | 64.02 | 65.21 | 38.33 | 31.82 | 31.43 | 44.44 | 45.81 | 40.74 | NA | 56.20 | 16.04 | 17.20 | 18.75 | 15.58 | 19.49 | 33.85 | |
| Cash Cash Equivalents Restricted Cash And Restricted Cash Equivalents | 44.82 | 46.44 | 28.83 | 31.34 | 38.54 | 54.17 | 44.42 | 81.95 | 47.98 | 121.40 | 113.02 | 92.92 | 64.91 | 64.02 | 65.21 | 38.33 | 31.82 | 31.43 | 44.44 | 45.81 | 40.74 | NA | 56.20 | 16.04 | NA | 18.75 | NA | NA | NA | |
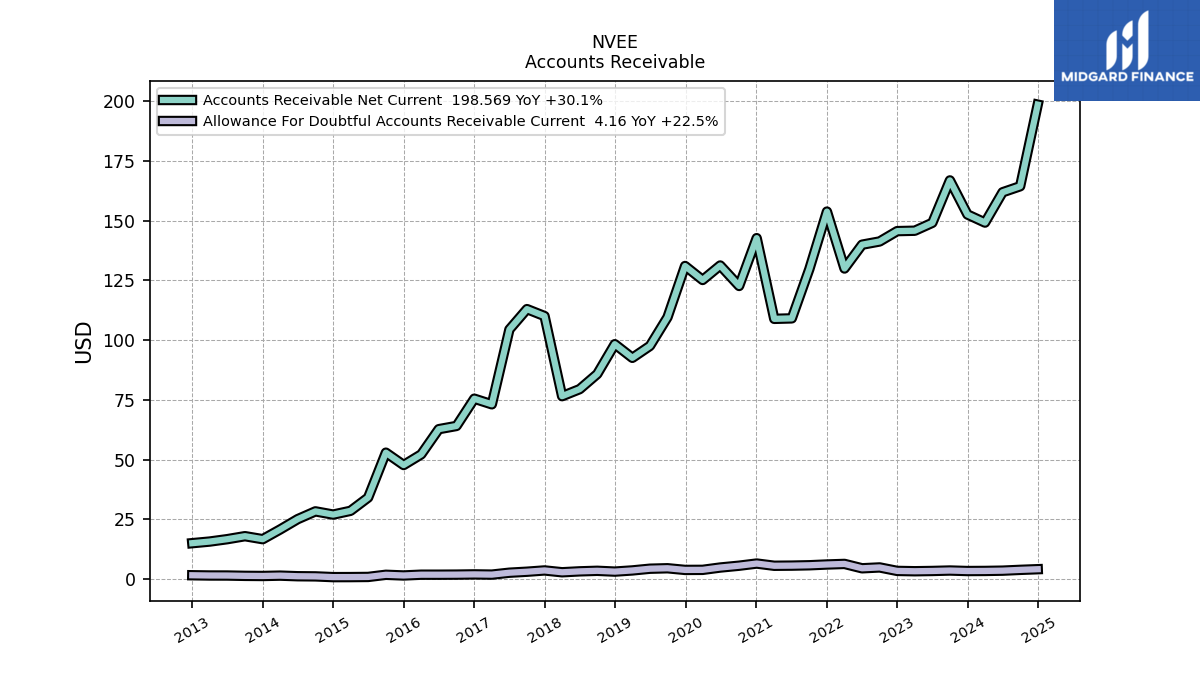
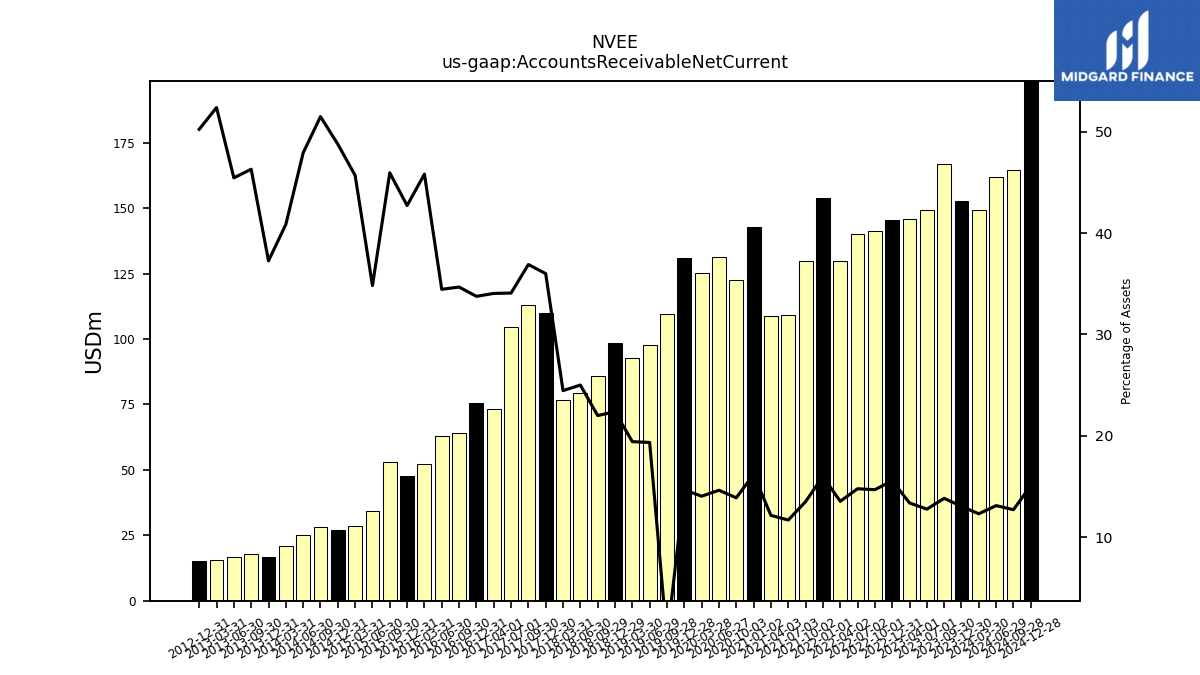
| Accounts Receivable Net Current | 152.59 | 166.86 | 149.11 | 145.80 | 145.64 | 141.31 | 139.96 | 129.99 | 153.81 | 129.78 | 109.12 | 108.92 | 142.71 | 122.68 | 131.25 | 125.19 | 131.04 | 109.59 | 97.59 | 92.60 | 98.32 | NA | 85.83 | 79.51 | 76.57 | 110.09 | 113.00 | 104.47 | 73.16 | |
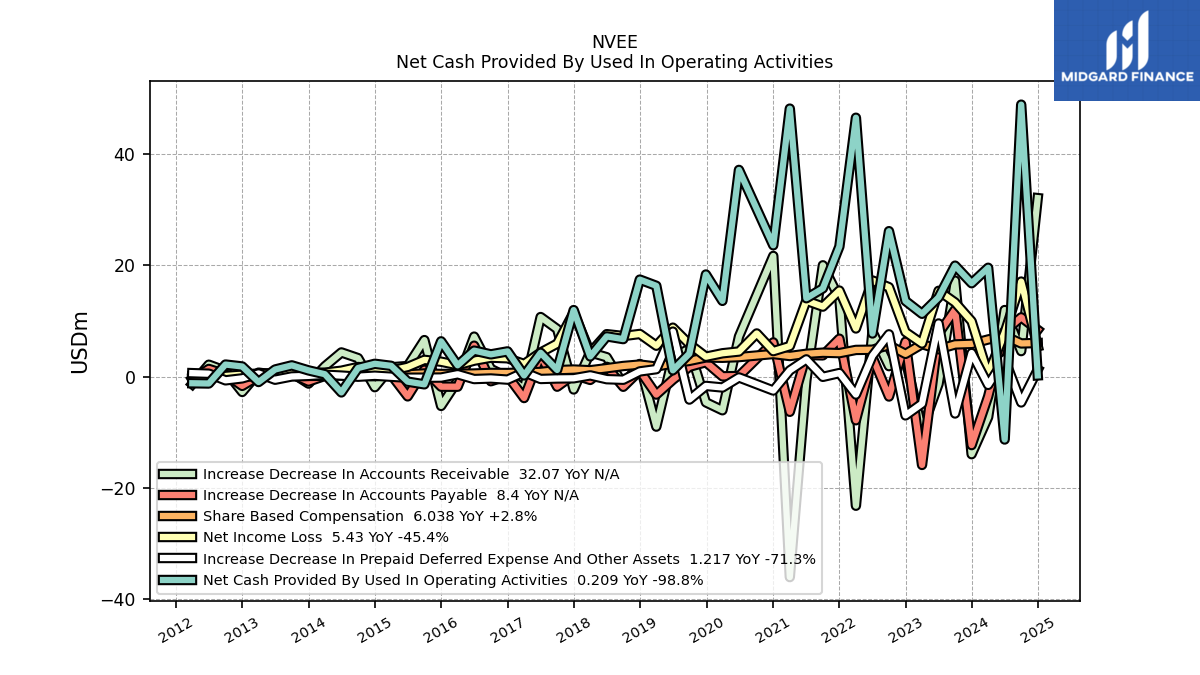
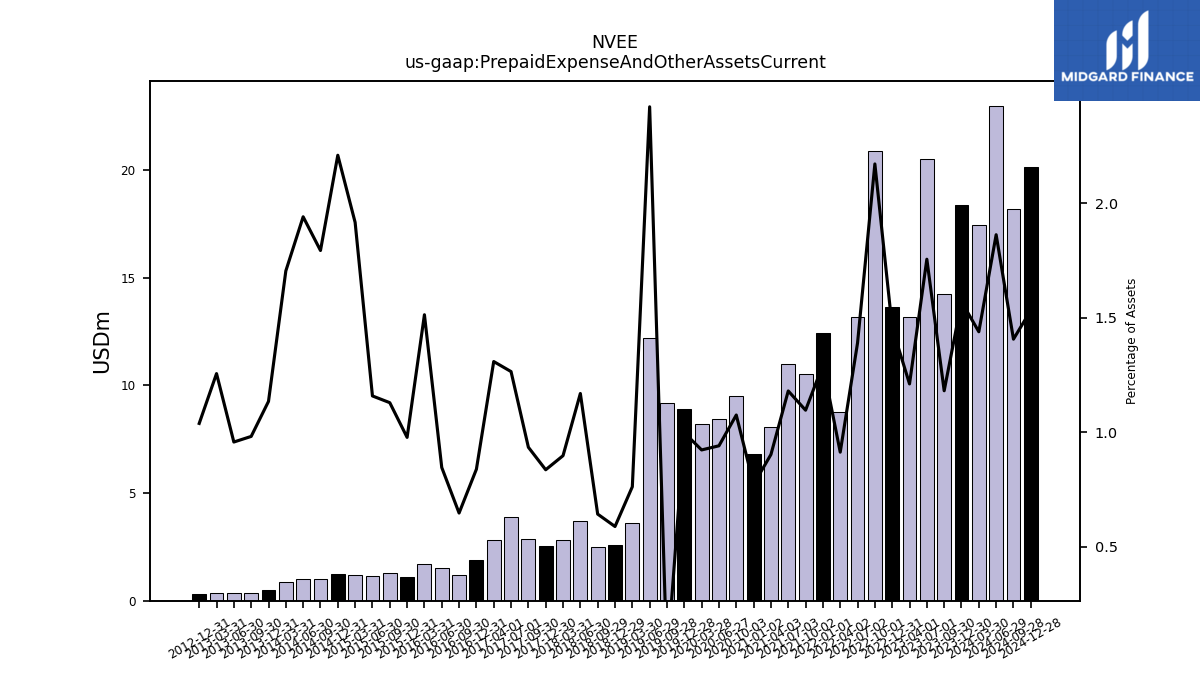
| Prepaid Expense And Other Assets Current | 18.38 | 14.24 | 20.50 | 13.19 | 13.64 | 20.90 | 13.16 | 8.76 | 12.44 | 10.53 | 11.01 | 8.09 | 6.80 | 9.49 | 8.44 | 8.22 | 8.91 | 9.20 | 12.21 | 3.63 | 2.58 | NA | 2.50 | 3.72 | 2.81 | 2.56 | 2.86 | 3.88 | 2.81 |
| 2023-12-30 | 2023-09-30 | 2023-07-01 | 2023-04-01 | 2022-12-31 | 2022-10-01 | 2022-07-02 | 2022-04-02 | 2022-01-01 | 2021-10-02 | 2021-07-03 | 2021-04-03 | 2021-01-02 | 2020-10-03 | 2020-06-27 | 2020-03-28 | 2019-12-28 | 2019-09-28 | 2019-06-29 | 2019-03-30 | 2018-12-29 | 2018-09-30 | 2018-09-29 | 2018-06-30 | 2018-03-31 | 2017-12-30 | 2017-09-30 | 2017-07-01 | 2017-04-01 | ||
|---|---|---|---|---|---|---|---|---|---|---|---|---|---|---|---|---|---|---|---|---|---|---|---|---|---|---|---|---|---|---|
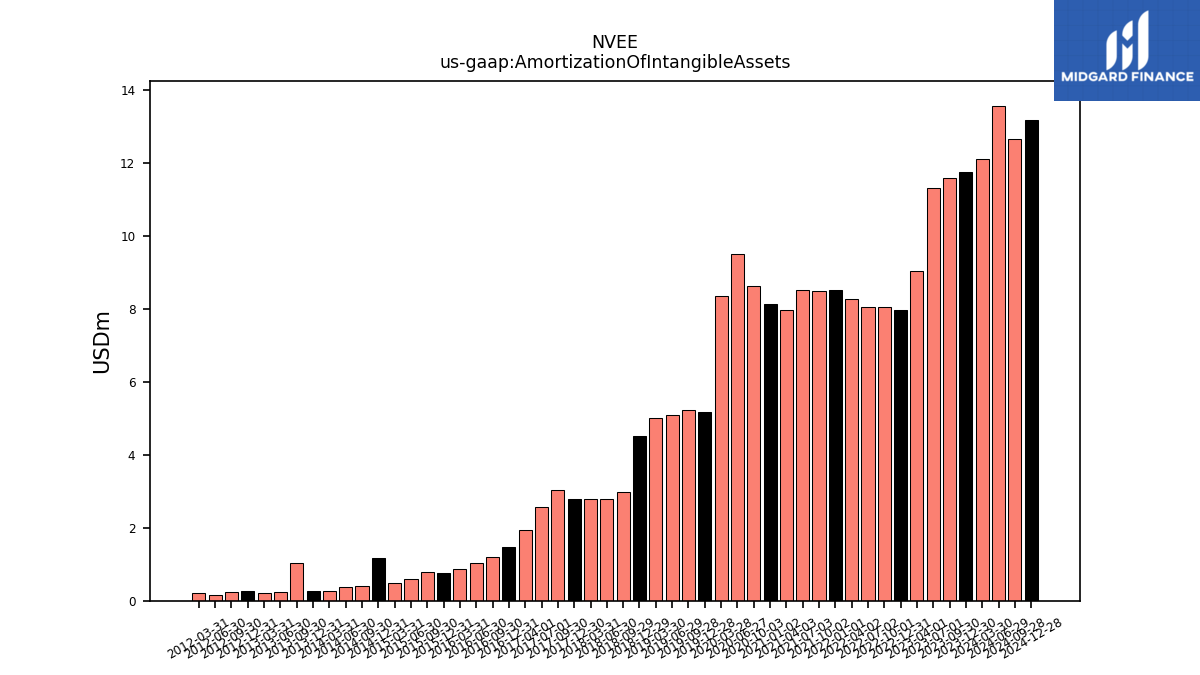
| Amortization Of Intangible Assets | 11.75 | 11.59 | 11.30 | 9.04 | 7.98 | 8.04 | 8.06 | 8.26 | 8.51 | 8.49 | 8.53 | 7.97 | 8.13 | 8.62 | 9.51 | 8.34 | 5.17 | 5.23 | 5.08 | 5.00 | 4.50 | NA | 2.98 | 2.79 | 2.78 | 2.78 | 3.03 | 2.57 | 1.93 | |
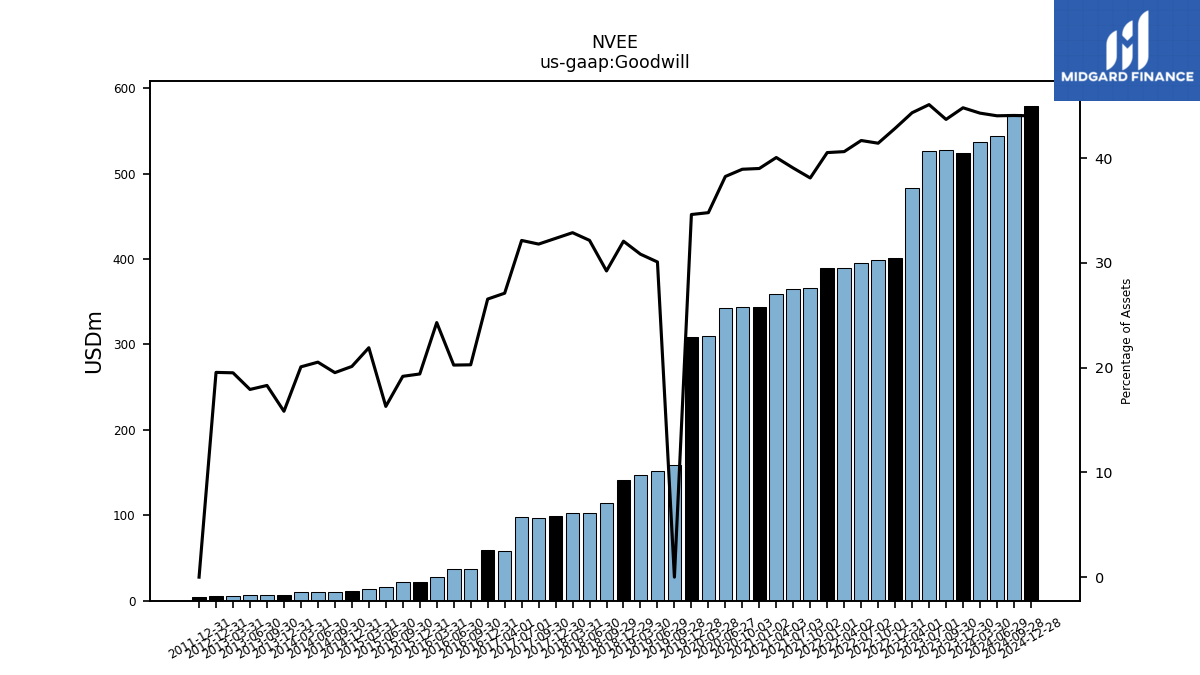
| Goodwill | 524.57 | 527.03 | 526.85 | 483.24 | 400.96 | 398.61 | 394.76 | 389.95 | 389.92 | 366.20 | 364.56 | 359.10 | 343.80 | 344.00 | 343.17 | 310.21 | 309.22 | 158.42 | 151.79 | 146.99 | 140.93 | NA | 114.05 | 102.23 | 102.95 | 98.90 | 97.38 | 98.54 | 58.24 | |
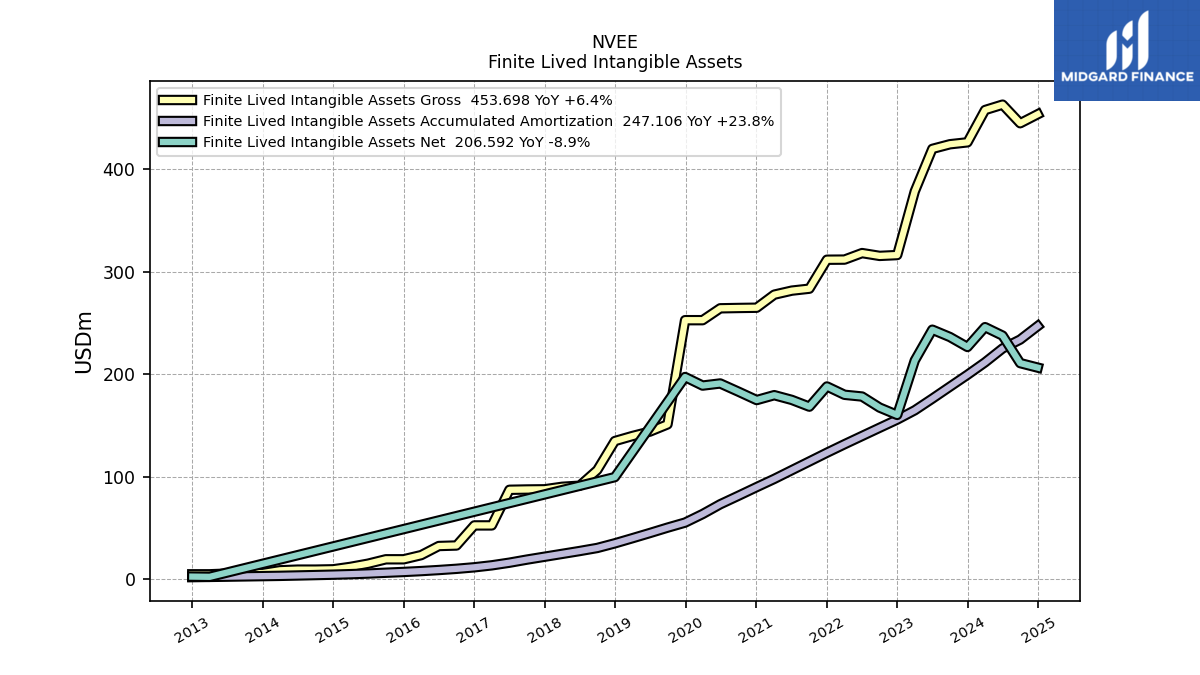
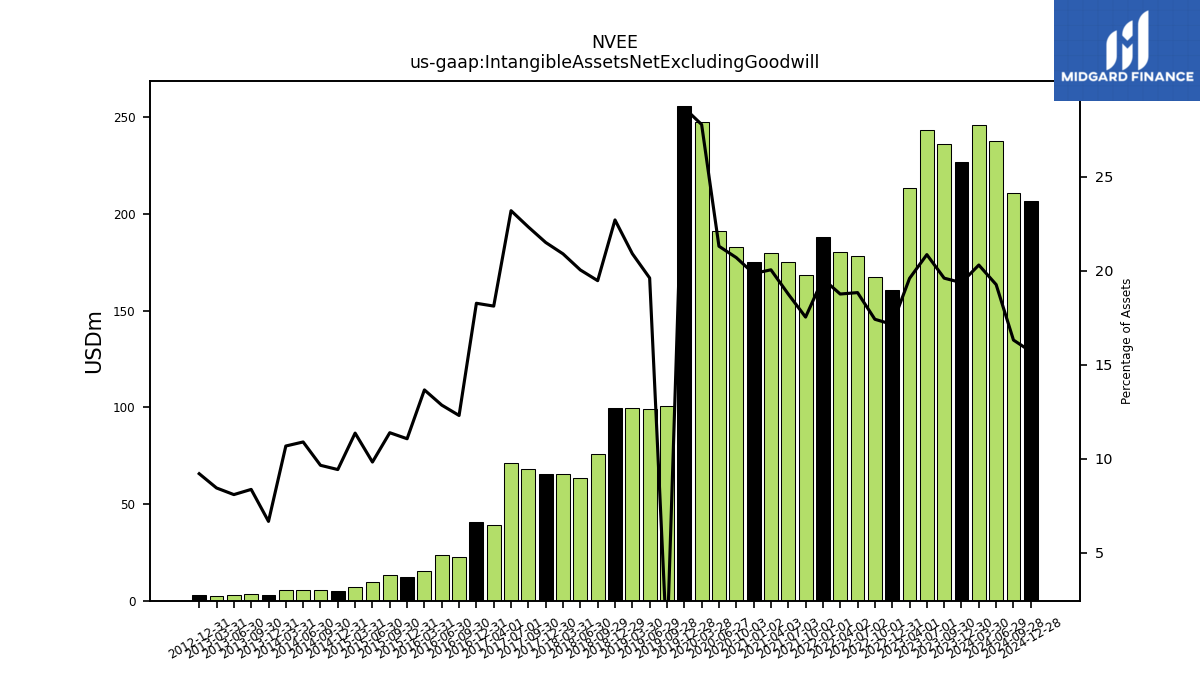
| Intangible Assets Net Excluding Goodwill | 226.70 | 236.43 | 243.58 | 213.52 | 160.43 | 167.59 | 178.38 | 180.08 | 188.22 | 168.50 | 175.09 | 179.71 | 174.93 | 182.83 | 191.13 | 247.61 | 255.96 | 100.69 | 98.94 | 99.67 | 99.76 | NA | 75.97 | 63.72 | 65.42 | 65.75 | 68.37 | 71.09 | 38.93 | |
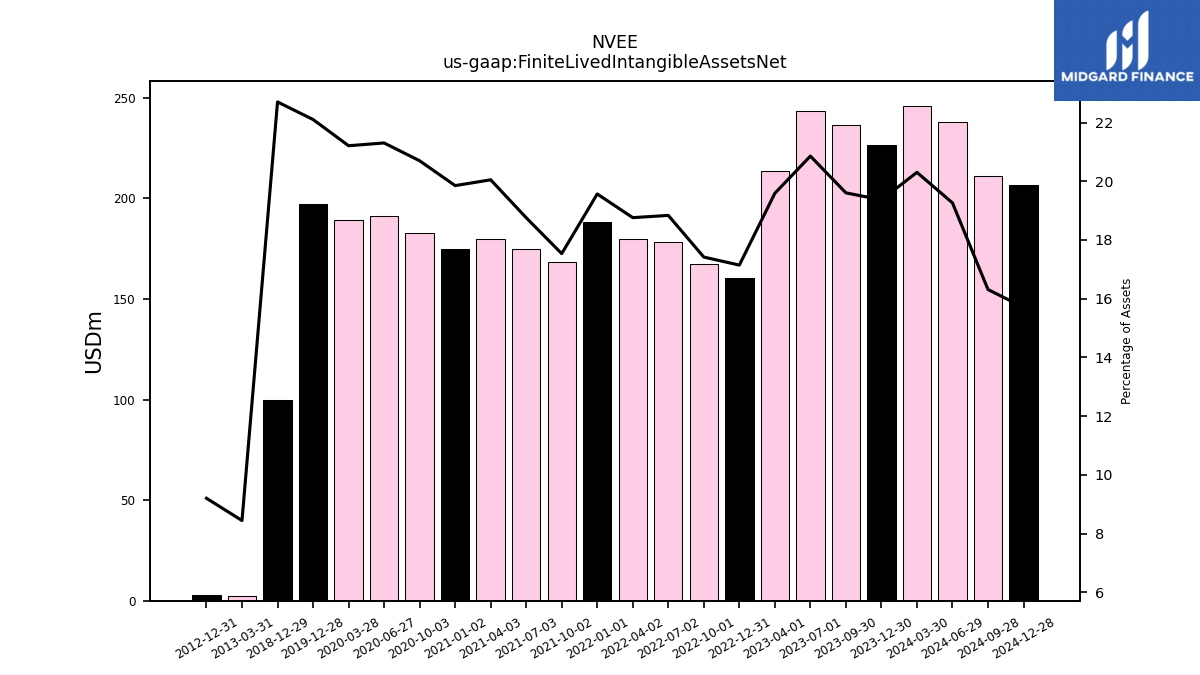
| Finite Lived Intangible Assets Net | 226.70 | 236.43 | 243.58 | 213.52 | 160.43 | 167.59 | 178.38 | 180.08 | 188.22 | 168.50 | 175.09 | 179.71 | 174.93 | 182.83 | 191.13 | 189.07 | 197.41 | NA | NA | NA | 99.76 | NA | NA | NA | NA | NA | NA | NA | NA | |
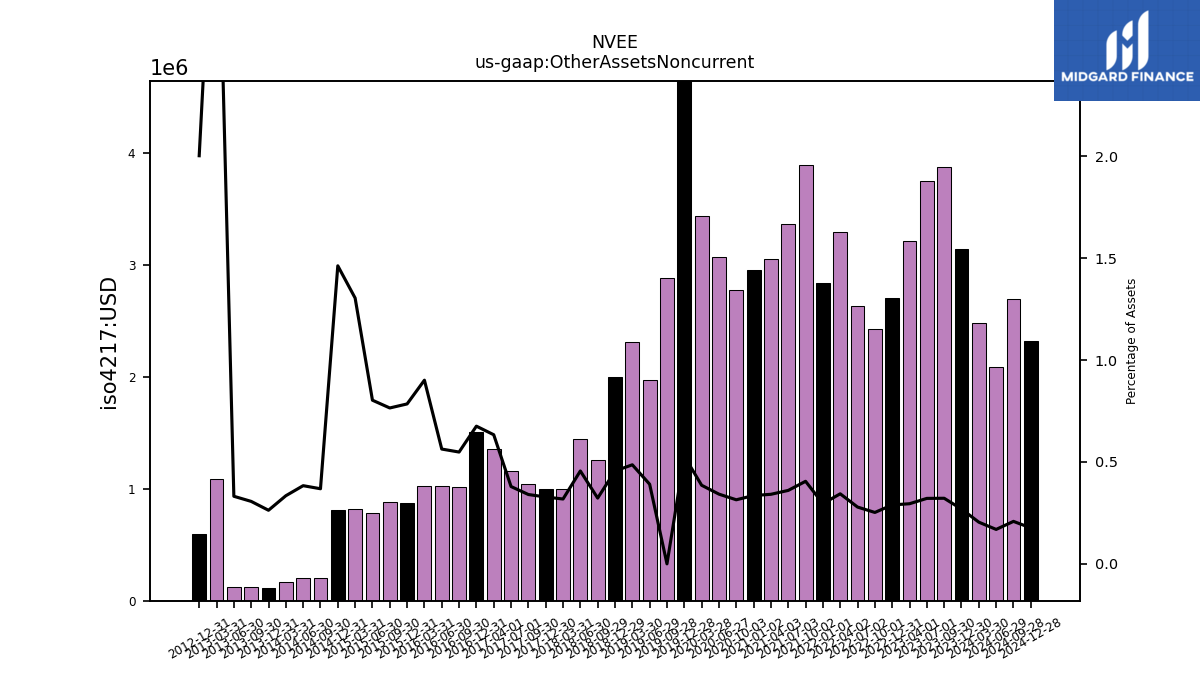
| Other Assets Noncurrent | 3.15 | 3.88 | 3.75 | 3.21 | 2.71 | 2.43 | 2.64 | 3.30 | 2.84 | 3.89 | 3.36 | 3.06 | 2.95 | 2.78 | 3.07 | 3.44 | 4.71 | 2.89 | 1.97 | 2.32 | 2.00 | NA | 1.26 | 1.45 | 1.00 | 1.00 | 1.04 | 1.16 | 1.36 |
| 2023-12-30 | 2023-09-30 | 2023-07-01 | 2023-04-01 | 2022-12-31 | 2022-10-01 | 2022-07-02 | 2022-04-02 | 2022-01-01 | 2021-10-02 | 2021-07-03 | 2021-04-03 | 2021-01-02 | 2020-10-03 | 2020-06-27 | 2020-03-28 | 2019-12-28 | 2019-09-28 | 2019-06-29 | 2019-03-30 | 2018-12-29 | 2018-09-30 | 2018-09-29 | 2018-06-30 | 2018-03-31 | 2017-12-30 | 2017-09-30 | 2017-07-01 | 2017-04-01 | ||
|---|---|---|---|---|---|---|---|---|---|---|---|---|---|---|---|---|---|---|---|---|---|---|---|---|---|---|---|---|---|---|
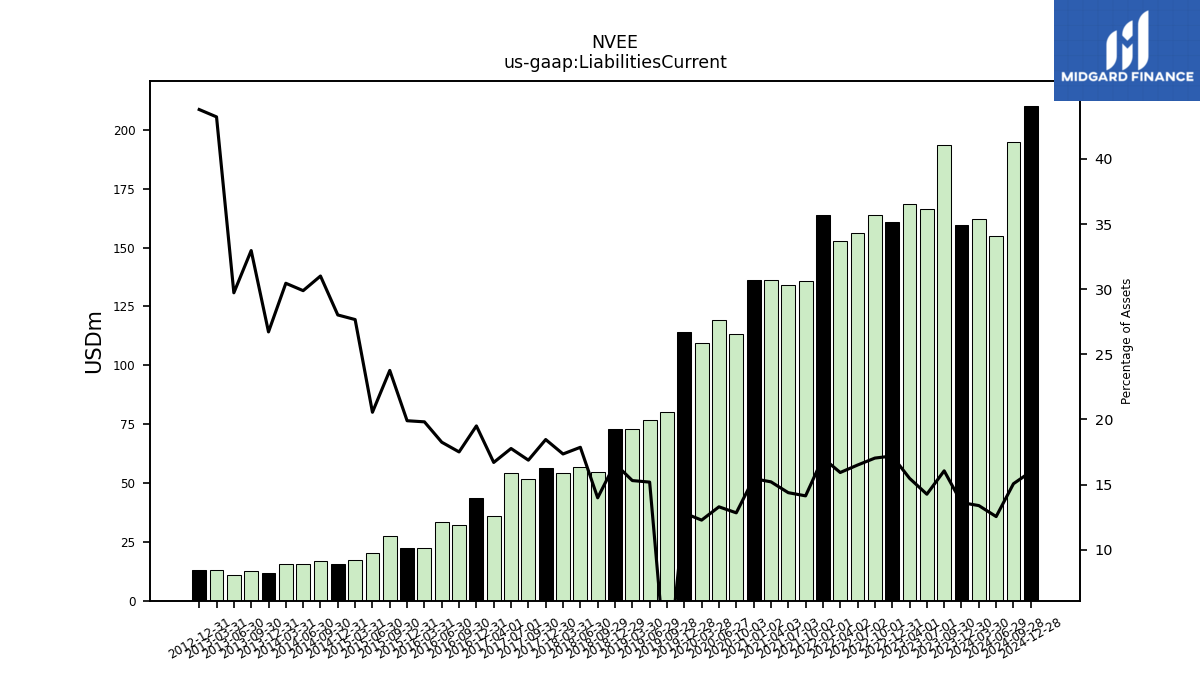
| Liabilities Current | 159.42 | 193.61 | 166.53 | 168.73 | 160.89 | 163.87 | 156.23 | 152.86 | 163.95 | 135.81 | 134.20 | 136.33 | 136.19 | 113.33 | 119.24 | 109.39 | 114.36 | 80.18 | 76.62 | 72.97 | 72.95 | NA | 54.56 | 56.79 | 54.31 | 56.44 | 51.68 | 54.46 | 35.88 | |
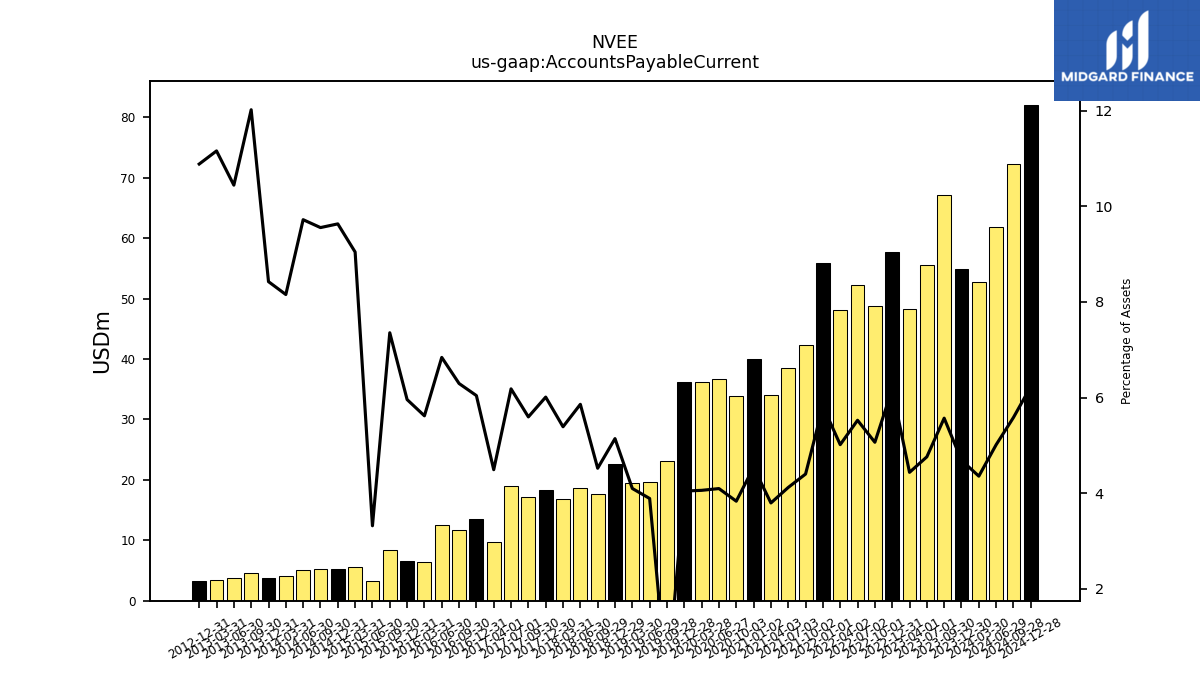
| Accounts Payable Current | 54.87 | 67.14 | 55.58 | 48.33 | 57.77 | 48.72 | 52.31 | 48.13 | 55.95 | 42.27 | 38.45 | 34.01 | 39.99 | 33.84 | 36.74 | 36.18 | 36.12 | 23.08 | 19.61 | 19.53 | 22.59 | NA | 17.64 | 18.62 | 16.87 | 18.37 | 17.13 | 18.95 | 9.65 | |
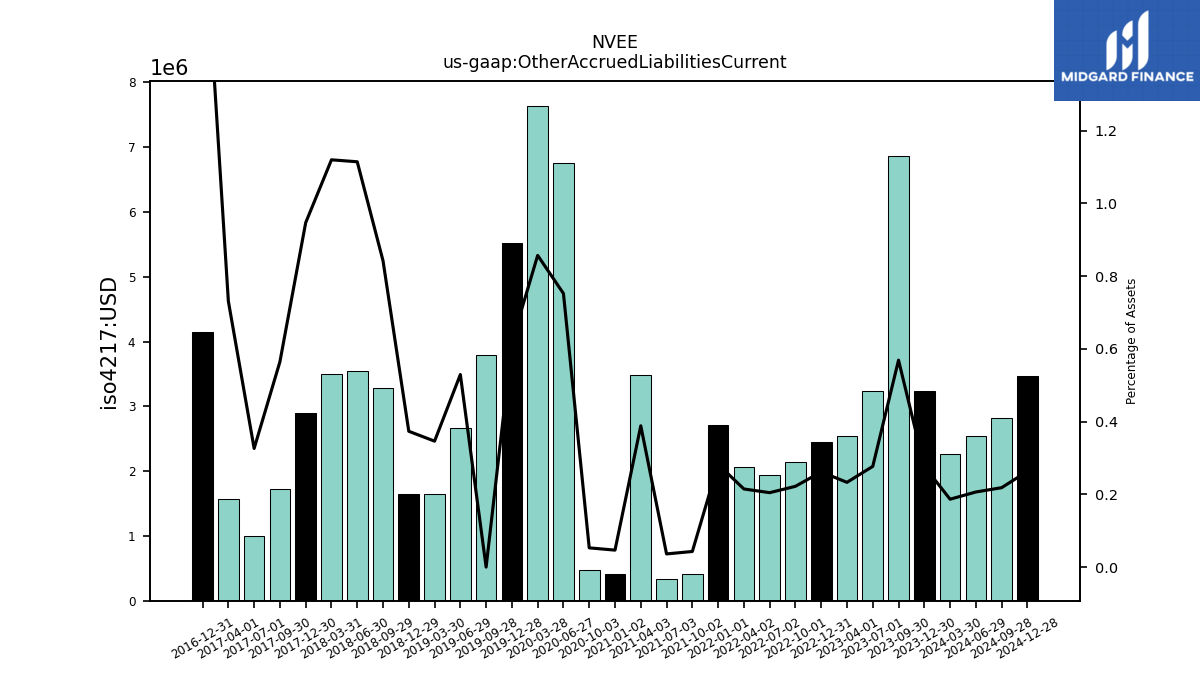
| Other Accrued Liabilities Current | 3.24 | 6.86 | 3.23 | 2.54 | 2.45 | 2.14 | 1.94 | 2.06 | 2.72 | 0.41 | 0.34 | 3.48 | 0.41 | 0.47 | 6.75 | 7.64 | 5.52 | 3.79 | 2.67 | 1.65 | 1.64 | NA | 3.29 | 3.54 | 3.51 | 2.90 | 1.73 | 1.00 | 1.57 | |
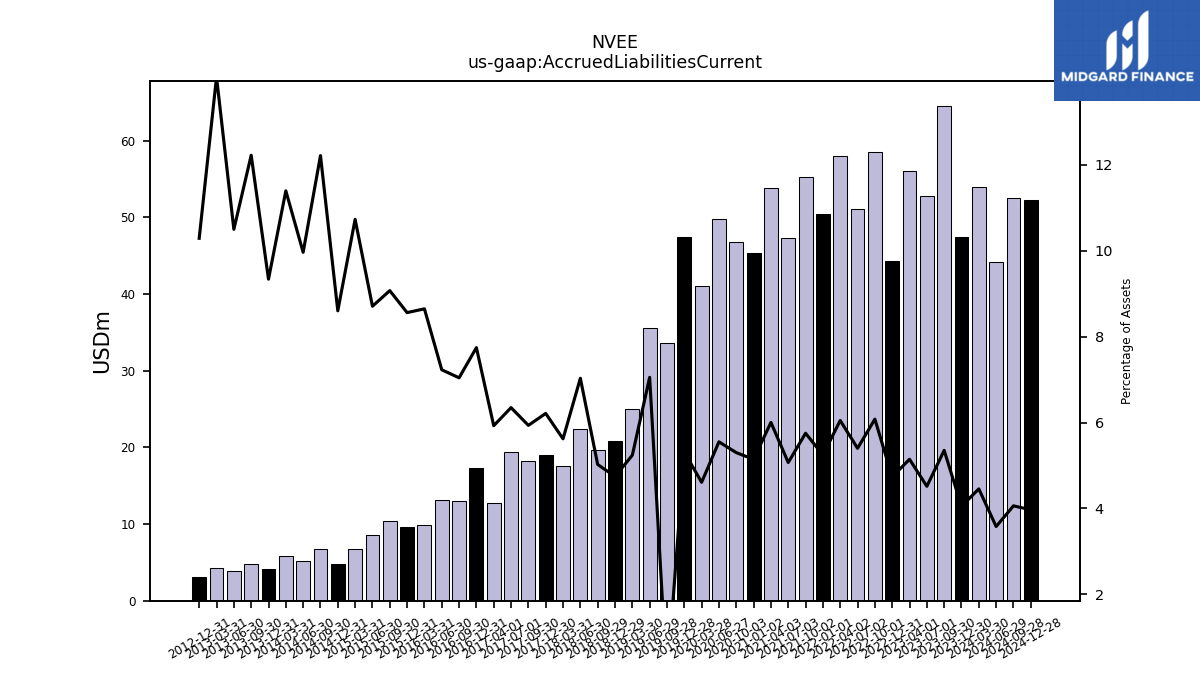
| Accrued Liabilities Current | 47.42 | 64.54 | 52.73 | 56.07 | 44.31 | 58.48 | 51.13 | 58.04 | 50.46 | 55.25 | 47.32 | 53.80 | 45.33 | 46.81 | 49.80 | 41.09 | 47.43 | 33.65 | 35.56 | 24.97 | 20.85 | NA | 19.60 | 22.35 | 17.59 | 18.99 | 18.17 | 19.45 | 12.73 | |
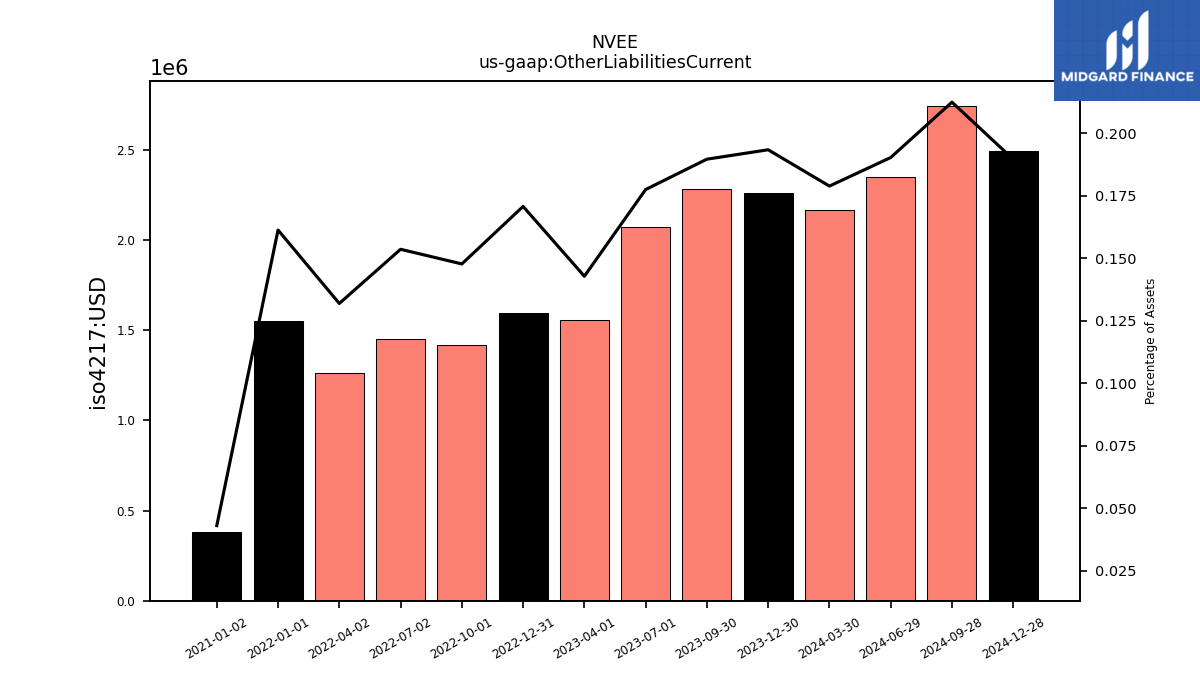
| Other Liabilities Current | 2.26 | 2.29 | 2.07 | 1.56 | 1.60 | 1.42 | 1.45 | 1.27 | 1.55 | NA | NA | NA | 0.38 | NA | NA | NA | NA | NA | NA | NA | NA | NA | NA | NA | NA | NA | NA | NA | NA |
| 2023-12-30 | 2023-09-30 | 2023-07-01 | 2023-04-01 | 2022-12-31 | 2022-10-01 | 2022-07-02 | 2022-04-02 | 2022-01-01 | 2021-10-02 | 2021-07-03 | 2021-04-03 | 2021-01-02 | 2020-10-03 | 2020-06-27 | 2020-03-28 | 2019-12-28 | 2019-09-28 | 2019-06-29 | 2019-03-30 | 2018-12-29 | 2018-09-30 | 2018-09-29 | 2018-06-30 | 2018-03-31 | 2017-12-30 | 2017-09-30 | 2017-07-01 | 2017-04-01 | ||
|---|---|---|---|---|---|---|---|---|---|---|---|---|---|---|---|---|---|---|---|---|---|---|---|---|---|---|---|---|---|---|
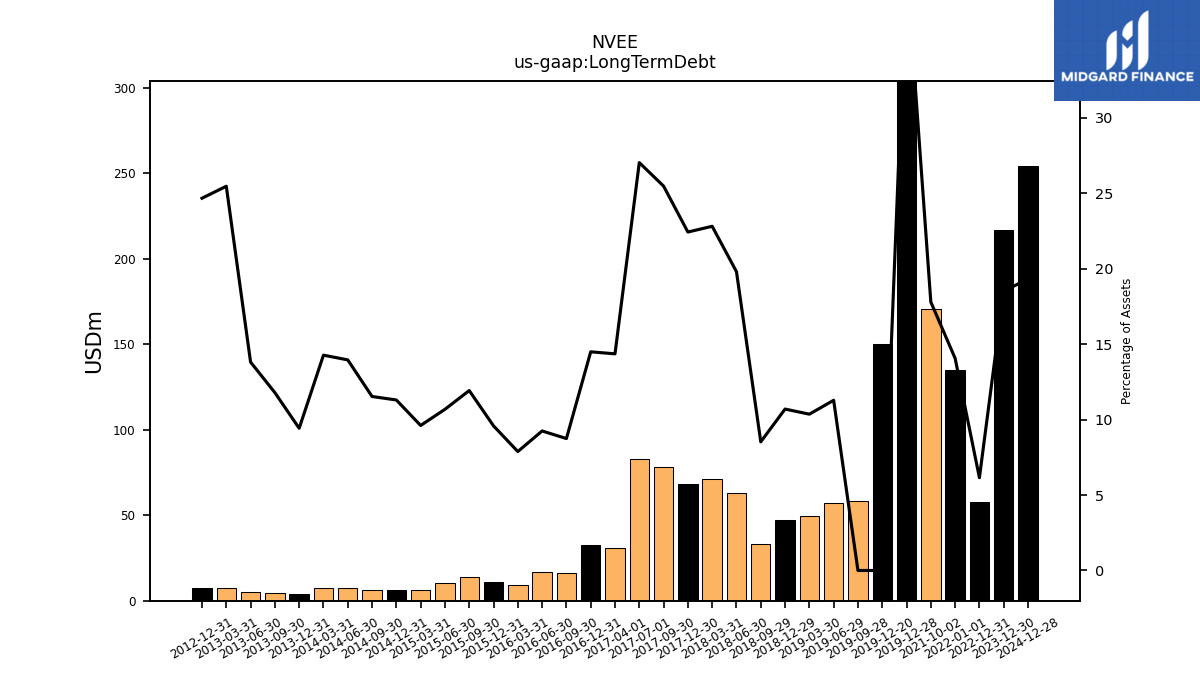
| Long Term Debt | 216.65 | NA | NA | NA | 57.52 | NA | NA | NA | 135.19 | 170.88 | NA | NA | NA | NA | NA | NA | 358.19 | 58.22 | 56.88 | 49.36 | 46.99 | NA | 33.25 | 62.93 | 71.37 | 68.56 | 77.98 | 82.83 | 30.84 | |
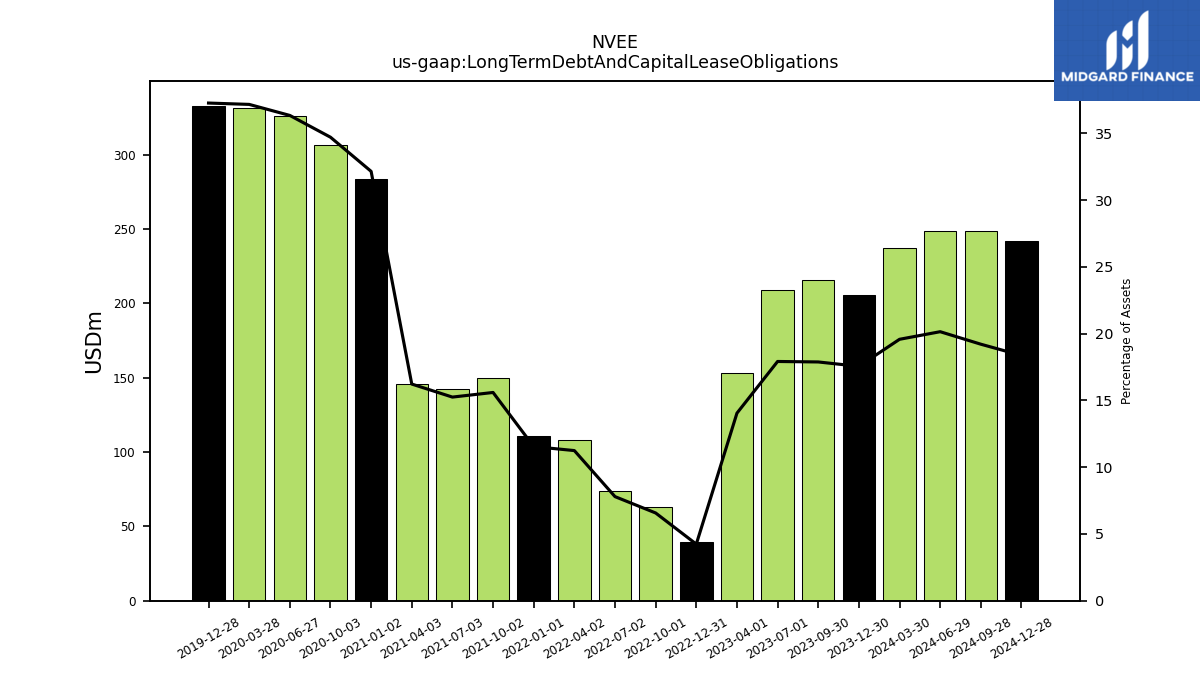
| Long Term Debt And Capital Lease Obligations | 205.47 | 215.64 | 209.24 | 153.08 | 39.67 | 63.24 | 73.84 | 107.93 | 111.06 | 149.86 | 142.35 | 145.44 | 283.33 | 306.61 | 326.02 | 331.32 | 332.85 | NA | NA | NA | NA | NA | NA | NA | NA | NA | NA | NA | NA | |
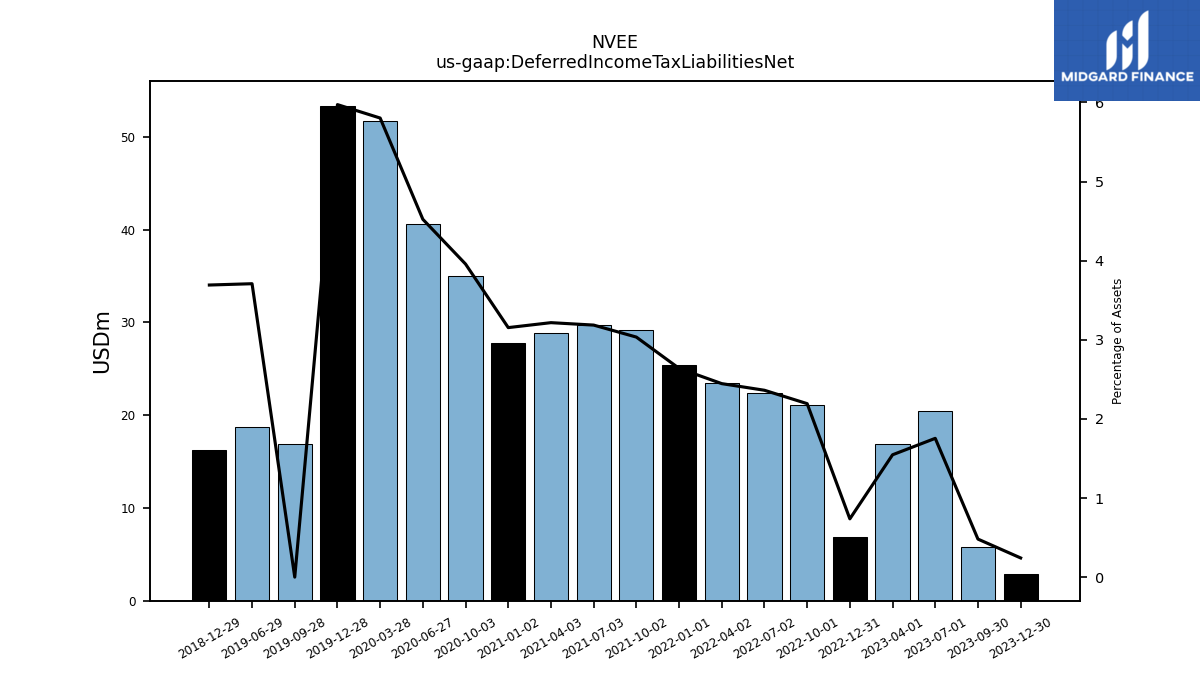
| Deferred Income Tax Liabilities Net | 2.84 | 5.80 | 20.49 | 16.85 | 6.89 | 21.10 | 22.37 | 23.48 | 25.39 | 29.15 | 29.74 | 28.83 | 27.79 | 34.96 | 40.58 | 51.73 | 53.34 | 16.88 | 18.71 | NA | 16.22 | NA | NA | NA | NA | NA | NA | NA | NA | |
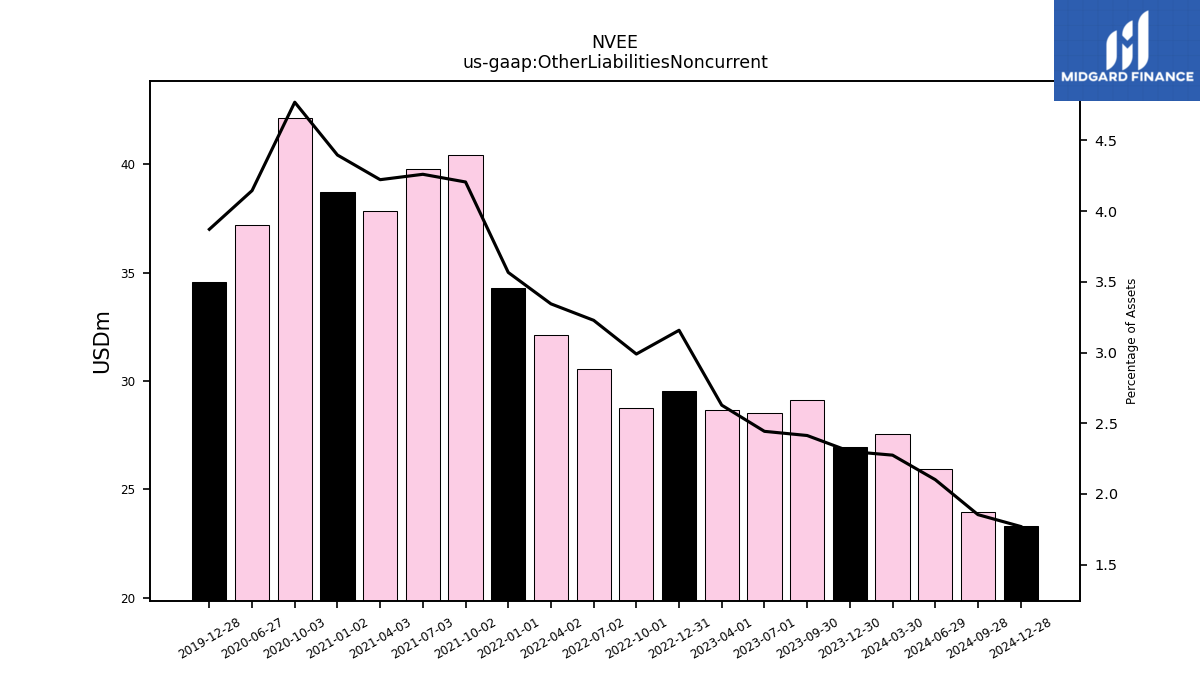
| Other Liabilities Noncurrent | 26.93 | 29.10 | 28.53 | 28.64 | 29.54 | 28.76 | 30.56 | 32.10 | 34.30 | 40.41 | 39.76 | 37.84 | 38.74 | 42.13 | 37.18 | NA | 34.57 | NA | NA | NA | NA | NA | NA | NA | NA | NA | NA | NA | NA | |
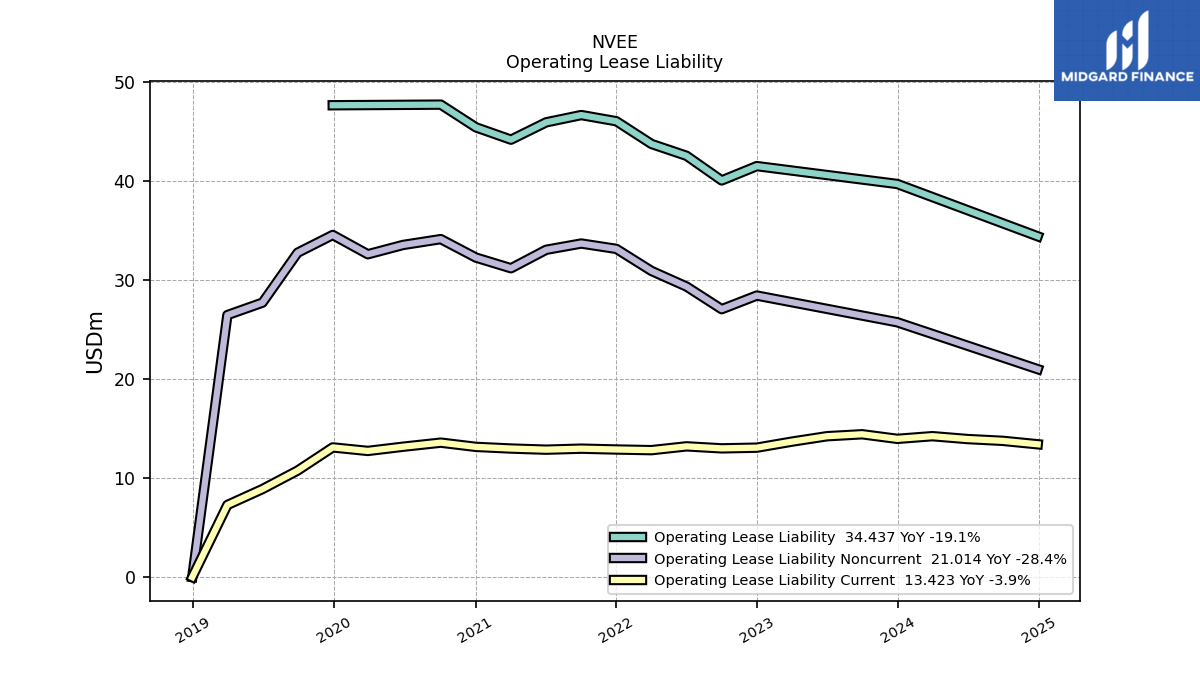
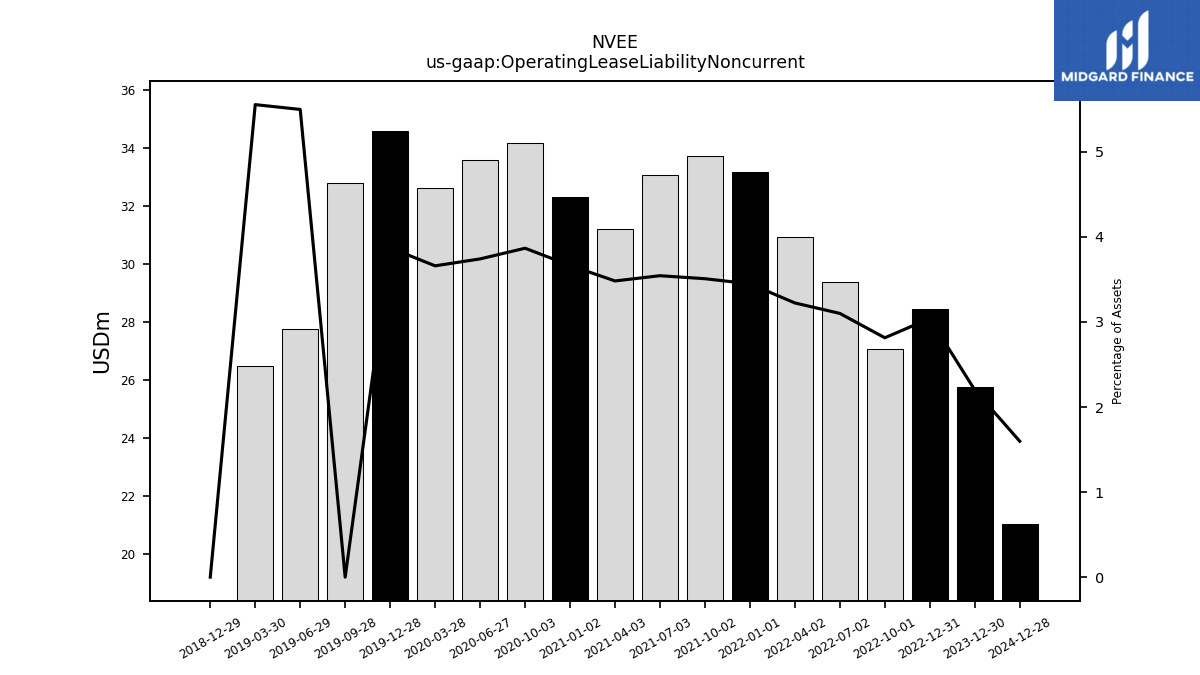
| Operating Lease Liability Noncurrent | 25.75 | NA | NA | NA | 28.45 | 27.07 | 29.36 | 30.94 | 33.17 | 33.71 | 33.08 | 31.21 | 32.29 | 34.16 | 33.56 | 32.62 | 34.57 | 32.78 | 27.74 | 26.48 | 0.00 | NA | NA | NA | NA | NA | NA | NA | NA |
| 2023-12-30 | 2023-09-30 | 2023-07-01 | 2023-04-01 | 2022-12-31 | 2022-10-01 | 2022-07-02 | 2022-04-02 | 2022-01-01 | 2021-10-02 | 2021-07-03 | 2021-04-03 | 2021-01-02 | 2020-10-03 | 2020-06-27 | 2020-03-28 | 2019-12-28 | 2019-09-28 | 2019-06-29 | 2019-03-30 | 2018-12-29 | 2018-09-30 | 2018-09-29 | 2018-06-30 | 2018-03-31 | 2017-12-30 | 2017-09-30 | 2017-07-01 | 2017-04-01 | ||
|---|---|---|---|---|---|---|---|---|---|---|---|---|---|---|---|---|---|---|---|---|---|---|---|---|---|---|---|---|---|---|
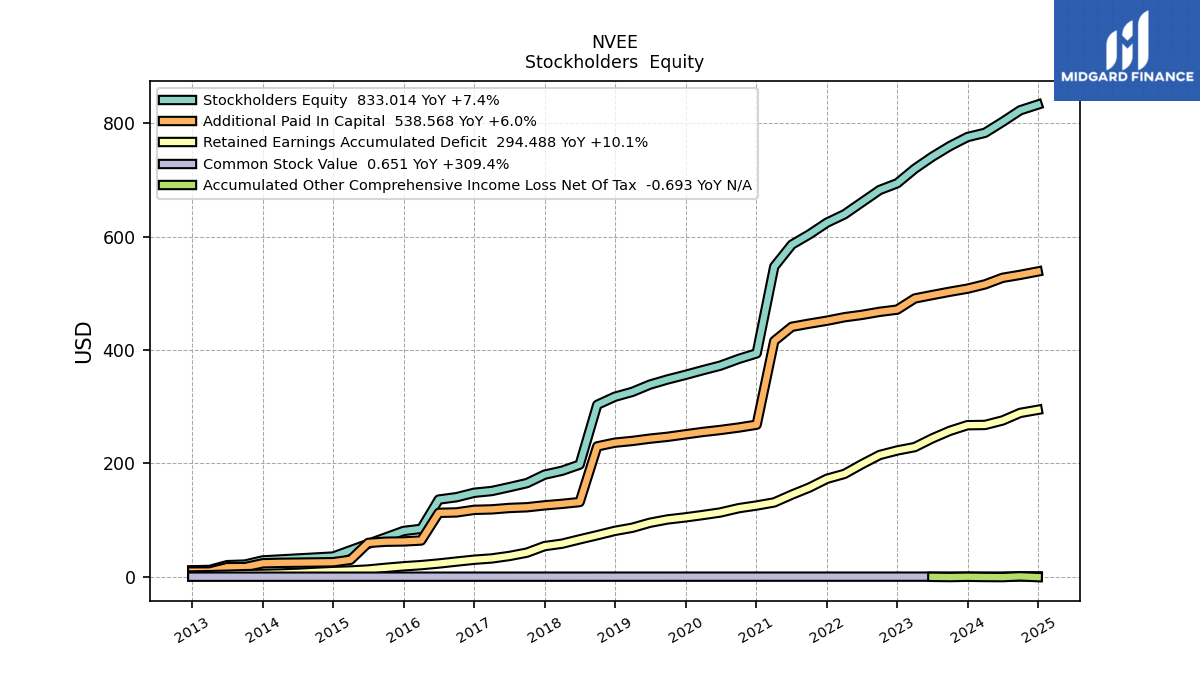
| Stockholders Equity | 775.79 | 759.92 | 741.15 | 719.87 | 694.24 | 682.36 | 660.94 | 639.50 | 624.72 | 604.12 | 585.99 | 547.19 | 394.07 | 384.56 | 372.37 | 364.37 | 355.96 | 348.07 | 339.00 | 326.17 | 317.54 | NA | 303.35 | 197.80 | 187.02 | 180.10 | 165.21 | 158.07 | 151.25 | |
| Common Stock Value | 0.16 | 0.16 | 0.16 | 0.16 | 0.15 | 0.16 | 0.15 | 0.15 | 0.15 | 0.15 | 0.15 | 0.15 | 0.13 | 0.13 | 0.13 | 0.13 | 0.13 | 0.13 | 0.13 | 0.13 | 0.13 | NA | 0.12 | 0.11 | 0.11 | 0.11 | 0.11 | 0.11 | 0.11 | |
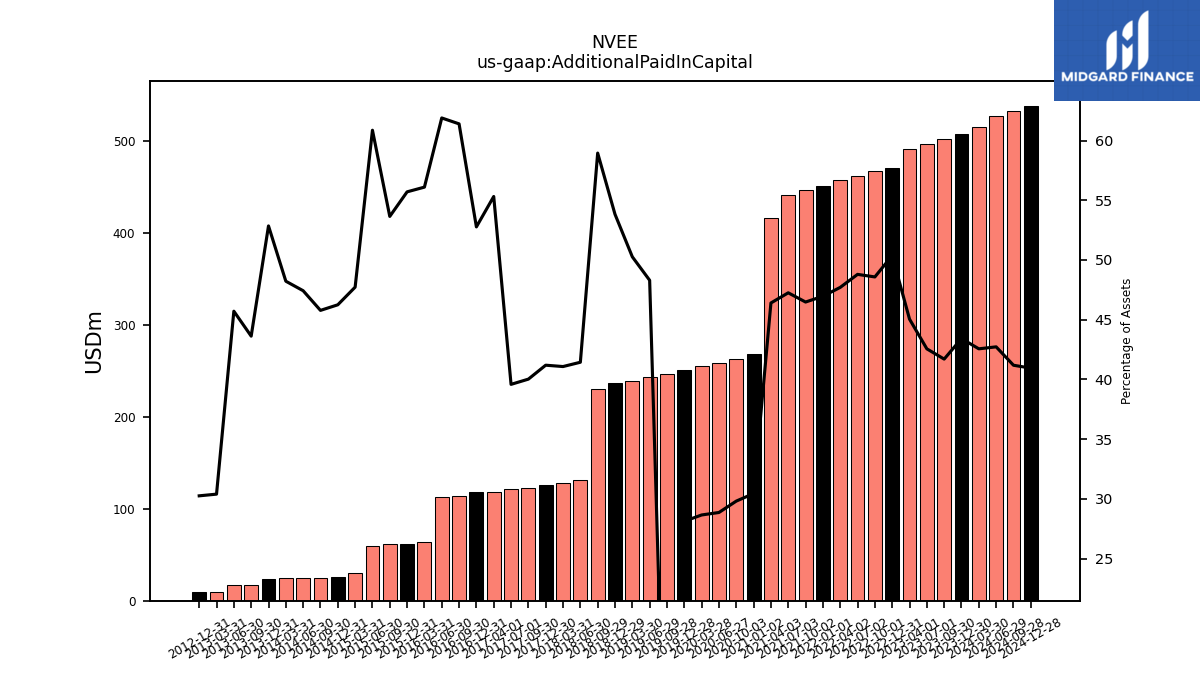
| Additional Paid In Capital | 508.26 | 502.91 | 497.04 | 490.98 | 471.30 | 467.42 | 462.07 | 457.89 | 451.75 | 446.61 | 441.05 | 415.89 | 268.27 | 263.34 | 258.90 | 255.40 | 251.19 | 246.87 | 243.65 | 239.61 | 236.53 | NA | 229.99 | 131.75 | 128.59 | 125.95 | 122.58 | 121.34 | 118.84 | |
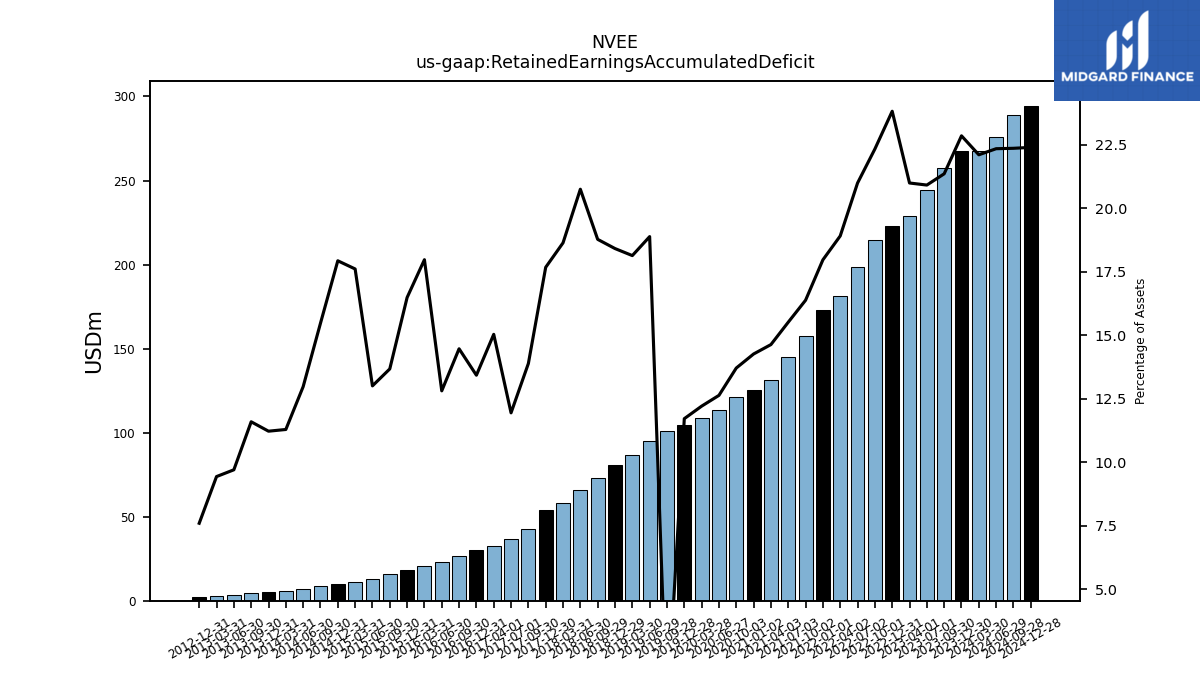
| Retained Earnings Accumulated Deficit | 267.40 | 257.46 | 244.15 | 228.73 | 222.78 | 214.78 | 198.72 | 181.45 | 172.81 | 157.36 | 144.78 | 131.15 | 125.67 | 121.09 | 113.34 | 108.83 | 104.65 | 101.07 | 95.23 | 86.43 | 80.89 | NA | 73.23 | 65.95 | 58.33 | 54.03 | 42.53 | 36.62 | 32.30 | |
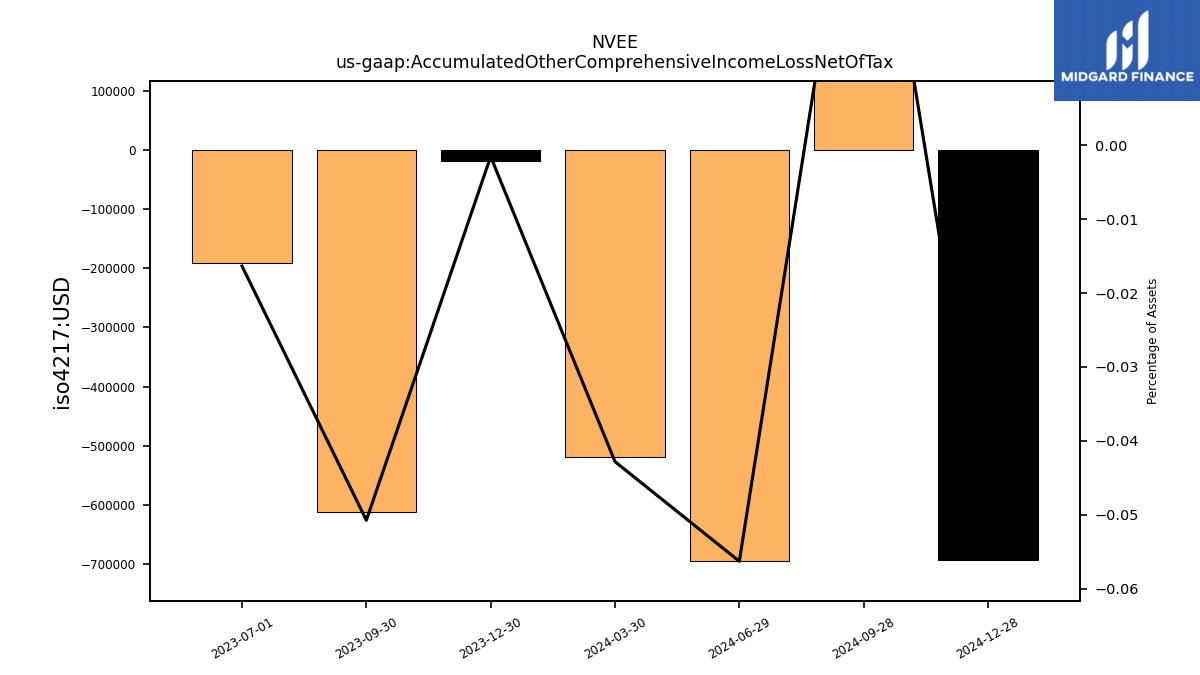
| Accumulated Other Comprehensive Income Loss Net Of Tax | -0.02 | -0.61 | -0.19 | NA | NA | NA | NA | NA | NA | NA | NA | NA | NA | NA | NA | NA | NA | NA | NA | NA | NA | NA | NA | NA | NA | NA | NA | NA | NA | |
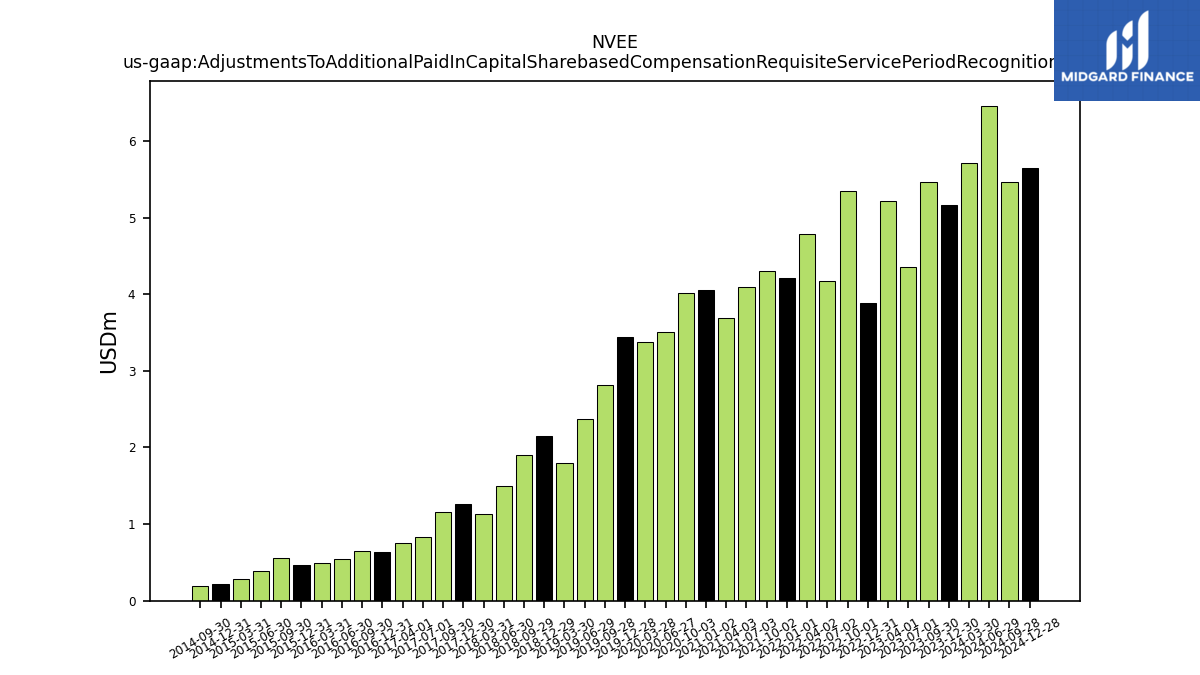
| Adjustments To Additional Paid In Capital Sharebased Compensation Requisite Service Period Recognition Value | 5.16 | 5.46 | 4.36 | 5.21 | 3.88 | 5.35 | 4.17 | 4.79 | 4.21 | 4.30 | 4.09 | 3.70 | 4.05 | 4.02 | 3.50 | 3.38 | 3.44 | 2.82 | 2.37 | 1.80 | 2.16 | NA | 1.90 | 1.50 | 1.14 | 1.27 | 1.16 | 0.83 | 0.75 |
| 2023-12-30 | 2023-09-30 | 2023-07-01 | 2023-04-01 | 2022-12-31 | 2022-10-01 | 2022-07-02 | 2022-04-02 | 2022-01-01 | 2021-10-02 | 2021-07-03 | 2021-04-03 | 2021-01-02 | 2020-10-03 | 2020-06-27 | 2020-03-28 | 2019-12-28 | 2019-09-28 | 2019-06-29 | 2019-03-30 | 2018-12-29 | 2018-09-30 | 2018-09-29 | 2018-06-30 | 2018-03-31 | 2017-12-30 | 2017-09-30 | 2017-07-01 | 2017-04-01 | ||
|---|---|---|---|---|---|---|---|---|---|---|---|---|---|---|---|---|---|---|---|---|---|---|---|---|---|---|---|---|---|---|
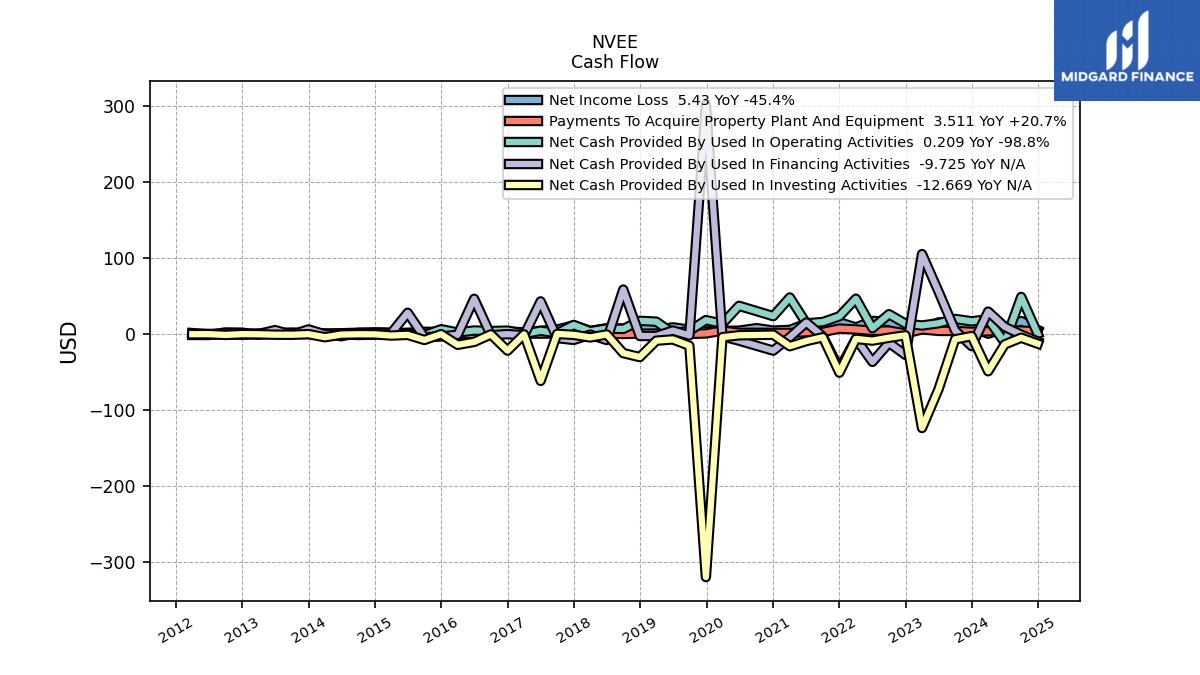
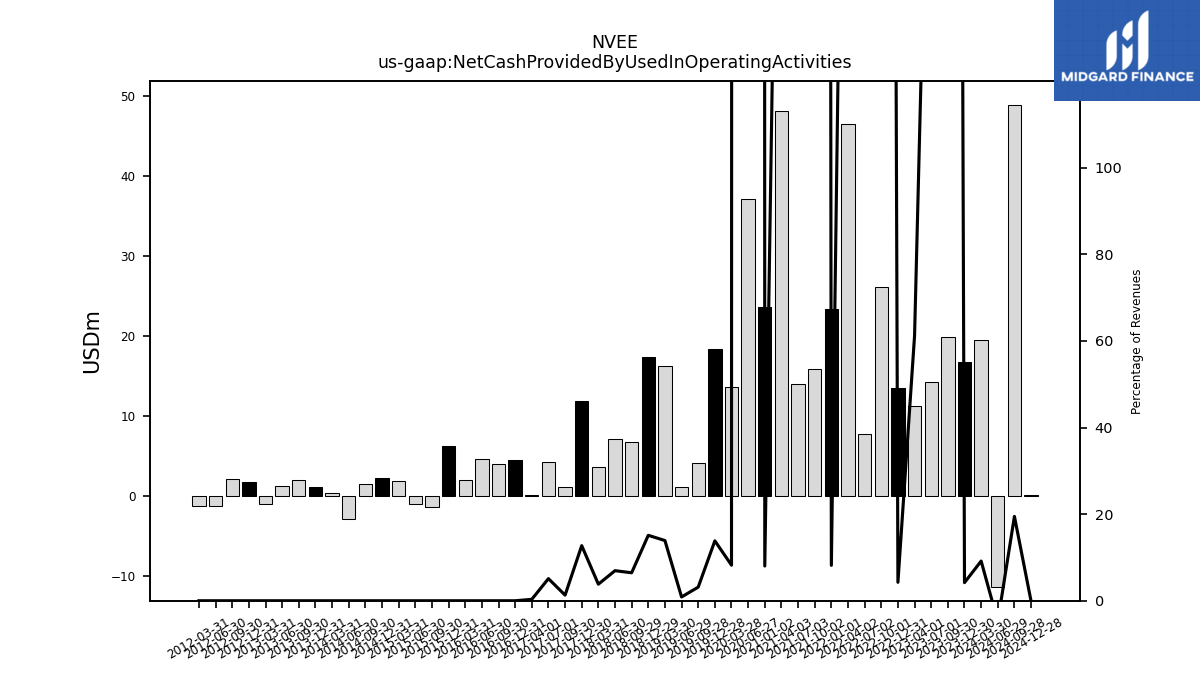
| Net Cash Provided By Used In Operating Activities | 16.77 | 19.93 | 14.22 | 11.28 | 13.59 | 26.13 | 7.74 | 46.52 | 23.37 | 15.84 | 14.07 | 48.16 | 23.59 | NA | 37.14 | 13.60 | 18.34 | 4.12 | 1.12 | 16.31 | 17.43 | NA | 6.73 | 7.22 | 3.62 | 11.95 | 1.19 | 4.28 | 0.21 | |
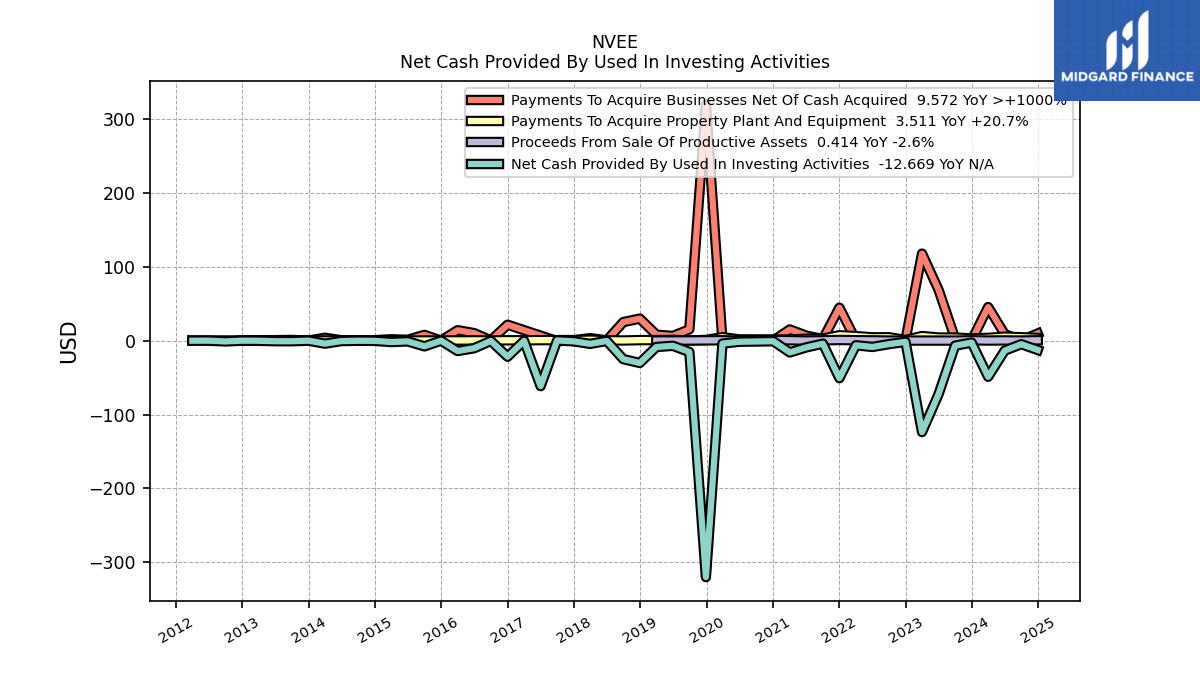
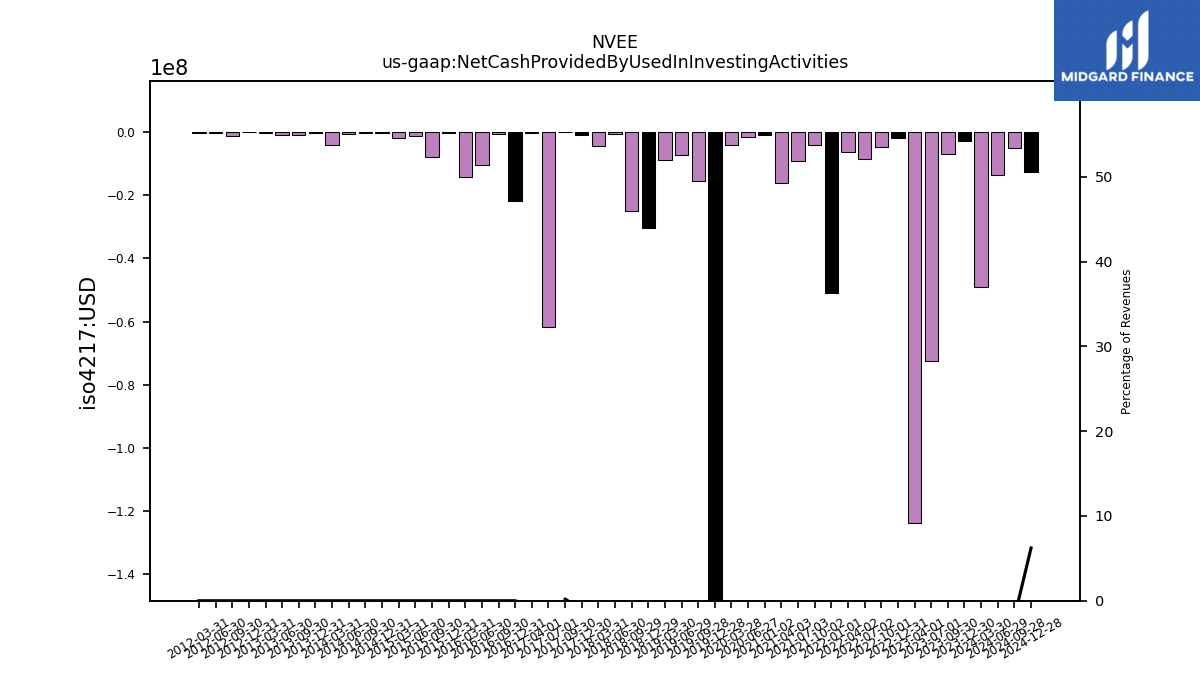
| Net Cash Provided By Used In Investing Activities | -2.72 | -6.88 | -72.49 | -123.70 | -1.70 | -4.81 | -8.63 | -6.37 | -50.82 | -4.22 | -9.20 | -16.02 | -0.90 | NA | -1.61 | -4.10 | -319.82 | -15.39 | -7.10 | -8.69 | -30.32 | NA | -25.11 | -0.51 | -4.42 | -1.04 | 0.20 | -61.64 | -0.39 | |
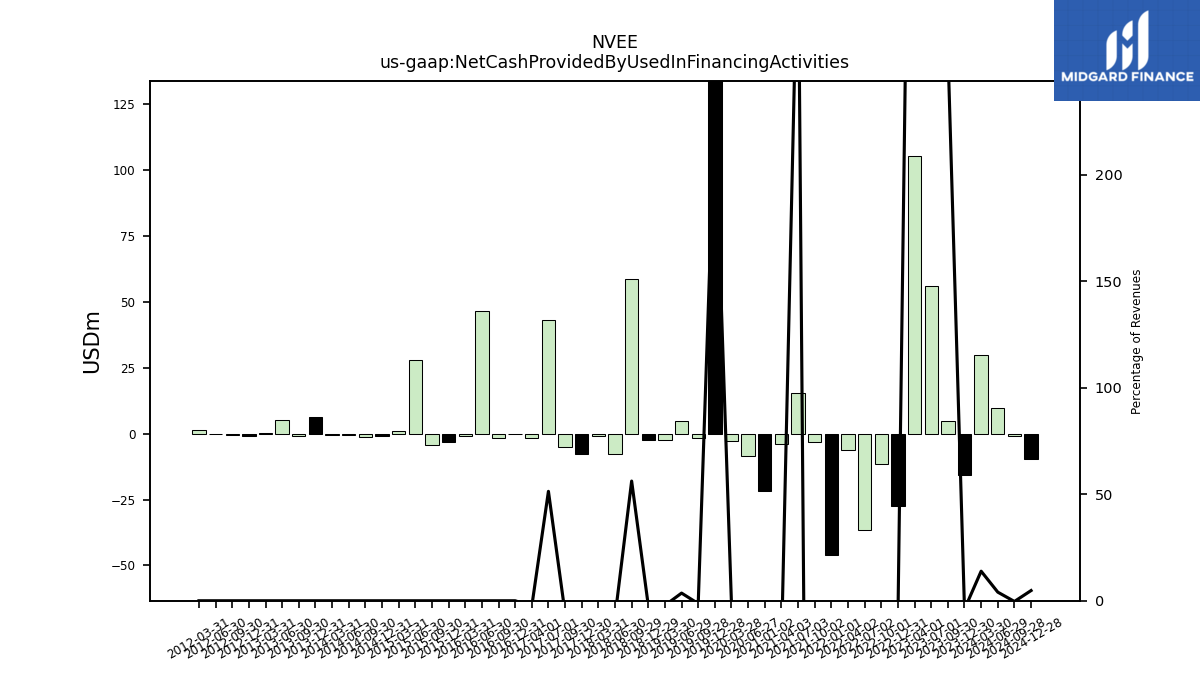
| Net Cash Provided By Used In Financing Activities | -15.87 | 4.65 | 55.86 | 105.22 | -27.52 | -11.58 | -36.64 | -6.18 | -45.97 | -3.25 | 15.23 | -4.12 | -21.81 | NA | -8.65 | -3.00 | 301.88 | -1.75 | 4.60 | -2.55 | -2.58 | NA | 58.54 | -7.87 | -0.74 | -7.75 | -5.29 | 43.01 | -1.64 |
| 2023-12-30 | 2023-09-30 | 2023-07-01 | 2023-04-01 | 2022-12-31 | 2022-10-01 | 2022-07-02 | 2022-04-02 | 2022-01-01 | 2021-10-02 | 2021-07-03 | 2021-04-03 | 2021-01-02 | 2020-10-03 | 2020-06-27 | 2020-03-28 | 2019-12-28 | 2019-09-28 | 2019-06-29 | 2019-03-30 | 2018-12-29 | 2018-09-30 | 2018-09-29 | 2018-06-30 | 2018-03-31 | 2017-12-30 | 2017-09-30 | 2017-07-01 | 2017-04-01 | ||
|---|---|---|---|---|---|---|---|---|---|---|---|---|---|---|---|---|---|---|---|---|---|---|---|---|---|---|---|---|---|---|
| Net Cash Provided By Used In Operating Activities | 16.77 | 19.93 | 14.22 | 11.28 | 13.59 | 26.13 | 7.74 | 46.52 | 23.37 | 15.84 | 14.07 | 48.16 | 23.59 | NA | 37.14 | 13.60 | 18.34 | 4.12 | 1.12 | 16.31 | 17.43 | NA | 6.73 | 7.22 | 3.62 | 11.95 | 1.19 | 4.28 | 0.21 | |
| Net Income Loss | 9.94 | 13.32 | 15.41 | 5.95 | 8.00 | 16.06 | 17.27 | 8.64 | 15.46 | 12.57 | 13.64 | 5.48 | 4.57 | 7.75 | 4.50 | 4.19 | 3.58 | 5.84 | 8.79 | 5.54 | 7.66 | 7.29 | 7.29 | 7.62 | 4.29 | 11.51 | 5.91 | 4.32 | 2.27 | |
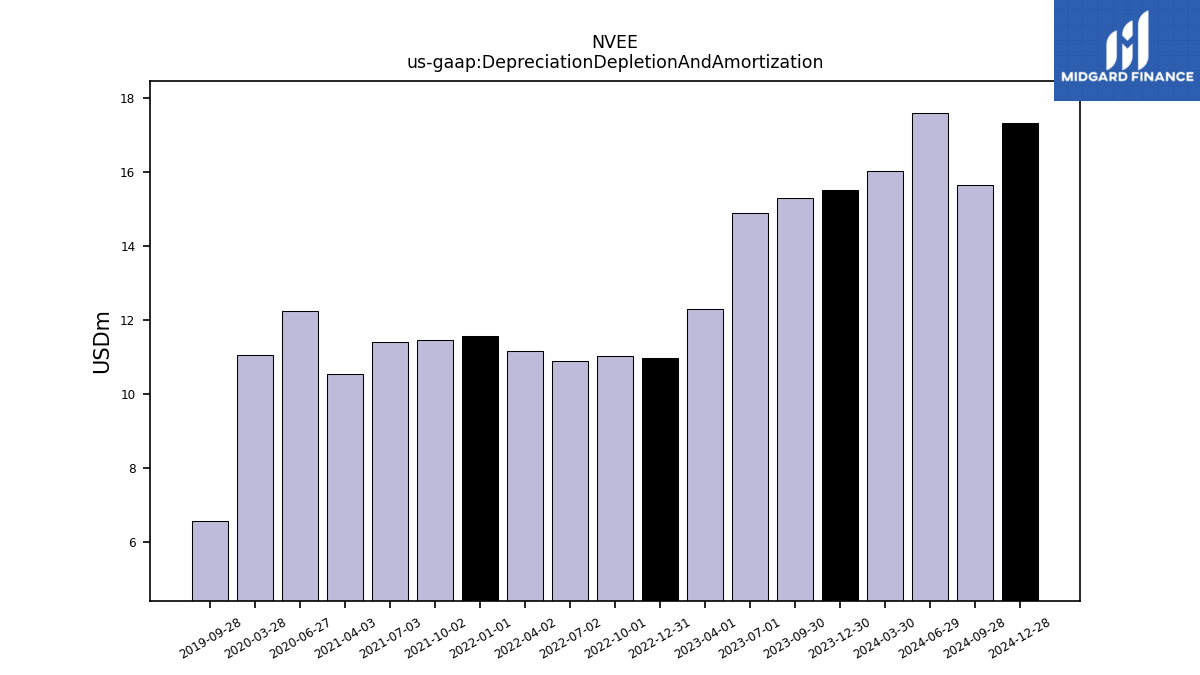
| Depreciation Depletion And Amortization | 15.52 | 15.29 | 14.90 | 12.30 | 10.97 | 11.03 | 10.89 | 11.17 | 11.57 | 11.46 | 11.39 | 10.54 | NA | NA | 12.24 | 11.04 | NA | 6.55 | NA | NA | NA | NA | NA | NA | NA | NA | NA | NA | NA | |
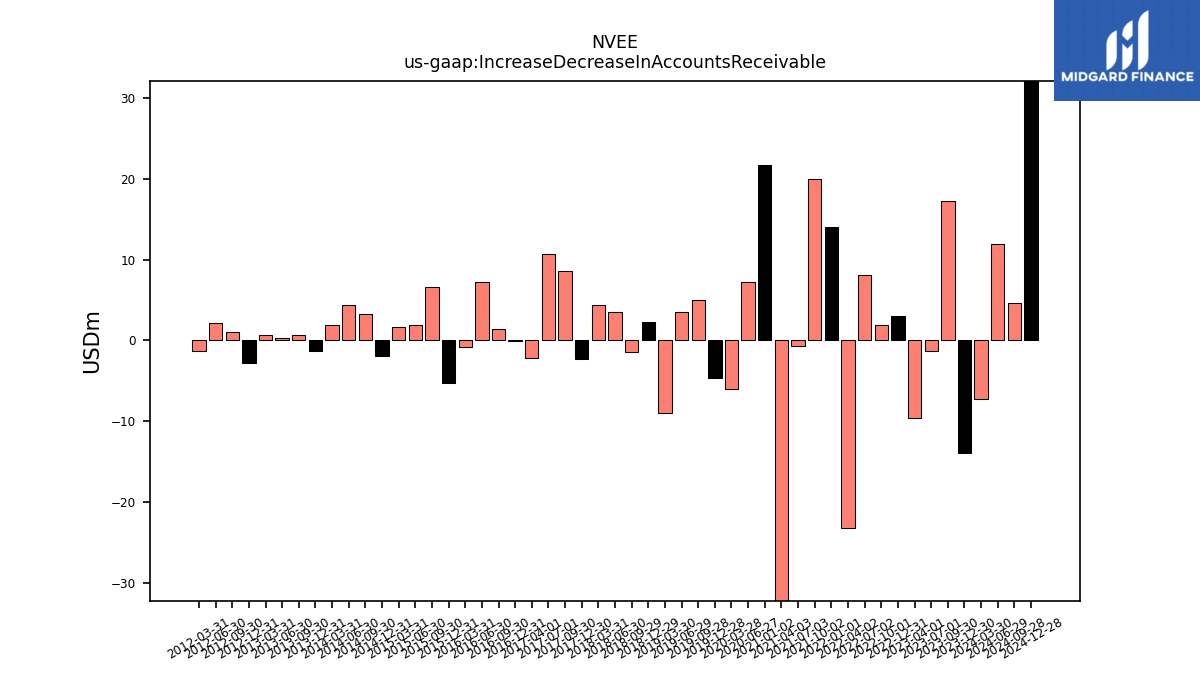
| Increase Decrease In Accounts Receivable | -13.95 | 17.25 | -1.32 | -9.56 | 3.07 | 1.87 | 8.06 | -23.21 | 14.05 | 20.00 | -0.69 | -36.04 | 21.68 | NA | 7.19 | -6.05 | -4.63 | 5.00 | 3.48 | -8.99 | 2.27 | NA | -1.44 | 3.48 | 4.35 | -2.32 | 8.55 | 10.70 | -2.22 | |
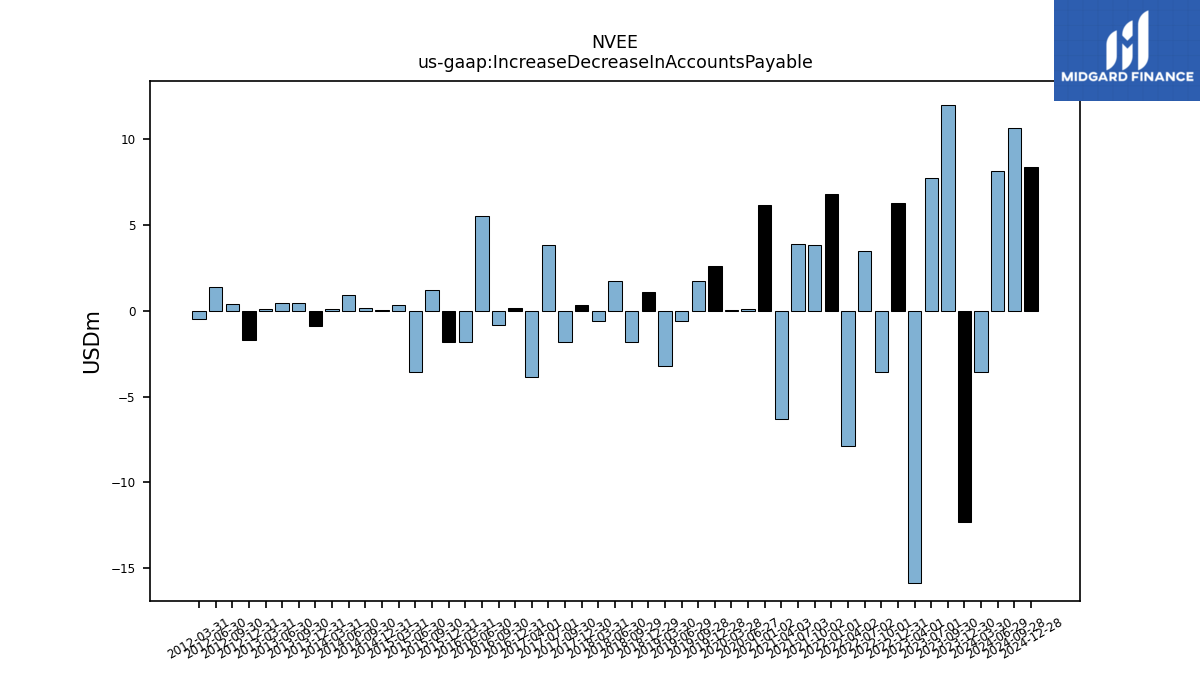
| Increase Decrease In Accounts Payable | -12.32 | 12.01 | 7.72 | -15.88 | 6.26 | -3.59 | 3.50 | -7.85 | 6.82 | 3.81 | 3.89 | -6.33 | 6.15 | NA | 0.09 | 0.04 | 2.59 | 1.76 | -0.58 | -3.24 | 1.08 | NA | -1.84 | 1.76 | -0.60 | 0.33 | -1.82 | 3.86 | -3.86 | |
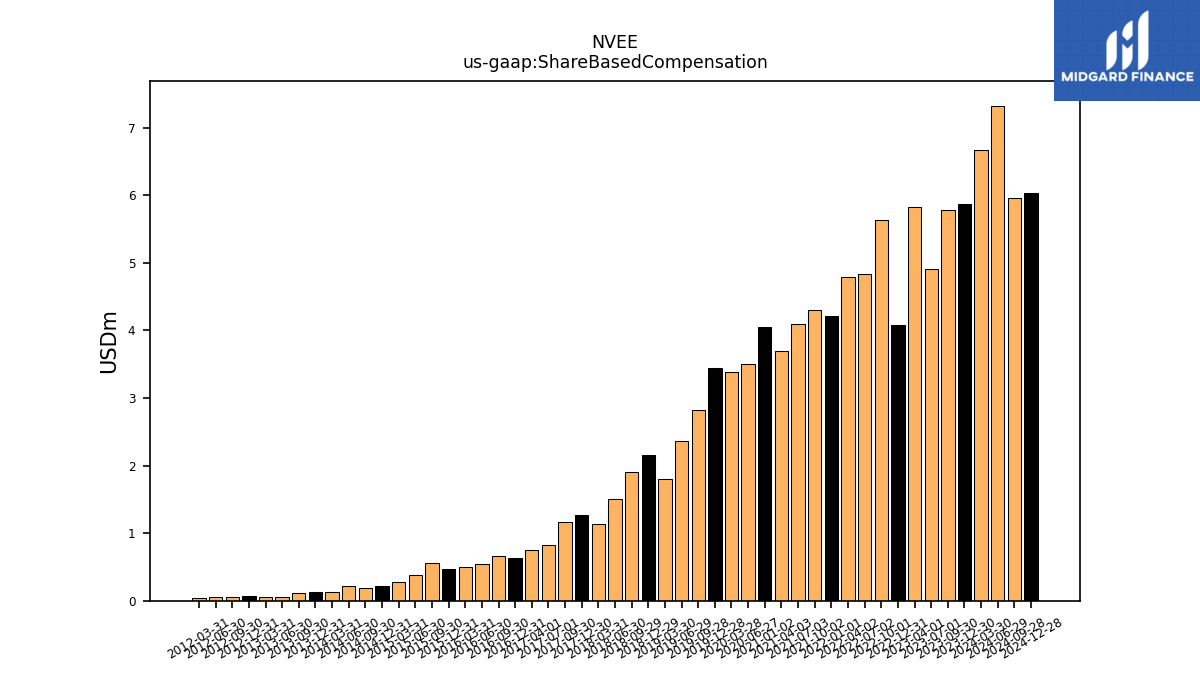
| Share Based Compensation | 5.88 | 5.78 | 4.90 | 5.83 | 4.08 | 5.63 | 4.83 | 4.79 | 4.21 | 4.30 | 4.09 | 3.70 | 4.05 | NA | 3.50 | 3.38 | 3.44 | 2.82 | 2.37 | 1.80 | 2.16 | NA | 1.90 | 1.50 | 1.14 | 1.27 | 1.16 | 0.83 | 0.75 | |
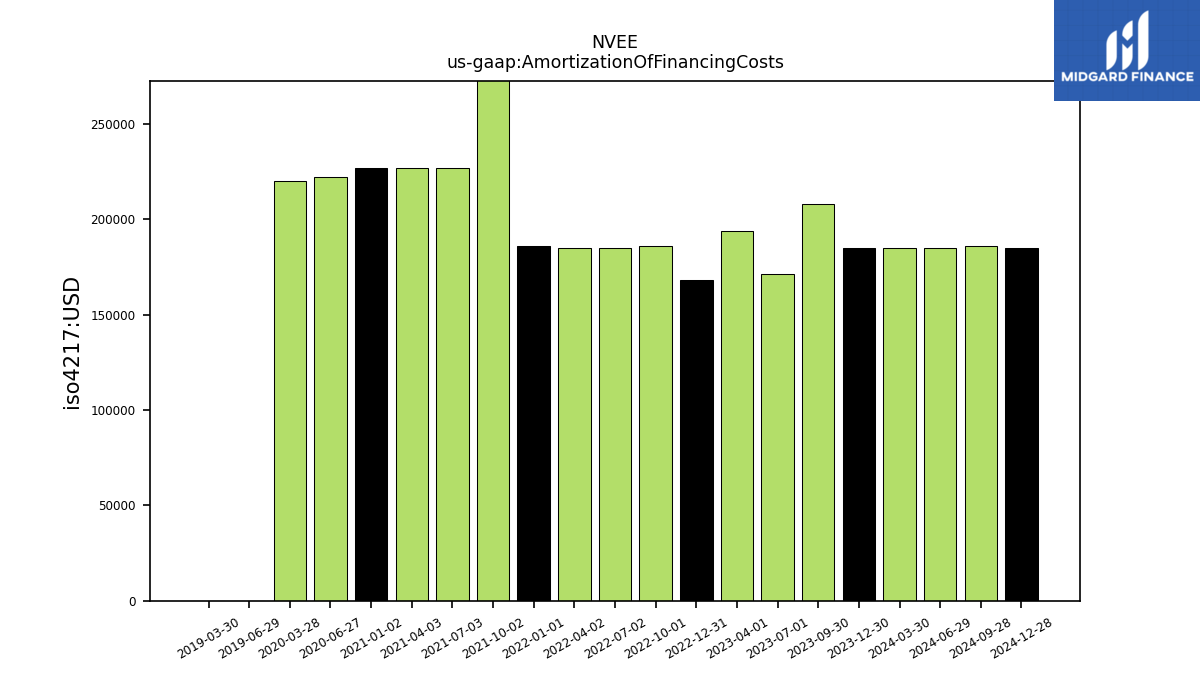
| Amortization Of Financing Costs | 0.18 | 0.21 | 0.17 | 0.19 | 0.17 | 0.19 | 0.18 | 0.18 | 0.19 | 0.57 | 0.23 | 0.23 | 0.23 | NA | 0.22 | 0.22 | NA | NA | 0.00 | 0.00 | NA | NA | NA | NA | NA | NA | NA | NA | NA |
| 2023-12-30 | 2023-09-30 | 2023-07-01 | 2023-04-01 | 2022-12-31 | 2022-10-01 | 2022-07-02 | 2022-04-02 | 2022-01-01 | 2021-10-02 | 2021-07-03 | 2021-04-03 | 2021-01-02 | 2020-10-03 | 2020-06-27 | 2020-03-28 | 2019-12-28 | 2019-09-28 | 2019-06-29 | 2019-03-30 | 2018-12-29 | 2018-09-30 | 2018-09-29 | 2018-06-30 | 2018-03-31 | 2017-12-30 | 2017-09-30 | 2017-07-01 | 2017-04-01 | ||
|---|---|---|---|---|---|---|---|---|---|---|---|---|---|---|---|---|---|---|---|---|---|---|---|---|---|---|---|---|---|---|
| Net Cash Provided By Used In Investing Activities | -2.72 | -6.88 | -72.49 | -123.70 | -1.70 | -4.81 | -8.63 | -6.37 | -50.82 | -4.22 | -9.20 | -16.02 | -0.90 | NA | -1.61 | -4.10 | -319.82 | -15.39 | -7.10 | -8.69 | -30.32 | NA | -25.11 | -0.51 | -4.42 | -1.04 | 0.20 | -61.64 | -0.39 | |
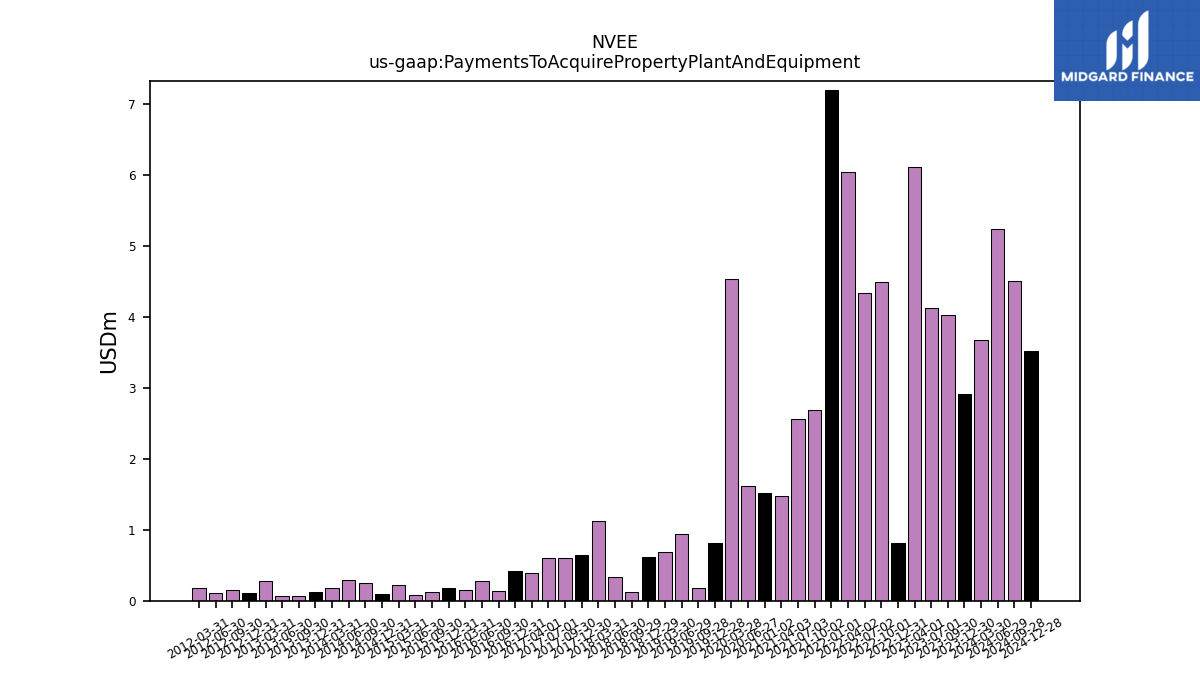
| Payments To Acquire Property Plant And Equipment | 2.91 | 4.02 | 4.13 | 6.11 | 0.81 | 4.50 | 4.33 | 6.04 | 7.19 | 2.69 | 2.56 | 1.47 | 1.51 | NA | 1.62 | 4.53 | 0.81 | 0.18 | 0.94 | 0.69 | 0.62 | NA | 0.12 | 0.34 | 1.12 | 0.65 | 0.60 | 0.60 | 0.39 |
| 2023-12-30 | 2023-09-30 | 2023-07-01 | 2023-04-01 | 2022-12-31 | 2022-10-01 | 2022-07-02 | 2022-04-02 | 2022-01-01 | 2021-10-02 | 2021-07-03 | 2021-04-03 | 2021-01-02 | 2020-10-03 | 2020-06-27 | 2020-03-28 | 2019-12-28 | 2019-09-28 | 2019-06-29 | 2019-03-30 | 2018-12-29 | 2018-09-30 | 2018-09-29 | 2018-06-30 | 2018-03-31 | 2017-12-30 | 2017-09-30 | 2017-07-01 | 2017-04-01 | ||
|---|---|---|---|---|---|---|---|---|---|---|---|---|---|---|---|---|---|---|---|---|---|---|---|---|---|---|---|---|---|---|
| Net Cash Provided By Used In Financing Activities | -15.87 | 4.65 | 55.86 | 105.22 | -27.52 | -11.58 | -36.64 | -6.18 | -45.97 | -3.25 | 15.23 | -4.12 | -21.81 | NA | -8.65 | -3.00 | 301.88 | -1.75 | 4.60 | -2.55 | -2.58 | NA | 58.54 | -7.87 | -0.74 | -7.75 | -5.29 | 43.01 | -1.64 |
| 2023-12-30 | 2023-09-30 | 2023-07-01 | 2023-04-01 | 2022-12-31 | 2022-10-01 | 2022-07-02 | 2022-04-02 | 2022-01-01 | 2021-10-02 | 2021-07-03 | 2021-04-03 | 2021-01-02 | 2020-10-03 | 2020-06-27 | 2020-03-28 | 2019-12-28 | 2019-09-28 | 2019-06-29 | 2019-03-30 | 2018-12-29 | 2018-09-30 | 2018-09-29 | 2018-06-30 | 2018-03-31 | 2017-12-30 | 2017-09-30 | 2017-07-01 | 2017-04-01 | ||
|---|---|---|---|---|---|---|---|---|---|---|---|---|---|---|---|---|---|---|---|---|---|---|---|---|---|---|---|---|---|---|
| Revenues | 400.62 | 1.79 | 6.62 | 18.43 | 319.04 | 2.42 | 6.07 | 16.01 | 285.74 | 0.52 | 4.74 | 18.62 | 293.94 | 0.14 | 0.27 | 165.48 | 132.60 | 131.03 | 127.97 | 117.33 | 115.34 | 104.19 | 104.19 | 104.02 | 94.53 | 93.98 | 91.26 | 83.74 | 64.06 | |
| Revenue From Contract With Customer Excluding Assessed Tax | 400.62 | 1.79 | 6.62 | 18.43 | 319.04 | 2.42 | 6.07 | 16.01 | 285.74 | 0.52 | 4.74 | 18.62 | 293.94 | 0.14 | 0.27 | 165.48 | 132.60 | 131.03 | 127.97 | 117.33 | 115.34 | 104.19 | 104.19 | 104.02 | 94.53 | 93.98 | 91.26 | 83.74 | 64.06 | |
| Revenue From Contract With Customer Including Assessed Tax | 215.50 | 239.29 | 222.64 | 184.32 | 189.82 | 204.07 | 202.73 | 190.15 | 188.56 | 185.55 | 179.50 | 153.09 | 161.18 | 169.95 | 162.69 | 165.48 | 132.60 | 131.03 | 127.97 | 117.33 | 115.34 | 104.19 | 104.19 | 104.02 | 94.53 | 93.98 | 91.26 | 83.74 | 64.06 | |
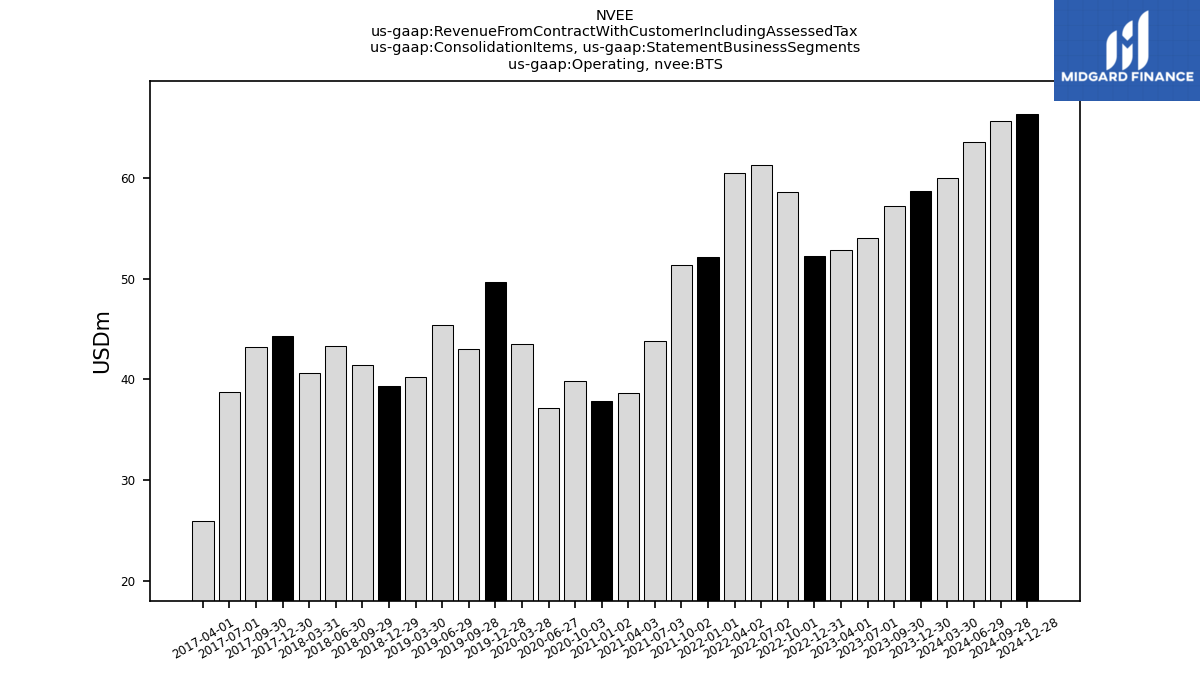
| Operating,BTS | 58.69 | 57.23 | 54.03 | 52.85 | 52.21 | 58.58 | 61.33 | 60.45 | 52.19 | 51.38 | 43.82 | 38.60 | 37.82 | 39.86 | 37.17 | 43.52 | 49.71 | 43.06 | 45.37 | 40.27 | 39.40 | NA | 41.44 | 43.28 | 40.65 | 44.31 | 43.26 | 38.77 | 25.97 | |
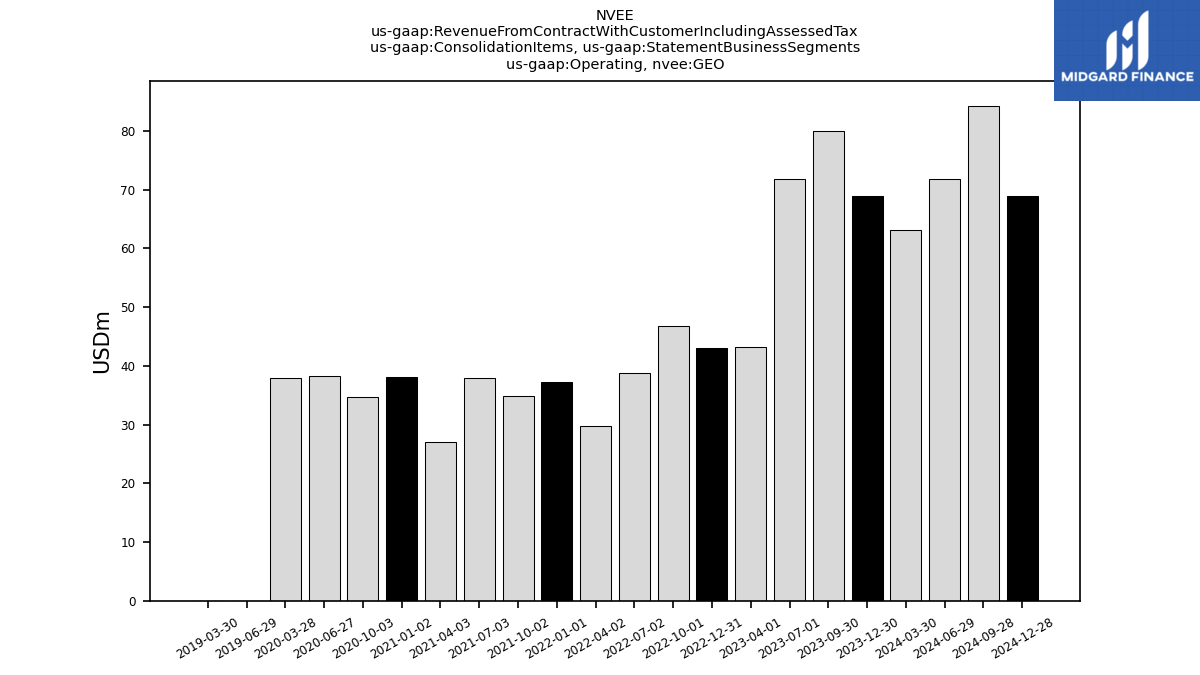
| Operating,GEO | 68.89 | 79.92 | 71.88 | 43.26 | 43.08 | 46.74 | 38.76 | 29.74 | 37.29 | 34.81 | 37.93 | 26.96 | 38.13 | 34.67 | 38.23 | 37.96 | NA | NA | 0.00 | 0.00 | NA | NA | NA | NA | NA | NA | NA | NA | NA | |
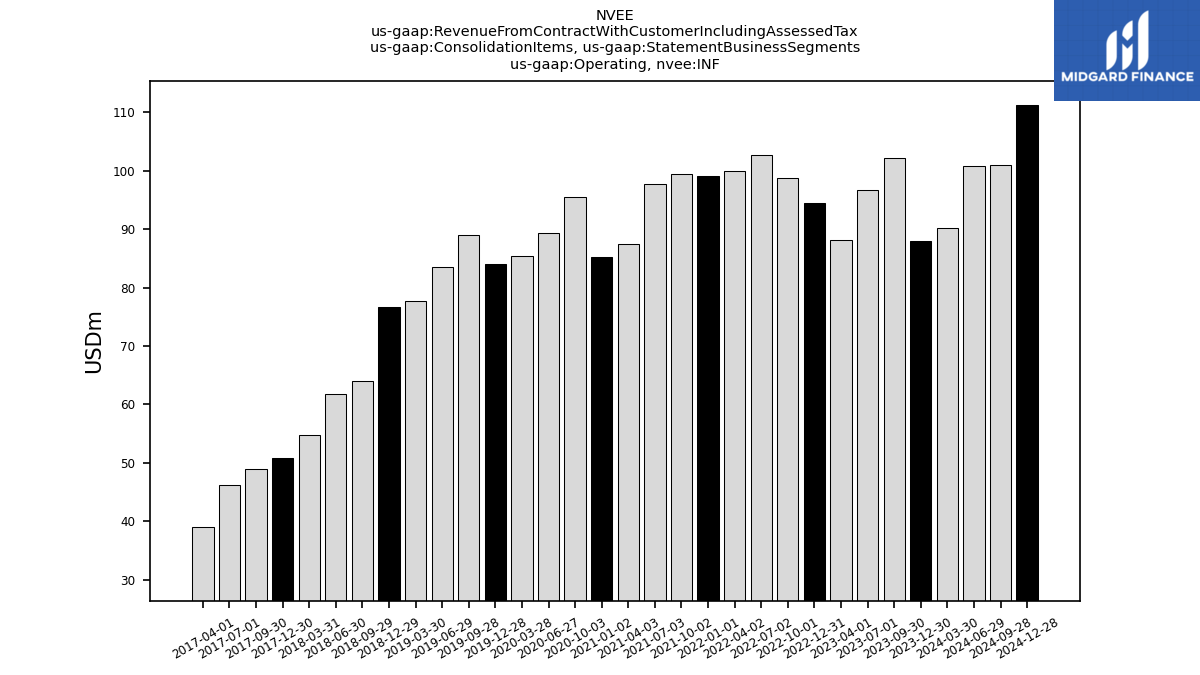
| Operating,INF | 87.91 | 102.14 | 96.73 | 88.21 | 94.52 | 98.75 | 102.64 | 99.96 | 99.07 | 99.36 | 97.75 | 87.53 | 85.23 | 95.42 | 89.37 | 85.48 | 84.10 | 89.03 | 83.55 | 77.77 | 76.74 | NA | 64.05 | 61.72 | 54.81 | 50.79 | 49.02 | 46.30 | 39.13 | |
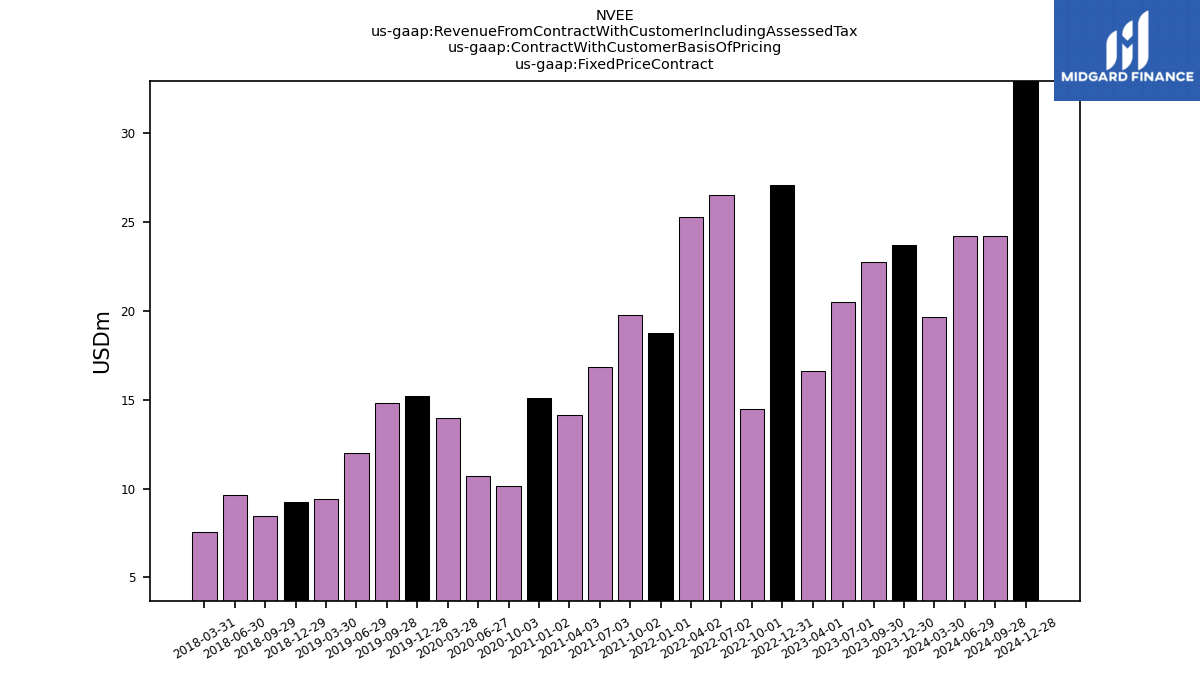
| Fixed Price Contract | 23.69 | 22.72 | 20.51 | 16.61 | 27.05 | 14.50 | 26.48 | 25.30 | 18.76 | 19.74 | 16.83 | 14.11 | 15.10 | 10.16 | 10.73 | 13.96 | 15.18 | 14.81 | 12.01 | 9.42 | 9.25 | NA | 8.48 | 9.66 | 7.58 | NA | NA | NA | NA | |
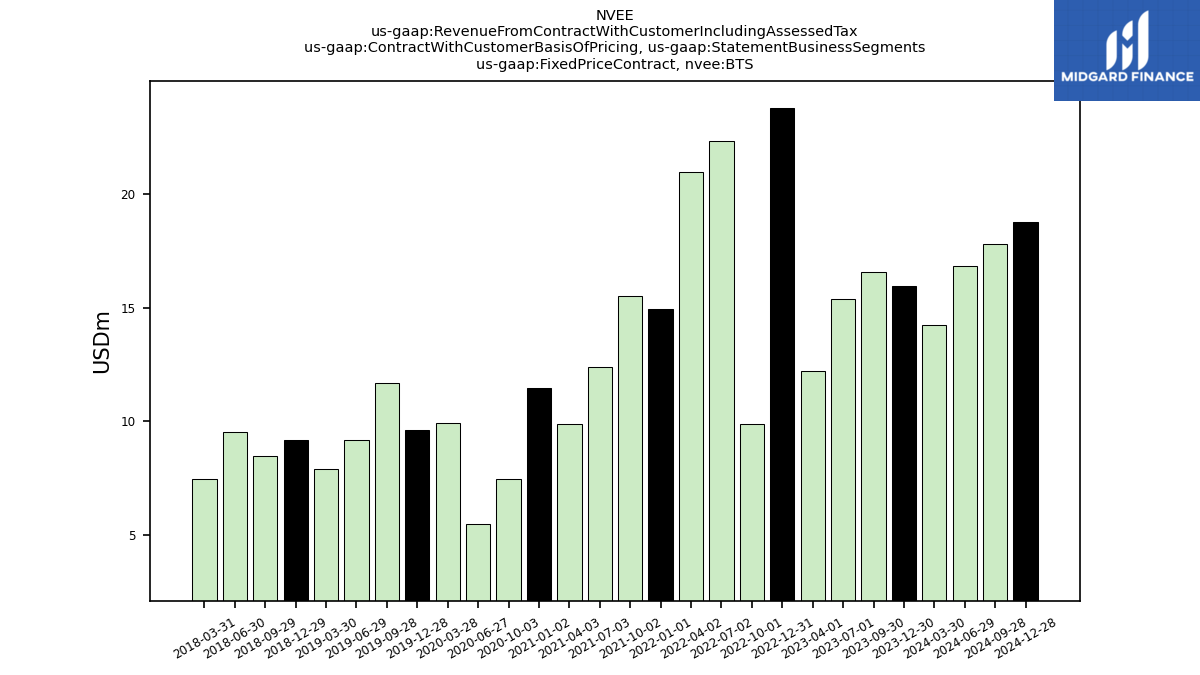
| Fixed Price Contract,BTS | 15.93 | 16.57 | 15.36 | 12.22 | 23.77 | 9.88 | 22.32 | 20.97 | 14.95 | 15.51 | 12.37 | 9.90 | 11.46 | 7.46 | 5.47 | 9.90 | 9.60 | 11.66 | 9.19 | 7.92 | 9.17 | NA | 8.47 | 9.53 | 7.45 | NA | NA | NA | NA | |
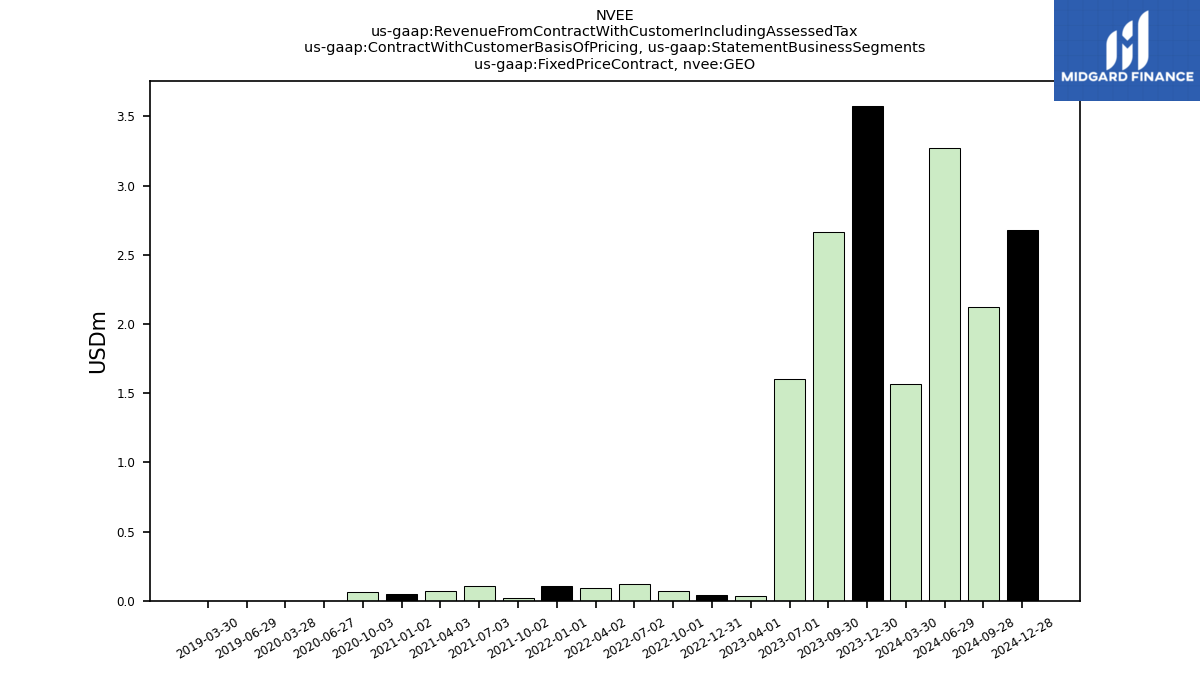
| Fixed Price Contract,GEO | 3.58 | 2.67 | 1.60 | 0.03 | 0.04 | 0.07 | 0.12 | 0.09 | 0.11 | 0.02 | 0.11 | 0.07 | 0.05 | 0.06 | 0.00 | 0.00 | NA | NA | 0.00 | 0.00 | NA | NA | NA | NA | NA | NA | NA | NA | NA | |
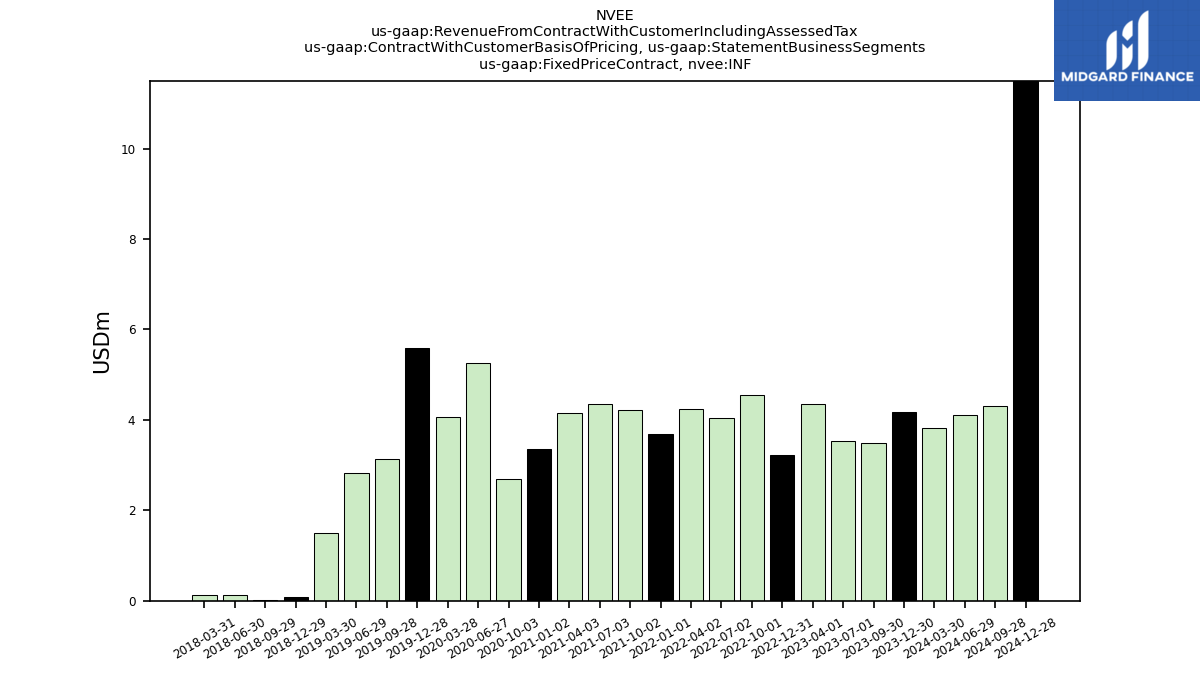
| Fixed Price Contract,INF | 4.18 | 3.48 | 3.54 | 4.35 | 3.23 | 4.55 | 4.04 | 4.24 | 3.70 | 4.21 | 4.36 | 4.15 | 3.37 | 2.70 | 5.26 | 4.06 | 5.58 | 3.15 | 2.82 | 1.51 | 0.08 | NA | 0.01 | 0.13 | 0.14 | NA | NA | NA | NA | |
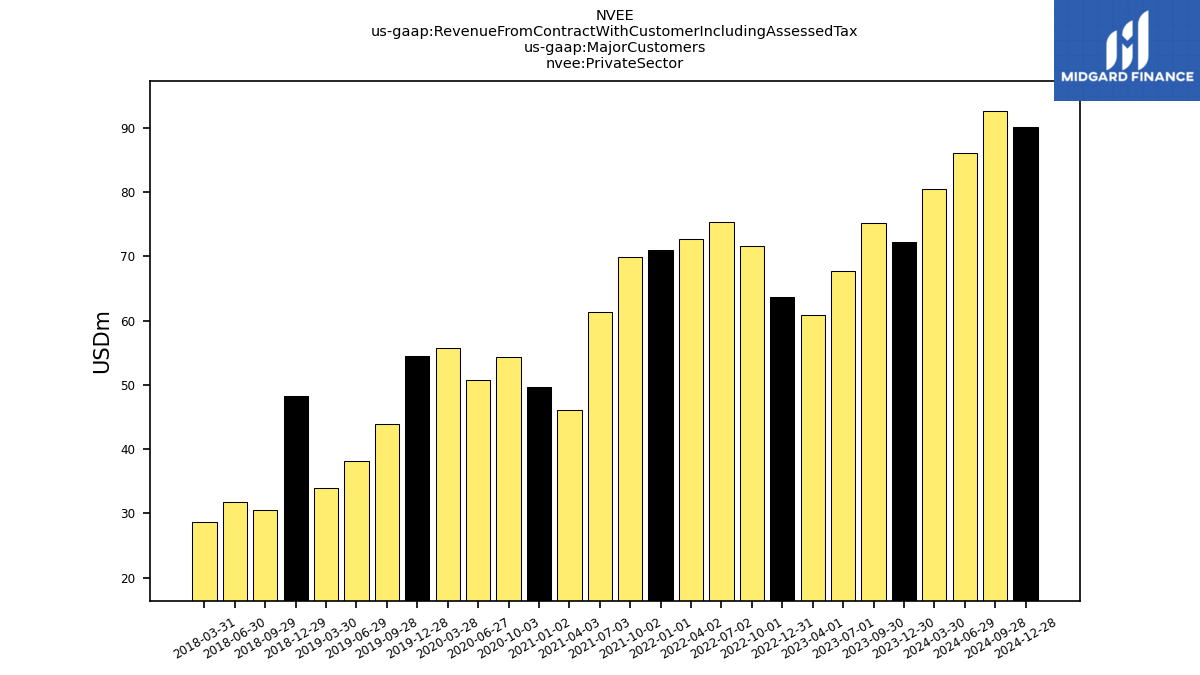
| Private Sector | 72.22 | 75.14 | 67.67 | 60.87 | 63.67 | 71.68 | 75.40 | 72.70 | 71.02 | 69.91 | 61.32 | 46.12 | 49.63 | 54.28 | 50.78 | 55.75 | 54.43 | 43.84 | 38.16 | 33.89 | 48.27 | NA | 30.56 | 31.80 | 28.67 | NA | NA | NA | NA | |
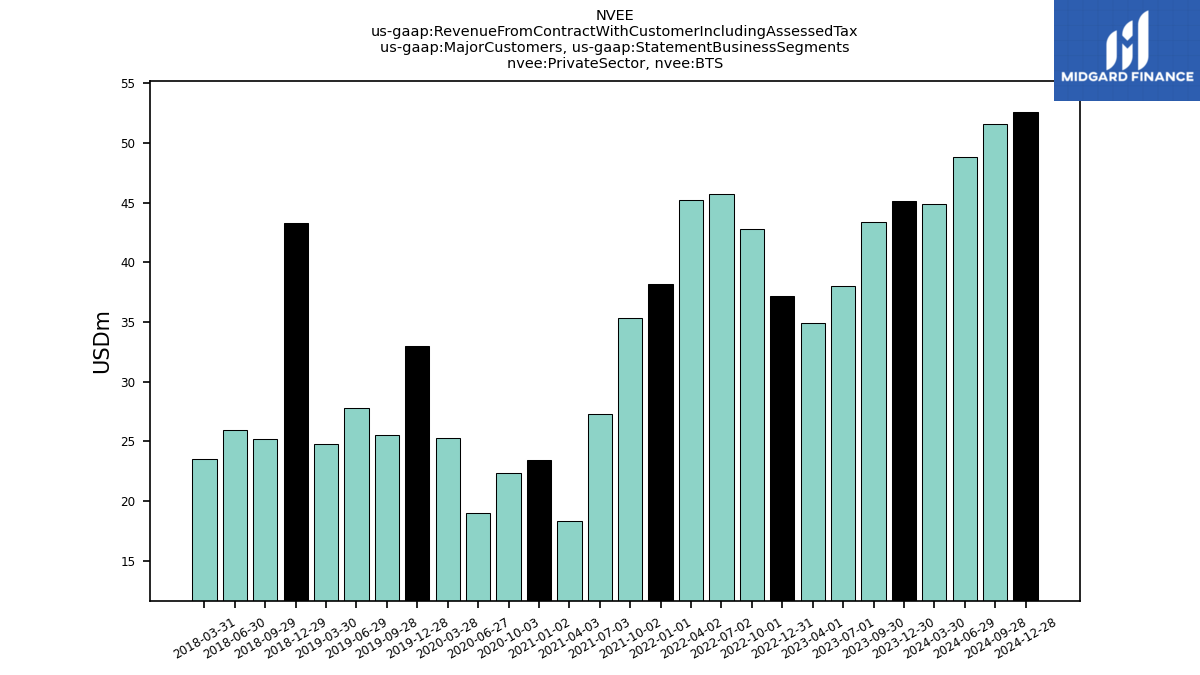
| Private Sector,BTS | 45.16 | 43.40 | 38.03 | 34.90 | 37.20 | 42.77 | 45.70 | 45.19 | 38.18 | 35.32 | 27.26 | 18.28 | 23.40 | 22.34 | 18.98 | 25.28 | 33.00 | 25.56 | 27.78 | 24.75 | 43.28 | NA | 25.20 | 25.96 | 23.53 | NA | NA | NA | NA | |
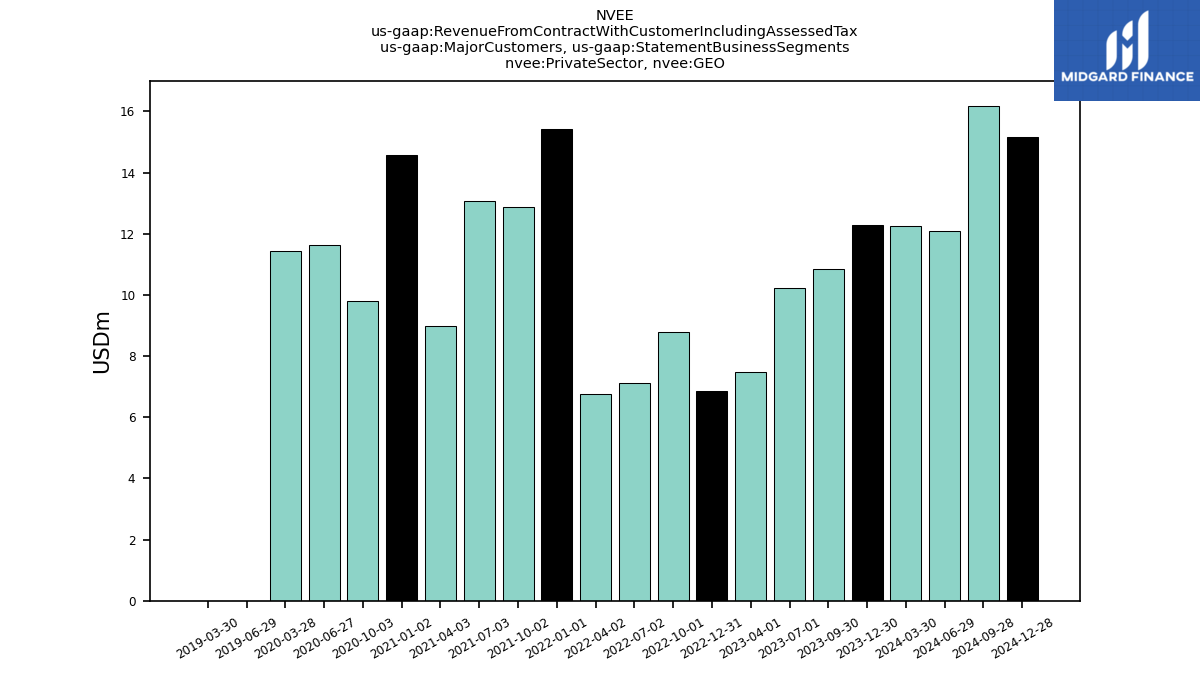
| Private Sector,GEO | 12.28 | 10.83 | 10.24 | 7.49 | 6.87 | 8.80 | 7.12 | 6.75 | 15.42 | 12.87 | 13.08 | 8.98 | 14.57 | 9.81 | 11.63 | 11.43 | NA | NA | 0.00 | 0.00 | NA | NA | NA | NA | NA | NA | NA | NA | NA | |
| Private Sector,INF | 14.78 | 20.90 | 19.40 | 18.48 | 19.61 | 20.11 | 22.59 | 20.76 | 17.41 | 21.73 | 20.98 | 18.85 | 11.66 | 22.13 | 20.17 | 19.04 | 21.43 | 18.27 | 10.38 | 9.14 | 4.99 | NA | 5.36 | 5.84 | 5.14 | NA | NA | NA | NA | |
| BTS | 58.69 | 57.23 | 54.03 | 52.85 | 52.21 | 58.58 | 61.33 | 60.45 | 52.19 | 51.38 | 43.82 | 38.60 | 37.82 | 39.86 | 36.64 | 43.11 | 49.07 | 43.46 | 45.18 | 40.06 | 39.15 | NA | 40.67 | 42.93 | 40.60 | NA | NA | NA | NA | |
| GEO | 68.89 | 79.92 | 71.88 | 43.26 | 43.08 | 46.74 | 38.76 | 29.74 | 37.29 | 34.81 | 37.93 | 26.96 | 38.13 | 34.67 | 38.16 | 37.94 | NA | NA | 0.00 | 0.00 | NA | NA | NA | NA | NA | NA | NA | NA | NA | |
| INF | 87.91 | 102.14 | 96.73 | 88.21 | 94.52 | 98.75 | 102.64 | 99.96 | 99.07 | 99.36 | 97.75 | 87.53 | 85.23 | 95.42 | 87.89 | 84.43 | 83.53 | 87.57 | 82.79 | 77.27 | 76.19 | NA | 63.51 | 61.09 | 53.93 | NA | NA | NA | NA | |
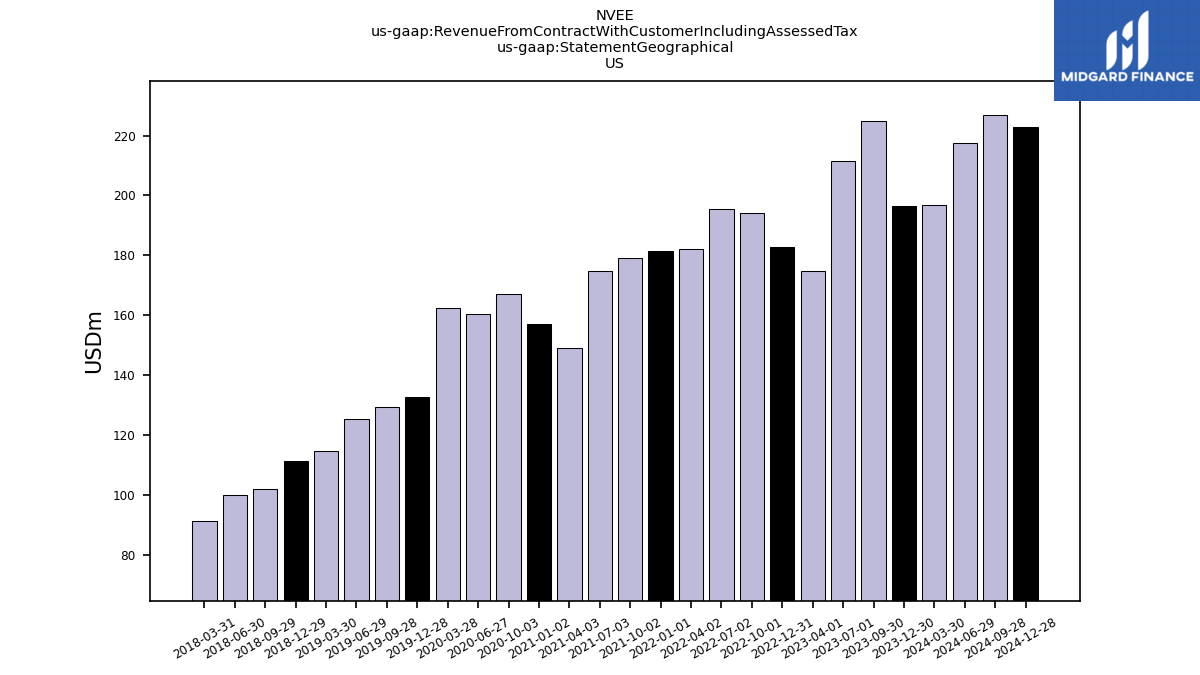
| US | 196.40 | 224.86 | 211.51 | 174.82 | 182.92 | 194.00 | 195.49 | 182.09 | 181.59 | 179.02 | 174.96 | 149.21 | 157.24 | 167.07 | 160.56 | 162.41 | 132.94 | 129.44 | 125.47 | 114.77 | 111.52 | NA | 102.19 | 100.21 | 91.50 | NA | NA | NA | NA | |
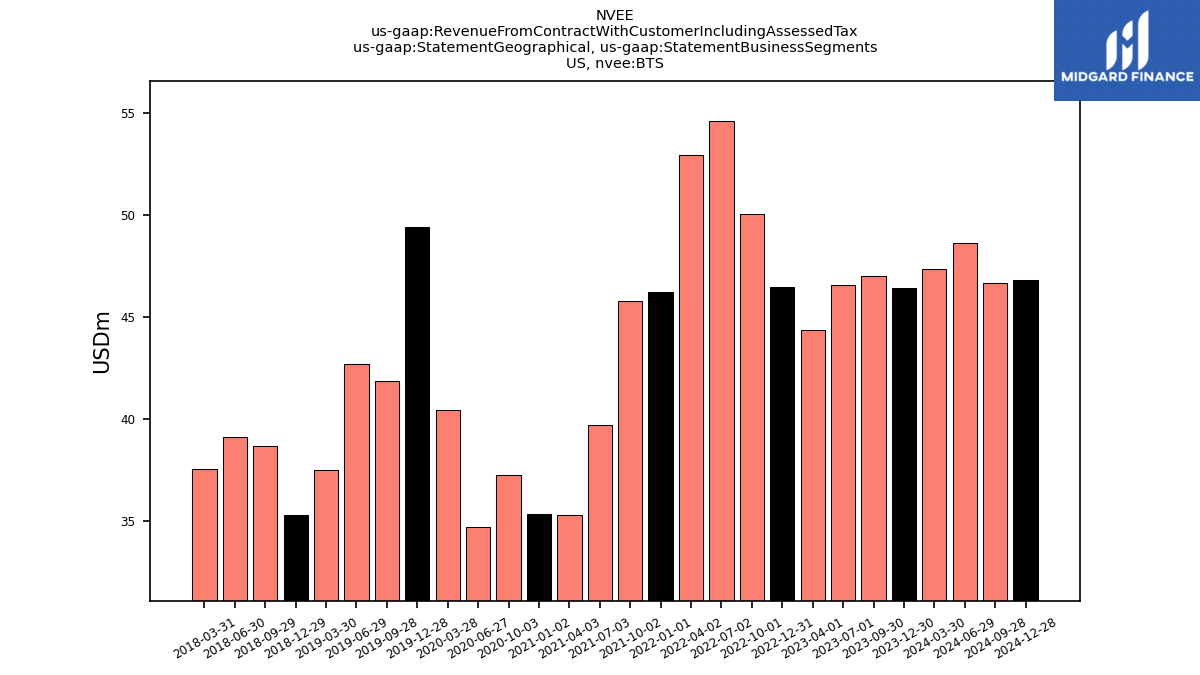
| US,BTS | 46.41 | 46.99 | 46.56 | 44.39 | 46.48 | 50.04 | 54.60 | 52.92 | 46.24 | 45.80 | 39.72 | 35.30 | 35.35 | 37.28 | 34.74 | 40.44 | 49.42 | 41.87 | 42.68 | 37.50 | 35.33 | NA | 38.68 | 39.13 | 37.57 | NA | NA | NA | NA | |
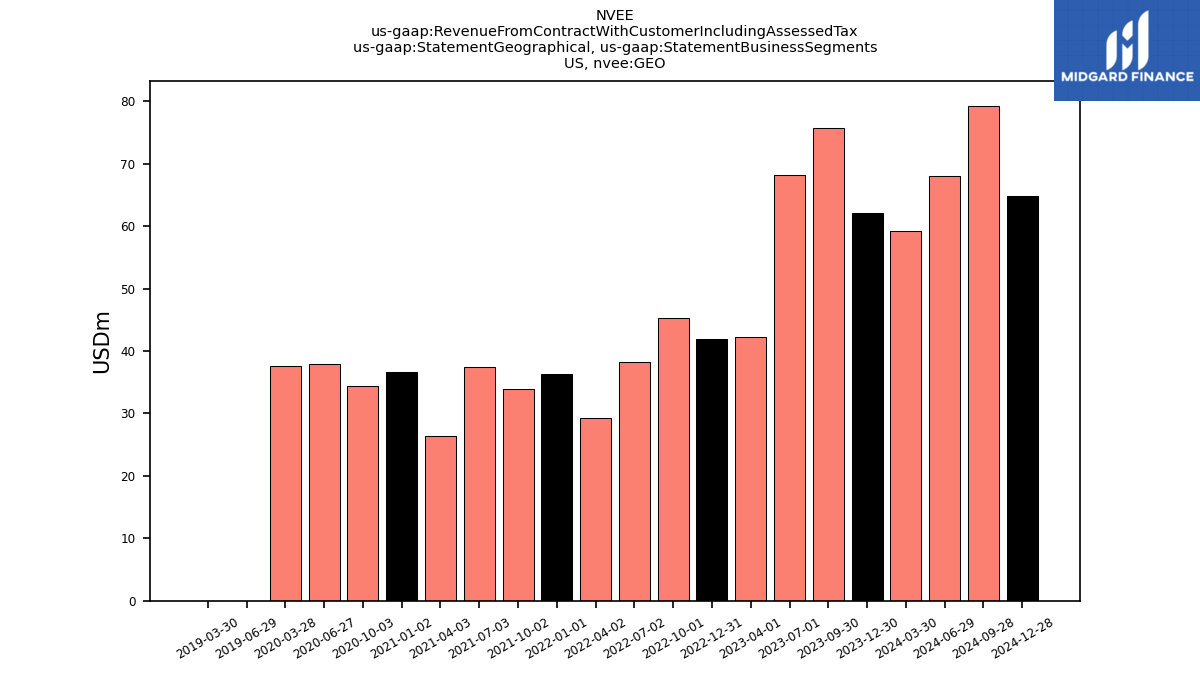
| US,GEO | 62.08 | 75.74 | 68.22 | 42.22 | 41.92 | 45.20 | 38.24 | 29.21 | 36.28 | 33.86 | 37.49 | 26.37 | 36.66 | 34.38 | 37.93 | 37.54 | NA | NA | 0.00 | 0.00 | NA | NA | NA | NA | NA | NA | NA | NA | NA | |
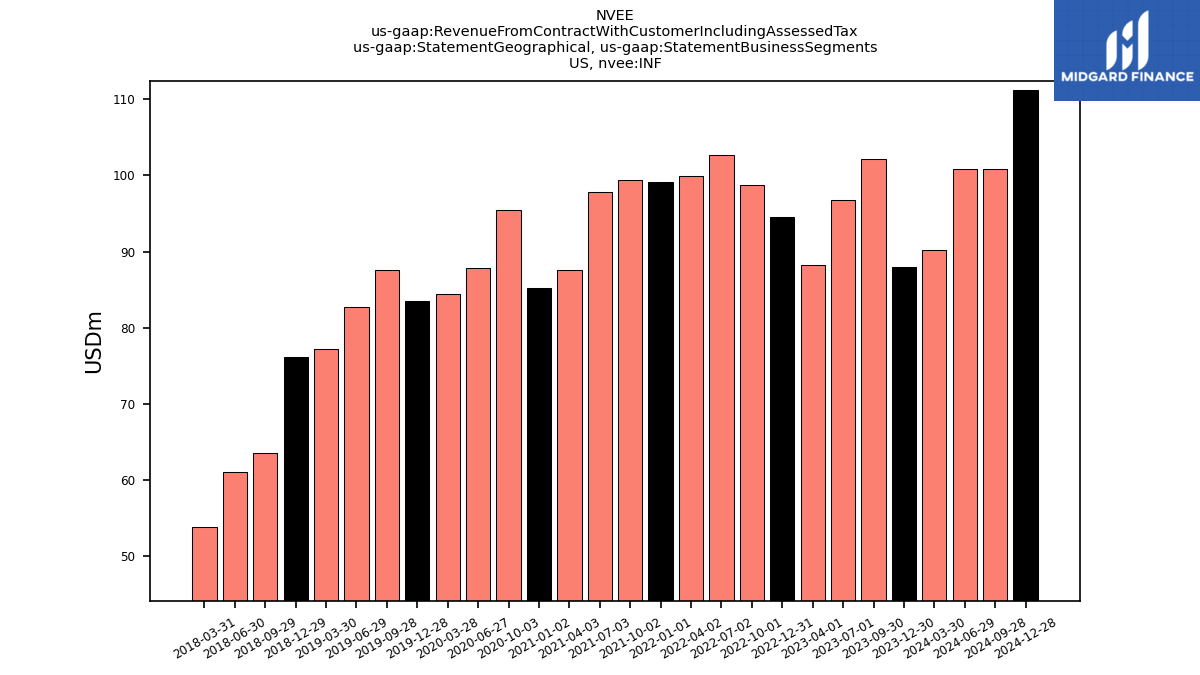
| US,INF | 87.91 | 102.14 | 96.73 | 88.21 | 94.52 | 98.75 | 102.64 | 99.96 | 99.07 | 99.36 | 97.75 | 87.53 | 85.23 | 95.42 | 87.89 | 84.43 | 83.53 | 87.57 | 82.79 | 77.27 | 76.19 | NA | 63.51 | 61.09 | 53.93 | NA | NA | NA | NA |