
| 2023-09-30 | 2023-06-30 | 2023-03-31 | 2022-12-31 | 2022-09-30 | 2022-06-30 | 2022-03-31 | 2021-12-31 | 2021-09-30 | 2021-06-30 | 2021-03-31 | 2020-12-31 | 2020-09-30 | 2020-06-30 | 2020-03-31 | 2019-12-31 | 2019-09-30 | 2019-06-30 | 2019-03-31 | 2018-12-31 | 2018-09-30 | 2018-06-30 | 2018-03-31 | 2017-12-31 | 2017-09-30 | 2017-06-30 | 2017-03-31 | 2016-12-31 | 2016-09-30 | 2016-06-30 | 2016-03-31 | 2015-12-31 | 2015-09-30 | 2015-06-30 | 2015-03-31 | 2014-12-31 | 2014-09-30 | 2014-06-30 | 2014-03-31 | 2013-12-31 | 2013-09-30 | 2013-06-30 | 2013-03-31 | ||
|---|---|---|---|---|---|---|---|---|---|---|---|---|---|---|---|---|---|---|---|---|---|---|---|---|---|---|---|---|---|---|---|---|---|---|---|---|---|---|---|---|---|---|---|---|
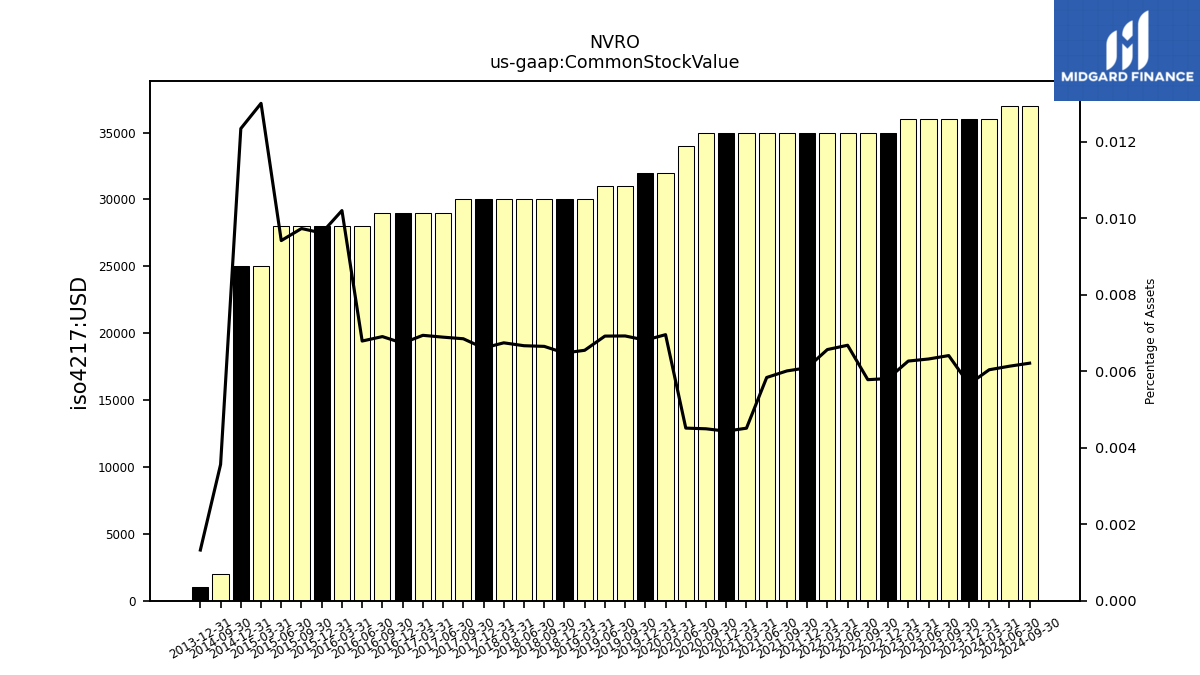
| Common Stock Value | 0.04 | 0.04 | 0.04 | 0.04 | 0.04 | 0.04 | 0.04 | 0.04 | 0.04 | 0.04 | 0.04 | 0.04 | 0.04 | 0.03 | 0.03 | 0.03 | 0.03 | 0.03 | 0.03 | 0.03 | 0.03 | 0.03 | 0.03 | 0.03 | 0.03 | 0.03 | 0.03 | 0.03 | 0.03 | 0.03 | 0.03 | 0.03 | 0.03 | 0.03 | 0.03 | 0.03 | 0.00 | NA | NA | 0.00 | NA | NA | NA | |
| dei: Entity Common Stock Shares Outstanding | NA | NA | NA | NA | NA | NA | NA | NA | NA | NA | NA | NA | NA | NA | NA | NA | NA | NA | NA | NA | NA | NA | NA | NA | NA | NA | NA | NA | NA | NA | NA | NA | NA | NA | NA | NA | NA | NA | NA | NA | NA | NA | NA | |
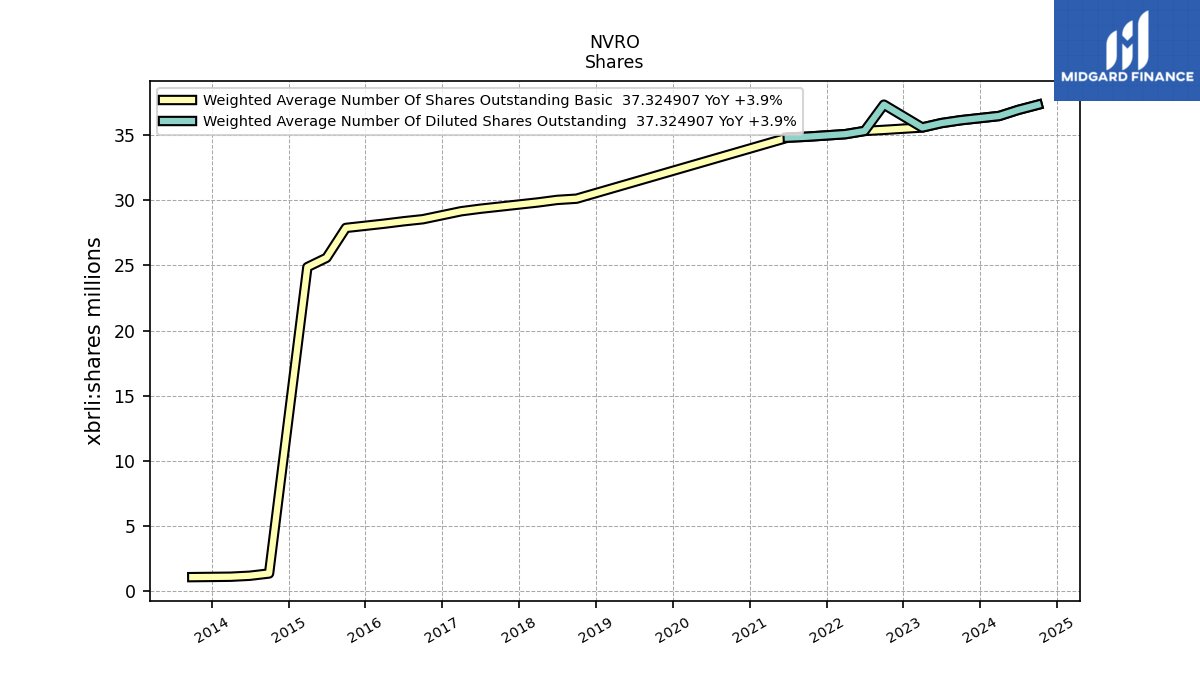
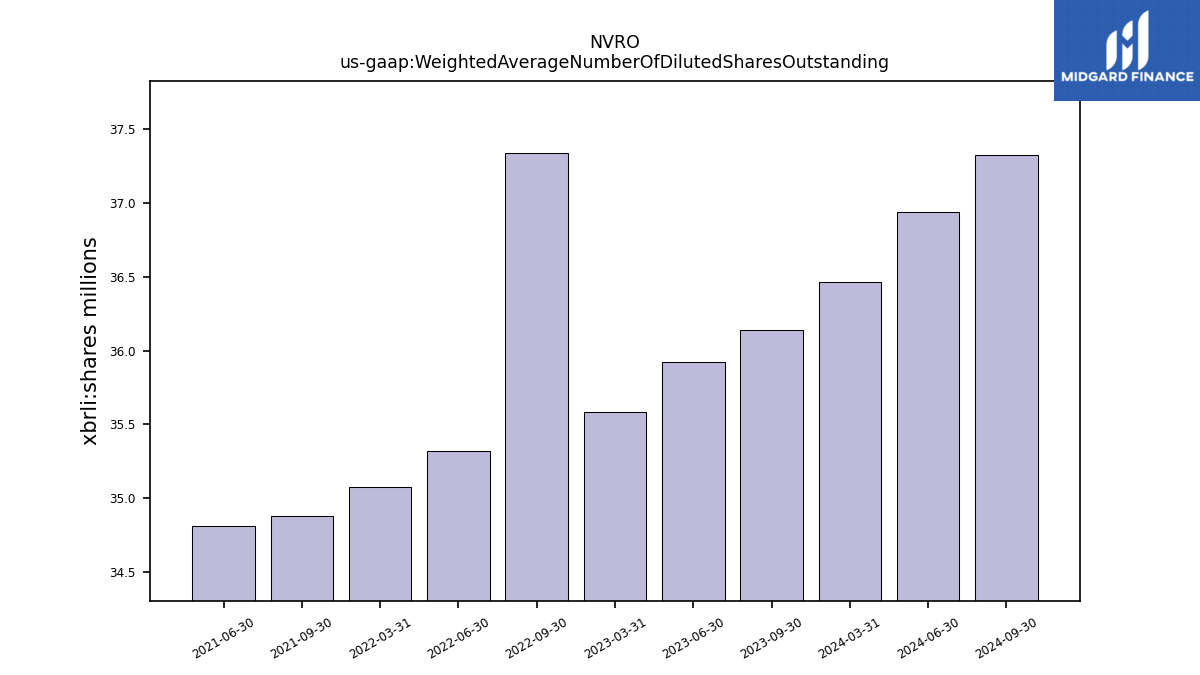
| Weighted Average Number Of Diluted Shares Outstanding | 36.14 | 35.92 | 35.58 | NA | 37.34 | 35.32 | 35.07 | NA | 34.88 | 34.81 | NA | NA | NA | NA | NA | NA | NA | NA | NA | NA | NA | NA | NA | NA | NA | NA | NA | NA | NA | NA | NA | NA | NA | NA | NA | NA | NA | NA | NA | NA | NA | NA | NA | |
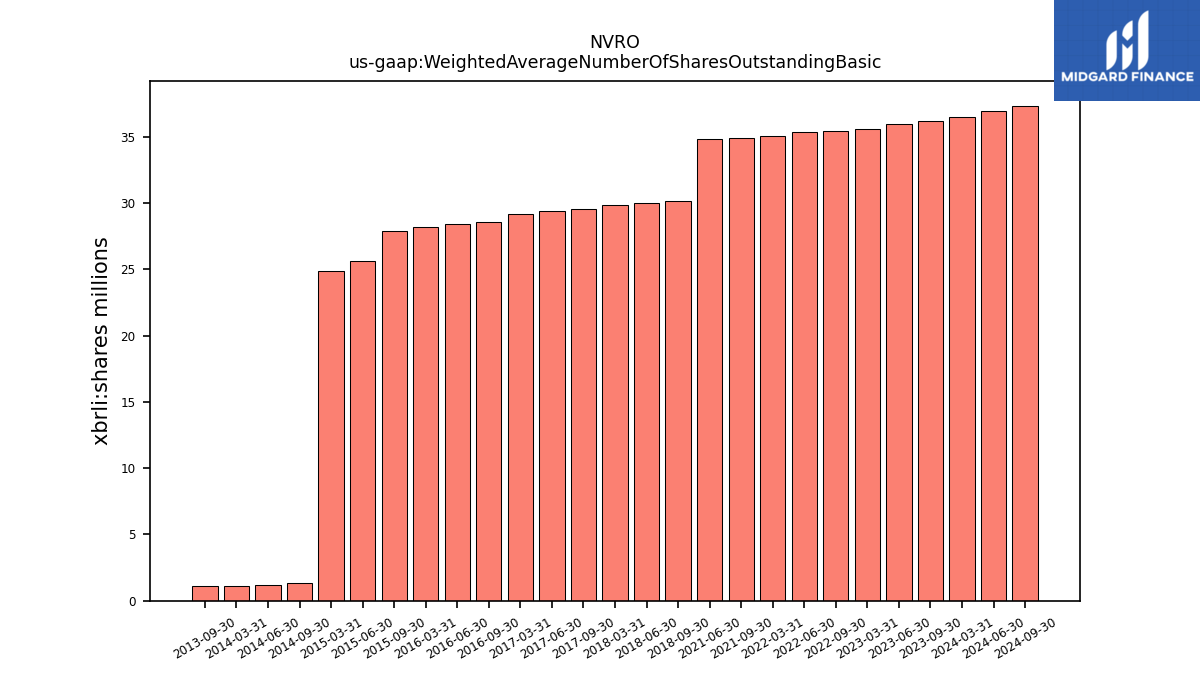
| Weighted Average Number Of Shares Outstanding Basic | 36.14 | 35.92 | 35.58 | NA | 35.40 | 35.32 | 35.07 | NA | 34.88 | 34.81 | NA | NA | NA | NA | NA | NA | NA | NA | NA | NA | 30.12 | 30.03 | 29.84 | NA | 29.51 | 29.35 | 29.16 | NA | 28.55 | 28.39 | 28.21 | NA | 27.88 | 25.59 | 24.88 | NA | 1.37 | 1.20 | 1.12 | NA | 1.09 | NA | NA | |
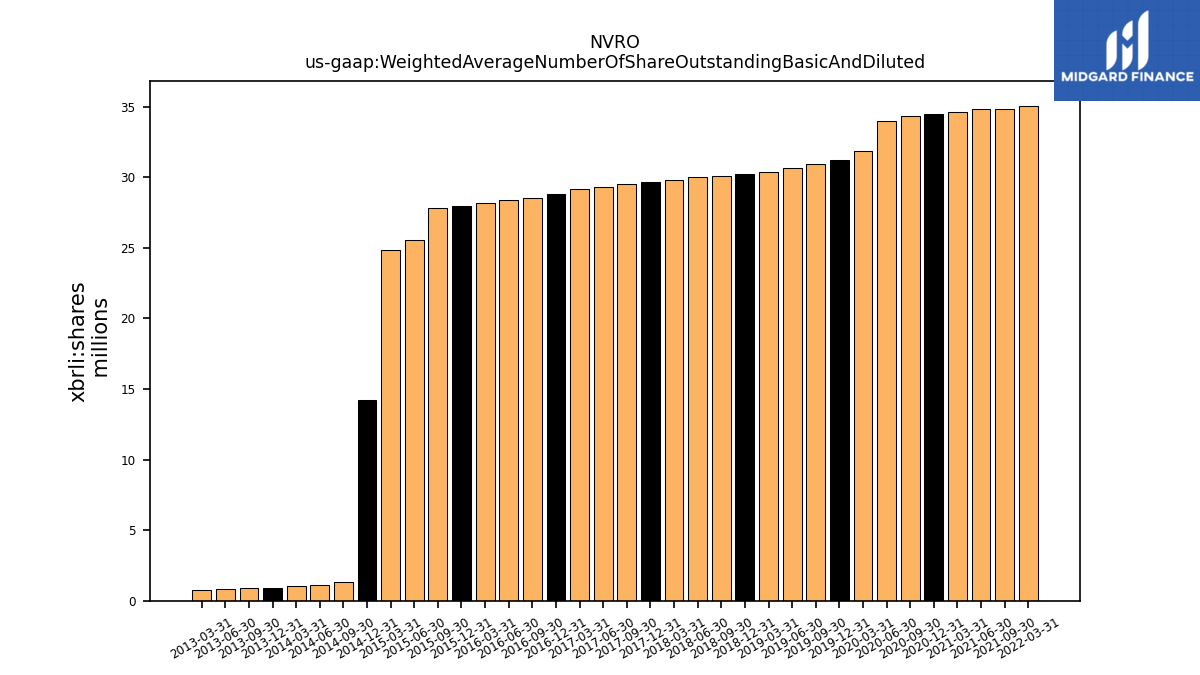
| Weighted Average Number Of Share Outstanding Basic And Diluted | NA | NA | NA | NA | NA | NA | 35.07 | NA | 34.88 | 34.81 | 34.63 | 34.51 | 34.36 | 33.99 | 31.84 | 31.23 | 30.93 | 30.68 | 30.36 | 30.21 | 30.12 | 30.03 | 29.84 | 29.66 | 29.51 | 29.35 | 29.16 | 28.82 | 28.54 | 28.38 | 28.19 | 28.00 | 27.86 | 25.56 | 24.85 | 14.23 | 1.33 | 1.14 | 1.08 | 0.93 | 0.91 | 0.84 | 0.76 | |
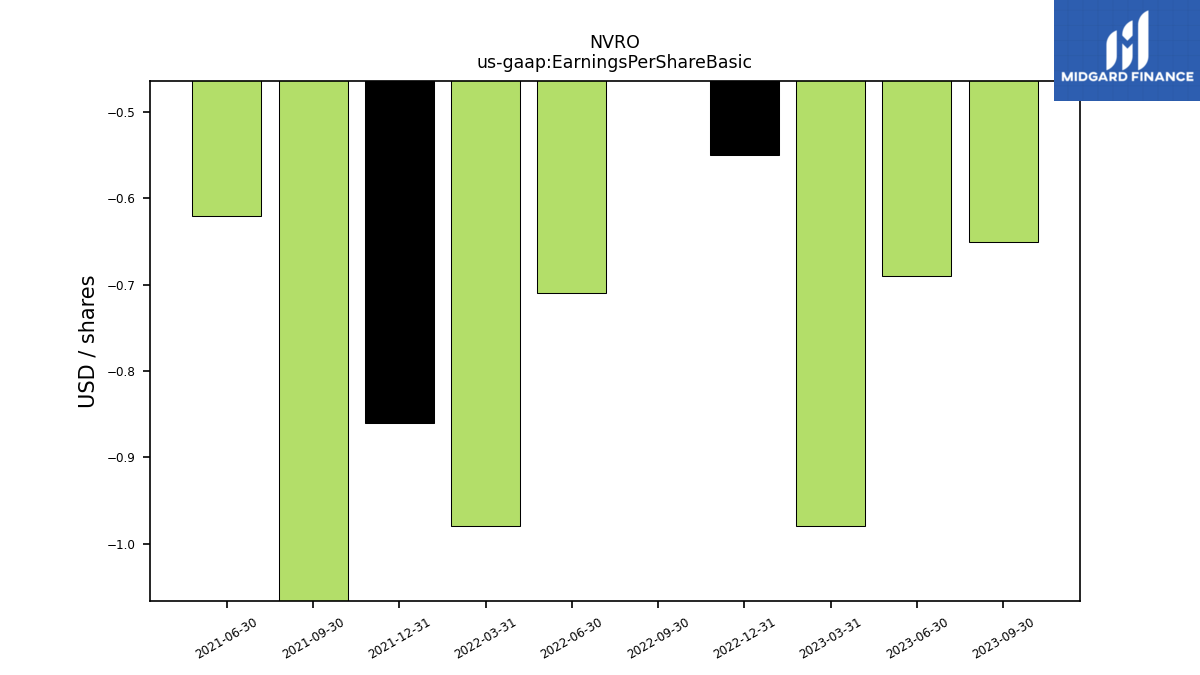
| Earnings Per Share Basic | -0.65 | -0.69 | -0.98 | -0.55 | 2.30 | -0.71 | -0.98 | -0.86 | -1.44 | -0.62 | NA | NA | NA | NA | NA | NA | NA | NA | NA | NA | NA | NA | NA | NA | NA | NA | NA | NA | NA | NA | NA | NA | NA | NA | NA | NA | NA | NA | NA | NA | NA | NA | NA | |
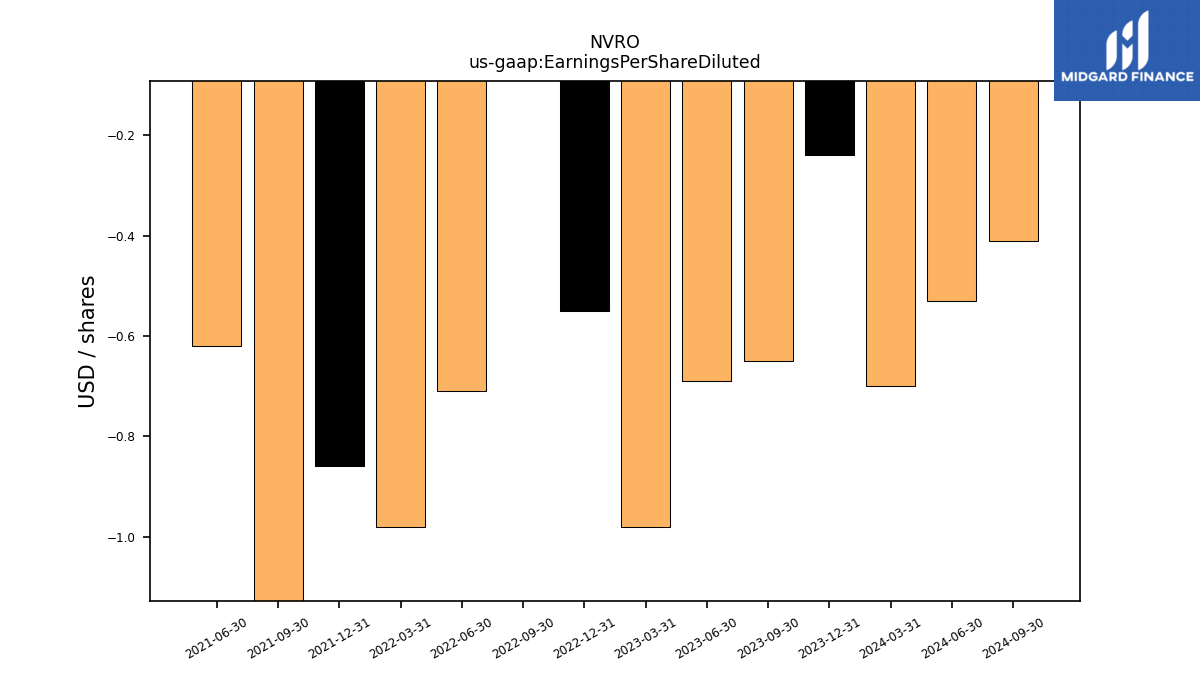
| Earnings Per Share Diluted | -0.65 | -0.69 | -0.98 | -0.55 | 2.22 | -0.71 | -0.98 | -0.86 | -1.44 | -0.62 | NA | NA | NA | NA | NA | NA | NA | NA | NA | NA | NA | NA | NA | NA | NA | NA | NA | NA | NA | NA | NA | NA | NA | NA | NA | NA | NA | NA | NA | NA | NA | NA | NA | |
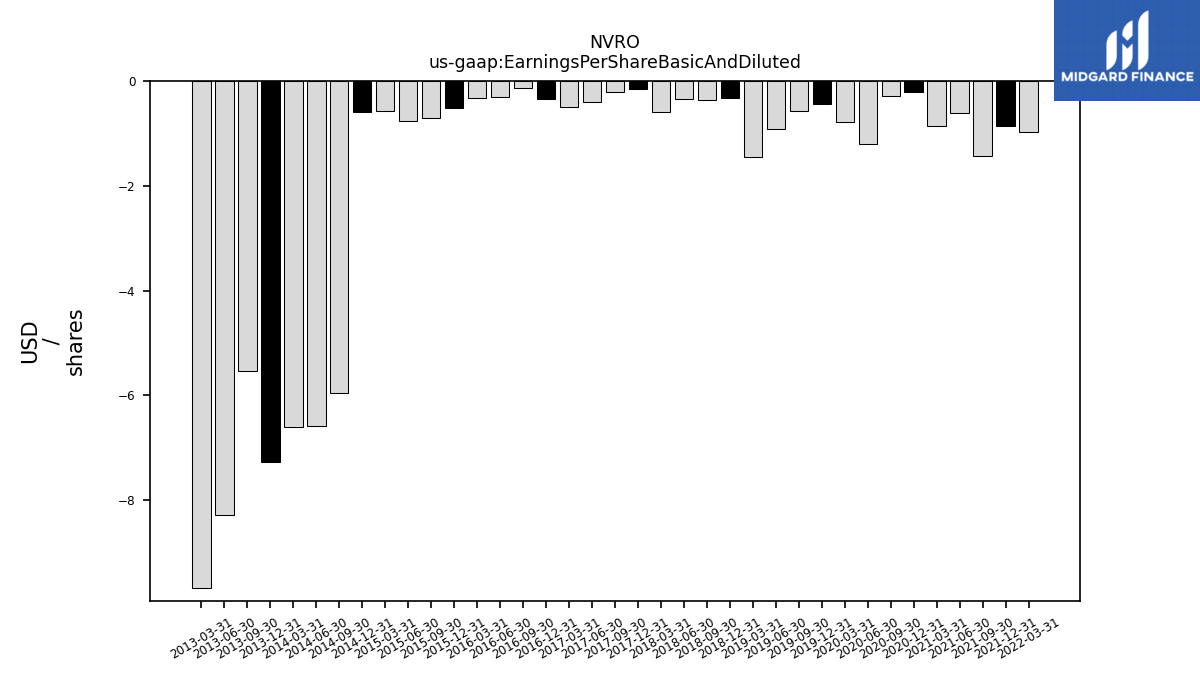
| Earnings Per Share Basic And Diluted | NA | NA | NA | NA | NA | NA | -0.98 | -0.86 | -1.44 | -0.62 | -0.85 | -0.21 | -0.29 | -1.21 | -0.78 | -0.44 | -0.58 | -0.91 | -1.45 | -0.32 | -0.37 | -0.35 | -0.59 | -0.15 | -0.21 | -0.40 | -0.50 | -0.34 | -0.14 | -0.31 | -0.33 | -0.51 | -0.70 | -0.77 | -0.57 | -0.59 | -5.96 | -6.58 | -6.60 | -7.27 | -5.54 | -8.29 | -9.68 |
| 2023-09-30 | 2023-06-30 | 2023-03-31 | 2022-12-31 | 2022-09-30 | 2022-06-30 | 2022-03-31 | 2021-12-31 | 2021-09-30 | 2021-06-30 | 2021-03-31 | 2020-12-31 | 2020-09-30 | 2020-06-30 | 2020-03-31 | 2019-12-31 | 2019-09-30 | 2019-06-30 | 2019-03-31 | 2018-12-31 | 2018-09-30 | 2018-06-30 | 2018-03-31 | 2017-12-31 | 2017-09-30 | 2017-06-30 | 2017-03-31 | 2016-12-31 | 2016-09-30 | 2016-06-30 | 2016-03-31 | 2015-12-31 | 2015-09-30 | 2015-06-30 | 2015-03-31 | 2014-12-31 | 2014-09-30 | 2014-06-30 | 2014-03-31 | 2013-12-31 | 2013-09-30 | 2013-06-30 | 2013-03-31 | ||
|---|---|---|---|---|---|---|---|---|---|---|---|---|---|---|---|---|---|---|---|---|---|---|---|---|---|---|---|---|---|---|---|---|---|---|---|---|---|---|---|---|---|---|---|---|
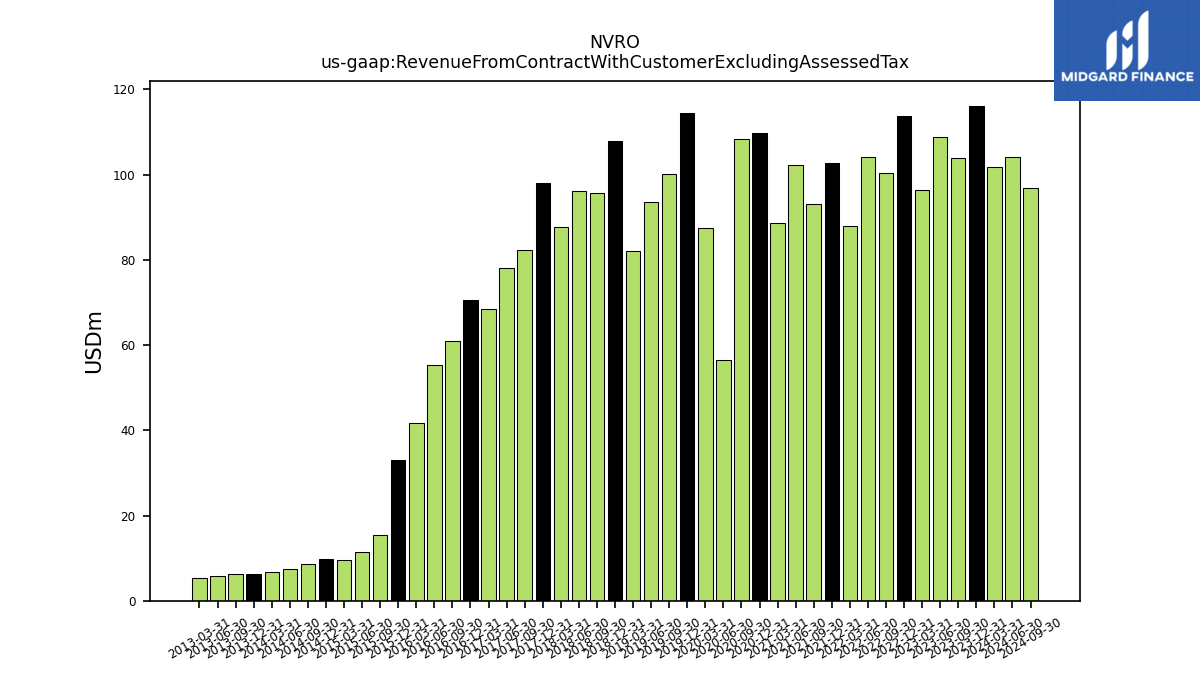
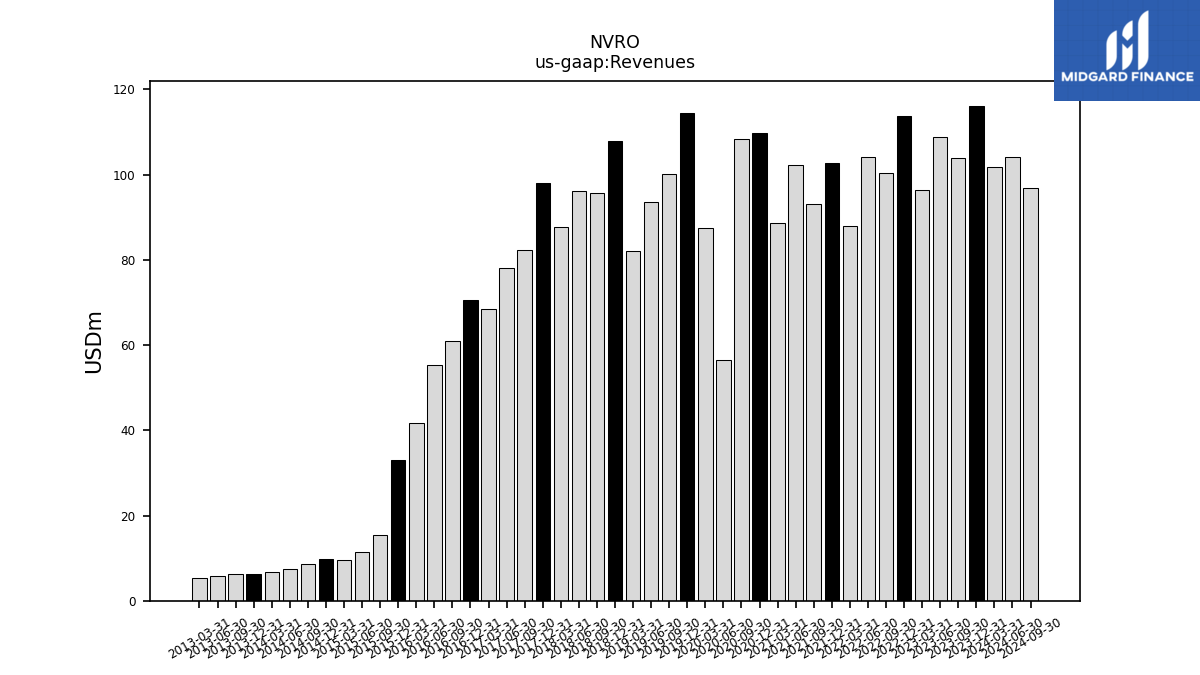
| Revenue From Contract With Customer Excluding Assessed Tax | 103.86 | 108.81 | 96.33 | 113.84 | 100.47 | 104.21 | 87.84 | 102.76 | 93.20 | 102.33 | 88.61 | 109.73 | 108.46 | 56.39 | 87.47 | 114.37 | 100.16 | 93.57 | 82.15 | 107.94 | 95.63 | 96.08 | 87.64 | 97.96 | 82.26 | 78.02 | 68.44 | 70.53 | 60.92 | 55.40 | 41.65 | 33.12 | 15.40 | 11.42 | 9.66 | 9.71 | 8.67 | 7.53 | 6.66 | 6.20 | 6.20 | 5.70 | 5.41 | |
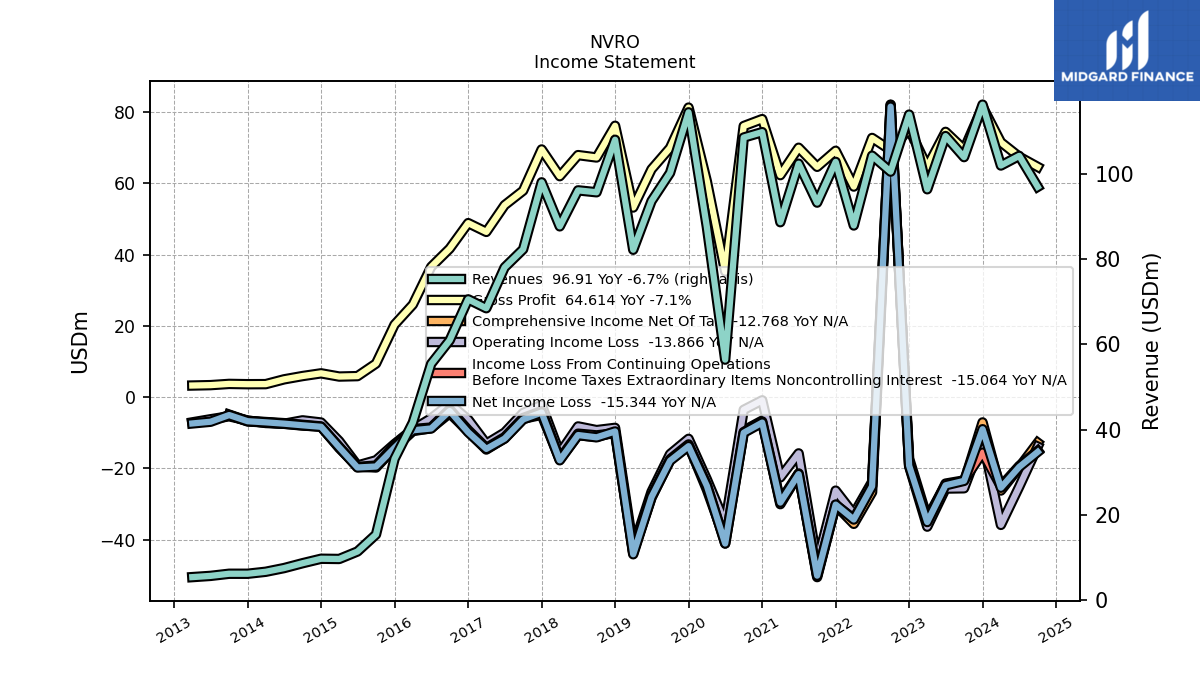
| Revenues | 103.86 | 108.81 | 96.33 | 113.84 | 100.47 | 104.21 | 87.84 | 102.76 | 93.20 | 102.33 | 88.61 | 109.73 | 108.46 | 56.39 | 87.47 | 114.37 | 100.16 | 93.57 | 82.15 | 107.94 | 95.63 | 96.08 | 87.64 | 97.96 | 82.26 | 78.02 | 68.44 | 70.53 | 60.92 | 55.40 | 41.65 | 33.12 | 15.40 | 11.42 | 9.66 | 9.71 | 8.67 | 7.53 | 6.66 | 6.20 | 6.20 | 5.70 | 5.41 | |
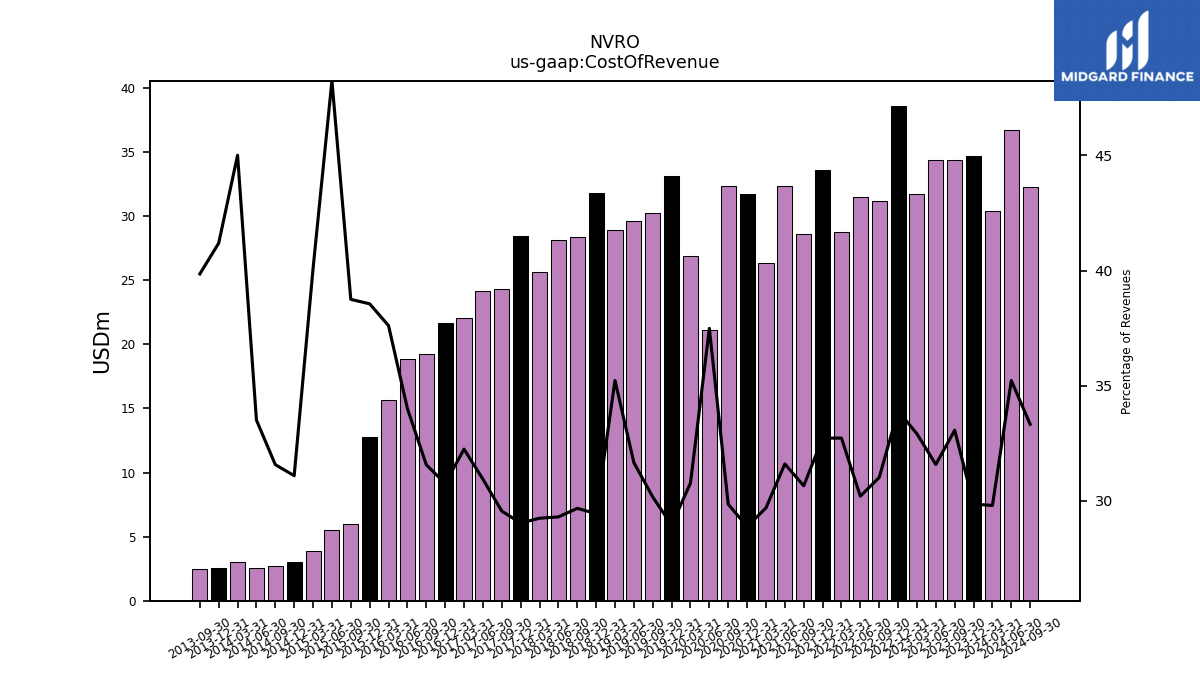
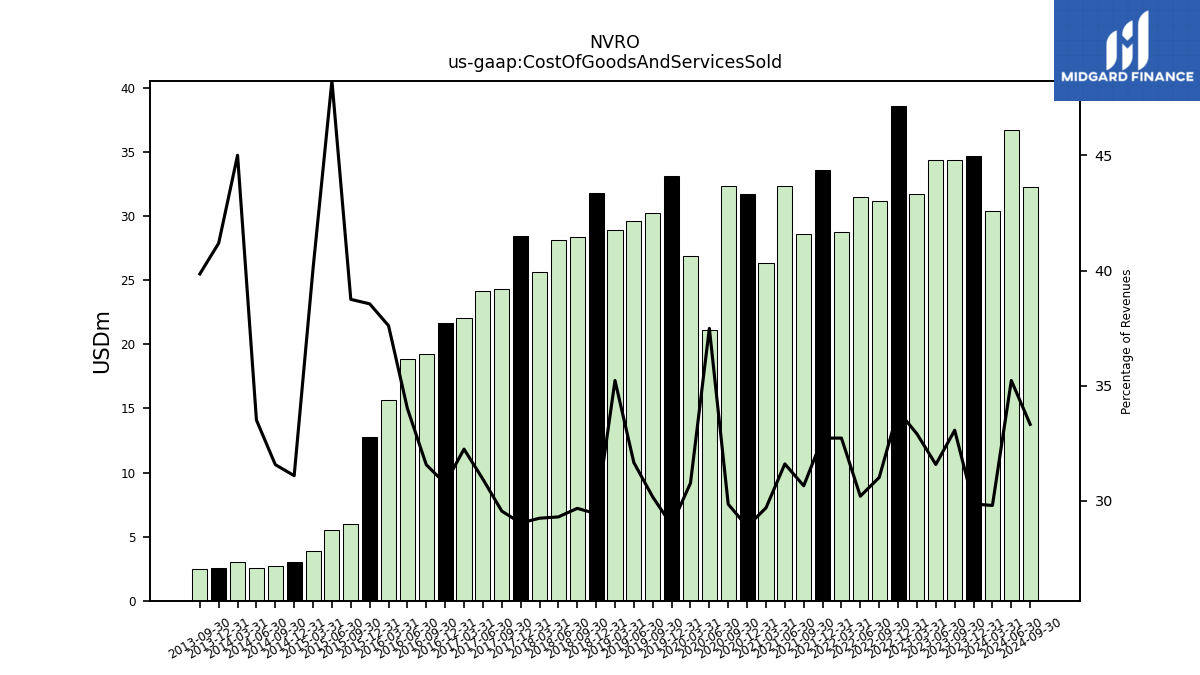
| Cost Of Revenue | 34.35 | 34.37 | 31.70 | 38.60 | 31.16 | 31.48 | 28.75 | 33.63 | 28.57 | 32.34 | 26.32 | 31.70 | 32.38 | 21.14 | 26.92 | 33.12 | 30.22 | 29.63 | 28.94 | 31.79 | 28.38 | 28.16 | 25.63 | 28.45 | 24.32 | 24.14 | 22.07 | 21.69 | 19.23 | 18.84 | 15.66 | 12.77 | 5.97 | 5.51 | 3.87 | 3.02 | 2.74 | 2.52 | 3.00 | 2.55 | 2.47 | NA | NA | |
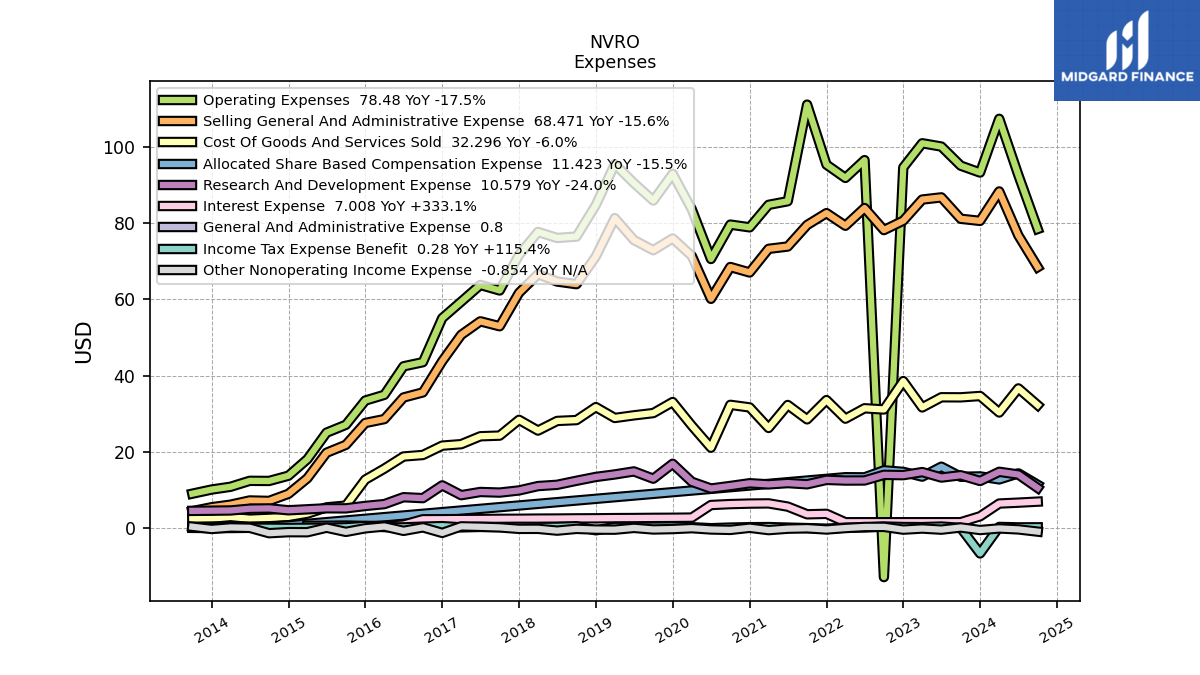
| Cost Of Goods And Services Sold | 34.35 | 34.37 | 31.70 | 38.60 | 31.16 | 31.48 | 28.75 | 33.63 | 28.57 | 32.34 | 26.32 | 31.70 | 32.38 | 21.14 | 26.92 | 33.12 | 30.22 | 29.63 | 28.94 | 31.79 | 28.38 | 28.16 | 25.63 | 28.45 | 24.32 | 24.14 | 22.07 | 21.69 | 19.23 | 18.84 | 15.66 | 12.77 | 5.97 | 5.51 | 3.87 | 3.02 | 2.74 | 2.52 | 3.00 | 2.55 | 2.47 | NA | NA | |
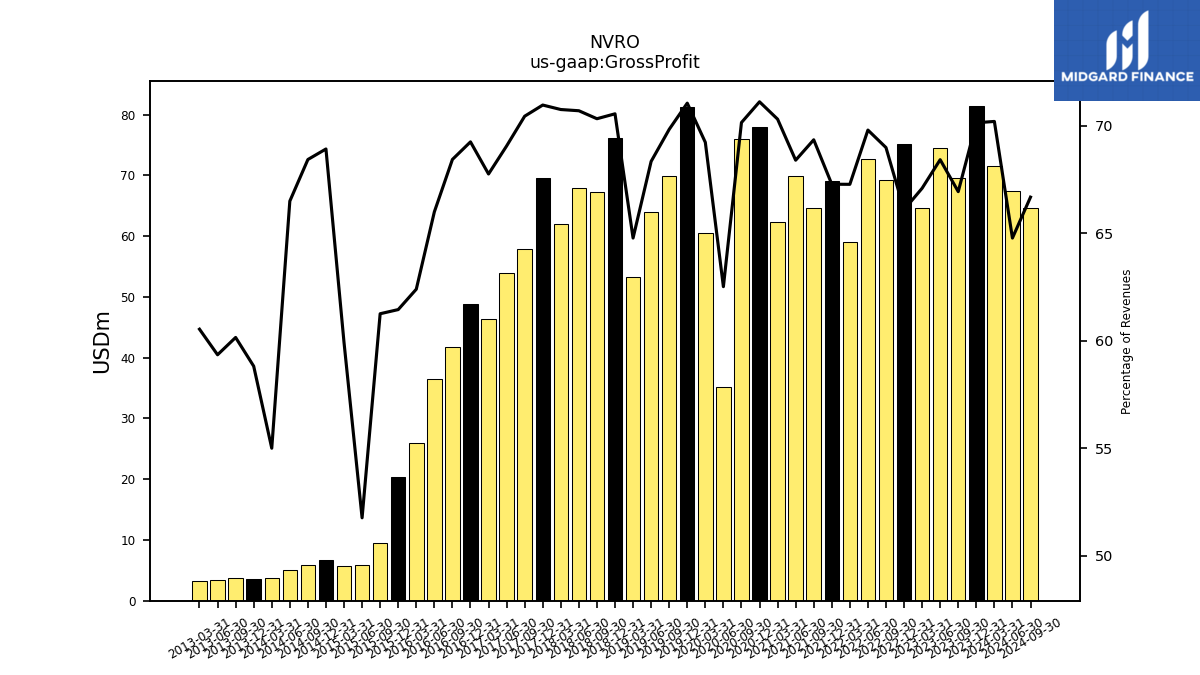
| Gross Profit | 69.52 | 74.44 | 64.62 | 75.24 | 69.30 | 72.73 | 59.09 | 69.13 | 64.63 | 69.99 | 62.29 | 78.03 | 76.08 | 35.25 | 60.55 | 81.26 | 69.94 | 63.94 | 53.21 | 76.15 | 67.25 | 67.92 | 62.00 | 69.51 | 57.94 | 53.87 | 46.37 | 48.84 | 41.69 | 36.56 | 25.99 | 20.35 | 9.43 | 5.91 | 5.79 | 6.70 | 5.93 | 5.00 | 3.67 | 3.64 | 3.73 | 3.38 | 3.27 | |
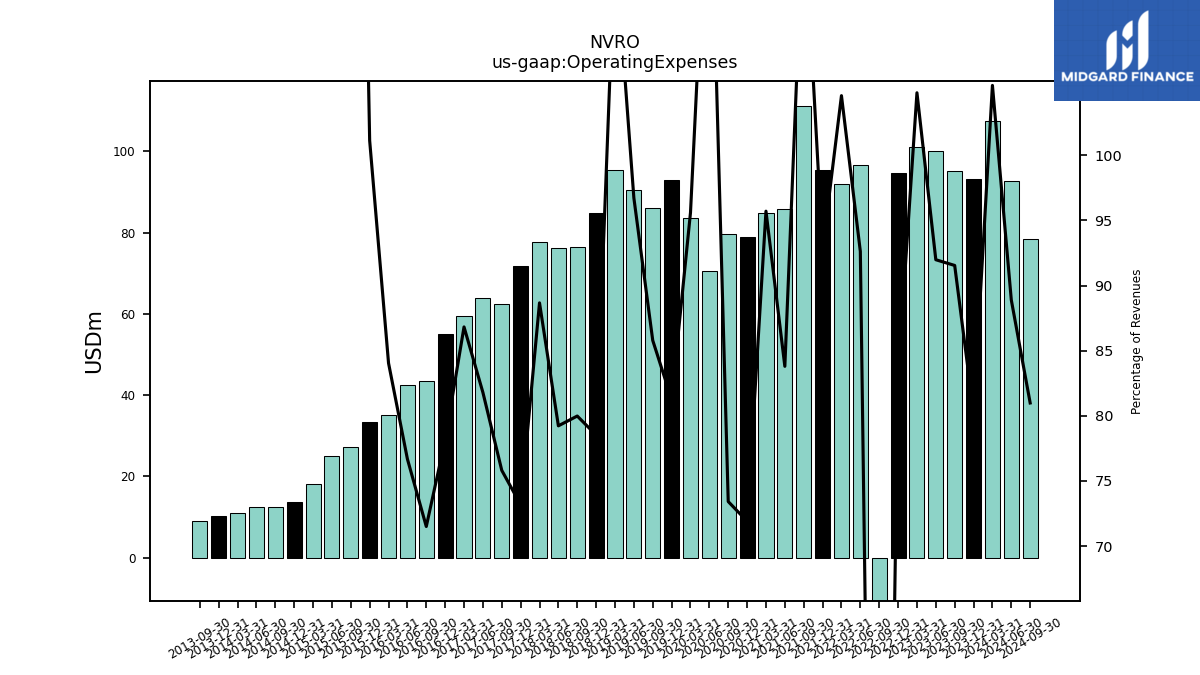
| Operating Expenses | 95.08 | 100.08 | 100.95 | 94.60 | -12.78 | 96.53 | 91.86 | 95.35 | 111.07 | 85.75 | 84.81 | 78.90 | 79.63 | 70.61 | 83.61 | 92.94 | 85.92 | 90.50 | 95.46 | 84.76 | 76.48 | 76.12 | 77.70 | 71.68 | 62.36 | 63.81 | 59.42 | 55.11 | 43.56 | 42.48 | 35.00 | 33.50 | 27.14 | 25.09 | 18.13 | 13.80 | 12.43 | 12.46 | 10.91 | 10.18 | 9.09 | NA | NA | |
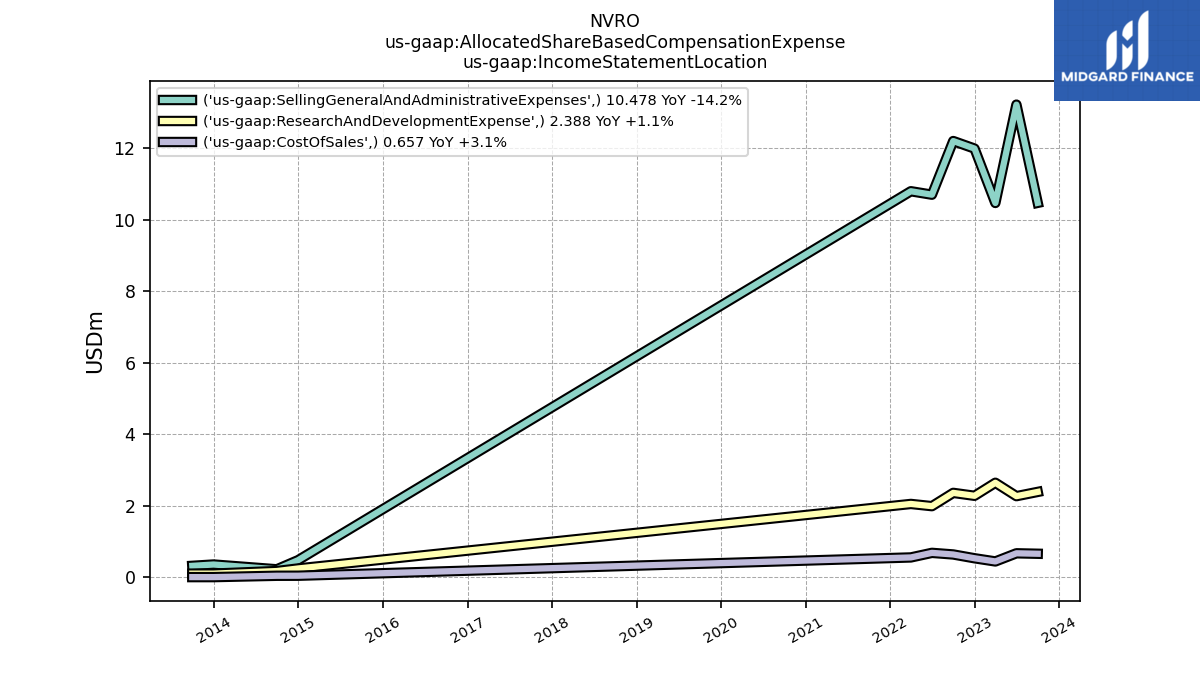
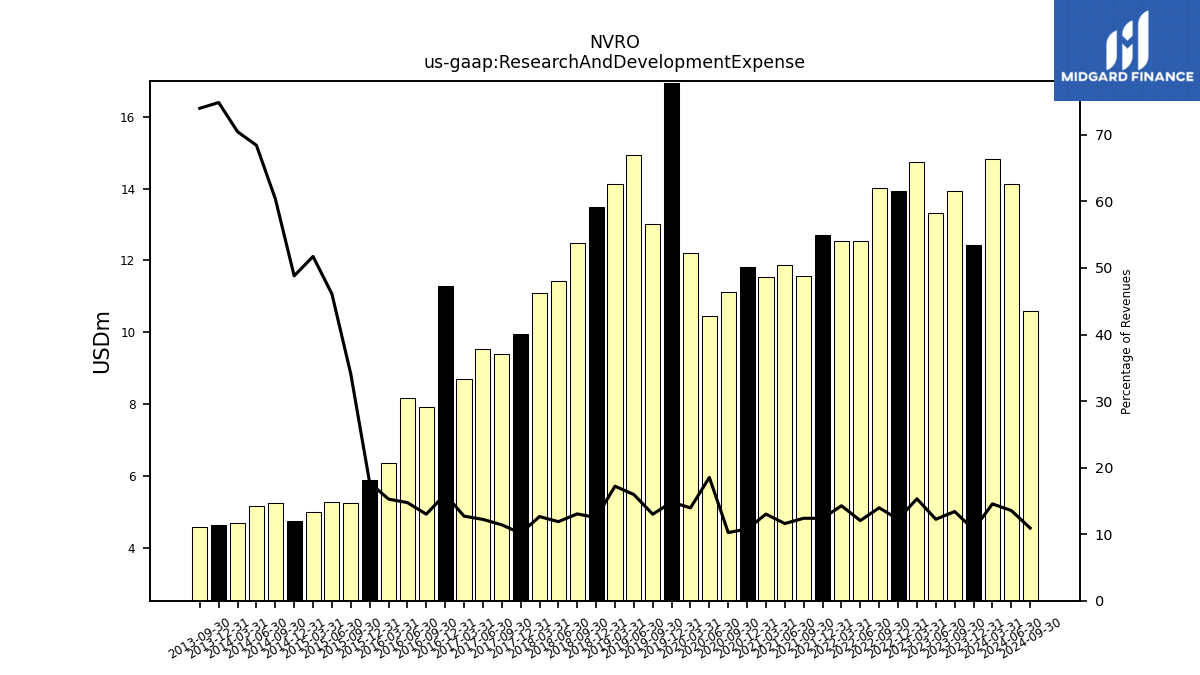
| Research And Development Expense | 13.92 | 13.32 | 14.76 | 13.95 | 14.03 | 12.55 | 12.54 | 12.71 | 11.55 | 11.87 | 11.53 | 11.83 | 11.11 | 10.44 | 12.21 | 16.93 | 13.02 | 14.93 | 14.13 | 13.48 | 12.48 | 11.42 | 11.09 | 9.94 | 9.38 | 9.54 | 8.70 | 11.28 | 7.92 | 8.17 | 6.36 | 5.87 | 5.25 | 5.26 | 5.00 | 4.74 | 5.24 | 5.15 | 4.70 | 4.64 | 4.59 | NA | NA | |
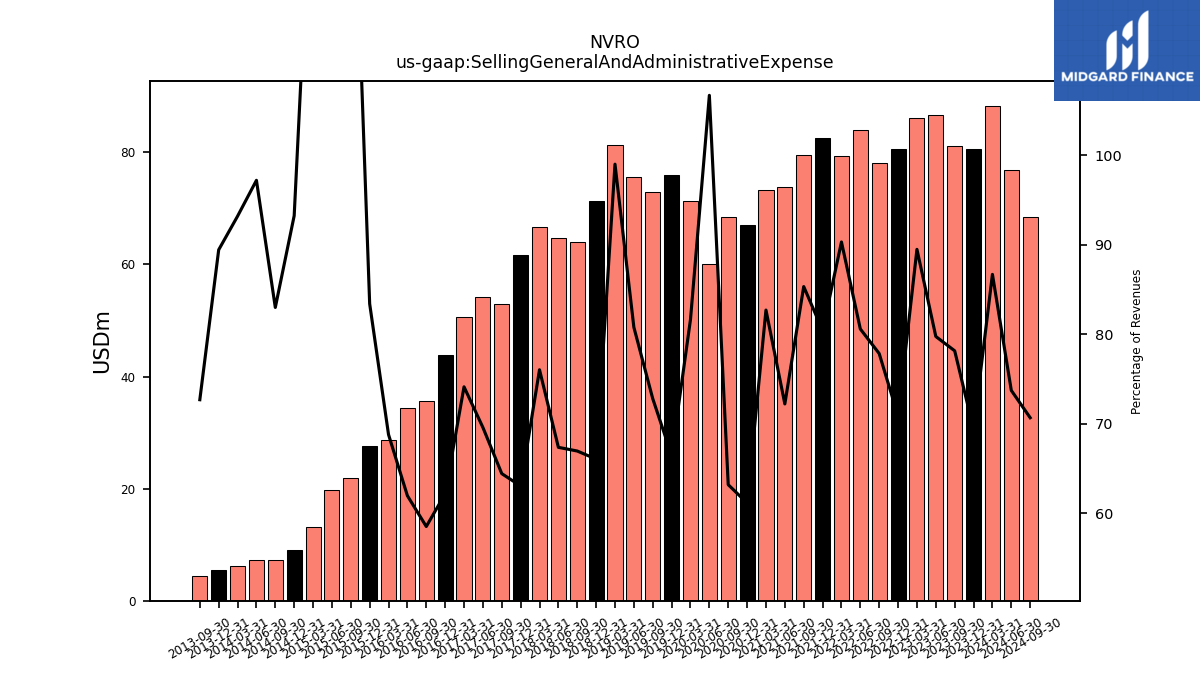
| Selling General And Administrative Expense | 81.15 | 86.76 | 86.19 | 80.65 | 78.19 | 83.97 | 79.33 | 82.64 | 79.52 | 73.88 | 73.27 | 67.07 | 68.51 | 60.17 | 71.40 | 76.01 | 72.91 | 75.57 | 81.33 | 71.28 | 64.01 | 64.71 | 66.62 | 61.74 | 52.98 | 54.27 | 50.72 | 43.83 | 35.64 | 34.31 | 28.64 | 27.62 | 21.90 | 19.82 | 13.13 | 9.06 | 7.19 | 7.32 | 6.21 | 5.54 | 4.50 | NA | NA | |
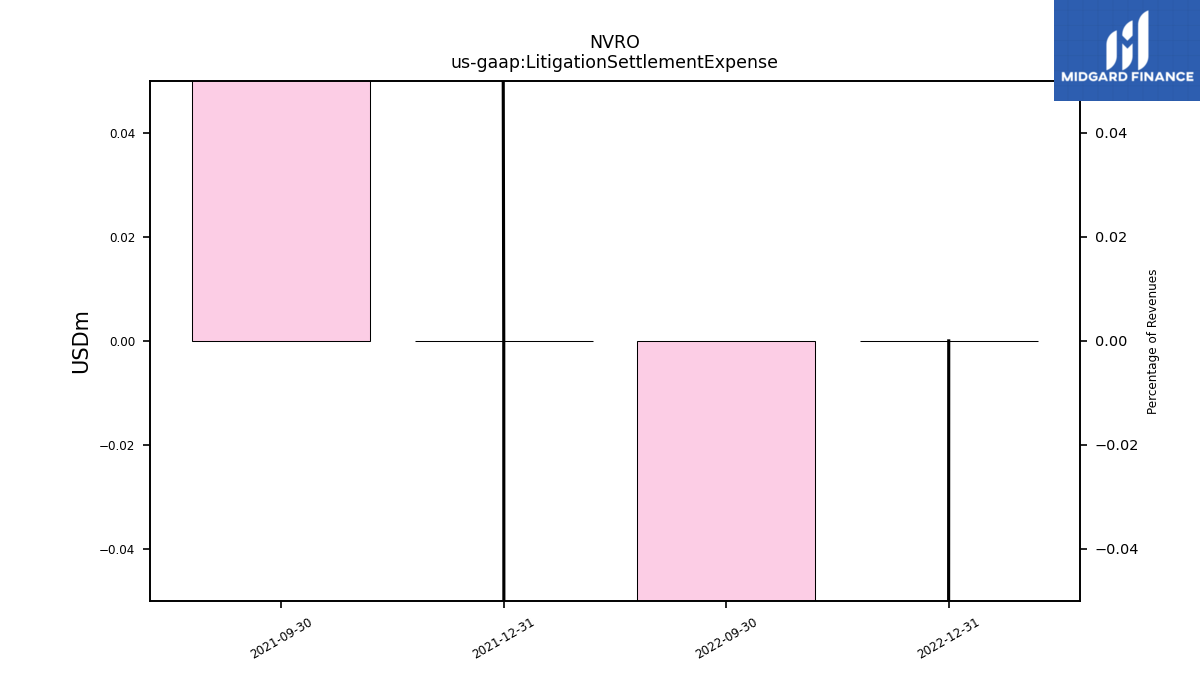
| Litigation Settlement Expense | NA | NA | NA | 0.00 | -105.00 | NA | NA | 0.00 | 20.00 | NA | NA | NA | NA | NA | NA | NA | NA | NA | NA | NA | NA | NA | NA | NA | NA | NA | NA | NA | NA | NA | NA | NA | NA | NA | NA | NA | NA | NA | NA | NA | NA | NA | NA | |
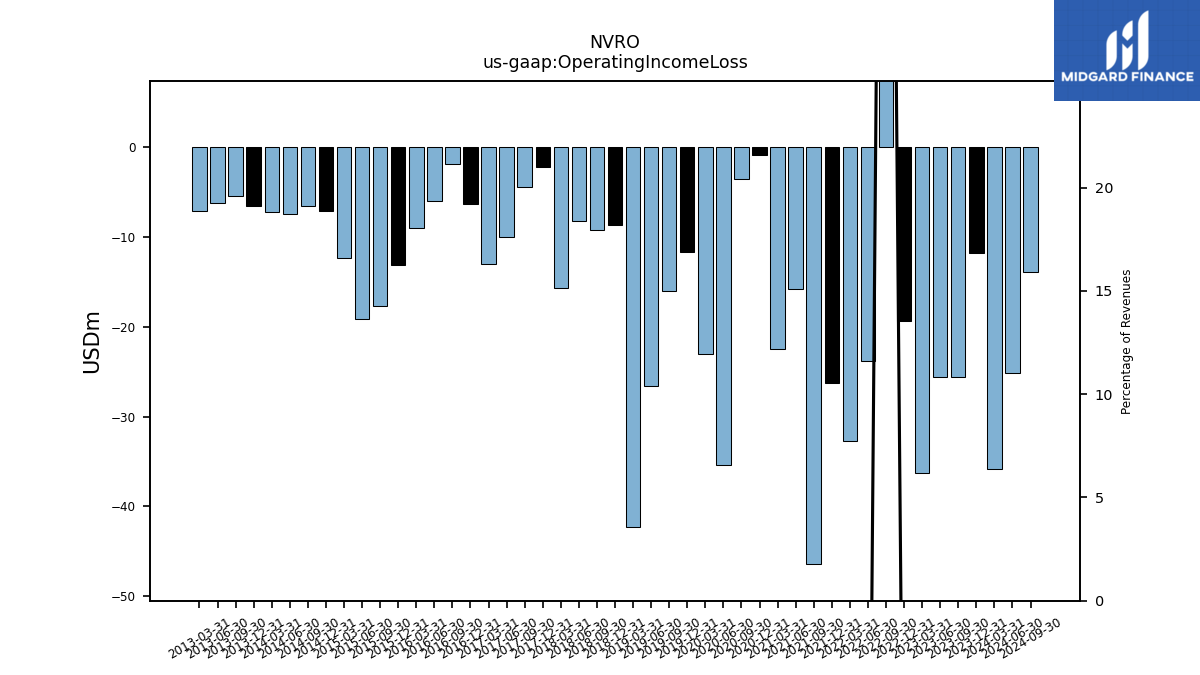
| Operating Income Loss | -25.56 | -25.64 | -36.32 | -19.36 | 82.08 | -23.79 | -32.77 | -26.21 | -46.44 | -15.76 | -22.51 | -0.88 | -3.55 | -35.36 | -23.07 | -11.68 | -15.98 | -26.56 | -42.25 | -8.60 | -9.24 | -8.20 | -15.70 | -2.17 | -4.42 | -9.94 | -13.05 | -6.27 | -1.87 | -5.92 | -9.02 | -13.14 | -17.71 | -19.18 | -12.34 | -7.11 | -6.50 | -7.46 | -7.24 | -6.54 | -5.36 | -6.19 | -7.06 | |
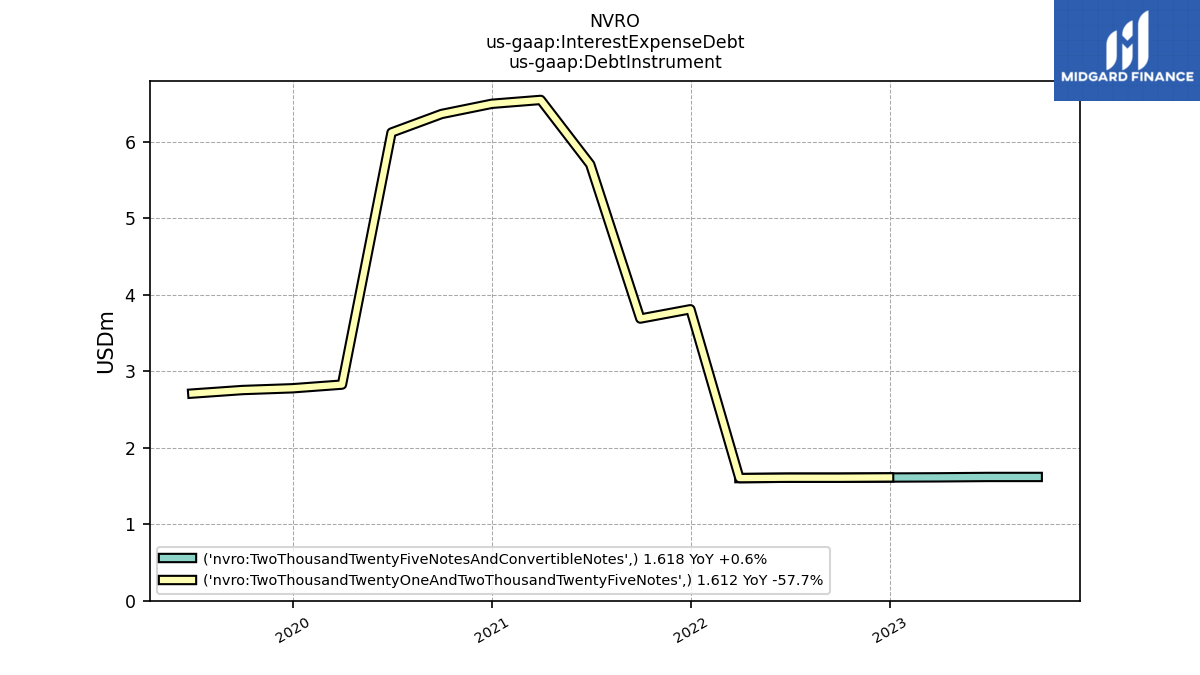
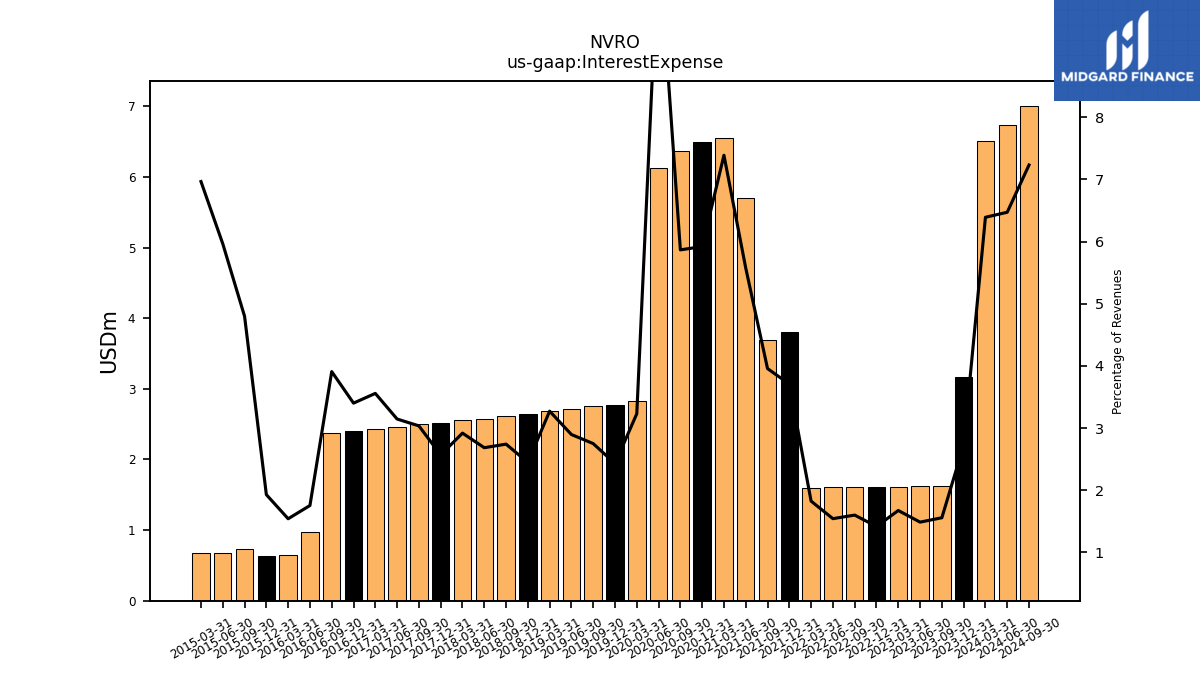
| Interest Expense | 1.62 | 1.62 | 1.61 | 1.61 | 1.61 | 1.61 | 1.60 | 3.81 | 3.69 | 5.70 | 6.55 | 6.50 | 6.36 | 6.12 | 2.83 | 2.78 | 2.75 | 2.71 | 2.69 | 2.64 | 2.62 | 2.58 | 2.56 | 2.52 | 2.50 | 2.45 | 2.44 | 2.40 | 2.38 | 0.97 | 0.64 | 0.64 | 0.74 | 0.68 | 0.67 | NA | NA | NA | NA | NA | NA | NA | NA | |
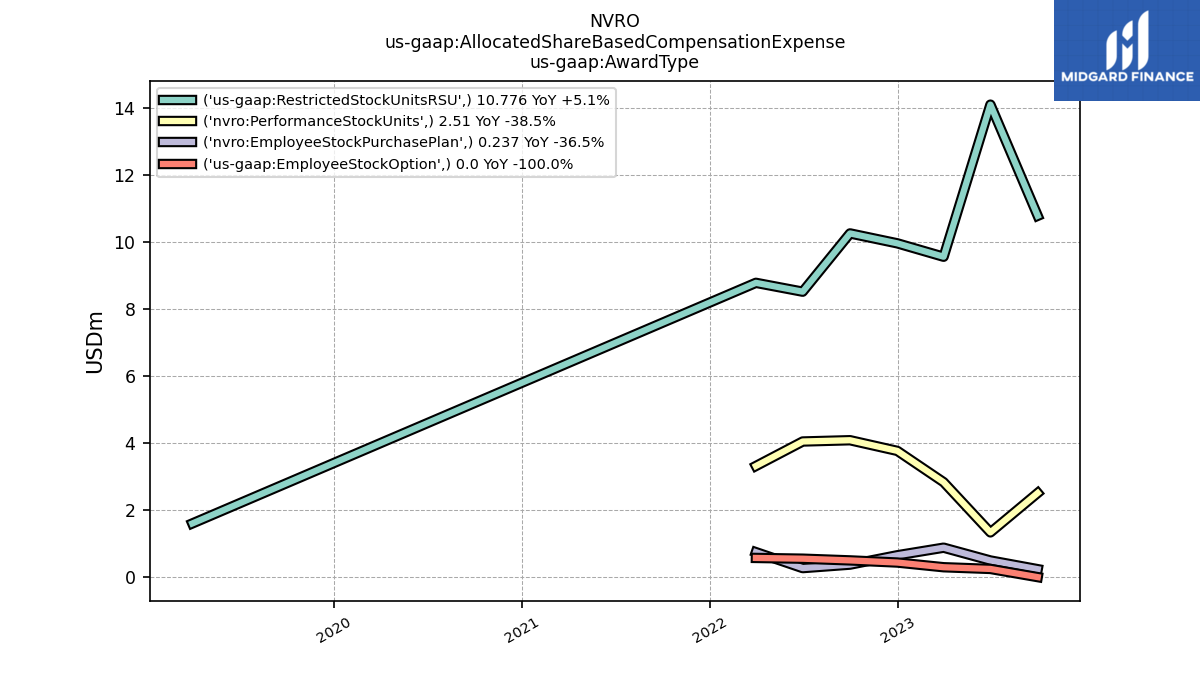
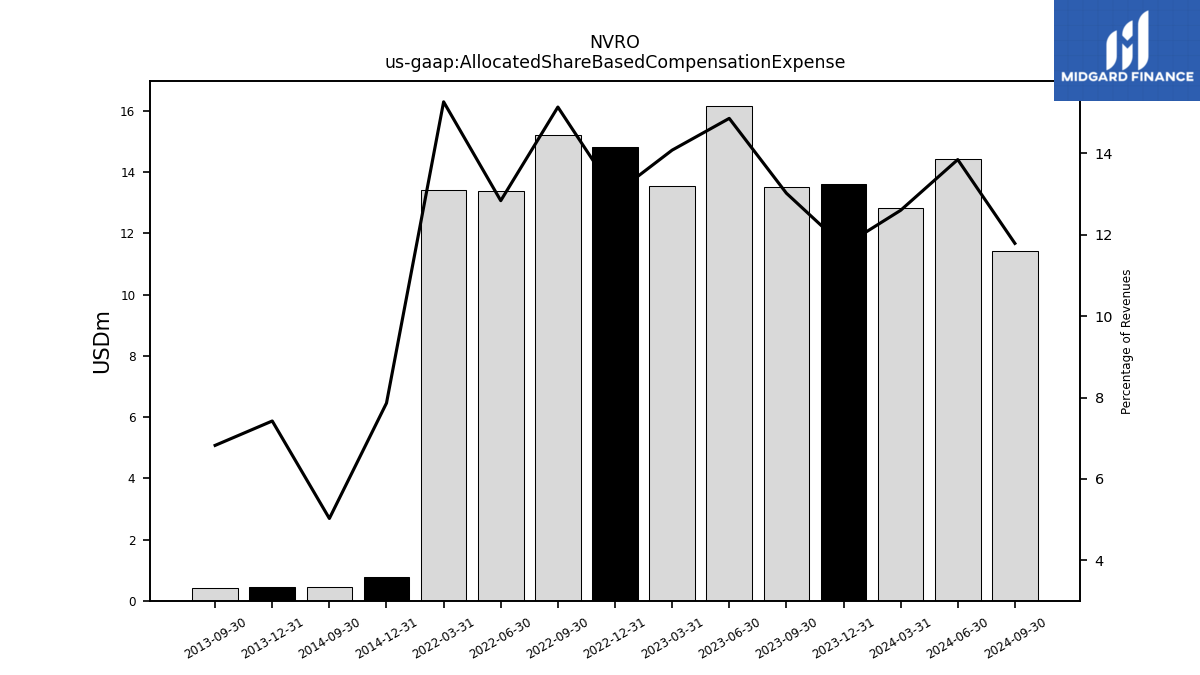
| Allocated Share Based Compensation Expense | 13.52 | 16.17 | 13.56 | 14.81 | 15.21 | 13.38 | 13.41 | NA | NA | NA | NA | NA | NA | NA | NA | NA | NA | NA | NA | NA | NA | NA | NA | NA | NA | NA | NA | NA | NA | NA | NA | NA | NA | NA | NA | 0.76 | 0.44 | NA | NA | 0.46 | 0.42 | NA | NA | |
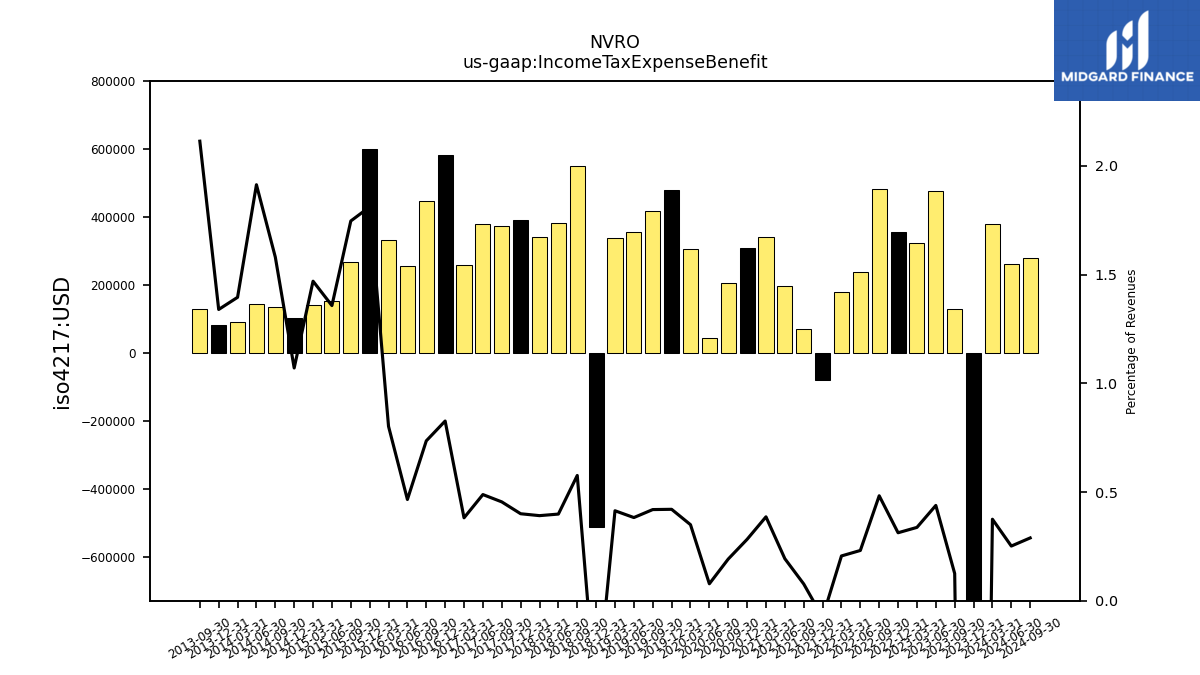
| Income Tax Expense Benefit | 0.13 | 0.48 | 0.33 | 0.36 | 0.48 | 0.24 | 0.18 | -0.08 | 0.07 | 0.20 | 0.34 | 0.31 | 0.21 | 0.04 | 0.31 | 0.48 | 0.42 | 0.36 | 0.34 | -0.51 | 0.55 | 0.38 | 0.34 | 0.39 | 0.37 | 0.38 | 0.26 | 0.58 | 0.45 | 0.26 | 0.33 | 0.60 | 0.27 | 0.15 | 0.14 | 0.10 | 0.14 | 0.14 | 0.09 | 0.08 | 0.13 | NA | NA | |
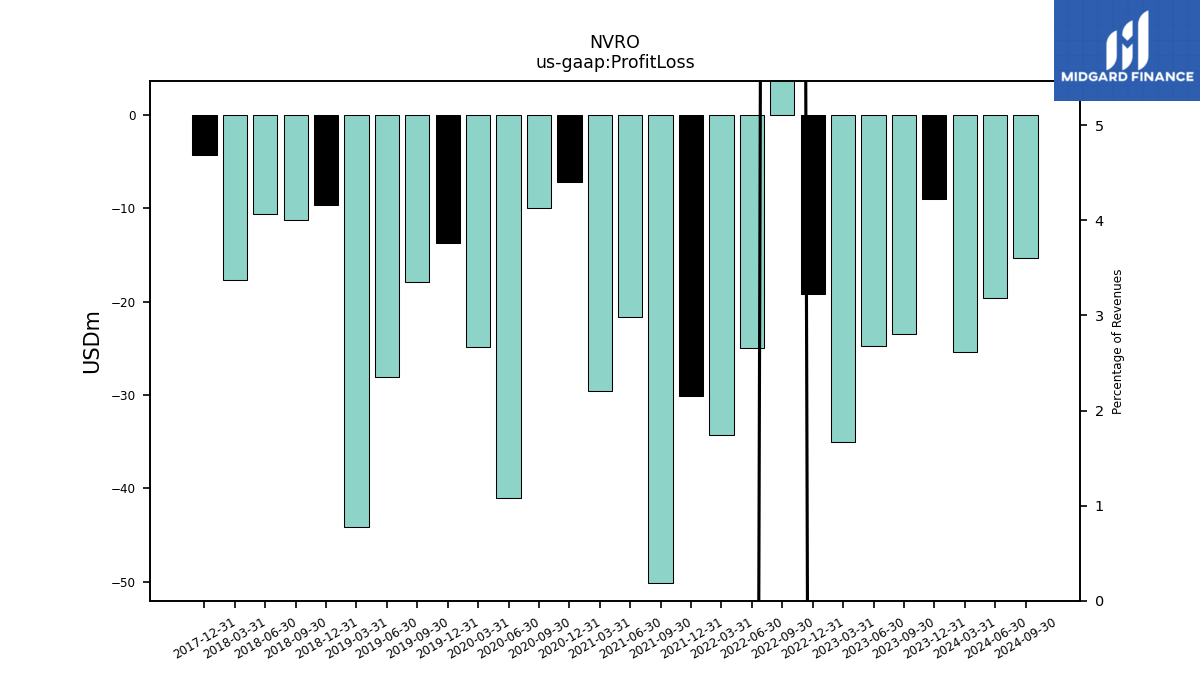
| Profit Loss | -23.48 | -24.72 | -35.03 | -19.19 | 81.51 | -24.99 | -34.33 | -30.13 | -50.08 | -21.59 | -29.56 | -7.13 | -9.98 | -41.06 | -24.89 | -13.74 | -17.85 | -28.02 | -44.08 | -9.61 | -11.27 | -10.62 | -17.71 | -4.31 | NA | NA | NA | NA | NA | NA | NA | NA | NA | NA | NA | NA | NA | NA | NA | NA | NA | NA | NA | |
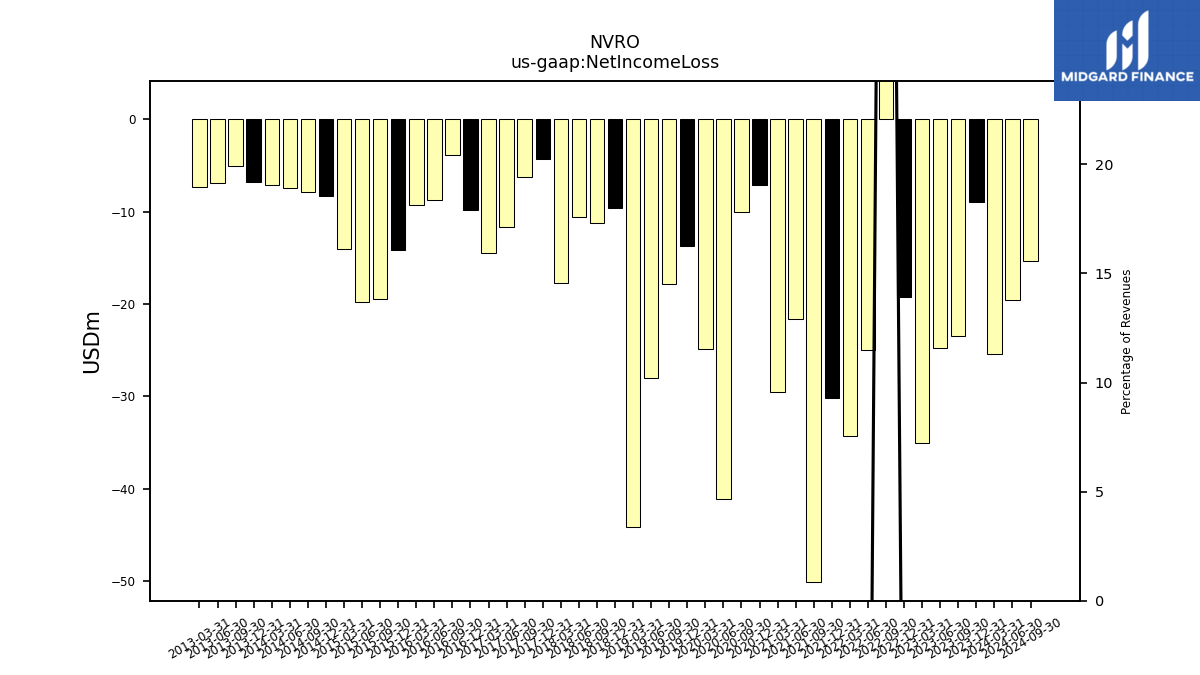
| Net Income Loss | -23.48 | -24.72 | -35.03 | -19.19 | 81.51 | -24.99 | -34.33 | -30.13 | -50.08 | -21.59 | -29.56 | -7.13 | -9.98 | -41.06 | -24.89 | -13.74 | -17.85 | -28.02 | -44.08 | -9.61 | -11.27 | -10.62 | -17.71 | -4.31 | -6.23 | -11.61 | -14.51 | -9.82 | -3.89 | -8.78 | -9.29 | -14.19 | -19.45 | -19.73 | -14.06 | -8.31 | -7.88 | -7.43 | -7.06 | -6.74 | -5.02 | -6.89 | -7.37 | |
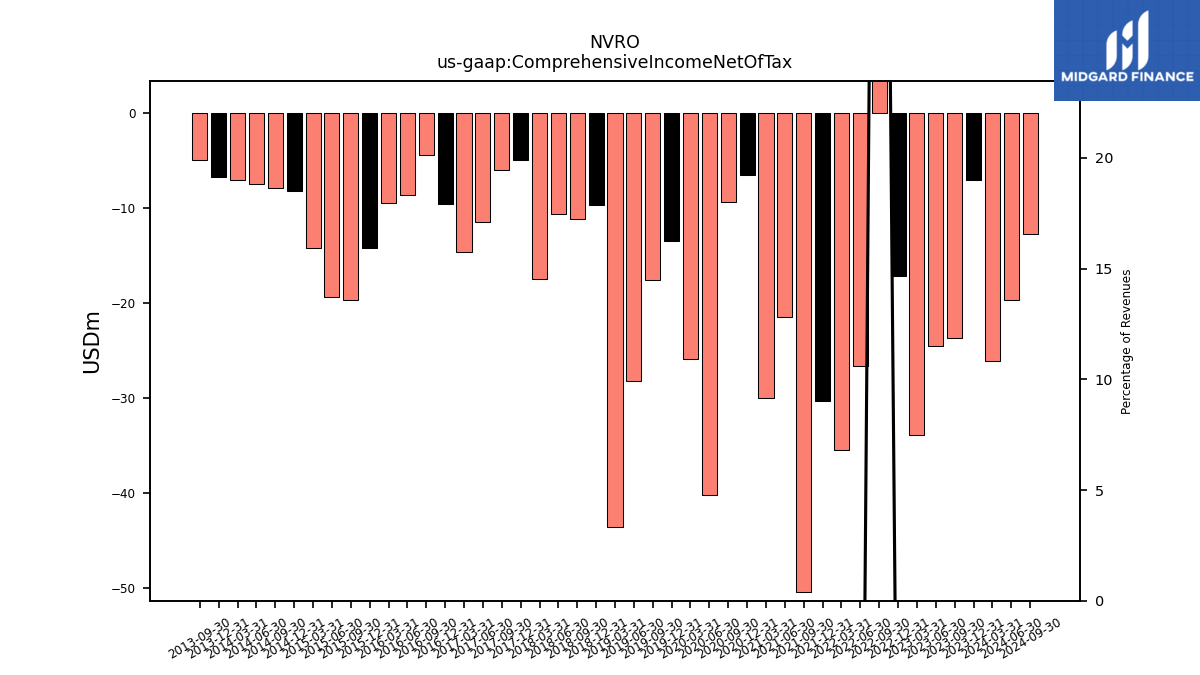
| Comprehensive Income Net Of Tax | -23.77 | -24.58 | -33.94 | -17.25 | 79.72 | -26.66 | -35.54 | -30.32 | -50.48 | -21.50 | -30.02 | -6.58 | -9.38 | -40.26 | -25.93 | -13.52 | -17.65 | -28.20 | -43.55 | -9.74 | -11.15 | -10.66 | -17.49 | -4.94 | -6.05 | -11.54 | -14.69 | -9.59 | -4.49 | -8.69 | -9.51 | -14.25 | -19.73 | -19.44 | -14.26 | -8.23 | -7.97 | -7.47 | -7.11 | -6.79 | -5.04 | NA | NA | |
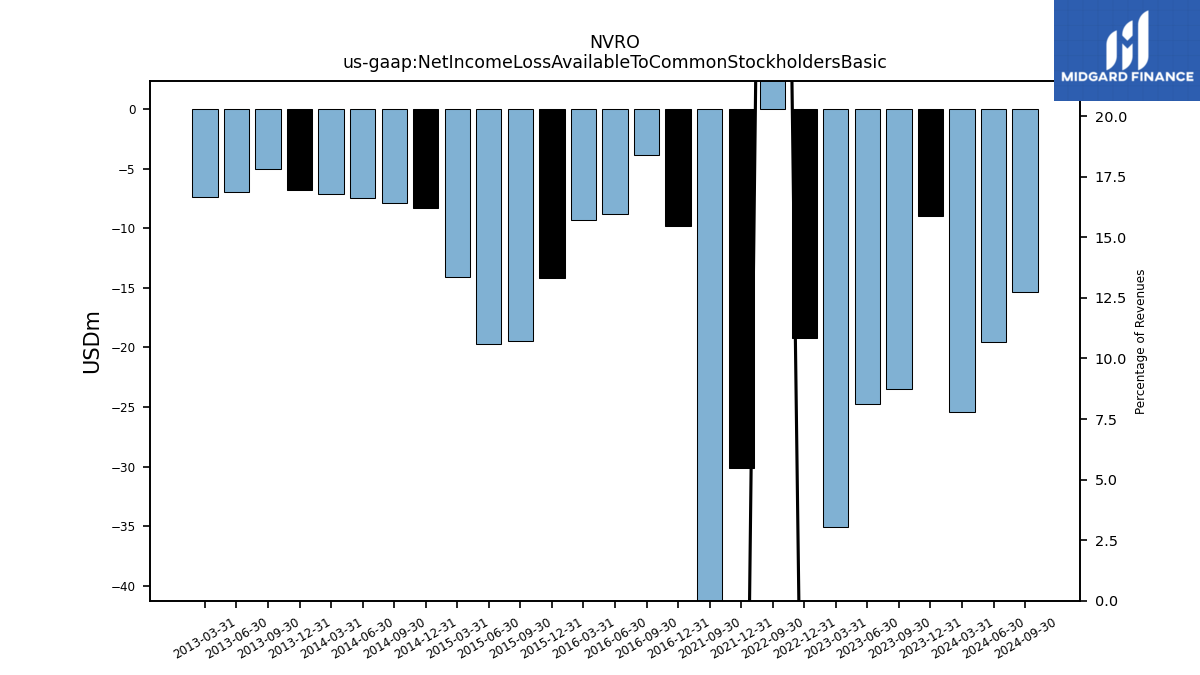
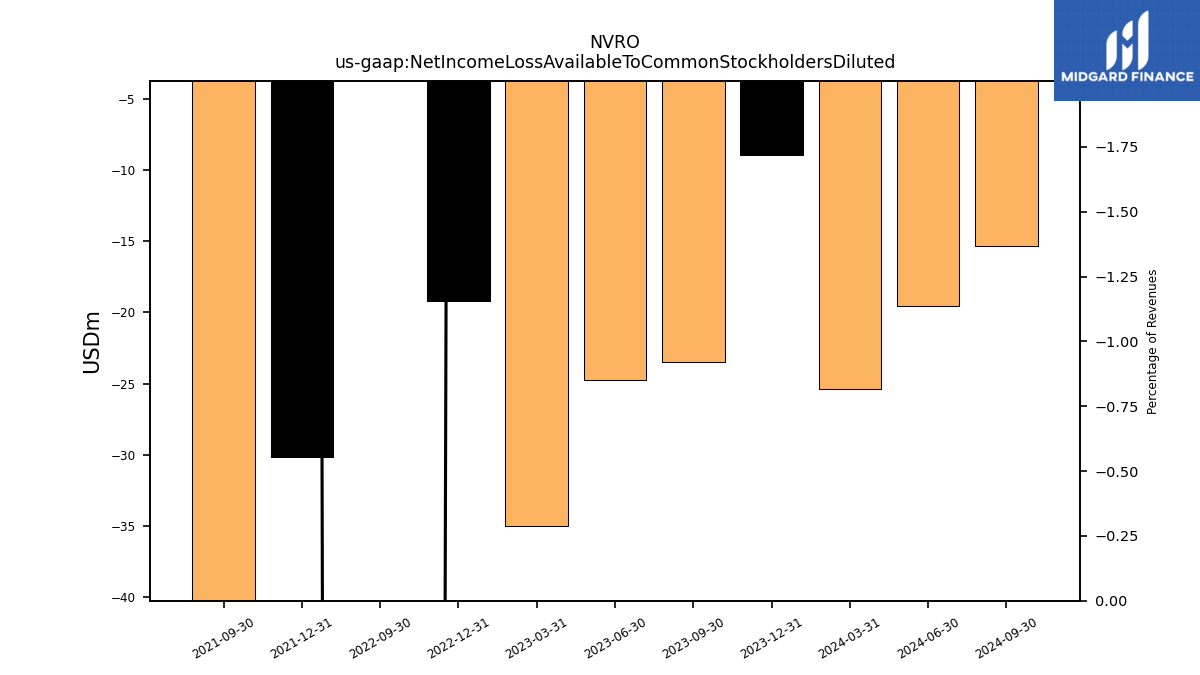
| Net Income Loss Available To Common Stockholders Basic | -23.48 | NA | NA | -19.19 | 81.51 | NA | NA | -30.13 | -50.08 | NA | NA | NA | NA | NA | NA | NA | NA | NA | NA | NA | NA | NA | NA | NA | NA | NA | NA | -9.82 | -3.89 | -8.78 | -9.29 | -14.19 | -19.45 | -19.73 | -14.06 | -8.33 | -7.93 | -7.47 | -7.10 | -6.78 | -5.06 | -6.93 | -7.40 | |
| Net Income Loss Available To Common Stockholders Diluted | -23.48 | NA | NA | -19.19 | 82.81 | NA | NA | -30.13 | -50.08 | NA | NA | NA | NA | NA | NA | NA | NA | NA | NA | NA | NA | NA | NA | NA | NA | NA | NA | NA | NA | NA | NA | NA | NA | NA | NA | NA | NA | NA | NA | NA | NA | NA | NA |
| 2023-09-30 | 2023-06-30 | 2023-03-31 | 2022-12-31 | 2022-09-30 | 2022-06-30 | 2022-03-31 | 2021-12-31 | 2021-09-30 | 2021-06-30 | 2021-03-31 | 2020-12-31 | 2020-09-30 | 2020-06-30 | 2020-03-31 | 2019-12-31 | 2019-09-30 | 2019-06-30 | 2019-03-31 | 2018-12-31 | 2018-09-30 | 2018-06-30 | 2018-03-31 | 2017-12-31 | 2017-09-30 | 2017-06-30 | 2017-03-31 | 2016-12-31 | 2016-09-30 | 2016-06-30 | 2016-03-31 | 2015-12-31 | 2015-09-30 | 2015-06-30 | 2015-03-31 | 2014-12-31 | 2014-09-30 | 2014-06-30 | 2014-03-31 | 2013-12-31 | 2013-09-30 | 2013-06-30 | 2013-03-31 | ||
|---|---|---|---|---|---|---|---|---|---|---|---|---|---|---|---|---|---|---|---|---|---|---|---|---|---|---|---|---|---|---|---|---|---|---|---|---|---|---|---|---|---|---|---|---|
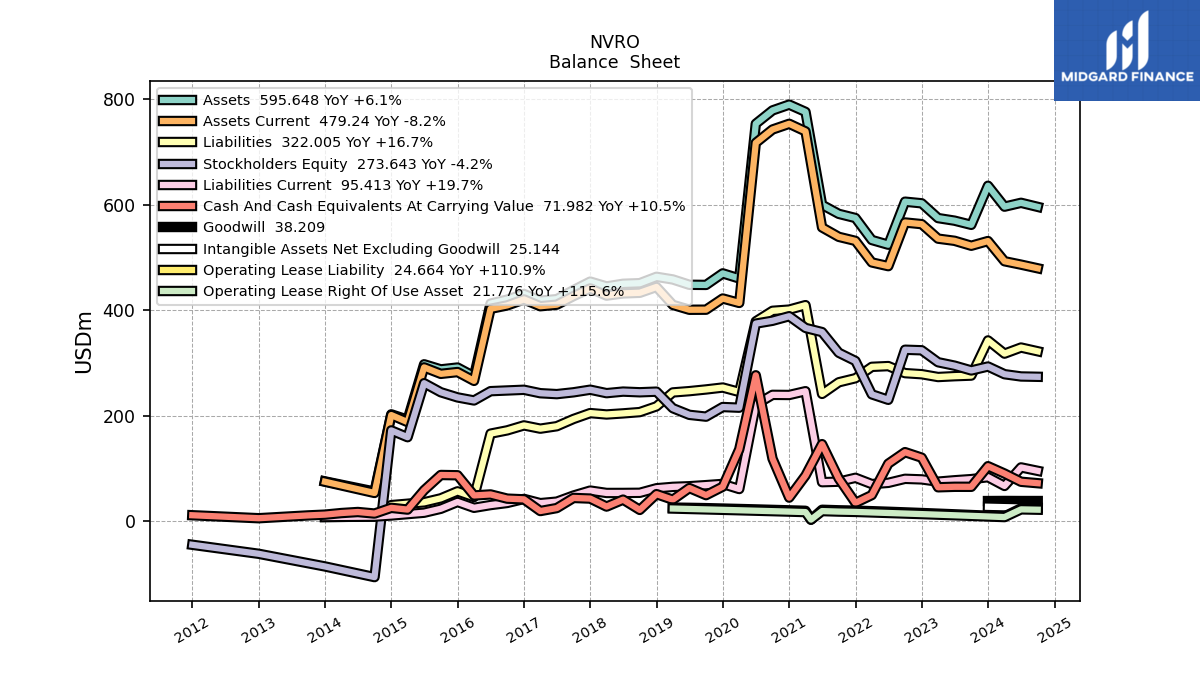
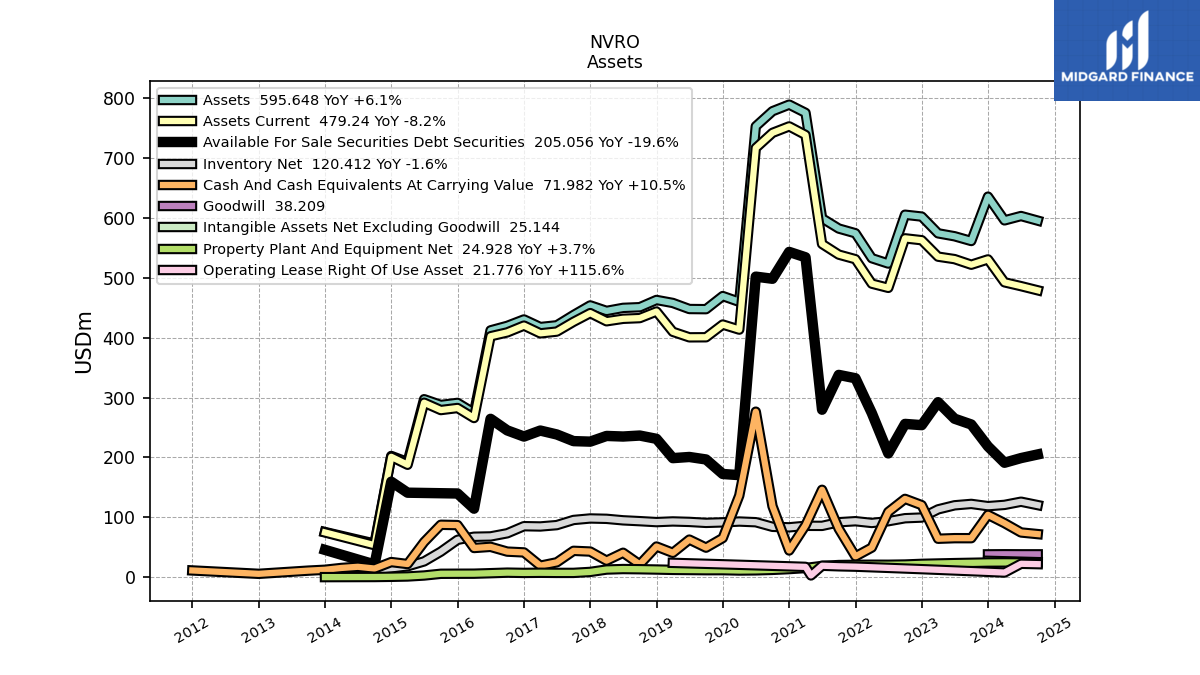
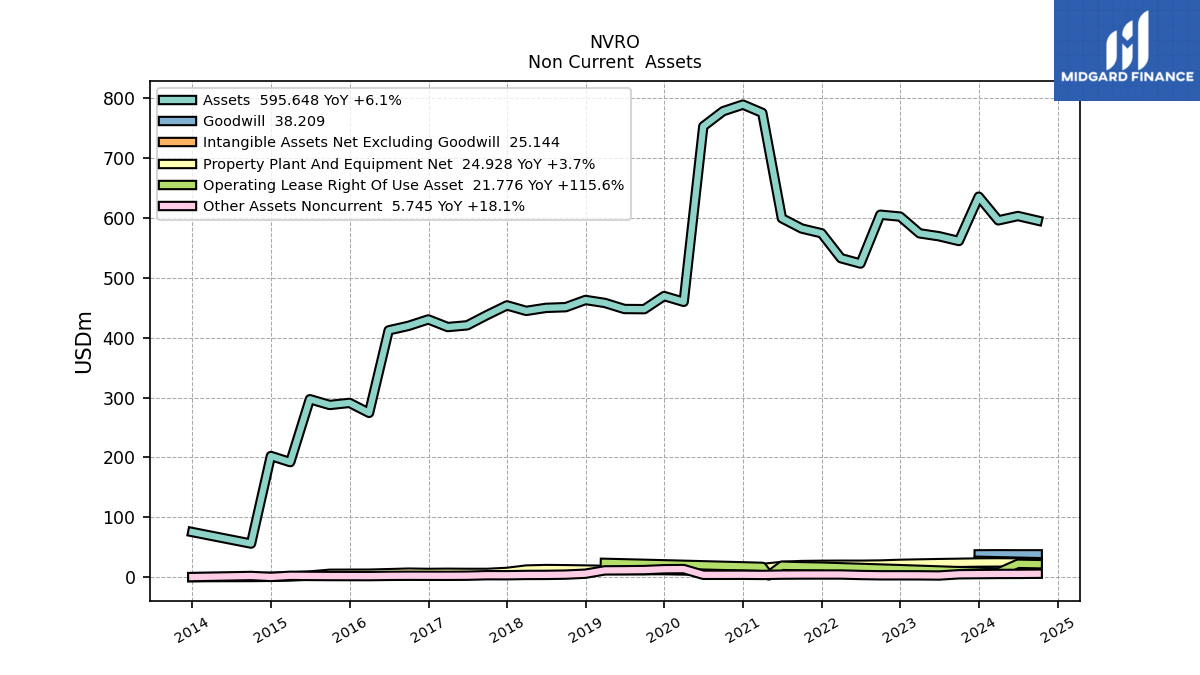
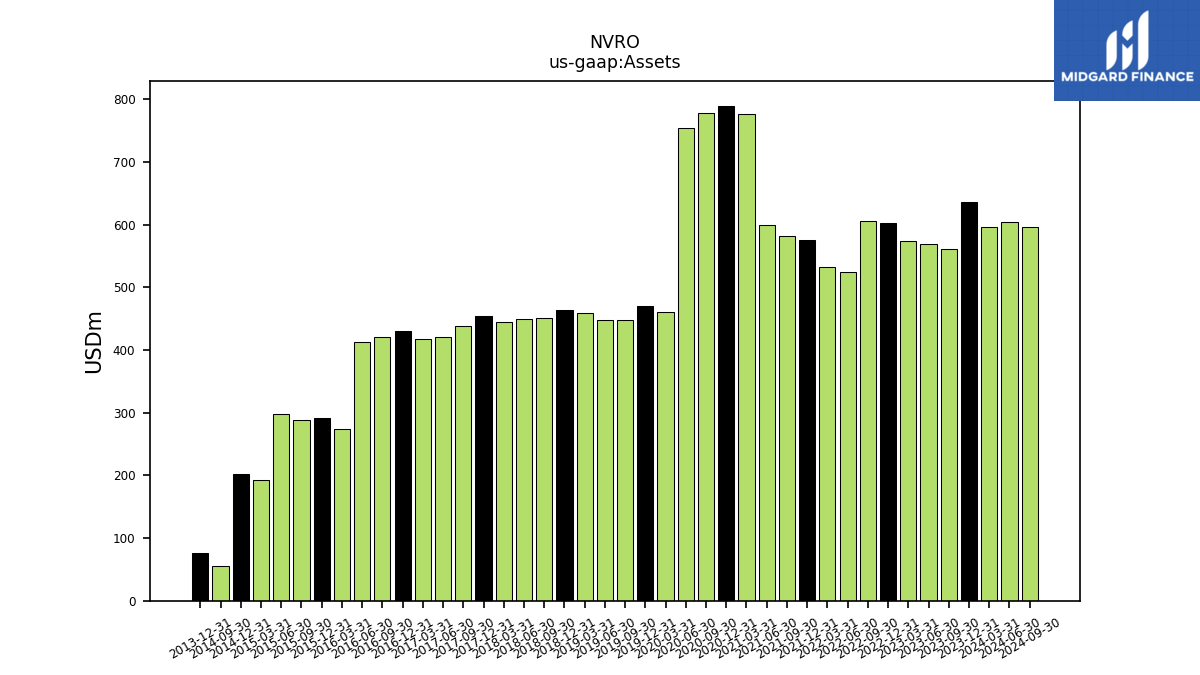
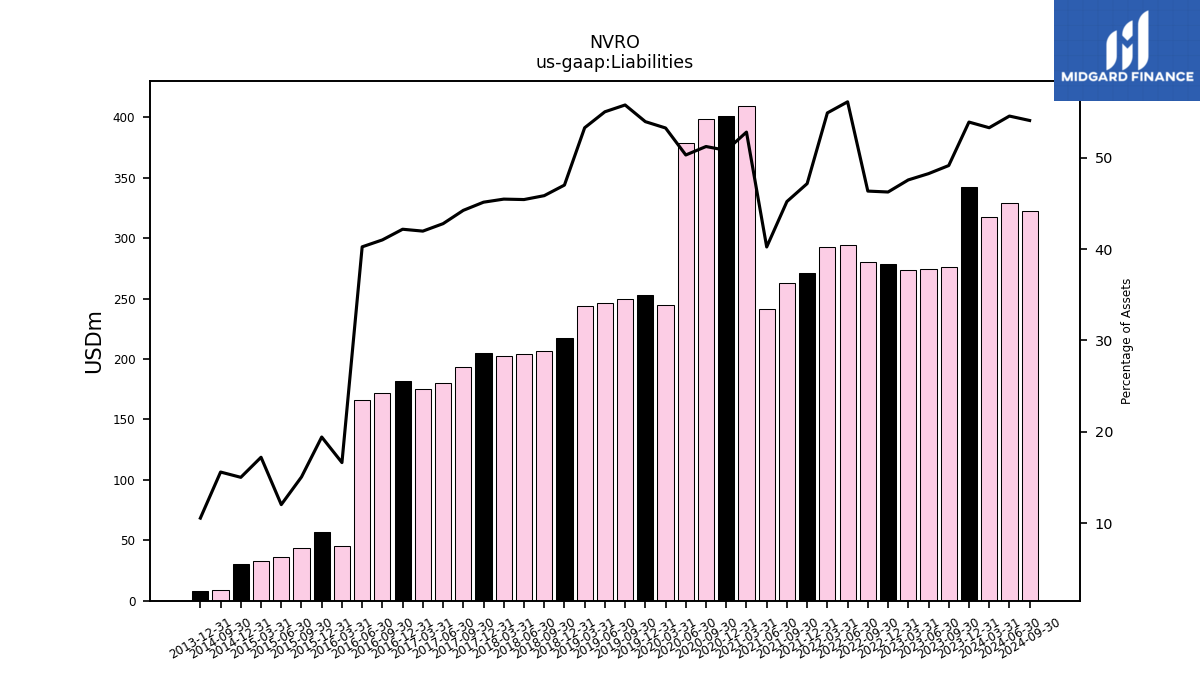
| Assets | 561.58 | 569.52 | 574.42 | 602.41 | 605.51 | 523.92 | 532.88 | 574.54 | 582.43 | 599.54 | 775.67 | 789.43 | 778.44 | 753.17 | 459.96 | 469.64 | 447.74 | 447.99 | 458.11 | 463.12 | 451.05 | 449.89 | 444.85 | 454.06 | 437.94 | 420.77 | 417.87 | 430.58 | 419.86 | 412.31 | 274.45 | 291.18 | 287.68 | 297.33 | 192.22 | 202.50 | 56.11 | NA | NA | 75.41 | NA | NA | NA | |
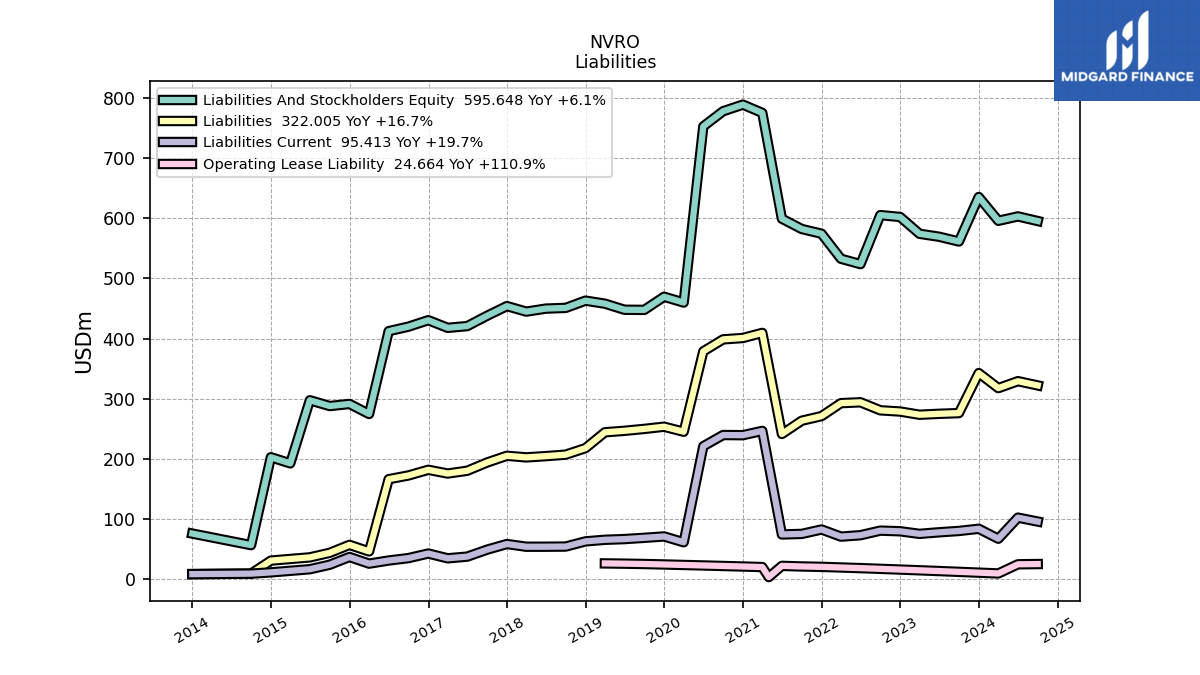
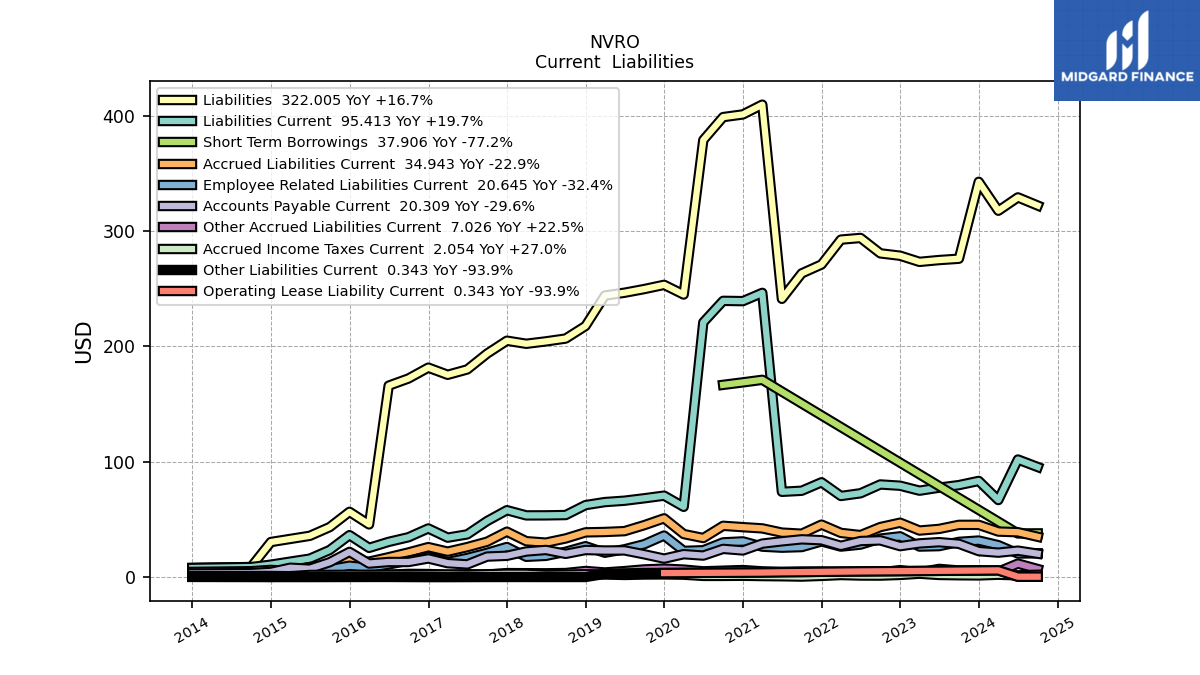
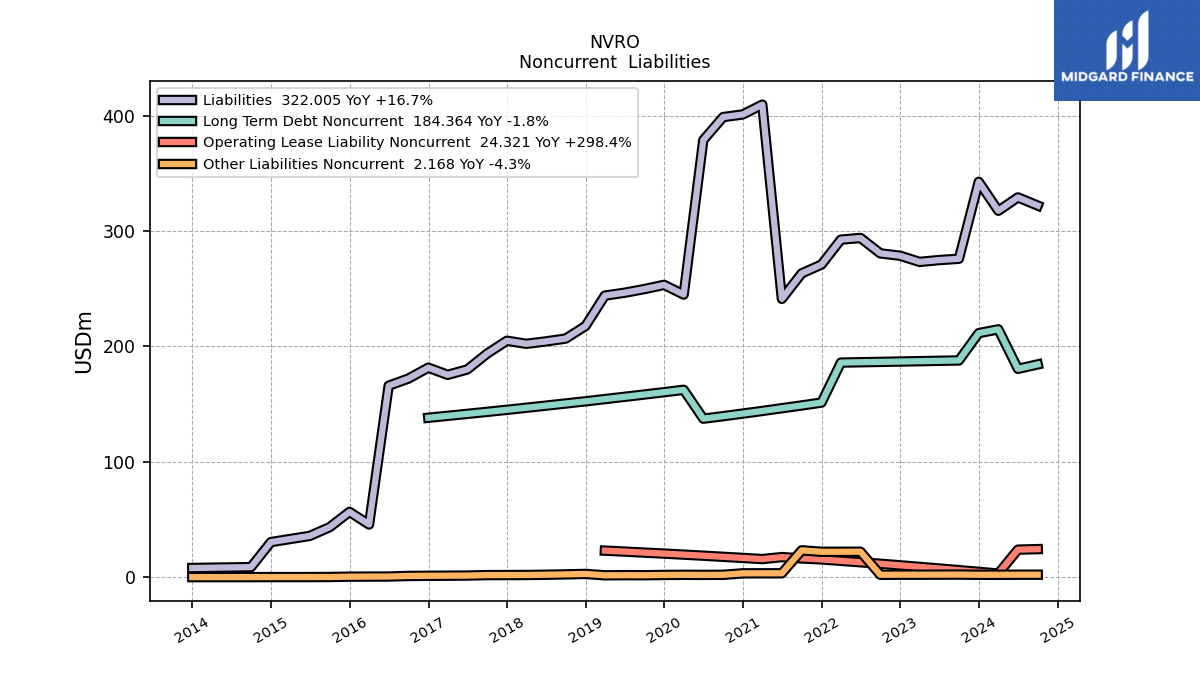
| Liabilities | 275.92 | 274.77 | 273.20 | 278.53 | 280.58 | 293.93 | 292.49 | 270.93 | 263.23 | 241.17 | 409.47 | 400.97 | 398.66 | 378.74 | 244.88 | 253.29 | 249.64 | 246.45 | 244.01 | 217.63 | 206.75 | 204.30 | 202.22 | 204.88 | 193.70 | 179.98 | 175.33 | 181.55 | 172.13 | 165.91 | 45.67 | 56.59 | 43.34 | 35.80 | 33.10 | 30.43 | 8.76 | NA | NA | 7.97 | NA | NA | NA | |
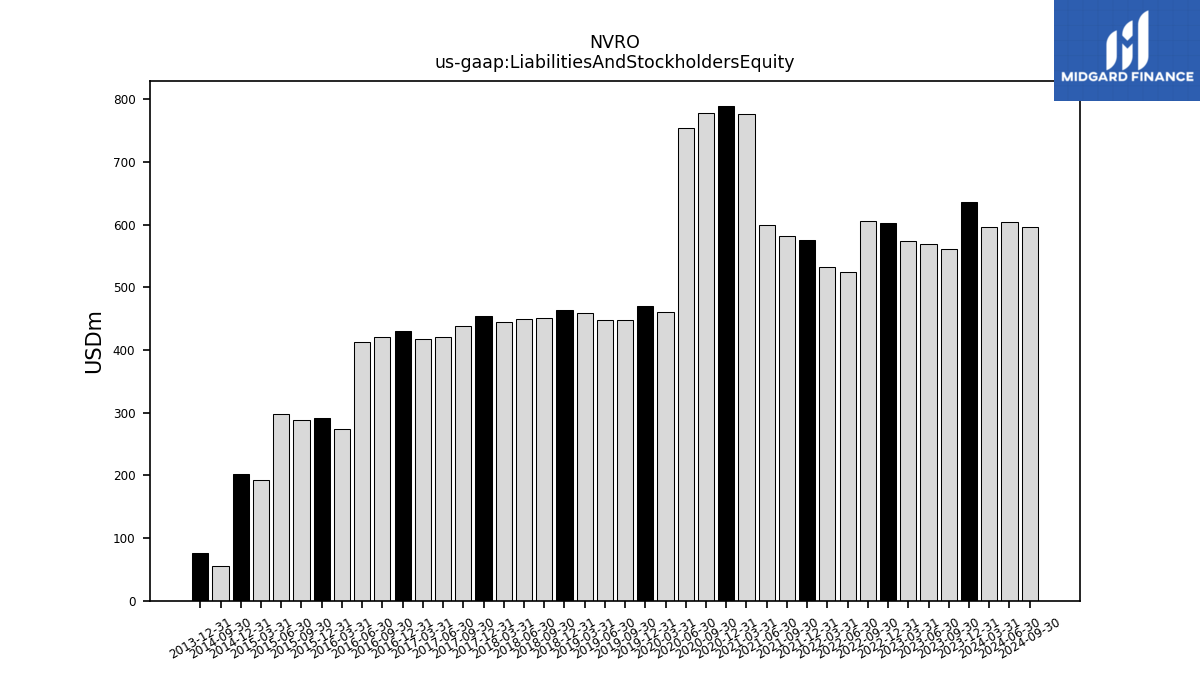
| Liabilities And Stockholders Equity | 561.58 | 569.52 | 574.42 | 602.41 | 605.51 | 523.92 | 532.88 | 574.54 | 582.43 | 599.54 | 775.67 | 789.43 | 778.44 | 753.17 | 459.96 | 469.64 | 447.74 | 447.99 | 458.11 | 463.12 | 451.05 | 449.89 | 444.85 | 454.06 | 437.94 | 420.77 | 417.87 | 430.58 | 419.86 | 412.31 | 274.45 | 291.18 | 287.68 | 297.33 | 192.22 | 202.50 | 56.11 | NA | NA | 75.41 | NA | NA | NA | |
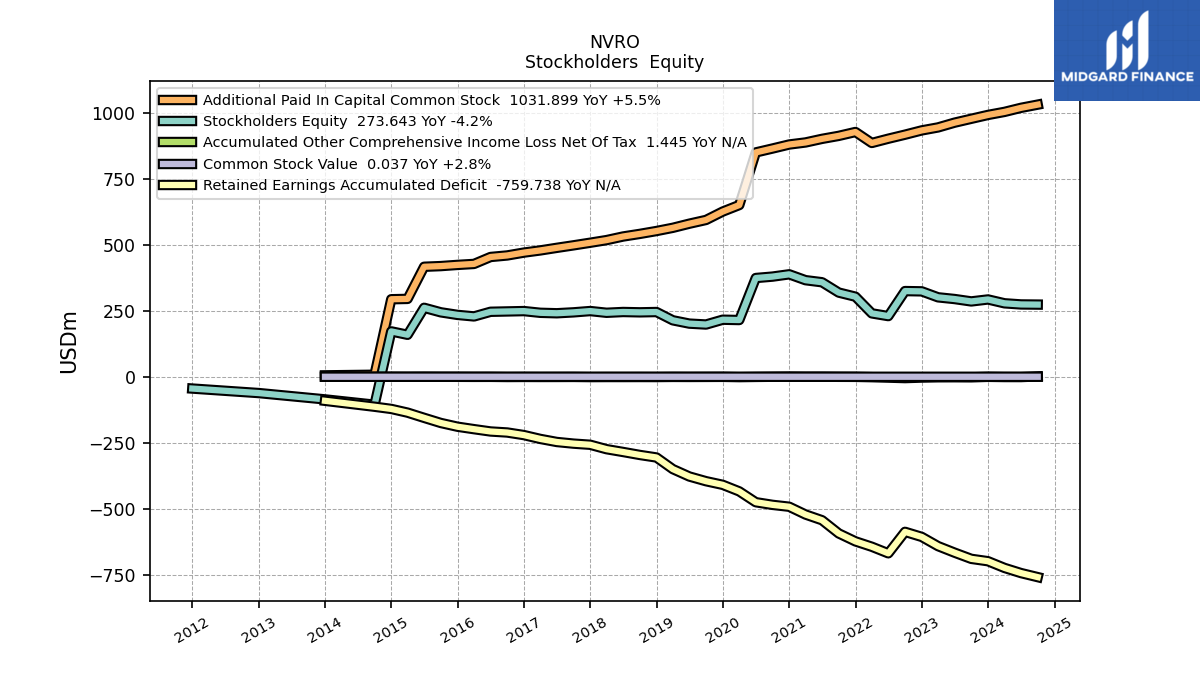
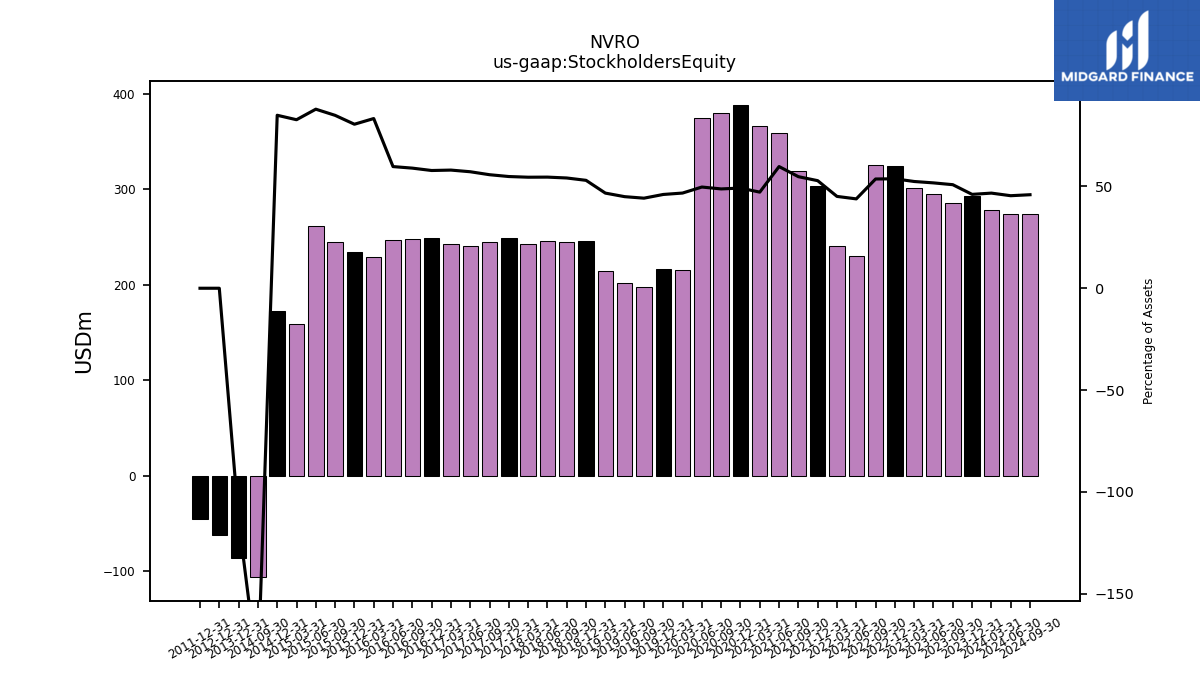
| Stockholders Equity | 285.67 | 294.75 | 301.23 | 323.88 | 324.94 | 229.99 | 240.39 | 303.62 | 319.20 | 358.38 | 366.20 | 388.46 | 379.78 | 374.43 | 215.08 | 216.35 | 198.10 | 201.54 | 214.10 | 245.48 | 244.30 | 245.59 | 242.62 | 249.17 | 244.24 | 240.79 | 242.53 | 249.03 | 247.73 | 246.40 | 228.78 | 234.59 | 244.34 | 261.53 | 159.12 | 172.07 | -106.01 | NA | NA | -85.79 | NA | NA | NA |
| 2023-09-30 | 2023-06-30 | 2023-03-31 | 2022-12-31 | 2022-09-30 | 2022-06-30 | 2022-03-31 | 2021-12-31 | 2021-09-30 | 2021-06-30 | 2021-03-31 | 2020-12-31 | 2020-09-30 | 2020-06-30 | 2020-03-31 | 2019-12-31 | 2019-09-30 | 2019-06-30 | 2019-03-31 | 2018-12-31 | 2018-09-30 | 2018-06-30 | 2018-03-31 | 2017-12-31 | 2017-09-30 | 2017-06-30 | 2017-03-31 | 2016-12-31 | 2016-09-30 | 2016-06-30 | 2016-03-31 | 2015-12-31 | 2015-09-30 | 2015-06-30 | 2015-03-31 | 2014-12-31 | 2014-09-30 | 2014-06-30 | 2014-03-31 | 2013-12-31 | 2013-09-30 | 2013-06-30 | 2013-03-31 | ||
|---|---|---|---|---|---|---|---|---|---|---|---|---|---|---|---|---|---|---|---|---|---|---|---|---|---|---|---|---|---|---|---|---|---|---|---|---|---|---|---|---|---|---|---|---|
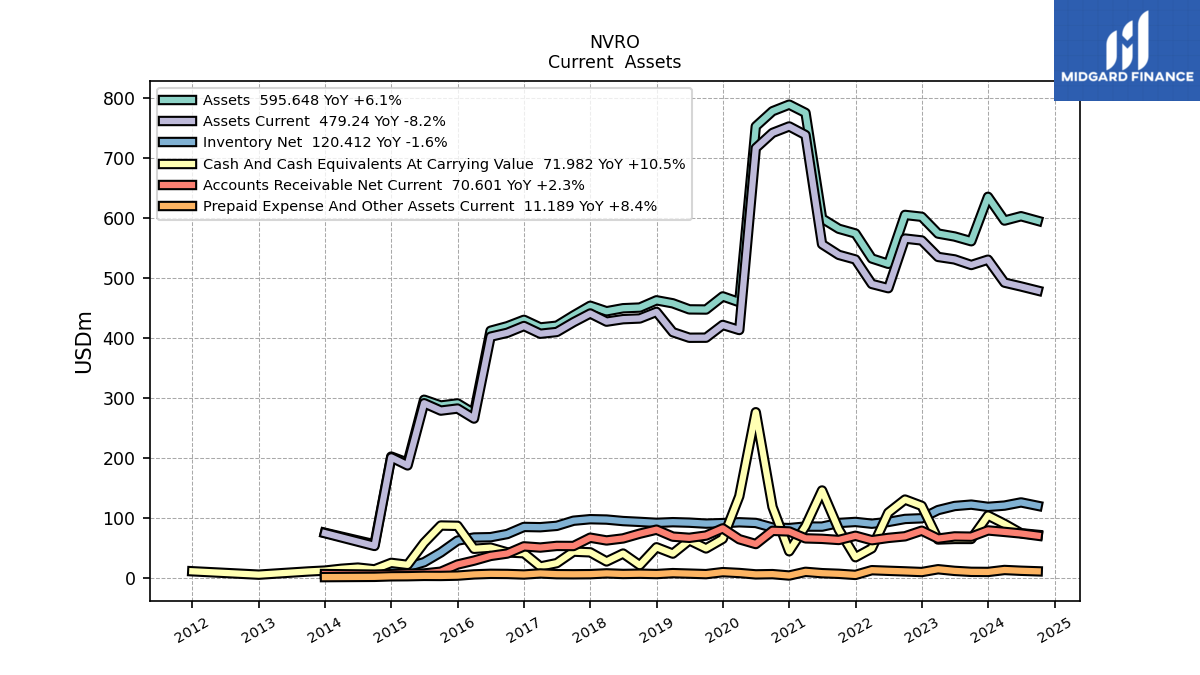
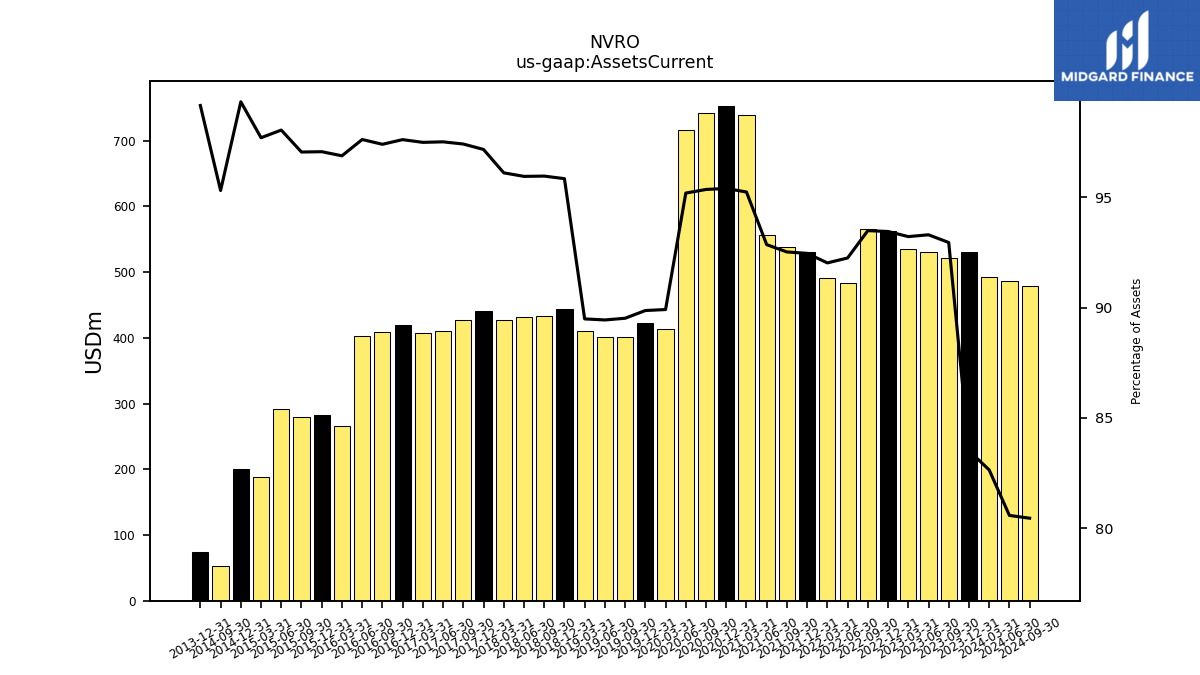
| Assets Current | 521.98 | 531.35 | 535.46 | 562.94 | 566.07 | 483.30 | 490.38 | 531.20 | 538.87 | 556.68 | 738.72 | 753.11 | 742.26 | 716.94 | 413.56 | 422.05 | 400.80 | 400.68 | 409.95 | 443.86 | 432.82 | 431.64 | 427.52 | 441.18 | 426.60 | 410.29 | 407.36 | 420.29 | 408.94 | 402.48 | 265.88 | 282.63 | 279.19 | 291.51 | 187.79 | 201.12 | 53.48 | NA | NA | 74.77 | NA | NA | NA | |
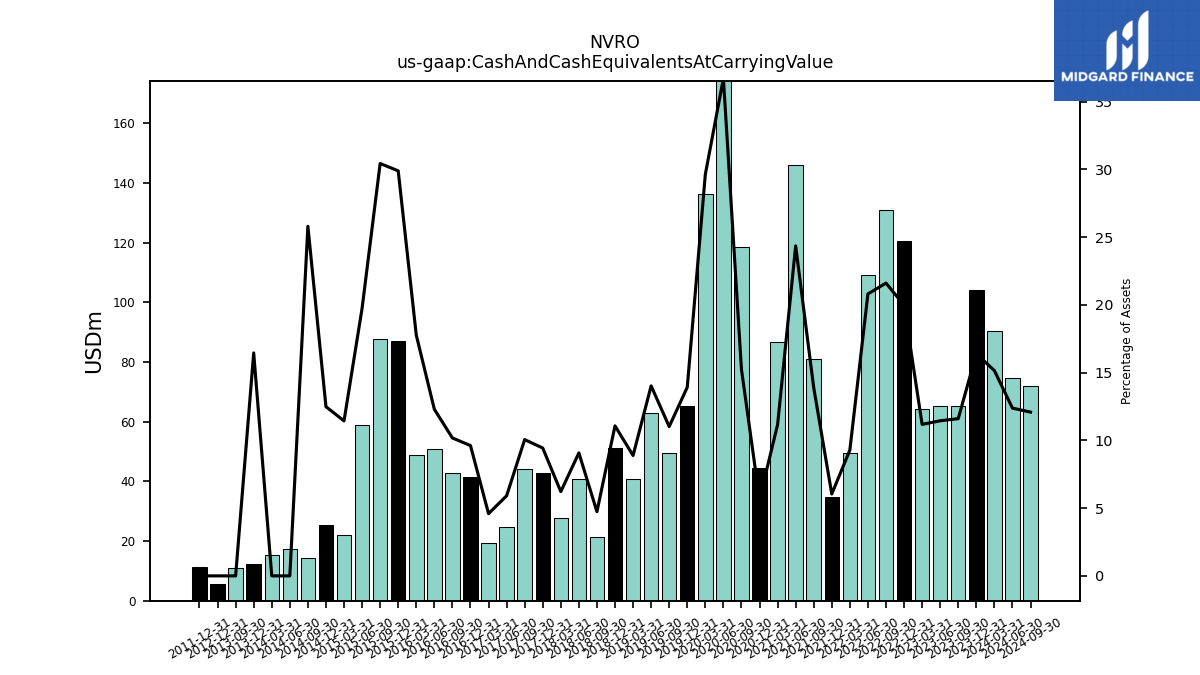
| Cash And Cash Equivalents At Carrying Value | 65.16 | 65.19 | 64.23 | 120.37 | 130.84 | 109.01 | 49.47 | 34.71 | 80.89 | 146.02 | 86.54 | 44.60 | 118.63 | 276.51 | 136.30 | 65.37 | 49.34 | 62.81 | 40.70 | 51.27 | 21.38 | 40.84 | 27.65 | 42.84 | 44.04 | 24.87 | 19.20 | 41.41 | 42.73 | 50.70 | 48.76 | 87.04 | 87.56 | 58.71 | 21.98 | 25.29 | 14.48 | 17.39 | 15.41 | 12.41 | 10.97 | NA | NA | |
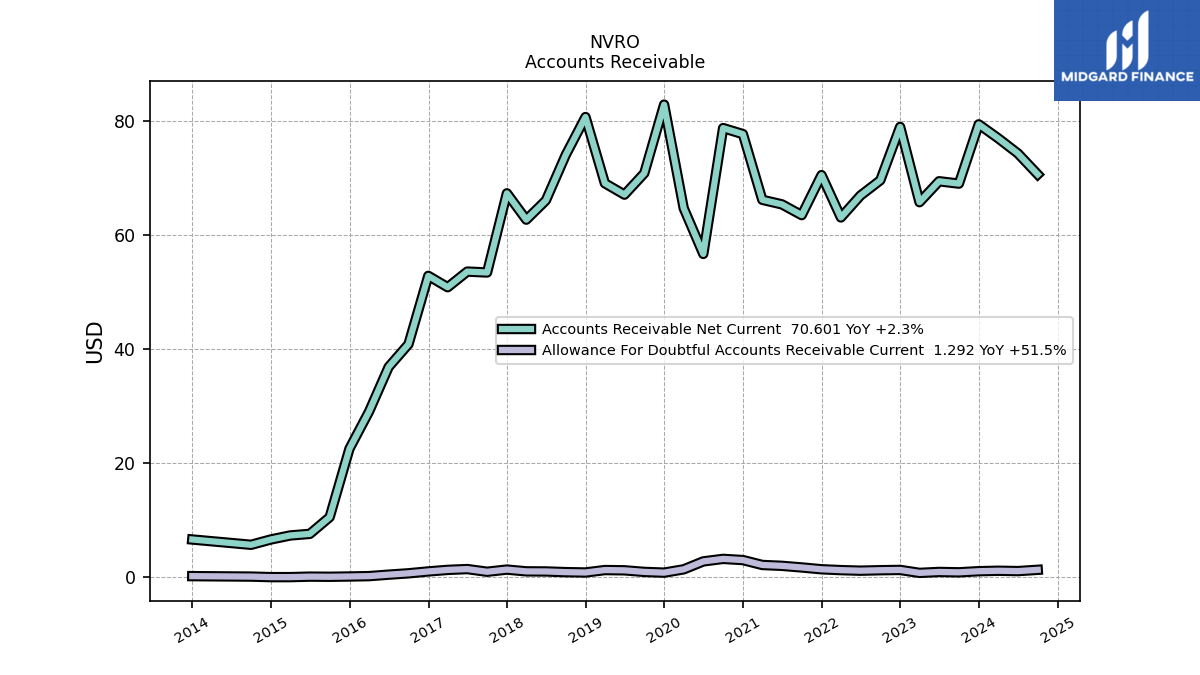
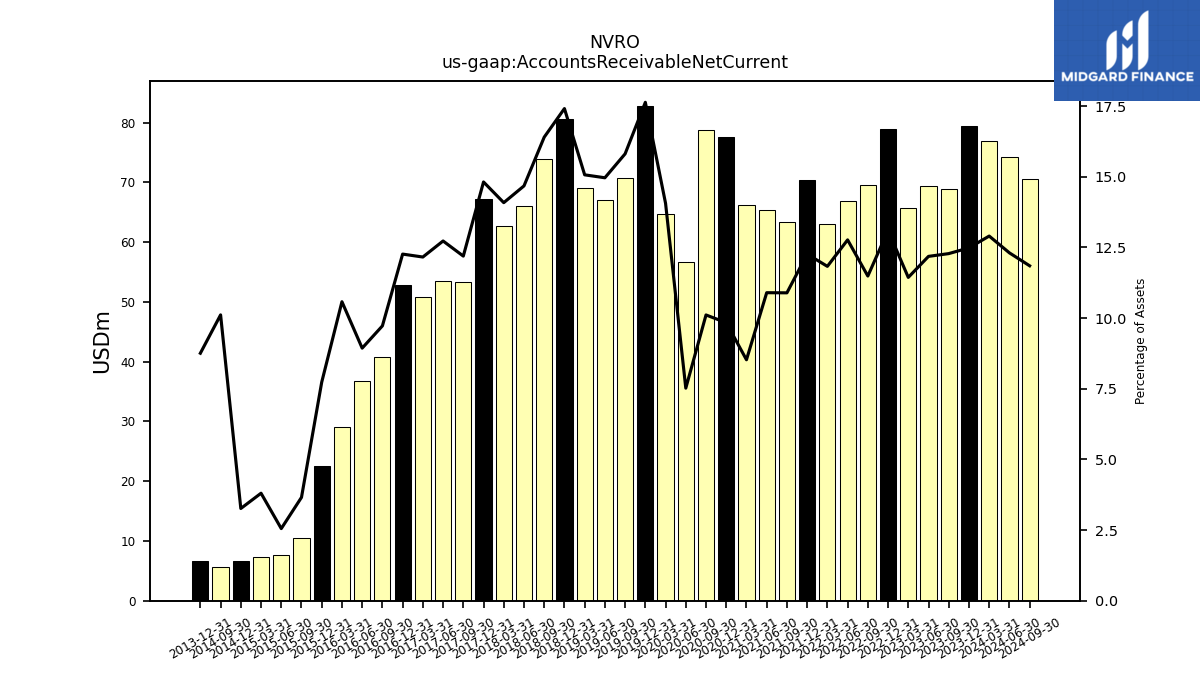
| Accounts Receivable Net Current | 68.98 | 69.40 | 65.72 | 78.93 | 69.57 | 66.90 | 63.05 | 70.47 | 63.46 | 65.35 | 66.15 | 77.67 | 78.72 | 56.66 | 64.68 | 82.83 | 70.81 | 67.05 | 69.04 | 80.66 | 73.99 | 66.04 | 62.66 | 67.29 | 53.41 | 53.57 | 50.82 | 52.82 | 40.84 | 36.85 | 29.04 | 22.52 | 10.53 | 7.59 | 7.31 | 6.61 | 5.68 | NA | NA | 6.61 | NA | NA | NA | |
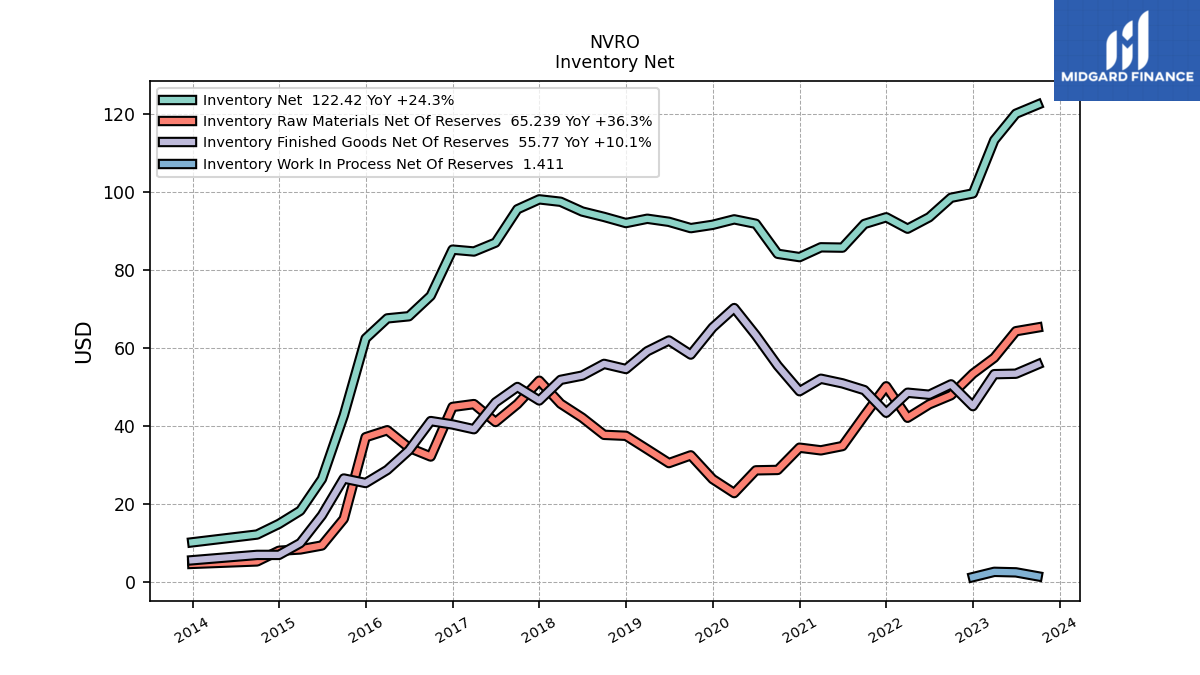
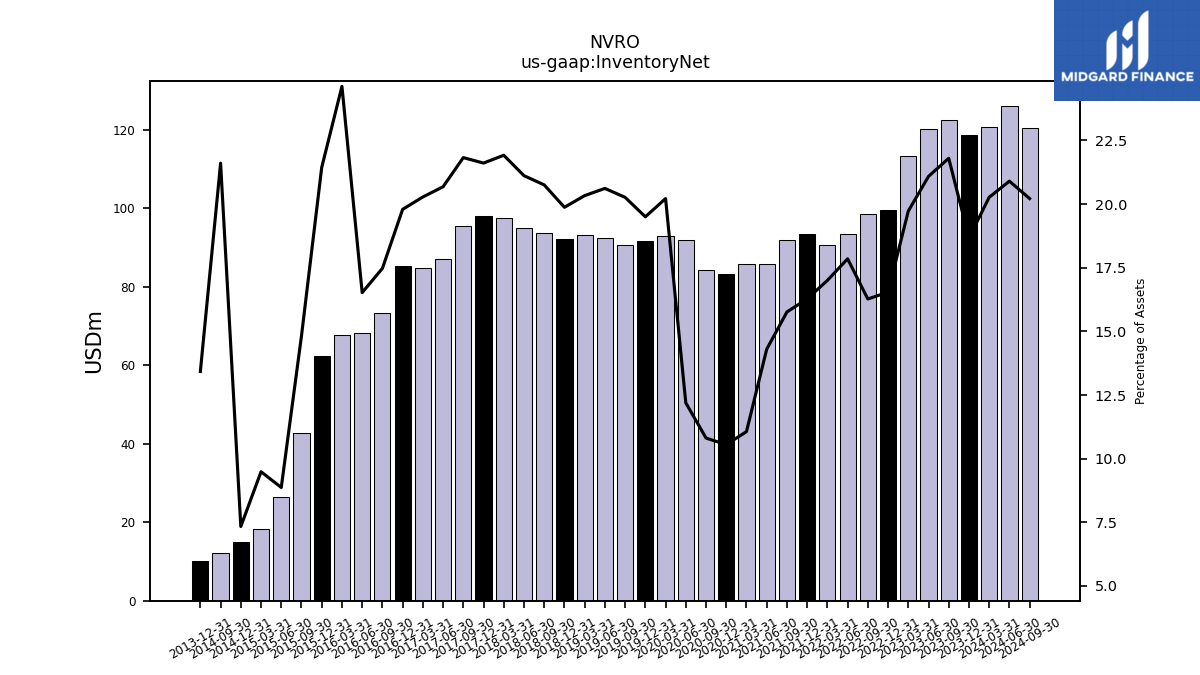
| Inventory Net | 122.42 | 120.09 | 113.29 | 99.64 | 98.53 | 93.52 | 90.59 | 93.52 | 91.80 | 85.73 | 85.81 | 83.30 | 84.15 | 91.85 | 92.98 | 91.58 | 90.73 | 92.35 | 93.14 | 92.03 | 93.61 | 94.99 | 97.50 | 98.12 | 95.58 | 87.02 | 84.73 | 85.22 | 73.37 | 68.12 | 67.58 | 62.43 | 42.65 | 26.37 | 18.24 | 14.86 | 12.12 | NA | NA | 10.12 | NA | NA | NA | |
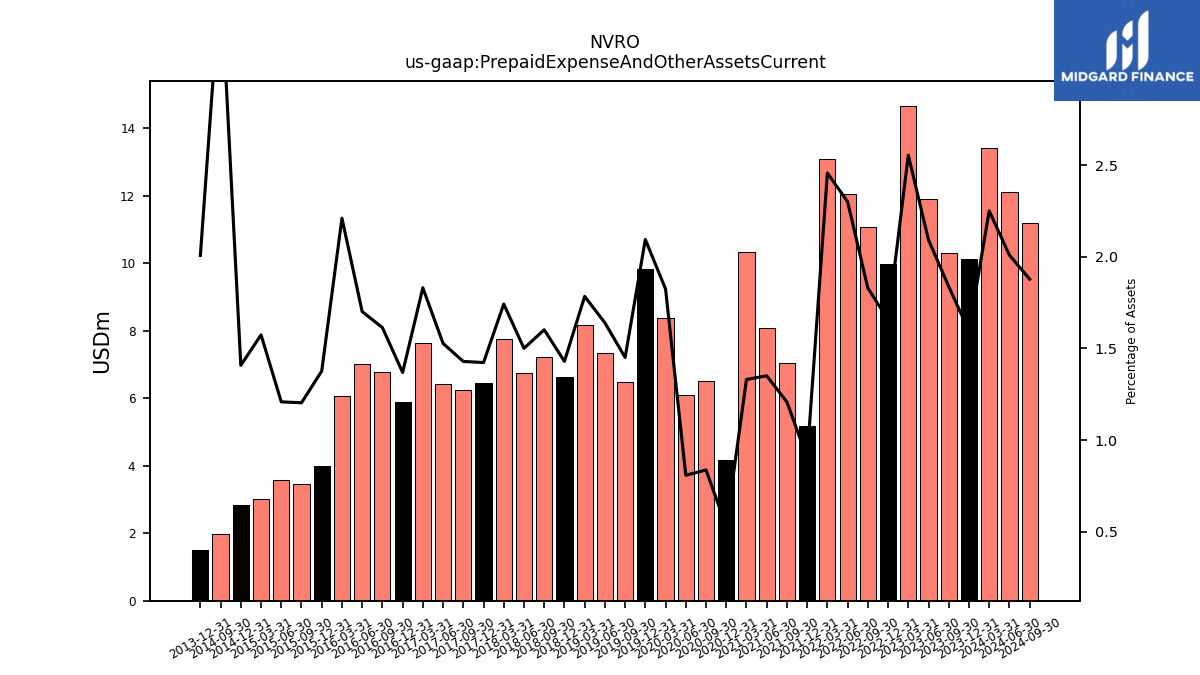
| Prepaid Expense And Other Assets Current | 10.32 | 11.92 | 14.67 | 9.98 | 11.08 | 12.06 | 13.10 | 5.18 | 7.04 | 8.10 | 10.32 | 4.17 | 6.52 | 6.09 | 8.39 | 9.84 | 6.50 | 7.35 | 8.17 | 6.62 | 7.23 | 6.75 | 7.75 | 6.46 | 6.26 | 6.43 | 7.65 | 5.89 | 6.78 | 7.01 | 6.07 | 4.01 | 3.46 | 3.59 | 3.03 | 2.85 | 1.99 | NA | NA | 1.51 | NA | NA | NA | |
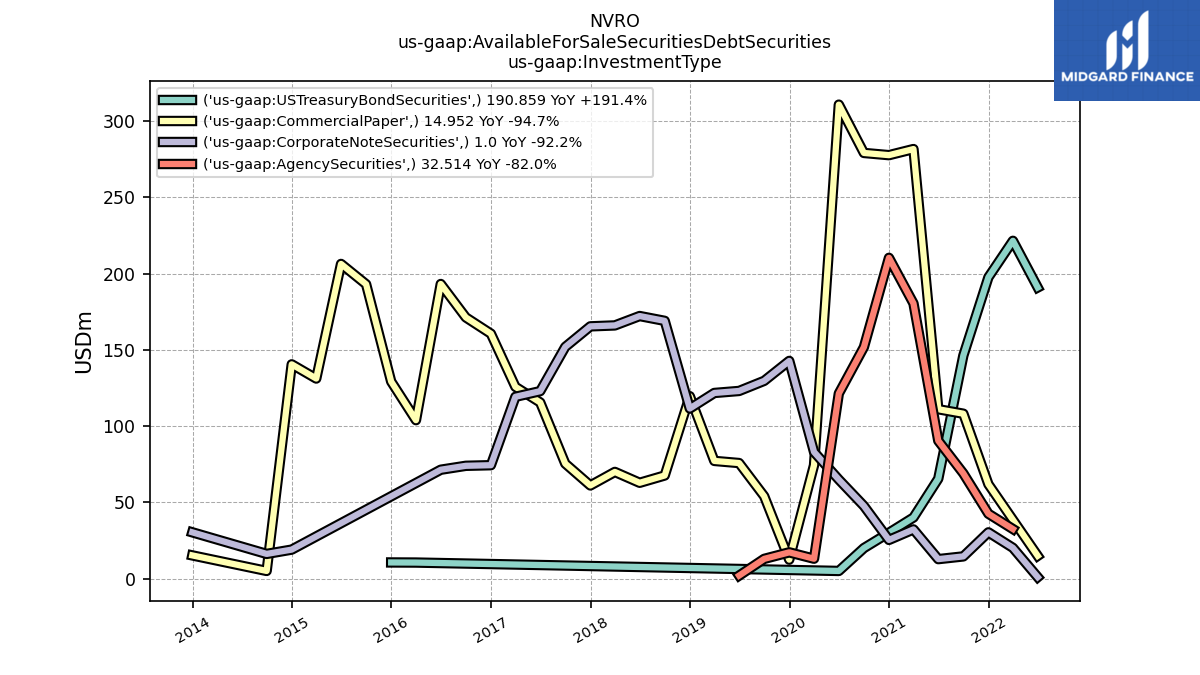
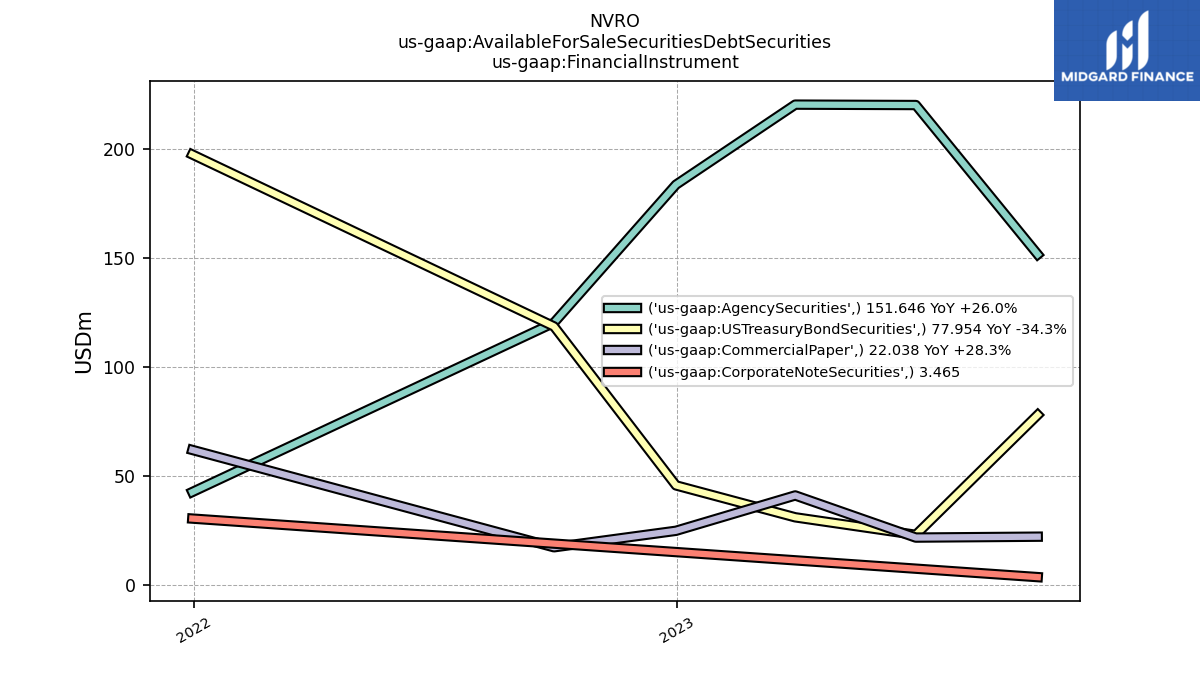
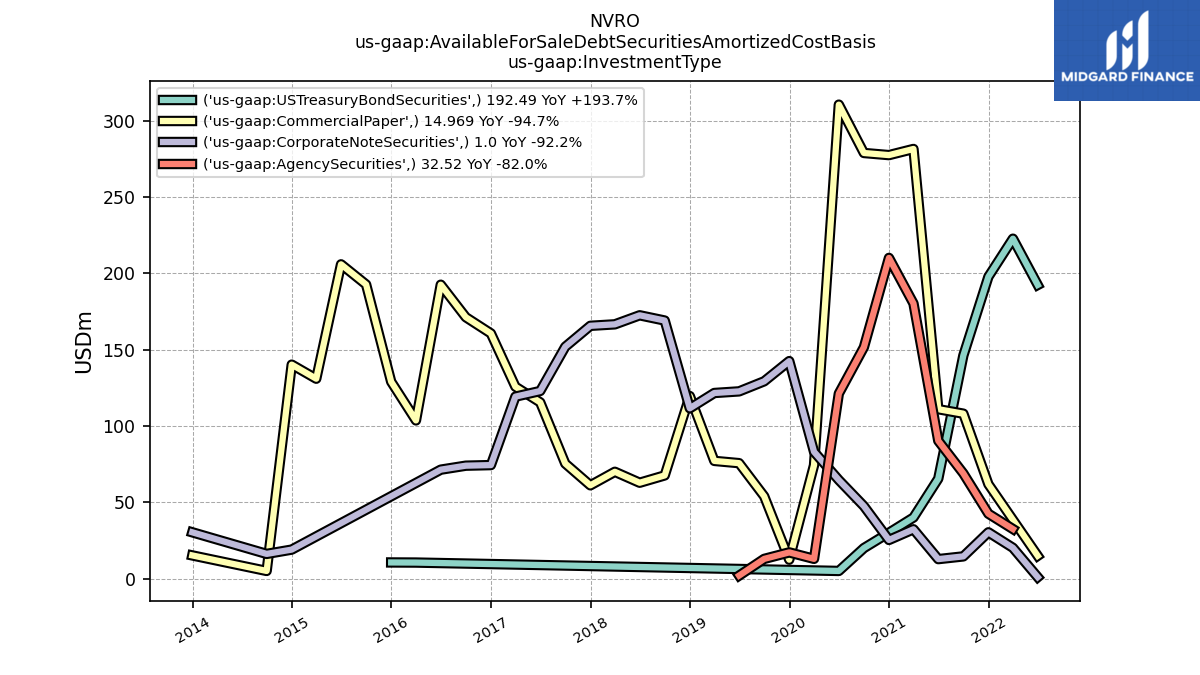
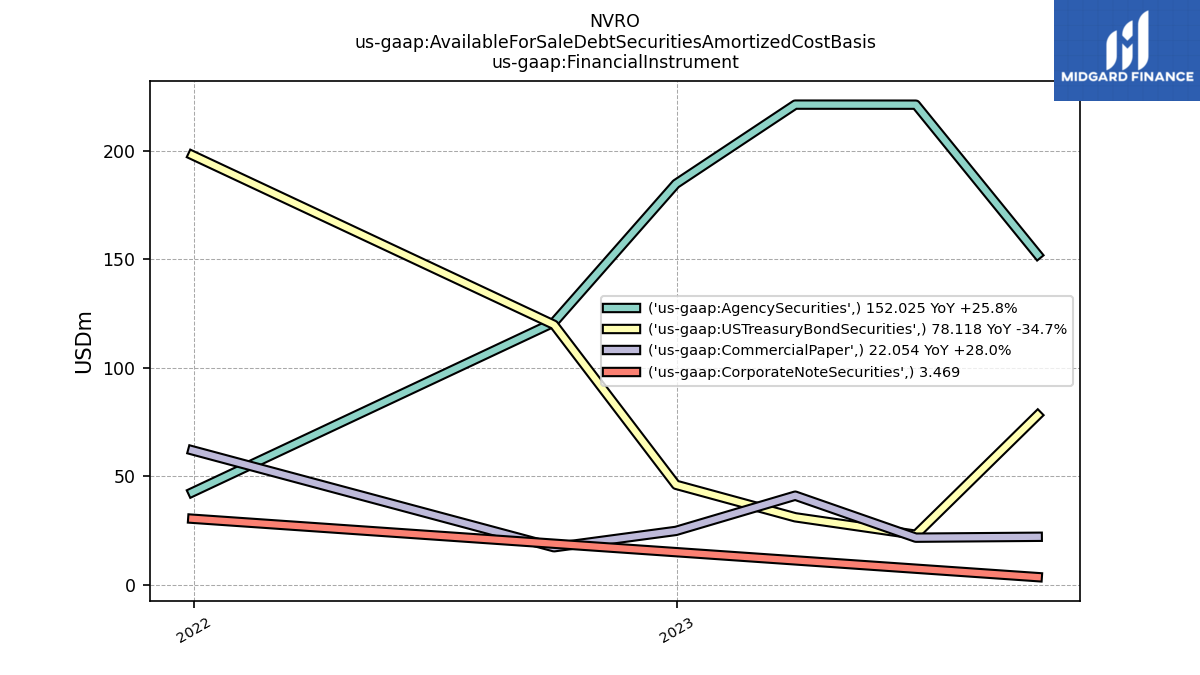
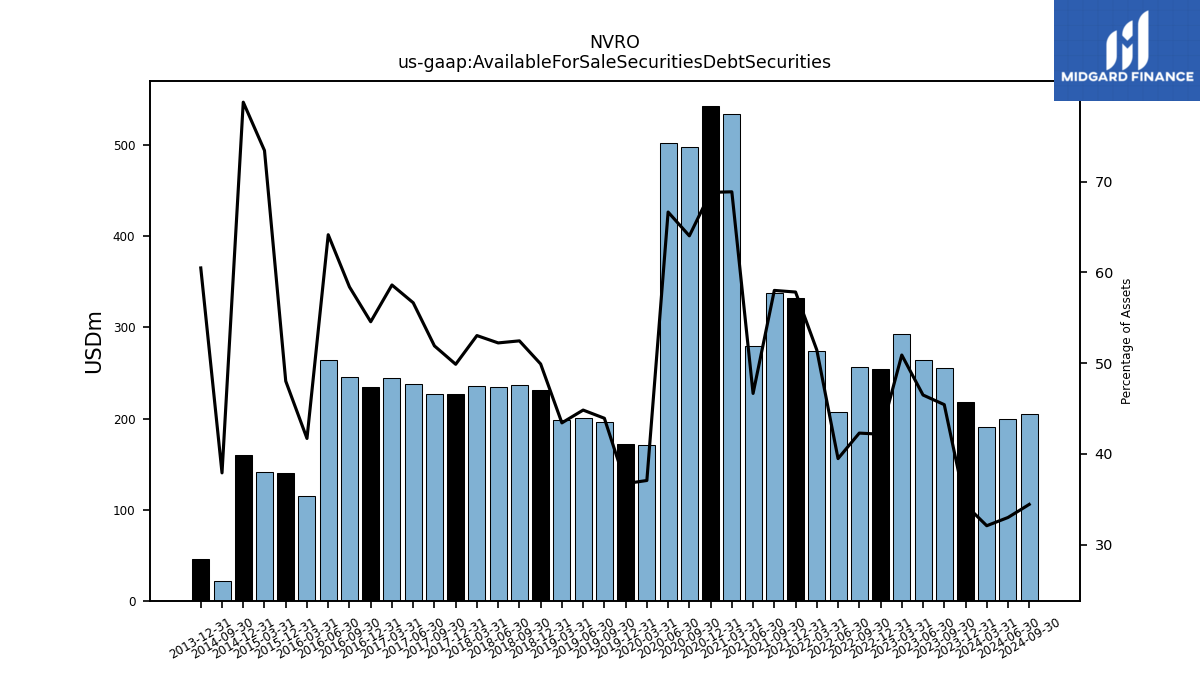
| Available For Sale Securities Debt Securities | 255.10 | 264.76 | 292.35 | 254.01 | 256.06 | 206.81 | 274.17 | 332.32 | 337.93 | 279.75 | 534.39 | 543.37 | 498.51 | 502.07 | 170.47 | 172.43 | 196.66 | 200.82 | 198.89 | 231.13 | 236.62 | 234.99 | 235.96 | 226.47 | 227.31 | 238.41 | 244.95 | 234.95 | 245.23 | 264.55 | 114.44 | 139.82 | NA | NA | 141.17 | 159.52 | 21.27 | NA | NA | 45.62 | NA | NA | NA |
| 2023-09-30 | 2023-06-30 | 2023-03-31 | 2022-12-31 | 2022-09-30 | 2022-06-30 | 2022-03-31 | 2021-12-31 | 2021-09-30 | 2021-06-30 | 2021-03-31 | 2020-12-31 | 2020-09-30 | 2020-06-30 | 2020-03-31 | 2019-12-31 | 2019-09-30 | 2019-06-30 | 2019-03-31 | 2018-12-31 | 2018-09-30 | 2018-06-30 | 2018-03-31 | 2017-12-31 | 2017-09-30 | 2017-06-30 | 2017-03-31 | 2016-12-31 | 2016-09-30 | 2016-06-30 | 2016-03-31 | 2015-12-31 | 2015-09-30 | 2015-06-30 | 2015-03-31 | 2014-12-31 | 2014-09-30 | 2014-06-30 | 2014-03-31 | 2013-12-31 | 2013-09-30 | 2013-06-30 | 2013-03-31 | ||
|---|---|---|---|---|---|---|---|---|---|---|---|---|---|---|---|---|---|---|---|---|---|---|---|---|---|---|---|---|---|---|---|---|---|---|---|---|---|---|---|---|---|---|---|---|
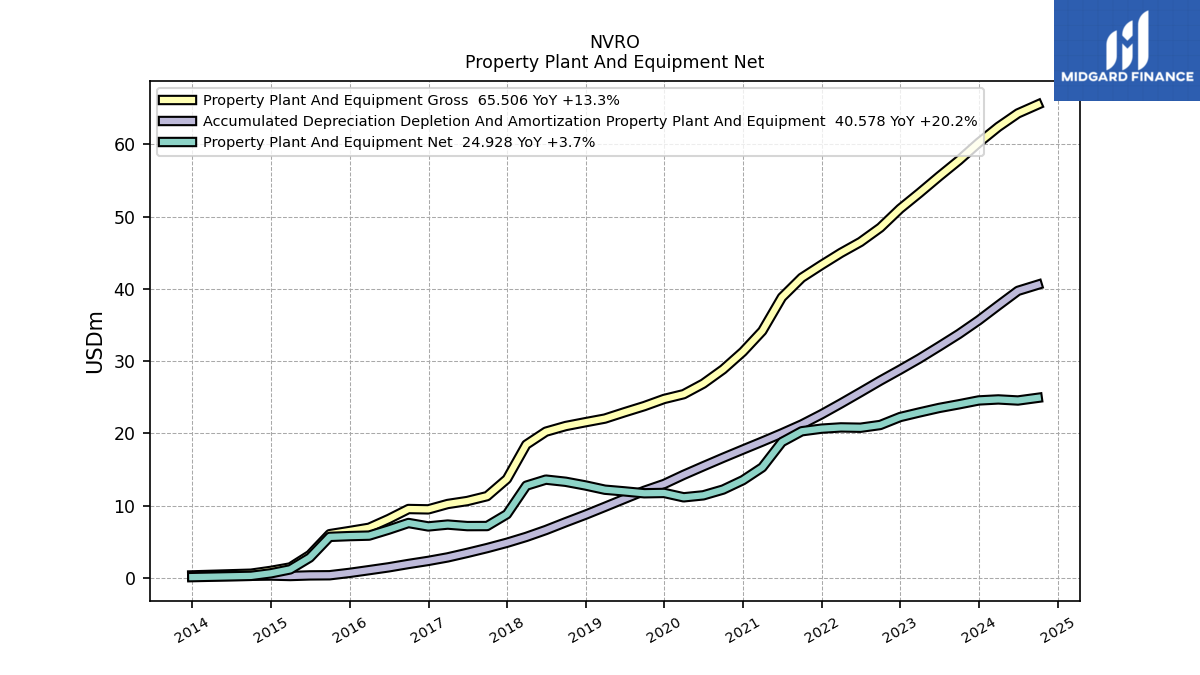
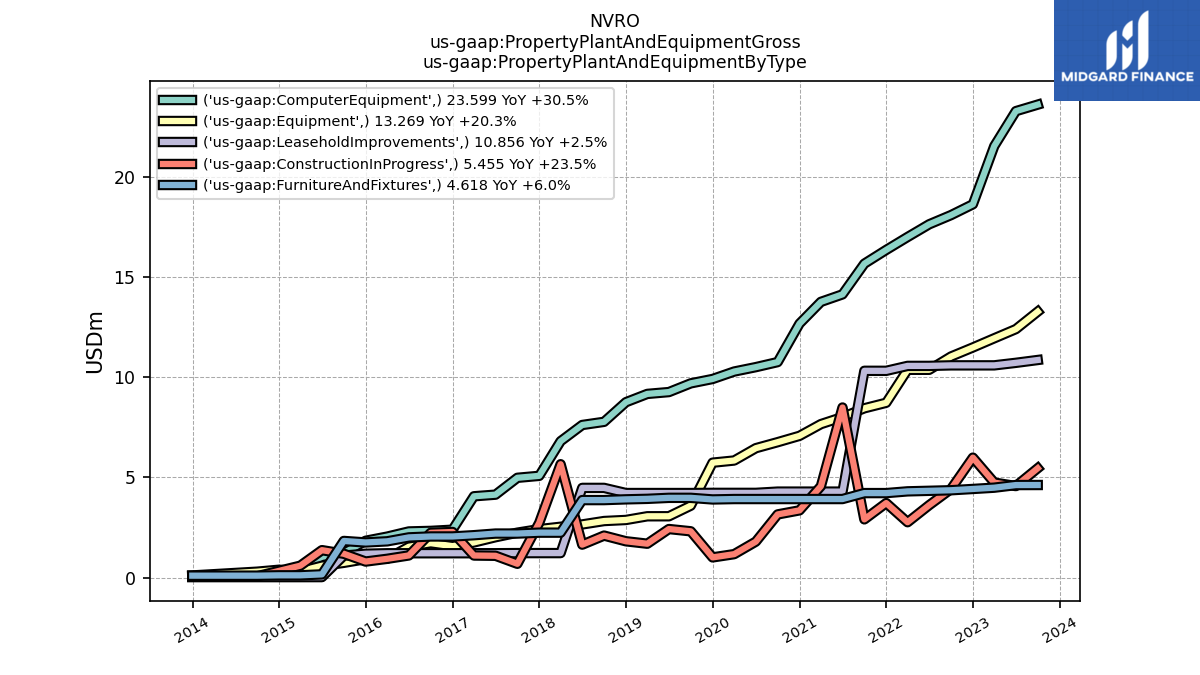
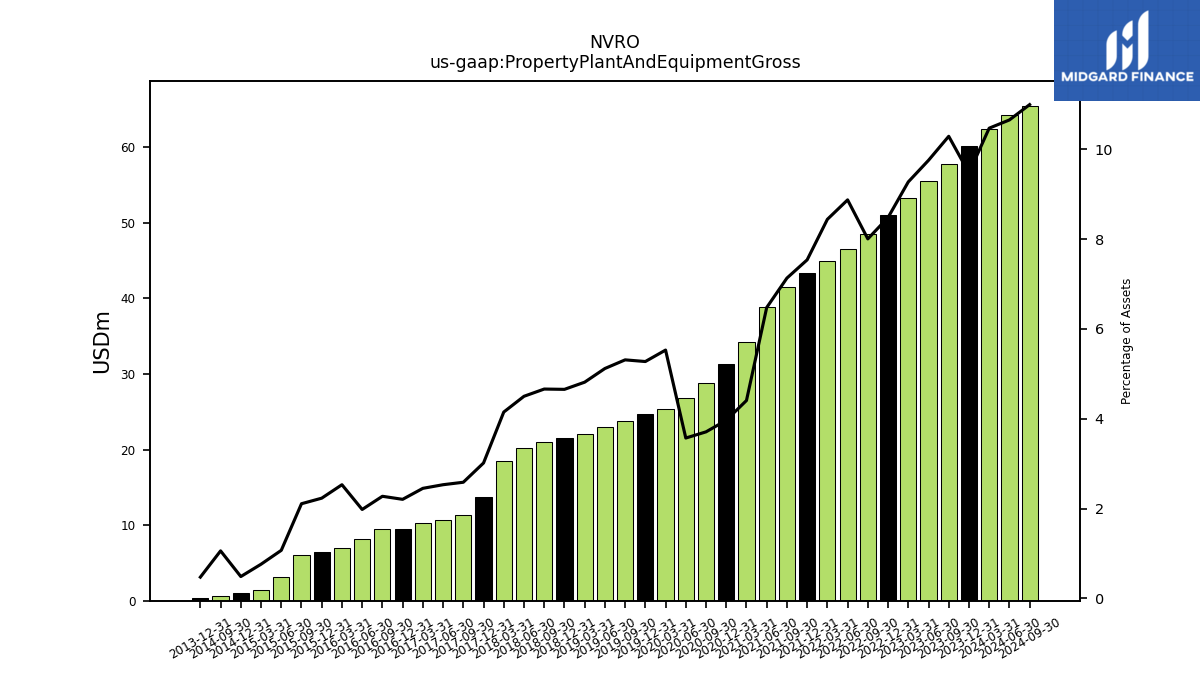
| Property Plant And Equipment Gross | 57.80 | 55.57 | 53.28 | 51.10 | 48.48 | 46.50 | 44.99 | 43.32 | 41.55 | 38.84 | 34.18 | 31.30 | 28.87 | 26.89 | 25.43 | 24.77 | 23.78 | 22.93 | 22.06 | 21.56 | 21.03 | 20.25 | 18.46 | 13.69 | 11.32 | 10.65 | 10.24 | 9.49 | 9.54 | 8.16 | 6.95 | 6.50 | 6.06 | 3.18 | 1.46 | 0.98 | 0.59 | NA | NA | 0.36 | NA | NA | NA | |
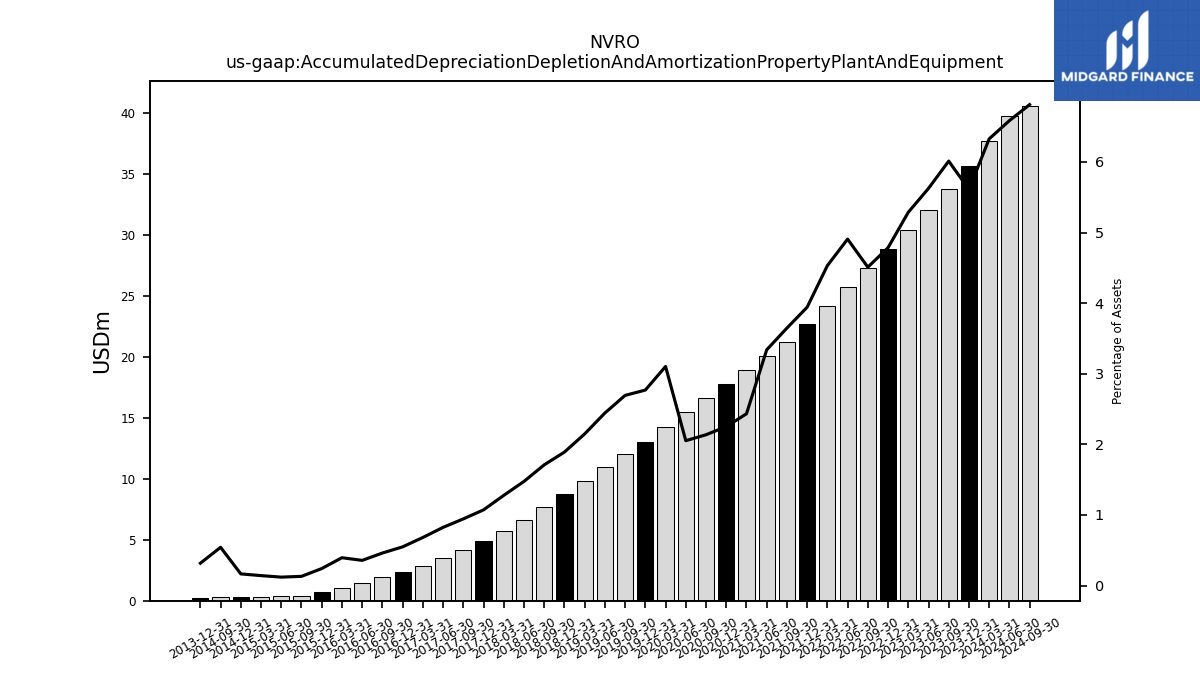
| Accumulated Depreciation Depletion And Amortization Property Plant And Equipment | 33.77 | 32.04 | 30.37 | 28.83 | 27.31 | 25.71 | 24.15 | 22.66 | 21.24 | 20.02 | 18.88 | 17.77 | 16.63 | 15.46 | 14.27 | 13.01 | 12.06 | 10.95 | 9.84 | 8.76 | 7.71 | 6.64 | 5.68 | 4.87 | 4.14 | 3.47 | 2.85 | 2.36 | 1.94 | 1.47 | 1.08 | 0.70 | 0.38 | 0.36 | 0.27 | 0.34 | 0.30 | NA | NA | 0.24 | NA | NA | NA | |
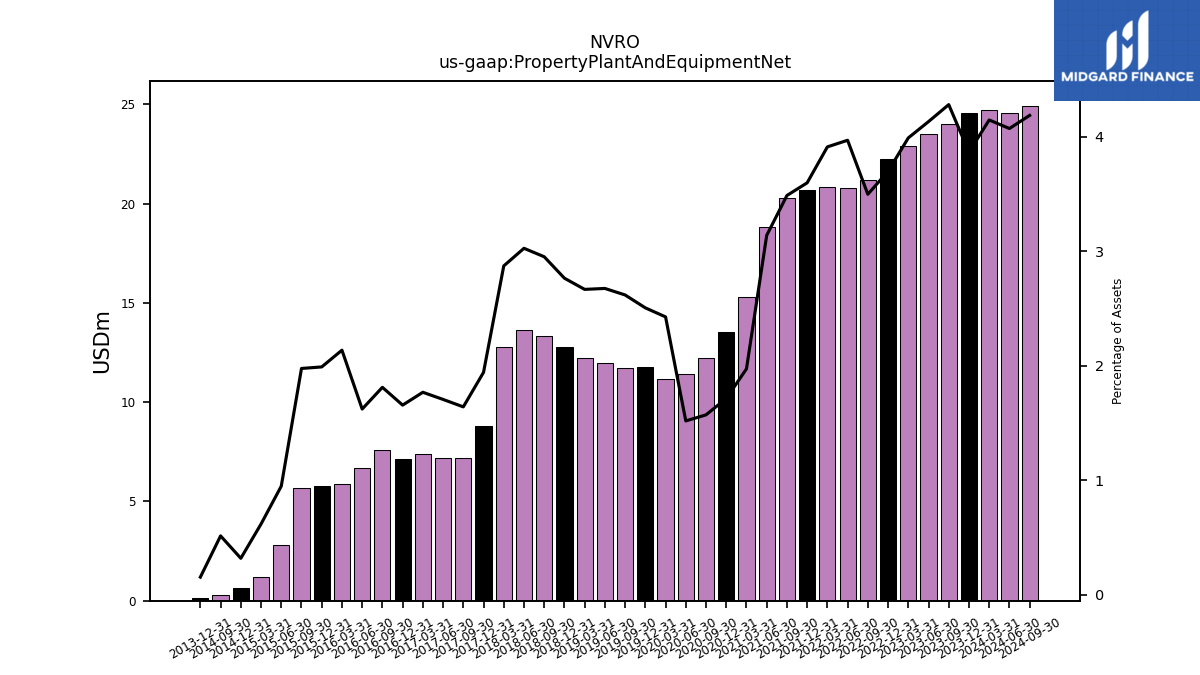
| Property Plant And Equipment Net | 24.03 | 23.53 | 22.91 | 22.27 | 21.17 | 20.79 | 20.84 | 20.66 | 20.30 | 18.81 | 15.30 | 13.53 | 12.23 | 11.44 | 11.16 | 11.77 | 11.72 | 11.98 | 12.22 | 12.80 | 13.31 | 13.61 | 12.77 | 8.82 | 7.19 | 7.18 | 7.39 | 7.13 | 7.61 | 6.69 | 5.86 | 5.79 | 5.69 | 2.82 | 1.19 | 0.65 | 0.29 | NA | NA | 0.12 | NA | NA | NA | |
| Other Assets Noncurrent | 4.86 | 2.81 | 3.11 | 3.16 | 3.16 | 3.67 | 4.49 | 4.49 | 4.46 | 4.28 | 3.79 | 4.04 | 3.98 | 3.98 | 13.58 | 13.34 | 11.91 | 11.57 | 11.39 | 5.85 | 4.32 | 3.83 | 3.74 | 3.25 | 3.35 | 2.49 | 2.31 | 2.35 | 2.41 | 2.24 | 1.80 | 1.85 | 1.90 | 2.09 | 2.33 | 0.42 | 2.04 | NA | NA | 0.22 | NA | NA | NA | |
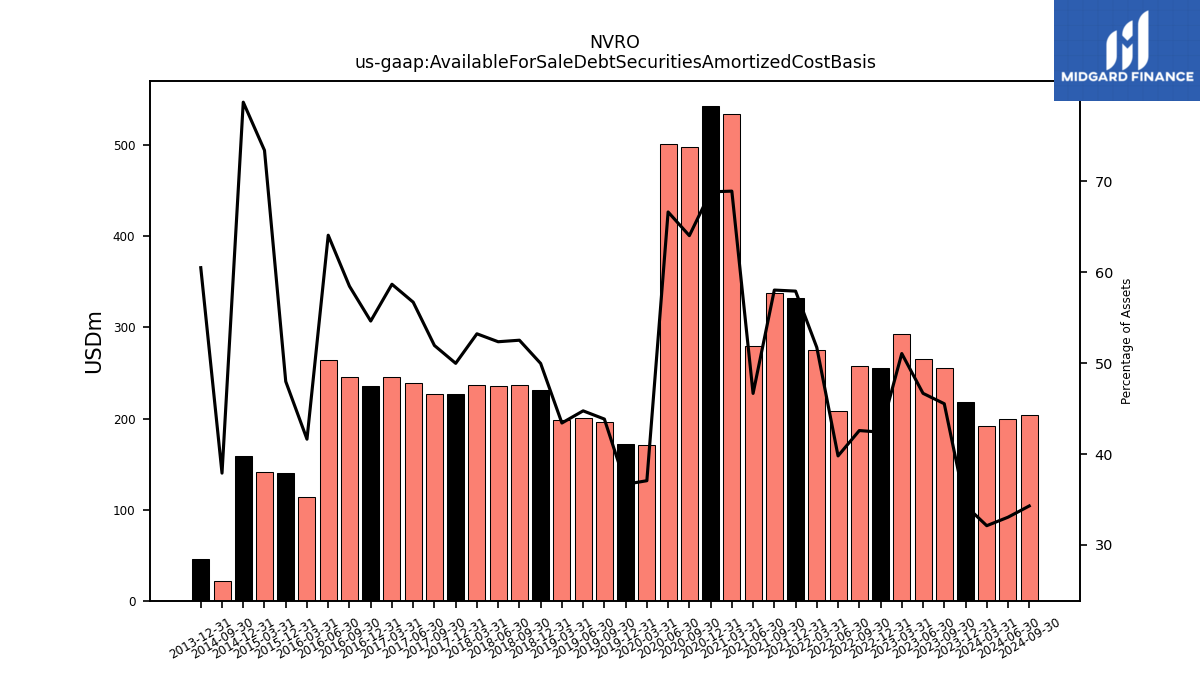
| Available For Sale Debt Securities Amortized Cost Basis | 255.67 | 265.79 | 293.19 | 255.44 | 257.81 | 208.46 | 275.56 | 332.69 | 337.93 | 279.75 | 534.41 | 543.25 | 498.23 | 501.64 | 170.48 | 172.22 | 196.29 | 200.44 | 198.86 | 231.34 | 236.84 | 235.47 | 236.72 | 226.88 | 227.41 | 238.53 | 245.12 | 235.16 | 245.39 | 264.08 | 114.25 | 139.69 | NA | NA | 141.04 | 159.31 | 21.27 | NA | NA | 45.61 | NA | NA | NA |
| 2023-09-30 | 2023-06-30 | 2023-03-31 | 2022-12-31 | 2022-09-30 | 2022-06-30 | 2022-03-31 | 2021-12-31 | 2021-09-30 | 2021-06-30 | 2021-03-31 | 2020-12-31 | 2020-09-30 | 2020-06-30 | 2020-03-31 | 2019-12-31 | 2019-09-30 | 2019-06-30 | 2019-03-31 | 2018-12-31 | 2018-09-30 | 2018-06-30 | 2018-03-31 | 2017-12-31 | 2017-09-30 | 2017-06-30 | 2017-03-31 | 2016-12-31 | 2016-09-30 | 2016-06-30 | 2016-03-31 | 2015-12-31 | 2015-09-30 | 2015-06-30 | 2015-03-31 | 2014-12-31 | 2014-09-30 | 2014-06-30 | 2014-03-31 | 2013-12-31 | 2013-09-30 | 2013-06-30 | 2013-03-31 | ||
|---|---|---|---|---|---|---|---|---|---|---|---|---|---|---|---|---|---|---|---|---|---|---|---|---|---|---|---|---|---|---|---|---|---|---|---|---|---|---|---|---|---|---|---|---|
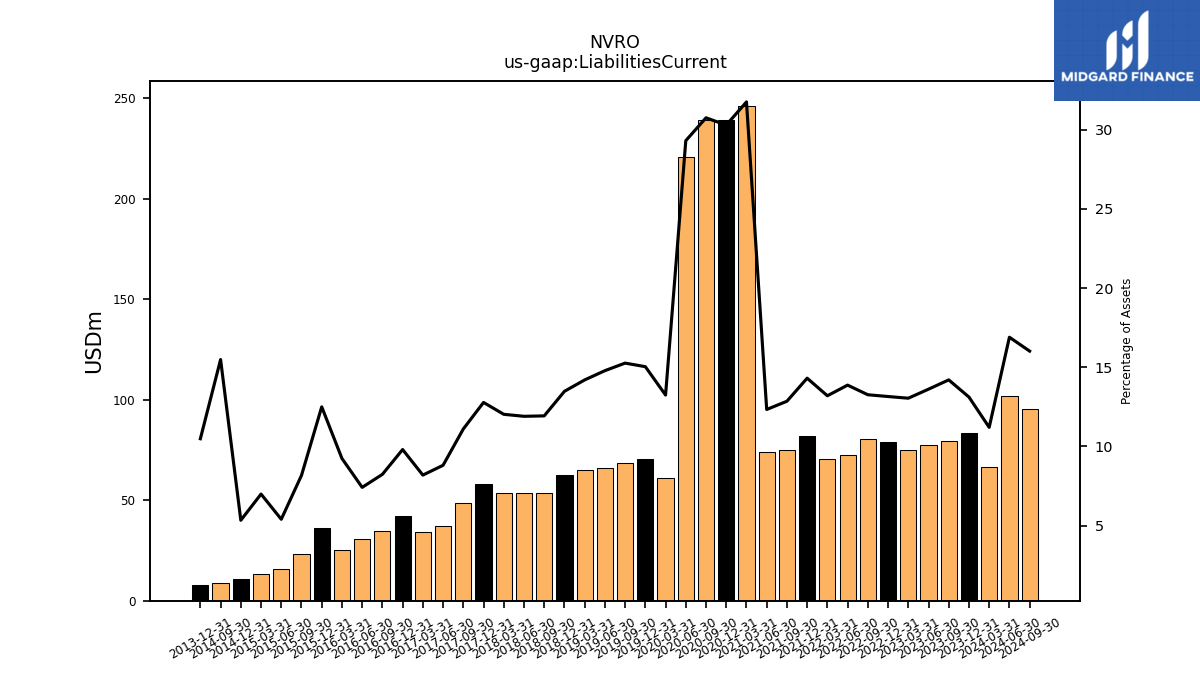
| Liabilities Current | 79.74 | 77.53 | 74.92 | 79.21 | 80.30 | 72.67 | 70.32 | 82.20 | 74.85 | 73.93 | 246.36 | 239.16 | 239.43 | 220.77 | 60.91 | 70.61 | 68.33 | 66.22 | 65.04 | 62.41 | 53.80 | 53.53 | 53.50 | 58.00 | 48.61 | 37.05 | 34.20 | 42.20 | 34.56 | 30.55 | 25.35 | 36.39 | 23.50 | 16.04 | 13.43 | 10.80 | 8.69 | NA | NA | 7.90 | NA | NA | NA | |
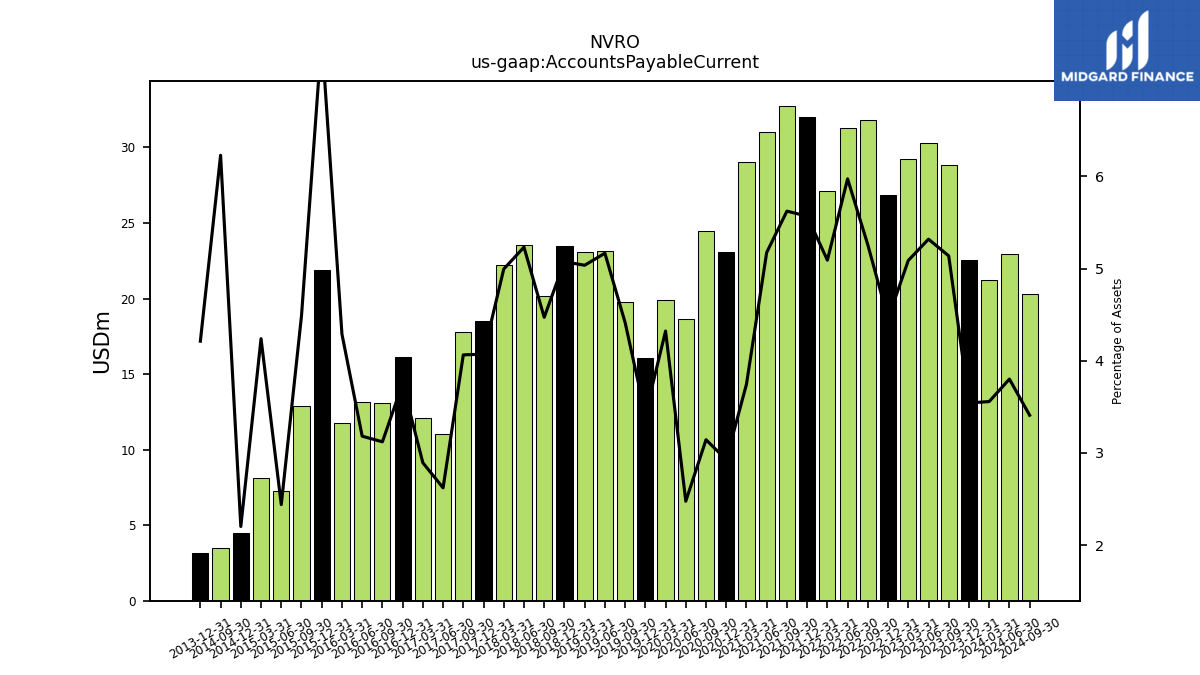
| Accounts Payable Current | 28.85 | 30.30 | 29.23 | 26.85 | 31.84 | 31.30 | 27.14 | 32.00 | 32.76 | 31.03 | 29.06 | 23.11 | 24.47 | 18.66 | 19.88 | 16.05 | 19.77 | 23.15 | 23.07 | 23.50 | 20.17 | 23.54 | 22.22 | 18.49 | 17.80 | 11.03 | 12.10 | 16.16 | 13.11 | 13.12 | 11.77 | 21.89 | 12.91 | 7.26 | 8.15 | 4.46 | 3.50 | NA | NA | 3.18 | NA | NA | NA | |
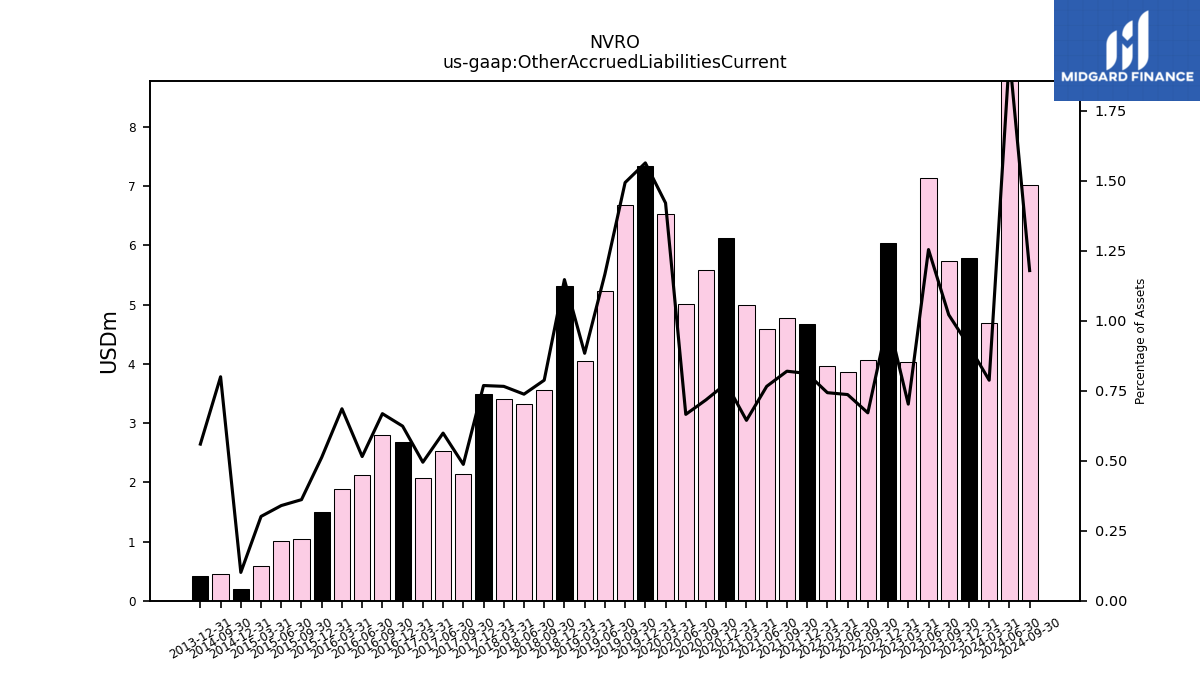
| Other Accrued Liabilities Current | 5.74 | 7.14 | 4.04 | 6.04 | 4.07 | 3.86 | 3.96 | 4.67 | 4.78 | 4.59 | 5.00 | 6.13 | 5.59 | 5.01 | 6.54 | 7.35 | 6.69 | 5.23 | 4.05 | 5.31 | 3.55 | 3.32 | 3.41 | 3.49 | 2.13 | 2.52 | 2.07 | 2.69 | 2.81 | 2.12 | 1.88 | 1.49 | 1.04 | 1.01 | 0.58 | 0.20 | 0.45 | NA | NA | 0.42 | NA | NA | NA | |
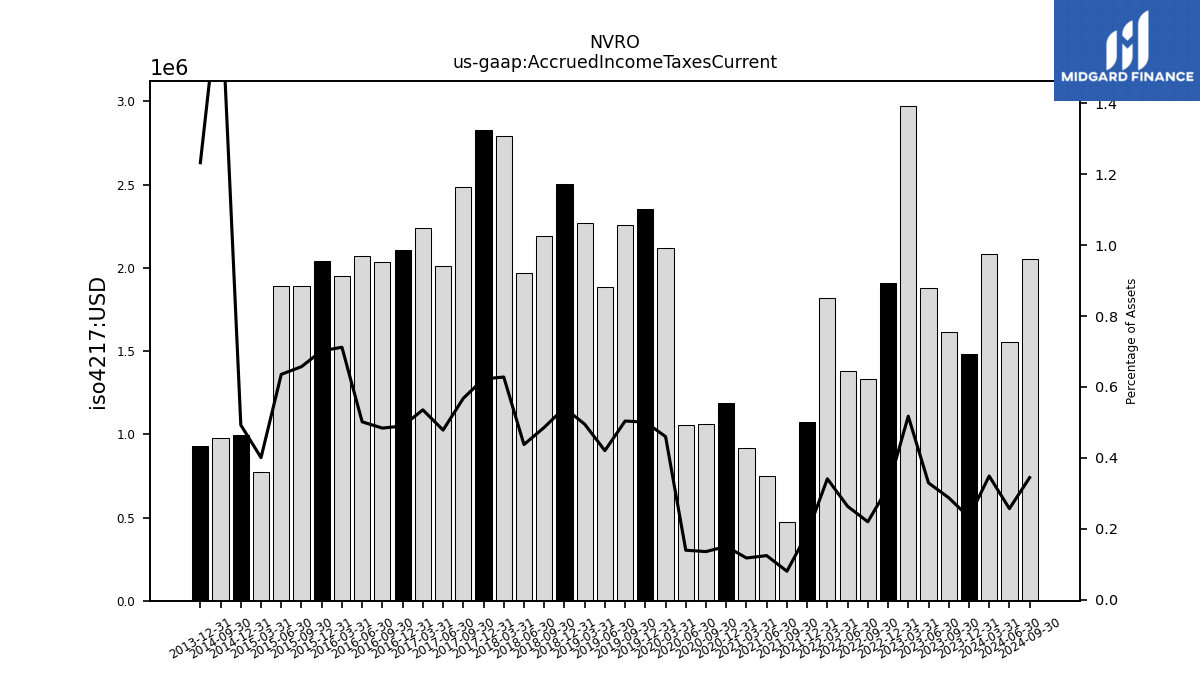
| Accrued Income Taxes Current | 1.62 | 1.88 | 2.97 | 1.91 | 1.33 | 1.38 | 1.82 | 1.07 | 0.47 | 0.75 | 0.92 | 1.19 | 1.06 | 1.05 | 2.12 | 2.35 | 2.26 | 1.89 | 2.27 | 2.51 | 2.19 | 1.97 | 2.79 | 2.83 | 2.49 | 2.01 | 2.24 | 2.11 | 2.03 | 2.07 | 1.95 | 2.04 | 1.89 | 1.89 | 0.77 | 1.00 | 0.98 | NA | NA | 0.93 | NA | NA | NA | |
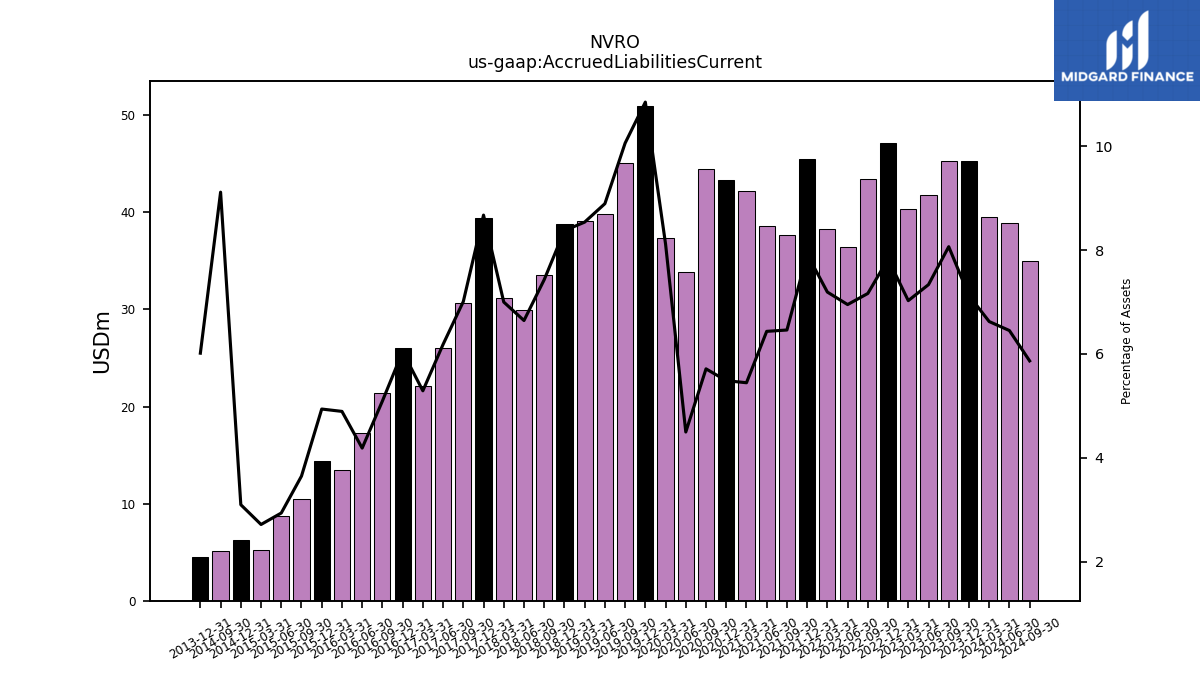
| Accrued Liabilities Current | 45.30 | 41.78 | 40.37 | 47.17 | 43.39 | 36.42 | 38.33 | 45.52 | 37.63 | 38.58 | 42.24 | 43.30 | 44.47 | 33.87 | 37.34 | 50.97 | 45.05 | 39.85 | 39.12 | 38.79 | 33.52 | 29.89 | 31.14 | 39.39 | 30.70 | 26.02 | 22.11 | 26.03 | 21.38 | 17.26 | 13.43 | 14.38 | 10.49 | 8.73 | 5.22 | 6.27 | 5.12 | NA | NA | 4.54 | NA | NA | NA | |
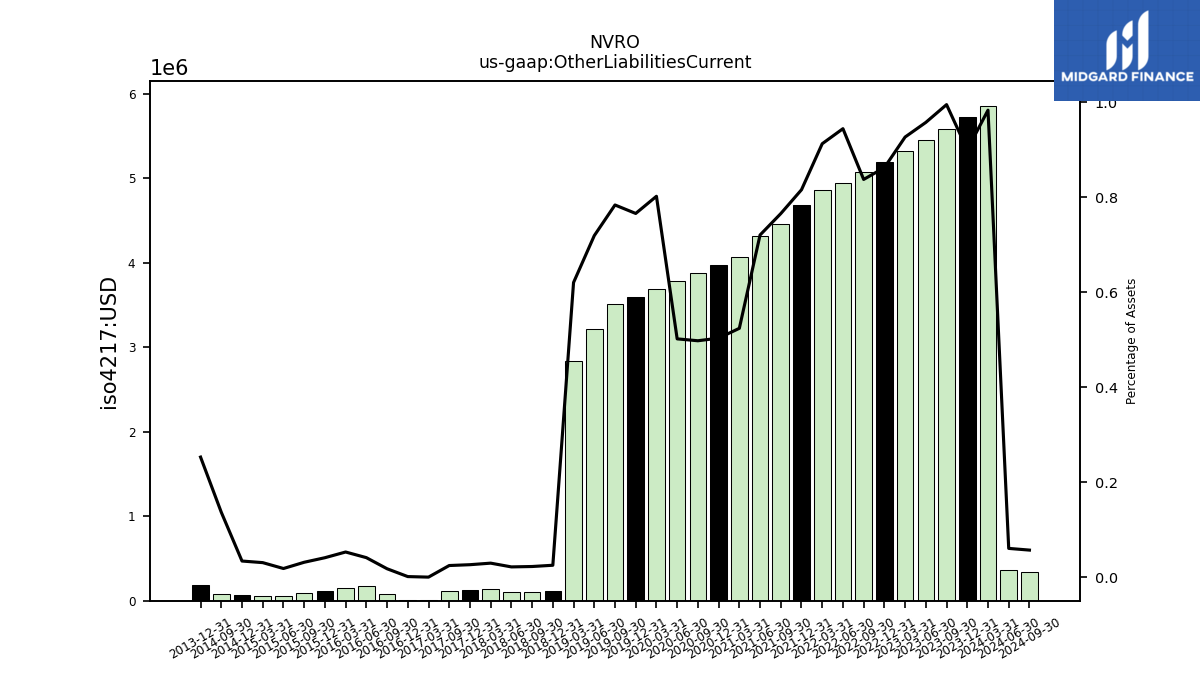
| Other Liabilities Current | 5.59 | 5.45 | 5.32 | 5.20 | 5.07 | 4.95 | 4.86 | 4.69 | 4.46 | 4.32 | 4.07 | 3.98 | 3.88 | 3.78 | 3.69 | 3.60 | 3.51 | 3.22 | 2.84 | 0.12 | 0.10 | 0.10 | 0.13 | 0.12 | 0.11 | NA | 0.00 | 0.01 | 0.08 | 0.17 | 0.15 | 0.12 | 0.09 | 0.06 | 0.06 | 0.07 | 0.08 | NA | NA | 0.19 | NA | NA | NA |
| 2023-09-30 | 2023-06-30 | 2023-03-31 | 2022-12-31 | 2022-09-30 | 2022-06-30 | 2022-03-31 | 2021-12-31 | 2021-09-30 | 2021-06-30 | 2021-03-31 | 2020-12-31 | 2020-09-30 | 2020-06-30 | 2020-03-31 | 2019-12-31 | 2019-09-30 | 2019-06-30 | 2019-03-31 | 2018-12-31 | 2018-09-30 | 2018-06-30 | 2018-03-31 | 2017-12-31 | 2017-09-30 | 2017-06-30 | 2017-03-31 | 2016-12-31 | 2016-09-30 | 2016-06-30 | 2016-03-31 | 2015-12-31 | 2015-09-30 | 2015-06-30 | 2015-03-31 | 2014-12-31 | 2014-09-30 | 2014-06-30 | 2014-03-31 | 2013-12-31 | 2013-09-30 | 2013-06-30 | 2013-03-31 | ||
|---|---|---|---|---|---|---|---|---|---|---|---|---|---|---|---|---|---|---|---|---|---|---|---|---|---|---|---|---|---|---|---|---|---|---|---|---|---|---|---|---|---|---|---|---|
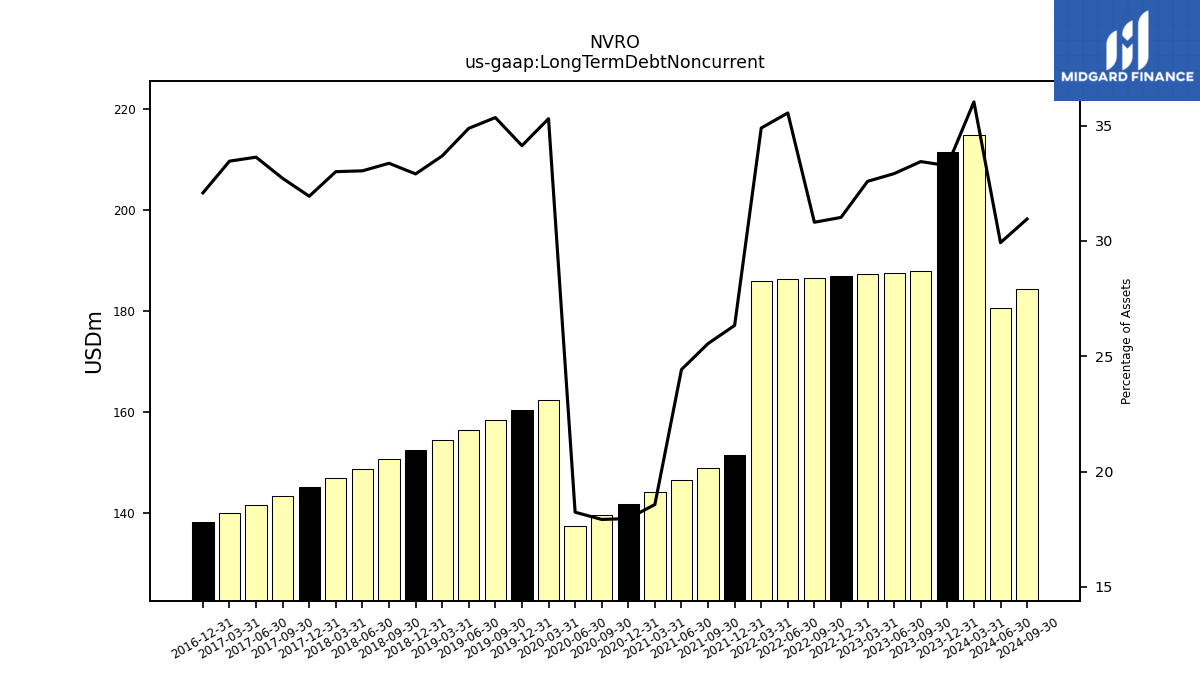
| Long Term Debt Noncurrent | 187.80 | 187.49 | 187.18 | 186.87 | 186.56 | 186.26 | 185.95 | 151.31 | 148.81 | 146.42 | 144.04 | 141.77 | 139.50 | 137.34 | 162.37 | 160.30 | 158.28 | 156.28 | 154.32 | 152.39 | 150.51 | 148.64 | 146.82 | 145.02 | 143.26 | 141.52 | 139.82 | 138.14 | NA | NA | NA | NA | NA | NA | NA | NA | NA | NA | NA | NA | NA | NA | NA | |
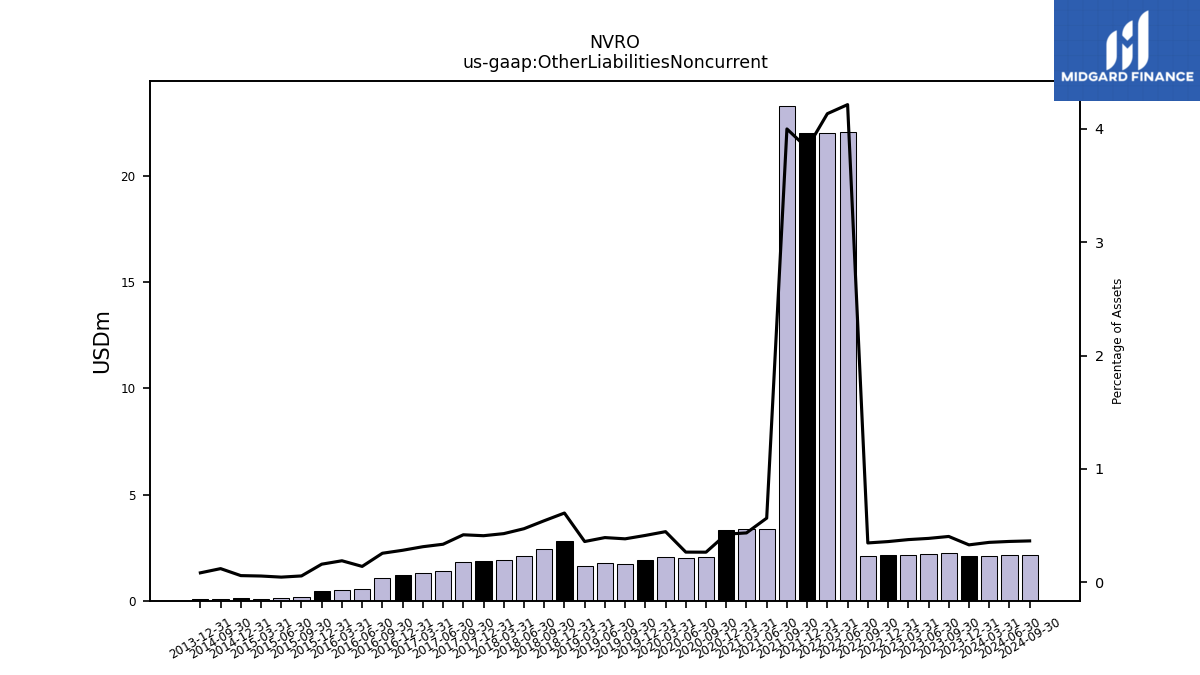
| Other Liabilities Noncurrent | 2.27 | 2.20 | 2.16 | 2.16 | 2.10 | 22.08 | 22.03 | 22.01 | 23.30 | 3.39 | 3.37 | 3.34 | 2.06 | 2.00 | 2.05 | 1.94 | 1.71 | 1.76 | 1.64 | 2.83 | 2.44 | 2.12 | 1.91 | 1.86 | 1.83 | 1.41 | 1.31 | 1.21 | 1.07 | 0.57 | 0.52 | 0.46 | 0.16 | 0.13 | 0.10 | 0.12 | 0.07 | NA | NA | 0.06 | NA | NA | NA | |
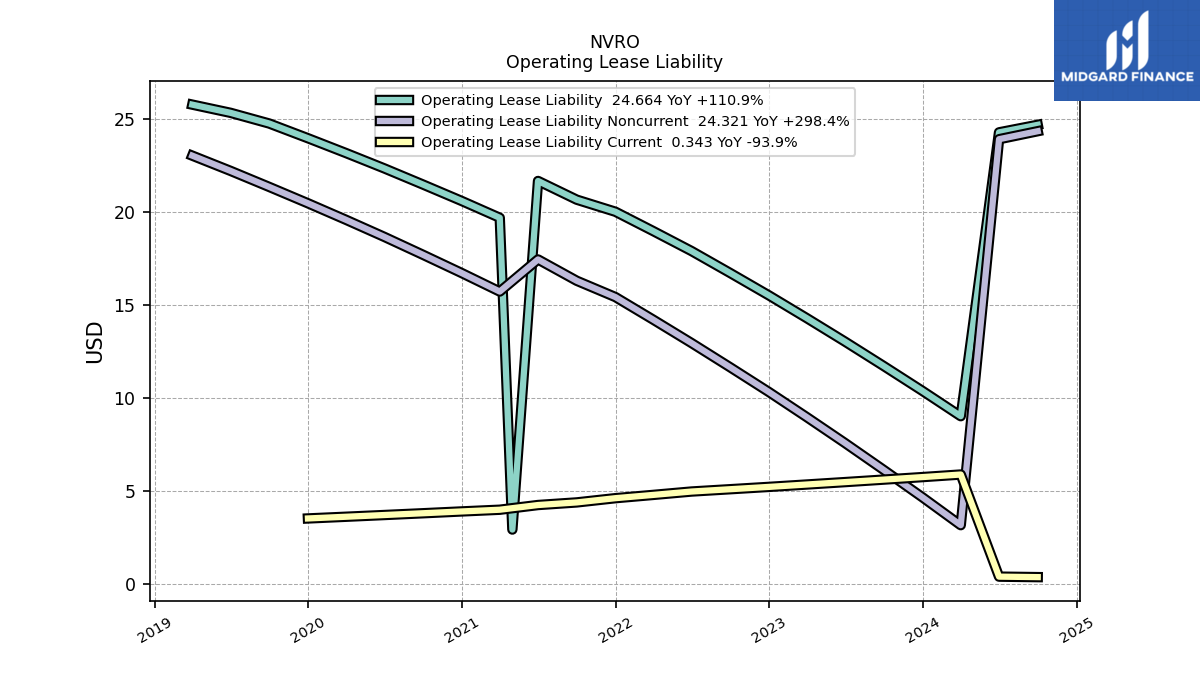
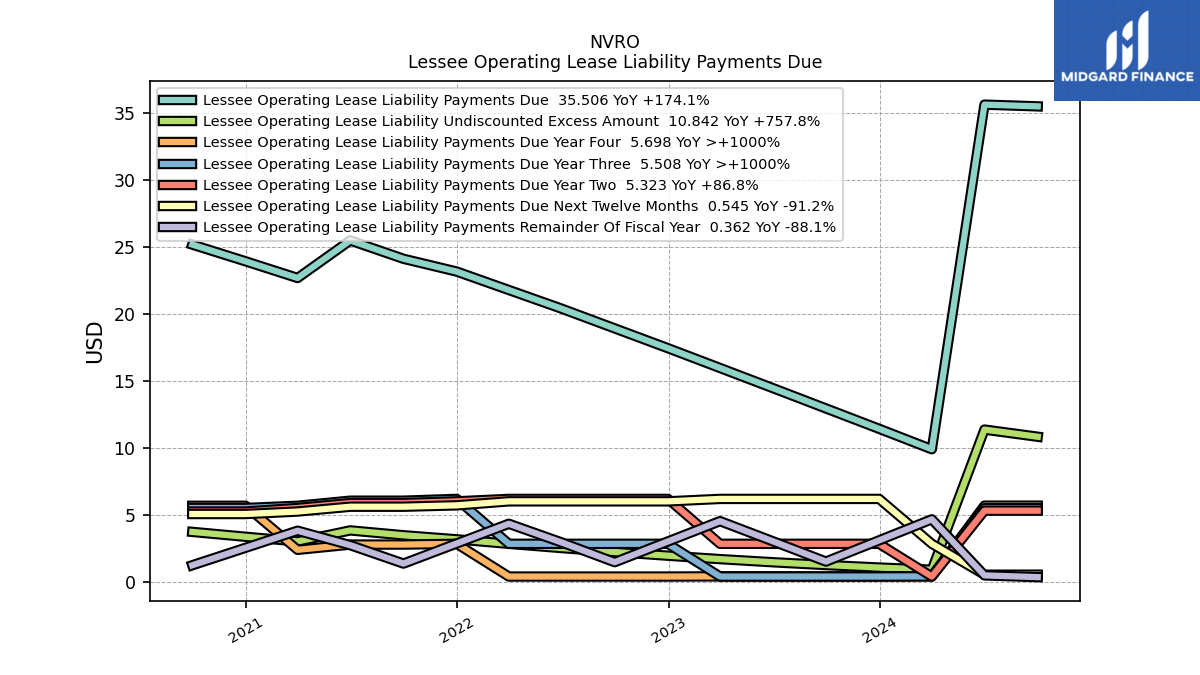
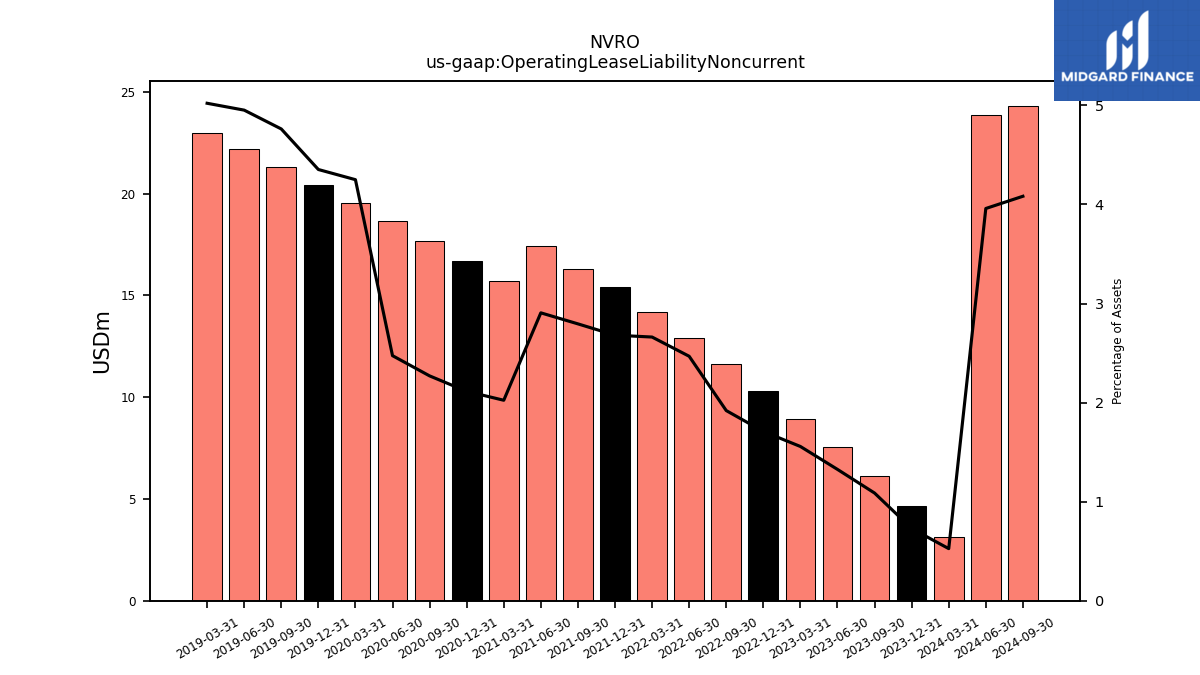
| Operating Lease Liability Noncurrent | 6.11 | 7.55 | 8.95 | 10.30 | 11.62 | 12.93 | 14.19 | 15.40 | 16.28 | 17.43 | 15.70 | 16.69 | 17.67 | 18.63 | 19.55 | 20.45 | 21.32 | 22.19 | 23.01 | NA | NA | NA | NA | NA | NA | NA | NA | NA | NA | NA | NA | NA | NA | NA | NA | NA | NA | NA | NA | NA | NA | NA | NA |
| 2023-09-30 | 2023-06-30 | 2023-03-31 | 2022-12-31 | 2022-09-30 | 2022-06-30 | 2022-03-31 | 2021-12-31 | 2021-09-30 | 2021-06-30 | 2021-03-31 | 2020-12-31 | 2020-09-30 | 2020-06-30 | 2020-03-31 | 2019-12-31 | 2019-09-30 | 2019-06-30 | 2019-03-31 | 2018-12-31 | 2018-09-30 | 2018-06-30 | 2018-03-31 | 2017-12-31 | 2017-09-30 | 2017-06-30 | 2017-03-31 | 2016-12-31 | 2016-09-30 | 2016-06-30 | 2016-03-31 | 2015-12-31 | 2015-09-30 | 2015-06-30 | 2015-03-31 | 2014-12-31 | 2014-09-30 | 2014-06-30 | 2014-03-31 | 2013-12-31 | 2013-09-30 | 2013-06-30 | 2013-03-31 | ||
|---|---|---|---|---|---|---|---|---|---|---|---|---|---|---|---|---|---|---|---|---|---|---|---|---|---|---|---|---|---|---|---|---|---|---|---|---|---|---|---|---|---|---|---|---|
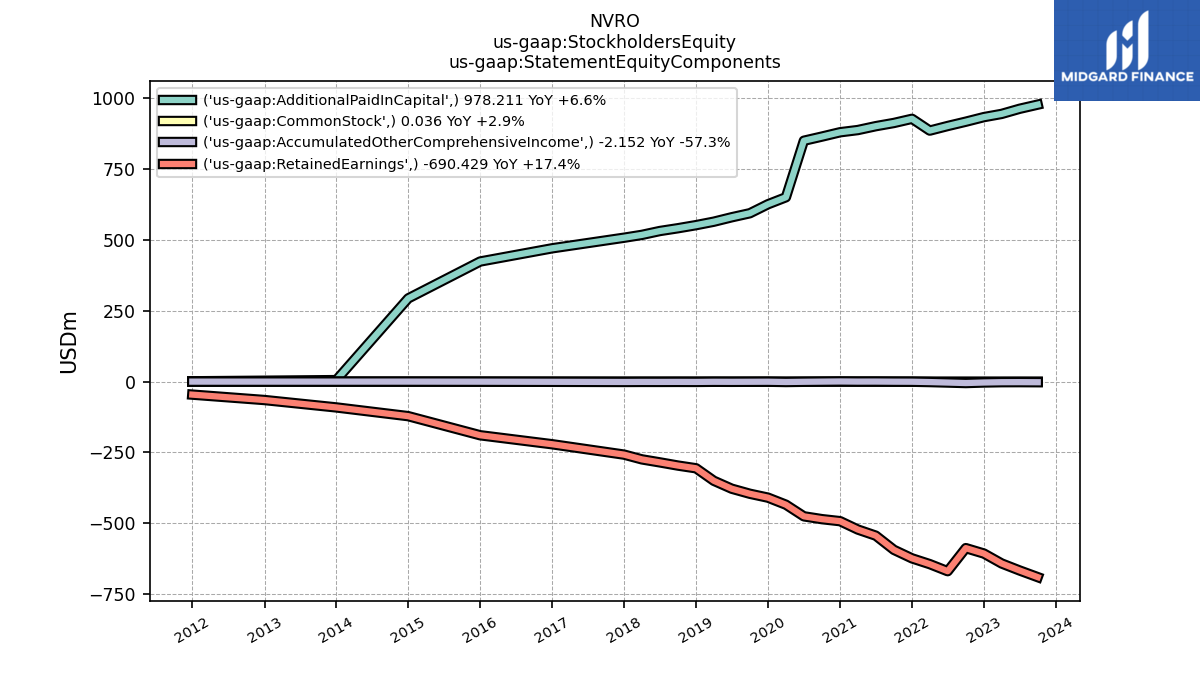
| Stockholders Equity | 285.67 | 294.75 | 301.23 | 323.88 | 324.94 | 229.99 | 240.39 | 303.62 | 319.20 | 358.38 | 366.20 | 388.46 | 379.78 | 374.43 | 215.08 | 216.35 | 198.10 | 201.54 | 214.10 | 245.48 | 244.30 | 245.59 | 242.62 | 249.17 | 244.24 | 240.79 | 242.53 | 249.03 | 247.73 | 246.40 | 228.78 | 234.59 | 244.34 | 261.53 | 159.12 | 172.07 | -106.01 | NA | NA | -85.79 | NA | NA | NA | |
| Common Stock Value | 0.04 | 0.04 | 0.04 | 0.04 | 0.04 | 0.04 | 0.04 | 0.04 | 0.04 | 0.04 | 0.04 | 0.04 | 0.04 | 0.03 | 0.03 | 0.03 | 0.03 | 0.03 | 0.03 | 0.03 | 0.03 | 0.03 | 0.03 | 0.03 | 0.03 | 0.03 | 0.03 | 0.03 | 0.03 | 0.03 | 0.03 | 0.03 | 0.03 | 0.03 | 0.03 | 0.03 | 0.00 | NA | NA | 0.00 | NA | NA | NA | |
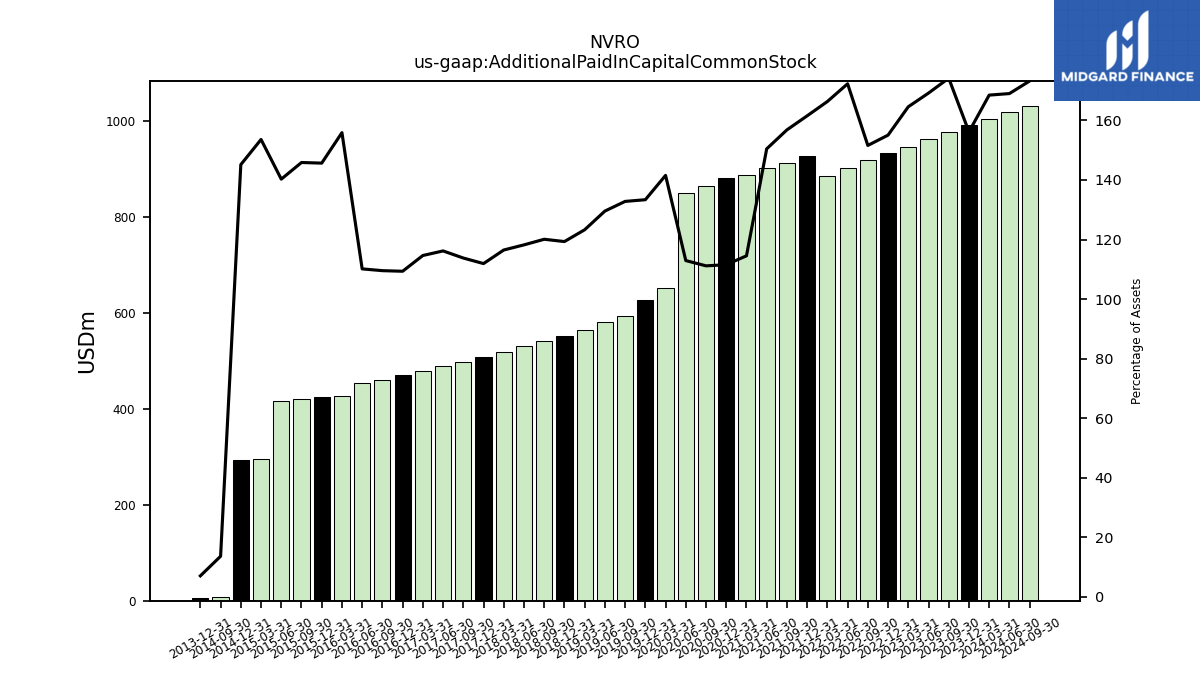
| Additional Paid In Capital Common Stock | 978.21 | 963.52 | 945.42 | 934.13 | 917.95 | 902.71 | 886.45 | 928.14 | 913.41 | 902.10 | 888.42 | 880.66 | 865.40 | 850.67 | 651.06 | 626.40 | 594.63 | 580.43 | 564.78 | 552.61 | 541.70 | 531.83 | 518.20 | 508.23 | 498.35 | 488.85 | 479.06 | 470.87 | 459.98 | 454.16 | 427.85 | 424.15 | 419.65 | 417.10 | 295.25 | 293.94 | 7.66 | NA | NA | 5.33 | NA | NA | NA | |
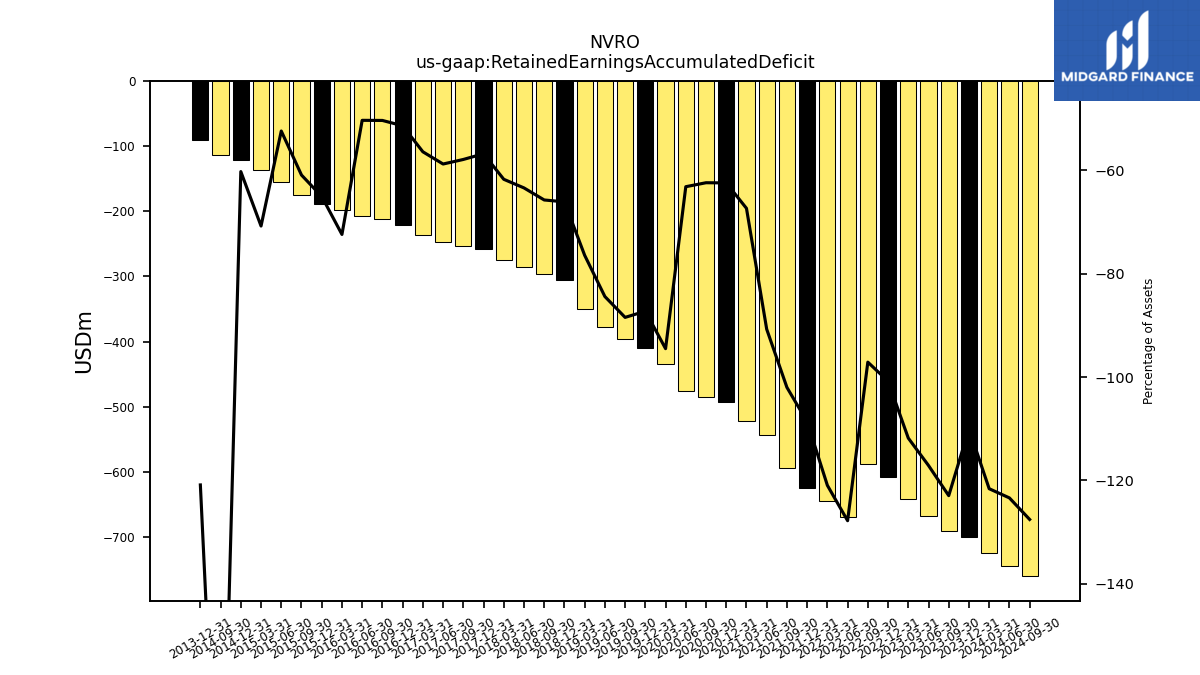
| Retained Earnings Accumulated Deficit | -690.43 | -666.95 | -642.23 | -607.20 | -588.00 | -669.51 | -644.52 | -624.19 | -594.06 | -543.98 | -522.39 | -492.83 | -485.70 | -475.72 | -434.66 | -409.77 | -396.03 | -378.18 | -350.16 | -306.08 | -296.48 | -285.21 | -274.59 | -257.84 | -253.53 | -247.30 | -235.69 | -221.19 | -211.36 | -207.47 | -198.70 | -189.41 | -175.22 | -155.76 | -136.04 | -121.98 | -113.65 | NA | NA | -91.15 | NA | NA | NA | |
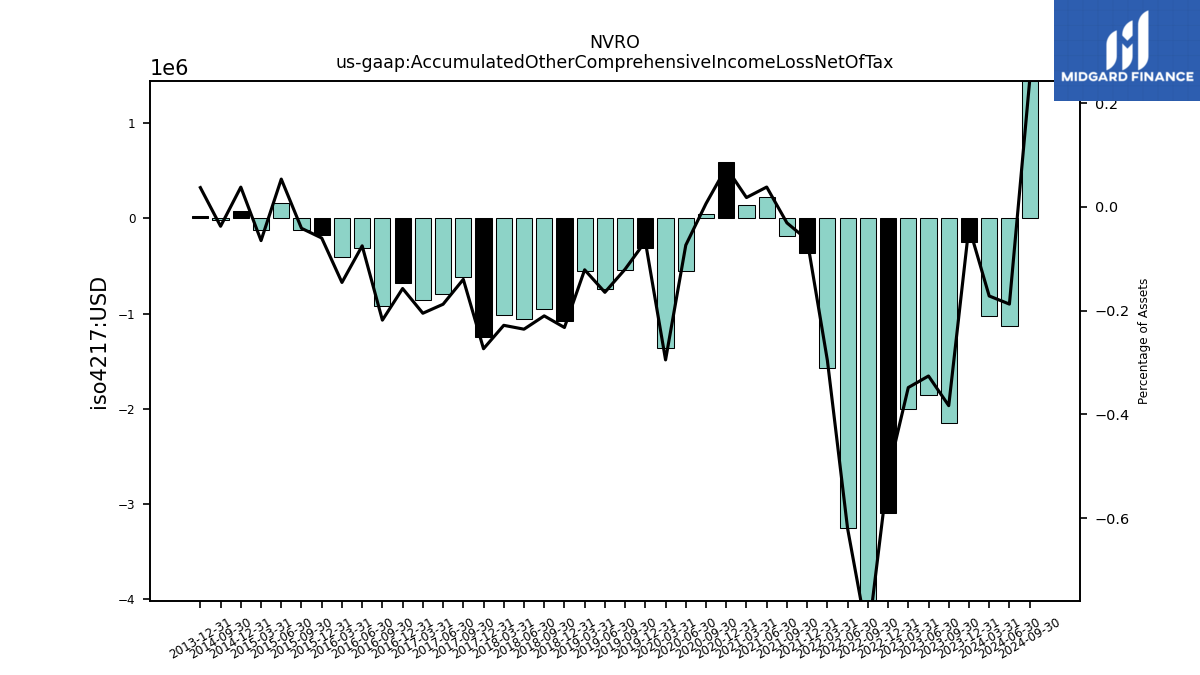
| Accumulated Other Comprehensive Income Loss Net Of Tax | -2.15 | -1.86 | -2.00 | -3.09 | -5.04 | -3.25 | -1.58 | -0.36 | -0.18 | 0.23 | 0.14 | 0.60 | 0.05 | -0.56 | -1.36 | -0.31 | -0.54 | -0.74 | -0.56 | -1.08 | -0.95 | -1.06 | -1.02 | -1.24 | -0.61 | -0.79 | -0.86 | -0.68 | -0.92 | -0.31 | -0.40 | -0.17 | -0.12 | 0.16 | -0.12 | 0.08 | -0.02 | NA | NA | 0.03 | NA | NA | NA | |
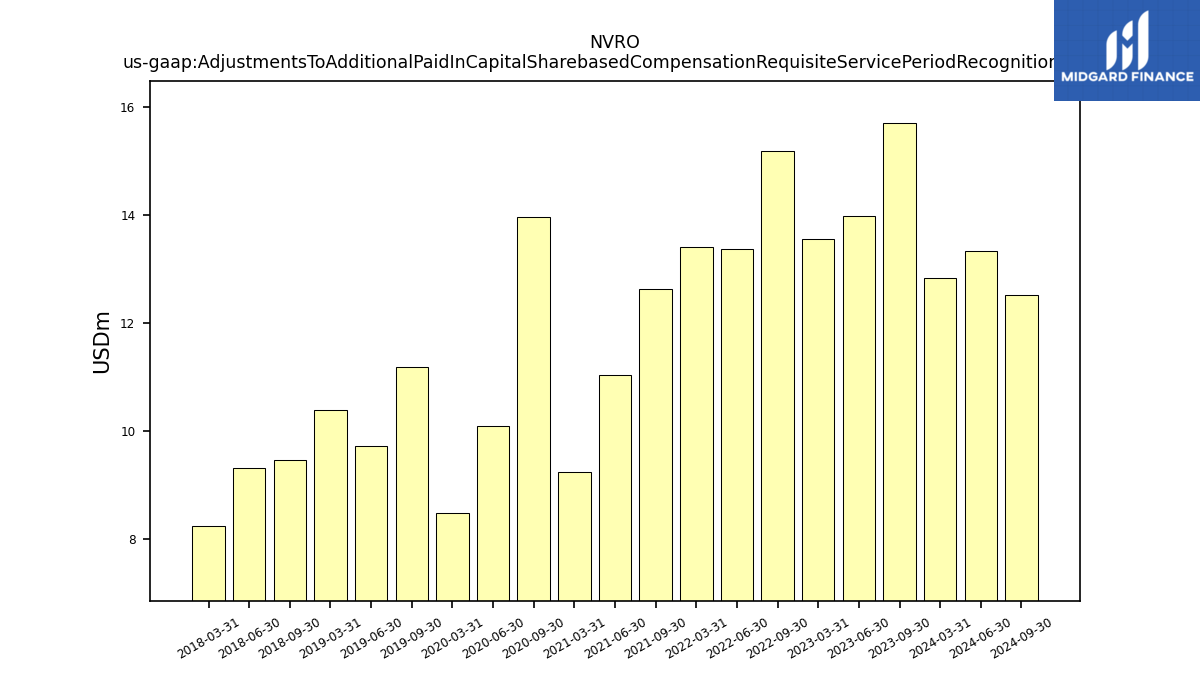
| Adjustments To Additional Paid In Capital Sharebased Compensation Requisite Service Period Recognition Value | 15.70 | 13.98 | 13.56 | NA | 15.20 | 13.38 | 13.41 | NA | 12.63 | 11.03 | 9.23 | NA | 13.97 | 10.09 | 8.48 | NA | 11.19 | 9.72 | 10.40 | NA | 9.45 | 9.31 | 8.24 | NA | NA | NA | NA | NA | NA | NA | NA | NA | NA | NA | NA | NA | NA | NA | NA | NA | NA | NA | NA |
| 2023-09-30 | 2023-06-30 | 2023-03-31 | 2022-12-31 | 2022-09-30 | 2022-06-30 | 2022-03-31 | 2021-12-31 | 2021-09-30 | 2021-06-30 | 2021-03-31 | 2020-12-31 | 2020-09-30 | 2020-06-30 | 2020-03-31 | 2019-12-31 | 2019-09-30 | 2019-06-30 | 2019-03-31 | 2018-12-31 | 2018-09-30 | 2018-06-30 | 2018-03-31 | 2017-12-31 | 2017-09-30 | 2017-06-30 | 2017-03-31 | 2016-12-31 | 2016-09-30 | 2016-06-30 | 2016-03-31 | 2015-12-31 | 2015-09-30 | 2015-06-30 | 2015-03-31 | 2014-12-31 | 2014-09-30 | 2014-06-30 | 2014-03-31 | 2013-12-31 | 2013-09-30 | 2013-06-30 | 2013-03-31 | ||
|---|---|---|---|---|---|---|---|---|---|---|---|---|---|---|---|---|---|---|---|---|---|---|---|---|---|---|---|---|---|---|---|---|---|---|---|---|---|---|---|---|---|---|---|---|
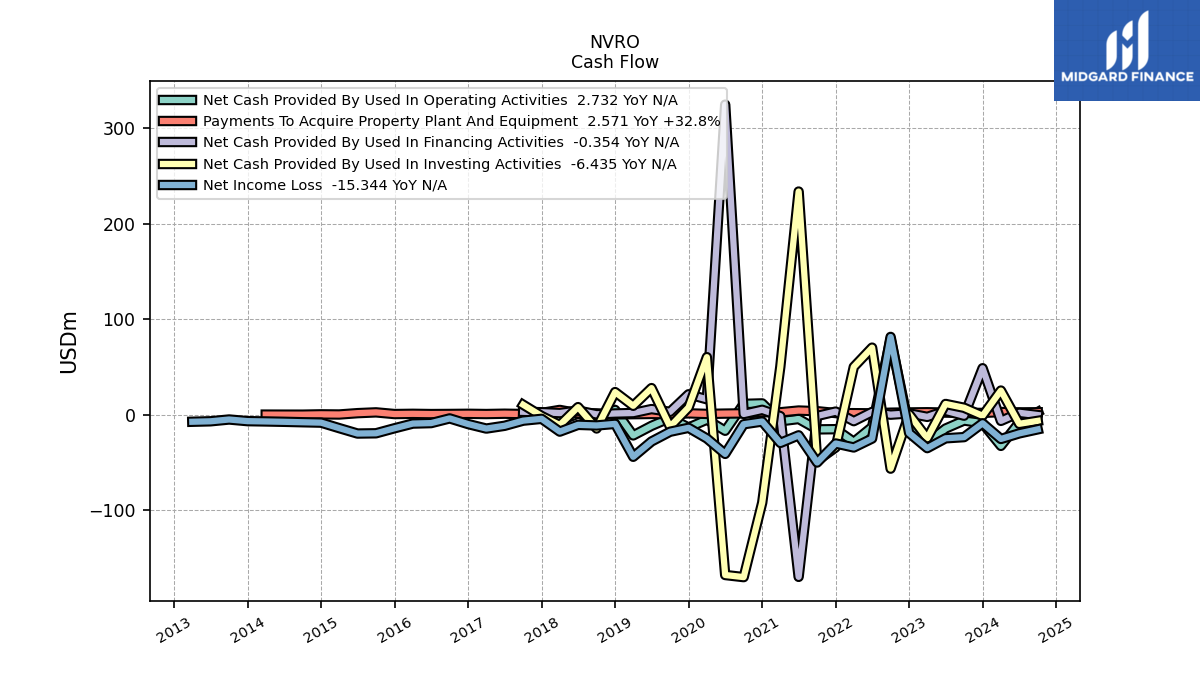
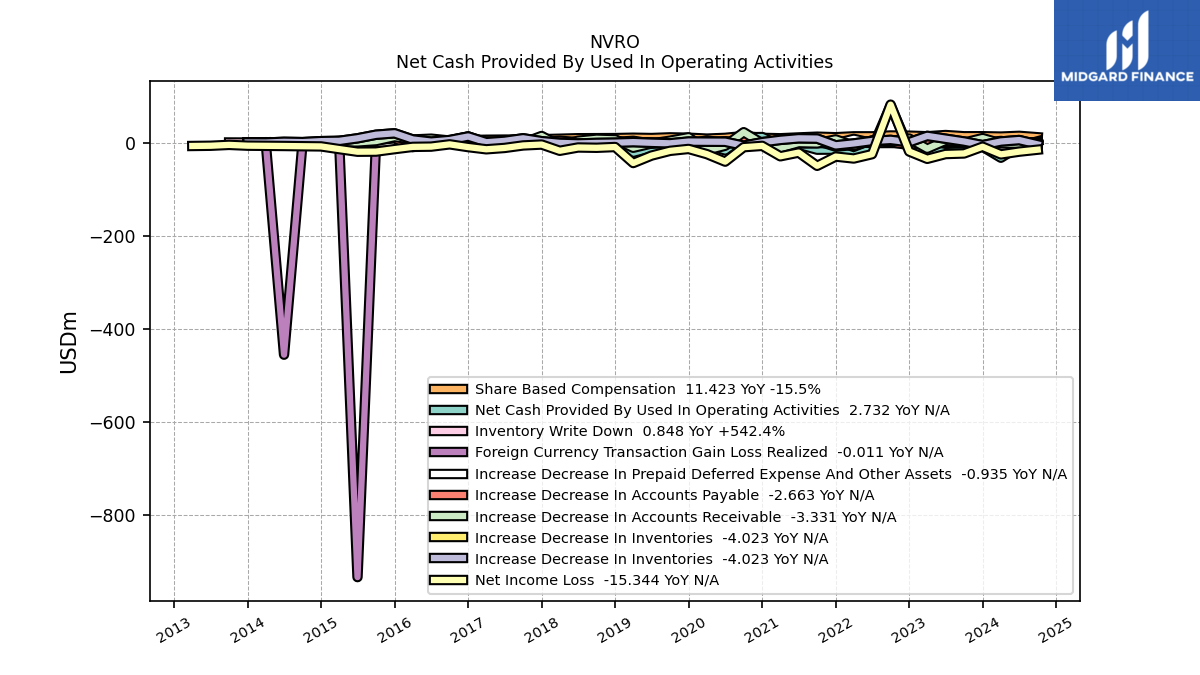
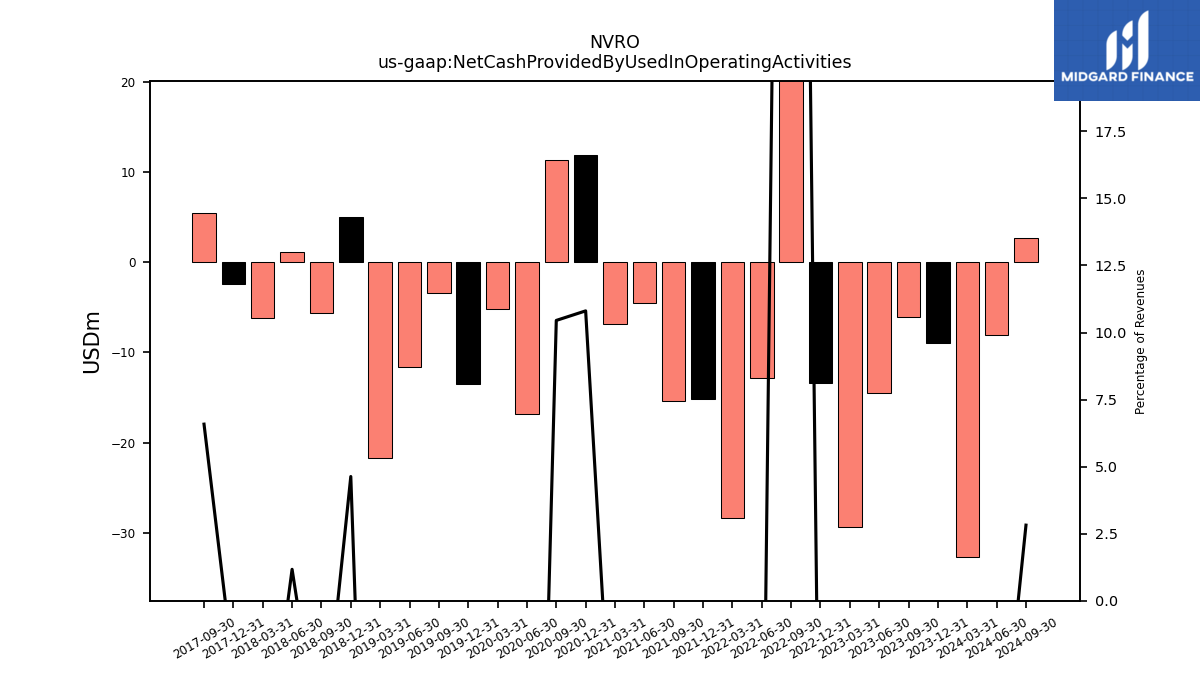
| Net Cash Provided By Used In Operating Activities | -6.09 | -14.50 | -29.31 | -13.42 | 79.35 | -12.83 | -28.42 | -15.16 | -15.36 | -4.49 | -6.87 | 11.86 | 11.34 | -16.82 | -5.18 | -13.47 | -3.37 | -11.67 | -21.71 | 5.00 | -5.60 | 1.13 | -6.24 | -2.47 | 5.42 | NA | NA | NA | NA | NA | NA | NA | NA | NA | NA | NA | NA | NA | NA | NA | NA | NA | NA | |
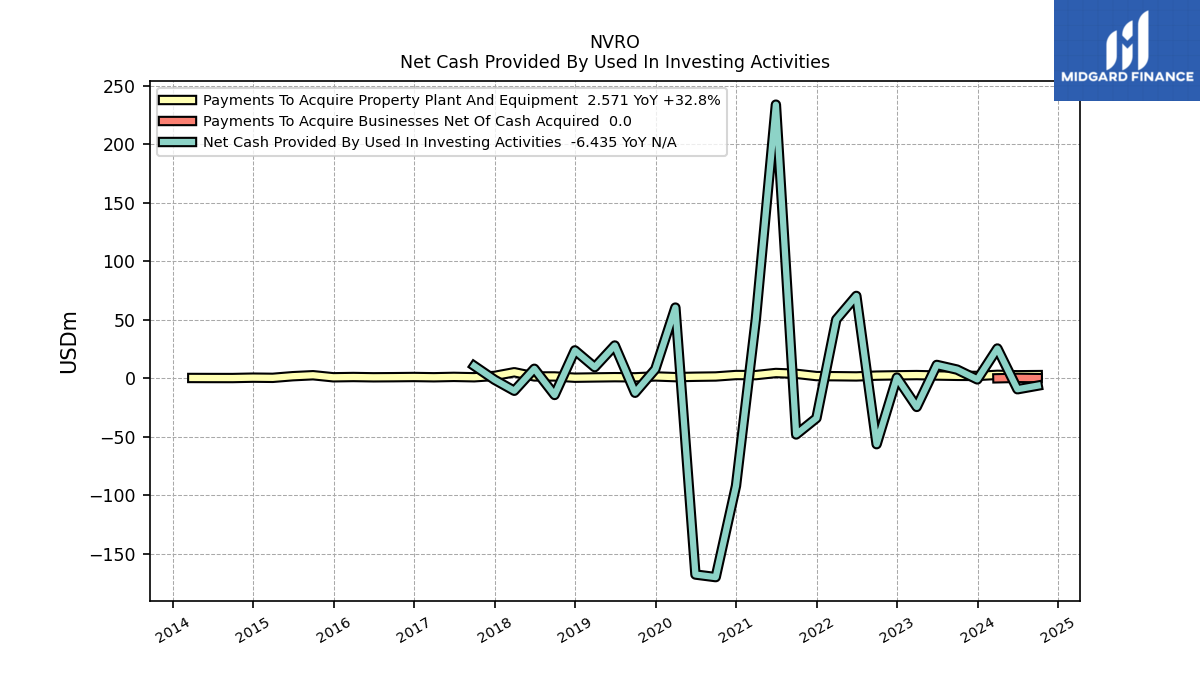
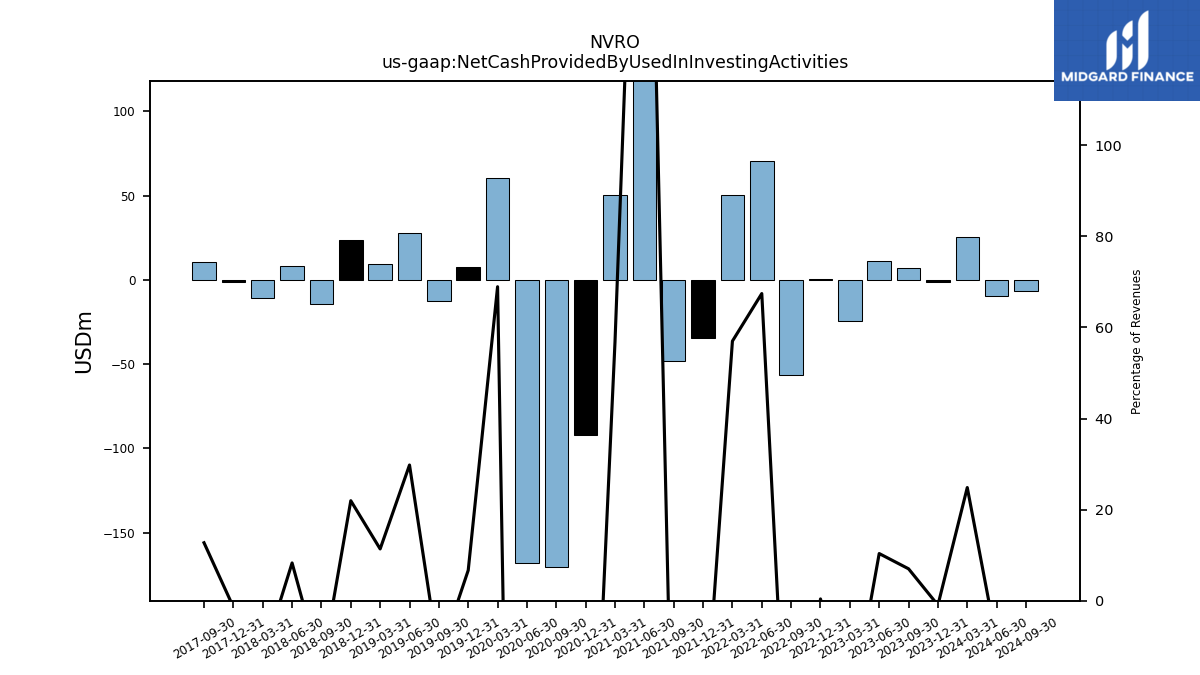
| Net Cash Provided By Used In Investing Activities | 7.28 | 11.27 | -24.65 | 0.46 | -56.50 | 70.27 | 50.07 | -34.23 | -48.19 | 233.79 | 50.34 | -92.11 | -170.13 | -167.92 | 60.29 | 7.65 | -12.54 | 27.88 | 9.34 | 23.70 | -14.43 | 7.97 | -10.82 | -1.37 | 10.47 | NA | NA | NA | NA | NA | NA | NA | NA | NA | NA | NA | NA | NA | NA | NA | NA | NA | NA | |
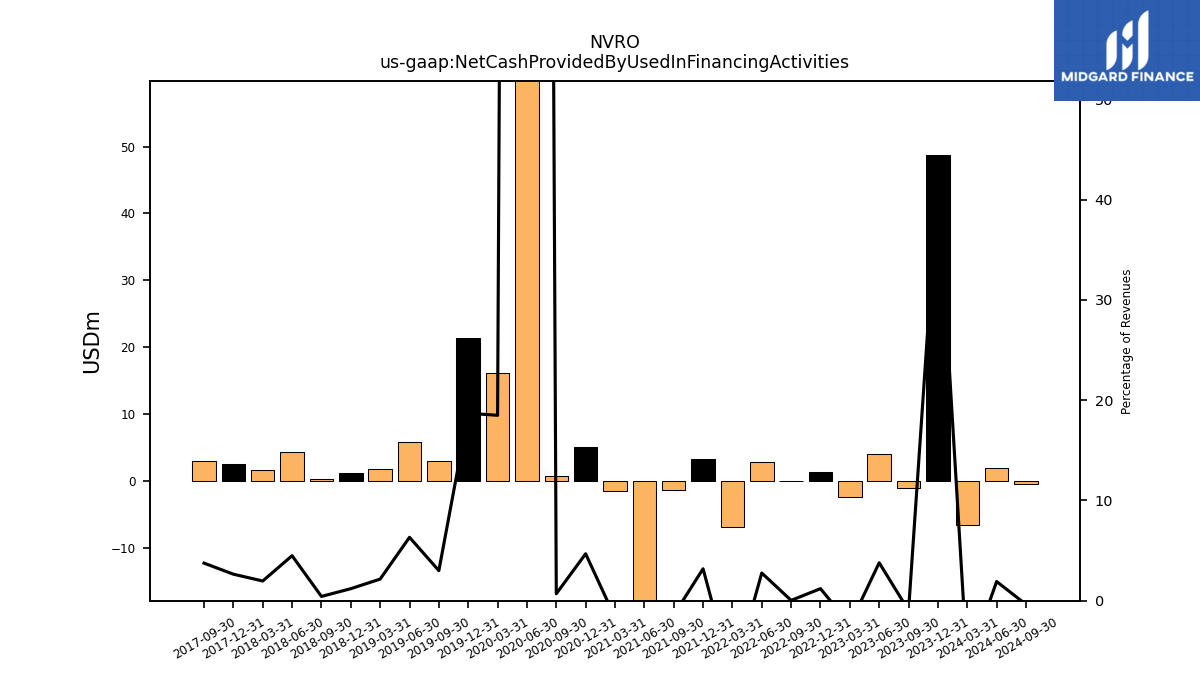
| Net Cash Provided By Used In Financing Activities | -1.01 | 4.12 | -2.27 | 1.37 | 0.04 | 2.88 | -6.75 | 3.28 | -1.32 | -169.86 | -1.47 | 5.14 | 0.76 | 324.83 | 16.18 | 21.39 | 3.01 | 5.92 | 1.77 | 1.30 | 0.41 | 4.32 | 1.73 | 2.59 | 3.09 | NA | NA | NA | NA | NA | NA | NA | NA | NA | NA | NA | NA | NA | NA | NA | NA | NA | NA |
| 2023-09-30 | 2023-06-30 | 2023-03-31 | 2022-12-31 | 2022-09-30 | 2022-06-30 | 2022-03-31 | 2021-12-31 | 2021-09-30 | 2021-06-30 | 2021-03-31 | 2020-12-31 | 2020-09-30 | 2020-06-30 | 2020-03-31 | 2019-12-31 | 2019-09-30 | 2019-06-30 | 2019-03-31 | 2018-12-31 | 2018-09-30 | 2018-06-30 | 2018-03-31 | 2017-12-31 | 2017-09-30 | 2017-06-30 | 2017-03-31 | 2016-12-31 | 2016-09-30 | 2016-06-30 | 2016-03-31 | 2015-12-31 | 2015-09-30 | 2015-06-30 | 2015-03-31 | 2014-12-31 | 2014-09-30 | 2014-06-30 | 2014-03-31 | 2013-12-31 | 2013-09-30 | 2013-06-30 | 2013-03-31 | ||
|---|---|---|---|---|---|---|---|---|---|---|---|---|---|---|---|---|---|---|---|---|---|---|---|---|---|---|---|---|---|---|---|---|---|---|---|---|---|---|---|---|---|---|---|---|
| Net Cash Provided By Used In Operating Activities | -6.09 | -14.50 | -29.31 | -13.42 | 79.35 | -12.83 | -28.42 | -15.16 | -15.36 | -4.49 | -6.87 | 11.86 | 11.34 | -16.82 | -5.18 | -13.47 | -3.37 | -11.67 | -21.71 | 5.00 | -5.60 | 1.13 | -6.24 | -2.47 | 5.42 | NA | NA | NA | NA | NA | NA | NA | NA | NA | NA | NA | NA | NA | NA | NA | NA | NA | NA | |
| Net Income Loss | -23.48 | -24.72 | -35.03 | -19.19 | 81.51 | -24.99 | -34.33 | -30.13 | -50.08 | -21.59 | -29.56 | -7.13 | -9.98 | -41.06 | -24.89 | -13.74 | -17.85 | -28.02 | -44.08 | -9.61 | -11.27 | -10.62 | -17.71 | -4.31 | -6.23 | -11.61 | -14.51 | -9.82 | -3.89 | -8.78 | -9.29 | -14.19 | -19.45 | -19.73 | -14.06 | -8.31 | -7.88 | -7.43 | -7.06 | -6.74 | -5.02 | -6.89 | -7.37 | |
| Profit Loss | -23.48 | -24.72 | -35.03 | -19.19 | 81.51 | -24.99 | -34.33 | -30.13 | -50.08 | -21.59 | -29.56 | -7.13 | -9.98 | -41.06 | -24.89 | -13.74 | -17.85 | -28.02 | -44.08 | -9.61 | -11.27 | -10.62 | -17.71 | -4.31 | NA | NA | NA | NA | NA | NA | NA | NA | NA | NA | NA | NA | NA | NA | NA | NA | NA | NA | NA | |
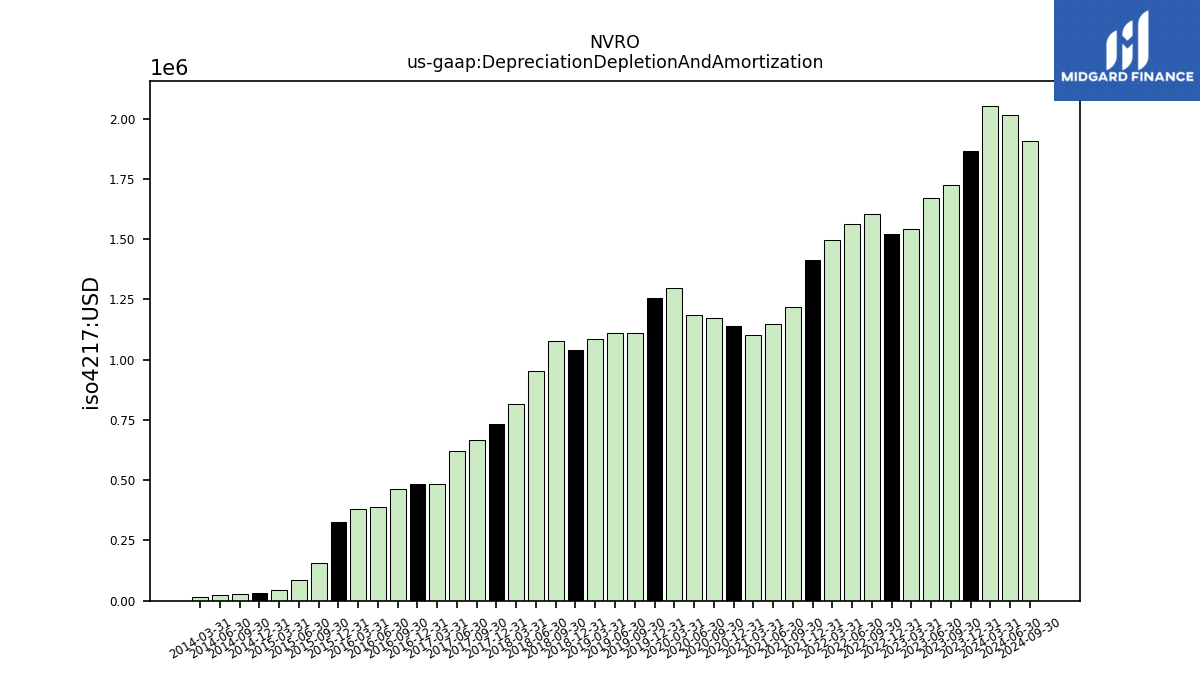
| Depreciation Depletion And Amortization | 1.72 | 1.67 | 1.54 | 1.52 | 1.60 | 1.56 | 1.50 | 1.41 | 1.22 | 1.15 | 1.10 | 1.14 | 1.17 | 1.18 | 1.30 | 1.26 | 1.11 | 1.11 | 1.08 | 1.04 | 1.08 | 0.95 | 0.81 | 0.73 | 0.67 | 0.62 | 0.48 | 0.48 | 0.47 | 0.39 | 0.38 | 0.33 | 0.16 | 0.08 | 0.05 | 0.03 | 0.03 | 0.02 | 0.02 | NA | NA | NA | NA | |
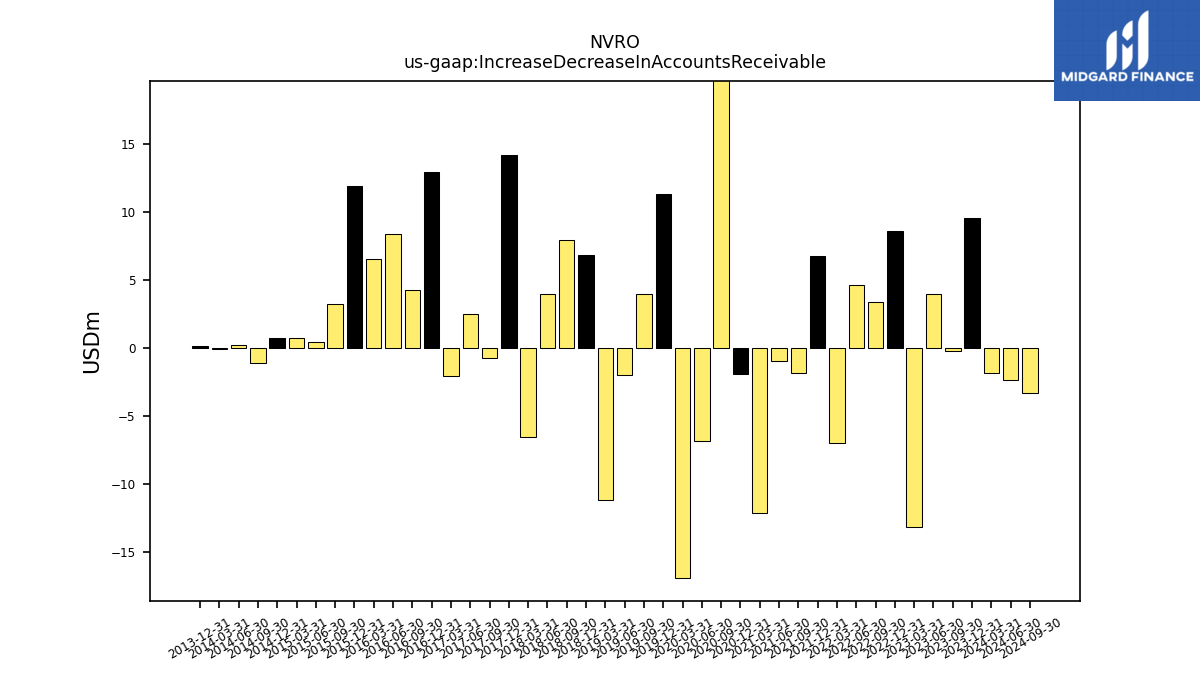
| Increase Decrease In Accounts Receivable | -0.21 | 3.99 | -13.13 | 8.65 | 3.37 | 4.61 | -7.01 | 6.78 | -1.87 | -0.97 | -12.14 | -1.91 | 22.29 | -6.84 | -16.91 | 11.34 | 4.01 | -1.99 | -11.21 | 6.84 | 7.99 | 3.95 | -6.56 | 14.19 | -0.76 | 2.52 | -2.05 | 12.93 | 4.30 | 8.36 | 6.58 | 11.89 | 3.22 | 0.41 | 0.70 | 0.76 | -1.07 | 0.22 | -0.08 | 0.14 | NA | NA | NA | |
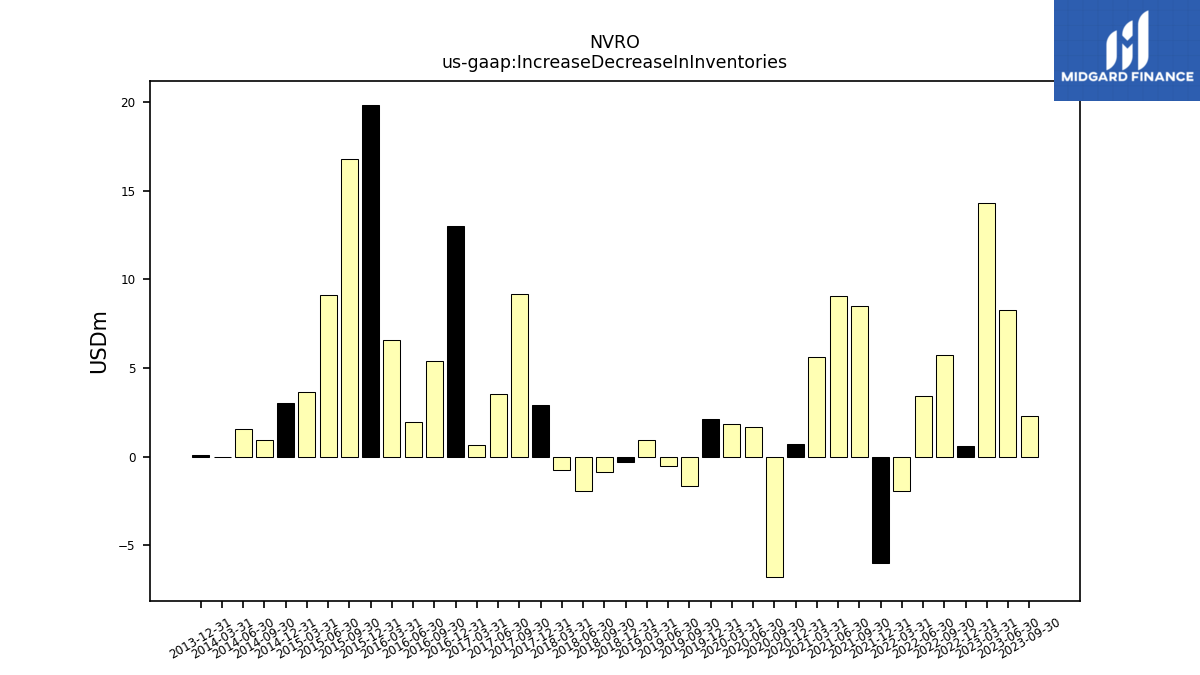
| Increase Decrease In Inventories | 2.28 | 8.26 | 14.30 | 0.62 | 5.71 | 3.41 | -1.92 | -6.01 | 8.52 | 9.07 | 5.64 | 0.71 | -6.79 | 1.69 | 1.86 | 2.13 | -1.65 | -0.51 | 0.97 | -0.30 | -0.86 | -1.92 | -0.77 | 2.90 | 9.17 | 3.55 | 0.69 | 13.03 | 5.40 | 1.98 | 6.61 | 19.86 | 16.80 | 9.10 | 3.64 | 3.03 | 0.92 | 1.54 | -0.01 | 0.10 | NA | NA | NA | |
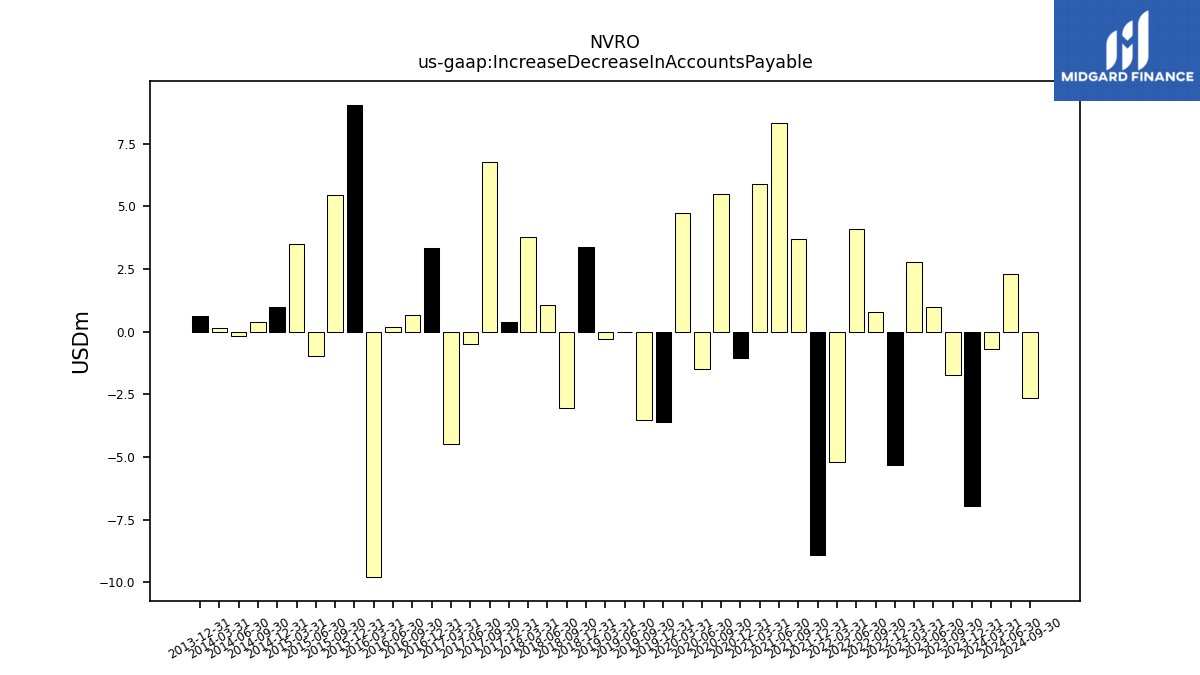
| Increase Decrease In Accounts Payable | -1.72 | 0.99 | 2.78 | -5.34 | 0.77 | 4.11 | -5.19 | -8.89 | 3.70 | 8.32 | 5.87 | -1.04 | 5.49 | -1.50 | 4.73 | -3.61 | -3.54 | -0.02 | -0.30 | 3.38 | -3.05 | 1.05 | 3.79 | 0.37 | 6.78 | -0.51 | -4.48 | 3.34 | 0.67 | 0.19 | -9.79 | 9.06 | 5.46 | -0.96 | 3.50 | 0.96 | 0.37 | -0.18 | 0.13 | 0.62 | NA | NA | NA | |
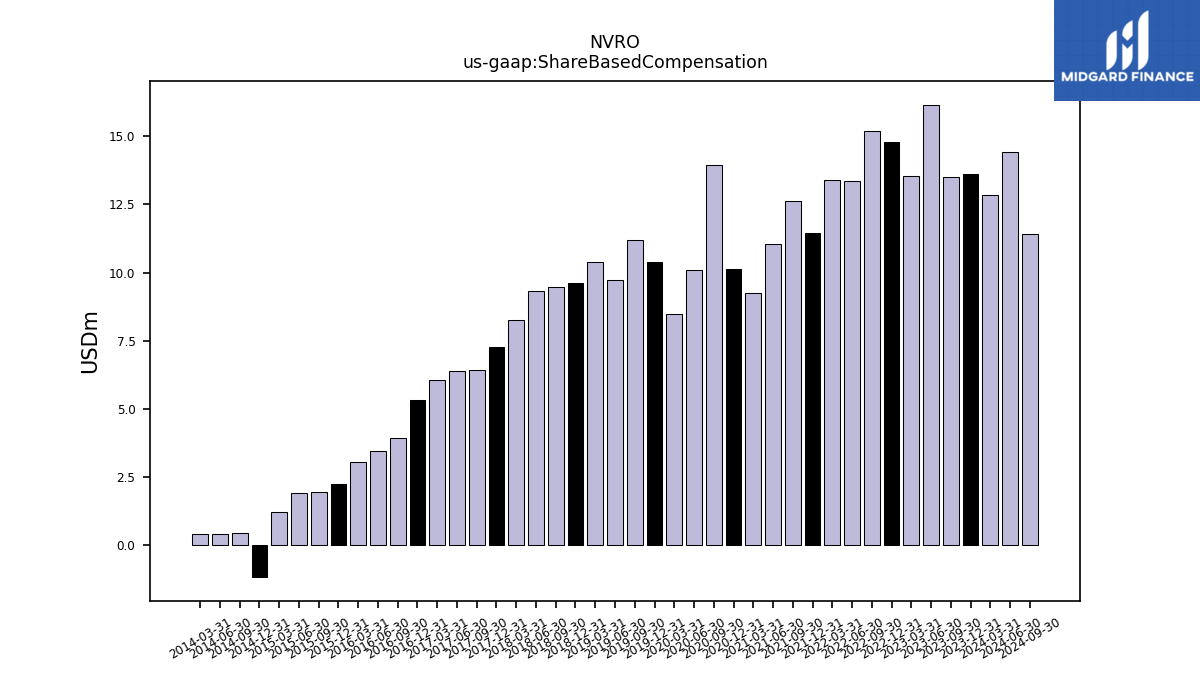
| Share Based Compensation | 13.52 | 16.17 | 13.56 | 14.81 | 15.21 | 13.38 | 13.41 | 11.46 | 12.64 | 11.03 | 9.24 | 10.12 | 13.96 | 10.08 | 8.49 | 10.38 | 11.19 | 9.72 | 10.40 | 9.62 | 9.45 | 9.32 | 8.24 | 7.28 | 6.41 | 6.38 | 6.07 | 5.33 | 3.92 | 3.45 | 3.06 | 2.24 | 1.95 | 1.91 | 1.22 | -1.19 | 0.44 | 0.39 | 0.41 | NA | NA | NA | NA |
| 2023-09-30 | 2023-06-30 | 2023-03-31 | 2022-12-31 | 2022-09-30 | 2022-06-30 | 2022-03-31 | 2021-12-31 | 2021-09-30 | 2021-06-30 | 2021-03-31 | 2020-12-31 | 2020-09-30 | 2020-06-30 | 2020-03-31 | 2019-12-31 | 2019-09-30 | 2019-06-30 | 2019-03-31 | 2018-12-31 | 2018-09-30 | 2018-06-30 | 2018-03-31 | 2017-12-31 | 2017-09-30 | 2017-06-30 | 2017-03-31 | 2016-12-31 | 2016-09-30 | 2016-06-30 | 2016-03-31 | 2015-12-31 | 2015-09-30 | 2015-06-30 | 2015-03-31 | 2014-12-31 | 2014-09-30 | 2014-06-30 | 2014-03-31 | 2013-12-31 | 2013-09-30 | 2013-06-30 | 2013-03-31 | ||
|---|---|---|---|---|---|---|---|---|---|---|---|---|---|---|---|---|---|---|---|---|---|---|---|---|---|---|---|---|---|---|---|---|---|---|---|---|---|---|---|---|---|---|---|---|
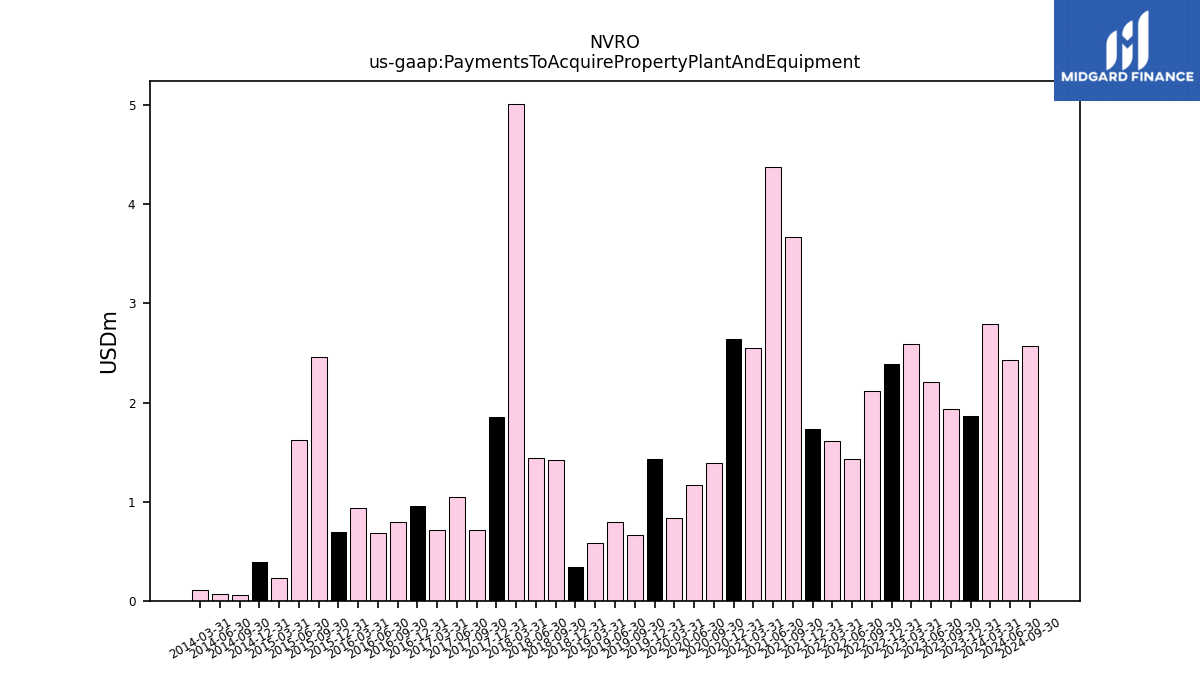
| Net Cash Provided By Used In Investing Activities | 7.28 | 11.27 | -24.65 | 0.46 | -56.50 | 70.27 | 50.07 | -34.23 | -48.19 | 233.79 | 50.34 | -92.11 | -170.13 | -167.92 | 60.29 | 7.65 | -12.54 | 27.88 | 9.34 | 23.70 | -14.43 | 7.97 | -10.82 | -1.37 | 10.47 | NA | NA | NA | NA | NA | NA | NA | NA | NA | NA | NA | NA | NA | NA | NA | NA | NA | NA | |
| Payments To Acquire Property Plant And Equipment | 1.94 | 2.21 | 2.59 | 2.39 | 2.11 | 1.44 | 1.61 | 1.73 | 3.67 | 4.38 | 2.56 | 2.64 | 1.39 | 1.16 | 0.83 | 1.43 | 0.66 | 0.80 | 0.58 | 0.34 | 1.42 | 1.44 | 5.02 | 1.85 | 0.72 | 1.05 | 0.71 | 0.95 | 0.79 | 0.68 | 0.94 | 0.70 | 2.46 | 1.62 | 0.23 | 0.39 | 0.06 | 0.07 | 0.11 | NA | NA | NA | NA |
| 2023-09-30 | 2023-06-30 | 2023-03-31 | 2022-12-31 | 2022-09-30 | 2022-06-30 | 2022-03-31 | 2021-12-31 | 2021-09-30 | 2021-06-30 | 2021-03-31 | 2020-12-31 | 2020-09-30 | 2020-06-30 | 2020-03-31 | 2019-12-31 | 2019-09-30 | 2019-06-30 | 2019-03-31 | 2018-12-31 | 2018-09-30 | 2018-06-30 | 2018-03-31 | 2017-12-31 | 2017-09-30 | 2017-06-30 | 2017-03-31 | 2016-12-31 | 2016-09-30 | 2016-06-30 | 2016-03-31 | 2015-12-31 | 2015-09-30 | 2015-06-30 | 2015-03-31 | 2014-12-31 | 2014-09-30 | 2014-06-30 | 2014-03-31 | 2013-12-31 | 2013-09-30 | 2013-06-30 | 2013-03-31 | ||
|---|---|---|---|---|---|---|---|---|---|---|---|---|---|---|---|---|---|---|---|---|---|---|---|---|---|---|---|---|---|---|---|---|---|---|---|---|---|---|---|---|---|---|---|---|
| Net Cash Provided By Used In Financing Activities | -1.01 | 4.12 | -2.27 | 1.37 | 0.04 | 2.88 | -6.75 | 3.28 | -1.32 | -169.86 | -1.47 | 5.14 | 0.76 | 324.83 | 16.18 | 21.39 | 3.01 | 5.92 | 1.77 | 1.30 | 0.41 | 4.32 | 1.73 | 2.59 | 3.09 | NA | NA | NA | NA | NA | NA | NA | NA | NA | NA | NA | NA | NA | NA | NA | NA | NA | NA |
| 2023-09-30 | 2023-06-30 | 2023-03-31 | 2022-12-31 | 2022-09-30 | 2022-06-30 | 2022-03-31 | 2021-12-31 | 2021-09-30 | 2021-06-30 | 2021-03-31 | 2020-12-31 | 2020-09-30 | 2020-06-30 | 2020-03-31 | 2019-12-31 | 2019-09-30 | 2019-06-30 | 2019-03-31 | 2018-12-31 | 2018-09-30 | 2018-06-30 | 2018-03-31 | 2017-12-31 | 2017-09-30 | 2017-06-30 | 2017-03-31 | 2016-12-31 | 2016-09-30 | 2016-06-30 | 2016-03-31 | 2015-12-31 | 2015-09-30 | 2015-06-30 | 2015-03-31 | 2014-12-31 | 2014-09-30 | 2014-06-30 | 2014-03-31 | 2013-12-31 | 2013-09-30 | 2013-06-30 | 2013-03-31 | ||
|---|---|---|---|---|---|---|---|---|---|---|---|---|---|---|---|---|---|---|---|---|---|---|---|---|---|---|---|---|---|---|---|---|---|---|---|---|---|---|---|---|---|---|---|---|
| Revenues | 103.86 | 108.81 | 96.33 | 113.84 | 100.47 | 104.21 | 87.84 | 102.76 | 93.20 | 102.33 | 88.61 | 109.73 | 108.46 | 56.39 | 87.47 | 114.37 | 100.16 | 93.57 | 82.15 | 107.94 | 95.63 | 96.08 | 87.64 | 97.96 | 82.26 | 78.02 | 68.44 | 70.53 | 60.92 | 55.40 | 41.65 | 33.12 | 15.40 | 11.42 | 9.66 | 9.71 | 8.67 | 7.53 | 6.66 | 6.20 | 6.20 | 5.70 | 5.41 | |
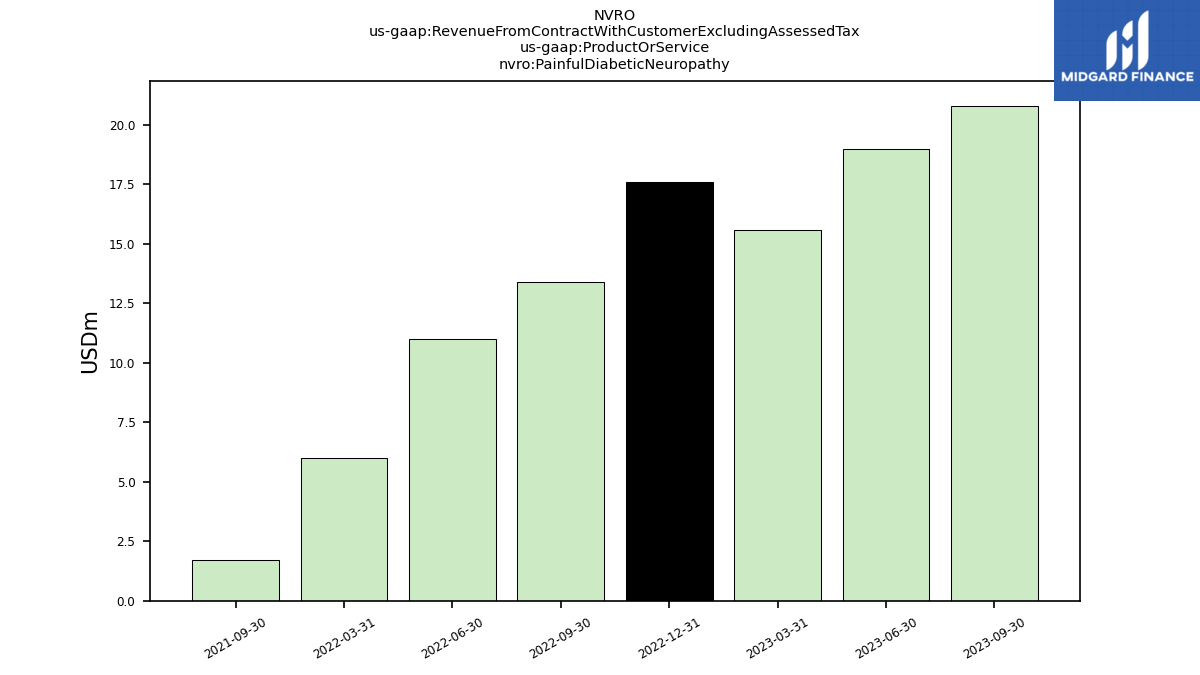
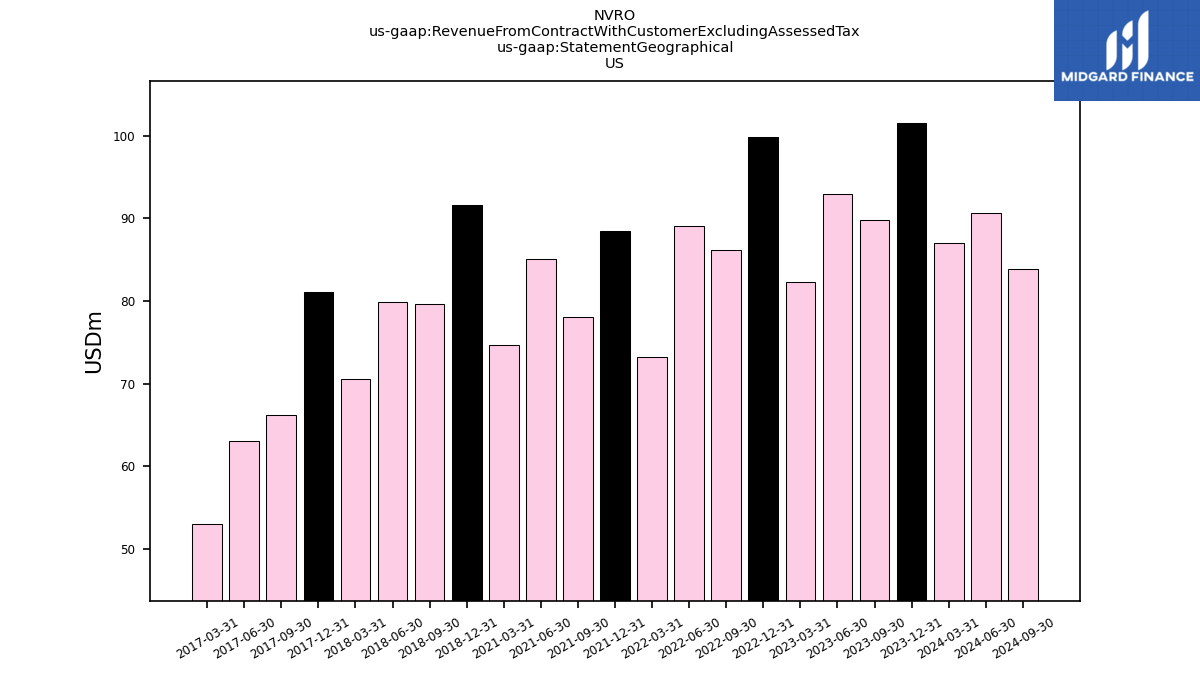
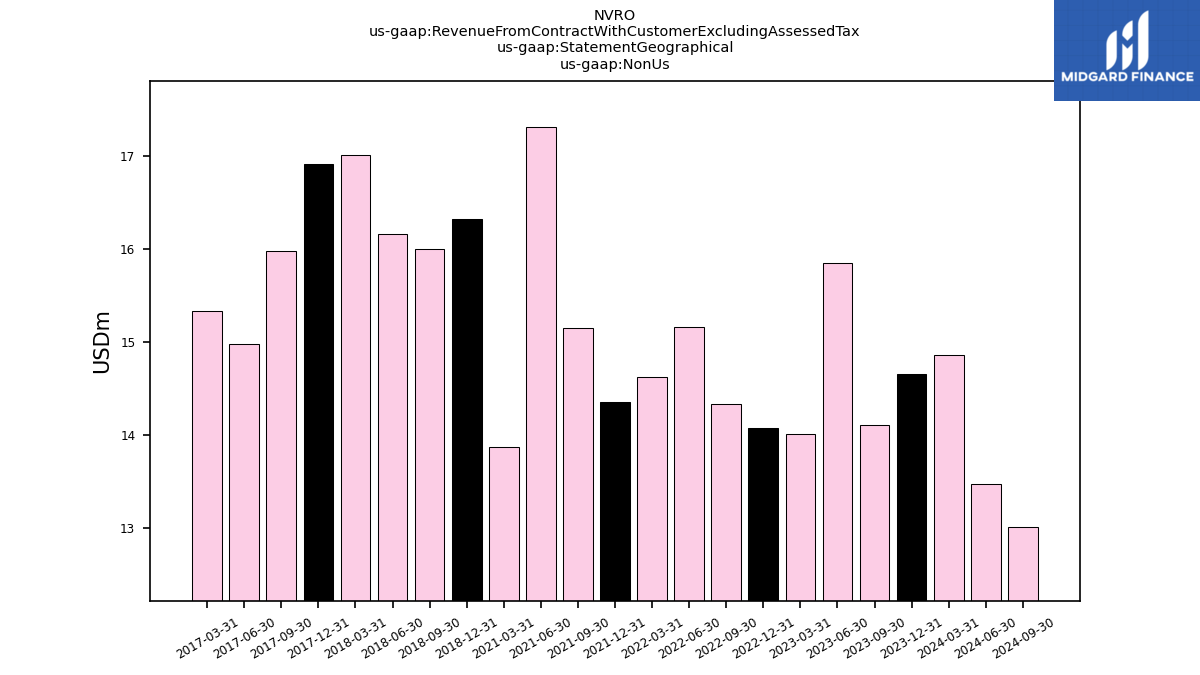
| Revenue From Contract With Customer Excluding Assessed Tax | 103.86 | 108.81 | 96.33 | 113.84 | 100.47 | 104.21 | 87.84 | 102.76 | 93.20 | 102.33 | 88.61 | 109.73 | 108.46 | 56.39 | 87.47 | 114.37 | 100.16 | 93.57 | 82.15 | 107.94 | 95.63 | 96.08 | 87.64 | 97.96 | 82.26 | 78.02 | 68.44 | 70.53 | 60.92 | 55.40 | 41.65 | 33.12 | 15.40 | 11.42 | 9.66 | 9.71 | 8.67 | 7.53 | 6.66 | 6.20 | 6.20 | 5.70 | 5.41 | |
| Painful Diabetic Neuropathy | 20.80 | 19.00 | 15.60 | 17.60 | 13.40 | 11.00 | 6.00 | NA | 1.70 | NA | NA | NA | NA | NA | NA | NA | NA | NA | NA | NA | NA | NA | NA | NA | NA | NA | NA | NA | NA | NA | NA | NA | NA | NA | NA | NA | NA | NA | NA | NA | NA | NA | NA | |
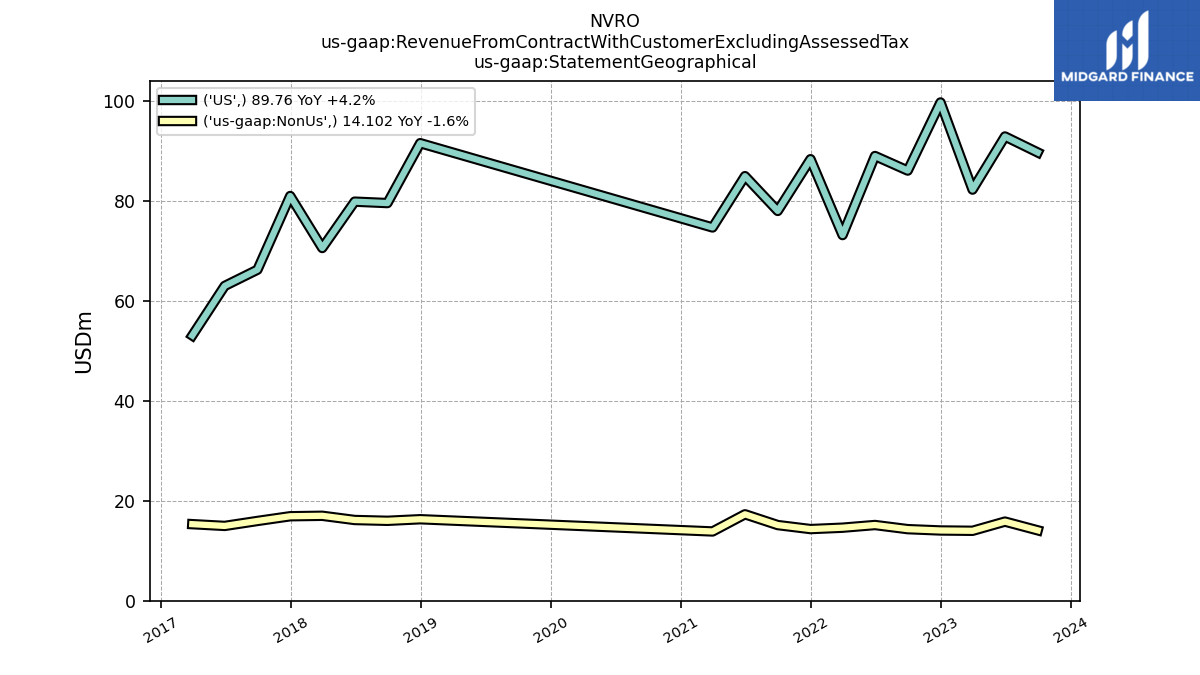
| US | 89.76 | 92.96 | 82.32 | 99.77 | 86.13 | 89.05 | 73.21 | 88.41 | 78.05 | 85.02 | 74.74 | NA | NA | NA | NA | NA | NA | NA | NA | 91.62 | 79.62 | 79.91 | 70.62 | 81.04 | 66.28 | 63.03 | 53.10 | NA | NA | NA | NA | NA | NA | NA | NA | NA | NA | NA | NA | NA | NA | NA | NA | |
| Non Us | 14.10 | 15.85 | 14.01 | 14.07 | 14.34 | 15.16 | 14.63 | 14.35 | 15.15 | 17.31 | 13.87 | NA | NA | NA | NA | NA | NA | NA | NA | 16.32 | 16.01 | 16.17 | 17.01 | 16.92 | 15.97 | 14.98 | 15.34 | NA | NA | NA | NA | NA | NA | NA | NA | NA | NA | NA | NA | NA | NA | NA | NA |