
| 2023-12-31 | 2023-09-29 | 2023-06-30 | 2023-03-31 | 2022-12-31 | 2022-09-30 | 2022-07-01 | 2022-04-01 | 2021-12-31 | 2021-10-01 | 2021-07-02 | 2021-04-02 | 2020-12-31 | 2020-10-02 | 2020-07-03 | 2020-04-03 | 2019-12-31 | 2019-09-27 | 2019-06-28 | 2019-03-29 | 2018-12-31 | 2018-09-28 | 2018-06-29 | 2018-03-30 | ||
|---|---|---|---|---|---|---|---|---|---|---|---|---|---|---|---|---|---|---|---|---|---|---|---|---|---|
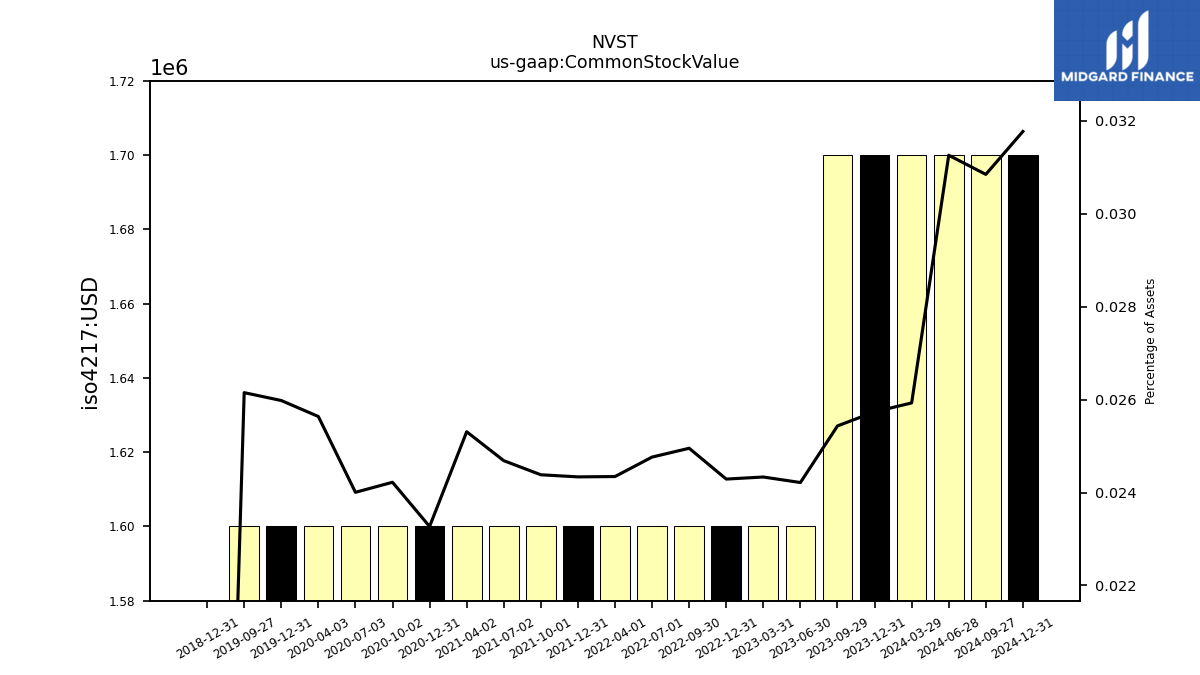
| Common Stock Value | 1.70 | 1.70 | 1.60 | 1.60 | 1.60 | 1.60 | 1.60 | 1.60 | 1.60 | 1.60 | 1.60 | 1.60 | 1.60 | 1.60 | 1.60 | 1.60 | 1.60 | 1.60 | NA | NA | 0.00 | NA | NA | NA | |
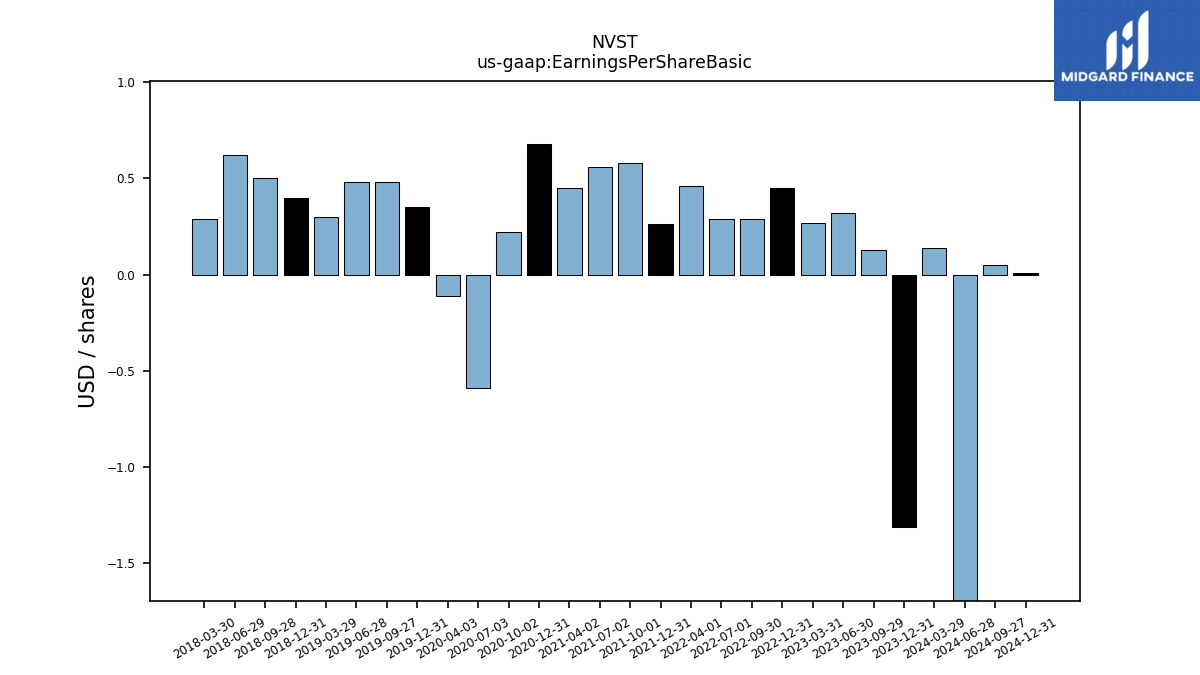
| Earnings Per Share Basic | -1.31 | 0.13 | 0.32 | 0.27 | 0.45 | 0.29 | 0.29 | 0.46 | 0.26 | 0.58 | 0.56 | 0.45 | 0.68 | 0.22 | -0.59 | -0.11 | 0.35 | 0.48 | 0.48 | 0.30 | 0.40 | 0.50 | 0.62 | 0.29 | |
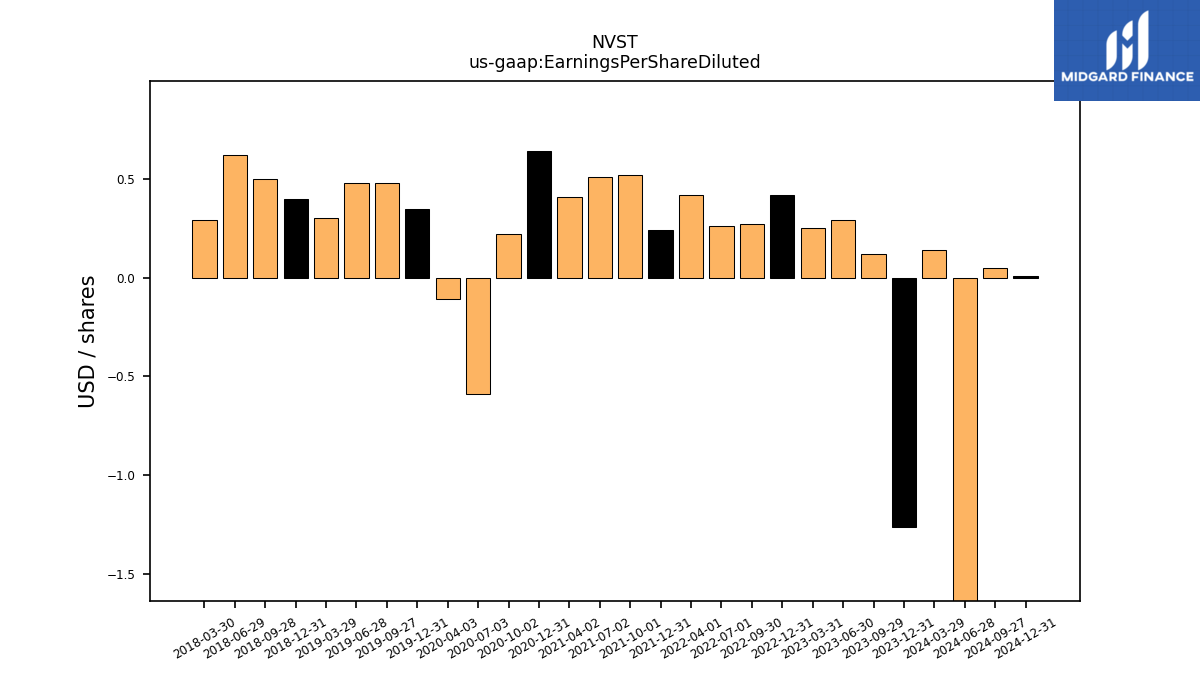
| Earnings Per Share Diluted | -1.26 | 0.12 | 0.29 | 0.25 | 0.42 | 0.27 | 0.26 | 0.42 | 0.24 | 0.52 | 0.51 | 0.41 | 0.64 | 0.22 | -0.59 | -0.11 | 0.35 | 0.48 | 0.48 | 0.30 | 0.40 | 0.50 | 0.62 | 0.29 | |
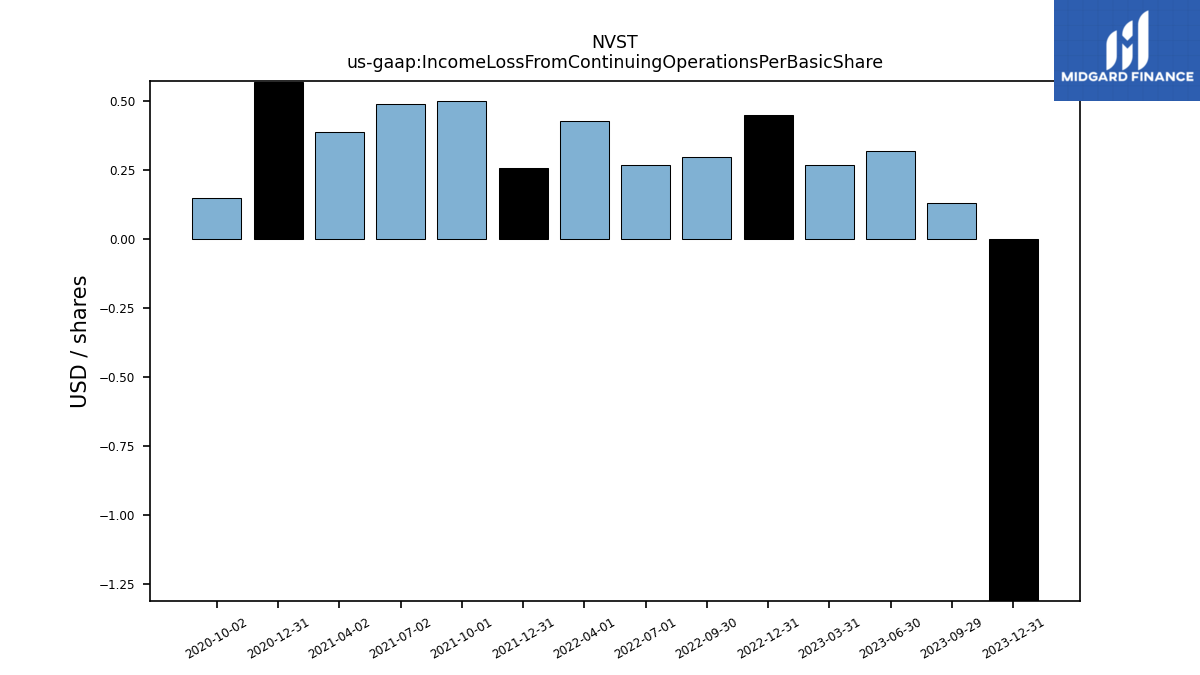
| Income Loss From Continuing Operations Per Basic Share | -0.00 | 0.00 | 0.00 | 0.00 | 0.00 | 0.00 | 0.00 | 0.00 | 0.00 | 0.00 | 0.00 | 0.00 | 0.00 | 0.00 | NA | NA | NA | NA | NA | NA | NA | NA | NA | NA | |
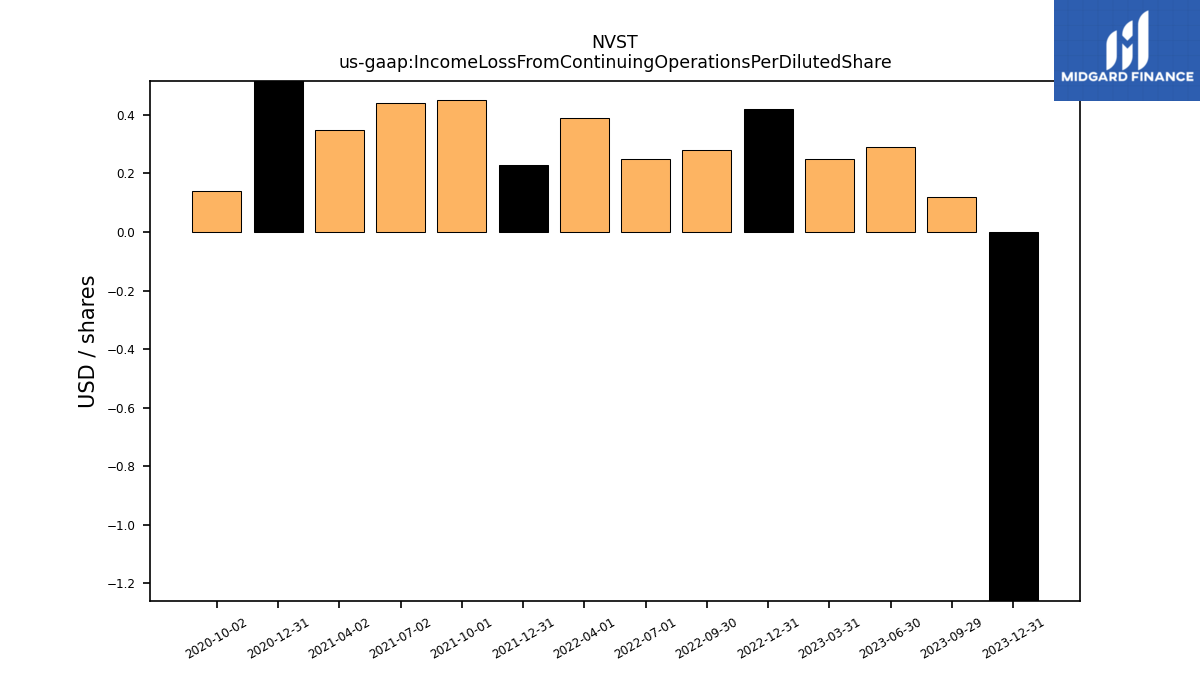
| Income Loss From Continuing Operations Per Diluted Share | -0.00 | 0.00 | 0.00 | 0.00 | 0.00 | 0.00 | 0.00 | 0.00 | 0.00 | 0.00 | 0.00 | 0.00 | 0.00 | 0.00 | NA | NA | NA | NA | NA | NA | NA | NA | NA | NA |
| 2023-12-31 | 2023-09-29 | 2023-06-30 | 2023-03-31 | 2022-12-31 | 2022-09-30 | 2022-07-01 | 2022-04-01 | 2021-12-31 | 2021-10-01 | 2021-07-02 | 2021-04-02 | 2020-12-31 | 2020-10-02 | 2020-07-03 | 2020-04-03 | 2019-12-31 | 2019-09-27 | 2019-06-28 | 2019-03-29 | 2018-12-31 | 2018-09-28 | 2018-06-29 | 2018-03-30 | ||
|---|---|---|---|---|---|---|---|---|---|---|---|---|---|---|---|---|---|---|---|---|---|---|---|---|---|
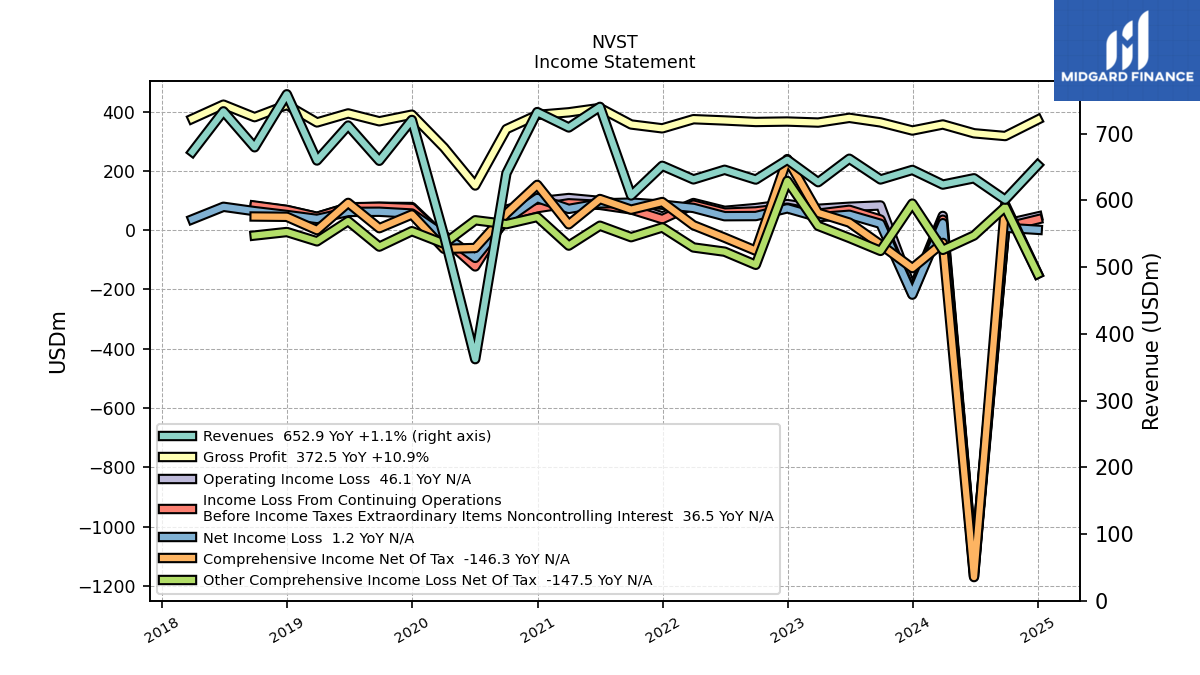
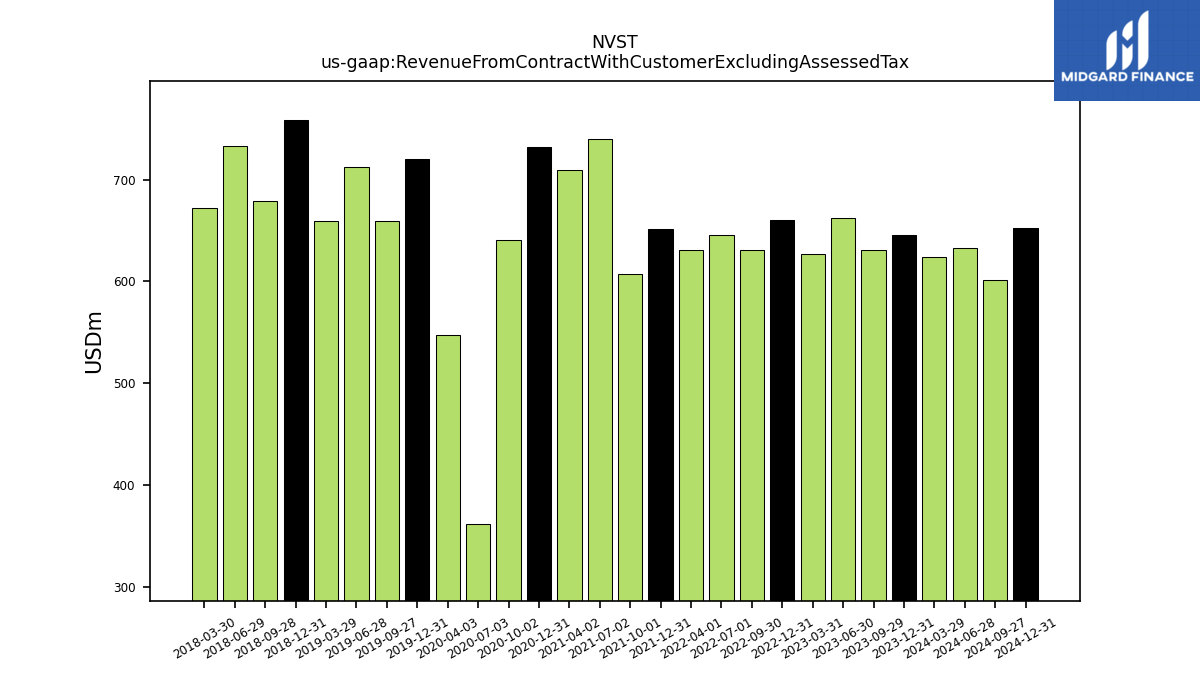
| Revenue From Contract With Customer Excluding Assessed Tax | 645.60 | 631.30 | 662.40 | 627.20 | 660.80 | 631.10 | 645.80 | 631.40 | 651.80 | 607.30 | 740.10 | 709.20 | 732.30 | 640.50 | 362.00 | 547.20 | 720.50 | 659.30 | 712.10 | 659.70 | 759.00 | 679.50 | 733.40 | 672.60 | |
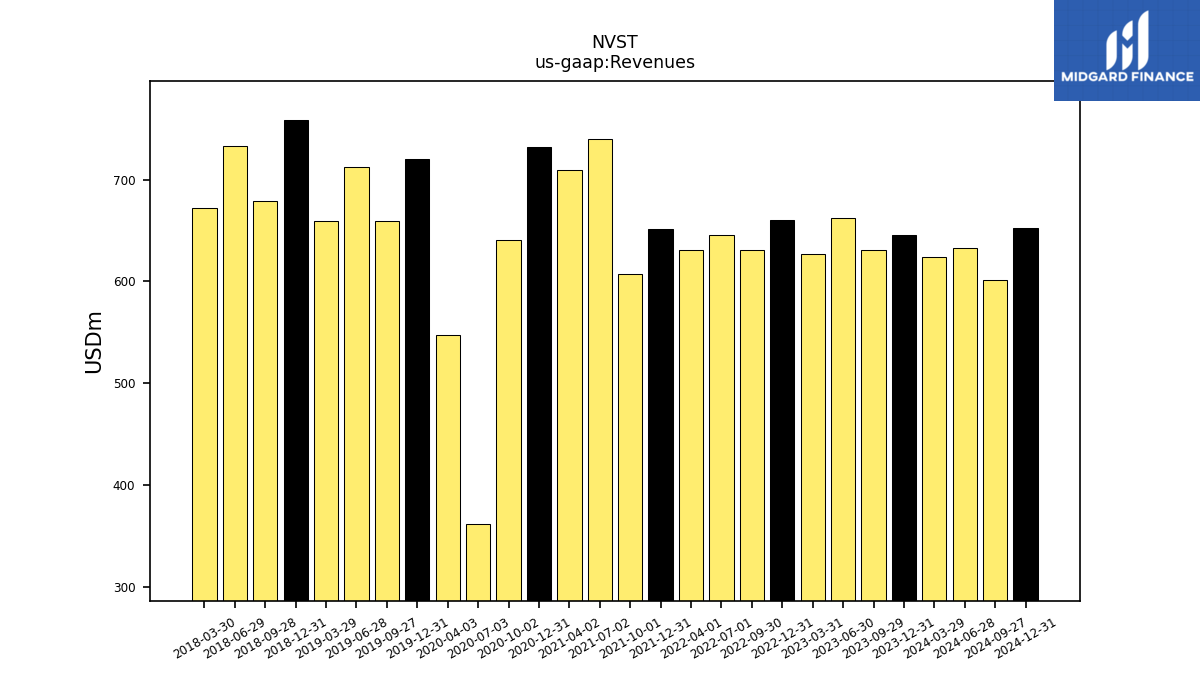
| Revenues | 645.60 | 631.30 | 662.40 | 627.20 | 660.80 | 631.10 | 645.80 | 631.40 | 651.80 | 607.30 | 740.10 | 709.20 | 732.30 | 640.50 | 362.00 | 547.20 | 720.50 | 659.30 | 712.10 | 659.70 | 759.00 | 679.50 | 733.40 | 672.60 | |
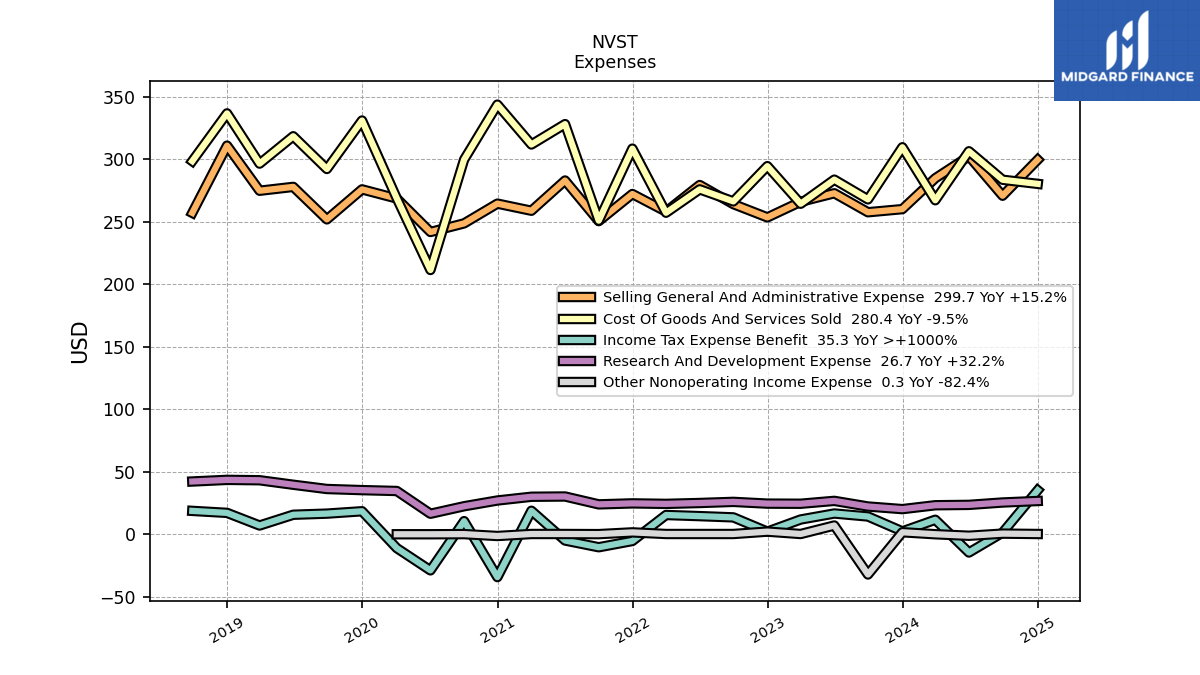
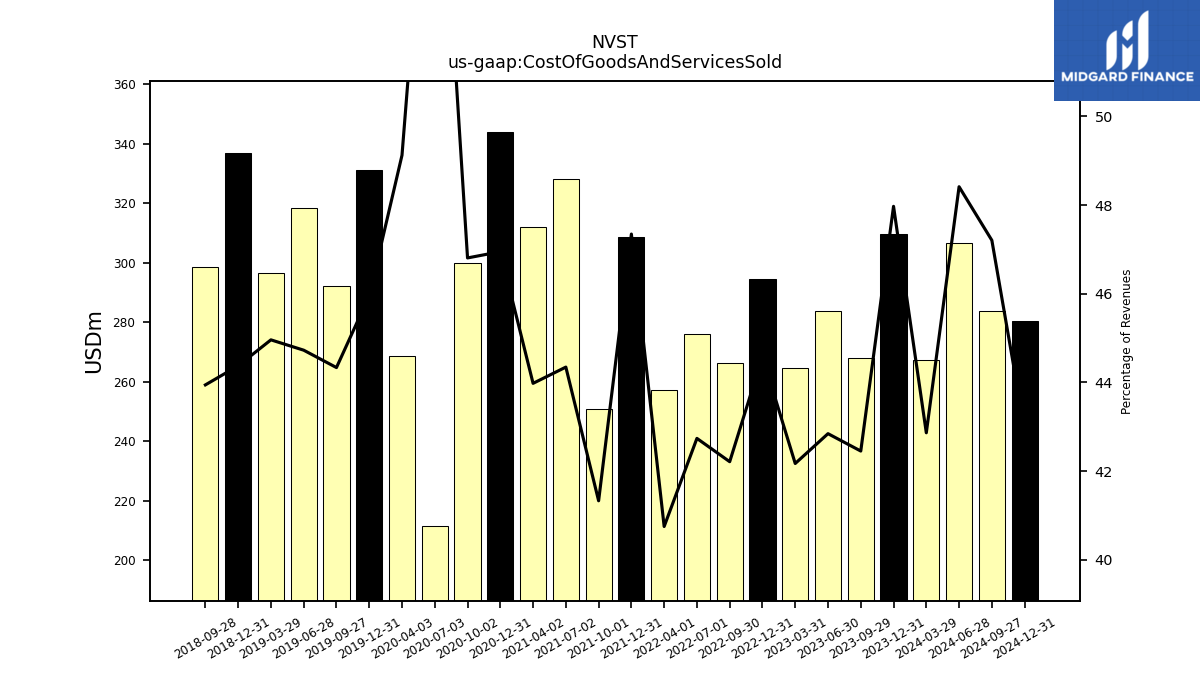
| Cost Of Goods And Services Sold | 309.70 | 268.00 | 283.80 | 264.50 | 294.60 | 266.40 | 276.00 | 257.30 | 308.60 | 251.00 | 328.20 | 311.90 | 343.80 | 299.80 | 211.50 | 268.80 | 331.10 | 292.30 | 318.50 | 296.60 | 336.80 | 298.60 | NA | NA | |
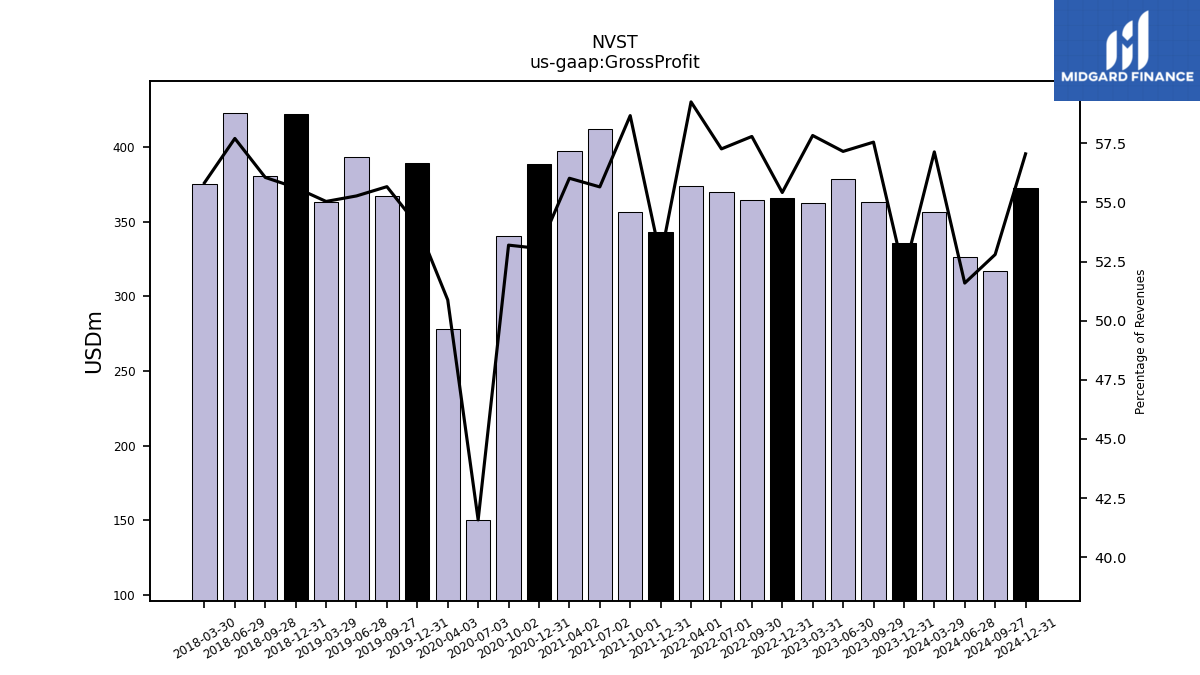
| Gross Profit | 335.90 | 363.30 | 378.60 | 362.70 | 366.20 | 364.70 | 369.80 | 374.10 | 343.20 | 356.30 | 411.90 | 397.30 | 388.50 | 340.70 | 150.50 | 278.40 | 389.40 | 367.00 | 393.60 | 363.10 | 422.20 | 380.90 | 423.20 | 375.50 | |
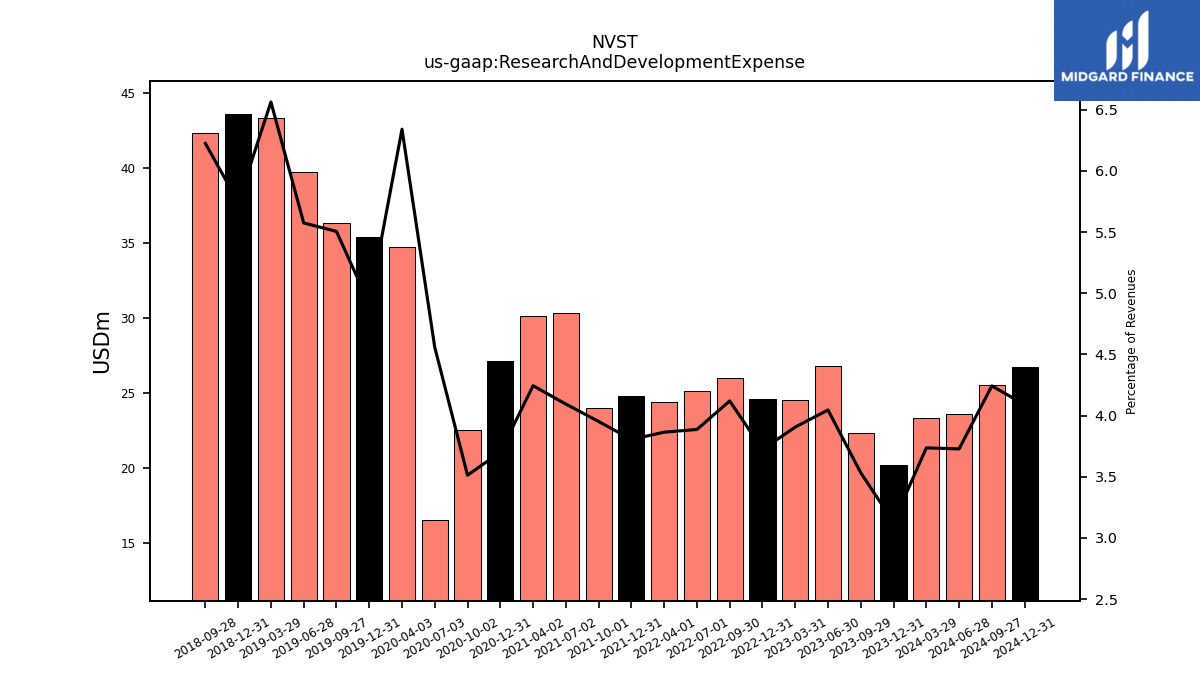
| Research And Development Expense | 20.20 | 22.30 | 26.80 | 24.50 | 24.60 | 26.00 | 25.10 | 24.40 | 24.80 | 24.00 | 30.30 | 30.10 | 27.10 | 22.50 | 16.50 | 34.70 | 35.40 | 36.30 | 39.70 | 43.30 | 43.60 | 42.30 | NA | NA | |
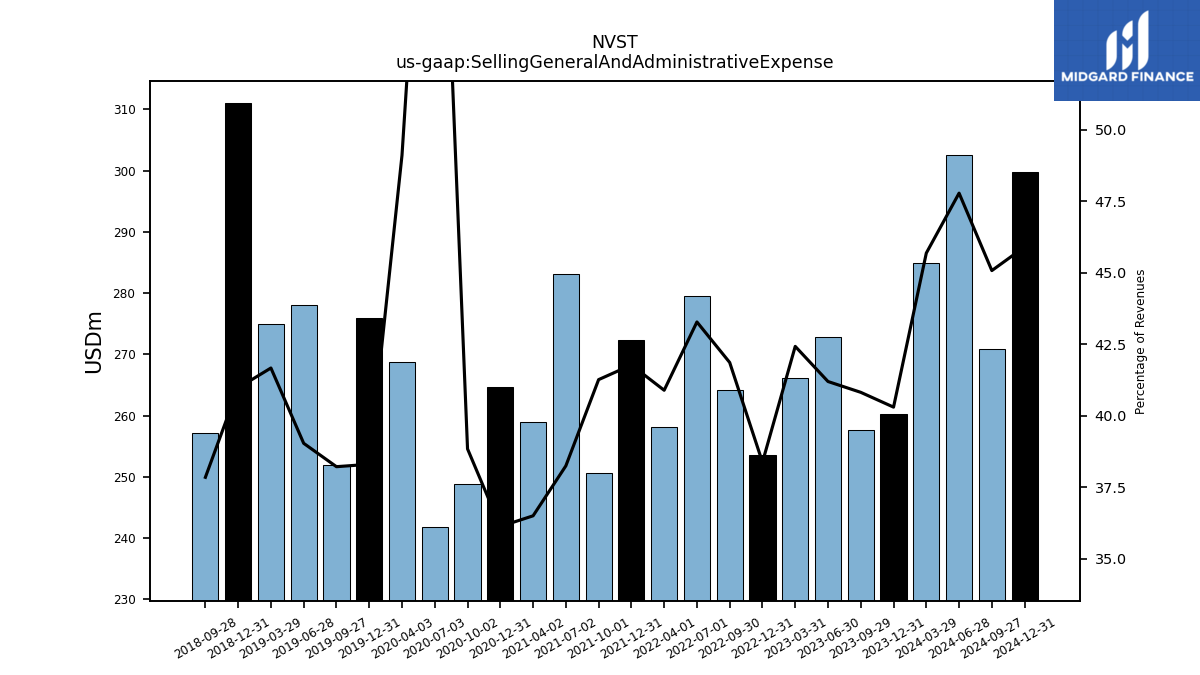
| Selling General And Administrative Expense | 260.20 | 257.70 | 272.90 | 266.10 | 253.60 | 264.20 | 279.50 | 258.20 | 272.30 | 250.60 | 283.10 | 258.90 | 264.60 | 248.80 | 241.90 | 268.70 | 276.00 | 252.00 | 278.00 | 274.90 | 311.00 | 257.20 | NA | NA | |
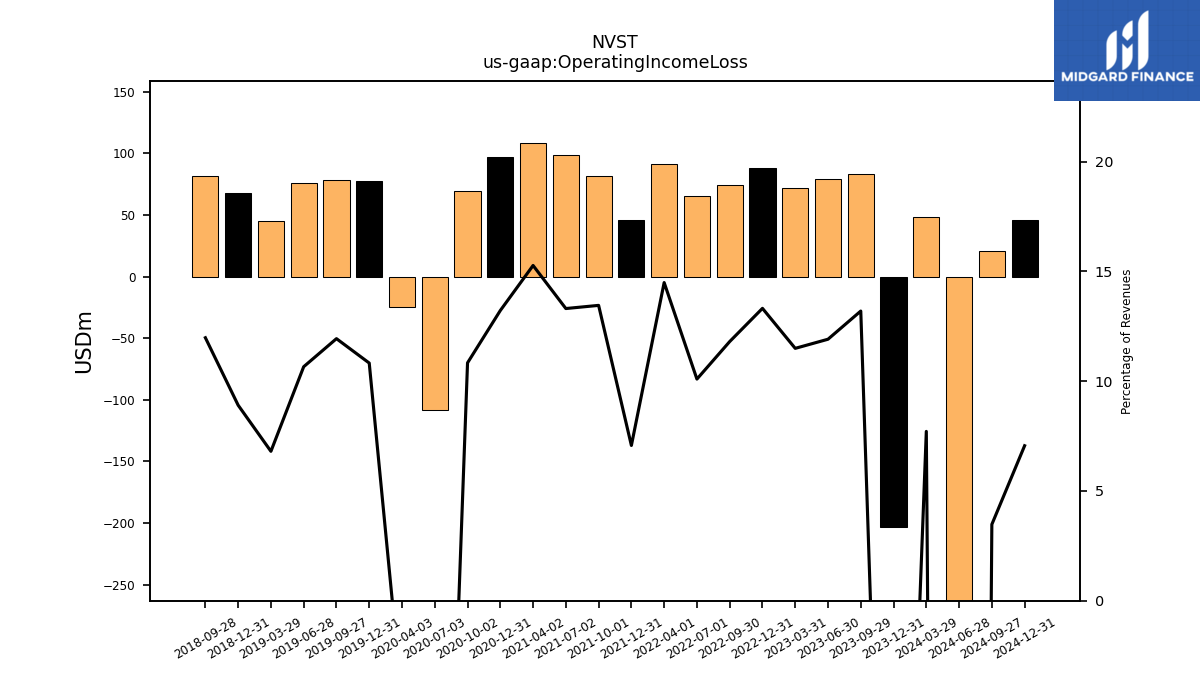
| Operating Income Loss | -202.80 | 83.30 | 78.90 | 72.10 | 88.00 | 74.50 | 65.20 | 91.50 | 46.10 | 81.70 | 98.50 | 108.30 | 96.80 | 69.40 | -107.90 | -25.00 | 78.00 | 78.70 | 75.90 | 44.90 | 67.60 | 81.40 | NA | NA | |
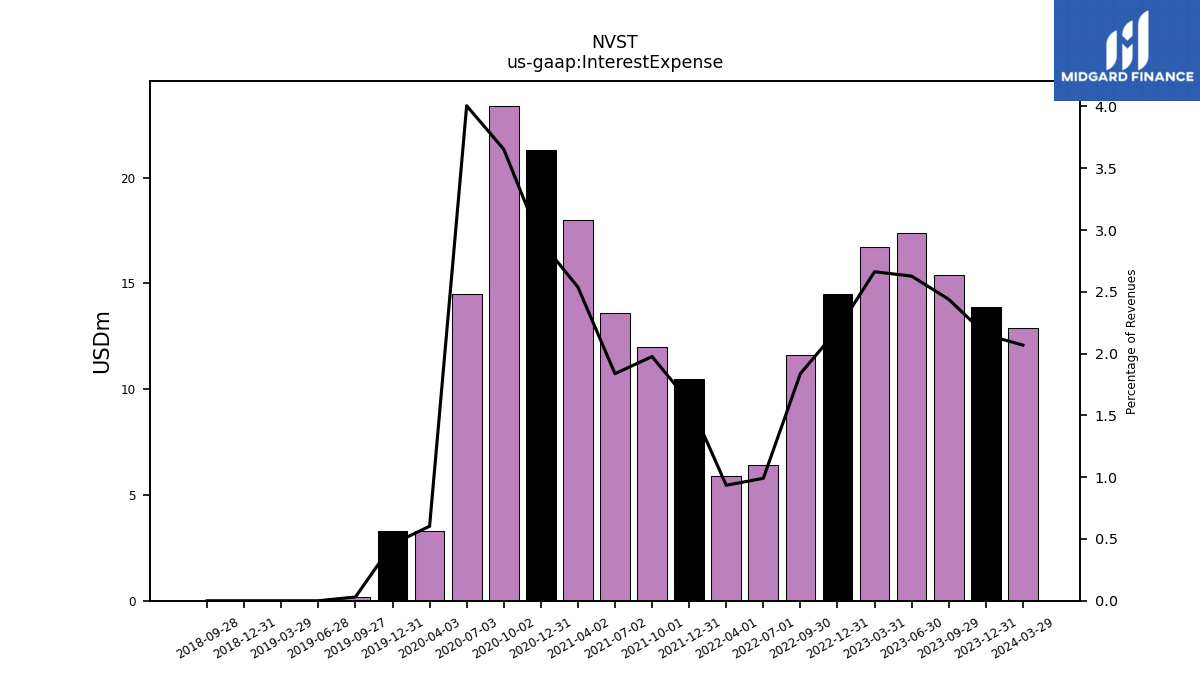
| Interest Expense | 13.90 | 15.40 | 17.40 | 16.70 | 14.50 | 11.60 | 6.40 | 5.90 | 10.50 | 12.00 | 13.60 | 18.00 | 21.30 | 23.40 | 14.50 | 3.30 | 3.30 | 0.20 | 0.00 | 0.00 | 0.00 | 0.00 | NA | NA | |
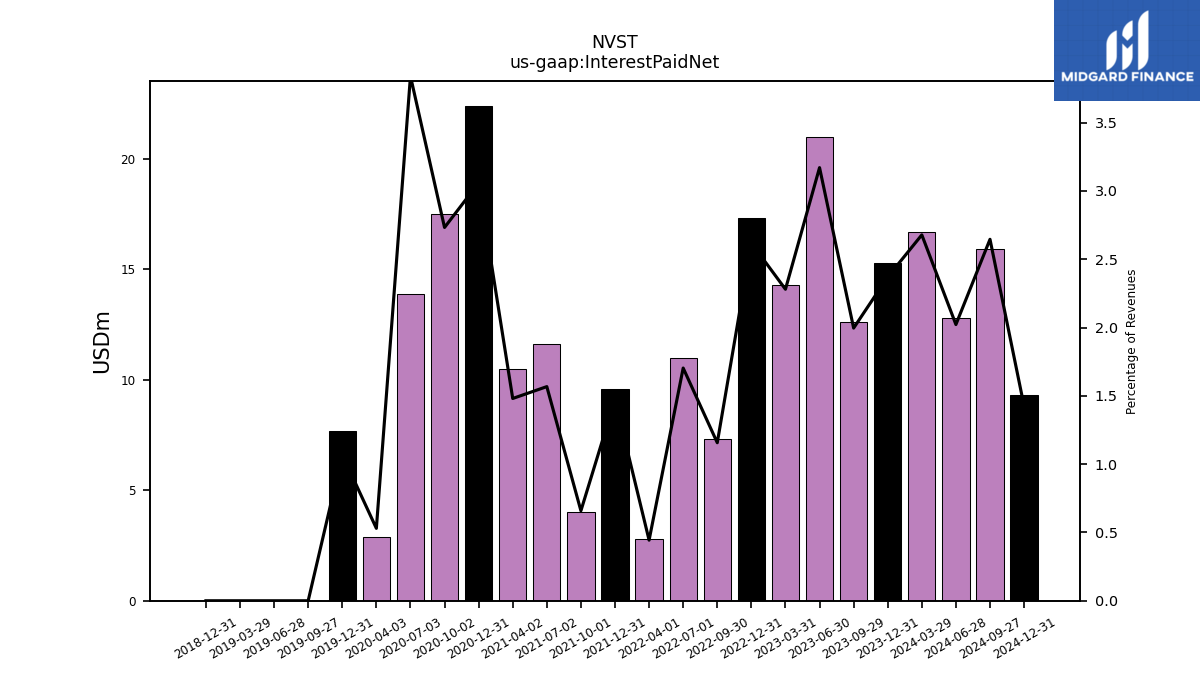
| Interest Paid Net | 15.30 | 12.60 | 21.00 | 14.30 | 17.30 | 7.30 | 11.00 | 2.80 | 9.60 | 4.00 | 11.60 | 10.50 | 22.40 | 17.50 | 13.90 | 2.90 | 7.70 | 0.00 | 0.00 | 0.00 | 0.00 | NA | NA | NA | |
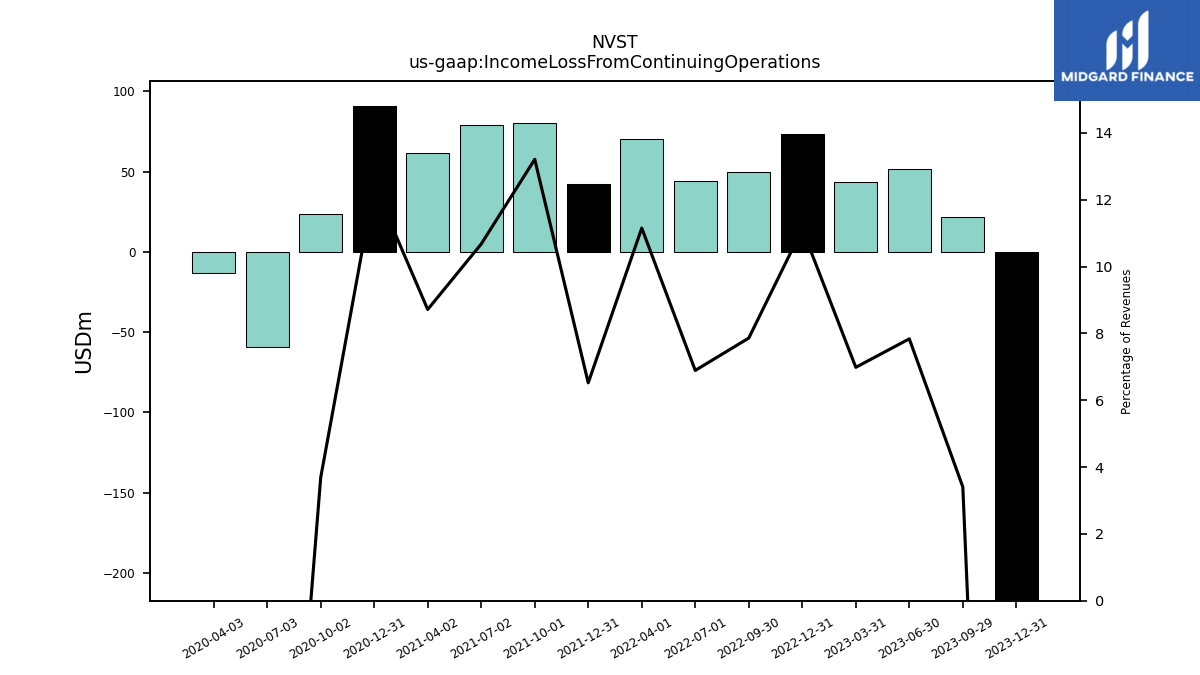
| Income Loss From Continuing Operations | -217.40 | 21.50 | 51.90 | 43.80 | 73.50 | 49.60 | 44.50 | 70.40 | 42.50 | 80.20 | 79.00 | 61.80 | 91.10 | 23.60 | -59.00 | -13.20 | NA | NA | NA | NA | NA | NA | NA | NA | |
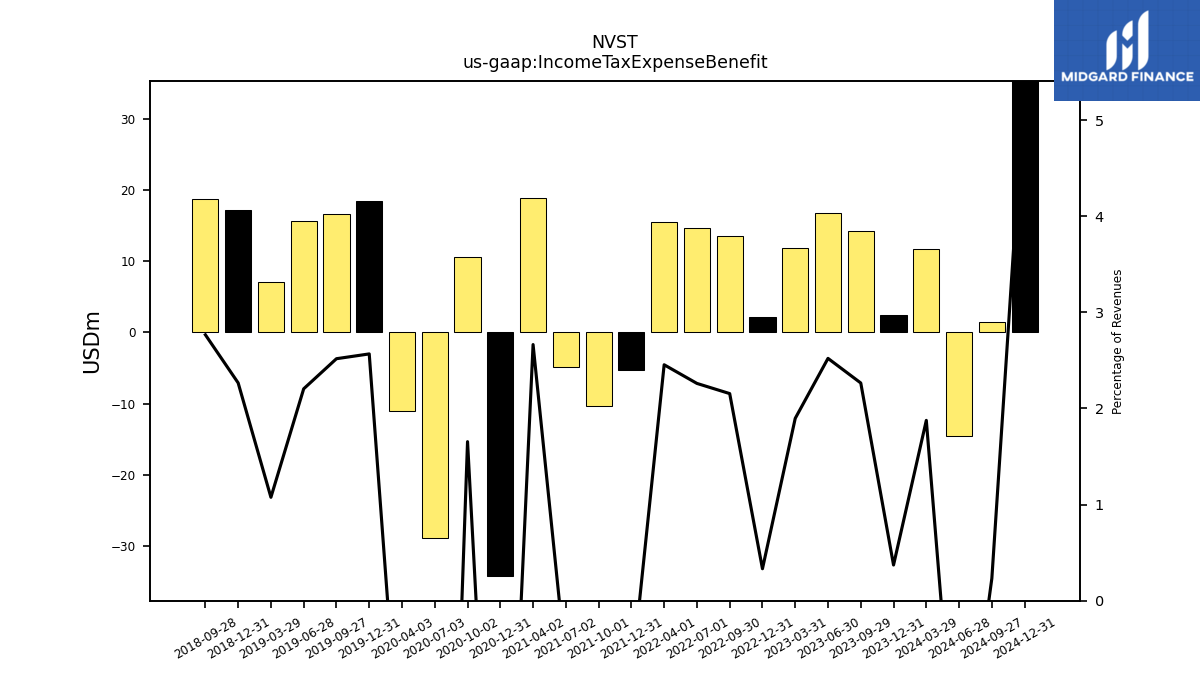
| Income Tax Expense Benefit | 2.40 | 14.30 | 16.70 | 11.90 | 2.20 | 13.60 | 14.60 | 15.50 | -5.30 | -10.30 | -4.90 | 18.90 | -34.20 | 10.60 | -28.80 | -11.00 | 18.50 | 16.60 | 15.70 | 7.10 | 17.20 | 18.80 | NA | NA | |
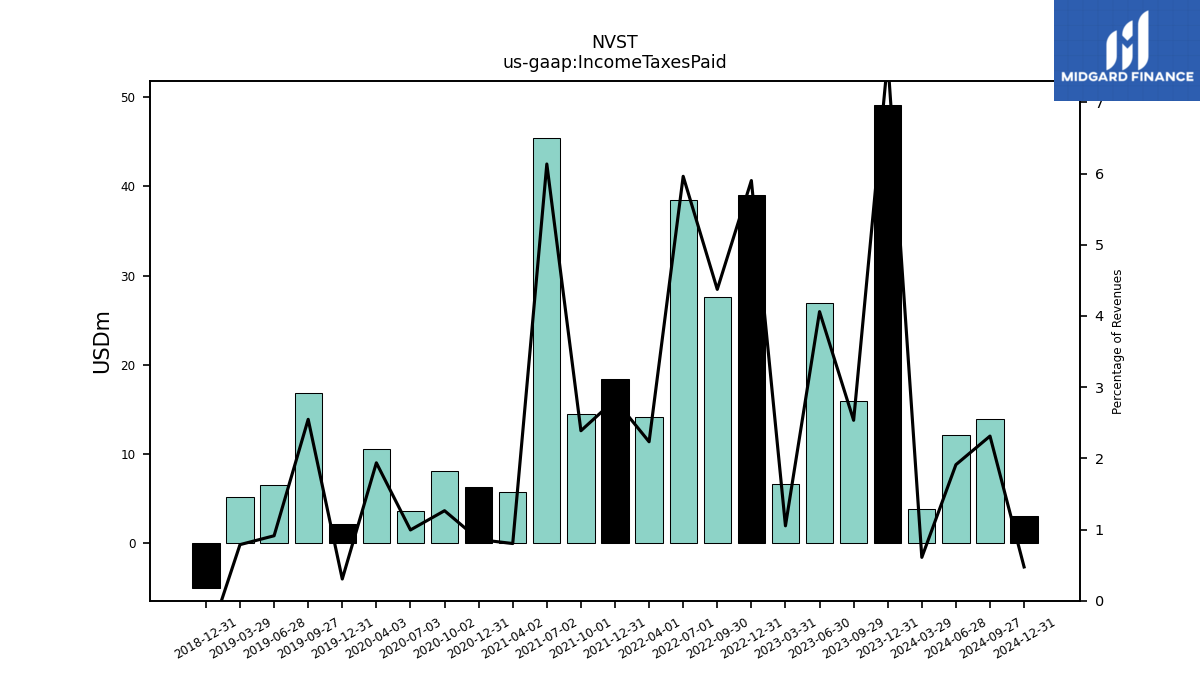
| Income Taxes Paid | 49.10 | 16.00 | 26.90 | 6.60 | 39.00 | 27.60 | 38.50 | 14.10 | 18.40 | 14.50 | 45.40 | 5.70 | 6.30 | 8.10 | 3.60 | 10.60 | 2.20 | 16.80 | 6.50 | 5.20 | -5.00 | NA | NA | NA | |
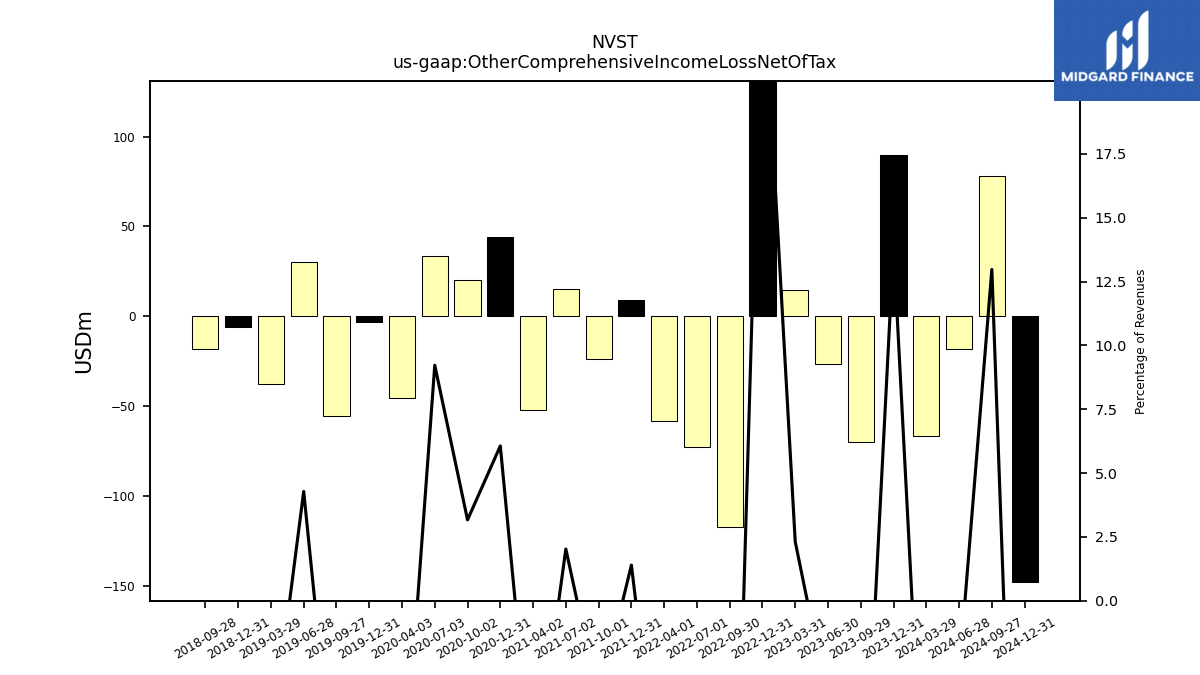
| Other Comprehensive Income Loss Net Of Tax | 89.60 | -69.90 | -26.30 | 14.50 | 166.10 | -116.90 | -72.50 | -58.30 | 9.10 | -23.70 | 15.00 | -52.10 | 44.40 | 20.30 | 33.40 | -45.70 | -3.30 | -55.50 | 30.50 | -37.70 | -6.20 | -18.10 | NA | NA | |
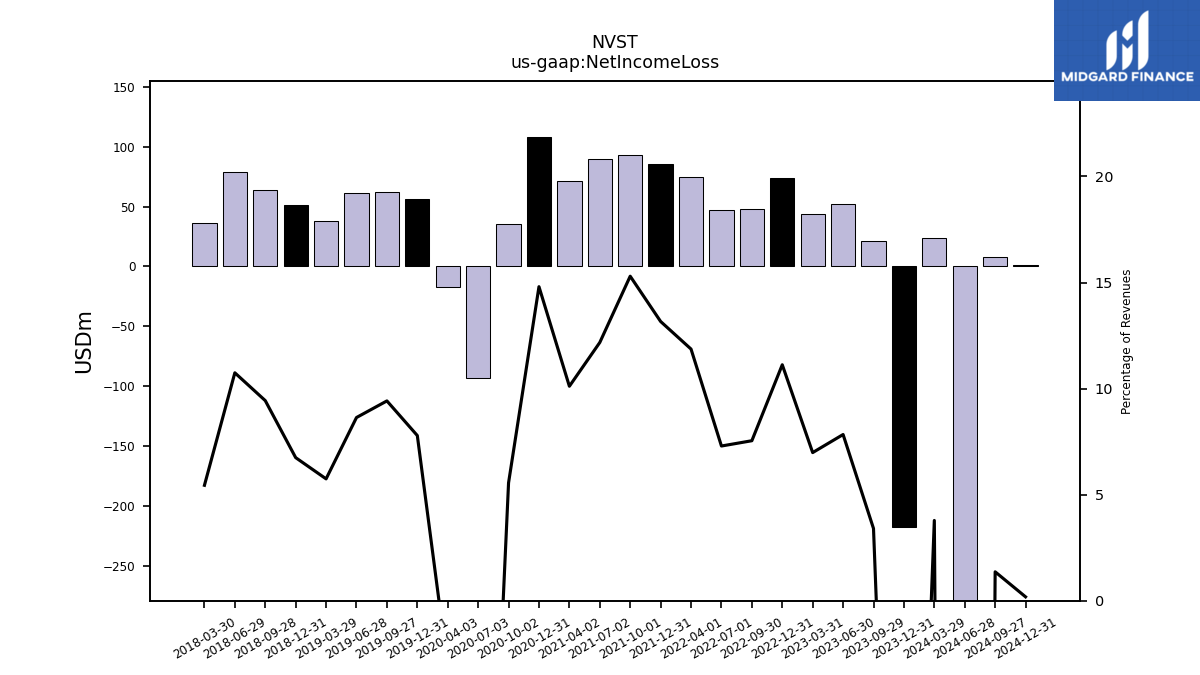
| Net Income Loss | -217.40 | 21.50 | 51.90 | 43.80 | 73.50 | 47.60 | 47.10 | 74.90 | 85.80 | 92.90 | 90.10 | 71.70 | 108.40 | 35.60 | -93.50 | -17.20 | 56.10 | 62.10 | 61.50 | 37.90 | 51.20 | 64.10 | 78.80 | 36.60 | |
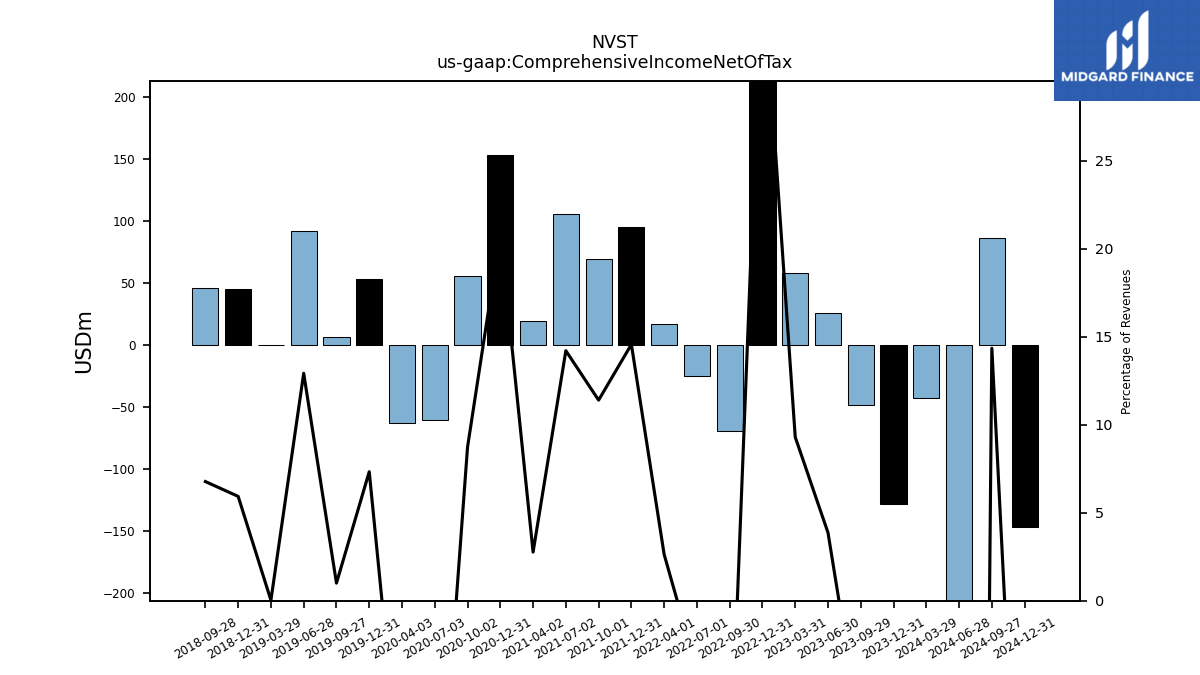
| Comprehensive Income Net Of Tax | -127.80 | -48.40 | 25.60 | 58.30 | 239.60 | -69.30 | -25.40 | 16.60 | 94.90 | 69.20 | 105.10 | 19.60 | 152.80 | 55.90 | -60.10 | -62.90 | 52.80 | 6.60 | 92.00 | 0.20 | 45.00 | 46.00 | NA | NA |
| 2023-12-31 | 2023-09-29 | 2023-06-30 | 2023-03-31 | 2022-12-31 | 2022-09-30 | 2022-07-01 | 2022-04-01 | 2021-12-31 | 2021-10-01 | 2021-07-02 | 2021-04-02 | 2020-12-31 | 2020-10-02 | 2020-07-03 | 2020-04-03 | 2019-12-31 | 2019-09-27 | 2019-06-28 | 2019-03-29 | 2018-12-31 | 2018-09-28 | 2018-06-29 | 2018-03-30 | ||
|---|---|---|---|---|---|---|---|---|---|---|---|---|---|---|---|---|---|---|---|---|---|---|---|---|---|
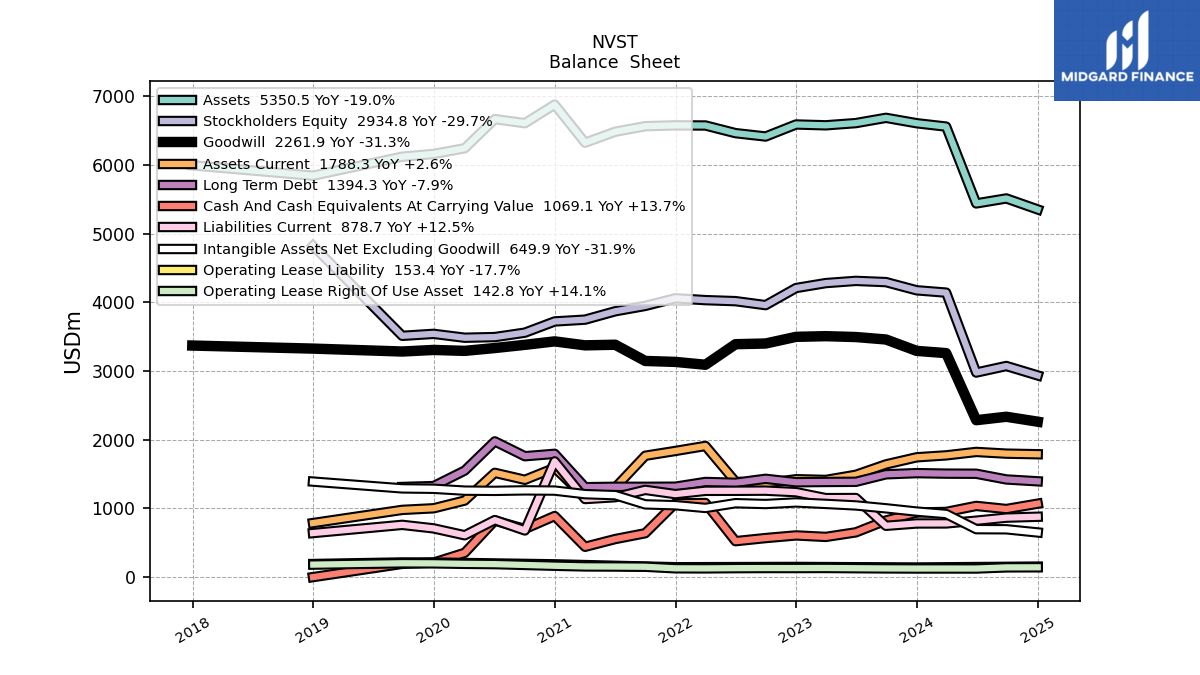
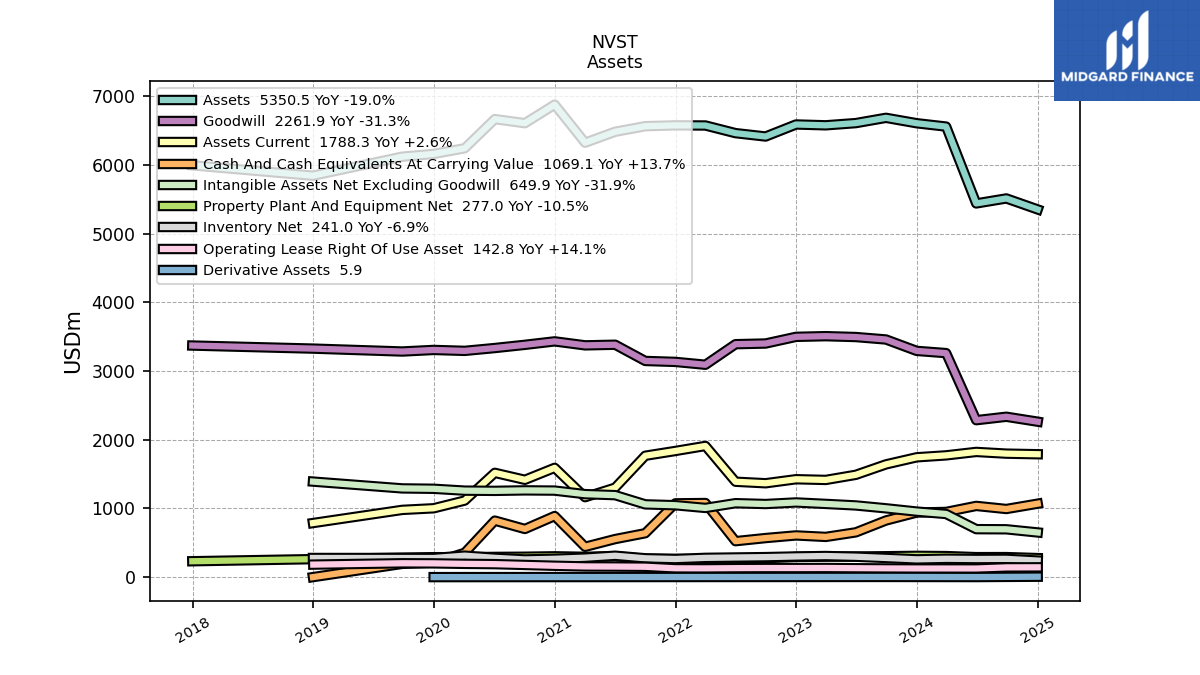
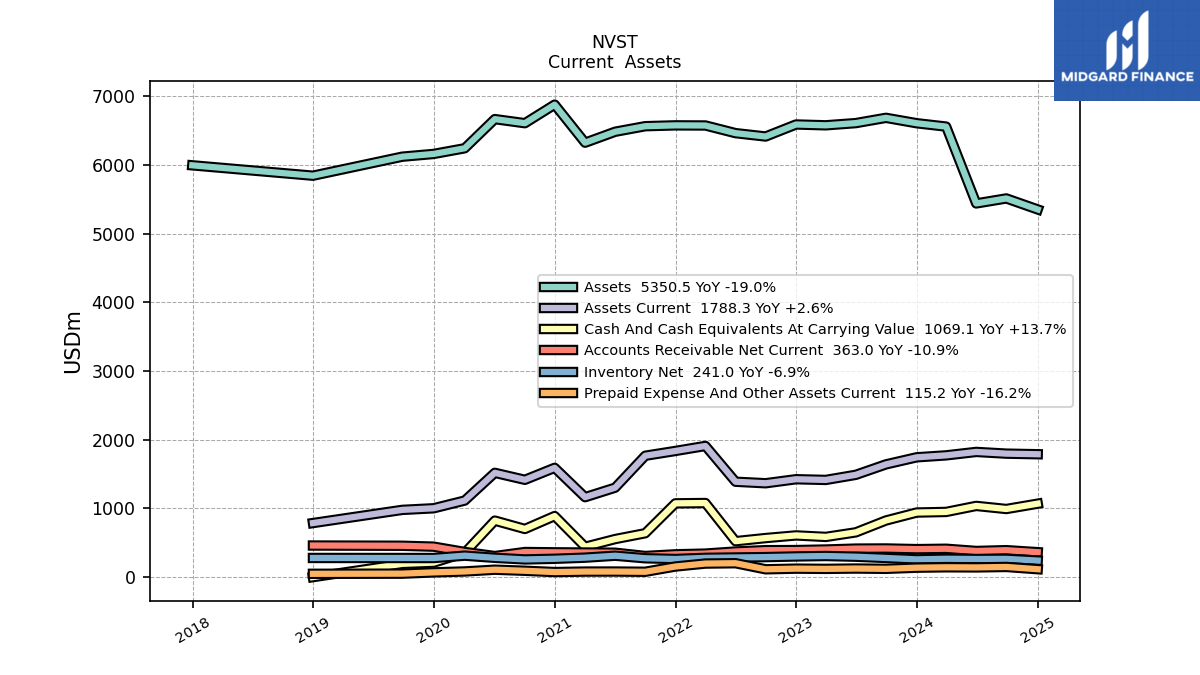
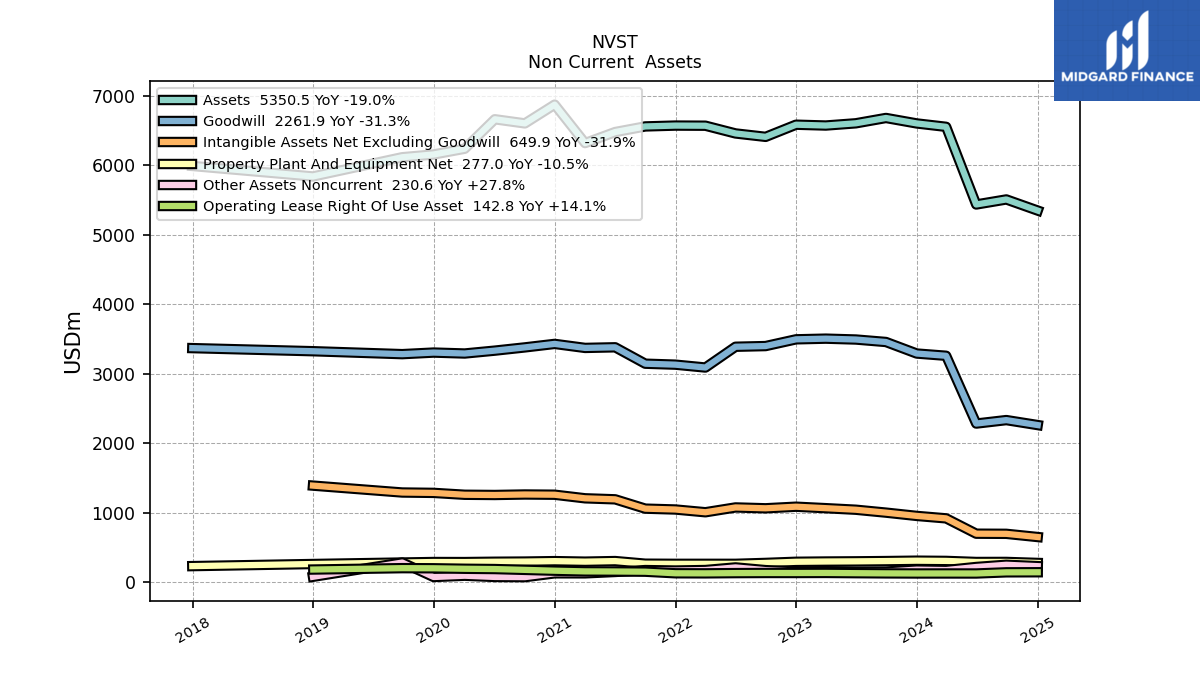
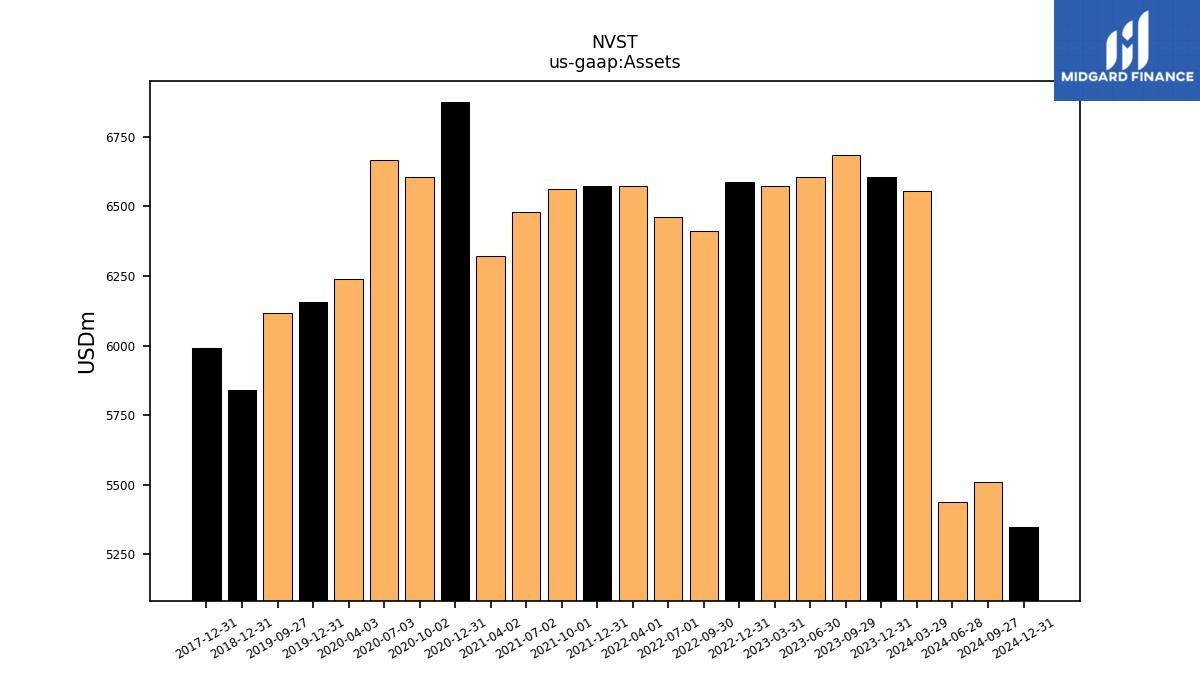
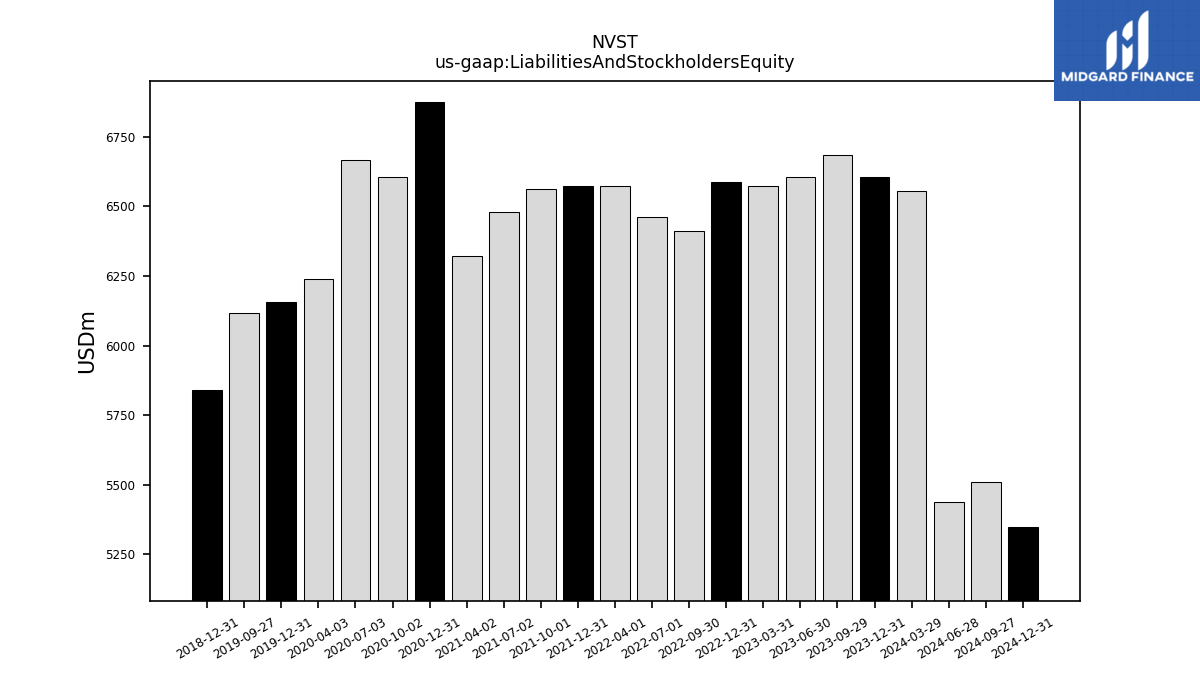
| Assets | 6605.10 | 6683.80 | 6607.20 | 6575.00 | 6587.00 | 6411.90 | 6461.00 | 6572.30 | 6574.20 | 6562.00 | 6481.30 | 6321.90 | 6876.00 | 6605.70 | 6665.20 | 6240.90 | 6158.30 | 6118.40 | NA | NA | 5841.60 | NA | NA | NA | |
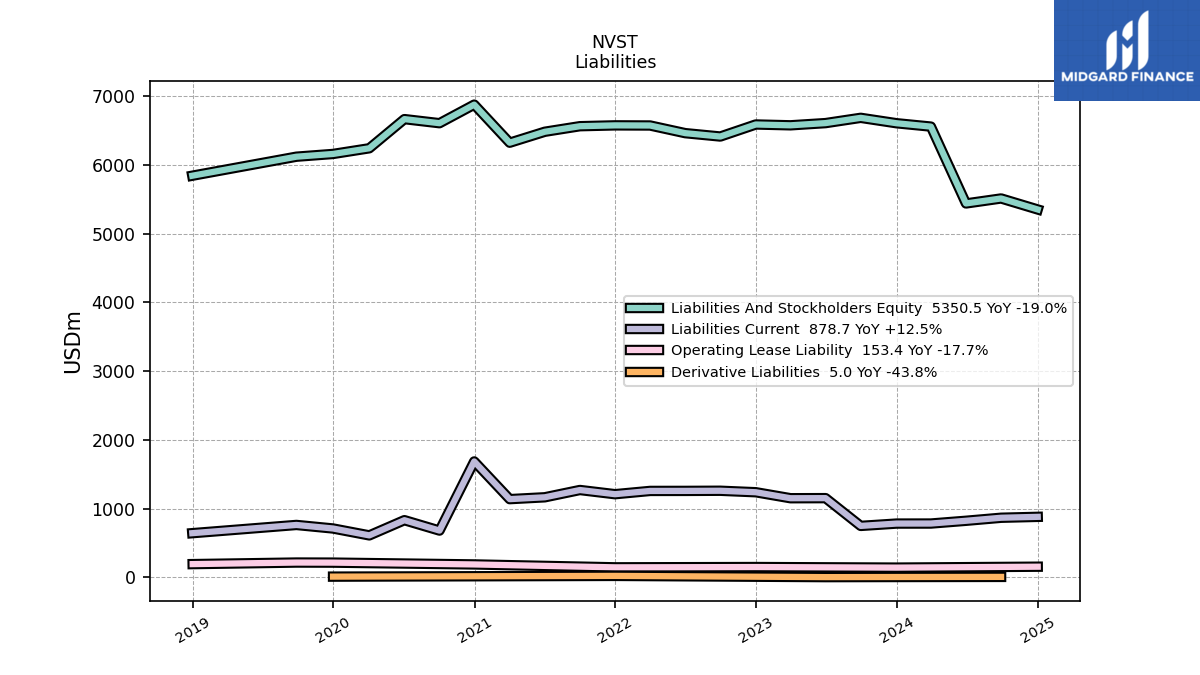
| Liabilities And Stockholders Equity | 6605.10 | 6683.80 | 6607.20 | 6575.00 | 6587.00 | 6411.90 | 6461.00 | 6572.30 | 6574.20 | 6562.00 | 6481.30 | 6321.90 | 6876.00 | 6605.70 | 6665.20 | 6240.90 | 6158.30 | 6118.40 | NA | NA | 5841.60 | NA | NA | NA |
| 2023-12-31 | 2023-09-29 | 2023-06-30 | 2023-03-31 | 2022-12-31 | 2022-09-30 | 2022-07-01 | 2022-04-01 | 2021-12-31 | 2021-10-01 | 2021-07-02 | 2021-04-02 | 2020-12-31 | 2020-10-02 | 2020-07-03 | 2020-04-03 | 2019-12-31 | 2019-09-27 | 2019-06-28 | 2019-03-29 | 2018-12-31 | 2018-09-28 | 2018-06-29 | 2018-03-30 | ||
|---|---|---|---|---|---|---|---|---|---|---|---|---|---|---|---|---|---|---|---|---|---|---|---|---|---|
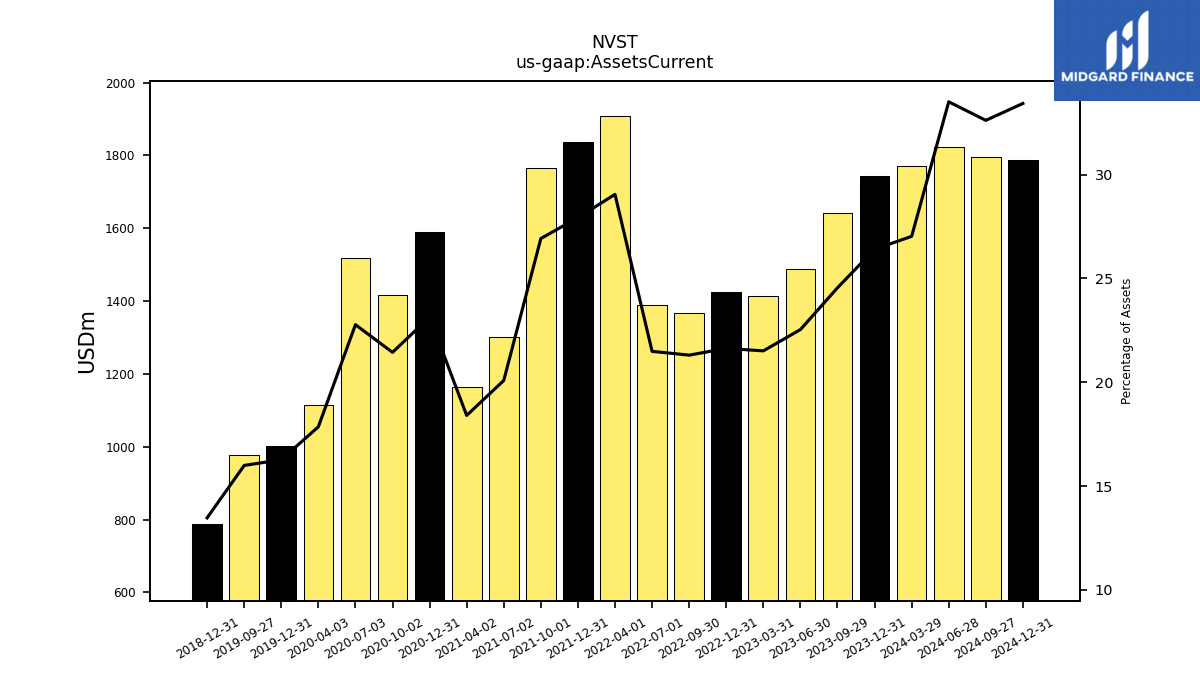
| Assets Current | 1743.70 | 1640.70 | 1488.90 | 1414.30 | 1424.60 | 1366.00 | 1388.30 | 1908.90 | 1835.80 | 1766.40 | 1301.70 | 1163.30 | 1590.50 | 1416.20 | 1517.70 | 1114.20 | 1001.90 | 978.50 | NA | NA | 786.80 | NA | NA | NA | |
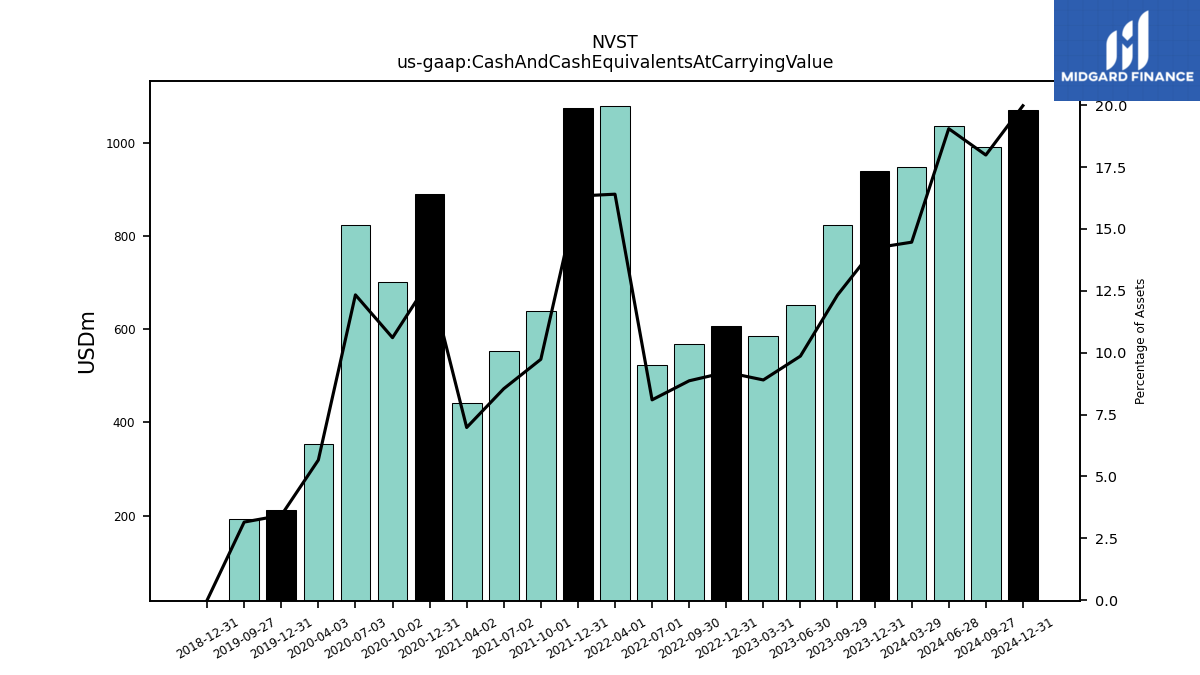
| Cash And Cash Equivalents At Carrying Value | 940.00 | 824.20 | 651.70 | 585.20 | 606.90 | 568.50 | 523.10 | 1078.30 | 1073.60 | 638.80 | 553.90 | 441.20 | 888.90 | 700.80 | 822.40 | 353.60 | 211.20 | 193.20 | NA | NA | 0.00 | NA | NA | NA | |
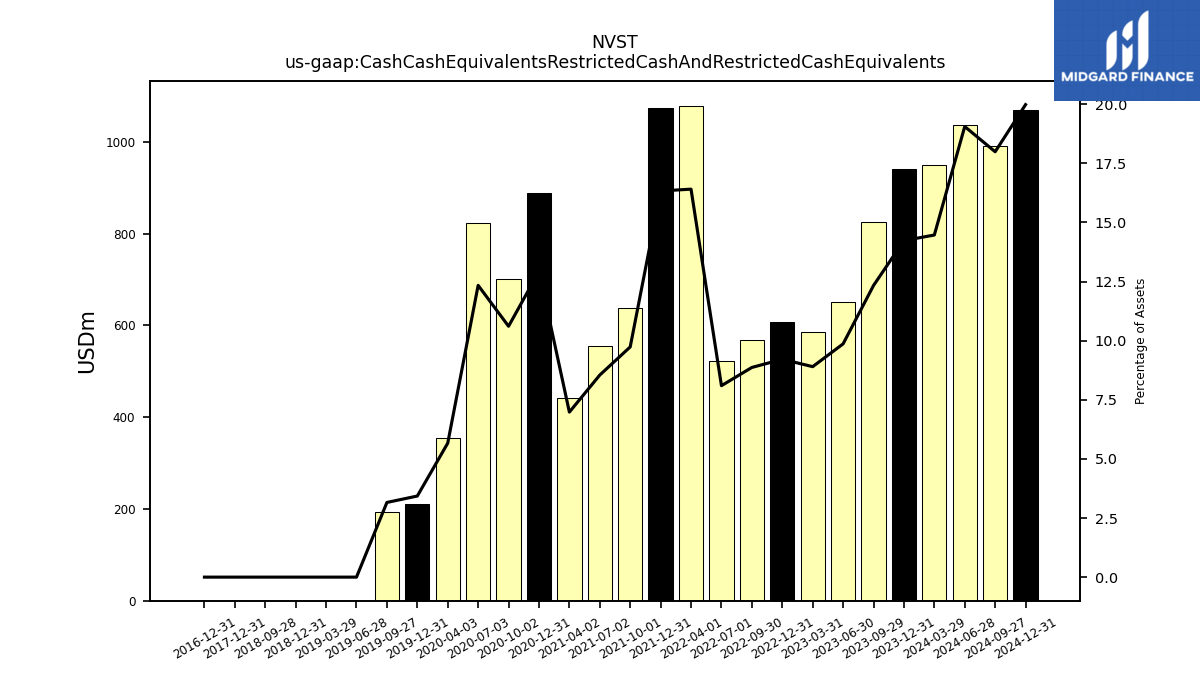
| Cash Cash Equivalents Restricted Cash And Restricted Cash Equivalents | 940.00 | 824.20 | 651.70 | 585.20 | 606.90 | 568.50 | 523.10 | 1078.30 | 1073.60 | 638.80 | 553.90 | 441.20 | 888.90 | 700.80 | 822.40 | 353.60 | 211.20 | 193.20 | 0.00 | 0.00 | 0.00 | 0.00 | NA | NA | |
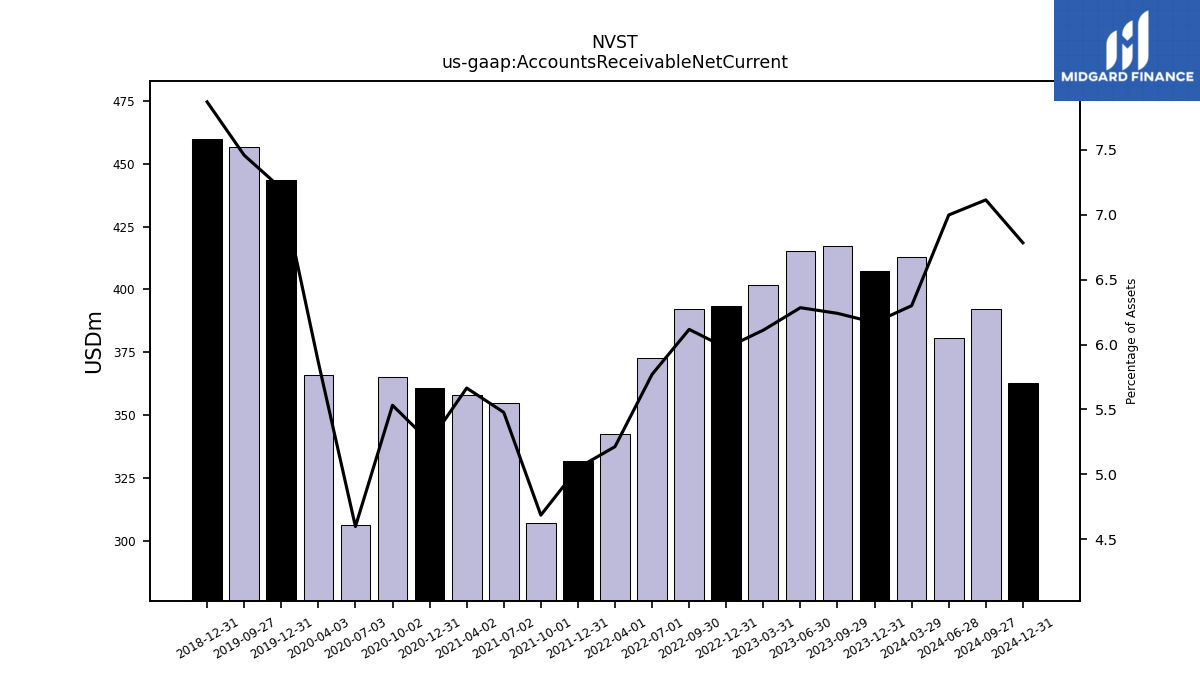
| Accounts Receivable Net Current | 407.50 | 417.10 | 415.20 | 401.80 | 393.50 | 392.20 | 372.80 | 342.60 | 331.90 | 307.40 | 355.00 | 358.10 | 361.00 | 365.40 | 306.40 | 365.90 | 443.60 | 456.40 | NA | NA | 459.80 | NA | NA | NA | |
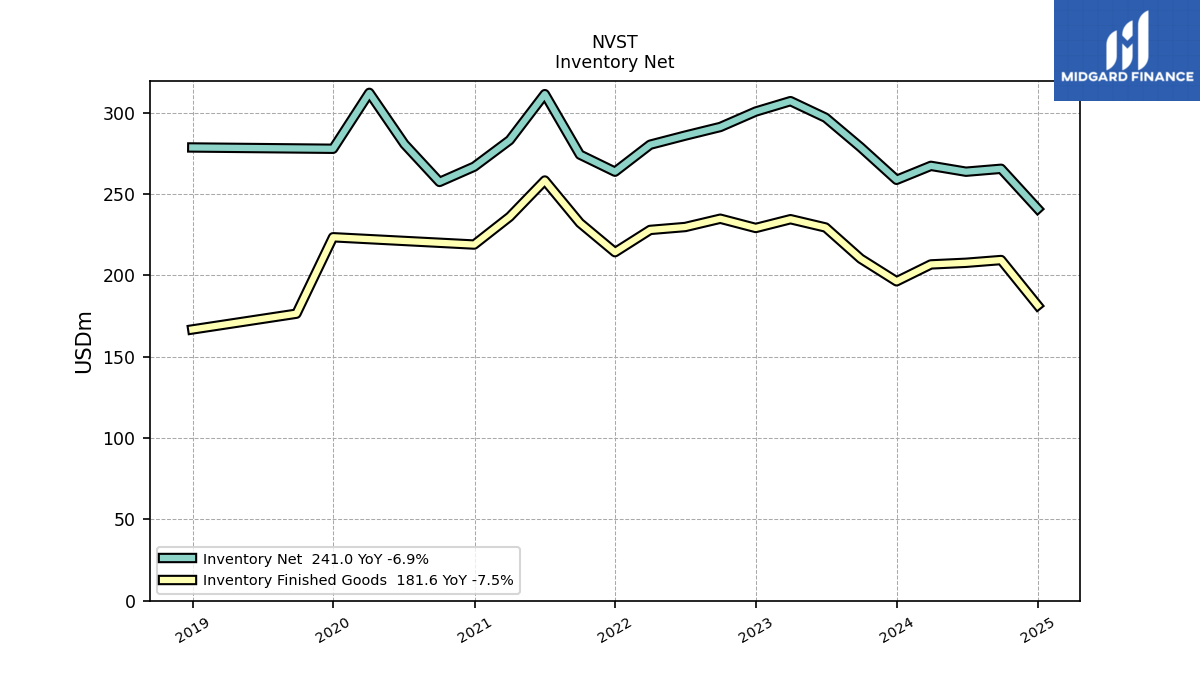
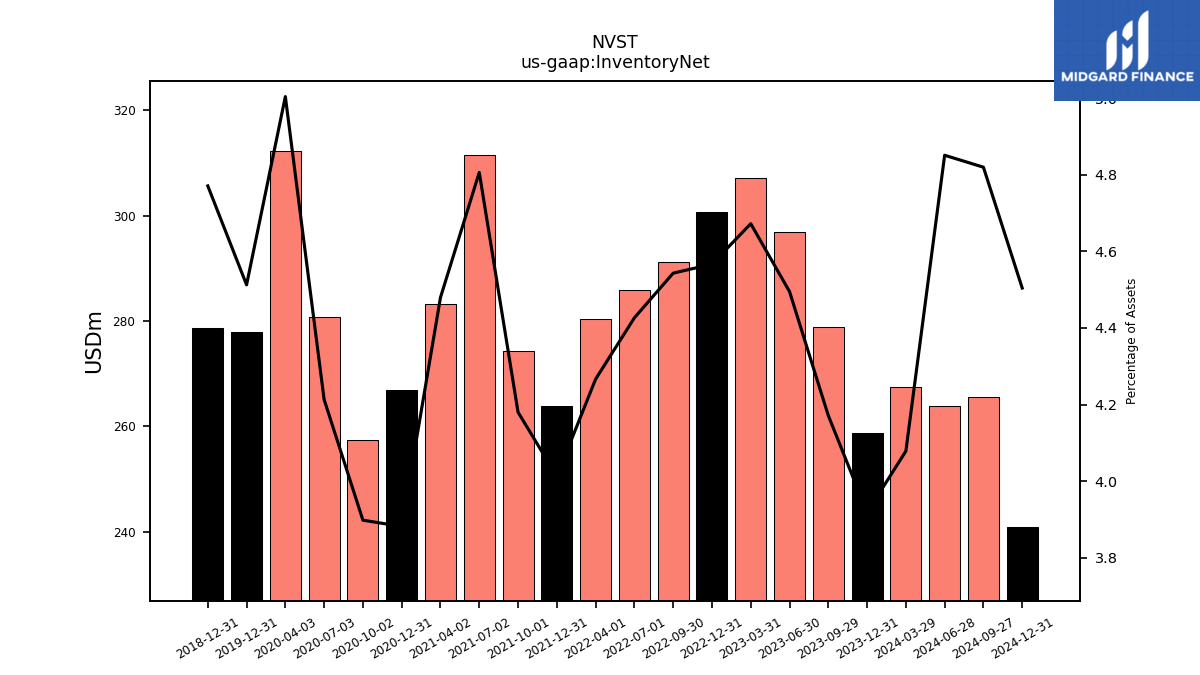
| Inventory Net | 258.80 | 278.80 | 297.00 | 307.20 | 300.80 | 291.30 | 286.00 | 280.40 | 263.80 | 274.30 | 311.50 | 283.20 | 266.90 | 257.50 | 280.80 | 312.30 | 277.90 | NA | NA | NA | 278.70 | NA | NA | NA | |
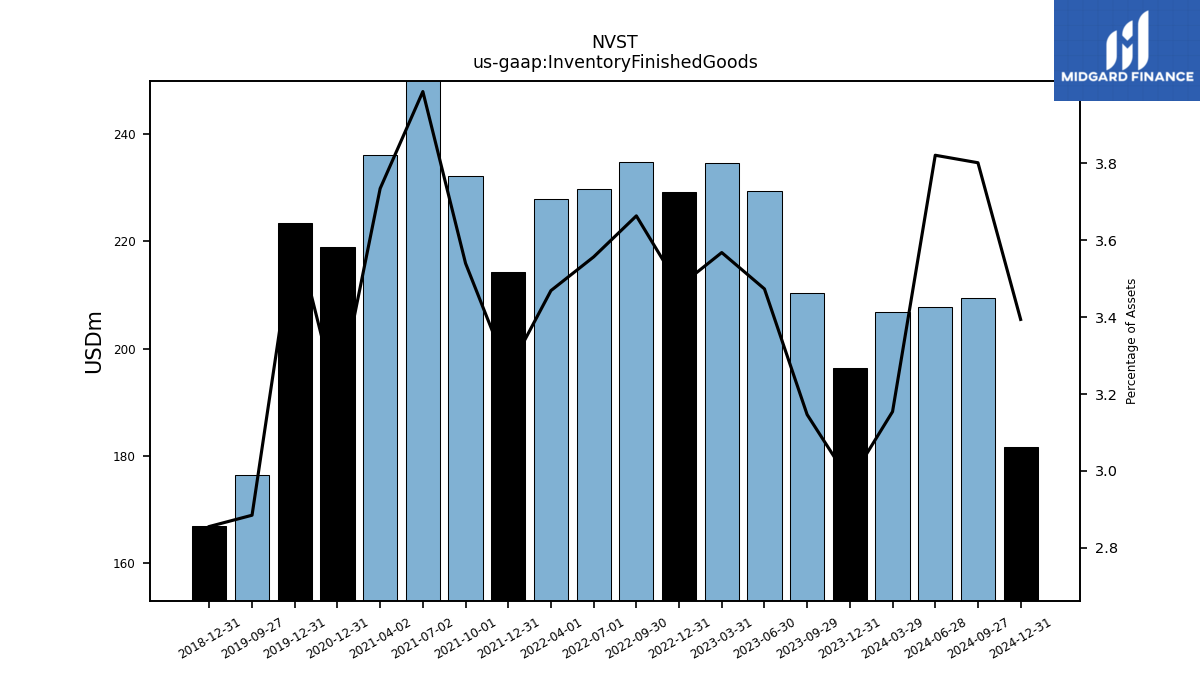
| Inventory Finished Goods | 196.40 | 210.30 | 229.50 | 234.60 | 229.20 | 234.90 | 229.80 | 228.00 | 214.30 | 232.30 | 258.40 | 236.10 | 219.00 | NA | NA | NA | 223.50 | 176.50 | NA | NA | 166.80 | NA | NA | NA | |
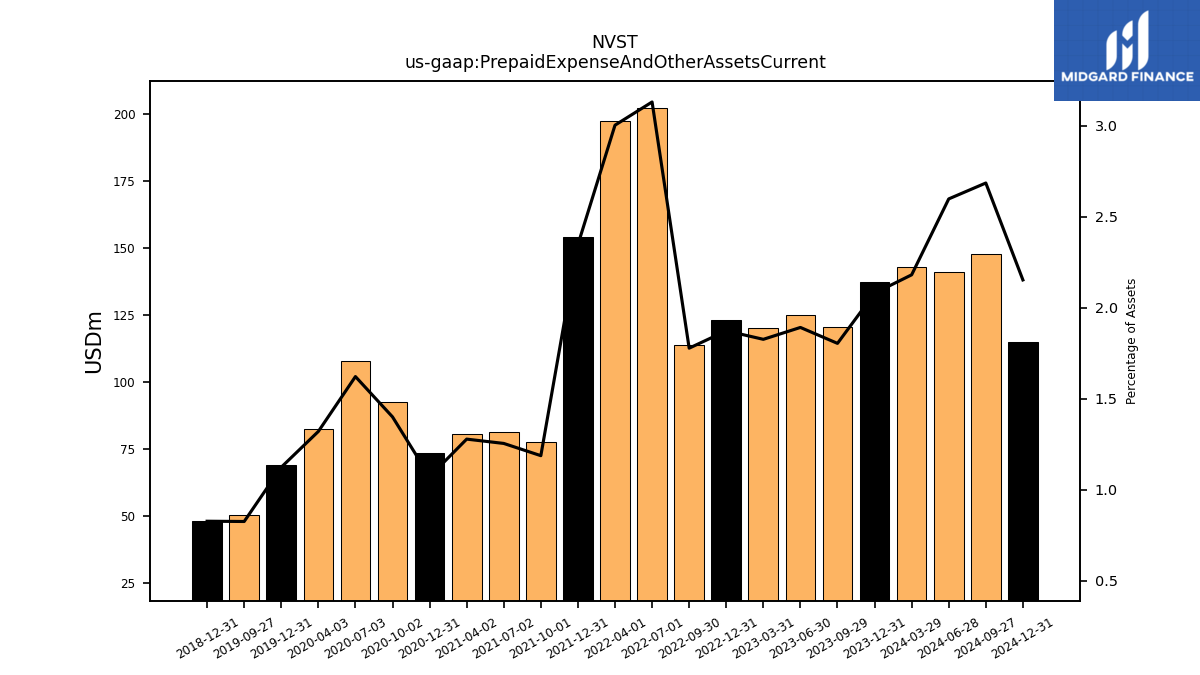
| Prepaid Expense And Other Assets Current | 137.40 | 120.60 | 125.00 | 120.10 | 123.40 | 114.00 | 202.30 | 197.40 | 154.30 | 77.90 | 81.30 | 80.80 | 73.70 | 92.50 | 108.10 | 82.40 | 69.20 | 50.50 | NA | NA | 48.30 | NA | NA | NA |
| 2023-12-31 | 2023-09-29 | 2023-06-30 | 2023-03-31 | 2022-12-31 | 2022-09-30 | 2022-07-01 | 2022-04-01 | 2021-12-31 | 2021-10-01 | 2021-07-02 | 2021-04-02 | 2020-12-31 | 2020-10-02 | 2020-07-03 | 2020-04-03 | 2019-12-31 | 2019-09-27 | 2019-06-28 | 2019-03-29 | 2018-12-31 | 2018-09-28 | 2018-06-29 | 2018-03-30 | ||
|---|---|---|---|---|---|---|---|---|---|---|---|---|---|---|---|---|---|---|---|---|---|---|---|---|---|
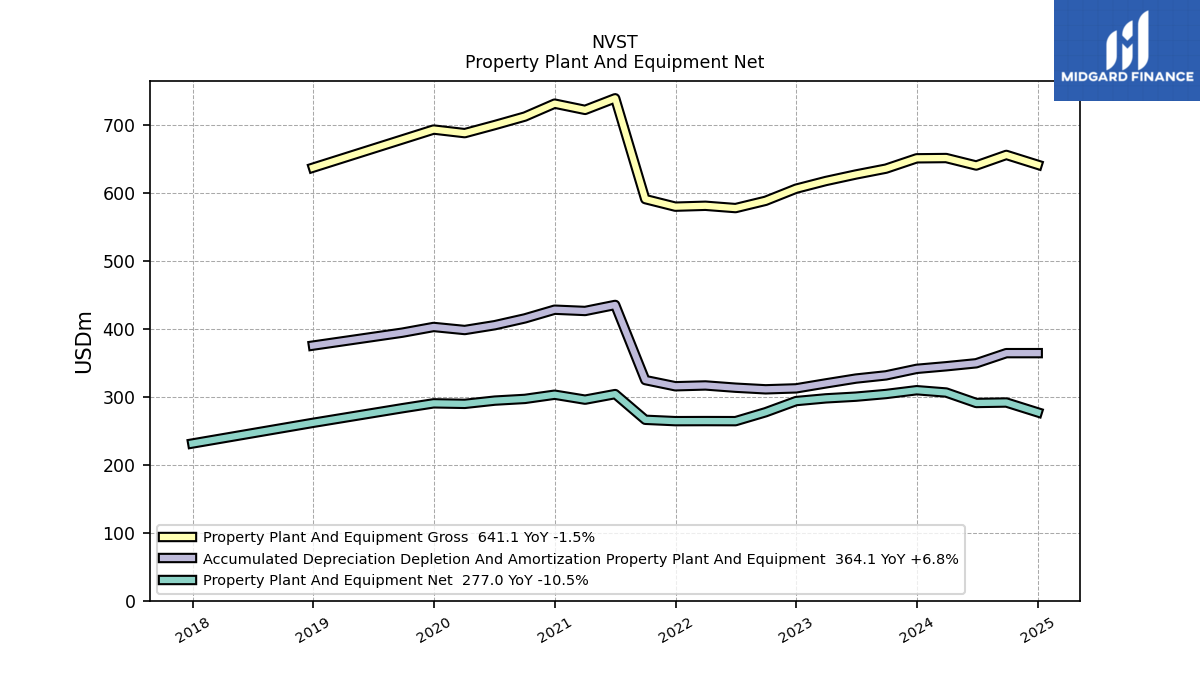
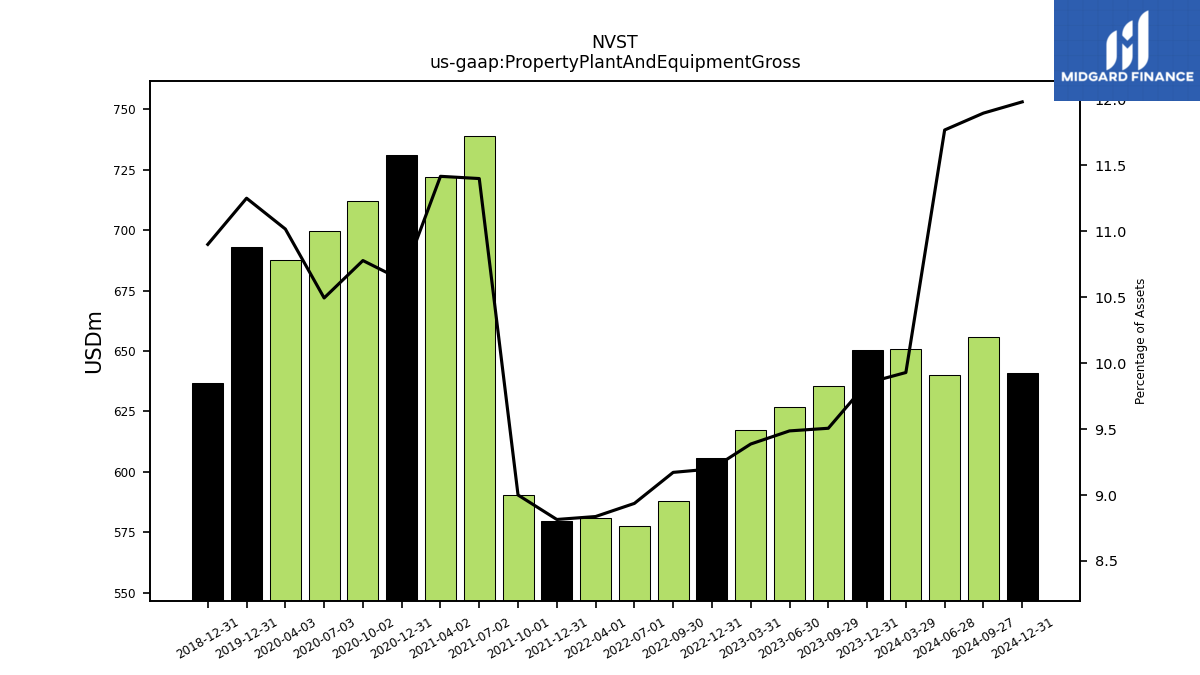
| Property Plant And Equipment Gross | 650.60 | 635.40 | 626.80 | 617.20 | 605.90 | 588.10 | 577.40 | 580.80 | 579.50 | 590.60 | 738.90 | 721.80 | 731.00 | 712.00 | 699.50 | 687.60 | 692.90 | NA | NA | NA | 636.80 | NA | NA | NA | |
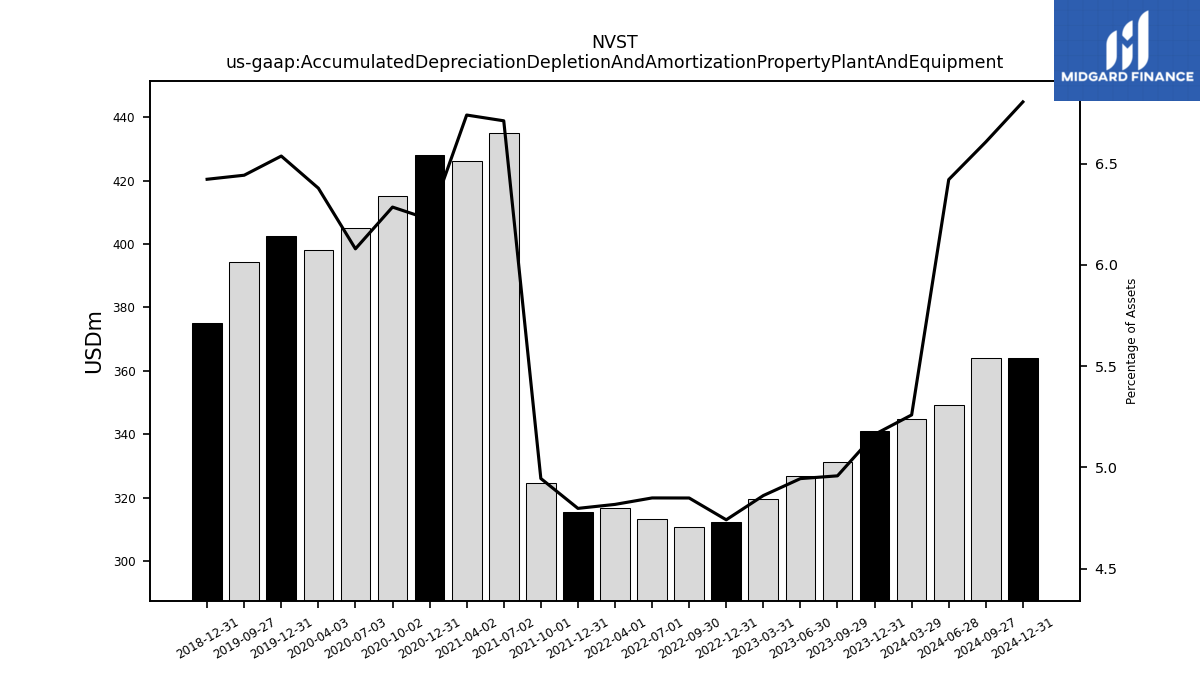
| Accumulated Depreciation Depletion And Amortization Property Plant And Equipment | 341.00 | 331.40 | 326.70 | 319.60 | 312.30 | 310.90 | 313.30 | 316.60 | 315.40 | 324.50 | 435.00 | 426.10 | 428.00 | 415.20 | 405.20 | 398.10 | 402.60 | 394.20 | NA | NA | 375.20 | NA | NA | NA | |
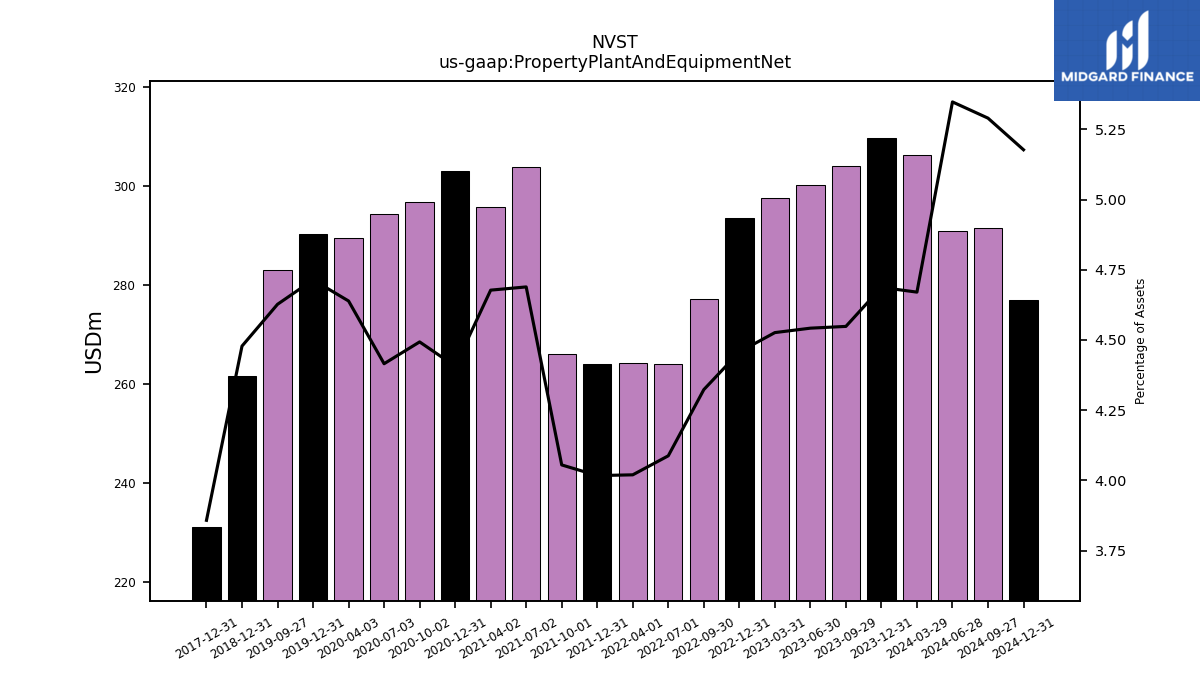
| Property Plant And Equipment Net | 309.60 | 304.00 | 300.10 | 297.60 | 293.60 | 277.20 | 264.10 | 264.20 | 264.10 | 266.10 | 303.90 | 295.70 | 303.00 | 296.80 | 294.30 | 289.50 | 290.30 | 283.10 | NA | NA | 261.60 | NA | NA | NA | |
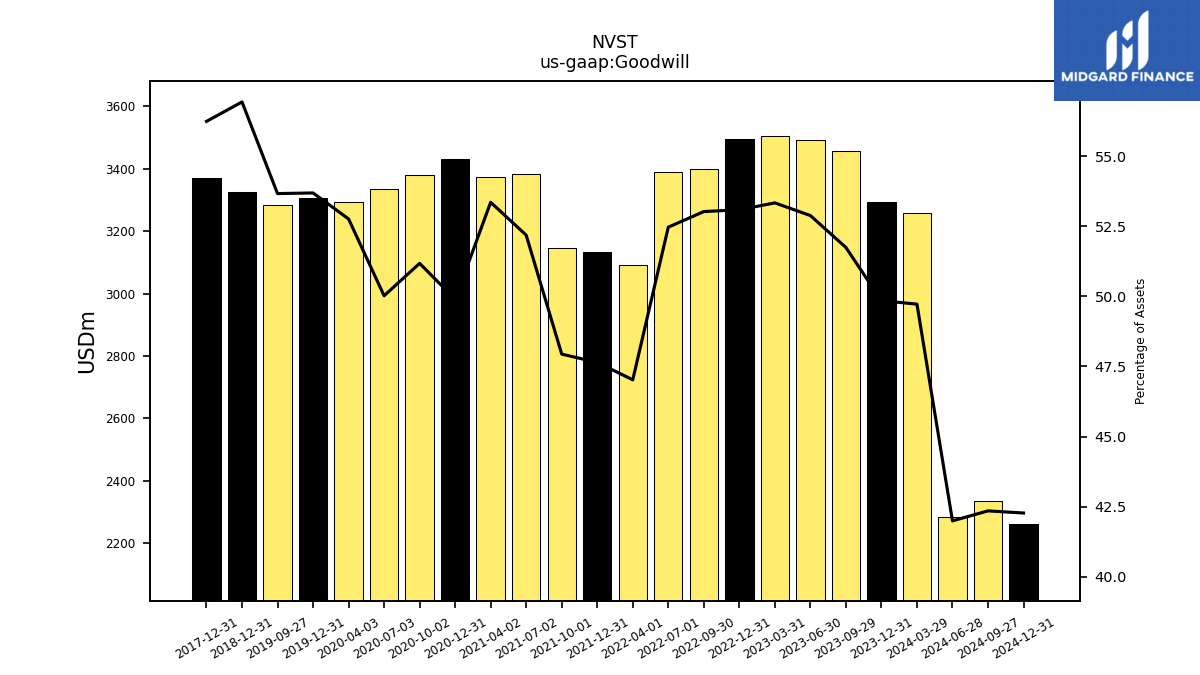
| Goodwill | 3292.20 | 3458.20 | 3493.80 | 3506.40 | 3496.60 | 3399.60 | 3389.70 | 3090.50 | 3132.00 | 3145.80 | 3381.90 | 3372.80 | 3430.70 | 3380.40 | 3333.80 | 3292.50 | 3306.00 | 3283.20 | NA | NA | 3325.50 | NA | NA | NA | |
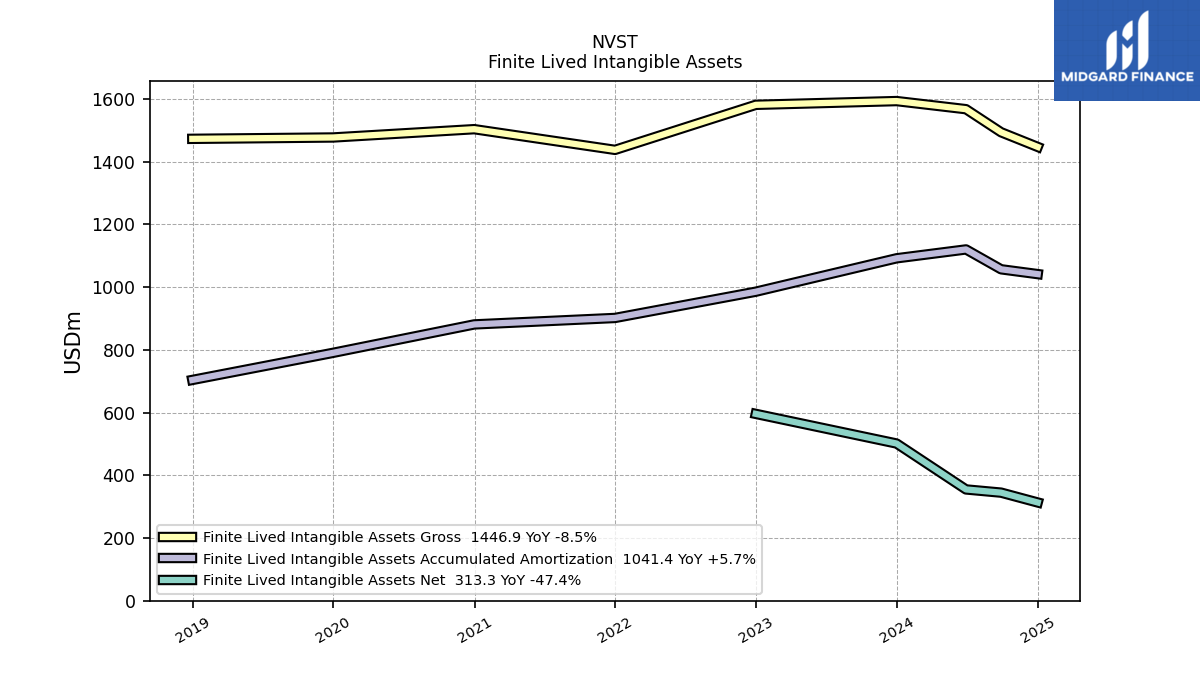
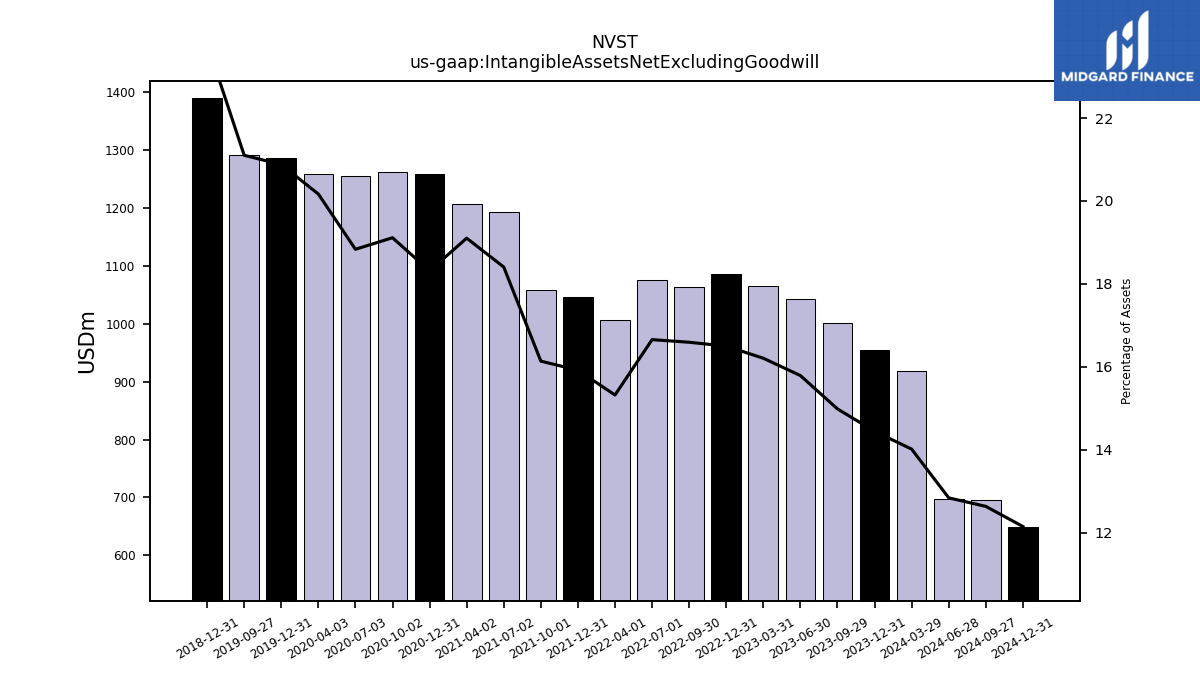
| Intangible Assets Net Excluding Goodwill | 954.00 | 1001.40 | 1043.10 | 1065.50 | 1086.70 | 1063.80 | 1076.00 | 1006.80 | 1046.40 | 1058.80 | 1192.90 | 1207.60 | 1259.20 | 1262.50 | 1255.30 | 1258.60 | 1285.60 | 1291.10 | NA | NA | 1390.30 | NA | NA | NA | |
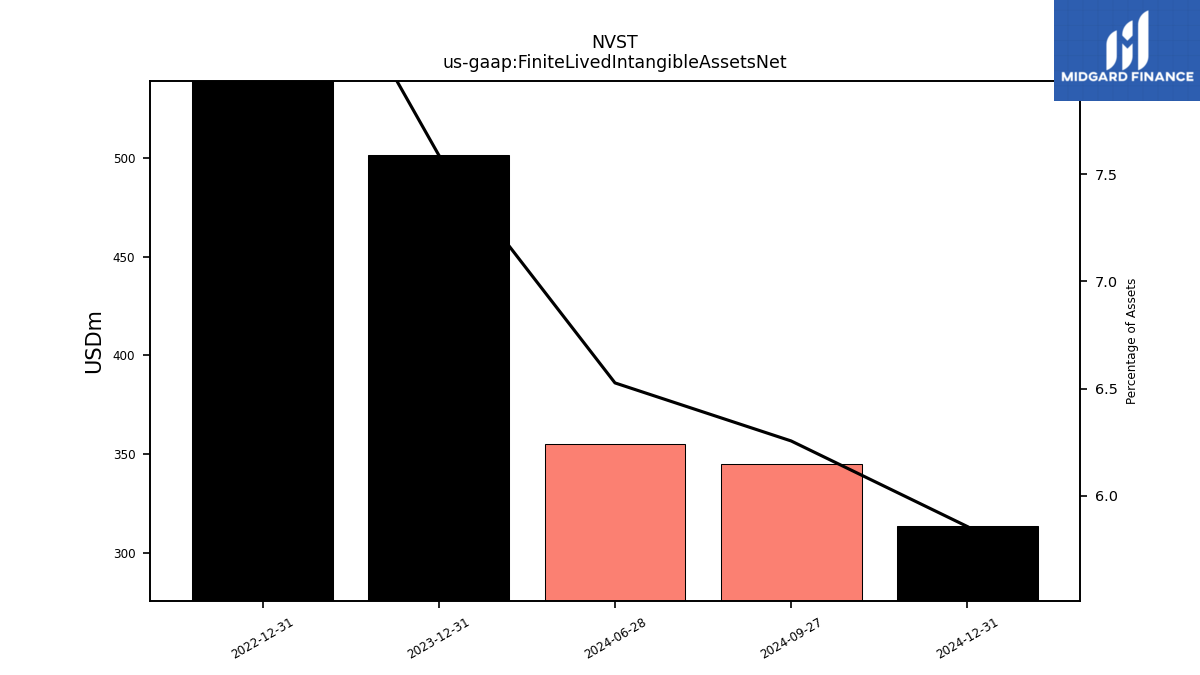
| Finite Lived Intangible Assets Net | 501.30 | NA | NA | NA | 595.80 | NA | NA | NA | NA | NA | NA | NA | NA | NA | NA | NA | NA | NA | NA | NA | NA | NA | NA | NA | |
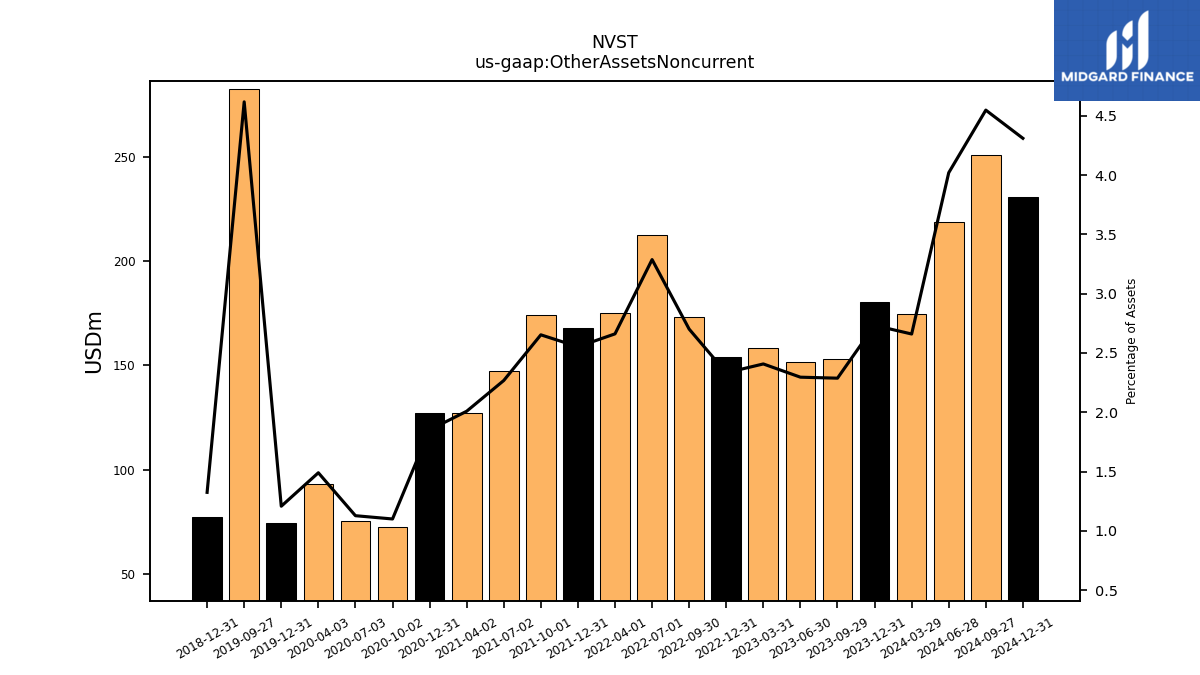
| Other Assets Noncurrent | 180.50 | 152.90 | 151.70 | 158.30 | 153.70 | 173.20 | 212.40 | 174.90 | 167.80 | 174.10 | 147.00 | 127.00 | 127.30 | 72.70 | 75.20 | 93.00 | 74.40 | 282.50 | NA | NA | 77.40 | NA | NA | NA |
| 2023-12-31 | 2023-09-29 | 2023-06-30 | 2023-03-31 | 2022-12-31 | 2022-09-30 | 2022-07-01 | 2022-04-01 | 2021-12-31 | 2021-10-01 | 2021-07-02 | 2021-04-02 | 2020-12-31 | 2020-10-02 | 2020-07-03 | 2020-04-03 | 2019-12-31 | 2019-09-27 | 2019-06-28 | 2019-03-29 | 2018-12-31 | 2018-09-28 | 2018-06-29 | 2018-03-30 | ||
|---|---|---|---|---|---|---|---|---|---|---|---|---|---|---|---|---|---|---|---|---|---|---|---|---|---|
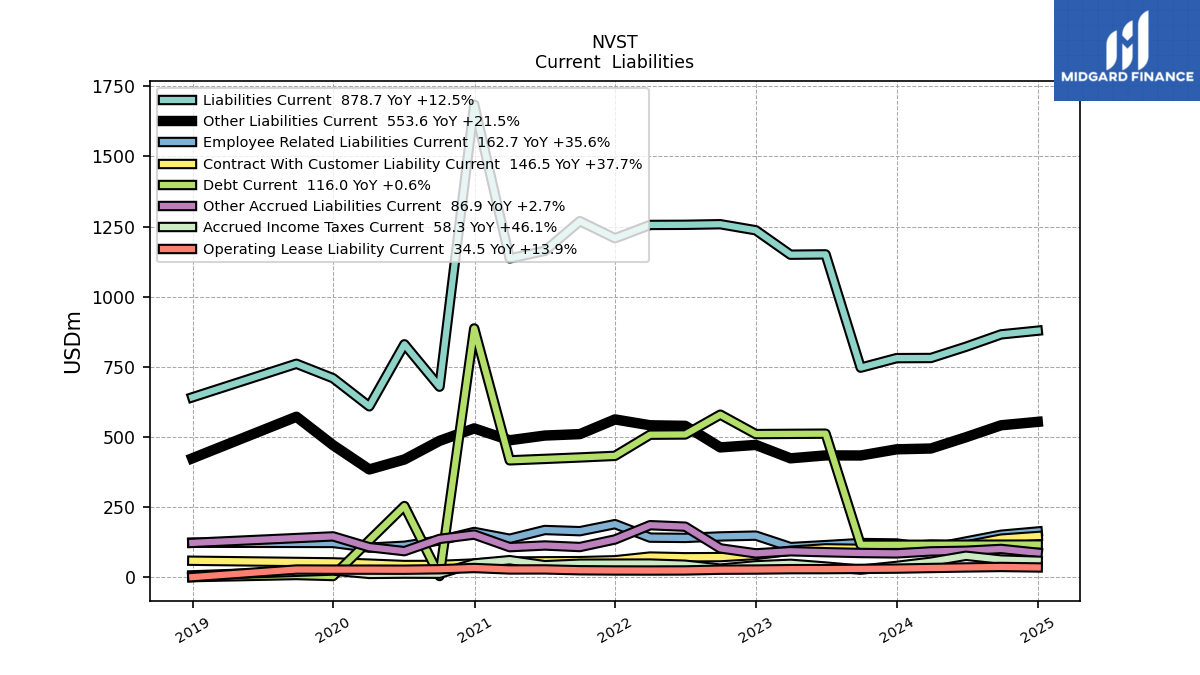
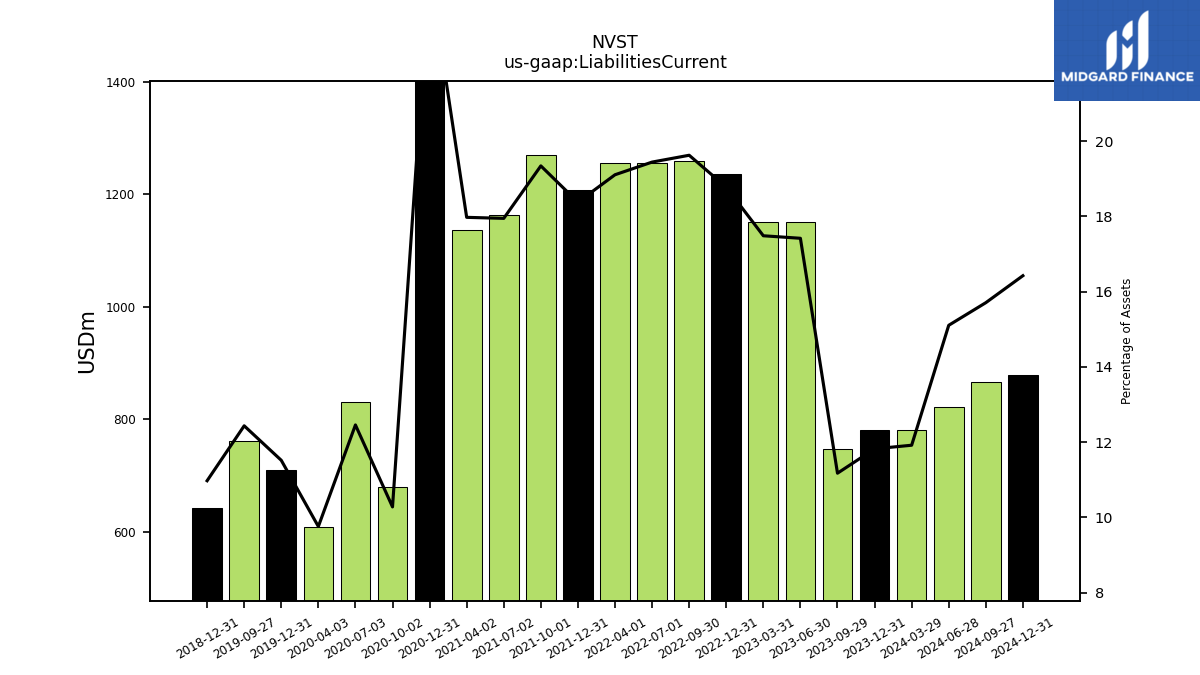
| Liabilities Current | 780.80 | 746.80 | 1150.80 | 1149.60 | 1236.70 | 1258.30 | 1256.20 | 1255.70 | 1208.20 | 1269.20 | 1163.20 | 1136.30 | 1684.70 | 678.90 | 830.20 | 608.90 | 709.20 | 760.70 | NA | NA | 641.00 | NA | NA | NA | |
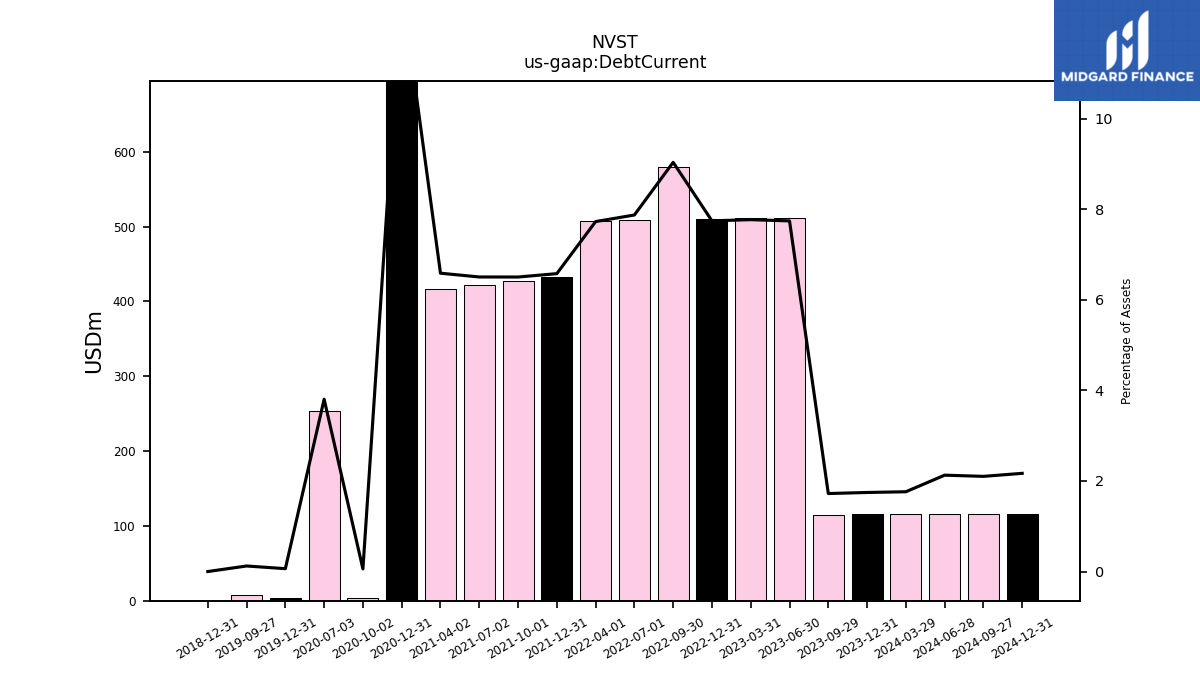
| Debt Current | 115.30 | 115.10 | 511.50 | 510.80 | 510.00 | 579.30 | 508.60 | 507.80 | 432.40 | 426.70 | 421.50 | 416.40 | 886.80 | 3.80 | 253.50 | NA | 3.90 | 7.50 | NA | NA | 0.00 | NA | NA | NA | |
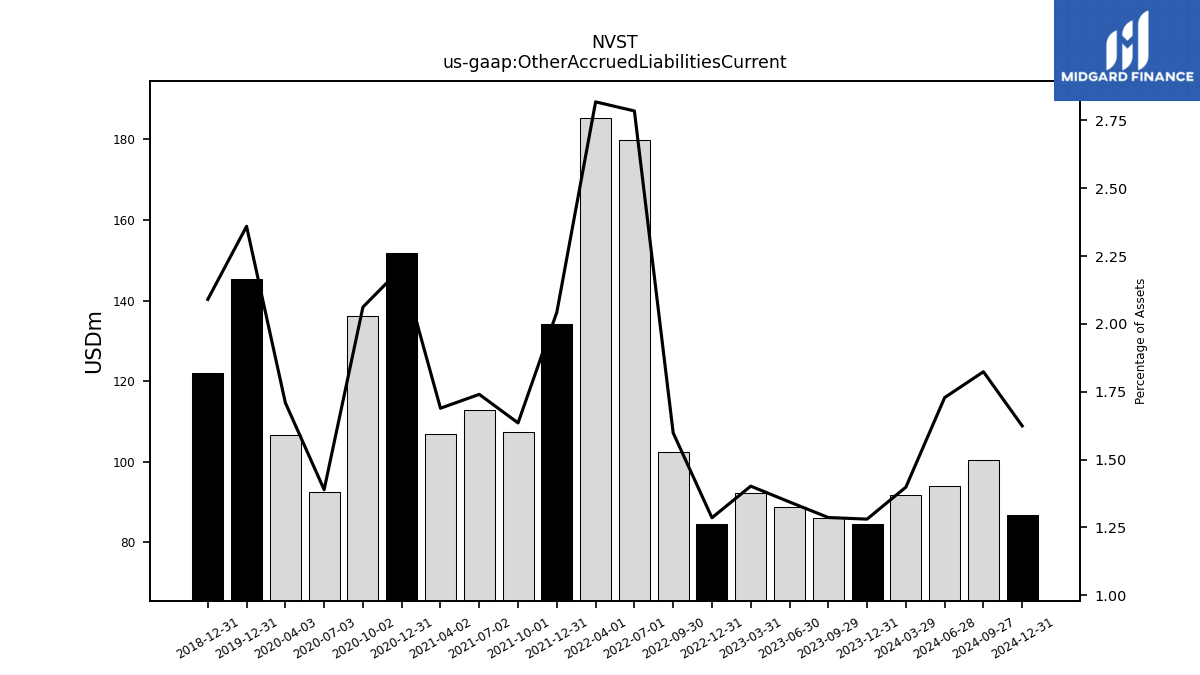
| Other Accrued Liabilities Current | 84.60 | 86.00 | 88.80 | 92.20 | 84.70 | 102.50 | 179.90 | 185.20 | 134.30 | 107.30 | 112.80 | 106.80 | 151.70 | 136.20 | 92.60 | 106.70 | 145.30 | NA | NA | NA | 122.10 | NA | NA | NA | |
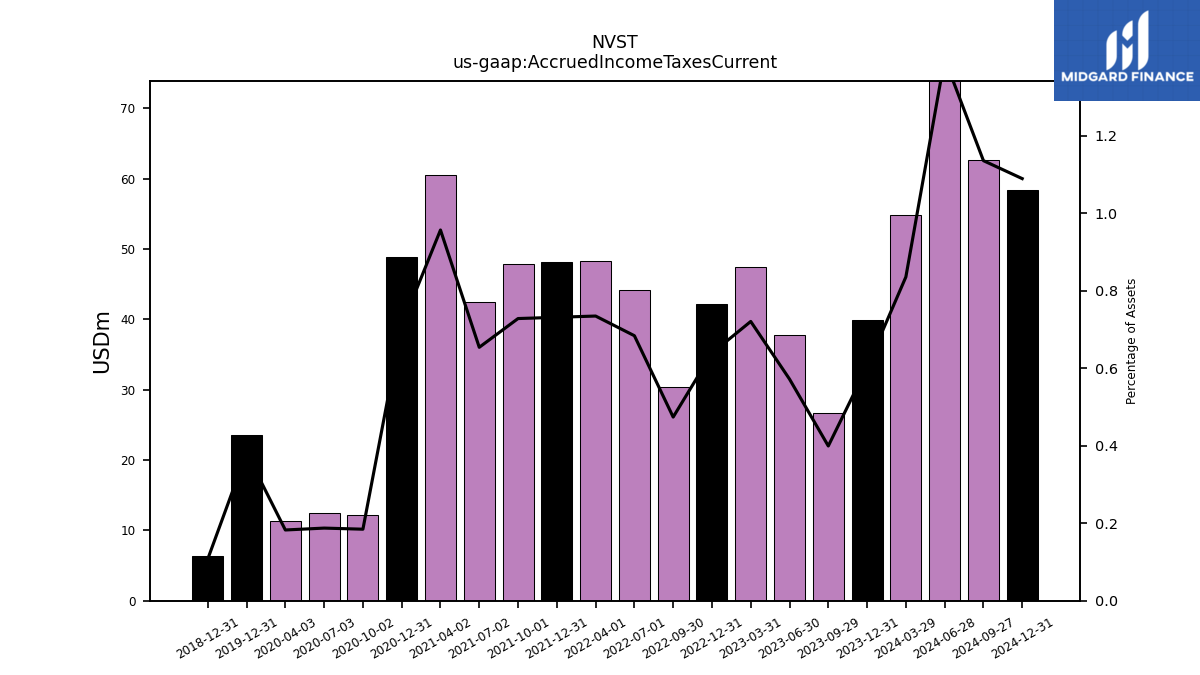
| Accrued Income Taxes Current | 39.90 | 26.70 | 37.80 | 47.40 | 42.10 | 30.40 | 44.20 | 48.30 | 48.10 | 47.80 | 42.40 | 60.50 | 48.80 | 12.20 | 12.50 | 11.40 | 23.50 | NA | NA | NA | 6.30 | NA | NA | NA | |
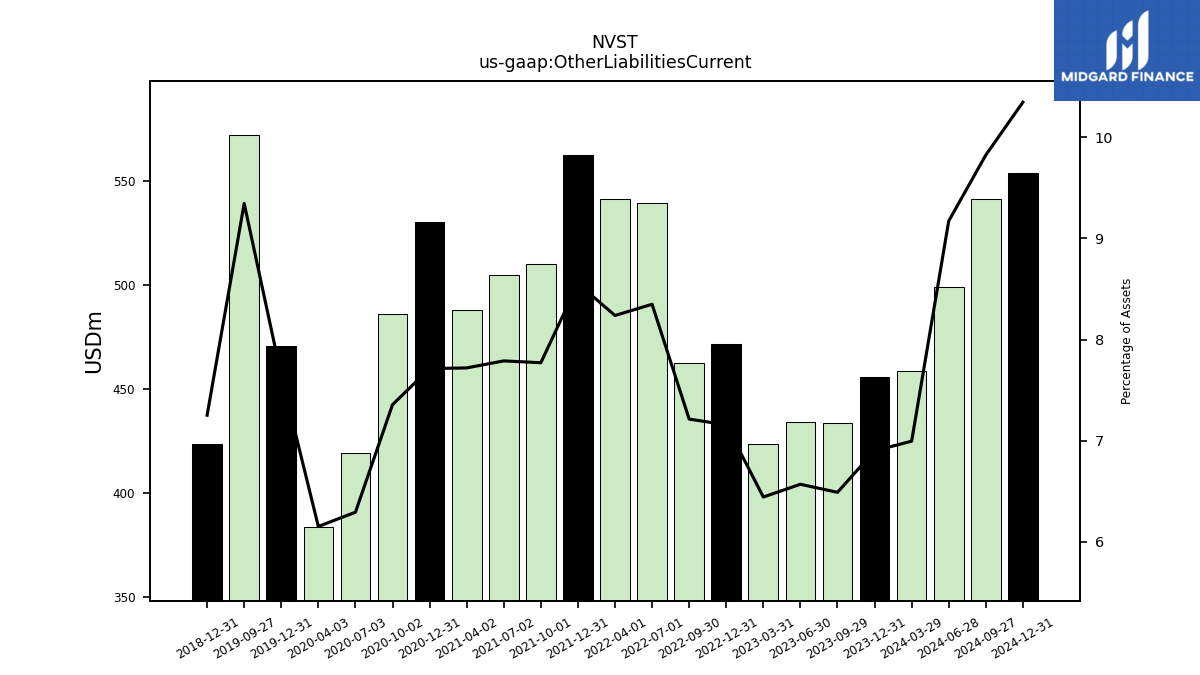
| Other Liabilities Current | 455.70 | 433.70 | 434.00 | 423.60 | 471.40 | 462.50 | 539.40 | 541.40 | 562.30 | 509.90 | 504.80 | 488.00 | 530.30 | 485.90 | 419.40 | 383.90 | 470.60 | 571.80 | NA | NA | 423.60 | NA | NA | NA | |
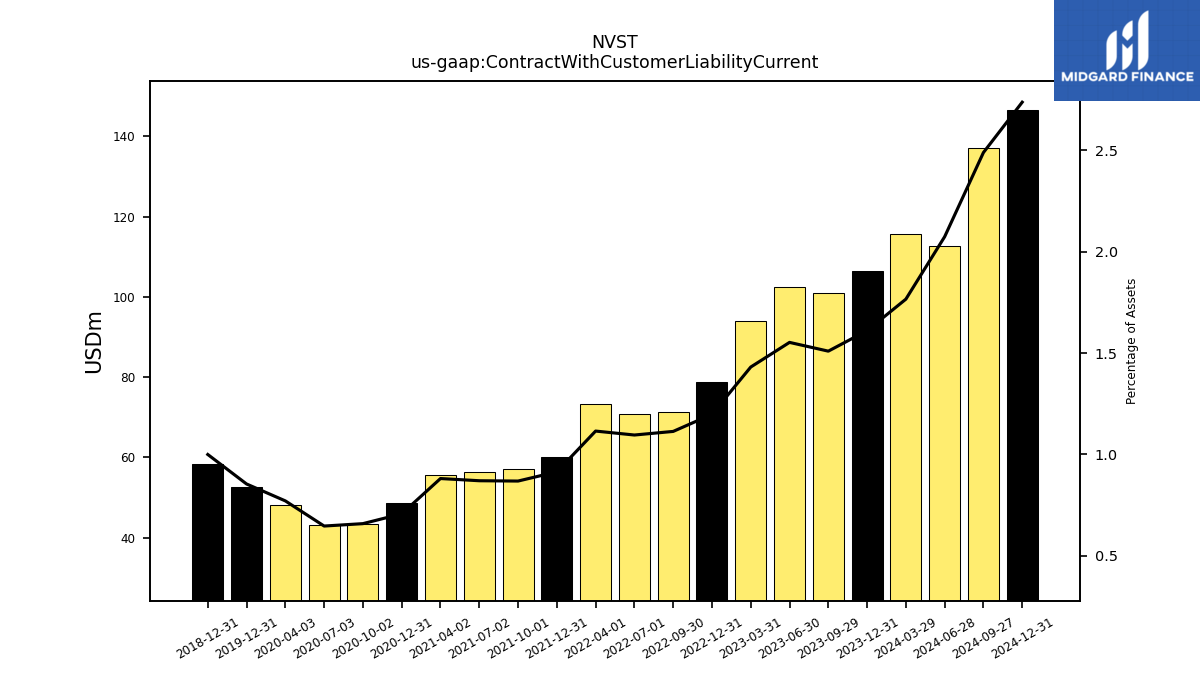
| Contract With Customer Liability Current | 106.40 | 100.90 | 102.60 | 94.10 | 78.90 | 71.40 | 70.80 | 73.30 | 60.10 | 57.00 | 56.40 | 55.70 | 48.60 | 43.50 | 43.10 | 48.10 | 52.60 | NA | NA | NA | 58.40 | NA | NA | NA |
| 2023-12-31 | 2023-09-29 | 2023-06-30 | 2023-03-31 | 2022-12-31 | 2022-09-30 | 2022-07-01 | 2022-04-01 | 2021-12-31 | 2021-10-01 | 2021-07-02 | 2021-04-02 | 2020-12-31 | 2020-10-02 | 2020-07-03 | 2020-04-03 | 2019-12-31 | 2019-09-27 | 2019-06-28 | 2019-03-29 | 2018-12-31 | 2018-09-28 | 2018-06-29 | 2018-03-30 | ||
|---|---|---|---|---|---|---|---|---|---|---|---|---|---|---|---|---|---|---|---|---|---|---|---|---|---|
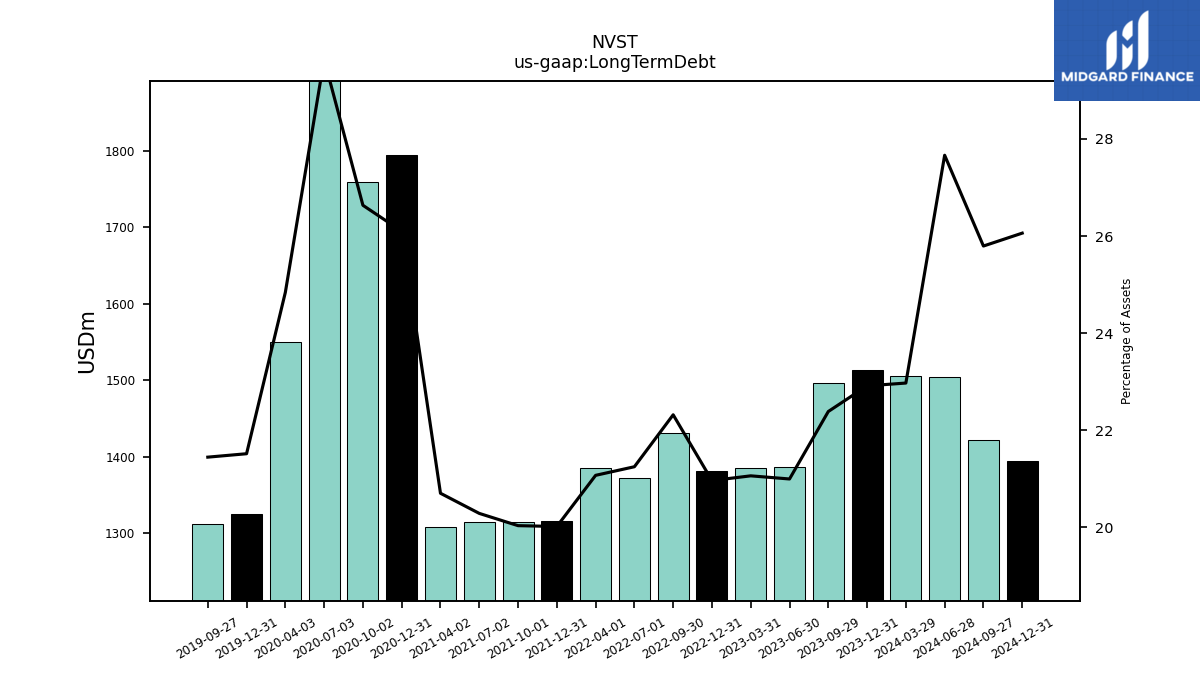
| Long Term Debt | 1513.40 | 1496.10 | 1387.10 | 1384.60 | 1380.70 | 1430.90 | 1372.70 | 1384.70 | 1315.80 | 1314.50 | 1314.70 | 1308.60 | 1794.50 | 1759.30 | 1975.70 | 1550.20 | 1324.90 | 1312.00 | NA | NA | NA | NA | NA | NA | |
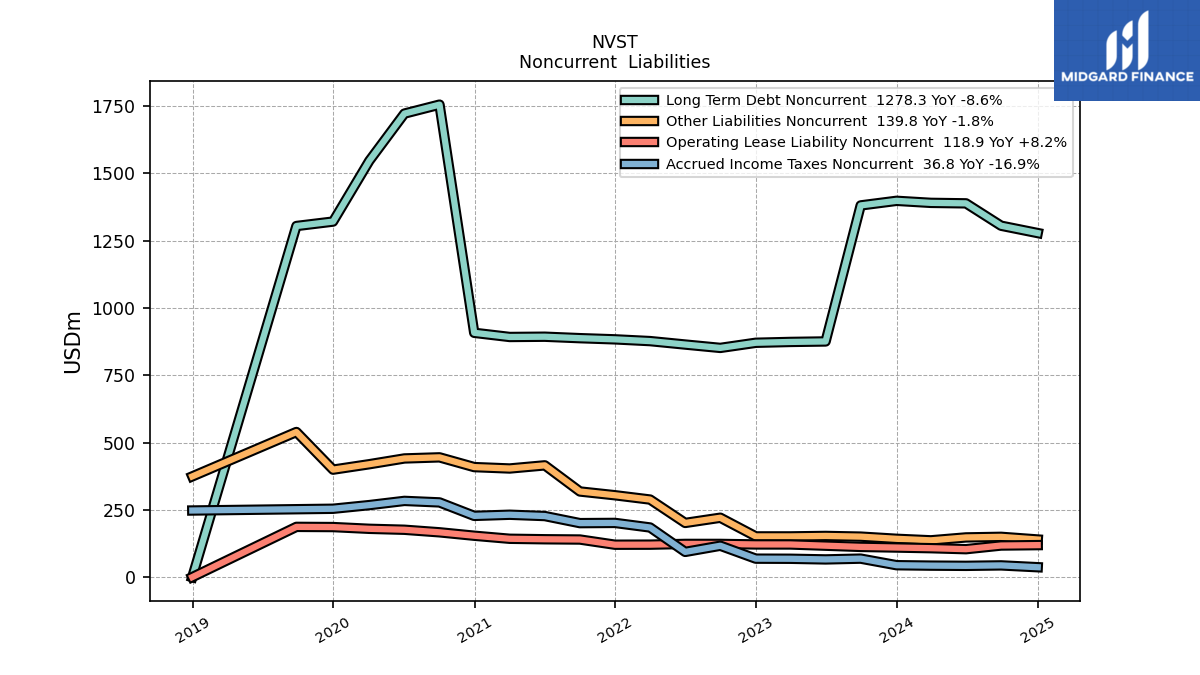
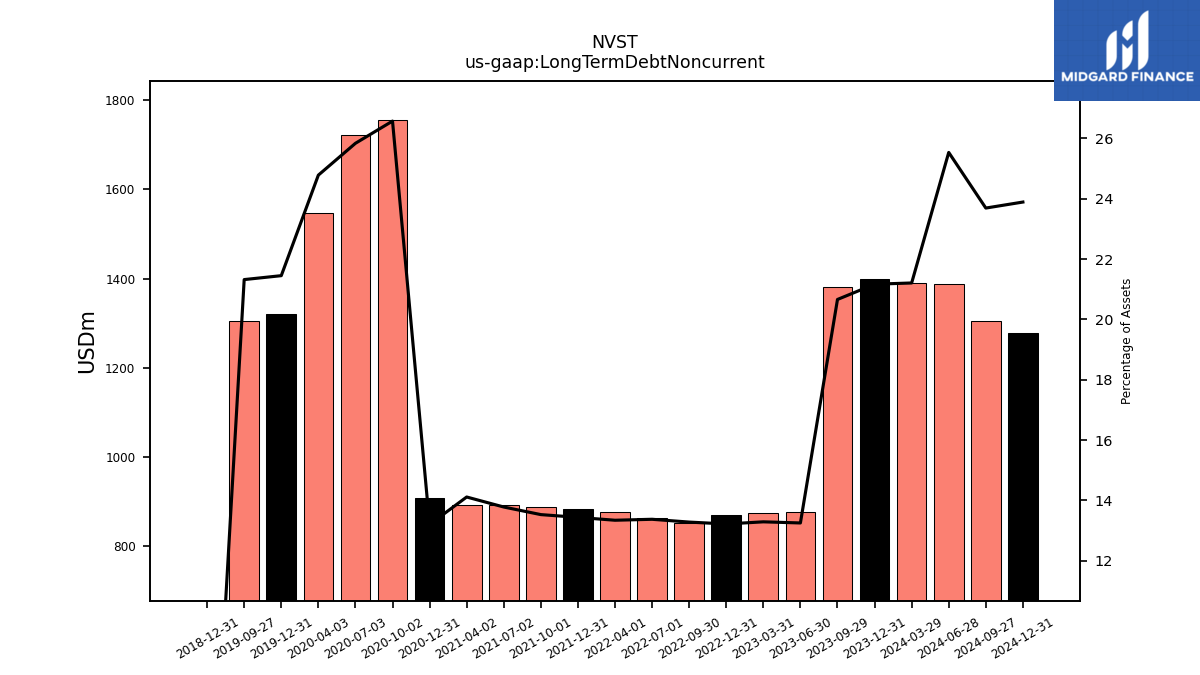
| Long Term Debt Noncurrent | 1398.10 | 1381.00 | 875.60 | 873.80 | 870.70 | 851.60 | 864.10 | 876.90 | 883.40 | 887.80 | 893.20 | 892.20 | 907.70 | 1755.50 | 1722.20 | 1546.70 | 1321.00 | 1304.50 | NA | NA | 0.00 | NA | NA | NA | |
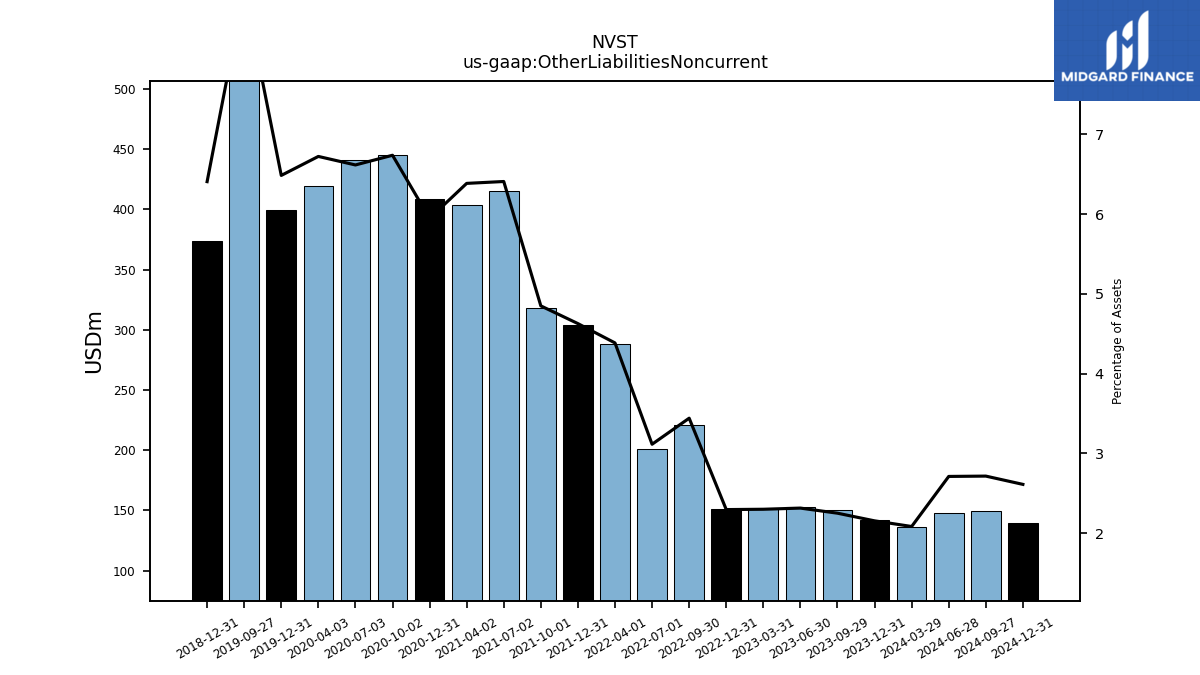
| Other Liabilities Noncurrent | 142.40 | 150.50 | 153.00 | 151.30 | 151.30 | 220.70 | 201.30 | 288.20 | 304.20 | 318.20 | 415.30 | 403.60 | 408.80 | 445.00 | 440.90 | 419.50 | 399.30 | 539.20 | NA | NA | 374.20 | NA | NA | NA | |
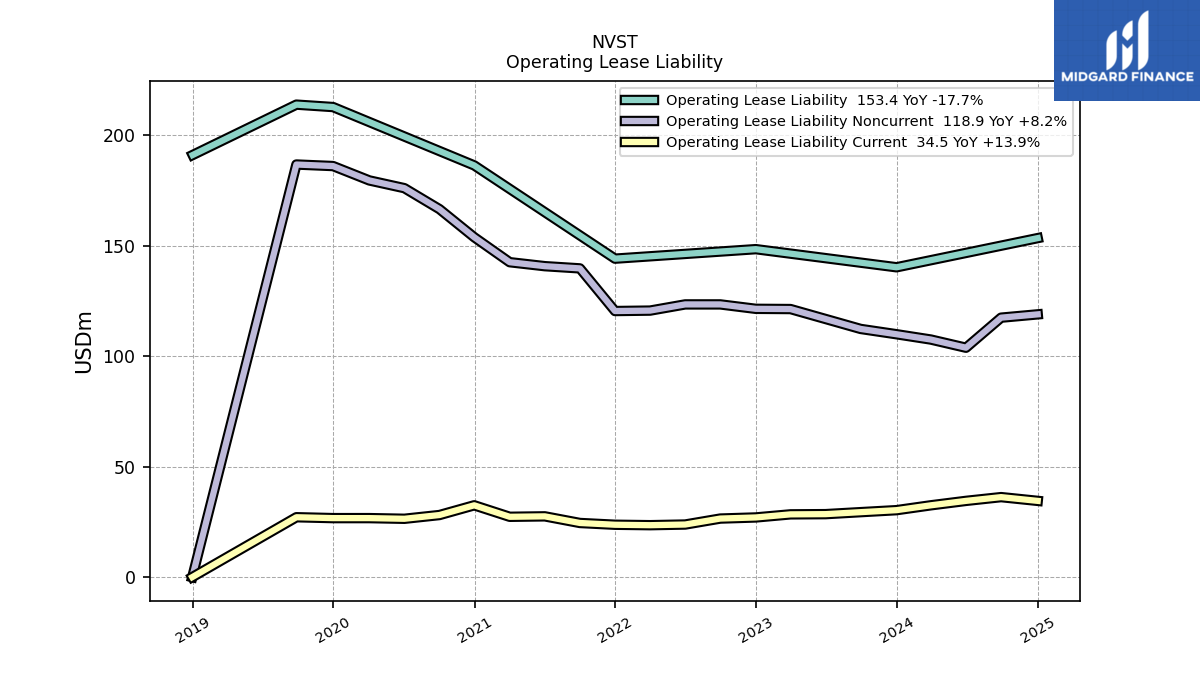
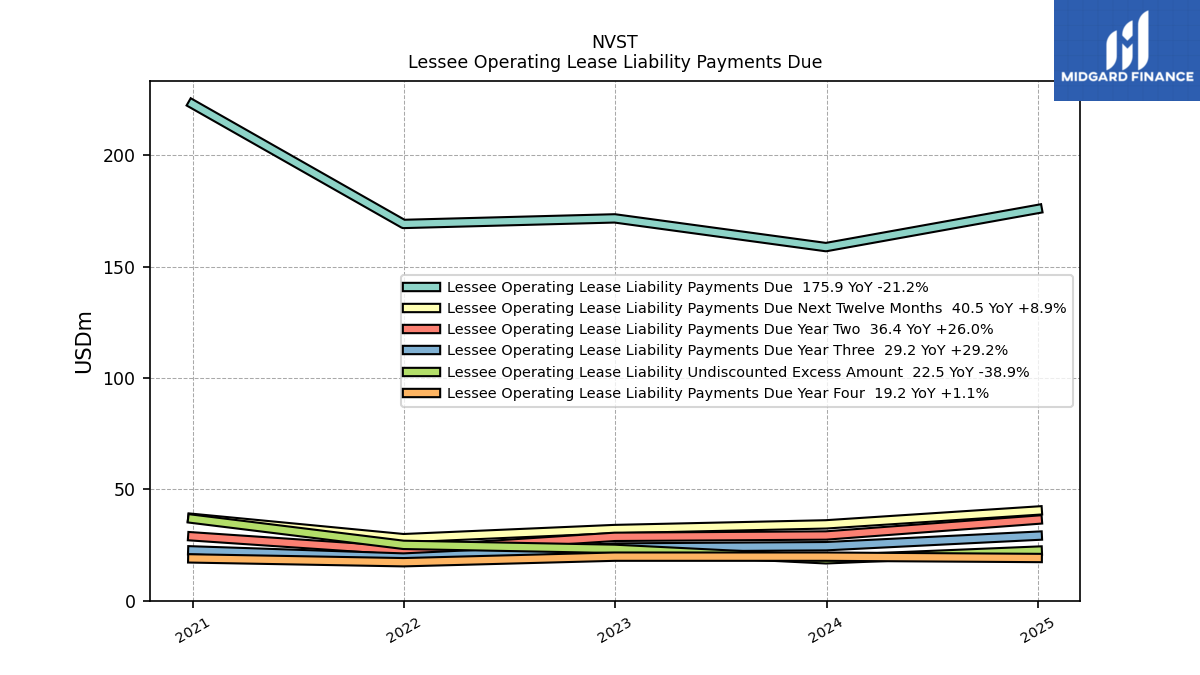
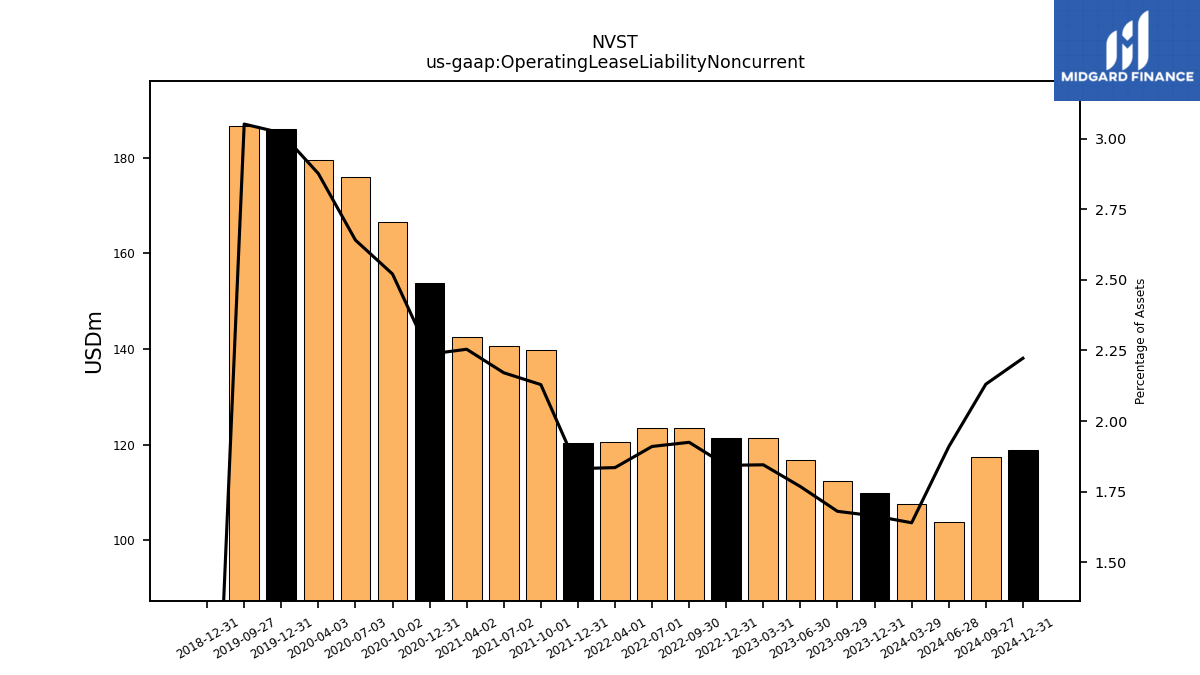
| Operating Lease Liability Noncurrent | 109.90 | 112.30 | 116.80 | 121.30 | 121.40 | 123.40 | 123.40 | 120.60 | 120.40 | 139.70 | 140.70 | 142.50 | 153.80 | 166.50 | 176.00 | 179.50 | 186.00 | 186.70 | NA | NA | 0.00 | NA | NA | NA |
| 2023-12-31 | 2023-09-29 | 2023-06-30 | 2023-03-31 | 2022-12-31 | 2022-09-30 | 2022-07-01 | 2022-04-01 | 2021-12-31 | 2021-10-01 | 2021-07-02 | 2021-04-02 | 2020-12-31 | 2020-10-02 | 2020-07-03 | 2020-04-03 | 2019-12-31 | 2019-09-27 | 2019-06-28 | 2019-03-29 | 2018-12-31 | 2018-09-28 | 2018-06-29 | 2018-03-30 | ||
|---|---|---|---|---|---|---|---|---|---|---|---|---|---|---|---|---|---|---|---|---|---|---|---|---|---|
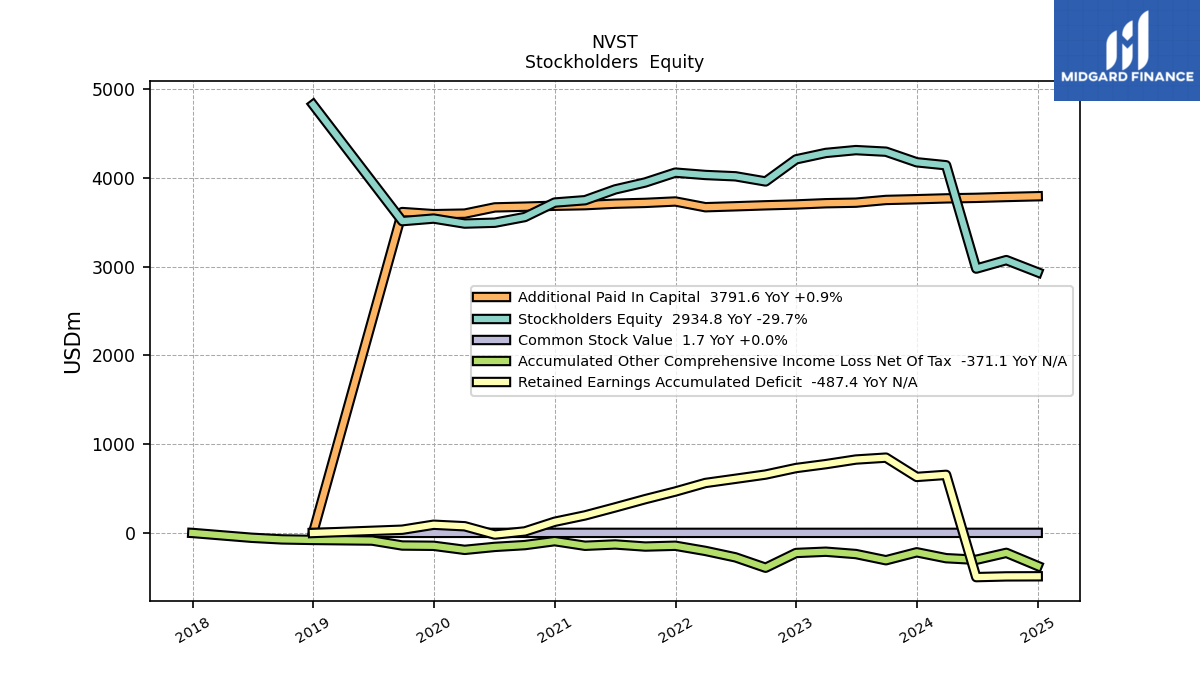
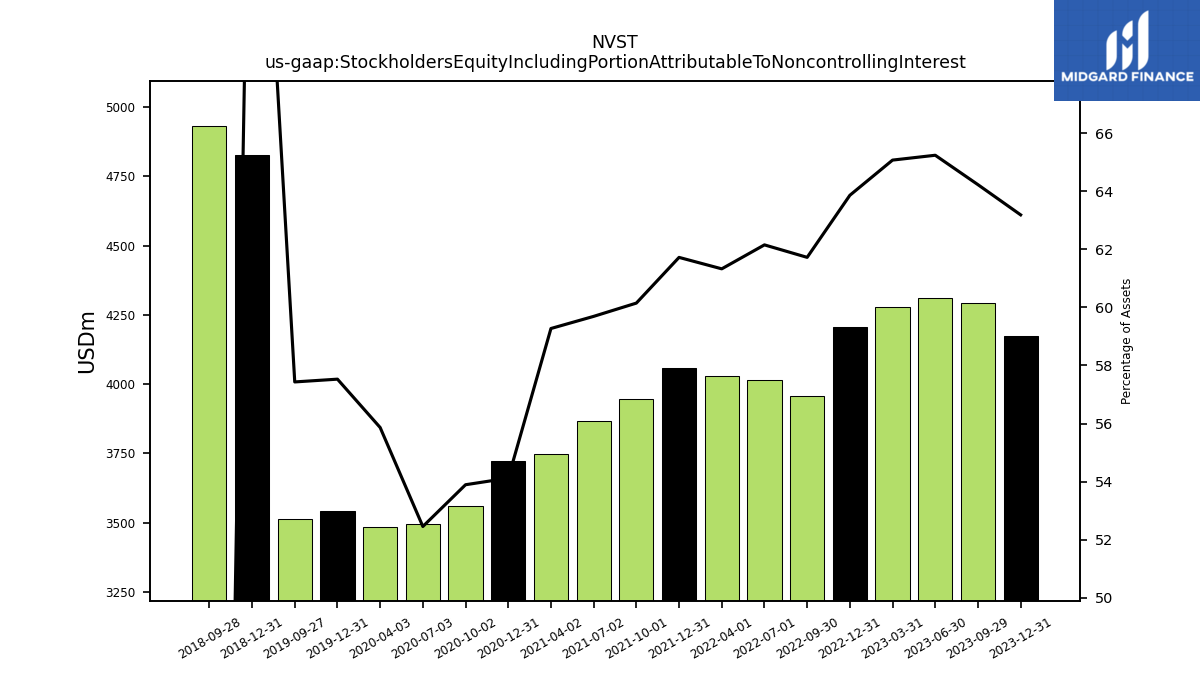
| Stockholders Equity Including Portion Attributable To Noncontrolling Interest | 4173.90 | 4293.20 | 4311.00 | 4279.00 | 4206.90 | 3957.90 | 4016.00 | 4030.90 | 4058.00 | 3947.10 | 3868.90 | 3747.30 | 3721.00 | 3559.80 | 3495.90 | 3486.30 | 3542.80 | 3514.00 | NA | NA | 4826.40 | 4932.30 | NA | NA | |
| Common Stock Value | 1.70 | 1.70 | 1.60 | 1.60 | 1.60 | 1.60 | 1.60 | 1.60 | 1.60 | 1.60 | 1.60 | 1.60 | 1.60 | 1.60 | 1.60 | 1.60 | 1.60 | 1.60 | NA | NA | 0.00 | NA | NA | NA | |
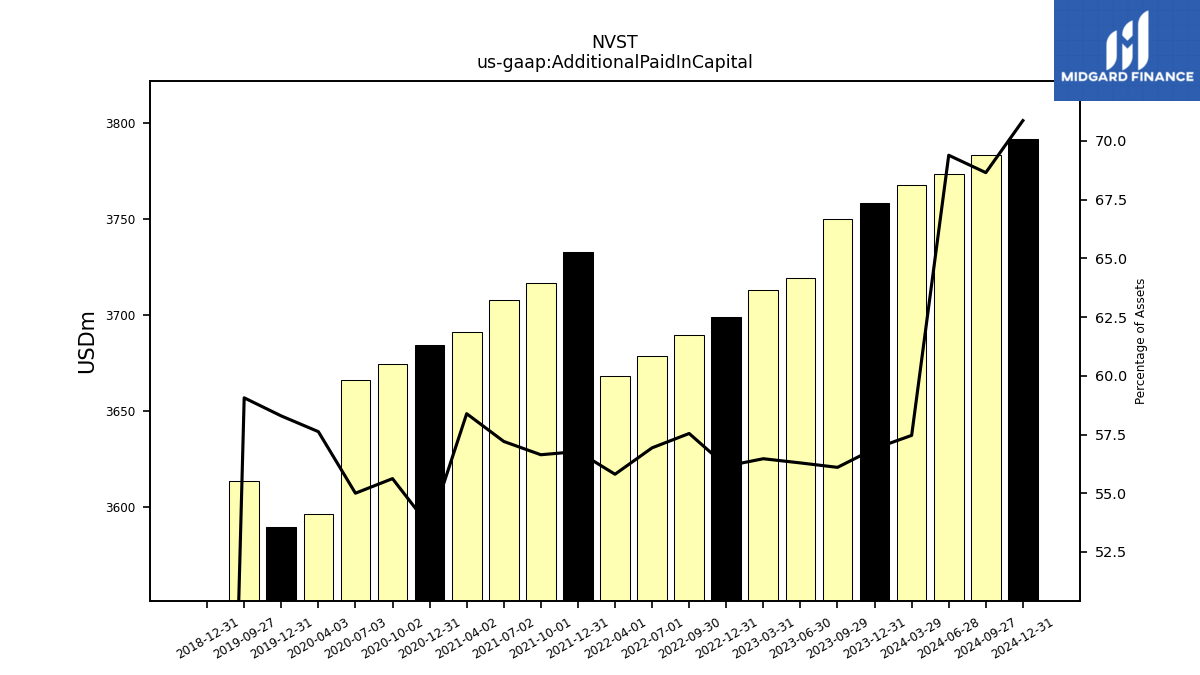
| Additional Paid In Capital | 3758.20 | 3749.70 | 3719.20 | 3712.80 | 3699.00 | 3689.60 | 3678.40 | 3667.90 | 3732.60 | 3716.60 | 3707.60 | 3691.10 | 3684.40 | 3674.20 | 3665.90 | 3596.10 | 3589.70 | 3613.60 | NA | NA | 0.00 | NA | NA | NA | |
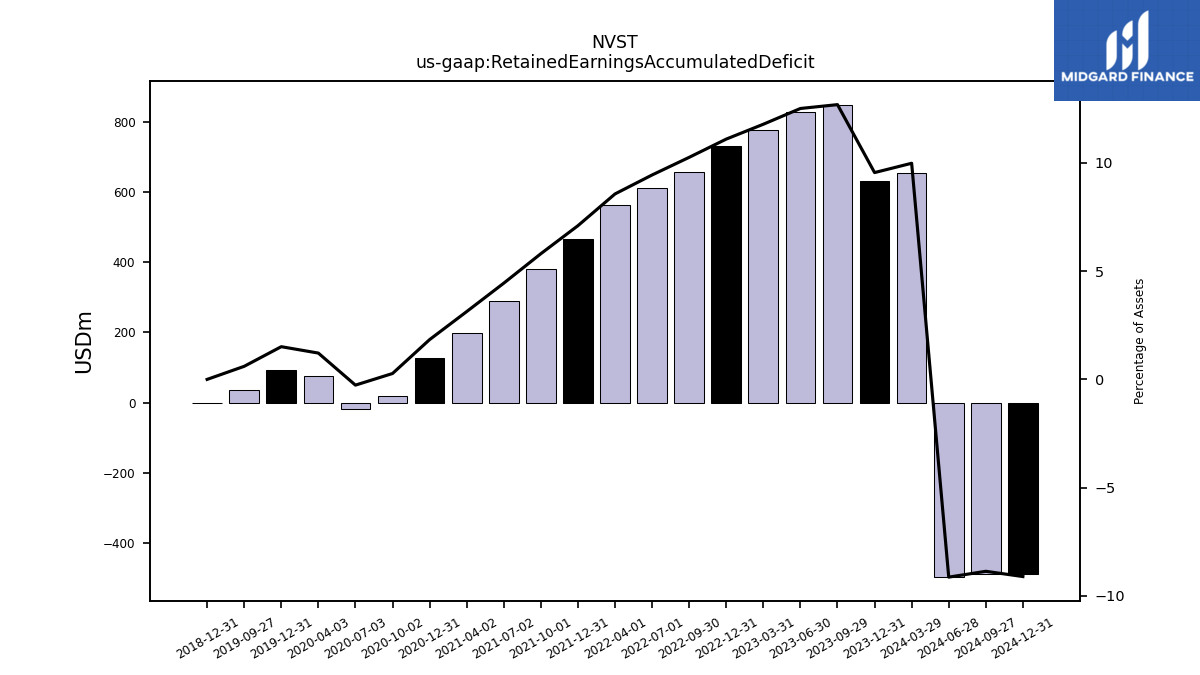
| Retained Earnings Accumulated Deficit | 631.20 | 848.60 | 827.10 | 775.20 | 731.40 | 657.90 | 610.30 | 563.20 | 466.90 | 381.10 | 288.20 | 198.10 | 126.40 | 18.00 | -17.60 | 75.90 | 93.10 | 37.00 | NA | NA | 0.00 | NA | NA | NA | |
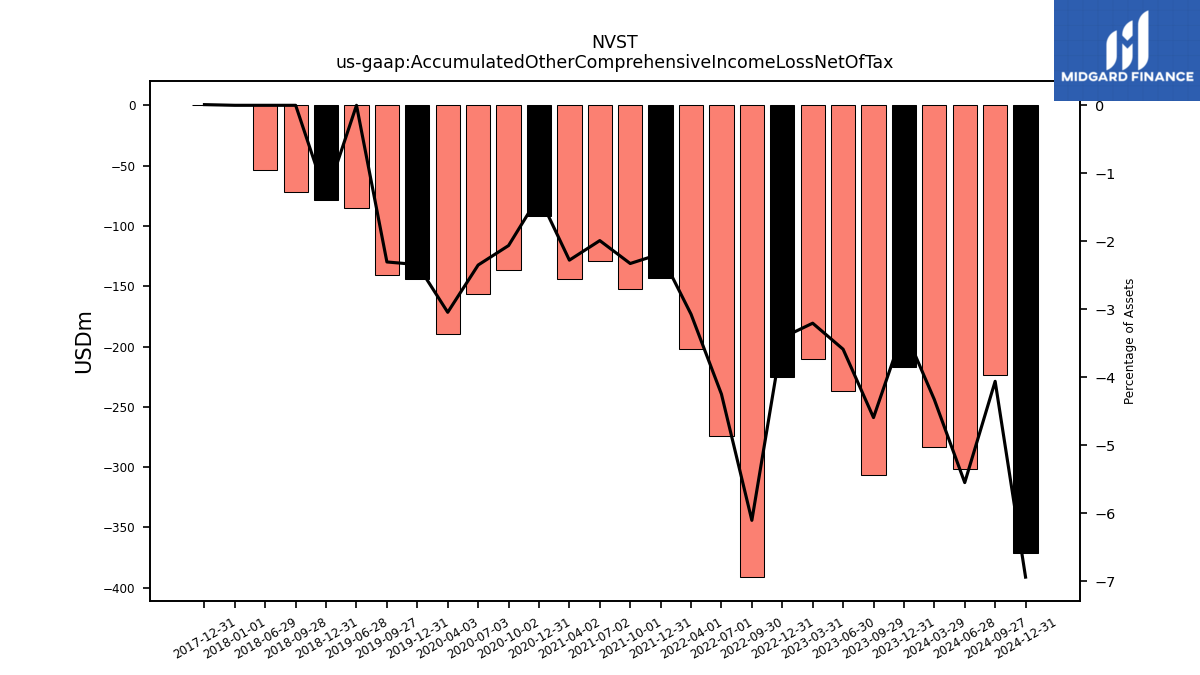
| Accumulated Other Comprehensive Income Loss Net Of Tax | -217.20 | -306.80 | -236.90 | -210.60 | -225.10 | -391.20 | -274.30 | -201.80 | -143.50 | -152.60 | -128.90 | -143.90 | -91.80 | -136.20 | -156.50 | -189.90 | -144.20 | -140.90 | -85.40 | NA | -78.20 | -72.00 | -53.90 | NA |
| 2023-12-31 | 2023-09-29 | 2023-06-30 | 2023-03-31 | 2022-12-31 | 2022-09-30 | 2022-07-01 | 2022-04-01 | 2021-12-31 | 2021-10-01 | 2021-07-02 | 2021-04-02 | 2020-12-31 | 2020-10-02 | 2020-07-03 | 2020-04-03 | 2019-12-31 | 2019-09-27 | 2019-06-28 | 2019-03-29 | 2018-12-31 | 2018-09-28 | 2018-06-29 | 2018-03-30 | ||
|---|---|---|---|---|---|---|---|---|---|---|---|---|---|---|---|---|---|---|---|---|---|---|---|---|---|
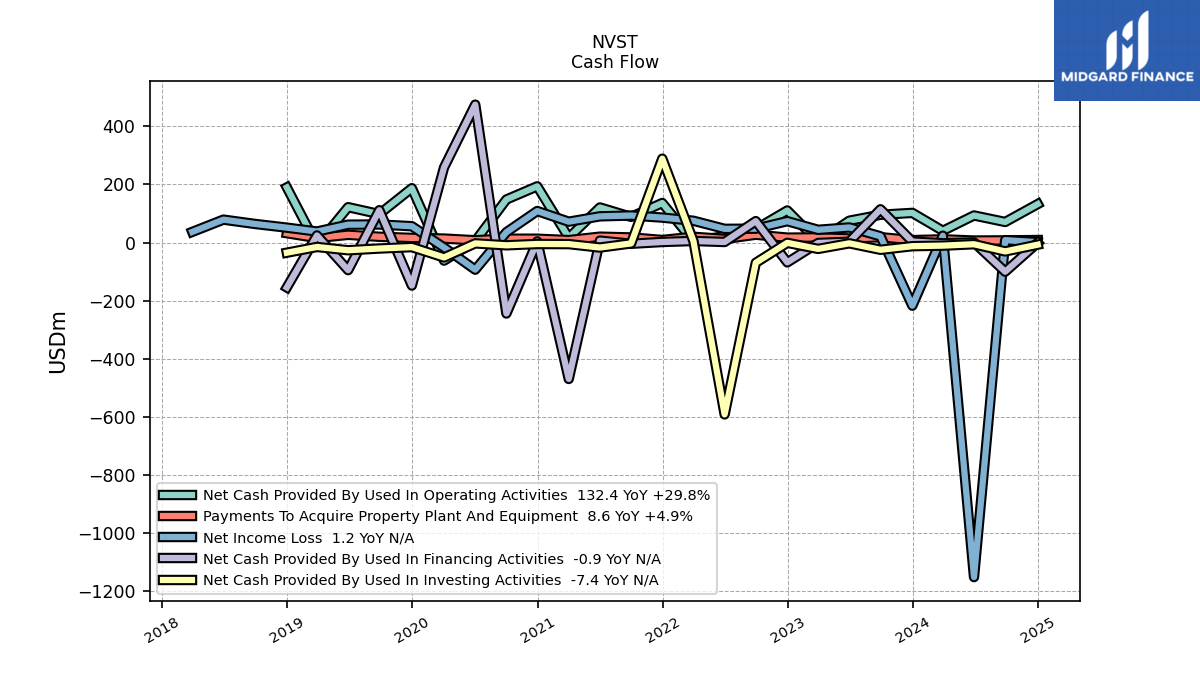
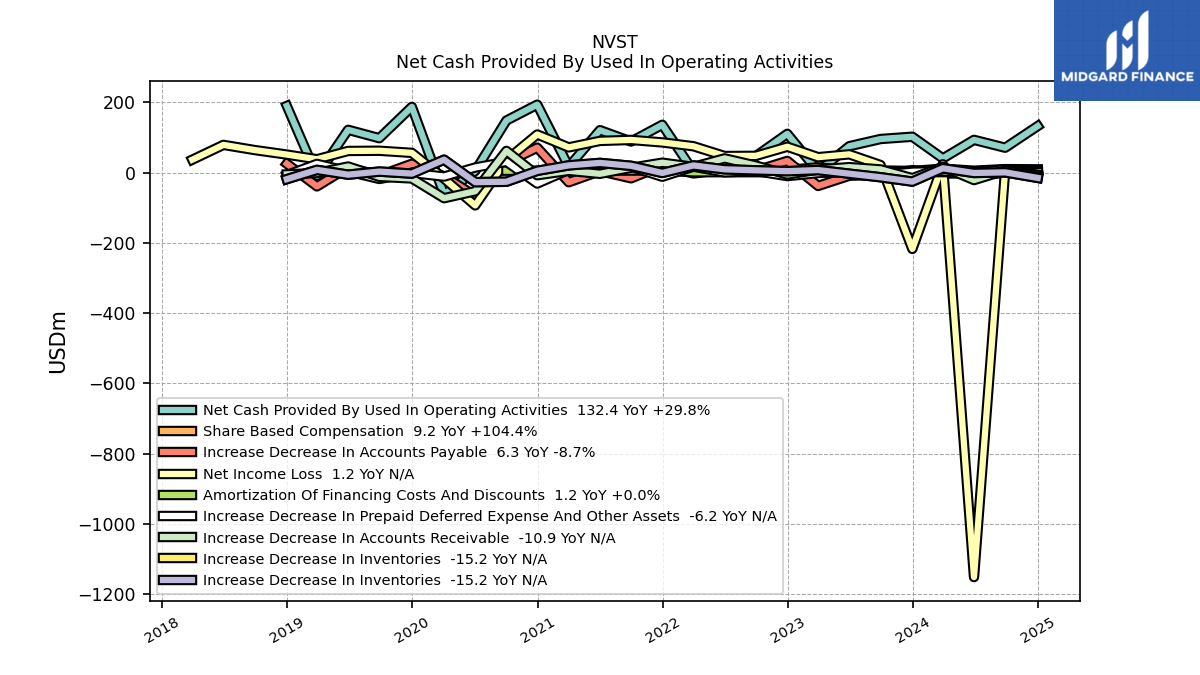
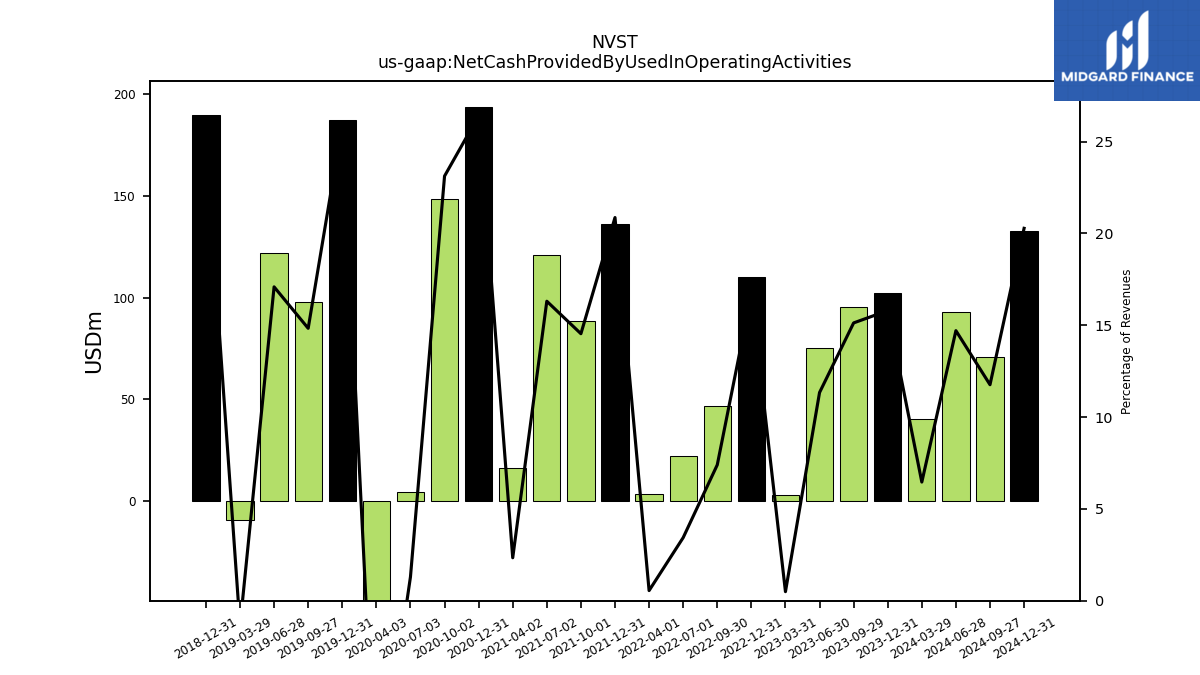
| Net Cash Provided By Used In Operating Activities | 102.00 | 95.50 | 75.10 | 3.10 | 110.30 | 46.70 | 22.20 | 3.50 | 136.00 | 88.30 | 120.70 | 16.60 | 193.40 | 148.10 | 4.70 | -62.30 | 187.00 | 97.80 | 121.70 | -9.00 | 189.60 | NA | NA | NA | |
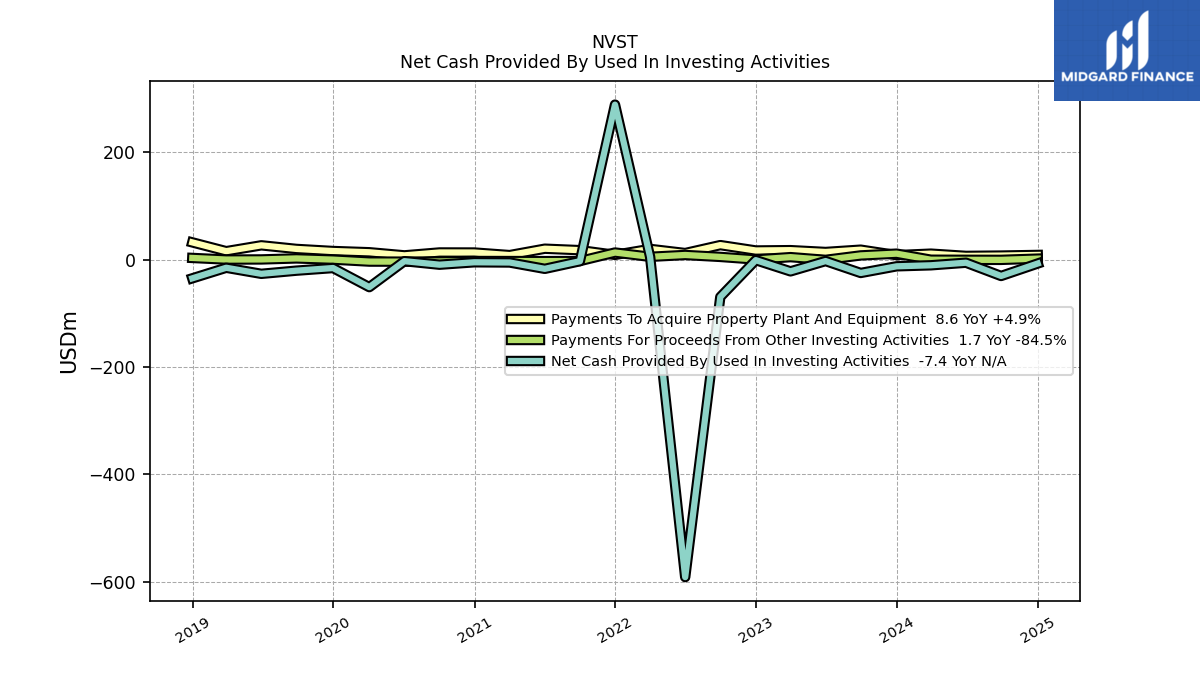
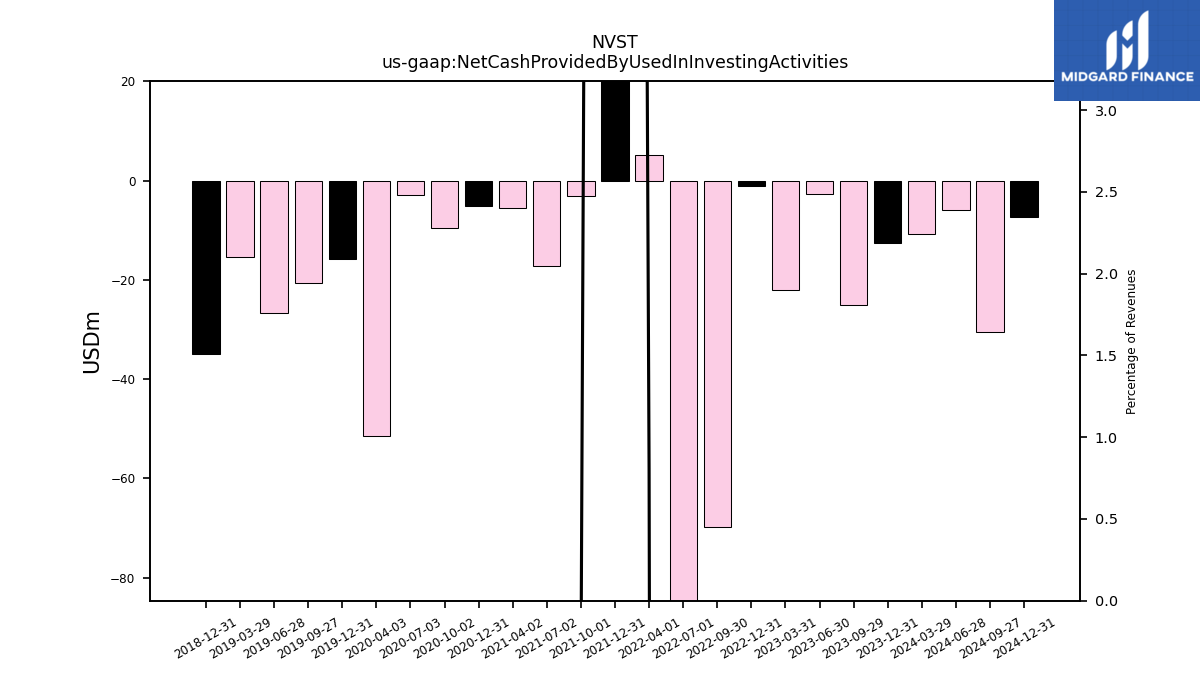
| Net Cash Provided By Used In Investing Activities | -12.60 | -25.00 | -2.80 | -22.00 | -1.10 | -69.70 | -591.60 | 5.10 | 288.60 | -3.10 | -17.30 | -5.50 | -5.10 | -9.60 | -3.00 | -51.40 | -15.80 | -20.70 | -26.60 | -15.30 | -35.00 | NA | NA | NA | |
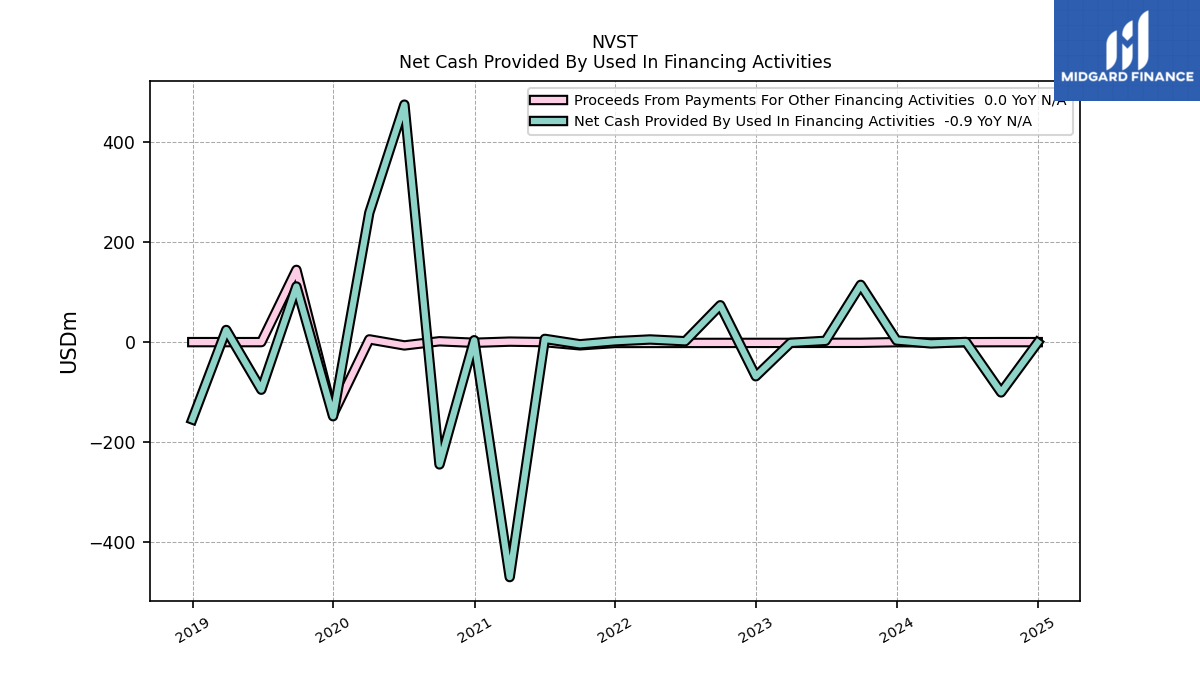
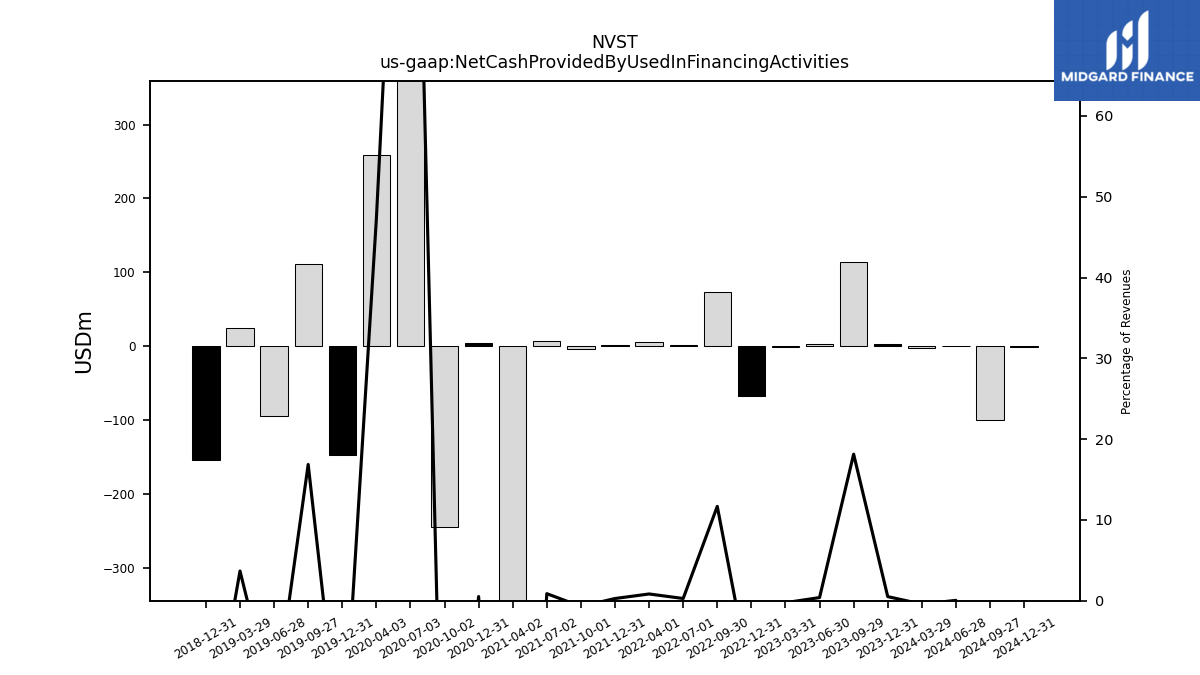
| Net Cash Provided By Used In Financing Activities | 3.30 | 114.50 | 2.60 | -1.50 | -68.30 | 73.70 | 1.80 | 5.30 | 1.80 | -4.30 | 6.50 | -469.60 | 3.80 | -244.40 | 474.60 | 258.50 | -148.10 | 111.20 | -95.10 | 24.30 | -154.60 | NA | NA | NA |
| 2023-12-31 | 2023-09-29 | 2023-06-30 | 2023-03-31 | 2022-12-31 | 2022-09-30 | 2022-07-01 | 2022-04-01 | 2021-12-31 | 2021-10-01 | 2021-07-02 | 2021-04-02 | 2020-12-31 | 2020-10-02 | 2020-07-03 | 2020-04-03 | 2019-12-31 | 2019-09-27 | 2019-06-28 | 2019-03-29 | 2018-12-31 | 2018-09-28 | 2018-06-29 | 2018-03-30 | ||
|---|---|---|---|---|---|---|---|---|---|---|---|---|---|---|---|---|---|---|---|---|---|---|---|---|---|
| Net Cash Provided By Used In Operating Activities | 102.00 | 95.50 | 75.10 | 3.10 | 110.30 | 46.70 | 22.20 | 3.50 | 136.00 | 88.30 | 120.70 | 16.60 | 193.40 | 148.10 | 4.70 | -62.30 | 187.00 | 97.80 | 121.70 | -9.00 | 189.60 | NA | NA | NA | |
| Net Income Loss | -217.40 | 21.50 | 51.90 | 43.80 | 73.50 | 47.60 | 47.10 | 74.90 | 85.80 | 92.90 | 90.10 | 71.70 | 108.40 | 35.60 | -93.50 | -17.20 | 56.10 | 62.10 | 61.50 | 37.90 | 51.20 | 64.10 | 78.80 | 36.60 | |
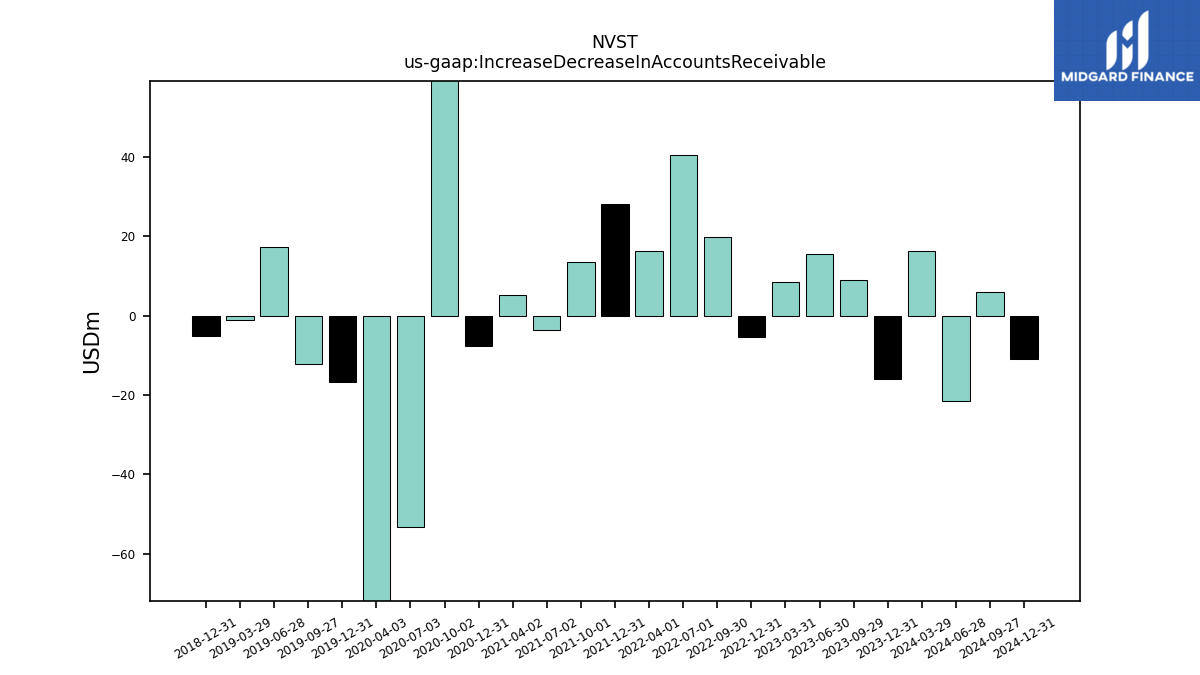
| Increase Decrease In Accounts Receivable | -16.00 | 9.00 | 15.50 | 8.50 | -5.50 | 19.90 | 40.40 | 16.20 | 28.10 | 13.60 | -3.60 | 5.10 | -7.60 | 61.80 | -53.10 | -73.00 | -16.80 | -12.10 | 17.30 | -1.20 | -5.20 | NA | NA | NA | |
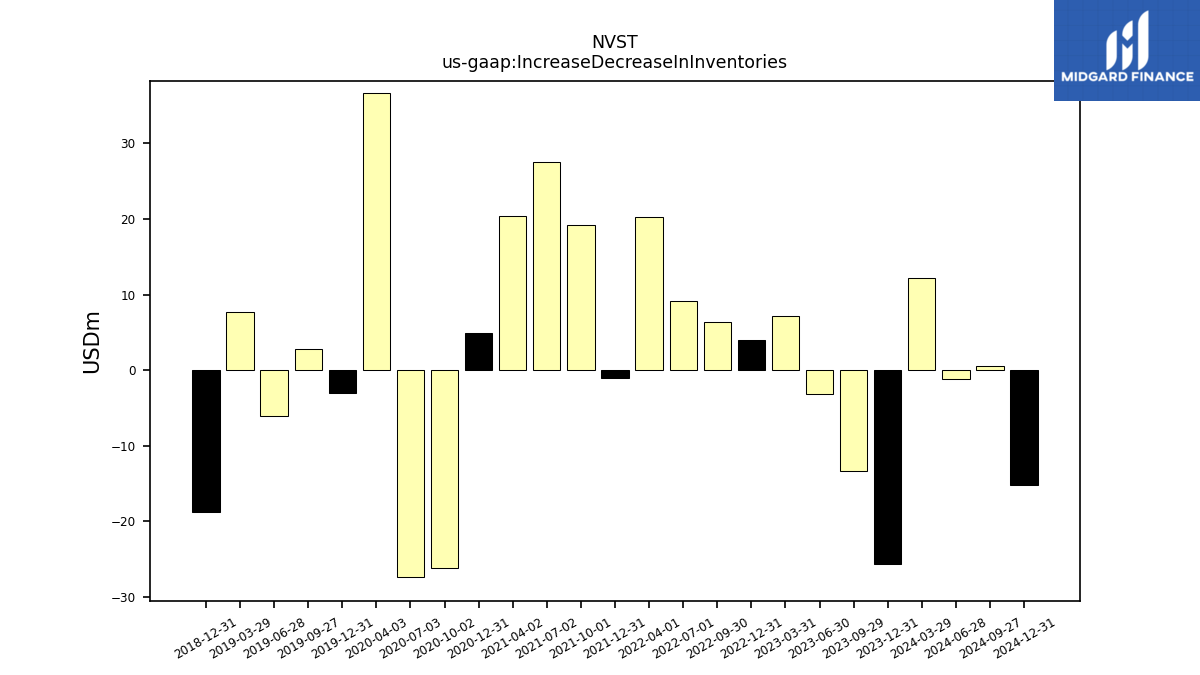
| Increase Decrease In Inventories | -25.70 | -13.30 | -3.20 | 7.10 | 4.00 | 6.40 | 9.20 | 20.30 | -1.10 | 19.20 | 27.50 | 20.40 | 4.90 | -26.20 | -27.30 | 36.70 | -3.00 | 2.80 | -6.00 | 7.70 | -18.80 | NA | NA | NA | |
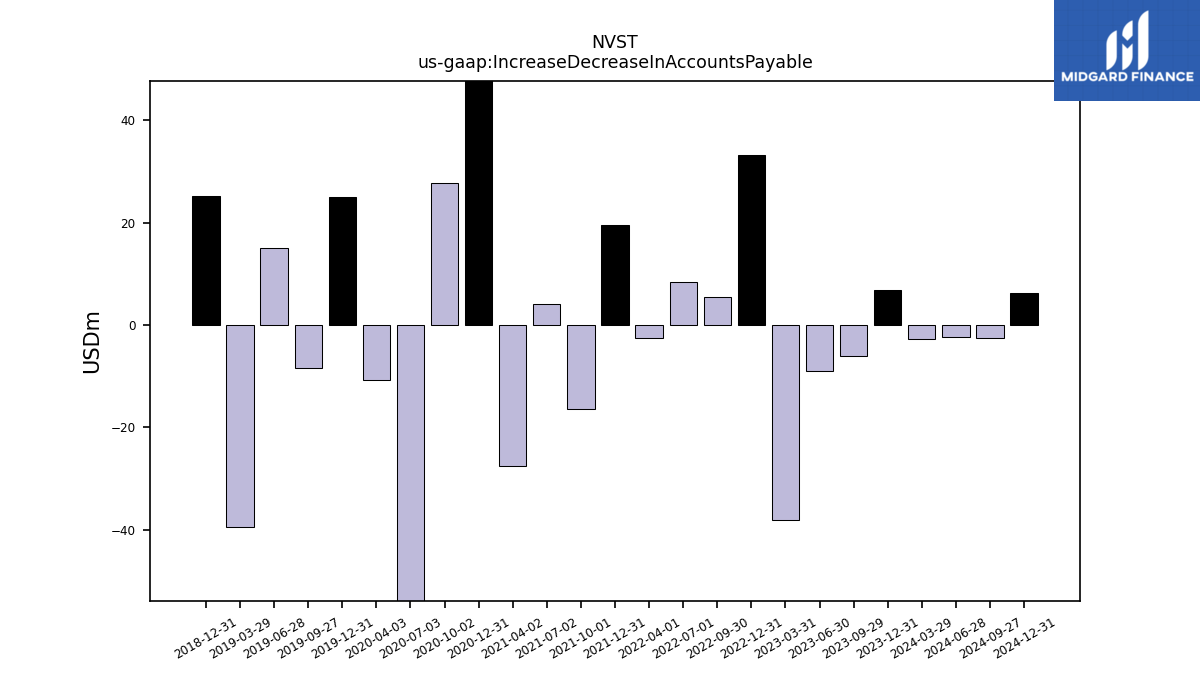
| Increase Decrease In Accounts Payable | 6.90 | -6.10 | -9.00 | -38.10 | 33.20 | 5.40 | 8.40 | -2.50 | 19.60 | -16.40 | 4.10 | -27.60 | 70.90 | 27.80 | -66.40 | -10.70 | 25.00 | -8.50 | 15.00 | -39.40 | 25.20 | NA | NA | NA | |
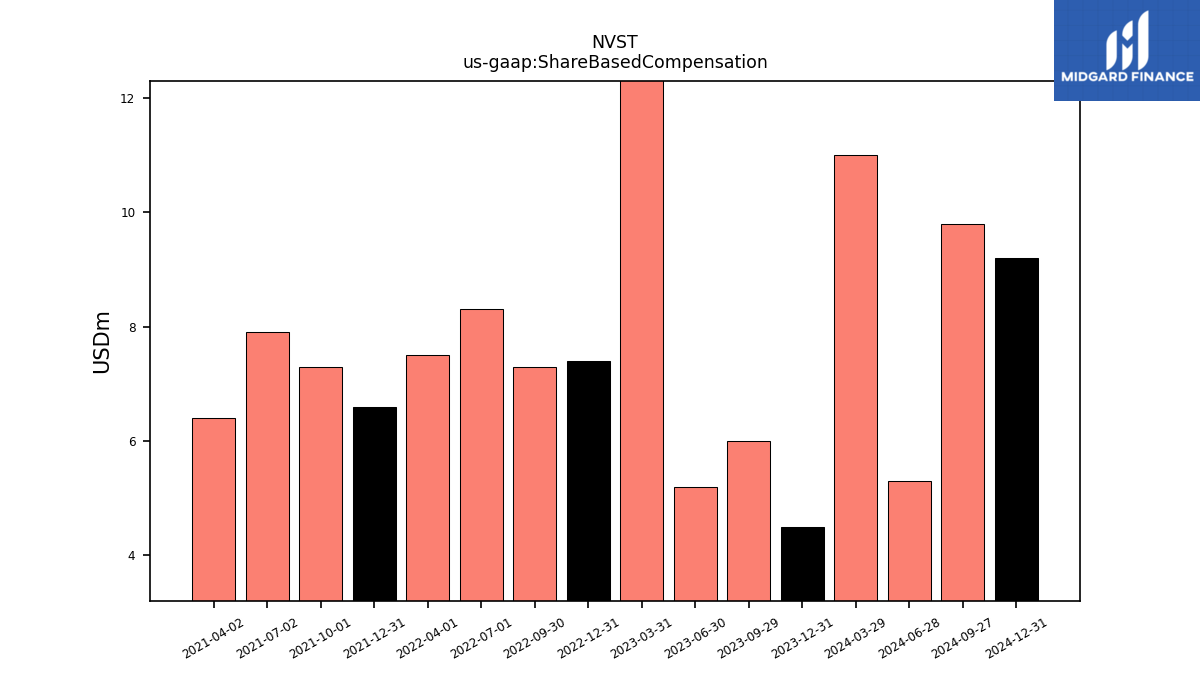
| Share Based Compensation | 4.50 | 6.00 | 5.20 | 15.00 | 7.40 | 7.30 | 8.30 | 7.50 | 6.60 | 7.30 | 7.90 | 6.40 | NA | NA | NA | NA | NA | NA | NA | NA | NA | NA | NA | NA |
| 2023-12-31 | 2023-09-29 | 2023-06-30 | 2023-03-31 | 2022-12-31 | 2022-09-30 | 2022-07-01 | 2022-04-01 | 2021-12-31 | 2021-10-01 | 2021-07-02 | 2021-04-02 | 2020-12-31 | 2020-10-02 | 2020-07-03 | 2020-04-03 | 2019-12-31 | 2019-09-27 | 2019-06-28 | 2019-03-29 | 2018-12-31 | 2018-09-28 | 2018-06-29 | 2018-03-30 | ||
|---|---|---|---|---|---|---|---|---|---|---|---|---|---|---|---|---|---|---|---|---|---|---|---|---|---|
| Net Cash Provided By Used In Investing Activities | -12.60 | -25.00 | -2.80 | -22.00 | -1.10 | -69.70 | -591.60 | 5.10 | 288.60 | -3.10 | -17.30 | -5.50 | -5.10 | -9.60 | -3.00 | -51.40 | -15.80 | -20.70 | -26.60 | -15.30 | -35.00 | NA | NA | NA | |
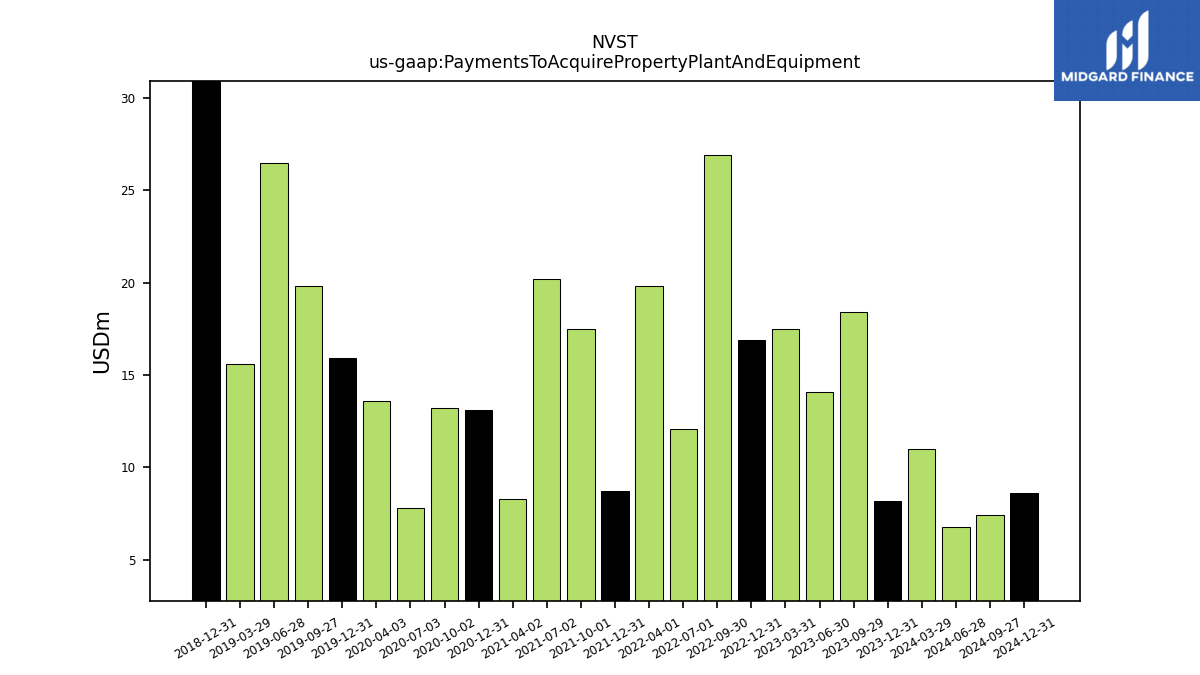
| Payments To Acquire Property Plant And Equipment | 8.20 | 18.40 | 14.10 | 17.50 | 16.90 | 26.90 | 12.10 | 19.80 | 8.70 | 17.50 | 20.20 | 8.30 | 13.10 | 13.20 | 7.80 | 13.60 | 15.90 | 19.80 | 26.50 | 15.60 | 32.00 | NA | NA | NA |
| 2023-12-31 | 2023-09-29 | 2023-06-30 | 2023-03-31 | 2022-12-31 | 2022-09-30 | 2022-07-01 | 2022-04-01 | 2021-12-31 | 2021-10-01 | 2021-07-02 | 2021-04-02 | 2020-12-31 | 2020-10-02 | 2020-07-03 | 2020-04-03 | 2019-12-31 | 2019-09-27 | 2019-06-28 | 2019-03-29 | 2018-12-31 | 2018-09-28 | 2018-06-29 | 2018-03-30 | ||
|---|---|---|---|---|---|---|---|---|---|---|---|---|---|---|---|---|---|---|---|---|---|---|---|---|---|
| Net Cash Provided By Used In Financing Activities | 3.30 | 114.50 | 2.60 | -1.50 | -68.30 | 73.70 | 1.80 | 5.30 | 1.80 | -4.30 | 6.50 | -469.60 | 3.80 | -244.40 | 474.60 | 258.50 | -148.10 | 111.20 | -95.10 | 24.30 | -154.60 | NA | NA | NA |
| 2023-12-31 | 2023-09-29 | 2023-06-30 | 2023-03-31 | 2022-12-31 | 2022-09-30 | 2022-07-01 | 2022-04-01 | 2021-12-31 | 2021-10-01 | 2021-07-02 | 2021-04-02 | 2020-12-31 | 2020-10-02 | 2020-07-03 | 2020-04-03 | 2019-12-31 | 2019-09-27 | 2019-06-28 | 2019-03-29 | 2018-12-31 | 2018-09-28 | 2018-06-29 | 2018-03-30 | ||
|---|---|---|---|---|---|---|---|---|---|---|---|---|---|---|---|---|---|---|---|---|---|---|---|---|---|
| Revenues | 645.60 | 631.30 | 662.40 | 627.20 | 660.80 | 631.10 | 645.80 | 631.40 | 651.80 | 607.30 | 740.10 | 709.20 | 732.30 | 640.50 | 362.00 | 547.20 | 720.50 | 659.30 | 712.10 | 659.70 | 759.00 | 679.50 | 733.40 | 672.60 | |
| Revenue From Contract With Customer Excluding Assessed Tax | 645.60 | 631.30 | 662.40 | 627.20 | 660.80 | 631.10 | 645.80 | 631.40 | 651.80 | 607.30 | 740.10 | 709.20 | 732.30 | 640.50 | 362.00 | 547.20 | 720.50 | 659.30 | 712.10 | 659.70 | 759.00 | 679.50 | 733.40 | 672.60 | |
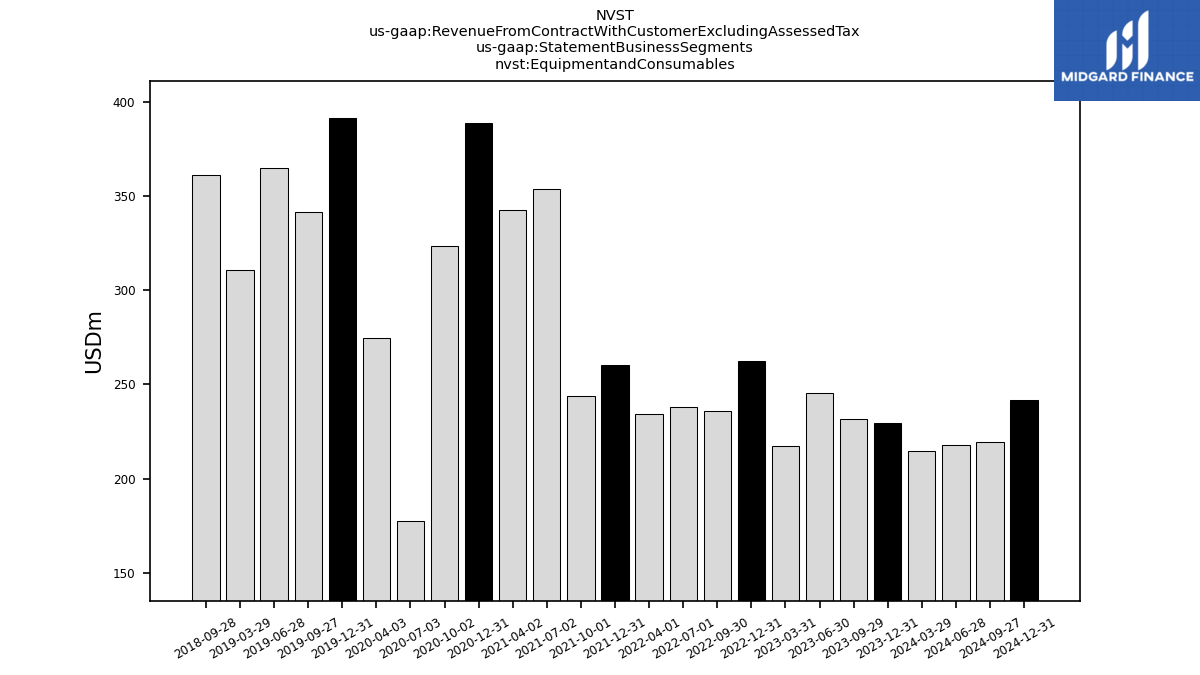
| Equipmentand Consumables | 229.70 | 231.80 | 245.40 | 217.20 | 262.40 | 235.70 | 238.10 | 234.30 | 260.10 | 243.90 | 353.90 | 342.70 | 389.10 | 323.60 | 177.40 | 274.60 | 391.70 | 341.50 | 364.80 | 310.90 | NA | 361.20 | NA | NA | |
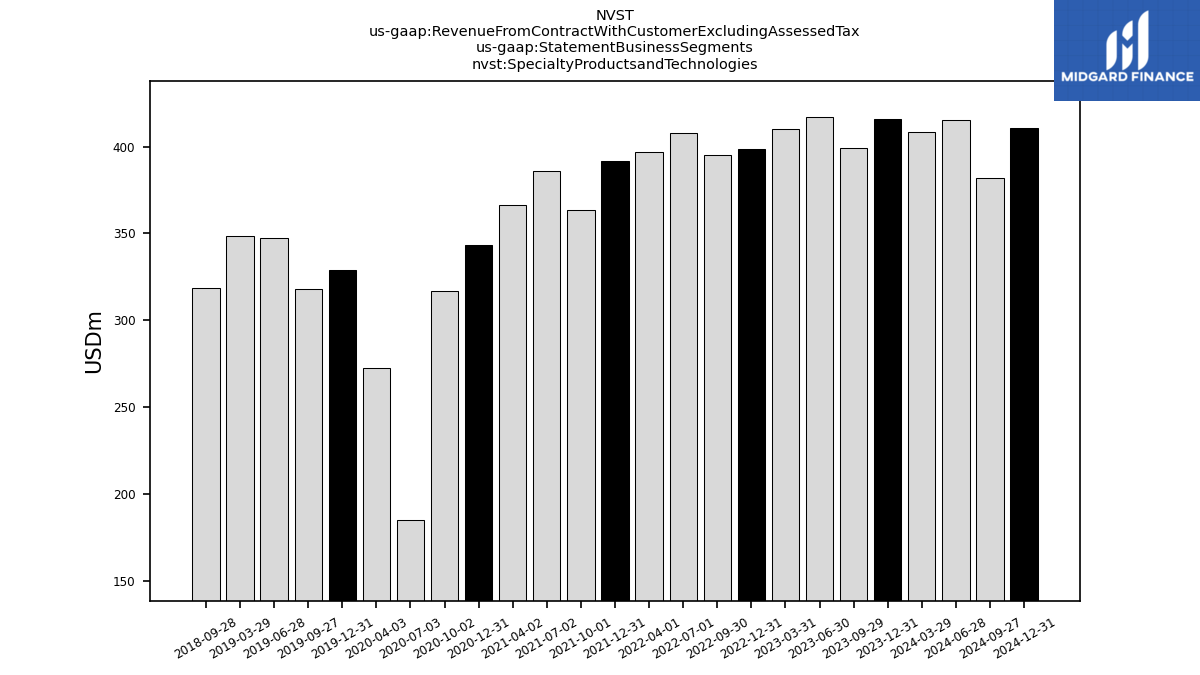
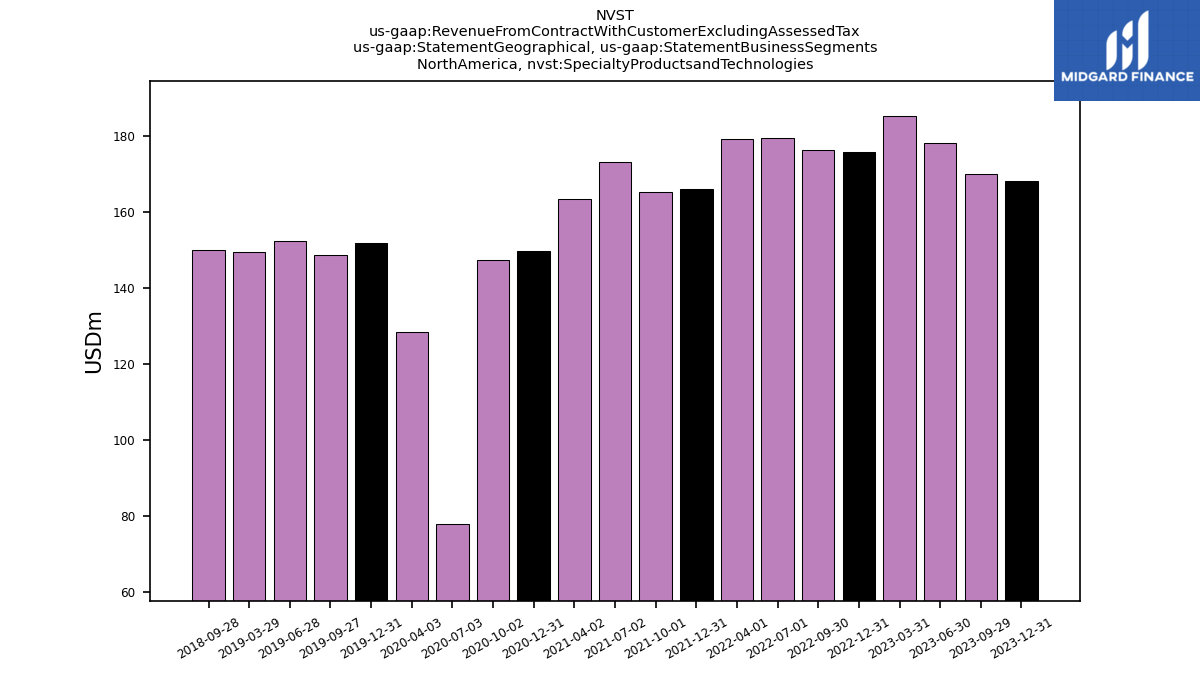
| Specialty Productsand Technologies | 415.90 | 399.50 | 417.00 | 410.00 | 398.40 | 395.40 | 407.70 | 397.10 | 391.70 | 363.40 | 386.20 | 366.50 | 343.20 | 316.90 | 184.60 | 272.60 | 328.80 | 317.80 | 347.30 | 348.80 | NA | 318.30 | NA | NA | |
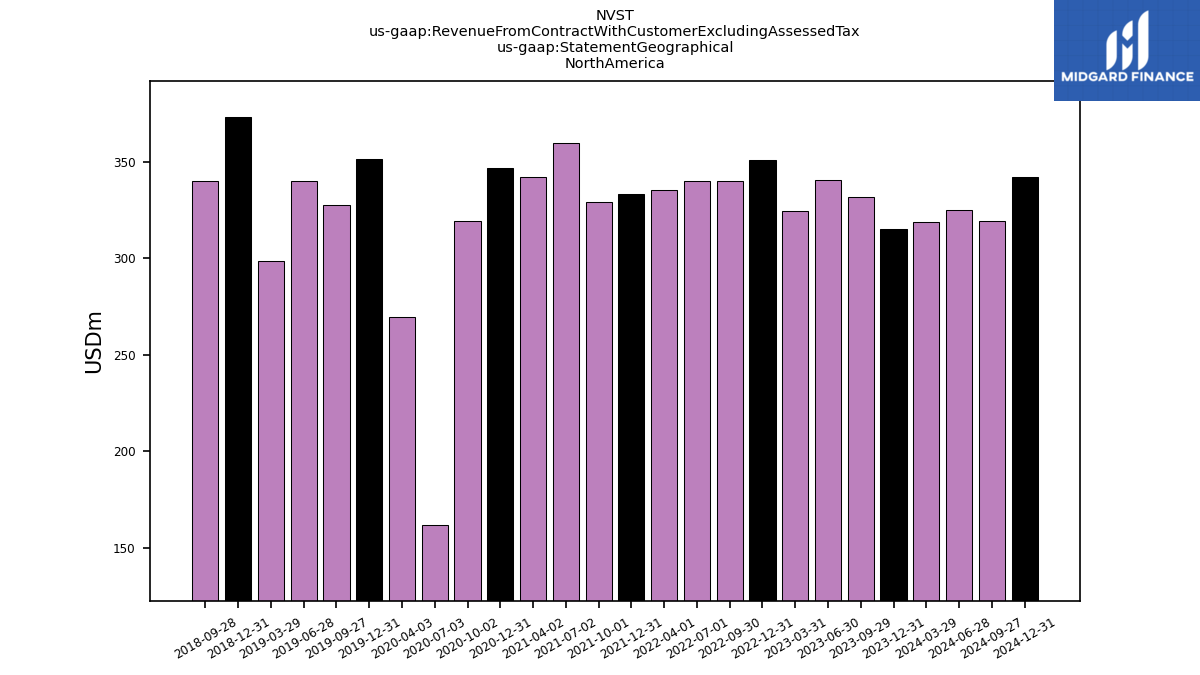
| 315.40 | 332.00 | 340.40 | 324.70 | 351.00 | 340.00 | 339.80 | 335.60 | 333.50 | 329.40 | 359.50 | 342.00 | 346.60 | 319.30 | 162.10 | 269.80 | 351.20 | 327.70 | 340.20 | 298.50 | 373.20 | 339.80 | NA | NA | ||
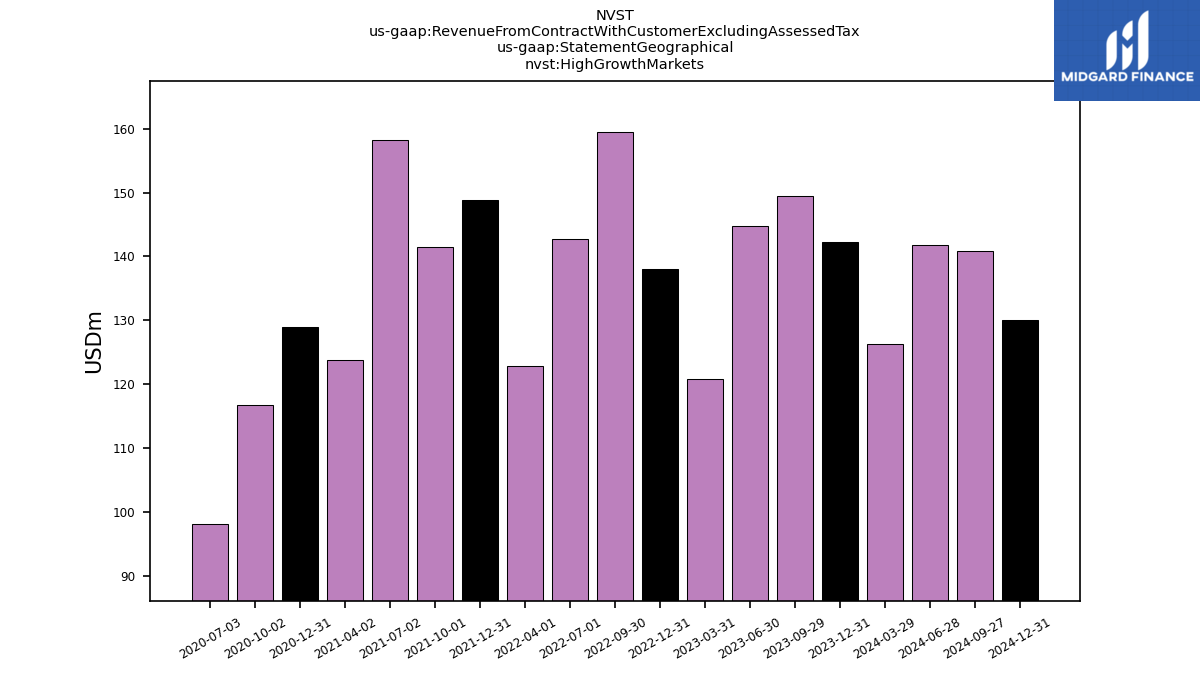
| High Growth Markets | 142.30 | 149.40 | 144.80 | 120.80 | 138.00 | 159.50 | 142.80 | 122.80 | 148.80 | 141.50 | 158.30 | 123.80 | 128.90 | 116.70 | 98.10 | NA | NA | NA | NA | NA | NA | NA | NA | NA | |
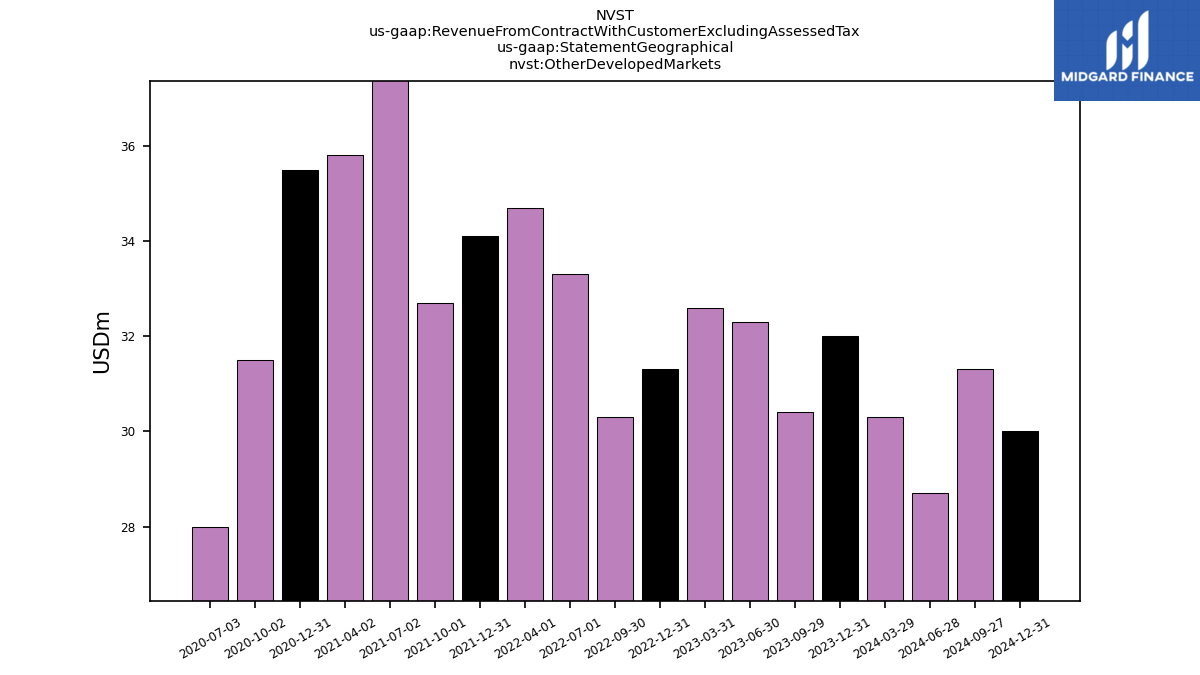
| Other Developed Markets | 32.00 | 30.40 | 32.30 | 32.60 | 31.30 | 30.30 | 33.30 | 34.70 | 34.10 | 32.70 | 48.10 | 35.80 | 35.50 | 31.50 | 28.00 | NA | NA | NA | NA | NA | NA | NA | NA | NA | |
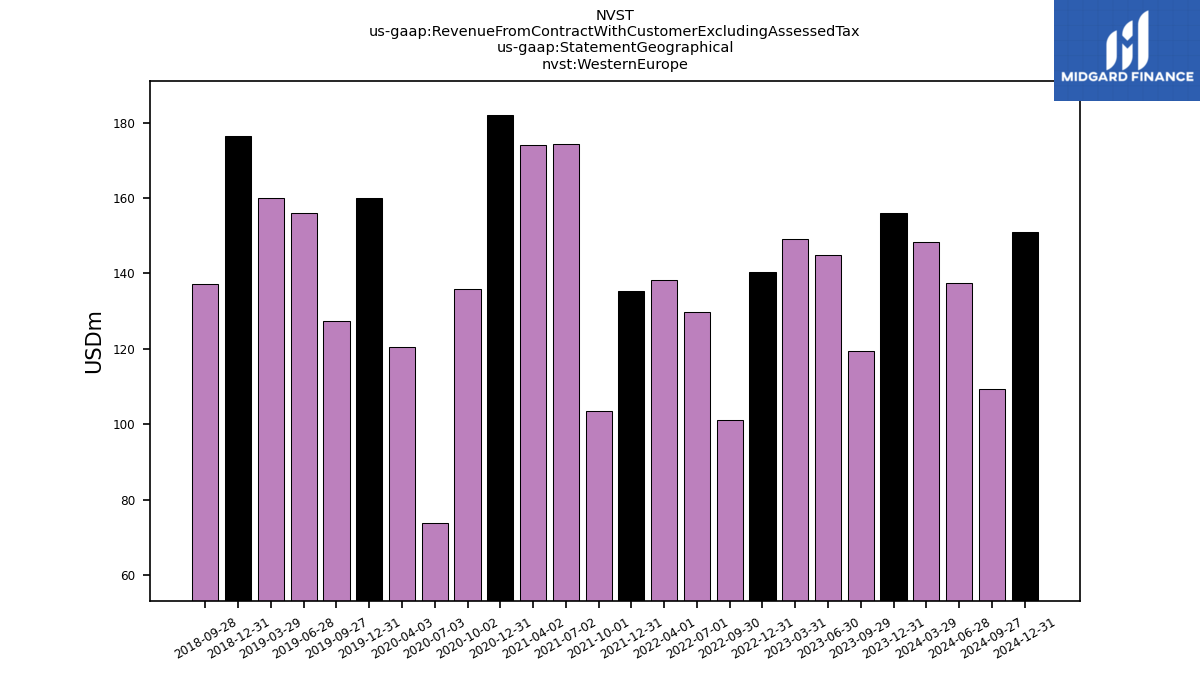
| Western Europe | 155.90 | 119.50 | 144.90 | 149.10 | 140.50 | 101.30 | 129.90 | 138.30 | 135.40 | 103.70 | 174.20 | 174.00 | 181.90 | 135.90 | 73.80 | 120.60 | 160.00 | 127.50 | 156.10 | 160.10 | 176.30 | 137.20 | NA | NA | |
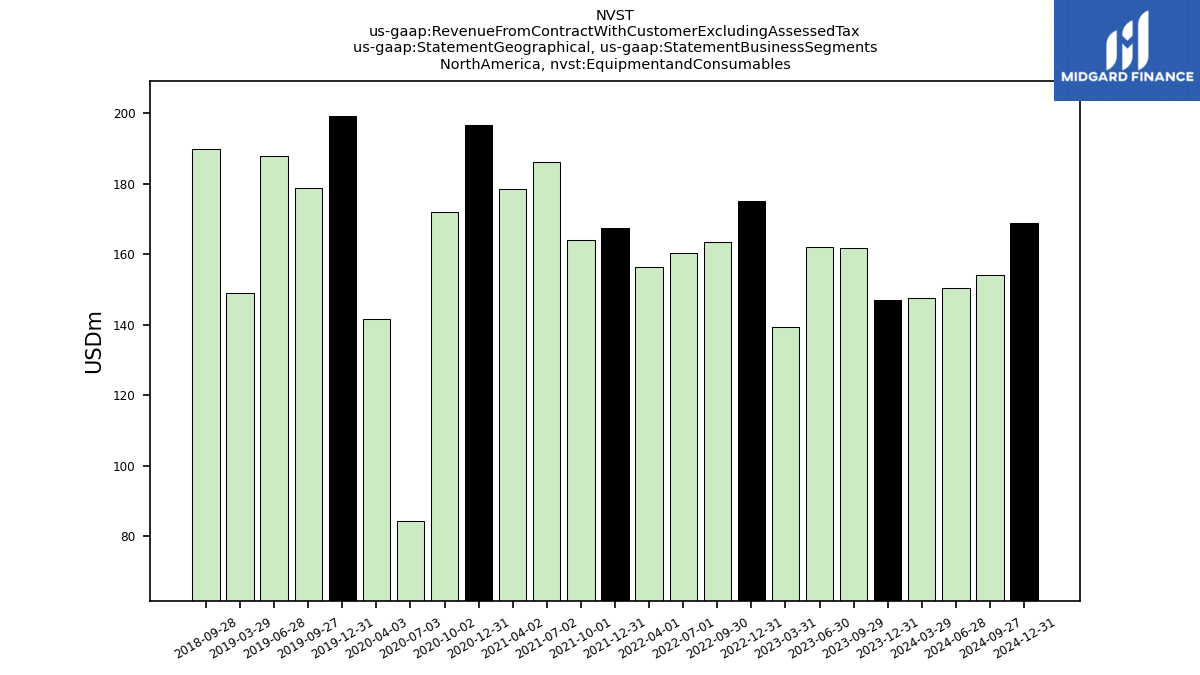
| , Equipmentand Consumables | 147.10 | 161.90 | 162.10 | 139.40 | 175.20 | 163.50 | 160.30 | 156.30 | 167.40 | 164.00 | 186.20 | 178.60 | 196.80 | 172.00 | 84.20 | 141.50 | 199.20 | 178.90 | 187.90 | 148.90 | NA | 189.90 | NA | NA | |
| , Specialty Productsand Technologies | 168.30 | 170.10 | 178.30 | 185.30 | 175.80 | 176.50 | 179.50 | 179.30 | 166.10 | 165.40 | 173.30 | 163.40 | 149.80 | 147.30 | 77.90 | 128.30 | 152.00 | 148.80 | 152.30 | 149.60 | NA | 149.90 | NA | NA | |
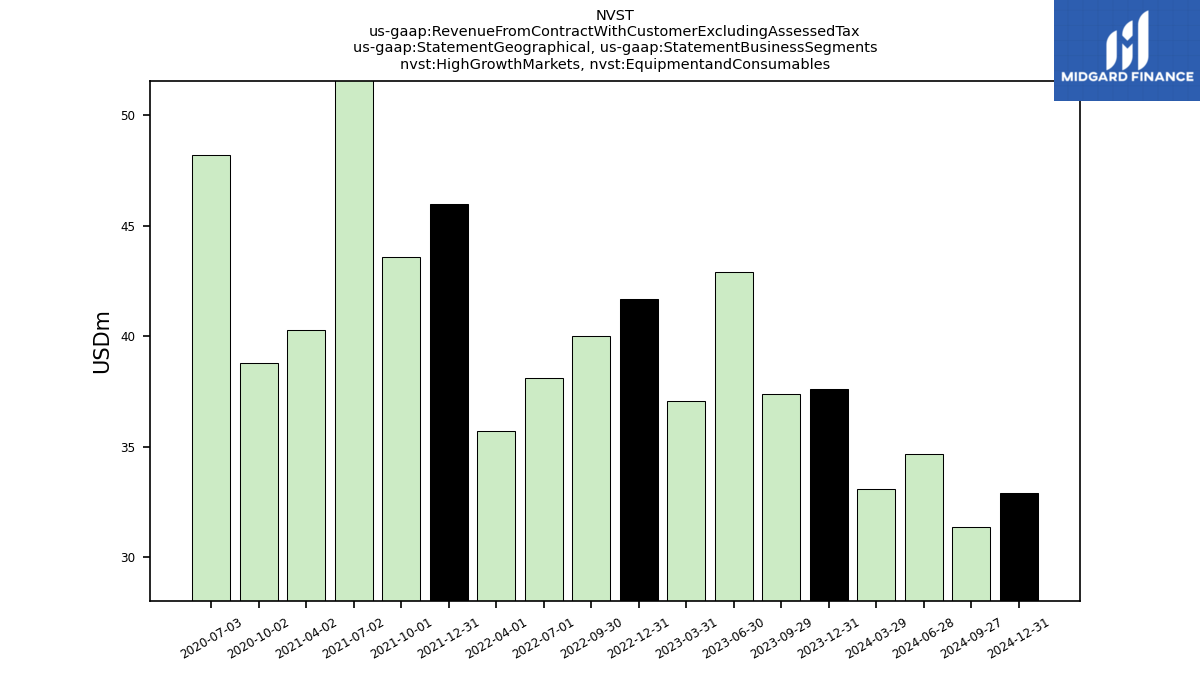
| High Growth Markets, Equipmentand Consumables | 37.60 | 37.40 | 42.90 | 37.10 | 41.70 | 40.00 | 38.10 | 35.70 | 46.00 | 43.60 | 67.30 | 40.30 | NA | 38.80 | 48.20 | NA | NA | NA | NA | NA | NA | NA | NA | NA | |
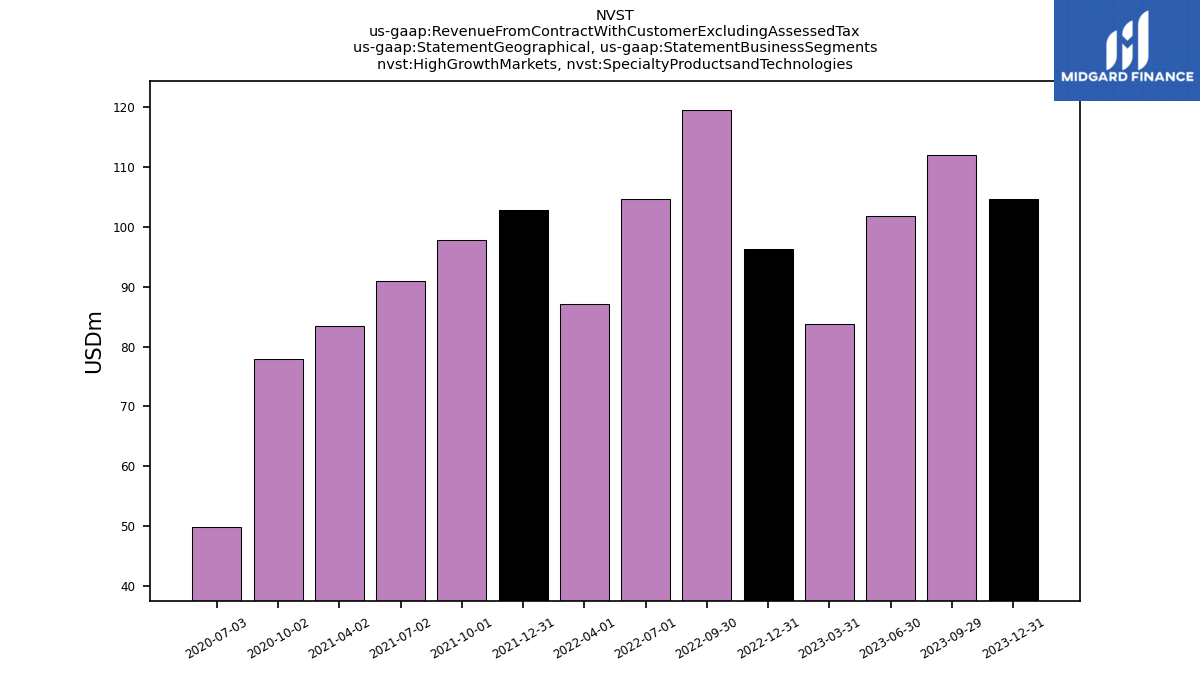
| High Growth Markets, Specialty Productsand Technologies | 104.70 | 112.00 | 101.90 | 83.70 | 96.30 | 119.50 | 104.70 | 87.10 | 102.80 | 97.90 | 91.00 | 83.50 | NA | 77.90 | 49.90 | NA | NA | NA | NA | NA | NA | NA | NA | NA | |
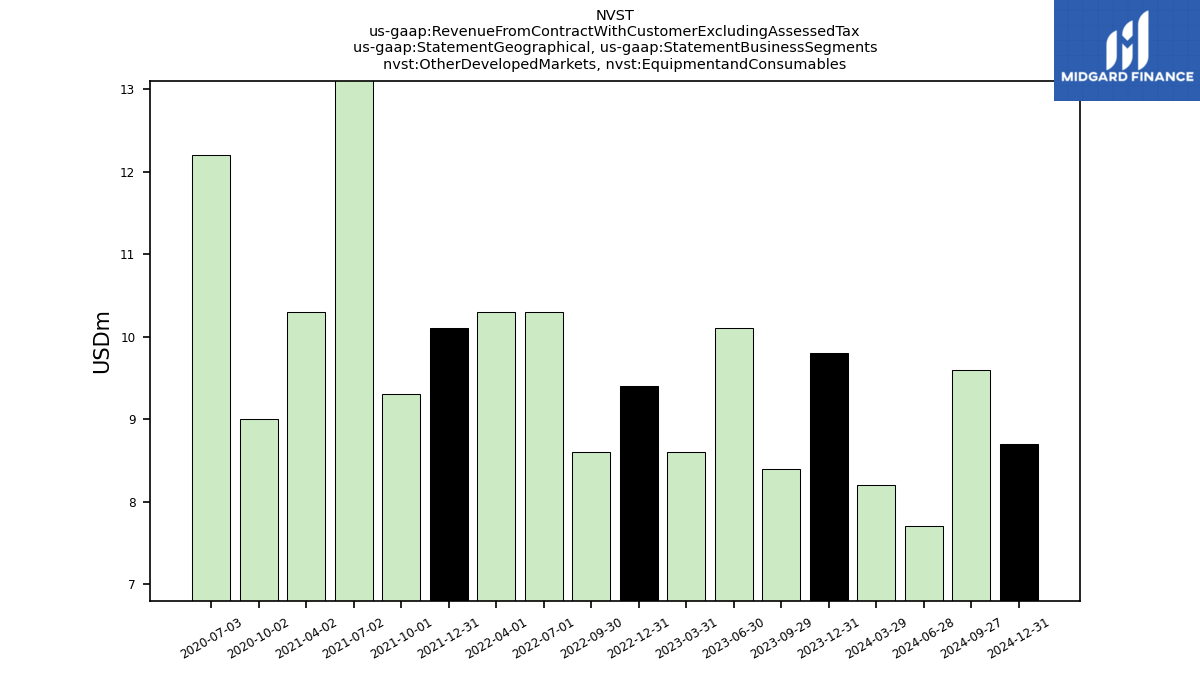
| Other Developed Markets, Equipmentand Consumables | 9.80 | 8.40 | 10.10 | 8.60 | 9.40 | 8.60 | 10.30 | 10.30 | 10.10 | 9.30 | 22.90 | 10.30 | NA | 9.00 | 12.20 | NA | NA | NA | NA | NA | NA | NA | NA | NA | |
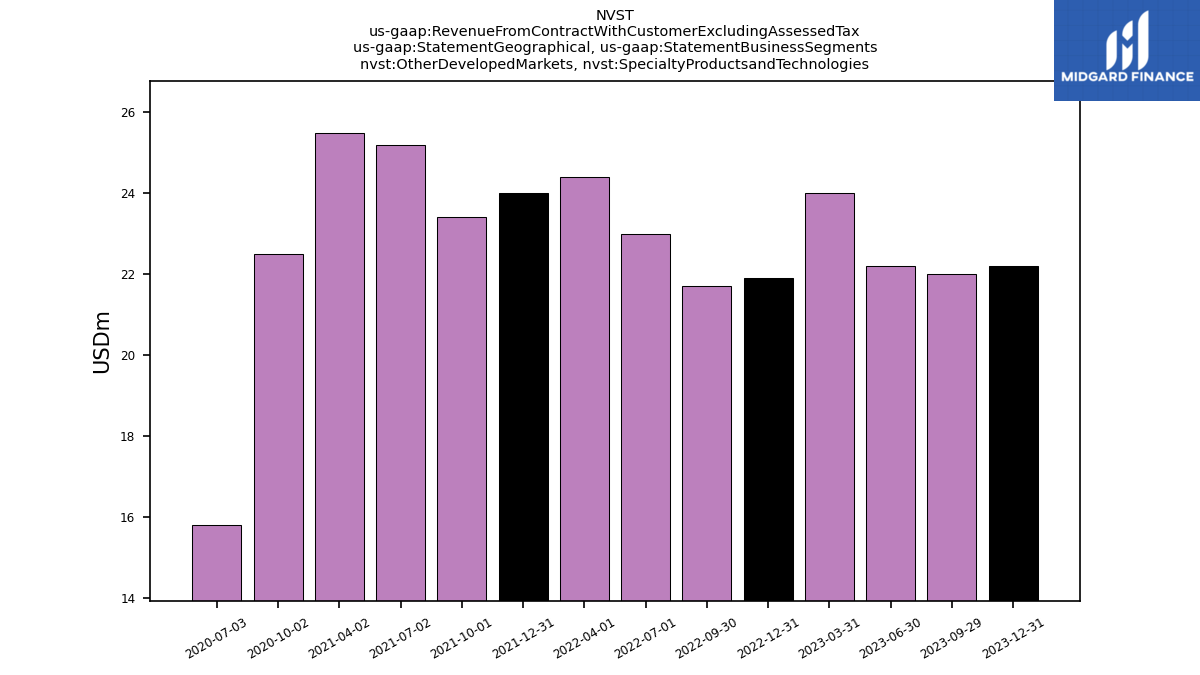
| Other Developed Markets, Specialty Productsand Technologies | 22.20 | 22.00 | 22.20 | 24.00 | 21.90 | 21.70 | 23.00 | 24.40 | 24.00 | 23.40 | 25.20 | 25.50 | NA | 22.50 | 15.80 | NA | NA | NA | NA | NA | NA | NA | NA | NA | |
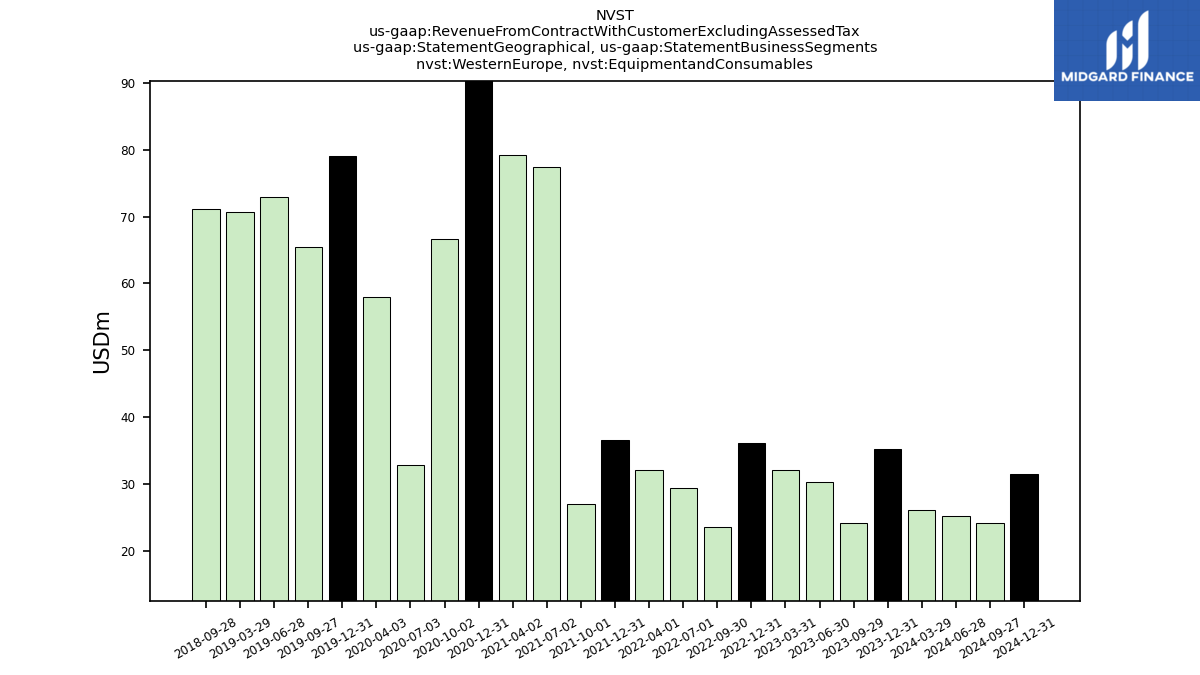
| Western Europe, Equipmentand Consumables | 35.20 | 24.10 | 30.30 | 32.10 | 36.10 | 23.60 | 29.40 | 32.00 | 36.60 | 27.00 | 77.50 | 79.20 | 95.60 | 66.70 | 32.80 | 57.90 | 79.10 | 65.40 | 72.90 | 70.70 | NA | 71.20 | NA | NA | |
| Western Europe, Specialty Productsand Technologies | 120.70 | 95.40 | 114.60 | 117.00 | 104.40 | 77.70 | 100.50 | 106.30 | 98.80 | 76.70 | 96.70 | 94.80 | 86.30 | 69.20 | 41.00 | 62.70 | 80.90 | 62.10 | 83.20 | 89.40 | NA | 66.00 | NA | NA |