
| 2023-12-31 | 2023-09-30 | 2023-06-30 | 2023-03-31 | 2022-12-31 | 2022-09-30 | 2022-06-30 | 2022-03-31 | 2021-12-31 | 2021-09-30 | 2021-06-30 | 2021-03-31 | 2020-12-31 | 2020-09-30 | 2020-06-30 | 2020-03-31 | 2019-12-31 | 2019-09-30 | 2019-06-30 | 2019-03-31 | 2018-12-31 | 2018-09-30 | 2018-06-30 | 2018-03-31 | 2017-12-31 | 2017-09-30 | 2017-06-30 | 2017-03-31 | 2016-12-31 | 2016-09-30 | 2016-06-30 | 2016-03-31 | 2015-12-31 | 2015-09-30 | 2015-06-30 | 2015-03-31 | 2014-12-31 | 2014-09-30 | 2014-06-30 | 2014-03-31 | 2013-12-31 | 2013-09-30 | 2013-06-30 | 2013-03-31 | 2012-12-31 | 2012-09-30 | 2012-06-30 | 2012-03-31 | 2011-12-31 | 2011-09-30 | 2011-06-30 | 2010-12-31 | ||
|---|---|---|---|---|---|---|---|---|---|---|---|---|---|---|---|---|---|---|---|---|---|---|---|---|---|---|---|---|---|---|---|---|---|---|---|---|---|---|---|---|---|---|---|---|---|---|---|---|---|---|---|---|---|
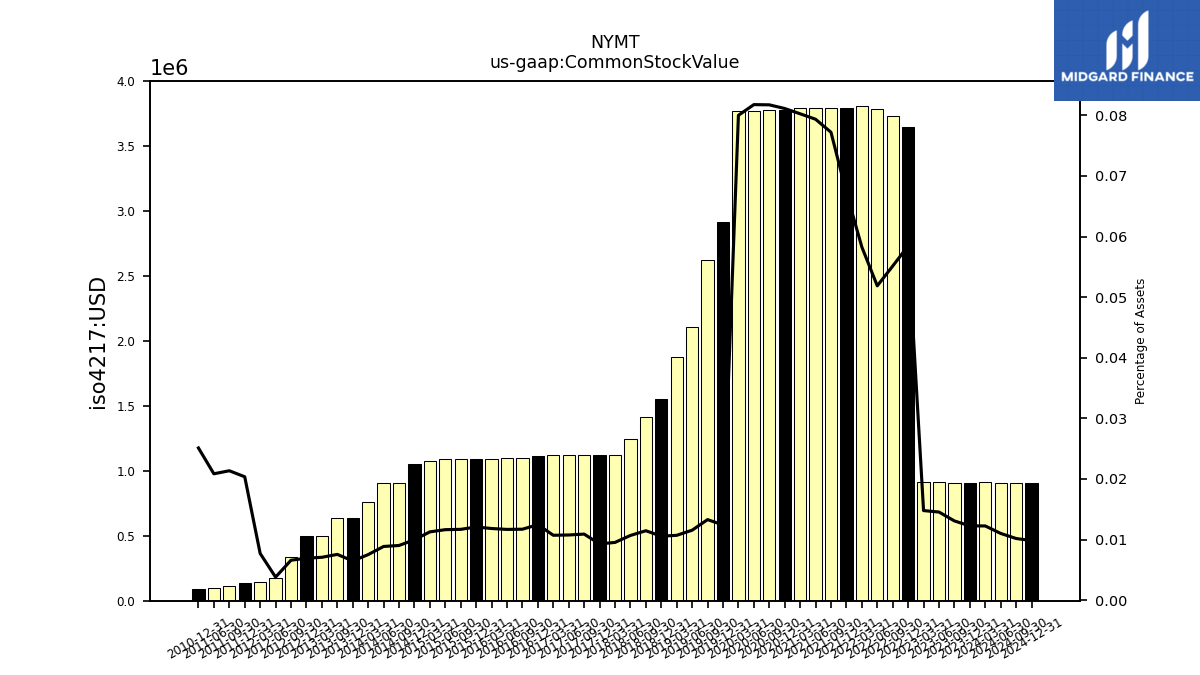
| Common Stock Value | 0.91 | 0.91 | 0.91 | 0.91 | 3.65 | 3.73 | 3.79 | 3.81 | 3.79 | 3.79 | 3.79 | 3.79 | 3.78 | 3.78 | 3.77 | 3.77 | 2.91 | 2.63 | 2.11 | 1.88 | 1.56 | 1.41 | 1.24 | 1.12 | 1.12 | 1.12 | 1.12 | 1.12 | 1.11 | 1.10 | 1.10 | 1.09 | 1.09 | 1.09 | 1.09 | 1.08 | 1.05 | 0.91 | 0.91 | 0.76 | 0.64 | 0.64 | NA | 0.50 | 0.50 | 0.34 | 0.17 | 0.14 | 0.14 | 0.11 | 0.10 | 0.09 | |
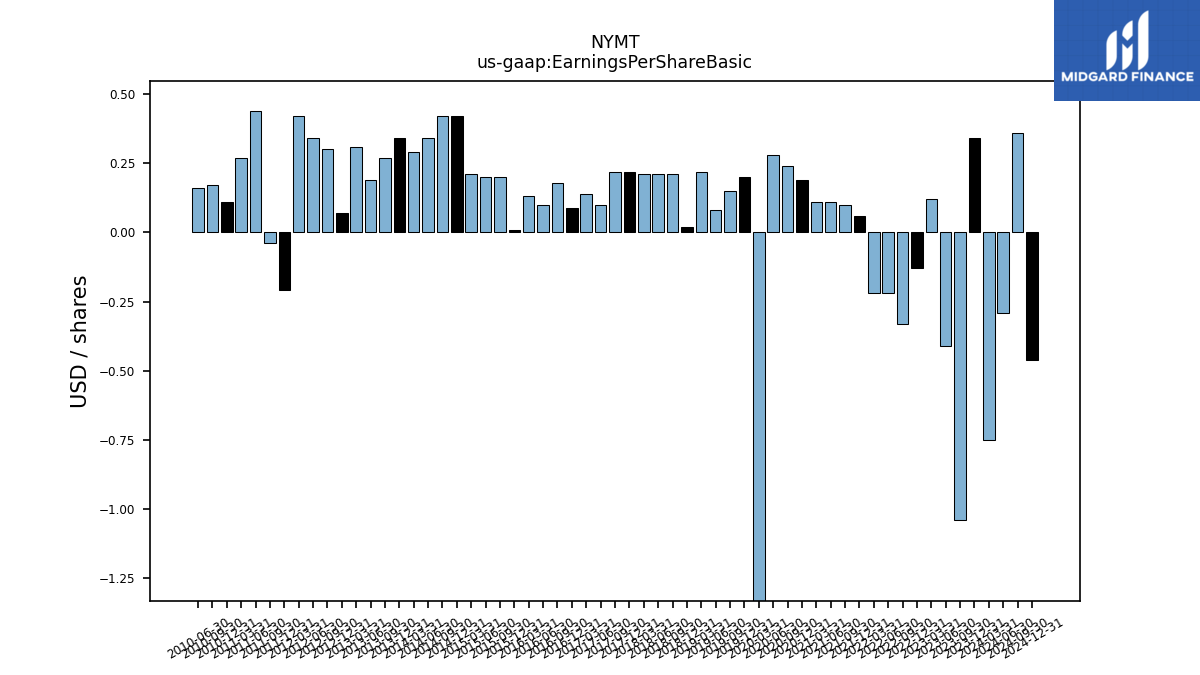
| Earnings Per Share Basic | 0.34 | -1.04 | -0.41 | 0.12 | -0.13 | -0.33 | -0.22 | -0.22 | 0.06 | 0.10 | 0.11 | 0.11 | 0.19 | 0.24 | 0.28 | -1.71 | 0.20 | 0.15 | 0.08 | 0.22 | 0.02 | 0.21 | 0.21 | 0.21 | 0.22 | 0.22 | 0.10 | 0.14 | 0.09 | 0.18 | 0.10 | 0.13 | 0.01 | 0.20 | 0.20 | 0.21 | 0.42 | 0.42 | 0.34 | 0.29 | 0.34 | 0.27 | 0.19 | 0.31 | 0.07 | 0.30 | 0.34 | 0.42 | -0.21 | -0.04 | 0.44 | 0.11 | |
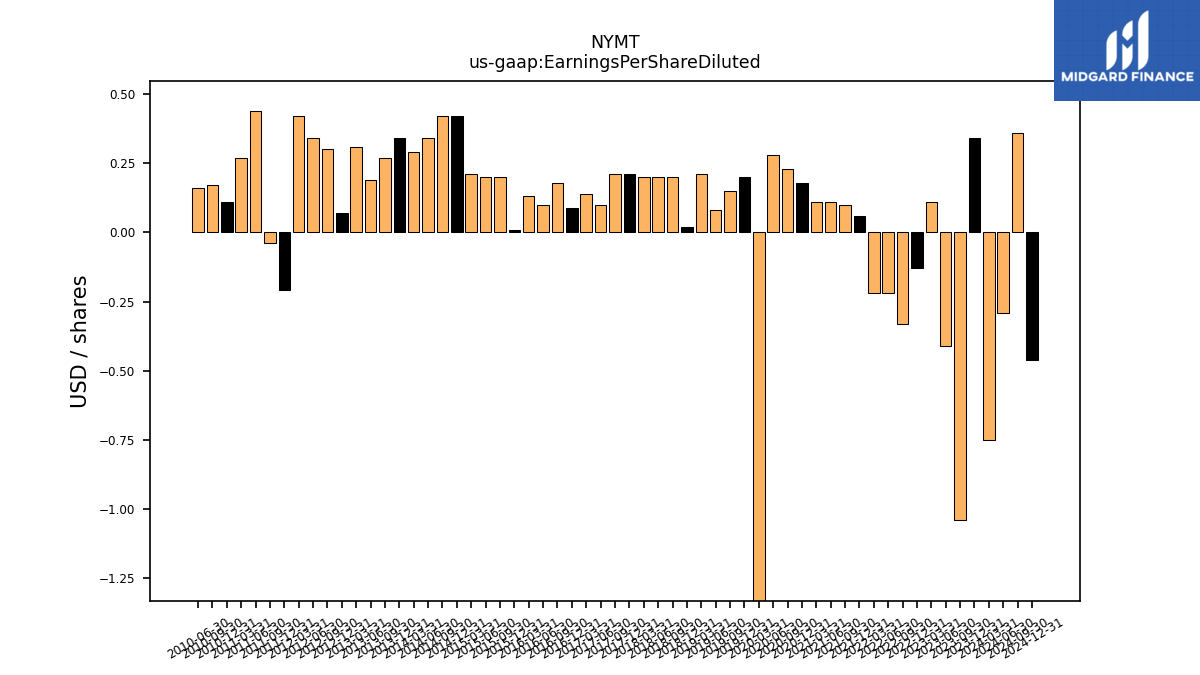
| Earnings Per Share Diluted | 0.34 | -1.04 | -0.41 | 0.11 | -0.13 | -0.33 | -0.22 | -0.22 | 0.06 | 0.10 | 0.11 | 0.11 | 0.18 | 0.23 | 0.28 | -1.71 | 0.20 | 0.15 | 0.08 | 0.21 | 0.02 | 0.20 | 0.20 | 0.20 | 0.21 | 0.21 | 0.10 | 0.14 | 0.09 | 0.18 | 0.10 | 0.13 | 0.01 | 0.20 | 0.20 | 0.21 | 0.42 | 0.42 | 0.34 | 0.29 | 0.34 | 0.27 | 0.19 | 0.31 | 0.07 | 0.30 | 0.34 | 0.42 | -0.21 | -0.04 | 0.44 | 0.11 |
| 2023-12-31 | 2023-09-30 | 2023-06-30 | 2023-03-31 | 2022-12-31 | 2022-09-30 | 2022-06-30 | 2022-03-31 | 2021-12-31 | 2021-09-30 | 2021-06-30 | 2021-03-31 | 2020-12-31 | 2020-09-30 | 2020-06-30 | 2020-03-31 | 2019-12-31 | 2019-09-30 | 2019-06-30 | 2019-03-31 | 2018-12-31 | 2018-09-30 | 2018-06-30 | 2018-03-31 | 2017-12-31 | 2017-09-30 | 2017-06-30 | 2017-03-31 | 2016-12-31 | 2016-09-30 | 2016-06-30 | 2016-03-31 | 2015-12-31 | 2015-09-30 | 2015-06-30 | 2015-03-31 | 2014-12-31 | 2014-09-30 | 2014-06-30 | 2014-03-31 | 2013-12-31 | 2013-09-30 | 2013-06-30 | 2013-03-31 | 2012-12-31 | 2012-09-30 | 2012-06-30 | 2012-03-31 | 2011-12-31 | 2011-09-30 | 2011-06-30 | 2010-12-31 | ||
|---|---|---|---|---|---|---|---|---|---|---|---|---|---|---|---|---|---|---|---|---|---|---|---|---|---|---|---|---|---|---|---|---|---|---|---|---|---|---|---|---|---|---|---|---|---|---|---|---|---|---|---|---|---|
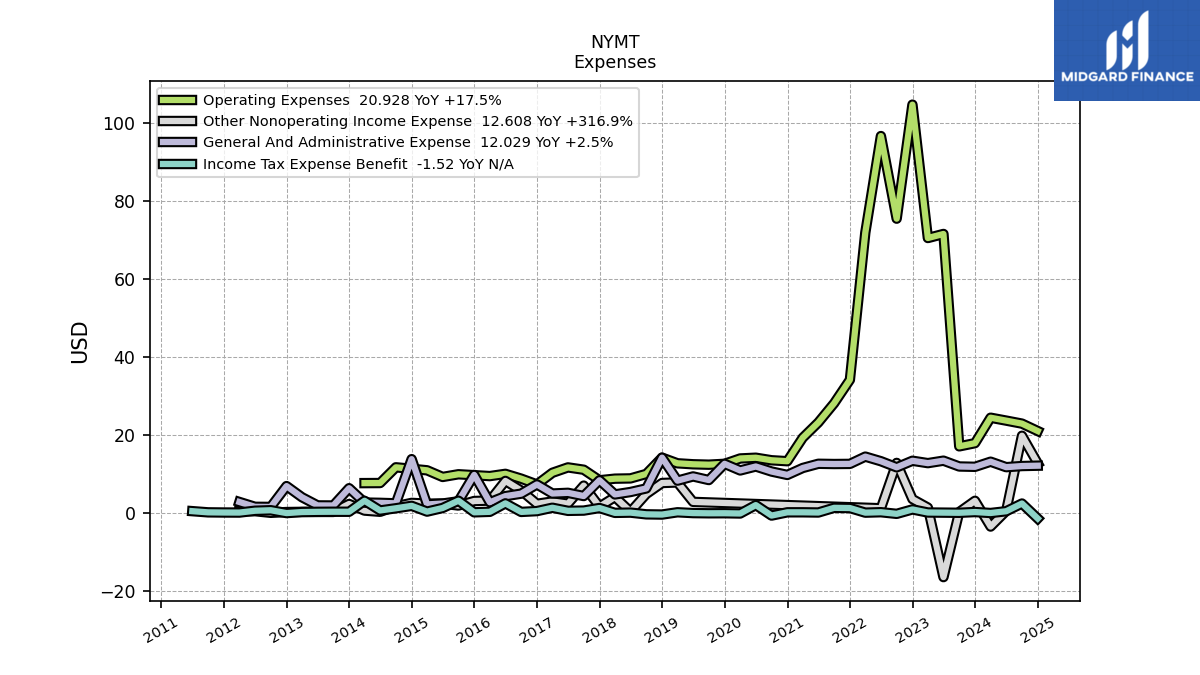
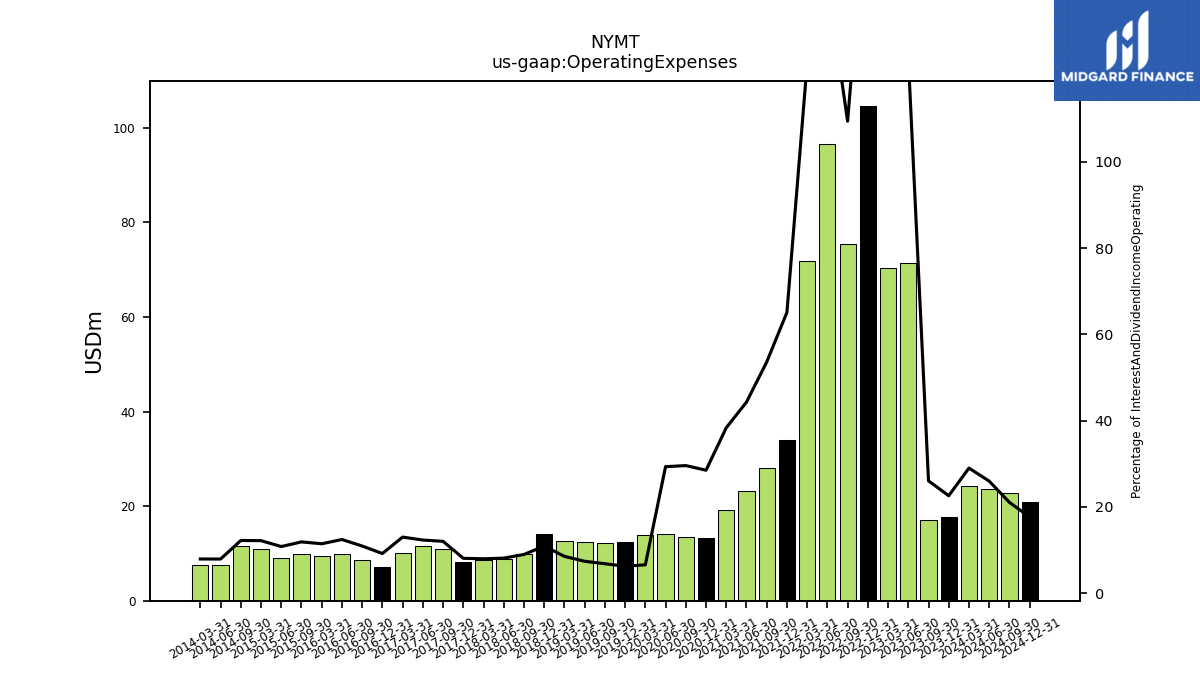
| Operating Expenses | 17.81 | 16.99 | 71.50 | 70.45 | 104.69 | 75.42 | 96.62 | 71.84 | 34.06 | 28.05 | 23.12 | 19.20 | 13.18 | 13.42 | 14.07 | 13.88 | 12.51 | 12.29 | 12.39 | 12.64 | 14.09 | 9.91 | 8.77 | 8.70 | 8.29 | 11.00 | 11.59 | 10.20 | 7.22 | 8.71 | 9.94 | 9.36 | NA | 9.83 | 9.14 | 10.85 | NA | 11.61 | 7.58 | 7.56 | NA | NA | NA | NA | NA | NA | NA | NA | NA | NA | NA | NA | |
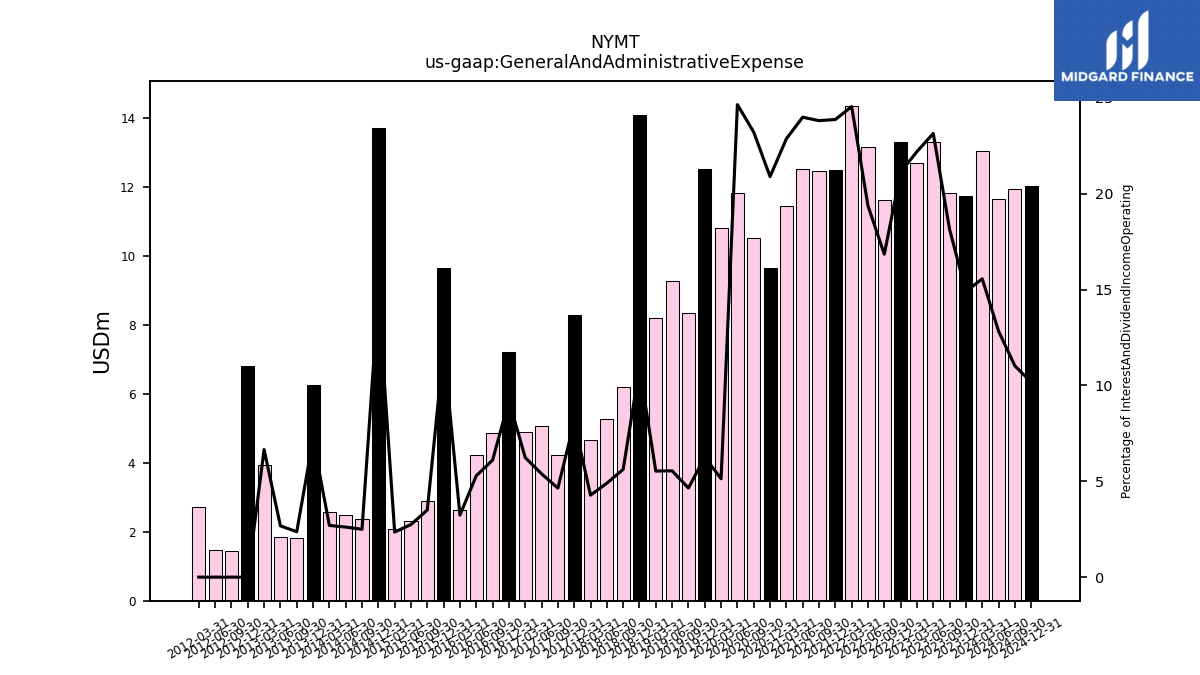
| General And Administrative Expense | 11.74 | 11.83 | 13.32 | 12.68 | 13.30 | 11.61 | 13.18 | 14.36 | 12.49 | 12.46 | 12.52 | 11.44 | 9.66 | 10.53 | 11.82 | 10.81 | 12.51 | 8.35 | 9.27 | 8.19 | 14.09 | 6.20 | 5.28 | 4.66 | 8.29 | 4.24 | 5.07 | 4.89 | 7.22 | 4.85 | 4.22 | 2.64 | 9.66 | 2.89 | 2.32 | 2.09 | 13.71 | 2.37 | 2.49 | 2.57 | 6.25 | 1.82 | 1.84 | 3.94 | 6.80 | 1.45 | 1.48 | 2.72 | NA | NA | NA | NA | |
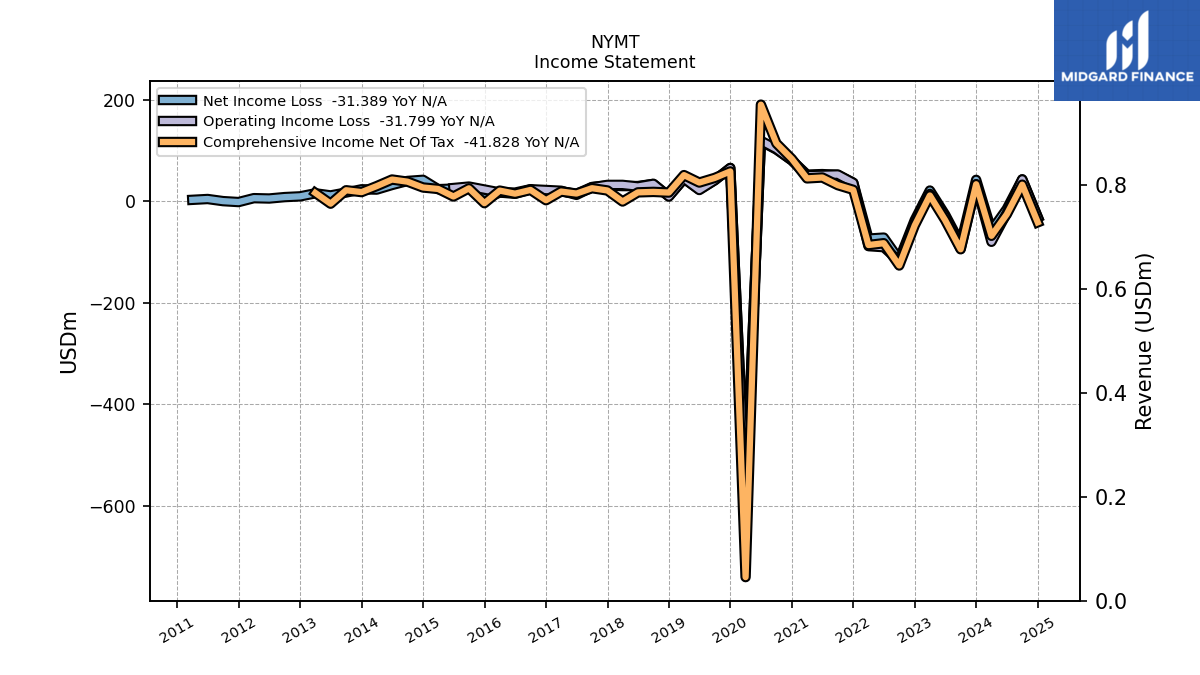
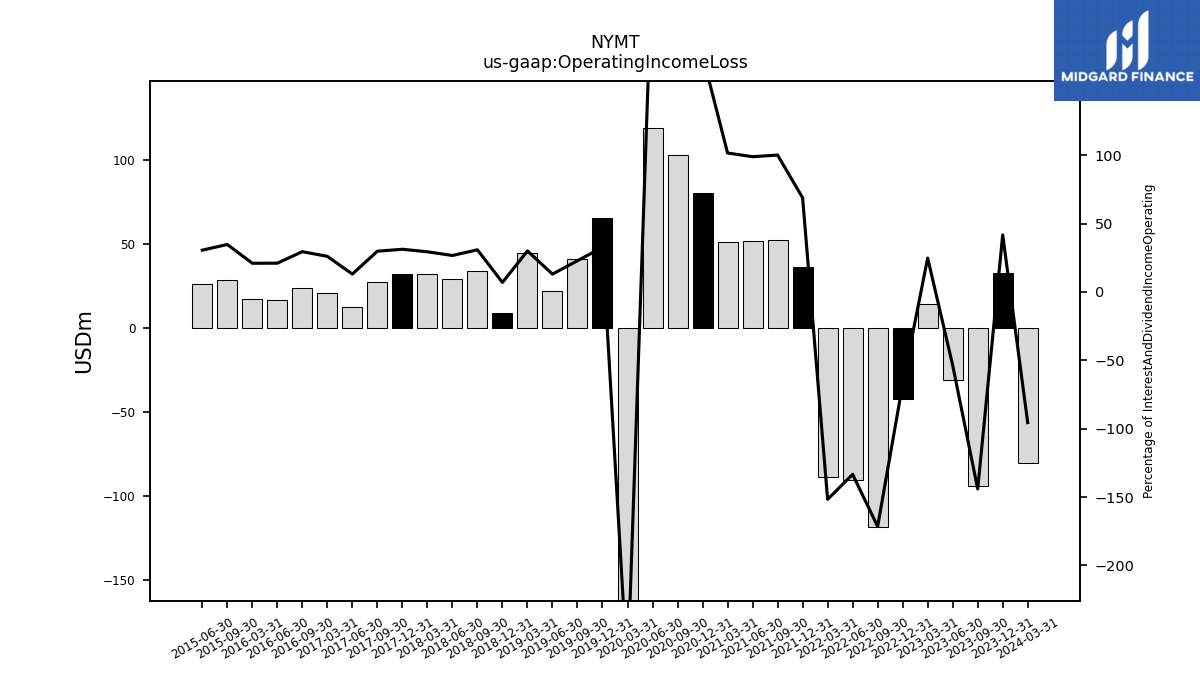
| Operating Income Loss | 32.87 | -93.93 | -30.84 | 14.18 | -42.41 | -118.22 | -90.73 | -88.74 | 36.04 | 52.40 | 51.63 | 50.87 | 80.05 | 102.63 | 118.86 | -588.81 | 65.11 | 41.08 | 21.86 | 44.42 | 9.00 | 33.99 | 28.74 | 32.01 | 31.97 | 27.24 | 12.29 | 20.42 | NA | 23.45 | 16.80 | 17.14 | NA | 28.68 | 25.81 | NA | NA | NA | NA | NA | NA | NA | NA | NA | NA | NA | NA | NA | NA | NA | NA | NA | |
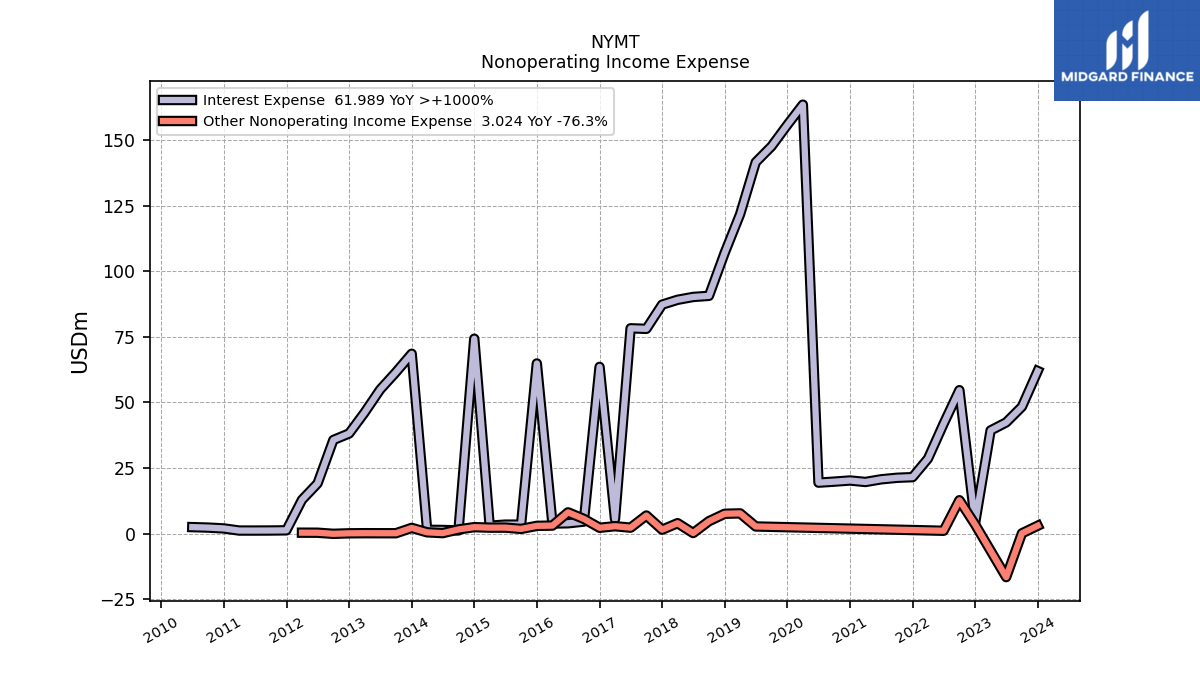
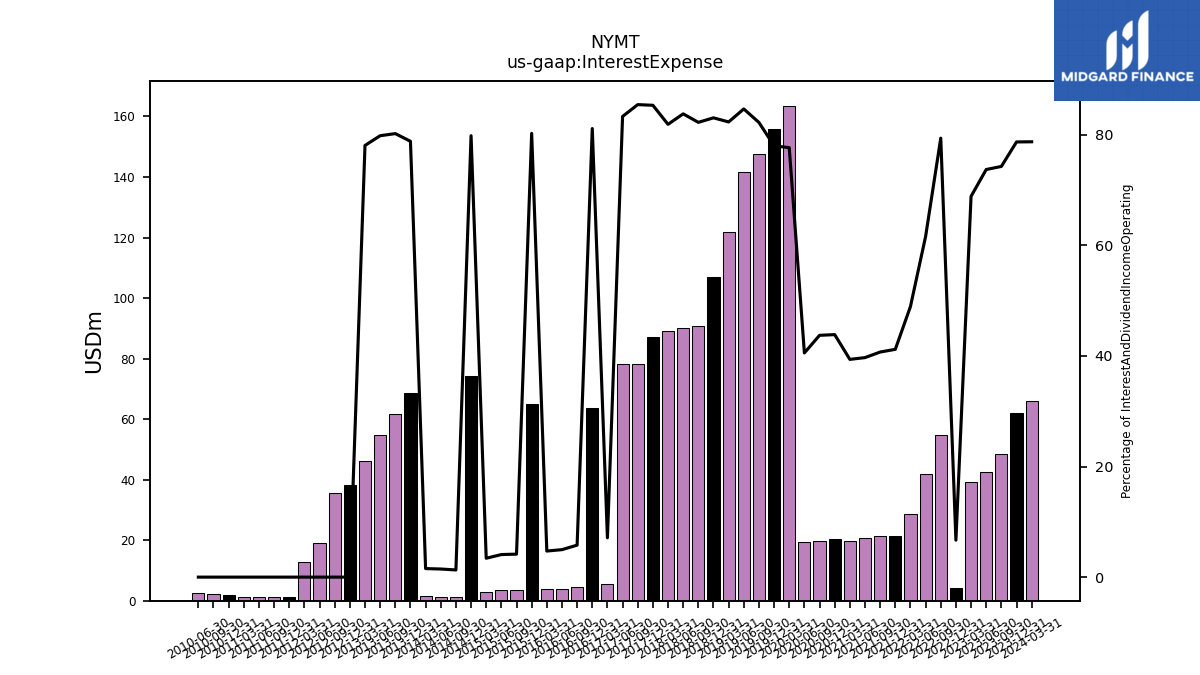
| Interest Expense | 61.99 | 48.41 | 42.40 | 39.34 | 4.21 | 54.70 | 41.89 | 28.62 | 21.55 | 21.29 | 20.71 | 19.70 | 20.26 | 19.83 | 19.44 | 163.53 | 155.77 | 147.63 | 141.57 | 121.78 | 107.06 | 90.65 | 90.22 | 89.14 | 87.30 | 78.06 | 78.27 | 5.57 | 63.58 | 4.60 | 3.96 | 3.85 | 64.88 | 3.43 | 3.44 | 3.04 | 74.31 | 1.23 | 1.40 | 1.47 | 68.58 | 61.53 | 54.92 | 46.15 | 38.19 | 35.71 | 19.15 | 12.88 | 1.27 | 1.20 | 1.18 | 1.99 | |
| Interest Income Expense Net | 16.80 | 16.79 | 15.14 | 17.80 | 58.74 | 14.22 | 26.13 | 29.88 | 30.77 | 31.03 | 31.48 | 30.34 | 25.96 | 25.53 | 28.53 | 47.08 | 44.00 | 31.97 | 25.69 | 26.20 | 21.87 | 19.60 | 17.50 | 19.75 | 15.04 | 13.32 | 15.71 | 13.92 | 14.81 | 15.52 | 16.66 | 17.64 | 15.99 | 18.29 | 20.30 | 21.60 | 18.81 | 19.32 | 19.88 | 19.82 | 18.46 | 15.34 | 13.97 | 13.07 | 11.42 | 8.13 | 5.84 | 6.21 | 5.42 | 6.23 | 5.30 | 1.97 | |
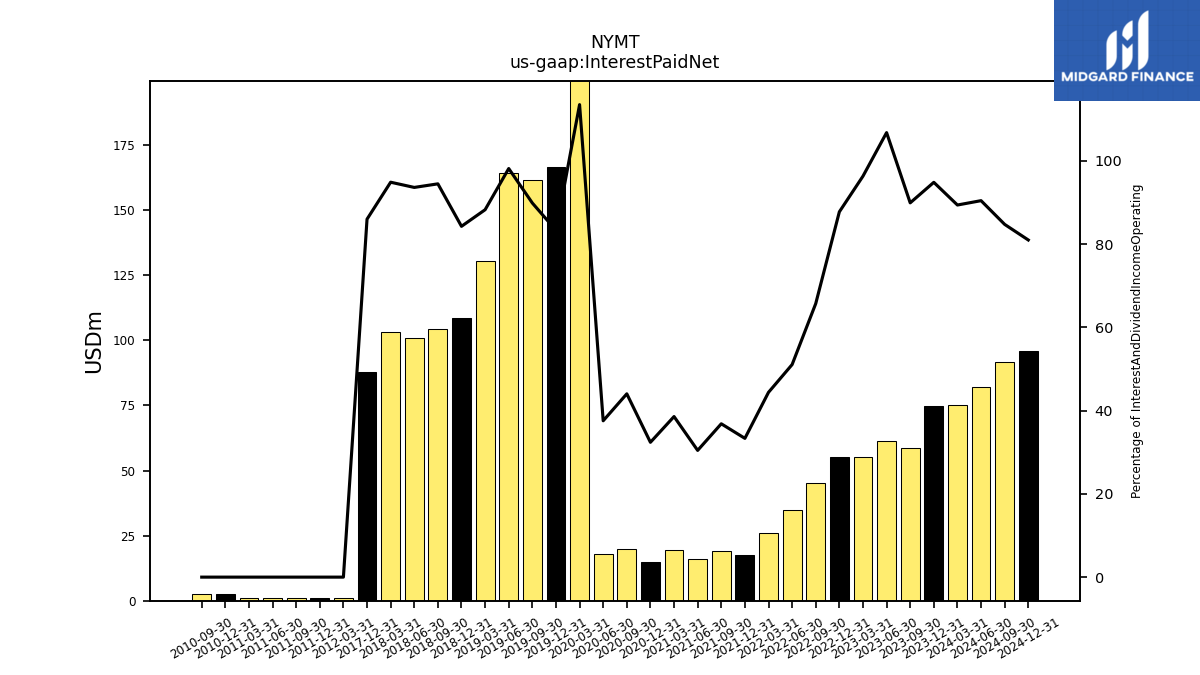
| Interest Paid Net | 74.73 | 58.63 | 61.45 | 55.04 | 55.25 | 45.29 | 34.74 | 25.97 | 17.44 | 19.28 | 15.89 | 19.30 | 14.97 | 19.98 | 18.02 | 239.09 | 166.48 | 161.43 | 164.19 | 130.63 | 108.67 | 104.17 | 100.86 | 103.32 | 88.02 | NA | NA | NA | NA | NA | NA | NA | NA | NA | NA | NA | NA | NA | NA | NA | NA | NA | NA | NA | NA | NA | NA | 1.16 | 1.20 | 1.17 | 1.19 | 2.46 | |
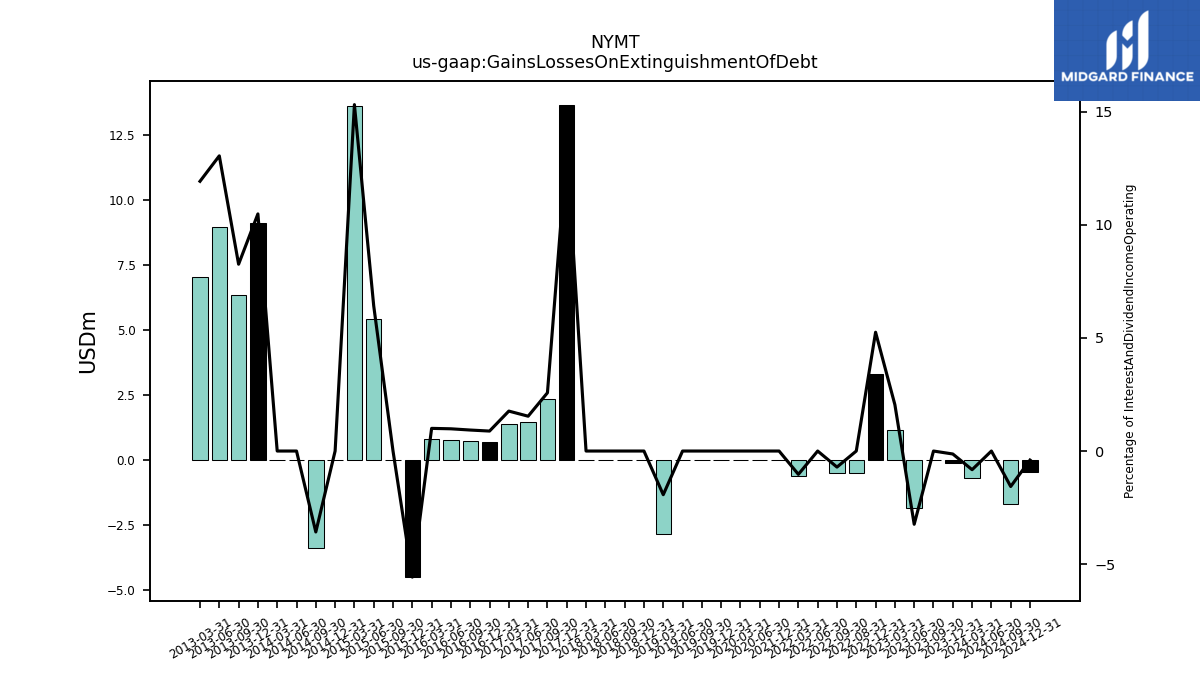
| Gains Losses On Extinguishment Of Debt | -0.10 | 0.00 | -1.86 | 1.17 | 3.31 | -0.49 | 0.00 | -0.60 | 0.00 | NA | NA | NA | NA | NA | 0.00 | 0.00 | 0.00 | 0.00 | 0.00 | -2.86 | 0.00 | 0.00 | 0.00 | 0.00 | 13.69 | 2.35 | 1.45 | 1.38 | 0.69 | 0.74 | 0.78 | 0.82 | -4.51 | 0.00 | 5.42 | 13.63 | 0.00 | -3.40 | 0.00 | 0.00 | 9.12 | 6.34 | 8.98 | 7.05 | NA | NA | NA | NA | NA | NA | NA | NA | |
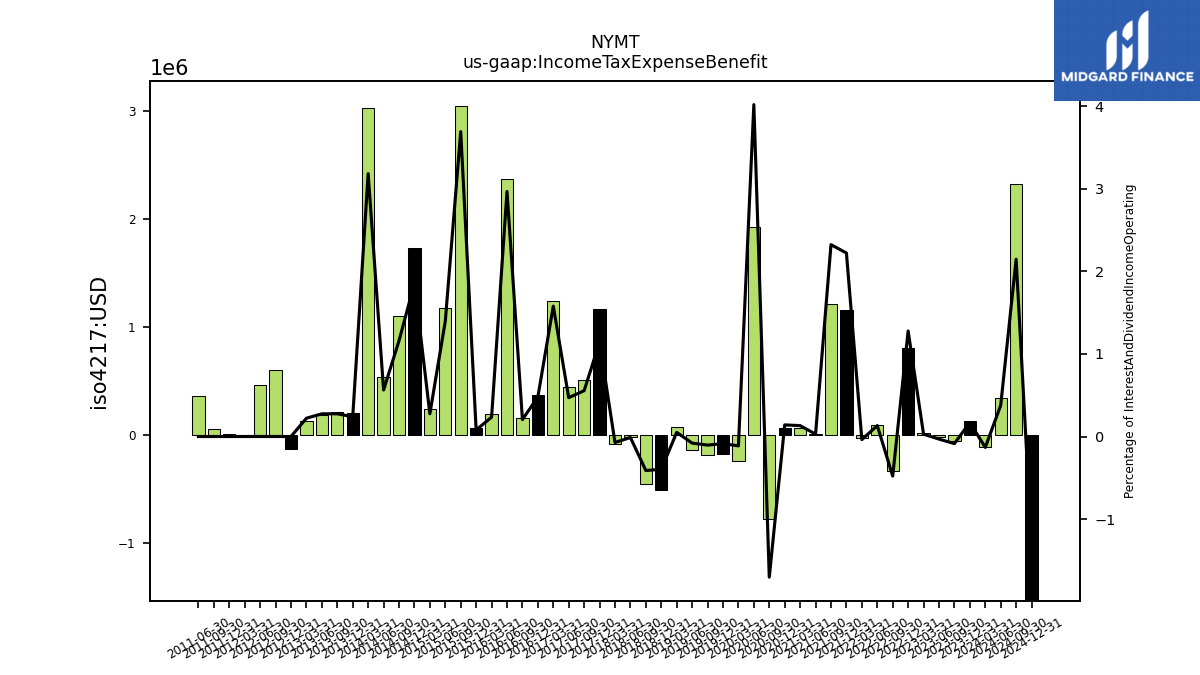
| Income Tax Expense Benefit | 0.13 | -0.06 | -0.02 | 0.02 | 0.80 | -0.33 | 0.09 | -0.02 | 1.16 | 1.22 | 0.01 | 0.07 | 0.07 | -0.77 | 1.93 | -0.24 | -0.17 | -0.19 | -0.13 | 0.07 | -0.51 | -0.45 | -0.01 | -0.08 | 1.17 | 0.51 | 0.44 | 1.24 | 0.38 | 0.16 | 2.37 | 0.19 | 0.06 | 3.05 | 1.18 | 0.24 | 1.73 | 1.10 | 0.54 | 3.03 | 0.21 | 0.21 | 0.19 | 0.13 | -0.13 | 0.60 | 0.47 | 0.00 | 0.01 | 0.06 | 0.36 | NA | |
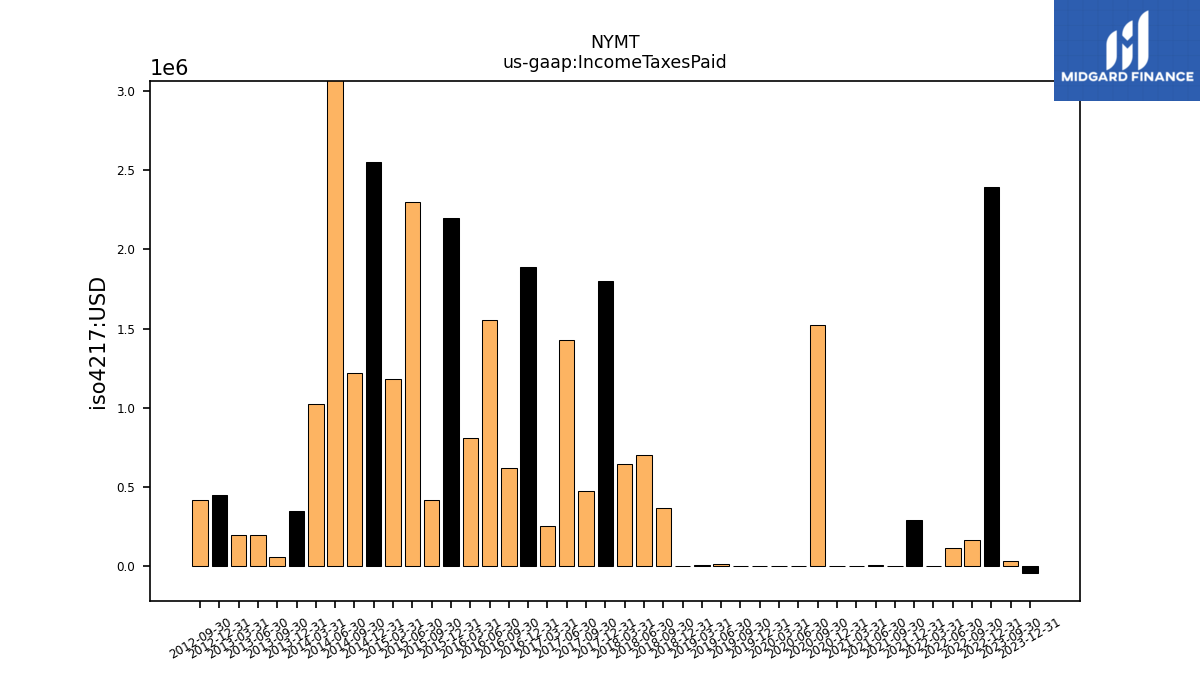
| Income Taxes Paid | -0.04 | 0.03 | NA | NA | 2.40 | 0.17 | 0.11 | 0.00 | 0.29 | 0.00 | 0.00 | 0.00 | 0.00 | 1.52 | 0.00 | 0.00 | 0.00 | 0.00 | 0.01 | 0.01 | 0.00 | 0.37 | 0.70 | 0.64 | 1.80 | 0.47 | 1.43 | 0.26 | 1.89 | 0.62 | 1.55 | 0.81 | 2.20 | 0.42 | 2.30 | 1.18 | 2.55 | 1.22 | 3.49 | 1.03 | 0.35 | 0.05 | 0.19 | 0.20 | 0.45 | 0.42 | NA | NA | NA | NA | NA | NA | |
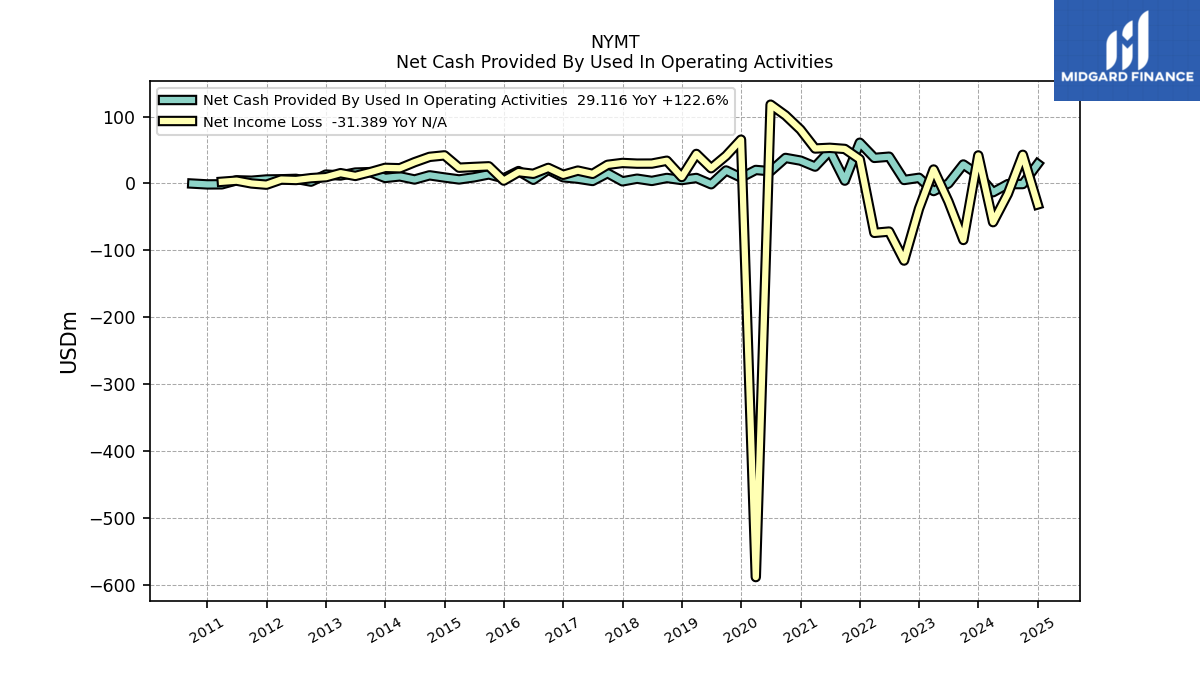
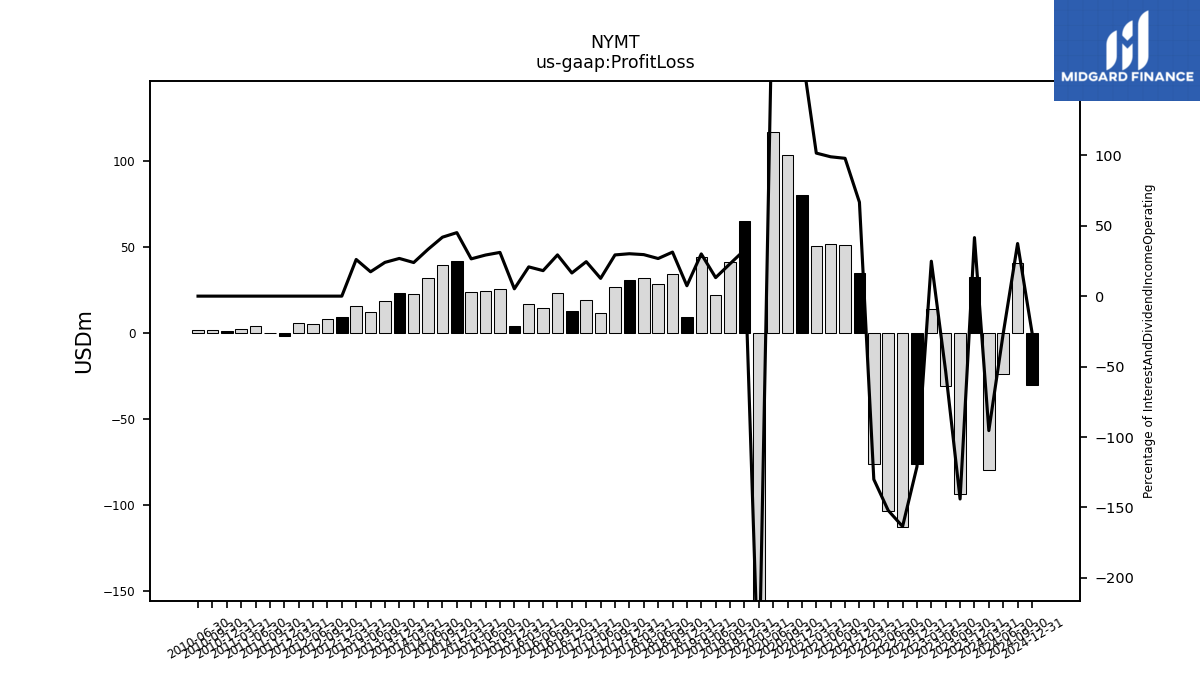
| Profit Loss | 32.73 | -93.87 | -30.82 | 14.16 | -76.21 | -112.69 | -103.45 | -76.09 | 34.88 | 51.18 | 51.62 | 50.80 | 79.98 | 103.41 | 116.94 | -588.57 | 65.29 | 41.27 | 21.99 | 44.35 | 9.51 | 34.45 | 28.75 | 32.09 | 30.80 | 26.73 | 11.85 | 19.18 | 12.89 | 23.28 | 14.43 | 16.95 | 4.21 | 25.63 | 24.63 | 23.54 | 41.98 | 39.73 | 31.78 | 22.71 | 23.29 | 18.39 | 11.90 | 15.38 | 9.39 | 7.91 | 4.99 | 5.89 | -1.85 | 0.02 | 4.19 | 1.02 | |
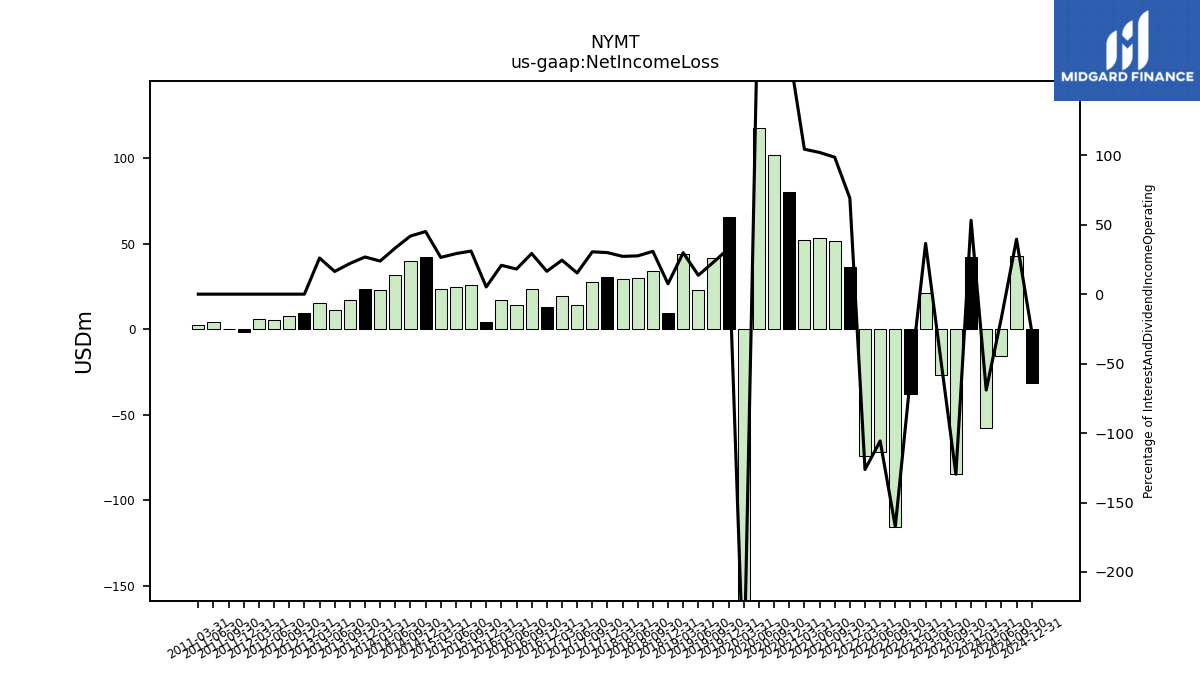
| Net Income Loss | 41.91 | -84.51 | -26.93 | 20.86 | -37.58 | -115.28 | -71.90 | -73.85 | 36.18 | 51.58 | 53.24 | 52.21 | 80.42 | 101.64 | 117.81 | -588.38 | 65.48 | 41.38 | 22.73 | 44.14 | 9.60 | 33.97 | 29.69 | 29.62 | 30.62 | 27.84 | 14.34 | 19.18 | 12.90 | 23.27 | 14.44 | 16.95 | 4.21 | 25.63 | 24.63 | 23.54 | 41.98 | 39.73 | 31.78 | 22.71 | 23.29 | 16.93 | 11.24 | 15.38 | 9.39 | 7.91 | 5.14 | 5.84 | -1.85 | -0.01 | 4.17 | NA | |
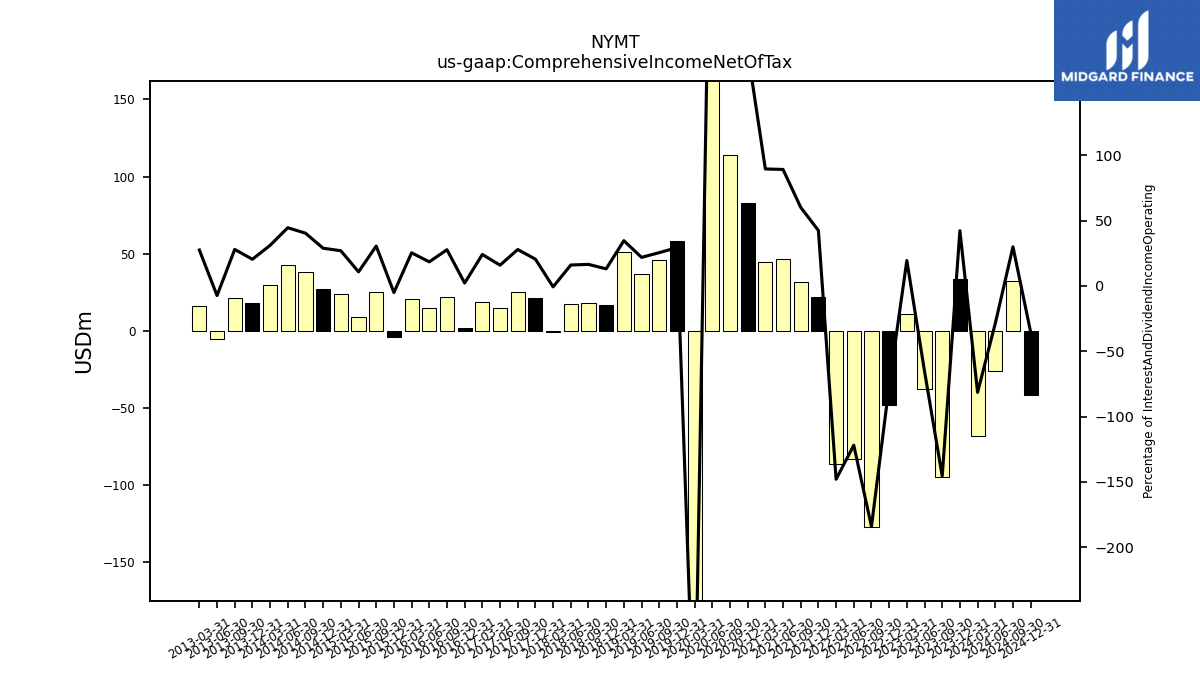
| Comprehensive Income Net Of Tax | 33.29 | -94.88 | -37.59 | 11.11 | -47.99 | -126.88 | -82.92 | -86.53 | 22.20 | 31.45 | 46.52 | 44.79 | 83.06 | 113.83 | 190.12 | -740.84 | 58.52 | 45.75 | 36.57 | 51.26 | 16.86 | 18.17 | 17.24 | -0.79 | 20.98 | 25.47 | 14.91 | 18.88 | 1.73 | 22.03 | 14.70 | 20.69 | -4.09 | 25.19 | 9.09 | 23.97 | 26.86 | 38.33 | 42.55 | 29.58 | 17.76 | 21.42 | -5.07 | 16.26 | NA | NA | NA | NA | NA | NA | NA | NA | |
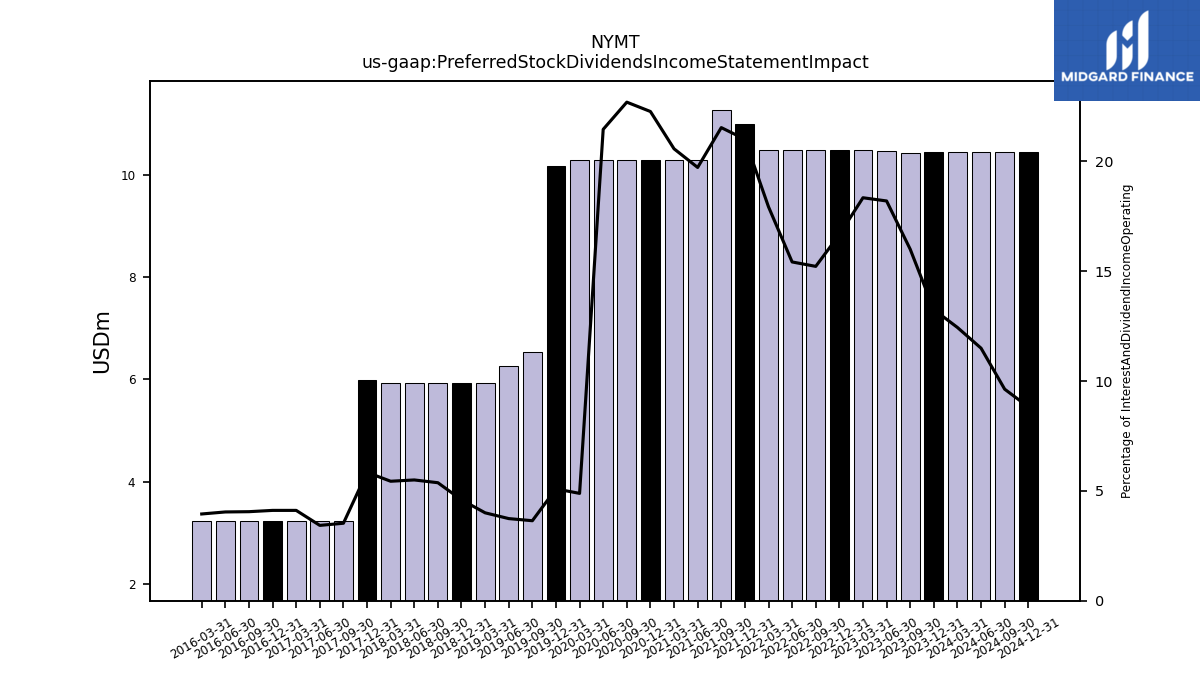
| Preferred Stock Dividends Income Statement Impact | 10.44 | 10.44 | 10.47 | 10.48 | 10.49 | 10.49 | 10.49 | 10.49 | 10.99 | 11.27 | 10.30 | 10.30 | 10.30 | 10.30 | 10.30 | 10.30 | 10.18 | 6.54 | 6.26 | 5.92 | 5.92 | 5.92 | 5.92 | 5.92 | 5.99 | 3.23 | 3.23 | 3.23 | 3.23 | 3.23 | 3.23 | 3.23 | NA | NA | NA | NA | NA | NA | NA | NA | NA | NA | NA | NA | NA | NA | NA | NA | NA | NA | NA | NA | |
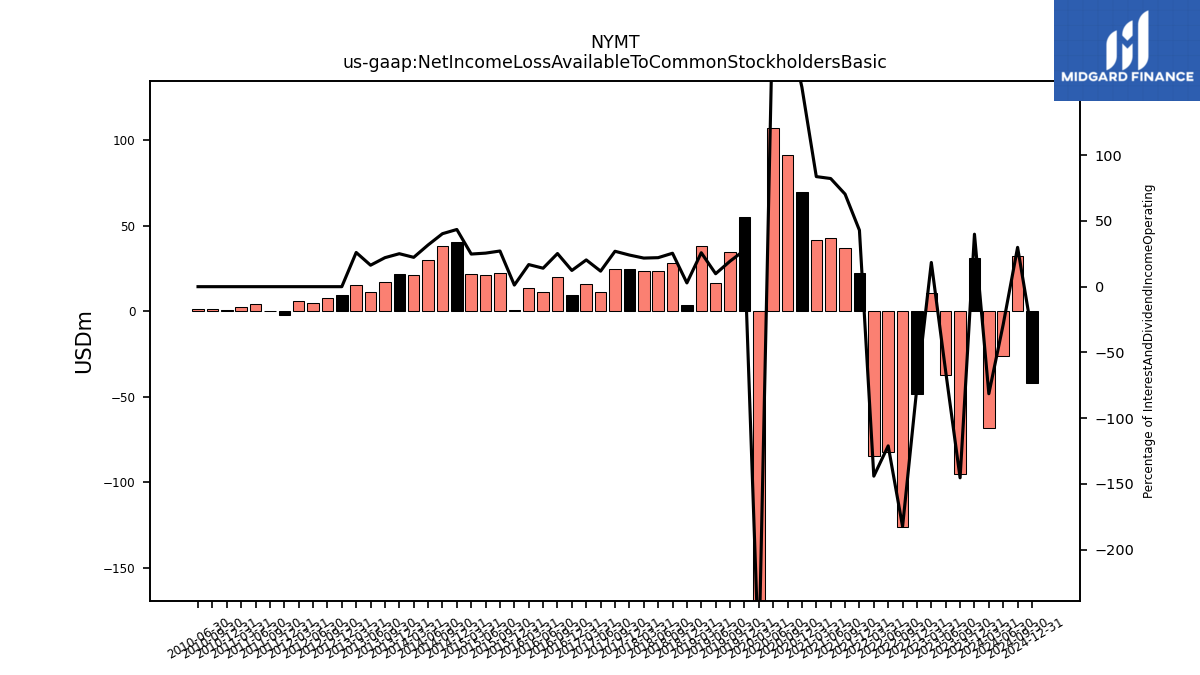
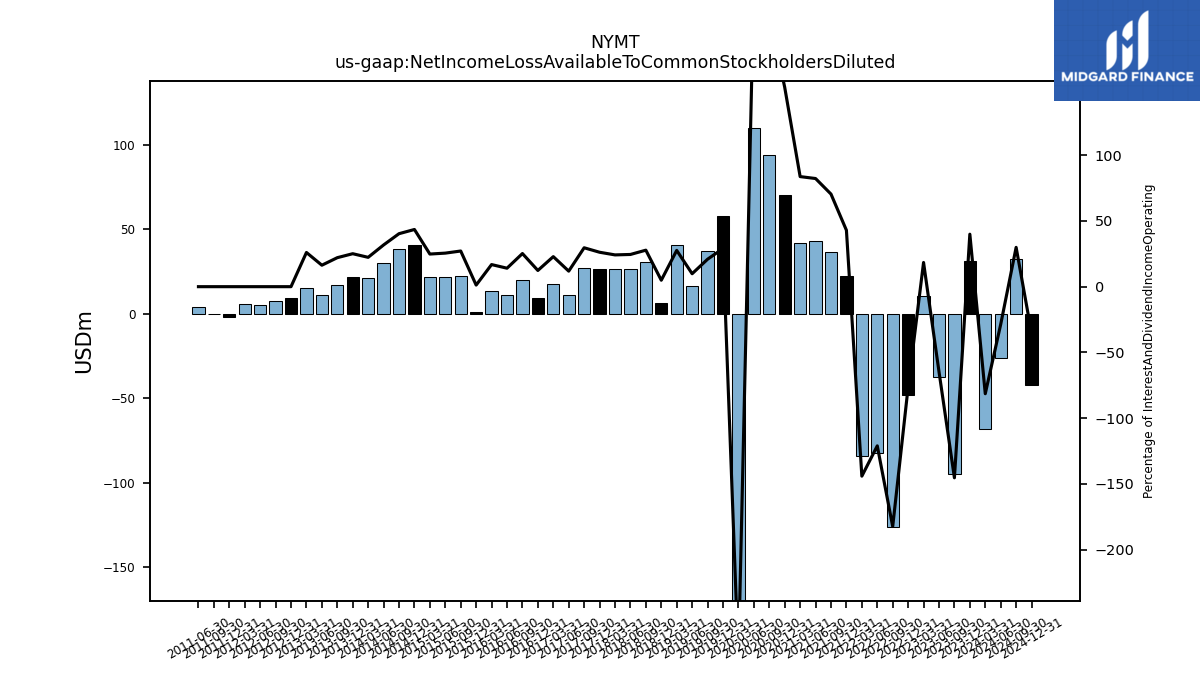
| Net Income Loss Available To Common Stockholders Basic | 31.46 | -94.82 | -37.20 | 10.52 | -48.08 | -125.77 | -82.39 | -84.34 | 22.46 | 36.86 | 42.94 | 41.91 | 70.12 | 91.34 | 107.52 | -598.68 | 55.31 | 34.84 | 16.48 | 38.21 | 3.68 | 28.05 | 23.77 | 23.69 | 24.63 | 24.62 | 11.11 | 15.96 | 9.67 | 20.04 | 11.21 | 13.73 | 0.98 | 22.41 | 21.54 | 22.09 | 40.52 | 38.27 | 30.33 | 21.26 | 21.83 | 16.93 | 11.24 | 15.38 | 9.39 | 7.91 | 5.14 | 5.84 | -1.89 | -0.01 | 4.17 | 1.02 | |
| Net Income Loss Available To Common Stockholders Diluted | 31.46 | -94.82 | -37.20 | 10.52 | -48.08 | -125.77 | -82.39 | -84.34 | 22.46 | 36.86 | 42.94 | 41.91 | 70.12 | 93.87 | 110.18 | -598.68 | 57.99 | 37.51 | 16.48 | 40.84 | 6.31 | 30.62 | 26.40 | 26.33 | 26.81 | 27.05 | 11.11 | 17.92 | 9.67 | 20.04 | 11.21 | 13.73 | 0.98 | 22.41 | 21.54 | 22.09 | 40.52 | 38.27 | 30.33 | 21.26 | 21.83 | 16.93 | 11.24 | 15.38 | 9.39 | 7.91 | 5.14 | 5.84 | -1.89 | -0.01 | 4.17 | NA |
| 2023-12-31 | 2023-09-30 | 2023-06-30 | 2023-03-31 | 2022-12-31 | 2022-09-30 | 2022-06-30 | 2022-03-31 | 2021-12-31 | 2021-09-30 | 2021-06-30 | 2021-03-31 | 2020-12-31 | 2020-09-30 | 2020-06-30 | 2020-03-31 | 2019-12-31 | 2019-09-30 | 2019-06-30 | 2019-03-31 | 2018-12-31 | 2018-09-30 | 2018-06-30 | 2018-03-31 | 2017-12-31 | 2017-09-30 | 2017-06-30 | 2017-03-31 | 2016-12-31 | 2016-09-30 | 2016-06-30 | 2016-03-31 | 2015-12-31 | 2015-09-30 | 2015-06-30 | 2015-03-31 | 2014-12-31 | 2014-09-30 | 2014-06-30 | 2014-03-31 | 2013-12-31 | 2013-09-30 | 2013-06-30 | 2013-03-31 | 2012-12-31 | 2012-09-30 | 2012-06-30 | 2012-03-31 | 2011-12-31 | 2011-09-30 | 2011-06-30 | 2010-12-31 | ||
|---|---|---|---|---|---|---|---|---|---|---|---|---|---|---|---|---|---|---|---|---|---|---|---|---|---|---|---|---|---|---|---|---|---|---|---|---|---|---|---|---|---|---|---|---|---|---|---|---|---|---|---|---|---|
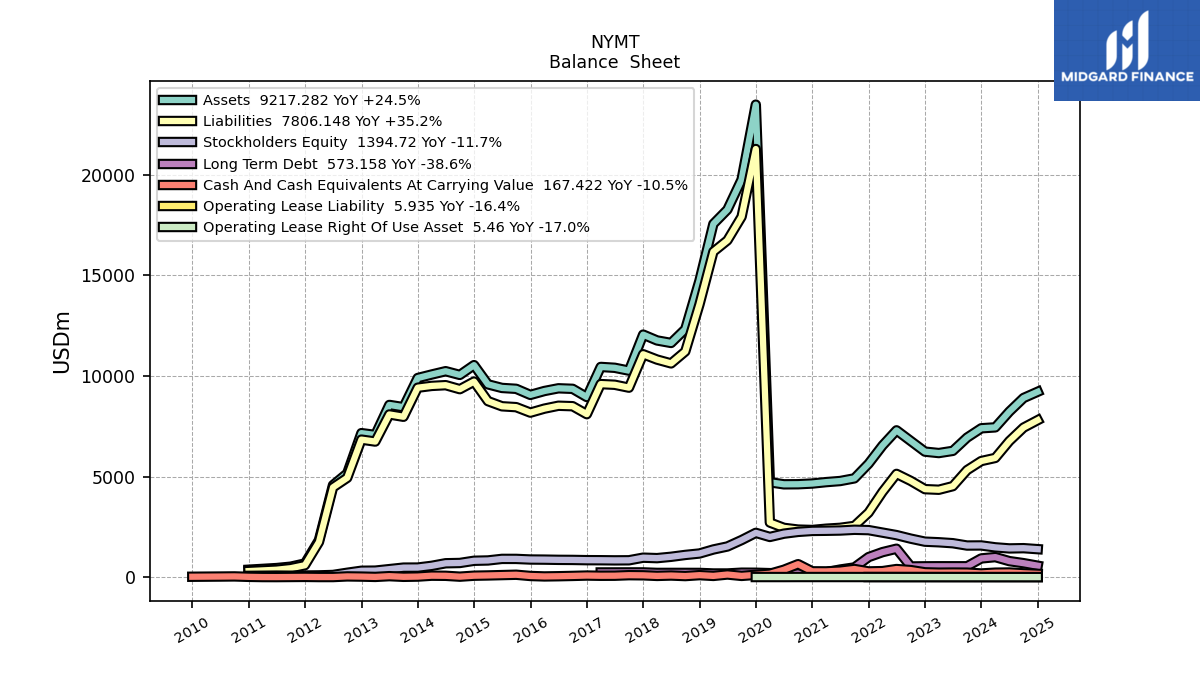
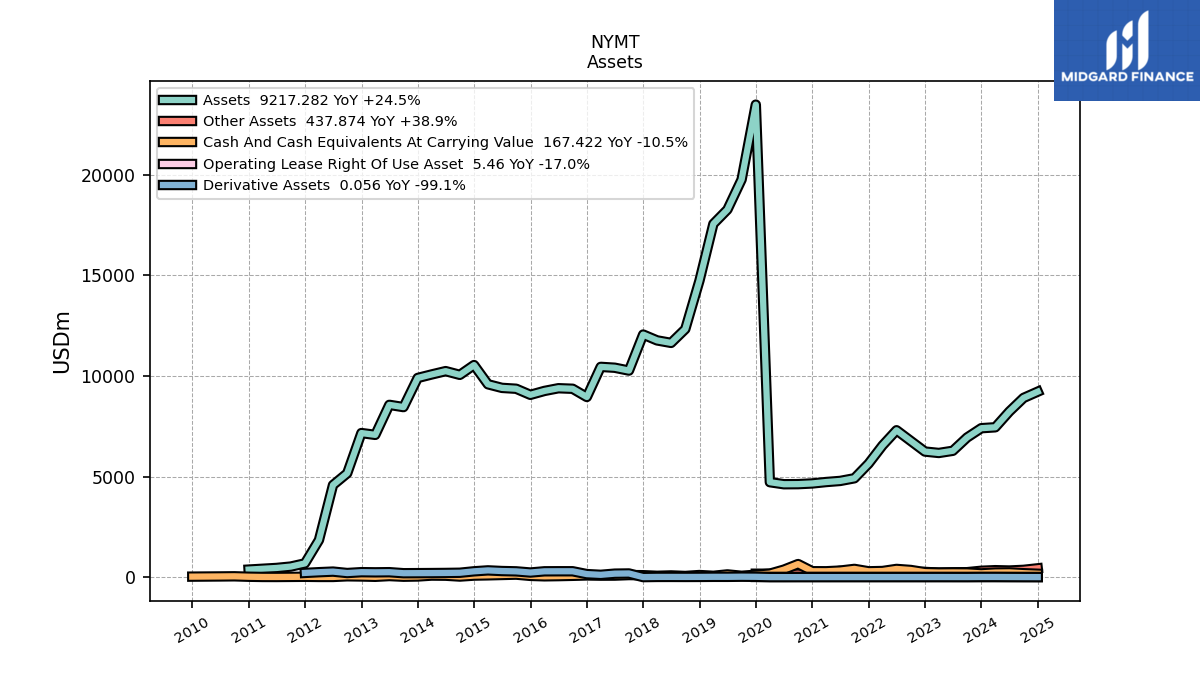
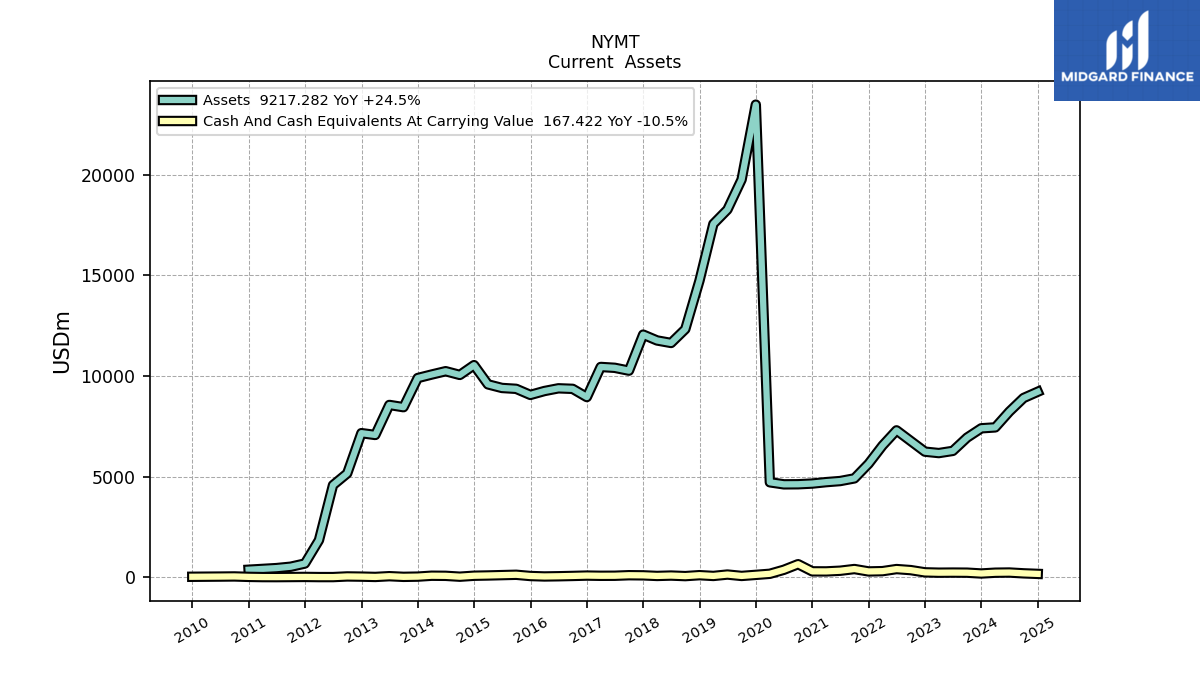
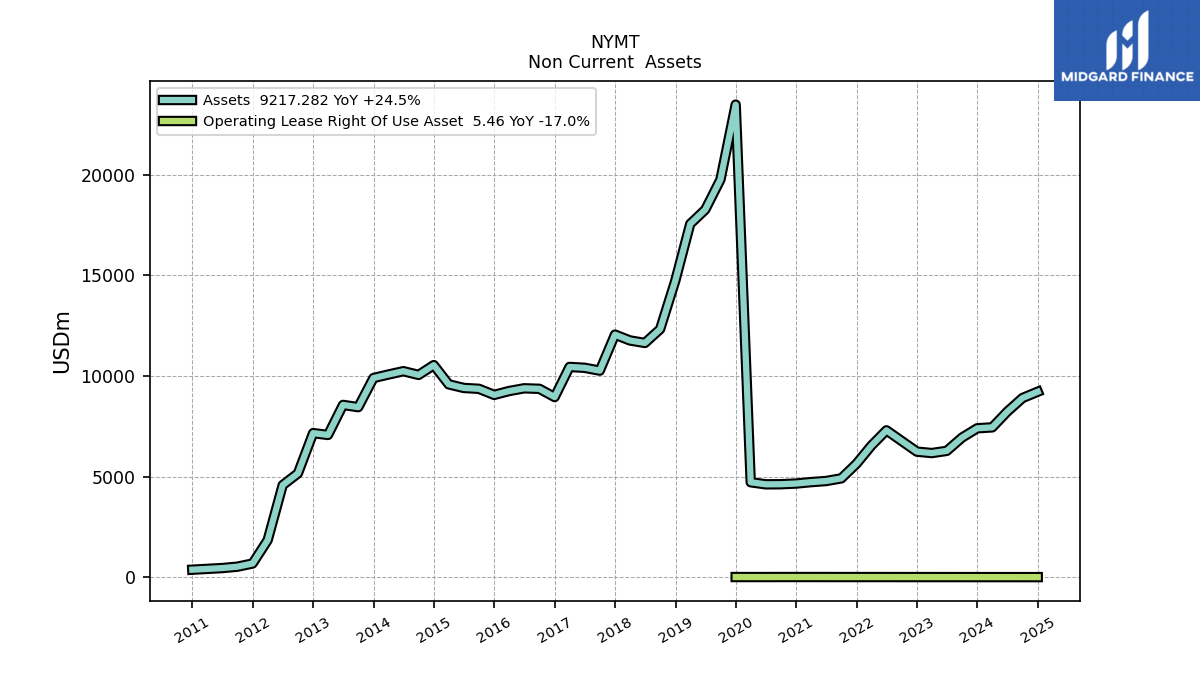
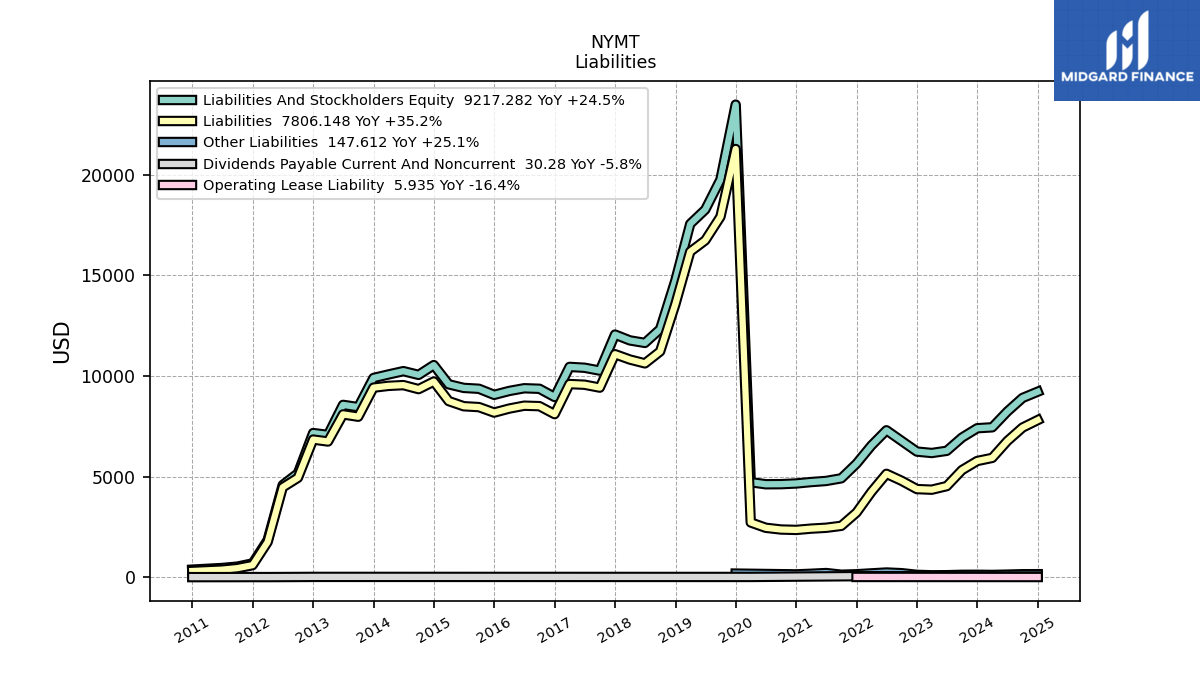
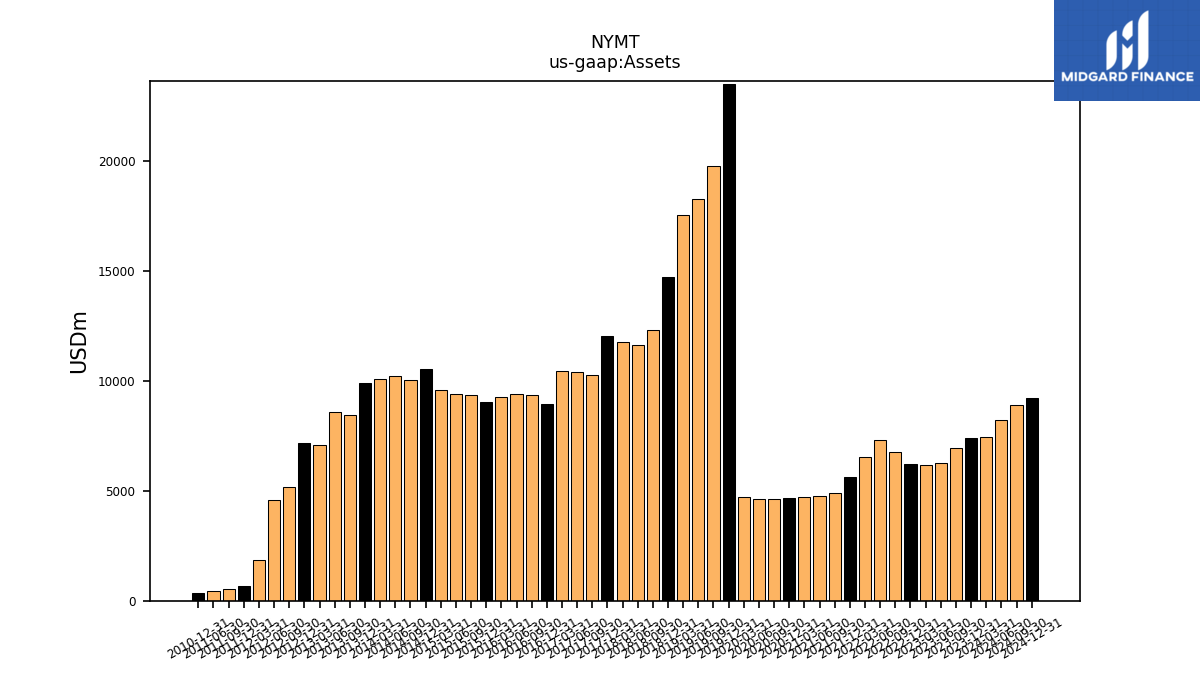
| Assets | 7401.33 | 6937.87 | 6279.05 | 6170.25 | 6240.74 | 6769.47 | 7299.54 | 6541.75 | 5641.70 | 4912.81 | 4780.93 | 4726.17 | 4655.59 | 4621.11 | 4616.73 | 4718.30 | 23483.37 | 19759.25 | 18265.48 | 17555.14 | 14737.64 | 12326.91 | 11640.87 | 11765.88 | 12056.28 | 10264.92 | 10406.57 | 10449.59 | 8951.63 | 9361.33 | 9388.14 | 9252.94 | 9059.56 | 9361.81 | 9405.44 | 9584.79 | 10540.00 | 10052.25 | 10238.06 | 10071.96 | 9898.67 | 8450.05 | 8562.53 | 7069.69 | 7160.40 | 5159.55 | 4577.91 | 1841.45 | 682.71 | 524.54 | 455.58 | 374.29 | |
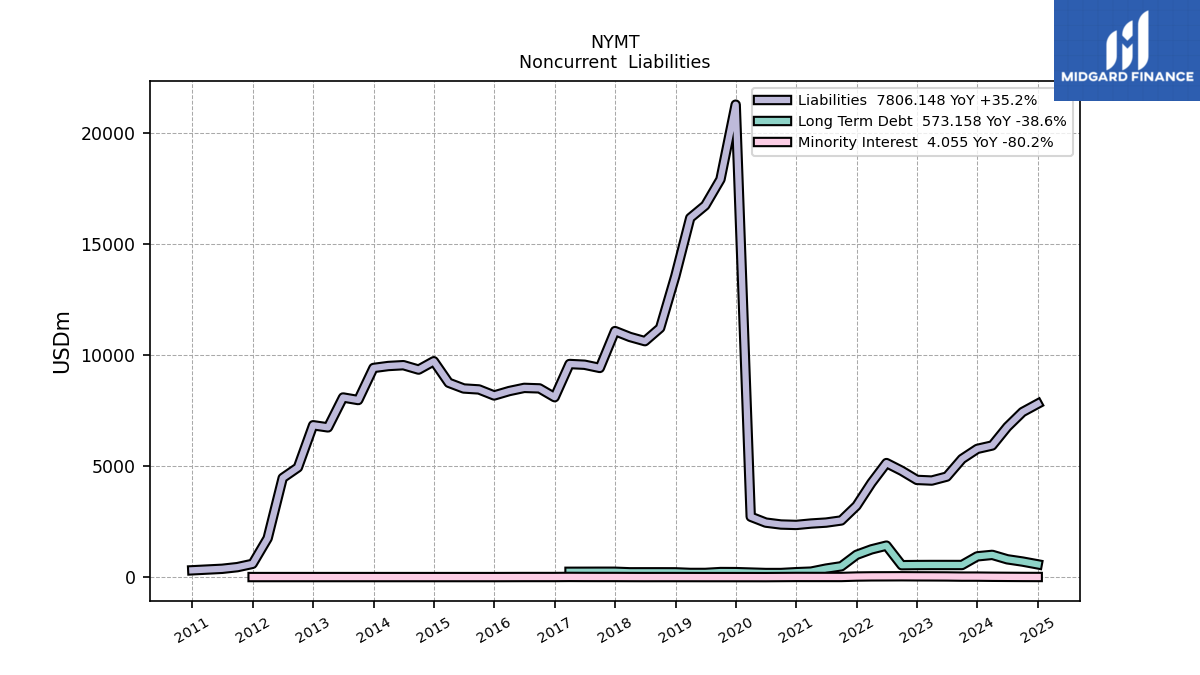
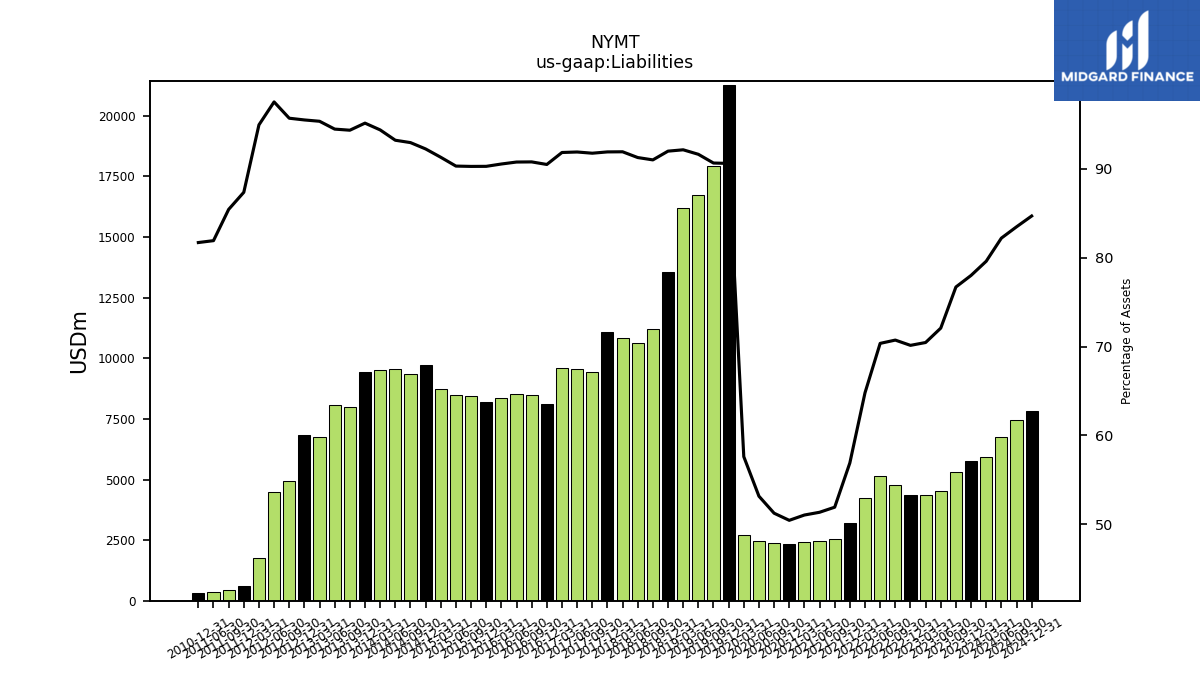
| Liabilities | 5773.20 | 5321.29 | 4525.36 | 4346.96 | 4376.63 | 4787.56 | 5135.36 | 4238.39 | 3209.92 | 2550.39 | 2454.57 | 2411.82 | 2348.01 | 2367.73 | 2453.79 | 2717.85 | 21278.34 | 17912.25 | 16737.80 | 16175.69 | 13557.34 | 11218.22 | 10624.67 | 10815.09 | 11080.28 | 9418.92 | 9563.13 | 9596.84 | 8100.47 | 8498.25 | 8521.10 | 8377.94 | 8179.04 | 8451.16 | 8494.00 | 8751.03 | 9722.08 | 9343.88 | 9543.82 | 9506.12 | 9418.01 | 7972.36 | 8089.20 | 6741.24 | 6838.40 | 4937.53 | 4464.91 | 1748.41 | 596.40 | 448.12 | 373.19 | 305.81 | |
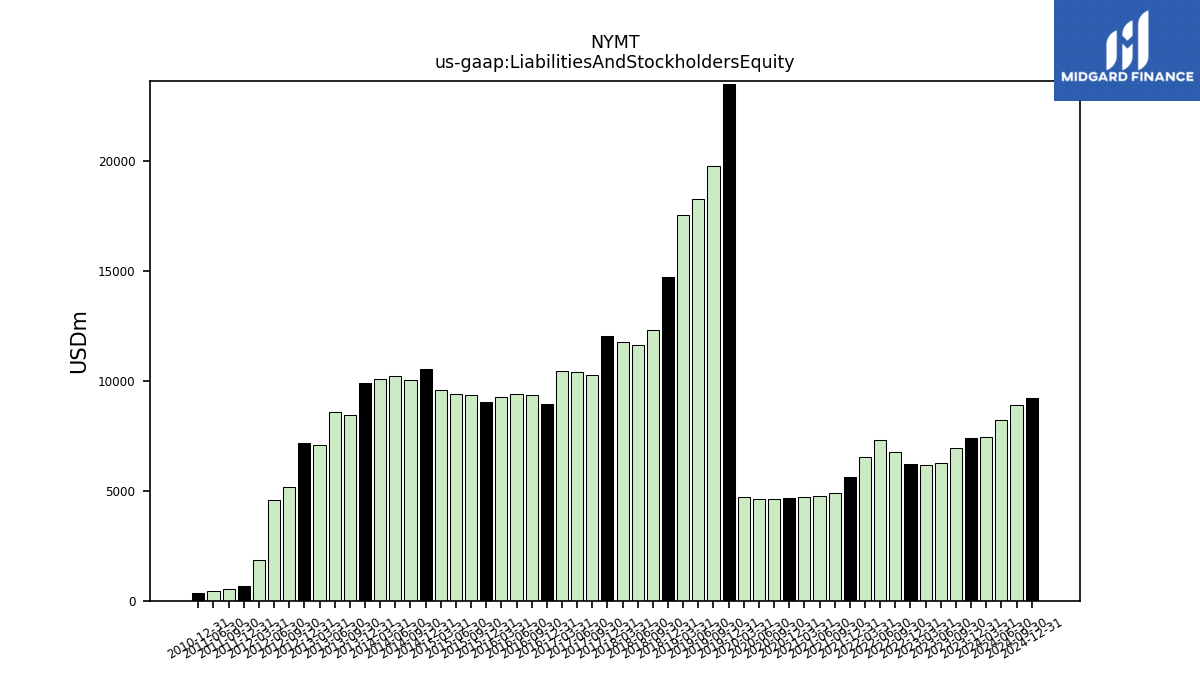
| Liabilities And Stockholders Equity | 7401.33 | 6937.87 | 6279.05 | 6170.25 | 6240.74 | 6769.47 | 7299.54 | 6541.75 | 5641.70 | 4912.81 | 4780.93 | 4726.17 | 4655.59 | 4621.11 | 4616.73 | 4718.30 | 23483.37 | 19759.25 | 18265.48 | 17555.14 | 14737.64 | 12326.91 | 11640.87 | 11765.88 | 12056.28 | 10264.92 | 10406.57 | 10449.59 | 8951.63 | 9361.33 | 9388.14 | 9252.94 | 9059.56 | 9361.81 | 9405.44 | 9584.79 | 10540.00 | 10052.25 | 10238.06 | 10071.96 | 9898.67 | 8450.05 | 8562.53 | 7069.69 | 7160.40 | 5159.55 | 4577.91 | 1841.45 | 682.71 | 524.54 | 455.58 | 374.29 | |
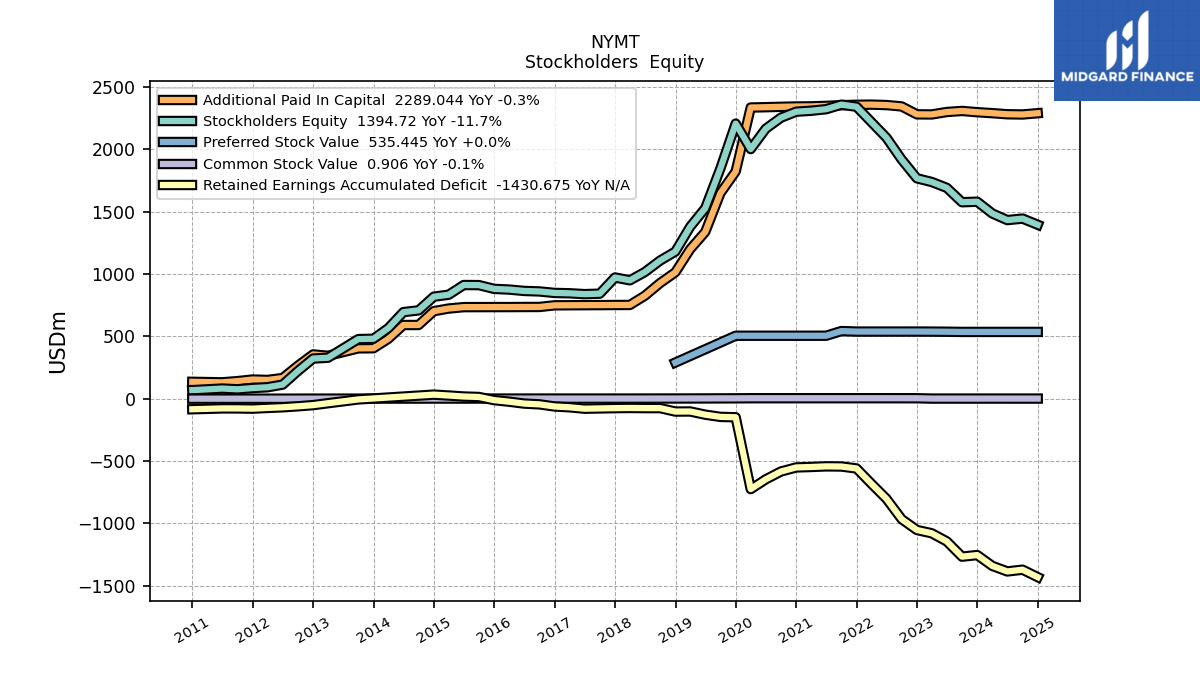
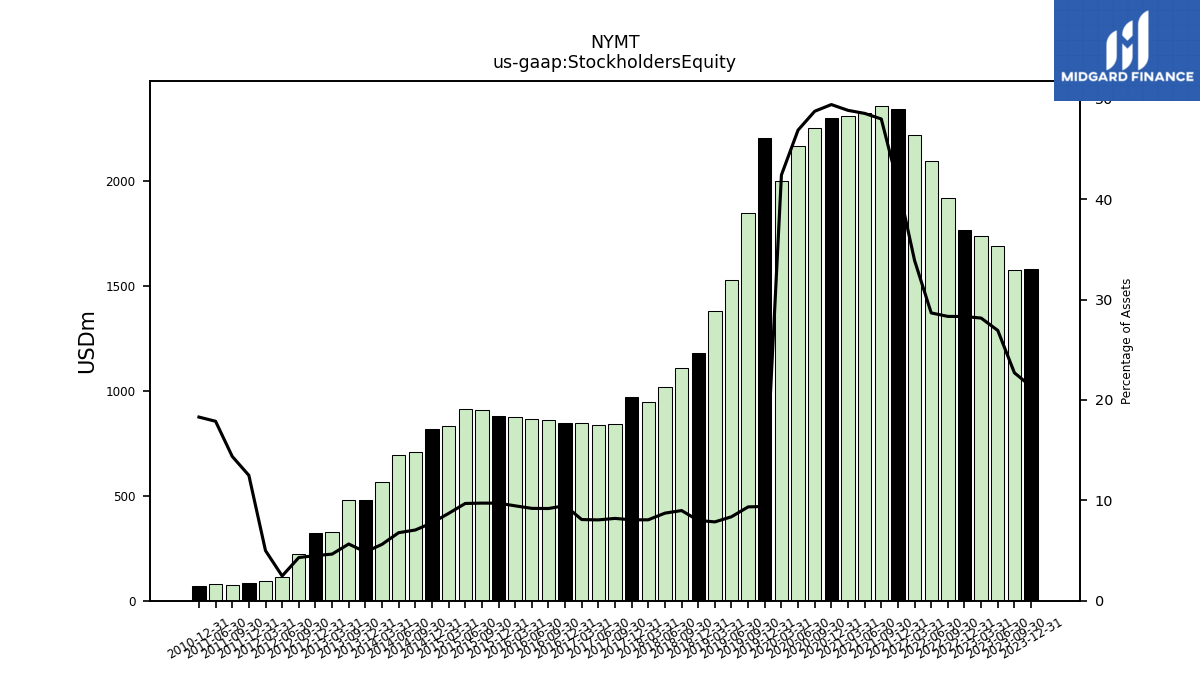
| Stockholders Equity | 1579.61 | 1575.23 | 1690.71 | 1737.51 | 1767.22 | 1917.51 | 2092.99 | 2217.62 | 2341.03 | 2357.79 | 2321.16 | 2308.85 | 2301.20 | 2253.38 | 2164.70 | 2001.34 | 2205.73 | 1847.51 | 1528.08 | 1379.11 | 1179.39 | 1107.69 | 1015.97 | 949.05 | 971.87 | 842.05 | 838.38 | 845.20 | 848.08 | 859.99 | 863.97 | 875.01 | 880.53 | 910.65 | 911.45 | 833.76 | 817.93 | 708.38 | 694.25 | 565.84 | 480.67 | 477.68 | NA | 328.45 | 322.01 | 222.01 | 112.99 | 91.96 | 85.28 | 75.44 | 81.46 | 68.49 |
| 2023-12-31 | 2023-09-30 | 2023-06-30 | 2023-03-31 | 2022-12-31 | 2022-09-30 | 2022-06-30 | 2022-03-31 | 2021-12-31 | 2021-09-30 | 2021-06-30 | 2021-03-31 | 2020-12-31 | 2020-09-30 | 2020-06-30 | 2020-03-31 | 2019-12-31 | 2019-09-30 | 2019-06-30 | 2019-03-31 | 2018-12-31 | 2018-09-30 | 2018-06-30 | 2018-03-31 | 2017-12-31 | 2017-09-30 | 2017-06-30 | 2017-03-31 | 2016-12-31 | 2016-09-30 | 2016-06-30 | 2016-03-31 | 2015-12-31 | 2015-09-30 | 2015-06-30 | 2015-03-31 | 2014-12-31 | 2014-09-30 | 2014-06-30 | 2014-03-31 | 2013-12-31 | 2013-09-30 | 2013-06-30 | 2013-03-31 | 2012-12-31 | 2012-09-30 | 2012-06-30 | 2012-03-31 | 2011-12-31 | 2011-09-30 | 2011-06-30 | 2010-12-31 | ||
|---|---|---|---|---|---|---|---|---|---|---|---|---|---|---|---|---|---|---|---|---|---|---|---|---|---|---|---|---|---|---|---|---|---|---|---|---|---|---|---|---|---|---|---|---|---|---|---|---|---|---|---|---|---|
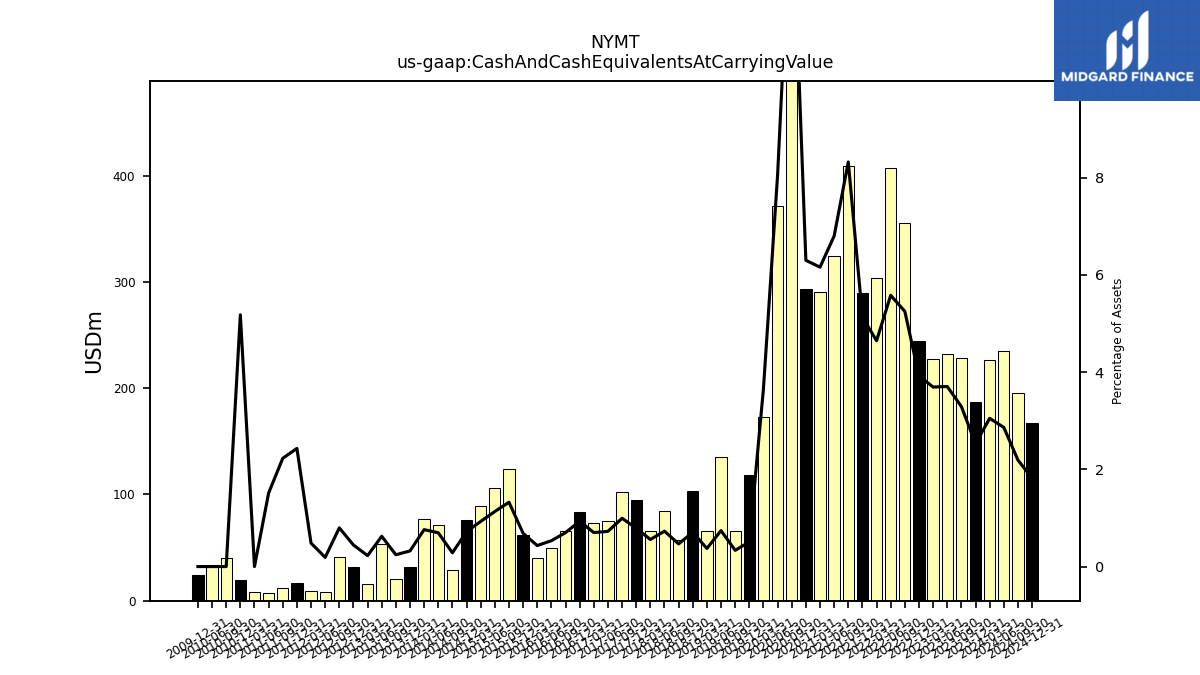
| Cash And Cash Equivalents At Carrying Value | 187.11 | 228.33 | 232.50 | 227.75 | 244.72 | 355.28 | 407.10 | 303.76 | 289.60 | 408.79 | 324.93 | 290.98 | 293.18 | 649.82 | 371.70 | 172.51 | 118.76 | 65.91 | 134.99 | 65.36 | 103.70 | 57.50 | 84.72 | 65.50 | 95.19 | 101.90 | 75.40 | 73.00 | 83.55 | 65.28 | 49.94 | 39.93 | 61.96 | 123.80 | 106.46 | 88.99 | 75.60 | 28.51 | 71.13 | 76.51 | 31.80 | 20.51 | 53.27 | 15.89 | 31.78 | 41.04 | 8.62 | 8.88 | 16.59 | 11.68 | 6.88 | 19.38 | |
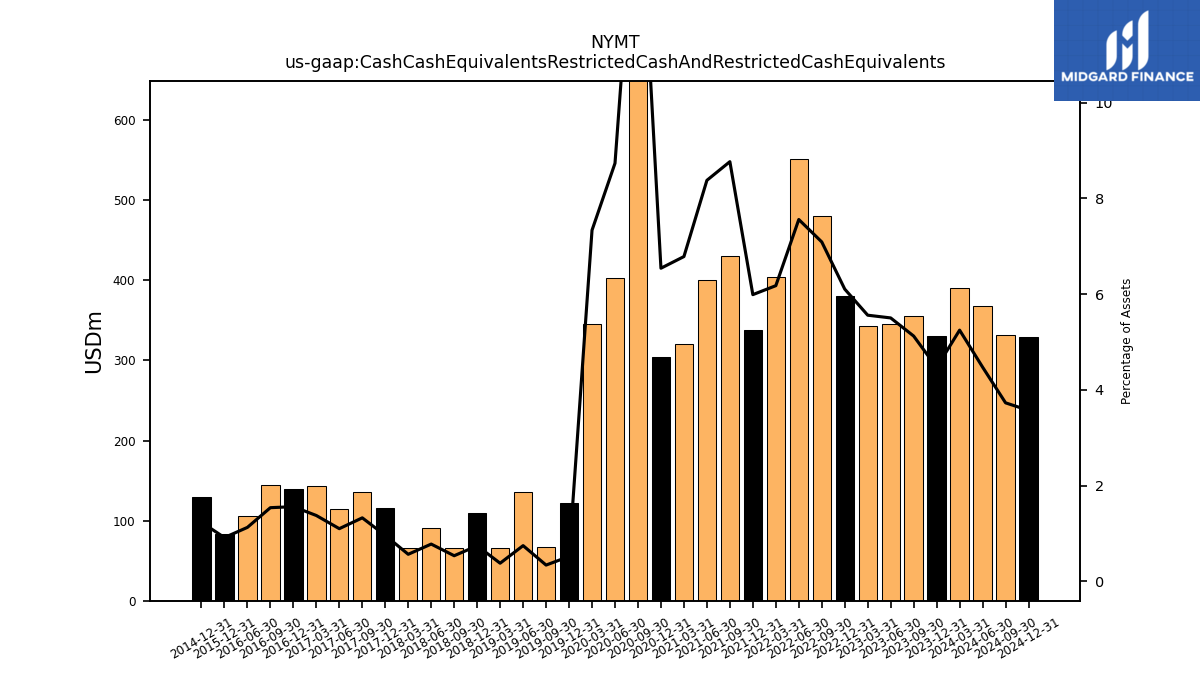
| Cash Cash Equivalents Restricted Cash And Restricted Cash Equivalents | 330.64 | 355.43 | 345.47 | 343.00 | 380.94 | 479.92 | 551.72 | 404.01 | 337.86 | 430.68 | 400.48 | 320.63 | 304.49 | 704.62 | 403.21 | 346.11 | 121.61 | 66.84 | 135.95 | 66.21 | 109.14 | 65.77 | 90.41 | 66.30 | 115.45 | 135.99 | 114.36 | 143.56 | 139.53 | 143.91 | 105.68 | NA | 82.74 | NA | NA | NA | 129.83 | NA | NA | NA | NA | NA | NA | NA | NA | NA | NA | NA | NA | NA | NA | NA |
| 2023-12-31 | 2023-09-30 | 2023-06-30 | 2023-03-31 | 2022-12-31 | 2022-09-30 | 2022-06-30 | 2022-03-31 | 2021-12-31 | 2021-09-30 | 2021-06-30 | 2021-03-31 | 2020-12-31 | 2020-09-30 | 2020-06-30 | 2020-03-31 | 2019-12-31 | 2019-09-30 | 2019-06-30 | 2019-03-31 | 2018-12-31 | 2018-09-30 | 2018-06-30 | 2018-03-31 | 2017-12-31 | 2017-09-30 | 2017-06-30 | 2017-03-31 | 2016-12-31 | 2016-09-30 | 2016-06-30 | 2016-03-31 | 2015-12-31 | 2015-09-30 | 2015-06-30 | 2015-03-31 | 2014-12-31 | 2014-09-30 | 2014-06-30 | 2014-03-31 | 2013-12-31 | 2013-09-30 | 2013-06-30 | 2013-03-31 | 2012-12-31 | 2012-09-30 | 2012-06-30 | 2012-03-31 | 2011-12-31 | 2011-09-30 | 2011-06-30 | 2010-12-31 | ||
|---|---|---|---|---|---|---|---|---|---|---|---|---|---|---|---|---|---|---|---|---|---|---|---|---|---|---|---|---|---|---|---|---|---|---|---|---|---|---|---|---|---|---|---|---|---|---|---|---|---|---|---|---|---|
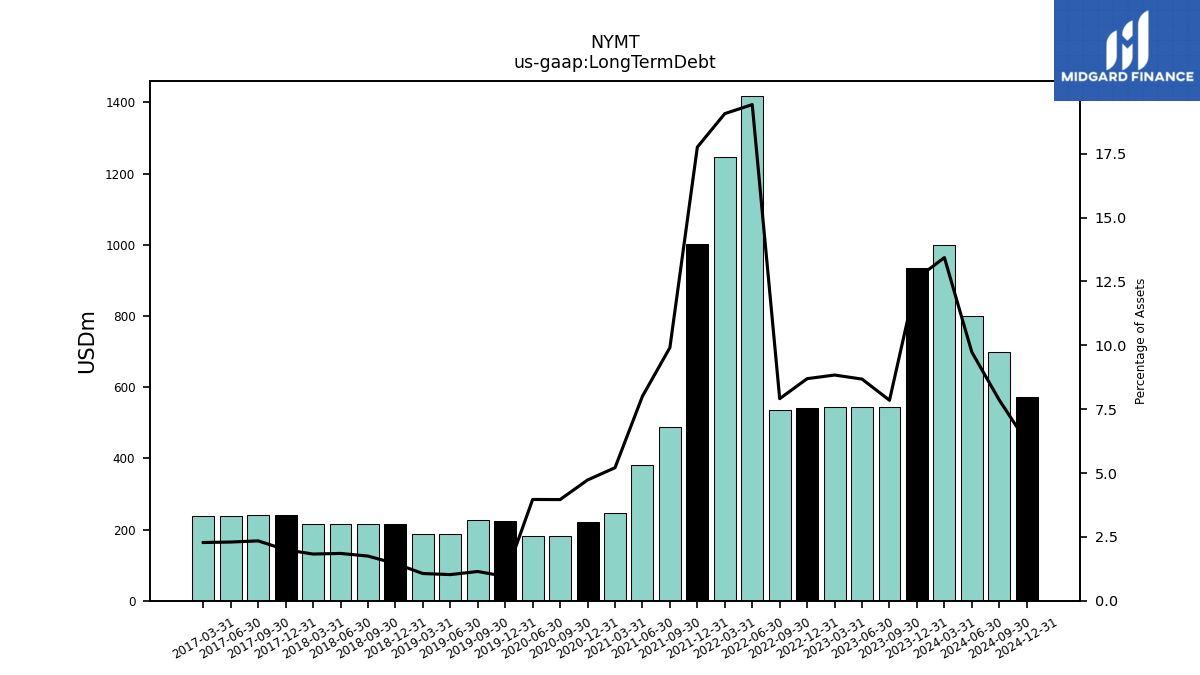
| Long Term Debt | 934.05 | 544.35 | 544.74 | 545.11 | 542.45 | 535.39 | 1417.52 | 1247.18 | 1001.72 | 486.79 | 382.68 | 246.07 | 220.03 | 183.00 | 183.00 | NA | 223.62 | 226.25 | 186.99 | 186.99 | 214.28 | 215.54 | 215.58 | 215.13 | 240.37 | 240.60 | 239.12 | 238.20 | NA | NA | NA | NA | NA | NA | NA | NA | NA | NA | NA | NA | NA | NA | NA | NA | NA | NA | NA | NA | NA | NA | NA | NA | |
| Minority Interest | 20.45 | 20.33 | 28.41 | 31.43 | 33.09 | 36.61 | 34.08 | 32.38 | 24.36 | 4.63 | 5.20 | 5.50 | 6.37 | NA | -1.76 | -0.89 | -0.70 | -0.51 | -0.40 | 0.35 | 0.90 | 1.00 | 0.23 | 1.74 | 4.14 | 3.95 | 5.06 | 7.55 | 3.09 | 3.09 | 3.08 | NA | 0.00 | NA | NA | NA | NA | NA | NA | NA | NA | NA | NA | NA | NA | NA | NA | 1.08 | 1.03 | NA | NA | NA |
| 2023-12-31 | 2023-09-30 | 2023-06-30 | 2023-03-31 | 2022-12-31 | 2022-09-30 | 2022-06-30 | 2022-03-31 | 2021-12-31 | 2021-09-30 | 2021-06-30 | 2021-03-31 | 2020-12-31 | 2020-09-30 | 2020-06-30 | 2020-03-31 | 2019-12-31 | 2019-09-30 | 2019-06-30 | 2019-03-31 | 2018-12-31 | 2018-09-30 | 2018-06-30 | 2018-03-31 | 2017-12-31 | 2017-09-30 | 2017-06-30 | 2017-03-31 | 2016-12-31 | 2016-09-30 | 2016-06-30 | 2016-03-31 | 2015-12-31 | 2015-09-30 | 2015-06-30 | 2015-03-31 | 2014-12-31 | 2014-09-30 | 2014-06-30 | 2014-03-31 | 2013-12-31 | 2013-09-30 | 2013-06-30 | 2013-03-31 | 2012-12-31 | 2012-09-30 | 2012-06-30 | 2012-03-31 | 2011-12-31 | 2011-09-30 | 2011-06-30 | 2010-12-31 | ||
|---|---|---|---|---|---|---|---|---|---|---|---|---|---|---|---|---|---|---|---|---|---|---|---|---|---|---|---|---|---|---|---|---|---|---|---|---|---|---|---|---|---|---|---|---|---|---|---|---|---|---|---|---|---|
| Stockholders Equity | 1579.61 | 1575.23 | 1690.71 | 1737.51 | 1767.22 | 1917.51 | 2092.99 | 2217.62 | 2341.03 | 2357.79 | 2321.16 | 2308.85 | 2301.20 | 2253.38 | 2164.70 | 2001.34 | 2205.73 | 1847.51 | 1528.08 | 1379.11 | 1179.39 | 1107.69 | 1015.97 | 949.05 | 971.87 | 842.05 | 838.38 | 845.20 | 848.08 | 859.99 | 863.97 | 875.01 | 880.53 | 910.65 | 911.45 | 833.76 | 817.93 | 708.38 | 694.25 | 565.84 | 480.67 | 477.68 | NA | 328.45 | 322.01 | 222.01 | 112.99 | 91.96 | 85.28 | 75.44 | 81.46 | 68.49 | |
| Stockholders Equity Including Portion Attributable To Noncontrolling Interest | 1600.07 | 1595.56 | 1719.12 | 1768.94 | 1800.31 | 1954.12 | 2127.07 | 2250.00 | 2365.39 | 2362.42 | 2326.36 | 2314.35 | 2307.57 | 2253.38 | 2162.94 | 2000.45 | 2205.03 | 1847.00 | 1527.68 | 1379.45 | 1180.29 | 1108.69 | 1016.20 | 950.79 | 976.00 | 846.00 | 843.44 | 852.75 | 851.16 | 863.08 | 867.04 | 875.01 | 880.53 | 910.65 | 911.45 | 833.76 | 817.93 | NA | NA | NA | 480.67 | 477.68 | 473.33 | 328.45 | 322.01 | 222.01 | 112.99 | 93.04 | 86.31 | 76.42 | 82.39 | 68.49 | |
| Common Stock Value | 0.91 | 0.91 | 0.91 | 0.91 | 3.65 | 3.73 | 3.79 | 3.81 | 3.79 | 3.79 | 3.79 | 3.79 | 3.78 | 3.78 | 3.77 | 3.77 | 2.91 | 2.63 | 2.11 | 1.88 | 1.56 | 1.41 | 1.24 | 1.12 | 1.12 | 1.12 | 1.12 | 1.12 | 1.11 | 1.10 | 1.10 | 1.09 | 1.09 | 1.09 | 1.09 | 1.08 | 1.05 | 0.91 | 0.91 | 0.76 | 0.64 | 0.64 | NA | 0.50 | 0.50 | 0.34 | 0.17 | 0.14 | 0.14 | 0.11 | 0.10 | 0.09 | |
| Additional Paid In Capital | 2297.08 | 2307.20 | 2298.67 | 2279.13 | 2279.95 | 2343.39 | 2354.38 | 2357.91 | 2356.58 | 2353.48 | 2347.75 | 2343.91 | 2342.93 | 2340.39 | 2337.22 | 2334.79 | 1821.79 | 1648.66 | 1337.33 | 1199.09 | 1013.39 | 927.59 | 825.96 | 751.54 | 751.15 | 750.44 | 749.86 | 749.21 | 748.60 | 735.51 | 735.22 | 734.66 | 734.61 | 734.38 | 734.12 | 722.86 | 701.87 | 590.95 | 590.67 | 480.48 | 404.56 | 403.42 | NA | 344.01 | 355.01 | 264.30 | 165.78 | 150.22 | 153.71 | 140.84 | 131.32 | 135.30 | |
| Retained Earnings Accumulated Deficit | -1253.82 | -1266.49 | -1144.09 | -1079.05 | -1052.77 | -965.79 | -802.45 | -681.91 | -559.34 | -543.76 | -542.60 | -547.49 | -551.27 | -583.62 | -646.63 | -724.96 | -148.86 | -145.90 | -128.21 | -102.53 | -103.18 | -75.74 | -75.54 | -74.45 | -75.72 | -77.97 | -80.22 | -68.95 | -62.54 | -45.46 | -39.20 | -24.11 | -11.58 | 13.69 | 17.54 | 25.54 | 32.59 | NA | NA | NA | NA | -5.92 | NA | -36.20 | -51.58 | -60.97 | -68.89 | -74.02 | -79.86 | -77.97 | -77.94 | -84.64 | |
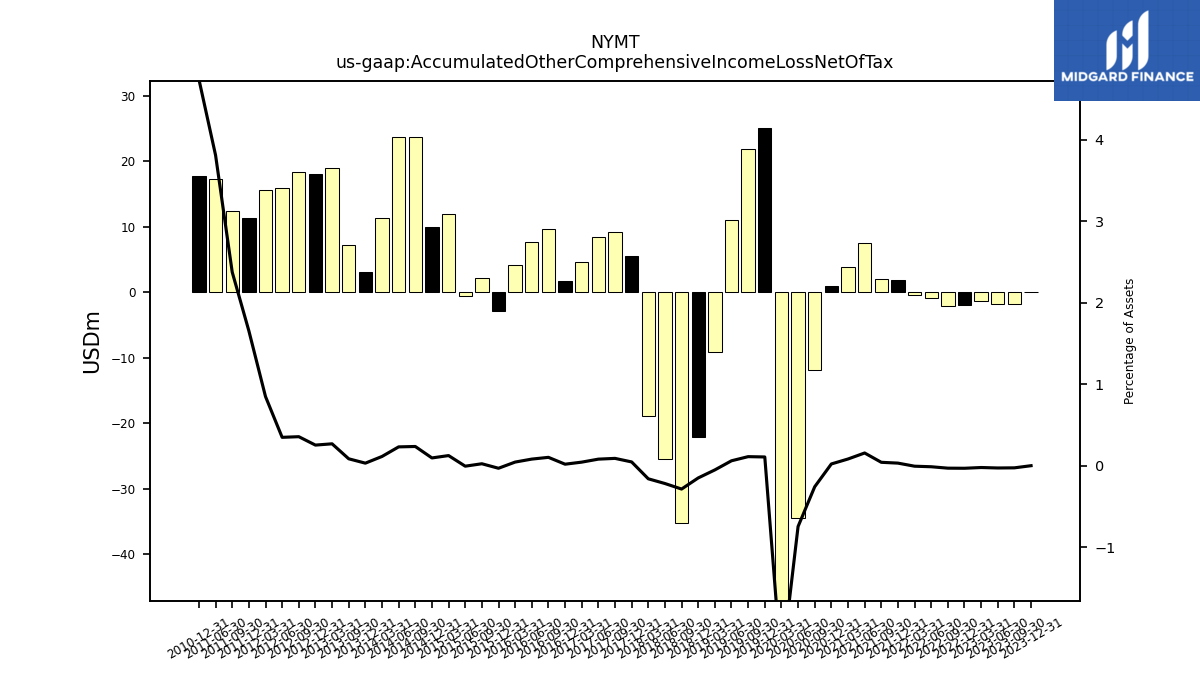
| Accumulated Other Comprehensive Income Loss Net Of Tax | -0.00 | -1.83 | -1.76 | -1.38 | -1.97 | -2.05 | -0.94 | -0.41 | 1.78 | 2.04 | 7.45 | 3.87 | 0.99 | -11.94 | -34.43 | -117.03 | 25.13 | 21.92 | 11.00 | -9.09 | -22.14 | -35.32 | -25.45 | -18.93 | 5.55 | 9.20 | 8.36 | 4.56 | 1.64 | 9.58 | 7.59 | 4.11 | -2.85 | 2.22 | -0.56 | 11.89 | 10.02 | 23.68 | 23.62 | 11.39 | 3.07 | 7.14 | NA | 18.96 | 18.09 | 18.35 | 15.92 | 15.62 | 11.29 | 12.45 | 17.34 | 17.73 | |
| Minority Interest | 20.45 | 20.33 | 28.41 | 31.43 | 33.09 | 36.61 | 34.08 | 32.38 | 24.36 | 4.63 | 5.20 | 5.50 | 6.37 | NA | -1.76 | -0.89 | -0.70 | -0.51 | -0.40 | 0.35 | 0.90 | 1.00 | 0.23 | 1.74 | 4.14 | 3.95 | 5.06 | 7.55 | 3.09 | 3.09 | 3.08 | NA | 0.00 | NA | NA | NA | NA | NA | NA | NA | NA | NA | NA | NA | NA | NA | NA | 1.08 | 1.03 | NA | NA | NA | |
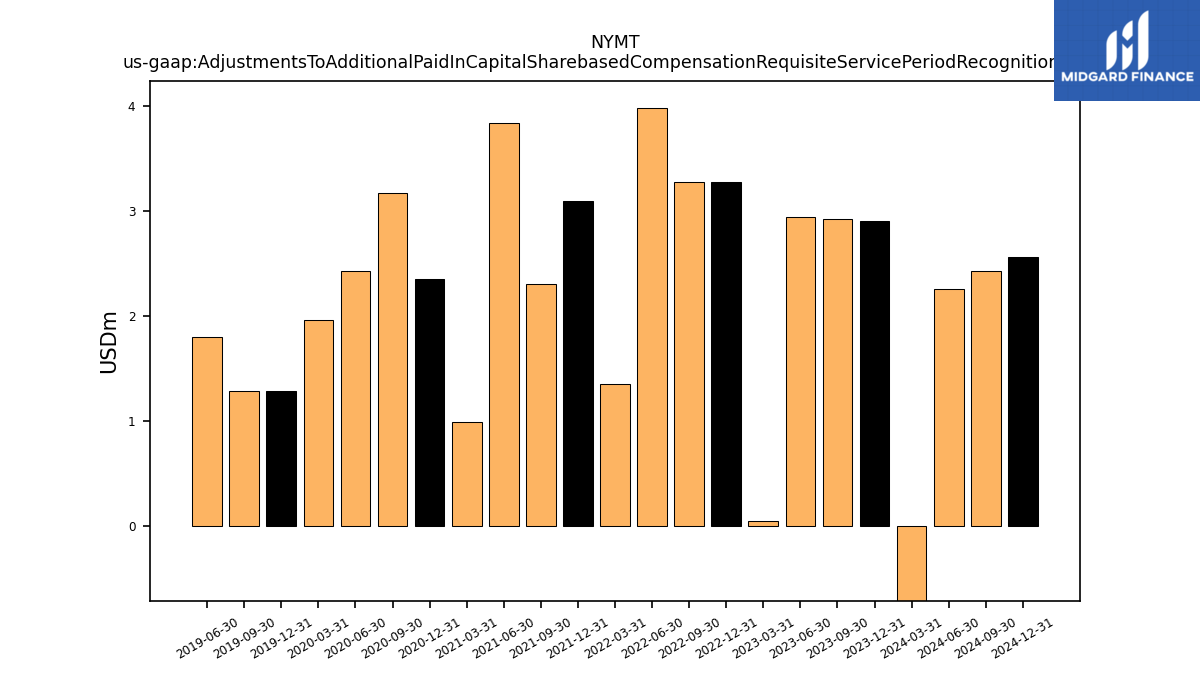
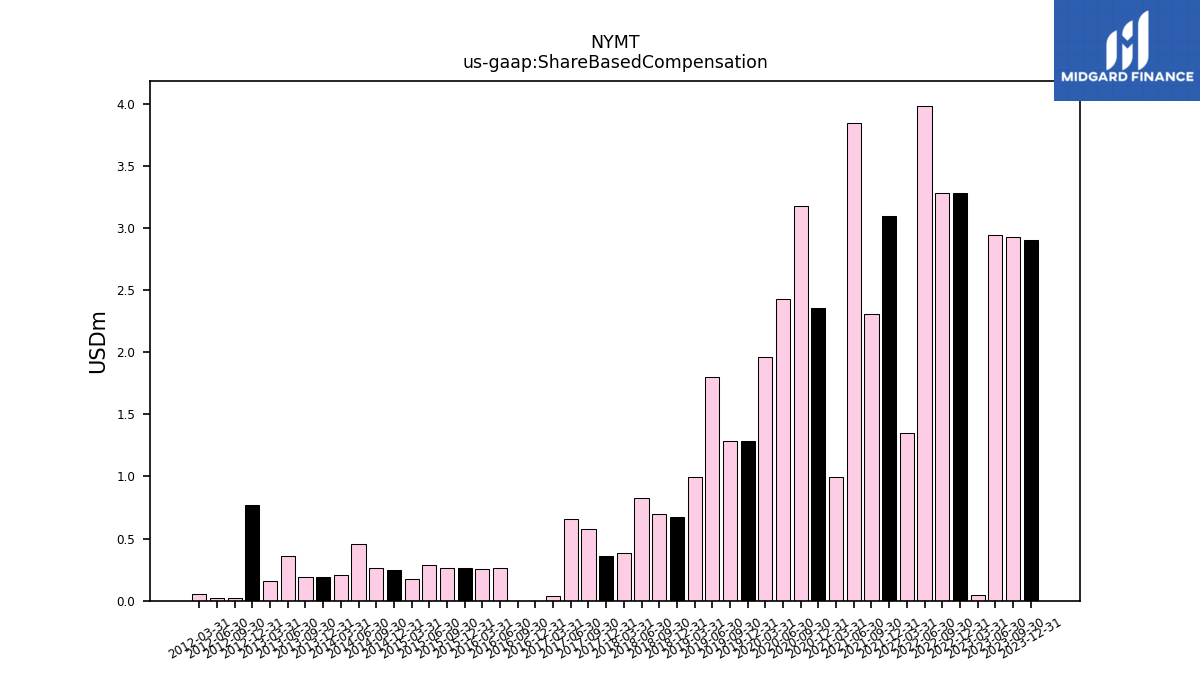
| Adjustments To Additional Paid In Capital Sharebased Compensation Requisite Service Period Recognition Value | 2.90 | 2.93 | 2.94 | 0.05 | 3.28 | 3.28 | 3.98 | 1.35 | 3.09 | 2.31 | 3.84 | 0.99 | 2.35 | 3.17 | 2.43 | 1.96 | 1.29 | 1.29 | 1.80 | NA | NA | NA | NA | NA | NA | NA | NA | NA | NA | NA | NA | NA | NA | NA | NA | NA | NA | NA | NA | NA | NA | NA | NA | NA | NA | NA | NA | NA | NA | NA | NA | NA | |
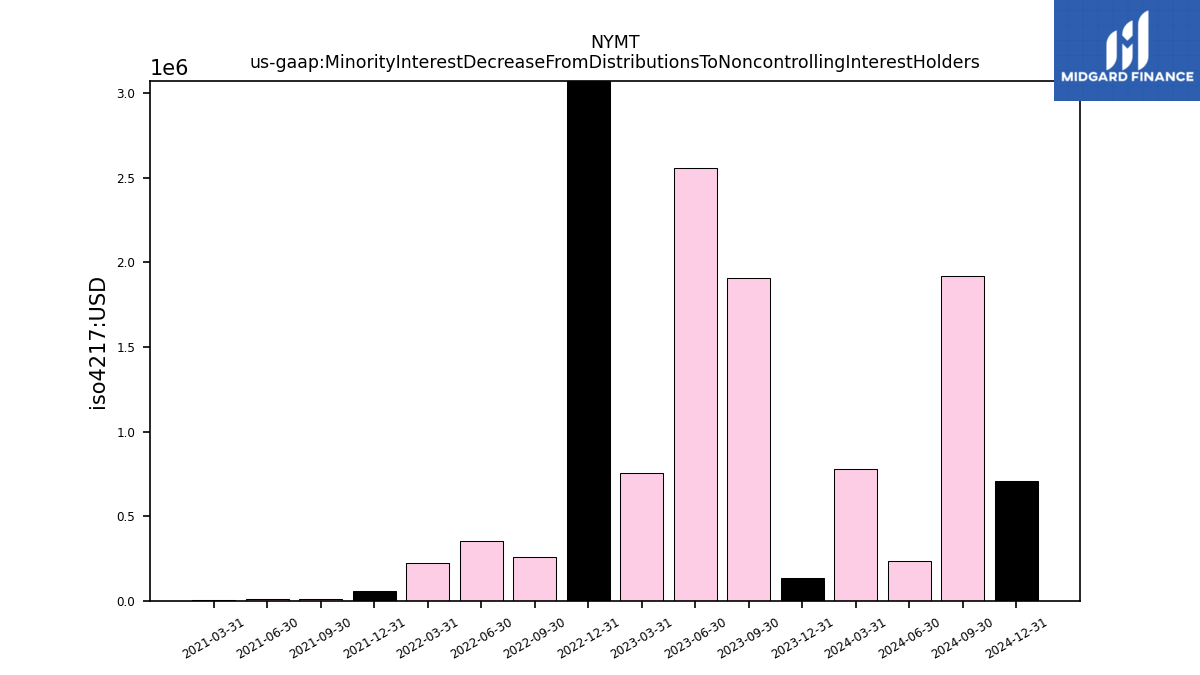
| Minority Interest Decrease From Distributions To Noncontrolling Interest Holders | 0.13 | 1.91 | 2.56 | 0.76 | 3.38 | 0.26 | 0.35 | 0.22 | 0.06 | 0.01 | 0.01 | 0.00 | NA | NA | NA | NA | NA | NA | NA | NA | NA | NA | NA | NA | NA | NA | NA | NA | NA | NA | NA | NA | NA | NA | NA | NA | NA | NA | NA | NA | NA | NA | NA | NA | NA | NA | NA | NA | NA | NA | NA | NA |
| 2023-12-31 | 2023-09-30 | 2023-06-30 | 2023-03-31 | 2022-12-31 | 2022-09-30 | 2022-06-30 | 2022-03-31 | 2021-12-31 | 2021-09-30 | 2021-06-30 | 2021-03-31 | 2020-12-31 | 2020-09-30 | 2020-06-30 | 2020-03-31 | 2019-12-31 | 2019-09-30 | 2019-06-30 | 2019-03-31 | 2018-12-31 | 2018-09-30 | 2018-06-30 | 2018-03-31 | 2017-12-31 | 2017-09-30 | 2017-06-30 | 2017-03-31 | 2016-12-31 | 2016-09-30 | 2016-06-30 | 2016-03-31 | 2015-12-31 | 2015-09-30 | 2015-06-30 | 2015-03-31 | 2014-12-31 | 2014-09-30 | 2014-06-30 | 2014-03-31 | 2013-12-31 | 2013-09-30 | 2013-06-30 | 2013-03-31 | 2012-12-31 | 2012-09-30 | 2012-06-30 | 2012-03-31 | 2011-12-31 | 2011-09-30 | 2011-06-30 | 2010-12-31 | ||
|---|---|---|---|---|---|---|---|---|---|---|---|---|---|---|---|---|---|---|---|---|---|---|---|---|---|---|---|---|---|---|---|---|---|---|---|---|---|---|---|---|---|---|---|---|---|---|---|---|---|---|---|---|---|
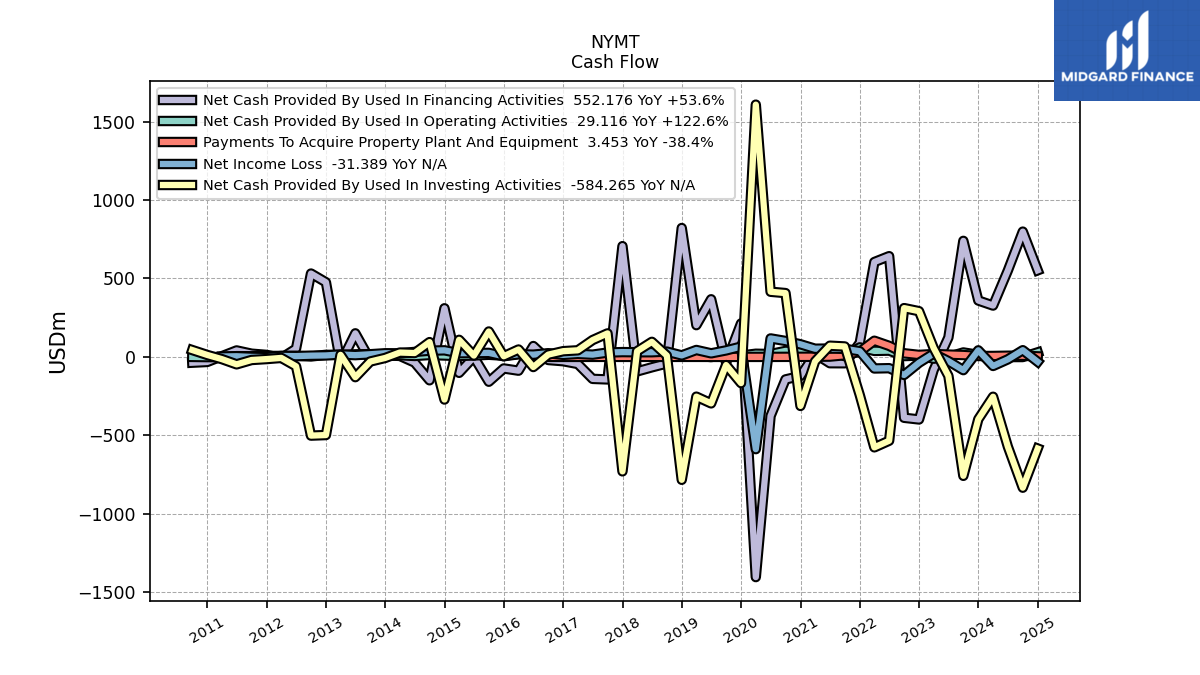
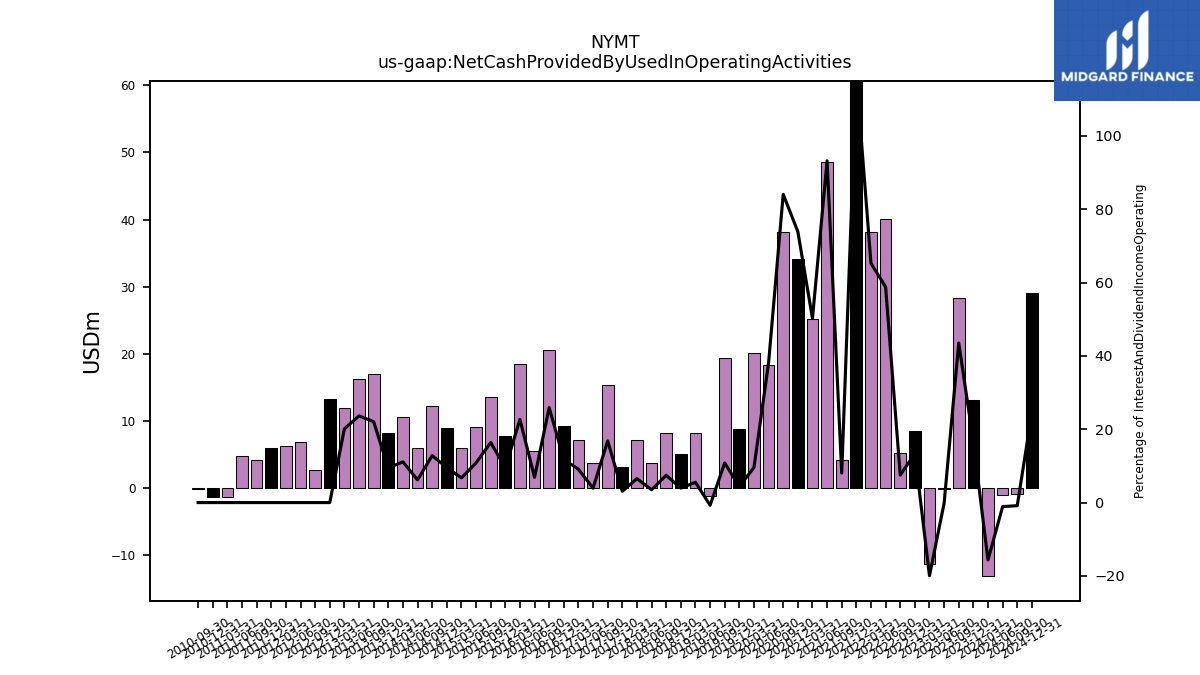
| Net Cash Provided By Used In Operating Activities | 13.08 | 28.38 | -0.10 | -11.40 | 8.41 | 5.17 | 40.02 | 38.18 | 60.91 | 4.21 | 48.65 | 25.14 | 34.16 | 38.14 | 18.29 | 20.17 | 8.72 | 19.41 | -1.23 | 8.19 | 5.10 | 8.20 | 3.78 | 7.11 | 3.15 | 15.38 | 3.69 | 7.12 | 9.24 | 20.59 | 5.50 | 18.52 | 7.69 | 13.53 | 9.13 | 5.99 | 8.90 | 12.15 | 5.92 | 10.58 | 8.21 | 16.93 | 16.27 | 11.89 | 13.28 | 2.71 | 6.88 | 6.23 | 5.94 | 4.08 | 4.70 | -1.44 | |
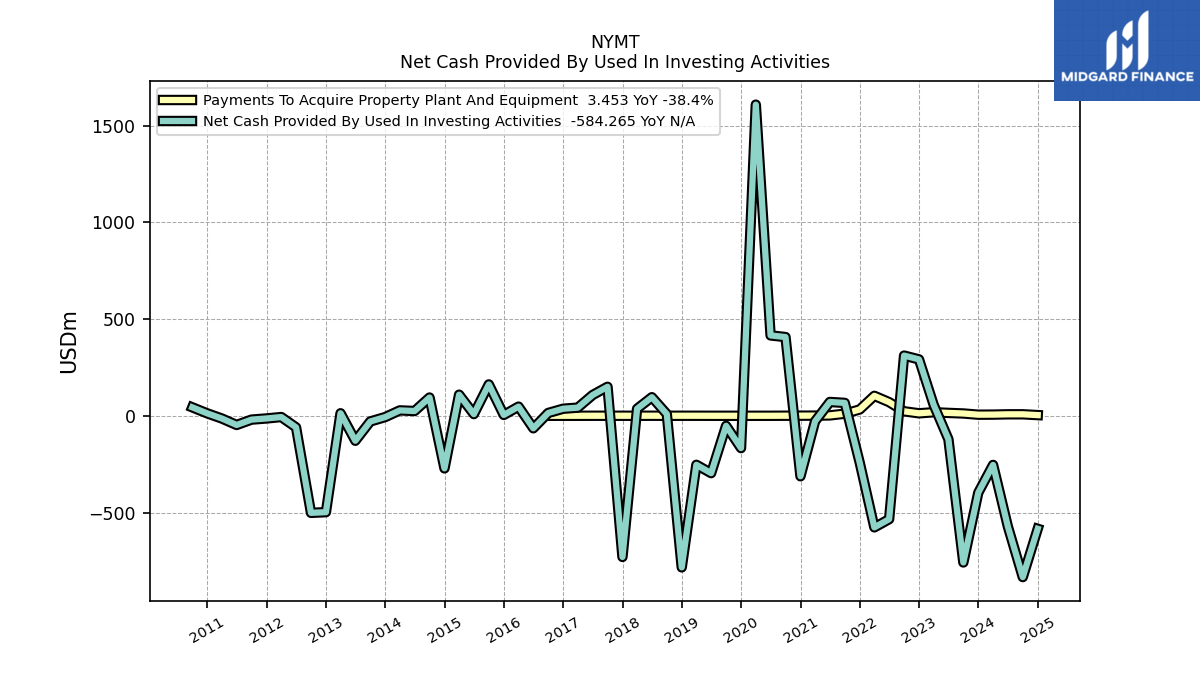
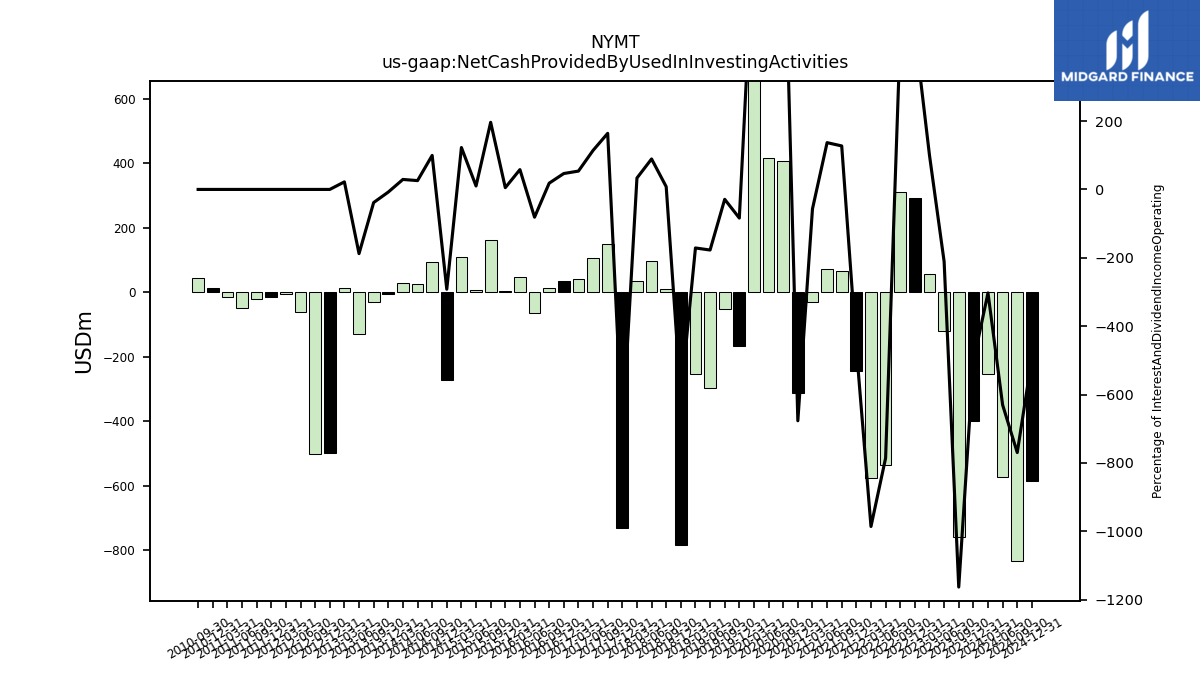
| Net Cash Provided By Used In Investing Activities | -397.39 | -758.35 | -121.26 | 57.06 | 291.48 | 311.18 | -534.58 | -576.86 | -242.52 | 66.58 | 71.42 | -28.51 | -312.79 | 406.89 | 415.36 | 1608.42 | -167.22 | -51.94 | -296.52 | -253.38 | -783.71 | 8.90 | 96.02 | 36.31 | -729.91 | 149.92 | 107.24 | 42.06 | 36.51 | 14.58 | -64.77 | 47.35 | 4.22 | 162.16 | 8.51 | 109.08 | -271.94 | 94.44 | 24.64 | 27.84 | -6.71 | -29.44 | -129.21 | 13.07 | -498.28 | -501.83 | -59.76 | -6.51 | -13.87 | -19.81 | -47.50 | 12.53 | |
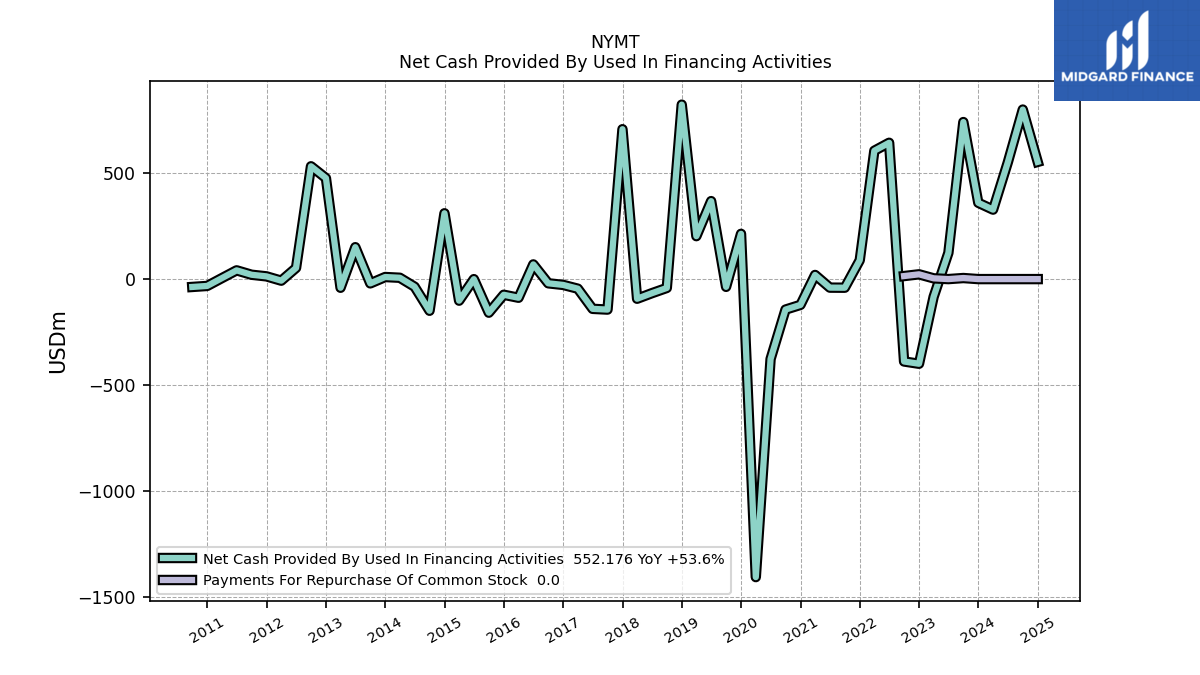
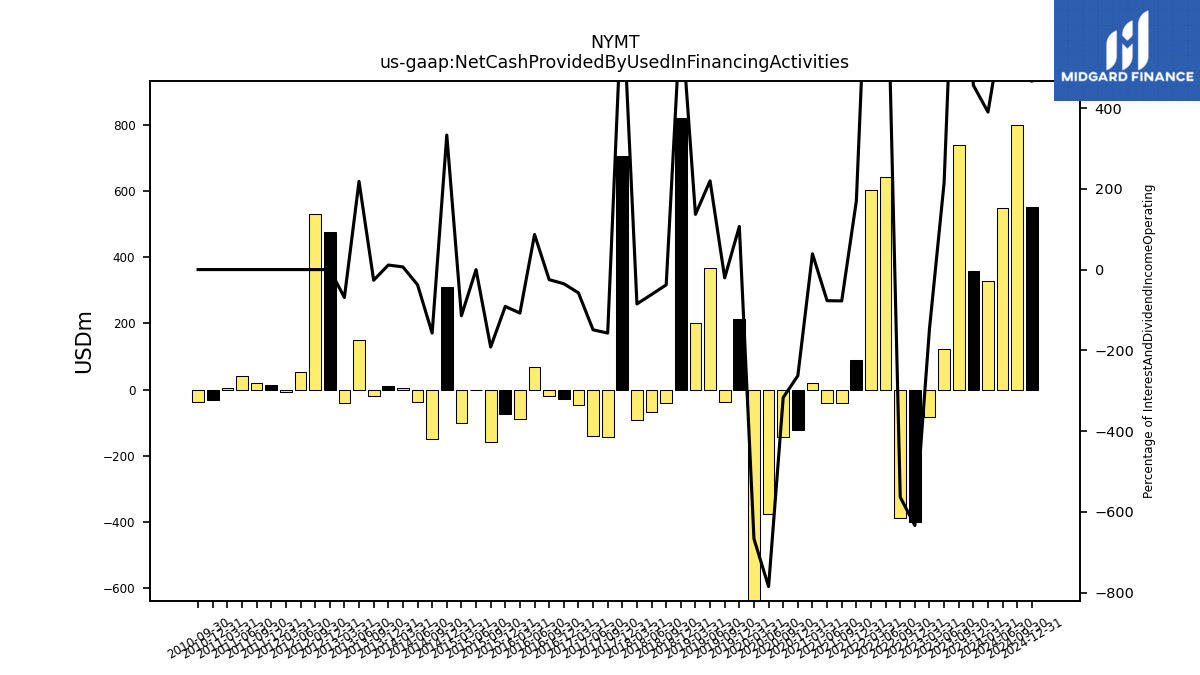
| Net Cash Provided By Used In Financing Activities | 359.52 | 739.93 | 123.83 | -83.60 | -398.87 | -388.16 | 642.27 | 604.82 | 88.79 | -40.59 | -40.22 | 19.51 | -121.51 | -143.61 | -376.55 | -1404.09 | 213.28 | -36.59 | 367.49 | 202.25 | 821.99 | -41.74 | -66.43 | -92.57 | 706.23 | -143.67 | -140.12 | -45.16 | -27.47 | -19.83 | 69.28 | -87.90 | -73.75 | -158.34 | -0.16 | -101.69 | 310.12 | -149.22 | -35.93 | 6.29 | 9.78 | -20.25 | 150.31 | -40.84 | 475.74 | 531.54 | 52.63 | -7.43 | 12.84 | 20.52 | 41.25 | -32.23 |
| 2023-12-31 | 2023-09-30 | 2023-06-30 | 2023-03-31 | 2022-12-31 | 2022-09-30 | 2022-06-30 | 2022-03-31 | 2021-12-31 | 2021-09-30 | 2021-06-30 | 2021-03-31 | 2020-12-31 | 2020-09-30 | 2020-06-30 | 2020-03-31 | 2019-12-31 | 2019-09-30 | 2019-06-30 | 2019-03-31 | 2018-12-31 | 2018-09-30 | 2018-06-30 | 2018-03-31 | 2017-12-31 | 2017-09-30 | 2017-06-30 | 2017-03-31 | 2016-12-31 | 2016-09-30 | 2016-06-30 | 2016-03-31 | 2015-12-31 | 2015-09-30 | 2015-06-30 | 2015-03-31 | 2014-12-31 | 2014-09-30 | 2014-06-30 | 2014-03-31 | 2013-12-31 | 2013-09-30 | 2013-06-30 | 2013-03-31 | 2012-12-31 | 2012-09-30 | 2012-06-30 | 2012-03-31 | 2011-12-31 | 2011-09-30 | 2011-06-30 | 2010-12-31 | ||
|---|---|---|---|---|---|---|---|---|---|---|---|---|---|---|---|---|---|---|---|---|---|---|---|---|---|---|---|---|---|---|---|---|---|---|---|---|---|---|---|---|---|---|---|---|---|---|---|---|---|---|---|---|---|
| Net Cash Provided By Used In Operating Activities | 13.08 | 28.38 | -0.10 | -11.40 | 8.41 | 5.17 | 40.02 | 38.18 | 60.91 | 4.21 | 48.65 | 25.14 | 34.16 | 38.14 | 18.29 | 20.17 | 8.72 | 19.41 | -1.23 | 8.19 | 5.10 | 8.20 | 3.78 | 7.11 | 3.15 | 15.38 | 3.69 | 7.12 | 9.24 | 20.59 | 5.50 | 18.52 | 7.69 | 13.53 | 9.13 | 5.99 | 8.90 | 12.15 | 5.92 | 10.58 | 8.21 | 16.93 | 16.27 | 11.89 | 13.28 | 2.71 | 6.88 | 6.23 | 5.94 | 4.08 | 4.70 | -1.44 | |
| Net Income Loss | 41.91 | -84.51 | -26.93 | 20.86 | -37.58 | -115.28 | -71.90 | -73.85 | 36.18 | 51.58 | 53.24 | 52.21 | 80.42 | 101.64 | 117.81 | -588.38 | 65.48 | 41.38 | 22.73 | 44.14 | 9.60 | 33.97 | 29.69 | 29.62 | 30.62 | 27.84 | 14.34 | 19.18 | 12.90 | 23.27 | 14.44 | 16.95 | 4.21 | 25.63 | 24.63 | 23.54 | 41.98 | 39.73 | 31.78 | 22.71 | 23.29 | 16.93 | 11.24 | 15.38 | 9.39 | 7.91 | 5.14 | 5.84 | -1.85 | -0.01 | 4.17 | NA | |
| Profit Loss | 32.73 | -93.87 | -30.82 | 14.16 | -76.21 | -112.69 | -103.45 | -76.09 | 34.88 | 51.18 | 51.62 | 50.80 | 79.98 | 103.41 | 116.94 | -588.57 | 65.29 | 41.27 | 21.99 | 44.35 | 9.51 | 34.45 | 28.75 | 32.09 | 30.80 | 26.73 | 11.85 | 19.18 | 12.89 | 23.28 | 14.43 | 16.95 | 4.21 | 25.63 | 24.63 | 23.54 | 41.98 | 39.73 | 31.78 | 22.71 | 23.29 | 18.39 | 11.90 | 15.38 | 9.39 | 7.91 | 4.99 | 5.89 | -1.85 | 0.02 | 4.19 | 1.02 | |
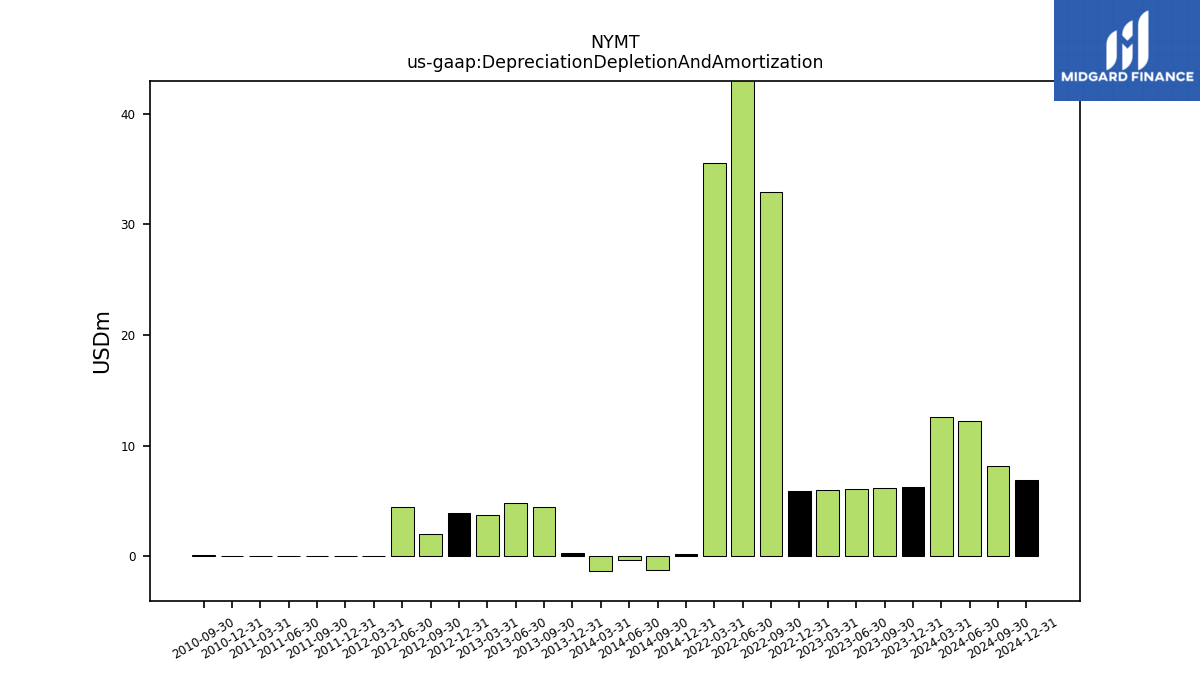
| Depreciation Depletion And Amortization | 6.25 | 6.20 | 6.13 | 6.04 | 5.91 | 32.93 | 52.39 | 35.59 | NA | NA | NA | NA | NA | NA | NA | NA | NA | NA | NA | NA | NA | NA | NA | NA | NA | NA | NA | NA | NA | NA | NA | NA | NA | NA | NA | NA | 0.21 | -1.27 | -0.30 | -1.32 | 0.35 | 4.48 | 4.86 | 3.74 | 3.90 | 2.06 | 4.50 | 0.03 | 0.02 | 0.03 | 0.03 | 0.04 | |
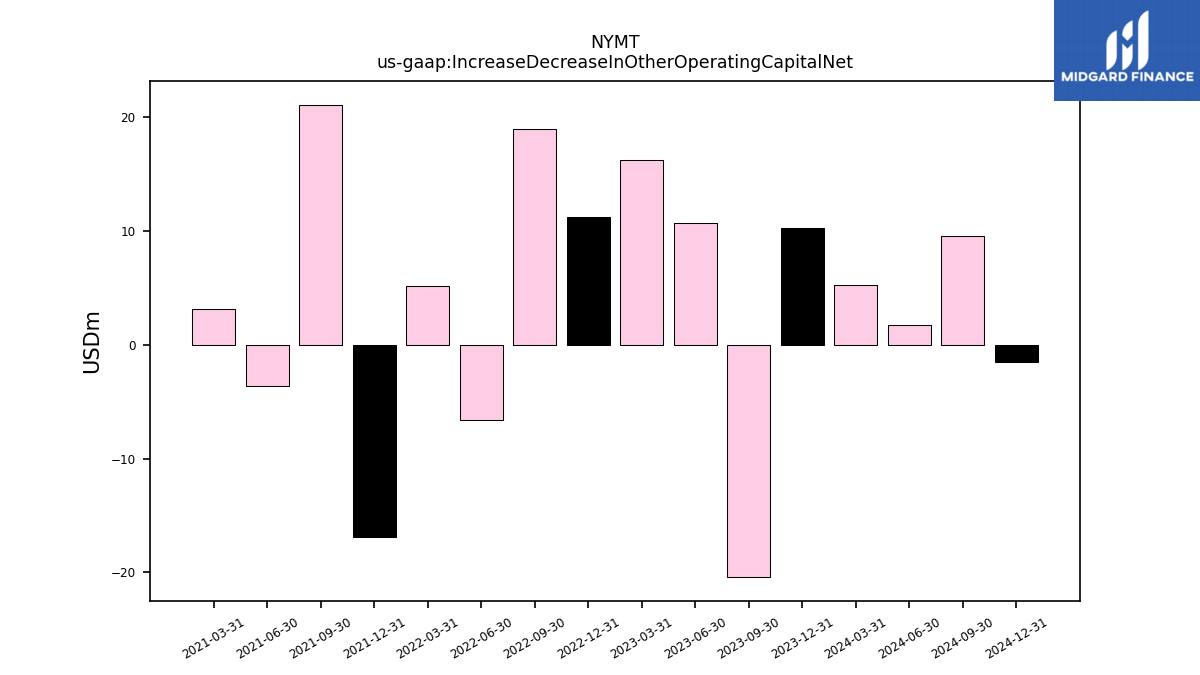
| Increase Decrease In Other Operating Capital Net | 10.29 | -20.41 | 10.67 | 16.20 | 11.21 | 18.99 | -6.64 | 5.17 | -16.92 | 21.09 | -3.61 | 3.13 | NA | NA | NA | NA | NA | NA | NA | NA | NA | NA | NA | NA | NA | NA | NA | NA | NA | NA | NA | NA | NA | NA | NA | NA | NA | NA | NA | NA | NA | NA | NA | NA | NA | NA | NA | NA | NA | NA | NA | NA | |
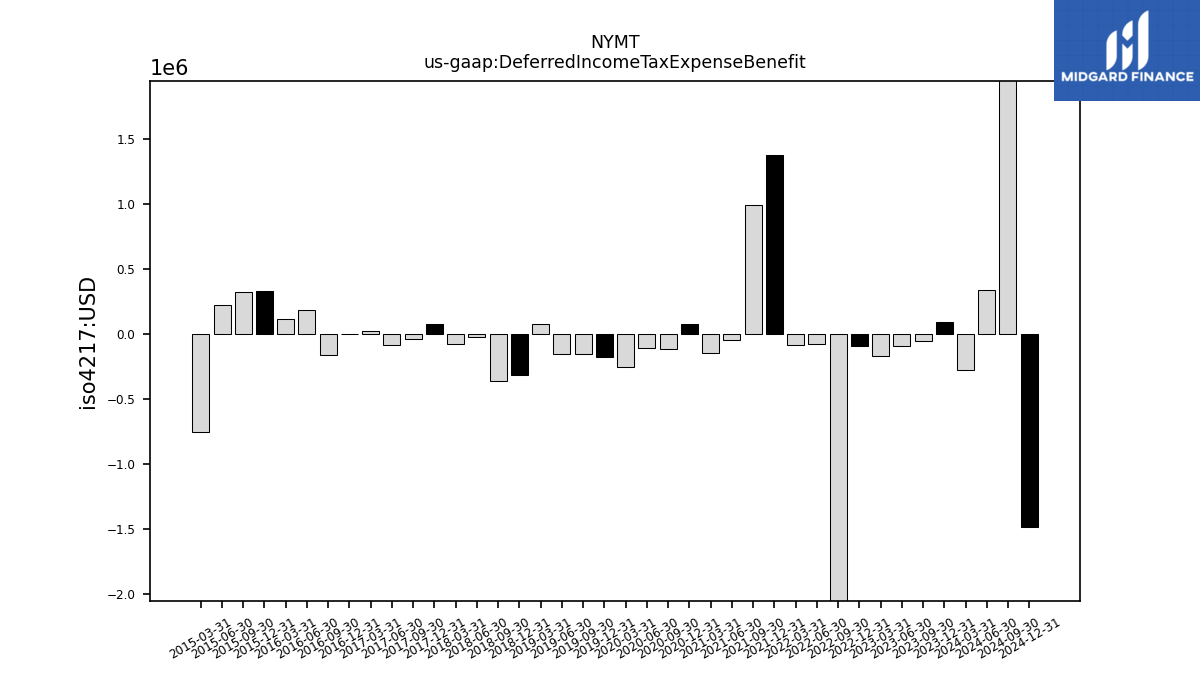
| Deferred Income Tax Expense Benefit | 0.09 | -0.05 | -0.09 | -0.17 | -0.09 | -2.42 | -0.08 | -0.09 | 1.37 | 0.99 | -0.04 | -0.15 | 0.07 | -0.11 | -0.11 | -0.25 | -0.17 | -0.15 | -0.15 | 0.08 | -0.32 | -0.36 | -0.02 | -0.08 | 0.07 | -0.03 | -0.08 | 0.02 | -0.00 | -0.16 | 0.18 | 0.12 | 0.33 | 0.33 | 0.22 | -0.75 | NA | NA | NA | NA | NA | NA | NA | NA | NA | NA | NA | NA | NA | NA | NA | NA | |
| Share Based Compensation | 2.90 | 2.93 | 2.94 | 0.05 | 3.28 | 3.28 | 3.98 | 1.35 | 3.09 | 2.31 | 3.84 | 0.99 | 2.35 | 3.17 | 2.43 | 1.96 | 1.29 | 1.29 | 1.80 | 0.99 | 0.68 | 0.69 | 0.82 | 0.39 | 0.36 | 0.57 | 0.65 | 0.04 | 0.00 | 0.00 | 0.26 | 0.25 | 0.26 | 0.26 | 0.28 | 0.17 | 0.25 | 0.26 | 0.46 | 0.21 | 0.19 | 0.19 | 0.36 | 0.16 | 0.77 | 0.02 | 0.02 | 0.06 | NA | NA | NA | NA |
| 2023-12-31 | 2023-09-30 | 2023-06-30 | 2023-03-31 | 2022-12-31 | 2022-09-30 | 2022-06-30 | 2022-03-31 | 2021-12-31 | 2021-09-30 | 2021-06-30 | 2021-03-31 | 2020-12-31 | 2020-09-30 | 2020-06-30 | 2020-03-31 | 2019-12-31 | 2019-09-30 | 2019-06-30 | 2019-03-31 | 2018-12-31 | 2018-09-30 | 2018-06-30 | 2018-03-31 | 2017-12-31 | 2017-09-30 | 2017-06-30 | 2017-03-31 | 2016-12-31 | 2016-09-30 | 2016-06-30 | 2016-03-31 | 2015-12-31 | 2015-09-30 | 2015-06-30 | 2015-03-31 | 2014-12-31 | 2014-09-30 | 2014-06-30 | 2014-03-31 | 2013-12-31 | 2013-09-30 | 2013-06-30 | 2013-03-31 | 2012-12-31 | 2012-09-30 | 2012-06-30 | 2012-03-31 | 2011-12-31 | 2011-09-30 | 2011-06-30 | 2010-12-31 | ||
|---|---|---|---|---|---|---|---|---|---|---|---|---|---|---|---|---|---|---|---|---|---|---|---|---|---|---|---|---|---|---|---|---|---|---|---|---|---|---|---|---|---|---|---|---|---|---|---|---|---|---|---|---|---|
| Net Cash Provided By Used In Investing Activities | -397.39 | -758.35 | -121.26 | 57.06 | 291.48 | 311.18 | -534.58 | -576.86 | -242.52 | 66.58 | 71.42 | -28.51 | -312.79 | 406.89 | 415.36 | 1608.42 | -167.22 | -51.94 | -296.52 | -253.38 | -783.71 | 8.90 | 96.02 | 36.31 | -729.91 | 149.92 | 107.24 | 42.06 | 36.51 | 14.58 | -64.77 | 47.35 | 4.22 | 162.16 | 8.51 | 109.08 | -271.94 | 94.44 | 24.64 | 27.84 | -6.71 | -29.44 | -129.21 | 13.07 | -498.28 | -501.83 | -59.76 | -6.51 | -13.87 | -19.81 | -47.50 | 12.53 | |
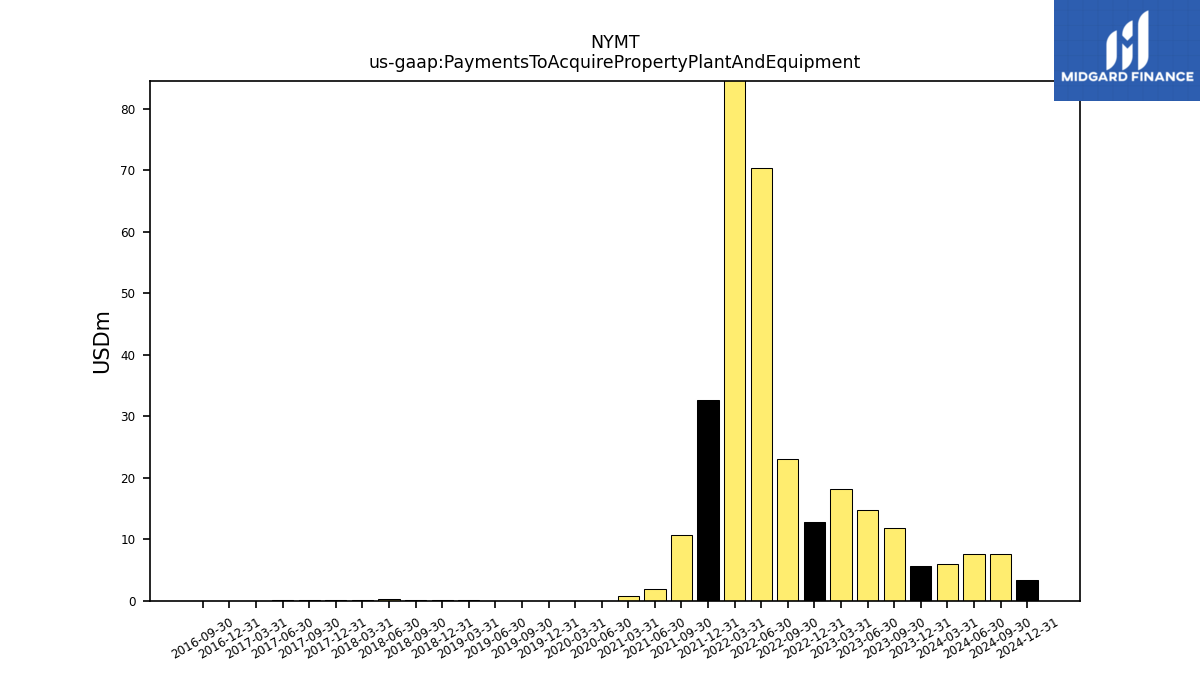
| Payments To Acquire Property Plant And Equipment | 5.61 | 11.84 | 14.83 | 18.14 | 12.75 | 23.08 | 70.42 | 103.12 | 32.59 | 10.74 | 1.90 | 0.83 | NA | NA | 0.00 | 0.00 | 0.00 | 0.00 | 0.00 | 0.13 | 0.15 | 0.06 | 0.21 | 0.05 | 0.10 | 0.09 | 0.10 | 0.00 | 0.00 | 0.00 | NA | NA | NA | NA | NA | NA | NA | NA | NA | NA | NA | NA | NA | NA | NA | NA | NA | NA | NA | NA | NA | NA |
| 2023-12-31 | 2023-09-30 | 2023-06-30 | 2023-03-31 | 2022-12-31 | 2022-09-30 | 2022-06-30 | 2022-03-31 | 2021-12-31 | 2021-09-30 | 2021-06-30 | 2021-03-31 | 2020-12-31 | 2020-09-30 | 2020-06-30 | 2020-03-31 | 2019-12-31 | 2019-09-30 | 2019-06-30 | 2019-03-31 | 2018-12-31 | 2018-09-30 | 2018-06-30 | 2018-03-31 | 2017-12-31 | 2017-09-30 | 2017-06-30 | 2017-03-31 | 2016-12-31 | 2016-09-30 | 2016-06-30 | 2016-03-31 | 2015-12-31 | 2015-09-30 | 2015-06-30 | 2015-03-31 | 2014-12-31 | 2014-09-30 | 2014-06-30 | 2014-03-31 | 2013-12-31 | 2013-09-30 | 2013-06-30 | 2013-03-31 | 2012-12-31 | 2012-09-30 | 2012-06-30 | 2012-03-31 | 2011-12-31 | 2011-09-30 | 2011-06-30 | 2010-12-31 | ||
|---|---|---|---|---|---|---|---|---|---|---|---|---|---|---|---|---|---|---|---|---|---|---|---|---|---|---|---|---|---|---|---|---|---|---|---|---|---|---|---|---|---|---|---|---|---|---|---|---|---|---|---|---|---|
| Net Cash Provided By Used In Financing Activities | 359.52 | 739.93 | 123.83 | -83.60 | -398.87 | -388.16 | 642.27 | 604.82 | 88.79 | -40.59 | -40.22 | 19.51 | -121.51 | -143.61 | -376.55 | -1404.09 | 213.28 | -36.59 | 367.49 | 202.25 | 821.99 | -41.74 | -66.43 | -92.57 | 706.23 | -143.67 | -140.12 | -45.16 | -27.47 | -19.83 | 69.28 | -87.90 | -73.75 | -158.34 | -0.16 | -101.69 | 310.12 | -149.22 | -35.93 | 6.29 | 9.78 | -20.25 | 150.31 | -40.84 | 475.74 | 531.54 | 52.63 | -7.43 | 12.84 | 20.52 | 41.25 | -32.23 | |
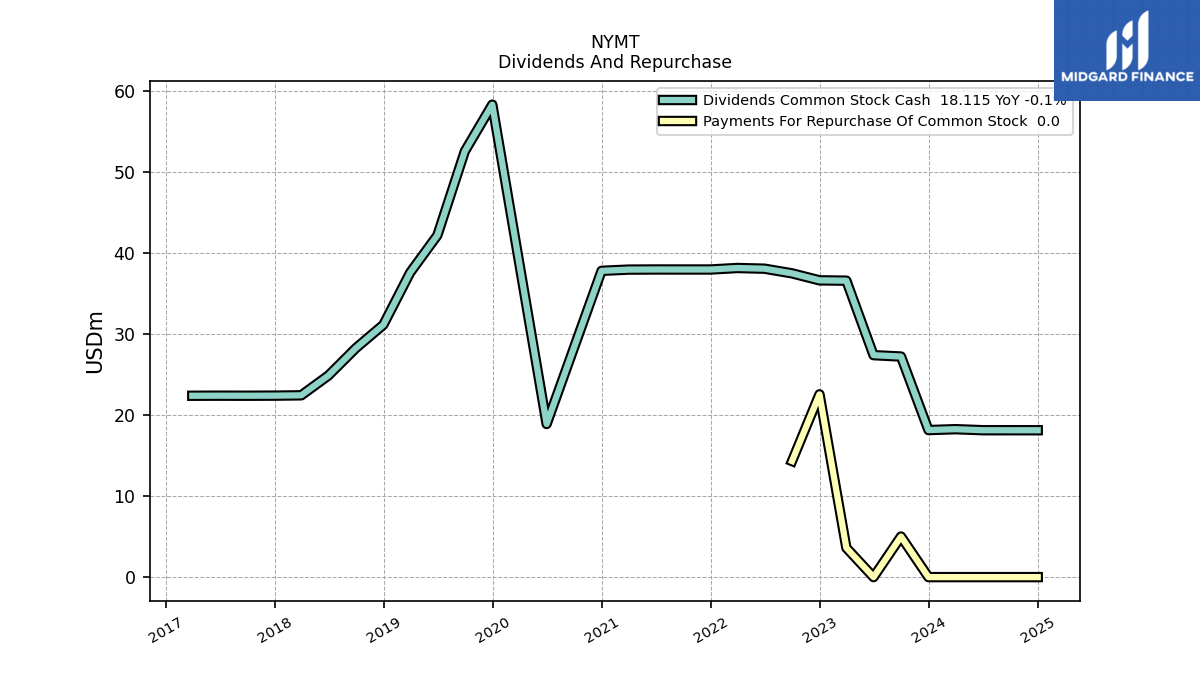
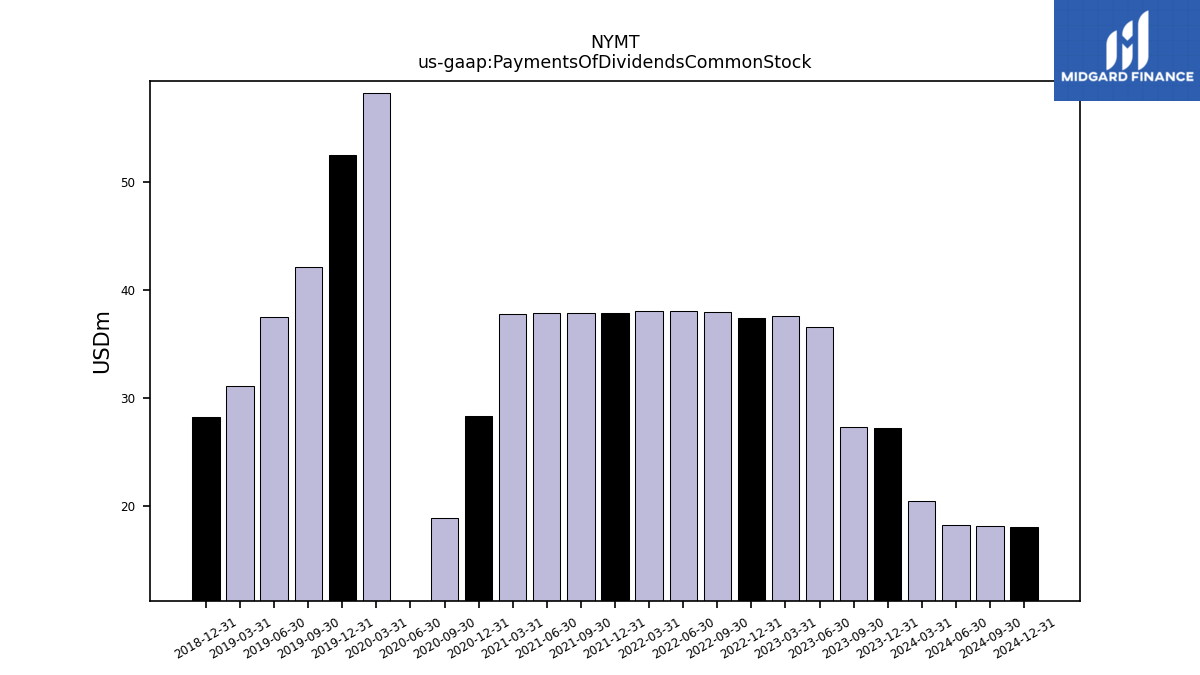
| Payments Of Dividends Common Stock | 27.21 | 27.38 | 36.56 | 37.66 | 37.47 | 38.04 | 38.12 | 38.12 | 37.94 | 37.94 | 37.93 | 37.81 | 28.33 | 18.89 | 0.00 | 58.27 | 52.52 | 42.16 | 37.57 | 31.12 | 28.24 | NA | NA | NA | NA | NA | NA | NA | NA | NA | NA | NA | NA | NA | NA | NA | NA | NA | NA | NA | NA | NA | NA | NA | NA | NA | NA | NA | NA | NA | NA | NA | |
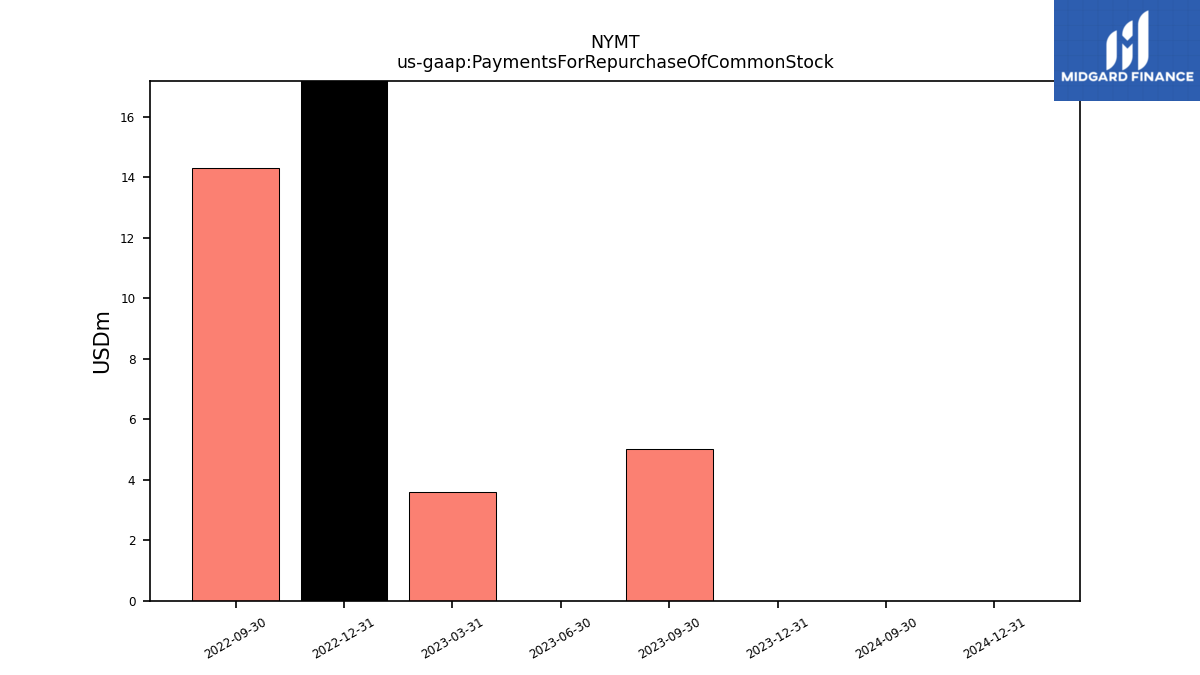
| Payments For Repurchase Of Common Stock | 0.00 | 5.00 | 0.00 | 3.61 | 22.54 | 14.31 | NA | NA | NA | NA | NA | NA | NA | NA | NA | NA | NA | NA | NA | NA | NA | NA | NA | NA | NA | NA | NA | NA | NA | NA | NA | NA | NA | NA | NA | NA | NA | NA | NA | NA | NA | NA | NA | NA | NA | NA | NA | NA | NA | NA | NA | NA |
