
| 2023-12-30 | 2023-09-30 | 2023-07-01 | 2023-04-01 | 2022-12-31 | 2022-10-01 | 2022-07-02 | 2022-04-02 | 2021-09-25 | 2021-06-26 | 2021-03-27 | 2020-12-26 | 2020-09-26 | 2020-06-27 | 2020-03-28 | 2019-12-31 | 2019-09-30 | 2019-09-28 | 2019-06-30 | 2019-06-29 | 2019-03-31 | 2019-03-30 | 2018-12-31 | 2018-12-29 | 2018-09-30 | 2018-09-29 | 2018-06-30 | 2018-03-31 | 2017-12-31 | 2017-12-30 | 2017-09-30 | 2017-07-01 | 2017-04-01 | 2016-12-31 | 2016-09-24 | 2016-06-25 | 2016-03-26 | 2015-12-26 | 2015-09-26 | 2015-06-27 | 2015-03-28 | 2014-12-27 | 2014-09-27 | 2014-06-28 | 2014-03-29 | 2013-12-28 | 2013-09-28 | 2013-06-29 | 2013-03-30 | 2012-12-29 | 2012-09-29 | 2012-06-30 | 2012-03-31 | 2011-12-31 | 2011-10-01 | 2011-07-02 | 2011-04-02 | 2011-01-01 | 2010-10-02 | 2010-07-03 | ||
|---|---|---|---|---|---|---|---|---|---|---|---|---|---|---|---|---|---|---|---|---|---|---|---|---|---|---|---|---|---|---|---|---|---|---|---|---|---|---|---|---|---|---|---|---|---|---|---|---|---|---|---|---|---|---|---|---|---|---|---|---|---|
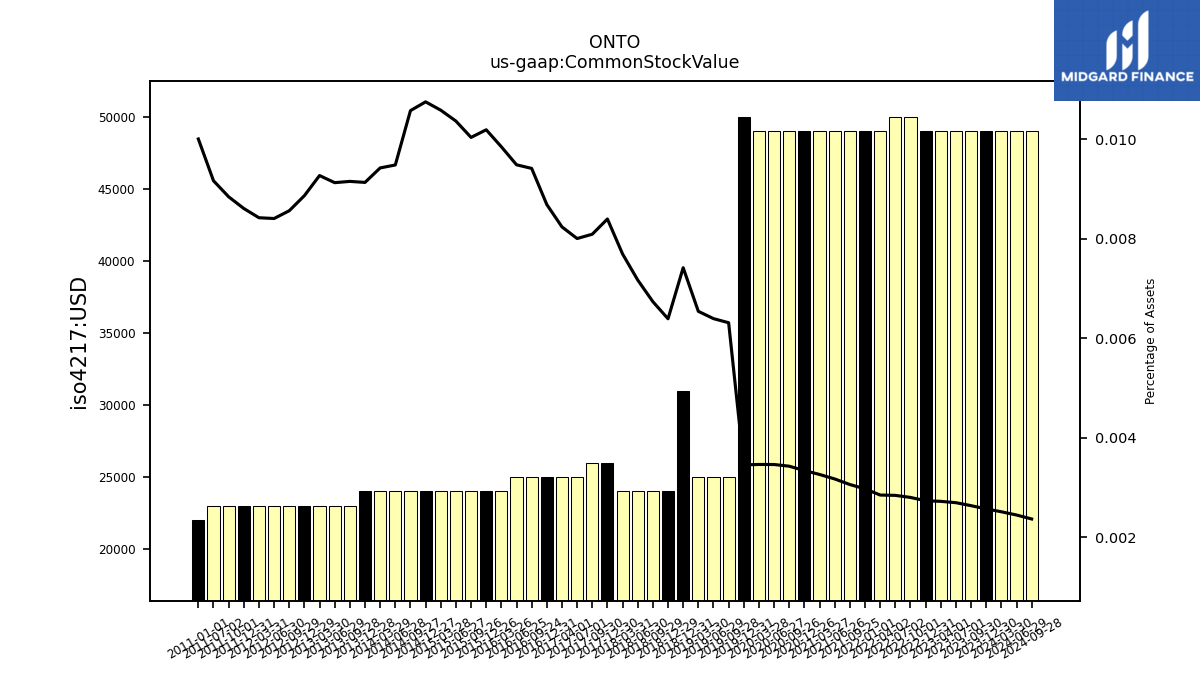
| Common Stock Value | 0.05 | 0.05 | 0.05 | 0.05 | 0.05 | 0.05 | 0.05 | 0.05 | 0.05 | 0.05 | 0.05 | 0.05 | 0.05 | 0.05 | 0.05 | 0.05 | NA | 0.03 | NA | 0.03 | NA | 0.03 | 0.03 | 0.02 | NA | 0.02 | 0.02 | 0.02 | NA | 0.03 | 0.03 | 0.03 | 0.03 | 0.03 | 0.03 | 0.03 | 0.02 | 0.02 | 0.02 | 0.02 | 0.02 | 0.02 | 0.02 | 0.02 | 0.02 | 0.02 | 0.02 | 0.02 | 0.02 | 0.02 | 0.02 | 0.02 | 0.02 | 0.02 | 0.02 | 0.02 | NA | 0.02 | NA | NA | |
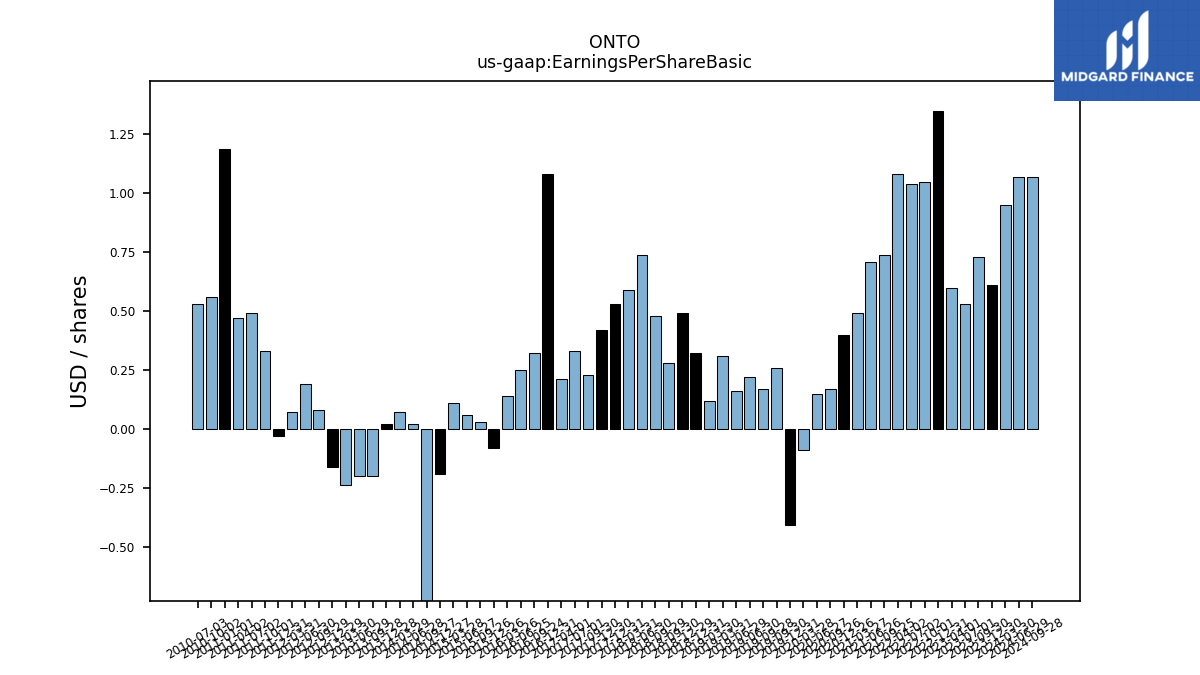
| Earnings Per Share Basic | 0.61 | 0.73 | 0.53 | 0.60 | 1.35 | 1.05 | 1.04 | 1.08 | 0.74 | 0.71 | 0.49 | 0.40 | 0.17 | 0.15 | -0.09 | -0.41 | 0.26 | 0.17 | 0.22 | 0.16 | 0.31 | 0.12 | 0.32 | 0.49 | 0.28 | 0.48 | 0.74 | 0.59 | 0.53 | 0.42 | 0.23 | 0.33 | 0.21 | 1.08 | 0.32 | 0.25 | 0.14 | -0.08 | 0.03 | 0.06 | 0.11 | -0.19 | -1.19 | 0.02 | 0.07 | 0.02 | -0.20 | -0.20 | -0.24 | -0.16 | 0.08 | 0.19 | 0.07 | -0.03 | 0.33 | 0.49 | 0.47 | 1.19 | 0.56 | 0.53 | |
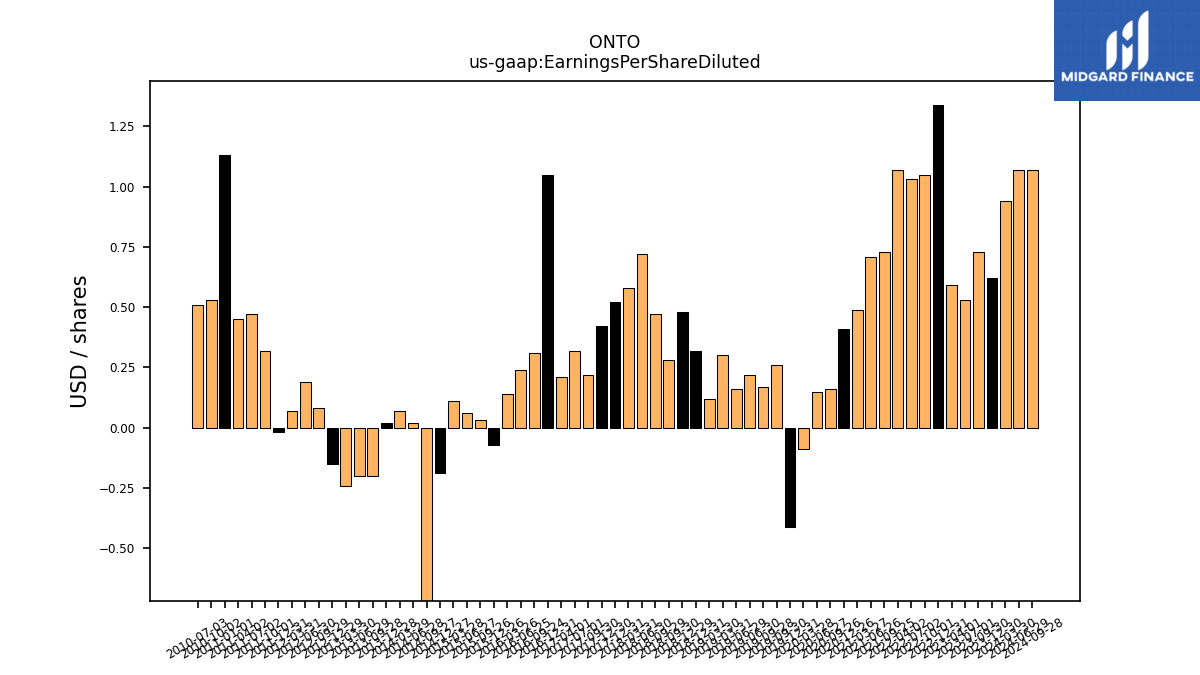
| Earnings Per Share Diluted | 0.62 | 0.73 | 0.53 | 0.59 | 1.34 | 1.05 | 1.03 | 1.07 | 0.73 | 0.71 | 0.49 | 0.41 | 0.16 | 0.15 | -0.09 | -0.41 | 0.26 | 0.17 | 0.22 | 0.16 | 0.30 | 0.12 | 0.32 | 0.48 | 0.28 | 0.47 | 0.72 | 0.58 | 0.52 | 0.42 | 0.22 | 0.32 | 0.21 | 1.05 | 0.31 | 0.24 | 0.14 | -0.07 | 0.03 | 0.06 | 0.11 | -0.19 | -1.19 | 0.02 | 0.07 | 0.02 | -0.20 | -0.20 | -0.24 | -0.15 | 0.08 | 0.19 | 0.07 | -0.02 | 0.32 | 0.47 | 0.45 | 1.13 | 0.53 | 0.51 |
| 2023-12-30 | 2023-09-30 | 2023-07-01 | 2023-04-01 | 2022-12-31 | 2022-10-01 | 2022-07-02 | 2022-04-02 | 2021-09-25 | 2021-06-26 | 2021-03-27 | 2020-12-26 | 2020-09-26 | 2020-06-27 | 2020-03-28 | 2019-12-31 | 2019-09-30 | 2019-09-28 | 2019-06-30 | 2019-06-29 | 2019-03-31 | 2019-03-30 | 2018-12-31 | 2018-12-29 | 2018-09-30 | 2018-09-29 | 2018-06-30 | 2018-03-31 | 2017-12-31 | 2017-12-30 | 2017-09-30 | 2017-07-01 | 2017-04-01 | 2016-12-31 | 2016-09-24 | 2016-06-25 | 2016-03-26 | 2015-12-26 | 2015-09-26 | 2015-06-27 | 2015-03-28 | 2014-12-27 | 2014-09-27 | 2014-06-28 | 2014-03-29 | 2013-12-28 | 2013-09-28 | 2013-06-29 | 2013-03-30 | 2012-12-29 | 2012-09-29 | 2012-06-30 | 2012-03-31 | 2011-12-31 | 2011-10-01 | 2011-07-02 | 2011-04-02 | 2011-01-01 | 2010-10-02 | 2010-07-03 | ||
|---|---|---|---|---|---|---|---|---|---|---|---|---|---|---|---|---|---|---|---|---|---|---|---|---|---|---|---|---|---|---|---|---|---|---|---|---|---|---|---|---|---|---|---|---|---|---|---|---|---|---|---|---|---|---|---|---|---|---|---|---|---|
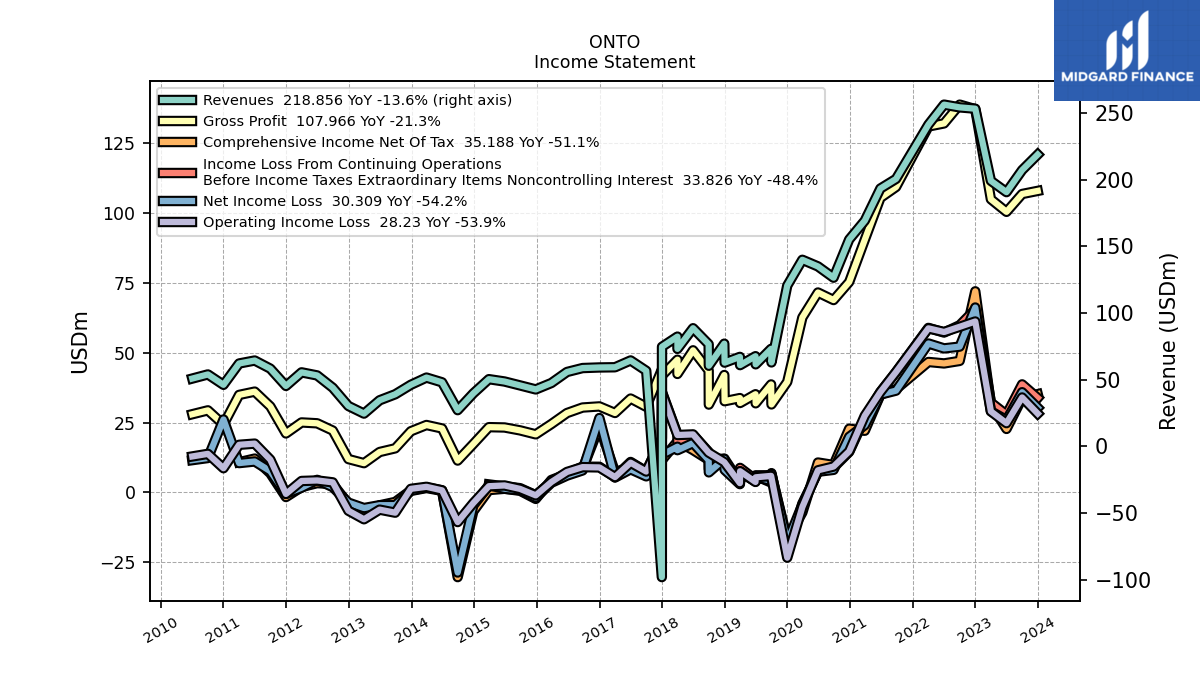
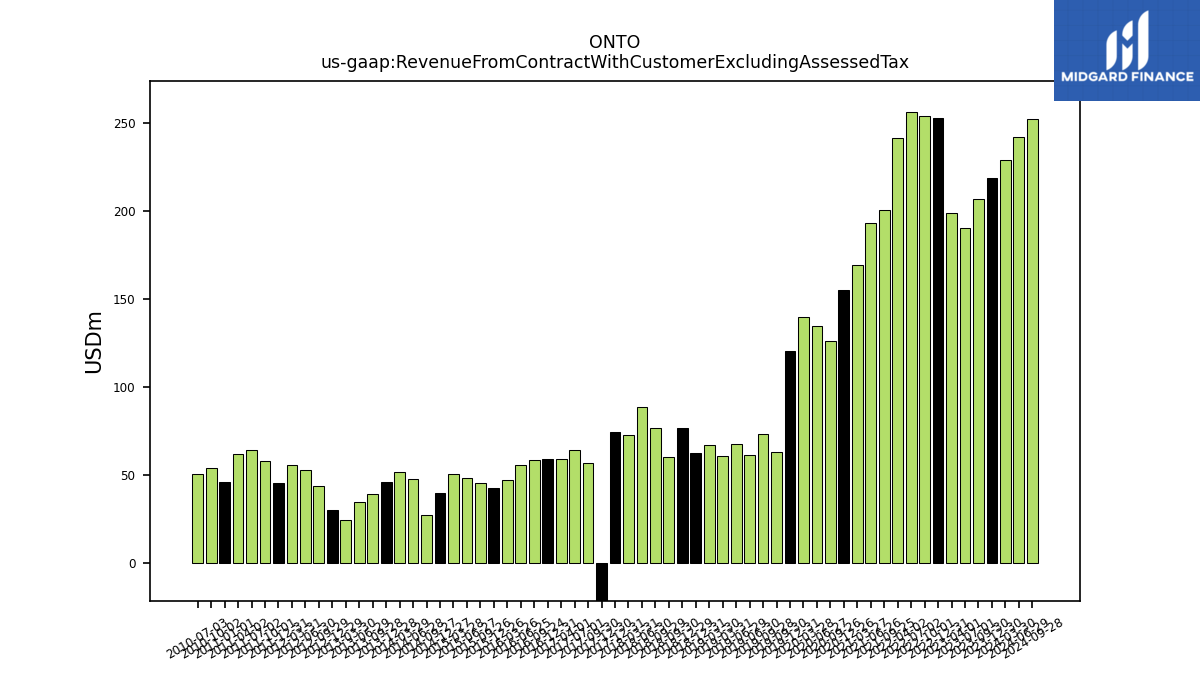
| Revenue From Contract With Customer Excluding Assessed Tax | 218.86 | 207.19 | 190.66 | 199.16 | 253.27 | 254.25 | 256.31 | 241.35 | 200.59 | 193.39 | 169.28 | 155.13 | 126.49 | 134.95 | 139.93 | 120.56 | 62.94 | 73.12 | 61.51 | 67.62 | 60.89 | 67.10 | 62.78 | 77.02 | 60.43 | 76.59 | 88.60 | 73.10 | 74.68 | -98.10 | 56.67 | 64.43 | 59.31 | 59.16 | 58.71 | 55.77 | 47.49 | 42.69 | 45.68 | 48.63 | 50.38 | 39.70 | 27.13 | 48.03 | 51.58 | 46.16 | 39.04 | 34.55 | 24.55 | 30.27 | 43.94 | 53.18 | 55.49 | 45.28 | 58.27 | 64.37 | 62.14 | 46.13 | 53.94 | 50.84 | |
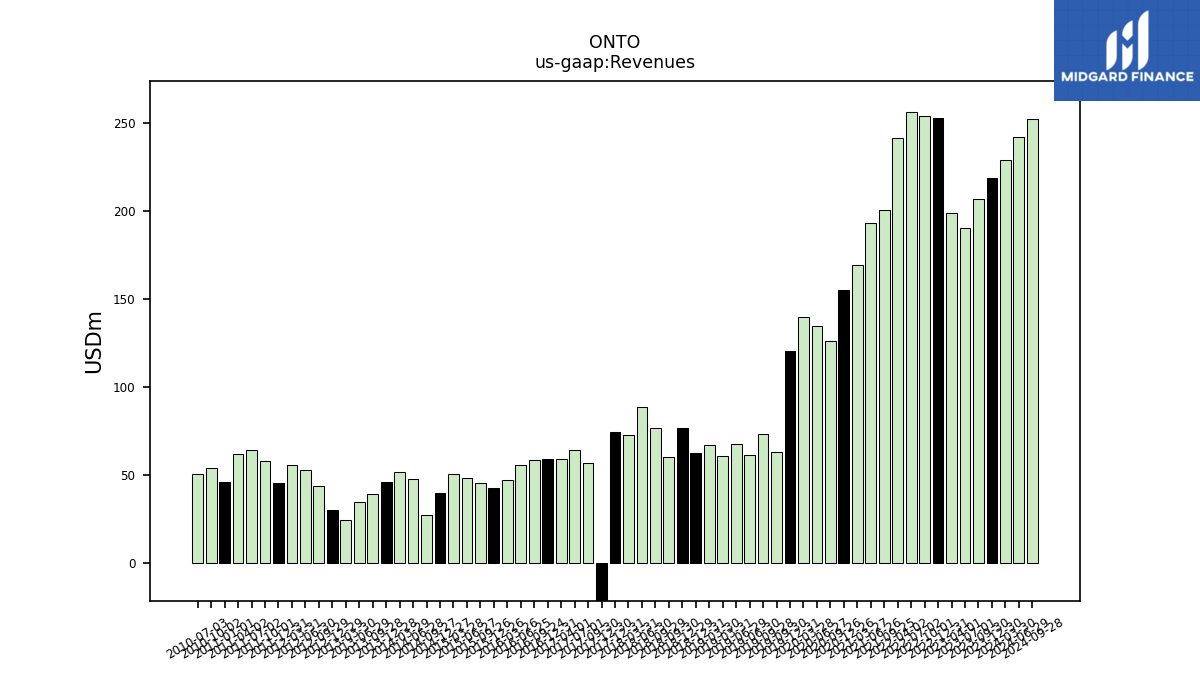
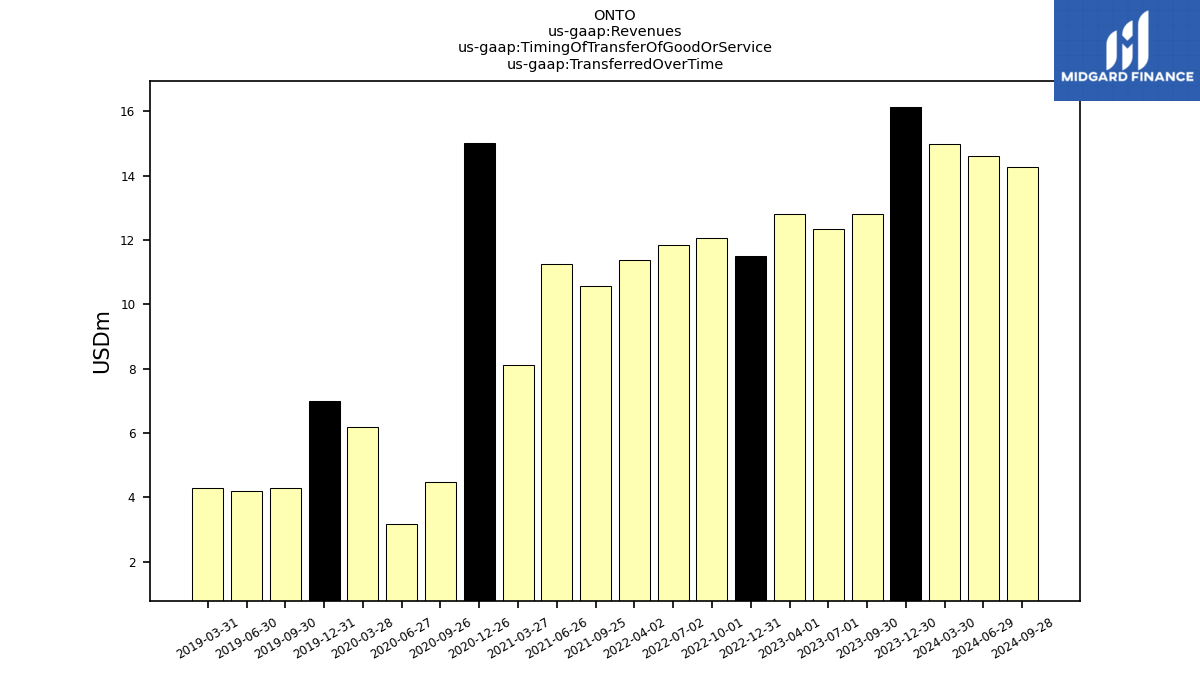
| Revenues | 218.86 | 207.19 | 190.66 | 199.16 | 253.27 | 254.25 | 256.31 | 241.35 | 200.59 | 193.39 | 169.28 | 155.13 | 126.49 | 134.95 | 139.93 | 120.56 | 62.94 | 73.12 | 61.51 | 67.62 | 60.89 | 67.10 | 62.78 | 77.02 | 60.43 | 76.59 | 88.60 | 73.10 | 74.68 | -98.10 | 56.67 | 64.43 | 59.31 | 59.16 | 58.71 | 55.77 | 47.49 | 42.69 | 45.68 | 48.63 | 50.38 | 39.70 | 27.13 | 48.03 | 51.58 | 46.16 | 39.04 | 34.55 | 24.55 | 30.27 | 43.94 | 53.18 | 55.49 | 45.28 | 58.27 | 64.37 | 62.14 | 46.13 | 53.94 | 50.84 | |
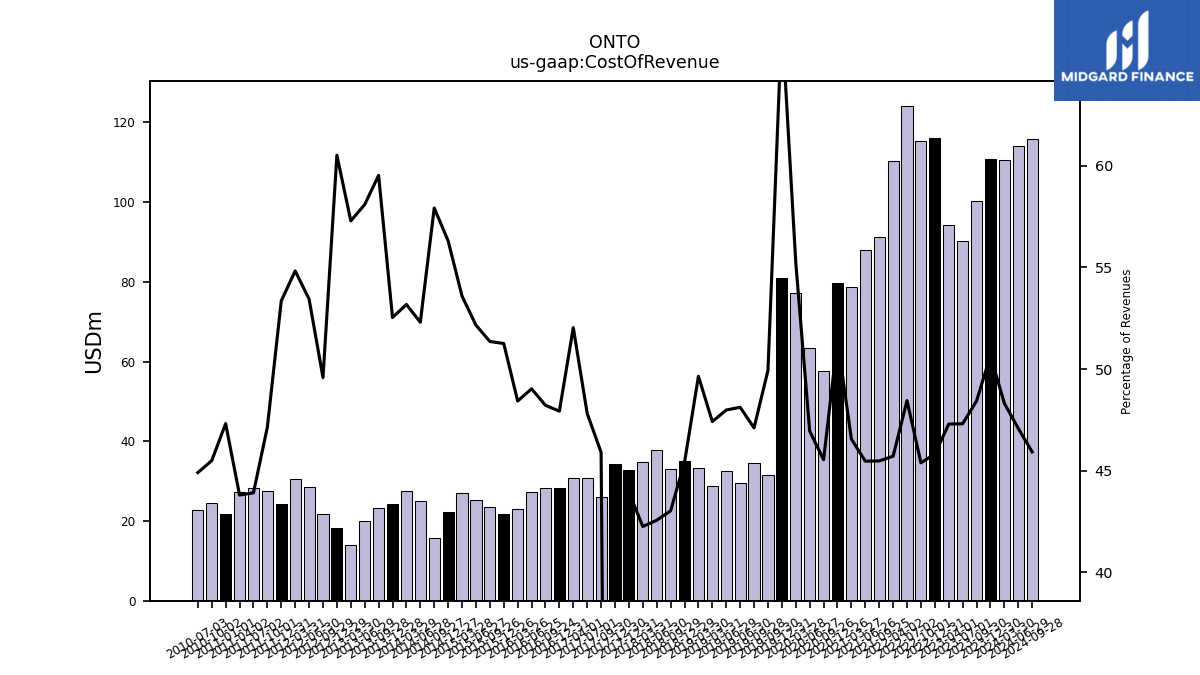
| Cost Of Revenue | 110.89 | 100.33 | 90.20 | 94.19 | 116.05 | 115.40 | 124.18 | 110.33 | 91.23 | 87.93 | 78.81 | 79.78 | 57.60 | 63.36 | 77.30 | 80.97 | 31.42 | 34.45 | 29.60 | 32.45 | 28.87 | 33.31 | NA | 34.98 | NA | 32.96 | 37.71 | 34.78 | 32.81 | 34.23 | 26.02 | 30.81 | 30.87 | 28.36 | 28.31 | 27.34 | 23.00 | 21.88 | 23.46 | 25.36 | 27.00 | 22.36 | 15.72 | 25.12 | 27.43 | 24.25 | 23.24 | 20.07 | 14.07 | 18.32 | 21.79 | 28.42 | 30.43 | 24.16 | 27.47 | 28.27 | 27.22 | 21.83 | 24.54 | 22.83 | |
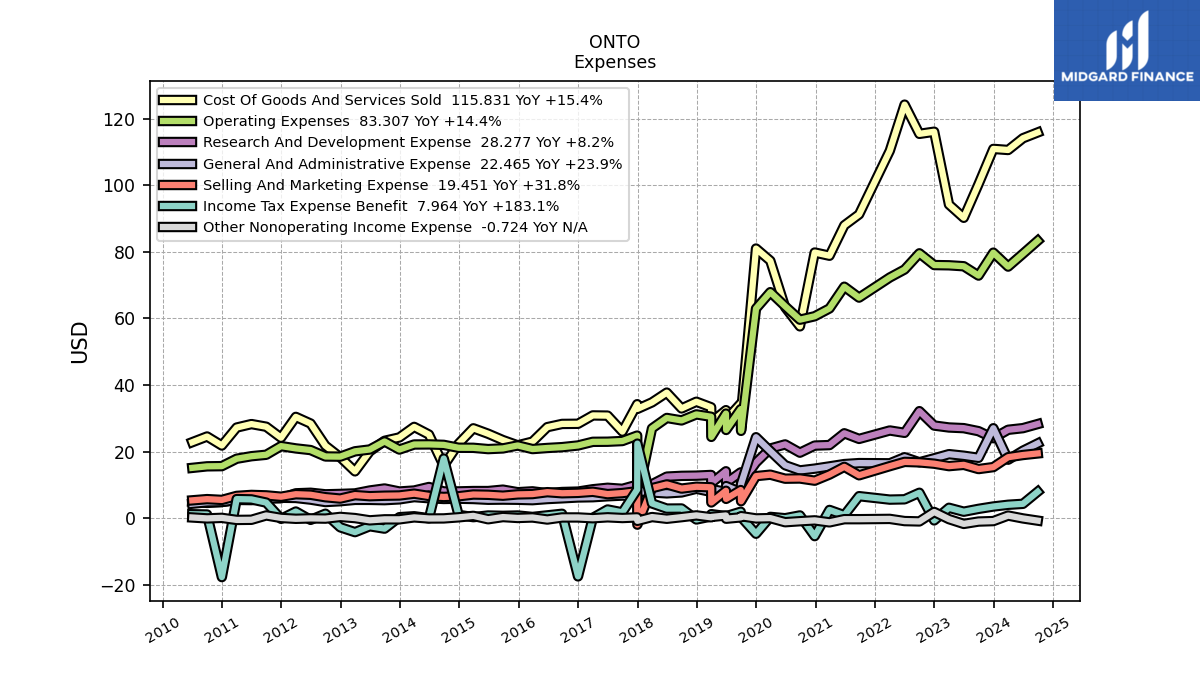
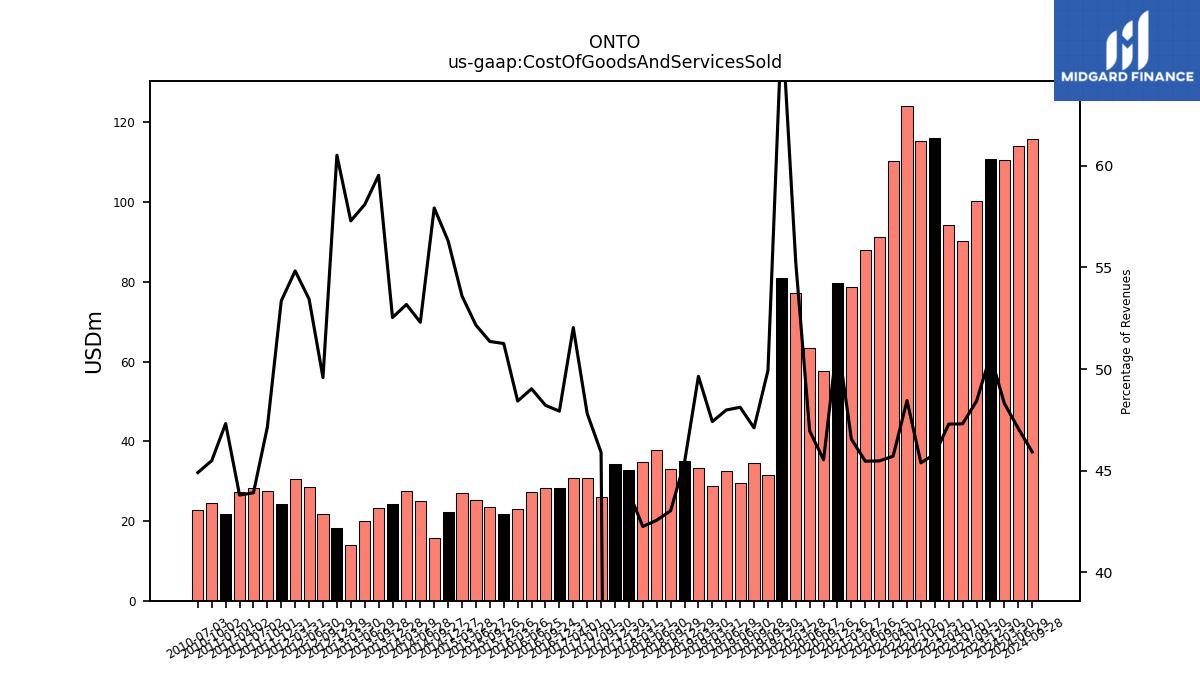
| Cost Of Goods And Services Sold | 110.89 | 100.33 | 90.20 | 94.19 | 116.05 | 115.40 | 124.18 | 110.33 | 91.23 | 87.93 | 78.81 | 79.78 | 57.60 | 63.36 | 77.30 | 80.97 | 31.42 | 34.45 | 29.60 | 32.45 | 28.87 | 33.31 | NA | 34.98 | NA | 32.96 | 37.71 | 34.78 | 32.81 | 34.23 | 26.02 | 30.81 | 30.87 | 28.36 | 28.31 | 27.34 | 23.00 | 21.88 | 23.46 | 25.36 | 27.00 | 22.36 | 15.72 | 25.12 | 27.43 | 24.25 | 23.24 | 20.07 | 14.07 | 18.32 | 21.79 | 28.42 | 30.43 | 24.16 | 27.47 | 28.27 | 27.22 | 21.83 | 24.54 | 22.83 | |
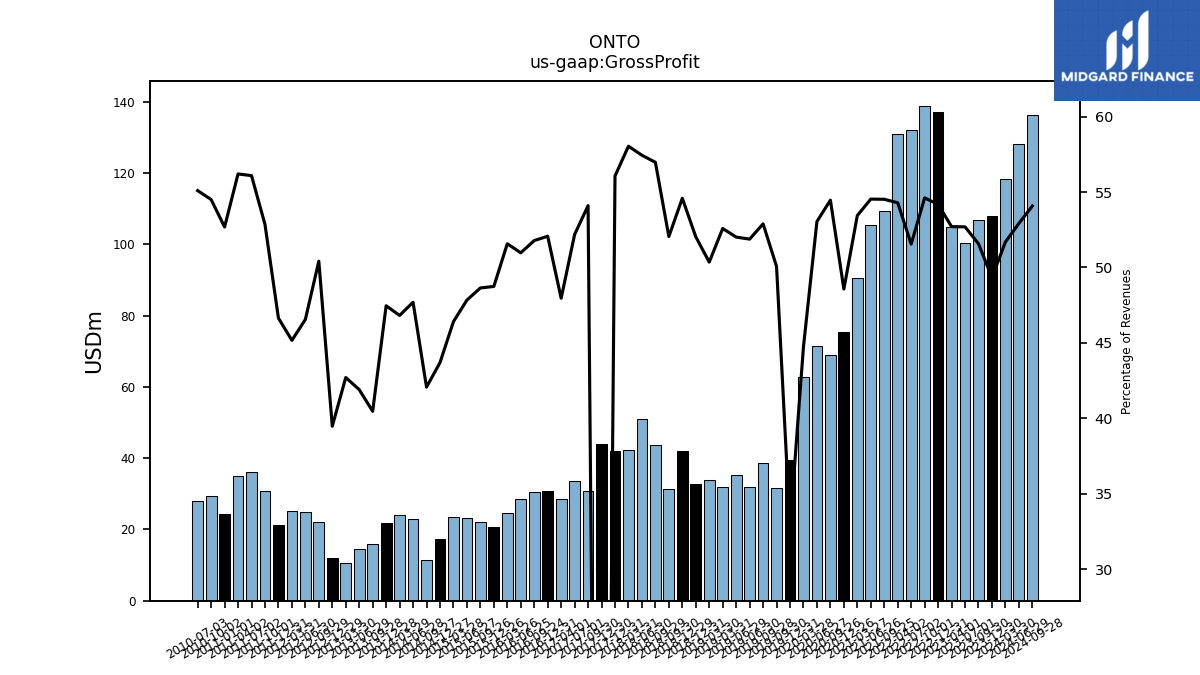
| Gross Profit | 107.97 | 106.85 | 100.46 | 104.97 | 137.22 | 138.85 | 132.13 | 131.02 | 109.36 | 105.46 | 90.47 | 75.35 | 68.89 | 71.58 | 62.63 | 39.59 | 31.51 | 38.68 | 31.91 | 35.17 | 32.02 | 33.79 | 32.67 | 42.04 | 31.45 | 43.63 | 50.89 | 42.42 | 41.87 | 43.97 | 30.66 | 33.62 | 28.45 | 30.80 | 30.40 | 28.43 | 24.49 | 20.81 | 22.22 | 23.26 | 23.38 | 17.35 | 11.42 | 22.91 | 24.15 | 21.91 | 15.80 | 14.48 | 10.49 | 11.95 | 22.15 | 24.76 | 25.07 | 21.12 | 30.80 | 36.10 | 34.92 | 24.30 | 29.40 | 28.01 | |
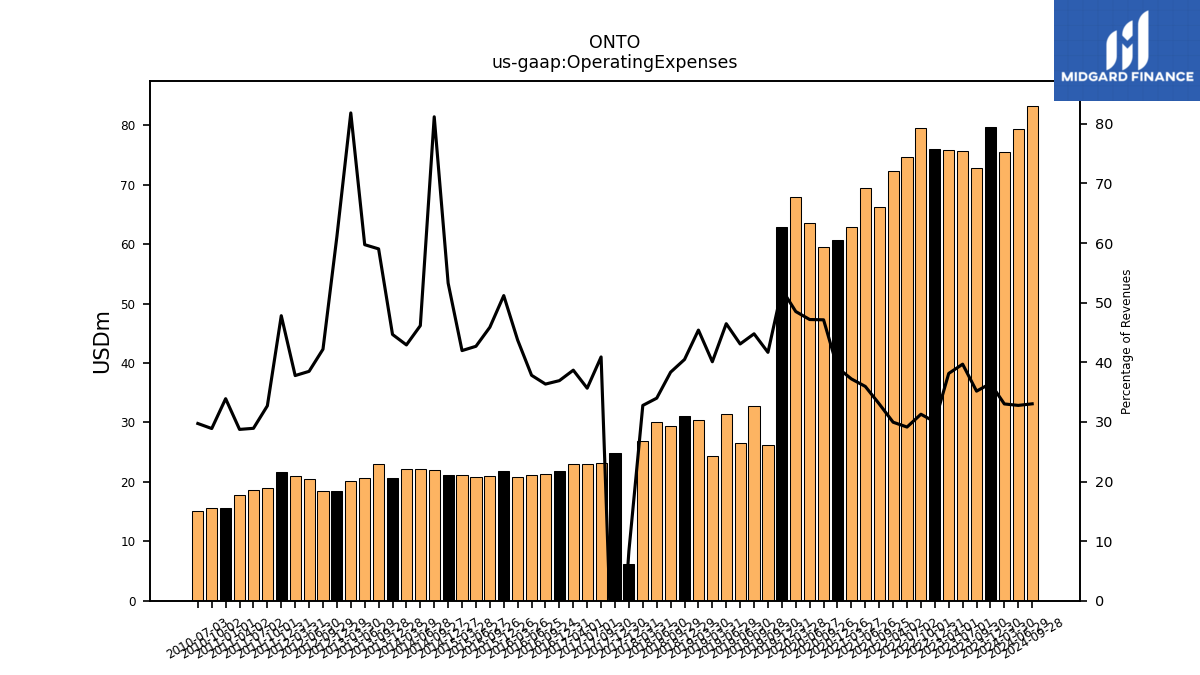
| Operating Expenses | 79.74 | 72.85 | 75.65 | 75.94 | 76.01 | 79.54 | 74.68 | 72.28 | 66.23 | 69.52 | 62.98 | 60.64 | 59.61 | 63.66 | 67.88 | 62.95 | 26.22 | 32.74 | 26.49 | 31.42 | 24.41 | 30.46 | NA | 31.17 | NA | 29.36 | 30.11 | 26.97 | 6.22 | 24.81 | 23.18 | 22.97 | 22.94 | 21.84 | 21.34 | 21.09 | 20.76 | 21.85 | 20.95 | 20.75 | 21.14 | 21.16 | 22.02 | 22.16 | 22.13 | 20.62 | 23.04 | 20.64 | 20.09 | 18.49 | 18.54 | 20.46 | 20.96 | 21.65 | 19.05 | 18.62 | 17.86 | 15.63 | 15.58 | 15.11 | |
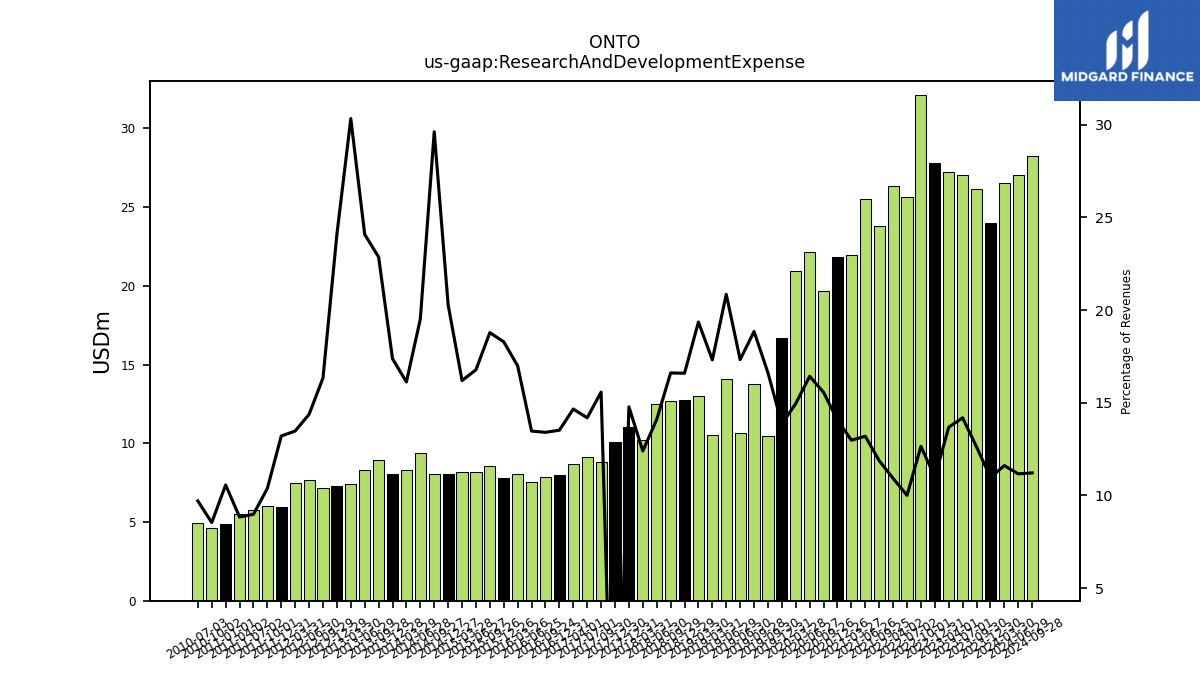
| Research And Development Expense | 24.02 | 26.14 | 27.04 | 27.24 | 27.82 | 32.15 | 25.64 | 26.34 | 23.81 | 25.51 | 21.96 | 21.81 | 19.68 | 22.17 | 20.93 | 16.70 | 10.46 | 13.78 | 10.66 | 14.10 | 10.54 | 12.99 | NA | 12.78 | NA | 12.72 | 12.49 | 10.20 | 11.04 | 10.06 | 8.82 | 9.14 | 8.69 | 8.00 | 7.87 | 7.51 | 8.07 | 7.80 | 8.58 | 8.16 | 8.16 | 8.05 | 8.04 | 9.37 | 8.31 | 8.02 | 8.93 | 8.32 | 7.45 | 7.29 | 7.18 | 7.64 | 7.48 | 5.98 | 6.04 | 5.78 | 5.49 | 4.87 | 4.60 | 4.93 | |
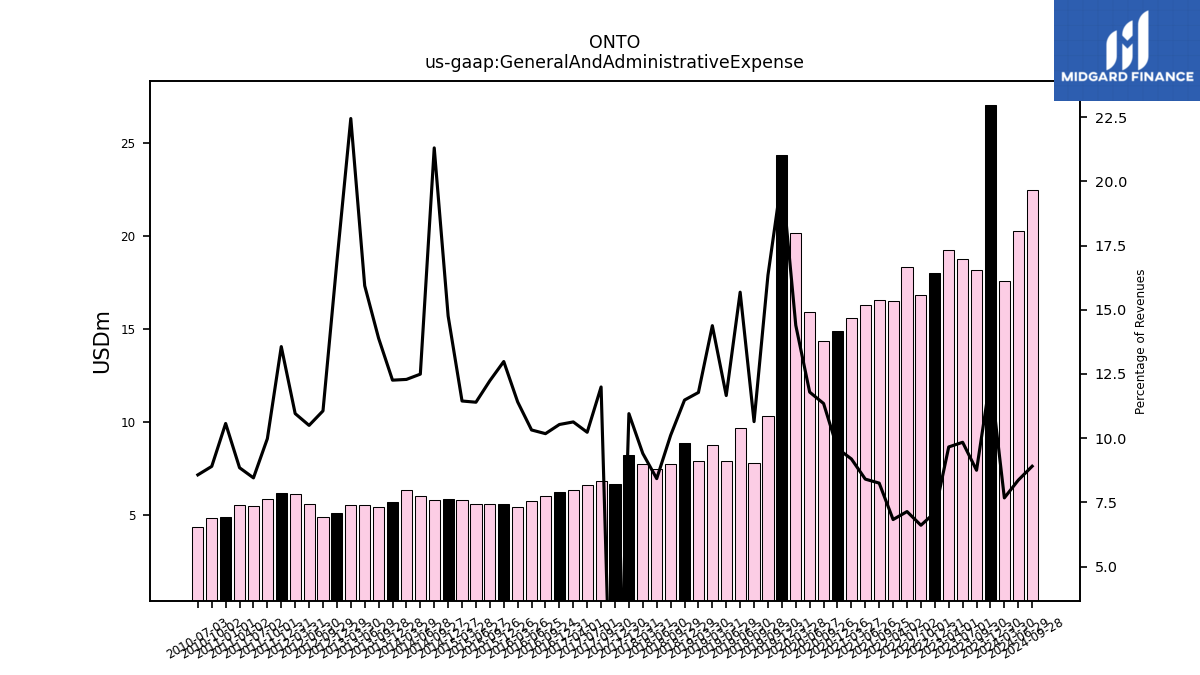
| General And Administrative Expense | 27.02 | 18.13 | 18.76 | 19.24 | 17.99 | 16.80 | 18.31 | 16.49 | 16.55 | 16.25 | 15.56 | 14.89 | 14.36 | 15.92 | 20.15 | 24.32 | 10.29 | 7.78 | 9.65 | 7.88 | 8.76 | 7.91 | NA | 8.85 | NA | 7.74 | 7.46 | 7.74 | 8.18 | 6.64 | 6.80 | 6.59 | 6.31 | 6.23 | 5.97 | 5.75 | 5.42 | 5.54 | 5.59 | 5.54 | 5.77 | 5.86 | 5.78 | 6.00 | 6.34 | 5.66 | 5.42 | 5.51 | 5.51 | 5.11 | 4.86 | 5.58 | 6.08 | 6.14 | 5.82 | 5.44 | 5.50 | 4.88 | 4.80 | 4.36 | |
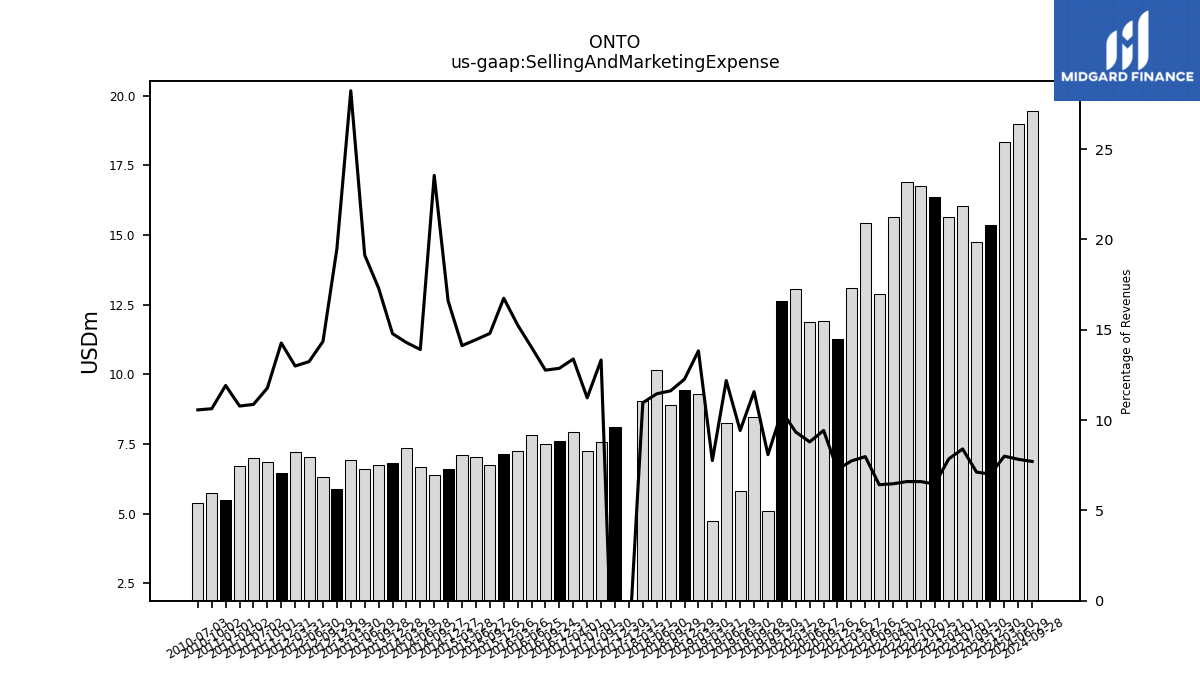
| Selling And Marketing Expense | 15.35 | 14.76 | 16.02 | 15.64 | 16.37 | 16.77 | 16.91 | 15.63 | 12.88 | 15.43 | 13.10 | 11.27 | 11.92 | 11.87 | 13.07 | 12.64 | 5.09 | 8.46 | 5.80 | 8.24 | 4.73 | 9.28 | NA | 9.45 | NA | 8.90 | 10.15 | 9.02 | -1.94 | 8.11 | 7.55 | 7.24 | 7.94 | 7.61 | 7.50 | 7.82 | 7.25 | 7.15 | 6.76 | 7.03 | 7.12 | 6.59 | 6.39 | 6.68 | 7.37 | 6.83 | 6.76 | 6.61 | 6.93 | 5.90 | 6.31 | 7.04 | 7.21 | 6.46 | 6.86 | 7.00 | 6.70 | 5.50 | 5.73 | 5.37 | |
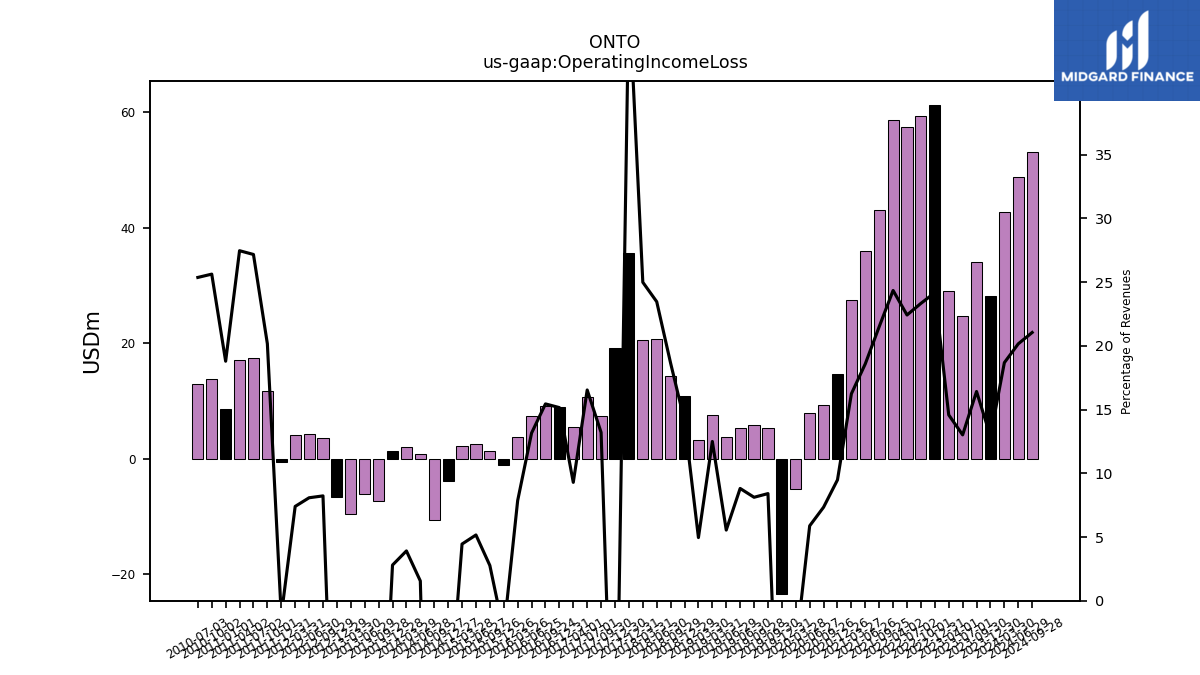
| Operating Income Loss | 28.23 | 34.01 | 24.81 | 29.04 | 61.21 | 59.31 | 57.45 | 58.74 | 43.13 | 35.94 | 27.48 | 14.71 | 9.28 | 7.93 | -5.25 | -23.36 | 5.29 | 5.93 | 5.42 | 3.75 | 7.61 | 3.33 | NA | 10.87 | NA | 14.27 | 20.78 | 20.56 | 35.64 | 19.16 | 7.48 | 10.65 | 5.51 | 8.96 | 9.07 | 7.34 | 3.73 | -1.04 | 1.26 | 2.51 | 2.24 | -3.81 | -10.61 | 0.75 | 2.02 | 1.29 | -7.24 | -6.16 | -9.60 | -6.54 | 3.61 | 4.30 | 4.11 | -0.53 | 11.75 | 17.48 | 17.06 | 8.67 | 13.82 | 12.89 | |
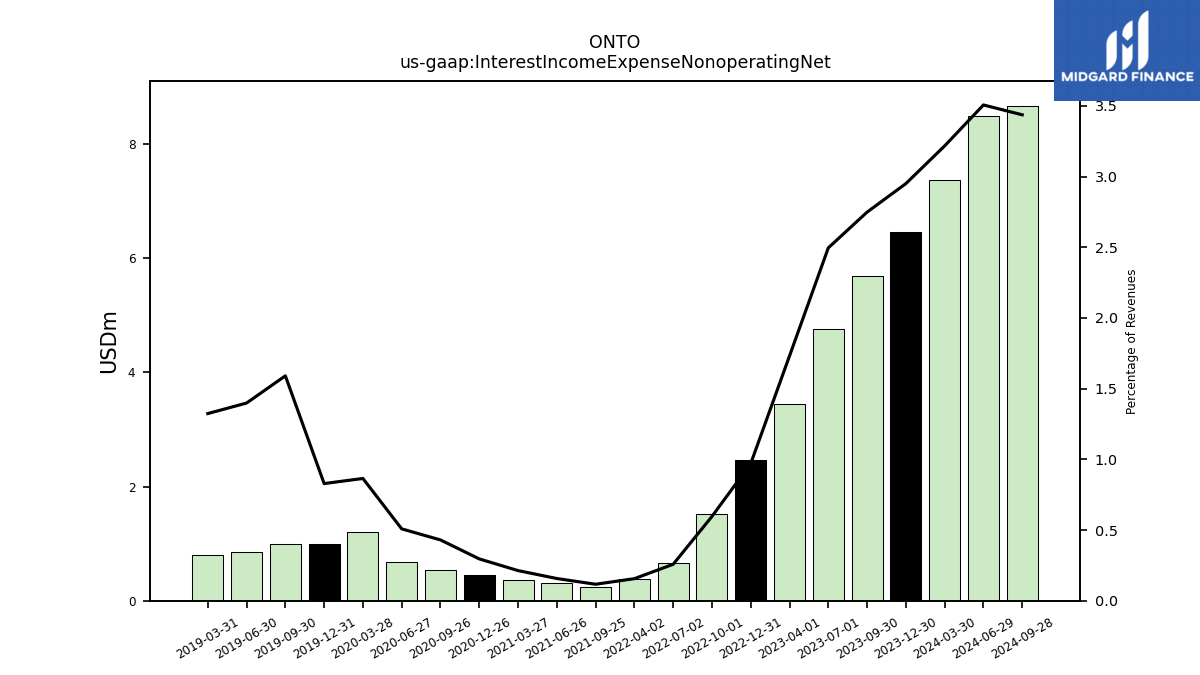
| Interest Income Expense Nonoperating Net | 6.46 | 5.69 | 4.76 | 3.45 | 2.46 | 1.52 | 0.66 | 0.38 | 0.23 | 0.30 | 0.36 | 0.46 | 0.54 | 0.69 | 1.21 | 1.00 | 1.00 | NA | 0.86 | NA | 0.81 | NA | NA | NA | NA | NA | NA | NA | NA | NA | NA | NA | NA | NA | NA | NA | NA | NA | NA | NA | NA | NA | NA | NA | NA | NA | NA | NA | NA | NA | NA | NA | NA | NA | NA | NA | NA | NA | NA | NA | |
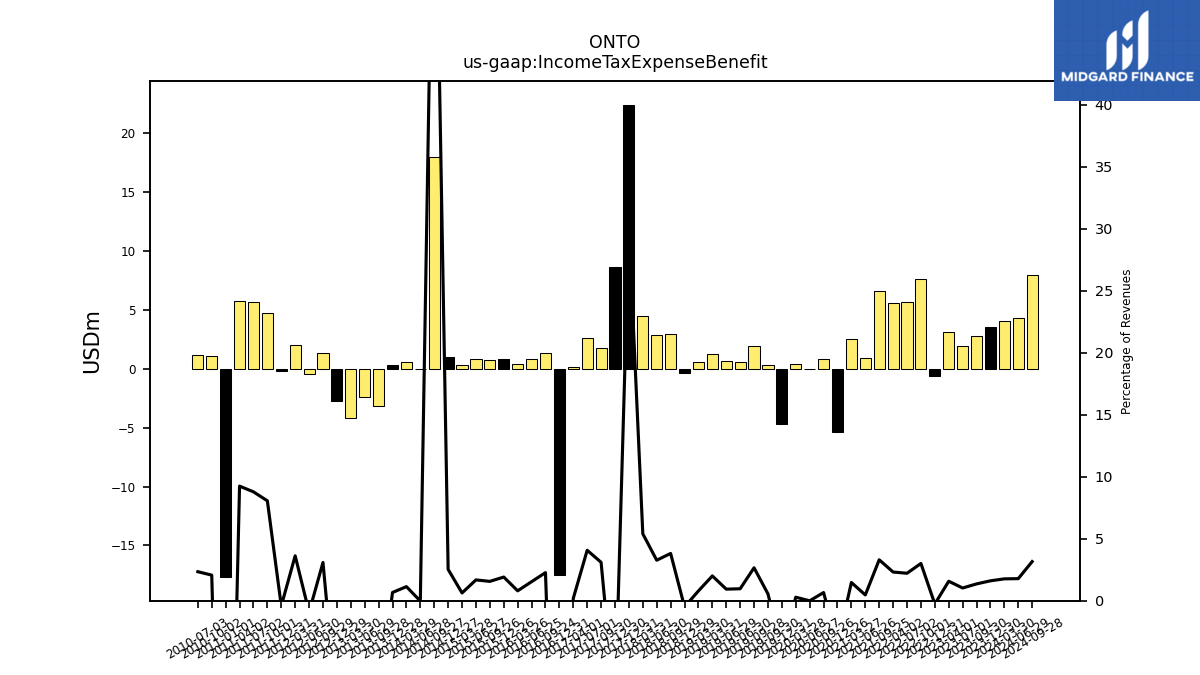
| Income Tax Expense Benefit | 3.52 | 2.81 | 1.96 | 3.13 | -0.66 | 7.65 | 5.68 | 5.59 | 6.62 | 0.91 | 2.49 | -5.39 | 0.84 | -0.01 | 0.40 | -4.67 | 0.35 | 1.94 | 0.59 | 0.63 | 1.22 | 0.53 | NA | -0.38 | NA | 2.92 | 2.90 | 4.44 | 22.40 | 8.60 | 1.76 | 2.62 | 0.11 | -17.47 | 1.33 | 0.86 | 0.38 | 0.82 | 0.71 | 0.82 | 0.32 | 1.00 | 17.92 | -0.01 | 0.59 | 0.31 | -3.13 | -2.41 | -4.18 | -2.72 | 1.36 | -0.49 | 2.01 | -0.19 | 4.69 | 5.65 | 5.74 | -17.69 | 1.11 | 1.19 | |
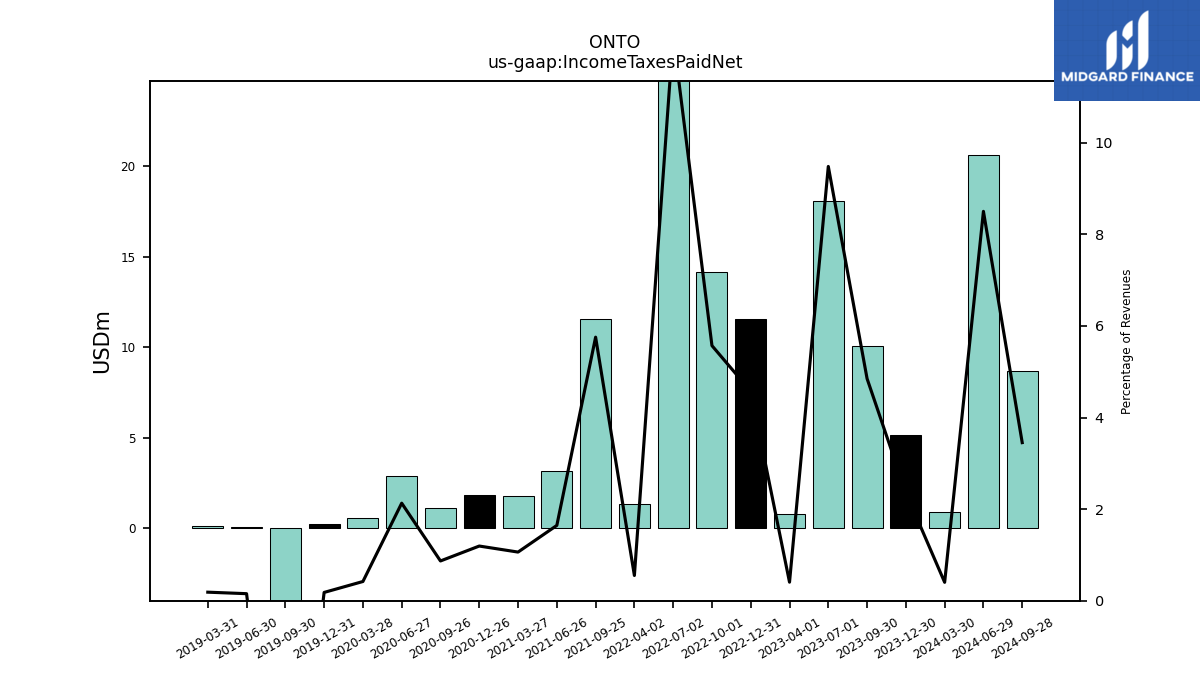
| Income Taxes Paid Net | 5.17 | 10.05 | 18.08 | 0.81 | 11.58 | 14.16 | 31.61 | 1.33 | 11.54 | 3.18 | 1.80 | 1.85 | 1.10 | 2.88 | 0.59 | 0.22 | -4.28 | NA | 0.10 | NA | 0.11 | NA | NA | NA | NA | NA | NA | NA | NA | NA | NA | NA | NA | NA | NA | NA | NA | NA | NA | NA | NA | NA | NA | NA | NA | NA | NA | NA | NA | NA | NA | NA | NA | NA | NA | NA | NA | NA | NA | NA | |
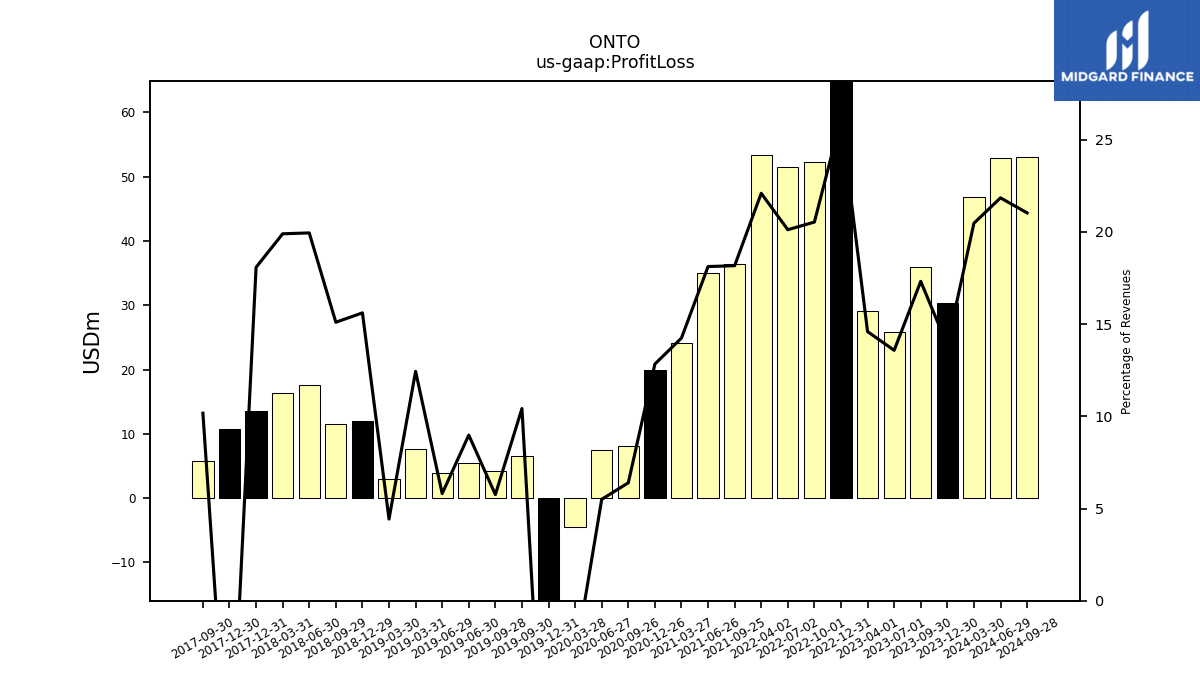
| Profit Loss | 30.31 | 35.89 | 25.90 | 29.07 | 66.21 | 52.22 | 51.58 | 53.33 | 36.45 | 35.05 | 24.11 | 19.91 | 8.09 | 7.42 | -4.40 | -17.75 | 6.56 | 4.21 | 5.53 | 3.93 | 7.58 | 2.97 | NA | 12.02 | NA | 11.57 | 17.68 | 16.38 | 13.51 | 10.80 | 5.76 | NA | NA | NA | NA | NA | NA | NA | NA | NA | NA | NA | NA | NA | NA | NA | NA | NA | NA | NA | NA | NA | NA | NA | NA | NA | NA | NA | NA | NA | |
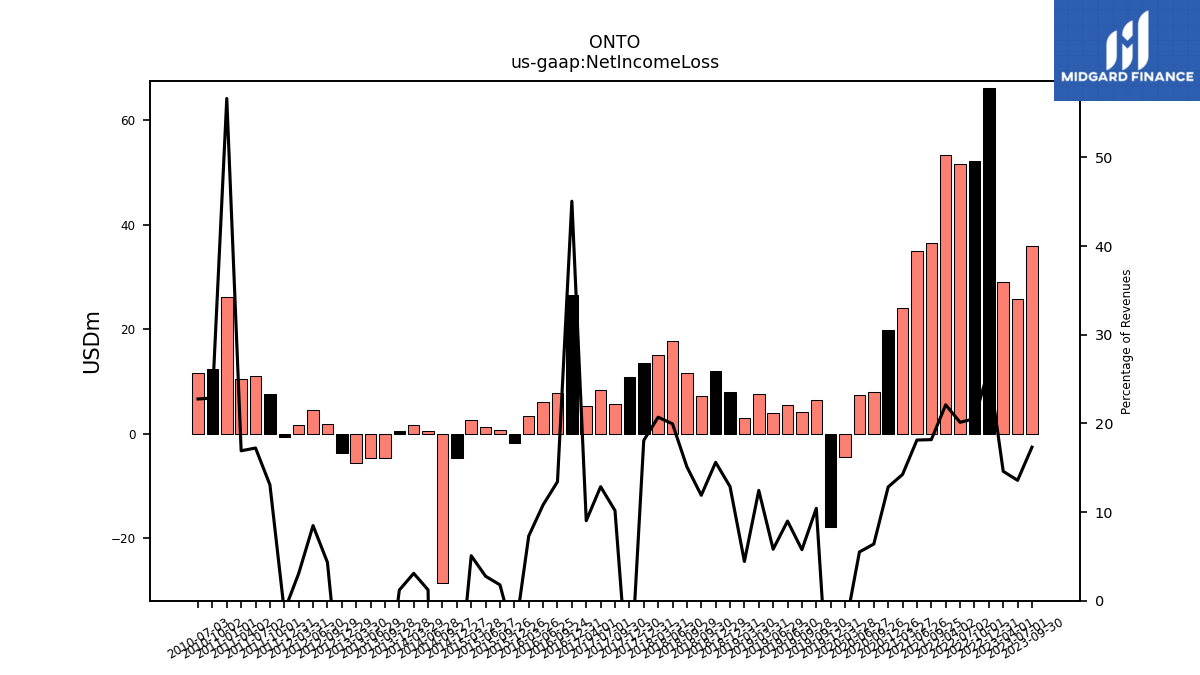
| Net Income Loss | 30.31 | 35.89 | 25.90 | 29.07 | 66.21 | 52.22 | 51.58 | 53.33 | 36.45 | 35.05 | 24.11 | 19.91 | 8.09 | 7.42 | -4.40 | -17.75 | 6.56 | 4.21 | 5.53 | 3.93 | 7.58 | 2.97 | 8.08 | 12.02 | 7.19 | 11.57 | 17.68 | 15.13 | 13.51 | 10.80 | 5.76 | 8.29 | 5.35 | 26.65 | 7.88 | 6.03 | 3.47 | -1.81 | 0.82 | 1.34 | 2.56 | -4.64 | -28.66 | 0.59 | 1.59 | 0.56 | -4.55 | -4.57 | -5.58 | -3.65 | 1.90 | 4.51 | 1.70 | -0.53 | 7.62 | 11.09 | 10.51 | 26.13 | 12.33 | 11.57 | |
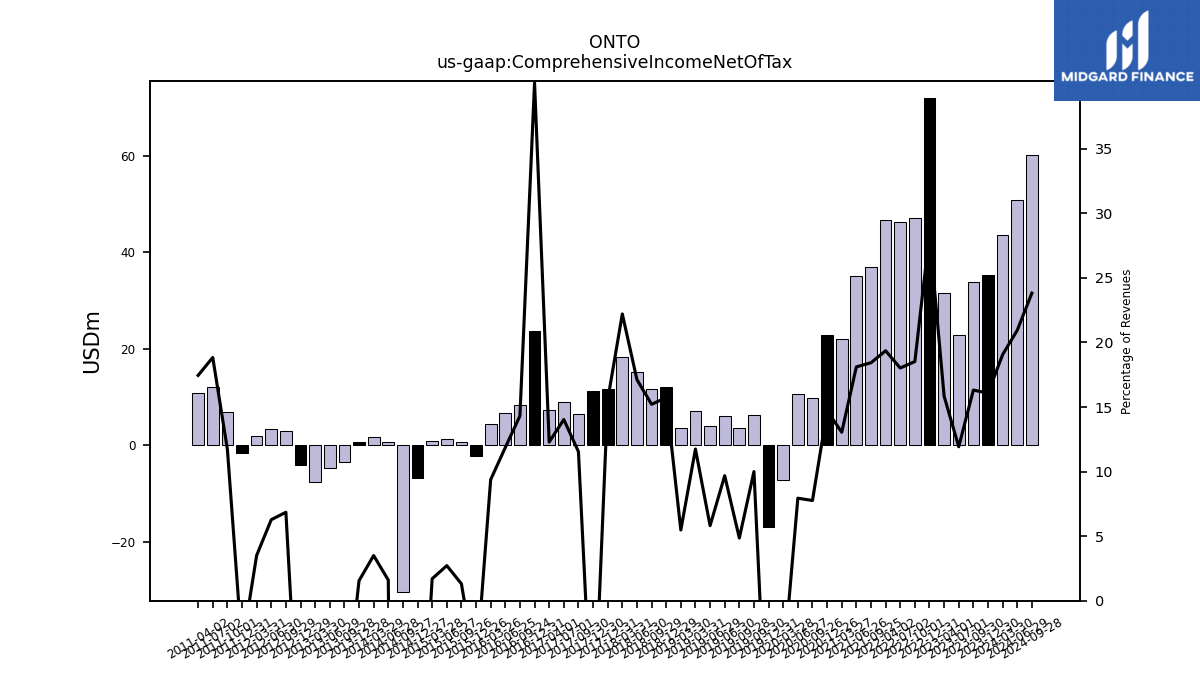
| Comprehensive Income Net Of Tax | 35.19 | 33.80 | 22.73 | 31.55 | 72.01 | 47.09 | 46.19 | 46.72 | 36.96 | 35.02 | 22.08 | 22.82 | 9.82 | 10.71 | -7.16 | -16.83 | 6.30 | 3.55 | 5.96 | 3.93 | 7.15 | 3.67 | NA | 12.11 | NA | 11.65 | 15.17 | 18.28 | 11.61 | 11.25 | 6.54 | 9.04 | 7.29 | 23.72 | 8.40 | 6.62 | 4.45 | -2.31 | 0.60 | 1.32 | 0.86 | -6.76 | -30.31 | 0.77 | 1.81 | 0.72 | -3.39 | -4.61 | -7.52 | -4.11 | 3.01 | 3.34 | 1.95 | -1.64 | 6.84 | 12.13 | 10.84 | NA | NA | NA |
| 2023-12-30 | 2023-09-30 | 2023-07-01 | 2023-04-01 | 2022-12-31 | 2022-10-01 | 2022-07-02 | 2022-04-02 | 2021-09-25 | 2021-06-26 | 2021-03-27 | 2020-12-26 | 2020-09-26 | 2020-06-27 | 2020-03-28 | 2019-12-31 | 2019-09-30 | 2019-09-28 | 2019-06-30 | 2019-06-29 | 2019-03-31 | 2019-03-30 | 2018-12-31 | 2018-12-29 | 2018-09-30 | 2018-09-29 | 2018-06-30 | 2018-03-31 | 2017-12-31 | 2017-12-30 | 2017-09-30 | 2017-07-01 | 2017-04-01 | 2016-12-31 | 2016-09-24 | 2016-06-25 | 2016-03-26 | 2015-12-26 | 2015-09-26 | 2015-06-27 | 2015-03-28 | 2014-12-27 | 2014-09-27 | 2014-06-28 | 2014-03-29 | 2013-12-28 | 2013-09-28 | 2013-06-29 | 2013-03-30 | 2012-12-29 | 2012-09-29 | 2012-06-30 | 2012-03-31 | 2011-12-31 | 2011-10-01 | 2011-07-02 | 2011-04-02 | 2011-01-01 | 2010-10-02 | 2010-07-03 | ||
|---|---|---|---|---|---|---|---|---|---|---|---|---|---|---|---|---|---|---|---|---|---|---|---|---|---|---|---|---|---|---|---|---|---|---|---|---|---|---|---|---|---|---|---|---|---|---|---|---|---|---|---|---|---|---|---|---|---|---|---|---|---|
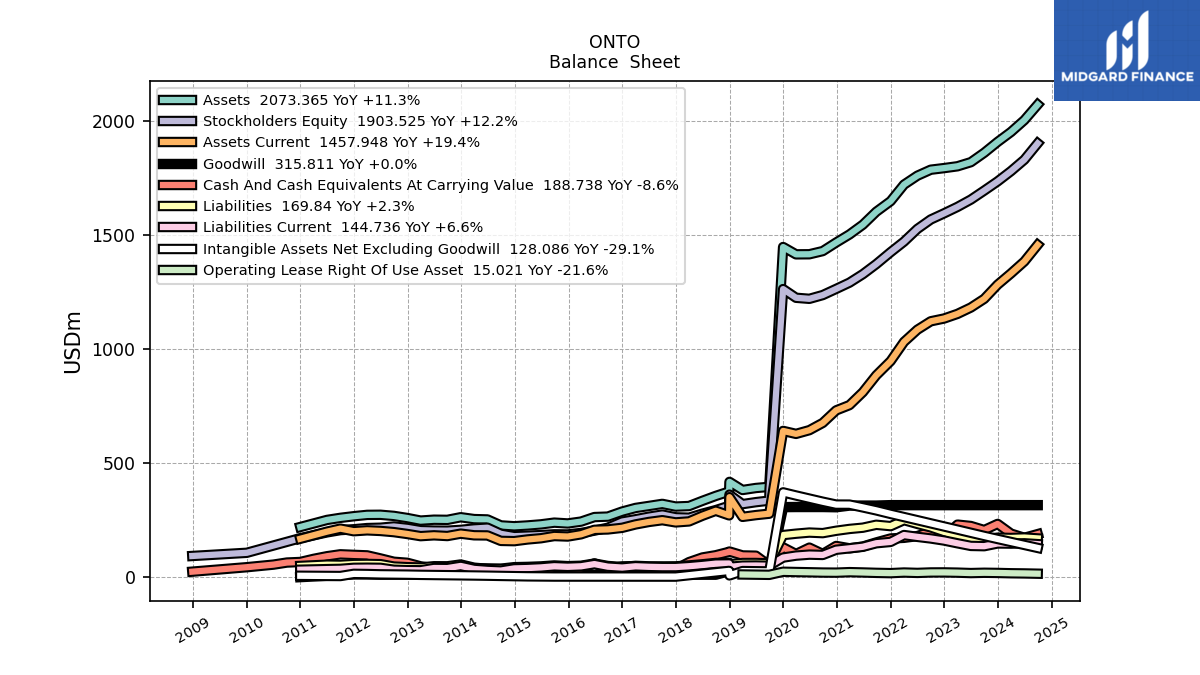
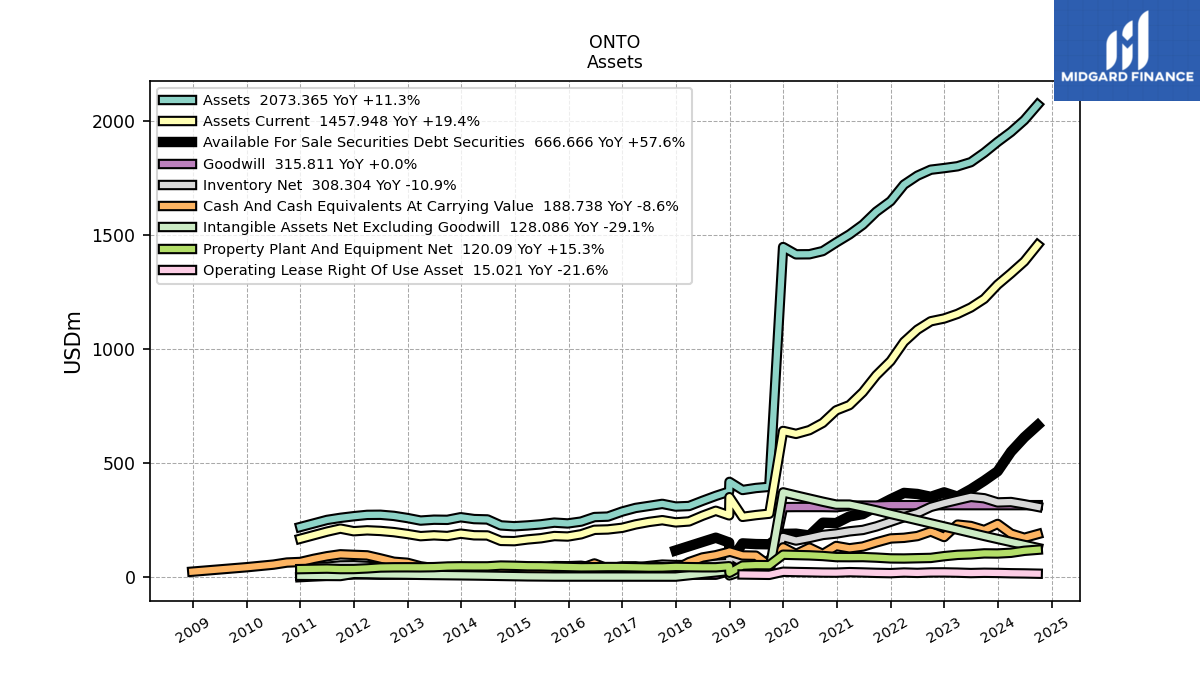
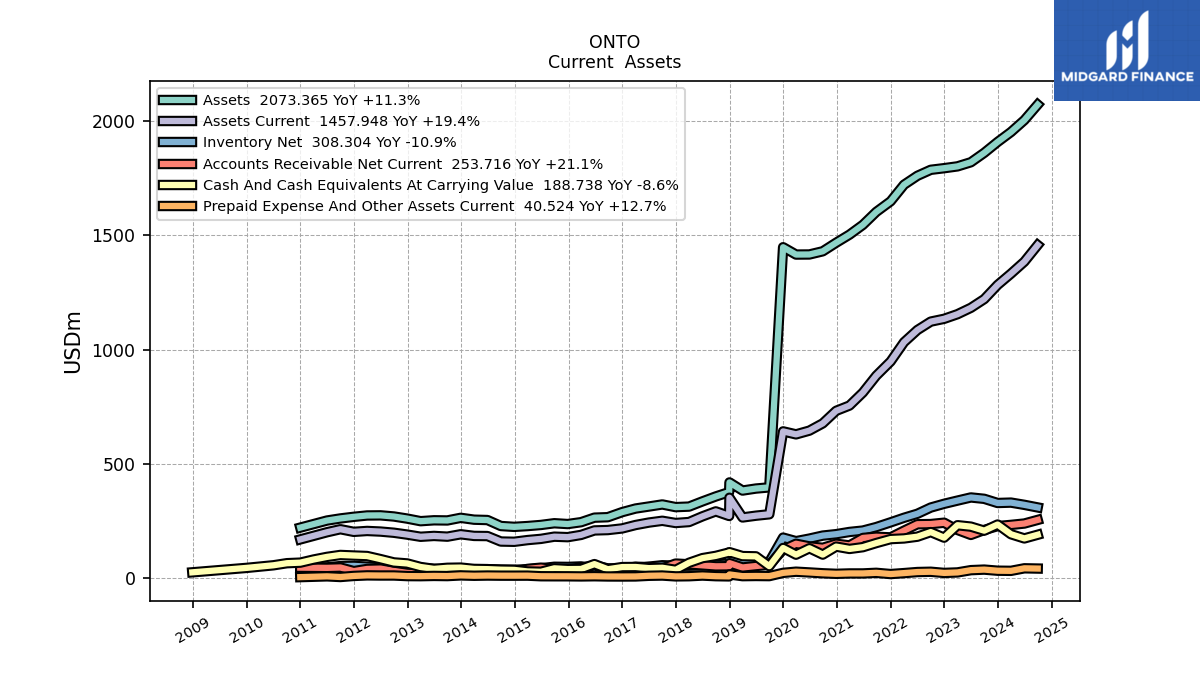
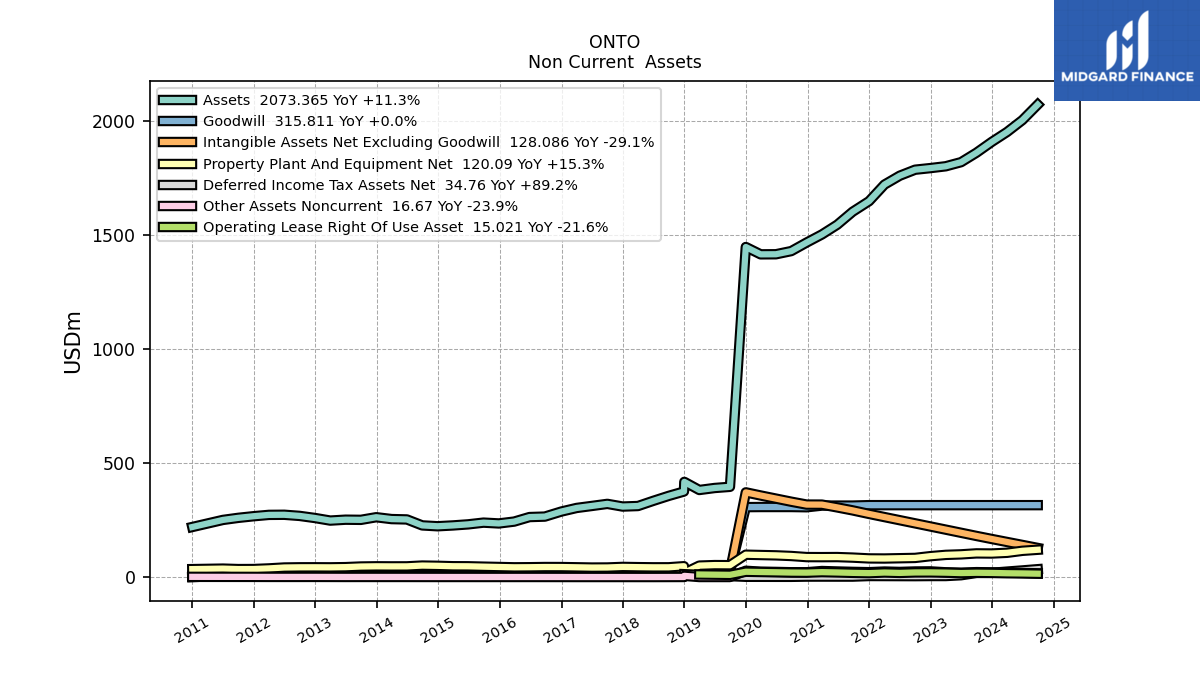
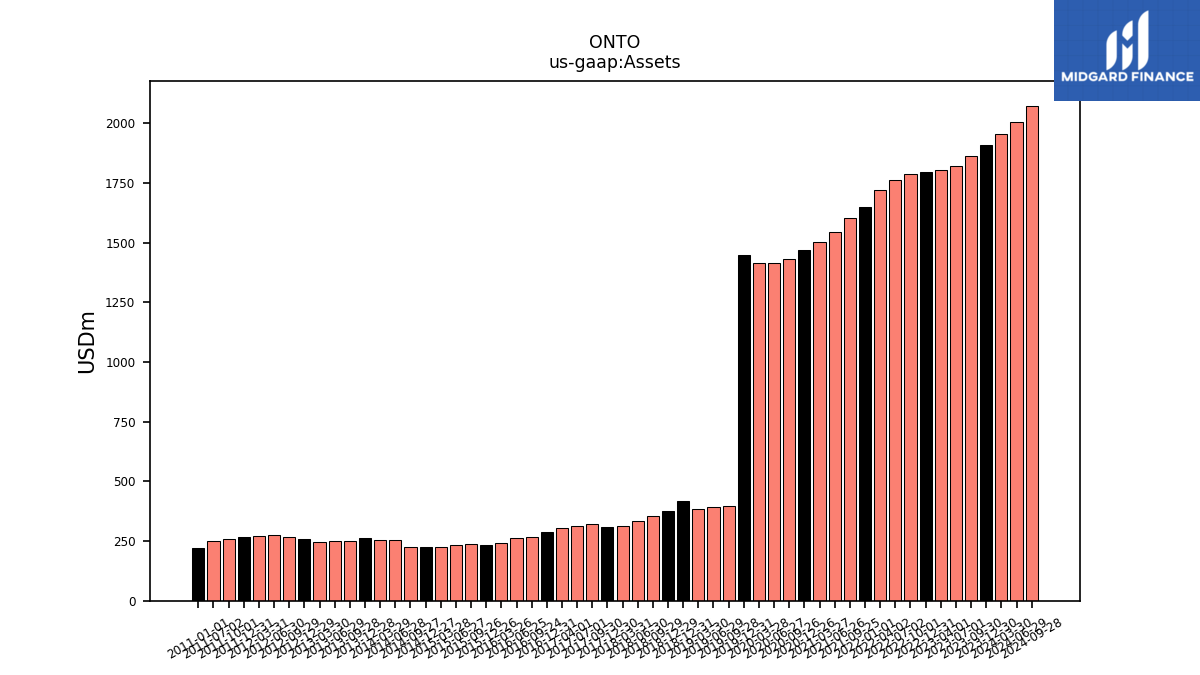
| Assets | 1909.71 | 1862.19 | 1820.86 | 1802.84 | 1794.86 | 1787.77 | 1761.46 | 1722.41 | 1603.26 | 1546.49 | 1503.72 | 1468.17 | 1430.71 | 1416.77 | 1416.39 | 1448.58 | NA | 396.22 | NA | 391.10 | NA | 382.32 | 418.04 | 375.63 | NA | 356.45 | 334.80 | 312.02 | NA | 309.70 | 321.40 | 312.39 | 303.54 | 287.83 | 265.61 | 263.56 | 243.72 | 235.54 | 239.14 | 231.56 | 226.77 | 223.24 | 226.96 | 253.12 | 254.72 | 262.83 | 251.32 | 252.03 | 248.13 | 259.45 | 268.65 | 273.64 | 273.13 | 267.22 | 260.11 | 250.97 | NA | 219.90 | NA | NA | |
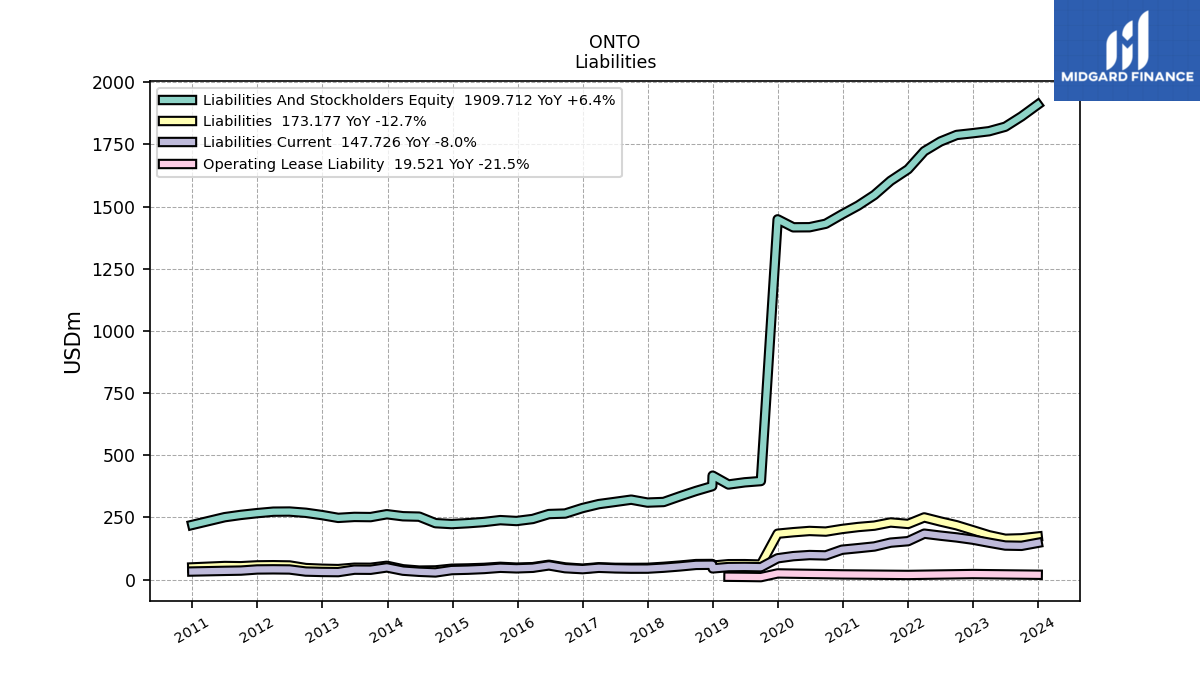
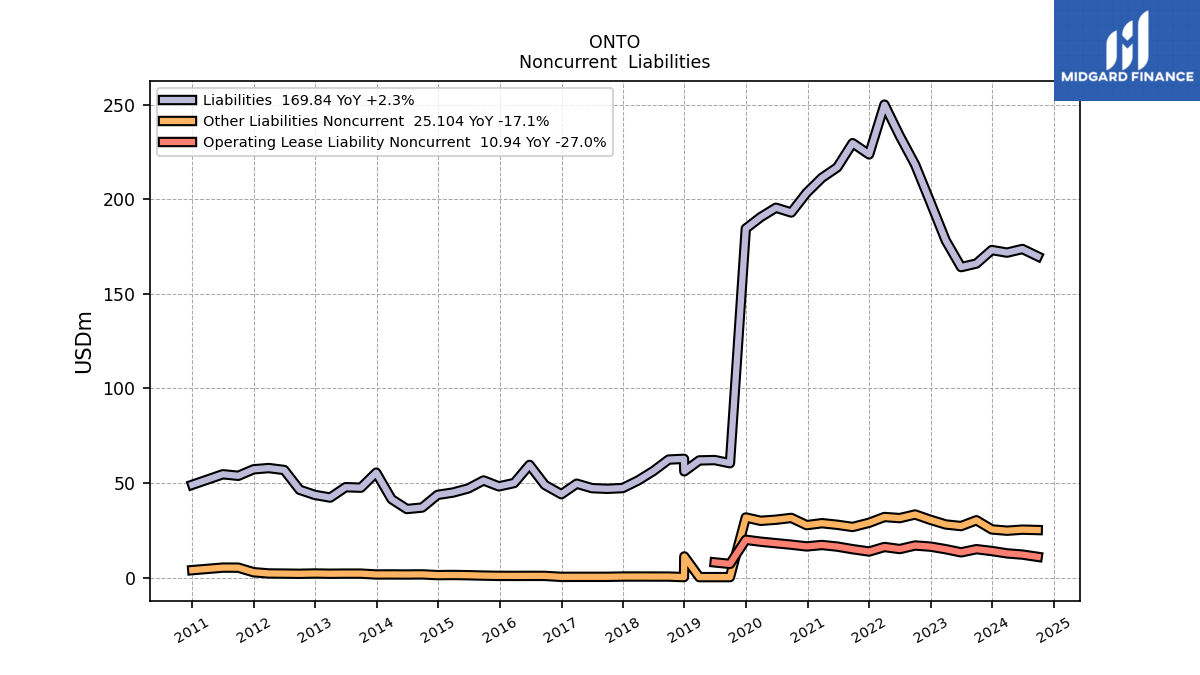
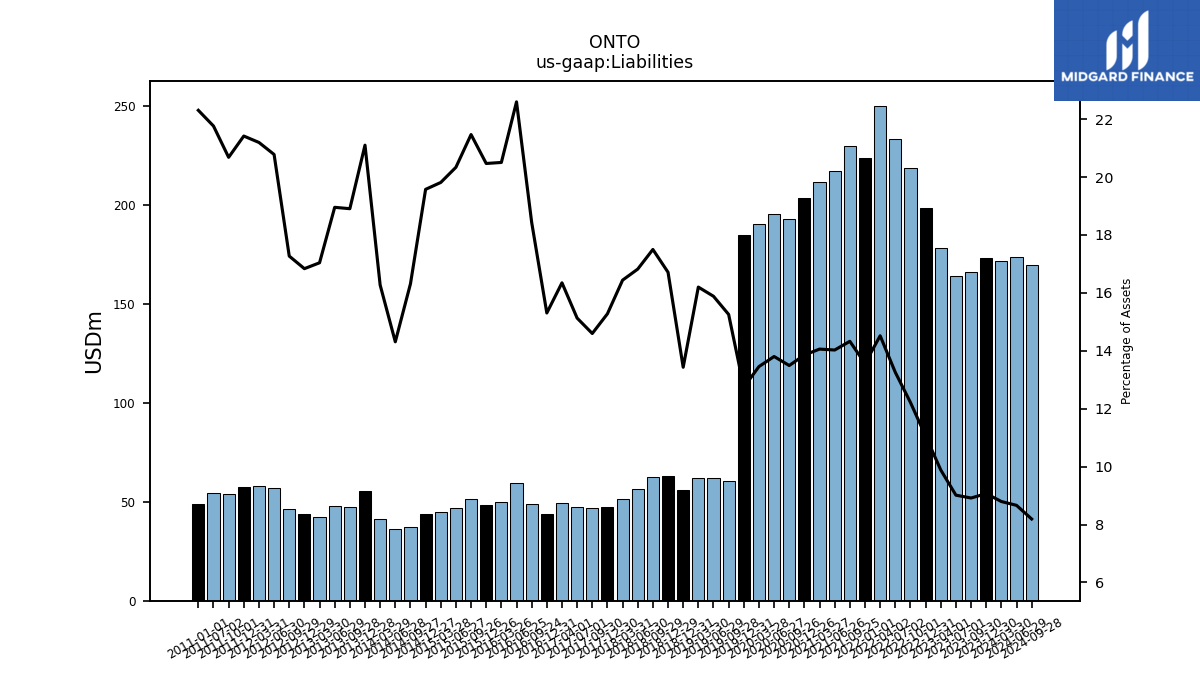
| Liabilities | 173.18 | 166.05 | 164.15 | 178.22 | 198.44 | 218.39 | 233.52 | 250.09 | 229.71 | 216.93 | 211.41 | 203.43 | 193.03 | 195.56 | 190.58 | 184.55 | NA | 60.45 | NA | 62.12 | NA | 61.94 | 56.15 | 62.78 | NA | 62.38 | 56.32 | 51.30 | NA | 47.32 | 46.92 | 47.27 | 49.62 | 44.06 | 48.97 | 59.55 | 49.97 | 48.21 | 51.34 | 47.09 | 44.93 | 43.70 | 37.02 | 36.22 | 41.45 | 55.46 | 47.52 | 47.77 | 42.28 | 43.68 | 46.40 | 56.86 | 57.89 | 57.23 | 53.80 | 54.62 | NA | 49.05 | NA | NA | |
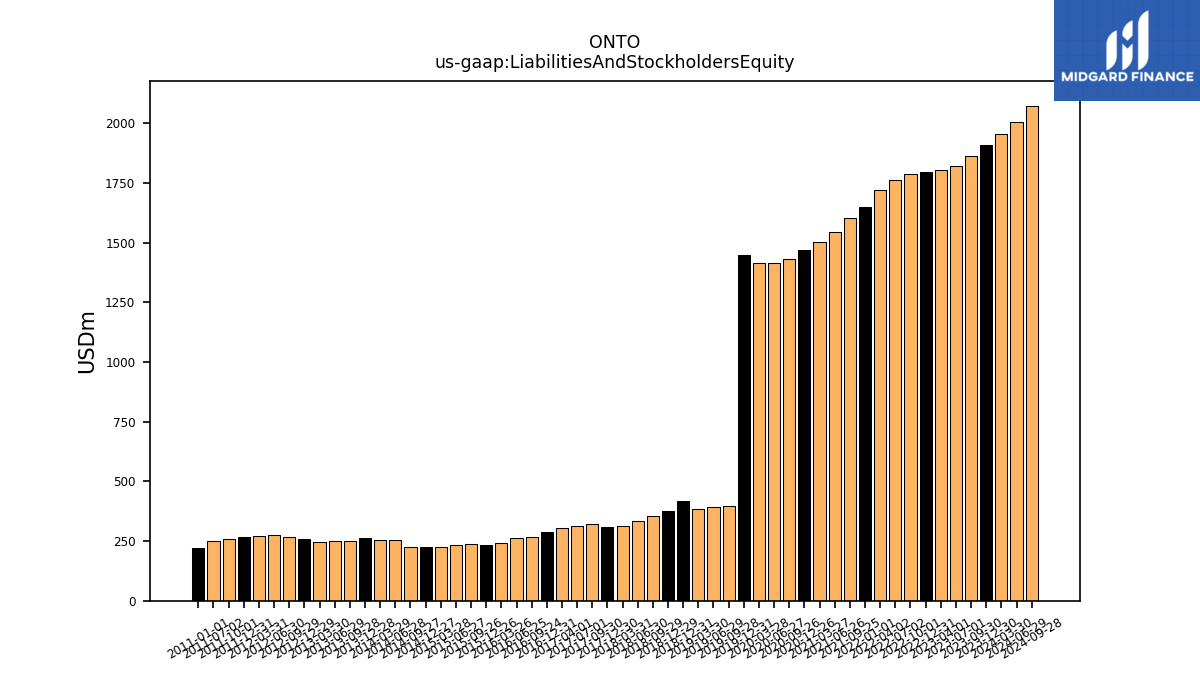
| Liabilities And Stockholders Equity | 1909.71 | 1862.19 | 1820.86 | 1802.84 | 1794.86 | 1787.77 | 1761.46 | 1722.41 | 1603.26 | 1546.49 | 1503.72 | 1468.17 | 1430.71 | 1416.77 | 1416.39 | 1448.58 | NA | 396.22 | NA | 391.10 | NA | 382.32 | 418.04 | 375.63 | NA | 356.45 | 334.80 | 312.02 | NA | 309.70 | 321.40 | 312.39 | 303.54 | 287.83 | 265.61 | 263.56 | 243.72 | 235.54 | 239.14 | 231.56 | 226.77 | 223.24 | 226.96 | 253.12 | 254.72 | 262.83 | 251.32 | 252.03 | 248.13 | 259.45 | 268.65 | 273.64 | 273.13 | 267.22 | 260.11 | 250.97 | NA | 219.90 | NA | NA | |
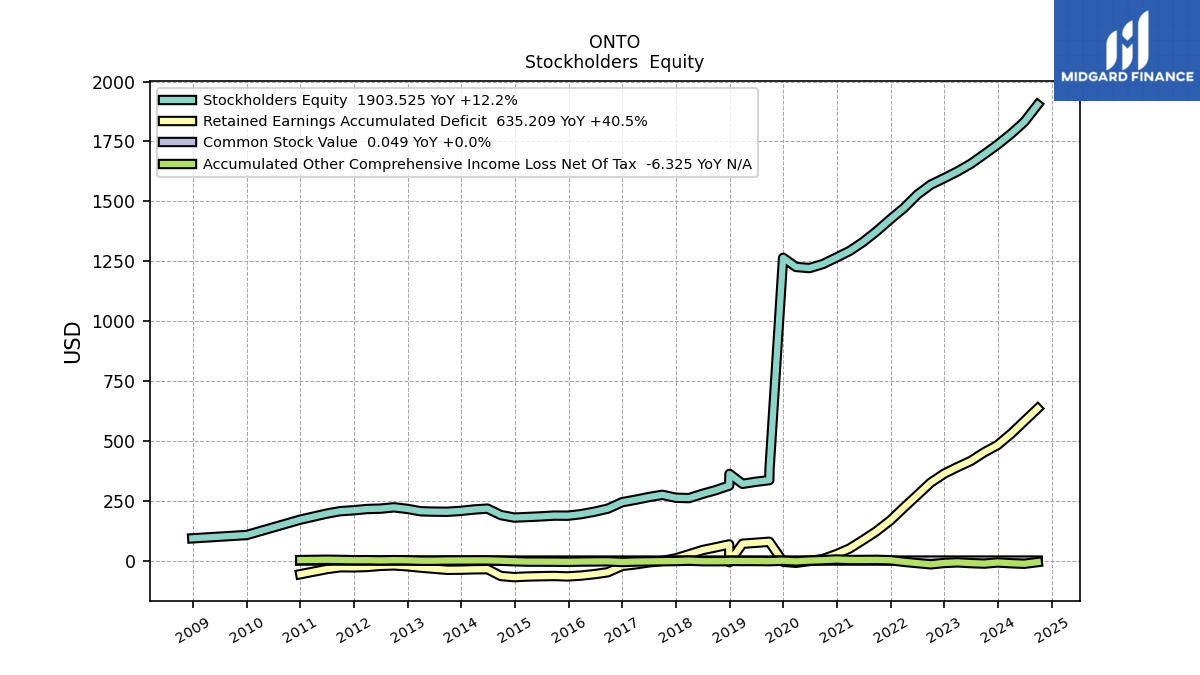
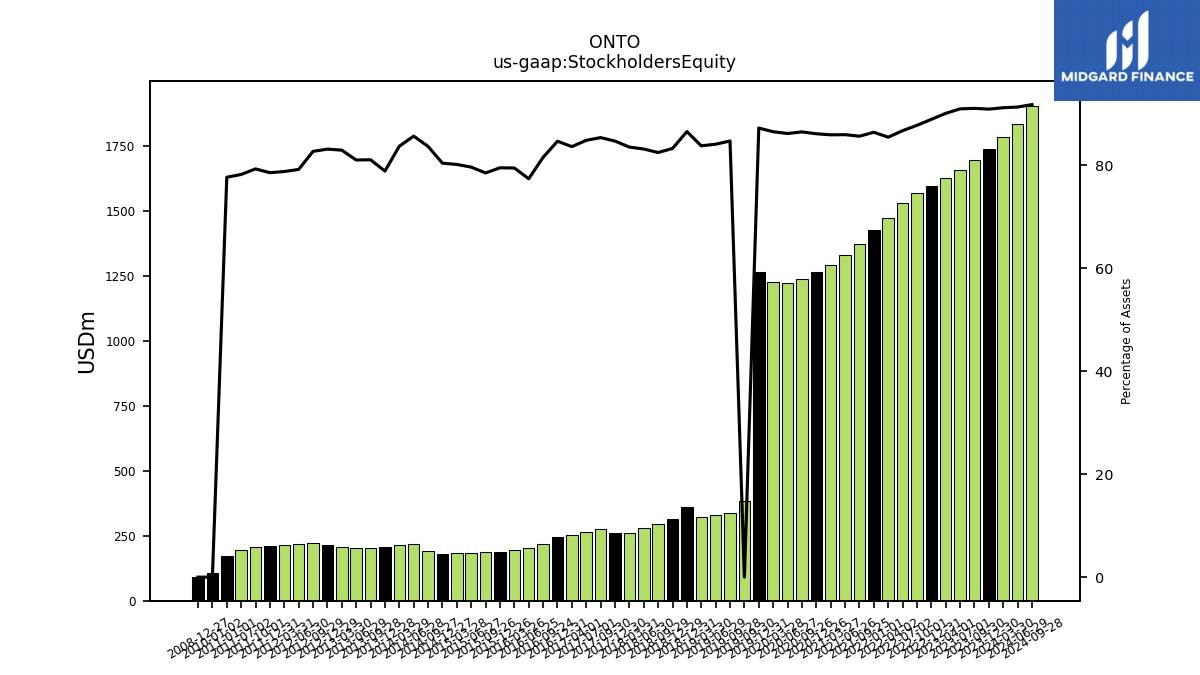
| Stockholders Equity | 1736.54 | 1696.14 | 1656.71 | 1624.62 | 1596.43 | 1569.37 | 1527.94 | 1472.32 | 1373.55 | 1329.56 | 1292.31 | 1264.75 | 1237.68 | 1221.21 | 1225.81 | 1264.03 | 385.47 | 335.77 | NA | 328.98 | NA | 320.39 | 361.89 | 312.85 | NA | 294.07 | 278.48 | 260.73 | NA | 262.38 | 274.49 | 265.13 | 253.91 | 243.77 | 216.64 | 204.00 | 193.75 | 187.33 | 187.80 | 184.46 | 181.84 | 179.54 | 189.94 | 216.90 | 213.27 | 207.37 | 203.80 | 204.25 | 205.85 | 215.77 | 222.25 | 216.78 | 215.24 | 209.99 | 206.31 | 196.35 | NA | 170.85 | NA | NA |
| 2023-12-30 | 2023-09-30 | 2023-07-01 | 2023-04-01 | 2022-12-31 | 2022-10-01 | 2022-07-02 | 2022-04-02 | 2021-09-25 | 2021-06-26 | 2021-03-27 | 2020-12-26 | 2020-09-26 | 2020-06-27 | 2020-03-28 | 2019-12-31 | 2019-09-30 | 2019-09-28 | 2019-06-30 | 2019-06-29 | 2019-03-31 | 2019-03-30 | 2018-12-31 | 2018-12-29 | 2018-09-30 | 2018-09-29 | 2018-06-30 | 2018-03-31 | 2017-12-31 | 2017-12-30 | 2017-09-30 | 2017-07-01 | 2017-04-01 | 2016-12-31 | 2016-09-24 | 2016-06-25 | 2016-03-26 | 2015-12-26 | 2015-09-26 | 2015-06-27 | 2015-03-28 | 2014-12-27 | 2014-09-27 | 2014-06-28 | 2014-03-29 | 2013-12-28 | 2013-09-28 | 2013-06-29 | 2013-03-30 | 2012-12-29 | 2012-09-29 | 2012-06-30 | 2012-03-31 | 2011-12-31 | 2011-10-01 | 2011-07-02 | 2011-04-02 | 2011-01-01 | 2010-10-02 | 2010-07-03 | ||
|---|---|---|---|---|---|---|---|---|---|---|---|---|---|---|---|---|---|---|---|---|---|---|---|---|---|---|---|---|---|---|---|---|---|---|---|---|---|---|---|---|---|---|---|---|---|---|---|---|---|---|---|---|---|---|---|---|---|---|---|---|---|
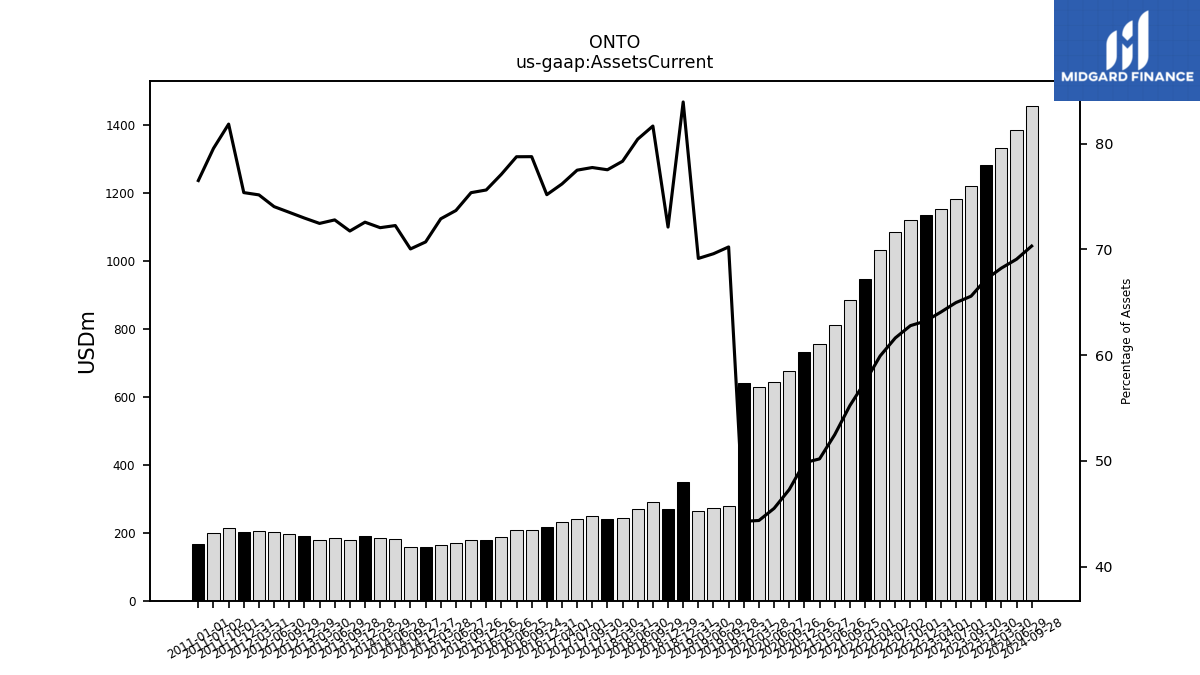
| Assets Current | 1283.27 | 1221.20 | 1183.05 | 1155.10 | 1134.87 | 1122.64 | 1085.63 | 1032.24 | 885.47 | 811.63 | 754.83 | 731.66 | 676.72 | 644.91 | 628.52 | 641.66 | NA | 278.29 | NA | 272.18 | NA | 264.37 | 350.91 | 270.88 | NA | 291.10 | 269.27 | 244.43 | NA | 240.11 | 249.87 | 242.08 | 231.26 | 216.38 | 209.22 | 207.58 | 187.92 | 178.11 | 180.23 | 170.61 | 165.31 | 157.85 | 158.97 | 182.90 | 183.54 | 190.75 | 180.29 | 183.45 | 179.80 | 189.31 | 197.48 | 202.62 | 205.28 | 201.41 | 212.89 | 199.65 | NA | 168.25 | NA | NA | |
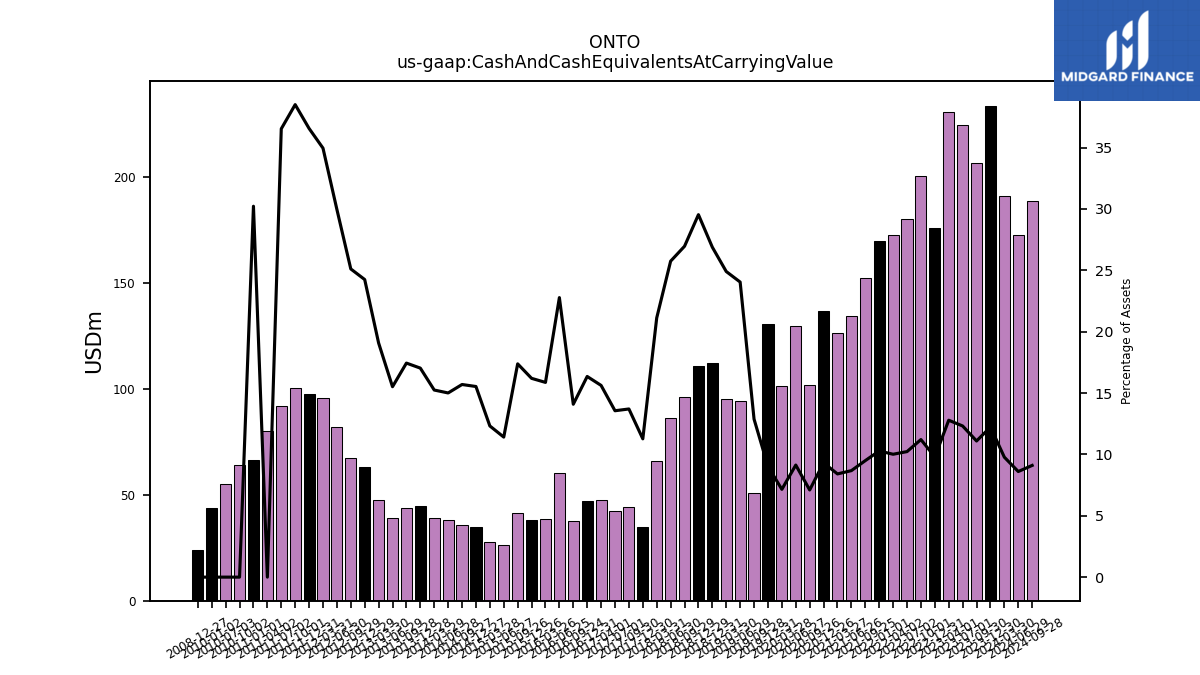
| Cash And Cash Equivalents At Carrying Value | 233.51 | 206.59 | 224.26 | 230.48 | 175.87 | 200.38 | 180.18 | 172.46 | 152.21 | 134.22 | 126.45 | 136.72 | 101.61 | 129.39 | 101.32 | 130.67 | NA | 51.01 | NA | 94.03 | NA | 95.21 | 112.39 | 110.95 | NA | 96.10 | 86.20 | 65.91 | NA | 34.90 | 44.04 | 42.35 | 47.42 | 47.06 | 37.42 | 60.03 | 38.67 | 38.15 | 41.56 | 26.42 | 27.93 | 34.68 | 35.62 | 37.99 | 38.83 | 44.77 | 43.83 | 39.10 | 47.34 | 62.91 | 67.46 | 81.99 | 95.48 | 97.70 | 100.15 | 91.69 | 80.17 | 66.46 | 64.00 | 54.90 | |
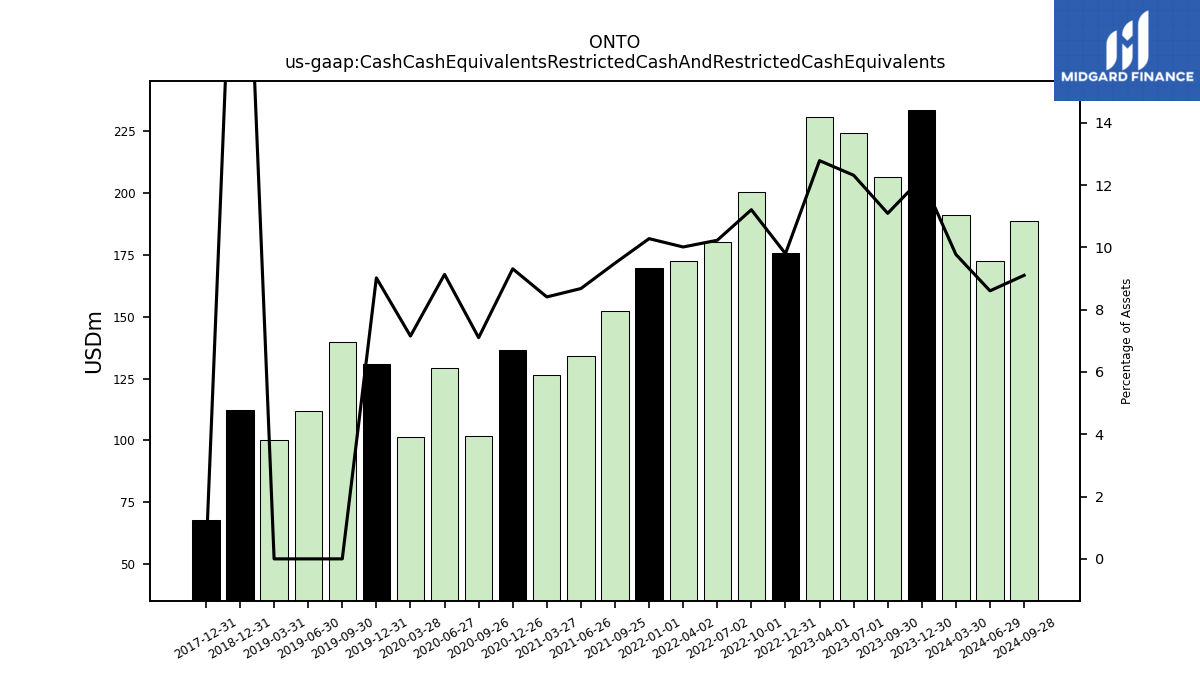
| Cash Cash Equivalents Restricted Cash And Restricted Cash Equivalents | 233.51 | 206.59 | 224.26 | 230.48 | 175.87 | 200.38 | 180.18 | 172.46 | 152.21 | 134.22 | 126.45 | 136.72 | 101.61 | 129.39 | 101.32 | 130.67 | 139.70 | NA | 111.96 | NA | 100.17 | NA | 112.39 | NA | NA | NA | NA | NA | 67.77 | NA | NA | NA | NA | NA | NA | NA | NA | NA | NA | NA | NA | NA | NA | NA | NA | NA | NA | NA | NA | NA | NA | NA | NA | NA | NA | NA | NA | NA | NA | NA | |
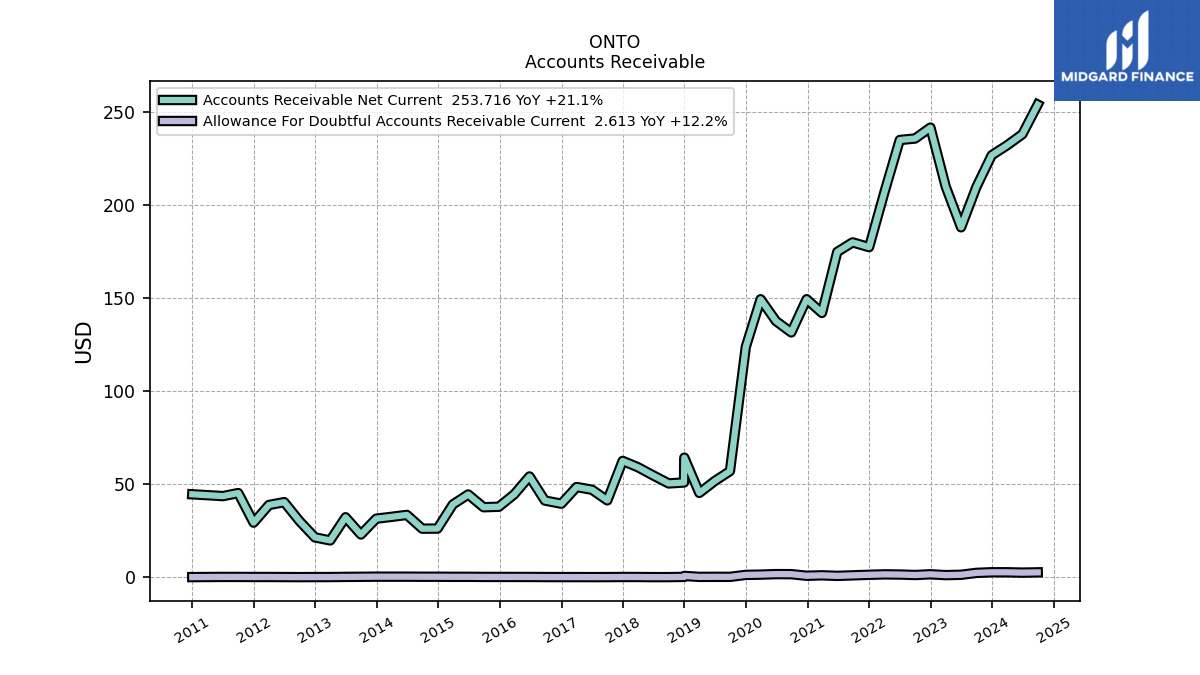
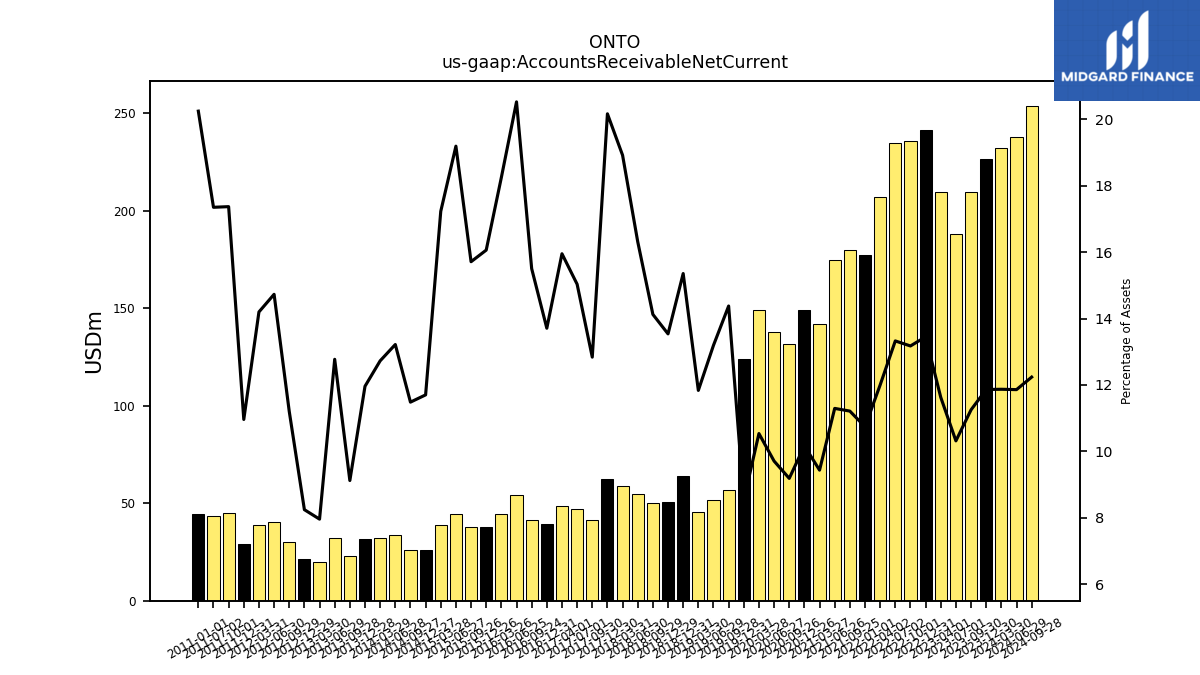
| Accounts Receivable Net Current | 226.56 | 209.52 | 187.85 | 209.62 | 241.40 | 235.53 | 234.73 | 206.69 | 179.77 | 174.66 | 141.88 | 149.25 | 131.43 | 137.53 | 149.23 | 123.66 | NA | 56.97 | NA | 51.60 | NA | 45.25 | 64.19 | 50.85 | NA | 50.35 | 54.62 | 59.03 | NA | 62.46 | 41.26 | 46.97 | 48.42 | 39.46 | 41.18 | 54.10 | 44.48 | 37.83 | 37.57 | 44.44 | 39.07 | 26.12 | 26.06 | 33.46 | 32.42 | 31.44 | 22.92 | 32.19 | 19.75 | 21.39 | 30.10 | 40.31 | 38.78 | 29.29 | 45.18 | 43.55 | NA | 44.52 | NA | NA | |
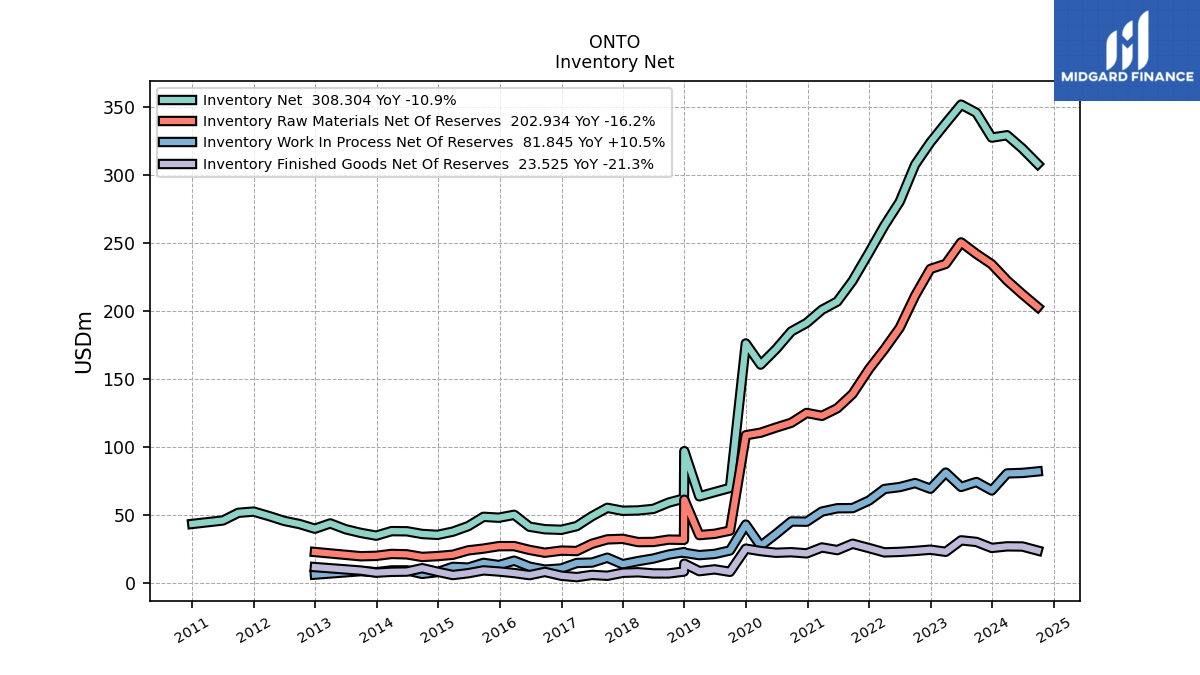
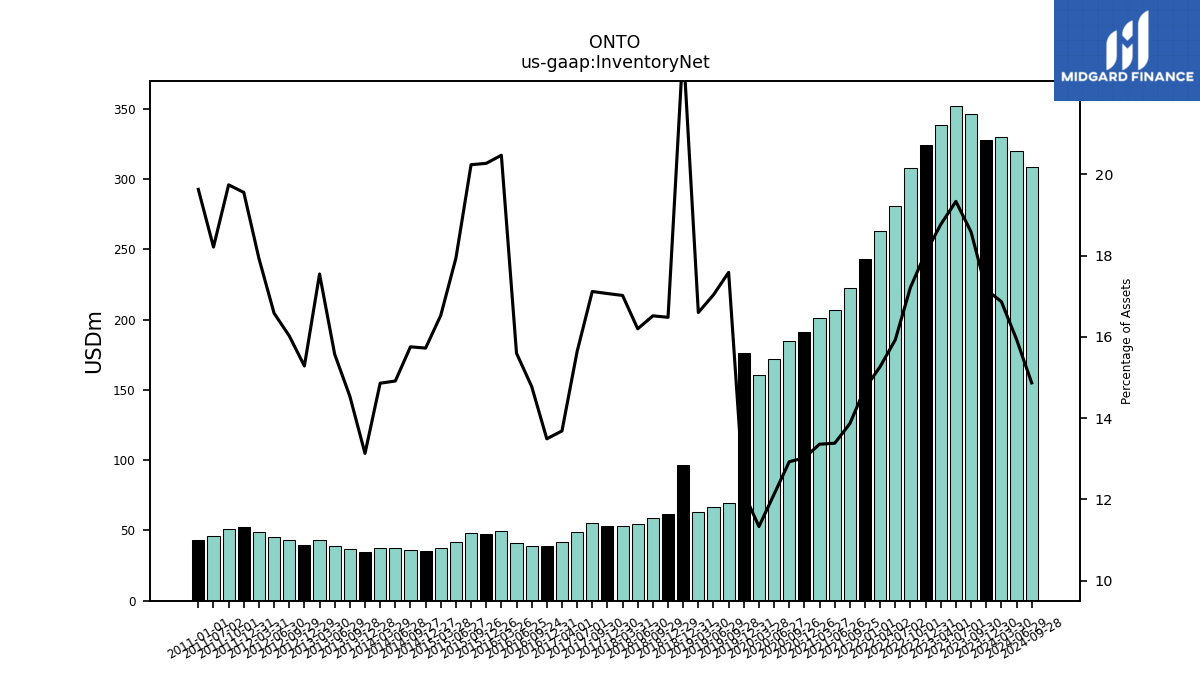
| Inventory Net | 327.77 | 346.06 | 352.07 | 338.36 | 324.28 | 307.86 | 280.61 | 263.01 | 222.31 | 206.98 | 200.90 | 191.22 | 184.98 | 171.84 | 160.54 | 176.13 | NA | 69.69 | NA | 66.63 | NA | 63.47 | 96.82 | 61.91 | NA | 58.88 | 54.24 | 53.11 | NA | 52.86 | 55.02 | 48.86 | 41.54 | 38.84 | 39.26 | 41.11 | 49.89 | 47.75 | 48.40 | 41.54 | 37.49 | 35.10 | 35.76 | 37.75 | 37.85 | 34.52 | 36.54 | 39.25 | 43.55 | 39.66 | 43.05 | 45.38 | 48.98 | 52.26 | 51.35 | 45.71 | NA | 43.17 | NA | NA | |
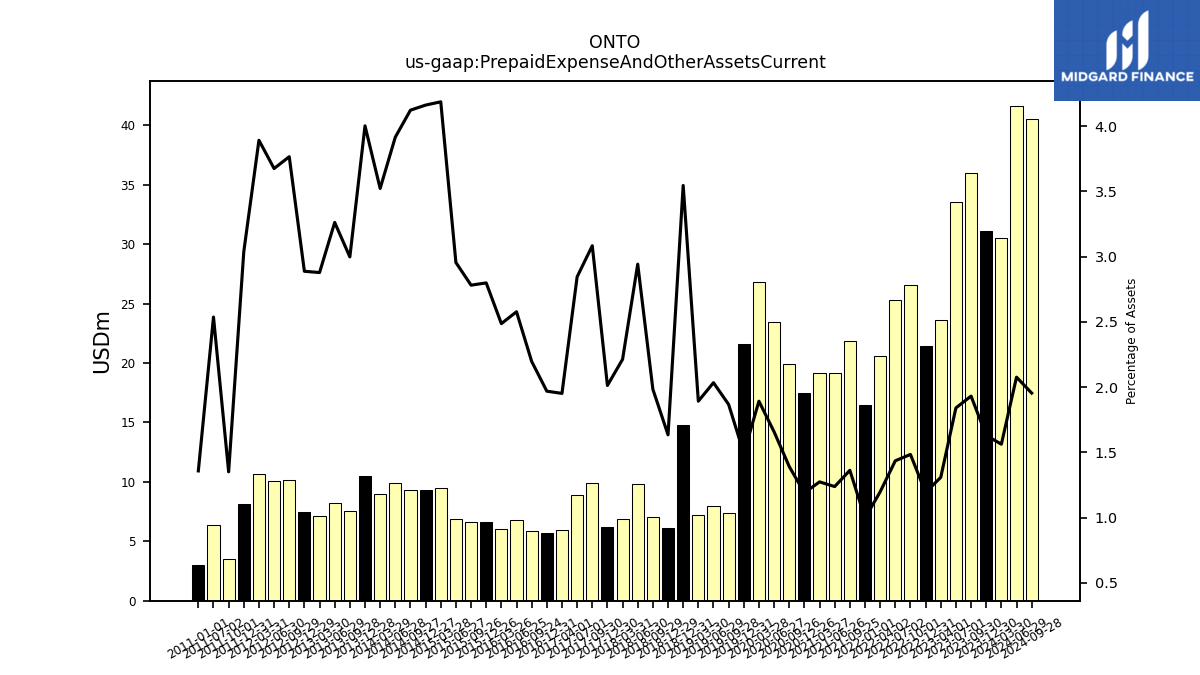
| Prepaid Expense And Other Assets Current | 31.13 | 35.96 | 33.52 | 23.60 | 21.41 | 26.53 | 25.29 | 20.63 | 21.85 | 19.15 | 19.16 | 17.47 | 19.91 | 23.49 | 26.80 | 21.64 | NA | 7.40 | NA | 7.96 | NA | 7.24 | 14.82 | 6.14 | NA | 7.07 | 9.85 | 6.91 | NA | 6.23 | 9.91 | 8.89 | 5.92 | 5.67 | 5.83 | 6.79 | 6.06 | 6.59 | 6.65 | 6.84 | 9.49 | 9.29 | 9.36 | 9.91 | 8.97 | 10.52 | 7.53 | 8.22 | 7.14 | 7.49 | 10.12 | 10.06 | 10.63 | 8.12 | 3.51 | 6.37 | NA | 2.99 | NA | NA | |
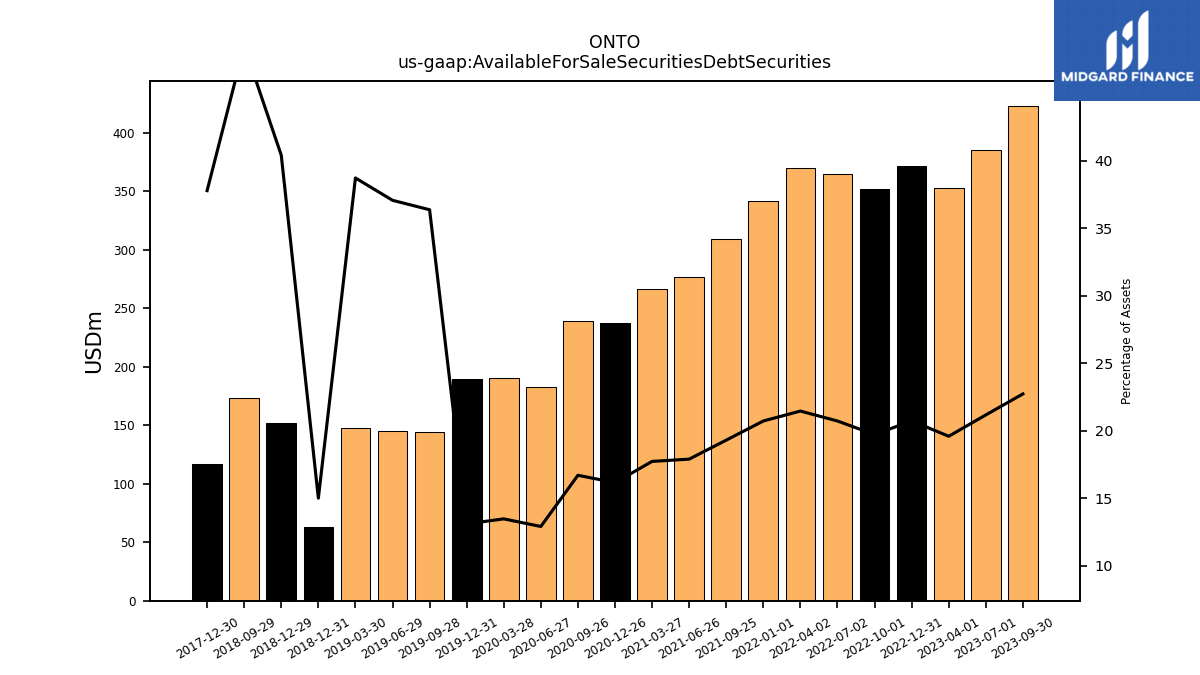
| Available For Sale Securities Debt Securities | 464.30 | 423.08 | 385.35 | 353.03 | 371.91 | 352.33 | 364.82 | 369.45 | 309.34 | 276.62 | 266.45 | 237.00 | 238.80 | 182.67 | 190.63 | 189.56 | NA | 144.11 | NA | 144.98 | NA | 148.06 | 62.68 | 151.79 | NA | 172.94 | NA | NA | NA | 117.03 | NA | NA | NA | NA | NA | NA | NA | NA | NA | NA | NA | NA | NA | NA | NA | NA | NA | NA | NA | NA | NA | NA | NA | NA | NA | NA | NA | NA | NA | NA |
| 2023-12-30 | 2023-09-30 | 2023-07-01 | 2023-04-01 | 2022-12-31 | 2022-10-01 | 2022-07-02 | 2022-04-02 | 2021-09-25 | 2021-06-26 | 2021-03-27 | 2020-12-26 | 2020-09-26 | 2020-06-27 | 2020-03-28 | 2019-12-31 | 2019-09-30 | 2019-09-28 | 2019-06-30 | 2019-06-29 | 2019-03-31 | 2019-03-30 | 2018-12-31 | 2018-12-29 | 2018-09-30 | 2018-09-29 | 2018-06-30 | 2018-03-31 | 2017-12-31 | 2017-12-30 | 2017-09-30 | 2017-07-01 | 2017-04-01 | 2016-12-31 | 2016-09-24 | 2016-06-25 | 2016-03-26 | 2015-12-26 | 2015-09-26 | 2015-06-27 | 2015-03-28 | 2014-12-27 | 2014-09-27 | 2014-06-28 | 2014-03-29 | 2013-12-28 | 2013-09-28 | 2013-06-29 | 2013-03-30 | 2012-12-29 | 2012-09-29 | 2012-06-30 | 2012-03-31 | 2011-12-31 | 2011-10-01 | 2011-07-02 | 2011-04-02 | 2011-01-01 | 2010-10-02 | 2010-07-03 | ||
|---|---|---|---|---|---|---|---|---|---|---|---|---|---|---|---|---|---|---|---|---|---|---|---|---|---|---|---|---|---|---|---|---|---|---|---|---|---|---|---|---|---|---|---|---|---|---|---|---|---|---|---|---|---|---|---|---|---|---|---|---|---|
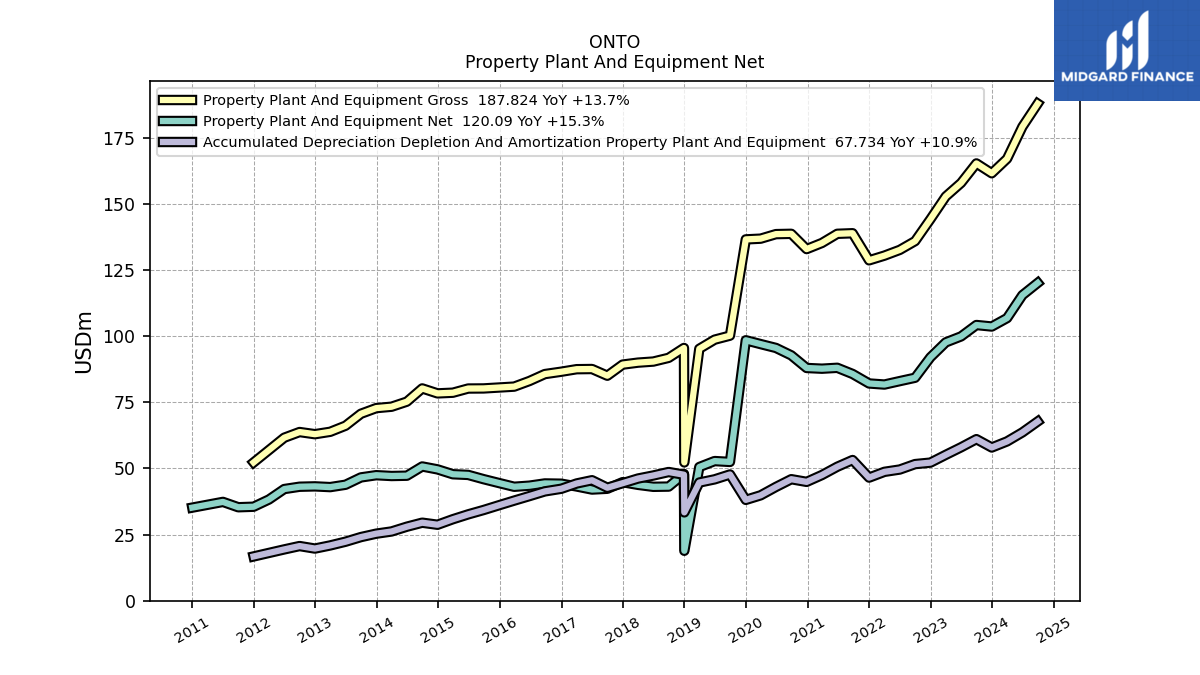
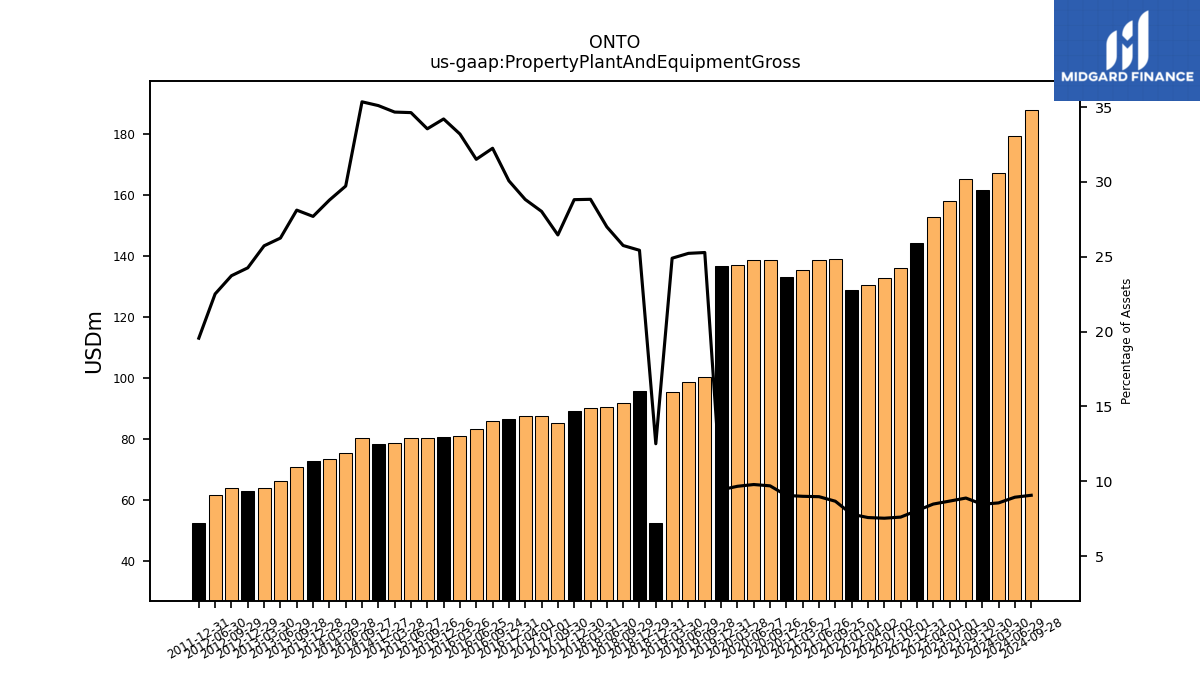
| Property Plant And Equipment Gross | 161.52 | 165.24 | 157.87 | 152.75 | 144.17 | 135.88 | 132.57 | 130.40 | 138.86 | 138.64 | 135.18 | 132.87 | 138.64 | 138.52 | 136.81 | 136.53 | NA | 100.16 | NA | 98.65 | NA | 95.20 | 52.26 | 95.52 | NA | 91.78 | 90.38 | 89.97 | NA | 89.23 | 85.02 | 87.56 | 87.49 | 86.55 | 85.64 | 83.04 | 80.91 | 80.56 | 80.22 | 80.18 | 78.60 | 78.35 | 80.23 | 75.23 | 73.31 | 72.78 | 70.65 | 66.14 | 63.84 | 62.93 | 63.75 | 61.60 | NA | 52.26 | NA | NA | NA | NA | NA | NA | |
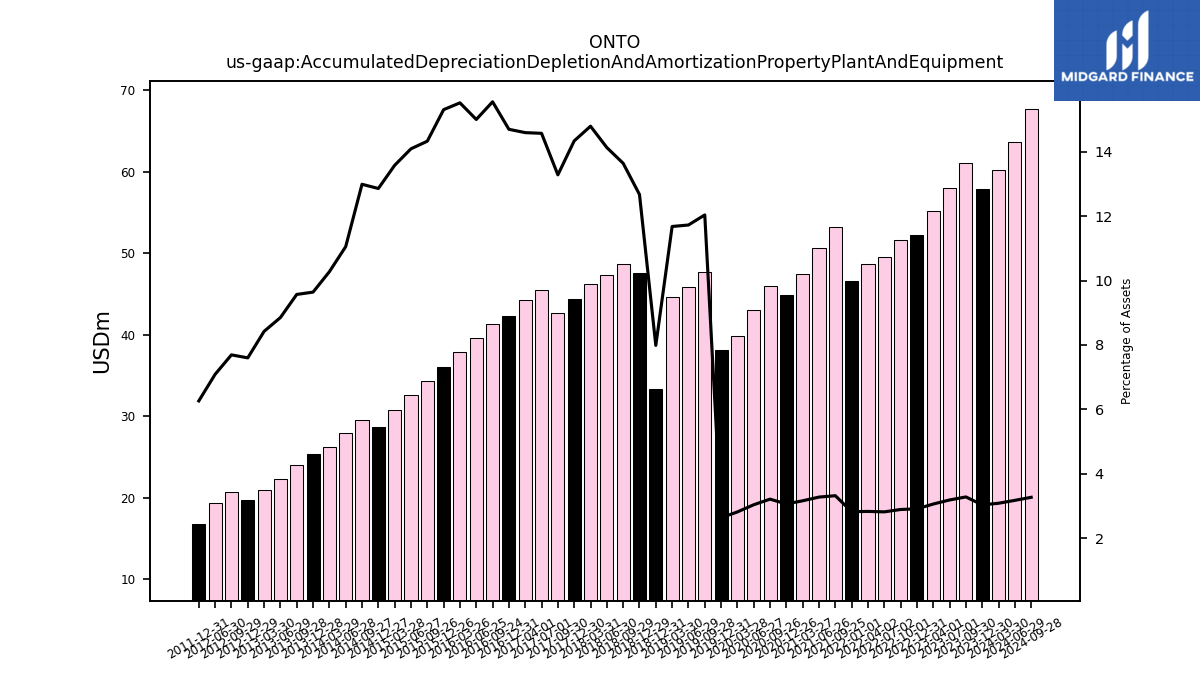
| Accumulated Depreciation Depletion And Amortization Property Plant And Equipment | 57.91 | 61.05 | 57.98 | 55.13 | 52.19 | 51.63 | 49.58 | 48.71 | 53.17 | 50.63 | 47.50 | 44.92 | 45.92 | 43.01 | 39.84 | 38.11 | NA | 47.71 | NA | 45.87 | NA | 44.67 | 33.39 | 47.62 | NA | 48.64 | 47.33 | 46.17 | NA | 44.42 | 42.71 | 45.54 | 44.31 | 42.32 | 41.32 | 39.55 | 37.84 | 36.07 | 34.28 | 32.64 | 30.80 | 28.71 | 29.49 | 27.98 | 26.18 | 25.34 | 24.05 | 22.31 | 20.90 | 19.72 | 20.67 | 19.40 | NA | 16.73 | NA | NA | NA | NA | NA | NA | |
| Amortization Of Intangible Assets | 13.35 | 13.82 | 13.82 | 13.82 | 13.82 | 13.82 | 13.82 | 13.82 | 12.99 | 12.32 | 12.36 | 12.66 | 13.65 | 13.70 | 13.73 | 9.28 | 0.39 | 0.29 | 0.39 | 0.29 | 0.39 | NA | NA | NA | NA | NA | NA | NA | 1.94 | NA | 0.00 | 0.00 | 0.00 | 0.00 | 0.00 | 0.00 | 0.02 | 0.03 | 0.03 | 0.03 | 0.04 | 0.10 | 0.10 | 0.11 | 0.11 | 0.11 | 0.20 | 0.20 | 0.20 | 0.20 | 0.19 | 0.20 | 0.19 | 0.57 | 0.33 | 0.40 | 0.17 | 0.39 | 0.37 | 0.41 | |
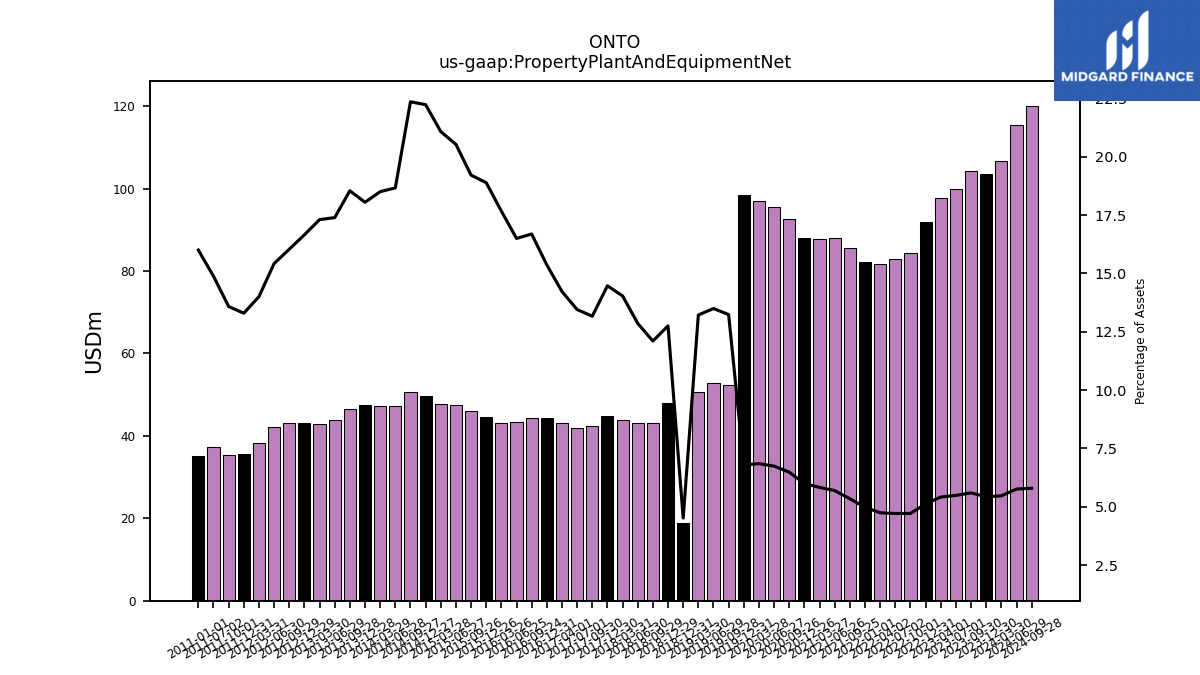
| Property Plant And Equipment Net | 103.61 | 104.18 | 99.88 | 97.62 | 91.98 | 84.25 | 82.99 | 81.69 | 85.69 | 88.02 | 87.68 | 87.95 | 92.72 | 95.52 | 96.97 | 98.42 | NA | 52.45 | NA | 52.78 | NA | 50.53 | 18.87 | 47.90 | NA | 43.13 | 43.05 | 43.80 | NA | 44.81 | 42.32 | 42.02 | 43.18 | 44.23 | 44.32 | 43.48 | 43.07 | 44.49 | 45.94 | 47.54 | 47.80 | 49.63 | 50.74 | 47.24 | 47.13 | 47.44 | 46.60 | 43.83 | 42.94 | 43.21 | 43.08 | 42.20 | 38.26 | 35.52 | 35.33 | 37.35 | NA | 35.19 | NA | NA | |
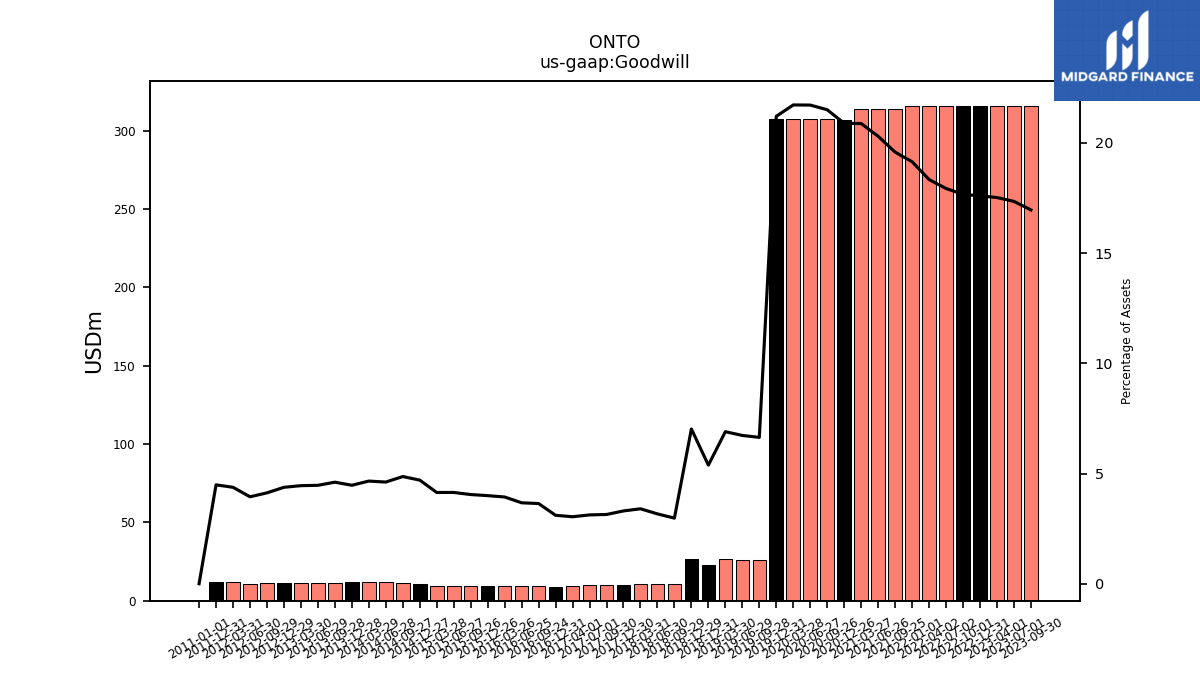
| Goodwill | 315.81 | 315.81 | 315.81 | 315.81 | 315.81 | 315.81 | 315.81 | 315.81 | 313.89 | 313.89 | 313.89 | 306.63 | 307.63 | 307.63 | 307.63 | 307.15 | NA | 26.31 | NA | 26.31 | NA | 26.37 | 22.50 | 26.37 | NA | 10.61 | 10.61 | 10.61 | NA | 10.23 | 10.10 | 9.76 | 9.23 | 8.94 | 9.66 | 9.68 | 9.59 | 9.41 | 9.68 | 9.59 | 9.39 | 10.49 | 11.04 | 11.68 | 11.87 | 11.74 | 11.58 | 11.26 | 11.04 | 11.35 | 11.08 | 10.80 | 11.95 | 11.99 | NA | NA | NA | 0.00 | NA | NA | |
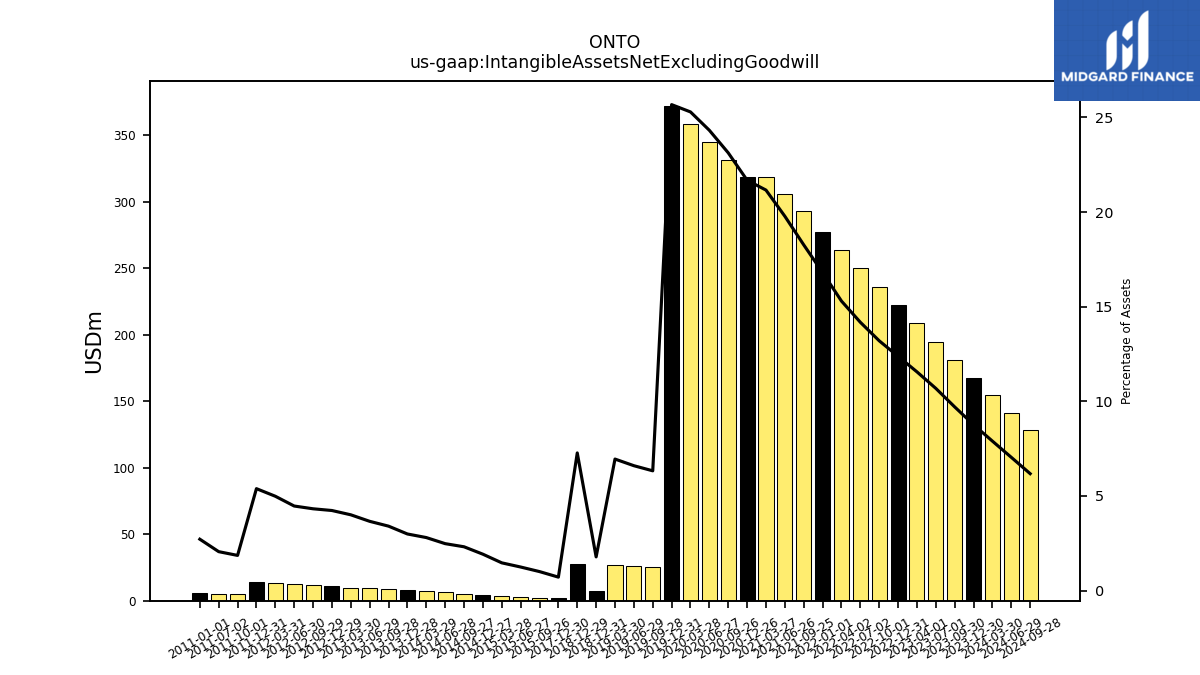
| Intangible Assets Net Excluding Goodwill | 167.38 | 180.72 | 194.55 | 208.37 | 222.20 | 235.97 | 249.74 | 263.51 | 292.89 | 305.89 | 318.21 | 318.36 | 330.92 | 344.57 | 358.22 | 371.95 | NA | 25.08 | NA | 25.81 | NA | 26.57 | 7.45 | 27.33 | NA | NA | NA | NA | NA | 2.21 | NA | NA | NA | NA | NA | NA | NA | NA | 2.40 | 2.89 | 3.33 | 4.29 | 5.25 | 6.28 | 7.14 | 7.86 | 8.56 | 9.23 | 9.94 | 10.98 | 11.61 | 12.23 | 13.62 | 14.39 | 4.84 | 5.17 | NA | 5.97 | NA | NA | |
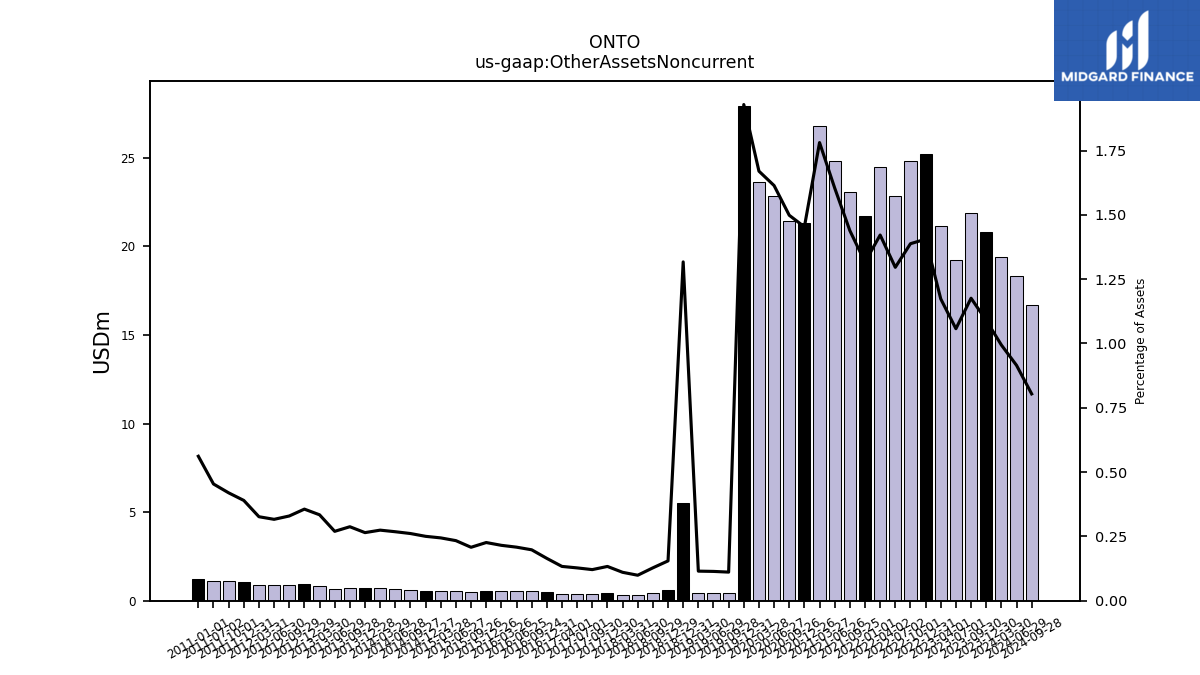
| Other Assets Noncurrent | 20.81 | 21.90 | 19.25 | 21.15 | 25.23 | 24.81 | 22.83 | 24.48 | 23.07 | 24.81 | 26.78 | 21.34 | 21.44 | 22.86 | 23.65 | 27.94 | NA | 0.44 | NA | 0.45 | NA | 0.44 | 5.51 | 0.58 | NA | 0.46 | 0.33 | 0.34 | NA | 0.41 | 0.39 | 0.40 | 0.41 | 0.47 | 0.53 | 0.55 | 0.53 | 0.53 | 0.50 | 0.54 | 0.55 | 0.56 | 0.59 | 0.68 | 0.70 | 0.70 | 0.72 | 0.68 | 0.83 | 0.92 | 0.89 | 0.87 | 0.89 | 1.04 | 1.09 | 1.14 | NA | 1.24 | NA | NA | |
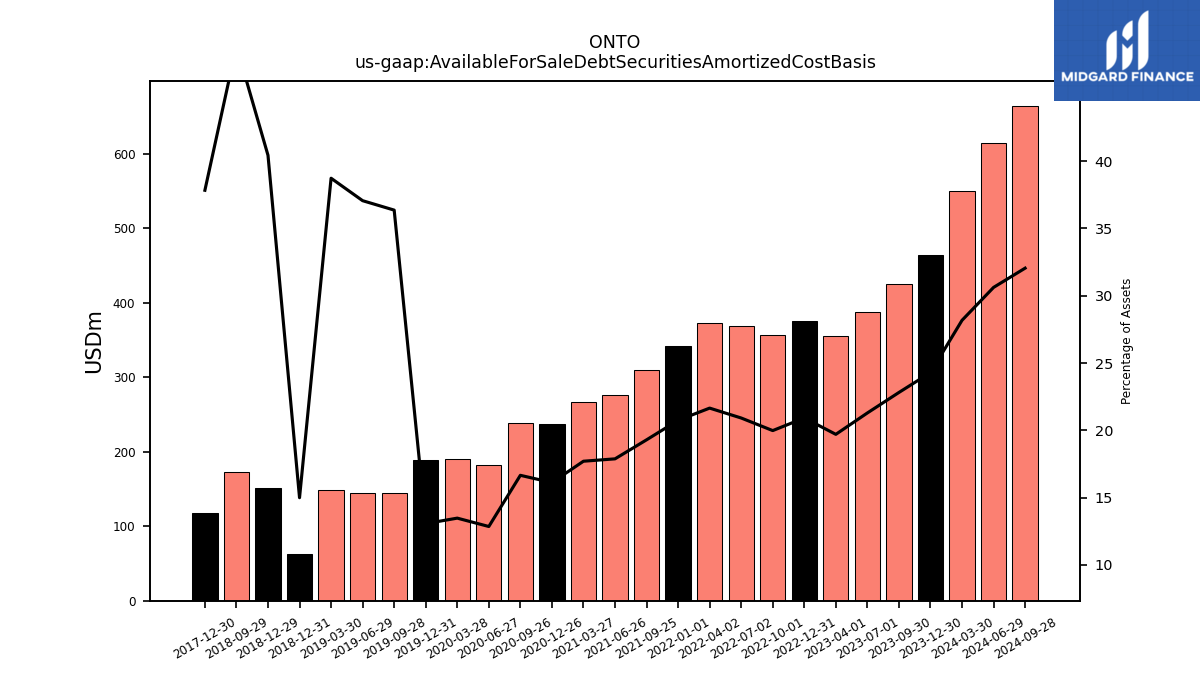
| Available For Sale Debt Securities Amortized Cost Basis | 463.85 | 424.81 | 387.67 | 355.19 | 375.47 | 357.19 | 368.41 | 372.90 | 309.33 | 276.53 | 266.23 | 236.65 | 238.33 | 182.13 | 190.89 | 189.31 | NA | 144.06 | NA | 144.93 | NA | 148.06 | 62.68 | 151.88 | NA | 173.05 | NA | NA | NA | 117.16 | NA | NA | NA | NA | NA | NA | NA | NA | NA | NA | NA | NA | NA | NA | NA | NA | NA | NA | NA | NA | NA | NA | NA | NA | NA | NA | NA | NA | NA | NA |
| 2023-12-30 | 2023-09-30 | 2023-07-01 | 2023-04-01 | 2022-12-31 | 2022-10-01 | 2022-07-02 | 2022-04-02 | 2021-09-25 | 2021-06-26 | 2021-03-27 | 2020-12-26 | 2020-09-26 | 2020-06-27 | 2020-03-28 | 2019-12-31 | 2019-09-30 | 2019-09-28 | 2019-06-30 | 2019-06-29 | 2019-03-31 | 2019-03-30 | 2018-12-31 | 2018-12-29 | 2018-09-30 | 2018-09-29 | 2018-06-30 | 2018-03-31 | 2017-12-31 | 2017-12-30 | 2017-09-30 | 2017-07-01 | 2017-04-01 | 2016-12-31 | 2016-09-24 | 2016-06-25 | 2016-03-26 | 2015-12-26 | 2015-09-26 | 2015-06-27 | 2015-03-28 | 2014-12-27 | 2014-09-27 | 2014-06-28 | 2014-03-29 | 2013-12-28 | 2013-09-28 | 2013-06-29 | 2013-03-30 | 2012-12-29 | 2012-09-29 | 2012-06-30 | 2012-03-31 | 2011-12-31 | 2011-10-01 | 2011-07-02 | 2011-04-02 | 2011-01-01 | 2010-10-02 | 2010-07-03 | ||
|---|---|---|---|---|---|---|---|---|---|---|---|---|---|---|---|---|---|---|---|---|---|---|---|---|---|---|---|---|---|---|---|---|---|---|---|---|---|---|---|---|---|---|---|---|---|---|---|---|---|---|---|---|---|---|---|---|---|---|---|---|---|
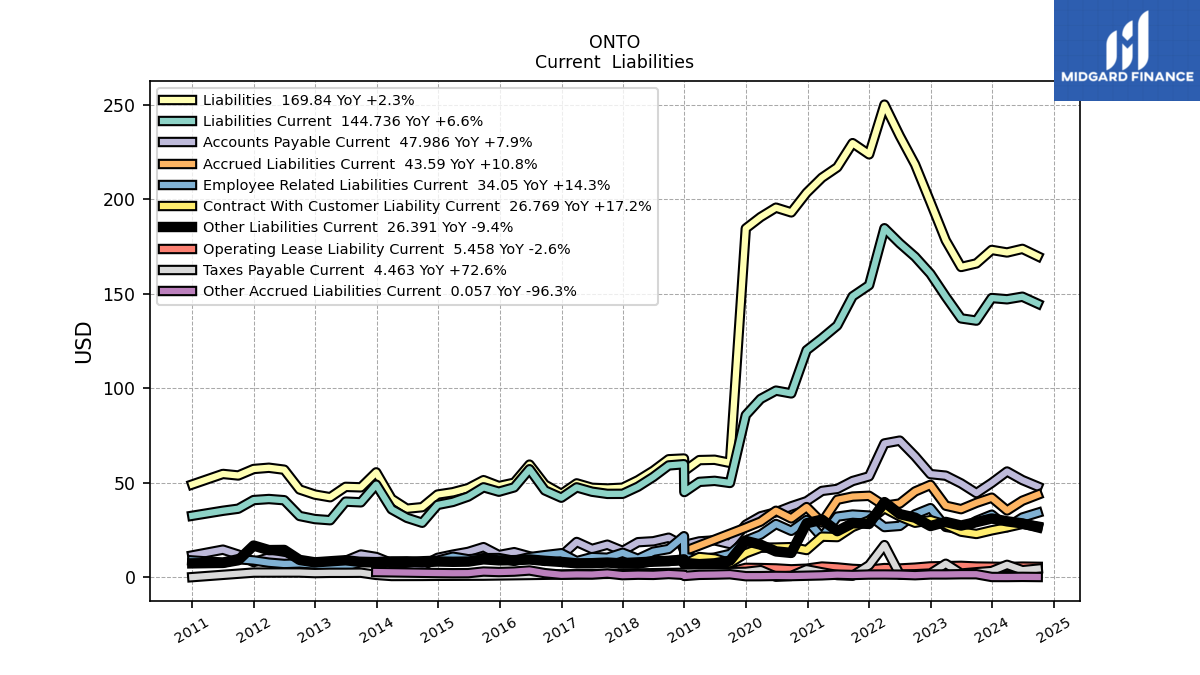
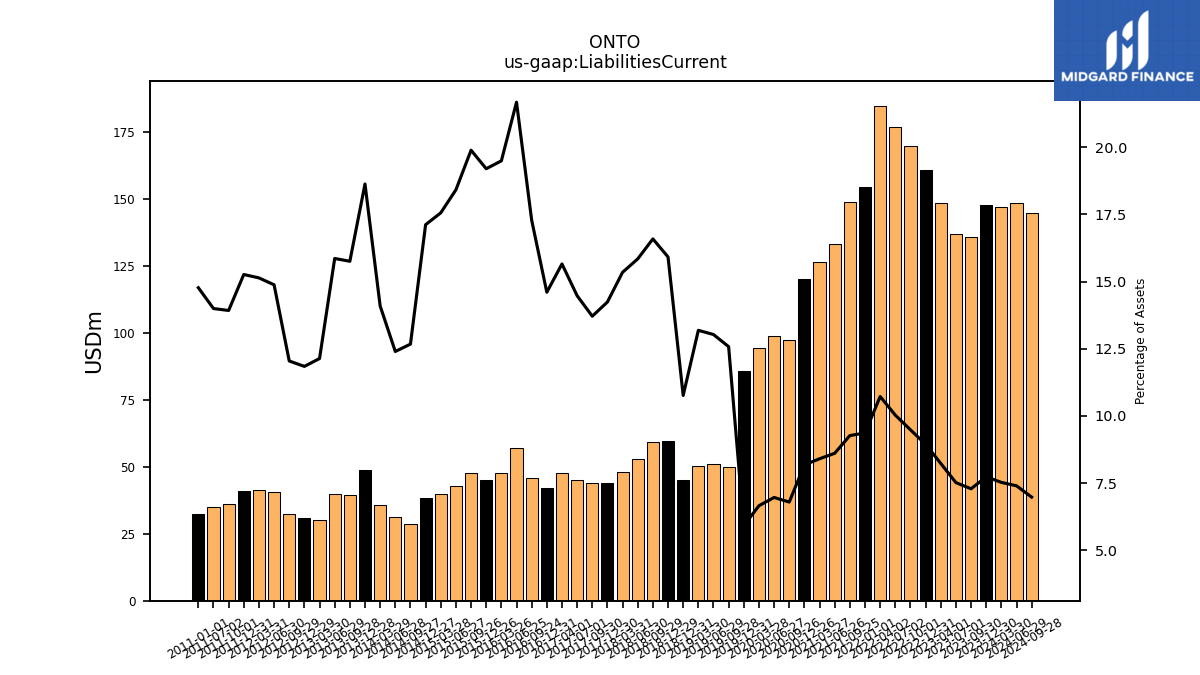
| Liabilities Current | 147.73 | 135.76 | 136.94 | 148.42 | 160.56 | 169.55 | 176.67 | 184.68 | 148.62 | 133.17 | 126.41 | 120.09 | 97.23 | 98.72 | 94.33 | 85.74 | NA | 49.83 | NA | 50.95 | NA | 50.41 | 44.99 | 59.77 | NA | 59.12 | 53.04 | 47.88 | NA | 44.09 | 44.06 | 45.21 | 47.51 | 42.03 | 45.91 | 57.11 | 47.50 | 45.21 | 47.55 | 42.63 | 39.81 | 38.20 | 28.76 | 31.38 | 35.89 | 48.96 | 39.59 | 39.96 | 30.11 | 30.73 | 32.36 | 40.71 | 41.34 | 40.78 | 36.21 | 35.12 | NA | 32.48 | NA | NA | |
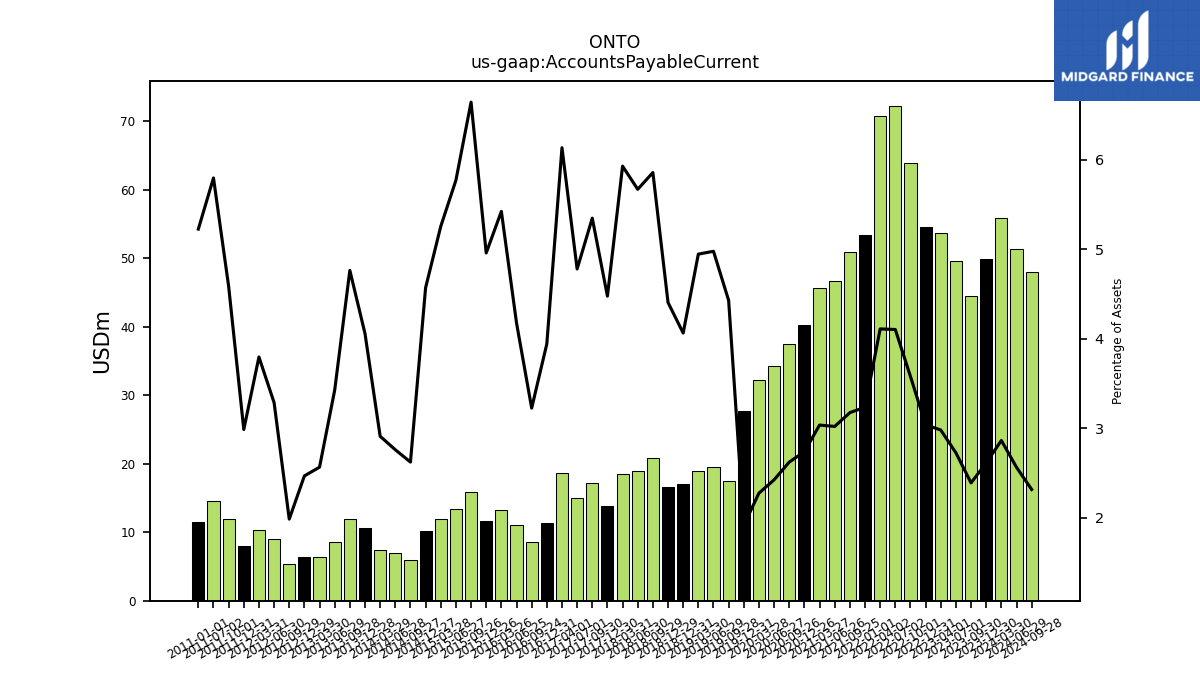
| Accounts Payable Current | 49.87 | 44.47 | 49.60 | 53.70 | 54.53 | 63.95 | 72.25 | 70.76 | 50.87 | 46.69 | 45.62 | 40.18 | 37.49 | 34.32 | 32.20 | 27.74 | NA | 17.54 | NA | 19.46 | NA | 18.90 | 16.98 | 16.54 | NA | 20.87 | 18.98 | 18.49 | NA | 13.86 | 17.18 | 14.93 | 18.61 | 11.34 | 8.56 | 11.00 | 13.21 | 11.68 | 15.88 | 13.36 | 11.91 | 10.20 | 5.95 | 6.98 | 7.41 | 10.66 | 11.97 | 8.63 | 6.36 | 6.40 | 5.33 | 8.99 | 10.36 | 7.97 | 11.92 | 14.54 | NA | 11.49 | NA | NA | |
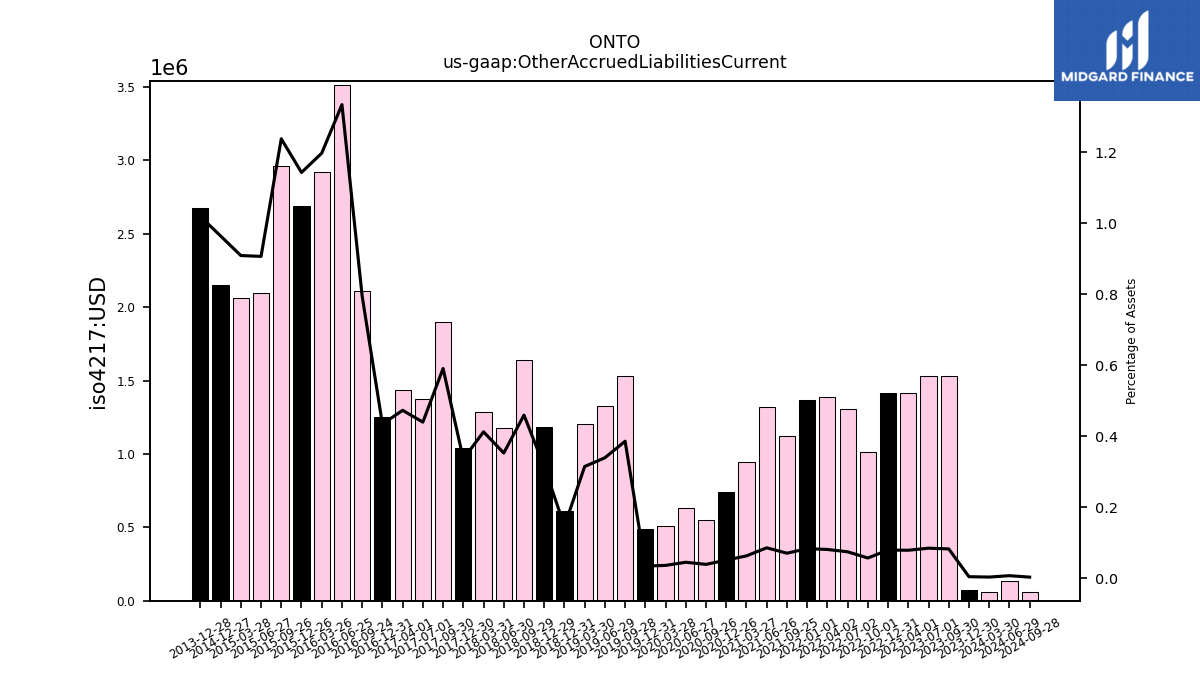
| Other Accrued Liabilities Current | 0.08 | 1.53 | 1.53 | 1.42 | 1.42 | 1.01 | 1.30 | 1.39 | 1.12 | 1.32 | 0.94 | 0.74 | 0.55 | 0.63 | 0.51 | 0.49 | NA | 1.53 | NA | 1.33 | NA | 1.20 | 0.61 | 1.18 | NA | 1.64 | 1.18 | 1.29 | NA | 1.04 | 1.90 | 1.37 | 1.44 | 1.25 | 2.11 | 3.52 | 2.92 | 2.69 | 2.96 | 2.10 | 2.06 | 2.15 | NA | NA | NA | 2.68 | NA | NA | NA | NA | NA | NA | NA | NA | NA | NA | NA | NA | NA | NA | |
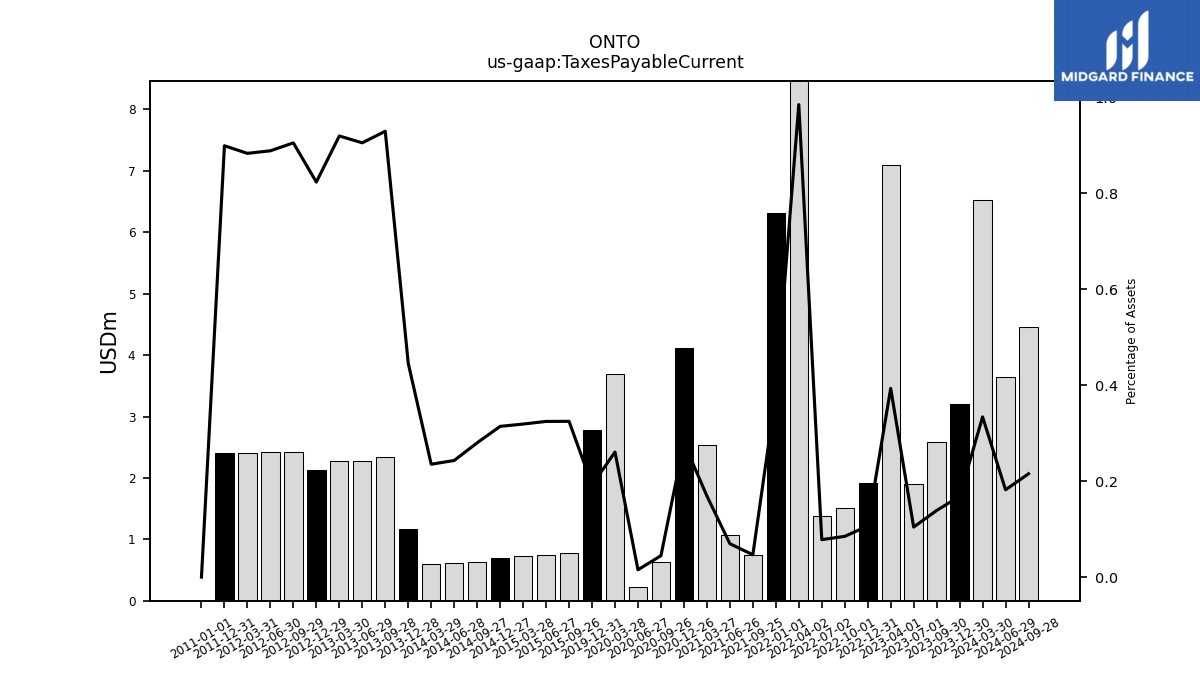
| Taxes Payable Current | 3.21 | 2.59 | 1.90 | 7.09 | 1.91 | 1.52 | 1.38 | 16.95 | 0.75 | 1.08 | 2.54 | 4.11 | 0.64 | 0.22 | 3.69 | 2.78 | NA | NA | NA | NA | NA | NA | NA | NA | NA | NA | NA | NA | NA | NA | NA | NA | NA | NA | NA | NA | NA | NA | 0.78 | 0.75 | 0.72 | 0.70 | 0.64 | 0.61 | 0.60 | 1.17 | 2.33 | 2.28 | 2.28 | 2.13 | 2.43 | 2.43 | 2.41 | 2.40 | NA | NA | NA | 0.00 | NA | NA | |
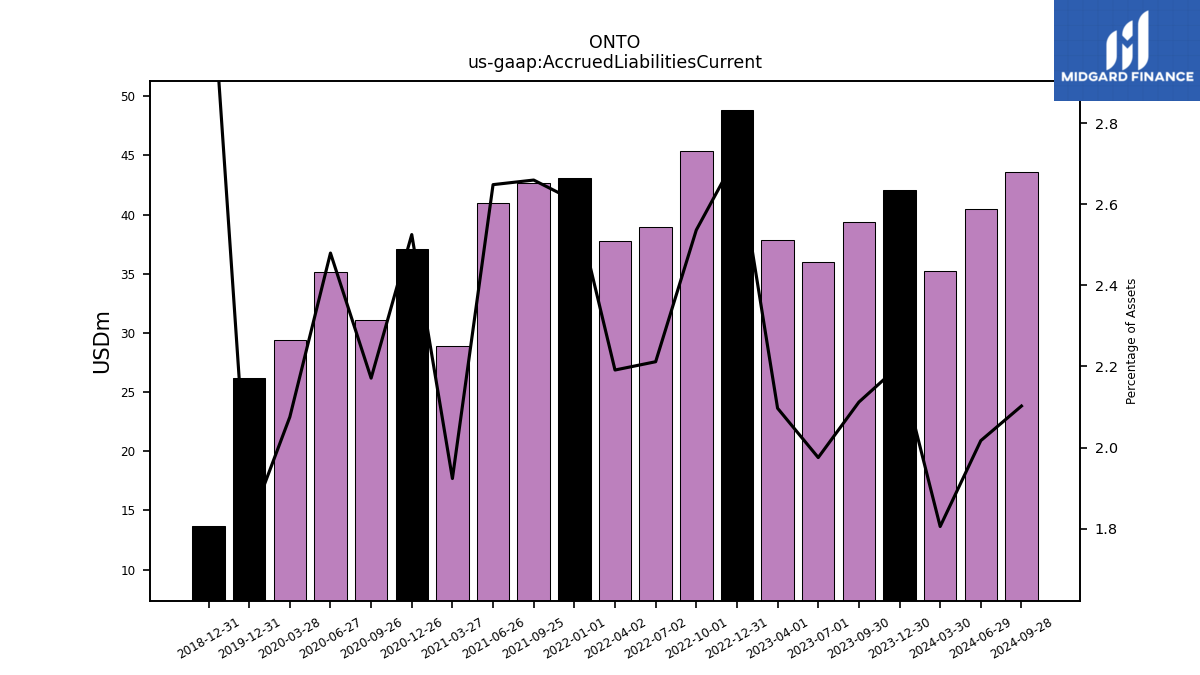
| Accrued Liabilities Current | 42.06 | 39.33 | 35.97 | 37.80 | 48.84 | 45.35 | 38.96 | 37.74 | 42.64 | 40.96 | 28.93 | 37.08 | 31.06 | 35.13 | 29.39 | 26.20 | NA | NA | NA | NA | NA | NA | 13.70 | NA | NA | NA | NA | NA | NA | NA | NA | NA | NA | NA | NA | NA | NA | NA | NA | NA | NA | NA | NA | NA | NA | NA | NA | NA | NA | NA | NA | NA | NA | NA | NA | NA | NA | NA | NA | NA | |
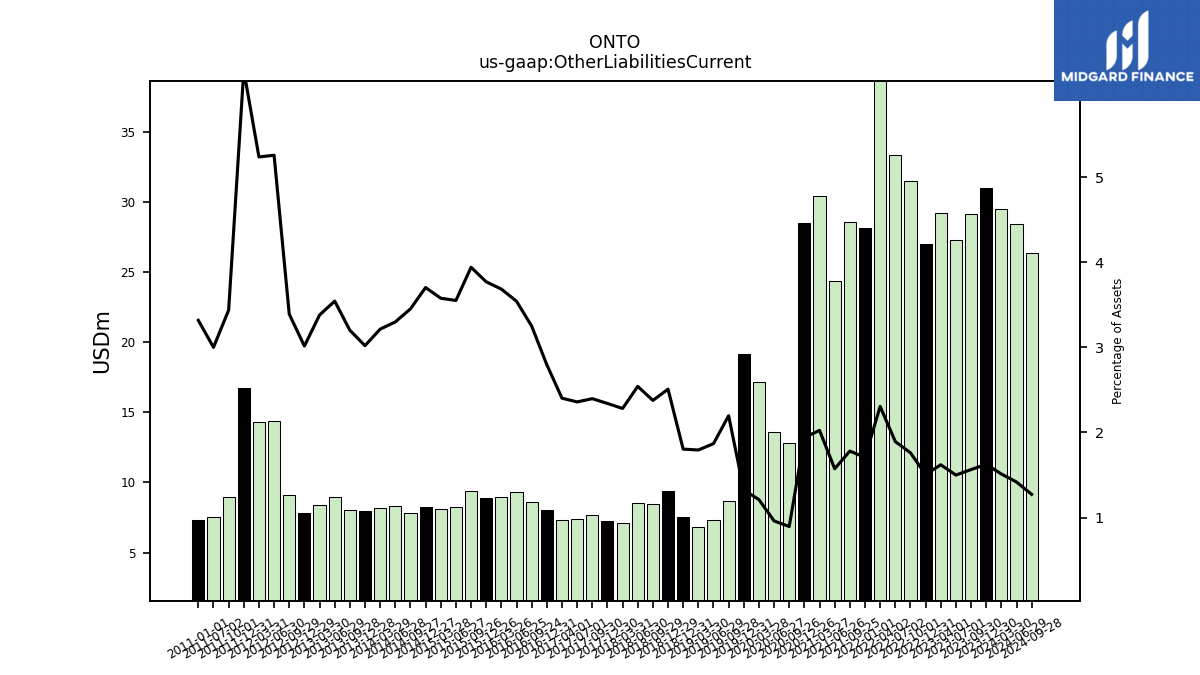
| Other Liabilities Current | 31.03 | 29.13 | 27.30 | 29.21 | 27.03 | 31.48 | 33.34 | 39.72 | 28.56 | 24.34 | 30.44 | 28.50 | 12.81 | 13.61 | 17.16 | 19.17 | NA | 8.70 | NA | 7.31 | NA | 6.86 | 7.54 | 9.42 | NA | 8.47 | 8.51 | 7.12 | NA | 7.25 | 7.70 | 7.37 | 7.29 | 8.05 | 8.63 | 9.33 | 8.98 | 8.88 | 9.42 | 8.22 | 8.11 | 8.27 | 7.83 | 8.35 | 8.19 | 7.94 | 8.04 | 8.93 | 8.38 | 7.82 | 9.11 | 14.38 | 14.30 | 16.71 | 8.94 | 7.53 | NA | 7.29 | NA | NA | |
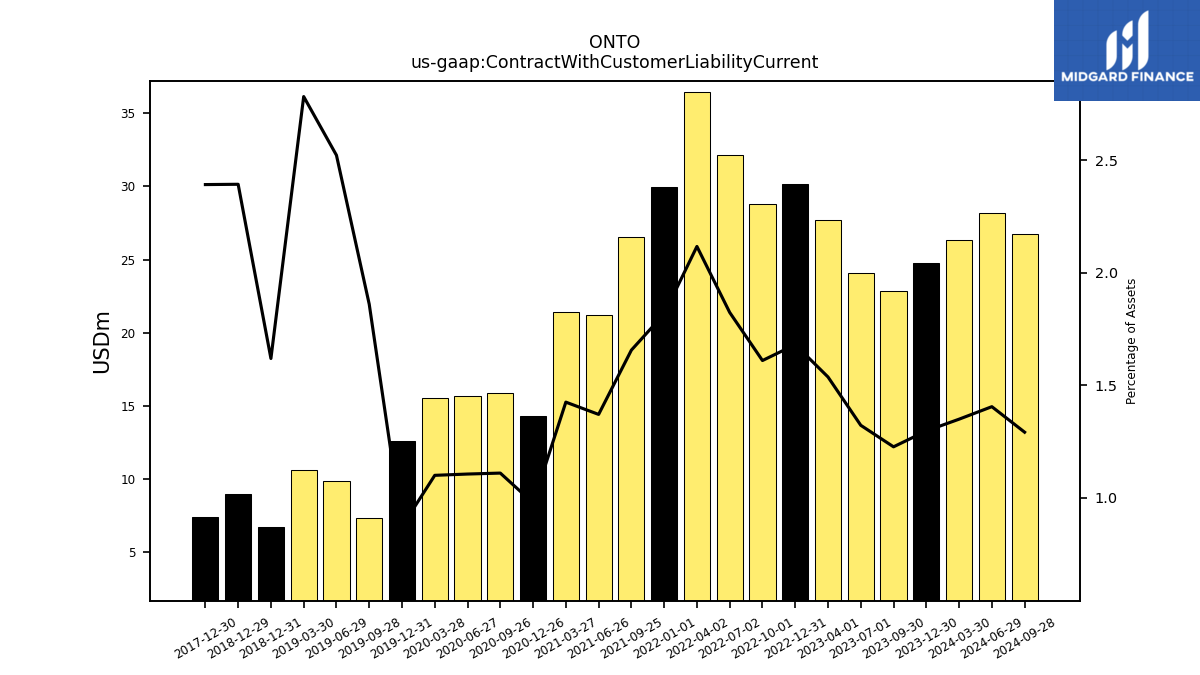
| Contract With Customer Liability Current | 24.76 | 22.83 | 24.07 | 27.70 | 30.16 | 28.78 | 32.12 | 36.46 | 26.55 | 21.19 | 21.42 | 14.33 | 15.87 | 15.66 | 15.57 | 12.63 | NA | 7.37 | NA | 9.87 | NA | 10.64 | 6.77 | 8.99 | NA | NA | NA | NA | NA | 7.41 | NA | NA | NA | NA | NA | NA | NA | NA | NA | NA | NA | NA | NA | NA | NA | NA | NA | NA | NA | NA | NA | NA | NA | NA | NA | NA | NA | NA | NA | NA |
| 2023-12-30 | 2023-09-30 | 2023-07-01 | 2023-04-01 | 2022-12-31 | 2022-10-01 | 2022-07-02 | 2022-04-02 | 2021-09-25 | 2021-06-26 | 2021-03-27 | 2020-12-26 | 2020-09-26 | 2020-06-27 | 2020-03-28 | 2019-12-31 | 2019-09-30 | 2019-09-28 | 2019-06-30 | 2019-06-29 | 2019-03-31 | 2019-03-30 | 2018-12-31 | 2018-12-29 | 2018-09-30 | 2018-09-29 | 2018-06-30 | 2018-03-31 | 2017-12-31 | 2017-12-30 | 2017-09-30 | 2017-07-01 | 2017-04-01 | 2016-12-31 | 2016-09-24 | 2016-06-25 | 2016-03-26 | 2015-12-26 | 2015-09-26 | 2015-06-27 | 2015-03-28 | 2014-12-27 | 2014-09-27 | 2014-06-28 | 2014-03-29 | 2013-12-28 | 2013-09-28 | 2013-06-29 | 2013-03-30 | 2012-12-29 | 2012-09-29 | 2012-06-30 | 2012-03-31 | 2011-12-31 | 2011-10-01 | 2011-07-02 | 2011-04-02 | 2011-01-01 | 2010-10-02 | 2010-07-03 | ||
|---|---|---|---|---|---|---|---|---|---|---|---|---|---|---|---|---|---|---|---|---|---|---|---|---|---|---|---|---|---|---|---|---|---|---|---|---|---|---|---|---|---|---|---|---|---|---|---|---|---|---|---|---|---|---|---|---|---|---|---|---|---|
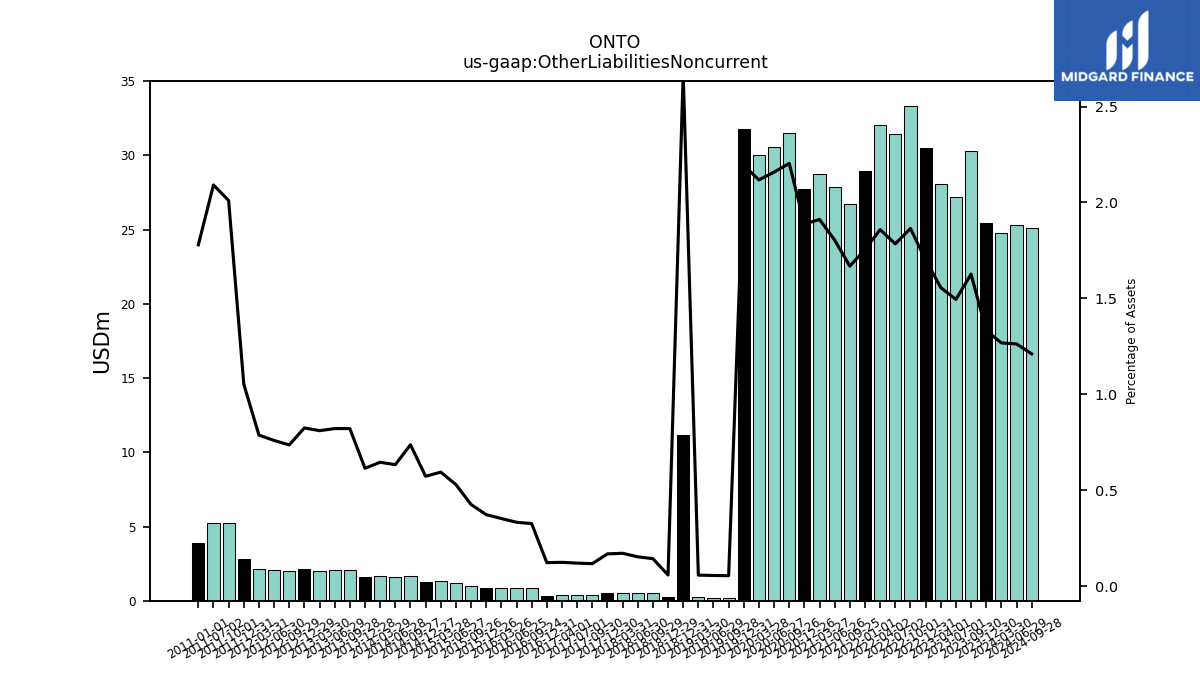
| Other Liabilities Noncurrent | 25.45 | 30.29 | 27.21 | 28.06 | 30.51 | 33.34 | 31.43 | 32.01 | 26.74 | 27.89 | 28.74 | 27.71 | 31.52 | 30.58 | 29.99 | 31.77 | NA | 0.22 | NA | 0.22 | NA | 0.22 | 11.16 | 0.22 | NA | 0.51 | 0.51 | 0.54 | NA | 0.52 | 0.38 | 0.38 | 0.38 | 0.35 | 0.87 | 0.88 | 0.86 | 0.88 | 1.02 | 1.23 | 1.35 | 1.28 | 1.67 | 1.60 | 1.65 | 1.61 | 2.06 | 2.07 | 2.01 | 2.14 | 1.98 | 2.08 | 2.15 | 2.81 | 5.23 | 5.25 | NA | 3.91 | NA | NA | |
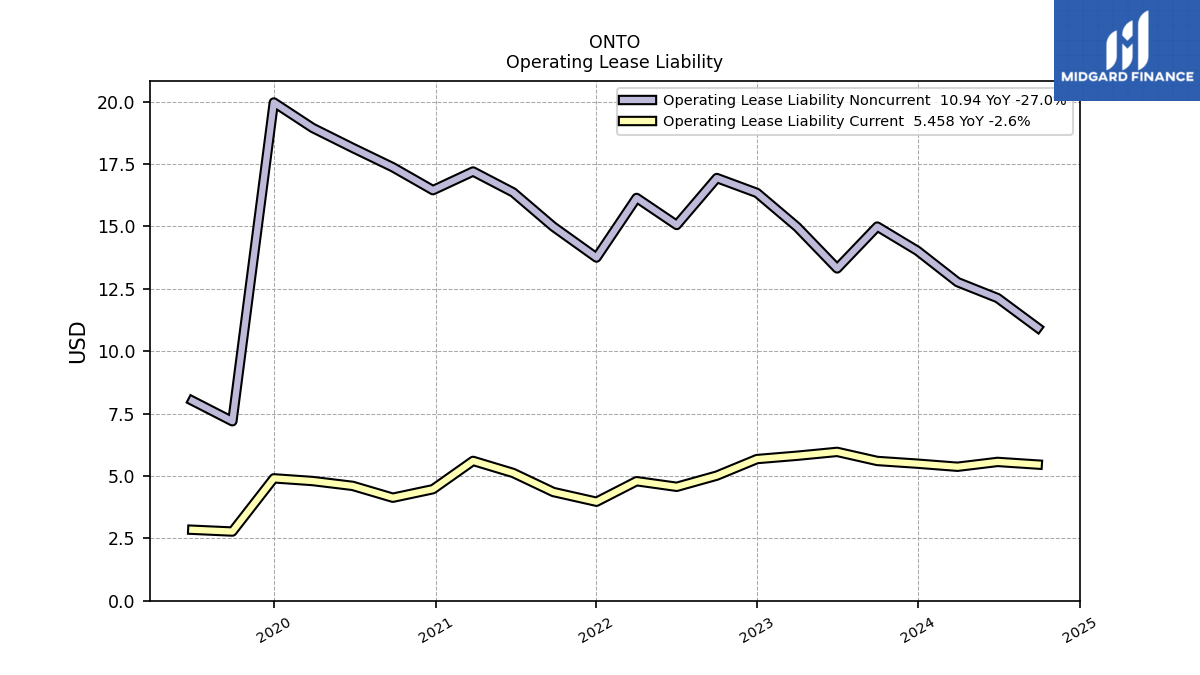
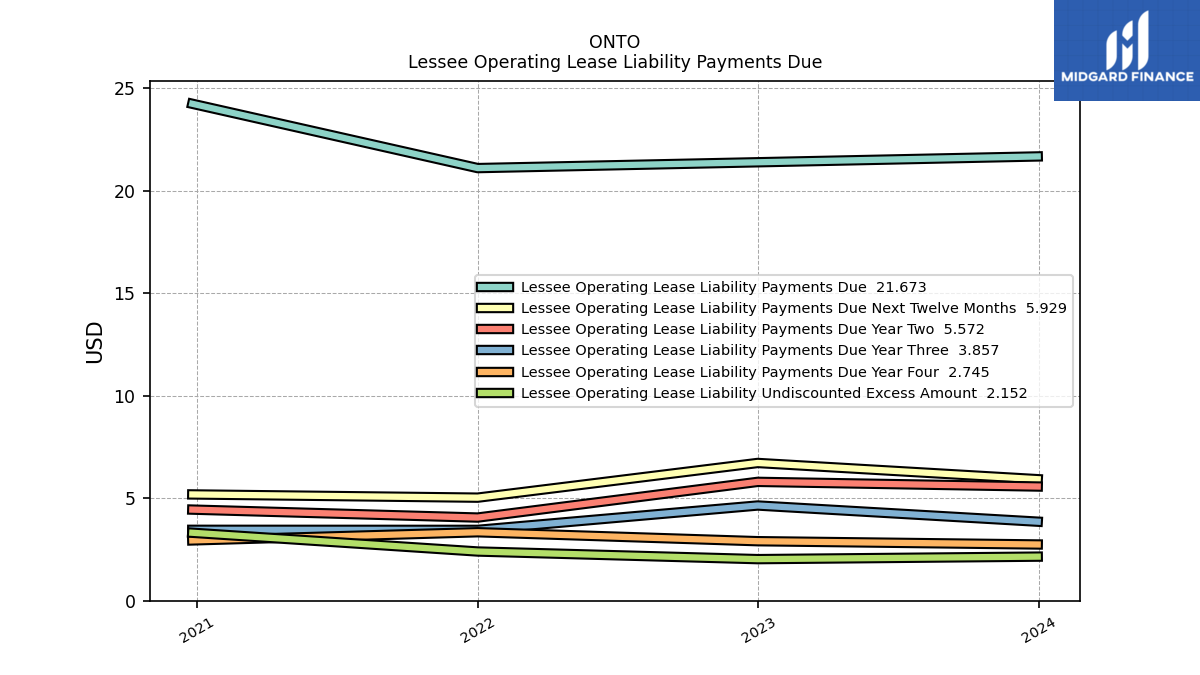
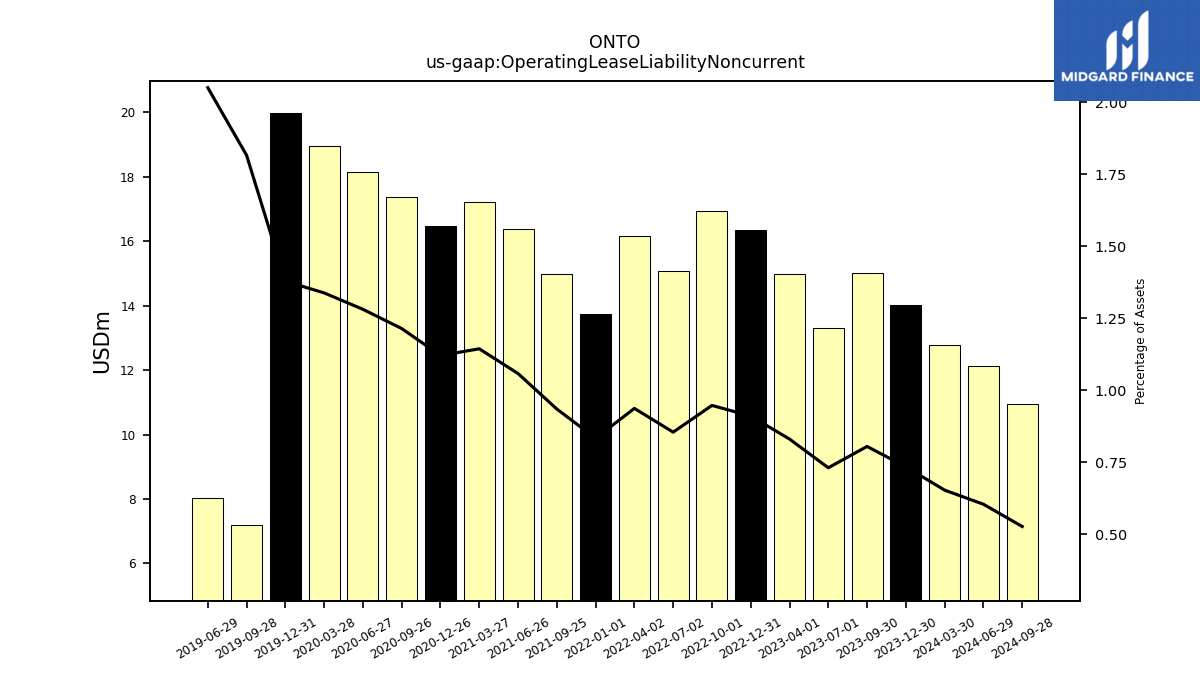
| Operating Lease Liability Noncurrent | 14.03 | 15.00 | 13.32 | 14.98 | 16.34 | 16.94 | 15.06 | 16.14 | 14.99 | 16.36 | 17.20 | 16.45 | 17.37 | 18.15 | 18.95 | 19.97 | NA | 7.19 | NA | 8.02 | NA | NA | NA | NA | NA | NA | NA | NA | NA | NA | NA | NA | NA | NA | NA | NA | NA | NA | NA | NA | NA | NA | NA | NA | NA | NA | NA | NA | NA | NA | NA | NA | NA | NA | NA | NA | NA | NA | NA | NA |
| 2023-12-30 | 2023-09-30 | 2023-07-01 | 2023-04-01 | 2022-12-31 | 2022-10-01 | 2022-07-02 | 2022-04-02 | 2021-09-25 | 2021-06-26 | 2021-03-27 | 2020-12-26 | 2020-09-26 | 2020-06-27 | 2020-03-28 | 2019-12-31 | 2019-09-30 | 2019-09-28 | 2019-06-30 | 2019-06-29 | 2019-03-31 | 2019-03-30 | 2018-12-31 | 2018-12-29 | 2018-09-30 | 2018-09-29 | 2018-06-30 | 2018-03-31 | 2017-12-31 | 2017-12-30 | 2017-09-30 | 2017-07-01 | 2017-04-01 | 2016-12-31 | 2016-09-24 | 2016-06-25 | 2016-03-26 | 2015-12-26 | 2015-09-26 | 2015-06-27 | 2015-03-28 | 2014-12-27 | 2014-09-27 | 2014-06-28 | 2014-03-29 | 2013-12-28 | 2013-09-28 | 2013-06-29 | 2013-03-30 | 2012-12-29 | 2012-09-29 | 2012-06-30 | 2012-03-31 | 2011-12-31 | 2011-10-01 | 2011-07-02 | 2011-04-02 | 2011-01-01 | 2010-10-02 | 2010-07-03 | ||
|---|---|---|---|---|---|---|---|---|---|---|---|---|---|---|---|---|---|---|---|---|---|---|---|---|---|---|---|---|---|---|---|---|---|---|---|---|---|---|---|---|---|---|---|---|---|---|---|---|---|---|---|---|---|---|---|---|---|---|---|---|---|
| Stockholders Equity | 1736.54 | 1696.14 | 1656.71 | 1624.62 | 1596.43 | 1569.37 | 1527.94 | 1472.32 | 1373.55 | 1329.56 | 1292.31 | 1264.75 | 1237.68 | 1221.21 | 1225.81 | 1264.03 | 385.47 | 335.77 | NA | 328.98 | NA | 320.39 | 361.89 | 312.85 | NA | 294.07 | 278.48 | 260.73 | NA | 262.38 | 274.49 | 265.13 | 253.91 | 243.77 | 216.64 | 204.00 | 193.75 | 187.33 | 187.80 | 184.46 | 181.84 | 179.54 | 189.94 | 216.90 | 213.27 | 207.37 | 203.80 | 204.25 | 205.85 | 215.77 | 222.25 | 216.78 | 215.24 | 209.99 | 206.31 | 196.35 | NA | 170.85 | NA | NA | |
| Common Stock Value | 0.05 | 0.05 | 0.05 | 0.05 | 0.05 | 0.05 | 0.05 | 0.05 | 0.05 | 0.05 | 0.05 | 0.05 | 0.05 | 0.05 | 0.05 | 0.05 | NA | 0.03 | NA | 0.03 | NA | 0.03 | 0.03 | 0.02 | NA | 0.02 | 0.02 | 0.02 | NA | 0.03 | 0.03 | 0.03 | 0.03 | 0.03 | 0.03 | 0.03 | 0.02 | 0.02 | 0.02 | 0.02 | 0.02 | 0.02 | 0.02 | 0.02 | 0.02 | 0.02 | 0.02 | 0.02 | 0.02 | 0.02 | 0.02 | 0.02 | 0.02 | 0.02 | 0.02 | 0.02 | NA | 0.02 | NA | NA | |
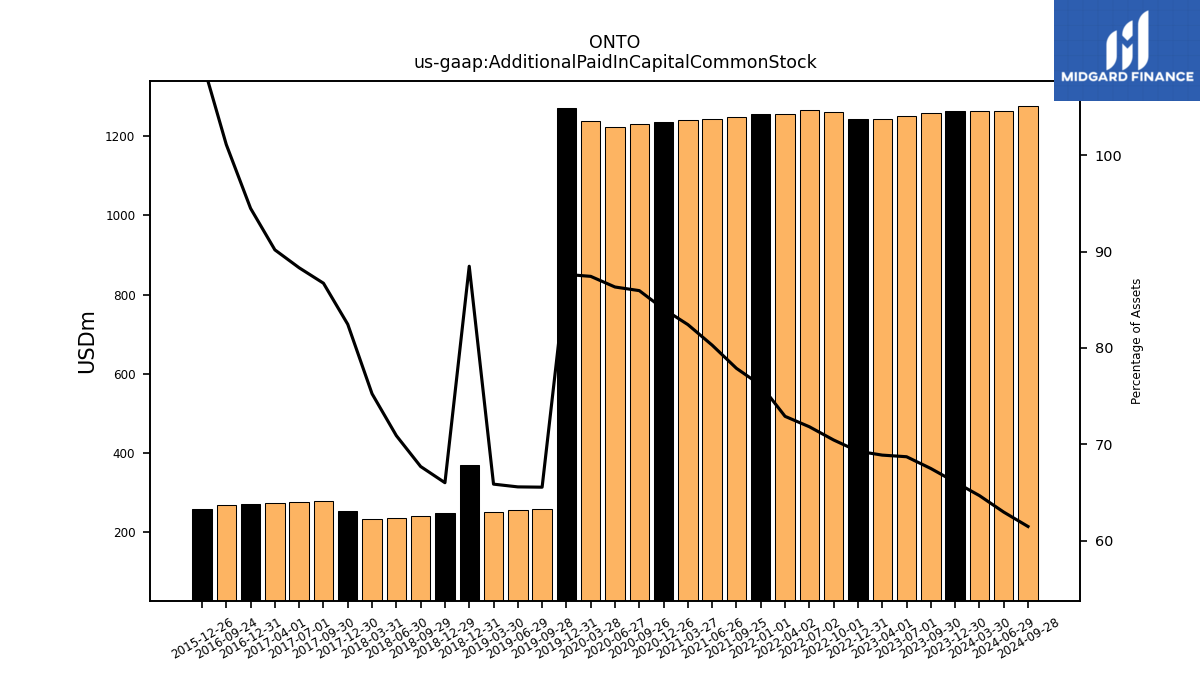
| Additional Paid In Capital Common Stock | 1262.03 | 1256.82 | 1251.19 | 1241.84 | 1243.63 | 1259.50 | 1265.16 | 1255.73 | 1248.70 | 1241.68 | 1239.45 | 1233.97 | 1229.72 | 1223.07 | 1238.38 | 1269.44 | NA | 259.74 | NA | 256.50 | NA | 251.84 | 369.89 | 247.98 | NA | 241.32 | 237.38 | 234.79 | NA | 255.37 | 278.72 | 275.91 | 273.74 | 271.97 | 268.55 | NA | NA | 258.71 | NA | NA | NA | NA | NA | NA | NA | NA | NA | NA | NA | NA | NA | NA | NA | NA | NA | NA | NA | NA | NA | NA | |
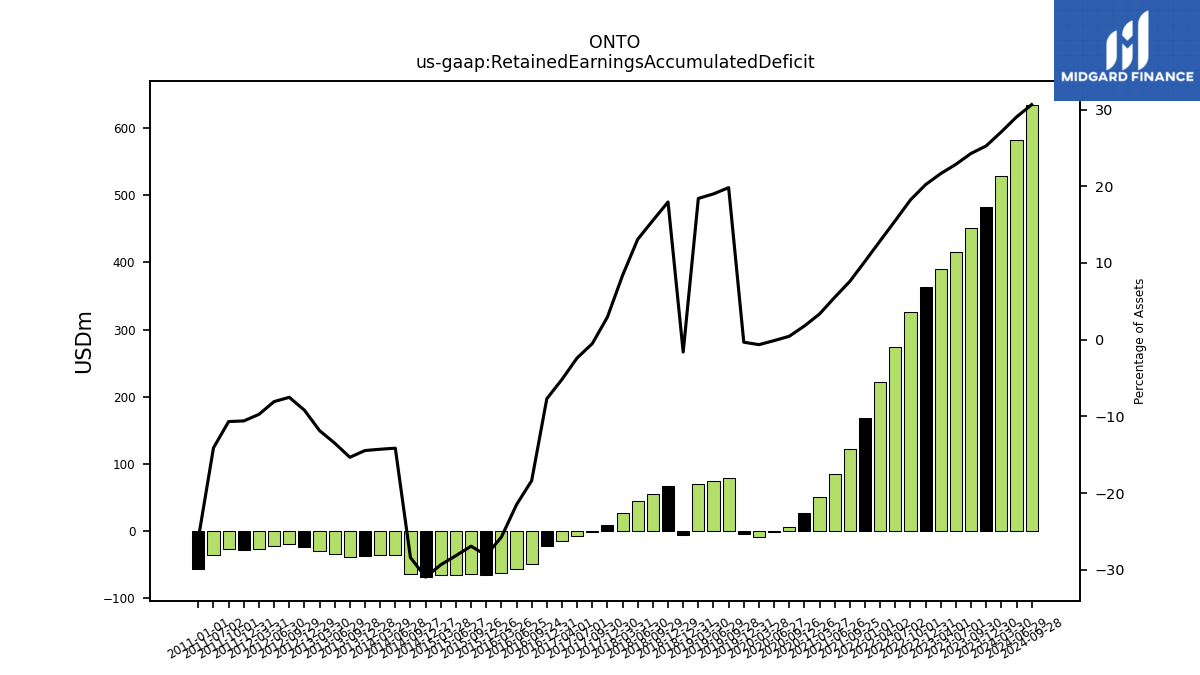
| Retained Earnings Accumulated Deficit | 482.36 | 452.05 | 416.16 | 390.26 | 362.76 | 325.63 | 273.42 | 221.84 | 121.77 | 85.33 | 50.27 | 26.16 | 6.25 | -1.84 | -9.27 | -4.86 | NA | 78.52 | NA | 74.31 | NA | 70.38 | -6.77 | 67.40 | NA | 55.38 | 43.81 | 26.14 | NA | 9.11 | -1.69 | -7.45 | -15.74 | -22.17 | -48.83 | -56.71 | -62.74 | -66.21 | -64.40 | -65.21 | -66.56 | -69.11 | -64.47 | -35.81 | -36.40 | -38.00 | -38.55 | -34.00 | -29.43 | -23.85 | -20.20 | -22.11 | -26.61 | -28.32 | -27.78 | -35.40 | NA | -57.00 | NA | NA | |
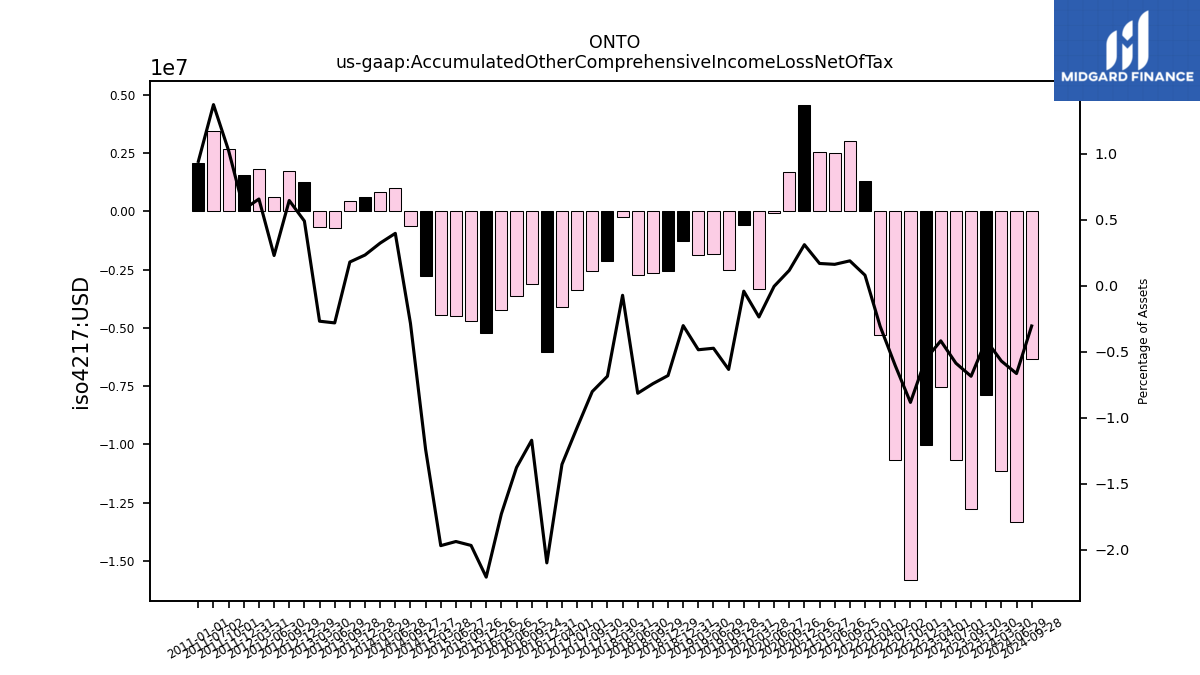
| Accumulated Other Comprehensive Income Loss Net Of Tax | -7.90 | -12.78 | -10.69 | -7.53 | -10.01 | -15.80 | -10.68 | -5.30 | 3.02 | 2.51 | 2.54 | 4.57 | 1.67 | -0.07 | -3.35 | -0.60 | NA | -2.51 | NA | -1.85 | NA | -1.85 | -1.26 | -2.56 | NA | -2.65 | -2.73 | -0.23 | NA | -2.12 | -2.58 | -3.36 | -4.11 | -6.05 | -3.11 | -3.63 | -4.21 | -5.20 | -4.71 | -4.49 | -4.47 | -2.77 | -0.65 | 1.00 | 0.82 | 0.61 | 0.45 | -0.71 | -0.67 | 1.27 | 1.74 | 0.63 | 1.79 | 1.55 | 2.66 | 3.44 | NA | 2.07 | NA | NA |
| 2023-12-30 | 2023-09-30 | 2023-07-01 | 2023-04-01 | 2022-12-31 | 2022-10-01 | 2022-07-02 | 2022-04-02 | 2021-09-25 | 2021-06-26 | 2021-03-27 | 2020-12-26 | 2020-09-26 | 2020-06-27 | 2020-03-28 | 2019-12-31 | 2019-09-30 | 2019-09-28 | 2019-06-30 | 2019-06-29 | 2019-03-31 | 2019-03-30 | 2018-12-31 | 2018-12-29 | 2018-09-30 | 2018-09-29 | 2018-06-30 | 2018-03-31 | 2017-12-31 | 2017-12-30 | 2017-09-30 | 2017-07-01 | 2017-04-01 | 2016-12-31 | 2016-09-24 | 2016-06-25 | 2016-03-26 | 2015-12-26 | 2015-09-26 | 2015-06-27 | 2015-03-28 | 2014-12-27 | 2014-09-27 | 2014-06-28 | 2014-03-29 | 2013-12-28 | 2013-09-28 | 2013-06-29 | 2013-03-30 | 2012-12-29 | 2012-09-29 | 2012-06-30 | 2012-03-31 | 2011-12-31 | 2011-10-01 | 2011-07-02 | 2011-04-02 | 2011-01-01 | 2010-10-02 | 2010-07-03 | ||
|---|---|---|---|---|---|---|---|---|---|---|---|---|---|---|---|---|---|---|---|---|---|---|---|---|---|---|---|---|---|---|---|---|---|---|---|---|---|---|---|---|---|---|---|---|---|---|---|---|---|---|---|---|---|---|---|---|---|---|---|---|---|
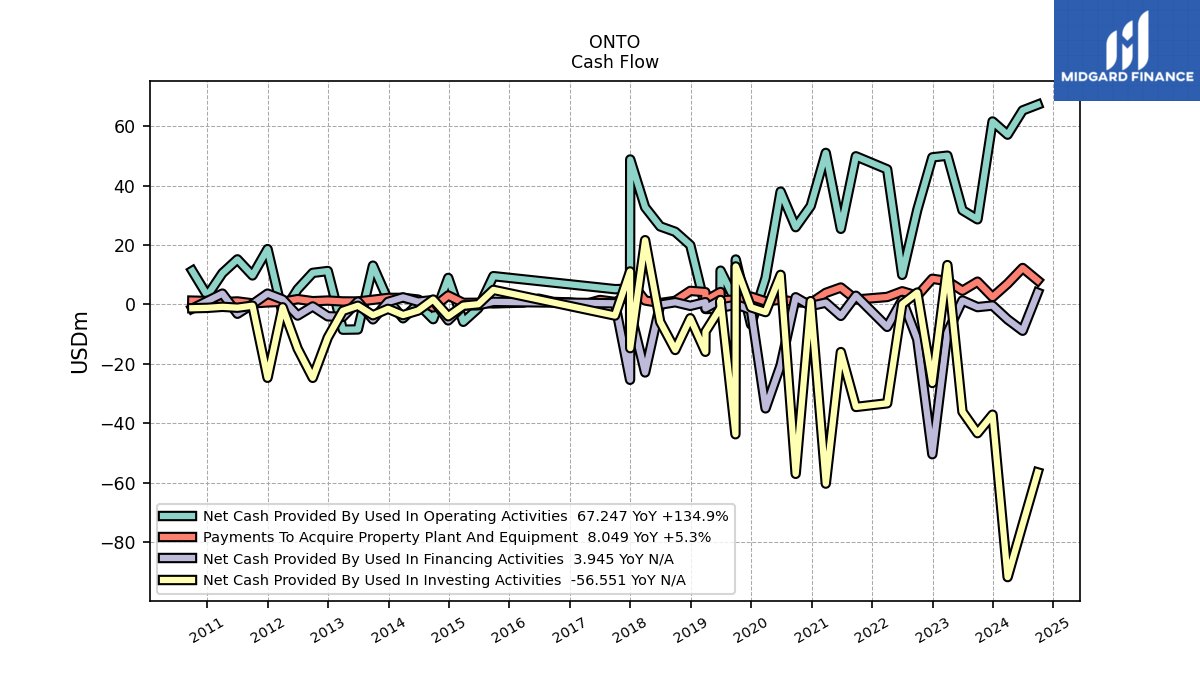
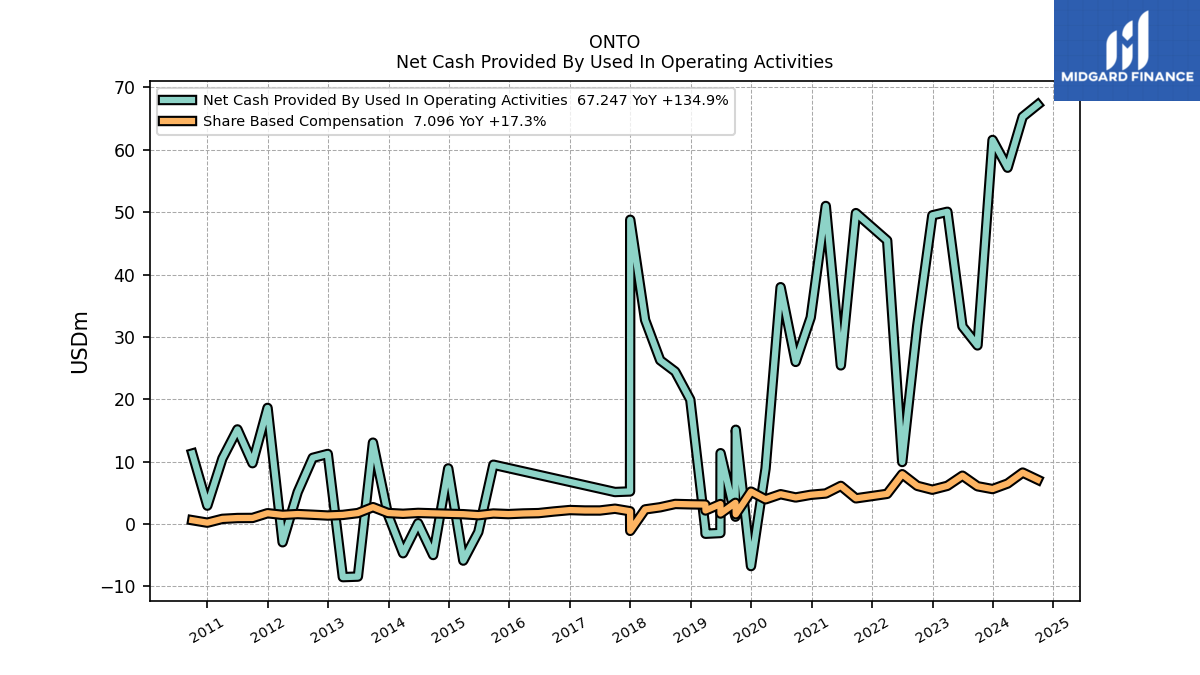
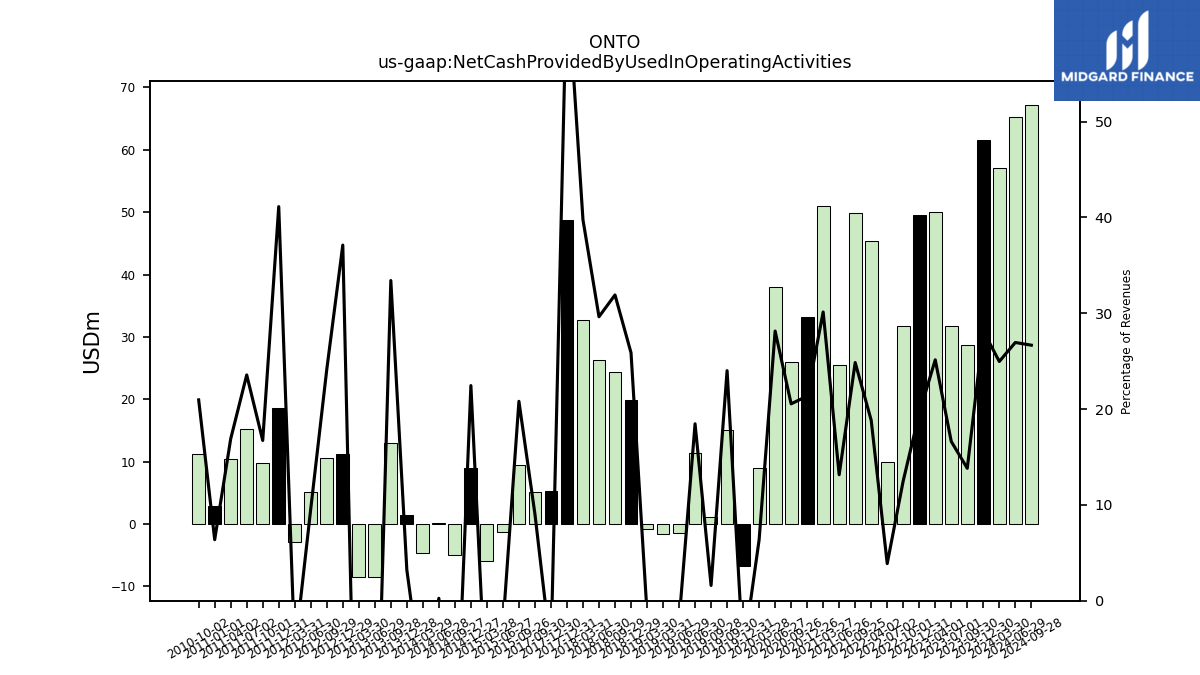
| Net Cash Provided By Used In Operating Activities | 61.59 | 28.63 | 31.69 | 50.07 | 49.49 | 31.82 | 9.93 | 45.46 | 49.85 | 25.43 | 51.00 | 33.12 | 25.99 | 37.97 | 8.90 | -6.75 | 15.11 | 1.17 | 11.36 | -1.45 | -1.57 | -0.86 | NA | 19.93 | NA | 24.44 | 26.26 | 32.71 | 48.79 | 5.22 | 5.13 | NA | NA | NA | NA | NA | NA | NA | 9.51 | -1.28 | -5.87 | 8.91 | -4.98 | 0.12 | -4.69 | 1.48 | 13.04 | -8.44 | -8.52 | 11.23 | 10.61 | 5.11 | -2.94 | 18.62 | 9.74 | 15.17 | 10.50 | 2.94 | 11.30 | NA | |
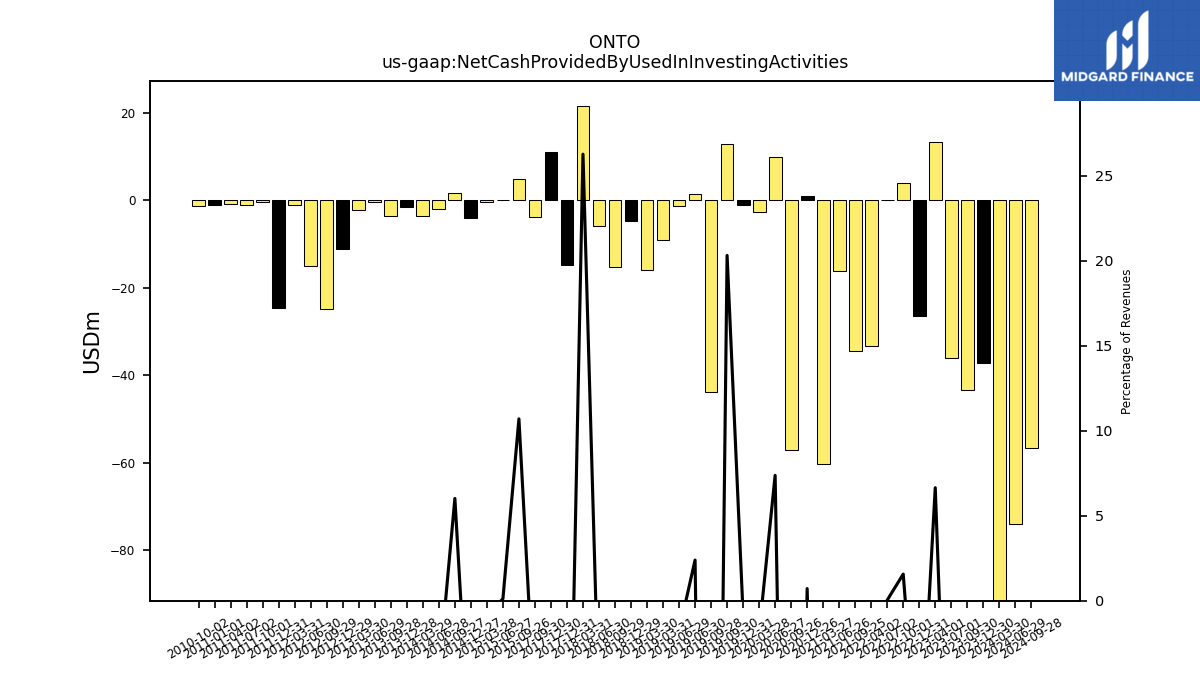
| Net Cash Provided By Used In Investing Activities | -37.13 | -43.36 | -36.14 | 13.24 | -26.46 | 3.98 | 0.09 | -33.30 | -34.53 | -16.05 | -60.35 | 1.11 | -57.05 | 9.95 | -2.60 | -0.98 | 12.78 | -43.73 | 1.47 | -1.22 | -9.17 | -15.96 | NA | -4.68 | NA | -15.35 | -5.84 | 21.62 | -14.74 | 11.09 | -3.77 | NA | NA | NA | NA | NA | NA | NA | 4.88 | 0.06 | -0.44 | -4.01 | 1.63 | -2.07 | -3.60 | -1.50 | -3.65 | -0.46 | -2.18 | -11.17 | -24.73 | -14.92 | -0.97 | -24.72 | -0.45 | -1.12 | -0.82 | -1.17 | -1.29 | NA | |
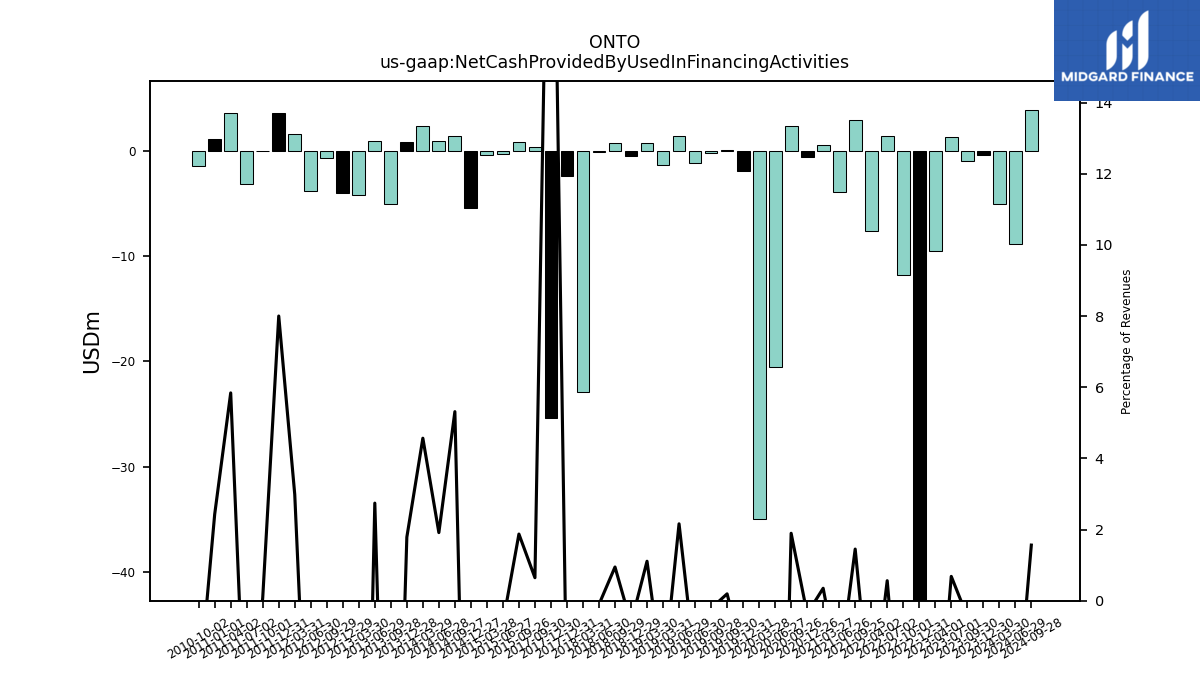
| Net Cash Provided By Used In Financing Activities | -0.39 | -0.92 | 1.30 | -9.47 | -50.45 | -11.77 | 1.45 | -7.57 | 2.91 | -3.88 | 0.59 | -0.57 | 2.40 | -20.52 | -35.02 | -1.87 | 0.12 | -0.16 | -1.11 | 1.46 | -1.34 | 0.74 | NA | -0.49 | NA | 0.73 | -0.09 | -22.92 | -2.39 | -25.40 | 0.37 | NA | NA | NA | NA | NA | NA | NA | 0.86 | -0.30 | -0.35 | -5.39 | 1.44 | 0.92 | 2.36 | 0.82 | -5.05 | 0.95 | -4.21 | -4.01 | -0.69 | -3.76 | 1.66 | 3.62 | 0.05 | -3.16 | 3.63 | 1.12 | -1.40 | NA |
| 2023-12-30 | 2023-09-30 | 2023-07-01 | 2023-04-01 | 2022-12-31 | 2022-10-01 | 2022-07-02 | 2022-04-02 | 2021-09-25 | 2021-06-26 | 2021-03-27 | 2020-12-26 | 2020-09-26 | 2020-06-27 | 2020-03-28 | 2019-12-31 | 2019-09-30 | 2019-09-28 | 2019-06-30 | 2019-06-29 | 2019-03-31 | 2019-03-30 | 2018-12-31 | 2018-12-29 | 2018-09-30 | 2018-09-29 | 2018-06-30 | 2018-03-31 | 2017-12-31 | 2017-12-30 | 2017-09-30 | 2017-07-01 | 2017-04-01 | 2016-12-31 | 2016-09-24 | 2016-06-25 | 2016-03-26 | 2015-12-26 | 2015-09-26 | 2015-06-27 | 2015-03-28 | 2014-12-27 | 2014-09-27 | 2014-06-28 | 2014-03-29 | 2013-12-28 | 2013-09-28 | 2013-06-29 | 2013-03-30 | 2012-12-29 | 2012-09-29 | 2012-06-30 | 2012-03-31 | 2011-12-31 | 2011-10-01 | 2011-07-02 | 2011-04-02 | 2011-01-01 | 2010-10-02 | 2010-07-03 | ||
|---|---|---|---|---|---|---|---|---|---|---|---|---|---|---|---|---|---|---|---|---|---|---|---|---|---|---|---|---|---|---|---|---|---|---|---|---|---|---|---|---|---|---|---|---|---|---|---|---|---|---|---|---|---|---|---|---|---|---|---|---|---|
| Net Cash Provided By Used In Operating Activities | 61.59 | 28.63 | 31.69 | 50.07 | 49.49 | 31.82 | 9.93 | 45.46 | 49.85 | 25.43 | 51.00 | 33.12 | 25.99 | 37.97 | 8.90 | -6.75 | 15.11 | 1.17 | 11.36 | -1.45 | -1.57 | -0.86 | NA | 19.93 | NA | 24.44 | 26.26 | 32.71 | 48.79 | 5.22 | 5.13 | NA | NA | NA | NA | NA | NA | NA | 9.51 | -1.28 | -5.87 | 8.91 | -4.98 | 0.12 | -4.69 | 1.48 | 13.04 | -8.44 | -8.52 | 11.23 | 10.61 | 5.11 | -2.94 | 18.62 | 9.74 | 15.17 | 10.50 | 2.94 | 11.30 | NA | |
| Net Income Loss | 30.31 | 35.89 | 25.90 | 29.07 | 66.21 | 52.22 | 51.58 | 53.33 | 36.45 | 35.05 | 24.11 | 19.91 | 8.09 | 7.42 | -4.40 | -17.75 | 6.56 | 4.21 | 5.53 | 3.93 | 7.58 | 2.97 | 8.08 | 12.02 | 7.19 | 11.57 | 17.68 | 15.13 | 13.51 | 10.80 | 5.76 | 8.29 | 5.35 | 26.65 | 7.88 | 6.03 | 3.47 | -1.81 | 0.82 | 1.34 | 2.56 | -4.64 | -28.66 | 0.59 | 1.59 | 0.56 | -4.55 | -4.57 | -5.58 | -3.65 | 1.90 | 4.51 | 1.70 | -0.53 | 7.62 | 11.09 | 10.51 | 26.13 | 12.33 | 11.57 | |
| Profit Loss | 30.31 | 35.89 | 25.90 | 29.07 | 66.21 | 52.22 | 51.58 | 53.33 | 36.45 | 35.05 | 24.11 | 19.91 | 8.09 | 7.42 | -4.40 | -17.75 | 6.56 | 4.21 | 5.53 | 3.93 | 7.58 | 2.97 | NA | 12.02 | NA | 11.57 | 17.68 | 16.38 | 13.51 | 10.80 | 5.76 | NA | NA | NA | NA | NA | NA | NA | NA | NA | NA | NA | NA | NA | NA | NA | NA | NA | NA | NA | NA | NA | NA | NA | NA | NA | NA | NA | NA | NA | |
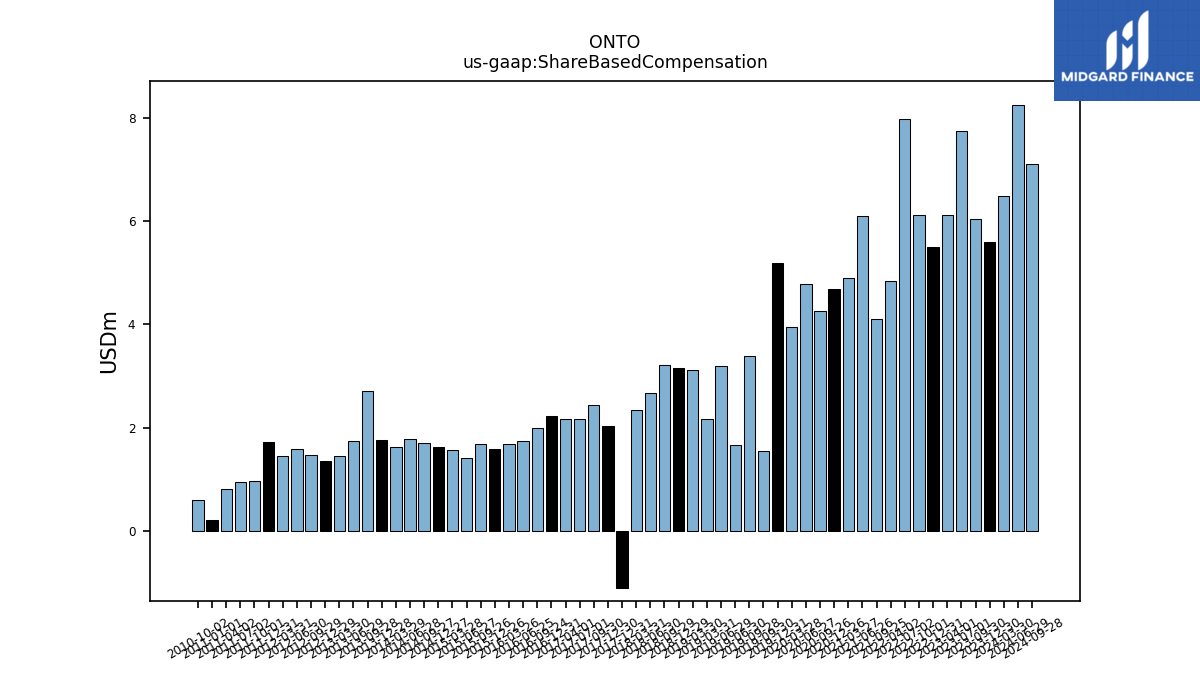
| Share Based Compensation | 5.60 | 6.05 | 7.75 | 6.12 | 5.50 | 6.11 | 7.98 | 4.83 | 4.11 | 6.11 | 4.89 | 4.68 | 4.25 | 4.78 | 3.96 | 5.19 | 1.55 | 3.40 | 1.67 | 3.20 | 2.16 | 3.11 | NA | 3.15 | NA | 3.21 | 2.68 | 2.34 | -1.10 | 2.04 | 2.45 | 2.16 | 2.16 | 2.23 | 2.00 | 1.74 | 1.69 | 1.58 | 1.68 | 1.41 | 1.57 | 1.64 | 1.71 | 1.78 | 1.63 | 1.76 | 2.70 | 1.75 | 1.46 | 1.35 | 1.48 | 1.59 | 1.46 | 1.73 | 0.97 | 0.95 | 0.82 | 0.21 | 0.61 | NA |
| 2023-12-30 | 2023-09-30 | 2023-07-01 | 2023-04-01 | 2022-12-31 | 2022-10-01 | 2022-07-02 | 2022-04-02 | 2021-09-25 | 2021-06-26 | 2021-03-27 | 2020-12-26 | 2020-09-26 | 2020-06-27 | 2020-03-28 | 2019-12-31 | 2019-09-30 | 2019-09-28 | 2019-06-30 | 2019-06-29 | 2019-03-31 | 2019-03-30 | 2018-12-31 | 2018-12-29 | 2018-09-30 | 2018-09-29 | 2018-06-30 | 2018-03-31 | 2017-12-31 | 2017-12-30 | 2017-09-30 | 2017-07-01 | 2017-04-01 | 2016-12-31 | 2016-09-24 | 2016-06-25 | 2016-03-26 | 2015-12-26 | 2015-09-26 | 2015-06-27 | 2015-03-28 | 2014-12-27 | 2014-09-27 | 2014-06-28 | 2014-03-29 | 2013-12-28 | 2013-09-28 | 2013-06-29 | 2013-03-30 | 2012-12-29 | 2012-09-29 | 2012-06-30 | 2012-03-31 | 2011-12-31 | 2011-10-01 | 2011-07-02 | 2011-04-02 | 2011-01-01 | 2010-10-02 | 2010-07-03 | ||
|---|---|---|---|---|---|---|---|---|---|---|---|---|---|---|---|---|---|---|---|---|---|---|---|---|---|---|---|---|---|---|---|---|---|---|---|---|---|---|---|---|---|---|---|---|---|---|---|---|---|---|---|---|---|---|---|---|---|---|---|---|---|
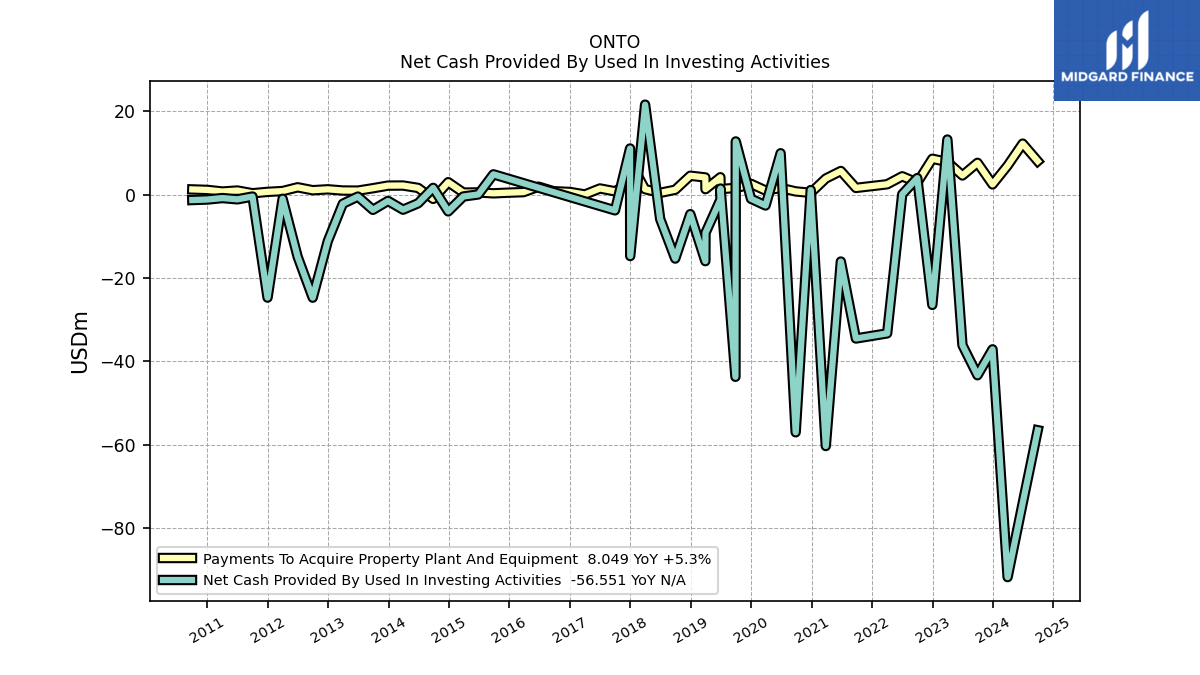
| Net Cash Provided By Used In Investing Activities | -37.13 | -43.36 | -36.14 | 13.24 | -26.46 | 3.98 | 0.09 | -33.30 | -34.53 | -16.05 | -60.35 | 1.11 | -57.05 | 9.95 | -2.60 | -0.98 | 12.78 | -43.73 | 1.47 | -1.22 | -9.17 | -15.96 | NA | -4.68 | NA | -15.35 | -5.84 | 21.62 | -14.74 | 11.09 | -3.77 | NA | NA | NA | NA | NA | NA | NA | 4.88 | 0.06 | -0.44 | -4.01 | 1.63 | -2.07 | -3.60 | -1.50 | -3.65 | -0.46 | -2.18 | -11.17 | -24.73 | -14.92 | -0.97 | -24.72 | -0.45 | -1.12 | -0.82 | -1.17 | -1.29 | NA | |
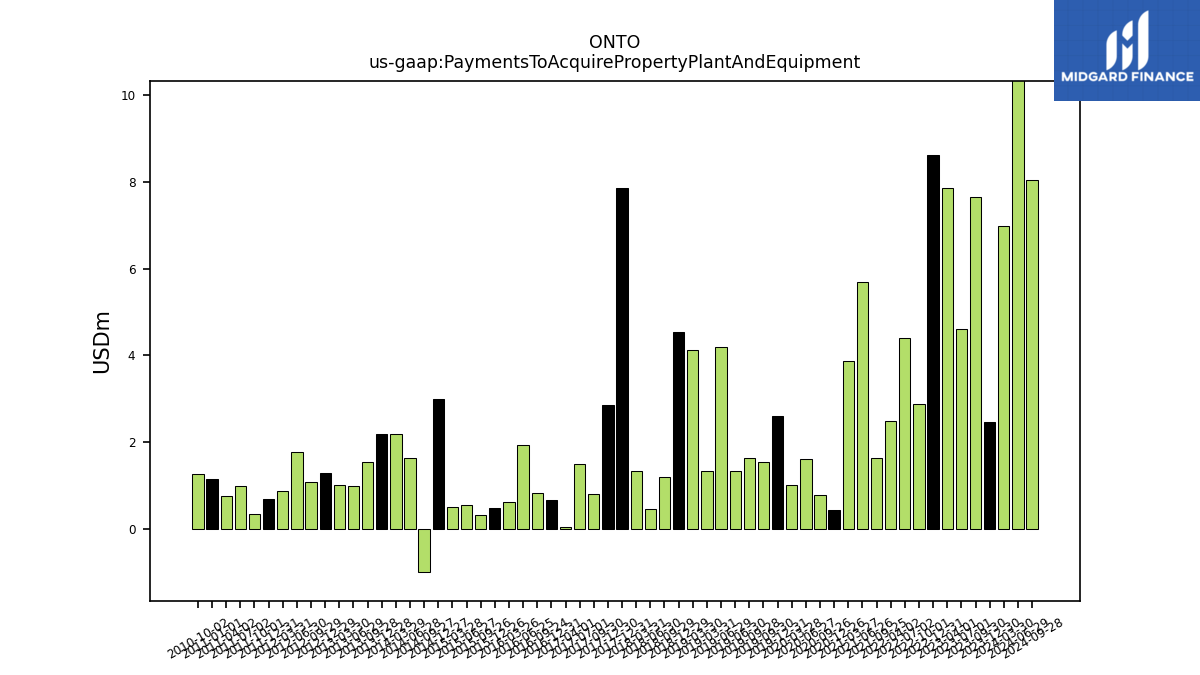
| Payments To Acquire Property Plant And Equipment | 2.46 | 7.65 | 4.61 | 7.86 | 8.62 | 2.88 | 4.41 | 2.49 | 1.62 | 5.68 | 3.88 | 0.44 | 0.78 | 1.61 | 1.00 | 2.60 | 1.55 | 1.63 | 1.33 | 4.18 | 1.32 | 4.13 | NA | 4.54 | NA | 1.18 | 0.44 | 1.32 | 7.87 | 2.86 | 0.81 | 1.49 | 0.05 | 0.65 | 0.82 | 1.92 | 0.61 | 0.48 | 0.32 | 0.54 | 0.50 | 2.99 | -1.01 | 1.62 | 2.19 | 2.17 | 1.55 | 0.97 | 1.00 | 1.28 | 1.07 | 1.77 | 0.87 | 0.67 | 0.34 | 0.99 | 0.76 | 1.14 | 1.26 | NA |
| 2023-12-30 | 2023-09-30 | 2023-07-01 | 2023-04-01 | 2022-12-31 | 2022-10-01 | 2022-07-02 | 2022-04-02 | 2021-09-25 | 2021-06-26 | 2021-03-27 | 2020-12-26 | 2020-09-26 | 2020-06-27 | 2020-03-28 | 2019-12-31 | 2019-09-30 | 2019-09-28 | 2019-06-30 | 2019-06-29 | 2019-03-31 | 2019-03-30 | 2018-12-31 | 2018-12-29 | 2018-09-30 | 2018-09-29 | 2018-06-30 | 2018-03-31 | 2017-12-31 | 2017-12-30 | 2017-09-30 | 2017-07-01 | 2017-04-01 | 2016-12-31 | 2016-09-24 | 2016-06-25 | 2016-03-26 | 2015-12-26 | 2015-09-26 | 2015-06-27 | 2015-03-28 | 2014-12-27 | 2014-09-27 | 2014-06-28 | 2014-03-29 | 2013-12-28 | 2013-09-28 | 2013-06-29 | 2013-03-30 | 2012-12-29 | 2012-09-29 | 2012-06-30 | 2012-03-31 | 2011-12-31 | 2011-10-01 | 2011-07-02 | 2011-04-02 | 2011-01-01 | 2010-10-02 | 2010-07-03 | ||
|---|---|---|---|---|---|---|---|---|---|---|---|---|---|---|---|---|---|---|---|---|---|---|---|---|---|---|---|---|---|---|---|---|---|---|---|---|---|---|---|---|---|---|---|---|---|---|---|---|---|---|---|---|---|---|---|---|---|---|---|---|---|
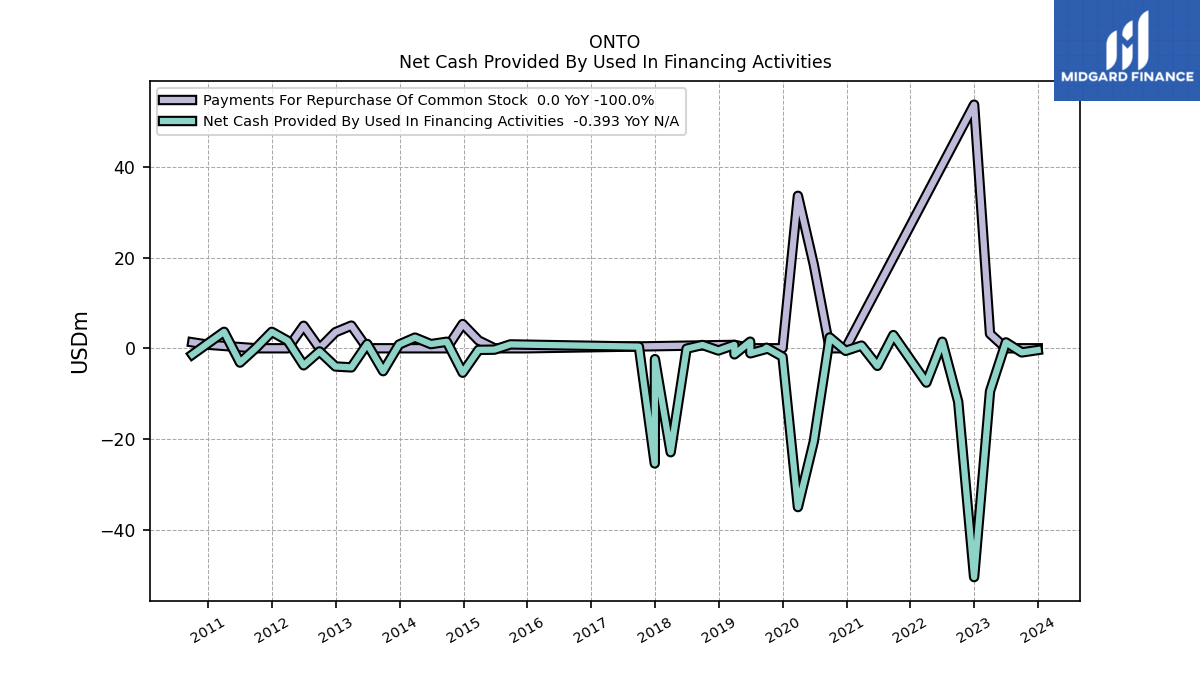
| Net Cash Provided By Used In Financing Activities | -0.39 | -0.92 | 1.30 | -9.47 | -50.45 | -11.77 | 1.45 | -7.57 | 2.91 | -3.88 | 0.59 | -0.57 | 2.40 | -20.52 | -35.02 | -1.87 | 0.12 | -0.16 | -1.11 | 1.46 | -1.34 | 0.74 | NA | -0.49 | NA | 0.73 | -0.09 | -22.92 | -2.39 | -25.40 | 0.37 | NA | NA | NA | NA | NA | NA | NA | 0.86 | -0.30 | -0.35 | -5.39 | 1.44 | 0.92 | 2.36 | 0.82 | -5.05 | 0.95 | -4.21 | -4.01 | -0.69 | -3.76 | 1.66 | 3.62 | 0.05 | -3.16 | 3.63 | 1.12 | -1.40 | NA | |
| Payments For Repurchase Of Common Stock | 0.00 | 0.00 | 0.00 | 3.20 | 53.72 | NA | NA | NA | NA | NA | NA | 0.00 | 0.00 | 18.39 | 33.61 | 0.00 | 0.00 | NA | 0.00 | NA | 0.74 | NA | NA | NA | NA | NA | NA | NA | NA | NA | NA | NA | NA | NA | NA | NA | NA | 0.00 | 0.00 | 0.00 | 1.72 | 5.34 | 0.00 | 0.00 | 0.00 | 0.00 | 0.00 | 0.00 | 5.00 | 3.54 | 0.00 | 4.96 | 0.00 | 0.00 | 0.00 | NA | NA | 0.78 | 1.32 | NA |
| 2023-12-30 | 2023-09-30 | 2023-07-01 | 2023-04-01 | 2022-12-31 | 2022-10-01 | 2022-07-02 | 2022-04-02 | 2021-09-25 | 2021-06-26 | 2021-03-27 | 2020-12-26 | 2020-09-26 | 2020-06-27 | 2020-03-28 | 2019-12-31 | 2019-09-30 | 2019-09-28 | 2019-06-30 | 2019-06-29 | 2019-03-31 | 2019-03-30 | 2018-12-31 | 2018-12-29 | 2018-09-30 | 2018-09-29 | 2018-06-30 | 2018-03-31 | 2017-12-31 | 2017-12-30 | 2017-09-30 | 2017-07-01 | 2017-04-01 | 2016-12-31 | 2016-09-24 | 2016-06-25 | 2016-03-26 | 2015-12-26 | 2015-09-26 | 2015-06-27 | 2015-03-28 | 2014-12-27 | 2014-09-27 | 2014-06-28 | 2014-03-29 | 2013-12-28 | 2013-09-28 | 2013-06-29 | 2013-03-30 | 2012-12-29 | 2012-09-29 | 2012-06-30 | 2012-03-31 | 2011-12-31 | 2011-10-01 | 2011-07-02 | 2011-04-02 | 2011-01-01 | 2010-10-02 | 2010-07-03 | ||
|---|---|---|---|---|---|---|---|---|---|---|---|---|---|---|---|---|---|---|---|---|---|---|---|---|---|---|---|---|---|---|---|---|---|---|---|---|---|---|---|---|---|---|---|---|---|---|---|---|---|---|---|---|---|---|---|---|---|---|---|---|---|
| Revenues | 218.86 | 207.19 | 190.66 | 199.16 | 253.27 | 254.25 | 256.31 | 241.35 | 200.59 | 193.39 | 169.28 | 155.13 | 126.49 | 134.95 | 139.93 | 120.56 | 62.94 | 73.12 | 61.51 | 67.62 | 60.89 | 67.10 | 62.78 | 77.02 | 60.43 | 76.59 | 88.60 | 73.10 | 74.68 | -98.10 | 56.67 | 64.43 | 59.31 | 59.16 | 58.71 | 55.77 | 47.49 | 42.69 | 45.68 | 48.63 | 50.38 | 39.70 | 27.13 | 48.03 | 51.58 | 46.16 | 39.04 | 34.55 | 24.55 | 30.27 | 43.94 | 53.18 | 55.49 | 45.28 | 58.27 | 64.37 | 62.14 | 46.13 | 53.94 | 50.84 | |
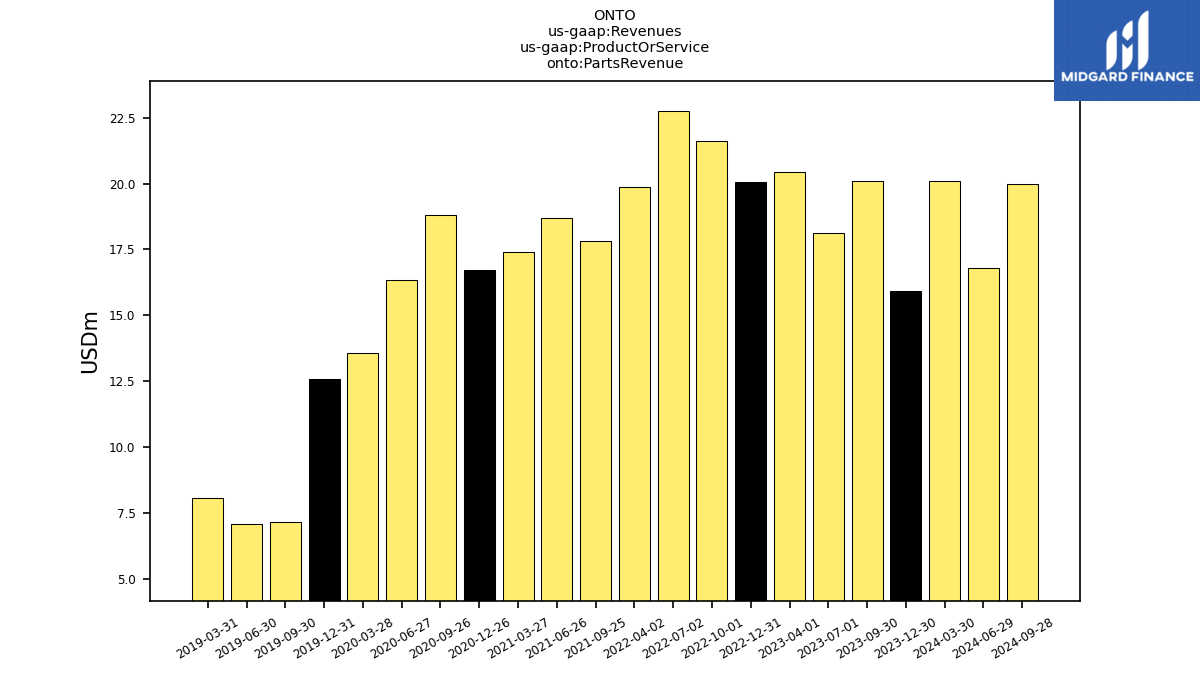
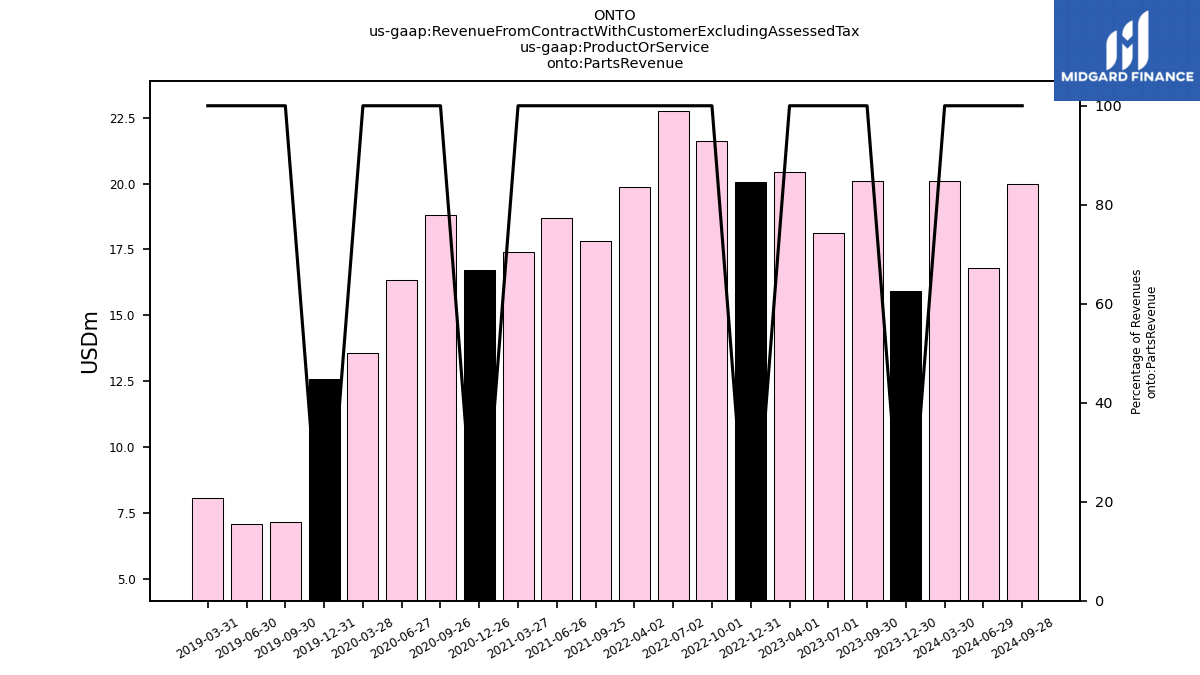
| Parts Revenue | 15.94 | 20.10 | 18.14 | 20.42 | 20.05 | 21.60 | 22.76 | 19.86 | 17.80 | 18.70 | 17.42 | 16.73 | 18.82 | 16.33 | 13.57 | 12.60 | 7.14 | NA | 7.07 | NA | 8.08 | NA | NA | NA | NA | NA | NA | NA | NA | NA | NA | NA | NA | NA | NA | NA | NA | NA | NA | NA | NA | NA | NA | NA | NA | NA | NA | NA | NA | NA | NA | NA | NA | NA | NA | NA | NA | NA | NA | NA | |
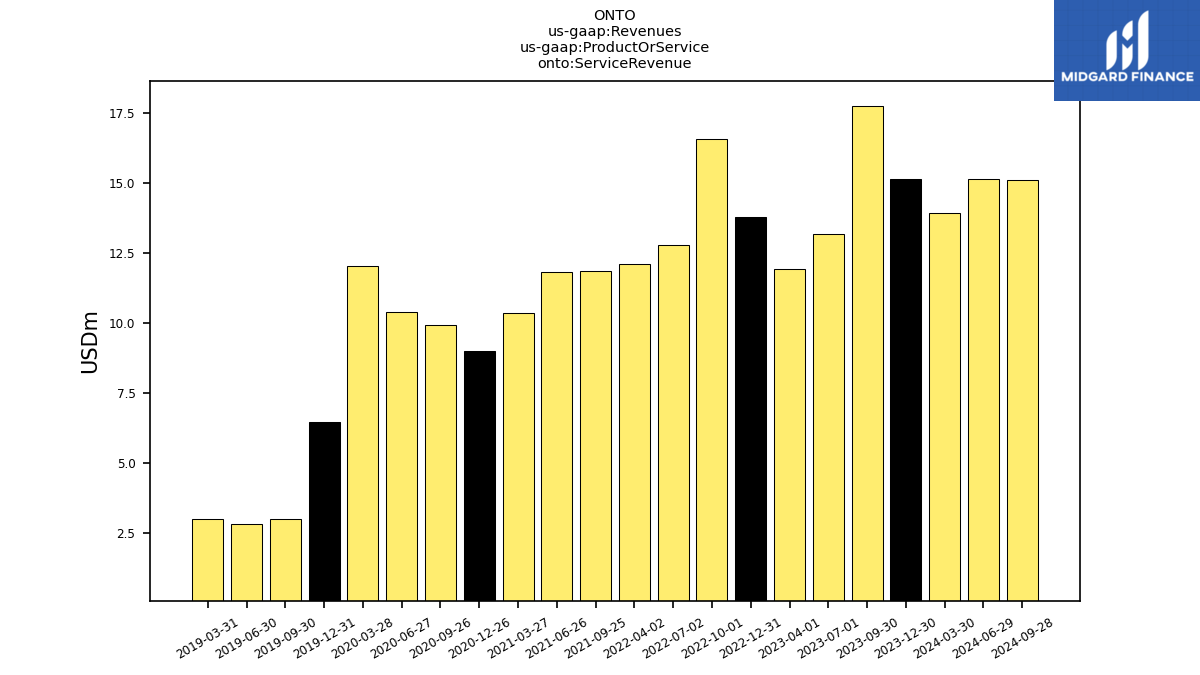
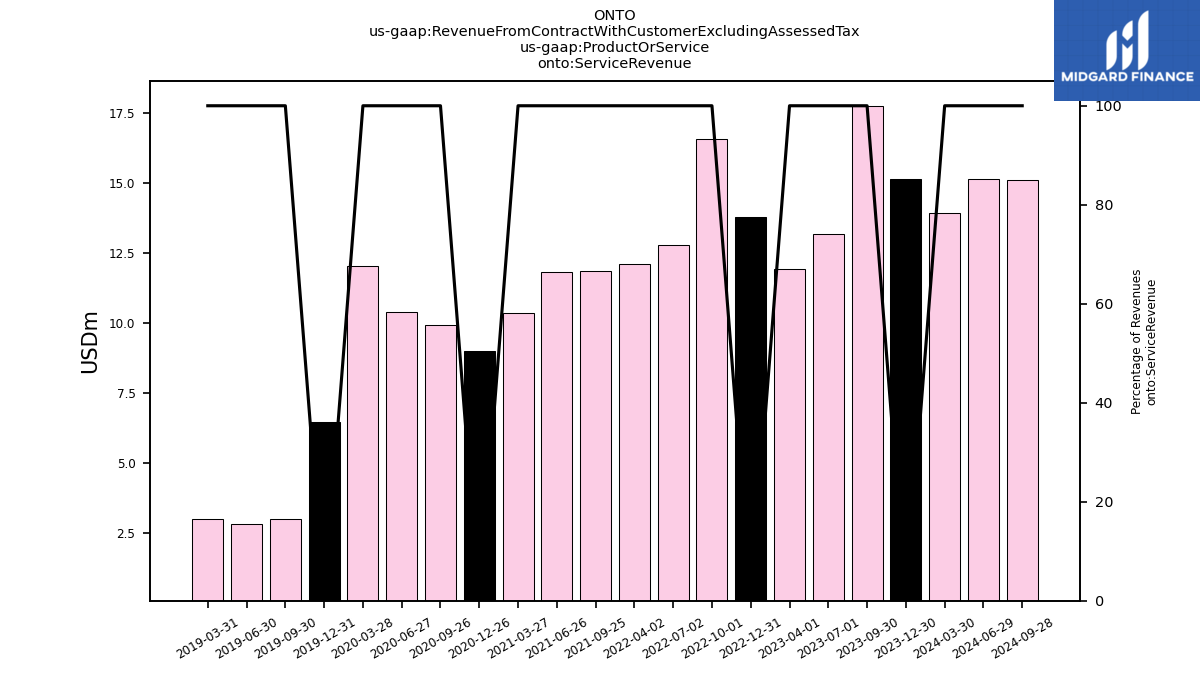
| Service Revenue | 15.12 | 17.74 | 13.17 | 11.92 | 13.76 | 16.57 | 12.77 | 12.11 | 11.85 | 11.79 | 10.35 | 9.01 | 9.90 | 10.37 | 12.02 | 6.44 | 3.01 | NA | 2.83 | NA | 3.01 | NA | NA | NA | NA | NA | NA | NA | NA | NA | NA | NA | NA | NA | NA | NA | NA | NA | NA | NA | NA | NA | NA | NA | NA | NA | NA | NA | NA | NA | NA | NA | NA | NA | NA | NA | NA | NA | NA | NA | |
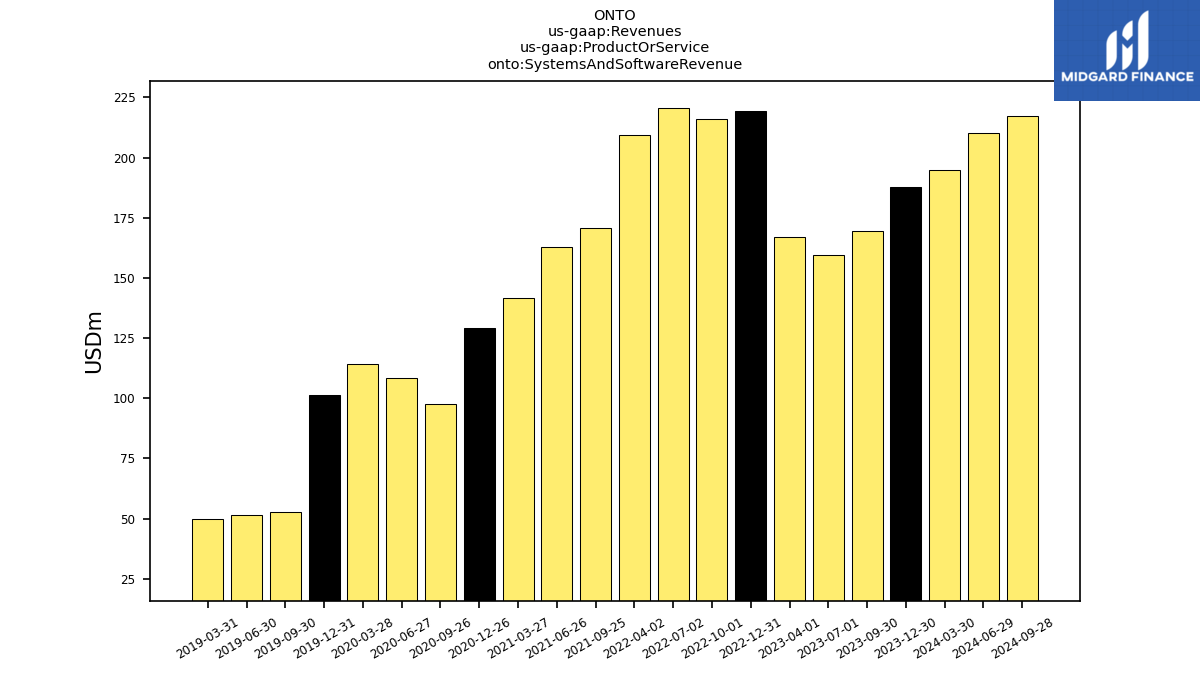
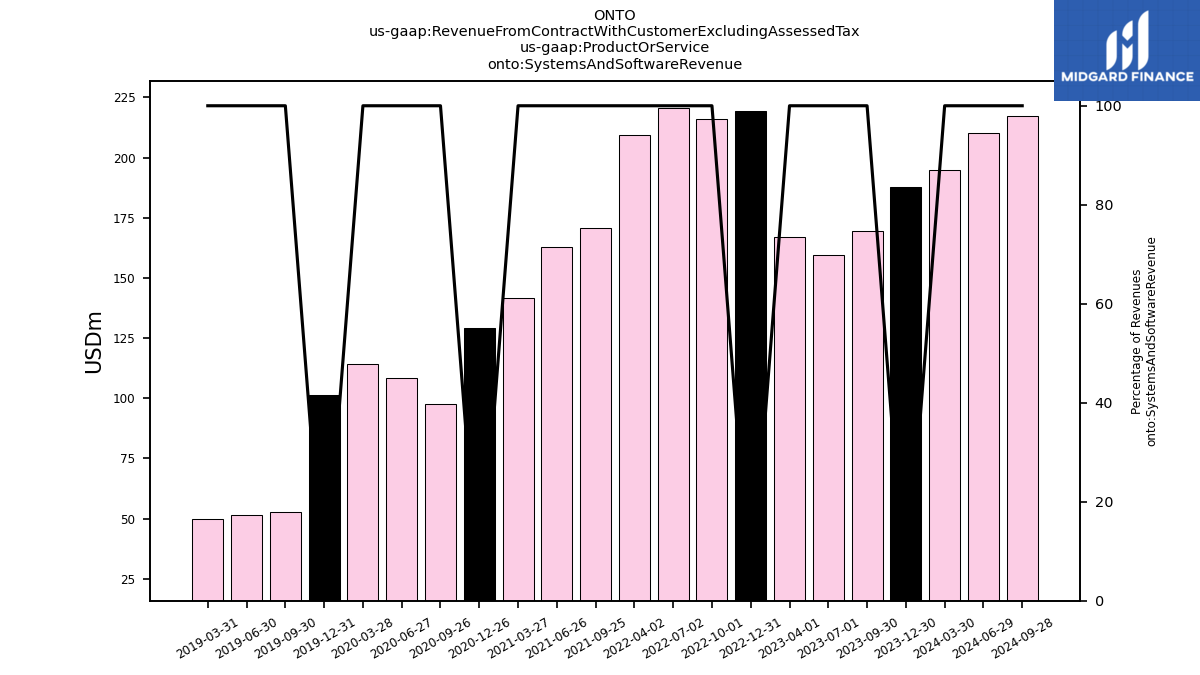
| Systems And Software Revenue | 187.79 | 169.35 | 159.35 | 166.82 | 219.46 | 216.08 | 220.79 | 209.38 | 170.94 | 162.90 | 141.51 | 129.40 | 97.77 | 108.25 | 114.33 | 101.52 | 52.79 | NA | 51.61 | NA | 49.81 | NA | NA | NA | NA | NA | NA | NA | NA | NA | NA | NA | NA | NA | NA | NA | NA | NA | NA | NA | NA | NA | NA | NA | NA | NA | NA | NA | NA | NA | NA | NA | NA | NA | NA | NA | NA | NA | NA | NA | |
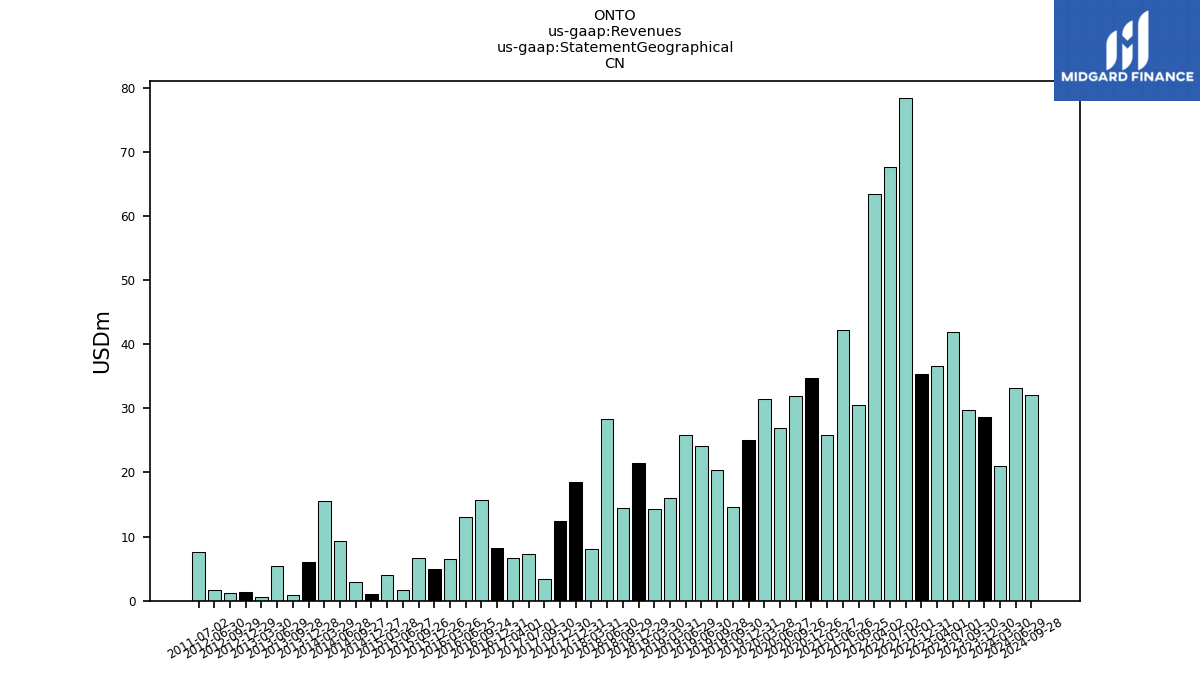
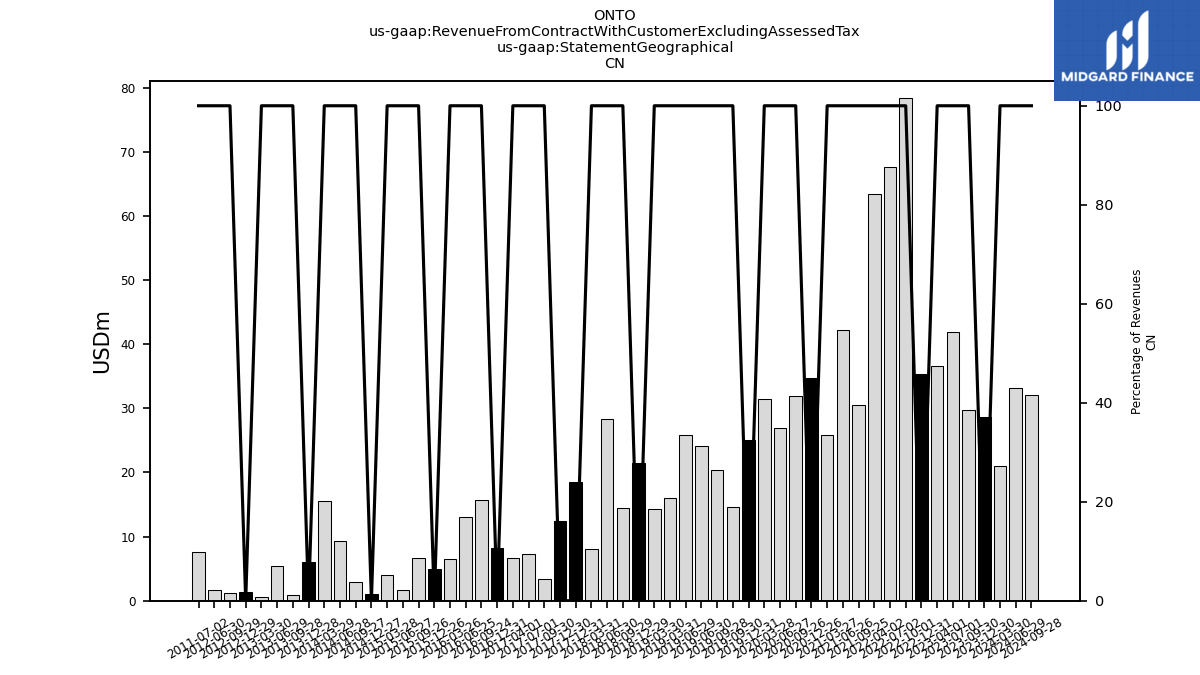
| 28.65 | 29.79 | 41.96 | 36.55 | 35.39 | 78.41 | 67.62 | 63.39 | 30.44 | 42.27 | 25.78 | 34.73 | 31.91 | 27.00 | 31.38 | 25.13 | 14.67 | 20.36 | 24.18 | 25.87 | 16.04 | 14.36 | NA | 21.44 | NA | 14.49 | 28.33 | 8.04 | 18.50 | 12.41 | 3.40 | 7.33 | 6.69 | 8.23 | 15.71 | 13.01 | 6.51 | 5.02 | 6.73 | 1.62 | 4.00 | 1.01 | 2.85 | 9.36 | 15.49 | 6.11 | 0.90 | 5.41 | 0.64 | 1.42 | 1.27 | 1.70 | NA | NA | NA | 7.57 | NA | NA | NA | NA | ||
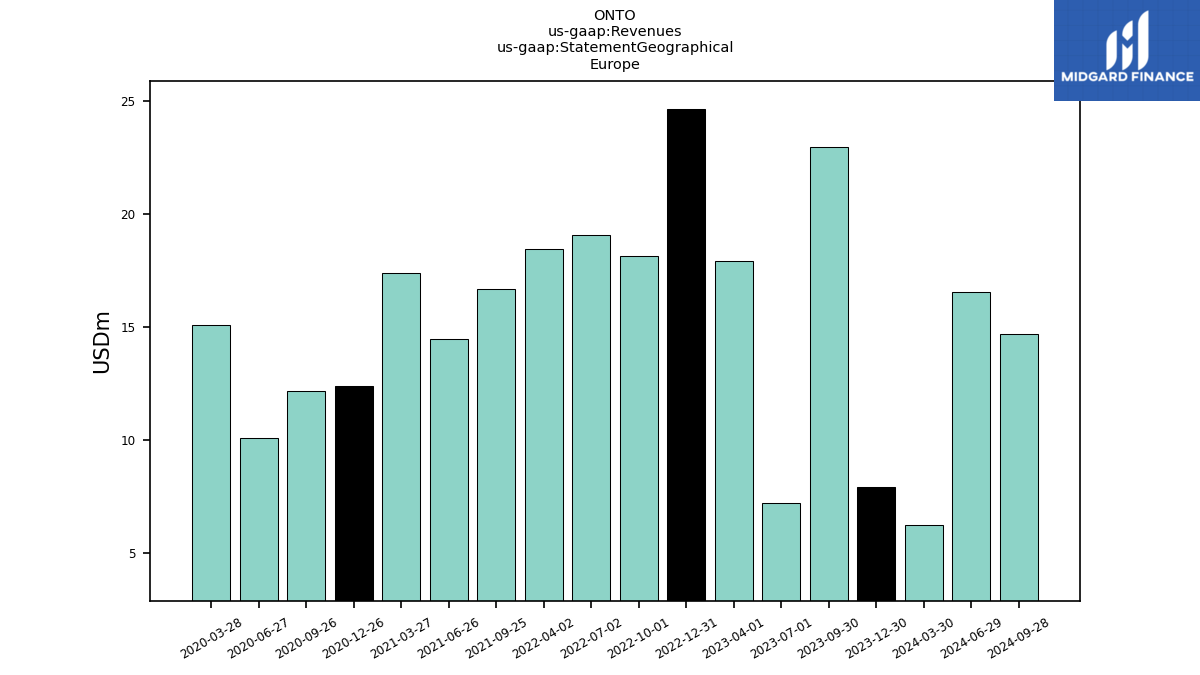
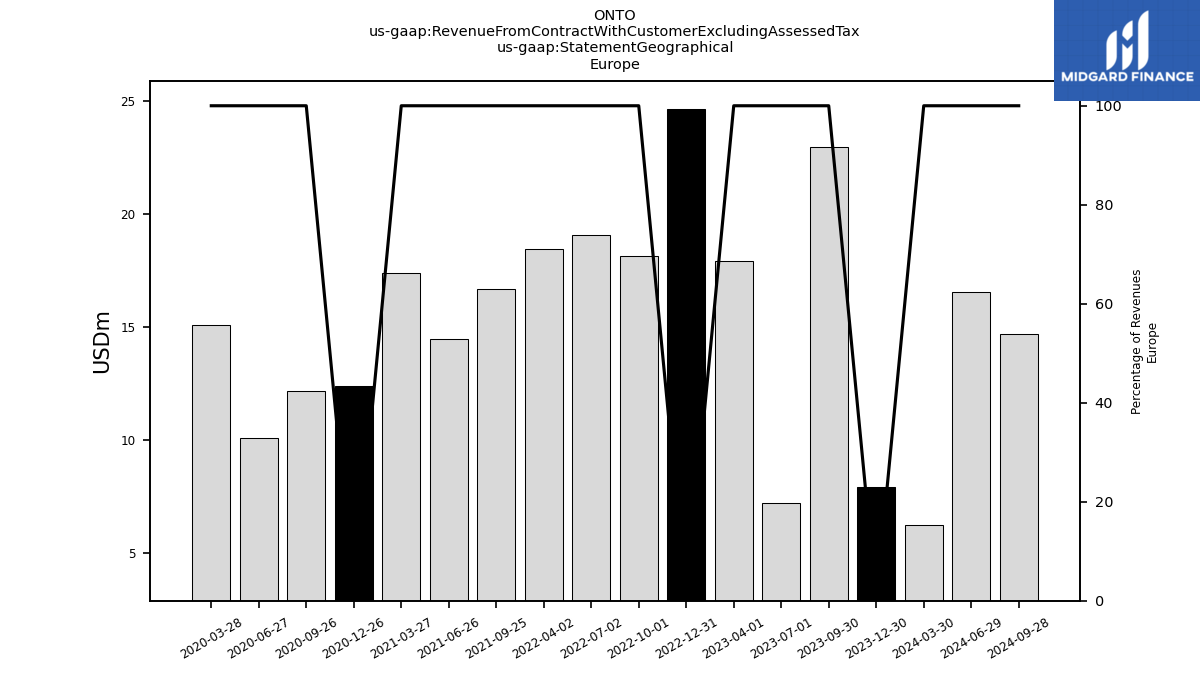
| 7.90 | 22.96 | 7.20 | 17.92 | 24.65 | 18.13 | 19.05 | 18.43 | 16.68 | 14.45 | 17.39 | 12.37 | 12.17 | 10.09 | 15.07 | NA | NA | NA | NA | NA | NA | NA | NA | NA | NA | NA | NA | NA | NA | NA | NA | NA | NA | NA | NA | NA | NA | NA | NA | NA | NA | NA | NA | NA | NA | NA | NA | NA | NA | NA | NA | NA | NA | NA | NA | NA | NA | NA | NA | NA | ||
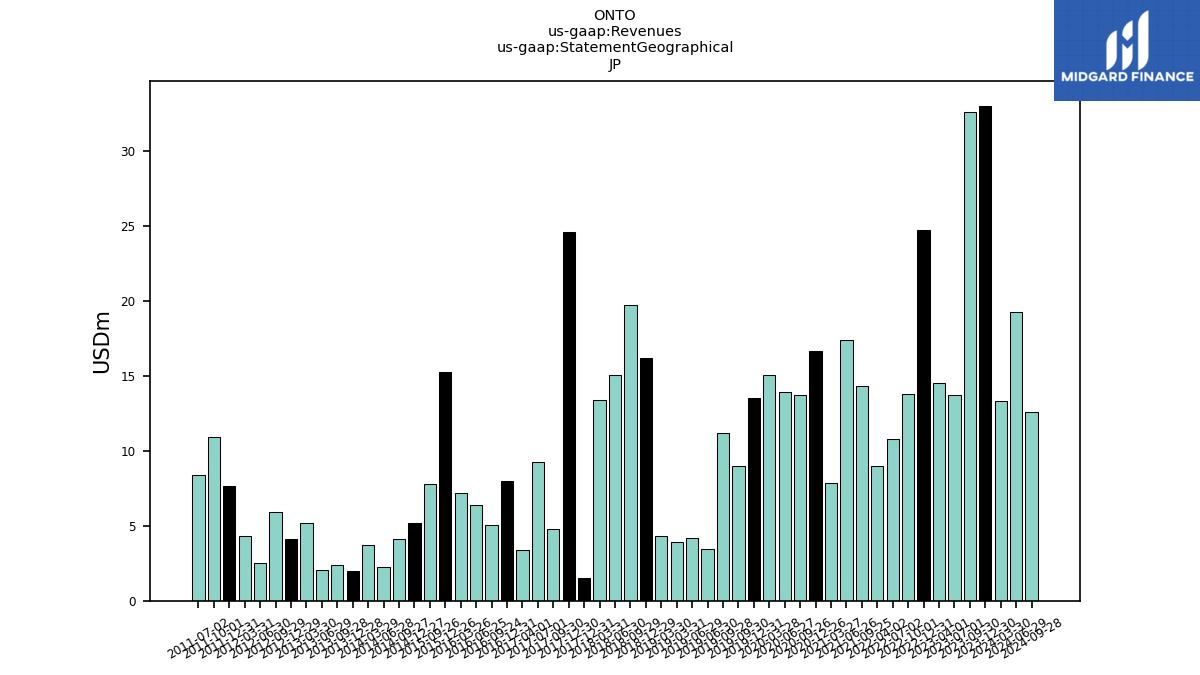
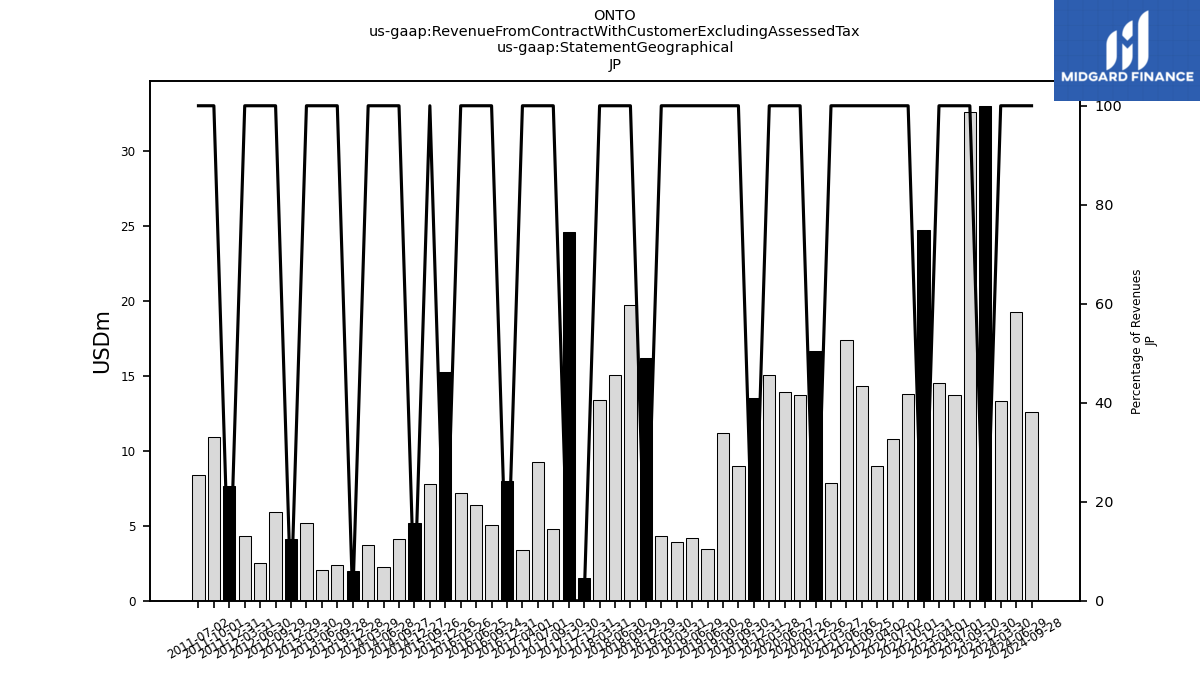
| 33.00 | 32.60 | 13.73 | 14.50 | 24.71 | 13.76 | 10.79 | 8.97 | 14.31 | 17.39 | 7.87 | 16.66 | 13.70 | 13.91 | 15.03 | 13.49 | 8.96 | 11.19 | 3.43 | 4.21 | 3.94 | 4.32 | NA | 16.16 | NA | 19.69 | 15.02 | 13.38 | 1.54 | 24.58 | 4.78 | 9.27 | 3.35 | 7.96 | 5.08 | 6.38 | 7.19 | 15.22 | 7.78 | NA | NA | 5.18 | 4.10 | 2.22 | 3.68 | 2.01 | 2.39 | 2.02 | 5.21 | 4.09 | 5.90 | 2.51 | 4.34 | 7.63 | 10.91 | 8.37 | NA | NA | NA | NA | ||
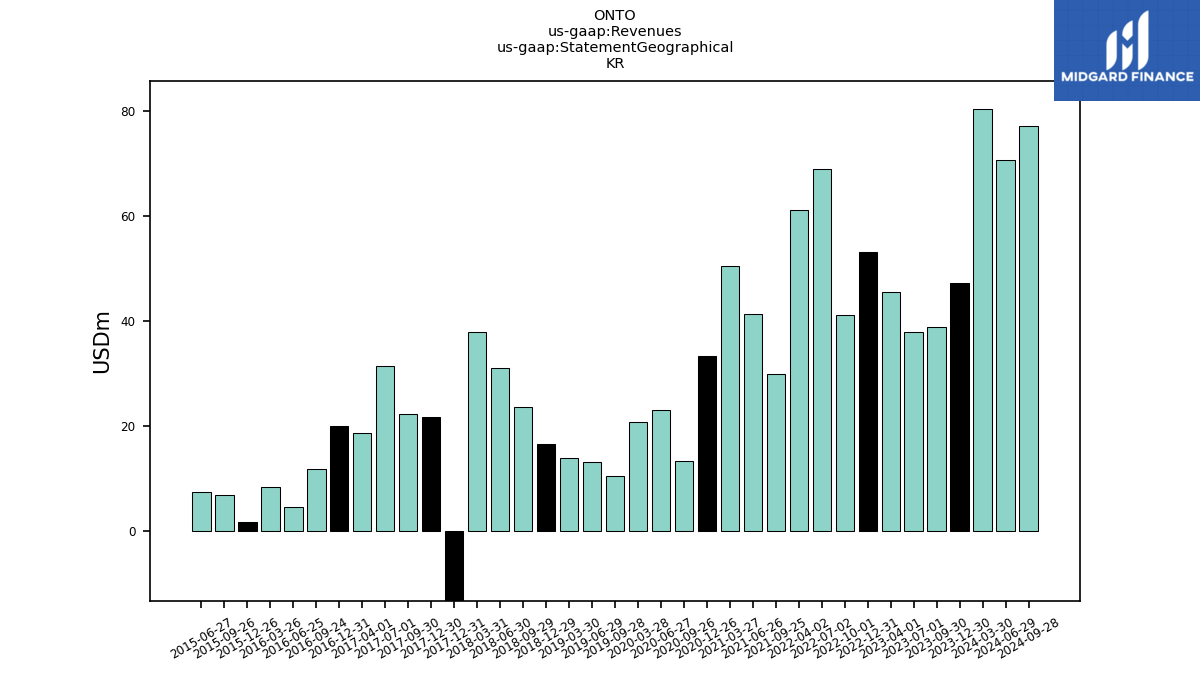
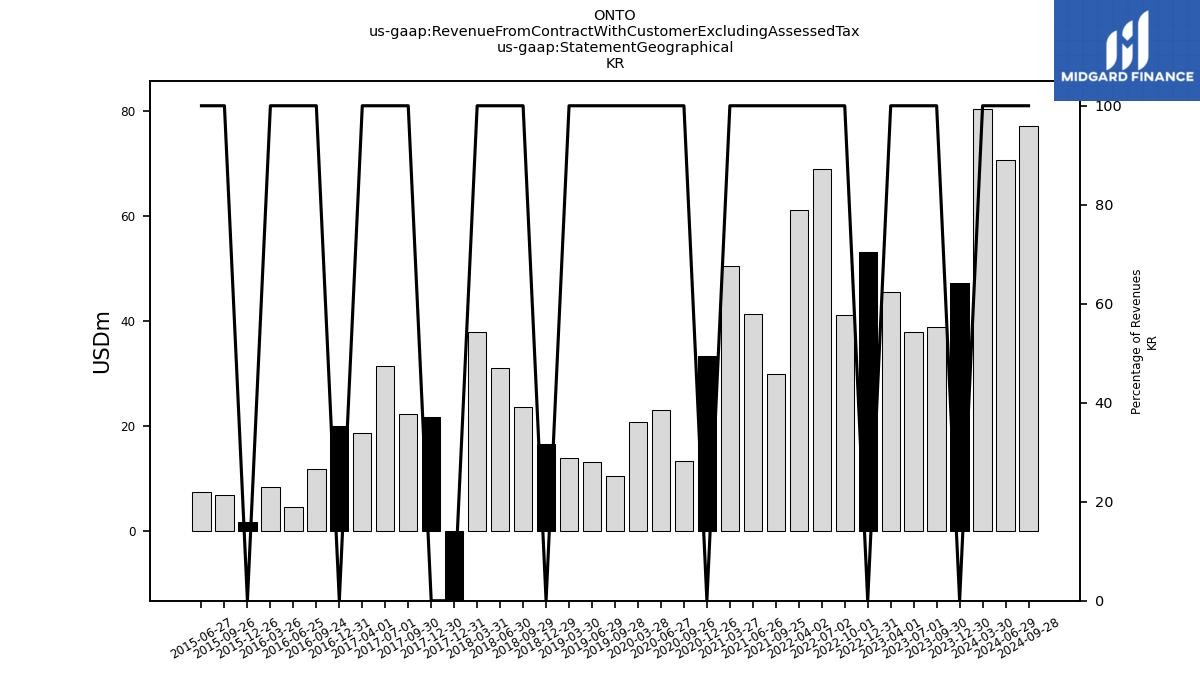
| 47.12 | 38.89 | 37.84 | 45.47 | 53.12 | 41.04 | 68.88 | 61.13 | 29.88 | 41.30 | 50.53 | 33.22 | 13.25 | 22.96 | 20.76 | NA | NA | 10.52 | NA | 13.07 | NA | 13.97 | NA | 16.54 | NA | 23.60 | 30.98 | 37.82 | -28.21 | 21.69 | 22.27 | 31.50 | 18.62 | 20.07 | 11.77 | 4.47 | 8.44 | 1.76 | 6.79 | 7.37 | NA | NA | NA | NA | NA | NA | NA | NA | NA | NA | NA | NA | NA | NA | NA | NA | NA | NA | NA | NA | ||
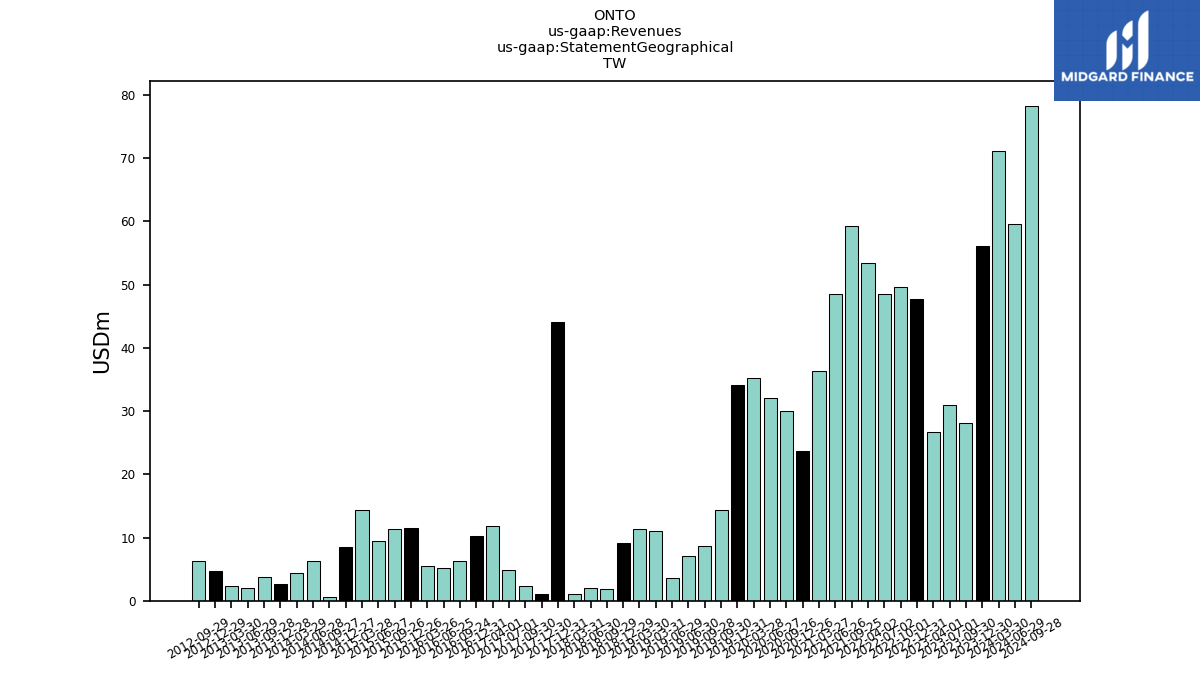
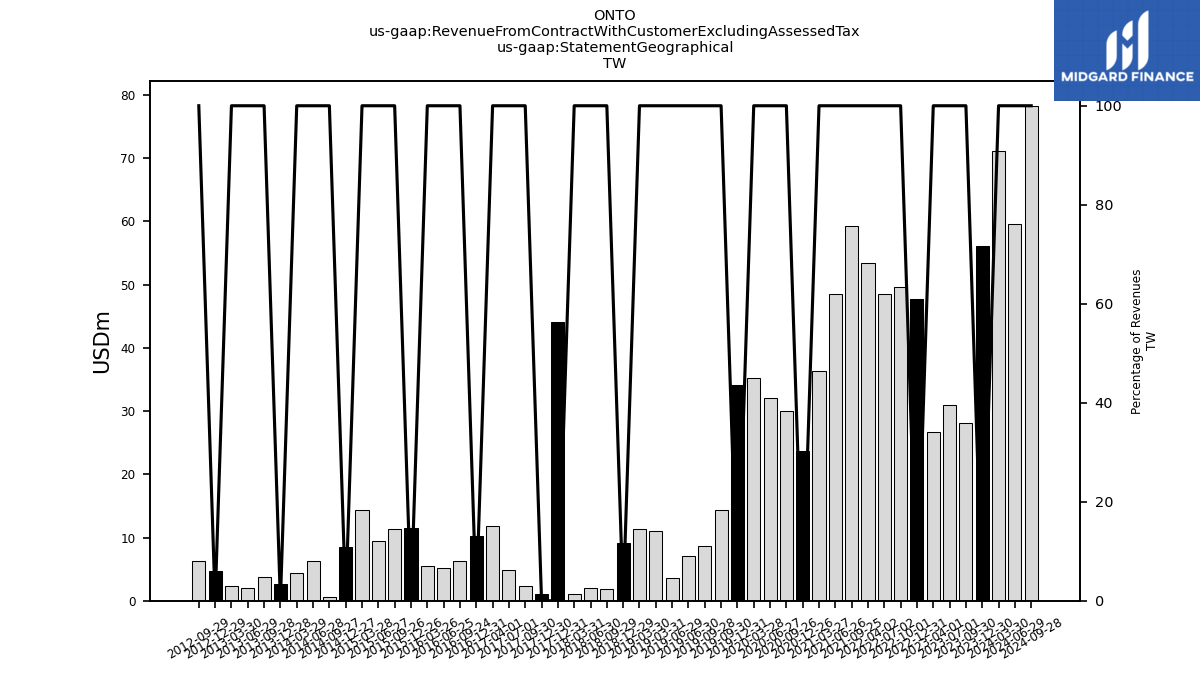
| 56.11 | 28.08 | 31.01 | 26.70 | 47.64 | 49.61 | 48.46 | 53.39 | 59.26 | 48.50 | 36.29 | 23.75 | 30.03 | 32.00 | 35.18 | 34.16 | 14.30 | 8.59 | 7.11 | 3.65 | 11.03 | 11.29 | NA | 9.09 | NA | 1.88 | 1.97 | 1.06 | 44.06 | 1.13 | 2.30 | 4.88 | 11.83 | 10.23 | 6.33 | 5.15 | 5.48 | 11.54 | 11.33 | 9.41 | 14.43 | 8.45 | 0.64 | 6.28 | 4.42 | 2.69 | 3.74 | 2.02 | 2.31 | 4.65 | 6.23 | NA | NA | NA | NA | NA | NA | NA | NA | NA | ||
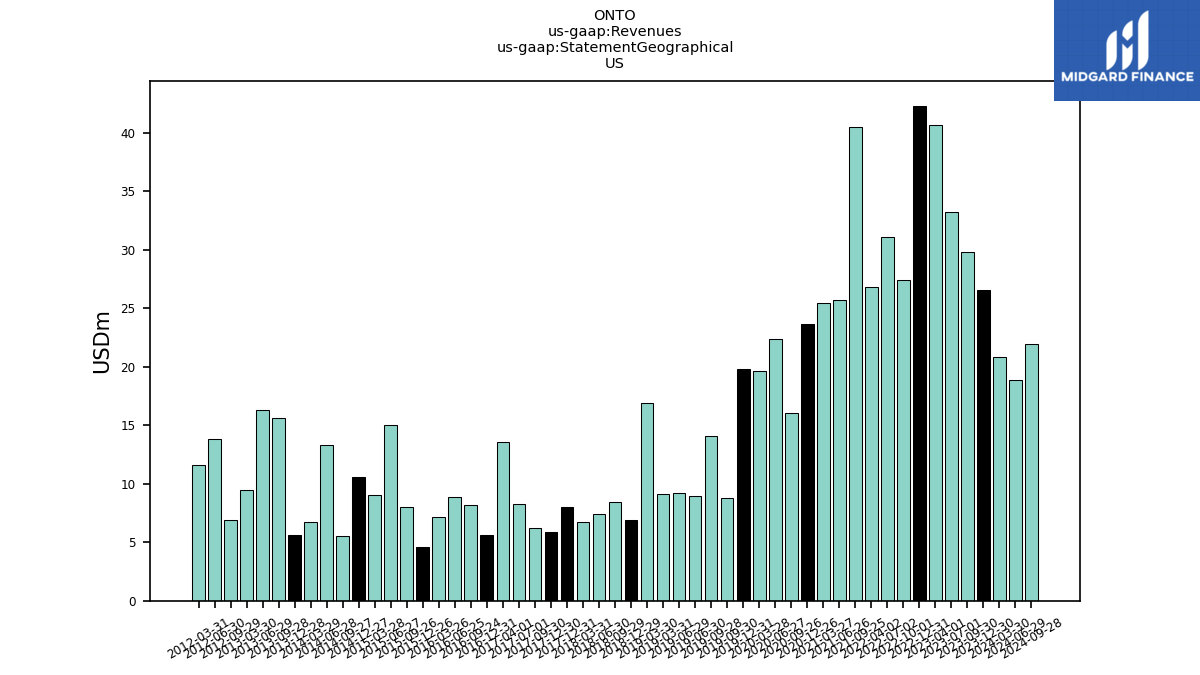
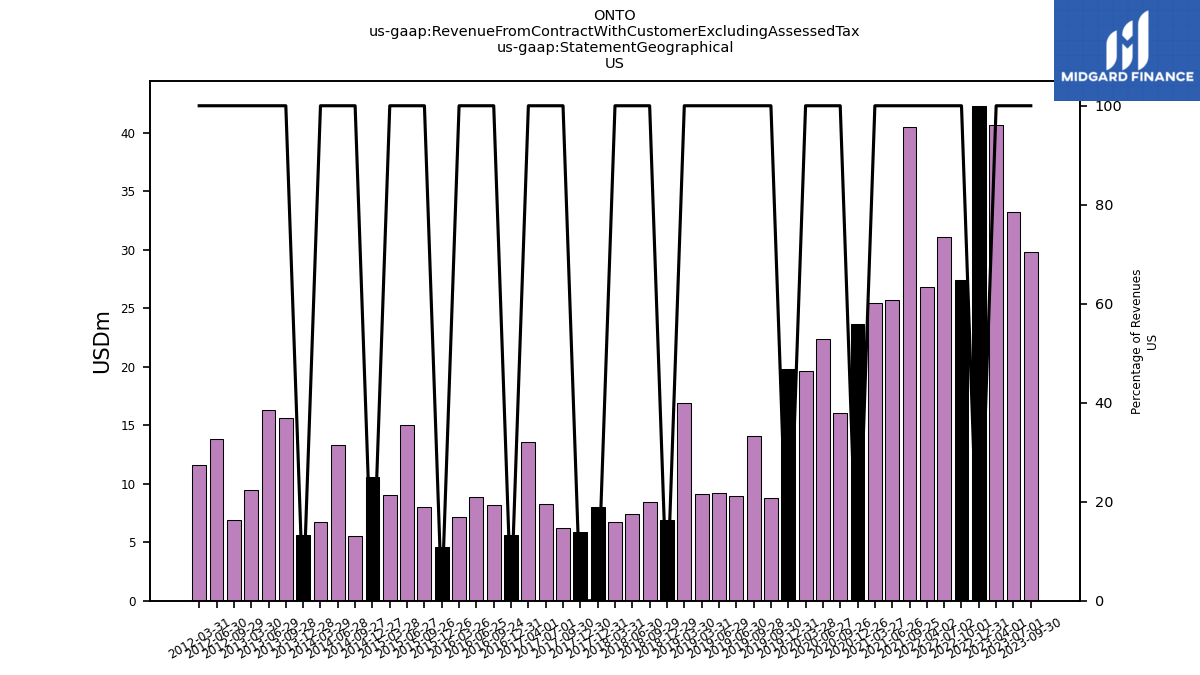
| US | 26.54 | 29.80 | 33.24 | 40.71 | 42.32 | 27.44 | 31.07 | 26.80 | 40.48 | 25.70 | 25.48 | 23.65 | 16.04 | 22.38 | 19.65 | 19.84 | 8.82 | 14.09 | 8.93 | 9.17 | 9.13 | 16.87 | NA | 6.87 | NA | 8.41 | 7.39 | 6.74 | 8.00 | 5.88 | 6.23 | 8.30 | 13.57 | 5.58 | 8.21 | 8.90 | 7.19 | 4.61 | 7.99 | 15.05 | 9.08 | 10.57 | 5.51 | 13.30 | 6.74 | 5.59 | 15.66 | 16.33 | 9.43 | NA | 6.89 | 13.87 | 11.58 | NA | NA | NA | NA | NA | NA | NA | |
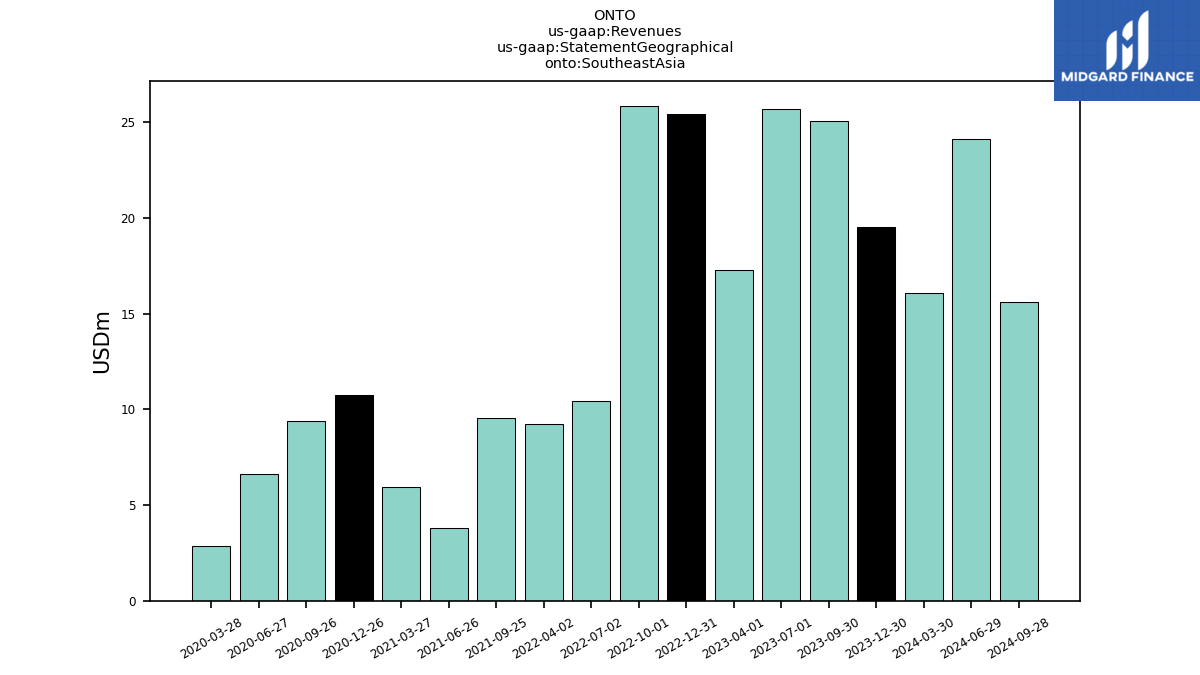
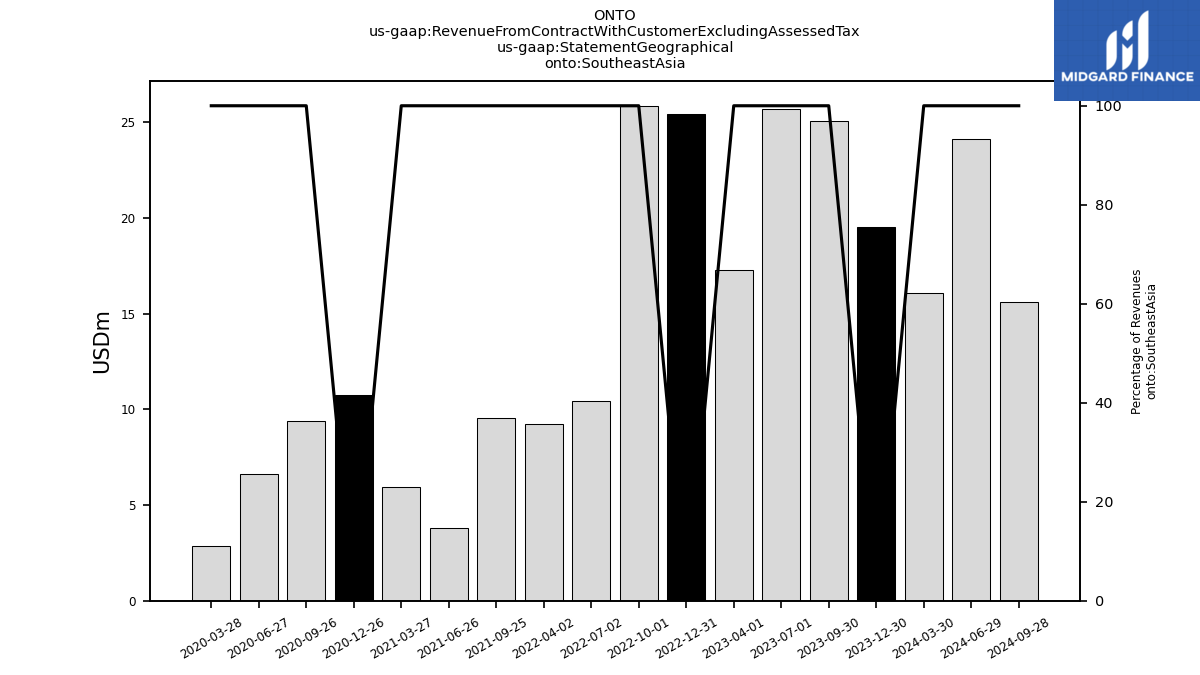
| Southeast Asia | 19.55 | 25.06 | 25.68 | 17.30 | 25.43 | 25.86 | 10.44 | 9.22 | 9.54 | 3.78 | 5.95 | 10.75 | 9.40 | 6.61 | 2.86 | NA | NA | NA | NA | NA | NA | NA | NA | NA | NA | NA | NA | NA | NA | NA | NA | NA | NA | NA | NA | NA | NA | NA | NA | NA | NA | NA | NA | NA | NA | NA | NA | NA | NA | NA | NA | NA | NA | NA | NA | NA | NA | NA | NA | NA | |
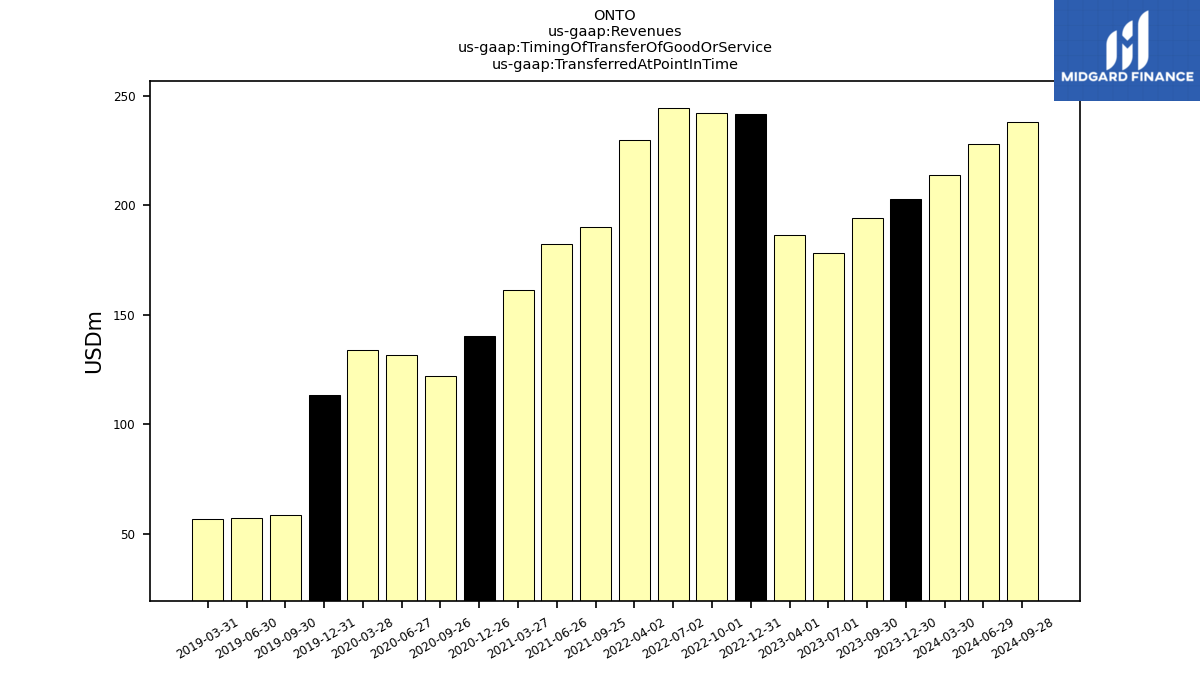
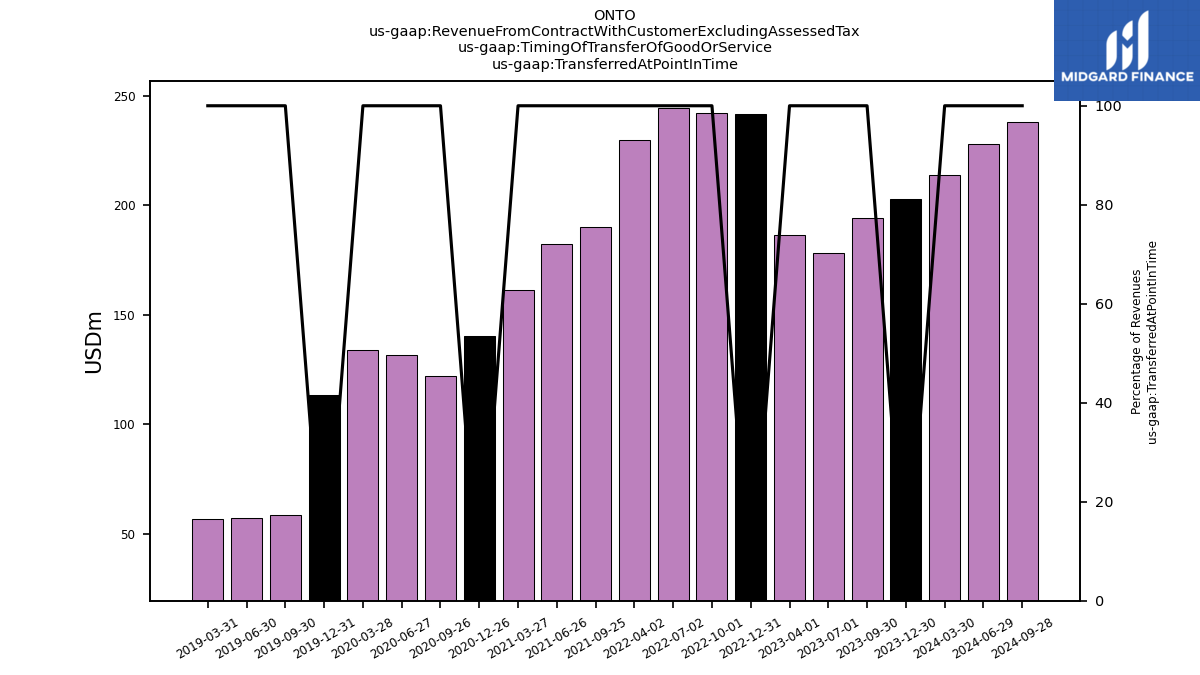
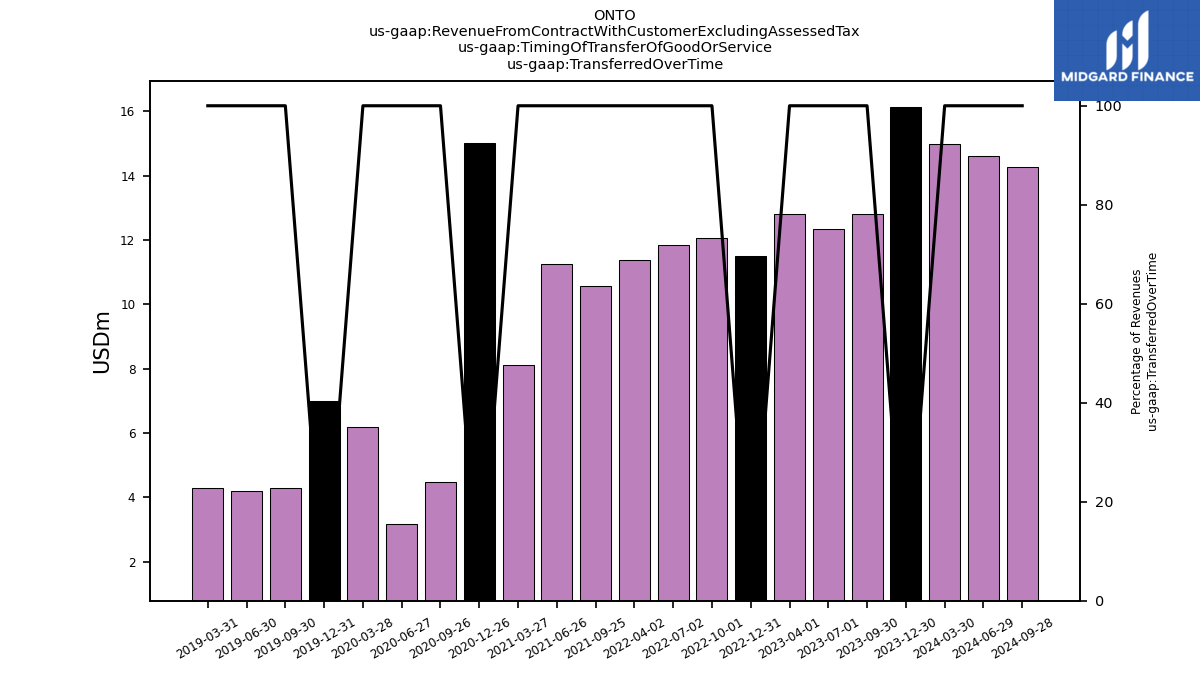
| Transferred At Point In Time | 202.72 | 194.38 | 178.32 | 186.37 | 241.76 | 242.21 | 244.47 | 229.97 | 190.01 | 182.13 | 161.16 | 140.12 | 122.02 | 131.80 | 133.75 | 113.57 | 58.66 | NA | 57.31 | NA | 56.59 | NA | NA | NA | NA | NA | NA | NA | NA | NA | NA | NA | NA | NA | NA | NA | NA | NA | NA | NA | NA | NA | NA | NA | NA | NA | NA | NA | NA | NA | NA | NA | NA | NA | NA | NA | NA | NA | NA | NA | |
| Transferred Over Time | 16.13 | 12.81 | 12.34 | 12.79 | 11.51 | 12.04 | 11.84 | 11.38 | 10.57 | 11.25 | 8.12 | 15.01 | 4.48 | 3.15 | 6.18 | 6.99 | 4.27 | NA | 4.20 | NA | 4.30 | NA | NA | NA | NA | NA | NA | NA | NA | NA | NA | NA | NA | NA | NA | NA | NA | NA | NA | NA | NA | NA | NA | NA | NA | NA | NA | NA | NA | NA | NA | NA | NA | NA | NA | NA | NA | NA | NA | NA | |
| Revenue From Contract With Customer Excluding Assessed Tax | 218.86 | 207.19 | 190.66 | 199.16 | 253.27 | 254.25 | 256.31 | 241.35 | 200.59 | 193.39 | 169.28 | 155.13 | 126.49 | 134.95 | 139.93 | 120.56 | 62.94 | 73.12 | 61.51 | 67.62 | 60.89 | 67.10 | 62.78 | 77.02 | 60.43 | 76.59 | 88.60 | 73.10 | 74.68 | -98.10 | 56.67 | 64.43 | 59.31 | 59.16 | 58.71 | 55.77 | 47.49 | 42.69 | 45.68 | 48.63 | 50.38 | 39.70 | 27.13 | 48.03 | 51.58 | 46.16 | 39.04 | 34.55 | 24.55 | 30.27 | 43.94 | 53.18 | 55.49 | 45.28 | 58.27 | 64.37 | 62.14 | 46.13 | 53.94 | 50.84 | |
| Parts Revenue | 15.94 | 20.10 | 18.14 | 20.42 | 20.05 | 21.60 | 22.76 | 19.86 | 17.80 | 18.70 | 17.42 | 16.73 | 18.82 | 16.33 | 13.57 | 12.60 | 7.14 | NA | 7.07 | NA | 8.08 | NA | NA | NA | NA | NA | NA | NA | NA | NA | NA | NA | NA | NA | NA | NA | NA | NA | NA | NA | NA | NA | NA | NA | NA | NA | NA | NA | NA | NA | NA | NA | NA | NA | NA | NA | NA | NA | NA | NA | |
| Service Revenue | 15.12 | 17.74 | 13.17 | 11.92 | 13.76 | 16.57 | 12.77 | 12.11 | 11.85 | 11.79 | 10.35 | 9.01 | 9.90 | 10.37 | 12.02 | 6.44 | 3.01 | NA | 2.83 | NA | 3.01 | NA | NA | NA | NA | NA | NA | NA | NA | NA | NA | NA | NA | NA | NA | NA | NA | NA | NA | NA | NA | NA | NA | NA | NA | NA | NA | NA | NA | NA | NA | NA | NA | NA | NA | NA | NA | NA | NA | NA | |
| Systems And Software Revenue | 187.79 | 169.35 | 159.35 | 166.82 | 219.46 | 216.08 | 220.79 | 209.38 | 170.94 | 162.90 | 141.51 | 129.40 | 97.77 | 108.25 | 114.33 | 101.52 | 52.79 | NA | 51.61 | NA | 49.81 | NA | NA | NA | NA | NA | NA | NA | NA | NA | NA | NA | NA | NA | NA | NA | NA | NA | NA | NA | NA | NA | NA | NA | NA | NA | NA | NA | NA | NA | NA | NA | NA | NA | NA | NA | NA | NA | NA | NA | |
| 28.65 | 29.79 | 41.96 | 36.55 | 35.39 | 78.41 | 67.62 | 63.39 | 30.44 | 42.27 | 25.78 | 34.73 | 31.91 | 27.00 | 31.38 | 25.13 | 14.67 | 20.36 | 24.18 | 25.87 | 16.04 | 14.36 | NA | 21.44 | NA | 14.49 | 28.33 | 8.04 | 18.50 | 12.41 | 3.40 | 7.33 | 6.69 | 8.23 | 15.71 | 13.01 | 6.51 | 5.02 | 6.73 | 1.62 | 4.00 | 1.01 | 2.85 | 9.36 | 15.49 | 6.11 | 0.90 | 5.41 | 0.64 | 1.42 | 1.27 | 1.70 | NA | NA | NA | 7.57 | NA | NA | NA | NA | ||
| 7.90 | 22.96 | 7.20 | 17.92 | 24.65 | 18.13 | 19.05 | 18.43 | 16.68 | 14.45 | 17.39 | 12.37 | 12.17 | 10.09 | 15.07 | NA | NA | NA | NA | NA | NA | NA | NA | NA | NA | NA | NA | NA | NA | NA | NA | NA | NA | NA | NA | NA | NA | NA | NA | NA | NA | NA | NA | NA | NA | NA | NA | NA | NA | NA | NA | NA | NA | NA | NA | NA | NA | NA | NA | NA | ||
| 33.00 | 32.60 | 13.73 | 14.50 | 24.71 | 13.76 | 10.79 | 8.97 | 14.31 | 17.39 | 7.87 | 16.66 | 13.70 | 13.91 | 15.03 | 13.49 | 8.96 | 11.19 | 3.43 | 4.21 | 3.94 | 4.32 | NA | 16.16 | NA | 19.69 | 15.02 | 13.38 | 1.54 | 24.58 | 4.78 | 9.27 | 3.35 | 7.96 | 5.08 | 6.38 | 7.19 | 15.22 | 7.78 | NA | NA | 5.18 | 4.10 | 2.22 | 3.68 | 2.01 | 2.39 | 2.02 | 5.21 | 4.09 | 5.90 | 2.51 | 4.34 | 7.63 | 10.91 | 8.37 | NA | NA | NA | NA | ||
| 47.12 | 38.89 | 37.84 | 45.47 | 53.12 | 41.04 | 68.88 | 61.13 | 29.88 | 41.30 | 50.53 | 33.22 | 13.25 | 22.96 | 20.76 | NA | NA | 10.52 | NA | 13.07 | NA | 13.97 | NA | 16.54 | NA | 23.60 | 30.98 | 37.82 | -28.21 | 21.69 | 22.27 | 31.50 | 18.62 | 20.07 | 11.77 | 4.47 | 8.44 | 1.76 | 6.79 | 7.37 | NA | NA | NA | NA | NA | NA | NA | NA | NA | NA | NA | NA | NA | NA | NA | NA | NA | NA | NA | NA | ||
| 56.11 | 28.08 | 31.01 | 26.70 | 47.64 | 49.61 | 48.46 | 53.39 | 59.26 | 48.50 | 36.29 | 23.75 | 30.03 | 32.00 | 35.18 | 34.16 | 14.30 | 8.59 | 7.11 | 3.65 | 11.03 | 11.29 | NA | 9.09 | NA | 1.88 | 1.97 | 1.06 | 44.06 | 1.13 | 2.30 | 4.88 | 11.83 | 10.23 | 6.33 | 5.15 | 5.48 | 11.54 | 11.33 | 9.41 | 14.43 | 8.45 | 0.64 | 6.28 | 4.42 | 2.69 | 3.74 | 2.02 | 2.31 | 4.65 | 6.23 | NA | NA | NA | NA | NA | NA | NA | NA | NA | ||
| US | 26.54 | 29.80 | 33.24 | 40.71 | 42.32 | 27.44 | 31.07 | 26.80 | 40.48 | 25.70 | 25.48 | 23.65 | 16.04 | 22.38 | 19.65 | 19.84 | 8.82 | 14.09 | 8.93 | 9.17 | 9.13 | 16.87 | NA | 6.87 | NA | 8.41 | 7.39 | 6.74 | 8.00 | 5.88 | 6.23 | 8.30 | 13.57 | 5.58 | 8.21 | 8.90 | 7.19 | 4.61 | 7.99 | 15.05 | 9.08 | 10.57 | 5.51 | 13.30 | 6.74 | 5.59 | 15.66 | 16.33 | 9.43 | NA | 6.89 | 13.87 | 11.58 | NA | NA | NA | NA | NA | NA | NA | |
| Southeast Asia | 19.55 | 25.06 | 25.68 | 17.30 | 25.43 | 25.86 | 10.44 | 9.22 | 9.54 | 3.78 | 5.95 | 10.75 | 9.40 | 6.61 | 2.86 | NA | NA | NA | NA | NA | NA | NA | NA | NA | NA | NA | NA | NA | NA | NA | NA | NA | NA | NA | NA | NA | NA | NA | NA | NA | NA | NA | NA | NA | NA | NA | NA | NA | NA | NA | NA | NA | NA | NA | NA | NA | NA | NA | NA | NA | |
| Transferred At Point In Time | 202.72 | 194.38 | 178.32 | 186.37 | 241.76 | 242.21 | 244.47 | 229.97 | 190.01 | 182.13 | 161.16 | 140.12 | 122.02 | 131.80 | 133.75 | 113.57 | 58.66 | NA | 57.31 | NA | 56.59 | NA | NA | NA | NA | NA | NA | NA | NA | NA | NA | NA | NA | NA | NA | NA | NA | NA | NA | NA | NA | NA | NA | NA | NA | NA | NA | NA | NA | NA | NA | NA | NA | NA | NA | NA | NA | NA | NA | NA | |
| Transferred Over Time | 16.13 | 12.81 | 12.34 | 12.79 | 11.51 | 12.04 | 11.84 | 11.38 | 10.57 | 11.25 | 8.12 | 15.01 | 4.48 | 3.15 | 6.18 | 6.99 | 4.27 | NA | 4.20 | NA | 4.30 | NA | NA | NA | NA | NA | NA | NA | NA | NA | NA | NA | NA | NA | NA | NA | NA | NA | NA | NA | NA | NA | NA | NA | NA | NA | NA | NA | NA | NA | NA | NA | NA | NA | NA | NA | NA | NA | NA | NA |