
| 2022-12-31 | 2022-09-30 | 2022-06-30 | 2022-03-31 | 2021-12-31 | 2021-09-30 | 2021-06-30 | 2021-03-31 | 2020-12-31 | 2020-09-30 | 2020-06-30 | 2020-03-31 | 2019-12-31 | 2019-09-30 | 2019-06-30 | 2019-03-31 | 2018-12-31 | 2018-09-30 | 2018-06-30 | 2018-03-31 | 2017-12-31 | 2017-09-30 | 2017-06-30 | 2017-03-31 | 2016-12-31 | 2016-09-30 | 2016-06-30 | 2016-03-31 | 2015-12-31 | 2015-09-30 | 2015-06-30 | 2015-03-31 | 2014-12-31 | 2014-09-30 | 2014-06-30 | 2014-03-31 | 2013-12-31 | 2013-09-30 | 2013-06-30 | 2013-03-31 | 2012-12-31 | 2012-09-30 | 2012-06-30 | 2012-03-31 | 2011-12-31 | 2011-09-30 | 2011-06-30 | 2011-03-31 | 2010-12-31 | 2010-09-30 | 2010-06-30 | 2010-03-31 | 2009-12-31 | ||
|---|---|---|---|---|---|---|---|---|---|---|---|---|---|---|---|---|---|---|---|---|---|---|---|---|---|---|---|---|---|---|---|---|---|---|---|---|---|---|---|---|---|---|---|---|---|---|---|---|---|---|---|---|---|---|
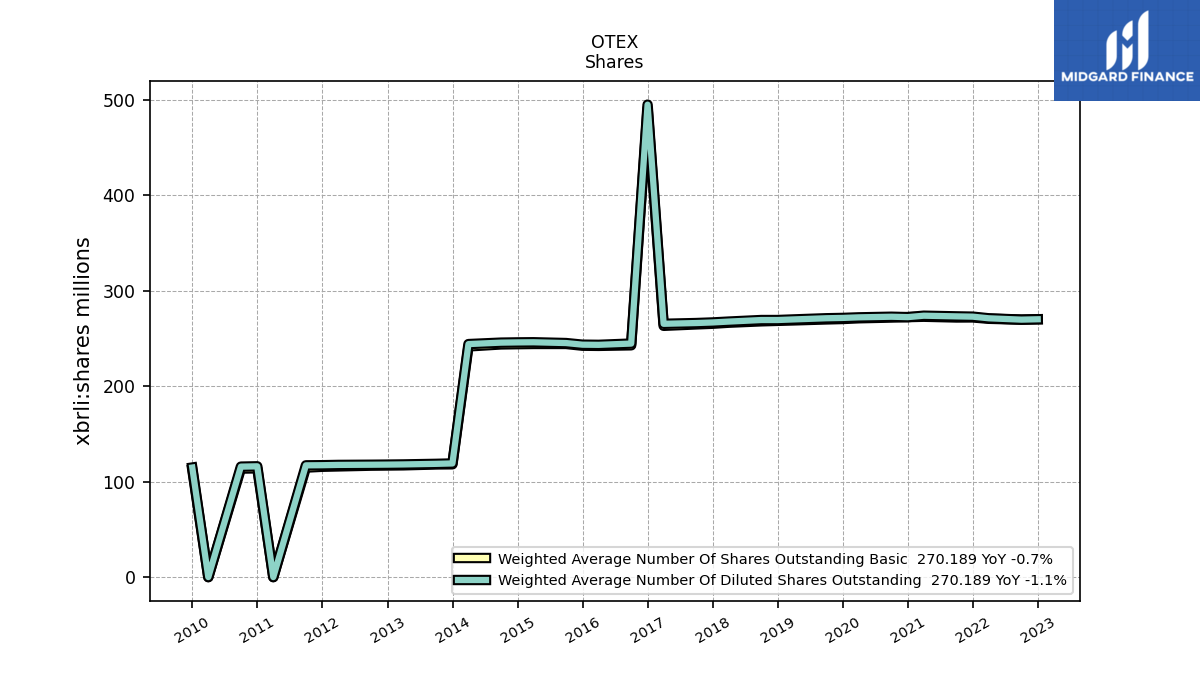
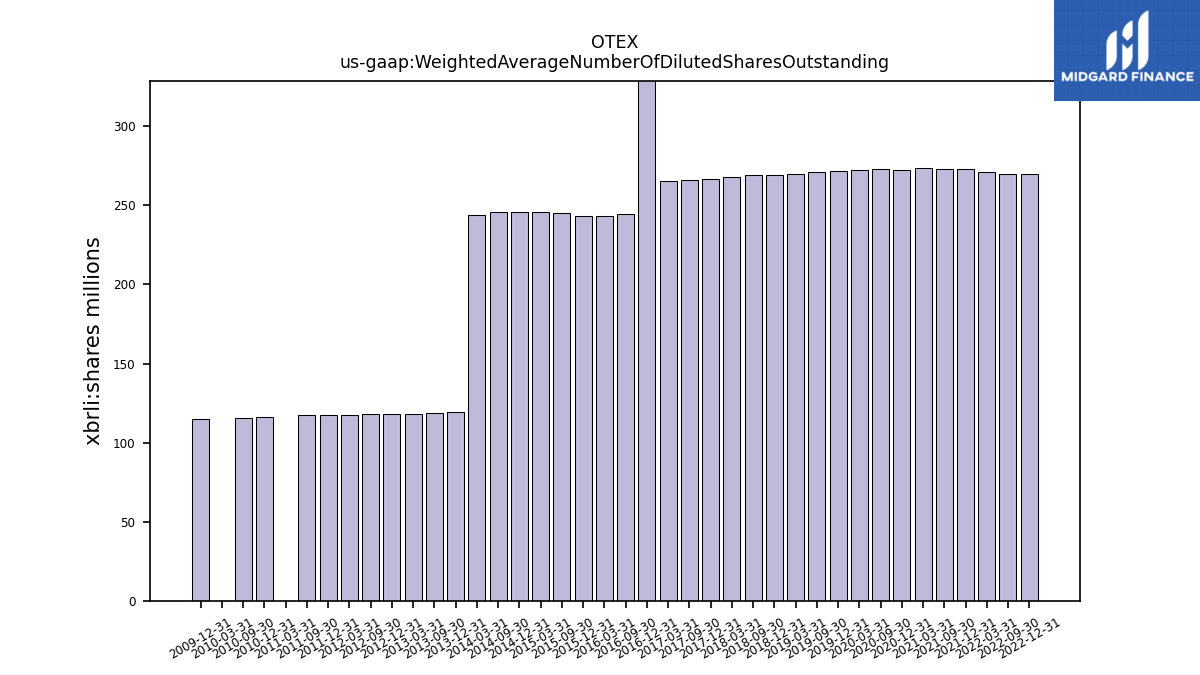
| Weighted Average Number Of Diluted Shares Outstanding | 270.19 | 269.80 | NA | 271.21 | 272.93 | 273.23 | NA | 273.92 | 272.43 | 272.85 | NA | 272.20 | 271.59 | 271.25 | NA | 270.03 | 269.40 | 269.39 | NA | 267.76 | 266.86 | 266.24 | NA | 265.44 | 495.00 | 244.74 | NA | 243.41 | 243.58 | 245.28 | NA | 246.11 | 245.97 | 245.72 | NA | 244.20 | 119.19 | 118.76 | NA | 118.15 | 117.97 | 117.84 | NA | 117.64 | 117.34 | 117.20 | NA | 0.12 | 116.18 | 115.84 | NA | 0.12 | 114.90 | |
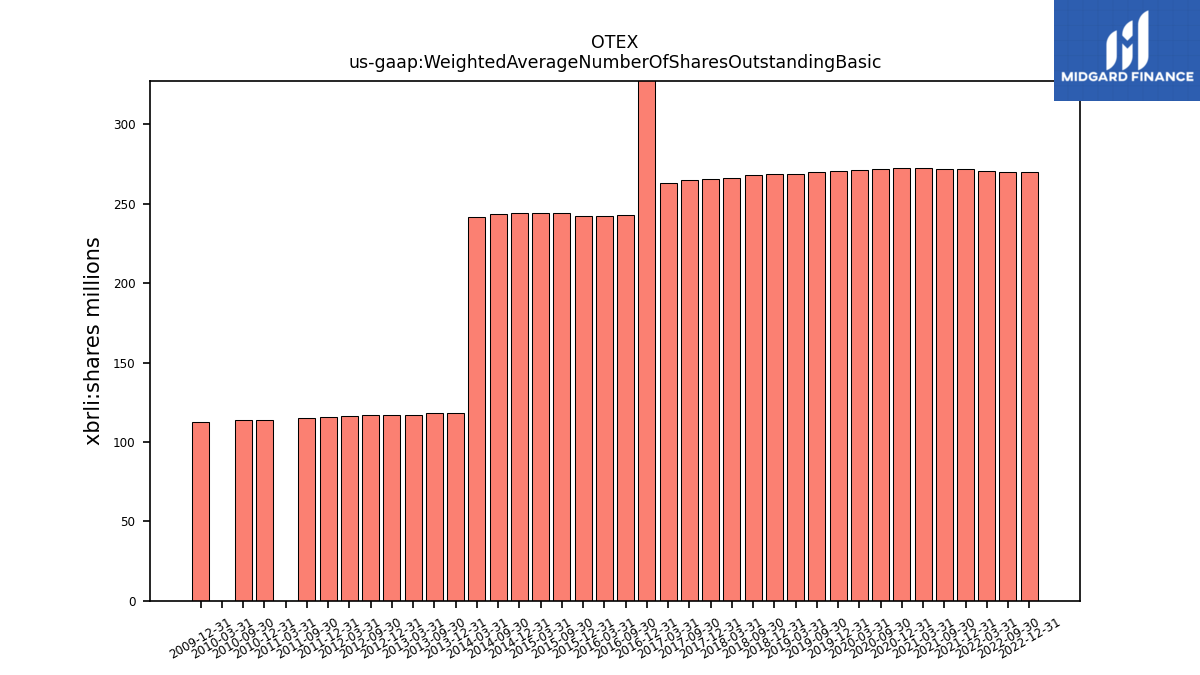
| Weighted Average Number Of Shares Outstanding Basic | 270.19 | 269.80 | NA | 270.69 | 272.11 | 272.04 | NA | 272.83 | 272.43 | 271.99 | NA | 271.22 | 270.45 | 270.01 | NA | 268.99 | 268.52 | 268.03 | NA | 266.57 | 265.50 | 264.80 | NA | 263.33 | 491.31 | 242.91 | NA | 242.32 | 242.49 | 244.32 | NA | 244.32 | 244.10 | 243.84 | NA | 241.75 | 118.27 | 118.13 | NA | 117.19 | 117.01 | 116.85 | NA | 116.08 | 115.69 | 114.82 | NA | 0.11 | 114.04 | 113.77 | NA | 0.11 | 112.81 | |
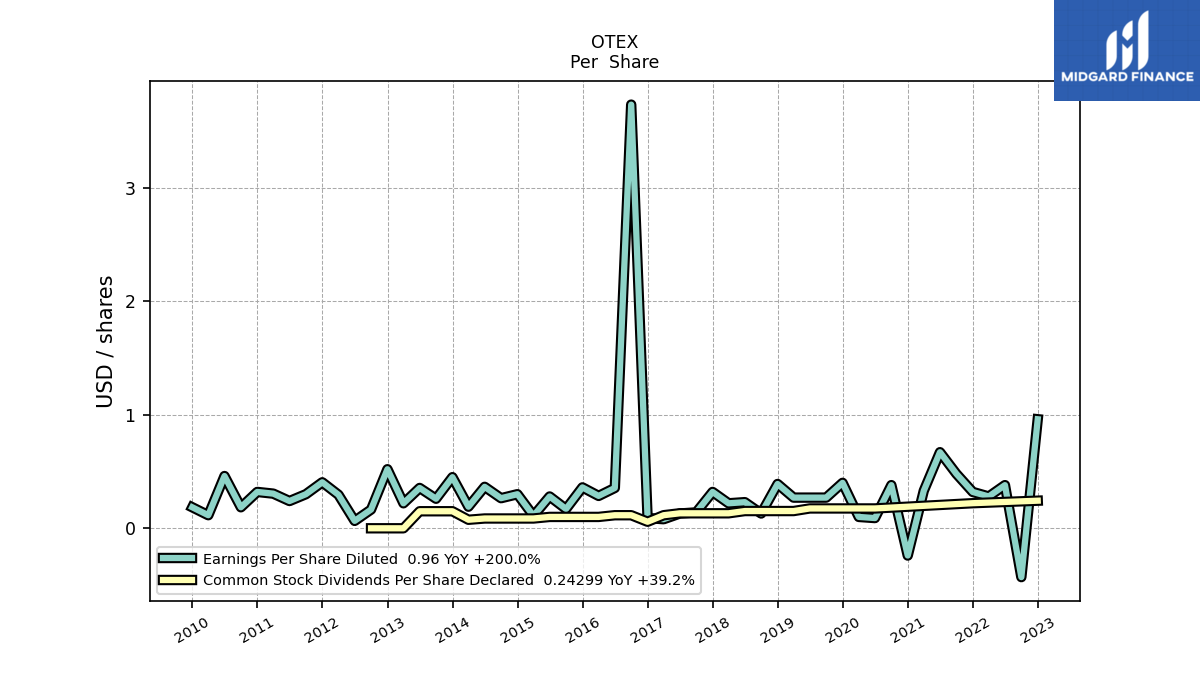
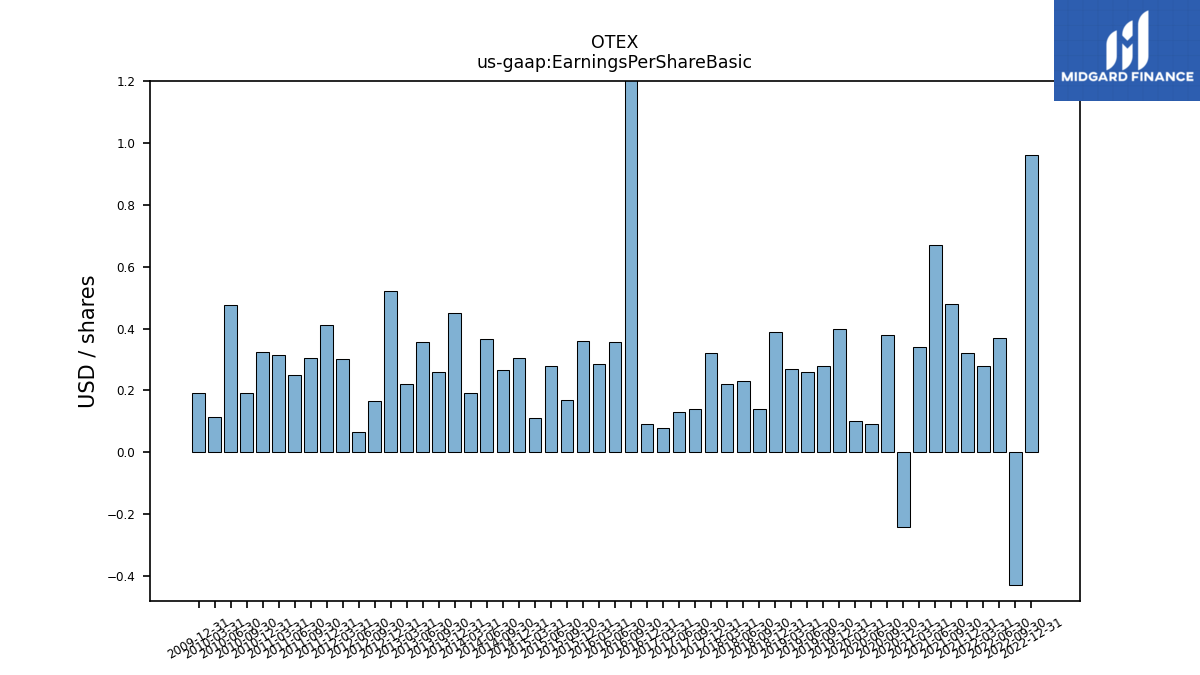
| Earnings Per Share Basic | 0.96 | -0.43 | 0.37 | 0.28 | 0.32 | 0.48 | 0.67 | 0.34 | -0.24 | 0.38 | 0.09 | 0.10 | 0.40 | 0.28 | 0.26 | 0.27 | 0.39 | 0.14 | 0.23 | 0.22 | 0.32 | 0.14 | 0.13 | 0.08 | 0.09 | 3.76 | 0.35 | 0.28 | 0.36 | 0.17 | 0.28 | 0.11 | 0.30 | 0.27 | 0.36 | 0.19 | 0.45 | 0.26 | 0.35 | 0.22 | 0.52 | 0.17 | 0.07 | 0.30 | 0.41 | 0.30 | 0.25 | 0.32 | 0.33 | 0.19 | 0.48 | 0.12 | 0.19 | |
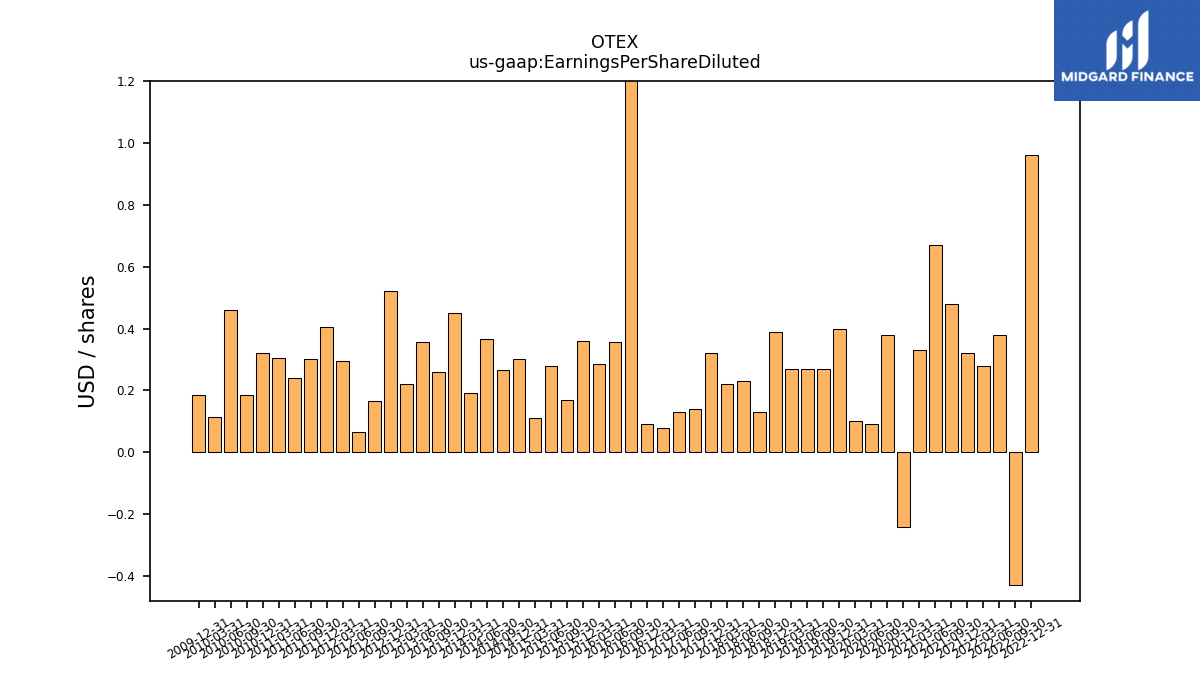
| Earnings Per Share Diluted | 0.96 | -0.43 | 0.38 | 0.28 | 0.32 | 0.48 | 0.67 | 0.33 | -0.24 | 0.38 | 0.09 | 0.10 | 0.40 | 0.27 | 0.27 | 0.27 | 0.39 | 0.13 | 0.23 | 0.22 | 0.32 | 0.14 | 0.13 | 0.08 | 0.09 | 3.73 | 0.35 | 0.28 | 0.36 | 0.17 | 0.28 | 0.11 | 0.30 | 0.27 | 0.36 | 0.19 | 0.45 | 0.26 | 0.35 | 0.22 | 0.52 | 0.17 | 0.06 | 0.29 | 0.41 | 0.30 | 0.24 | 0.30 | 0.32 | 0.18 | 0.46 | 0.12 | 0.18 |
| 2022-12-31 | 2022-09-30 | 2022-06-30 | 2022-03-31 | 2021-12-31 | 2021-09-30 | 2021-06-30 | 2021-03-31 | 2020-12-31 | 2020-09-30 | 2020-06-30 | 2020-03-31 | 2019-12-31 | 2019-09-30 | 2019-06-30 | 2019-03-31 | 2018-12-31 | 2018-09-30 | 2018-06-30 | 2018-03-31 | 2017-12-31 | 2017-09-30 | 2017-06-30 | 2017-03-31 | 2016-12-31 | 2016-09-30 | 2016-06-30 | 2016-03-31 | 2015-12-31 | 2015-09-30 | 2015-06-30 | 2015-03-31 | 2014-12-31 | 2014-09-30 | 2014-06-30 | 2014-03-31 | 2013-12-31 | 2013-09-30 | 2013-06-30 | 2013-03-31 | 2012-12-31 | 2012-09-30 | 2012-06-30 | 2012-03-31 | 2011-12-31 | 2011-09-30 | 2011-06-30 | 2011-03-31 | 2010-12-31 | 2010-09-30 | 2010-06-30 | 2010-03-31 | 2009-12-31 | ||
|---|---|---|---|---|---|---|---|---|---|---|---|---|---|---|---|---|---|---|---|---|---|---|---|---|---|---|---|---|---|---|---|---|---|---|---|---|---|---|---|---|---|---|---|---|---|---|---|---|---|---|---|---|---|---|
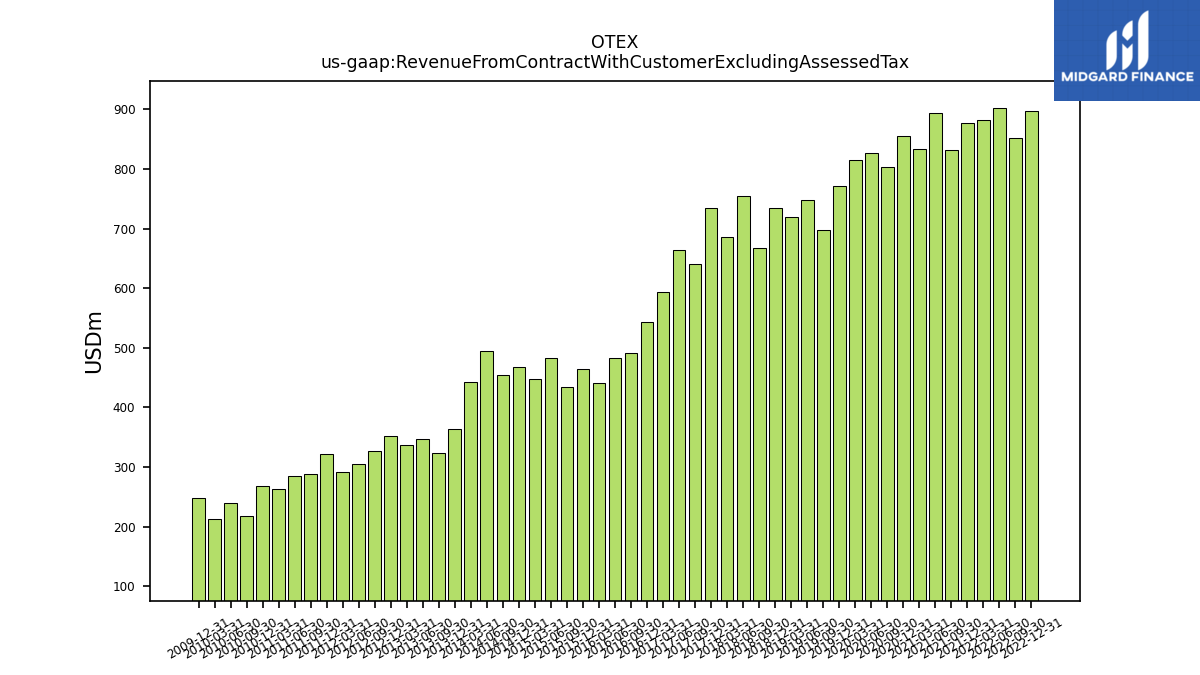
| Revenue From Contract With Customer Excluding Assessed Tax | 897.44 | 852.04 | 902.45 | 882.28 | 876.80 | 832.31 | 893.53 | 832.93 | 855.64 | 804.01 | 826.61 | 814.68 | 771.56 | 696.89 | 747.22 | 719.15 | 735.23 | 667.16 | 754.27 | 685.88 | 734.40 | 640.69 | 663.55 | 593.13 | 542.71 | 491.66 | 483.80 | 440.54 | 465.35 | 434.54 | 482.71 | 447.58 | 467.85 | 453.79 | 493.98 | 442.75 | 363.51 | 324.46 | 347.27 | 337.69 | 352.18 | 326.19 | 305.62 | 292.35 | 321.46 | 288.05 | 285.45 | 262.96 | 267.49 | 217.41 | 240.03 | 212.78 | 247.79 | |
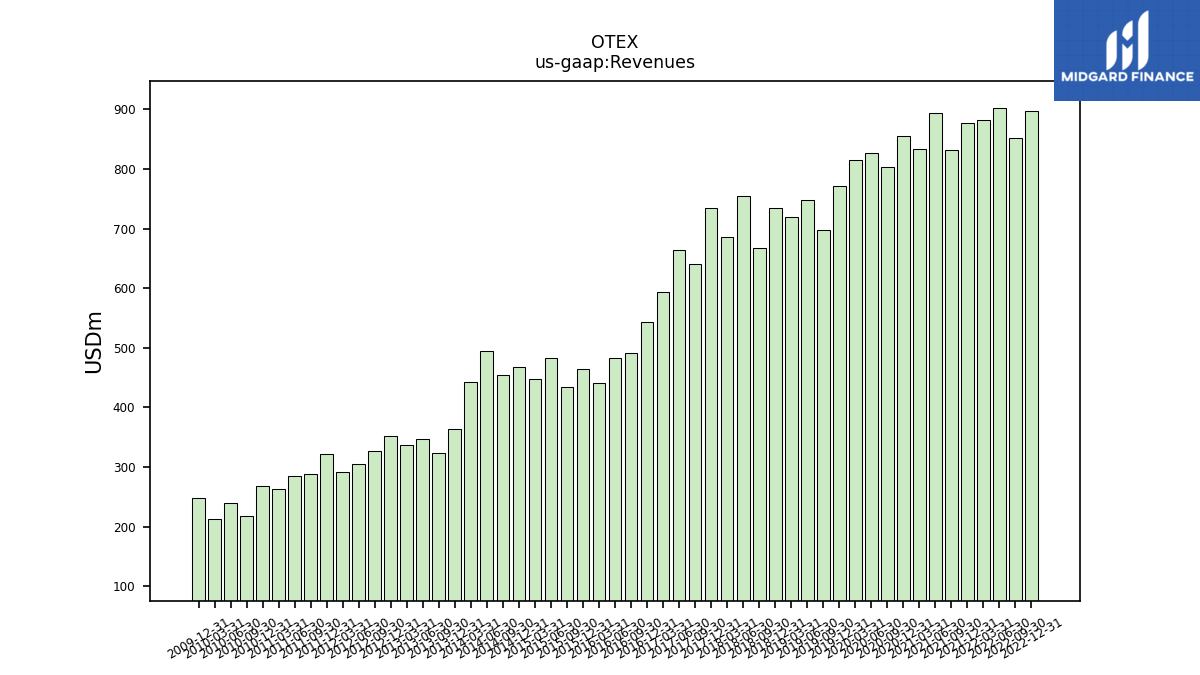
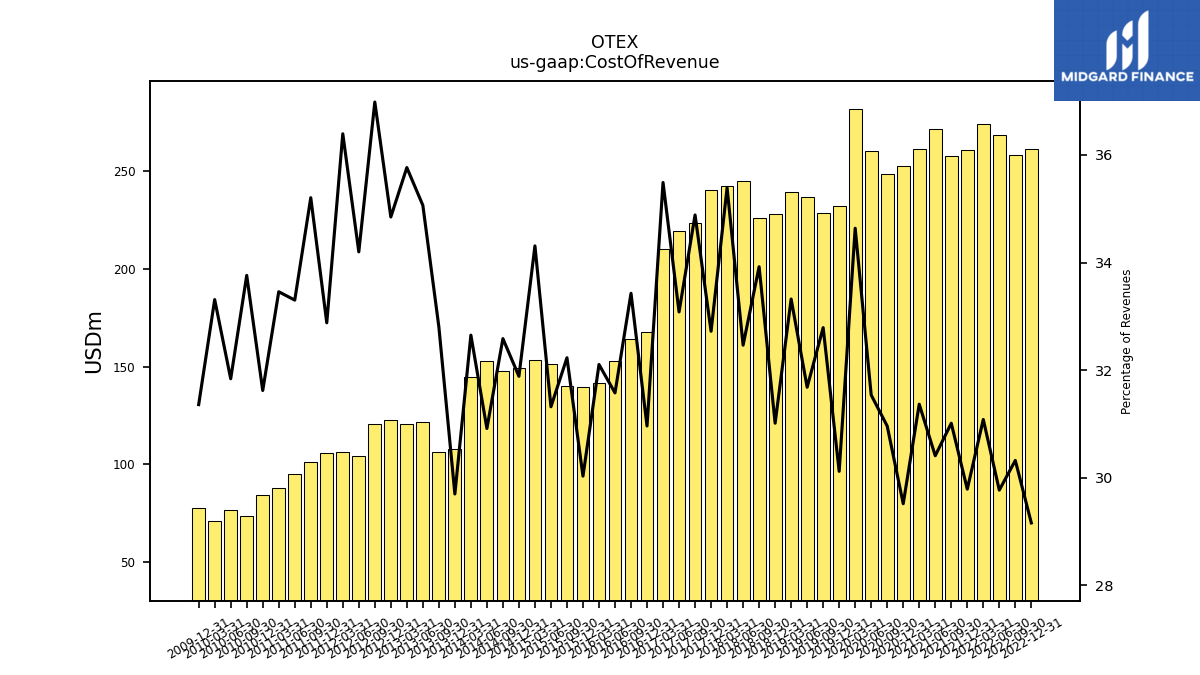
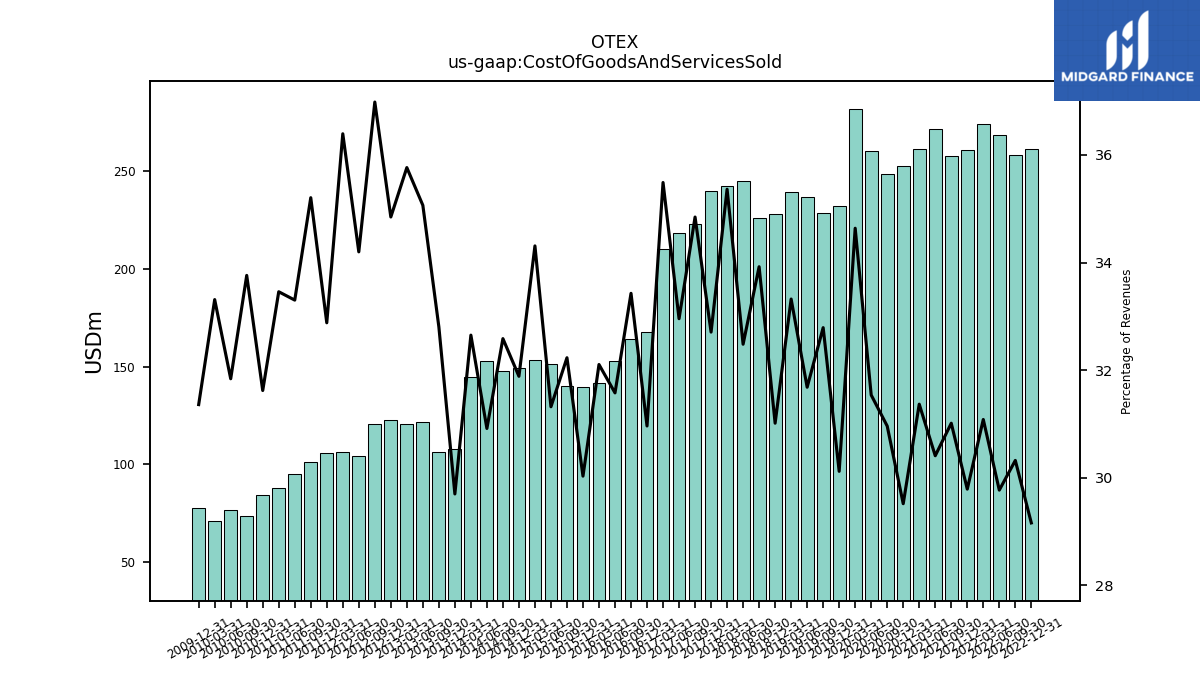
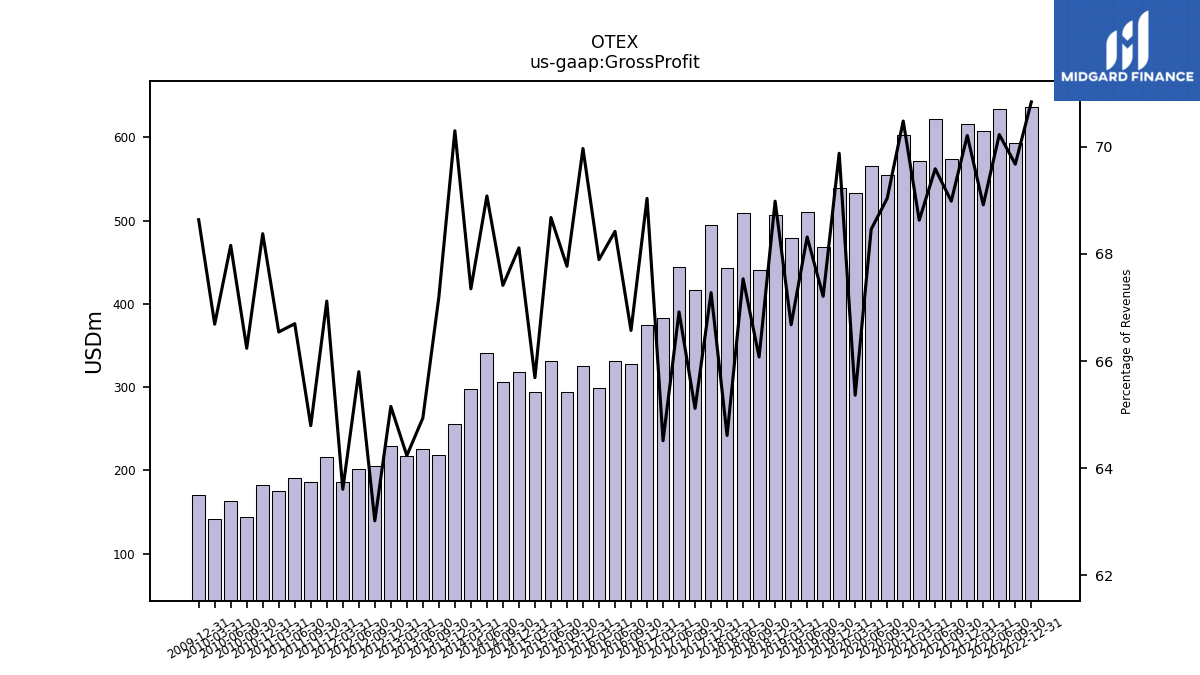
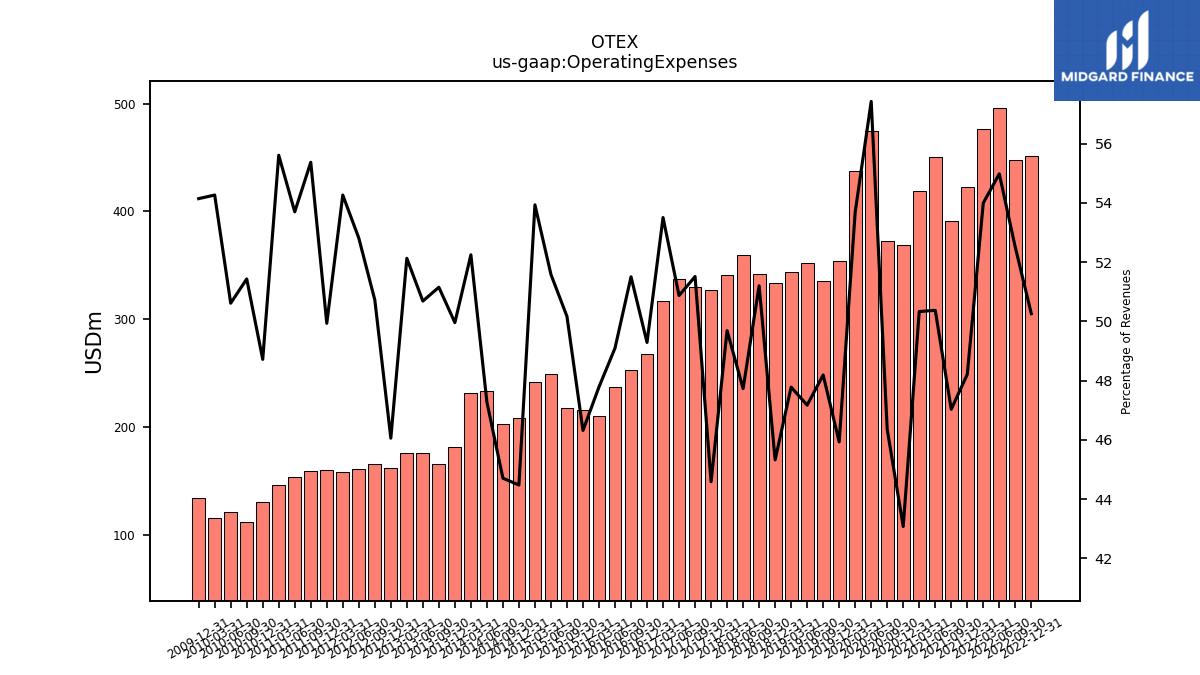
| Revenues | 897.44 | 852.04 | 902.45 | 882.28 | 876.80 | 832.31 | 893.53 | 832.93 | 855.64 | 804.01 | 826.61 | 814.68 | 771.56 | 696.89 | 747.22 | 719.15 | 735.23 | 667.16 | 754.27 | 685.88 | 734.40 | 640.69 | 663.55 | 593.13 | 542.71 | 491.66 | 483.80 | 440.54 | 465.35 | 434.54 | 482.71 | 447.58 | 467.85 | 453.79 | 493.98 | 442.75 | 363.51 | 324.46 | 347.27 | 337.69 | 352.18 | 326.19 | 305.62 | 292.35 | 321.46 | 288.05 | 285.45 | 262.96 | 267.49 | 217.41 | 240.03 | 212.78 | 247.79 | |
| Cost Of Revenue | 261.69 | 258.35 | 268.66 | 274.24 | 261.18 | 258.12 | 271.71 | 261.27 | 252.56 | 248.93 | 260.69 | 282.19 | 232.38 | 228.51 | 236.74 | 239.63 | 228.02 | 226.31 | 244.87 | 242.73 | 240.31 | 223.50 | 219.52 | 210.49 | 168.03 | 164.35 | 152.77 | 141.43 | 139.74 | 140.05 | 151.18 | 153.56 | 149.18 | 147.87 | 152.72 | 144.56 | 107.96 | 106.44 | 121.77 | 120.78 | 122.72 | 120.64 | 104.52 | 106.40 | 105.69 | 101.41 | 95.06 | 87.98 | 84.58 | 73.40 | 76.43 | 70.88 | 77.71 | |
| Cost Of Goods And Services Sold | 261.69 | 258.35 | 268.66 | 274.24 | 261.18 | 258.12 | 271.71 | 261.27 | 252.56 | 248.93 | 260.69 | 282.19 | 232.38 | 228.51 | 236.74 | 239.63 | 228.02 | 226.31 | 245.00 | 242.54 | 240.20 | 223.25 | 218.68 | 210.49 | 168.03 | 164.35 | 152.77 | 141.43 | 139.74 | 140.05 | 151.18 | 153.56 | 149.18 | 147.87 | 152.72 | 144.56 | 107.96 | 106.44 | 121.77 | 120.78 | 122.72 | 120.64 | 104.52 | 106.40 | 105.69 | 101.41 | 95.06 | 87.98 | 84.58 | 73.40 | 76.43 | 70.88 | 77.71 | |
| Gross Profit | 635.75 | 593.69 | 633.79 | 608.05 | 615.62 | 574.18 | 621.81 | 571.66 | 603.08 | 555.09 | 565.92 | 532.49 | 539.17 | 468.38 | 510.48 | 479.51 | 507.21 | 440.84 | 509.40 | 443.15 | 494.09 | 417.19 | 444.04 | 382.64 | 374.68 | 327.31 | 331.03 | 299.11 | 325.61 | 294.48 | 331.53 | 294.02 | 318.67 | 305.92 | 341.26 | 298.19 | 255.55 | 218.02 | 225.50 | 216.92 | 229.46 | 205.56 | 201.10 | 185.95 | 215.76 | 186.64 | 190.39 | 174.98 | 182.91 | 144.01 | 163.61 | 141.90 | 170.08 | |
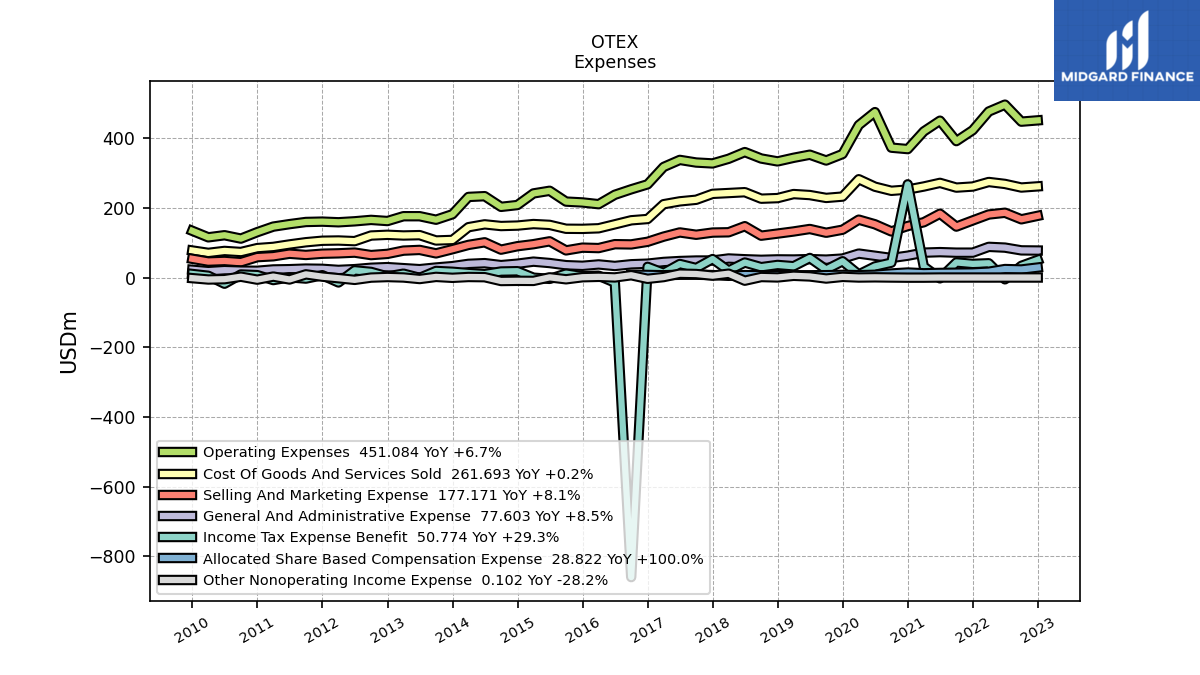
| Operating Expenses | 451.08 | 447.33 | 496.20 | 476.44 | 422.73 | 391.50 | 450.13 | 419.27 | 368.61 | 372.73 | 474.72 | 437.42 | 354.43 | 335.87 | 352.51 | 343.64 | 333.28 | 341.62 | 360.05 | 340.82 | 327.49 | 330.06 | 337.59 | 317.38 | 267.52 | 253.25 | 237.55 | 210.54 | 215.56 | 218.01 | 249.02 | 241.41 | 208.10 | 202.89 | 233.56 | 231.34 | 181.62 | 165.98 | 176.03 | 176.05 | 162.22 | 165.47 | 161.41 | 158.65 | 160.53 | 159.50 | 153.29 | 146.24 | 130.32 | 111.82 | 121.50 | 115.47 | 134.17 | |
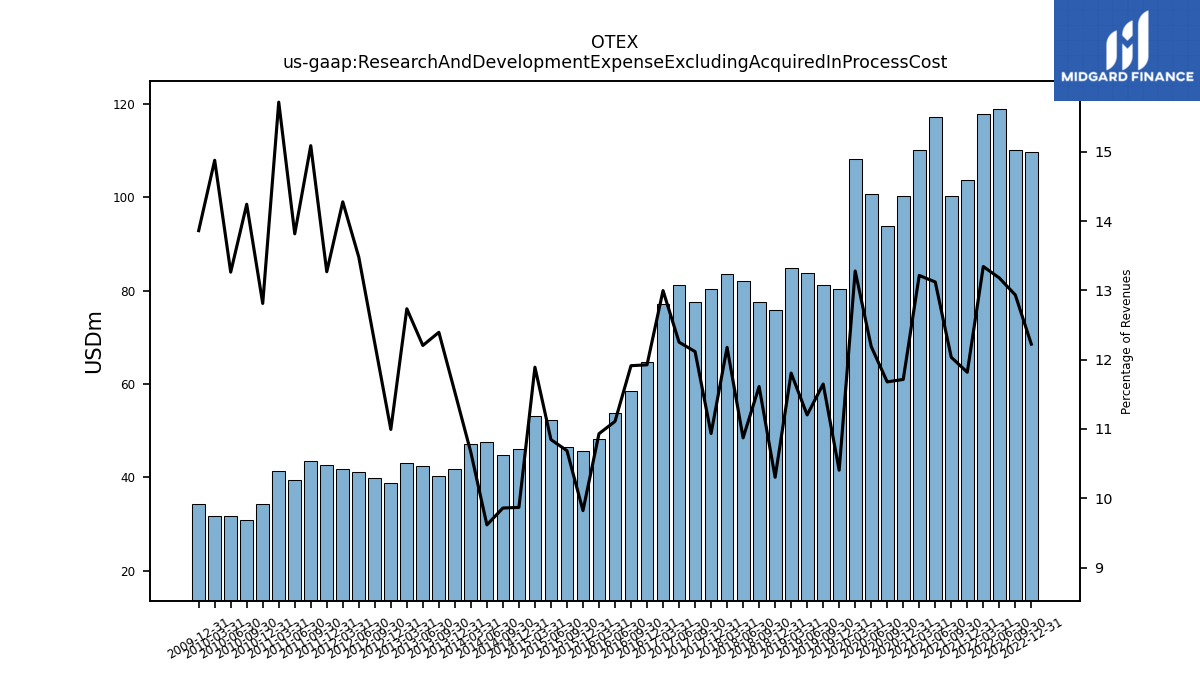
| Research And Development Expense Excluding Acquired In Process Cost | 109.70 | 110.20 | 118.93 | 117.73 | 103.62 | 100.17 | 117.23 | 110.07 | 100.24 | 93.90 | 100.77 | 108.18 | 80.28 | 81.18 | 83.71 | 84.91 | 75.75 | 77.47 | 82.01 | 83.52 | 80.30 | 77.63 | 81.30 | 77.09 | 64.72 | 58.57 | 53.75 | 48.16 | 45.71 | 46.44 | 52.36 | 53.22 | 46.17 | 44.74 | 47.50 | 47.20 | 41.92 | 40.22 | 42.38 | 43.00 | 38.72 | 39.91 | 41.20 | 41.74 | 42.65 | 43.46 | 39.44 | 41.32 | 34.27 | 30.96 | 31.84 | 31.65 | 34.35 | |
| General And Administrative Expense | 77.60 | 78.07 | 85.96 | 88.14 | 71.51 | 71.48 | 73.02 | 71.55 | 62.77 | 56.19 | 62.57 | 68.83 | 54.59 | 51.53 | 52.95 | 51.83 | 52.20 | 50.92 | 52.60 | 54.82 | 48.98 | 48.91 | 47.50 | 44.83 | 39.91 | 38.20 | 33.33 | 37.73 | 33.77 | 35.57 | 41.72 | 45.72 | 39.85 | 35.76 | 41.41 | 39.34 | 32.81 | 28.89 | 24.13 | 27.06 | 30.00 | 28.13 | 24.19 | 22.00 | 25.13 | 25.76 | 24.09 | 23.32 | 19.48 | 19.81 | 21.29 | 18.41 | 22.38 | |
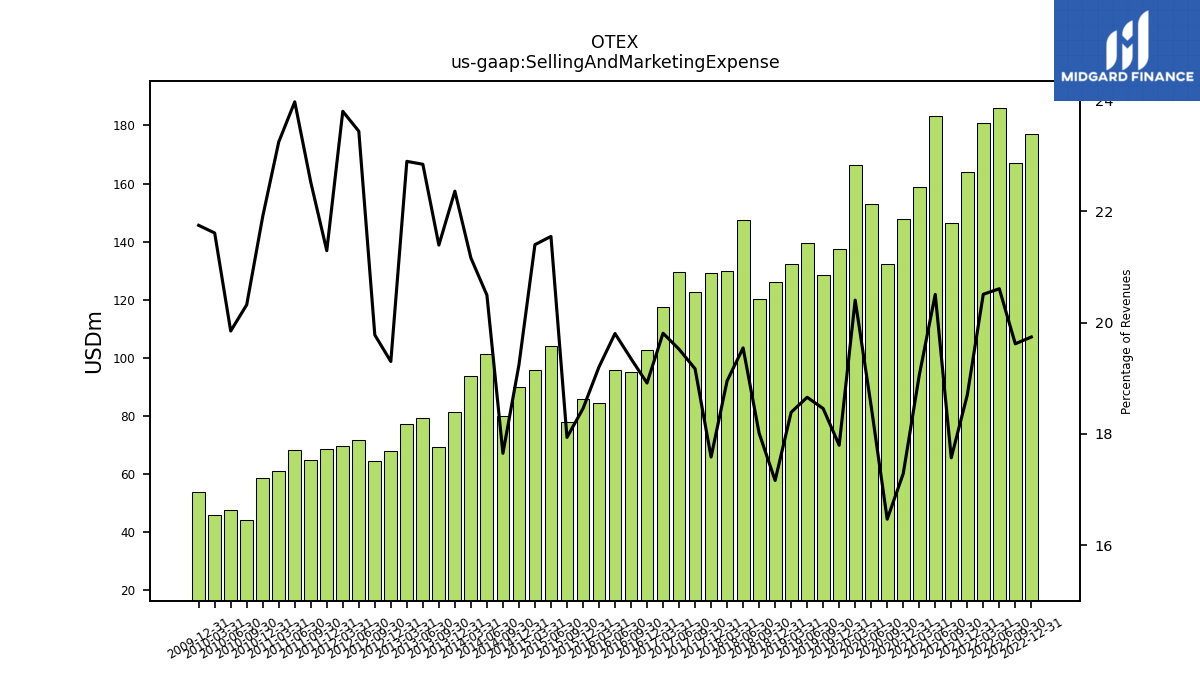
| Selling And Marketing Expense | 177.17 | 167.17 | 185.99 | 180.96 | 163.94 | 146.24 | 183.24 | 158.69 | 147.90 | 132.40 | 152.88 | 166.23 | 137.31 | 128.62 | 139.42 | 132.24 | 126.19 | 120.18 | 147.43 | 129.99 | 129.14 | 122.82 | 129.54 | 117.50 | 102.65 | 95.15 | 95.81 | 84.60 | 85.88 | 77.94 | 104.02 | 95.79 | 90.01 | 80.10 | 101.24 | 93.70 | 81.29 | 69.41 | 79.34 | 77.33 | 67.98 | 64.52 | 71.64 | 69.57 | 68.45 | 64.88 | 68.42 | 61.13 | 58.60 | 44.18 | 47.64 | 45.98 | 53.89 | |
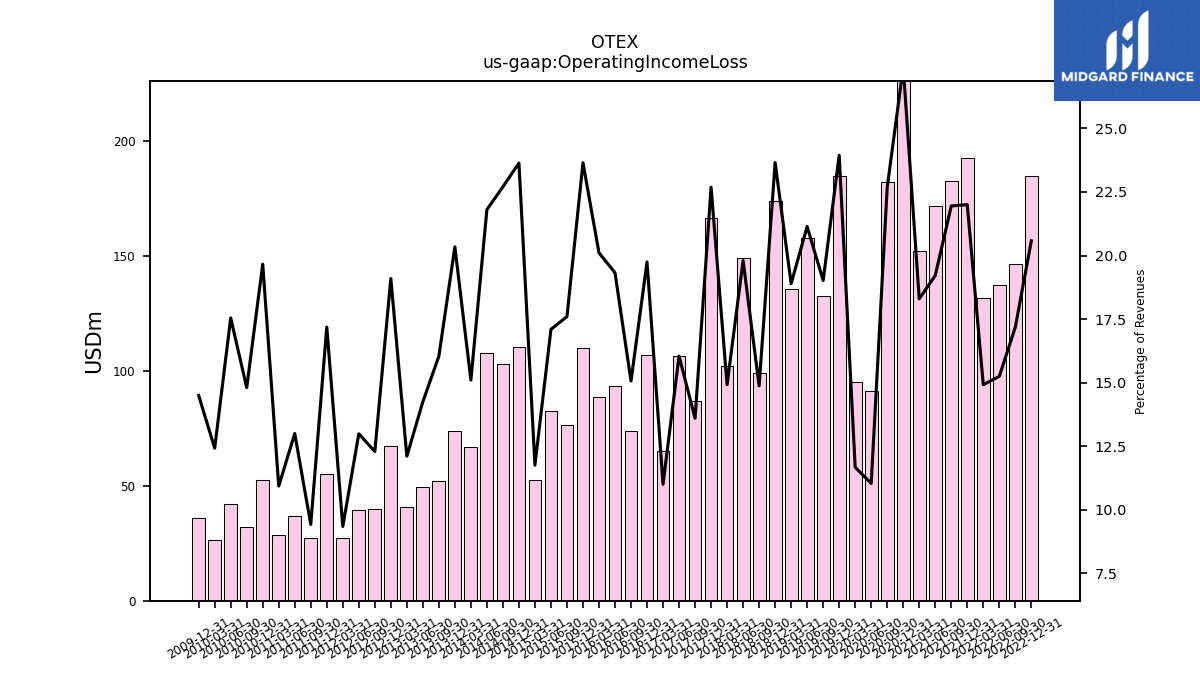
| Operating Income Loss | 184.66 | 146.35 | 137.59 | 131.61 | 192.88 | 182.69 | 171.68 | 152.40 | 234.47 | 182.36 | 91.20 | 95.08 | 184.74 | 132.51 | 157.97 | 135.88 | 173.93 | 99.23 | 149.35 | 102.32 | 166.61 | 87.12 | 106.45 | 65.26 | 107.16 | 74.06 | 93.48 | 88.57 | 110.04 | 76.47 | 82.51 | 52.60 | 110.57 | 103.03 | 107.70 | 66.85 | 73.93 | 52.04 | 49.47 | 40.87 | 67.23 | 40.09 | 39.69 | 27.30 | 55.23 | 27.14 | 37.10 | 28.74 | 52.58 | 32.18 | 42.11 | 26.43 | 35.91 | |
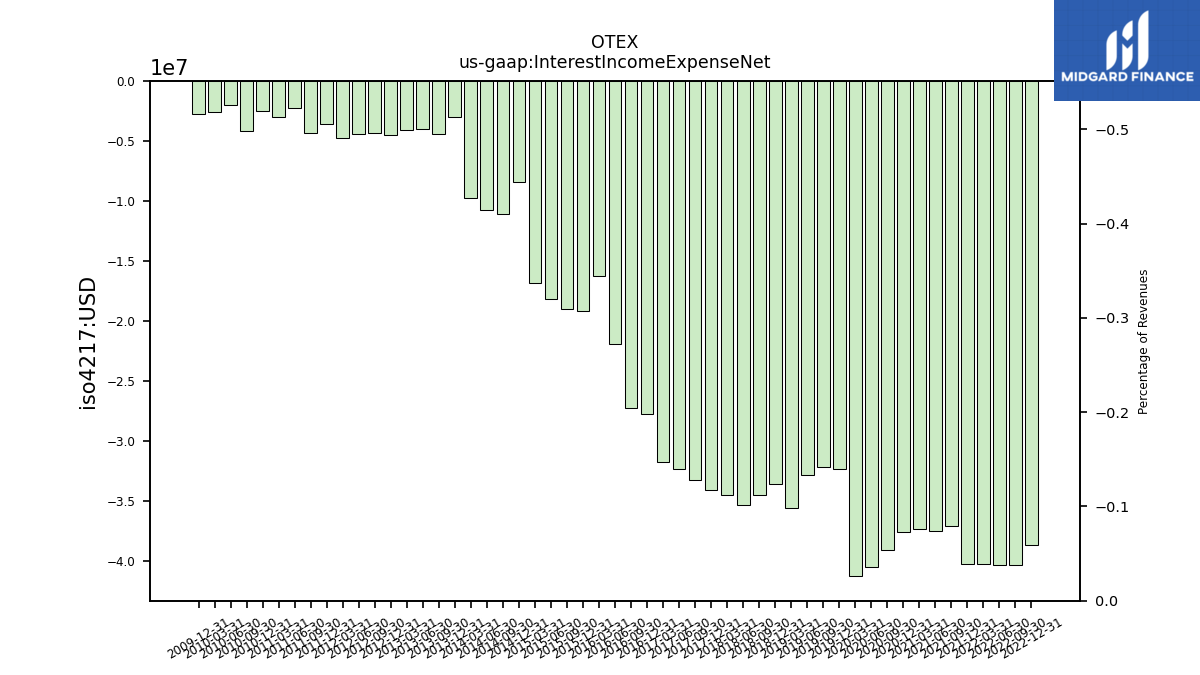
| Interest Income Expense Net | -38.72 | -40.38 | -40.34 | -40.24 | -40.24 | -37.05 | -37.55 | -37.33 | -37.59 | -39.09 | -40.53 | -41.26 | -32.38 | -32.21 | -32.84 | -35.61 | -33.61 | -34.53 | -35.34 | -34.53 | -34.09 | -33.29 | -32.37 | -31.73 | -27.74 | -27.27 | -21.90 | -16.23 | -19.19 | -19.05 | -18.19 | -16.87 | -8.46 | -11.10 | -10.78 | -9.73 | -3.04 | -4.38 | -3.99 | -4.11 | -4.51 | -4.37 | -4.41 | -4.76 | -3.61 | -4.35 | -2.25 | -2.98 | -2.47 | -4.13 | -1.98 | -2.62 | -2.72 | |
| Interest Paid Net | 45.59 | 46.42 | 37.65 | 41.71 | 31.73 | 41.66 | 30.64 | 41.93 | 31.56 | 43.87 | 34.91 | 43.66 | 34.69 | 33.44 | 36.28 | 33.59 | 36.14 | 32.63 | 35.45 | 32.49 | 34.40 | 30.47 | 31.64 | 29.89 | 24.39 | 29.19 | 6.65 | 29.18 | 6.94 | 29.29 | 6.76 | 7.29 | 10.09 | 10.51 | 10.37 | 8.83 | 3.76 | 3.74 | 3.83 | 3.93 | 4.30 | 4.24 | 4.29 | 7.30 | 1.14 | 2.58 | 2.02 | 2.22 | 2.06 | 2.11 | NA | NA | NA | |
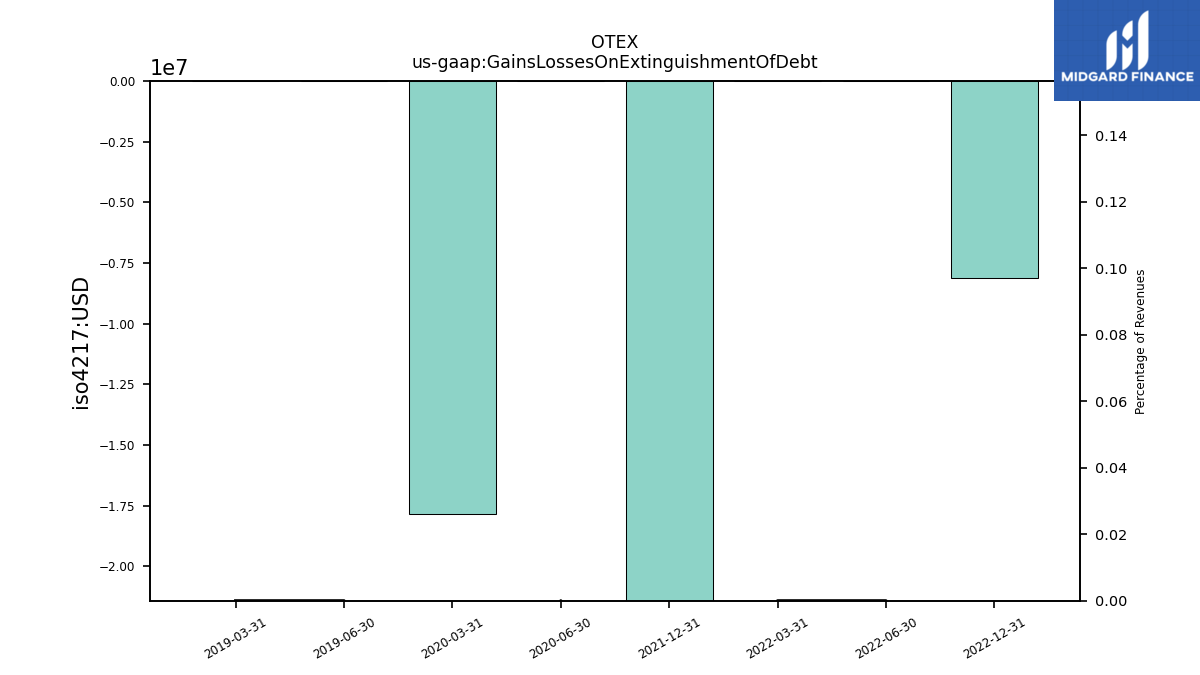
| Gains Losses On Extinguishment Of Debt | -8.10 | NA | 0.00 | 0.00 | -27.41 | NA | NA | NA | NA | NA | 0.00 | -17.85 | NA | NA | 0.00 | 0.00 | NA | NA | NA | NA | NA | NA | NA | NA | NA | NA | NA | NA | NA | NA | NA | NA | NA | NA | NA | NA | NA | NA | NA | NA | NA | NA | NA | NA | NA | NA | NA | NA | NA | NA | NA | NA | NA | |
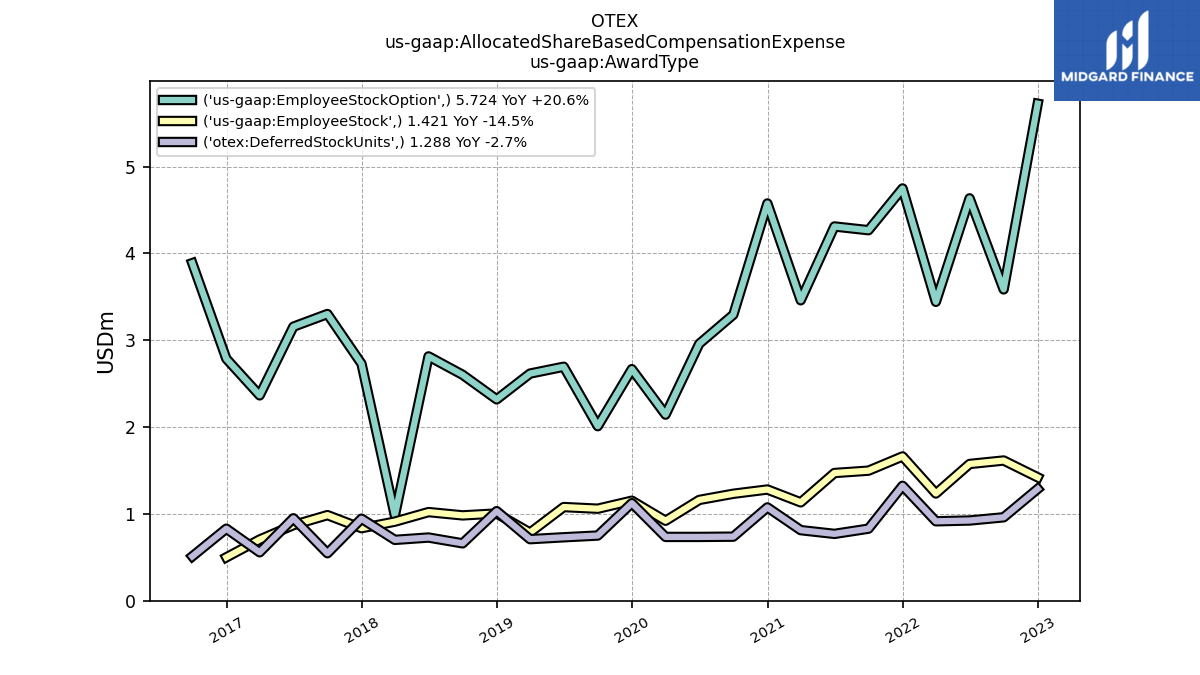
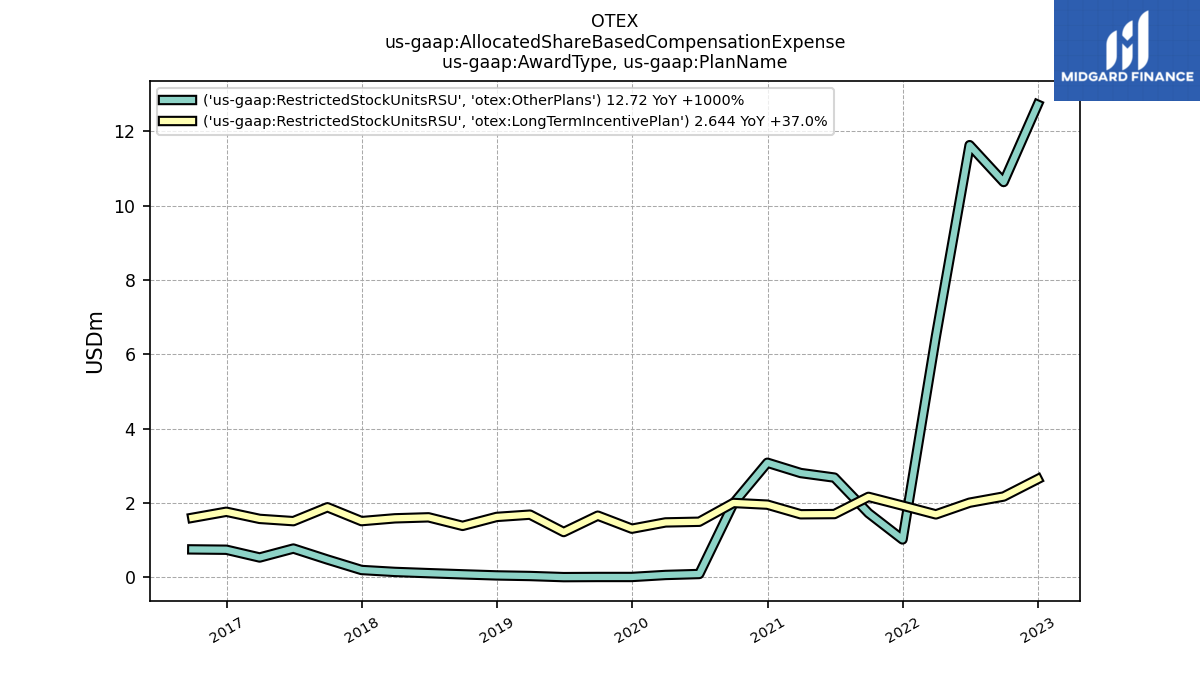
| Allocated Share Based Compensation Expense | 28.82 | 23.21 | 24.46 | 16.75 | 14.41 | 13.93 | 13.35 | 12.36 | 14.53 | 11.74 | 8.00 | 6.86 | 7.78 | 6.89 | 6.62 | 6.71 | 6.88 | 6.55 | 7.12 | 5.08 | 7.16 | 8.23 | 8.13 | 6.66 | 7.57 | 8.14 | NA | NA | NA | NA | NA | NA | NA | NA | NA | NA | NA | NA | NA | NA | NA | NA | NA | NA | NA | NA | NA | NA | NA | NA | NA | NA | NA | |
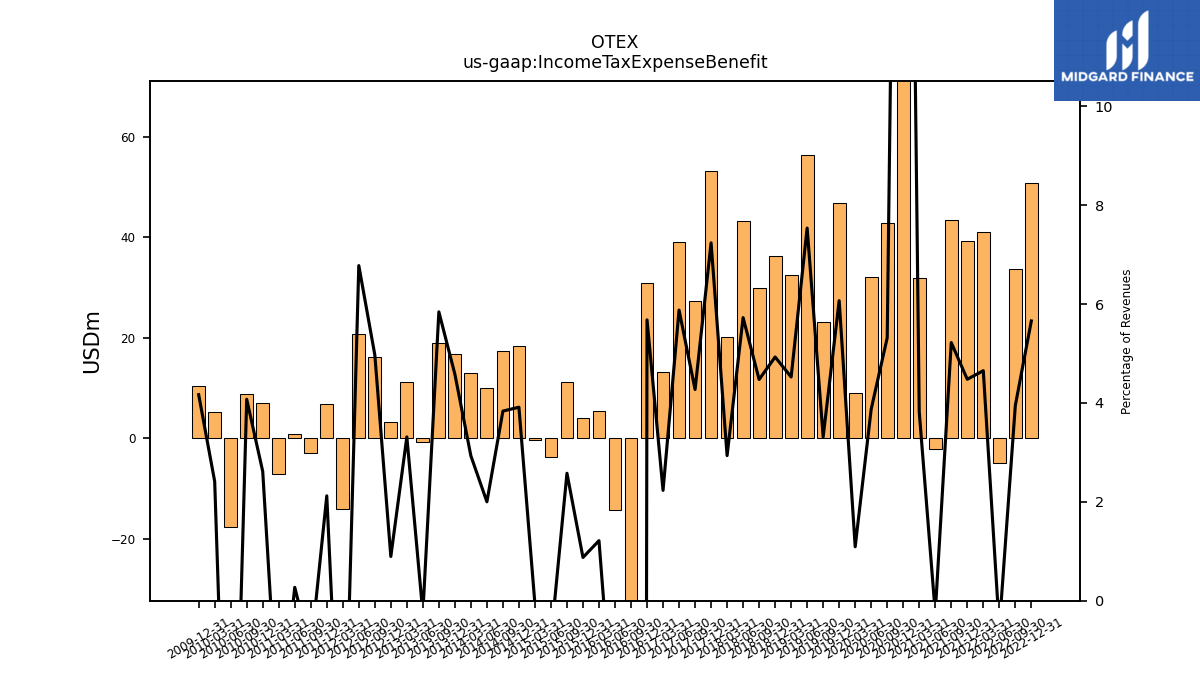
| Income Tax Expense Benefit | 50.77 | 33.62 | -5.00 | 41.04 | 39.27 | 43.45 | -2.21 | 31.82 | 267.56 | 42.74 | 32.04 | 8.89 | 46.82 | 23.09 | 56.31 | 32.54 | 36.24 | 29.85 | 43.18 | 20.13 | 53.15 | 27.37 | 39.00 | 13.24 | 30.82 | -859.42 | -14.35 | 5.35 | 4.07 | 11.20 | -3.76 | -0.31 | 18.31 | 17.40 | 9.88 | 12.97 | 16.65 | 18.95 | -0.87 | 11.19 | 3.15 | 16.22 | 20.71 | -14.04 | 6.82 | -2.92 | 0.78 | -7.16 | 7.00 | 8.86 | -17.60 | 5.13 | 10.32 | |
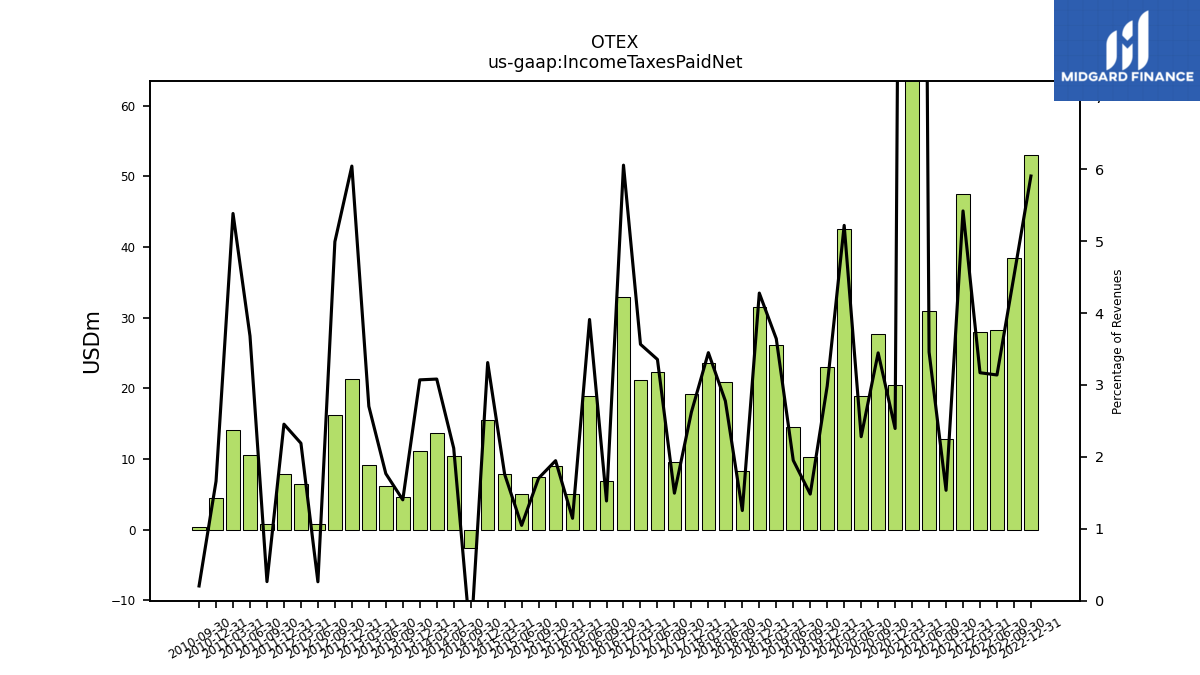
| Income Taxes Paid Net | 52.98 | 38.46 | 28.32 | 27.97 | 47.51 | 12.78 | 30.89 | 321.05 | 20.49 | 27.70 | 18.85 | 42.51 | 23.04 | 10.34 | 14.58 | 26.19 | 31.45 | 8.37 | 20.95 | 23.65 | 19.25 | 9.58 | 22.26 | 21.15 | 32.86 | 6.82 | 18.92 | 5.05 | 9.06 | 7.41 | 5.06 | 7.87 | 15.49 | -2.55 | 10.47 | 13.64 | 11.16 | 4.55 | 6.14 | 9.13 | 21.28 | 16.28 | 0.81 | 6.40 | 7.89 | 0.77 | 10.50 | 14.16 | 4.44 | 0.45 | NA | NA | NA | |
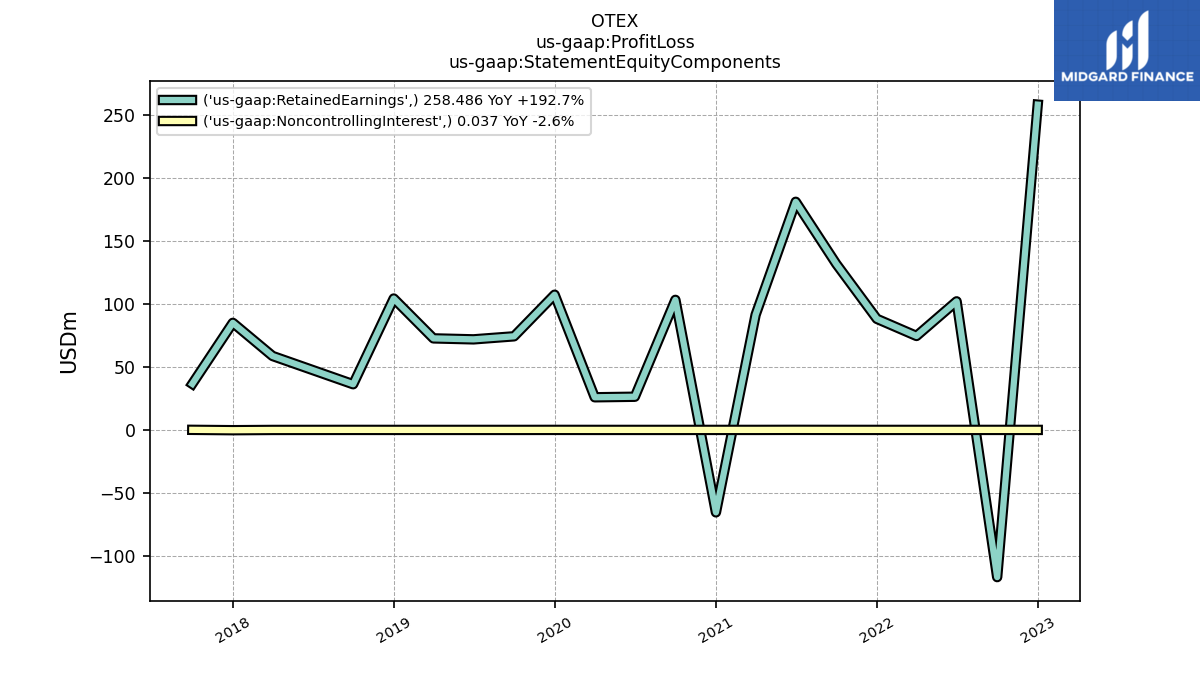
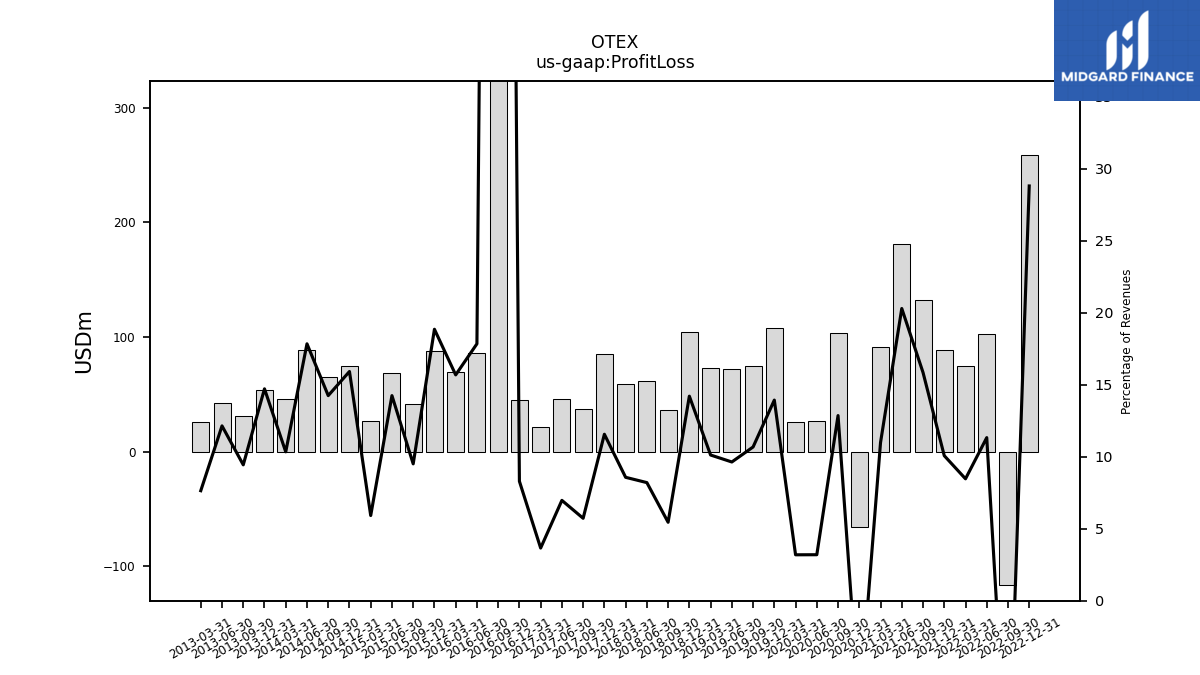
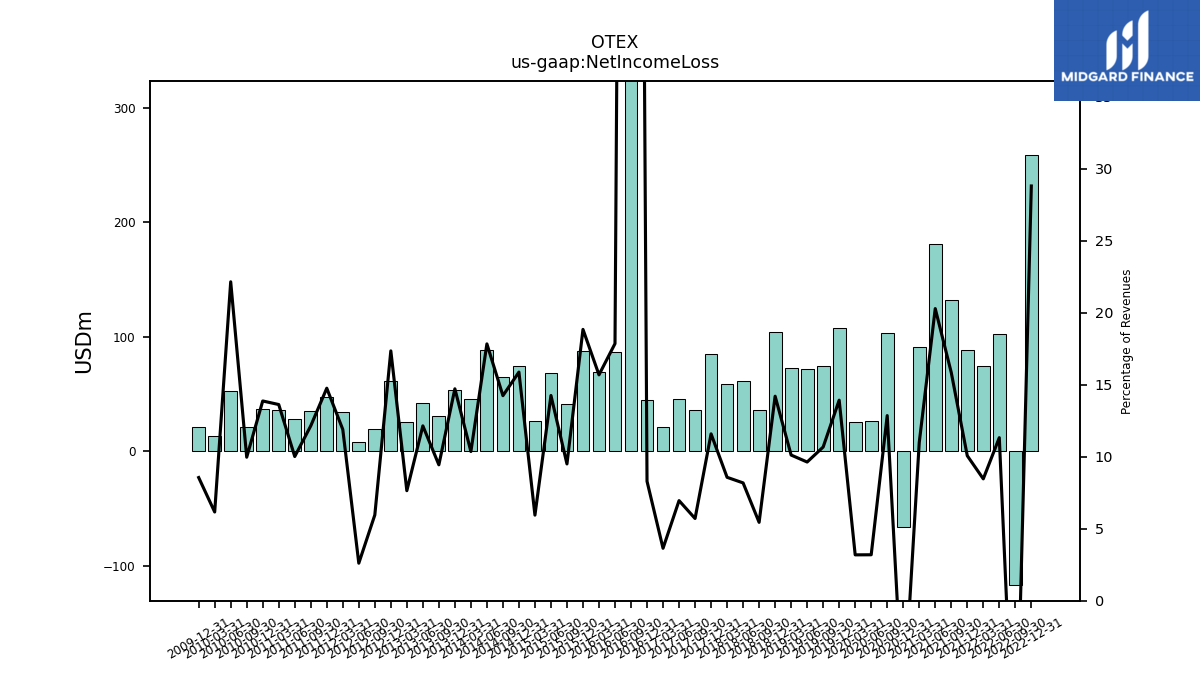
| Profit Loss | 258.52 | -116.89 | 102.23 | 74.72 | 88.34 | 131.97 | 181.36 | 91.53 | -65.43 | 103.41 | 26.42 | 26.00 | 107.52 | 74.43 | 72.02 | 72.79 | 104.46 | 36.37 | 61.89 | 58.80 | 84.92 | 36.69 | 46.26 | 21.71 | 45.03 | 912.91 | 86.33 | 69.11 | 87.74 | 41.31 | 68.77 | 26.49 | 74.49 | 64.65 | 88.15 | 45.80 | 53.50 | 30.63 | 42.17 | 25.81 | NA | NA | NA | NA | NA | NA | NA | NA | NA | NA | NA | NA | NA | |
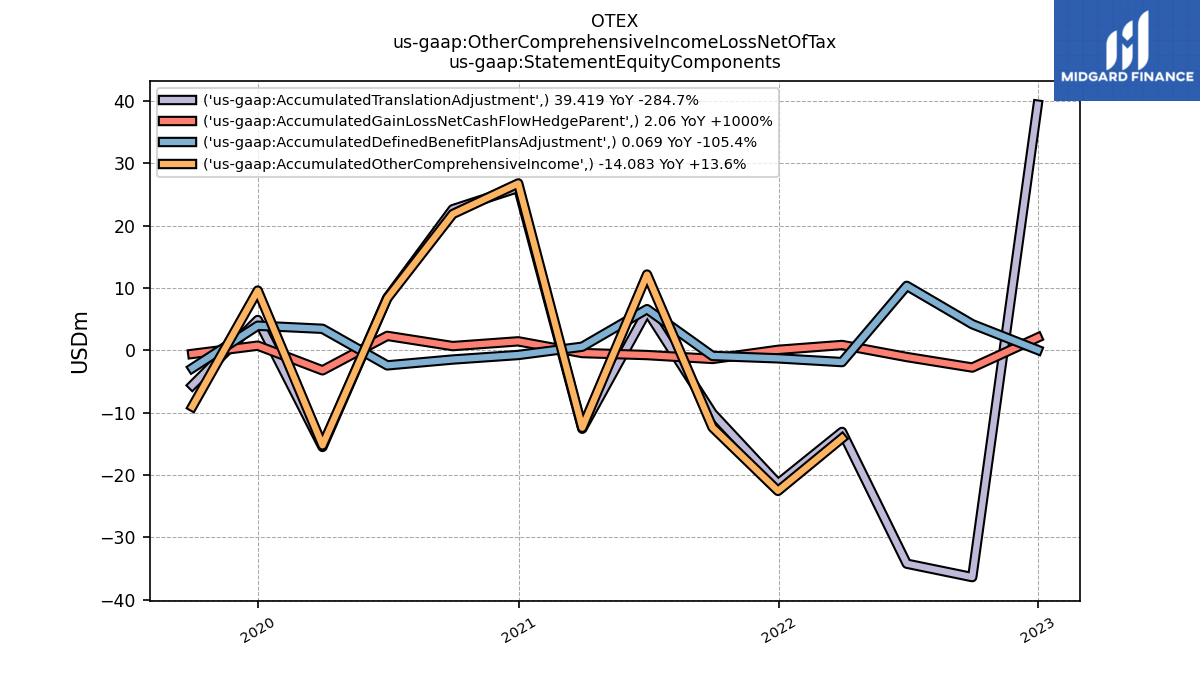
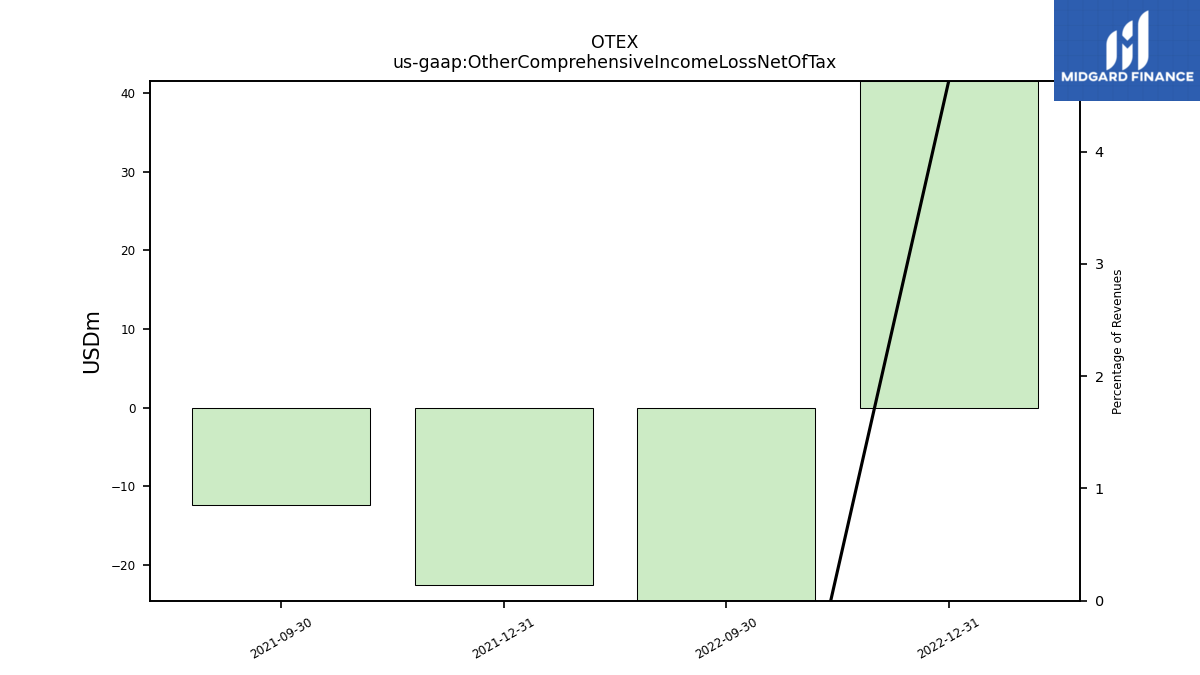
| Other Comprehensive Income Loss Net Of Tax | 41.55 | -34.92 | NA | NA | -22.54 | -12.35 | NA | NA | NA | NA | NA | NA | NA | NA | NA | NA | NA | NA | NA | NA | NA | NA | NA | NA | NA | NA | NA | NA | NA | NA | NA | NA | NA | NA | NA | NA | NA | NA | NA | NA | NA | NA | NA | NA | NA | NA | NA | NA | NA | NA | NA | NA | NA | |
| Net Income Loss | 258.49 | -116.93 | 102.20 | 74.68 | 88.30 | 131.91 | 181.28 | 91.49 | -65.48 | 103.38 | 26.39 | 25.96 | 107.47 | 74.40 | 71.98 | 72.76 | 104.43 | 36.32 | 61.72 | 58.79 | 85.11 | 36.60 | 46.14 | 21.62 | 45.02 | 912.88 | 86.39 | 69.11 | 87.69 | 41.29 | 68.80 | 26.61 | 74.29 | 64.63 | 88.11 | 45.88 | 53.50 | 30.63 | 42.17 | 25.81 | 61.11 | 19.43 | 7.97 | 34.77 | 47.44 | 34.99 | 28.59 | 35.83 | 37.11 | 21.67 | 53.17 | 13.11 | 21.20 | |
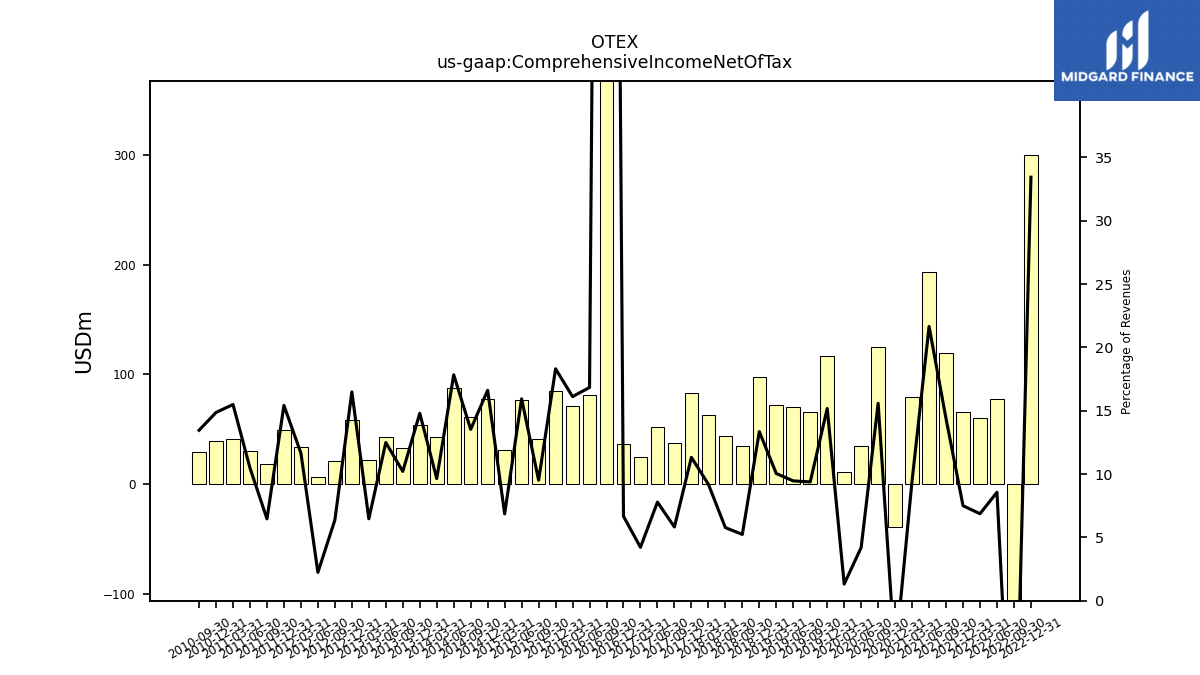
| Comprehensive Income Net Of Tax | 300.03 | -151.85 | 77.27 | 60.60 | 65.76 | 119.56 | 193.45 | 79.09 | -38.70 | 125.25 | 34.75 | 10.74 | 117.06 | 65.37 | 70.69 | 72.21 | 98.15 | 34.94 | 43.56 | 63.08 | 83.11 | 37.31 | 51.66 | 25.01 | 36.18 | 915.30 | 81.45 | 70.99 | 85.18 | 41.34 | 76.91 | 30.70 | 77.70 | 61.39 | 88.07 | 42.70 | 53.79 | 33.13 | 43.36 | 21.85 | 58.05 | 20.79 | 6.85 | 34.04 | 49.56 | 18.62 | 29.91 | 40.73 | 39.75 | 29.26 | NA | NA | NA |
| 2022-12-31 | 2022-09-30 | 2022-06-30 | 2022-03-31 | 2021-12-31 | 2021-09-30 | 2021-06-30 | 2021-03-31 | 2020-12-31 | 2020-09-30 | 2020-06-30 | 2020-03-31 | 2019-12-31 | 2019-09-30 | 2019-06-30 | 2019-03-31 | 2018-12-31 | 2018-09-30 | 2018-06-30 | 2018-03-31 | 2017-12-31 | 2017-09-30 | 2017-06-30 | 2017-03-31 | 2016-12-31 | 2016-09-30 | 2016-06-30 | 2016-03-31 | 2015-12-31 | 2015-09-30 | 2015-06-30 | 2015-03-31 | 2014-12-31 | 2014-09-30 | 2014-06-30 | 2014-03-31 | 2013-12-31 | 2013-09-30 | 2013-06-30 | 2013-03-31 | 2012-12-31 | 2012-09-30 | 2012-06-30 | 2012-03-31 | 2011-12-31 | 2011-09-30 | 2011-06-30 | 2011-03-31 | 2010-12-31 | 2010-09-30 | 2010-06-30 | 2010-03-31 | 2009-12-31 | ||
|---|---|---|---|---|---|---|---|---|---|---|---|---|---|---|---|---|---|---|---|---|---|---|---|---|---|---|---|---|---|---|---|---|---|---|---|---|---|---|---|---|---|---|---|---|---|---|---|---|---|---|---|---|---|---|
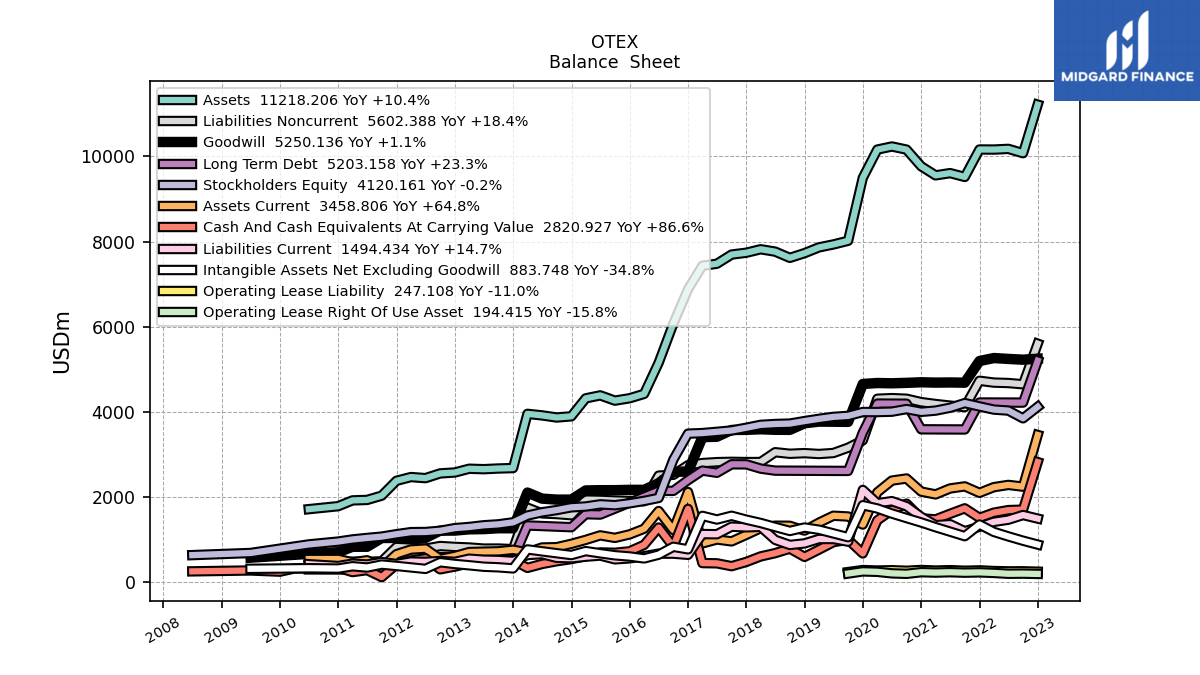
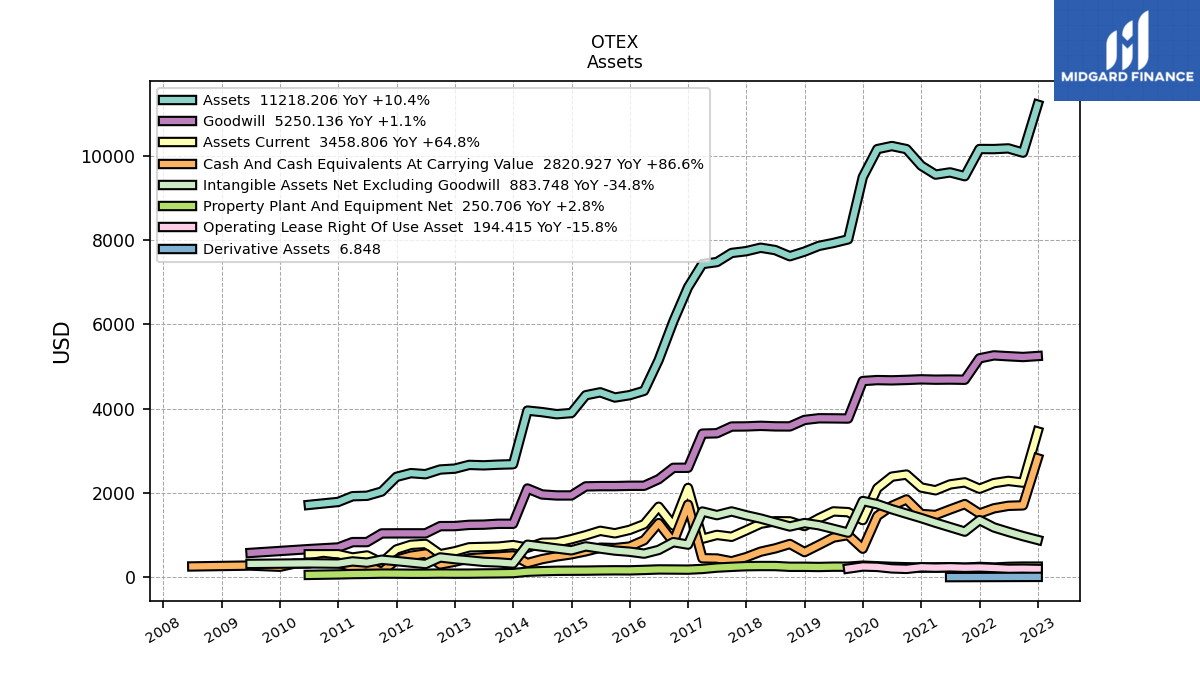
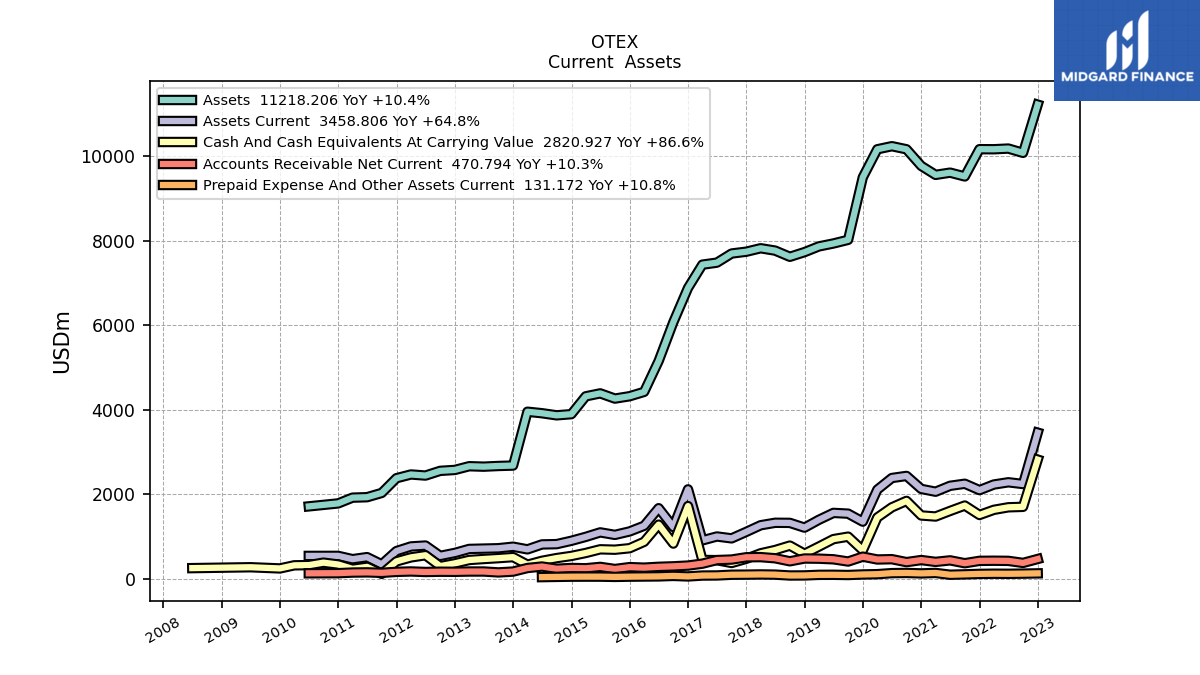
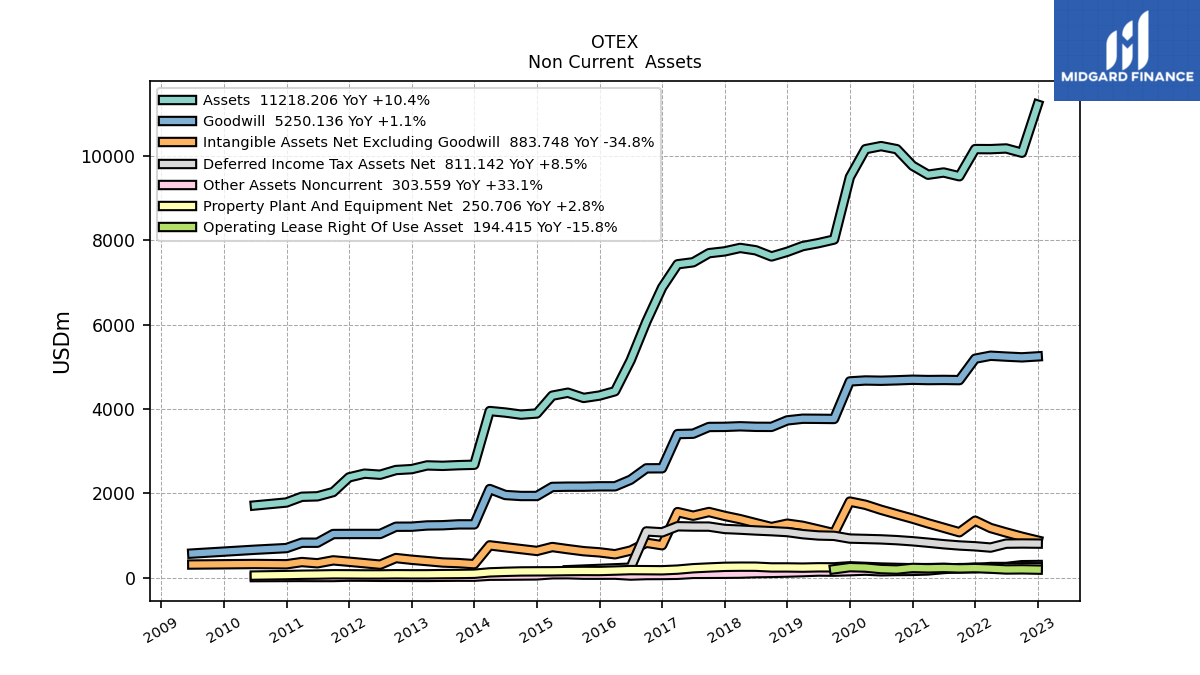
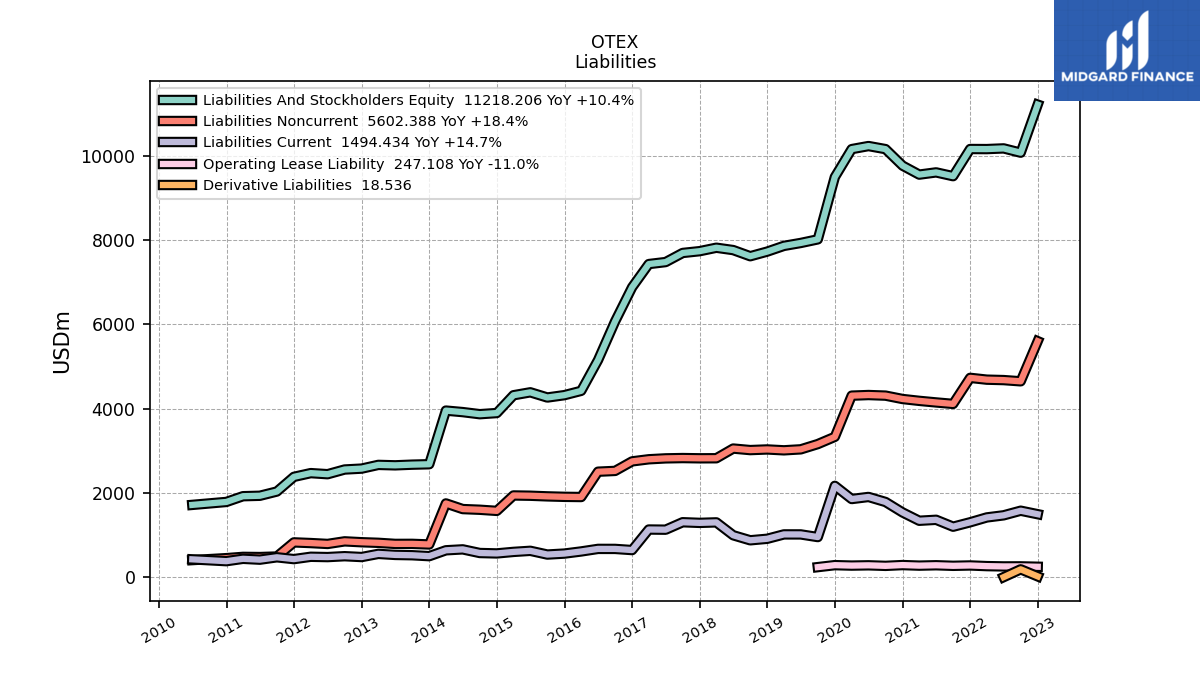
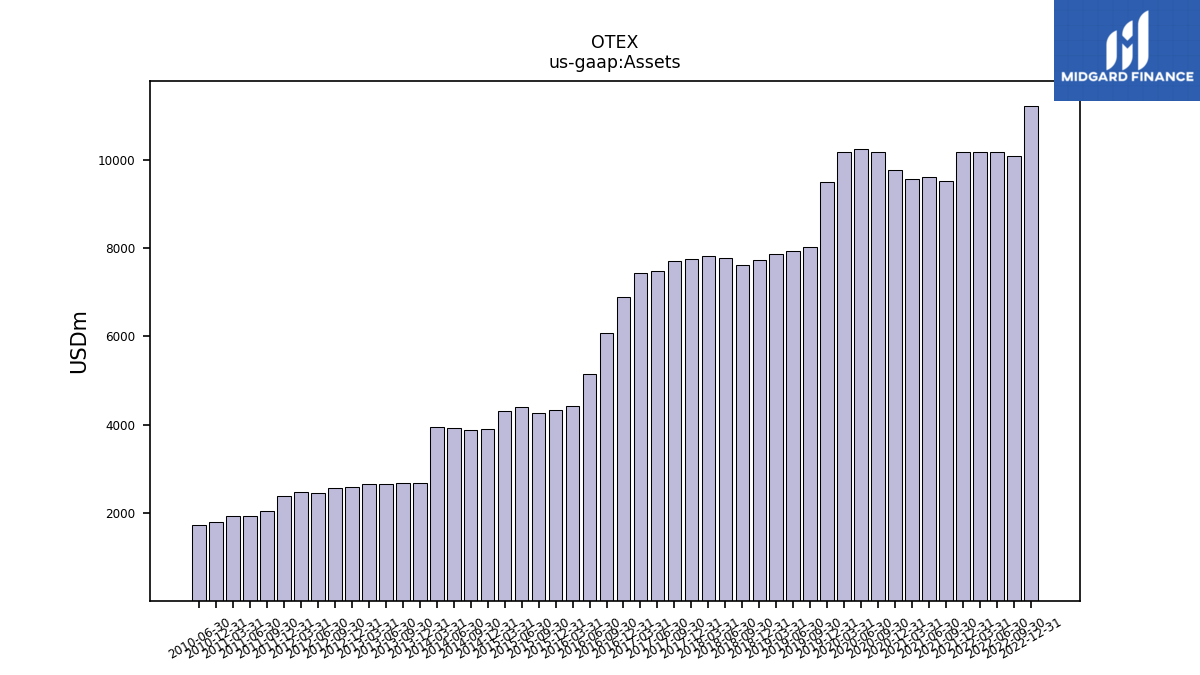
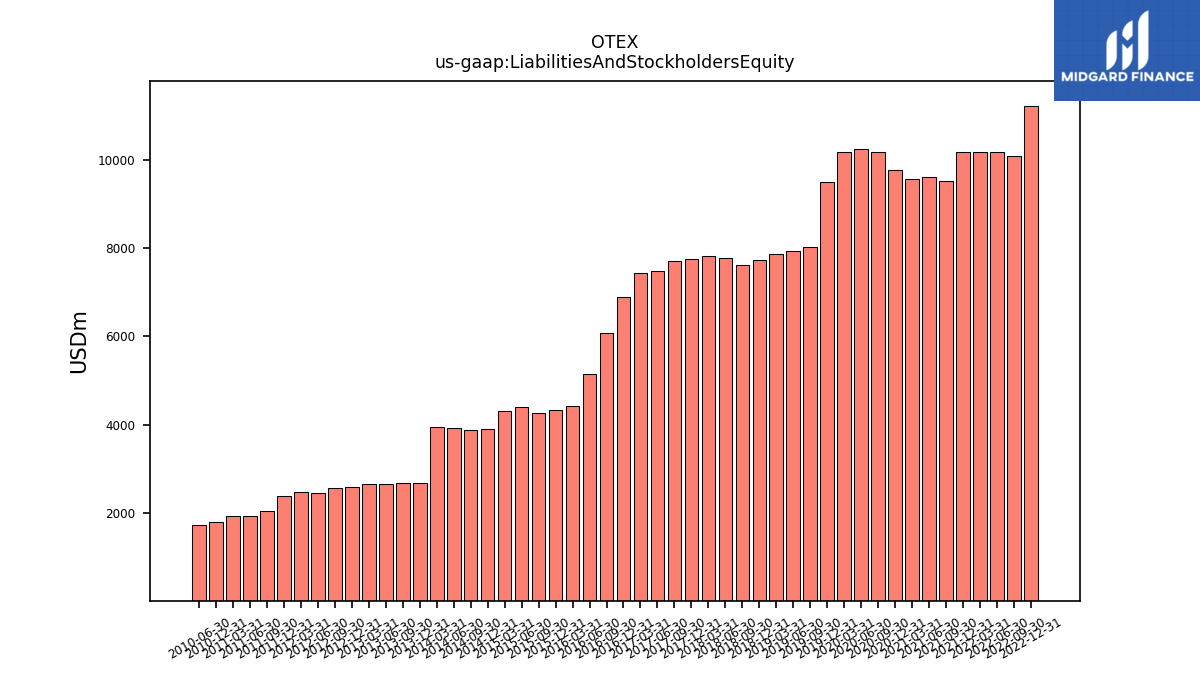
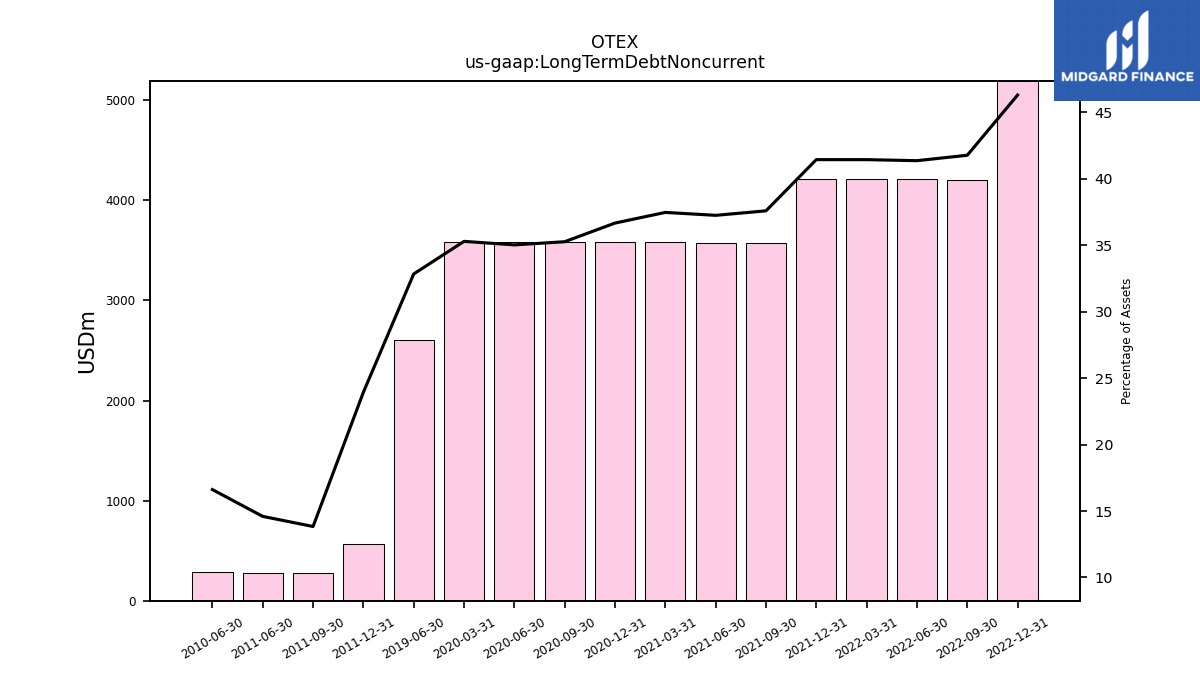
| Assets | 11218.21 | 10077.09 | 10178.97 | 10162.64 | 10164.53 | 9519.36 | 9609.34 | 9556.62 | 9769.10 | 10161.81 | 10234.82 | 10162.07 | 9498.23 | 8019.51 | 7933.98 | 7864.64 | 7729.40 | 7619.05 | 7765.03 | 7820.88 | 7739.22 | 7696.42 | 7480.56 | 7433.22 | 6882.19 | 6072.31 | 5154.14 | 4423.36 | 4320.77 | 4264.99 | 4388.49 | 4318.54 | 3896.32 | 3868.88 | 3918.64 | 3954.52 | 2680.72 | 2670.87 | 2654.82 | 2665.32 | 2577.20 | 2555.64 | 2444.29 | 2470.04 | 2381.58 | 2033.14 | 1932.36 | 1921.99 | 1785.65 | NA | 1715.68 | NA | NA | |
| Liabilities And Stockholders Equity | 11218.21 | 10077.09 | 10178.97 | 10162.64 | 10164.53 | 9519.36 | 9609.34 | 9556.62 | 9769.10 | 10161.81 | 10234.82 | 10162.07 | 9498.23 | 8019.51 | 7933.98 | 7864.64 | 7729.40 | 7619.05 | 7765.03 | 7820.88 | 7739.22 | 7696.42 | 7480.56 | 7433.22 | 6882.19 | 6072.31 | 5154.14 | 4423.36 | 4320.77 | 4264.99 | 4388.49 | 4318.54 | 3896.32 | 3868.88 | 3918.64 | 3954.52 | 2680.72 | 2670.87 | 2654.82 | 2665.32 | 2577.20 | 2555.64 | 2444.29 | 2470.04 | 2381.58 | 2033.14 | 1932.36 | 1921.99 | 1785.65 | NA | 1715.68 | NA | NA | |
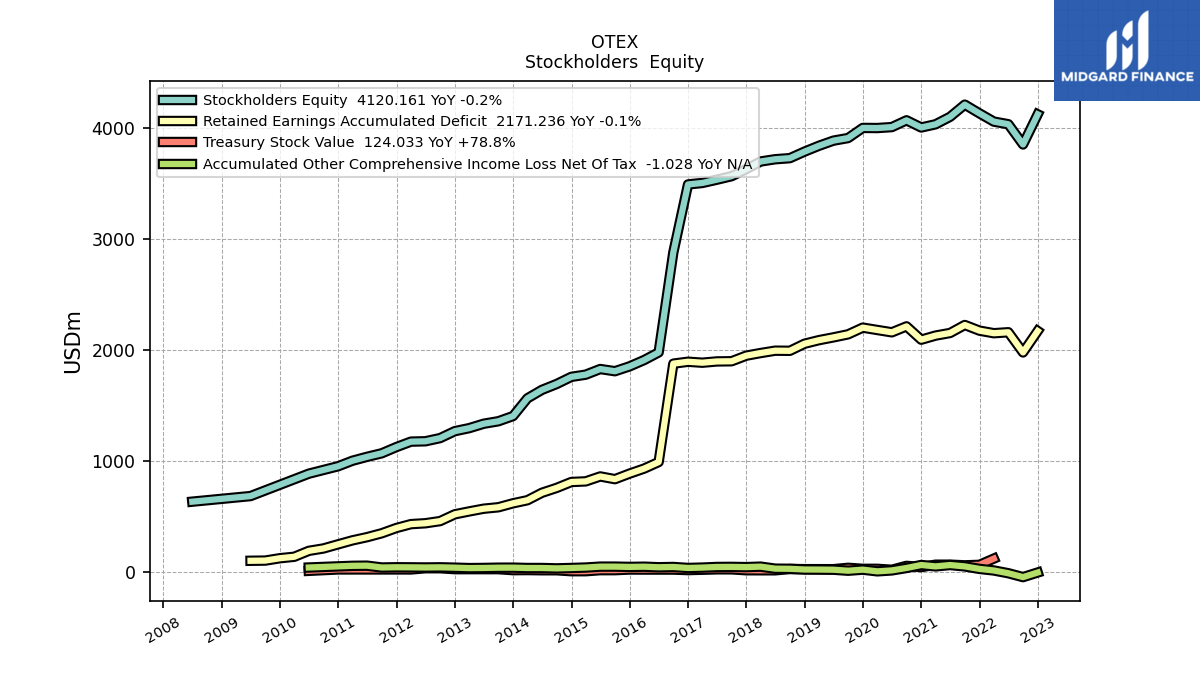
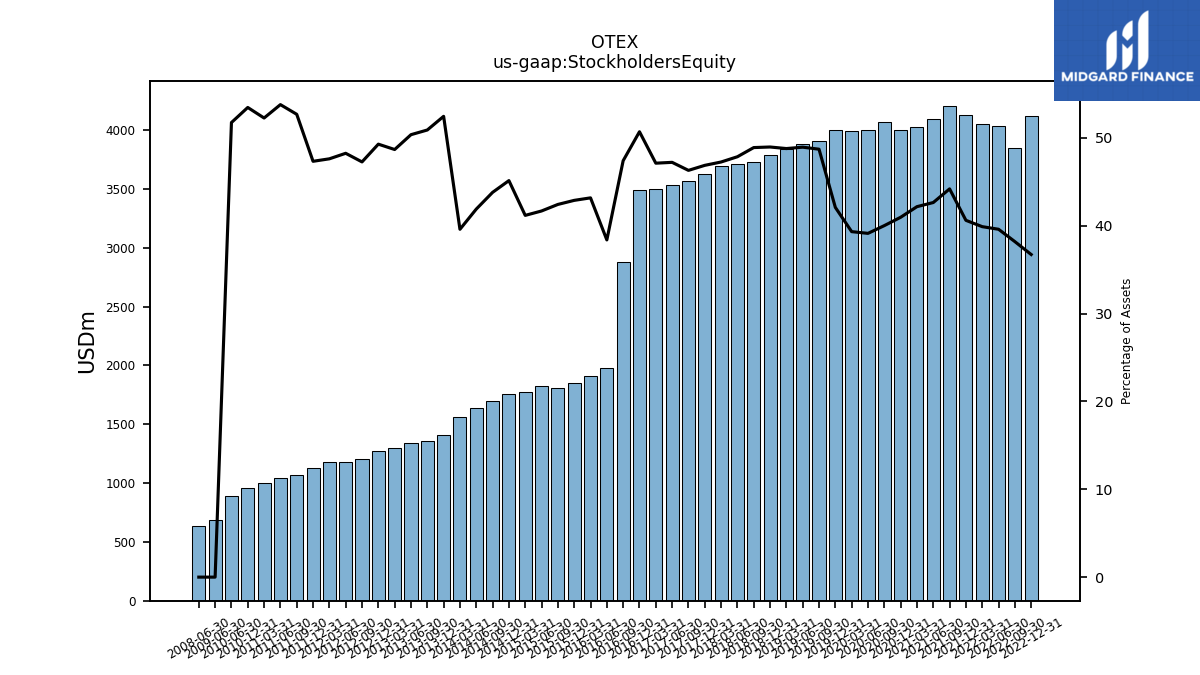
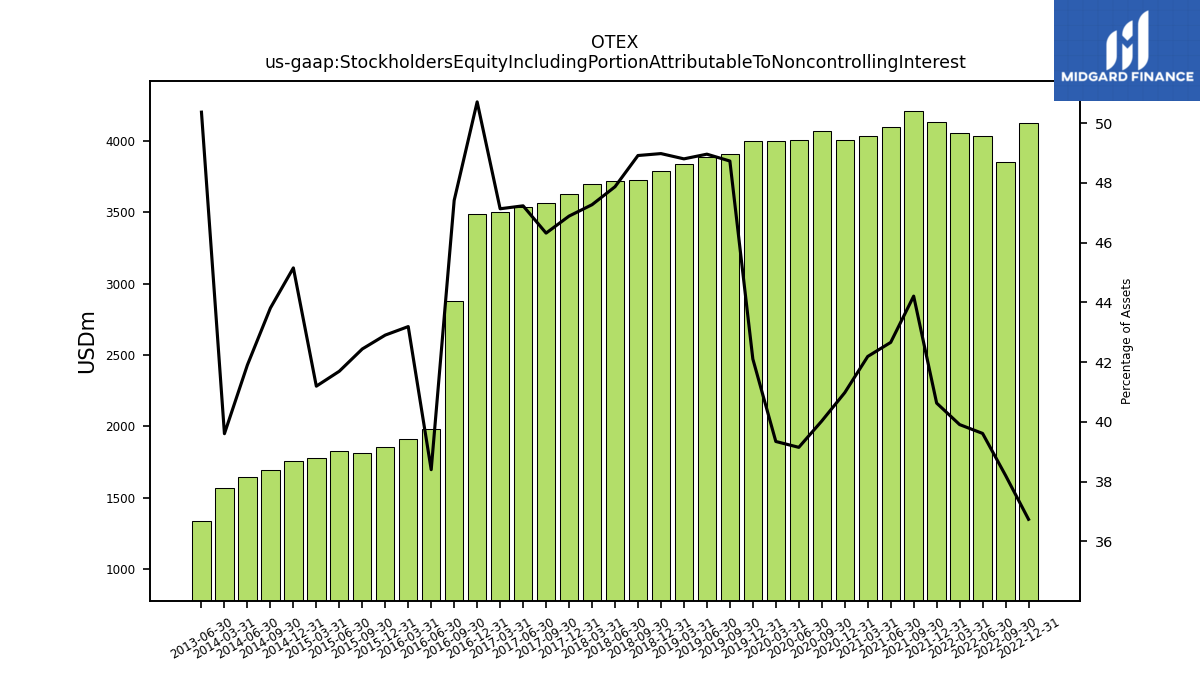
| Stockholders Equity | 4120.16 | 3848.95 | 4031.12 | 4054.75 | 4128.76 | 4207.49 | 4097.94 | 4030.49 | 4001.85 | 4066.37 | 4005.39 | 3996.89 | 3997.94 | 3906.87 | 3883.45 | 3837.19 | 3784.86 | 3725.91 | 3716.22 | 3696.11 | 3627.99 | 3563.88 | 3532.36 | 3502.92 | 3489.60 | 2878.66 | 1978.66 | 1909.88 | 1853.25 | 1809.55 | 1829.28 | 1778.48 | 1758.84 | 1694.65 | 1641.87 | 1565.91 | 1406.29 | 1359.55 | 1337.21 | 1297.50 | 1270.34 | 1208.03 | 1179.39 | 1176.29 | 1127.41 | 1071.27 | 1039.44 | 1004.58 | 954.75 | NA | 887.88 | NA | NA |
| 2022-12-31 | 2022-09-30 | 2022-06-30 | 2022-03-31 | 2021-12-31 | 2021-09-30 | 2021-06-30 | 2021-03-31 | 2020-12-31 | 2020-09-30 | 2020-06-30 | 2020-03-31 | 2019-12-31 | 2019-09-30 | 2019-06-30 | 2019-03-31 | 2018-12-31 | 2018-09-30 | 2018-06-30 | 2018-03-31 | 2017-12-31 | 2017-09-30 | 2017-06-30 | 2017-03-31 | 2016-12-31 | 2016-09-30 | 2016-06-30 | 2016-03-31 | 2015-12-31 | 2015-09-30 | 2015-06-30 | 2015-03-31 | 2014-12-31 | 2014-09-30 | 2014-06-30 | 2014-03-31 | 2013-12-31 | 2013-09-30 | 2013-06-30 | 2013-03-31 | 2012-12-31 | 2012-09-30 | 2012-06-30 | 2012-03-31 | 2011-12-31 | 2011-09-30 | 2011-06-30 | 2011-03-31 | 2010-12-31 | 2010-09-30 | 2010-06-30 | 2010-03-31 | 2009-12-31 | ||
|---|---|---|---|---|---|---|---|---|---|---|---|---|---|---|---|---|---|---|---|---|---|---|---|---|---|---|---|---|---|---|---|---|---|---|---|---|---|---|---|---|---|---|---|---|---|---|---|---|---|---|---|---|---|---|
| Assets Current | 3458.81 | 2244.05 | 2285.37 | 2232.46 | 2099.36 | 2250.79 | 2202.06 | 2062.18 | 2128.56 | 2436.06 | 2386.40 | 2110.98 | 1353.79 | 1543.29 | 1561.33 | 1398.31 | 1212.54 | 1325.11 | 1327.58 | 1269.05 | 1112.91 | 958.65 | 1003.48 | 911.34 | 2118.65 | 1225.80 | 1672.27 | 1256.42 | 1122.66 | 1041.10 | 1100.35 | 994.07 | 901.32 | 822.45 | 815.74 | 698.77 | 761.77 | 725.52 | 717.09 | 708.97 | 614.43 | 544.87 | 789.27 | 767.96 | 657.96 | 344.71 | 515.16 | 467.00 | 544.78 | NA | 544.17 | NA | NA | |
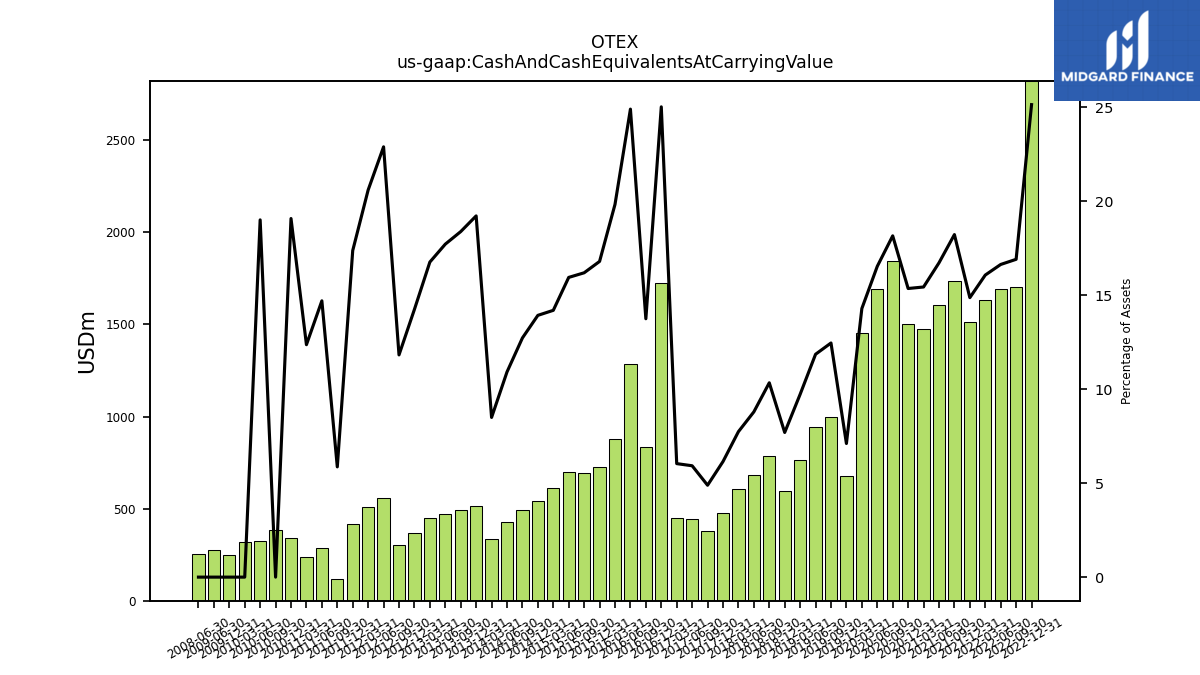
| Cash And Cash Equivalents At Carrying Value | 2820.93 | 1704.38 | 1693.74 | 1633.70 | 1511.79 | 1735.27 | 1607.31 | 1475.63 | 1500.56 | 1845.58 | 1692.85 | 1452.57 | 675.40 | 999.30 | 941.01 | 765.22 | 595.07 | 787.92 | 682.94 | 605.50 | 476.01 | 376.39 | 443.36 | 449.00 | 1722.49 | 834.94 | 1283.76 | 877.40 | 725.96 | 690.78 | 700.00 | 613.18 | 542.81 | 492.49 | 427.89 | 336.07 | 515.35 | 491.15 | 470.44 | 446.91 | 367.26 | 302.24 | 559.75 | 508.91 | 413.91 | 119.29 | 284.14 | 237.75 | 340.78 | 384.69 | 326.19 | 321.33 | 247.63 | |
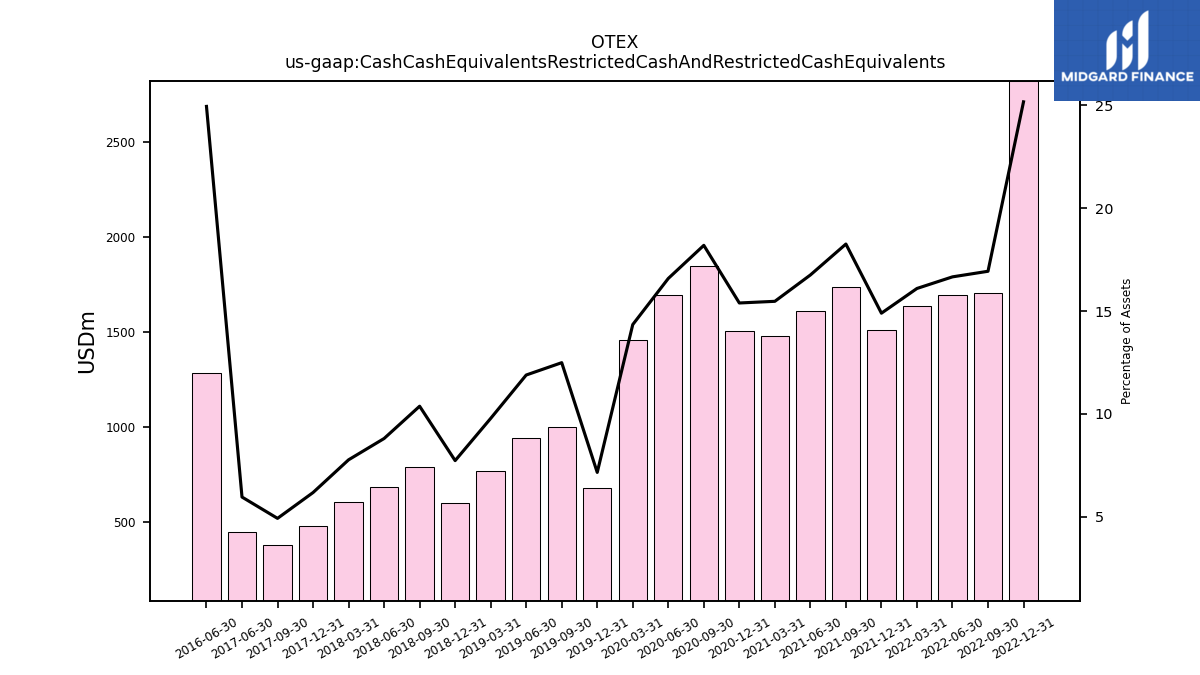
| Cash Cash Equivalents Restricted Cash And Restricted Cash Equivalents | 2822.92 | 1706.28 | 1695.91 | 1635.85 | 1514.10 | 1737.72 | 1609.80 | 1478.68 | 1503.68 | 1848.62 | 1697.26 | 1457.60 | 680.23 | 1001.82 | 943.54 | 769.52 | 597.87 | 790.58 | 683.99 | 607.95 | 478.55 | 379.39 | 446.21 | NA | NA | NA | 1285.51 | NA | NA | NA | NA | NA | NA | NA | NA | NA | NA | NA | NA | NA | NA | NA | NA | NA | NA | NA | NA | NA | NA | NA | NA | NA | NA | |
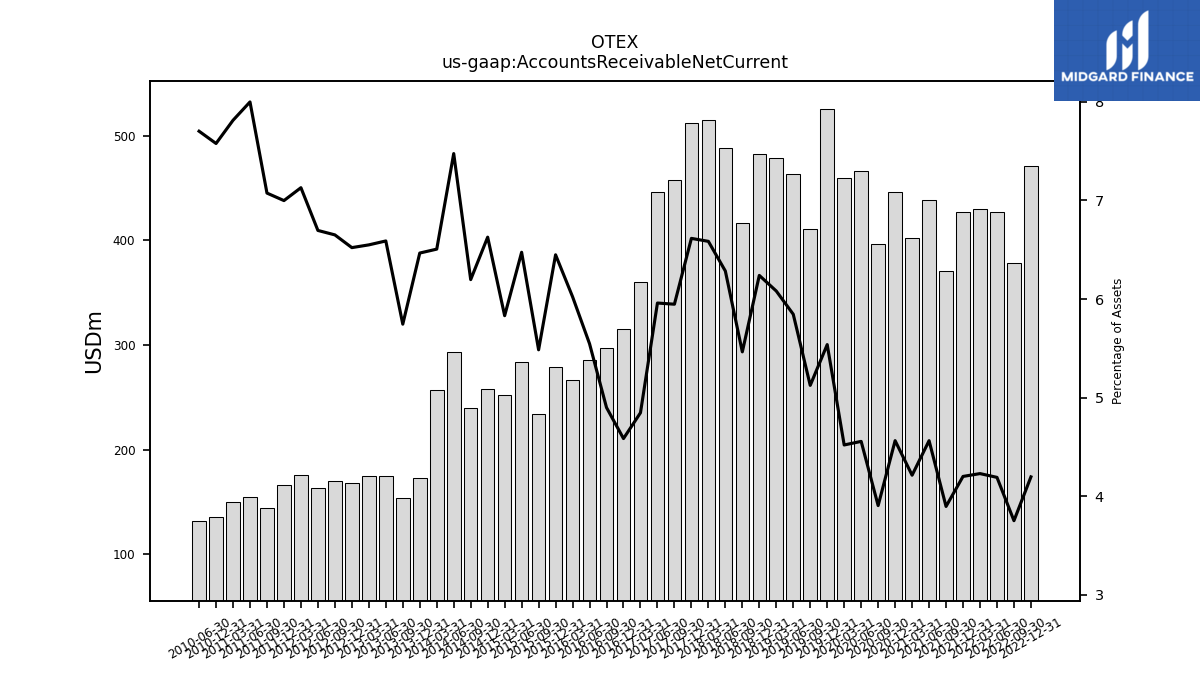
| Accounts Receivable Net Current | 470.79 | 378.14 | 426.65 | 429.88 | 427.02 | 370.97 | 438.55 | 402.67 | 445.84 | 396.90 | 466.36 | 459.35 | 526.02 | 410.98 | 463.79 | 478.26 | 482.29 | 416.35 | 487.96 | 515.01 | 511.97 | 457.76 | 445.81 | 360.27 | 315.56 | 297.54 | 285.90 | 266.45 | 278.63 | 233.95 | 284.13 | 251.83 | 258.23 | 239.76 | 292.93 | 257.29 | 173.35 | 153.45 | 174.93 | 174.56 | 168.07 | 169.97 | 163.66 | 176.09 | 166.68 | 143.84 | 154.57 | 150.16 | 135.31 | NA | 132.14 | NA | NA | |
| Prepaid Expense And Other Assets Current | 131.17 | 124.87 | 120.55 | 122.62 | 118.35 | 107.49 | 98.55 | 140.58 | 130.18 | 140.47 | 136.44 | 112.07 | 104.96 | 91.75 | 97.24 | 96.05 | 82.19 | 80.62 | 101.06 | 105.66 | 101.06 | 98.53 | 81.62 | 79.32 | 58.13 | 70.64 | 59.02 | 56.03 | 53.02 | 47.10 | 53.19 | 53.56 | 52.53 | 47.50 | 42.05 | NA | NA | NA | NA | NA | NA | NA | NA | NA | NA | NA | NA | NA | NA | NA | NA | NA | NA |
| 2022-12-31 | 2022-09-30 | 2022-06-30 | 2022-03-31 | 2021-12-31 | 2021-09-30 | 2021-06-30 | 2021-03-31 | 2020-12-31 | 2020-09-30 | 2020-06-30 | 2020-03-31 | 2019-12-31 | 2019-09-30 | 2019-06-30 | 2019-03-31 | 2018-12-31 | 2018-09-30 | 2018-06-30 | 2018-03-31 | 2017-12-31 | 2017-09-30 | 2017-06-30 | 2017-03-31 | 2016-12-31 | 2016-09-30 | 2016-06-30 | 2016-03-31 | 2015-12-31 | 2015-09-30 | 2015-06-30 | 2015-03-31 | 2014-12-31 | 2014-09-30 | 2014-06-30 | 2014-03-31 | 2013-12-31 | 2013-09-30 | 2013-06-30 | 2013-03-31 | 2012-12-31 | 2012-09-30 | 2012-06-30 | 2012-03-31 | 2011-12-31 | 2011-09-30 | 2011-06-30 | 2011-03-31 | 2010-12-31 | 2010-09-30 | 2010-06-30 | 2010-03-31 | 2009-12-31 | ||
|---|---|---|---|---|---|---|---|---|---|---|---|---|---|---|---|---|---|---|---|---|---|---|---|---|---|---|---|---|---|---|---|---|---|---|---|---|---|---|---|---|---|---|---|---|---|---|---|---|---|---|---|---|---|---|
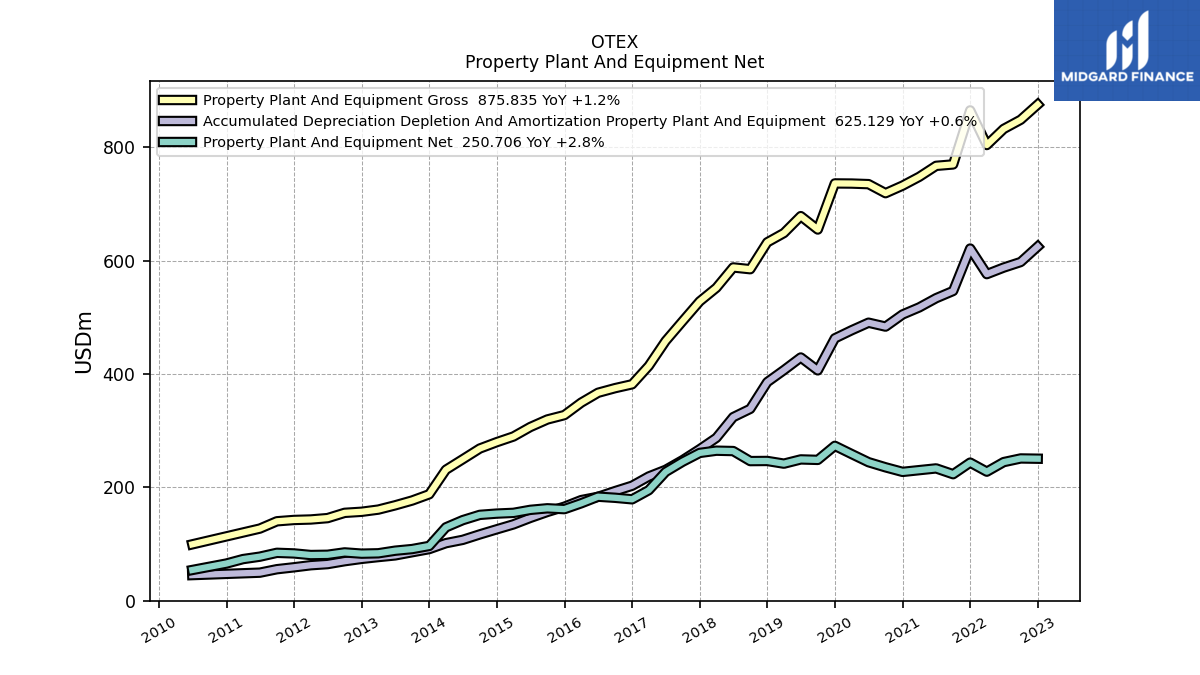
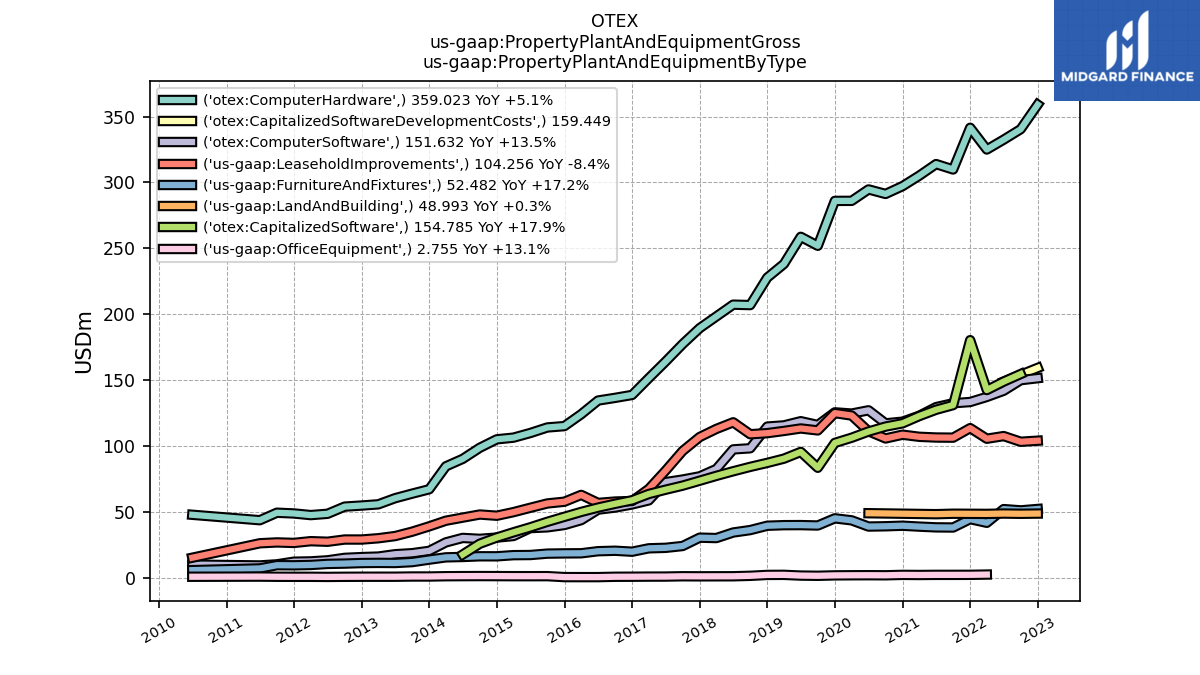
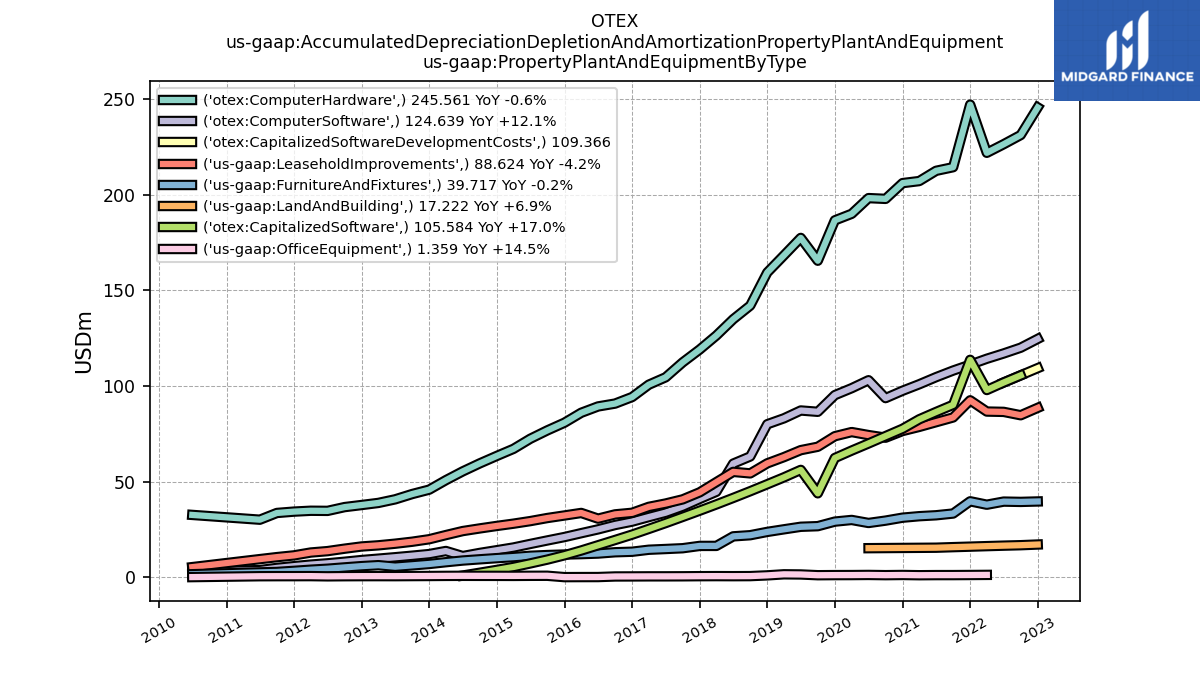
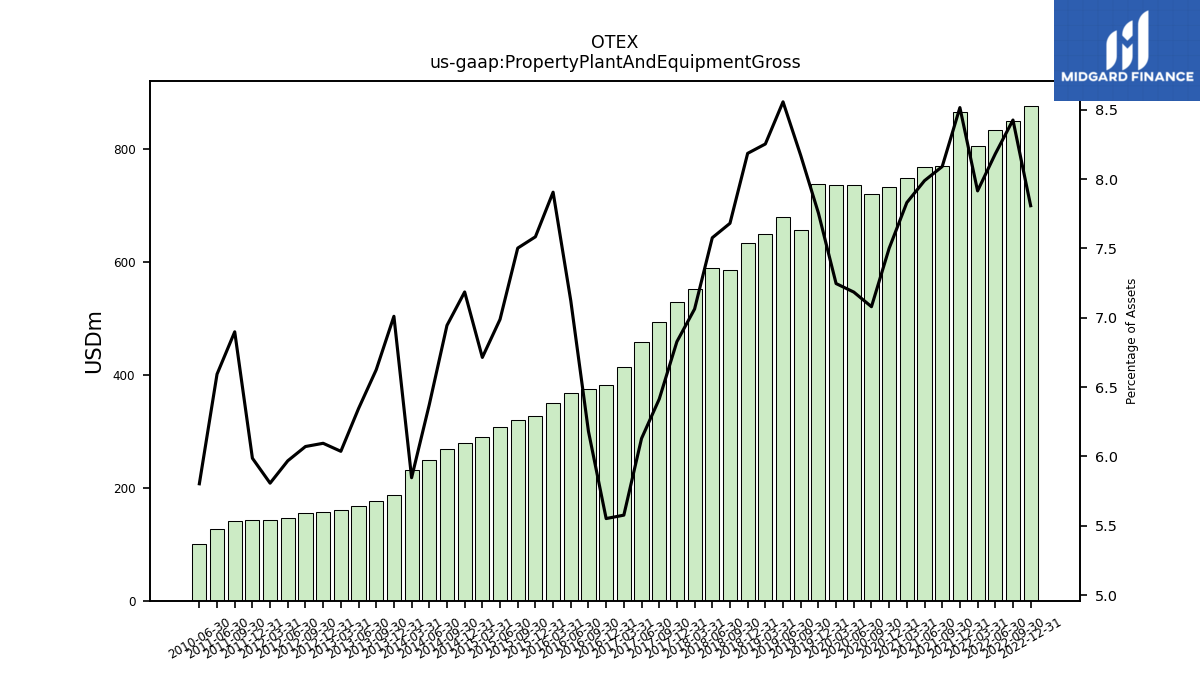
| Property Plant And Equipment Gross | 875.84 | 849.02 | 832.74 | 804.31 | 865.51 | 770.11 | 767.60 | 748.29 | 732.72 | 719.36 | 735.33 | 736.35 | 736.59 | 655.20 | 678.87 | 649.03 | 632.64 | 585.17 | 588.30 | 552.35 | 528.37 | 493.55 | 458.46 | 414.47 | 382.05 | 375.25 | 367.09 | 349.66 | 327.65 | 319.94 | 306.65 | 289.92 | 279.96 | 268.67 | 249.74 | 231.18 | 187.92 | 176.93 | 168.43 | 160.89 | 157.06 | 155.15 | 145.87 | 143.43 | 142.57 | 140.25 | 127.39 | NA | NA | NA | 99.55 | NA | NA | |
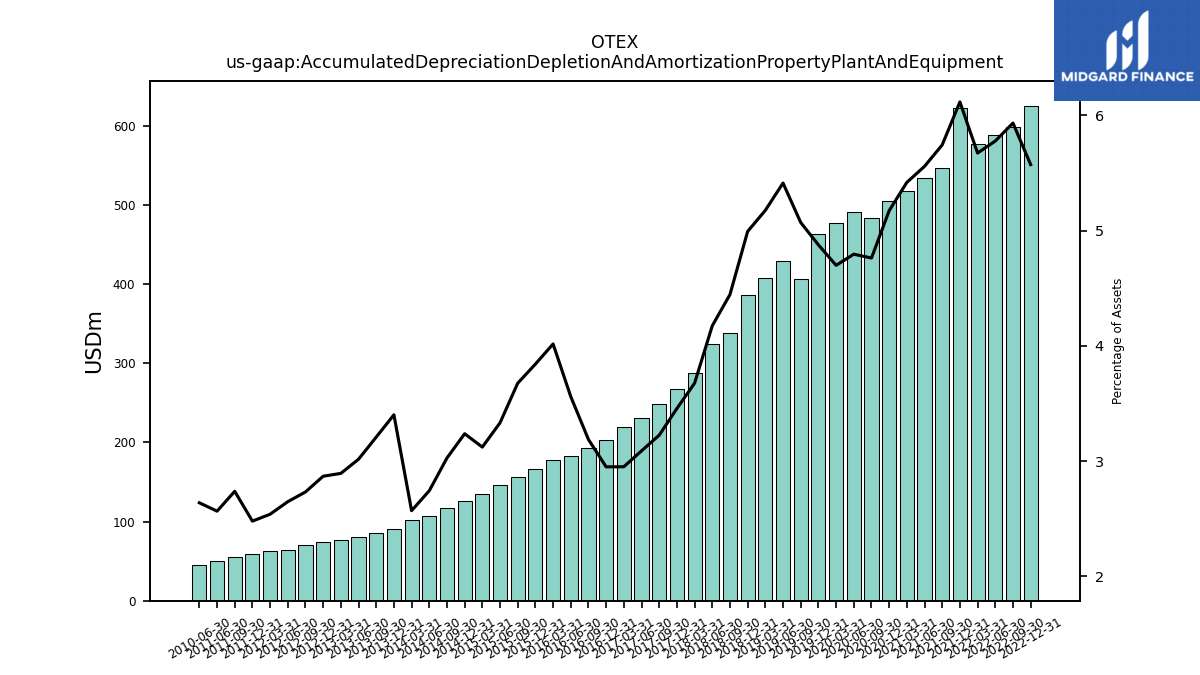
| Accumulated Depreciation Depletion And Amortization Property Plant And Equipment | 625.13 | 597.87 | 588.03 | 576.48 | 621.66 | 546.75 | 534.00 | 517.78 | 505.28 | 483.86 | 490.77 | 477.45 | 463.14 | 406.58 | 429.42 | 407.05 | 385.92 | 338.67 | 324.10 | 287.49 | 267.47 | 248.17 | 231.04 | 219.35 | 203.01 | 193.53 | 183.43 | 177.64 | 165.98 | 156.76 | 146.23 | 134.79 | 126.12 | 117.09 | 107.47 | 101.61 | 91.18 | 85.68 | 80.07 | 77.11 | 73.92 | 69.82 | 64.72 | 62.70 | 59.03 | 55.66 | 49.57 | NA | NA | NA | 45.26 | NA | NA | |
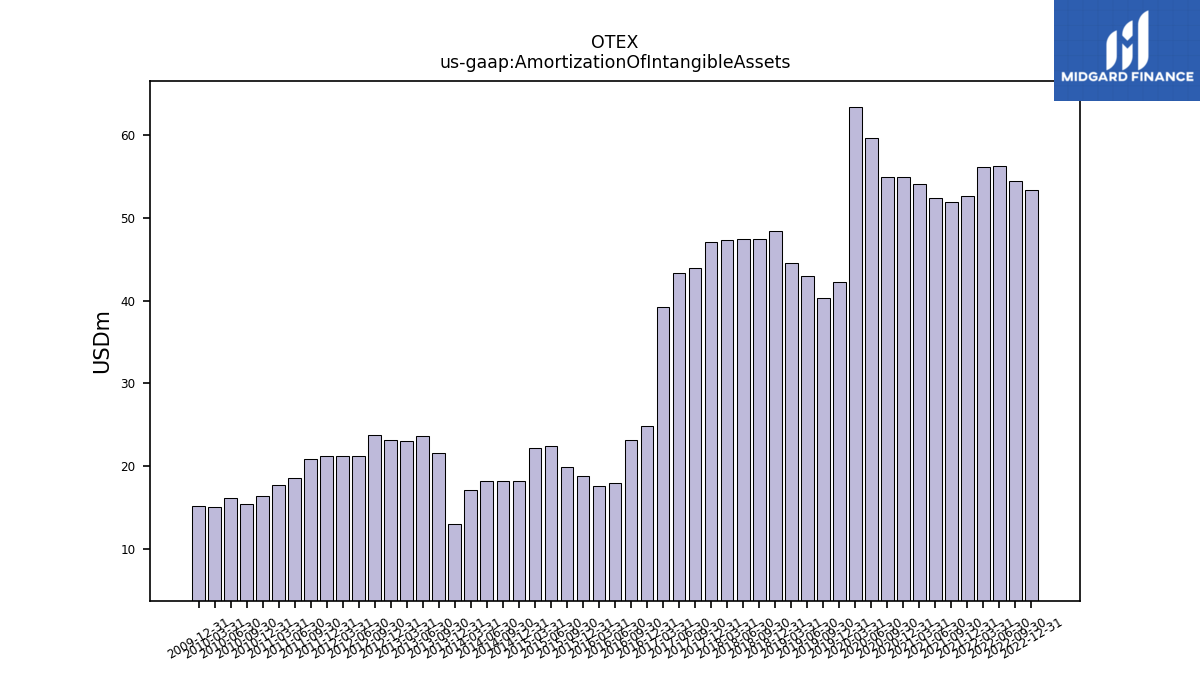
| Amortization Of Intangible Assets | 53.45 | 54.44 | 56.34 | 56.22 | 52.66 | 51.88 | 52.47 | 54.16 | 54.93 | 54.99 | 59.72 | 63.40 | 42.30 | 40.30 | 42.95 | 44.60 | 48.37 | 47.48 | 47.48 | 47.30 | 47.13 | 43.96 | 43.29 | 39.28 | 24.85 | 23.14 | 17.99 | 17.63 | 18.73 | 19.88 | 22.45 | 22.14 | 18.21 | 18.21 | 18.20 | 17.15 | 13.04 | 21.53 | 23.58 | 23.06 | 23.19 | 23.78 | 21.27 | 21.26 | 21.25 | 20.79 | 18.52 | 17.68 | 16.42 | 15.43 | 16.13 | 15.04 | 15.15 | |
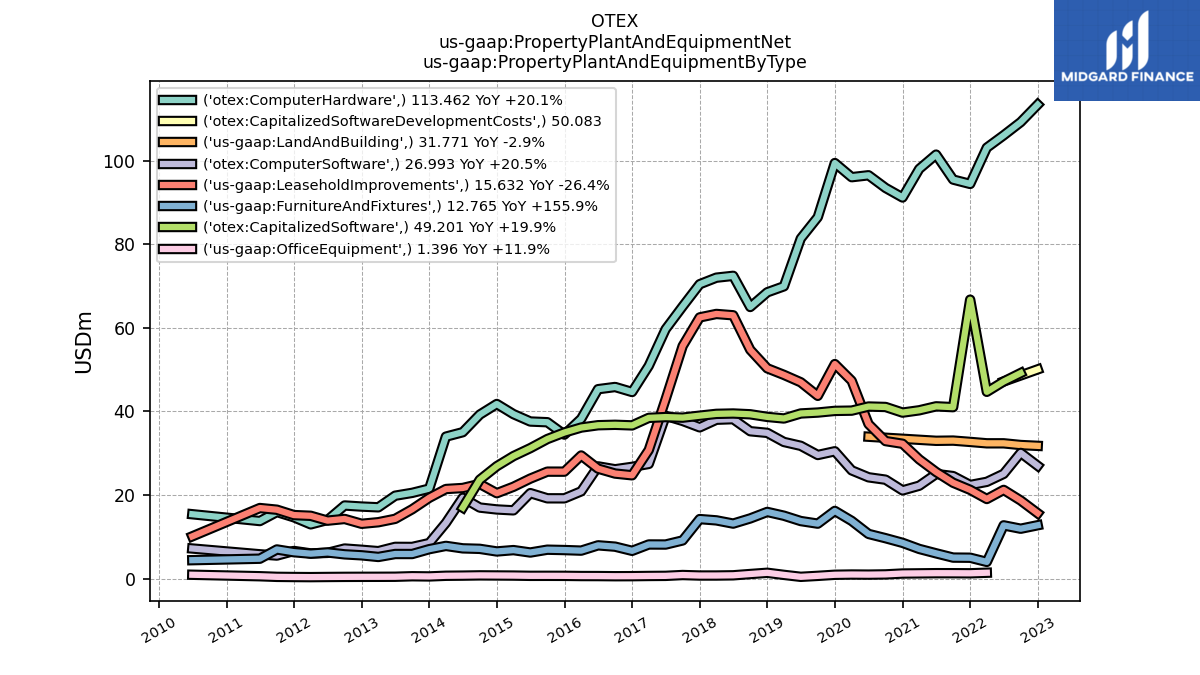
| Property Plant And Equipment Net | 250.71 | 251.15 | 244.71 | 227.83 | 243.85 | 223.36 | 233.59 | 230.52 | 227.43 | 235.50 | 244.56 | 258.89 | 273.45 | 248.61 | 249.45 | 241.97 | 246.73 | 246.50 | 264.20 | 264.86 | 260.90 | 245.38 | 227.42 | 195.12 | 179.04 | 181.73 | 183.66 | 172.02 | 161.68 | 163.18 | 160.42 | 155.13 | 153.84 | 151.57 | 142.26 | 129.57 | 96.74 | 91.25 | 88.36 | 83.78 | 83.14 | 85.33 | 81.16 | 80.72 | 83.54 | 84.59 | 77.83 | 73.53 | 65.65 | NA | 54.29 | NA | NA | |
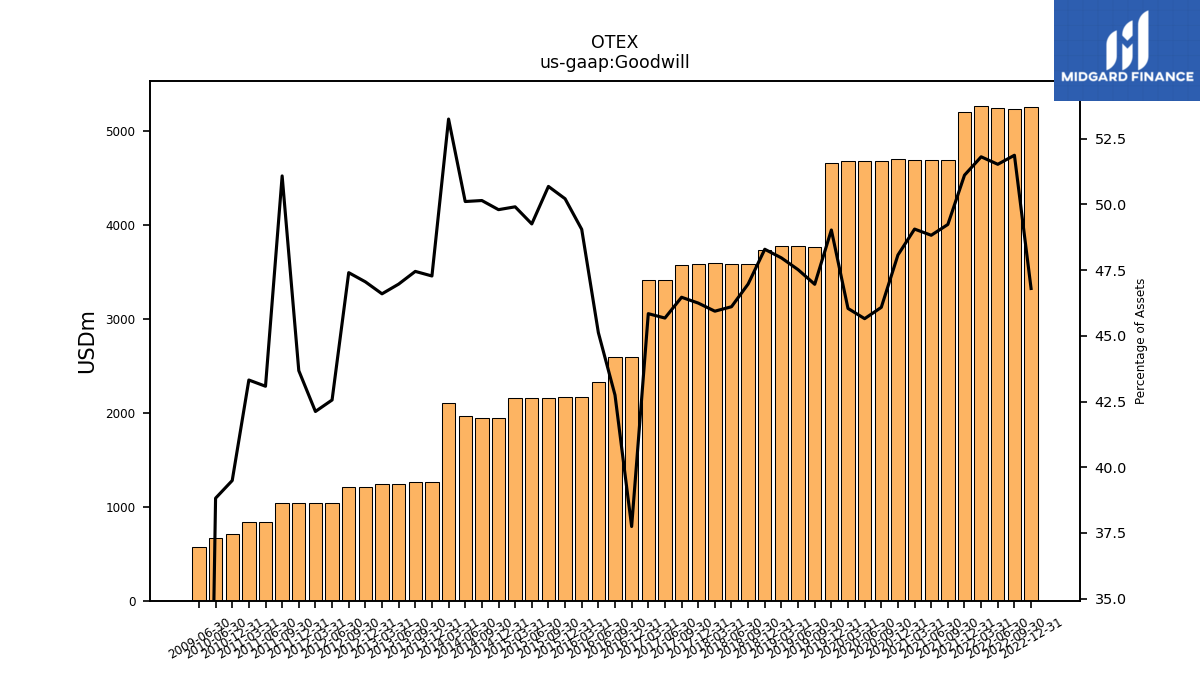
| Goodwill | 5250.14 | 5226.81 | 5244.65 | 5265.19 | 5195.08 | 4686.91 | 4691.67 | 4688.45 | 4696.35 | 4682.78 | 4672.36 | 4678.69 | 4656.49 | 3765.90 | 3769.91 | 3772.11 | 3732.67 | 3578.64 | 3580.13 | 3592.60 | 3578.98 | 3576.22 | 3416.75 | 3407.53 | 2597.68 | 2595.61 | 2325.59 | 2169.64 | 2169.64 | 2161.59 | 2161.59 | 2155.24 | 1940.30 | 1940.08 | 1963.56 | 2105.60 | 1267.32 | 1267.32 | 1246.87 | 1241.96 | 1212.66 | 1211.42 | 1040.23 | 1040.39 | 1040.14 | 1038.57 | 832.48 | 832.56 | 705.21 | NA | 666.05 | NA | NA | |
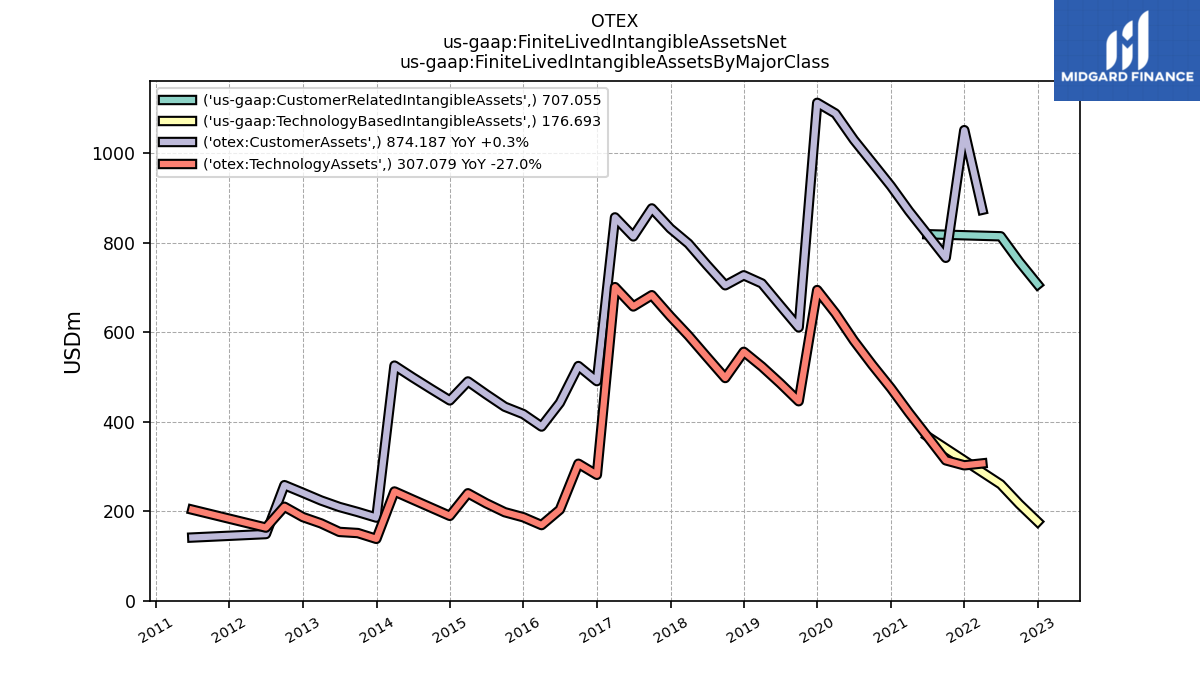
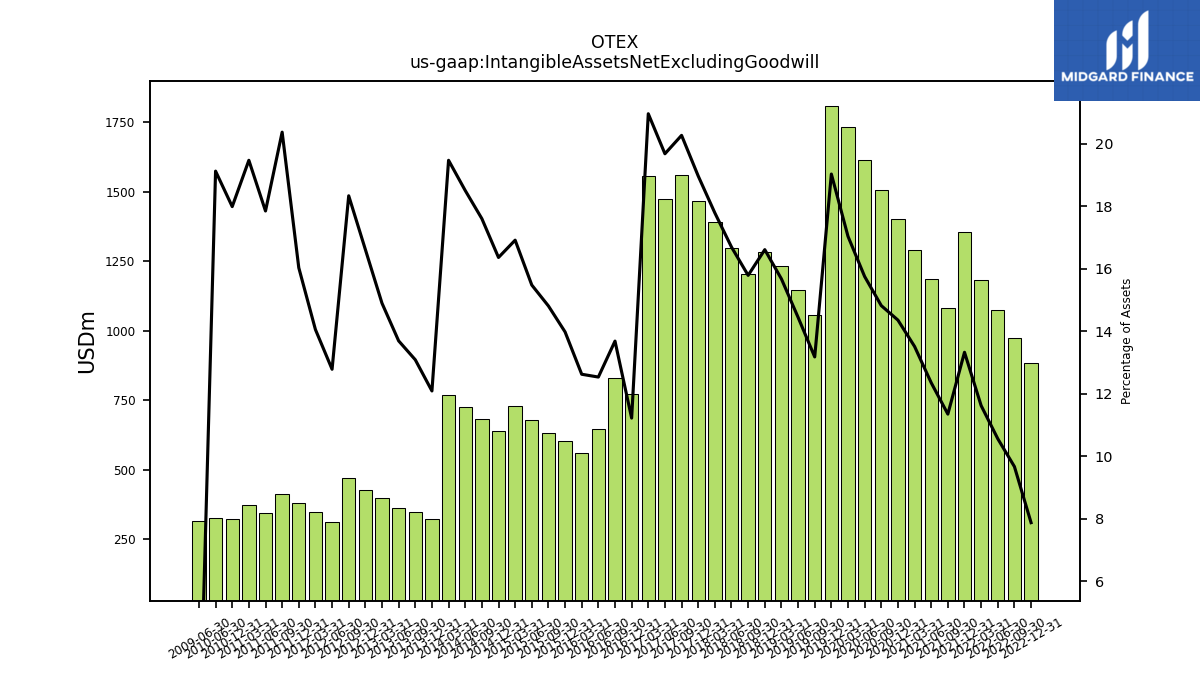
| Intangible Assets Net Excluding Goodwill | 883.75 | 974.59 | 1075.21 | 1181.27 | 1355.00 | 1080.69 | 1187.26 | 1291.80 | 1402.93 | 1506.41 | 1612.56 | 1731.78 | 1808.07 | 1057.15 | 1146.50 | 1233.14 | 1284.30 | 1203.28 | 1296.64 | 1391.41 | 1468.38 | 1560.37 | 1472.54 | 1558.42 | 772.53 | 831.20 | 646.24 | 558.57 | 604.17 | 631.79 | 679.48 | 730.67 | 637.66 | 681.23 | 725.32 | 770.16 | 324.19 | 349.65 | 363.62 | 397.15 | 428.36 | 468.70 | 312.56 | 347.25 | 381.92 | 414.28 | 345.00 | 374.32 | 321.31 | NA | 328.19 | NA | NA | |
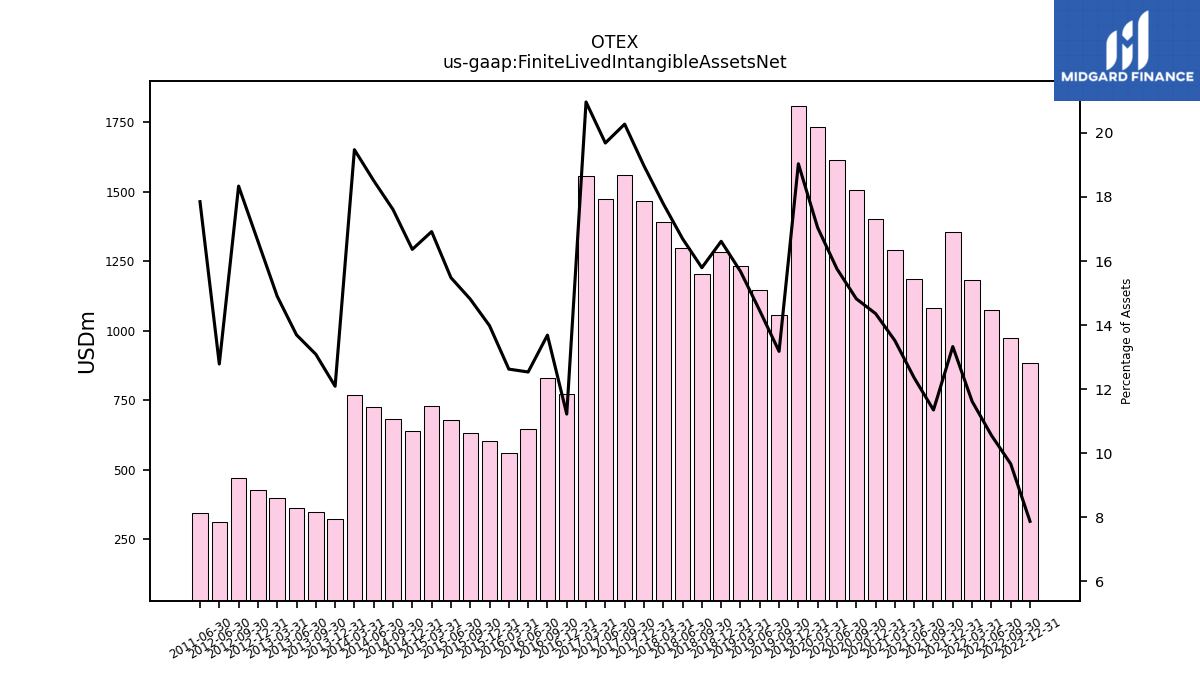
| Finite Lived Intangible Assets Net | 883.75 | 974.59 | 1075.21 | 1181.27 | 1355.00 | 1080.69 | 1187.26 | 1291.80 | 1402.93 | 1506.41 | 1612.56 | 1731.78 | 1808.07 | 1057.15 | 1146.50 | 1233.14 | 1284.30 | 1203.28 | 1296.64 | 1391.41 | 1468.38 | 1560.37 | 1472.54 | 1558.42 | 772.53 | 831.20 | 646.24 | 558.57 | 604.17 | 631.79 | 679.48 | 730.67 | 637.66 | 681.23 | 725.32 | 770.16 | 324.19 | 349.65 | 363.62 | 397.15 | 428.36 | 468.70 | 312.56 | NA | NA | NA | 345.00 | NA | NA | NA | NA | NA | NA | |
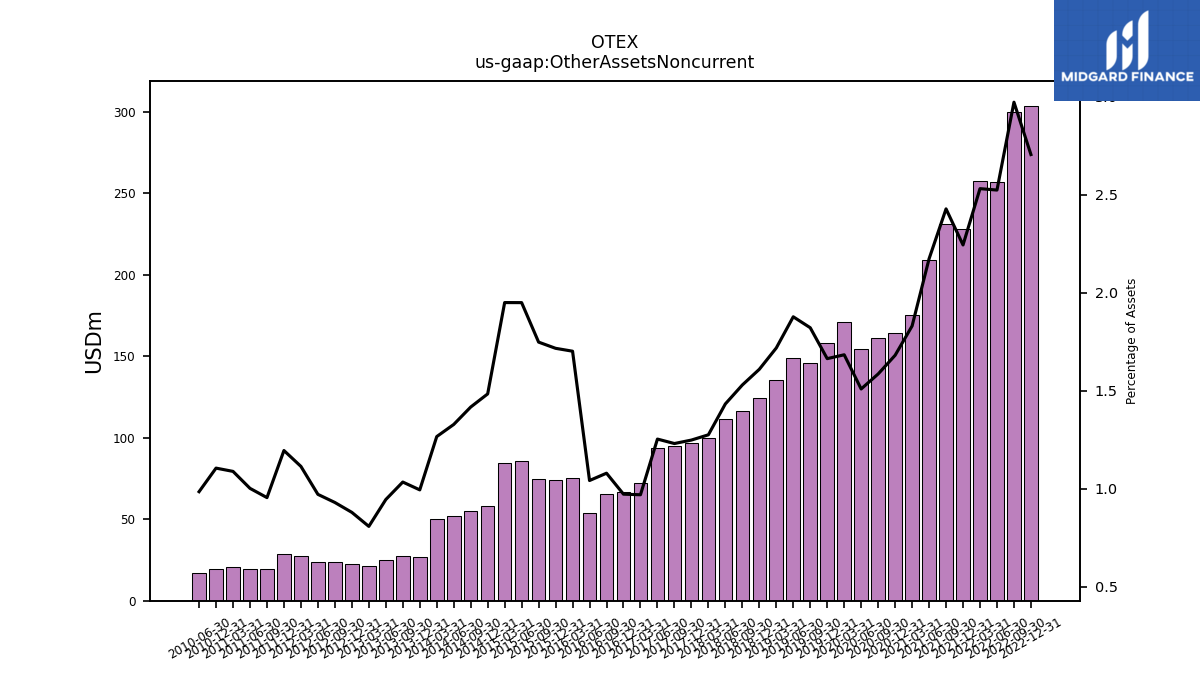
| Other Assets Noncurrent | 303.56 | 299.61 | 256.99 | 257.30 | 228.14 | 231.18 | 208.89 | 174.97 | 164.24 | 161.14 | 154.47 | 171.11 | 158.06 | 146.10 | 148.98 | 135.16 | 124.41 | 116.54 | 111.27 | 99.73 | 96.61 | 94.72 | 93.76 | 72.04 | 66.91 | 65.53 | 53.70 | 75.29 | 74.18 | 74.57 | 85.58 | 84.22 | 57.82 | 54.82 | 52.04 | 50.07 | 26.65 | 27.62 | 25.08 | 21.53 | 22.66 | 23.76 | 23.74 | 27.51 | 28.46 | 19.41 | 19.36 | 20.92 | 19.73 | NA | 16.90 | NA | NA |
| 2022-12-31 | 2022-09-30 | 2022-06-30 | 2022-03-31 | 2021-12-31 | 2021-09-30 | 2021-06-30 | 2021-03-31 | 2020-12-31 | 2020-09-30 | 2020-06-30 | 2020-03-31 | 2019-12-31 | 2019-09-30 | 2019-06-30 | 2019-03-31 | 2018-12-31 | 2018-09-30 | 2018-06-30 | 2018-03-31 | 2017-12-31 | 2017-09-30 | 2017-06-30 | 2017-03-31 | 2016-12-31 | 2016-09-30 | 2016-06-30 | 2016-03-31 | 2015-12-31 | 2015-09-30 | 2015-06-30 | 2015-03-31 | 2014-12-31 | 2014-09-30 | 2014-06-30 | 2014-03-31 | 2013-12-31 | 2013-09-30 | 2013-06-30 | 2013-03-31 | 2012-12-31 | 2012-09-30 | 2012-06-30 | 2012-03-31 | 2011-12-31 | 2011-09-30 | 2011-06-30 | 2011-03-31 | 2010-12-31 | 2010-09-30 | 2010-06-30 | 2010-03-31 | 2009-12-31 | ||
|---|---|---|---|---|---|---|---|---|---|---|---|---|---|---|---|---|---|---|---|---|---|---|---|---|---|---|---|---|---|---|---|---|---|---|---|---|---|---|---|---|---|---|---|---|---|---|---|---|---|---|---|---|---|---|
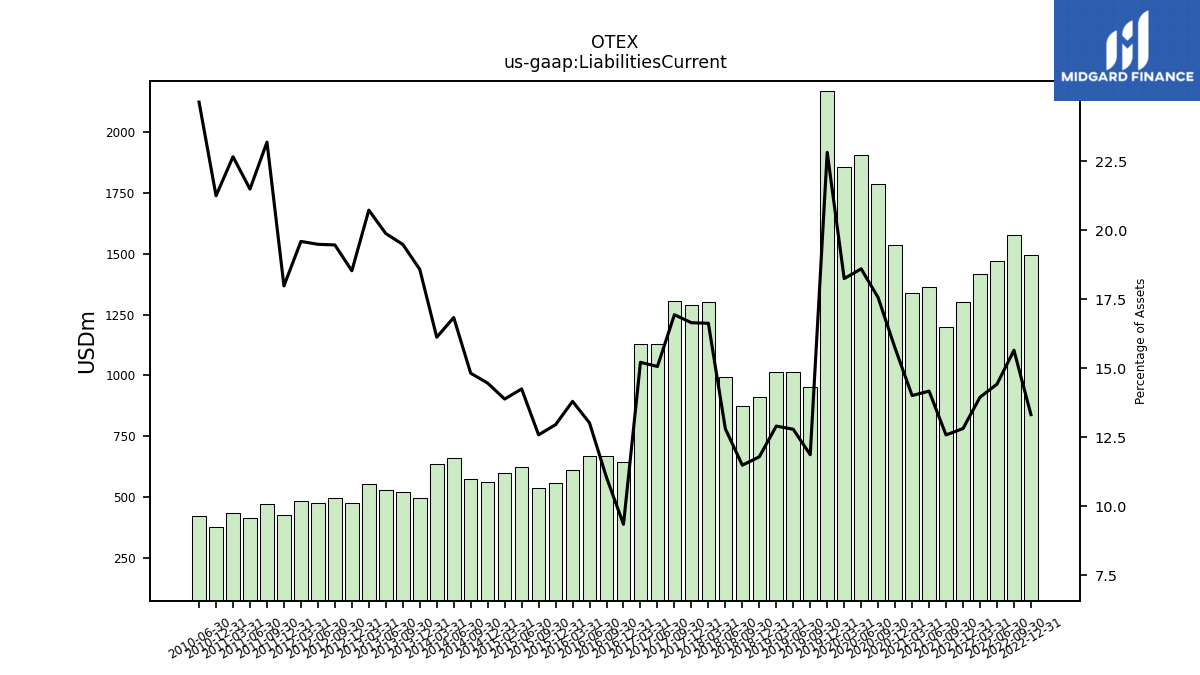
| Liabilities Current | 1494.43 | 1577.52 | 1468.26 | 1417.96 | 1302.85 | 1198.01 | 1361.90 | 1339.02 | 1536.38 | 1784.50 | 1904.23 | 1854.74 | 2167.98 | 951.85 | 1014.72 | 1015.08 | 911.47 | 875.27 | 994.60 | 1300.80 | 1288.72 | 1304.02 | 1127.04 | 1131.04 | 643.15 | 670.63 | 671.03 | 610.55 | 559.84 | 536.87 | 625.43 | 599.68 | 563.52 | 573.45 | 659.88 | 637.77 | 498.27 | 520.57 | 527.88 | 552.62 | 477.70 | 497.61 | 476.51 | 484.10 | 428.41 | 471.64 | 415.37 | 435.69 | 379.53 | NA | 422.89 | NA | NA | |
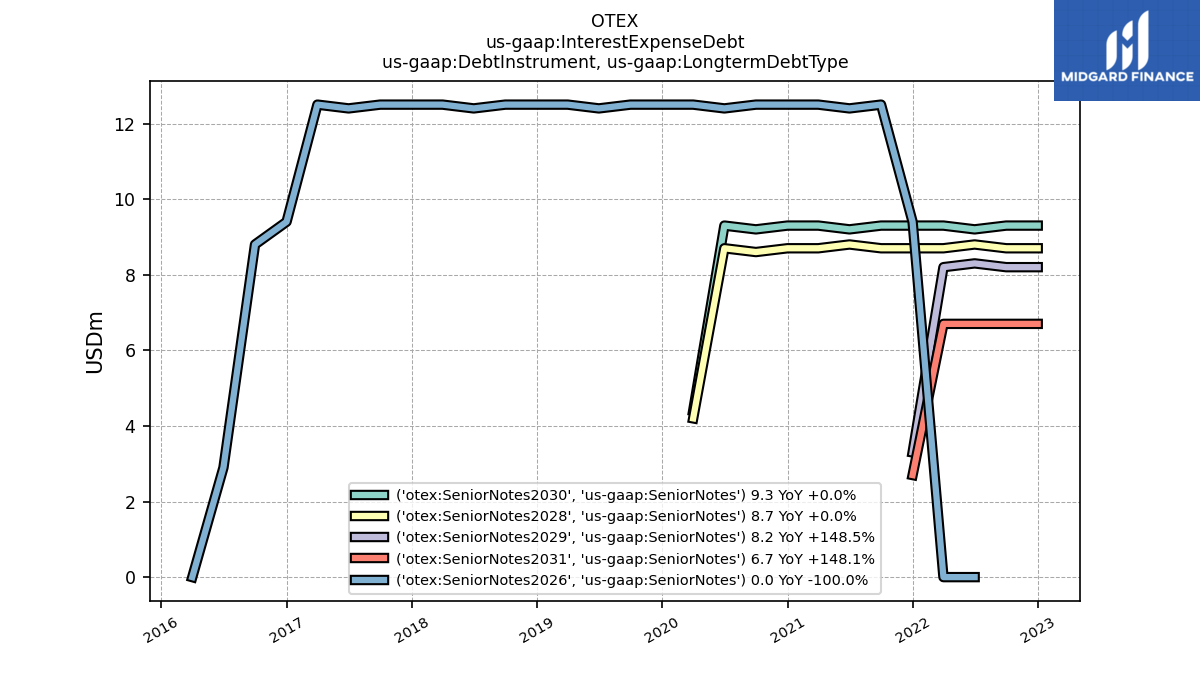
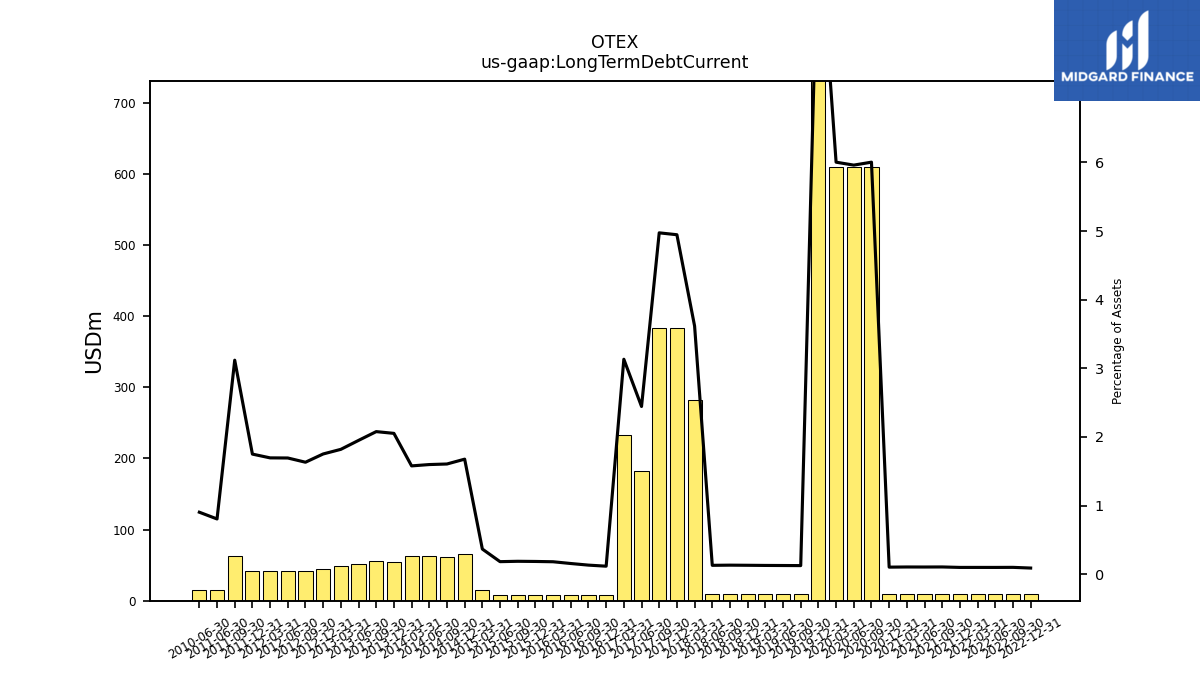
| Long Term Debt Current | 10.00 | 10.00 | 10.00 | 10.00 | 10.00 | 10.00 | 10.00 | 10.00 | 10.00 | 610.00 | 610.00 | 610.00 | 913.63 | 10.00 | 10.00 | 10.00 | 10.00 | 10.00 | 10.00 | 282.76 | 382.76 | 382.76 | 182.76 | 232.76 | 8.00 | 8.00 | 8.00 | 8.00 | 8.00 | 8.00 | 8.00 | 15.80 | 65.29 | 62.10 | 62.58 | 62.38 | 54.99 | 55.47 | 51.74 | 48.48 | 45.14 | 41.68 | 41.37 | 41.85 | 41.66 | 63.39 | 15.54 | NA | NA | NA | 15.49 | NA | NA | |
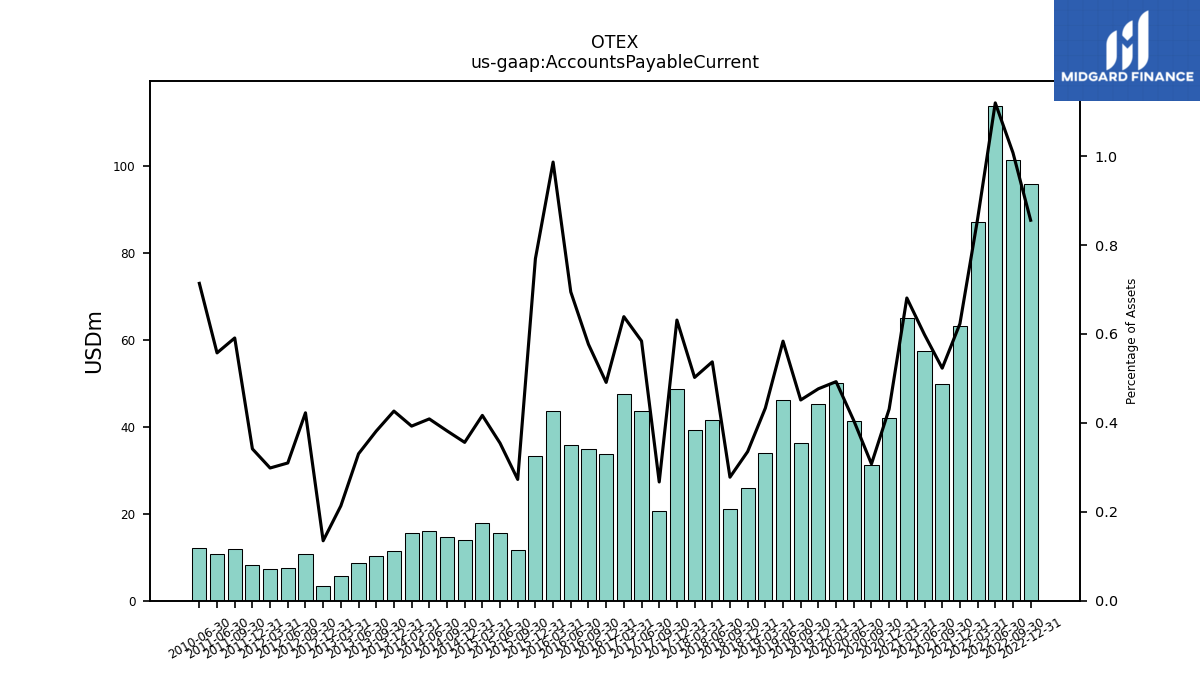
| Accounts Payable Current | 96.01 | 101.54 | 113.98 | 87.24 | 63.32 | 49.79 | 57.50 | 65.07 | 42.12 | 31.27 | 41.47 | 50.08 | 45.28 | 36.21 | 46.32 | 34.08 | 25.93 | 21.18 | 41.72 | 39.28 | 48.86 | 20.56 | 43.70 | 47.50 | 33.80 | 35.02 | 35.80 | 43.64 | 33.24 | 11.64 | 15.56 | 18.00 | 13.88 | 14.79 | 16.02 | 15.53 | 11.44 | 10.19 | 8.78 | 5.69 | 3.48 | 10.80 | 7.57 | 7.38 | 8.13 | 12.02 | 10.77 | NA | NA | NA | 12.25 | NA | NA | |
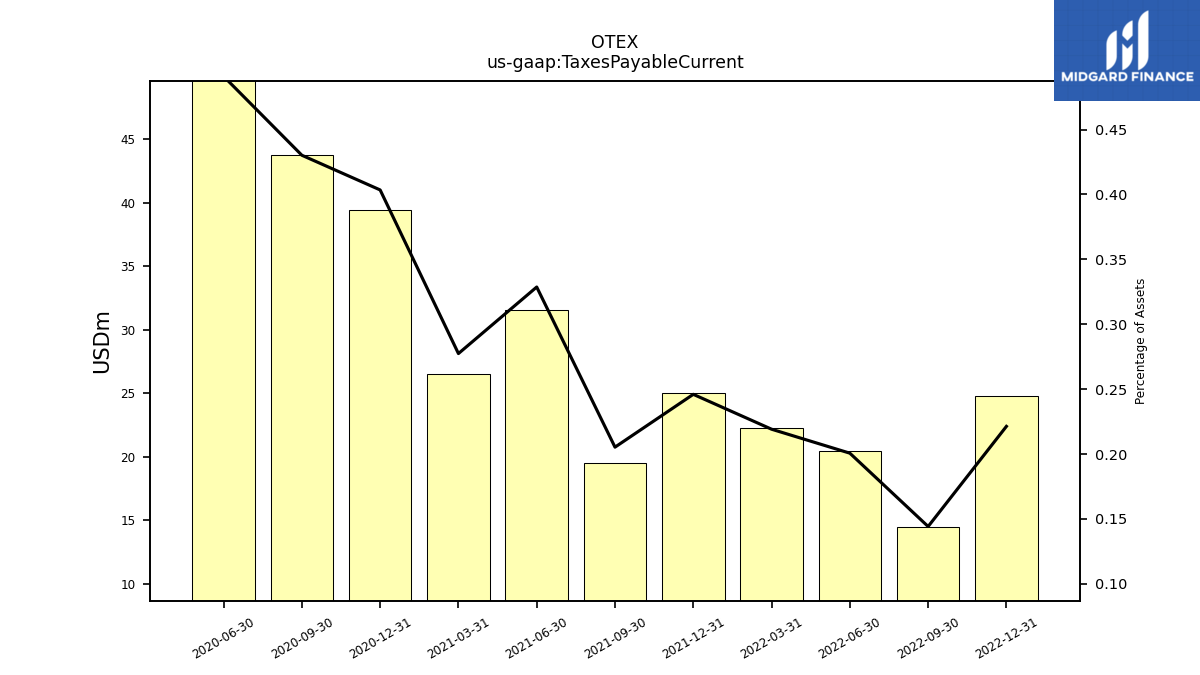
| Taxes Payable Current | 24.82 | 14.53 | 20.42 | 22.27 | 25.00 | 19.54 | 31.58 | 26.51 | 39.41 | 43.72 | 50.26 | NA | NA | NA | NA | NA | NA | NA | NA | NA | NA | NA | NA | NA | NA | NA | NA | NA | NA | NA | NA | NA | NA | NA | NA | NA | NA | NA | NA | NA | NA | NA | NA | NA | NA | NA | NA | NA | NA | NA | NA | NA | NA | |
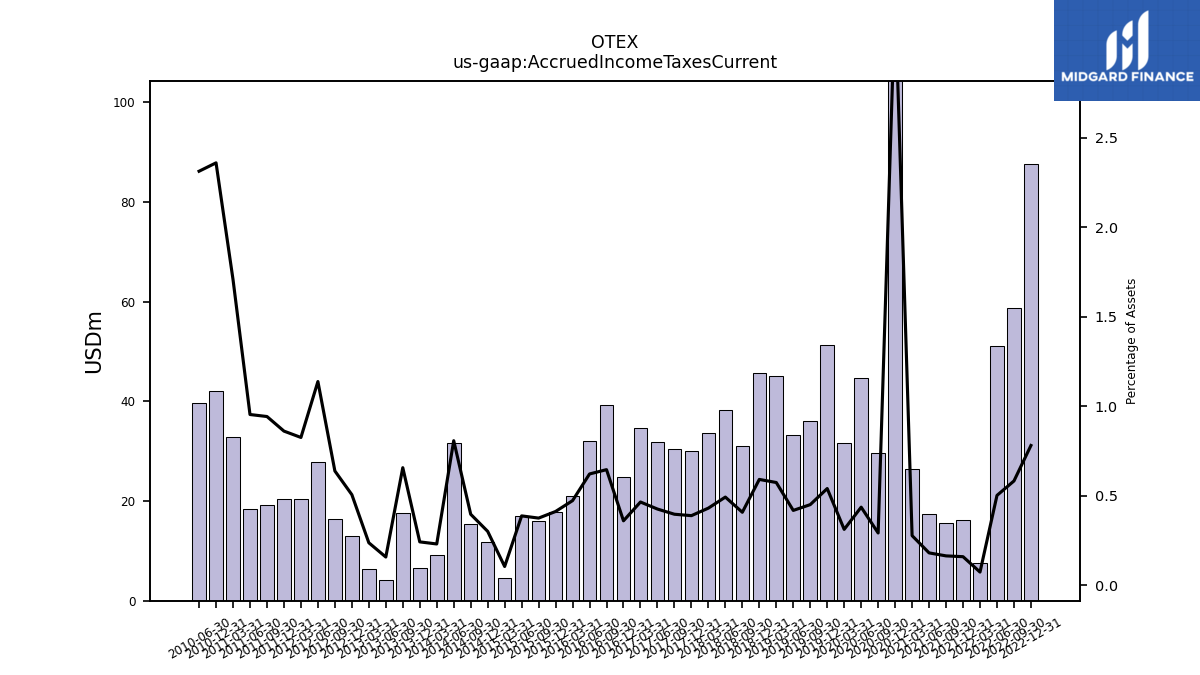
| Accrued Income Taxes Current | 87.55 | 58.69 | 51.07 | 7.48 | 16.22 | 15.62 | 17.37 | 26.48 | 320.08 | 29.67 | 44.63 | 31.71 | 51.30 | 36.10 | 33.16 | 45.12 | 45.68 | 31.05 | 38.23 | 33.69 | 30.08 | 30.52 | 31.84 | 34.55 | 24.77 | 39.20 | 32.03 | 20.91 | 17.80 | 16.00 | 17.00 | 4.53 | 11.73 | 15.34 | 31.63 | 9.12 | 6.49 | 17.54 | 4.18 | 6.32 | 13.04 | 16.31 | 27.81 | 20.39 | 20.50 | 19.16 | 18.42 | 32.81 | 42.12 | NA | 39.67 | NA | NA | |
| Accrued Liabilities Current | 103.25 | 93.30 | 81.56 | 103.58 | 93.09 | 76.72 | 82.20 | 94.45 | 91.37 | 83.20 | 129.05 | 114.28 | 229.41 | 102.15 | 117.55 | 111.47 | 126.24 | 100.46 | 108.90 | 118.63 | 138.50 | 161.74 | 135.51 | 114.84 | 116.33 | 110.79 | 113.27 | 82.10 | 100.37 | 93.58 | 107.87 | 106.65 | 110.09 | 110.71 | 121.56 | 133.33 | 124.47 | 115.67 | 120.98 | 142.85 | 123.95 | 114.94 | 64.83 | 70.61 | 77.40 | 72.22 | 60.06 | NA | NA | NA | 53.84 | NA | NA | |
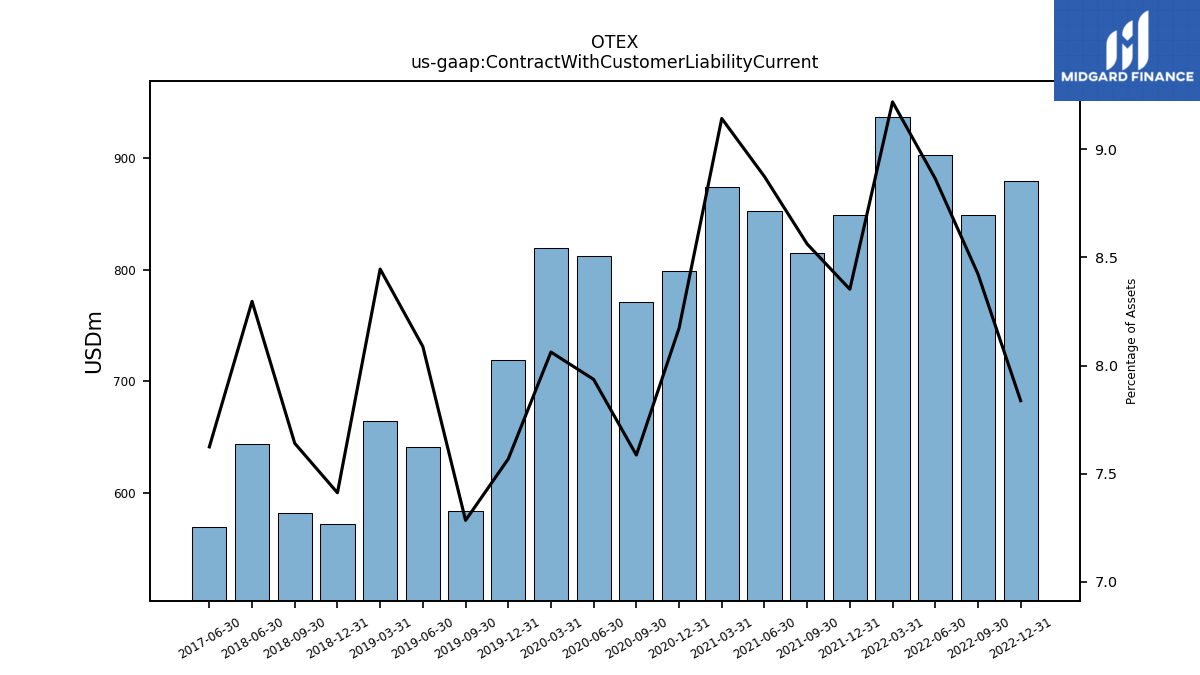
| Contract With Customer Liability Current | 879.23 | 848.79 | 902.20 | 936.75 | 848.98 | 814.99 | 852.63 | 873.58 | 798.34 | 770.92 | 812.22 | 819.27 | 718.86 | 584.19 | 641.66 | 664.21 | 572.91 | 582.14 | 644.21 | NA | NA | NA | 570.33 | NA | NA | NA | NA | NA | NA | NA | NA | NA | NA | NA | NA | NA | NA | NA | NA | NA | NA | NA | NA | NA | NA | NA | NA | NA | NA | NA | NA | NA | NA |
| 2022-12-31 | 2022-09-30 | 2022-06-30 | 2022-03-31 | 2021-12-31 | 2021-09-30 | 2021-06-30 | 2021-03-31 | 2020-12-31 | 2020-09-30 | 2020-06-30 | 2020-03-31 | 2019-12-31 | 2019-09-30 | 2019-06-30 | 2019-03-31 | 2018-12-31 | 2018-09-30 | 2018-06-30 | 2018-03-31 | 2017-12-31 | 2017-09-30 | 2017-06-30 | 2017-03-31 | 2016-12-31 | 2016-09-30 | 2016-06-30 | 2016-03-31 | 2015-12-31 | 2015-09-30 | 2015-06-30 | 2015-03-31 | 2014-12-31 | 2014-09-30 | 2014-06-30 | 2014-03-31 | 2013-12-31 | 2013-09-30 | 2013-06-30 | 2013-03-31 | 2012-12-31 | 2012-09-30 | 2012-06-30 | 2012-03-31 | 2011-12-31 | 2011-09-30 | 2011-06-30 | 2011-03-31 | 2010-12-31 | 2010-09-30 | 2010-06-30 | 2010-03-31 | 2009-12-31 | ||
|---|---|---|---|---|---|---|---|---|---|---|---|---|---|---|---|---|---|---|---|---|---|---|---|---|---|---|---|---|---|---|---|---|---|---|---|---|---|---|---|---|---|---|---|---|---|---|---|---|---|---|---|---|---|---|
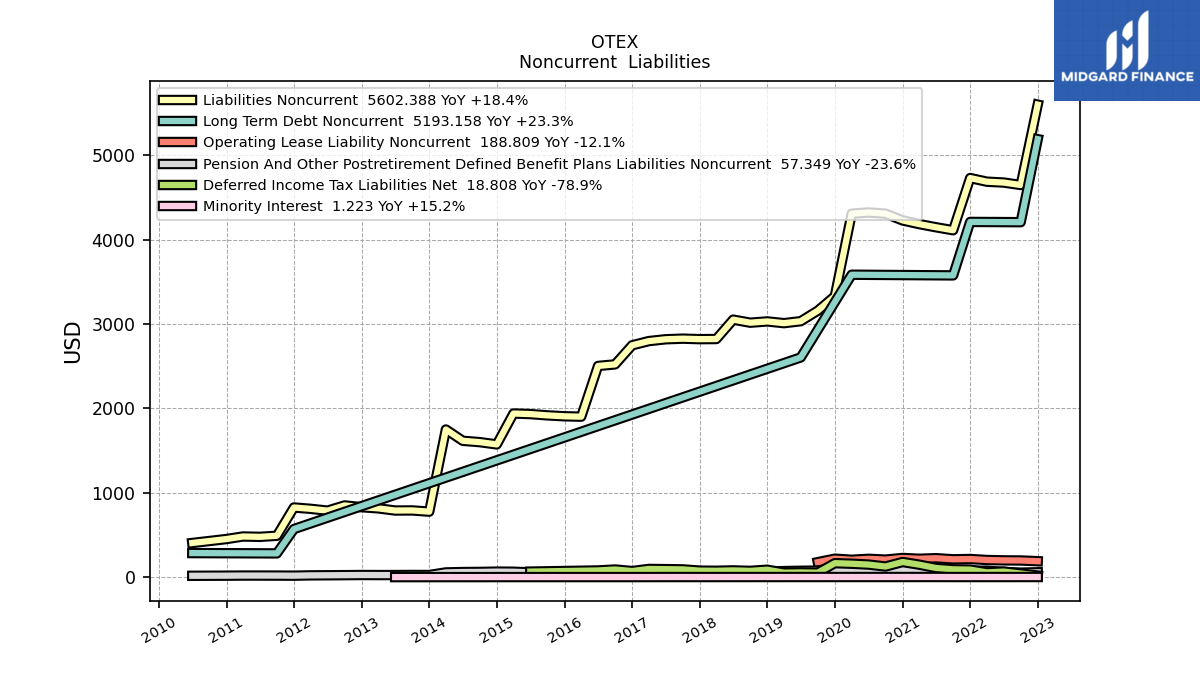
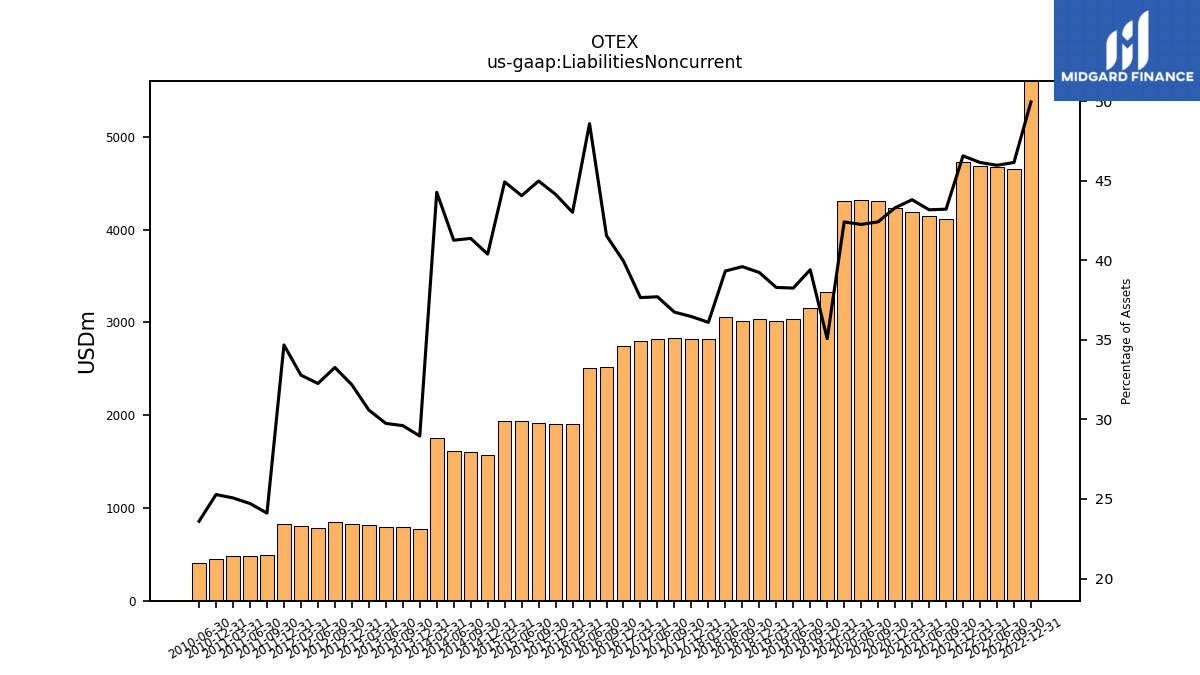
| Liabilities Noncurrent | 5602.39 | 4649.42 | 4678.45 | 4688.83 | 4731.86 | 4112.84 | 4147.98 | 4185.67 | 4229.47 | 4309.59 | 4323.88 | 4309.15 | 3331.02 | 3159.54 | 3034.59 | 3011.18 | 3031.93 | 3016.74 | 3053.17 | 2823.10 | 2821.64 | 2827.46 | 2820.20 | 2798.59 | 2748.87 | 2522.45 | 2503.92 | 1902.34 | 1907.08 | 1918.03 | 1933.25 | 1939.82 | 1573.41 | 1600.46 | 1616.59 | 1750.58 | 776.16 | 790.75 | 789.73 | 815.21 | 829.16 | 850.00 | 788.39 | 809.65 | 825.75 | 490.23 | 477.55 | 481.73 | 451.37 | NA | 404.91 | NA | NA | |
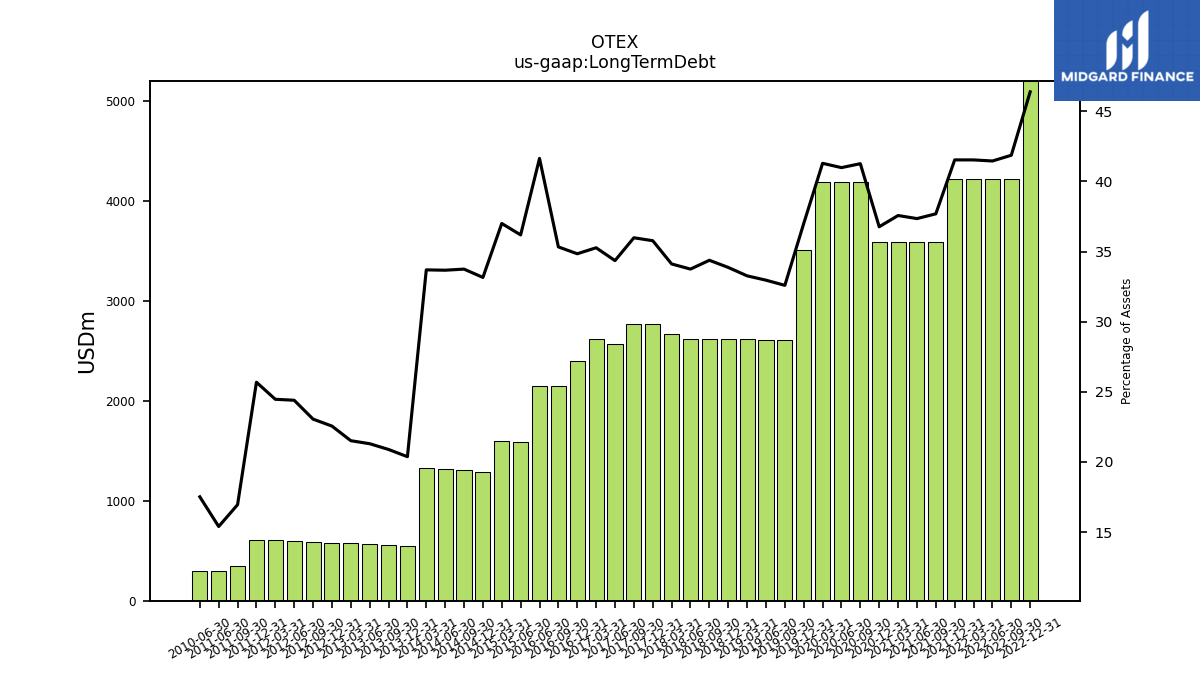
| Long Term Debt | 5203.16 | 4218.55 | 4219.57 | 4220.58 | 4221.49 | 3587.52 | 3588.86 | 3590.21 | 3591.57 | 4192.92 | 4194.31 | 4195.68 | 3514.02 | 2613.51 | 2614.88 | 2616.28 | 2617.71 | 2619.13 | 2620.52 | 2668.08 | 2768.47 | 2769.18 | 2569.82 | 2621.57 | 2397.83 | 2145.28 | 2145.99 | NA | NA | NA | 1588.00 | 1597.80 | 1291.79 | 1305.61 | 1319.33 | 1332.38 | 546.24 | 557.97 | 565.49 | 573.48 | 581.39 | 589.18 | 596.37 | 604.35 | 611.66 | 344.67 | 297.58 | NA | NA | NA | 300.51 | NA | NA | |
| Long Term Debt Noncurrent | 5193.16 | 4208.55 | 4209.57 | 4210.58 | 4211.49 | 3577.52 | 3578.86 | 3580.21 | 3581.57 | 3582.92 | 3584.31 | 3585.68 | NA | NA | 2604.88 | NA | NA | NA | NA | NA | NA | NA | NA | NA | NA | NA | NA | NA | NA | NA | NA | NA | NA | NA | NA | NA | NA | NA | NA | NA | NA | NA | NA | NA | 570.00 | 281.29 | 282.03 | NA | NA | NA | 285.03 | NA | NA | |
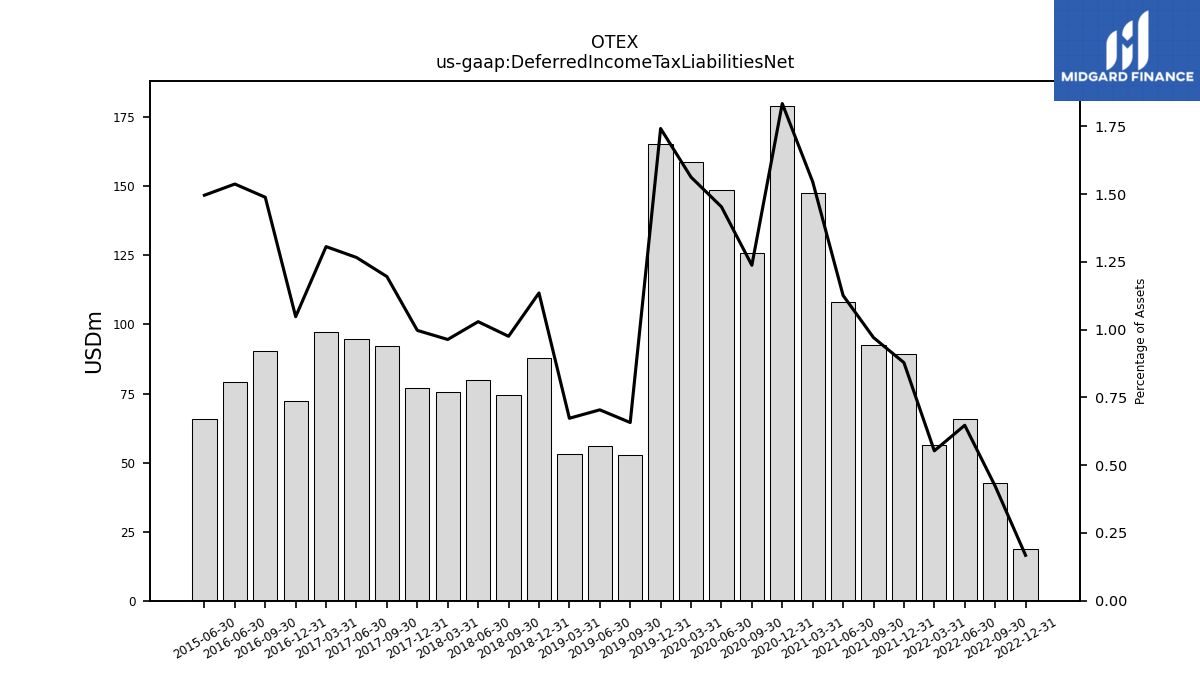
| Deferred Income Tax Liabilities Net | 18.81 | 42.63 | 65.89 | 56.21 | 89.29 | 92.42 | 108.22 | 147.73 | 179.16 | 125.75 | 148.74 | 158.81 | 165.46 | 52.73 | 55.87 | 52.94 | 87.75 | 74.33 | 79.94 | 75.38 | 77.18 | 92.03 | 94.72 | 97.10 | 72.12 | 90.38 | 79.23 | NA | NA | NA | 65.65 | NA | NA | NA | NA | NA | NA | NA | NA | NA | NA | NA | NA | NA | NA | NA | NA | NA | NA | NA | NA | NA | NA | |
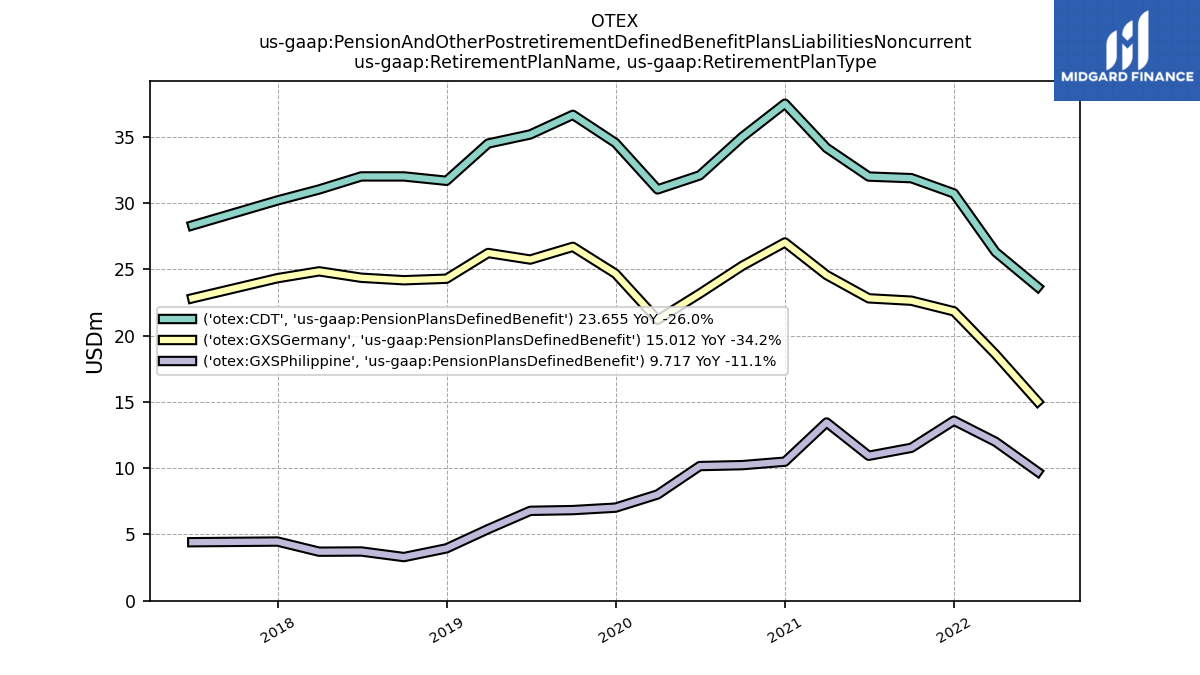
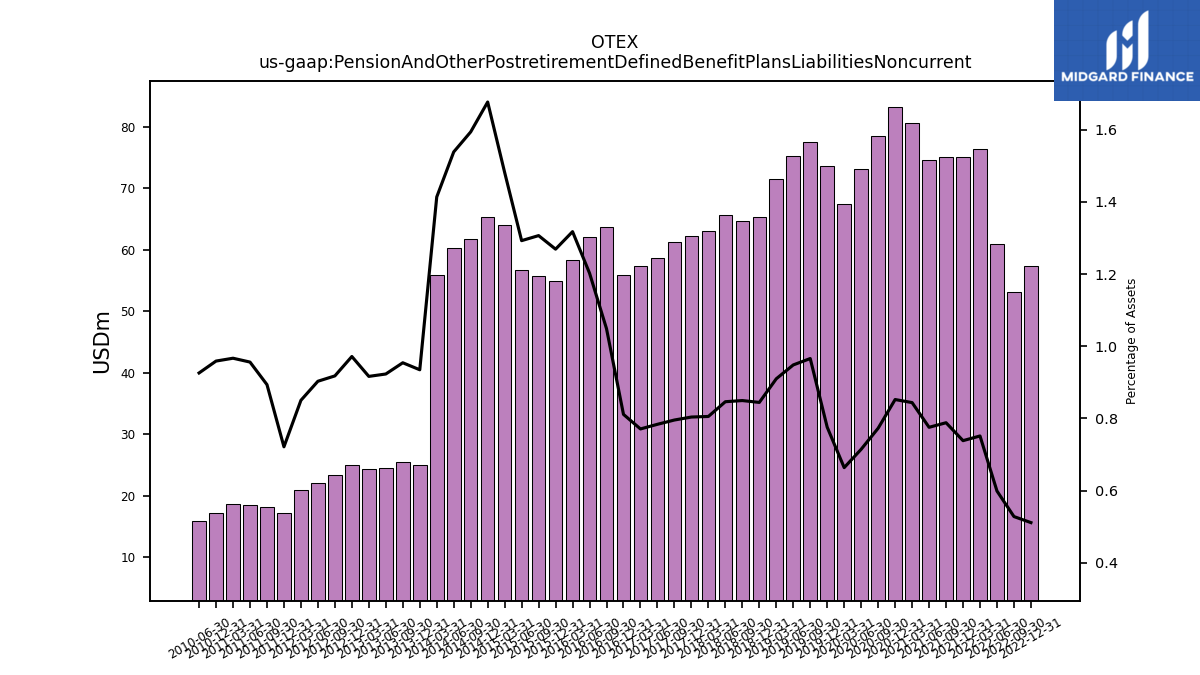
| Pension And Other Postretirement Defined Benefit Plans Liabilities Noncurrent | 57.35 | 53.20 | 60.95 | 76.36 | 75.06 | 75.02 | 74.51 | 80.65 | 83.27 | 78.54 | 73.13 | 67.44 | 73.68 | 77.47 | 75.24 | 71.56 | 65.27 | 64.73 | 65.72 | 63.00 | 62.21 | 61.23 | 58.63 | 57.30 | 55.83 | 63.69 | 61.99 | 58.29 | 54.84 | 55.74 | 56.74 | 64.00 | 65.35 | 61.68 | 60.30 | 55.92 | 25.06 | 25.49 | 24.51 | 24.43 | 25.04 | 23.46 | 22.07 | 21.00 | 17.18 | 18.17 | 18.48 | 18.58 | 17.12 | NA | 15.89 | NA | NA | |
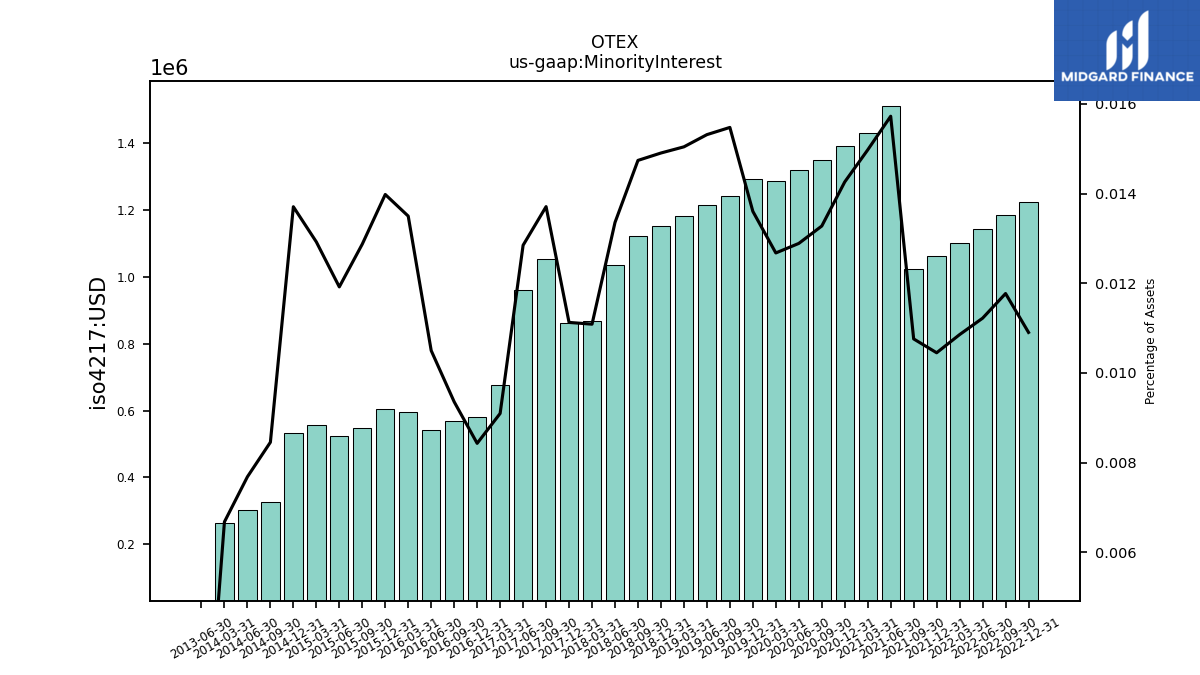
| Minority Interest | 1.22 | 1.19 | 1.14 | 1.10 | 1.06 | 1.02 | 1.51 | 1.43 | 1.39 | 1.35 | 1.32 | 1.29 | 1.29 | 1.24 | 1.22 | 1.18 | 1.15 | 1.12 | 1.04 | 0.87 | 0.86 | 1.05 | 0.96 | 0.68 | 0.58 | 0.57 | 0.54 | 0.60 | 0.60 | 0.55 | 0.52 | 0.56 | 0.53 | 0.33 | 0.30 | 0.26 | NA | NA | 0.00 | NA | NA | NA | NA | NA | NA | NA | NA | NA | NA | NA | NA | NA | NA | |
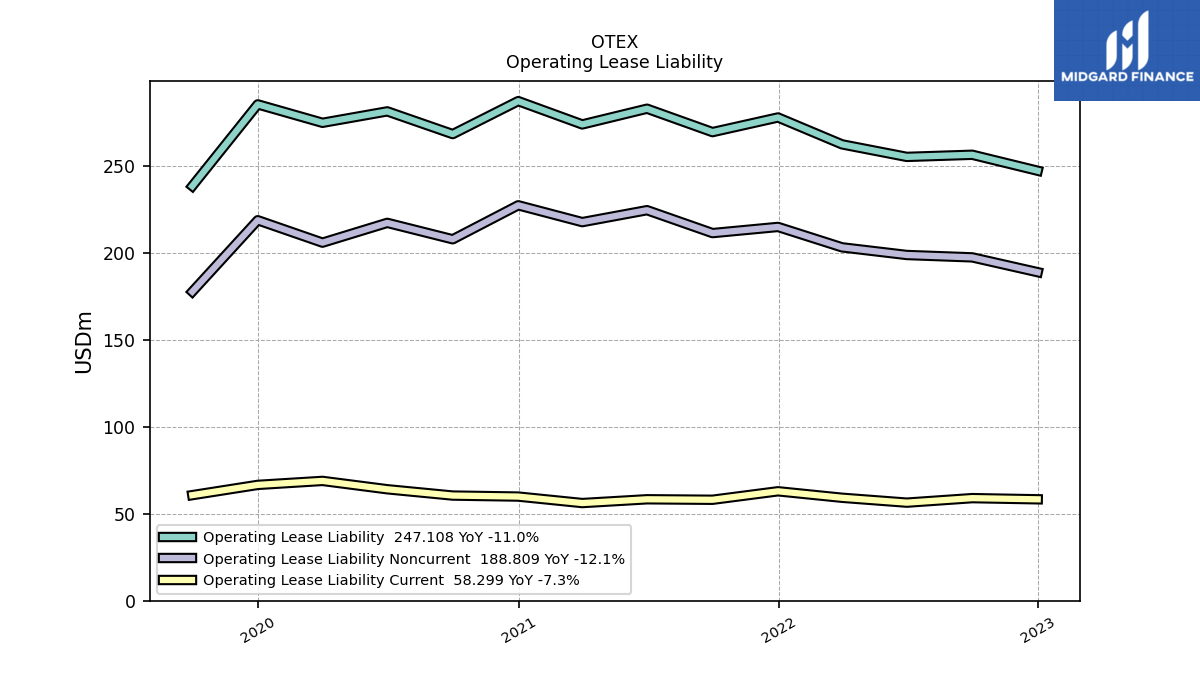
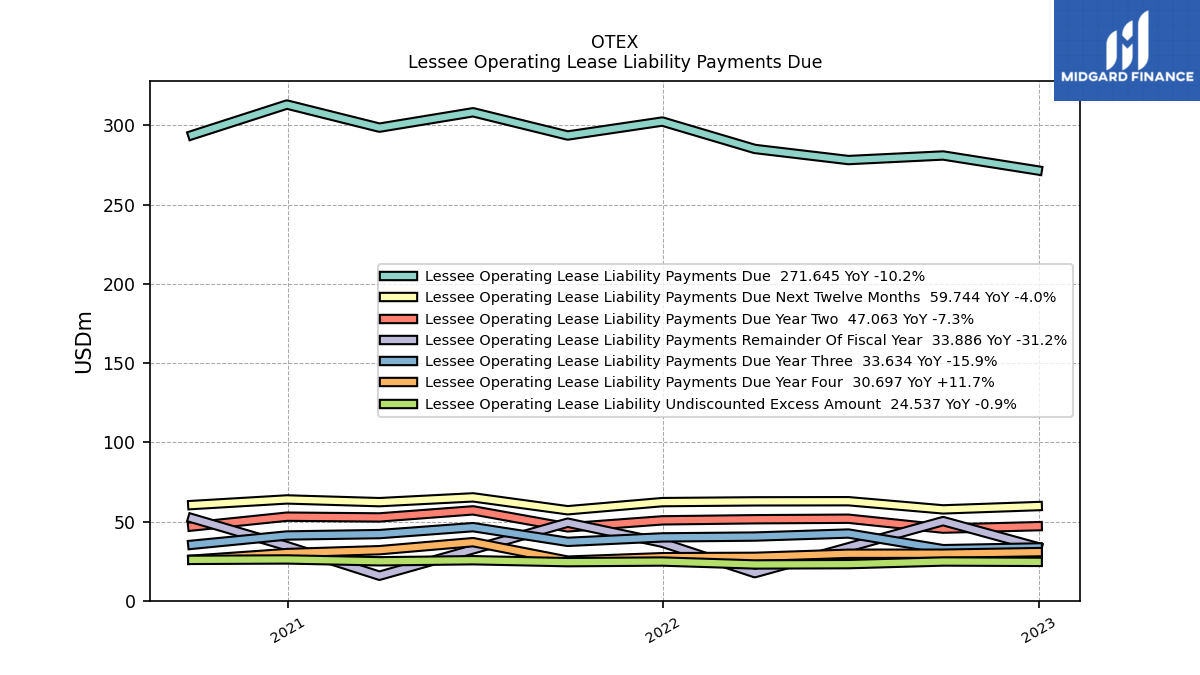
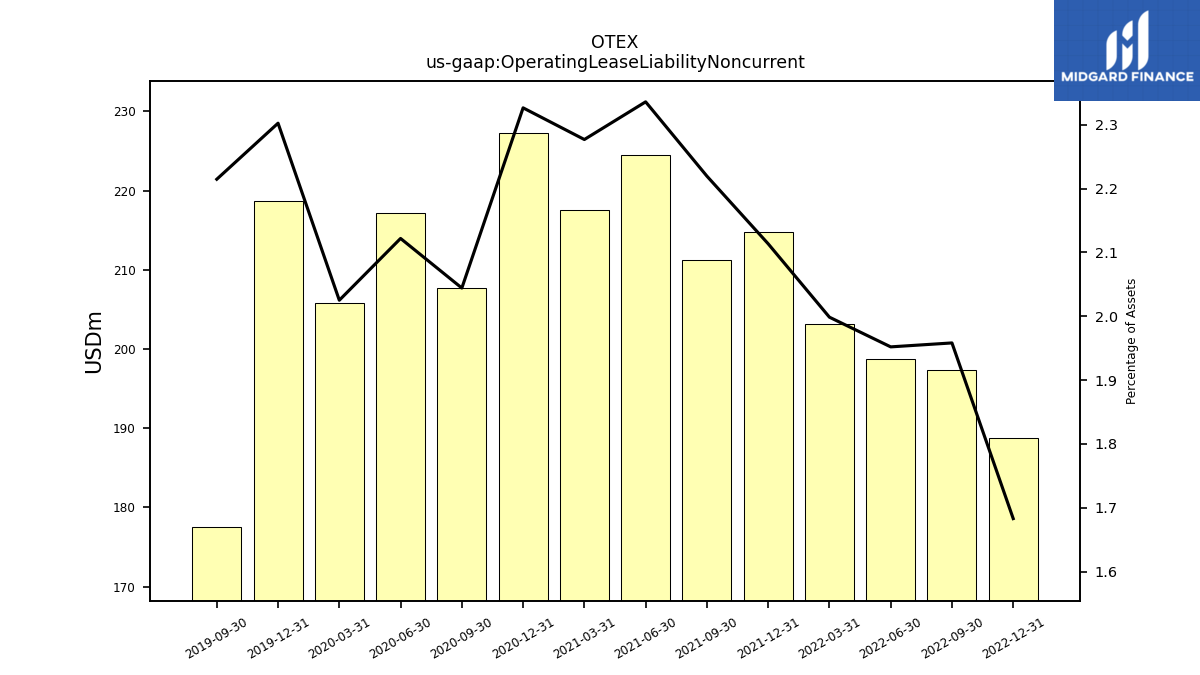
| Operating Lease Liability Noncurrent | 188.81 | 197.33 | 198.69 | 203.10 | 214.82 | 211.28 | 224.45 | 217.58 | 227.26 | 207.72 | 217.16 | 205.79 | 218.68 | 177.60 | NA | NA | NA | NA | NA | NA | NA | NA | NA | NA | NA | NA | NA | NA | NA | NA | NA | NA | NA | NA | NA | NA | NA | NA | NA | NA | NA | NA | NA | NA | NA | NA | NA | NA | NA | NA | NA | NA | NA |
| 2022-12-31 | 2022-09-30 | 2022-06-30 | 2022-03-31 | 2021-12-31 | 2021-09-30 | 2021-06-30 | 2021-03-31 | 2020-12-31 | 2020-09-30 | 2020-06-30 | 2020-03-31 | 2019-12-31 | 2019-09-30 | 2019-06-30 | 2019-03-31 | 2018-12-31 | 2018-09-30 | 2018-06-30 | 2018-03-31 | 2017-12-31 | 2017-09-30 | 2017-06-30 | 2017-03-31 | 2016-12-31 | 2016-09-30 | 2016-06-30 | 2016-03-31 | 2015-12-31 | 2015-09-30 | 2015-06-30 | 2015-03-31 | 2014-12-31 | 2014-09-30 | 2014-06-30 | 2014-03-31 | 2013-12-31 | 2013-09-30 | 2013-06-30 | 2013-03-31 | 2012-12-31 | 2012-09-30 | 2012-06-30 | 2012-03-31 | 2011-12-31 | 2011-09-30 | 2011-06-30 | 2011-03-31 | 2010-12-31 | 2010-09-30 | 2010-06-30 | 2010-03-31 | 2009-12-31 | ||
|---|---|---|---|---|---|---|---|---|---|---|---|---|---|---|---|---|---|---|---|---|---|---|---|---|---|---|---|---|---|---|---|---|---|---|---|---|---|---|---|---|---|---|---|---|---|---|---|---|---|---|---|---|---|---|
| Stockholders Equity | 4120.16 | 3848.95 | 4031.12 | 4054.75 | 4128.76 | 4207.49 | 4097.94 | 4030.49 | 4001.85 | 4066.37 | 4005.39 | 3996.89 | 3997.94 | 3906.87 | 3883.45 | 3837.19 | 3784.86 | 3725.91 | 3716.22 | 3696.11 | 3627.99 | 3563.88 | 3532.36 | 3502.92 | 3489.60 | 2878.66 | 1978.66 | 1909.88 | 1853.25 | 1809.55 | 1829.28 | 1778.48 | 1758.84 | 1694.65 | 1641.87 | 1565.91 | 1406.29 | 1359.55 | 1337.21 | 1297.50 | 1270.34 | 1208.03 | 1179.39 | 1176.29 | 1127.41 | 1071.27 | 1039.44 | 1004.58 | 954.75 | NA | 887.88 | NA | NA | |
| Stockholders Equity Including Portion Attributable To Noncontrolling Interest | 4121.38 | 3850.14 | 4032.26 | 4055.85 | 4129.82 | 4208.52 | 4099.45 | 4031.93 | 4003.25 | 4067.72 | 4006.71 | 3998.18 | 3999.23 | 3908.11 | 3884.67 | 3838.37 | 3786.01 | 3727.03 | 3717.26 | 3696.98 | 3628.85 | 3564.94 | 3533.32 | 3503.60 | 3490.18 | 2879.23 | 1979.20 | 1910.48 | 1853.85 | 1810.10 | 1829.81 | 1779.04 | 1759.38 | 1694.97 | 1642.17 | 1566.17 | NA | NA | 1337.21 | NA | NA | NA | NA | NA | NA | NA | NA | NA | NA | NA | NA | NA | NA | |
| Common Stocks Including Additional Paid In Capital | 2092.08 | 2067.88 | 2038.67 | 2010.15 | 1990.91 | 1991.72 | 1947.76 | 1915.76 | 1889.86 | 1872.41 | 1851.78 | 1839.15 | NA | NA | 1774.21 | NA | NA | NA | NA | NA | NA | NA | NA | NA | NA | NA | NA | NA | NA | NA | NA | NA | NA | NA | NA | NA | NA | NA | NA | NA | NA | NA | NA | NA | NA | NA | NA | NA | NA | NA | NA | NA | NA | |
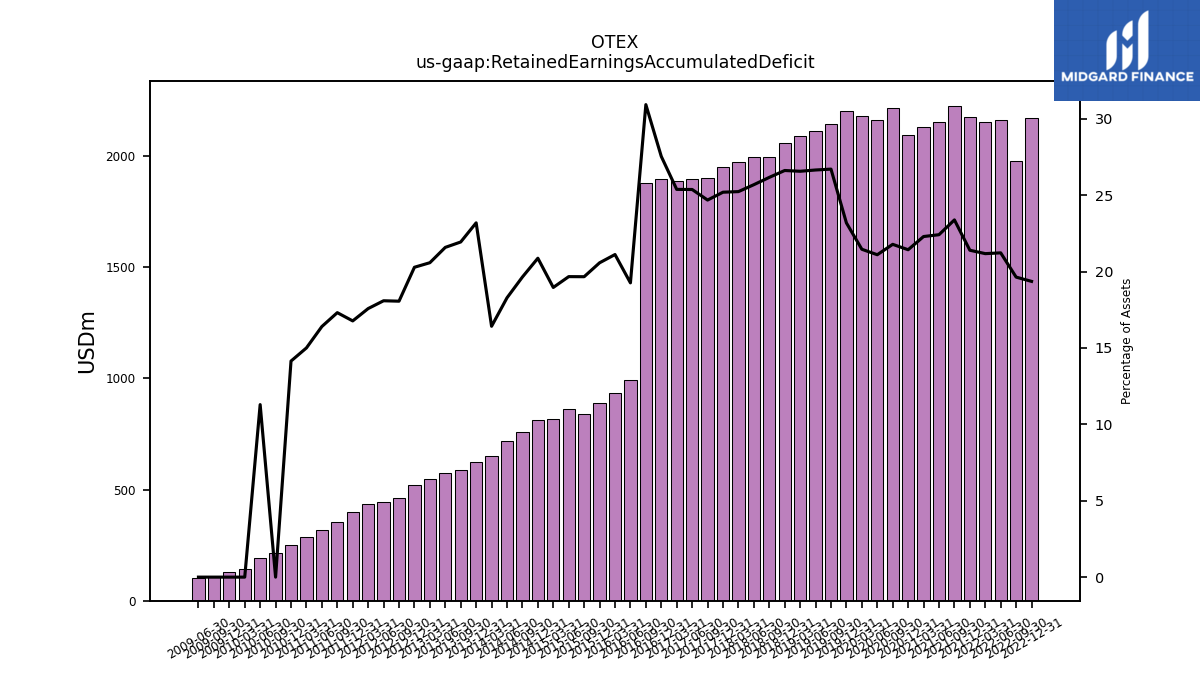
| Retained Earnings Accumulated Deficit | 2171.24 | 1978.44 | 2160.07 | 2151.37 | 2174.47 | 2225.36 | 2153.33 | 2130.05 | 2093.08 | 2213.05 | 2159.40 | 2180.34 | 2201.65 | 2141.28 | 2113.88 | 2088.86 | 2056.83 | 1993.10 | 1994.23 | 1973.13 | 1949.50 | 1899.20 | 1897.62 | 1886.12 | 1894.80 | 1877.64 | 992.55 | 933.79 | 888.77 | 838.49 | 863.01 | 818.67 | 813.13 | 759.90 | 716.32 | 649.21 | 621.55 | 585.79 | 572.88 | 548.42 | 522.61 | 461.50 | 442.07 | 434.10 | 399.32 | 351.88 | 316.89 | 288.30 | 252.47 | 215.36 | 193.69 | 140.52 | 127.41 | |
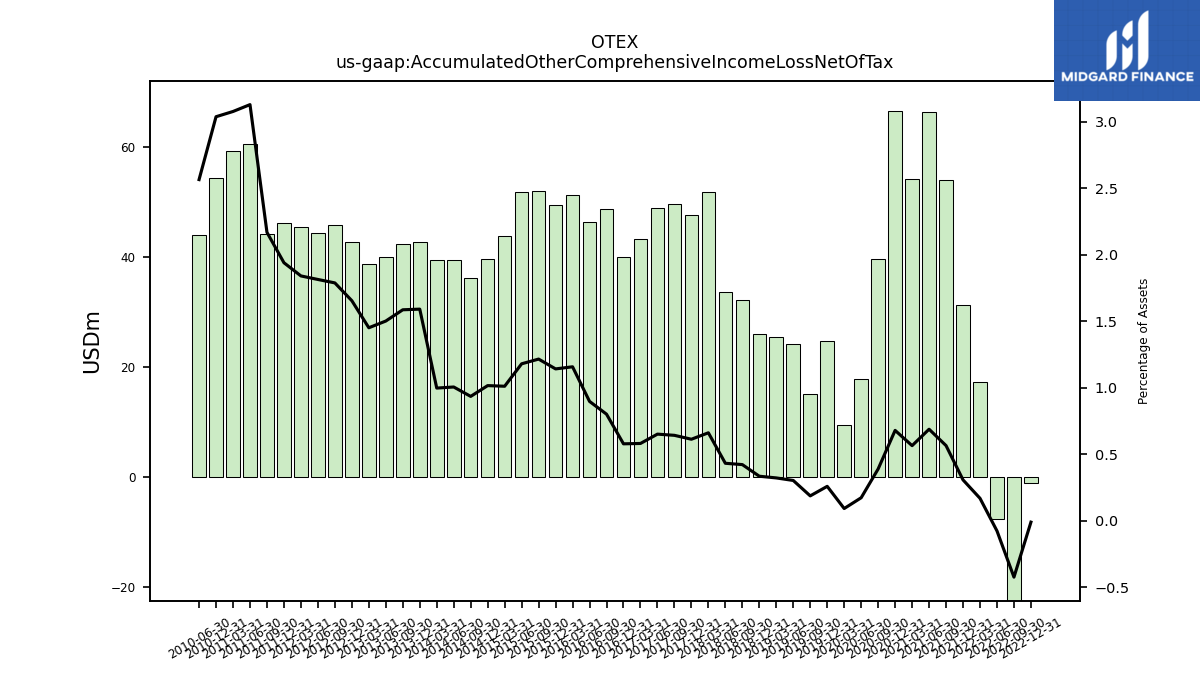
| Accumulated Other Comprehensive Income Loss Net Of Tax | -1.03 | -42.58 | -7.66 | 17.27 | 31.35 | 53.89 | 66.24 | 54.07 | 66.48 | 39.70 | 17.82 | 9.47 | 24.69 | 15.10 | 24.12 | 25.42 | 25.97 | 32.26 | 33.65 | 51.81 | 47.52 | 49.52 | 48.80 | 43.28 | 39.88 | 48.73 | 46.31 | 51.25 | 49.38 | 51.88 | 51.83 | 43.72 | 39.63 | 36.22 | 39.45 | 39.49 | 42.68 | 42.39 | 39.89 | 38.70 | 42.66 | 45.72 | 44.36 | 45.49 | 46.22 | 44.10 | 60.47 | 59.15 | 54.26 | NA | 44.02 | NA | NA | |
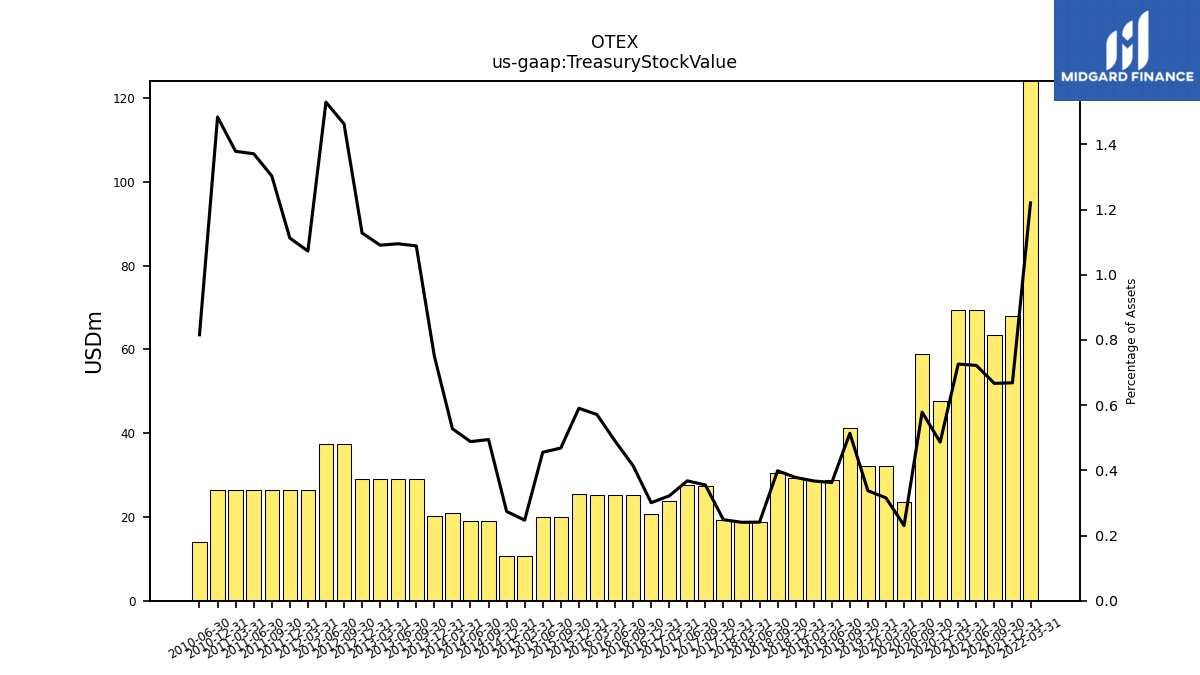
| Treasury Stock Value | NA | NA | NA | 124.03 | 67.97 | 63.48 | 69.39 | 69.39 | 47.55 | 58.79 | 23.61 | 32.07 | 32.07 | 41.19 | 28.77 | 28.90 | 29.24 | 30.38 | 18.73 | 18.82 | 19.25 | 27.34 | 27.52 | 23.91 | 20.71 | 25.17 | 25.27 | 25.27 | 25.52 | 19.99 | 19.99 | 10.68 | 10.68 | 19.13 | 19.13 | 20.87 | 20.12 | 29.07 | 29.07 | 29.07 | 29.07 | 37.39 | 37.39 | 26.50 | 26.50 | 26.50 | 26.50 | 26.50 | 26.50 | NA | 14.00 | NA | NA | |
| Minority Interest | 1.22 | 1.19 | 1.14 | 1.10 | 1.06 | 1.02 | 1.51 | 1.43 | 1.39 | 1.35 | 1.32 | 1.29 | 1.29 | 1.24 | 1.22 | 1.18 | 1.15 | 1.12 | 1.04 | 0.87 | 0.86 | 1.05 | 0.96 | 0.68 | 0.58 | 0.57 | 0.54 | 0.60 | 0.60 | 0.55 | 0.52 | 0.56 | 0.53 | 0.33 | 0.30 | 0.26 | NA | NA | 0.00 | NA | NA | NA | NA | NA | NA | NA | NA | NA | NA | NA | NA | NA | NA | |
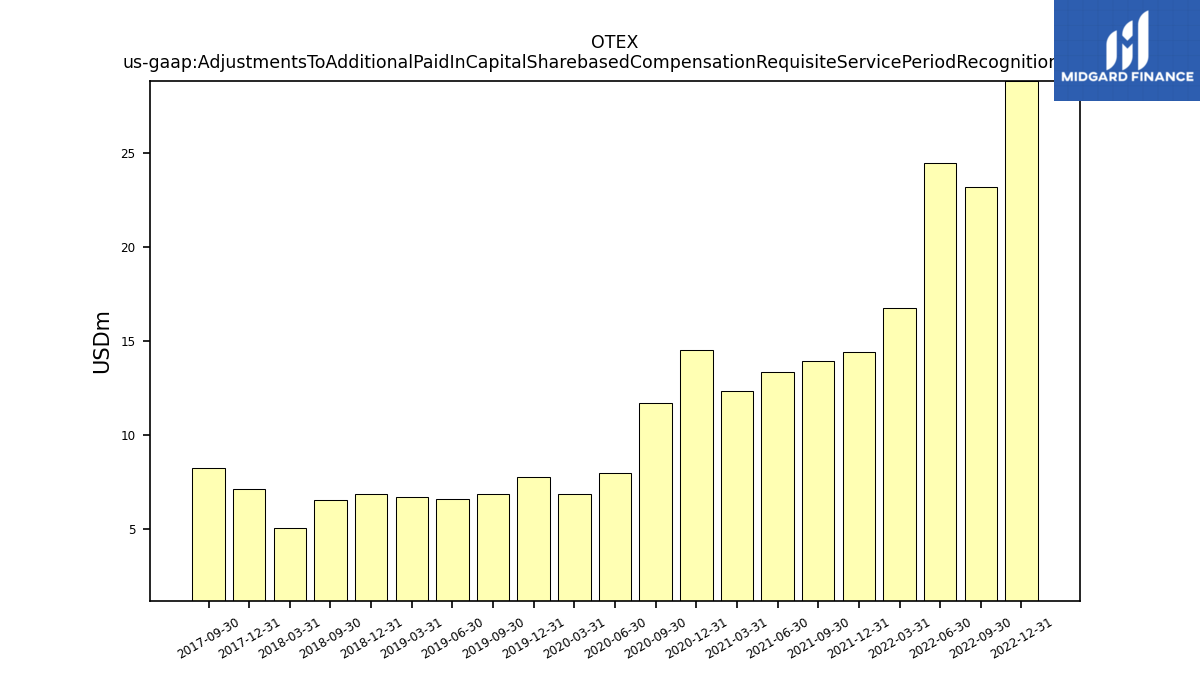
| Adjustments To Additional Paid In Capital Sharebased Compensation Requisite Service Period Recognition Value | 28.82 | 23.21 | 24.46 | 16.75 | 14.41 | 13.93 | 13.35 | 12.36 | 14.53 | 11.74 | 8.00 | 6.86 | 7.78 | 6.89 | 6.62 | 6.71 | 6.88 | 6.55 | NA | 5.08 | 7.16 | 8.23 | NA | NA | NA | NA | NA | NA | NA | NA | NA | NA | NA | NA | NA | NA | NA | NA | NA | NA | NA | NA | NA | NA | NA | NA | NA | NA | NA | NA | NA | NA | NA | |
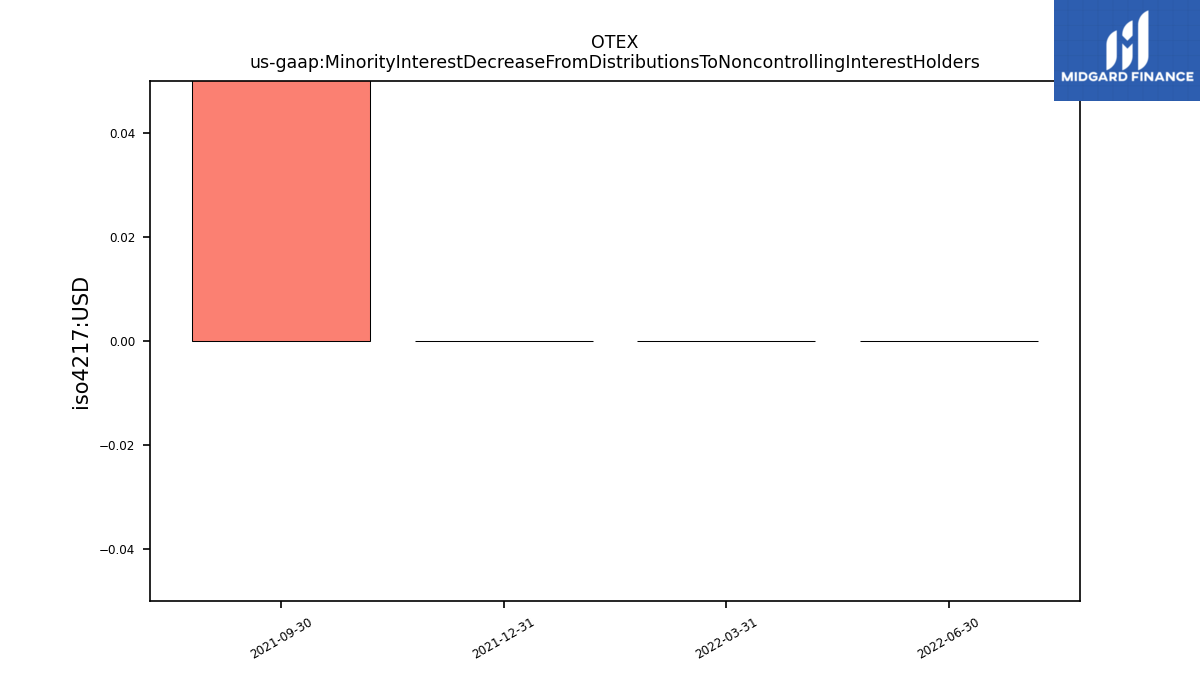
| Minority Interest Decrease From Distributions To Noncontrolling Interest Holders | NA | NA | 0.00 | 0.00 | 0.00 | 0.40 | NA | NA | NA | NA | NA | NA | NA | NA | NA | NA | NA | NA | NA | NA | NA | NA | NA | NA | NA | NA | NA | NA | NA | NA | NA | NA | NA | NA | NA | NA | NA | NA | NA | NA | NA | NA | NA | NA | NA | NA | NA | NA | NA | NA | NA | NA | NA |
| 2022-12-31 | 2022-09-30 | 2022-06-30 | 2022-03-31 | 2021-12-31 | 2021-09-30 | 2021-06-30 | 2021-03-31 | 2020-12-31 | 2020-09-30 | 2020-06-30 | 2020-03-31 | 2019-12-31 | 2019-09-30 | 2019-06-30 | 2019-03-31 | 2018-12-31 | 2018-09-30 | 2018-06-30 | 2018-03-31 | 2017-12-31 | 2017-09-30 | 2017-06-30 | 2017-03-31 | 2016-12-31 | 2016-09-30 | 2016-06-30 | 2016-03-31 | 2015-12-31 | 2015-09-30 | 2015-06-30 | 2015-03-31 | 2014-12-31 | 2014-09-30 | 2014-06-30 | 2014-03-31 | 2013-12-31 | 2013-09-30 | 2013-06-30 | 2013-03-31 | 2012-12-31 | 2012-09-30 | 2012-06-30 | 2012-03-31 | 2011-12-31 | 2011-09-30 | 2011-06-30 | 2011-03-31 | 2010-12-31 | 2010-09-30 | 2010-06-30 | 2010-03-31 | 2009-12-31 | ||
|---|---|---|---|---|---|---|---|---|---|---|---|---|---|---|---|---|---|---|---|---|---|---|---|---|---|---|---|---|---|---|---|---|---|---|---|---|---|---|---|---|---|---|---|---|---|---|---|---|---|---|---|---|---|---|
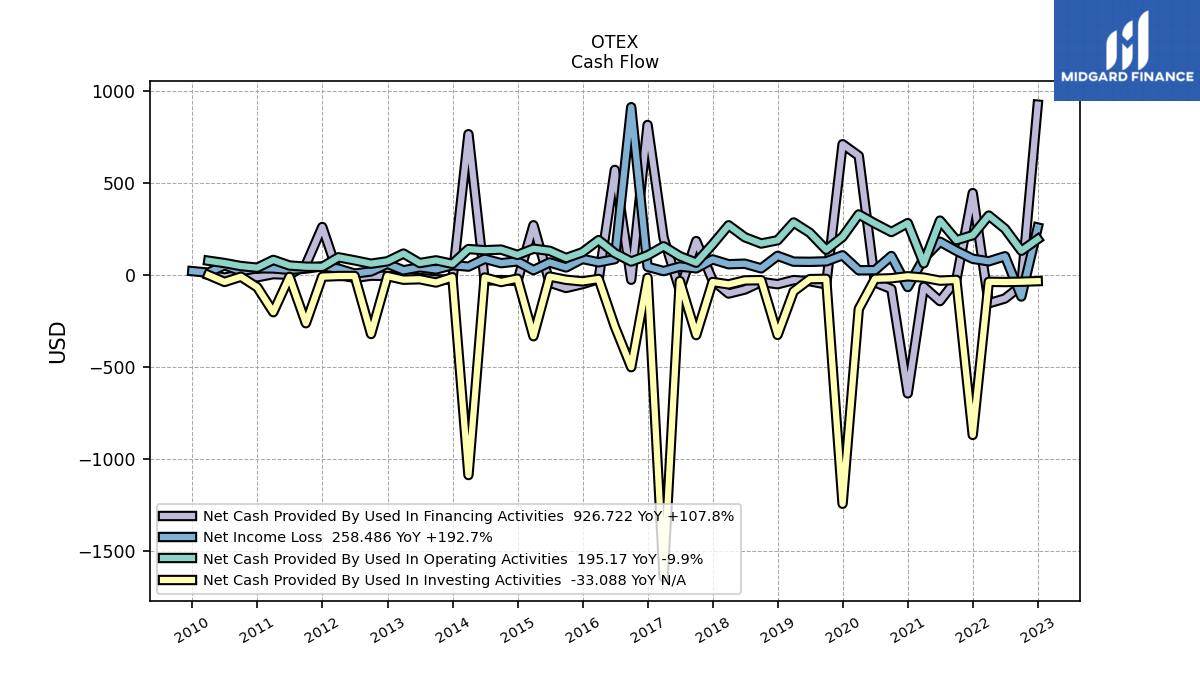
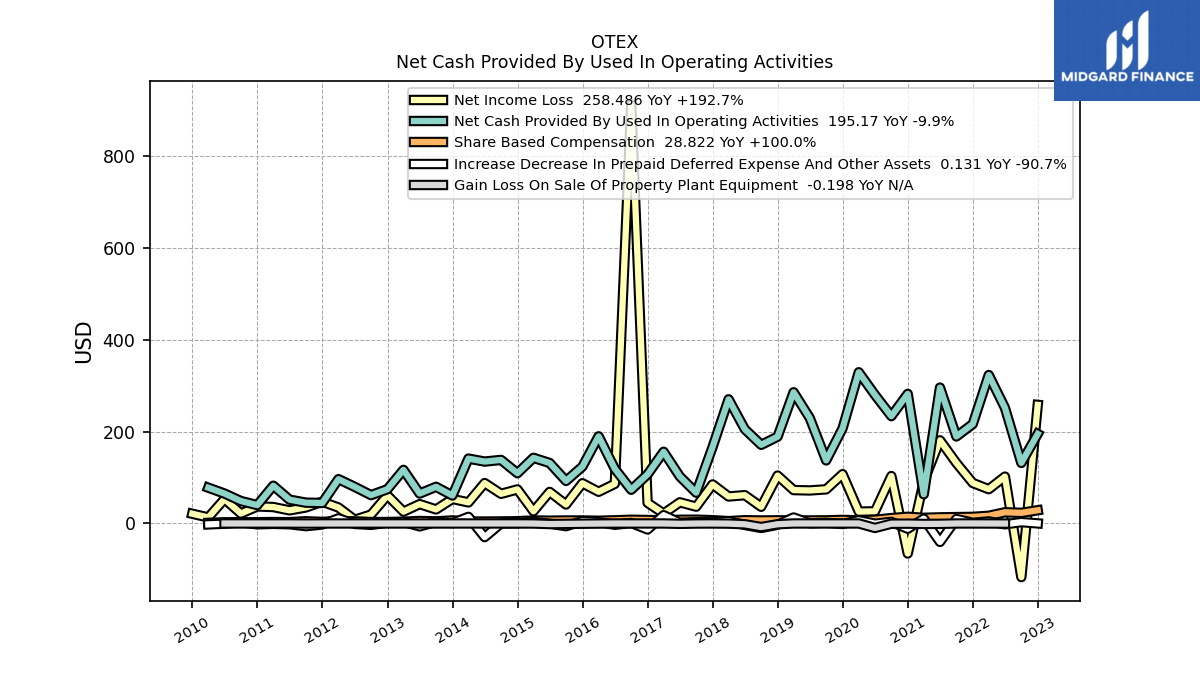
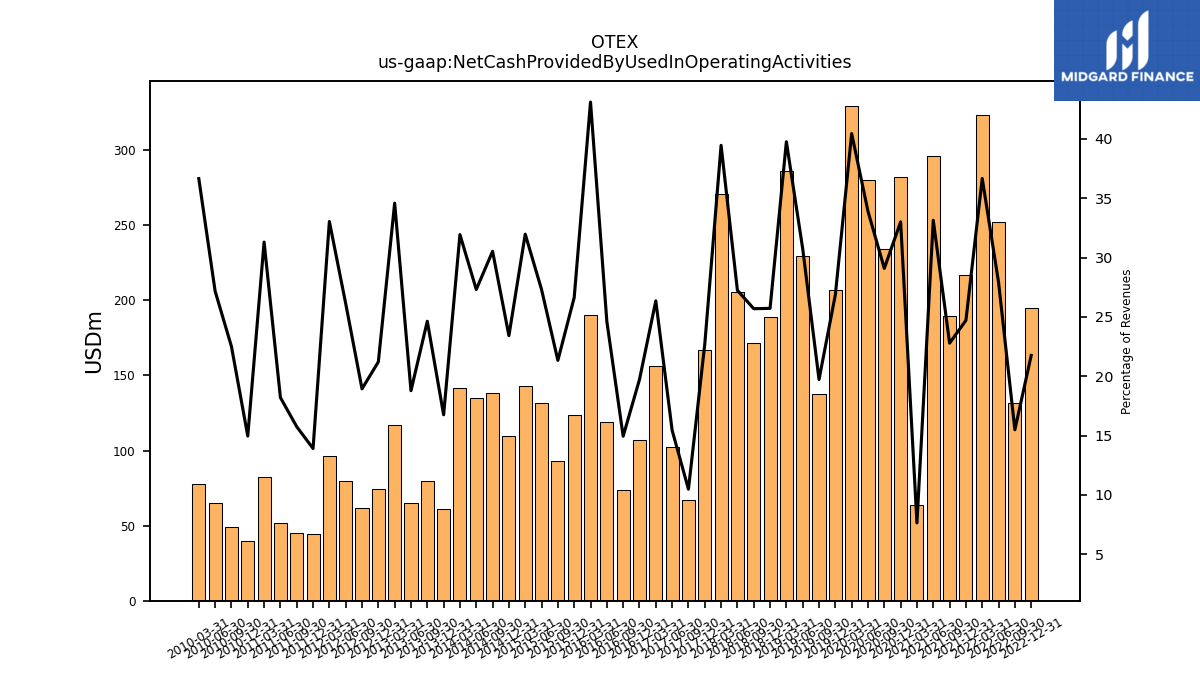
| Net Cash Provided By Used In Operating Activities | 195.17 | 131.96 | 251.94 | 323.56 | 216.64 | 189.67 | 296.19 | 63.57 | 282.45 | 233.90 | 280.25 | 329.60 | 207.24 | 137.45 | 229.78 | 286.00 | 189.10 | 171.40 | 205.46 | 270.68 | 166.65 | 67.10 | 102.48 | 156.30 | 107.02 | 73.45 | 119.12 | 189.94 | 123.94 | 92.72 | 131.82 | 143.11 | 109.57 | 138.53 | 134.91 | 141.41 | 60.88 | 79.92 | 65.22 | 116.83 | 74.69 | 61.76 | 79.85 | 96.60 | 44.70 | 45.35 | 51.96 | 82.33 | 40.00 | 48.93 | 65.22 | 78.00 | NA | |
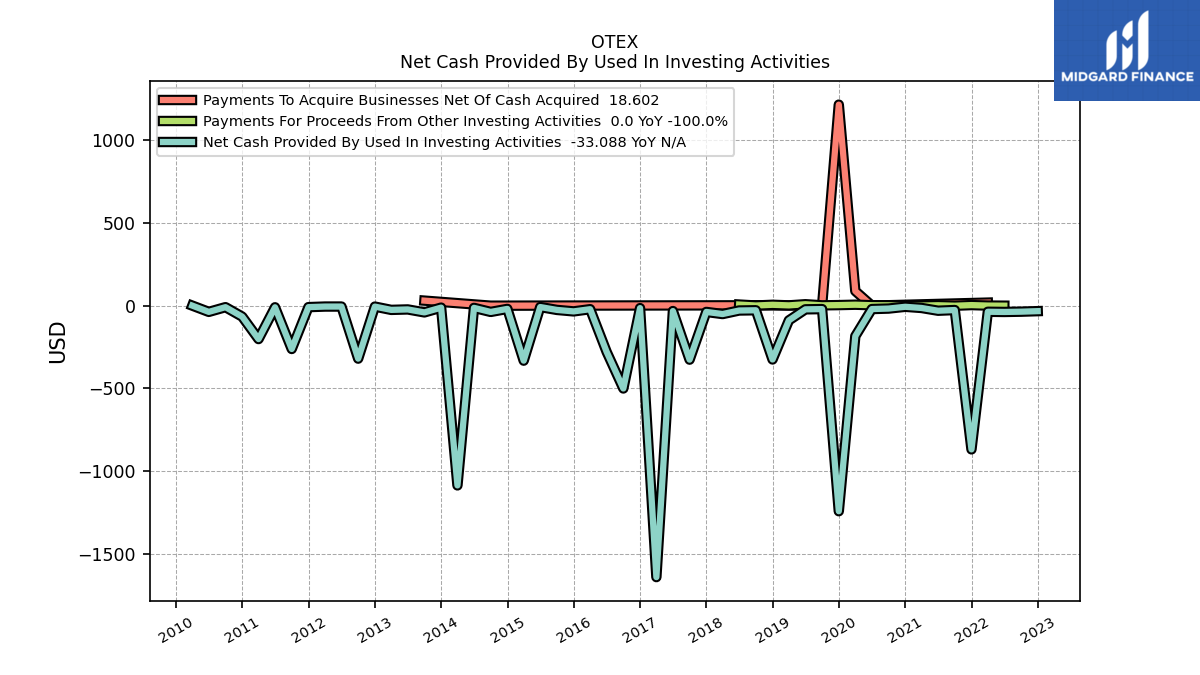
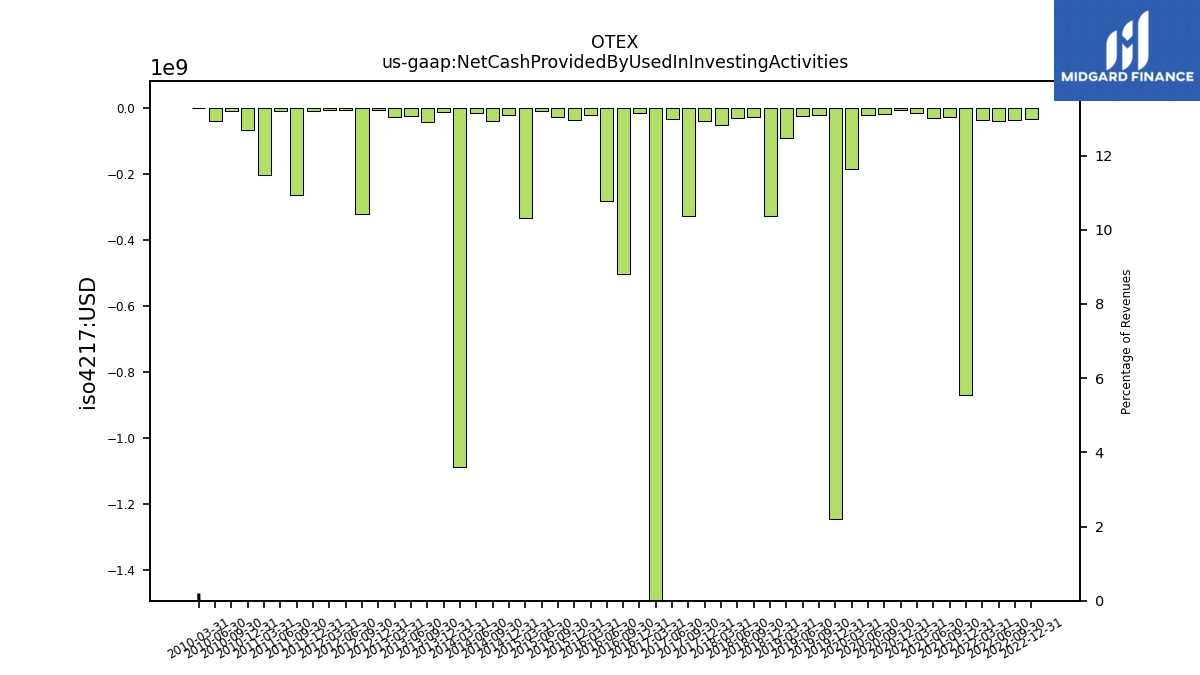
| Net Cash Provided By Used In Investing Activities | -33.09 | -36.32 | -38.00 | -36.84 | -869.70 | -26.42 | -30.56 | -13.96 | -6.71 | -17.54 | -20.49 | -184.39 | -1243.89 | -20.65 | -22.17 | -88.96 | -325.62 | -27.78 | -29.20 | -50.69 | -37.85 | -326.70 | -32.45 | -1642.64 | -14.71 | -501.17 | -279.60 | -21.31 | -34.58 | -25.68 | -8.23 | -332.81 | -19.53 | -37.83 | -13.26 | -1087.68 | -11.80 | -40.62 | -22.74 | -25.46 | -5.61 | -320.59 | -5.26 | -5.36 | -8.78 | -262.15 | -9.78 | -202.20 | -66.27 | -9.02 | -37.51 | 0.33 | NA | |
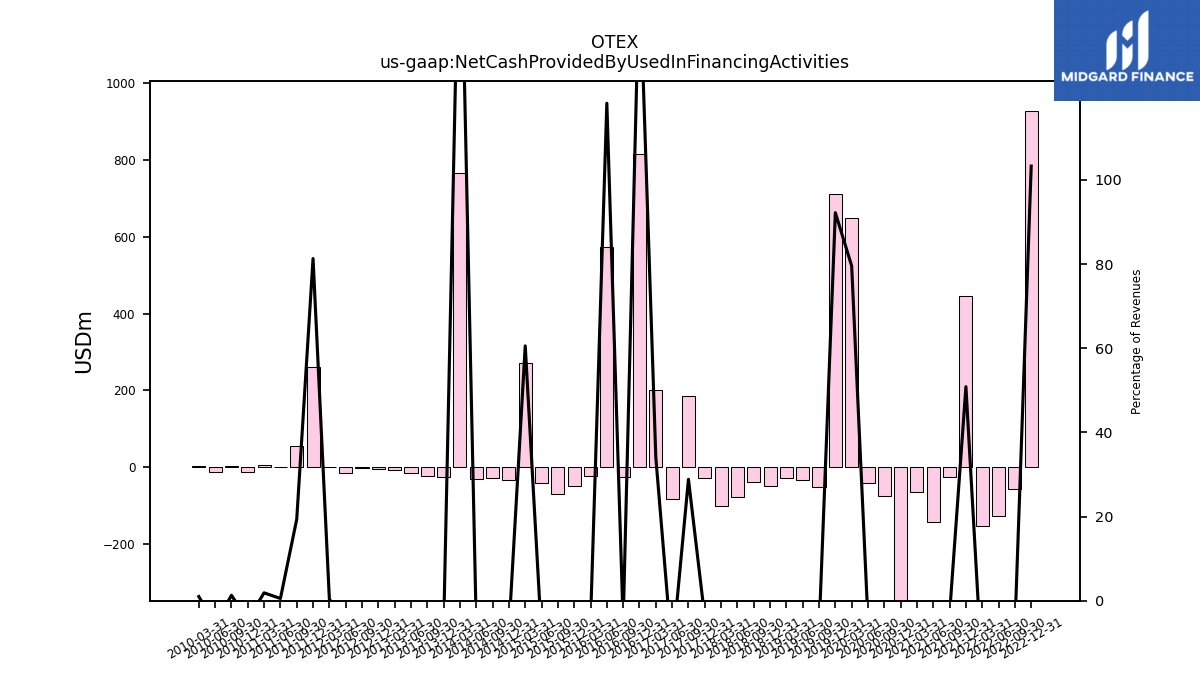
| Net Cash Provided By Used In Financing Activities | 926.72 | -57.16 | -127.61 | -153.75 | 445.87 | -26.05 | -141.69 | -63.39 | -643.66 | -75.80 | -39.98 | 648.14 | 711.43 | -50.81 | -33.67 | -27.39 | -49.86 | -37.46 | -78.92 | -100.67 | -28.95 | 184.87 | -83.00 | 202.13 | 816.22 | -25.81 | 571.84 | -22.04 | -49.33 | -70.30 | -40.85 | 271.02 | -32.42 | -27.15 | -29.81 | 766.07 | -24.82 | -23.49 | -16.25 | -6.54 | -5.00 | -3.32 | -15.61 | 1.10 | 261.34 | 55.75 | 1.52 | 4.95 | -11.97 | 2.80 | -13.61 | 2.13 | NA |
| 2022-12-31 | 2022-09-30 | 2022-06-30 | 2022-03-31 | 2021-12-31 | 2021-09-30 | 2021-06-30 | 2021-03-31 | 2020-12-31 | 2020-09-30 | 2020-06-30 | 2020-03-31 | 2019-12-31 | 2019-09-30 | 2019-06-30 | 2019-03-31 | 2018-12-31 | 2018-09-30 | 2018-06-30 | 2018-03-31 | 2017-12-31 | 2017-09-30 | 2017-06-30 | 2017-03-31 | 2016-12-31 | 2016-09-30 | 2016-06-30 | 2016-03-31 | 2015-12-31 | 2015-09-30 | 2015-06-30 | 2015-03-31 | 2014-12-31 | 2014-09-30 | 2014-06-30 | 2014-03-31 | 2013-12-31 | 2013-09-30 | 2013-06-30 | 2013-03-31 | 2012-12-31 | 2012-09-30 | 2012-06-30 | 2012-03-31 | 2011-12-31 | 2011-09-30 | 2011-06-30 | 2011-03-31 | 2010-12-31 | 2010-09-30 | 2010-06-30 | 2010-03-31 | 2009-12-31 | ||
|---|---|---|---|---|---|---|---|---|---|---|---|---|---|---|---|---|---|---|---|---|---|---|---|---|---|---|---|---|---|---|---|---|---|---|---|---|---|---|---|---|---|---|---|---|---|---|---|---|---|---|---|---|---|---|
| Net Cash Provided By Used In Operating Activities | 195.17 | 131.96 | 251.94 | 323.56 | 216.64 | 189.67 | 296.19 | 63.57 | 282.45 | 233.90 | 280.25 | 329.60 | 207.24 | 137.45 | 229.78 | 286.00 | 189.10 | 171.40 | 205.46 | 270.68 | 166.65 | 67.10 | 102.48 | 156.30 | 107.02 | 73.45 | 119.12 | 189.94 | 123.94 | 92.72 | 131.82 | 143.11 | 109.57 | 138.53 | 134.91 | 141.41 | 60.88 | 79.92 | 65.22 | 116.83 | 74.69 | 61.76 | 79.85 | 96.60 | 44.70 | 45.35 | 51.96 | 82.33 | 40.00 | 48.93 | 65.22 | 78.00 | NA | |
| Net Income Loss | 258.49 | -116.93 | 102.20 | 74.68 | 88.30 | 131.91 | 181.28 | 91.49 | -65.48 | 103.38 | 26.39 | 25.96 | 107.47 | 74.40 | 71.98 | 72.76 | 104.43 | 36.32 | 61.72 | 58.79 | 85.11 | 36.60 | 46.14 | 21.62 | 45.02 | 912.88 | 86.39 | 69.11 | 87.69 | 41.29 | 68.80 | 26.61 | 74.29 | 64.63 | 88.11 | 45.88 | 53.50 | 30.63 | 42.17 | 25.81 | 61.11 | 19.43 | 7.97 | 34.77 | 47.44 | 34.99 | 28.59 | 35.83 | 37.11 | 21.67 | 53.17 | 13.11 | 21.20 | |
| Profit Loss | 258.52 | -116.89 | 102.23 | 74.72 | 88.34 | 131.97 | 181.36 | 91.53 | -65.43 | 103.41 | 26.42 | 26.00 | 107.52 | 74.43 | 72.02 | 72.79 | 104.46 | 36.37 | 61.89 | 58.80 | 84.92 | 36.69 | 46.26 | 21.71 | 45.03 | 912.91 | 86.33 | 69.11 | 87.74 | 41.31 | 68.77 | 26.49 | 74.49 | 64.65 | 88.15 | 45.80 | 53.50 | 30.63 | 42.17 | 25.81 | NA | NA | NA | NA | NA | NA | NA | NA | NA | NA | NA | NA | NA | |
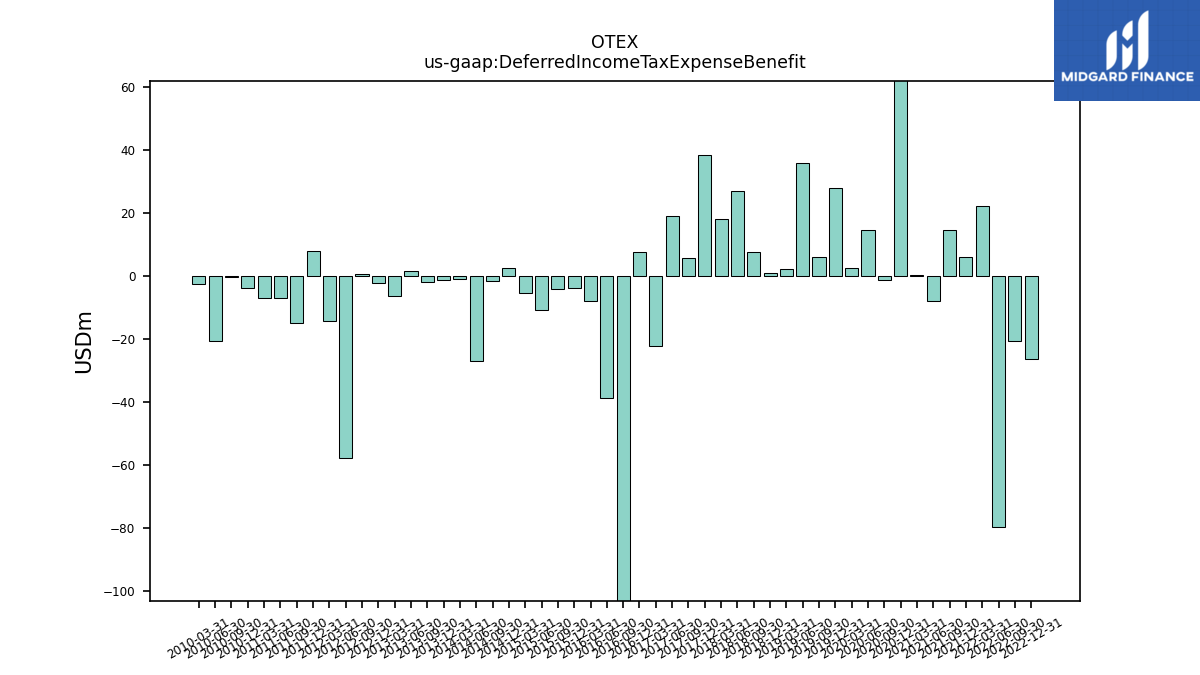
| Deferred Income Tax Expense Benefit | -26.14 | -20.67 | -79.42 | 22.44 | 6.21 | 14.68 | -7.80 | 0.45 | 81.58 | -1.18 | 14.68 | 2.54 | 27.92 | 6.24 | 36.12 | 2.40 | 1.14 | 7.77 | 27.10 | 18.27 | 38.43 | 5.95 | 19.05 | -22.01 | 7.59 | -875.82 | -38.77 | -7.82 | -3.69 | -4.18 | -10.54 | -5.26 | 2.76 | -1.54 | -26.81 | -1.00 | -1.33 | -1.87 | 1.57 | -6.21 | -2.01 | 0.86 | -57.70 | -14.13 | 7.89 | -14.85 | -6.99 | -6.96 | -3.65 | -0.18 | -20.50 | -2.41 | NA | |
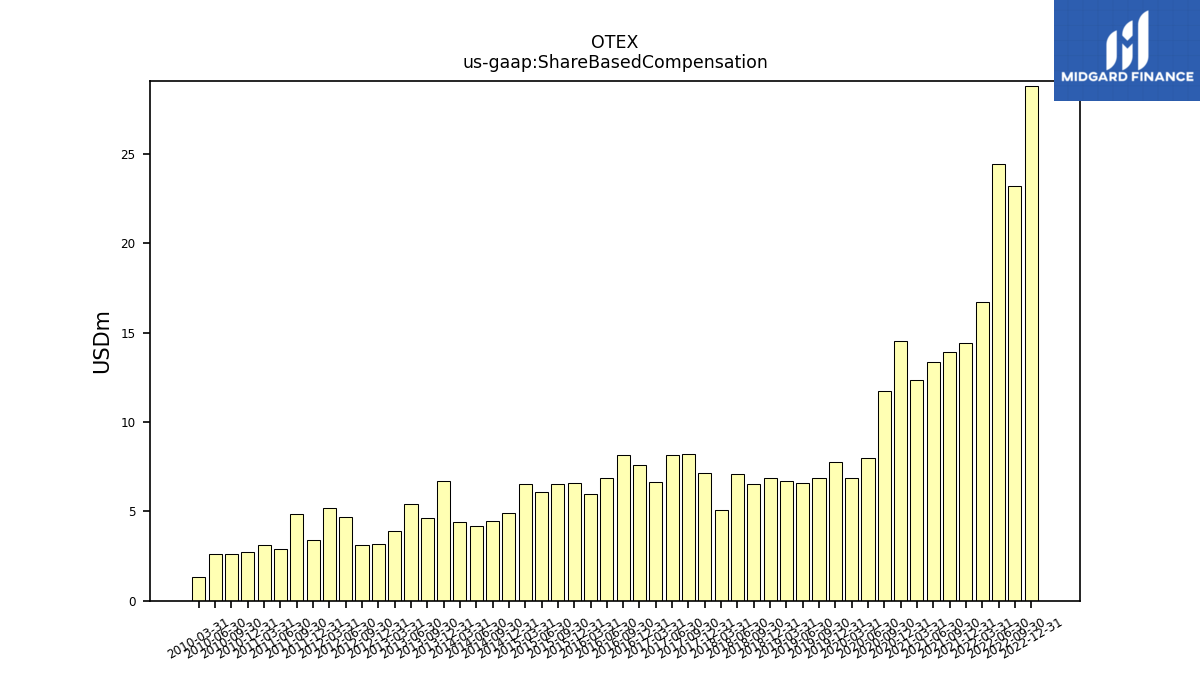
| Share Based Compensation | 28.82 | 23.21 | 24.46 | 16.75 | 14.41 | 13.93 | 13.35 | 12.36 | 14.53 | 11.74 | 8.00 | 6.86 | 7.78 | 6.89 | 6.62 | 6.71 | 6.88 | 6.55 | 7.12 | 5.08 | 7.16 | 8.23 | 8.13 | 6.66 | 7.57 | 8.14 | 6.90 | 5.97 | 6.58 | 6.53 | 6.11 | 6.56 | 4.93 | 4.45 | 4.20 | 4.42 | 6.68 | 4.61 | 5.42 | 3.88 | 3.17 | 3.10 | 4.69 | 5.17 | 3.40 | 4.84 | 2.88 | 3.10 | 2.74 | 2.60 | 2.61 | 1.33 | NA | |
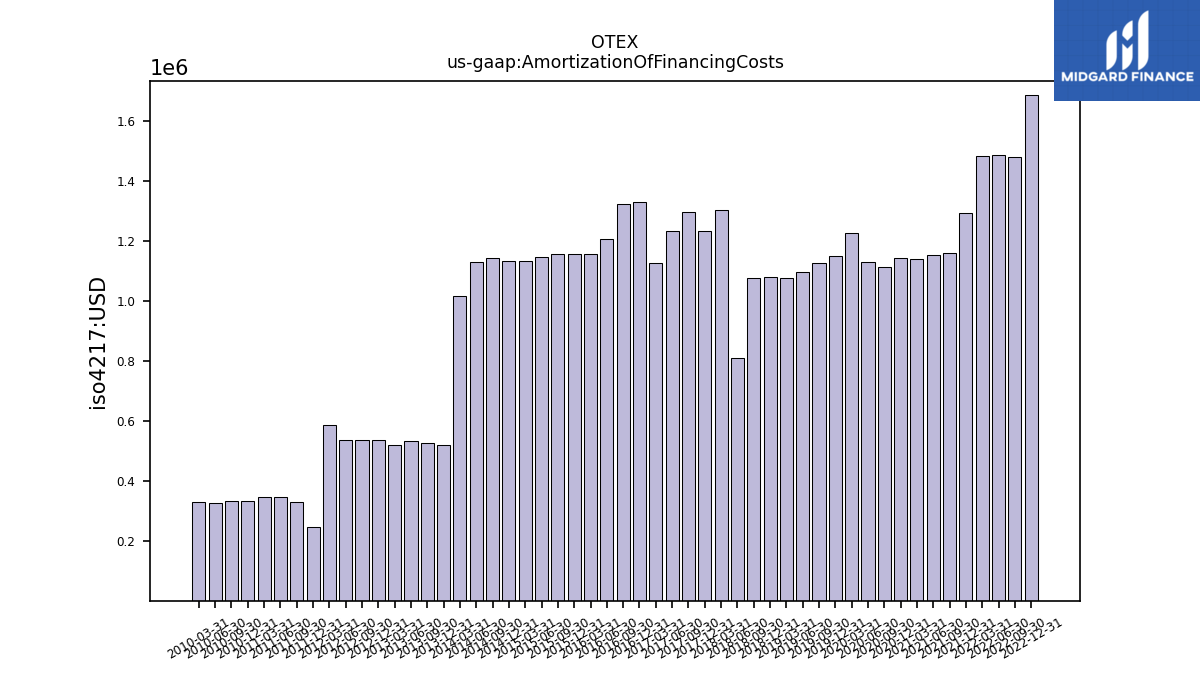
| Amortization Of Financing Costs | 1.69 | 1.48 | 1.49 | 1.48 | 1.29 | 1.16 | 1.15 | 1.14 | 1.14 | 1.11 | 1.13 | 1.23 | 1.15 | 1.13 | 1.10 | 1.08 | 1.08 | 1.08 | 0.81 | 1.30 | 1.23 | 1.30 | 1.23 | 1.13 | 1.33 | 1.32 | 1.21 | 1.16 | 1.16 | 1.16 | 1.15 | 1.14 | 1.13 | 1.14 | 1.13 | 1.02 | 0.52 | 0.53 | 0.53 | 0.52 | 0.54 | 0.54 | 0.54 | 0.59 | 0.25 | 0.33 | 0.35 | 0.34 | 0.33 | 0.33 | 0.33 | 0.33 | NA |
| 2022-12-31 | 2022-09-30 | 2022-06-30 | 2022-03-31 | 2021-12-31 | 2021-09-30 | 2021-06-30 | 2021-03-31 | 2020-12-31 | 2020-09-30 | 2020-06-30 | 2020-03-31 | 2019-12-31 | 2019-09-30 | 2019-06-30 | 2019-03-31 | 2018-12-31 | 2018-09-30 | 2018-06-30 | 2018-03-31 | 2017-12-31 | 2017-09-30 | 2017-06-30 | 2017-03-31 | 2016-12-31 | 2016-09-30 | 2016-06-30 | 2016-03-31 | 2015-12-31 | 2015-09-30 | 2015-06-30 | 2015-03-31 | 2014-12-31 | 2014-09-30 | 2014-06-30 | 2014-03-31 | 2013-12-31 | 2013-09-30 | 2013-06-30 | 2013-03-31 | 2012-12-31 | 2012-09-30 | 2012-06-30 | 2012-03-31 | 2011-12-31 | 2011-09-30 | 2011-06-30 | 2011-03-31 | 2010-12-31 | 2010-09-30 | 2010-06-30 | 2010-03-31 | 2009-12-31 | ||
|---|---|---|---|---|---|---|---|---|---|---|---|---|---|---|---|---|---|---|---|---|---|---|---|---|---|---|---|---|---|---|---|---|---|---|---|---|---|---|---|---|---|---|---|---|---|---|---|---|---|---|---|---|---|---|
| Net Cash Provided By Used In Investing Activities | -33.09 | -36.32 | -38.00 | -36.84 | -869.70 | -26.42 | -30.56 | -13.96 | -6.71 | -17.54 | -20.49 | -184.39 | -1243.89 | -20.65 | -22.17 | -88.96 | -325.62 | -27.78 | -29.20 | -50.69 | -37.85 | -326.70 | -32.45 | -1642.64 | -14.71 | -501.17 | -279.60 | -21.31 | -34.58 | -25.68 | -8.23 | -332.81 | -19.53 | -37.83 | -13.26 | -1087.68 | -11.80 | -40.62 | -22.74 | -25.46 | -5.61 | -320.59 | -5.26 | -5.36 | -8.78 | -262.15 | -9.78 | -202.20 | -66.27 | -9.02 | -37.51 | 0.33 | NA | |
| Payments To Acquire Productive Assets | 32.22 | 36.32 | 38.17 | 17.59 | 10.63 | 26.71 | 27.41 | 13.31 | 7.65 | 15.30 | 17.70 | 16.79 | 19.60 | 18.61 | 13.40 | 16.97 | 8.97 | 24.50 | 22.28 | 27.10 | 25.49 | 30.45 | 29.52 | 17.80 | 11.61 | 20.66 | 21.11 | 19.00 | 12.70 | 17.20 | 16.46 | 12.32 | 18.03 | 30.23 | 13.82 | 8.21 | 11.91 | 8.31 | 7.32 | 5.88 | 4.88 | 5.04 | 4.45 | 4.69 | 8.79 | 7.90 | 10.13 | 11.95 | 7.64 | 6.94 | 4.04 | 3.50 | NA |
| 2022-12-31 | 2022-09-30 | 2022-06-30 | 2022-03-31 | 2021-12-31 | 2021-09-30 | 2021-06-30 | 2021-03-31 | 2020-12-31 | 2020-09-30 | 2020-06-30 | 2020-03-31 | 2019-12-31 | 2019-09-30 | 2019-06-30 | 2019-03-31 | 2018-12-31 | 2018-09-30 | 2018-06-30 | 2018-03-31 | 2017-12-31 | 2017-09-30 | 2017-06-30 | 2017-03-31 | 2016-12-31 | 2016-09-30 | 2016-06-30 | 2016-03-31 | 2015-12-31 | 2015-09-30 | 2015-06-30 | 2015-03-31 | 2014-12-31 | 2014-09-30 | 2014-06-30 | 2014-03-31 | 2013-12-31 | 2013-09-30 | 2013-06-30 | 2013-03-31 | 2012-12-31 | 2012-09-30 | 2012-06-30 | 2012-03-31 | 2011-12-31 | 2011-09-30 | 2011-06-30 | 2011-03-31 | 2010-12-31 | 2010-09-30 | 2010-06-30 | 2010-03-31 | 2009-12-31 | ||
|---|---|---|---|---|---|---|---|---|---|---|---|---|---|---|---|---|---|---|---|---|---|---|---|---|---|---|---|---|---|---|---|---|---|---|---|---|---|---|---|---|---|---|---|---|---|---|---|---|---|---|---|---|---|---|
| Net Cash Provided By Used In Financing Activities | 926.72 | -57.16 | -127.61 | -153.75 | 445.87 | -26.05 | -141.69 | -63.39 | -643.66 | -75.80 | -39.98 | 648.14 | 711.43 | -50.81 | -33.67 | -27.39 | -49.86 | -37.46 | -78.92 | -100.67 | -28.95 | 184.87 | -83.00 | 202.13 | 816.22 | -25.81 | 571.84 | -22.04 | -49.33 | -70.30 | -40.85 | 271.02 | -32.42 | -27.15 | -29.81 | 766.07 | -24.82 | -23.49 | -16.25 | -6.54 | -5.00 | -3.32 | -15.61 | 1.10 | 261.34 | 55.75 | 1.52 | 4.95 | -11.97 | 2.80 | -13.61 | 2.13 | NA | |
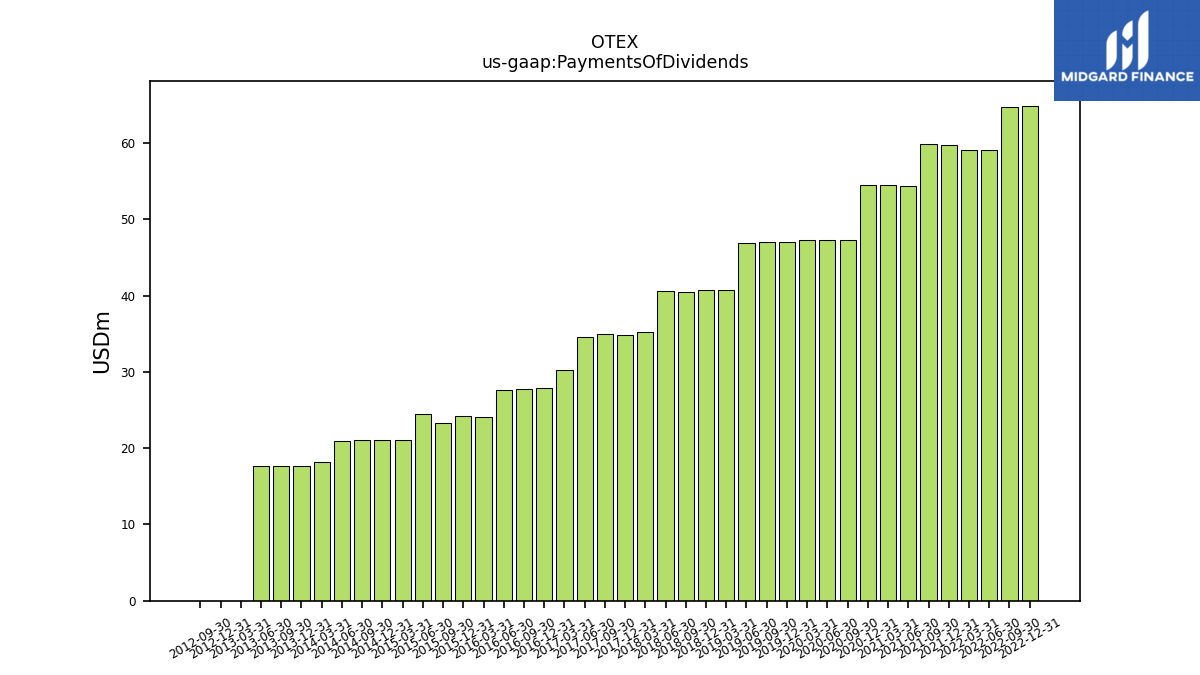
| Payments Of Dividends | 64.90 | 64.70 | 59.04 | 59.10 | 59.70 | 59.88 | 54.37 | 54.50 | 54.50 | 47.27 | 47.34 | 47.30 | 47.10 | 47.01 | 46.96 | 40.70 | 40.70 | 40.47 | 40.62 | 35.20 | 34.80 | 35.02 | 34.63 | 30.30 | 27.90 | 27.79 | 27.64 | 24.10 | 24.20 | 23.31 | 24.45 | 21.10 | 21.10 | 21.05 | 21.00 | 18.20 | 17.70 | 17.72 | 17.70 | 0.00 | 0.00 | 0.00 | NA | NA | NA | NA | NA | NA | NA | NA | NA | NA | NA | |
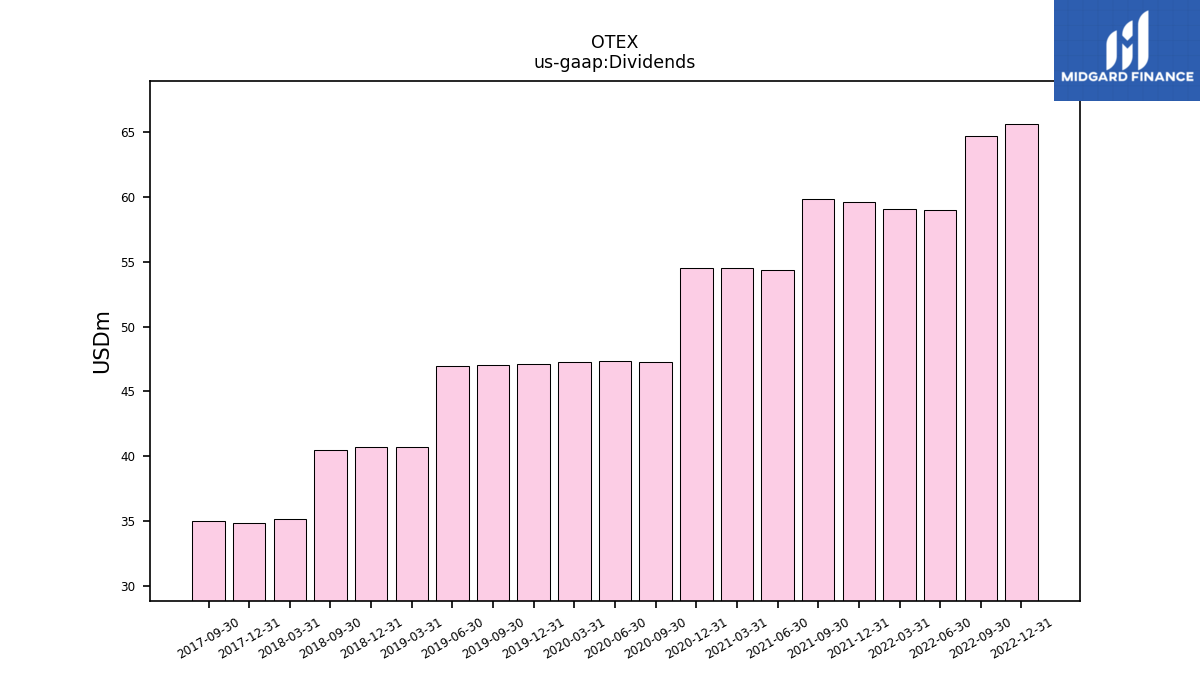
| Dividends | 65.69 | 64.70 | 59.04 | 59.08 | 59.66 | 59.88 | 54.37 | 54.52 | 54.50 | 47.27 | 47.34 | 47.28 | 47.09 | 47.01 | 46.96 | 40.73 | 40.70 | 40.47 | NA | 35.17 | 34.81 | 35.02 | NA | NA | NA | NA | NA | NA | NA | NA | NA | NA | NA | NA | NA | NA | NA | NA | NA | NA | NA | NA | NA | NA | NA | NA | NA | NA | NA | NA | NA | NA | NA | |
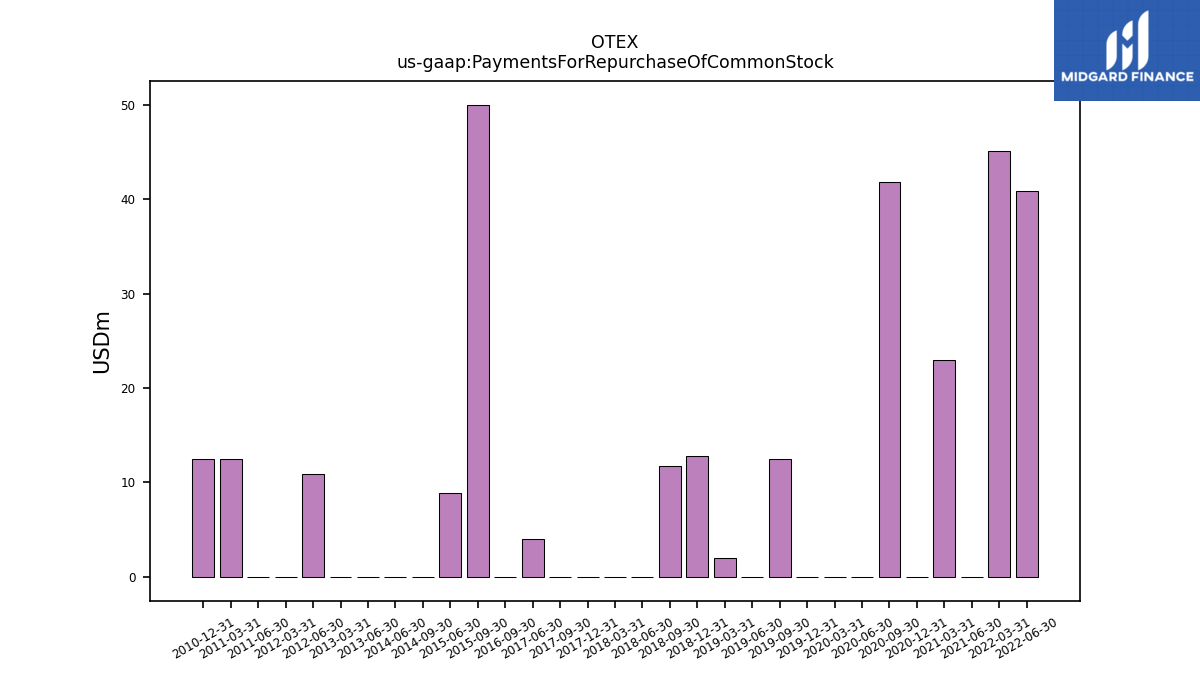
| Payments For Repurchase Of Common Stock | NA | NA | 40.87 | 45.08 | NA | NA | -0.05 | 23.00 | 0.00 | 41.87 | 0.00 | 0.00 | 0.00 | 12.42 | 0.00 | 2.00 | 12.80 | 11.72 | 0.00 | 0.00 | 0.00 | 0.00 | 3.96 | NA | NA | 0.00 | NA | NA | NA | 50.03 | 8.88 | NA | NA | 0.00 | 0.00 | NA | NA | NA | 0.00 | 0.00 | NA | NA | 10.89 | 0.00 | NA | NA | 0.00 | 12.50 | 12.50 | NA | NA | NA | NA |
| 2022-12-31 | 2022-09-30 | 2022-06-30 | 2022-03-31 | 2021-12-31 | 2021-09-30 | 2021-06-30 | 2021-03-31 | 2020-12-31 | 2020-09-30 | 2020-06-30 | 2020-03-31 | 2019-12-31 | 2019-09-30 | 2019-06-30 | 2019-03-31 | 2018-12-31 | 2018-09-30 | 2018-06-30 | 2018-03-31 | 2017-12-31 | 2017-09-30 | 2017-06-30 | 2017-03-31 | 2016-12-31 | 2016-09-30 | 2016-06-30 | 2016-03-31 | 2015-12-31 | 2015-09-30 | 2015-06-30 | 2015-03-31 | 2014-12-31 | 2014-09-30 | 2014-06-30 | 2014-03-31 | 2013-12-31 | 2013-09-30 | 2013-06-30 | 2013-03-31 | 2012-12-31 | 2012-09-30 | 2012-06-30 | 2012-03-31 | 2011-12-31 | 2011-09-30 | 2011-06-30 | 2011-03-31 | 2010-12-31 | 2010-09-30 | 2010-06-30 | 2010-03-31 | 2009-12-31 | ||
|---|---|---|---|---|---|---|---|---|---|---|---|---|---|---|---|---|---|---|---|---|---|---|---|---|---|---|---|---|---|---|---|---|---|---|---|---|---|---|---|---|---|---|---|---|---|---|---|---|---|---|---|---|---|---|
| Revenues | 897.44 | 852.04 | 902.45 | 882.28 | 876.80 | 832.31 | 893.53 | 832.93 | 855.64 | 804.01 | 826.61 | 814.68 | 771.56 | 696.89 | 747.22 | 719.15 | 735.23 | 667.16 | 754.27 | 685.88 | 734.40 | 640.69 | 663.55 | 593.13 | 542.71 | 491.66 | 483.80 | 440.54 | 465.35 | 434.54 | 482.71 | 447.58 | 467.85 | 453.79 | 493.98 | 442.75 | 363.51 | 324.46 | 347.27 | 337.69 | 352.18 | 326.19 | 305.62 | 292.35 | 321.46 | 288.05 | 285.45 | 262.96 | 267.49 | 217.41 | 240.03 | 212.78 | 247.79 | |
| Revenue From Contract With Customer Excluding Assessed Tax | 897.44 | 852.04 | 902.45 | 882.28 | 876.80 | 832.31 | 893.53 | 832.93 | 855.64 | 804.01 | 826.61 | 814.68 | 771.56 | 696.89 | 747.22 | 719.15 | 735.23 | 667.16 | 754.27 | 685.88 | 734.40 | 640.69 | 663.55 | 593.13 | 542.71 | 491.66 | 483.80 | 440.54 | 465.35 | 434.54 | 482.71 | 447.58 | 467.85 | 453.79 | 493.98 | 442.75 | 363.51 | 324.46 | 347.27 | 337.69 | 352.18 | 326.19 | 305.62 | 292.35 | 321.46 | 288.05 | 285.45 | 262.96 | 267.49 | 217.41 | 240.03 | 212.78 | 247.79 | |
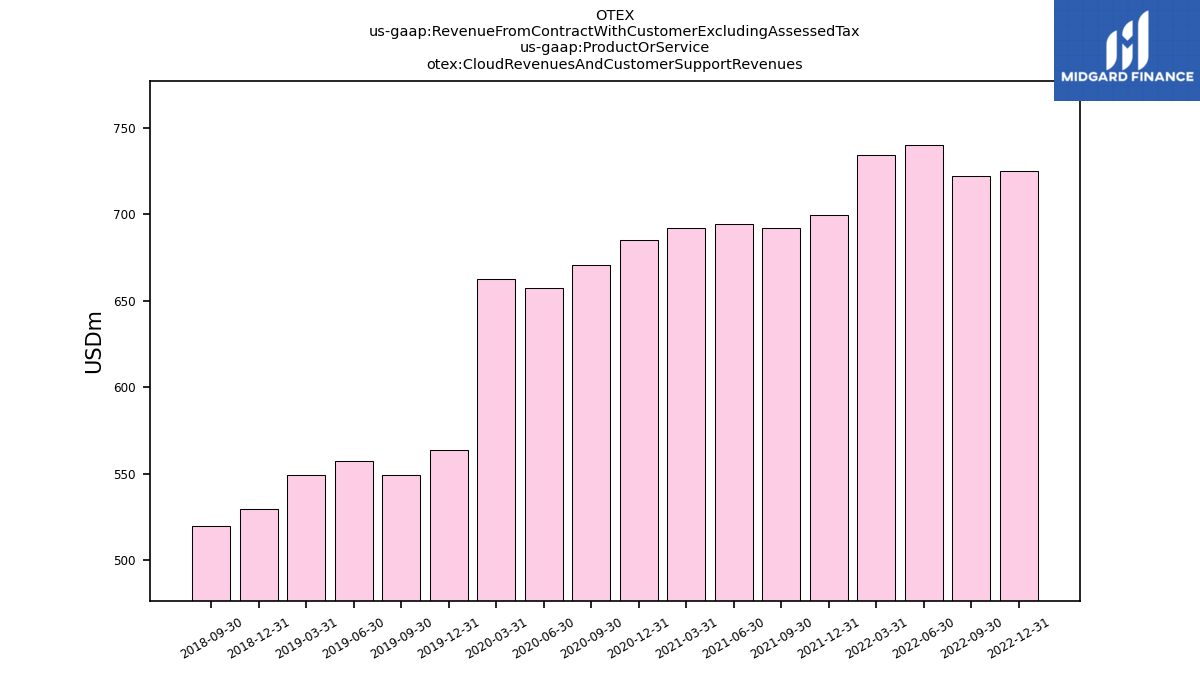
| Cloud Revenues And Customer Support Revenues | 725.18 | 722.00 | 739.93 | 734.46 | 699.76 | 691.83 | 694.42 | 691.76 | 684.95 | 670.38 | 657.53 | 662.33 | 563.85 | 549.56 | 557.14 | 549.37 | 529.59 | 519.63 | NA | NA | NA | NA | NA | NA | NA | NA | NA | NA | NA | NA | NA | NA | NA | NA | NA | NA | NA | NA | NA | NA | NA | NA | NA | NA | NA | NA | NA | NA | NA | NA | NA | NA | NA | |
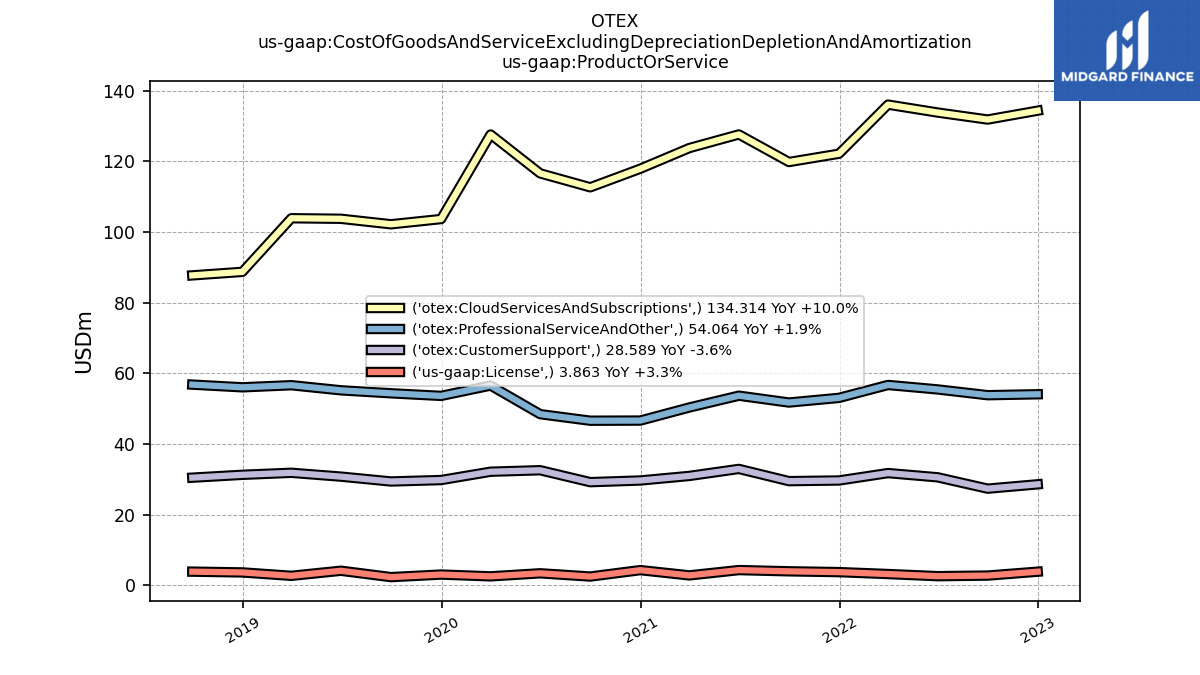
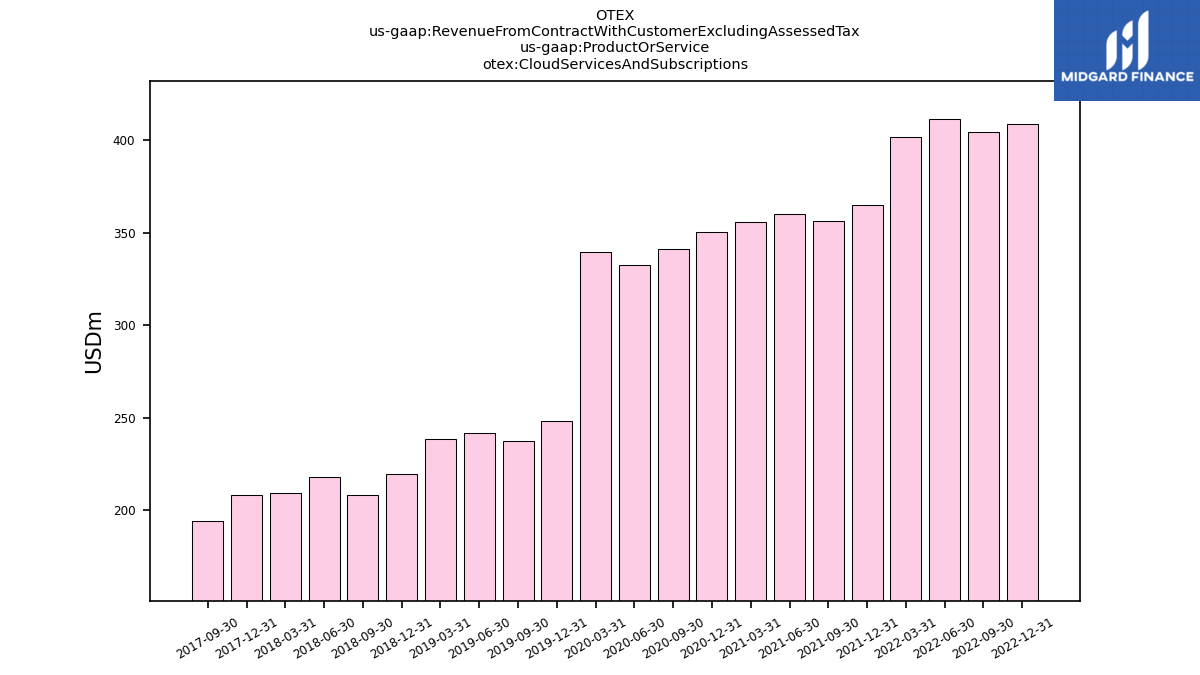
| Cloud Services And Subscriptions | 408.67 | 404.65 | 411.60 | 401.95 | 364.89 | 356.59 | 360.16 | 355.85 | 350.45 | 340.99 | 332.62 | 339.46 | 248.34 | 237.26 | 241.89 | 238.61 | 219.23 | 208.08 | 217.89 | 209.10 | 208.12 | 193.85 | NA | NA | NA | NA | NA | NA | NA | NA | NA | NA | NA | NA | NA | NA | NA | NA | NA | NA | NA | NA | NA | NA | NA | NA | NA | NA | NA | NA | NA | NA | NA | |
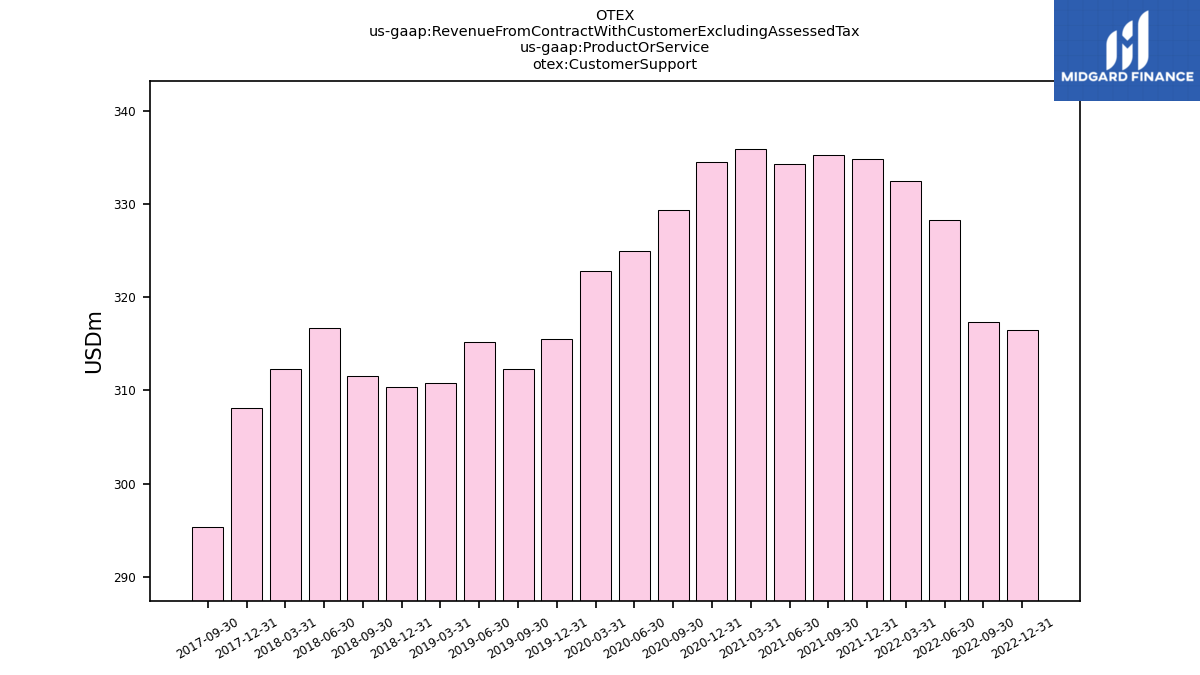
| Customer Support | 316.51 | 317.35 | 328.34 | 332.51 | 334.88 | 335.24 | 334.26 | 335.92 | 334.49 | 329.40 | 324.92 | 322.87 | 315.51 | 312.30 | 315.25 | 310.76 | 310.35 | 311.55 | 316.75 | 312.28 | 308.07 | 295.40 | NA | NA | NA | NA | NA | NA | NA | NA | NA | NA | NA | NA | NA | NA | NA | NA | NA | NA | NA | NA | NA | NA | NA | NA | NA | NA | NA | NA | NA | NA | NA | |
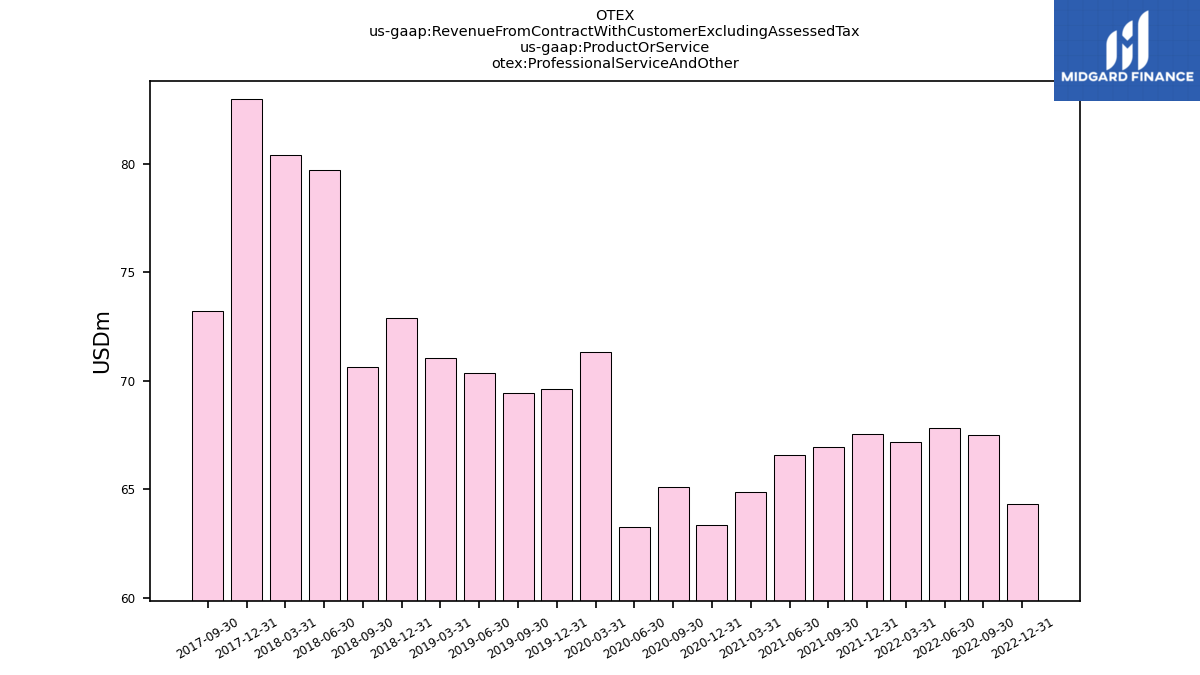
| Professional Service And Other | 64.30 | 67.49 | 67.83 | 67.18 | 67.55 | 66.95 | 66.57 | 64.87 | 63.35 | 65.11 | 63.28 | 71.30 | 69.61 | 69.43 | 70.36 | 71.06 | 72.89 | 70.64 | 79.70 | 80.39 | 82.97 | 73.20 | NA | NA | NA | NA | NA | NA | NA | NA | NA | NA | NA | NA | NA | NA | NA | NA | NA | NA | NA | NA | NA | NA | NA | NA | NA | NA | NA | NA | NA | NA | NA | |
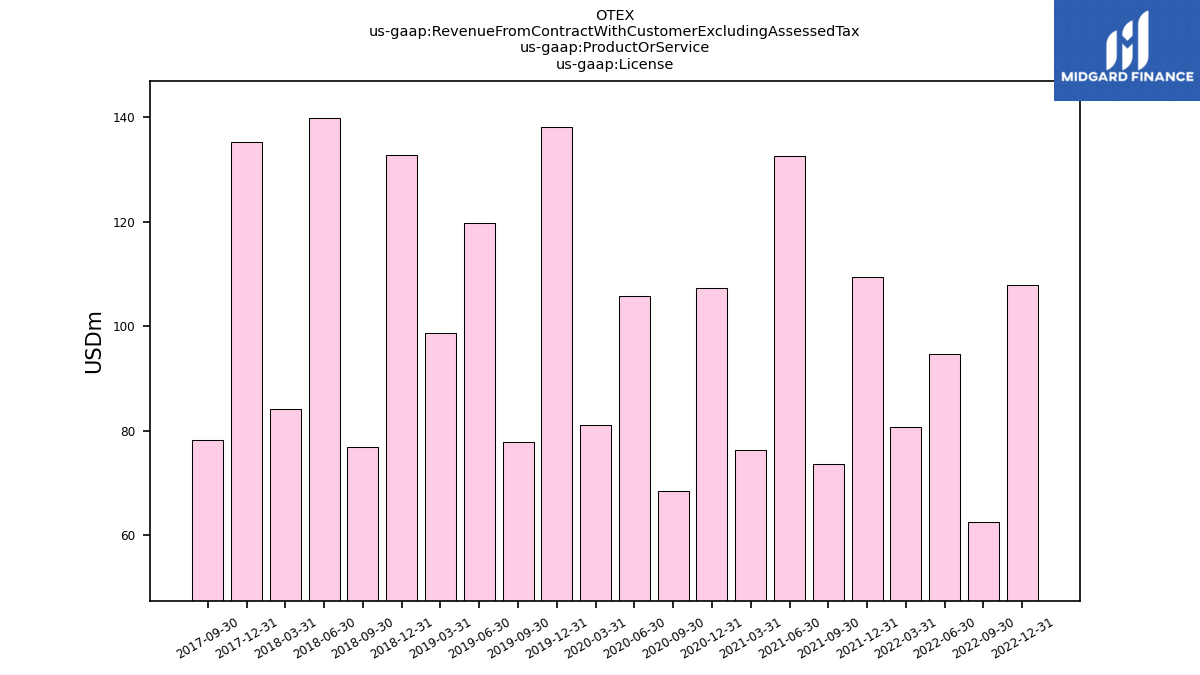
| License | 107.96 | 62.55 | 94.69 | 80.64 | 109.49 | 73.53 | 132.54 | 76.30 | 107.35 | 68.52 | 105.80 | 81.06 | 138.09 | 77.90 | 119.73 | 98.72 | 132.76 | 76.89 | 139.92 | 84.11 | 135.24 | 78.23 | NA | NA | NA | NA | NA | NA | NA | NA | NA | NA | NA | NA | NA | NA | NA | NA | NA | NA | NA | NA | NA | NA | NA | NA | NA | NA | NA | NA | NA | NA | NA | |
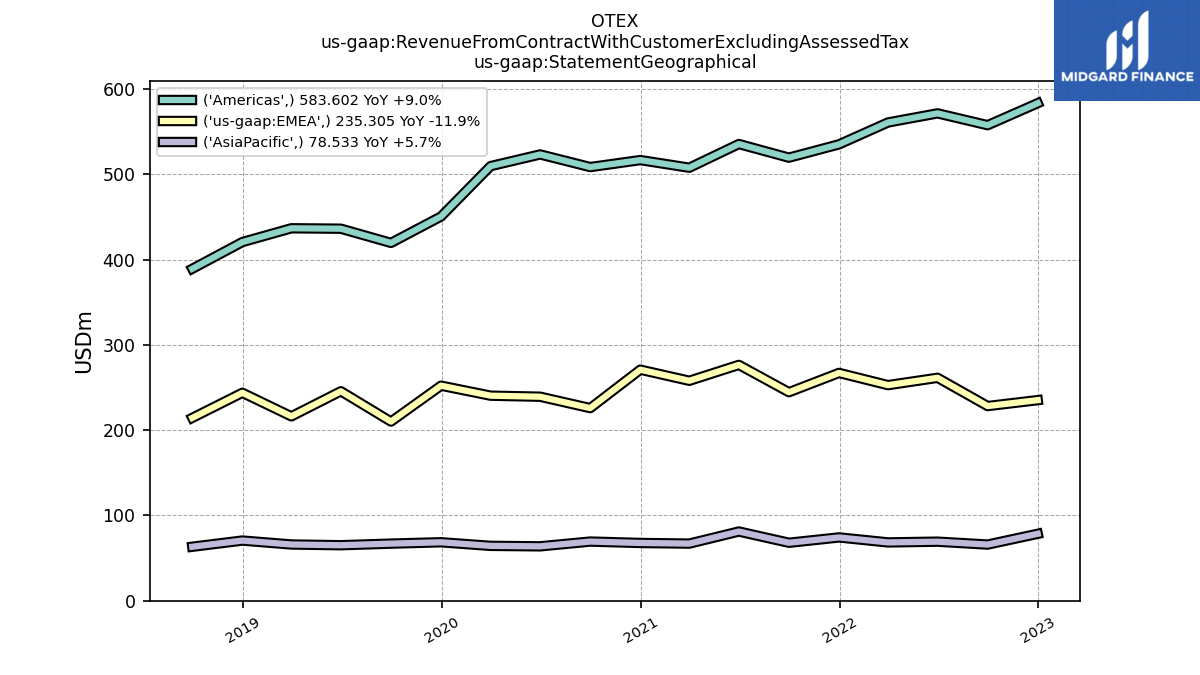
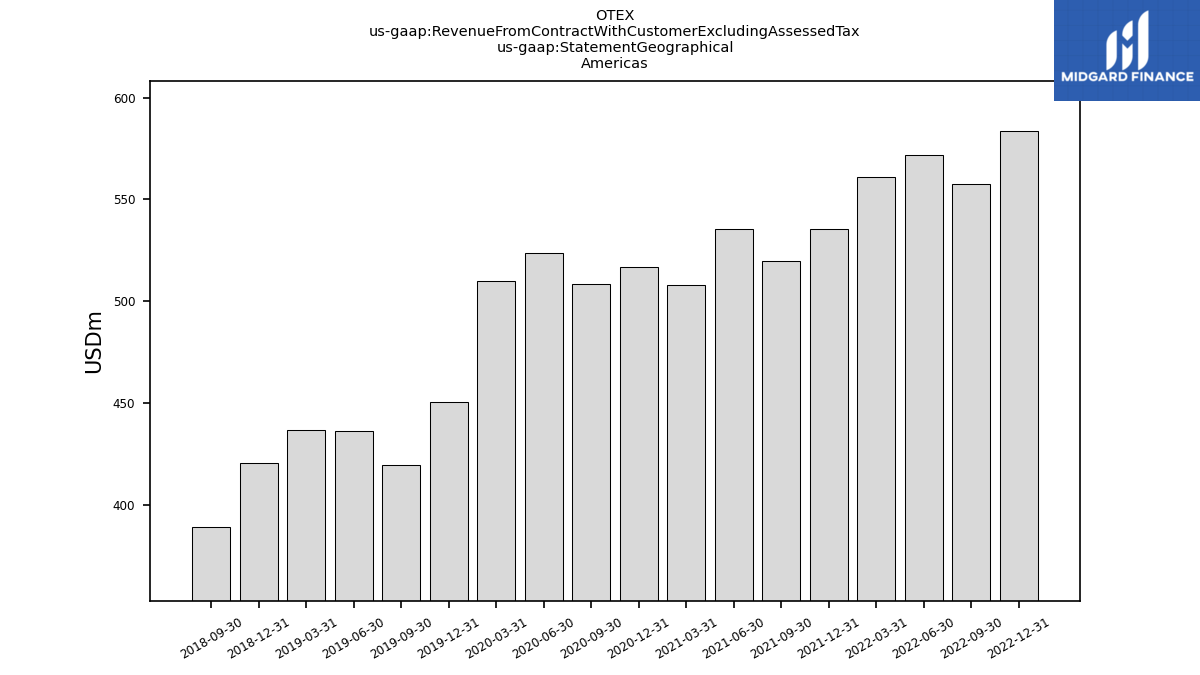
| 583.60 | 557.79 | 571.66 | 560.97 | 535.31 | 519.69 | 535.68 | 507.89 | 516.85 | 508.66 | 523.47 | 509.78 | 450.69 | 419.71 | 436.37 | 436.87 | 420.70 | 389.34 | NA | NA | NA | NA | NA | NA | NA | NA | NA | NA | NA | NA | NA | NA | NA | NA | NA | NA | NA | NA | NA | NA | NA | NA | NA | NA | NA | NA | NA | NA | NA | NA | NA | NA | NA | ||
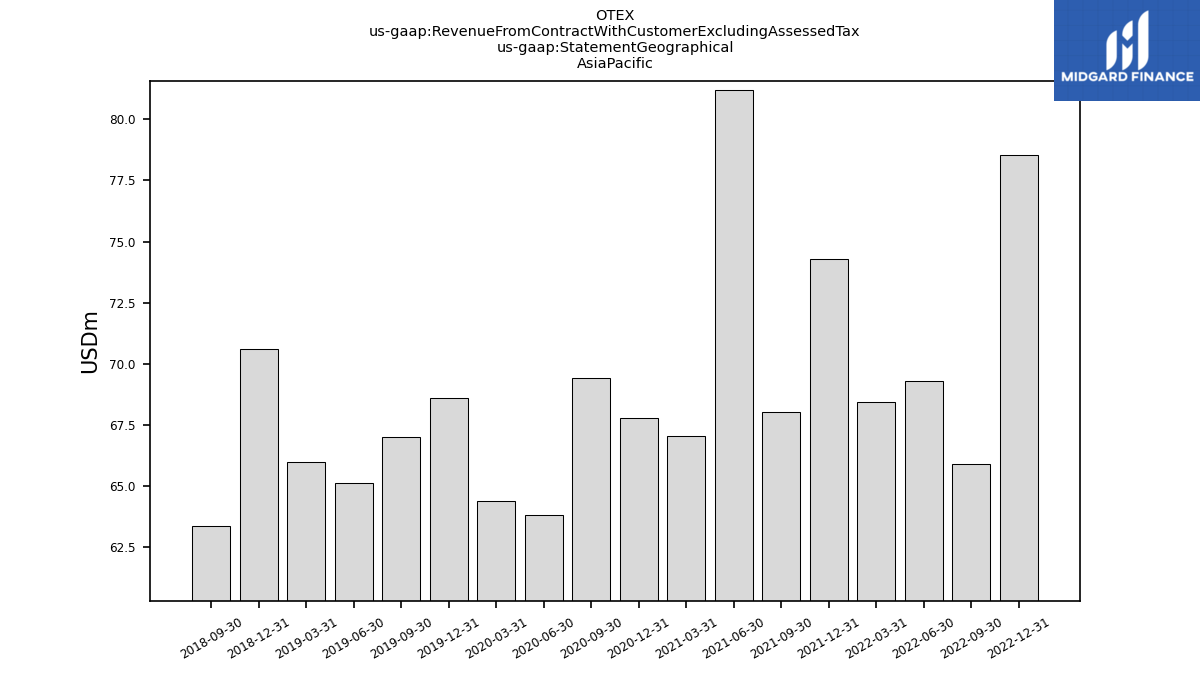
| 78.53 | 65.89 | 69.30 | 68.43 | 74.27 | 68.02 | 81.20 | 67.03 | 67.77 | 69.42 | 63.82 | 64.37 | 68.60 | 67.01 | 65.12 | 65.99 | 70.60 | 63.34 | NA | NA | NA | NA | NA | NA | NA | NA | NA | NA | NA | NA | NA | NA | NA | NA | NA | NA | NA | NA | NA | NA | NA | NA | NA | NA | NA | NA | NA | NA | NA | NA | NA | NA | NA | ||
| EMEA | 235.31 | 228.35 | 261.49 | 252.89 | 267.22 | 244.60 | 276.64 | 258.01 | 271.02 | 225.94 | 239.32 | 240.53 | 252.27 | 210.17 | 245.72 | 216.29 | 243.94 | 214.47 | NA | NA | NA | NA | NA | NA | NA | NA | NA | NA | NA | NA | NA | NA | NA | NA | NA | NA | NA | NA | NA | NA | NA | NA | NA | NA | NA | NA | NA | NA | NA | NA | NA | NA | NA | |
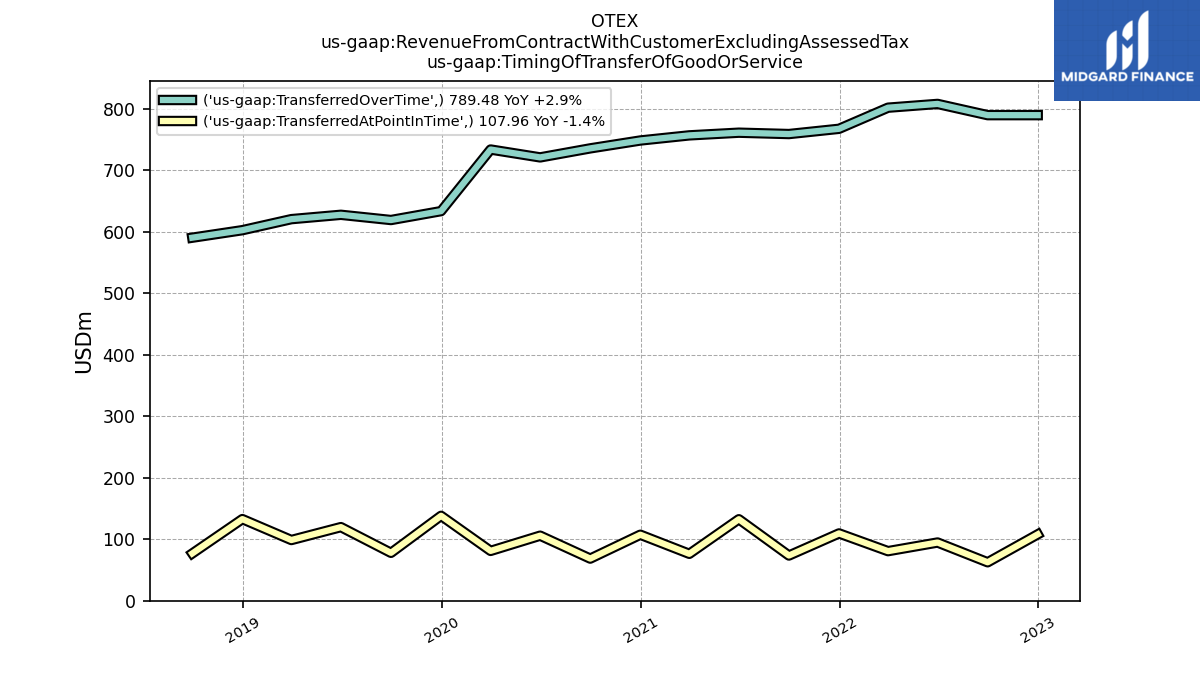
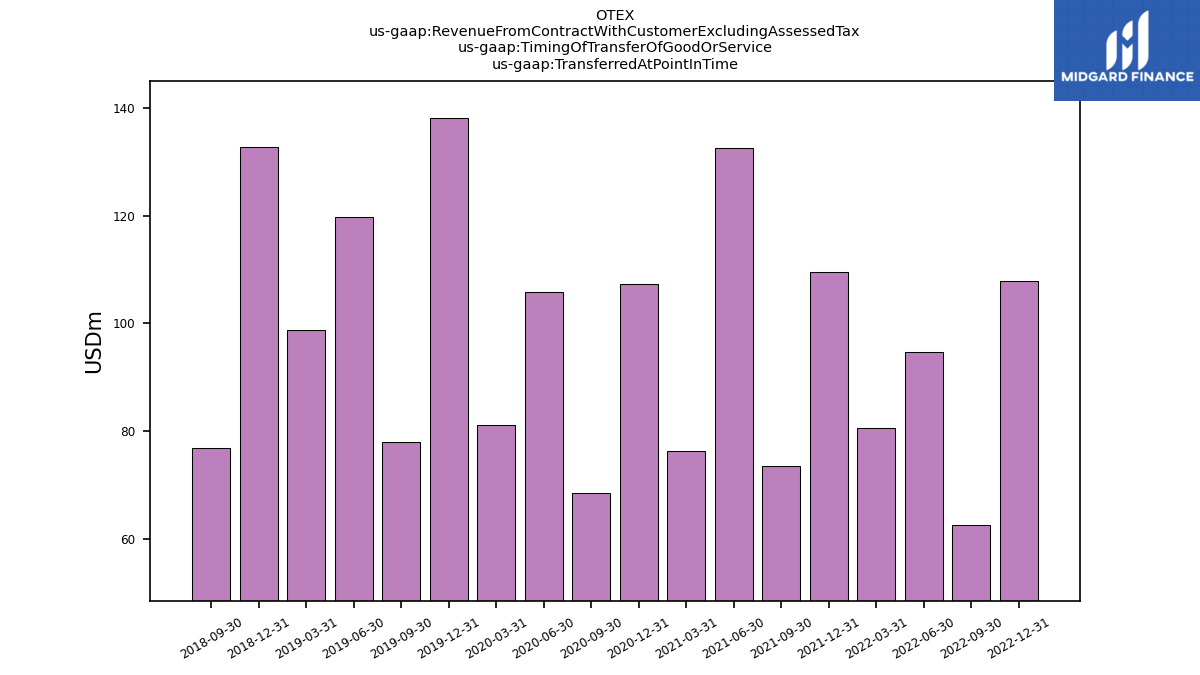
| Transferred At Point In Time | 107.96 | 62.55 | 94.69 | 80.64 | 109.49 | 73.53 | 132.54 | 76.30 | 107.35 | 68.52 | 105.80 | 81.06 | 138.09 | 77.90 | 119.73 | 98.72 | 132.76 | 76.89 | NA | NA | NA | NA | NA | NA | NA | NA | NA | NA | NA | NA | NA | NA | NA | NA | NA | NA | NA | NA | NA | NA | NA | NA | NA | NA | NA | NA | NA | NA | NA | NA | NA | NA | NA | |
| Transferred Over Time | 789.48 | 789.49 | 807.77 | 801.64 | 767.31 | 758.78 | 760.99 | 756.63 | 748.30 | 735.49 | 720.81 | 733.62 | 633.46 | 618.99 | 627.49 | 620.42 | 602.48 | 590.27 | NA | NA | NA | NA | NA | NA | NA | NA | NA | NA | NA | NA | NA | NA | NA | NA | NA | NA | NA | NA | NA | NA | NA | NA | NA | NA | NA | NA | NA | NA | NA | NA | NA | NA | NA |


