
| 2023-12-31 | 2023-09-30 | 2023-06-30 | 2023-03-31 | 2022-12-31 | 2022-09-30 | 2022-06-30 | 2022-03-31 | 2021-12-31 | 2021-09-30 | 2021-06-30 | 2021-03-31 | 2020-12-31 | 2020-09-30 | 2020-06-30 | 2020-03-31 | 2019-12-31 | 2019-09-30 | 2019-06-30 | 2019-03-31 | 2018-12-31 | 2018-09-30 | 2018-06-30 | 2018-03-31 | ||
|---|---|---|---|---|---|---|---|---|---|---|---|---|---|---|---|---|---|---|---|---|---|---|---|---|---|
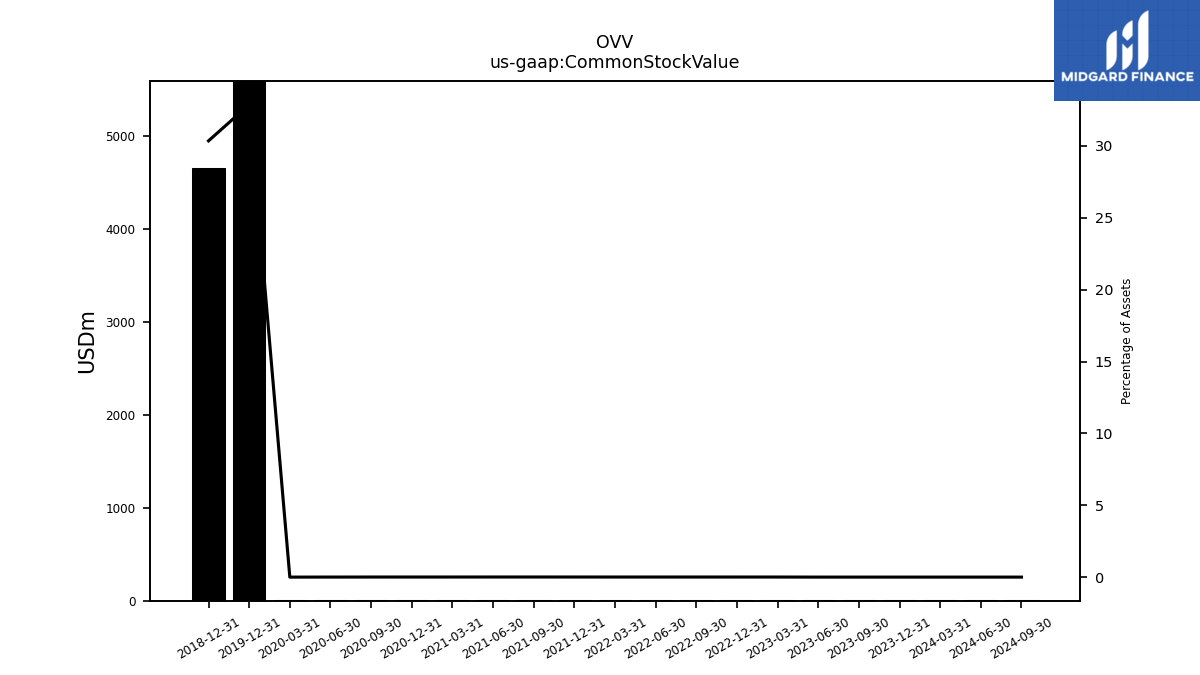
| Common Stock Value | 3.00 | 3.00 | 3.00 | 3.00 | 3.00 | 3.00 | 3.00 | 3.00 | 3.00 | 3.00 | 3.00 | 3.00 | 3.00 | 3.00 | 3.00 | 3.00 | 7061.00 | NA | NA | NA | 4656.00 | NA | NA | NA | |
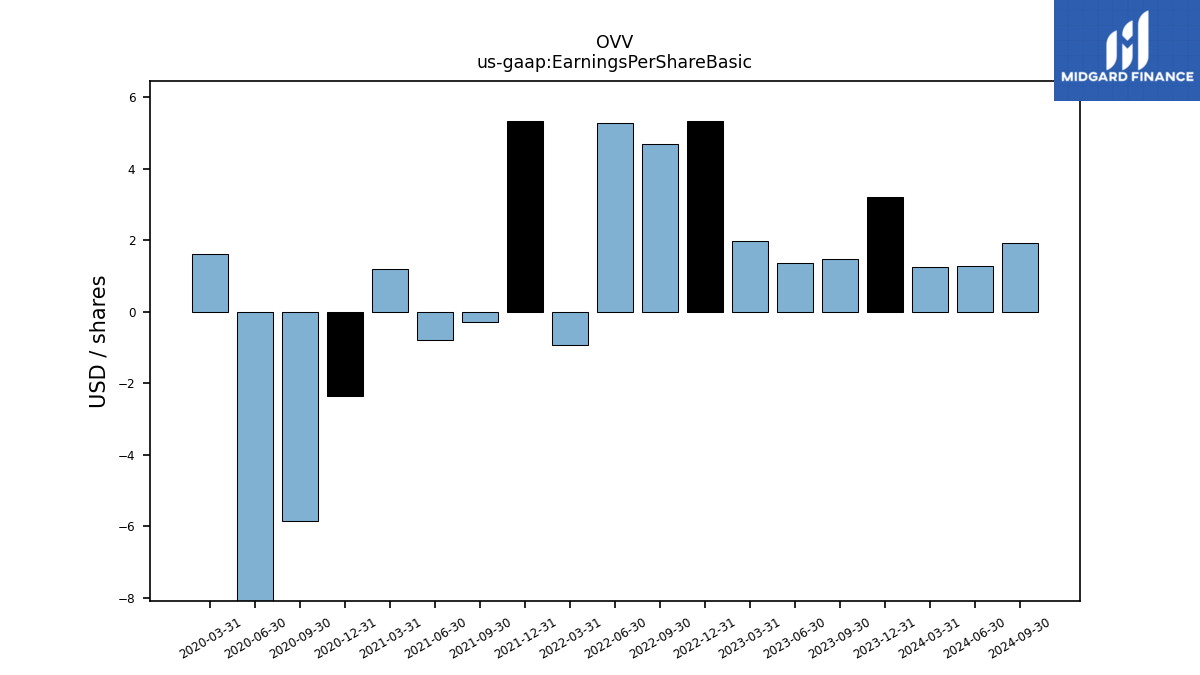
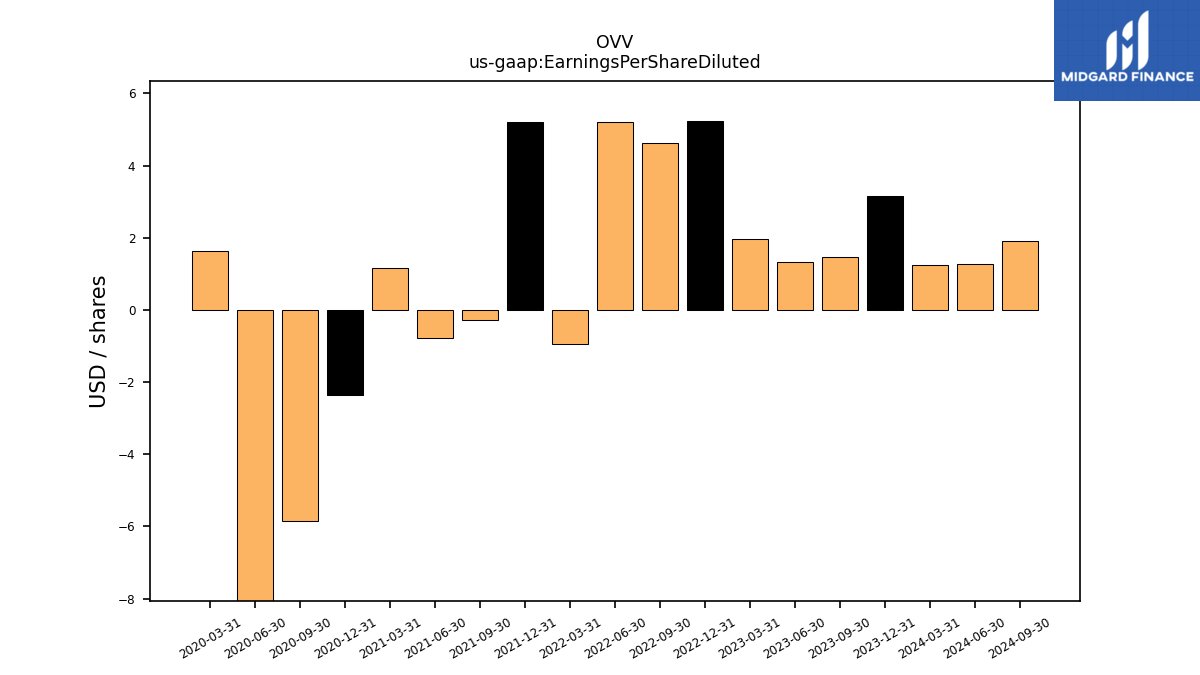
| Earnings Per Share Basic | 3.22 | 1.48 | 1.35 | 1.99 | 5.34 | 4.70 | 5.28 | -0.94 | 5.32 | -0.28 | -0.79 | 1.19 | -2.36 | -5.85 | -16.87 | 1.62 | NA | NA | NA | NA | NA | NA | NA | NA | |
| Earnings Per Share Diluted | 3.17 | 1.47 | 1.34 | 1.97 | 5.24 | 4.63 | 5.21 | -0.94 | 5.20 | -0.28 | -0.79 | 1.16 | -2.36 | -5.85 | -16.87 | 1.62 | NA | NA | NA | NA | NA | NA | NA | NA |
| 2023-12-31 | 2023-09-30 | 2023-06-30 | 2023-03-31 | 2022-12-31 | 2022-09-30 | 2022-06-30 | 2022-03-31 | 2021-12-31 | 2021-09-30 | 2021-06-30 | 2021-03-31 | 2020-12-31 | 2020-09-30 | 2020-06-30 | 2020-03-31 | 2019-12-31 | 2019-09-30 | 2019-06-30 | 2019-03-31 | 2018-12-31 | 2018-09-30 | 2018-06-30 | 2018-03-31 | ||
|---|---|---|---|---|---|---|---|---|---|---|---|---|---|---|---|---|---|---|---|---|---|---|---|---|---|
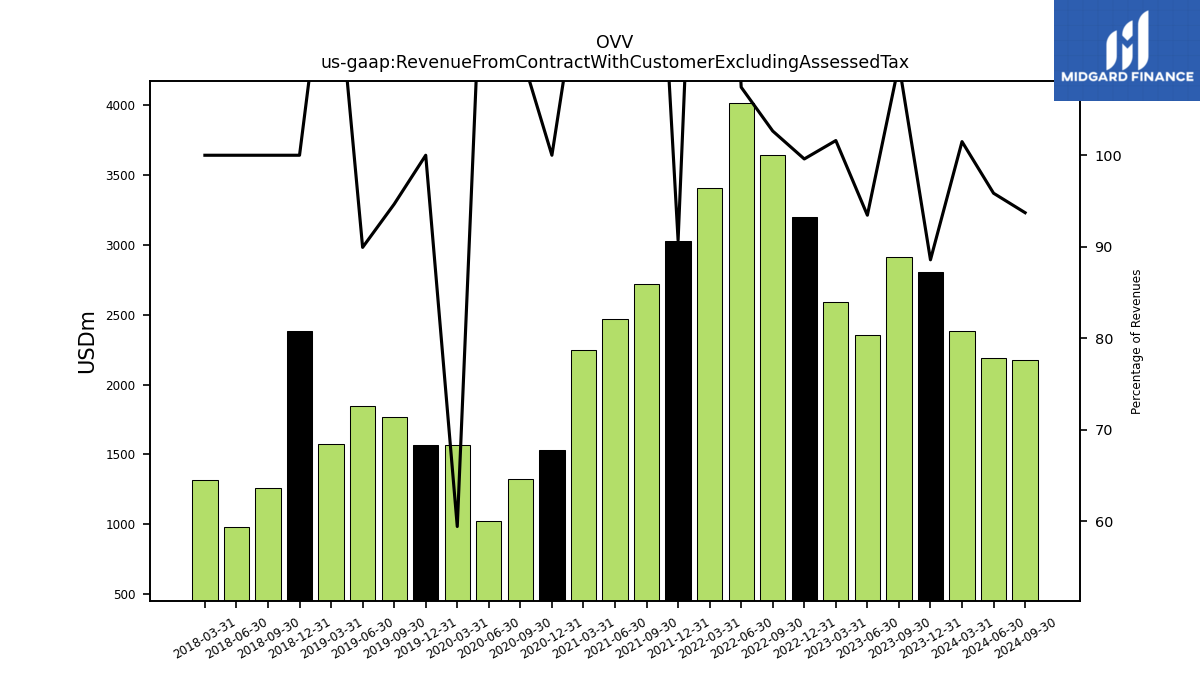
| Revenue From Contract With Customer Excluding Assessed Tax | 2804.00 | 2913.00 | 2352.00 | 2592.00 | 3199.00 | 3643.00 | 4014.00 | 3407.00 | 3028.00 | 2720.00 | 2473.00 | 2247.00 | 1528.00 | 1326.00 | 1023.00 | 1570.00 | 1565.00 | 1771.00 | 1848.00 | 1572.00 | 2381.00 | 1262.00 | 983.00 | 1313.00 | |
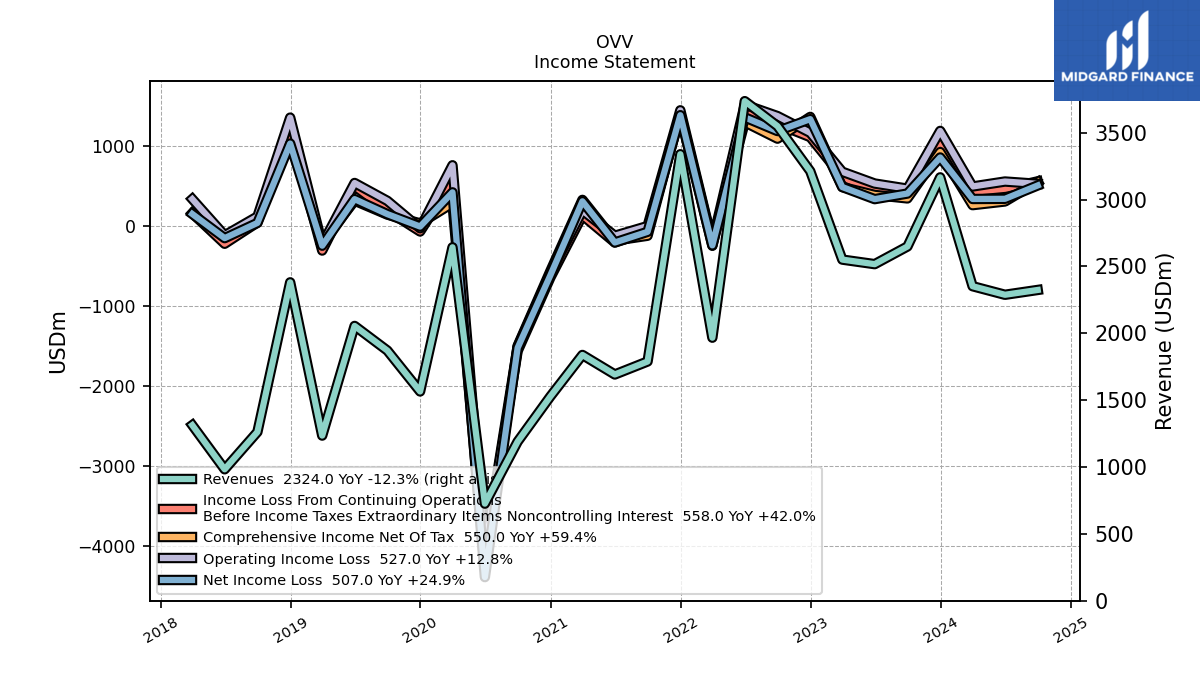
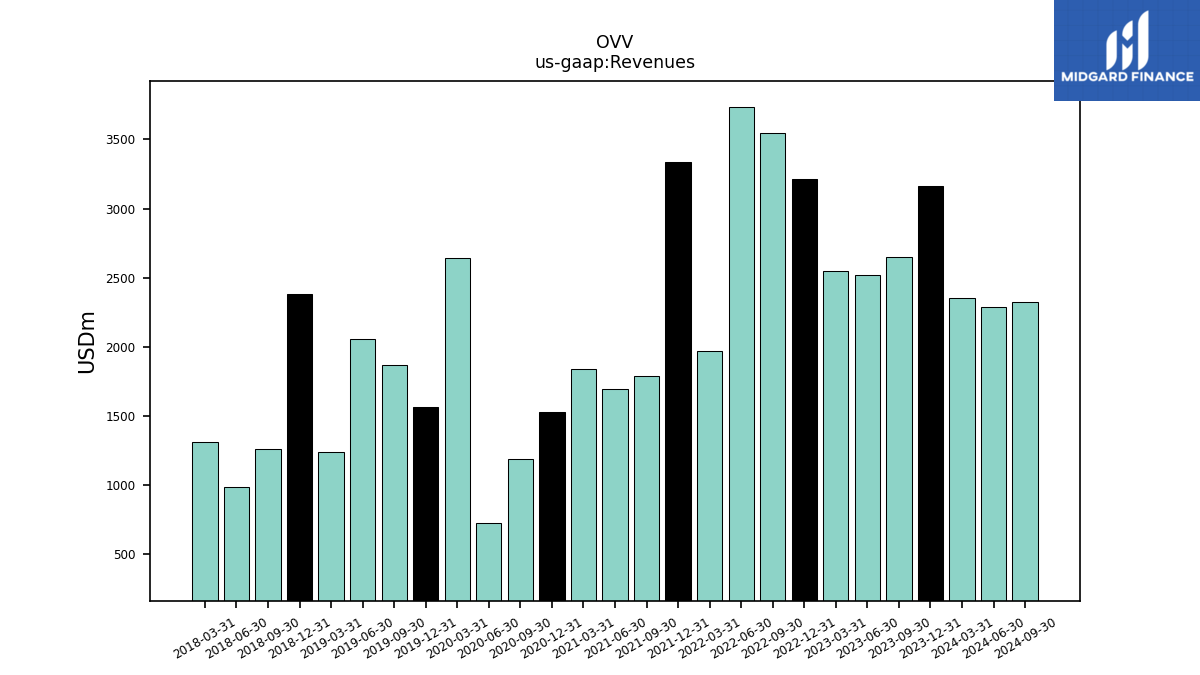
| Revenues | 3166.00 | 2649.00 | 2517.00 | 2551.00 | 3212.00 | 3549.00 | 3736.00 | 1967.00 | 3339.00 | 1789.00 | 1692.00 | 1838.00 | 1528.00 | 1190.00 | 726.00 | 2643.00 | 1565.00 | 1871.00 | 2055.00 | 1235.00 | 2381.00 | 1262.00 | 983.00 | 1313.00 | |
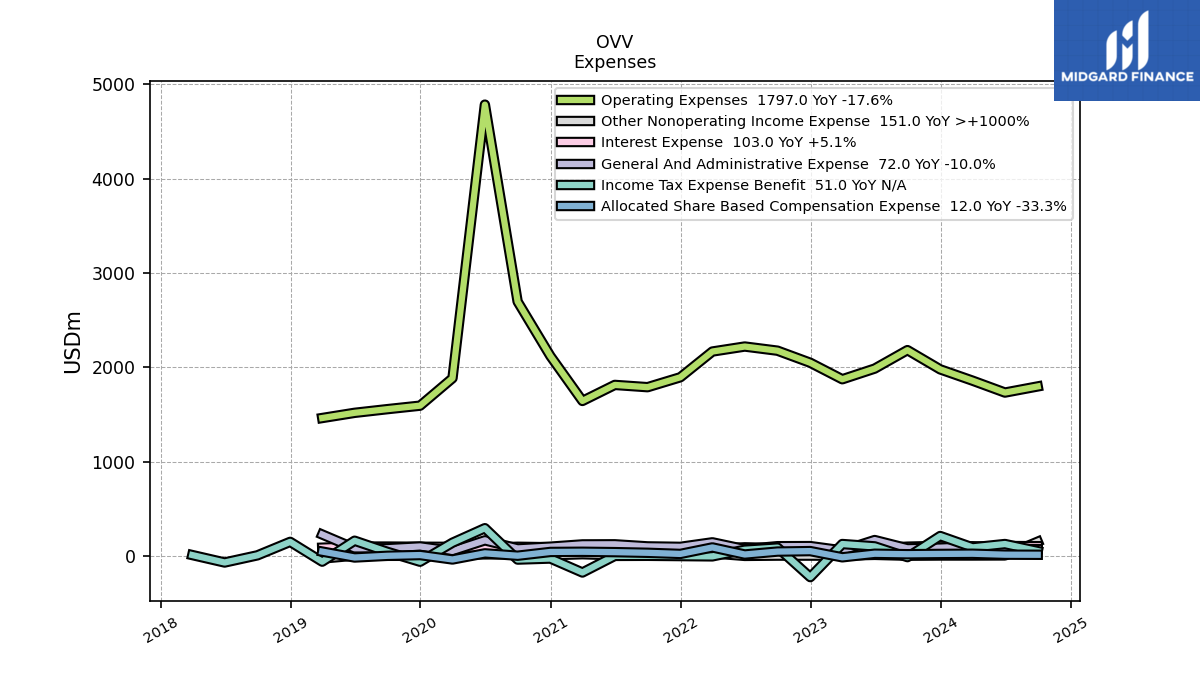
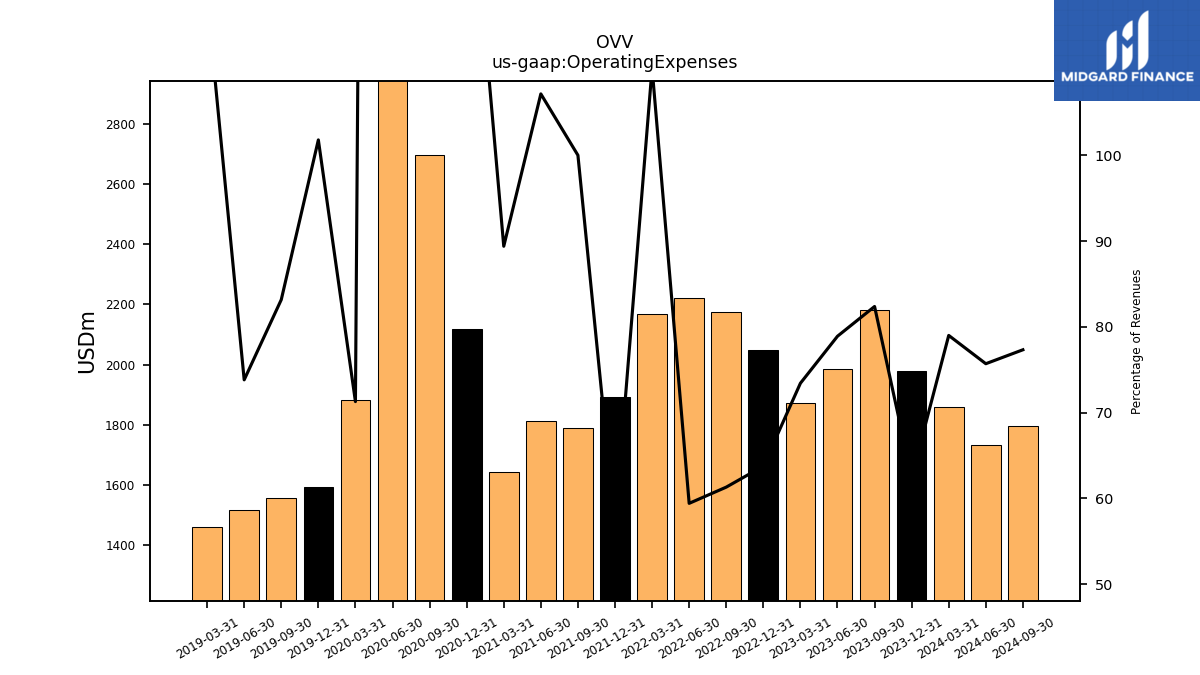
| Operating Expenses | 1978.00 | 2182.00 | 1986.00 | 1873.00 | 2048.00 | 2176.00 | 2220.00 | 2167.00 | 1894.00 | 1789.00 | 1813.00 | 1643.00 | 2119.00 | 2696.00 | 4785.00 | 1884.00 | 1593.00 | 1556.00 | 1517.00 | 1462.00 | NA | NA | NA | NA | |
| Costs And Expenses | 1978.00 | 2182.00 | 1986.00 | 1873.00 | 2048.00 | 2176.00 | 2220.00 | 2167.00 | 1894.00 | 1789.00 | 1813.00 | 1643.00 | 2119.00 | 2696.00 | 4785.00 | 1884.00 | 1593.00 | 1556.00 | 1517.00 | 1462.00 | NA | NA | NA | NA | |
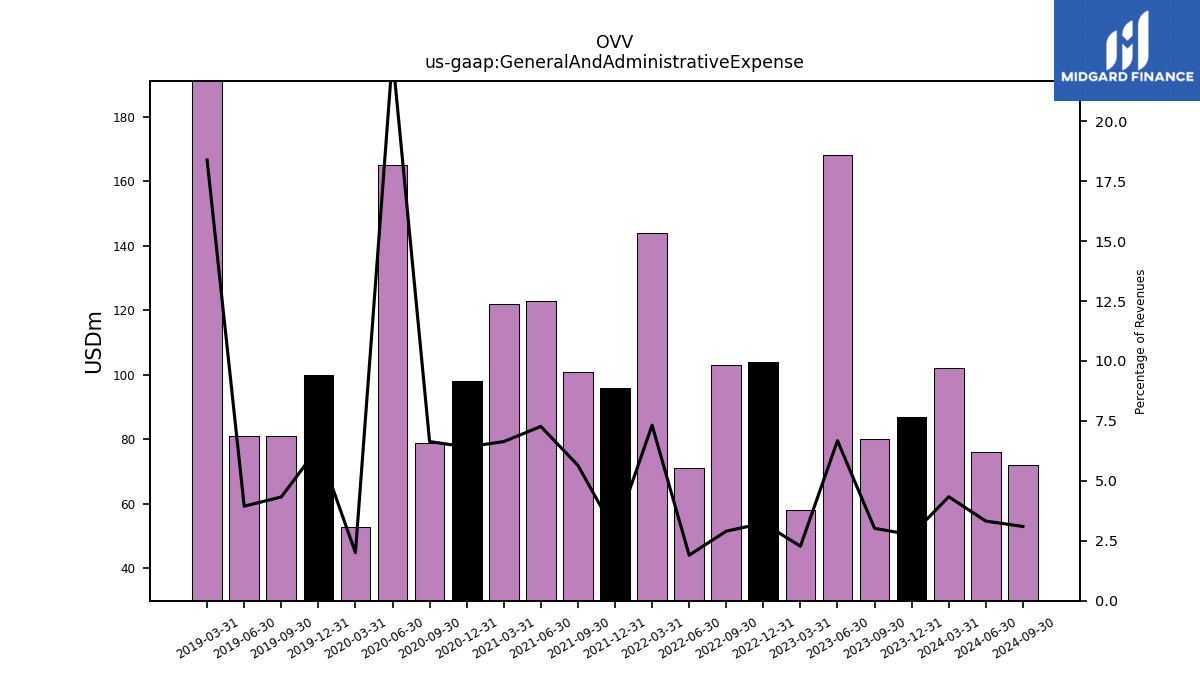
| General And Administrative Expense | 87.00 | 80.00 | 168.00 | 58.00 | 104.00 | 103.00 | 71.00 | 144.00 | 96.00 | 101.00 | 123.00 | 122.00 | 98.00 | 79.00 | 165.00 | 53.00 | 100.00 | 81.00 | 81.00 | 227.00 | NA | NA | NA | NA | |
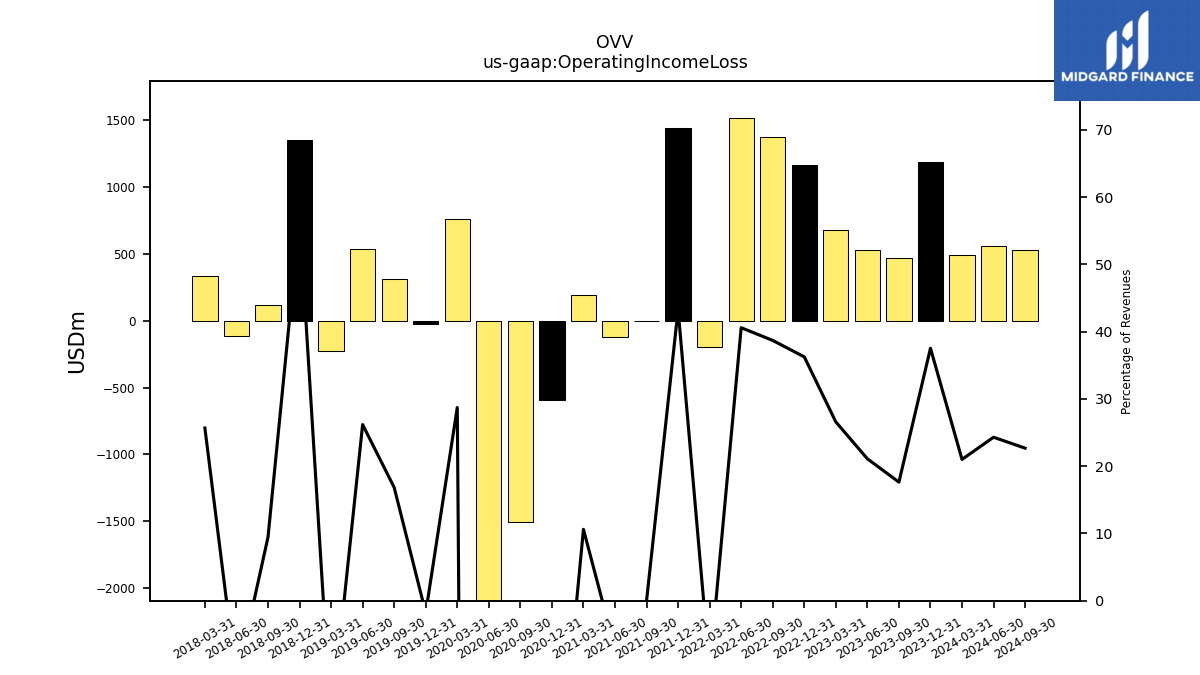
| Operating Income Loss | 1188.00 | 467.00 | 531.00 | 678.00 | 1164.00 | 1373.00 | 1516.00 | -200.00 | 1445.00 | 0.00 | -121.00 | 195.00 | -591.00 | -1506.00 | -4059.00 | 759.00 | -28.00 | 315.00 | 538.00 | -227.00 | 1354.00 | 119.00 | -116.00 | 337.00 | |
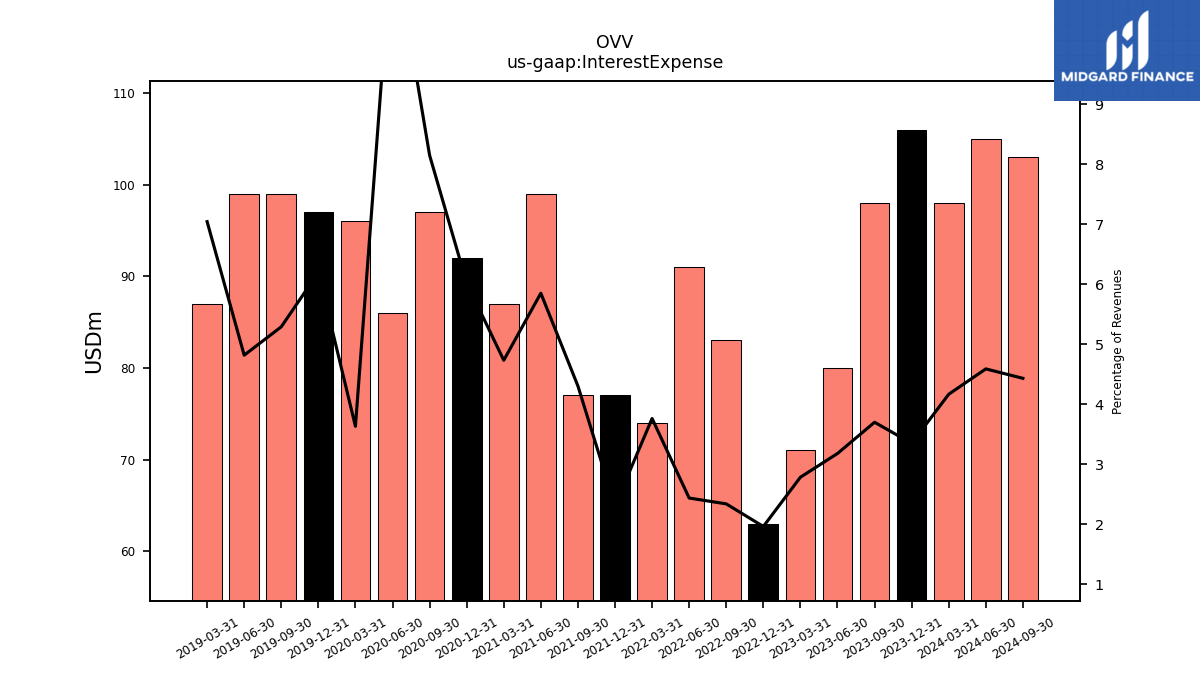
| Interest Expense | 106.00 | 98.00 | 80.00 | 71.00 | 63.00 | 83.00 | 91.00 | 74.00 | 77.00 | 77.00 | 99.00 | 87.00 | 92.00 | 97.00 | 86.00 | 96.00 | 97.00 | 99.00 | 99.00 | 87.00 | NA | NA | NA | NA | |
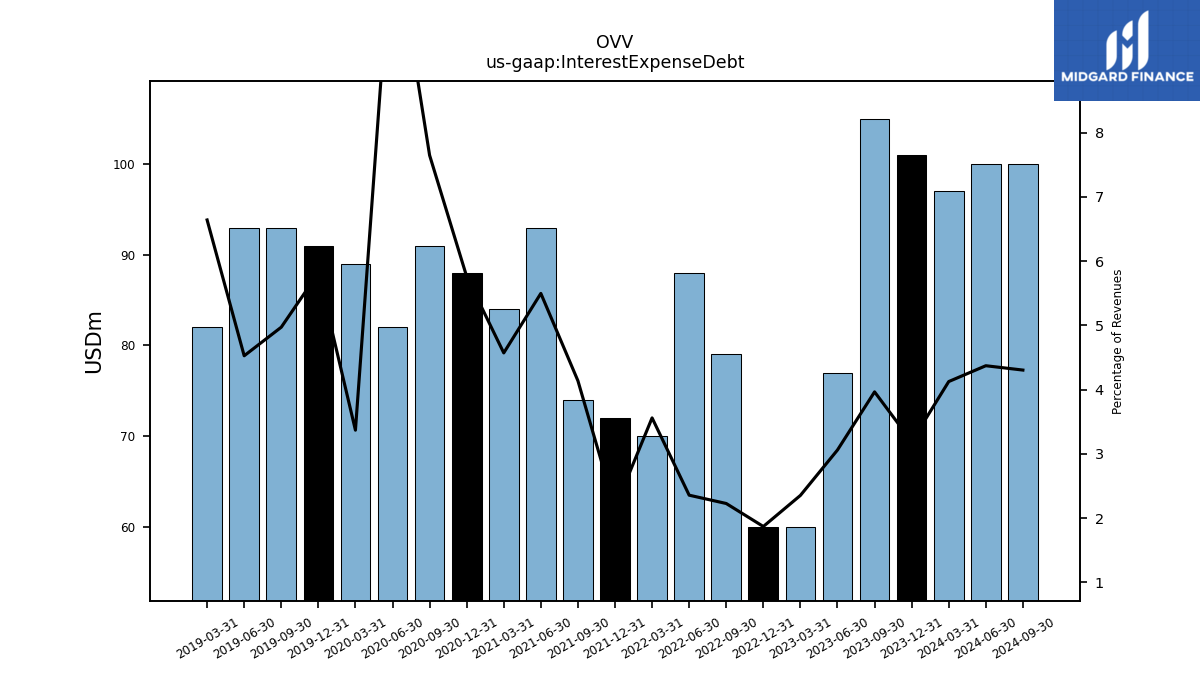
| Interest Expense Debt | 101.00 | 105.00 | 77.00 | 60.00 | 60.00 | 79.00 | 88.00 | 70.00 | 72.00 | 74.00 | 93.00 | 84.00 | 88.00 | 91.00 | 82.00 | 89.00 | 91.00 | 93.00 | 93.00 | 82.00 | NA | NA | NA | NA | |
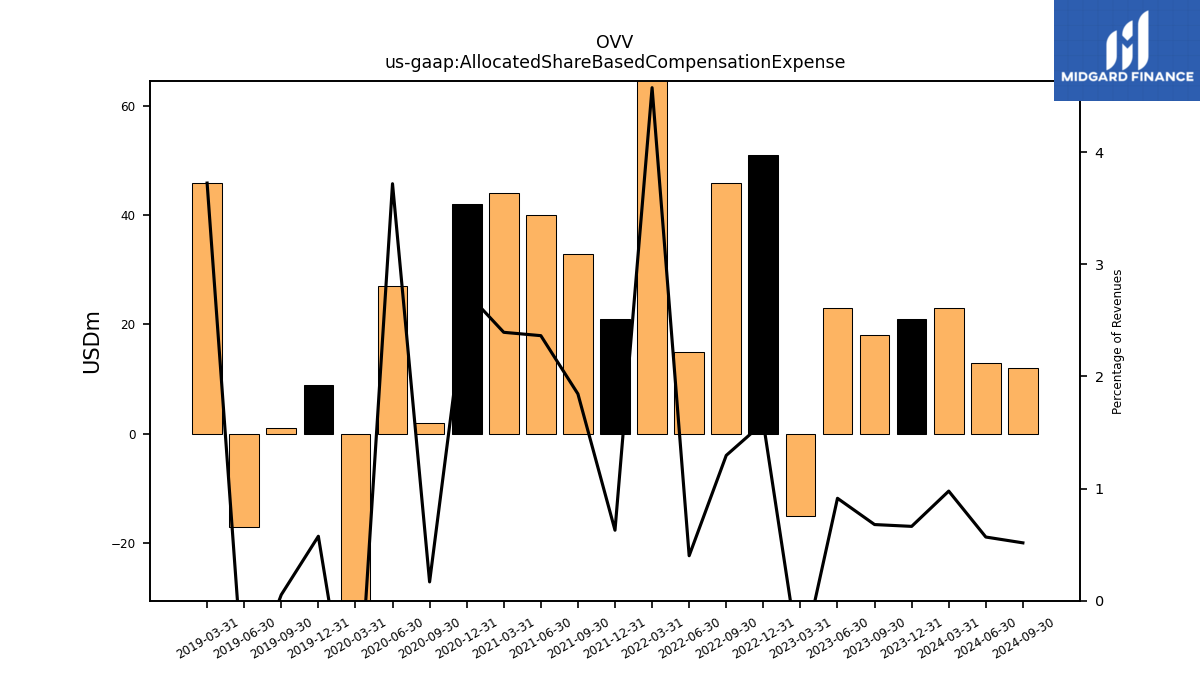
| Allocated Share Based Compensation Expense | 21.00 | 18.00 | 23.00 | -15.00 | 51.00 | 46.00 | 15.00 | 90.00 | 21.00 | 33.00 | 40.00 | 44.00 | 42.00 | 2.00 | 27.00 | -38.00 | 9.00 | 1.00 | -17.00 | 46.00 | NA | NA | NA | NA | |
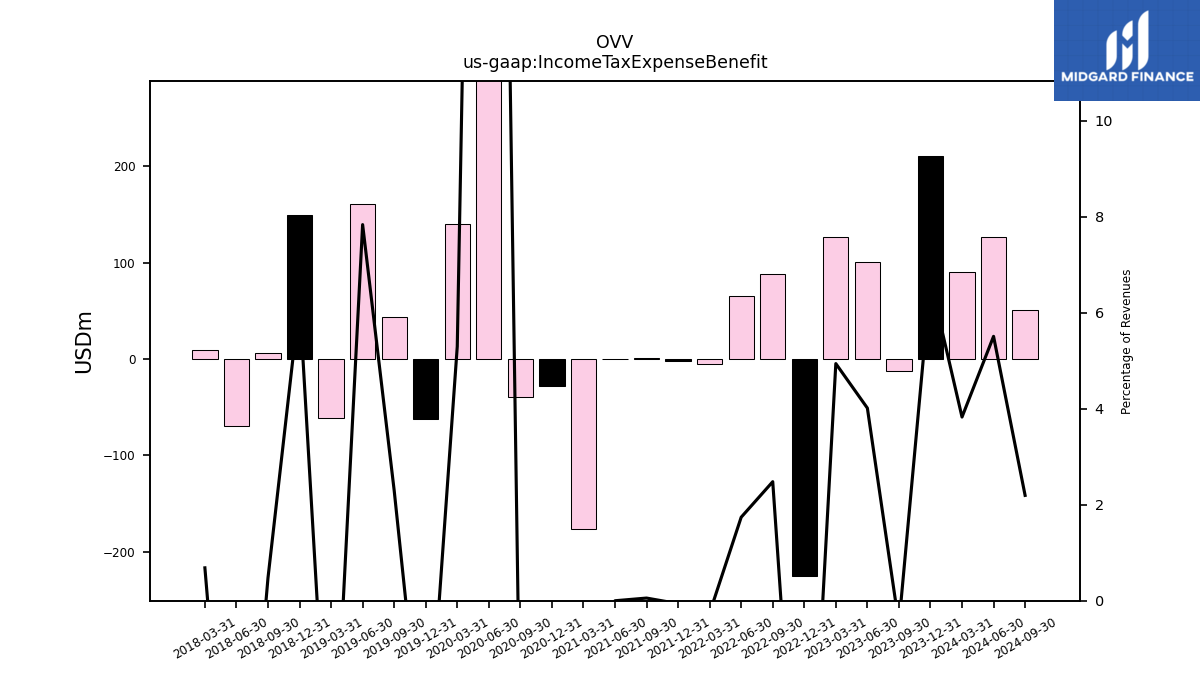
| Income Tax Expense Benefit | 211.00 | -13.00 | 101.00 | 126.00 | -225.00 | 88.00 | 65.00 | -5.00 | -2.00 | 1.00 | 0.00 | -176.00 | -28.00 | -39.00 | 294.00 | 140.00 | -62.00 | 43.00 | 161.00 | -61.00 | 149.00 | 6.00 | -70.00 | 9.00 | |
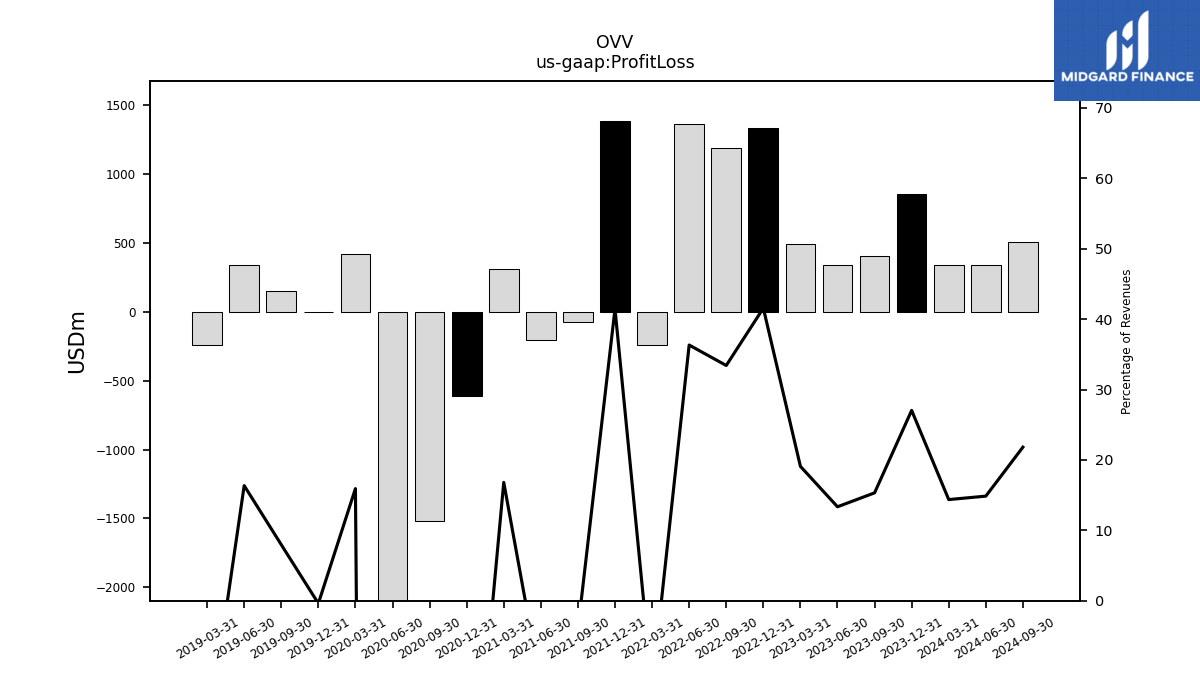
| Profit Loss | 856.00 | 406.00 | 336.00 | 487.00 | 1335.00 | 1186.00 | 1357.00 | -241.00 | 1384.00 | -72.00 | -205.00 | 309.00 | -614.00 | -1521.00 | -4383.00 | 421.00 | -6.00 | 149.00 | 336.00 | -245.00 | NA | NA | NA | NA | |
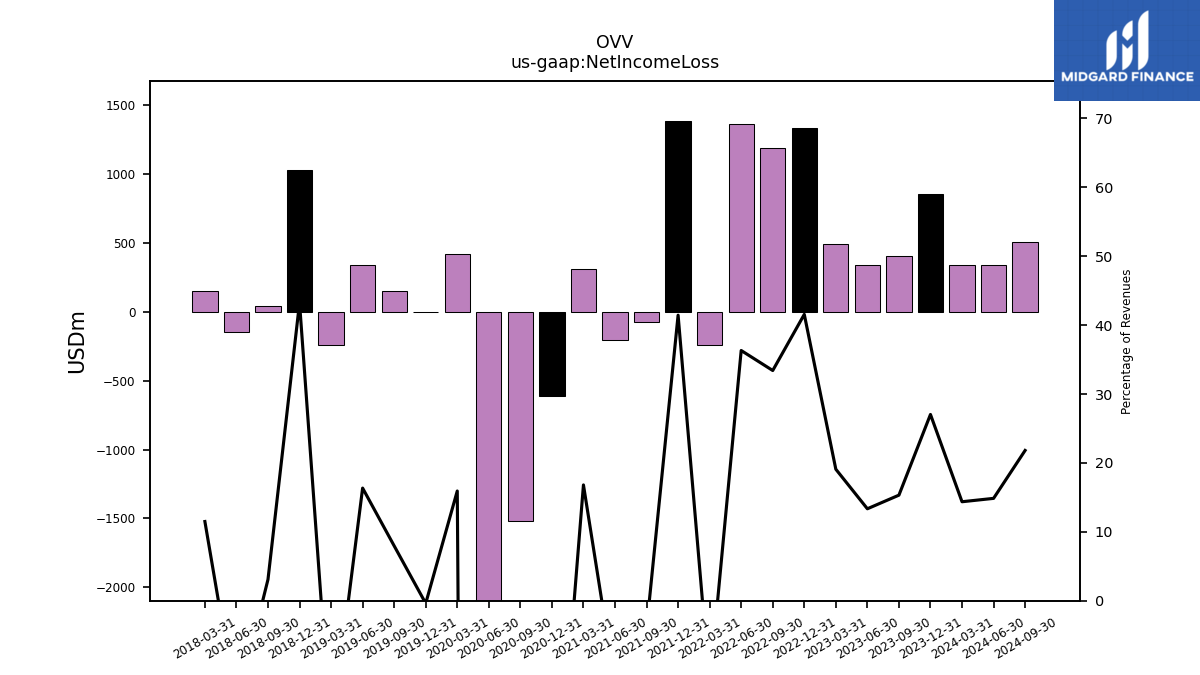
| Net Income Loss | 856.00 | 406.00 | 336.00 | 487.00 | 1335.00 | 1186.00 | 1357.00 | -241.00 | 1384.00 | -72.00 | -205.00 | 309.00 | -614.00 | -1521.00 | -4383.00 | 421.00 | -6.00 | 149.00 | 336.00 | -245.00 | 1030.00 | 39.00 | -151.00 | 151.00 | |
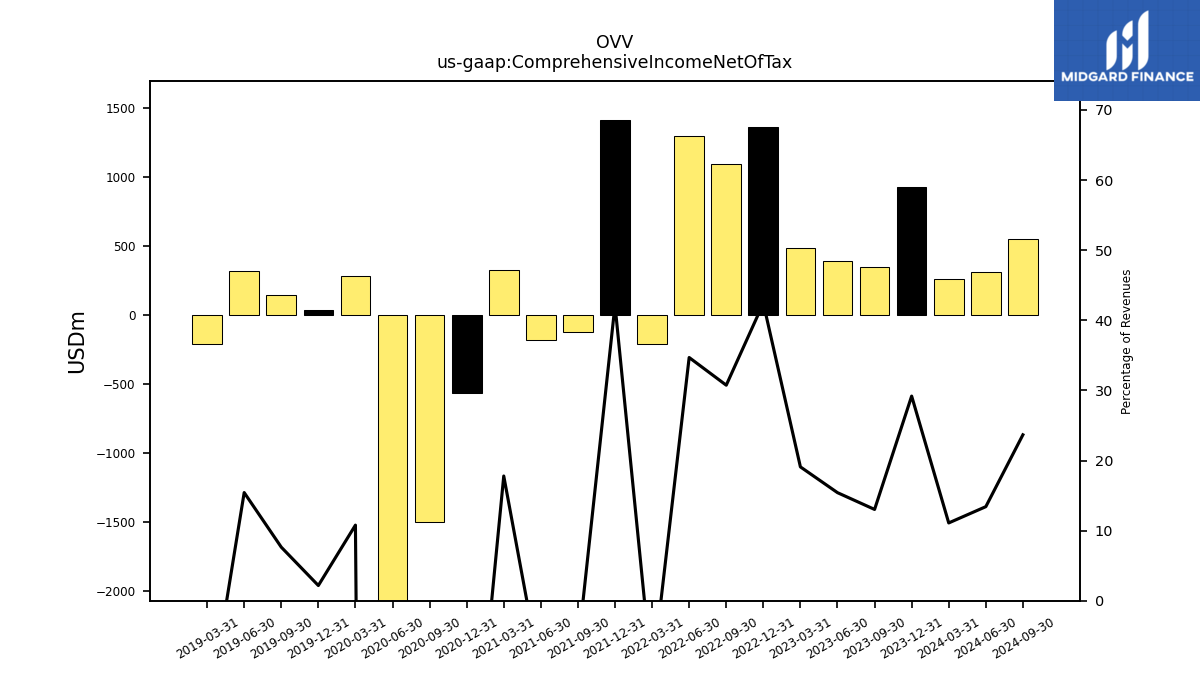
| Comprehensive Income Net Of Tax | 924.00 | 345.00 | 388.00 | 487.00 | 1363.00 | 1091.00 | 1296.00 | -214.00 | 1408.00 | -121.00 | -182.00 | 327.00 | -562.00 | -1497.00 | -4293.00 | 285.00 | 34.00 | 143.00 | 317.00 | -212.00 | NA | NA | NA | NA |
| 2023-12-31 | 2023-09-30 | 2023-06-30 | 2023-03-31 | 2022-12-31 | 2022-09-30 | 2022-06-30 | 2022-03-31 | 2021-12-31 | 2021-09-30 | 2021-06-30 | 2021-03-31 | 2020-12-31 | 2020-09-30 | 2020-06-30 | 2020-03-31 | 2019-12-31 | 2019-09-30 | 2019-06-30 | 2019-03-31 | 2018-12-31 | 2018-09-30 | 2018-06-30 | 2018-03-31 | ||
|---|---|---|---|---|---|---|---|---|---|---|---|---|---|---|---|---|---|---|---|---|---|---|---|---|---|
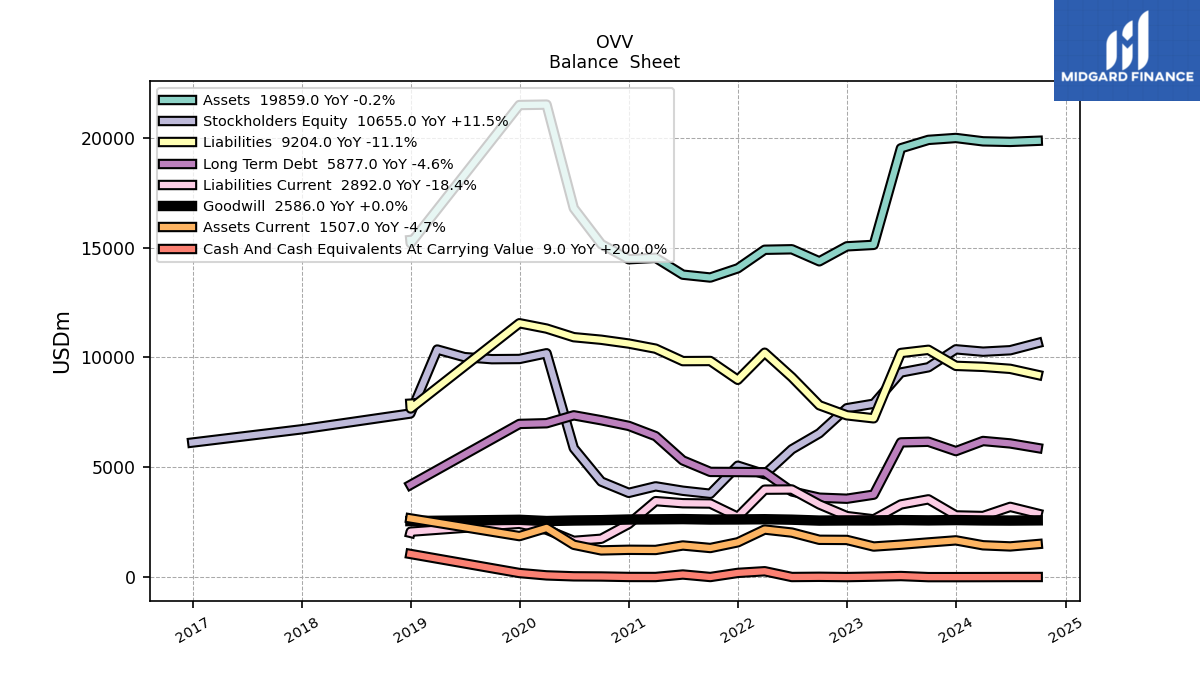
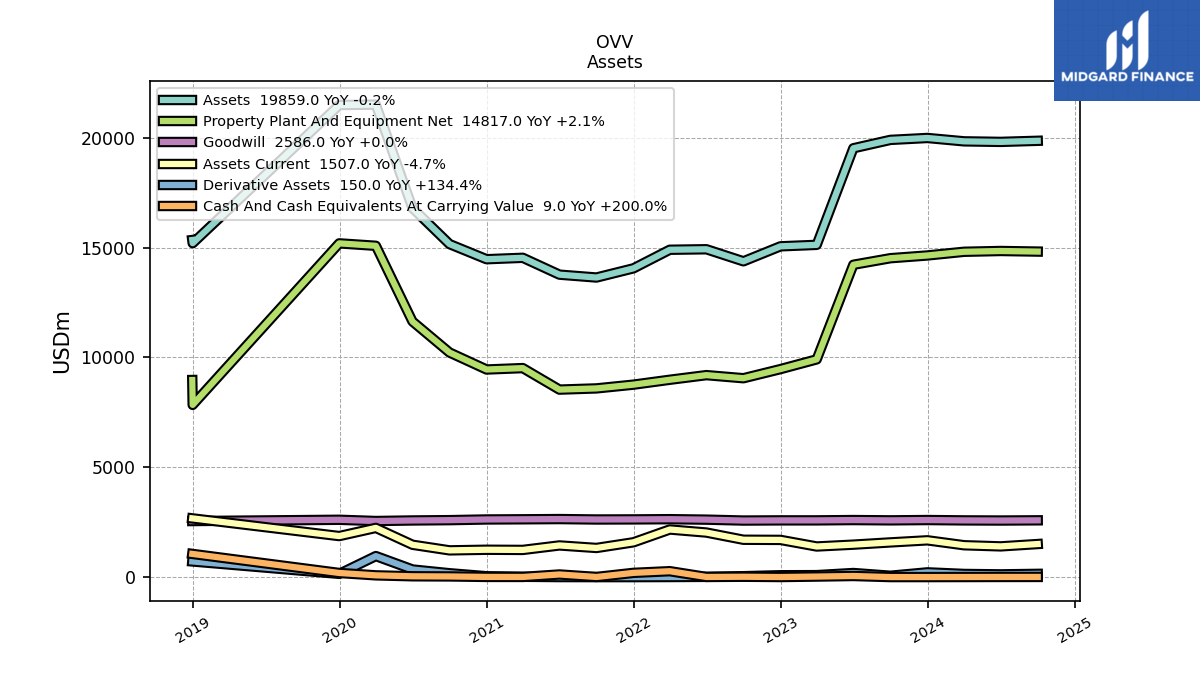
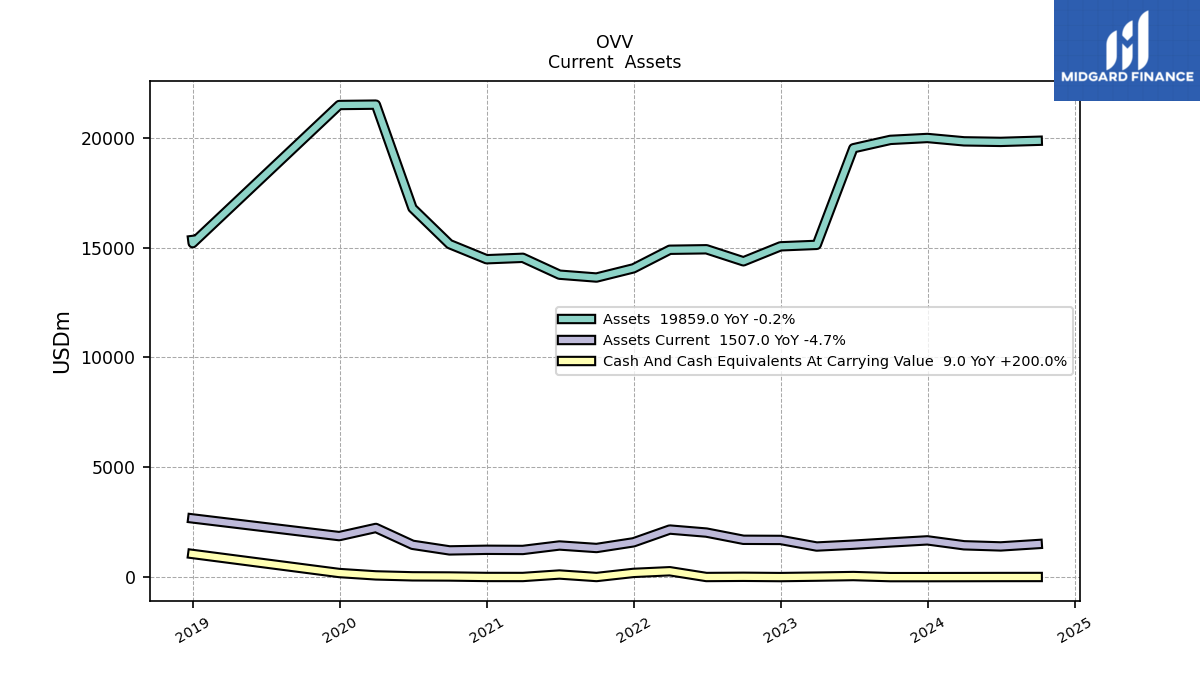
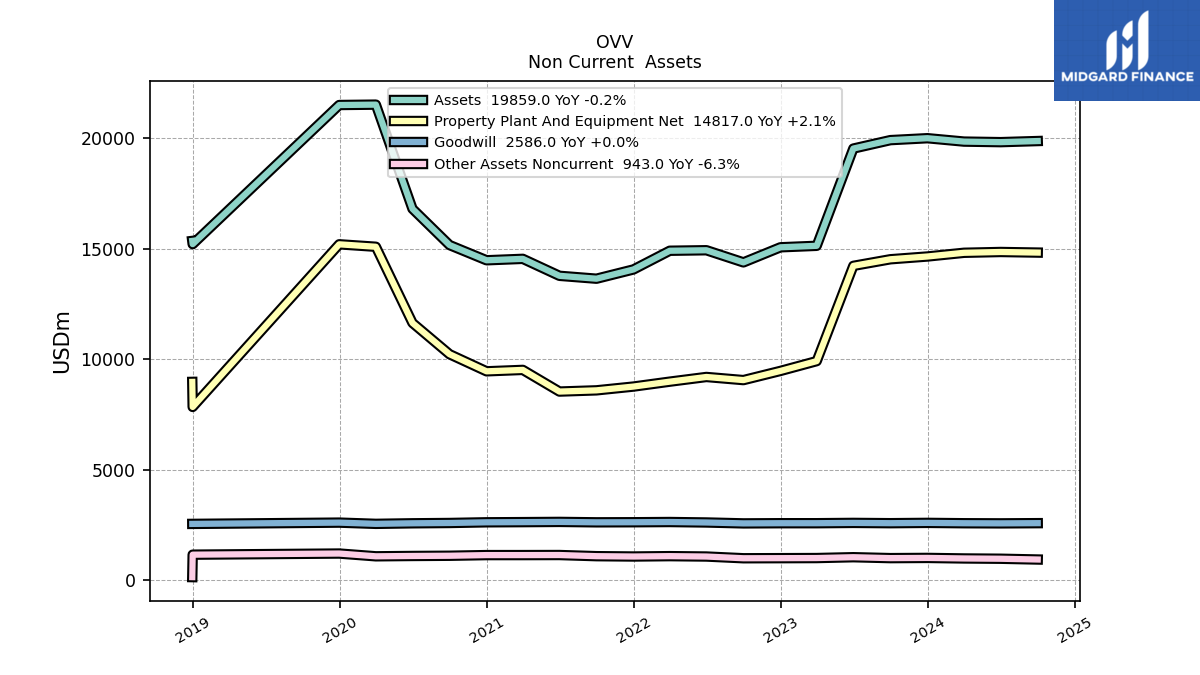
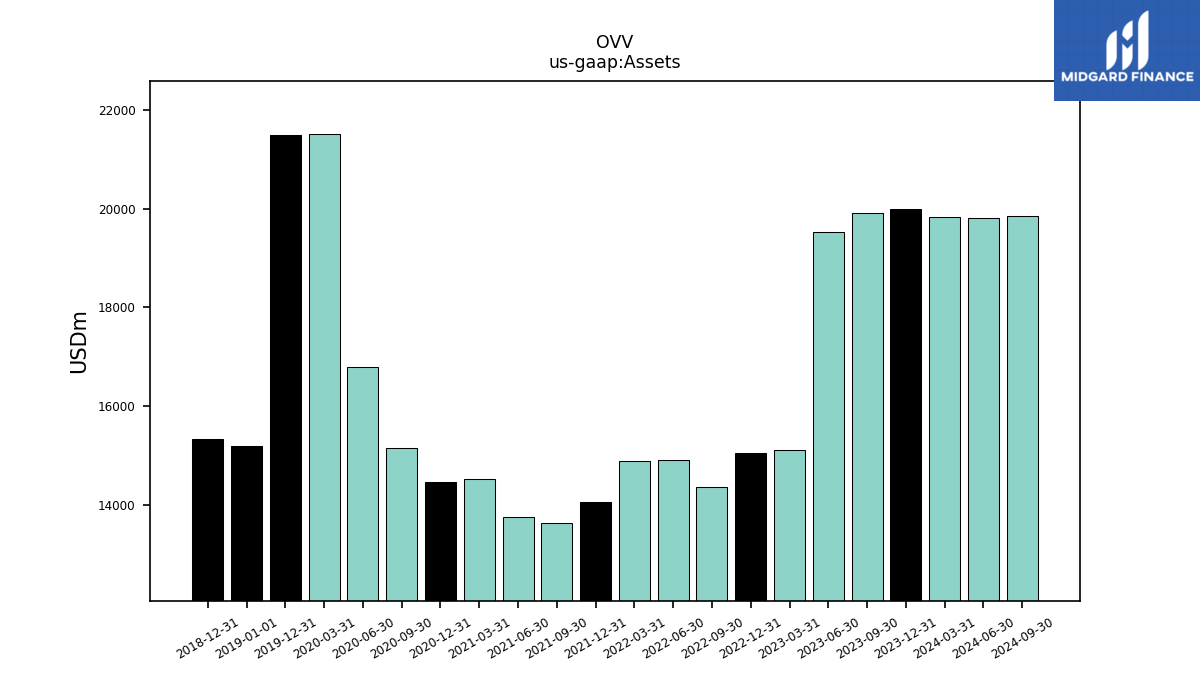
| Assets | 19987.00 | 19900.00 | 19519.00 | 15123.00 | 15056.00 | 14374.00 | 14923.00 | 14900.00 | 14055.00 | 13636.00 | 13767.00 | 14534.00 | 14469.00 | 15157.00 | 16795.00 | 21505.00 | 21487.00 | NA | NA | NA | 15344.00 | NA | NA | NA | |
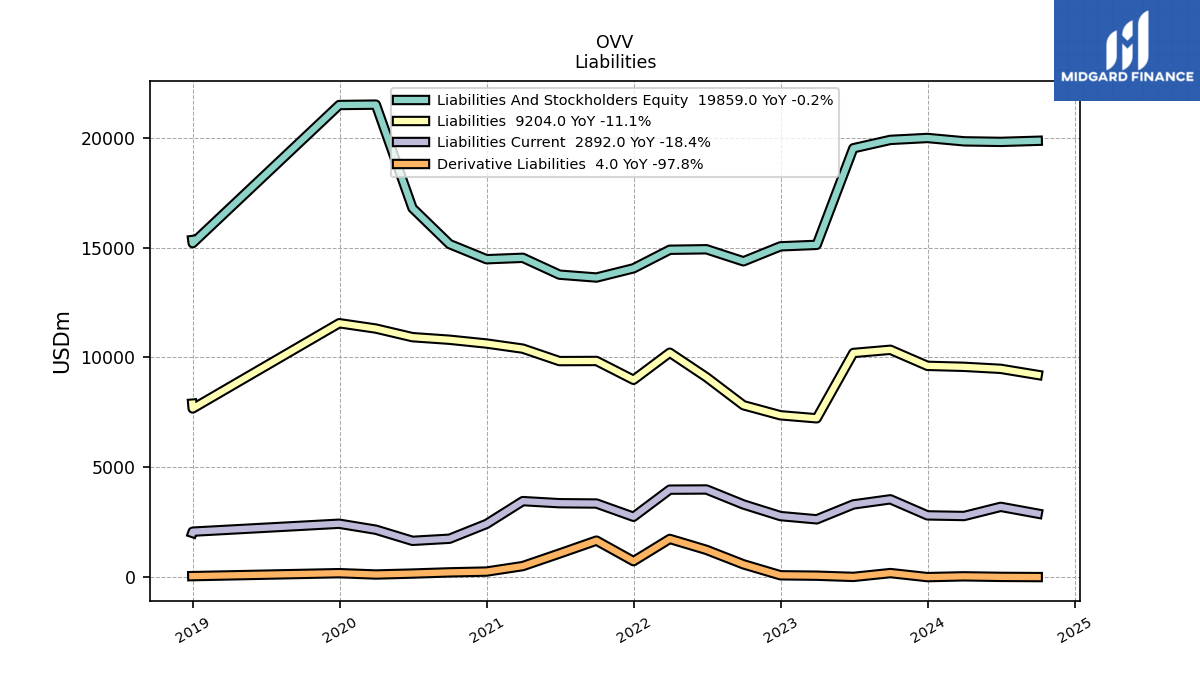
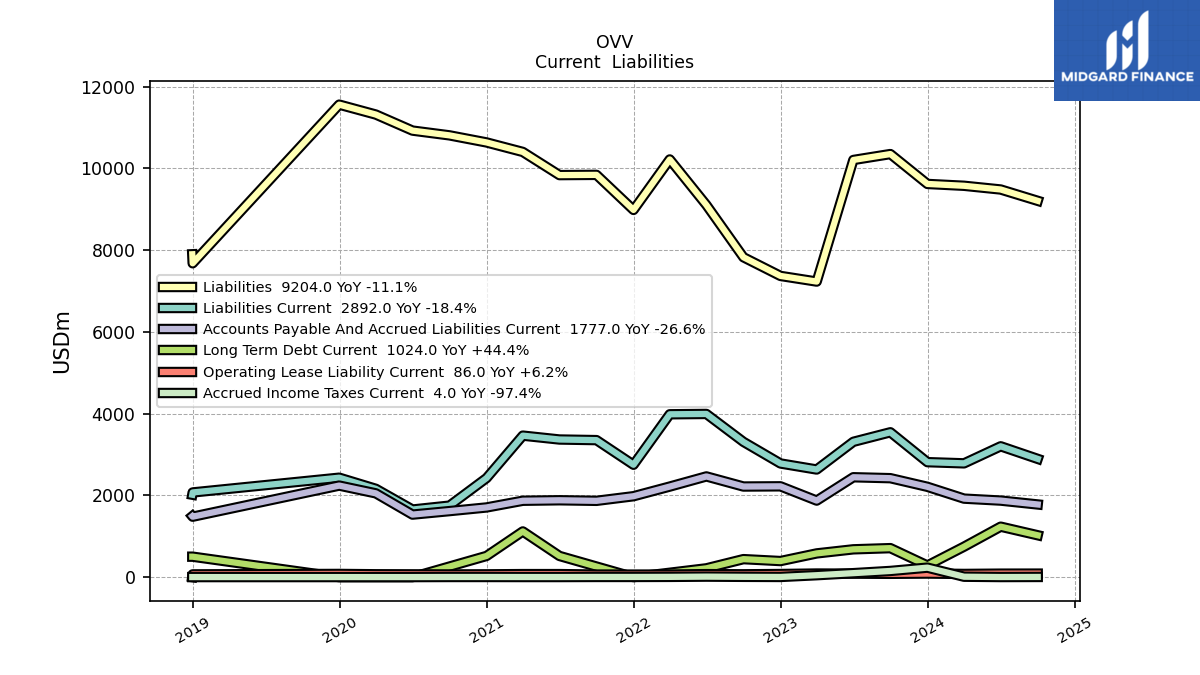
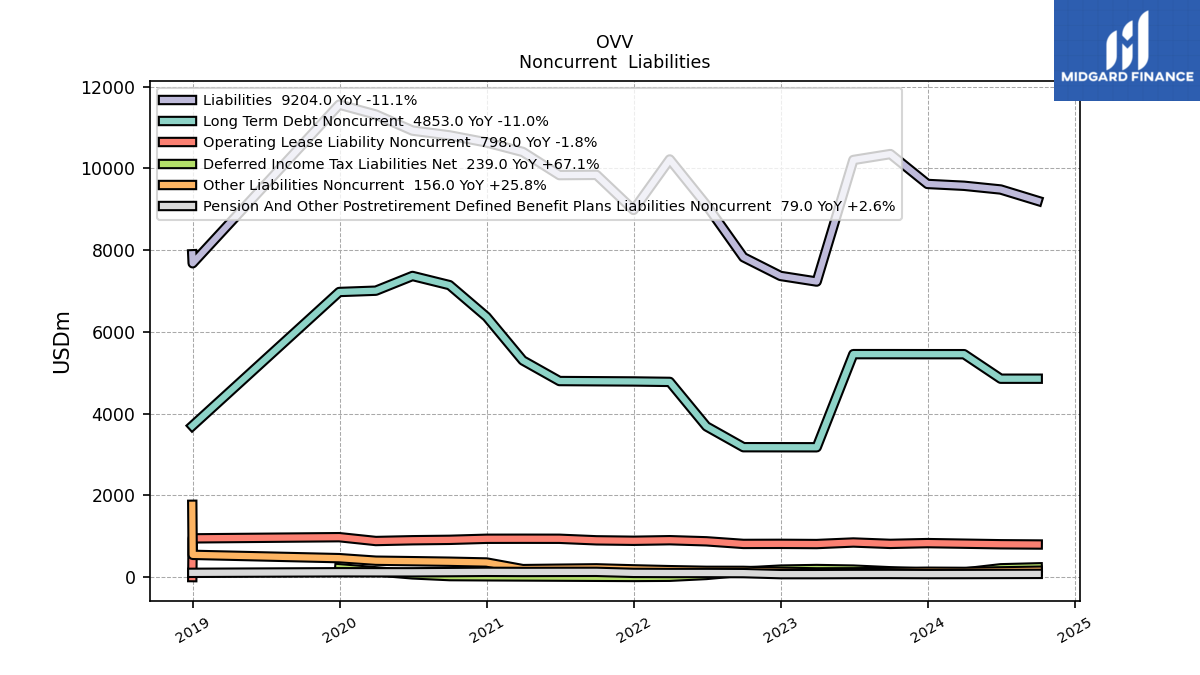
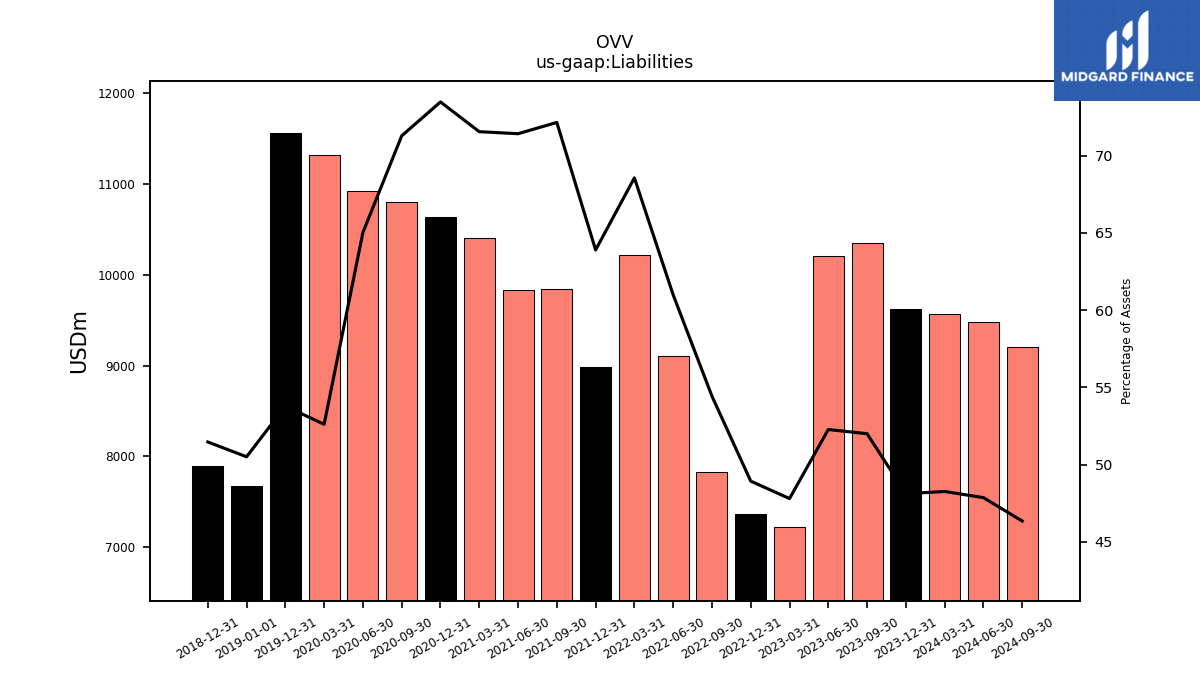
| Liabilities | 9617.00 | 10348.00 | 10203.00 | 7229.00 | 7367.00 | 7824.00 | 9102.00 | 10216.00 | 8981.00 | 9839.00 | 9833.00 | 10400.00 | 10632.00 | 10805.00 | 10922.00 | 11314.00 | 11557.00 | NA | NA | NA | 7897.00 | NA | NA | NA | |
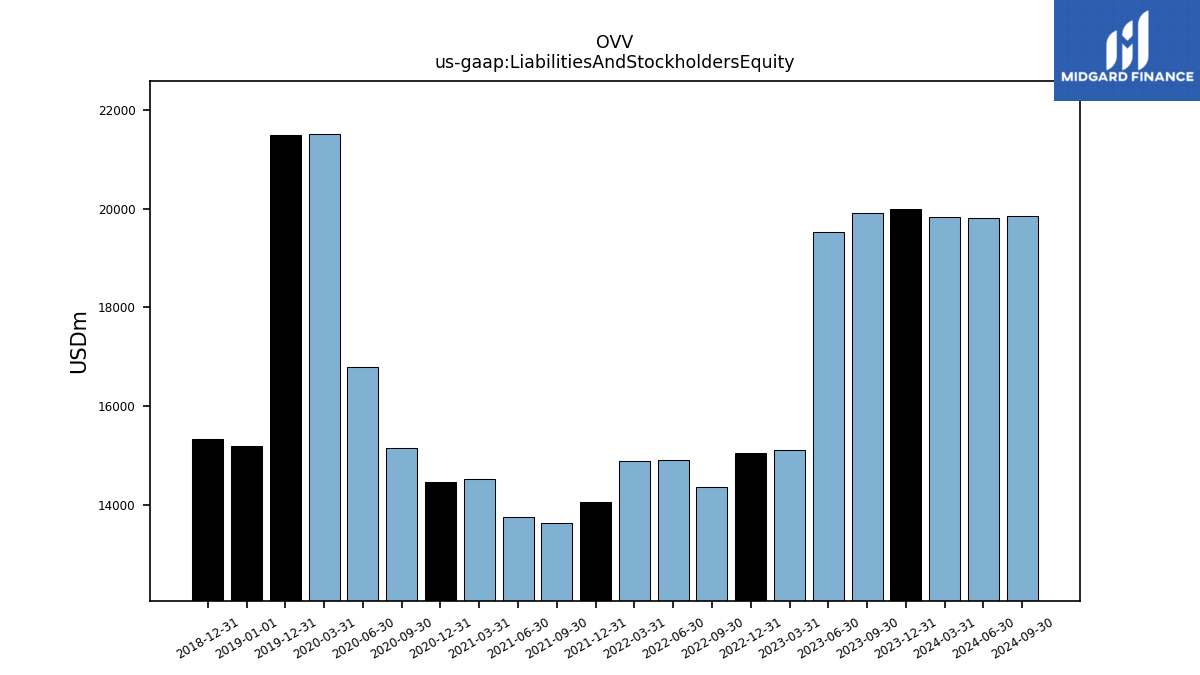
| Liabilities And Stockholders Equity | 19987.00 | 19900.00 | 19519.00 | 15123.00 | 15056.00 | 14374.00 | 14923.00 | 14900.00 | 14055.00 | 13636.00 | 13767.00 | 14534.00 | 14469.00 | 15157.00 | 16795.00 | 21505.00 | 21487.00 | NA | NA | NA | 15344.00 | NA | NA | NA | |
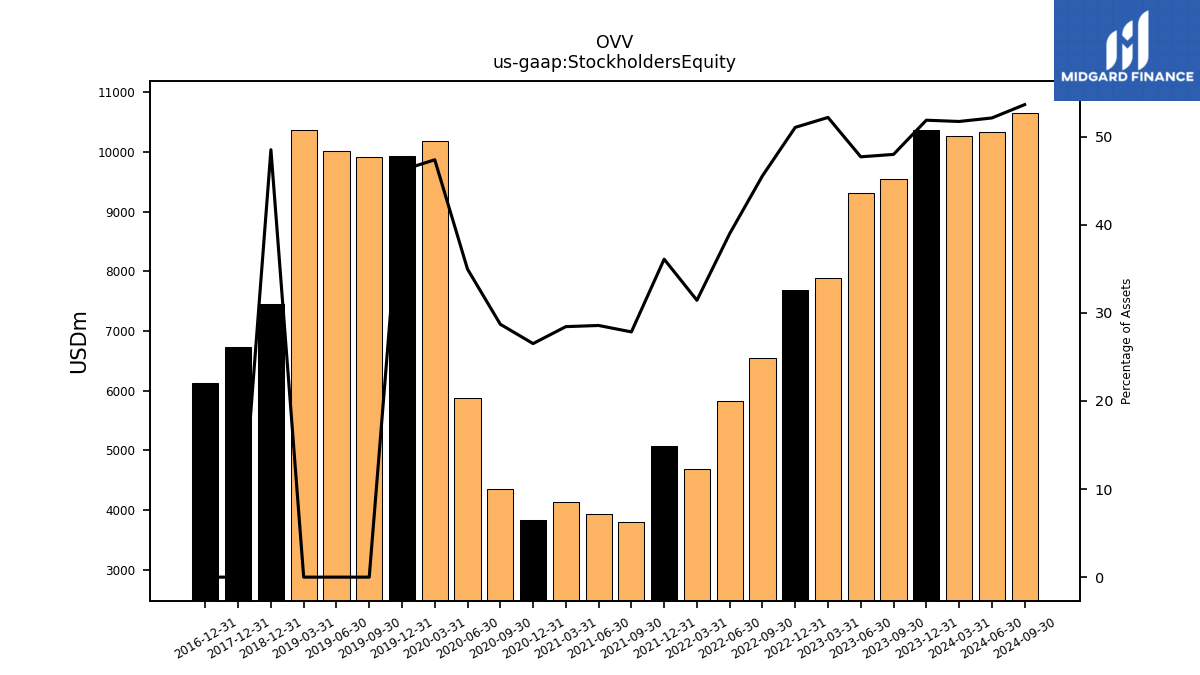
| Stockholders Equity | 10370.00 | 9552.00 | 9316.00 | 7894.00 | 7689.00 | 6550.00 | 5821.00 | 4684.00 | 5074.00 | 3797.00 | 3934.00 | 4134.00 | 3837.00 | 4352.00 | 5873.00 | 10191.00 | 9930.00 | 9921.00 | 10015.00 | 10360.00 | 7447.00 | NA | NA | NA |
| 2023-12-31 | 2023-09-30 | 2023-06-30 | 2023-03-31 | 2022-12-31 | 2022-09-30 | 2022-06-30 | 2022-03-31 | 2021-12-31 | 2021-09-30 | 2021-06-30 | 2021-03-31 | 2020-12-31 | 2020-09-30 | 2020-06-30 | 2020-03-31 | 2019-12-31 | 2019-09-30 | 2019-06-30 | 2019-03-31 | 2018-12-31 | 2018-09-30 | 2018-06-30 | 2018-03-31 | ||
|---|---|---|---|---|---|---|---|---|---|---|---|---|---|---|---|---|---|---|---|---|---|---|---|---|---|
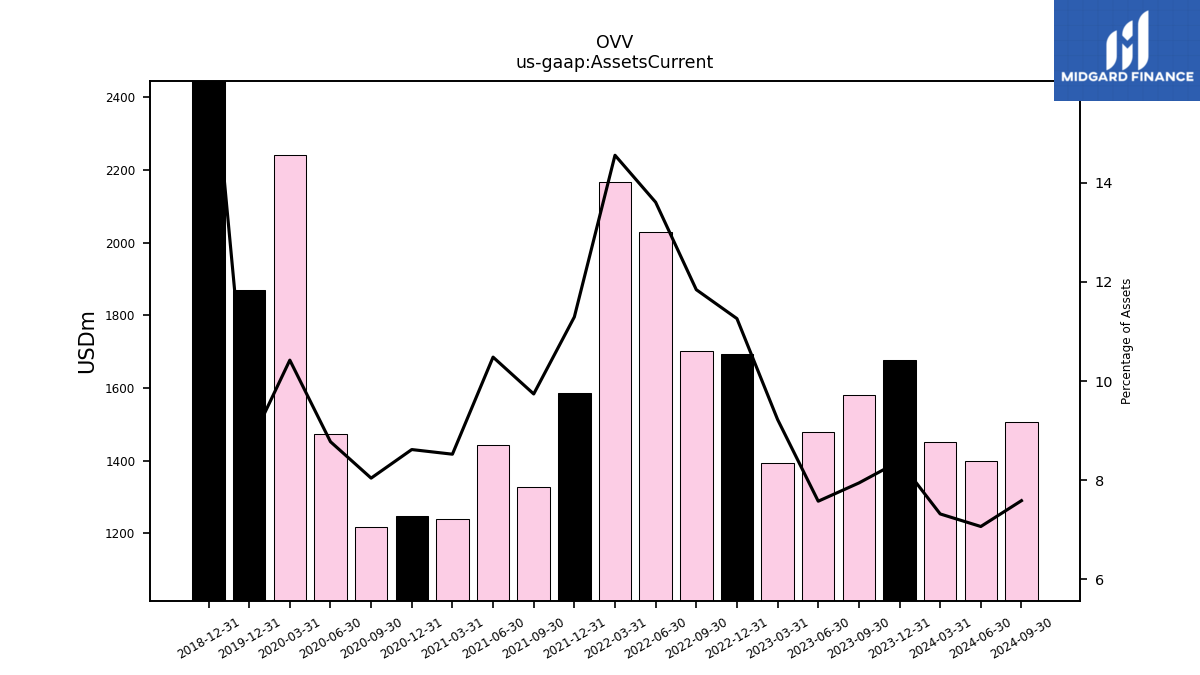
| Assets Current | 1676.00 | 1581.00 | 1479.00 | 1395.00 | 1695.00 | 1702.00 | 2030.00 | 2168.00 | 1587.00 | 1328.00 | 1443.00 | 1239.00 | 1247.00 | 1219.00 | 1474.00 | 2241.00 | 1869.00 | NA | NA | NA | 2676.00 | NA | NA | NA | |
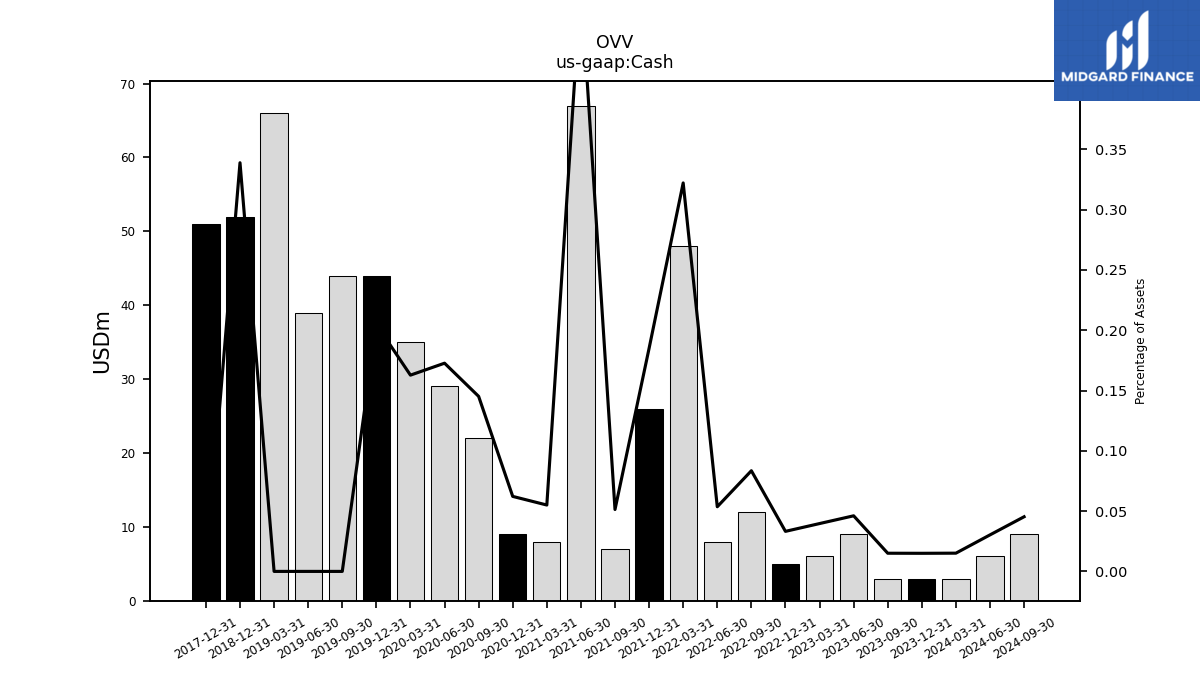
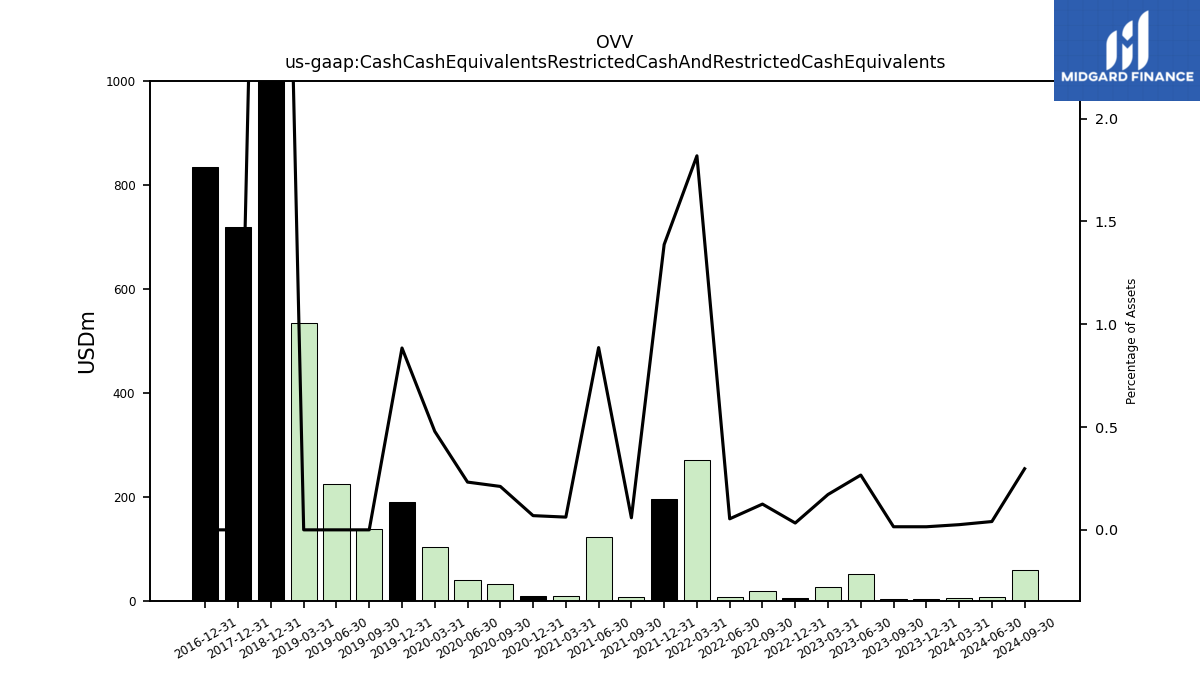
| Cash | 3.00 | 3.00 | 9.00 | 6.00 | 5.00 | 12.00 | 8.00 | 48.00 | 26.00 | 7.00 | 67.00 | 8.00 | 9.00 | 22.00 | 29.00 | 35.00 | 44.00 | 44.00 | 39.00 | 66.00 | 52.00 | NA | NA | NA | |
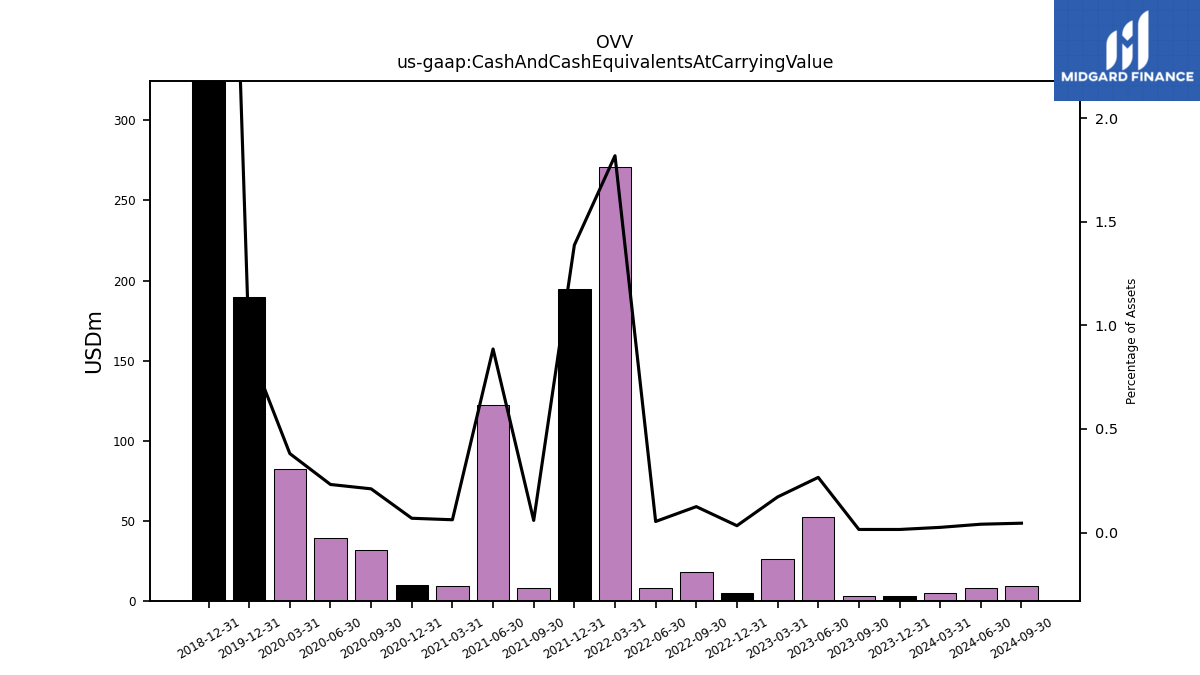
| Cash And Cash Equivalents At Carrying Value | 3.00 | 3.00 | 52.00 | 26.00 | 5.00 | 18.00 | 8.00 | 271.00 | 195.00 | 8.00 | 122.00 | 9.00 | 10.00 | 32.00 | 39.00 | 82.00 | 190.00 | NA | NA | NA | 1058.00 | NA | NA | NA | |
| Cash Cash Equivalents Restricted Cash And Restricted Cash Equivalents | 3.00 | 3.00 | 52.00 | 26.00 | 5.00 | 18.00 | 8.00 | 271.00 | 195.00 | 8.00 | 122.00 | 9.00 | 10.00 | 32.00 | 39.00 | 103.00 | 190.00 | 138.00 | 224.00 | 534.00 | 1058.00 | NA | NA | NA | |
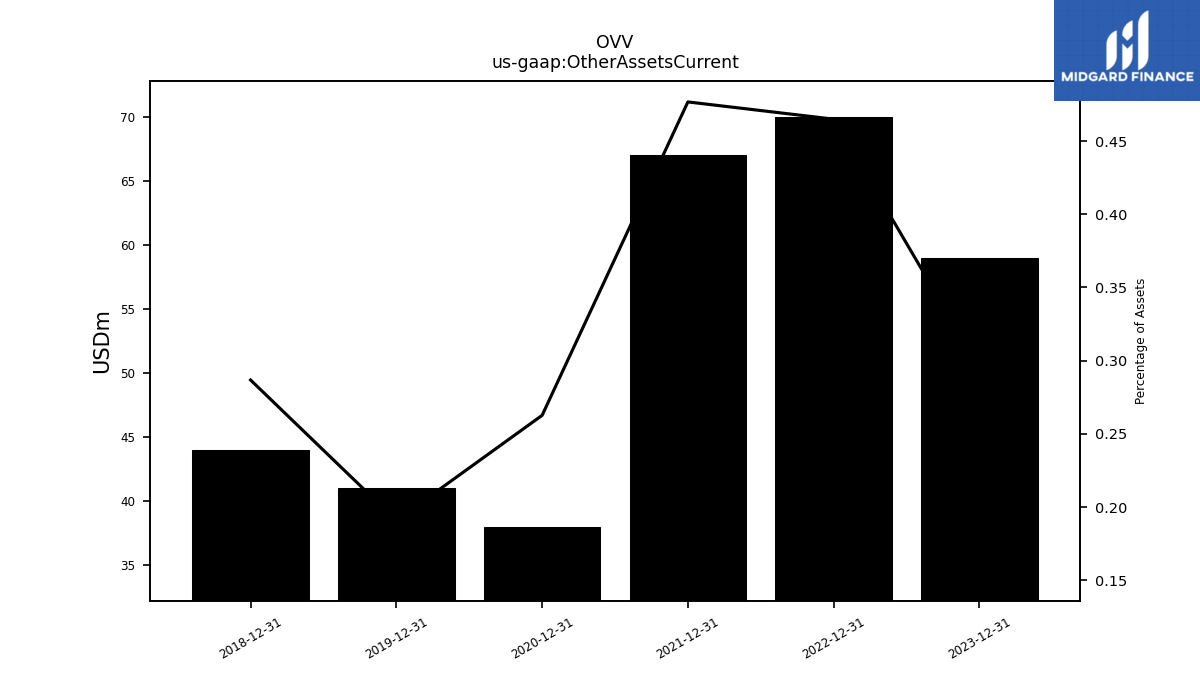
| Other Assets Current | 59.00 | NA | NA | NA | 70.00 | NA | NA | NA | 67.00 | NA | NA | NA | 38.00 | NA | NA | NA | 41.00 | NA | NA | NA | 44.00 | NA | NA | NA |
| 2023-12-31 | 2023-09-30 | 2023-06-30 | 2023-03-31 | 2022-12-31 | 2022-09-30 | 2022-06-30 | 2022-03-31 | 2021-12-31 | 2021-09-30 | 2021-06-30 | 2021-03-31 | 2020-12-31 | 2020-09-30 | 2020-06-30 | 2020-03-31 | 2019-12-31 | 2019-09-30 | 2019-06-30 | 2019-03-31 | 2018-12-31 | 2018-09-30 | 2018-06-30 | 2018-03-31 | ||
|---|---|---|---|---|---|---|---|---|---|---|---|---|---|---|---|---|---|---|---|---|---|---|---|---|---|
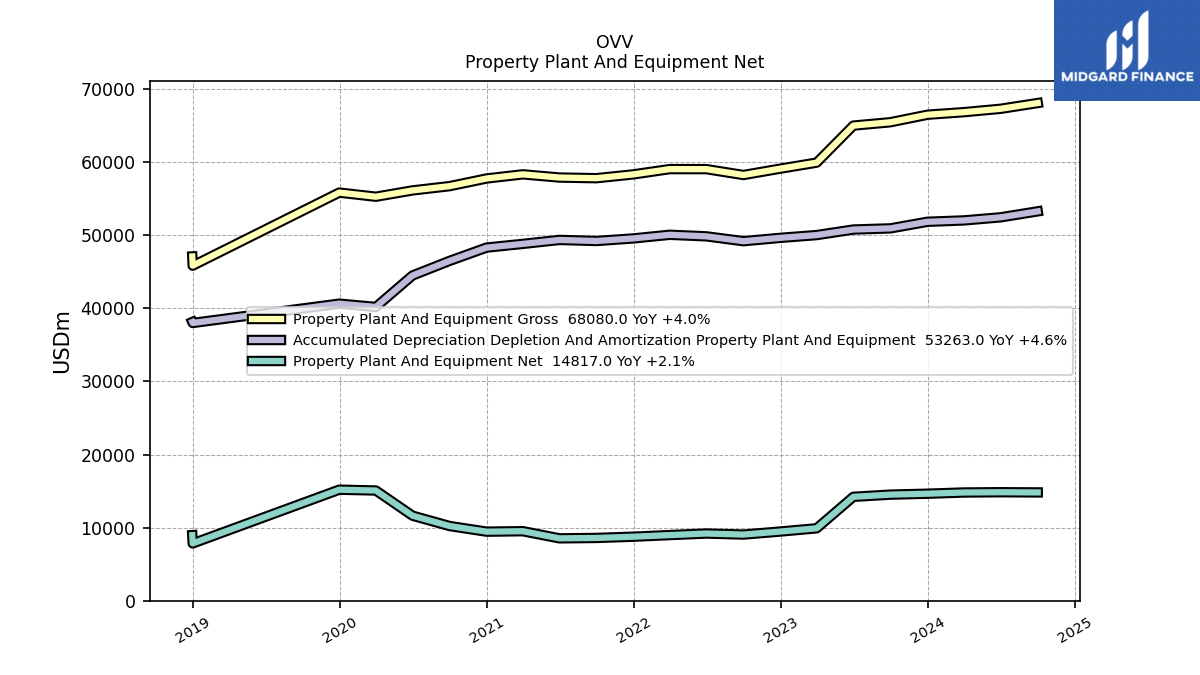
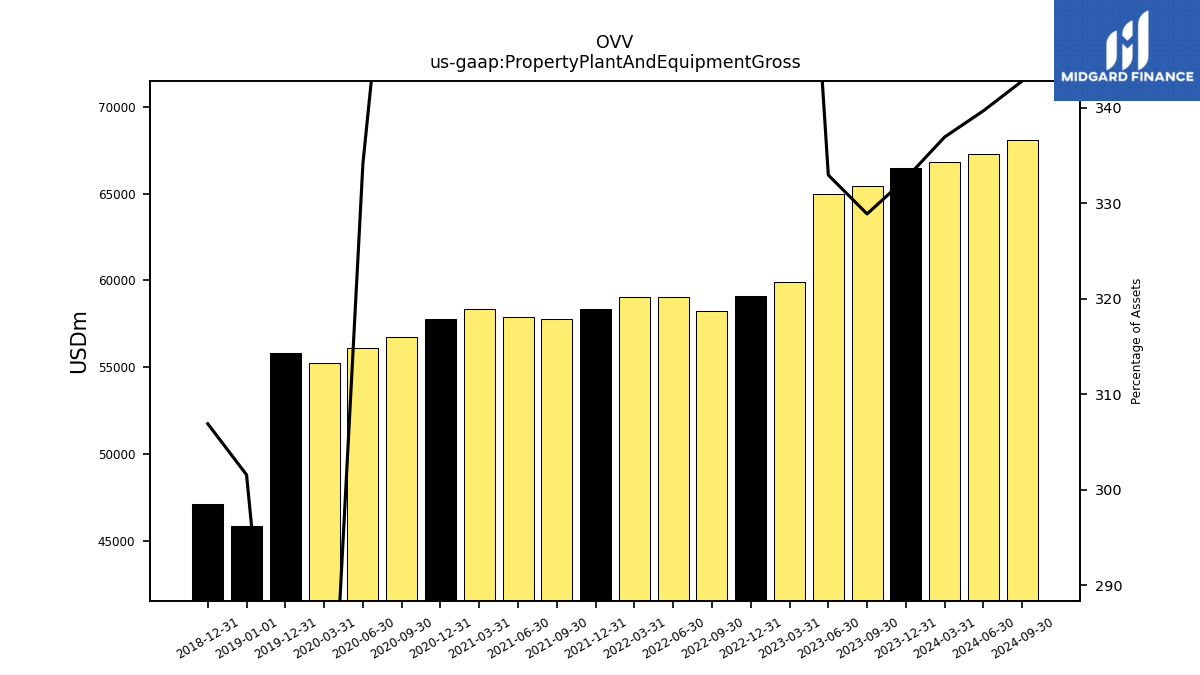
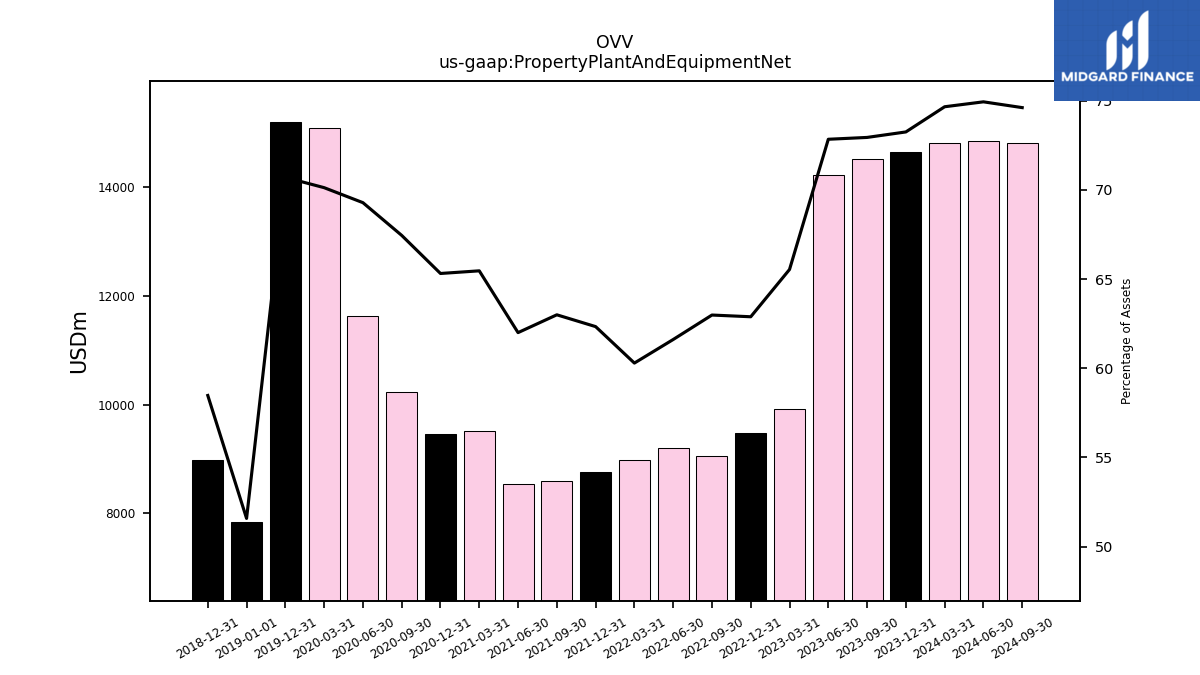
| Property Plant And Equipment Gross | 66477.00 | 65450.00 | 64992.00 | 59928.00 | 59108.00 | 58233.00 | 59036.00 | 59041.00 | 58322.00 | 57798.00 | 57887.00 | 58325.00 | 57756.00 | 56708.00 | 56125.00 | 55264.00 | 55828.00 | NA | NA | NA | 47093.00 | NA | NA | NA | |
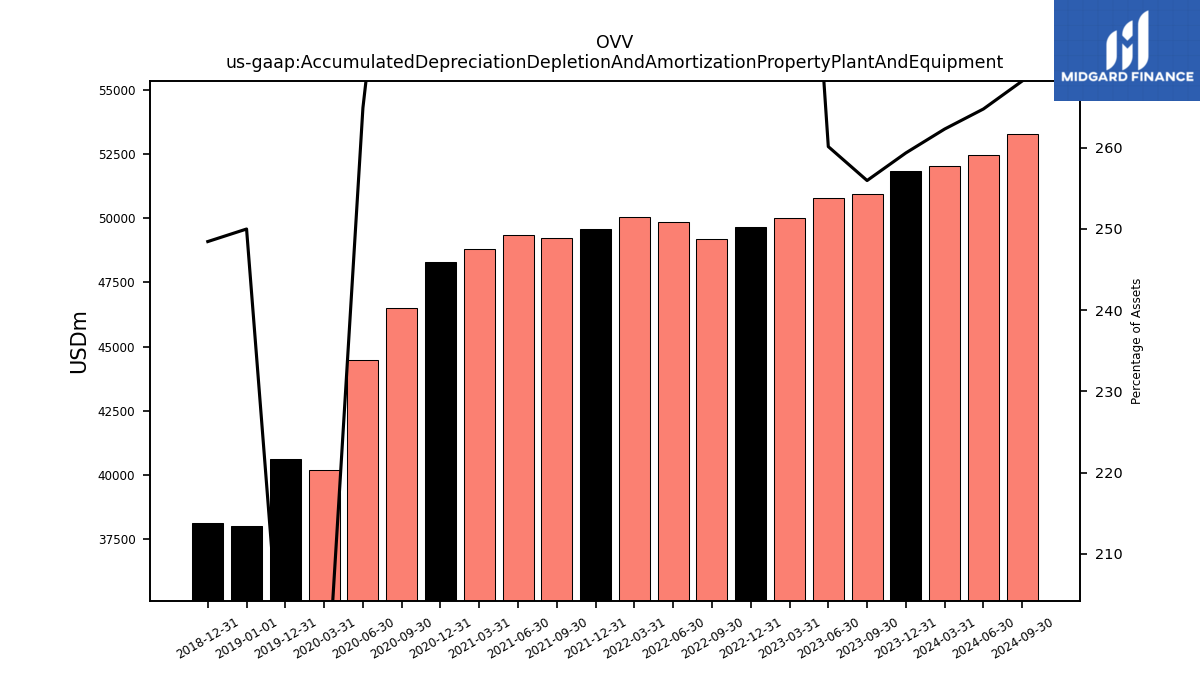
| Accumulated Depreciation Depletion And Amortization Property Plant And Equipment | 51837.00 | 50935.00 | 50775.00 | 50017.00 | 49640.00 | 49180.00 | 49842.00 | 50058.00 | 49561.00 | 49208.00 | 49352.00 | 48811.00 | 48306.00 | 46485.00 | 44489.00 | 40184.00 | 40637.00 | NA | NA | NA | 38121.00 | NA | NA | NA | |
| Property Plant And Equipment Net | 14640.00 | 14515.00 | 14217.00 | 9911.00 | 9468.00 | 9053.00 | 9194.00 | 8983.00 | 8761.00 | 8590.00 | 8535.00 | 9514.00 | 9450.00 | 10223.00 | 11636.00 | 15080.00 | 15191.00 | NA | NA | NA | 8972.00 | NA | NA | NA | |
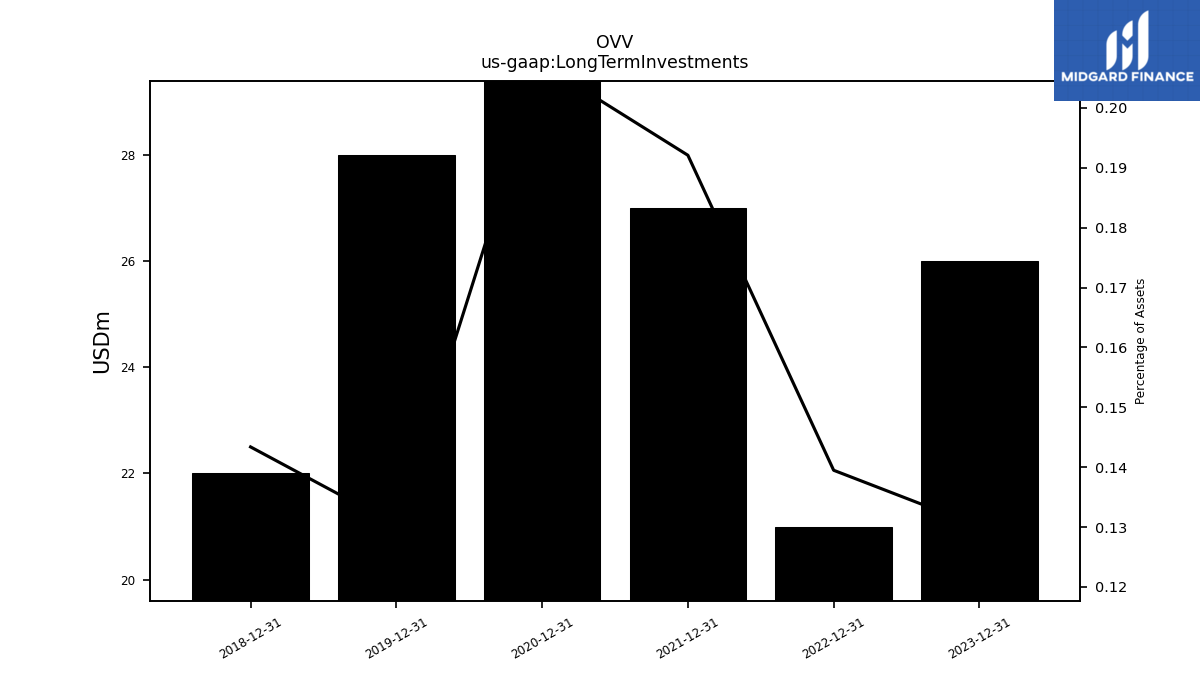
| Long Term Investments | 26.00 | NA | NA | NA | 21.00 | NA | NA | NA | 27.00 | NA | NA | NA | 30.00 | NA | NA | NA | 28.00 | NA | NA | NA | 22.00 | NA | NA | NA | |
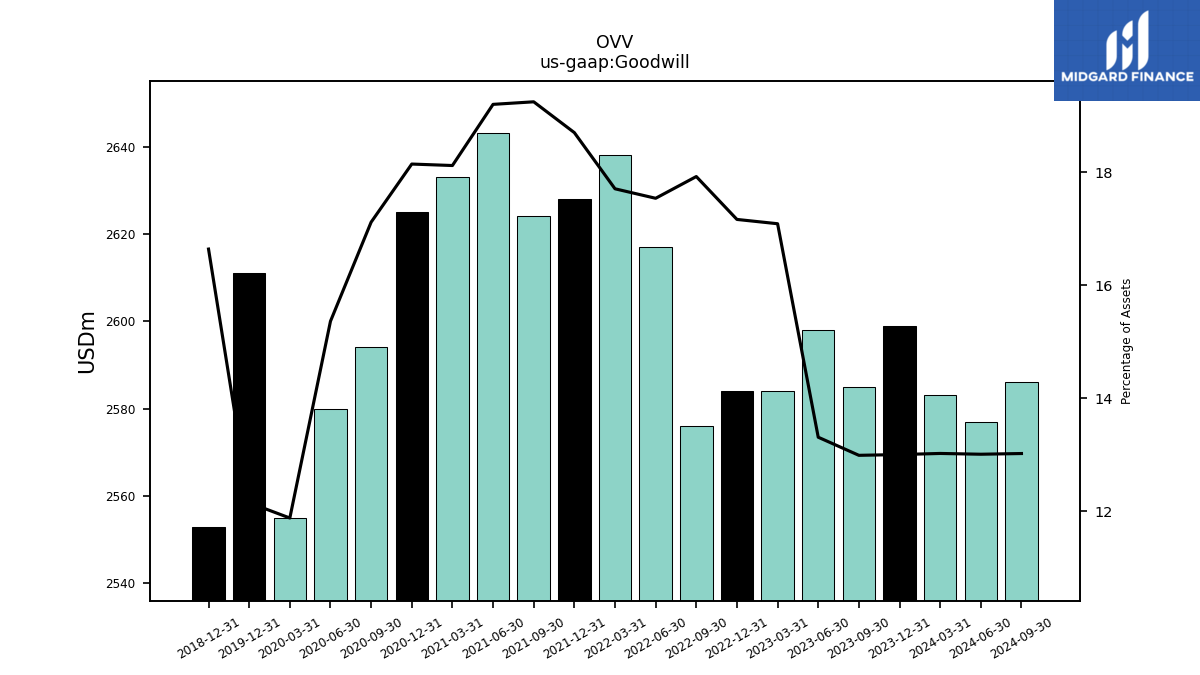
| Goodwill | 2599.00 | 2585.00 | 2598.00 | 2584.00 | 2584.00 | 2576.00 | 2617.00 | 2638.00 | 2628.00 | 2624.00 | 2643.00 | 2633.00 | 2625.00 | 2594.00 | 2580.00 | 2555.00 | 2611.00 | NA | NA | NA | 2553.00 | NA | NA | NA | |
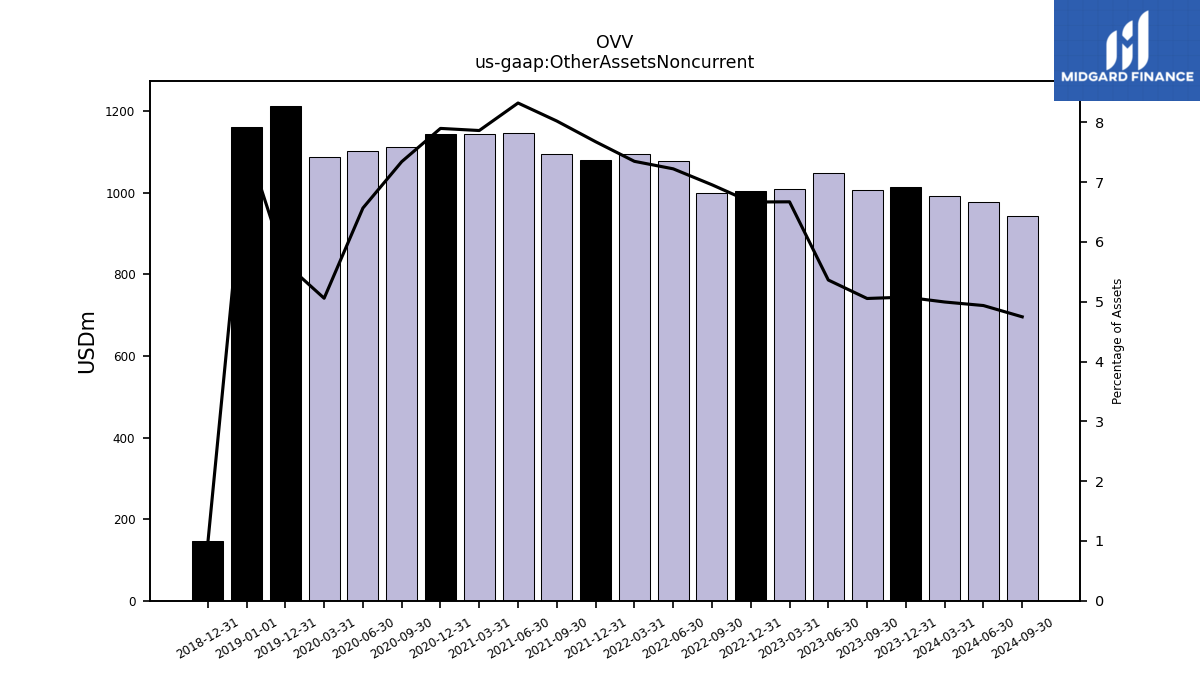
| Other Assets Noncurrent | 1015.00 | 1006.00 | 1047.00 | 1009.00 | 1004.00 | 1000.00 | 1078.00 | 1095.00 | 1079.00 | 1094.00 | 1146.00 | 1143.00 | 1143.00 | 1113.00 | 1103.00 | 1088.00 | 1213.00 | NA | NA | NA | 147.00 | NA | NA | NA |
| 2023-12-31 | 2023-09-30 | 2023-06-30 | 2023-03-31 | 2022-12-31 | 2022-09-30 | 2022-06-30 | 2022-03-31 | 2021-12-31 | 2021-09-30 | 2021-06-30 | 2021-03-31 | 2020-12-31 | 2020-09-30 | 2020-06-30 | 2020-03-31 | 2019-12-31 | 2019-09-30 | 2019-06-30 | 2019-03-31 | 2018-12-31 | 2018-09-30 | 2018-06-30 | 2018-03-31 | ||
|---|---|---|---|---|---|---|---|---|---|---|---|---|---|---|---|---|---|---|---|---|---|---|---|---|---|
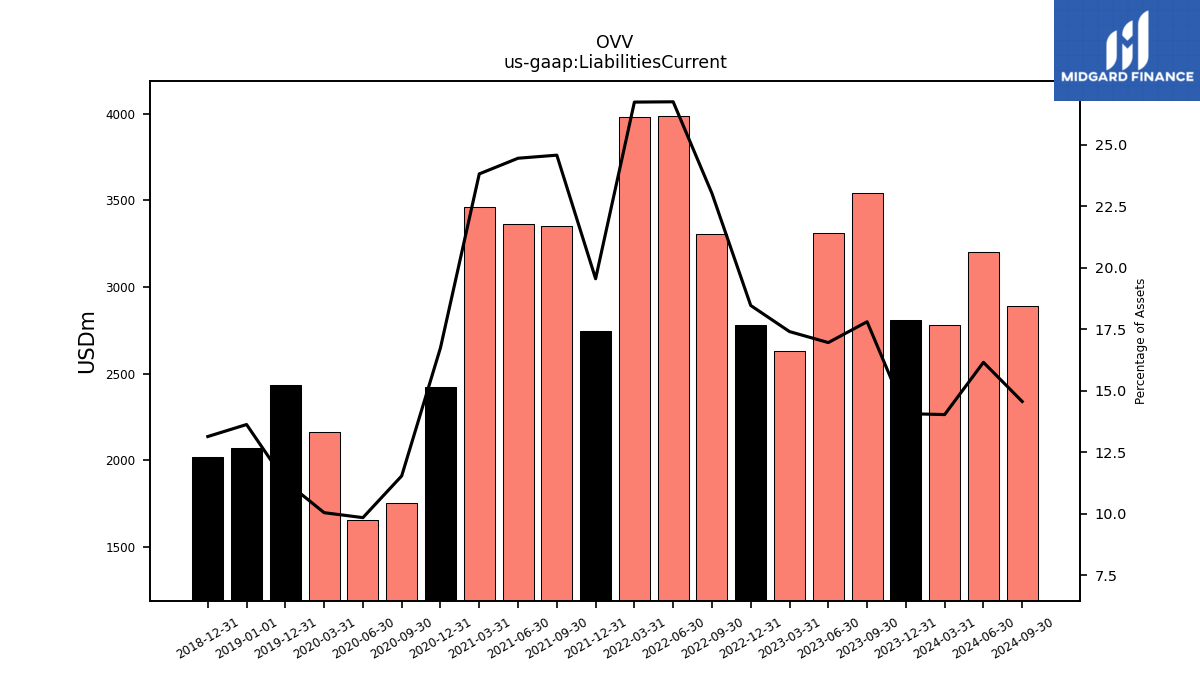
| Liabilities Current | 2812.00 | 3543.00 | 3310.00 | 2632.00 | 2780.00 | 3309.00 | 3991.00 | 3983.00 | 2748.00 | 3351.00 | 3366.00 | 3461.00 | 2423.00 | 1749.00 | 1653.00 | 2160.00 | 2432.00 | NA | NA | NA | 2016.00 | NA | NA | NA | |
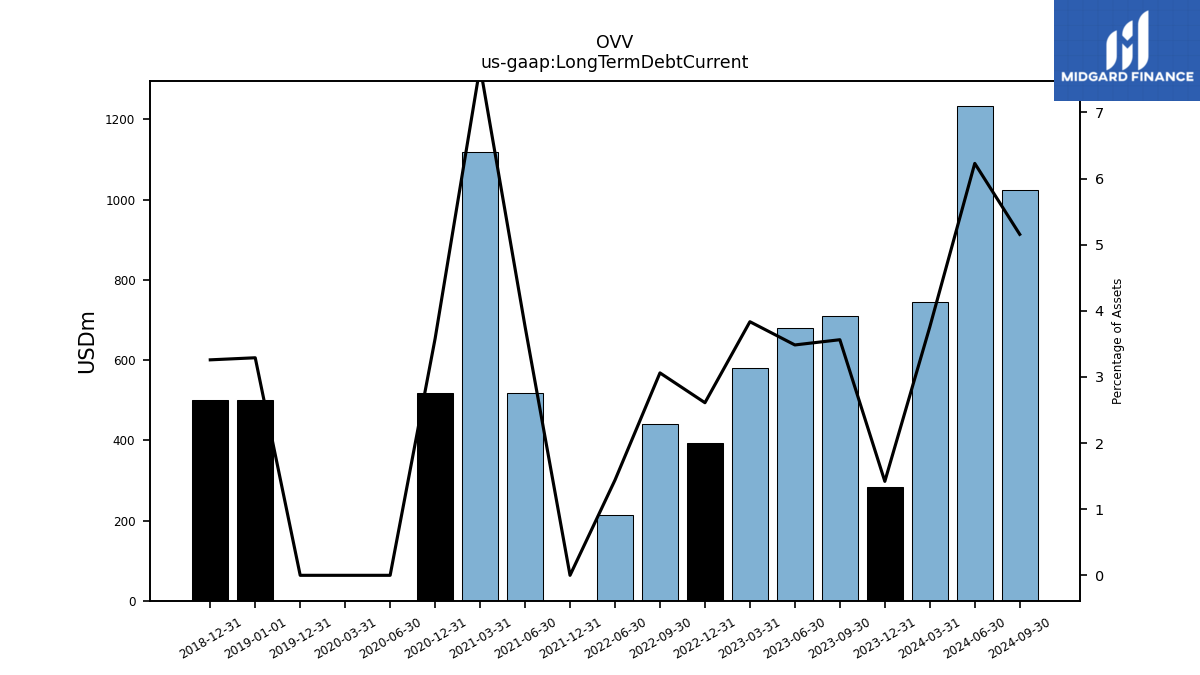
| Long Term Debt Current | 284.00 | 709.00 | 680.00 | 580.00 | 393.00 | 440.00 | 215.00 | NA | 0.00 | NA | 518.00 | 1118.00 | 518.00 | NA | 0.00 | 0.00 | 0.00 | NA | NA | NA | 500.00 | NA | NA | NA | |
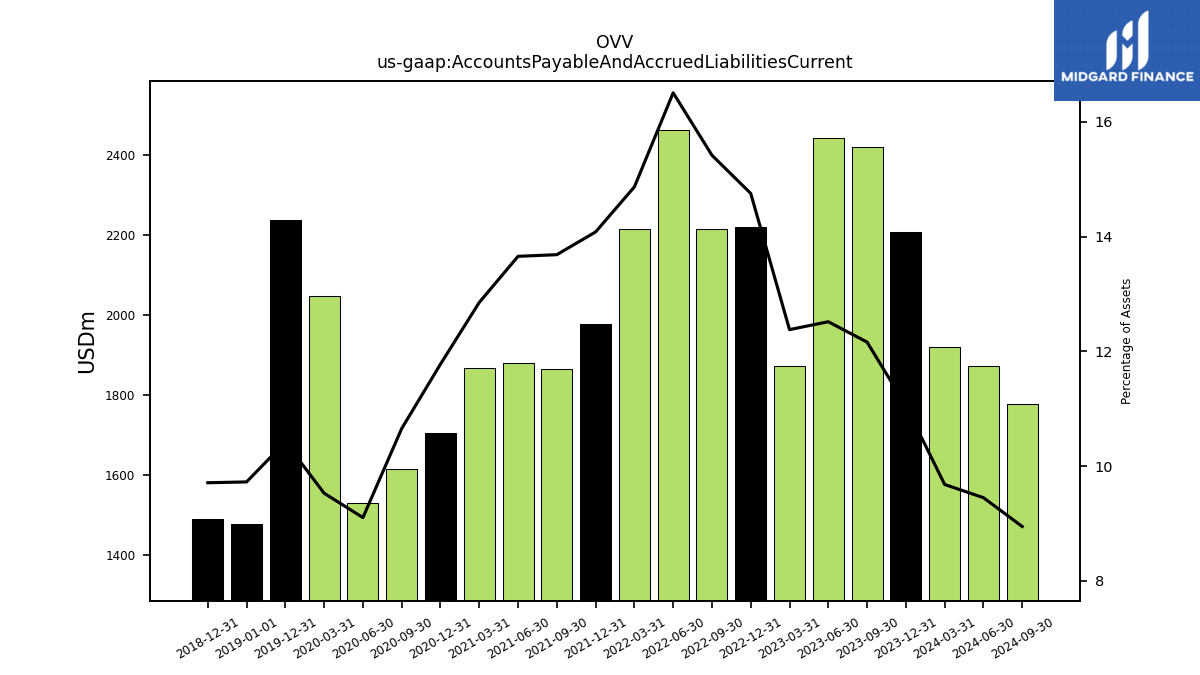
| Accounts Payable And Accrued Liabilities Current | 2209.00 | 2420.00 | 2443.00 | 1872.00 | 2221.00 | 2216.00 | 2463.00 | 2215.00 | 1979.00 | 1866.00 | 1880.00 | 1868.00 | 1704.00 | 1615.00 | 1529.00 | 2049.00 | 2239.00 | NA | NA | NA | 1490.00 | NA | NA | NA | |
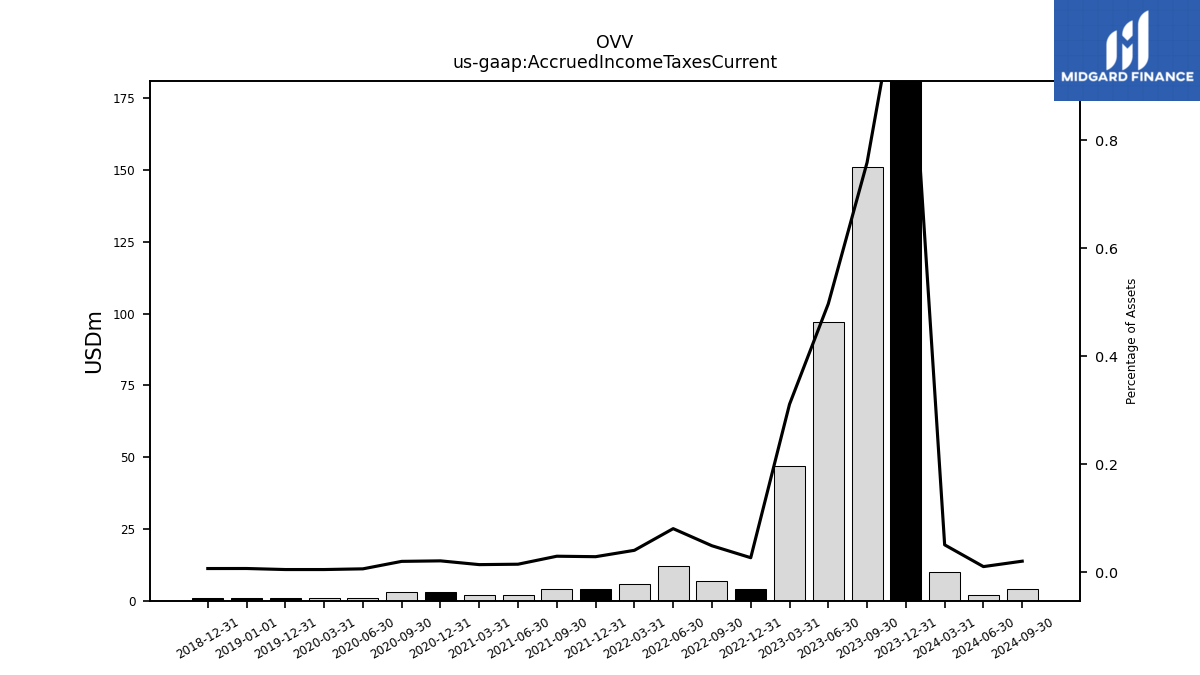
| Accrued Income Taxes Current | 232.00 | 151.00 | 97.00 | 47.00 | 4.00 | 7.00 | 12.00 | 6.00 | 4.00 | 4.00 | 2.00 | 2.00 | 3.00 | 3.00 | 1.00 | 1.00 | 1.00 | NA | NA | NA | 1.00 | NA | NA | NA |
| 2023-12-31 | 2023-09-30 | 2023-06-30 | 2023-03-31 | 2022-12-31 | 2022-09-30 | 2022-06-30 | 2022-03-31 | 2021-12-31 | 2021-09-30 | 2021-06-30 | 2021-03-31 | 2020-12-31 | 2020-09-30 | 2020-06-30 | 2020-03-31 | 2019-12-31 | 2019-09-30 | 2019-06-30 | 2019-03-31 | 2018-12-31 | 2018-09-30 | 2018-06-30 | 2018-03-31 | ||
|---|---|---|---|---|---|---|---|---|---|---|---|---|---|---|---|---|---|---|---|---|---|---|---|---|---|
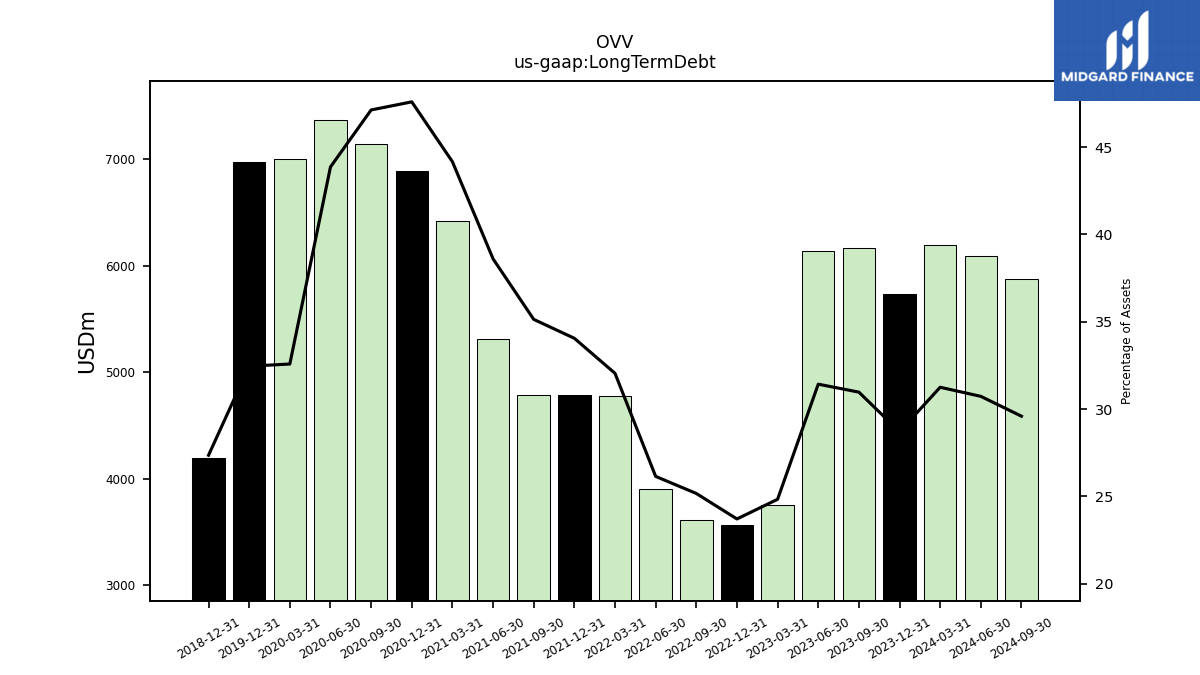
| Long Term Debt | 5737.00 | 6163.00 | 6134.00 | 3756.00 | 3570.00 | 3618.00 | 3902.00 | 4775.00 | 4786.00 | 4791.00 | 5314.00 | 6418.00 | 6885.00 | 7142.00 | 7366.00 | 7006.00 | 6974.00 | NA | NA | NA | 4198.00 | NA | NA | NA | |
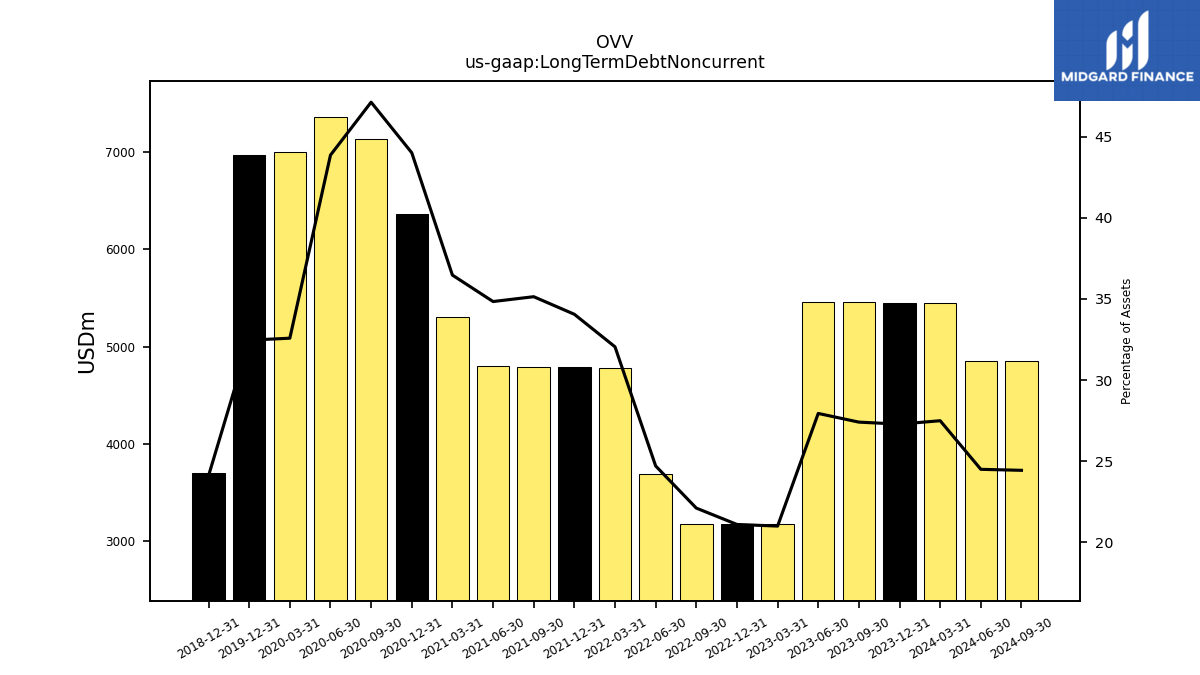
| Long Term Debt Noncurrent | 5453.00 | 5454.00 | 5454.00 | 3176.00 | 3177.00 | 3178.00 | 3687.00 | 4775.00 | 4786.00 | 4791.00 | 4796.00 | 5300.00 | 6367.00 | 7142.00 | 7366.00 | 7006.00 | 6974.00 | NA | NA | NA | 3698.00 | NA | NA | NA | |
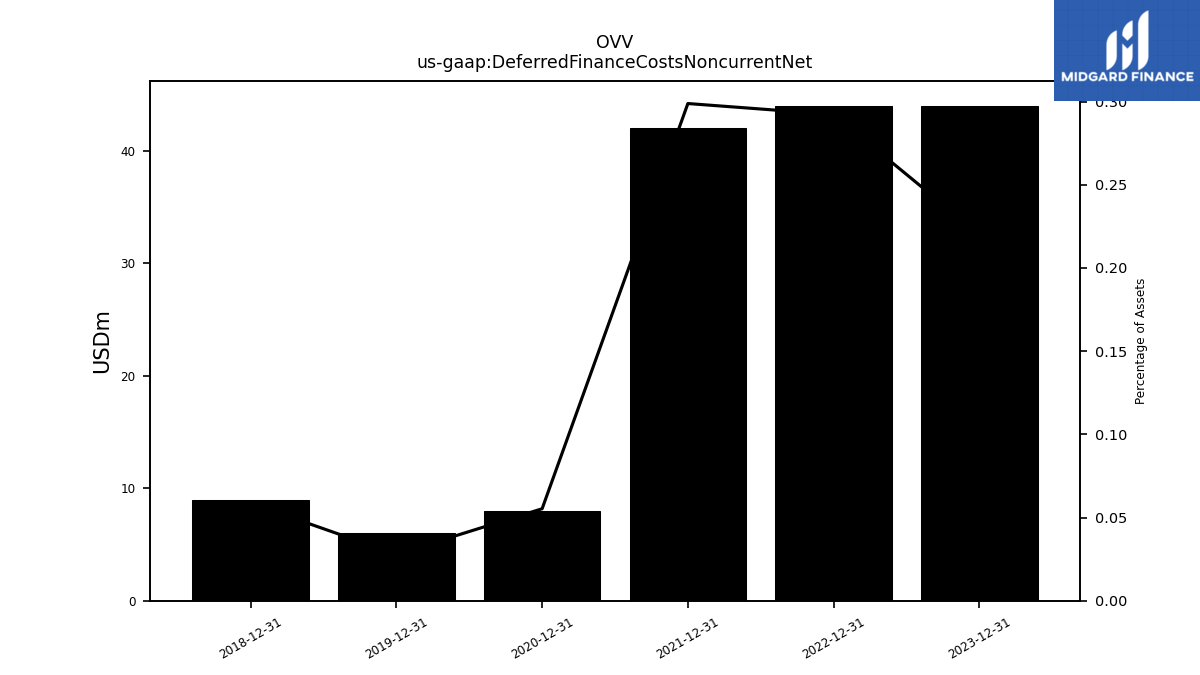
| Deferred Finance Costs Noncurrent Net | 44.00 | NA | NA | NA | 44.00 | NA | NA | NA | 42.00 | NA | NA | NA | 8.00 | NA | NA | NA | 6.00 | NA | NA | NA | 9.00 | NA | NA | NA | |
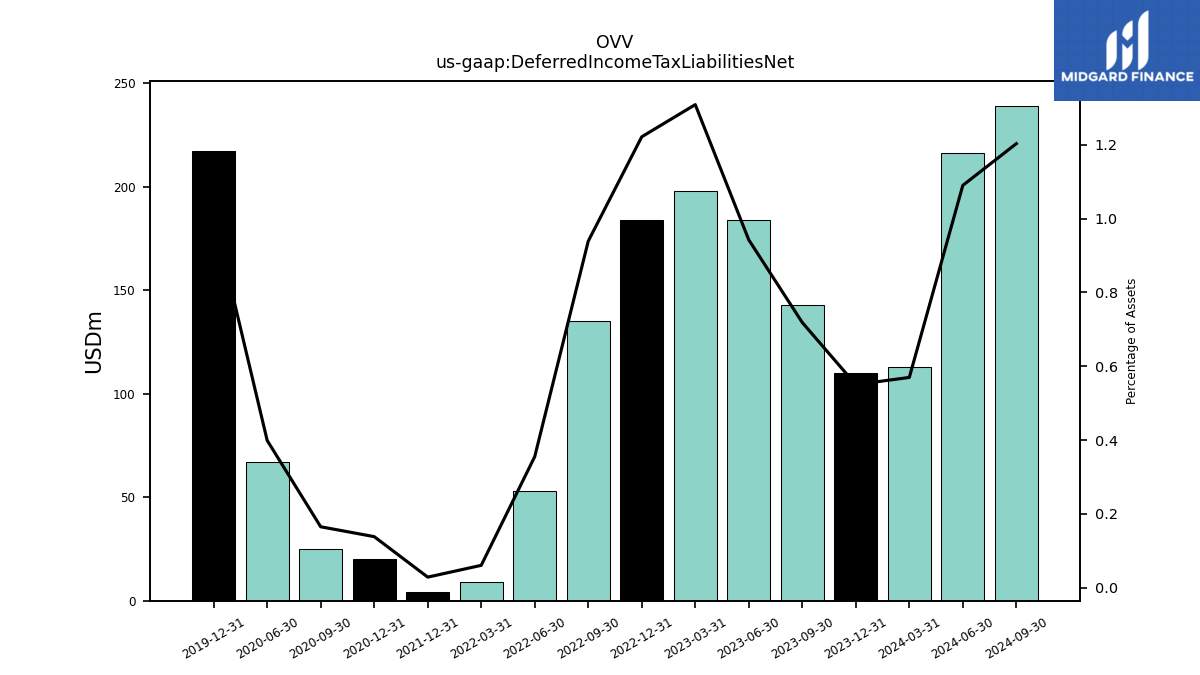
| Deferred Income Tax Liabilities Net | 110.00 | 143.00 | 184.00 | 198.00 | 184.00 | 135.00 | 53.00 | 9.00 | 4.00 | NA | NA | NA | 20.00 | 25.00 | 67.00 | NA | 217.00 | NA | NA | NA | NA | NA | NA | NA | |
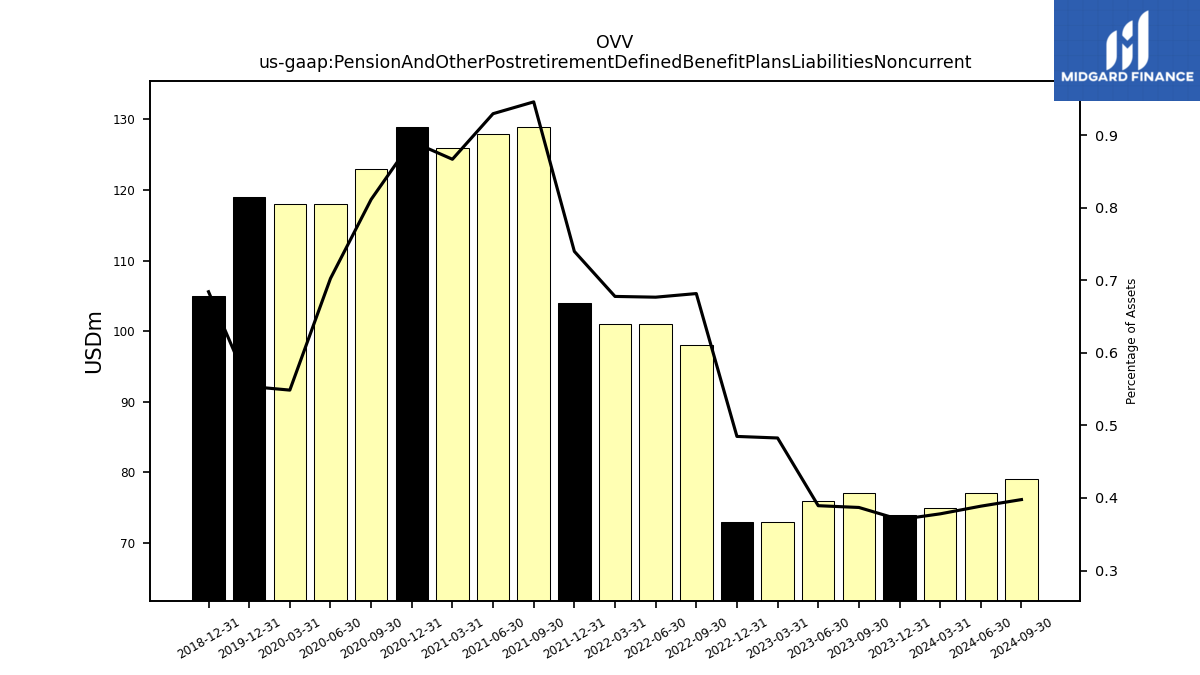
| Pension And Other Postretirement Defined Benefit Plans Liabilities Noncurrent | 74.00 | 77.00 | 76.00 | 73.00 | 73.00 | 98.00 | 101.00 | 101.00 | 104.00 | 129.00 | 128.00 | 126.00 | 129.00 | 123.00 | 118.00 | 118.00 | 119.00 | NA | NA | NA | 105.00 | NA | NA | NA | |
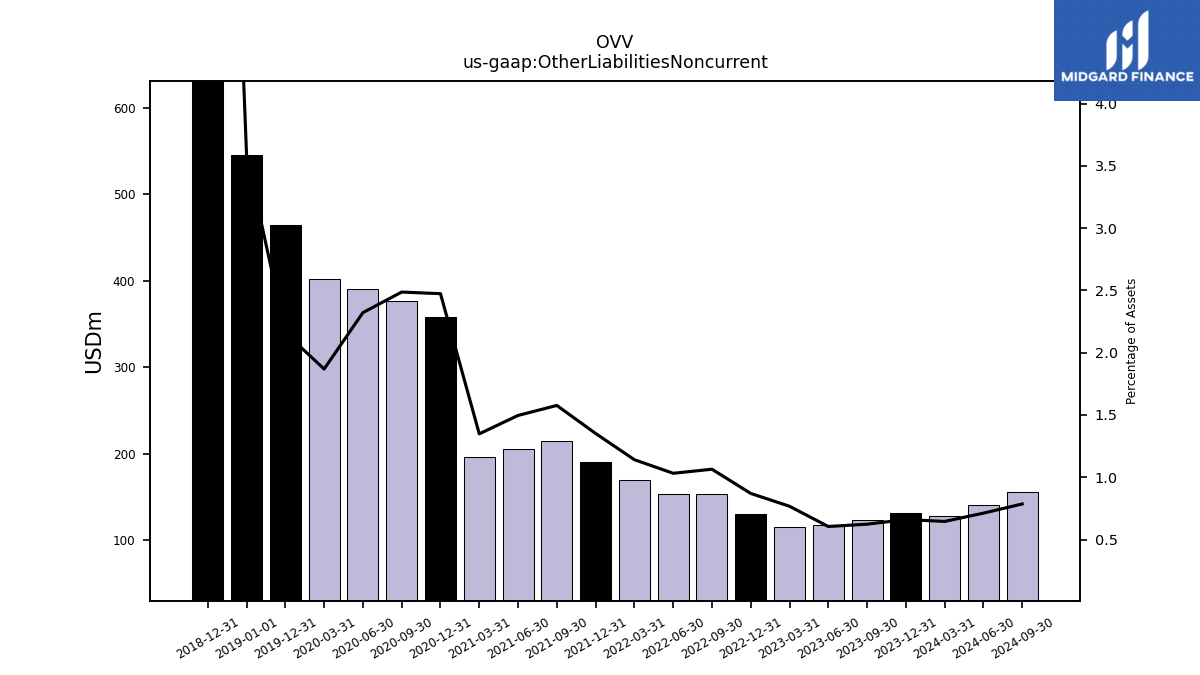
| Other Liabilities Noncurrent | 132.00 | 124.00 | 118.00 | 116.00 | 131.00 | 153.00 | 154.00 | 170.00 | 190.00 | 215.00 | 206.00 | 196.00 | 358.00 | 377.00 | 390.00 | 402.00 | 464.00 | NA | NA | NA | 1769.00 | NA | NA | NA | |
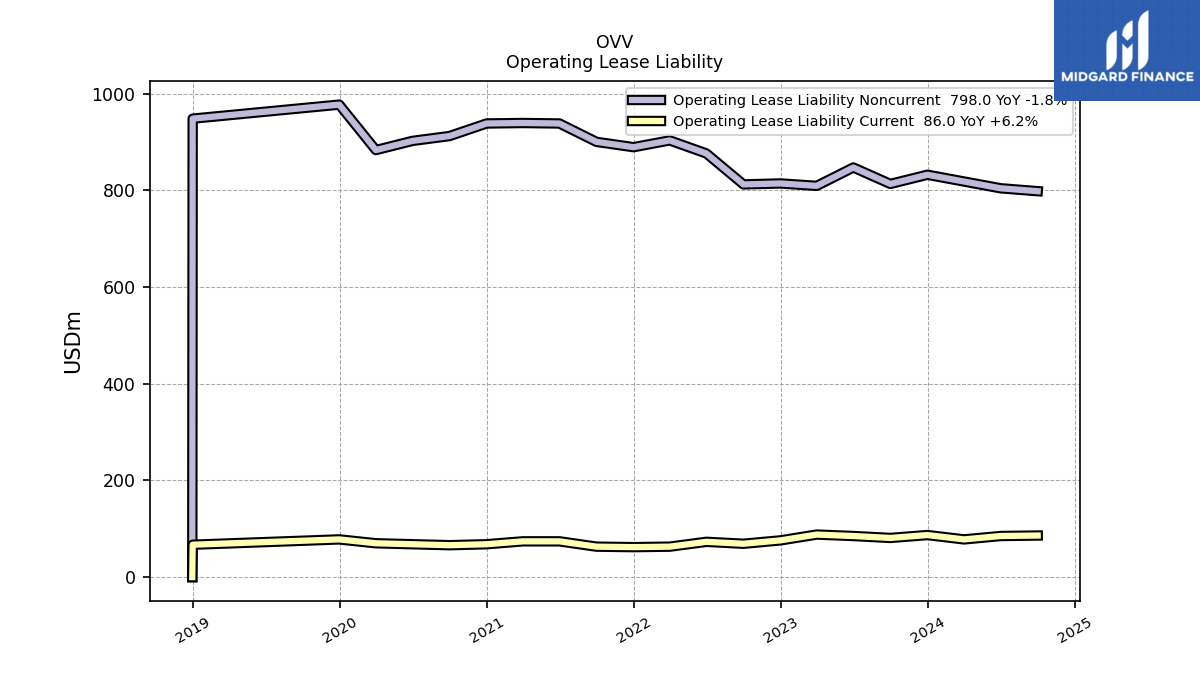
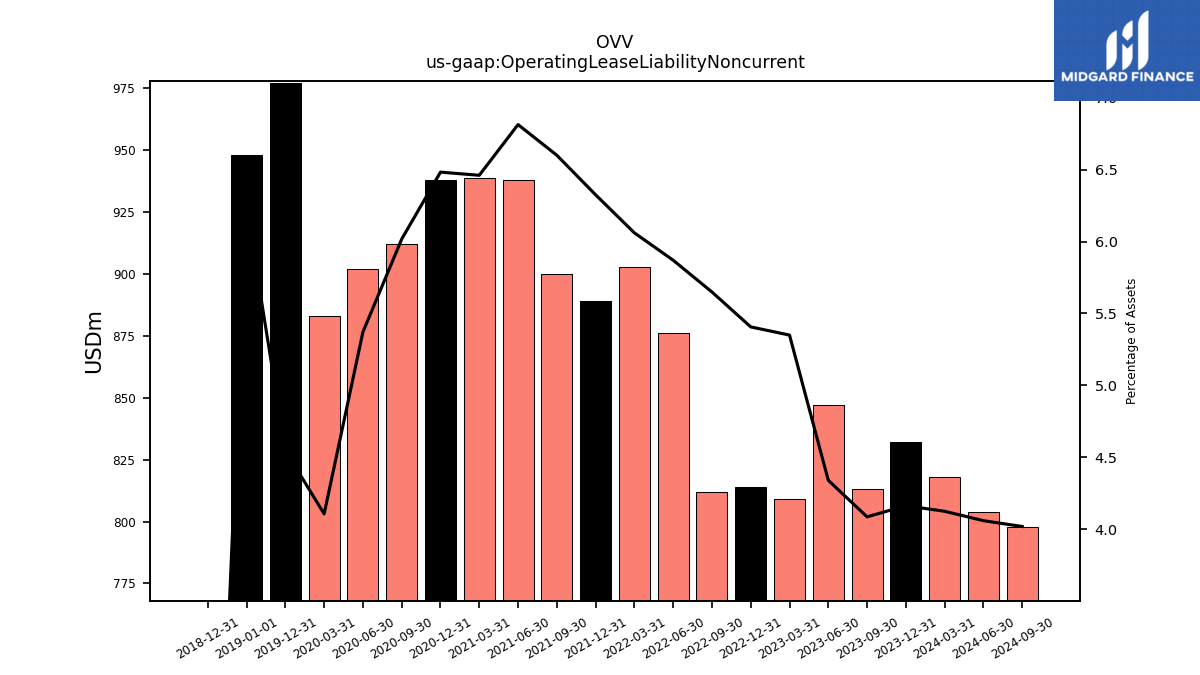
| Operating Lease Liability Noncurrent | 832.00 | 813.00 | 847.00 | 809.00 | 814.00 | 812.00 | 876.00 | 903.00 | 889.00 | 900.00 | 938.00 | 939.00 | 938.00 | 912.00 | 902.00 | 883.00 | 977.00 | NA | NA | NA | 0.00 | NA | NA | NA |
| 2023-12-31 | 2023-09-30 | 2023-06-30 | 2023-03-31 | 2022-12-31 | 2022-09-30 | 2022-06-30 | 2022-03-31 | 2021-12-31 | 2021-09-30 | 2021-06-30 | 2021-03-31 | 2020-12-31 | 2020-09-30 | 2020-06-30 | 2020-03-31 | 2019-12-31 | 2019-09-30 | 2019-06-30 | 2019-03-31 | 2018-12-31 | 2018-09-30 | 2018-06-30 | 2018-03-31 | ||
|---|---|---|---|---|---|---|---|---|---|---|---|---|---|---|---|---|---|---|---|---|---|---|---|---|---|
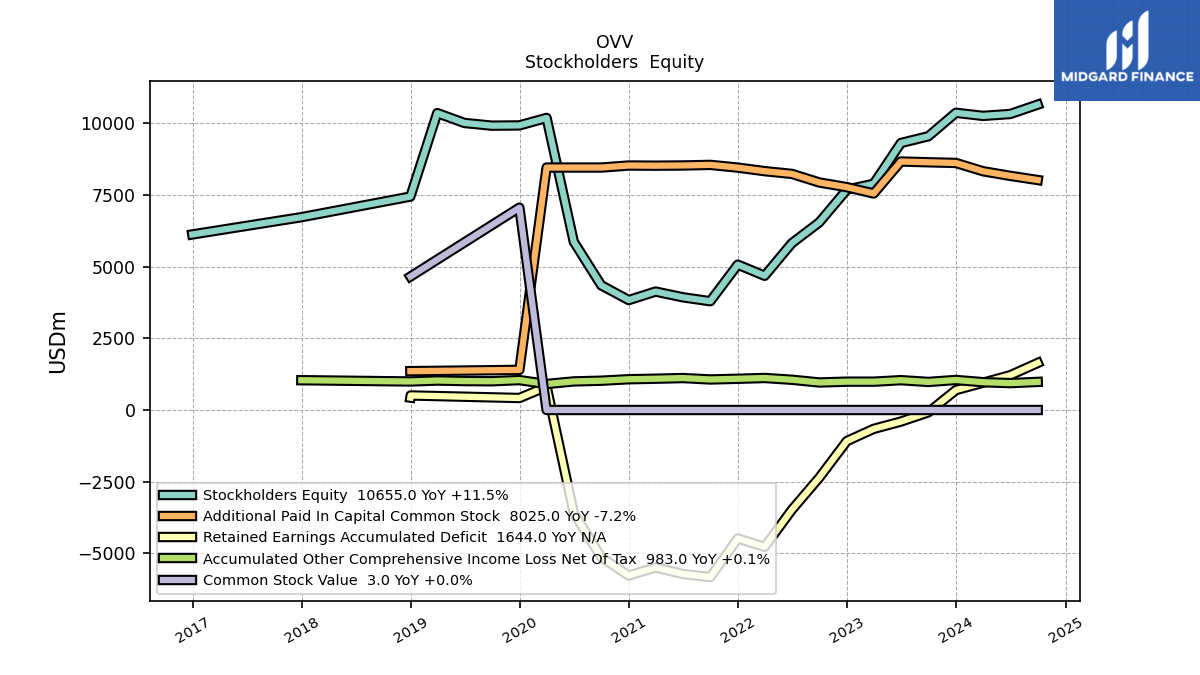
| Stockholders Equity | 10370.00 | 9552.00 | 9316.00 | 7894.00 | 7689.00 | 6550.00 | 5821.00 | 4684.00 | 5074.00 | 3797.00 | 3934.00 | 4134.00 | 3837.00 | 4352.00 | 5873.00 | 10191.00 | 9930.00 | 9921.00 | 10015.00 | 10360.00 | 7447.00 | NA | NA | NA | |
| Common Stock Value | 3.00 | 3.00 | 3.00 | 3.00 | 3.00 | 3.00 | 3.00 | 3.00 | 3.00 | 3.00 | 3.00 | 3.00 | 3.00 | 3.00 | 3.00 | 3.00 | 7061.00 | NA | NA | NA | 4656.00 | NA | NA | NA | |
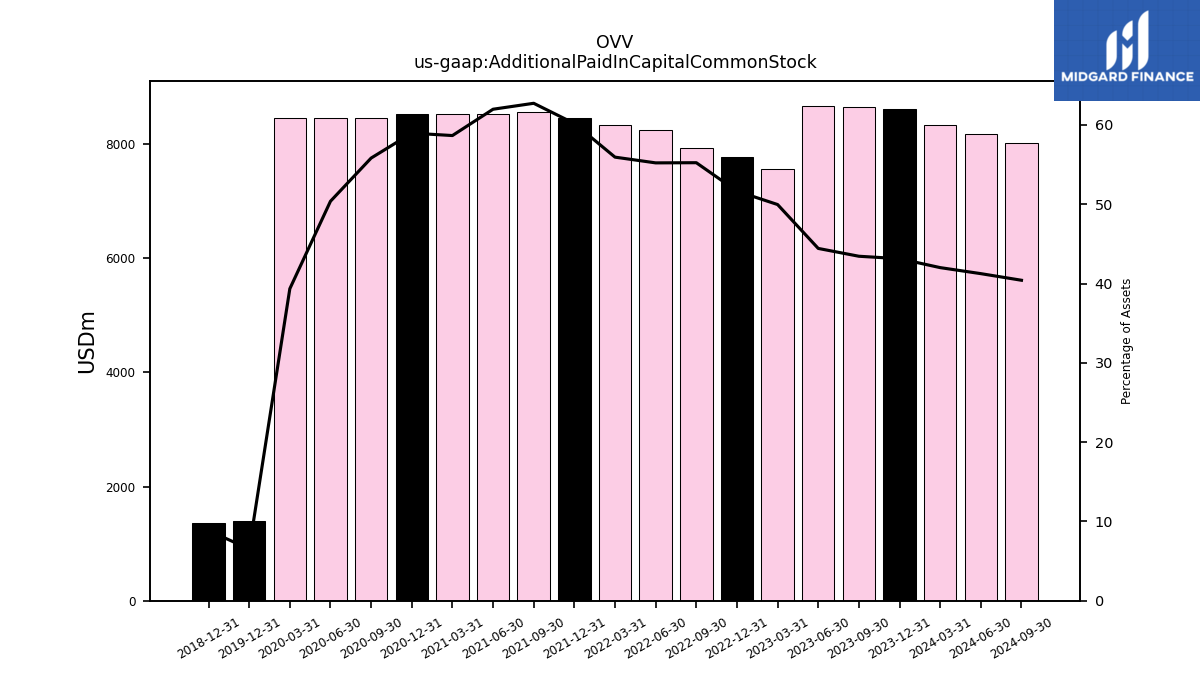
| Additional Paid In Capital Common Stock | 8620.00 | 8644.00 | 8671.00 | 7555.00 | 7776.00 | 7939.00 | 8239.00 | 8334.00 | 8458.00 | 8553.00 | 8532.00 | 8525.00 | 8531.00 | 8460.00 | 8460.00 | 8460.00 | 1402.00 | NA | NA | NA | 1358.00 | NA | NA | NA | |
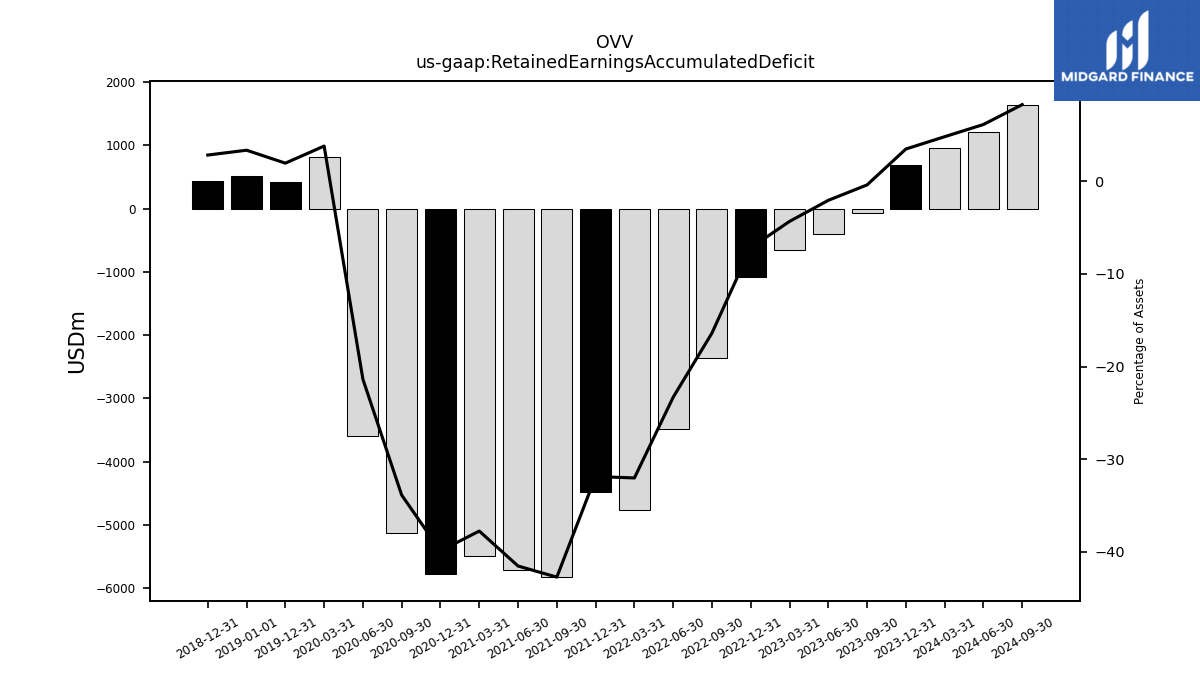
| Retained Earnings Accumulated Deficit | 697.00 | -77.00 | -401.00 | -655.00 | -1081.00 | -2355.00 | -3479.00 | -4772.00 | -4479.00 | -5827.00 | -5718.00 | -5488.00 | -5773.00 | -5135.00 | -3590.00 | 818.00 | 421.00 | NA | NA | NA | 435.00 | NA | NA | NA | |
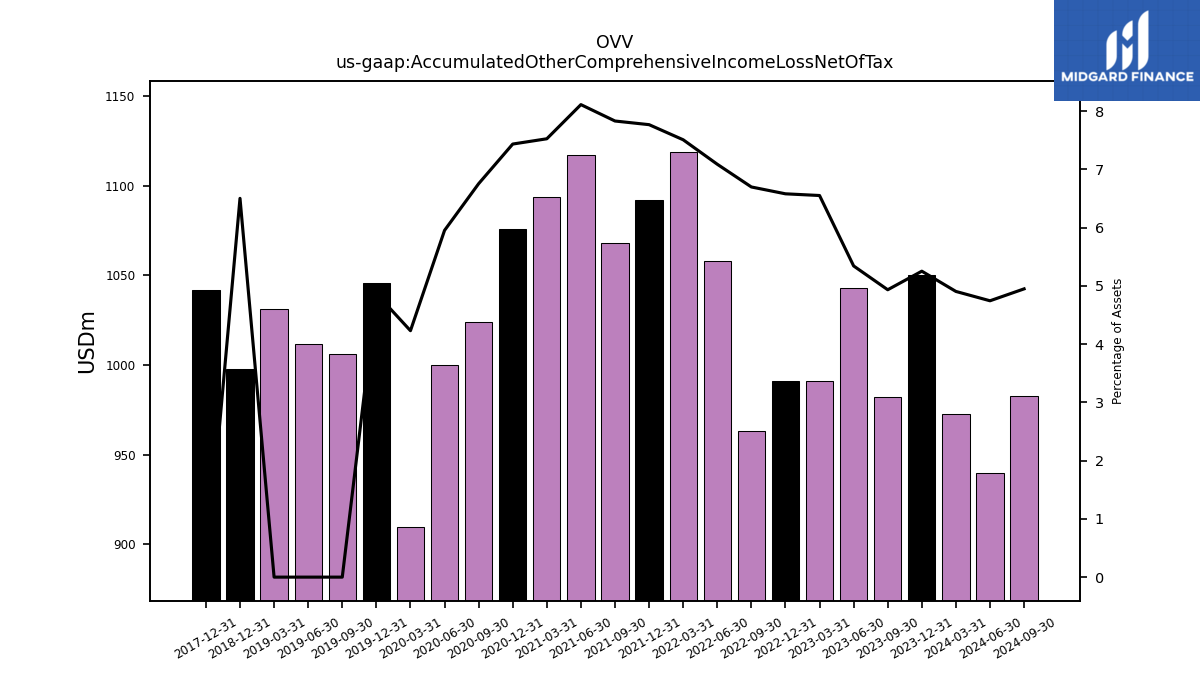
| Accumulated Other Comprehensive Income Loss Net Of Tax | 1050.00 | 982.00 | 1043.00 | 991.00 | 991.00 | 963.00 | 1058.00 | 1119.00 | 1092.00 | 1068.00 | 1117.00 | 1094.00 | 1076.00 | 1024.00 | 1000.00 | 910.00 | 1046.00 | 1006.00 | 1012.00 | 1031.00 | 998.00 | NA | NA | NA | |
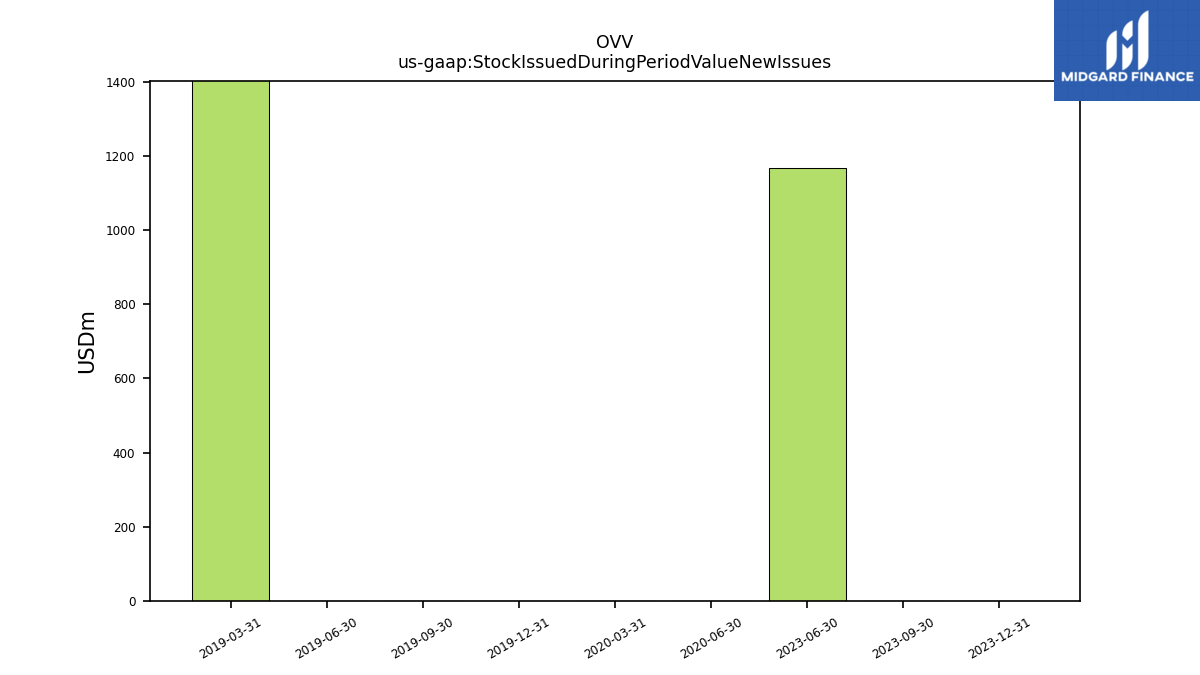
| Stock Issued During Period Value New Issues | 0.00 | 0.00 | 1169.00 | NA | NA | NA | NA | NA | NA | NA | NA | NA | NA | NA | 0.00 | 0.00 | 0.00 | 0.00 | 0.00 | 3478.00 | NA | NA | NA | NA | |
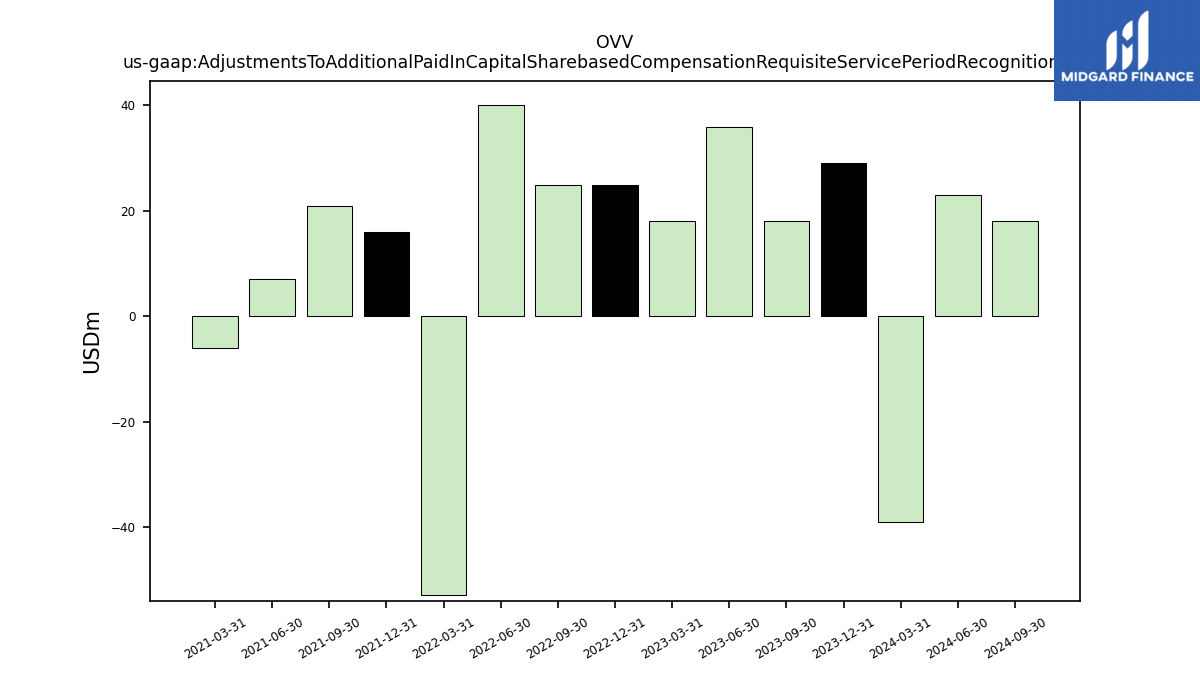
| Adjustments To Additional Paid In Capital Sharebased Compensation Requisite Service Period Recognition Value | 29.00 | 18.00 | 36.00 | 18.00 | 25.00 | 25.00 | 40.00 | -53.00 | 16.00 | 21.00 | 7.00 | -6.00 | NA | NA | NA | NA | NA | NA | NA | NA | NA | NA | NA | NA |
| 2023-12-31 | 2023-09-30 | 2023-06-30 | 2023-03-31 | 2022-12-31 | 2022-09-30 | 2022-06-30 | 2022-03-31 | 2021-12-31 | 2021-09-30 | 2021-06-30 | 2021-03-31 | 2020-12-31 | 2020-09-30 | 2020-06-30 | 2020-03-31 | 2019-12-31 | 2019-09-30 | 2019-06-30 | 2019-03-31 | 2018-12-31 | 2018-09-30 | 2018-06-30 | 2018-03-31 | ||
|---|---|---|---|---|---|---|---|---|---|---|---|---|---|---|---|---|---|---|---|---|---|---|---|---|---|
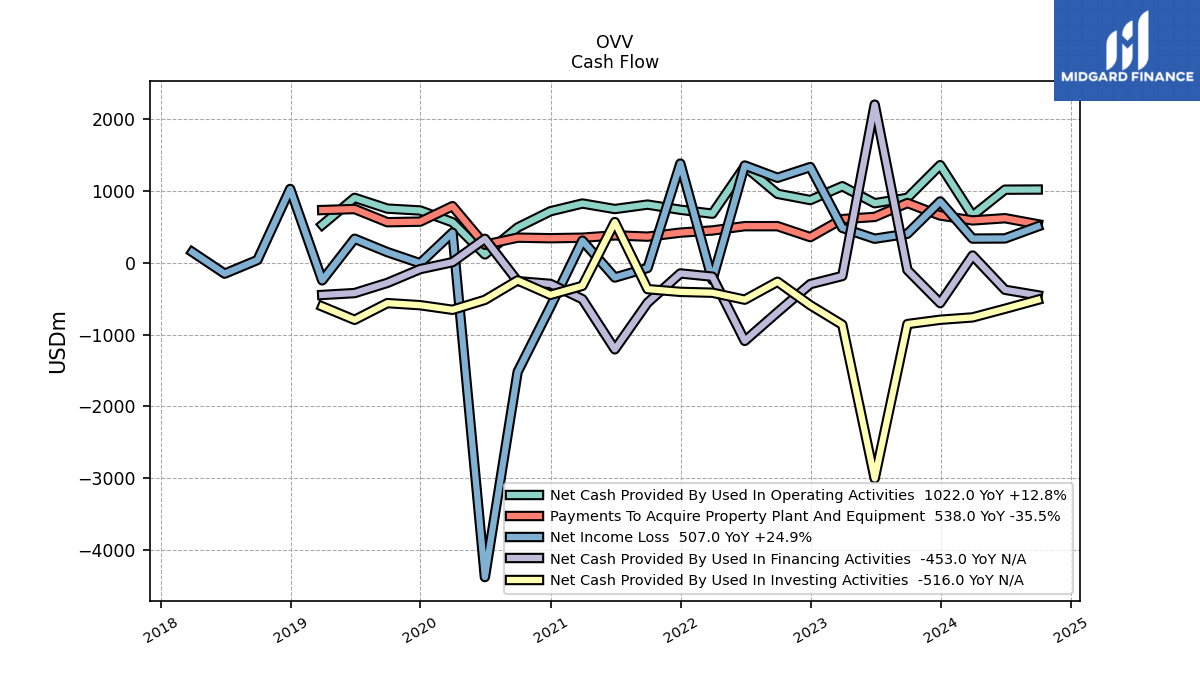
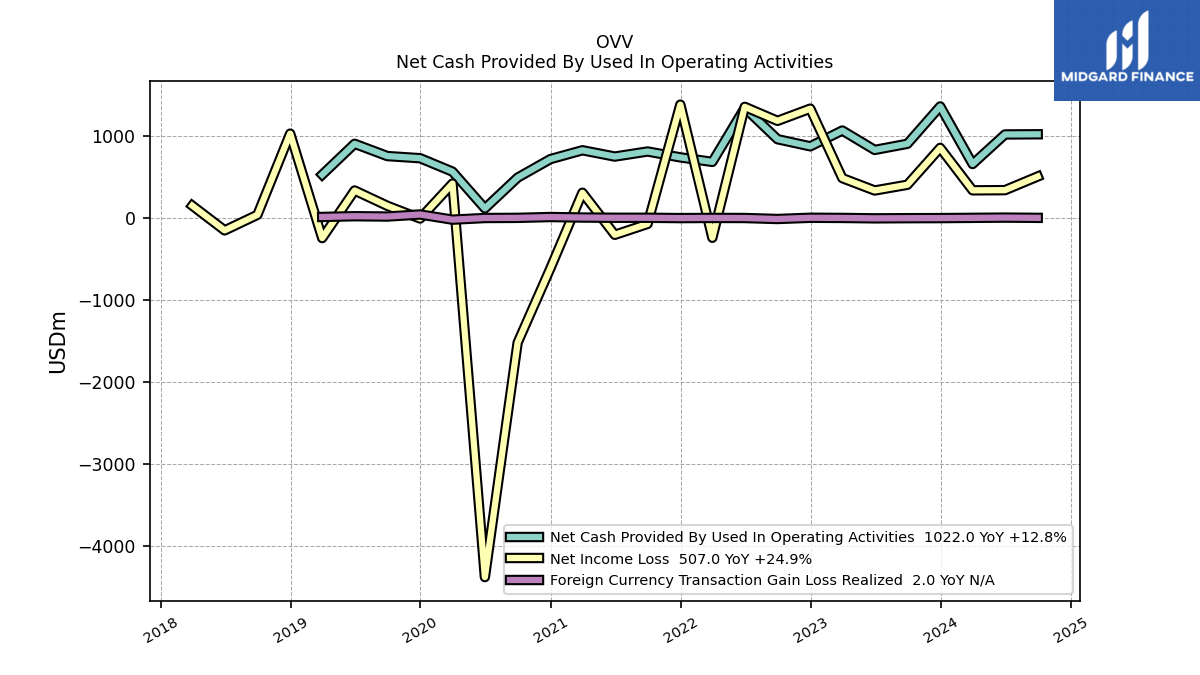
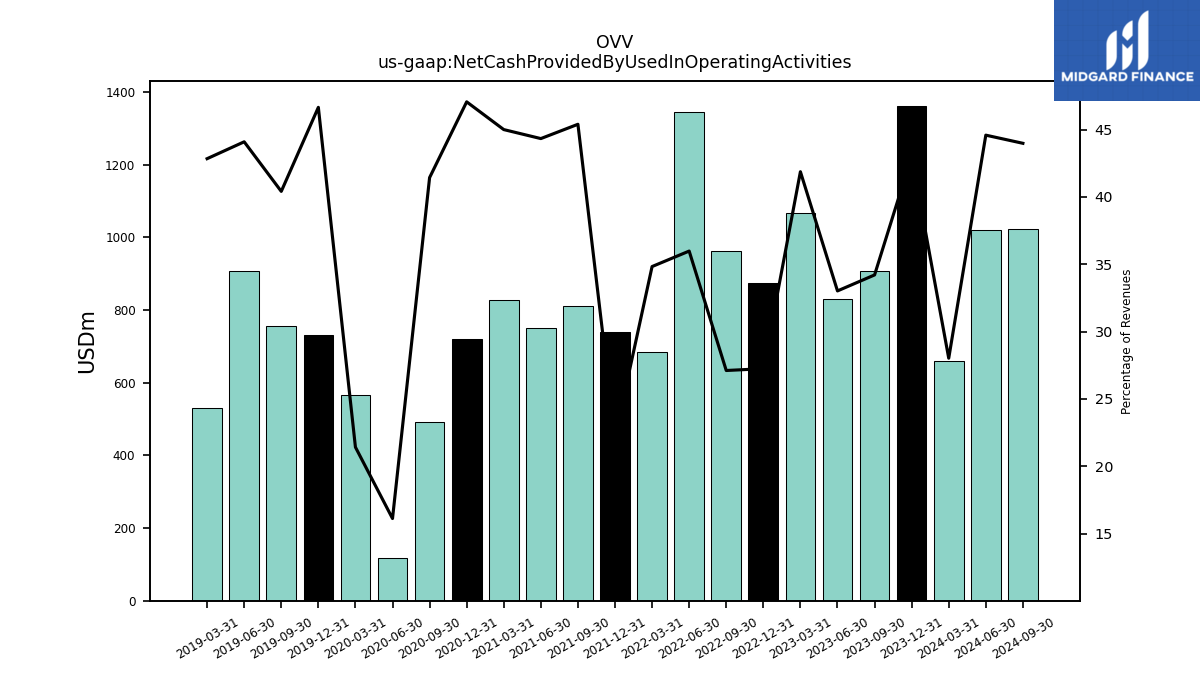
| Net Cash Provided By Used In Operating Activities | 1362.00 | 906.00 | 831.00 | 1068.00 | 875.00 | 962.00 | 1344.00 | 685.00 | 740.00 | 812.00 | 750.00 | 827.00 | 719.00 | 493.00 | 117.00 | 566.00 | 730.00 | 756.00 | 906.00 | 529.00 | NA | NA | NA | NA | |
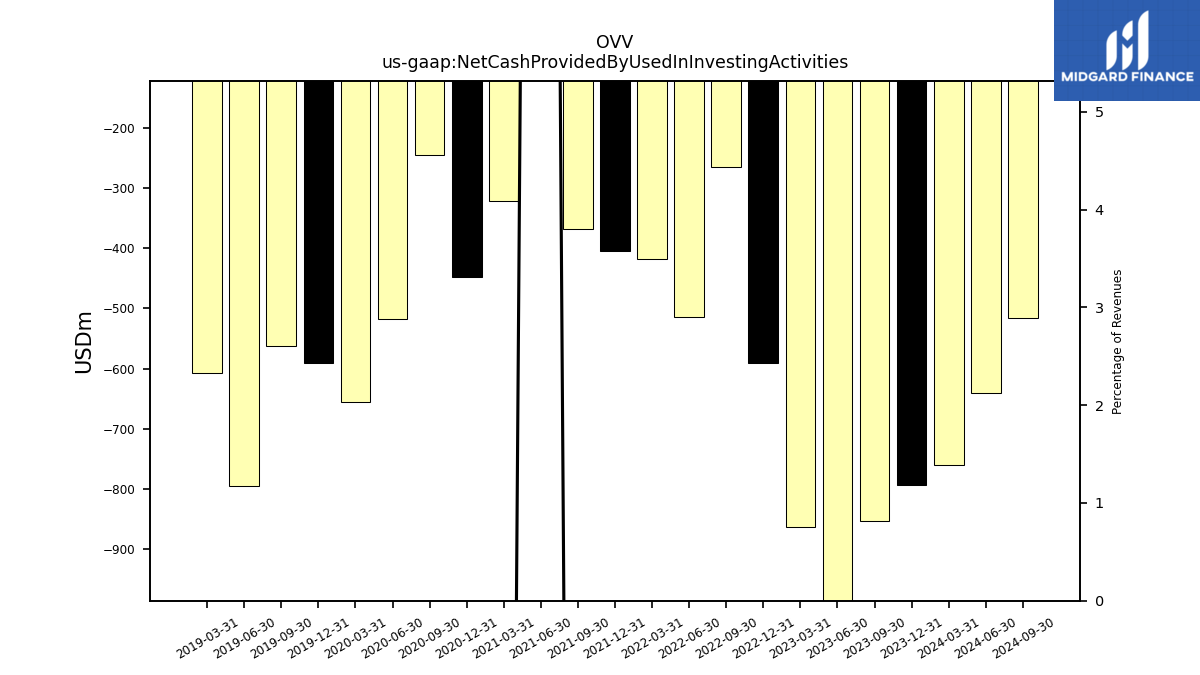
| Net Cash Provided By Used In Investing Activities | -794.00 | -854.00 | -3008.00 | -863.00 | -591.00 | -264.00 | -514.00 | -417.00 | -405.00 | -367.00 | 568.00 | -321.00 | -447.00 | -245.00 | -517.00 | -655.00 | -591.00 | -562.00 | -795.00 | -608.00 | NA | NA | NA | NA | |
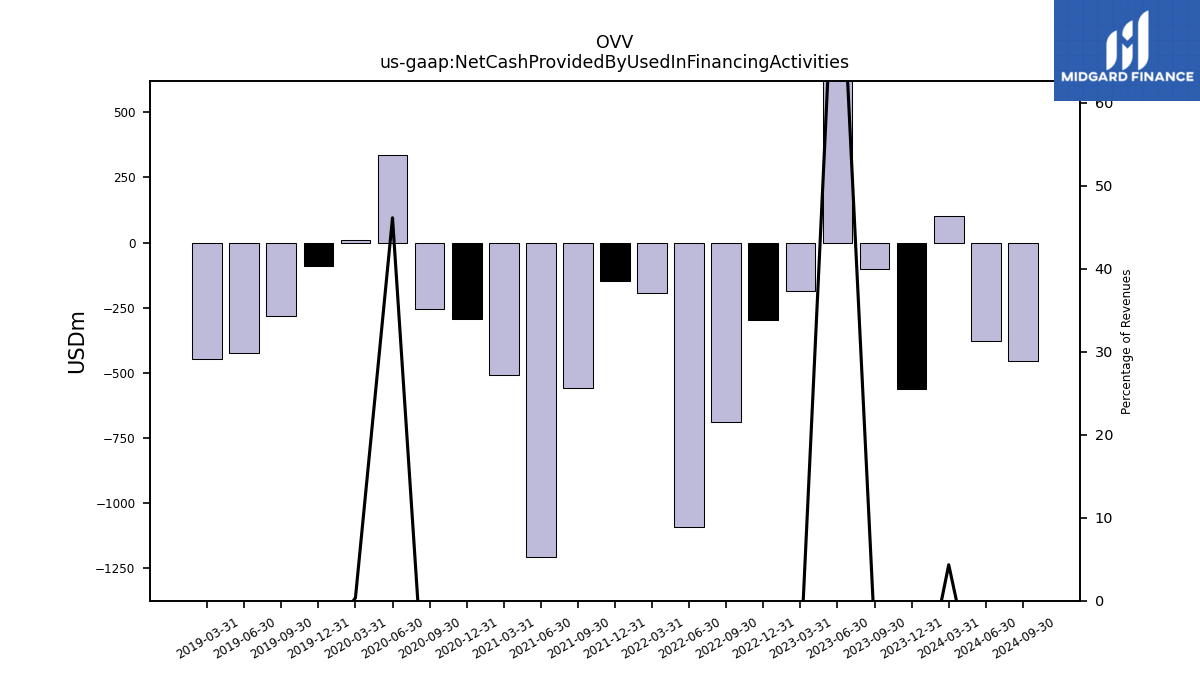
| Net Cash Provided By Used In Financing Activities | -562.00 | -101.00 | 2206.00 | -184.00 | -297.00 | -689.00 | -1089.00 | -193.00 | -148.00 | -557.00 | -1207.00 | -507.00 | -294.00 | -256.00 | 335.00 | 9.00 | -88.00 | -280.00 | -422.00 | -448.00 | NA | NA | NA | NA |
| 2023-12-31 | 2023-09-30 | 2023-06-30 | 2023-03-31 | 2022-12-31 | 2022-09-30 | 2022-06-30 | 2022-03-31 | 2021-12-31 | 2021-09-30 | 2021-06-30 | 2021-03-31 | 2020-12-31 | 2020-09-30 | 2020-06-30 | 2020-03-31 | 2019-12-31 | 2019-09-30 | 2019-06-30 | 2019-03-31 | 2018-12-31 | 2018-09-30 | 2018-06-30 | 2018-03-31 | ||
|---|---|---|---|---|---|---|---|---|---|---|---|---|---|---|---|---|---|---|---|---|---|---|---|---|---|
| Net Cash Provided By Used In Operating Activities | 1362.00 | 906.00 | 831.00 | 1068.00 | 875.00 | 962.00 | 1344.00 | 685.00 | 740.00 | 812.00 | 750.00 | 827.00 | 719.00 | 493.00 | 117.00 | 566.00 | 730.00 | 756.00 | 906.00 | 529.00 | NA | NA | NA | NA | |
| Net Income Loss | 856.00 | 406.00 | 336.00 | 487.00 | 1335.00 | 1186.00 | 1357.00 | -241.00 | 1384.00 | -72.00 | -205.00 | 309.00 | -614.00 | -1521.00 | -4383.00 | 421.00 | -6.00 | 149.00 | 336.00 | -245.00 | 1030.00 | 39.00 | -151.00 | 151.00 | |
| Profit Loss | 856.00 | 406.00 | 336.00 | 487.00 | 1335.00 | 1186.00 | 1357.00 | -241.00 | 1384.00 | -72.00 | -205.00 | 309.00 | -614.00 | -1521.00 | -4383.00 | 421.00 | -6.00 | 149.00 | 336.00 | -245.00 | NA | NA | NA | NA | |
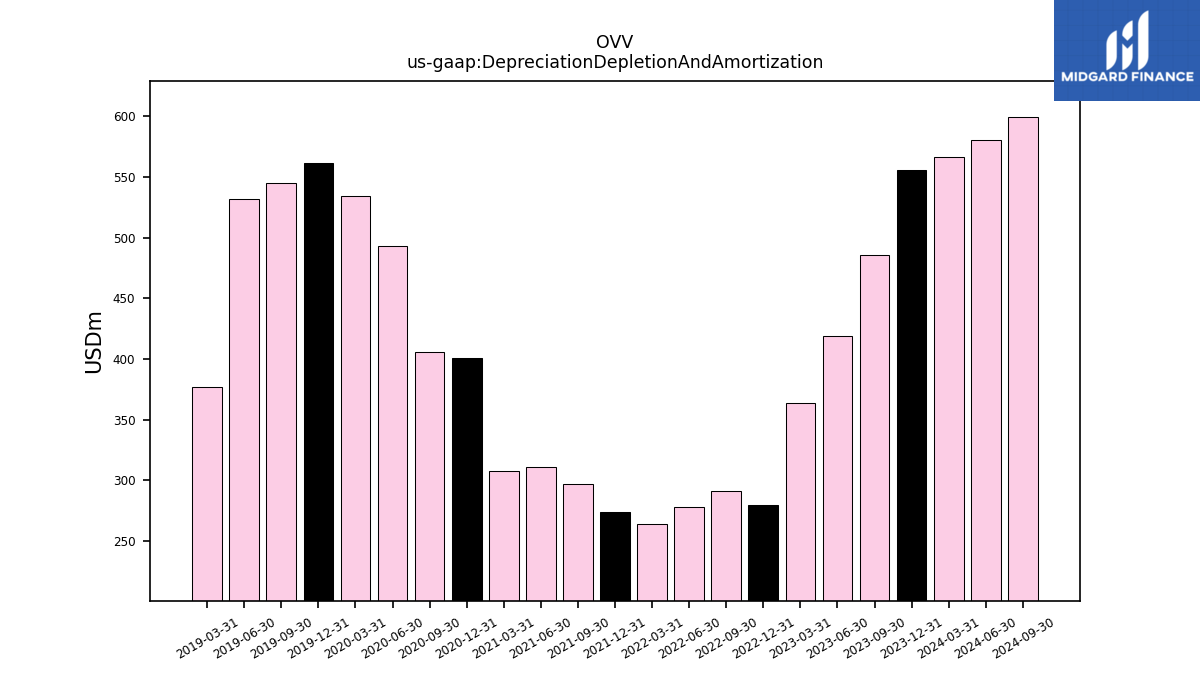
| Depreciation Depletion And Amortization | 556.00 | 486.00 | 419.00 | 364.00 | 280.00 | 291.00 | 278.00 | 264.00 | 274.00 | 297.00 | 311.00 | 308.00 | 401.00 | 406.00 | 493.00 | 534.00 | 561.00 | 545.00 | 532.00 | 377.00 | NA | NA | NA | NA | |
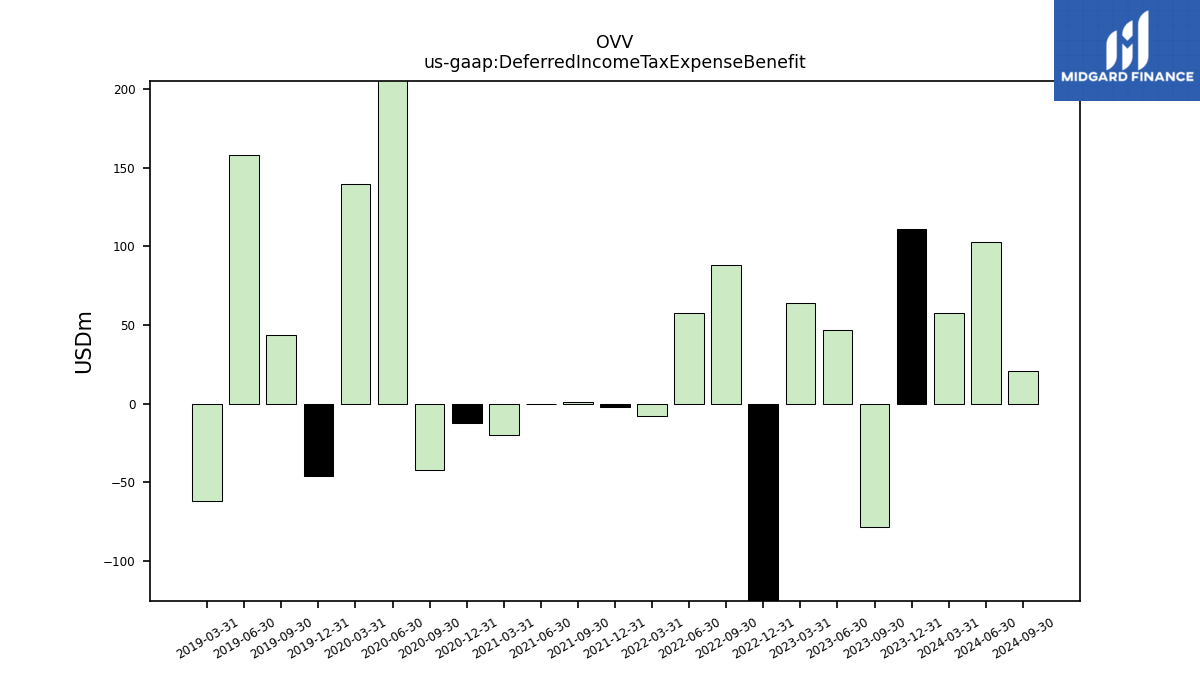
| Deferred Income Tax Expense Benefit | 111.00 | -78.00 | 47.00 | 64.00 | -225.00 | 88.00 | 58.00 | -8.00 | -2.00 | 1.00 | 0.00 | -20.00 | -12.00 | -42.00 | 295.00 | 140.00 | -46.00 | 44.00 | 158.00 | -62.00 | NA | NA | NA | NA |
| 2023-12-31 | 2023-09-30 | 2023-06-30 | 2023-03-31 | 2022-12-31 | 2022-09-30 | 2022-06-30 | 2022-03-31 | 2021-12-31 | 2021-09-30 | 2021-06-30 | 2021-03-31 | 2020-12-31 | 2020-09-30 | 2020-06-30 | 2020-03-31 | 2019-12-31 | 2019-09-30 | 2019-06-30 | 2019-03-31 | 2018-12-31 | 2018-09-30 | 2018-06-30 | 2018-03-31 | ||
|---|---|---|---|---|---|---|---|---|---|---|---|---|---|---|---|---|---|---|---|---|---|---|---|---|---|
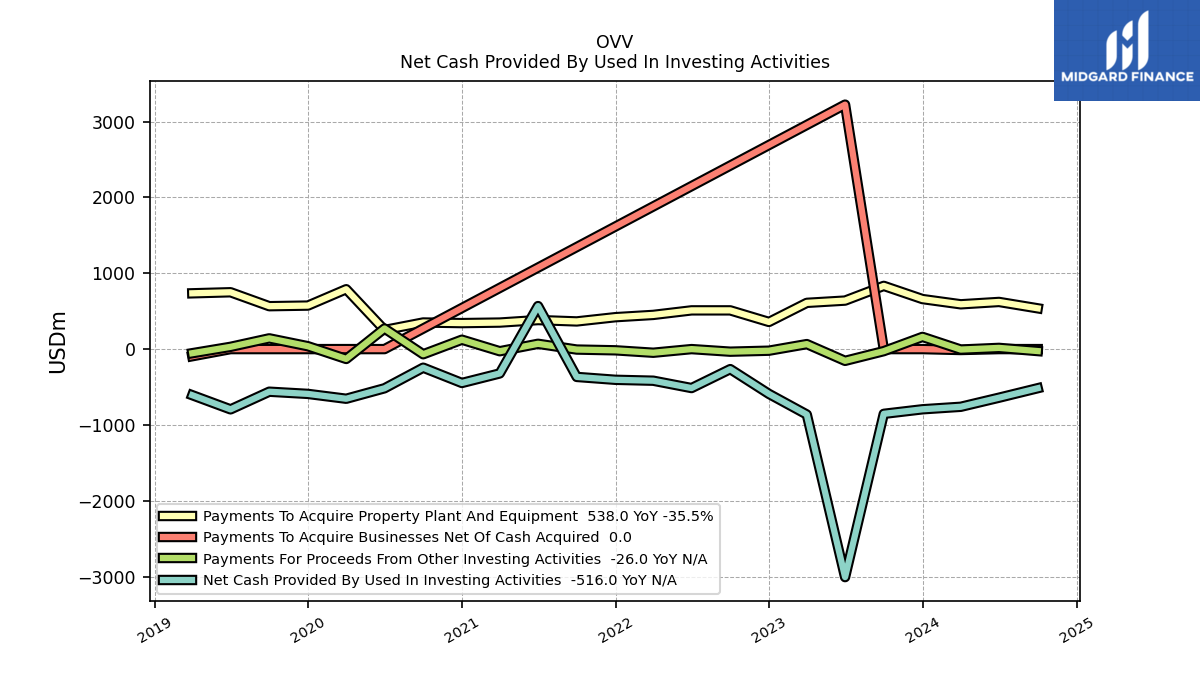
| Net Cash Provided By Used In Investing Activities | -794.00 | -854.00 | -3008.00 | -863.00 | -591.00 | -264.00 | -514.00 | -417.00 | -405.00 | -367.00 | 568.00 | -321.00 | -447.00 | -245.00 | -517.00 | -655.00 | -591.00 | -562.00 | -795.00 | -608.00 | NA | NA | NA | NA | |
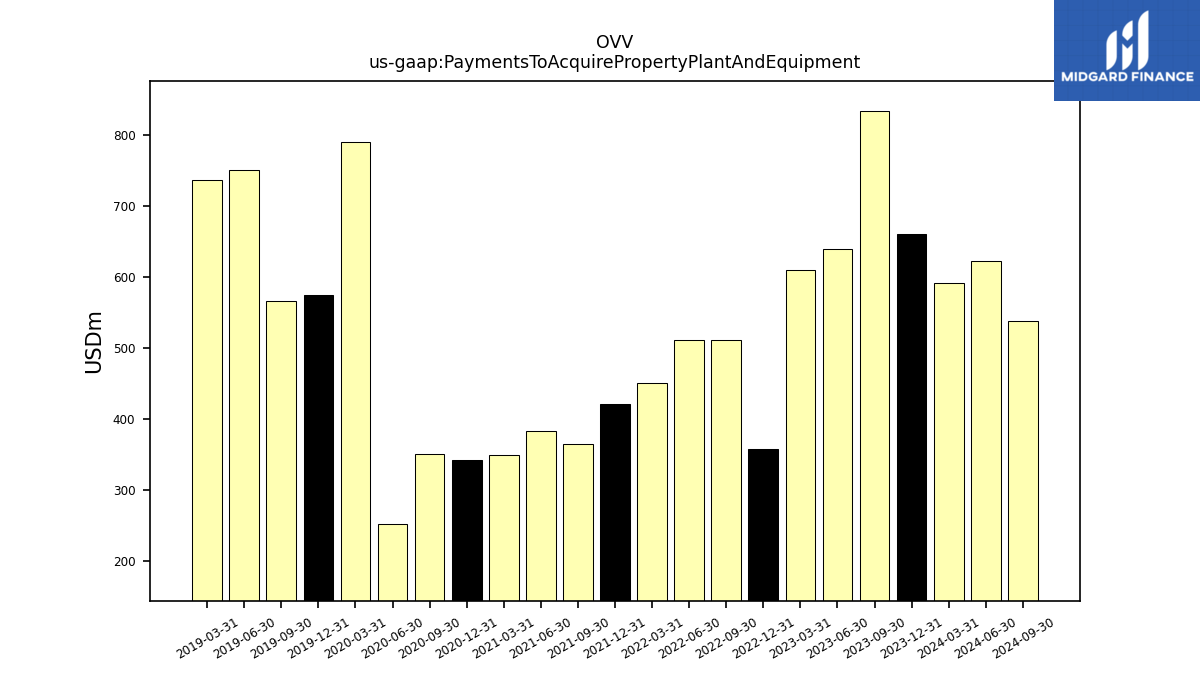
| Payments To Acquire Property Plant And Equipment | 660.00 | 834.00 | 640.00 | 610.00 | 358.00 | 511.00 | 511.00 | 451.00 | 421.00 | 365.00 | 383.00 | 350.00 | 343.00 | 351.00 | 252.00 | 790.00 | 574.00 | 566.00 | 750.00 | 736.00 | NA | NA | NA | NA |
| 2023-12-31 | 2023-09-30 | 2023-06-30 | 2023-03-31 | 2022-12-31 | 2022-09-30 | 2022-06-30 | 2022-03-31 | 2021-12-31 | 2021-09-30 | 2021-06-30 | 2021-03-31 | 2020-12-31 | 2020-09-30 | 2020-06-30 | 2020-03-31 | 2019-12-31 | 2019-09-30 | 2019-06-30 | 2019-03-31 | 2018-12-31 | 2018-09-30 | 2018-06-30 | 2018-03-31 | ||
|---|---|---|---|---|---|---|---|---|---|---|---|---|---|---|---|---|---|---|---|---|---|---|---|---|---|
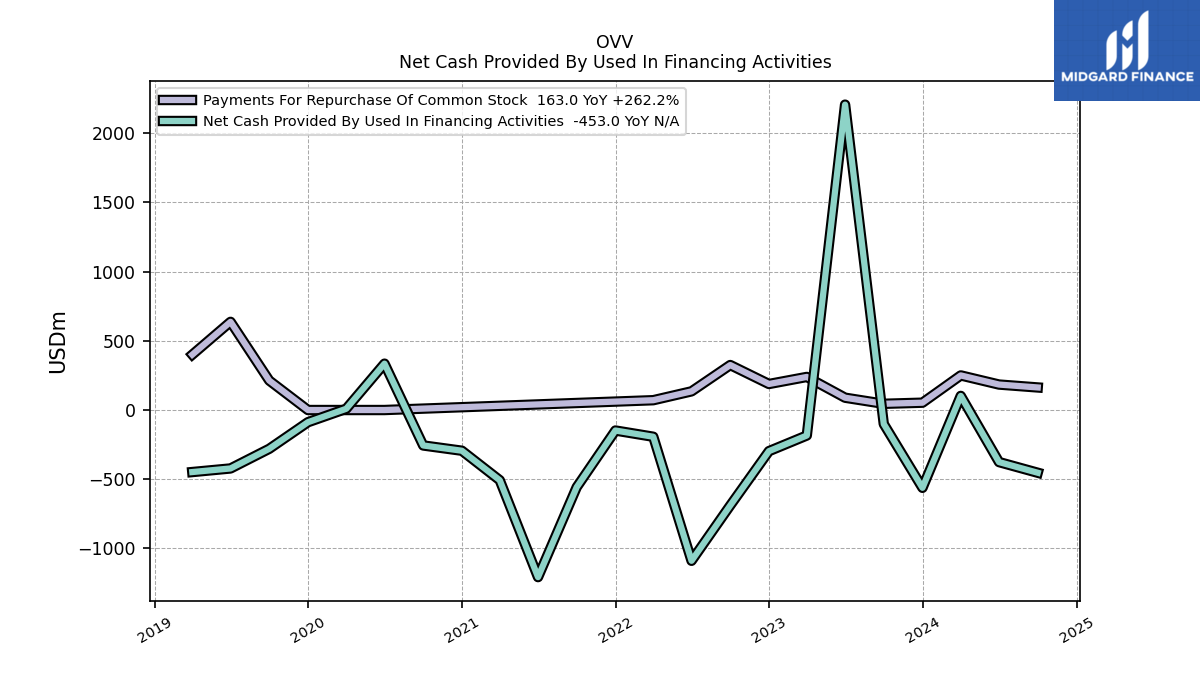
| Net Cash Provided By Used In Financing Activities | -562.00 | -101.00 | 2206.00 | -184.00 | -297.00 | -689.00 | -1089.00 | -193.00 | -148.00 | -557.00 | -1207.00 | -507.00 | -294.00 | -256.00 | 335.00 | 9.00 | -88.00 | -280.00 | -422.00 | -448.00 | NA | NA | NA | NA | |
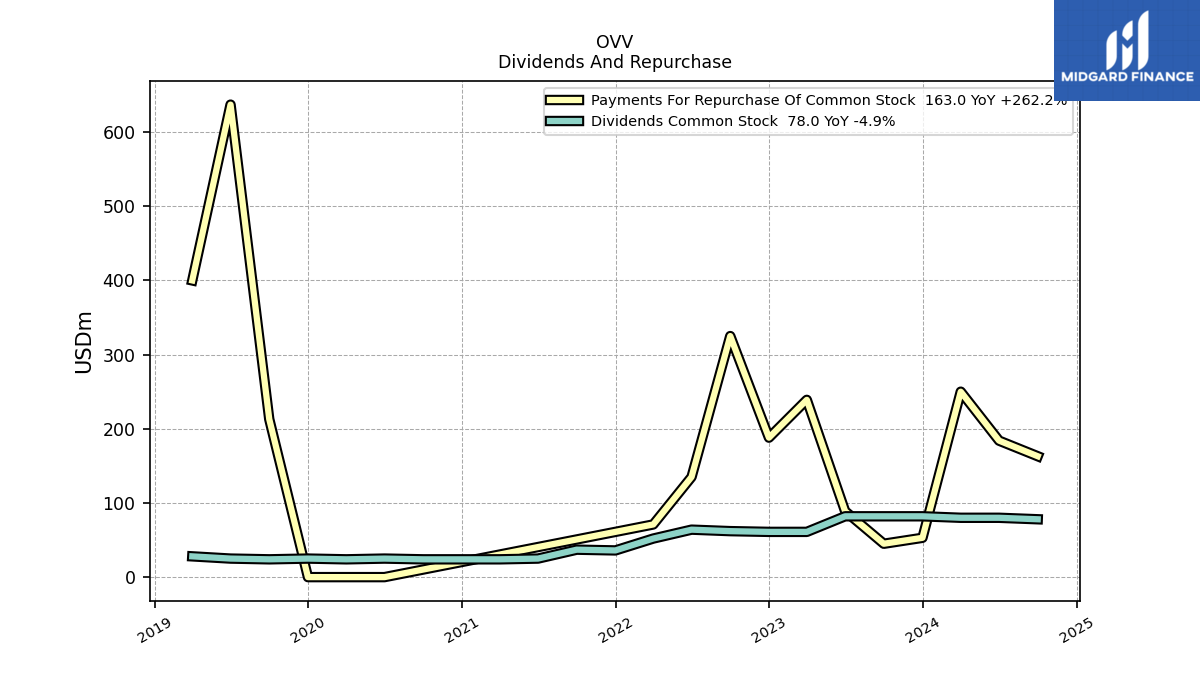
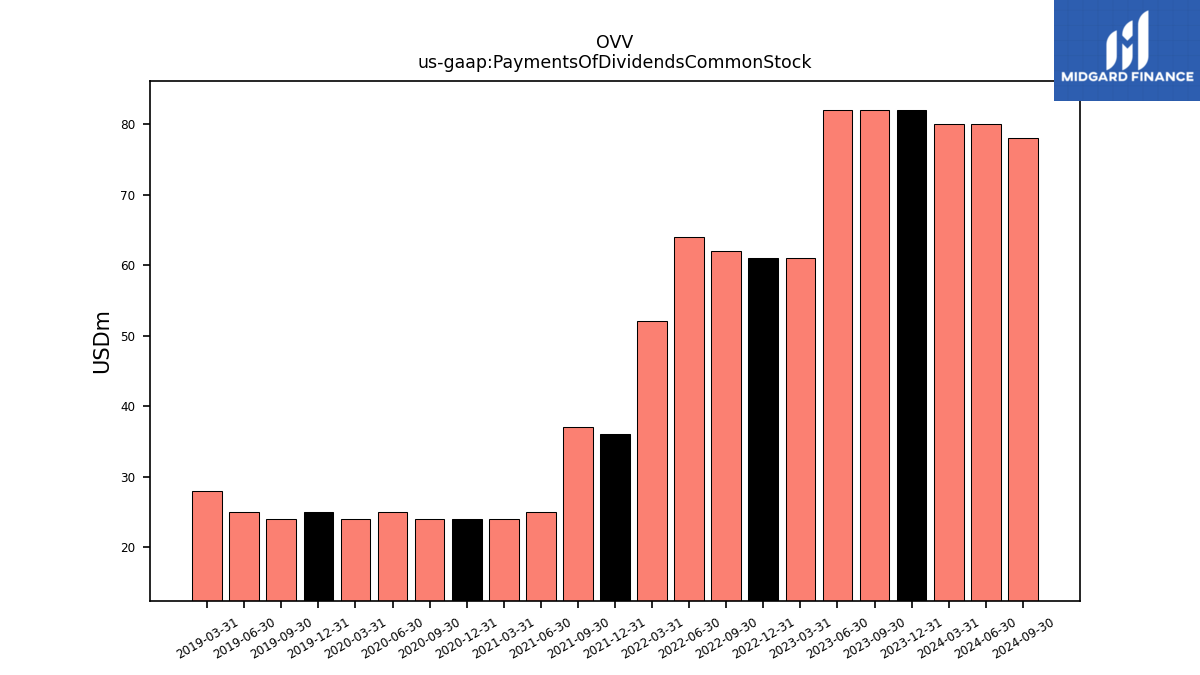
| Payments Of Dividends Common Stock | 82.00 | 82.00 | 82.00 | 61.00 | 61.00 | 62.00 | 64.00 | 52.00 | 36.00 | 37.00 | 25.00 | 24.00 | 24.00 | 24.00 | 25.00 | 24.00 | 25.00 | 24.00 | 25.00 | 28.00 | NA | NA | NA | NA | |
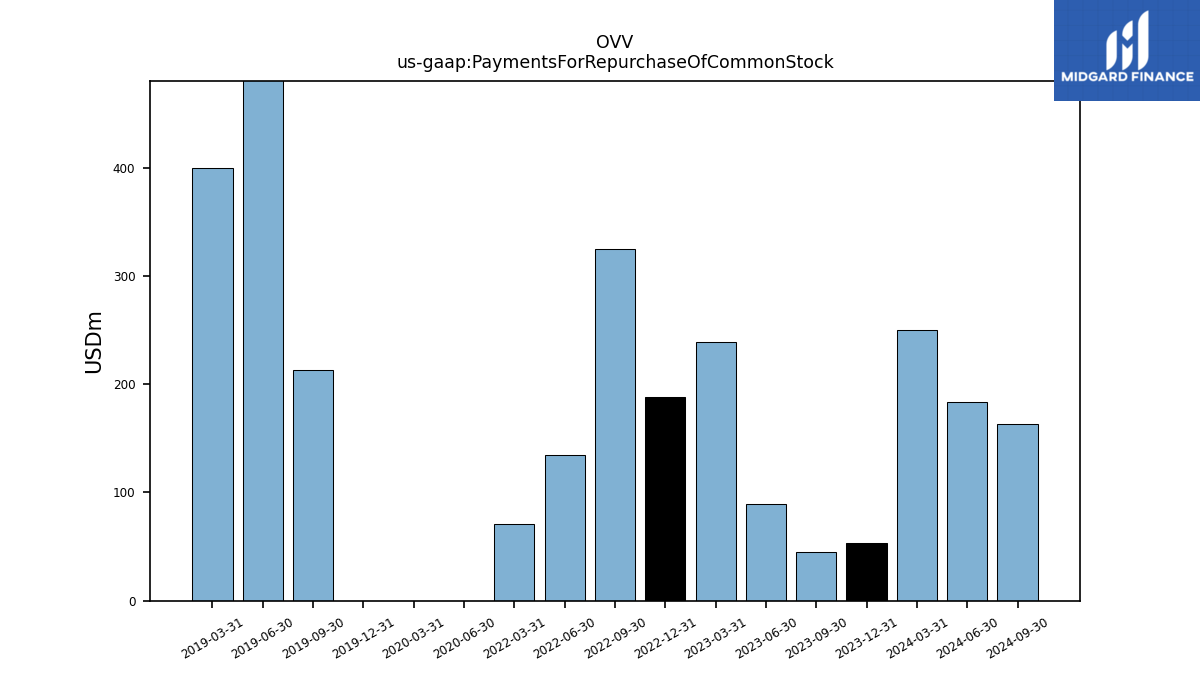
| Payments For Repurchase Of Common Stock | 53.00 | 45.00 | 89.00 | 239.00 | 188.00 | 325.00 | 135.00 | 71.00 | NA | NA | NA | NA | NA | NA | 0.00 | 0.00 | 0.00 | 213.00 | 637.00 | 400.00 | NA | NA | NA | NA |
| 2023-12-31 | 2023-09-30 | 2023-06-30 | 2023-03-31 | 2022-12-31 | 2022-09-30 | 2022-06-30 | 2022-03-31 | 2021-12-31 | 2021-09-30 | 2021-06-30 | 2021-03-31 | 2020-12-31 | 2020-09-30 | 2020-06-30 | 2020-03-31 | 2019-12-31 | 2019-09-30 | 2019-06-30 | 2019-03-31 | 2018-12-31 | 2018-09-30 | 2018-06-30 | 2018-03-31 | ||
|---|---|---|---|---|---|---|---|---|---|---|---|---|---|---|---|---|---|---|---|---|---|---|---|---|---|
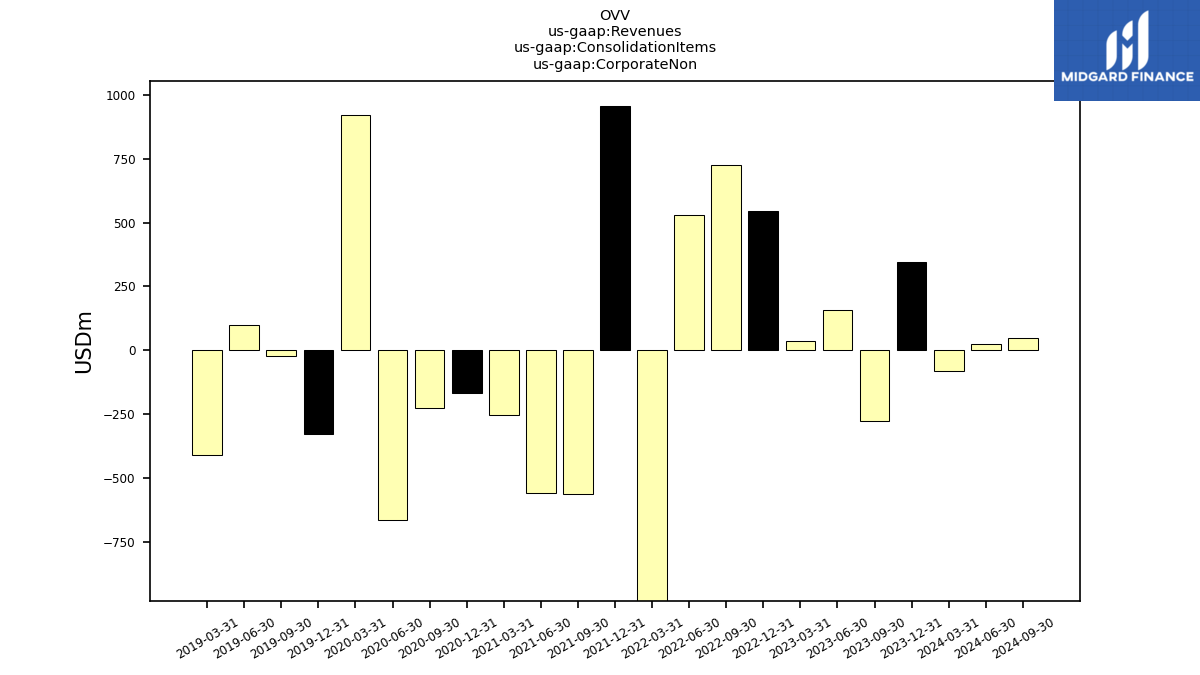
| Revenues | 3166.00 | 2649.00 | 2517.00 | 2551.00 | 3212.00 | 3549.00 | 3736.00 | 1967.00 | 3339.00 | 1789.00 | 1692.00 | 1838.00 | 1528.00 | 1190.00 | 726.00 | 2643.00 | 1565.00 | 1871.00 | 2055.00 | 1235.00 | 2381.00 | 1262.00 | 983.00 | 1313.00 | |
| Corporate Non | 344.00 | -274.00 | 160.00 | 35.00 | 546.00 | 727.00 | 530.00 | -994.00 | 956.00 | -560.00 | -558.00 | -253.00 | -168.00 | -225.00 | -662.00 | 922.00 | -325.00 | -22.00 | 100.00 | -409.00 | NA | NA | NA | NA | |
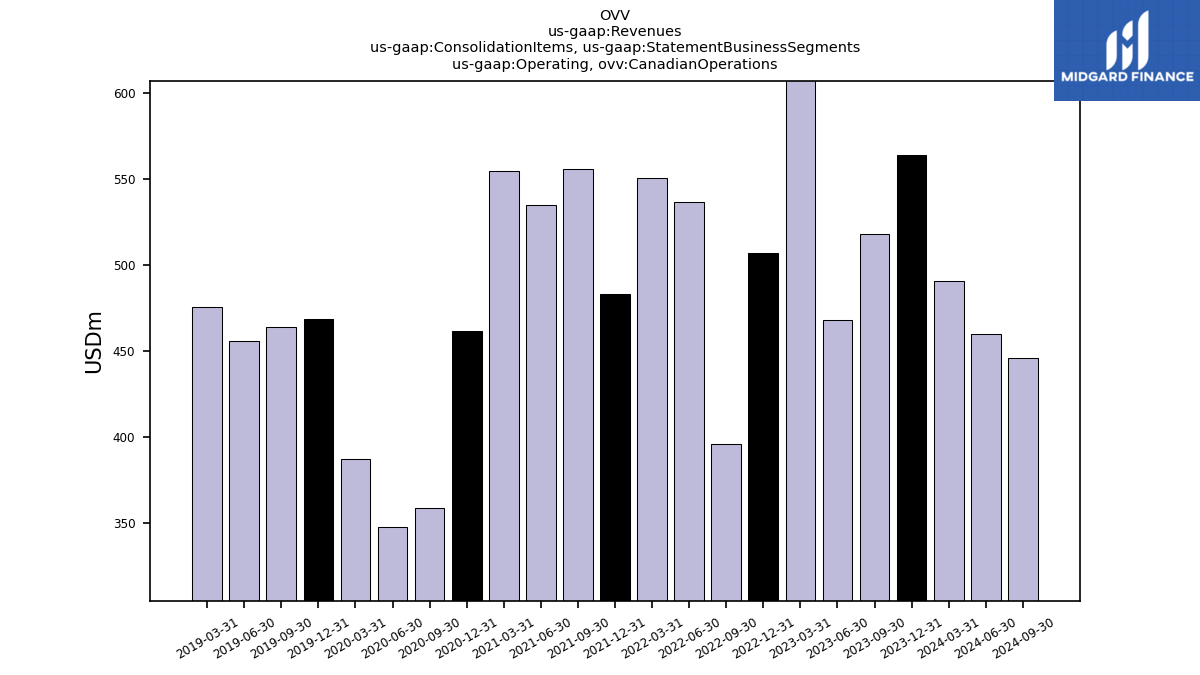
| Operating, Canadian Operations | 564.00 | 518.00 | 468.00 | 612.00 | 507.00 | 396.00 | 537.00 | 551.00 | 483.00 | 556.00 | 535.00 | 555.00 | 462.00 | 359.00 | 348.00 | 387.00 | 469.00 | 464.00 | 456.00 | 476.00 | NA | NA | NA | NA | |
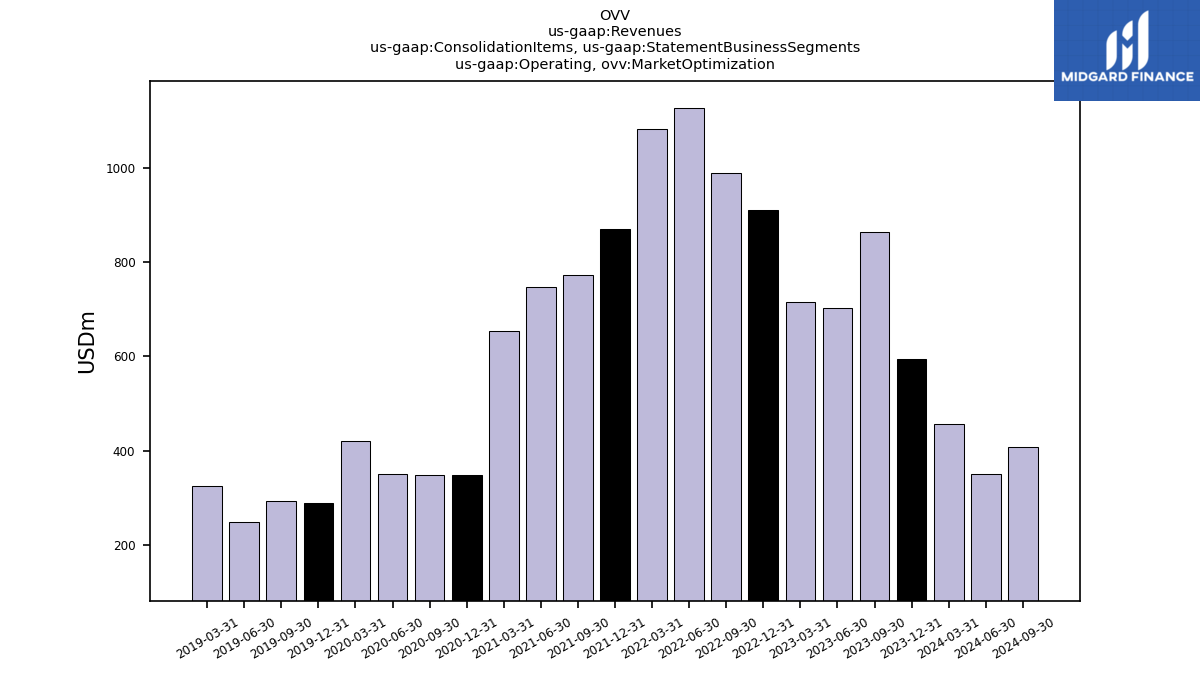
| Operating, Market Optimization | 594.00 | 863.00 | 703.00 | 716.00 | 910.00 | 988.00 | 1127.00 | 1082.00 | 869.00 | 772.00 | 748.00 | 654.00 | 348.00 | 348.00 | 350.00 | 420.00 | 290.00 | 294.00 | 249.00 | 326.00 | NA | NA | NA | NA | |
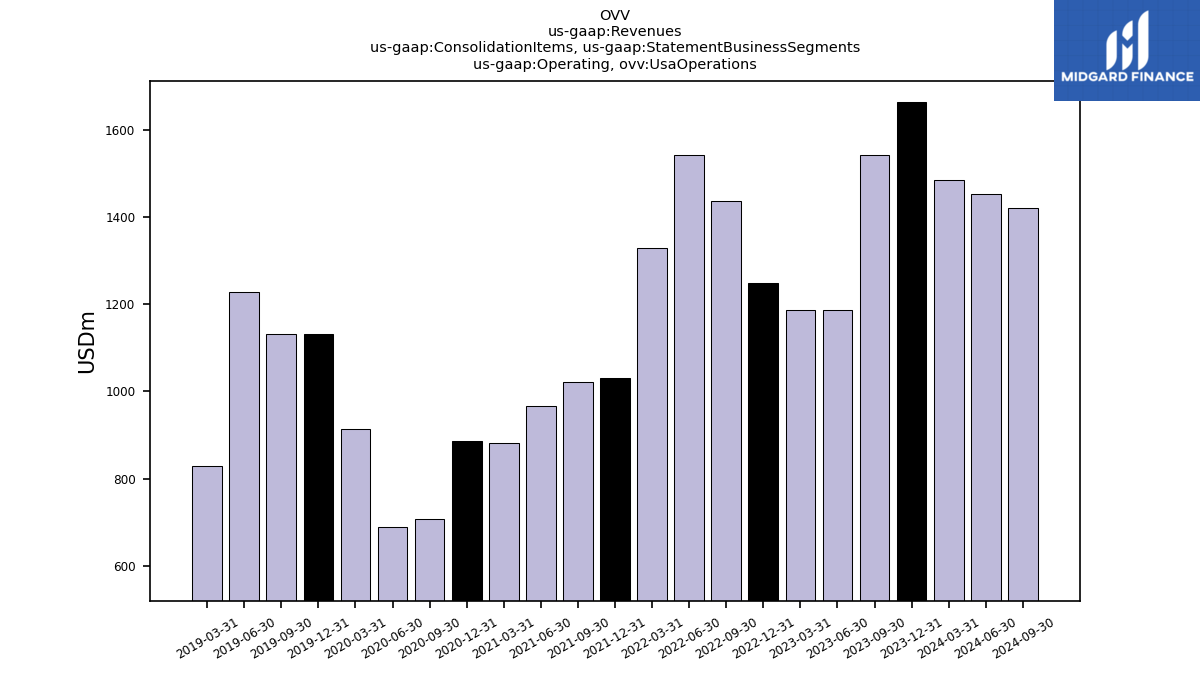
| Operating, Usa Operations | 1664.00 | 1542.00 | 1186.00 | 1188.00 | 1249.00 | 1438.00 | 1542.00 | 1328.00 | 1031.00 | 1021.00 | 967.00 | 882.00 | 886.00 | 708.00 | 690.00 | 914.00 | 1131.00 | 1132.00 | 1229.00 | 829.00 | NA | NA | NA | NA | |
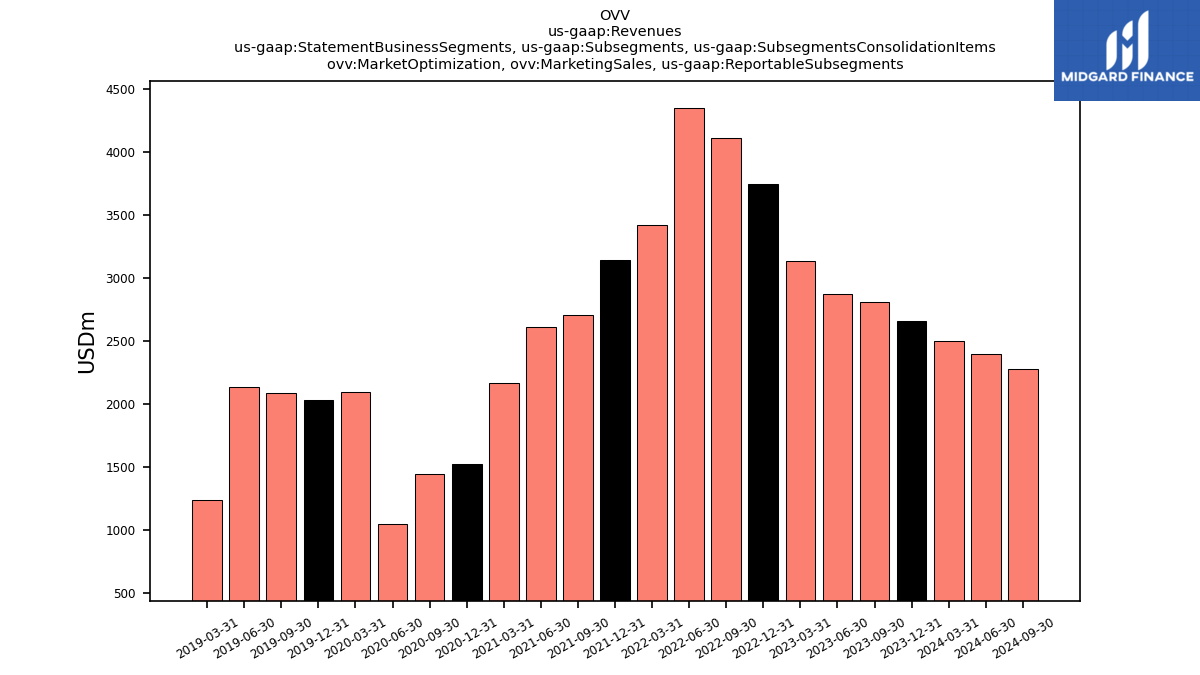
| Market Optimization, Marketing Sales, Reportable Subsegments | 2653.00 | 2811.00 | 2874.00 | 3136.00 | 3744.00 | 4109.00 | 4346.00 | 3423.00 | 3144.00 | 2705.00 | 2613.00 | 2168.00 | 1521.00 | 1445.00 | 1047.00 | 2095.00 | 2030.00 | 2088.00 | 2135.00 | 1236.00 | NA | NA | NA | NA | |
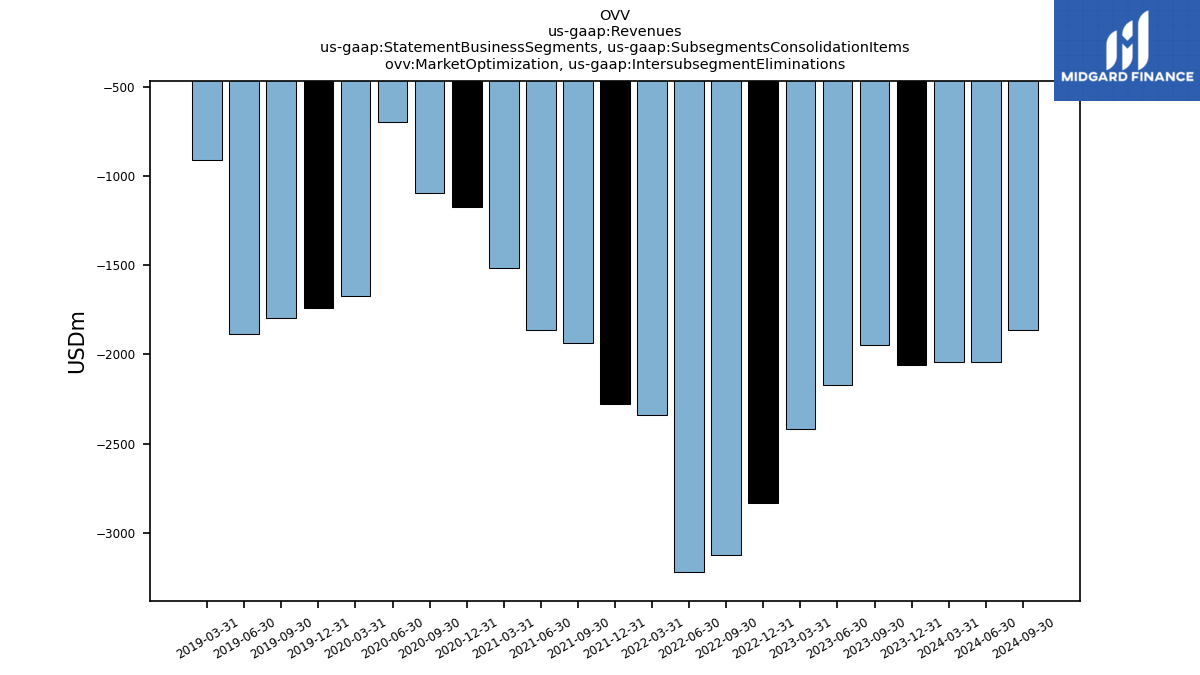
| Market Optimization, Intersubsegment Eliminations | -2059.00 | -1948.00 | -2171.00 | -2420.00 | -2834.00 | -3121.00 | -3219.00 | -2341.00 | -2275.00 | -1933.00 | -1865.00 | -1514.00 | -1173.00 | -1097.00 | -697.00 | -1675.00 | -1740.00 | -1794.00 | -1886.00 | -910.00 | NA | NA | NA | NA | |
| Revenue From Contract With Customer Excluding Assessed Tax | 2804.00 | 2913.00 | 2352.00 | 2592.00 | 3199.00 | 3643.00 | 4014.00 | 3407.00 | 3028.00 | 2720.00 | 2473.00 | 2247.00 | 1528.00 | 1326.00 | 1023.00 | 1570.00 | 1565.00 | 1771.00 | 1848.00 | 1572.00 | 2381.00 | 1262.00 | 983.00 | 1313.00 | |
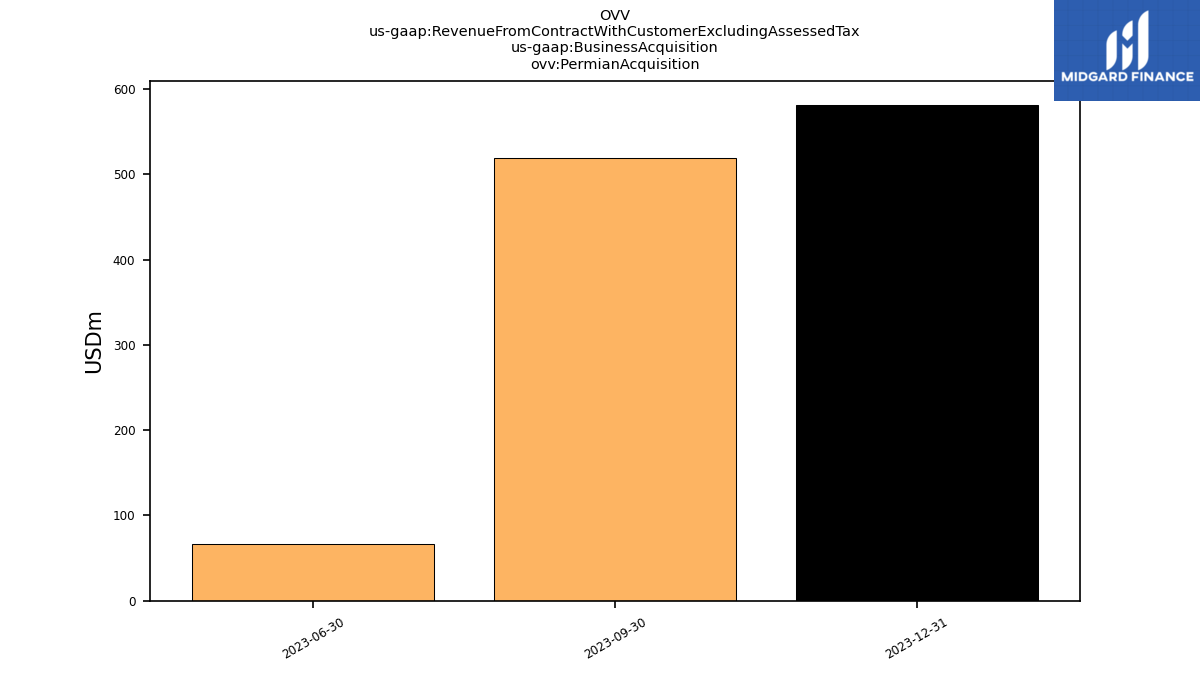
| Permian Acquisition | 581.00 | 519.00 | 67.00 | NA | NA | NA | NA | NA | NA | NA | NA | NA | NA | NA | NA | NA | NA | NA | NA | NA | NA | NA | NA | NA | |
| Operating, Product Revenues Including Sale Of Product Purchased From Third Parties,, Canadian Operations Excluding Intercompany Segment Transactions | 286.00 | 260.00 | 246.00 | 237.00 | 291.00 | 327.00 | 383.00 | 362.00 | 319.00 | 303.00 | 285.00 | 256.00 | 200.00 | 139.00 | 88.00 | 179.00 | 219.00 | 225.00 | 230.00 | 204.00 | NA | NA | NA | NA | |
| Operating, Product Revenues Including Sale Of Product Purchased From Third Parties,, Market Optimization Excluding Intercompany Segment Transactions | 1.00 | 0.00 | 5.00 | 20.00 | 6.00 | 2.00 | 8.00 | 3.00 | 8.00 | 8.00 | 11.00 | 15.00 | 6.00 | 0.00 | 2.00 | 2.00 | 1.00 | 2.00 | 1.00 | 3.00 | NA | NA | NA | NA | |
| Operating, Product Revenues Including Sale Of Product Purchased From Third Parties,, Usa Operations Excluding Intercompany Segment Transactions | 171.00 | 175.00 | 149.00 | 184.00 | 199.00 | 271.00 | 312.00 | 267.00 | 277.00 | 250.00 | 179.00 | 158.00 | 110.00 | 98.00 | 60.00 | 86.00 | 122.00 | 99.00 | 136.00 | 97.00 | NA | NA | NA | NA | |
| Operating, Product Revenues Including Sale Of Product Purchased From Third Parties,, Canadian Operations Excluding Intercompany Segment Transactions | 268.00 | 246.00 | 223.00 | 455.00 | 554.00 | 565.00 | 581.00 | 419.00 | 414.00 | 360.00 | 286.00 | 317.00 | 242.00 | 172.00 | 157.00 | 172.00 | 211.00 | 150.00 | 158.00 | 255.00 | NA | NA | NA | NA | |
| Operating, Product Revenues Including Sale Of Product Purchased From Third Parties,, Market Optimization Excluding Intercompany Segment Transactions | 46.00 | 56.00 | 49.00 | 80.00 | 143.00 | 137.00 | 183.00 | 183.00 | 185.00 | 150.00 | 128.00 | 241.00 | 217.00 | 210.00 | 181.00 | 205.00 | 237.00 | 181.00 | 206.00 | 253.00 | NA | NA | NA | NA | |
| Operating, Product Revenues Including Sale Of Product Purchased From Third Parties,, Usa Operations Excluding Intercompany Segment Transactions | 114.00 | 103.00 | 86.00 | 155.00 | 251.00 | 348.00 | 302.00 | 206.00 | 251.00 | 172.00 | 118.00 | 123.00 | 101.00 | 71.00 | 65.00 | 72.00 | 103.00 | 95.00 | 105.00 | 76.00 | NA | NA | NA | NA | |
| Operating, Product Revenues Including Sale Of Product Purchased From Third Parties, Oil One, Canadian Operations Excluding Intercompany Segment Transactions | 1.00 | 2.00 | NA | NA | 1.00 | 1.00 | 1.00 | NA | NA | NA | NA | NA | NA | NA | NA | NA | NA | NA | NA | NA | NA | NA | NA | NA | |
| Operating, Product Revenues Including Sale Of Product Purchased From Third Parties, Oil One, Market Optimization Excluding Intercompany Segment Transactions | 539.00 | 800.00 | 644.00 | 609.00 | 754.00 | 844.00 | 931.00 | 886.00 | NA | NA | NA | NA | NA | NA | NA | NA | NA | NA | NA | NA | NA | NA | NA | NA | |
| Operating, Product Revenues Including Sale Of Product Purchased From Third Parties, Oil One, Usa Operations Excluding Intercompany Segment Transactions | 1376.00 | 1270.00 | 947.00 | 851.00 | 998.00 | 1146.00 | 1313.00 | 1080.00 | NA | NA | NA | NA | NA | NA | NA | NA | NA | NA | NA | NA | NA | NA | NA | NA | |
| Operating, Natural Gas Gathering And Processing, Canadian Operations Excluding Intercompany Segment Transactions | 0.00 | 0.00 | 1.00 | 1.00 | 0.00 | 2.00 | -1.00 | 1.00 | 1.00 | 1.00 | 2.00 | 1.00 | 2.00 | 0.00 | 1.00 | 0.00 | 1.00 | 2.00 | 2.00 | 0.00 | NA | NA | NA | NA | |
| Operating, Natural Gas Gathering And Processing, Usa Operations Excluding Intercompany Segment Transactions | 2.00 | 1.00 | 2.00 | NA | 2.00 | 0.00 | 1.00 | NA | NA | NA | NA | NA | 2.00 | 0.00 | 1.00 | 0.00 | 0.00 | -1.00 | 2.00 | 1.00 | NA | NA | NA | NA | |
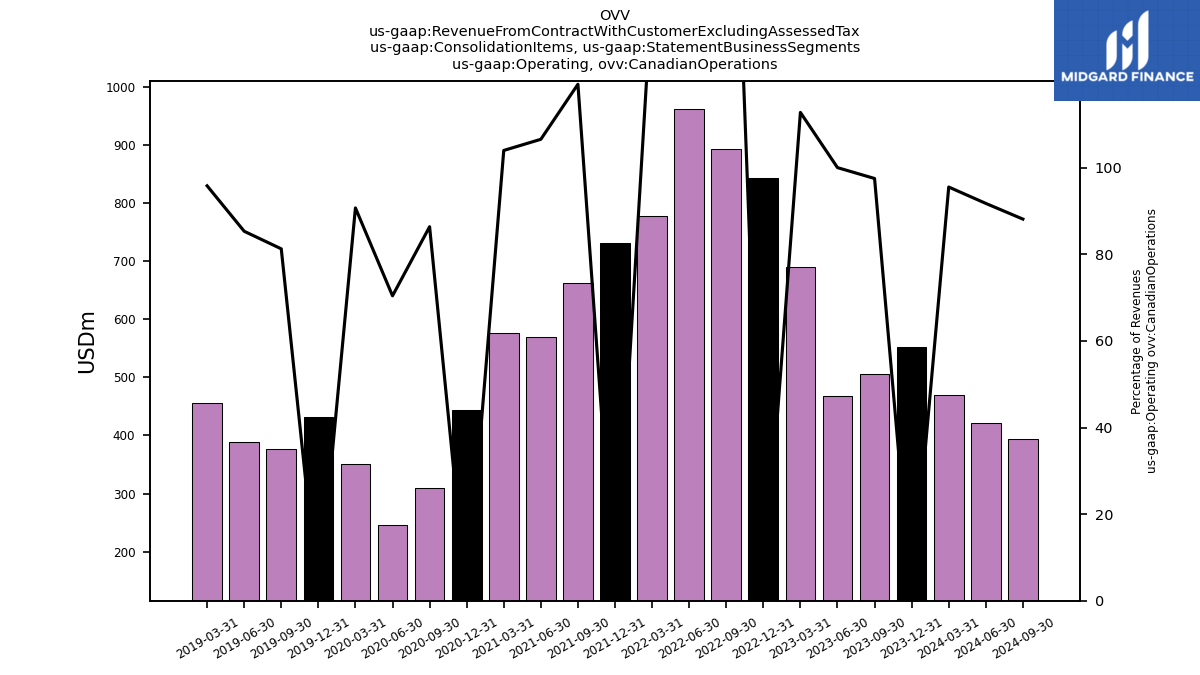
| Operating, Canadian Operations | 552.00 | 505.00 | 468.00 | 690.00 | 843.00 | 893.00 | 962.00 | 778.00 | 732.00 | 663.00 | 570.00 | 577.00 | 443.00 | 310.00 | 245.00 | 351.00 | 432.00 | 377.00 | 389.00 | 456.00 | NA | NA | NA | NA | |
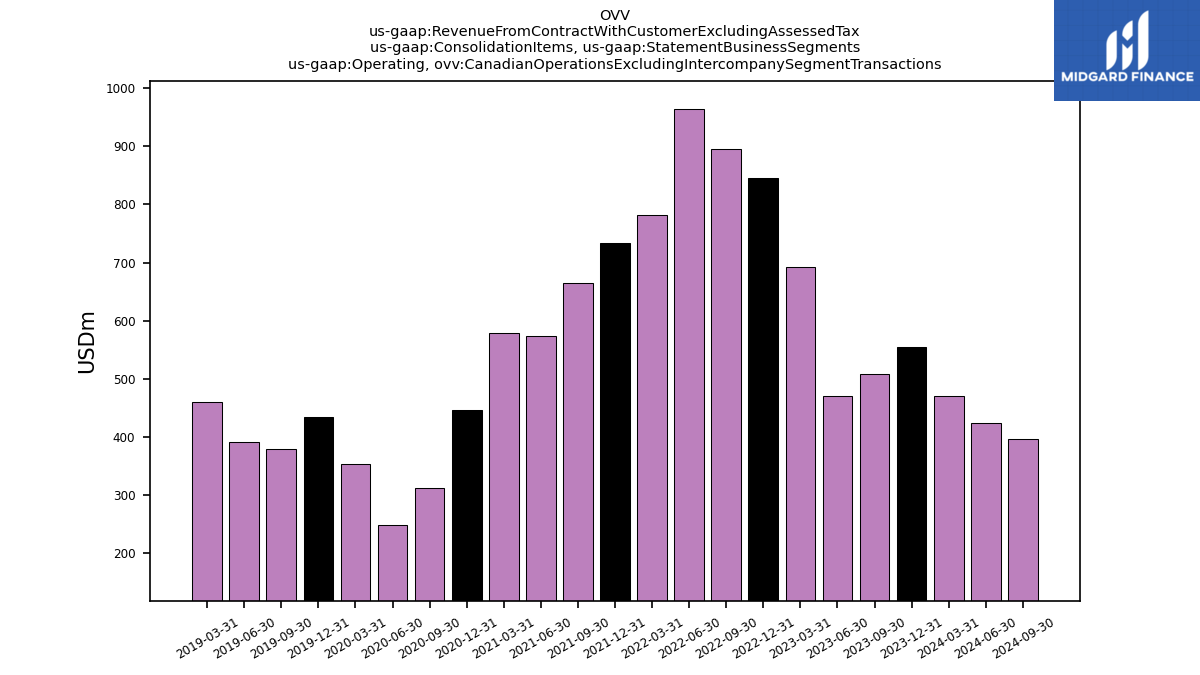
| Operating, Canadian Operations Excluding Intercompany Segment Transactions | 555.00 | 508.00 | 470.00 | 693.00 | 846.00 | 895.00 | 964.00 | 782.00 | 734.00 | 665.00 | 574.00 | 579.00 | 446.00 | 312.00 | 248.00 | 353.00 | 435.00 | 380.00 | 392.00 | 460.00 | NA | NA | NA | NA | |
| Operating, Market Optimization | 594.00 | 863.00 | 703.00 | 716.00 | 910.00 | 988.00 | 1127.00 | 1082.00 | 872.00 | 771.00 | 748.00 | 652.00 | 346.00 | 346.00 | 348.00 | 419.00 | 289.00 | 294.00 | 250.00 | 326.00 | NA | NA | NA | NA | |
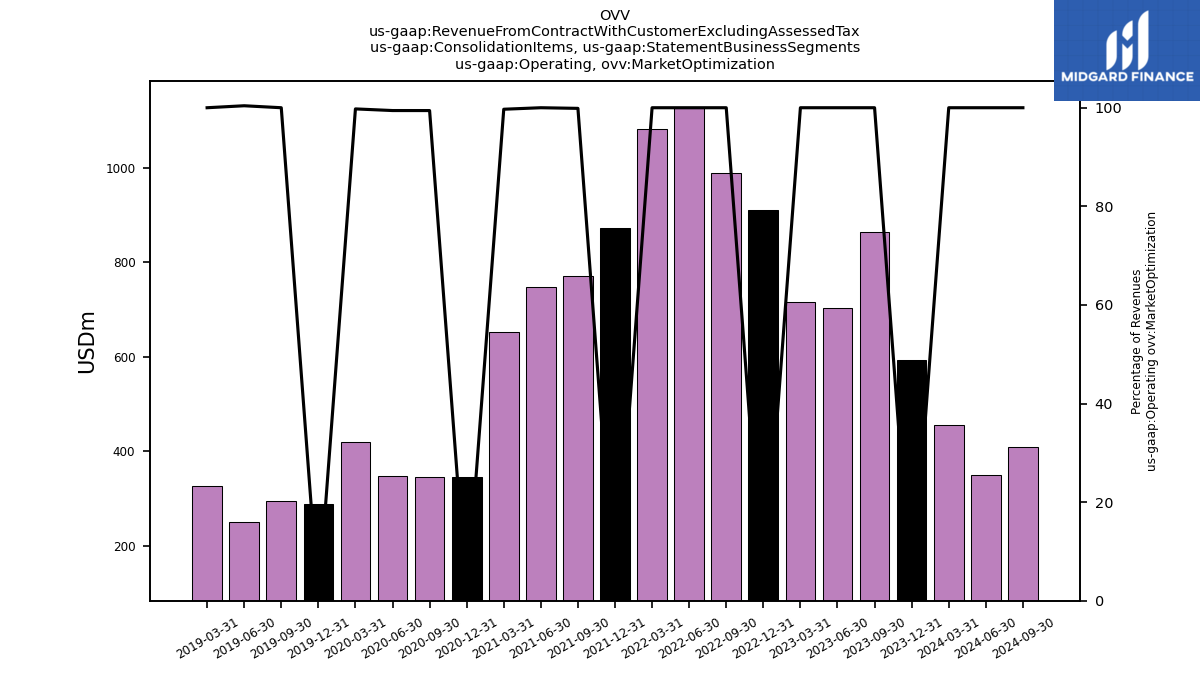
| Operating, Market Optimization Excluding Intercompany Segment Transactions | 586.00 | 856.00 | 698.00 | 709.00 | 903.00 | 983.00 | 1122.00 | 1072.00 | 865.00 | 767.00 | 741.00 | 646.00 | 339.00 | 341.00 | 342.00 | 417.00 | 282.00 | 290.00 | 245.00 | 316.00 | NA | NA | NA | NA | |
| Operating, Usa Operations | 1658.00 | 1545.00 | 1181.00 | 1186.00 | 1446.00 | 1762.00 | 1925.00 | 1547.00 | 1424.00 | 1286.00 | 1155.00 | 1018.00 | 801.00 | 670.00 | 430.00 | 800.00 | 1101.00 | 1097.00 | 1188.00 | 777.00 | NA | NA | NA | NA | |
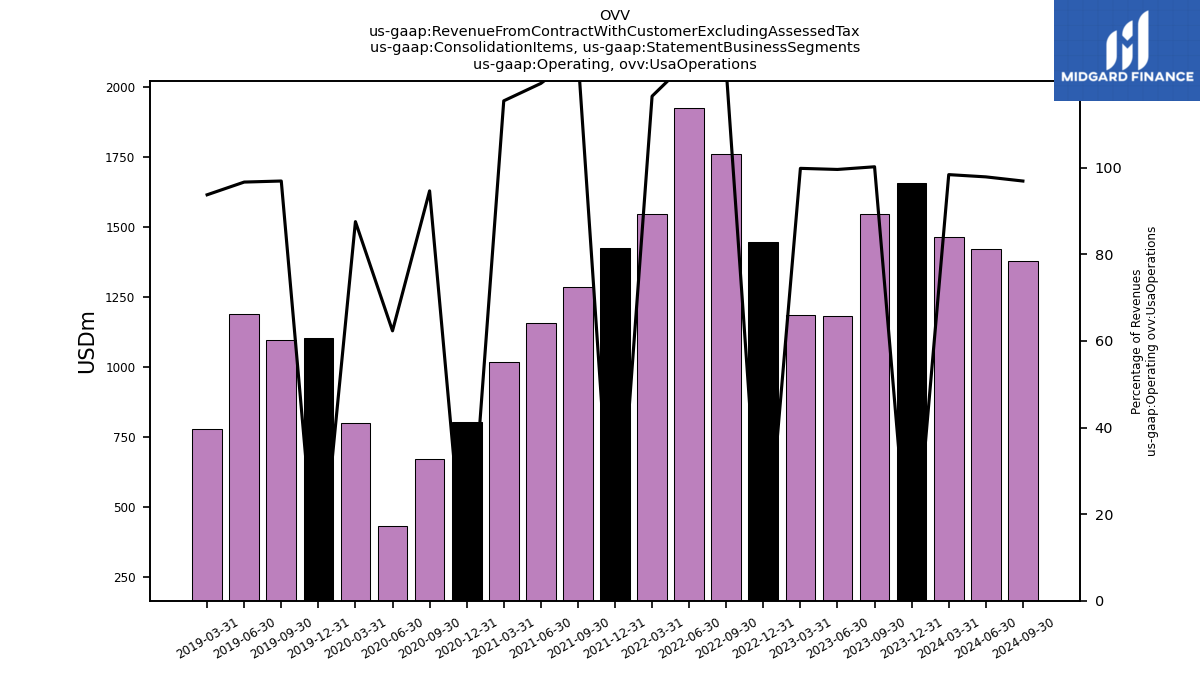
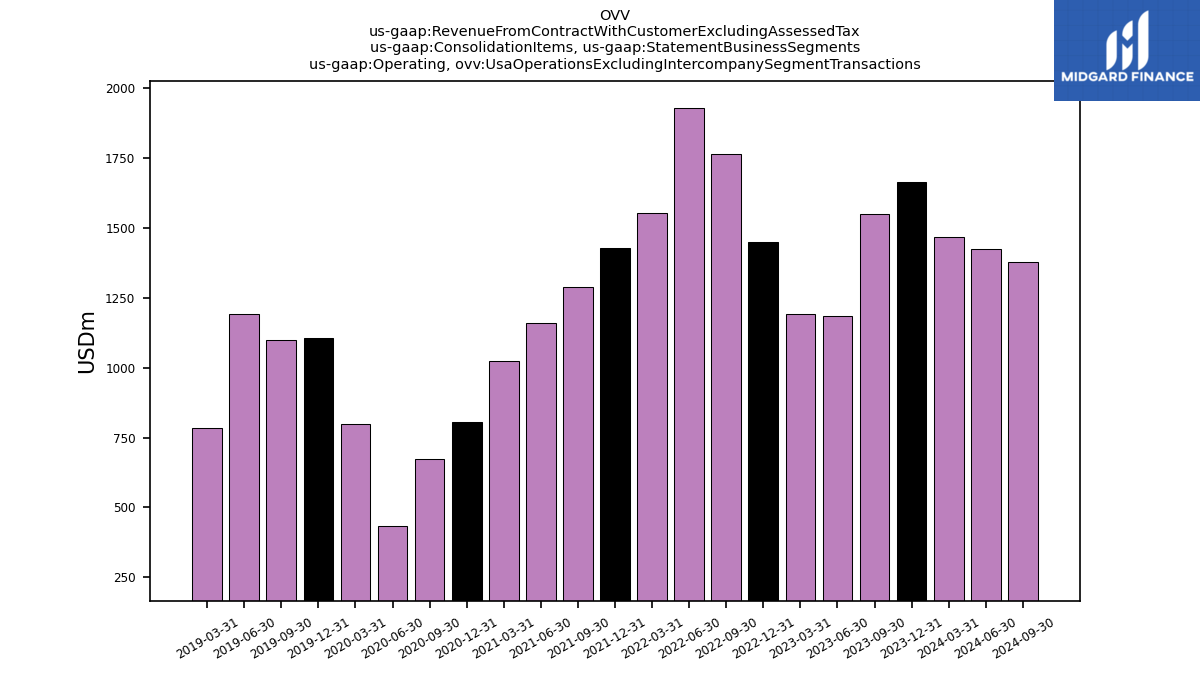
| Operating, Usa Operations Excluding Intercompany Segment Transactions | 1663.00 | 1549.00 | 1184.00 | 1190.00 | 1450.00 | 1765.00 | 1928.00 | 1553.00 | 1429.00 | 1288.00 | 1158.00 | 1022.00 | 805.00 | 673.00 | 433.00 | 800.00 | 1105.00 | 1098.00 | 1190.00 | 783.00 | NA | NA | NA | NA | |
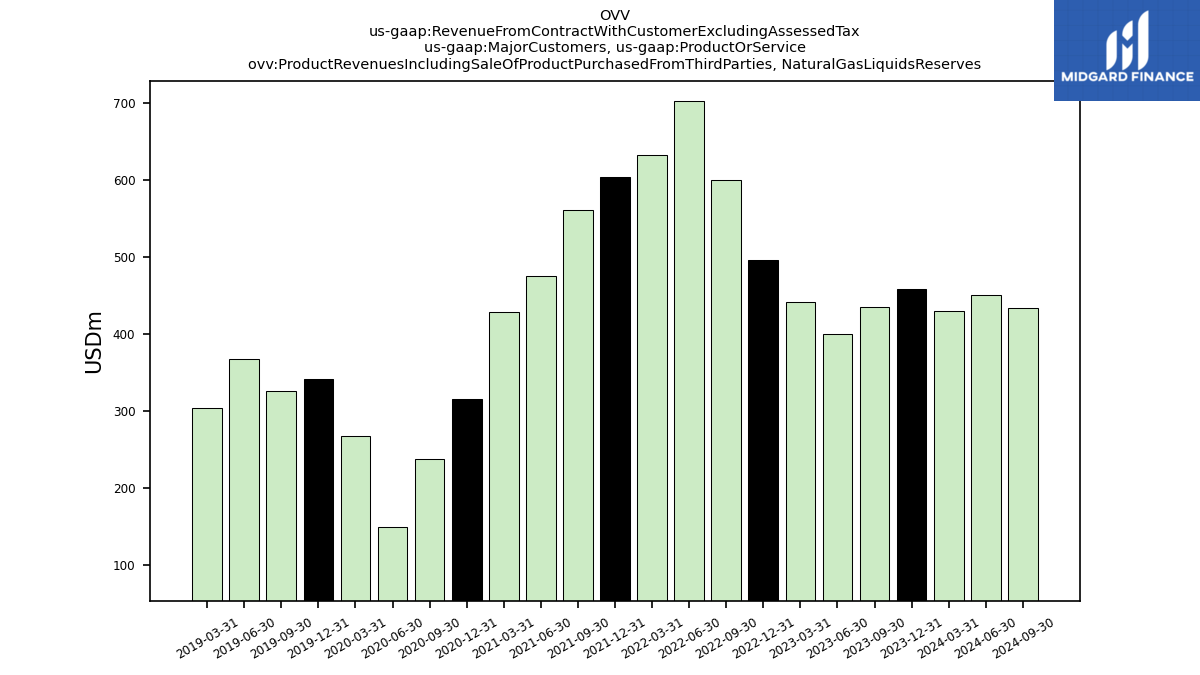
| Product Revenues Including Sale Of Product Purchased From Third Parties, | 458.00 | 435.00 | 400.00 | 441.00 | 496.00 | 600.00 | 703.00 | 632.00 | 604.00 | 561.00 | 475.00 | 429.00 | 316.00 | 237.00 | 150.00 | 267.00 | 342.00 | 326.00 | 367.00 | 304.00 | NA | NA | NA | NA | |
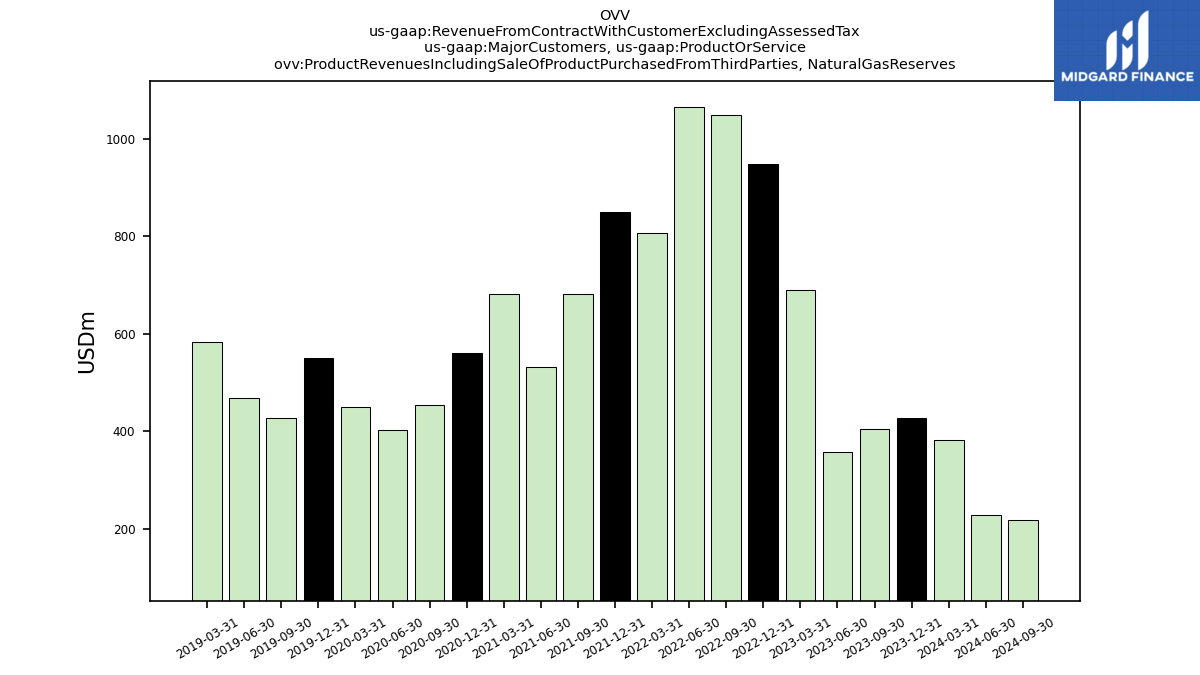
| Product Revenues Including Sale Of Product Purchased From Third Parties, | 428.00 | 405.00 | 358.00 | 690.00 | 948.00 | 1050.00 | 1066.00 | 808.00 | 850.00 | 682.00 | 532.00 | 681.00 | 560.00 | 453.00 | 403.00 | 449.00 | 551.00 | 426.00 | 469.00 | 584.00 | NA | NA | NA | NA | |
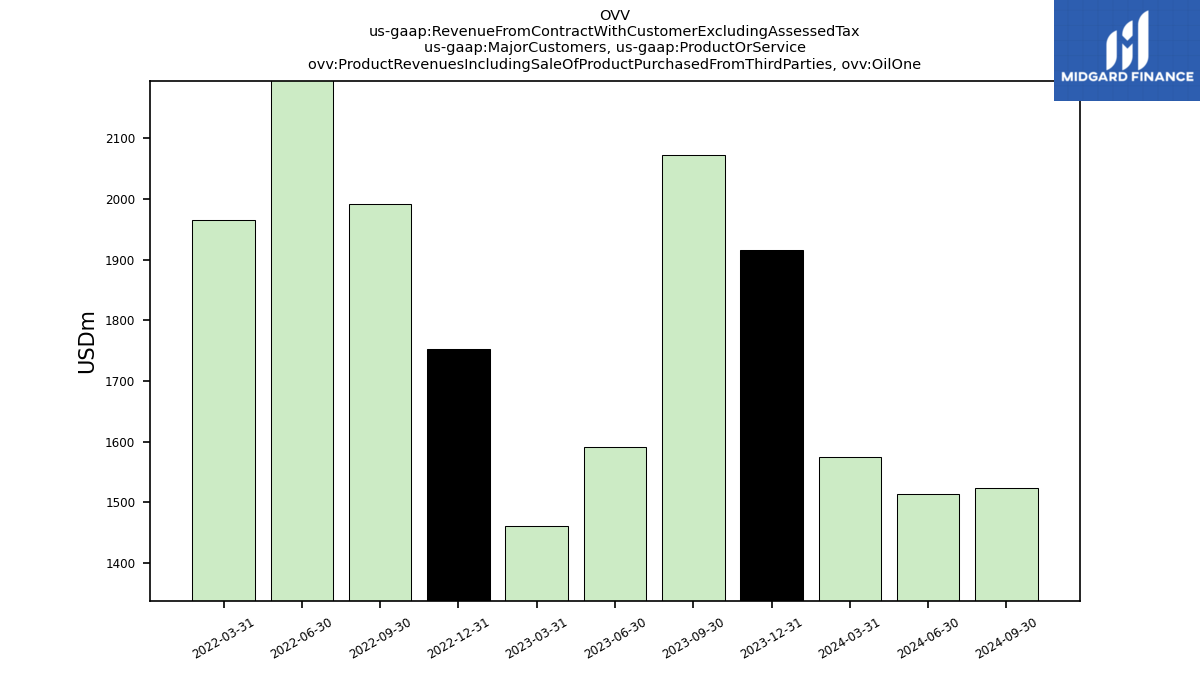
| Product Revenues Including Sale Of Product Purchased From Third Parties, Oil One | 1916.00 | 2072.00 | 1591.00 | 1460.00 | 1753.00 | 1991.00 | 2245.00 | 1966.00 | NA | NA | NA | NA | NA | NA | NA | NA | NA | NA | NA | NA | NA | NA | NA | NA | |
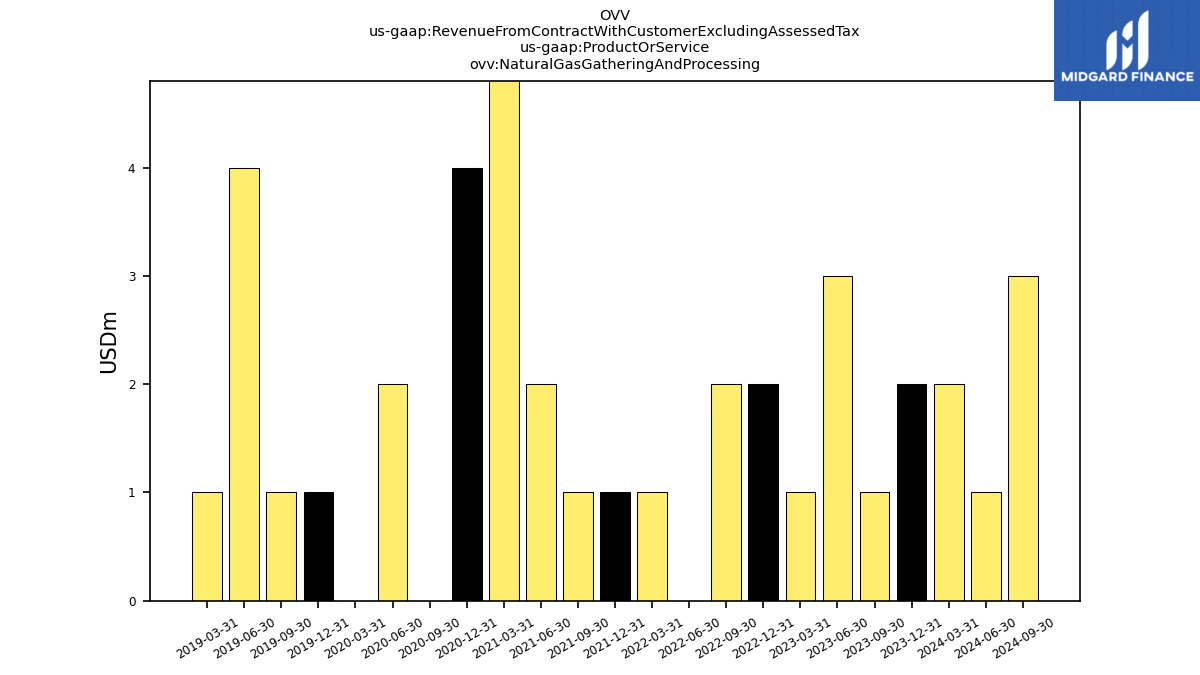
| Natural Gas Gathering And Processing | 2.00 | 1.00 | 3.00 | 1.00 | 2.00 | 2.00 | 0.00 | 1.00 | 1.00 | 1.00 | 2.00 | 6.00 | 4.00 | 0.00 | 2.00 | 0.00 | 1.00 | 1.00 | 4.00 | 1.00 | NA | NA | NA | NA |