
| 2023-12-31 | 2023-09-30 | 2023-06-30 | 2023-03-31 | 2022-12-31 | 2022-09-30 | 2022-06-30 | 2022-03-31 | 2021-12-31 | 2021-09-30 | 2021-06-30 | 2021-03-31 | 2020-12-31 | 2020-09-30 | 2020-06-30 | 2020-03-31 | 2019-12-31 | 2019-09-30 | 2019-06-30 | 2019-03-31 | 2018-12-31 | 2018-09-30 | 2018-06-30 | 2018-03-31 | 2017-12-31 | 2017-09-30 | 2017-06-30 | 2017-03-31 | 2016-12-31 | 2016-09-30 | 2016-06-30 | 2016-03-31 | 2015-12-31 | 2015-09-30 | 2015-06-30 | 2015-03-31 | 2014-12-31 | 2014-09-30 | 2014-06-30 | 2014-03-31 | 2013-12-31 | 2013-09-30 | 2013-06-30 | 2013-03-31 | 2012-12-31 | 2012-09-30 | 2012-06-30 | 2012-03-31 | 2011-12-31 | 2011-09-30 | 2011-06-30 | 2011-03-31 | 2010-12-31 | 2010-09-30 | 2010-06-30 | ||
|---|---|---|---|---|---|---|---|---|---|---|---|---|---|---|---|---|---|---|---|---|---|---|---|---|---|---|---|---|---|---|---|---|---|---|---|---|---|---|---|---|---|---|---|---|---|---|---|---|---|---|---|---|---|---|---|---|
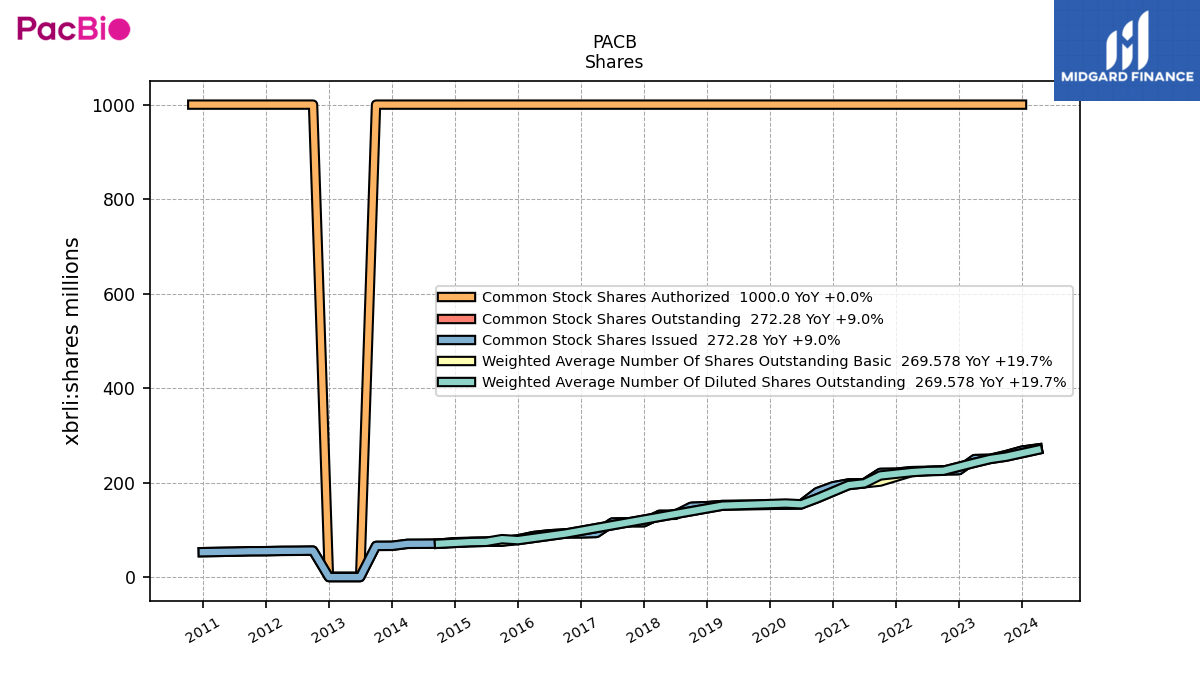
| Common Stock Value | 0.27 | 0.26 | 0.25 | 0.25 | 0.23 | 0.23 | 0.23 | 0.22 | 0.22 | 0.22 | 0.20 | 0.20 | 0.19 | 0.18 | 0.15 | 0.15 | 0.15 | 0.15 | 0.15 | 0.15 | 0.15 | 0.15 | 0.13 | 0.13 | 0.12 | 0.12 | 0.12 | 0.09 | 0.09 | 0.09 | 0.09 | 0.09 | 0.08 | 0.08 | 0.07 | 0.07 | 0.07 | 0.07 | 0.07 | 0.07 | 0.07 | NA | NA | 664.20 | 645.37 | 642.82 | 639.75 | NA | 632.96 | 0.06 | 0.05 | NA | 0.05 | NA | NA | |
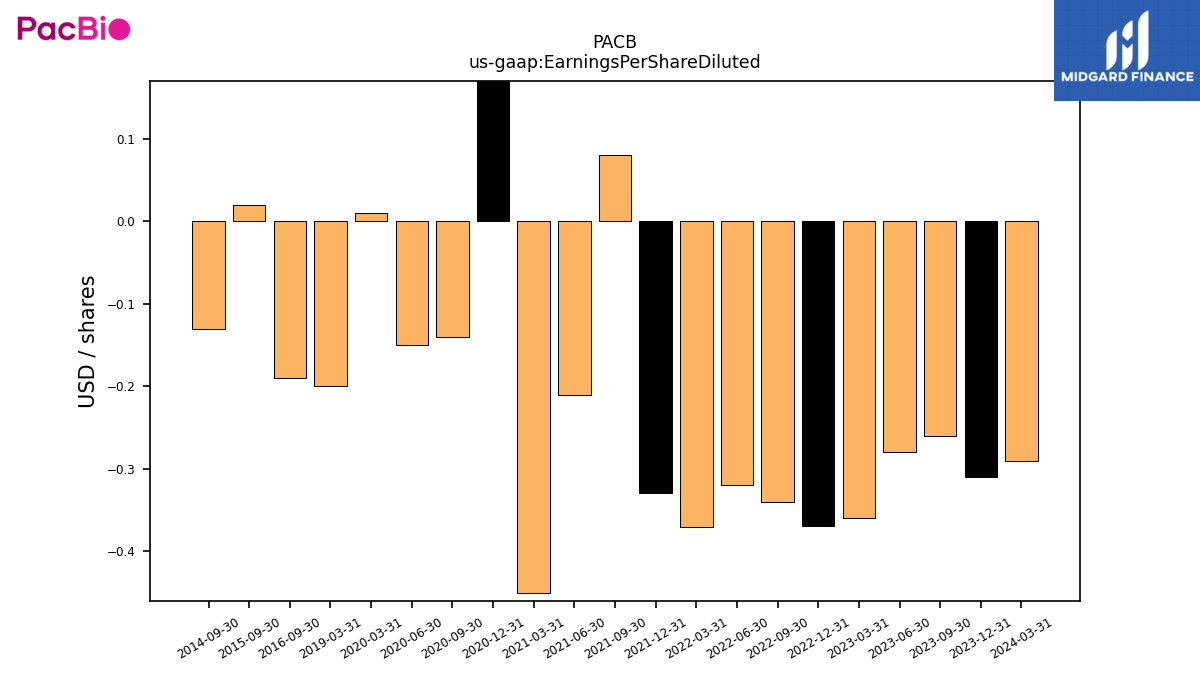
| Earnings Per Share Basic | -0.31 | -0.26 | -0.28 | -0.36 | -0.37 | -0.34 | -0.32 | -0.37 | -0.33 | 0.08 | -0.21 | -0.45 | 0.47 | -0.14 | -0.15 | 0.01 | NA | NA | NA | -0.20 | NA | NA | NA | NA | NA | NA | NA | NA | NA | -0.19 | NA | NA | NA | 0.02 | NA | NA | NA | -0.13 | NA | NA | NA | NA | NA | NA | NA | NA | NA | NA | NA | NA | NA | NA | NA | NA | NA | |
| Earnings Per Share Diluted | -0.31 | -0.26 | -0.28 | -0.36 | -0.37 | -0.34 | -0.32 | -0.37 | -0.33 | 0.08 | -0.21 | -0.45 | 0.46 | -0.14 | -0.15 | 0.01 | NA | NA | NA | -0.20 | NA | NA | NA | NA | NA | NA | NA | NA | NA | -0.19 | NA | NA | NA | 0.02 | NA | NA | NA | -0.13 | NA | NA | NA | NA | NA | NA | NA | NA | NA | NA | NA | NA | NA | NA | NA | NA | NA |
| 2023-12-31 | 2023-09-30 | 2023-06-30 | 2023-03-31 | 2022-12-31 | 2022-09-30 | 2022-06-30 | 2022-03-31 | 2021-12-31 | 2021-09-30 | 2021-06-30 | 2021-03-31 | 2020-12-31 | 2020-09-30 | 2020-06-30 | 2020-03-31 | 2019-12-31 | 2019-09-30 | 2019-06-30 | 2019-03-31 | 2018-12-31 | 2018-09-30 | 2018-06-30 | 2018-03-31 | 2017-12-31 | 2017-09-30 | 2017-06-30 | 2017-03-31 | 2016-12-31 | 2016-09-30 | 2016-06-30 | 2016-03-31 | 2015-12-31 | 2015-09-30 | 2015-06-30 | 2015-03-31 | 2014-12-31 | 2014-09-30 | 2014-06-30 | 2014-03-31 | 2013-12-31 | 2013-09-30 | 2013-06-30 | 2013-03-31 | 2012-12-31 | 2012-09-30 | 2012-06-30 | 2012-03-31 | 2011-12-31 | 2011-09-30 | 2011-06-30 | 2011-03-31 | 2010-12-31 | 2010-09-30 | 2010-06-30 | ||
|---|---|---|---|---|---|---|---|---|---|---|---|---|---|---|---|---|---|---|---|---|---|---|---|---|---|---|---|---|---|---|---|---|---|---|---|---|---|---|---|---|---|---|---|---|---|---|---|---|---|---|---|---|---|---|---|---|
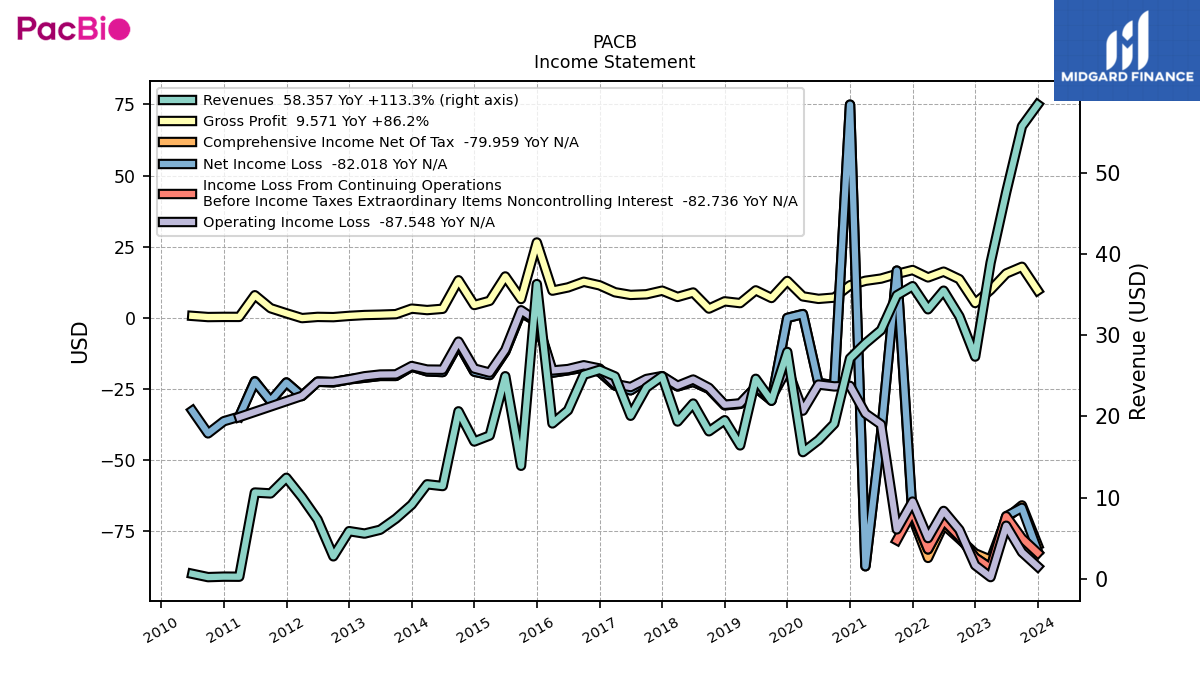
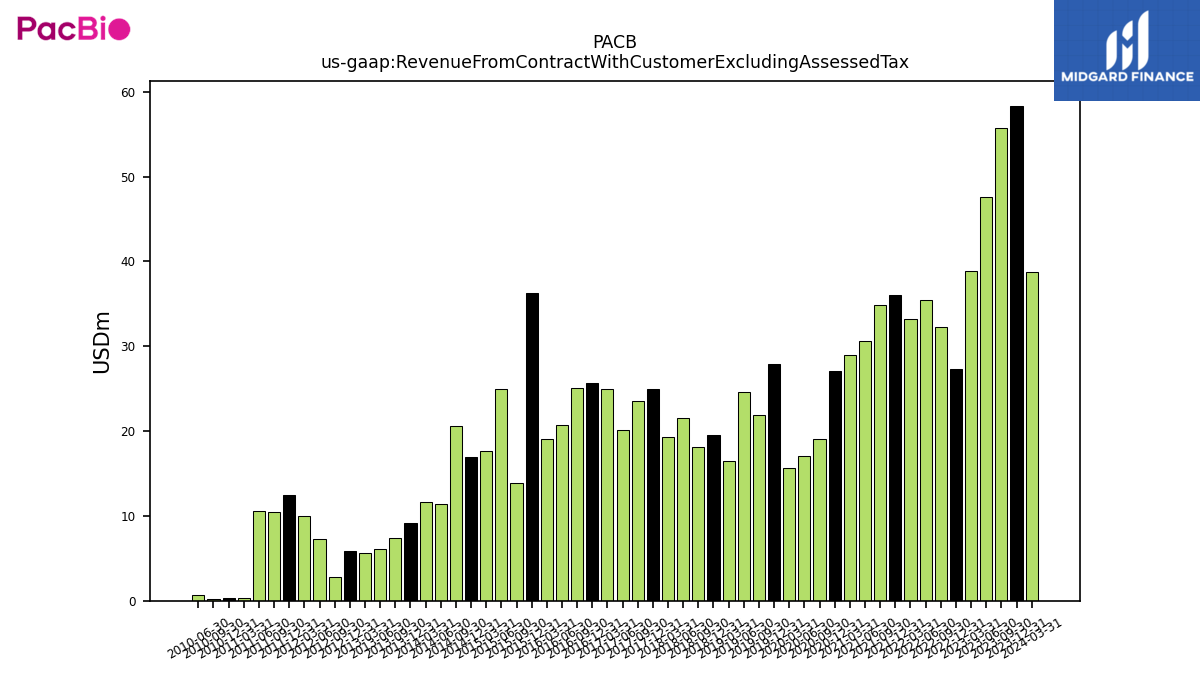
| Revenue From Contract With Customer Excluding Assessed Tax | 58.36 | 55.69 | 47.57 | 38.90 | 27.35 | 32.31 | 35.47 | 33.17 | 36.02 | 34.89 | 30.61 | 29.00 | 27.14 | 19.08 | 17.08 | 15.60 | 27.93 | 21.91 | 24.62 | 16.43 | 19.53 | 18.16 | 21.58 | 19.36 | 24.93 | 23.55 | 20.07 | 24.91 | 25.72 | 25.12 | 20.75 | 19.13 | 36.28 | 13.92 | 24.94 | 17.64 | 16.90 | 20.62 | 11.43 | 11.64 | 9.13 | 7.42 | 6.05 | 5.58 | 5.88 | 2.78 | 7.29 | 10.04 | 12.44 | 10.52 | 10.63 | 0.27 | 0.28 | 0.22 | 0.63 | |
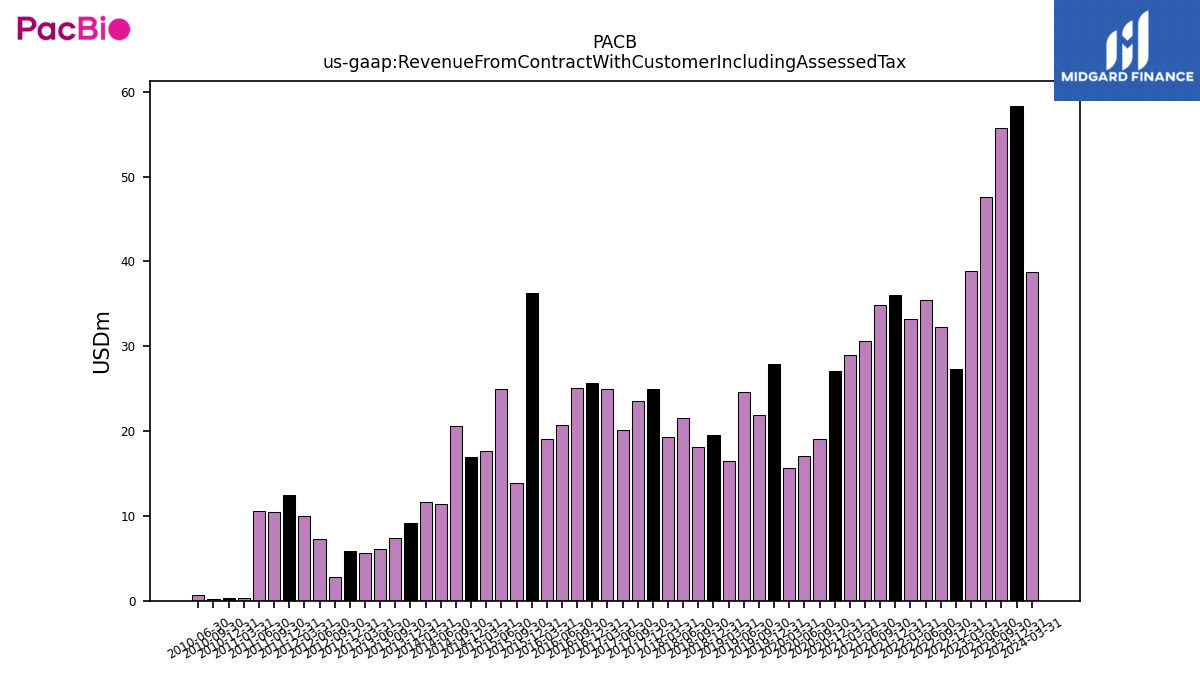
| Revenue From Contract With Customer Including Assessed Tax | 58.36 | 55.69 | 47.57 | 38.90 | 27.35 | 32.31 | 35.47 | 33.17 | 36.02 | 34.89 | 30.61 | 29.00 | 27.14 | 19.08 | 17.08 | 15.60 | 27.93 | 21.91 | 24.62 | 16.43 | 19.53 | 18.16 | 21.58 | 19.36 | 24.93 | 23.55 | 20.07 | 24.91 | 25.72 | 25.12 | 20.75 | 19.13 | 36.28 | 13.92 | 24.94 | 17.64 | 16.90 | 20.62 | 11.43 | 11.64 | 9.13 | 7.42 | 6.05 | 5.58 | 5.88 | 2.78 | 7.29 | 10.04 | 12.44 | 10.52 | 10.63 | 0.27 | 0.28 | 0.22 | 0.63 | |
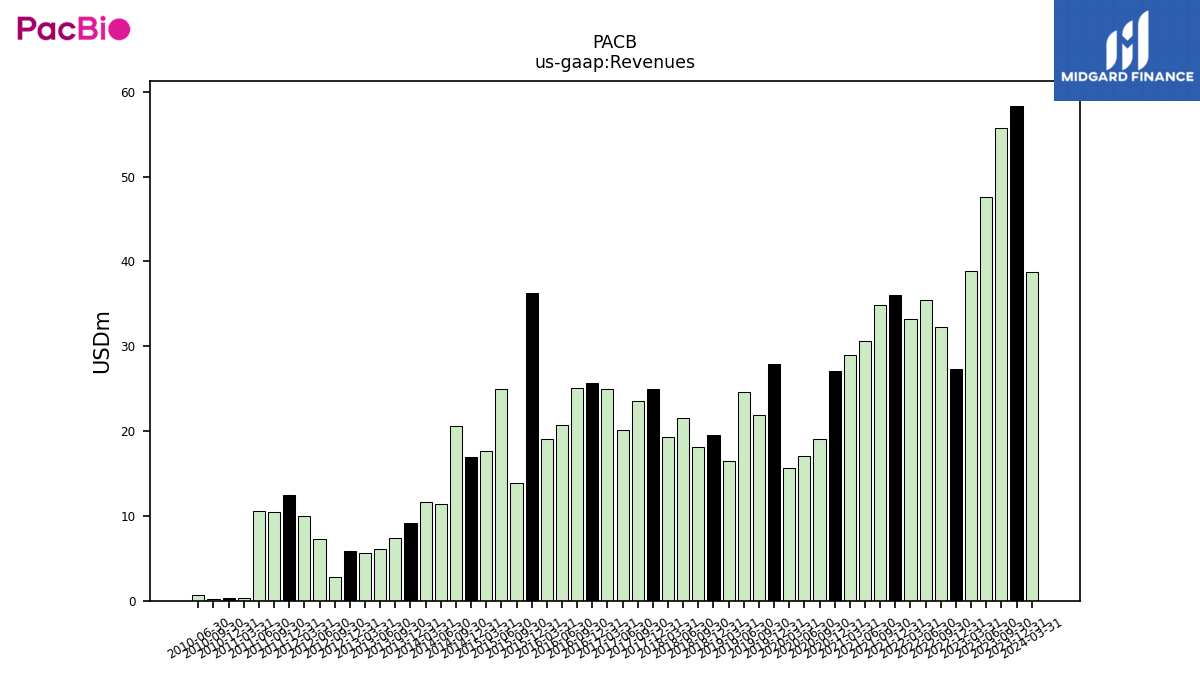
| Revenues | 58.36 | 55.69 | 47.57 | 38.90 | 27.35 | 32.31 | 35.47 | 33.17 | 36.02 | 34.89 | 30.61 | 29.00 | 27.14 | 19.08 | 17.08 | 15.60 | 27.93 | 21.91 | 24.62 | 16.43 | 19.53 | 18.16 | 21.58 | 19.36 | 24.93 | 23.55 | 20.07 | 24.91 | 25.72 | 25.12 | 20.75 | 19.13 | 36.28 | 13.92 | 24.94 | 17.64 | 16.90 | 20.62 | 11.43 | 11.64 | 9.13 | 7.42 | 6.05 | 5.58 | 5.88 | 2.78 | 7.29 | 10.04 | 12.44 | 10.52 | 10.63 | 0.27 | 0.28 | 0.22 | 0.63 | |
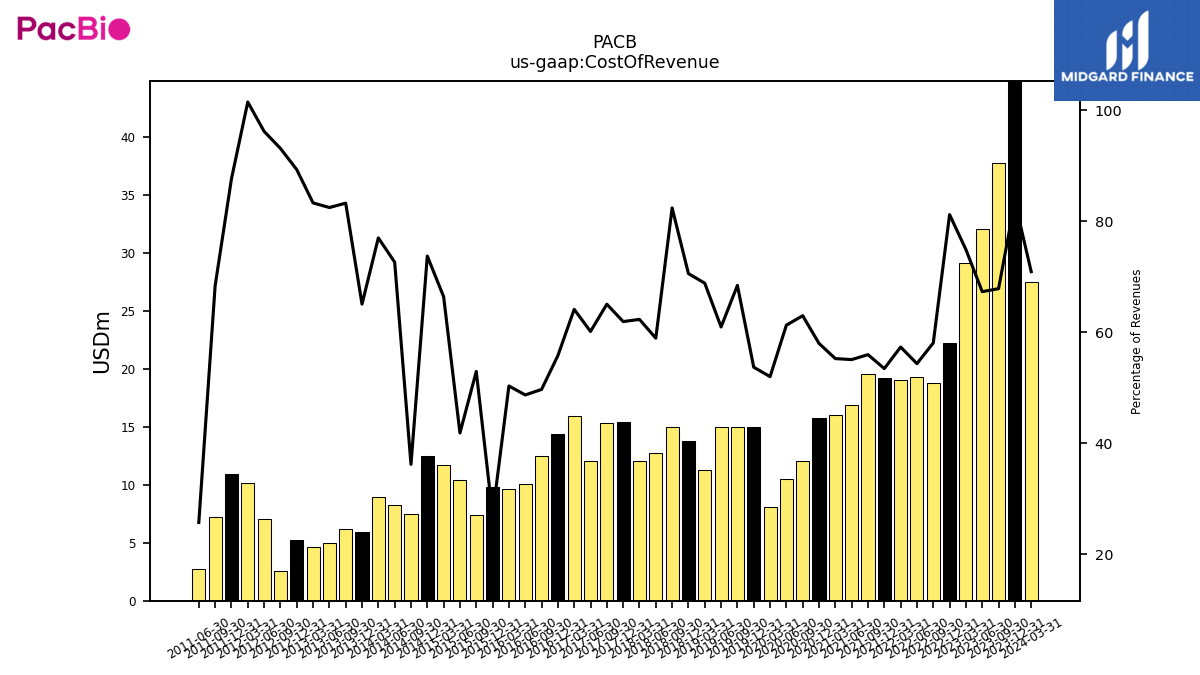
| Cost Of Revenue | 48.79 | 37.79 | 32.03 | 29.14 | 22.21 | 18.76 | 19.27 | 19.02 | 19.25 | 19.52 | 16.86 | 16.02 | 15.73 | 12.02 | 10.46 | 8.11 | 15.00 | 15.00 | 15.01 | 11.31 | 13.78 | 14.97 | 12.72 | 12.07 | 15.44 | 15.32 | 12.07 | 15.98 | 14.35 | 12.48 | 10.10 | 9.62 | 9.81 | 7.37 | 10.43 | 11.72 | 12.47 | 7.46 | 8.30 | 8.97 | 5.94 | 6.18 | 4.99 | 4.65 | 5.25 | 2.59 | 7.02 | 10.19 | 10.91 | 7.19 | 2.73 | NA | NA | NA | NA | |
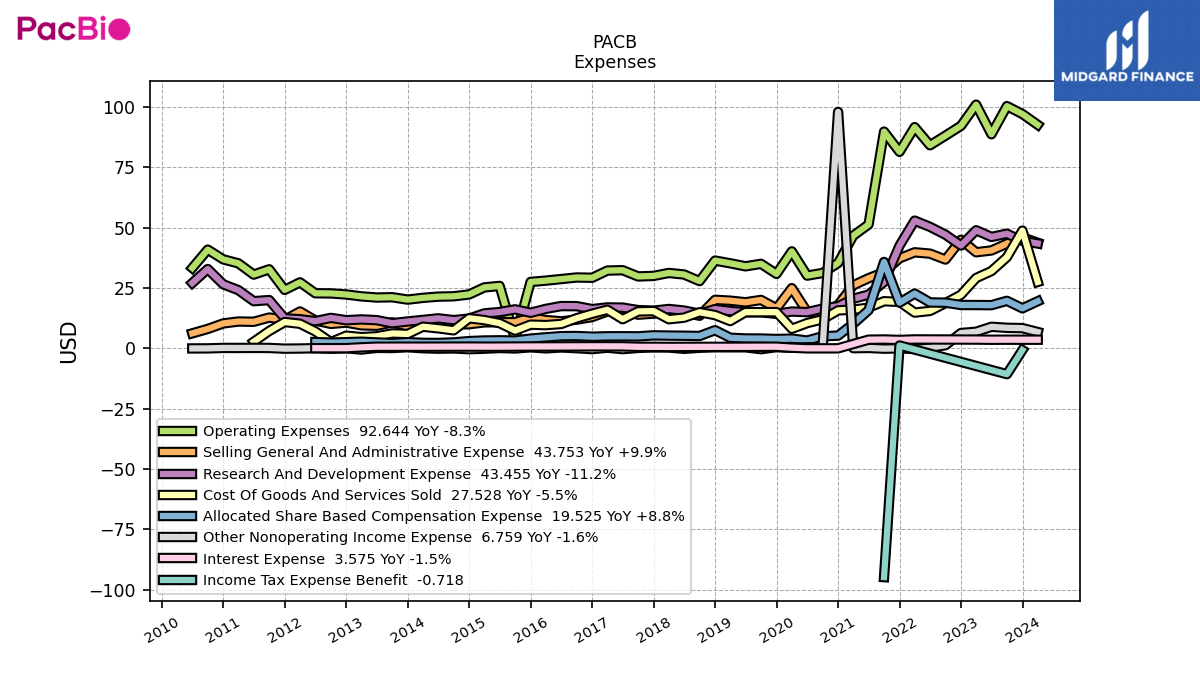
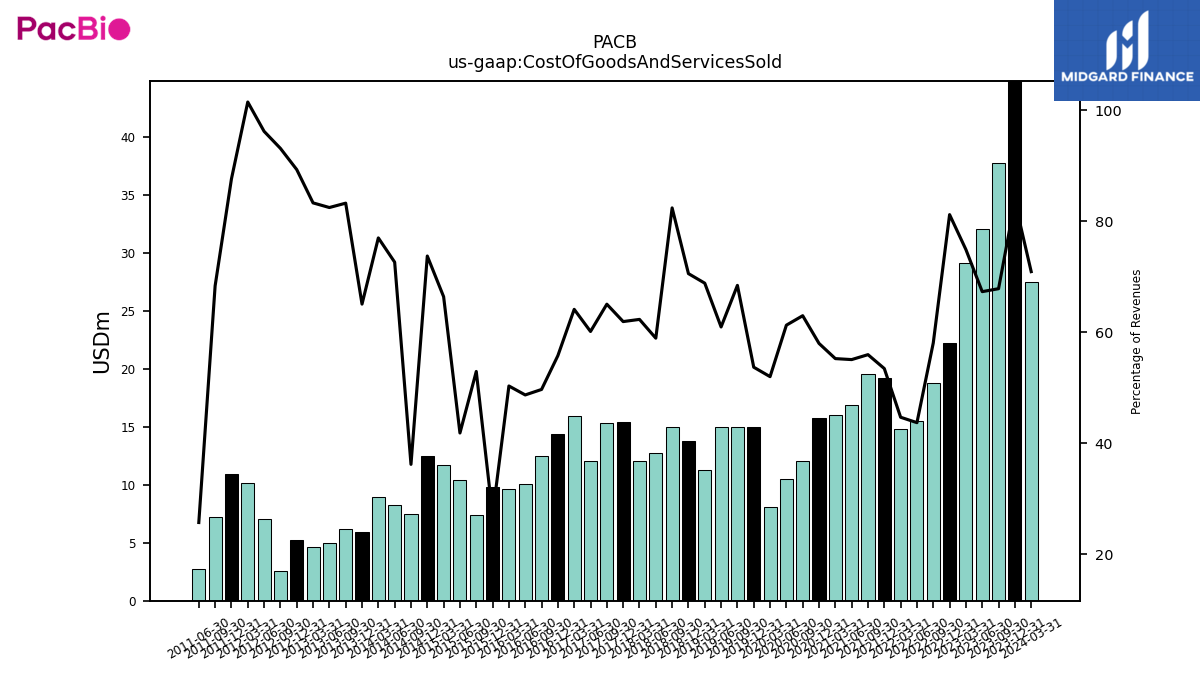
| Cost Of Goods And Services Sold | 48.79 | 37.79 | 32.03 | 29.14 | 22.21 | 18.76 | 15.50 | 14.82 | 19.25 | 19.52 | 16.86 | 16.02 | 15.73 | 12.02 | 10.46 | 8.11 | 15.00 | 15.00 | 15.01 | 11.31 | 13.78 | 14.97 | 12.72 | 12.07 | 15.44 | 15.32 | 12.07 | 15.98 | 14.35 | 12.48 | 10.10 | 9.62 | 9.81 | 7.37 | 10.43 | 11.72 | 12.47 | 7.46 | 8.30 | 8.97 | 5.94 | 6.18 | 4.99 | 4.65 | 5.25 | 2.59 | 7.02 | 10.19 | 10.91 | 7.19 | 2.73 | NA | NA | NA | NA | |
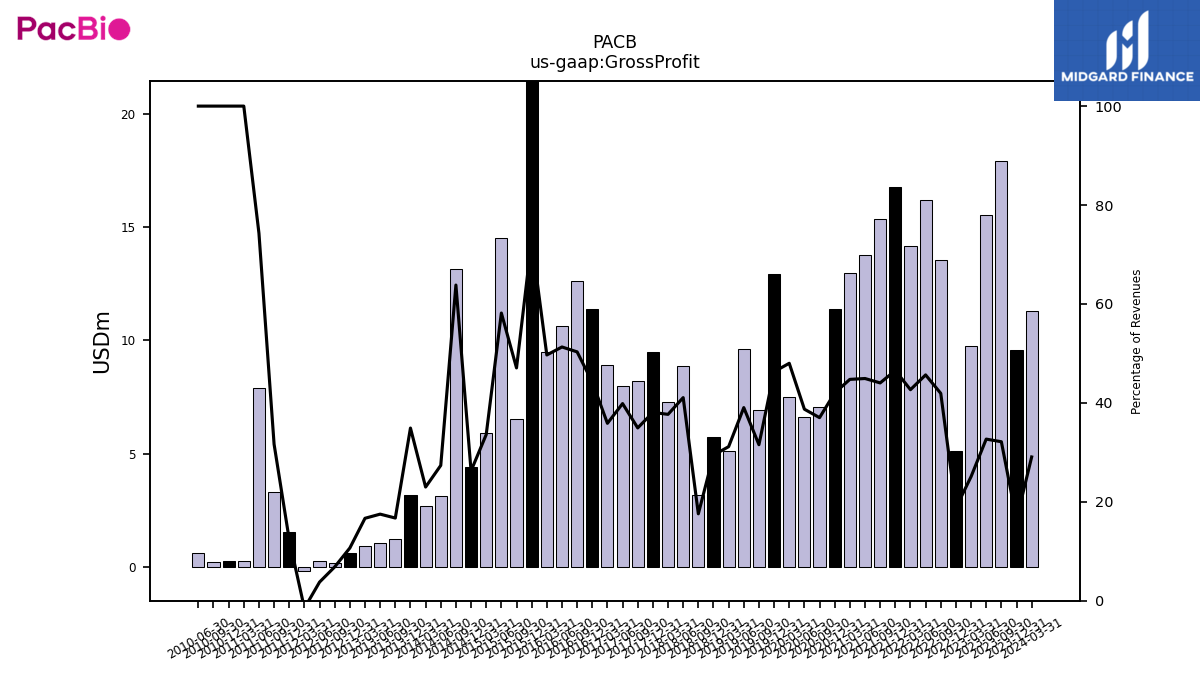
| Gross Profit | 9.57 | 17.90 | 15.55 | 9.76 | 5.14 | 13.55 | 16.19 | 14.15 | 16.77 | 15.36 | 13.75 | 12.98 | 11.40 | 7.06 | 6.61 | 7.49 | 12.93 | 6.91 | 9.61 | 5.12 | 5.75 | 3.19 | 8.86 | 7.30 | 9.49 | 8.23 | 8.00 | 8.94 | 11.37 | 12.64 | 10.64 | 9.50 | 26.47 | 6.55 | 14.51 | 5.93 | 4.44 | 13.16 | 3.13 | 2.68 | 3.19 | 1.24 | 1.06 | 0.93 | 0.63 | 0.19 | 0.28 | -0.15 | 1.54 | 3.33 | 7.90 | 0.27 | 0.28 | 0.22 | 0.63 | |
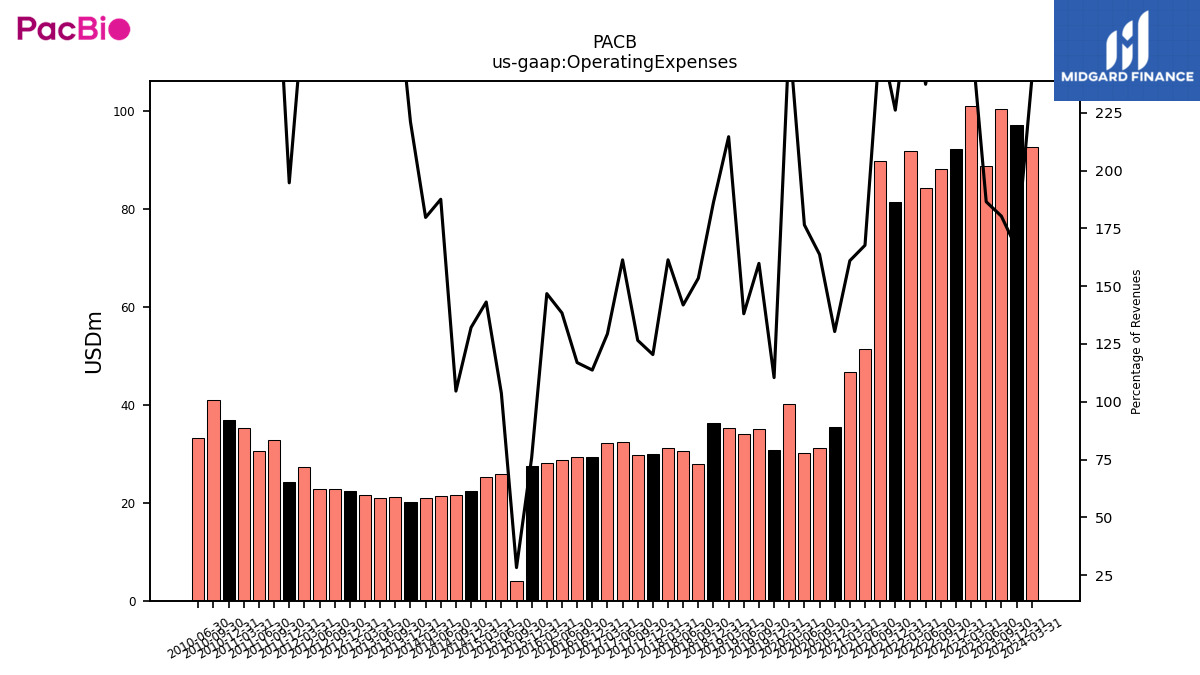
| Operating Expenses | 97.12 | 100.39 | 88.72 | 101.01 | 92.22 | 88.17 | 84.16 | 91.68 | 81.44 | 89.84 | 51.33 | 46.69 | 35.38 | 31.24 | 30.14 | 40.20 | 30.85 | 35.03 | 33.99 | 35.25 | 36.37 | 27.86 | 30.61 | 31.25 | 30.02 | 29.80 | 32.39 | 32.24 | 29.25 | 29.37 | 28.71 | 28.07 | 27.53 | 3.94 | 25.86 | 25.25 | 22.33 | 21.57 | 21.43 | 20.92 | 20.19 | 21.18 | 21.06 | 21.54 | 22.32 | 22.77 | 22.83 | 27.36 | 24.23 | 32.77 | 30.56 | 35.24 | 36.87 | 40.92 | 33.30 | |
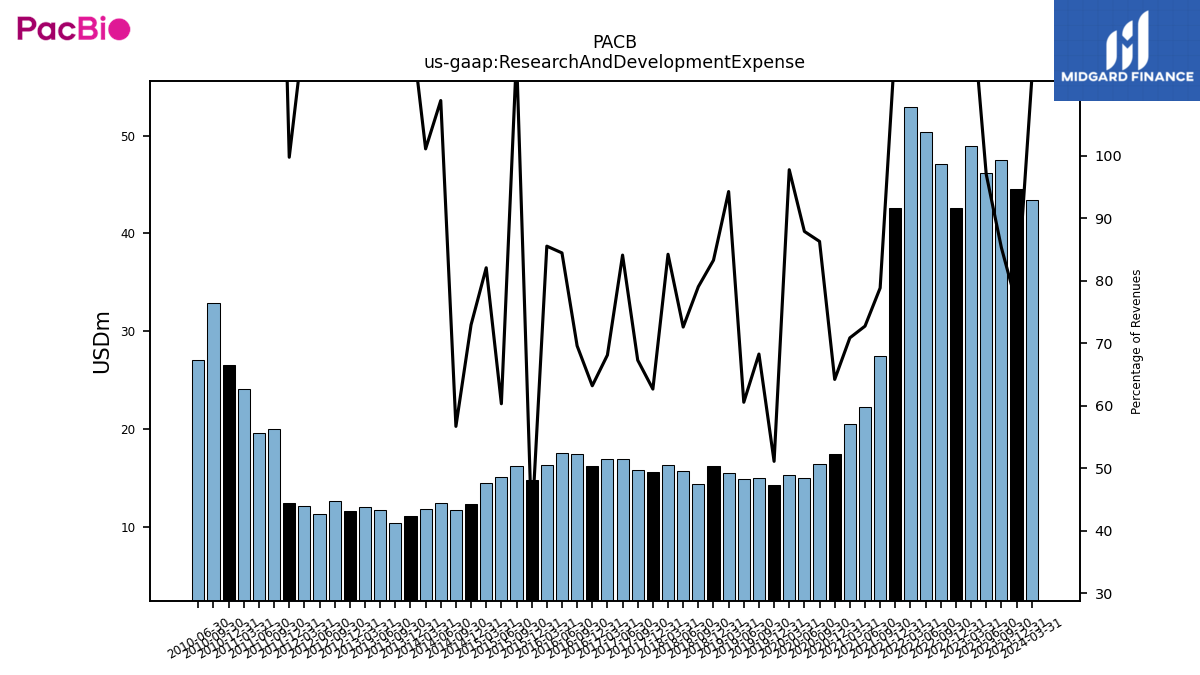
| Research And Development Expense | 44.54 | 47.51 | 46.17 | 48.94 | 42.62 | 47.09 | 50.35 | 52.94 | 42.58 | 27.51 | 22.27 | 20.55 | 17.43 | 16.47 | 15.01 | 15.25 | 14.27 | 14.96 | 14.91 | 15.48 | 16.26 | 14.36 | 15.66 | 16.31 | 15.63 | 15.84 | 16.88 | 16.97 | 16.25 | 17.48 | 17.52 | 16.36 | 14.75 | 16.16 | 15.04 | 14.48 | 12.33 | 11.69 | 12.44 | 11.77 | 11.13 | 10.42 | 11.68 | 11.98 | 11.65 | 12.63 | 11.27 | 12.07 | 12.41 | 20.00 | 19.55 | 24.12 | 26.54 | 32.87 | 27.08 | |
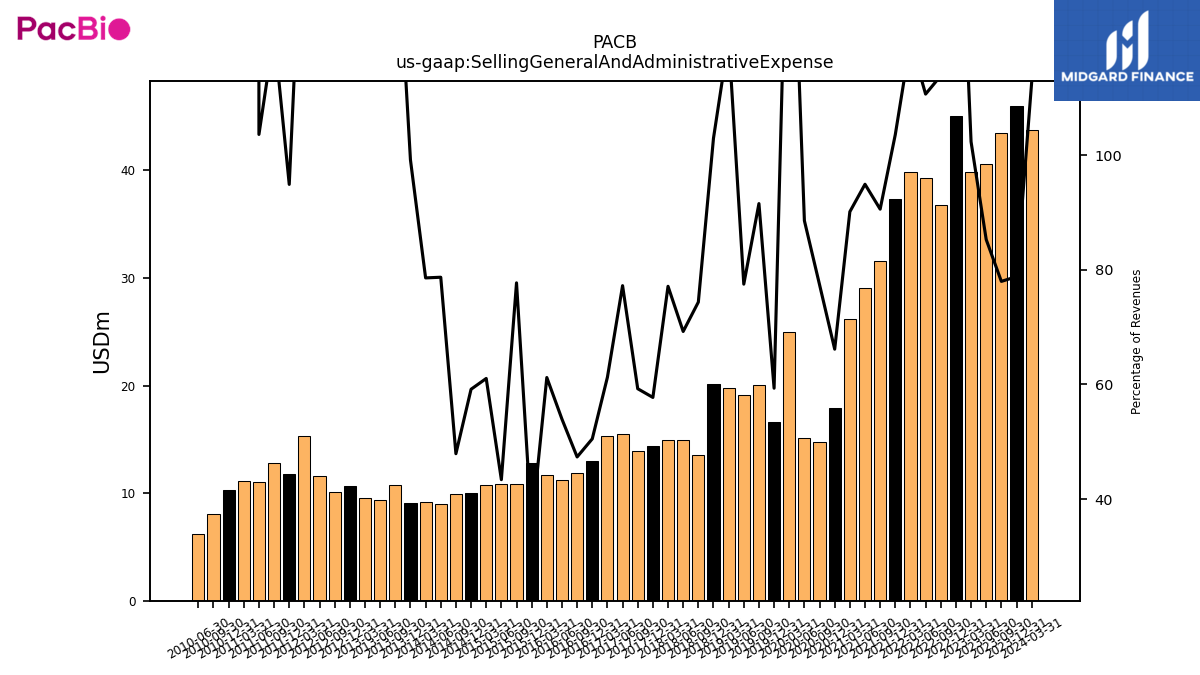
| Selling General And Administrative Expense | 46.00 | 43.43 | 40.57 | 39.82 | 45.00 | 36.80 | 39.25 | 39.80 | 37.32 | 31.61 | 29.06 | 26.14 | 17.95 | 14.77 | 15.13 | 24.95 | 16.58 | 20.07 | 19.08 | 19.77 | 20.11 | 13.51 | 14.94 | 14.93 | 14.40 | 13.95 | 15.51 | 15.27 | 12.99 | 11.89 | 11.19 | 11.71 | 12.78 | 10.82 | 10.82 | 10.77 | 10.00 | 9.88 | 8.99 | 9.15 | 9.06 | 10.76 | 9.37 | 9.55 | 10.67 | 10.14 | 11.56 | 15.29 | 11.81 | 12.76 | 11.02 | 11.12 | 10.33 | 8.04 | 6.22 | |
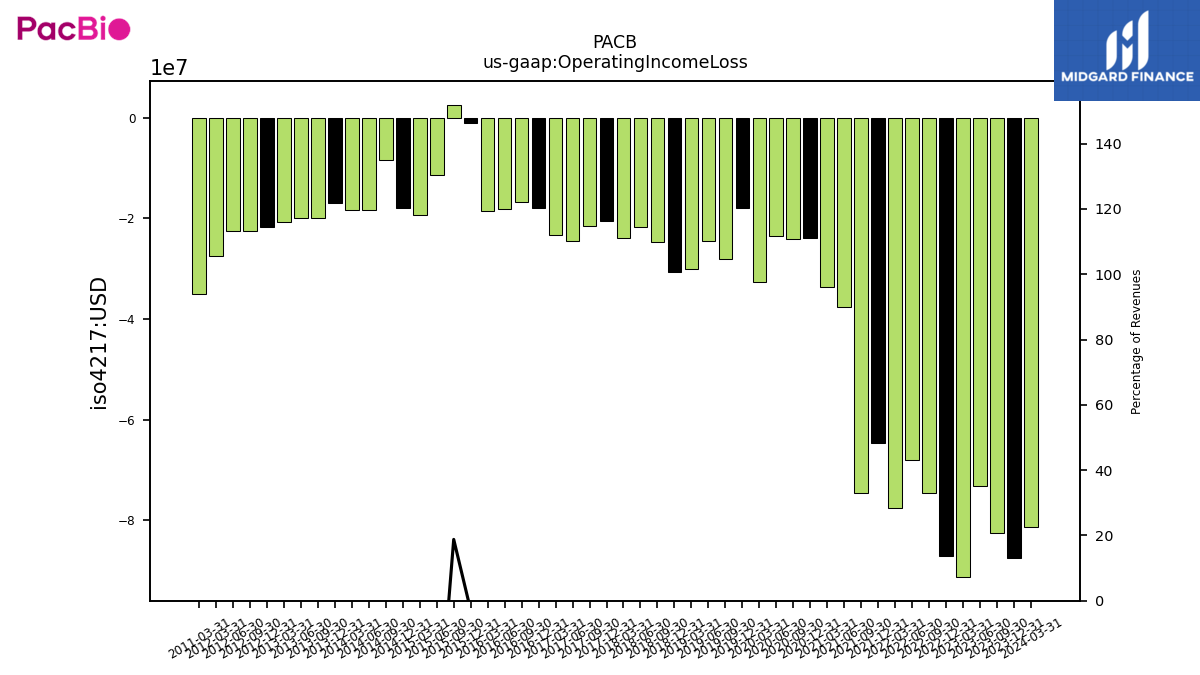
| Operating Income Loss | -87.55 | -82.49 | -73.17 | -91.25 | -87.08 | -74.62 | -67.97 | -77.52 | -64.68 | -74.48 | -37.57 | -33.71 | -23.98 | -24.18 | -23.52 | -32.71 | -17.92 | -28.11 | -24.38 | -30.13 | -30.62 | -24.67 | -21.75 | -23.95 | -20.53 | -21.57 | -24.39 | -23.30 | -17.87 | -16.73 | -18.07 | -18.57 | -1.06 | 2.61 | -11.36 | -19.33 | -17.89 | -8.41 | -18.30 | -18.25 | -17.00 | -19.93 | -20.00 | -20.61 | -21.69 | -22.58 | -22.55 | -27.51 | NA | NA | NA | -34.97 | NA | NA | NA | |
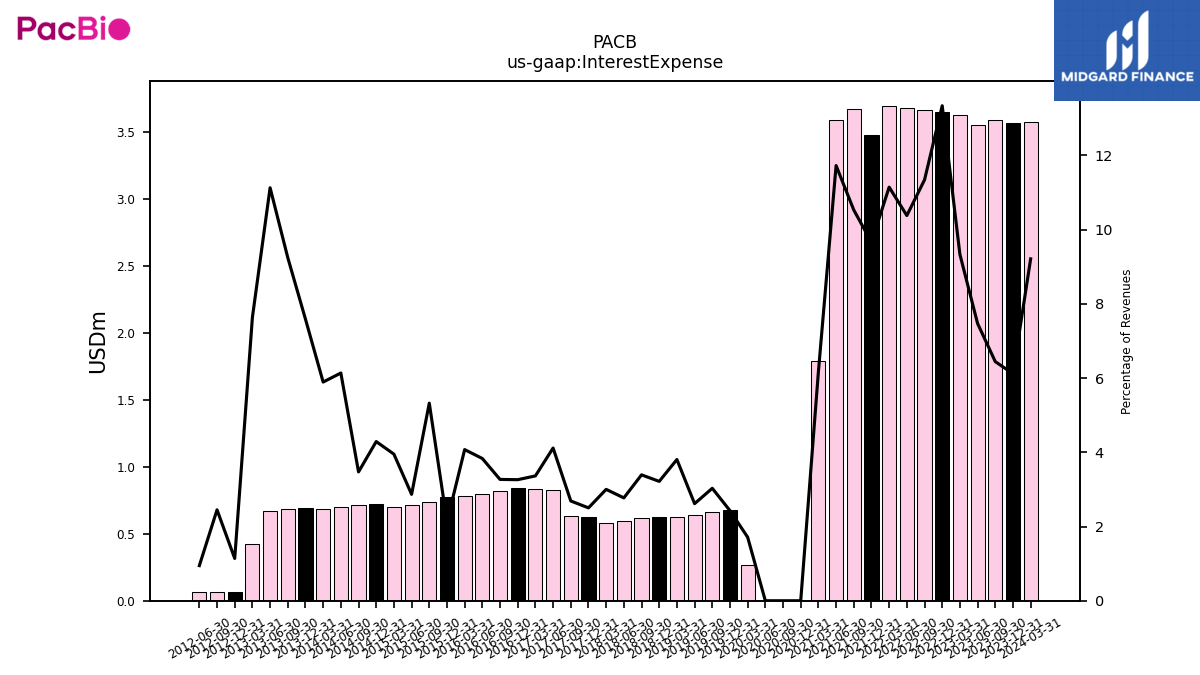
| Interest Expense | 3.57 | 3.59 | 3.55 | 3.63 | 3.65 | 3.66 | 3.68 | 3.70 | 3.48 | 3.67 | 3.59 | 1.79 | 0.00 | 0.00 | 0.00 | 0.27 | 0.68 | 0.66 | 0.64 | 0.62 | 0.63 | 0.62 | 0.60 | 0.58 | 0.62 | 0.63 | 0.83 | 0.84 | 0.84 | 0.82 | 0.80 | 0.78 | 0.77 | 0.74 | 0.71 | 0.70 | 0.72 | 0.72 | 0.70 | 0.69 | 0.69 | 0.69 | 0.67 | 0.43 | 0.07 | 0.07 | 0.07 | NA | NA | NA | NA | NA | NA | NA | NA | |
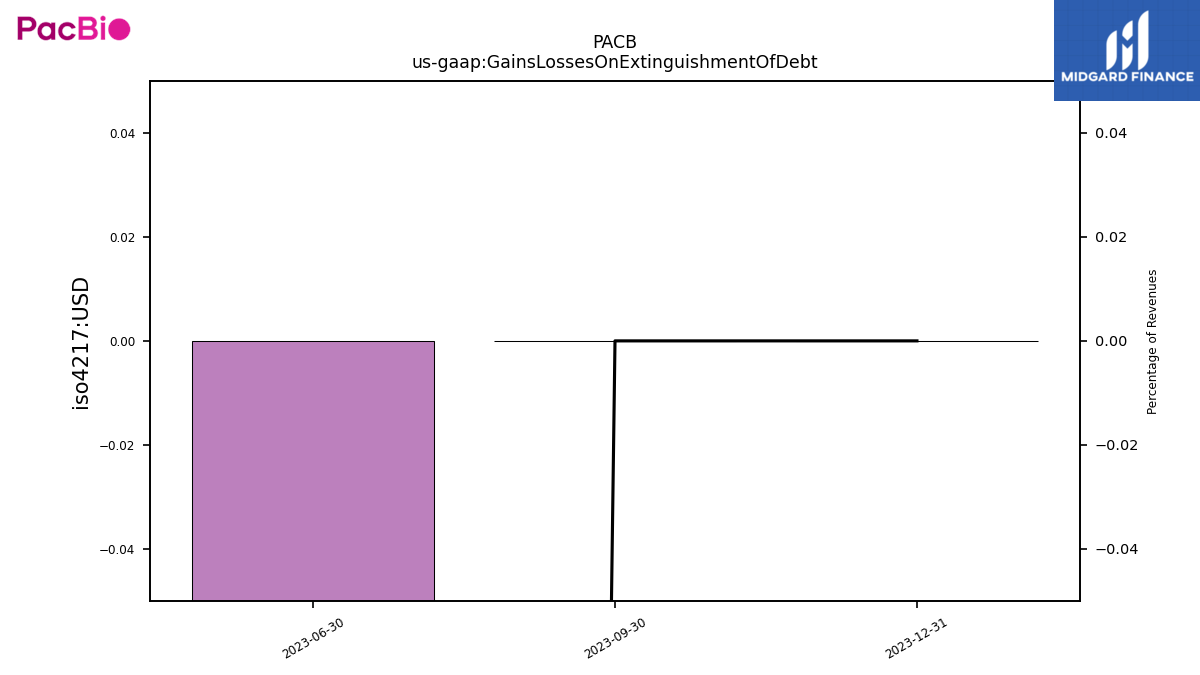
| Gains Losses On Extinguishment Of Debt | 0.00 | 0.00 | -2.03 | NA | NA | NA | NA | NA | NA | NA | NA | NA | NA | NA | NA | NA | NA | NA | NA | NA | NA | NA | NA | NA | NA | NA | NA | NA | NA | NA | NA | NA | NA | NA | NA | NA | NA | NA | NA | NA | NA | NA | NA | NA | NA | NA | NA | NA | NA | NA | NA | NA | NA | NA | NA | |
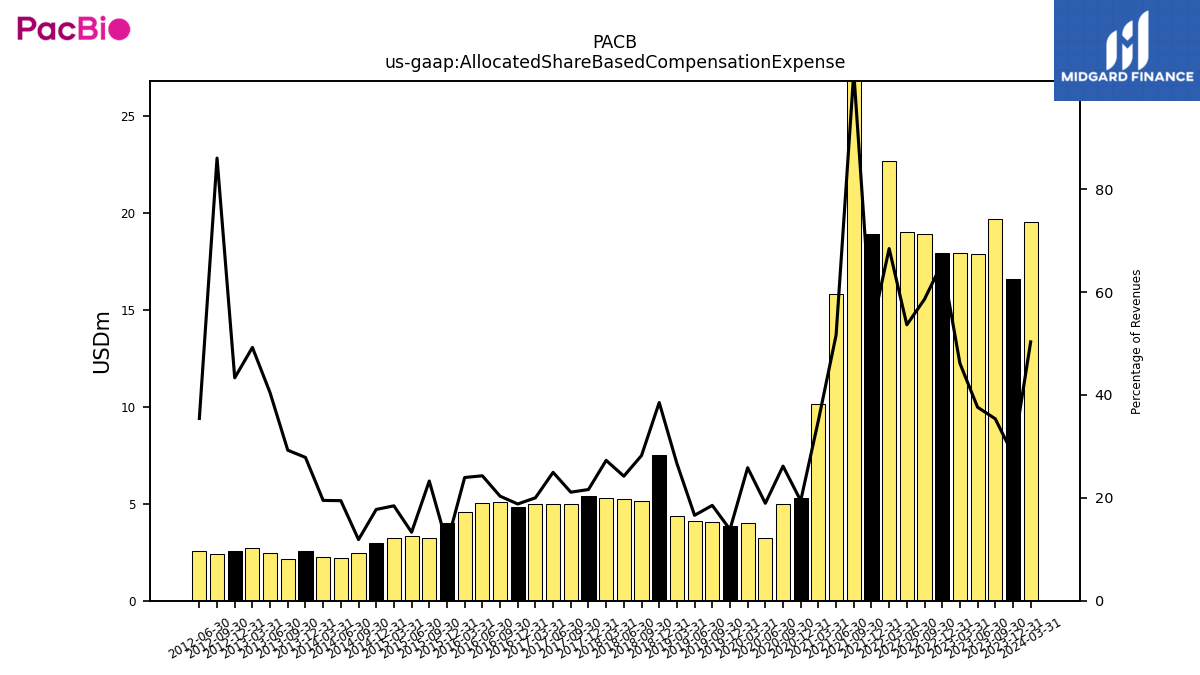
| Allocated Share Based Compensation Expense | 16.58 | 19.69 | 17.89 | 17.95 | 17.95 | 18.94 | 19.02 | 22.70 | 18.94 | 35.82 | 15.80 | 10.16 | 5.28 | 4.99 | 3.23 | 4.03 | 3.87 | 4.06 | 4.09 | 4.38 | 7.52 | 5.12 | 5.22 | 5.28 | 5.39 | 4.97 | 5.01 | 4.98 | 4.84 | 5.11 | 5.04 | 4.58 | 4.03 | 3.24 | 3.32 | 3.25 | 3.00 | 2.45 | 2.22 | 2.27 | 2.54 | 2.17 | 2.44 | 2.75 | 2.55 | 2.39 | 2.58 | NA | NA | NA | NA | NA | NA | NA | NA | |
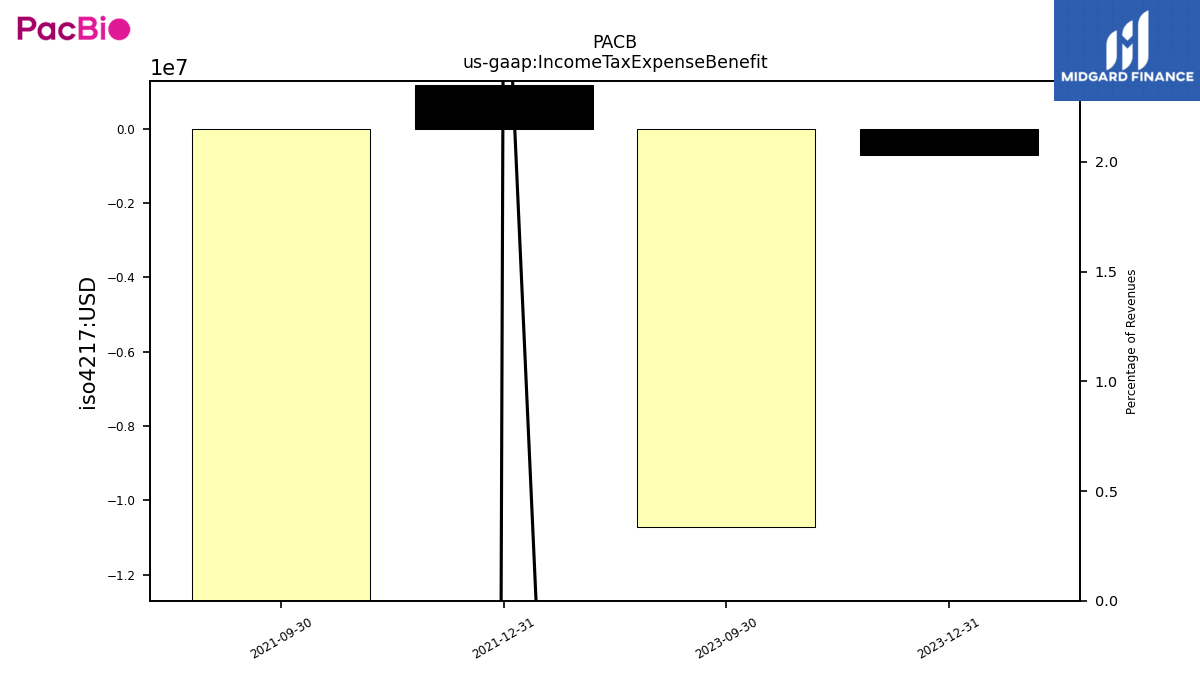
| Income Tax Expense Benefit | -0.72 | -10.71 | NA | NA | NA | NA | NA | NA | 1.18 | -94.82 | NA | NA | NA | NA | NA | NA | NA | NA | NA | NA | NA | NA | NA | NA | NA | NA | NA | NA | NA | NA | NA | NA | NA | NA | NA | NA | NA | NA | NA | NA | NA | NA | NA | NA | NA | NA | NA | NA | NA | NA | NA | NA | NA | NA | NA | |
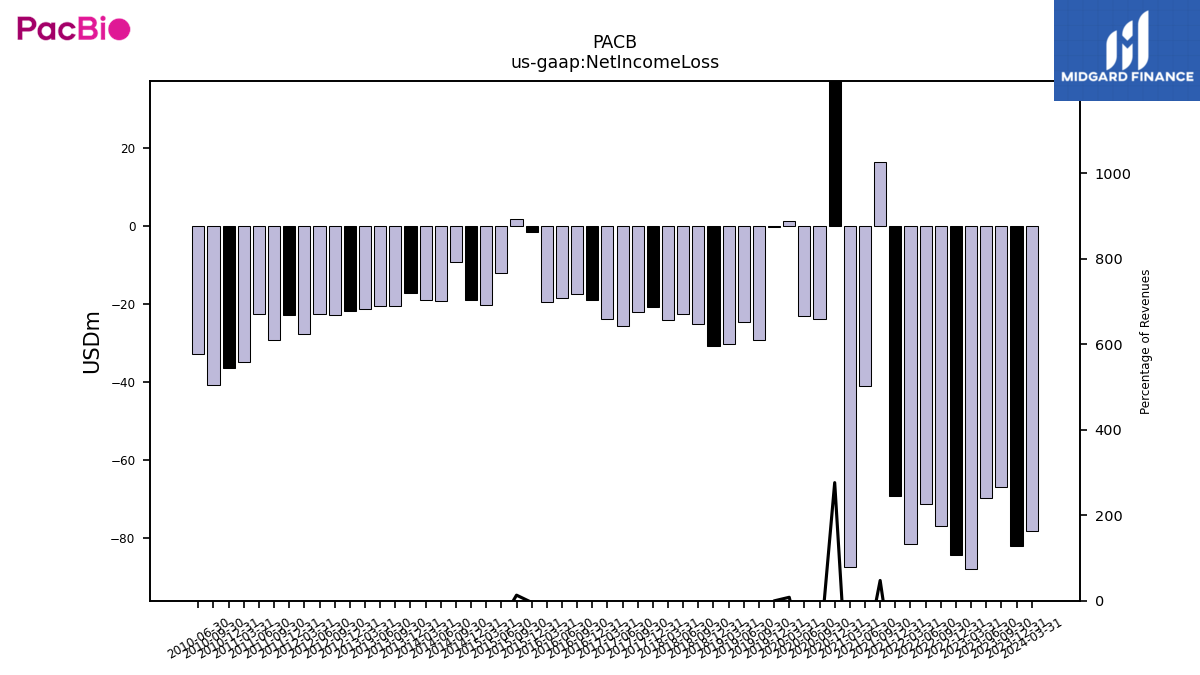
| Net Income Loss | -82.02 | -66.87 | -69.83 | -88.02 | -84.38 | -76.97 | -71.39 | -81.50 | -69.33 | 16.54 | -41.00 | -87.44 | 74.94 | -23.71 | -23.09 | 1.26 | -0.09 | -29.12 | -24.60 | -30.32 | -30.80 | -25.04 | -22.54 | -24.18 | -20.76 | -22.02 | -25.54 | -23.87 | -19.03 | -17.49 | -18.50 | -19.35 | -1.41 | 1.82 | -11.94 | -20.17 | -18.98 | -9.16 | -19.14 | -18.89 | -17.23 | -20.49 | -20.47 | -21.10 | -21.67 | -22.73 | -22.49 | -27.58 | -22.82 | -29.28 | -22.48 | -34.81 | -36.42 | -40.71 | -32.71 | |
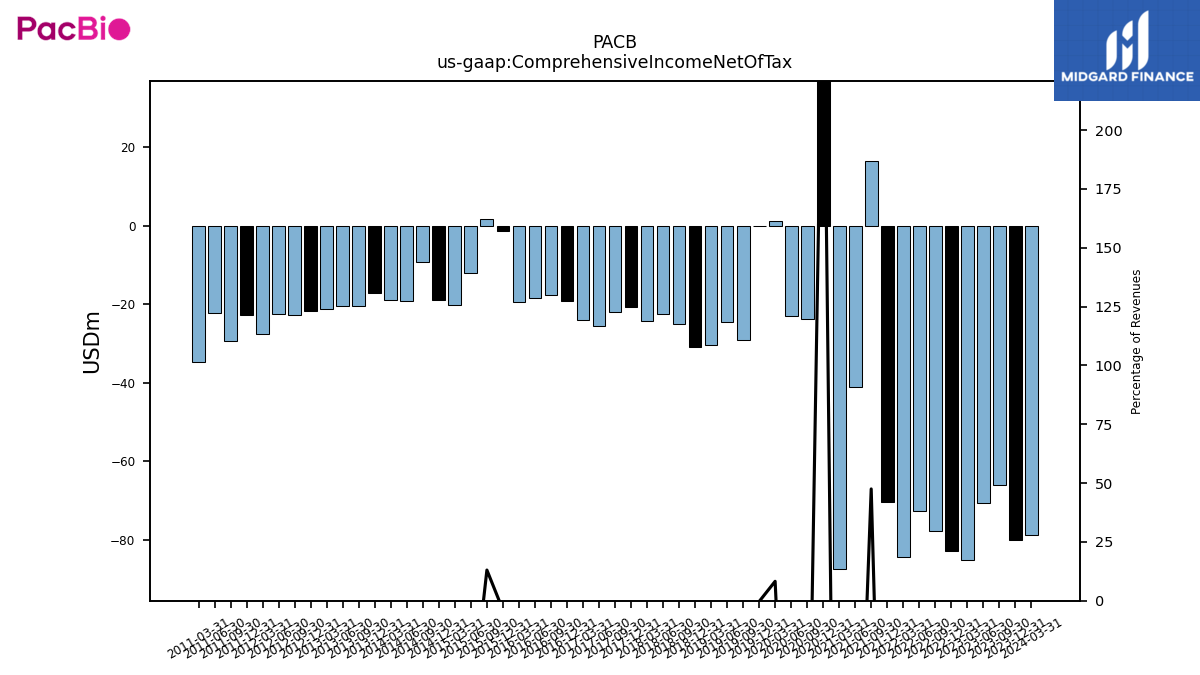
| Comprehensive Income Net Of Tax | -79.96 | -66.02 | -70.59 | -85.17 | -82.89 | -77.77 | -72.77 | -84.50 | -70.44 | 16.57 | -41.08 | -87.45 | 74.90 | -23.83 | -22.87 | 1.29 | -0.10 | -29.13 | -24.59 | -30.28 | -30.81 | -25.05 | -22.52 | -24.18 | -20.79 | -22.01 | -25.55 | -23.88 | -19.05 | -17.52 | -18.49 | -19.30 | -1.42 | 1.81 | -11.94 | -20.17 | -18.99 | -9.18 | -19.11 | -18.88 | -17.23 | -20.47 | -20.48 | -21.12 | -21.70 | -22.74 | -22.55 | -27.50 | -22.76 | -29.47 | -22.30 | -34.78 | NA | NA | NA |
| 2023-12-31 | 2023-09-30 | 2023-06-30 | 2023-03-31 | 2022-12-31 | 2022-09-30 | 2022-06-30 | 2022-03-31 | 2021-12-31 | 2021-09-30 | 2021-06-30 | 2021-03-31 | 2020-12-31 | 2020-09-30 | 2020-06-30 | 2020-03-31 | 2019-12-31 | 2019-09-30 | 2019-06-30 | 2019-03-31 | 2018-12-31 | 2018-09-30 | 2018-06-30 | 2018-03-31 | 2017-12-31 | 2017-09-30 | 2017-06-30 | 2017-03-31 | 2016-12-31 | 2016-09-30 | 2016-06-30 | 2016-03-31 | 2015-12-31 | 2015-09-30 | 2015-06-30 | 2015-03-31 | 2014-12-31 | 2014-09-30 | 2014-06-30 | 2014-03-31 | 2013-12-31 | 2013-09-30 | 2013-06-30 | 2013-03-31 | 2012-12-31 | 2012-09-30 | 2012-06-30 | 2012-03-31 | 2011-12-31 | 2011-09-30 | 2011-06-30 | 2011-03-31 | 2010-12-31 | 2010-09-30 | 2010-06-30 | ||
|---|---|---|---|---|---|---|---|---|---|---|---|---|---|---|---|---|---|---|---|---|---|---|---|---|---|---|---|---|---|---|---|---|---|---|---|---|---|---|---|---|---|---|---|---|---|---|---|---|---|---|---|---|---|---|---|---|
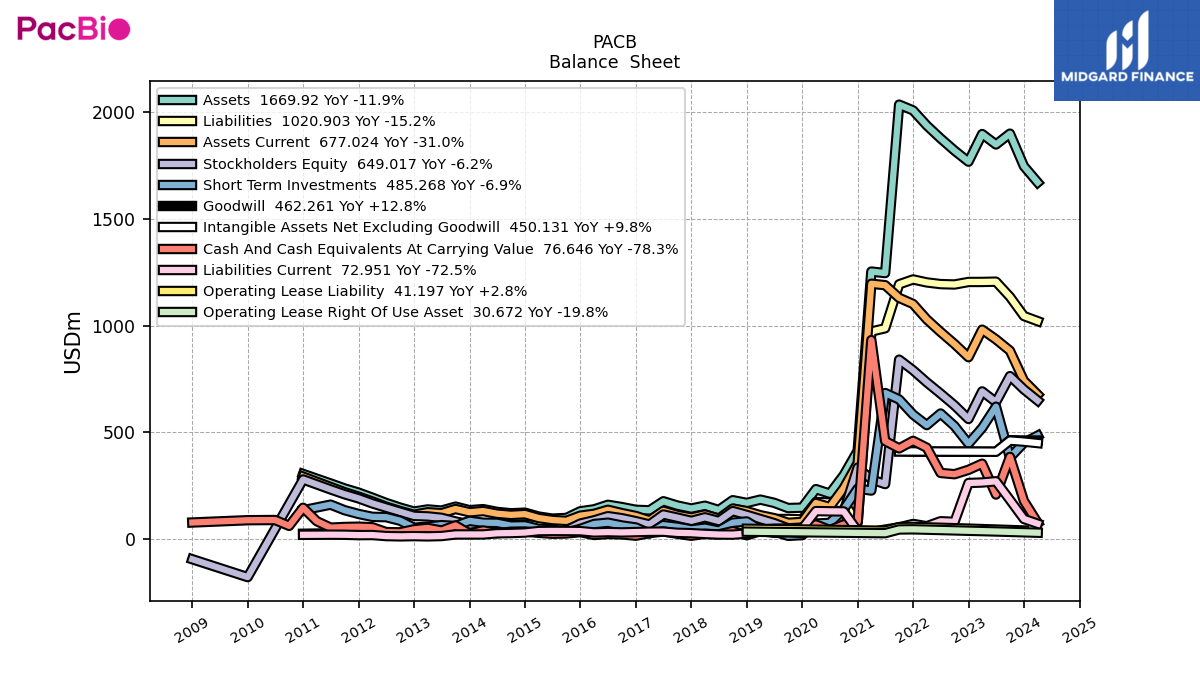
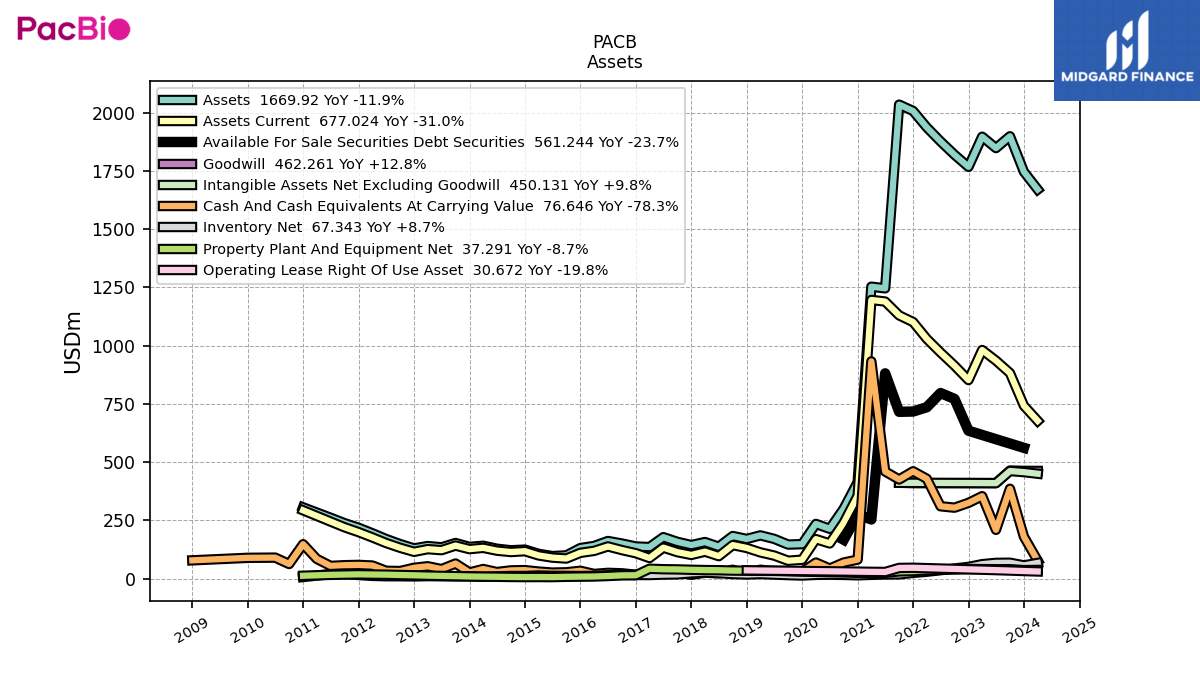
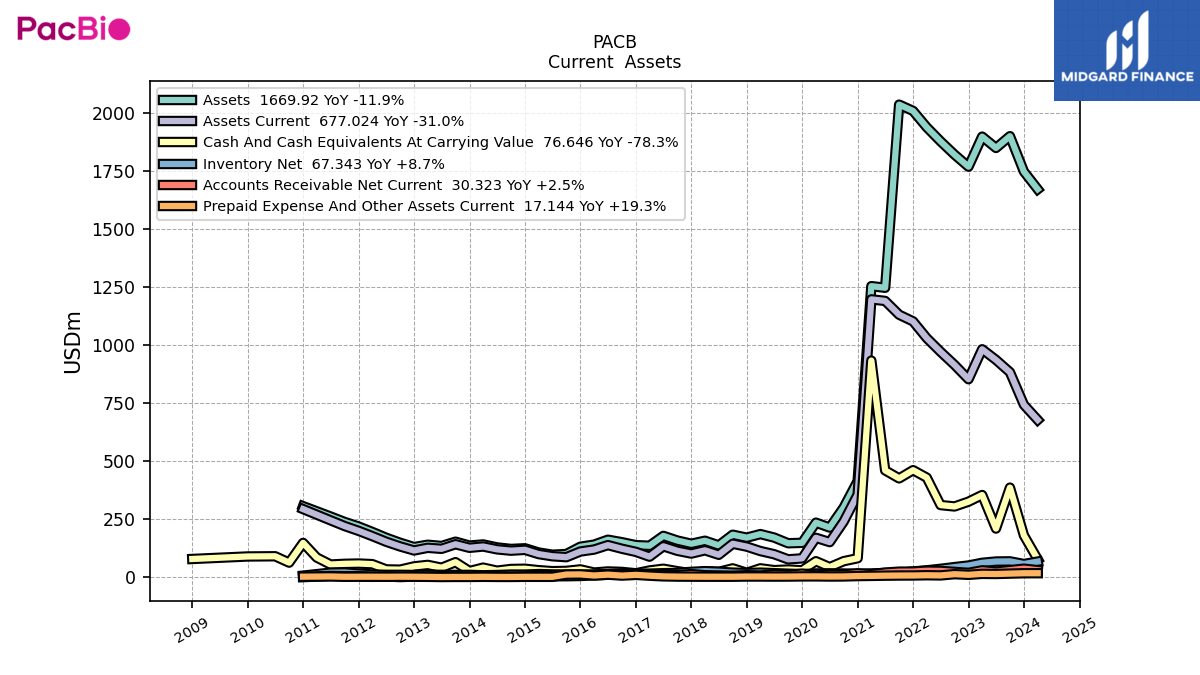
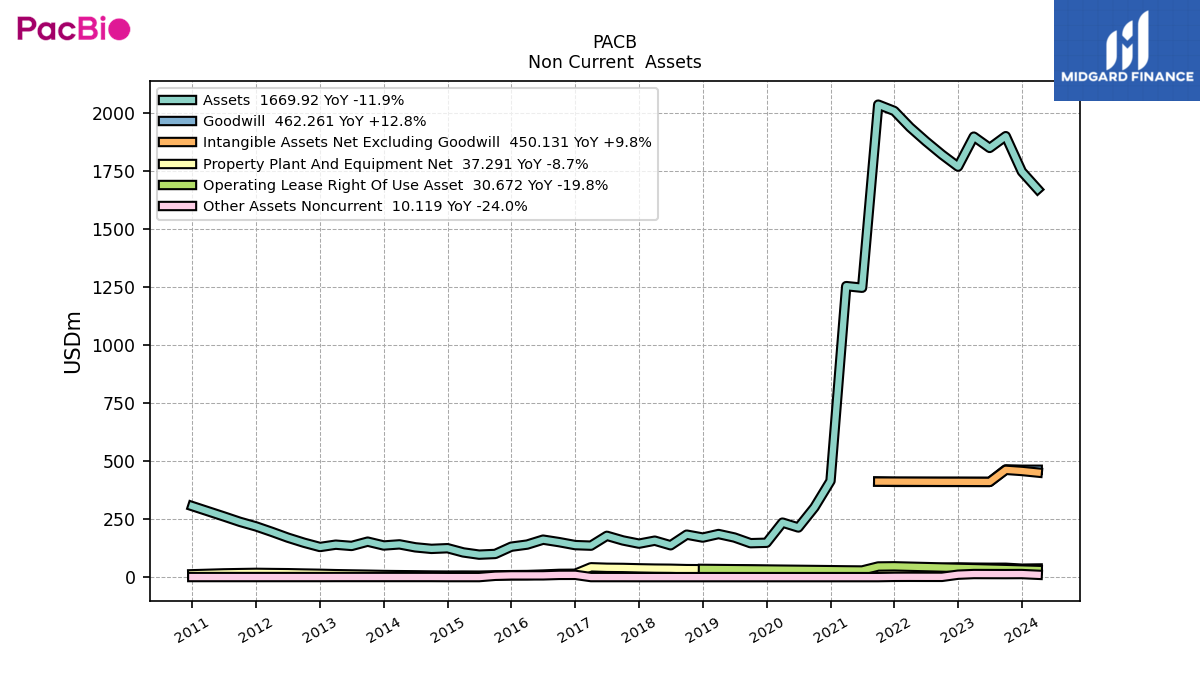
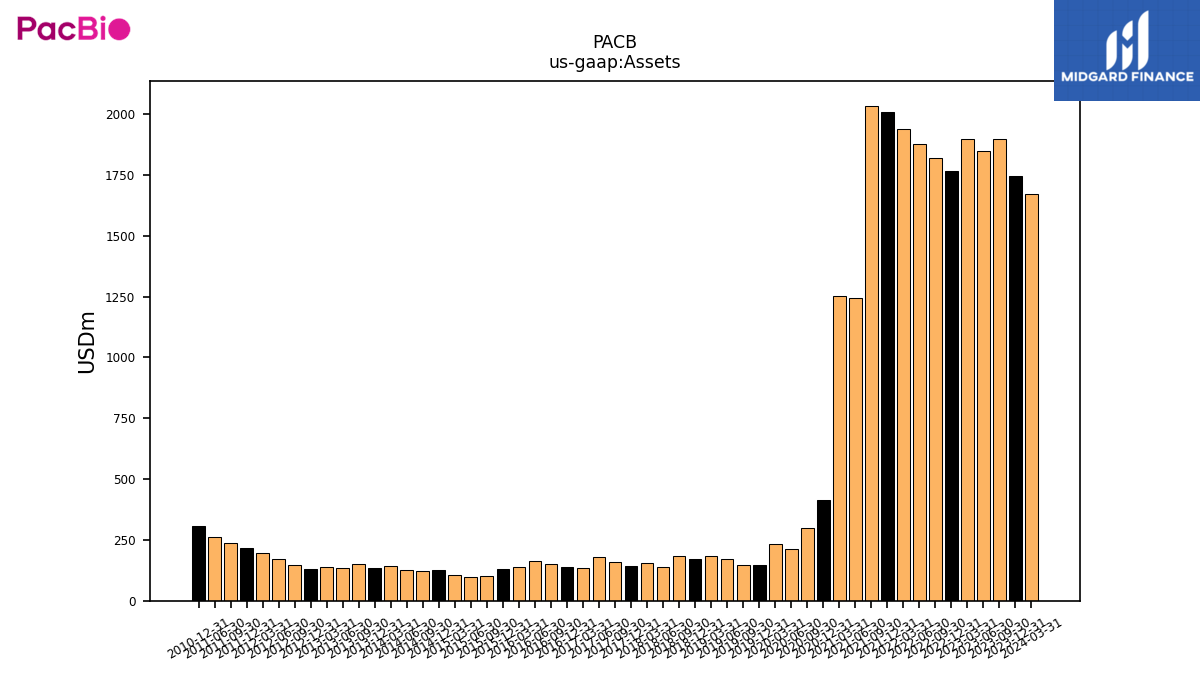
| Assets | 1746.01 | 1898.35 | 1847.63 | 1896.42 | 1767.09 | 1818.95 | 1876.14 | 1936.67 | 2006.97 | 2034.15 | 1245.78 | 1252.89 | 413.98 | 300.32 | 213.65 | 234.76 | 147.99 | 146.11 | 170.58 | 185.58 | 170.28 | 182.91 | 137.06 | 156.95 | 144.08 | 157.90 | 177.91 | 135.51 | 137.88 | 150.63 | 161.37 | 140.18 | 131.11 | 99.78 | 96.77 | 106.42 | 124.52 | 121.64 | 128.24 | 141.04 | 136.19 | 152.80 | 134.28 | 139.77 | 129.68 | 148.21 | 169.93 | 194.74 | 218.32 | 237.96 | 261.22 | NA | 305.75 | NA | NA | |
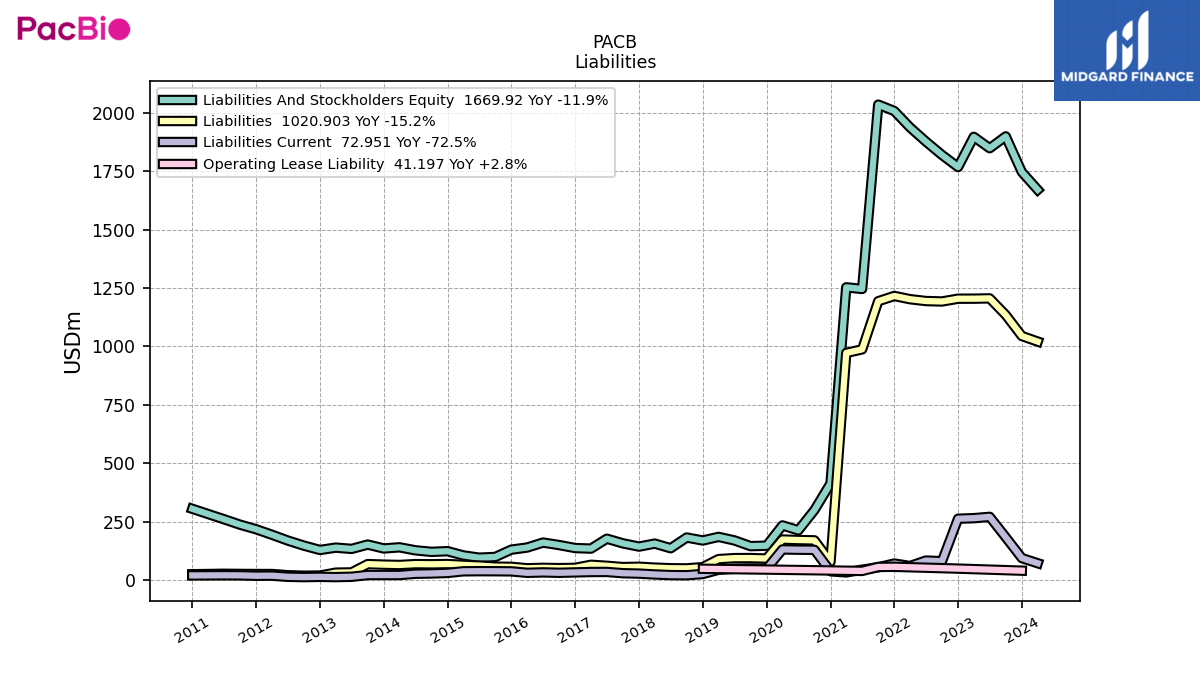
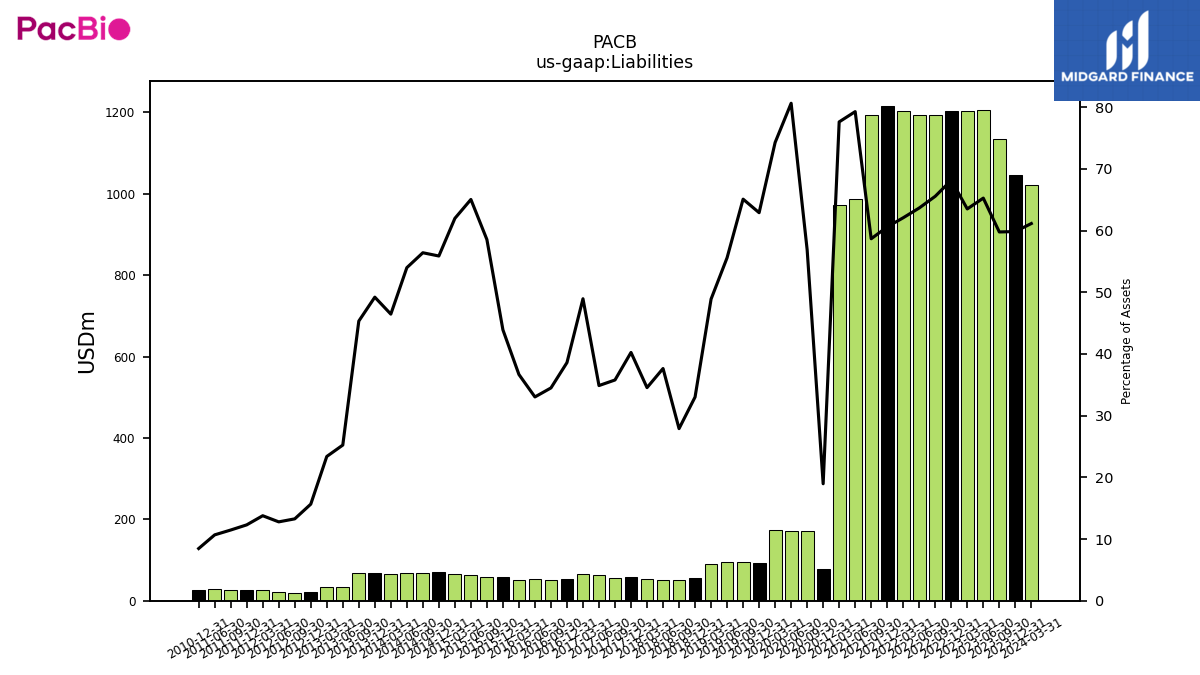
| Liabilities | 1044.71 | 1134.61 | 1205.63 | 1204.30 | 1204.18 | 1192.36 | 1194.26 | 1202.09 | 1215.98 | 1193.35 | 987.54 | 972.34 | 78.49 | 170.82 | 172.26 | 174.36 | 93.07 | 95.10 | 94.83 | 90.73 | 56.21 | 51.03 | 51.58 | 54.21 | 57.98 | 56.50 | 62.05 | 66.32 | 53.22 | 51.95 | 53.30 | 51.40 | 57.57 | 58.41 | 62.93 | 65.95 | 69.57 | 68.61 | 69.23 | 65.52 | 67.00 | 69.26 | 33.88 | 32.68 | 20.30 | 19.67 | 21.73 | 26.84 | 26.85 | 27.28 | 27.89 | NA | 25.88 | NA | NA | |
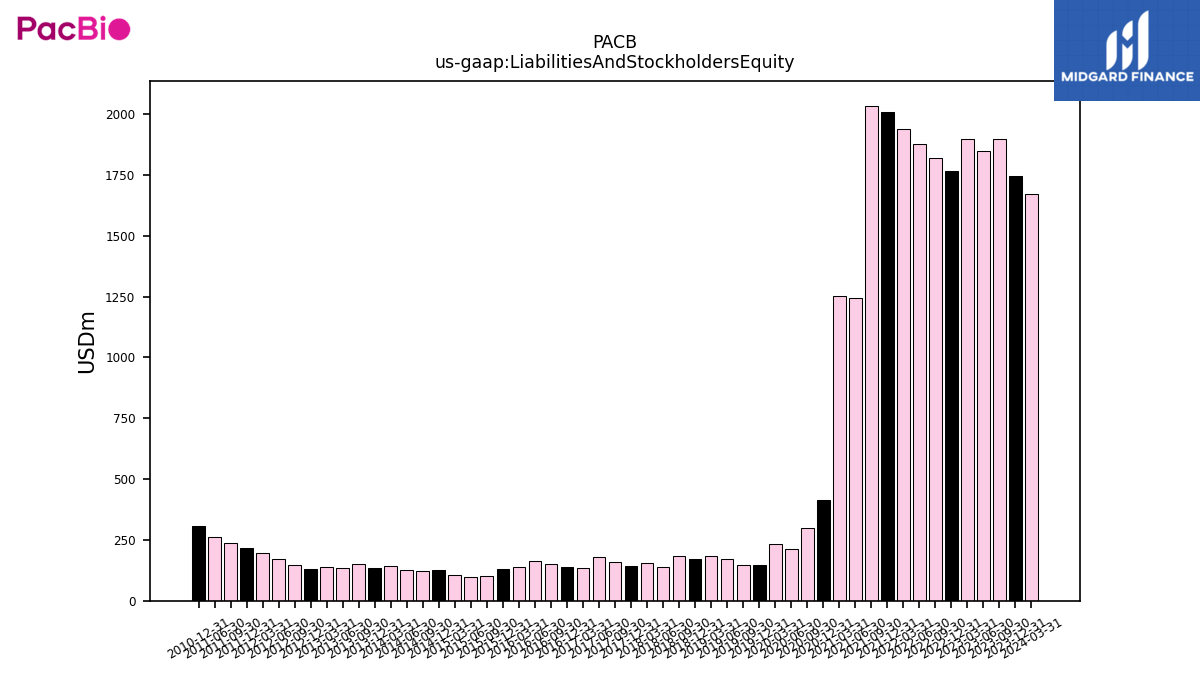
| Liabilities And Stockholders Equity | 1746.01 | 1898.35 | 1847.63 | 1896.42 | 1767.09 | 1818.95 | 1876.14 | 1936.67 | 2006.97 | 2034.15 | 1245.78 | 1252.89 | 413.98 | 300.32 | 213.65 | 234.76 | 147.99 | 146.11 | 170.58 | 185.58 | 170.28 | 182.91 | 137.06 | 156.95 | 144.08 | 157.90 | 177.91 | 135.51 | 137.88 | 150.63 | 161.37 | 140.18 | 131.11 | 99.78 | 96.77 | 106.42 | 124.52 | 121.64 | 128.24 | 141.04 | 136.19 | 152.80 | 134.28 | 139.77 | 129.68 | 148.21 | 169.93 | 194.74 | 218.32 | 237.96 | 261.22 | NA | 305.75 | NA | NA | |
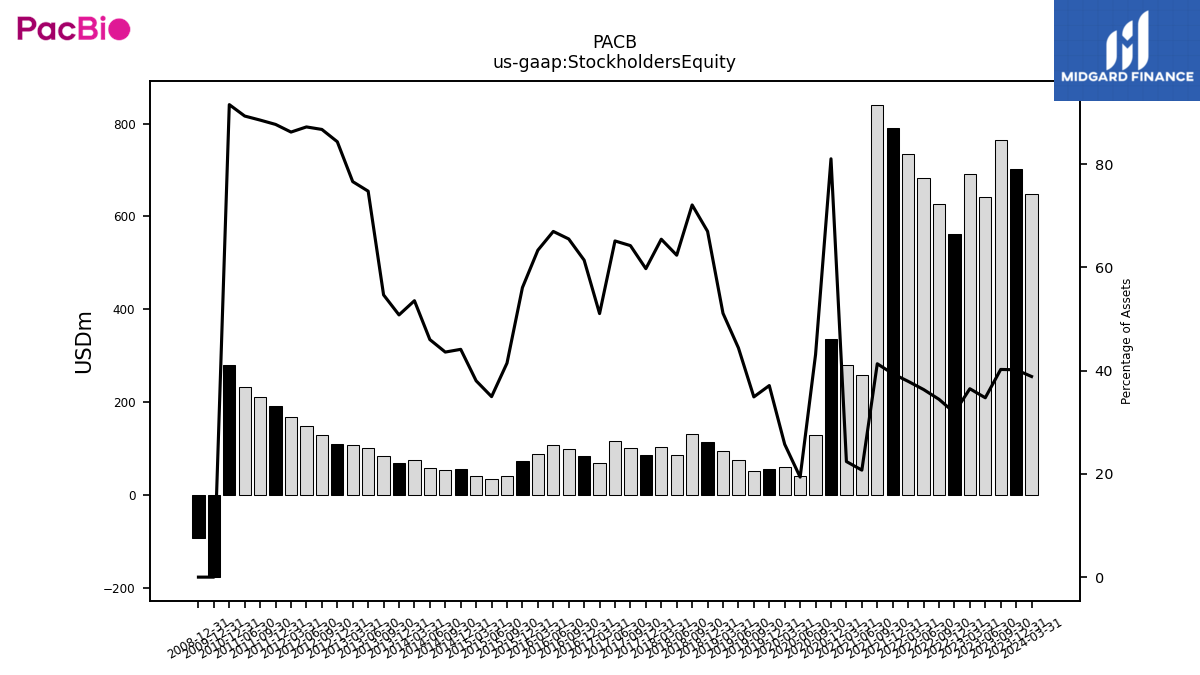
| Stockholders Equity | 701.30 | 763.74 | 642.00 | 692.12 | 562.90 | 626.59 | 681.89 | 734.58 | 790.99 | 840.81 | 258.25 | 280.55 | 335.49 | 129.50 | 41.39 | 60.40 | 54.92 | 51.01 | 75.75 | 94.85 | 114.06 | 131.88 | 85.47 | 102.74 | 86.10 | 101.41 | 115.86 | 69.19 | 84.67 | 98.68 | 108.07 | 88.78 | 73.54 | 41.37 | 33.84 | 40.47 | 54.95 | 53.03 | 59.02 | 75.53 | 69.18 | 83.54 | 100.40 | 107.09 | 109.38 | 128.54 | 148.20 | 167.90 | 191.46 | 210.68 | 233.33 | NA | 279.87 | NA | NA |
| 2023-12-31 | 2023-09-30 | 2023-06-30 | 2023-03-31 | 2022-12-31 | 2022-09-30 | 2022-06-30 | 2022-03-31 | 2021-12-31 | 2021-09-30 | 2021-06-30 | 2021-03-31 | 2020-12-31 | 2020-09-30 | 2020-06-30 | 2020-03-31 | 2019-12-31 | 2019-09-30 | 2019-06-30 | 2019-03-31 | 2018-12-31 | 2018-09-30 | 2018-06-30 | 2018-03-31 | 2017-12-31 | 2017-09-30 | 2017-06-30 | 2017-03-31 | 2016-12-31 | 2016-09-30 | 2016-06-30 | 2016-03-31 | 2015-12-31 | 2015-09-30 | 2015-06-30 | 2015-03-31 | 2014-12-31 | 2014-09-30 | 2014-06-30 | 2014-03-31 | 2013-12-31 | 2013-09-30 | 2013-06-30 | 2013-03-31 | 2012-12-31 | 2012-09-30 | 2012-06-30 | 2012-03-31 | 2011-12-31 | 2011-09-30 | 2011-06-30 | 2011-03-31 | 2010-12-31 | 2010-09-30 | 2010-06-30 | ||
|---|---|---|---|---|---|---|---|---|---|---|---|---|---|---|---|---|---|---|---|---|---|---|---|---|---|---|---|---|---|---|---|---|---|---|---|---|---|---|---|---|---|---|---|---|---|---|---|---|---|---|---|---|---|---|---|---|
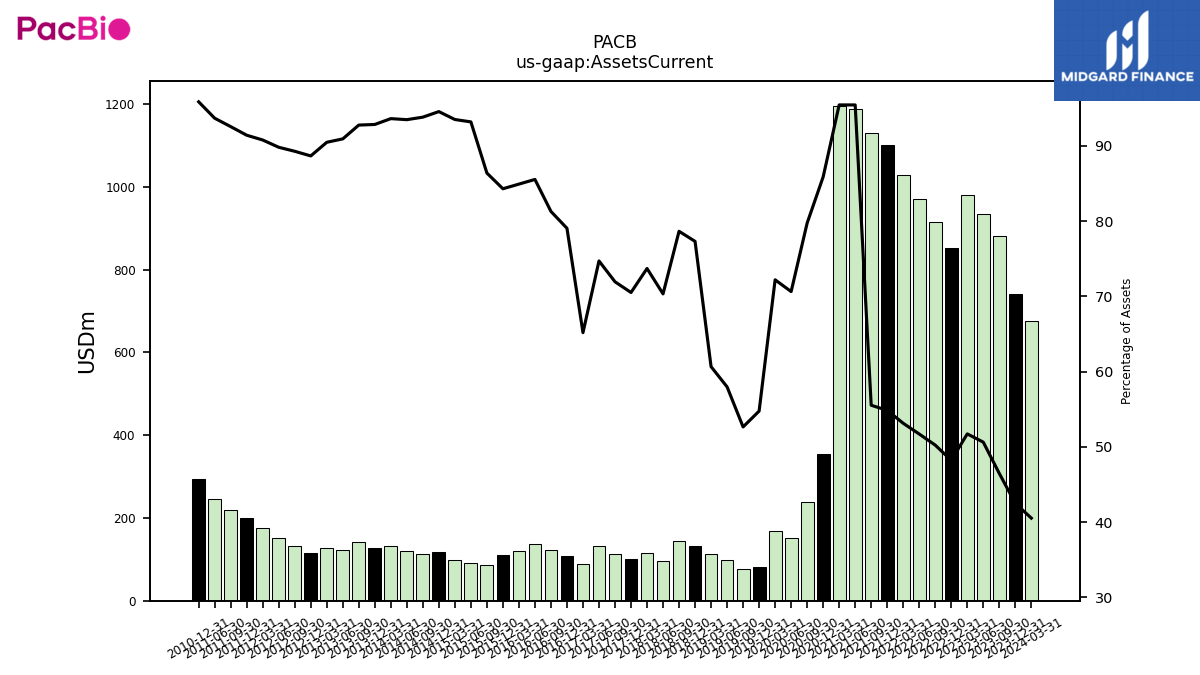
| Assets Current | 742.05 | 882.30 | 935.55 | 981.11 | 852.07 | 913.90 | 970.29 | 1029.19 | 1101.13 | 1129.81 | 1189.14 | 1195.95 | 355.59 | 239.51 | 150.94 | 169.53 | 81.05 | 76.94 | 98.91 | 112.59 | 131.66 | 143.87 | 96.41 | 115.70 | 101.62 | 113.61 | 132.93 | 88.34 | 109.01 | 122.47 | 138.06 | 119.05 | 110.54 | 86.21 | 90.19 | 99.52 | 117.76 | 114.14 | 119.90 | 132.06 | 126.46 | 141.76 | 122.11 | 126.48 | 115.00 | 132.34 | 152.64 | 176.81 | 199.60 | 220.28 | 244.73 | NA | 293.11 | NA | NA | |
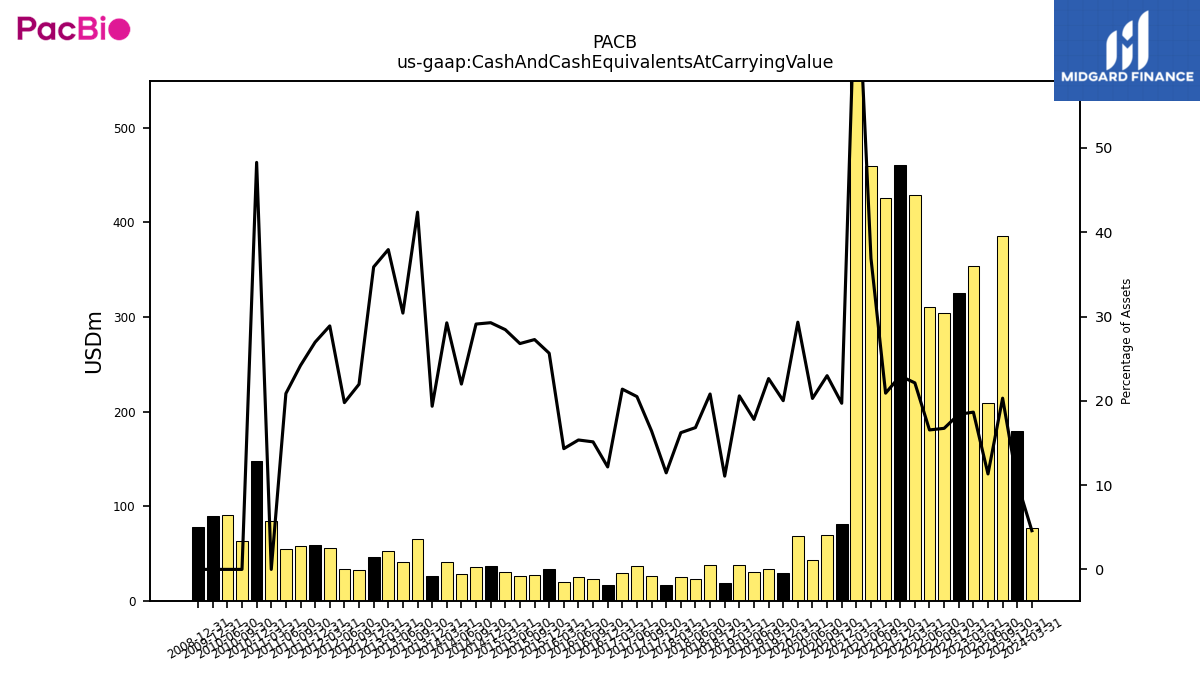
| Cash And Cash Equivalents At Carrying Value | 179.91 | 385.65 | 209.29 | 353.83 | 325.09 | 304.43 | 310.44 | 428.57 | 460.73 | 425.39 | 459.79 | 932.40 | 81.61 | 69.03 | 43.34 | 68.86 | 29.63 | 33.08 | 30.36 | 38.20 | 18.84 | 38.06 | 23.06 | 25.46 | 16.51 | 25.93 | 36.48 | 28.98 | 16.77 | 22.79 | 24.78 | 20.08 | 33.63 | 27.21 | 25.93 | 30.27 | 36.45 | 35.41 | 28.20 | 41.26 | 26.36 | 64.77 | 40.83 | 53.04 | 46.54 | 32.56 | 33.62 | 56.26 | 58.87 | 57.58 | 54.51 | 84.61 | 147.65 | 62.72 | 90.14 | |
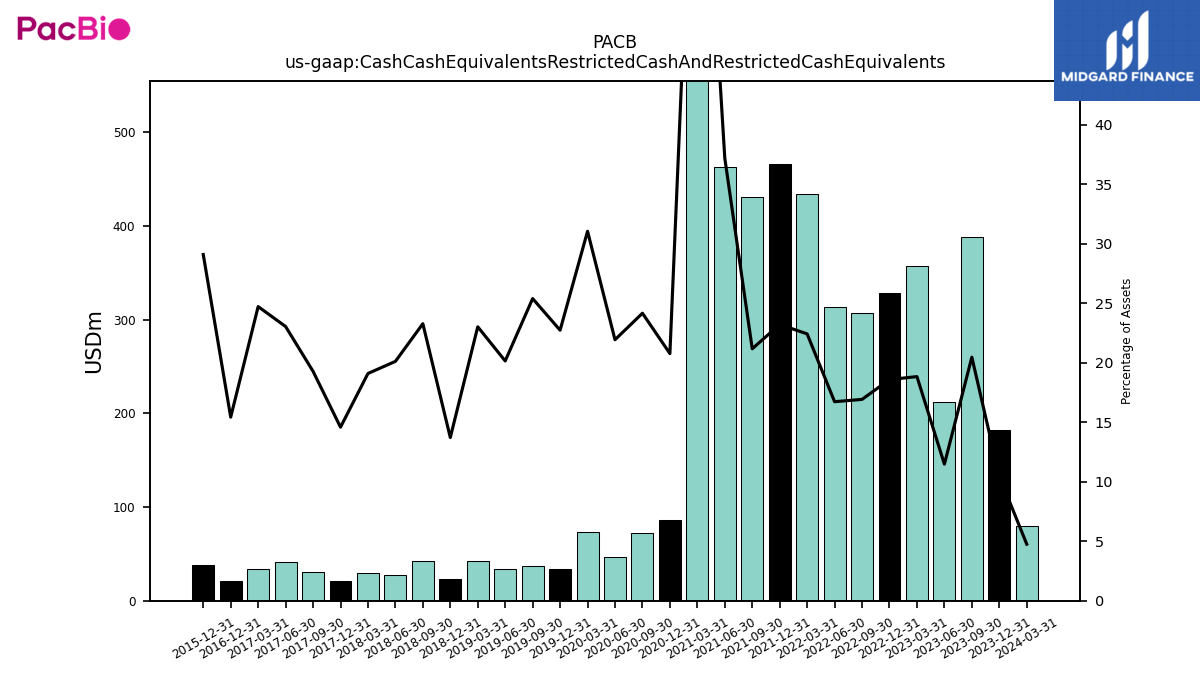
| Cash Cash Equivalents Restricted Cash And Restricted Cash Equivalents | 182.63 | 388.37 | 212.01 | 357.06 | 328.31 | 307.65 | 313.67 | 434.06 | 465.82 | 430.45 | 463.09 | 936.73 | 85.95 | 72.53 | 46.84 | 72.86 | 33.63 | 37.08 | 34.36 | 42.70 | 23.34 | 42.56 | 27.56 | 29.96 | 21.01 | 30.43 | 40.98 | 33.48 | 21.27 | NA | NA | NA | 38.13 | NA | NA | NA | NA | NA | NA | NA | NA | NA | NA | NA | NA | NA | NA | NA | NA | NA | NA | NA | NA | NA | NA | |
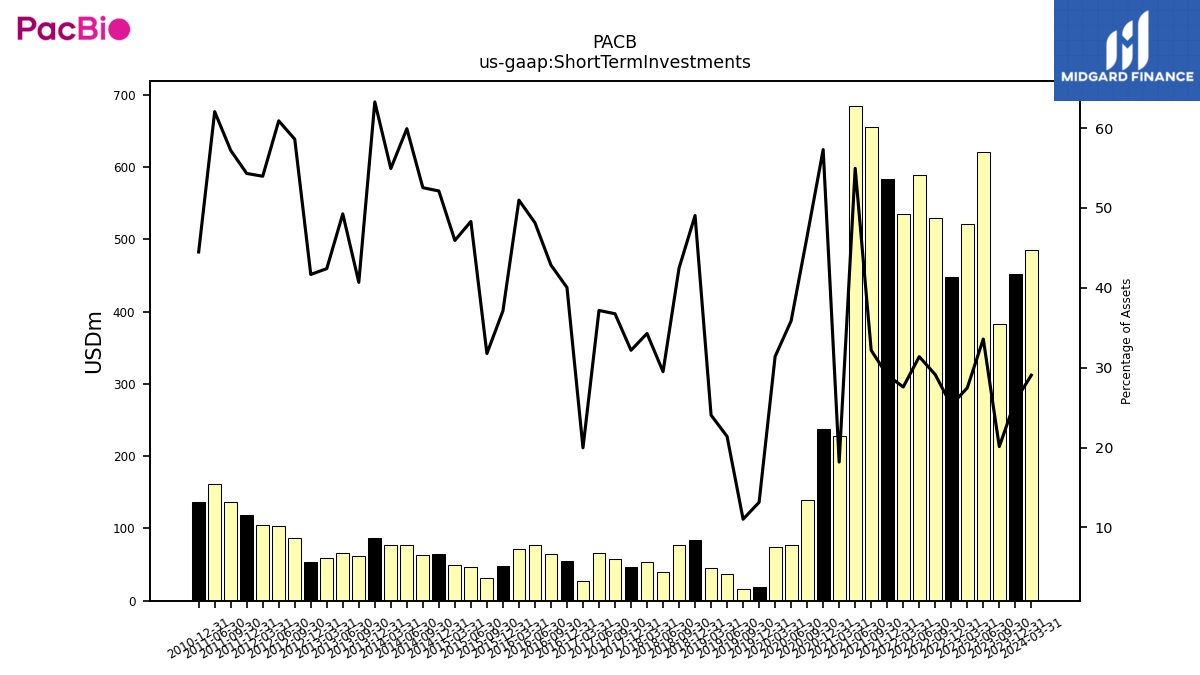
| Short Term Investments | 451.50 | 382.14 | 620.58 | 521.06 | 447.23 | 529.91 | 588.71 | 534.20 | 583.67 | 654.50 | 684.58 | 227.92 | 237.20 | 139.52 | 76.62 | 73.73 | 19.47 | 16.12 | 36.49 | 44.67 | 83.51 | 77.68 | 40.43 | 53.80 | 46.37 | 58.03 | 66.12 | 27.07 | 55.21 | 64.54 | 77.69 | 71.45 | 48.64 | 31.70 | 46.74 | 48.88 | 64.90 | 63.90 | 76.83 | 77.47 | 86.17 | 62.17 | 66.14 | 59.27 | 54.04 | 86.84 | 103.48 | 105.09 | 118.57 | 136.12 | 162.07 | NA | 136.02 | NA | NA | |
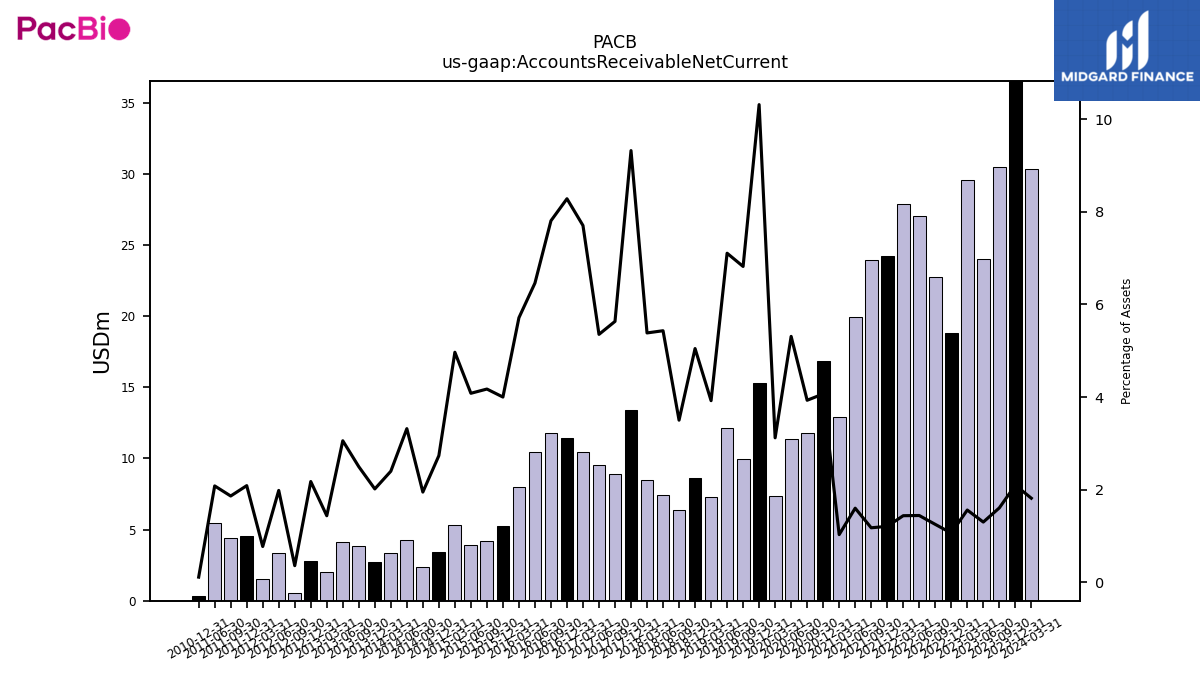
| Accounts Receivable Net Current | 36.62 | 30.49 | 24.03 | 29.59 | 18.79 | 22.76 | 27.06 | 27.85 | 24.24 | 23.95 | 19.94 | 12.91 | 16.84 | 11.81 | 11.35 | 7.33 | 15.27 | 9.97 | 12.12 | 7.28 | 8.60 | 6.40 | 7.45 | 8.45 | 13.43 | 8.90 | 9.53 | 10.44 | 11.42 | 11.76 | 10.43 | 8.01 | 5.25 | 4.16 | 3.95 | 5.29 | 3.41 | 2.37 | 4.25 | 3.38 | 2.75 | 3.81 | 4.10 | 2.01 | 2.82 | 0.53 | 3.37 | 1.50 | 4.56 | 4.43 | 5.44 | NA | 0.34 | NA | NA | |
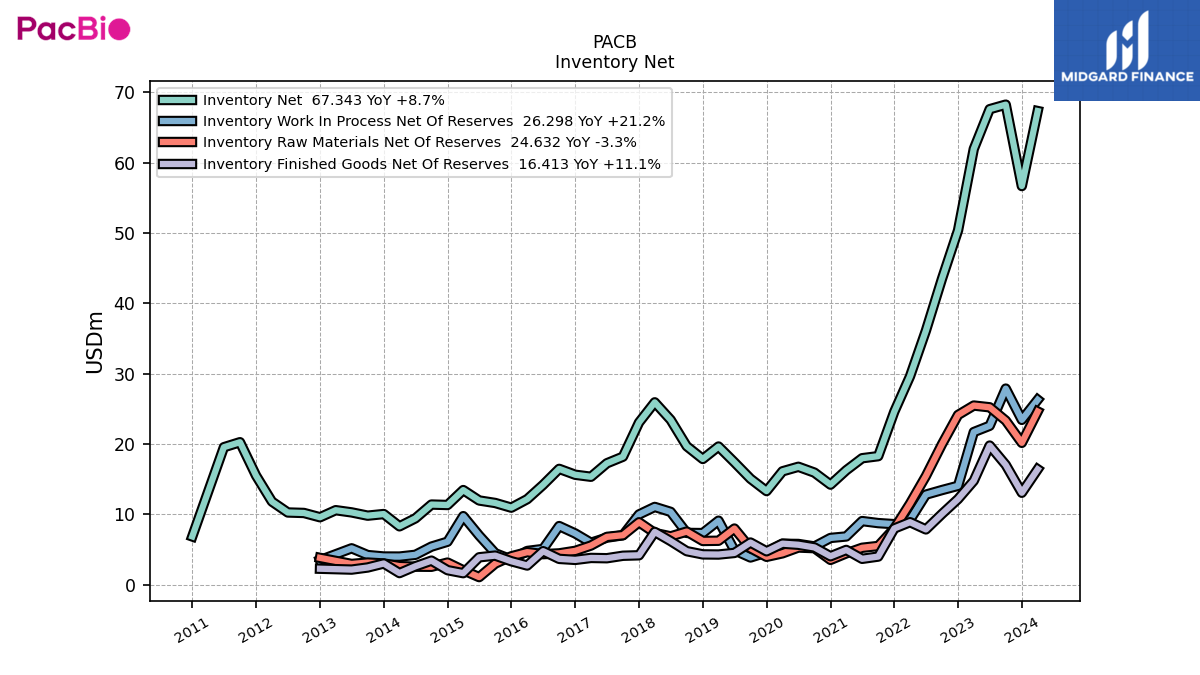
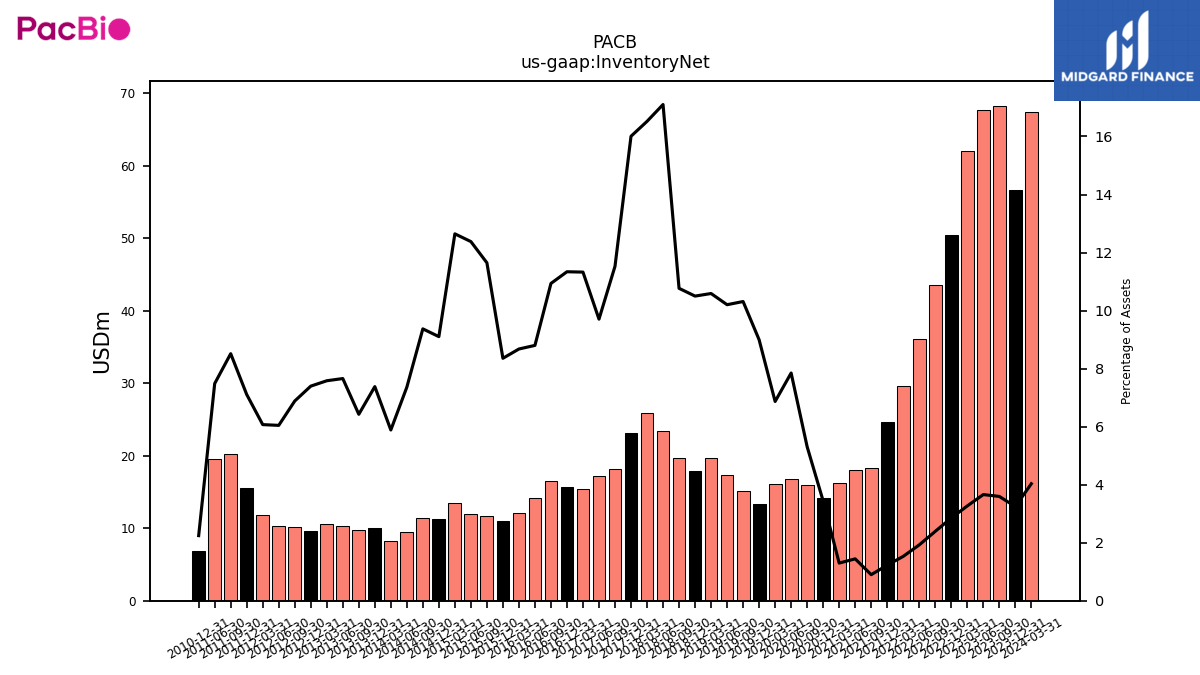
| Inventory Net | 56.68 | 68.26 | 67.61 | 61.95 | 50.38 | 43.49 | 36.12 | 29.62 | 24.60 | 18.28 | 17.98 | 16.27 | 14.23 | 15.94 | 16.77 | 16.12 | 13.31 | 15.07 | 17.40 | 19.65 | 17.88 | 19.69 | 23.44 | 25.93 | 23.07 | 18.20 | 17.27 | 15.35 | 15.63 | 16.47 | 14.20 | 12.16 | 10.96 | 11.62 | 11.98 | 13.46 | 11.34 | 11.40 | 9.44 | 8.30 | 10.05 | 9.82 | 10.28 | 10.60 | 9.59 | 10.20 | 10.27 | 11.82 | 15.52 | 20.26 | 19.55 | NA | 6.86 | NA | NA | |
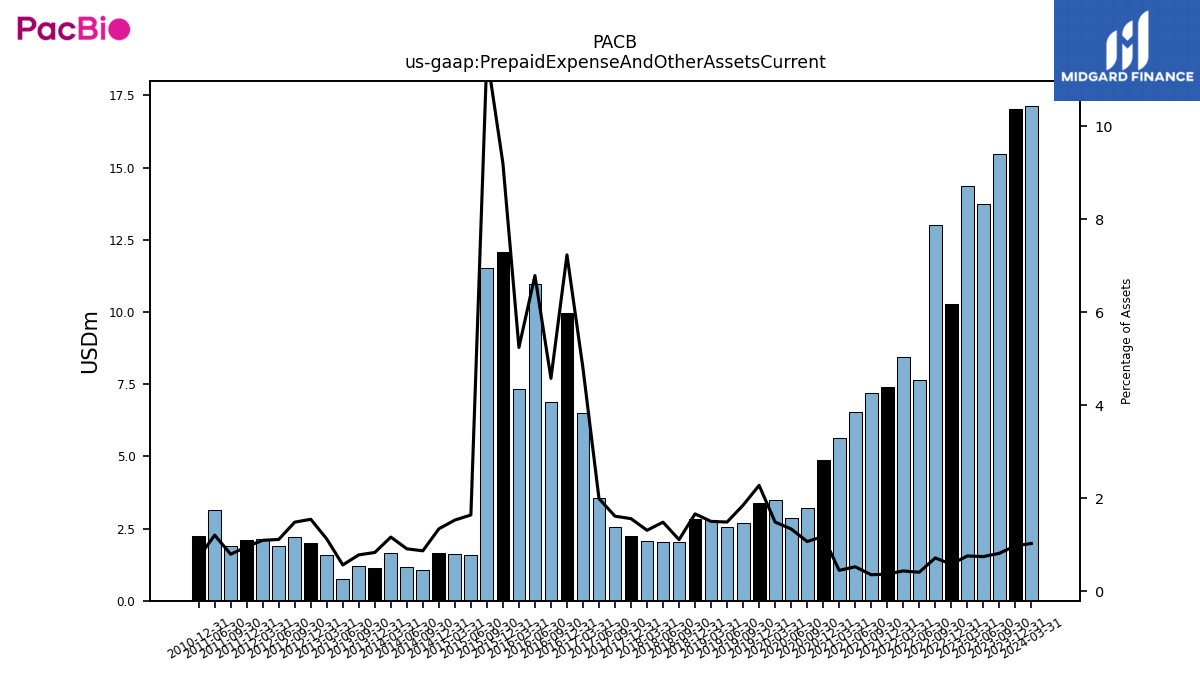
| Prepaid Expense And Other Assets Current | 17.04 | 15.47 | 13.75 | 14.38 | 10.29 | 13.01 | 7.66 | 8.44 | 7.39 | 7.19 | 6.54 | 5.62 | 4.87 | 3.21 | 2.86 | 3.49 | 3.37 | 2.70 | 2.54 | 2.79 | 2.83 | 2.03 | 2.04 | 2.06 | 2.25 | 2.55 | 3.54 | 6.50 | 9.98 | 6.90 | 10.96 | 7.35 | 12.07 | 11.51 | 1.59 | 1.63 | 1.67 | 1.06 | 1.17 | 1.64 | 1.14 | 1.19 | 0.76 | 1.57 | 2.01 | 2.20 | 1.89 | 2.13 | 2.09 | 1.89 | 3.15 | NA | 2.23 | NA | NA | |
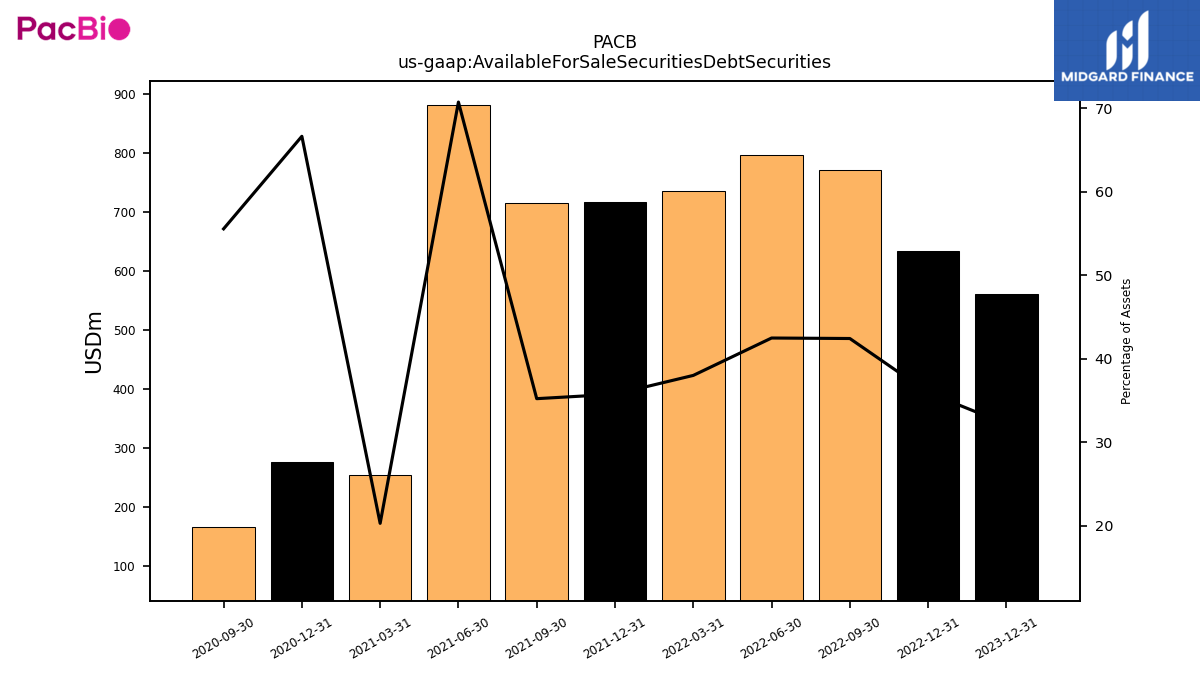
| Available For Sale Securities Debt Securities | 561.24 | NA | NA | NA | 634.68 | 771.19 | 796.54 | 735.52 | 717.09 | 715.87 | 880.94 | 253.87 | 275.77 | 166.77 | NA | NA | NA | NA | NA | NA | NA | NA | NA | NA | NA | NA | NA | NA | NA | NA | NA | NA | NA | NA | NA | NA | NA | NA | NA | NA | NA | NA | NA | NA | NA | NA | NA | NA | NA | NA | NA | NA | NA | NA | NA |
| 2023-12-31 | 2023-09-30 | 2023-06-30 | 2023-03-31 | 2022-12-31 | 2022-09-30 | 2022-06-30 | 2022-03-31 | 2021-12-31 | 2021-09-30 | 2021-06-30 | 2021-03-31 | 2020-12-31 | 2020-09-30 | 2020-06-30 | 2020-03-31 | 2019-12-31 | 2019-09-30 | 2019-06-30 | 2019-03-31 | 2018-12-31 | 2018-09-30 | 2018-06-30 | 2018-03-31 | 2017-12-31 | 2017-09-30 | 2017-06-30 | 2017-03-31 | 2016-12-31 | 2016-09-30 | 2016-06-30 | 2016-03-31 | 2015-12-31 | 2015-09-30 | 2015-06-30 | 2015-03-31 | 2014-12-31 | 2014-09-30 | 2014-06-30 | 2014-03-31 | 2013-12-31 | 2013-09-30 | 2013-06-30 | 2013-03-31 | 2012-12-31 | 2012-09-30 | 2012-06-30 | 2012-03-31 | 2011-12-31 | 2011-09-30 | 2011-06-30 | 2011-03-31 | 2010-12-31 | 2010-09-30 | 2010-06-30 | ||
|---|---|---|---|---|---|---|---|---|---|---|---|---|---|---|---|---|---|---|---|---|---|---|---|---|---|---|---|---|---|---|---|---|---|---|---|---|---|---|---|---|---|---|---|---|---|---|---|---|---|---|---|---|---|---|---|---|
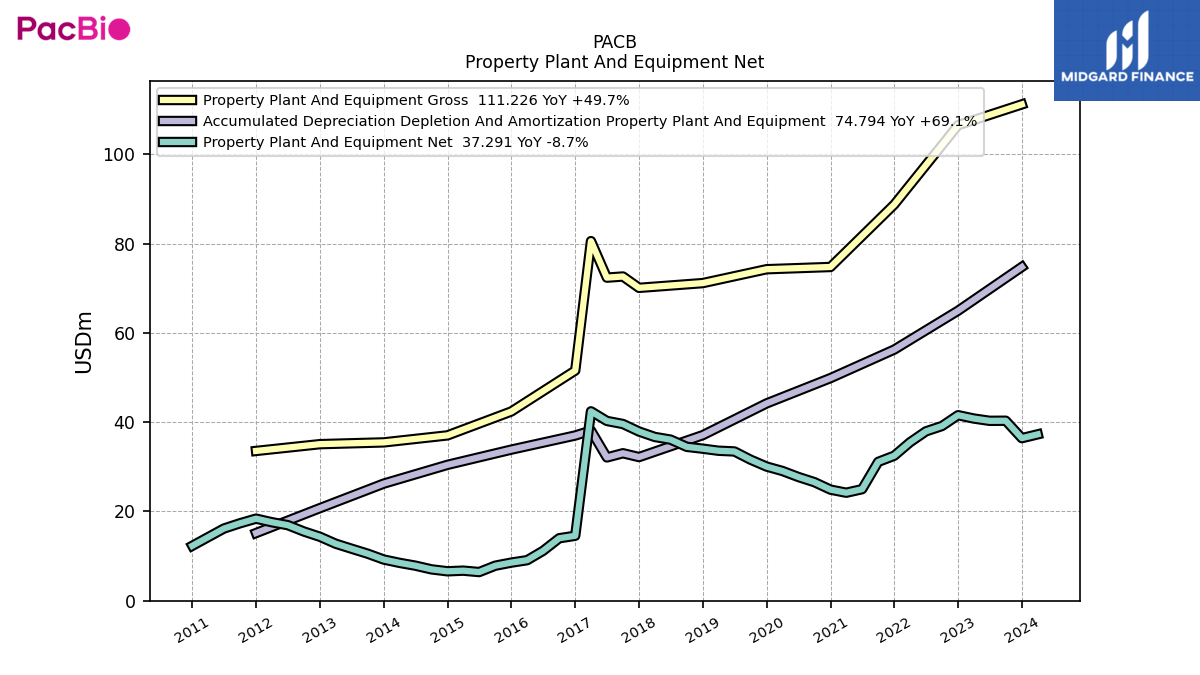
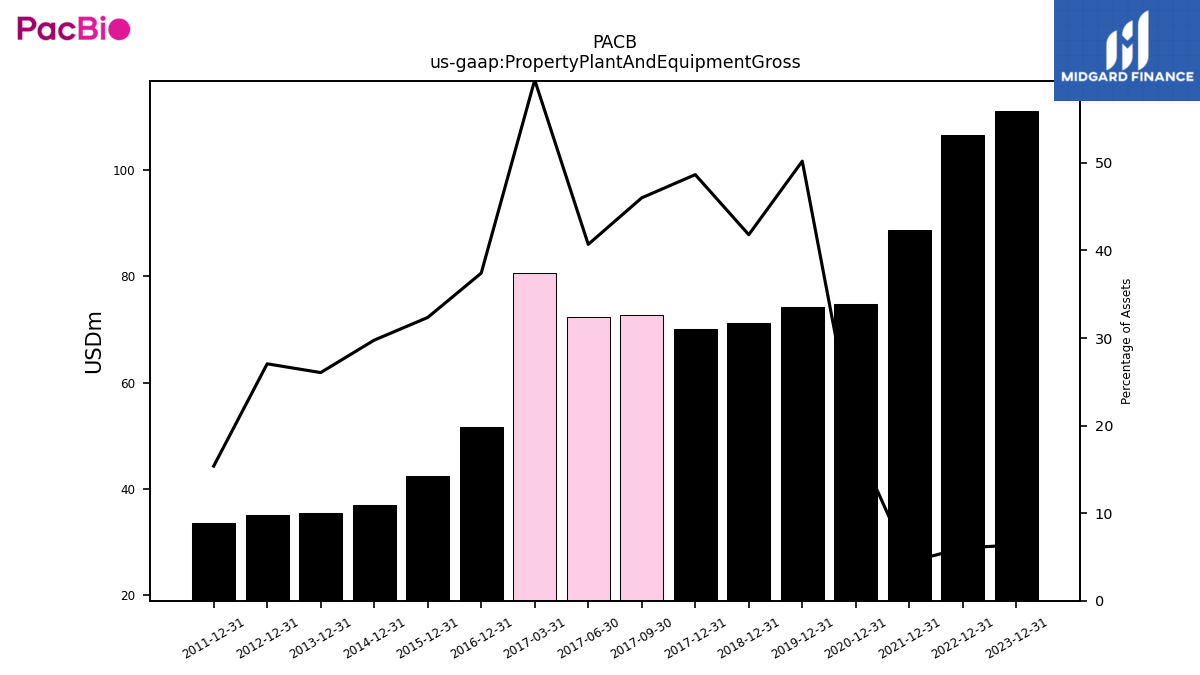
| Property Plant And Equipment Gross | 111.23 | NA | NA | NA | 106.57 | NA | NA | NA | 88.79 | NA | NA | NA | 74.79 | NA | NA | NA | 74.29 | NA | NA | NA | 71.18 | NA | NA | NA | 70.11 | 72.66 | 72.40 | 80.59 | 51.59 | NA | NA | NA | 42.41 | NA | NA | NA | 37.06 | NA | NA | NA | 35.48 | NA | NA | NA | 35.09 | NA | NA | NA | 33.57 | NA | NA | NA | NA | NA | NA | |
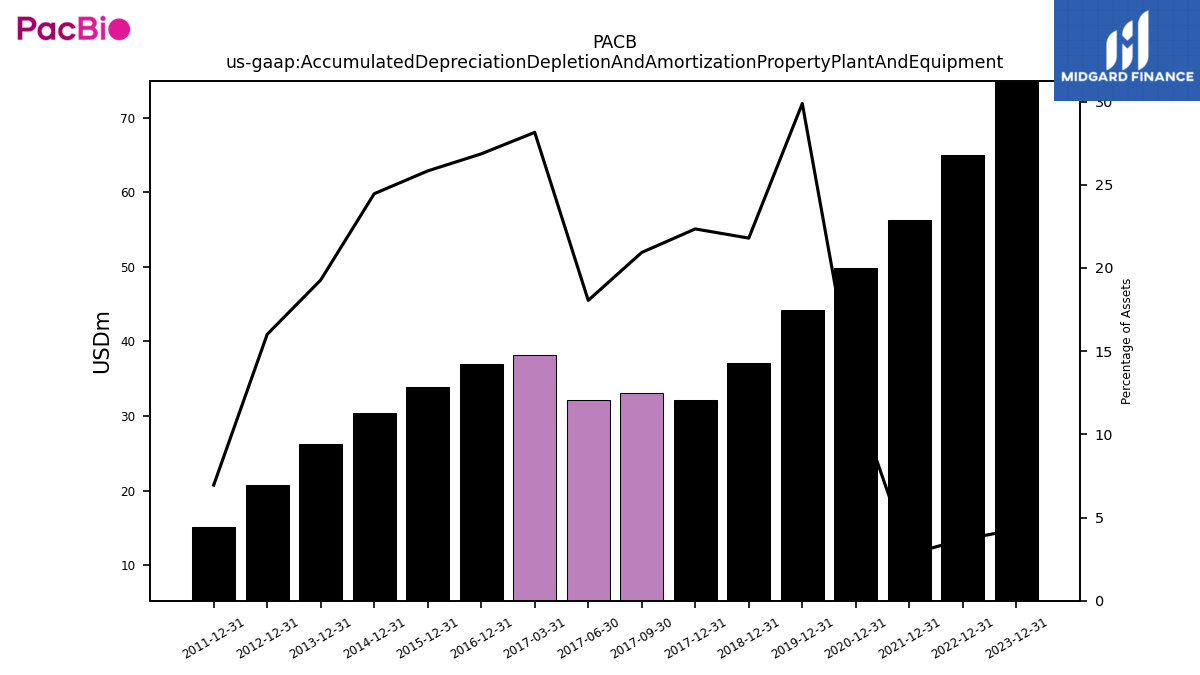
| Accumulated Depreciation Depletion And Amortization Property Plant And Equipment | 74.79 | NA | NA | NA | 64.99 | NA | NA | NA | 56.29 | NA | NA | NA | 49.89 | NA | NA | NA | 44.22 | NA | NA | NA | 37.11 | NA | NA | NA | 32.19 | 33.05 | 32.11 | 38.14 | 37.03 | NA | NA | NA | 33.87 | NA | NA | NA | 30.46 | NA | NA | NA | 26.25 | NA | NA | NA | 20.76 | NA | NA | NA | 15.17 | NA | NA | NA | NA | NA | NA | |
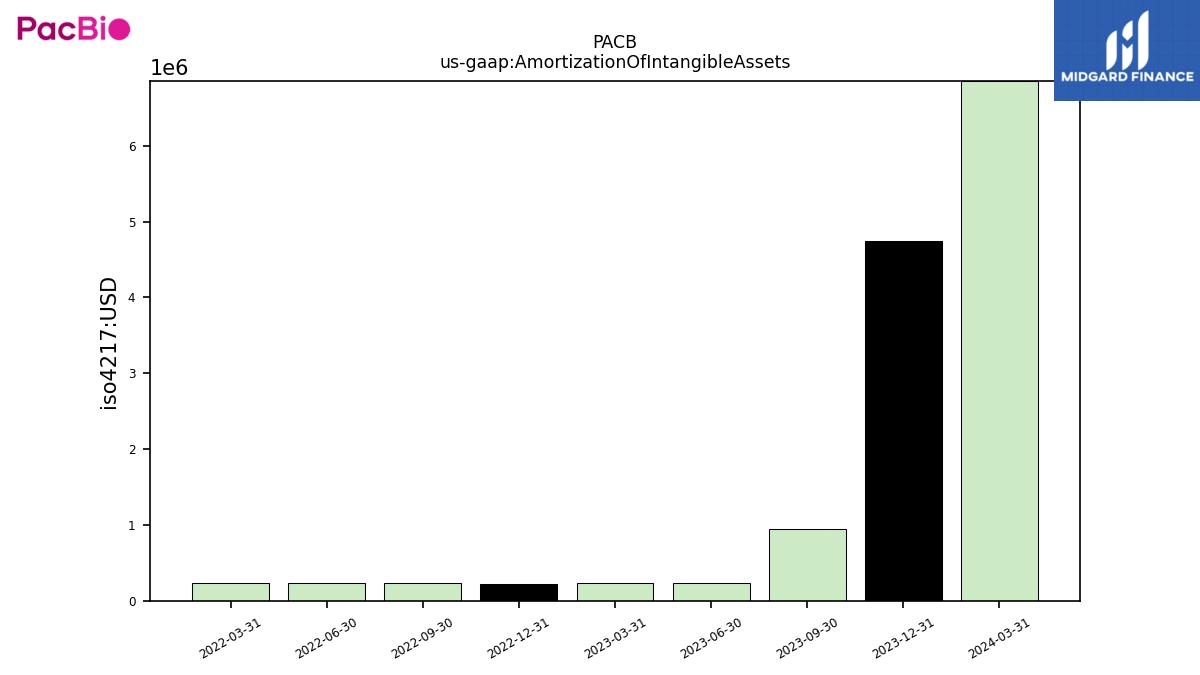
| Amortization Of Intangible Assets | 4.75 | 0.94 | 0.23 | 0.23 | 0.21 | 0.23 | 0.23 | 0.23 | NA | NA | NA | NA | NA | NA | NA | NA | NA | NA | NA | NA | NA | NA | NA | NA | NA | NA | NA | NA | NA | NA | NA | NA | NA | NA | NA | NA | NA | NA | NA | NA | NA | NA | NA | NA | NA | NA | NA | NA | NA | NA | NA | NA | NA | NA | NA | |
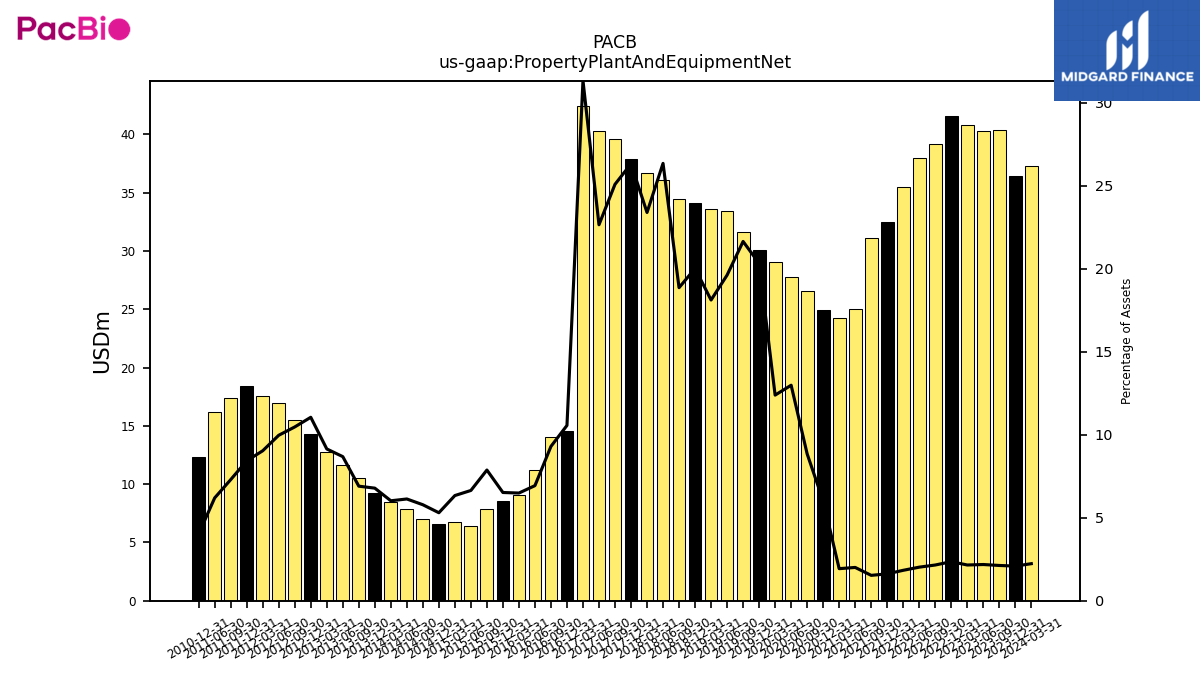
| Property Plant And Equipment Net | 36.43 | 40.34 | 40.32 | 40.83 | 41.58 | 39.15 | 37.96 | 35.51 | 32.50 | 31.12 | 25.00 | 24.21 | 24.90 | 26.57 | 27.73 | 29.08 | 30.07 | 31.62 | 33.46 | 33.61 | 34.07 | 34.49 | 36.10 | 36.70 | 37.92 | 39.60 | 40.29 | 42.45 | 14.56 | 14.00 | 11.19 | 9.09 | 8.55 | 7.86 | 6.43 | 6.74 | 6.60 | 7.03 | 7.86 | 8.49 | 9.24 | 10.54 | 11.65 | 12.78 | 14.33 | 15.51 | 16.94 | 17.59 | 18.40 | 17.36 | 16.18 | NA | 12.31 | NA | NA | |
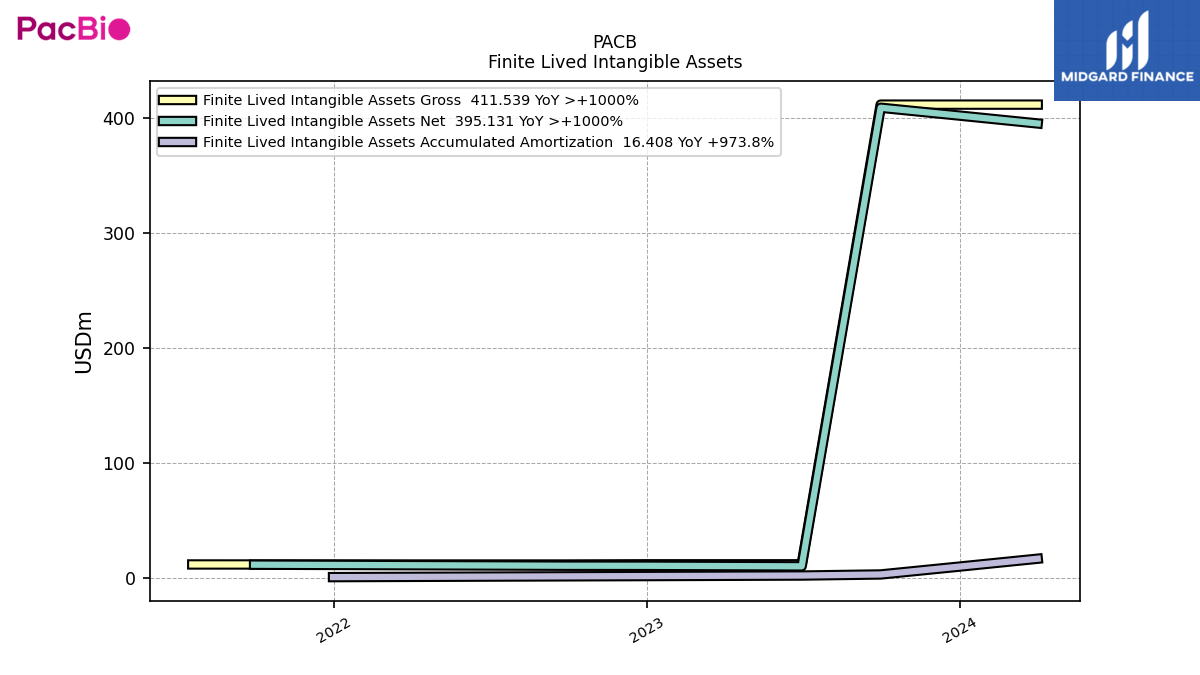
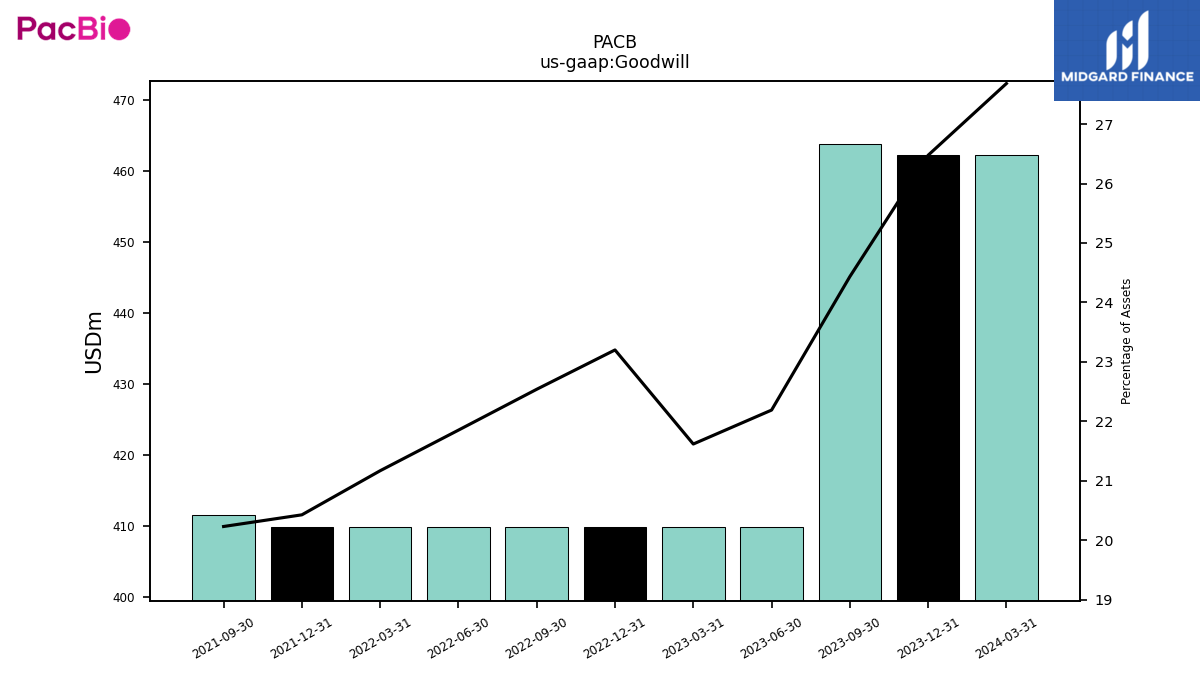
| Goodwill | 462.26 | 463.84 | 409.97 | 409.97 | 409.97 | 409.97 | 409.97 | 409.97 | 409.97 | 411.53 | NA | NA | NA | NA | NA | NA | NA | NA | NA | NA | NA | NA | NA | NA | NA | NA | NA | NA | NA | NA | NA | NA | NA | NA | NA | NA | NA | NA | NA | NA | NA | NA | NA | NA | NA | NA | NA | NA | NA | NA | NA | NA | NA | NA | NA | |
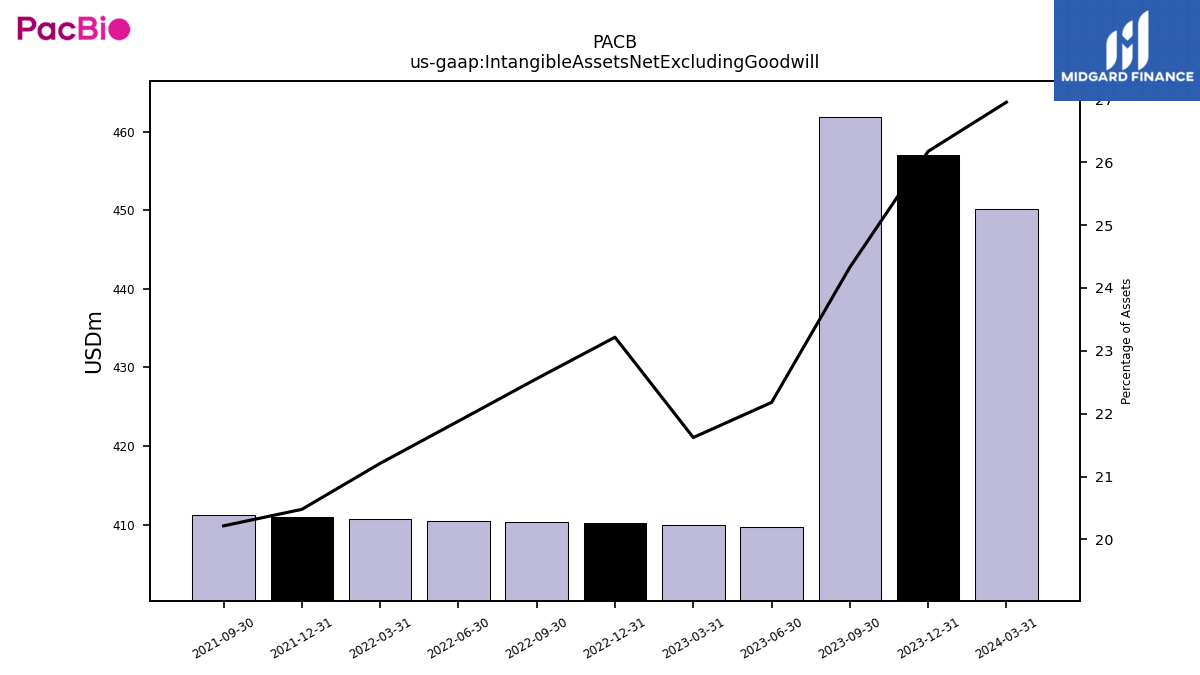
| Intangible Assets Net Excluding Goodwill | 456.98 | 461.84 | 409.78 | 410.01 | 410.25 | 410.29 | 410.52 | 410.75 | 410.98 | 411.21 | NA | NA | NA | NA | NA | NA | NA | NA | NA | NA | NA | NA | NA | NA | NA | NA | NA | NA | NA | NA | NA | NA | NA | NA | NA | NA | NA | NA | NA | NA | NA | NA | NA | NA | NA | NA | NA | NA | NA | NA | NA | NA | NA | NA | NA | |
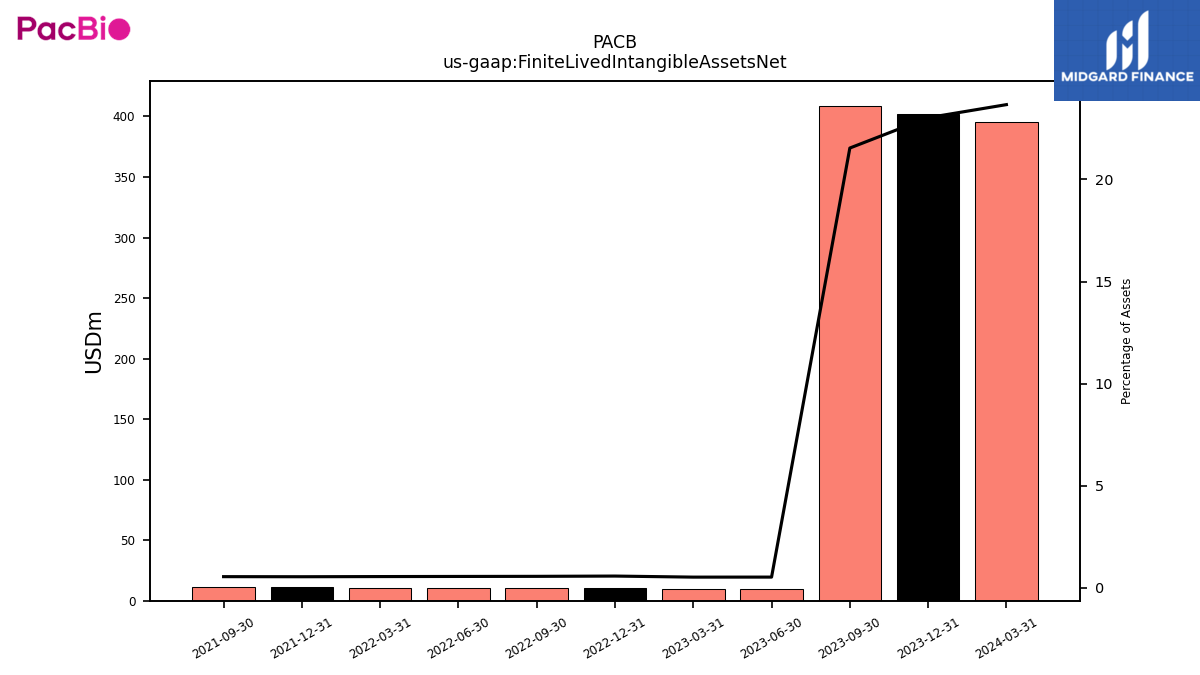
| Finite Lived Intangible Assets Net | 401.98 | 408.84 | 9.78 | 10.01 | 10.24 | 10.29 | 10.52 | 10.75 | 10.98 | 11.21 | NA | NA | NA | NA | NA | NA | NA | NA | NA | NA | NA | NA | NA | NA | NA | NA | NA | NA | NA | NA | NA | NA | NA | NA | NA | NA | NA | NA | NA | NA | NA | NA | NA | NA | NA | NA | NA | NA | NA | NA | NA | NA | NA | NA | NA | |
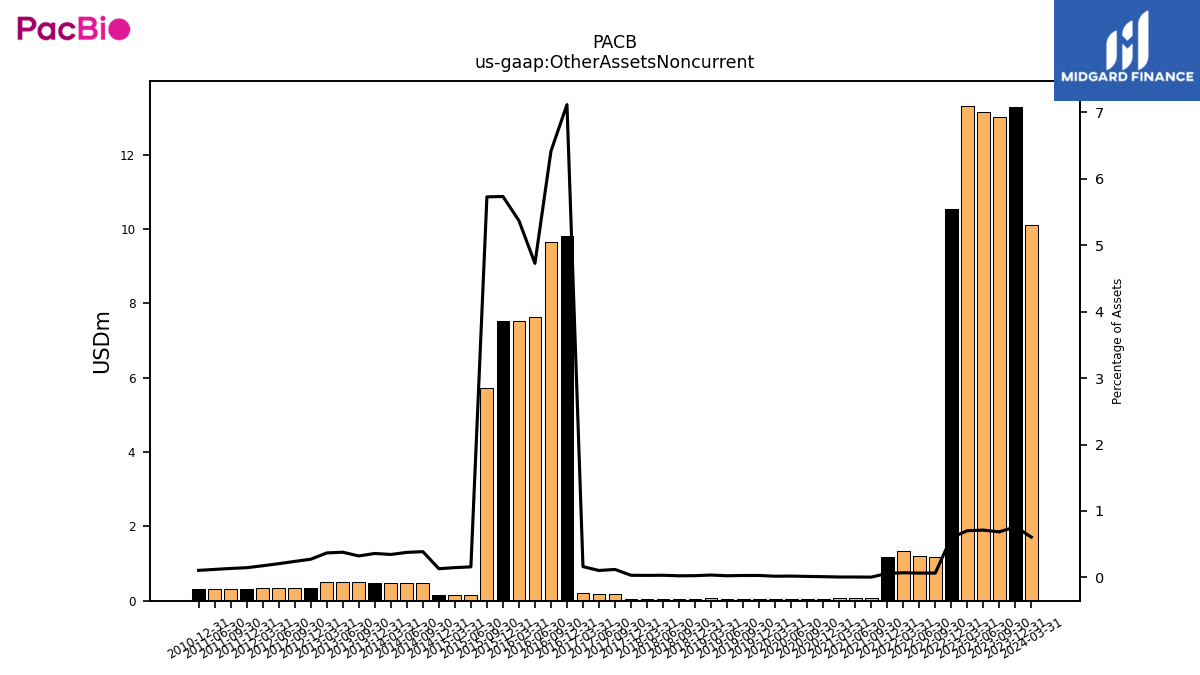
| Other Assets Noncurrent | 13.27 | 13.00 | 13.14 | 13.32 | 10.53 | 1.18 | 1.21 | 1.34 | 1.17 | 0.07 | 0.07 | 0.07 | 0.04 | 0.04 | 0.04 | 0.04 | 0.04 | 0.04 | 0.04 | 0.07 | 0.04 | 0.04 | 0.04 | 0.05 | 0.04 | 0.19 | 0.18 | 0.22 | 9.81 | 9.66 | 7.63 | 7.53 | 7.52 | 5.71 | 0.15 | 0.16 | 0.16 | 0.47 | 0.48 | 0.49 | 0.49 | 0.49 | 0.51 | 0.51 | 0.35 | 0.36 | 0.35 | 0.34 | 0.32 | 0.32 | 0.31 | NA | 0.32 | NA | NA |
| 2023-12-31 | 2023-09-30 | 2023-06-30 | 2023-03-31 | 2022-12-31 | 2022-09-30 | 2022-06-30 | 2022-03-31 | 2021-12-31 | 2021-09-30 | 2021-06-30 | 2021-03-31 | 2020-12-31 | 2020-09-30 | 2020-06-30 | 2020-03-31 | 2019-12-31 | 2019-09-30 | 2019-06-30 | 2019-03-31 | 2018-12-31 | 2018-09-30 | 2018-06-30 | 2018-03-31 | 2017-12-31 | 2017-09-30 | 2017-06-30 | 2017-03-31 | 2016-12-31 | 2016-09-30 | 2016-06-30 | 2016-03-31 | 2015-12-31 | 2015-09-30 | 2015-06-30 | 2015-03-31 | 2014-12-31 | 2014-09-30 | 2014-06-30 | 2014-03-31 | 2013-12-31 | 2013-09-30 | 2013-06-30 | 2013-03-31 | 2012-12-31 | 2012-09-30 | 2012-06-30 | 2012-03-31 | 2011-12-31 | 2011-09-30 | 2011-06-30 | 2011-03-31 | 2010-12-31 | 2010-09-30 | 2010-06-30 | ||
|---|---|---|---|---|---|---|---|---|---|---|---|---|---|---|---|---|---|---|---|---|---|---|---|---|---|---|---|---|---|---|---|---|---|---|---|---|---|---|---|---|---|---|---|---|---|---|---|---|---|---|---|---|---|---|---|---|
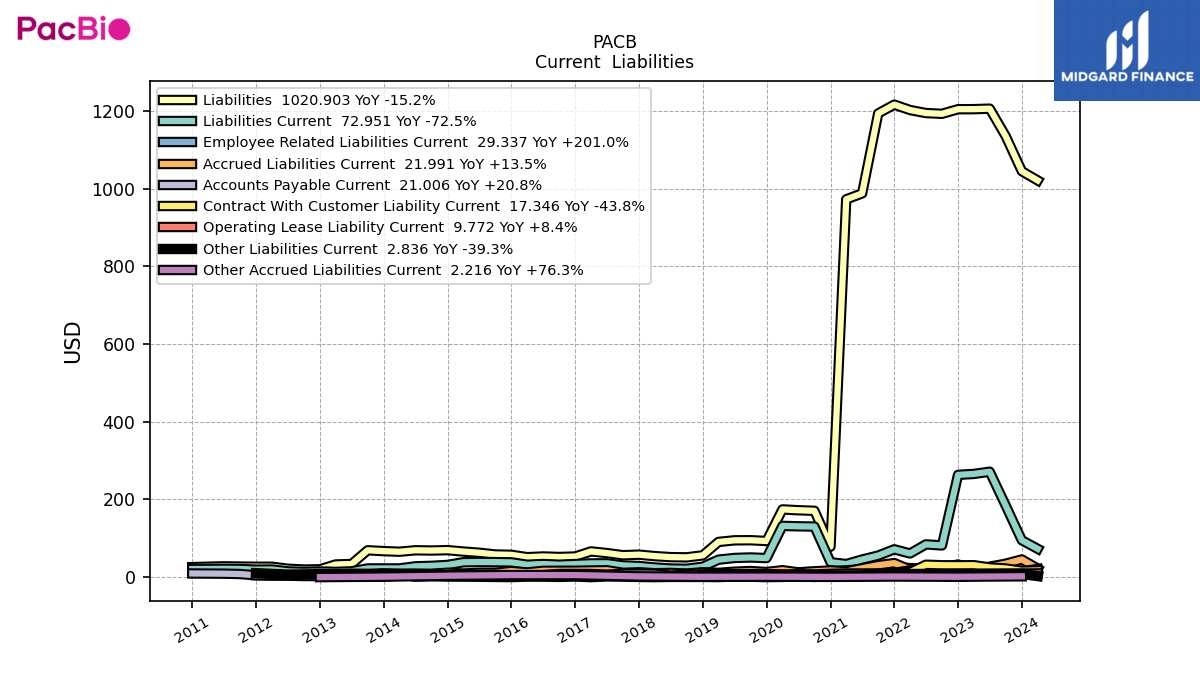
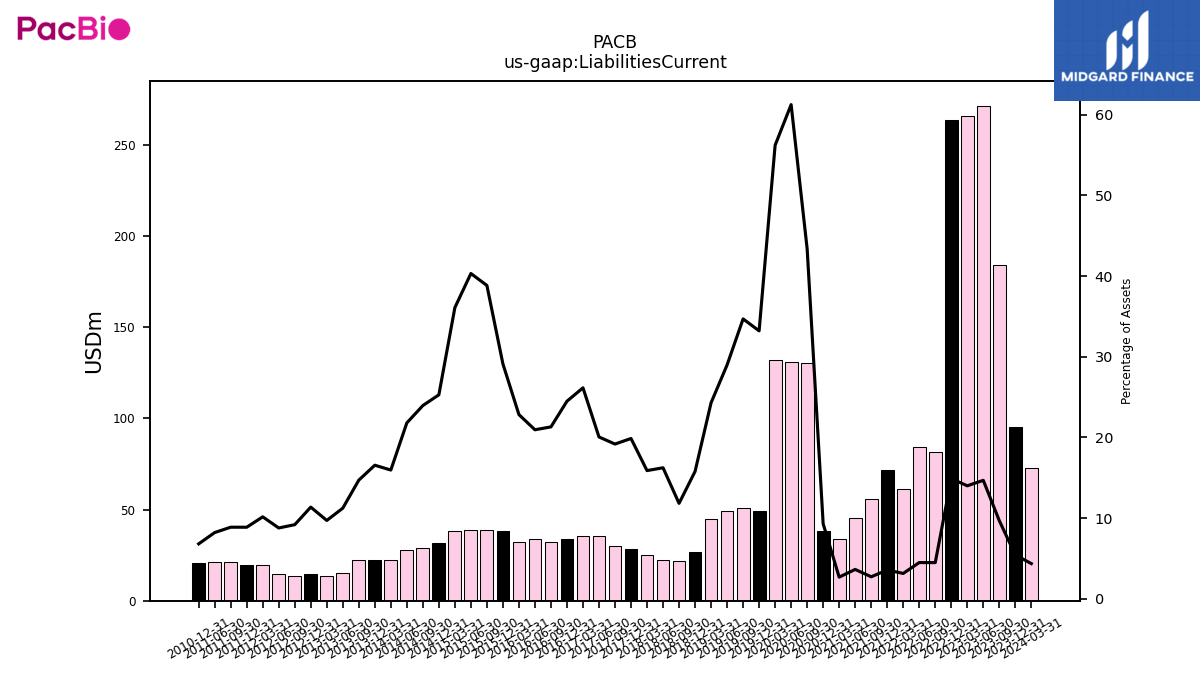
| Liabilities Current | 95.03 | 183.96 | 271.41 | 265.67 | 263.33 | 81.65 | 84.40 | 61.01 | 71.71 | 55.61 | 45.43 | 33.74 | 38.50 | 130.27 | 130.86 | 131.97 | 49.15 | 50.69 | 49.45 | 45.10 | 26.88 | 21.65 | 22.26 | 24.95 | 28.64 | 30.29 | 35.69 | 35.44 | 33.77 | 32.11 | 33.81 | 32.01 | 38.18 | 38.75 | 39.02 | 38.41 | 31.49 | 29.14 | 27.97 | 22.51 | 22.55 | 22.48 | 15.09 | 13.58 | 14.74 | 13.63 | 14.93 | 19.80 | 19.38 | 21.13 | 21.46 | NA | 20.84 | NA | NA | |
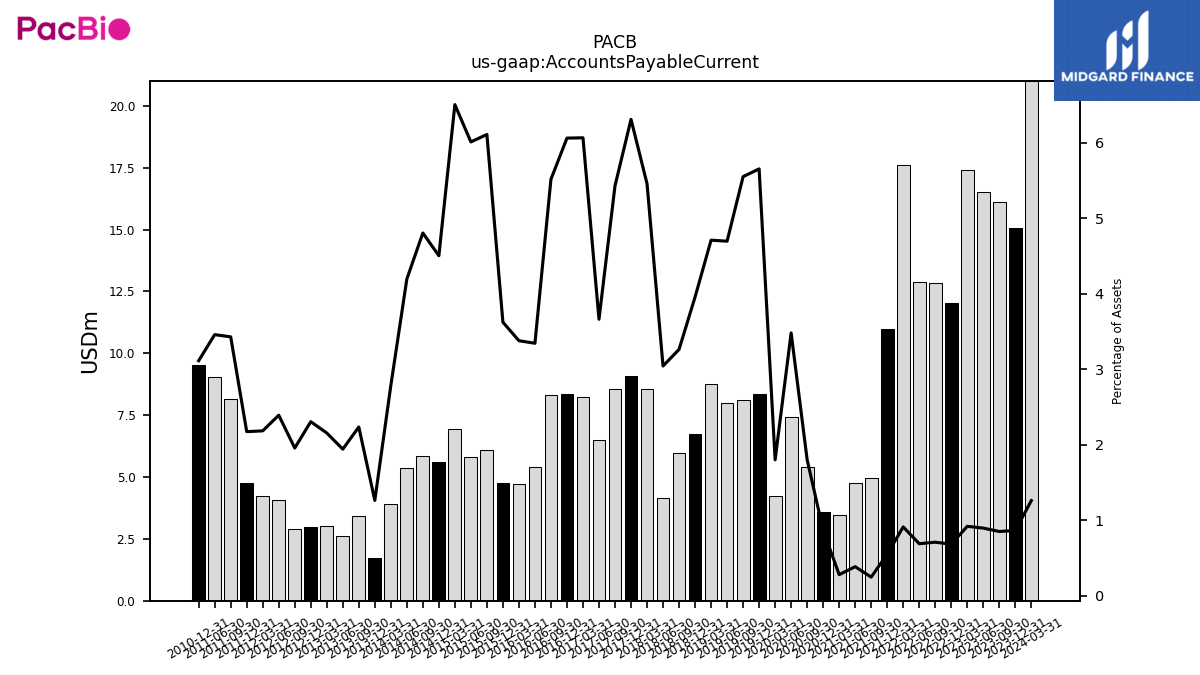
| Accounts Payable Current | 15.06 | 16.11 | 16.51 | 17.39 | 12.03 | 12.85 | 12.88 | 17.61 | 11.00 | 4.96 | 4.76 | 3.47 | 3.58 | 5.41 | 7.44 | 4.22 | 8.37 | 8.11 | 8.01 | 8.74 | 6.74 | 5.97 | 4.17 | 8.57 | 9.09 | 8.57 | 6.51 | 8.22 | 8.36 | 8.31 | 5.39 | 4.73 | 4.75 | 6.10 | 5.82 | 6.92 | 5.61 | 5.84 | 5.38 | 3.93 | 1.72 | 3.41 | 2.60 | 3.01 | 2.99 | 2.90 | 4.06 | 4.25 | 4.74 | 8.16 | 9.03 | NA | 9.52 | NA | NA | |
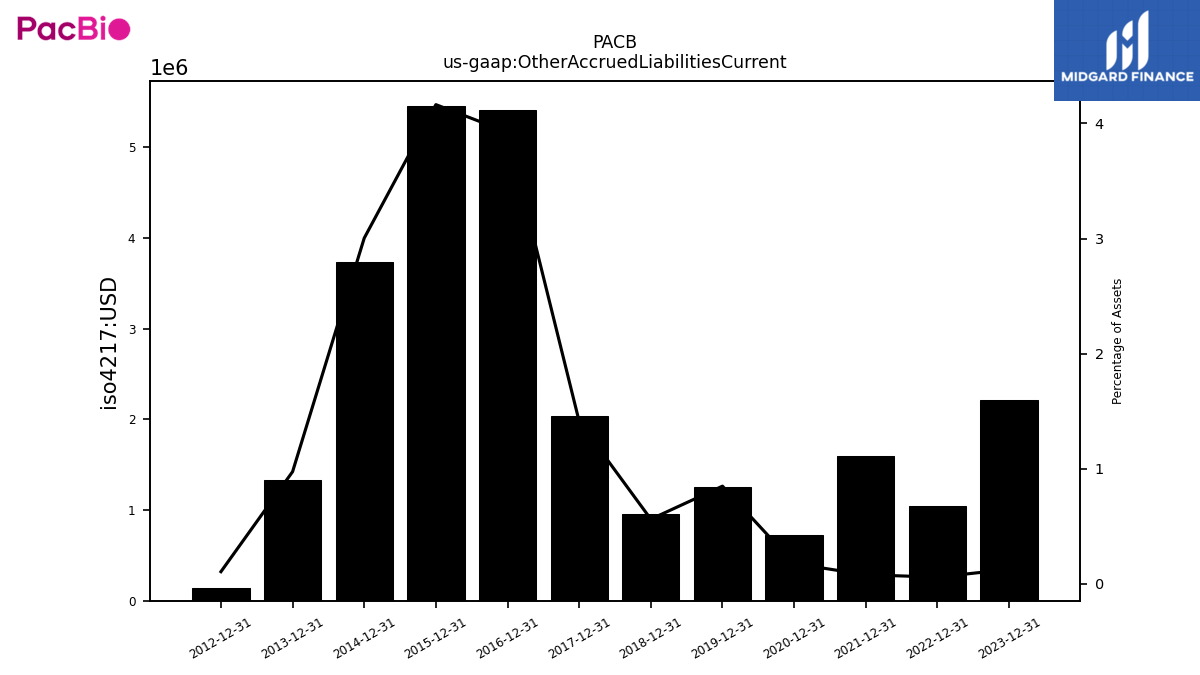
| Other Accrued Liabilities Current | 2.22 | NA | NA | NA | 1.04 | NA | NA | NA | 1.60 | NA | NA | NA | 0.73 | NA | NA | NA | 1.26 | NA | NA | NA | 0.96 | NA | NA | NA | 2.03 | NA | NA | NA | 5.41 | NA | NA | NA | 5.46 | NA | NA | NA | 3.74 | NA | NA | NA | 1.33 | NA | NA | NA | 0.14 | NA | NA | NA | NA | NA | NA | NA | NA | NA | NA | |
| Accrued Liabilities Current | 45.71 | 34.66 | 27.01 | 19.38 | 32.60 | 24.89 | 25.17 | 19.49 | 36.26 | 30.82 | 22.91 | 14.67 | 17.35 | 15.08 | 12.20 | 17.96 | 13.24 | 15.82 | 14.11 | 11.16 | 12.82 | 9.30 | 10.94 | 10.24 | 12.62 | 11.23 | 17.84 | 17.25 | 16.60 | 16.48 | 16.33 | 12.20 | 15.55 | 11.34 | 11.32 | 9.44 | 11.44 | 8.73 | 9.22 | NA | 8.77 | NA | NA | NA | NA | NA | NA | NA | NA | NA | NA | NA | NA | NA | NA | |
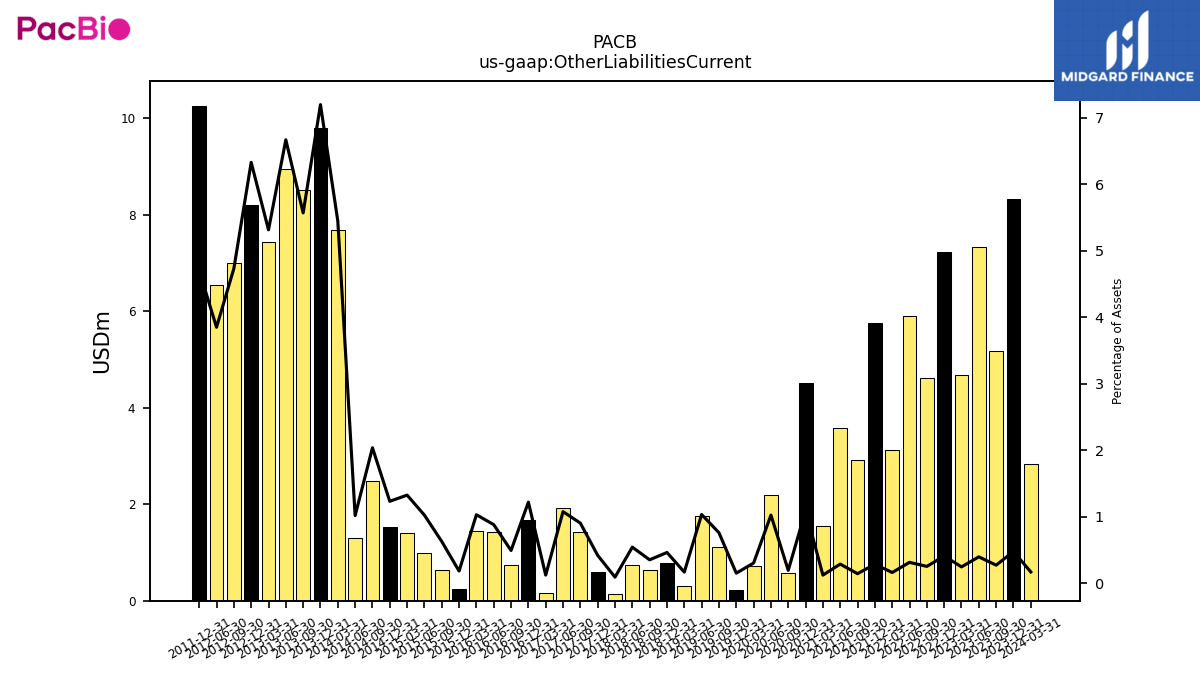
| Other Liabilities Current | 8.33 | 5.17 | 7.34 | 4.67 | 7.23 | 4.61 | 5.91 | 3.13 | 5.76 | 2.93 | 3.59 | 1.54 | 4.52 | 0.58 | 2.19 | 0.71 | 0.23 | 1.11 | 1.76 | 0.31 | 0.79 | 0.65 | 0.74 | 0.14 | 0.60 | 1.43 | 1.92 | 0.17 | 1.68 | 0.74 | 1.42 | 1.44 | 0.24 | 0.63 | 0.99 | 1.41 | 1.53 | 2.48 | 1.30 | 7.68 | 9.80 | 8.51 | 8.95 | 7.42 | 8.20 | 7.01 | 6.54 | NA | 10.26 | NA | NA | NA | NA | NA | NA | |
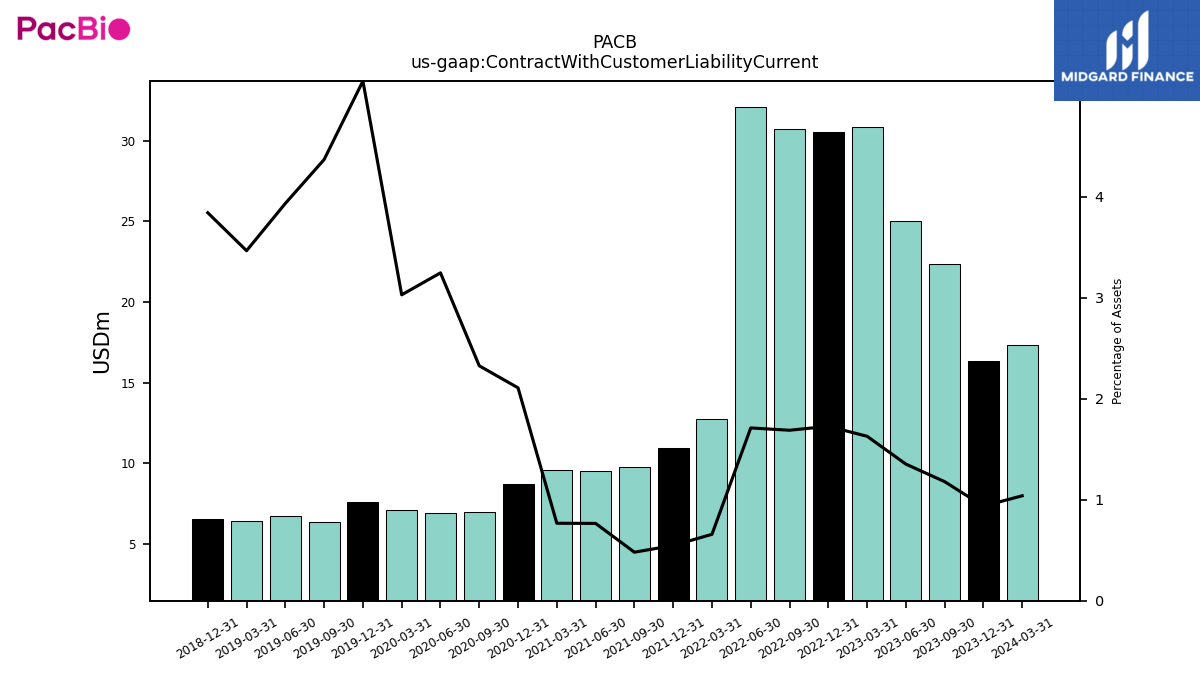
| Contract With Customer Liability Current | 16.34 | 22.37 | 24.98 | 30.87 | 30.50 | 30.69 | 32.08 | 12.73 | 10.98 | 9.77 | 9.53 | 9.61 | 8.72 | 6.98 | 6.93 | 7.11 | 7.61 | 6.38 | 6.71 | 6.43 | 6.54 | NA | NA | NA | NA | NA | NA | NA | NA | NA | NA | NA | NA | NA | NA | NA | NA | NA | NA | NA | NA | NA | NA | NA | NA | NA | NA | NA | NA | NA | NA | NA | NA | NA | NA |
| 2023-12-31 | 2023-09-30 | 2023-06-30 | 2023-03-31 | 2022-12-31 | 2022-09-30 | 2022-06-30 | 2022-03-31 | 2021-12-31 | 2021-09-30 | 2021-06-30 | 2021-03-31 | 2020-12-31 | 2020-09-30 | 2020-06-30 | 2020-03-31 | 2019-12-31 | 2019-09-30 | 2019-06-30 | 2019-03-31 | 2018-12-31 | 2018-09-30 | 2018-06-30 | 2018-03-31 | 2017-12-31 | 2017-09-30 | 2017-06-30 | 2017-03-31 | 2016-12-31 | 2016-09-30 | 2016-06-30 | 2016-03-31 | 2015-12-31 | 2015-09-30 | 2015-06-30 | 2015-03-31 | 2014-12-31 | 2014-09-30 | 2014-06-30 | 2014-03-31 | 2013-12-31 | 2013-09-30 | 2013-06-30 | 2013-03-31 | 2012-12-31 | 2012-09-30 | 2012-06-30 | 2012-03-31 | 2011-12-31 | 2011-09-30 | 2011-06-30 | 2011-03-31 | 2010-12-31 | 2010-09-30 | 2010-06-30 | ||
|---|---|---|---|---|---|---|---|---|---|---|---|---|---|---|---|---|---|---|---|---|---|---|---|---|---|---|---|---|---|---|---|---|---|---|---|---|---|---|---|---|---|---|---|---|---|---|---|---|---|---|---|---|---|---|---|---|
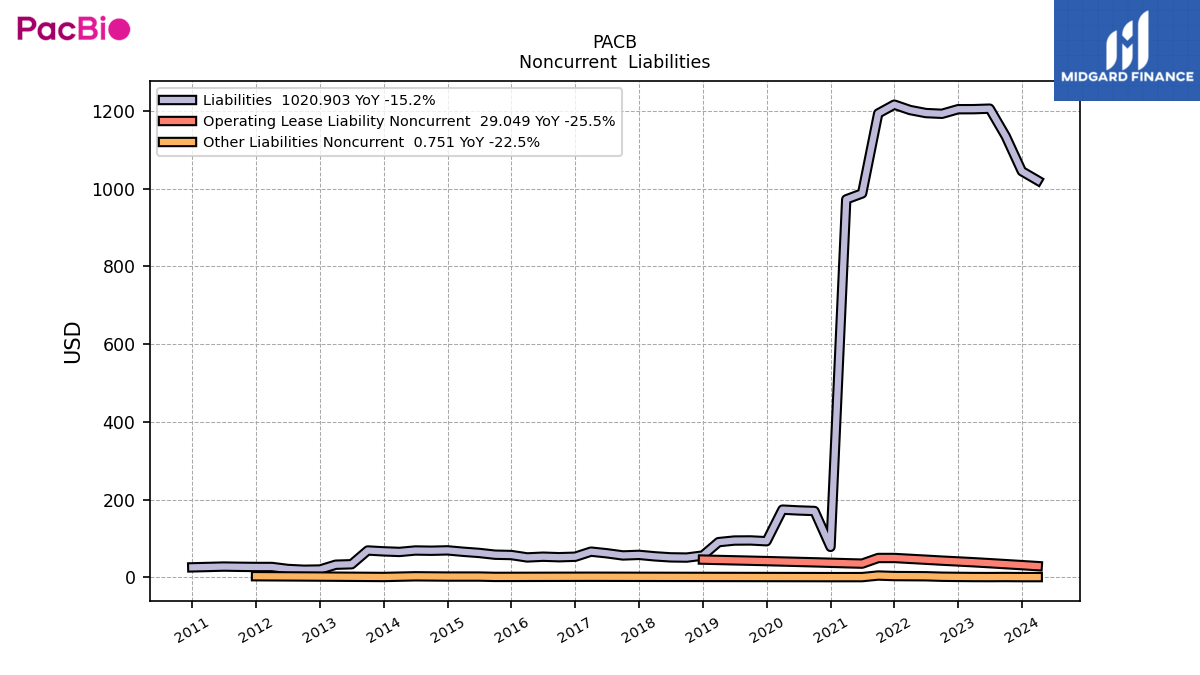
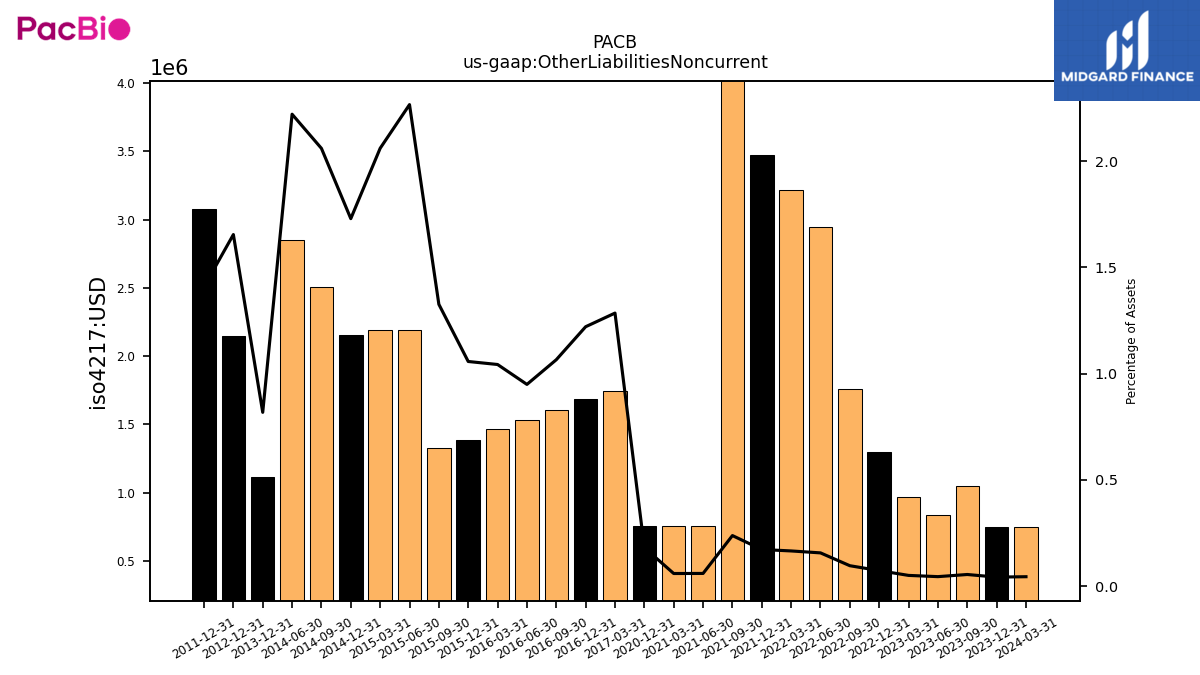
| Other Liabilities Noncurrent | 0.75 | 1.05 | 0.84 | 0.97 | 1.30 | 1.76 | 2.95 | 3.22 | 3.47 | 4.85 | 0.75 | 0.75 | 0.75 | NA | NA | NA | NA | NA | NA | NA | NA | NA | NA | NA | NA | NA | NA | 1.74 | 1.68 | 1.60 | 1.53 | 1.46 | 1.39 | 1.32 | 2.19 | 2.19 | 2.15 | 2.50 | 2.85 | NA | 1.11 | NA | NA | NA | 2.15 | NA | NA | NA | 3.08 | NA | NA | NA | NA | NA | NA | |
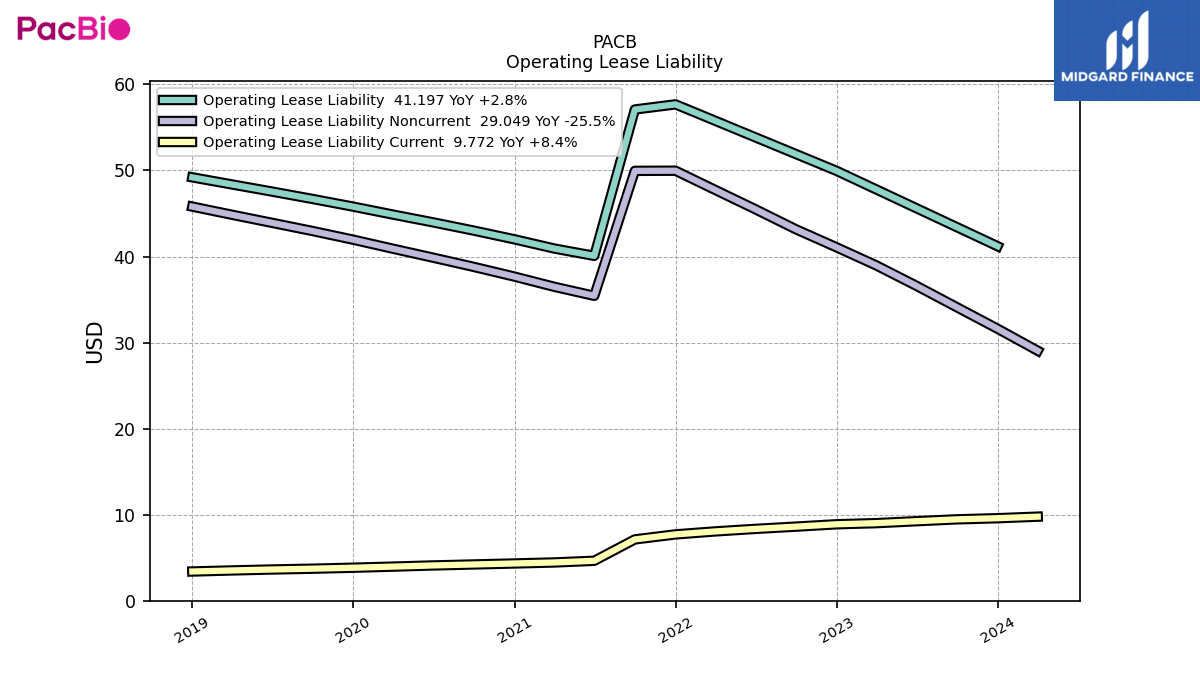
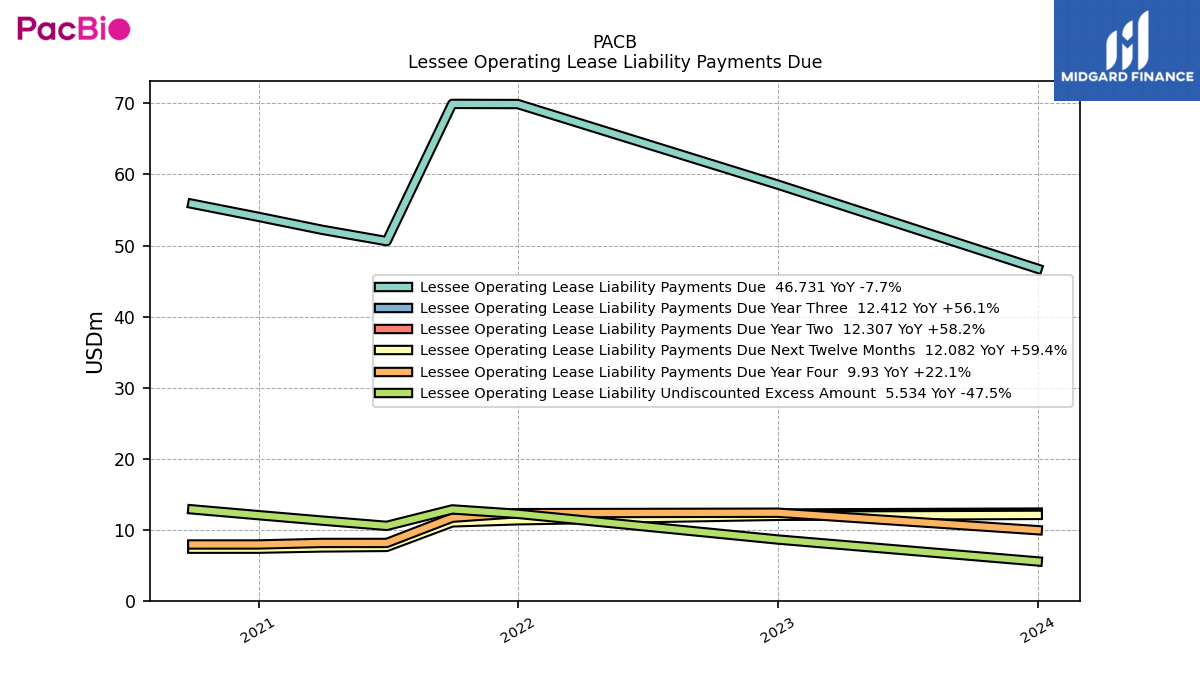
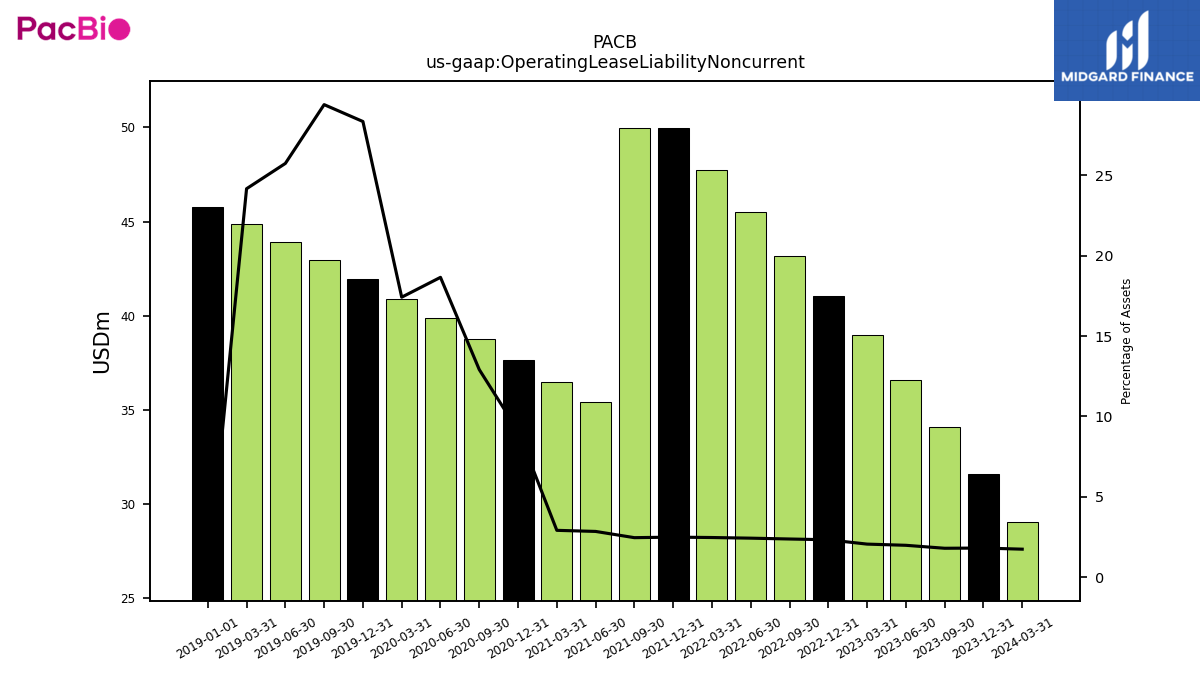
| Operating Lease Liability Noncurrent | 31.61 | 34.10 | 36.60 | 38.97 | 41.07 | 43.16 | 45.50 | 47.74 | 49.97 | 49.95 | 35.43 | 36.48 | 37.67 | 38.79 | 39.86 | 40.90 | 41.96 | 42.97 | 43.92 | 44.86 | NA | NA | NA | NA | NA | NA | NA | NA | NA | NA | NA | NA | NA | NA | NA | NA | NA | NA | NA | NA | NA | NA | NA | NA | NA | NA | NA | NA | NA | NA | NA | NA | NA | NA | NA |
| 2023-12-31 | 2023-09-30 | 2023-06-30 | 2023-03-31 | 2022-12-31 | 2022-09-30 | 2022-06-30 | 2022-03-31 | 2021-12-31 | 2021-09-30 | 2021-06-30 | 2021-03-31 | 2020-12-31 | 2020-09-30 | 2020-06-30 | 2020-03-31 | 2019-12-31 | 2019-09-30 | 2019-06-30 | 2019-03-31 | 2018-12-31 | 2018-09-30 | 2018-06-30 | 2018-03-31 | 2017-12-31 | 2017-09-30 | 2017-06-30 | 2017-03-31 | 2016-12-31 | 2016-09-30 | 2016-06-30 | 2016-03-31 | 2015-12-31 | 2015-09-30 | 2015-06-30 | 2015-03-31 | 2014-12-31 | 2014-09-30 | 2014-06-30 | 2014-03-31 | 2013-12-31 | 2013-09-30 | 2013-06-30 | 2013-03-31 | 2012-12-31 | 2012-09-30 | 2012-06-30 | 2012-03-31 | 2011-12-31 | 2011-09-30 | 2011-06-30 | 2011-03-31 | 2010-12-31 | 2010-09-30 | 2010-06-30 | ||
|---|---|---|---|---|---|---|---|---|---|---|---|---|---|---|---|---|---|---|---|---|---|---|---|---|---|---|---|---|---|---|---|---|---|---|---|---|---|---|---|---|---|---|---|---|---|---|---|---|---|---|---|---|---|---|---|---|
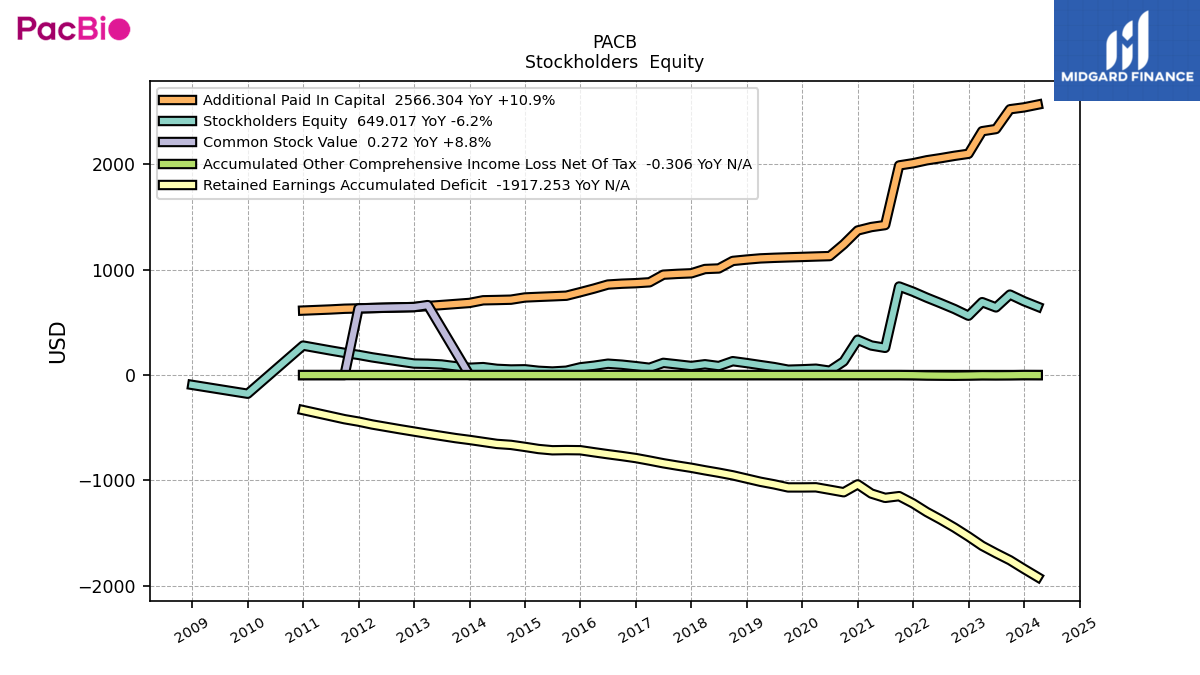
| Stockholders Equity | 701.30 | 763.74 | 642.00 | 692.12 | 562.90 | 626.59 | 681.89 | 734.58 | 790.99 | 840.81 | 258.25 | 280.55 | 335.49 | 129.50 | 41.39 | 60.40 | 54.92 | 51.01 | 75.75 | 94.85 | 114.06 | 131.88 | 85.47 | 102.74 | 86.10 | 101.41 | 115.86 | 69.19 | 84.67 | 98.68 | 108.07 | 88.78 | 73.54 | 41.37 | 33.84 | 40.47 | 54.95 | 53.03 | 59.02 | 75.53 | 69.18 | 83.54 | 100.40 | 107.09 | 109.38 | 128.54 | 148.20 | 167.90 | 191.46 | 210.68 | 233.33 | NA | 279.87 | NA | NA | |
| Common Stock Value | 0.27 | 0.26 | 0.25 | 0.25 | 0.23 | 0.23 | 0.23 | 0.22 | 0.22 | 0.22 | 0.20 | 0.20 | 0.19 | 0.18 | 0.15 | 0.15 | 0.15 | 0.15 | 0.15 | 0.15 | 0.15 | 0.15 | 0.13 | 0.13 | 0.12 | 0.12 | 0.12 | 0.09 | 0.09 | 0.09 | 0.09 | 0.09 | 0.08 | 0.08 | 0.07 | 0.07 | 0.07 | 0.07 | 0.07 | 0.07 | 0.07 | NA | NA | 664.20 | 645.37 | 642.82 | 639.75 | NA | 632.96 | 0.06 | 0.05 | NA | 0.05 | NA | NA | |
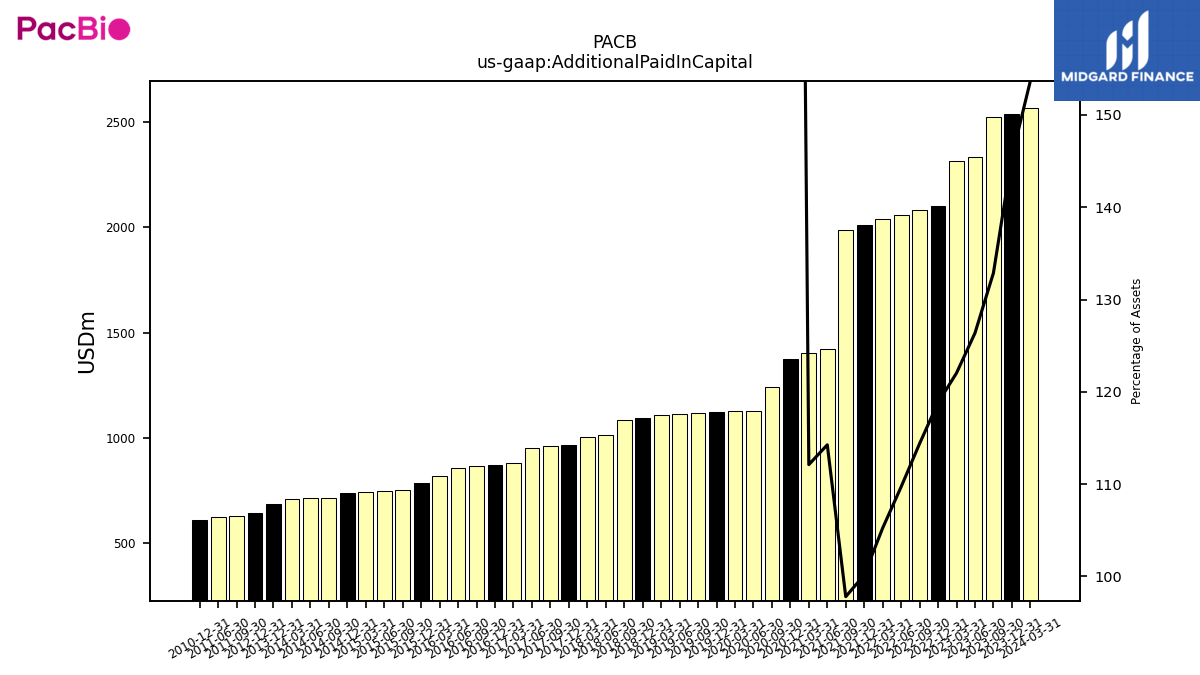
| Additional Paid In Capital | 2539.89 | 2522.38 | 2334.62 | 2314.15 | 2099.78 | 2080.58 | 2058.10 | 2038.03 | 2009.94 | 1989.32 | 1423.36 | 1404.59 | 1372.08 | 1241.00 | 1129.09 | 1125.23 | 1121.00 | 1117.00 | 1112.61 | 1107.12 | 1096.05 | 1083.06 | 1011.62 | 1006.37 | 965.75 | 960.26 | 952.71 | 880.50 | 872.11 | 867.08 | 858.95 | 821.17 | 786.64 | 753.05 | 747.33 | 742.03 | 736.34 | 715.44 | 712.24 | 709.64 | 684.41 | NA | NA | NA | 645.32 | NA | NA | NA | NA | 629.37 | 622.54 | NA | 612.00 | NA | NA | |
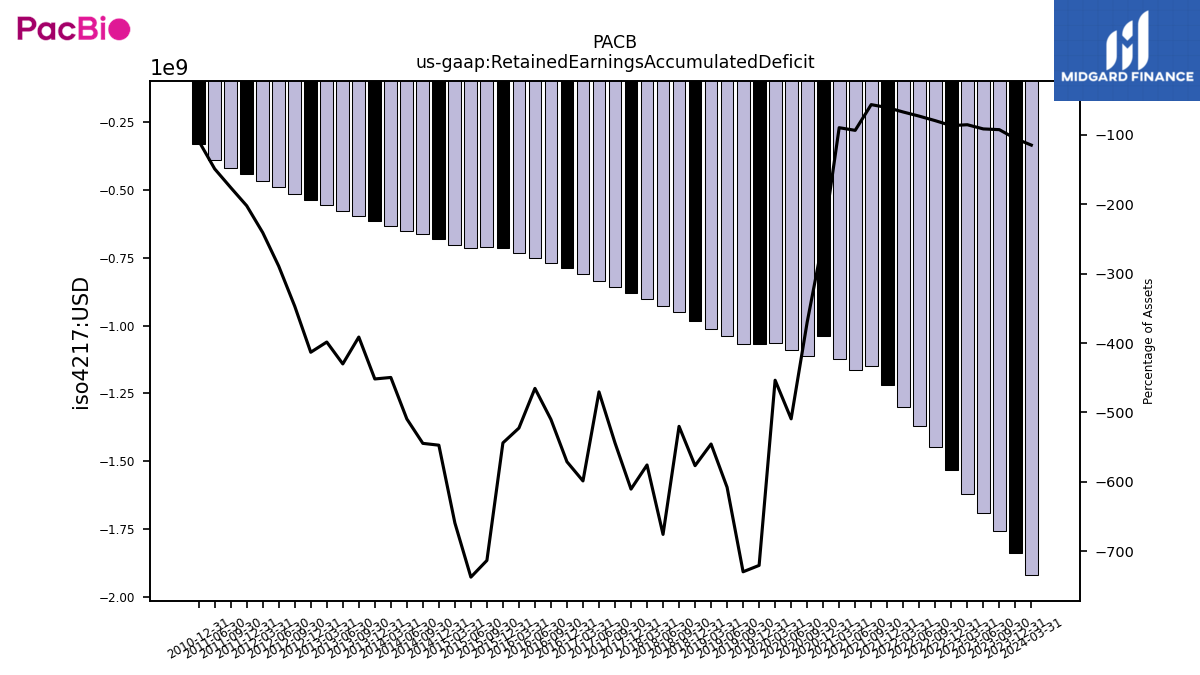
| Retained Earnings Accumulated Deficit | -1839.08 | -1757.06 | -1690.19 | -1620.36 | -1532.34 | -1447.96 | -1370.98 | -1299.59 | -1218.09 | -1148.76 | -1165.31 | -1124.30 | -1036.87 | -1111.80 | -1088.10 | -1065.01 | -1066.24 | -1066.15 | -1037.03 | -1012.43 | -982.11 | -951.31 | -926.26 | -903.72 | -879.73 | -858.97 | -836.95 | -811.41 | -787.54 | -768.51 | -751.02 | -732.52 | -713.17 | -711.76 | -713.58 | -701.65 | -681.47 | -662.50 | -653.34 | -634.20 | -615.31 | -598.08 | -577.60 | -557.12 | -536.02 | -514.35 | -491.62 | -469.13 | -441.56 | -418.73 | -389.45 | NA | -332.17 | NA | NA | |
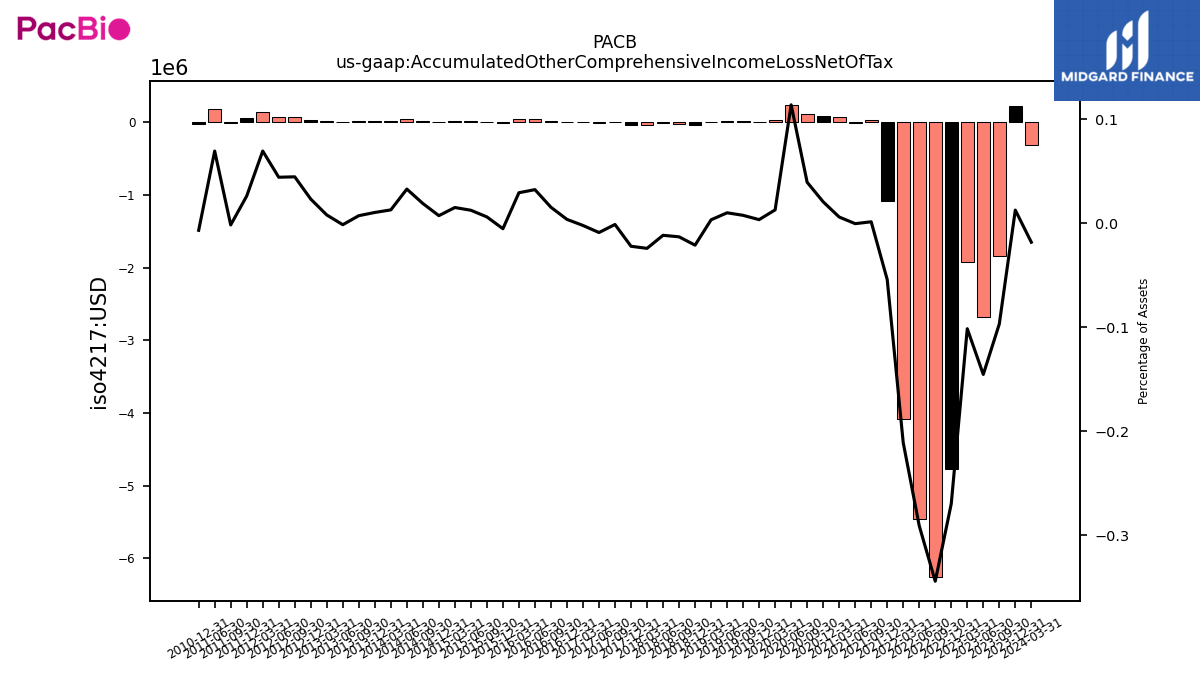
| Accumulated Other Comprehensive Income Loss Net Of Tax | 0.22 | -1.84 | -2.69 | -1.92 | -4.76 | -6.26 | -5.46 | -4.08 | -1.09 | 0.03 | -0.01 | 0.07 | 0.09 | 0.12 | 0.24 | 0.03 | 0.01 | 0.01 | 0.02 | 0.01 | -0.04 | -0.02 | -0.02 | -0.04 | -0.03 | -0.00 | -0.02 | -0.00 | 0.01 | 0.02 | 0.05 | 0.04 | -0.01 | 0.01 | 0.01 | 0.02 | 0.01 | 0.02 | 0.04 | 0.02 | 0.01 | 0.01 | -0.00 | 0.01 | 0.03 | 0.07 | 0.07 | 0.14 | 0.06 | -0.00 | 0.18 | NA | -0.02 | NA | NA | |
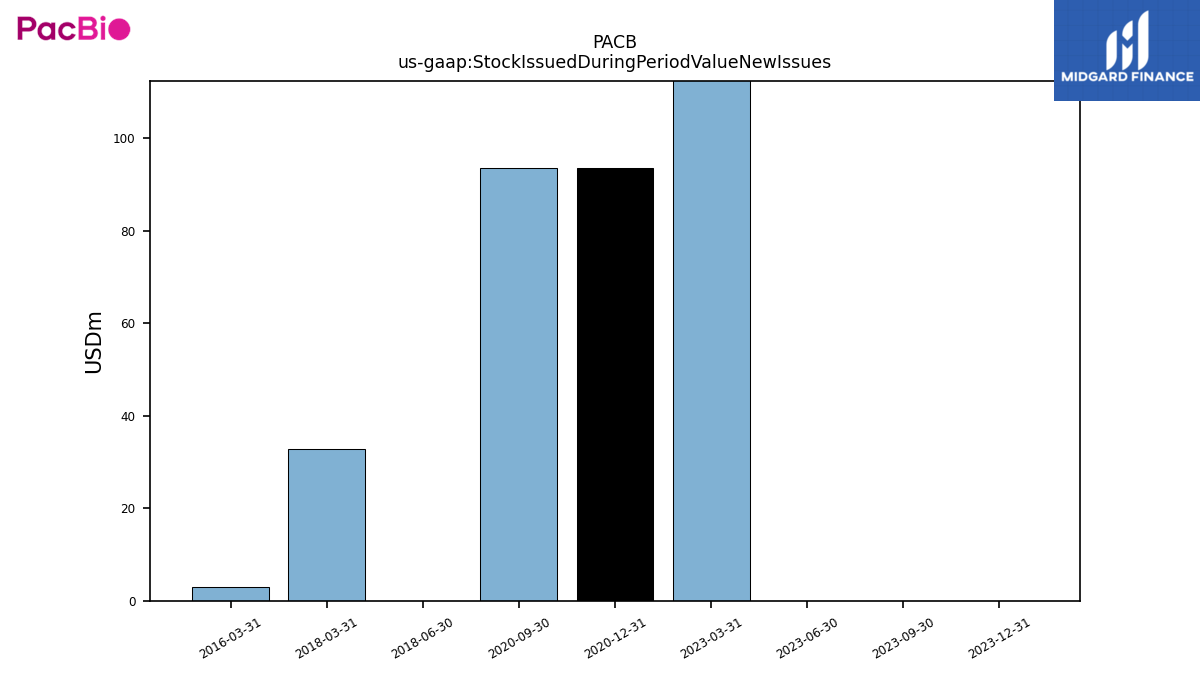
| Stock Issued During Period Value New Issues | 0.00 | 0.00 | 0.00 | 189.20 | NA | NA | NA | NA | NA | NA | NA | NA | 93.63 | 93.60 | NA | NA | NA | NA | NA | NA | NA | NA | 0.00 | 32.86 | NA | NA | NA | NA | NA | NA | NA | 3.00 | NA | NA | NA | NA | NA | NA | NA | NA | NA | NA | NA | NA | NA | NA | NA | NA | NA | NA | NA | NA | NA | NA | NA | |
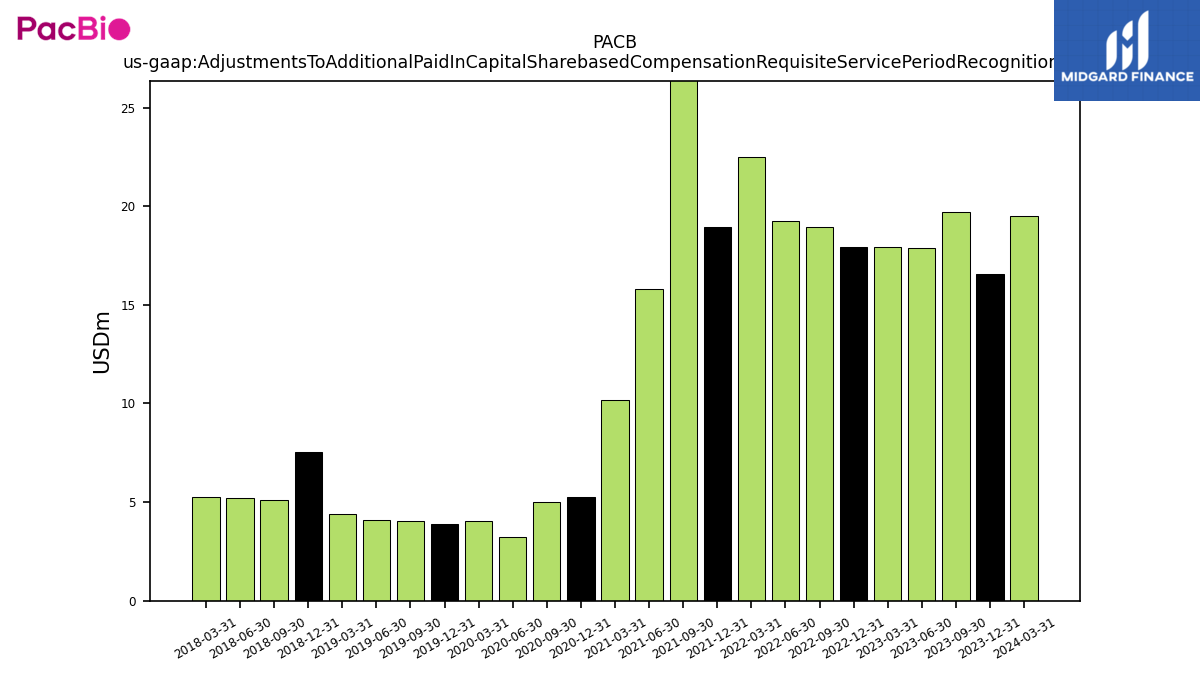
| Adjustments To Additional Paid In Capital Sharebased Compensation Requisite Service Period Recognition Value | 16.58 | 19.69 | 17.89 | 17.95 | 17.95 | 18.94 | 19.23 | 22.50 | 18.94 | 28.45 | 15.80 | 10.16 | 5.28 | 4.99 | 3.23 | 4.03 | 3.87 | 4.06 | 4.09 | 4.38 | 7.52 | 5.13 | 5.22 | 5.28 | NA | NA | NA | NA | NA | NA | NA | NA | NA | NA | NA | NA | NA | NA | NA | NA | NA | NA | NA | NA | NA | NA | NA | NA | NA | NA | NA | NA | NA | NA | NA |
| 2023-12-31 | 2023-09-30 | 2023-06-30 | 2023-03-31 | 2022-12-31 | 2022-09-30 | 2022-06-30 | 2022-03-31 | 2021-12-31 | 2021-09-30 | 2021-06-30 | 2021-03-31 | 2020-12-31 | 2020-09-30 | 2020-06-30 | 2020-03-31 | 2019-12-31 | 2019-09-30 | 2019-06-30 | 2019-03-31 | 2018-12-31 | 2018-09-30 | 2018-06-30 | 2018-03-31 | 2017-12-31 | 2017-09-30 | 2017-06-30 | 2017-03-31 | 2016-12-31 | 2016-09-30 | 2016-06-30 | 2016-03-31 | 2015-12-31 | 2015-09-30 | 2015-06-30 | 2015-03-31 | 2014-12-31 | 2014-09-30 | 2014-06-30 | 2014-03-31 | 2013-12-31 | 2013-09-30 | 2013-06-30 | 2013-03-31 | 2012-12-31 | 2012-09-30 | 2012-06-30 | 2012-03-31 | 2011-12-31 | 2011-09-30 | 2011-06-30 | 2011-03-31 | 2010-12-31 | 2010-09-30 | 2010-06-30 | ||
|---|---|---|---|---|---|---|---|---|---|---|---|---|---|---|---|---|---|---|---|---|---|---|---|---|---|---|---|---|---|---|---|---|---|---|---|---|---|---|---|---|---|---|---|---|---|---|---|---|---|---|---|---|---|---|---|---|
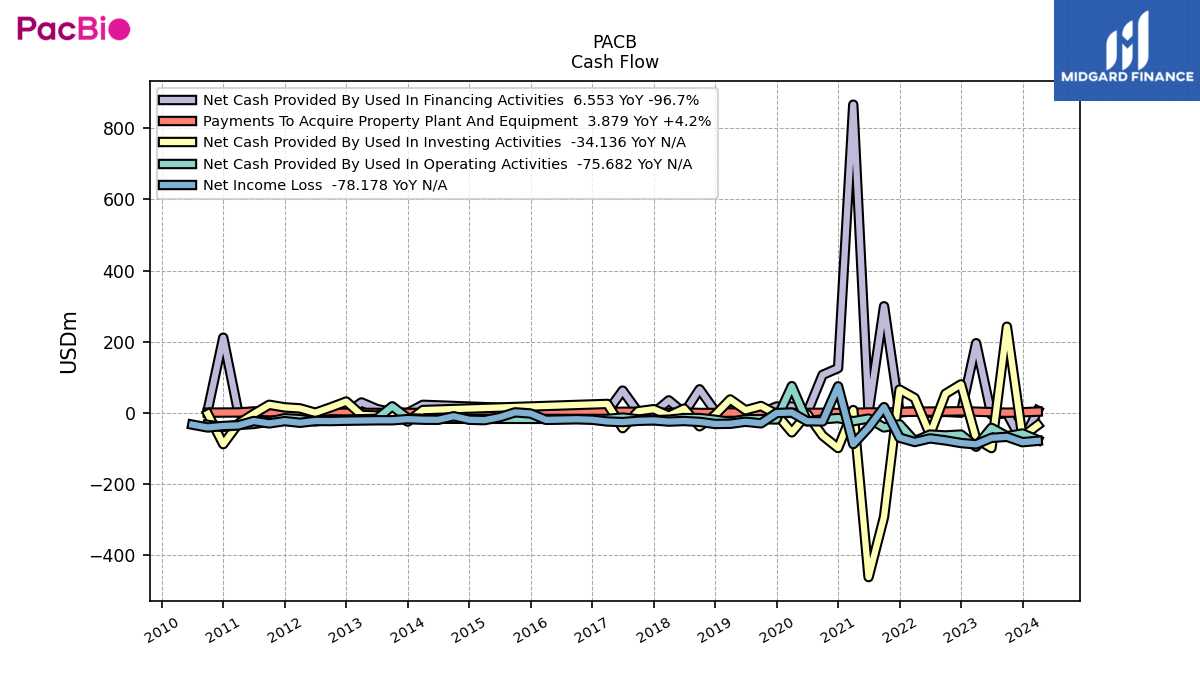
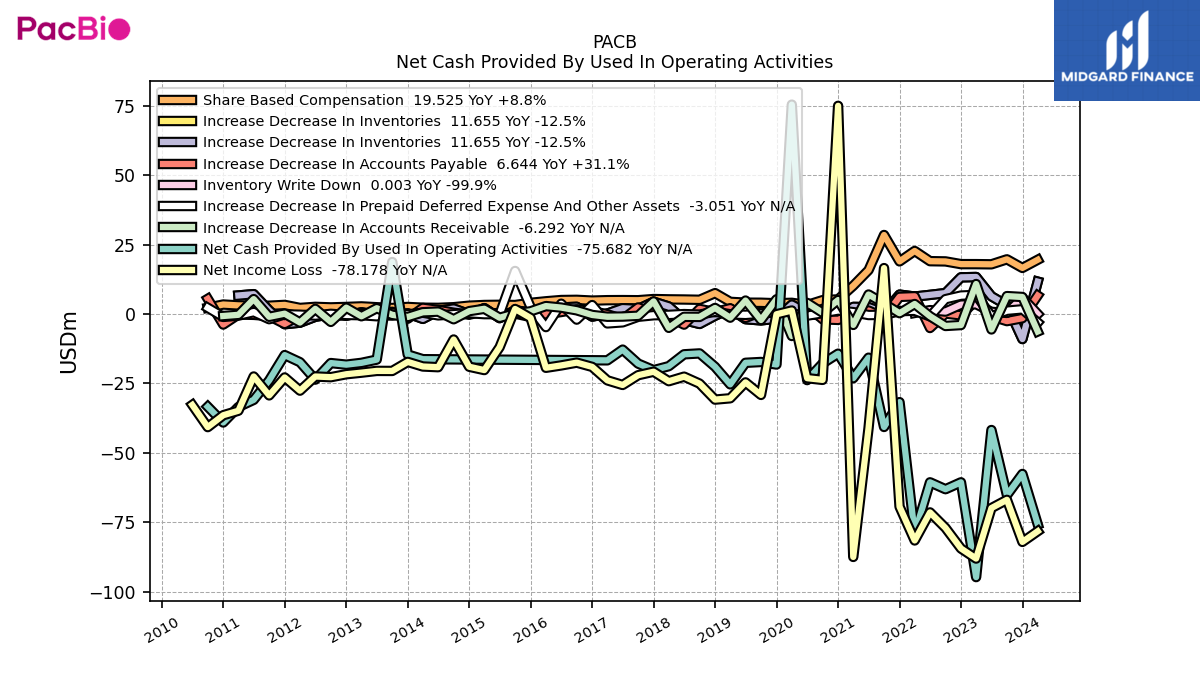
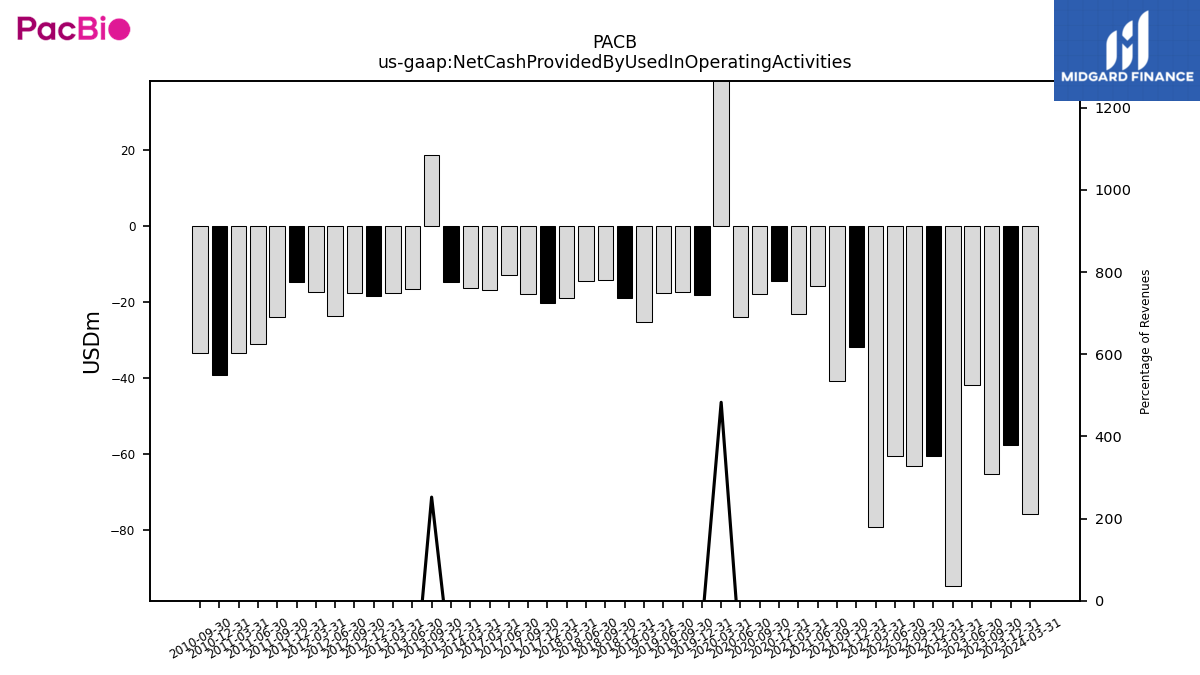
| Net Cash Provided By Used In Operating Activities | -57.56 | -65.18 | -41.74 | -94.69 | -60.57 | -63.05 | -60.56 | -79.03 | -31.71 | -40.66 | -15.71 | -23.10 | -14.26 | -17.81 | -23.79 | 75.36 | -18.18 | -17.26 | -17.56 | -25.31 | -18.98 | -14.18 | -14.50 | -18.77 | -20.20 | -17.84 | -12.81 | -16.67 | NA | NA | NA | NA | NA | NA | NA | NA | NA | NA | NA | -16.26 | -14.57 | 18.72 | -16.41 | -17.57 | -18.22 | -17.65 | -23.61 | -17.34 | -14.77 | -23.85 | -30.89 | -33.46 | -39.05 | -33.35 | NA | |
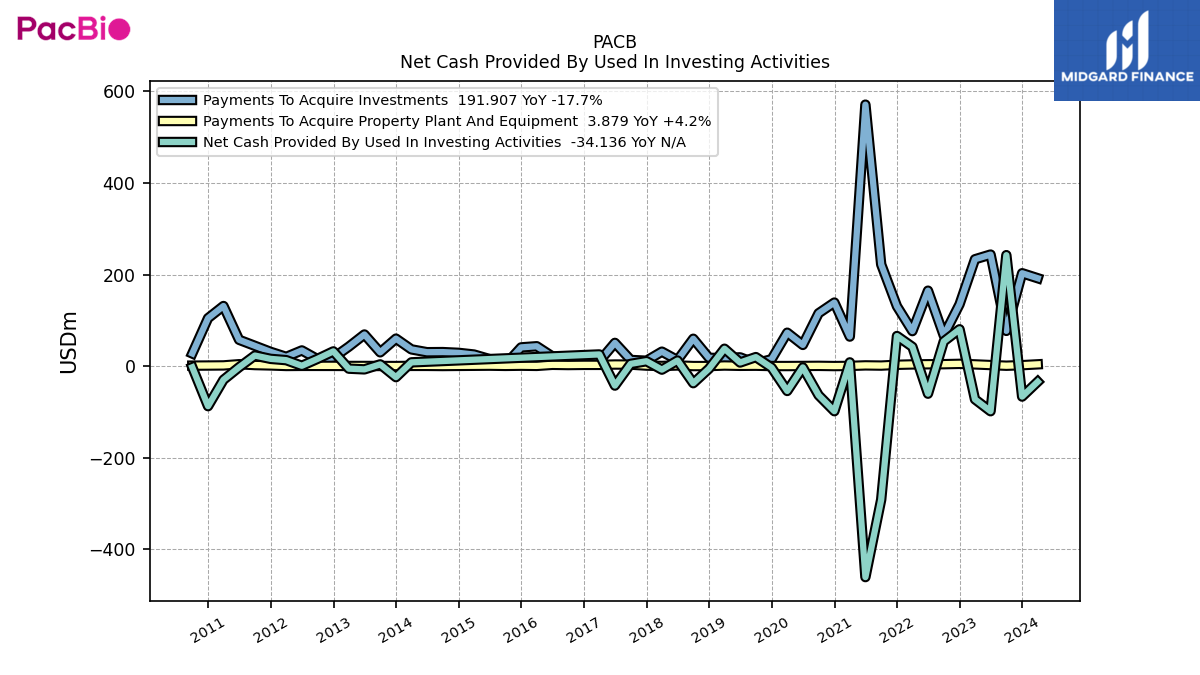
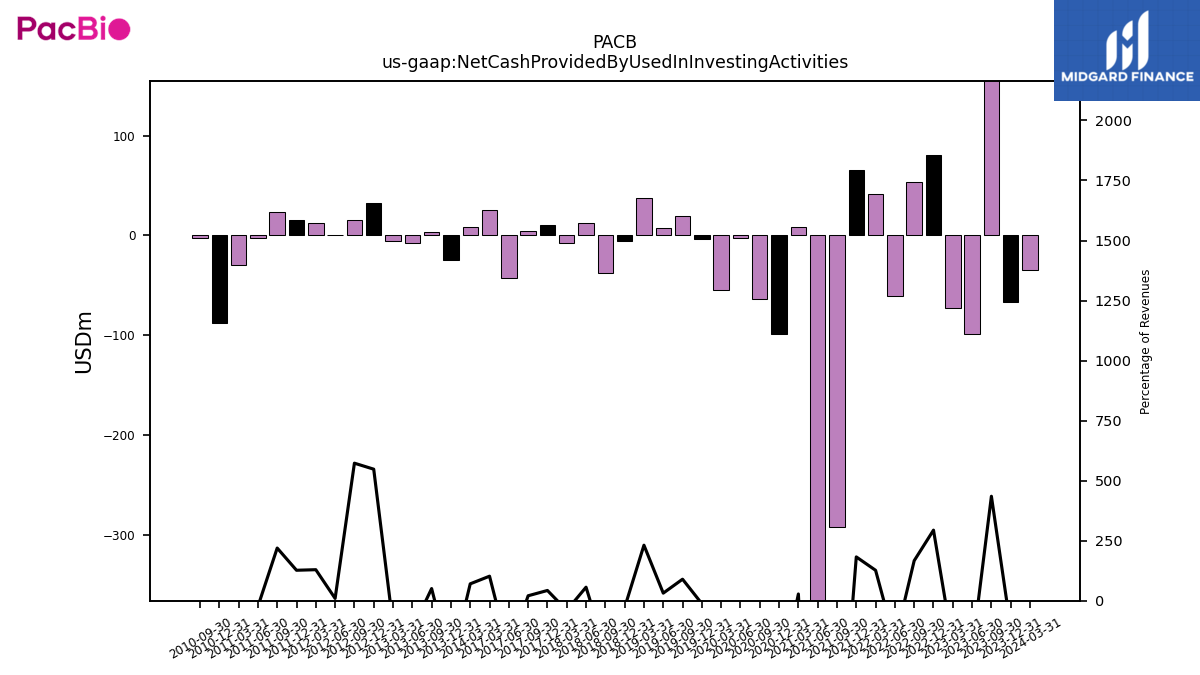
| Net Cash Provided By Used In Investing Activities | -66.58 | 242.32 | -98.59 | -72.55 | 80.40 | 53.91 | -60.28 | 42.05 | 65.75 | -291.65 | -460.81 | 8.17 | -98.50 | -63.64 | -2.86 | -54.33 | -3.41 | 19.66 | 7.81 | 37.98 | -5.51 | -37.34 | 12.19 | -7.75 | 10.68 | 4.88 | -42.59 | 25.48 | NA | NA | NA | NA | NA | NA | NA | NA | NA | NA | NA | 8.20 | -24.15 | 3.76 | -7.14 | -5.58 | 32.20 | 15.90 | 0.71 | 12.98 | 15.80 | 23.08 | -2.53 | -29.91 | -87.51 | -2.51 | NA | |
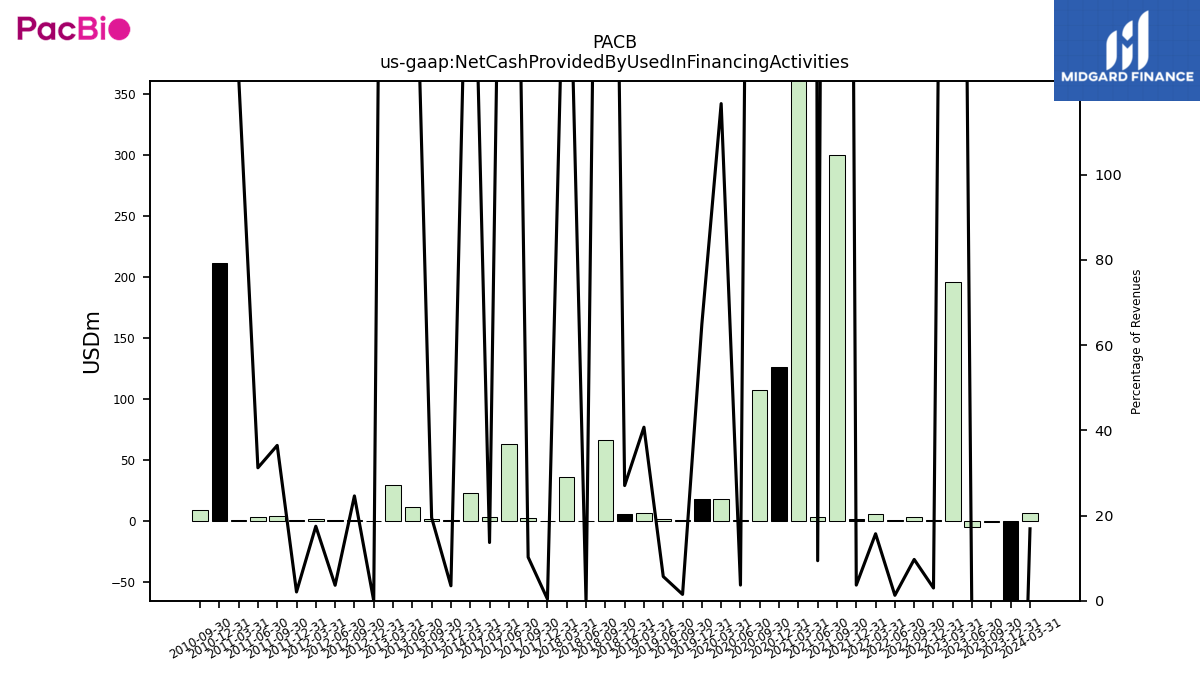
| Net Cash Provided By Used In Financing Activities | -81.60 | -0.78 | -4.71 | 195.99 | 0.82 | 3.13 | 0.46 | 5.21 | 1.32 | 299.66 | 2.88 | 865.72 | 125.88 | 107.14 | 0.63 | 18.20 | 18.13 | 0.33 | 1.40 | 6.69 | 5.28 | 66.52 | -0.09 | 35.47 | 0.10 | 2.41 | 62.90 | 3.41 | NA | NA | NA | NA | NA | NA | NA | NA | NA | NA | NA | 22.96 | 0.32 | 1.45 | 11.35 | 29.66 | 0.00 | 0.68 | 0.27 | 1.75 | 0.26 | 3.83 | 3.32 | 0.33 | 211.49 | 8.44 | NA |
| 2023-12-31 | 2023-09-30 | 2023-06-30 | 2023-03-31 | 2022-12-31 | 2022-09-30 | 2022-06-30 | 2022-03-31 | 2021-12-31 | 2021-09-30 | 2021-06-30 | 2021-03-31 | 2020-12-31 | 2020-09-30 | 2020-06-30 | 2020-03-31 | 2019-12-31 | 2019-09-30 | 2019-06-30 | 2019-03-31 | 2018-12-31 | 2018-09-30 | 2018-06-30 | 2018-03-31 | 2017-12-31 | 2017-09-30 | 2017-06-30 | 2017-03-31 | 2016-12-31 | 2016-09-30 | 2016-06-30 | 2016-03-31 | 2015-12-31 | 2015-09-30 | 2015-06-30 | 2015-03-31 | 2014-12-31 | 2014-09-30 | 2014-06-30 | 2014-03-31 | 2013-12-31 | 2013-09-30 | 2013-06-30 | 2013-03-31 | 2012-12-31 | 2012-09-30 | 2012-06-30 | 2012-03-31 | 2011-12-31 | 2011-09-30 | 2011-06-30 | 2011-03-31 | 2010-12-31 | 2010-09-30 | 2010-06-30 | ||
|---|---|---|---|---|---|---|---|---|---|---|---|---|---|---|---|---|---|---|---|---|---|---|---|---|---|---|---|---|---|---|---|---|---|---|---|---|---|---|---|---|---|---|---|---|---|---|---|---|---|---|---|---|---|---|---|---|
| Net Cash Provided By Used In Operating Activities | -57.56 | -65.18 | -41.74 | -94.69 | -60.57 | -63.05 | -60.56 | -79.03 | -31.71 | -40.66 | -15.71 | -23.10 | -14.26 | -17.81 | -23.79 | 75.36 | -18.18 | -17.26 | -17.56 | -25.31 | -18.98 | -14.18 | -14.50 | -18.77 | -20.20 | -17.84 | -12.81 | -16.67 | NA | NA | NA | NA | NA | NA | NA | NA | NA | NA | NA | -16.26 | -14.57 | 18.72 | -16.41 | -17.57 | -18.22 | -17.65 | -23.61 | -17.34 | -14.77 | -23.85 | -30.89 | -33.46 | -39.05 | -33.35 | NA | |
| Net Income Loss | -82.02 | -66.87 | -69.83 | -88.02 | -84.38 | -76.97 | -71.39 | -81.50 | -69.33 | 16.54 | -41.00 | -87.44 | 74.94 | -23.71 | -23.09 | 1.26 | -0.09 | -29.12 | -24.60 | -30.32 | -30.80 | -25.04 | -22.54 | -24.18 | -20.76 | -22.02 | -25.54 | -23.87 | -19.03 | -17.49 | -18.50 | -19.35 | -1.41 | 1.82 | -11.94 | -20.17 | -18.98 | -9.16 | -19.14 | -18.89 | -17.23 | -20.49 | -20.47 | -21.10 | -21.67 | -22.73 | -22.49 | -27.58 | -22.82 | -29.28 | -22.48 | -34.81 | -36.42 | -40.71 | -32.71 | |
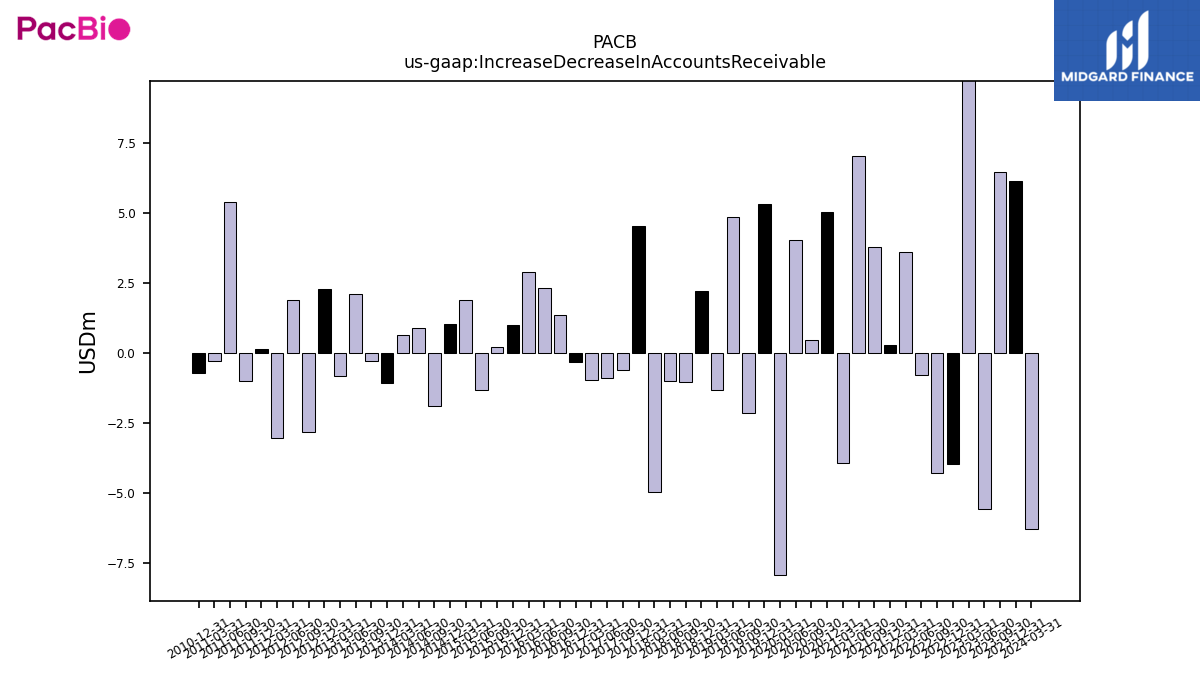
| Increase Decrease In Accounts Receivable | 6.13 | 6.45 | -5.55 | 10.80 | -3.97 | -4.30 | -0.79 | 3.61 | 0.29 | 3.77 | 7.03 | -3.93 | 5.03 | 0.46 | 4.02 | -7.91 | 5.30 | -2.16 | 4.84 | -1.32 | 2.19 | -1.04 | -1.01 | -4.98 | 4.54 | -0.63 | -0.92 | -0.98 | -0.34 | 1.33 | 2.32 | 2.87 | 0.98 | 0.21 | -1.34 | 1.88 | 1.04 | -1.89 | 0.87 | 0.64 | -1.07 | -0.29 | 2.10 | -0.81 | 2.29 | -2.84 | 1.87 | -3.05 | 0.12 | -1.00 | 5.38 | -0.28 | -0.71 | NA | NA | |
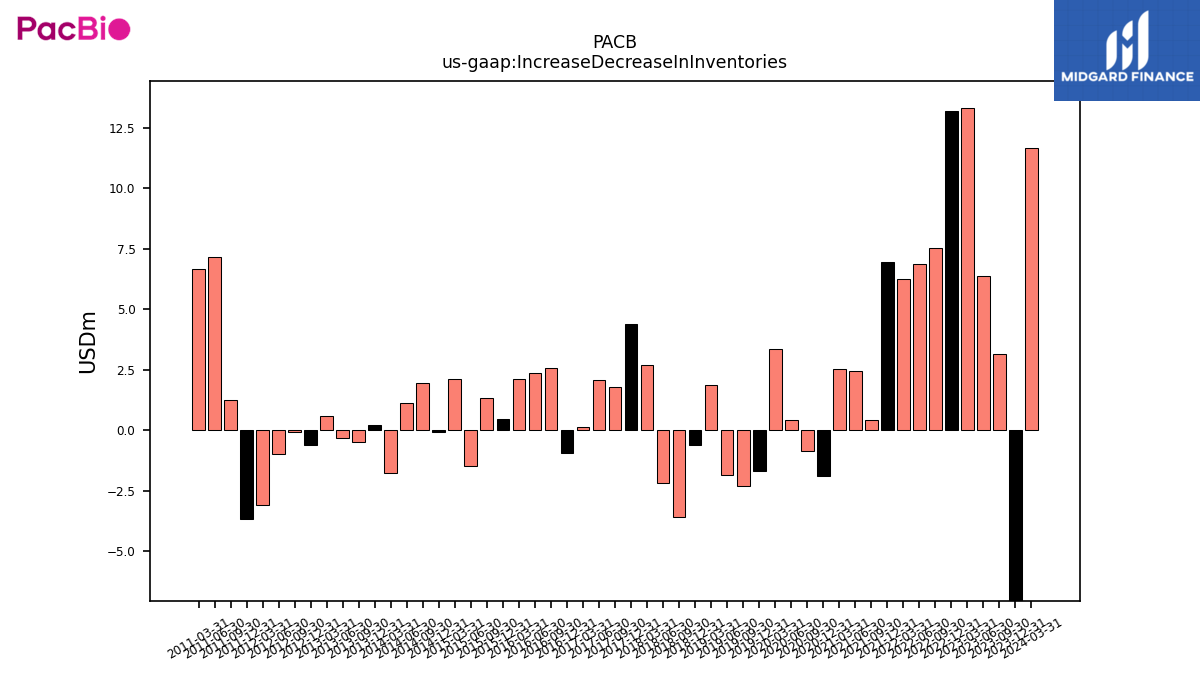
| Increase Decrease In Inventories | -9.01 | 3.15 | 6.38 | 13.32 | 13.21 | 7.53 | 6.89 | 6.28 | 6.98 | 0.42 | 2.47 | 2.56 | -1.89 | -0.83 | 0.45 | 3.37 | -1.66 | -2.29 | -1.85 | 1.89 | -0.61 | -3.57 | -2.16 | 2.72 | 4.42 | 1.79 | 2.09 | 0.15 | -0.93 | 2.59 | 2.37 | 2.12 | 0.48 | 1.35 | -1.48 | 2.12 | -0.06 | 1.96 | 1.14 | -1.75 | 0.23 | -0.46 | -0.31 | 0.61 | -0.61 | -0.07 | -0.99 | -3.09 | -3.66 | 1.25 | 7.15 | 6.67 | NA | NA | NA | |
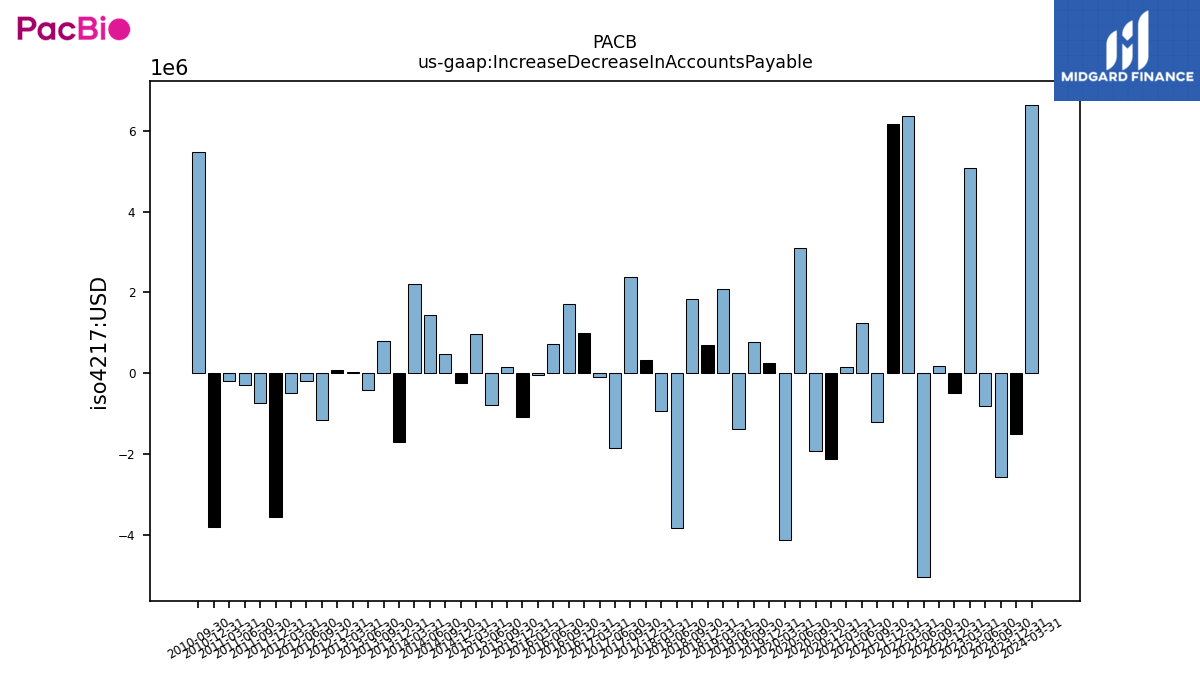
| Increase Decrease In Accounts Payable | -1.50 | -2.56 | -0.81 | 5.07 | -0.49 | 0.18 | -5.04 | 6.37 | 6.17 | -1.21 | 1.25 | 0.15 | -2.12 | -1.92 | 3.09 | -4.13 | 0.26 | 0.77 | -1.39 | 2.08 | 0.69 | 1.84 | -3.82 | -0.94 | 0.33 | 2.38 | -1.85 | -0.09 | 1.00 | 1.72 | 0.72 | -0.04 | -1.08 | 0.16 | -0.78 | 0.98 | -0.24 | 0.47 | 1.45 | 2.21 | -1.70 | 0.81 | -0.41 | 0.02 | 0.09 | -1.16 | -0.19 | -0.49 | -3.56 | -0.73 | -0.30 | -0.18 | -3.80 | 5.47 | NA | |
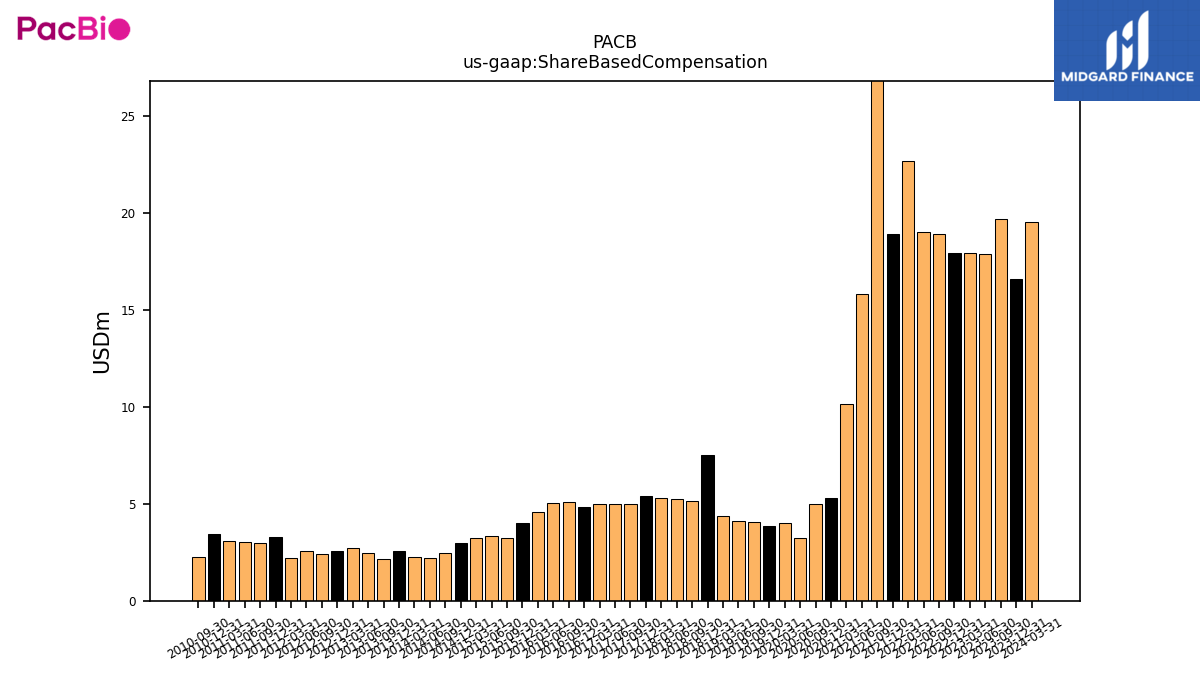
| Share Based Compensation | 16.58 | 19.69 | 17.89 | 17.95 | 17.95 | 18.94 | 19.02 | 22.70 | 18.94 | 28.45 | 15.80 | 10.16 | 5.28 | 4.99 | 3.23 | 4.03 | 3.87 | 4.06 | 4.09 | 4.38 | 7.52 | 5.12 | 5.22 | 5.28 | 5.39 | 4.97 | 5.01 | 4.98 | 4.84 | 5.11 | 5.04 | 4.58 | 4.03 | 3.24 | 3.32 | 3.25 | 3.00 | 2.45 | 2.22 | 2.27 | 2.54 | 2.17 | 2.44 | 2.75 | 2.55 | 2.39 | 2.58 | 2.19 | 3.28 | 2.99 | 3.01 | 3.10 | 3.42 | 2.26 | NA |
| 2023-12-31 | 2023-09-30 | 2023-06-30 | 2023-03-31 | 2022-12-31 | 2022-09-30 | 2022-06-30 | 2022-03-31 | 2021-12-31 | 2021-09-30 | 2021-06-30 | 2021-03-31 | 2020-12-31 | 2020-09-30 | 2020-06-30 | 2020-03-31 | 2019-12-31 | 2019-09-30 | 2019-06-30 | 2019-03-31 | 2018-12-31 | 2018-09-30 | 2018-06-30 | 2018-03-31 | 2017-12-31 | 2017-09-30 | 2017-06-30 | 2017-03-31 | 2016-12-31 | 2016-09-30 | 2016-06-30 | 2016-03-31 | 2015-12-31 | 2015-09-30 | 2015-06-30 | 2015-03-31 | 2014-12-31 | 2014-09-30 | 2014-06-30 | 2014-03-31 | 2013-12-31 | 2013-09-30 | 2013-06-30 | 2013-03-31 | 2012-12-31 | 2012-09-30 | 2012-06-30 | 2012-03-31 | 2011-12-31 | 2011-09-30 | 2011-06-30 | 2011-03-31 | 2010-12-31 | 2010-09-30 | 2010-06-30 | ||
|---|---|---|---|---|---|---|---|---|---|---|---|---|---|---|---|---|---|---|---|---|---|---|---|---|---|---|---|---|---|---|---|---|---|---|---|---|---|---|---|---|---|---|---|---|---|---|---|---|---|---|---|---|---|---|---|---|
| Net Cash Provided By Used In Investing Activities | -66.58 | 242.32 | -98.59 | -72.55 | 80.40 | 53.91 | -60.28 | 42.05 | 65.75 | -291.65 | -460.81 | 8.17 | -98.50 | -63.64 | -2.86 | -54.33 | -3.41 | 19.66 | 7.81 | 37.98 | -5.51 | -37.34 | 12.19 | -7.75 | 10.68 | 4.88 | -42.59 | 25.48 | NA | NA | NA | NA | NA | NA | NA | NA | NA | NA | NA | 8.20 | -24.15 | 3.76 | -7.14 | -5.58 | 32.20 | 15.90 | 0.71 | 12.98 | 15.80 | 23.08 | -2.53 | -29.91 | -87.51 | -2.51 | NA | |
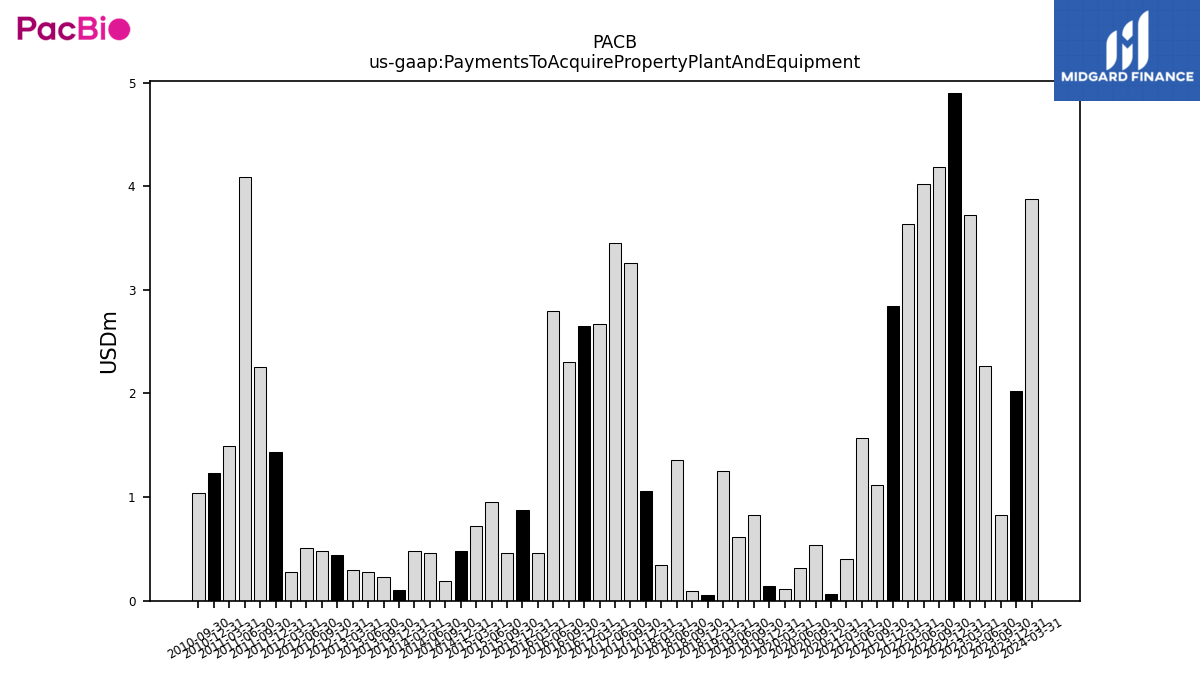
| Payments To Acquire Property Plant And Equipment | 2.02 | 0.83 | 2.27 | 3.72 | 4.90 | 4.19 | 4.02 | 3.64 | 2.84 | 1.12 | 1.57 | 0.40 | 0.07 | 0.54 | 0.32 | 0.12 | 0.14 | 0.83 | 0.61 | 1.25 | 0.06 | 0.10 | 1.36 | 0.34 | 1.06 | 3.26 | 3.45 | 2.67 | 2.65 | 2.30 | 2.80 | 0.46 | 0.88 | 0.46 | 0.95 | 0.72 | 0.48 | 0.19 | 0.47 | 0.48 | 0.10 | 0.23 | 0.28 | 0.30 | 0.44 | 0.48 | 0.51 | 0.27 | 1.44 | 2.26 | 4.09 | 1.50 | 1.23 | 1.04 | NA | |
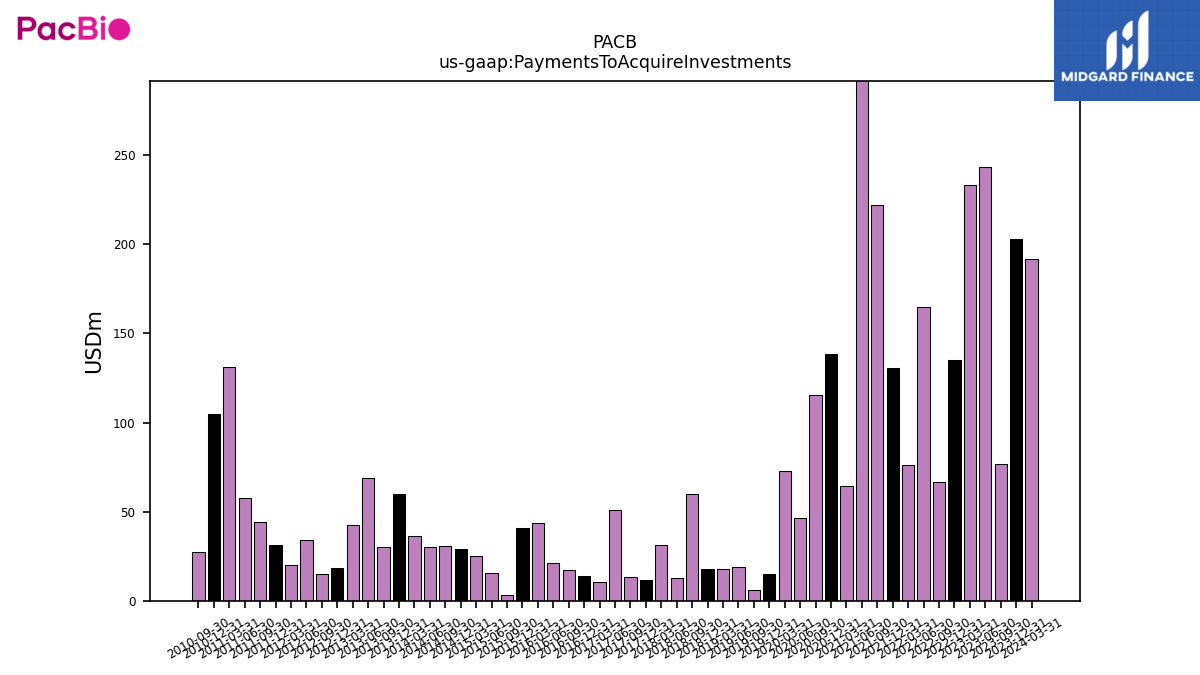
| Payments To Acquire Investments | 202.82 | 76.87 | 243.59 | 233.29 | 134.89 | 66.81 | 164.72 | 76.37 | 130.62 | 222.02 | 570.97 | 64.43 | 138.73 | 115.36 | 46.24 | 72.96 | 15.02 | 5.96 | 19.12 | 17.62 | 17.95 | 59.73 | 12.95 | 31.55 | 11.75 | 13.41 | 50.76 | 10.42 | 13.82 | 17.46 | 21.19 | 43.38 | 40.86 | 3.13 | 15.31 | 25.27 | 28.95 | 30.59 | 30.36 | 36.52 | 60.00 | 30.02 | 69.06 | 42.47 | 18.45 | 15.08 | 34.22 | 20.14 | 31.11 | 44.30 | 57.43 | 131.22 | 104.65 | 27.58 | NA |
| 2023-12-31 | 2023-09-30 | 2023-06-30 | 2023-03-31 | 2022-12-31 | 2022-09-30 | 2022-06-30 | 2022-03-31 | 2021-12-31 | 2021-09-30 | 2021-06-30 | 2021-03-31 | 2020-12-31 | 2020-09-30 | 2020-06-30 | 2020-03-31 | 2019-12-31 | 2019-09-30 | 2019-06-30 | 2019-03-31 | 2018-12-31 | 2018-09-30 | 2018-06-30 | 2018-03-31 | 2017-12-31 | 2017-09-30 | 2017-06-30 | 2017-03-31 | 2016-12-31 | 2016-09-30 | 2016-06-30 | 2016-03-31 | 2015-12-31 | 2015-09-30 | 2015-06-30 | 2015-03-31 | 2014-12-31 | 2014-09-30 | 2014-06-30 | 2014-03-31 | 2013-12-31 | 2013-09-30 | 2013-06-30 | 2013-03-31 | 2012-12-31 | 2012-09-30 | 2012-06-30 | 2012-03-31 | 2011-12-31 | 2011-09-30 | 2011-06-30 | 2011-03-31 | 2010-12-31 | 2010-09-30 | 2010-06-30 | ||
|---|---|---|---|---|---|---|---|---|---|---|---|---|---|---|---|---|---|---|---|---|---|---|---|---|---|---|---|---|---|---|---|---|---|---|---|---|---|---|---|---|---|---|---|---|---|---|---|---|---|---|---|---|---|---|---|---|
| Net Cash Provided By Used In Financing Activities | -81.60 | -0.78 | -4.71 | 195.99 | 0.82 | 3.13 | 0.46 | 5.21 | 1.32 | 299.66 | 2.88 | 865.72 | 125.88 | 107.14 | 0.63 | 18.20 | 18.13 | 0.33 | 1.40 | 6.69 | 5.28 | 66.52 | -0.09 | 35.47 | 0.10 | 2.41 | 62.90 | 3.41 | NA | NA | NA | NA | NA | NA | NA | NA | NA | NA | NA | 22.96 | 0.32 | 1.45 | 11.35 | 29.66 | 0.00 | 0.68 | 0.27 | 1.75 | 0.26 | 3.83 | 3.32 | 0.33 | 211.49 | 8.44 | NA |
| 2023-12-31 | 2023-09-30 | 2023-06-30 | 2023-03-31 | 2022-12-31 | 2022-09-30 | 2022-06-30 | 2022-03-31 | 2021-12-31 | 2021-09-30 | 2021-06-30 | 2021-03-31 | 2020-12-31 | 2020-09-30 | 2020-06-30 | 2020-03-31 | 2019-12-31 | 2019-09-30 | 2019-06-30 | 2019-03-31 | 2018-12-31 | 2018-09-30 | 2018-06-30 | 2018-03-31 | 2017-12-31 | 2017-09-30 | 2017-06-30 | 2017-03-31 | 2016-12-31 | 2016-09-30 | 2016-06-30 | 2016-03-31 | 2015-12-31 | 2015-09-30 | 2015-06-30 | 2015-03-31 | 2014-12-31 | 2014-09-30 | 2014-06-30 | 2014-03-31 | 2013-12-31 | 2013-09-30 | 2013-06-30 | 2013-03-31 | 2012-12-31 | 2012-09-30 | 2012-06-30 | 2012-03-31 | 2011-12-31 | 2011-09-30 | 2011-06-30 | 2011-03-31 | 2010-12-31 | 2010-09-30 | 2010-06-30 | ||
|---|---|---|---|---|---|---|---|---|---|---|---|---|---|---|---|---|---|---|---|---|---|---|---|---|---|---|---|---|---|---|---|---|---|---|---|---|---|---|---|---|---|---|---|---|---|---|---|---|---|---|---|---|---|---|---|---|
| Revenues | 58.36 | 55.69 | 47.57 | 38.90 | 27.35 | 32.31 | 35.47 | 33.17 | 36.02 | 34.89 | 30.61 | 29.00 | 27.14 | 19.08 | 17.08 | 15.60 | 27.93 | 21.91 | 24.62 | 16.43 | 19.53 | 18.16 | 21.58 | 19.36 | 24.93 | 23.55 | 20.07 | 24.91 | 25.72 | 25.12 | 20.75 | 19.13 | 36.28 | 13.92 | 24.94 | 17.64 | 16.90 | 20.62 | 11.43 | 11.64 | 9.13 | 7.42 | 6.05 | 5.58 | 5.88 | 2.78 | 7.29 | 10.04 | 12.44 | 10.52 | 10.63 | 0.27 | 0.28 | 0.22 | 0.63 | |
| Revenue From Contract With Customer Excluding Assessed Tax | 58.36 | 55.69 | 47.57 | 38.90 | 27.35 | 32.31 | 35.47 | 33.17 | 36.02 | 34.89 | 30.61 | 29.00 | 27.14 | 19.08 | 17.08 | 15.60 | 27.93 | 21.91 | 24.62 | 16.43 | 19.53 | 18.16 | 21.58 | 19.36 | 24.93 | 23.55 | 20.07 | 24.91 | 25.72 | 25.12 | 20.75 | 19.13 | 36.28 | 13.92 | 24.94 | 17.64 | 16.90 | 20.62 | 11.43 | 11.64 | 9.13 | 7.42 | 6.05 | 5.58 | 5.88 | 2.78 | 7.29 | 10.04 | 12.44 | 10.52 | 10.63 | 0.27 | 0.28 | 0.22 | 0.63 | |
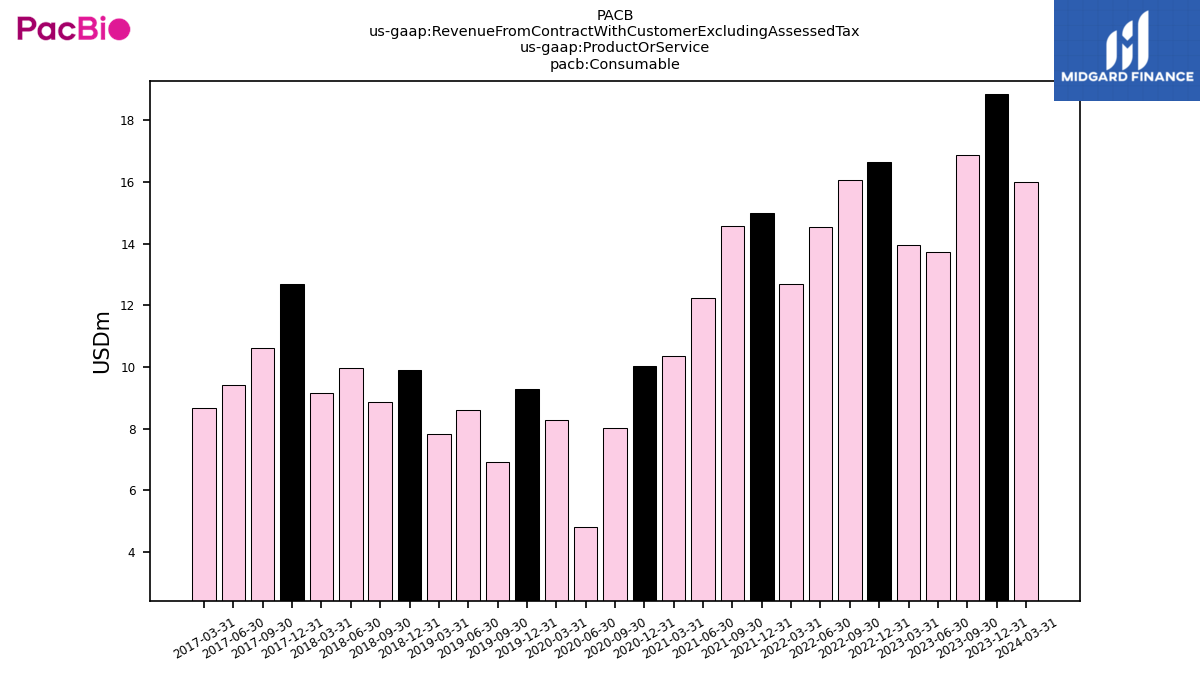
| Consumable | 18.87 | 16.87 | 13.73 | 13.95 | 16.66 | 16.07 | 14.56 | 12.69 | 14.99 | 14.58 | 12.25 | 10.36 | 10.03 | 8.02 | 4.82 | 8.27 | 9.29 | 6.90 | 8.59 | 7.83 | 9.91 | 8.85 | 9.96 | 9.14 | 12.69 | 10.63 | 9.43 | 8.66 | NA | NA | NA | NA | NA | NA | NA | NA | NA | NA | NA | NA | NA | NA | NA | NA | NA | NA | NA | NA | NA | NA | NA | NA | NA | NA | NA | |
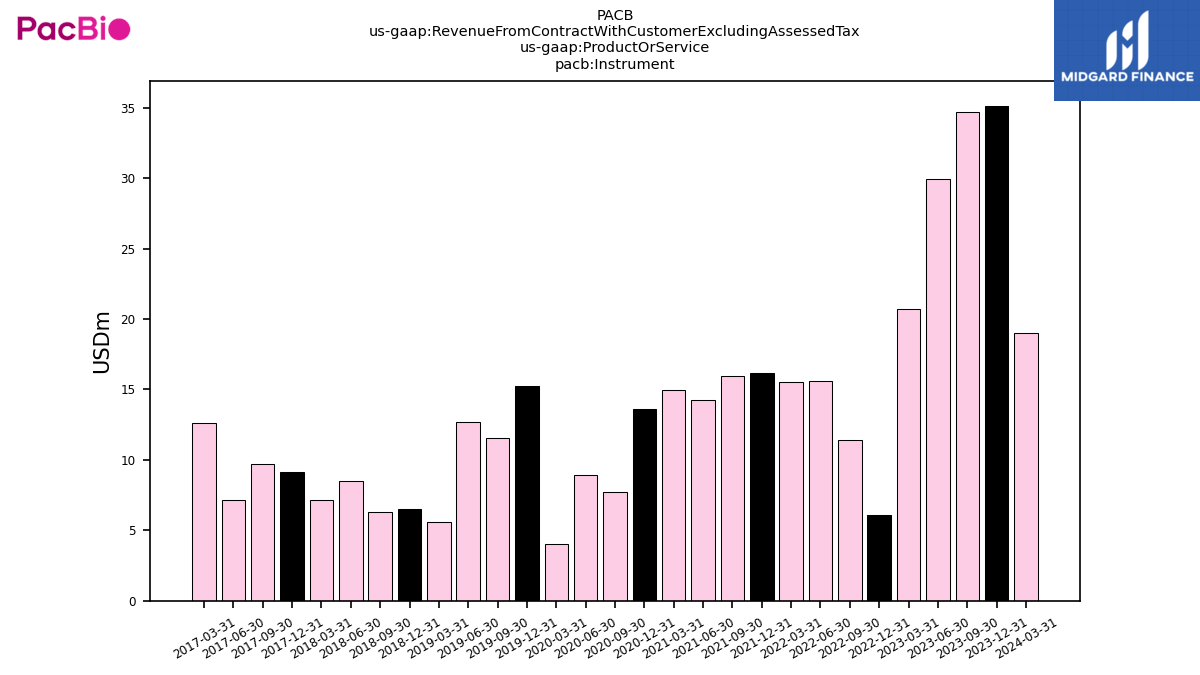
| Instrument | 35.13 | 34.69 | 29.92 | 20.70 | 6.11 | 11.44 | 15.62 | 15.55 | 16.18 | 15.93 | 14.28 | 14.94 | 13.60 | 7.73 | 8.93 | 4.02 | 15.26 | 11.58 | 12.66 | 5.62 | 6.53 | 6.30 | 8.53 | 7.14 | 9.16 | 9.72 | 7.12 | 12.63 | NA | NA | NA | NA | NA | NA | NA | NA | NA | NA | NA | NA | NA | NA | NA | NA | NA | NA | NA | NA | NA | NA | NA | NA | NA | NA | NA | |
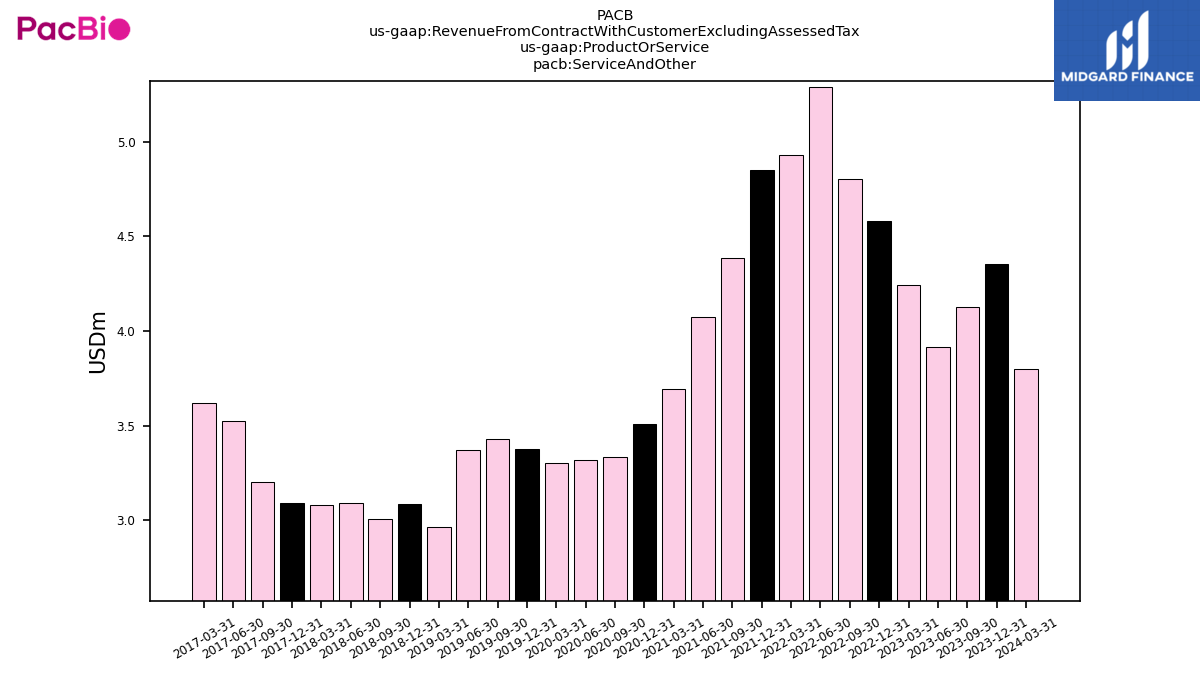
| Service And Other | 4.36 | 4.13 | 3.92 | 4.25 | 4.58 | 4.80 | 5.29 | 4.93 | 4.85 | 4.38 | 4.08 | 3.69 | 3.51 | 3.33 | 3.32 | 3.31 | 3.38 | 3.43 | 3.37 | 2.97 | 3.09 | 3.01 | 3.09 | 3.08 | 3.09 | 3.20 | 3.52 | 3.62 | NA | NA | NA | NA | NA | NA | NA | NA | NA | NA | NA | NA | NA | NA | NA | NA | NA | NA | NA | NA | NA | NA | NA | NA | NA | NA | NA | |
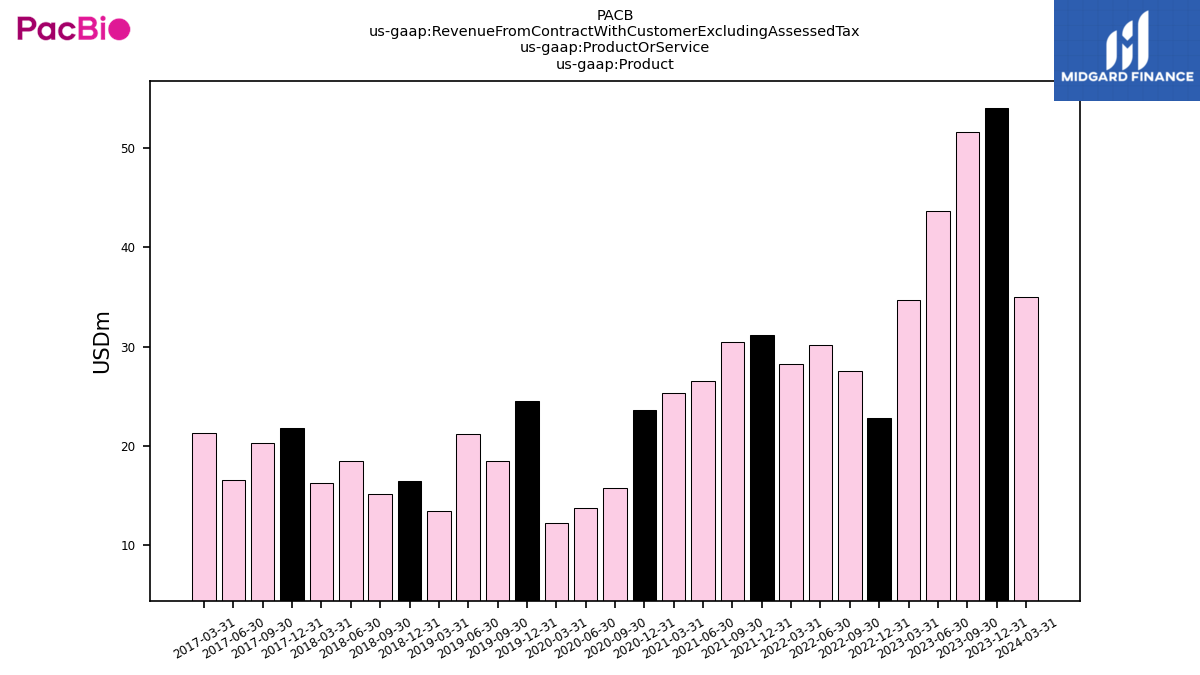
| Product | 54.00 | 51.56 | 43.66 | 34.65 | 22.77 | 27.51 | 30.18 | 28.24 | 31.17 | 30.50 | 26.53 | 25.30 | 23.63 | 15.75 | 13.76 | 12.29 | 24.55 | 18.48 | 21.25 | 13.46 | 16.44 | 15.15 | 18.48 | 16.28 | 21.84 | 20.34 | 16.55 | 21.29 | NA | NA | NA | NA | NA | NA | NA | NA | NA | NA | NA | NA | NA | NA | NA | NA | NA | NA | NA | NA | NA | NA | NA | NA | NA | NA | NA | |
| Revenue From Contract With Customer Including Assessed Tax | 58.36 | 55.69 | 47.57 | 38.90 | 27.35 | 32.31 | 35.47 | 33.17 | 36.02 | 34.89 | 30.61 | 29.00 | 27.14 | 19.08 | 17.08 | 15.60 | 27.93 | 21.91 | 24.62 | 16.43 | 19.53 | 18.16 | 21.58 | 19.36 | 24.93 | 23.55 | 20.07 | 24.91 | 25.72 | 25.12 | 20.75 | 19.13 | 36.28 | 13.92 | 24.94 | 17.64 | 16.90 | 20.62 | 11.43 | 11.64 | 9.13 | 7.42 | 6.05 | 5.58 | 5.88 | 2.78 | 7.29 | 10.04 | 12.44 | 10.52 | 10.63 | 0.27 | 0.28 | 0.22 | 0.63 |