
| 2023-12-31 | 2023-09-30 | 2023-06-30 | 2023-03-31 | 2022-12-31 | 2022-09-30 | 2022-06-30 | 2022-03-31 | 2021-12-31 | 2021-09-30 | 2021-06-30 | 2021-03-31 | 2020-12-31 | 2020-09-30 | 2020-06-30 | 2020-03-31 | 2019-12-31 | 2019-09-30 | 2019-06-30 | 2019-03-31 | 2018-12-31 | 2018-09-30 | 2018-06-30 | 2018-03-31 | 2017-12-31 | 2017-09-30 | 2017-06-30 | 2017-03-31 | 2016-12-31 | 2016-09-30 | 2016-06-30 | 2016-03-31 | 2015-12-31 | 2015-09-30 | 2015-06-30 | 2015-03-31 | 2014-12-31 | 2014-09-30 | 2014-06-30 | 2014-03-31 | 2013-12-31 | 2013-09-30 | 2013-06-30 | 2013-03-31 | 2012-12-31 | 2012-09-30 | 2012-06-30 | 2012-03-31 | 2011-12-31 | 2011-09-30 | 2011-06-30 | 2011-03-31 | 2010-12-31 | 2010-09-30 | 2010-06-30 | 2010-03-31 | ||
|---|---|---|---|---|---|---|---|---|---|---|---|---|---|---|---|---|---|---|---|---|---|---|---|---|---|---|---|---|---|---|---|---|---|---|---|---|---|---|---|---|---|---|---|---|---|---|---|---|---|---|---|---|---|---|---|---|---|
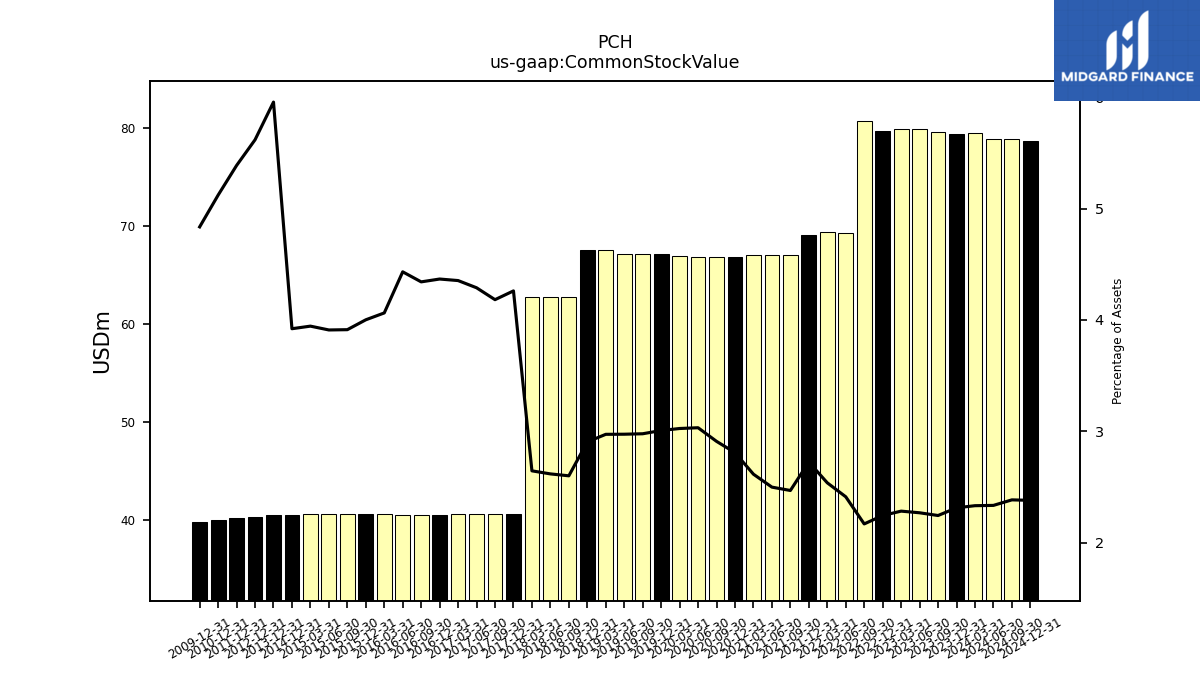
| Common Stock Value | 79.36 | 79.63 | 79.91 | 79.92 | 79.68 | 80.78 | 69.28 | 69.37 | 69.06 | 67.10 | 67.05 | 67.04 | 66.88 | 66.87 | 66.87 | 66.95 | 67.22 | 67.22 | 67.19 | 67.59 | 67.57 | 62.76 | 62.75 | 62.76 | 40.61 | 40.61 | 40.61 | 40.61 | 40.52 | 40.52 | 40.52 | 40.69 | 40.68 | 40.68 | 40.68 | 40.68 | 40.60 | NA | NA | NA | 40.54 | NA | NA | NA | 40.39 | NA | NA | NA | 40.20 | NA | NA | NA | 40.03 | NA | NA | NA | |
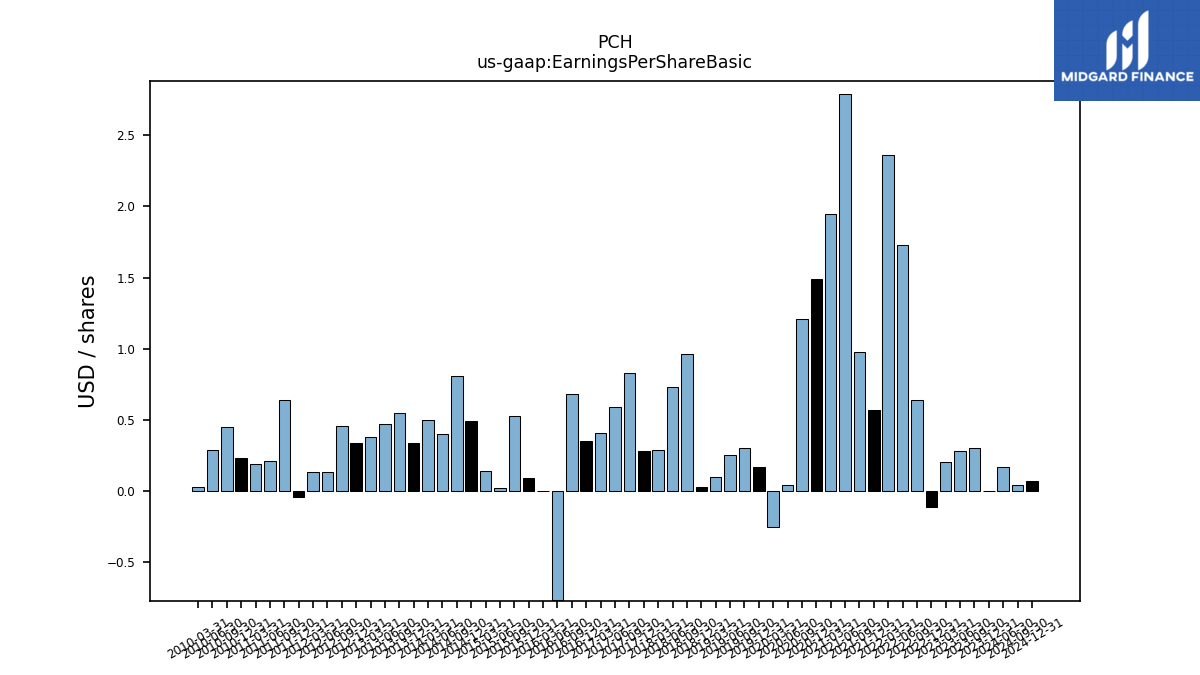
| Earnings Per Share Basic | 0.00 | 0.30 | 0.28 | 0.20 | -0.11 | 0.64 | 1.73 | 2.36 | 0.57 | 0.98 | 2.79 | 1.95 | 1.49 | 1.21 | 0.04 | -0.25 | 0.17 | 0.30 | 0.25 | 0.10 | 0.03 | 0.96 | 0.73 | 0.29 | 0.28 | 0.83 | 0.59 | 0.41 | 0.35 | 0.68 | -0.77 | 0.00 | 0.09 | 0.53 | 0.02 | 0.14 | 0.49 | 0.81 | 0.40 | 0.50 | 0.34 | 0.55 | 0.47 | 0.38 | 0.34 | 0.46 | 0.13 | 0.13 | -0.04 | 0.64 | 0.21 | 0.19 | 0.23 | 0.45 | 0.29 | 0.03 | |
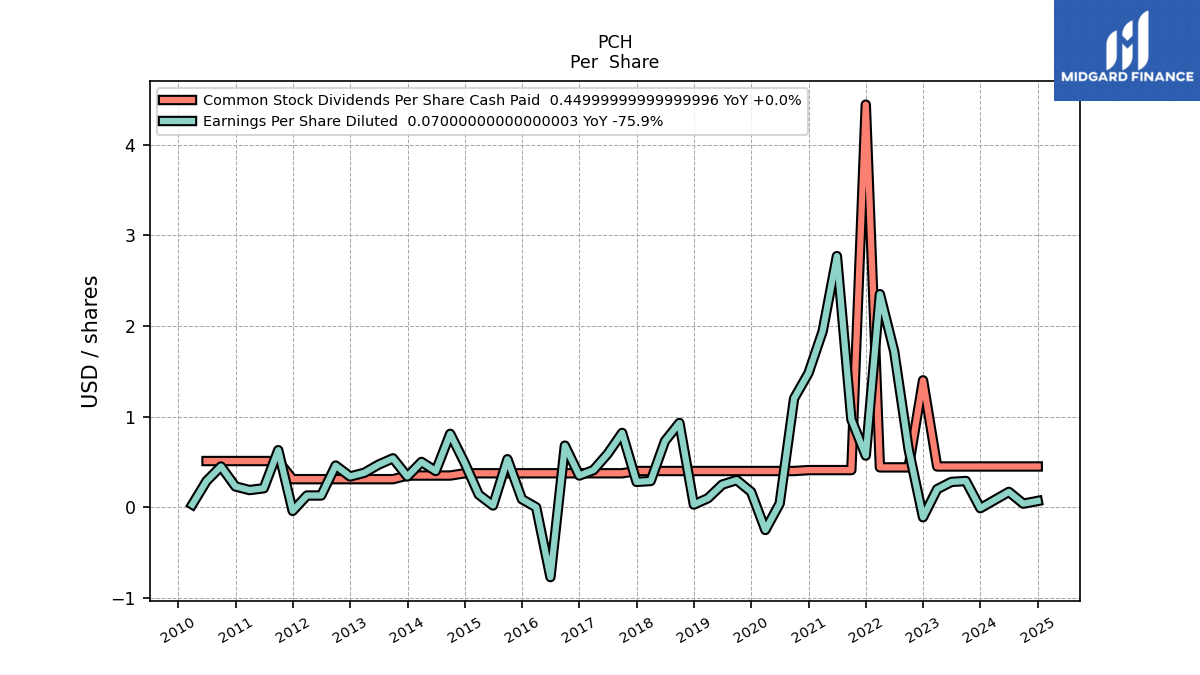
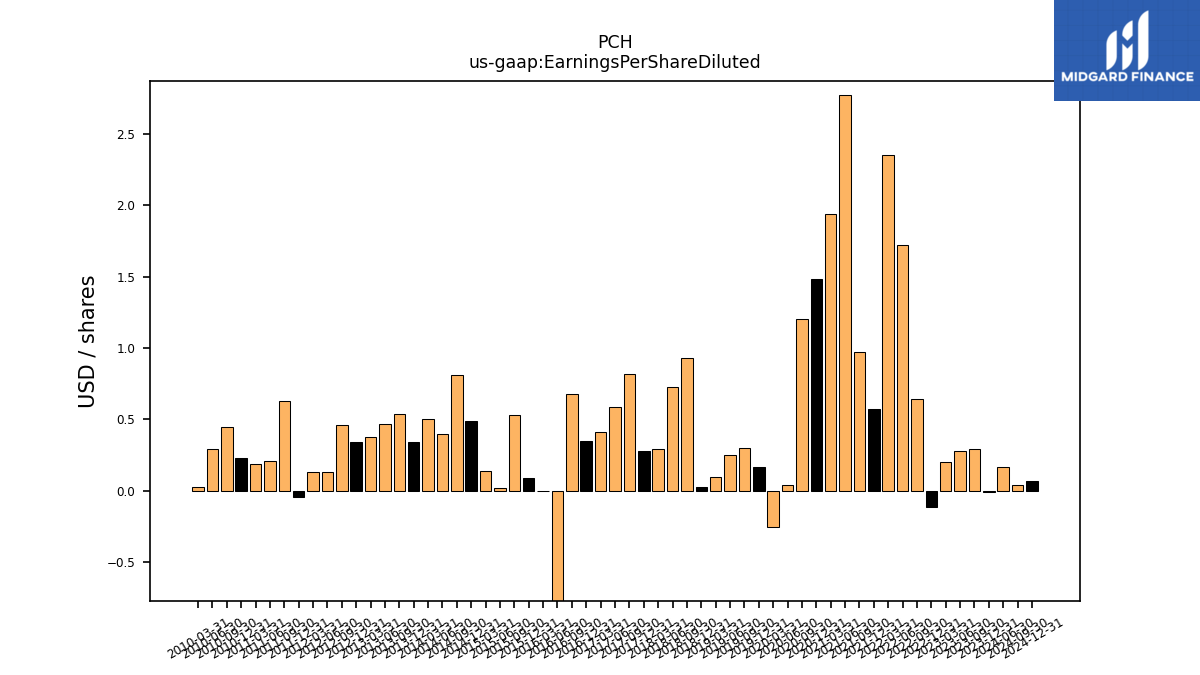
| Earnings Per Share Diluted | -0.01 | 0.29 | 0.28 | 0.20 | -0.11 | 0.64 | 1.72 | 2.35 | 0.57 | 0.97 | 2.77 | 1.94 | 1.48 | 1.20 | 0.04 | -0.25 | 0.17 | 0.30 | 0.25 | 0.10 | 0.03 | 0.93 | 0.73 | 0.29 | 0.28 | 0.82 | 0.59 | 0.41 | 0.35 | 0.68 | -0.77 | 0.00 | 0.09 | 0.53 | 0.02 | 0.14 | 0.49 | 0.81 | 0.40 | 0.50 | 0.34 | 0.54 | 0.47 | 0.38 | 0.34 | 0.46 | 0.13 | 0.13 | -0.04 | 0.63 | 0.21 | 0.19 | 0.23 | 0.45 | 0.29 | 0.03 |
| 2023-12-31 | 2023-09-30 | 2023-06-30 | 2023-03-31 | 2022-12-31 | 2022-09-30 | 2022-06-30 | 2022-03-31 | 2021-12-31 | 2021-09-30 | 2021-06-30 | 2021-03-31 | 2020-12-31 | 2020-09-30 | 2020-06-30 | 2020-03-31 | 2019-12-31 | 2019-09-30 | 2019-06-30 | 2019-03-31 | 2018-12-31 | 2018-09-30 | 2018-06-30 | 2018-03-31 | 2017-12-31 | 2017-09-30 | 2017-06-30 | 2017-03-31 | 2016-12-31 | 2016-09-30 | 2016-06-30 | 2016-03-31 | 2015-12-31 | 2015-09-30 | 2015-06-30 | 2015-03-31 | 2014-12-31 | 2014-09-30 | 2014-06-30 | 2014-03-31 | 2013-12-31 | 2013-09-30 | 2013-06-30 | 2013-03-31 | 2012-12-31 | 2012-09-30 | 2012-06-30 | 2012-03-31 | 2011-12-31 | 2011-09-30 | 2011-06-30 | 2011-03-31 | 2010-12-31 | 2010-09-30 | 2010-06-30 | 2010-03-31 | ||
|---|---|---|---|---|---|---|---|---|---|---|---|---|---|---|---|---|---|---|---|---|---|---|---|---|---|---|---|---|---|---|---|---|---|---|---|---|---|---|---|---|---|---|---|---|---|---|---|---|---|---|---|---|---|---|---|---|---|
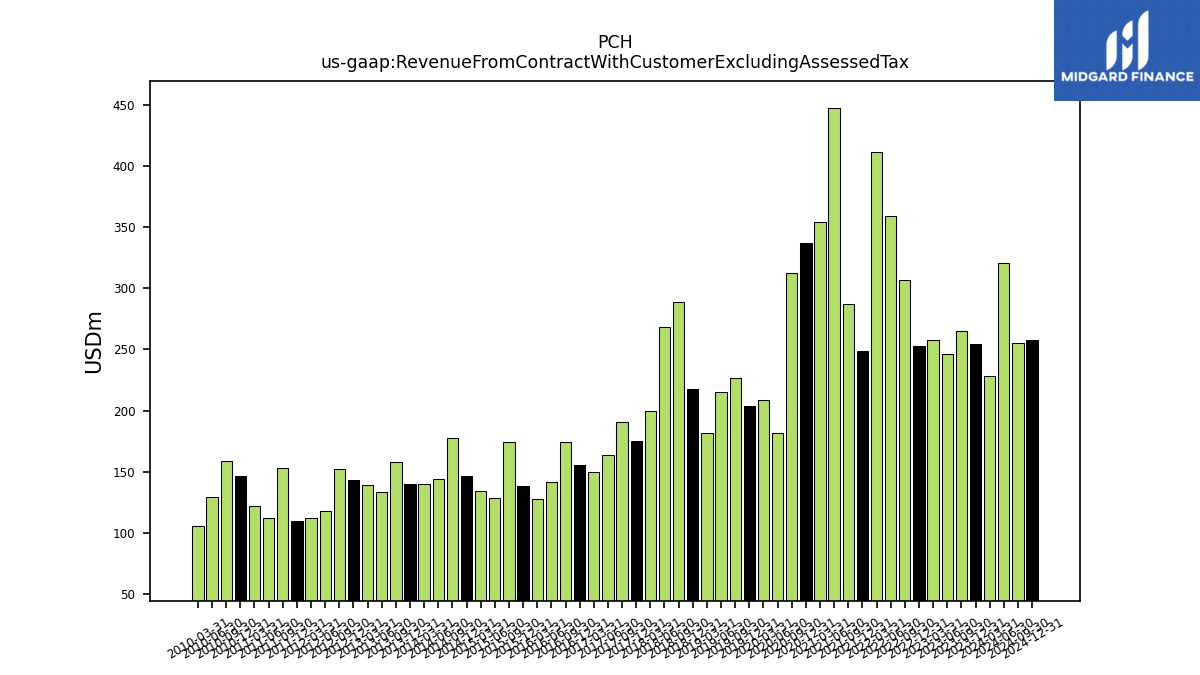
| Revenue From Contract With Customer Excluding Assessed Tax | 254.50 | 265.51 | 246.10 | 257.96 | 253.14 | 306.69 | 359.60 | 411.35 | 248.41 | 287.33 | 447.51 | 354.19 | 337.45 | 313.05 | 181.56 | 208.88 | 203.50 | 226.30 | 215.58 | 181.72 | 217.25 | 289.20 | 268.23 | 199.90 | 175.24 | 190.44 | 163.23 | 149.68 | 155.68 | 174.03 | 141.50 | 127.90 | 137.99 | 174.47 | 128.75 | 134.12 | 146.24 | 177.22 | 143.92 | 139.58 | 139.96 | 157.87 | 133.21 | 139.25 | 143.30 | 151.91 | 117.54 | 112.38 | 109.93 | 152.89 | 112.37 | 122.23 | 146.17 | 158.88 | 128.98 | 105.42 | |
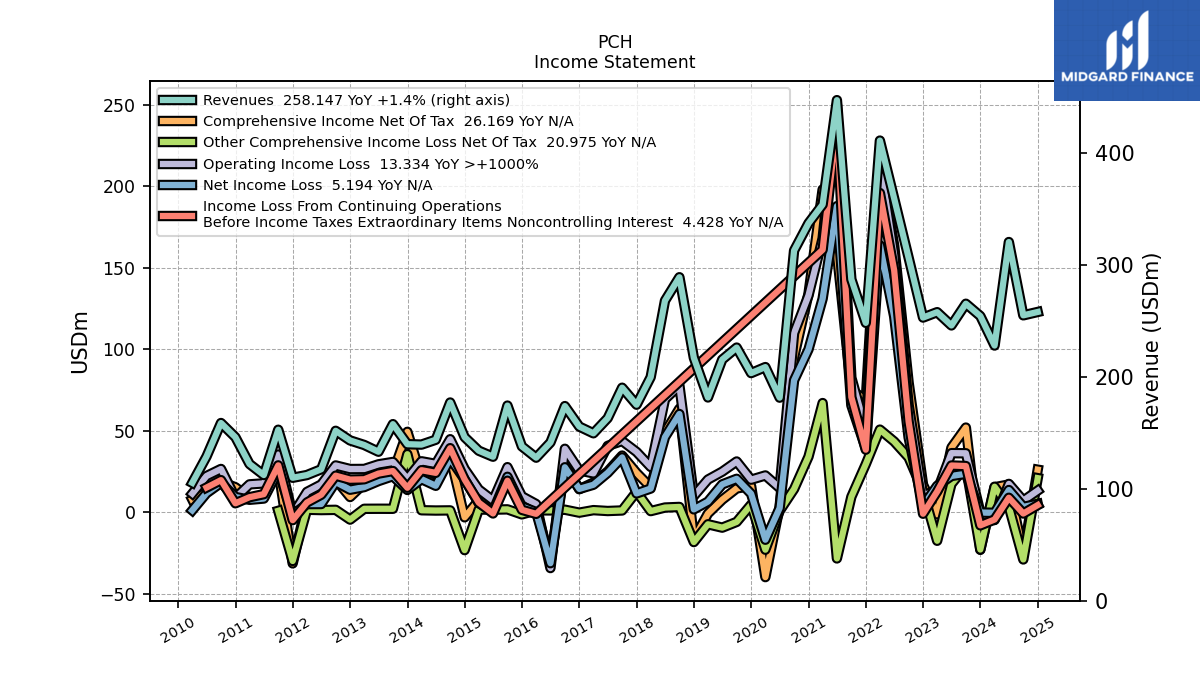
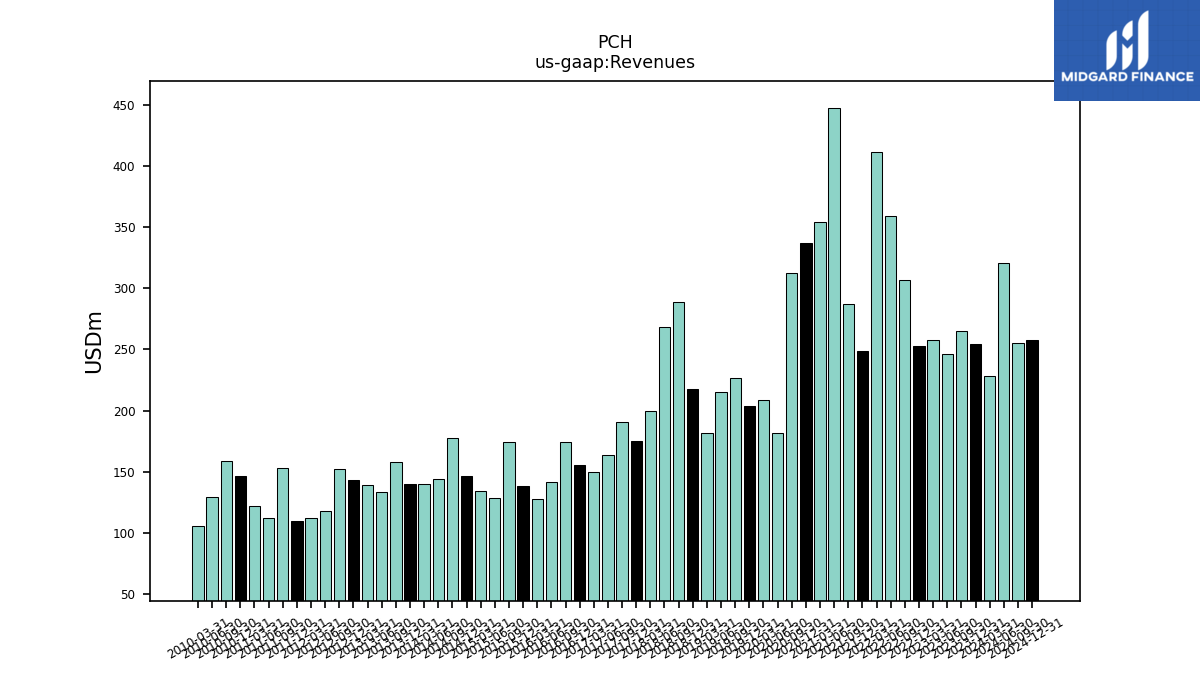
| Revenues | 254.50 | 265.51 | 246.10 | 257.96 | 253.14 | 306.69 | 359.60 | 411.35 | 248.41 | 287.33 | 447.51 | 354.19 | 337.45 | 313.05 | 181.56 | 208.88 | 203.50 | 226.30 | 215.58 | 181.72 | 217.25 | 289.20 | 268.23 | 199.90 | 175.24 | 190.44 | 163.23 | 149.68 | 155.68 | 174.03 | 141.50 | 127.90 | 137.99 | 174.47 | 128.75 | 134.12 | 146.24 | 177.22 | 143.92 | 139.58 | 139.96 | 157.87 | 133.21 | 139.25 | 143.30 | 151.91 | 117.54 | 112.38 | 109.93 | 152.89 | 112.37 | 122.23 | 146.17 | 158.88 | 128.98 | 105.42 | |
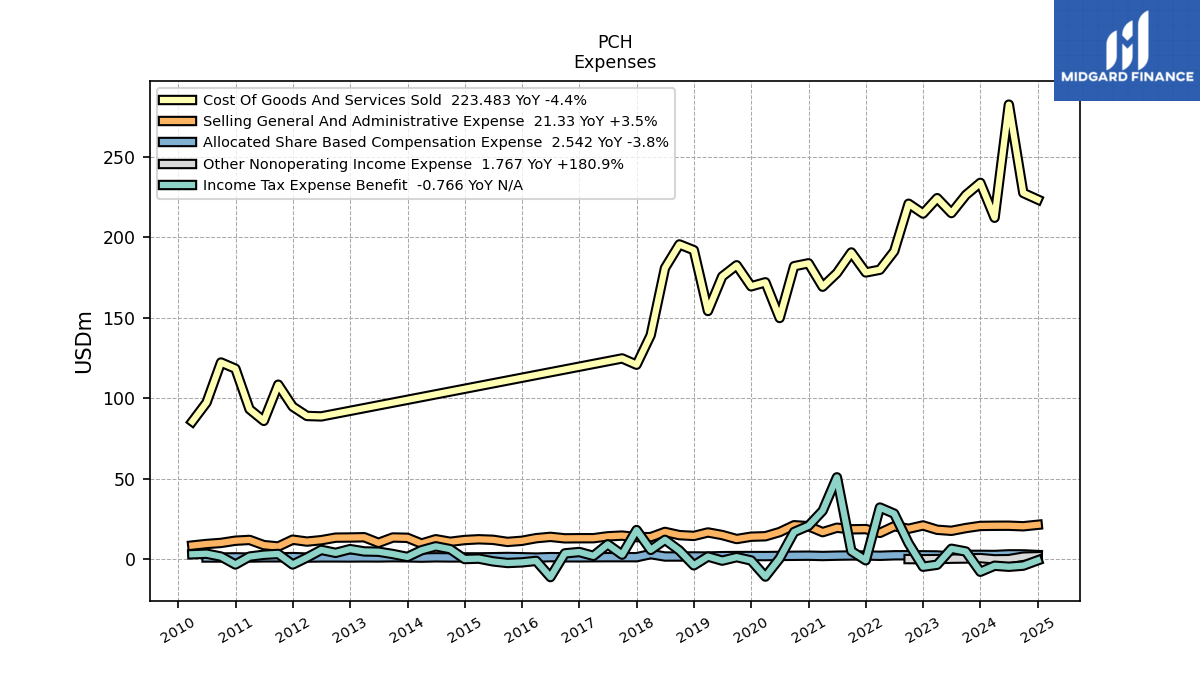
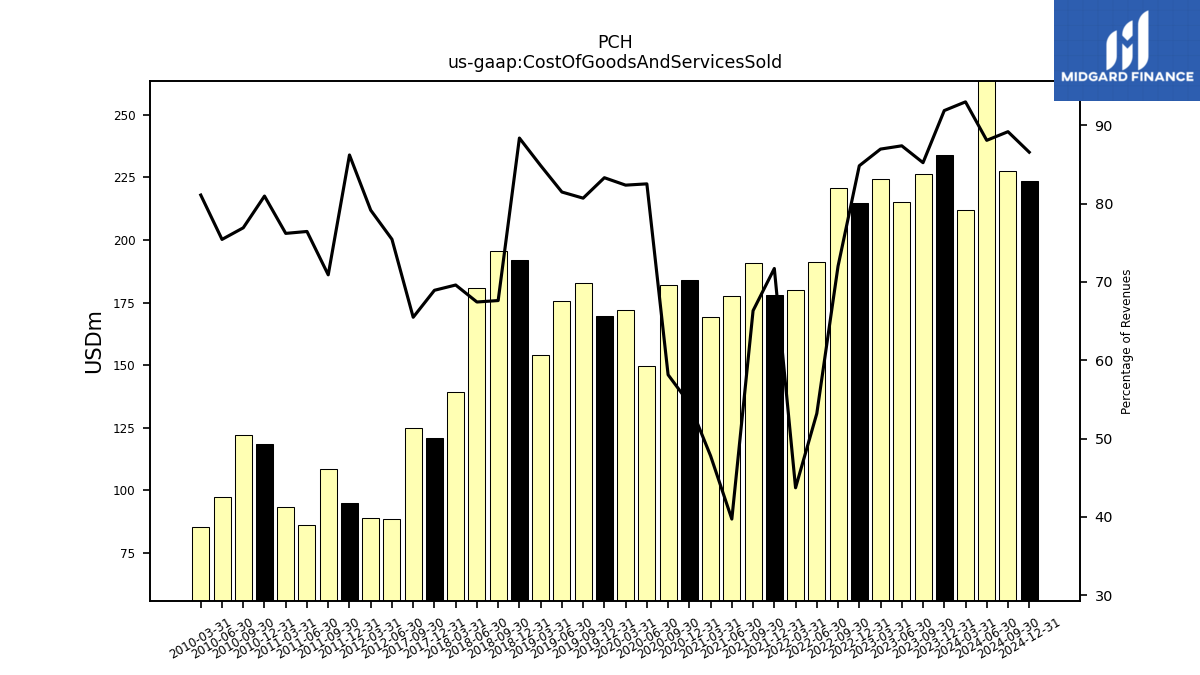
| Cost Of Goods And Services Sold | 233.86 | 226.30 | 215.06 | 224.35 | 214.76 | 220.88 | 191.33 | 179.85 | 178.16 | 190.60 | 177.78 | 169.30 | 183.86 | 182.04 | 149.84 | 172.05 | 169.54 | 182.63 | 175.67 | 154.22 | 192.00 | 195.58 | 180.91 | 139.16 | 120.81 | 124.73 | NA | NA | NA | NA | NA | NA | NA | NA | NA | NA | NA | NA | NA | NA | NA | NA | NA | NA | NA | NA | 88.69 | 88.97 | 94.78 | 108.42 | 85.91 | 93.15 | 118.36 | 122.20 | 97.30 | 85.49 | |
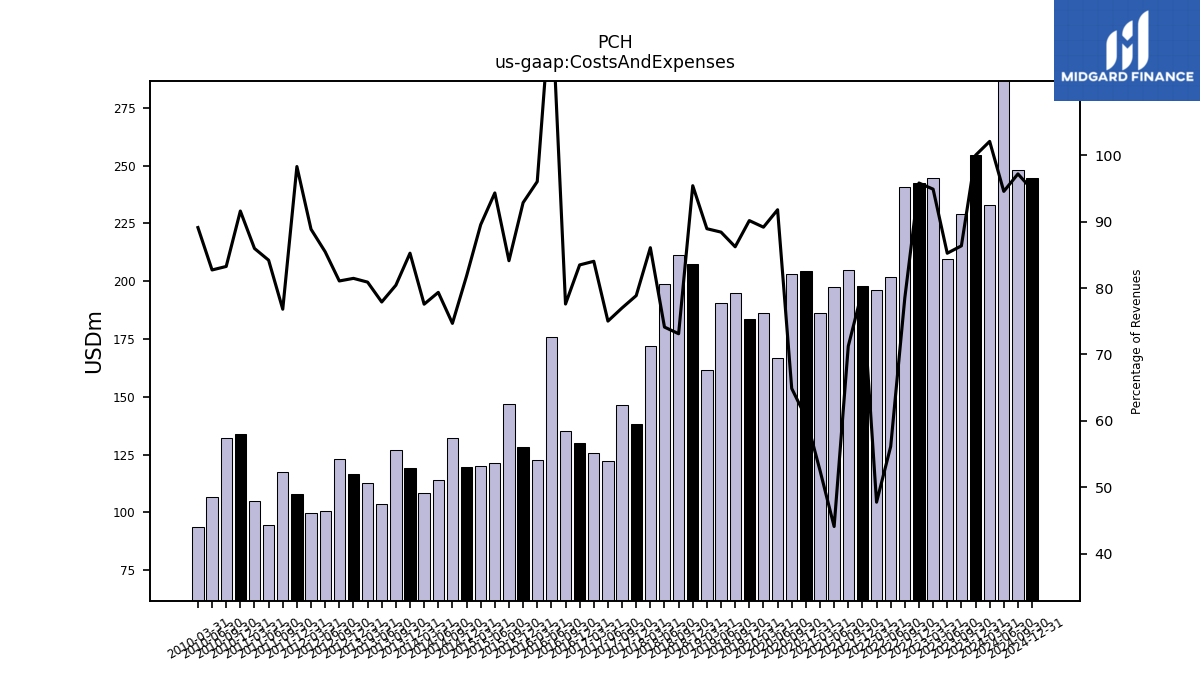
| Costs And Expenses | 254.47 | 229.28 | 209.78 | 244.79 | 242.56 | 240.85 | 201.88 | 196.42 | 197.85 | 204.72 | 197.29 | 186.06 | 204.31 | 203.09 | 166.65 | 186.25 | 183.47 | 195.11 | 190.62 | 161.61 | 207.29 | 211.46 | 198.82 | 172.07 | 138.20 | 146.65 | 122.46 | 125.77 | 129.97 | 135.03 | 175.72 | 122.82 | 128.13 | 146.76 | 121.44 | 120.10 | 119.63 | 132.35 | 114.19 | 108.27 | 119.31 | 126.97 | 103.77 | 112.64 | 116.73 | 123.15 | 100.45 | 99.86 | 108.06 | 117.44 | 94.61 | 105.08 | 133.89 | 132.27 | 106.70 | 93.94 | |
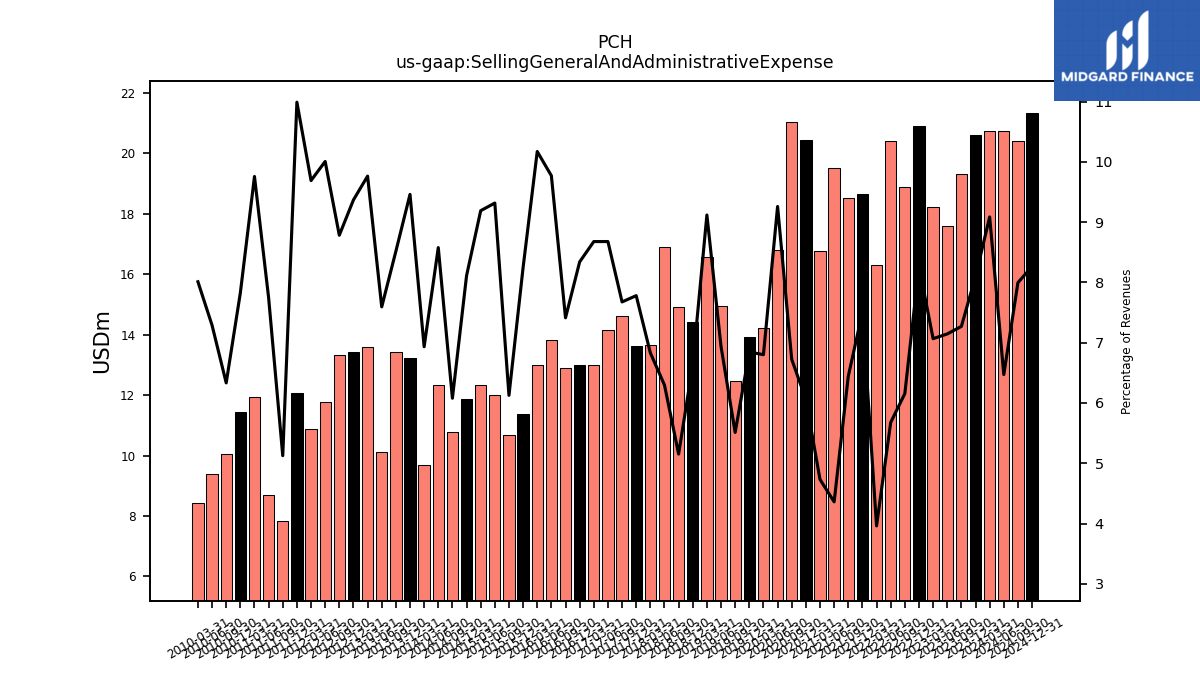
| Selling General And Administrative Expense | 20.61 | 19.30 | 17.59 | 18.23 | 20.92 | 18.88 | 20.41 | 16.29 | 18.65 | 18.51 | 19.51 | 16.76 | 20.45 | 21.05 | 16.81 | 14.21 | 13.93 | 12.47 | 14.95 | 16.57 | 14.41 | 14.90 | 16.89 | 13.66 | 13.63 | 14.62 | 14.16 | 12.99 | 12.98 | 12.90 | 13.82 | 13.01 | 11.38 | 10.69 | 11.99 | 12.33 | 11.86 | 10.77 | 12.35 | 9.68 | 13.24 | 13.44 | 10.12 | 13.60 | 13.43 | 13.34 | 11.76 | 10.89 | 12.08 | 7.84 | 8.70 | 11.93 | 11.44 | 10.06 | 9.40 | 8.45 | |
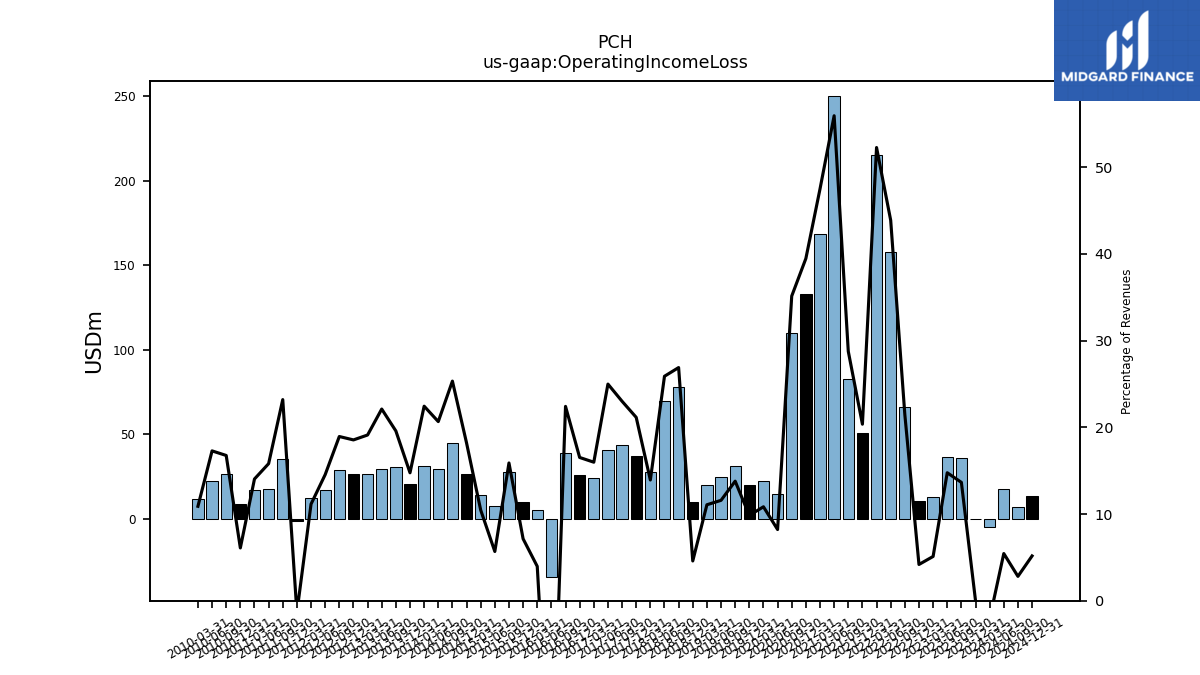
| Operating Income Loss | 0.03 | 36.23 | 36.32 | 13.17 | 10.59 | 65.84 | 157.72 | 214.93 | 50.56 | 82.61 | 250.22 | 168.13 | 133.13 | 109.96 | 14.91 | 22.63 | 20.02 | 31.20 | 24.96 | 20.11 | 9.96 | 77.74 | 69.42 | 27.83 | 37.05 | 43.79 | 40.77 | 23.91 | 25.72 | 38.99 | -34.23 | 5.07 | 9.86 | 27.71 | 7.31 | 14.03 | 26.60 | 44.87 | 29.73 | 31.31 | 20.64 | 30.90 | 29.44 | 26.61 | 26.57 | 28.76 | 17.09 | 12.52 | -1.48 | 35.45 | 17.76 | 17.16 | 8.90 | 26.61 | 22.28 | 11.48 | |
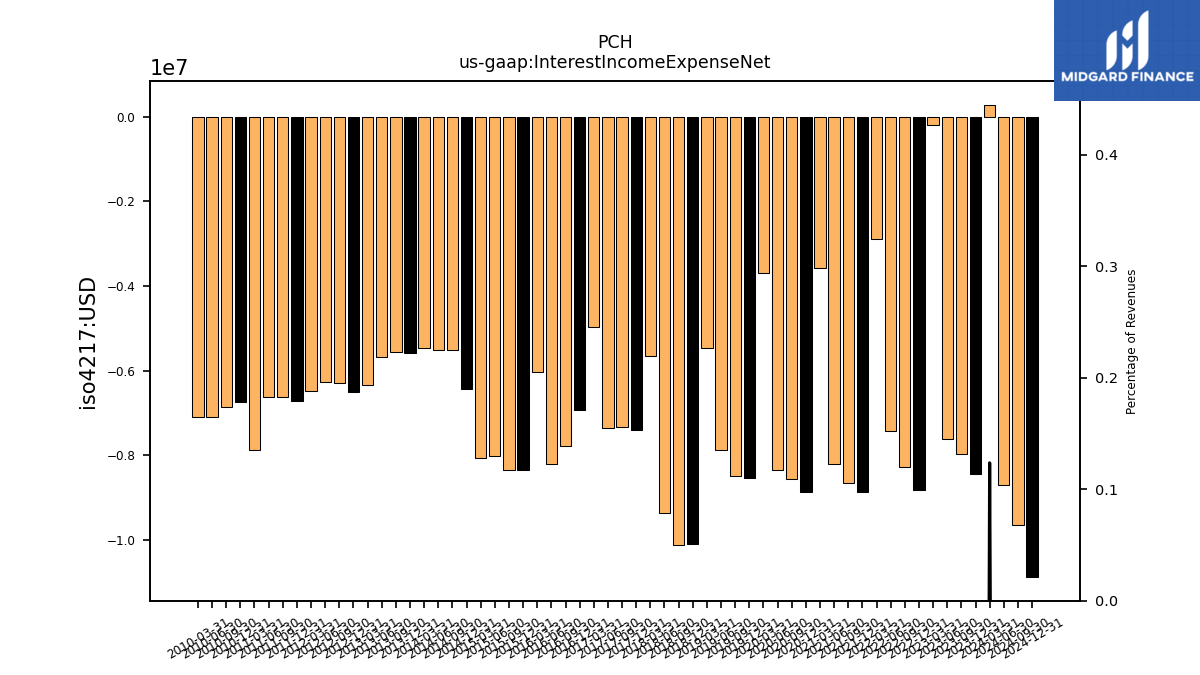
| Interest Income Expense Net | -8.44 | -7.97 | -7.61 | -0.20 | -8.81 | -8.28 | -7.42 | -2.89 | -8.86 | -8.64 | -8.20 | -3.57 | -8.87 | -8.56 | -8.34 | -3.70 | -8.54 | -8.47 | -7.88 | -5.46 | -10.10 | -10.11 | -9.36 | -5.66 | -7.39 | -7.34 | -7.35 | -4.97 | -6.92 | -7.79 | -8.21 | -6.03 | -8.34 | -8.34 | -8.02 | -8.07 | -6.43 | -5.51 | -5.51 | -5.46 | -5.57 | -5.56 | -5.67 | -6.34 | -6.50 | -6.28 | -6.28 | -6.49 | -6.71 | -6.63 | -6.61 | -7.88 | -6.75 | -6.86 | -7.09 | -7.09 | |
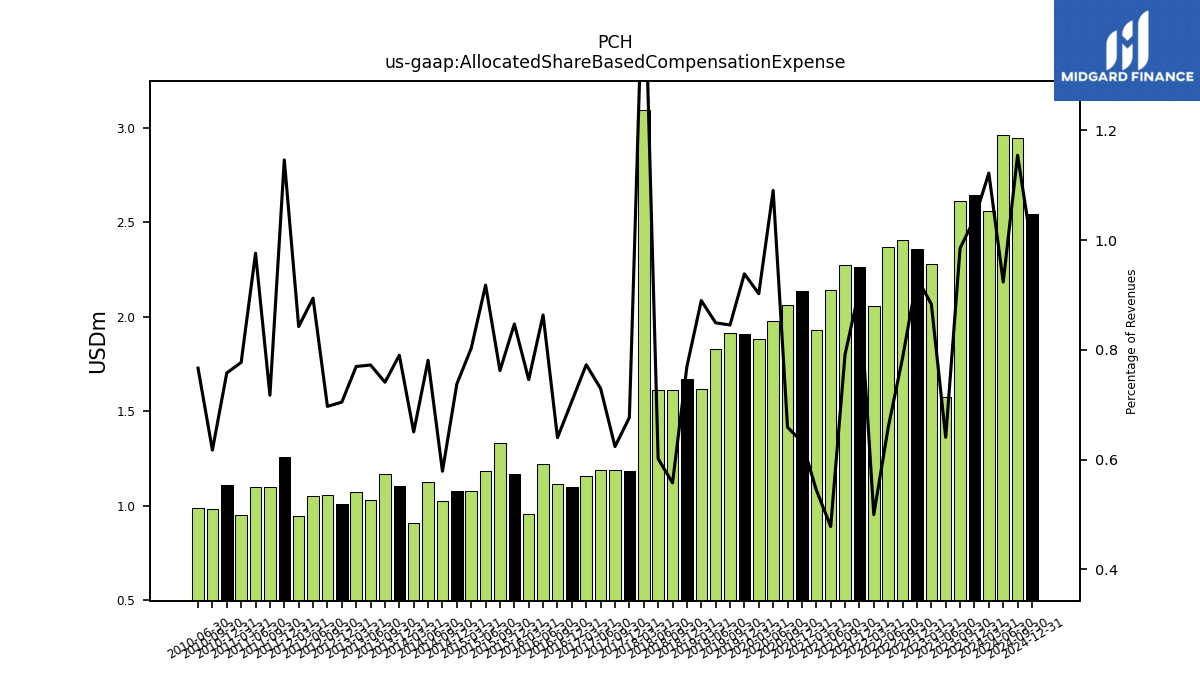
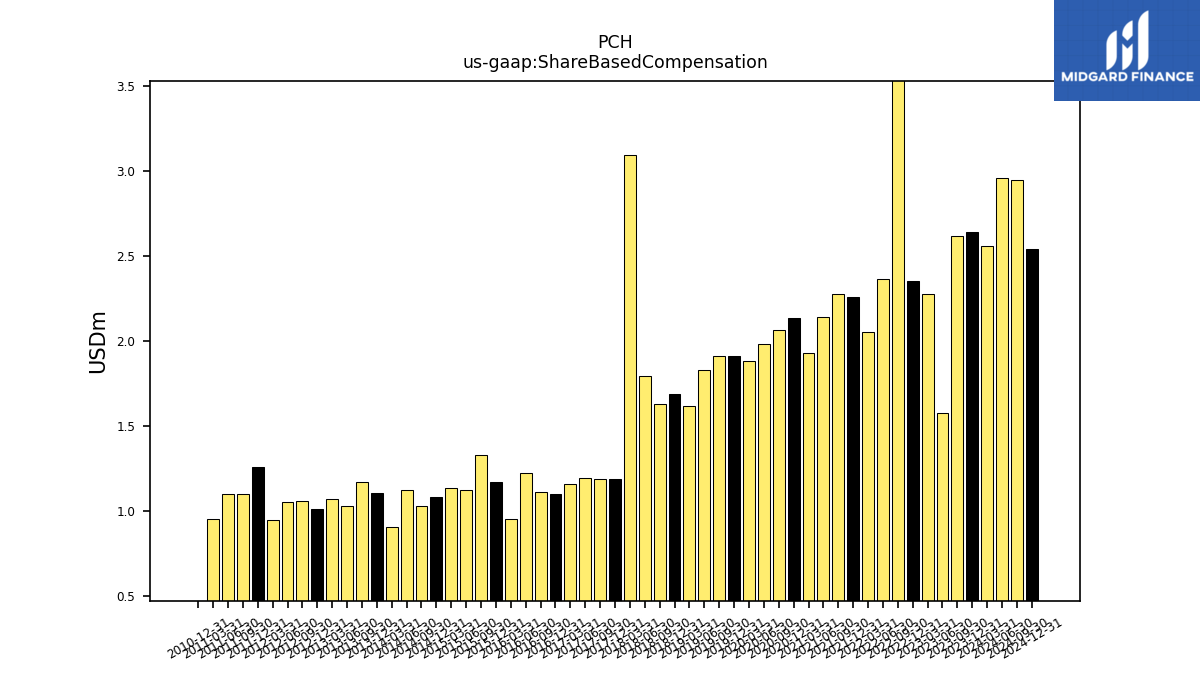
| Allocated Share Based Compensation Expense | 2.64 | 2.62 | 1.58 | 2.28 | 2.36 | 2.41 | 2.37 | 2.06 | 2.26 | 2.27 | 2.14 | 1.93 | 2.13 | 2.06 | 1.98 | 1.89 | 1.91 | 1.91 | 1.83 | 1.62 | 1.67 | 1.61 | 1.61 | 3.09 | 1.19 | 1.19 | 1.19 | 1.16 | 1.10 | 1.11 | 1.22 | 0.95 | 1.17 | 1.33 | 1.18 | 1.08 | 1.08 | 1.03 | 1.12 | 0.91 | 1.11 | 1.17 | 1.03 | 1.07 | 1.01 | 1.06 | 1.05 | 0.95 | 1.26 | 1.10 | 1.10 | 0.95 | 1.11 | 0.98 | 0.99 | NA | |
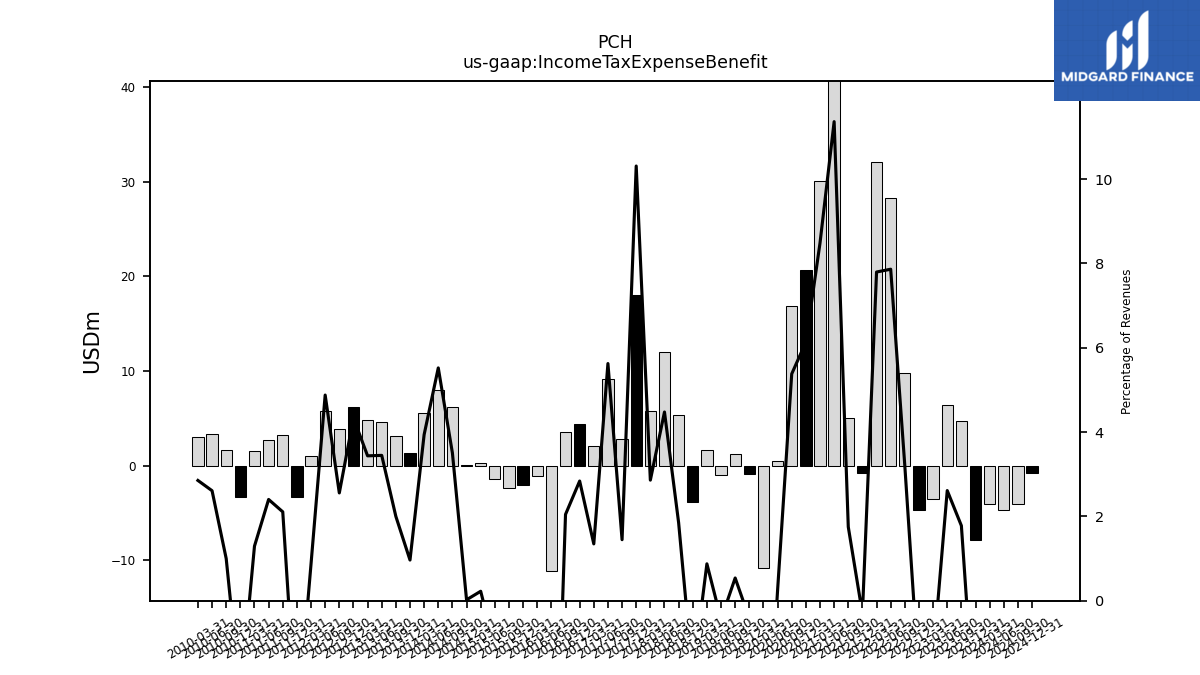
| Income Tax Expense Benefit | -7.87 | 4.72 | 6.43 | -3.50 | -4.72 | 9.80 | 28.27 | 32.06 | -0.75 | 5.03 | 50.84 | 30.04 | 20.69 | 16.84 | 0.45 | -10.86 | -0.85 | 1.22 | -0.95 | 1.59 | -3.88 | 5.36 | 12.01 | 5.72 | 18.07 | 2.76 | 9.18 | 2.02 | 4.42 | 3.56 | -11.20 | -1.11 | -2.04 | -2.42 | -1.42 | 0.30 | 0.03 | 6.21 | 7.95 | 5.50 | 1.35 | 3.16 | 4.59 | 4.79 | 6.21 | 3.88 | 5.73 | 0.98 | -3.36 | 3.22 | 2.70 | 1.58 | -3.36 | 1.59 | 3.37 | 3.01 | |
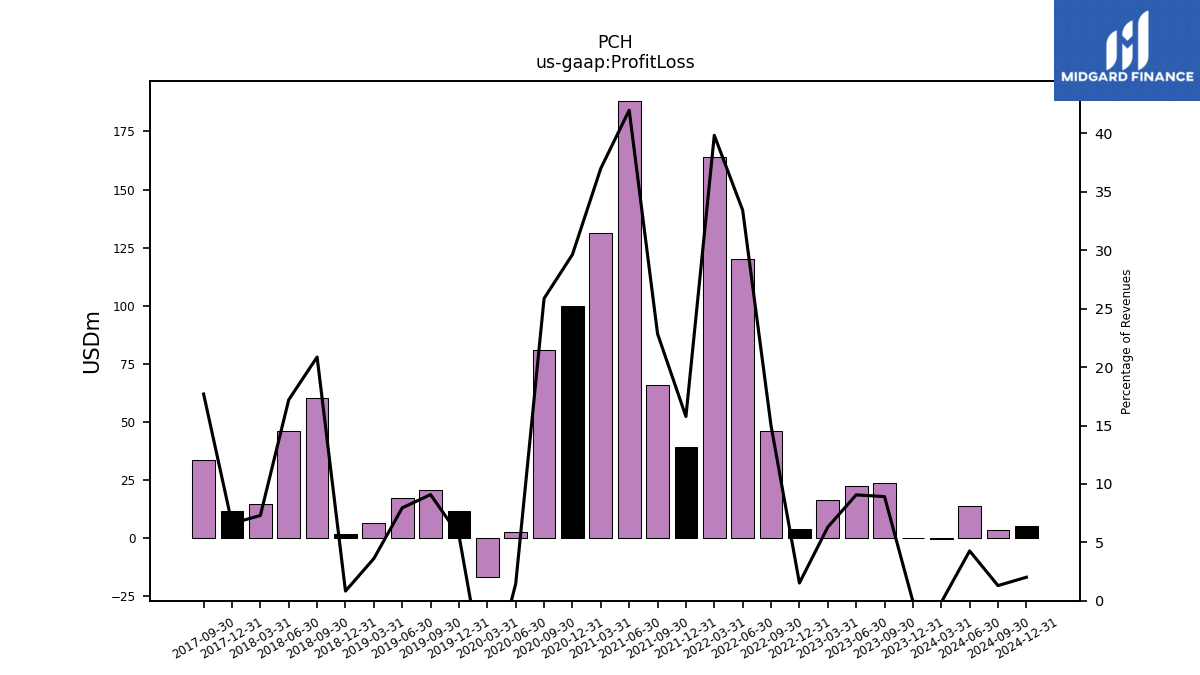
| Profit Loss | -0.14 | 23.68 | 22.31 | 16.26 | 3.84 | 45.95 | 120.22 | 163.88 | 39.18 | 65.67 | 187.91 | 131.11 | 100.02 | 81.01 | 2.64 | -16.83 | 11.40 | 20.57 | 17.14 | 6.56 | 1.80 | 60.34 | 46.15 | 14.60 | 11.59 | 33.70 | NA | NA | NA | NA | NA | NA | NA | NA | NA | NA | NA | NA | NA | NA | NA | NA | NA | NA | NA | NA | NA | NA | NA | NA | NA | NA | NA | NA | NA | NA | |
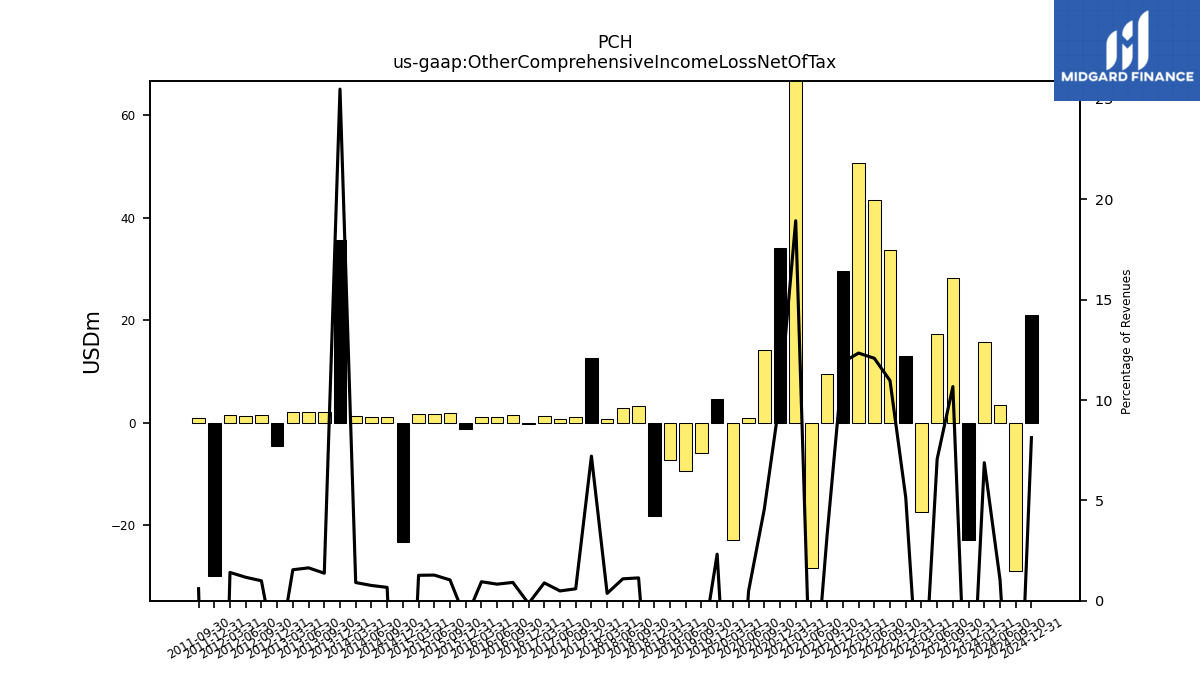
| Other Comprehensive Income Loss Net Of Tax | -22.86 | 28.33 | 17.38 | -17.47 | 13.05 | 33.64 | 43.44 | 50.76 | 29.53 | 9.48 | -28.32 | 67.06 | 34.16 | 14.28 | 0.88 | -22.95 | 4.72 | -5.89 | -9.41 | -7.35 | -18.27 | 3.29 | 2.93 | 0.73 | 12.63 | 1.13 | 0.80 | 1.33 | -0.21 | 1.59 | 1.17 | 1.21 | -1.27 | 1.81 | 1.65 | 1.70 | -23.21 | 1.18 | 1.10 | 1.27 | 35.68 | 2.17 | 2.18 | 2.15 | -4.49 | 1.51 | 1.38 | 1.58 | -29.89 | 0.92 | NA | NA | NA | NA | NA | NA | |
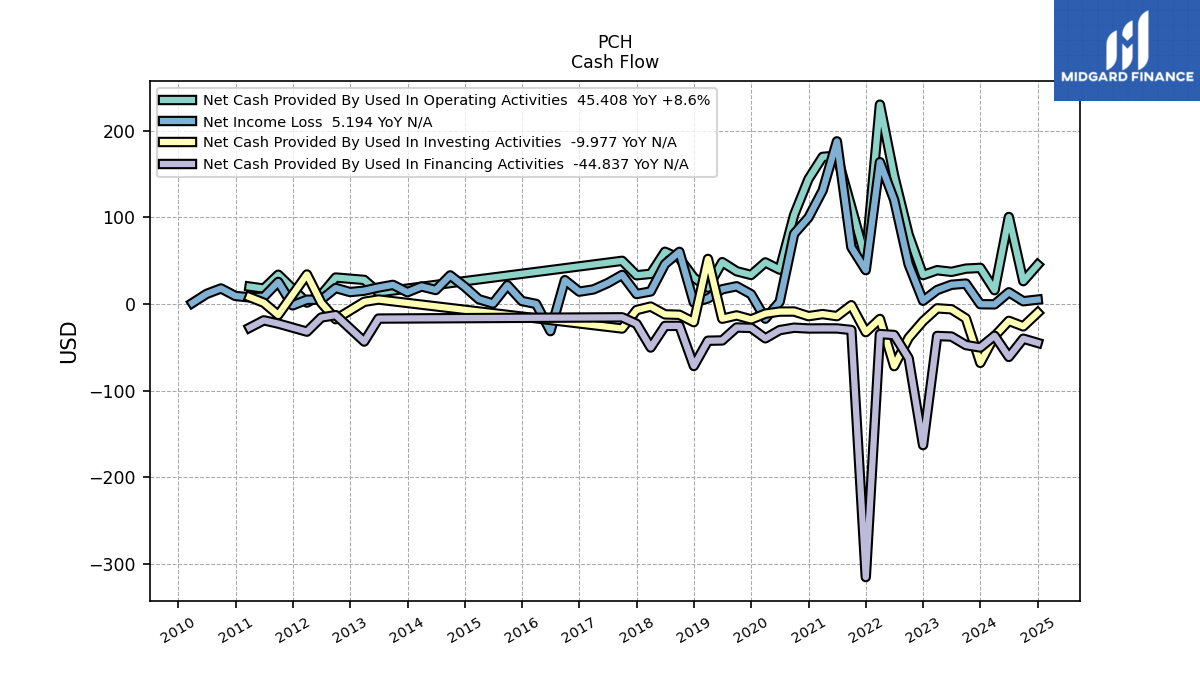
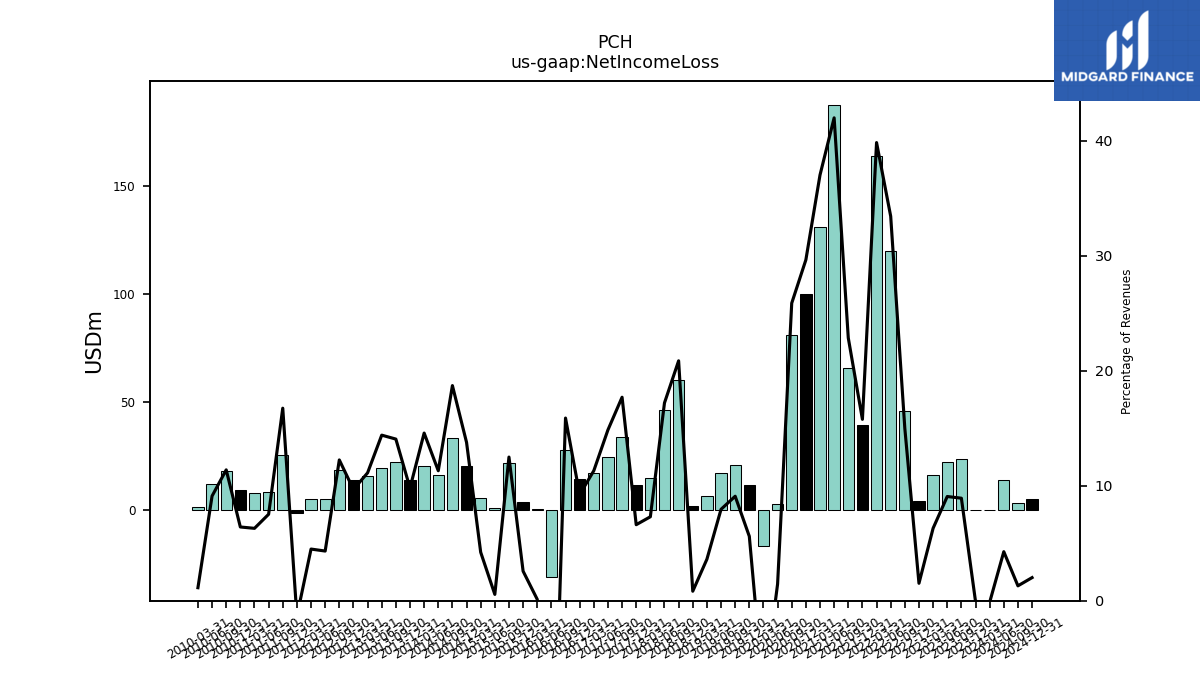
| Net Income Loss | -0.14 | 23.68 | 22.31 | 16.26 | 3.84 | 45.95 | 120.22 | 163.88 | 39.18 | 65.67 | 187.91 | 131.11 | 100.02 | 81.01 | 2.64 | -16.83 | 11.40 | 20.57 | 17.14 | 6.56 | 1.80 | 60.34 | 46.15 | 14.60 | 11.59 | 33.70 | 24.24 | 16.92 | 14.37 | 27.65 | -31.24 | 0.16 | 3.55 | 21.80 | 0.71 | 5.66 | 20.14 | 33.15 | 16.27 | 20.35 | 13.72 | 22.19 | 19.18 | 15.49 | 13.86 | 18.60 | 5.08 | 5.05 | -1.48 | 25.60 | 8.45 | 7.70 | 9.38 | 18.08 | 11.74 | 1.20 | |
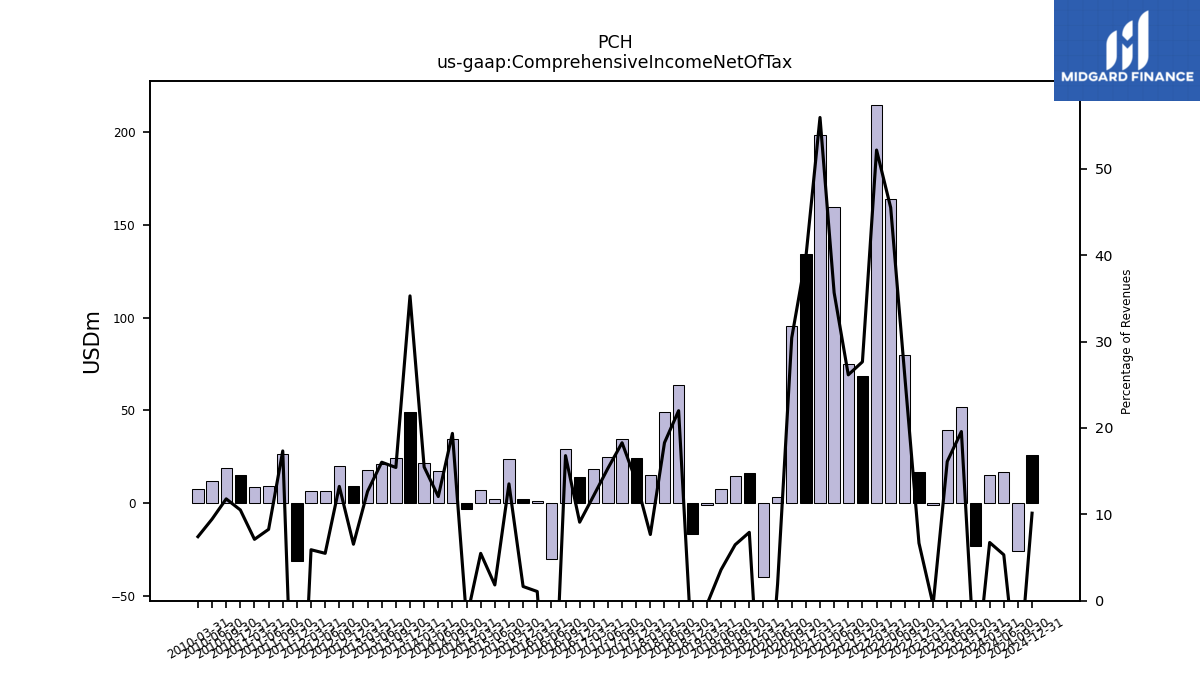
| Comprehensive Income Net Of Tax | -23.00 | 52.01 | 39.68 | -1.21 | 16.89 | 79.59 | 163.67 | 214.64 | 68.71 | 75.15 | 159.59 | 198.17 | 134.17 | 95.29 | 3.52 | -39.78 | 16.12 | 14.67 | 7.73 | -0.79 | -16.48 | 63.63 | 49.08 | 15.33 | 24.22 | 34.83 | 25.04 | 18.25 | 14.16 | 29.24 | -30.07 | 1.37 | 2.28 | 23.61 | 2.36 | 7.36 | -3.08 | 34.34 | 17.37 | 21.62 | 49.40 | 24.36 | 21.36 | 17.64 | 9.38 | 20.11 | 6.46 | 6.64 | -31.36 | 26.52 | 9.29 | 8.69 | 15.37 | 18.74 | 12.19 | 7.82 |
| 2023-12-31 | 2023-09-30 | 2023-06-30 | 2023-03-31 | 2022-12-31 | 2022-09-30 | 2022-06-30 | 2022-03-31 | 2021-12-31 | 2021-09-30 | 2021-06-30 | 2021-03-31 | 2020-12-31 | 2020-09-30 | 2020-06-30 | 2020-03-31 | 2019-12-31 | 2019-09-30 | 2019-06-30 | 2019-03-31 | 2018-12-31 | 2018-09-30 | 2018-06-30 | 2018-03-31 | 2017-12-31 | 2017-09-30 | 2017-06-30 | 2017-03-31 | 2016-12-31 | 2016-09-30 | 2016-06-30 | 2016-03-31 | 2015-12-31 | 2015-09-30 | 2015-06-30 | 2015-03-31 | 2014-12-31 | 2014-09-30 | 2014-06-30 | 2014-03-31 | 2013-12-31 | 2013-09-30 | 2013-06-30 | 2013-03-31 | 2012-12-31 | 2012-09-30 | 2012-06-30 | 2012-03-31 | 2011-12-31 | 2011-09-30 | 2011-06-30 | 2011-03-31 | 2010-12-31 | 2010-09-30 | 2010-06-30 | 2010-03-31 | ||
|---|---|---|---|---|---|---|---|---|---|---|---|---|---|---|---|---|---|---|---|---|---|---|---|---|---|---|---|---|---|---|---|---|---|---|---|---|---|---|---|---|---|---|---|---|---|---|---|---|---|---|---|---|---|---|---|---|---|
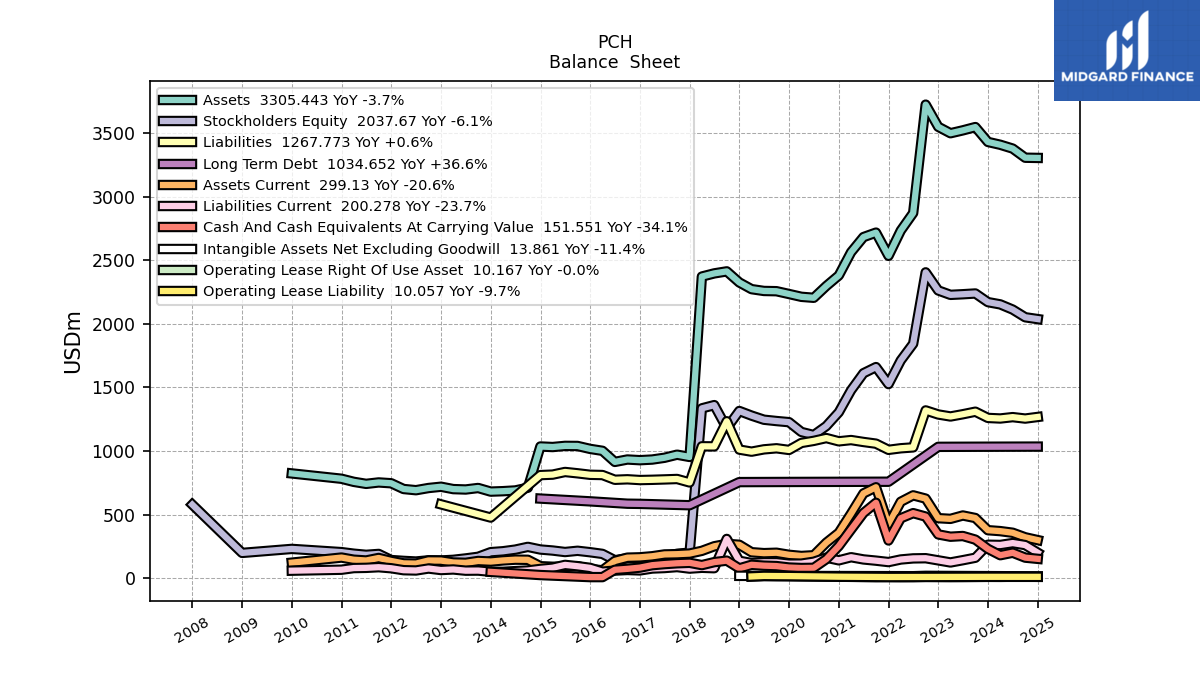
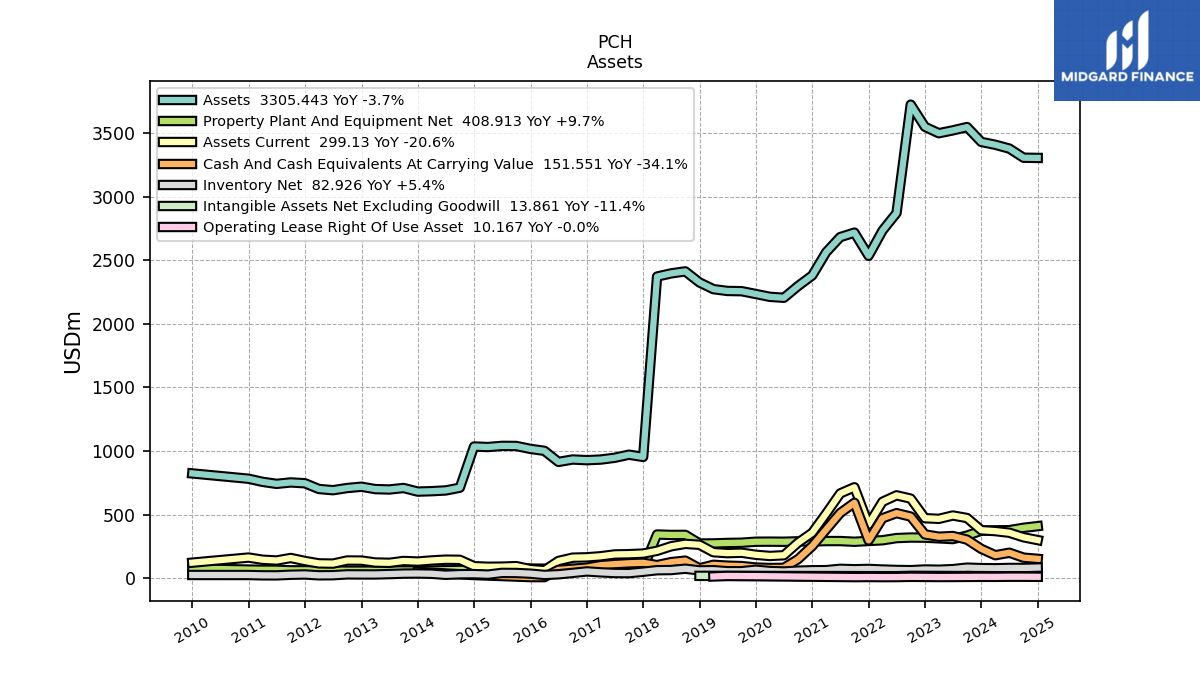
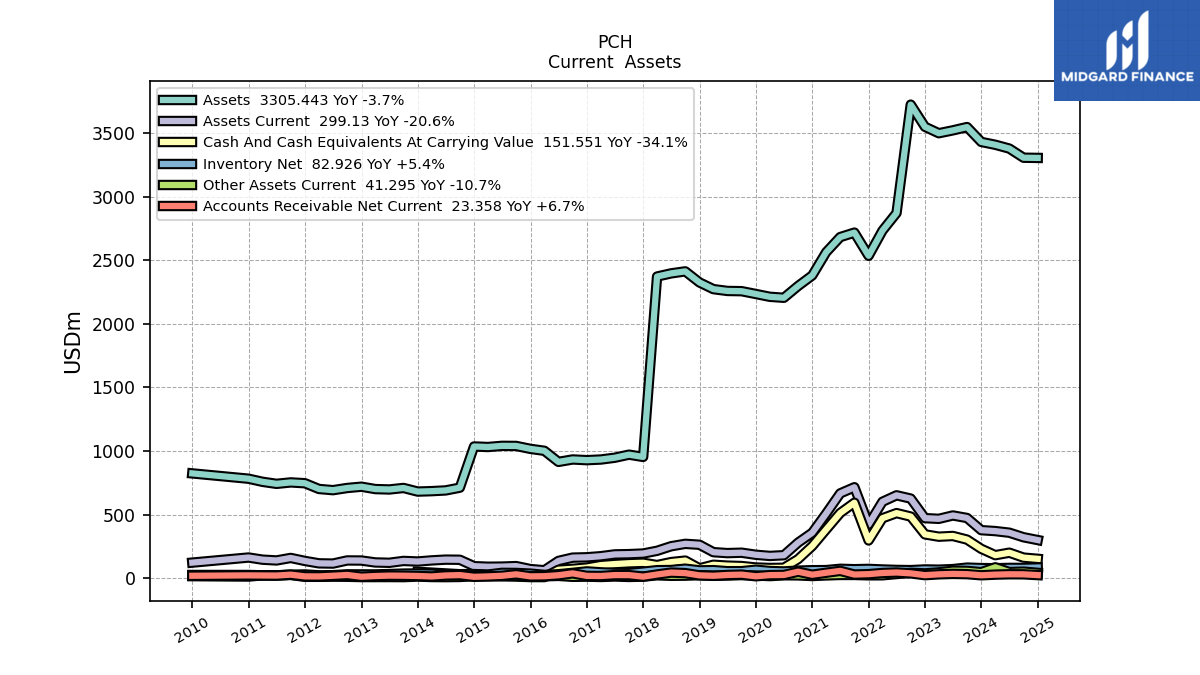
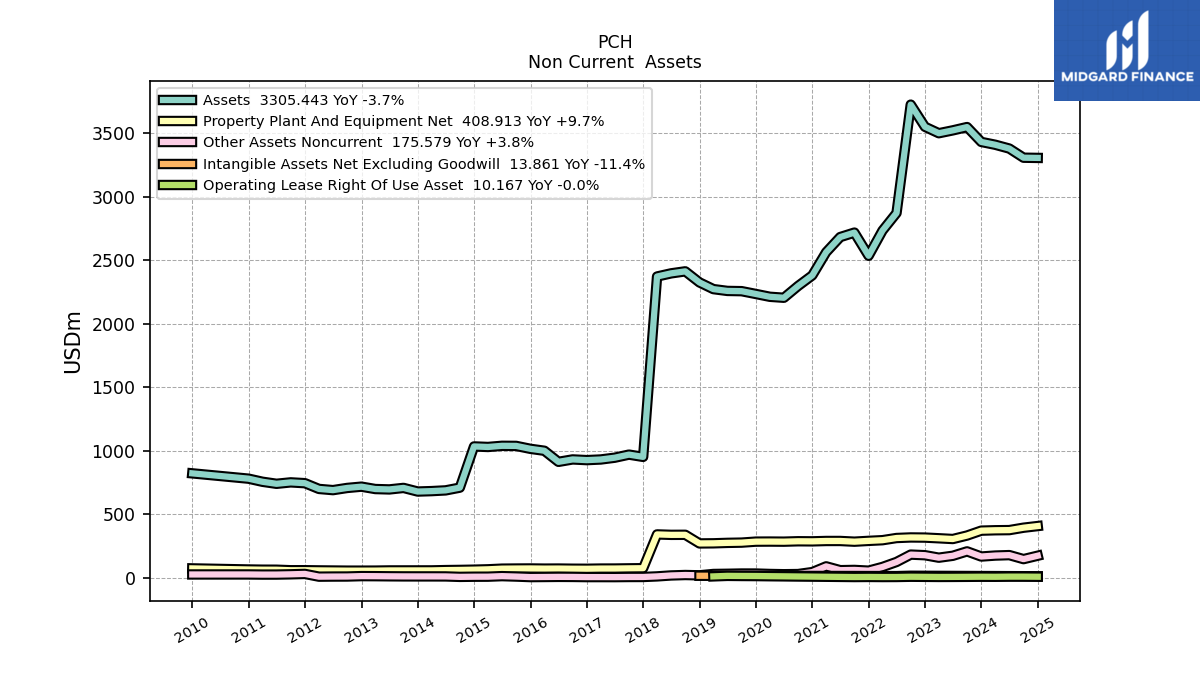
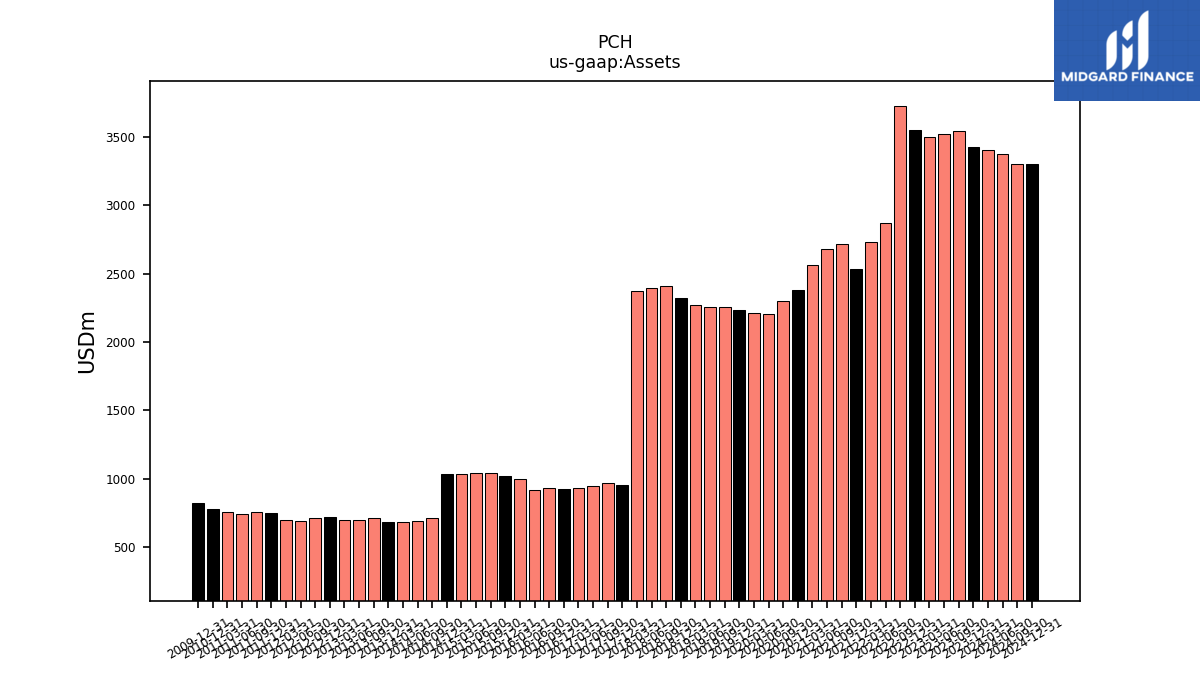
| Assets | 3431.26 | 3548.28 | 3522.35 | 3499.77 | 3550.55 | 3724.79 | 2871.92 | 2733.62 | 2535.22 | 2717.87 | 2682.80 | 2563.63 | 2381.07 | 2297.91 | 2205.17 | 2212.88 | 2235.06 | 2257.05 | 2258.94 | 2273.21 | 2325.85 | 2413.07 | 2397.15 | 2372.35 | 953.08 | 970.99 | 946.77 | 932.67 | 927.68 | 933.12 | 914.14 | 1001.36 | 1016.61 | 1039.58 | 1040.25 | 1031.15 | 1035.42 | 711.18 | 689.62 | 683.88 | 680.53 | 708.99 | 697.11 | 700.24 | 718.90 | 708.72 | 691.61 | 701.03 | 746.22 | 752.61 | 741.40 | 757.41 | 781.71 | NA | NA | NA | |
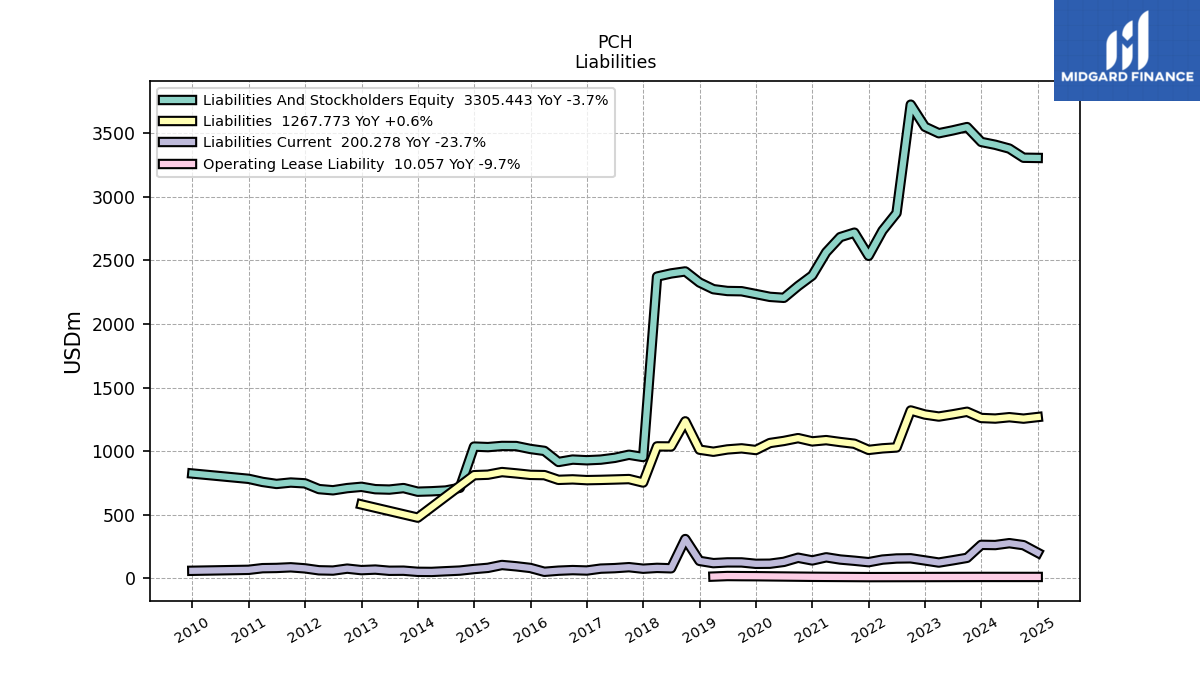
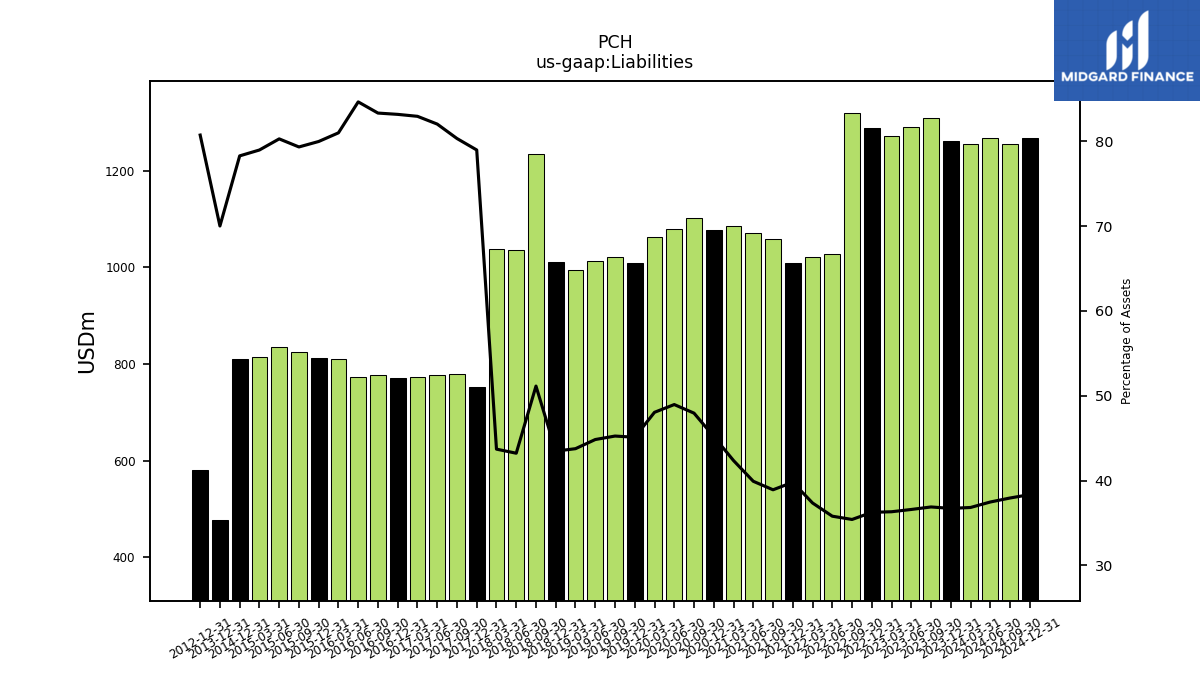
| Liabilities | 1260.16 | 1309.18 | 1289.18 | 1271.51 | 1287.40 | 1319.37 | 1028.37 | 1021.42 | 1009.08 | 1057.76 | 1071.01 | 1086.08 | 1076.11 | 1101.84 | 1079.69 | 1063.27 | 1008.23 | 1021.33 | 1012.89 | 994.83 | 1011.07 | 1234.00 | 1036.22 | 1036.91 | 752.54 | 779.80 | 776.45 | 773.41 | 771.41 | 777.36 | 773.60 | 810.88 | 812.88 | 824.54 | 834.96 | 814.15 | 810.36 | NA | NA | NA | 476.38 | NA | NA | NA | 580.25 | NA | NA | NA | NA | NA | NA | NA | NA | NA | NA | NA | |
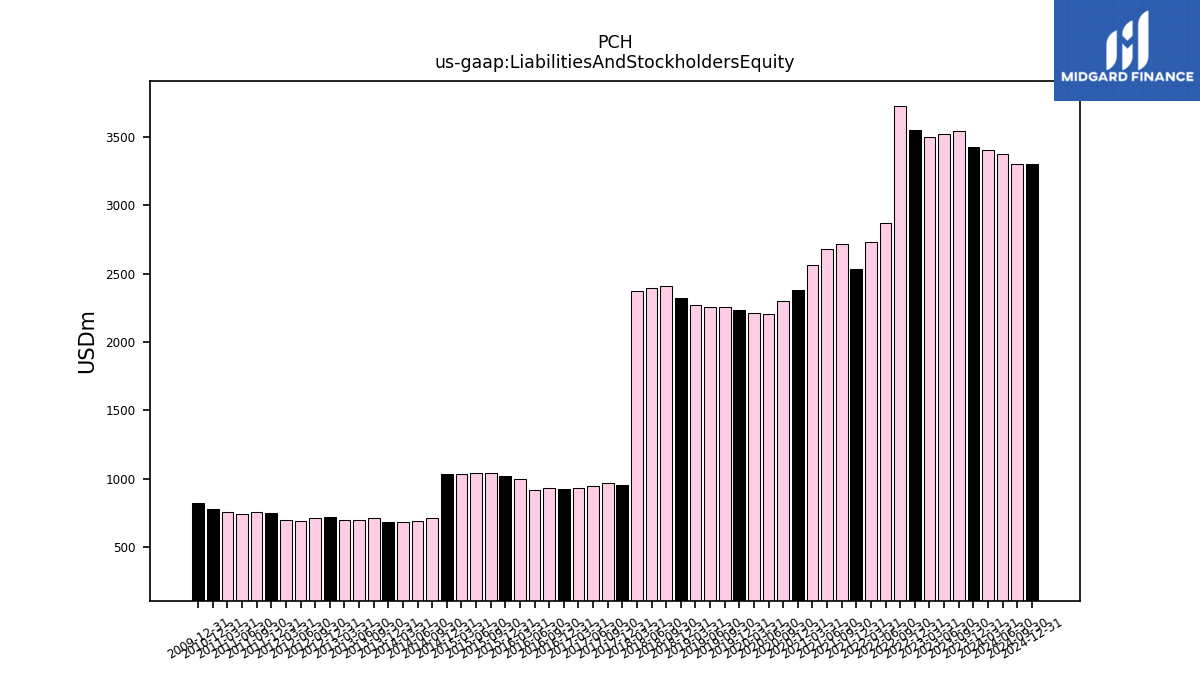
| Liabilities And Stockholders Equity | 3431.26 | 3548.28 | 3522.35 | 3499.77 | 3550.55 | 3724.79 | 2871.92 | 2733.62 | 2535.22 | 2717.87 | 2682.80 | 2563.63 | 2381.07 | 2297.91 | 2205.17 | 2212.88 | 2235.06 | 2257.05 | 2258.94 | 2273.21 | 2325.85 | 2413.07 | 2397.15 | 2372.35 | 953.08 | 970.99 | 946.77 | 932.67 | 927.68 | 933.12 | 914.14 | 1001.36 | 1016.61 | 1039.58 | 1040.25 | 1031.15 | 1035.42 | 711.18 | 689.62 | 683.88 | 680.53 | 708.99 | 697.11 | 700.24 | 718.90 | 708.72 | 691.61 | 701.03 | 746.22 | 752.61 | 741.40 | 757.41 | 781.71 | NA | NA | NA | |
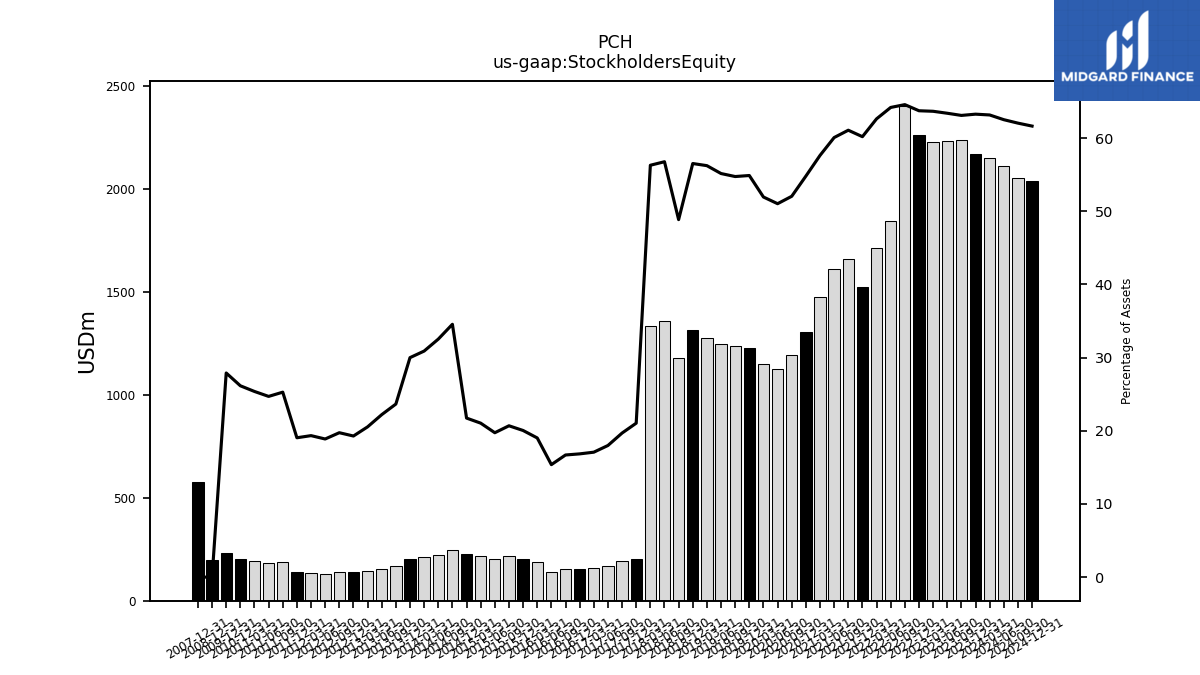
| Stockholders Equity | 2171.10 | 2239.10 | 2233.17 | 2228.26 | 2263.15 | 2405.42 | 1843.55 | 1712.20 | 1526.13 | 1660.11 | 1611.79 | 1477.55 | 1304.95 | 1196.08 | 1125.48 | 1149.61 | 1226.83 | 1235.73 | 1246.05 | 1278.39 | 1314.78 | 1179.07 | 1360.93 | 1335.44 | 200.54 | 191.19 | 170.33 | 159.26 | 156.27 | 155.76 | 140.54 | 190.48 | 203.74 | 215.04 | 205.29 | 216.99 | 225.07 | 245.76 | 224.34 | 211.30 | 204.15 | 167.71 | 154.80 | 143.81 | 138.64 | 139.88 | 130.57 | 135.57 | 142.14 | 190.25 | 183.13 | 192.19 | 204.44 | NA | NA | NA |
| 2023-12-31 | 2023-09-30 | 2023-06-30 | 2023-03-31 | 2022-12-31 | 2022-09-30 | 2022-06-30 | 2022-03-31 | 2021-12-31 | 2021-09-30 | 2021-06-30 | 2021-03-31 | 2020-12-31 | 2020-09-30 | 2020-06-30 | 2020-03-31 | 2019-12-31 | 2019-09-30 | 2019-06-30 | 2019-03-31 | 2018-12-31 | 2018-09-30 | 2018-06-30 | 2018-03-31 | 2017-12-31 | 2017-09-30 | 2017-06-30 | 2017-03-31 | 2016-12-31 | 2016-09-30 | 2016-06-30 | 2016-03-31 | 2015-12-31 | 2015-09-30 | 2015-06-30 | 2015-03-31 | 2014-12-31 | 2014-09-30 | 2014-06-30 | 2014-03-31 | 2013-12-31 | 2013-09-30 | 2013-06-30 | 2013-03-31 | 2012-12-31 | 2012-09-30 | 2012-06-30 | 2012-03-31 | 2011-12-31 | 2011-09-30 | 2011-06-30 | 2011-03-31 | 2010-12-31 | 2010-09-30 | 2010-06-30 | 2010-03-31 | ||
|---|---|---|---|---|---|---|---|---|---|---|---|---|---|---|---|---|---|---|---|---|---|---|---|---|---|---|---|---|---|---|---|---|---|---|---|---|---|---|---|---|---|---|---|---|---|---|---|---|---|---|---|---|---|---|---|---|---|
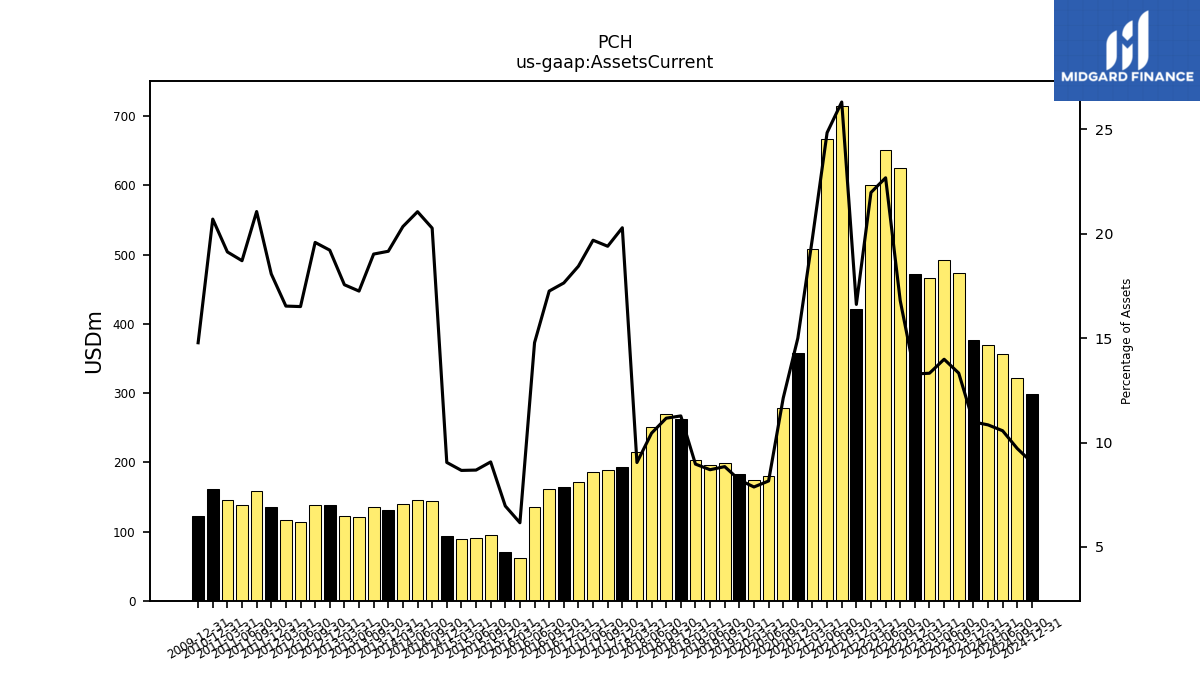
| Assets Current | 376.93 | 472.70 | 492.67 | 466.08 | 471.54 | 625.38 | 651.23 | 600.62 | 421.18 | 714.88 | 666.27 | 507.57 | 357.12 | 278.67 | 179.90 | 174.17 | 183.44 | 199.66 | 196.46 | 203.83 | 262.20 | 269.42 | 250.45 | 214.53 | 193.31 | 188.34 | 186.38 | 172.01 | 163.65 | 160.98 | 135.12 | 61.67 | 70.75 | 94.29 | 90.30 | 89.33 | 93.66 | 144.13 | 145.18 | 139.10 | 130.37 | 134.87 | 120.26 | 122.93 | 138.10 | 138.77 | 114.18 | 115.90 | 134.85 | 158.49 | 138.68 | 144.86 | 161.79 | NA | NA | NA | |
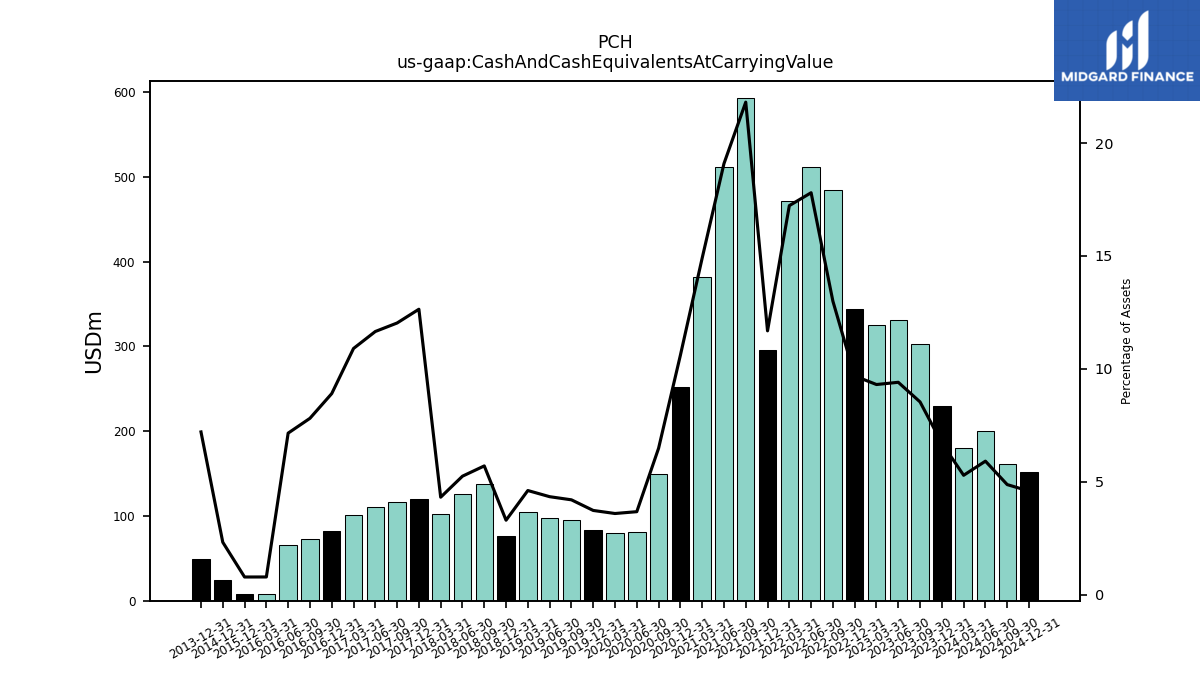
| Cash And Cash Equivalents At Carrying Value | 230.12 | 302.80 | 331.23 | 325.63 | 343.81 | 484.02 | 511.16 | 470.92 | 296.15 | 592.77 | 512.03 | 382.03 | 252.34 | 148.92 | 80.99 | 79.48 | 83.31 | 94.75 | 97.97 | 104.79 | 76.64 | 137.53 | 125.72 | 102.34 | 120.46 | 116.80 | 110.32 | 101.66 | 82.58 | 72.86 | 65.38 | 7.82 | 7.92 | NA | NA | NA | 24.02 | NA | NA | NA | 49.03 | NA | NA | NA | NA | NA | NA | NA | NA | NA | NA | NA | NA | NA | NA | NA | |
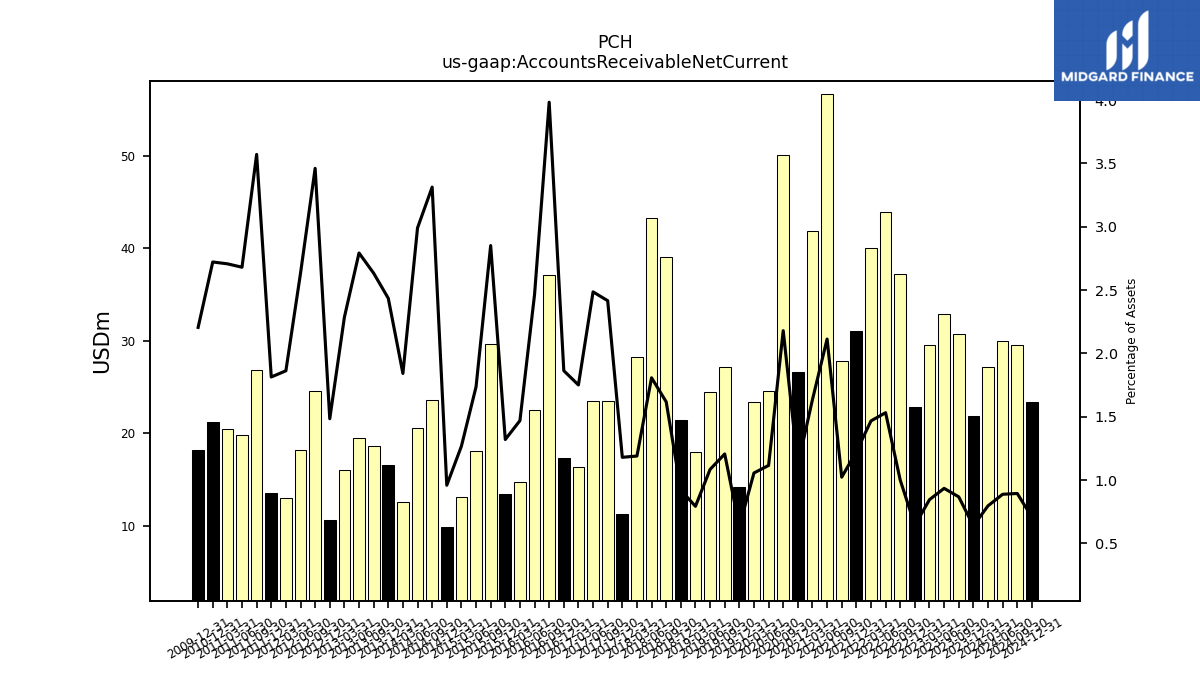
| Accounts Receivable Net Current | 21.89 | 30.76 | 32.90 | 29.57 | 22.81 | 37.22 | 43.99 | 40.09 | 31.03 | 27.79 | 56.69 | 41.92 | 26.61 | 50.08 | 24.59 | 23.36 | 14.17 | 27.21 | 24.48 | 18.01 | 21.41 | 39.03 | 43.32 | 28.21 | 11.24 | 23.46 | 23.54 | 16.33 | 17.28 | 37.17 | 22.53 | 14.71 | 13.42 | 29.64 | 18.05 | 13.06 | 9.93 | 23.56 | 20.63 | 12.59 | 16.57 | 18.67 | 19.47 | 16.01 | 10.67 | 24.53 | 18.21 | 13.06 | 13.53 | 26.88 | 19.87 | 20.51 | 21.28 | NA | NA | NA | |
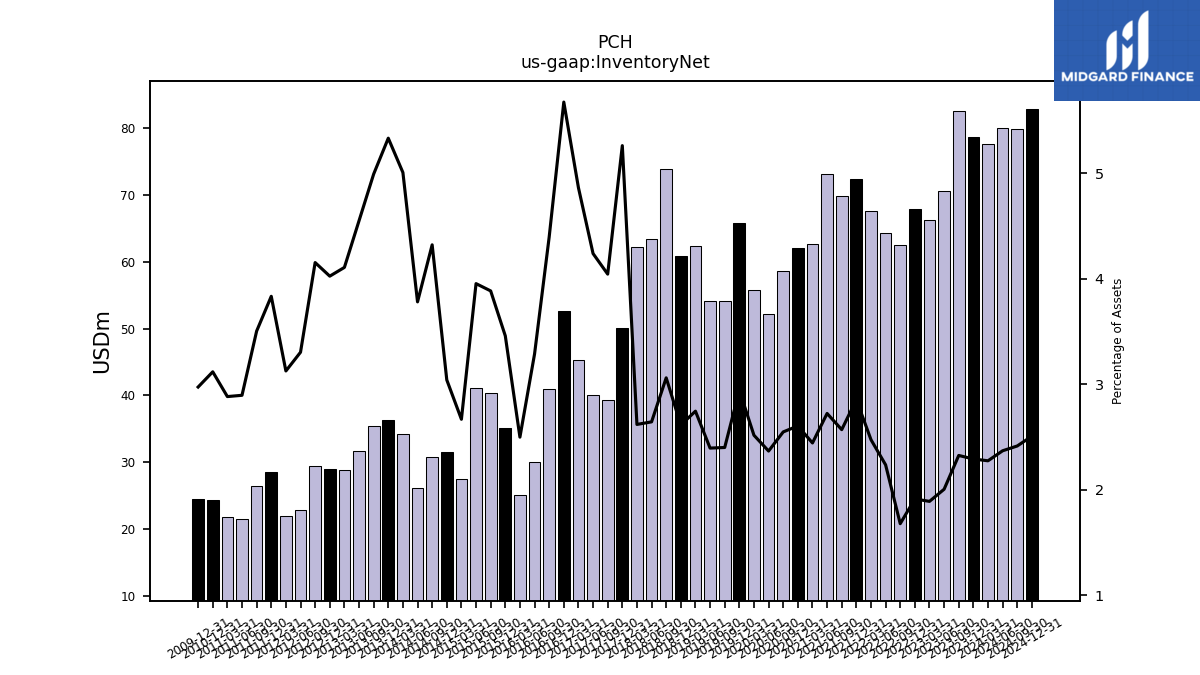
| Inventory Net | 78.67 | 82.54 | 70.66 | 66.19 | 67.96 | 62.58 | 64.25 | 67.67 | 72.37 | 69.86 | 73.07 | 62.66 | 62.04 | 58.57 | 52.22 | 55.71 | 65.78 | 54.20 | 54.12 | 62.41 | 60.80 | 73.86 | 63.38 | 62.15 | 50.13 | 39.26 | 40.12 | 45.35 | 52.62 | 41.01 | 30.05 | 25.03 | 35.16 | 40.38 | 41.12 | 27.52 | 31.49 | 30.73 | 26.07 | 34.23 | 36.27 | 35.38 | 31.71 | 28.76 | 28.93 | 29.43 | 22.85 | 21.91 | 28.60 | 26.37 | 21.47 | 21.84 | 24.38 | NA | NA | NA | |
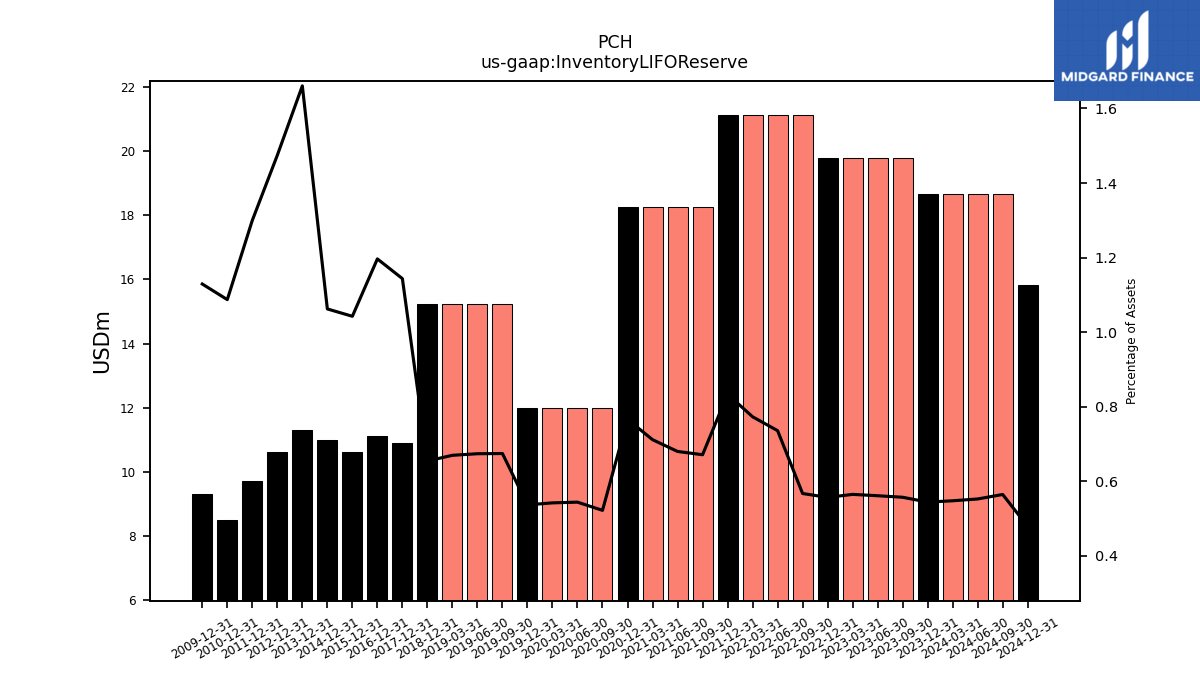
| Inventory L I F O Reserve | 18.68 | 19.78 | 19.78 | 19.78 | 19.78 | 21.14 | 21.14 | 21.14 | 21.14 | 18.25 | 18.25 | 18.25 | 18.25 | 12.00 | 12.00 | 12.00 | 12.00 | 15.23 | 15.23 | 15.23 | 15.23 | NA | NA | NA | 10.90 | NA | NA | NA | 11.10 | NA | NA | NA | 10.60 | NA | NA | NA | 11.00 | NA | NA | NA | 11.30 | NA | NA | NA | 10.60 | NA | NA | NA | 9.70 | NA | NA | NA | 8.50 | NA | NA | NA | |
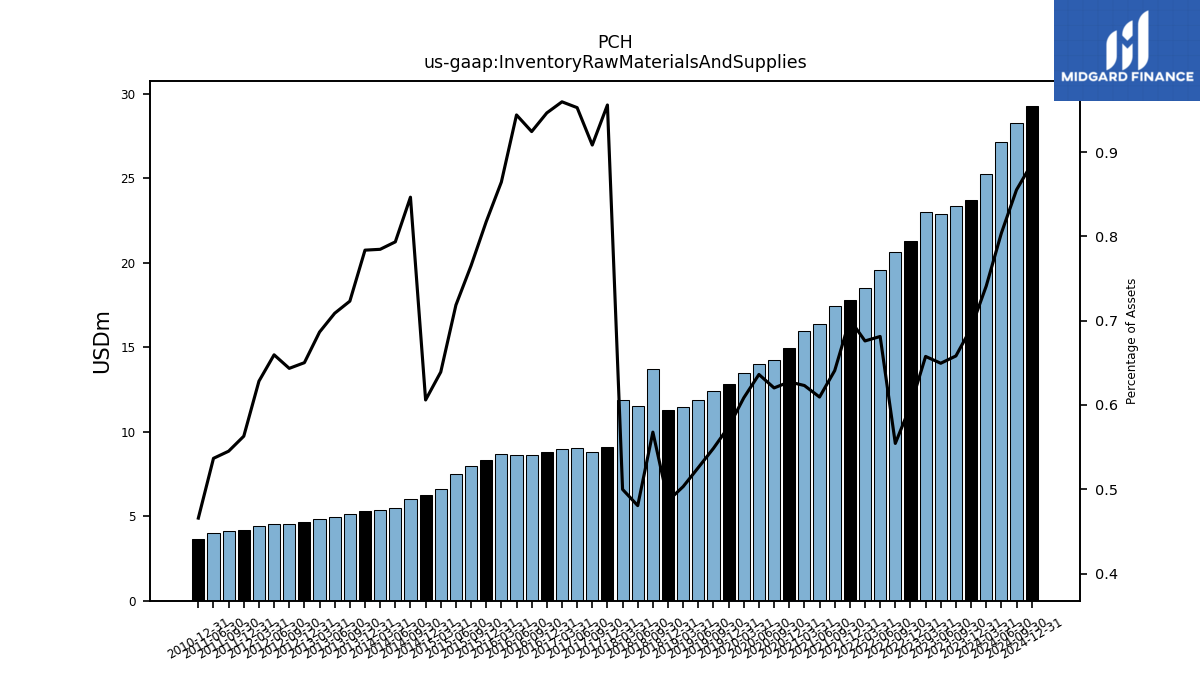
| Inventory Raw Materials And Supplies | 23.71 | 23.35 | 22.88 | 23.01 | 21.26 | 20.65 | 19.57 | 18.48 | 17.78 | 17.41 | 16.35 | 15.97 | 14.94 | 14.25 | 14.03 | 13.46 | 12.83 | 12.38 | 11.88 | 11.44 | 11.31 | 13.70 | 11.52 | 11.86 | 9.11 | 8.82 | 9.02 | 8.95 | 8.78 | 8.62 | 8.63 | 8.66 | 8.31 | 7.96 | 7.47 | 6.59 | 6.27 | 6.02 | 5.47 | 5.37 | 5.33 | 5.13 | 4.94 | 4.81 | 4.67 | 4.56 | 4.56 | 4.40 | 4.20 | 4.10 | 3.98 | NA | 3.64 | NA | NA | NA | |
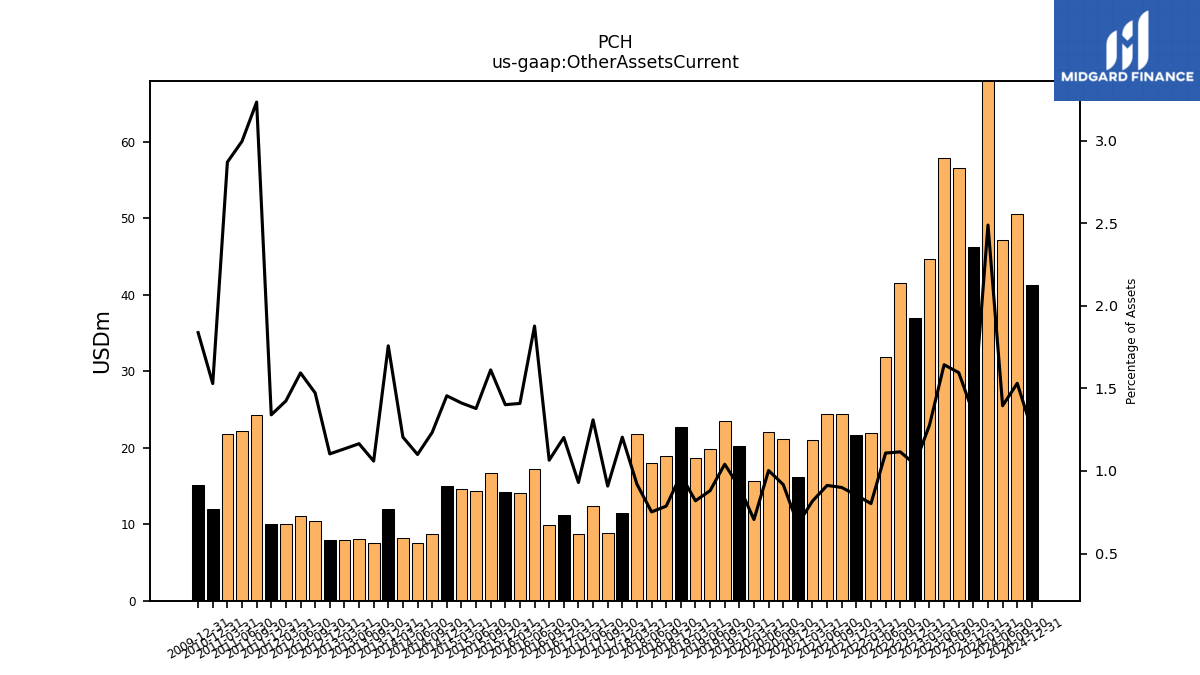
| Other Assets Current | 46.26 | 56.61 | 57.88 | 44.70 | 36.95 | 41.55 | 31.83 | 21.94 | 21.63 | 24.46 | 24.48 | 20.96 | 16.14 | 21.09 | 22.11 | 15.63 | 20.18 | 23.49 | 19.89 | 18.62 | 22.68 | 18.99 | 18.02 | 21.82 | 11.48 | 8.82 | 12.40 | 8.68 | 11.15 | 9.94 | 17.16 | 14.11 | 14.25 | 16.75 | 14.34 | 14.55 | 15.06 | 8.77 | 7.58 | 8.24 | 11.96 | 7.51 | 8.12 | 7.94 | 7.93 | 10.44 | 11.02 | 9.98 | 10.00 | 24.34 | 22.21 | 21.74 | 11.95 | NA | NA | NA |
| 2023-12-31 | 2023-09-30 | 2023-06-30 | 2023-03-31 | 2022-12-31 | 2022-09-30 | 2022-06-30 | 2022-03-31 | 2021-12-31 | 2021-09-30 | 2021-06-30 | 2021-03-31 | 2020-12-31 | 2020-09-30 | 2020-06-30 | 2020-03-31 | 2019-12-31 | 2019-09-30 | 2019-06-30 | 2019-03-31 | 2018-12-31 | 2018-09-30 | 2018-06-30 | 2018-03-31 | 2017-12-31 | 2017-09-30 | 2017-06-30 | 2017-03-31 | 2016-12-31 | 2016-09-30 | 2016-06-30 | 2016-03-31 | 2015-12-31 | 2015-09-30 | 2015-06-30 | 2015-03-31 | 2014-12-31 | 2014-09-30 | 2014-06-30 | 2014-03-31 | 2013-12-31 | 2013-09-30 | 2013-06-30 | 2013-03-31 | 2012-12-31 | 2012-09-30 | 2012-06-30 | 2012-03-31 | 2011-12-31 | 2011-09-30 | 2011-06-30 | 2011-03-31 | 2010-12-31 | 2010-09-30 | 2010-06-30 | 2010-03-31 | ||
|---|---|---|---|---|---|---|---|---|---|---|---|---|---|---|---|---|---|---|---|---|---|---|---|---|---|---|---|---|---|---|---|---|---|---|---|---|---|---|---|---|---|---|---|---|---|---|---|---|---|---|---|---|---|---|---|---|---|
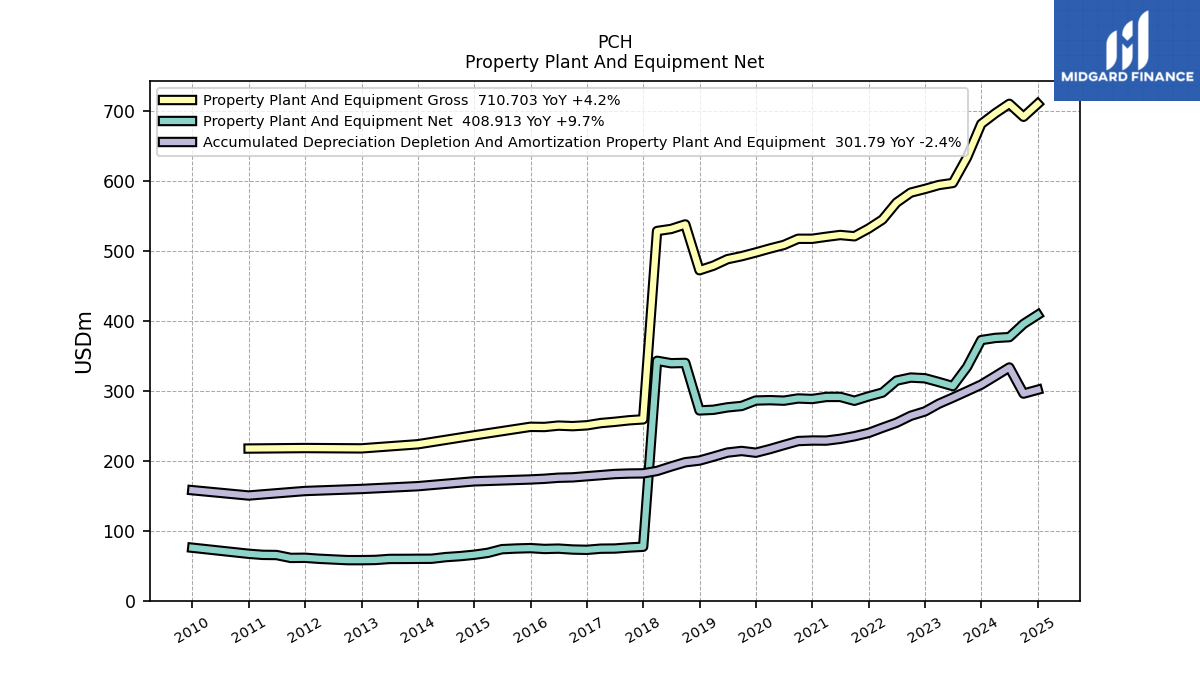
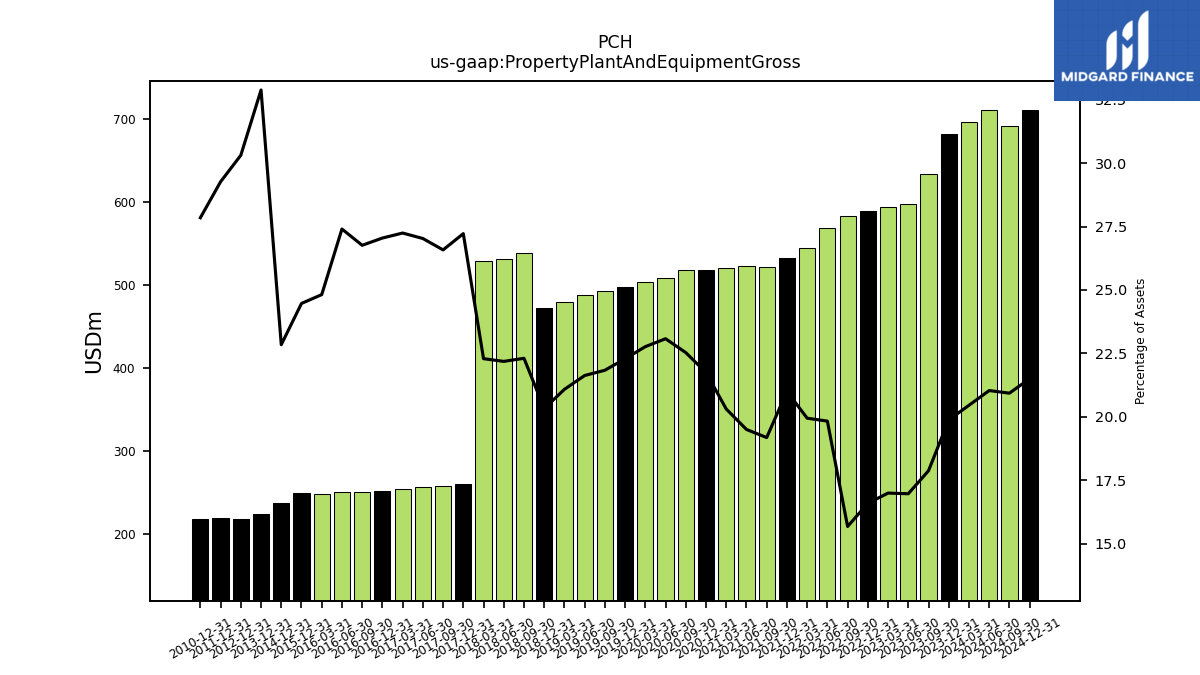
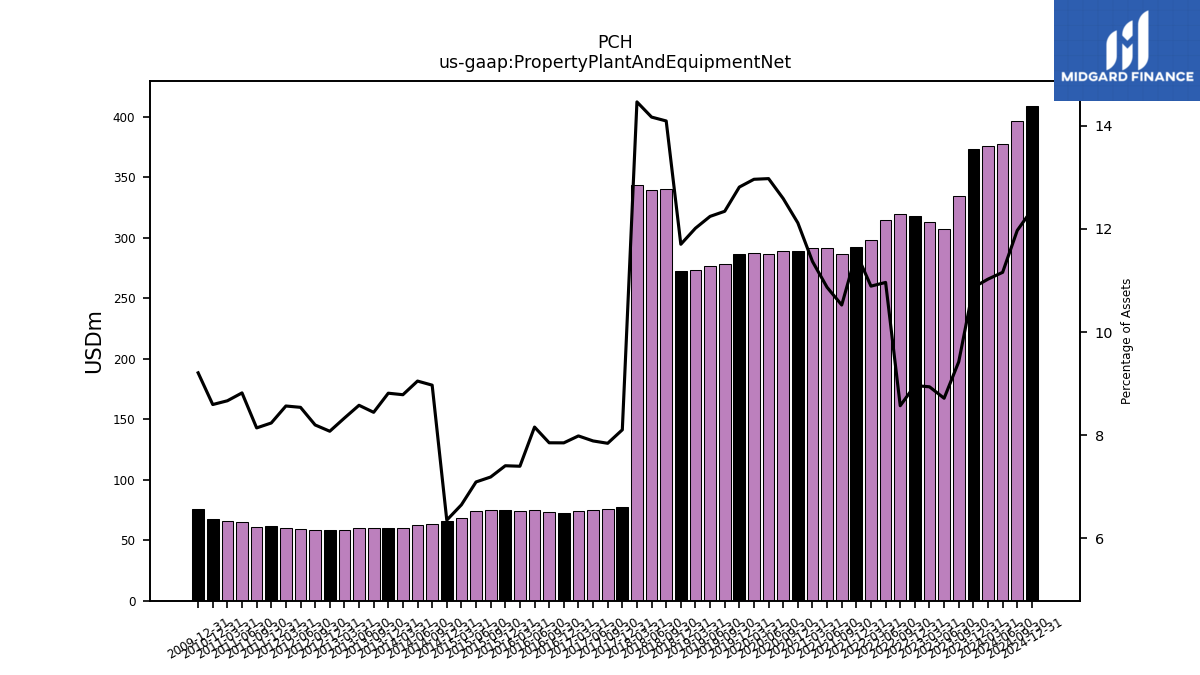
| Property Plant And Equipment Gross | 681.91 | 634.10 | 597.52 | 594.57 | 588.93 | 583.75 | 569.45 | 545.16 | 532.32 | 521.27 | 523.11 | 520.52 | 517.71 | 517.70 | 508.87 | 503.75 | 498.11 | 492.80 | 488.52 | 479.21 | 472.69 | 538.25 | 531.75 | 528.80 | 259.44 | 258.09 | 255.91 | 254.10 | 250.91 | 249.72 | 250.50 | 248.50 | 248.75 | NA | NA | NA | 236.51 | NA | NA | NA | 223.80 | NA | NA | NA | 217.91 | NA | NA | NA | 218.40 | NA | NA | NA | 217.68 | NA | NA | NA | |
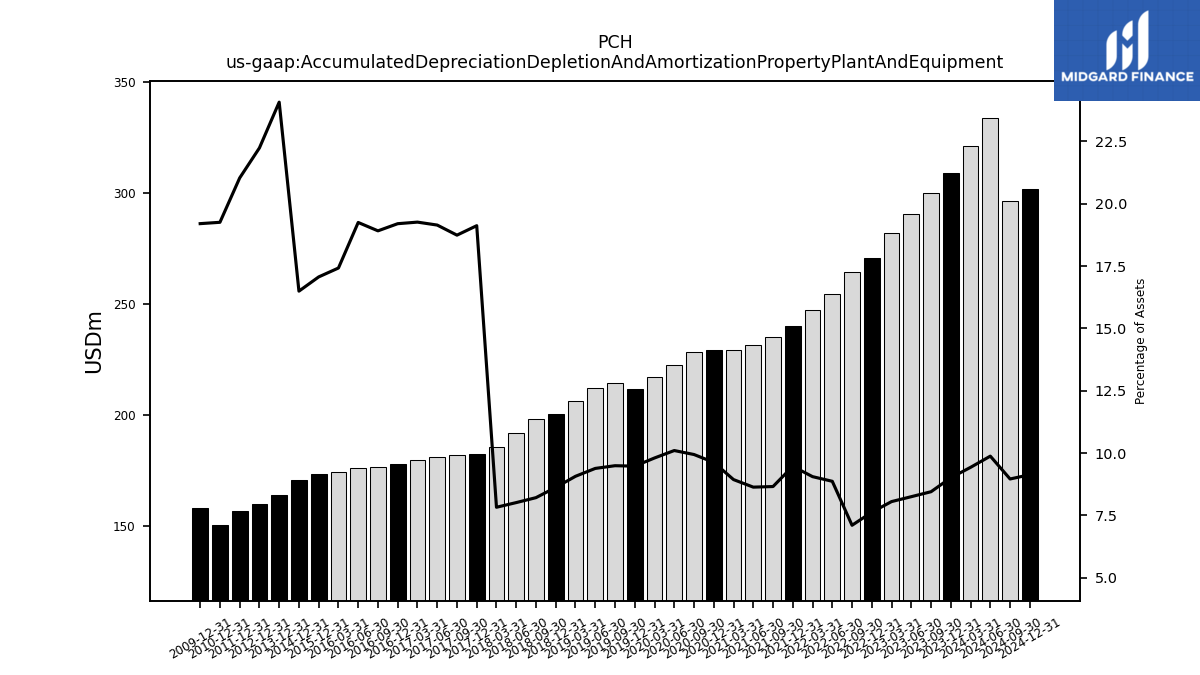
| Accumulated Depreciation Depletion And Amortization Property Plant And Equipment | 309.08 | 299.75 | 290.54 | 281.78 | 270.75 | 264.51 | 254.61 | 247.45 | 240.00 | 235.24 | 231.56 | 229.04 | 229.17 | 228.40 | 222.71 | 216.87 | 211.73 | 214.21 | 211.93 | 206.09 | 200.50 | 198.10 | 192.05 | 185.62 | 182.21 | 181.95 | 181.24 | 179.64 | 178.09 | 176.46 | 175.94 | 174.44 | 173.47 | NA | NA | NA | 170.76 | NA | NA | NA | 163.82 | NA | NA | NA | 159.86 | NA | NA | NA | 156.95 | NA | NA | NA | 150.51 | NA | NA | NA | |
| Property Plant And Equipment Net | 372.83 | 334.35 | 306.98 | 312.79 | 318.18 | 319.23 | 314.84 | 297.71 | 292.32 | 286.03 | 291.55 | 291.48 | 288.54 | 289.31 | 286.17 | 286.88 | 286.38 | 278.59 | 276.59 | 273.12 | 272.19 | 340.15 | 339.70 | 343.18 | 77.23 | 76.14 | 74.67 | 74.47 | 72.82 | 73.26 | 74.56 | 74.06 | 75.28 | 74.72 | 73.77 | 68.55 | 65.75 | 63.79 | 62.40 | 60.07 | 59.98 | 59.85 | 59.80 | 58.33 | 58.05 | 58.09 | 59.05 | 60.04 | 61.45 | 61.26 | 65.39 | 65.64 | 67.17 | NA | NA | NA | |
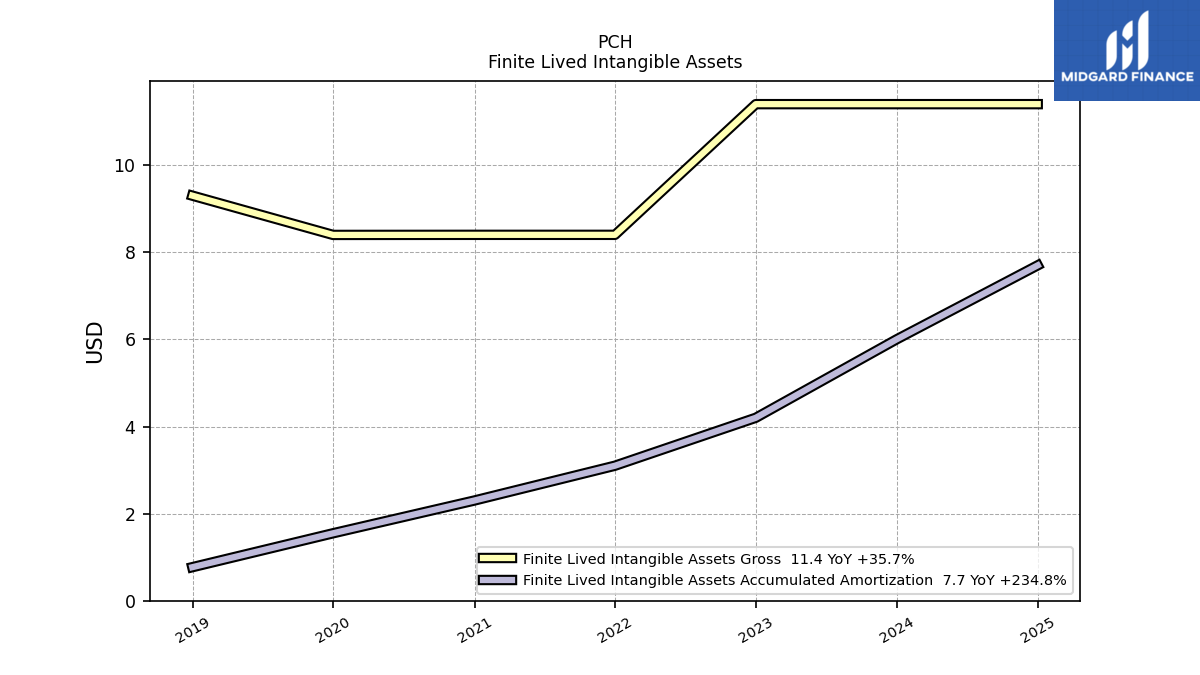
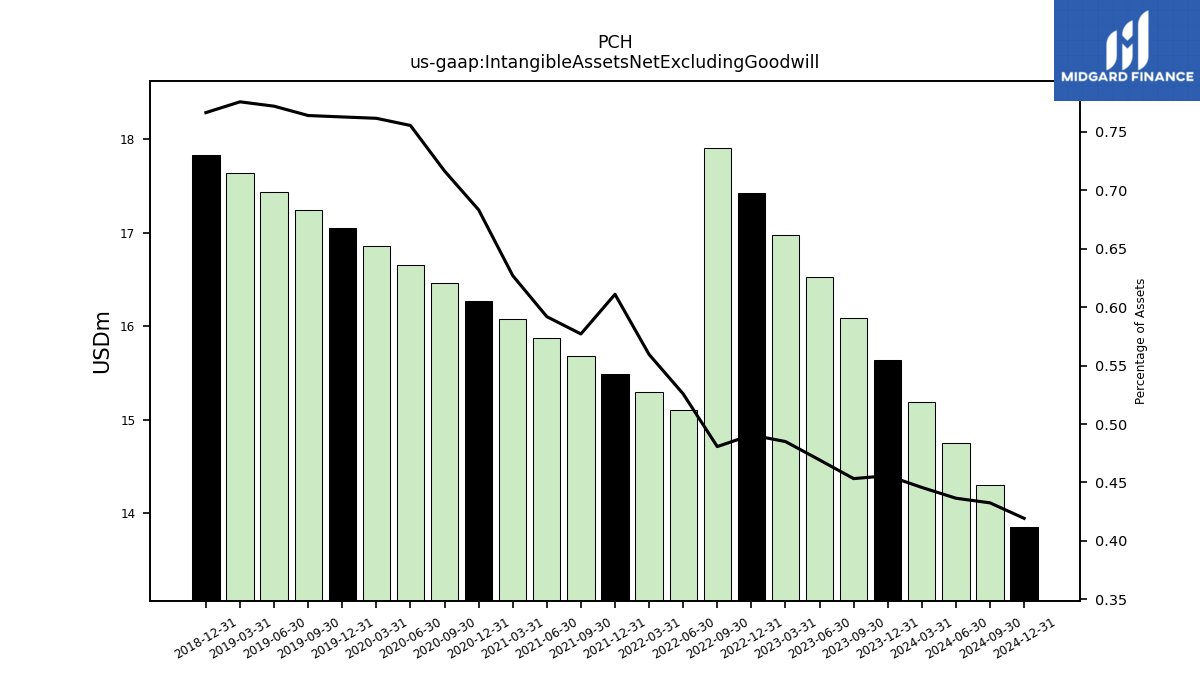
| Intangible Assets Net Excluding Goodwill | 15.64 | 16.09 | 16.53 | 16.98 | 17.42 | 17.91 | 15.10 | 15.30 | 15.49 | 15.69 | 15.88 | 16.07 | 16.27 | 16.46 | 16.66 | 16.85 | 17.05 | 17.24 | 17.44 | 17.63 | 17.83 | NA | NA | NA | NA | NA | NA | NA | NA | NA | NA | NA | NA | NA | NA | NA | NA | NA | NA | NA | NA | NA | NA | NA | NA | NA | NA | NA | NA | NA | NA | NA | NA | NA | NA | NA | |
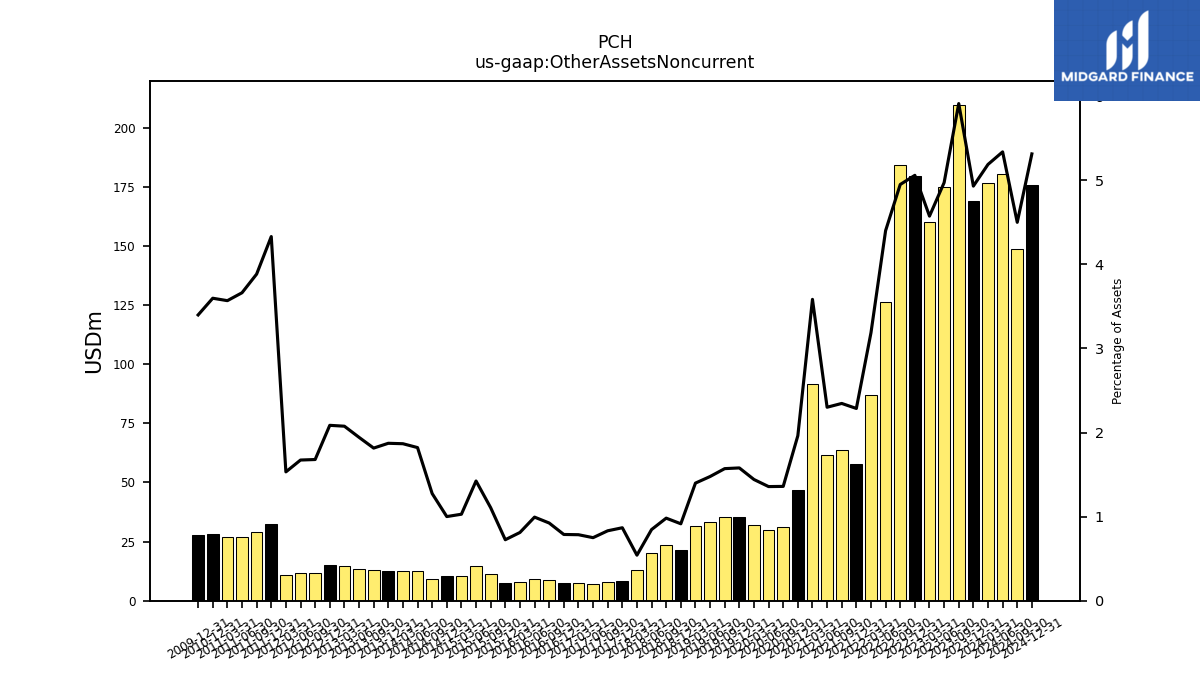
| Other Assets Noncurrent | 169.13 | 209.70 | 175.06 | 160.02 | 179.55 | 184.31 | 126.35 | 87.09 | 57.95 | 63.75 | 61.72 | 91.85 | 46.72 | 31.24 | 29.93 | 31.90 | 35.29 | 35.45 | 33.36 | 31.79 | 21.28 | 23.70 | 20.29 | 12.85 | 8.27 | 8.07 | 7.10 | 7.32 | 7.31 | 8.62 | 9.09 | 8.13 | 7.38 | 11.50 | 14.81 | 10.61 | 10.36 | 9.06 | 12.56 | 12.77 | 12.74 | 12.87 | 13.54 | 14.53 | 14.99 | 11.90 | 11.57 | 10.74 | 32.30 | 29.22 | 27.14 | 27.02 | 28.11 | NA | NA | NA |
| 2023-12-31 | 2023-09-30 | 2023-06-30 | 2023-03-31 | 2022-12-31 | 2022-09-30 | 2022-06-30 | 2022-03-31 | 2021-12-31 | 2021-09-30 | 2021-06-30 | 2021-03-31 | 2020-12-31 | 2020-09-30 | 2020-06-30 | 2020-03-31 | 2019-12-31 | 2019-09-30 | 2019-06-30 | 2019-03-31 | 2018-12-31 | 2018-09-30 | 2018-06-30 | 2018-03-31 | 2017-12-31 | 2017-09-30 | 2017-06-30 | 2017-03-31 | 2016-12-31 | 2016-09-30 | 2016-06-30 | 2016-03-31 | 2015-12-31 | 2015-09-30 | 2015-06-30 | 2015-03-31 | 2014-12-31 | 2014-09-30 | 2014-06-30 | 2014-03-31 | 2013-12-31 | 2013-09-30 | 2013-06-30 | 2013-03-31 | 2012-12-31 | 2012-09-30 | 2012-06-30 | 2012-03-31 | 2011-12-31 | 2011-09-30 | 2011-06-30 | 2011-03-31 | 2010-12-31 | 2010-09-30 | 2010-06-30 | 2010-03-31 | ||
|---|---|---|---|---|---|---|---|---|---|---|---|---|---|---|---|---|---|---|---|---|---|---|---|---|---|---|---|---|---|---|---|---|---|---|---|---|---|---|---|---|---|---|---|---|---|---|---|---|---|---|---|---|---|---|---|---|---|
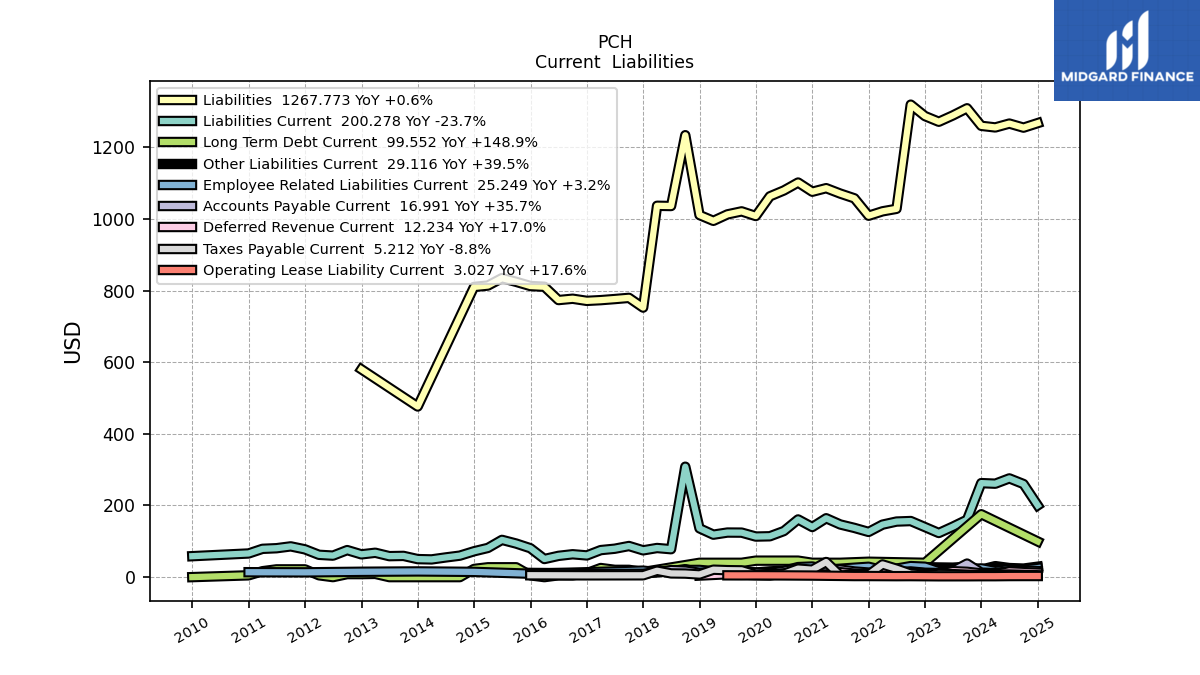
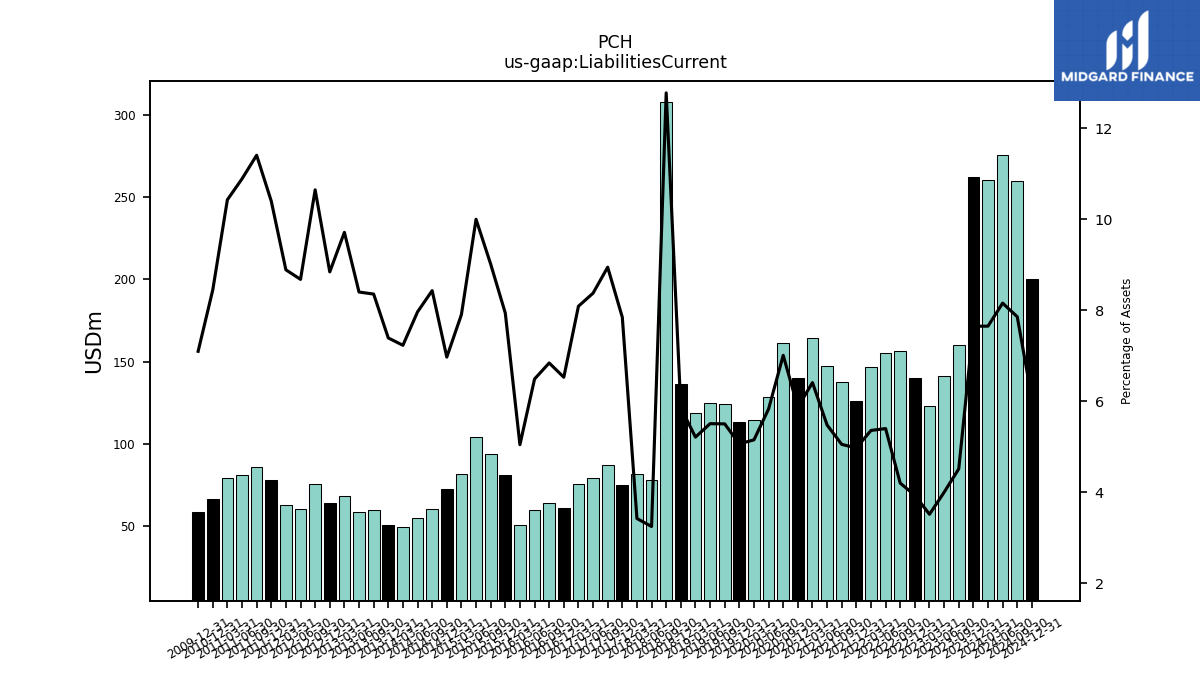
| Liabilities Current | 262.53 | 160.26 | 141.01 | 123.18 | 139.77 | 156.60 | 155.17 | 146.56 | 126.18 | 137.39 | 147.03 | 164.41 | 139.83 | 161.12 | 128.63 | 114.08 | 113.25 | 124.27 | 124.48 | 118.54 | 136.28 | 308.35 | 77.94 | 81.30 | 74.80 | 86.88 | 79.32 | 75.46 | 60.58 | 63.86 | 59.34 | 50.55 | 80.72 | 93.73 | 104.03 | 81.53 | 72.19 | 59.98 | 54.94 | 49.46 | 50.32 | 59.26 | 58.57 | 68.02 | 63.59 | 75.46 | 60.03 | 62.33 | 77.61 | 85.86 | 80.73 | 79.00 | 66.03 | NA | NA | NA | |
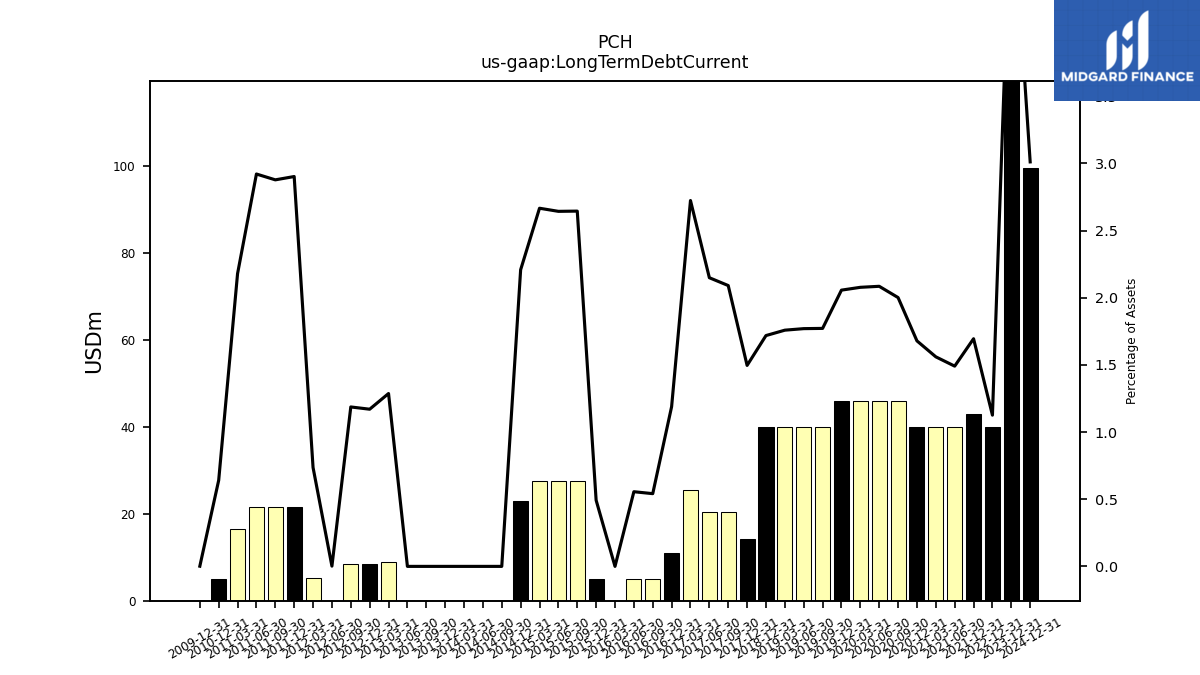
| Long Term Debt Current | 175.62 | NA | NA | NA | 39.98 | NA | NA | NA | 42.98 | NA | 40.00 | 40.00 | 39.98 | 45.99 | 45.99 | 45.98 | 45.97 | 39.99 | 39.99 | 39.98 | 39.97 | NA | NA | NA | 14.26 | 20.30 | 20.35 | 25.41 | 11.03 | 5.05 | 5.08 | 0.00 | 5.01 | 27.50 | 27.50 | 27.50 | 22.87 | 0.00 | 0.00 | 0.00 | 0.00 | 0.00 | 0.00 | 9.01 | 8.41 | 8.41 | 0.01 | 5.16 | 21.66 | 21.66 | 21.66 | 16.51 | 5.01 | NA | NA | NA | |
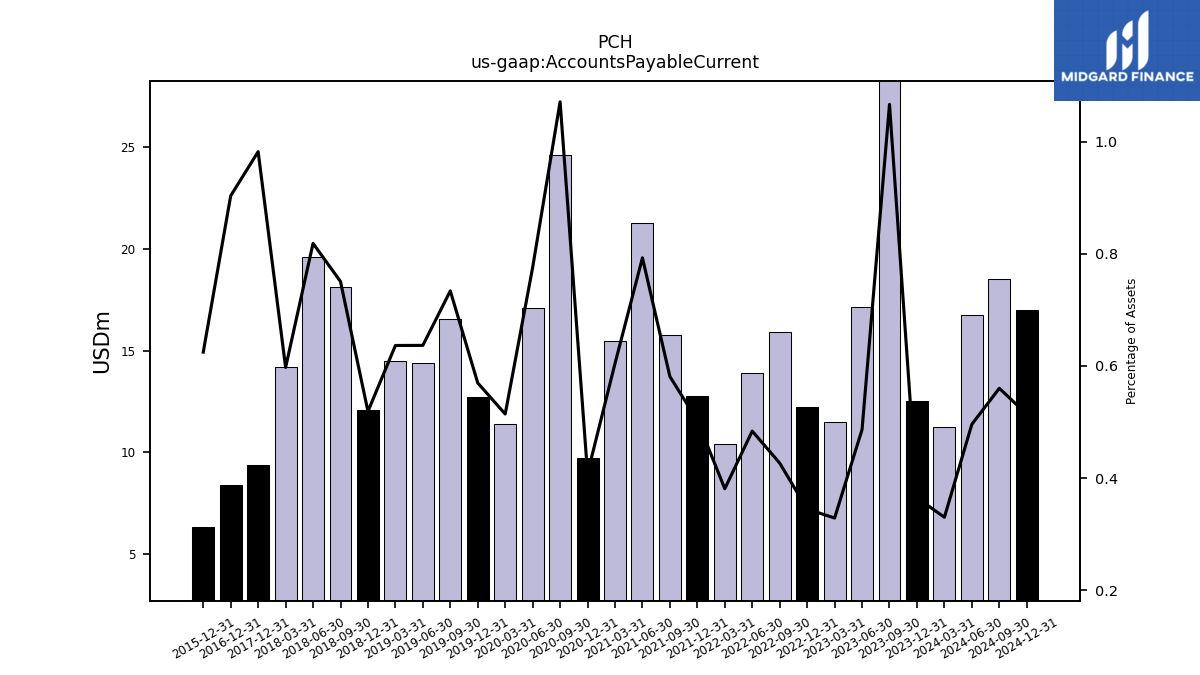
| Accounts Payable Current | 12.52 | 37.84 | 17.14 | 11.51 | 12.24 | 15.90 | 13.90 | 10.42 | 12.75 | 15.79 | 21.27 | 15.49 | 9.72 | 24.61 | 17.11 | 11.38 | 12.73 | 16.57 | 14.38 | 14.47 | 12.07 | 18.11 | 19.62 | 14.17 | 9.36 | NA | NA | NA | 8.38 | NA | NA | NA | 6.35 | NA | NA | NA | NA | NA | NA | NA | NA | NA | NA | NA | NA | NA | NA | NA | NA | NA | NA | NA | NA | NA | NA | NA | |
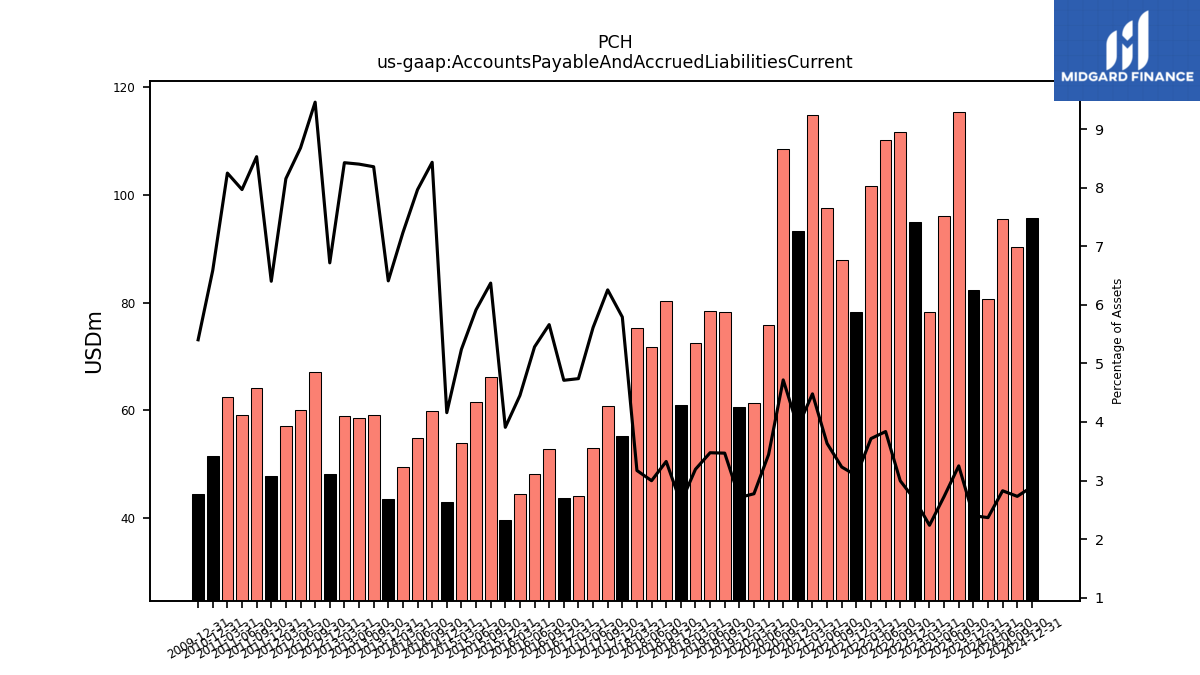
| Accounts Payable And Accrued Liabilities Current | 82.38 | 115.33 | 96.09 | 78.27 | 94.86 | 111.61 | 110.18 | 101.59 | 78.21 | 87.82 | 97.46 | 114.85 | 93.28 | 108.42 | 75.94 | 61.40 | 60.58 | 78.27 | 78.49 | 72.56 | 60.99 | 80.26 | 71.85 | 75.24 | 55.20 | 60.74 | 53.13 | 44.21 | 43.71 | 52.84 | 48.29 | 44.58 | 39.74 | 66.23 | 61.53 | 54.03 | 43.06 | 59.98 | 54.94 | 49.46 | 43.62 | 59.26 | 58.57 | 59.01 | 48.29 | 67.05 | 60.02 | 57.17 | 47.78 | 64.19 | 59.08 | 62.48 | 51.50 | NA | NA | NA | |
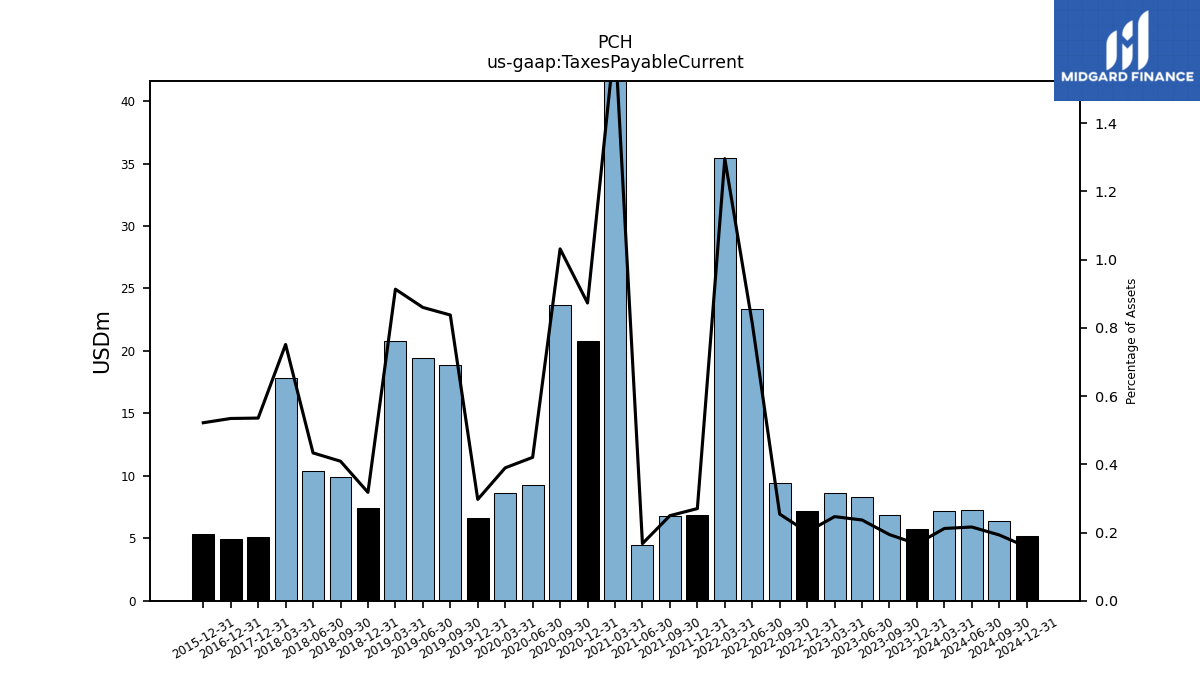
| Taxes Payable Current | 5.71 | 6.88 | 8.34 | 8.63 | 7.16 | 9.46 | 23.36 | 35.42 | 6.85 | 6.78 | 4.49 | 42.29 | 20.78 | 23.70 | 9.27 | 8.62 | 6.64 | 18.90 | 19.42 | 20.76 | 7.39 | 9.87 | 10.39 | 17.82 | 5.10 | NA | NA | NA | 4.96 | NA | NA | NA | 5.30 | NA | NA | NA | NA | NA | NA | NA | NA | NA | NA | NA | NA | NA | NA | NA | NA | NA | NA | NA | NA | NA | NA | NA | |
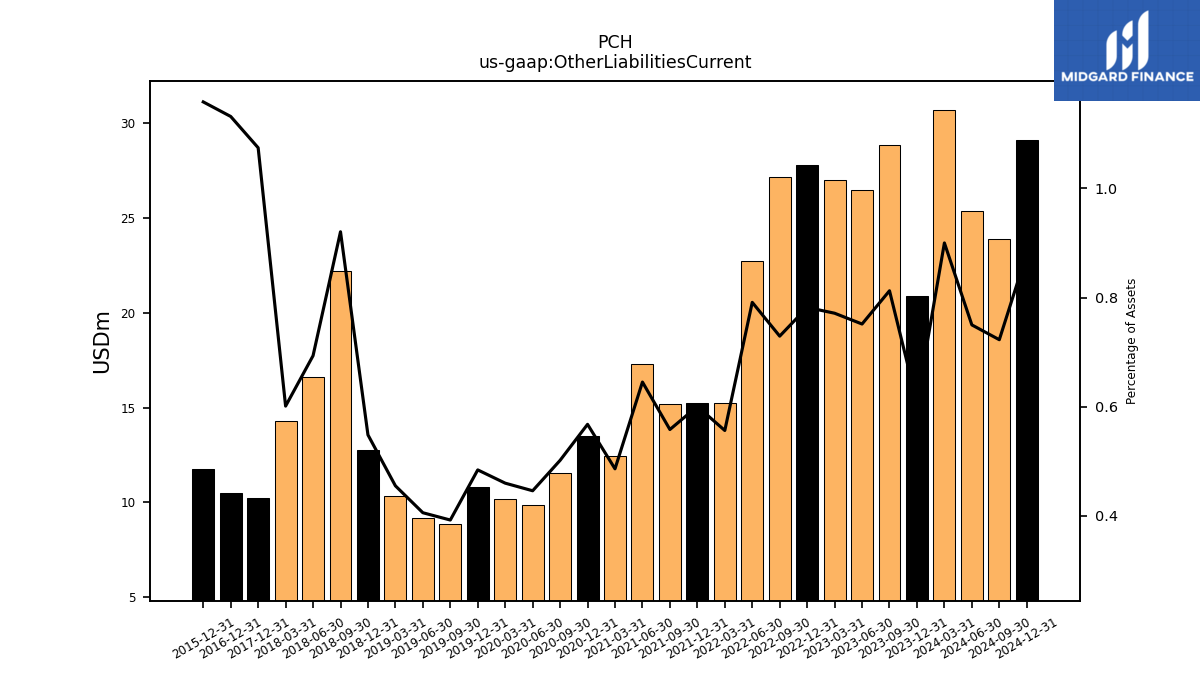
| Other Liabilities Current | 20.88 | 28.84 | 26.48 | 27.00 | 27.77 | 27.17 | 22.73 | 15.22 | 15.23 | 15.18 | 17.31 | 12.47 | 13.52 | 11.53 | 9.84 | 10.18 | 10.83 | 8.86 | 9.17 | 10.35 | 12.76 | 22.22 | 16.63 | 14.27 | 10.24 | NA | NA | NA | 10.50 | NA | NA | NA | 11.78 | NA | NA | NA | NA | NA | NA | NA | NA | NA | NA | NA | NA | NA | NA | NA | NA | NA | NA | NA | NA | NA | NA | NA |
| 2023-12-31 | 2023-09-30 | 2023-06-30 | 2023-03-31 | 2022-12-31 | 2022-09-30 | 2022-06-30 | 2022-03-31 | 2021-12-31 | 2021-09-30 | 2021-06-30 | 2021-03-31 | 2020-12-31 | 2020-09-30 | 2020-06-30 | 2020-03-31 | 2019-12-31 | 2019-09-30 | 2019-06-30 | 2019-03-31 | 2018-12-31 | 2018-09-30 | 2018-06-30 | 2018-03-31 | 2017-12-31 | 2017-09-30 | 2017-06-30 | 2017-03-31 | 2016-12-31 | 2016-09-30 | 2016-06-30 | 2016-03-31 | 2015-12-31 | 2015-09-30 | 2015-06-30 | 2015-03-31 | 2014-12-31 | 2014-09-30 | 2014-06-30 | 2014-03-31 | 2013-12-31 | 2013-09-30 | 2013-06-30 | 2013-03-31 | 2012-12-31 | 2012-09-30 | 2012-06-30 | 2012-03-31 | 2011-12-31 | 2011-09-30 | 2011-06-30 | 2011-03-31 | 2010-12-31 | 2010-09-30 | 2010-06-30 | 2010-03-31 | ||
|---|---|---|---|---|---|---|---|---|---|---|---|---|---|---|---|---|---|---|---|---|---|---|---|---|---|---|---|---|---|---|---|---|---|---|---|---|---|---|---|---|---|---|---|---|---|---|---|---|---|---|---|---|---|---|---|---|---|
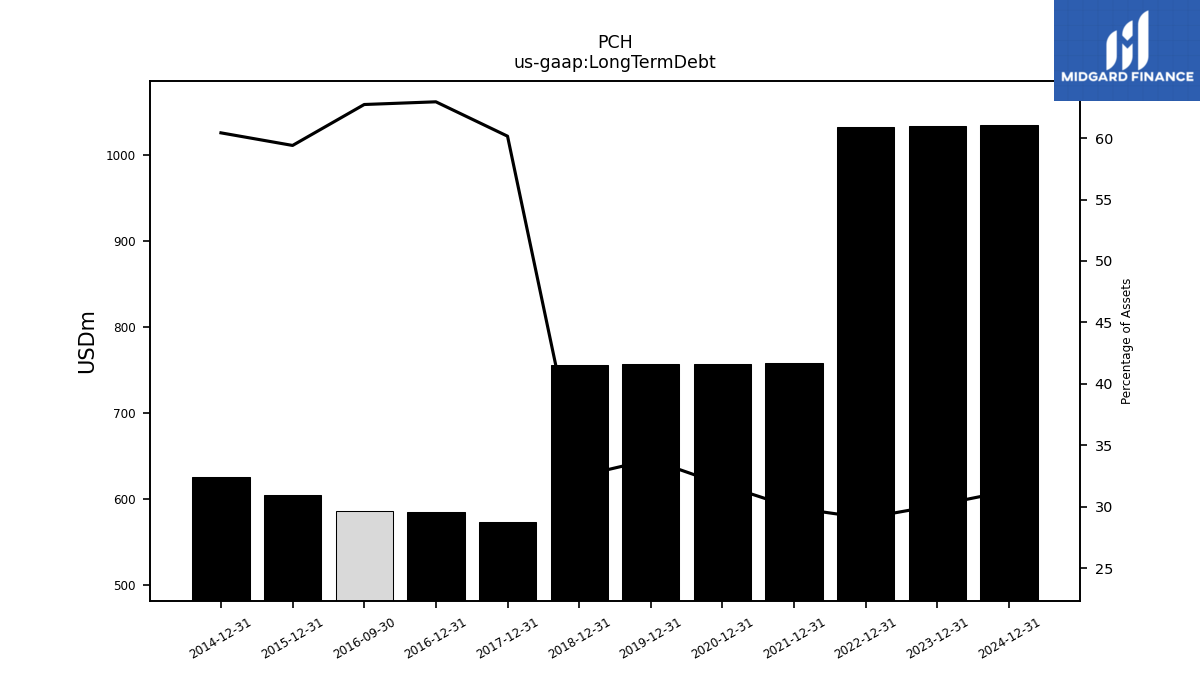
| Long Term Debt | 1033.73 | NA | NA | NA | 1032.68 | NA | NA | NA | 758.26 | NA | NA | NA | 757.35 | NA | NA | NA | 756.47 | NA | NA | NA | 755.36 | NA | NA | NA | 573.32 | NA | NA | NA | 583.99 | 585.37 | NA | NA | 603.88 | NA | NA | NA | 625.67 | NA | NA | NA | NA | NA | NA | NA | NA | NA | NA | NA | NA | NA | NA | NA | NA | NA | NA | NA | |
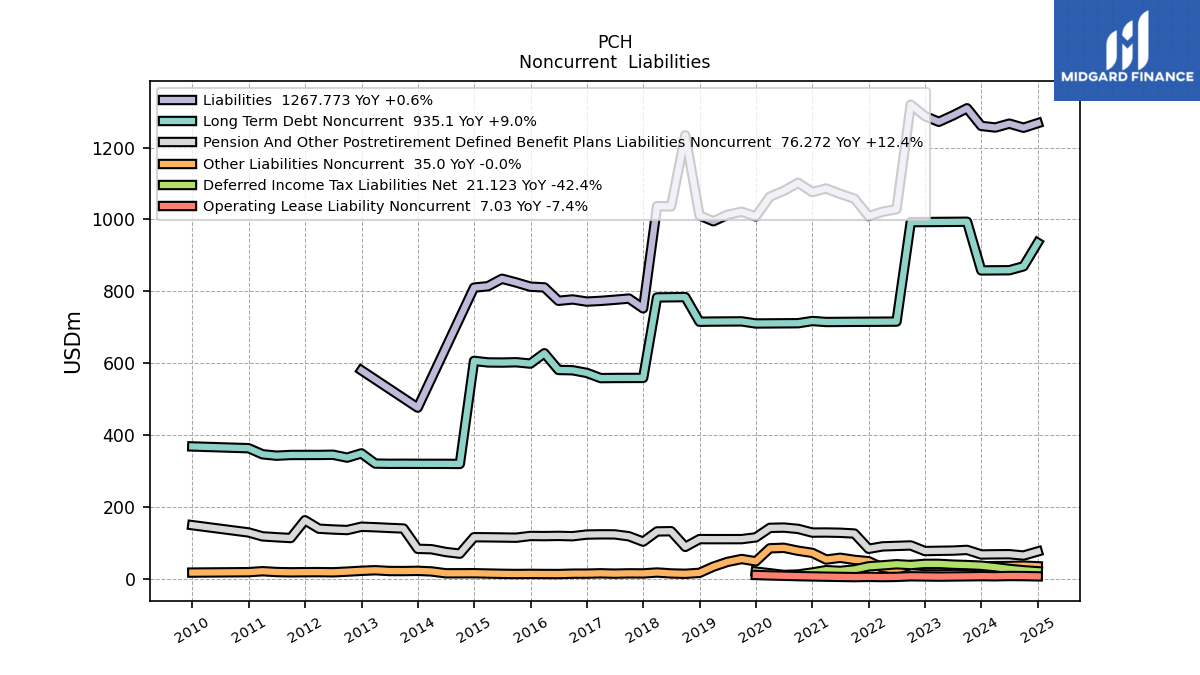
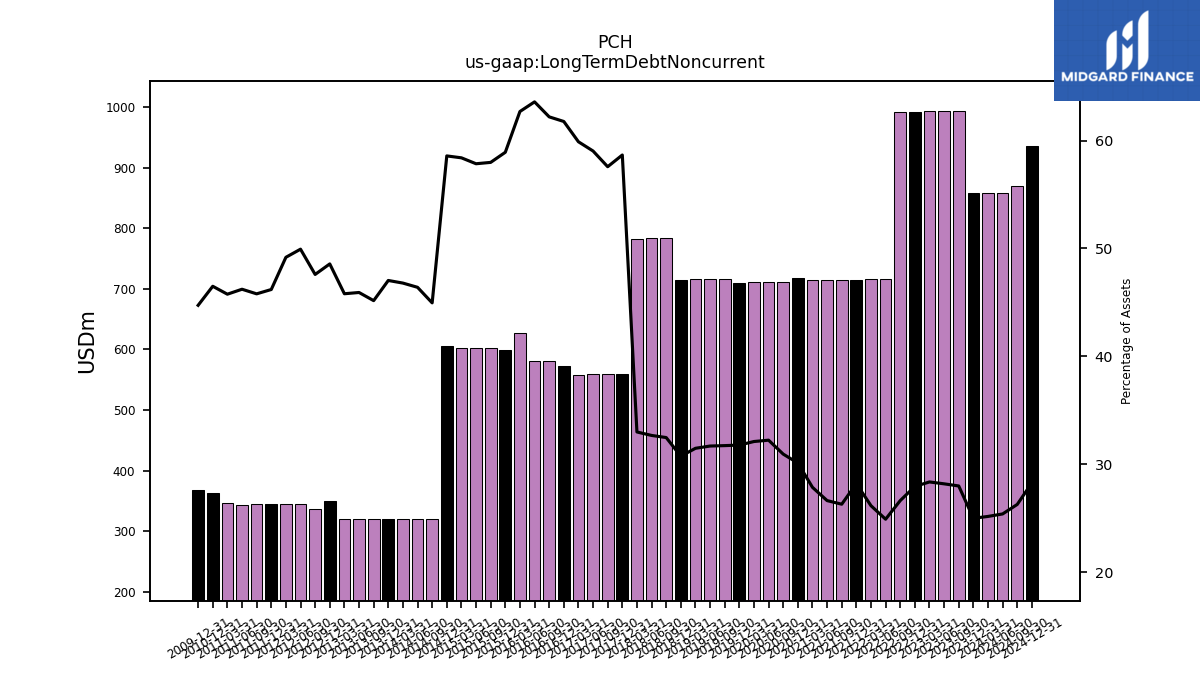
| Long Term Debt Noncurrent | 858.11 | 993.56 | 993.27 | 992.99 | 992.70 | 992.51 | 715.75 | 715.50 | 715.28 | 715.12 | 714.87 | 714.62 | 717.37 | 711.25 | 711.00 | 710.75 | 710.50 | 716.35 | 716.09 | 715.84 | 715.39 | 783.90 | 783.44 | 782.97 | 559.06 | 559.02 | 558.85 | 558.51 | 572.96 | 580.32 | 581.21 | 627.71 | 598.87 | 602.67 | 601.76 | 602.15 | 606.47 | 319.75 | 320.00 | 320.01 | 320.09 | 320.23 | 320.13 | 320.75 | 349.16 | 337.31 | 345.35 | 344.78 | 344.74 | 344.68 | 342.70 | 346.63 | 363.49 | NA | NA | NA | |
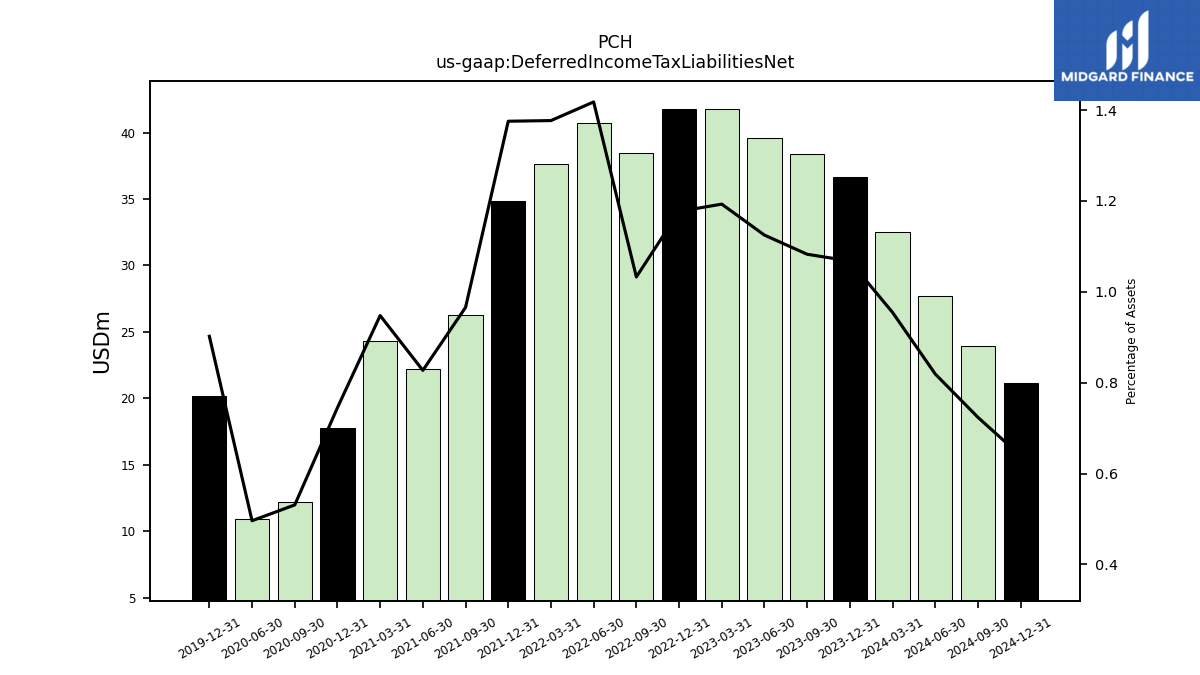
| Deferred Income Tax Liabilities Net | 36.64 | 38.42 | 39.62 | 41.76 | 41.79 | 38.47 | 40.73 | 37.64 | 34.87 | 26.25 | 22.19 | 24.30 | 17.74 | 12.20 | 10.94 | NA | 20.16 | NA | NA | NA | NA | NA | NA | NA | NA | NA | NA | NA | NA | NA | NA | NA | NA | NA | NA | NA | NA | NA | NA | NA | NA | NA | NA | NA | NA | NA | NA | NA | NA | NA | NA | NA | NA | NA | NA | NA | |
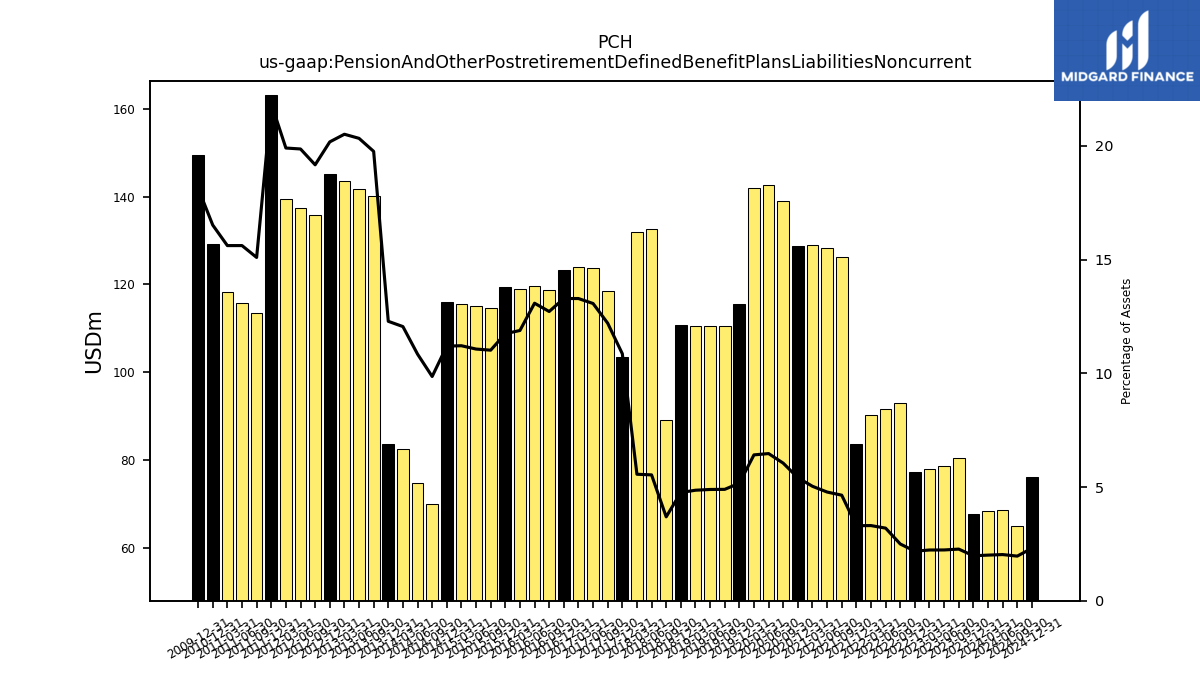
| Pension And Other Postretirement Defined Benefit Plans Liabilities Noncurrent | 67.86 | 80.58 | 78.67 | 78.10 | 77.40 | 92.99 | 91.70 | 90.36 | 83.67 | 126.15 | 128.25 | 129.03 | 128.81 | 139.02 | 142.71 | 141.92 | 115.46 | 110.55 | 110.53 | 110.48 | 110.66 | 89.03 | 132.68 | 131.96 | 103.52 | 118.50 | 123.75 | 123.94 | 123.28 | 118.68 | 119.59 | 119.00 | 119.37 | 114.54 | 115.13 | 115.63 | 115.94 | 70.13 | 74.79 | 82.45 | 83.62 | 140.09 | 141.74 | 143.64 | 145.05 | 135.85 | 137.38 | 139.55 | 163.12 | 113.61 | 115.79 | 118.28 | 129.12 | NA | NA | NA | |
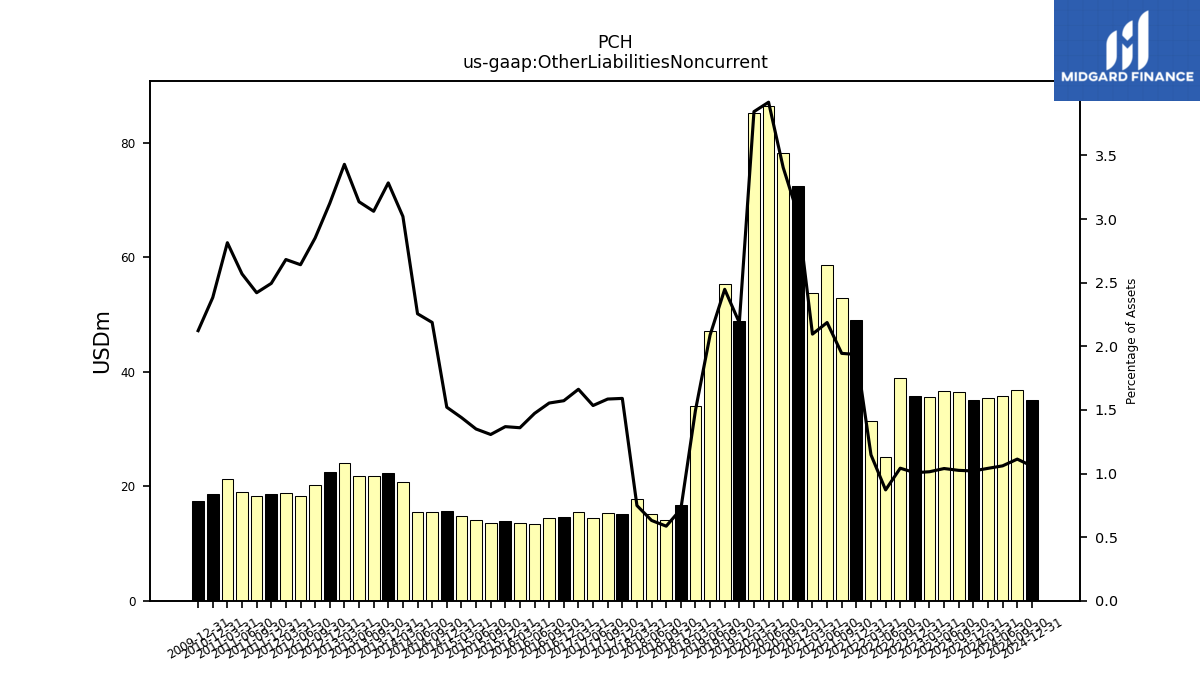
| Other Liabilities Noncurrent | 35.02 | 36.36 | 36.61 | 35.49 | 35.75 | 38.81 | 25.03 | 31.35 | 49.08 | 52.85 | 58.67 | 53.73 | 72.36 | 78.24 | 86.42 | 85.08 | 48.85 | 55.25 | 47.17 | 34.02 | 16.73 | 14.15 | 15.13 | 17.75 | 15.16 | 15.39 | 14.53 | 15.50 | 14.59 | 14.50 | 13.46 | 13.62 | 13.91 | 13.59 | 14.04 | 14.85 | 15.75 | 15.56 | 15.56 | 20.66 | 22.35 | 21.71 | 21.86 | 24.02 | 22.46 | 20.21 | 18.27 | 18.80 | 18.61 | 18.22 | 19.05 | 21.32 | 18.63 | NA | NA | NA | |
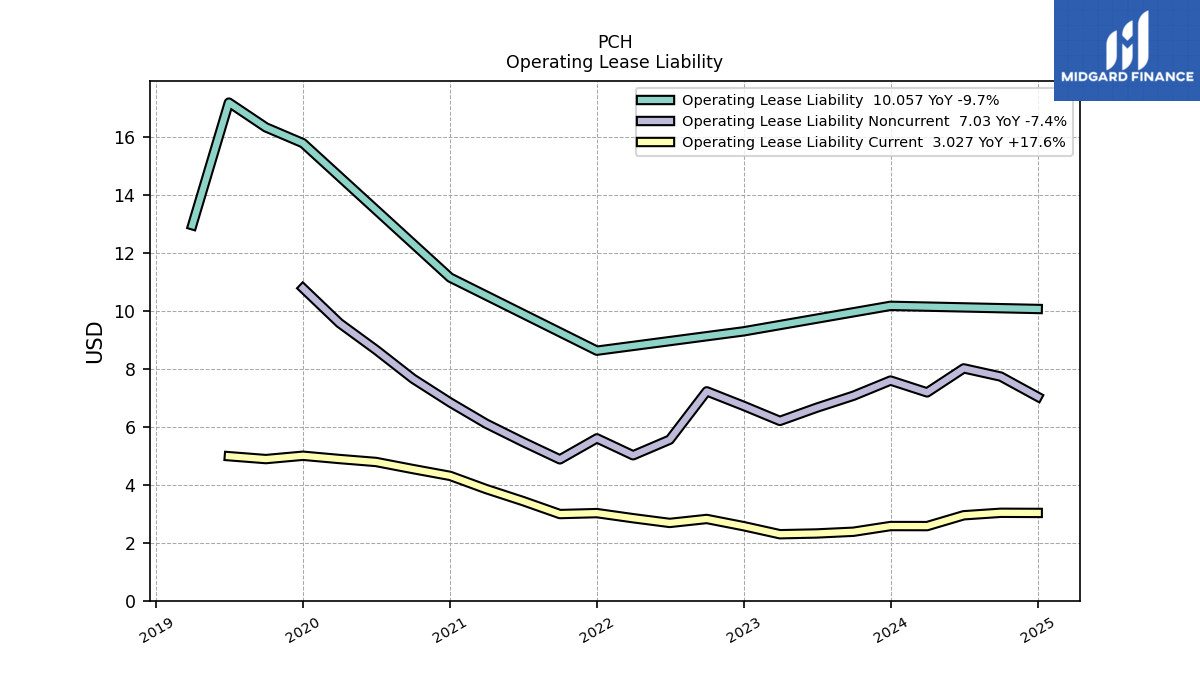
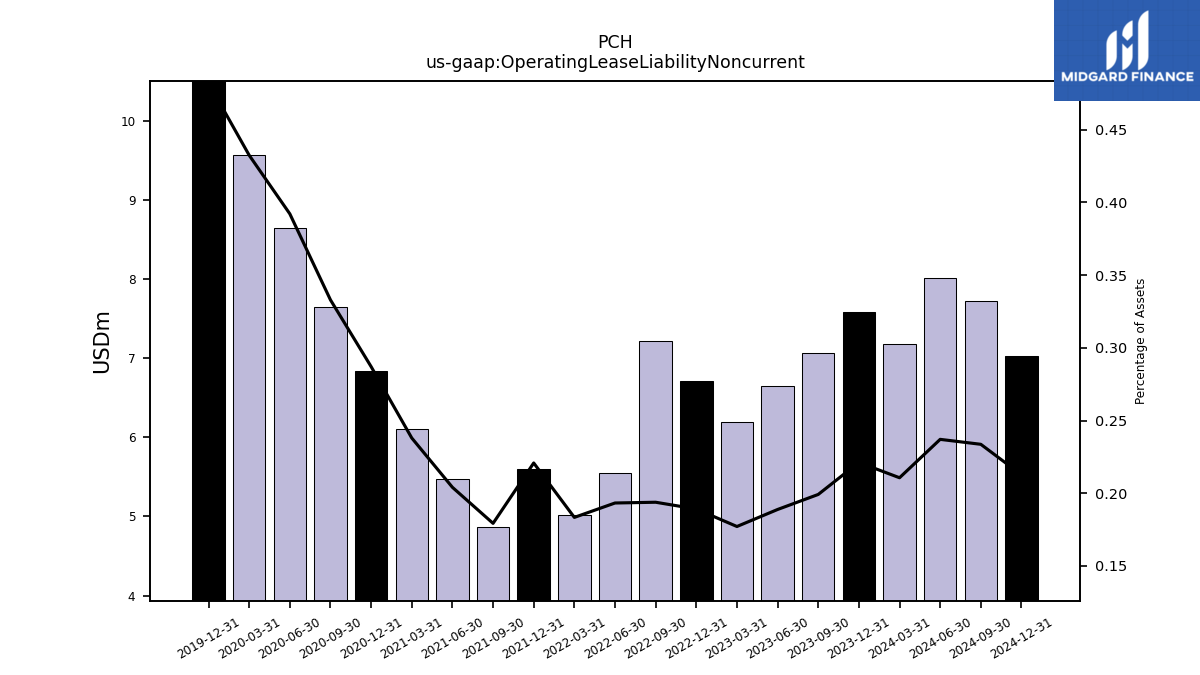
| Operating Lease Liability Noncurrent | 7.59 | 7.07 | 6.65 | 6.20 | 6.72 | 7.22 | 5.55 | 5.01 | 5.60 | 4.87 | 5.47 | 6.10 | 6.83 | 7.65 | 8.65 | 9.57 | 10.78 | NA | NA | NA | NA | NA | NA | NA | NA | NA | NA | NA | NA | NA | NA | NA | NA | NA | NA | NA | NA | NA | NA | NA | NA | NA | NA | NA | NA | NA | NA | NA | NA | NA | NA | NA | NA | NA | NA | NA |
| 2023-12-31 | 2023-09-30 | 2023-06-30 | 2023-03-31 | 2022-12-31 | 2022-09-30 | 2022-06-30 | 2022-03-31 | 2021-12-31 | 2021-09-30 | 2021-06-30 | 2021-03-31 | 2020-12-31 | 2020-09-30 | 2020-06-30 | 2020-03-31 | 2019-12-31 | 2019-09-30 | 2019-06-30 | 2019-03-31 | 2018-12-31 | 2018-09-30 | 2018-06-30 | 2018-03-31 | 2017-12-31 | 2017-09-30 | 2017-06-30 | 2017-03-31 | 2016-12-31 | 2016-09-30 | 2016-06-30 | 2016-03-31 | 2015-12-31 | 2015-09-30 | 2015-06-30 | 2015-03-31 | 2014-12-31 | 2014-09-30 | 2014-06-30 | 2014-03-31 | 2013-12-31 | 2013-09-30 | 2013-06-30 | 2013-03-31 | 2012-12-31 | 2012-09-30 | 2012-06-30 | 2012-03-31 | 2011-12-31 | 2011-09-30 | 2011-06-30 | 2011-03-31 | 2010-12-31 | 2010-09-30 | 2010-06-30 | 2010-03-31 | ||
|---|---|---|---|---|---|---|---|---|---|---|---|---|---|---|---|---|---|---|---|---|---|---|---|---|---|---|---|---|---|---|---|---|---|---|---|---|---|---|---|---|---|---|---|---|---|---|---|---|---|---|---|---|---|---|---|---|---|
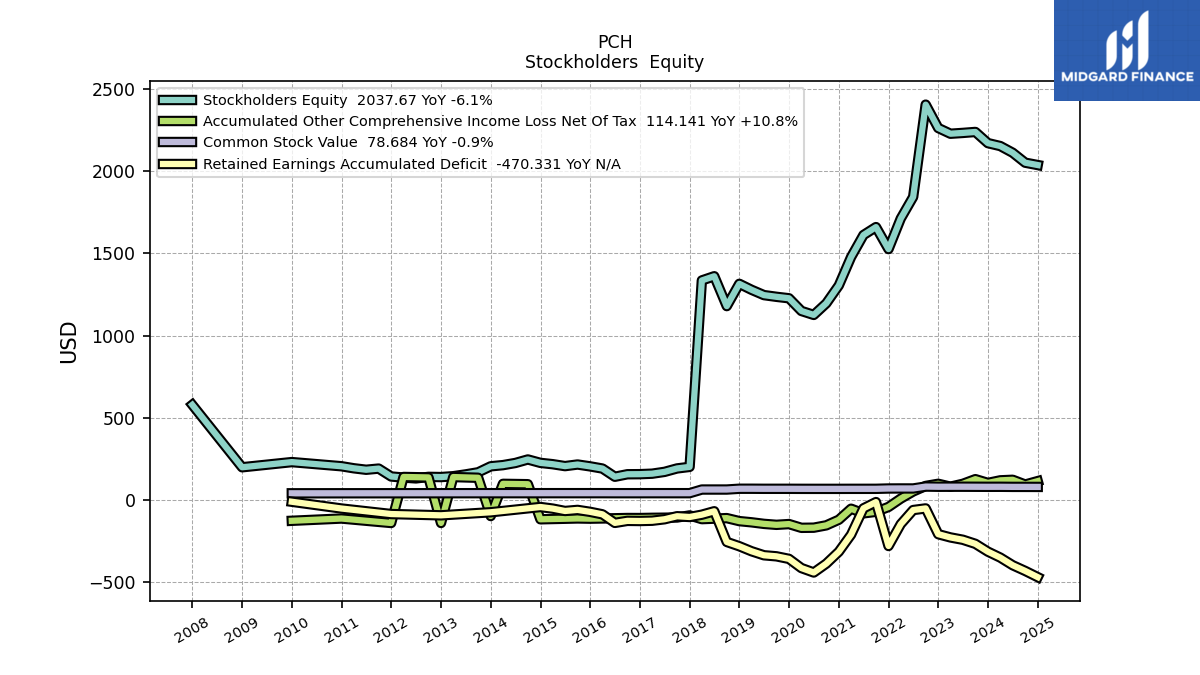
| Stockholders Equity | 2171.10 | 2239.10 | 2233.17 | 2228.26 | 2263.15 | 2405.42 | 1843.55 | 1712.20 | 1526.13 | 1660.11 | 1611.79 | 1477.55 | 1304.95 | 1196.08 | 1125.48 | 1149.61 | 1226.83 | 1235.73 | 1246.05 | 1278.39 | 1314.78 | 1179.07 | 1360.93 | 1335.44 | 200.54 | 191.19 | 170.33 | 159.26 | 156.27 | 155.76 | 140.54 | 190.48 | 203.74 | 215.04 | 205.29 | 216.99 | 225.07 | 245.76 | 224.34 | 211.30 | 204.15 | 167.71 | 154.80 | 143.81 | 138.64 | 139.88 | 130.57 | 135.57 | 142.14 | 190.25 | 183.13 | 192.19 | 204.44 | NA | NA | NA | |
| Common Stock Value | 79.36 | 79.63 | 79.91 | 79.92 | 79.68 | 80.78 | 69.28 | 69.37 | 69.06 | 67.10 | 67.05 | 67.04 | 66.88 | 66.87 | 66.87 | 66.95 | 67.22 | 67.22 | 67.19 | 67.59 | 67.57 | 62.76 | 62.75 | 62.76 | 40.61 | 40.61 | 40.61 | 40.61 | 40.52 | 40.52 | 40.52 | 40.69 | 40.68 | 40.68 | 40.68 | 40.68 | 40.60 | NA | NA | NA | 40.54 | NA | NA | NA | 40.39 | NA | NA | NA | 40.20 | NA | NA | NA | 40.03 | NA | NA | NA | |
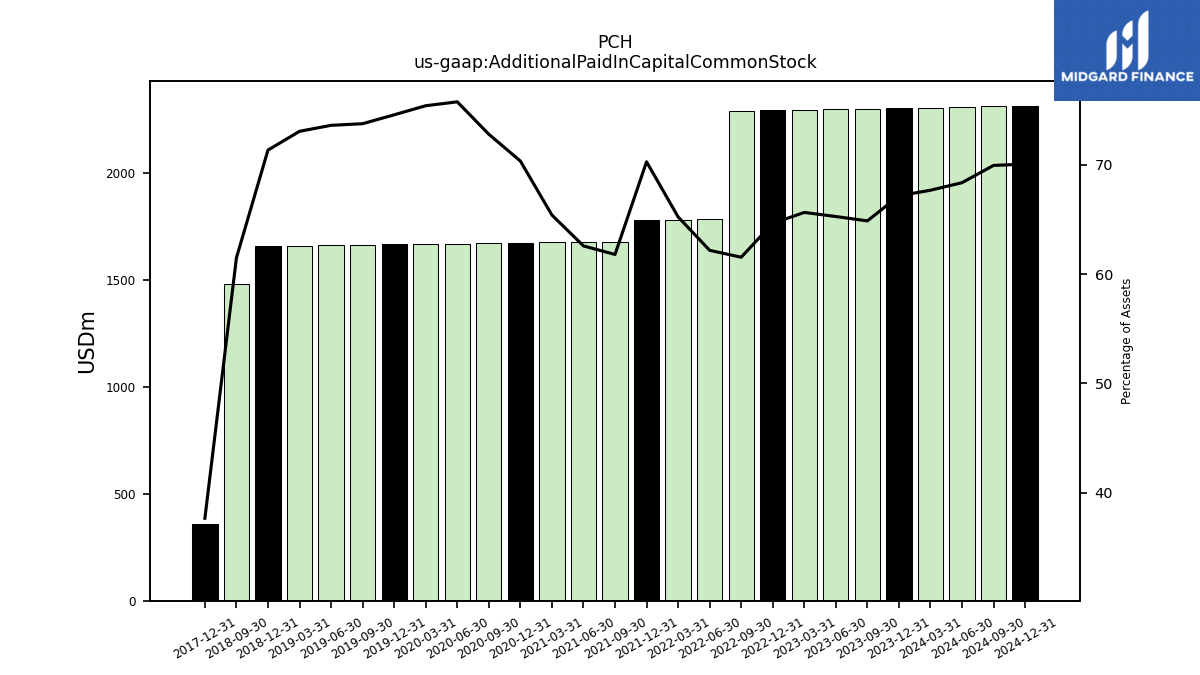
| Additional Paid In Capital Common Stock | 2303.99 | 2301.30 | 2298.59 | 2296.93 | 2294.80 | 2292.13 | 1785.38 | 1782.94 | 1781.22 | 1679.33 | 1678.66 | 1676.42 | 1674.58 | 1672.35 | 1670.18 | 1668.12 | 1666.30 | 1664.33 | 1662.38 | 1660.45 | 1659.03 | 1483.75 | NA | NA | 359.14 | NA | NA | NA | NA | NA | NA | NA | NA | NA | NA | NA | NA | NA | NA | NA | NA | NA | NA | NA | NA | NA | NA | NA | NA | NA | NA | NA | NA | NA | NA | NA | |
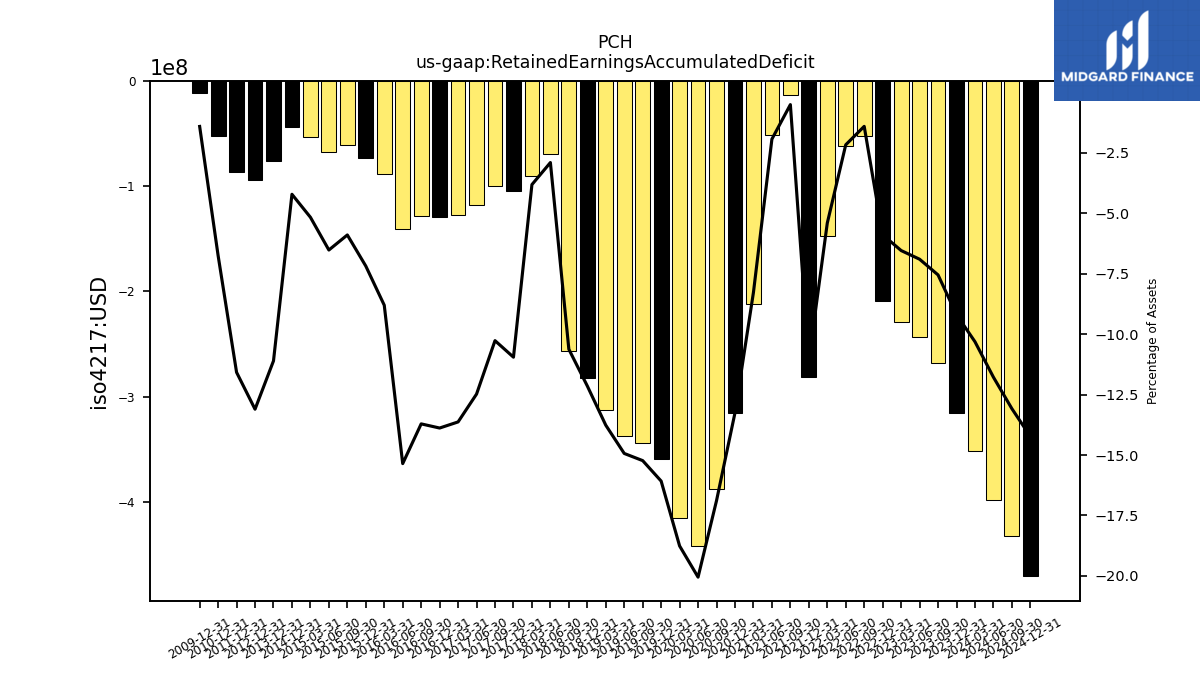
| Retained Earnings Accumulated Deficit | -315.29 | -267.73 | -242.90 | -228.77 | -208.98 | -52.09 | -62.07 | -147.63 | -280.91 | -13.56 | -51.67 | -211.99 | -315.51 | -388.00 | -442.15 | -415.15 | -359.33 | -343.75 | -337.33 | -312.87 | -282.39 | -256.28 | -69.43 | -90.33 | -104.36 | -99.68 | -118.12 | -127.11 | -128.78 | -127.93 | -140.35 | -88.11 | -72.98 | -61.25 | -67.77 | -53.21 | -43.59 | NA | NA | NA | -75.56 | NA | NA | NA | -94.20 | NA | NA | NA | -86.39 | NA | NA | NA | -52.73 | NA | NA | NA | |
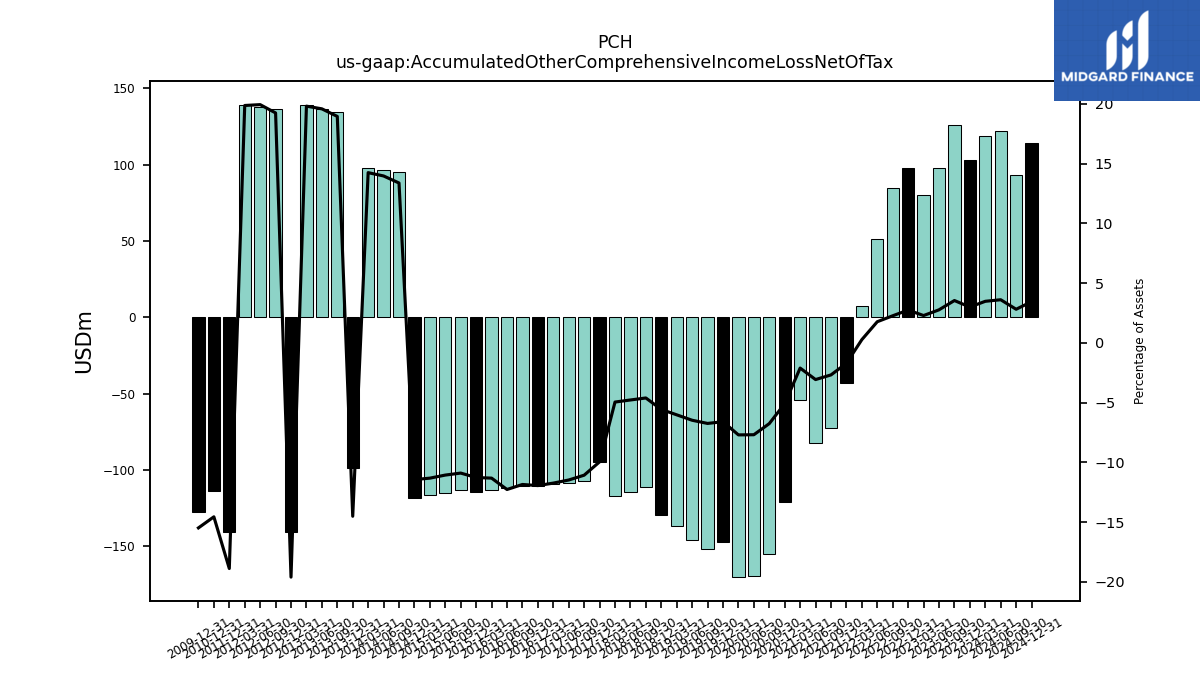
| Accumulated Other Comprehensive Income Loss Net Of Tax | 103.03 | 125.89 | 97.56 | 80.19 | 97.65 | 84.60 | 50.96 | 7.52 | -43.24 | -72.77 | -82.25 | -53.93 | -120.99 | -155.15 | -169.43 | -170.31 | -147.36 | -152.08 | -146.19 | -136.78 | -129.43 | -111.16 | -114.45 | -117.38 | -94.85 | -107.48 | -108.61 | -109.41 | -110.74 | -110.53 | -112.12 | -113.29 | -114.50 | -113.23 | -115.05 | -116.69 | -118.39 | 95.18 | 96.36 | 97.45 | -98.72 | 134.40 | 136.56 | 138.75 | -140.90 | 136.41 | 137.92 | 139.30 | -140.88 | NA | NA | NA | -113.75 | NA | NA | NA |
| 2023-12-31 | 2023-09-30 | 2023-06-30 | 2023-03-31 | 2022-12-31 | 2022-09-30 | 2022-06-30 | 2022-03-31 | 2021-12-31 | 2021-09-30 | 2021-06-30 | 2021-03-31 | 2020-12-31 | 2020-09-30 | 2020-06-30 | 2020-03-31 | 2019-12-31 | 2019-09-30 | 2019-06-30 | 2019-03-31 | 2018-12-31 | 2018-09-30 | 2018-06-30 | 2018-03-31 | 2017-12-31 | 2017-09-30 | 2017-06-30 | 2017-03-31 | 2016-12-31 | 2016-09-30 | 2016-06-30 | 2016-03-31 | 2015-12-31 | 2015-09-30 | 2015-06-30 | 2015-03-31 | 2014-12-31 | 2014-09-30 | 2014-06-30 | 2014-03-31 | 2013-12-31 | 2013-09-30 | 2013-06-30 | 2013-03-31 | 2012-12-31 | 2012-09-30 | 2012-06-30 | 2012-03-31 | 2011-12-31 | 2011-09-30 | 2011-06-30 | 2011-03-31 | 2010-12-31 | 2010-09-30 | 2010-06-30 | 2010-03-31 | ||
|---|---|---|---|---|---|---|---|---|---|---|---|---|---|---|---|---|---|---|---|---|---|---|---|---|---|---|---|---|---|---|---|---|---|---|---|---|---|---|---|---|---|---|---|---|---|---|---|---|---|---|---|---|---|---|---|---|---|
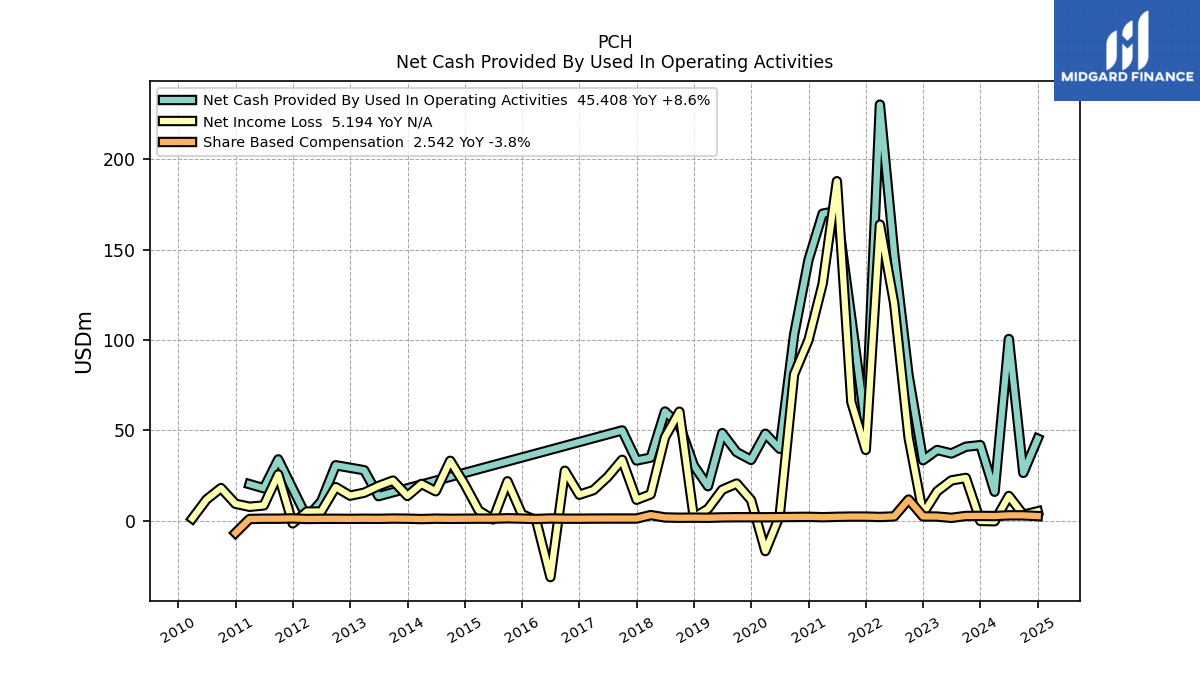
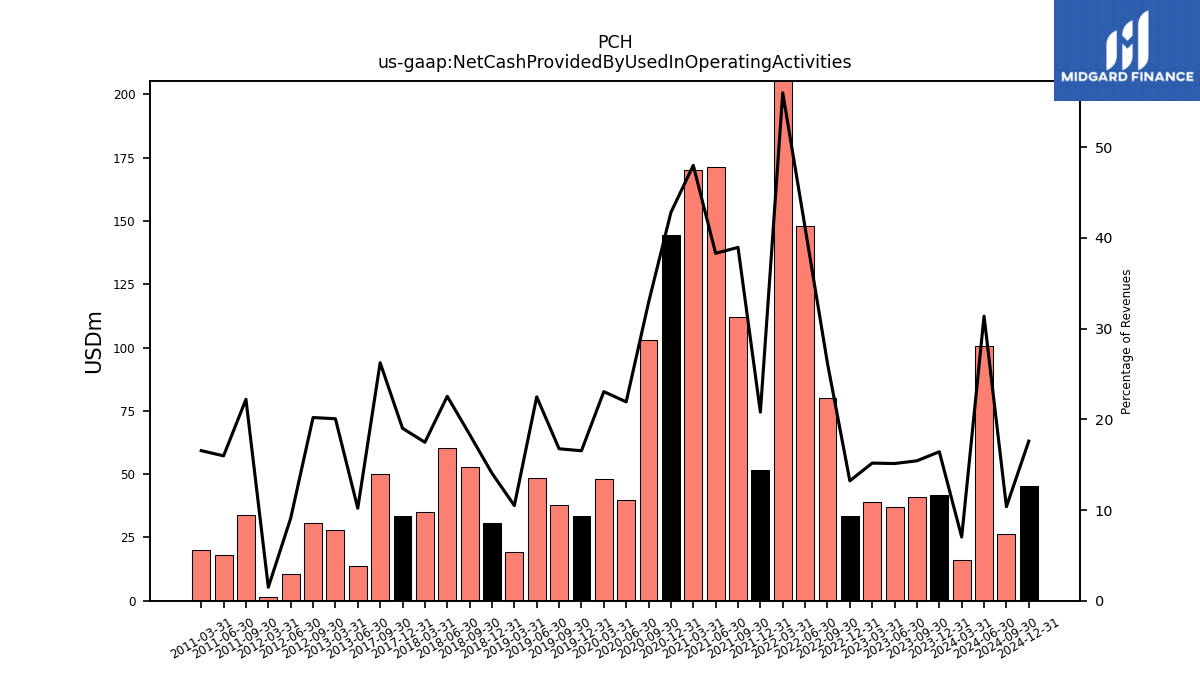
| Net Cash Provided By Used In Operating Activities | 41.80 | 40.95 | 37.22 | 39.14 | 33.46 | 80.25 | 147.89 | 230.30 | 51.64 | 111.90 | 171.38 | 169.97 | 144.42 | 102.90 | 39.80 | 48.14 | 33.64 | 37.91 | 48.45 | 19.07 | 30.53 | 53.01 | 60.44 | 34.91 | 33.31 | 49.96 | NA | NA | NA | NA | NA | NA | NA | NA | NA | NA | NA | NA | NA | NA | NA | NA | 13.58 | 27.93 | NA | 30.67 | 10.69 | 1.67 | NA | 33.94 | 17.95 | 20.22 | NA | NA | NA | NA | |
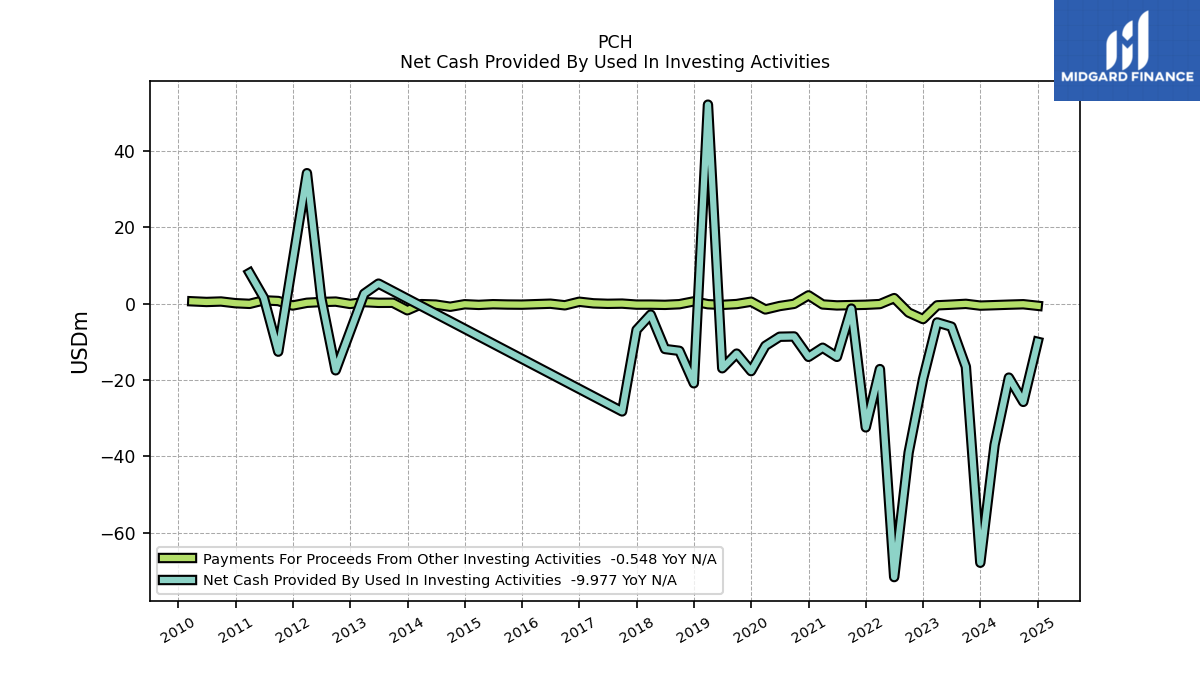
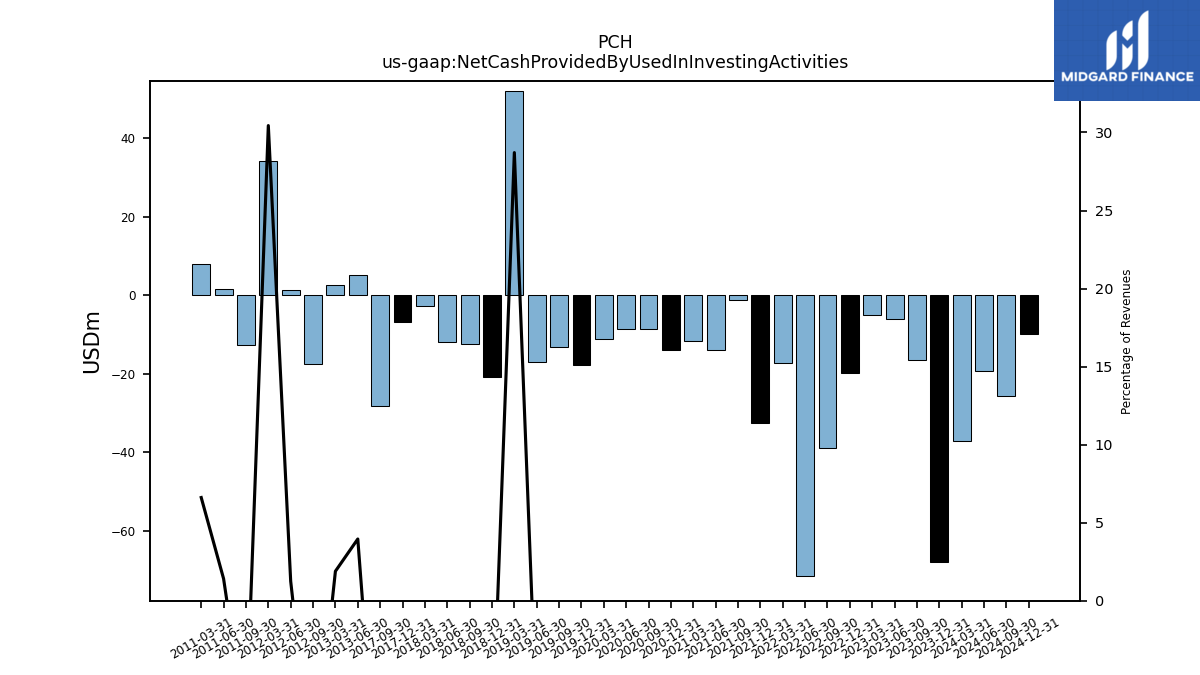
| Net Cash Provided By Used In Investing Activities | -67.88 | -16.52 | -6.01 | -4.90 | -19.73 | -39.03 | -71.64 | -17.12 | -32.41 | -1.28 | -13.93 | -11.53 | -13.93 | -8.58 | -8.65 | -11.03 | -17.67 | -13.07 | -16.92 | 52.17 | -20.86 | -12.35 | -11.86 | -2.84 | -6.86 | -28.22 | NA | NA | NA | NA | NA | NA | NA | NA | NA | NA | NA | NA | NA | NA | NA | NA | 5.27 | 2.63 | NA | -17.46 | 1.47 | 34.21 | NA | -12.57 | 1.59 | 8.08 | NA | NA | NA | NA | |
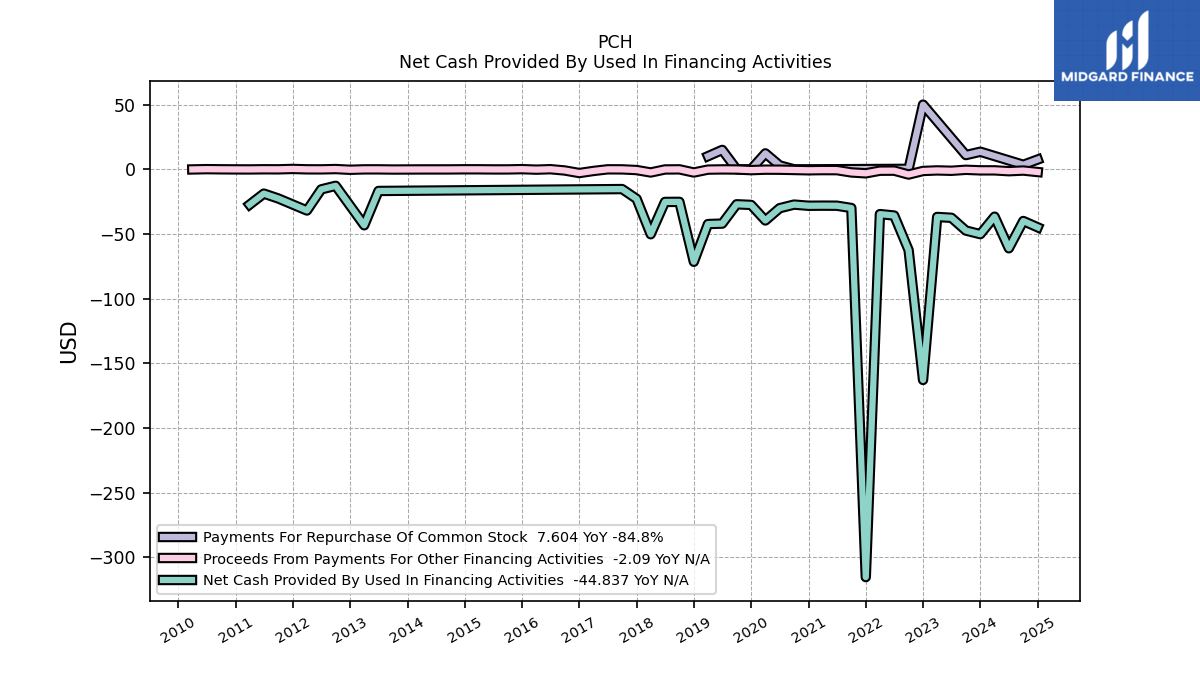
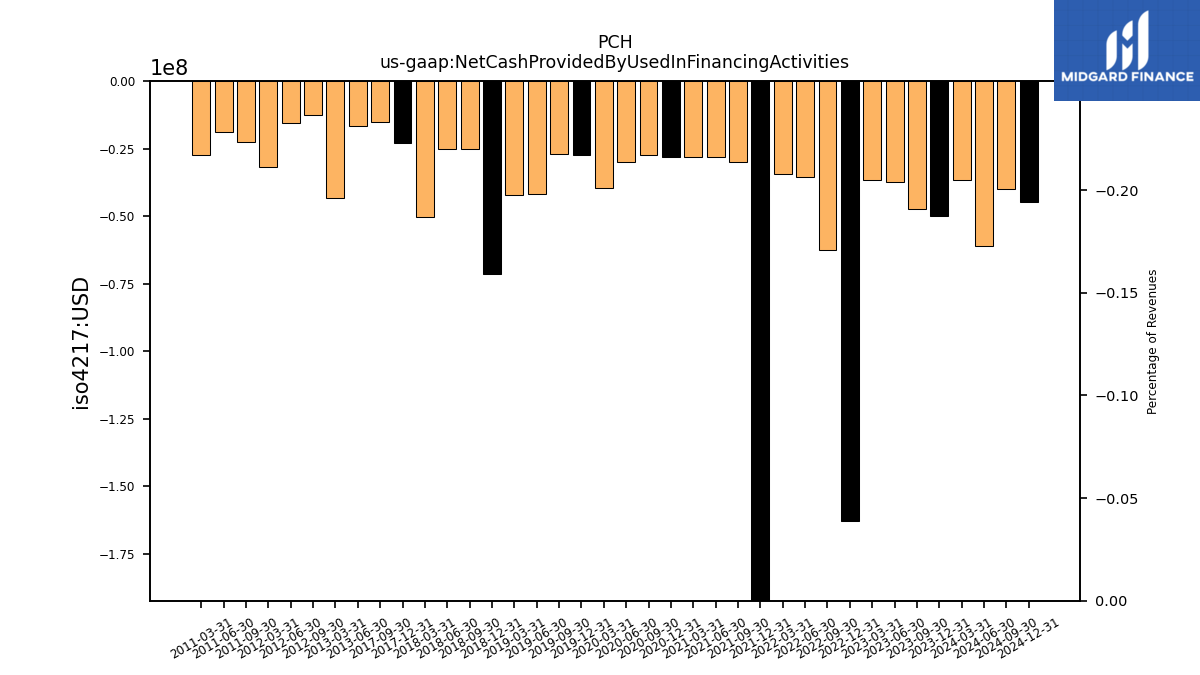
| Net Cash Provided By Used In Financing Activities | -50.11 | -47.33 | -37.47 | -36.80 | -162.84 | -62.43 | -35.70 | -34.59 | -315.23 | -29.89 | -28.12 | -28.07 | -28.16 | -27.25 | -30.04 | -39.54 | -27.51 | -27.02 | -41.95 | -42.30 | -71.47 | -25.14 | -25.20 | -50.19 | -22.80 | -15.26 | NA | NA | NA | NA | NA | NA | NA | NA | NA | NA | NA | NA | NA | NA | NA | NA | -16.72 | -43.27 | NA | -12.73 | -15.49 | -31.83 | NA | -22.52 | -18.76 | -27.31 | NA | NA | NA | NA |
| 2023-12-31 | 2023-09-30 | 2023-06-30 | 2023-03-31 | 2022-12-31 | 2022-09-30 | 2022-06-30 | 2022-03-31 | 2021-12-31 | 2021-09-30 | 2021-06-30 | 2021-03-31 | 2020-12-31 | 2020-09-30 | 2020-06-30 | 2020-03-31 | 2019-12-31 | 2019-09-30 | 2019-06-30 | 2019-03-31 | 2018-12-31 | 2018-09-30 | 2018-06-30 | 2018-03-31 | 2017-12-31 | 2017-09-30 | 2017-06-30 | 2017-03-31 | 2016-12-31 | 2016-09-30 | 2016-06-30 | 2016-03-31 | 2015-12-31 | 2015-09-30 | 2015-06-30 | 2015-03-31 | 2014-12-31 | 2014-09-30 | 2014-06-30 | 2014-03-31 | 2013-12-31 | 2013-09-30 | 2013-06-30 | 2013-03-31 | 2012-12-31 | 2012-09-30 | 2012-06-30 | 2012-03-31 | 2011-12-31 | 2011-09-30 | 2011-06-30 | 2011-03-31 | 2010-12-31 | 2010-09-30 | 2010-06-30 | 2010-03-31 | ||
|---|---|---|---|---|---|---|---|---|---|---|---|---|---|---|---|---|---|---|---|---|---|---|---|---|---|---|---|---|---|---|---|---|---|---|---|---|---|---|---|---|---|---|---|---|---|---|---|---|---|---|---|---|---|---|---|---|---|
| Net Cash Provided By Used In Operating Activities | 41.80 | 40.95 | 37.22 | 39.14 | 33.46 | 80.25 | 147.89 | 230.30 | 51.64 | 111.90 | 171.38 | 169.97 | 144.42 | 102.90 | 39.80 | 48.14 | 33.64 | 37.91 | 48.45 | 19.07 | 30.53 | 53.01 | 60.44 | 34.91 | 33.31 | 49.96 | NA | NA | NA | NA | NA | NA | NA | NA | NA | NA | NA | NA | NA | NA | NA | NA | 13.58 | 27.93 | NA | 30.67 | 10.69 | 1.67 | NA | 33.94 | 17.95 | 20.22 | NA | NA | NA | NA | |
| Net Income Loss | -0.14 | 23.68 | 22.31 | 16.26 | 3.84 | 45.95 | 120.22 | 163.88 | 39.18 | 65.67 | 187.91 | 131.11 | 100.02 | 81.01 | 2.64 | -16.83 | 11.40 | 20.57 | 17.14 | 6.56 | 1.80 | 60.34 | 46.15 | 14.60 | 11.59 | 33.70 | 24.24 | 16.92 | 14.37 | 27.65 | -31.24 | 0.16 | 3.55 | 21.80 | 0.71 | 5.66 | 20.14 | 33.15 | 16.27 | 20.35 | 13.72 | 22.19 | 19.18 | 15.49 | 13.86 | 18.60 | 5.08 | 5.05 | -1.48 | 25.60 | 8.45 | 7.70 | 9.38 | 18.08 | 11.74 | 1.20 | |
| Profit Loss | -0.14 | 23.68 | 22.31 | 16.26 | 3.84 | 45.95 | 120.22 | 163.88 | 39.18 | 65.67 | 187.91 | 131.11 | 100.02 | 81.01 | 2.64 | -16.83 | 11.40 | 20.57 | 17.14 | 6.56 | 1.80 | 60.34 | 46.15 | 14.60 | 11.59 | 33.70 | NA | NA | NA | NA | NA | NA | NA | NA | NA | NA | NA | NA | NA | NA | NA | NA | NA | NA | NA | NA | NA | NA | NA | NA | NA | NA | NA | NA | NA | NA | |
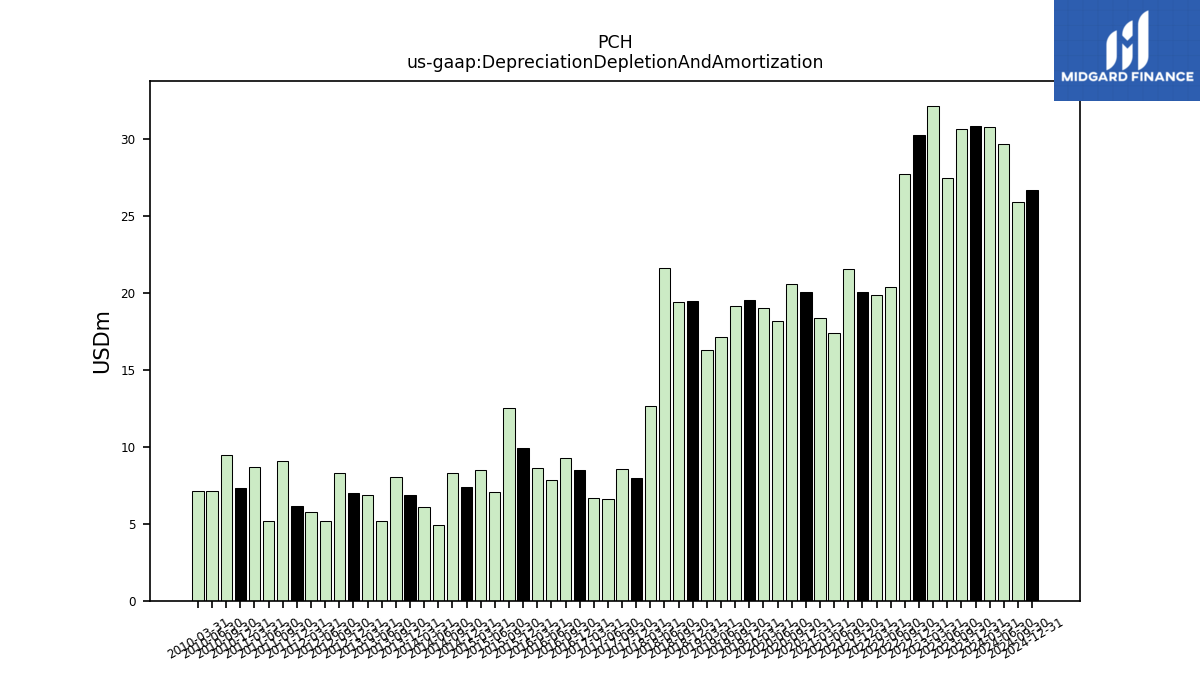
| Depreciation Depletion And Amortization | 30.83 | 30.66 | 27.50 | 32.17 | 30.27 | 27.71 | 20.38 | 19.87 | 20.06 | 21.53 | 17.43 | 18.40 | 20.08 | 20.59 | 18.17 | 19.04 | 19.52 | 19.18 | 17.14 | 16.27 | 19.48 | 19.45 | 21.61 | 12.63 | 8.00 | 8.56 | 6.64 | 6.70 | 8.47 | 9.25 | 7.87 | 8.61 | 9.95 | 12.56 | 7.09 | 8.50 | 7.42 | 8.32 | 4.90 | 6.10 | 6.89 | 8.05 | 5.16 | 6.87 | 6.98 | 8.30 | 5.18 | 5.79 | 6.18 | 9.09 | 5.16 | 8.67 | 7.35 | 9.50 | 7.15 | 7.14 | |
| Share Based Compensation | 2.64 | 2.62 | 1.58 | 2.28 | 2.36 | 11.72 | 2.37 | 2.06 | 2.26 | 2.27 | 2.14 | 1.93 | 2.13 | 2.06 | 1.98 | 1.89 | 1.91 | 1.91 | 1.83 | 1.62 | 1.69 | 1.63 | 1.79 | 3.09 | 1.19 | 1.19 | 1.19 | 1.16 | 1.10 | 1.11 | 1.22 | 0.95 | 1.17 | 1.33 | 1.12 | 1.14 | 1.08 | 1.03 | 1.12 | 0.91 | 1.11 | 1.17 | 1.03 | 1.07 | 1.01 | 1.06 | 1.05 | 0.95 | 1.26 | 1.10 | 1.10 | 0.95 | -6.80 | NA | NA | NA |
| 2023-12-31 | 2023-09-30 | 2023-06-30 | 2023-03-31 | 2022-12-31 | 2022-09-30 | 2022-06-30 | 2022-03-31 | 2021-12-31 | 2021-09-30 | 2021-06-30 | 2021-03-31 | 2020-12-31 | 2020-09-30 | 2020-06-30 | 2020-03-31 | 2019-12-31 | 2019-09-30 | 2019-06-30 | 2019-03-31 | 2018-12-31 | 2018-09-30 | 2018-06-30 | 2018-03-31 | 2017-12-31 | 2017-09-30 | 2017-06-30 | 2017-03-31 | 2016-12-31 | 2016-09-30 | 2016-06-30 | 2016-03-31 | 2015-12-31 | 2015-09-30 | 2015-06-30 | 2015-03-31 | 2014-12-31 | 2014-09-30 | 2014-06-30 | 2014-03-31 | 2013-12-31 | 2013-09-30 | 2013-06-30 | 2013-03-31 | 2012-12-31 | 2012-09-30 | 2012-06-30 | 2012-03-31 | 2011-12-31 | 2011-09-30 | 2011-06-30 | 2011-03-31 | 2010-12-31 | 2010-09-30 | 2010-06-30 | 2010-03-31 | ||
|---|---|---|---|---|---|---|---|---|---|---|---|---|---|---|---|---|---|---|---|---|---|---|---|---|---|---|---|---|---|---|---|---|---|---|---|---|---|---|---|---|---|---|---|---|---|---|---|---|---|---|---|---|---|---|---|---|---|
| Net Cash Provided By Used In Investing Activities | -67.88 | -16.52 | -6.01 | -4.90 | -19.73 | -39.03 | -71.64 | -17.12 | -32.41 | -1.28 | -13.93 | -11.53 | -13.93 | -8.58 | -8.65 | -11.03 | -17.67 | -13.07 | -16.92 | 52.17 | -20.86 | -12.35 | -11.86 | -2.84 | -6.86 | -28.22 | NA | NA | NA | NA | NA | NA | NA | NA | NA | NA | NA | NA | NA | NA | NA | NA | 5.27 | 2.63 | NA | -17.46 | 1.47 | 34.21 | NA | -12.57 | 1.59 | 8.08 | NA | NA | NA | NA |
| 2023-12-31 | 2023-09-30 | 2023-06-30 | 2023-03-31 | 2022-12-31 | 2022-09-30 | 2022-06-30 | 2022-03-31 | 2021-12-31 | 2021-09-30 | 2021-06-30 | 2021-03-31 | 2020-12-31 | 2020-09-30 | 2020-06-30 | 2020-03-31 | 2019-12-31 | 2019-09-30 | 2019-06-30 | 2019-03-31 | 2018-12-31 | 2018-09-30 | 2018-06-30 | 2018-03-31 | 2017-12-31 | 2017-09-30 | 2017-06-30 | 2017-03-31 | 2016-12-31 | 2016-09-30 | 2016-06-30 | 2016-03-31 | 2015-12-31 | 2015-09-30 | 2015-06-30 | 2015-03-31 | 2014-12-31 | 2014-09-30 | 2014-06-30 | 2014-03-31 | 2013-12-31 | 2013-09-30 | 2013-06-30 | 2013-03-31 | 2012-12-31 | 2012-09-30 | 2012-06-30 | 2012-03-31 | 2011-12-31 | 2011-09-30 | 2011-06-30 | 2011-03-31 | 2010-12-31 | 2010-09-30 | 2010-06-30 | 2010-03-31 | ||
|---|---|---|---|---|---|---|---|---|---|---|---|---|---|---|---|---|---|---|---|---|---|---|---|---|---|---|---|---|---|---|---|---|---|---|---|---|---|---|---|---|---|---|---|---|---|---|---|---|---|---|---|---|---|---|---|---|---|
| Net Cash Provided By Used In Financing Activities | -50.11 | -47.33 | -37.47 | -36.80 | -162.84 | -62.43 | -35.70 | -34.59 | -315.23 | -29.89 | -28.12 | -28.07 | -28.16 | -27.25 | -30.04 | -39.54 | -27.51 | -27.02 | -41.95 | -42.30 | -71.47 | -25.14 | -25.20 | -50.19 | -22.80 | -15.26 | NA | NA | NA | NA | NA | NA | NA | NA | NA | NA | NA | NA | NA | NA | NA | NA | -16.72 | -43.27 | NA | -12.73 | -15.49 | -31.83 | NA | -22.52 | -18.76 | -27.31 | NA | NA | NA | NA | |
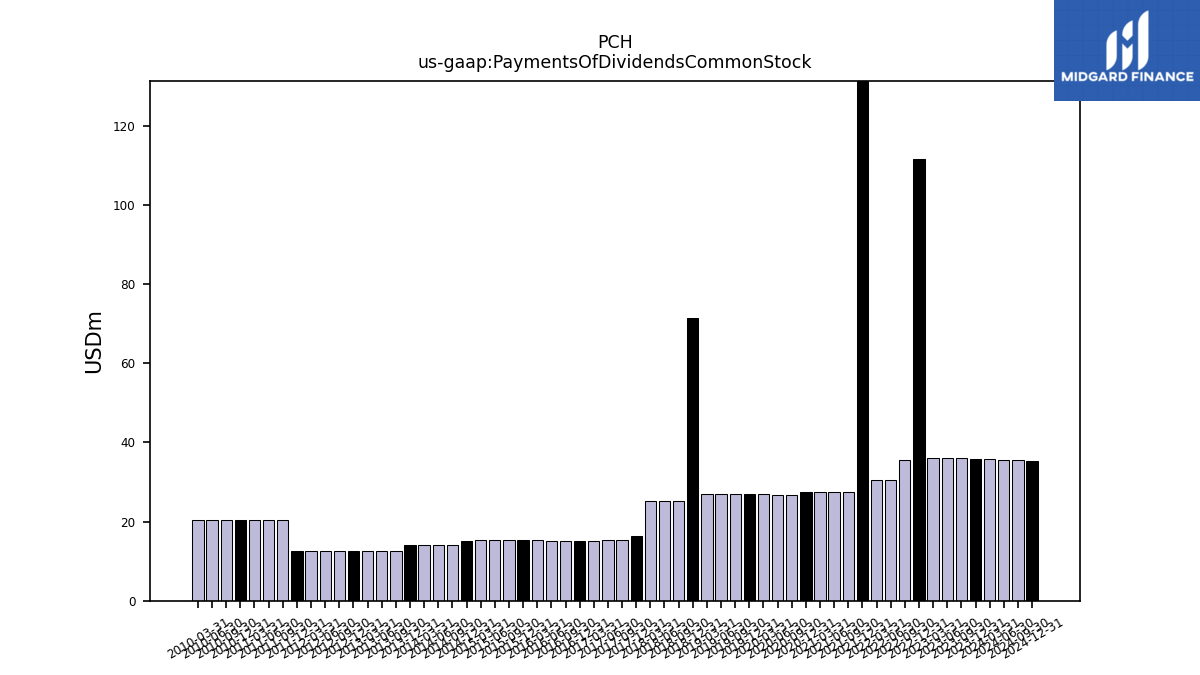
| Payments Of Dividends Common Stock | 35.72 | 35.96 | 35.96 | 35.96 | 111.56 | 35.53 | 30.52 | 30.52 | 305.78 | 27.49 | 27.49 | 27.48 | 27.42 | 26.75 | 26.74 | 26.94 | 26.89 | 26.89 | 26.88 | 27.07 | 71.46 | 25.10 | 25.10 | 25.10 | 16.25 | 15.23 | 15.23 | 15.23 | 15.20 | 15.19 | 15.20 | 15.26 | 15.26 | 15.25 | 15.25 | 15.25 | 15.23 | 14.21 | 14.21 | 14.21 | 14.19 | 12.56 | 12.56 | 12.55 | 12.52 | 12.51 | 12.50 | 12.50 | 12.46 | 20.50 | 20.50 | 20.47 | 20.42 | 20.40 | 20.39 | 20.37 | |
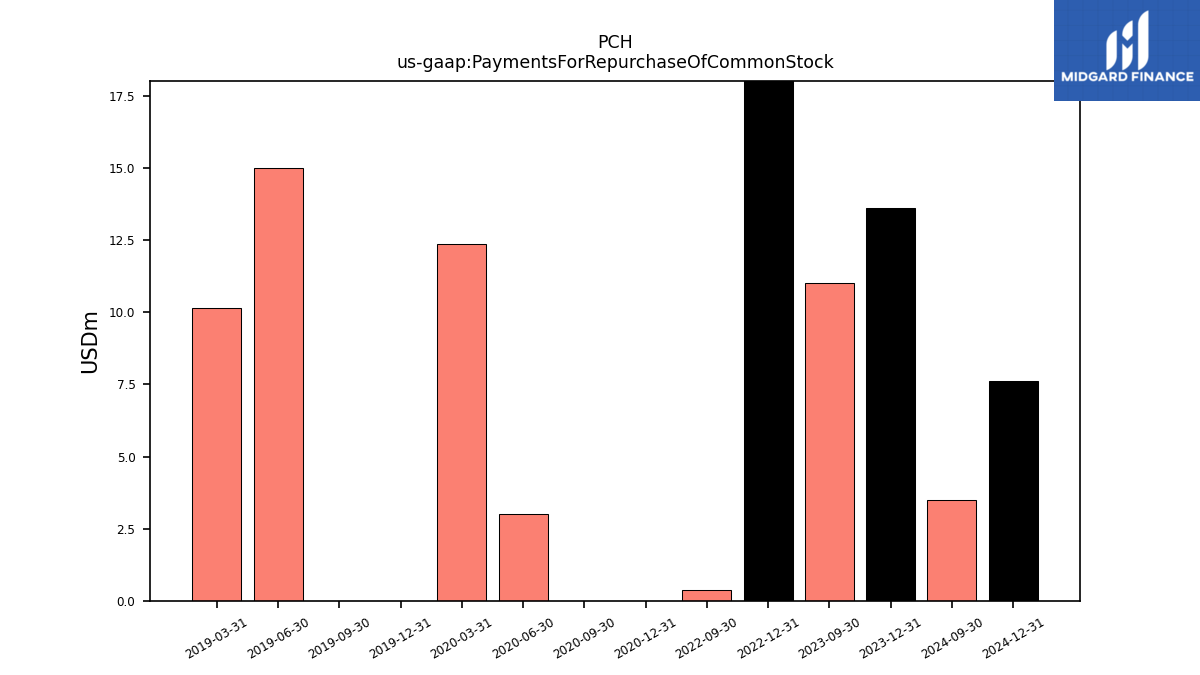
| Payments For Repurchase Of Common Stock | 13.61 | 11.01 | NA | NA | 50.02 | 0.37 | NA | NA | NA | NA | NA | NA | 0.00 | 0.00 | 3.01 | 12.36 | 0.00 | 0.00 | 15.02 | 10.16 | NA | NA | NA | NA | NA | NA | NA | NA | NA | NA | NA | NA | NA | NA | NA | NA | NA | NA | NA | NA | NA | NA | NA | NA | NA | NA | NA | NA | NA | NA | NA | NA | NA | NA | NA | NA |
| 2023-12-31 | 2023-09-30 | 2023-06-30 | 2023-03-31 | 2022-12-31 | 2022-09-30 | 2022-06-30 | 2022-03-31 | 2021-12-31 | 2021-09-30 | 2021-06-30 | 2021-03-31 | 2020-12-31 | 2020-09-30 | 2020-06-30 | 2020-03-31 | 2019-12-31 | 2019-09-30 | 2019-06-30 | 2019-03-31 | 2018-12-31 | 2018-09-30 | 2018-06-30 | 2018-03-31 | 2017-12-31 | 2017-09-30 | 2017-06-30 | 2017-03-31 | 2016-12-31 | 2016-09-30 | 2016-06-30 | 2016-03-31 | 2015-12-31 | 2015-09-30 | 2015-06-30 | 2015-03-31 | 2014-12-31 | 2014-09-30 | 2014-06-30 | 2014-03-31 | 2013-12-31 | 2013-09-30 | 2013-06-30 | 2013-03-31 | 2012-12-31 | 2012-09-30 | 2012-06-30 | 2012-03-31 | 2011-12-31 | 2011-09-30 | 2011-06-30 | 2011-03-31 | 2010-12-31 | 2010-09-30 | 2010-06-30 | 2010-03-31 | ||
|---|---|---|---|---|---|---|---|---|---|---|---|---|---|---|---|---|---|---|---|---|---|---|---|---|---|---|---|---|---|---|---|---|---|---|---|---|---|---|---|---|---|---|---|---|---|---|---|---|---|---|---|---|---|---|---|---|---|
| Revenues | 254.50 | 265.51 | 246.10 | 257.96 | 253.14 | 306.69 | 359.60 | 411.35 | 248.41 | 287.33 | 447.51 | 354.19 | 337.45 | 313.05 | 181.56 | 208.88 | 203.50 | 226.30 | 215.58 | 181.72 | 217.25 | 289.20 | 268.23 | 199.90 | 175.24 | 190.44 | 163.23 | 149.68 | 155.68 | 174.03 | 141.50 | 127.90 | 137.99 | 174.47 | 128.75 | 134.12 | 146.24 | 177.22 | 143.92 | 139.58 | 139.96 | 157.87 | 133.21 | 139.25 | 143.30 | 151.91 | 117.54 | 112.38 | 109.93 | 152.89 | 112.37 | 122.23 | 146.17 | 158.88 | 128.98 | 105.42 | |
| Revenue From Contract With Customer Excluding Assessed Tax | 254.50 | 265.51 | 246.10 | 257.96 | 253.14 | 306.69 | 359.60 | 411.35 | 248.41 | 287.33 | 447.51 | 354.19 | 337.45 | 313.05 | 181.56 | 208.88 | 203.50 | 226.30 | 215.58 | 181.72 | 217.25 | 289.20 | 268.23 | 199.90 | 175.24 | 190.44 | 163.23 | 149.68 | 155.68 | 174.03 | 141.50 | 127.90 | 137.99 | 174.47 | 128.75 | 134.12 | 146.24 | 177.22 | 143.92 | 139.58 | 139.96 | 157.87 | 133.21 | 139.25 | 143.30 | 151.91 | 117.54 | 112.38 | 109.93 | 152.89 | 112.37 | 122.23 | 146.17 | 158.88 | 128.98 | 105.42 | |
| 0.00 | NA | NA | NA | NA | NA | NA | NA | NA | NA | NA | NA | NA | NA | NA | NA | NA | NA | NA | NA | NA | NA | NA | NA | NA | NA | NA | NA | NA | NA | NA | NA | NA | NA | NA | NA | NA | NA | NA | NA | NA | NA | NA | NA | NA | NA | NA | NA | NA | NA | NA | NA | NA | NA | NA | NA | ||
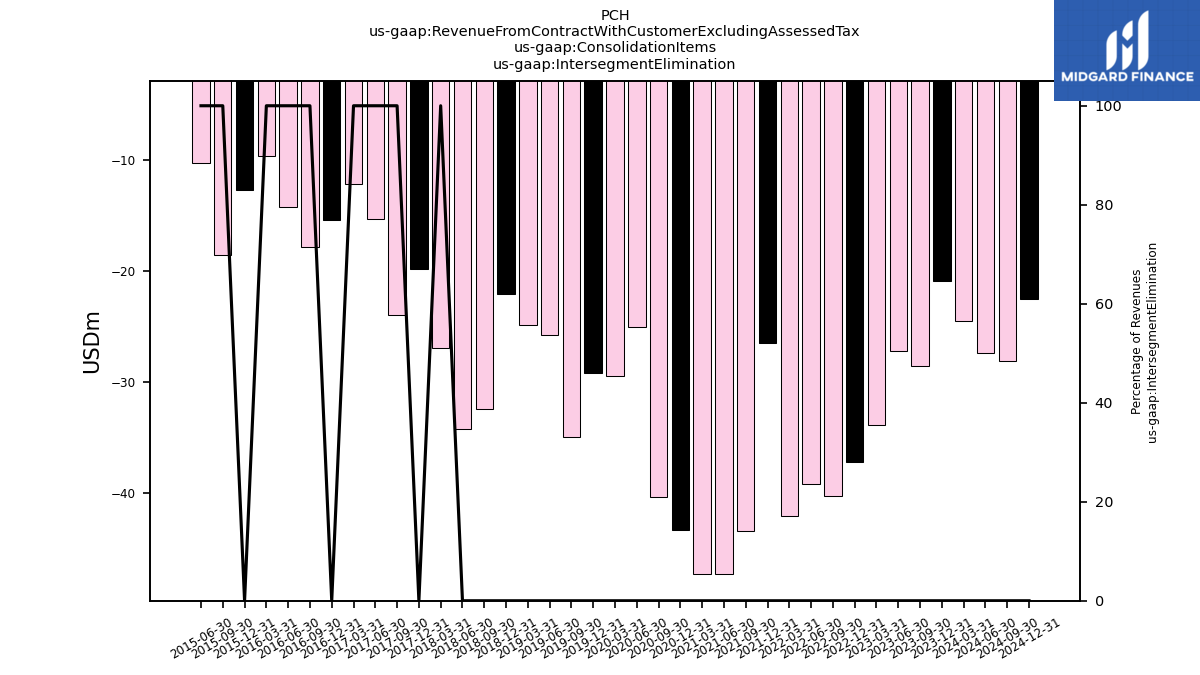
| Intersegment Elimination | -20.92 | -28.56 | -27.24 | -33.93 | -37.22 | -40.32 | -39.26 | -42.11 | -26.53 | -43.47 | -47.38 | -47.33 | -43.40 | -40.38 | -25.11 | -29.51 | -29.19 | -35.01 | -25.76 | -24.91 | -22.11 | -32.48 | -34.29 | -26.98 | -19.84 | -24.03 | -15.36 | -12.18 | -15.43 | -17.84 | -14.21 | -9.62 | -12.72 | -18.54 | -10.30 | NA | NA | NA | NA | NA | NA | NA | NA | NA | NA | NA | NA | NA | NA | NA | NA | NA | NA | NA | NA | NA | |
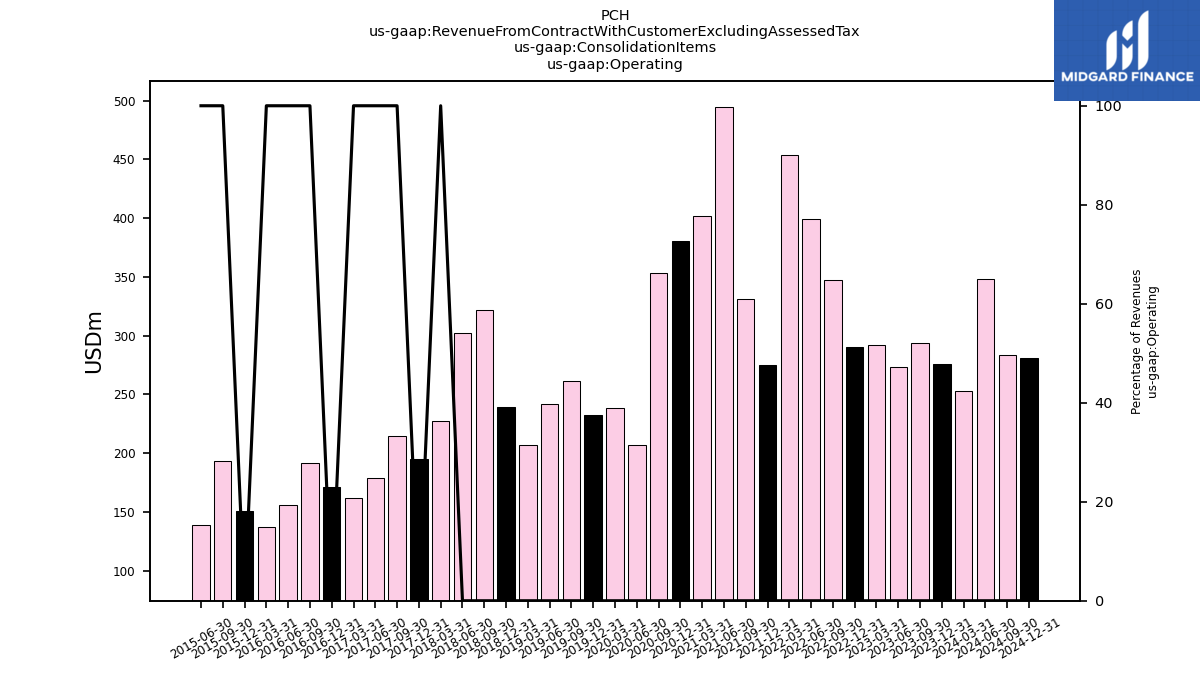
| Operating | 275.42 | 294.07 | 273.35 | 291.90 | 290.36 | 347.01 | 398.86 | 453.46 | 274.94 | 330.80 | 494.89 | 401.52 | 380.85 | 353.43 | 206.67 | 238.39 | 232.69 | 261.31 | 241.34 | 206.63 | 239.37 | 321.68 | 302.53 | 226.88 | 195.08 | 214.47 | 178.59 | 161.86 | 171.11 | 191.87 | 155.70 | 137.51 | 150.71 | 193.02 | 139.05 | NA | NA | NA | NA | NA | NA | NA | NA | NA | NA | NA | NA | NA | NA | NA | NA | NA | NA | NA | NA | NA | |
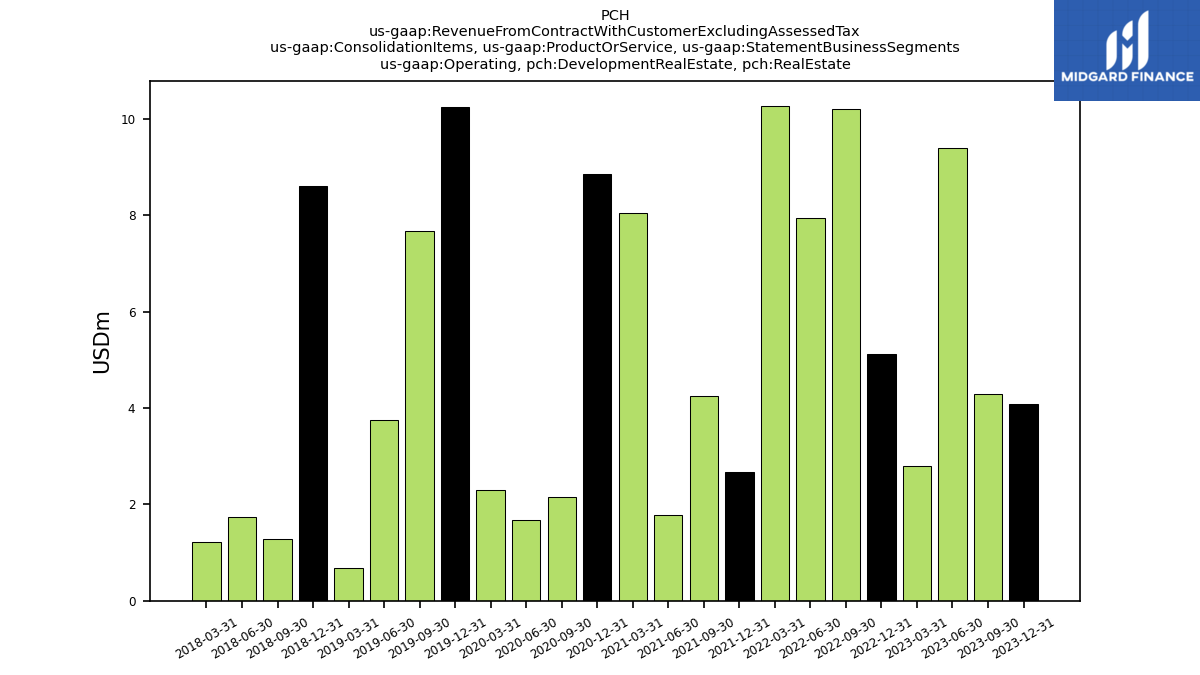
| Operating, Development Real Estate, Real Estate | 4.08 | 4.29 | 9.41 | 2.80 | 5.13 | 10.21 | 7.95 | 10.28 | 2.66 | 4.26 | 1.77 | 8.05 | 8.86 | 2.16 | 1.67 | 2.29 | 10.26 | 7.67 | 3.75 | 0.67 | 8.60 | 1.29 | 1.74 | 1.22 | NA | NA | NA | NA | NA | NA | NA | NA | NA | NA | NA | NA | NA | NA | NA | NA | NA | NA | NA | NA | NA | NA | NA | NA | NA | NA | NA | NA | NA | NA | NA | NA | |
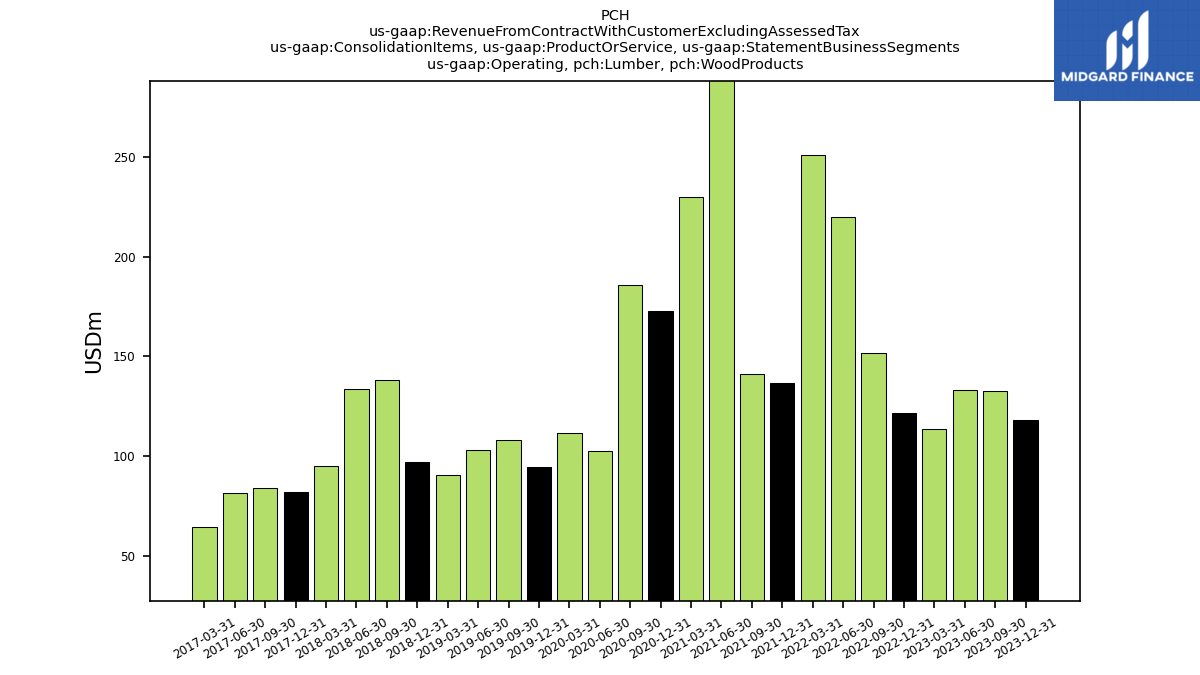
| Operating, Lumber, Wood Products | 118.37 | 132.85 | 133.29 | 113.80 | 121.91 | 151.54 | 219.92 | 250.76 | 136.73 | 141.25 | 308.48 | 229.68 | 172.78 | 185.56 | 102.79 | 111.94 | 94.72 | 108.36 | 103.05 | 90.50 | 97.12 | 138.28 | 133.79 | 94.99 | 82.28 | 84.23 | 81.70 | 64.87 | NA | NA | NA | NA | NA | NA | NA | NA | NA | NA | NA | NA | NA | NA | NA | NA | NA | NA | NA | NA | NA | NA | NA | NA | NA | NA | NA | NA | |
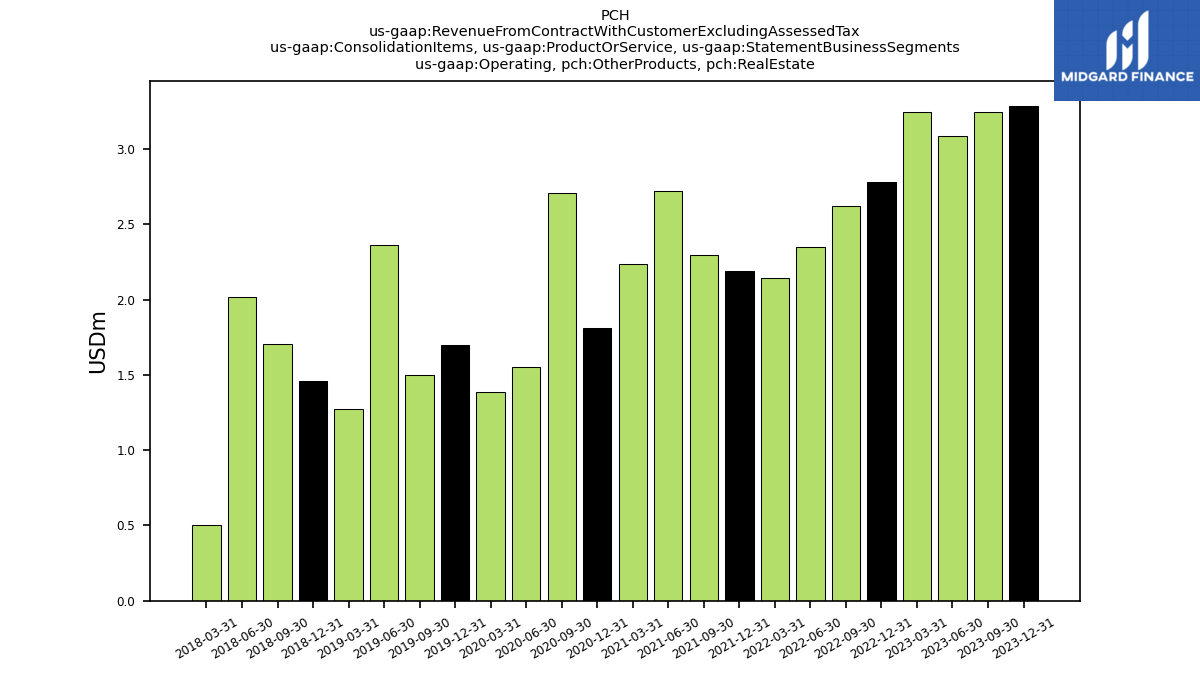
| Operating, Other Products, Real Estate | 3.29 | 3.25 | 3.08 | 3.24 | 2.78 | 2.62 | 2.35 | 2.14 | 2.19 | 2.30 | 2.72 | 2.23 | 1.81 | 2.71 | 1.55 | 1.39 | 1.70 | 1.50 | 2.36 | 1.27 | 1.46 | 1.71 | 2.02 | 0.50 | NA | NA | NA | NA | NA | NA | NA | NA | NA | NA | NA | NA | NA | NA | NA | NA | NA | NA | NA | NA | NA | NA | NA | NA | NA | NA | NA | NA | NA | NA | NA | NA | |
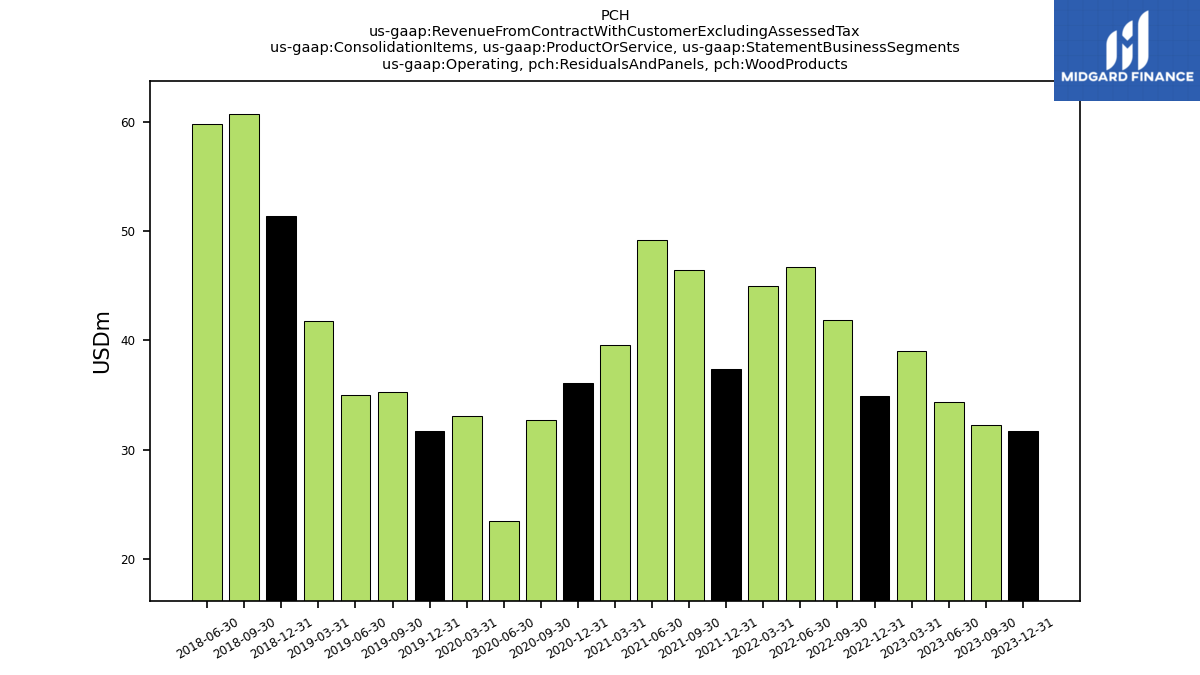
| Operating, Residuals And Panels, Wood Products | 31.73 | 32.26 | 34.38 | 39.00 | 34.90 | 41.89 | 46.71 | 44.98 | 37.43 | 46.51 | 49.19 | 39.61 | 36.12 | 32.73 | 23.42 | 33.06 | 31.70 | 35.28 | 34.98 | 41.80 | 51.39 | 60.74 | 59.80 | NA | NA | NA | NA | NA | NA | NA | NA | NA | NA | NA | NA | NA | NA | NA | NA | NA | NA | NA | NA | NA | NA | NA | NA | NA | NA | NA | NA | NA | NA | NA | NA | NA | |
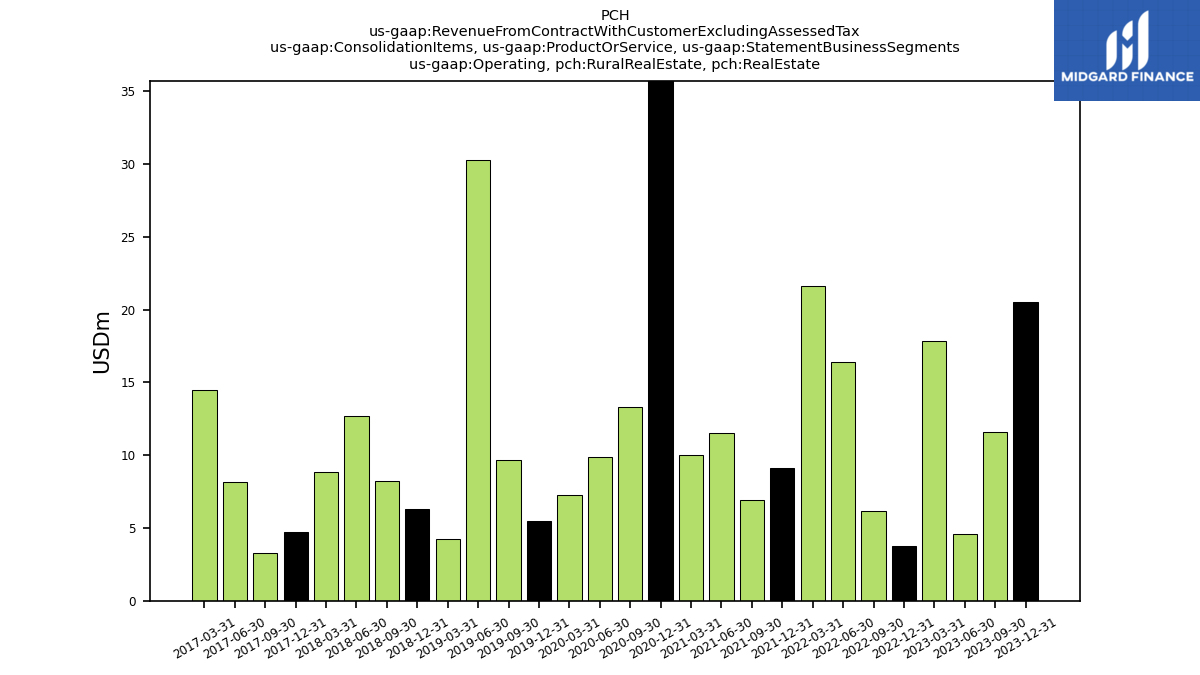
| Operating, Rural Real Estate, Real Estate | 20.54 | 11.62 | 4.57 | 17.82 | 3.77 | 6.18 | 16.44 | 21.65 | 9.15 | 6.94 | 11.51 | 10.03 | 51.52 | 13.28 | 9.88 | 7.29 | 5.45 | 9.69 | 30.32 | 4.22 | 6.28 | 8.24 | 12.67 | 8.83 | 4.73 | 3.28 | 8.14 | 14.50 | NA | NA | NA | NA | NA | NA | NA | NA | NA | NA | NA | NA | NA | NA | NA | NA | NA | NA | NA | NA | NA | NA | NA | NA | NA | NA | NA | NA | |
| Operating, Other Products, Northern Region, Timberlands | 0.45 | 0.36 | 0.37 | 0.26 | 0.33 | 0.28 | 0.21 | 0.30 | 0.25 | 0.20 | 0.23 | 0.30 | 0.13 | 0.85 | 0.29 | 0.30 | 0.32 | 1.08 | 0.35 | 0.21 | 0.57 | 0.77 | 0.25 | NA | NA | NA | NA | NA | NA | NA | NA | NA | NA | NA | NA | NA | NA | NA | NA | NA | NA | NA | NA | NA | NA | NA | NA | NA | NA | NA | NA | NA | NA | NA | NA | NA | |
| Operating, Other Products, Southern Region, Timberlands | 4.25 | 4.16 | 4.10 | 4.13 | 4.74 | 3.71 | 3.06 | 3.09 | 2.84 | 2.67 | 2.56 | 2.60 | 2.39 | 2.43 | 2.29 | 3.00 | 2.52 | 2.51 | 2.51 | 2.71 | 2.45 | 3.06 | 1.56 | NA | NA | NA | NA | NA | NA | NA | NA | NA | NA | NA | NA | NA | NA | NA | NA | NA | NA | NA | NA | NA | NA | NA | NA | NA | NA | NA | NA | NA | NA | NA | NA | NA | |
| Operating, Pulpwood, Northern Region, Timberlands | 0.14 | 0.33 | 0.37 | 16.13 | 0.48 | 0.58 | 0.59 | 0.39 | 0.32 | 0.12 | 0.20 | 0.50 | 0.59 | 1.24 | 1.24 | 1.44 | 1.07 | 1.49 | 1.15 | 2.06 | 1.34 | 1.57 | 1.30 | NA | NA | NA | NA | NA | NA | NA | NA | NA | NA | NA | NA | NA | NA | NA | NA | NA | NA | NA | NA | NA | NA | NA | NA | NA | NA | NA | NA | NA | NA | NA | NA | NA | |
| Operating, Pulpwood, Southern Region, Timberlands | 19.46 | 17.50 | 15.01 | 0.40 | 18.82 | 17.69 | 12.22 | 11.63 | 12.79 | 13.84 | 10.16 | 9.16 | 13.60 | 13.41 | 10.87 | 11.20 | 14.47 | 15.75 | 11.28 | 11.81 | 12.45 | 13.70 | 13.47 | NA | NA | NA | NA | NA | NA | NA | NA | NA | NA | NA | NA | NA | NA | NA | NA | NA | NA | NA | NA | NA | NA | NA | NA | NA | NA | NA | NA | NA | NA | NA | NA | NA | |
| Operating, Sawlogs, Northern Region, Timberlands | 35.81 | 48.54 | 36.82 | 53.33 | 63.87 | 78.67 | 62.93 | 81.50 | 48.13 | 88.24 | 86.77 | 76.18 | 68.17 | 72.81 | 30.64 | 41.41 | 45.45 | 53.15 | 30.47 | 32.50 | 37.11 | 69.66 | 49.63 | NA | NA | NA | NA | NA | NA | NA | NA | NA | NA | NA | NA | NA | NA | NA | NA | NA | NA | NA | NA | NA | NA | NA | NA | NA | NA | NA | NA | NA | NA | NA | NA | NA | |
| Operating, Sawlogs, Southern Region, Timberlands | 30.52 | 31.86 | 27.80 | 31.75 | 29.22 | 29.62 | 24.36 | 23.38 | 18.22 | 22.19 | 21.01 | 22.42 | 23.22 | 25.46 | 21.20 | 23.94 | 24.58 | 24.05 | 20.98 | 18.44 | 20.27 | 21.97 | 25.19 | NA | NA | NA | NA | NA | NA | NA | NA | NA | NA | NA | NA | NA | NA | NA | NA | NA | NA | NA | NA | NA | NA | NA | NA | NA | NA | NA | NA | NA | NA | NA | NA | NA | |
| Operating, Stumpage, Southern Region, Timberlands | 6.77 | 7.06 | 4.15 | 9.23 | 4.41 | 4.03 | 2.11 | 3.36 | 4.22 | 2.27 | 0.27 | 0.76 | 1.66 | 0.77 | 0.82 | 0.83 | 0.43 | 0.77 | 0.14 | 0.32 | 0.33 | 0.65 | 1.06 | NA | NA | NA | NA | NA | NA | NA | NA | NA | NA | NA | NA | NA | NA | NA | NA | NA | NA | NA | NA | NA | NA | NA | NA | NA | NA | NA | NA | NA | NA | NA | NA | NA | |
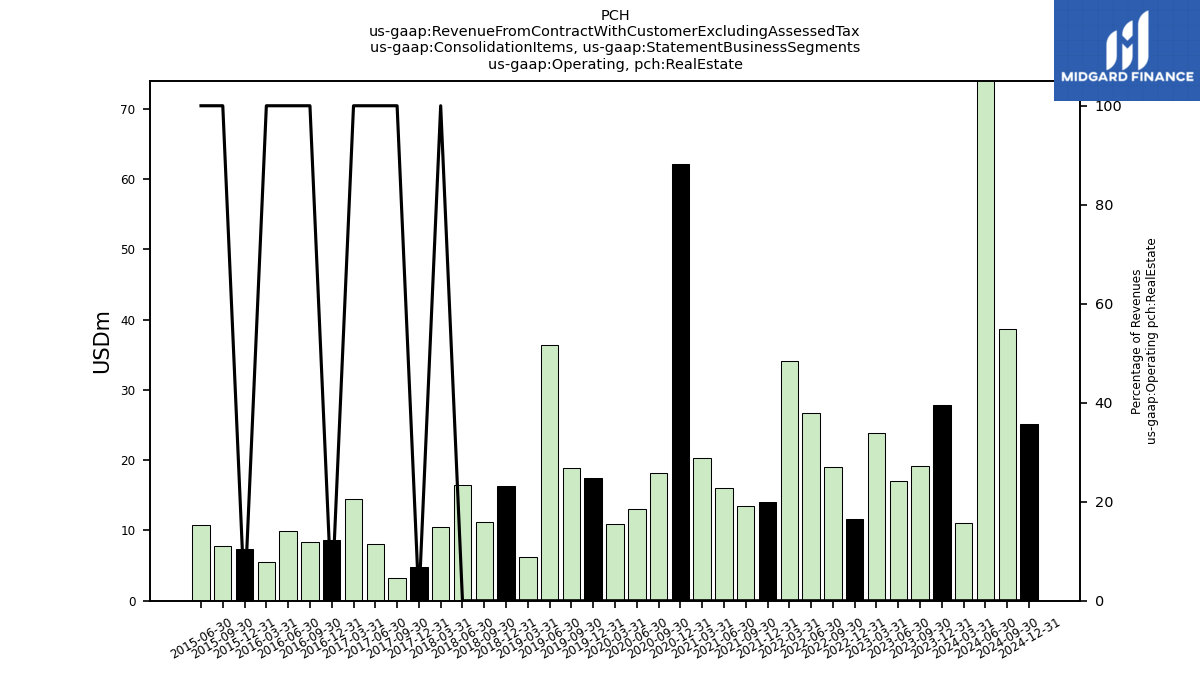
| Operating, Real Estate | 27.91 | 19.15 | 17.06 | 23.86 | 11.68 | 19.01 | 26.74 | 34.06 | 14.01 | 13.50 | 16.00 | 20.31 | 62.19 | 18.15 | 13.11 | 10.97 | 17.41 | 18.86 | 36.43 | 6.16 | 16.35 | 11.23 | 16.43 | 10.55 | 4.73 | 3.28 | 8.14 | 14.50 | 8.66 | 8.43 | 9.95 | 5.57 | 7.30 | 7.83 | 10.74 | NA | NA | NA | NA | NA | NA | NA | NA | NA | NA | NA | NA | NA | NA | NA | NA | NA | NA | NA | NA | NA | |
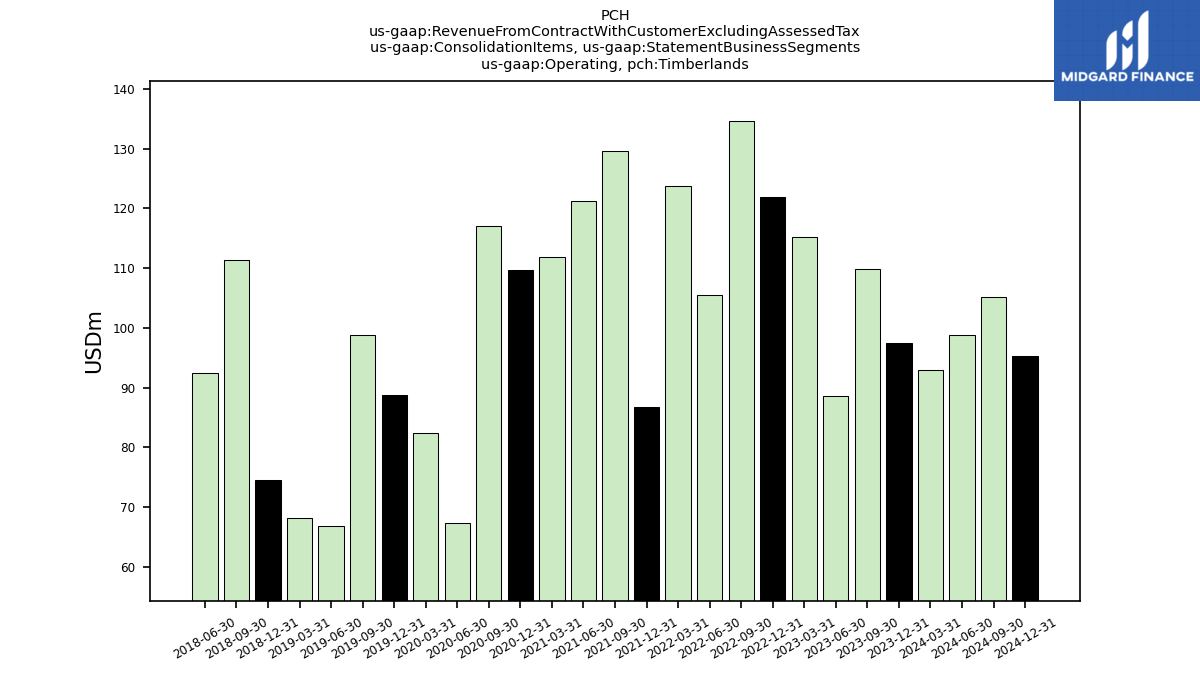
| Operating, Timberlands | 97.41 | 109.81 | 88.62 | 115.24 | 121.87 | 134.58 | 105.49 | 123.66 | 86.77 | 129.54 | 121.22 | 111.92 | 109.76 | 116.98 | 67.34 | 82.42 | 88.84 | 98.81 | 66.88 | 68.16 | 74.51 | 111.42 | 92.51 | NA | NA | NA | NA | NA | NA | NA | NA | NA | NA | NA | NA | NA | NA | NA | NA | NA | NA | NA | NA | NA | NA | NA | NA | NA | NA | NA | NA | NA | NA | NA | NA | NA | |
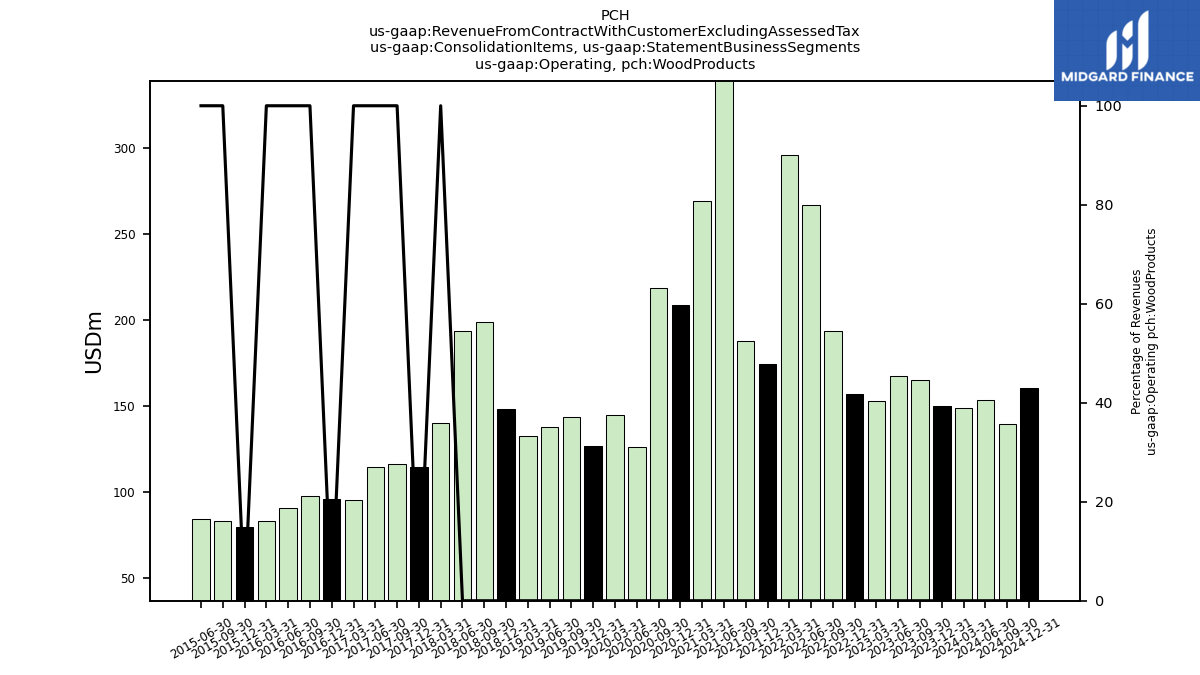
| Operating, Wood Products | 150.10 | 165.11 | 167.67 | 152.79 | 156.81 | 193.43 | 266.63 | 295.74 | 174.16 | 187.76 | 357.67 | 269.30 | 208.90 | 218.29 | 126.22 | 145.00 | 126.43 | 143.64 | 138.03 | 132.31 | 148.51 | 199.03 | 193.59 | 139.81 | 114.55 | 116.49 | 114.53 | 95.59 | 95.64 | 97.62 | 90.92 | 83.24 | 79.92 | 82.87 | 84.19 | NA | NA | NA | NA | NA | NA | NA | NA | NA | NA | NA | NA | NA | NA | NA | NA | NA | NA | NA | NA | NA | |
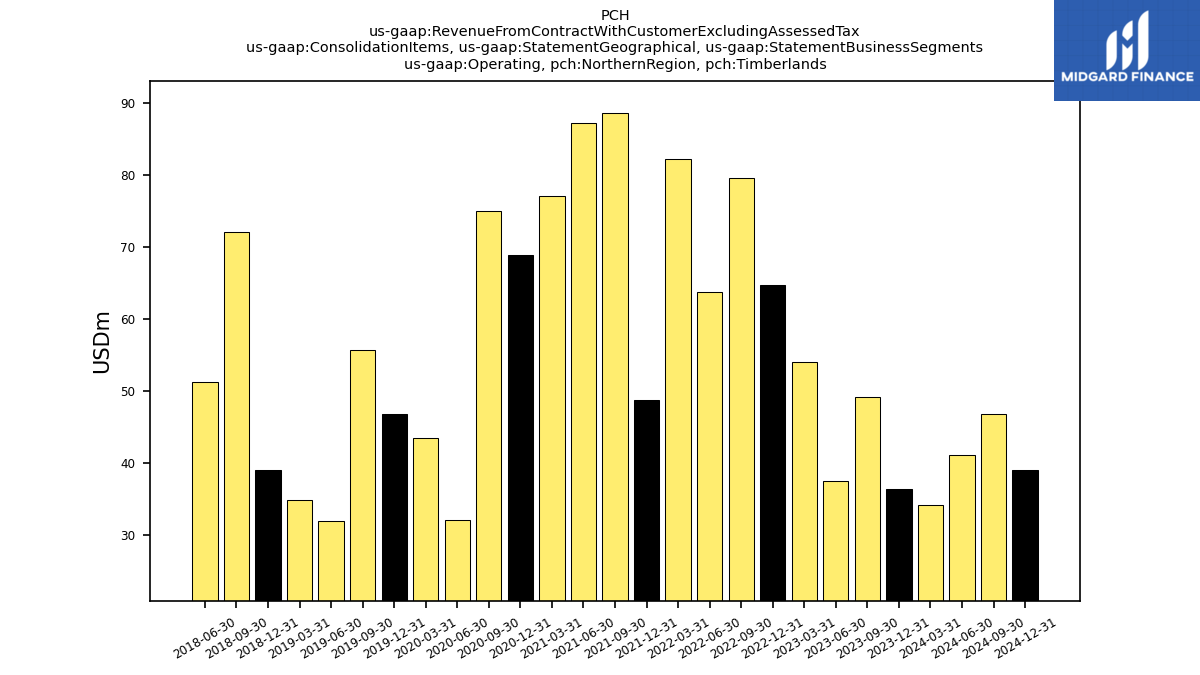
| Operating, Northern Region, Timberlands | 36.41 | 49.23 | 37.56 | 53.99 | 64.68 | 79.53 | 63.73 | 82.20 | 48.70 | 88.57 | 87.20 | 76.98 | 68.89 | 74.91 | 32.17 | 43.46 | 46.84 | 55.73 | 31.97 | 34.88 | 39.02 | 72.04 | 51.23 | NA | NA | NA | NA | NA | NA | NA | NA | NA | NA | NA | NA | NA | NA | NA | NA | NA | NA | NA | NA | NA | NA | NA | NA | NA | NA | NA | NA | NA | NA | NA | NA | NA | |
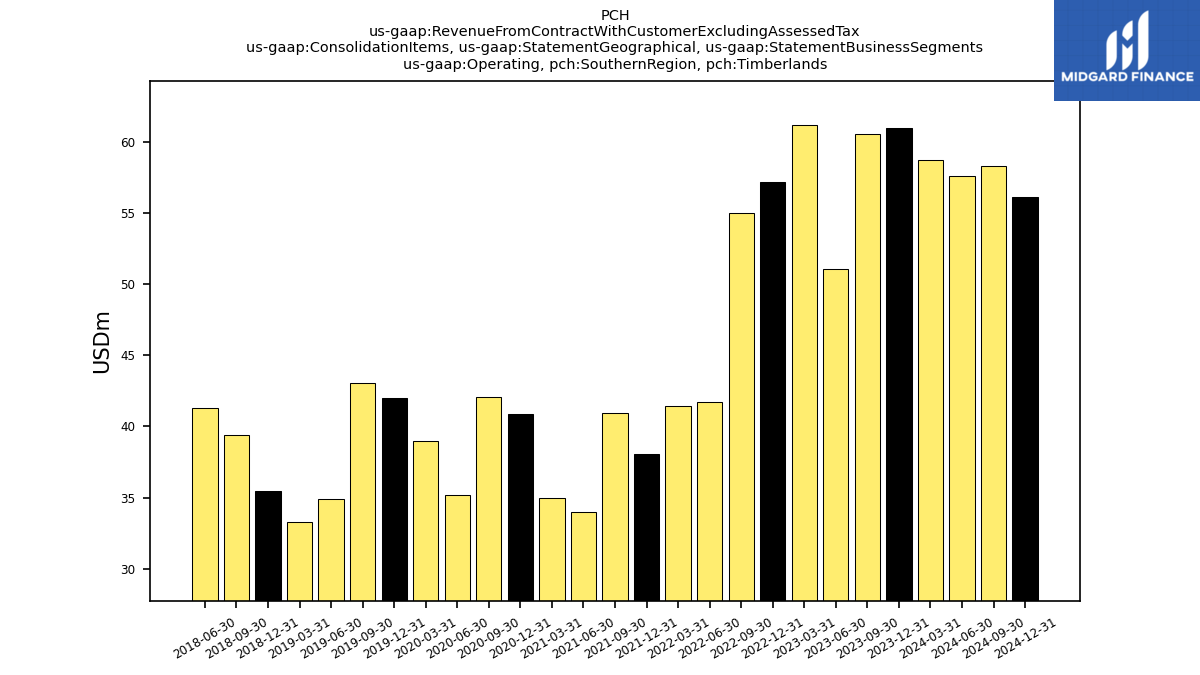
| Operating, Southern Region, Timberlands | 61.01 | 60.58 | 51.05 | 61.25 | 57.19 | 55.05 | 41.76 | 41.46 | 38.07 | 40.98 | 34.01 | 34.94 | 40.88 | 42.07 | 35.18 | 38.96 | 42.00 | 43.08 | 34.91 | 33.28 | 35.49 | 39.38 | 41.28 | NA | NA | NA | NA | NA | NA | NA | NA | NA | NA | NA | NA | NA | NA | NA | NA | NA | NA | NA | NA | NA | NA | NA | NA | NA | NA | NA | NA | NA | NA | NA | NA | NA |