
| 2023-10-31 | 2023-07-31 | 2023-04-30 | 2023-01-31 | 2022-10-31 | 2022-07-31 | 2022-04-30 | 2022-01-31 | 2021-10-31 | 2021-07-31 | 2021-04-30 | 2021-01-31 | 2020-10-31 | 2020-07-31 | 2020-04-30 | 2020-01-31 | 2019-10-31 | 2019-07-31 | 2019-04-30 | 2019-01-31 | 2018-10-31 | 2018-07-31 | 2018-04-30 | ||
|---|---|---|---|---|---|---|---|---|---|---|---|---|---|---|---|---|---|---|---|---|---|---|---|---|
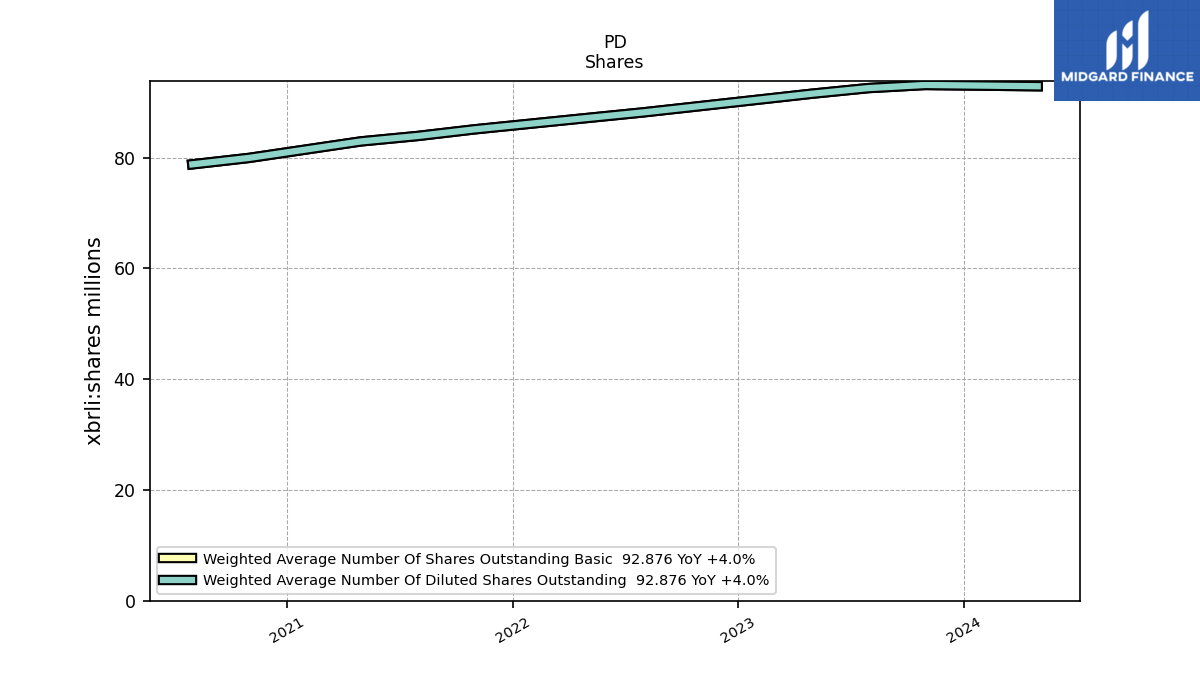
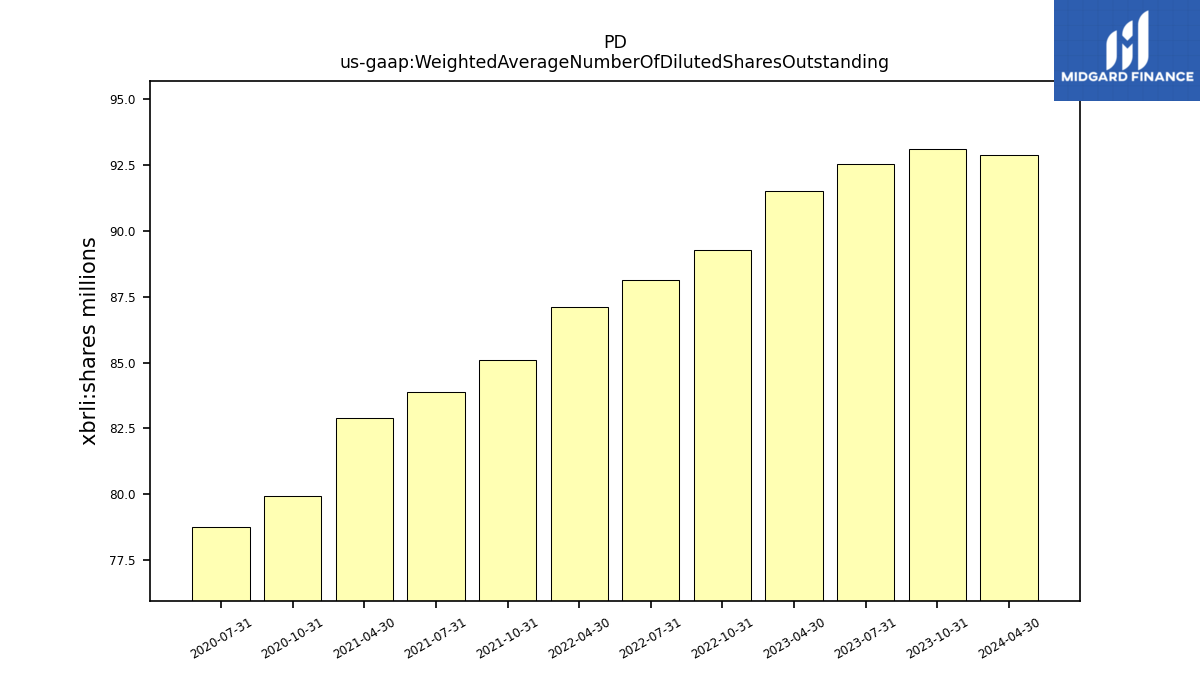
| Weighted Average Number Of Diluted Shares Outstanding | 93.10 | 92.54 | 91.52 | NA | 89.28 | 88.15 | 87.13 | NA | 85.09 | 83.89 | 82.92 | NA | 79.94 | 78.78 | NA | NA | NA | NA | NA | NA | NA | NA | NA | |
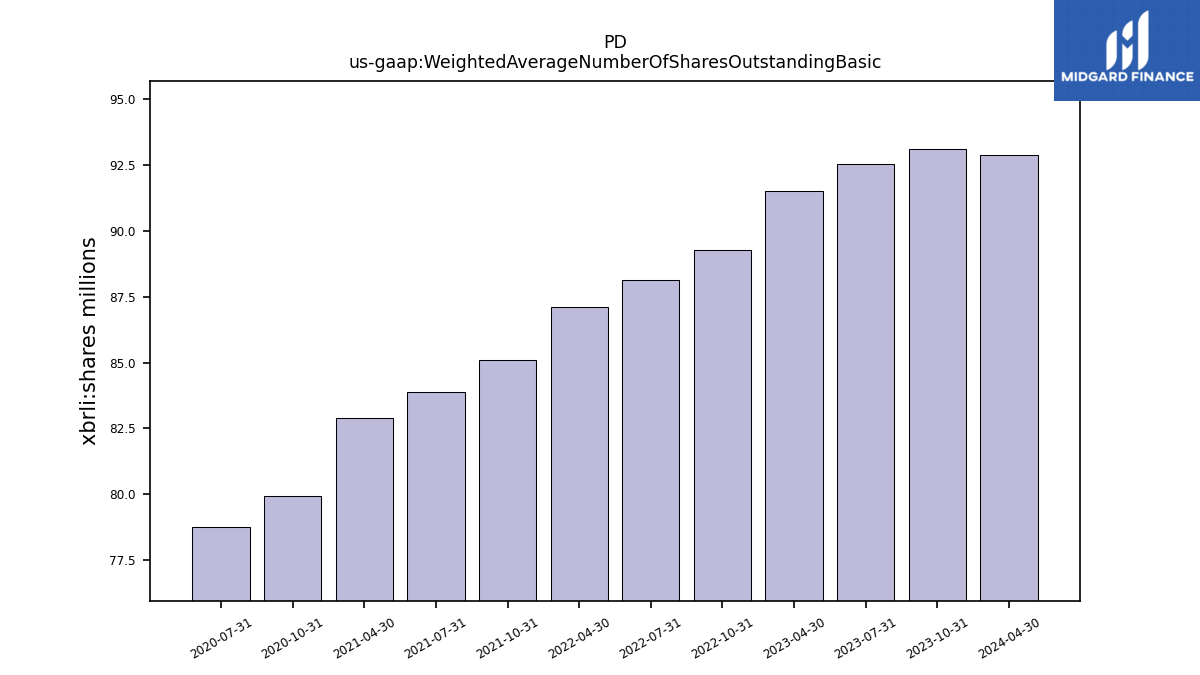
| Weighted Average Number Of Shares Outstanding Basic | 93.10 | 92.54 | 91.52 | NA | 89.28 | 88.15 | 87.13 | NA | 85.09 | 83.89 | 82.92 | NA | 79.94 | 78.78 | NA | NA | NA | NA | NA | NA | NA | NA | NA | |
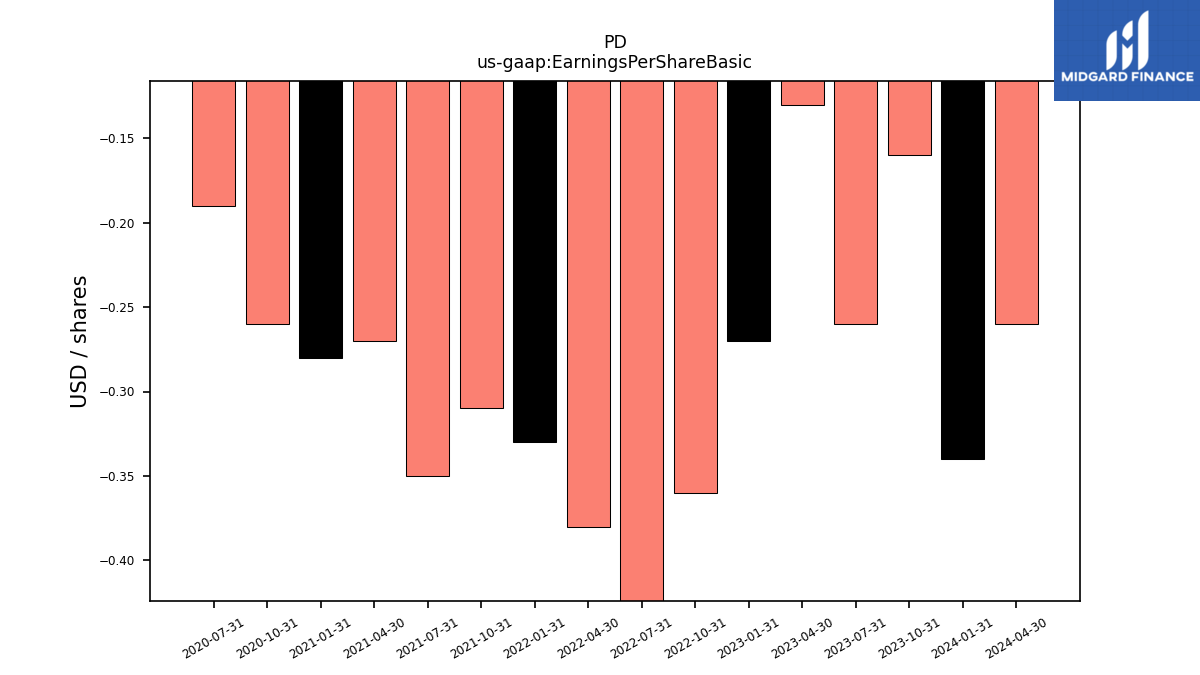
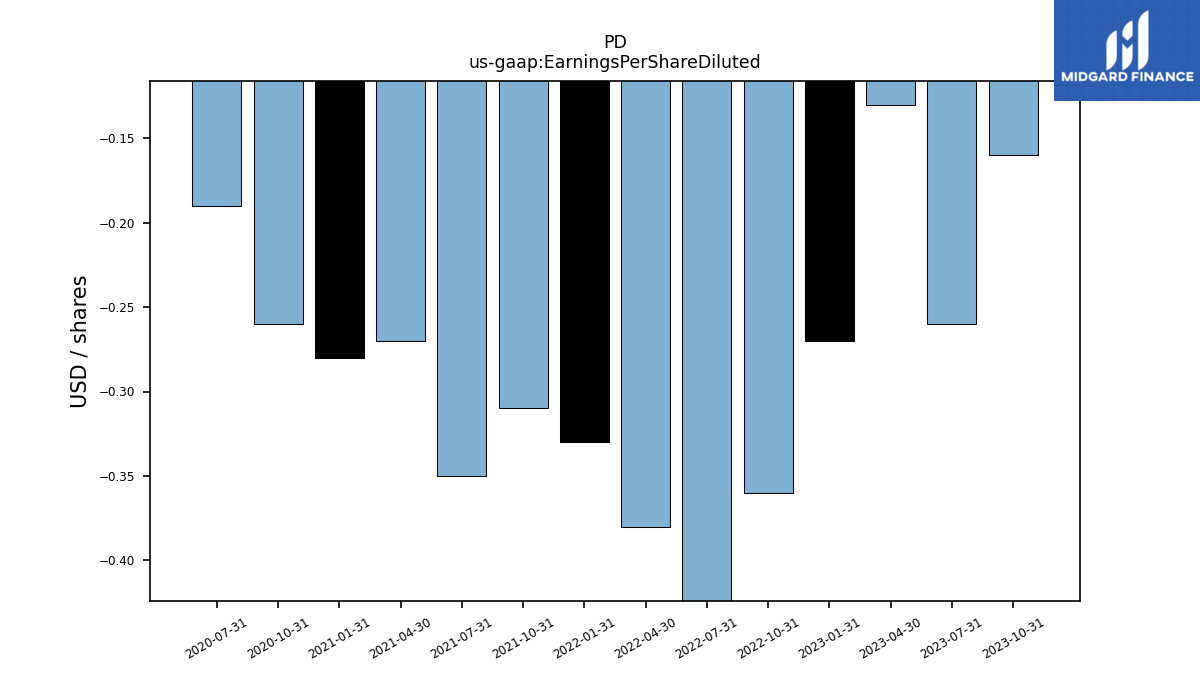
| Earnings Per Share Basic | -0.16 | -0.26 | -0.13 | -0.27 | -0.36 | -0.44 | -0.38 | -0.33 | -0.31 | -0.35 | -0.27 | -0.28 | -0.26 | -0.19 | NA | NA | NA | NA | NA | NA | NA | NA | NA | |
| Earnings Per Share Diluted | -0.16 | -0.26 | -0.13 | -0.27 | -0.36 | -0.44 | -0.38 | -0.33 | -0.31 | -0.35 | -0.27 | -0.28 | -0.26 | -0.19 | NA | NA | NA | NA | NA | NA | NA | NA | NA |
| 2023-10-31 | 2023-07-31 | 2023-04-30 | 2023-01-31 | 2022-10-31 | 2022-07-31 | 2022-04-30 | 2022-01-31 | 2021-10-31 | 2021-07-31 | 2021-04-30 | 2021-01-31 | 2020-10-31 | 2020-07-31 | 2020-04-30 | 2020-01-31 | 2019-10-31 | 2019-07-31 | 2019-04-30 | 2019-01-31 | 2018-10-31 | 2018-07-31 | 2018-04-30 | ||
|---|---|---|---|---|---|---|---|---|---|---|---|---|---|---|---|---|---|---|---|---|---|---|---|---|
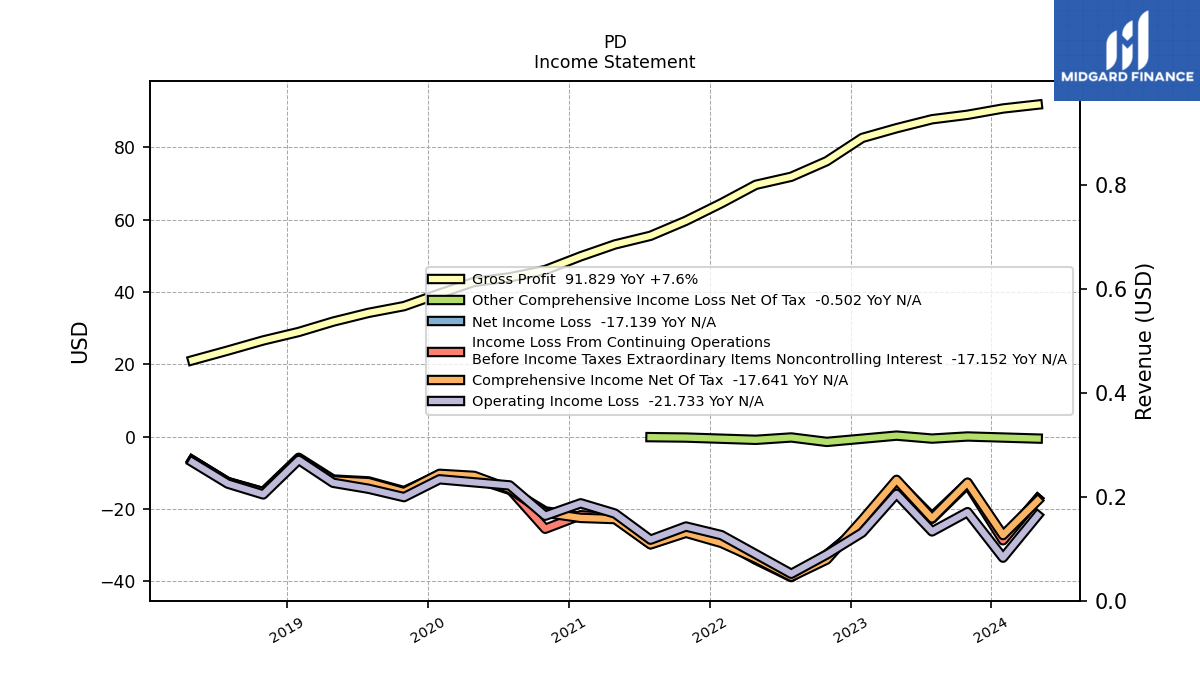
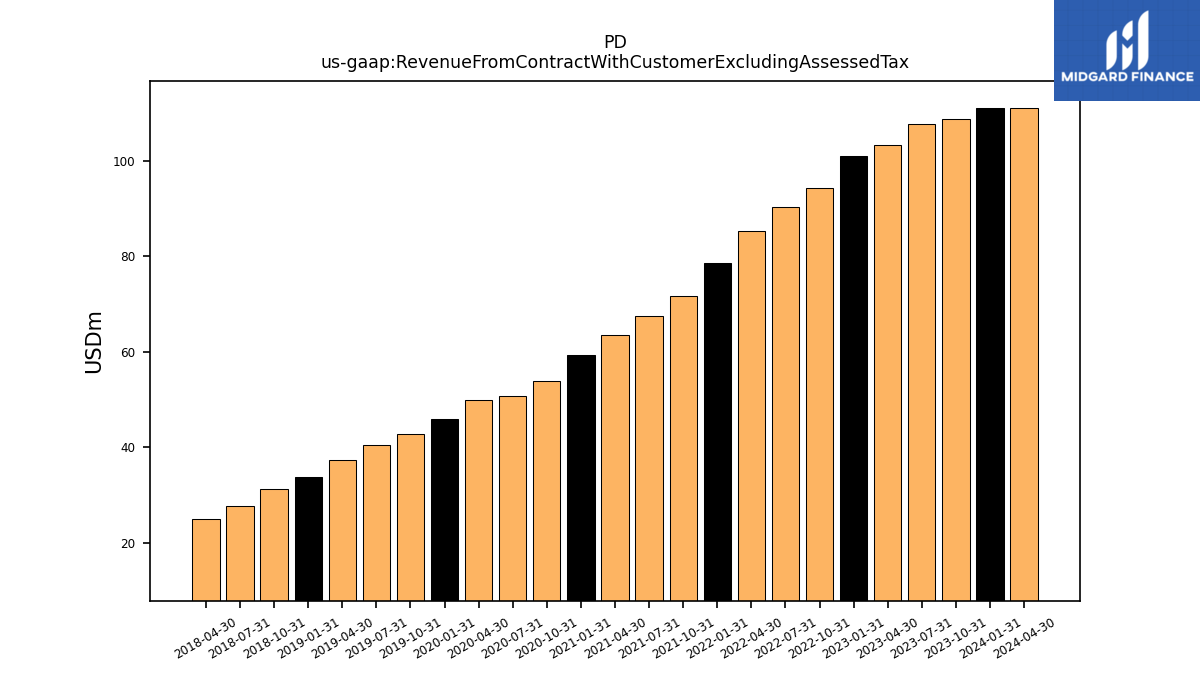
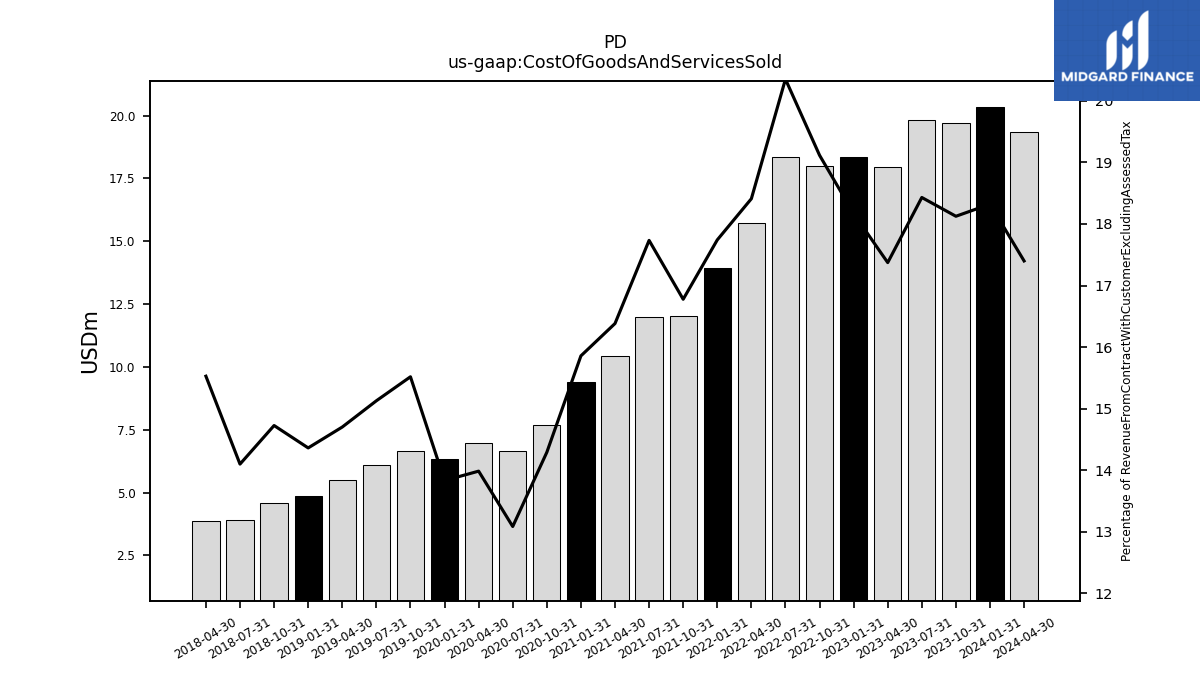
| Revenue From Contract With Customer Excluding Assessed Tax | 108.72 | 107.62 | 103.25 | 100.97 | 94.20 | 90.25 | 85.37 | 78.51 | 71.76 | 67.54 | 63.59 | 59.28 | 53.77 | 50.71 | 49.79 | 45.93 | 42.75 | 40.36 | 37.31 | 33.83 | 31.23 | 27.74 | 25.02 | |
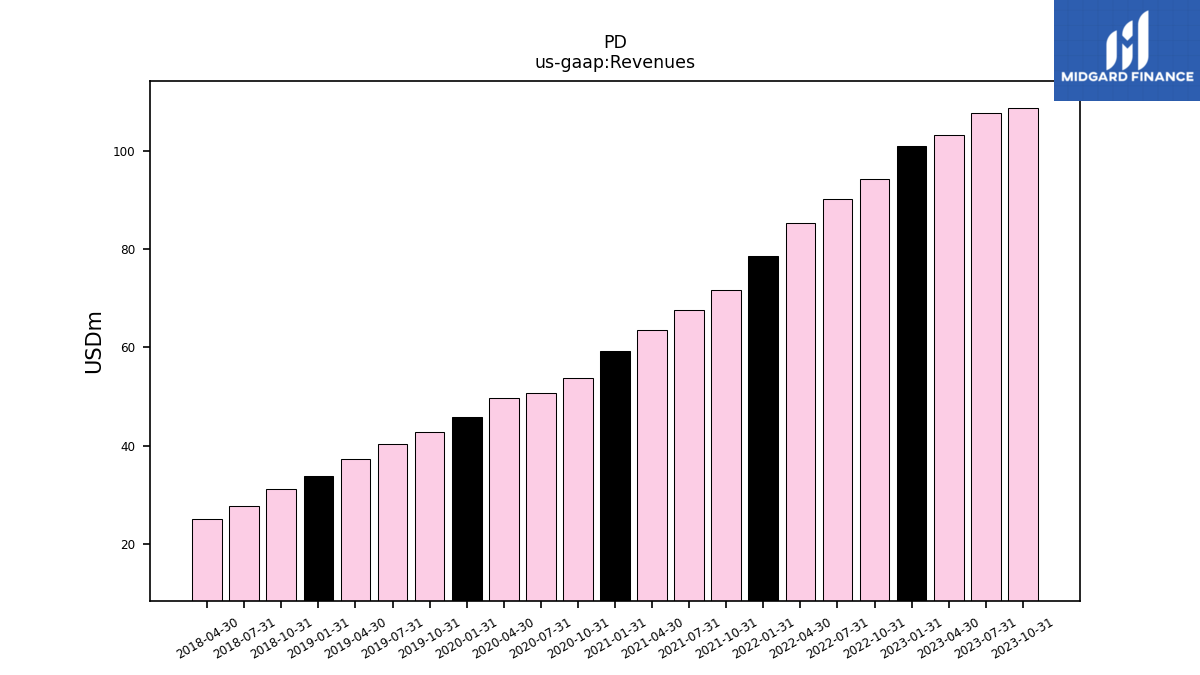
| Revenues | 108.72 | 107.62 | 103.25 | 100.97 | 94.20 | 90.25 | 85.37 | 78.51 | 71.76 | 67.54 | 63.59 | 59.28 | 53.77 | 50.71 | 49.79 | 45.93 | 42.75 | 40.36 | 37.31 | 33.83 | 31.23 | 27.74 | 25.02 | |
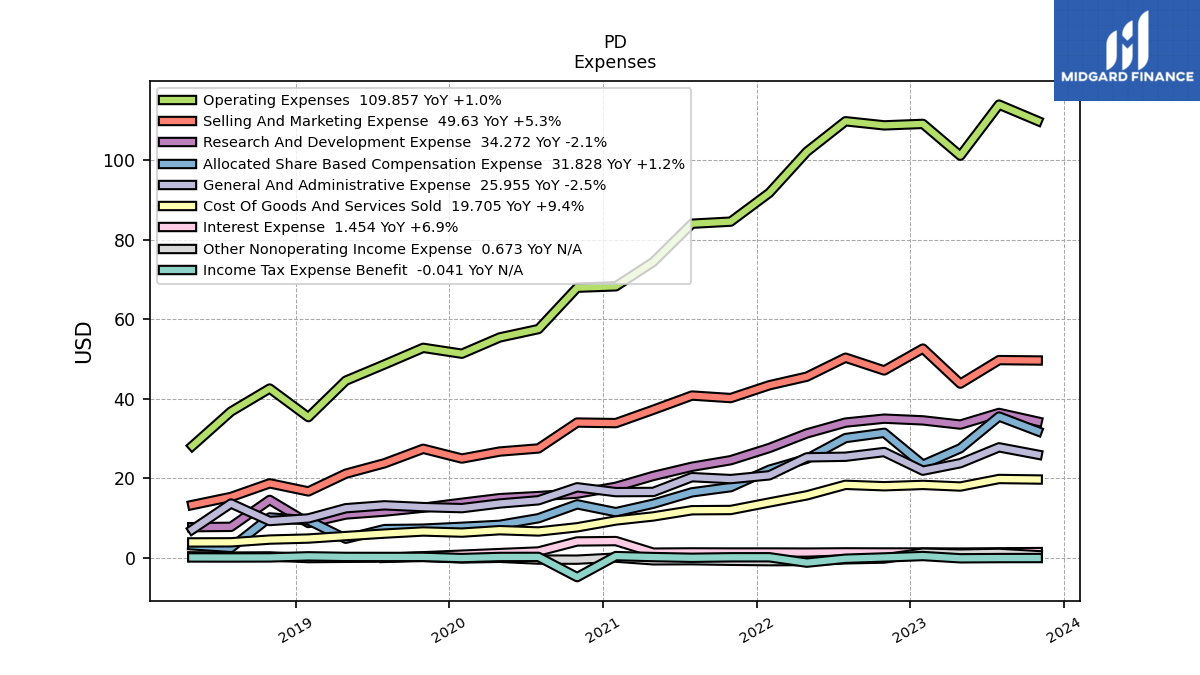
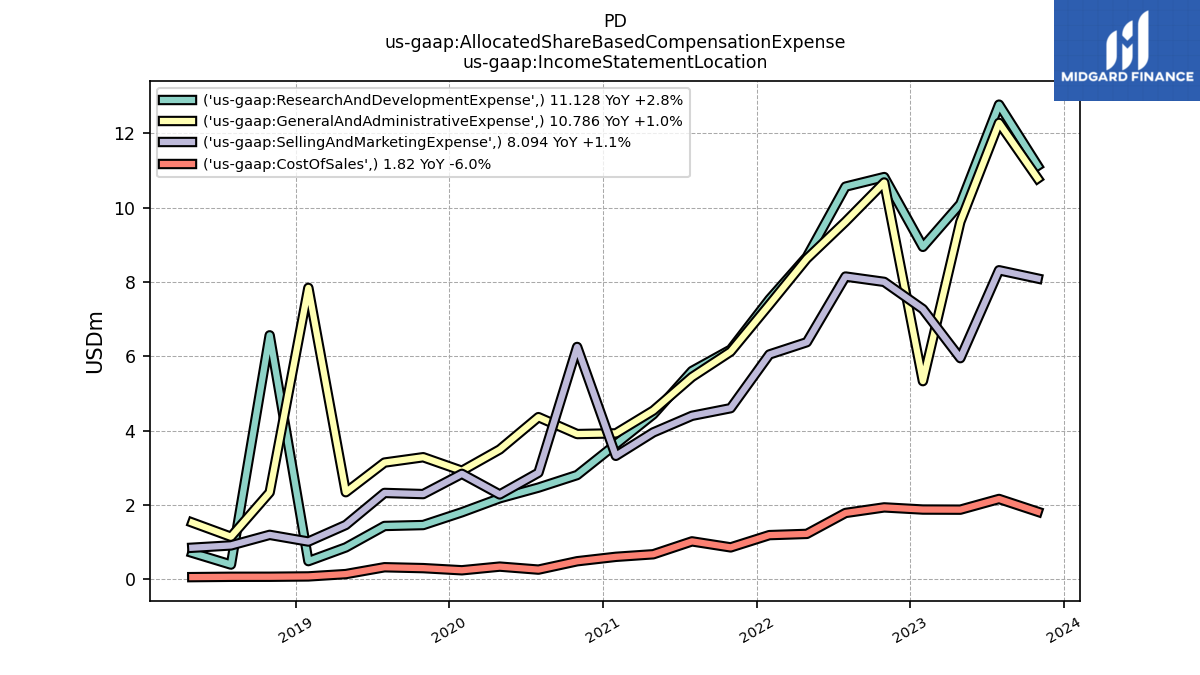
| Cost Of Goods And Services Sold | 19.70 | 19.83 | 17.94 | 18.34 | 18.01 | 18.37 | 15.72 | 13.93 | 12.04 | 11.98 | 10.42 | 9.40 | 7.68 | 6.64 | 6.96 | 6.35 | 6.63 | 6.11 | 5.49 | 4.86 | 4.60 | 3.91 | 3.88 | |
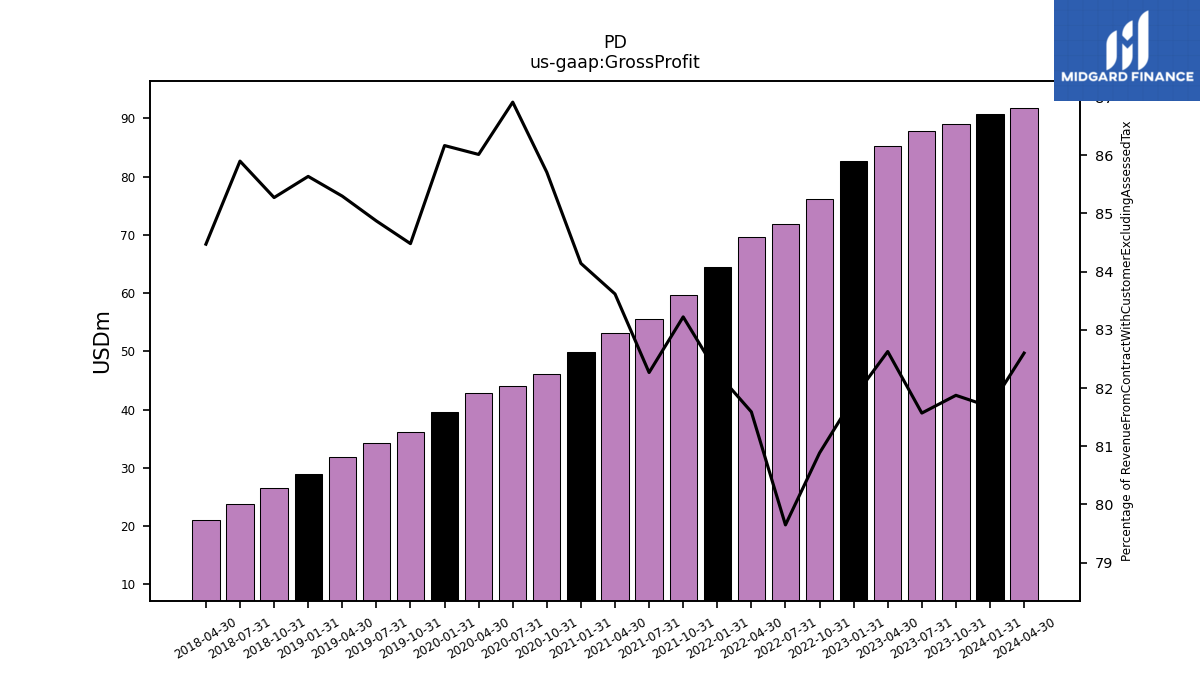
| Gross Profit | 89.02 | 87.78 | 85.31 | 82.62 | 76.20 | 71.89 | 69.66 | 64.58 | 59.72 | 55.56 | 53.17 | 49.88 | 46.09 | 44.08 | 42.82 | 39.57 | 36.12 | 34.26 | 31.83 | 28.97 | 26.63 | 23.83 | 21.14 | |
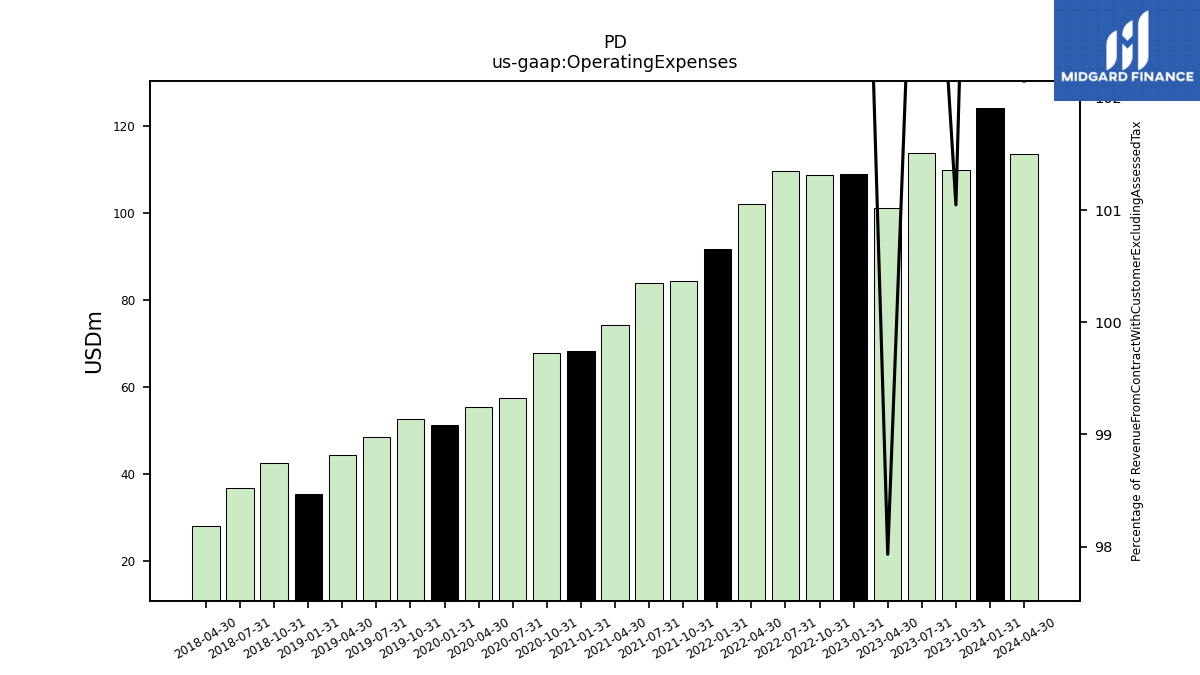
| Operating Expenses | 109.86 | 113.96 | 101.11 | 109.11 | 108.74 | 109.77 | 102.11 | 91.78 | 84.54 | 84.02 | 74.41 | 68.28 | 67.93 | 57.53 | 55.42 | 51.33 | 52.81 | 48.64 | 44.56 | 35.38 | 42.58 | 36.80 | 28.13 | |
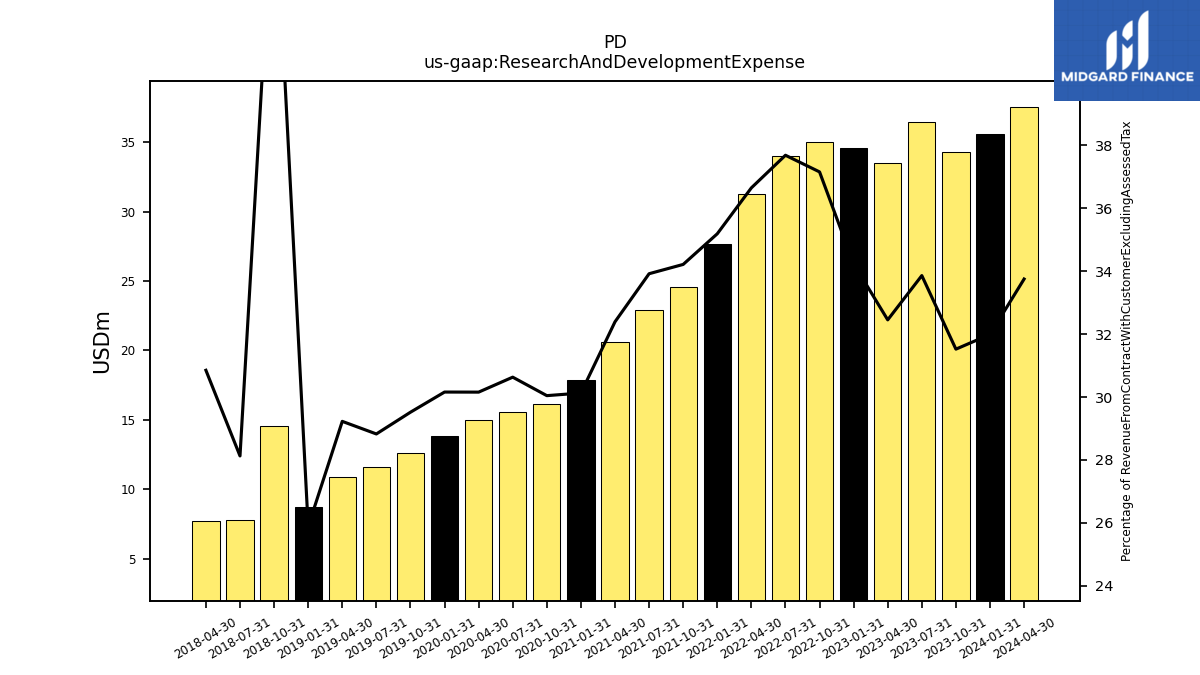
| Research And Development Expense | 34.27 | 36.44 | 33.51 | 34.57 | 35.00 | 34.01 | 31.29 | 27.63 | 24.55 | 22.91 | 20.60 | 17.86 | 16.16 | 15.54 | 15.01 | 13.85 | 12.62 | 11.63 | 10.91 | 8.76 | 14.58 | 7.80 | 7.72 | |
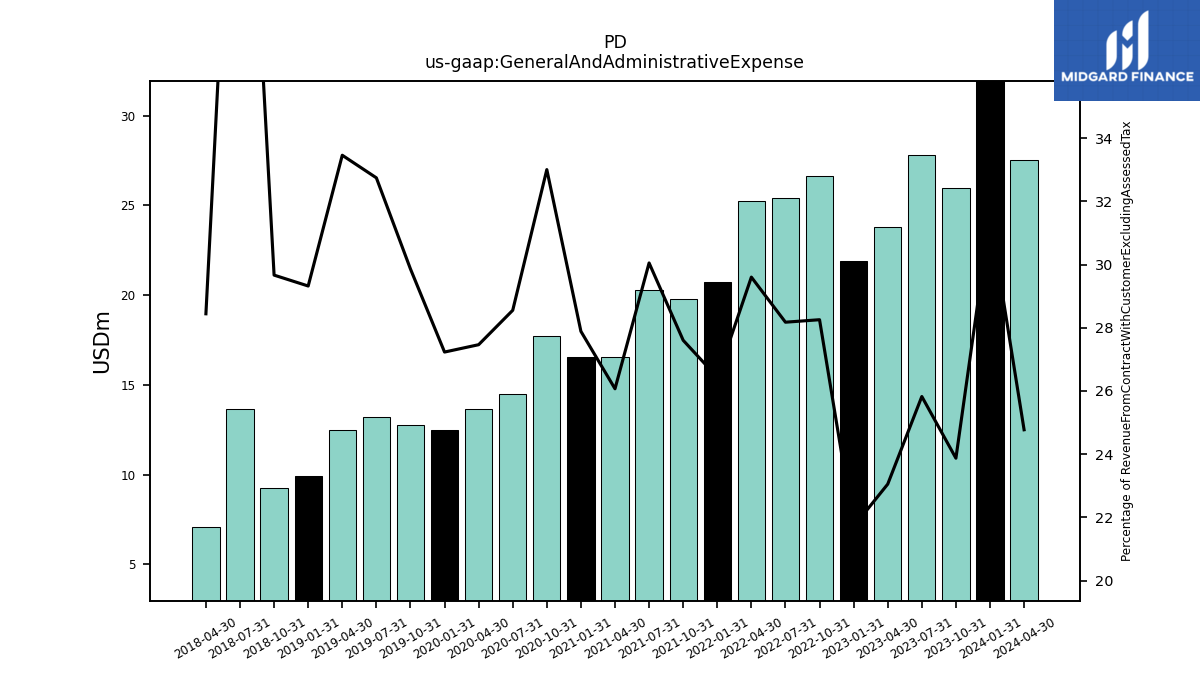
| General And Administrative Expense | 25.95 | 27.79 | 23.80 | 21.92 | 26.62 | 25.43 | 25.27 | 20.75 | 19.81 | 20.29 | 16.58 | 16.53 | 17.75 | 14.48 | 13.67 | 12.51 | 12.77 | 13.21 | 12.48 | 9.92 | 9.26 | 13.67 | 7.12 | |
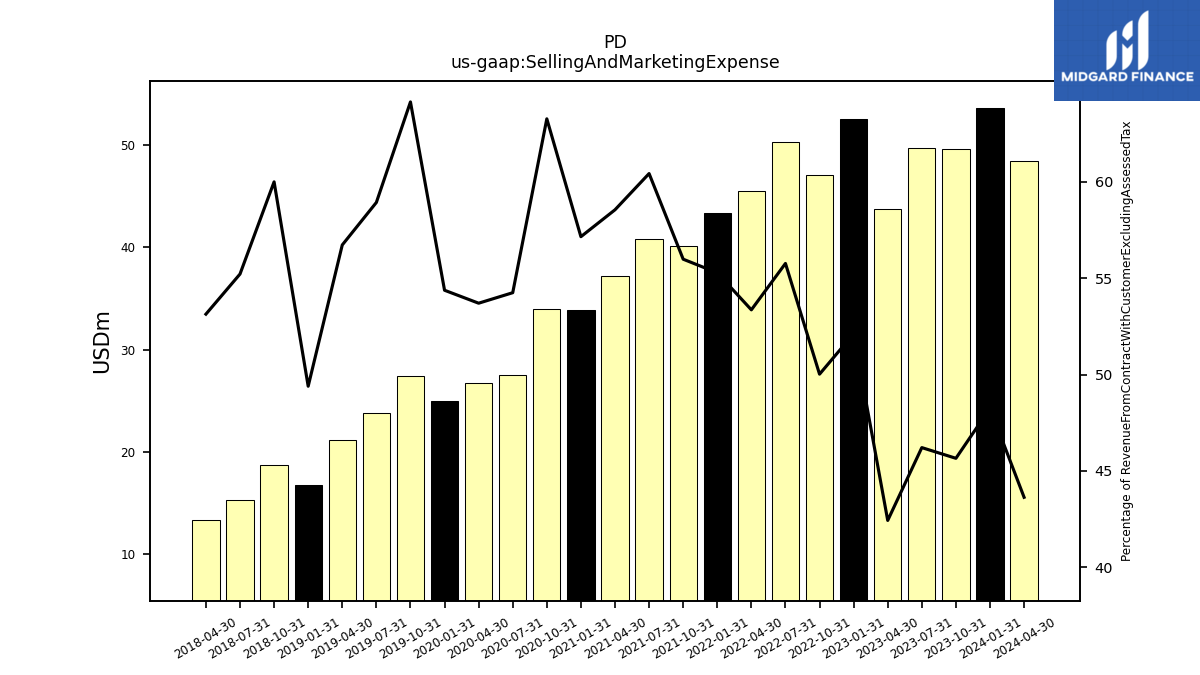
| Selling And Marketing Expense | 49.63 | 49.72 | 43.80 | 52.62 | 47.12 | 50.33 | 45.55 | 43.40 | 40.18 | 40.81 | 37.23 | 33.88 | 34.02 | 27.51 | 26.74 | 24.97 | 27.43 | 23.79 | 21.17 | 16.71 | 18.74 | 15.32 | 13.29 | |
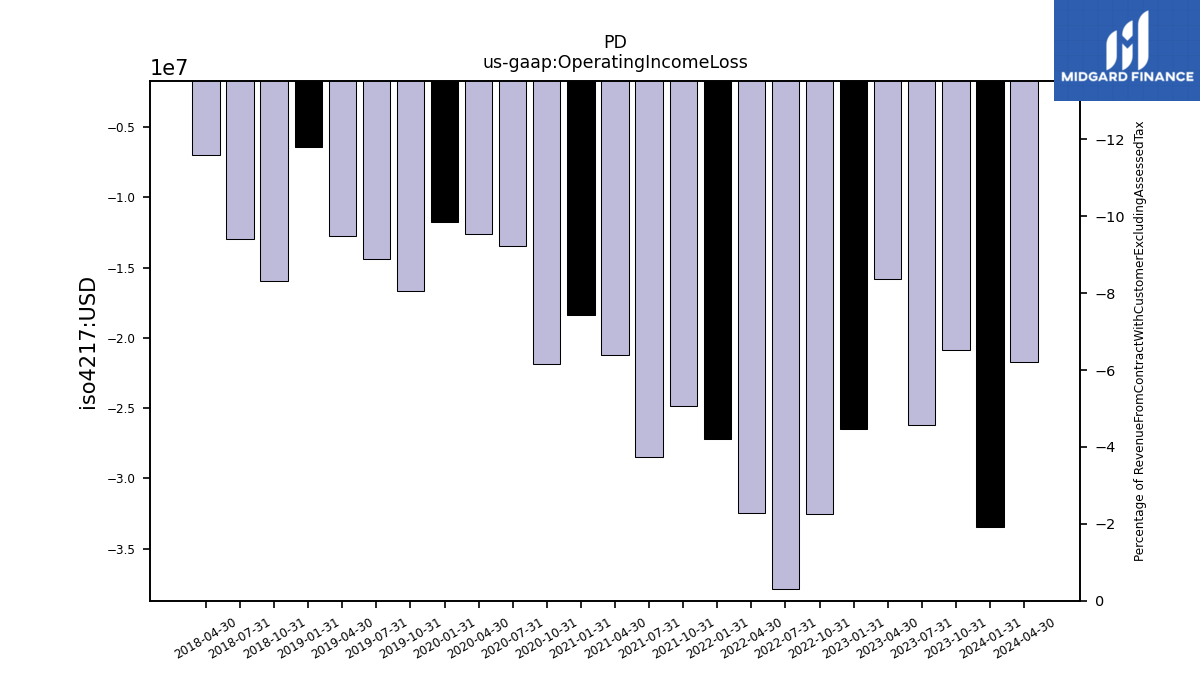
| Operating Income Loss | -20.84 | -26.17 | -15.80 | -26.49 | -32.54 | -37.89 | -32.46 | -27.20 | -24.82 | -28.46 | -21.24 | -18.39 | -21.84 | -13.45 | -12.60 | -11.76 | -16.69 | -14.38 | -12.73 | -6.41 | -15.95 | -12.96 | -6.99 | |
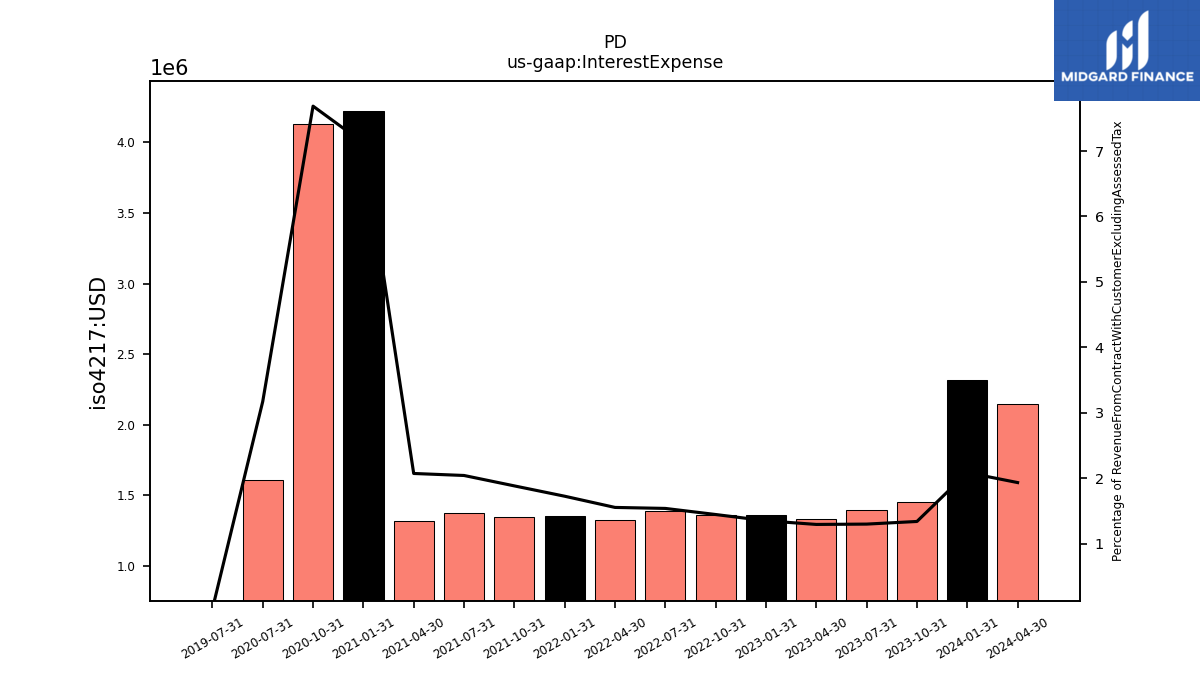
| Interest Expense | 1.45 | 1.40 | 1.33 | 1.36 | 1.36 | 1.39 | 1.32 | 1.35 | 1.35 | 1.38 | 1.32 | 4.22 | 4.13 | 1.61 | NA | NA | NA | 0.00 | NA | NA | NA | NA | NA | |
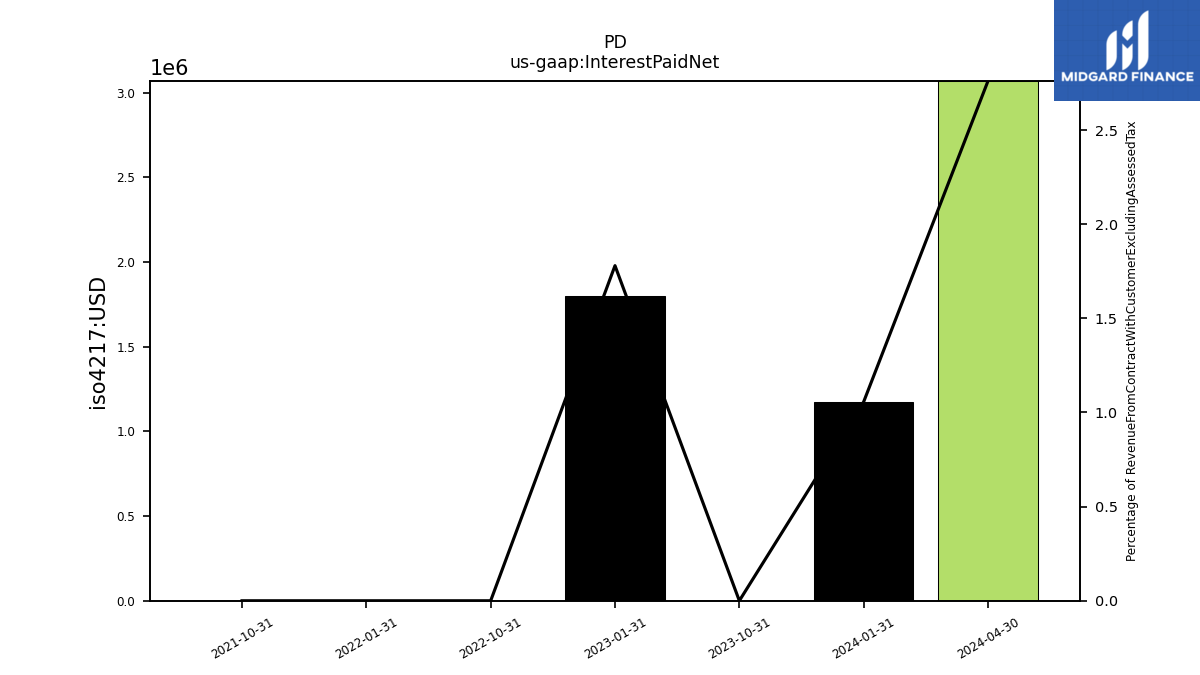
| Interest Paid Net | 0.00 | NA | NA | 1.80 | 0.00 | NA | NA | 0.00 | 0.00 | NA | NA | NA | NA | NA | NA | NA | NA | NA | NA | NA | NA | NA | NA | |
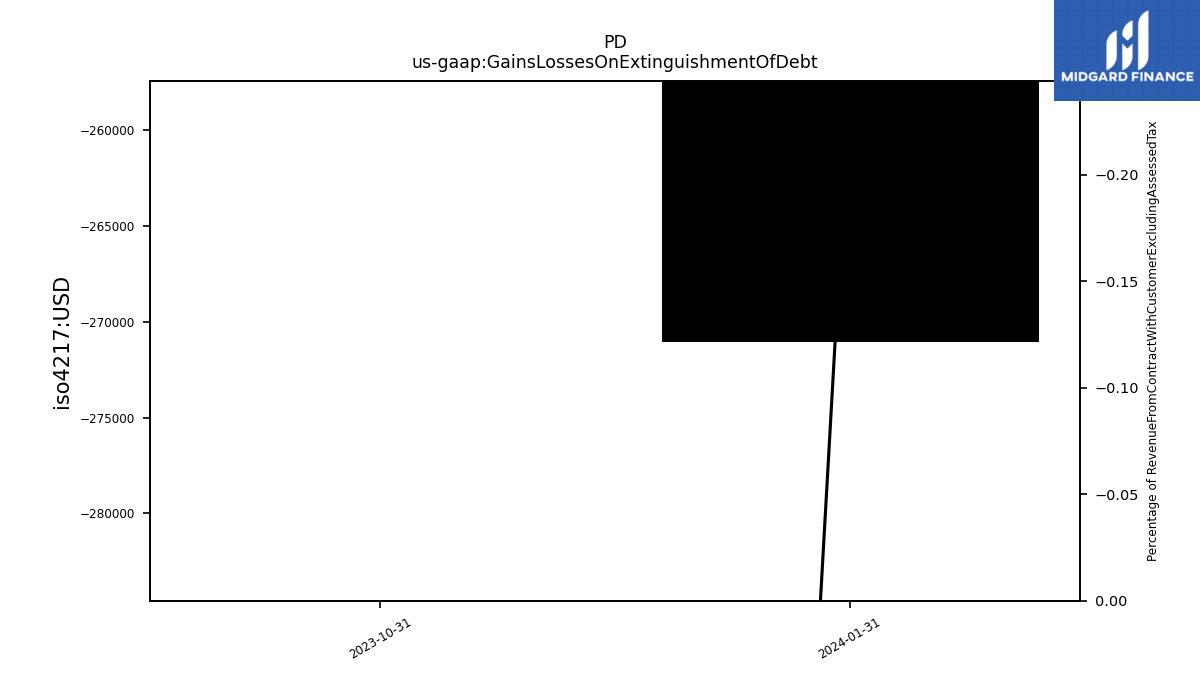
| Gains Losses On Extinguishment Of Debt | 3.97 | NA | NA | NA | NA | NA | NA | NA | NA | NA | NA | NA | NA | NA | NA | NA | NA | NA | NA | NA | NA | NA | NA | |
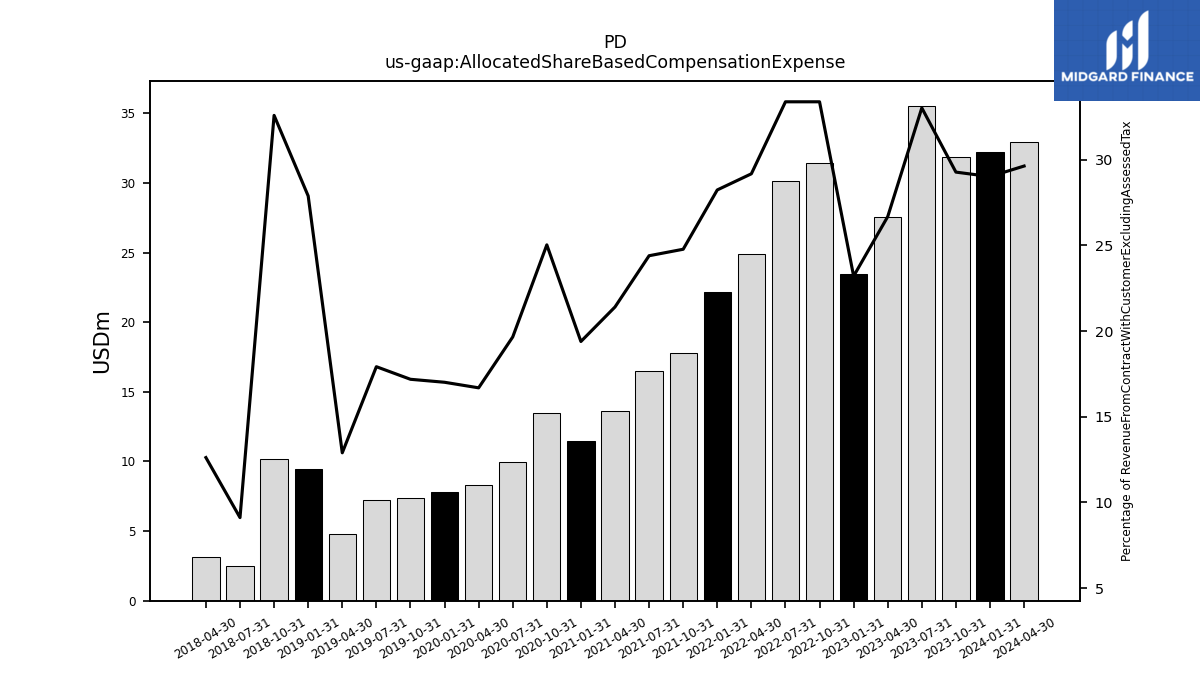
| Allocated Share Based Compensation Expense | 31.83 | 35.54 | 27.55 | 23.43 | 31.44 | 30.12 | 24.91 | 22.17 | 17.78 | 16.48 | 13.61 | 11.50 | 13.46 | 9.97 | 8.31 | 7.81 | 7.35 | 7.23 | 4.81 | 9.43 | 10.18 | 2.53 | 3.16 | |
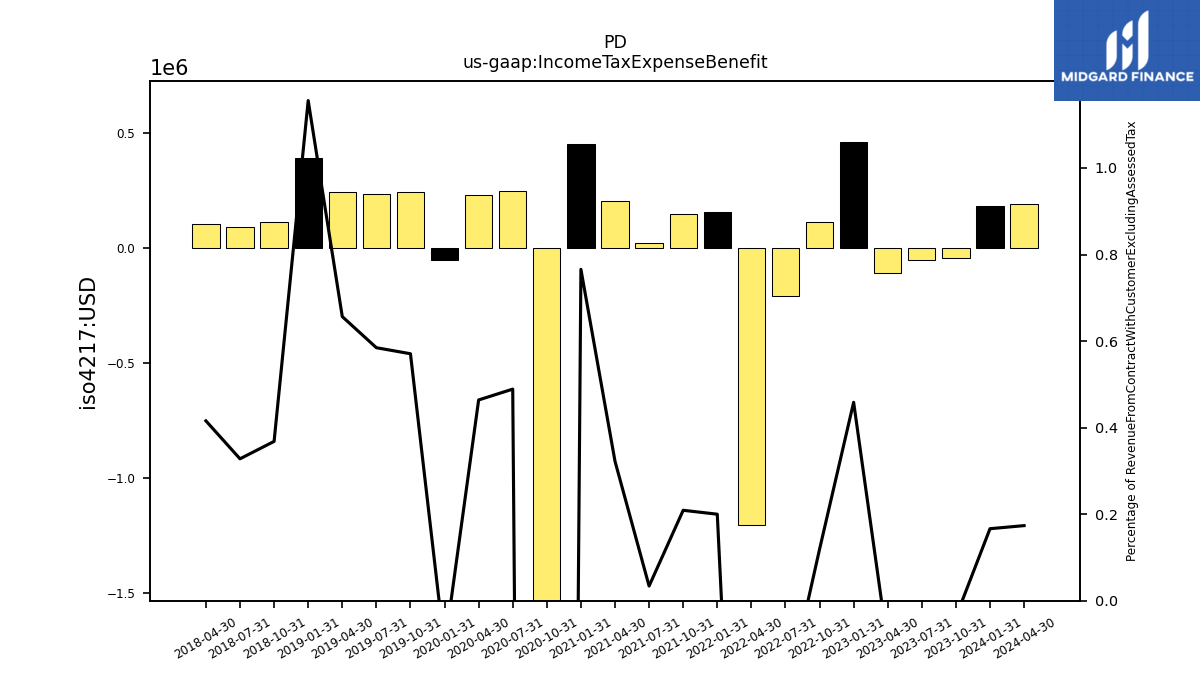
| Income Tax Expense Benefit | -0.04 | -0.05 | -0.11 | 0.46 | 0.11 | -0.21 | -1.20 | 0.16 | 0.15 | 0.02 | 0.20 | 0.45 | -4.84 | 0.25 | 0.23 | -0.05 | 0.24 | 0.24 | 0.24 | 0.39 | 0.12 | 0.09 | 0.10 | |
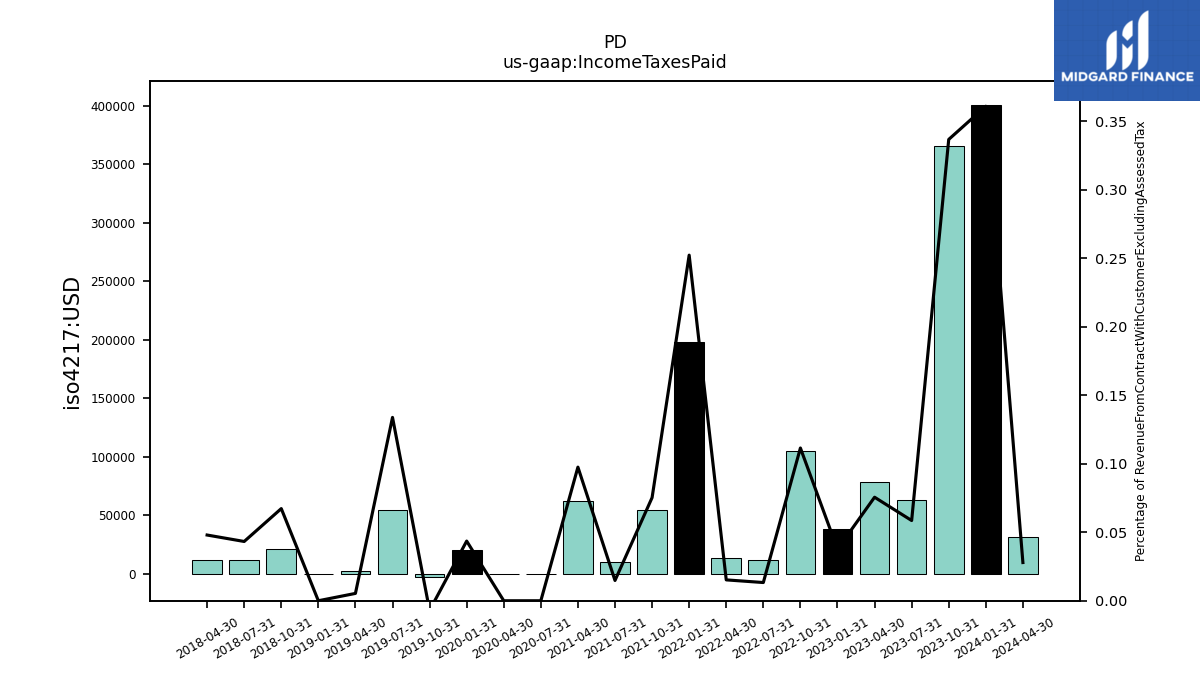
| Income Taxes Paid | 0.37 | 0.06 | 0.08 | 0.04 | 0.10 | 0.01 | 0.01 | 0.20 | 0.05 | 0.01 | 0.06 | NA | NA | 0.00 | 0.00 | 0.02 | -0.00 | 0.05 | 0.00 | 0.00 | 0.02 | 0.01 | 0.01 | |
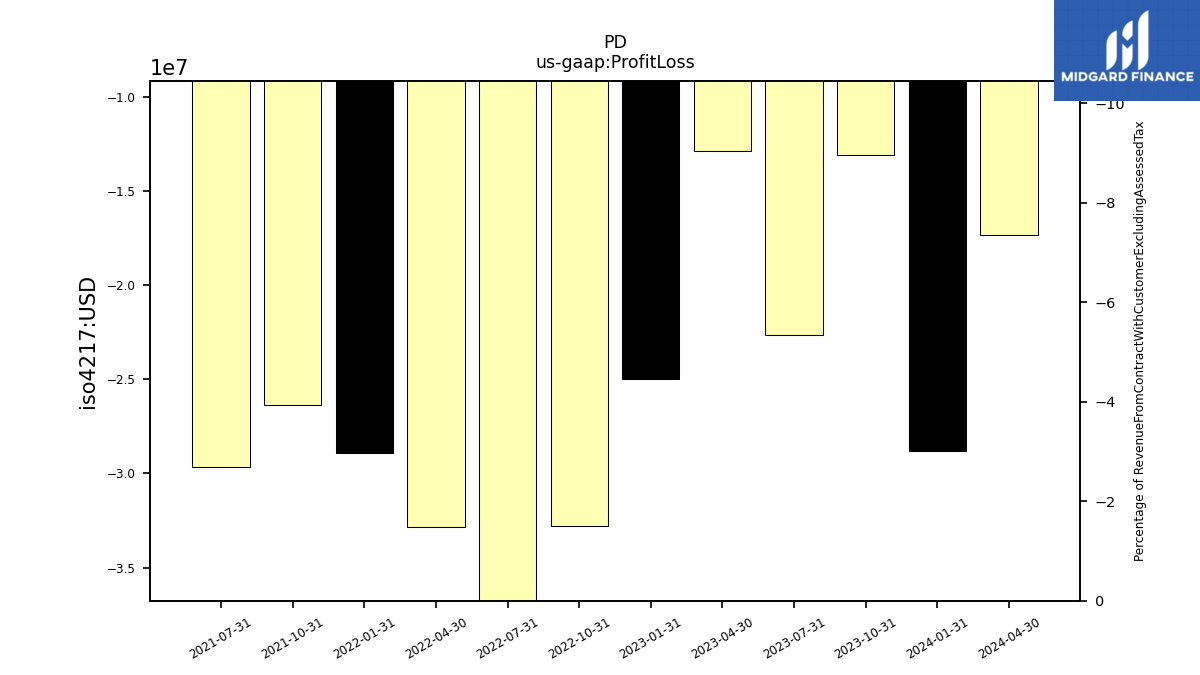
| Profit Loss | -13.09 | -22.62 | -12.84 | -25.00 | -32.80 | -38.60 | -32.82 | -28.89 | -26.34 | -29.66 | NA | NA | NA | NA | NA | NA | NA | NA | NA | NA | NA | NA | NA | |
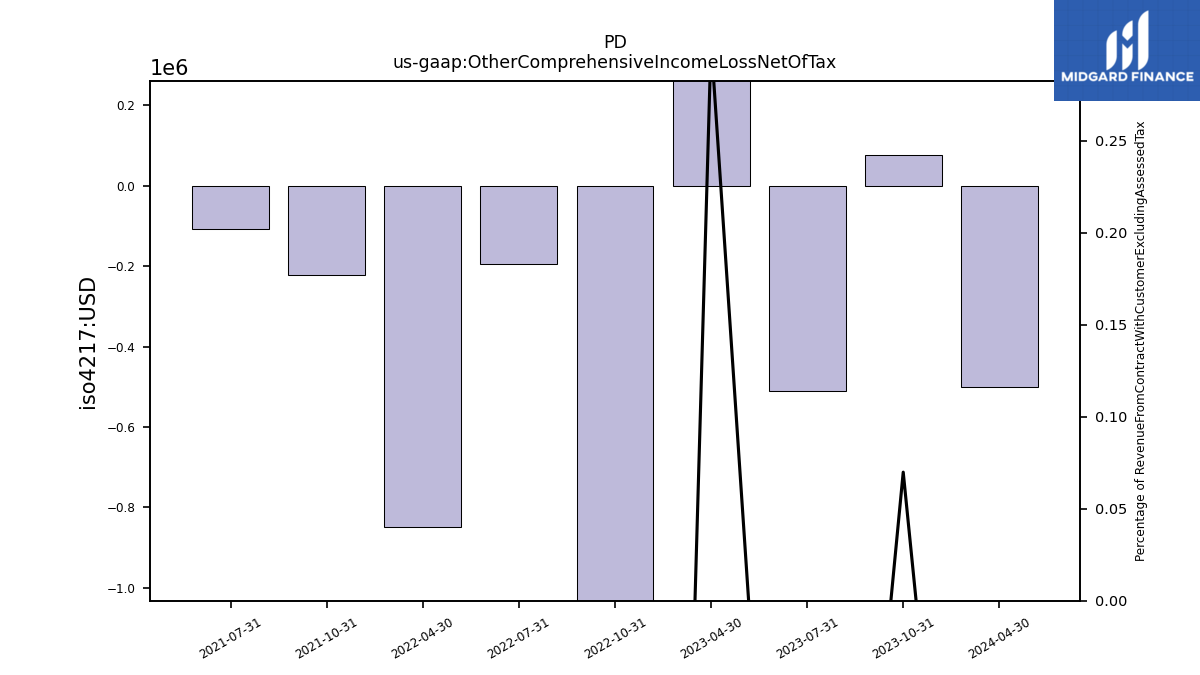
| Other Comprehensive Income Loss Net Of Tax | 0.08 | -0.51 | 0.31 | NA | -1.42 | -0.20 | -0.85 | NA | -0.22 | -0.11 | NA | NA | NA | NA | NA | NA | NA | NA | NA | NA | NA | NA | NA | |
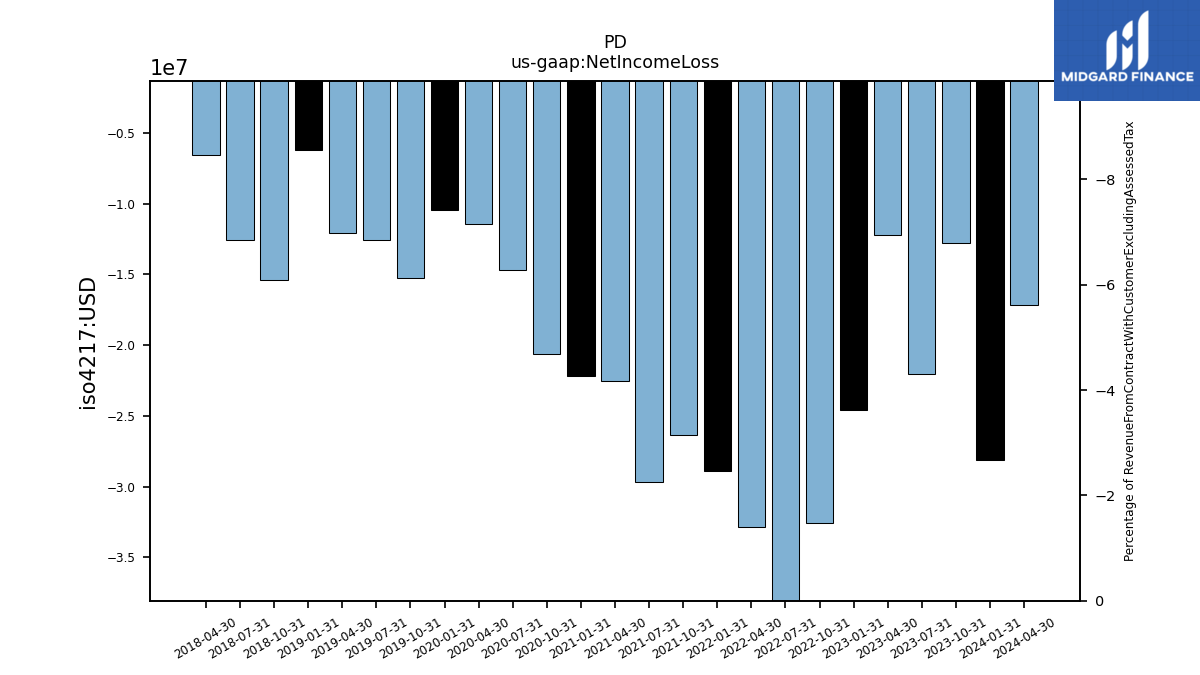
| Net Income Loss | -12.77 | -22.05 | -12.22 | -24.56 | -32.54 | -38.50 | -32.82 | -28.89 | -26.34 | -29.66 | -22.56 | -22.15 | -20.61 | -14.69 | -11.46 | -10.44 | -15.27 | -12.57 | -12.06 | -6.21 | -15.38 | -12.58 | -6.58 | |
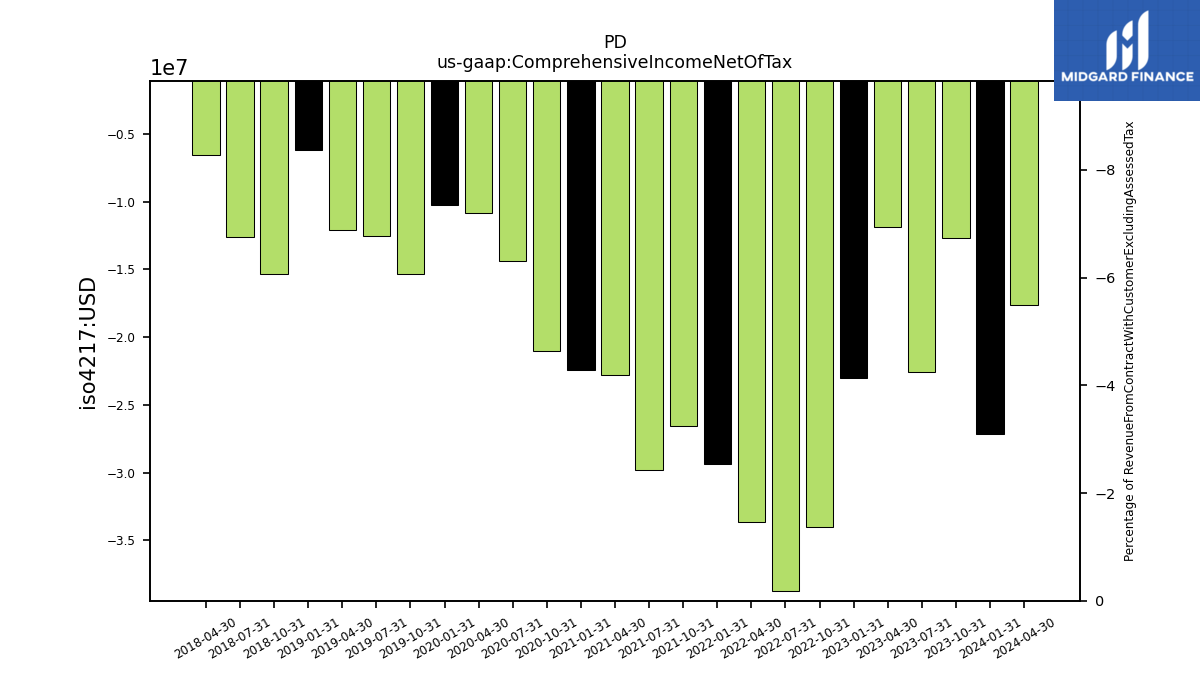
| Comprehensive Income Net Of Tax | -12.70 | -22.56 | -11.91 | -23.02 | -33.97 | -38.70 | -33.67 | -29.37 | -26.56 | -29.77 | -22.76 | -22.44 | -21.03 | -14.41 | -10.82 | -10.25 | -15.31 | -12.57 | -12.06 | -6.21 | -15.38 | -12.58 | -6.58 | |
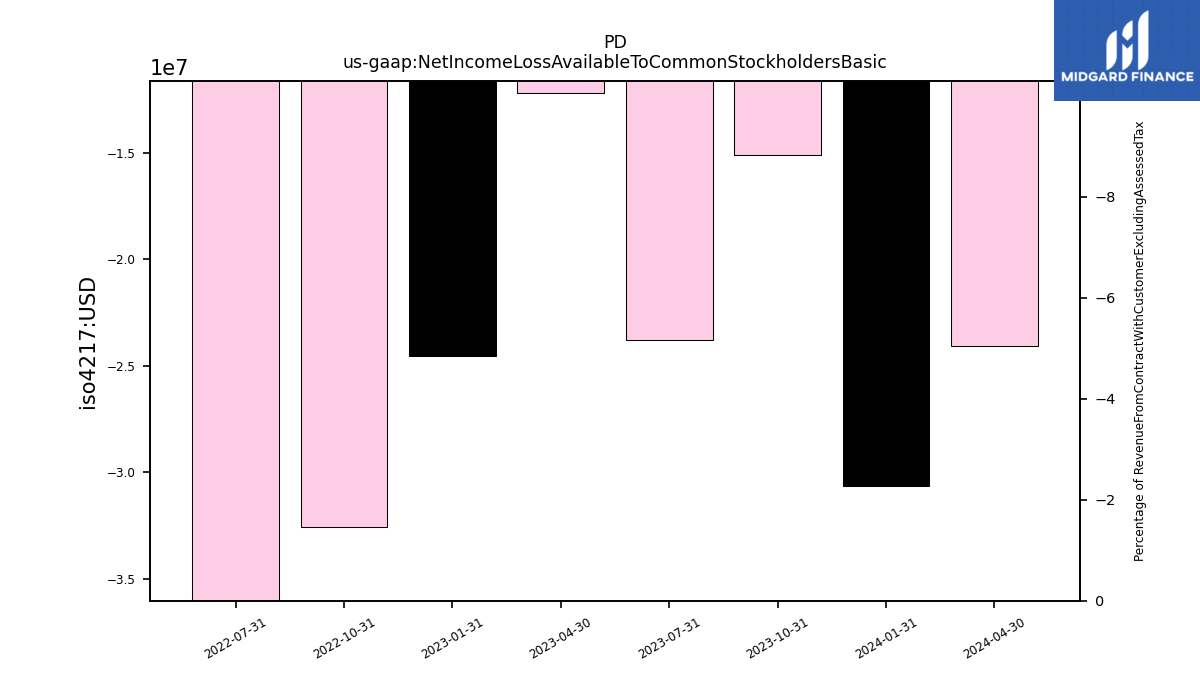
| Net Income Loss Available To Common Stockholders Basic | -15.12 | -23.78 | NA | NA | -32.54 | -38.50 | NA | NA | NA | NA | NA | NA | NA | NA | NA | NA | NA | NA | NA | NA | NA | NA | NA |
| 2023-10-31 | 2023-07-31 | 2023-04-30 | 2023-01-31 | 2022-10-31 | 2022-07-31 | 2022-04-30 | 2022-01-31 | 2021-10-31 | 2021-07-31 | 2021-04-30 | 2021-01-31 | 2020-10-31 | 2020-07-31 | 2020-04-30 | 2020-01-31 | 2019-10-31 | 2019-07-31 | 2019-04-30 | 2019-01-31 | 2018-10-31 | 2018-07-31 | 2018-04-30 | ||
|---|---|---|---|---|---|---|---|---|---|---|---|---|---|---|---|---|---|---|---|---|---|---|---|---|
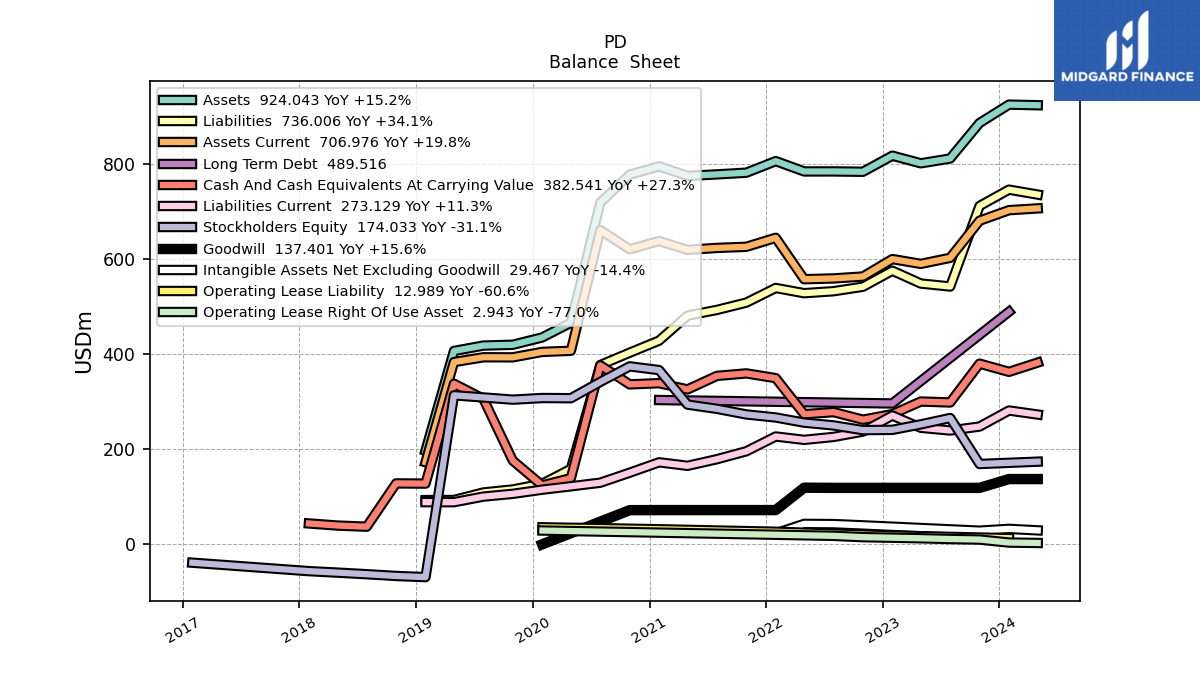
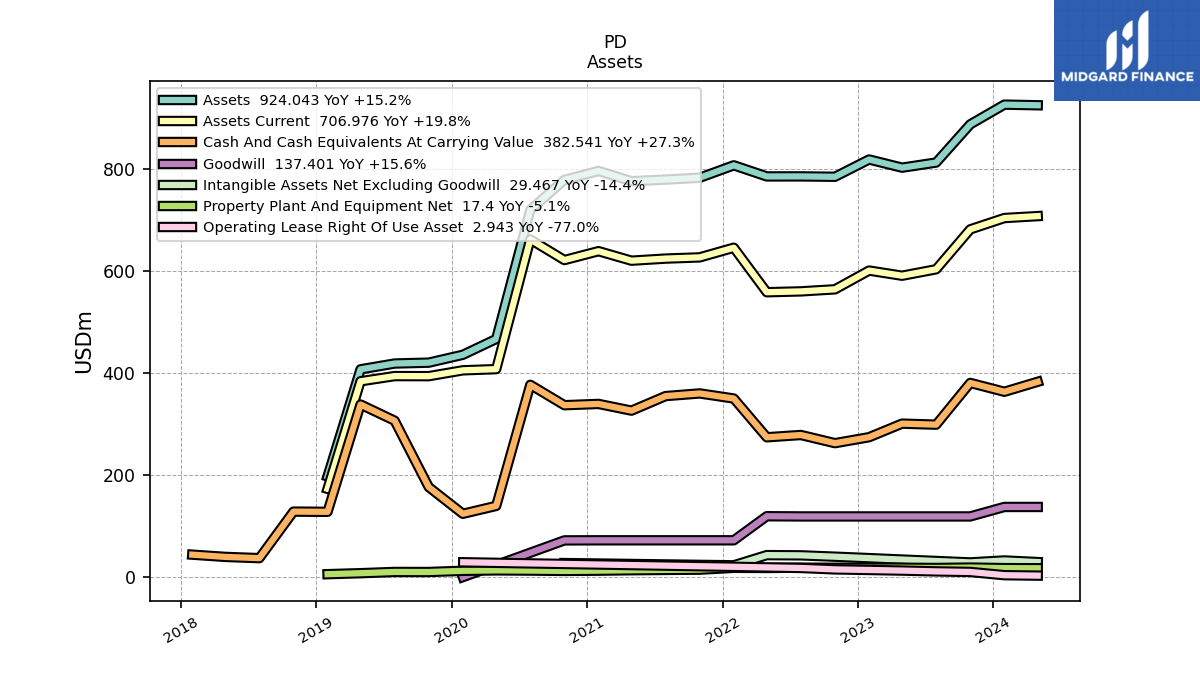
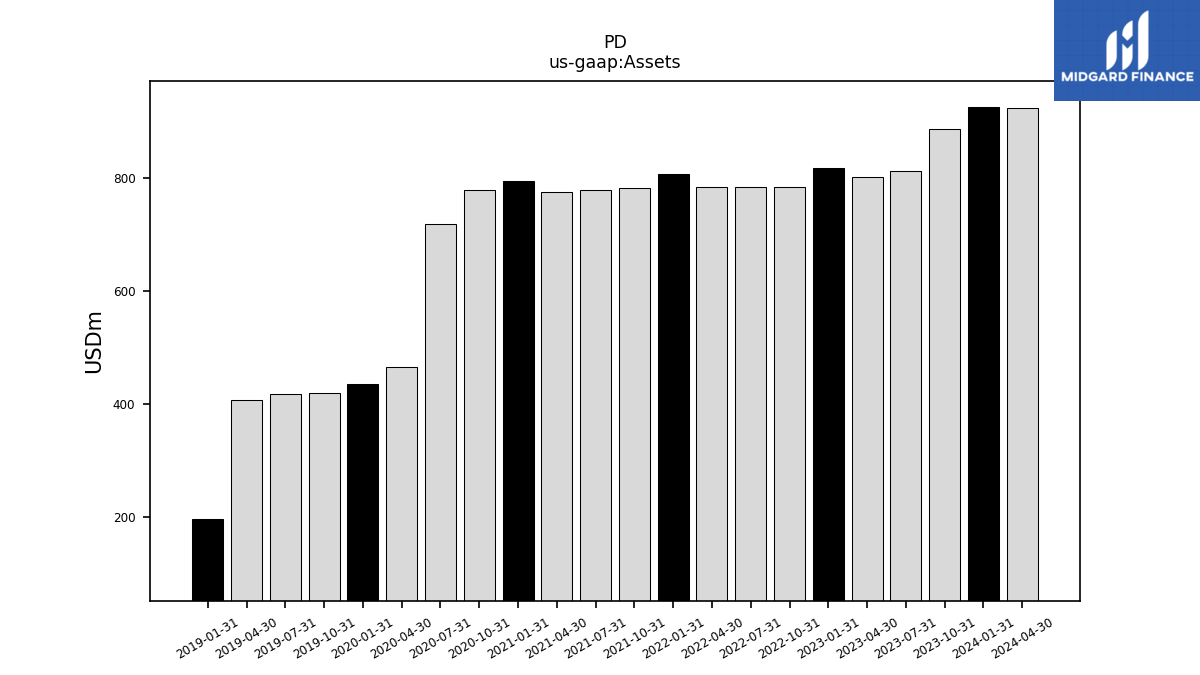
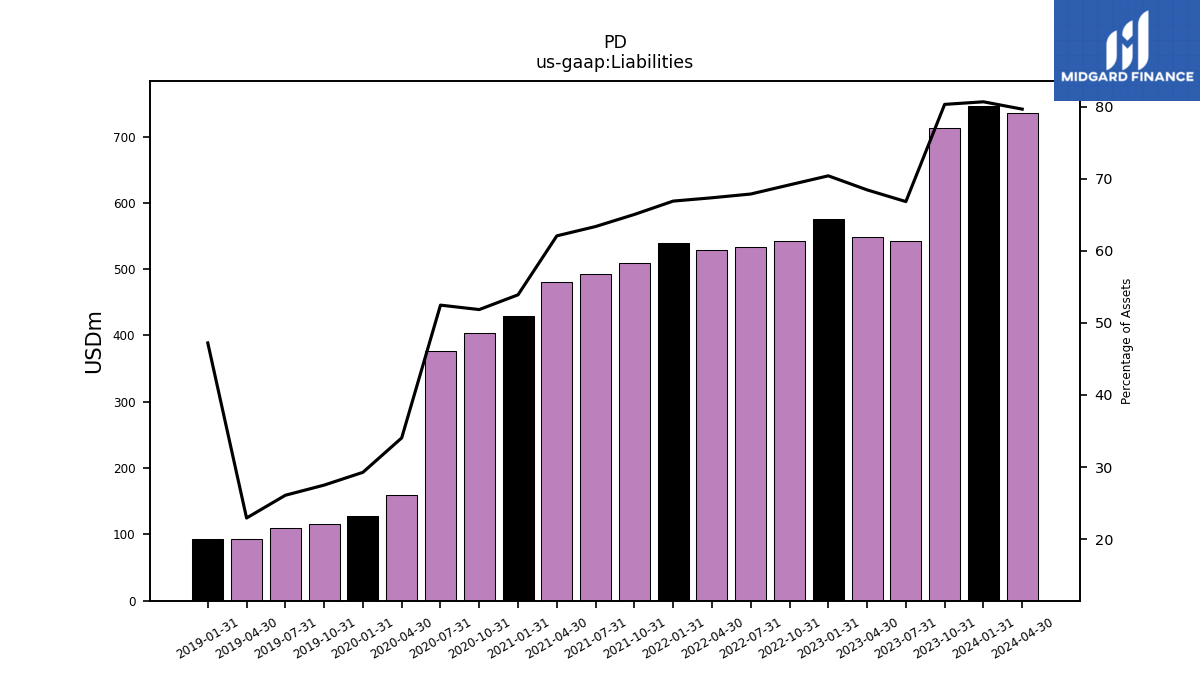
| Assets | 886.73 | 811.90 | 801.83 | 817.87 | 784.01 | 784.76 | 784.70 | 806.45 | 782.09 | 778.51 | 775.36 | 795.44 | 777.90 | 719.19 | 466.32 | 435.40 | 420.00 | 418.31 | 406.97 | 197.23 | NA | NA | NA | |
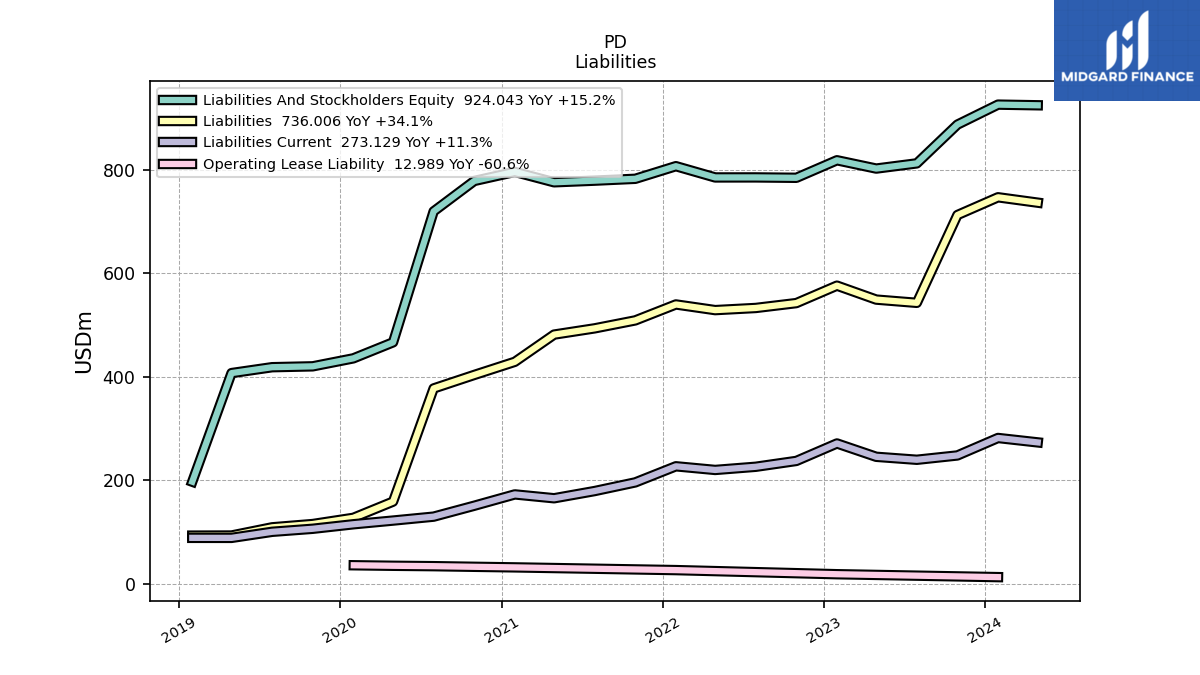
| Liabilities | 712.14 | 542.58 | 548.86 | 575.79 | 542.11 | 532.68 | 528.54 | 539.47 | 508.70 | 493.34 | 481.30 | 428.72 | 403.34 | 377.32 | 158.78 | 127.46 | 115.51 | 109.15 | 93.34 | 93.14 | NA | NA | NA | |
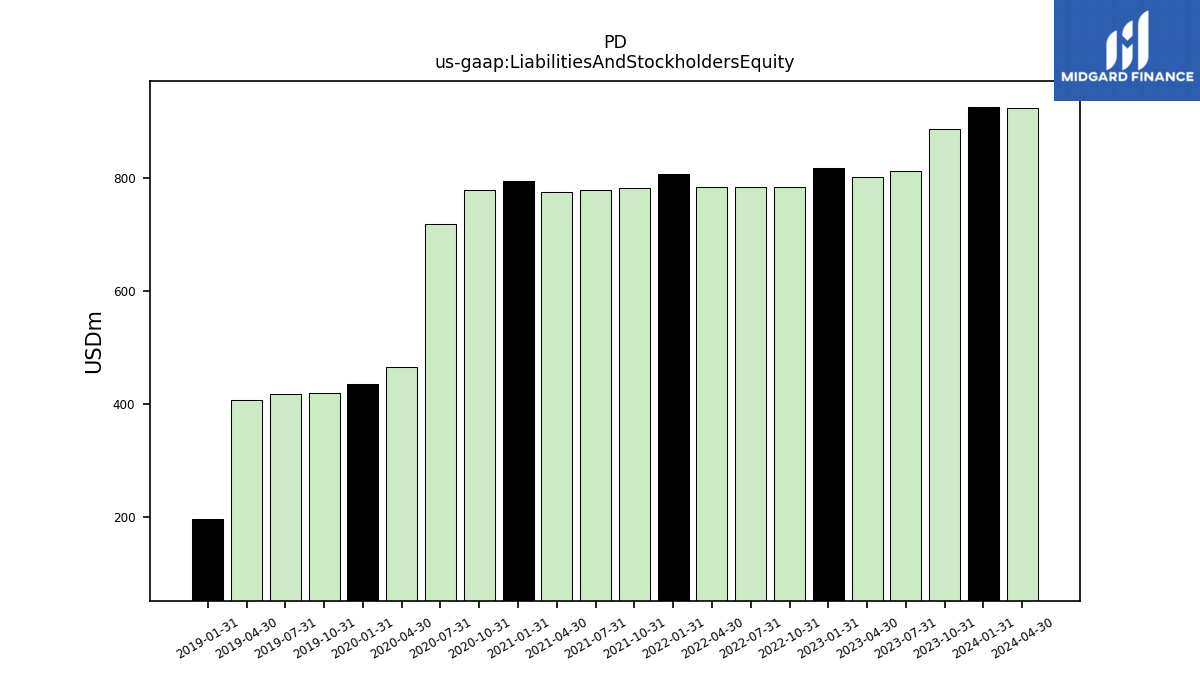
| Liabilities And Stockholders Equity | 886.73 | 811.90 | 801.83 | 817.87 | 784.01 | 784.76 | 784.70 | 806.45 | 782.09 | 778.51 | 775.36 | 795.44 | 777.90 | 719.19 | 466.32 | 435.40 | 420.00 | 418.31 | 406.97 | 197.23 | NA | NA | NA | |
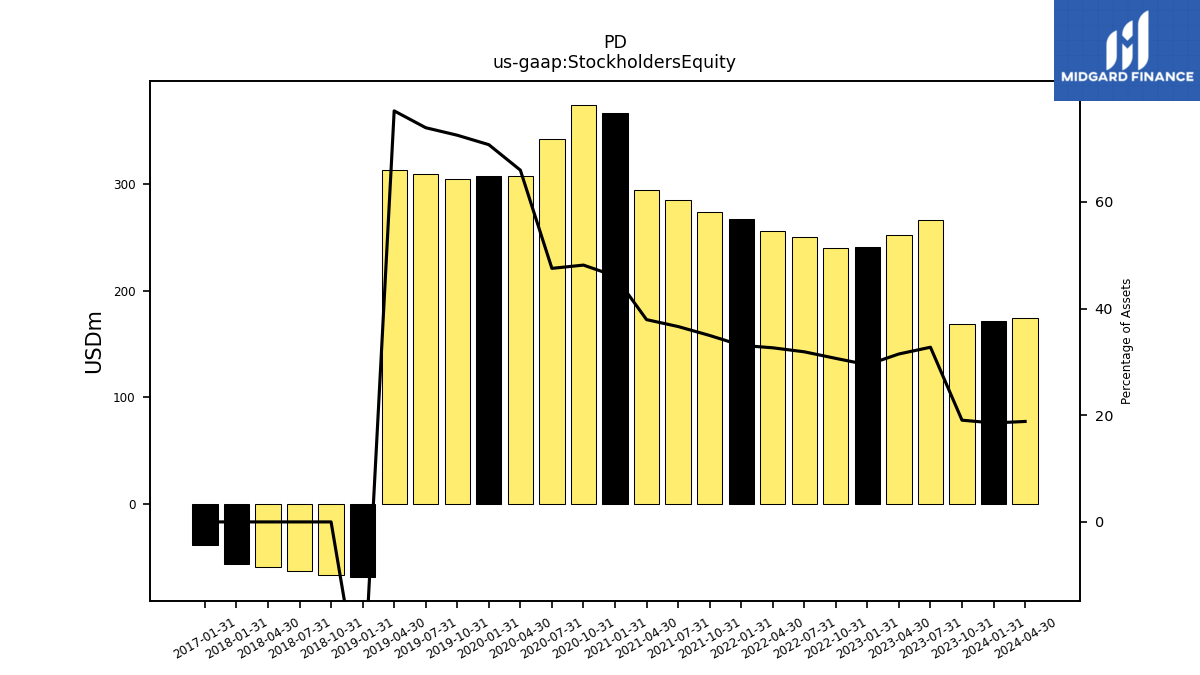
| Stockholders Equity | 169.12 | 265.89 | 252.48 | 240.98 | 240.35 | 250.27 | 256.16 | 266.98 | 273.39 | 285.17 | 294.06 | 366.73 | 374.56 | 341.87 | 307.54 | 307.94 | 304.49 | 309.16 | 313.63 | -68.93 | -66.50 | -62.81 | -59.42 |
| 2023-10-31 | 2023-07-31 | 2023-04-30 | 2023-01-31 | 2022-10-31 | 2022-07-31 | 2022-04-30 | 2022-01-31 | 2021-10-31 | 2021-07-31 | 2021-04-30 | 2021-01-31 | 2020-10-31 | 2020-07-31 | 2020-04-30 | 2020-01-31 | 2019-10-31 | 2019-07-31 | 2019-04-30 | 2019-01-31 | 2018-10-31 | 2018-07-31 | 2018-04-30 | ||
|---|---|---|---|---|---|---|---|---|---|---|---|---|---|---|---|---|---|---|---|---|---|---|---|---|
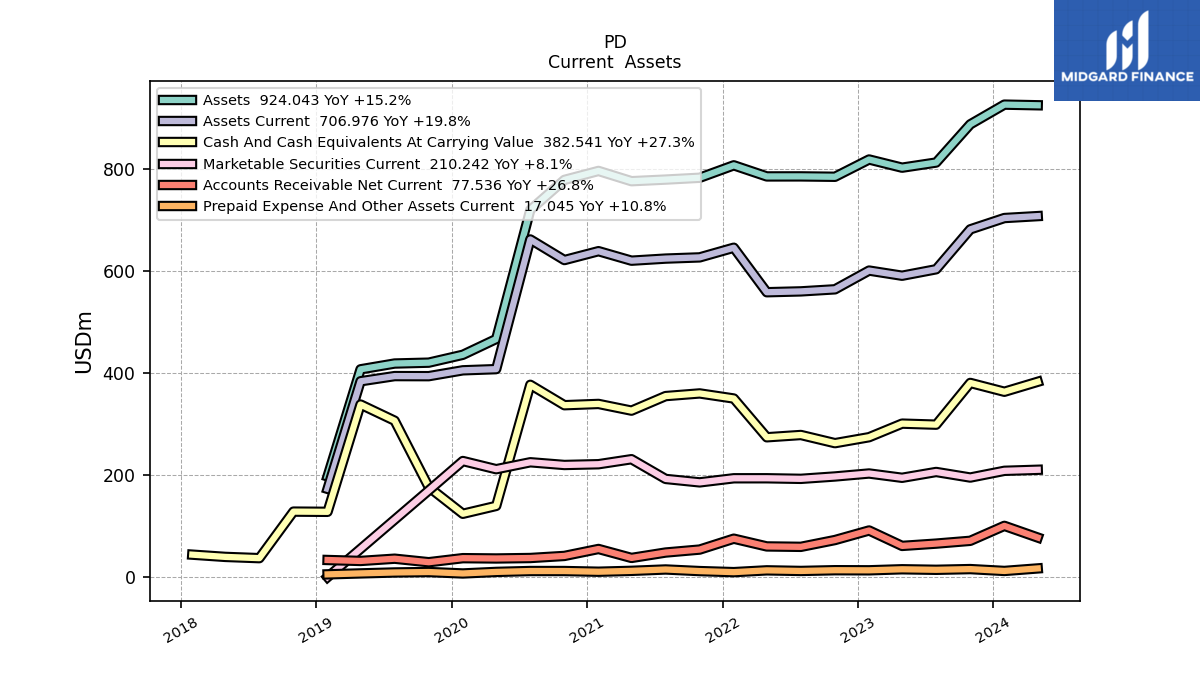
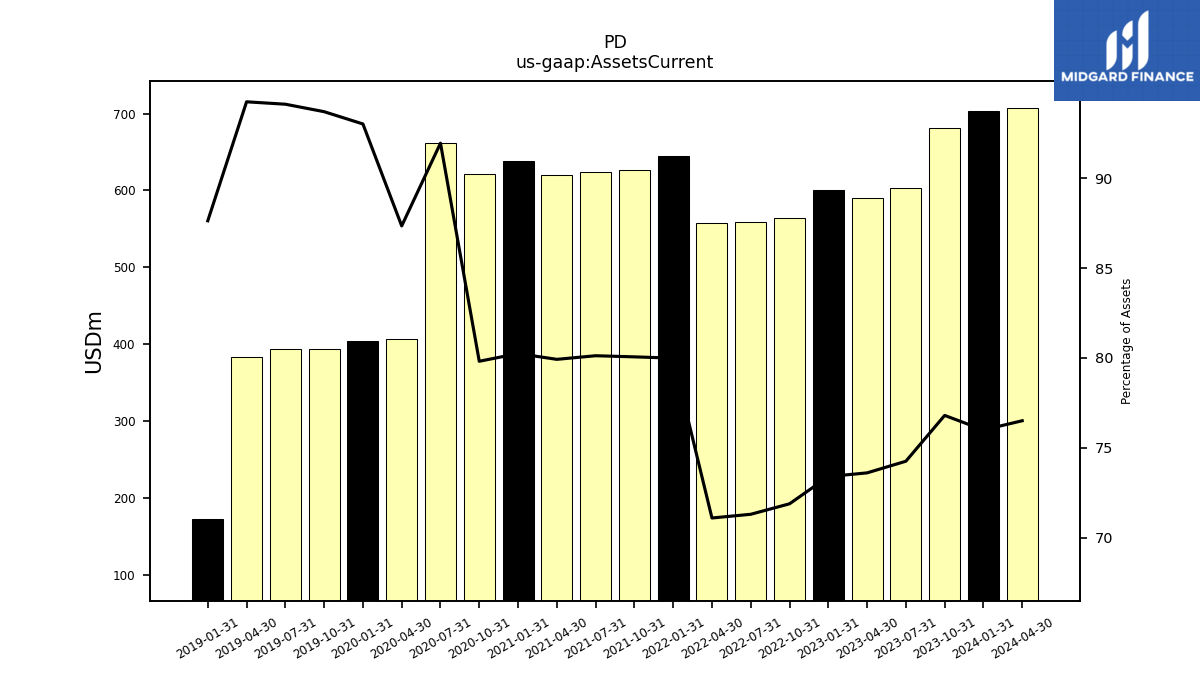
| Assets Current | 681.05 | 602.89 | 590.23 | 600.34 | 563.62 | 559.58 | 557.92 | 645.08 | 626.16 | 623.78 | 619.69 | 638.31 | 620.89 | 661.27 | 407.31 | 404.99 | 393.53 | 393.69 | 383.56 | 172.84 | NA | NA | NA | |
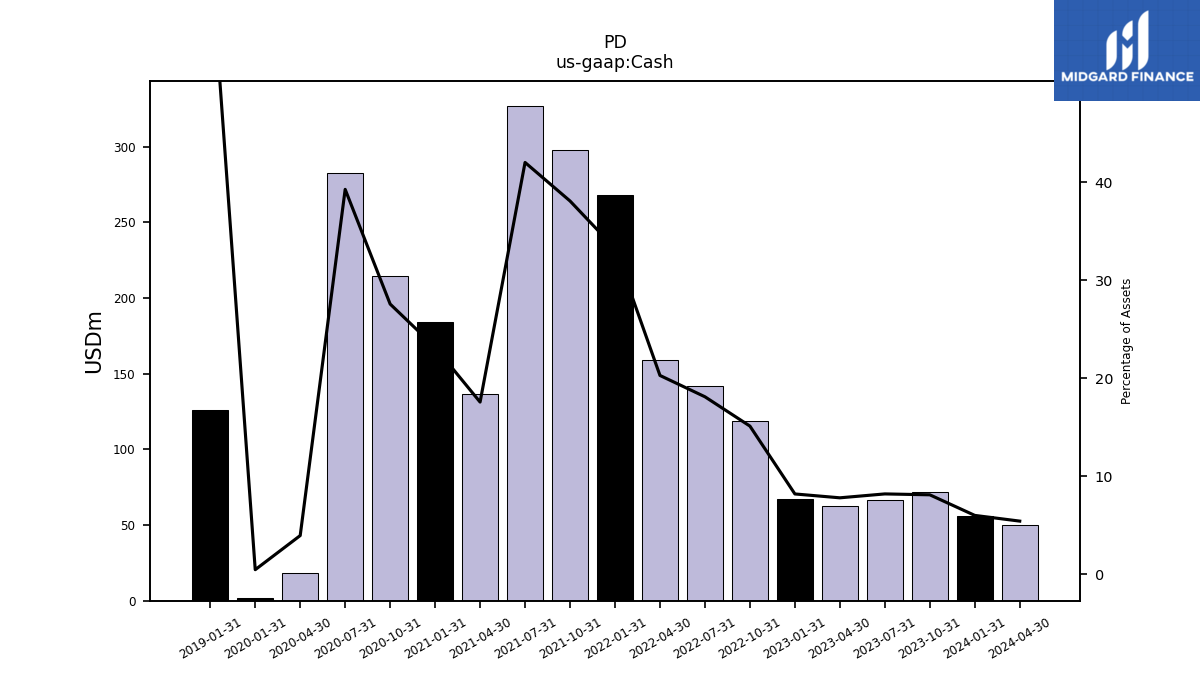
| Cash | 72.03 | 66.69 | 62.67 | 67.15 | 118.60 | 142.17 | 159.21 | 268.09 | 297.78 | 327.00 | 136.27 | 184.31 | 214.47 | 282.34 | 18.51 | 2.13 | NA | NA | NA | 125.85 | NA | NA | NA | |
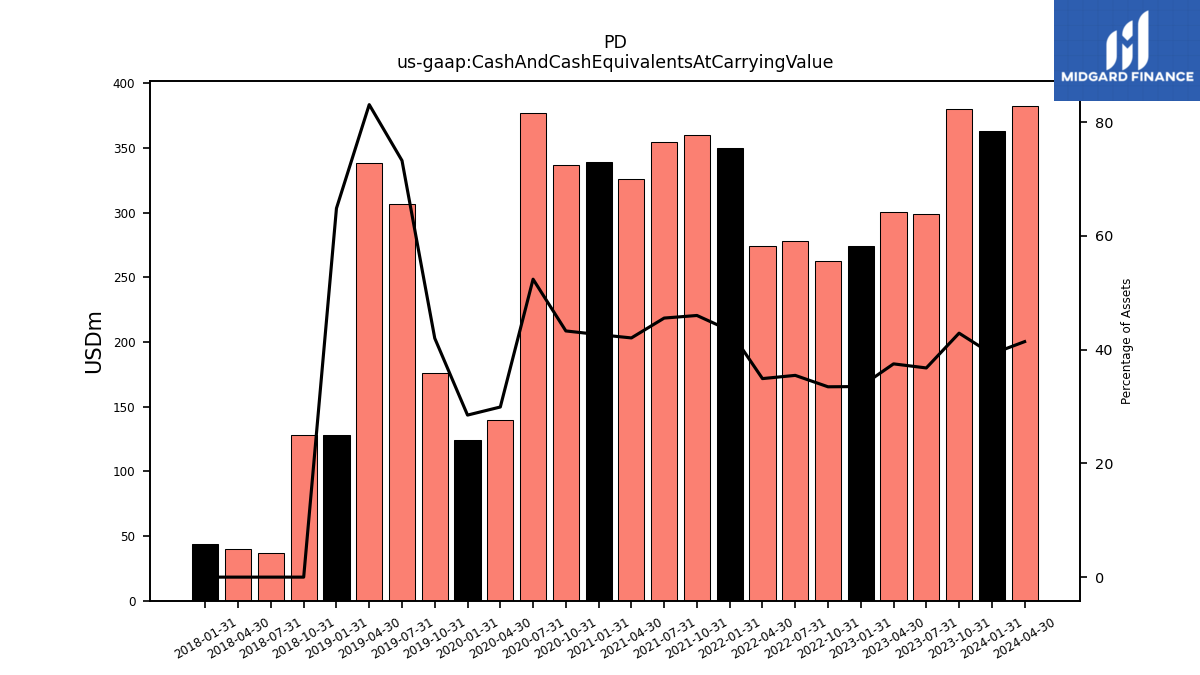
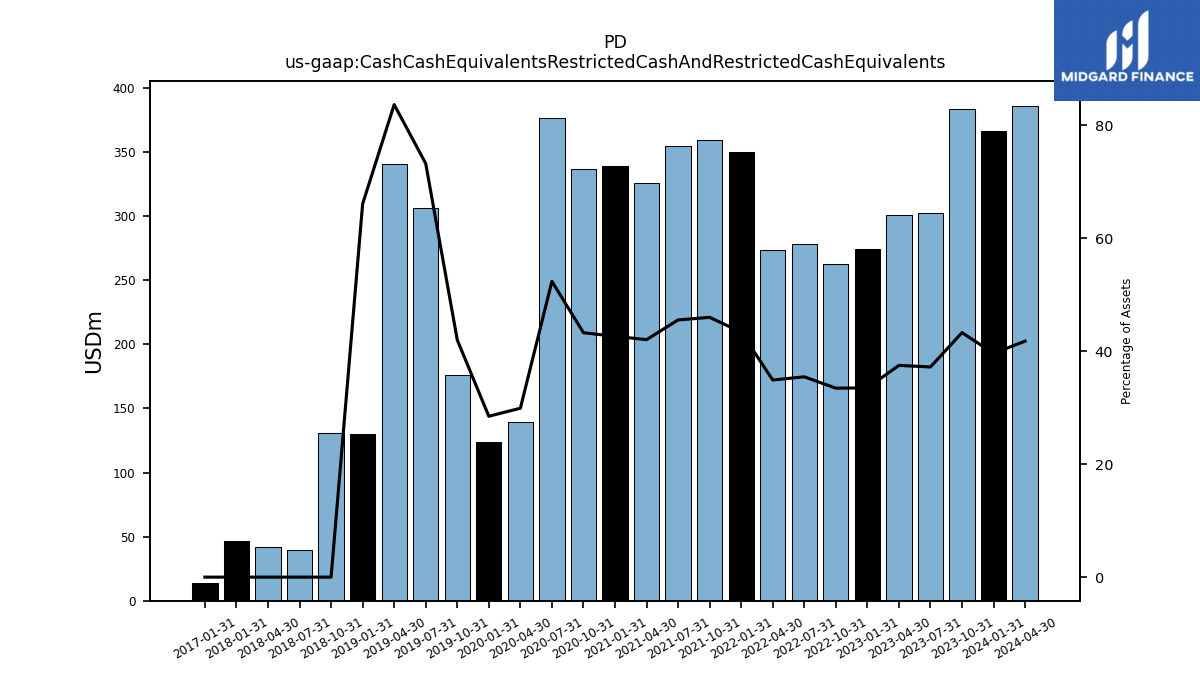
| Cash And Cash Equivalents At Carrying Value | 380.31 | 298.56 | 300.61 | 274.02 | 262.33 | 278.33 | 273.86 | 349.79 | 359.74 | 354.52 | 326.03 | 339.17 | 336.66 | 376.64 | 139.46 | 124.02 | 176.35 | 306.32 | 338.04 | 127.88 | 128.30 | 37.13 | 39.61 | |
| Cash Cash Equivalents Restricted Cash And Restricted Cash Equivalents | 383.92 | 302.14 | 300.61 | 274.02 | 262.33 | 278.33 | 273.86 | 349.79 | 359.74 | 354.52 | 326.03 | 339.17 | 336.66 | 376.64 | 139.46 | 124.02 | 176.40 | 306.37 | 340.49 | 130.32 | 130.74 | 39.58 | 42.06 | |
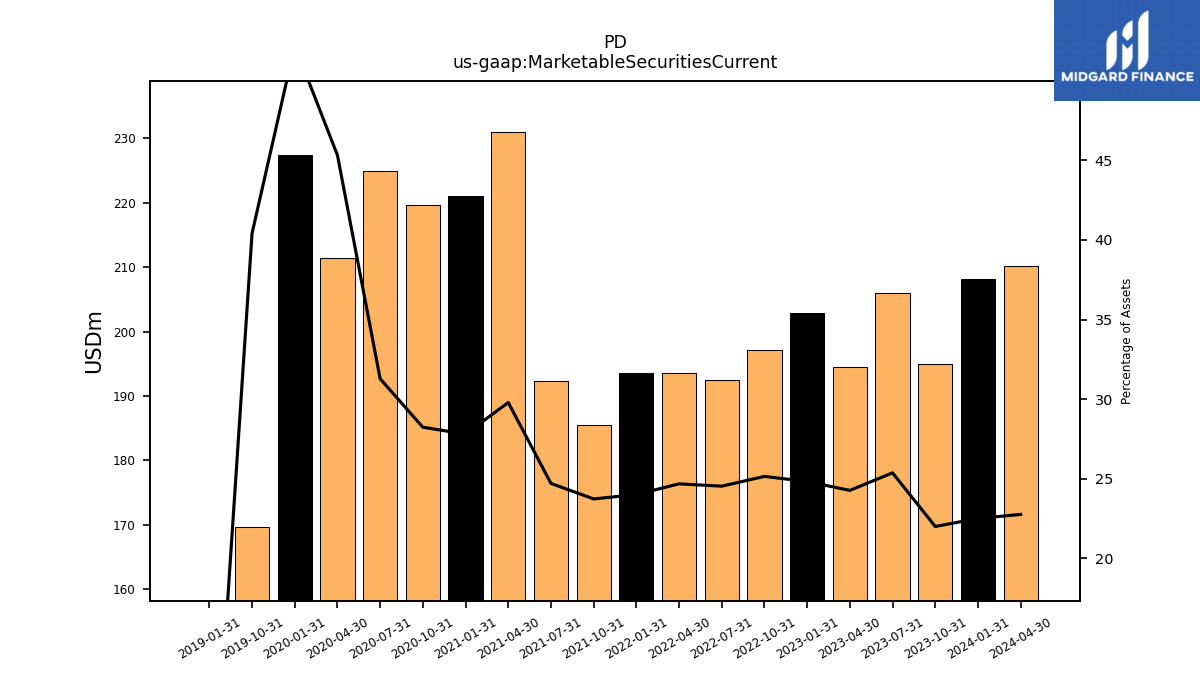
| Marketable Securities Current | 195.01 | 205.92 | 194.53 | 202.95 | 197.10 | 192.46 | 193.60 | 193.57 | 185.54 | 192.30 | 230.93 | 221.11 | 219.60 | 224.93 | 211.35 | 227.38 | 169.74 | NA | NA | 0.00 | NA | NA | NA | |
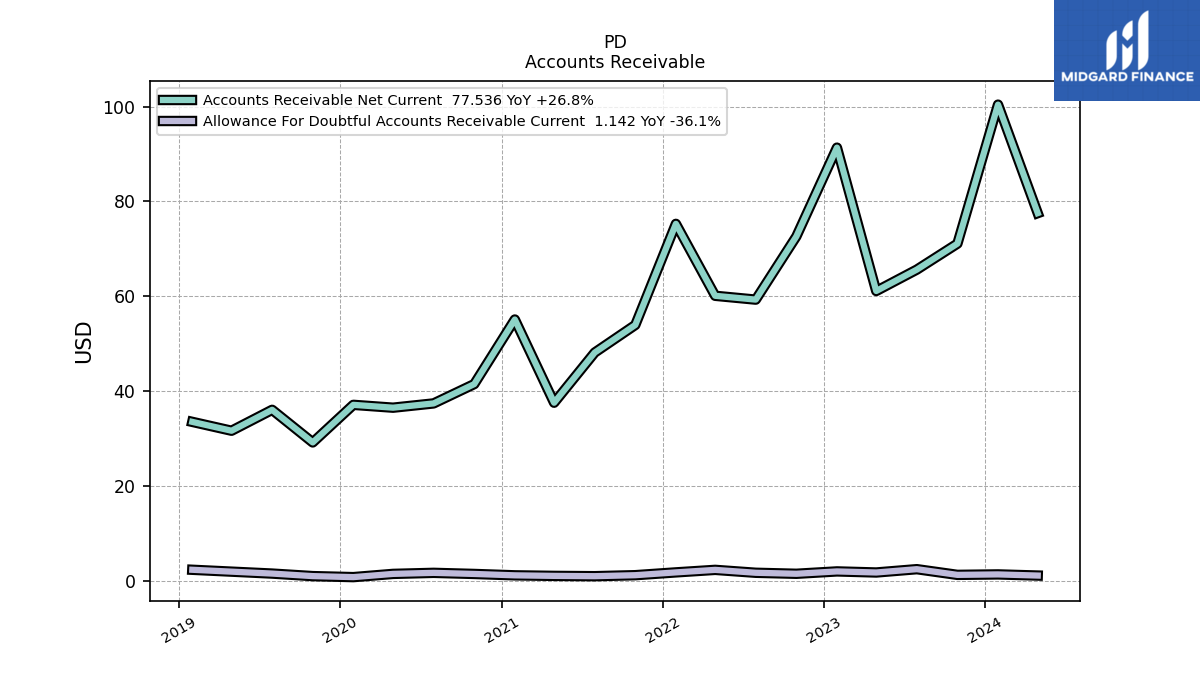
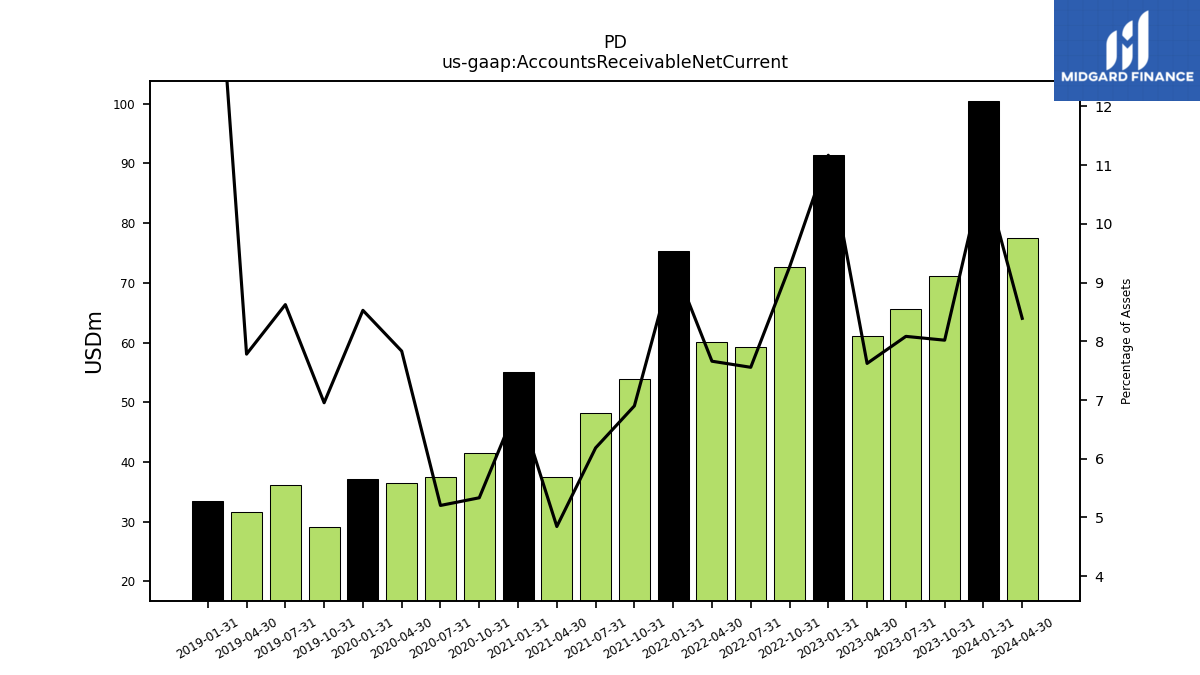
| Accounts Receivable Net Current | 71.11 | 65.63 | 61.12 | 91.34 | 72.63 | 59.30 | 60.11 | 75.28 | 53.97 | 48.15 | 37.57 | 55.12 | 41.50 | 37.43 | 36.53 | 37.13 | 29.20 | 36.08 | 31.67 | 33.54 | NA | NA | NA | |
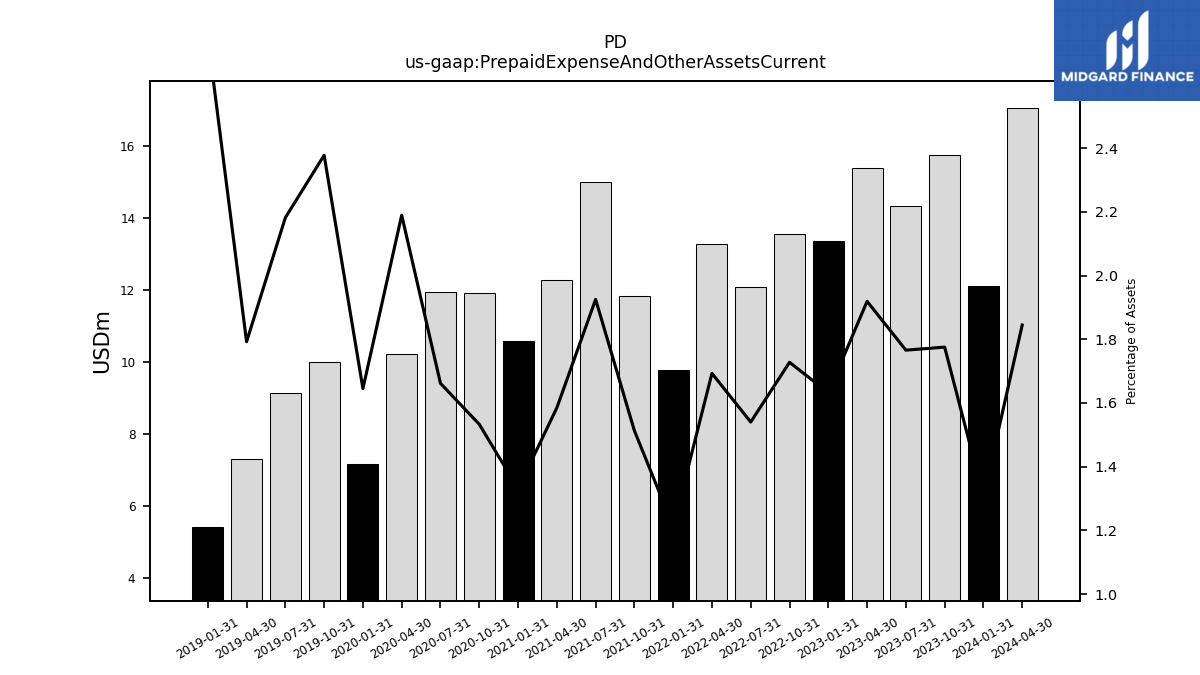
| Prepaid Expense And Other Assets Current | 15.74 | 14.34 | 15.39 | 13.35 | 13.54 | 12.09 | 13.28 | 9.78 | 11.83 | 14.99 | 12.29 | 10.59 | 11.93 | 11.95 | 10.21 | 7.16 | 9.98 | 9.13 | 7.29 | 5.42 | NA | NA | NA |
| 2023-10-31 | 2023-07-31 | 2023-04-30 | 2023-01-31 | 2022-10-31 | 2022-07-31 | 2022-04-30 | 2022-01-31 | 2021-10-31 | 2021-07-31 | 2021-04-30 | 2021-01-31 | 2020-10-31 | 2020-07-31 | 2020-04-30 | 2020-01-31 | 2019-10-31 | 2019-07-31 | 2019-04-30 | 2019-01-31 | 2018-10-31 | 2018-07-31 | 2018-04-30 | ||
|---|---|---|---|---|---|---|---|---|---|---|---|---|---|---|---|---|---|---|---|---|---|---|---|---|
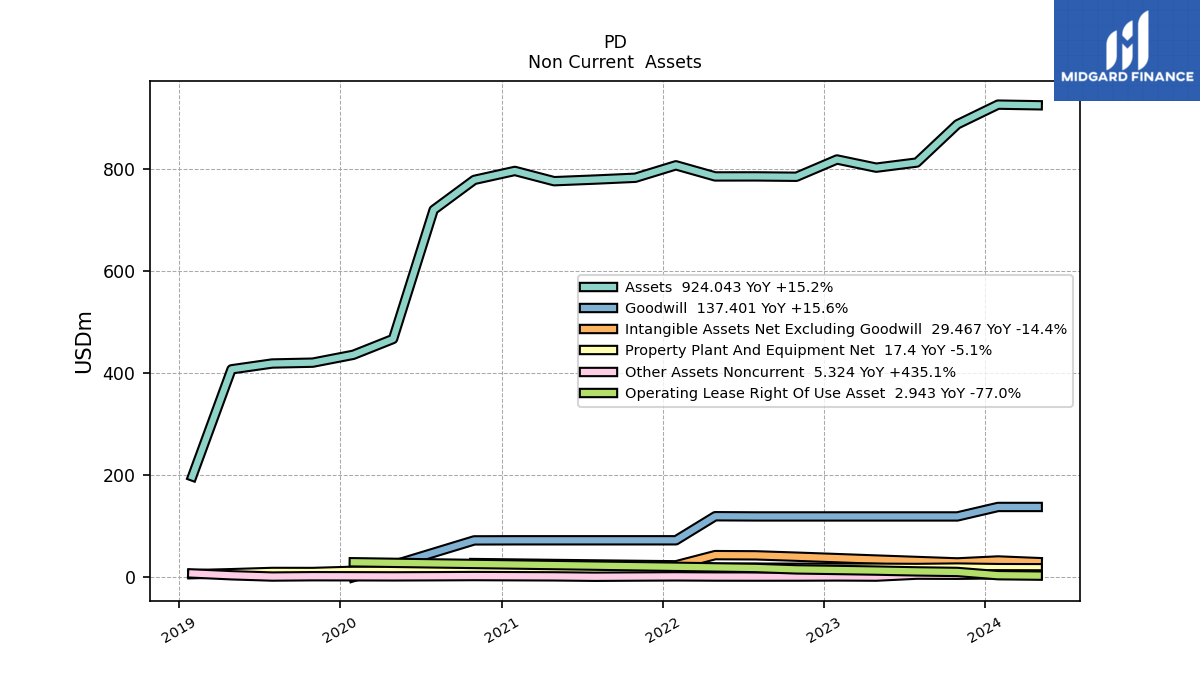
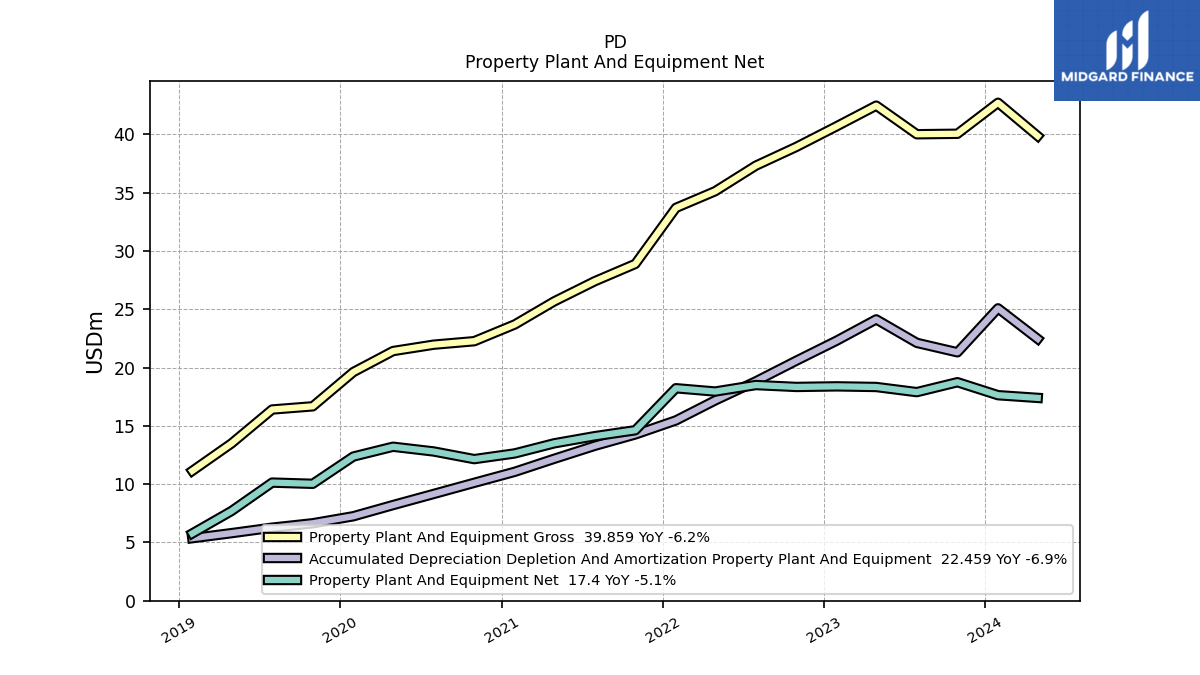
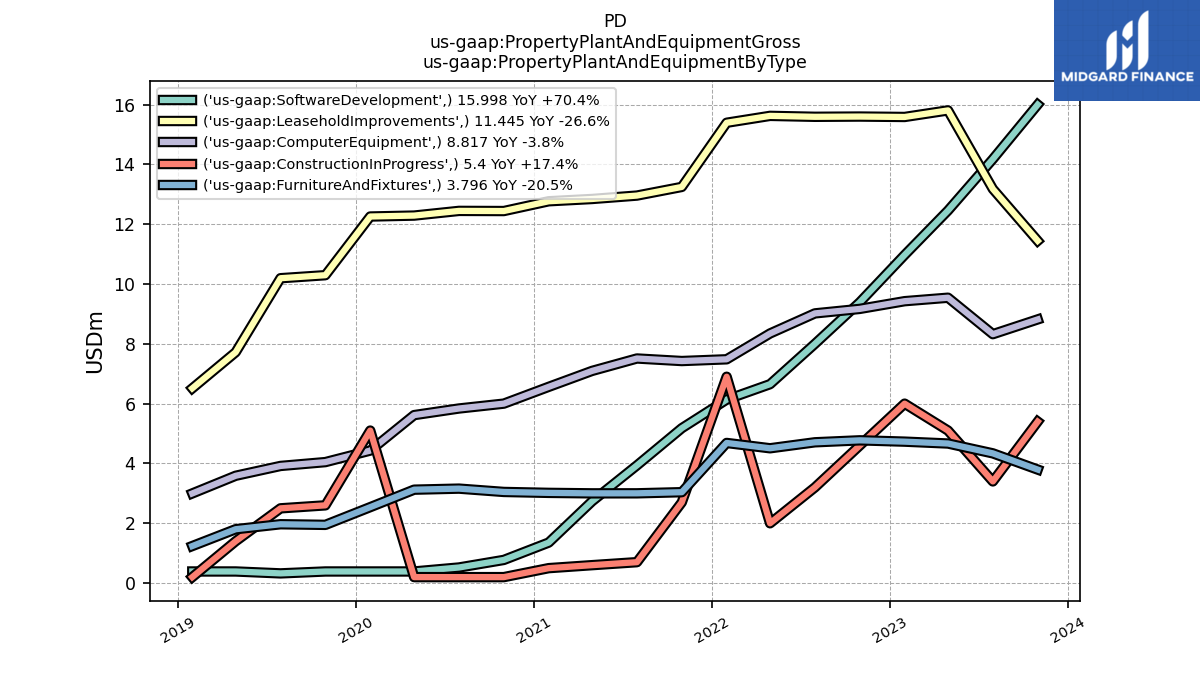
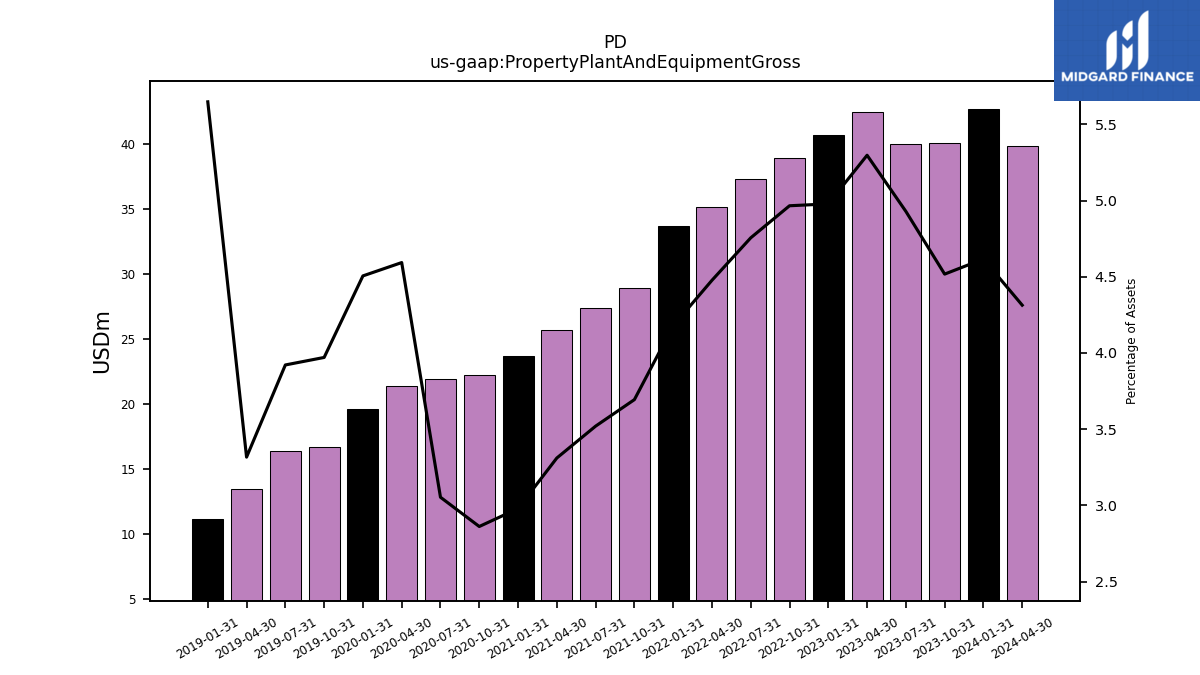
| Property Plant And Equipment Gross | 40.06 | 40.02 | 42.47 | 40.71 | 38.93 | 37.32 | 35.13 | 33.70 | 28.89 | 27.41 | 25.67 | 23.70 | 22.26 | 21.96 | 21.42 | 19.62 | 16.68 | 16.40 | 13.50 | 11.14 | NA | NA | NA | |
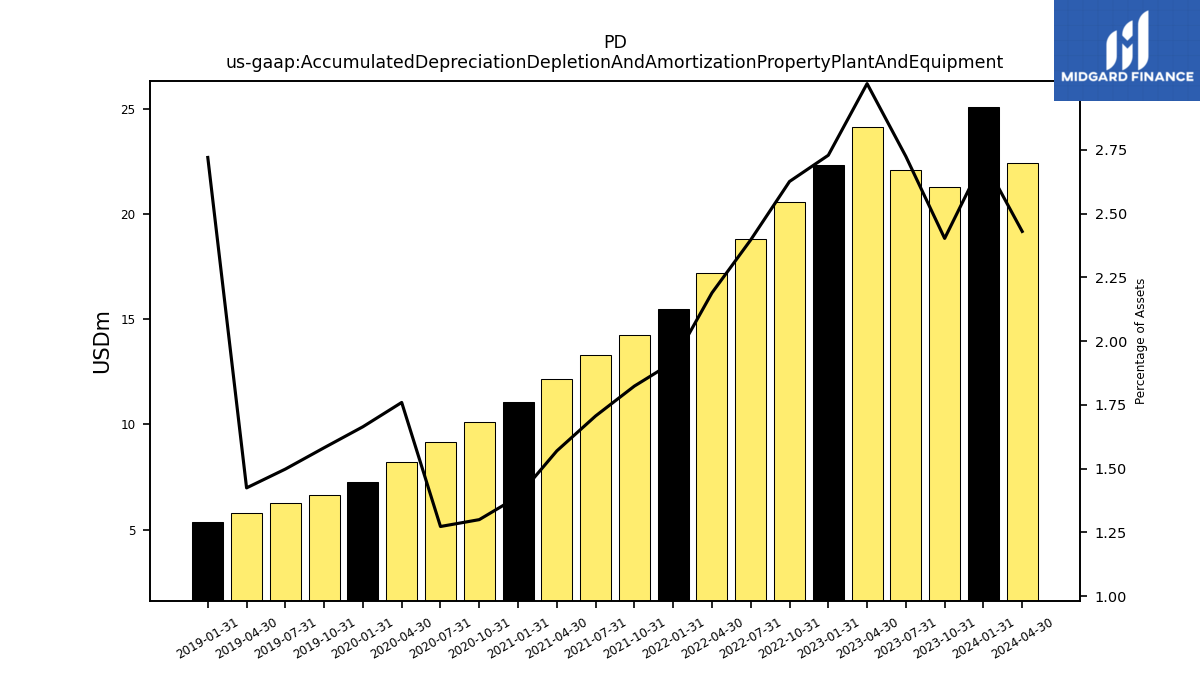
| Accumulated Depreciation Depletion And Amortization Property Plant And Equipment | 21.31 | 22.12 | 24.14 | 22.32 | 20.59 | 18.82 | 17.18 | 15.47 | 14.27 | 13.29 | 12.17 | 11.06 | 10.12 | 9.16 | 8.21 | 7.25 | 6.65 | 6.27 | 5.80 | 5.37 | NA | NA | NA | |
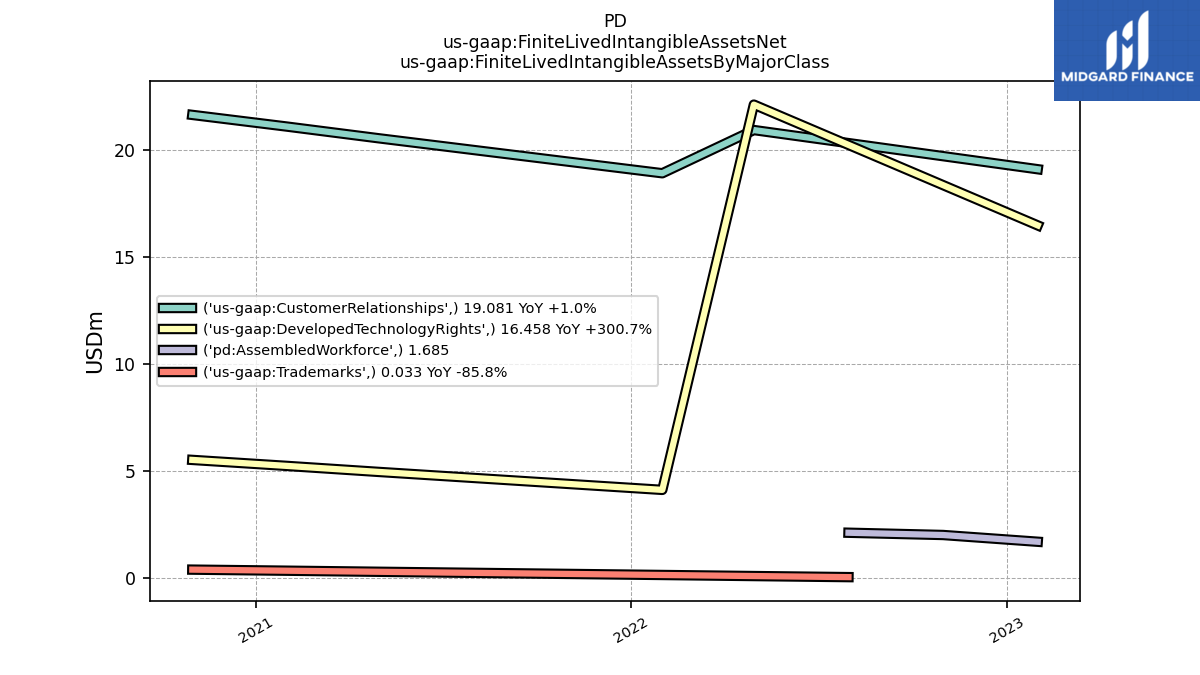
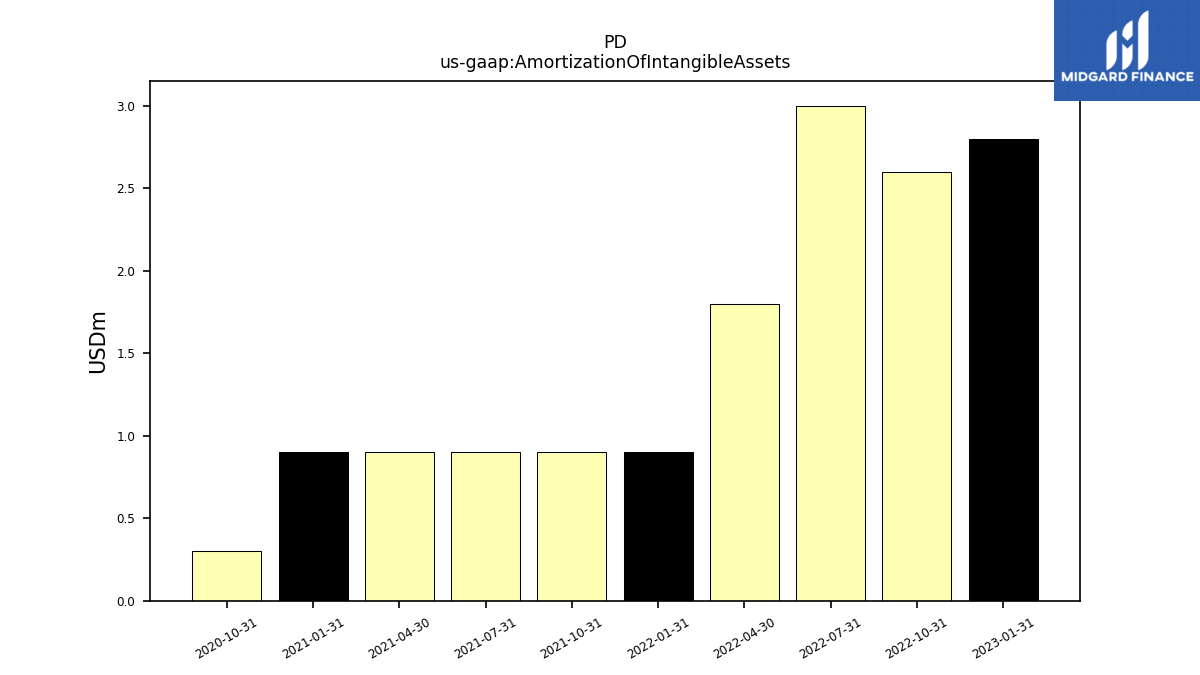
| Amortization Of Intangible Assets | NA | NA | NA | 2.80 | 2.60 | 3.00 | 1.80 | 0.90 | 0.90 | 0.90 | 0.90 | 0.90 | 0.30 | NA | NA | NA | NA | NA | NA | NA | NA | NA | NA | |
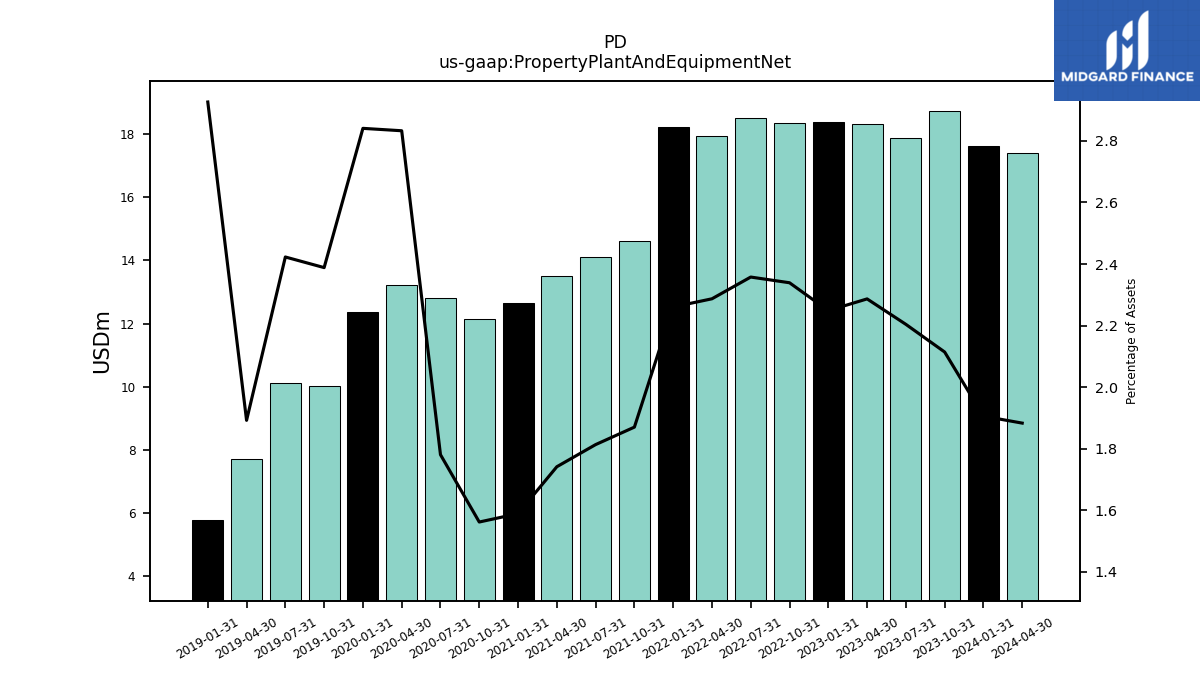
| Property Plant And Equipment Net | 18.75 | 17.89 | 18.34 | 18.39 | 18.34 | 18.50 | 17.95 | 18.23 | 14.62 | 14.12 | 13.50 | 12.64 | 12.15 | 12.80 | 13.21 | 12.37 | 10.03 | 10.13 | 7.70 | 5.77 | NA | NA | NA | |
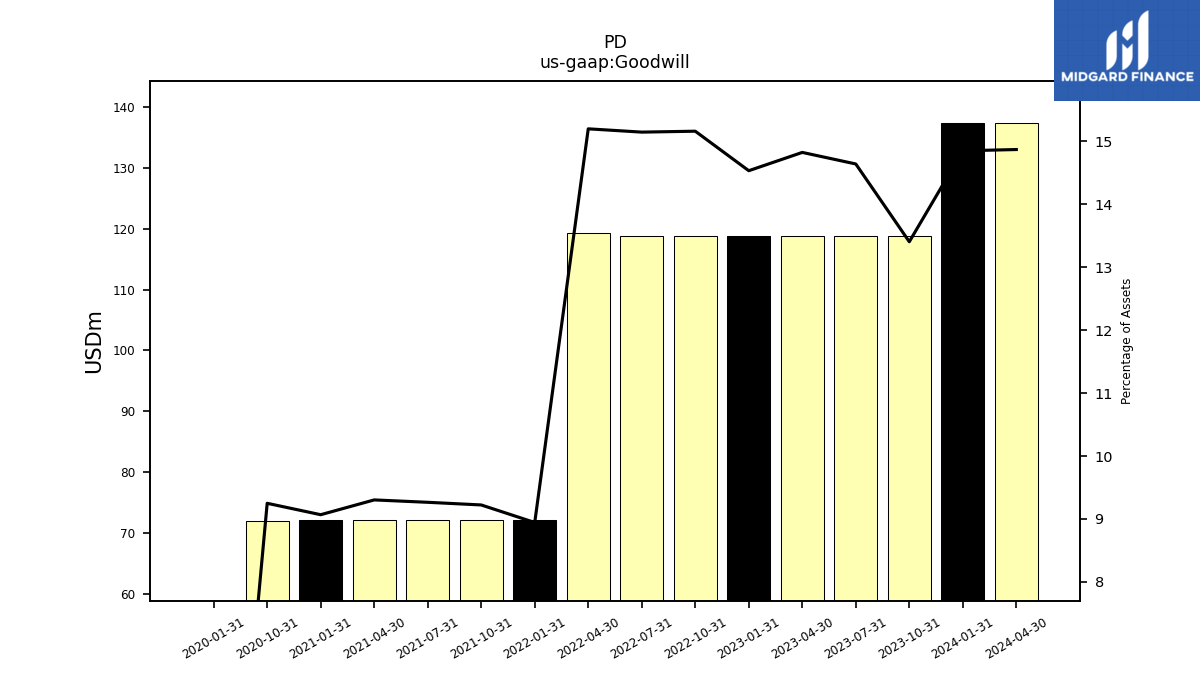
| Goodwill | 118.86 | 118.86 | 118.86 | 118.86 | 118.86 | 118.86 | 119.26 | 72.13 | 72.13 | 72.13 | 72.13 | 72.13 | 71.95 | NA | NA | 0.00 | NA | NA | NA | NA | NA | NA | NA | |
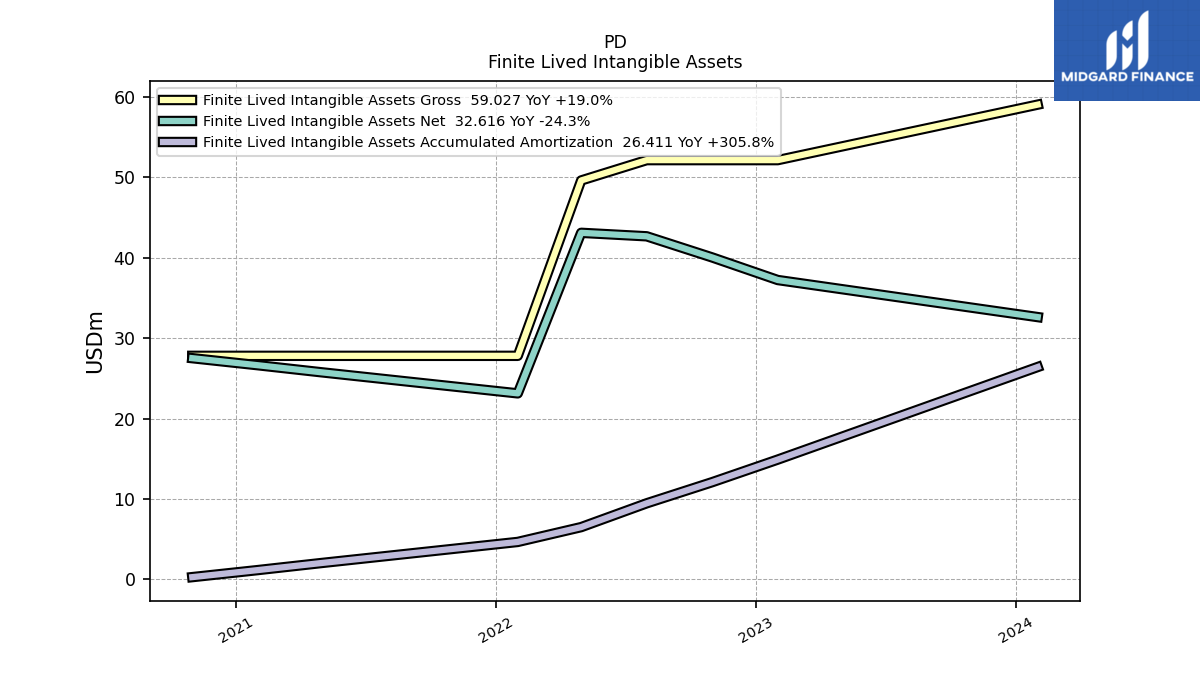
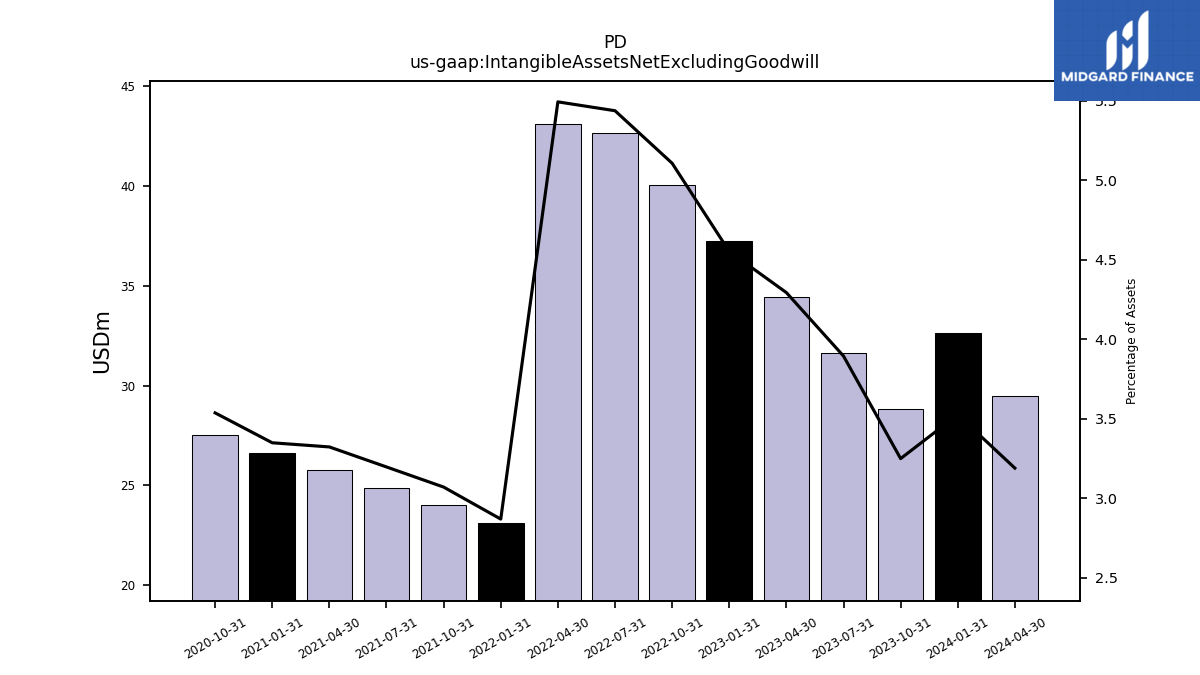
| Intangible Assets Net Excluding Goodwill | 28.81 | 31.61 | 34.42 | 37.22 | 40.03 | 42.66 | 43.09 | 23.13 | 24.01 | 24.88 | 25.76 | 26.63 | 27.51 | NA | NA | NA | NA | NA | NA | NA | NA | NA | NA | |
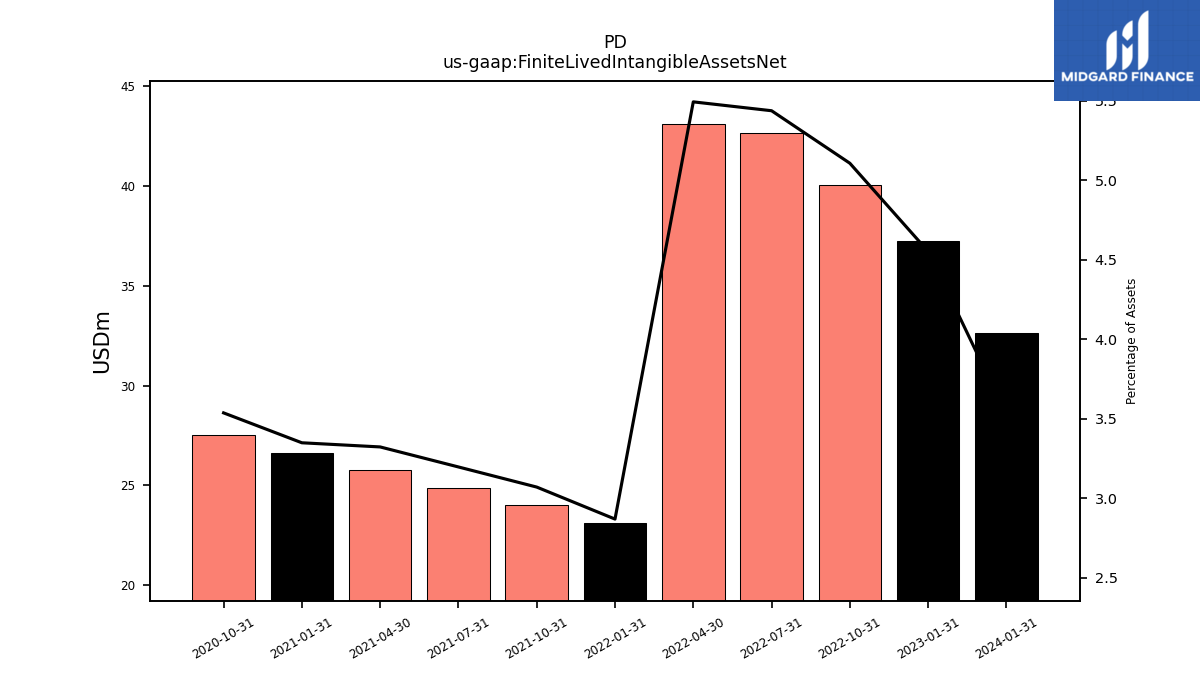
| Finite Lived Intangible Assets Net | NA | NA | NA | 37.22 | 40.03 | 42.66 | 43.09 | 23.13 | 24.01 | 24.88 | 25.76 | 26.63 | 27.51 | NA | NA | NA | NA | NA | NA | NA | NA | NA | NA | |
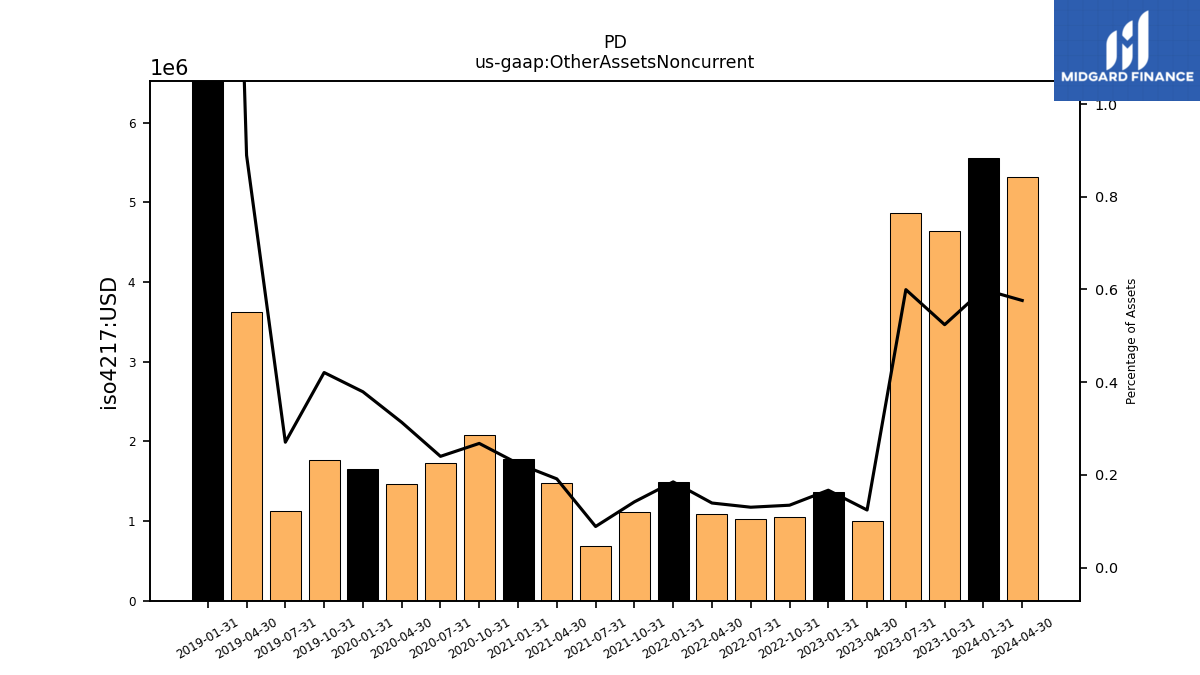
| Other Assets Noncurrent | 4.65 | 4.87 | 0.99 | 1.36 | 1.05 | 1.02 | 1.09 | 1.49 | 1.11 | 0.69 | 1.48 | 1.78 | 2.08 | 1.73 | 1.46 | 1.65 | 1.77 | 1.13 | 3.62 | 7.16 | NA | NA | NA |
| 2023-10-31 | 2023-07-31 | 2023-04-30 | 2023-01-31 | 2022-10-31 | 2022-07-31 | 2022-04-30 | 2022-01-31 | 2021-10-31 | 2021-07-31 | 2021-04-30 | 2021-01-31 | 2020-10-31 | 2020-07-31 | 2020-04-30 | 2020-01-31 | 2019-10-31 | 2019-07-31 | 2019-04-30 | 2019-01-31 | 2018-10-31 | 2018-07-31 | 2018-04-30 | ||
|---|---|---|---|---|---|---|---|---|---|---|---|---|---|---|---|---|---|---|---|---|---|---|---|---|
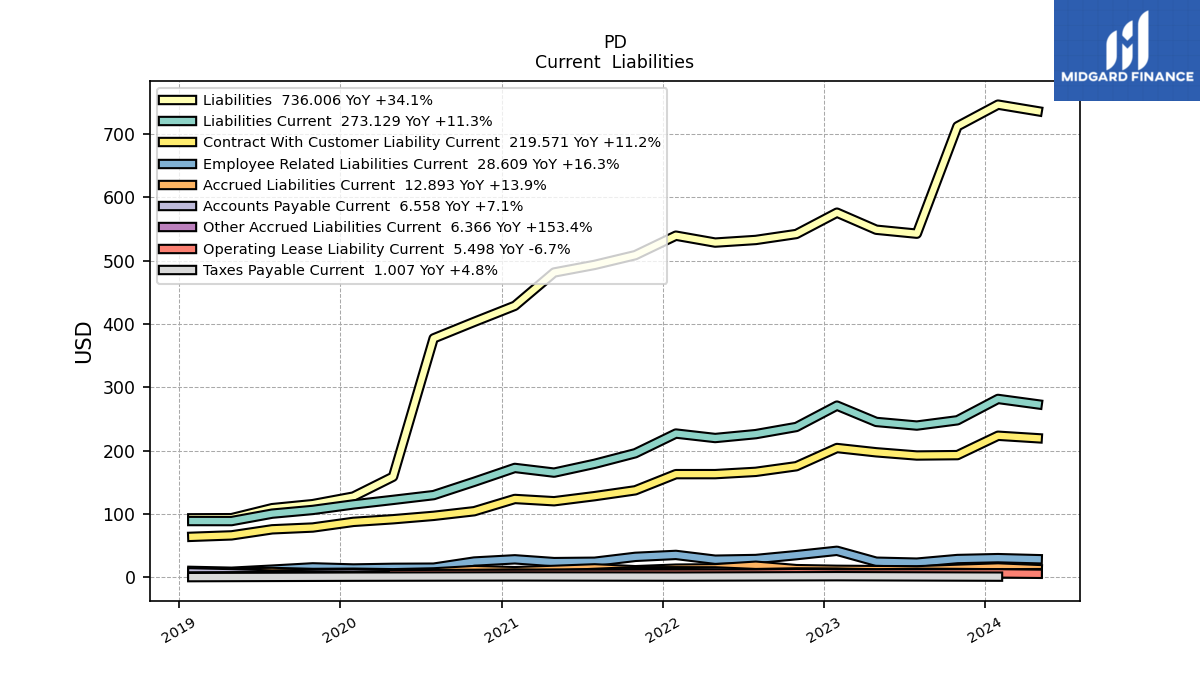
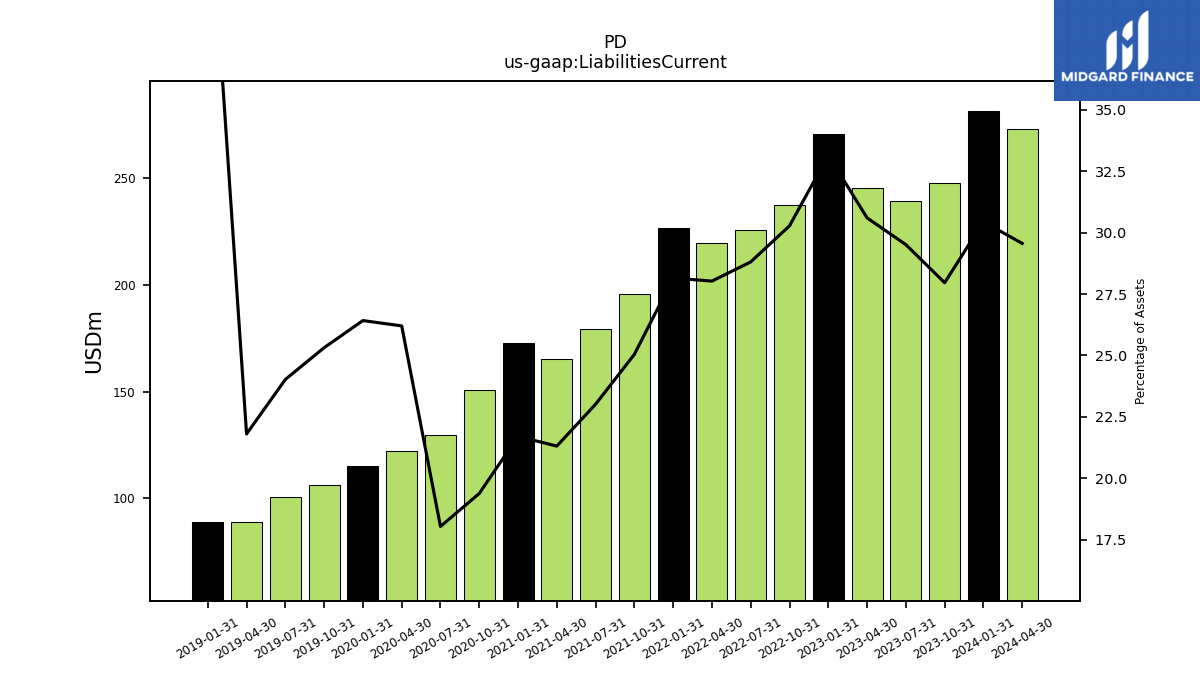
| Liabilities Current | 247.93 | 239.57 | 245.33 | 271.08 | 237.35 | 226.06 | 219.92 | 226.99 | 195.89 | 179.21 | 165.26 | 172.69 | 150.81 | 129.77 | 122.19 | 115.03 | 106.33 | 100.50 | 88.76 | 88.81 | NA | NA | NA | |
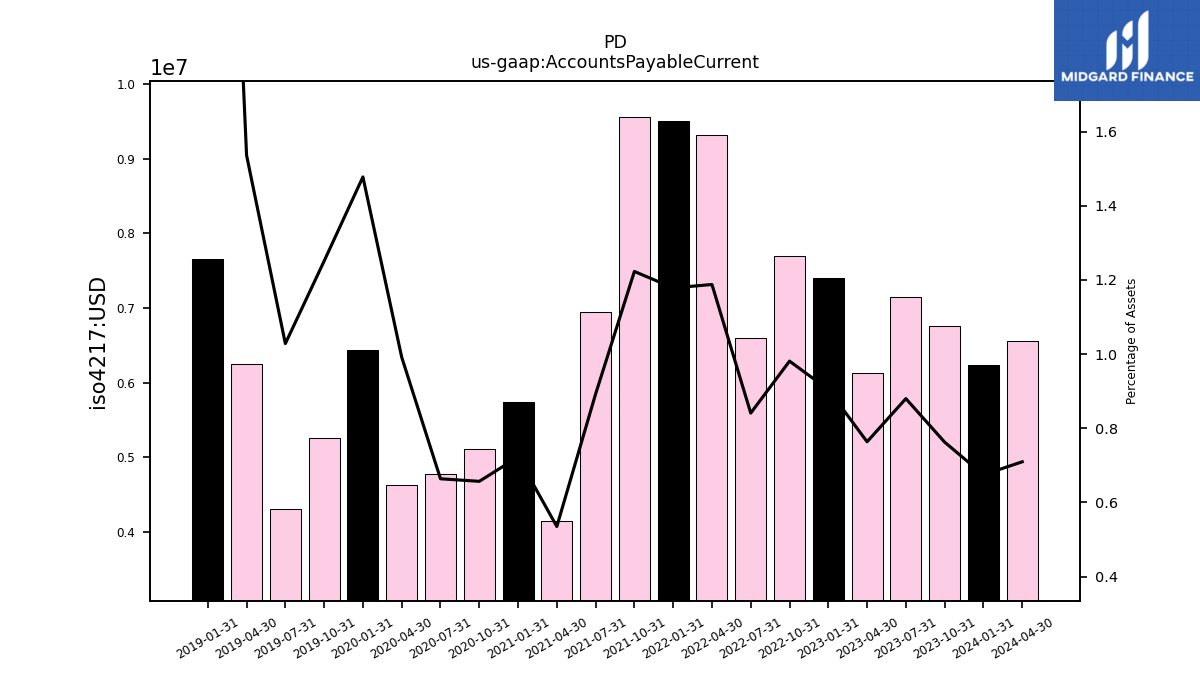
| Accounts Payable Current | 6.76 | 7.14 | 6.12 | 7.40 | 7.69 | 6.60 | 9.32 | 9.51 | 9.56 | 6.95 | 4.15 | 5.75 | 5.11 | 4.78 | 4.62 | 6.43 | 5.25 | 4.30 | 6.25 | 7.66 | NA | NA | NA | |
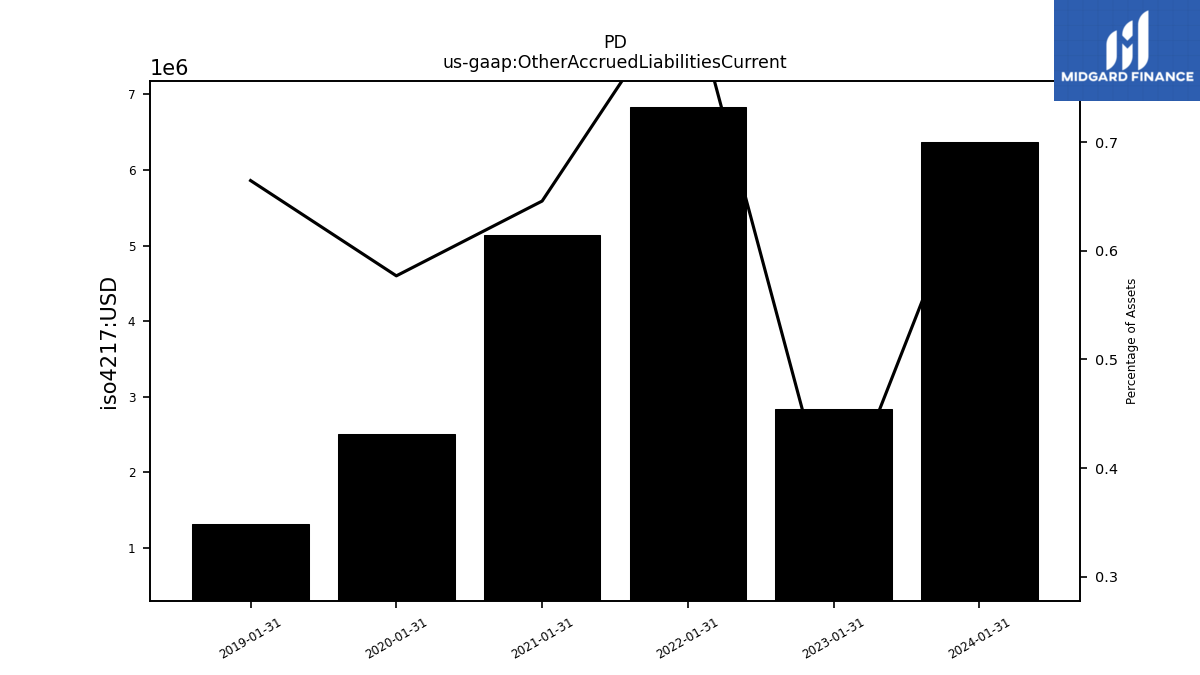
| Other Accrued Liabilities Current | NA | NA | NA | 2.83 | NA | NA | NA | 6.84 | NA | NA | NA | 5.14 | NA | NA | NA | 2.51 | NA | NA | NA | 1.31 | NA | NA | NA | |
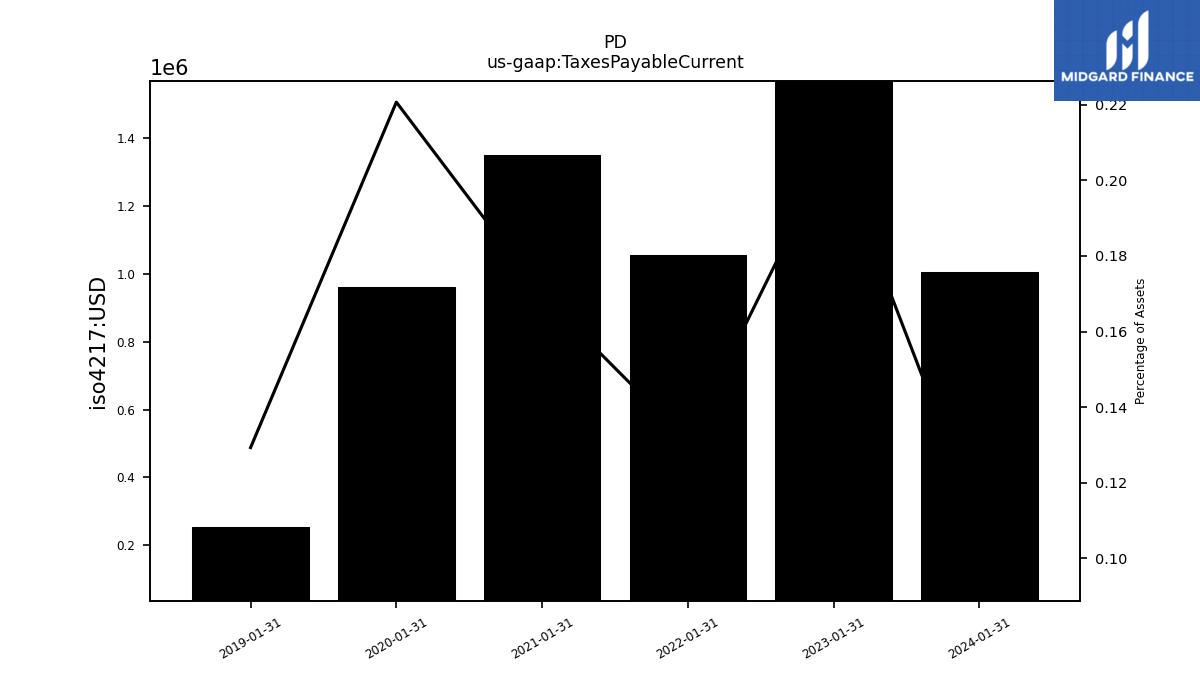
| Taxes Payable Current | NA | NA | NA | 1.71 | NA | NA | NA | 1.06 | NA | NA | NA | 1.35 | NA | NA | NA | 0.96 | NA | NA | NA | 0.26 | NA | NA | NA | |
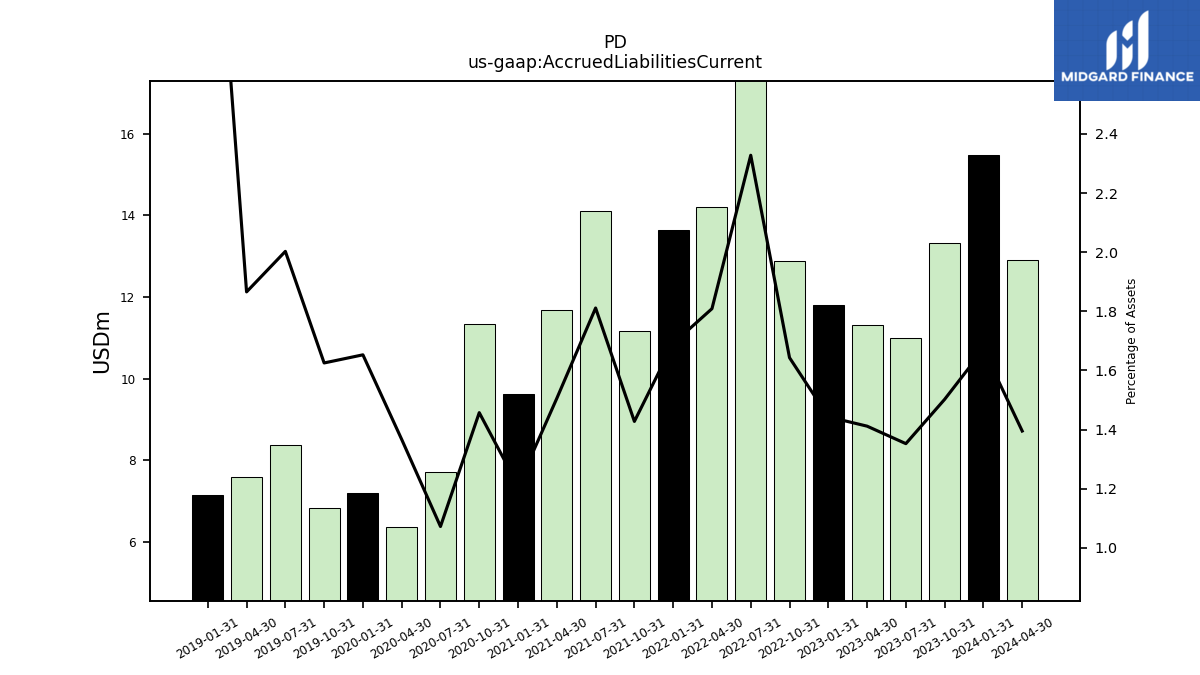
| Accrued Liabilities Current | 13.32 | 10.98 | 11.32 | 11.80 | 12.88 | 18.27 | 14.20 | 13.64 | 11.17 | 14.10 | 11.68 | 9.63 | 11.34 | 7.71 | 6.37 | 7.20 | 6.83 | 8.38 | 7.59 | 7.14 | NA | NA | NA | |
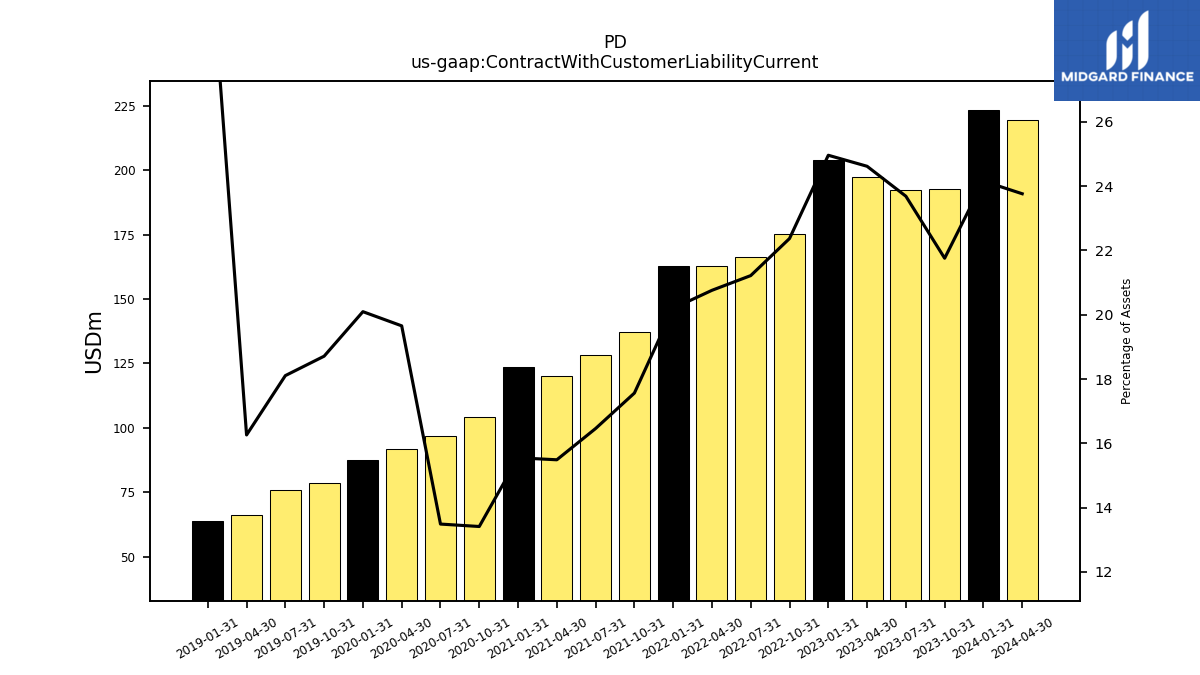
| Contract With Customer Liability Current | 192.92 | 192.30 | 197.38 | 204.14 | 175.38 | 166.50 | 162.89 | 162.88 | 137.35 | 128.15 | 120.08 | 123.69 | 104.34 | 97.01 | 91.65 | 87.49 | 78.58 | 75.74 | 66.18 | 63.96 | NA | NA | NA |
| 2023-10-31 | 2023-07-31 | 2023-04-30 | 2023-01-31 | 2022-10-31 | 2022-07-31 | 2022-04-30 | 2022-01-31 | 2021-10-31 | 2021-07-31 | 2021-04-30 | 2021-01-31 | 2020-10-31 | 2020-07-31 | 2020-04-30 | 2020-01-31 | 2019-10-31 | 2019-07-31 | 2019-04-30 | 2019-01-31 | 2018-10-31 | 2018-07-31 | 2018-04-30 | ||
|---|---|---|---|---|---|---|---|---|---|---|---|---|---|---|---|---|---|---|---|---|---|---|---|---|
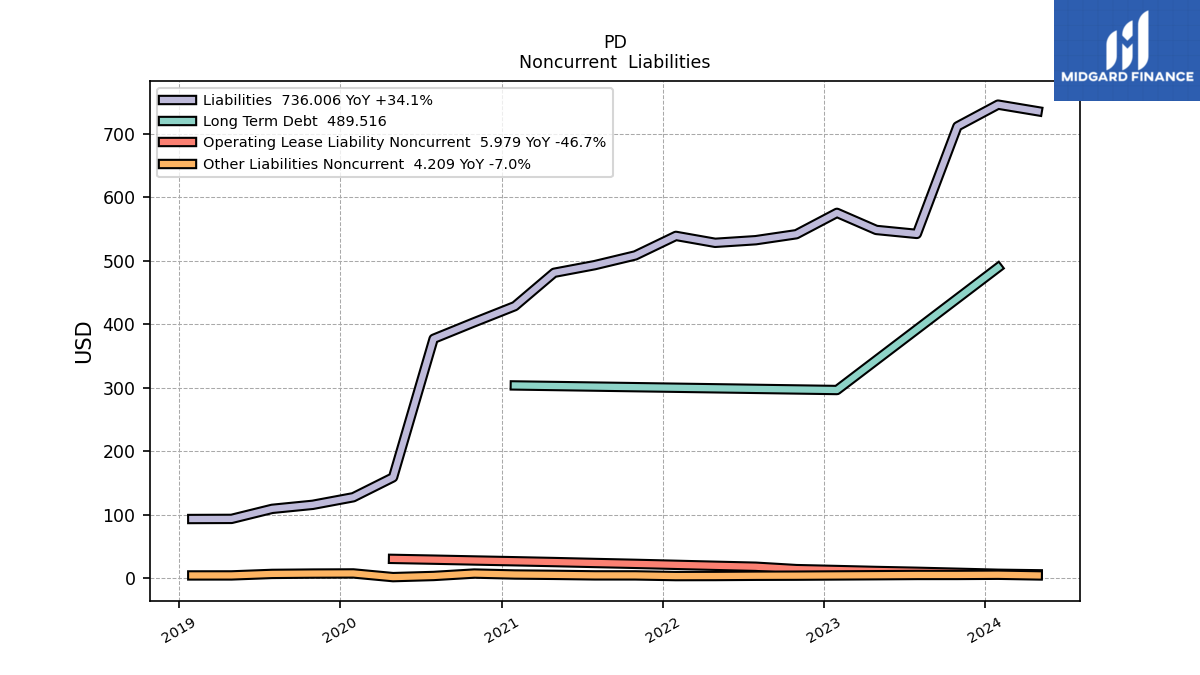
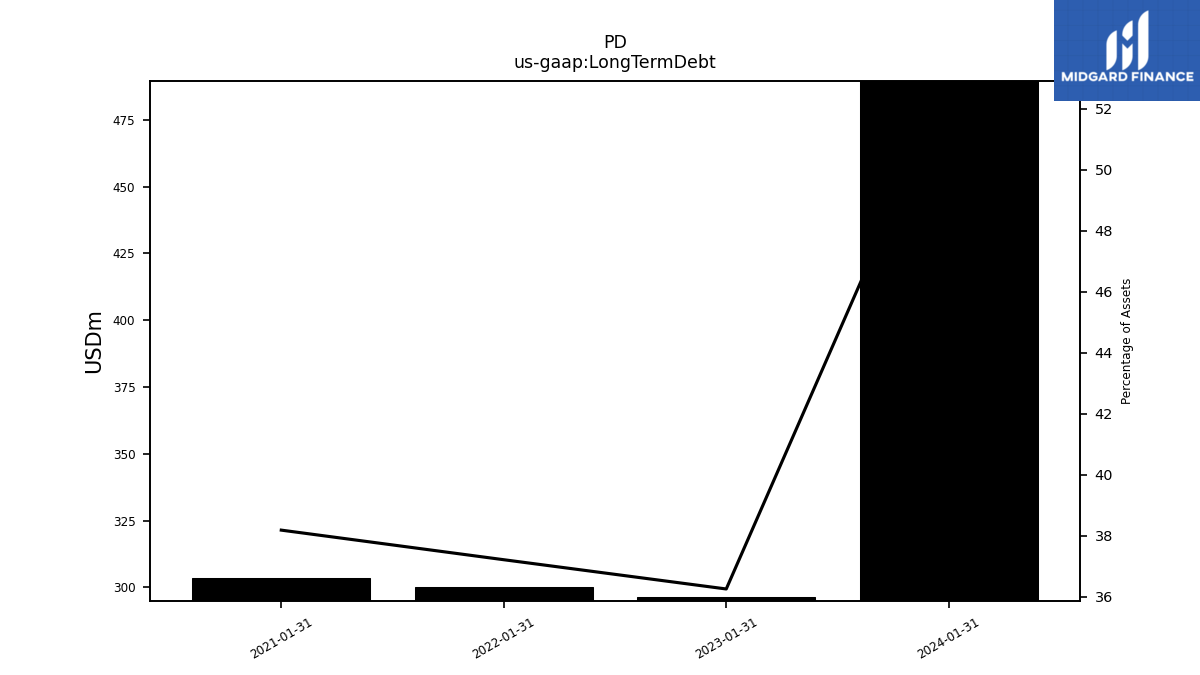
| Long Term Debt | NA | NA | NA | 296.49 | NA | NA | NA | 300.08 | NA | NA | NA | 303.70 | NA | NA | NA | NA | NA | NA | NA | NA | NA | NA | NA | |
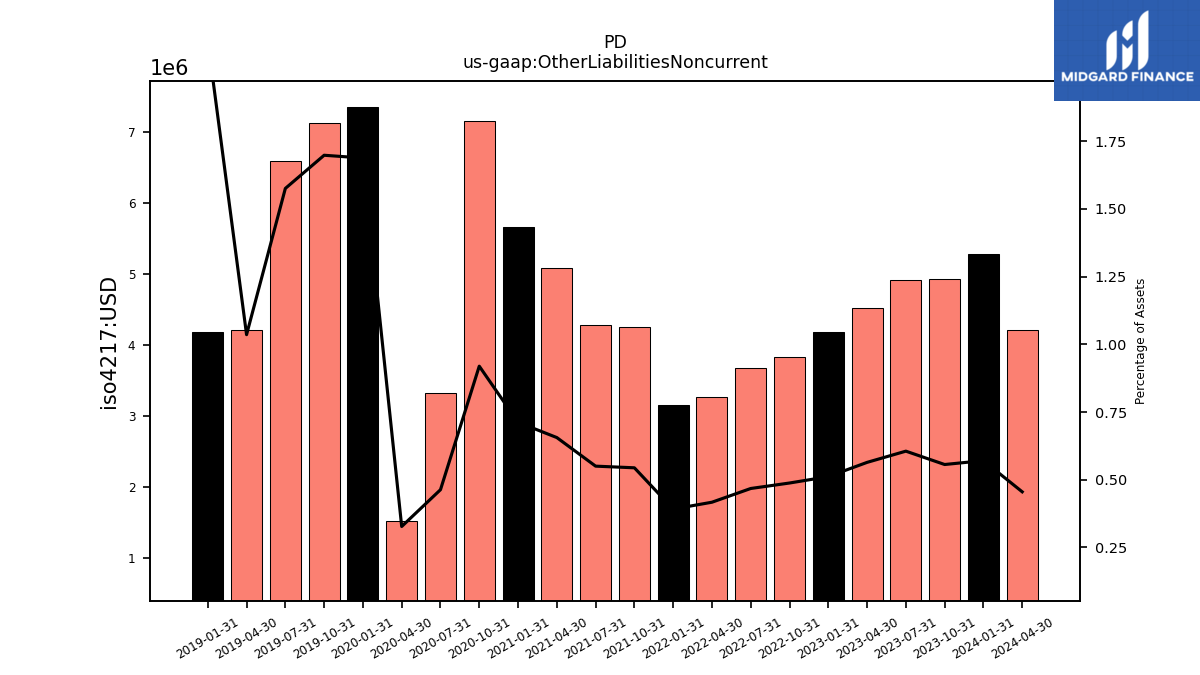
| Other Liabilities Noncurrent | 4.93 | 4.92 | 4.52 | 4.18 | 3.83 | 3.67 | 3.27 | 3.16 | 4.26 | 4.28 | 5.08 | 5.67 | 7.15 | 3.33 | 1.53 | 7.35 | 7.13 | 6.59 | 4.21 | 4.18 | NA | NA | NA | |
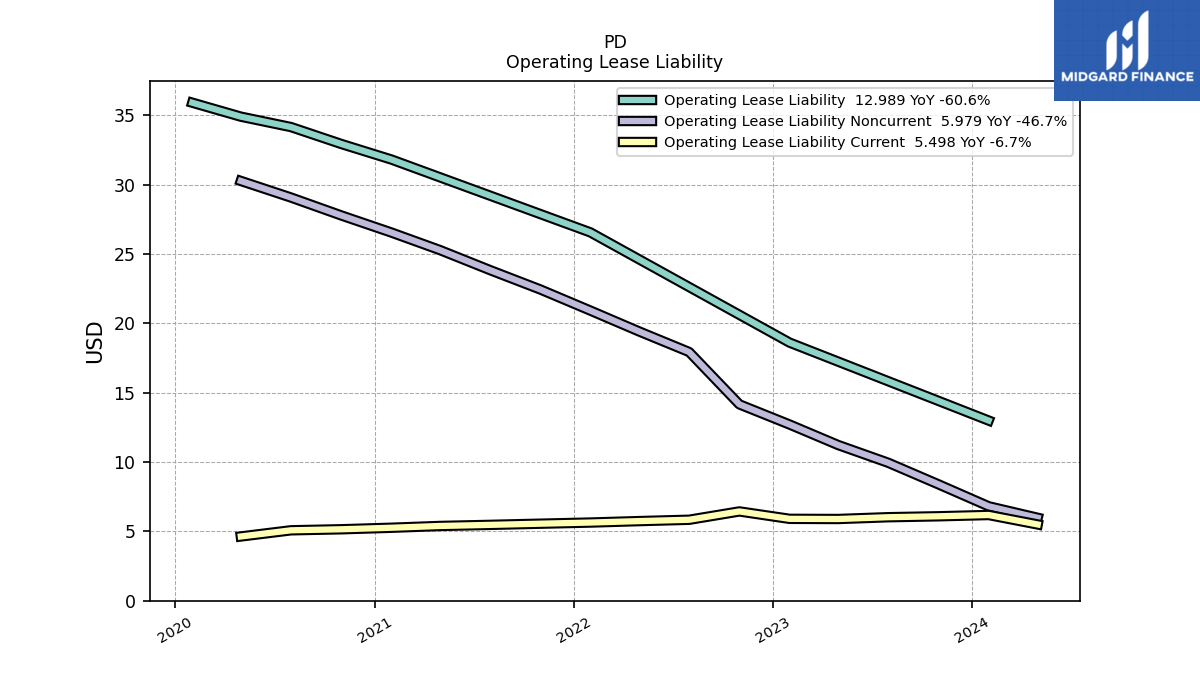
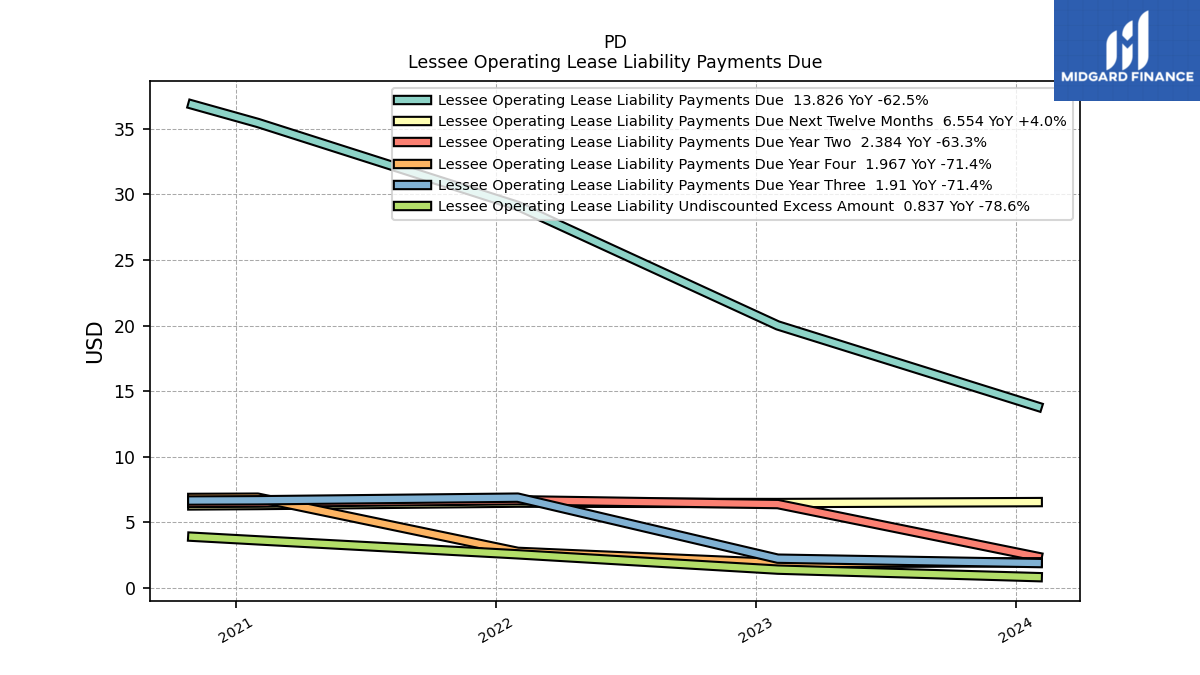
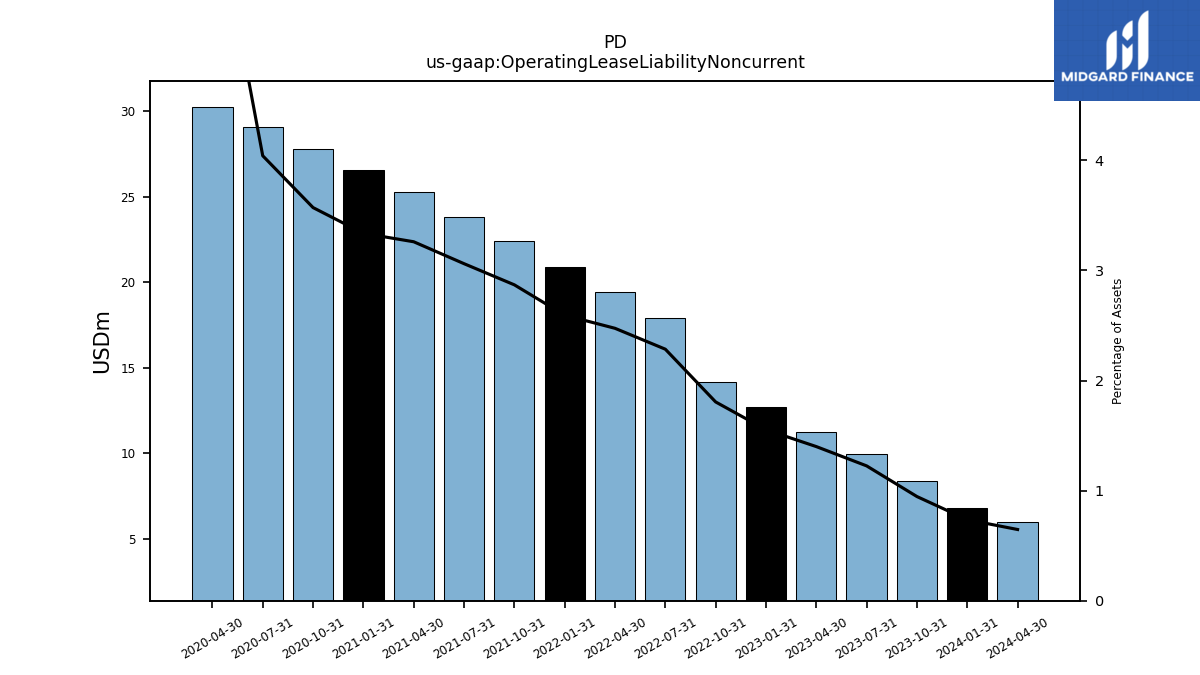
| Operating Lease Liability Noncurrent | 8.39 | 9.94 | 11.23 | 12.70 | 14.15 | 17.93 | 19.41 | 20.91 | 22.44 | 23.83 | 25.28 | 26.54 | 27.77 | 29.06 | 30.26 | NA | NA | NA | NA | NA | NA | NA | NA |
| 2023-10-31 | 2023-07-31 | 2023-04-30 | 2023-01-31 | 2022-10-31 | 2022-07-31 | 2022-04-30 | 2022-01-31 | 2021-10-31 | 2021-07-31 | 2021-04-30 | 2021-01-31 | 2020-10-31 | 2020-07-31 | 2020-04-30 | 2020-01-31 | 2019-10-31 | 2019-07-31 | 2019-04-30 | 2019-01-31 | 2018-10-31 | 2018-07-31 | 2018-04-30 | ||
|---|---|---|---|---|---|---|---|---|---|---|---|---|---|---|---|---|---|---|---|---|---|---|---|---|
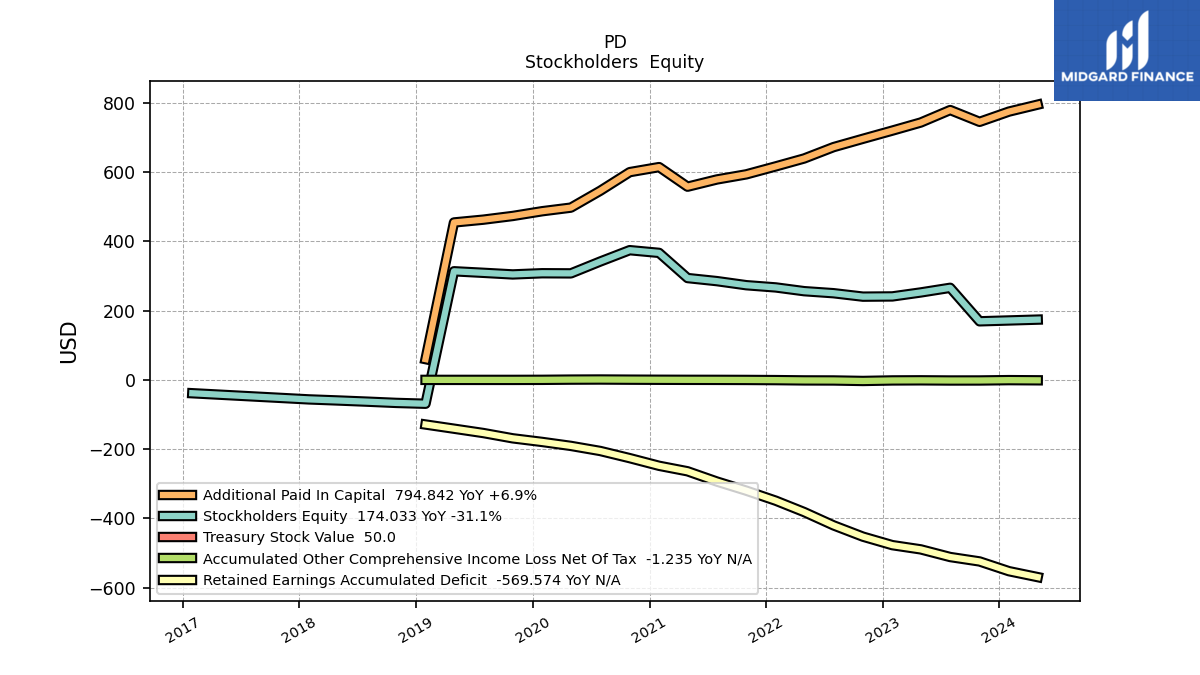
| Stockholders Equity | 169.12 | 265.89 | 252.48 | 240.98 | 240.35 | 250.27 | 256.16 | 266.98 | 273.39 | 285.17 | 294.06 | 366.73 | 374.56 | 341.87 | 307.54 | 307.94 | 304.49 | 309.16 | 313.63 | -68.93 | -66.50 | -62.81 | -59.42 | |
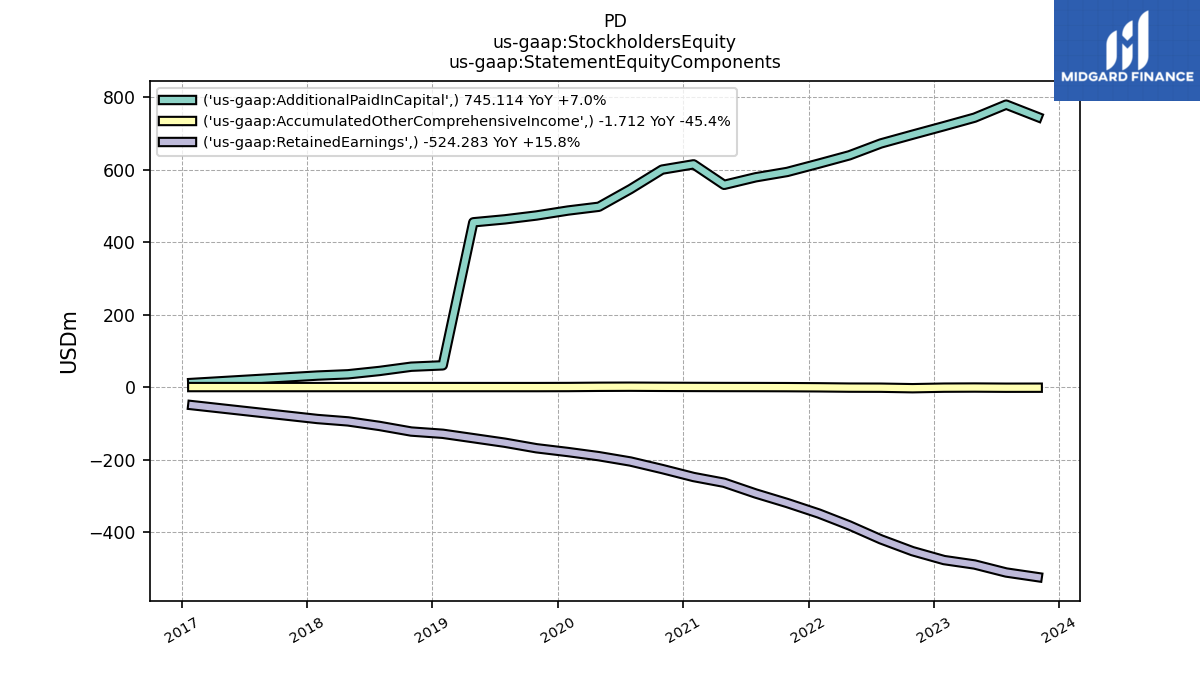
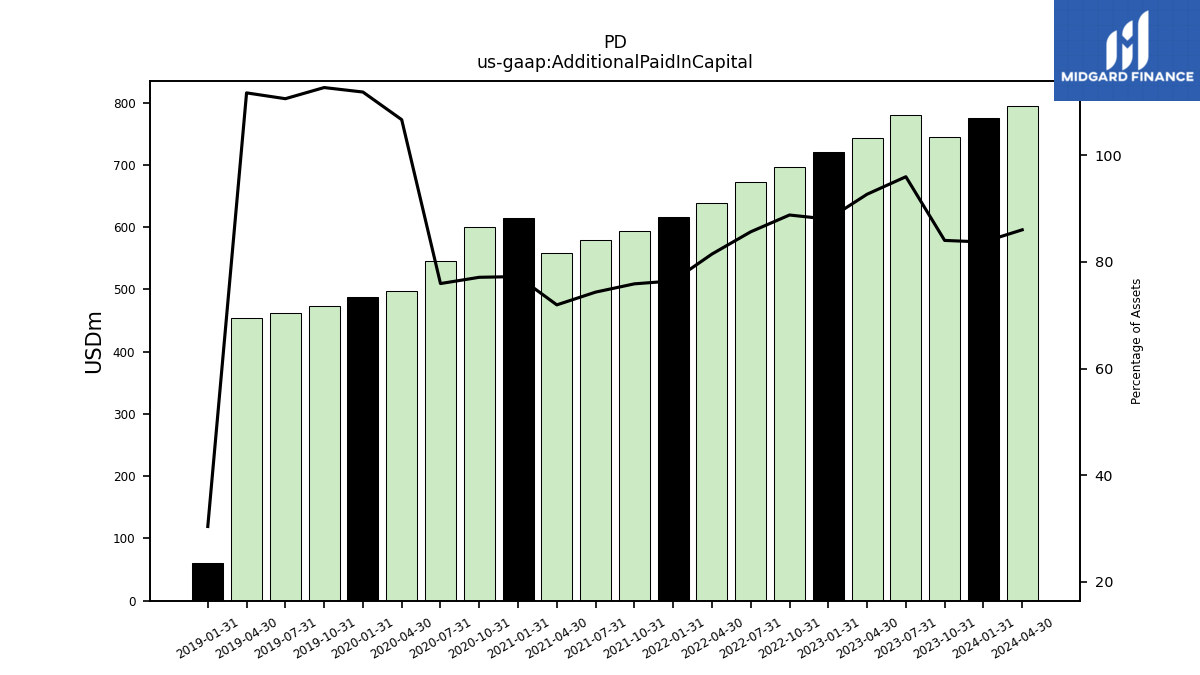
| Additional Paid In Capital | 745.11 | 779.19 | 743.22 | 719.82 | 696.17 | 672.13 | 639.32 | 616.47 | 593.51 | 578.73 | 557.84 | 614.49 | 599.89 | 546.17 | 497.43 | 487.01 | 473.31 | 462.67 | 454.56 | 59.94 | NA | NA | NA | |
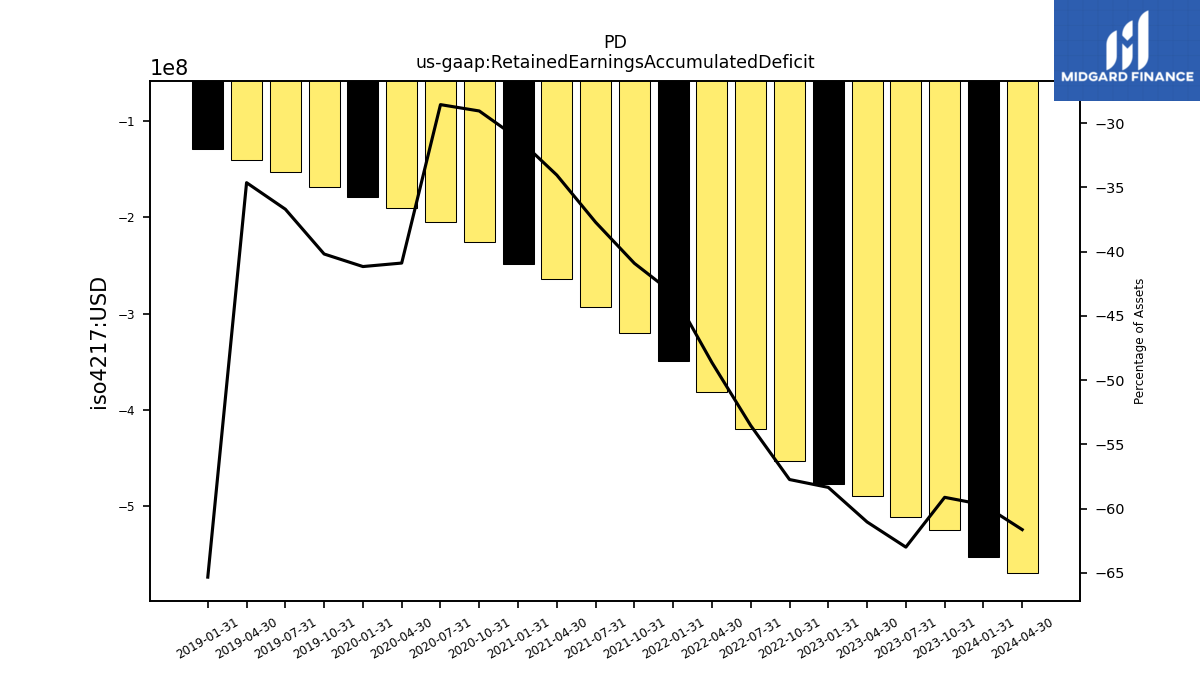
| Retained Earnings Accumulated Deficit | -524.28 | -511.52 | -489.46 | -477.25 | -452.68 | -420.14 | -381.64 | -348.82 | -319.93 | -293.59 | -263.93 | -248.11 | -225.96 | -205.35 | -190.67 | -179.21 | -168.77 | -153.50 | -140.93 | -128.87 | NA | NA | NA | |
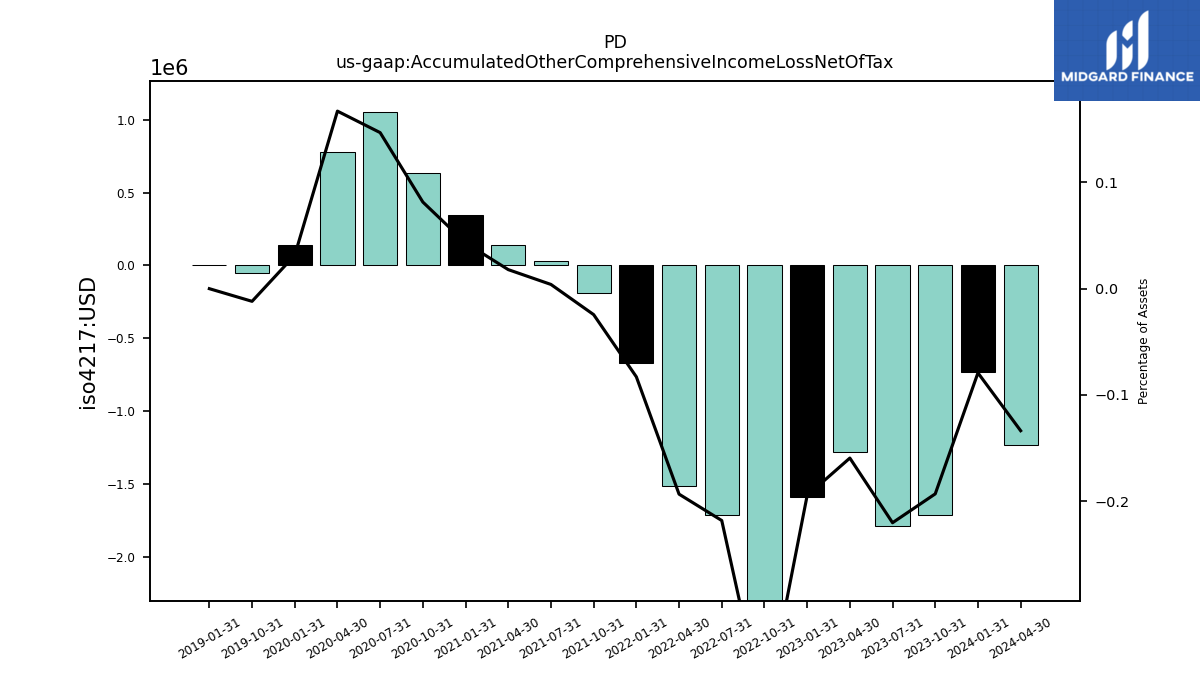
| Accumulated Other Comprehensive Income Loss Net Of Tax | -1.71 | -1.79 | -1.28 | -1.59 | -3.14 | -1.71 | -1.52 | -0.67 | -0.19 | 0.03 | 0.14 | 0.34 | 0.63 | 1.06 | 0.78 | 0.14 | -0.05 | NA | NA | 0.00 | NA | NA | NA | |
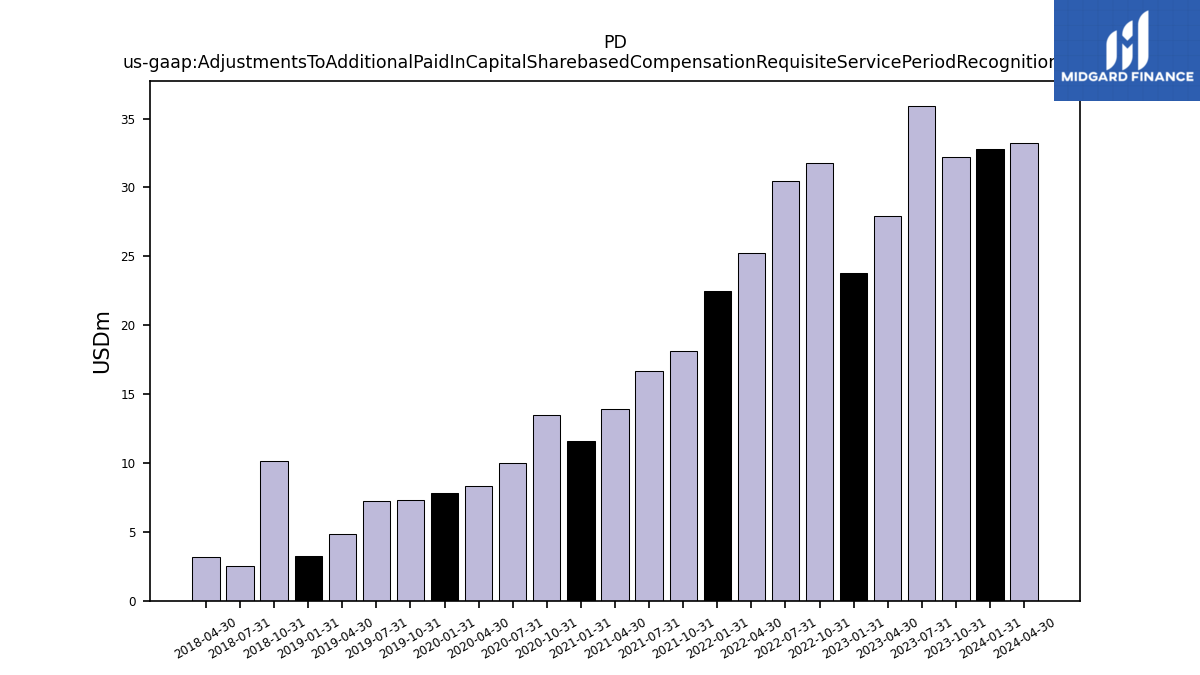
| Adjustments To Additional Paid In Capital Sharebased Compensation Requisite Service Period Recognition Value | 32.20 | 35.93 | 27.89 | 23.81 | 31.77 | 30.44 | 25.21 | 22.48 | 18.11 | 16.69 | 13.91 | 11.59 | 13.49 | 9.99 | 8.31 | 7.81 | 7.35 | 7.23 | 4.81 | 3.22 | 10.18 | 2.53 | 3.16 |
| 2023-10-31 | 2023-07-31 | 2023-04-30 | 2023-01-31 | 2022-10-31 | 2022-07-31 | 2022-04-30 | 2022-01-31 | 2021-10-31 | 2021-07-31 | 2021-04-30 | 2021-01-31 | 2020-10-31 | 2020-07-31 | 2020-04-30 | 2020-01-31 | 2019-10-31 | 2019-07-31 | 2019-04-30 | 2019-01-31 | 2018-10-31 | 2018-07-31 | 2018-04-30 | ||
|---|---|---|---|---|---|---|---|---|---|---|---|---|---|---|---|---|---|---|---|---|---|---|---|---|
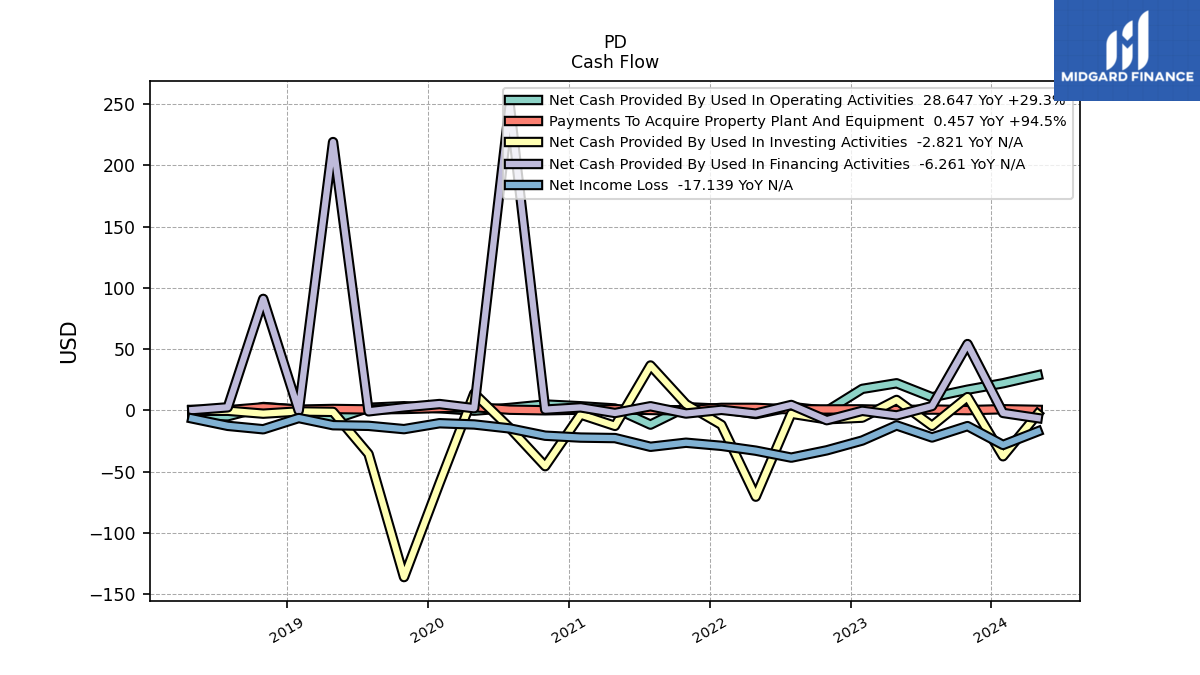
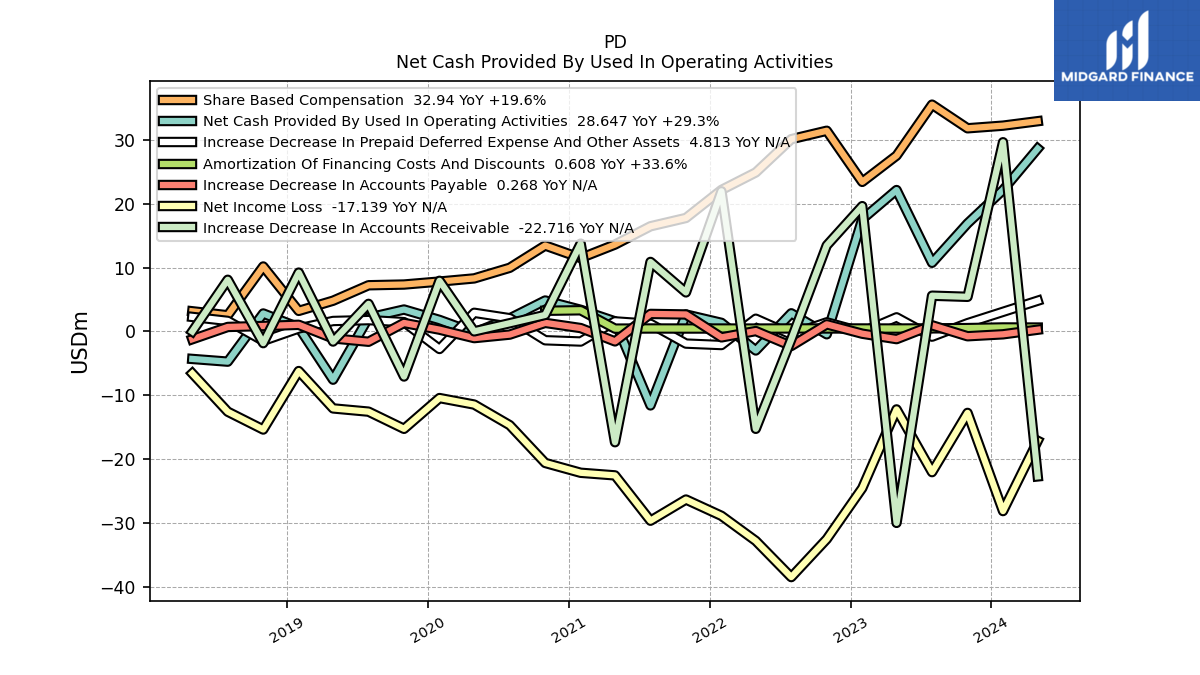
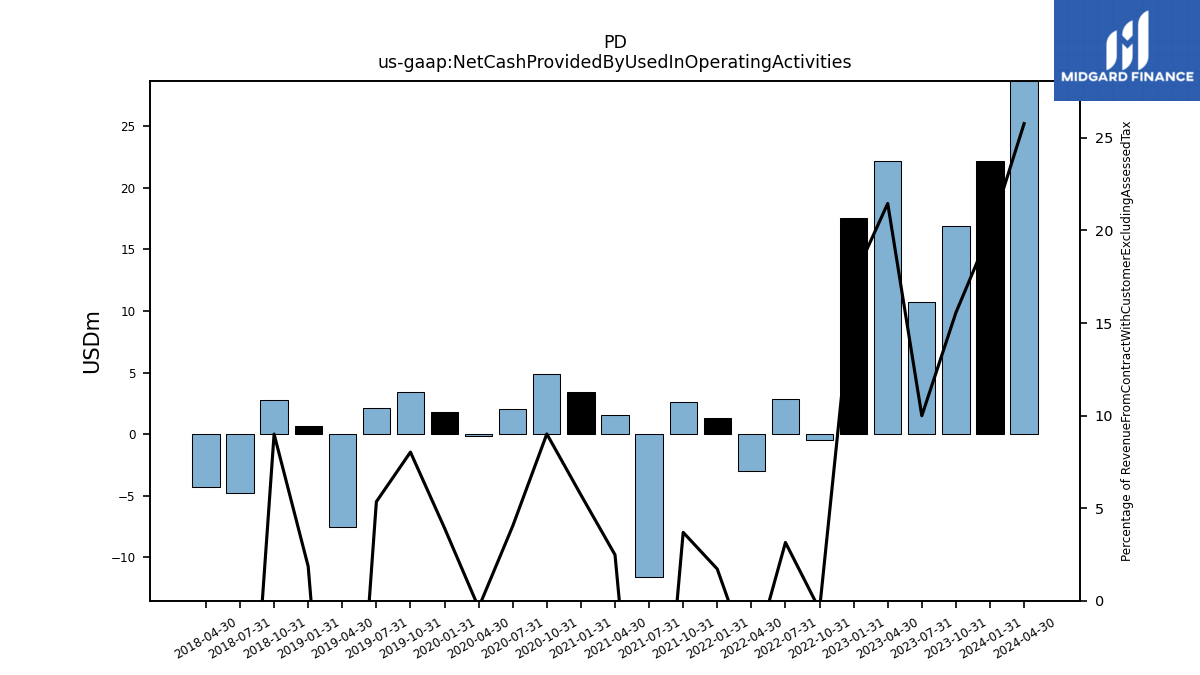
| Net Cash Provided By Used In Operating Activities | 16.92 | 10.75 | 22.15 | 17.57 | -0.45 | 2.84 | -2.98 | 1.34 | 2.65 | -11.60 | 1.58 | 3.39 | 4.84 | 2.05 | -0.18 | 1.80 | 3.43 | 2.16 | -7.57 | 0.63 | 2.81 | -4.74 | -4.31 | |
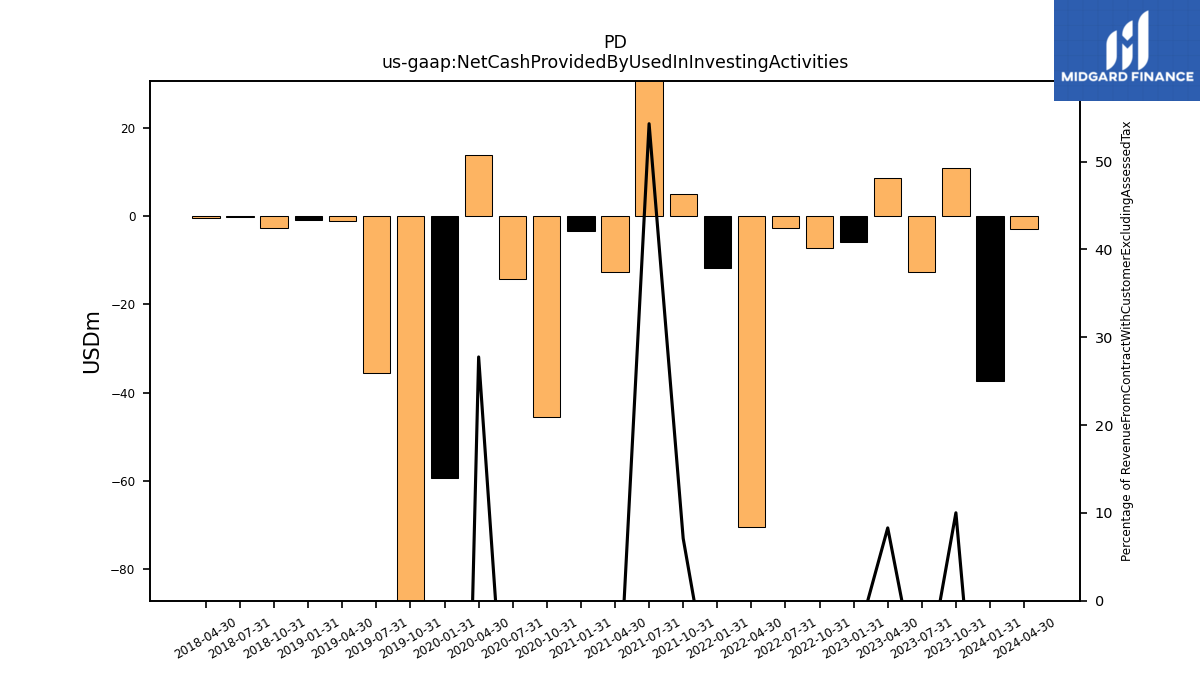
| Net Cash Provided By Used In Investing Activities | 10.89 | -12.57 | 8.56 | -5.89 | -7.22 | -2.69 | -70.36 | -11.78 | 5.09 | 36.67 | -12.62 | -3.36 | -45.49 | -14.29 | 13.82 | -59.39 | -135.97 | -35.52 | -1.19 | -0.82 | -2.65 | -0.27 | -0.38 | |
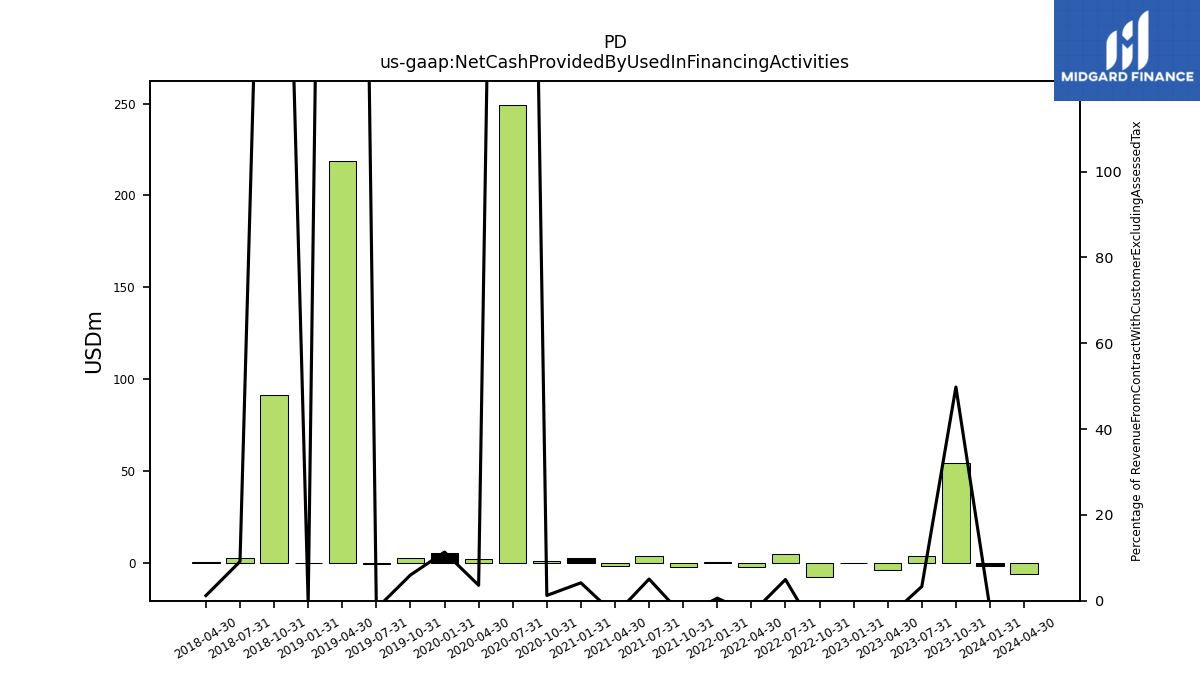
| Net Cash Provided By Used In Financing Activities | 54.16 | 3.57 | -4.07 | -0.33 | -7.96 | 4.46 | -2.58 | 0.48 | -2.53 | 3.41 | -2.10 | 2.48 | 0.66 | 249.43 | 1.80 | 5.21 | 2.57 | -0.75 | 218.92 | -0.23 | 91.00 | 2.53 | 0.30 |
| 2023-10-31 | 2023-07-31 | 2023-04-30 | 2023-01-31 | 2022-10-31 | 2022-07-31 | 2022-04-30 | 2022-01-31 | 2021-10-31 | 2021-07-31 | 2021-04-30 | 2021-01-31 | 2020-10-31 | 2020-07-31 | 2020-04-30 | 2020-01-31 | 2019-10-31 | 2019-07-31 | 2019-04-30 | 2019-01-31 | 2018-10-31 | 2018-07-31 | 2018-04-30 | ||
|---|---|---|---|---|---|---|---|---|---|---|---|---|---|---|---|---|---|---|---|---|---|---|---|---|
| Net Cash Provided By Used In Operating Activities | 16.92 | 10.75 | 22.15 | 17.57 | -0.45 | 2.84 | -2.98 | 1.34 | 2.65 | -11.60 | 1.58 | 3.39 | 4.84 | 2.05 | -0.18 | 1.80 | 3.43 | 2.16 | -7.57 | 0.63 | 2.81 | -4.74 | -4.31 | |
| Net Income Loss | -12.77 | -22.05 | -12.22 | -24.56 | -32.54 | -38.50 | -32.82 | -28.89 | -26.34 | -29.66 | -22.56 | -22.15 | -20.61 | -14.69 | -11.46 | -10.44 | -15.27 | -12.57 | -12.06 | -6.21 | -15.38 | -12.58 | -6.58 | |
| Profit Loss | -13.09 | -22.62 | -12.84 | -25.00 | -32.80 | -38.60 | -32.82 | -28.89 | -26.34 | -29.66 | NA | NA | NA | NA | NA | NA | NA | NA | NA | NA | NA | NA | NA | |
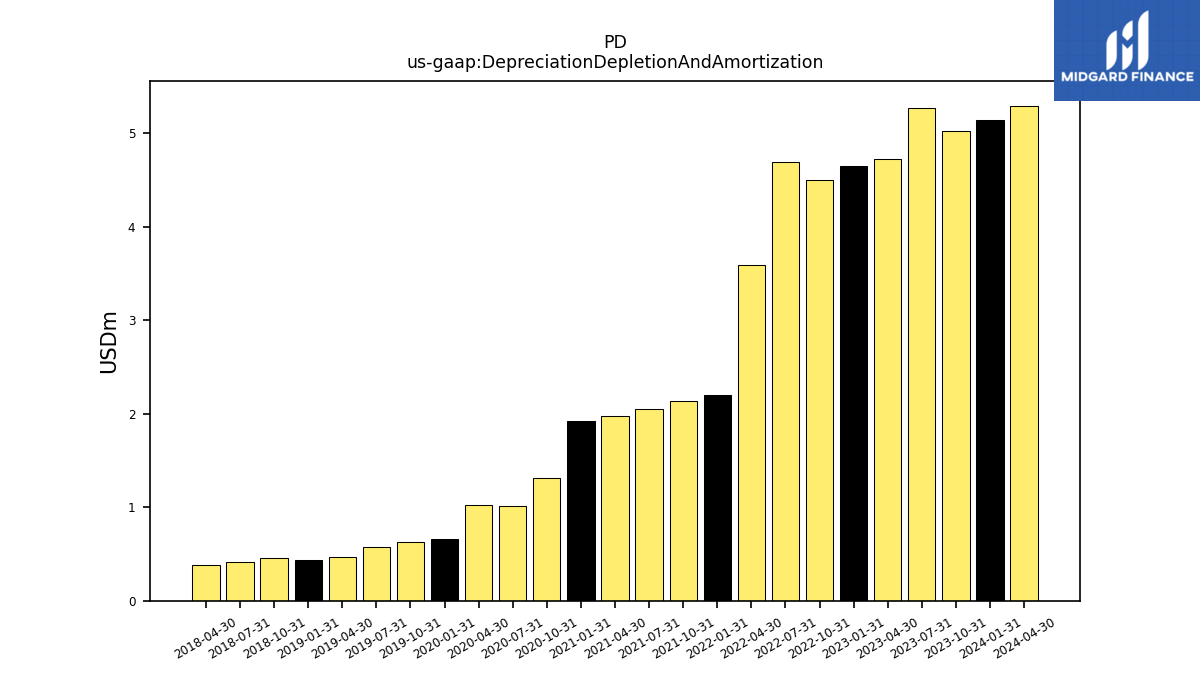
| Depreciation Depletion And Amortization | 5.03 | 5.27 | 4.72 | 4.65 | 4.50 | 4.69 | 3.59 | 2.20 | 2.13 | 2.06 | 1.97 | 1.92 | 1.31 | 1.02 | 1.02 | 0.66 | 0.63 | 0.58 | 0.47 | 0.44 | 0.46 | 0.41 | 0.38 | |
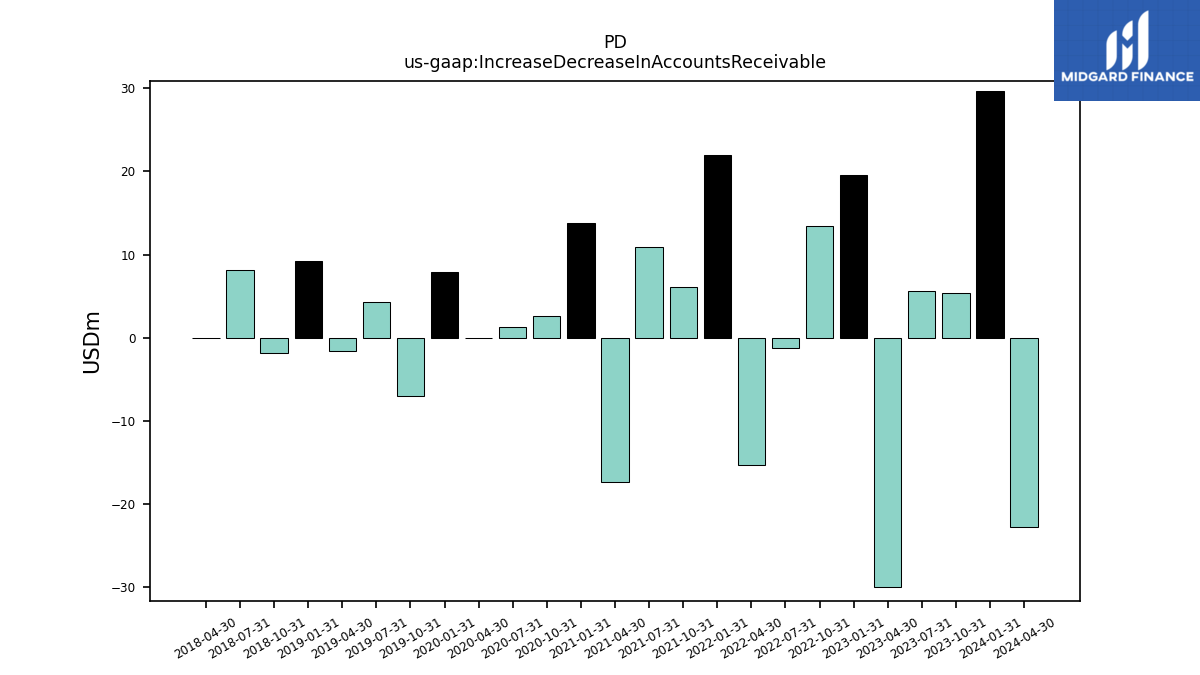
| Increase Decrease In Accounts Receivable | 5.42 | 5.60 | -30.00 | 19.63 | 13.47 | -1.26 | -15.26 | 21.95 | 6.11 | 10.89 | -17.36 | 13.76 | 2.59 | 1.28 | 0.01 | 7.93 | -7.07 | 4.32 | -1.59 | 9.22 | -1.84 | 8.10 | -0.01 | |
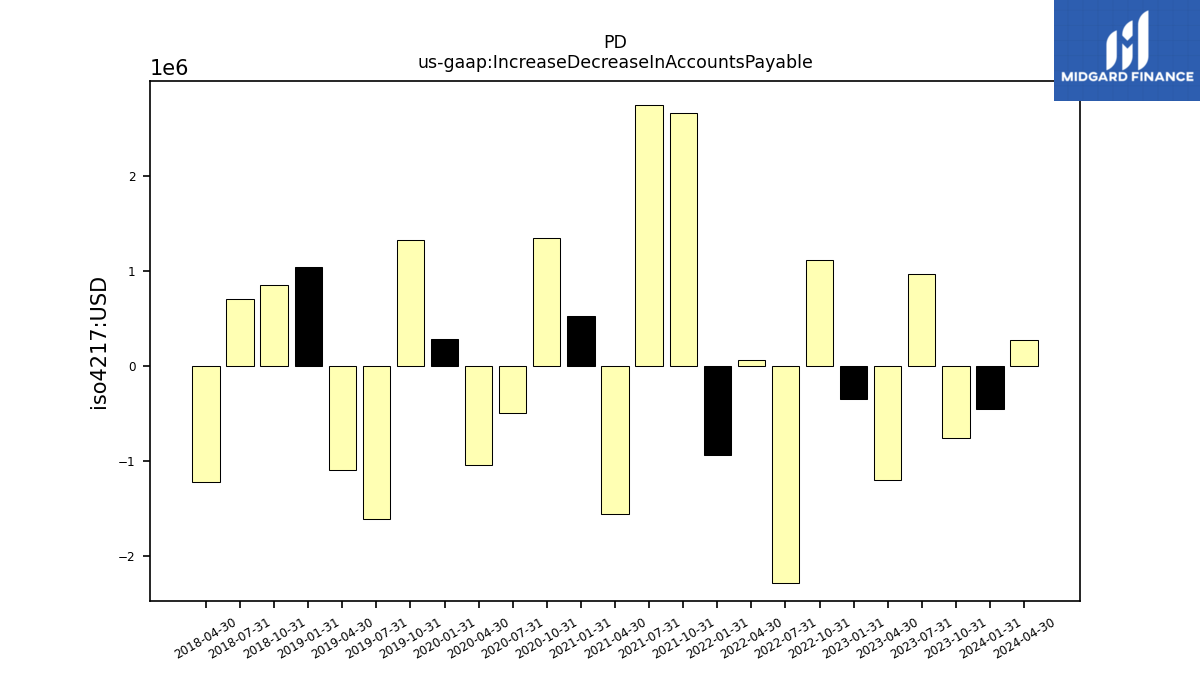
| Increase Decrease In Accounts Payable | -0.76 | 0.96 | -1.21 | -0.36 | 1.11 | -2.28 | 0.06 | -0.94 | 2.66 | 2.74 | -1.56 | 0.53 | 1.34 | -0.50 | -1.05 | 0.28 | 1.33 | -1.62 | -1.09 | 1.04 | 0.85 | 0.70 | -1.23 | |
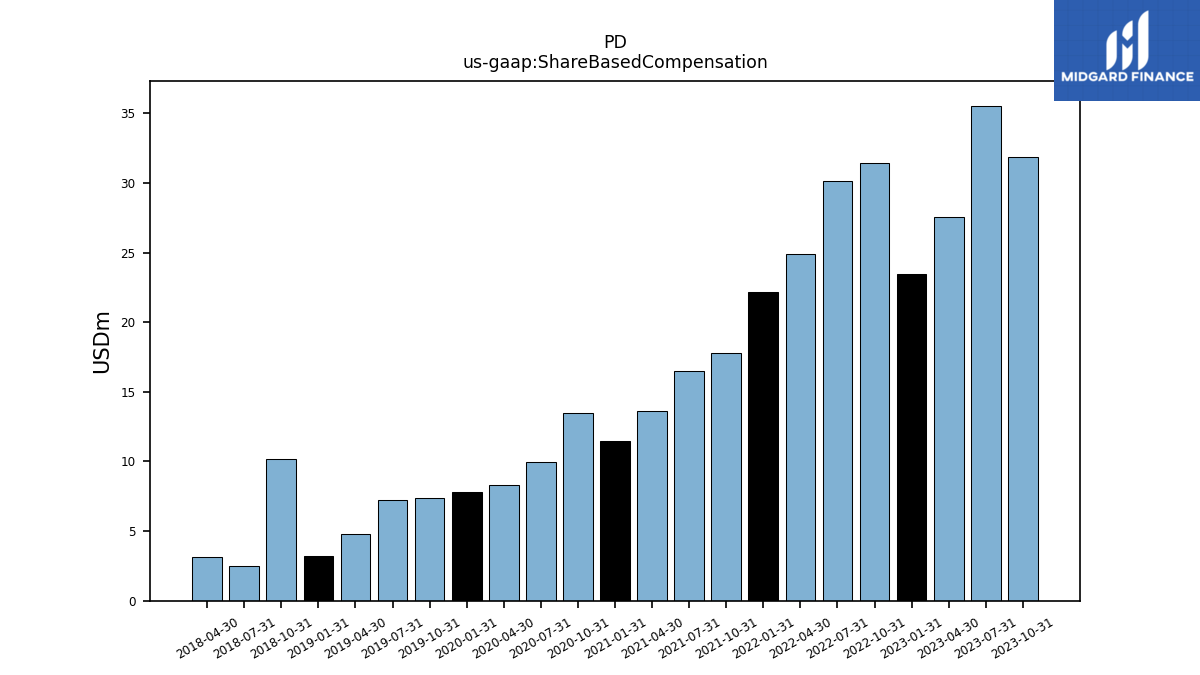
| Share Based Compensation | 31.83 | 35.54 | 27.55 | 23.43 | 31.44 | 30.12 | 24.91 | 22.17 | 17.78 | 16.48 | 13.61 | 11.50 | 13.46 | 9.97 | 8.31 | 7.81 | 7.35 | 7.23 | 4.81 | 3.22 | 10.18 | 2.53 | 3.16 |
| 2023-10-31 | 2023-07-31 | 2023-04-30 | 2023-01-31 | 2022-10-31 | 2022-07-31 | 2022-04-30 | 2022-01-31 | 2021-10-31 | 2021-07-31 | 2021-04-30 | 2021-01-31 | 2020-10-31 | 2020-07-31 | 2020-04-30 | 2020-01-31 | 2019-10-31 | 2019-07-31 | 2019-04-30 | 2019-01-31 | 2018-10-31 | 2018-07-31 | 2018-04-30 | ||
|---|---|---|---|---|---|---|---|---|---|---|---|---|---|---|---|---|---|---|---|---|---|---|---|---|
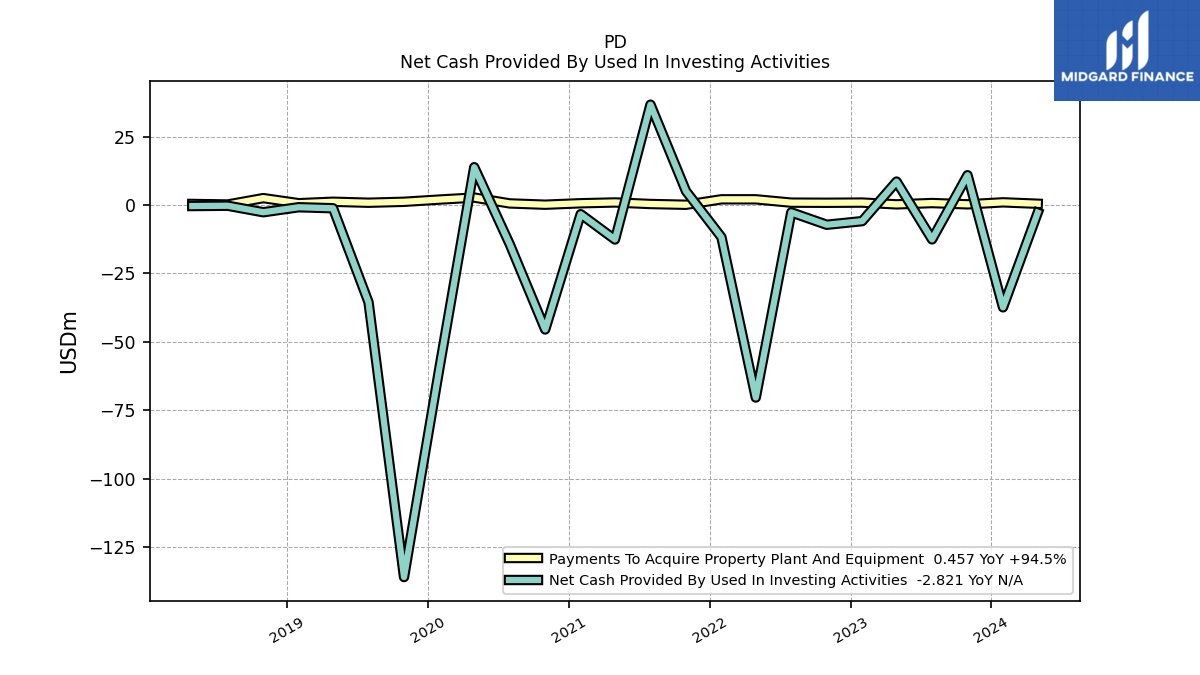
| Net Cash Provided By Used In Investing Activities | 10.89 | -12.57 | 8.56 | -5.89 | -7.22 | -2.69 | -70.36 | -11.78 | 5.09 | 36.67 | -12.62 | -3.36 | -45.49 | -14.29 | 13.82 | -59.39 | -135.97 | -35.52 | -1.19 | -0.82 | -2.65 | -0.27 | -0.38 | |
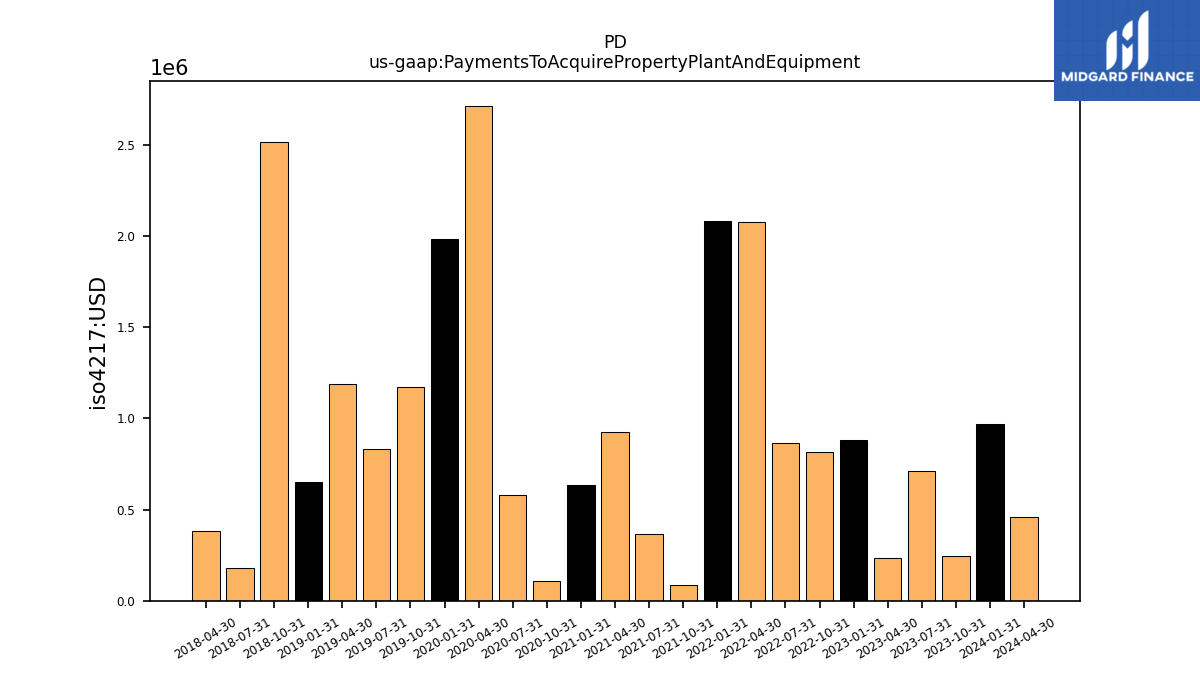
| Payments To Acquire Property Plant And Equipment | 0.24 | 0.71 | 0.23 | 0.88 | 0.81 | 0.86 | 2.08 | 2.08 | 0.09 | 0.36 | 0.93 | 0.64 | 0.11 | 0.58 | 2.71 | 1.98 | 1.17 | 0.83 | 1.19 | 0.65 | 2.51 | 0.18 | 0.38 |
| 2023-10-31 | 2023-07-31 | 2023-04-30 | 2023-01-31 | 2022-10-31 | 2022-07-31 | 2022-04-30 | 2022-01-31 | 2021-10-31 | 2021-07-31 | 2021-04-30 | 2021-01-31 | 2020-10-31 | 2020-07-31 | 2020-04-30 | 2020-01-31 | 2019-10-31 | 2019-07-31 | 2019-04-30 | 2019-01-31 | 2018-10-31 | 2018-07-31 | 2018-04-30 | ||
|---|---|---|---|---|---|---|---|---|---|---|---|---|---|---|---|---|---|---|---|---|---|---|---|---|
| Net Cash Provided By Used In Financing Activities | 54.16 | 3.57 | -4.07 | -0.33 | -7.96 | 4.46 | -2.58 | 0.48 | -2.53 | 3.41 | -2.10 | 2.48 | 0.66 | 249.43 | 1.80 | 5.21 | 2.57 | -0.75 | 218.92 | -0.23 | 91.00 | 2.53 | 0.30 |
| 2023-10-31 | 2023-07-31 | 2023-04-30 | 2023-01-31 | 2022-10-31 | 2022-07-31 | 2022-04-30 | 2022-01-31 | 2021-10-31 | 2021-07-31 | 2021-04-30 | 2021-01-31 | 2020-10-31 | 2020-07-31 | 2020-04-30 | 2020-01-31 | 2019-10-31 | 2019-07-31 | 2019-04-30 | 2019-01-31 | 2018-10-31 | 2018-07-31 | 2018-04-30 | ||
|---|---|---|---|---|---|---|---|---|---|---|---|---|---|---|---|---|---|---|---|---|---|---|---|---|
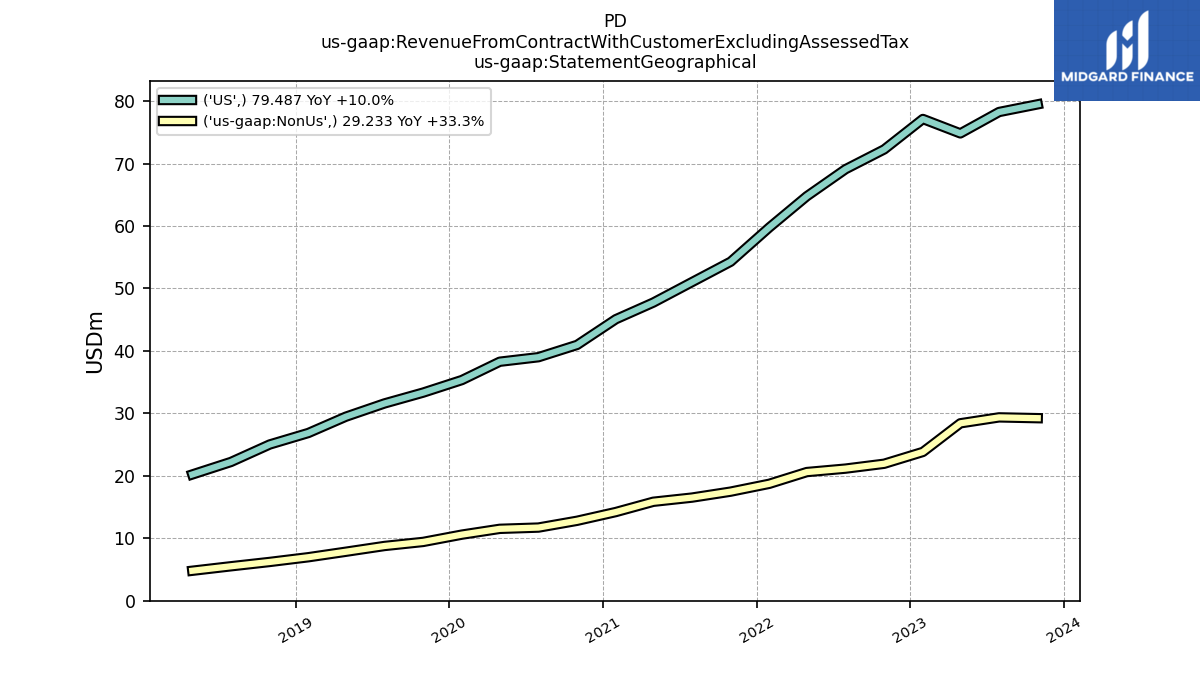
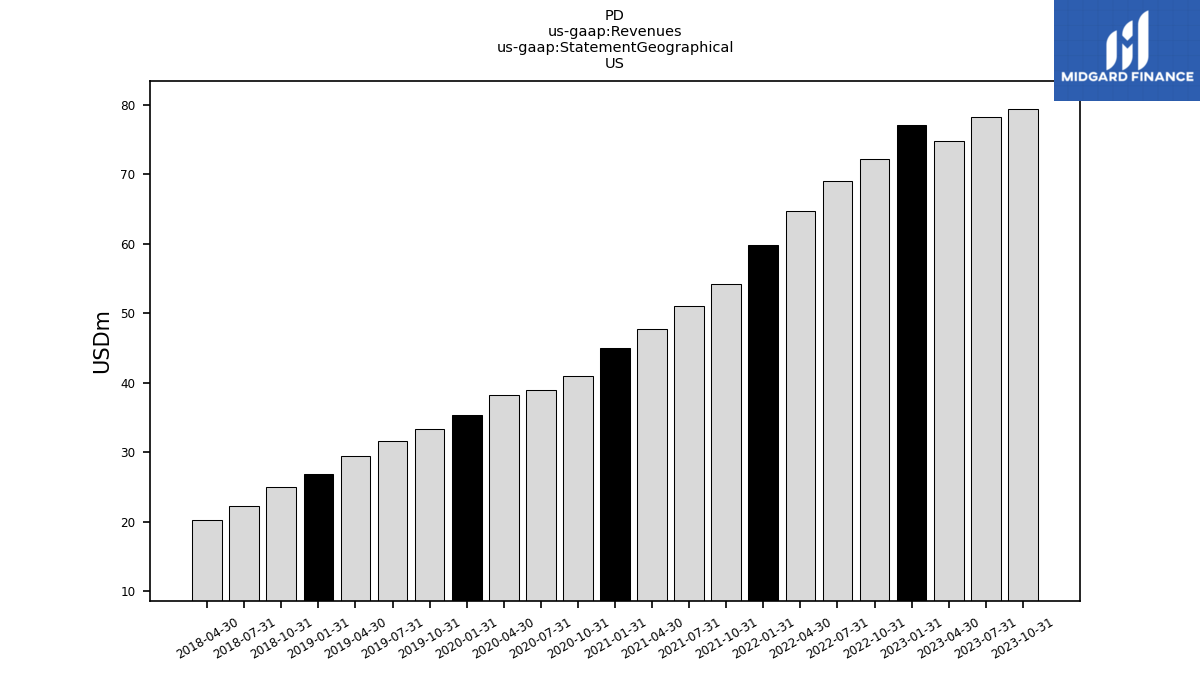
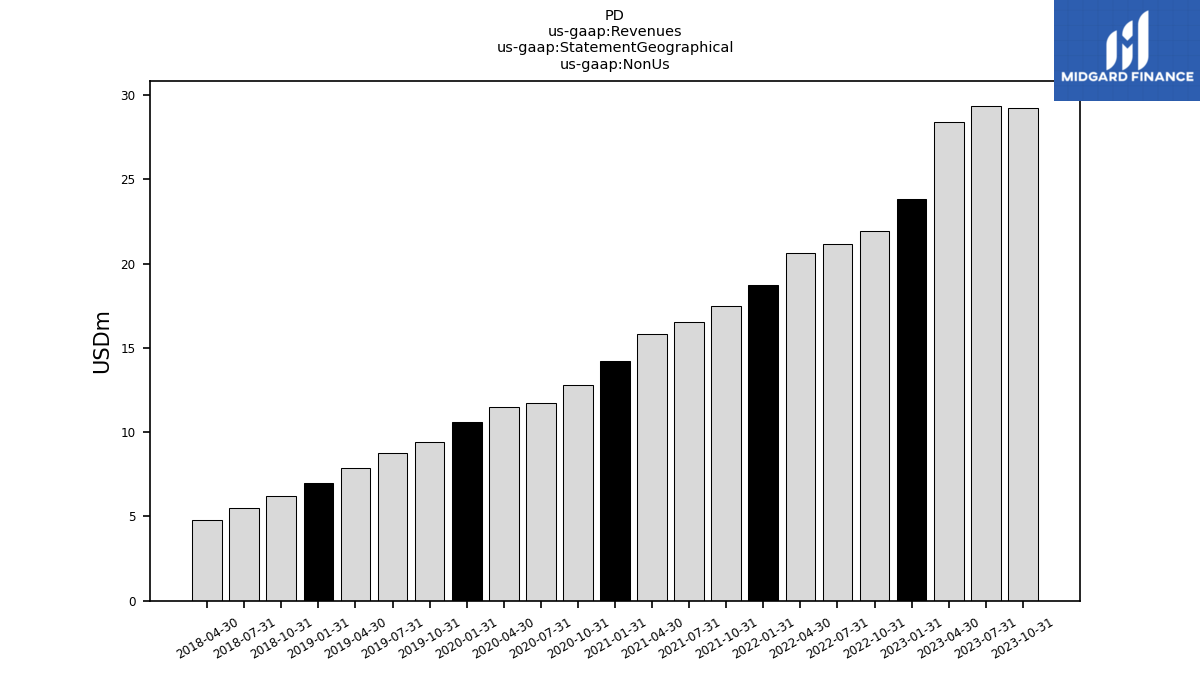
| Revenues | 108.72 | 107.62 | 103.25 | 100.97 | 94.20 | 90.25 | 85.37 | 78.51 | 71.76 | 67.54 | 63.59 | 59.28 | 53.77 | 50.71 | 49.79 | 45.93 | 42.75 | 40.36 | 37.31 | 33.83 | 31.23 | 27.74 | 25.02 | |
| US | 79.49 | 78.25 | 74.83 | 77.14 | 72.27 | 69.10 | 64.77 | 59.78 | 54.29 | 51.02 | 47.74 | 45.08 | 40.97 | 39.00 | 38.27 | 35.34 | 33.33 | 31.59 | 29.47 | 26.86 | 25.02 | 22.22 | 20.22 | |
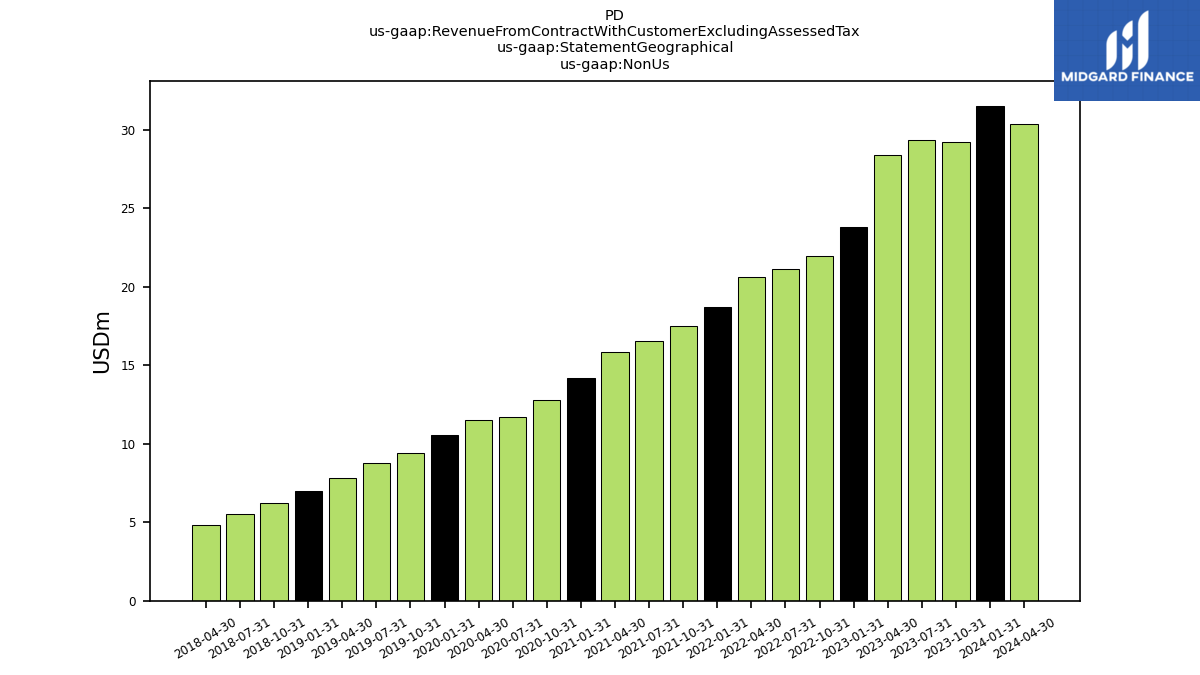
| Non Us | 29.23 | 29.36 | 28.41 | 23.83 | 21.94 | 21.16 | 20.61 | 18.73 | 17.47 | 16.52 | 15.85 | 14.21 | 12.81 | 11.72 | 11.51 | 10.59 | 9.42 | 8.77 | 7.85 | 6.97 | 6.21 | 5.52 | 4.80 | |
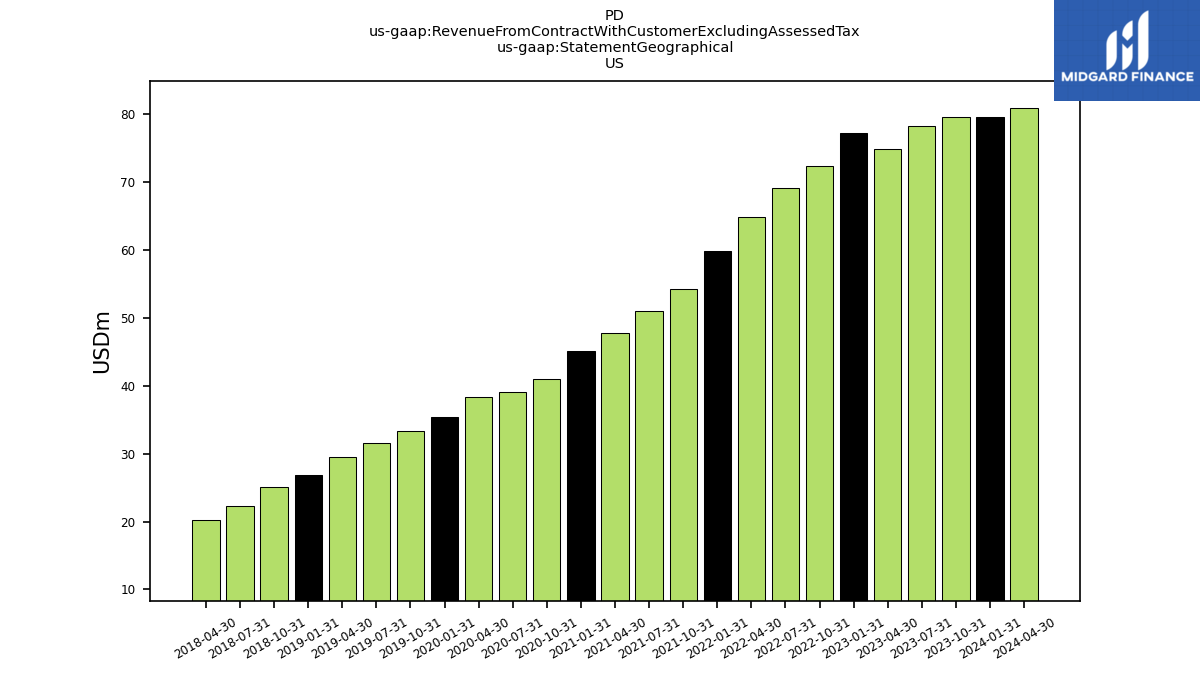
| Revenue From Contract With Customer Excluding Assessed Tax | 108.72 | 107.62 | 103.25 | 100.97 | 94.20 | 90.25 | 85.37 | 78.51 | 71.76 | 67.54 | 63.59 | 59.28 | 53.77 | 50.71 | 49.79 | 45.93 | 42.75 | 40.36 | 37.31 | 33.83 | 31.23 | 27.74 | 25.02 | |
| US | 79.49 | 78.25 | 74.83 | 77.14 | 72.27 | 69.10 | 64.77 | 59.78 | 54.29 | 51.02 | 47.74 | 45.08 | 40.97 | 39.00 | 38.27 | 35.34 | 33.33 | 31.59 | 29.47 | 26.86 | 25.02 | 22.22 | 20.22 | |
| Non Us | 29.23 | 29.36 | 28.41 | 23.83 | 21.94 | 21.16 | 20.61 | 18.73 | 17.47 | 16.52 | 15.85 | 14.21 | 12.81 | 11.72 | 11.51 | 10.59 | 9.42 | 8.77 | 7.85 | 6.97 | 6.21 | 5.52 | 4.80 |
