
| 2023-09-30 | 2023-06-30 | 2023-03-31 | 2022-12-31 | 2022-09-30 | 2022-06-30 | 2022-03-31 | 2021-12-31 | 2021-09-30 | 2021-06-30 | 2021-03-31 | 2020-12-31 | 2020-09-30 | 2020-06-30 | 2020-03-31 | 2019-12-31 | 2019-09-30 | 2019-06-30 | 2019-03-31 | 2018-12-31 | 2018-09-30 | 2018-06-30 | 2018-03-31 | 2017-12-31 | 2017-09-30 | 2017-06-30 | 2017-03-31 | 2016-12-31 | 2016-09-30 | 2016-06-30 | 2016-03-31 | 2015-12-31 | 2015-09-30 | 2015-06-30 | 2015-03-31 | 2014-12-31 | 2014-09-30 | 2014-06-30 | 2014-03-31 | 2013-12-31 | 2013-09-30 | 2013-06-30 | 2013-03-31 | 2012-12-31 | 2012-09-30 | 2012-06-30 | 2012-03-31 | 2011-12-31 | 2011-09-30 | 2011-06-30 | 2011-03-31 | 2010-12-31 | 2010-09-30 | 2010-06-30 | 2010-03-31 | ||
|---|---|---|---|---|---|---|---|---|---|---|---|---|---|---|---|---|---|---|---|---|---|---|---|---|---|---|---|---|---|---|---|---|---|---|---|---|---|---|---|---|---|---|---|---|---|---|---|---|---|---|---|---|---|---|---|---|
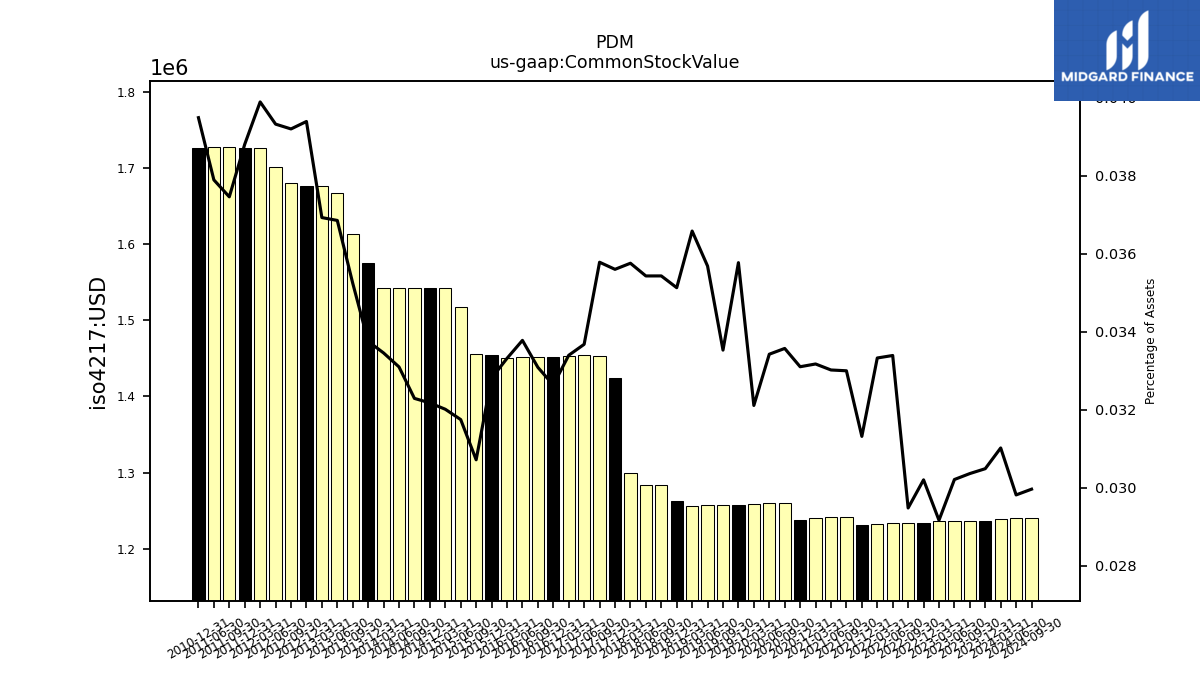
| Common Stock Value | 1.24 | 1.24 | 1.24 | 1.23 | 1.23 | 1.23 | 1.23 | 1.23 | 1.24 | 1.24 | 1.24 | 1.24 | 1.26 | 1.26 | 1.26 | 1.26 | 1.26 | 1.26 | 1.26 | 1.26 | 1.28 | 1.28 | 1.30 | 1.42 | 1.45 | 1.46 | 1.45 | 1.45 | 1.45 | 1.45 | 1.45 | 1.46 | 1.46 | 1.52 | 1.54 | 1.54 | 1.54 | 1.54 | 1.54 | 1.57 | 1.61 | 1.67 | 1.68 | 1.68 | 1.68 | 1.70 | 1.73 | 1.73 | 1.73 | 1.73 | NA | 1.73 | NA | NA | NA | |
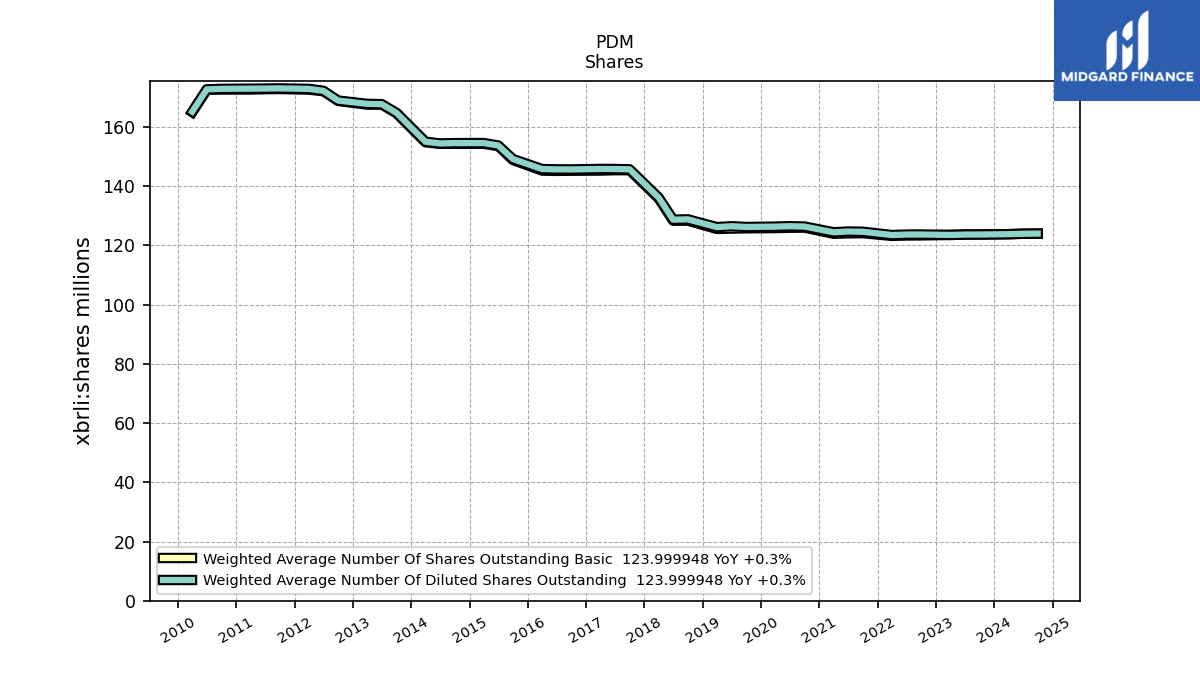
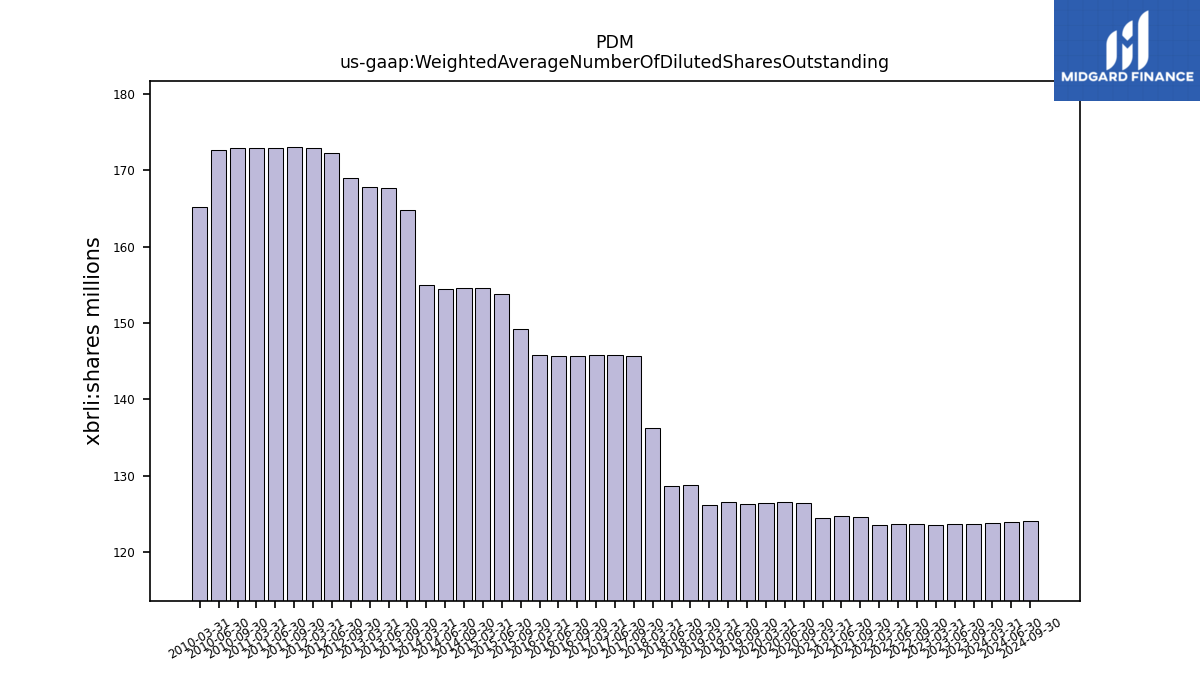
| Weighted Average Number Of Diluted Shares Outstanding | 123.70 | 123.67 | 123.55 | NA | 123.70 | 123.68 | 123.51 | NA | 124.63 | 124.70 | 124.45 | NA | 126.39 | 126.50 | 126.36 | NA | 126.24 | 126.49 | 126.18 | NA | 128.82 | 128.70 | 136.18 | NA | 145.72 | 145.81 | 145.83 | NA | 145.67 | 145.70 | 145.79 | NA | 149.18 | 153.76 | 154.58 | NA | 154.56 | 154.44 | 155.02 | NA | 164.80 | 167.71 | 167.81 | NA | 168.93 | 172.21 | 172.87 | NA | 173.05 | 172.99 | 172.95 | NA | 172.89 | 172.72 | 165.20 | |
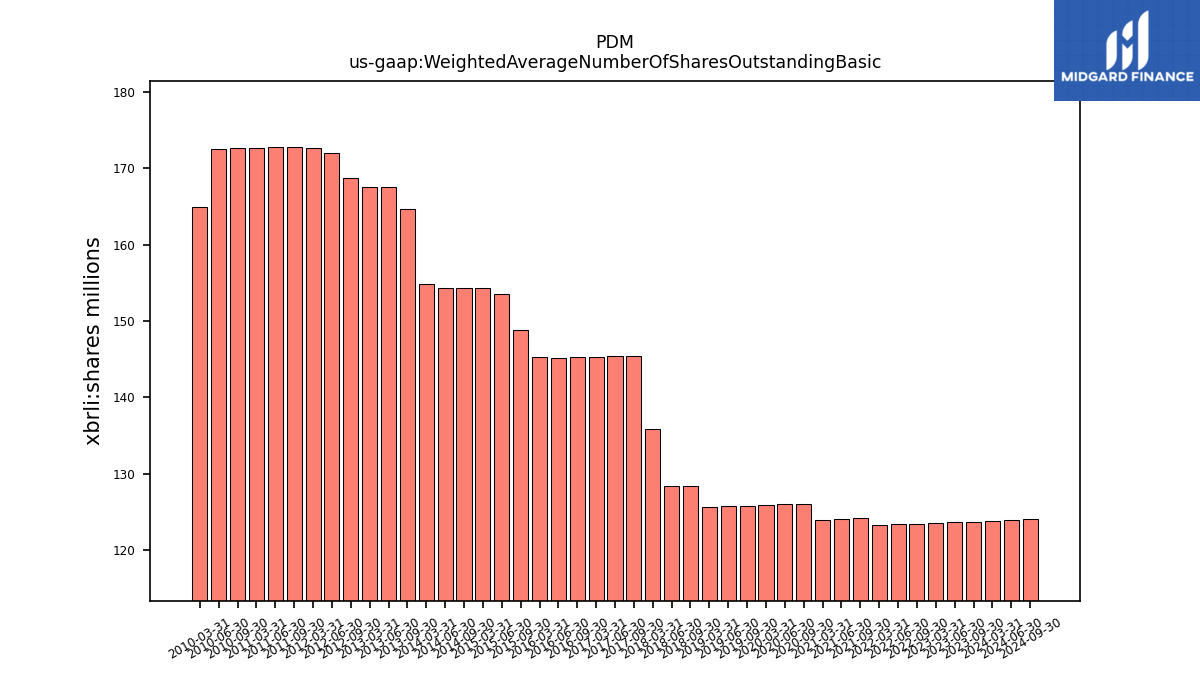
| Weighted Average Number Of Shares Outstanding Basic | 123.70 | 123.67 | 123.55 | NA | 123.40 | 123.37 | 123.23 | NA | 124.14 | 124.09 | 123.95 | NA | 126.03 | 125.97 | 125.86 | NA | 125.78 | 125.69 | 125.57 | NA | 128.37 | 128.35 | 135.88 | NA | 145.42 | 145.41 | 145.29 | NA | 145.23 | 145.18 | 145.28 | NA | 148.86 | 153.56 | 154.34 | NA | 154.33 | 154.32 | 154.85 | NA | 164.68 | 167.59 | 167.56 | NA | 168.81 | 172.08 | 172.63 | NA | 172.83 | 172.78 | 172.66 | NA | 172.66 | 172.60 | 164.99 | |
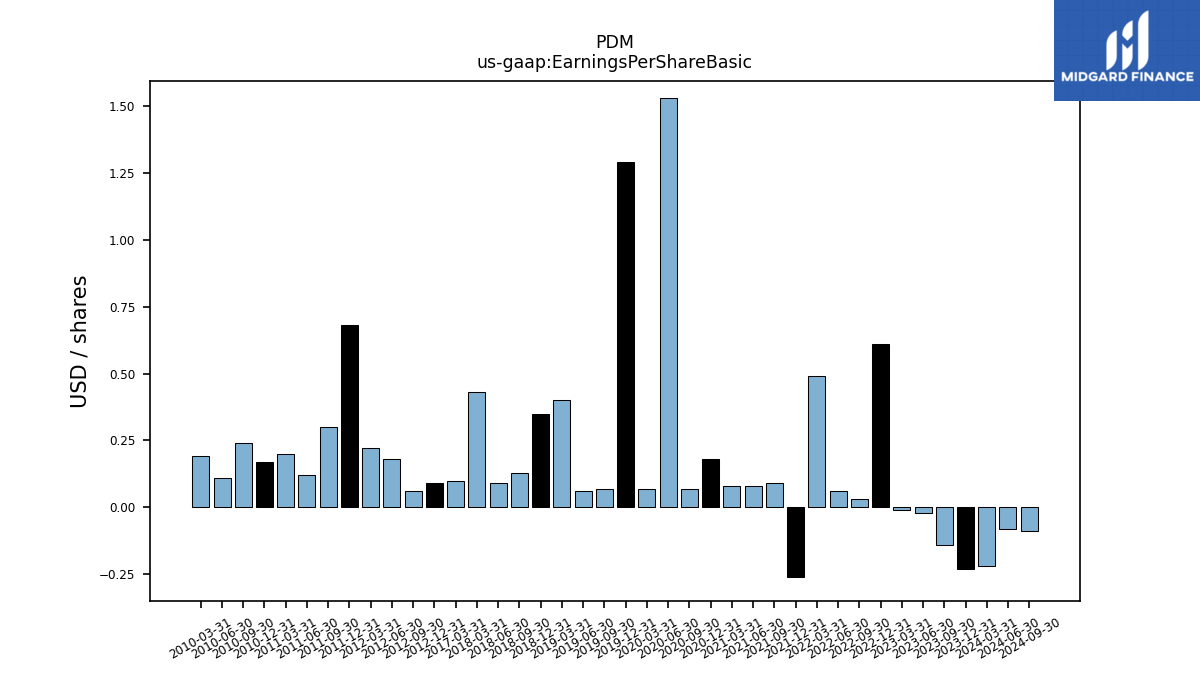
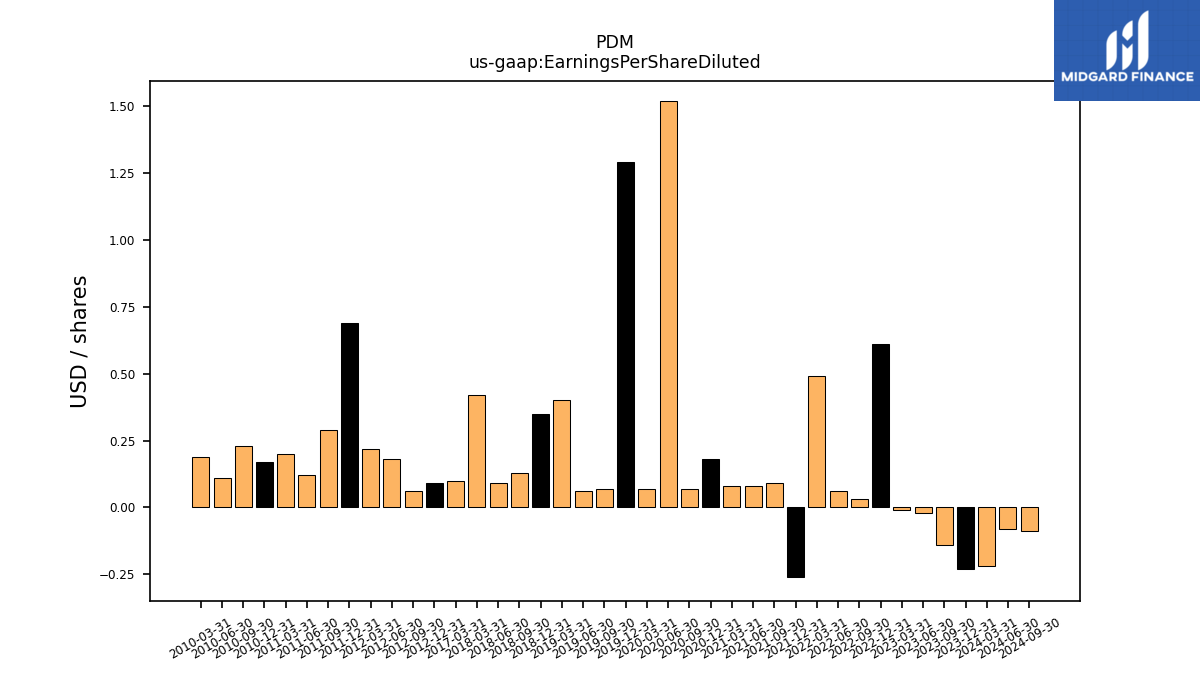
| Earnings Per Share Basic | -0.14 | -0.02 | -0.01 | 0.61 | 0.03 | 0.06 | 0.49 | -0.26 | 0.09 | 0.08 | 0.08 | 0.18 | 0.07 | 1.53 | 0.07 | 1.29 | 0.07 | 0.06 | 0.40 | 0.35 | 0.13 | 0.09 | 0.43 | NA | NA | NA | 0.10 | NA | NA | NA | NA | NA | NA | NA | NA | NA | NA | NA | NA | NA | NA | NA | NA | 0.09 | 0.06 | 0.18 | 0.22 | 0.68 | 0.30 | 0.12 | 0.20 | 0.17 | 0.24 | 0.11 | 0.19 | |
| Earnings Per Share Diluted | -0.14 | -0.02 | -0.01 | 0.61 | 0.03 | 0.06 | 0.49 | -0.26 | 0.09 | 0.08 | 0.08 | 0.18 | 0.07 | 1.52 | 0.07 | 1.29 | 0.07 | 0.06 | 0.40 | 0.35 | 0.13 | 0.09 | 0.42 | NA | NA | NA | 0.10 | NA | NA | NA | NA | NA | NA | NA | NA | NA | NA | NA | NA | NA | NA | NA | NA | 0.09 | 0.06 | 0.18 | 0.22 | 0.69 | 0.29 | 0.12 | 0.20 | 0.17 | 0.23 | 0.11 | 0.19 |
| 2023-09-30 | 2023-06-30 | 2023-03-31 | 2022-12-31 | 2022-09-30 | 2022-06-30 | 2022-03-31 | 2021-12-31 | 2021-09-30 | 2021-06-30 | 2021-03-31 | 2020-12-31 | 2020-09-30 | 2020-06-30 | 2020-03-31 | 2019-12-31 | 2019-09-30 | 2019-06-30 | 2019-03-31 | 2018-12-31 | 2018-09-30 | 2018-06-30 | 2018-03-31 | 2017-12-31 | 2017-09-30 | 2017-06-30 | 2017-03-31 | 2016-12-31 | 2016-09-30 | 2016-06-30 | 2016-03-31 | 2015-12-31 | 2015-09-30 | 2015-06-30 | 2015-03-31 | 2014-12-31 | 2014-09-30 | 2014-06-30 | 2014-03-31 | 2013-12-31 | 2013-09-30 | 2013-06-30 | 2013-03-31 | 2012-12-31 | 2012-09-30 | 2012-06-30 | 2012-03-31 | 2011-12-31 | 2011-09-30 | 2011-06-30 | 2011-03-31 | 2010-12-31 | 2010-09-30 | 2010-06-30 | 2010-03-31 | ||
|---|---|---|---|---|---|---|---|---|---|---|---|---|---|---|---|---|---|---|---|---|---|---|---|---|---|---|---|---|---|---|---|---|---|---|---|---|---|---|---|---|---|---|---|---|---|---|---|---|---|---|---|---|---|---|---|---|
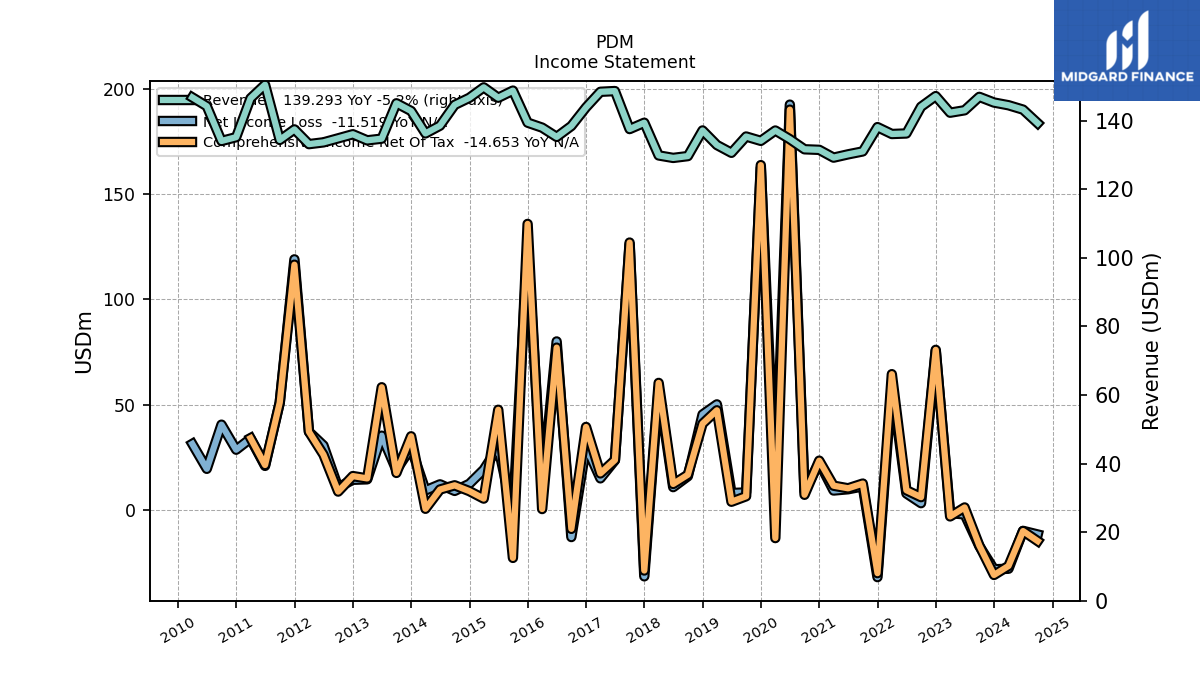
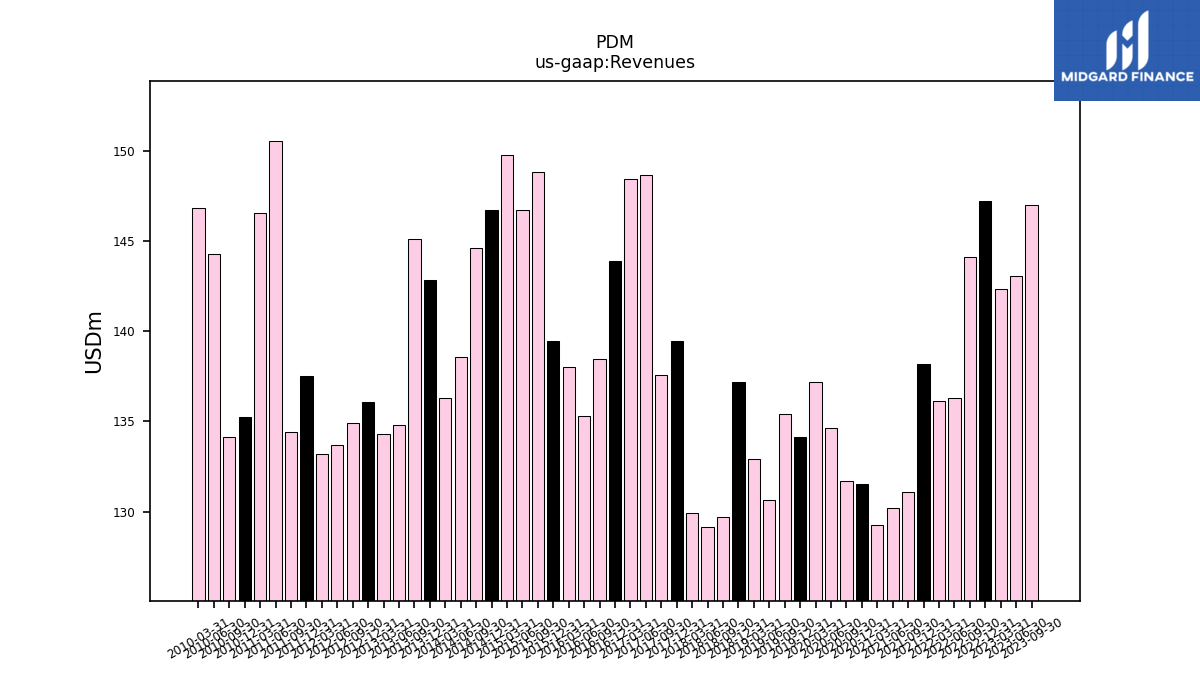
| Revenues | 146.99 | 143.07 | 142.37 | 147.21 | 144.10 | 136.31 | 136.15 | 138.16 | 131.07 | 130.22 | 129.26 | 131.53 | 131.69 | 134.63 | 137.17 | 134.15 | 135.42 | 130.67 | 132.94 | 137.19 | 129.71 | 129.17 | 129.90 | 139.44 | 137.59 | 148.68 | 148.46 | 143.91 | 138.49 | 135.31 | 138.01 | 139.46 | 148.81 | 146.73 | 149.76 | 146.71 | 144.64 | 138.58 | 136.32 | 142.87 | 145.12 | 134.79 | 134.30 | 136.08 | 134.89 | 133.72 | 133.20 | 137.49 | 134.41 | 150.54 | 146.55 | 135.23 | 134.12 | 144.27 | 146.84 | |
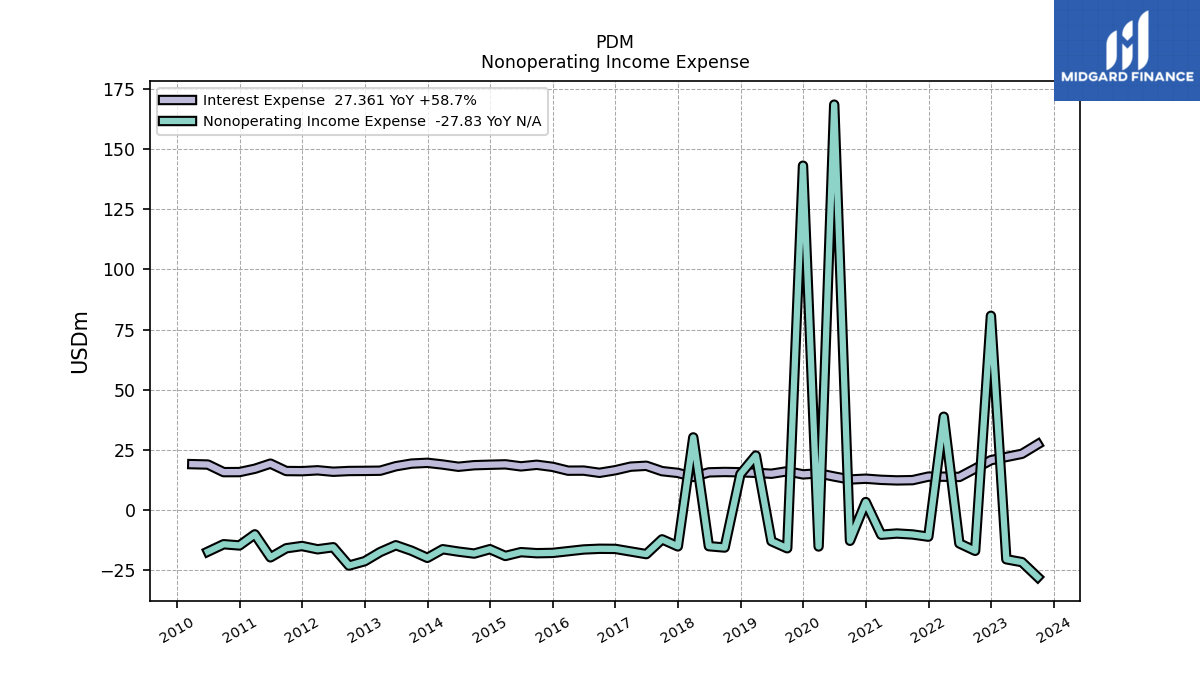
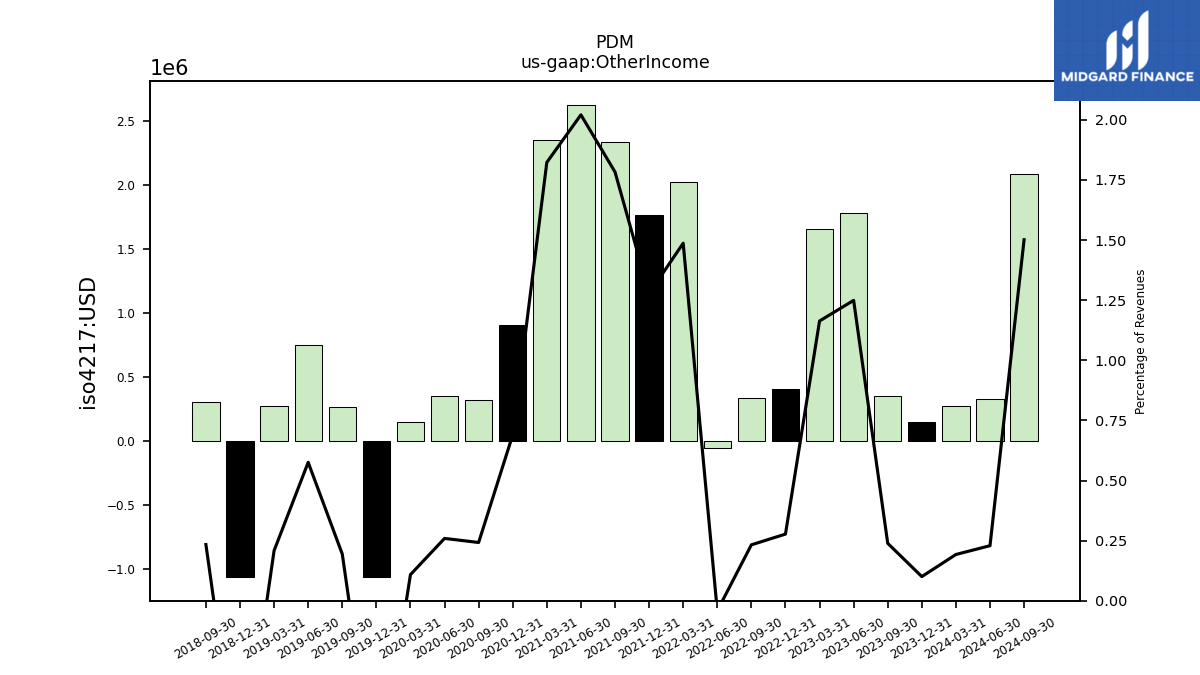
| Other Income | 0.35 | 1.79 | 1.66 | 0.41 | 0.34 | -0.06 | 2.02 | 1.76 | 2.34 | 2.63 | 2.36 | 0.91 | 0.32 | 0.35 | 0.15 | -1.06 | 0.26 | 0.75 | 0.28 | -1.06 | 0.30 | NA | NA | NA | NA | NA | NA | NA | NA | NA | NA | NA | NA | NA | NA | NA | NA | NA | NA | NA | NA | NA | NA | NA | NA | NA | NA | NA | NA | NA | NA | NA | NA | NA | NA | |
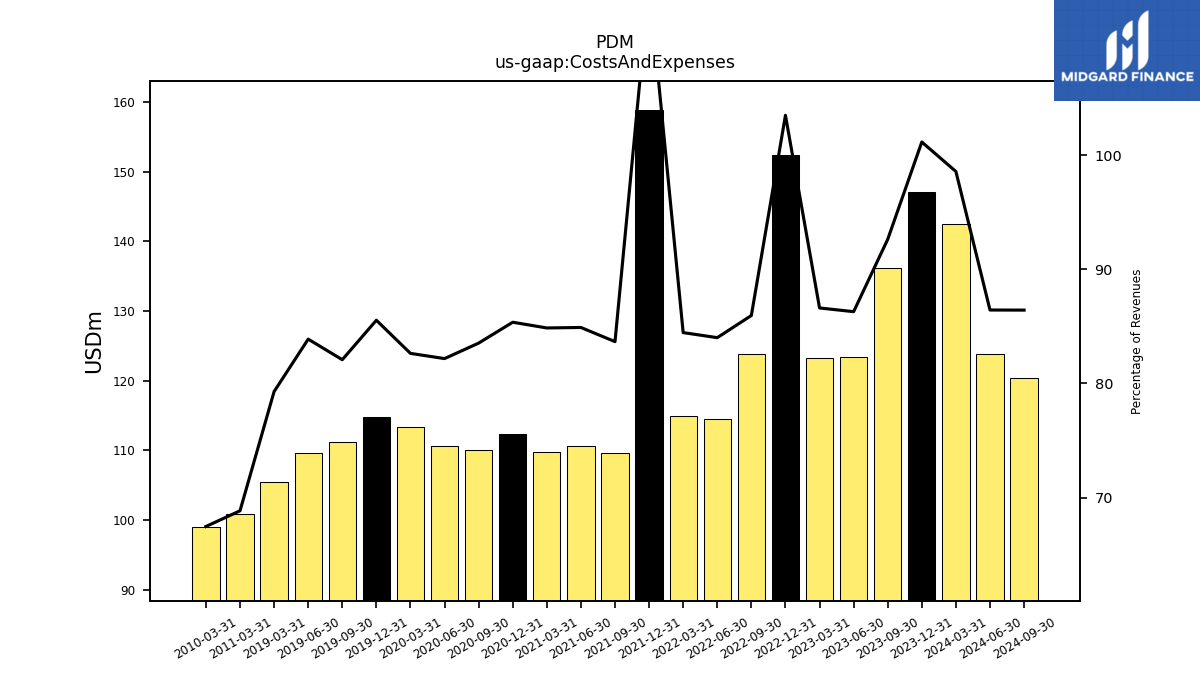
| Costs And Expenses | 136.16 | 123.45 | 123.31 | 152.36 | 123.86 | 114.51 | 114.98 | 158.88 | 109.66 | 110.56 | 109.69 | 112.28 | 110.01 | 110.63 | 113.35 | 114.75 | 111.15 | 109.61 | 105.40 | NA | NA | NA | NA | NA | NA | NA | NA | NA | NA | NA | NA | NA | NA | NA | NA | NA | NA | NA | NA | NA | NA | NA | NA | NA | NA | NA | NA | NA | NA | NA | 100.88 | NA | NA | NA | 99.06 | |
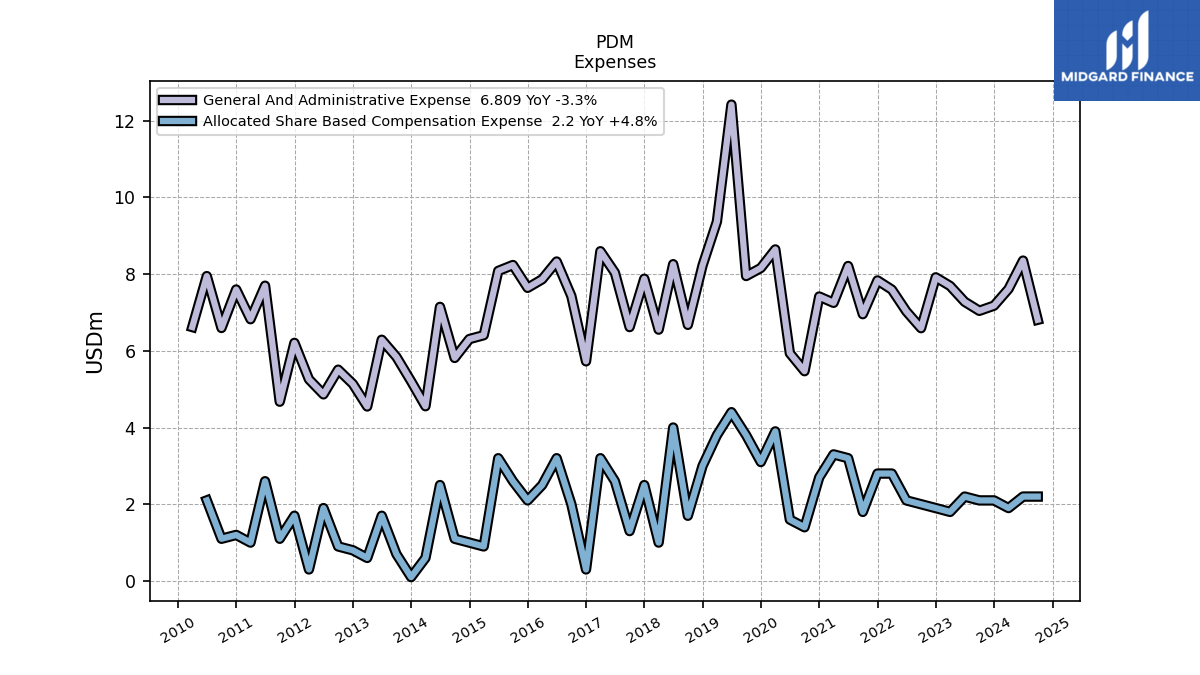
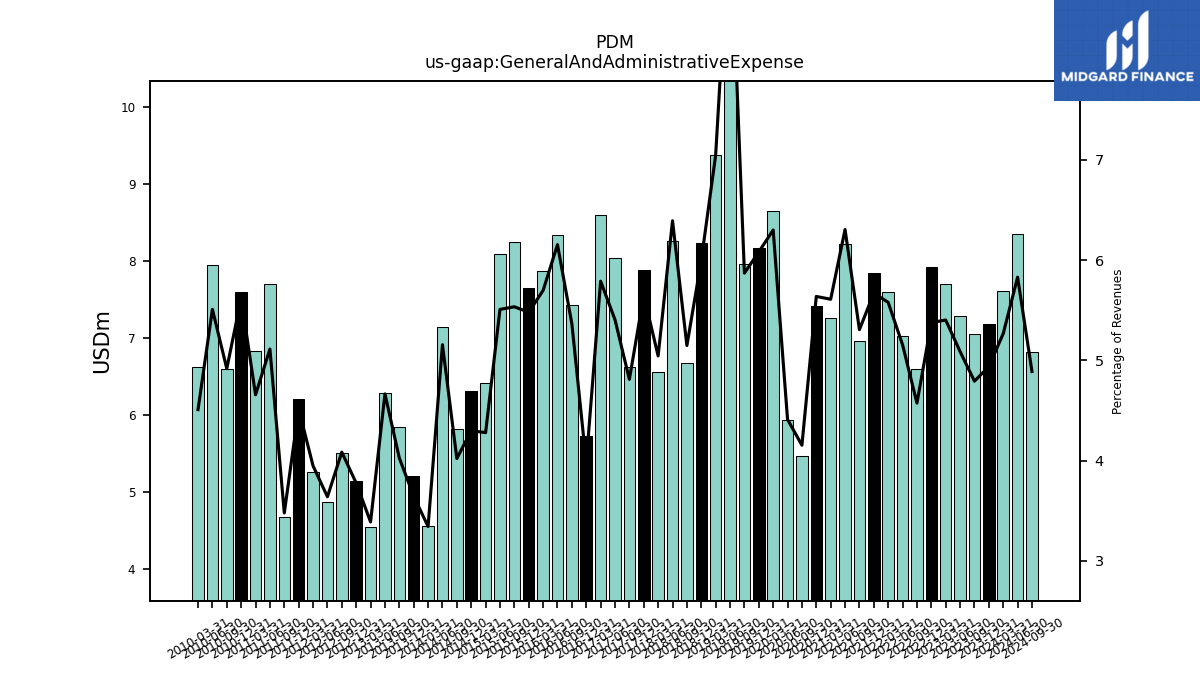
| General And Administrative Expense | 7.04 | 7.28 | 7.69 | 7.92 | 6.59 | 7.03 | 7.59 | 7.83 | 6.96 | 8.21 | 7.25 | 7.42 | 5.47 | 5.94 | 8.64 | 8.16 | 7.95 | 12.42 | 9.37 | 8.23 | 6.68 | 8.26 | 6.55 | 7.88 | 6.62 | 8.04 | 8.60 | 5.73 | 7.43 | 8.33 | 7.86 | 7.64 | 8.24 | 8.08 | 6.41 | 6.31 | 5.81 | 7.14 | 4.55 | 5.21 | 5.84 | 6.29 | 4.55 | 5.14 | 5.51 | 4.87 | 5.26 | 6.21 | 4.67 | 7.70 | 6.82 | 7.60 | 6.59 | 7.95 | 6.62 | |
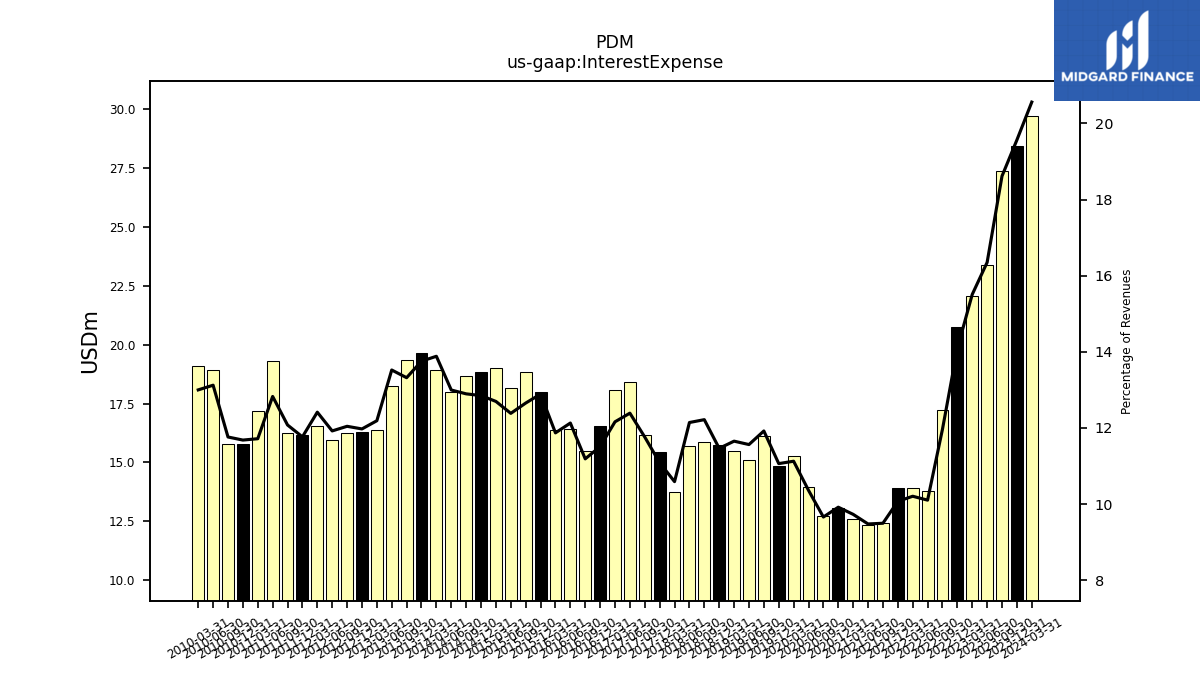
| Interest Expense | 27.36 | 23.39 | 22.08 | 20.74 | 17.24 | 13.78 | 13.90 | 13.92 | 12.45 | 12.35 | 12.58 | 13.05 | 12.72 | 13.95 | 15.26 | 14.84 | 16.14 | 15.11 | 15.49 | 15.73 | 15.85 | 15.69 | 13.76 | 15.46 | 16.18 | 18.42 | 18.06 | 16.57 | 15.50 | 16.41 | 16.39 | 17.98 | 18.83 | 18.17 | 19.02 | 18.85 | 18.65 | 18.01 | 18.93 | 19.65 | 19.33 | 18.23 | 16.37 | 16.30 | 16.25 | 15.94 | 16.54 | 16.18 | 16.24 | 19.31 | 17.17 | 15.80 | 15.78 | 18.93 | 19.09 | |
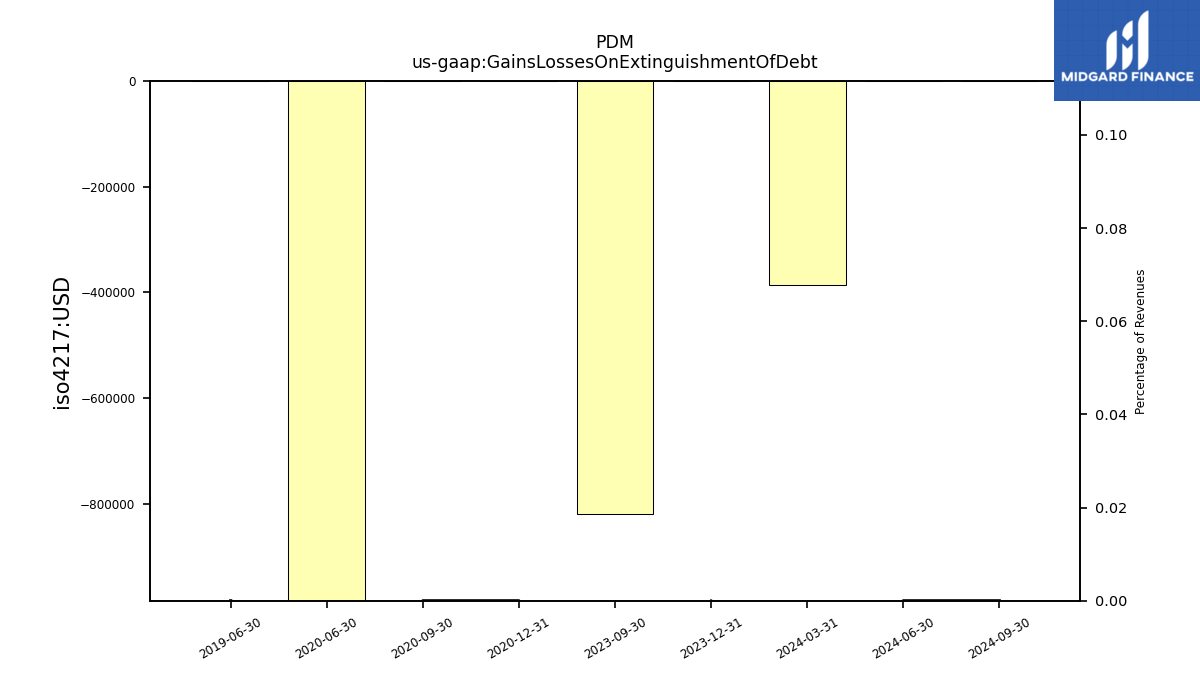
| Gains Losses On Extinguishment Of Debt | -0.82 | NA | NA | NA | NA | NA | NA | NA | NA | NA | NA | 0.00 | 0.00 | -9.34 | NA | NA | NA | 0.00 | NA | NA | NA | NA | NA | NA | NA | NA | NA | NA | NA | NA | NA | NA | NA | NA | NA | NA | NA | NA | NA | NA | NA | NA | NA | NA | NA | NA | NA | NA | NA | NA | NA | NA | NA | NA | NA | |
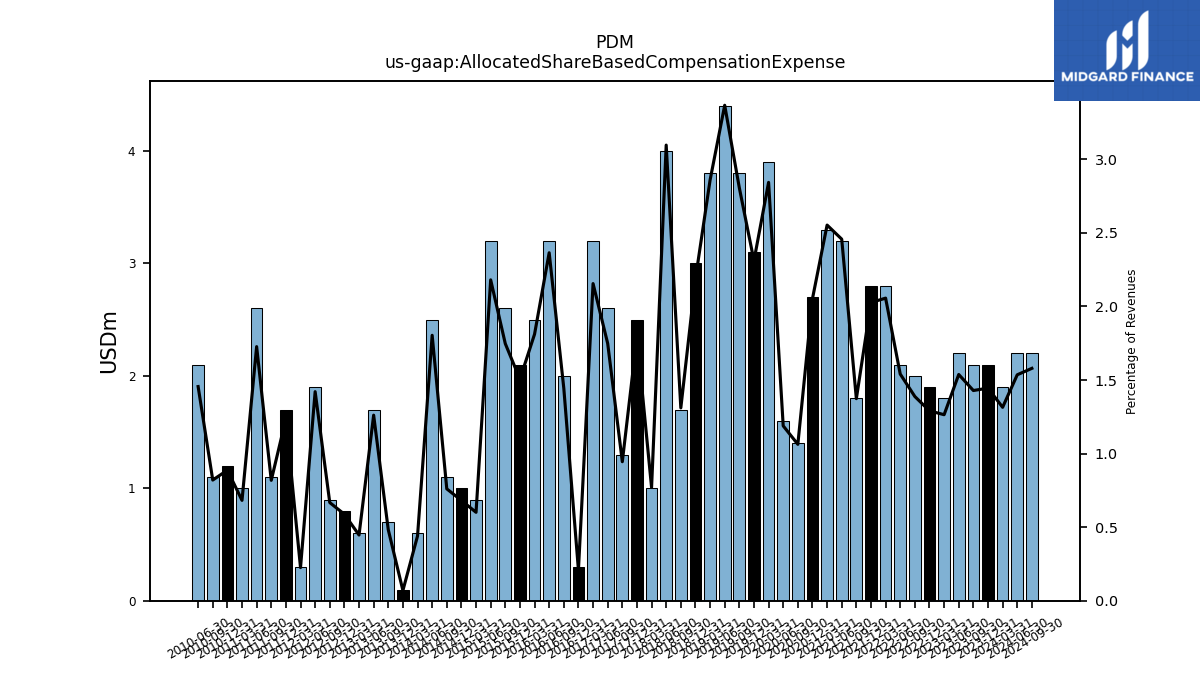
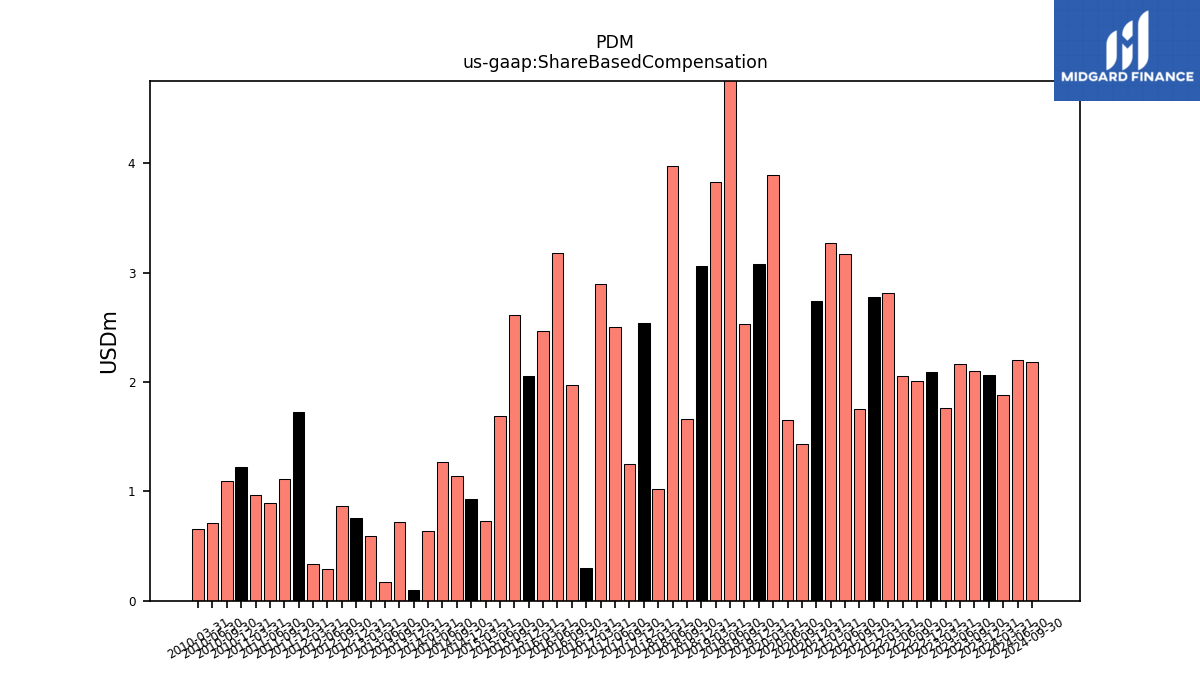
| Allocated Share Based Compensation Expense | 2.10 | 2.20 | 1.80 | 1.90 | 2.00 | 2.10 | 2.80 | 2.80 | 1.80 | 3.20 | 3.30 | 2.70 | 1.40 | 1.60 | 3.90 | 3.10 | 3.80 | 4.40 | 3.80 | 3.00 | 1.70 | 4.00 | 1.00 | 2.50 | 1.30 | 2.60 | 3.20 | 0.30 | 2.00 | 3.20 | 2.50 | 2.10 | 2.60 | 3.20 | 0.90 | 1.00 | 1.10 | 2.50 | 0.60 | 0.10 | 0.70 | 1.70 | 0.60 | 0.80 | 0.90 | 1.90 | 0.30 | 1.70 | 1.10 | 2.60 | 1.00 | 1.20 | 1.10 | 2.10 | NA | |
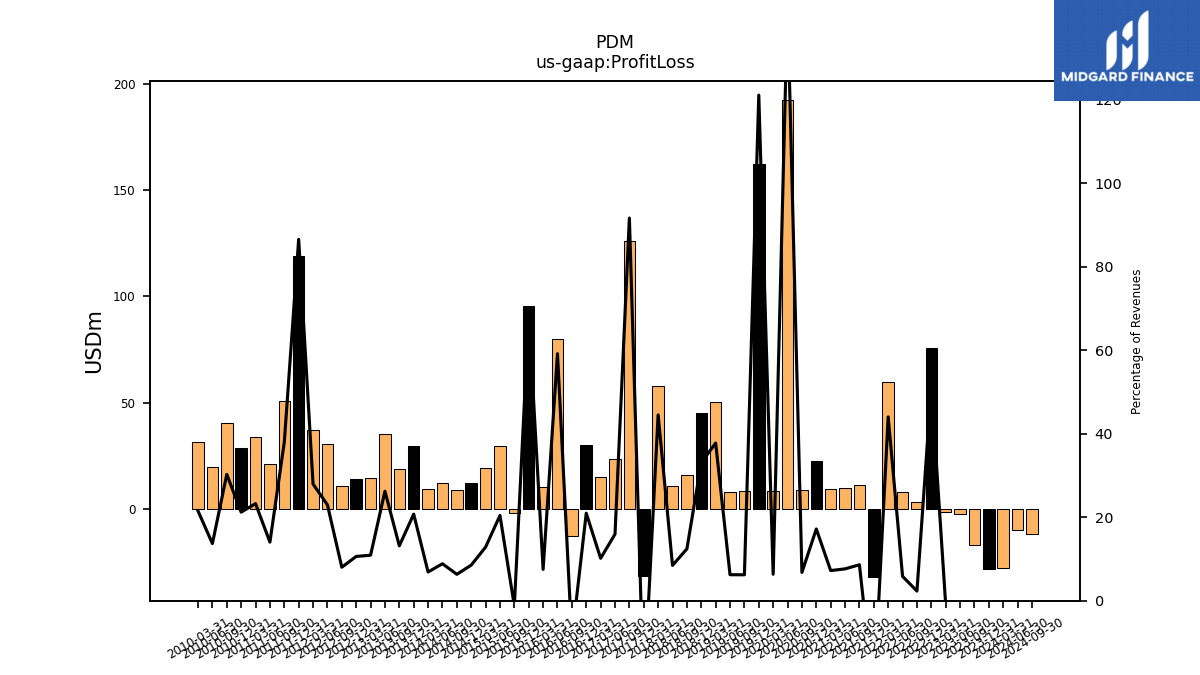
| Profit Loss | -17.00 | -1.99 | -1.36 | 75.57 | 3.33 | 7.96 | 59.96 | -31.75 | 11.30 | 9.94 | 9.34 | 22.61 | 8.94 | 192.43 | 8.71 | 162.48 | 8.42 | 8.15 | 50.21 | 45.41 | 16.11 | 10.94 | 57.83 | -31.39 | 126.13 | 23.71 | 15.10 | 30.18 | -12.76 | 80.08 | 10.38 | 95.66 | -1.87 | 29.98 | 19.25 | 12.52 | 9.17 | 12.28 | 9.40 | 29.63 | 19.10 | 35.36 | 14.65 | 14.44 | 10.84 | 30.71 | 37.23 | 119.02 | 51.03 | 21.15 | 34.09 | 28.70 | 40.59 | 19.76 | 31.59 | |
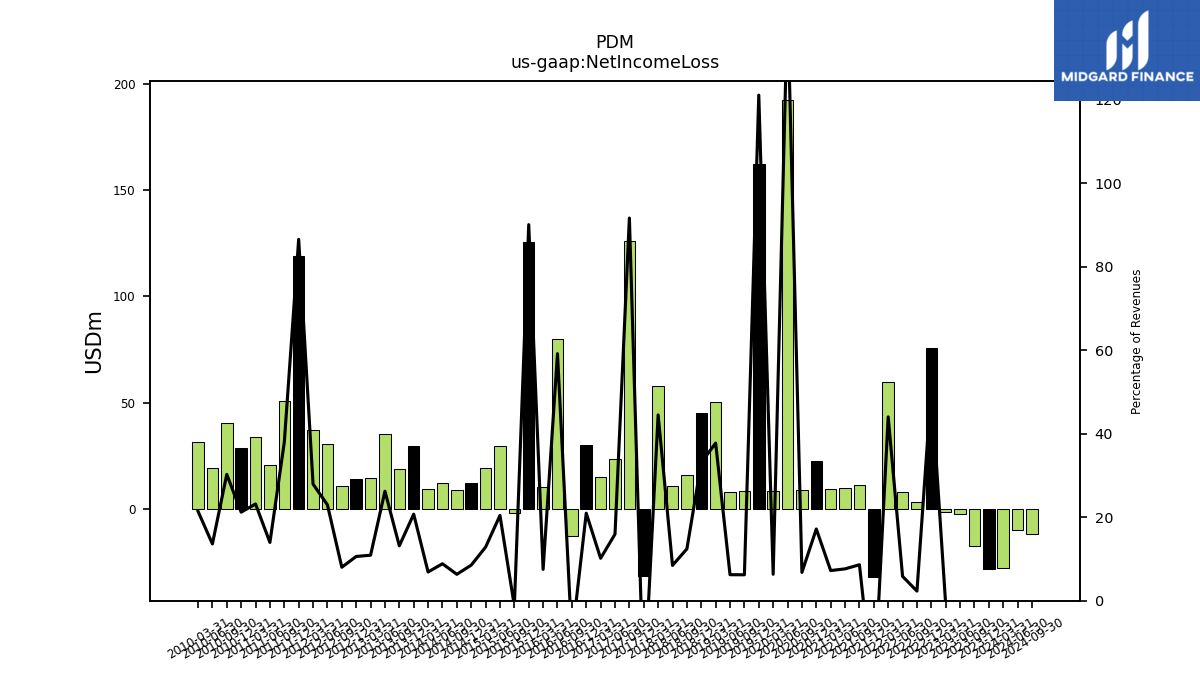
| Net Income Loss | -17.00 | -1.99 | -1.37 | 75.57 | 3.33 | 7.97 | 59.96 | -31.75 | 11.31 | 9.95 | 9.34 | 22.61 | 8.94 | 192.43 | 8.71 | 162.48 | 8.42 | 8.15 | 50.21 | 45.41 | 16.11 | 10.94 | 57.83 | -31.38 | 126.13 | 23.71 | 15.10 | 30.19 | -12.75 | 80.07 | 10.37 | 125.64 | -1.88 | 29.98 | 19.25 | 12.51 | 9.16 | 12.28 | 9.39 | 29.62 | 19.10 | 35.36 | 14.65 | 14.44 | 10.83 | 30.71 | 37.23 | 119.02 | 51.03 | 21.03 | 33.97 | 28.70 | 40.58 | 19.64 | 31.46 | |
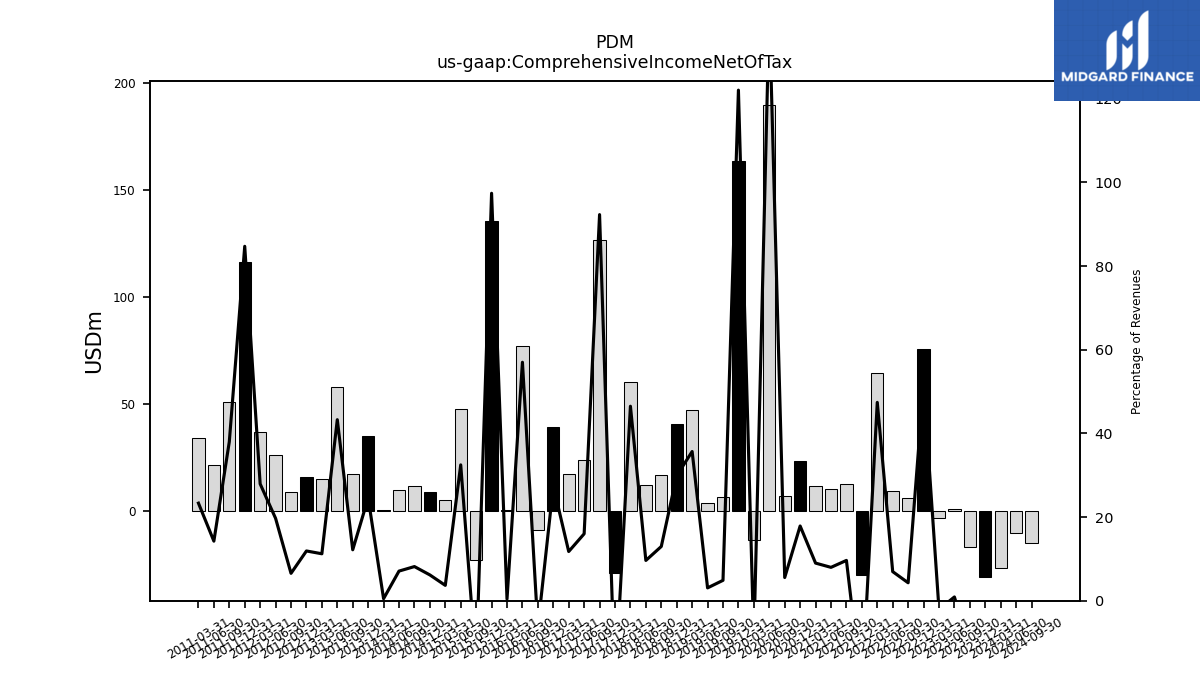
| Comprehensive Income Net Of Tax | -16.74 | 1.30 | -2.95 | 76.08 | 6.19 | 9.49 | 64.55 | -29.87 | 12.64 | 10.39 | 11.63 | 23.50 | 7.31 | 190.04 | -13.23 | 163.73 | 6.61 | 4.02 | 47.41 | 41.02 | 16.82 | 12.44 | 60.40 | -28.62 | 126.99 | 23.79 | 17.47 | 39.50 | -8.85 | 77.13 | 0.54 | 135.83 | -22.64 | 47.66 | 5.51 | 9.06 | 11.82 | 9.82 | 0.68 | 35.07 | 17.68 | 58.33 | 15.08 | 16.19 | 8.84 | 26.34 | 37.21 | 116.48 | 51.07 | 21.45 | 34.19 | NA | NA | NA | NA | |
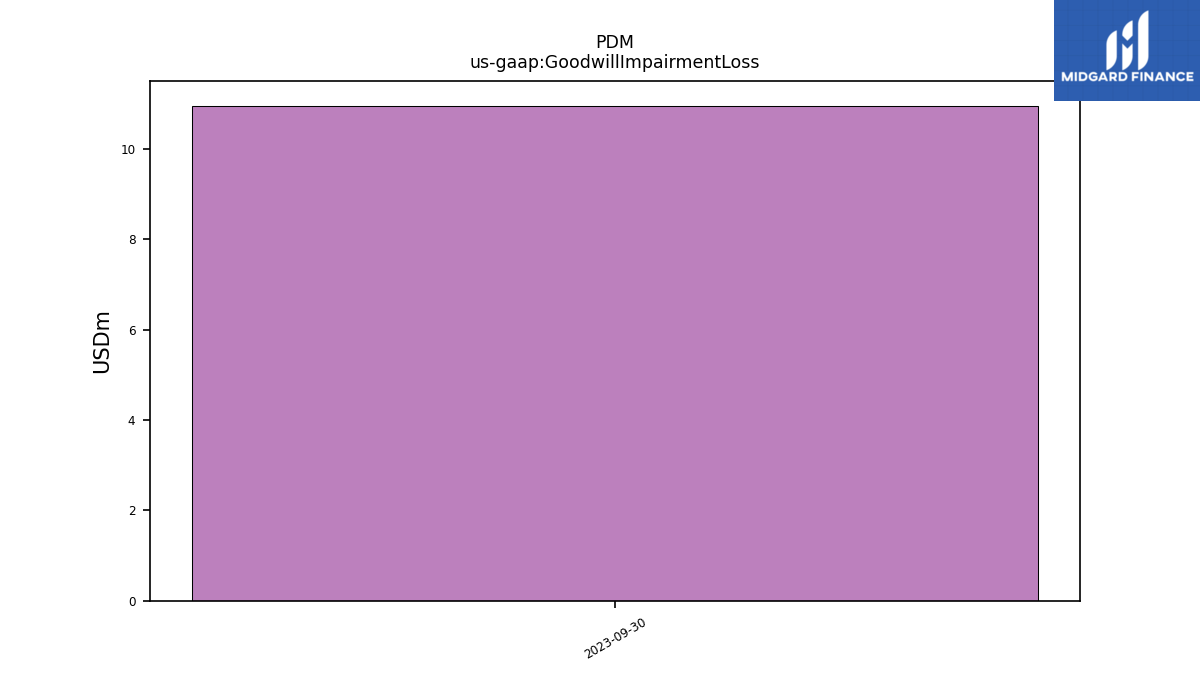
| Goodwill Impairment Loss | 10.96 | NA | NA | NA | NA | NA | NA | NA | NA | NA | NA | NA | NA | NA | NA | NA | NA | NA | NA | NA | NA | NA | NA | NA | NA | NA | NA | NA | NA | NA | NA | NA | NA | NA | NA | NA | NA | NA | NA | NA | NA | NA | NA | NA | NA | NA | NA | NA | NA | NA | NA | NA | NA | NA | NA |
| 2023-09-30 | 2023-06-30 | 2023-03-31 | 2022-12-31 | 2022-09-30 | 2022-06-30 | 2022-03-31 | 2021-12-31 | 2021-09-30 | 2021-06-30 | 2021-03-31 | 2020-12-31 | 2020-09-30 | 2020-06-30 | 2020-03-31 | 2019-12-31 | 2019-09-30 | 2019-06-30 | 2019-03-31 | 2018-12-31 | 2018-09-30 | 2018-06-30 | 2018-03-31 | 2017-12-31 | 2017-09-30 | 2017-06-30 | 2017-03-31 | 2016-12-31 | 2016-09-30 | 2016-06-30 | 2016-03-31 | 2015-12-31 | 2015-09-30 | 2015-06-30 | 2015-03-31 | 2014-12-31 | 2014-09-30 | 2014-06-30 | 2014-03-31 | 2013-12-31 | 2013-09-30 | 2013-06-30 | 2013-03-31 | 2012-12-31 | 2012-09-30 | 2012-06-30 | 2012-03-31 | 2011-12-31 | 2011-09-30 | 2011-06-30 | 2011-03-31 | 2010-12-31 | 2010-09-30 | 2010-06-30 | 2010-03-31 | ||
|---|---|---|---|---|---|---|---|---|---|---|---|---|---|---|---|---|---|---|---|---|---|---|---|---|---|---|---|---|---|---|---|---|---|---|---|---|---|---|---|---|---|---|---|---|---|---|---|---|---|---|---|---|---|---|---|---|
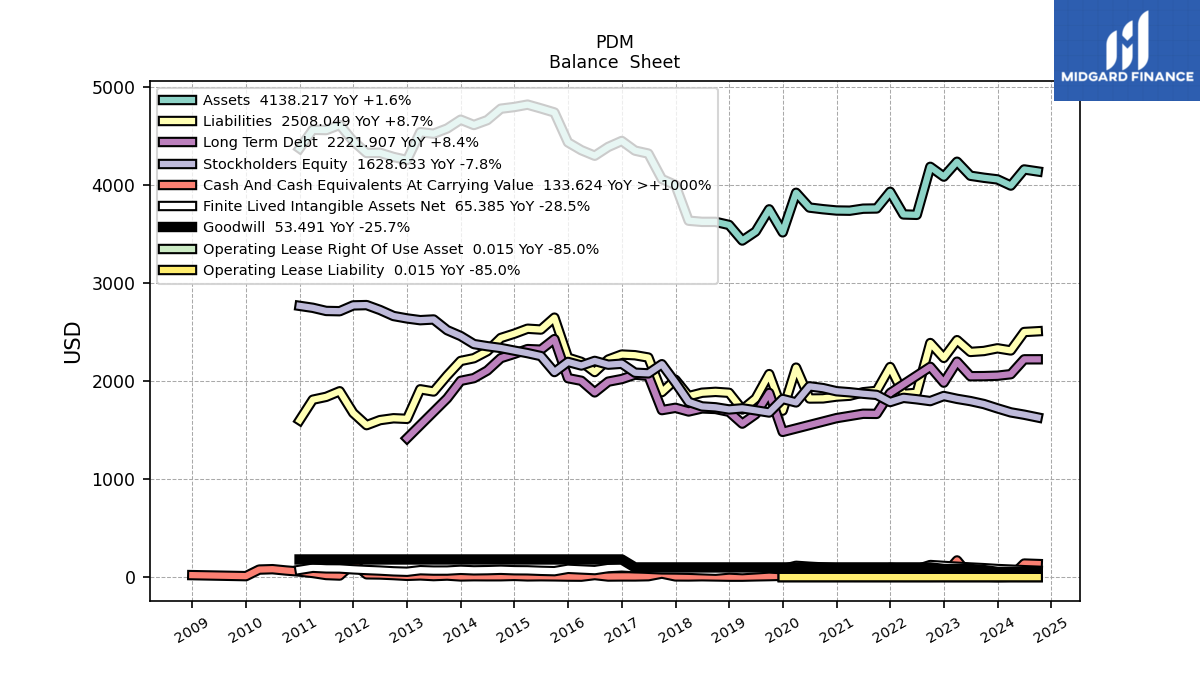
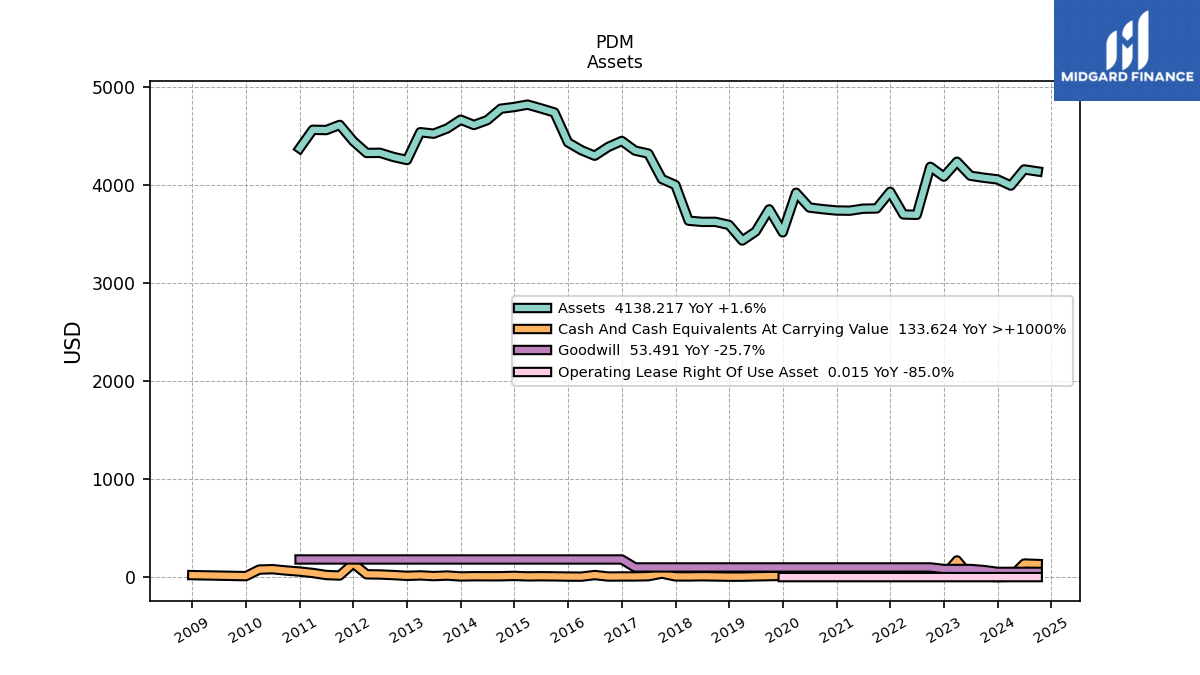
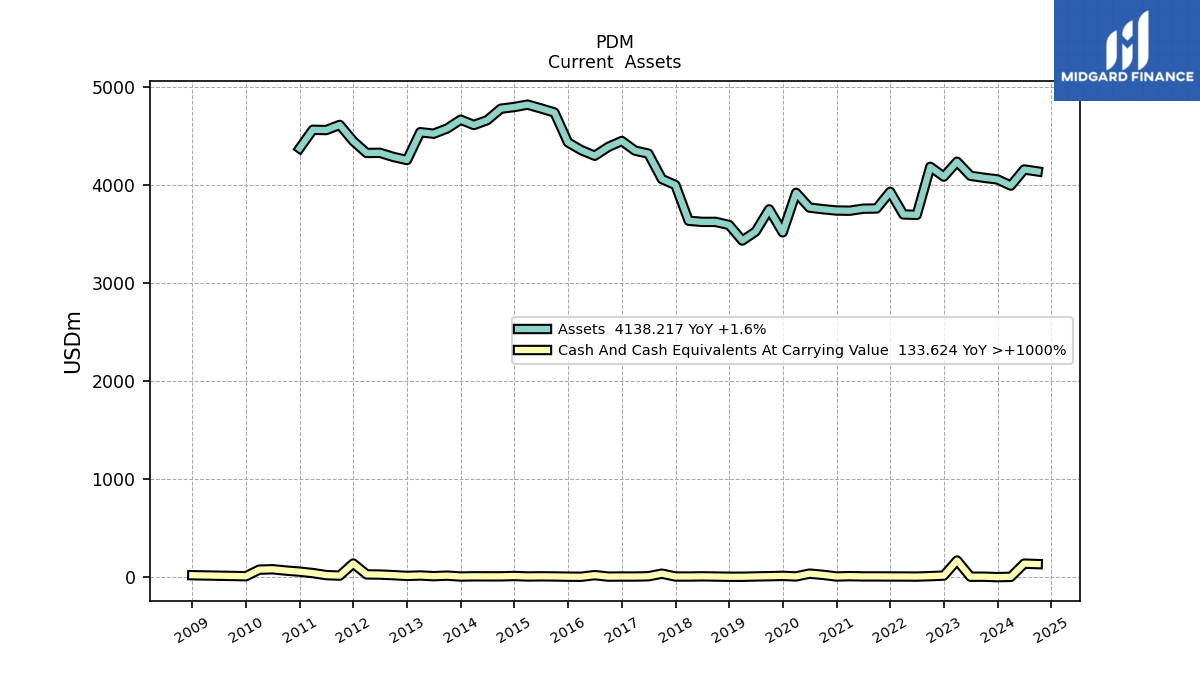
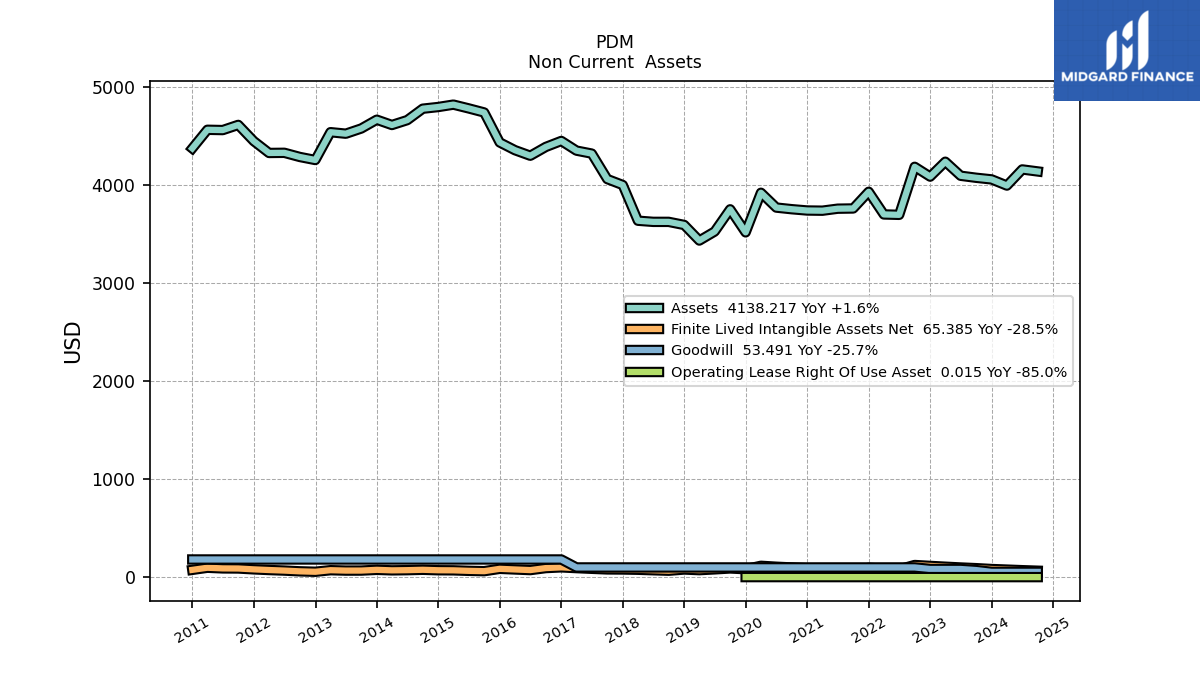
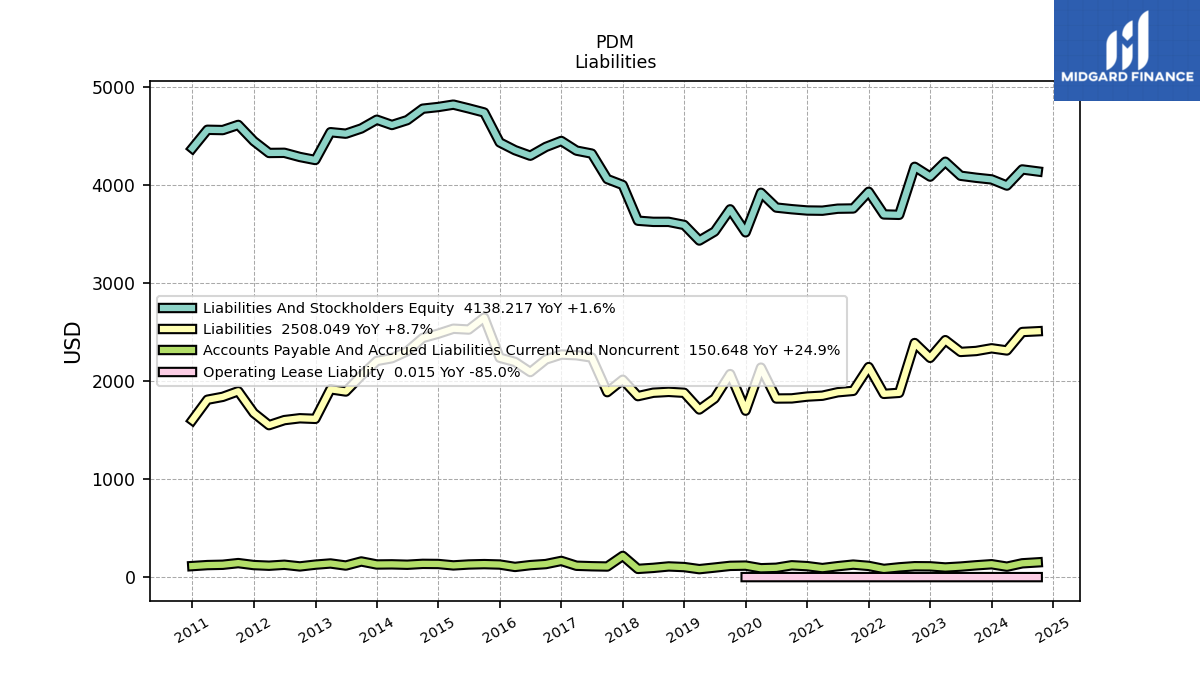
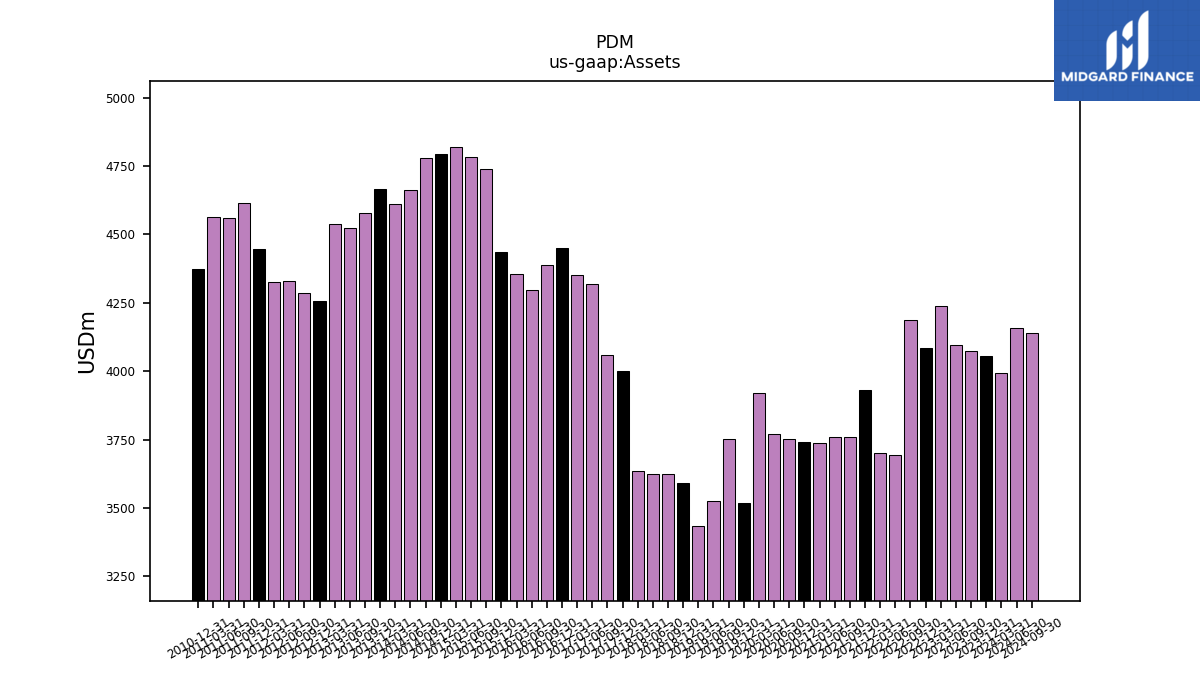
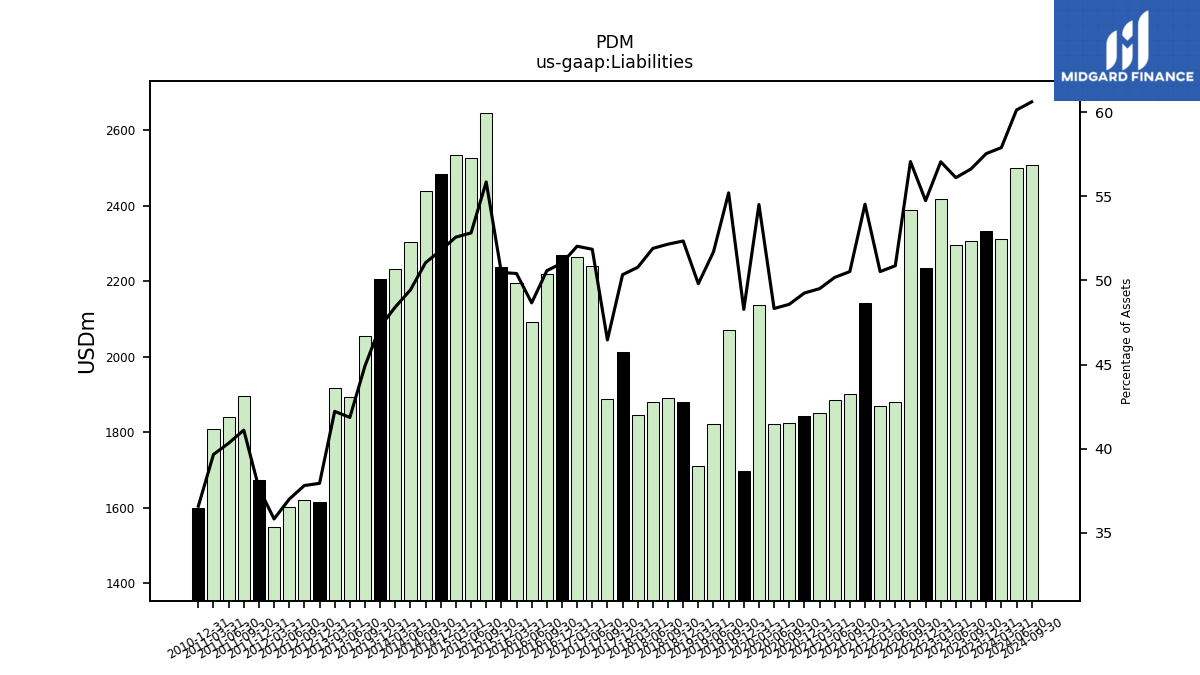
| Assets | 4073.78 | 4094.35 | 4237.46 | 4085.53 | 4185.49 | 3695.55 | 3699.64 | 3930.66 | 3760.65 | 3758.31 | 3737.87 | 3739.81 | 3753.08 | 3769.71 | 3920.82 | 3516.76 | 3751.93 | 3525.37 | 3433.44 | 3592.43 | 3623.89 | 3623.99 | 3635.69 | 3999.97 | 4060.65 | 4320.31 | 4350.74 | 4449.35 | 4388.30 | 4298.50 | 4355.02 | 4434.53 | 4739.87 | 4781.30 | 4819.86 | 4795.50 | 4778.30 | 4661.83 | 4611.94 | 4666.09 | 4576.55 | 4523.30 | 4538.66 | 4254.88 | 4285.83 | 4328.31 | 4326.70 | 4447.83 | 4613.12 | 4560.21 | 4563.27 | 4373.48 | NA | NA | NA | |
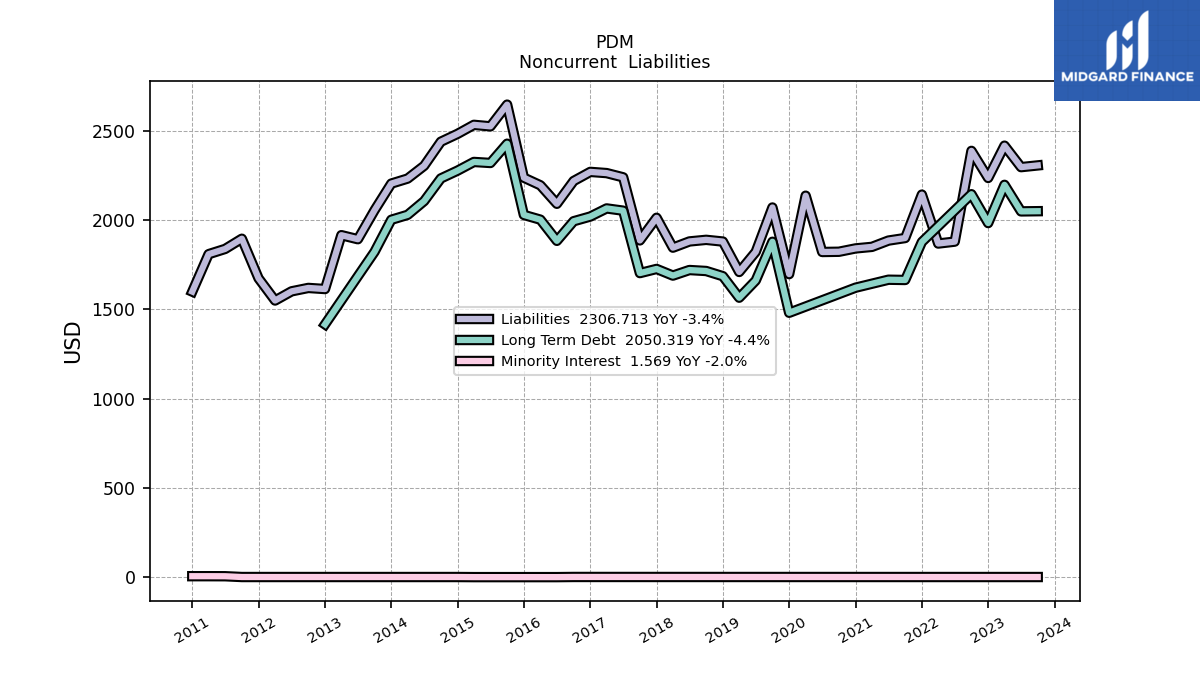
| Liabilities | 2306.71 | 2297.01 | 2417.36 | 2236.27 | 2388.16 | 1879.89 | 1869.17 | 2143.24 | 1900.03 | 1885.80 | 1850.53 | 1841.85 | 1823.15 | 1821.88 | 2137.10 | 1697.78 | 2071.15 | 1822.39 | 1709.92 | 1880.29 | 1889.89 | 1880.93 | 1846.10 | 2013.48 | 1886.65 | 2240.00 | 2263.64 | 2270.47 | 2219.31 | 2091.79 | 2195.35 | 2238.09 | 2647.14 | 2525.45 | 2533.94 | 2483.49 | 2439.46 | 2304.64 | 2232.99 | 2204.93 | 2055.87 | 1893.34 | 1916.04 | 1614.38 | 1620.55 | 1601.57 | 1550.04 | 1674.41 | 1896.19 | 1838.98 | 1809.76 | 1600.03 | NA | NA | NA | |
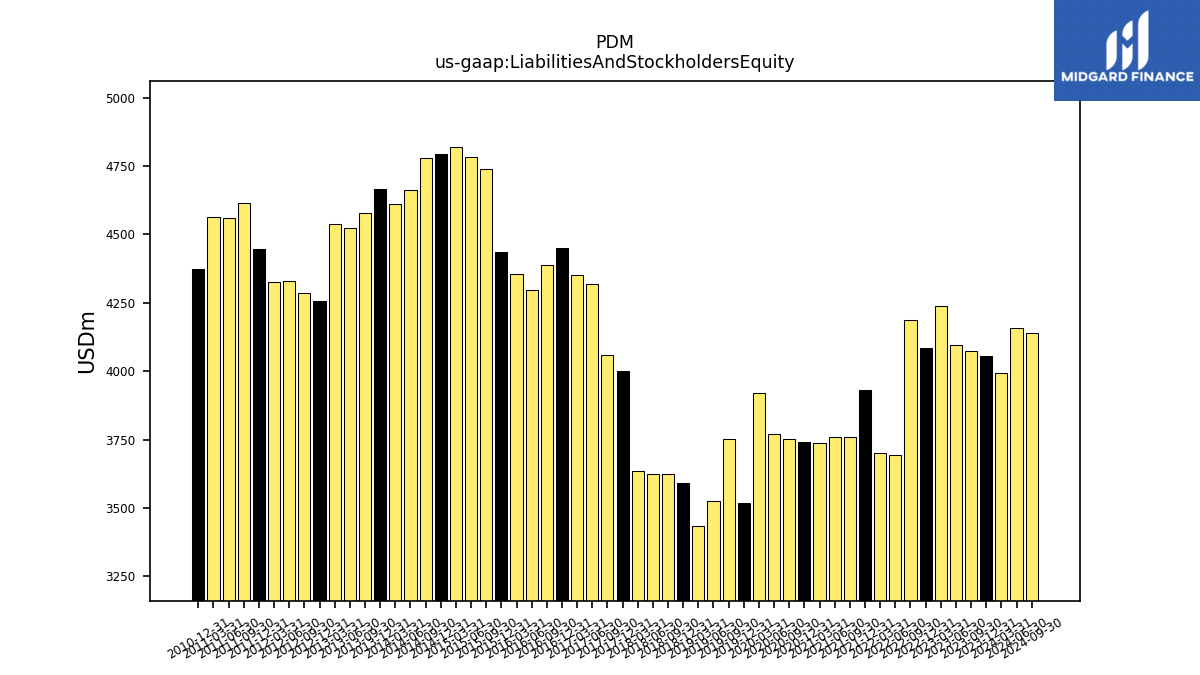
| Liabilities And Stockholders Equity | 4073.78 | 4094.35 | 4237.46 | 4085.53 | 4185.49 | 3695.55 | 3699.64 | 3930.66 | 3760.65 | 3758.31 | 3737.87 | 3739.81 | 3753.08 | 3769.71 | 3920.82 | 3516.76 | 3751.93 | 3525.37 | 3433.44 | 3592.43 | 3623.89 | 3623.99 | 3635.69 | 3999.97 | 4060.65 | 4320.31 | 4350.74 | 4449.35 | 4388.30 | 4298.50 | 4355.02 | 4434.53 | 4739.87 | 4781.30 | 4819.86 | 4795.50 | 4778.30 | 4661.83 | 4611.94 | 4666.09 | 4576.55 | 4523.30 | 4538.66 | 4254.88 | 4285.83 | 4328.31 | 4326.70 | 4447.83 | 4613.12 | 4560.21 | 4563.27 | 4373.48 | NA | NA | NA | |
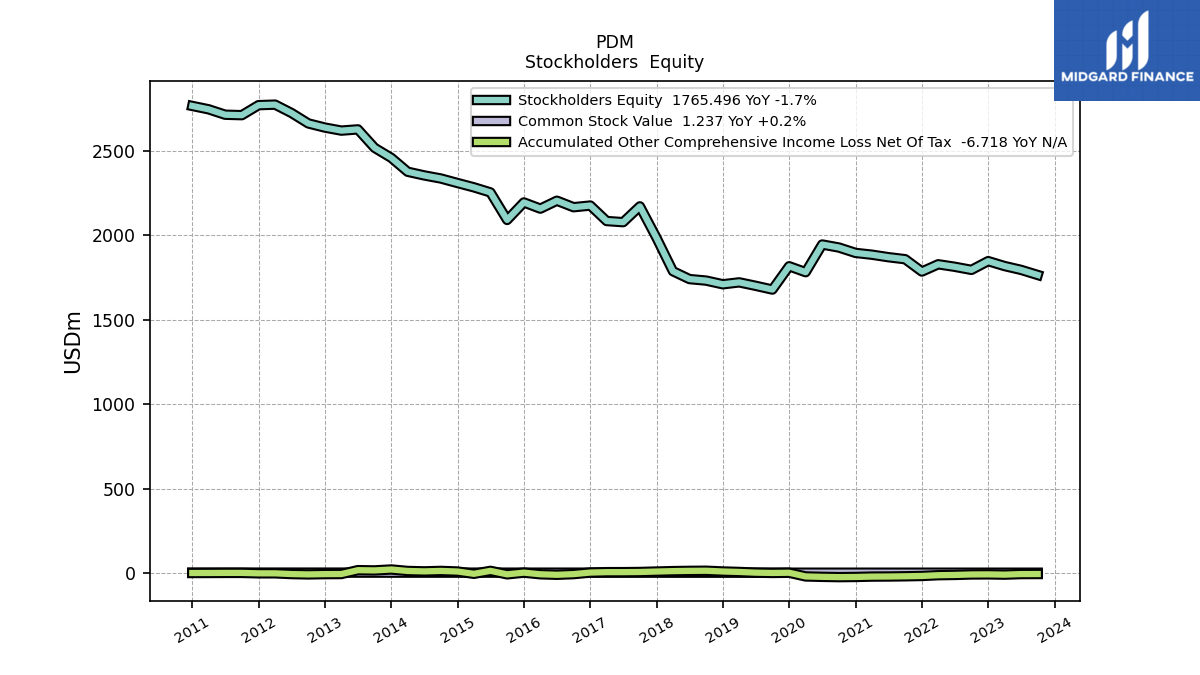
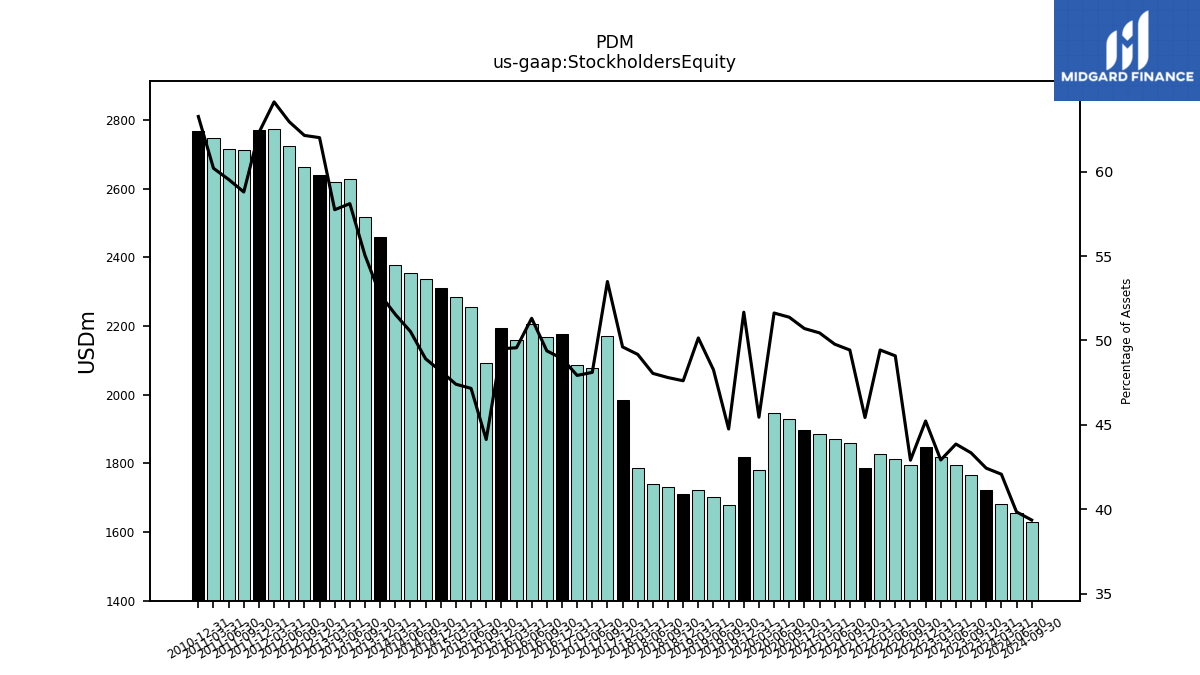
| Stockholders Equity | 1765.50 | 1795.76 | 1818.51 | 1847.67 | 1795.73 | 1814.06 | 1828.85 | 1785.79 | 1858.97 | 1870.85 | 1885.67 | 1896.28 | 1928.23 | 1946.13 | 1781.99 | 1817.25 | 1679.04 | 1701.22 | 1721.76 | 1710.37 | 1732.21 | 1741.26 | 1787.78 | 1984.67 | 2172.13 | 2078.45 | 2085.22 | 2177.00 | 2167.09 | 2205.69 | 2158.63 | 2195.42 | 2091.71 | 2254.83 | 2284.89 | 2310.41 | 2337.23 | 2355.58 | 2377.34 | 2459.55 | 2519.07 | 2628.35 | 2621.01 | 2638.89 | 2663.67 | 2725.13 | 2775.05 | 2771.82 | 2712.51 | 2715.25 | 2747.29 | 2767.22 | NA | NA | NA |
| 2023-09-30 | 2023-06-30 | 2023-03-31 | 2022-12-31 | 2022-09-30 | 2022-06-30 | 2022-03-31 | 2021-12-31 | 2021-09-30 | 2021-06-30 | 2021-03-31 | 2020-12-31 | 2020-09-30 | 2020-06-30 | 2020-03-31 | 2019-12-31 | 2019-09-30 | 2019-06-30 | 2019-03-31 | 2018-12-31 | 2018-09-30 | 2018-06-30 | 2018-03-31 | 2017-12-31 | 2017-09-30 | 2017-06-30 | 2017-03-31 | 2016-12-31 | 2016-09-30 | 2016-06-30 | 2016-03-31 | 2015-12-31 | 2015-09-30 | 2015-06-30 | 2015-03-31 | 2014-12-31 | 2014-09-30 | 2014-06-30 | 2014-03-31 | 2013-12-31 | 2013-09-30 | 2013-06-30 | 2013-03-31 | 2012-12-31 | 2012-09-30 | 2012-06-30 | 2012-03-31 | 2011-12-31 | 2011-09-30 | 2011-06-30 | 2011-03-31 | 2010-12-31 | 2010-09-30 | 2010-06-30 | 2010-03-31 | ||
|---|---|---|---|---|---|---|---|---|---|---|---|---|---|---|---|---|---|---|---|---|---|---|---|---|---|---|---|---|---|---|---|---|---|---|---|---|---|---|---|---|---|---|---|---|---|---|---|---|---|---|---|---|---|---|---|---|
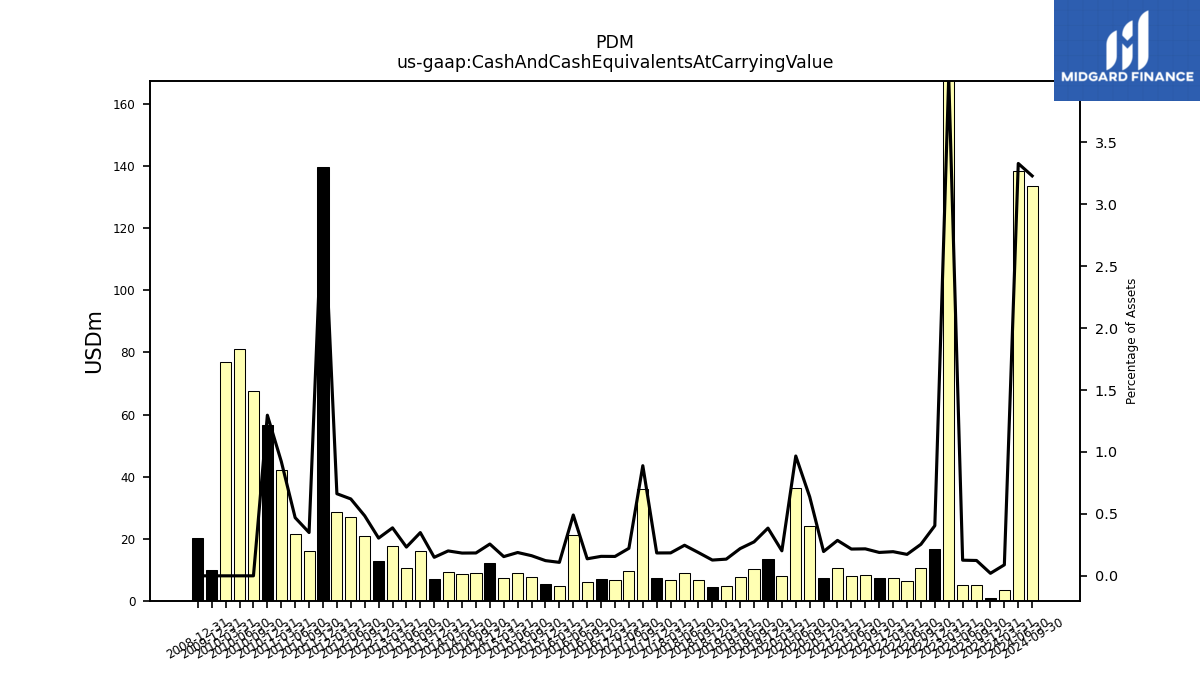
| Cash And Cash Equivalents At Carrying Value | 5.04 | 5.17 | 170.59 | 16.54 | 10.65 | 6.40 | 7.21 | 7.42 | 8.19 | 8.12 | 10.69 | 7.33 | 23.96 | 36.47 | 7.92 | 13.54 | 10.28 | 7.75 | 4.62 | 4.57 | 6.81 | 8.94 | 6.73 | 7.38 | 36.11 | 9.60 | 6.81 | 6.99 | 6.03 | 21.11 | 4.73 | 5.44 | 7.70 | 9.00 | 7.48 | 12.31 | 8.81 | 8.56 | 9.27 | 6.97 | 15.97 | 10.50 | 17.57 | 12.96 | 20.76 | 26.87 | 28.68 | 139.69 | 16.13 | 21.40 | 42.15 | 56.72 | 67.54 | 81.07 | 76.99 | |
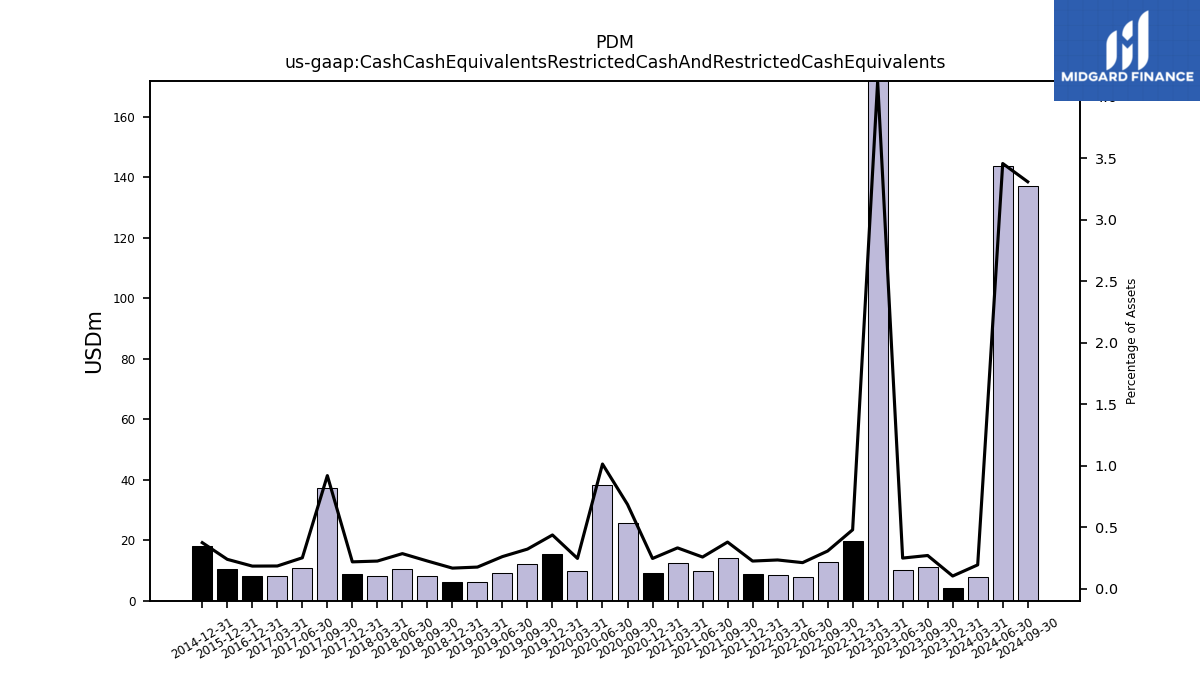
| Cash Cash Equivalents Restricted Cash And Restricted Cash Equivalents | 11.03 | 10.22 | 174.78 | 19.60 | 12.84 | 7.86 | 8.67 | 8.86 | 14.28 | 9.70 | 12.43 | 9.21 | 25.74 | 38.24 | 9.68 | 15.39 | 12.10 | 9.23 | 6.06 | 6.03 | 8.18 | 10.36 | 8.19 | 8.76 | 37.37 | 10.89 | 8.06 | 8.20 | NA | NA | NA | 10.62 | NA | NA | NA | 17.99 | NA | NA | NA | NA | NA | NA | NA | NA | NA | NA | NA | NA | NA | NA | NA | NA | NA | NA | NA | |
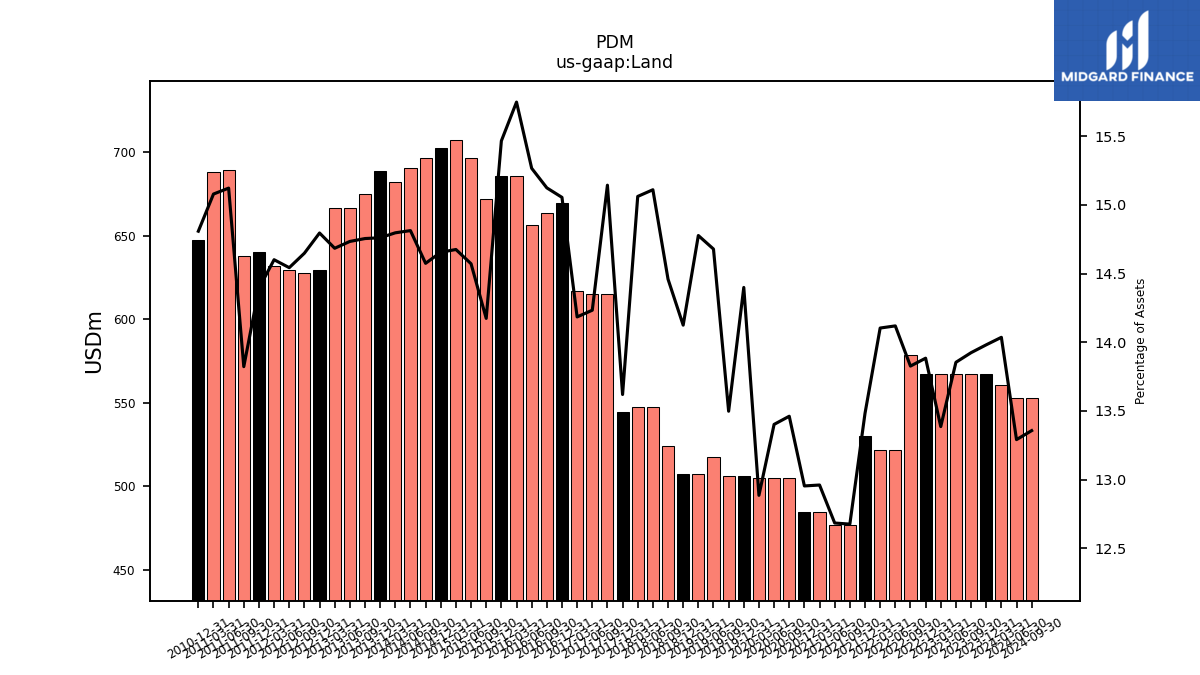
| Land | 567.24 | 567.24 | 567.24 | 567.24 | 578.72 | 521.79 | 521.79 | 529.94 | 476.72 | 476.72 | 484.47 | 484.47 | 505.23 | 505.23 | 505.23 | 506.39 | 506.44 | 517.48 | 507.37 | 507.42 | 523.99 | 547.60 | 547.60 | 544.79 | 614.93 | 614.93 | 617.14 | 669.85 | 663.70 | 656.24 | 685.85 | 685.85 | 671.83 | 696.71 | 707.34 | 702.80 | 696.43 | 690.56 | 682.43 | 688.76 | 675.28 | 666.47 | 666.48 | 629.54 | 627.81 | 629.48 | 631.75 | 640.20 | 637.66 | 689.61 | 688.10 | 647.65 | NA | NA | NA |
| 2023-09-30 | 2023-06-30 | 2023-03-31 | 2022-12-31 | 2022-09-30 | 2022-06-30 | 2022-03-31 | 2021-12-31 | 2021-09-30 | 2021-06-30 | 2021-03-31 | 2020-12-31 | 2020-09-30 | 2020-06-30 | 2020-03-31 | 2019-12-31 | 2019-09-30 | 2019-06-30 | 2019-03-31 | 2018-12-31 | 2018-09-30 | 2018-06-30 | 2018-03-31 | 2017-12-31 | 2017-09-30 | 2017-06-30 | 2017-03-31 | 2016-12-31 | 2016-09-30 | 2016-06-30 | 2016-03-31 | 2015-12-31 | 2015-09-30 | 2015-06-30 | 2015-03-31 | 2014-12-31 | 2014-09-30 | 2014-06-30 | 2014-03-31 | 2013-12-31 | 2013-09-30 | 2013-06-30 | 2013-03-31 | 2012-12-31 | 2012-09-30 | 2012-06-30 | 2012-03-31 | 2011-12-31 | 2011-09-30 | 2011-06-30 | 2011-03-31 | 2010-12-31 | 2010-09-30 | 2010-06-30 | 2010-03-31 | ||
|---|---|---|---|---|---|---|---|---|---|---|---|---|---|---|---|---|---|---|---|---|---|---|---|---|---|---|---|---|---|---|---|---|---|---|---|---|---|---|---|---|---|---|---|---|---|---|---|---|---|---|---|---|---|---|---|---|
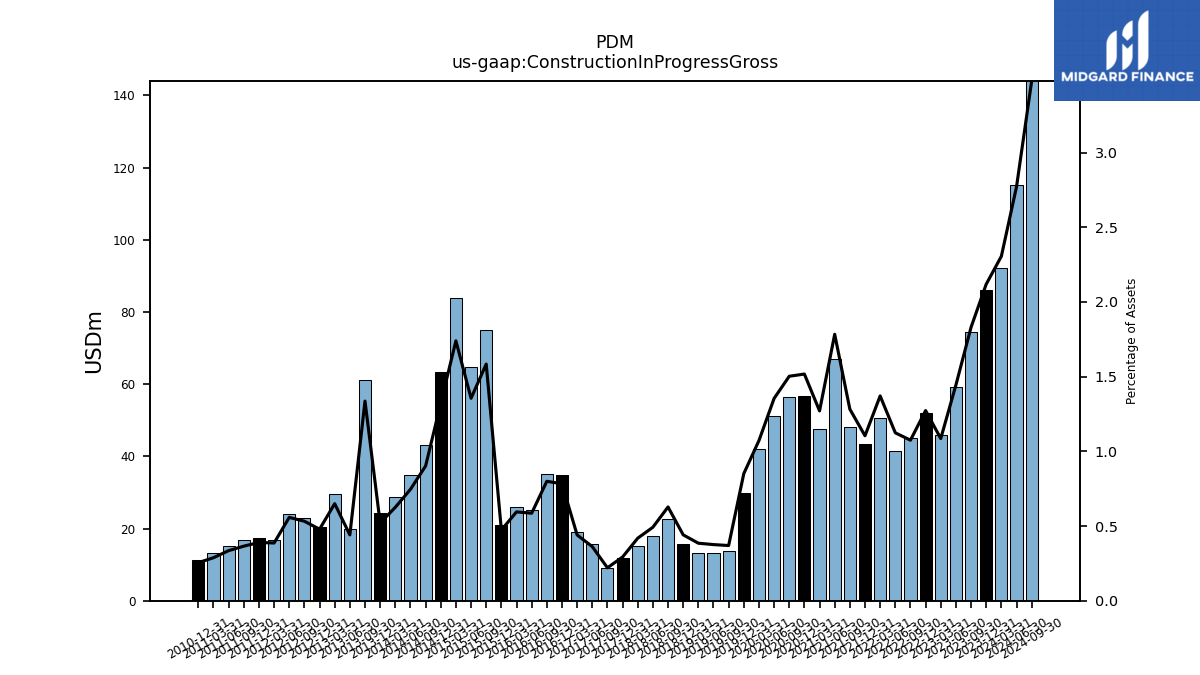
| Construction In Progress Gross | 74.58 | 59.12 | 46.01 | 52.01 | 44.98 | 41.54 | 50.72 | 43.41 | 48.23 | 67.03 | 47.50 | 56.75 | 56.39 | 51.05 | 42.03 | 29.92 | 13.87 | 13.25 | 13.22 | 15.85 | 22.75 | 17.83 | 15.23 | 11.71 | 8.96 | 15.65 | 19.16 | 34.83 | 35.09 | 25.19 | 25.90 | 20.99 | 75.08 | 64.80 | 83.85 | 63.39 | 43.11 | 34.77 | 28.85 | 24.27 | 61.16 | 19.95 | 29.49 | 20.37 | 22.81 | 24.15 | 16.73 | 17.35 | 16.85 | 15.30 | 13.14 | 11.15 | NA | NA | NA | |
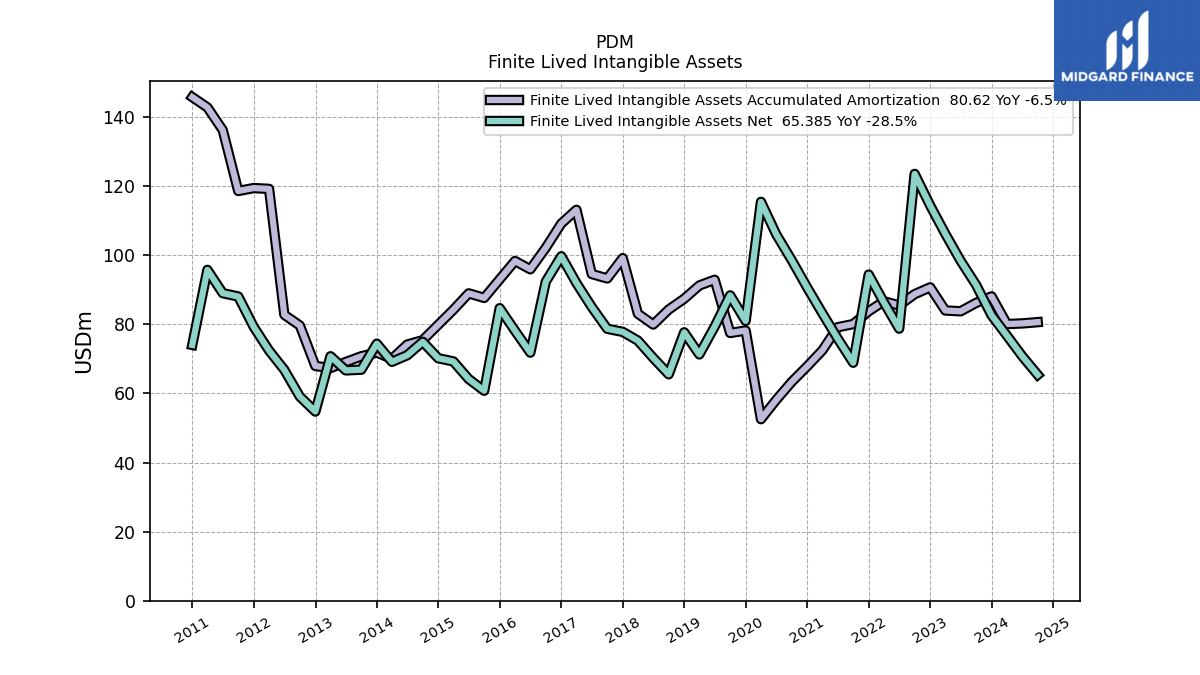
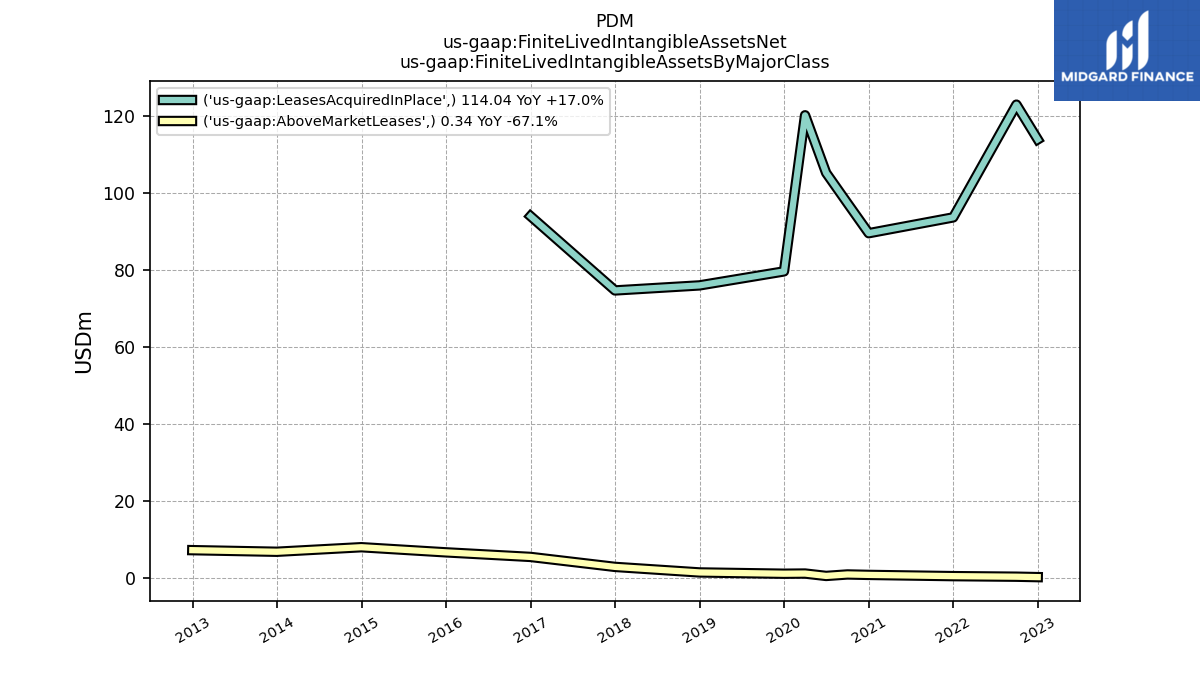
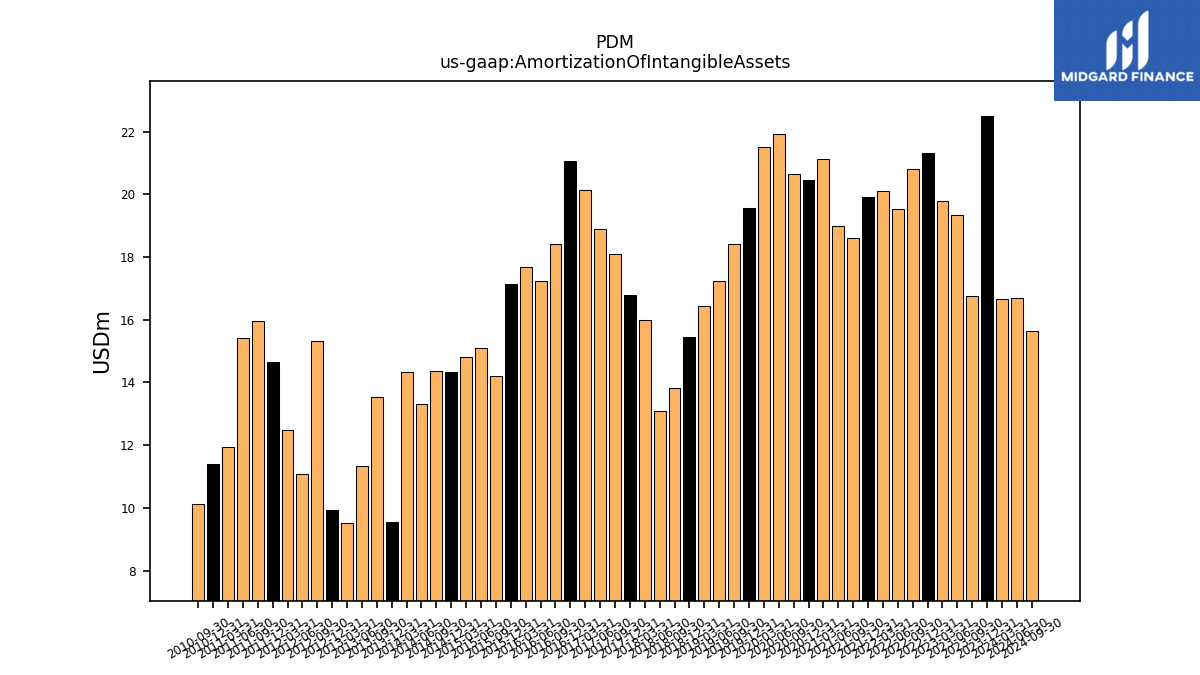
| Amortization Of Intangible Assets | 16.76 | 19.36 | 19.78 | 21.32 | 20.82 | 19.52 | 20.11 | 19.91 | 18.62 | 18.99 | 21.13 | 20.46 | 20.64 | 21.92 | 21.52 | 19.55 | 18.41 | 17.22 | 16.43 | 15.45 | 13.82 | 13.08 | 15.98 | 16.80 | 18.11 | 18.91 | 20.13 | 21.05 | 18.41 | 17.23 | 17.68 | 17.13 | 14.20 | 15.08 | 14.81 | 14.32 | 14.36 | 13.30 | 14.35 | 9.55 | 13.52 | 11.35 | 9.52 | 9.95 | 15.32 | 11.09 | 12.48 | 14.65 | 15.97 | 15.41 | 11.94 | 11.39 | 10.12 | NA | NA | |
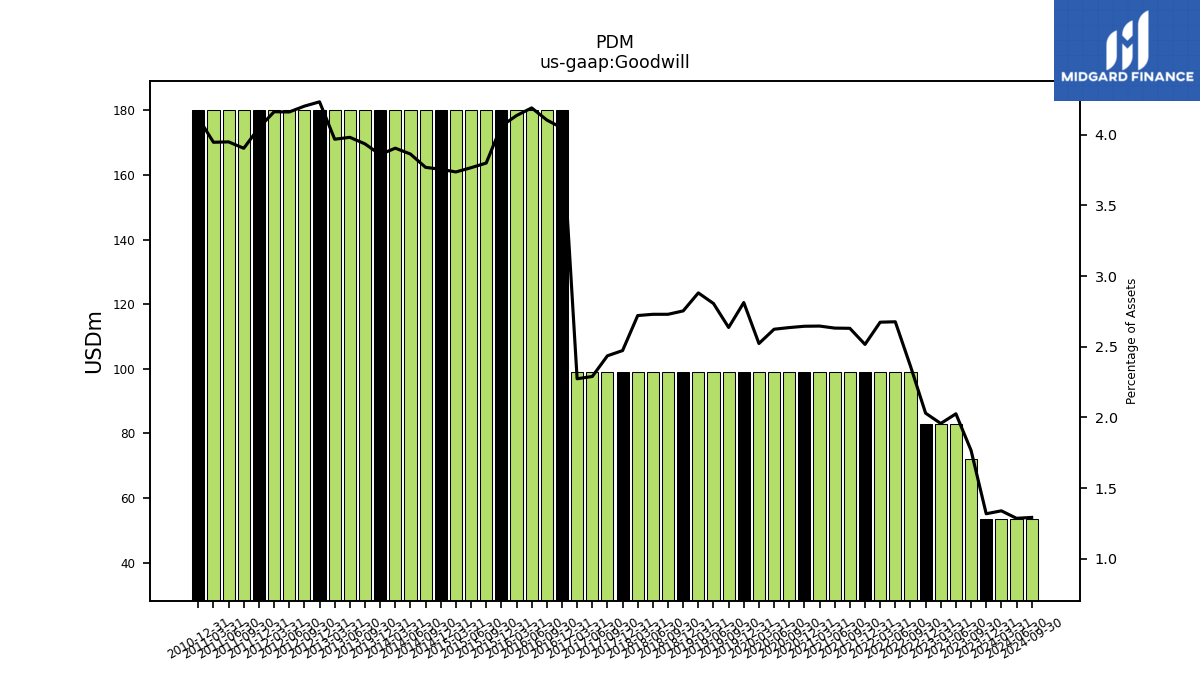
| Goodwill | 71.98 | 82.94 | 82.94 | 82.94 | 98.92 | 98.92 | 98.92 | 98.92 | 98.92 | 98.92 | 98.92 | 98.92 | 98.92 | 98.92 | 98.92 | 98.92 | 98.92 | 98.92 | 98.92 | 98.92 | 98.92 | 98.92 | 98.92 | 98.92 | 98.92 | 98.92 | 98.92 | 180.10 | 180.10 | 180.10 | 180.10 | 180.10 | 180.10 | 180.10 | 180.10 | 180.10 | 180.10 | 180.10 | 180.10 | 180.10 | 180.10 | 180.10 | 180.10 | 180.10 | 180.10 | 180.10 | 180.10 | 180.10 | 180.10 | 180.10 | 180.10 | 180.10 | NA | NA | NA | |
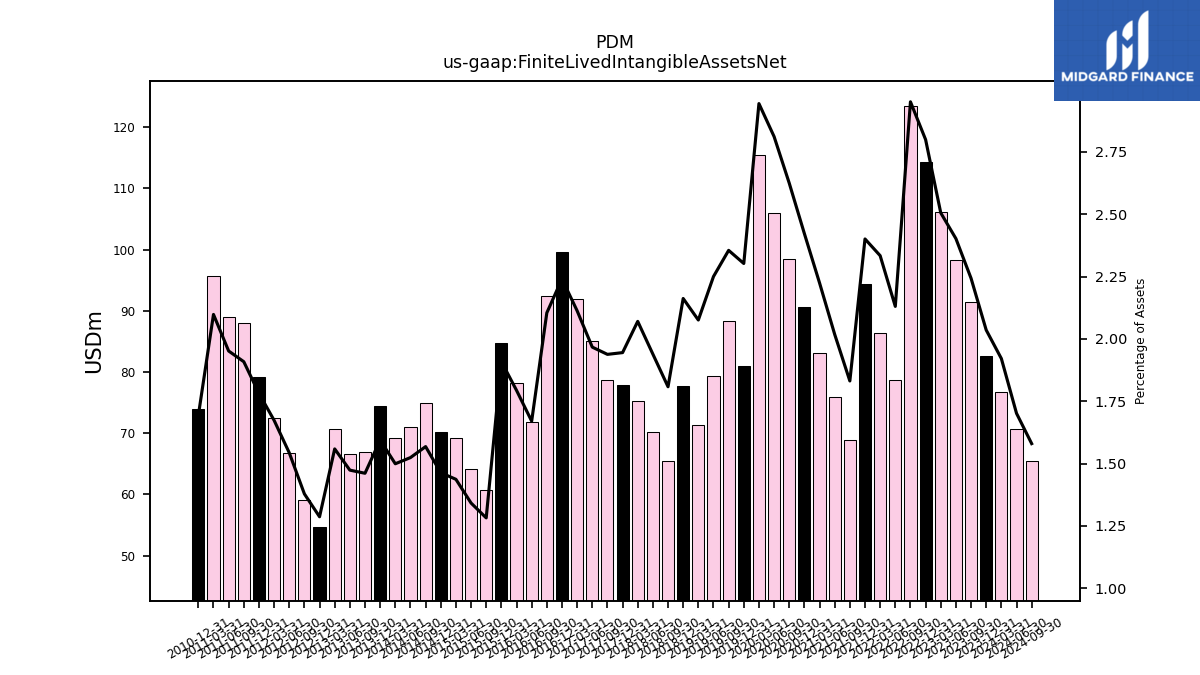
| Finite Lived Intangible Assets Net | 91.39 | 98.36 | 106.18 | 114.38 | 123.53 | 78.73 | 86.35 | 94.38 | 68.87 | 75.85 | 83.16 | 90.59 | 98.52 | 106.00 | 115.43 | 80.98 | 88.37 | 79.33 | 71.27 | 77.68 | 65.53 | 70.27 | 75.28 | 77.81 | 78.70 | 84.99 | 91.93 | 99.69 | 92.36 | 71.79 | 78.12 | 84.66 | 60.77 | 64.15 | 69.25 | 70.18 | 74.93 | 71.05 | 69.14 | 74.38 | 66.87 | 66.66 | 70.75 | 54.74 | 59.08 | 66.80 | 72.41 | 79.25 | 88.05 | 89.00 | 95.75 | 74.03 | NA | NA | NA |
| 2023-09-30 | 2023-06-30 | 2023-03-31 | 2022-12-31 | 2022-09-30 | 2022-06-30 | 2022-03-31 | 2021-12-31 | 2021-09-30 | 2021-06-30 | 2021-03-31 | 2020-12-31 | 2020-09-30 | 2020-06-30 | 2020-03-31 | 2019-12-31 | 2019-09-30 | 2019-06-30 | 2019-03-31 | 2018-12-31 | 2018-09-30 | 2018-06-30 | 2018-03-31 | 2017-12-31 | 2017-09-30 | 2017-06-30 | 2017-03-31 | 2016-12-31 | 2016-09-30 | 2016-06-30 | 2016-03-31 | 2015-12-31 | 2015-09-30 | 2015-06-30 | 2015-03-31 | 2014-12-31 | 2014-09-30 | 2014-06-30 | 2014-03-31 | 2013-12-31 | 2013-09-30 | 2013-06-30 | 2013-03-31 | 2012-12-31 | 2012-09-30 | 2012-06-30 | 2012-03-31 | 2011-12-31 | 2011-09-30 | 2011-06-30 | 2011-03-31 | 2010-12-31 | 2010-09-30 | 2010-06-30 | 2010-03-31 | ||
|---|---|---|---|---|---|---|---|---|---|---|---|---|---|---|---|---|---|---|---|---|---|---|---|---|---|---|---|---|---|---|---|---|---|---|---|---|---|---|---|---|---|---|---|---|---|---|---|---|---|---|---|---|---|---|---|---|
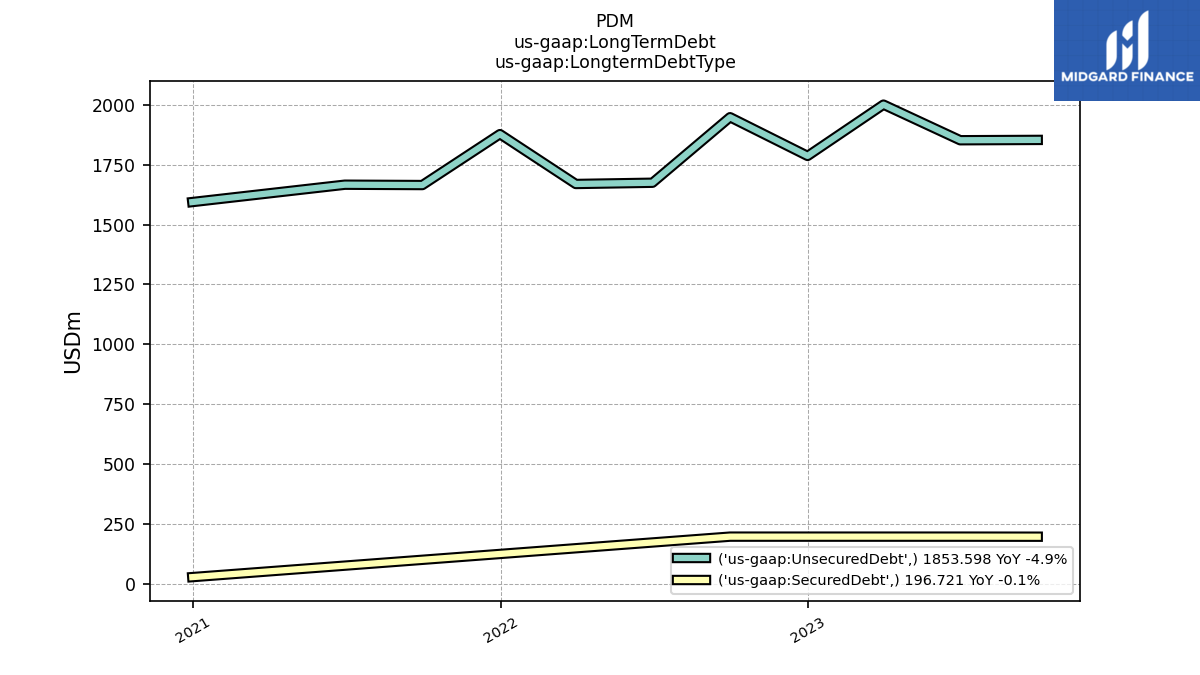
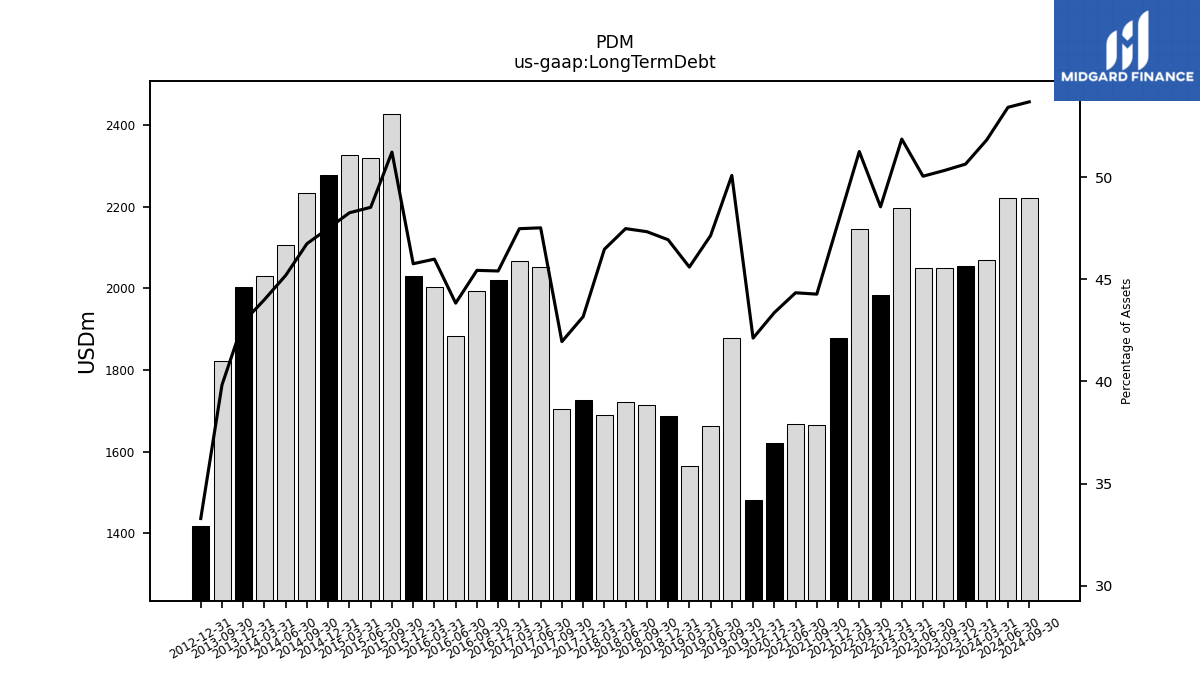
| Long Term Debt | 2050.32 | 2049.24 | 2197.95 | 1983.68 | 2145.41 | NA | NA | 1877.79 | 1665.10 | 1666.57 | NA | 1622.00 | NA | NA | NA | 1481.40 | 1879.24 | 1661.98 | 1565.76 | 1686.31 | 1715.37 | 1720.85 | 1689.64 | 1726.93 | 1703.59 | 2053.18 | 2065.81 | 2020.47 | 1994.08 | 1884.31 | 2002.92 | 2029.51 | 2428.32 | 2320.30 | 2326.11 | 2277.59 | 2233.84 | 2107.09 | 2029.82 | 2002.20 | 1823.17 | NA | NA | 1416.53 | NA | NA | NA | NA | NA | NA | NA | NA | NA | NA | NA | |
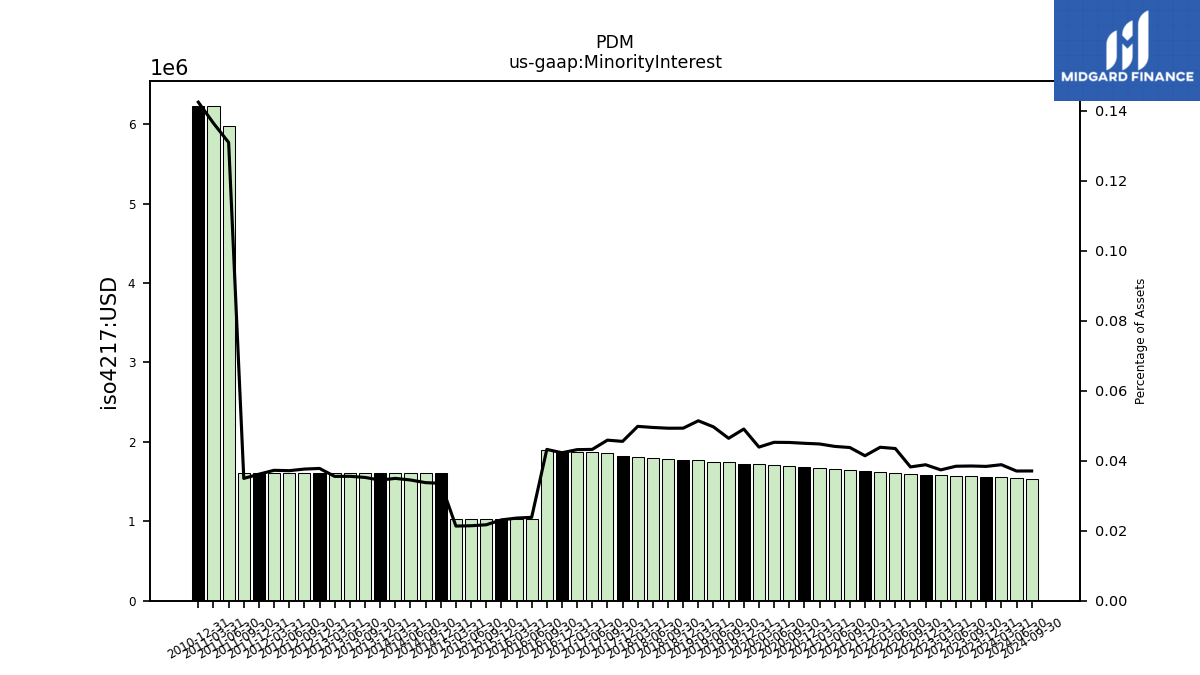
| Minority Interest | 1.57 | 1.57 | 1.58 | 1.59 | 1.60 | 1.61 | 1.62 | 1.63 | 1.65 | 1.66 | 1.68 | 1.68 | 1.70 | 1.71 | 1.72 | 1.73 | 1.74 | 1.75 | 1.77 | 1.77 | 1.79 | 1.79 | 1.81 | 1.82 | 1.86 | 1.87 | 1.88 | 1.88 | 1.90 | 1.02 | 1.03 | 1.02 | 1.03 | 1.02 | 1.03 | 1.61 | 1.61 | 1.61 | 1.61 | 1.61 | 1.61 | 1.61 | 1.61 | 1.61 | 1.61 | 1.61 | 1.61 | 1.61 | 1.61 | 5.97 | 6.23 | 6.23 | NA | NA | NA |
| 2023-09-30 | 2023-06-30 | 2023-03-31 | 2022-12-31 | 2022-09-30 | 2022-06-30 | 2022-03-31 | 2021-12-31 | 2021-09-30 | 2021-06-30 | 2021-03-31 | 2020-12-31 | 2020-09-30 | 2020-06-30 | 2020-03-31 | 2019-12-31 | 2019-09-30 | 2019-06-30 | 2019-03-31 | 2018-12-31 | 2018-09-30 | 2018-06-30 | 2018-03-31 | 2017-12-31 | 2017-09-30 | 2017-06-30 | 2017-03-31 | 2016-12-31 | 2016-09-30 | 2016-06-30 | 2016-03-31 | 2015-12-31 | 2015-09-30 | 2015-06-30 | 2015-03-31 | 2014-12-31 | 2014-09-30 | 2014-06-30 | 2014-03-31 | 2013-12-31 | 2013-09-30 | 2013-06-30 | 2013-03-31 | 2012-12-31 | 2012-09-30 | 2012-06-30 | 2012-03-31 | 2011-12-31 | 2011-09-30 | 2011-06-30 | 2011-03-31 | 2010-12-31 | 2010-09-30 | 2010-06-30 | 2010-03-31 | ||
|---|---|---|---|---|---|---|---|---|---|---|---|---|---|---|---|---|---|---|---|---|---|---|---|---|---|---|---|---|---|---|---|---|---|---|---|---|---|---|---|---|---|---|---|---|---|---|---|---|---|---|---|---|---|---|---|---|
| Stockholders Equity | 1765.50 | 1795.76 | 1818.51 | 1847.67 | 1795.73 | 1814.06 | 1828.85 | 1785.79 | 1858.97 | 1870.85 | 1885.67 | 1896.28 | 1928.23 | 1946.13 | 1781.99 | 1817.25 | 1679.04 | 1701.22 | 1721.76 | 1710.37 | 1732.21 | 1741.26 | 1787.78 | 1984.67 | 2172.13 | 2078.45 | 2085.22 | 2177.00 | 2167.09 | 2205.69 | 2158.63 | 2195.42 | 2091.71 | 2254.83 | 2284.89 | 2310.41 | 2337.23 | 2355.58 | 2377.34 | 2459.55 | 2519.07 | 2628.35 | 2621.01 | 2638.89 | 2663.67 | 2725.13 | 2775.05 | 2771.82 | 2712.51 | 2715.25 | 2747.29 | 2767.22 | NA | NA | NA | |
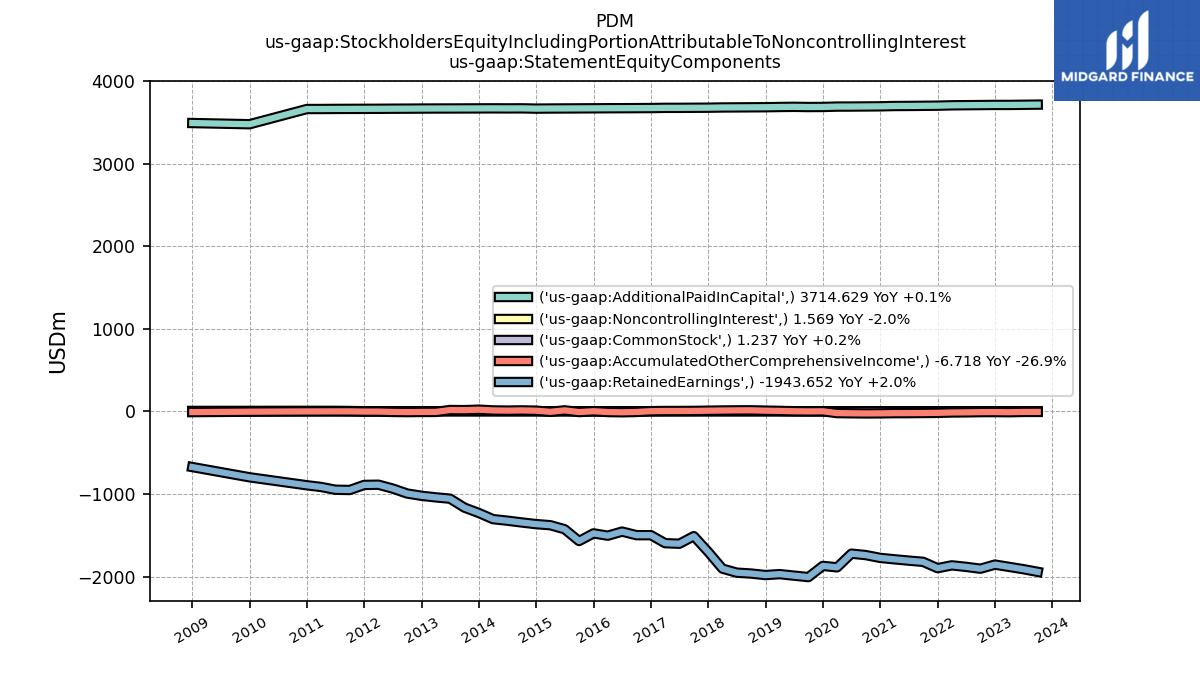
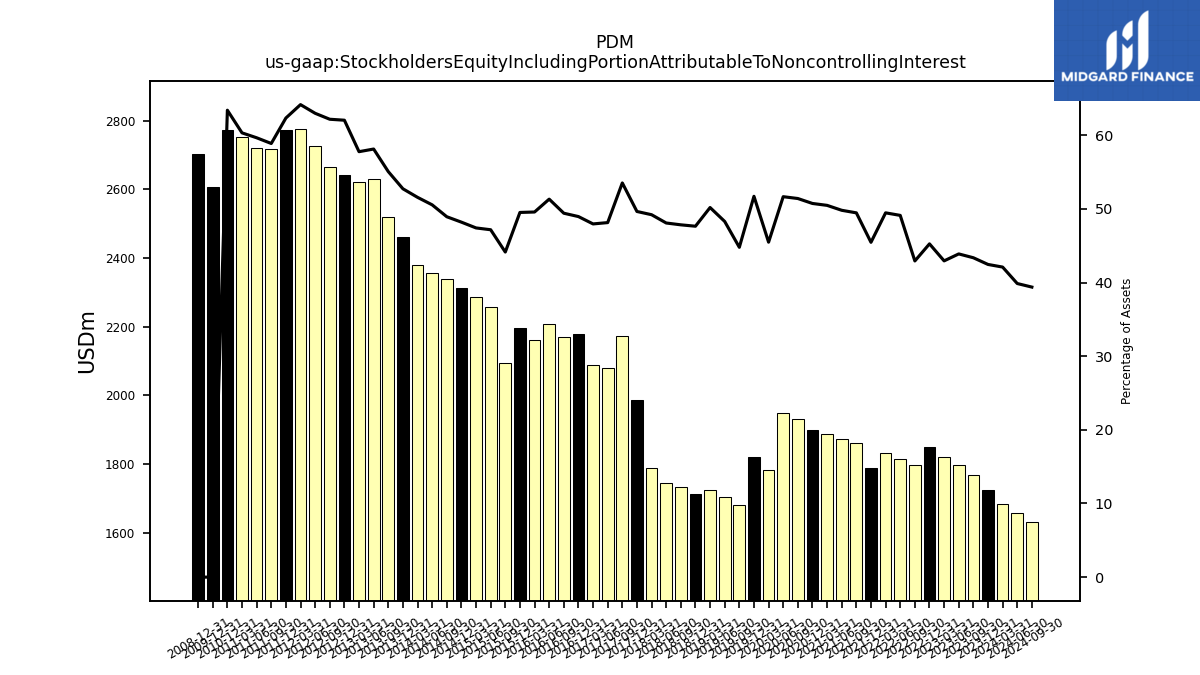
| Stockholders Equity Including Portion Attributable To Noncontrolling Interest | 1767.07 | 1797.33 | 1820.10 | 1849.26 | 1797.33 | 1815.66 | 1830.47 | 1787.42 | 1860.62 | 1872.51 | 1887.35 | 1897.96 | 1929.93 | 1947.84 | 1783.72 | 1818.97 | 1680.78 | 1702.97 | 1723.52 | 1712.14 | 1734.00 | 1743.06 | 1789.59 | 1986.49 | 2173.99 | 2080.31 | 2087.10 | 2178.88 | 2168.98 | 2206.71 | 2159.66 | 2196.44 | 2092.74 | 2255.85 | 2285.92 | 2312.01 | 2338.85 | 2357.18 | 2378.96 | 2461.16 | 2520.68 | 2629.96 | 2622.62 | 2640.49 | 2665.28 | 2726.74 | 2776.66 | 2773.43 | 2716.92 | 2721.22 | 2753.52 | 2773.45 | NA | NA | NA | |
| Common Stock Value | 1.24 | 1.24 | 1.24 | 1.23 | 1.23 | 1.23 | 1.23 | 1.23 | 1.24 | 1.24 | 1.24 | 1.24 | 1.26 | 1.26 | 1.26 | 1.26 | 1.26 | 1.26 | 1.26 | 1.26 | 1.28 | 1.28 | 1.30 | 1.42 | 1.45 | 1.46 | 1.45 | 1.45 | 1.45 | 1.45 | 1.45 | 1.46 | 1.46 | 1.52 | 1.54 | 1.54 | 1.54 | 1.54 | 1.54 | 1.57 | 1.61 | 1.67 | 1.68 | 1.68 | 1.68 | 1.70 | 1.73 | 1.73 | 1.73 | 1.73 | NA | 1.73 | NA | NA | NA | |
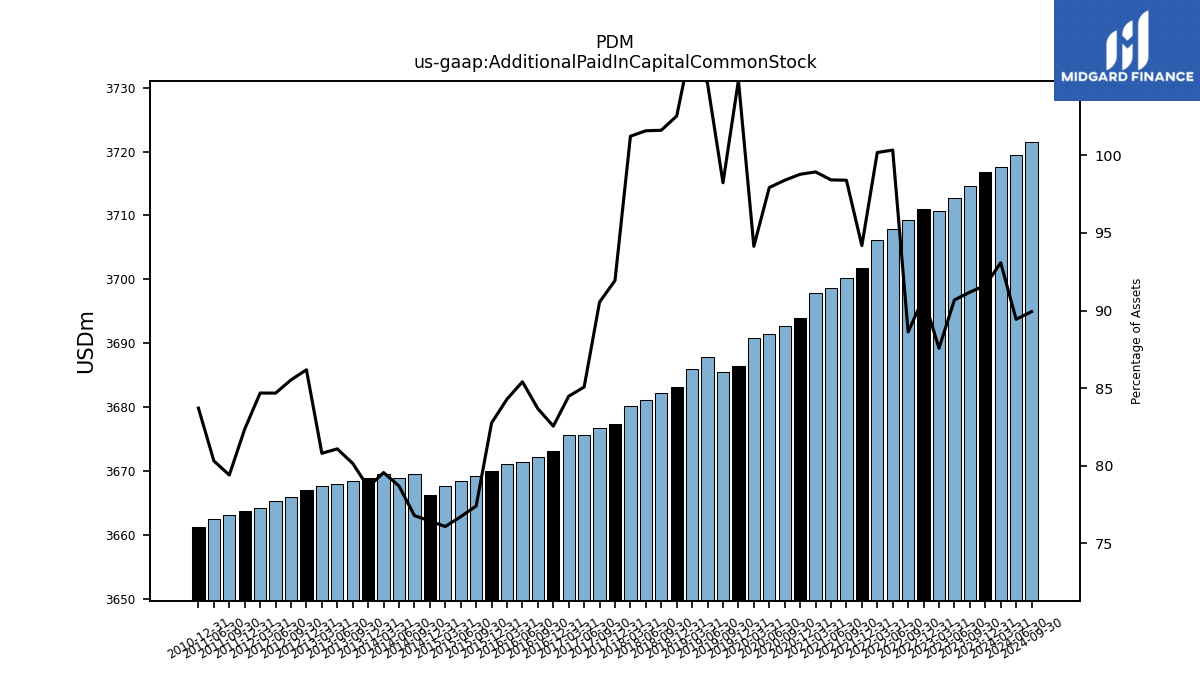
| Additional Paid In Capital Common Stock | 3714.63 | 3712.69 | 3710.77 | 3711.01 | 3709.23 | 3707.83 | 3706.21 | 3701.80 | 3700.21 | 3698.66 | 3697.80 | 3694.00 | 3692.63 | 3691.38 | 3690.82 | 3686.40 | 3685.50 | 3687.88 | 3686.02 | 3683.19 | 3682.21 | 3681.13 | 3680.24 | 3677.36 | 3676.71 | 3675.56 | 3675.57 | 3673.13 | 3672.22 | 3671.47 | 3671.05 | 3669.98 | 3669.15 | 3668.38 | 3667.57 | 3666.18 | 3669.54 | 3668.84 | 3669.56 | 3668.91 | 3668.42 | 3667.97 | 3667.61 | 3667.05 | 3665.87 | 3665.28 | 3664.20 | 3663.66 | 3663.16 | 3662.52 | NA | 3661.31 | NA | NA | NA | |
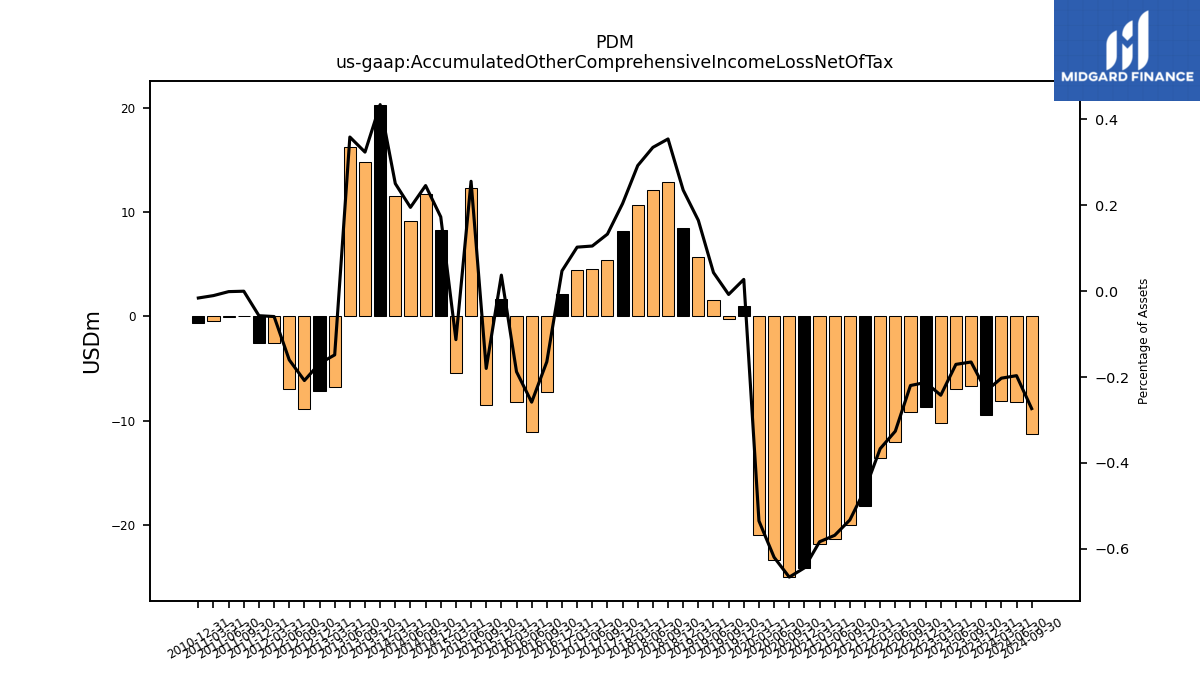
| Accumulated Other Comprehensive Income Loss Net Of Tax | -6.72 | -6.98 | -10.27 | -8.68 | -9.19 | -12.05 | -13.57 | -18.15 | -20.04 | -21.37 | -21.81 | -24.10 | -24.99 | -23.36 | -20.98 | 0.97 | -0.28 | 1.53 | 5.67 | 8.46 | 12.85 | 12.14 | 10.64 | 8.16 | 5.40 | 4.55 | 4.47 | 2.10 | -7.21 | -11.11 | -8.17 | 1.66 | -8.52 | 12.24 | -5.44 | 8.30 | 11.76 | 9.10 | 11.56 | 20.28 | 14.83 | 16.25 | -6.73 | -7.16 | -8.92 | -6.92 | -2.55 | -2.54 | 0.00 | -0.04 | -0.47 | -0.69 | NA | NA | NA | |
| Minority Interest | 1.57 | 1.57 | 1.58 | 1.59 | 1.60 | 1.61 | 1.62 | 1.63 | 1.65 | 1.66 | 1.68 | 1.68 | 1.70 | 1.71 | 1.72 | 1.73 | 1.74 | 1.75 | 1.77 | 1.77 | 1.79 | 1.79 | 1.81 | 1.82 | 1.86 | 1.87 | 1.88 | 1.88 | 1.90 | 1.02 | 1.03 | 1.02 | 1.03 | 1.02 | 1.03 | 1.61 | 1.61 | 1.61 | 1.61 | 1.61 | 1.61 | 1.61 | 1.61 | 1.61 | 1.61 | 1.61 | 1.61 | 1.61 | 1.61 | 5.97 | 6.23 | 6.23 | NA | NA | NA |
| 2023-09-30 | 2023-06-30 | 2023-03-31 | 2022-12-31 | 2022-09-30 | 2022-06-30 | 2022-03-31 | 2021-12-31 | 2021-09-30 | 2021-06-30 | 2021-03-31 | 2020-12-31 | 2020-09-30 | 2020-06-30 | 2020-03-31 | 2019-12-31 | 2019-09-30 | 2019-06-30 | 2019-03-31 | 2018-12-31 | 2018-09-30 | 2018-06-30 | 2018-03-31 | 2017-12-31 | 2017-09-30 | 2017-06-30 | 2017-03-31 | 2016-12-31 | 2016-09-30 | 2016-06-30 | 2016-03-31 | 2015-12-31 | 2015-09-30 | 2015-06-30 | 2015-03-31 | 2014-12-31 | 2014-09-30 | 2014-06-30 | 2014-03-31 | 2013-12-31 | 2013-09-30 | 2013-06-30 | 2013-03-31 | 2012-12-31 | 2012-09-30 | 2012-06-30 | 2012-03-31 | 2011-12-31 | 2011-09-30 | 2011-06-30 | 2011-03-31 | 2010-12-31 | 2010-09-30 | 2010-06-30 | 2010-03-31 | ||
|---|---|---|---|---|---|---|---|---|---|---|---|---|---|---|---|---|---|---|---|---|---|---|---|---|---|---|---|---|---|---|---|---|---|---|---|---|---|---|---|---|---|---|---|---|---|---|---|---|---|---|---|---|---|---|---|---|
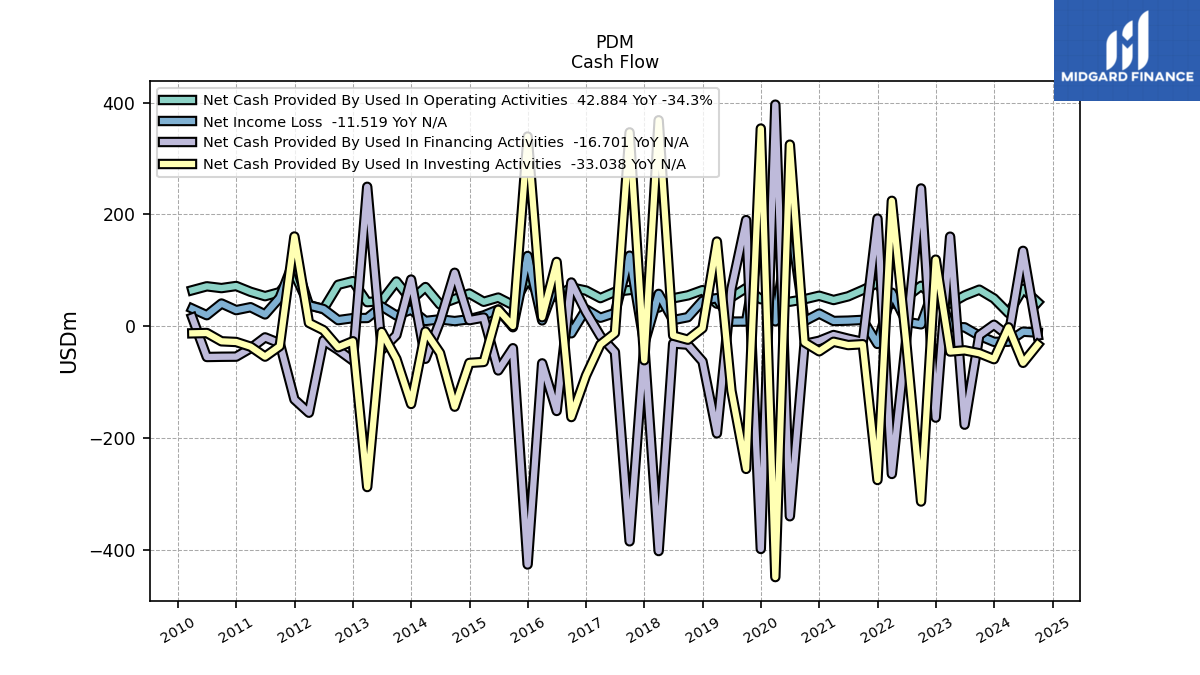
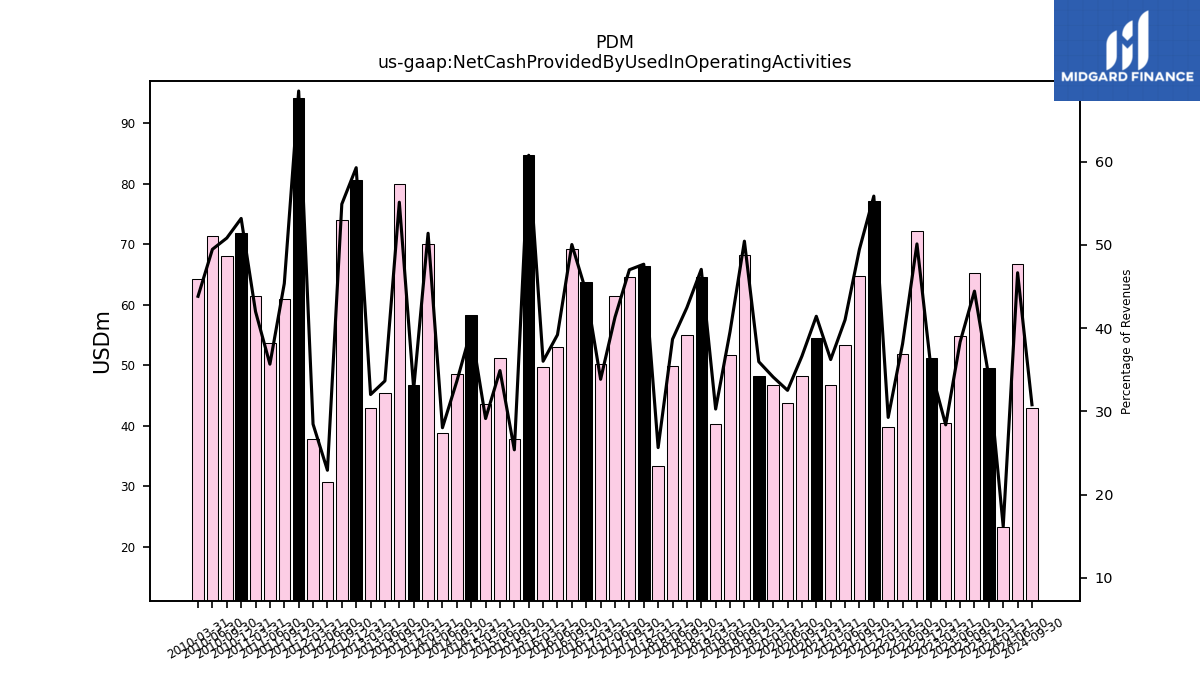
| Net Cash Provided By Used In Operating Activities | 65.31 | 54.82 | 40.40 | 51.23 | 72.21 | 51.93 | 39.85 | 77.17 | 64.84 | 53.37 | 46.82 | 54.47 | 48.23 | 43.78 | 46.80 | 48.24 | 68.30 | 51.70 | 40.24 | 64.55 | 55.08 | 49.94 | 33.31 | 66.47 | 64.67 | 61.41 | 50.25 | 63.77 | 69.29 | 53.04 | 49.71 | 84.74 | 37.76 | 51.20 | 43.63 | 58.37 | 48.62 | 38.84 | 70.05 | 46.73 | 79.99 | 45.36 | 43.00 | 80.65 | 74.05 | 30.65 | 37.91 | 94.15 | 60.96 | 53.69 | 61.53 | 71.90 | 68.15 | 71.36 | 64.34 | |
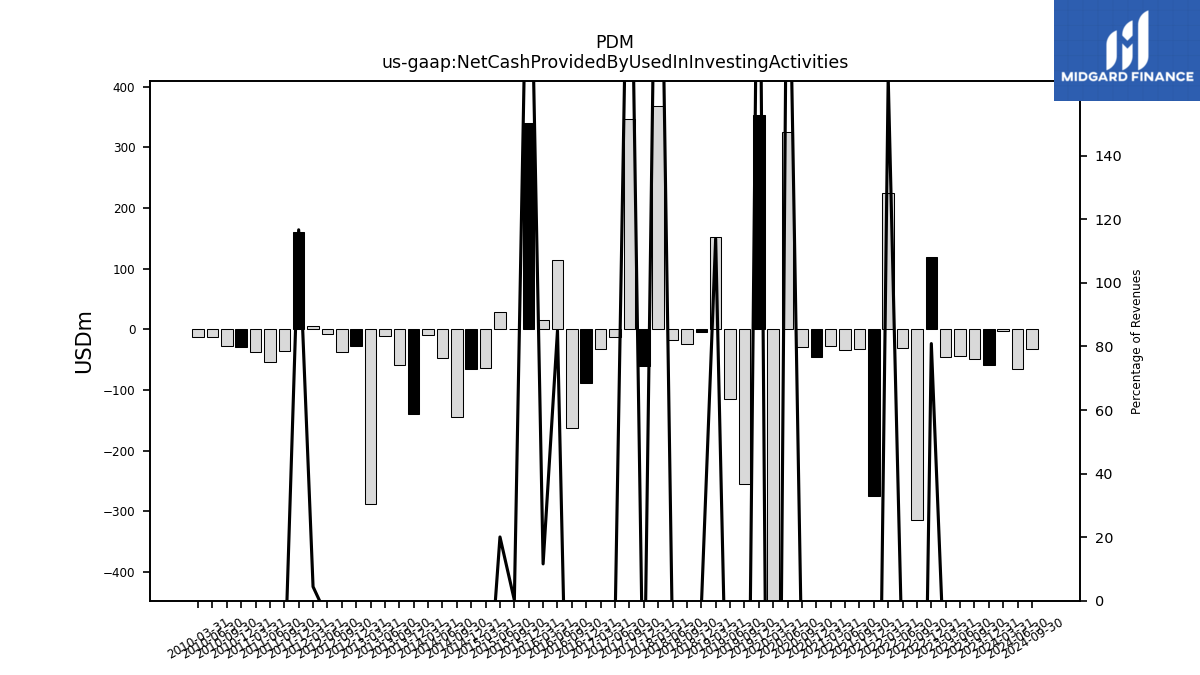
| Net Cash Provided By Used In Investing Activities | -48.41 | -43.19 | -45.40 | 119.11 | -313.65 | -31.00 | 224.29 | -275.13 | -32.22 | -33.76 | -27.81 | -44.92 | -28.94 | 324.79 | -448.81 | 353.54 | -255.29 | -115.34 | 151.46 | -3.57 | -24.14 | -16.89 | 368.38 | -60.93 | 346.69 | -12.32 | -32.82 | -88.29 | -162.58 | 115.00 | 16.00 | 339.26 | 0.31 | 29.44 | -63.97 | -65.69 | -143.98 | -47.83 | -9.45 | -139.16 | -58.63 | -10.29 | -287.75 | -26.89 | -37.70 | -7.10 | 5.89 | 160.47 | -35.70 | -54.48 | -36.57 | -28.26 | -27.01 | -12.18 | -12.74 | |
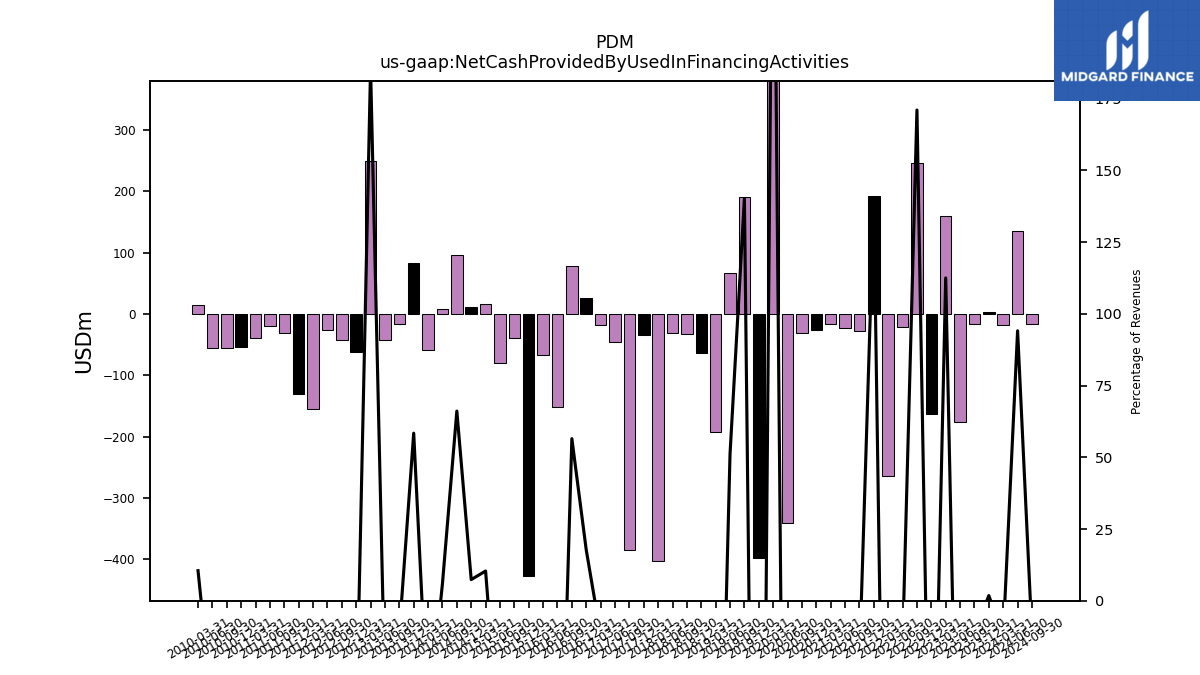
| Net Cash Provided By Used In Financing Activities | -16.10 | -176.19 | 160.18 | -163.58 | 246.43 | -21.74 | -264.33 | 192.54 | -28.04 | -22.34 | -15.79 | -26.08 | -31.79 | -340.01 | 396.30 | -398.50 | 189.87 | 66.81 | -191.68 | -63.12 | -33.12 | -30.88 | -402.25 | -34.10 | -384.85 | -46.30 | -17.62 | 25.48 | 78.22 | -151.66 | -66.42 | -426.26 | -39.37 | -79.13 | 15.51 | 10.82 | 95.61 | 8.28 | -58.31 | 83.43 | -15.88 | -42.15 | 249.37 | -61.56 | -42.45 | -25.36 | -154.81 | -131.07 | -30.54 | -19.96 | -39.53 | -54.46 | -54.66 | -55.11 | 15.39 |
| 2023-09-30 | 2023-06-30 | 2023-03-31 | 2022-12-31 | 2022-09-30 | 2022-06-30 | 2022-03-31 | 2021-12-31 | 2021-09-30 | 2021-06-30 | 2021-03-31 | 2020-12-31 | 2020-09-30 | 2020-06-30 | 2020-03-31 | 2019-12-31 | 2019-09-30 | 2019-06-30 | 2019-03-31 | 2018-12-31 | 2018-09-30 | 2018-06-30 | 2018-03-31 | 2017-12-31 | 2017-09-30 | 2017-06-30 | 2017-03-31 | 2016-12-31 | 2016-09-30 | 2016-06-30 | 2016-03-31 | 2015-12-31 | 2015-09-30 | 2015-06-30 | 2015-03-31 | 2014-12-31 | 2014-09-30 | 2014-06-30 | 2014-03-31 | 2013-12-31 | 2013-09-30 | 2013-06-30 | 2013-03-31 | 2012-12-31 | 2012-09-30 | 2012-06-30 | 2012-03-31 | 2011-12-31 | 2011-09-30 | 2011-06-30 | 2011-03-31 | 2010-12-31 | 2010-09-30 | 2010-06-30 | 2010-03-31 | ||
|---|---|---|---|---|---|---|---|---|---|---|---|---|---|---|---|---|---|---|---|---|---|---|---|---|---|---|---|---|---|---|---|---|---|---|---|---|---|---|---|---|---|---|---|---|---|---|---|---|---|---|---|---|---|---|---|---|
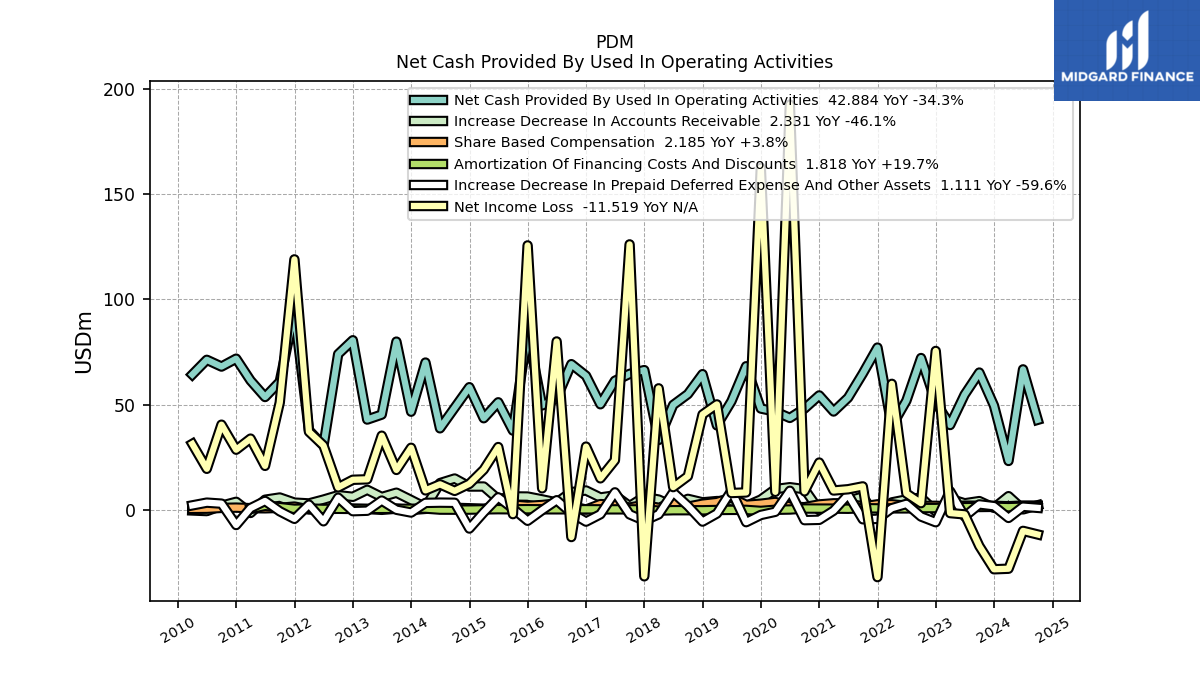
| Net Cash Provided By Used In Operating Activities | 65.31 | 54.82 | 40.40 | 51.23 | 72.21 | 51.93 | 39.85 | 77.17 | 64.84 | 53.37 | 46.82 | 54.47 | 48.23 | 43.78 | 46.80 | 48.24 | 68.30 | 51.70 | 40.24 | 64.55 | 55.08 | 49.94 | 33.31 | 66.47 | 64.67 | 61.41 | 50.25 | 63.77 | 69.29 | 53.04 | 49.71 | 84.74 | 37.76 | 51.20 | 43.63 | 58.37 | 48.62 | 38.84 | 70.05 | 46.73 | 79.99 | 45.36 | 43.00 | 80.65 | 74.05 | 30.65 | 37.91 | 94.15 | 60.96 | 53.69 | 61.53 | 71.90 | 68.15 | 71.36 | 64.34 | |
| Net Income Loss | -17.00 | -1.99 | -1.37 | 75.57 | 3.33 | 7.97 | 59.96 | -31.75 | 11.31 | 9.95 | 9.34 | 22.61 | 8.94 | 192.43 | 8.71 | 162.48 | 8.42 | 8.15 | 50.21 | 45.41 | 16.11 | 10.94 | 57.83 | -31.38 | 126.13 | 23.71 | 15.10 | 30.19 | -12.75 | 80.07 | 10.37 | 125.64 | -1.88 | 29.98 | 19.25 | 12.51 | 9.16 | 12.28 | 9.39 | 29.62 | 19.10 | 35.36 | 14.65 | 14.44 | 10.83 | 30.71 | 37.23 | 119.02 | 51.03 | 21.03 | 33.97 | 28.70 | 40.58 | 19.64 | 31.46 | |
| Profit Loss | -17.00 | -1.99 | -1.36 | 75.57 | 3.33 | 7.96 | 59.96 | -31.75 | 11.30 | 9.94 | 9.34 | 22.61 | 8.94 | 192.43 | 8.71 | 162.48 | 8.42 | 8.15 | 50.21 | 45.41 | 16.11 | 10.94 | 57.83 | -31.39 | 126.13 | 23.71 | 15.10 | 30.18 | -12.76 | 80.08 | 10.38 | 95.66 | -1.87 | 29.98 | 19.25 | 12.52 | 9.17 | 12.28 | 9.40 | 29.63 | 19.10 | 35.36 | 14.65 | 14.44 | 10.84 | 30.71 | 37.23 | 119.02 | 51.03 | 21.15 | 34.09 | 28.70 | 40.59 | 19.76 | 31.59 | |
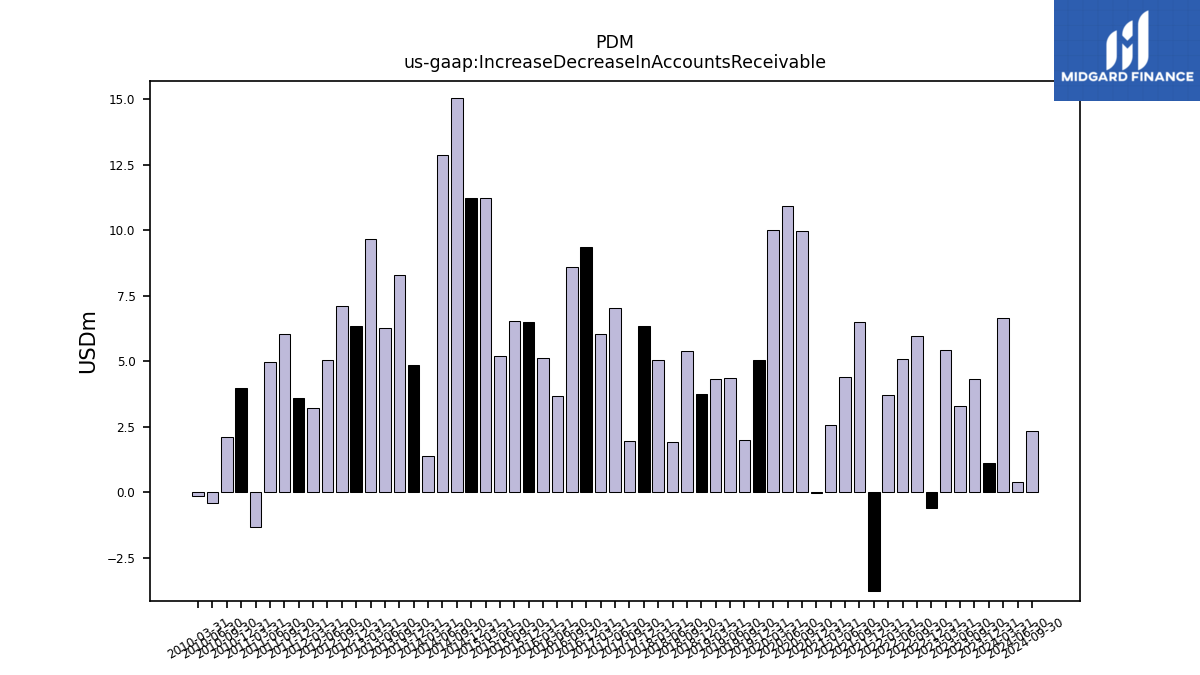
| Increase Decrease In Accounts Receivable | 4.32 | 3.27 | 5.42 | -0.60 | 5.96 | 5.09 | 3.71 | -3.76 | 6.49 | 4.40 | 2.56 | -0.01 | 9.97 | 10.91 | 10.01 | 5.05 | 1.98 | 4.35 | 4.33 | 3.73 | 5.39 | 1.93 | 5.05 | 6.35 | 1.96 | 7.04 | 6.04 | 9.35 | 8.60 | 3.66 | 5.13 | 6.48 | 6.55 | 5.21 | 11.23 | 11.23 | 15.04 | 12.87 | 1.37 | 4.84 | 8.30 | 6.27 | 9.69 | 6.36 | 7.10 | 5.04 | 3.22 | 3.60 | 6.02 | 4.98 | -1.31 | 3.99 | 2.12 | -0.42 | -0.13 | |
| Share Based Compensation | 2.10 | 2.16 | 1.76 | 2.09 | 2.01 | 2.05 | 2.81 | 2.78 | 1.75 | 3.18 | 3.27 | 2.74 | 1.44 | 1.65 | 3.90 | 3.08 | 2.53 | 6.00 | 3.83 | 3.07 | 1.67 | 3.98 | 1.02 | 2.54 | 1.25 | 2.51 | 2.90 | 0.30 | 1.98 | 3.18 | 2.47 | 2.05 | 2.61 | 1.69 | 0.72 | 0.93 | 1.14 | 1.27 | 0.64 | 0.10 | 0.72 | 0.18 | 0.59 | 0.75 | 0.87 | 0.29 | 0.33 | 1.73 | 1.11 | 0.90 | 0.97 | 1.22 | 1.09 | 0.71 | 0.65 |
| 2023-09-30 | 2023-06-30 | 2023-03-31 | 2022-12-31 | 2022-09-30 | 2022-06-30 | 2022-03-31 | 2021-12-31 | 2021-09-30 | 2021-06-30 | 2021-03-31 | 2020-12-31 | 2020-09-30 | 2020-06-30 | 2020-03-31 | 2019-12-31 | 2019-09-30 | 2019-06-30 | 2019-03-31 | 2018-12-31 | 2018-09-30 | 2018-06-30 | 2018-03-31 | 2017-12-31 | 2017-09-30 | 2017-06-30 | 2017-03-31 | 2016-12-31 | 2016-09-30 | 2016-06-30 | 2016-03-31 | 2015-12-31 | 2015-09-30 | 2015-06-30 | 2015-03-31 | 2014-12-31 | 2014-09-30 | 2014-06-30 | 2014-03-31 | 2013-12-31 | 2013-09-30 | 2013-06-30 | 2013-03-31 | 2012-12-31 | 2012-09-30 | 2012-06-30 | 2012-03-31 | 2011-12-31 | 2011-09-30 | 2011-06-30 | 2011-03-31 | 2010-12-31 | 2010-09-30 | 2010-06-30 | 2010-03-31 | ||
|---|---|---|---|---|---|---|---|---|---|---|---|---|---|---|---|---|---|---|---|---|---|---|---|---|---|---|---|---|---|---|---|---|---|---|---|---|---|---|---|---|---|---|---|---|---|---|---|---|---|---|---|---|---|---|---|---|
| Net Cash Provided By Used In Investing Activities | -48.41 | -43.19 | -45.40 | 119.11 | -313.65 | -31.00 | 224.29 | -275.13 | -32.22 | -33.76 | -27.81 | -44.92 | -28.94 | 324.79 | -448.81 | 353.54 | -255.29 | -115.34 | 151.46 | -3.57 | -24.14 | -16.89 | 368.38 | -60.93 | 346.69 | -12.32 | -32.82 | -88.29 | -162.58 | 115.00 | 16.00 | 339.26 | 0.31 | 29.44 | -63.97 | -65.69 | -143.98 | -47.83 | -9.45 | -139.16 | -58.63 | -10.29 | -287.75 | -26.89 | -37.70 | -7.10 | 5.89 | 160.47 | -35.70 | -54.48 | -36.57 | -28.26 | -27.01 | -12.18 | -12.74 |
| 2023-09-30 | 2023-06-30 | 2023-03-31 | 2022-12-31 | 2022-09-30 | 2022-06-30 | 2022-03-31 | 2021-12-31 | 2021-09-30 | 2021-06-30 | 2021-03-31 | 2020-12-31 | 2020-09-30 | 2020-06-30 | 2020-03-31 | 2019-12-31 | 2019-09-30 | 2019-06-30 | 2019-03-31 | 2018-12-31 | 2018-09-30 | 2018-06-30 | 2018-03-31 | 2017-12-31 | 2017-09-30 | 2017-06-30 | 2017-03-31 | 2016-12-31 | 2016-09-30 | 2016-06-30 | 2016-03-31 | 2015-12-31 | 2015-09-30 | 2015-06-30 | 2015-03-31 | 2014-12-31 | 2014-09-30 | 2014-06-30 | 2014-03-31 | 2013-12-31 | 2013-09-30 | 2013-06-30 | 2013-03-31 | 2012-12-31 | 2012-09-30 | 2012-06-30 | 2012-03-31 | 2011-12-31 | 2011-09-30 | 2011-06-30 | 2011-03-31 | 2010-12-31 | 2010-09-30 | 2010-06-30 | 2010-03-31 | ||
|---|---|---|---|---|---|---|---|---|---|---|---|---|---|---|---|---|---|---|---|---|---|---|---|---|---|---|---|---|---|---|---|---|---|---|---|---|---|---|---|---|---|---|---|---|---|---|---|---|---|---|---|---|---|---|---|---|
| Net Cash Provided By Used In Financing Activities | -16.10 | -176.19 | 160.18 | -163.58 | 246.43 | -21.74 | -264.33 | 192.54 | -28.04 | -22.34 | -15.79 | -26.08 | -31.79 | -340.01 | 396.30 | -398.50 | 189.87 | 66.81 | -191.68 | -63.12 | -33.12 | -30.88 | -402.25 | -34.10 | -384.85 | -46.30 | -17.62 | 25.48 | 78.22 | -151.66 | -66.42 | -426.26 | -39.37 | -79.13 | 15.51 | 10.82 | 95.61 | 8.28 | -58.31 | 83.43 | -15.88 | -42.15 | 249.37 | -61.56 | -42.45 | -25.36 | -154.81 | -131.07 | -30.54 | -19.96 | -39.53 | -54.46 | -54.66 | -55.11 | 15.39 | |
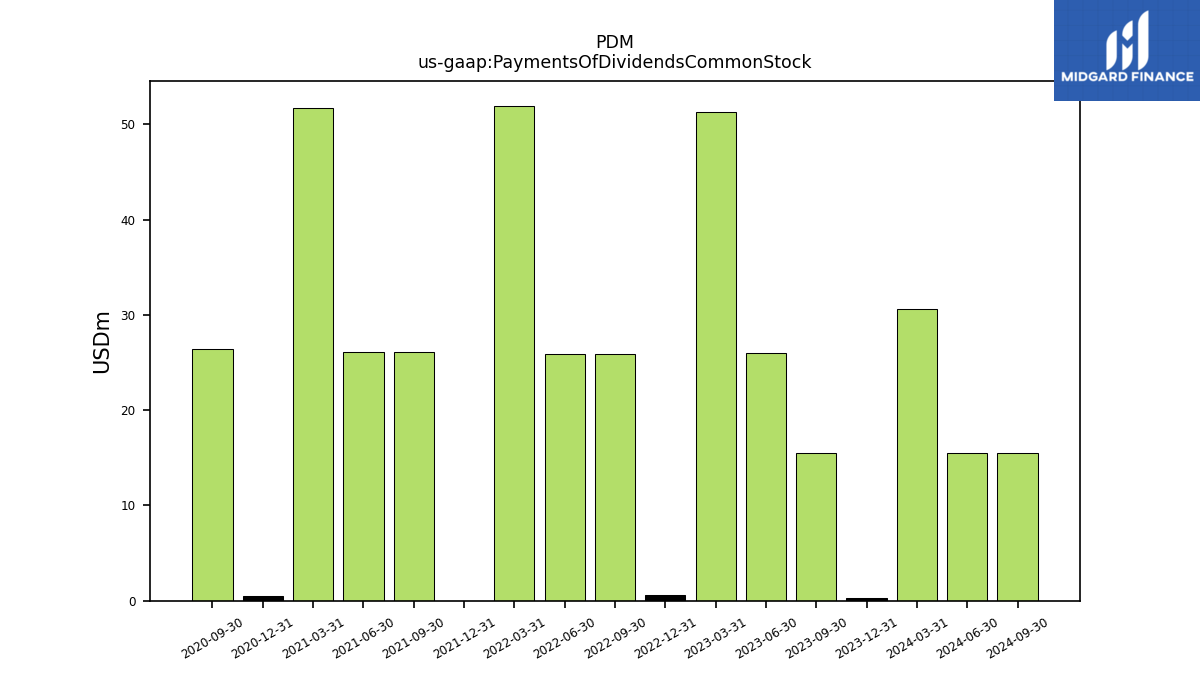
| Payments Of Dividends Common Stock | 15.47 | 25.99 | 51.33 | 0.57 | 25.92 | 25.93 | 51.95 | 0.01 | 26.07 | 26.08 | 51.74 | 0.48 | 26.47 | NA | NA | NA | NA | NA | NA | NA | NA | NA | NA | NA | NA | NA | NA | NA | NA | NA | NA | NA | NA | NA | NA | NA | NA | NA | NA | NA | NA | NA | NA | NA | NA | NA | NA | NA | NA | NA | NA | NA | NA | NA | NA |
| 2023-09-30 | 2023-06-30 | 2023-03-31 | 2022-12-31 | 2022-09-30 | 2022-06-30 | 2022-03-31 | 2021-12-31 | 2021-09-30 | 2021-06-30 | 2021-03-31 | 2020-12-31 | 2020-09-30 | 2020-06-30 | 2020-03-31 | 2019-12-31 | 2019-09-30 | 2019-06-30 | 2019-03-31 | 2018-12-31 | 2018-09-30 | 2018-06-30 | 2018-03-31 | 2017-12-31 | 2017-09-30 | 2017-06-30 | 2017-03-31 | 2016-12-31 | 2016-09-30 | 2016-06-30 | 2016-03-31 | 2015-12-31 | 2015-09-30 | 2015-06-30 | 2015-03-31 | 2014-12-31 | 2014-09-30 | 2014-06-30 | 2014-03-31 | 2013-12-31 | 2013-09-30 | 2013-06-30 | 2013-03-31 | 2012-12-31 | 2012-09-30 | 2012-06-30 | 2012-03-31 | 2011-12-31 | 2011-09-30 | 2011-06-30 | 2011-03-31 | 2010-12-31 | 2010-09-30 | 2010-06-30 | 2010-03-31 | ||
|---|---|---|---|---|---|---|---|---|---|---|---|---|---|---|---|---|---|---|---|---|---|---|---|---|---|---|---|---|---|---|---|---|---|---|---|---|---|---|---|---|---|---|---|---|---|---|---|---|---|---|---|---|---|---|---|---|
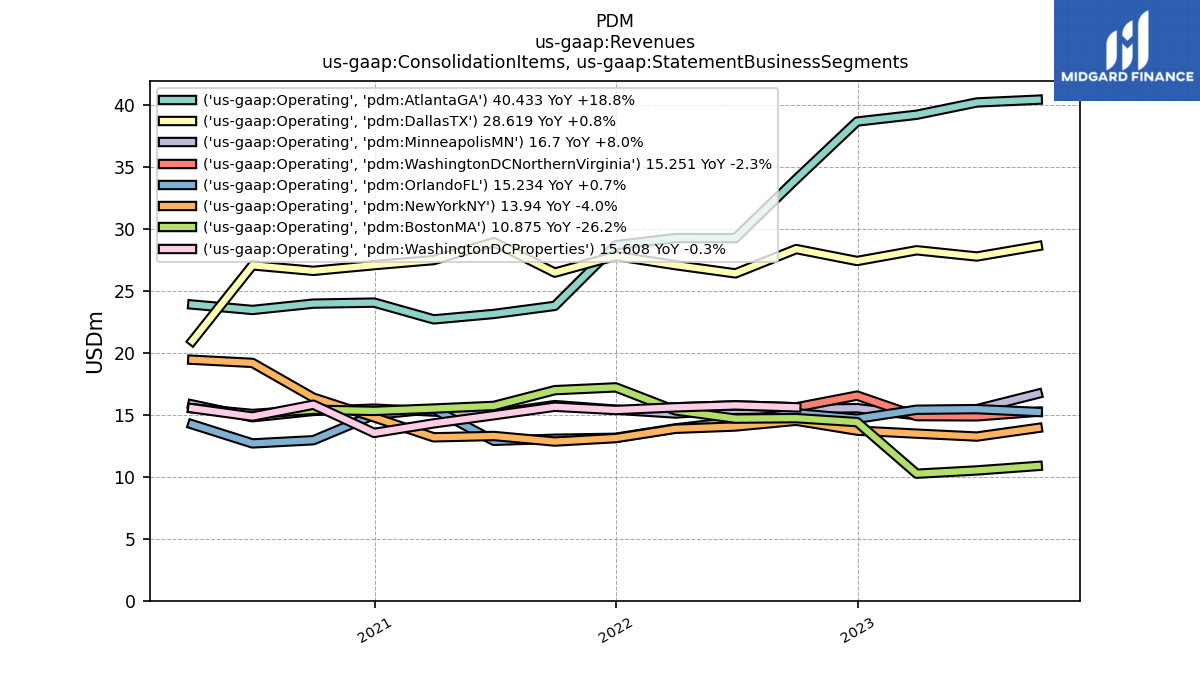
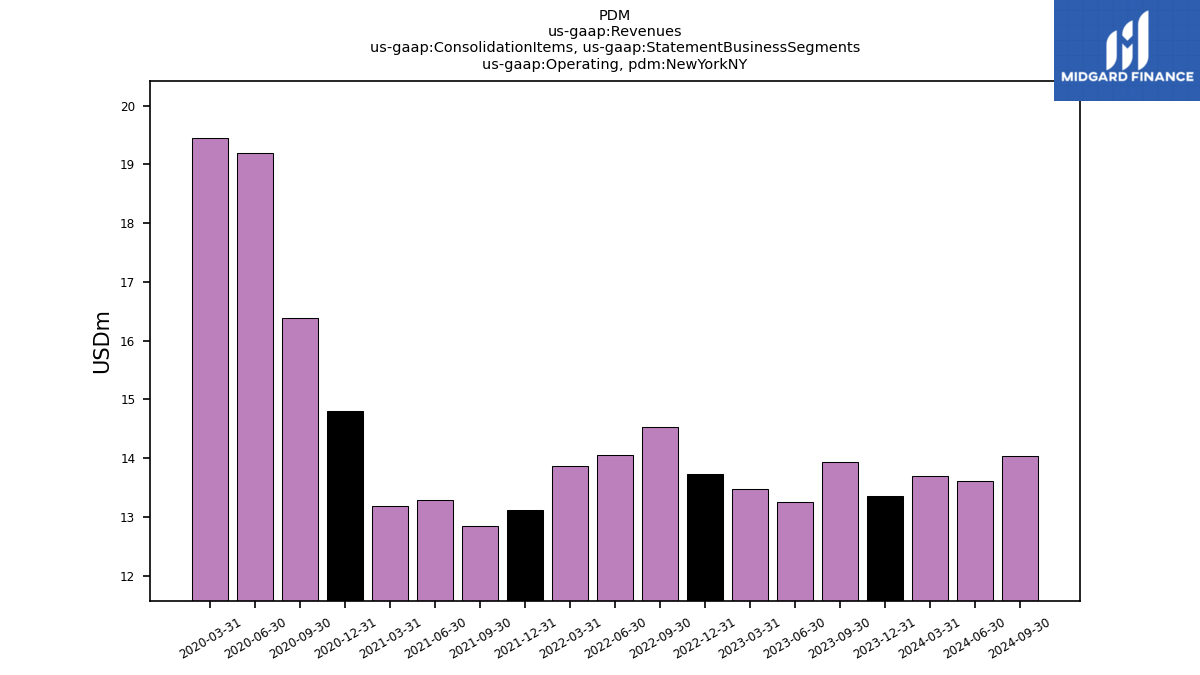
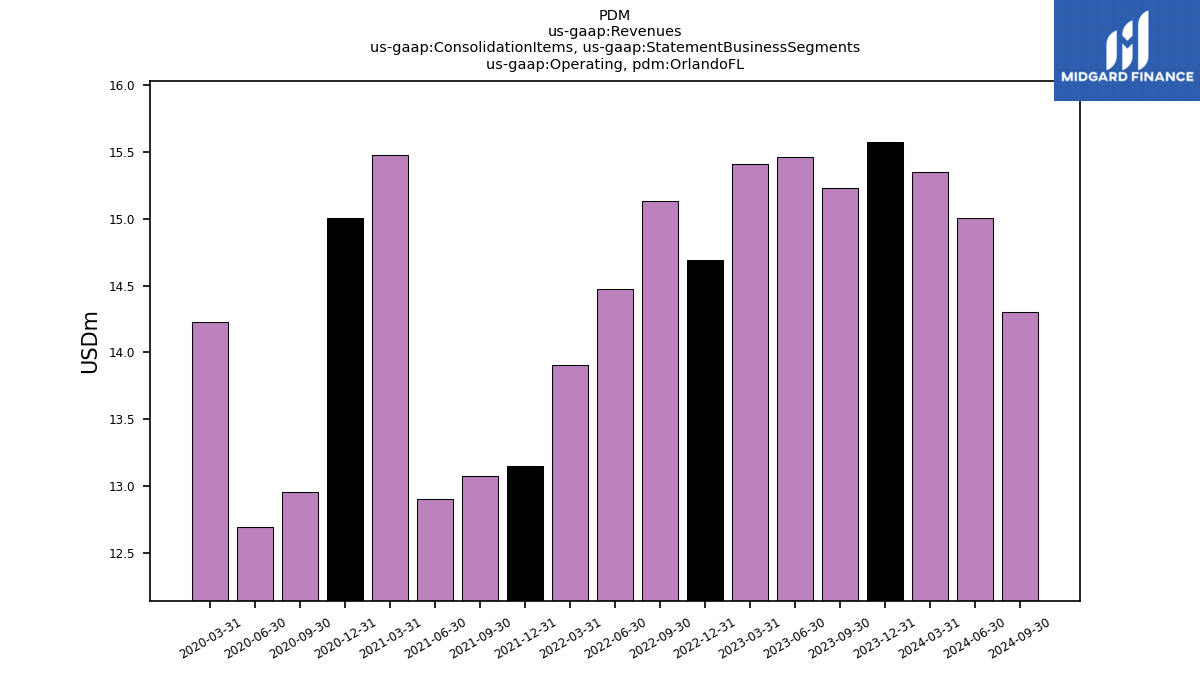
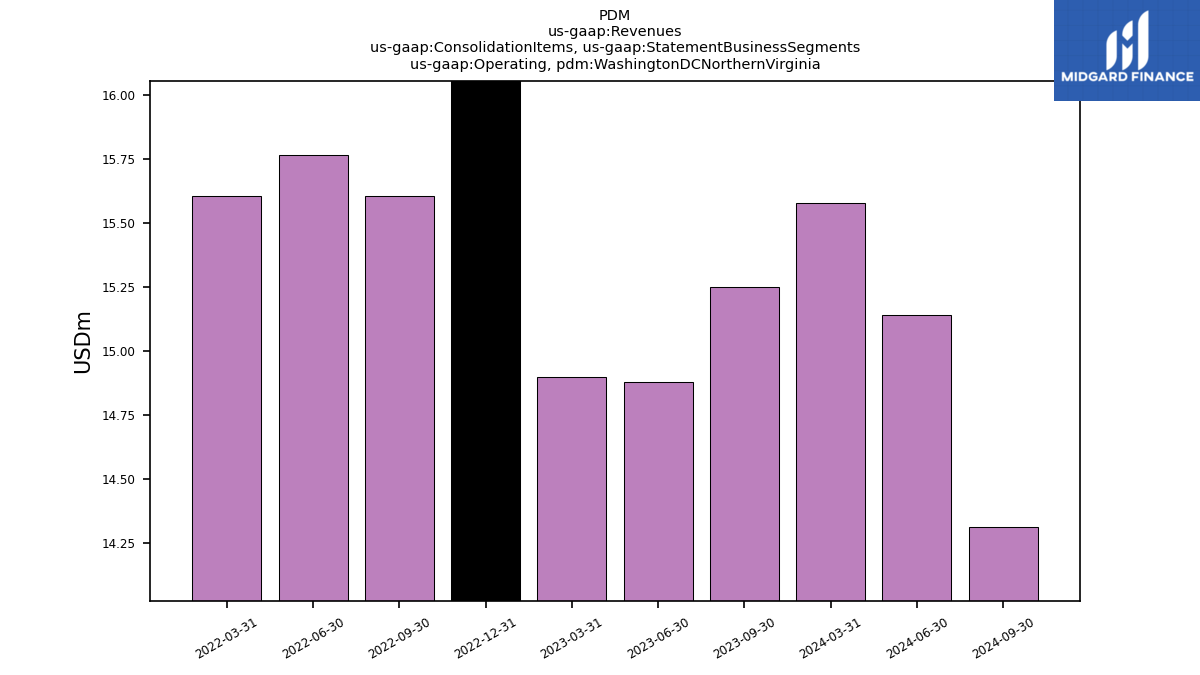
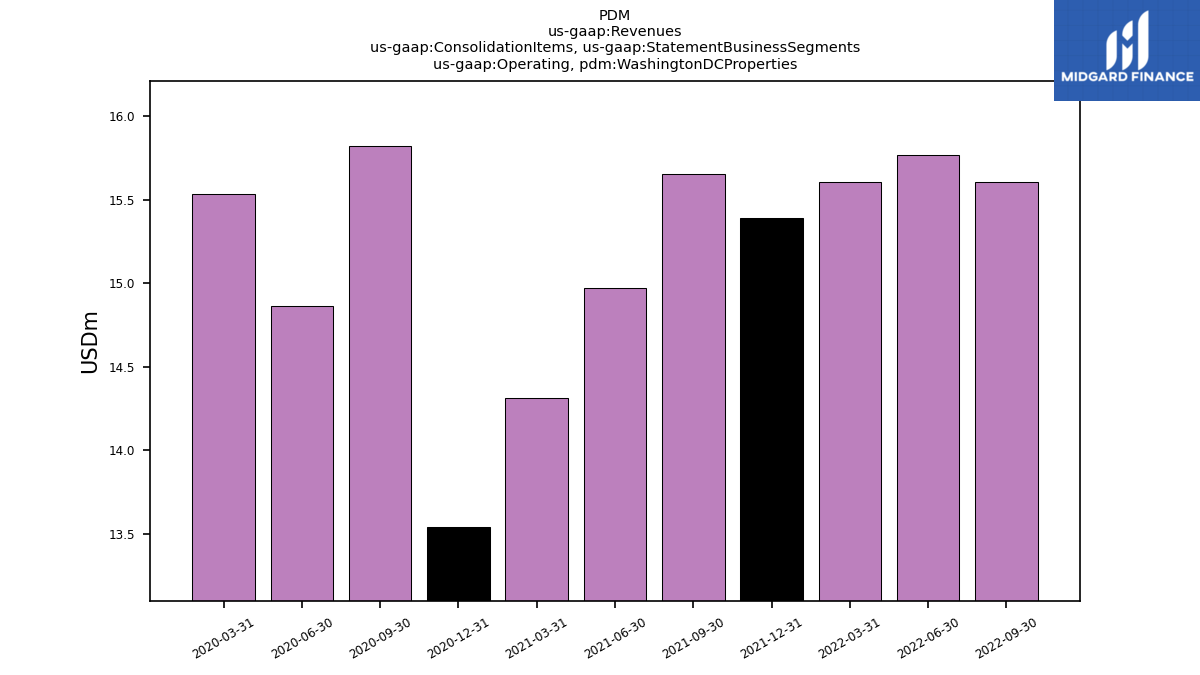
| Revenues | 146.99 | 143.07 | 142.37 | 147.21 | 144.10 | 136.31 | 136.15 | 138.16 | 131.07 | 130.22 | 129.26 | 131.53 | 131.69 | 134.63 | 137.17 | 134.15 | 135.42 | 130.67 | 132.94 | 137.19 | 129.71 | 129.17 | 129.90 | 139.44 | 137.59 | 148.68 | 148.46 | 143.91 | 138.49 | 135.31 | 138.01 | 139.46 | 148.81 | 146.73 | 149.76 | 146.71 | 144.64 | 138.58 | 136.32 | 142.87 | 145.12 | 134.79 | 134.30 | 136.08 | 134.89 | 133.72 | 133.20 | 137.49 | 134.41 | 150.54 | 146.55 | 135.23 | 134.12 | 144.27 | 146.84 | |
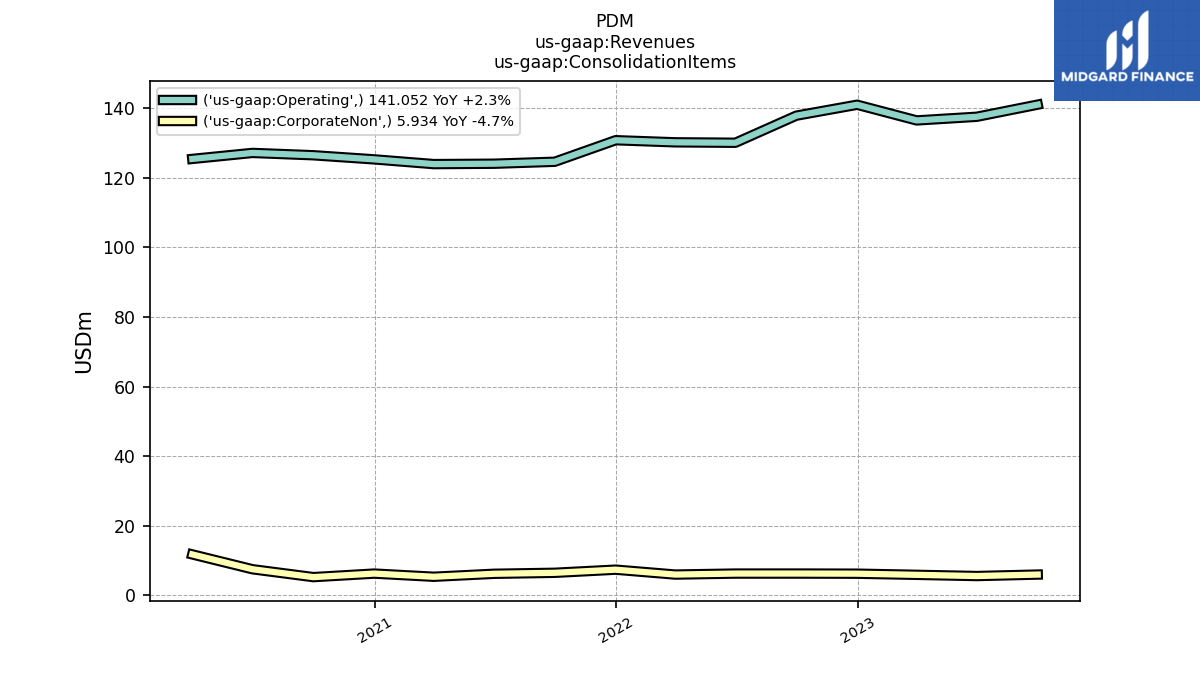
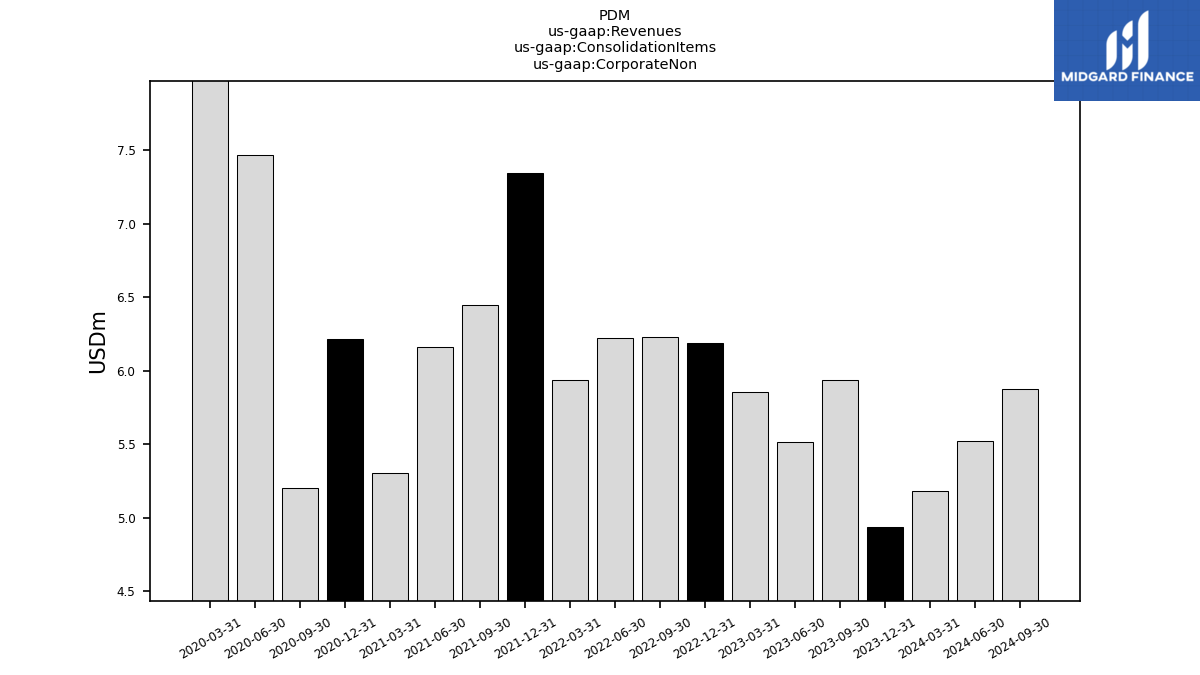
| Corporate Non | 5.93 | 5.51 | 5.86 | 6.19 | 6.23 | 6.22 | 5.93 | 7.34 | 6.45 | 6.16 | 5.31 | 6.22 | 5.20 | 7.47 | 11.73 | NA | NA | NA | NA | NA | NA | NA | NA | NA | NA | NA | NA | NA | NA | NA | NA | NA | NA | NA | NA | NA | NA | NA | NA | NA | NA | NA | NA | NA | NA | NA | NA | NA | NA | NA | NA | NA | NA | NA | NA | |
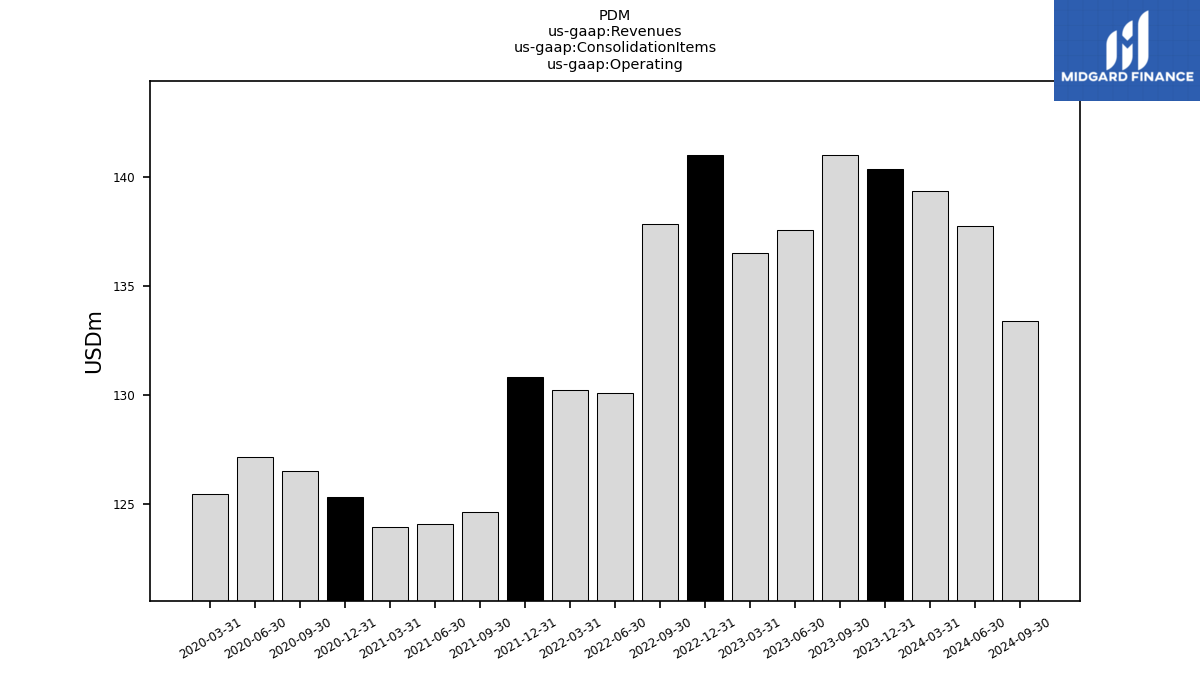
| Operating | 141.05 | 137.56 | 136.51 | 141.02 | 137.87 | 130.09 | 130.21 | 130.82 | 124.63 | 124.06 | 123.95 | 125.31 | 126.49 | 127.16 | 125.44 | NA | NA | NA | NA | NA | NA | NA | NA | NA | NA | NA | NA | NA | NA | NA | NA | NA | NA | NA | NA | NA | NA | NA | NA | NA | NA | NA | NA | NA | NA | NA | NA | NA | NA | NA | NA | NA | NA | NA | NA | |
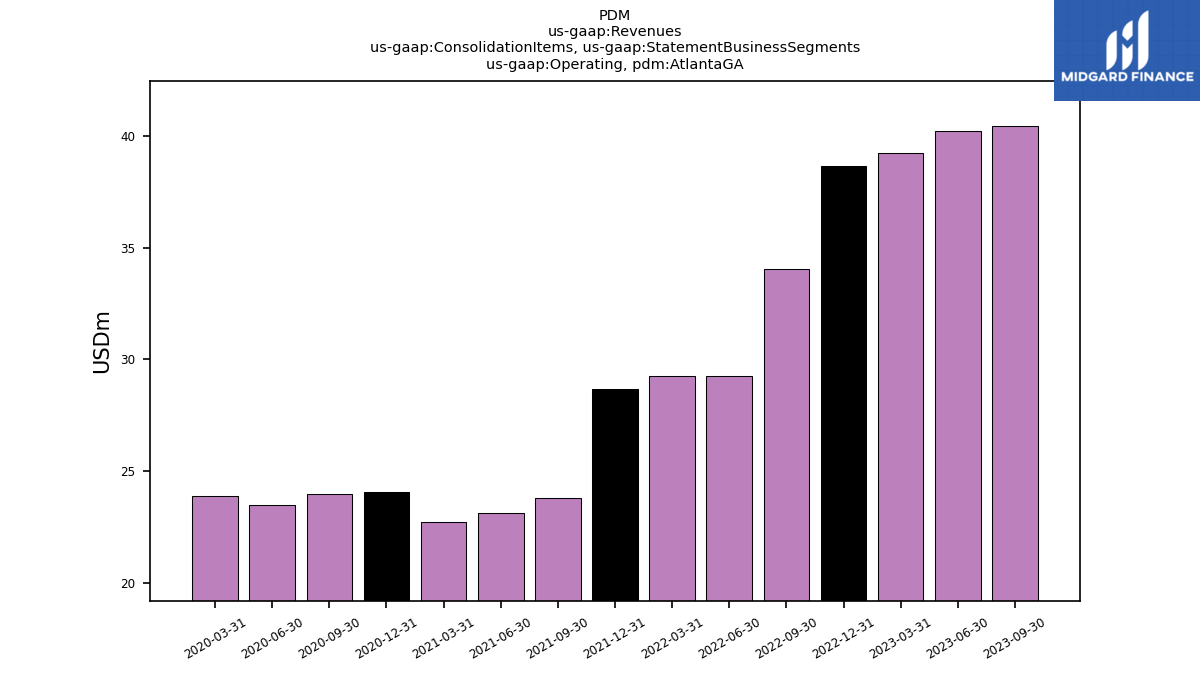
| Operating, Atlanta G A | 40.43 | 40.21 | 39.22 | 38.67 | 34.03 | 29.26 | 29.27 | 28.69 | 23.80 | 23.14 | 22.70 | 24.06 | 23.98 | 23.46 | 23.90 | NA | NA | NA | NA | NA | NA | NA | NA | NA | NA | NA | NA | NA | NA | NA | NA | NA | NA | NA | NA | NA | NA | NA | NA | NA | NA | NA | NA | NA | NA | NA | NA | NA | NA | NA | NA | NA | NA | NA | NA | |
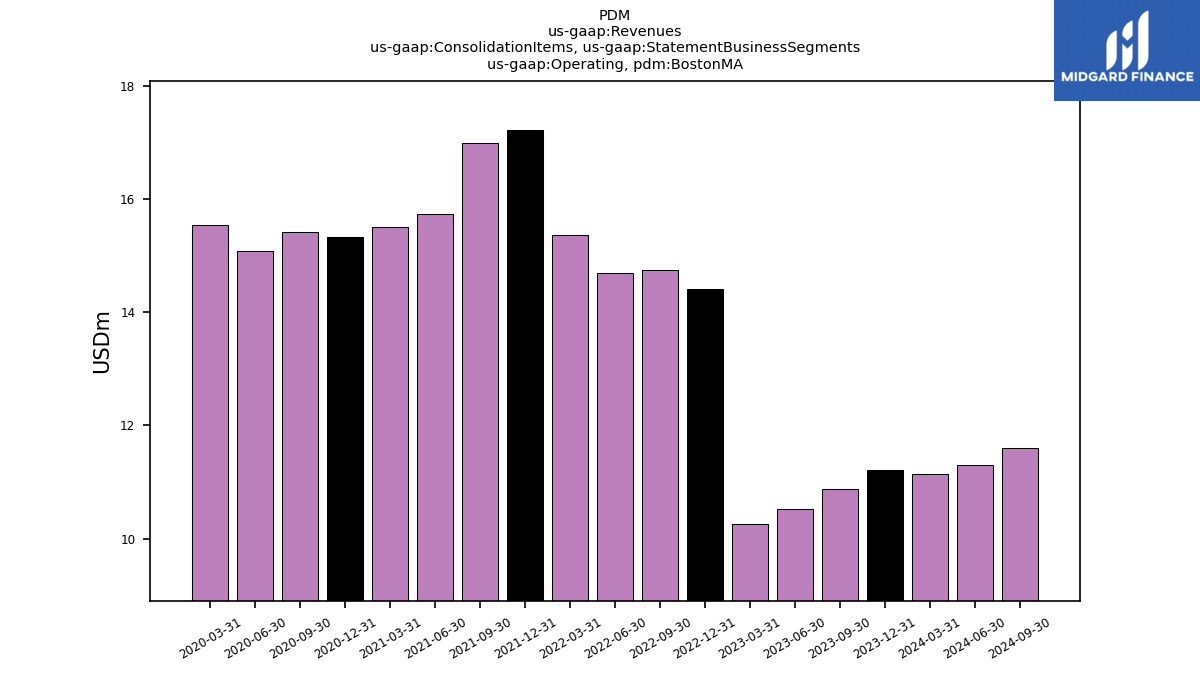
| Operating, Boston M A | 10.88 | 10.52 | 10.25 | 14.41 | 14.73 | 14.70 | 15.37 | 17.22 | 16.99 | 15.72 | 15.51 | 15.32 | 15.42 | 15.07 | 15.53 | NA | NA | NA | NA | NA | NA | NA | NA | NA | NA | NA | NA | NA | NA | NA | NA | NA | NA | NA | NA | NA | NA | NA | NA | NA | NA | NA | NA | NA | NA | NA | NA | NA | NA | NA | NA | NA | NA | NA | NA | |
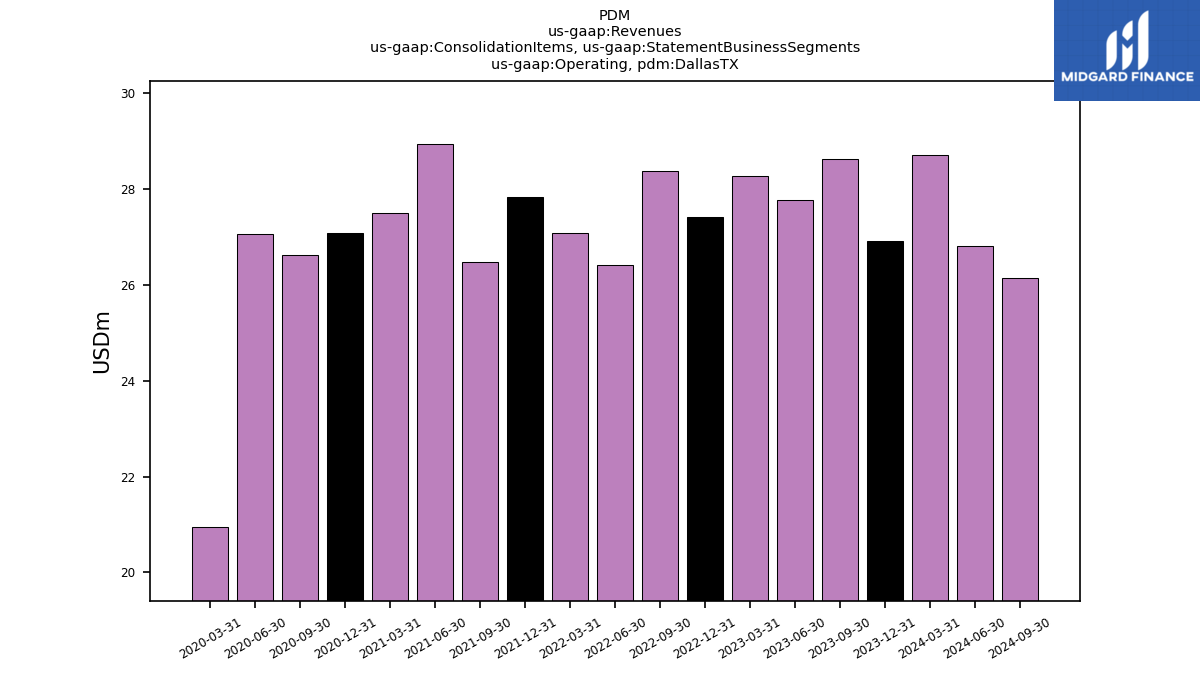
| Operating, Dallas T X | 28.62 | 27.78 | 28.28 | 27.42 | 28.38 | 26.42 | 27.09 | 27.83 | 26.48 | 28.93 | 27.49 | 27.08 | 26.62 | 27.07 | 20.96 | NA | NA | NA | NA | NA | NA | NA | NA | NA | NA | NA | NA | NA | NA | NA | NA | NA | NA | NA | NA | NA | NA | NA | NA | NA | NA | NA | NA | NA | NA | NA | NA | NA | NA | NA | NA | NA | NA | NA | NA | |
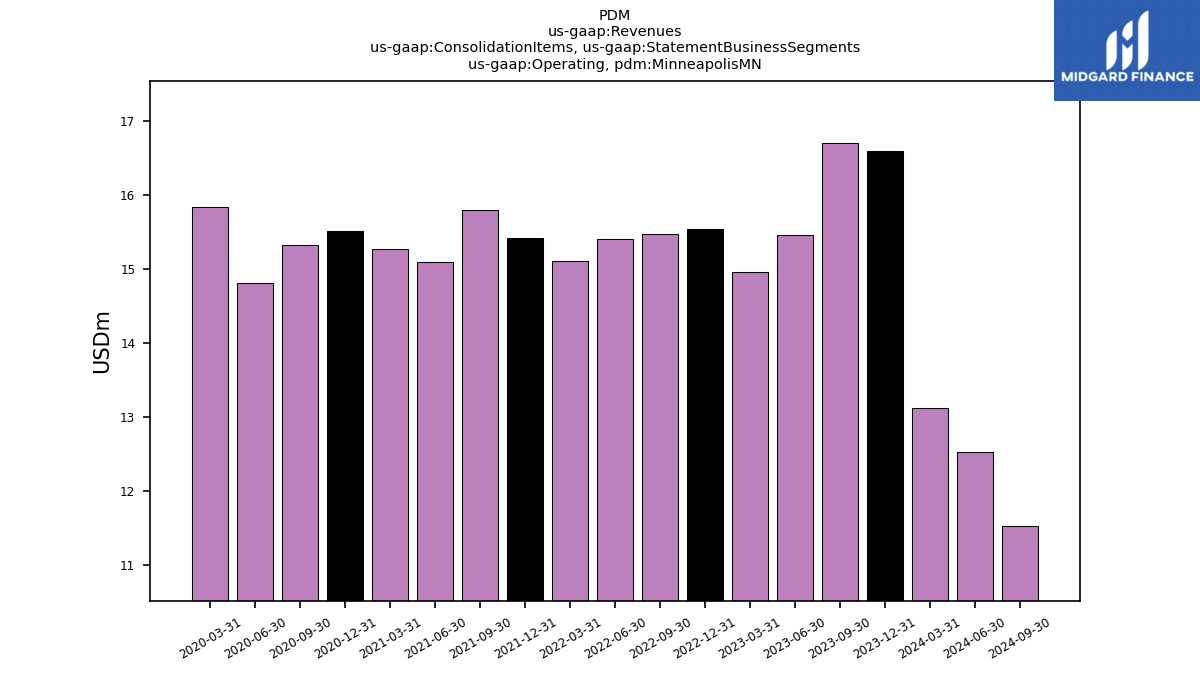
| Operating, Minneapolis M N | 16.70 | 15.46 | 14.96 | 15.54 | 15.47 | 15.41 | 15.11 | 15.42 | 15.79 | 15.09 | 15.27 | 15.51 | 15.32 | 14.81 | 15.84 | NA | NA | NA | NA | NA | NA | NA | NA | NA | NA | NA | NA | NA | NA | NA | NA | NA | NA | NA | NA | NA | NA | NA | NA | NA | NA | NA | NA | NA | NA | NA | NA | NA | NA | NA | NA | NA | NA | NA | NA | |
| Operating, New York N Y | 13.94 | 13.25 | 13.48 | 13.73 | 14.53 | 14.06 | 13.88 | 13.12 | 12.85 | 13.30 | 13.19 | 14.80 | 16.39 | 19.19 | 19.45 | NA | NA | NA | NA | NA | NA | NA | NA | NA | NA | NA | NA | NA | NA | NA | NA | NA | NA | NA | NA | NA | NA | NA | NA | NA | NA | NA | NA | NA | NA | NA | NA | NA | NA | NA | NA | NA | NA | NA | NA | |
| Operating, Orlando F L | 15.23 | 15.46 | 15.41 | 14.69 | 15.13 | 14.48 | 13.91 | 13.15 | 13.07 | 12.90 | 15.48 | 15.01 | 12.95 | 12.70 | 14.23 | NA | NA | NA | NA | NA | NA | NA | NA | NA | NA | NA | NA | NA | NA | NA | NA | NA | NA | NA | NA | NA | NA | NA | NA | NA | NA | NA | NA | NA | NA | NA | NA | NA | NA | NA | NA | NA | NA | NA | NA | |
| Operating, Washington D C Northern Virginia | 15.25 | 14.88 | 14.90 | 16.55 | 15.61 | 15.77 | 15.61 | NA | NA | NA | NA | NA | NA | NA | NA | NA | NA | NA | NA | NA | NA | NA | NA | NA | NA | NA | NA | NA | NA | NA | NA | NA | NA | NA | NA | NA | NA | NA | NA | NA | NA | NA | NA | NA | NA | NA | NA | NA | NA | NA | NA | NA | NA | NA | NA | |
| Operating, Washington D C Properties | NA | NA | NA | NA | 15.61 | 15.77 | 15.61 | 15.39 | 15.65 | 14.97 | 14.31 | 13.54 | 15.82 | 14.87 | 15.53 | NA | NA | NA | NA | NA | NA | NA | NA | NA | NA | NA | NA | NA | NA | NA | NA | NA | NA | NA | NA | NA | NA | NA | NA | NA | NA | NA | NA | NA | NA | NA | NA | NA | NA | NA | NA | NA | NA | NA | NA | |
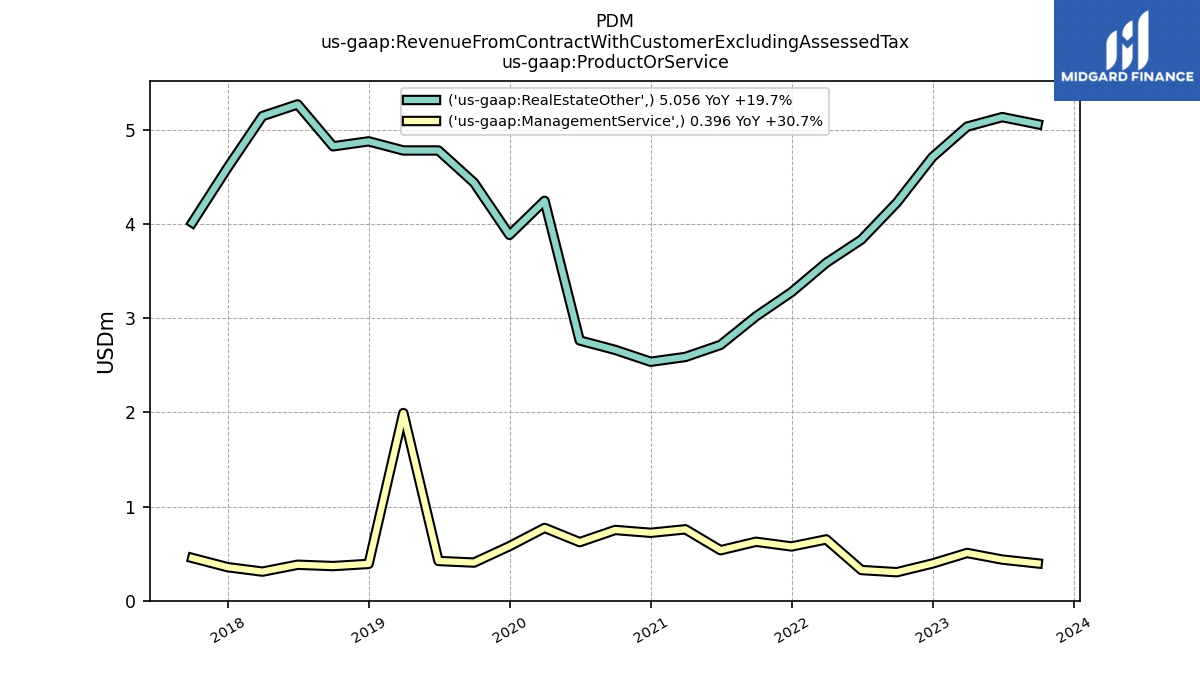
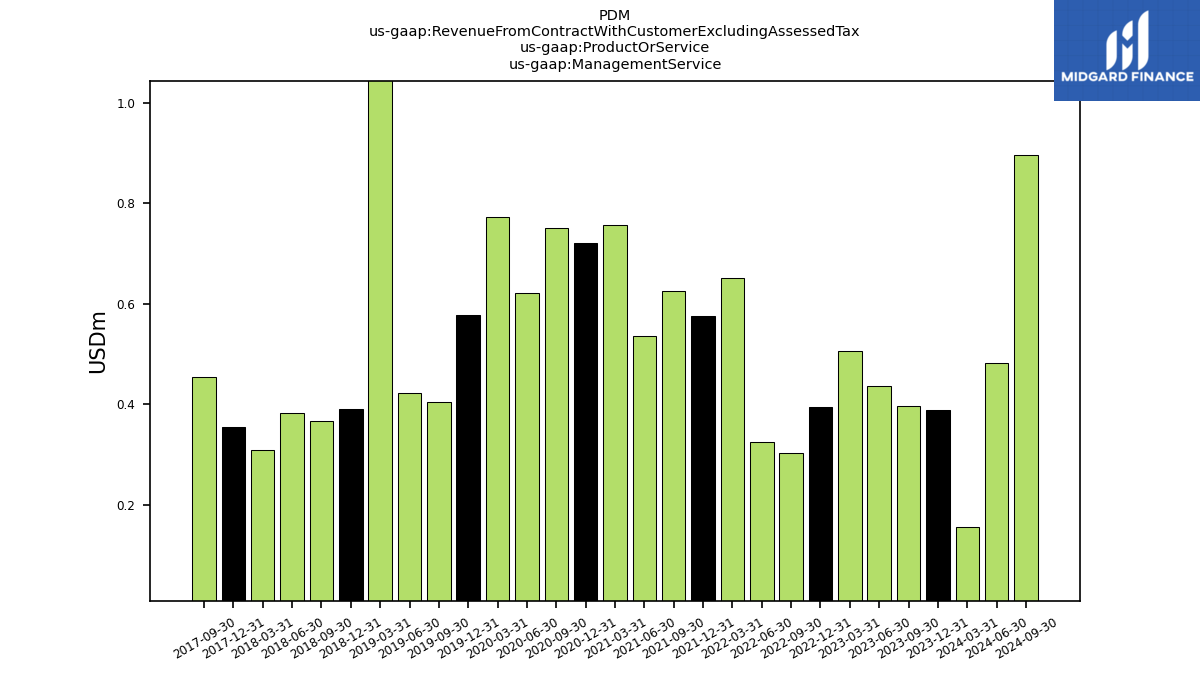
| Management Service | 0.40 | 0.44 | 0.51 | 0.40 | 0.30 | 0.33 | 0.65 | 0.58 | 0.63 | 0.54 | 0.76 | 0.72 | 0.75 | 0.62 | 0.77 | 0.58 | 0.41 | 0.42 | 1.99 | 0.39 | 0.37 | 0.38 | 0.31 | 0.36 | 0.45 | NA | NA | NA | NA | NA | NA | NA | NA | NA | NA | NA | NA | NA | NA | NA | NA | NA | NA | NA | NA | NA | NA | NA | NA | NA | NA | NA | NA | NA | NA | |
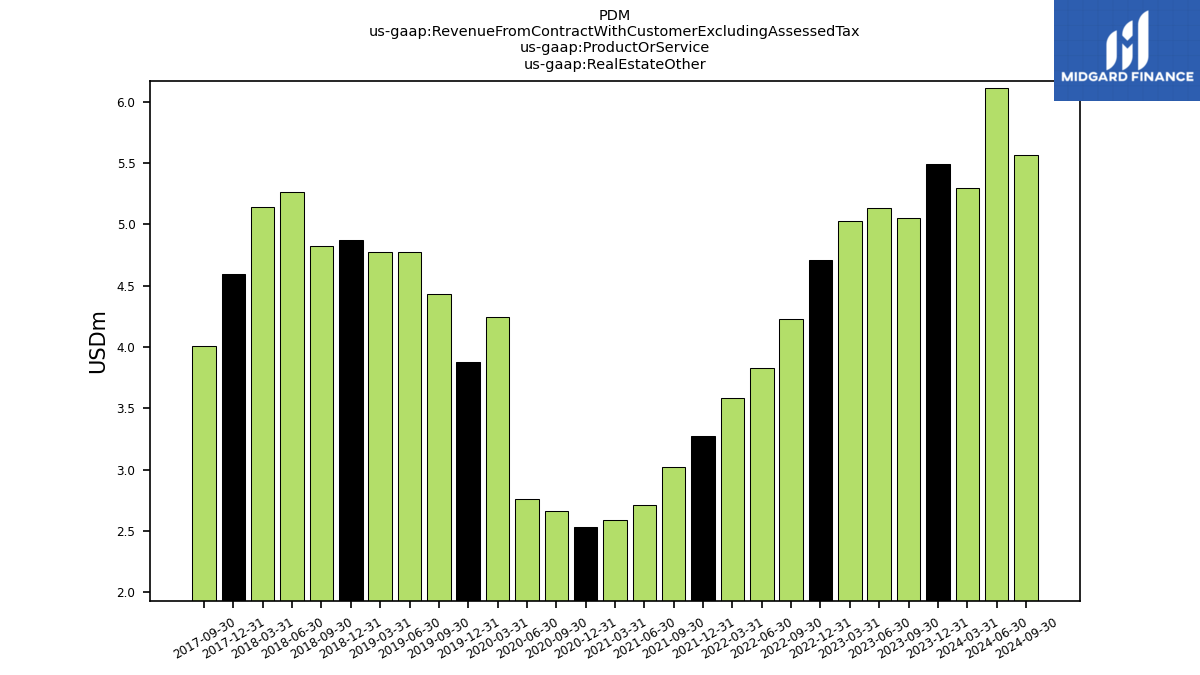
| Real Estate Other | 5.06 | 5.13 | 5.03 | 4.71 | 4.22 | 3.83 | 3.59 | 3.27 | 3.02 | 2.71 | 2.59 | 2.54 | 2.66 | 2.76 | 4.24 | 3.88 | 4.44 | 4.78 | 4.78 | 4.88 | 4.82 | 5.27 | 5.14 | 4.60 | 4.01 | NA | NA | NA | NA | NA | NA | NA | NA | NA | NA | NA | NA | NA | NA | NA | NA | NA | NA | NA | NA | NA | NA | NA | NA | NA | NA | NA | NA | NA | NA |