
| 2023-12-31 | 2023-09-30 | 2023-06-30 | 2023-03-31 | 2022-12-31 | 2022-09-30 | 2022-06-30 | 2022-03-31 | 2021-12-31 | 2021-09-30 | 2021-06-30 | 2021-03-31 | 2020-12-31 | 2020-09-30 | 2020-06-30 | 2020-03-31 | 2019-12-31 | 2019-09-30 | 2019-06-30 | 2019-03-31 | 2018-12-31 | 2018-09-30 | 2018-06-30 | 2018-03-31 | 2017-12-31 | 2017-09-30 | 2017-06-30 | 2017-03-31 | 2016-12-31 | 2016-09-30 | 2016-06-30 | 2016-03-31 | 2015-12-31 | 2015-09-30 | 2015-06-30 | 2015-03-31 | 2014-12-31 | 2014-09-30 | 2014-06-30 | 2014-03-31 | 2013-12-31 | 2013-09-30 | 2013-06-30 | 2013-03-31 | 2012-12-31 | 2012-09-30 | 2012-06-30 | 2012-03-31 | 2011-12-31 | 2011-09-30 | 2011-06-30 | 2011-03-31 | ||
|---|---|---|---|---|---|---|---|---|---|---|---|---|---|---|---|---|---|---|---|---|---|---|---|---|---|---|---|---|---|---|---|---|---|---|---|---|---|---|---|---|---|---|---|---|---|---|---|---|---|---|---|---|---|
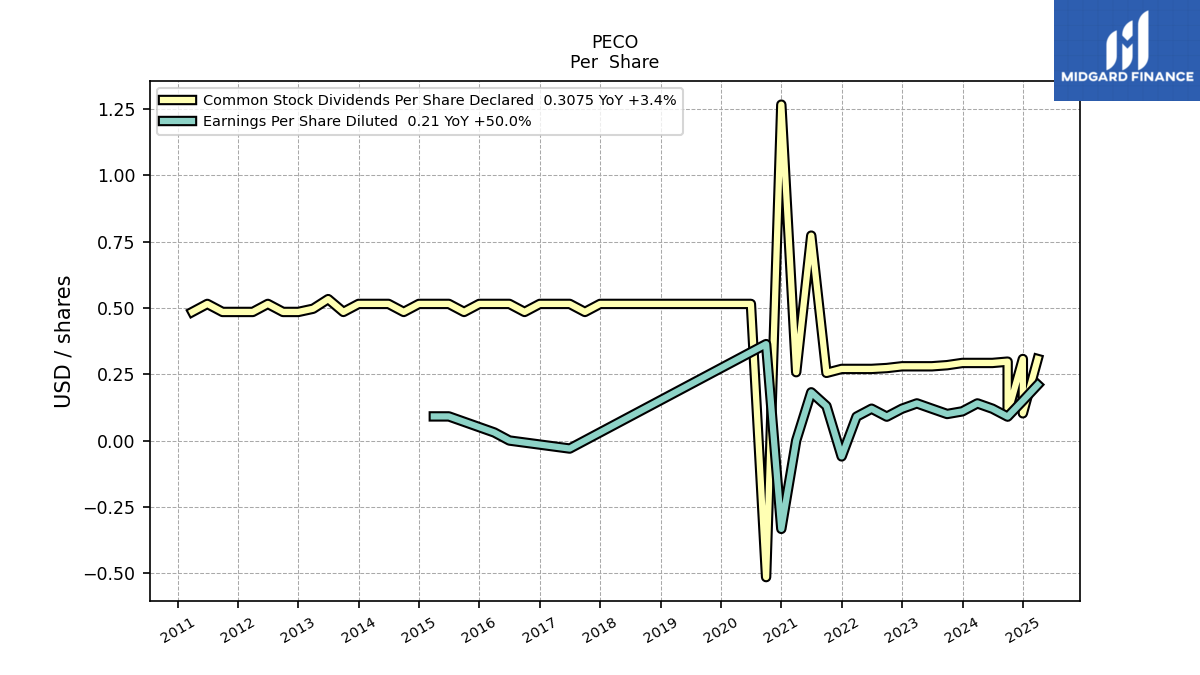
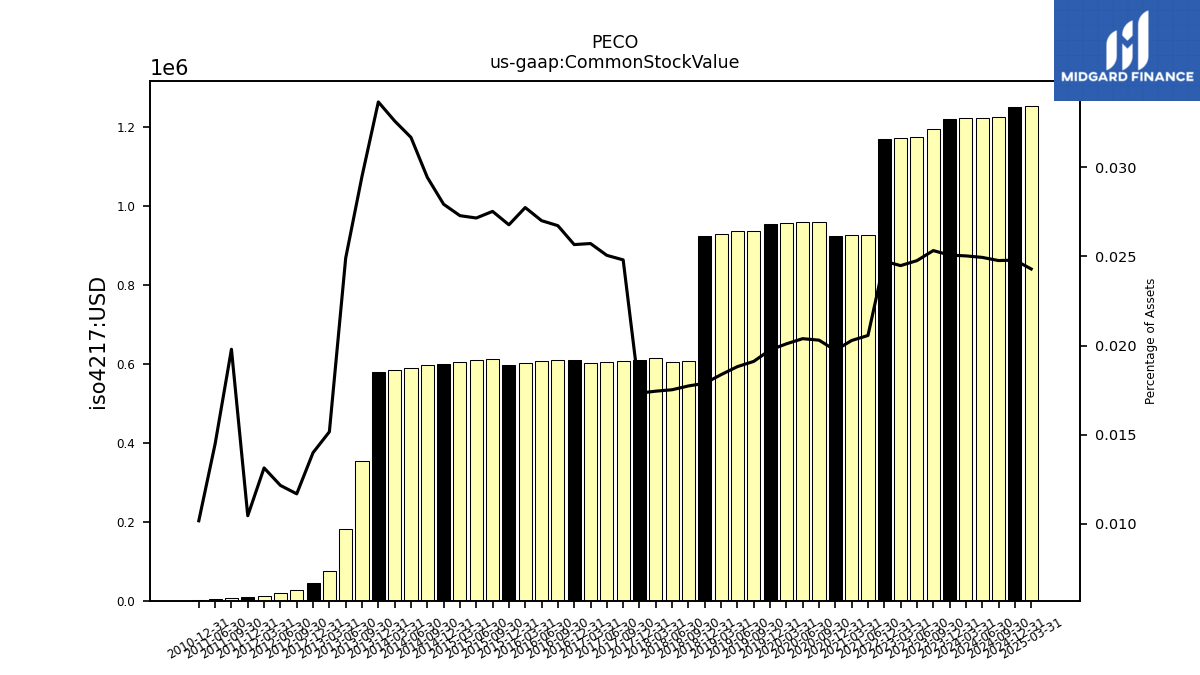
| Common Stock Value | 1.22 | 1.20 | 1.17 | 1.17 | 1.17 | NA | NA | NA | NA | NA | 0.93 | 0.93 | 0.92 | 0.96 | 0.96 | 0.96 | 0.95 | 0.94 | 0.94 | 0.93 | 0.92 | 0.61 | 0.60 | 0.61 | 0.61 | 0.61 | 0.60 | 0.60 | 0.61 | 0.61 | 0.61 | 0.60 | 0.60 | 0.61 | 0.61 | 0.60 | 0.60 | 0.60 | 0.59 | 0.59 | 0.58 | 0.36 | 0.18 | 0.07 | 0.05 | 0.03 | 0.02 | 0.01 | 0.01 | 0.01 | 0.00 | NA | |
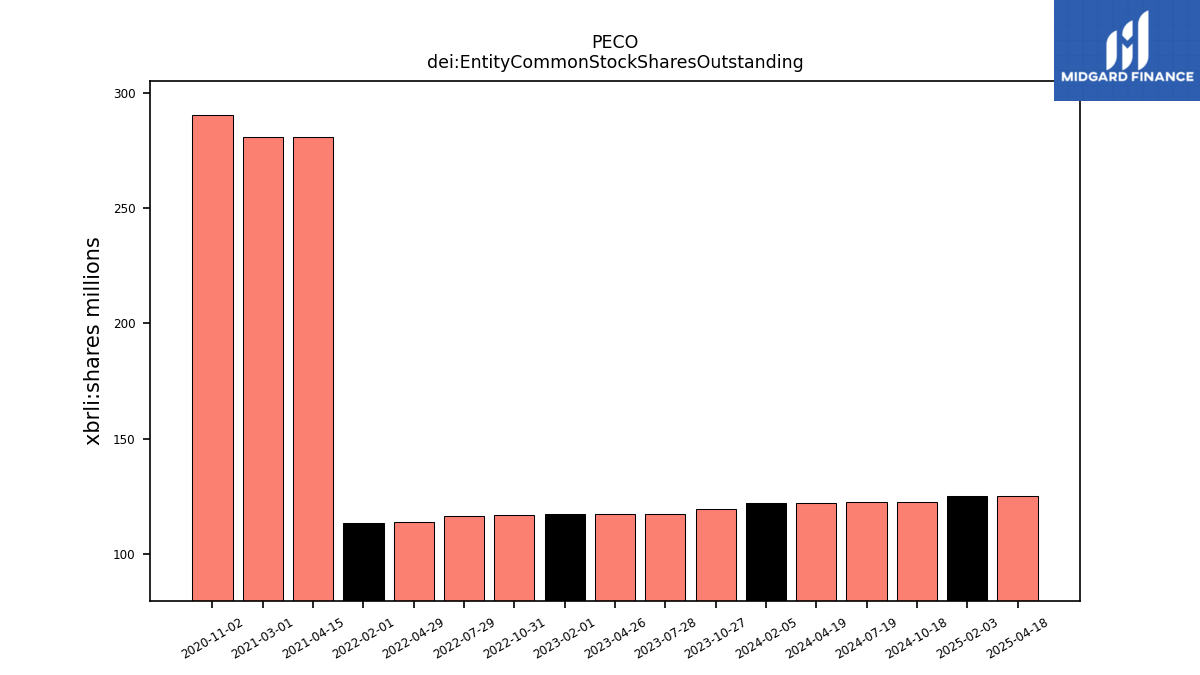
| dei: Entity Common Stock Shares Outstanding | NA | NA | NA | NA | NA | NA | NA | NA | NA | NA | NA | NA | NA | NA | NA | NA | NA | NA | NA | NA | NA | NA | NA | NA | NA | NA | NA | NA | NA | NA | NA | NA | NA | NA | NA | NA | NA | NA | NA | NA | NA | NA | NA | NA | NA | NA | NA | NA | NA | NA | NA | NA | |
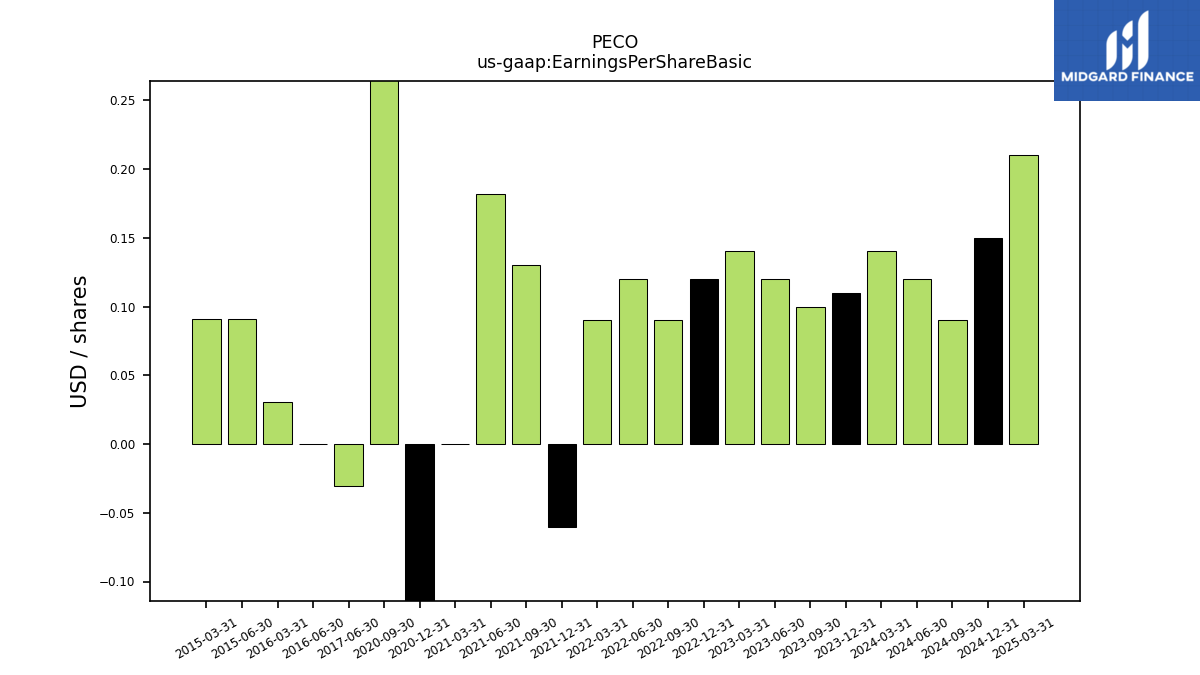
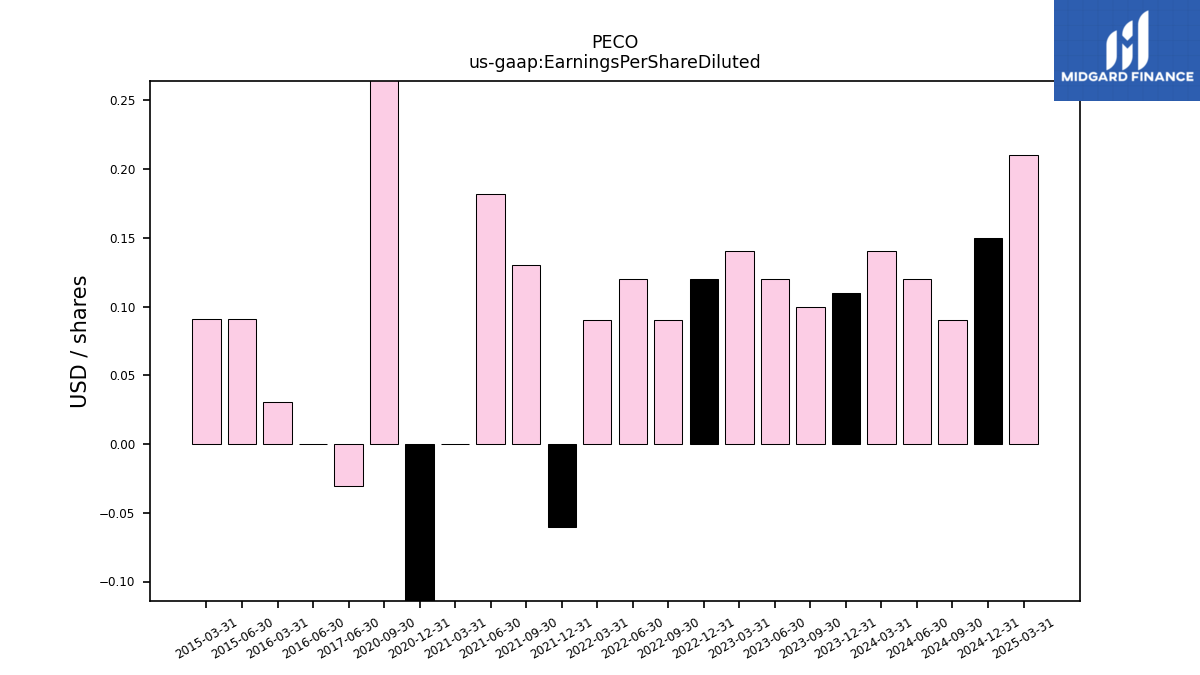
| Earnings Per Share Basic | 0.11 | 0.10 | 0.12 | 0.14 | 0.12 | 0.09 | 0.12 | 0.09 | -0.06 | 0.13 | 0.18 | 0.00 | -0.33 | 0.36 | NA | NA | NA | NA | NA | NA | NA | NA | NA | NA | NA | NA | -0.03 | NA | NA | NA | 0.00 | 0.03 | NA | NA | 0.09 | 0.09 | NA | NA | NA | NA | NA | NA | NA | NA | NA | NA | NA | NA | NA | NA | NA | NA | |
| Earnings Per Share Diluted | 0.11 | 0.10 | 0.12 | 0.14 | 0.12 | 0.09 | 0.12 | 0.09 | -0.06 | 0.13 | 0.18 | 0.00 | -0.33 | 0.36 | NA | NA | NA | NA | NA | NA | NA | NA | NA | NA | NA | NA | -0.03 | NA | NA | NA | 0.00 | 0.03 | NA | NA | 0.09 | 0.09 | NA | NA | NA | NA | NA | NA | NA | NA | NA | NA | NA | NA | NA | NA | NA | NA |
| 2023-12-31 | 2023-09-30 | 2023-06-30 | 2023-03-31 | 2022-12-31 | 2022-09-30 | 2022-06-30 | 2022-03-31 | 2021-12-31 | 2021-09-30 | 2021-06-30 | 2021-03-31 | 2020-12-31 | 2020-09-30 | 2020-06-30 | 2020-03-31 | 2019-12-31 | 2019-09-30 | 2019-06-30 | 2019-03-31 | 2018-12-31 | 2018-09-30 | 2018-06-30 | 2018-03-31 | 2017-12-31 | 2017-09-30 | 2017-06-30 | 2017-03-31 | 2016-12-31 | 2016-09-30 | 2016-06-30 | 2016-03-31 | 2015-12-31 | 2015-09-30 | 2015-06-30 | 2015-03-31 | 2014-12-31 | 2014-09-30 | 2014-06-30 | 2014-03-31 | 2013-12-31 | 2013-09-30 | 2013-06-30 | 2013-03-31 | 2012-12-31 | 2012-09-30 | 2012-06-30 | 2012-03-31 | 2011-12-31 | 2011-09-30 | 2011-06-30 | 2011-03-31 | ||
|---|---|---|---|---|---|---|---|---|---|---|---|---|---|---|---|---|---|---|---|---|---|---|---|---|---|---|---|---|---|---|---|---|---|---|---|---|---|---|---|---|---|---|---|---|---|---|---|---|---|---|---|---|---|
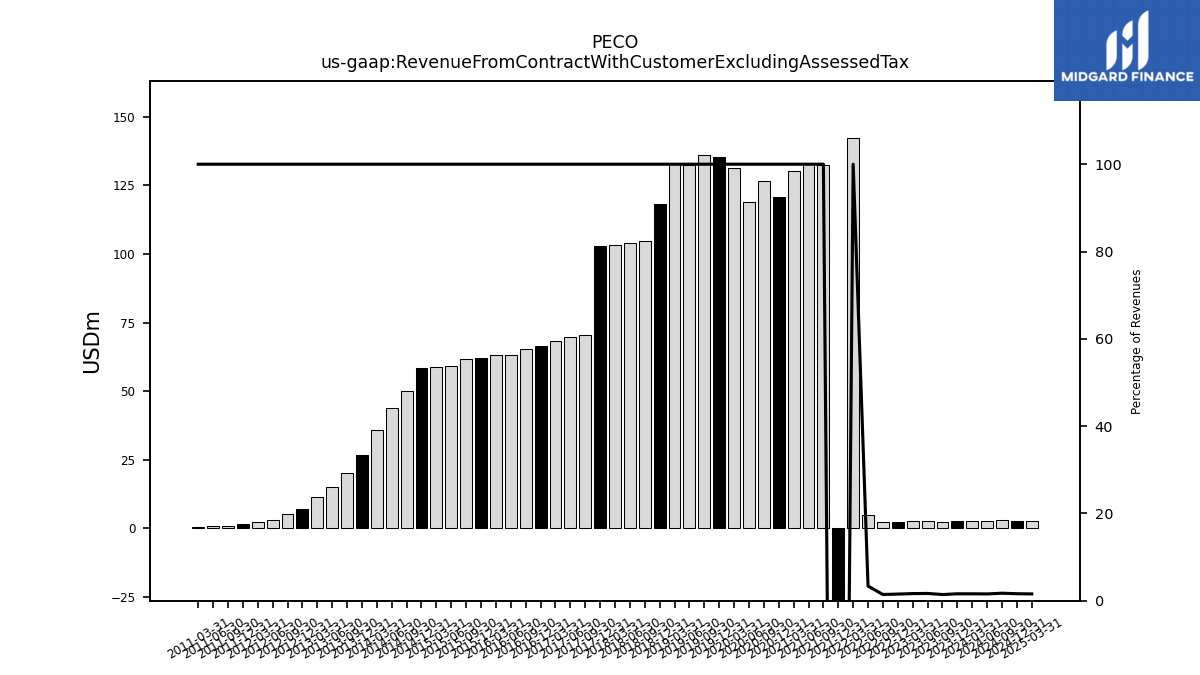
| Revenue From Contract With Customer Excluding Assessed Tax | 2.45 | 2.17 | 2.55 | 151.06 | 2.22 | 2.08 | 4.78 | 142.16 | -385.45 | 132.33 | 133.07 | 130.38 | 120.76 | 126.69 | 119.04 | 131.52 | 135.35 | 136.01 | 132.58 | 132.77 | 118.12 | 104.90 | 104.17 | 103.20 | 102.77 | 70.62 | 69.85 | 68.30 | 66.33 | 65.27 | 63.05 | 63.08 | 62.14 | 61.82 | 59.19 | 58.95 | 58.59 | 50.03 | 43.91 | 35.68 | 26.62 | 20.14 | 15.16 | 11.24 | 7.08 | 5.15 | 3.10 | 2.21 | 1.47 | 0.84 | 0.62 | 0.60 | |
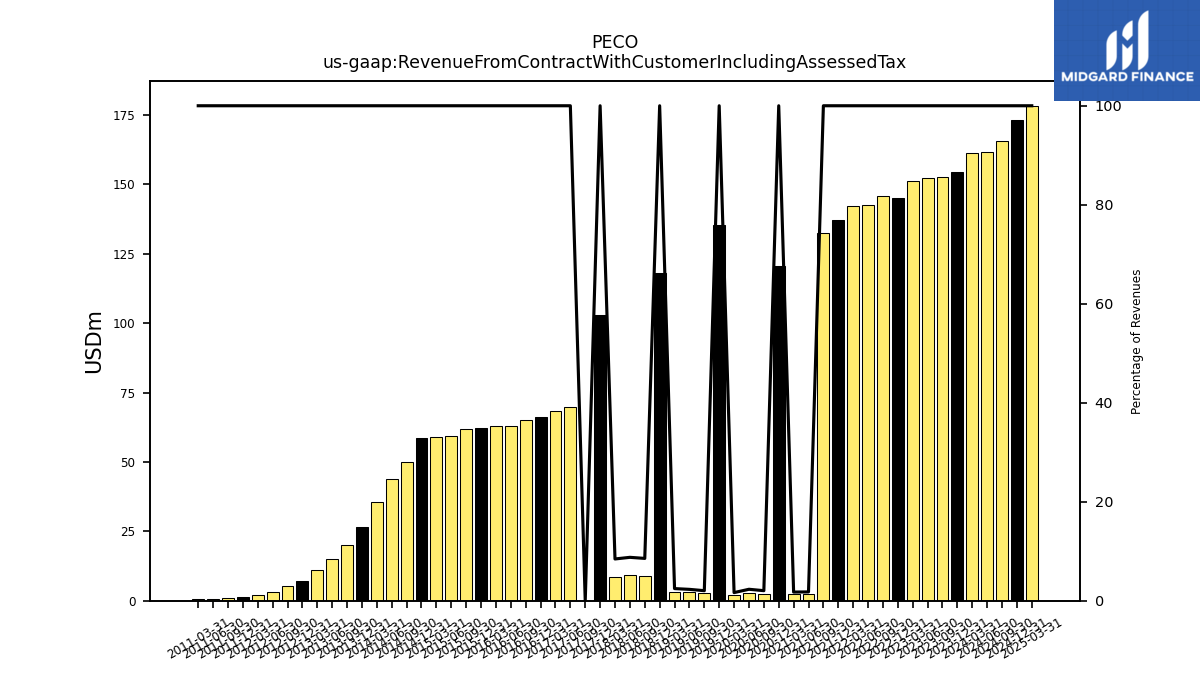
| Revenue From Contract With Customer Including Assessed Tax | 154.45 | 152.47 | 152.14 | 151.06 | 145.04 | 145.65 | 142.52 | 142.16 | 137.06 | 132.33 | 2.37 | 2.29 | 120.76 | 2.58 | 2.76 | 2.17 | 135.35 | 2.77 | 3.05 | 3.26 | 118.12 | 8.97 | 9.14 | 8.71 | 102.77 | 0.00 | 69.85 | 68.30 | 66.33 | 65.27 | 63.05 | 63.08 | 62.14 | 61.82 | 59.19 | 58.95 | 58.59 | 50.03 | 43.91 | 35.68 | 26.62 | 20.14 | 15.16 | 11.24 | 7.08 | 5.15 | 3.10 | 2.21 | 1.47 | 0.84 | 0.62 | 0.60 | |
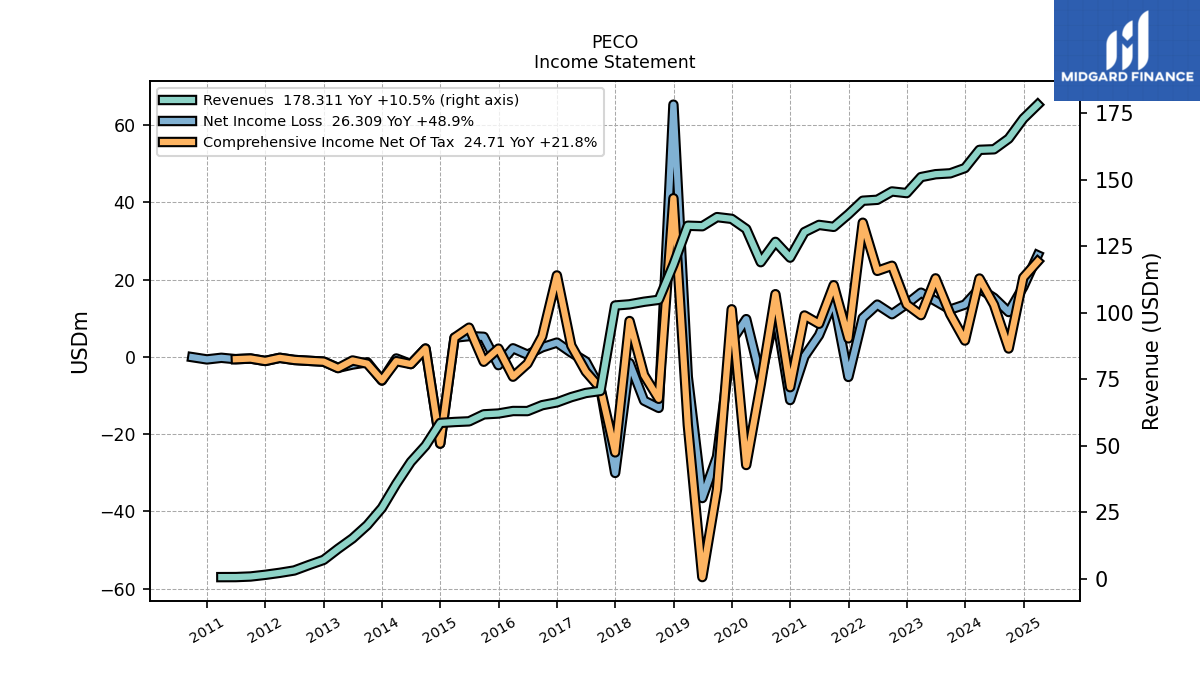
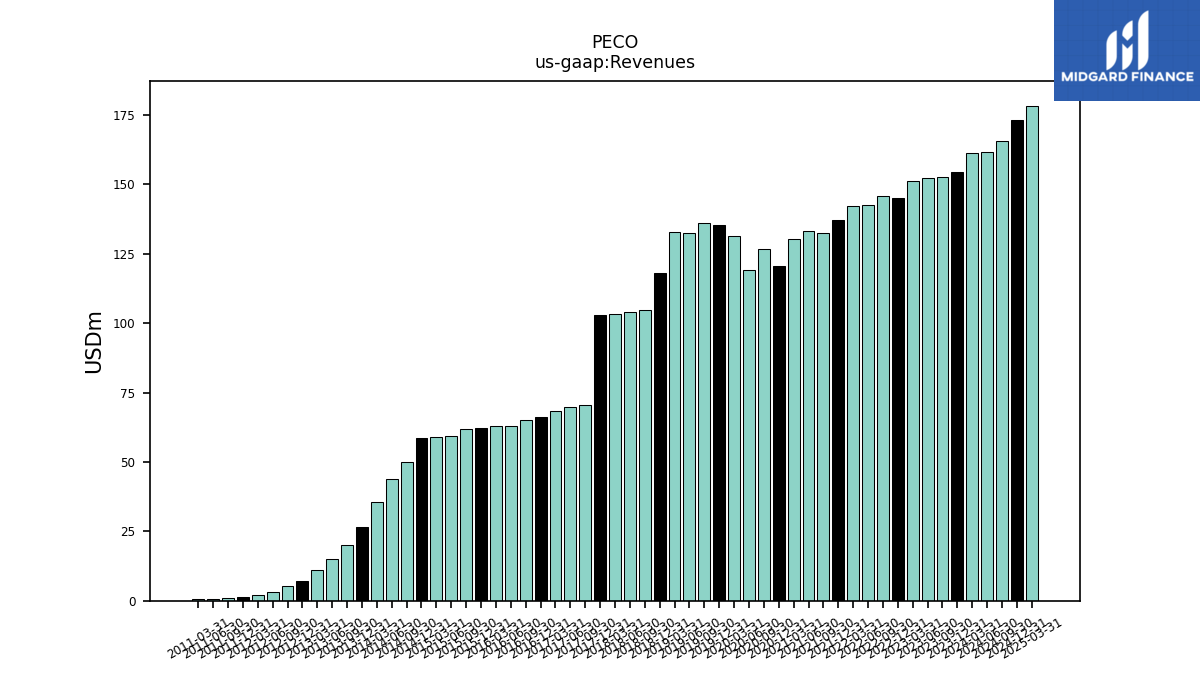
| Revenues | 154.45 | 152.47 | 152.14 | 151.06 | 145.04 | 145.65 | 142.52 | 142.16 | 137.06 | 132.33 | 133.07 | 130.38 | 120.76 | 126.69 | 119.04 | 131.52 | 135.35 | 136.01 | 132.58 | 132.77 | 118.12 | 104.90 | 104.17 | 103.20 | 102.77 | 70.62 | 69.85 | 68.30 | 66.33 | 65.27 | 63.05 | 63.08 | 62.14 | 61.82 | 59.19 | 58.95 | 58.59 | 50.03 | 43.91 | 35.68 | 26.62 | 20.14 | 15.16 | 11.24 | 7.08 | 5.15 | 3.10 | 2.21 | 1.47 | 0.84 | 0.62 | 0.60 | |
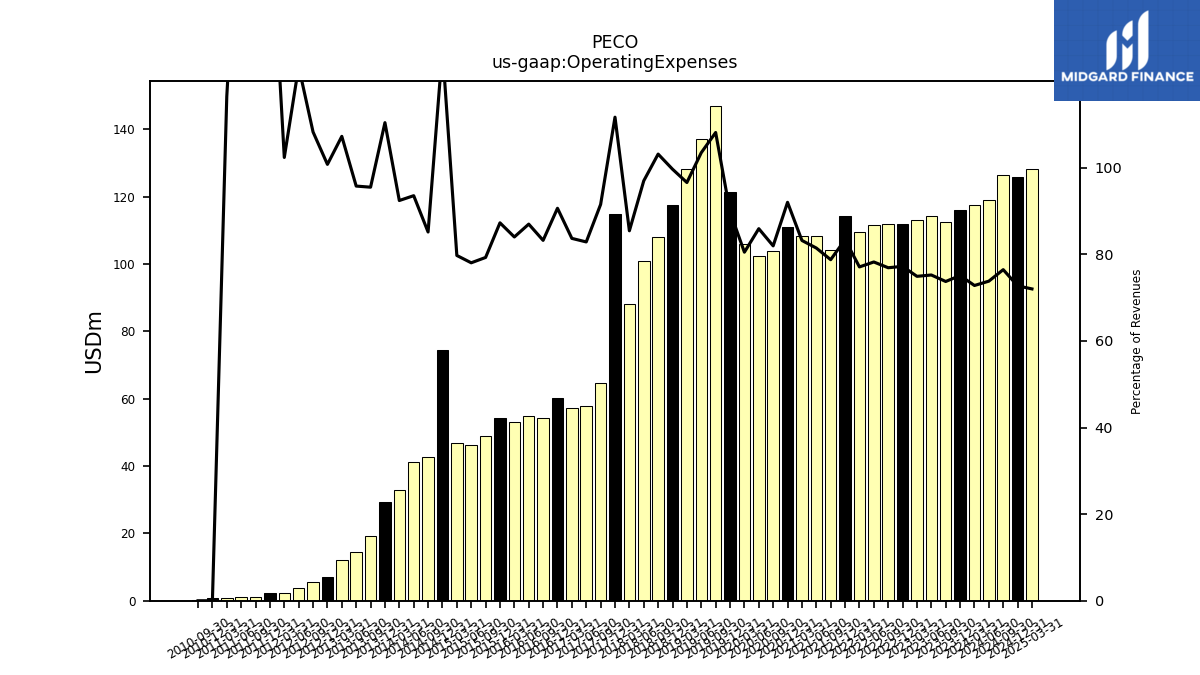
| Operating Expenses | 115.96 | 112.39 | 114.42 | 113.15 | 111.98 | 111.99 | 111.47 | 109.57 | 114.27 | 104.21 | 108.37 | 108.46 | 111.08 | 103.81 | 102.26 | 105.84 | 121.53 | 147.04 | 137.16 | 128.21 | 117.69 | 108.18 | 101.00 | 88.15 | 114.73 | 64.62 | 57.87 | 57.14 | 60.10 | 54.31 | 54.83 | 52.98 | 54.22 | 49.00 | 46.19 | 46.99 | 74.62 | 42.59 | 41.07 | 32.97 | 29.38 | 19.23 | 14.52 | 12.05 | 7.13 | 5.57 | 3.83 | 2.27 | 2.37 | 1.08 | 1.09 | 0.70 | |
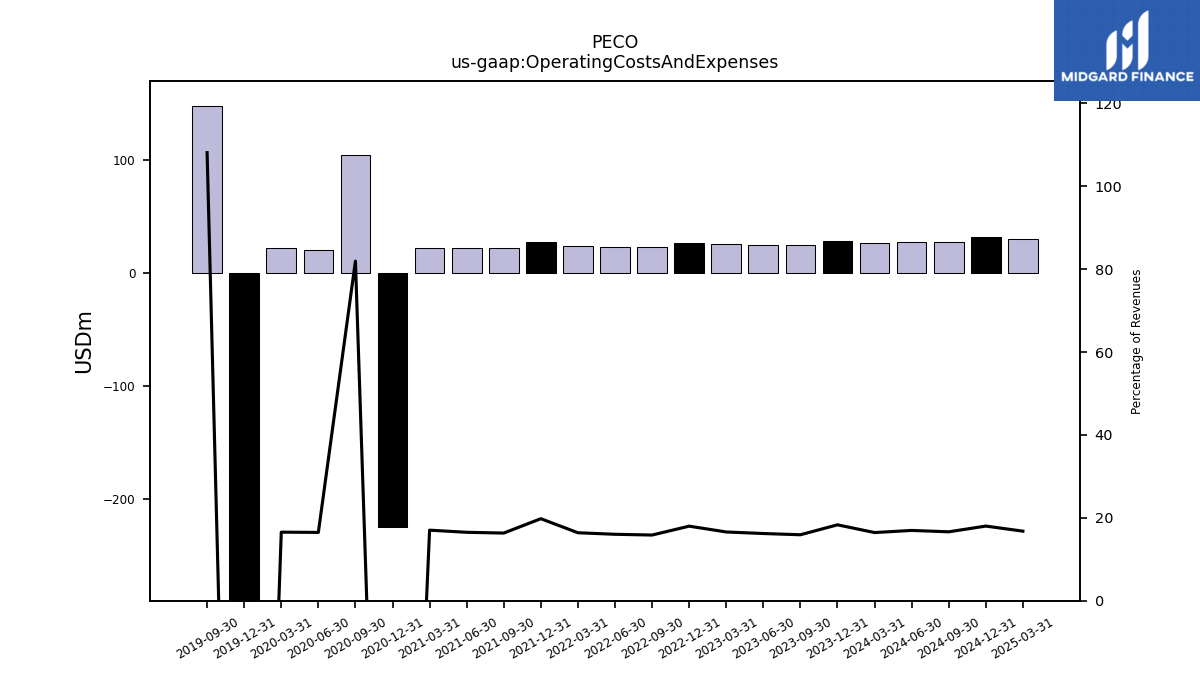
| Operating Costs And Expenses | 28.29 | 24.27 | 24.67 | 25.06 | 26.10 | 23.09 | 22.85 | 23.32 | 27.13 | 21.61 | 21.97 | 22.20 | -224.42 | 103.81 | 19.63 | 21.76 | -321.42 | 147.04 | NA | NA | NA | NA | NA | NA | NA | NA | NA | NA | NA | NA | NA | NA | NA | NA | NA | NA | NA | NA | NA | NA | NA | NA | NA | NA | NA | NA | NA | NA | NA | NA | NA | NA | |
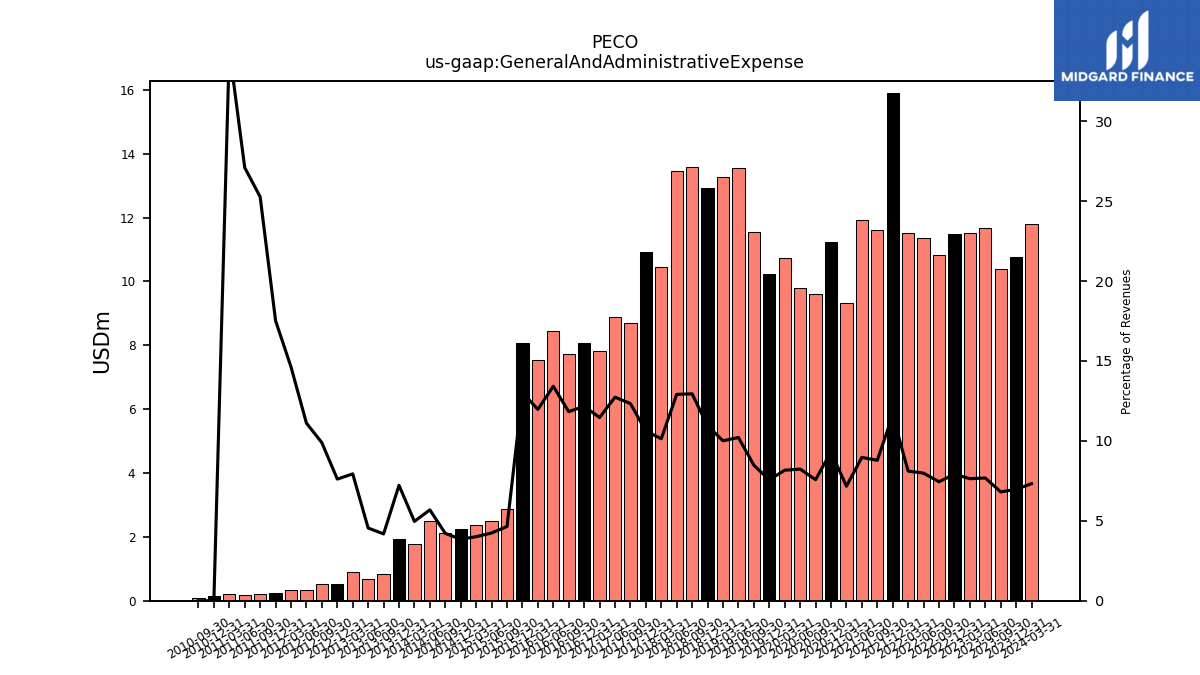
| General And Administrative Expense | 10.76 | 10.38 | 11.69 | 11.53 | 11.48 | 10.84 | 11.38 | 11.53 | 15.91 | 11.63 | 11.94 | 9.34 | 11.24 | 9.60 | 9.81 | 10.74 | 10.24 | 11.54 | 13.54 | 13.29 | 12.92 | 13.58 | 13.45 | 10.46 | 10.91 | 8.71 | 8.90 | 7.83 | 8.07 | 7.72 | 8.46 | 7.55 | 8.09 | 2.87 | 2.51 | 2.36 | 2.25 | 2.11 | 2.50 | 1.77 | 1.92 | 0.84 | 0.69 | 0.89 | 0.54 | 0.51 | 0.34 | 0.32 | 0.26 | 0.21 | 0.17 | 0.21 | |
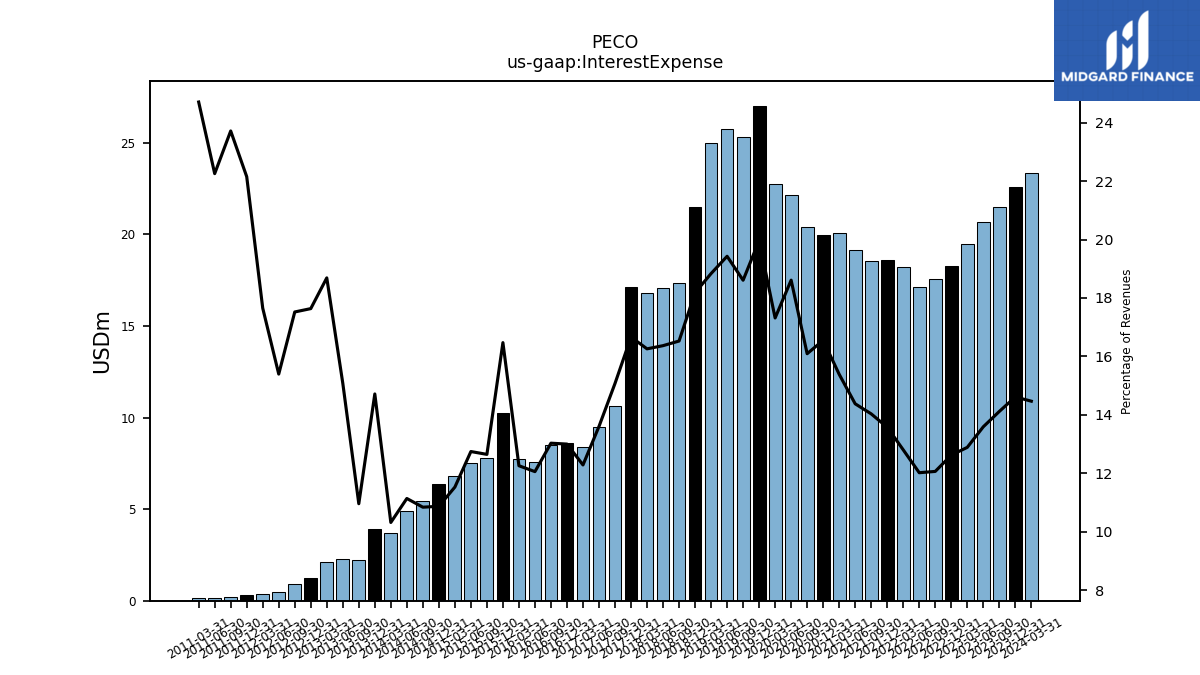
| Interest Expense | 22.57 | 21.52 | 20.68 | 19.47 | 18.30 | 17.57 | 17.13 | 18.20 | 18.61 | 18.57 | 19.13 | 20.06 | 19.99 | 20.39 | 22.15 | 22.77 | 27.02 | 25.31 | 25.76 | 25.01 | 21.48 | 17.34 | 17.05 | 16.78 | 17.12 | 10.65 | 9.50 | 8.39 | 8.62 | 8.50 | 7.60 | 7.73 | 10.23 | 7.82 | 7.54 | 6.79 | 6.37 | 5.42 | 4.89 | 3.68 | 3.92 | 2.21 | 2.29 | 2.10 | 1.25 | 0.90 | 0.48 | 0.39 | 0.33 | 0.20 | 0.14 | 0.15 | |
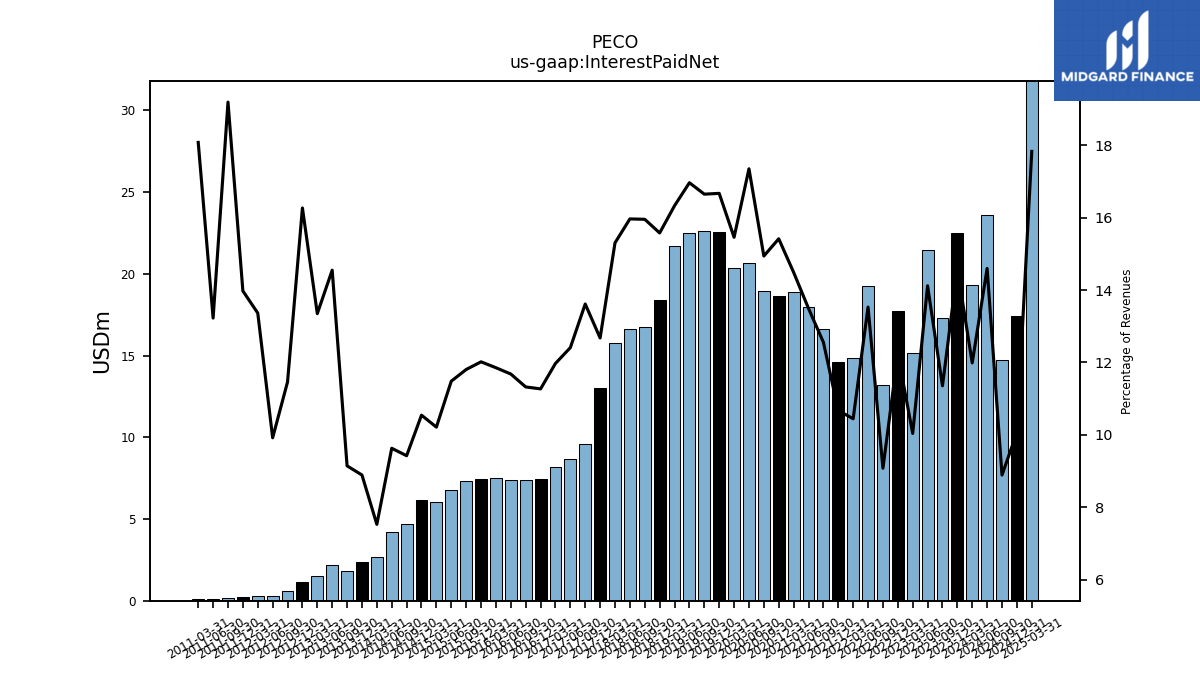
| Interest Paid Net | 22.52 | 17.31 | 21.48 | 15.17 | 17.74 | 13.22 | 19.28 | 14.85 | 14.63 | 16.62 | 17.95 | 18.89 | 18.61 | 18.93 | 20.65 | 20.33 | 22.56 | 22.64 | 22.49 | 21.68 | 18.40 | 16.73 | 16.63 | 15.79 | 13.03 | 9.62 | 8.67 | 8.18 | 7.47 | 7.39 | 7.37 | 7.48 | 7.47 | 7.30 | 6.80 | 6.02 | 6.18 | 4.71 | 4.23 | 2.69 | 2.37 | 1.84 | 2.21 | 1.50 | 1.15 | 0.59 | 0.31 | 0.30 | 0.20 | 0.16 | 0.08 | 0.11 | |
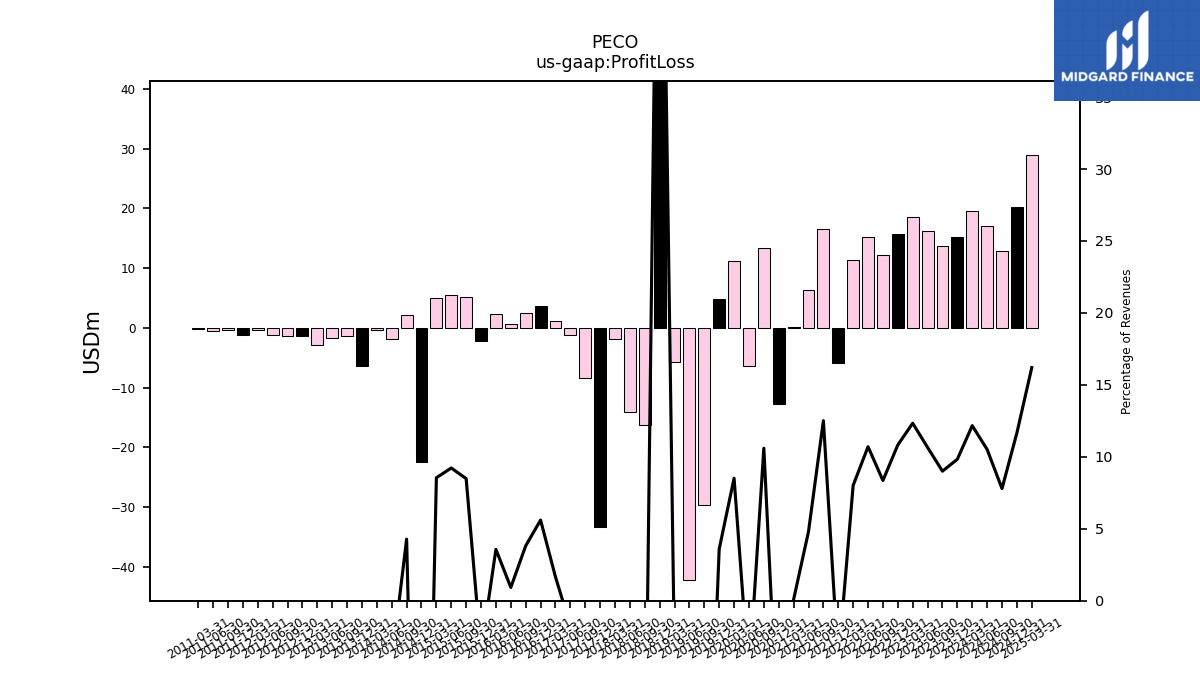
| Profit Loss | 15.19 | 13.73 | 16.21 | 18.64 | 15.70 | 12.17 | 15.26 | 11.40 | -5.84 | 16.56 | 6.39 | 0.12 | -12.75 | 13.43 | -6.41 | 11.20 | 4.86 | -29.73 | -42.17 | -5.79 | 79.16 | -16.27 | -14.08 | -1.84 | -33.26 | -8.38 | -1.22 | 1.13 | 3.72 | 2.49 | 0.58 | 2.25 | -2.19 | 5.25 | 5.46 | 5.04 | -22.48 | 2.14 | -1.88 | -0.42 | -6.46 | -1.33 | -1.65 | -2.91 | -1.30 | -1.32 | -1.20 | -0.44 | -1.22 | -0.44 | -0.60 | -0.25 | |
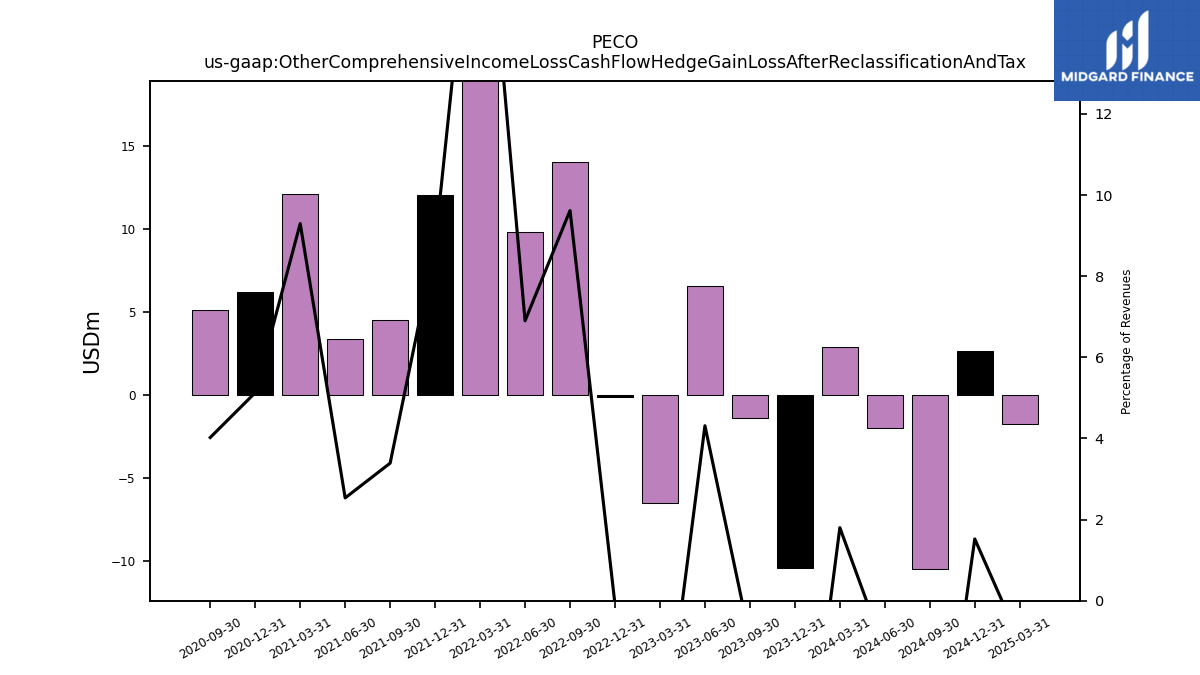
| Other Comprehensive Income Loss Cash Flow Hedge Gain Loss After Reclassification And Tax | -10.46 | -1.42 | 6.56 | -6.50 | -0.13 | 14.01 | 9.83 | 27.57 | 12.02 | 4.49 | 3.37 | 12.12 | 6.19 | 5.10 | NA | NA | NA | NA | NA | NA | NA | NA | NA | NA | NA | NA | NA | NA | NA | NA | NA | NA | NA | NA | NA | NA | NA | NA | NA | NA | NA | NA | NA | NA | NA | NA | NA | NA | NA | NA | NA | NA | |
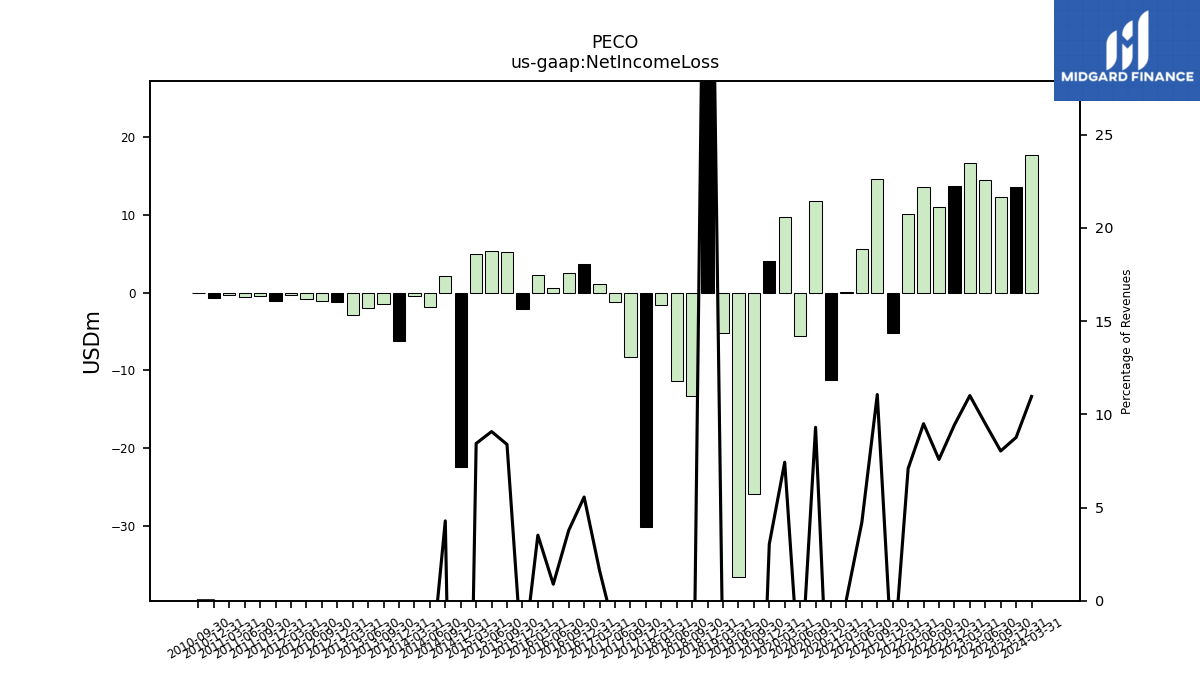
| Net Income Loss | 13.53 | 12.24 | 14.45 | 16.62 | 13.68 | 11.04 | 13.53 | 10.08 | -5.21 | 14.63 | 5.59 | 0.10 | -11.19 | 11.78 | -5.59 | 9.77 | 4.11 | -25.88 | -36.57 | -5.20 | 65.32 | -13.23 | -11.35 | -1.60 | -30.07 | -8.23 | -1.19 | 1.11 | 3.69 | 2.46 | 0.56 | 2.22 | -2.16 | 5.18 | 5.37 | 4.97 | -22.48 | 2.14 | -1.88 | -0.42 | -6.16 | -1.41 | -1.99 | -2.85 | -1.25 | -1.04 | -0.81 | -0.26 | -1.07 | -0.44 | -0.60 | -0.25 | |
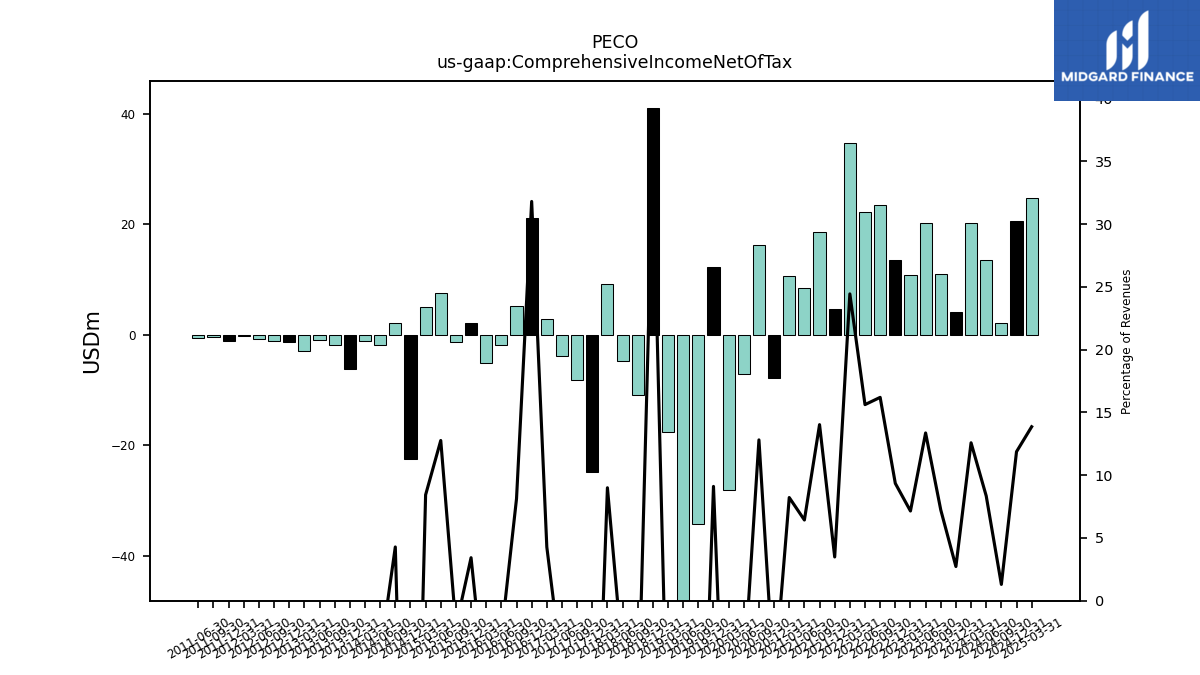
| Comprehensive Income Net Of Tax | 4.21 | 11.03 | 20.33 | 10.80 | 13.56 | 23.59 | 22.26 | 34.74 | 4.78 | 18.56 | 8.56 | 10.71 | -7.87 | 16.23 | -7.11 | -28.02 | 12.32 | -34.31 | -57.05 | -17.62 | 41.07 | -10.88 | -4.71 | 9.29 | -24.75 | -8.18 | -3.81 | 2.92 | 21.09 | 5.30 | -1.75 | -5.14 | 2.13 | -1.27 | 7.55 | 4.97 | -22.48 | 2.14 | -1.88 | -1.11 | -6.08 | -1.76 | -0.94 | -2.93 | -1.25 | -1.04 | -0.81 | -0.26 | -1.07 | -0.44 | -0.60 | NA |
| 2023-12-31 | 2023-09-30 | 2023-06-30 | 2023-03-31 | 2022-12-31 | 2022-09-30 | 2022-06-30 | 2022-03-31 | 2021-12-31 | 2021-09-30 | 2021-06-30 | 2021-03-31 | 2020-12-31 | 2020-09-30 | 2020-06-30 | 2020-03-31 | 2019-12-31 | 2019-09-30 | 2019-06-30 | 2019-03-31 | 2018-12-31 | 2018-09-30 | 2018-06-30 | 2018-03-31 | 2017-12-31 | 2017-09-30 | 2017-06-30 | 2017-03-31 | 2016-12-31 | 2016-09-30 | 2016-06-30 | 2016-03-31 | 2015-12-31 | 2015-09-30 | 2015-06-30 | 2015-03-31 | 2014-12-31 | 2014-09-30 | 2014-06-30 | 2014-03-31 | 2013-12-31 | 2013-09-30 | 2013-06-30 | 2013-03-31 | 2012-12-31 | 2012-09-30 | 2012-06-30 | 2012-03-31 | 2011-12-31 | 2011-09-30 | 2011-06-30 | 2011-03-31 | ||
|---|---|---|---|---|---|---|---|---|---|---|---|---|---|---|---|---|---|---|---|---|---|---|---|---|---|---|---|---|---|---|---|---|---|---|---|---|---|---|---|---|---|---|---|---|---|---|---|---|---|---|---|---|---|
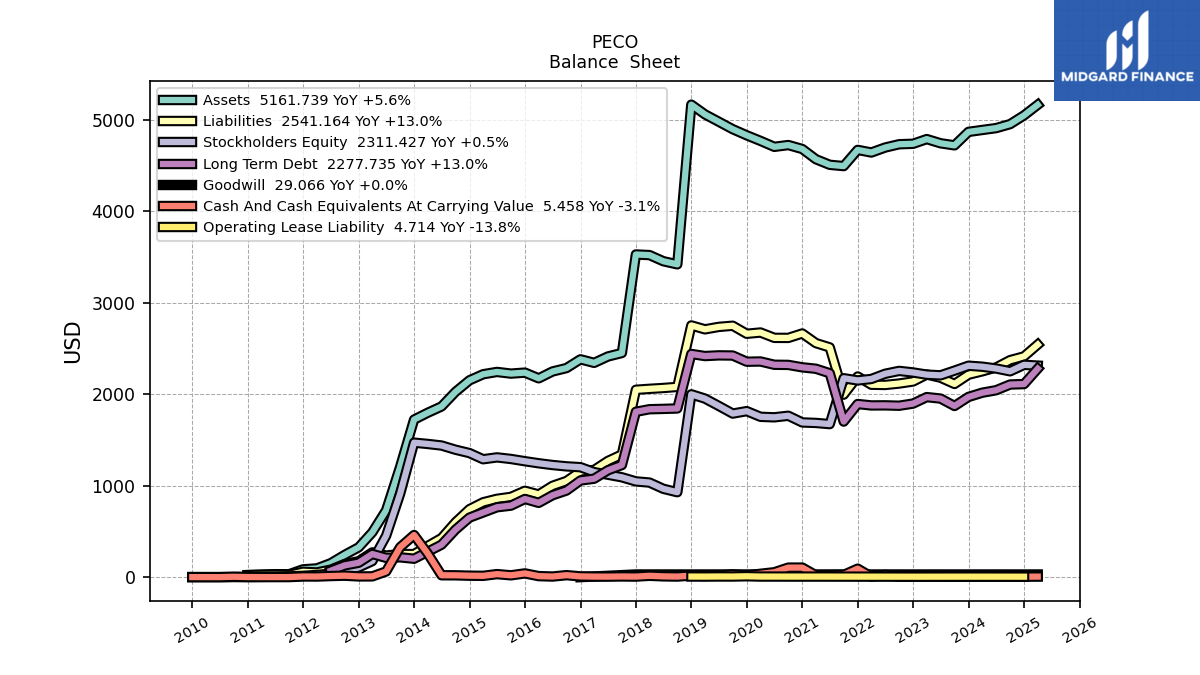
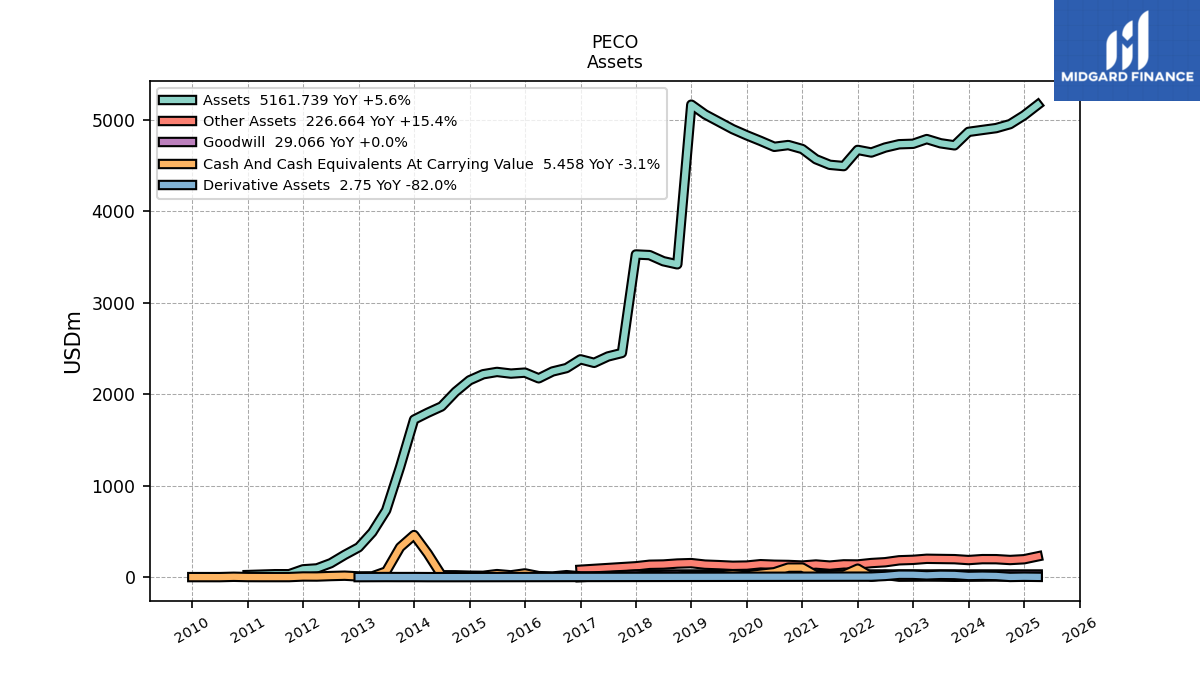
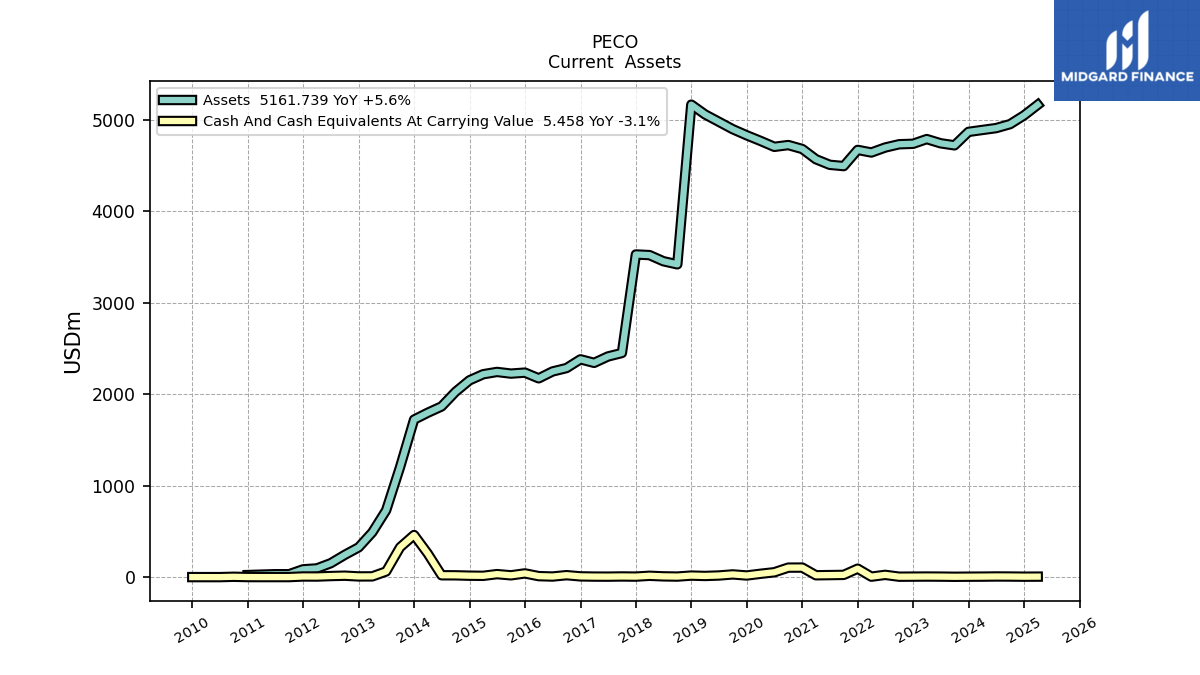
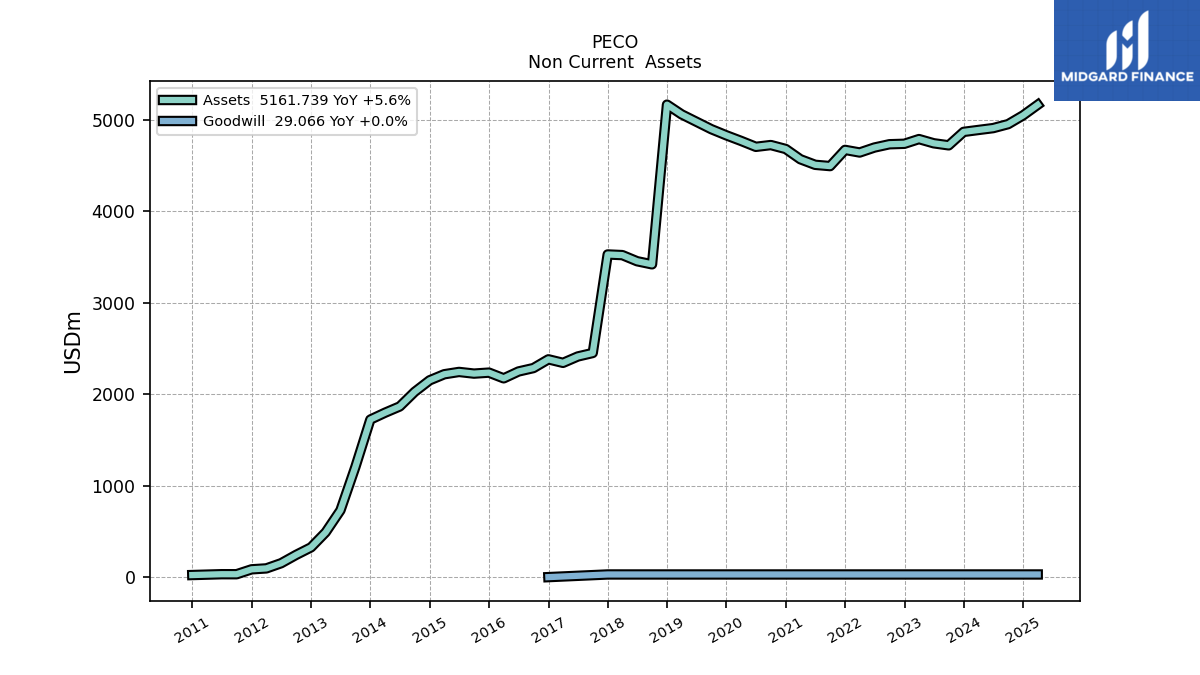
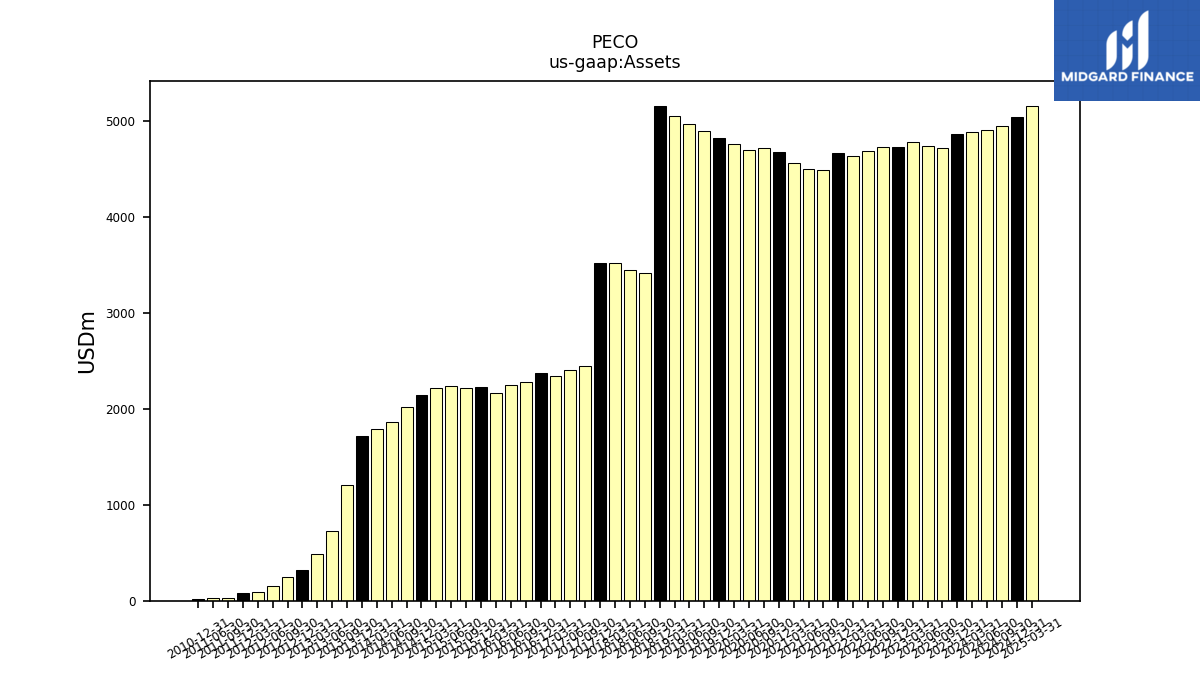
| Assets | 4865.67 | 4718.46 | 4741.01 | 4786.91 | 4735.49 | 4730.41 | 4694.61 | 4640.18 | 4668.77 | 4491.62 | 4505.77 | 4566.60 | 4678.56 | 4721.77 | 4702.19 | 4767.01 | 4828.19 | 4894.99 | 4976.45 | 5057.05 | 5163.48 | 3418.01 | 3452.12 | 3519.03 | 3526.08 | 2449.26 | 2411.25 | 2341.51 | 2380.19 | 2284.57 | 2247.29 | 2172.26 | 2234.81 | 2224.05 | 2242.29 | 2217.01 | 2150.77 | 2024.81 | 1865.07 | 1796.15 | 1721.53 | 1203.86 | 729.97 | 489.59 | 325.41 | 242.86 | 152.00 | 95.44 | 85.19 | 31.68 | 31.89 | NA | |
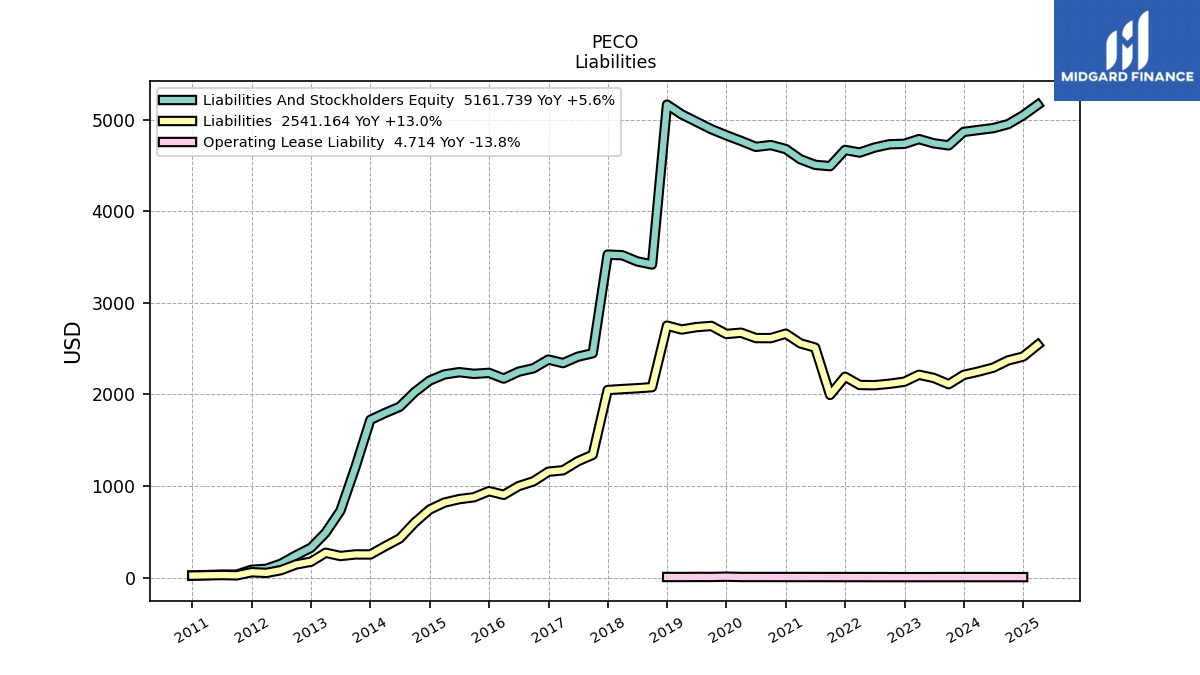
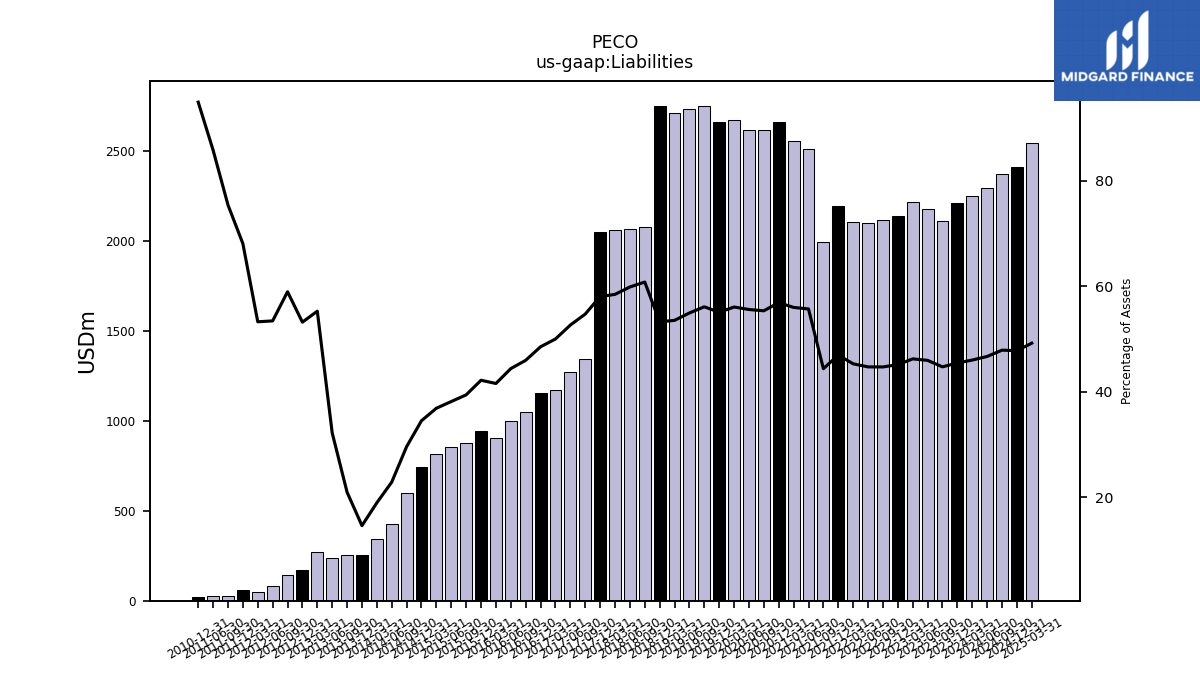
| Liabilities | 2212.32 | 2110.97 | 2179.26 | 2213.97 | 2138.06 | 2115.51 | 2099.97 | 2102.51 | 2192.44 | 1993.87 | 2510.38 | 2557.20 | 2662.63 | 2614.12 | 2614.72 | 2673.21 | 2659.40 | 2747.12 | 2734.43 | 2707.86 | 2750.58 | 2078.66 | 2066.85 | 2057.76 | 2047.40 | 1340.67 | 1269.67 | 1171.18 | 1155.40 | 1050.35 | 997.91 | 903.33 | 943.02 | 876.91 | 855.75 | 817.99 | 742.63 | 599.66 | 426.88 | 340.83 | 252.00 | 252.52 | 235.23 | 270.68 | 173.14 | 143.22 | 81.24 | 50.85 | 58.01 | 23.89 | 27.37 | NA | |
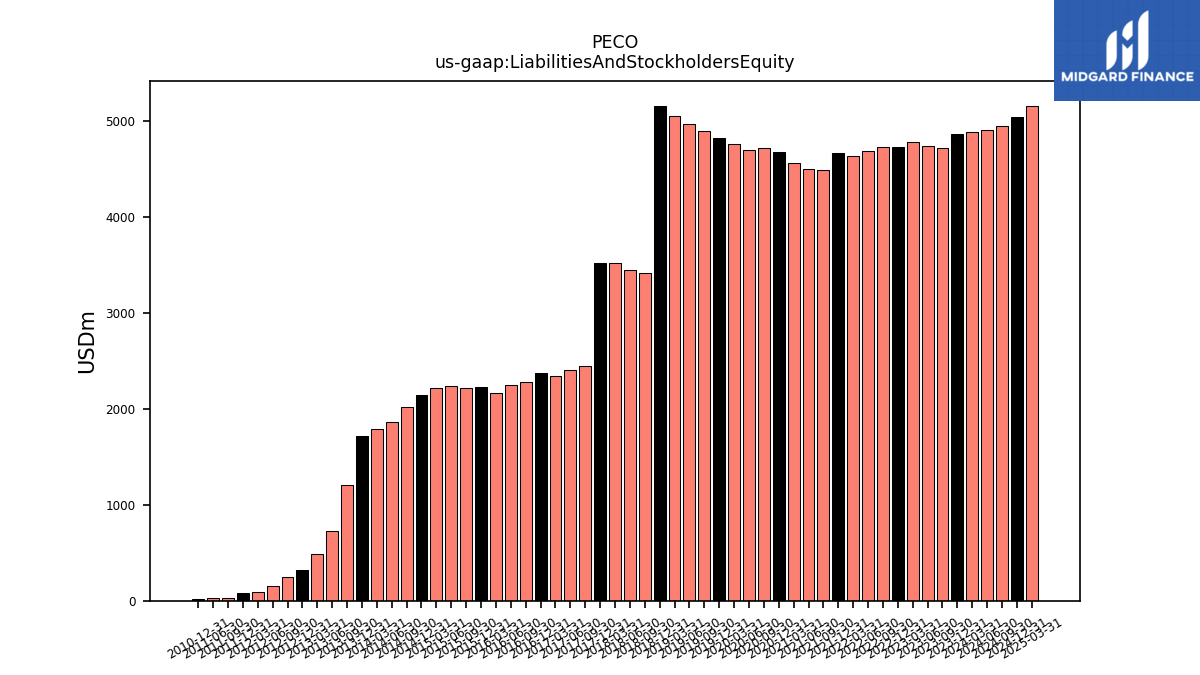
| Liabilities And Stockholders Equity | 4865.67 | 4718.46 | 4741.01 | 4786.91 | 4735.49 | 4730.41 | 4694.61 | 4640.18 | 4668.77 | 4491.62 | 4505.77 | 4566.60 | 4678.56 | 4721.77 | 4702.19 | 4767.01 | 4828.19 | 4894.99 | 4976.45 | 5057.05 | 5163.48 | 3418.01 | 3452.12 | 3519.03 | 3526.08 | 2449.26 | 2411.25 | 2341.51 | 2380.19 | 2284.57 | 2247.29 | 2172.26 | 2234.81 | 2224.05 | 2242.29 | 2217.01 | 2150.77 | 2024.81 | 1865.07 | 1796.15 | 1721.53 | 1203.86 | 729.97 | 489.59 | 325.41 | 242.86 | 152.00 | 95.44 | 85.19 | 31.68 | 31.89 | NA | |
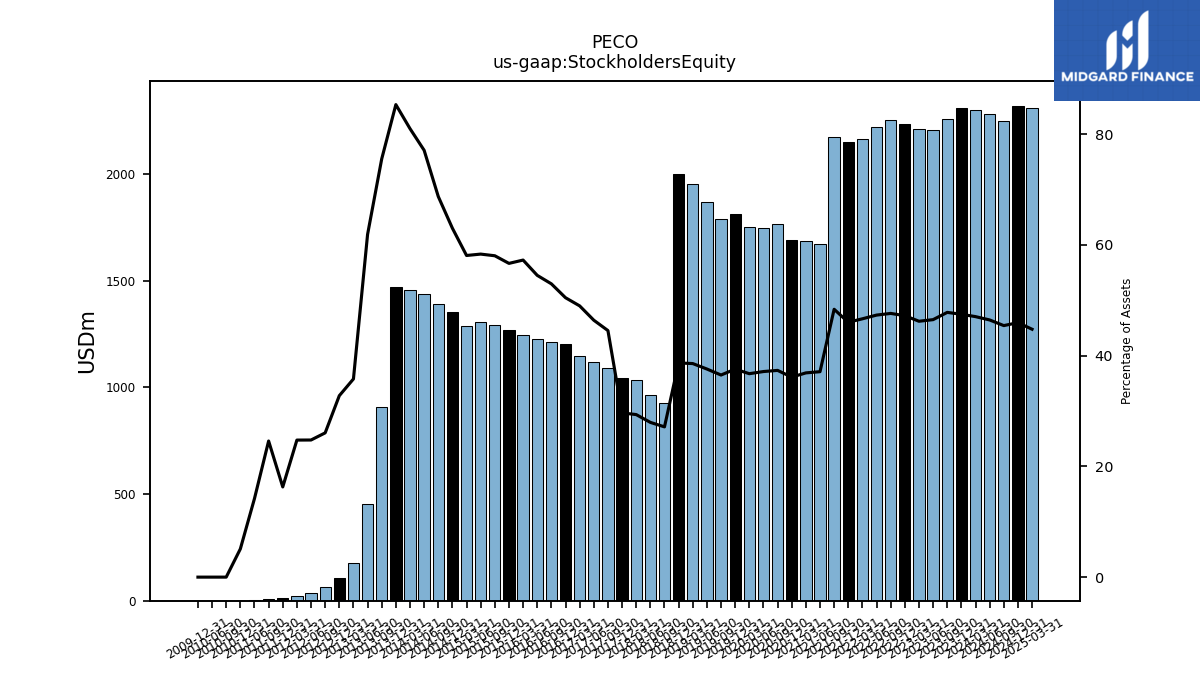
| Stockholders Equity | 2310.31 | 2256.64 | 2205.28 | 2212.65 | 2236.49 | 2253.59 | 2222.22 | 2165.46 | 2149.51 | 2173.43 | 1672.14 | 1684.85 | 1690.36 | 1763.40 | 1746.33 | 1751.86 | 1814.01 | 1787.10 | 1870.81 | 1950.96 | 1997.99 | 927.80 | 965.04 | 1033.25 | 1046.24 | 1090.89 | 1119.11 | 1147.36 | 1201.38 | 1210.38 | 1225.08 | 1244.19 | 1266.62 | 1291.15 | 1308.48 | 1288.18 | 1355.50 | 1392.19 | 1438.10 | 1455.23 | 1469.44 | 909.60 | 451.97 | 175.27 | 106.66 | 63.29 | 37.65 | 23.63 | 13.88 | 7.79 | 4.53 | NA |
| 2023-12-31 | 2023-09-30 | 2023-06-30 | 2023-03-31 | 2022-12-31 | 2022-09-30 | 2022-06-30 | 2022-03-31 | 2021-12-31 | 2021-09-30 | 2021-06-30 | 2021-03-31 | 2020-12-31 | 2020-09-30 | 2020-06-30 | 2020-03-31 | 2019-12-31 | 2019-09-30 | 2019-06-30 | 2019-03-31 | 2018-12-31 | 2018-09-30 | 2018-06-30 | 2018-03-31 | 2017-12-31 | 2017-09-30 | 2017-06-30 | 2017-03-31 | 2016-12-31 | 2016-09-30 | 2016-06-30 | 2016-03-31 | 2015-12-31 | 2015-09-30 | 2015-06-30 | 2015-03-31 | 2014-12-31 | 2014-09-30 | 2014-06-30 | 2014-03-31 | 2013-12-31 | 2013-09-30 | 2013-06-30 | 2013-03-31 | 2012-12-31 | 2012-09-30 | 2012-06-30 | 2012-03-31 | 2011-12-31 | 2011-09-30 | 2011-06-30 | 2011-03-31 | ||
|---|---|---|---|---|---|---|---|---|---|---|---|---|---|---|---|---|---|---|---|---|---|---|---|---|---|---|---|---|---|---|---|---|---|---|---|---|---|---|---|---|---|---|---|---|---|---|---|---|---|---|---|---|---|
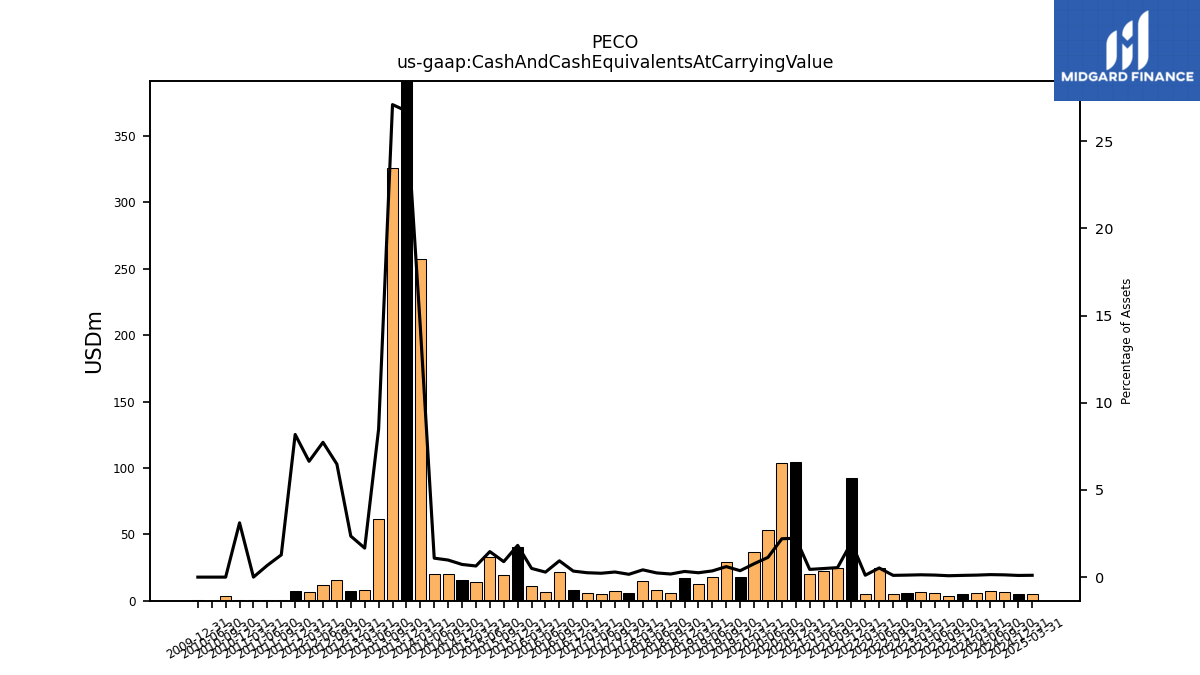
| Cash And Cash Equivalents At Carrying Value | 4.87 | 3.78 | 5.56 | 6.41 | 5.48 | 4.79 | 24.66 | 5.06 | 92.58 | 24.45 | 22.20 | 20.26 | 104.30 | 103.91 | 53.26 | 36.53 | 17.82 | 29.52 | 17.77 | 12.68 | 16.79 | 6.11 | 8.31 | 14.69 | 5.72 | 7.19 | 5.37 | 5.89 | 8.22 | 21.36 | 6.46 | 10.86 | 40.68 | 19.75 | 32.82 | 14.16 | 15.65 | 19.83 | 20.30 | 257.48 | 460.25 | 326.23 | 61.93 | 8.15 | 7.65 | 15.74 | 11.75 | 6.34 | 6.97 | 0.40 | 0.22 | 0.28 | |
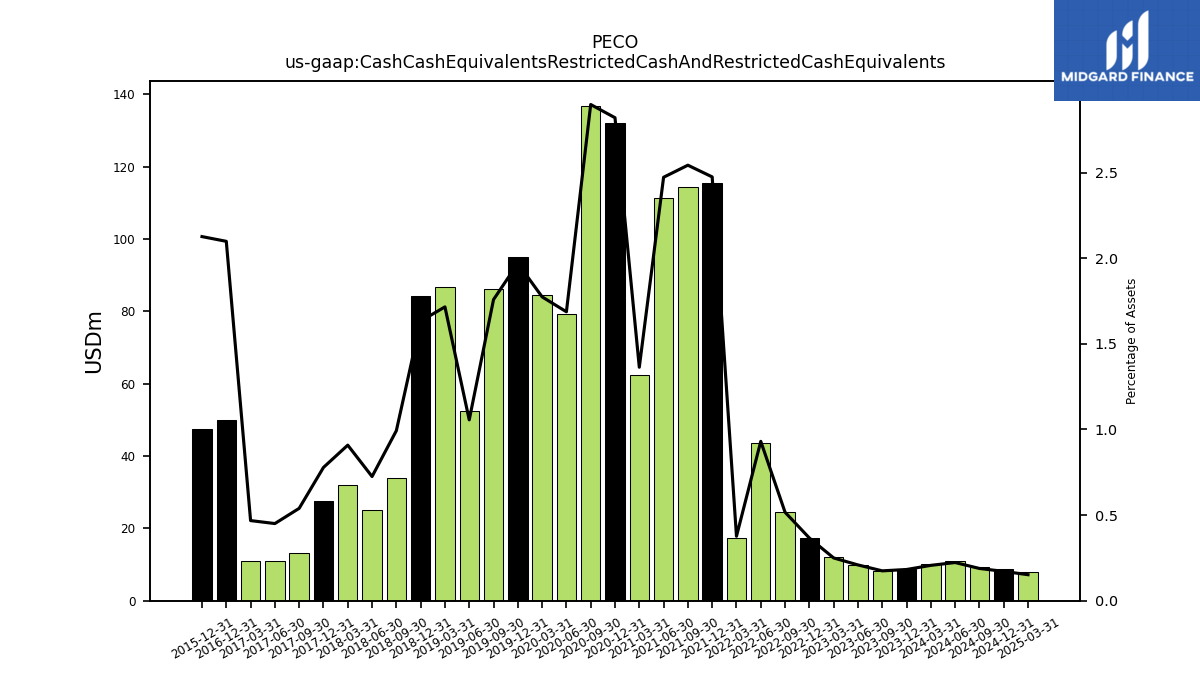
| Cash Cash Equivalents Restricted Cash And Restricted Cash Equivalents | 8.88 | 8.24 | 9.92 | 11.96 | 17.35 | 24.45 | 43.69 | 17.47 | 115.53 | 114.22 | 111.40 | 62.25 | 131.94 | 136.80 | 79.33 | 84.58 | 95.11 | 86.07 | 52.56 | 86.76 | 84.30 | 33.94 | 25.04 | 31.97 | 27.45 | 13.21 | 10.87 | 10.96 | 49.95 | NA | NA | NA | 47.51 | NA | NA | NA | NA | NA | NA | NA | NA | NA | NA | NA | NA | NA | NA | NA | NA | NA | NA | NA |
| 2023-12-31 | 2023-09-30 | 2023-06-30 | 2023-03-31 | 2022-12-31 | 2022-09-30 | 2022-06-30 | 2022-03-31 | 2021-12-31 | 2021-09-30 | 2021-06-30 | 2021-03-31 | 2020-12-31 | 2020-09-30 | 2020-06-30 | 2020-03-31 | 2019-12-31 | 2019-09-30 | 2019-06-30 | 2019-03-31 | 2018-12-31 | 2018-09-30 | 2018-06-30 | 2018-03-31 | 2017-12-31 | 2017-09-30 | 2017-06-30 | 2017-03-31 | 2016-12-31 | 2016-09-30 | 2016-06-30 | 2016-03-31 | 2015-12-31 | 2015-09-30 | 2015-06-30 | 2015-03-31 | 2014-12-31 | 2014-09-30 | 2014-06-30 | 2014-03-31 | 2013-12-31 | 2013-09-30 | 2013-06-30 | 2013-03-31 | 2012-12-31 | 2012-09-30 | 2012-06-30 | 2012-03-31 | 2011-12-31 | 2011-09-30 | 2011-06-30 | 2011-03-31 | ||
|---|---|---|---|---|---|---|---|---|---|---|---|---|---|---|---|---|---|---|---|---|---|---|---|---|---|---|---|---|---|---|---|---|---|---|---|---|---|---|---|---|---|---|---|---|---|---|---|---|---|---|---|---|---|
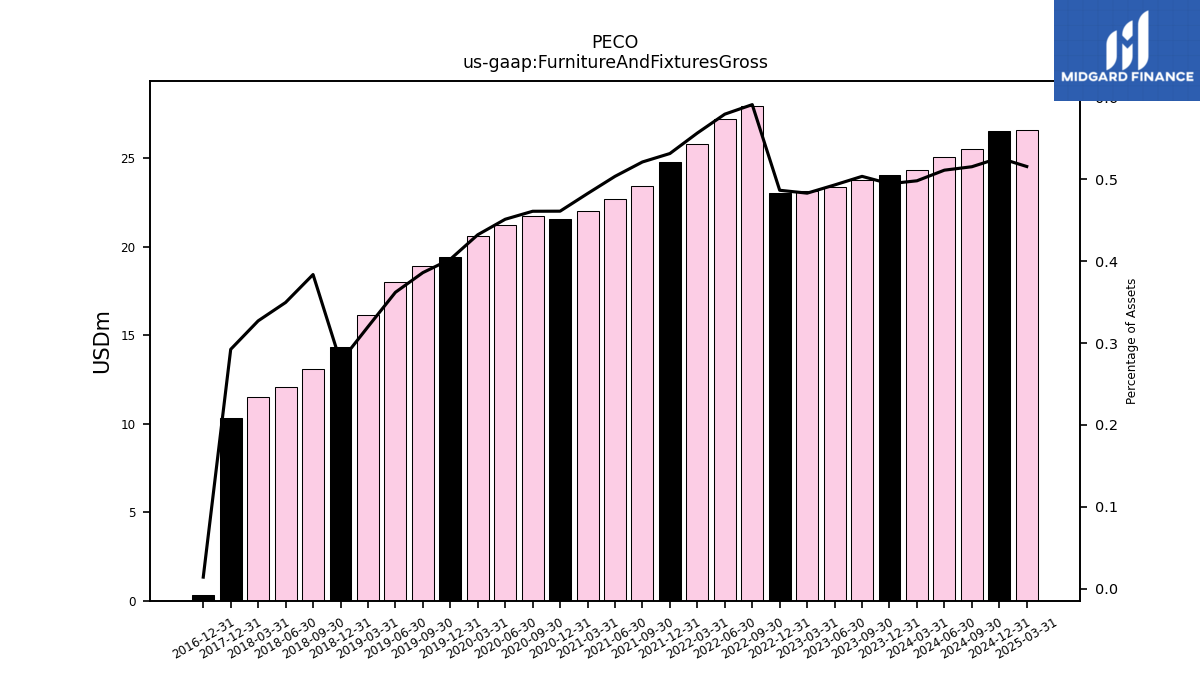
| Furniture And Fixtures Gross | 24.07 | 23.77 | 23.39 | 23.13 | 23.05 | 27.98 | 27.22 | 25.83 | 24.82 | 23.42 | 22.70 | 22.05 | 21.58 | 21.77 | 21.22 | 20.61 | 19.43 | 18.90 | 18.02 | 16.18 | 14.31 | 13.12 | 12.07 | 11.51 | 10.31 | NA | NA | NA | 0.33 | NA | NA | NA | NA | NA | NA | NA | NA | NA | NA | NA | NA | NA | NA | NA | NA | NA | NA | NA | NA | NA | NA | NA | |
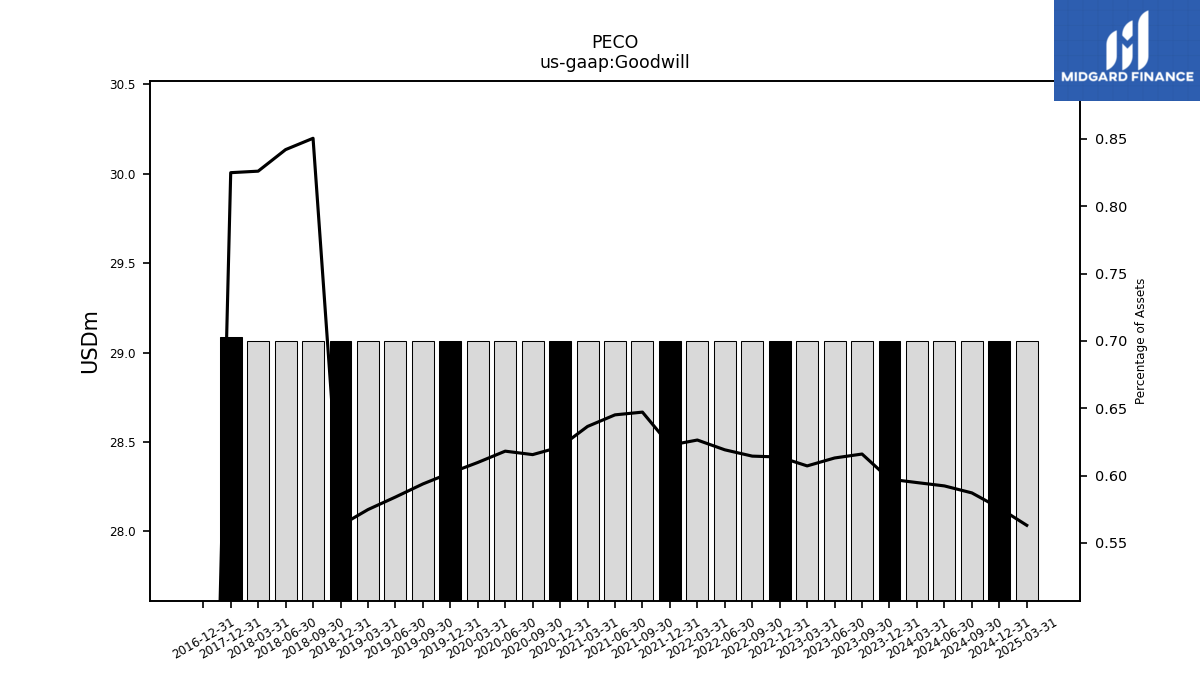
| Goodwill | 29.07 | 29.07 | 29.07 | 29.07 | 29.07 | 29.07 | 29.07 | 29.07 | 29.07 | 29.07 | 29.07 | 29.07 | 29.07 | 29.07 | 29.07 | 29.07 | 29.07 | 29.07 | 29.07 | 29.07 | 29.07 | 29.07 | 29.07 | 29.07 | 29.09 | NA | NA | NA | 0.00 | NA | NA | NA | NA | NA | NA | NA | NA | NA | NA | NA | NA | NA | NA | NA | NA | NA | NA | NA | NA | NA | NA | NA |
| 2023-12-31 | 2023-09-30 | 2023-06-30 | 2023-03-31 | 2022-12-31 | 2022-09-30 | 2022-06-30 | 2022-03-31 | 2021-12-31 | 2021-09-30 | 2021-06-30 | 2021-03-31 | 2020-12-31 | 2020-09-30 | 2020-06-30 | 2020-03-31 | 2019-12-31 | 2019-09-30 | 2019-06-30 | 2019-03-31 | 2018-12-31 | 2018-09-30 | 2018-06-30 | 2018-03-31 | 2017-12-31 | 2017-09-30 | 2017-06-30 | 2017-03-31 | 2016-12-31 | 2016-09-30 | 2016-06-30 | 2016-03-31 | 2015-12-31 | 2015-09-30 | 2015-06-30 | 2015-03-31 | 2014-12-31 | 2014-09-30 | 2014-06-30 | 2014-03-31 | 2013-12-31 | 2013-09-30 | 2013-06-30 | 2013-03-31 | 2012-12-31 | 2012-09-30 | 2012-06-30 | 2012-03-31 | 2011-12-31 | 2011-09-30 | 2011-06-30 | 2011-03-31 | ||
|---|---|---|---|---|---|---|---|---|---|---|---|---|---|---|---|---|---|---|---|---|---|---|---|---|---|---|---|---|---|---|---|---|---|---|---|---|---|---|---|---|---|---|---|---|---|---|---|---|---|---|---|---|---|
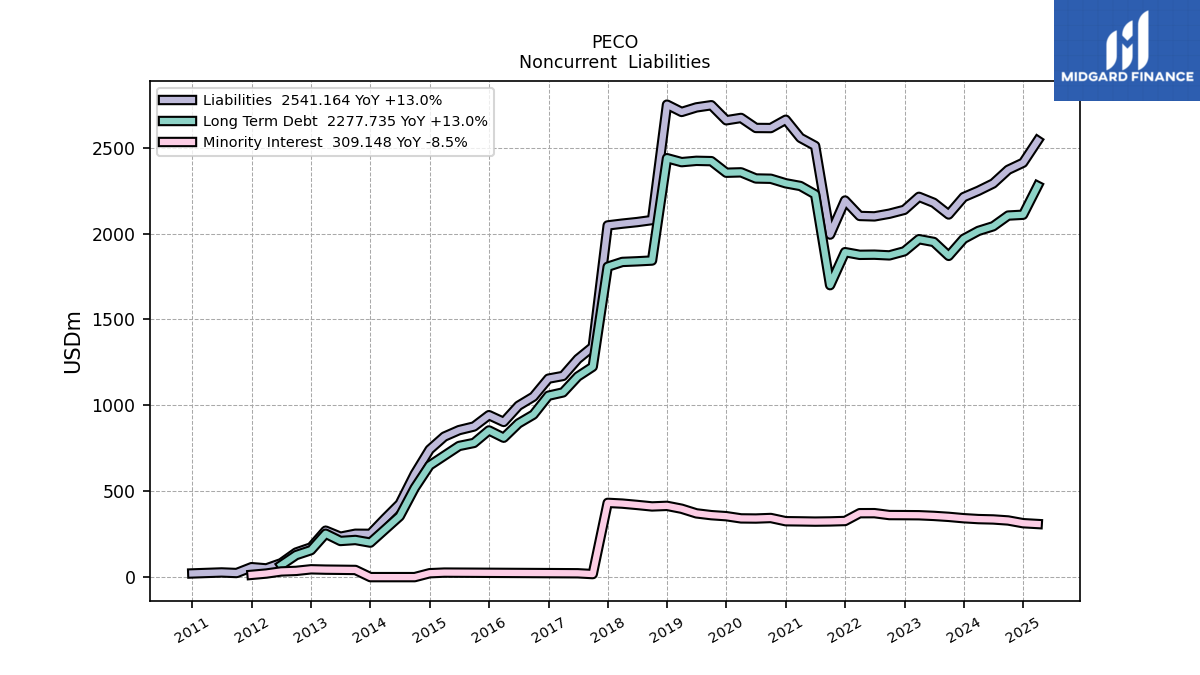
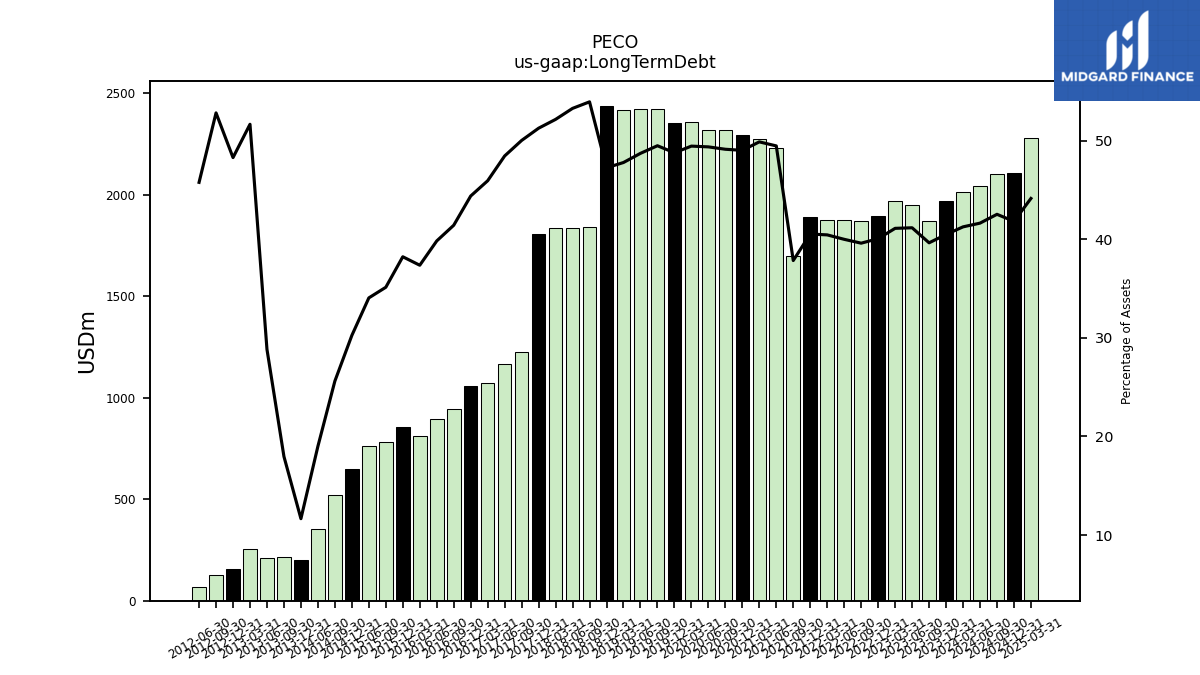
| Long Term Debt | 1969.27 | 1869.98 | 1951.19 | 1967.25 | 1896.59 | 1872.94 | 1877.11 | 1876.21 | 1891.72 | 1699.42 | 2228.23 | 2276.97 | 2292.61 | 2319.00 | 2320.72 | 2356.40 | 2354.10 | 2421.56 | 2423.41 | 2415.76 | 2438.83 | 1842.95 | 1838.47 | 1834.83 | 1807.00 | 1224.78 | 1167.85 | 1075.25 | 1056.16 | 946.04 | 894.89 | 811.50 | 854.08 | 781.19 | 763.44 | NA | 650.46 | 518.67 | 354.48 | NA | 200.87 | 216.31 | 210.44 | 252.84 | 157.07 | 128.23 | 69.55 | NA | NA | NA | NA | NA | |
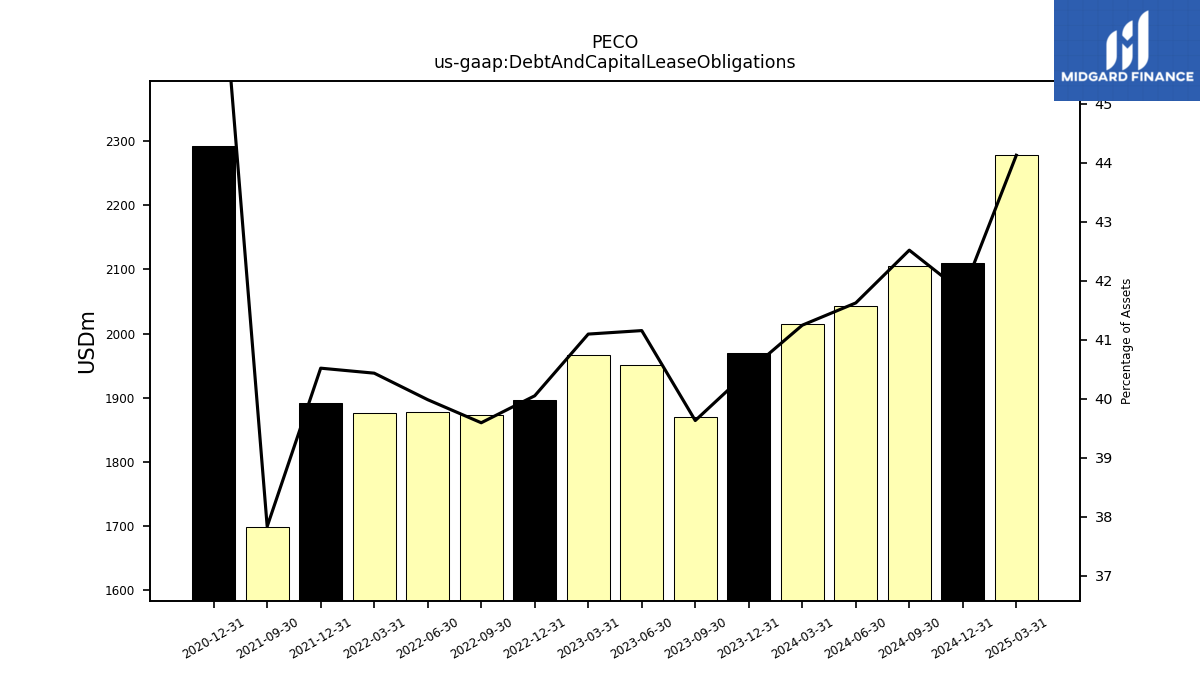
| Debt And Capital Lease Obligations | 1969.27 | 1869.98 | 1951.19 | 1967.25 | 1896.59 | 1872.94 | 1877.11 | 1876.21 | 1891.72 | 1699.42 | NA | NA | 2292.61 | NA | NA | NA | NA | NA | NA | NA | NA | NA | NA | NA | NA | NA | NA | NA | NA | NA | NA | NA | NA | NA | NA | NA | NA | NA | NA | NA | NA | NA | NA | NA | NA | NA | NA | NA | NA | NA | NA | NA | |
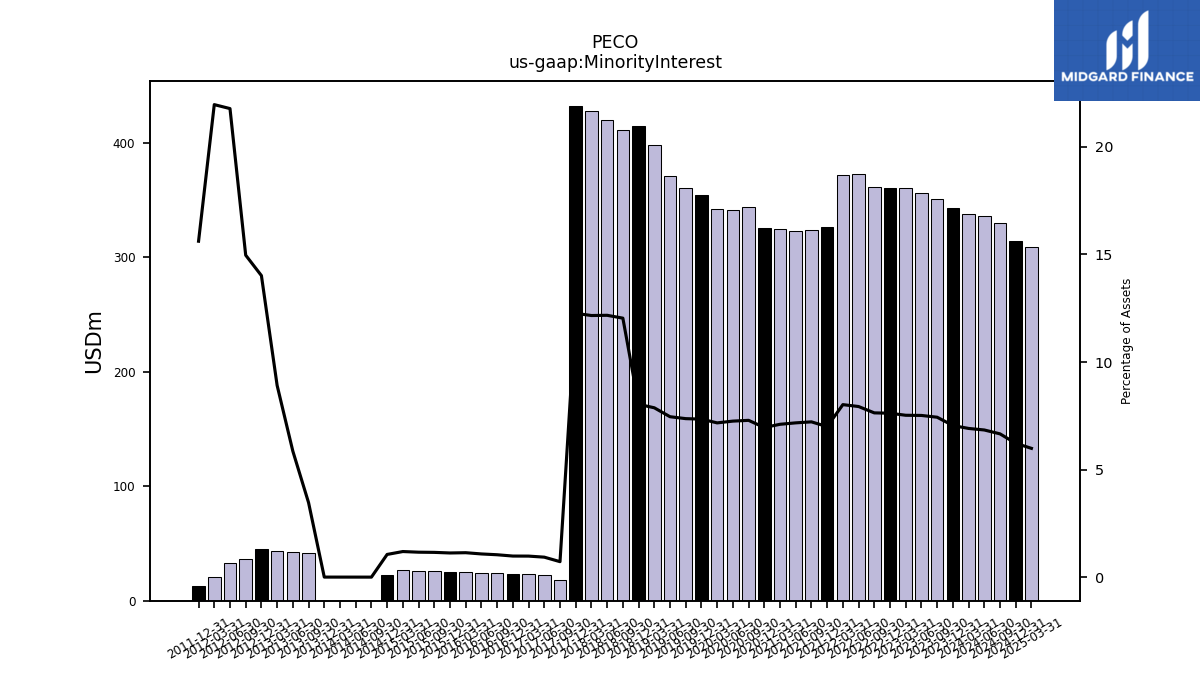
| Minority Interest | 343.04 | 350.85 | 356.46 | 360.29 | 360.95 | 361.31 | 372.42 | 372.21 | 326.81 | 324.32 | 323.25 | 324.56 | 325.57 | 344.26 | 341.14 | 341.94 | 354.79 | 360.77 | 371.21 | 398.23 | 414.91 | 411.55 | 420.23 | 428.02 | 432.44 | 17.70 | 22.47 | 22.97 | 23.41 | 23.85 | 24.30 | 24.74 | 25.18 | 25.67 | 26.07 | 26.45 | 22.76 | 0.08 | 0.09 | 0.09 | 0.09 | 41.73 | 42.76 | 43.64 | 45.62 | 36.35 | 33.11 | 20.96 | 13.30 | NA | NA | NA |
| 2023-12-31 | 2023-09-30 | 2023-06-30 | 2023-03-31 | 2022-12-31 | 2022-09-30 | 2022-06-30 | 2022-03-31 | 2021-12-31 | 2021-09-30 | 2021-06-30 | 2021-03-31 | 2020-12-31 | 2020-09-30 | 2020-06-30 | 2020-03-31 | 2019-12-31 | 2019-09-30 | 2019-06-30 | 2019-03-31 | 2018-12-31 | 2018-09-30 | 2018-06-30 | 2018-03-31 | 2017-12-31 | 2017-09-30 | 2017-06-30 | 2017-03-31 | 2016-12-31 | 2016-09-30 | 2016-06-30 | 2016-03-31 | 2015-12-31 | 2015-09-30 | 2015-06-30 | 2015-03-31 | 2014-12-31 | 2014-09-30 | 2014-06-30 | 2014-03-31 | 2013-12-31 | 2013-09-30 | 2013-06-30 | 2013-03-31 | 2012-12-31 | 2012-09-30 | 2012-06-30 | 2012-03-31 | 2011-12-31 | 2011-09-30 | 2011-06-30 | 2011-03-31 | ||
|---|---|---|---|---|---|---|---|---|---|---|---|---|---|---|---|---|---|---|---|---|---|---|---|---|---|---|---|---|---|---|---|---|---|---|---|---|---|---|---|---|---|---|---|---|---|---|---|---|---|---|---|---|---|
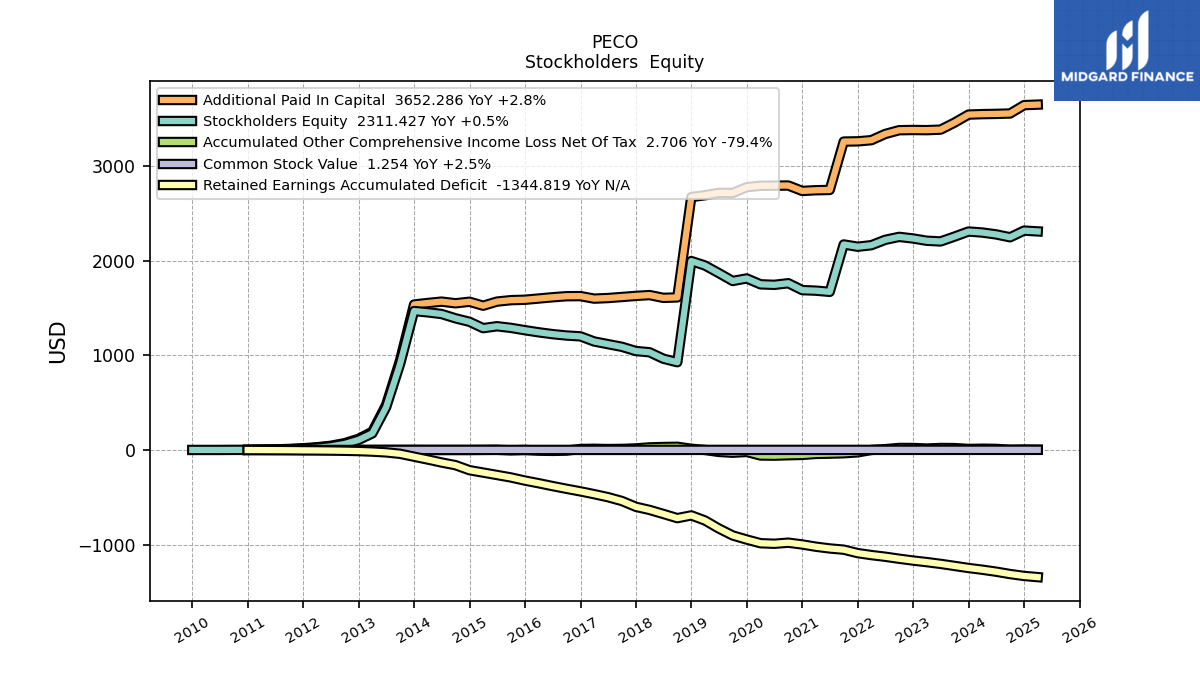
| Stockholders Equity | 2310.31 | 2256.64 | 2205.28 | 2212.65 | 2236.49 | 2253.59 | 2222.22 | 2165.46 | 2149.51 | 2173.43 | 1672.14 | 1684.85 | 1690.36 | 1763.40 | 1746.33 | 1751.86 | 1814.01 | 1787.10 | 1870.81 | 1950.96 | 1997.99 | 927.80 | 965.04 | 1033.25 | 1046.24 | 1090.89 | 1119.11 | 1147.36 | 1201.38 | 1210.38 | 1225.08 | 1244.19 | 1266.62 | 1291.15 | 1308.48 | 1288.18 | 1355.50 | 1392.19 | 1438.10 | 1455.23 | 1469.44 | 909.60 | 451.97 | 175.27 | 106.66 | 63.29 | 37.65 | 23.63 | 13.88 | 7.79 | 4.53 | NA | |
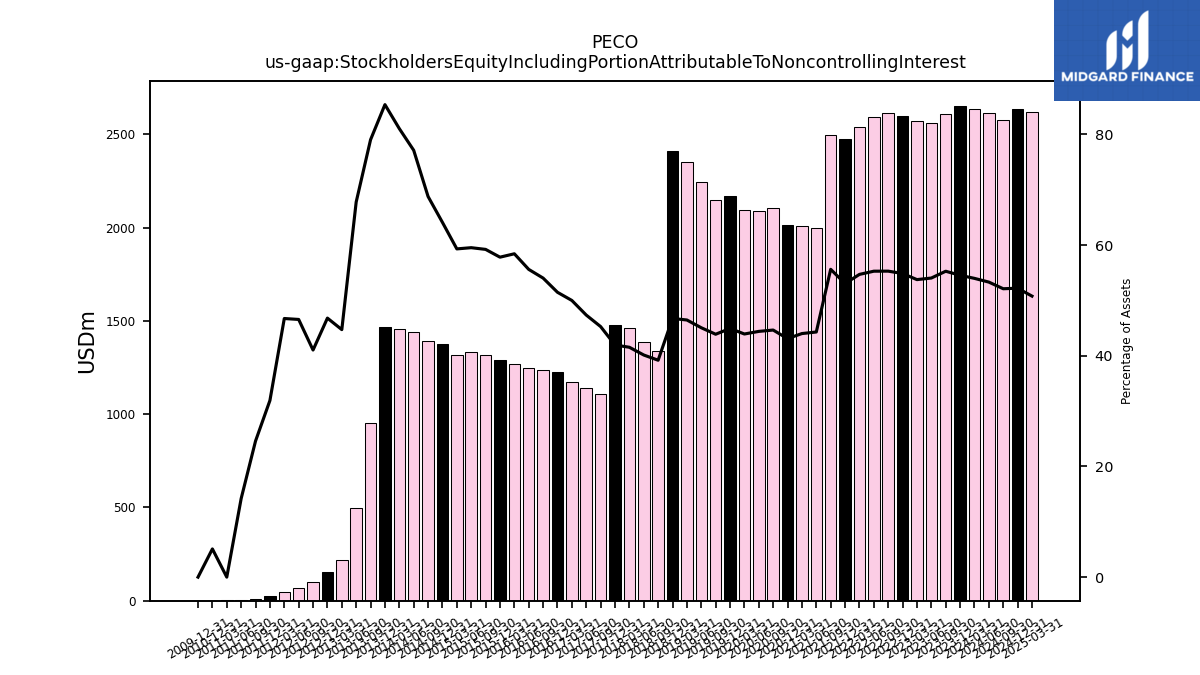
| Stockholders Equity Including Portion Attributable To Noncontrolling Interest | 2653.35 | 2607.49 | 2561.75 | 2572.94 | 2597.43 | 2614.91 | 2594.64 | 2537.67 | 2476.33 | 2497.75 | 1995.39 | 2009.41 | 2015.93 | 2107.65 | 2087.47 | 2093.81 | 2168.79 | 2147.86 | 2242.03 | 2349.18 | 2412.90 | 1339.35 | 1385.27 | 1461.27 | 1478.68 | 1108.59 | 1141.58 | 1170.33 | 1224.79 | 1234.23 | 1249.38 | 1268.93 | 1291.79 | 1316.83 | 1334.55 | 1314.63 | 1378.26 | 1392.27 | 1438.19 | 1455.32 | 1469.53 | 951.34 | 494.73 | 218.91 | 152.27 | 99.64 | 70.76 | 44.59 | 27.18 | 7.79 | 4.53 | 3.91 | |
| Common Stock Value | 1.22 | 1.20 | 1.17 | 1.17 | 1.17 | NA | NA | NA | NA | NA | 0.93 | 0.93 | 0.92 | 0.96 | 0.96 | 0.96 | 0.95 | 0.94 | 0.94 | 0.93 | 0.92 | 0.61 | 0.60 | 0.61 | 0.61 | 0.61 | 0.60 | 0.60 | 0.61 | 0.61 | 0.61 | 0.60 | 0.60 | 0.61 | 0.61 | 0.60 | 0.60 | 0.60 | 0.59 | 0.59 | 0.58 | 0.36 | 0.18 | 0.07 | 0.05 | 0.03 | 0.02 | 0.01 | 0.01 | 0.01 | 0.00 | NA | |
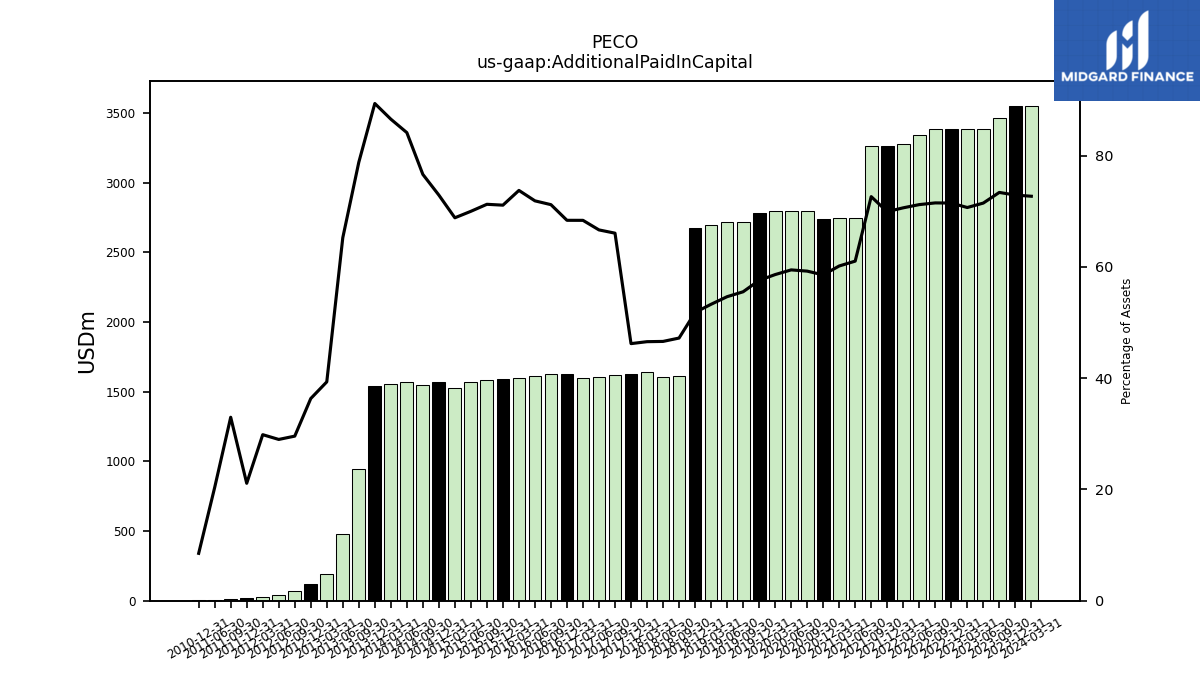
| Additional Paid In Capital | 3546.84 | 3461.98 | 3387.76 | 3382.37 | 3383.98 | 3381.64 | 3341.65 | 3276.15 | 3264.04 | 3261.59 | 2749.68 | 2746.89 | 2739.36 | 2796.66 | 2795.43 | 2793.80 | 2779.13 | 2717.54 | 2718.87 | 2693.95 | 2674.87 | 1613.38 | 1608.59 | 1638.18 | 1629.13 | 1617.72 | 1606.69 | 1600.52 | 1627.10 | 1625.96 | 1614.82 | 1601.62 | 1588.54 | 1584.35 | 1569.12 | 1525.59 | 1567.65 | 1551.20 | 1568.86 | 1554.30 | 1538.18 | 948.52 | 476.17 | 192.56 | 118.24 | 71.84 | 44.06 | 28.48 | 17.98 | 10.45 | 6.50 | NA | |
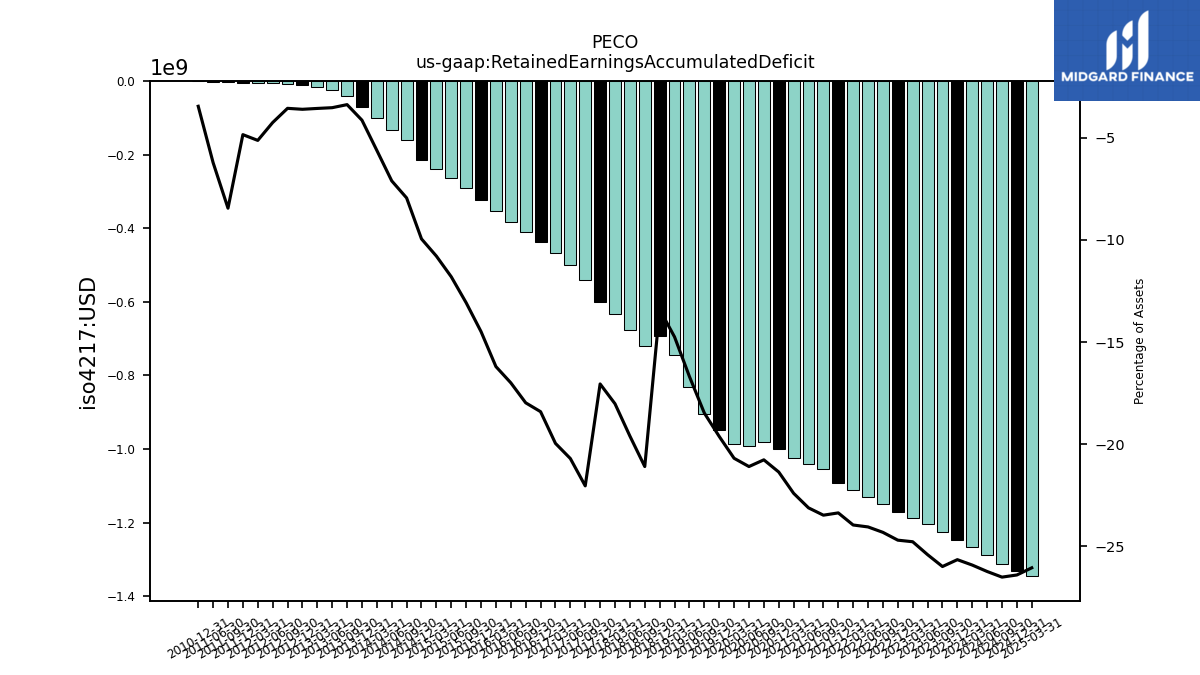
| Retained Earnings Accumulated Deficit | -1248.27 | -1226.38 | -1204.71 | -1186.07 | -1169.66 | -1150.34 | -1129.15 | -1111.67 | -1090.84 | -1054.48 | -1041.62 | -1023.15 | -999.49 | -980.53 | -991.94 | -986.29 | -947.25 | -904.30 | -830.36 | -745.74 | -692.04 | -721.02 | -676.67 | -634.16 | -601.24 | -539.84 | -499.20 | -467.38 | -438.15 | -410.62 | -381.93 | -351.92 | -323.76 | -290.77 | -264.67 | -239.24 | -213.97 | -160.81 | -132.55 | -100.85 | -71.19 | -40.61 | -25.72 | -17.43 | -11.72 | -8.63 | -6.46 | -4.89 | -4.13 | -2.67 | -1.98 | NA | |
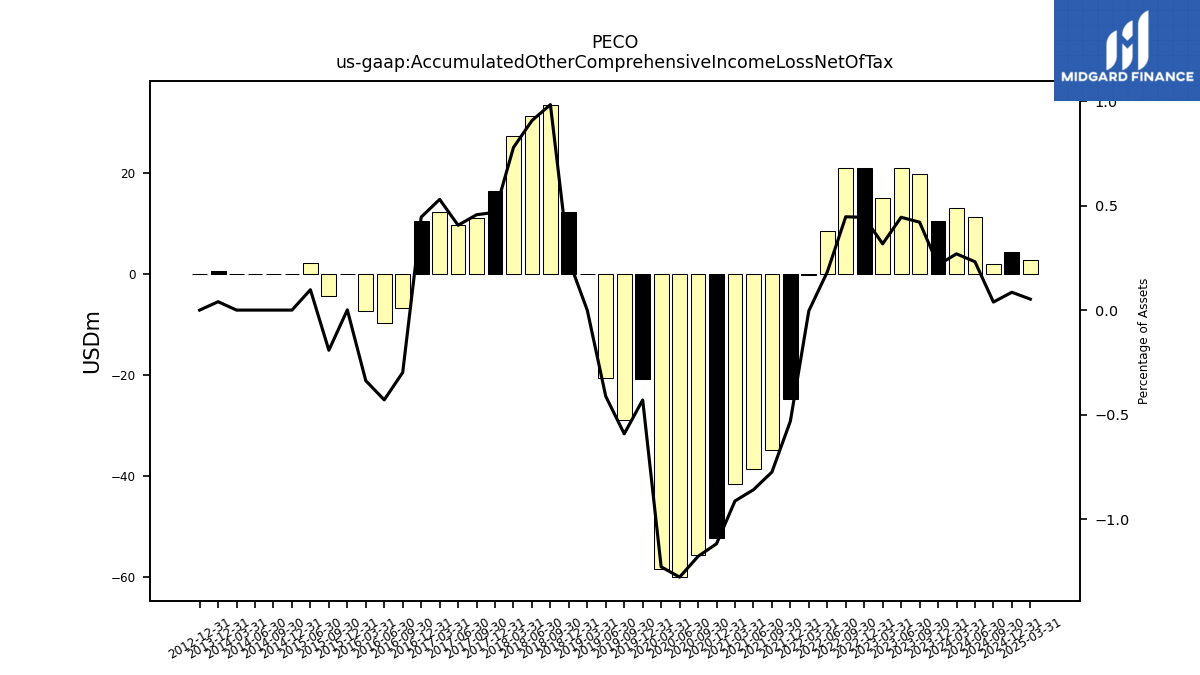
| Accumulated Other Comprehensive Income Loss Net Of Tax | 10.52 | 19.85 | 21.06 | 15.18 | 21.00 | 21.12 | 8.57 | -0.16 | -24.82 | -34.81 | -38.73 | -41.70 | -52.31 | -55.63 | -60.08 | -58.55 | -20.76 | -28.98 | -20.54 | -0.06 | 12.36 | 33.60 | 31.29 | 27.38 | 16.50 | 11.18 | 9.79 | 12.40 | 10.59 | -6.81 | -9.65 | -7.34 | 0.02 | -4.27 | 2.18 | NA | 0.00 | 0.00 | 0.00 | 0.00 | 0.69 | NA | NA | NA | 0.00 | NA | NA | NA | NA | NA | NA | NA | |
| Minority Interest | 343.04 | 350.85 | 356.46 | 360.29 | 360.95 | 361.31 | 372.42 | 372.21 | 326.81 | 324.32 | 323.25 | 324.56 | 325.57 | 344.26 | 341.14 | 341.94 | 354.79 | 360.77 | 371.21 | 398.23 | 414.91 | 411.55 | 420.23 | 428.02 | 432.44 | 17.70 | 22.47 | 22.97 | 23.41 | 23.85 | 24.30 | 24.74 | 25.18 | 25.67 | 26.07 | 26.45 | 22.76 | 0.08 | 0.09 | 0.09 | 0.09 | 41.73 | 42.76 | 43.64 | 45.62 | 36.35 | 33.11 | 20.96 | 13.30 | NA | NA | NA | |
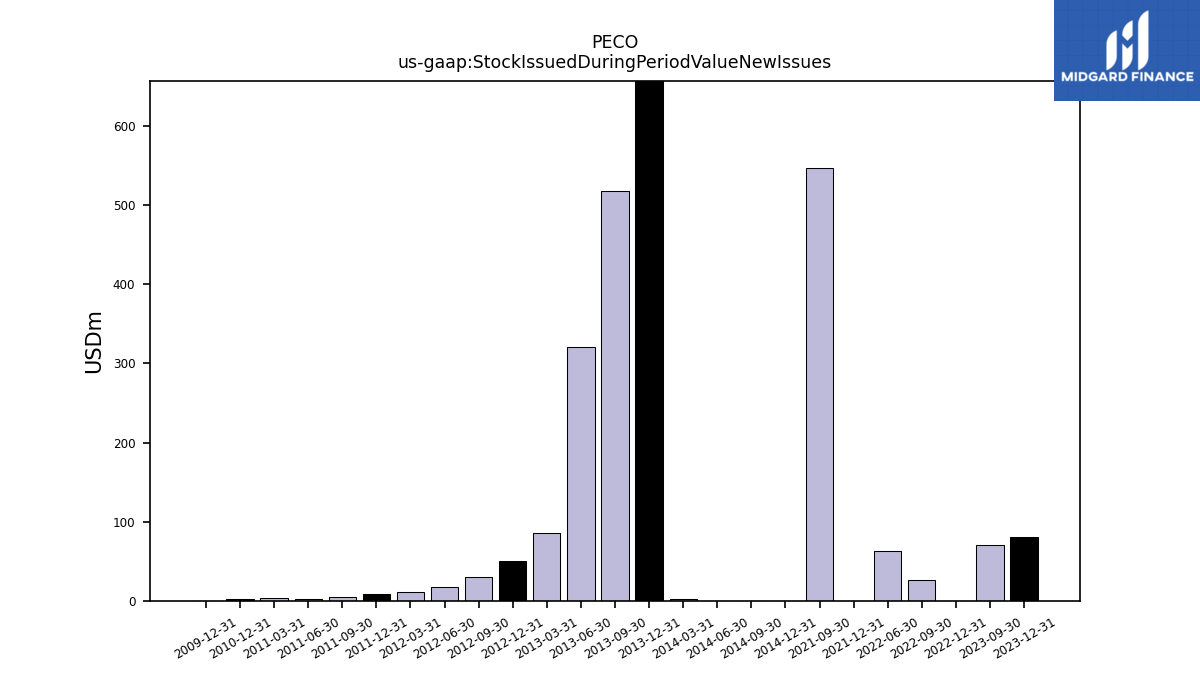
| Stock Issued During Period Value New Issues | 79.98 | 70.85 | NA | NA | 0.00 | 26.42 | 62.97 | NA | 0.00 | 547.40 | NA | NA | NA | NA | NA | NA | NA | NA | NA | NA | NA | NA | NA | NA | NA | NA | NA | NA | NA | NA | NA | NA | NA | NA | NA | NA | 0.00 | 0.00 | 0.00 | 2.53 | 663.00 | 517.34 | 320.63 | 85.62 | 50.65 | 30.40 | 16.94 | 11.49 | 7.95 | 4.95 | 2.07 | 3.65 | |
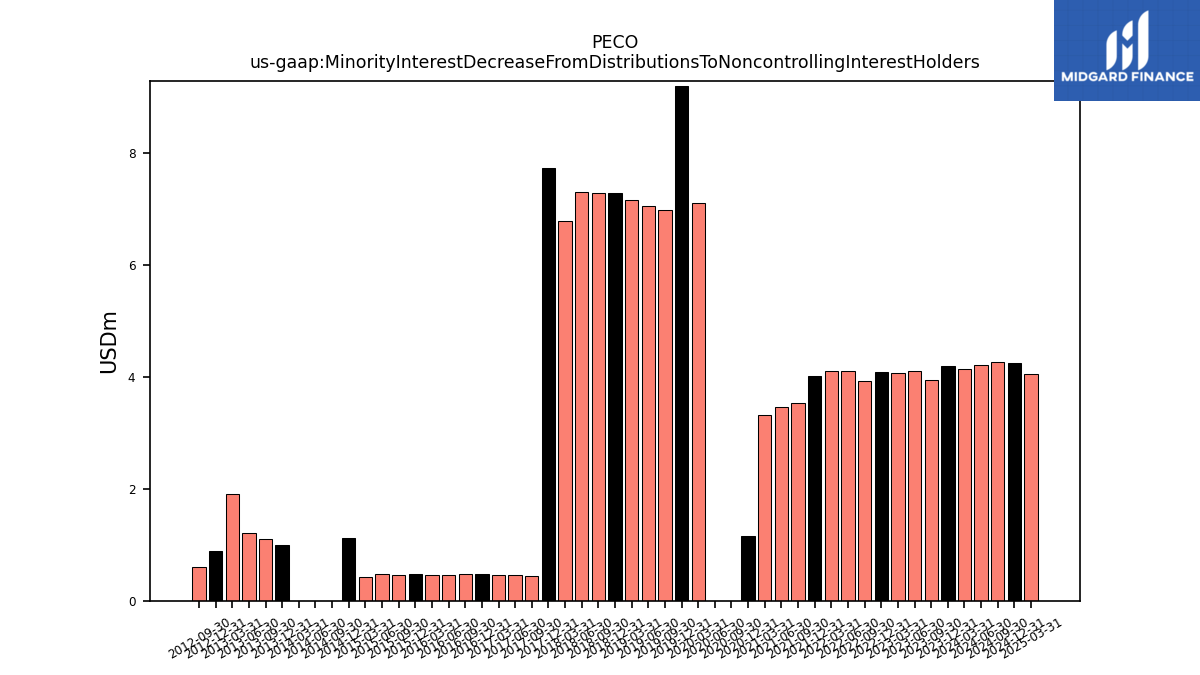
| Minority Interest Decrease From Distributions To Noncontrolling Interest Holders | 4.20 | 3.95 | 4.11 | 4.07 | 4.09 | 3.93 | 4.11 | 4.10 | 4.02 | 3.54 | 3.46 | 3.32 | 1.15 | 0.00 | 0.00 | 7.11 | 9.19 | 6.98 | 7.06 | 7.17 | 7.28 | 7.28 | 7.31 | 6.79 | 7.74 | 0.45 | 0.47 | 0.47 | 0.47 | 0.47 | 0.47 | 0.47 | 0.47 | 0.46 | 0.47 | 0.43 | 1.12 | 0.00 | 0.00 | 0.00 | 0.99 | 1.11 | 1.22 | 1.91 | 0.89 | 0.61 | NA | NA | NA | NA | NA | NA |
| 2023-12-31 | 2023-09-30 | 2023-06-30 | 2023-03-31 | 2022-12-31 | 2022-09-30 | 2022-06-30 | 2022-03-31 | 2021-12-31 | 2021-09-30 | 2021-06-30 | 2021-03-31 | 2020-12-31 | 2020-09-30 | 2020-06-30 | 2020-03-31 | 2019-12-31 | 2019-09-30 | 2019-06-30 | 2019-03-31 | 2018-12-31 | 2018-09-30 | 2018-06-30 | 2018-03-31 | 2017-12-31 | 2017-09-30 | 2017-06-30 | 2017-03-31 | 2016-12-31 | 2016-09-30 | 2016-06-30 | 2016-03-31 | 2015-12-31 | 2015-09-30 | 2015-06-30 | 2015-03-31 | 2014-12-31 | 2014-09-30 | 2014-06-30 | 2014-03-31 | 2013-12-31 | 2013-09-30 | 2013-06-30 | 2013-03-31 | 2012-12-31 | 2012-09-30 | 2012-06-30 | 2012-03-31 | 2011-12-31 | 2011-09-30 | 2011-06-30 | 2011-03-31 | ||
|---|---|---|---|---|---|---|---|---|---|---|---|---|---|---|---|---|---|---|---|---|---|---|---|---|---|---|---|---|---|---|---|---|---|---|---|---|---|---|---|---|---|---|---|---|---|---|---|---|---|---|---|---|---|
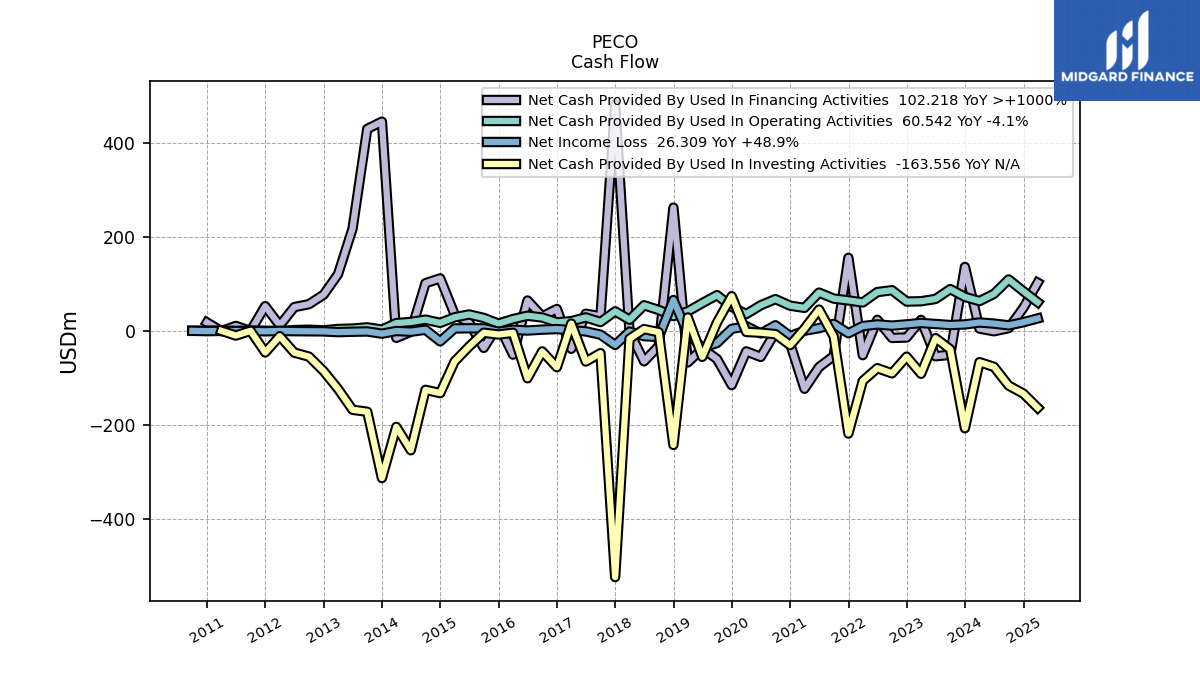
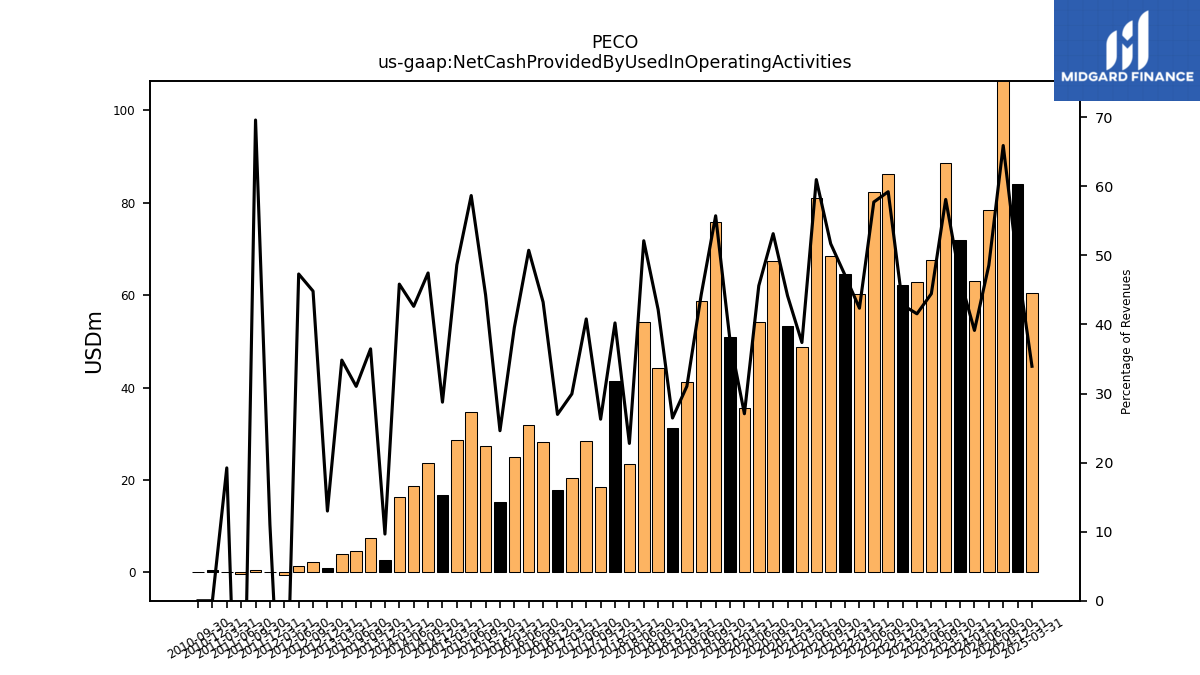
| Net Cash Provided By Used In Operating Activities | 71.98 | 88.60 | 67.63 | 62.76 | 62.13 | 86.26 | 82.28 | 60.22 | 64.59 | 68.42 | 81.15 | 48.75 | 53.33 | 67.34 | 54.29 | 35.61 | 50.99 | 75.81 | 58.83 | 41.24 | 31.25 | 44.22 | 54.30 | 23.51 | 41.34 | 18.57 | 28.50 | 20.46 | 17.90 | 28.22 | 32.00 | 24.96 | 15.30 | 27.37 | 34.73 | 28.67 | 16.85 | 23.75 | 18.72 | 16.36 | 2.57 | 7.35 | 4.71 | 3.92 | 0.92 | 2.31 | 1.47 | -0.66 | 0.16 | 0.58 | -0.27 | 0.12 | |
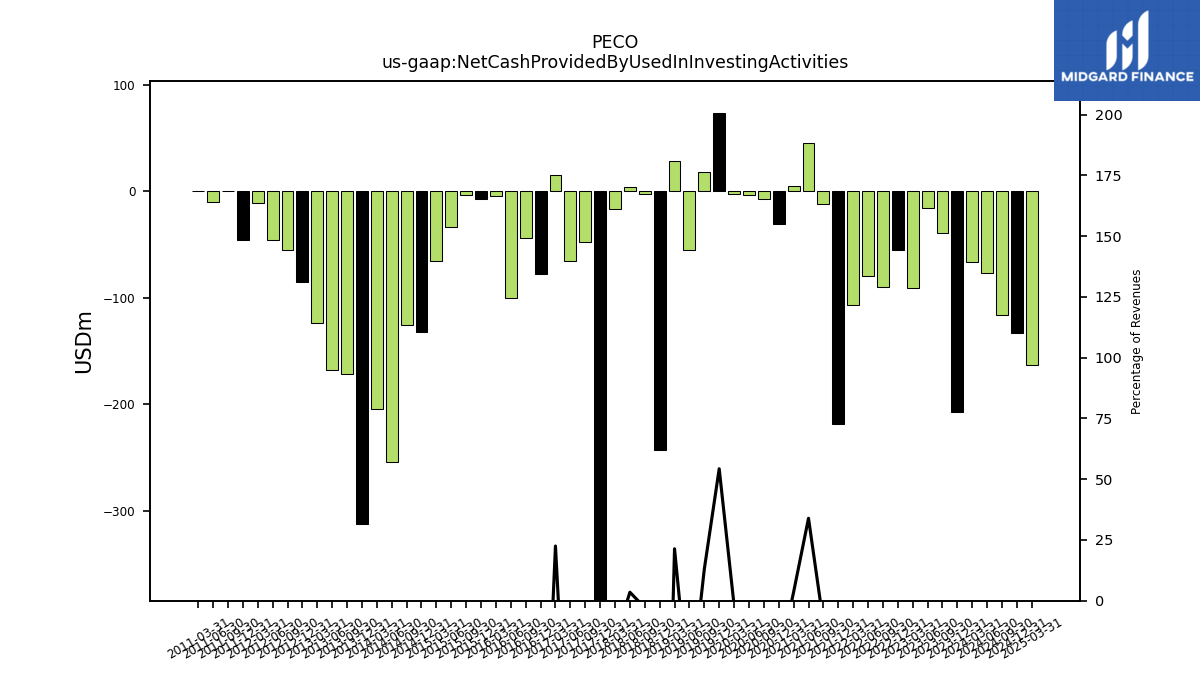
| Net Cash Provided By Used In Investing Activities | -207.05 | -39.34 | -15.59 | -91.42 | -54.97 | -90.38 | -79.40 | -106.50 | -218.33 | -12.00 | 45.15 | 4.69 | -30.53 | -7.09 | -4.05 | -2.41 | 73.48 | 17.68 | -55.37 | 28.38 | -242.61 | -2.99 | 3.66 | -16.93 | -523.34 | -47.46 | -65.33 | 15.38 | -77.41 | -43.80 | -100.81 | -4.20 | -7.87 | -4.11 | -33.46 | -65.34 | -132.43 | -125.39 | -253.83 | -204.13 | -312.91 | -171.98 | -167.81 | -123.52 | -85.79 | -54.87 | -46.38 | -11.44 | -46.00 | -0.03 | -10.10 | -0.02 | |
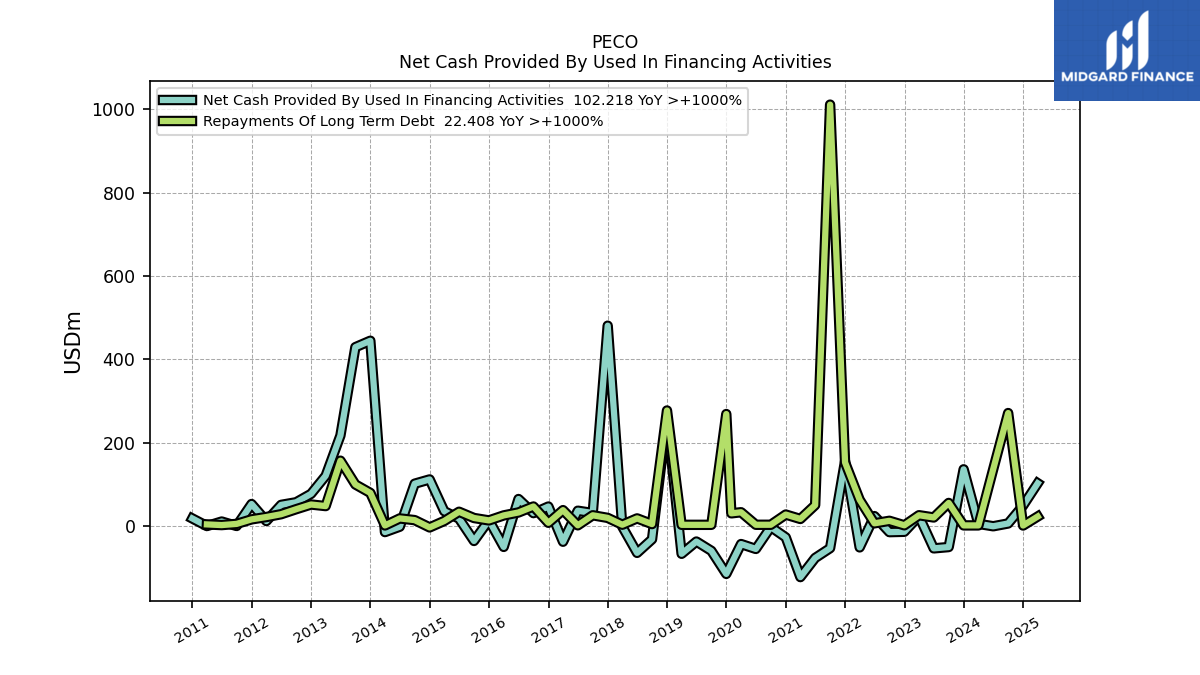
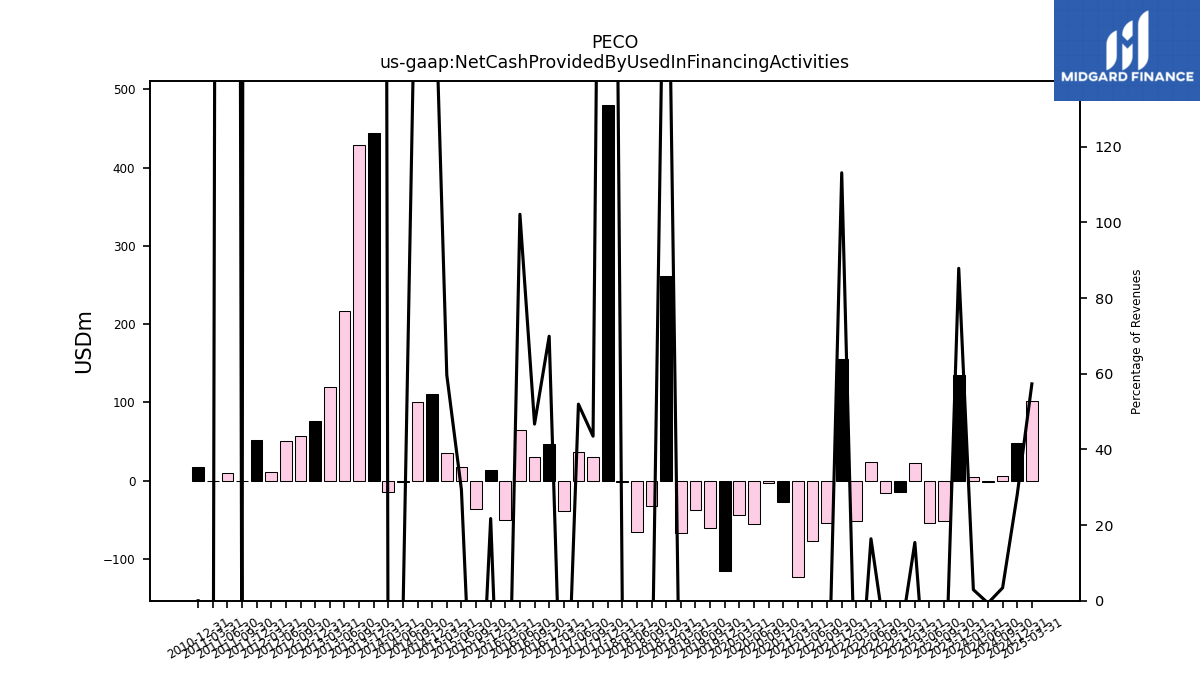
| Net Cash Provided By Used In Financing Activities | 135.71 | -50.94 | -54.09 | 23.27 | -14.25 | -15.12 | 23.34 | -51.78 | 155.05 | -53.60 | -77.14 | -123.12 | -27.66 | -2.78 | -55.48 | -43.73 | -115.44 | -59.99 | -37.66 | -67.17 | 261.72 | -32.34 | -64.89 | -2.06 | 480.53 | 30.72 | 36.30 | -38.17 | 46.37 | 30.48 | 64.41 | -50.58 | 13.50 | -36.33 | 17.38 | 35.18 | 111.40 | 101.17 | -2.08 | -15.00 | 444.36 | 428.93 | 216.88 | 120.10 | 76.79 | 56.54 | 50.32 | 11.47 | 52.41 | -0.37 | 10.31 | -0.52 |
| 2023-12-31 | 2023-09-30 | 2023-06-30 | 2023-03-31 | 2022-12-31 | 2022-09-30 | 2022-06-30 | 2022-03-31 | 2021-12-31 | 2021-09-30 | 2021-06-30 | 2021-03-31 | 2020-12-31 | 2020-09-30 | 2020-06-30 | 2020-03-31 | 2019-12-31 | 2019-09-30 | 2019-06-30 | 2019-03-31 | 2018-12-31 | 2018-09-30 | 2018-06-30 | 2018-03-31 | 2017-12-31 | 2017-09-30 | 2017-06-30 | 2017-03-31 | 2016-12-31 | 2016-09-30 | 2016-06-30 | 2016-03-31 | 2015-12-31 | 2015-09-30 | 2015-06-30 | 2015-03-31 | 2014-12-31 | 2014-09-30 | 2014-06-30 | 2014-03-31 | 2013-12-31 | 2013-09-30 | 2013-06-30 | 2013-03-31 | 2012-12-31 | 2012-09-30 | 2012-06-30 | 2012-03-31 | 2011-12-31 | 2011-09-30 | 2011-06-30 | 2011-03-31 | ||
|---|---|---|---|---|---|---|---|---|---|---|---|---|---|---|---|---|---|---|---|---|---|---|---|---|---|---|---|---|---|---|---|---|---|---|---|---|---|---|---|---|---|---|---|---|---|---|---|---|---|---|---|---|---|
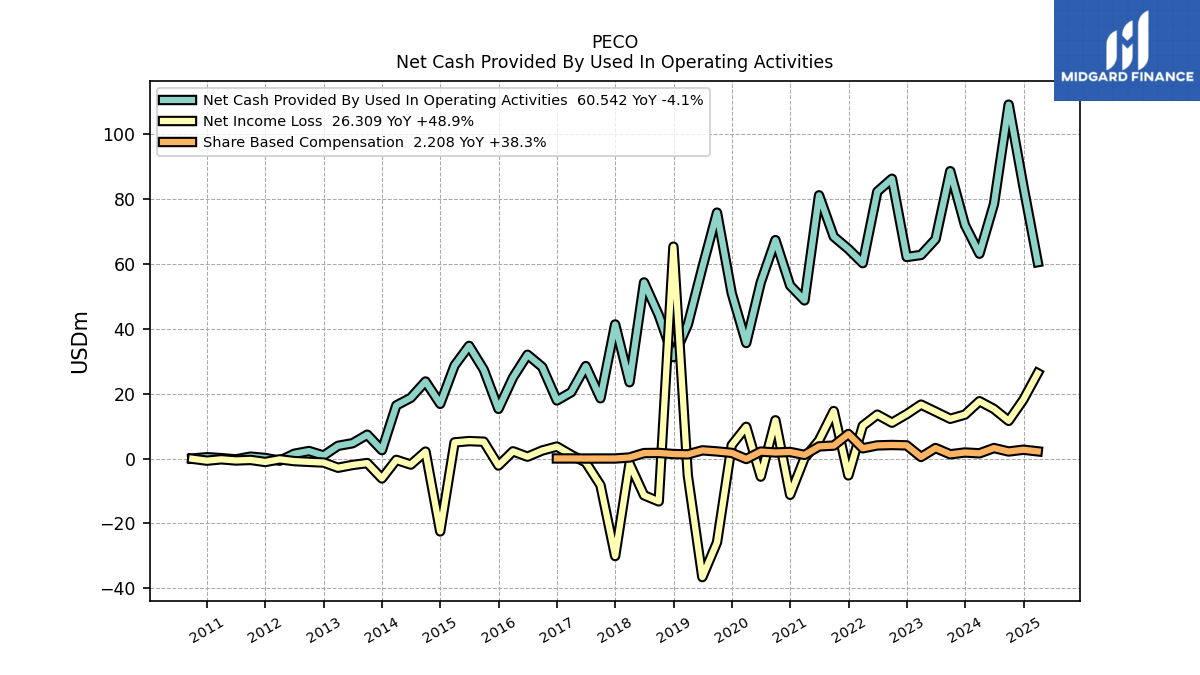
| Net Cash Provided By Used In Operating Activities | 71.98 | 88.60 | 67.63 | 62.76 | 62.13 | 86.26 | 82.28 | 60.22 | 64.59 | 68.42 | 81.15 | 48.75 | 53.33 | 67.34 | 54.29 | 35.61 | 50.99 | 75.81 | 58.83 | 41.24 | 31.25 | 44.22 | 54.30 | 23.51 | 41.34 | 18.57 | 28.50 | 20.46 | 17.90 | 28.22 | 32.00 | 24.96 | 15.30 | 27.37 | 34.73 | 28.67 | 16.85 | 23.75 | 18.72 | 16.36 | 2.57 | 7.35 | 4.71 | 3.92 | 0.92 | 2.31 | 1.47 | -0.66 | 0.16 | 0.58 | -0.27 | 0.12 | |
| Net Income Loss | 13.53 | 12.24 | 14.45 | 16.62 | 13.68 | 11.04 | 13.53 | 10.08 | -5.21 | 14.63 | 5.59 | 0.10 | -11.19 | 11.78 | -5.59 | 9.77 | 4.11 | -25.88 | -36.57 | -5.20 | 65.32 | -13.23 | -11.35 | -1.60 | -30.07 | -8.23 | -1.19 | 1.11 | 3.69 | 2.46 | 0.56 | 2.22 | -2.16 | 5.18 | 5.37 | 4.97 | -22.48 | 2.14 | -1.88 | -0.42 | -6.16 | -1.41 | -1.99 | -2.85 | -1.25 | -1.04 | -0.81 | -0.26 | -1.07 | -0.44 | -0.60 | -0.25 | |
| Profit Loss | 15.19 | 13.73 | 16.21 | 18.64 | 15.70 | 12.17 | 15.26 | 11.40 | -5.84 | 16.56 | 6.39 | 0.12 | -12.75 | 13.43 | -6.41 | 11.20 | 4.86 | -29.73 | -42.17 | -5.79 | 79.16 | -16.27 | -14.08 | -1.84 | -33.26 | -8.38 | -1.22 | 1.13 | 3.72 | 2.49 | 0.58 | 2.25 | -2.19 | 5.25 | 5.46 | 5.04 | -22.48 | 2.14 | -1.88 | -0.42 | -6.46 | -1.33 | -1.65 | -2.91 | -1.30 | -1.32 | -1.20 | -0.44 | -1.22 | -0.44 | -0.60 | -0.25 | |
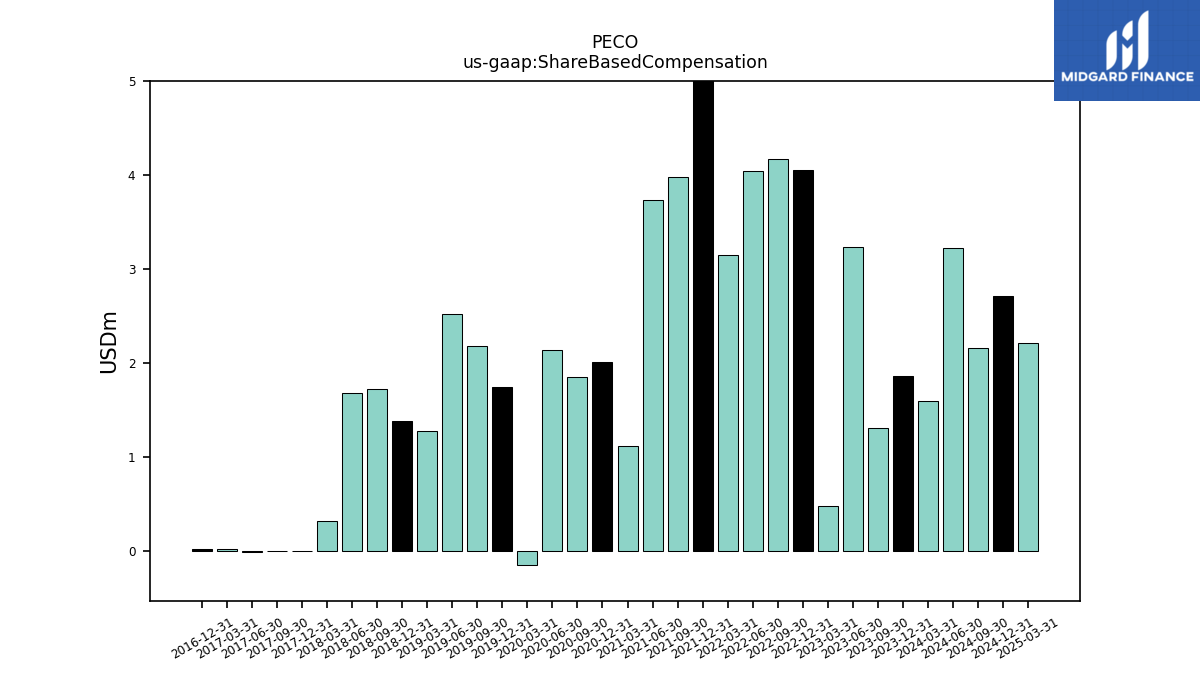
| Share Based Compensation | 1.86 | 1.30 | 3.23 | 0.47 | 4.05 | 4.17 | 4.04 | 3.15 | 7.56 | 3.99 | 3.73 | 1.11 | 2.02 | 1.85 | 2.14 | -0.15 | 1.75 | 2.18 | 2.52 | 1.27 | 1.39 | 1.72 | 1.68 | 0.32 | 0.00 | 0.00 | -0.01 | 0.01 | 0.01 | NA | NA | NA | NA | NA | NA | NA | NA | NA | NA | NA | NA | NA | NA | NA | NA | NA | NA | NA | NA | NA | NA | NA | |
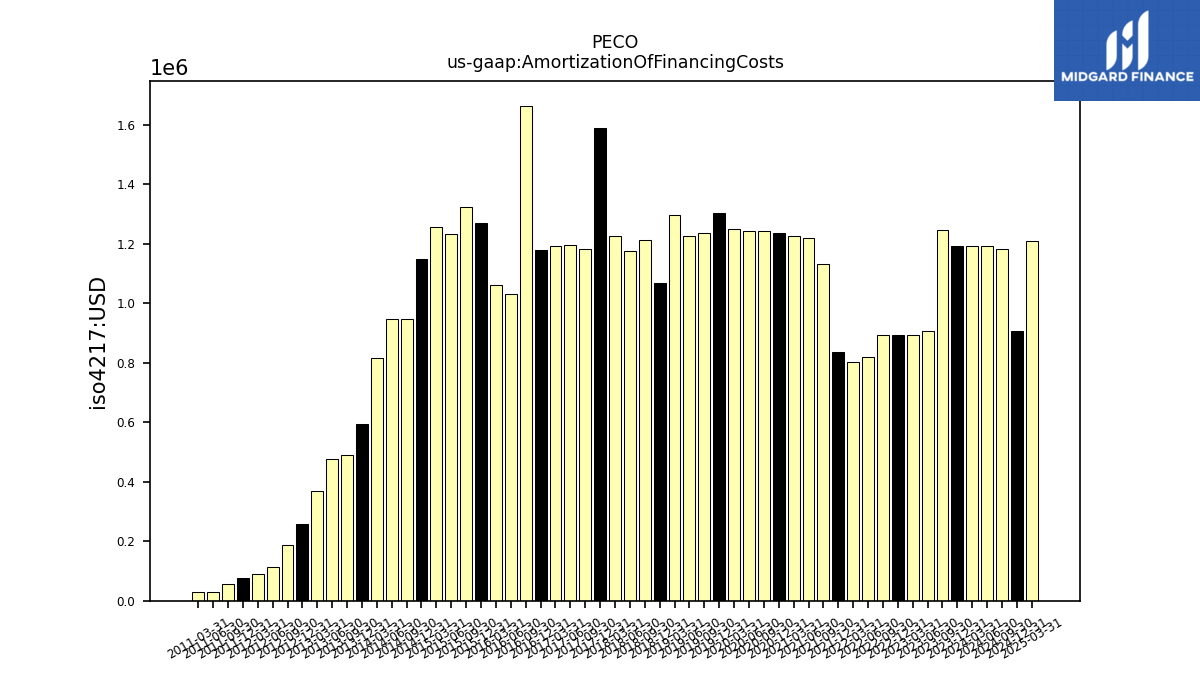
| Amortization Of Financing Costs | 1.19 | 1.25 | 0.91 | 0.89 | 0.89 | 0.89 | 0.82 | 0.80 | 0.83 | 1.13 | 1.22 | 1.23 | 1.24 | 1.24 | 1.24 | 1.25 | 1.30 | 1.24 | 1.23 | 1.30 | 1.07 | 1.21 | 1.18 | 1.23 | 1.59 | 1.18 | 1.20 | 1.19 | 1.18 | 1.66 | 1.03 | 1.06 | 1.27 | 1.32 | 1.23 | 1.26 | 1.15 | 0.95 | 0.95 | 0.82 | 0.59 | 0.49 | 0.48 | 0.37 | 0.26 | 0.19 | 0.11 | 0.09 | 0.08 | 0.06 | 0.03 | 0.03 |
| 2023-12-31 | 2023-09-30 | 2023-06-30 | 2023-03-31 | 2022-12-31 | 2022-09-30 | 2022-06-30 | 2022-03-31 | 2021-12-31 | 2021-09-30 | 2021-06-30 | 2021-03-31 | 2020-12-31 | 2020-09-30 | 2020-06-30 | 2020-03-31 | 2019-12-31 | 2019-09-30 | 2019-06-30 | 2019-03-31 | 2018-12-31 | 2018-09-30 | 2018-06-30 | 2018-03-31 | 2017-12-31 | 2017-09-30 | 2017-06-30 | 2017-03-31 | 2016-12-31 | 2016-09-30 | 2016-06-30 | 2016-03-31 | 2015-12-31 | 2015-09-30 | 2015-06-30 | 2015-03-31 | 2014-12-31 | 2014-09-30 | 2014-06-30 | 2014-03-31 | 2013-12-31 | 2013-09-30 | 2013-06-30 | 2013-03-31 | 2012-12-31 | 2012-09-30 | 2012-06-30 | 2012-03-31 | 2011-12-31 | 2011-09-30 | 2011-06-30 | 2011-03-31 | ||
|---|---|---|---|---|---|---|---|---|---|---|---|---|---|---|---|---|---|---|---|---|---|---|---|---|---|---|---|---|---|---|---|---|---|---|---|---|---|---|---|---|---|---|---|---|---|---|---|---|---|---|---|---|---|
| Net Cash Provided By Used In Investing Activities | -207.05 | -39.34 | -15.59 | -91.42 | -54.97 | -90.38 | -79.40 | -106.50 | -218.33 | -12.00 | 45.15 | 4.69 | -30.53 | -7.09 | -4.05 | -2.41 | 73.48 | 17.68 | -55.37 | 28.38 | -242.61 | -2.99 | 3.66 | -16.93 | -523.34 | -47.46 | -65.33 | 15.38 | -77.41 | -43.80 | -100.81 | -4.20 | -7.87 | -4.11 | -33.46 | -65.34 | -132.43 | -125.39 | -253.83 | -204.13 | -312.91 | -171.98 | -167.81 | -123.52 | -85.79 | -54.87 | -46.38 | -11.44 | -46.00 | -0.03 | -10.10 | -0.02 |
| 2023-12-31 | 2023-09-30 | 2023-06-30 | 2023-03-31 | 2022-12-31 | 2022-09-30 | 2022-06-30 | 2022-03-31 | 2021-12-31 | 2021-09-30 | 2021-06-30 | 2021-03-31 | 2020-12-31 | 2020-09-30 | 2020-06-30 | 2020-03-31 | 2019-12-31 | 2019-09-30 | 2019-06-30 | 2019-03-31 | 2018-12-31 | 2018-09-30 | 2018-06-30 | 2018-03-31 | 2017-12-31 | 2017-09-30 | 2017-06-30 | 2017-03-31 | 2016-12-31 | 2016-09-30 | 2016-06-30 | 2016-03-31 | 2015-12-31 | 2015-09-30 | 2015-06-30 | 2015-03-31 | 2014-12-31 | 2014-09-30 | 2014-06-30 | 2014-03-31 | 2013-12-31 | 2013-09-30 | 2013-06-30 | 2013-03-31 | 2012-12-31 | 2012-09-30 | 2012-06-30 | 2012-03-31 | 2011-12-31 | 2011-09-30 | 2011-06-30 | 2011-03-31 | ||
|---|---|---|---|---|---|---|---|---|---|---|---|---|---|---|---|---|---|---|---|---|---|---|---|---|---|---|---|---|---|---|---|---|---|---|---|---|---|---|---|---|---|---|---|---|---|---|---|---|---|---|---|---|---|
| Net Cash Provided By Used In Financing Activities | 135.71 | -50.94 | -54.09 | 23.27 | -14.25 | -15.12 | 23.34 | -51.78 | 155.05 | -53.60 | -77.14 | -123.12 | -27.66 | -2.78 | -55.48 | -43.73 | -115.44 | -59.99 | -37.66 | -67.17 | 261.72 | -32.34 | -64.89 | -2.06 | 480.53 | 30.72 | 36.30 | -38.17 | 46.37 | 30.48 | 64.41 | -50.58 | 13.50 | -36.33 | 17.38 | 35.18 | 111.40 | 101.17 | -2.08 | -15.00 | 444.36 | 428.93 | 216.88 | 120.10 | 76.79 | 56.54 | 50.32 | 11.47 | 52.41 | -0.37 | 10.31 | -0.52 | |
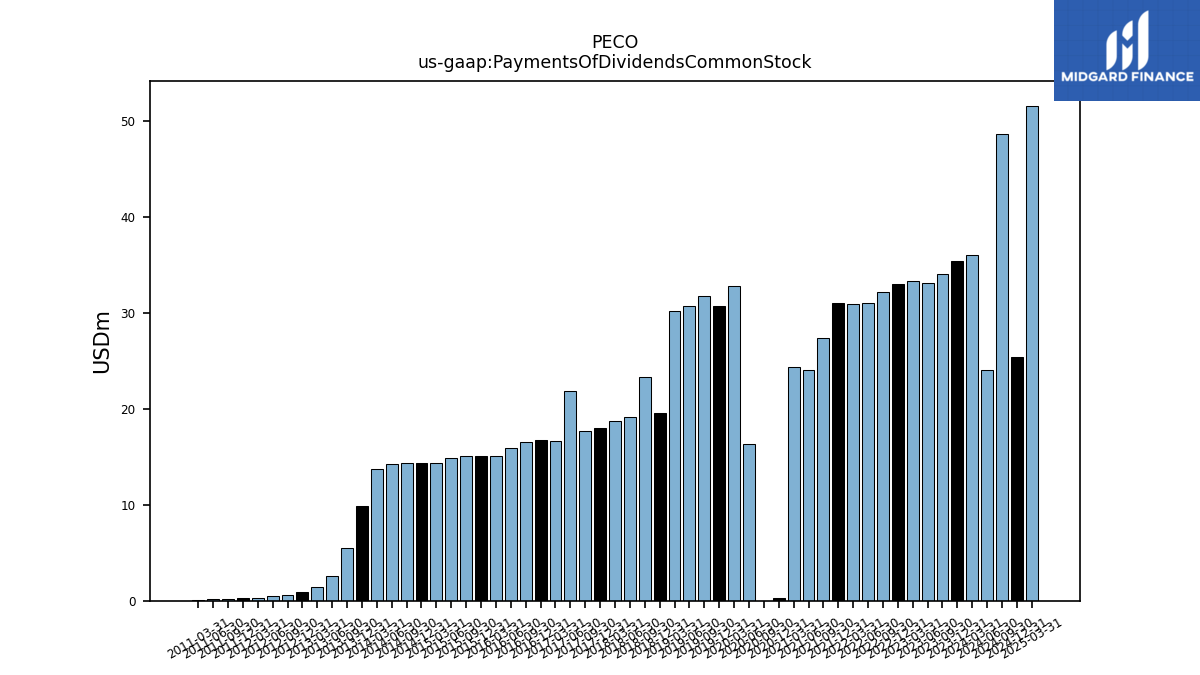
| Payments Of Dividends Common Stock | 35.41 | 34.02 | 33.05 | 33.28 | 32.97 | 32.14 | 31.05 | 30.93 | 31.03 | 27.36 | 24.01 | 24.30 | 0.25 | 0.00 | 16.29 | 32.79 | 30.65 | 31.70 | 30.66 | 30.13 | 19.60 | 23.31 | 19.11 | 18.71 | 17.97 | 17.71 | 21.86 | 16.66 | 16.73 | 16.56 | 15.91 | 15.06 | 15.10 | 15.03 | 14.90 | 14.37 | 14.30 | 14.36 | 14.25 | 13.70 | 9.86 | 5.51 | 2.53 | 1.40 | 0.92 | 0.64 | 0.46 | 0.33 | 0.25 | 0.19 | 0.16 | 0.10 |
| 2023-12-31 | 2023-09-30 | 2023-06-30 | 2023-03-31 | 2022-12-31 | 2022-09-30 | 2022-06-30 | 2022-03-31 | 2021-12-31 | 2021-09-30 | 2021-06-30 | 2021-03-31 | 2020-12-31 | 2020-09-30 | 2020-06-30 | 2020-03-31 | 2019-12-31 | 2019-09-30 | 2019-06-30 | 2019-03-31 | 2018-12-31 | 2018-09-30 | 2018-06-30 | 2018-03-31 | 2017-12-31 | 2017-09-30 | 2017-06-30 | 2017-03-31 | 2016-12-31 | 2016-09-30 | 2016-06-30 | 2016-03-31 | 2015-12-31 | 2015-09-30 | 2015-06-30 | 2015-03-31 | 2014-12-31 | 2014-09-30 | 2014-06-30 | 2014-03-31 | 2013-12-31 | 2013-09-30 | 2013-06-30 | 2013-03-31 | 2012-12-31 | 2012-09-30 | 2012-06-30 | 2012-03-31 | 2011-12-31 | 2011-09-30 | 2011-06-30 | 2011-03-31 | ||
|---|---|---|---|---|---|---|---|---|---|---|---|---|---|---|---|---|---|---|---|---|---|---|---|---|---|---|---|---|---|---|---|---|---|---|---|---|---|---|---|---|---|---|---|---|---|---|---|---|---|---|---|---|---|
| Revenues | 154.45 | 152.47 | 152.14 | 151.06 | 145.04 | 145.65 | 142.52 | 142.16 | 137.06 | 132.33 | 133.07 | 130.38 | 120.76 | 126.69 | 119.04 | 131.52 | 135.35 | 136.01 | 132.58 | 132.77 | 118.12 | 104.90 | 104.17 | 103.20 | 102.77 | 70.62 | 69.85 | 68.30 | 66.33 | 65.27 | 63.05 | 63.08 | 62.14 | 61.82 | 59.19 | 58.95 | 58.59 | 50.03 | 43.91 | 35.68 | 26.62 | 20.14 | 15.16 | 11.24 | 7.08 | 5.15 | 3.10 | 2.21 | 1.47 | 0.84 | 0.62 | 0.60 | |
| Revenue From Contract With Customer Excluding Assessed Tax | 2.45 | 2.17 | 2.55 | 151.06 | 2.22 | 2.08 | 4.78 | 142.16 | -385.45 | 132.33 | 133.07 | 130.38 | 120.76 | 126.69 | 119.04 | 131.52 | 135.35 | 136.01 | 132.58 | 132.77 | 118.12 | 104.90 | 104.17 | 103.20 | 102.77 | 70.62 | 69.85 | 68.30 | 66.33 | 65.27 | 63.05 | 63.08 | 62.14 | 61.82 | 59.19 | 58.95 | 58.59 | 50.03 | 43.91 | 35.68 | 26.62 | 20.14 | 15.16 | 11.24 | 7.08 | 5.15 | 3.10 | 2.21 | 1.47 | 0.84 | 0.62 | 0.60 | |
| Revenue From Contract With Customer Including Assessed Tax | 154.45 | 152.47 | 152.14 | 151.06 | 145.04 | 145.65 | 142.52 | 142.16 | 137.06 | 132.33 | 2.37 | 2.29 | 120.76 | 2.58 | 2.76 | 2.17 | 135.35 | 2.77 | 3.05 | 3.26 | 118.12 | 8.97 | 9.14 | 8.71 | 102.77 | 0.00 | 69.85 | 68.30 | 66.33 | 65.27 | 63.05 | 63.08 | 62.14 | 61.82 | 59.19 | 58.95 | 58.59 | 50.03 | 43.91 | 35.68 | 26.62 | 20.14 | 15.16 | 11.24 | 7.08 | 5.15 | 3.10 | 2.21 | 1.47 | 0.84 | 0.62 | 0.60 |