
| 2023-12-31 | 2023-09-30 | 2023-06-30 | 2023-03-31 | 2022-12-31 | 2022-09-30 | 2022-06-30 | 2022-03-31 | 2021-12-31 | 2021-09-30 | 2021-06-30 | 2021-03-31 | 2020-12-31 | 2020-09-30 | 2020-06-30 | 2020-03-31 | 2019-12-31 | 2019-09-30 | 2019-06-30 | 2019-03-31 | 2018-12-31 | 2018-09-30 | 2018-06-30 | 2018-03-31 | 2017-12-31 | 2017-09-30 | 2017-06-30 | 2017-03-31 | 2016-12-31 | 2016-09-30 | 2016-06-30 | 2016-03-31 | 2015-12-31 | 2015-09-30 | 2015-06-30 | 2015-03-31 | 2014-12-31 | 2014-09-30 | 2014-06-30 | 2014-03-31 | 2013-12-31 | 2013-09-30 | 2013-06-30 | 2013-03-31 | 2012-12-31 | 2012-09-30 | 2012-06-30 | 2012-03-31 | 2011-12-31 | 2011-09-30 | 2011-06-30 | 2011-03-31 | 2010-12-31 | 2010-09-30 | 2010-06-30 | 2010-03-31 | ||
|---|---|---|---|---|---|---|---|---|---|---|---|---|---|---|---|---|---|---|---|---|---|---|---|---|---|---|---|---|---|---|---|---|---|---|---|---|---|---|---|---|---|---|---|---|---|---|---|---|---|---|---|---|---|---|---|---|---|
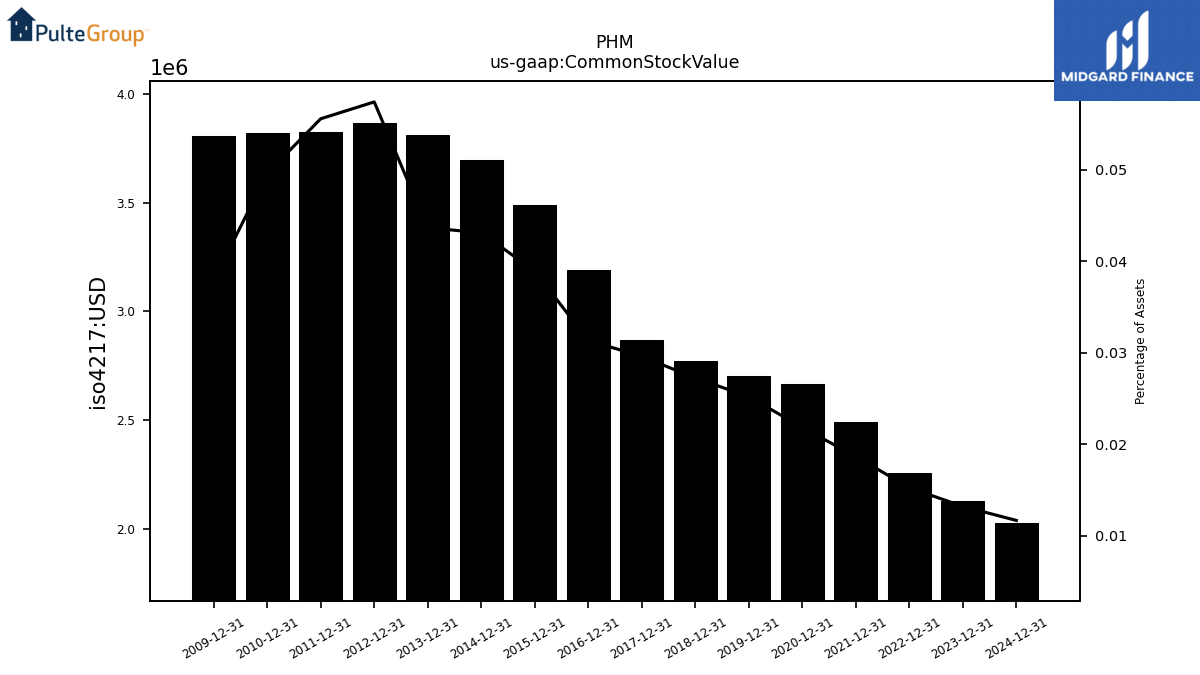
| Common Stock Value | 2.13 | NA | NA | NA | 2.26 | NA | NA | NA | 2.49 | NA | NA | NA | 2.67 | NA | NA | NA | 2.70 | NA | NA | NA | 2.77 | NA | NA | NA | 2.87 | NA | NA | NA | 3.19 | NA | NA | NA | 3.49 | NA | NA | NA | 3.69 | NA | NA | NA | 3.81 | NA | NA | NA | 3.87 | NA | NA | NA | 3.83 | NA | NA | NA | 3.82 | NA | NA | NA | |
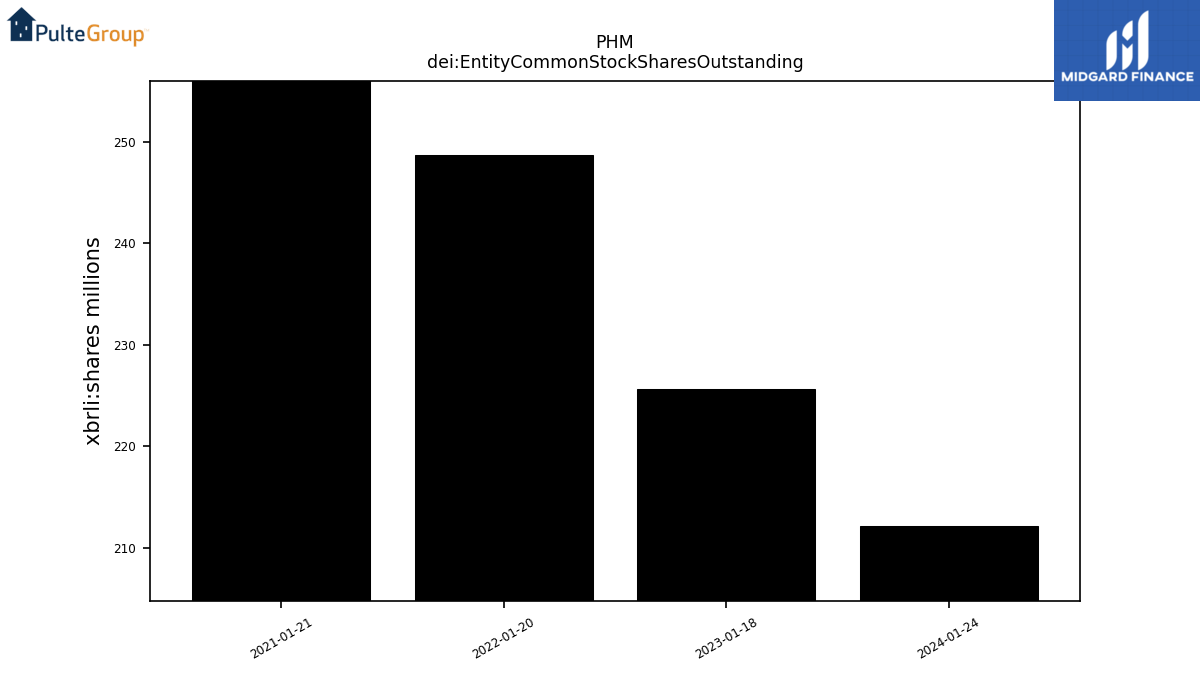
| dei: Entity Common Stock Shares Outstanding | NA | NA | NA | NA | NA | NA | NA | NA | NA | NA | NA | NA | NA | NA | NA | NA | NA | NA | NA | NA | NA | NA | NA | NA | NA | NA | NA | NA | NA | NA | NA | NA | NA | NA | NA | NA | NA | NA | NA | NA | NA | NA | NA | NA | NA | NA | NA | NA | NA | NA | NA | NA | NA | NA | NA | NA | |
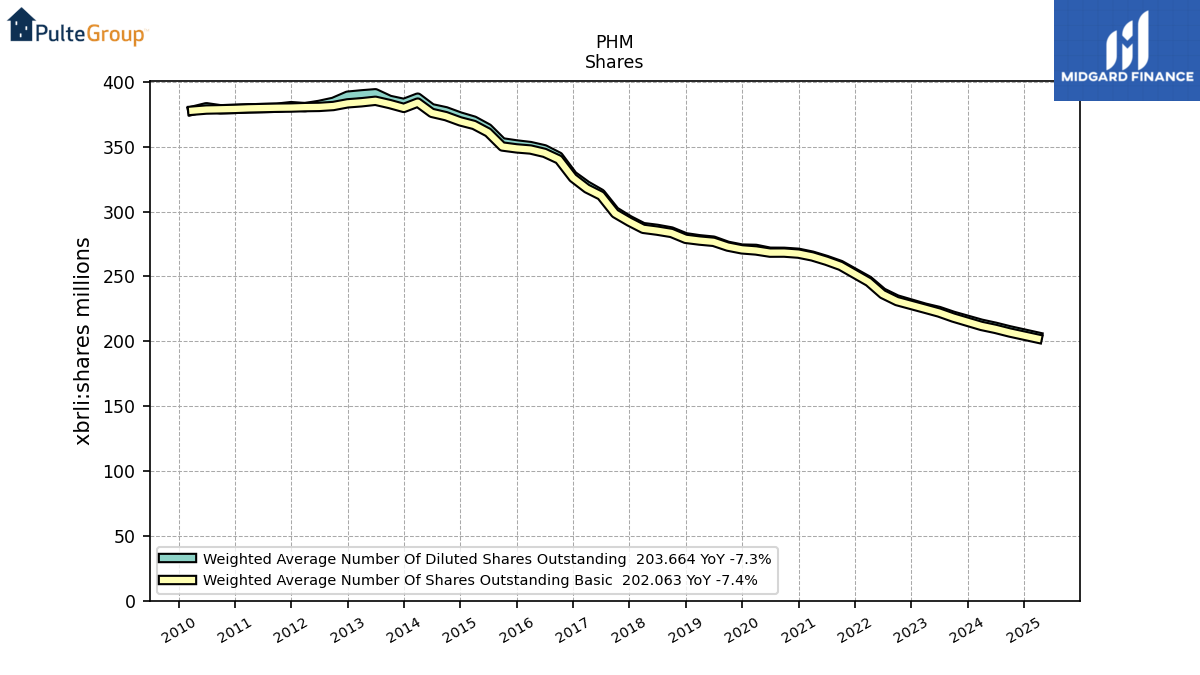
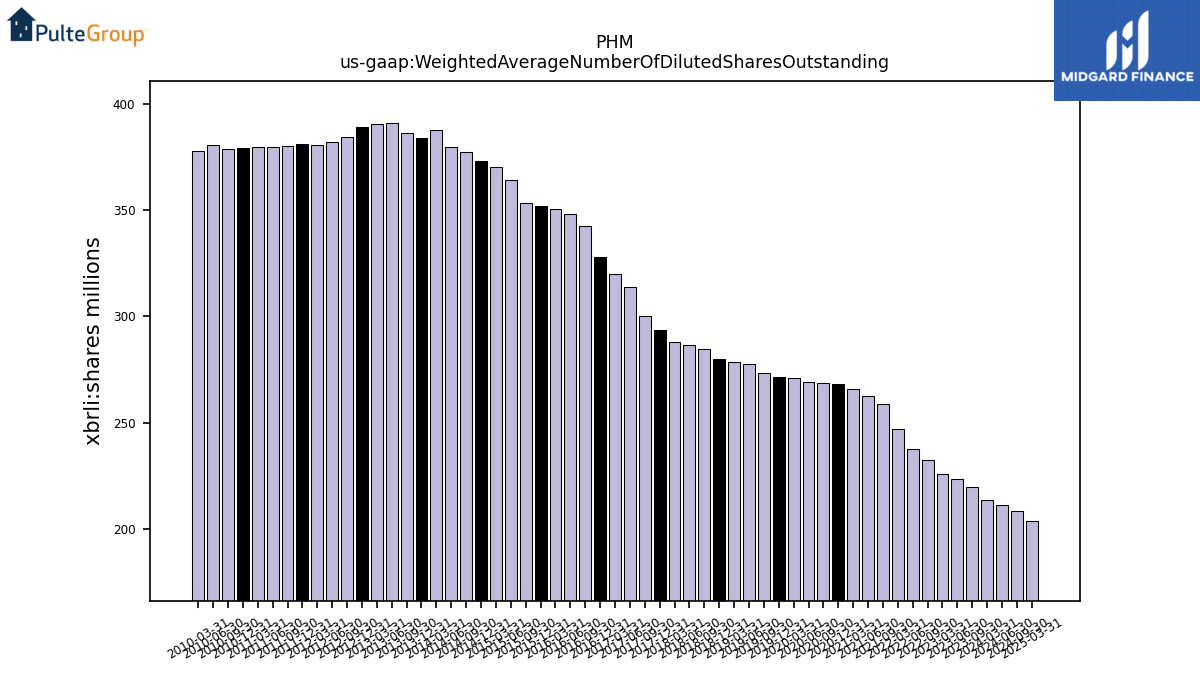
| Weighted Average Number Of Diluted Shares Outstanding | NA | 219.68 | 223.39 | 225.96 | NA | 232.30 | 237.65 | 246.87 | NA | 258.90 | 262.75 | 266.01 | 268.23 | 268.96 | 269.02 | 271.22 | 271.48 | 273.63 | 277.58 | 278.64 | 280.21 | 284.67 | 286.65 | 288.03 | 293.49 | 300.23 | 313.88 | 320.08 | 327.81 | 342.42 | 348.00 | 350.48 | 351.75 | 353.37 | 364.24 | 370.11 | 373.27 | 377.29 | 379.66 | 387.81 | 383.72 | 386.10 | 391.18 | 390.32 | 389.30 | 384.57 | 382.20 | 380.50 | 381.26 | 380.02 | 379.78 | 379.54 | 379.12 | 378.84 | 380.41 | 377.75 | |
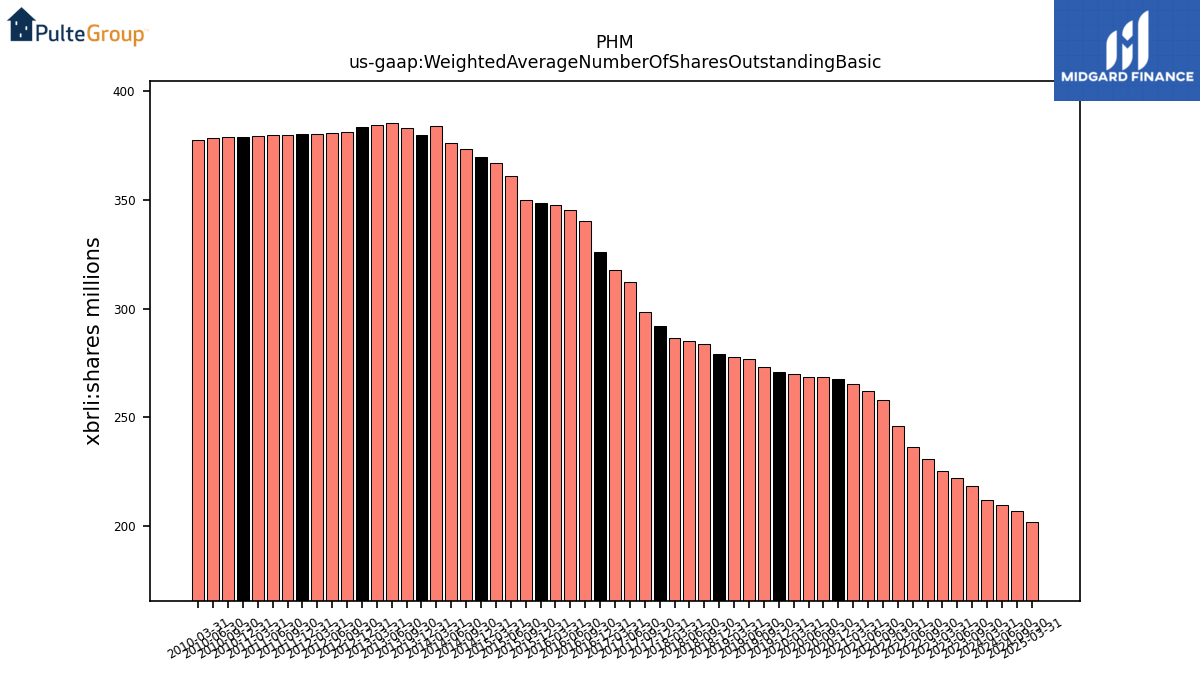
| Weighted Average Number Of Shares Outstanding Basic | NA | 218.29 | 222.16 | 225.13 | NA | 230.97 | 236.33 | 245.80 | NA | 258.15 | 262.10 | 265.41 | 267.56 | 268.36 | 268.32 | 270.00 | 270.84 | 272.99 | 276.65 | 277.64 | 278.96 | 283.49 | 285.28 | 286.68 | 292.17 | 298.54 | 312.31 | 317.76 | 325.98 | 340.17 | 345.24 | 347.81 | 348.70 | 350.15 | 361.01 | 366.75 | 369.53 | 373.53 | 376.07 | 383.99 | 379.88 | 382.88 | 385.39 | 384.23 | 383.40 | 381.36 | 380.65 | 380.50 | 380.15 | 380.02 | 379.78 | 379.54 | 379.12 | 378.84 | 378.62 | 377.75 | |
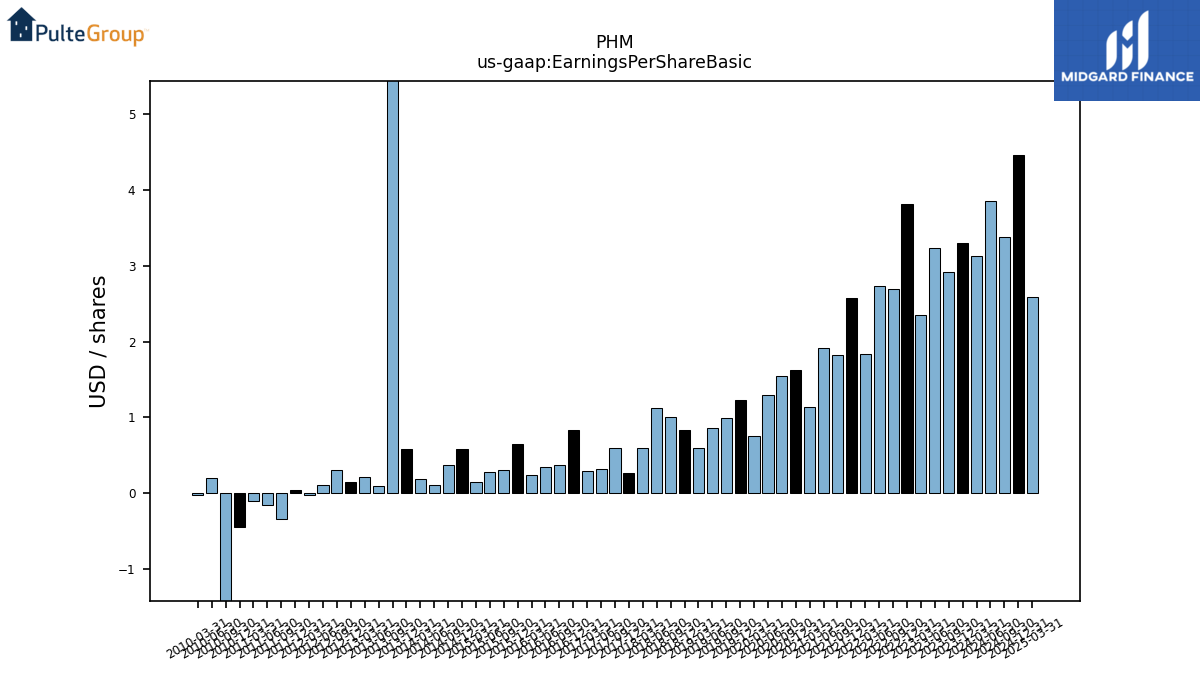
| Earnings Per Share Basic | 3.30 | 2.92 | 3.23 | 2.35 | 3.81 | 2.70 | 2.74 | 1.84 | 2.58 | 1.83 | 1.91 | 1.14 | 1.62 | 1.54 | 1.29 | 0.75 | 1.23 | 0.99 | 0.86 | 0.59 | 0.84 | 1.01 | 1.12 | 0.59 | 0.26 | 0.59 | 0.32 | 0.29 | 0.83 | 0.37 | 0.34 | 0.24 | 0.65 | 0.31 | 0.28 | 0.15 | 0.58 | 0.37 | 0.11 | 0.19 | 0.58 | 5.92 | 0.09 | 0.21 | 0.15 | 0.31 | 0.11 | -0.03 | 0.04 | -0.34 | -0.15 | -0.10 | -0.44 | -2.63 | 0.20 | -0.03 | |
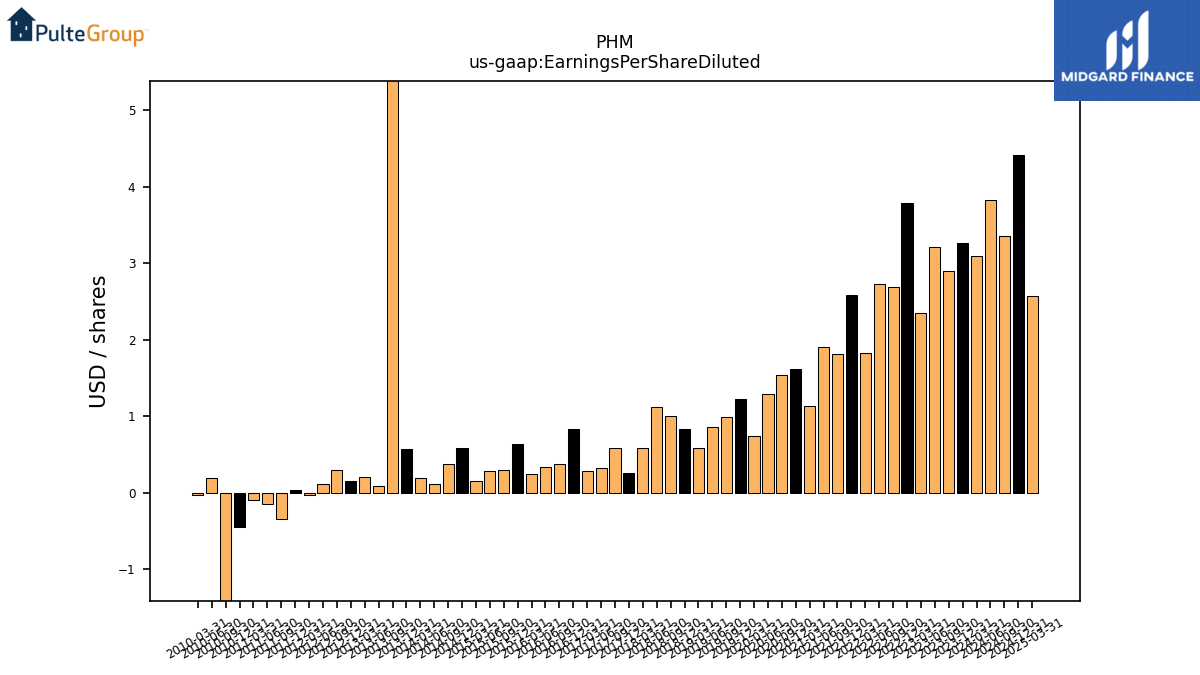
| Earnings Per Share Diluted | 3.27 | 2.90 | 3.21 | 2.35 | 3.79 | 2.69 | 2.73 | 1.83 | 2.58 | 1.82 | 1.90 | 1.13 | 1.62 | 1.54 | 1.29 | 0.74 | 1.22 | 0.99 | 0.86 | 0.59 | 0.84 | 1.01 | 1.12 | 0.59 | 0.26 | 0.58 | 0.32 | 0.28 | 0.83 | 0.37 | 0.34 | 0.24 | 0.64 | 0.30 | 0.28 | 0.15 | 0.58 | 0.37 | 0.11 | 0.19 | 0.57 | 5.87 | 0.09 | 0.21 | 0.15 | 0.30 | 0.11 | -0.03 | 0.04 | -0.34 | -0.15 | -0.10 | -0.44 | -2.63 | 0.20 | -0.03 |
| 2023-12-31 | 2023-09-30 | 2023-06-30 | 2023-03-31 | 2022-12-31 | 2022-09-30 | 2022-06-30 | 2022-03-31 | 2021-12-31 | 2021-09-30 | 2021-06-30 | 2021-03-31 | 2020-12-31 | 2020-09-30 | 2020-06-30 | 2020-03-31 | 2019-12-31 | 2019-09-30 | 2019-06-30 | 2019-03-31 | 2018-12-31 | 2018-09-30 | 2018-06-30 | 2018-03-31 | 2017-12-31 | 2017-09-30 | 2017-06-30 | 2017-03-31 | 2016-12-31 | 2016-09-30 | 2016-06-30 | 2016-03-31 | 2015-12-31 | 2015-09-30 | 2015-06-30 | 2015-03-31 | 2014-12-31 | 2014-09-30 | 2014-06-30 | 2014-03-31 | 2013-12-31 | 2013-09-30 | 2013-06-30 | 2013-03-31 | 2012-12-31 | 2012-09-30 | 2012-06-30 | 2012-03-31 | 2011-12-31 | 2011-09-30 | 2011-06-30 | 2011-03-31 | 2010-12-31 | 2010-09-30 | 2010-06-30 | 2010-03-31 | ||
|---|---|---|---|---|---|---|---|---|---|---|---|---|---|---|---|---|---|---|---|---|---|---|---|---|---|---|---|---|---|---|---|---|---|---|---|---|---|---|---|---|---|---|---|---|---|---|---|---|---|---|---|---|---|---|---|---|---|
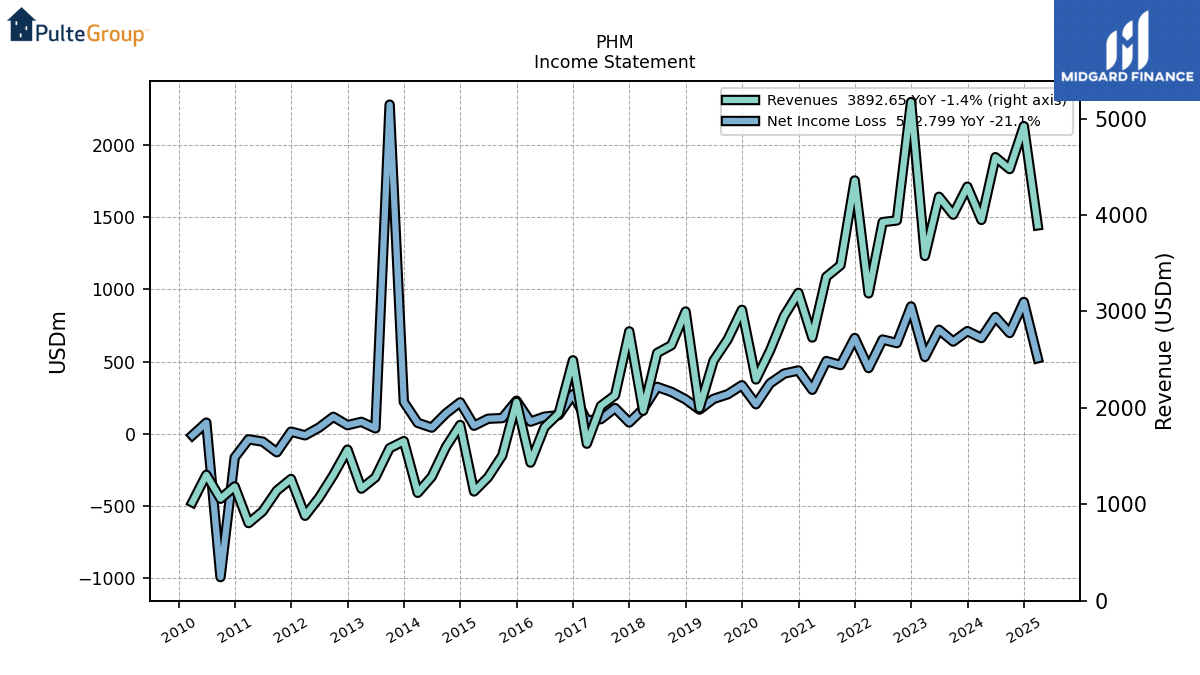
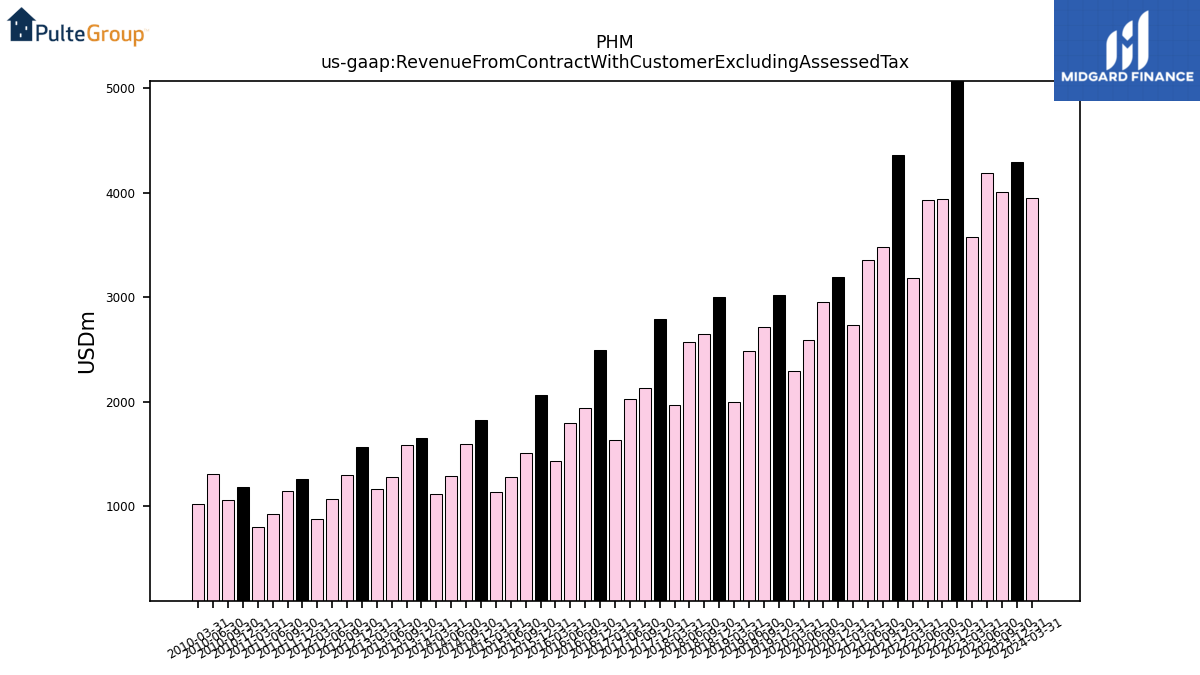
| Revenue From Contract With Customer Excluding Assessed Tax | 4293.65 | 4003.53 | 4188.75 | 3575.64 | 5171.38 | 3943.82 | 3926.19 | 3187.61 | 4358.56 | 3479.05 | 3359.48 | 2729.79 | 3192.36 | 2954.96 | 2593.78 | 2294.98 | 3016.91 | 2710.36 | 2488.99 | 1996.69 | 2999.15 | 2649.37 | 2569.72 | 1970.09 | 2793.56 | 2130.02 | 2020.85 | 1628.83 | 2493.08 | 1942.90 | 1799.91 | 1432.58 | 2061.63 | 1506.75 | 1280.29 | 1133.30 | 1822.56 | 1594.72 | 1286.19 | 1118.89 | 1655.34 | 1582.08 | 1279.42 | 1162.76 | 1566.97 | 1302.59 | 1069.40 | 881.04 | 1262.35 | 1141.93 | 927.21 | 805.20 | 1185.27 | 1057.76 | 1305.90 | 1020.36 | |
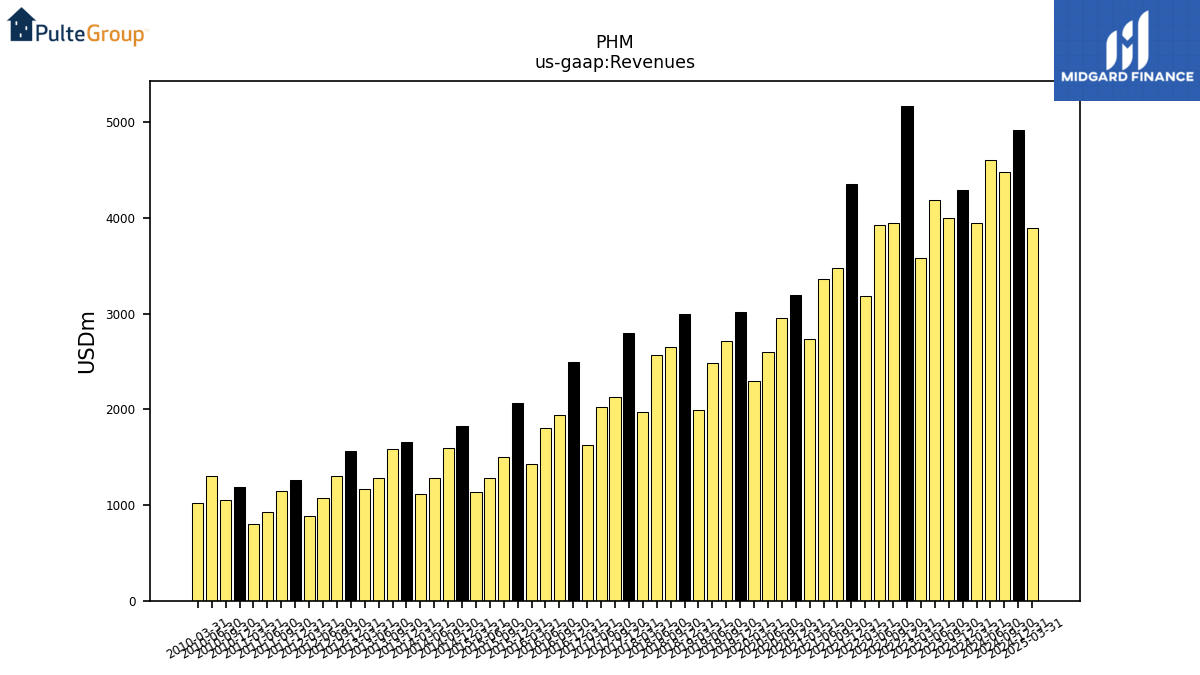
| Revenues | 4293.65 | 4003.53 | 4188.75 | 3575.64 | 5171.38 | 3943.82 | 3926.19 | 3187.61 | 4358.56 | 3479.05 | 3359.48 | 2729.79 | 3192.36 | 2954.96 | 2593.78 | 2294.98 | 3016.91 | 2710.36 | 2488.99 | 1996.69 | 2999.15 | 2649.37 | 2569.72 | 1970.09 | 2793.56 | 2130.02 | 2020.85 | 1628.83 | 2493.08 | 1942.90 | 1799.91 | 1432.58 | 2061.63 | 1506.75 | 1280.29 | 1133.30 | 1822.56 | 1594.72 | 1286.19 | 1118.89 | 1655.34 | 1582.08 | 1279.42 | 1162.76 | 1566.97 | 1302.59 | 1069.40 | 881.04 | 1262.35 | 1141.93 | 927.21 | 805.20 | 1185.27 | 1057.76 | 1305.90 | 1020.36 | |
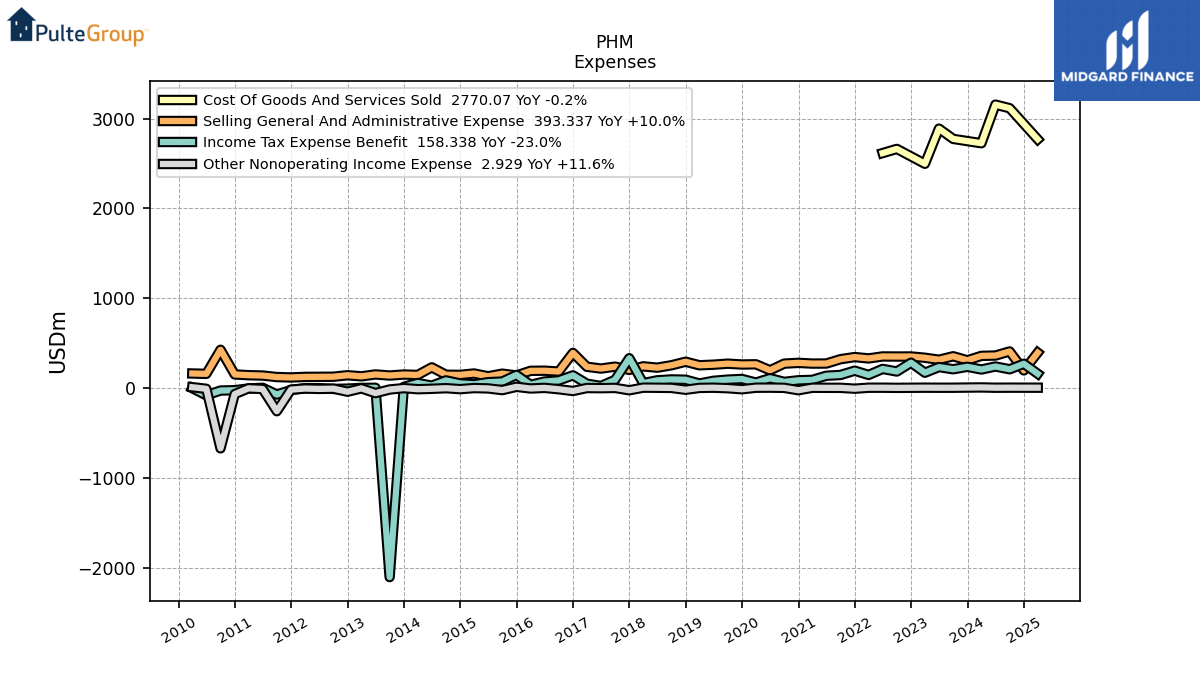
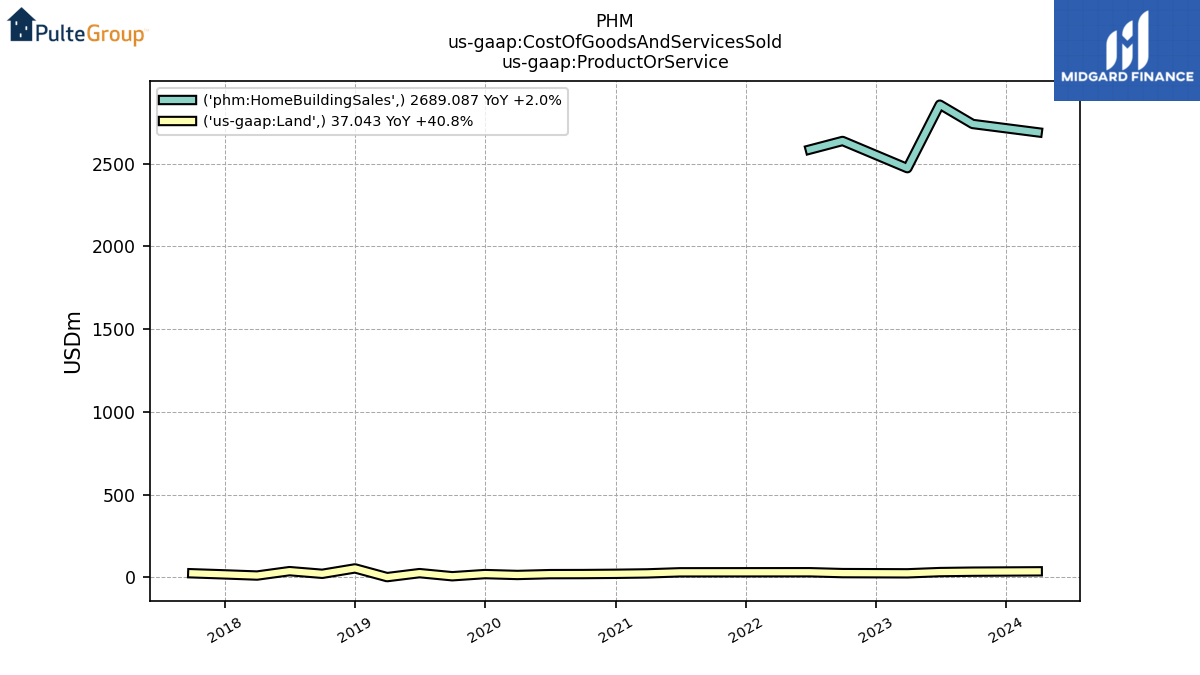
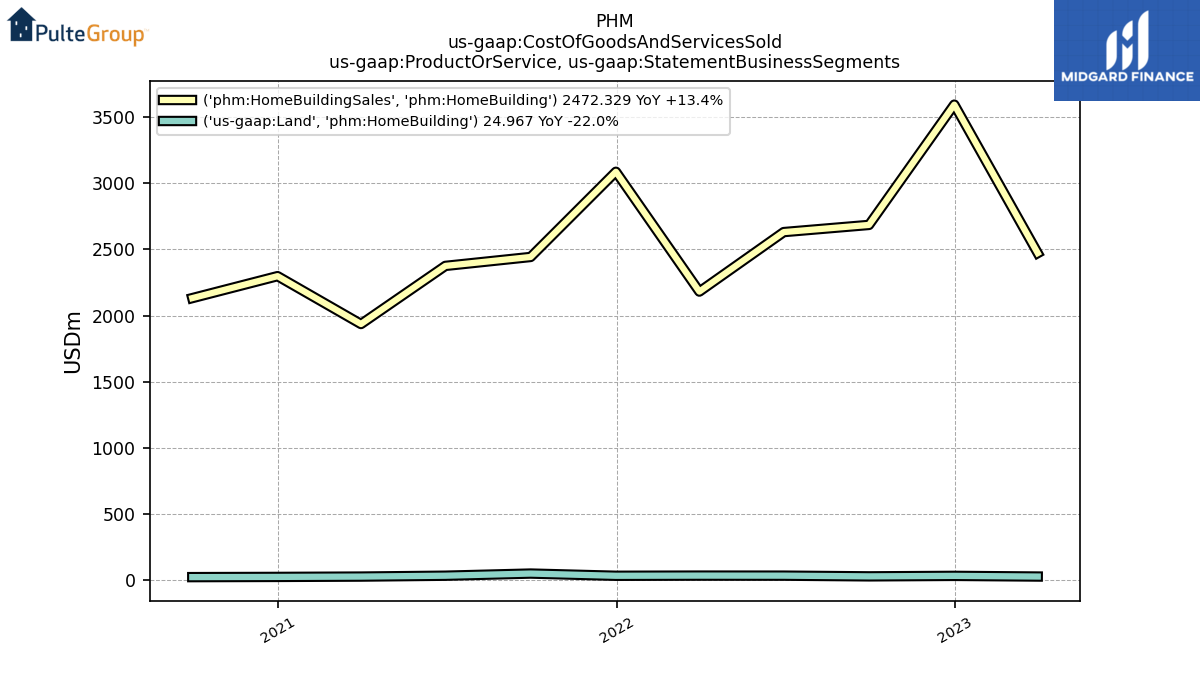
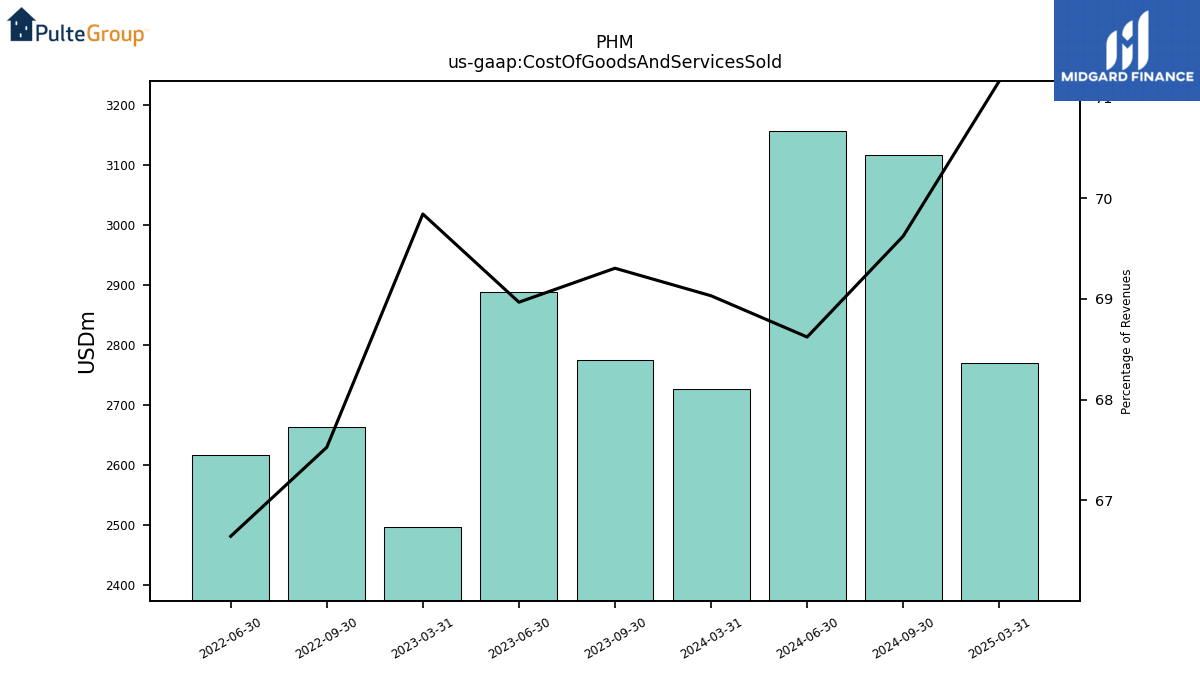
| Cost Of Goods And Services Sold | NA | 2774.60 | 2888.86 | NA | NA | 2663.16 | 2616.58 | NA | NA | NA | NA | NA | NA | NA | NA | NA | NA | NA | NA | NA | NA | NA | NA | NA | NA | NA | NA | NA | NA | NA | NA | NA | NA | NA | NA | NA | NA | NA | NA | NA | NA | NA | NA | NA | NA | NA | NA | NA | NA | NA | NA | NA | NA | NA | NA | NA | |
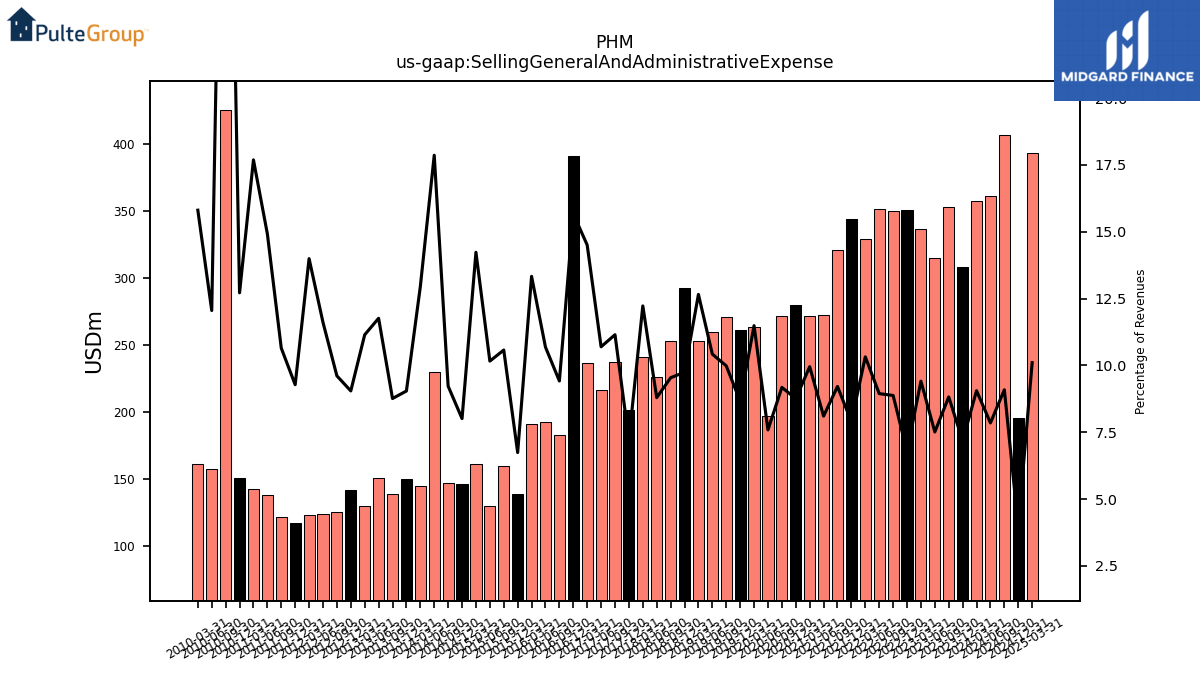
| Selling General And Administrative Expense | 308.32 | 353.17 | 314.64 | 336.52 | 350.83 | 350.11 | 351.26 | 329.02 | 344.22 | 320.51 | 272.29 | 271.69 | 279.66 | 271.26 | 196.86 | 263.67 | 261.55 | 270.62 | 259.44 | 252.73 | 292.32 | 252.76 | 226.06 | 240.89 | 201.61 | 237.50 | 216.21 | 236.27 | 390.80 | 183.01 | 192.33 | 191.01 | 138.99 | 159.36 | 130.12 | 161.31 | 146.02 | 147.14 | 229.77 | 144.89 | 149.71 | 138.64 | 150.53 | 129.63 | 141.77 | 125.19 | 124.19 | 123.31 | 117.15 | 121.61 | 138.38 | 142.45 | 150.74 | 425.64 | 157.41 | 161.31 | |
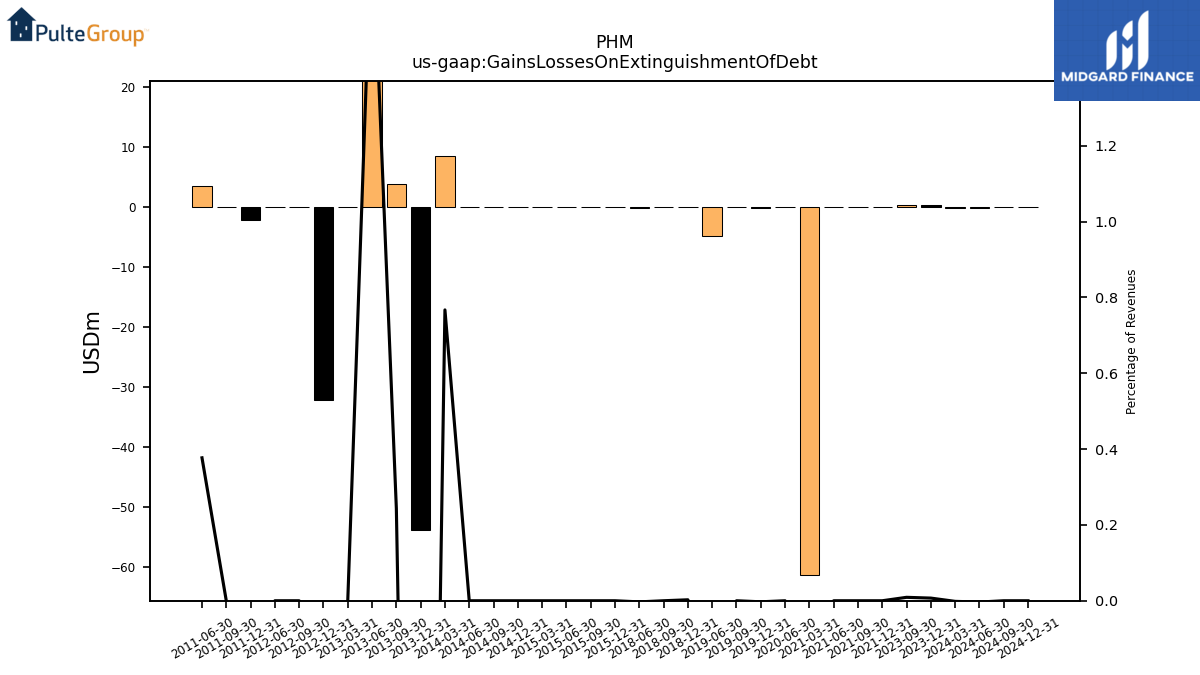
| Gains Losses On Extinguishment Of Debt | 0.30 | 0.36 | NA | NA | NA | NA | NA | NA | 0.00 | 0.00 | 0.00 | -61.47 | NA | NA | 0.00 | NA | -0.08 | 0.00 | -4.84 | NA | 0.08 | 0.00 | -0.08 | NA | NA | NA | NA | NA | NA | NA | NA | NA | 0.00 | 0.00 | 0.00 | 0.00 | 0.00 | 0.00 | 0.00 | 8.58 | -53.86 | 3.86 | 23.07 | 0.00 | -32.10 | 0.00 | 0.00 | NA | -2.10 | 0.00 | 3.50 | NA | NA | NA | NA | NA | |
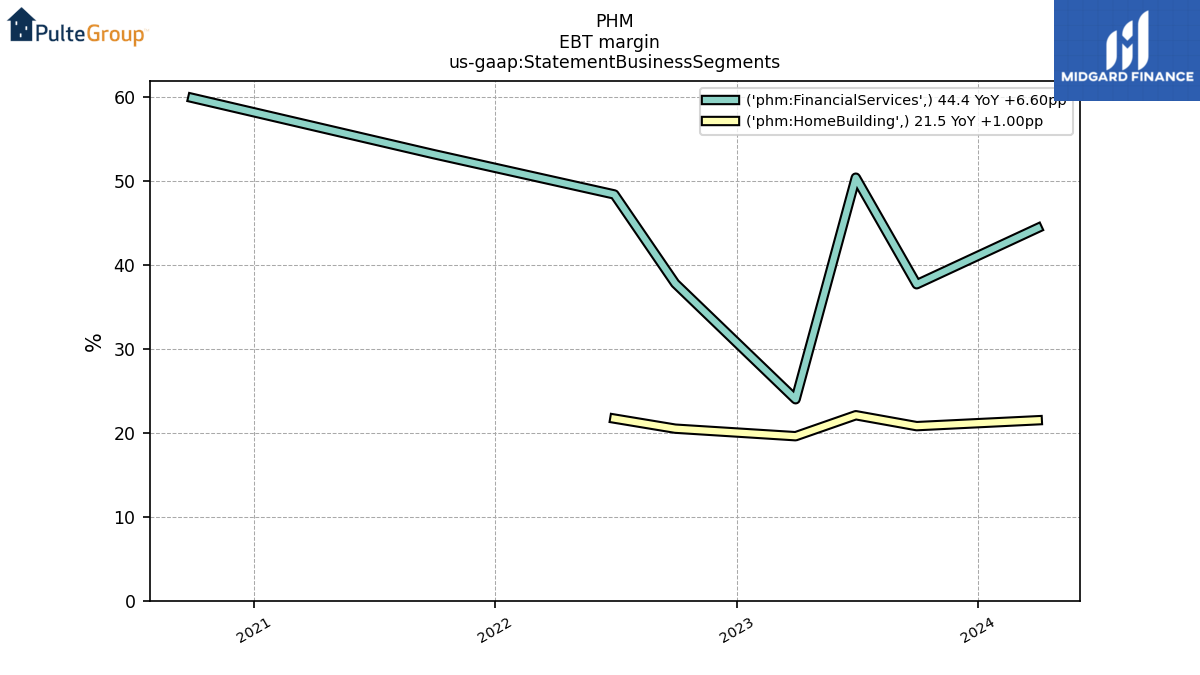
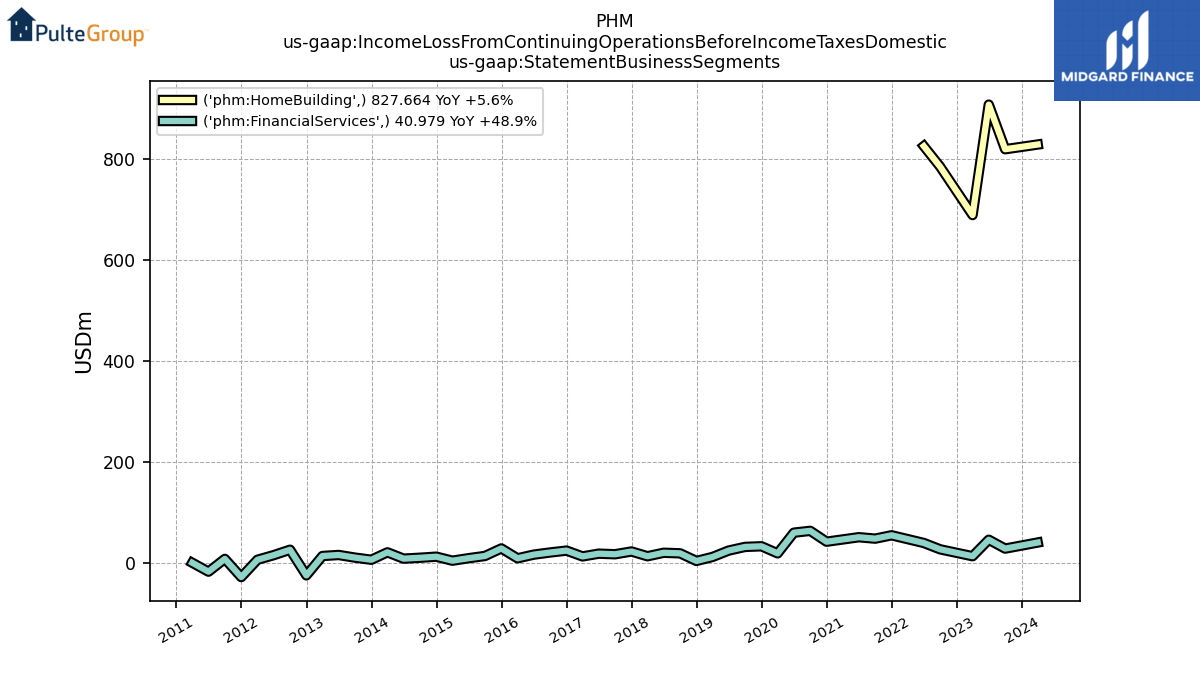
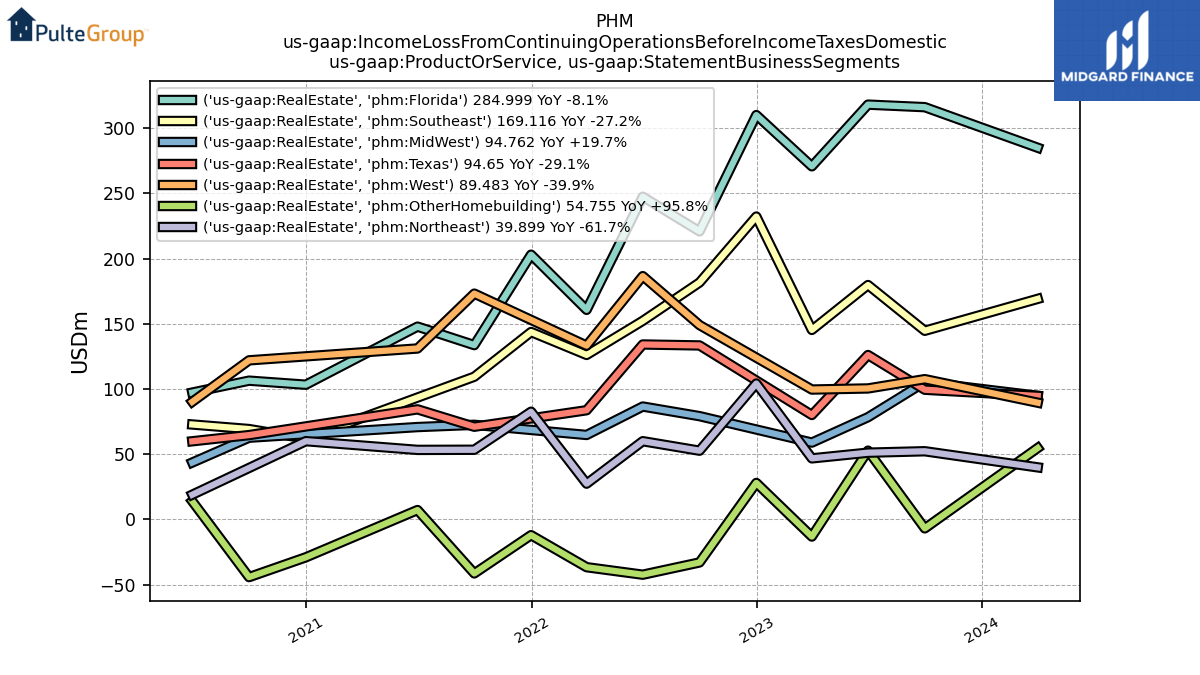
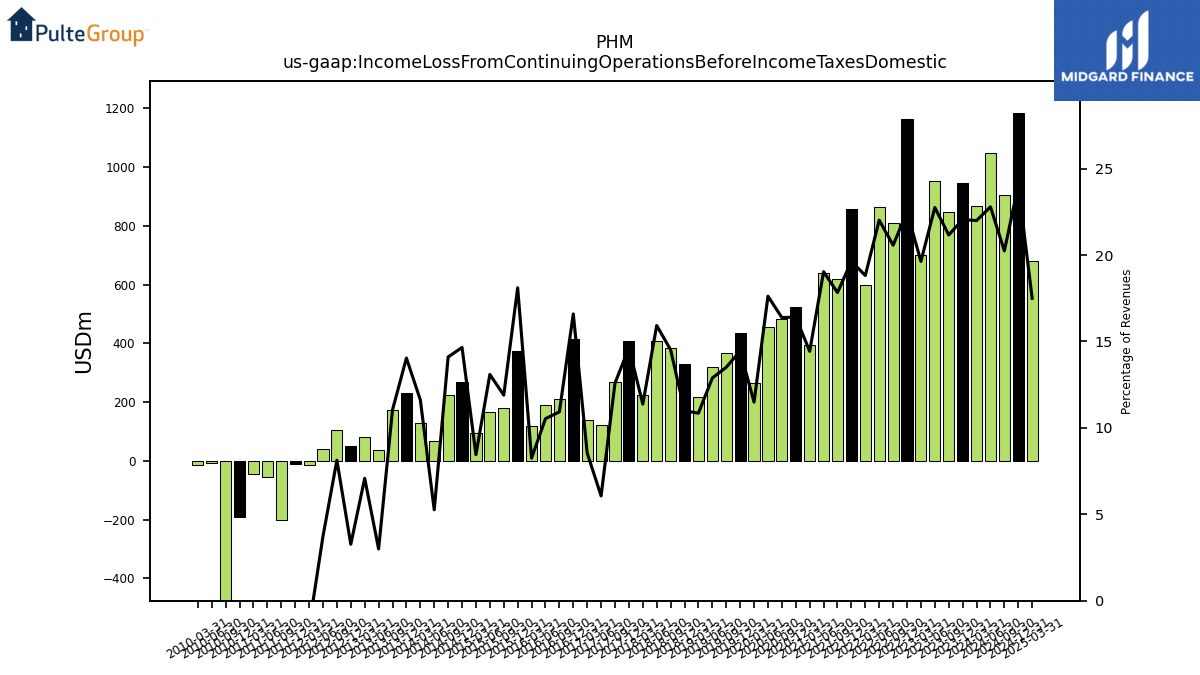
| Income Loss From Continuing Operations Before Income Taxes Domestic | 946.82 | 847.31 | 953.01 | 702.12 | 1163.82 | 811.28 | 864.57 | 599.89 | 855.92 | 620.40 | 639.47 | 394.05 | 523.75 | 484.17 | 457.01 | 263.77 | 435.95 | 366.15 | 320.78 | 216.70 | 329.49 | 384.69 | 409.17 | 224.19 | 408.77 | 268.25 | 122.55 | 139.26 | 413.72 | 212.34 | 189.58 | 118.21 | 373.31 | 179.28 | 167.63 | 95.81 | 267.12 | 224.93 | 67.68 | 130.03 | 232.42 | 174.72 | 38.33 | 82.35 | 51.21 | 105.91 | 39.93 | -13.49 | -9.07 | -202.50 | -53.33 | -45.39 | -190.47 | -1023.84 | -5.73 | -14.51 | |
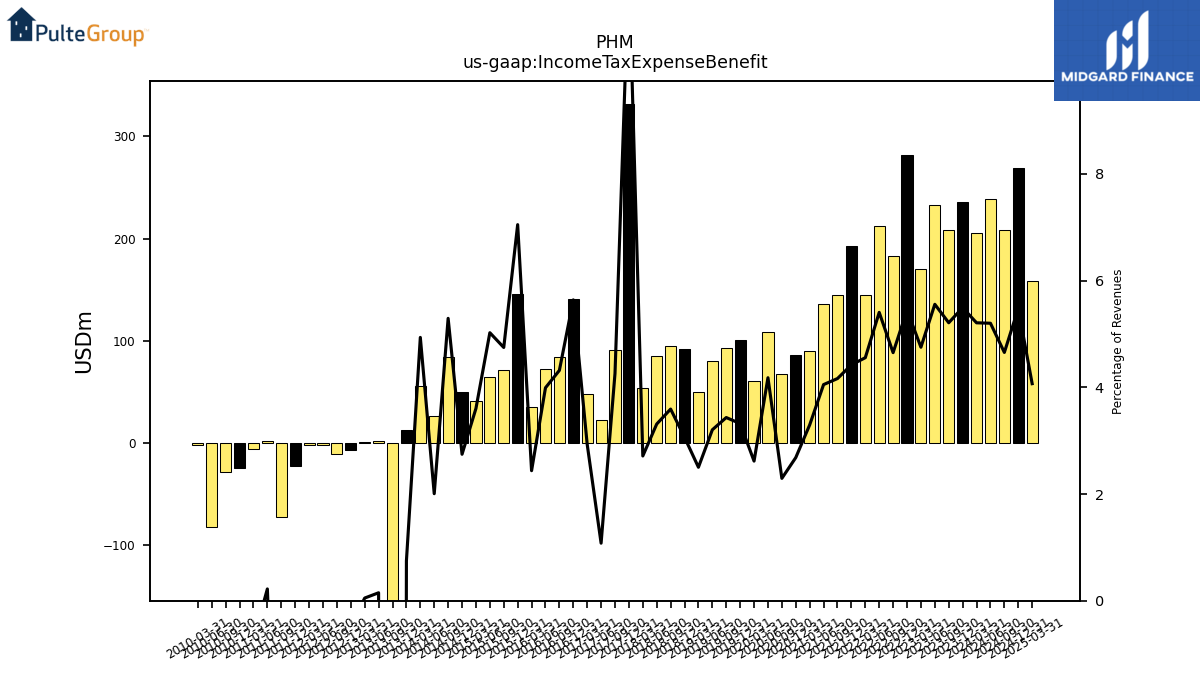
| Income Tax Expense Benefit | 235.82 | 208.54 | 232.67 | 169.86 | 281.58 | 183.35 | 212.14 | 145.17 | 192.65 | 144.85 | 136.07 | 89.94 | 85.64 | 67.77 | 108.39 | 60.06 | 100.15 | 93.04 | 79.73 | 49.95 | 91.84 | 95.15 | 85.08 | 53.44 | 331.35 | 90.71 | 21.80 | 47.75 | 140.55 | 83.86 | 71.82 | 34.91 | 145.29 | 71.51 | 64.30 | 40.83 | 50.02 | 84.38 | 25.80 | 55.21 | 12.37 | -2107.16 | 1.91 | 0.59 | -7.53 | -10.73 | -2.51 | -1.82 | -22.90 | -73.20 | 2.05 | -5.87 | -25.05 | -28.72 | -82.03 | -2.02 | |
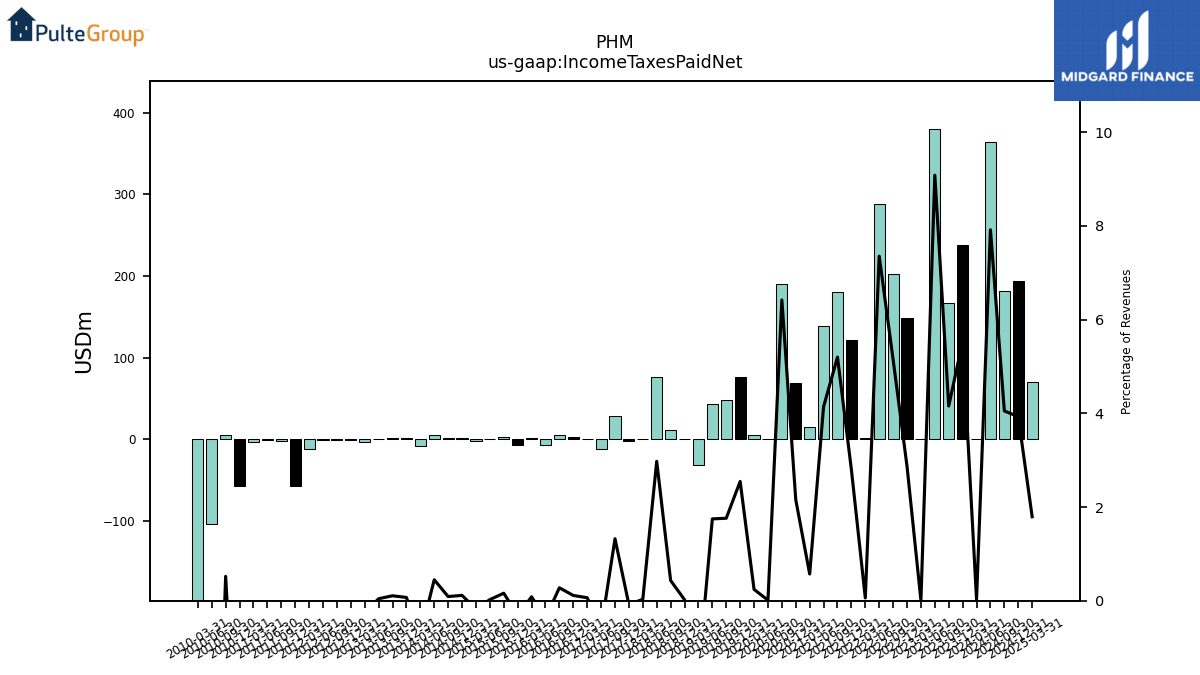
| Income Taxes Paid Net | 237.58 | 166.34 | 380.32 | 0.21 | 148.39 | 202.99 | 288.66 | 1.92 | 121.92 | 180.83 | 139.08 | 15.57 | 68.75 | 189.63 | 0.33 | 5.54 | 76.79 | 47.71 | 43.47 | -30.85 | 0.66 | 11.47 | 76.45 | 0.63 | -2.33 | 28.19 | -12.02 | 1.04 | 2.82 | 5.38 | -6.67 | 1.21 | -6.39 | 2.42 | 0.31 | -2.00 | 2.08 | 1.43 | 5.77 | -8.25 | 1.17 | 1.68 | 0.56 | -3.03 | -0.42 | -1.15 | -0.61 | -11.14 | -56.50 | -1.81 | -0.93 | -2.92 | -56.68 | 5.51 | -103.88 | -786.23 | |
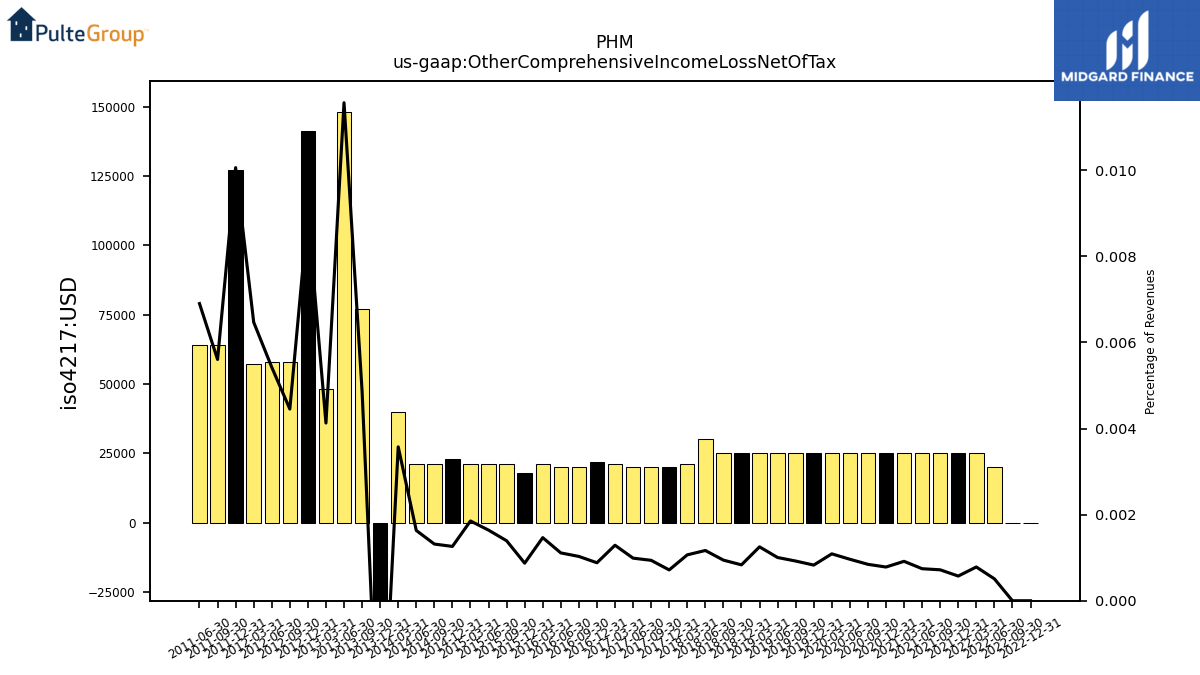
| Other Comprehensive Income Loss Net Of Tax | NA | NA | NA | NA | 0.00 | 0.00 | 0.02 | 0.03 | 0.03 | 0.03 | 0.03 | 0.03 | 0.03 | 0.03 | 0.03 | 0.03 | 0.03 | 0.03 | 0.03 | 0.03 | 0.03 | 0.03 | 0.03 | 0.02 | 0.02 | 0.02 | 0.02 | 0.02 | 0.02 | 0.02 | 0.02 | 0.02 | 0.02 | 0.02 | 0.02 | 0.02 | 0.02 | 0.02 | 0.02 | 0.04 | -0.08 | 0.08 | 0.15 | 0.05 | 0.14 | 0.06 | 0.06 | 0.06 | 0.13 | 0.06 | 0.06 | NA | NA | NA | NA | NA | |
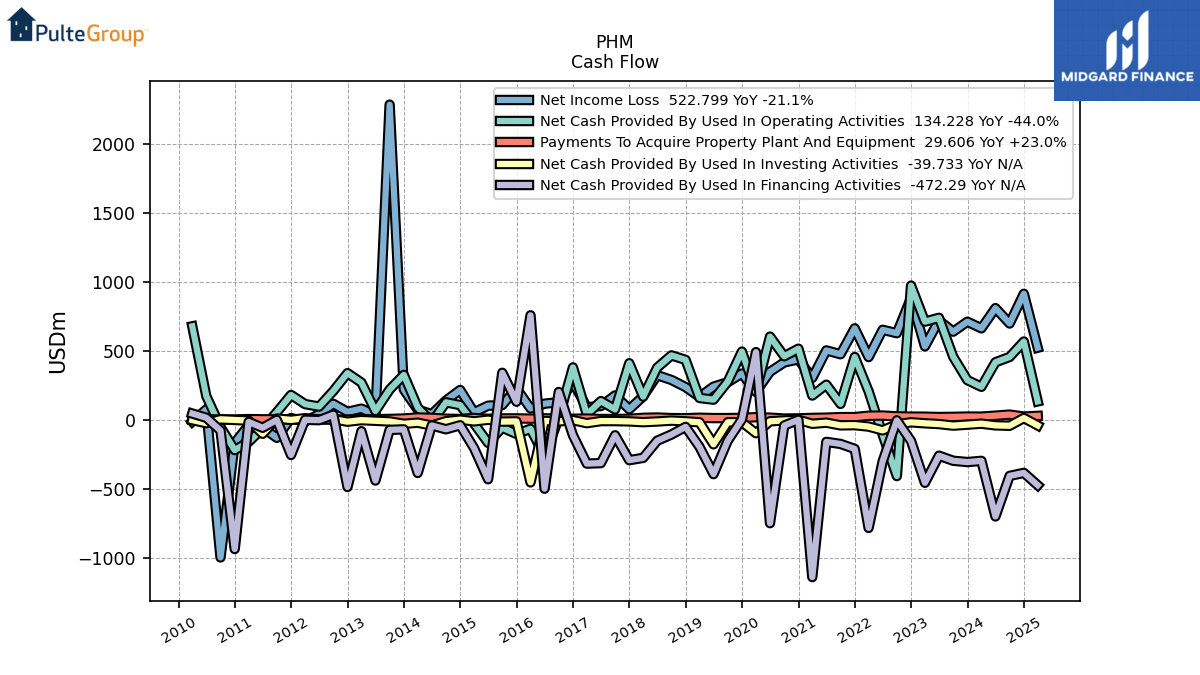
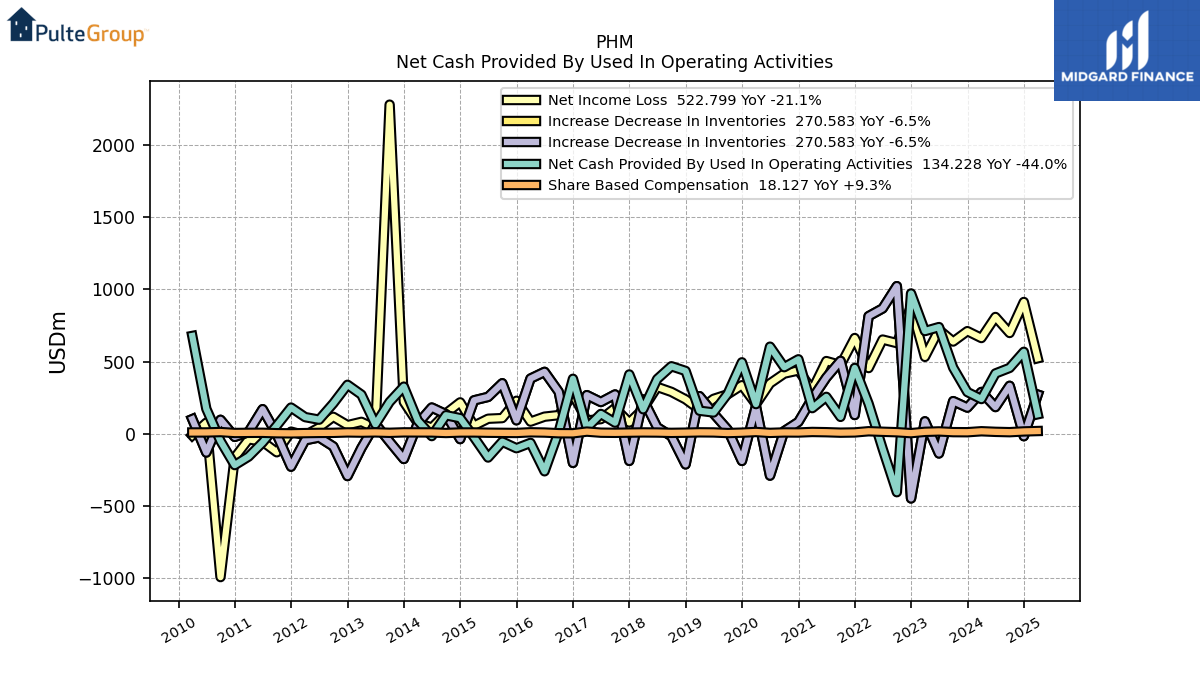
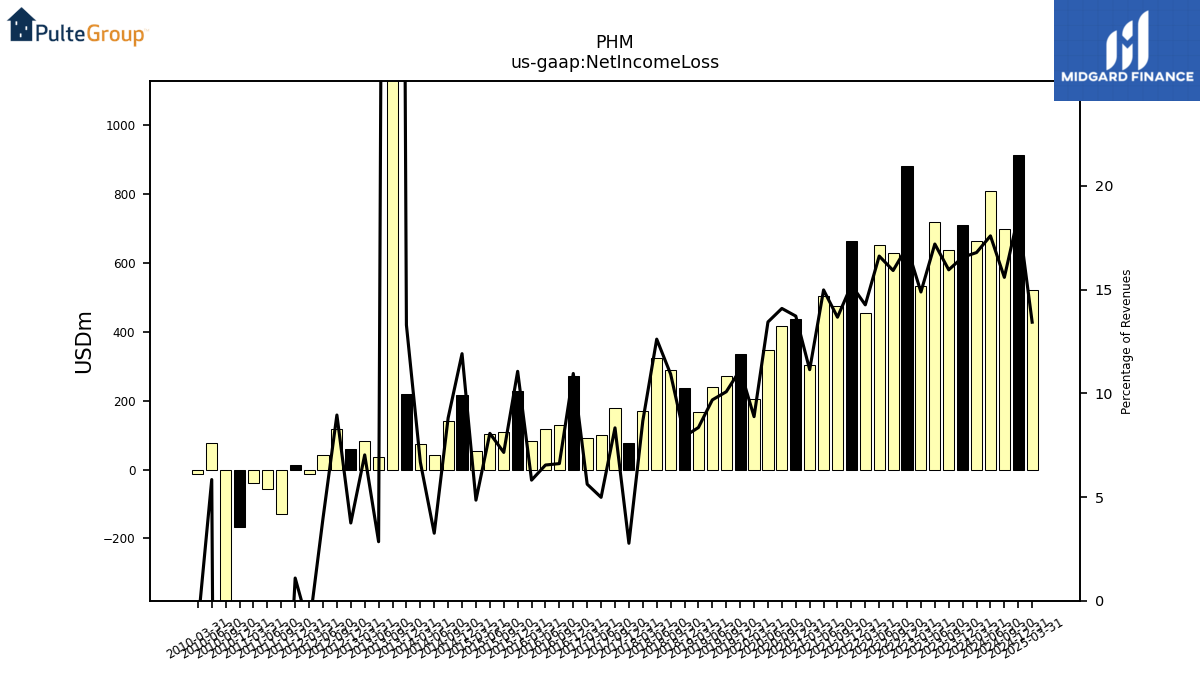
| Net Income Loss | 710.99 | 638.77 | 720.35 | 532.26 | 882.23 | 627.93 | 652.43 | 454.72 | 663.26 | 475.55 | 503.40 | 304.11 | 438.11 | 416.40 | 348.62 | 203.71 | 335.80 | 273.10 | 241.04 | 166.76 | 237.65 | 289.54 | 324.09 | 170.75 | 77.42 | 177.54 | 100.75 | 91.52 | 273.17 | 128.47 | 117.76 | 83.30 | 228.03 | 107.77 | 103.32 | 54.97 | 217.09 | 140.54 | 41.88 | 74.82 | 220.05 | 2281.88 | 36.42 | 81.76 | 58.74 | 116.63 | 42.44 | -11.67 | 13.82 | -129.30 | -55.38 | -39.53 | -165.43 | -995.12 | 76.30 | -12.49 | |
| Comprehensive Income Net Of Tax | 710.99 | 638.77 | 720.35 | 532.26 | 882.23 | 627.93 | 652.46 | 454.75 | 663.29 | 475.57 | 503.42 | 304.13 | 438.14 | 416.42 | 348.64 | 203.74 | 335.82 | 273.13 | 241.07 | 166.78 | 237.67 | 289.56 | 324.12 | 170.77 | 77.43 | 177.56 | 100.77 | 91.54 | 273.19 | 128.49 | 117.78 | 83.32 | 228.05 | 107.79 | 103.34 | 54.99 | 217.12 | 140.57 | 41.90 | 74.86 | 219.98 | 2281.96 | 36.56 | 81.81 | 58.88 | 116.69 | 42.49 | -11.61 | 13.95 | -129.23 | -55.32 | -39.57 | -164.95 | -995.04 | 76.38 | -12.39 | |
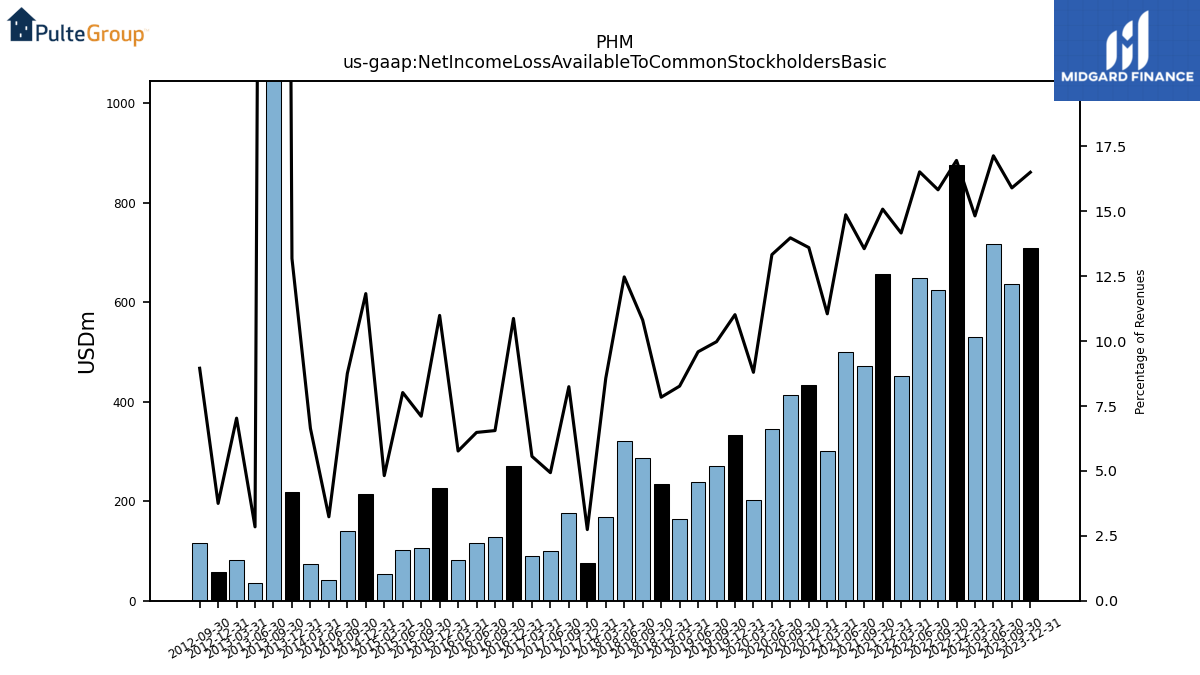
| Net Income Loss Available To Common Stockholders Basic | 708.55 | 636.57 | 717.86 | 529.99 | 876.98 | 624.19 | 648.55 | 451.44 | 657.38 | 471.71 | 499.37 | 301.65 | 434.23 | 413.01 | 345.75 | 201.90 | 332.41 | 270.39 | 238.65 | 165.04 | 235.08 | 286.38 | 320.50 | 168.83 | 76.58 | 175.60 | 99.68 | 90.59 | 271.05 | 127.33 | 116.69 | 82.61 | 226.55 | 107.07 | 102.66 | 54.62 | 215.59 | 139.60 | 41.59 | 74.30 | 218.24 | 2265.73 | 36.42 | 81.76 | 58.74 | 116.63 | NA | NA | NA | NA | NA | NA | NA | NA | NA | NA | |
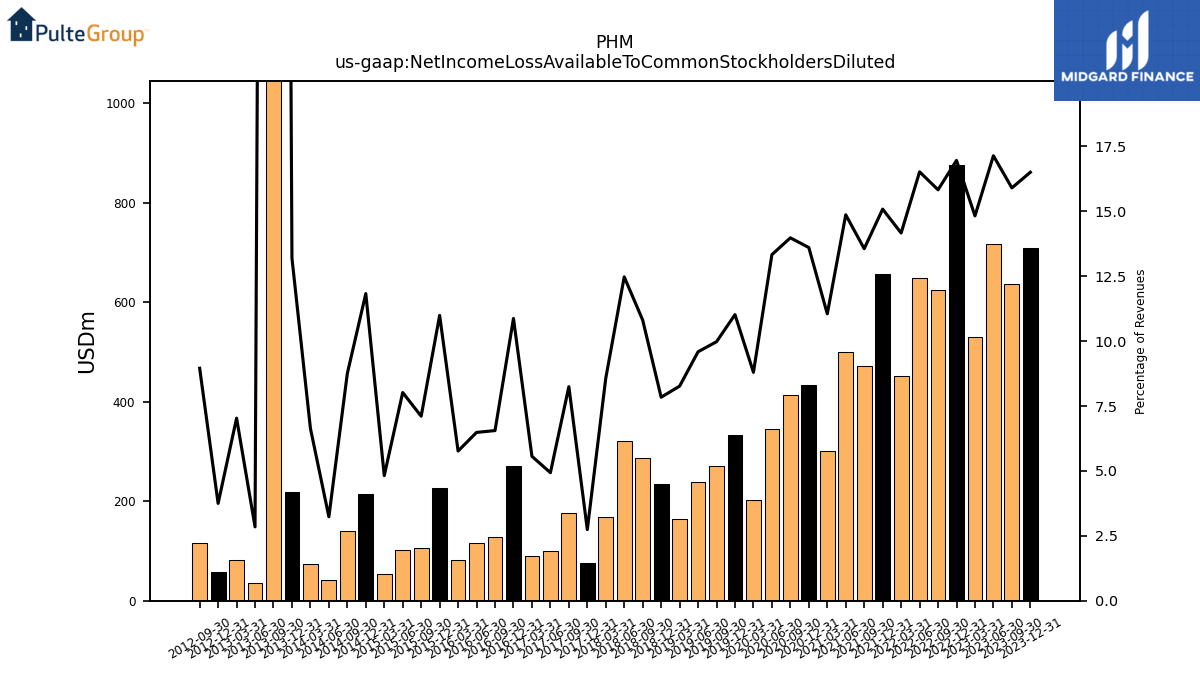
| Net Income Loss Available To Common Stockholders Diluted | 708.56 | 636.59 | 717.88 | 530.00 | 877.01 | 624.22 | 648.57 | 451.46 | 657.39 | 471.72 | 499.38 | 301.66 | 434.25 | 413.02 | 345.76 | 201.91 | 332.42 | 270.40 | 238.65 | 165.04 | 235.10 | 286.40 | 320.52 | 168.84 | 76.58 | 175.61 | 99.68 | 90.60 | 271.06 | 127.34 | 116.69 | 82.61 | 226.56 | 107.08 | 102.67 | 54.62 | 215.60 | 139.61 | 41.59 | 74.31 | 218.43 | 2265.86 | 36.42 | 81.76 | 58.74 | 116.63 | NA | NA | NA | NA | NA | NA | NA | NA | NA | NA |
| 2023-12-31 | 2023-09-30 | 2023-06-30 | 2023-03-31 | 2022-12-31 | 2022-09-30 | 2022-06-30 | 2022-03-31 | 2021-12-31 | 2021-09-30 | 2021-06-30 | 2021-03-31 | 2020-12-31 | 2020-09-30 | 2020-06-30 | 2020-03-31 | 2019-12-31 | 2019-09-30 | 2019-06-30 | 2019-03-31 | 2018-12-31 | 2018-09-30 | 2018-06-30 | 2018-03-31 | 2017-12-31 | 2017-09-30 | 2017-06-30 | 2017-03-31 | 2016-12-31 | 2016-09-30 | 2016-06-30 | 2016-03-31 | 2015-12-31 | 2015-09-30 | 2015-06-30 | 2015-03-31 | 2014-12-31 | 2014-09-30 | 2014-06-30 | 2014-03-31 | 2013-12-31 | 2013-09-30 | 2013-06-30 | 2013-03-31 | 2012-12-31 | 2012-09-30 | 2012-06-30 | 2012-03-31 | 2011-12-31 | 2011-09-30 | 2011-06-30 | 2011-03-31 | 2010-12-31 | 2010-09-30 | 2010-06-30 | 2010-03-31 | ||
|---|---|---|---|---|---|---|---|---|---|---|---|---|---|---|---|---|---|---|---|---|---|---|---|---|---|---|---|---|---|---|---|---|---|---|---|---|---|---|---|---|---|---|---|---|---|---|---|---|---|---|---|---|---|---|---|---|---|
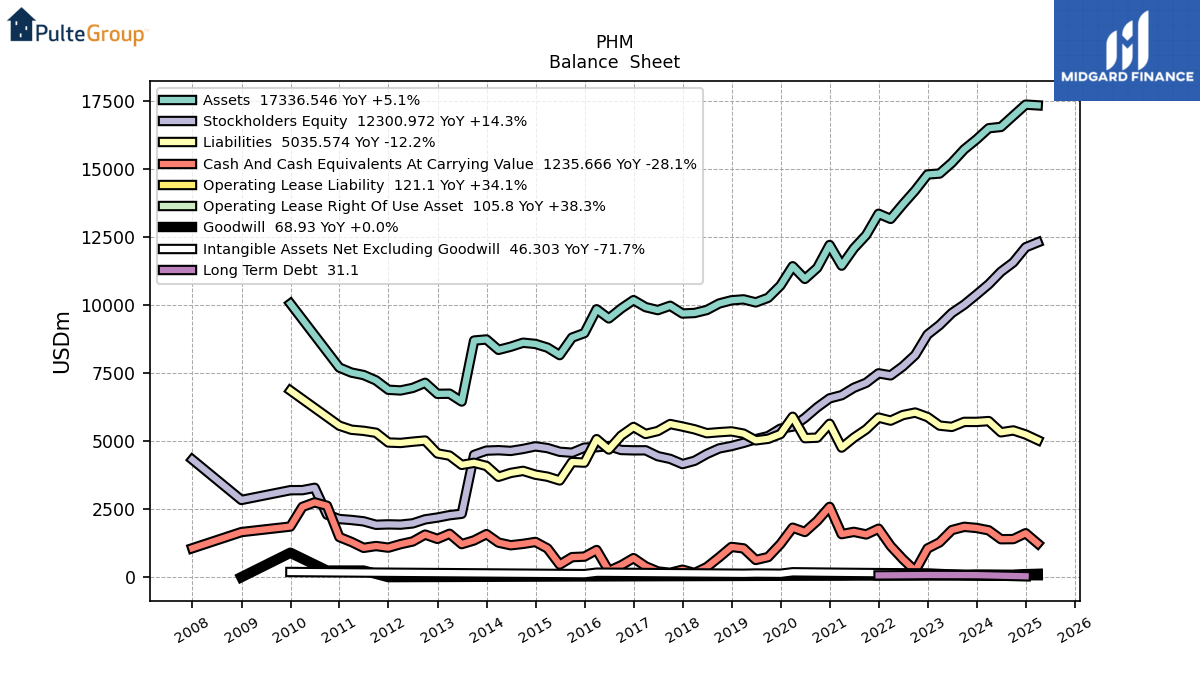
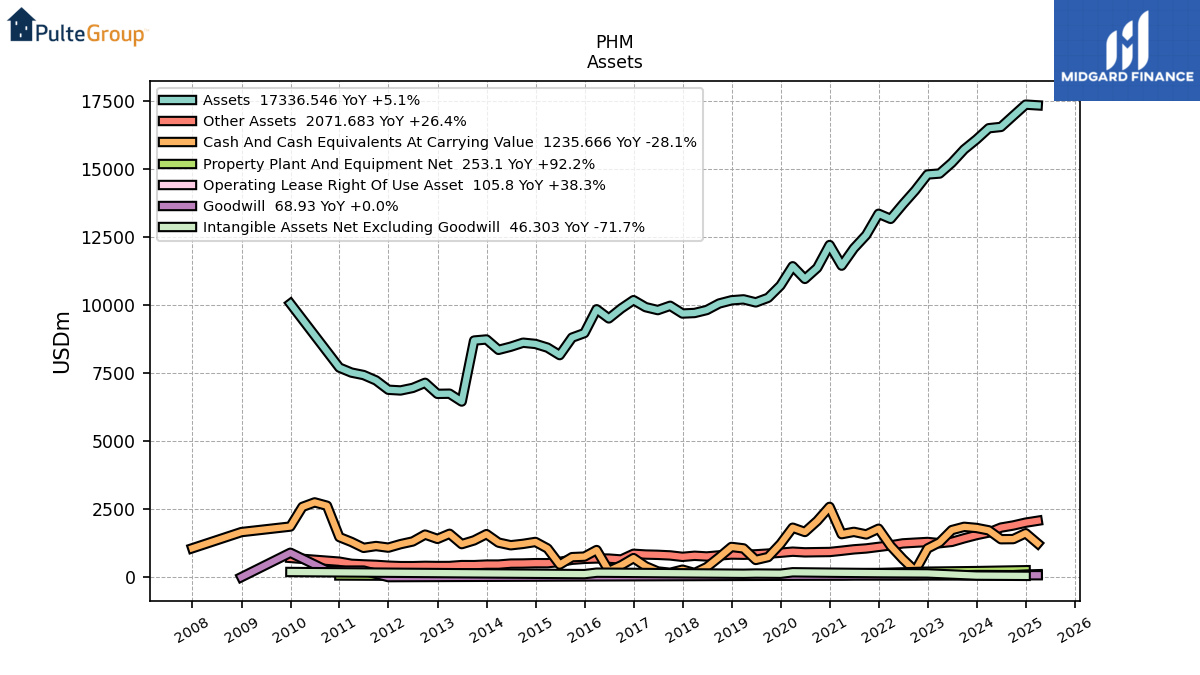
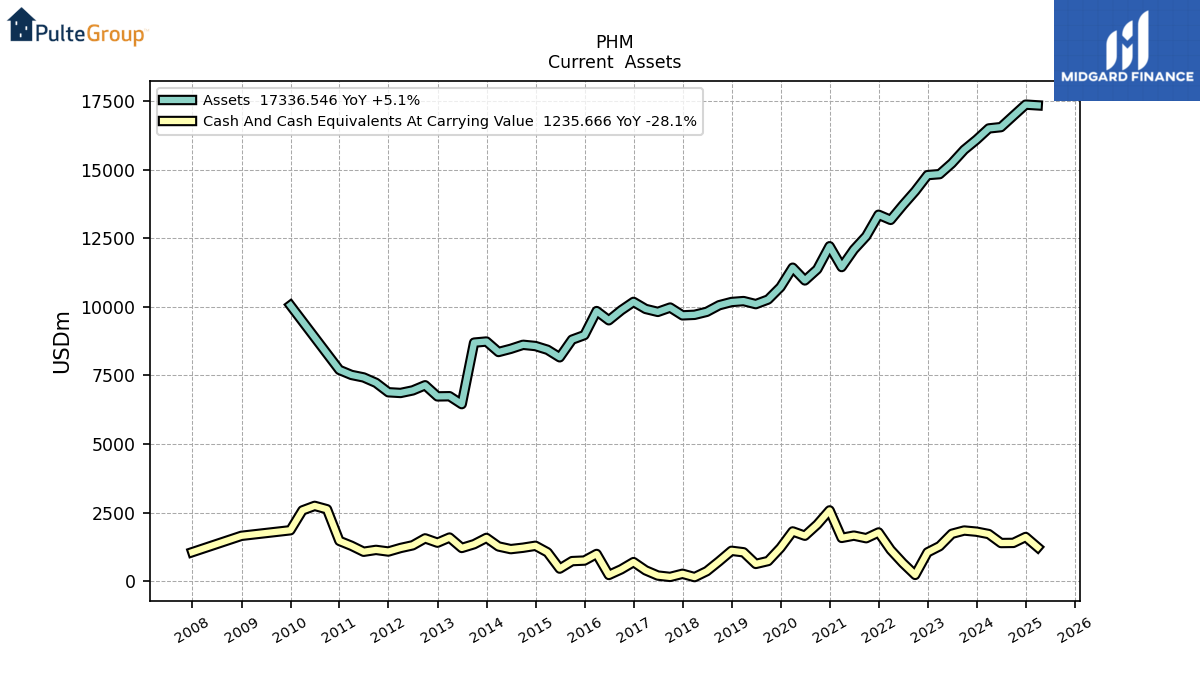
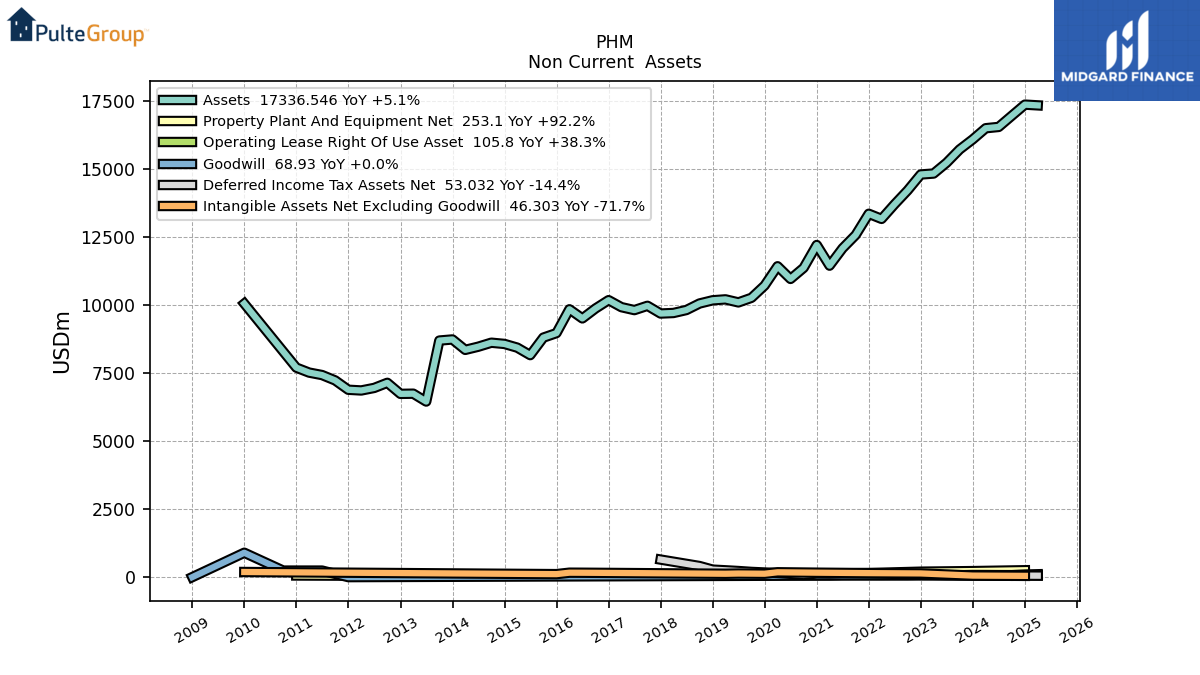
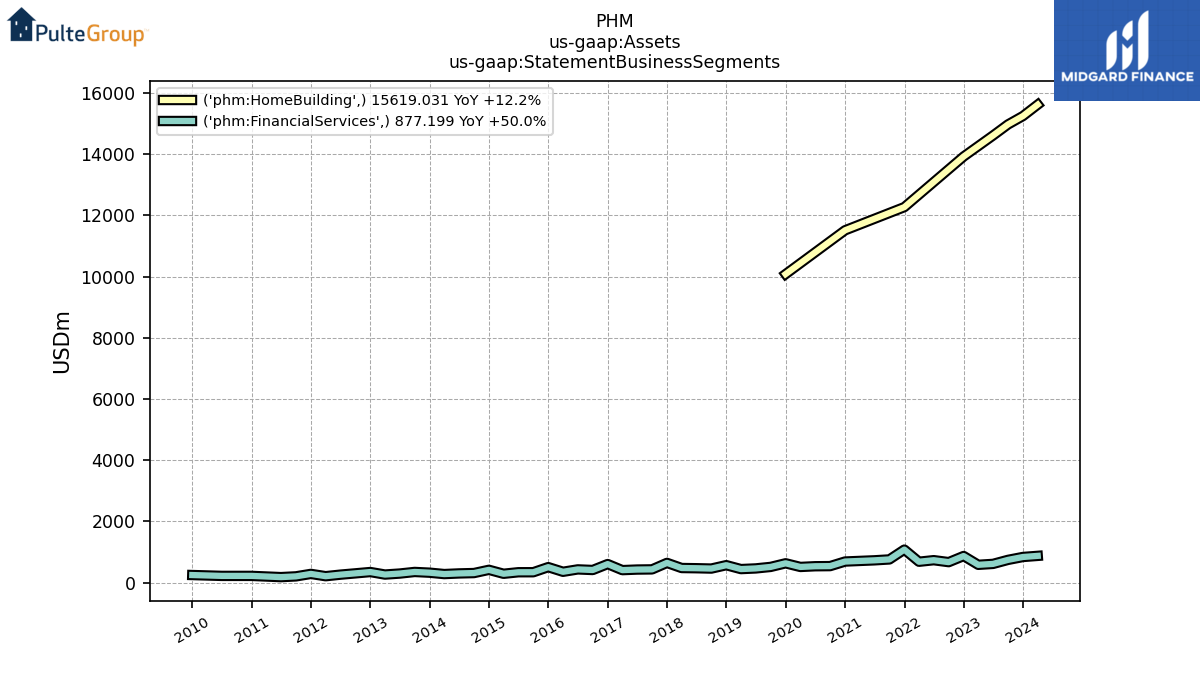
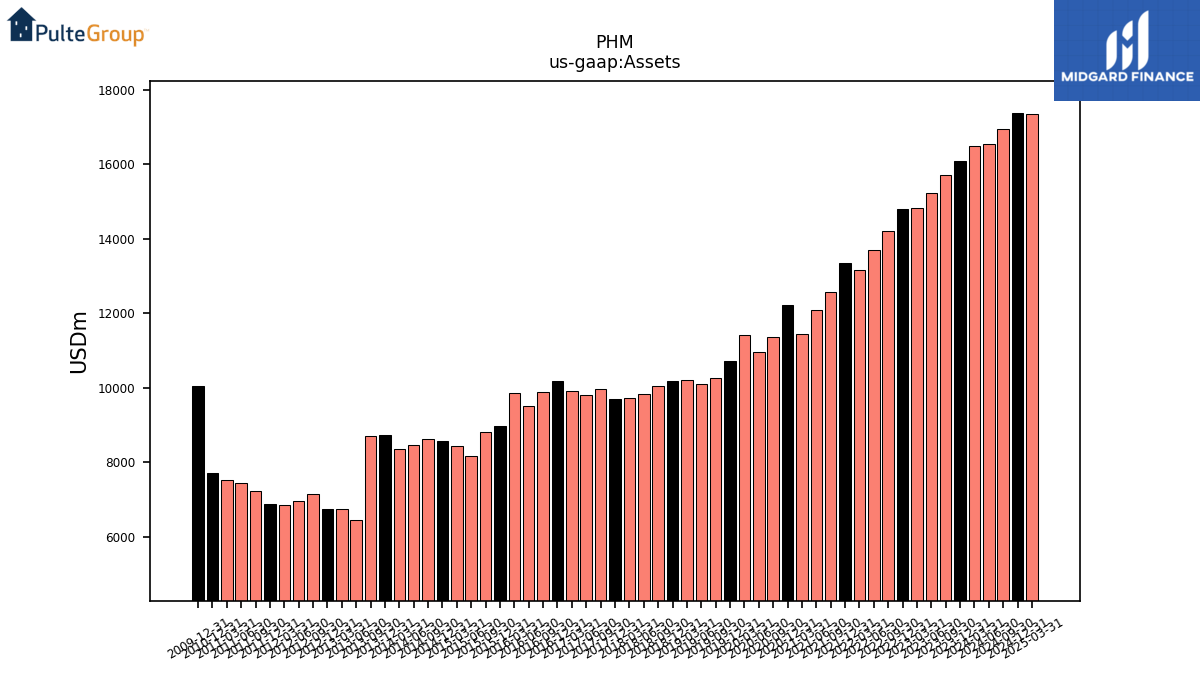
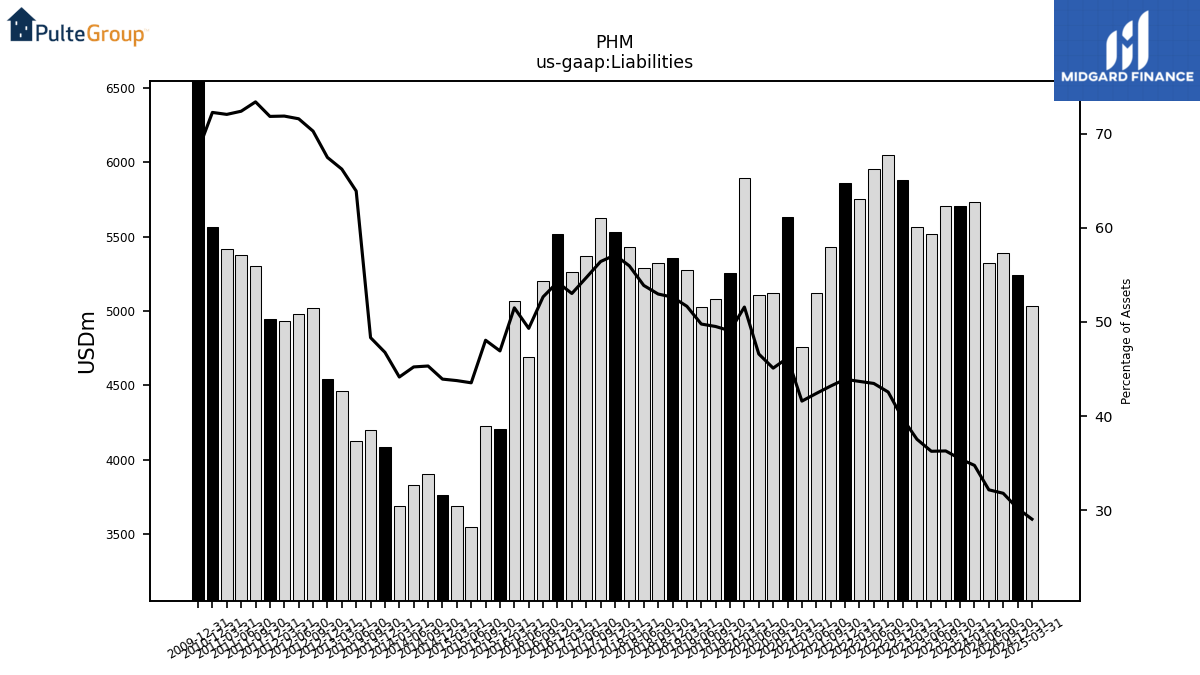
| Assets | 16087.05 | 15717.26 | 15225.92 | 14831.04 | 14796.51 | 14211.84 | 13700.34 | 13164.24 | 13352.63 | 12571.85 | 12082.02 | 11445.74 | 12205.50 | 11365.02 | 10958.49 | 11423.37 | 10715.60 | 10264.51 | 10095.54 | 10207.34 | 10172.98 | 10055.08 | 9815.58 | 9706.40 | 9686.65 | 9971.27 | 9812.88 | 9920.81 | 10178.20 | 9871.53 | 9507.06 | 9843.48 | 8967.16 | 8801.58 | 8157.96 | 8433.28 | 8569.41 | 8614.65 | 8467.34 | 8351.41 | 8734.14 | 8693.72 | 6452.27 | 6741.14 | 6734.41 | 7140.58 | 6952.82 | 6859.44 | 6885.62 | 7228.65 | 7425.60 | 7516.63 | 7699.38 | NA | NA | NA | |
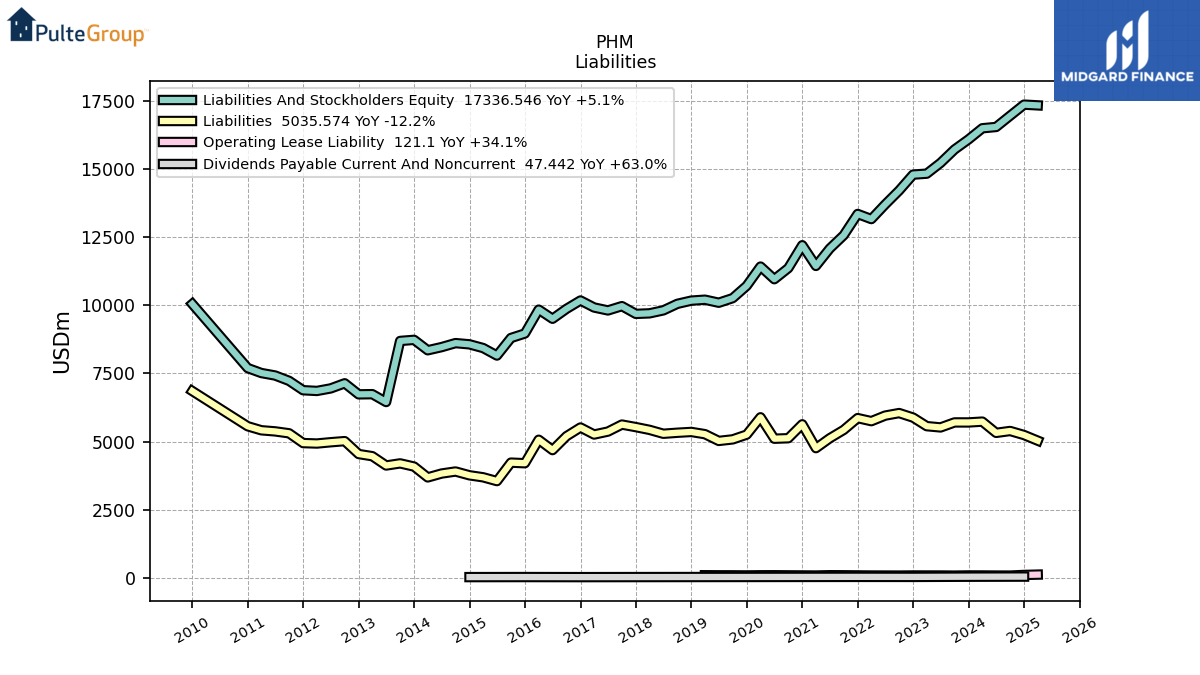
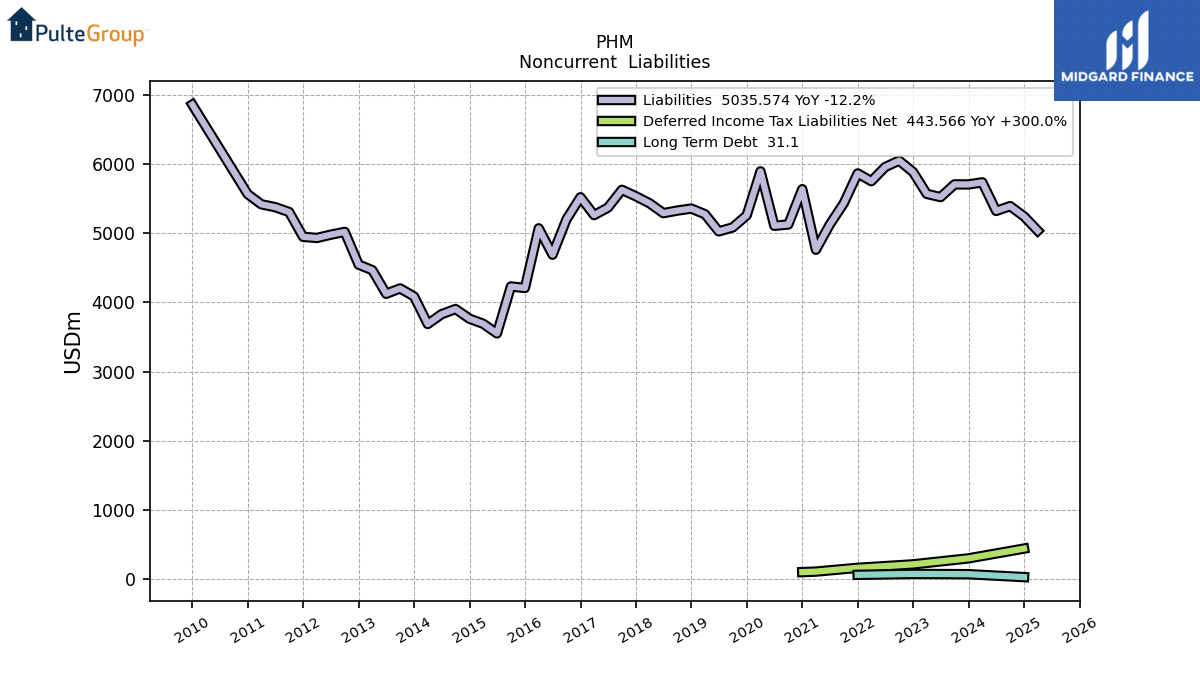
| Liabilities | 5703.79 | 5704.76 | 5520.89 | 5567.23 | 5882.42 | 6047.84 | 5955.12 | 5750.98 | 5863.12 | 5430.10 | 5123.55 | 4760.47 | 5635.51 | 5125.01 | 5106.82 | 5892.98 | 5257.42 | 5082.92 | 5025.73 | 5273.90 | 5355.19 | 5326.20 | 5288.86 | 5431.74 | 5532.62 | 5626.18 | 5368.88 | 5260.67 | 5518.84 | 5199.50 | 4688.94 | 5069.95 | 4207.84 | 4229.97 | 3551.70 | 3691.29 | 3764.46 | 3904.24 | 3829.29 | 3687.35 | 4085.19 | 4202.04 | 4124.06 | 4465.63 | 4544.79 | 5018.53 | 4977.78 | 4930.61 | 4947.01 | 5305.19 | 5375.88 | 5416.49 | 5564.21 | NA | NA | NA | |
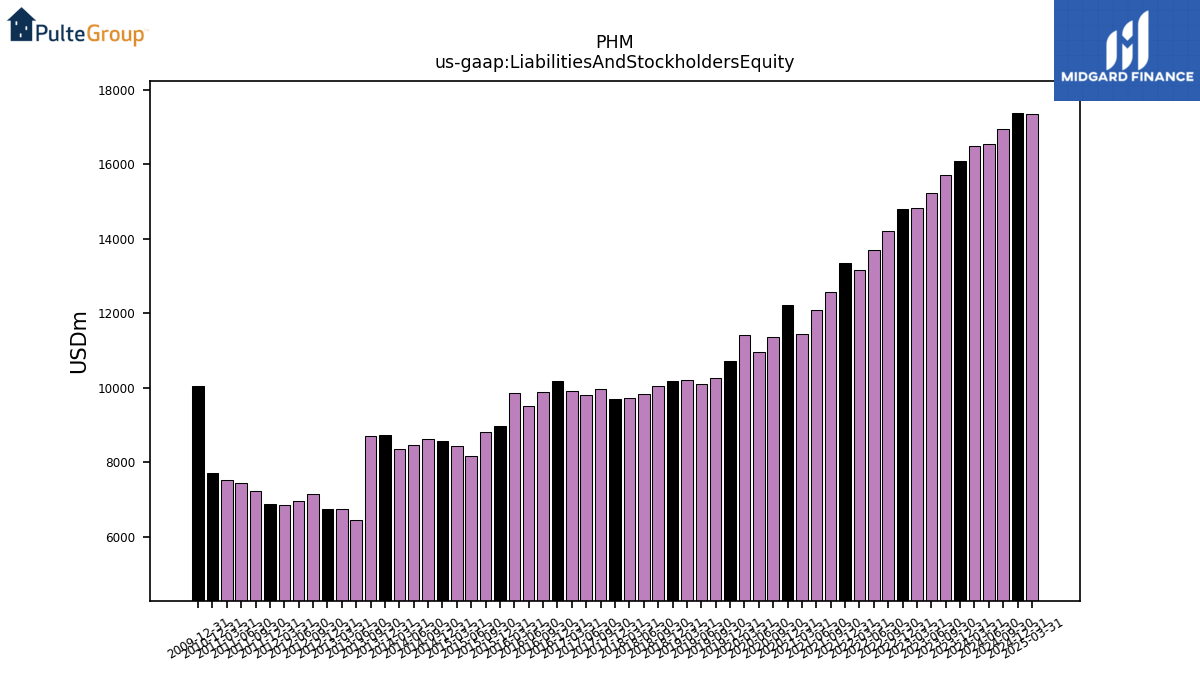
| Liabilities And Stockholders Equity | 16087.05 | 15717.26 | 15225.92 | 14831.04 | 14796.51 | 14211.84 | 13700.34 | 13164.24 | 13352.63 | 12571.85 | 12082.02 | 11445.74 | 12205.50 | 11365.02 | 10958.49 | 11423.37 | 10715.60 | 10264.51 | 10095.54 | 10207.34 | 10172.98 | 10055.08 | 9815.58 | 9706.40 | 9686.65 | 9971.27 | 9812.88 | 9920.81 | 10178.20 | 9871.53 | 9507.06 | 9843.48 | 8967.16 | 8801.58 | 8157.96 | 8433.28 | 8569.41 | 8614.65 | 8467.34 | 8351.41 | 8734.14 | 8693.72 | 6452.27 | 6741.14 | 6734.41 | 7140.58 | 6952.82 | 6859.44 | 6885.62 | 7228.65 | 7425.60 | 7516.63 | 7699.38 | NA | NA | NA | |
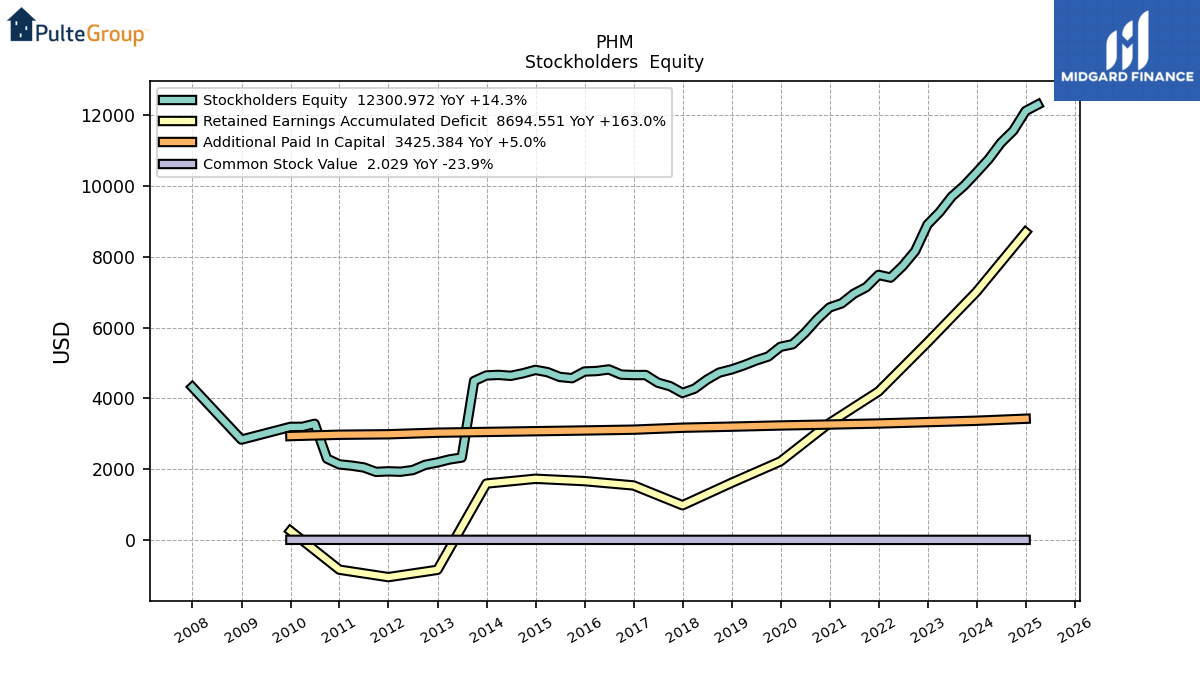
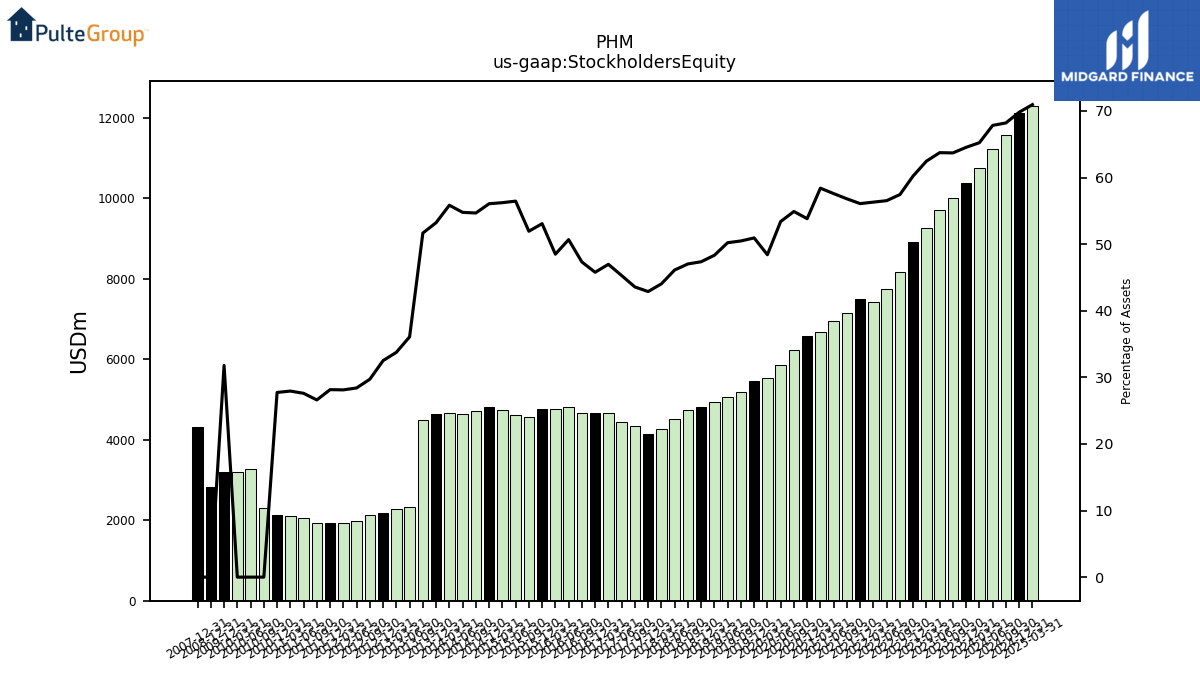
| Stockholders Equity | 10383.26 | 10012.50 | 9705.02 | 9263.81 | 8914.10 | 8164.00 | 7745.22 | 7413.26 | 7489.52 | 7141.75 | 6958.47 | 6685.27 | 6569.99 | 6240.02 | 5851.67 | 5530.39 | 5458.18 | 5181.59 | 5069.81 | 4933.44 | 4817.78 | 4728.88 | 4526.71 | 4274.66 | 4154.03 | 4345.09 | 4444.00 | 4660.15 | 4659.36 | 4672.03 | 4818.12 | 4773.53 | 4759.32 | 4571.60 | 4606.26 | 4741.99 | 4804.95 | 4710.41 | 4638.04 | 4664.06 | 4648.95 | 4491.69 | 2328.22 | 2275.51 | 2189.62 | 2122.05 | 1975.05 | 1928.83 | 1938.62 | 1923.47 | 2049.73 | 2100.14 | 2135.17 | 2296.42 | 3281.79 | 3196.55 |
| 2023-12-31 | 2023-09-30 | 2023-06-30 | 2023-03-31 | 2022-12-31 | 2022-09-30 | 2022-06-30 | 2022-03-31 | 2021-12-31 | 2021-09-30 | 2021-06-30 | 2021-03-31 | 2020-12-31 | 2020-09-30 | 2020-06-30 | 2020-03-31 | 2019-12-31 | 2019-09-30 | 2019-06-30 | 2019-03-31 | 2018-12-31 | 2018-09-30 | 2018-06-30 | 2018-03-31 | 2017-12-31 | 2017-09-30 | 2017-06-30 | 2017-03-31 | 2016-12-31 | 2016-09-30 | 2016-06-30 | 2016-03-31 | 2015-12-31 | 2015-09-30 | 2015-06-30 | 2015-03-31 | 2014-12-31 | 2014-09-30 | 2014-06-30 | 2014-03-31 | 2013-12-31 | 2013-09-30 | 2013-06-30 | 2013-03-31 | 2012-12-31 | 2012-09-30 | 2012-06-30 | 2012-03-31 | 2011-12-31 | 2011-09-30 | 2011-06-30 | 2011-03-31 | 2010-12-31 | 2010-09-30 | 2010-06-30 | 2010-03-31 | ||
|---|---|---|---|---|---|---|---|---|---|---|---|---|---|---|---|---|---|---|---|---|---|---|---|---|---|---|---|---|---|---|---|---|---|---|---|---|---|---|---|---|---|---|---|---|---|---|---|---|---|---|---|---|---|---|---|---|---|
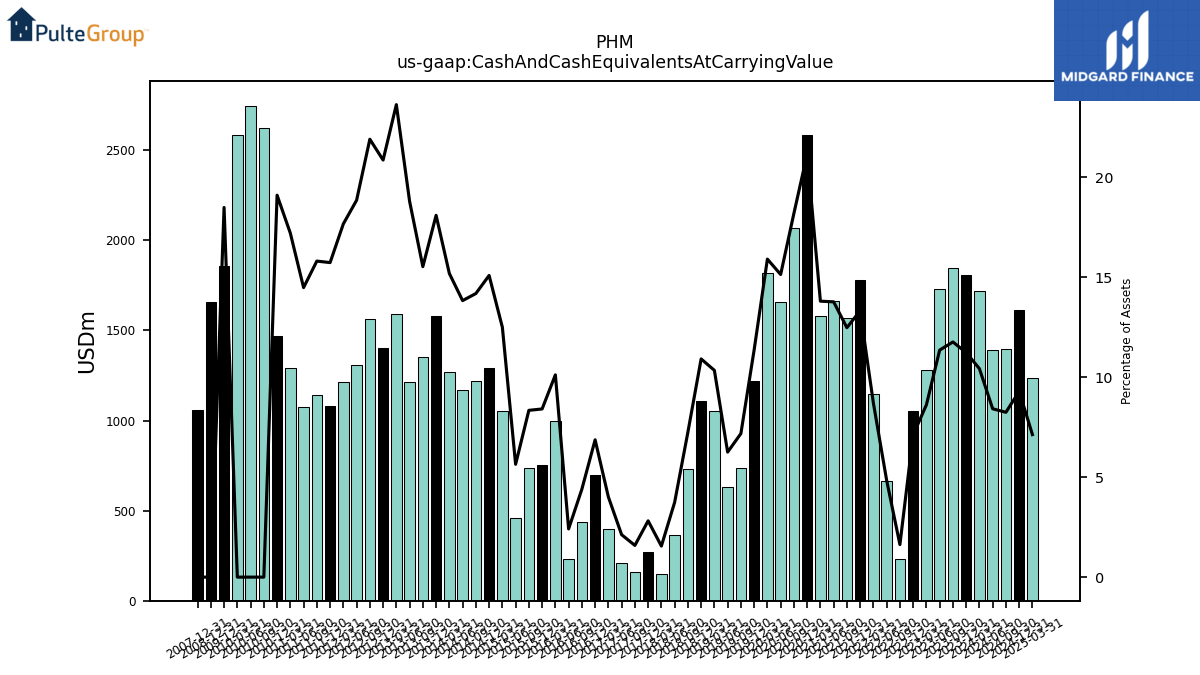
| Cash And Cash Equivalents At Carrying Value | 1806.58 | 1848.45 | 1728.71 | 1278.03 | 1053.10 | 231.30 | 662.78 | 1145.01 | 1779.09 | 1568.32 | 1663.27 | 1579.59 | 2582.20 | 2067.28 | 1658.53 | 1816.78 | 1217.91 | 736.99 | 631.31 | 1055.46 | 1110.09 | 728.63 | 367.09 | 150.82 | 272.68 | 158.24 | 208.20 | 397.76 | 698.88 | 434.20 | 229.19 | 995.70 | 754.16 | 734.15 | 460.36 | 1053.93 | 1292.86 | 1221.82 | 1170.93 | 1268.16 | 1580.33 | 1349.99 | 1212.67 | 1592.92 | 1404.76 | 1563.65 | 1310.48 | 1211.73 | 1083.07 | 1142.51 | 1075.22 | 1292.95 | 1470.62 | 2623.28 | 2746.63 | 2581.65 | |
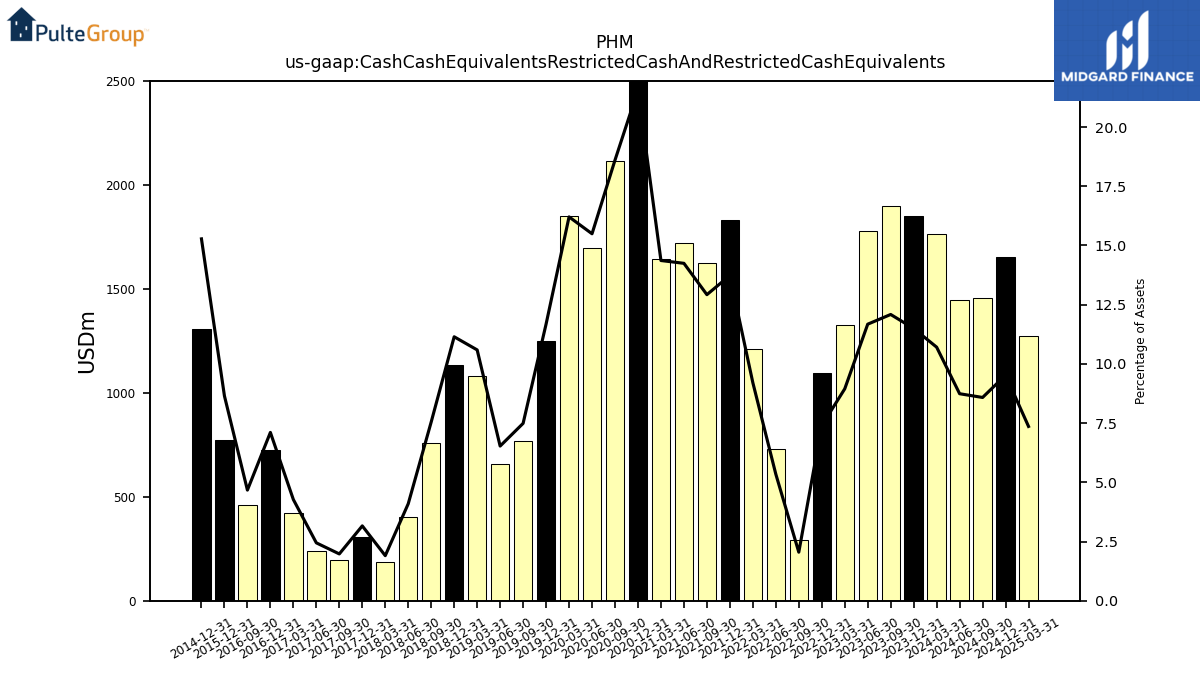
| Cash Cash Equivalents Restricted Cash And Restricted Cash Equivalents | 1849.18 | 1899.56 | 1777.78 | 1326.85 | 1094.55 | 291.40 | 732.10 | 1211.87 | 1833.57 | 1624.65 | 1721.12 | 1644.05 | 2632.24 | 2114.21 | 1697.80 | 1851.25 | 1251.46 | 768.64 | 659.27 | 1080.95 | 1133.70 | 759.01 | 401.92 | 184.79 | 306.17 | 197.10 | 239.85 | 423.86 | 723.25 | 461.19 | NA | NA | 775.43 | NA | NA | NA | 1309.22 | NA | NA | NA | NA | NA | NA | NA | NA | NA | NA | NA | NA | NA | NA | NA | NA | NA | NA | NA |
| 2023-12-31 | 2023-09-30 | 2023-06-30 | 2023-03-31 | 2022-12-31 | 2022-09-30 | 2022-06-30 | 2022-03-31 | 2021-12-31 | 2021-09-30 | 2021-06-30 | 2021-03-31 | 2020-12-31 | 2020-09-30 | 2020-06-30 | 2020-03-31 | 2019-12-31 | 2019-09-30 | 2019-06-30 | 2019-03-31 | 2018-12-31 | 2018-09-30 | 2018-06-30 | 2018-03-31 | 2017-12-31 | 2017-09-30 | 2017-06-30 | 2017-03-31 | 2016-12-31 | 2016-09-30 | 2016-06-30 | 2016-03-31 | 2015-12-31 | 2015-09-30 | 2015-06-30 | 2015-03-31 | 2014-12-31 | 2014-09-30 | 2014-06-30 | 2014-03-31 | 2013-12-31 | 2013-09-30 | 2013-06-30 | 2013-03-31 | 2012-12-31 | 2012-09-30 | 2012-06-30 | 2012-03-31 | 2011-12-31 | 2011-09-30 | 2011-06-30 | 2011-03-31 | 2010-12-31 | 2010-09-30 | 2010-06-30 | 2010-03-31 | ||
|---|---|---|---|---|---|---|---|---|---|---|---|---|---|---|---|---|---|---|---|---|---|---|---|---|---|---|---|---|---|---|---|---|---|---|---|---|---|---|---|---|---|---|---|---|---|---|---|---|---|---|---|---|---|---|---|---|---|
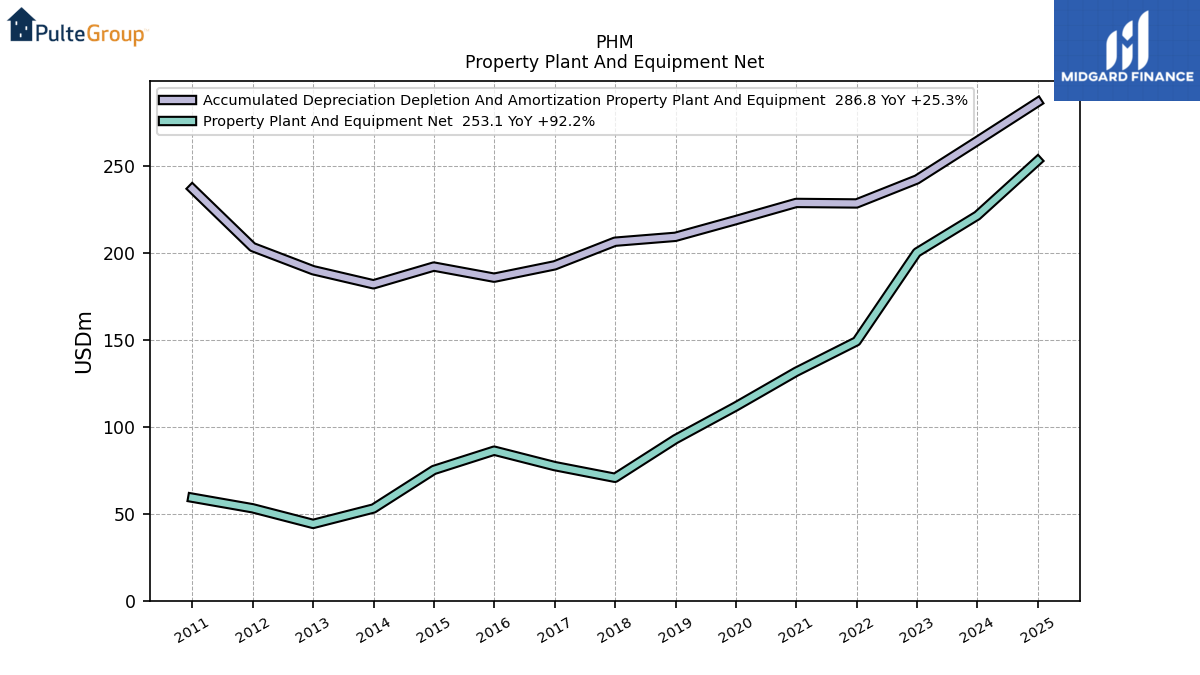
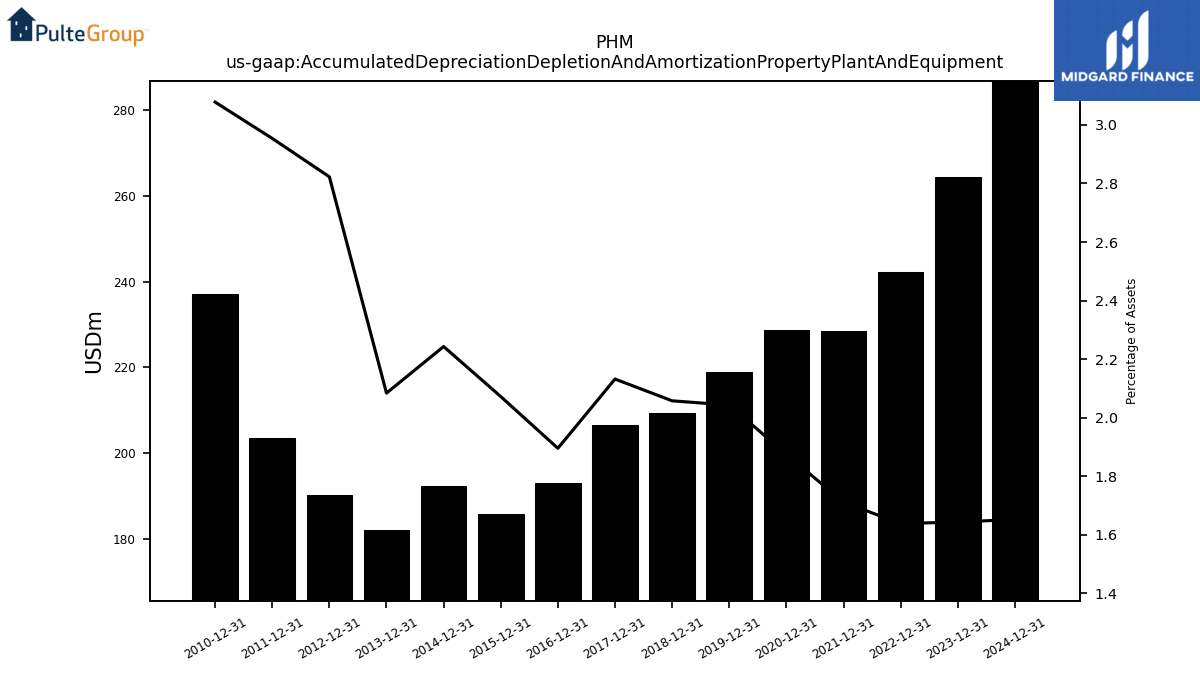
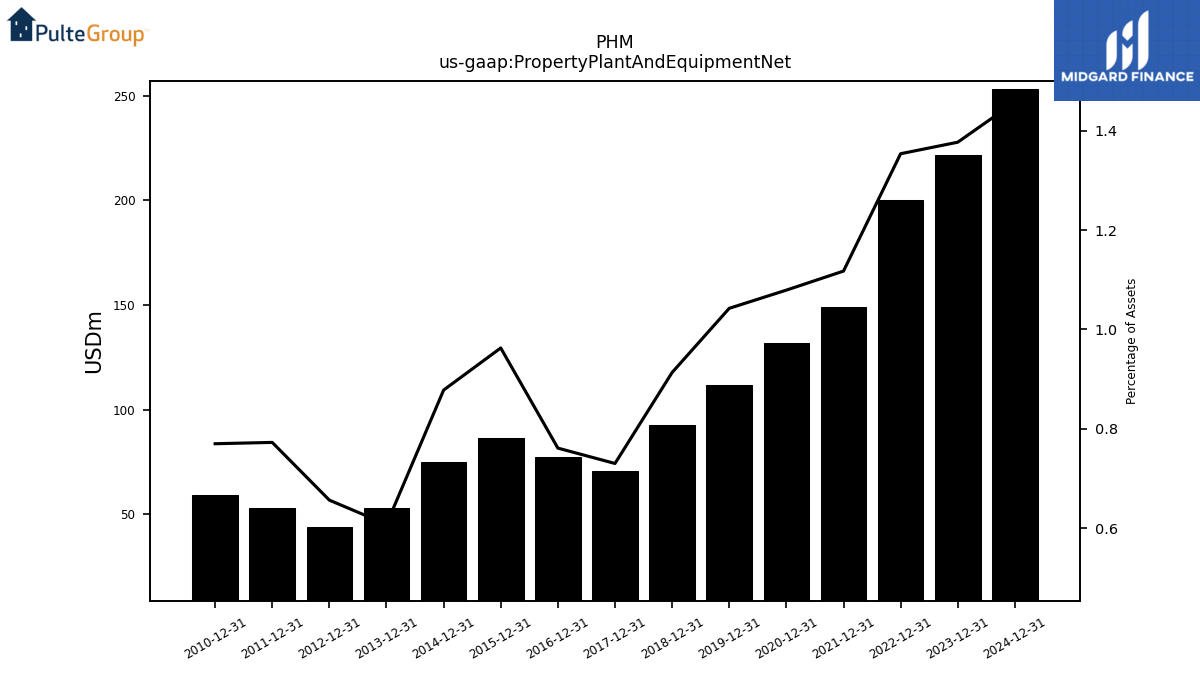
| Accumulated Depreciation Depletion And Amortization Property Plant And Equipment | 264.40 | NA | NA | NA | 242.30 | NA | NA | NA | 228.50 | NA | NA | NA | 228.80 | NA | NA | NA | 218.90 | NA | NA | NA | 209.30 | NA | NA | NA | 206.50 | NA | NA | NA | 192.90 | NA | NA | NA | 185.80 | NA | NA | NA | 192.20 | NA | NA | NA | 182.00 | NA | NA | NA | 190.10 | NA | NA | NA | 203.40 | NA | NA | NA | 237.00 | NA | NA | NA | |
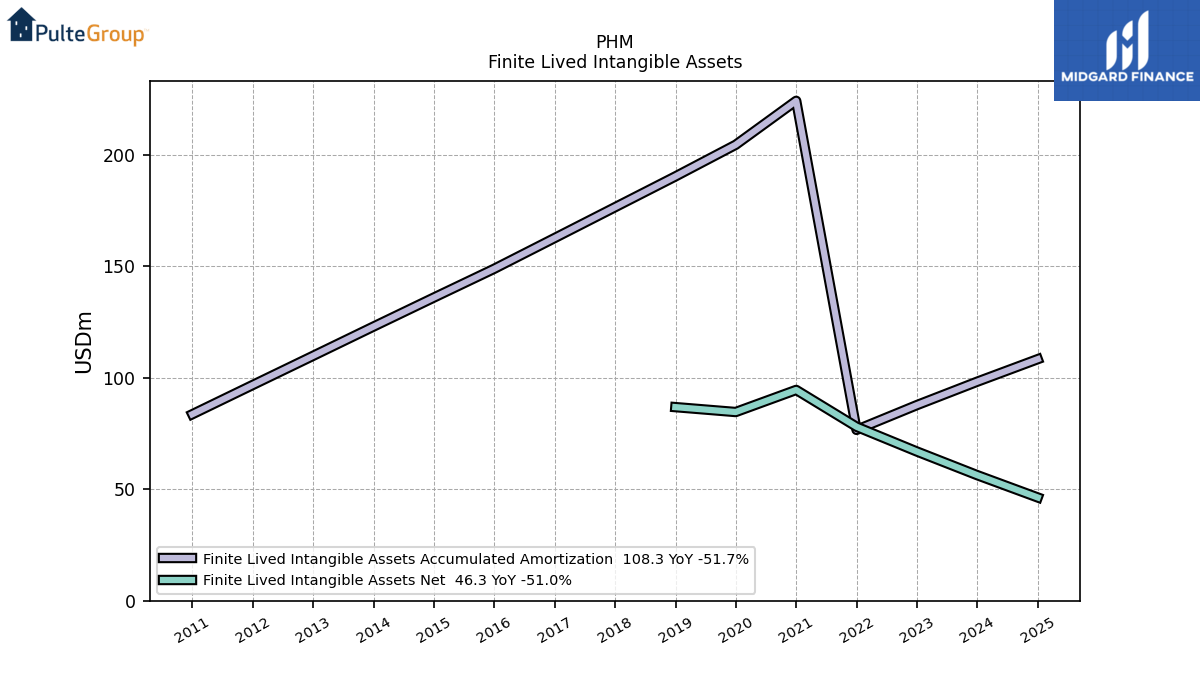
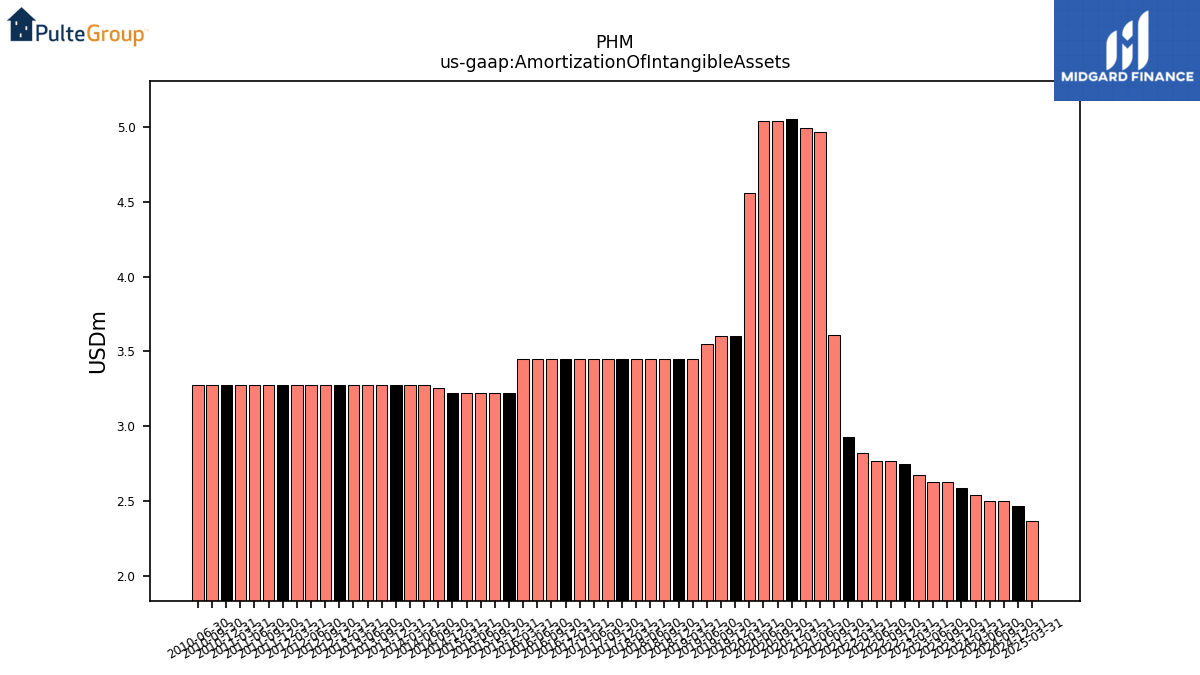
| Amortization Of Intangible Assets | 2.58 | 2.62 | 2.62 | 2.67 | 2.75 | 2.77 | 2.77 | 2.82 | 2.93 | 3.61 | 4.97 | 4.99 | 5.06 | 5.04 | 5.04 | 4.56 | 3.60 | 3.60 | 3.55 | 3.45 | 3.45 | 3.45 | 3.45 | 3.45 | 3.45 | 3.45 | 3.45 | 3.45 | 3.45 | 3.45 | 3.45 | 3.45 | 3.23 | 3.23 | 3.23 | 3.23 | 3.23 | 3.26 | 3.27 | 3.27 | 3.27 | 3.27 | 3.27 | 3.27 | 3.27 | 3.27 | 3.27 | 3.27 | 3.27 | 3.27 | 3.27 | 3.27 | 3.27 | 3.27 | 3.27 | NA | |
| Property Plant And Equipment Net | 221.50 | NA | NA | NA | 200.30 | NA | NA | NA | 149.20 | NA | NA | NA | 131.70 | NA | NA | NA | 111.70 | NA | NA | NA | 92.90 | NA | NA | NA | 70.71 | NA | NA | NA | 77.44 | NA | NA | NA | 86.31 | NA | NA | NA | 75.22 | NA | NA | NA | 53.05 | NA | NA | NA | 44.18 | NA | NA | NA | 53.18 | NA | NA | NA | 59.26 | NA | NA | NA | |
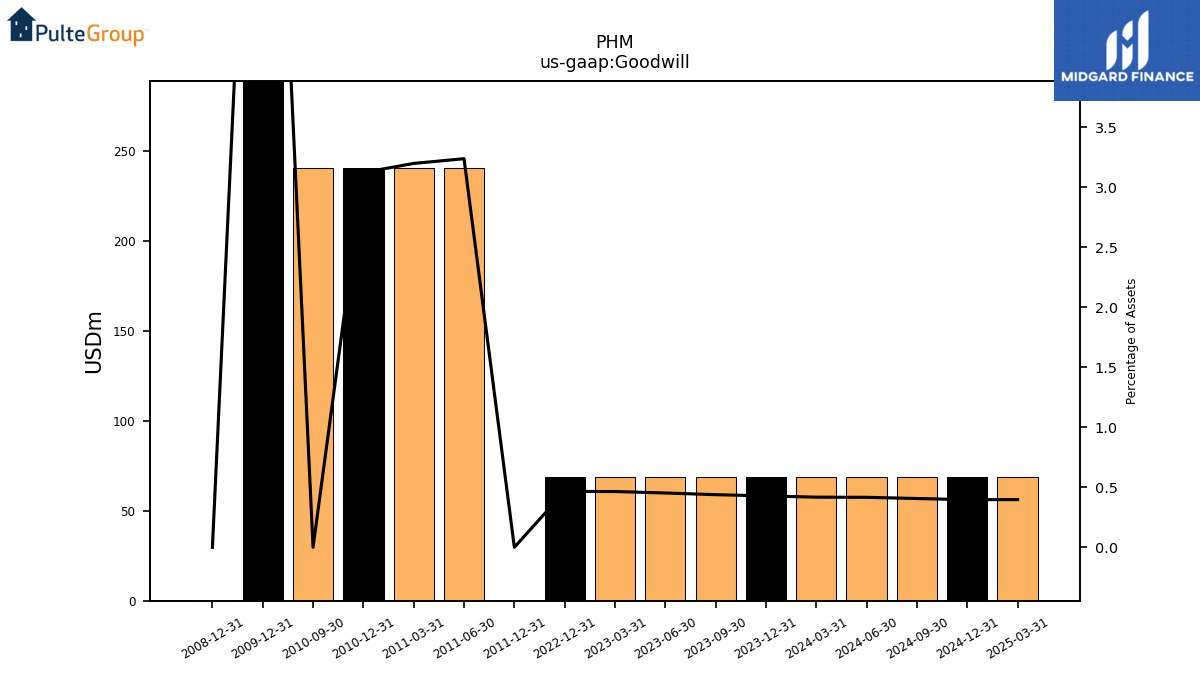
| Goodwill | 68.93 | 68.93 | 68.93 | 68.93 | 68.93 | NA | NA | NA | NA | NA | NA | NA | NA | NA | NA | NA | NA | NA | NA | NA | NA | NA | NA | NA | NA | NA | NA | NA | NA | NA | NA | NA | NA | NA | NA | NA | NA | NA | NA | NA | NA | NA | NA | NA | NA | NA | NA | NA | 0.00 | NA | 240.54 | 240.54 | 240.54 | 240.54 | NA | NA | |
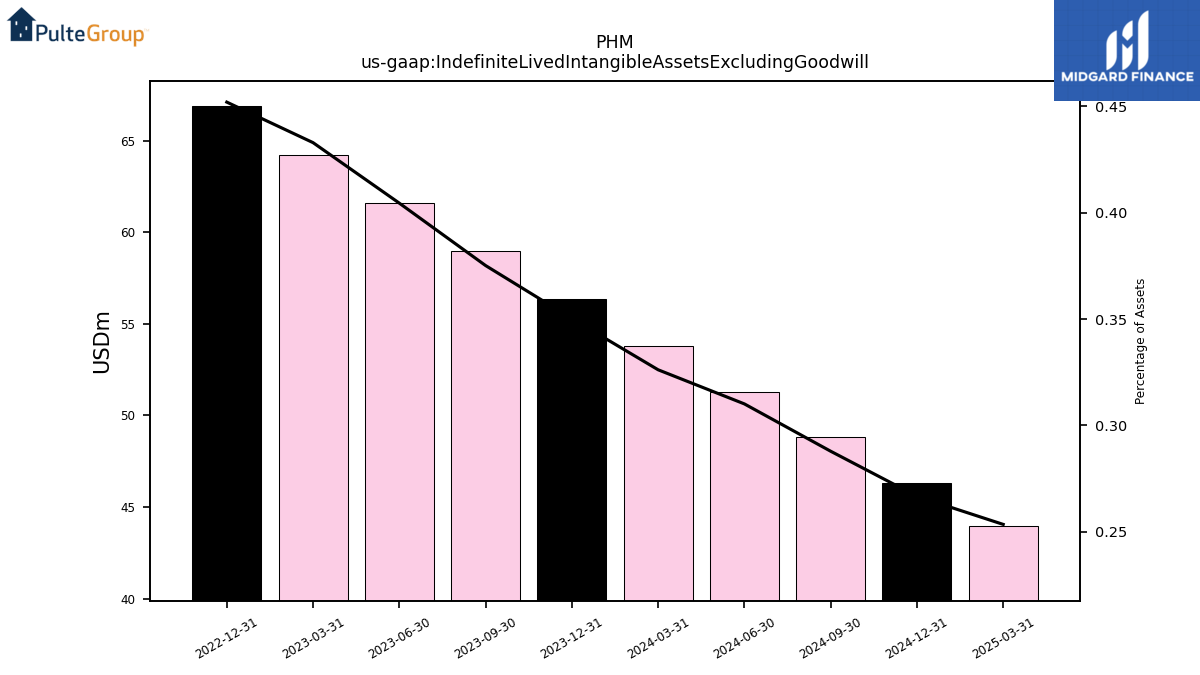
| Indefinite Lived Intangible Assets Excluding Goodwill | NA | 58.96 | 61.58 | 64.20 | 66.88 | NA | NA | NA | NA | NA | NA | NA | NA | NA | NA | NA | NA | NA | NA | NA | NA | NA | NA | NA | NA | NA | NA | NA | NA | NA | NA | NA | NA | NA | NA | NA | NA | NA | NA | NA | NA | NA | NA | NA | NA | NA | NA | NA | NA | NA | NA | NA | NA | NA | NA | NA | |
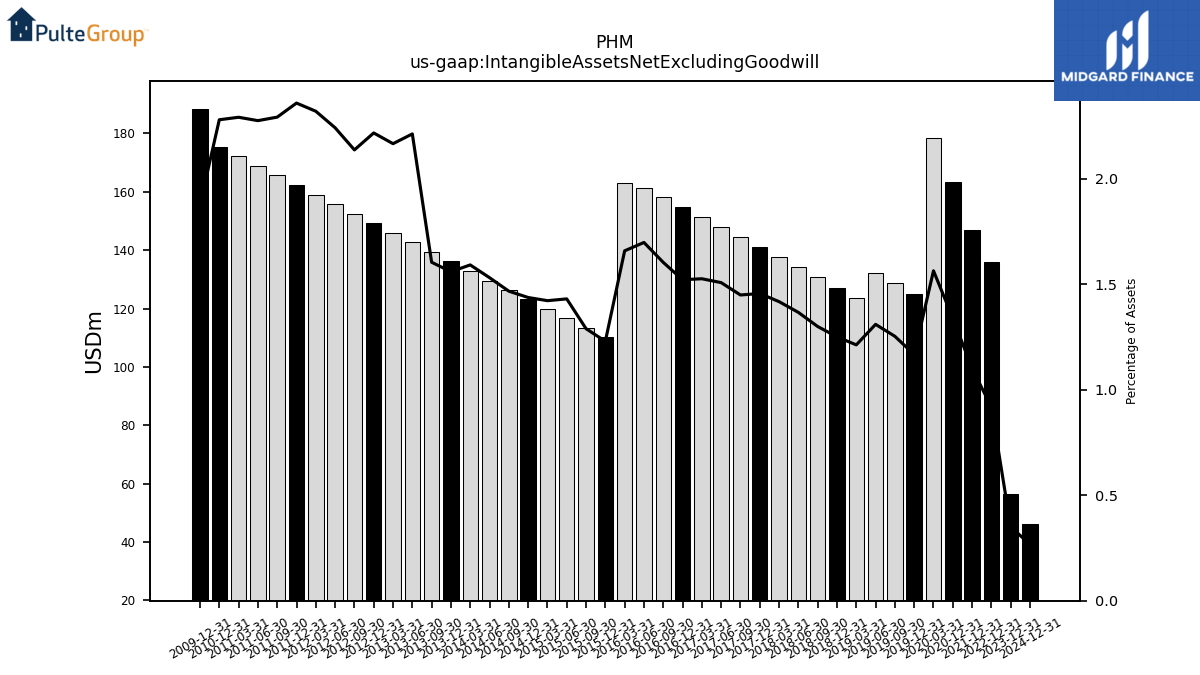
| Intangible Assets Net Excluding Goodwill | 56.34 | NA | NA | NA | 135.81 | NA | NA | NA | 146.92 | NA | NA | NA | 163.43 | NA | NA | 178.55 | 124.99 | 128.59 | 132.19 | 123.74 | 127.19 | 130.64 | 134.09 | 137.54 | 140.99 | 144.44 | 147.89 | 151.34 | 154.79 | 158.24 | 161.37 | 163.19 | 110.22 | 113.44 | 116.67 | 119.89 | 123.11 | 126.34 | 129.60 | 132.87 | 136.15 | 139.42 | 142.70 | 145.97 | 149.25 | 152.52 | 155.80 | 159.07 | 162.35 | 165.62 | 168.90 | 172.17 | 175.45 | NA | NA | NA | |
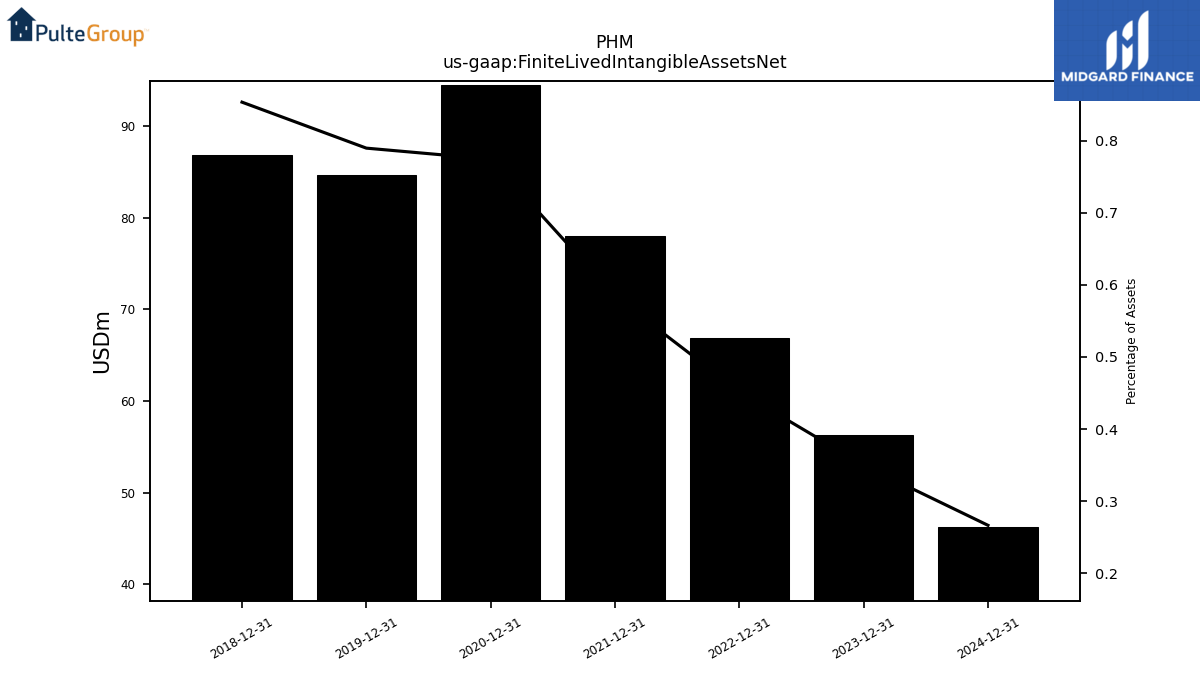
| Finite Lived Intangible Assets Net | 56.30 | NA | NA | NA | 66.90 | NA | NA | NA | 78.00 | NA | NA | NA | 94.50 | NA | NA | NA | 84.60 | NA | NA | NA | 86.80 | NA | NA | NA | NA | NA | NA | NA | NA | NA | NA | NA | NA | NA | NA | NA | NA | NA | NA | NA | NA | NA | NA | NA | NA | NA | NA | NA | NA | NA | NA | NA | NA | NA | NA | NA | |
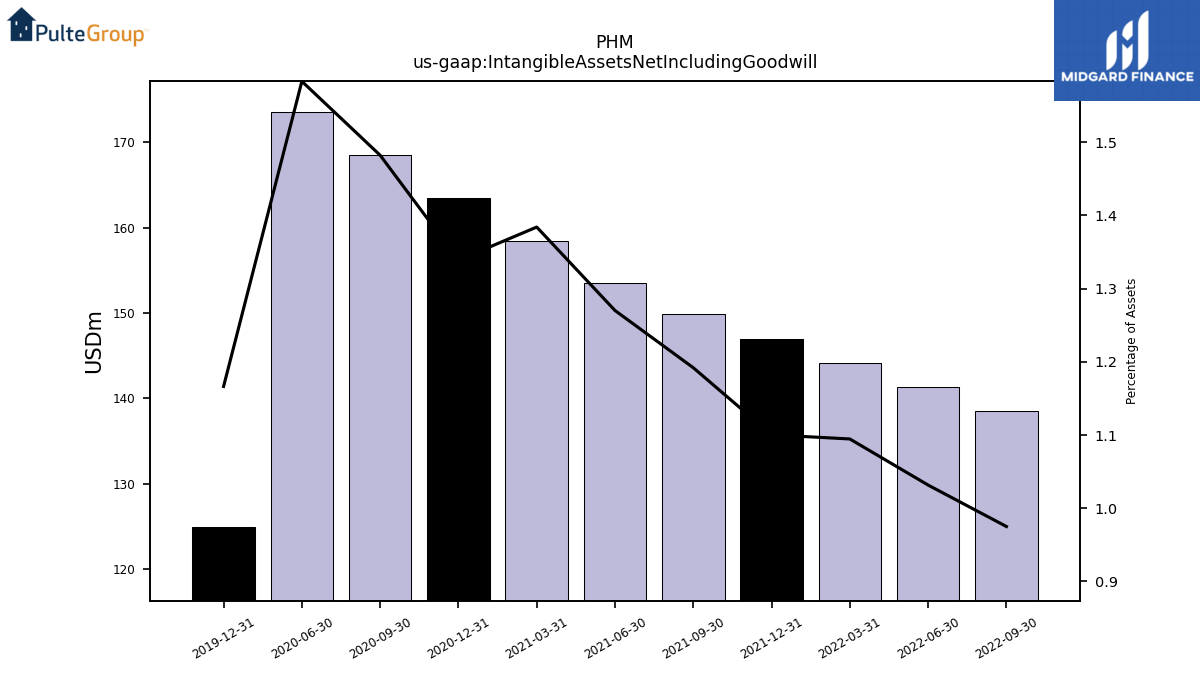
| Intangible Assets Net Including Goodwill | NA | NA | NA | NA | NA | 138.57 | 141.34 | 144.10 | 146.92 | 149.85 | 153.46 | 158.43 | 163.43 | 168.47 | 173.51 | NA | 124.99 | NA | NA | NA | NA | NA | NA | NA | NA | NA | NA | NA | NA | NA | NA | NA | NA | NA | NA | NA | NA | NA | NA | NA | NA | NA | NA | NA | NA | NA | NA | NA | NA | NA | NA | NA | NA | NA | NA | NA |
| 2023-12-31 | 2023-09-30 | 2023-06-30 | 2023-03-31 | 2022-12-31 | 2022-09-30 | 2022-06-30 | 2022-03-31 | 2021-12-31 | 2021-09-30 | 2021-06-30 | 2021-03-31 | 2020-12-31 | 2020-09-30 | 2020-06-30 | 2020-03-31 | 2019-12-31 | 2019-09-30 | 2019-06-30 | 2019-03-31 | 2018-12-31 | 2018-09-30 | 2018-06-30 | 2018-03-31 | 2017-12-31 | 2017-09-30 | 2017-06-30 | 2017-03-31 | 2016-12-31 | 2016-09-30 | 2016-06-30 | 2016-03-31 | 2015-12-31 | 2015-09-30 | 2015-06-30 | 2015-03-31 | 2014-12-31 | 2014-09-30 | 2014-06-30 | 2014-03-31 | 2013-12-31 | 2013-09-30 | 2013-06-30 | 2013-03-31 | 2012-12-31 | 2012-09-30 | 2012-06-30 | 2012-03-31 | 2011-12-31 | 2011-09-30 | 2011-06-30 | 2011-03-31 | 2010-12-31 | 2010-09-30 | 2010-06-30 | 2010-03-31 | ||
|---|---|---|---|---|---|---|---|---|---|---|---|---|---|---|---|---|---|---|---|---|---|---|---|---|---|---|---|---|---|---|---|---|---|---|---|---|---|---|---|---|---|---|---|---|---|---|---|---|---|---|---|---|---|---|---|---|---|
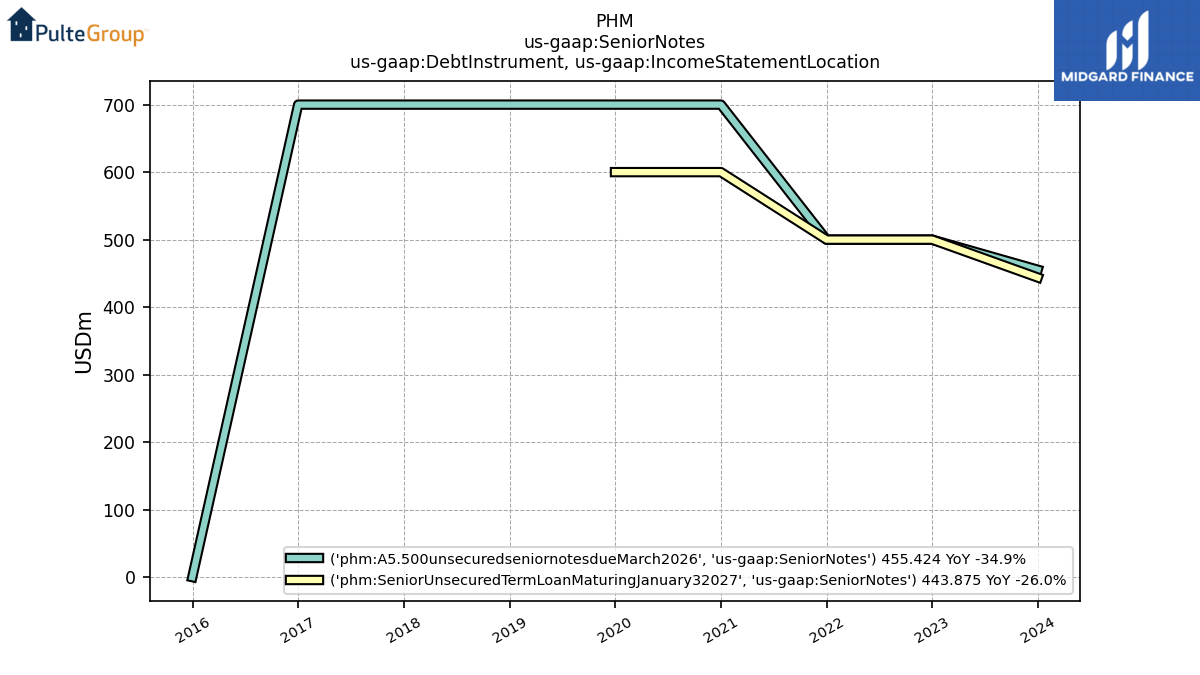
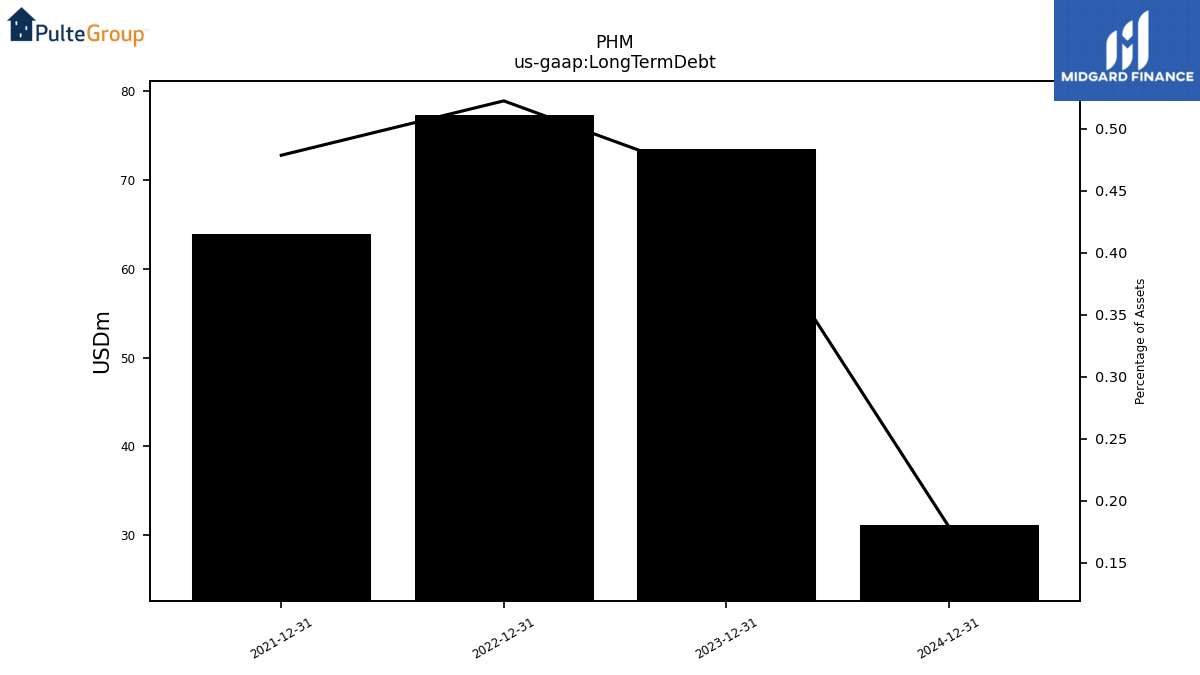
| Long Term Debt | 73.50 | NA | NA | NA | 77.30 | NA | NA | NA | 63.90 | NA | NA | NA | NA | NA | NA | NA | NA | NA | NA | NA | NA | NA | NA | NA | NA | NA | NA | NA | NA | NA | NA | NA | NA | NA | NA | NA | NA | NA | NA | NA | NA | NA | NA | NA | NA | NA | NA | NA | NA | NA | NA | NA | NA | NA | NA | NA | |
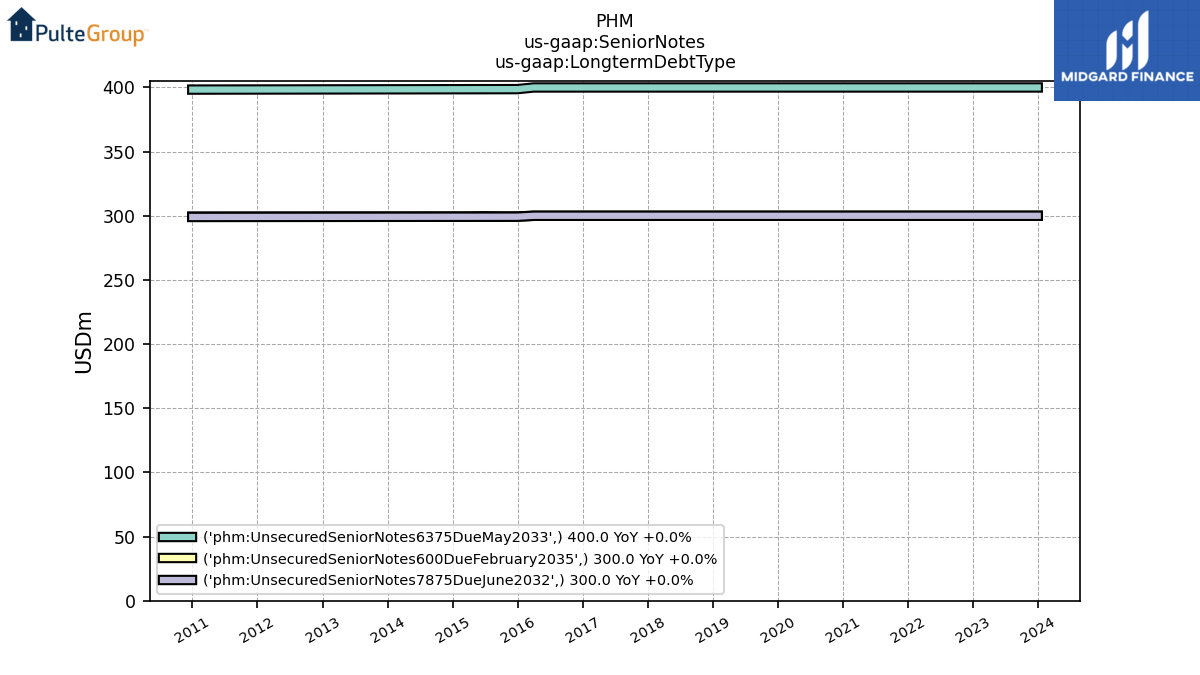
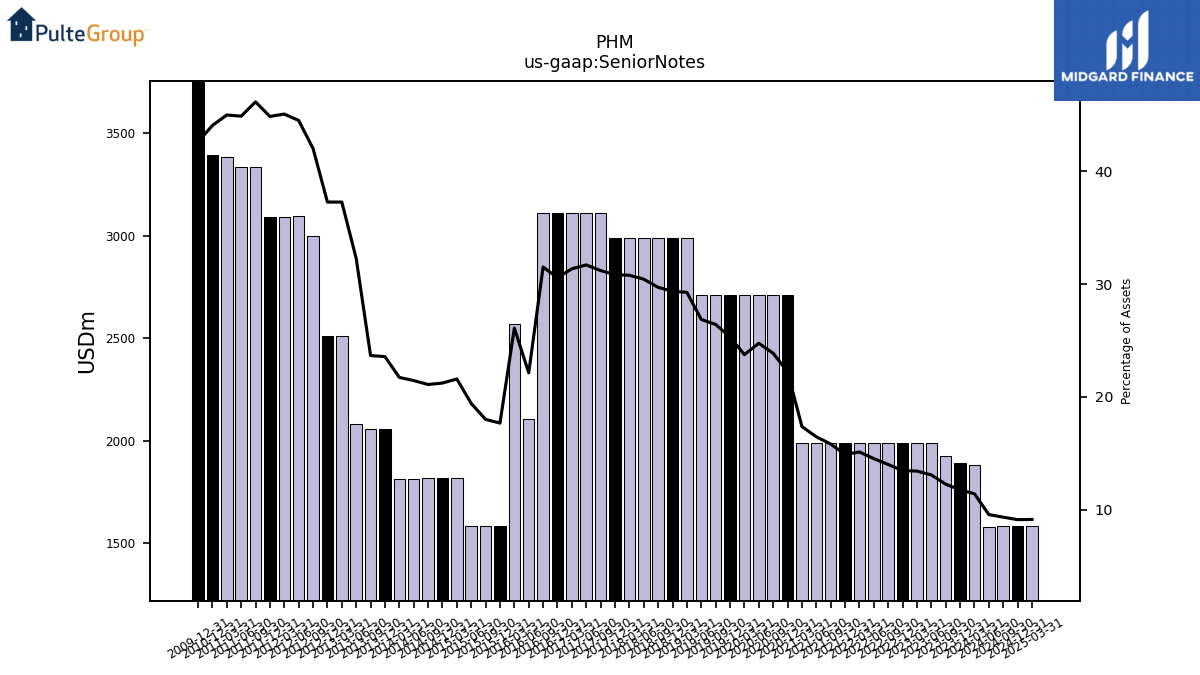
| Senior Notes | 1891.25 | 1926.54 | 1991.02 | 1990.66 | 1990.30 | 1989.94 | 1989.58 | 1989.22 | 1988.86 | 1988.50 | 1988.14 | 1987.78 | 2712.20 | 2712.07 | 2711.93 | 2711.80 | 2711.66 | 2711.52 | 2711.39 | 2986.70 | 2986.75 | 2986.80 | 2986.85 | 2986.89 | 2986.94 | 3109.98 | 3109.99 | 3110.00 | 3110.02 | 3110.07 | 2103.82 | 2568.55 | 1584.77 | 1584.10 | 1583.58 | 1820.07 | 1818.56 | 1817.05 | 1815.55 | 1814.04 | 2058.17 | 2056.66 | 2082.06 | 2511.73 | 2509.61 | 2999.84 | 3093.55 | 3090.95 | 3088.34 | 3335.36 | 3332.26 | 3380.98 | 3391.67 | NA | NA | NA | |
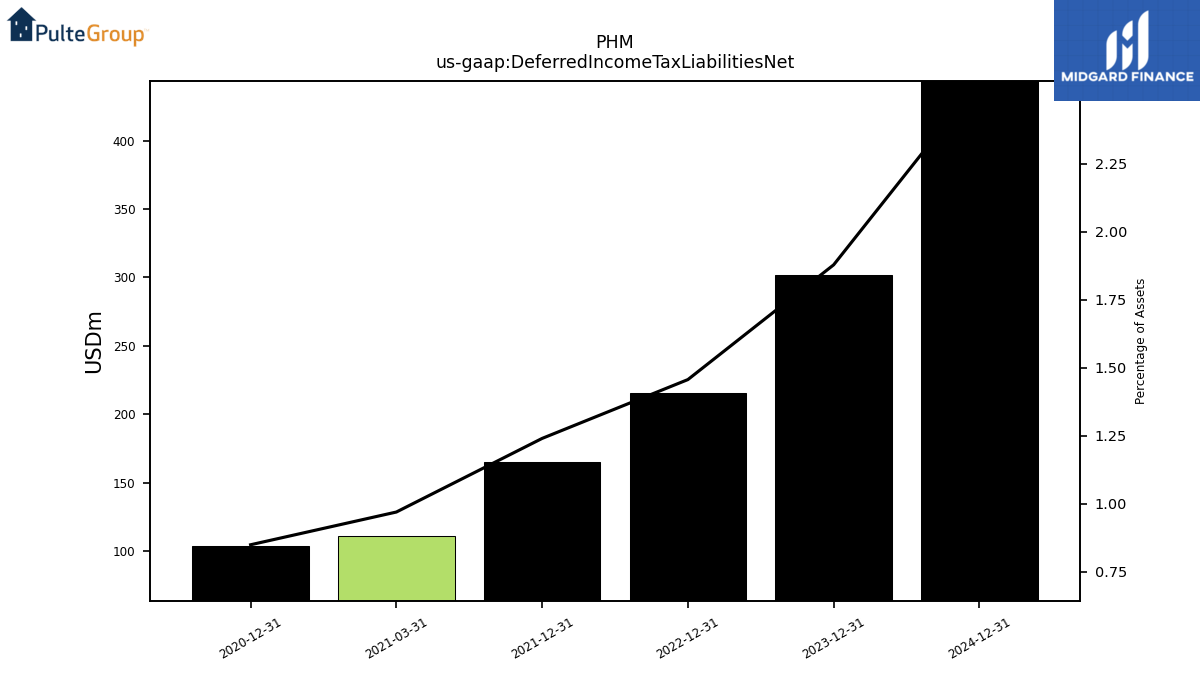
| Deferred Income Tax Liabilities Net | 302.15 | NA | NA | NA | 215.45 | NA | NA | NA | 165.52 | NA | NA | 110.88 | 103.55 | NA | NA | NA | NA | NA | NA | NA | NA | NA | NA | NA | NA | NA | NA | NA | NA | NA | NA | NA | NA | NA | NA | NA | NA | NA | NA | NA | NA | NA | NA | NA | NA | NA | NA | NA | NA | NA | NA | NA | NA | NA | NA | NA |
| 2023-12-31 | 2023-09-30 | 2023-06-30 | 2023-03-31 | 2022-12-31 | 2022-09-30 | 2022-06-30 | 2022-03-31 | 2021-12-31 | 2021-09-30 | 2021-06-30 | 2021-03-31 | 2020-12-31 | 2020-09-30 | 2020-06-30 | 2020-03-31 | 2019-12-31 | 2019-09-30 | 2019-06-30 | 2019-03-31 | 2018-12-31 | 2018-09-30 | 2018-06-30 | 2018-03-31 | 2017-12-31 | 2017-09-30 | 2017-06-30 | 2017-03-31 | 2016-12-31 | 2016-09-30 | 2016-06-30 | 2016-03-31 | 2015-12-31 | 2015-09-30 | 2015-06-30 | 2015-03-31 | 2014-12-31 | 2014-09-30 | 2014-06-30 | 2014-03-31 | 2013-12-31 | 2013-09-30 | 2013-06-30 | 2013-03-31 | 2012-12-31 | 2012-09-30 | 2012-06-30 | 2012-03-31 | 2011-12-31 | 2011-09-30 | 2011-06-30 | 2011-03-31 | 2010-12-31 | 2010-09-30 | 2010-06-30 | 2010-03-31 | ||
|---|---|---|---|---|---|---|---|---|---|---|---|---|---|---|---|---|---|---|---|---|---|---|---|---|---|---|---|---|---|---|---|---|---|---|---|---|---|---|---|---|---|---|---|---|---|---|---|---|---|---|---|---|---|---|---|---|---|
| Stockholders Equity | 10383.26 | 10012.50 | 9705.02 | 9263.81 | 8914.10 | 8164.00 | 7745.22 | 7413.26 | 7489.52 | 7141.75 | 6958.47 | 6685.27 | 6569.99 | 6240.02 | 5851.67 | 5530.39 | 5458.18 | 5181.59 | 5069.81 | 4933.44 | 4817.78 | 4728.88 | 4526.71 | 4274.66 | 4154.03 | 4345.09 | 4444.00 | 4660.15 | 4659.36 | 4672.03 | 4818.12 | 4773.53 | 4759.32 | 4571.60 | 4606.26 | 4741.99 | 4804.95 | 4710.41 | 4638.04 | 4664.06 | 4648.95 | 4491.69 | 2328.22 | 2275.51 | 2189.62 | 2122.05 | 1975.05 | 1928.83 | 1938.62 | 1923.47 | 2049.73 | 2100.14 | 2135.17 | 2296.42 | 3281.79 | 3196.55 | |
| Common Stock Value | 2.13 | NA | NA | NA | 2.26 | NA | NA | NA | 2.49 | NA | NA | NA | 2.67 | NA | NA | NA | 2.70 | NA | NA | NA | 2.77 | NA | NA | NA | 2.87 | NA | NA | NA | 3.19 | NA | NA | NA | 3.49 | NA | NA | NA | 3.69 | NA | NA | NA | 3.81 | NA | NA | NA | 3.87 | NA | NA | NA | 3.83 | NA | NA | NA | 3.82 | NA | NA | NA | |
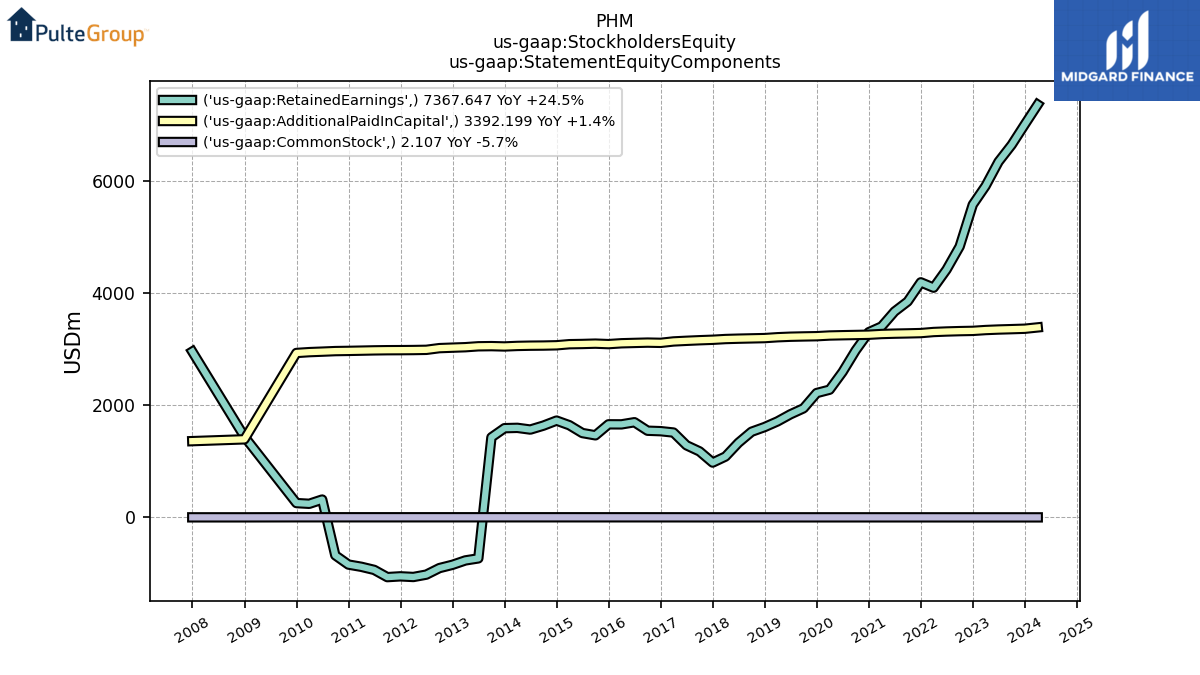
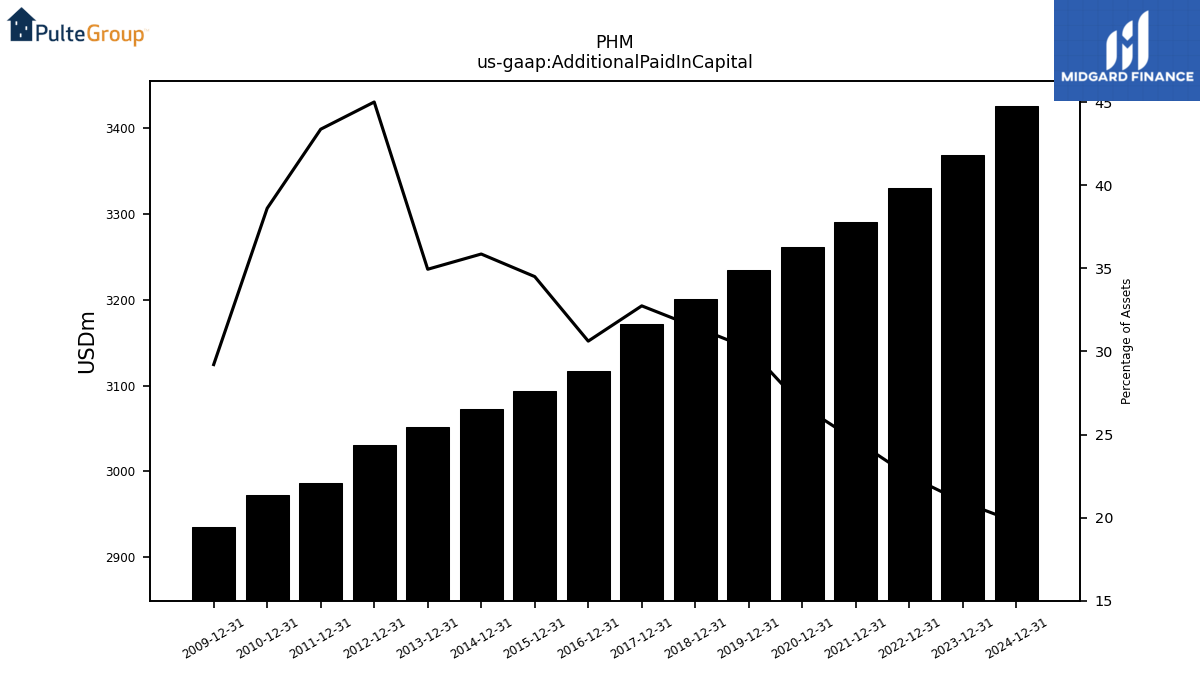
| Additional Paid In Capital | 3368.41 | NA | NA | NA | 3330.14 | NA | NA | NA | 3290.79 | NA | NA | NA | 3261.41 | NA | NA | NA | 3235.15 | NA | NA | NA | 3201.43 | NA | NA | NA | 3171.54 | NA | NA | NA | 3116.49 | NA | NA | NA | 3093.80 | NA | NA | NA | 3073.00 | NA | NA | NA | 3052.02 | NA | NA | NA | 3030.89 | NA | NA | NA | 2986.24 | NA | NA | NA | 2972.92 | NA | NA | NA | |
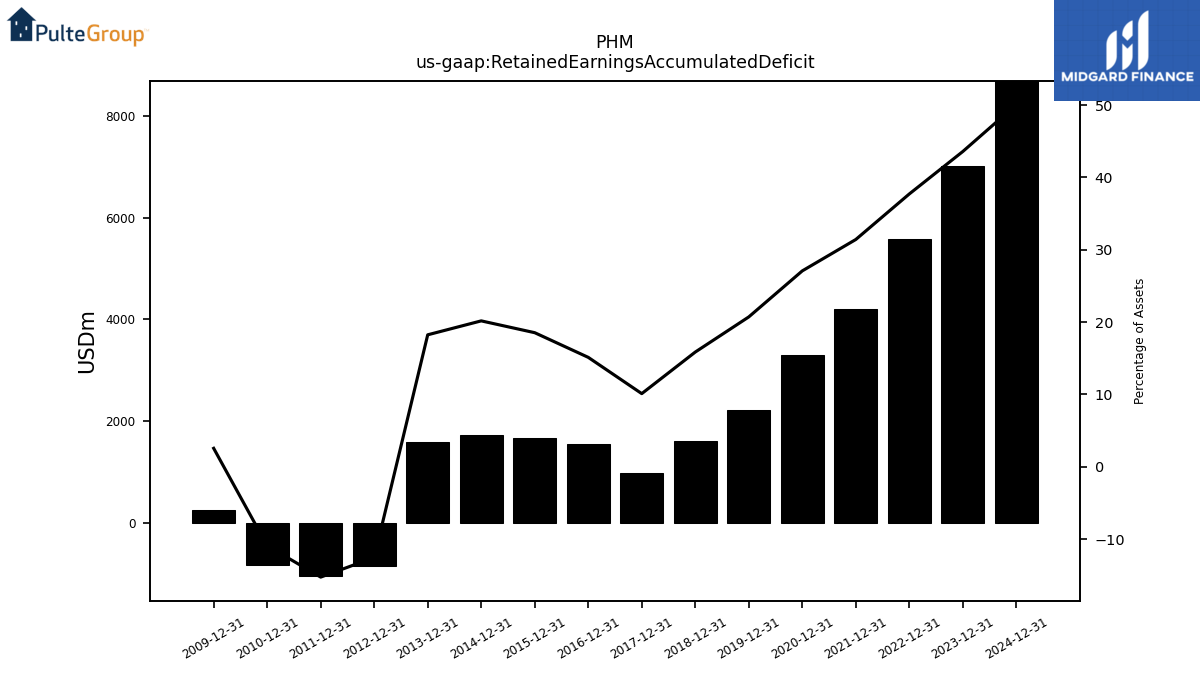
| Retained Earnings Accumulated Deficit | 7012.72 | NA | NA | NA | 5581.70 | NA | NA | NA | 4196.28 | NA | NA | NA | 3306.06 | NA | NA | NA | 2220.57 | NA | NA | NA | 1613.93 | NA | NA | NA | 980.06 | NA | NA | NA | 1540.21 | NA | NA | NA | 1662.64 | NA | NA | NA | 1728.95 | NA | NA | NA | 1593.92 | NA | NA | NA | -844.15 | NA | NA | NA | -1050.14 | NA | NA | NA | -840.05 | NA | NA | NA | |
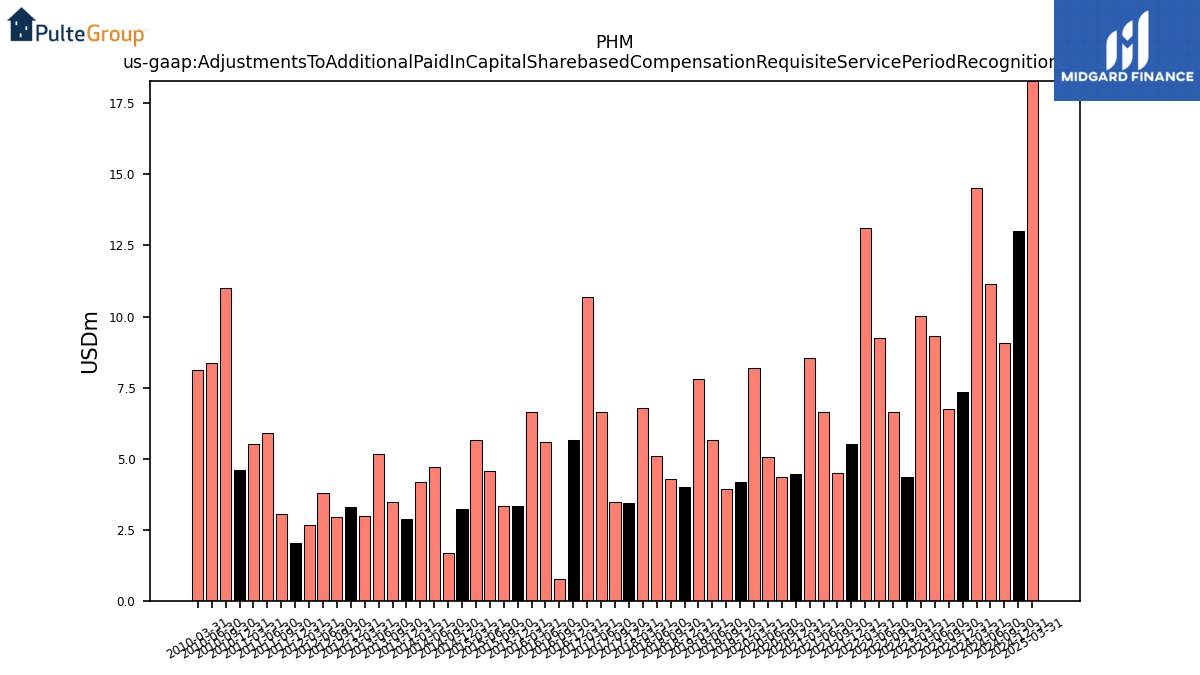
| Adjustments To Additional Paid In Capital Sharebased Compensation Requisite Service Period Recognition Value | 7.35 | 6.74 | 9.31 | 10.03 | 4.35 | 6.64 | 9.24 | 13.10 | 5.50 | 4.51 | 6.62 | 8.55 | 4.47 | 4.36 | 5.04 | 8.19 | 4.17 | 3.92 | 5.64 | 7.81 | 3.99 | 4.27 | 5.11 | 6.78 | 3.42 | 3.46 | 6.64 | 10.68 | 5.65 | 0.77 | 5.57 | 6.63 | 3.33 | 3.32 | 4.57 | 5.66 | 3.23 | 1.69 | 4.70 | 4.19 | 2.89 | 3.46 | 5.15 | 2.98 | 3.31 | 2.93 | 3.79 | 2.67 | 2.02 | 3.04 | 5.89 | 5.51 | 4.60 | 10.99 | 8.38 | 8.11 |
| 2023-12-31 | 2023-09-30 | 2023-06-30 | 2023-03-31 | 2022-12-31 | 2022-09-30 | 2022-06-30 | 2022-03-31 | 2021-12-31 | 2021-09-30 | 2021-06-30 | 2021-03-31 | 2020-12-31 | 2020-09-30 | 2020-06-30 | 2020-03-31 | 2019-12-31 | 2019-09-30 | 2019-06-30 | 2019-03-31 | 2018-12-31 | 2018-09-30 | 2018-06-30 | 2018-03-31 | 2017-12-31 | 2017-09-30 | 2017-06-30 | 2017-03-31 | 2016-12-31 | 2016-09-30 | 2016-06-30 | 2016-03-31 | 2015-12-31 | 2015-09-30 | 2015-06-30 | 2015-03-31 | 2014-12-31 | 2014-09-30 | 2014-06-30 | 2014-03-31 | 2013-12-31 | 2013-09-30 | 2013-06-30 | 2013-03-31 | 2012-12-31 | 2012-09-30 | 2012-06-30 | 2012-03-31 | 2011-12-31 | 2011-09-30 | 2011-06-30 | 2011-03-31 | 2010-12-31 | 2010-09-30 | 2010-06-30 | 2010-03-31 | ||
|---|---|---|---|---|---|---|---|---|---|---|---|---|---|---|---|---|---|---|---|---|---|---|---|---|---|---|---|---|---|---|---|---|---|---|---|---|---|---|---|---|---|---|---|---|---|---|---|---|---|---|---|---|---|---|---|---|---|
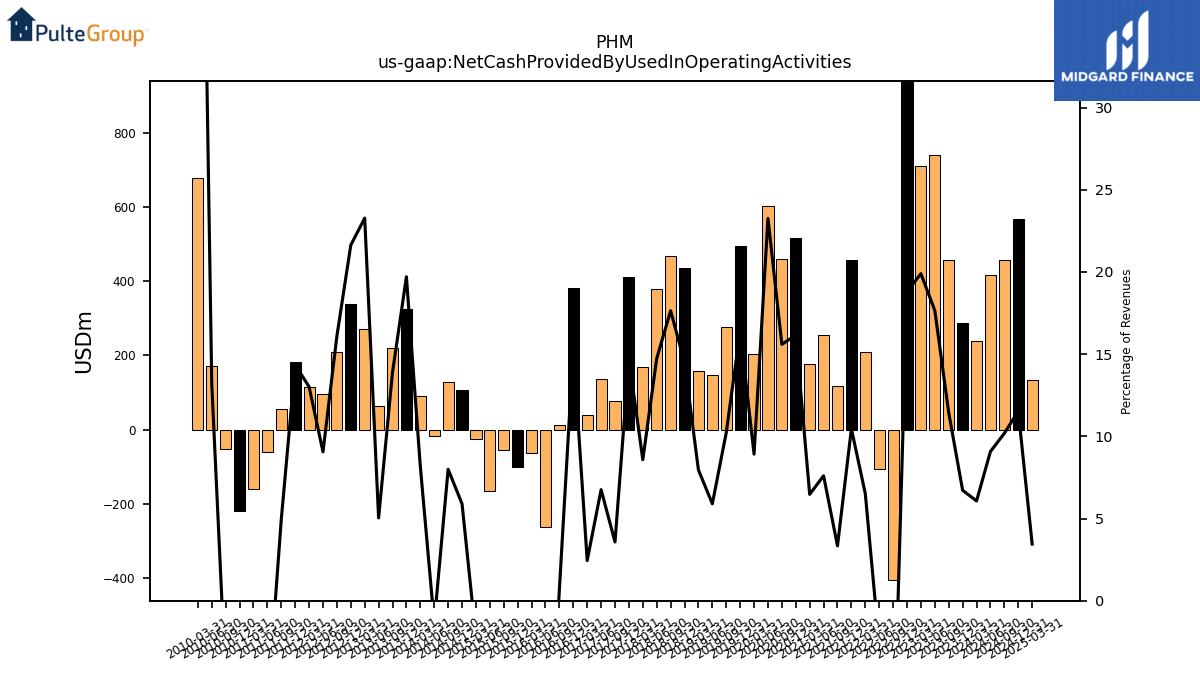
| Net Cash Provided By Used In Operating Activities | 288.42 | 457.76 | 739.22 | 711.37 | 972.39 | -406.27 | -105.32 | 207.67 | 455.80 | 116.16 | 255.32 | 176.75 | 515.72 | 460.75 | 603.26 | 204.62 | 494.76 | 277.07 | 146.80 | 158.91 | 434.76 | 467.40 | 378.57 | 169.01 | 410.60 | 76.15 | 136.52 | 39.80 | 380.49 | 13.10 | -261.25 | -64.06 | -101.32 | -55.71 | -165.71 | -25.40 | 107.41 | 127.55 | -17.11 | 91.40 | 326.19 | 219.88 | 64.44 | 270.62 | 338.91 | 209.69 | 96.85 | 114.69 | 180.95 | 56.47 | -61.18 | -159.02 | -218.33 | -51.48 | 172.50 | 677.57 | |
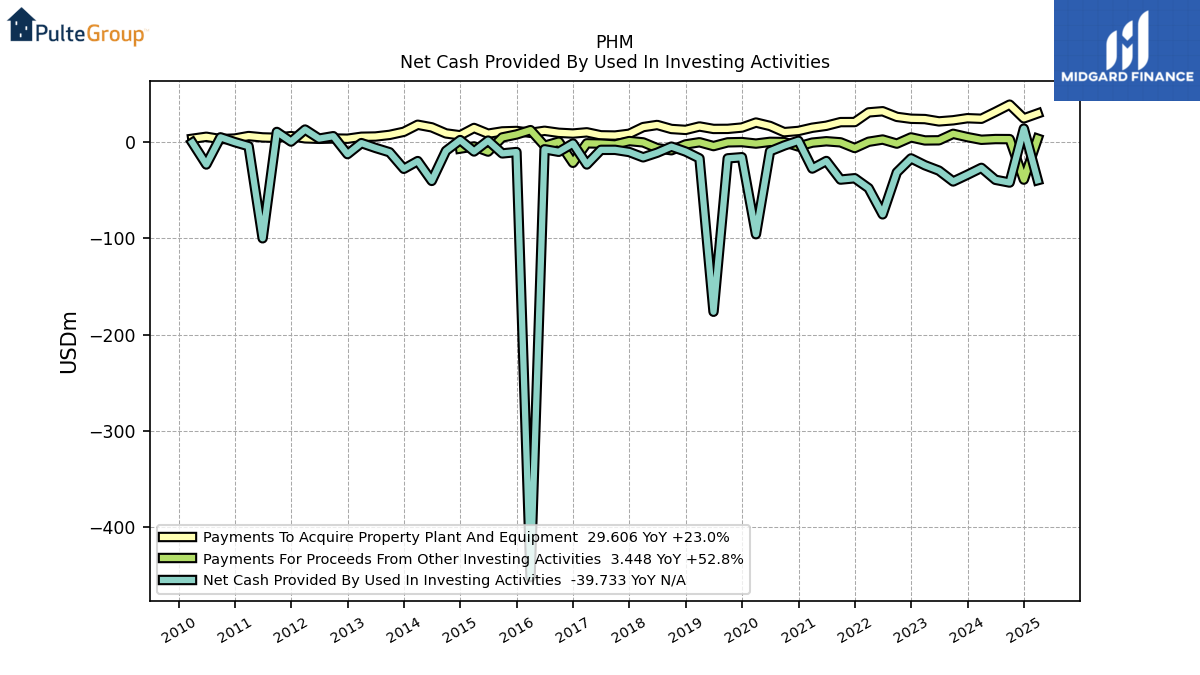
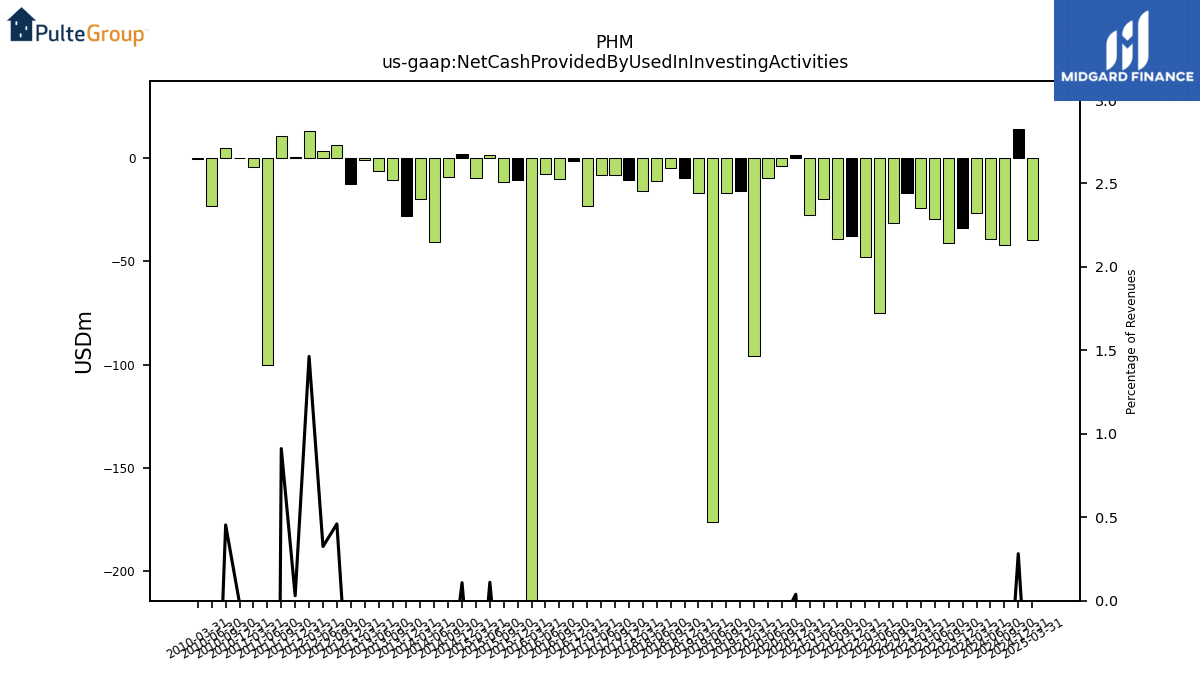
| Net Cash Provided By Used In Investing Activities | -34.06 | -41.03 | -29.78 | -24.21 | -17.05 | -31.55 | -75.17 | -47.97 | -37.66 | -39.08 | -19.76 | -27.62 | 1.23 | -3.73 | -9.65 | -95.80 | -15.84 | -17.02 | -176.30 | -17.07 | -9.96 | -4.84 | -11.17 | -15.98 | -10.47 | -8.19 | -8.21 | -23.38 | -1.61 | -10.22 | -7.61 | -451.75 | -10.47 | -11.91 | 1.42 | -9.88 | 1.97 | -9.28 | -40.47 | -19.85 | -27.89 | -10.72 | -6.19 | -1.19 | -12.66 | 6.00 | 3.48 | 12.90 | 0.38 | 10.41 | -100.04 | -4.38 | -0.17 | 4.80 | -23.43 | -0.66 | |
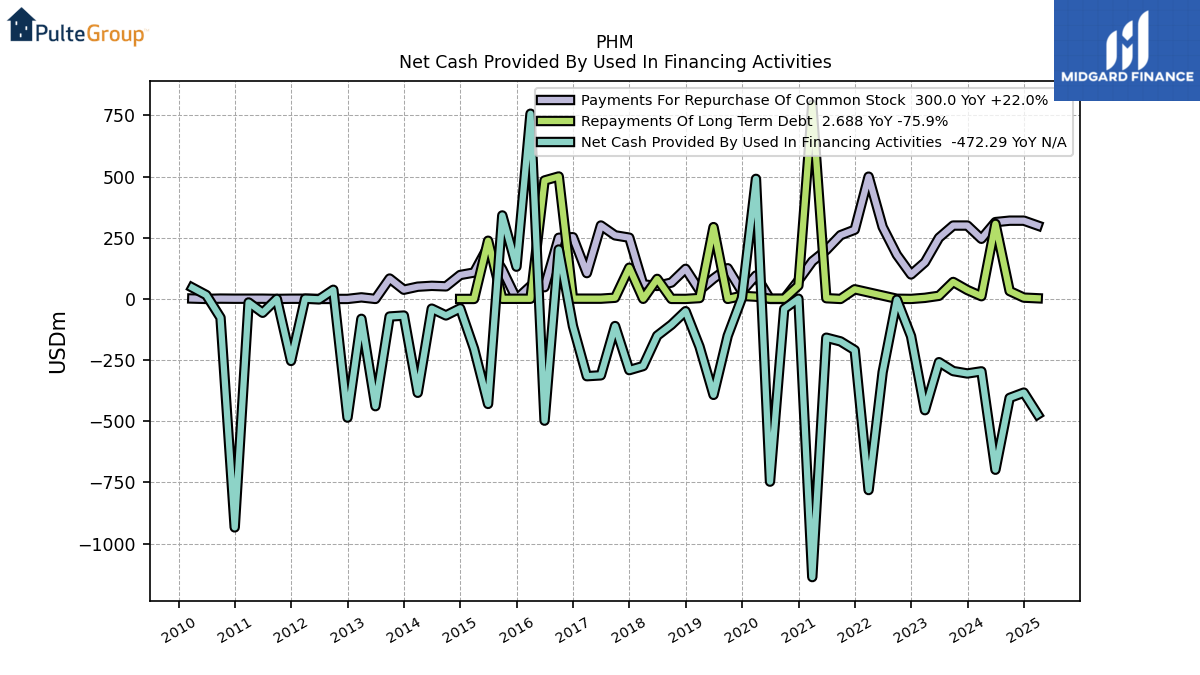
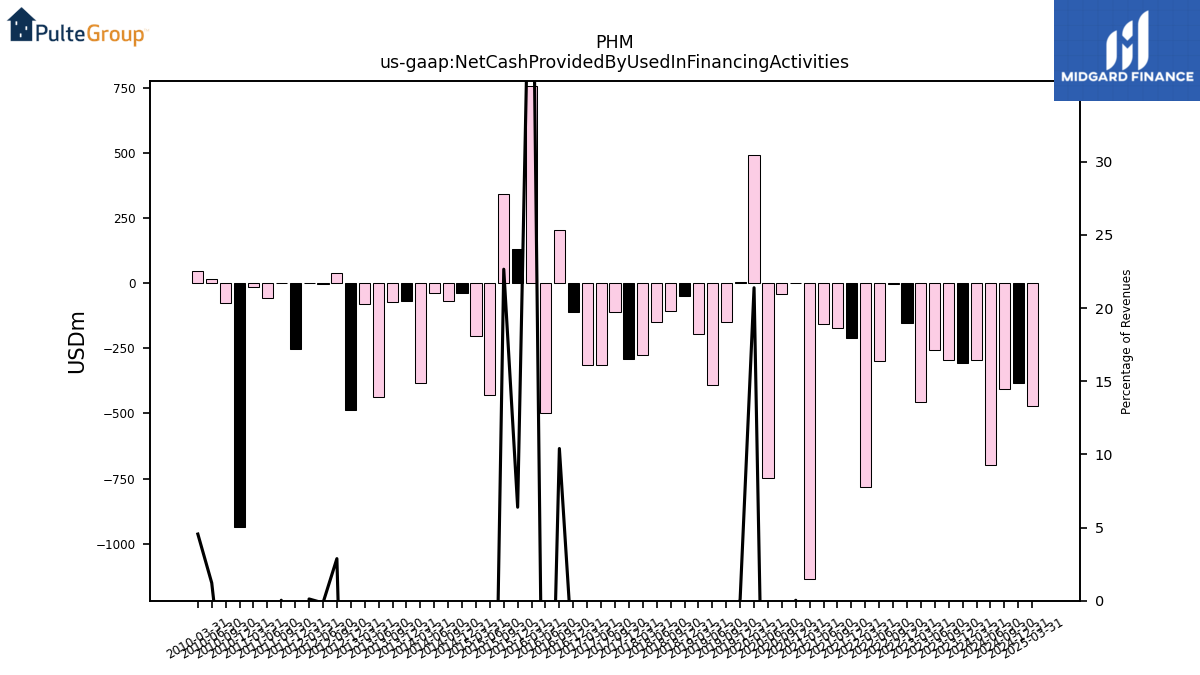
| Net Cash Provided By Used In Financing Activities | -304.74 | -294.94 | -258.51 | -454.85 | -152.18 | -2.89 | -299.27 | -781.39 | -209.22 | -173.54 | -158.49 | -1137.31 | 1.08 | -40.61 | -747.06 | 490.98 | 3.88 | -150.68 | -392.18 | -194.59 | -50.12 | -105.46 | -150.27 | -274.42 | -291.05 | -110.72 | -312.32 | -315.81 | -111.11 | 202.14 | -497.64 | 757.35 | 131.80 | 341.42 | -429.28 | -203.65 | -38.34 | -67.39 | -39.65 | -383.72 | -67.97 | -71.84 | -438.51 | -81.27 | -485.13 | 37.49 | -1.58 | 1.07 | -253.54 | 0.41 | -56.51 | -14.28 | -934.14 | -76.67 | 15.90 | 46.51 |
| 2023-12-31 | 2023-09-30 | 2023-06-30 | 2023-03-31 | 2022-12-31 | 2022-09-30 | 2022-06-30 | 2022-03-31 | 2021-12-31 | 2021-09-30 | 2021-06-30 | 2021-03-31 | 2020-12-31 | 2020-09-30 | 2020-06-30 | 2020-03-31 | 2019-12-31 | 2019-09-30 | 2019-06-30 | 2019-03-31 | 2018-12-31 | 2018-09-30 | 2018-06-30 | 2018-03-31 | 2017-12-31 | 2017-09-30 | 2017-06-30 | 2017-03-31 | 2016-12-31 | 2016-09-30 | 2016-06-30 | 2016-03-31 | 2015-12-31 | 2015-09-30 | 2015-06-30 | 2015-03-31 | 2014-12-31 | 2014-09-30 | 2014-06-30 | 2014-03-31 | 2013-12-31 | 2013-09-30 | 2013-06-30 | 2013-03-31 | 2012-12-31 | 2012-09-30 | 2012-06-30 | 2012-03-31 | 2011-12-31 | 2011-09-30 | 2011-06-30 | 2011-03-31 | 2010-12-31 | 2010-09-30 | 2010-06-30 | 2010-03-31 | ||
|---|---|---|---|---|---|---|---|---|---|---|---|---|---|---|---|---|---|---|---|---|---|---|---|---|---|---|---|---|---|---|---|---|---|---|---|---|---|---|---|---|---|---|---|---|---|---|---|---|---|---|---|---|---|---|---|---|---|
| Net Cash Provided By Used In Operating Activities | 288.42 | 457.76 | 739.22 | 711.37 | 972.39 | -406.27 | -105.32 | 207.67 | 455.80 | 116.16 | 255.32 | 176.75 | 515.72 | 460.75 | 603.26 | 204.62 | 494.76 | 277.07 | 146.80 | 158.91 | 434.76 | 467.40 | 378.57 | 169.01 | 410.60 | 76.15 | 136.52 | 39.80 | 380.49 | 13.10 | -261.25 | -64.06 | -101.32 | -55.71 | -165.71 | -25.40 | 107.41 | 127.55 | -17.11 | 91.40 | 326.19 | 219.88 | 64.44 | 270.62 | 338.91 | 209.69 | 96.85 | 114.69 | 180.95 | 56.47 | -61.18 | -159.02 | -218.33 | -51.48 | 172.50 | 677.57 | |
| Net Income Loss | 710.99 | 638.77 | 720.35 | 532.26 | 882.23 | 627.93 | 652.43 | 454.72 | 663.26 | 475.55 | 503.40 | 304.11 | 438.11 | 416.40 | 348.62 | 203.71 | 335.80 | 273.10 | 241.04 | 166.76 | 237.65 | 289.54 | 324.09 | 170.75 | 77.42 | 177.54 | 100.75 | 91.52 | 273.17 | 128.47 | 117.76 | 83.30 | 228.03 | 107.77 | 103.32 | 54.97 | 217.09 | 140.54 | 41.88 | 74.82 | 220.05 | 2281.88 | 36.42 | 81.76 | 58.74 | 116.63 | 42.44 | -11.67 | 13.82 | -129.30 | -55.38 | -39.53 | -165.43 | -995.12 | 76.30 | -12.49 | |
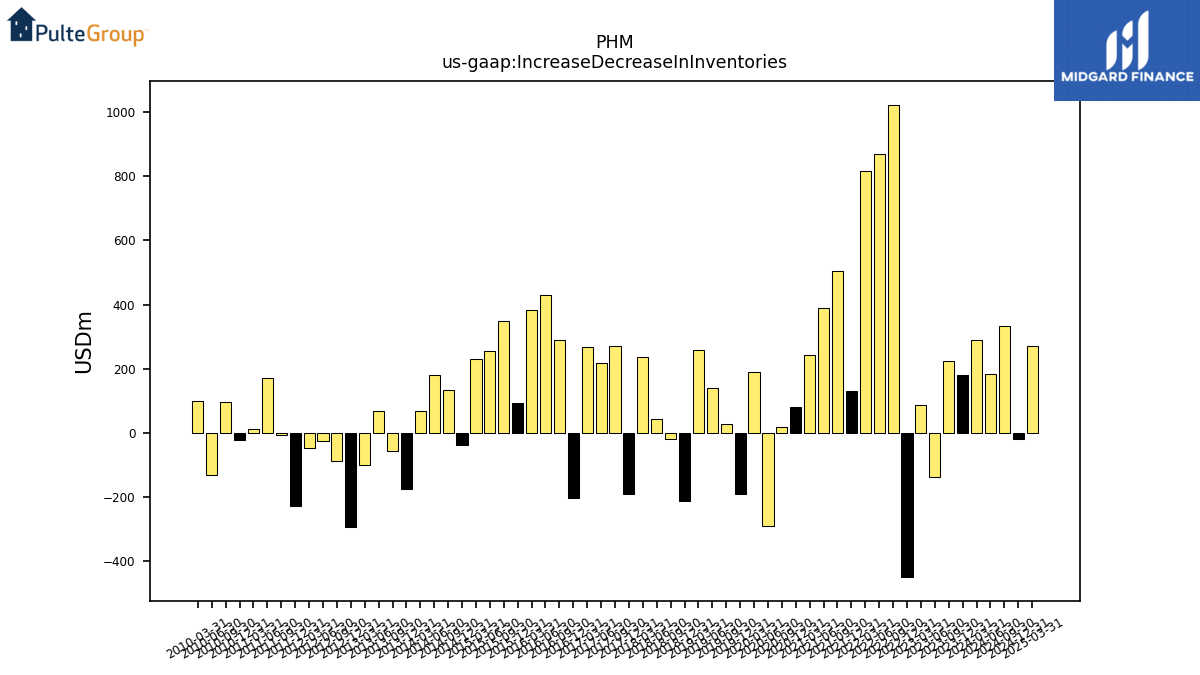
| Increase Decrease In Inventories | 180.64 | 225.38 | -137.41 | 85.41 | -449.45 | 1023.01 | 868.36 | 814.77 | 129.05 | 504.70 | 388.70 | 243.95 | 81.27 | 17.51 | -291.13 | 189.36 | -189.44 | 27.66 | 139.66 | 259.87 | -213.37 | -17.63 | 44.19 | 237.17 | -188.98 | 271.61 | 219.38 | 267.01 | -203.08 | 289.76 | 428.51 | 381.91 | 92.49 | 349.60 | 254.68 | 230.99 | -37.98 | 134.71 | 181.05 | 68.81 | -176.02 | -56.12 | 66.84 | -99.76 | -294.25 | -88.75 | -26.25 | -45.97 | -229.12 | -6.73 | 169.72 | 11.24 | -22.44 | 96.07 | -130.90 | 100.45 | |
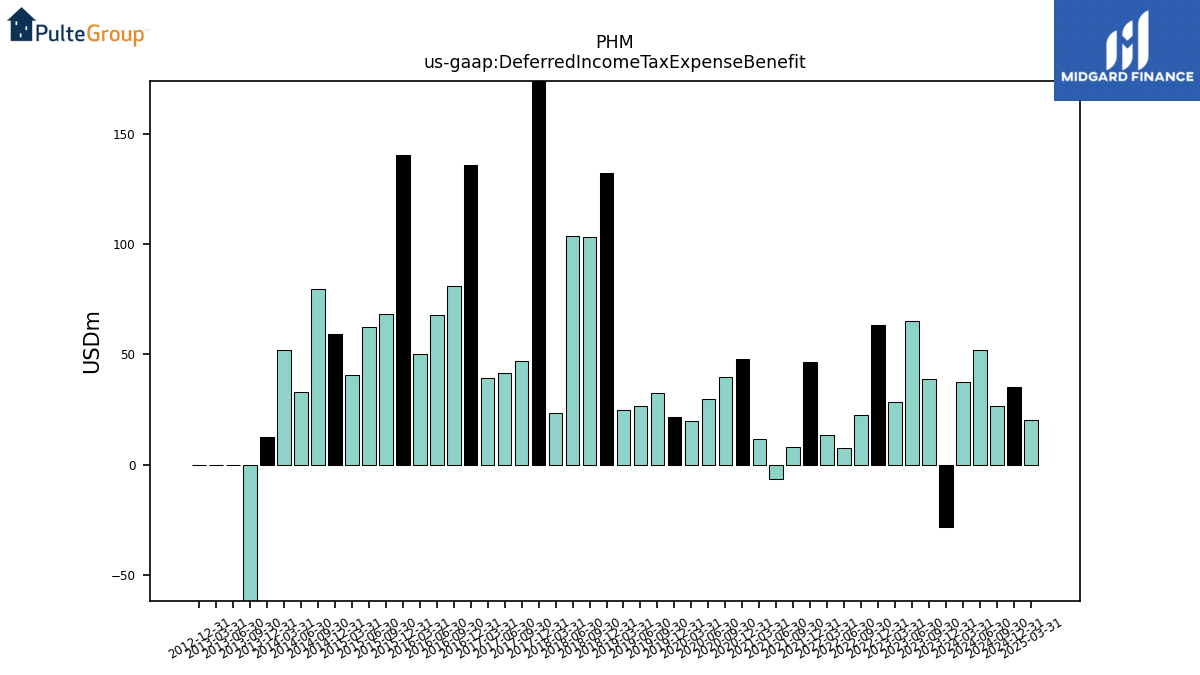
| Deferred Income Tax Expense Benefit | -28.12 | 39.00 | 65.24 | 28.15 | 63.10 | 22.66 | 7.42 | 13.41 | 46.33 | 8.06 | -6.61 | 11.39 | 48.11 | 39.83 | 29.71 | 19.95 | 21.69 | 32.29 | 26.77 | 24.69 | 132.44 | 103.34 | 103.51 | 23.48 | 294.45 | 47.02 | 41.62 | 39.23 | 135.81 | 81.19 | 67.76 | 50.03 | 140.34 | 68.31 | 62.25 | 40.80 | 59.31 | 79.43 | 32.94 | 52.09 | 12.33 | -2108.76 | 0.00 | 0.00 | 0.00 | NA | NA | NA | NA | NA | NA | NA | NA | NA | NA | NA | |
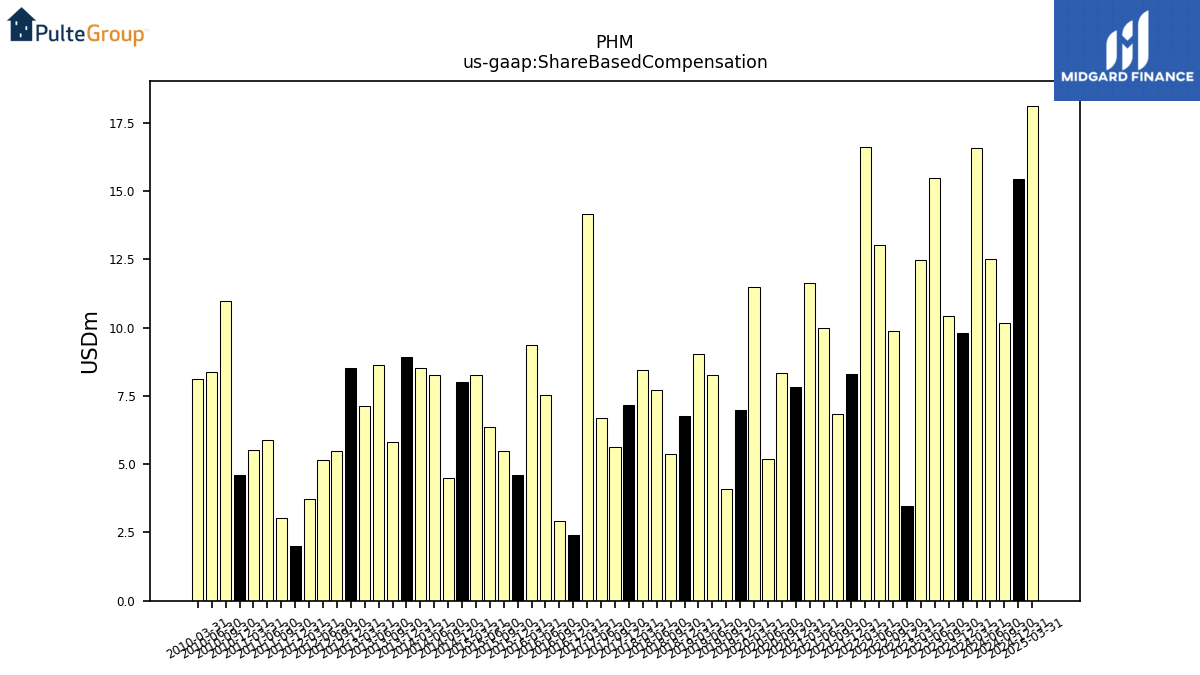
| Share Based Compensation | 9.80 | 10.44 | 15.47 | 12.49 | 3.47 | 9.88 | 13.03 | 16.61 | 8.31 | 6.84 | 9.97 | 11.63 | 7.83 | 8.33 | 5.20 | 11.48 | 6.98 | 4.08 | 8.29 | 9.02 | 6.77 | 5.36 | 7.71 | 8.45 | 7.18 | 5.63 | 6.71 | 14.16 | 2.42 | 2.91 | 7.55 | 9.36 | 4.61 | 5.49 | 6.37 | 8.28 | 8.00 | 4.49 | 8.28 | 8.52 | 8.91 | 5.80 | 8.62 | 7.14 | 8.53 | 5.48 | 5.17 | 3.72 | 2.02 | 3.04 | 5.89 | 5.51 | 4.60 | 10.99 | 8.38 | 8.11 |
| 2023-12-31 | 2023-09-30 | 2023-06-30 | 2023-03-31 | 2022-12-31 | 2022-09-30 | 2022-06-30 | 2022-03-31 | 2021-12-31 | 2021-09-30 | 2021-06-30 | 2021-03-31 | 2020-12-31 | 2020-09-30 | 2020-06-30 | 2020-03-31 | 2019-12-31 | 2019-09-30 | 2019-06-30 | 2019-03-31 | 2018-12-31 | 2018-09-30 | 2018-06-30 | 2018-03-31 | 2017-12-31 | 2017-09-30 | 2017-06-30 | 2017-03-31 | 2016-12-31 | 2016-09-30 | 2016-06-30 | 2016-03-31 | 2015-12-31 | 2015-09-30 | 2015-06-30 | 2015-03-31 | 2014-12-31 | 2014-09-30 | 2014-06-30 | 2014-03-31 | 2013-12-31 | 2013-09-30 | 2013-06-30 | 2013-03-31 | 2012-12-31 | 2012-09-30 | 2012-06-30 | 2012-03-31 | 2011-12-31 | 2011-09-30 | 2011-06-30 | 2011-03-31 | 2010-12-31 | 2010-09-30 | 2010-06-30 | 2010-03-31 | ||
|---|---|---|---|---|---|---|---|---|---|---|---|---|---|---|---|---|---|---|---|---|---|---|---|---|---|---|---|---|---|---|---|---|---|---|---|---|---|---|---|---|---|---|---|---|---|---|---|---|---|---|---|---|---|---|---|---|---|
| Net Cash Provided By Used In Investing Activities | -34.06 | -41.03 | -29.78 | -24.21 | -17.05 | -31.55 | -75.17 | -47.97 | -37.66 | -39.08 | -19.76 | -27.62 | 1.23 | -3.73 | -9.65 | -95.80 | -15.84 | -17.02 | -176.30 | -17.07 | -9.96 | -4.84 | -11.17 | -15.98 | -10.47 | -8.19 | -8.21 | -23.38 | -1.61 | -10.22 | -7.61 | -451.75 | -10.47 | -11.91 | 1.42 | -9.88 | 1.97 | -9.28 | -40.47 | -19.85 | -27.89 | -10.72 | -6.19 | -1.19 | -12.66 | 6.00 | 3.48 | 12.90 | 0.38 | 10.41 | -100.04 | -4.38 | -0.17 | 4.80 | -23.43 | -0.66 | |
| Payments To Acquire Property Plant And Equipment | 24.64 | 22.48 | 21.33 | 23.74 | 24.08 | 26.03 | 31.87 | 30.69 | 20.65 | 20.59 | 16.80 | 14.75 | 11.43 | 10.18 | 16.61 | 20.14 | 14.96 | 13.59 | 13.51 | 16.07 | 12.51 | 13.47 | 17.63 | 15.43 | 8.50 | 6.66 | 6.90 | 10.00 | 8.74 | 9.51 | 11.58 | 9.46 | 11.39 | 10.93 | 8.60 | 14.52 | 6.90 | 8.87 | 15.16 | 17.86 | 10.54 | 7.34 | 5.64 | 5.38 | 3.35 | 3.60 | 3.24 | 3.76 | 6.08 | 4.31 | 4.72 | 6.13 | 3.53 | 2.95 | 5.37 | 3.33 |
| 2023-12-31 | 2023-09-30 | 2023-06-30 | 2023-03-31 | 2022-12-31 | 2022-09-30 | 2022-06-30 | 2022-03-31 | 2021-12-31 | 2021-09-30 | 2021-06-30 | 2021-03-31 | 2020-12-31 | 2020-09-30 | 2020-06-30 | 2020-03-31 | 2019-12-31 | 2019-09-30 | 2019-06-30 | 2019-03-31 | 2018-12-31 | 2018-09-30 | 2018-06-30 | 2018-03-31 | 2017-12-31 | 2017-09-30 | 2017-06-30 | 2017-03-31 | 2016-12-31 | 2016-09-30 | 2016-06-30 | 2016-03-31 | 2015-12-31 | 2015-09-30 | 2015-06-30 | 2015-03-31 | 2014-12-31 | 2014-09-30 | 2014-06-30 | 2014-03-31 | 2013-12-31 | 2013-09-30 | 2013-06-30 | 2013-03-31 | 2012-12-31 | 2012-09-30 | 2012-06-30 | 2012-03-31 | 2011-12-31 | 2011-09-30 | 2011-06-30 | 2011-03-31 | 2010-12-31 | 2010-09-30 | 2010-06-30 | 2010-03-31 | ||
|---|---|---|---|---|---|---|---|---|---|---|---|---|---|---|---|---|---|---|---|---|---|---|---|---|---|---|---|---|---|---|---|---|---|---|---|---|---|---|---|---|---|---|---|---|---|---|---|---|---|---|---|---|---|---|---|---|---|
| Net Cash Provided By Used In Financing Activities | -304.74 | -294.94 | -258.51 | -454.85 | -152.18 | -2.89 | -299.27 | -781.39 | -209.22 | -173.54 | -158.49 | -1137.31 | 1.08 | -40.61 | -747.06 | 490.98 | 3.88 | -150.68 | -392.18 | -194.59 | -50.12 | -105.46 | -150.27 | -274.42 | -291.05 | -110.72 | -312.32 | -315.81 | -111.11 | 202.14 | -497.64 | 757.35 | 131.80 | 341.42 | -429.28 | -203.65 | -38.34 | -67.39 | -39.65 | -383.72 | -67.97 | -71.84 | -438.51 | -81.27 | -485.13 | 37.49 | -1.58 | 1.07 | -253.54 | 0.41 | -56.51 | -14.28 | -934.14 | -76.67 | 15.90 | 46.51 | |
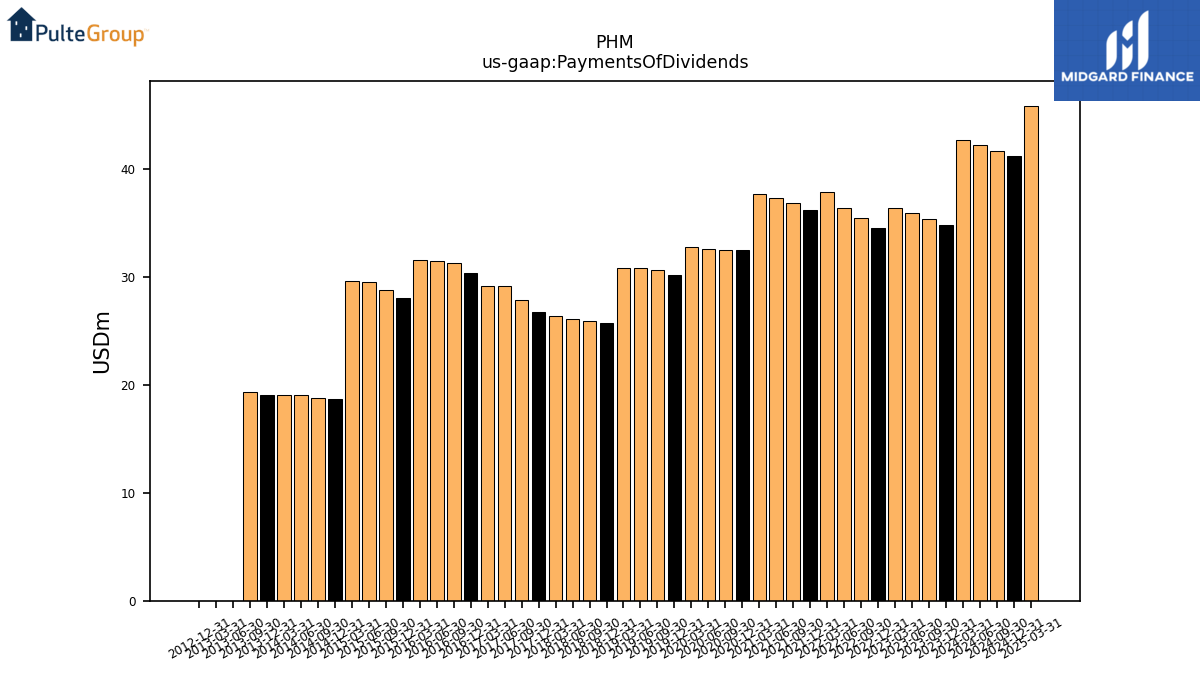
| Payments Of Dividends | 34.78 | 35.36 | 35.94 | 36.38 | 34.52 | 35.40 | 36.40 | 37.80 | 36.14 | 36.79 | 37.30 | 37.61 | 32.42 | 32.42 | 32.59 | 32.74 | 30.11 | 30.61 | 30.82 | 30.80 | 25.74 | 25.90 | 26.04 | 26.35 | 26.73 | 27.80 | 29.11 | 29.10 | 30.37 | 31.28 | 31.45 | 31.57 | 28.06 | 28.77 | 29.51 | 29.62 | 18.70 | 18.79 | 19.09 | 19.07 | 19.07 | 19.32 | 0.00 | 0.00 | 0.00 | NA | NA | NA | NA | NA | NA | NA | NA | NA | NA | NA | |
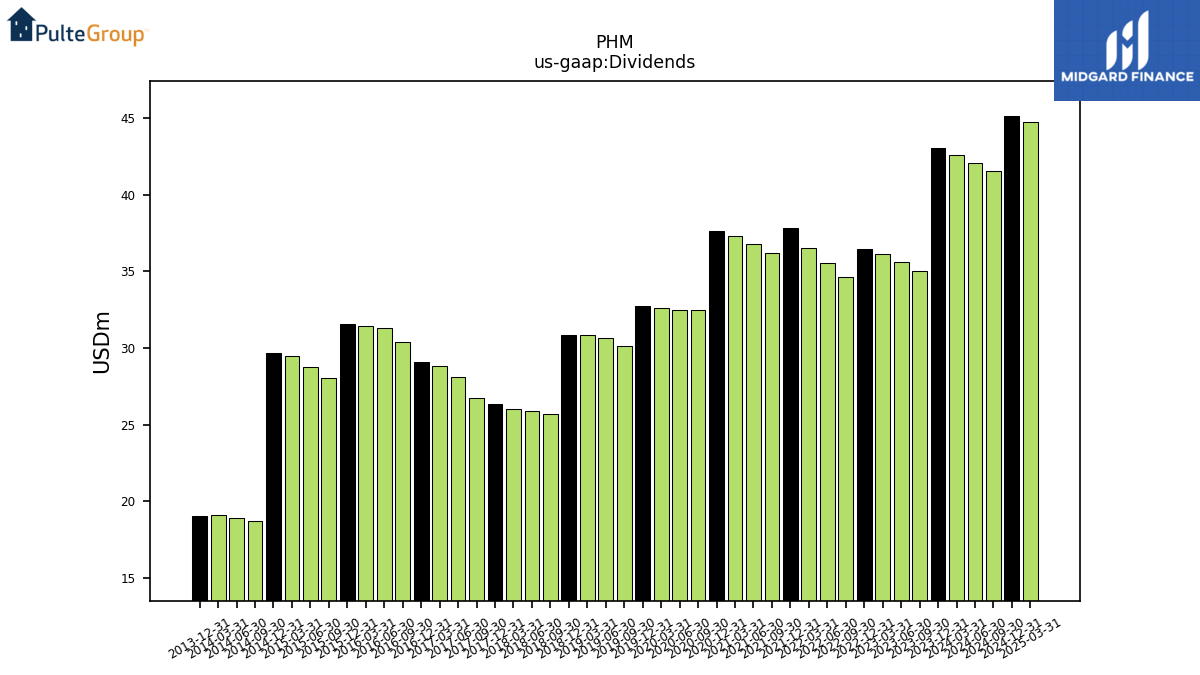
| Dividends | 43.01 | 35.02 | 35.63 | 36.14 | 36.48 | 34.62 | 35.51 | 36.51 | 37.83 | 36.17 | 36.81 | 37.33 | 37.64 | 32.45 | 32.45 | 32.61 | 32.76 | 30.13 | 30.63 | 30.83 | 30.82 | 25.71 | 25.91 | 26.05 | 26.36 | 26.74 | 28.10 | 28.84 | 29.11 | 30.38 | 31.29 | 31.46 | 31.58 | 28.07 | 28.78 | 29.45 | 29.68 | 18.71 | 18.89 | 19.09 | 19.07 | NA | NA | NA | NA | NA | NA | NA | NA | NA | NA | NA | NA | NA | NA | NA | |
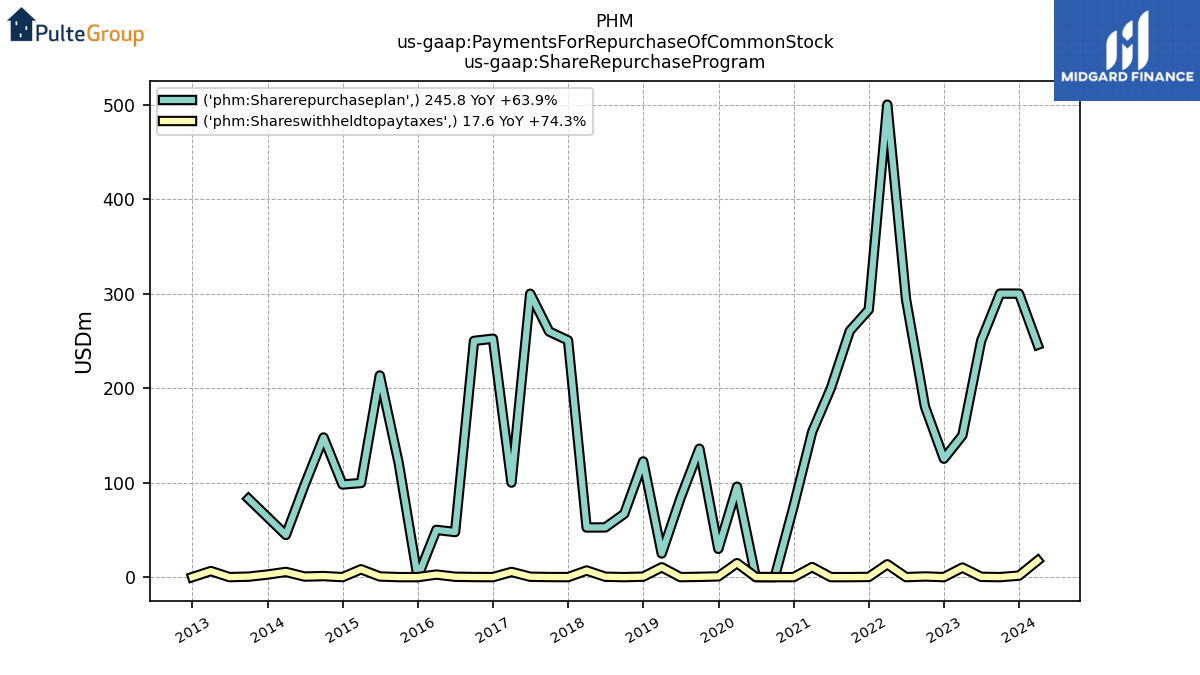
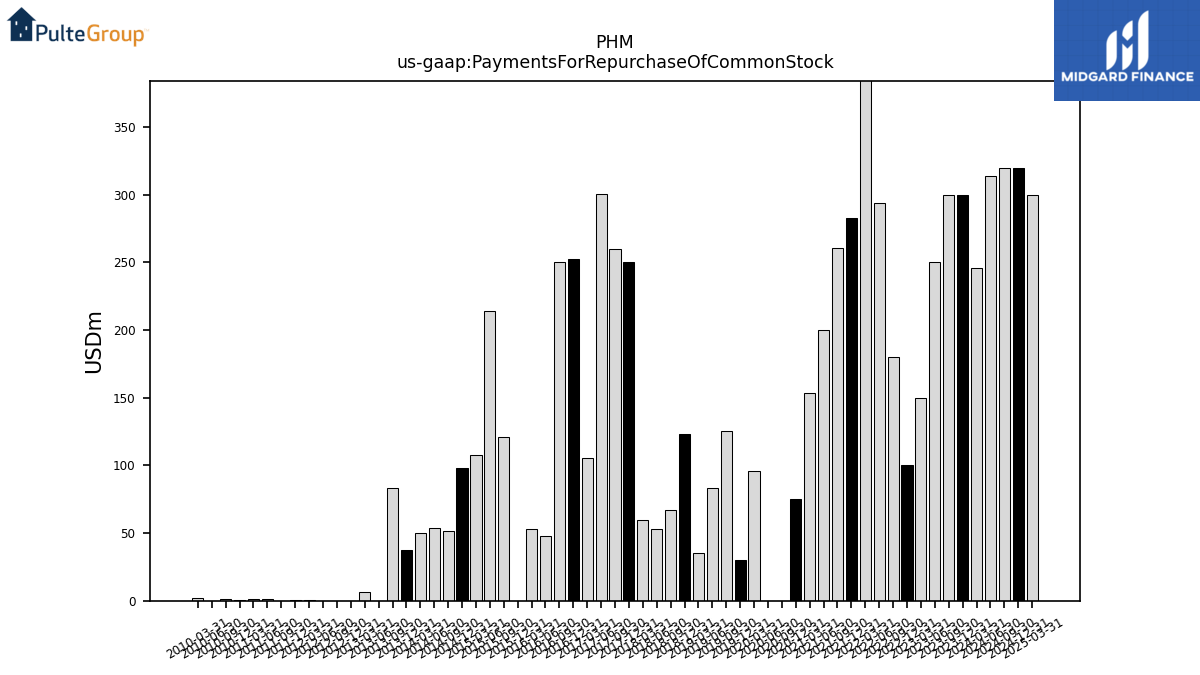
| Payments For Repurchase Of Common Stock | 300.00 | 300.00 | 250.00 | 150.00 | 100.00 | 180.45 | 294.23 | 500.00 | 283.00 | 260.60 | 200.00 | 153.70 | 75.00 | 0.00 | 0.00 | 95.68 | 29.95 | 125.56 | 83.47 | 35.35 | 123.03 | 66.95 | 53.00 | 59.49 | 250.51 | 259.99 | 300.30 | 105.52 | 252.36 | 250.04 | 48.06 | 52.74 | 0.00 | 120.67 | 214.11 | 107.95 | 97.88 | 51.43 | 53.61 | 50.10 | 37.72 | 83.49 | 0.02 | 6.43 | 0.00 | 0.05 | 0.06 | 0.84 | 0.81 | 0.07 | 0.99 | 0.97 | 0.91 | 1.37 | 0.05 | 1.70 |
| 2023-12-31 | 2023-09-30 | 2023-06-30 | 2023-03-31 | 2022-12-31 | 2022-09-30 | 2022-06-30 | 2022-03-31 | 2021-12-31 | 2021-09-30 | 2021-06-30 | 2021-03-31 | 2020-12-31 | 2020-09-30 | 2020-06-30 | 2020-03-31 | 2019-12-31 | 2019-09-30 | 2019-06-30 | 2019-03-31 | 2018-12-31 | 2018-09-30 | 2018-06-30 | 2018-03-31 | 2017-12-31 | 2017-09-30 | 2017-06-30 | 2017-03-31 | 2016-12-31 | 2016-09-30 | 2016-06-30 | 2016-03-31 | 2015-12-31 | 2015-09-30 | 2015-06-30 | 2015-03-31 | 2014-12-31 | 2014-09-30 | 2014-06-30 | 2014-03-31 | 2013-12-31 | 2013-09-30 | 2013-06-30 | 2013-03-31 | 2012-12-31 | 2012-09-30 | 2012-06-30 | 2012-03-31 | 2011-12-31 | 2011-09-30 | 2011-06-30 | 2011-03-31 | 2010-12-31 | 2010-09-30 | 2010-06-30 | 2010-03-31 | ||
|---|---|---|---|---|---|---|---|---|---|---|---|---|---|---|---|---|---|---|---|---|---|---|---|---|---|---|---|---|---|---|---|---|---|---|---|---|---|---|---|---|---|---|---|---|---|---|---|---|---|---|---|---|---|---|---|---|---|
| Revenues | 4293.65 | 4003.53 | 4188.75 | 3575.64 | 5171.38 | 3943.82 | 3926.19 | 3187.61 | 4358.56 | 3479.05 | 3359.48 | 2729.79 | 3192.36 | 2954.96 | 2593.78 | 2294.98 | 3016.91 | 2710.36 | 2488.99 | 1996.69 | 2999.15 | 2649.37 | 2569.72 | 1970.09 | 2793.56 | 2130.02 | 2020.85 | 1628.83 | 2493.08 | 1942.90 | 1799.91 | 1432.58 | 2061.63 | 1506.75 | 1280.29 | 1133.30 | 1822.56 | 1594.72 | 1286.19 | 1118.89 | 1655.34 | 1582.08 | 1279.42 | 1162.76 | 1566.97 | 1302.59 | 1069.40 | 881.04 | 1262.35 | 1141.93 | 927.21 | 805.20 | 1185.27 | 1057.76 | 1305.90 | 1020.36 | |
| Revenue From Contract With Customer Excluding Assessed Tax | 4293.65 | 4003.53 | 4188.75 | 3575.64 | 5171.38 | 3943.82 | 3926.19 | 3187.61 | 4358.56 | 3479.05 | 3359.48 | 2729.79 | 3192.36 | 2954.96 | 2593.78 | 2294.98 | 3016.91 | 2710.36 | 2488.99 | 1996.69 | 2999.15 | 2649.37 | 2569.72 | 1970.09 | 2793.56 | 2130.02 | 2020.85 | 1628.83 | 2493.08 | 1942.90 | 1799.91 | 1432.58 | 2061.63 | 1506.75 | 1280.29 | 1133.30 | 1822.56 | 1594.72 | 1286.19 | 1118.89 | 1655.34 | 1582.08 | 1279.42 | 1162.76 | 1566.97 | 1302.59 | 1069.40 | 881.04 | 1262.35 | 1141.93 | 927.21 | 805.20 | 1185.27 | 1057.76 | 1305.90 | 1020.36 | |
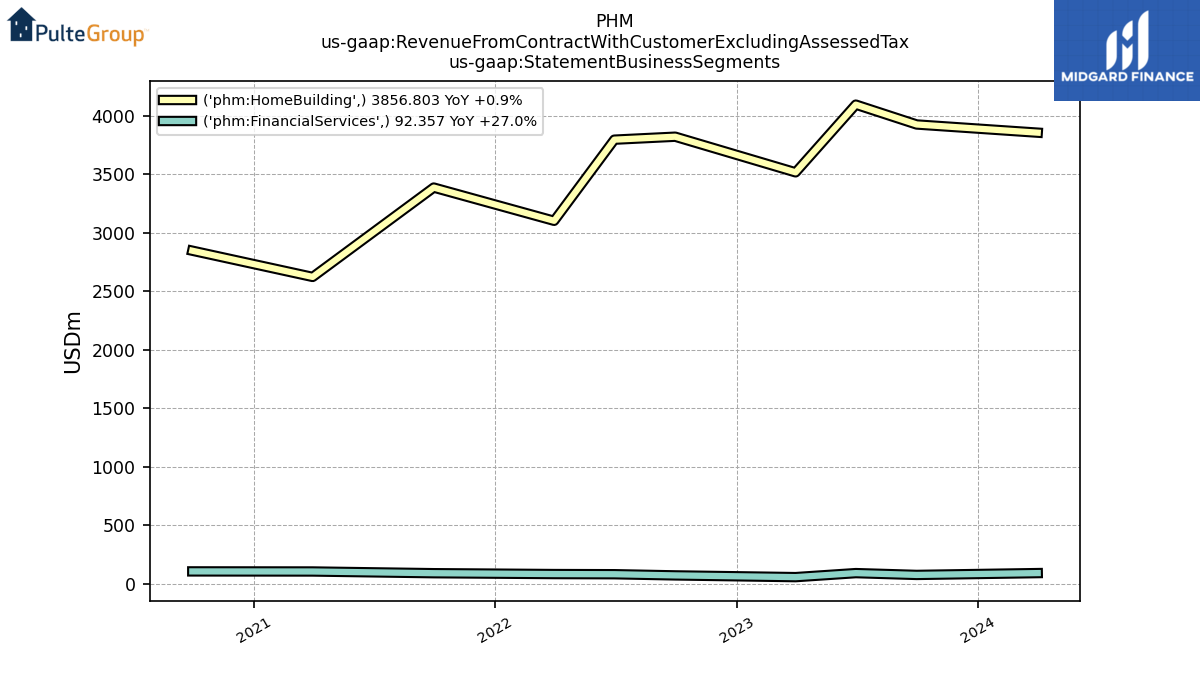
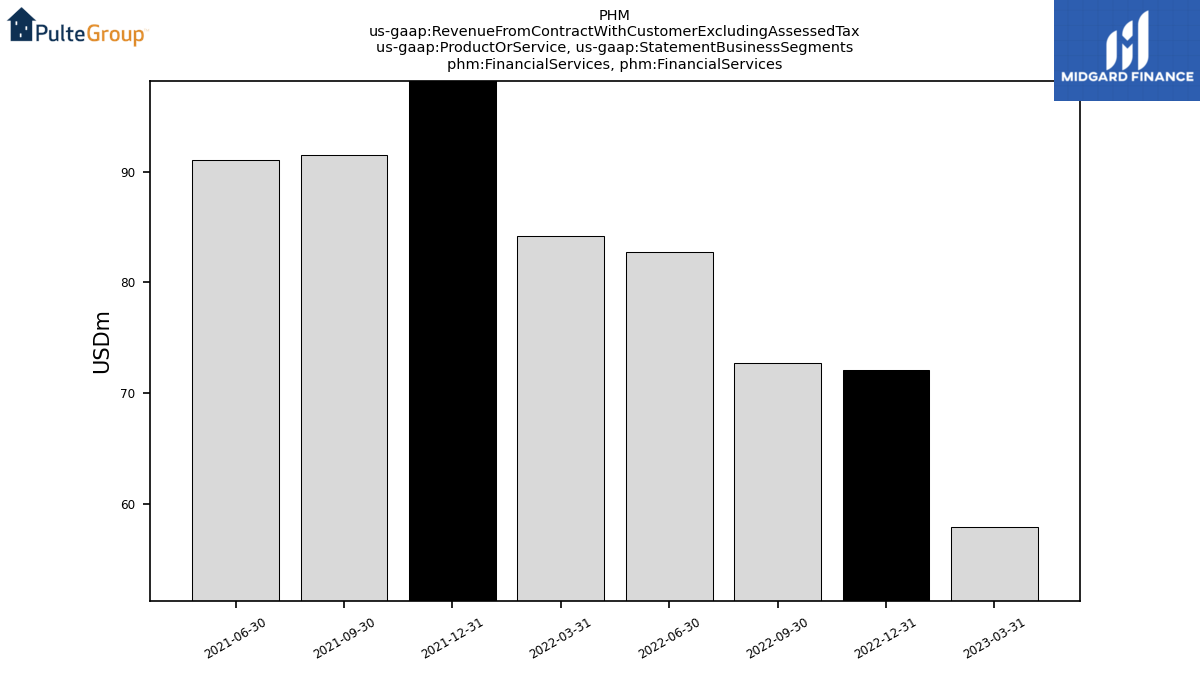
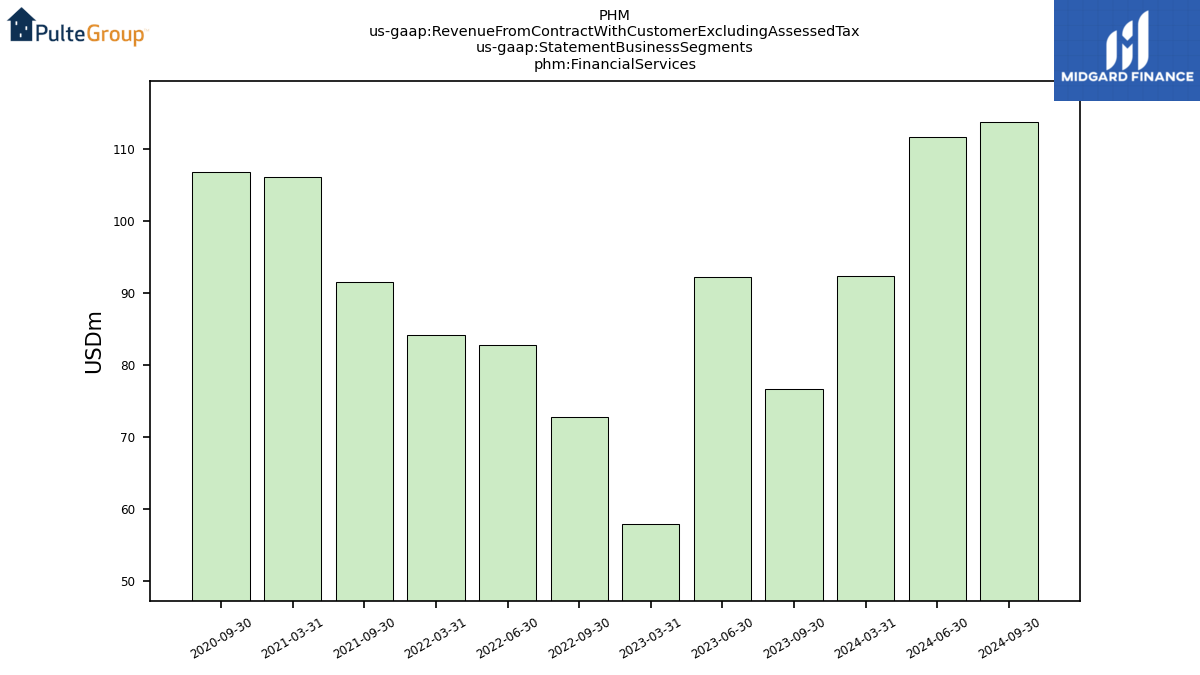
| Financial Services, Financial Services | NA | NA | NA | 57.94 | 72.09 | 72.71 | 82.78 | 84.14 | 100.90 | 91.48 | 91.03 | NA | NA | NA | NA | NA | NA | NA | NA | NA | NA | NA | NA | NA | NA | NA | NA | NA | NA | NA | NA | NA | NA | NA | NA | NA | NA | NA | NA | NA | NA | NA | NA | NA | NA | NA | NA | NA | NA | NA | NA | NA | NA | NA | NA | NA | |
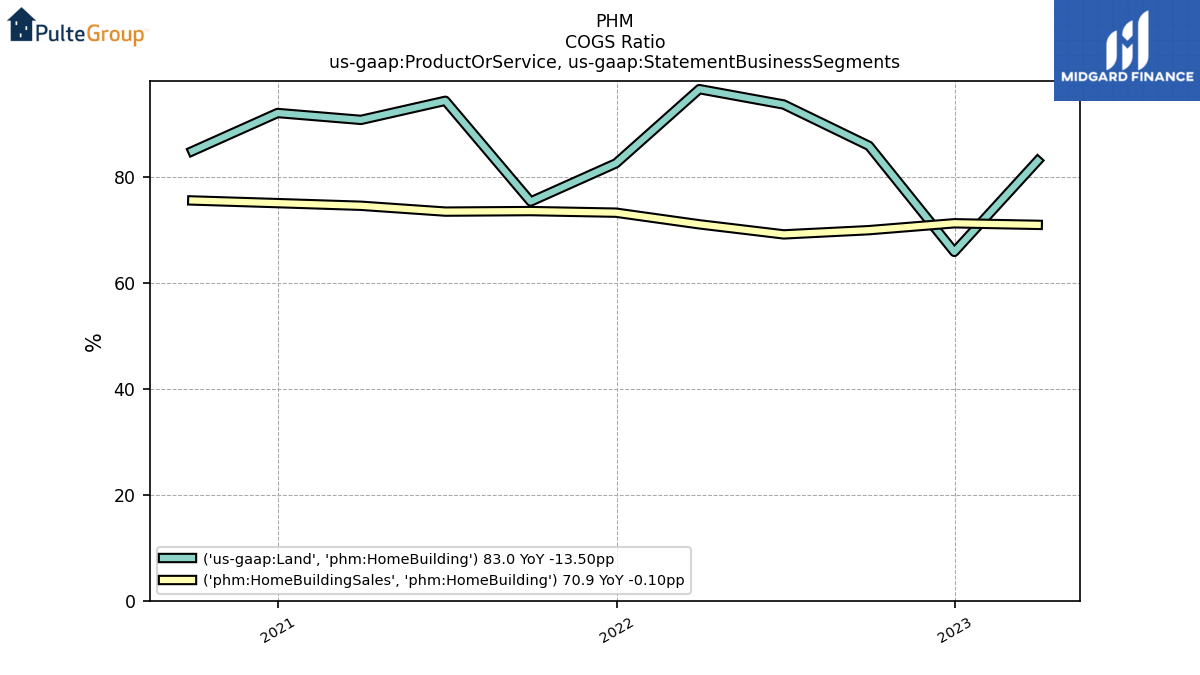
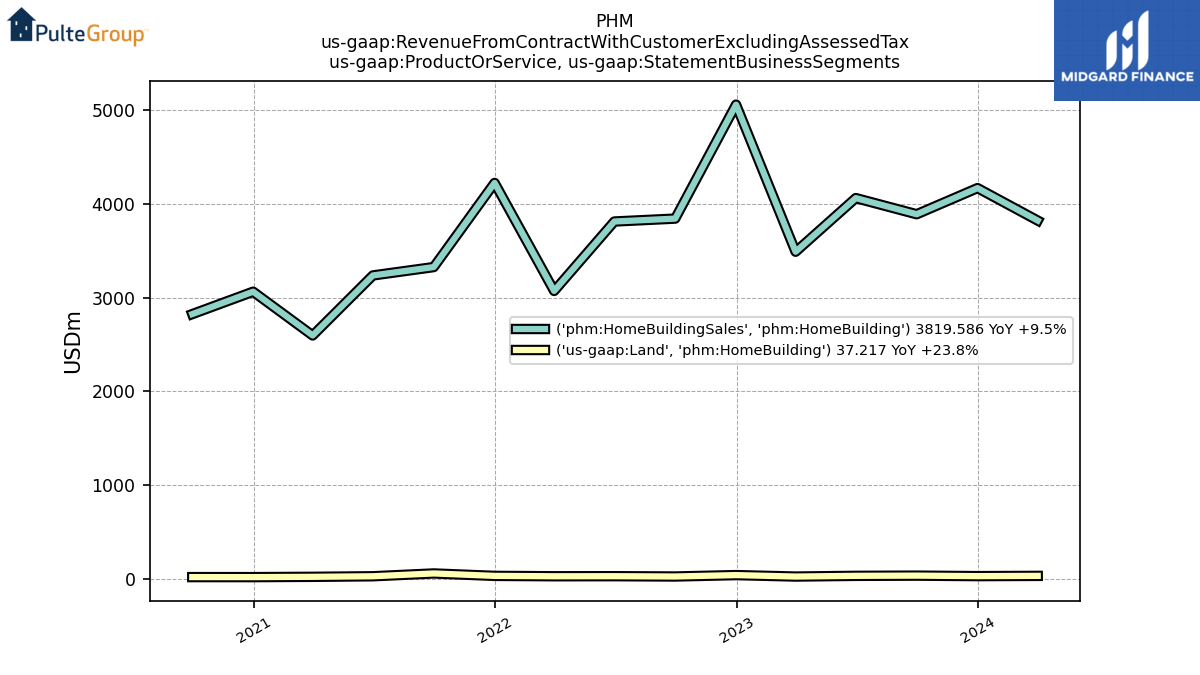
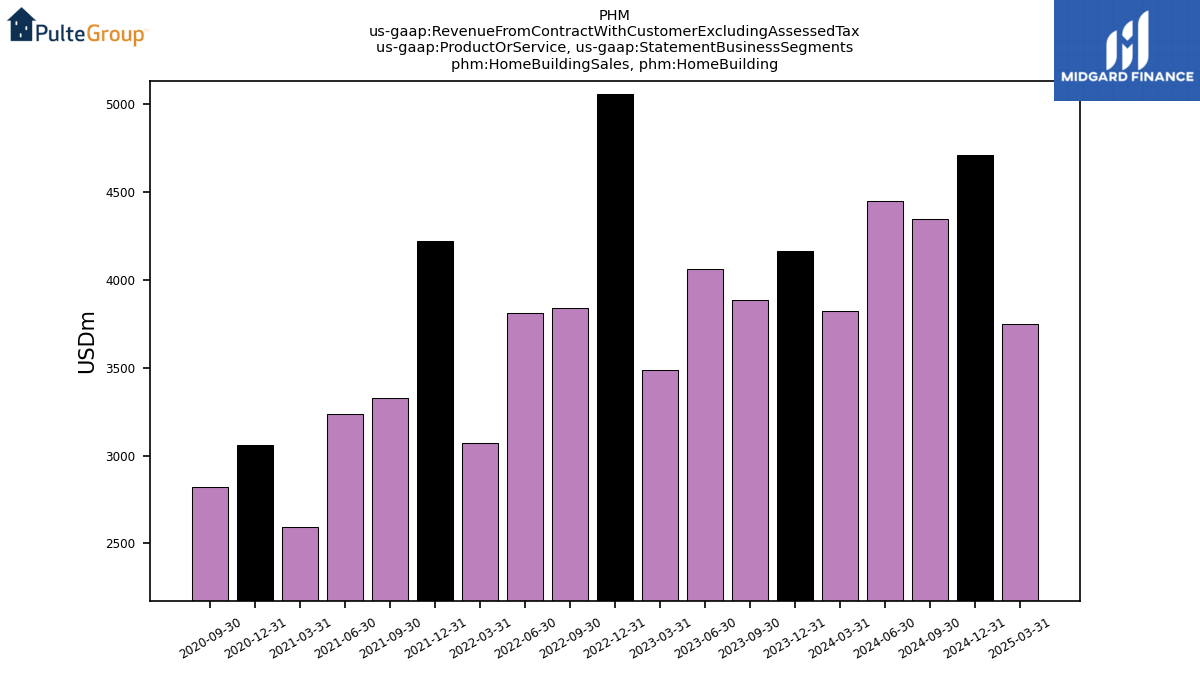
| Home Building Sales, Home Building | 4165.23 | 3886.91 | 4058.93 | 3487.64 | 5053.77 | 3840.45 | 3809.60 | 3070.31 | 4220.44 | 3324.48 | 3235.38 | 2596.51 | 3062.44 | 2823.92 | NA | NA | NA | NA | NA | NA | NA | NA | NA | NA | NA | NA | NA | NA | NA | NA | NA | NA | NA | NA | NA | NA | NA | NA | NA | NA | NA | NA | NA | NA | NA | NA | NA | NA | NA | NA | NA | NA | NA | NA | NA | NA | |
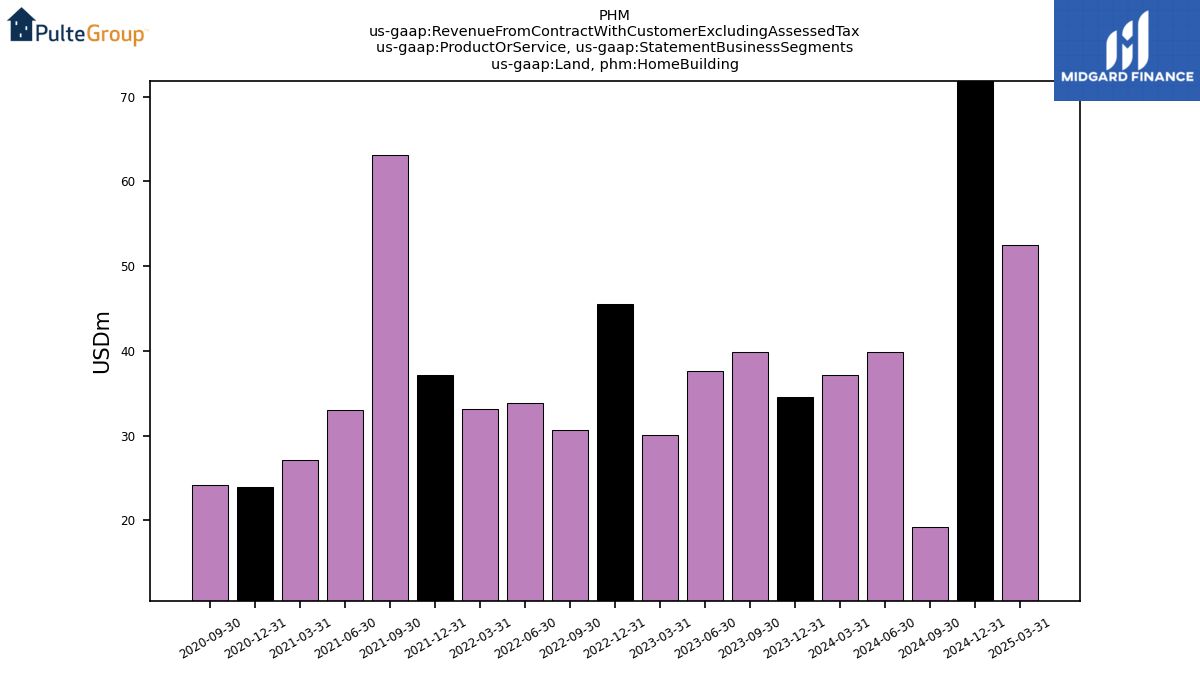
| Land, Home Building | 34.54 | 39.91 | 37.60 | 30.07 | 45.52 | 30.66 | 33.81 | 33.16 | 37.22 | 63.09 | 33.08 | 27.16 | 23.98 | 24.16 | NA | NA | NA | NA | NA | NA | NA | NA | NA | NA | NA | NA | NA | NA | NA | NA | NA | NA | NA | NA | NA | NA | NA | NA | NA | NA | NA | NA | NA | NA | NA | NA | NA | NA | NA | NA | NA | NA | NA | NA | NA | NA | |
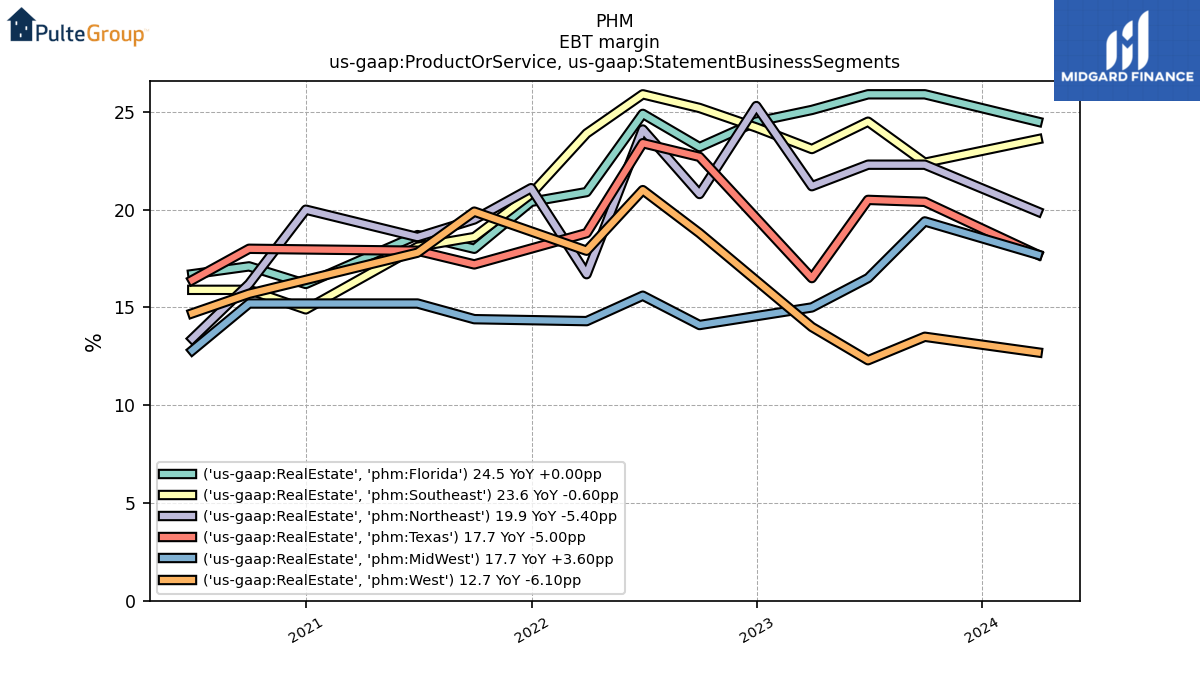
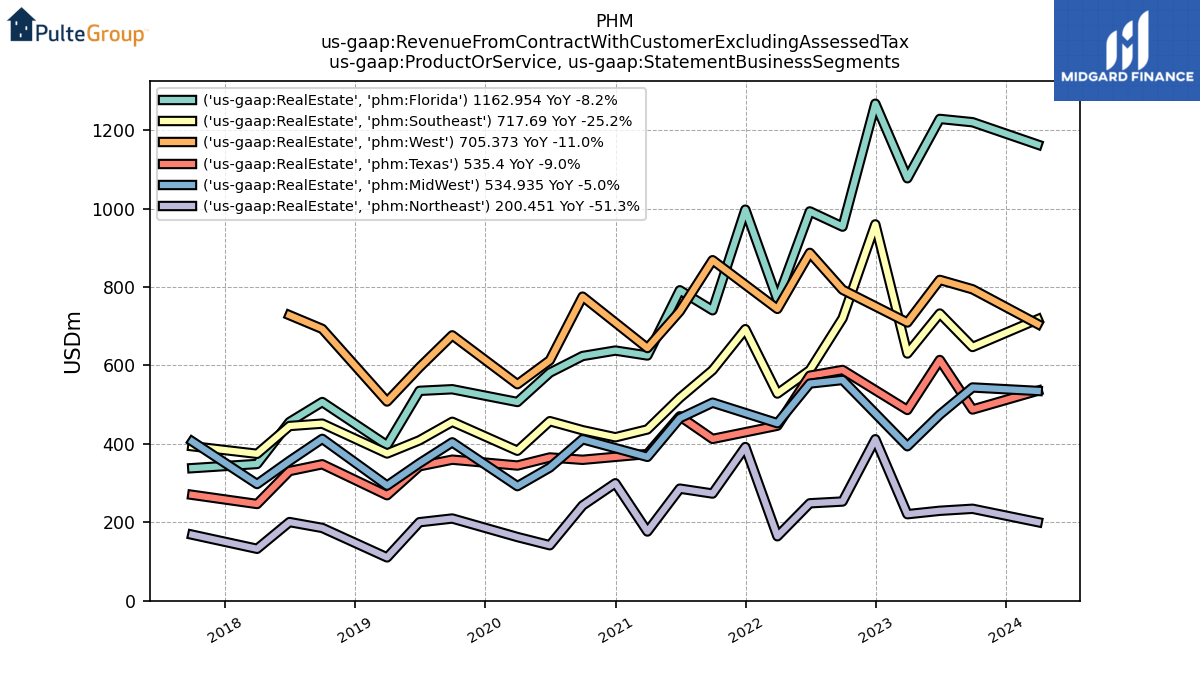
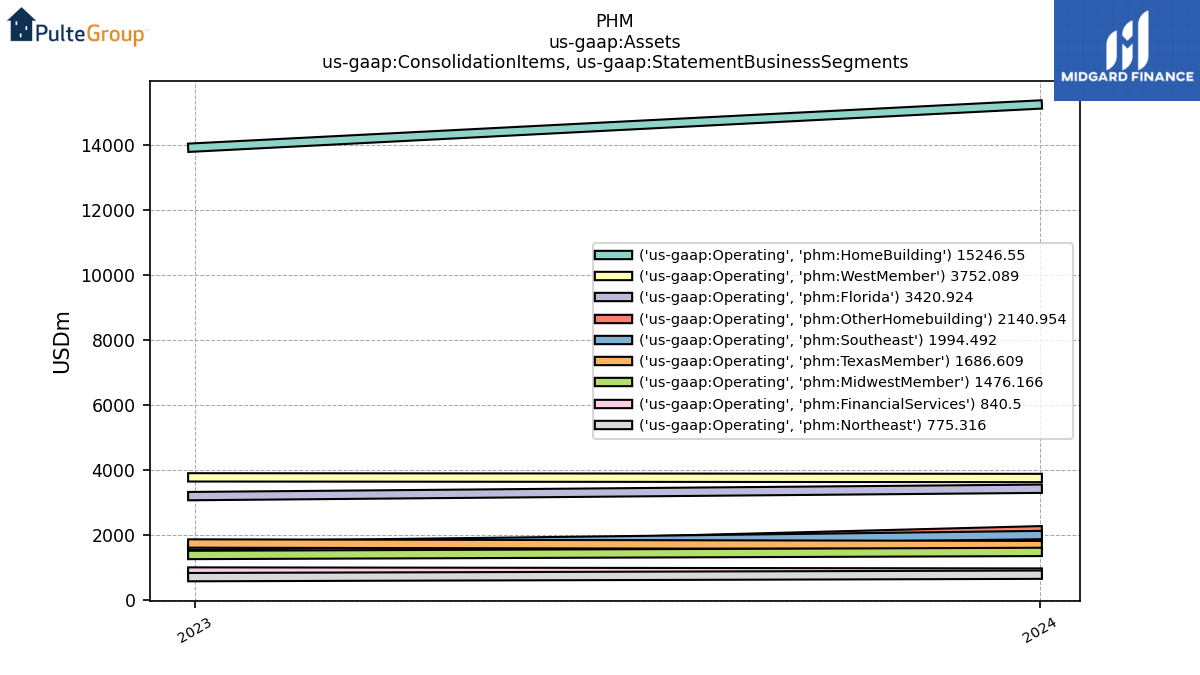
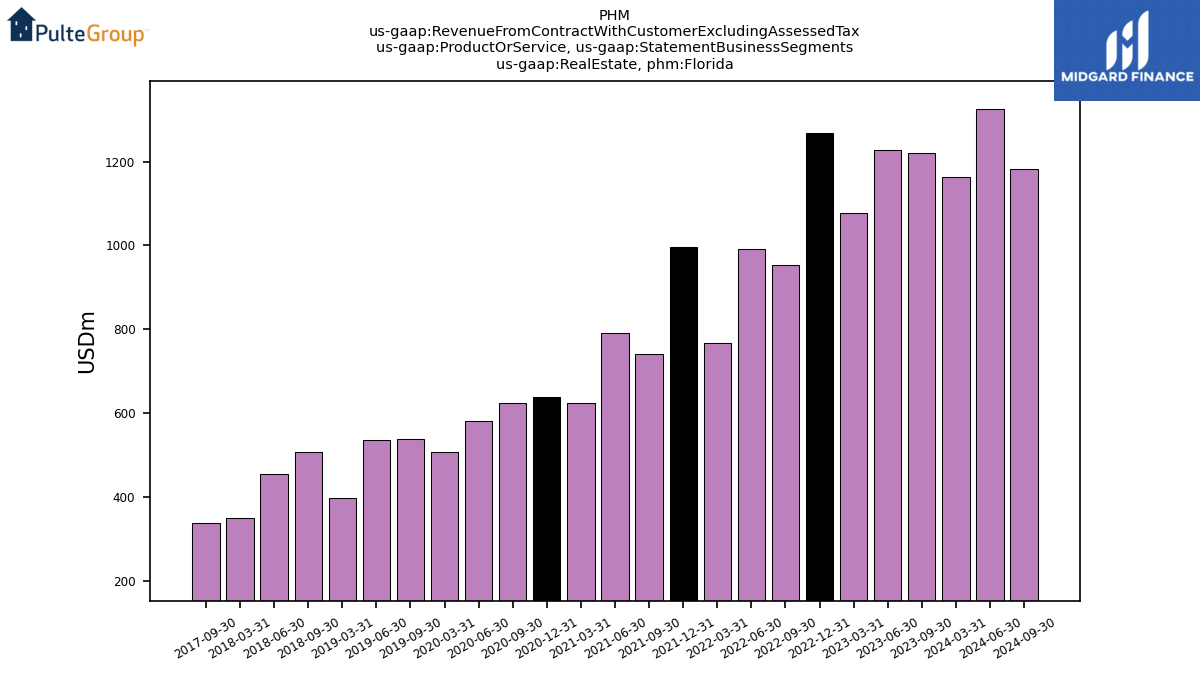
| Real Estate, Florida | NA | 1220.04 | 1228.47 | 1077.11 | 1267.28 | 953.78 | 992.74 | 767.97 | 997.21 | 740.57 | 791.56 | 625.24 | 637.88 | 623.97 | 581.52 | 506.69 | NA | 539.27 | 535.15 | 396.44 | NA | 506.67 | 455.64 | 348.71 | NA | 338.08 | NA | NA | NA | NA | NA | NA | NA | NA | NA | NA | NA | NA | NA | NA | NA | NA | NA | NA | NA | NA | NA | NA | NA | NA | NA | NA | NA | NA | NA | NA | |
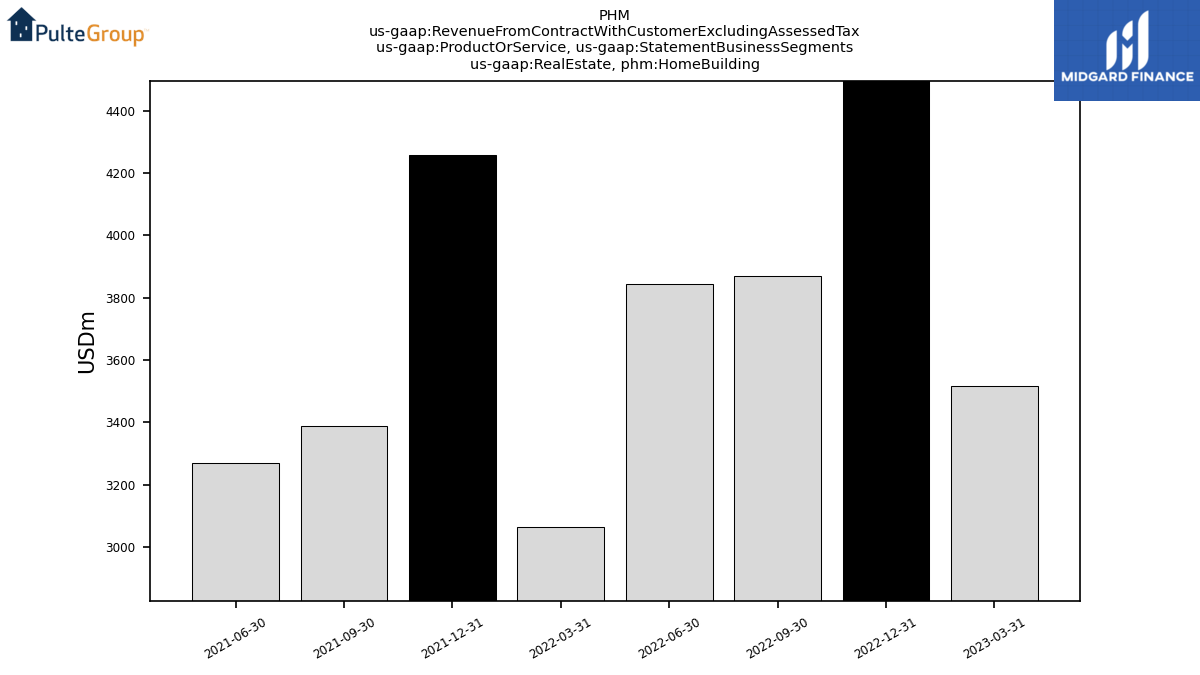
| Real Estate, Home Building | NA | NA | NA | 3517.70 | 5099.29 | 3871.11 | 3843.41 | 3065.38 | 4257.66 | 3387.57 | 3268.45 | NA | NA | NA | NA | NA | NA | NA | NA | NA | NA | NA | NA | NA | NA | NA | NA | NA | NA | NA | NA | NA | NA | NA | NA | NA | NA | NA | NA | NA | NA | NA | NA | NA | NA | NA | NA | NA | NA | NA | NA | NA | NA | NA | NA | NA | |
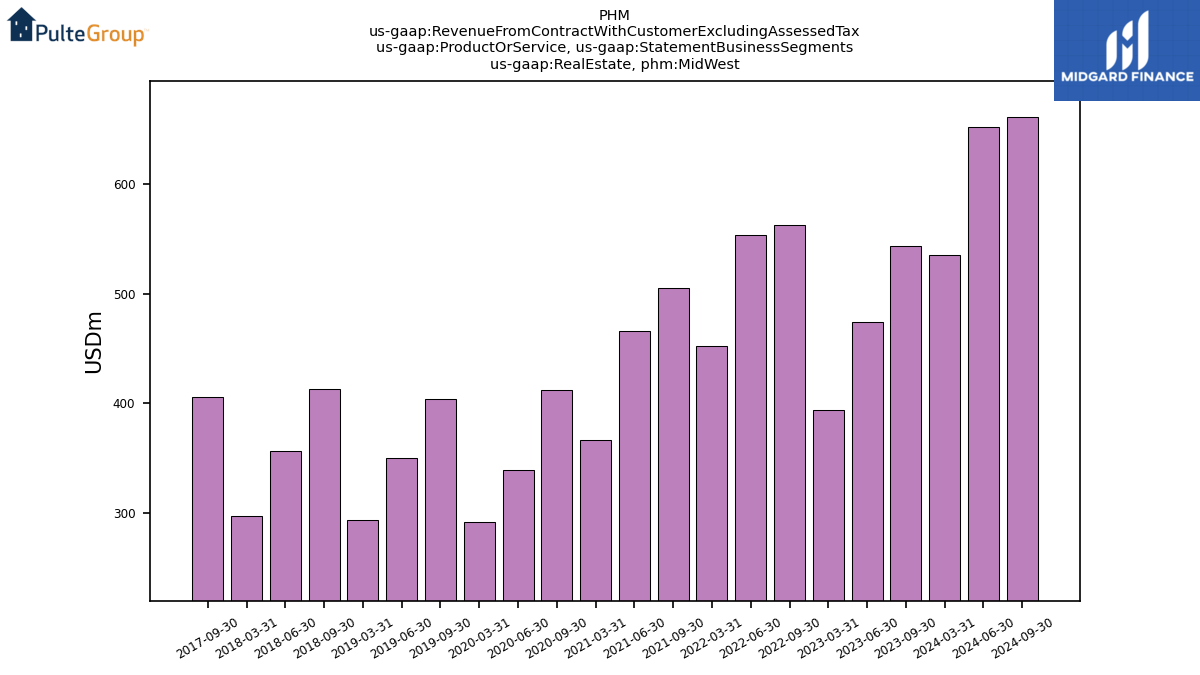
| Real Estate, Mid West | NA | 543.77 | 474.46 | 393.87 | NA | 562.89 | 553.77 | 452.67 | NA | 505.01 | 465.59 | 366.81 | NA | 411.80 | 339.68 | 292.17 | NA | 403.92 | 350.58 | 293.59 | NA | 412.80 | 356.47 | 297.51 | NA | 406.13 | NA | NA | NA | NA | NA | NA | NA | NA | NA | NA | NA | NA | NA | NA | NA | NA | NA | NA | NA | NA | NA | NA | NA | NA | NA | NA | NA | NA | NA | NA | |
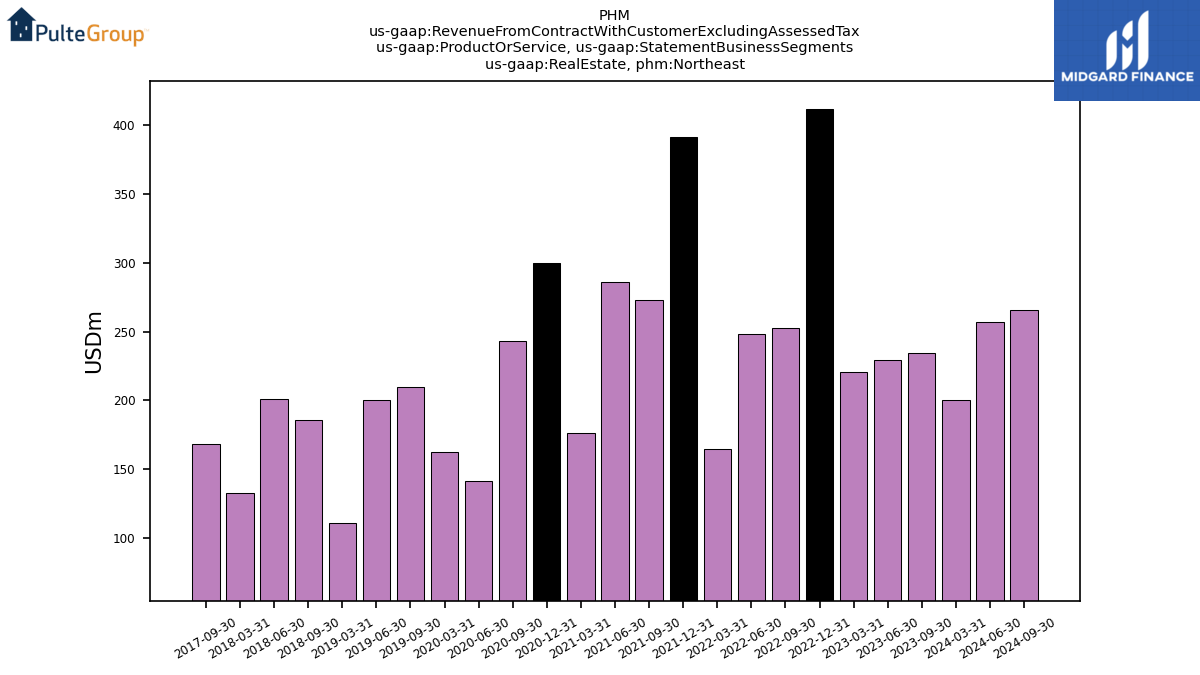
| Real Estate, Northeast | NA | 234.47 | 229.37 | 220.65 | 411.74 | 252.99 | 248.45 | 164.33 | 391.87 | 273.26 | 285.87 | 176.47 | 299.60 | 242.83 | 141.48 | 162.43 | NA | 209.70 | 200.24 | 110.49 | NA | 185.61 | 200.63 | 132.44 | NA | 168.37 | NA | NA | NA | NA | NA | NA | NA | NA | NA | NA | NA | NA | NA | NA | NA | NA | NA | NA | NA | NA | NA | NA | NA | NA | NA | NA | NA | NA | NA | NA | |
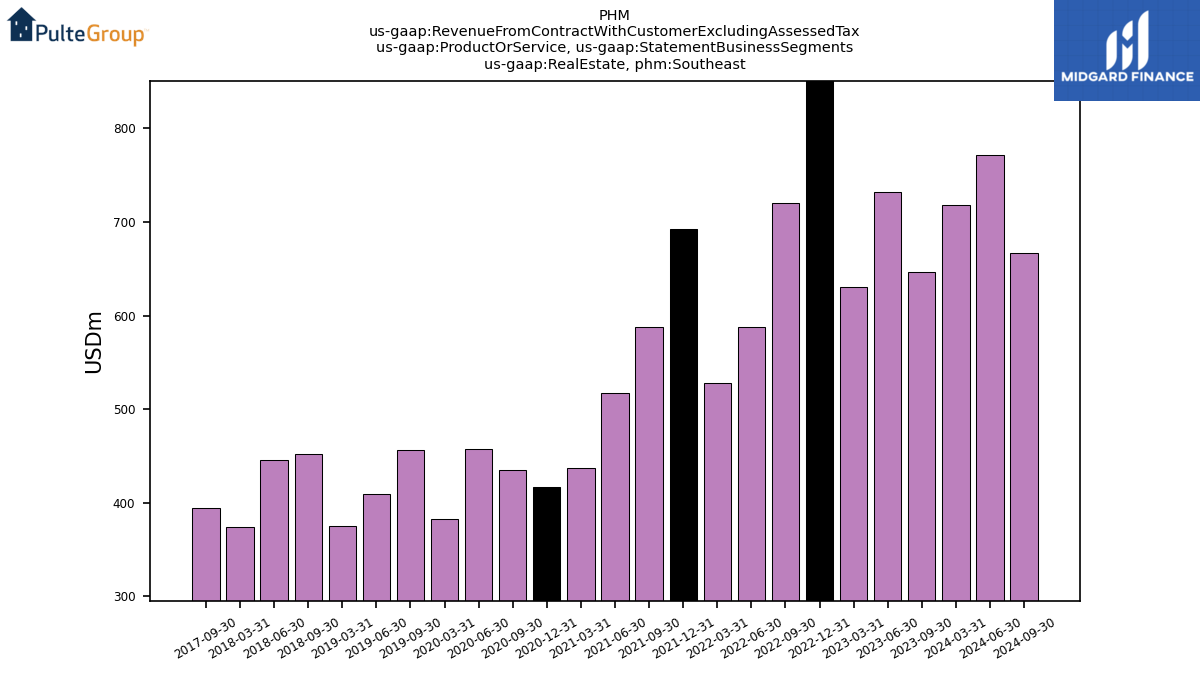
| Real Estate, Southeast | NA | 646.93 | 732.33 | 630.30 | 959.60 | 720.10 | 587.74 | 528.20 | 692.39 | 587.88 | 517.26 | 436.78 | 416.78 | 434.78 | 457.86 | 382.39 | NA | 456.24 | 409.12 | 375.42 | NA | 451.60 | 445.51 | 374.62 | NA | 393.90 | NA | NA | NA | NA | NA | NA | NA | NA | NA | NA | NA | NA | NA | NA | NA | NA | NA | NA | NA | NA | NA | NA | NA | NA | NA | NA | NA | NA | NA | NA | |
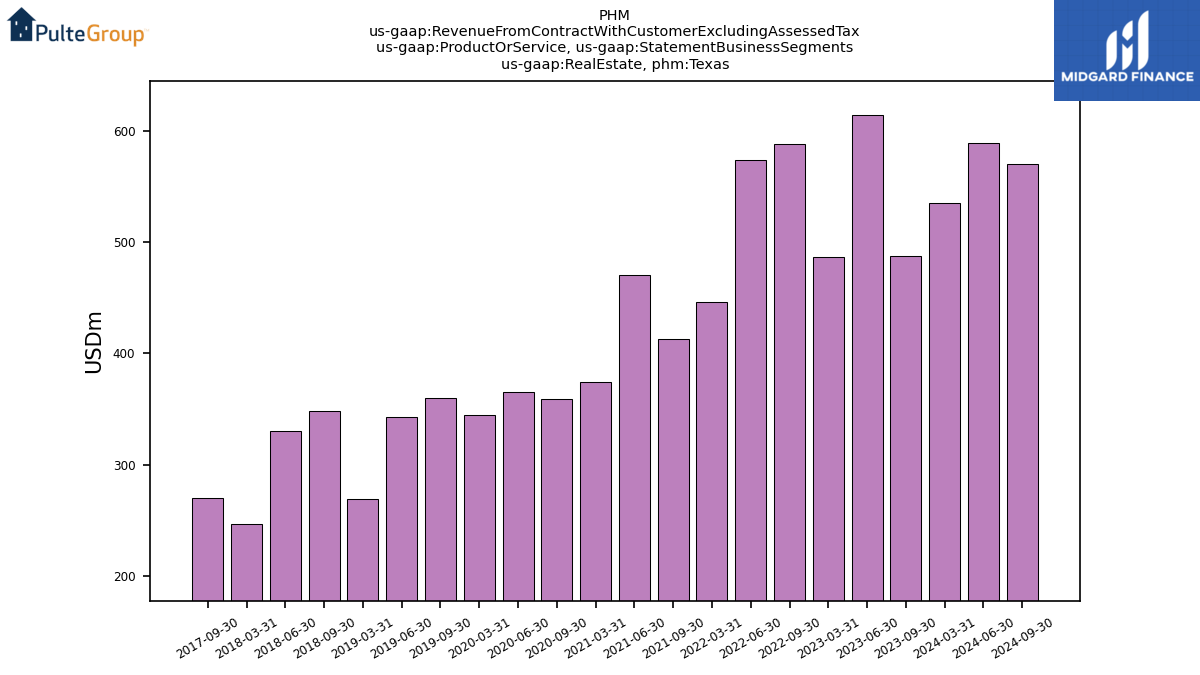
| Real Estate, Texas | NA | 487.52 | 613.84 | 486.39 | NA | 588.42 | 573.76 | 446.27 | NA | 412.57 | 470.29 | 374.12 | NA | 359.36 | 365.35 | 344.74 | NA | 359.72 | 342.89 | 269.00 | NA | 347.99 | 330.69 | 246.64 | NA | 270.00 | NA | NA | NA | NA | NA | NA | NA | NA | NA | NA | NA | NA | NA | NA | NA | NA | NA | NA | NA | NA | NA | NA | NA | NA | NA | NA | NA | NA | NA | NA | |
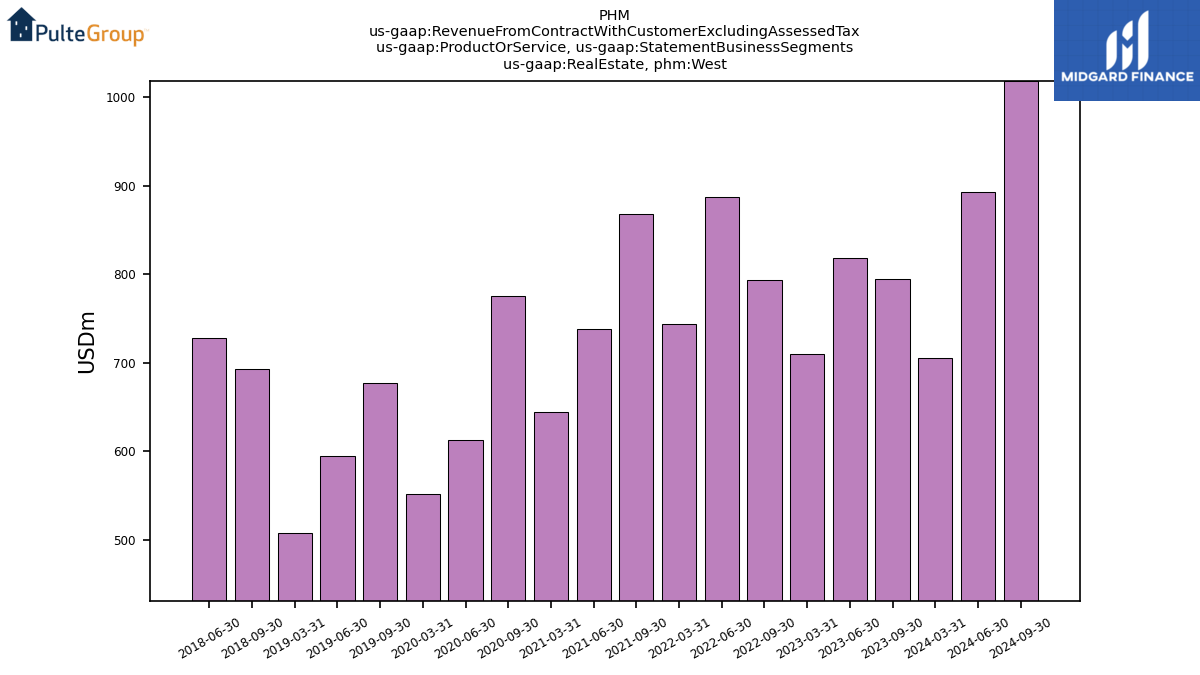
| Real Estate, West | NA | 794.08 | 818.06 | 709.38 | NA | 792.93 | 886.95 | 744.03 | NA | 868.28 | 737.88 | 644.25 | NA | 775.35 | 613.09 | 552.01 | NA | 676.71 | 595.05 | 507.89 | NA | 693.07 | 728.03 | NA | NA | NA | NA | NA | NA | NA | NA | NA | NA | NA | NA | NA | NA | NA | NA | NA | NA | NA | NA | NA | NA | NA | NA | NA | NA | NA | NA | NA | NA | NA | NA | NA | |
| Financial Services | NA | 76.72 | 92.22 | NA | NA | 72.71 | 82.78 | 84.14 | NA | 91.48 | NA | 106.12 | NA | 106.87 | NA | NA | NA | NA | NA | NA | NA | NA | NA | NA | NA | NA | NA | NA | NA | NA | NA | NA | NA | NA | NA | NA | NA | NA | NA | NA | NA | NA | NA | NA | NA | NA | NA | NA | NA | NA | NA | NA | NA | NA | NA | NA | |
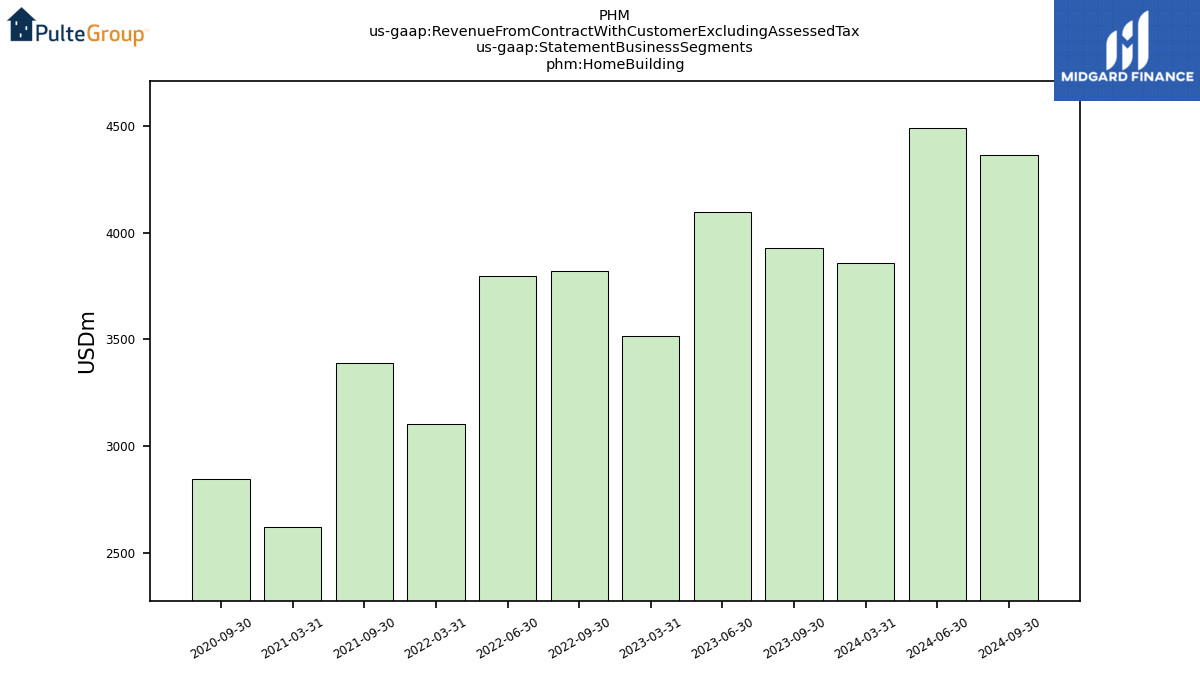
| Home Building | NA | 3926.81 | 4096.53 | NA | NA | 3822.35 | 3796.98 | 3103.47 | NA | 3387.57 | NA | 2623.67 | NA | 2848.09 | NA | NA | NA | NA | NA | NA | NA | NA | NA | NA | NA | NA | NA | NA | NA | NA | NA | NA | NA | NA | NA | NA | NA | NA | NA | NA | NA | NA | NA | NA | NA | NA | NA | NA | NA | NA | NA | NA | NA | NA | NA | NA |