
| 2023-09-30 | 2023-06-30 | 2023-03-31 | 2022-12-31 | 2022-09-30 | 2022-06-30 | 2022-03-31 | 2021-12-31 | 2021-09-30 | 2021-06-30 | 2021-03-31 | 2020-12-31 | 2020-09-30 | 2020-06-30 | 2020-03-31 | 2019-12-31 | 2019-09-30 | 2019-06-30 | 2019-03-31 | 2018-12-31 | 2018-09-30 | 2018-06-30 | 2018-03-31 | 2017-12-31 | 2017-09-30 | 2017-06-30 | 2017-03-31 | 2016-12-31 | 2016-09-30 | 2016-06-30 | 2016-03-31 | 2015-12-31 | 2015-09-30 | 2015-06-30 | ||
|---|---|---|---|---|---|---|---|---|---|---|---|---|---|---|---|---|---|---|---|---|---|---|---|---|---|---|---|---|---|---|---|---|---|---|---|
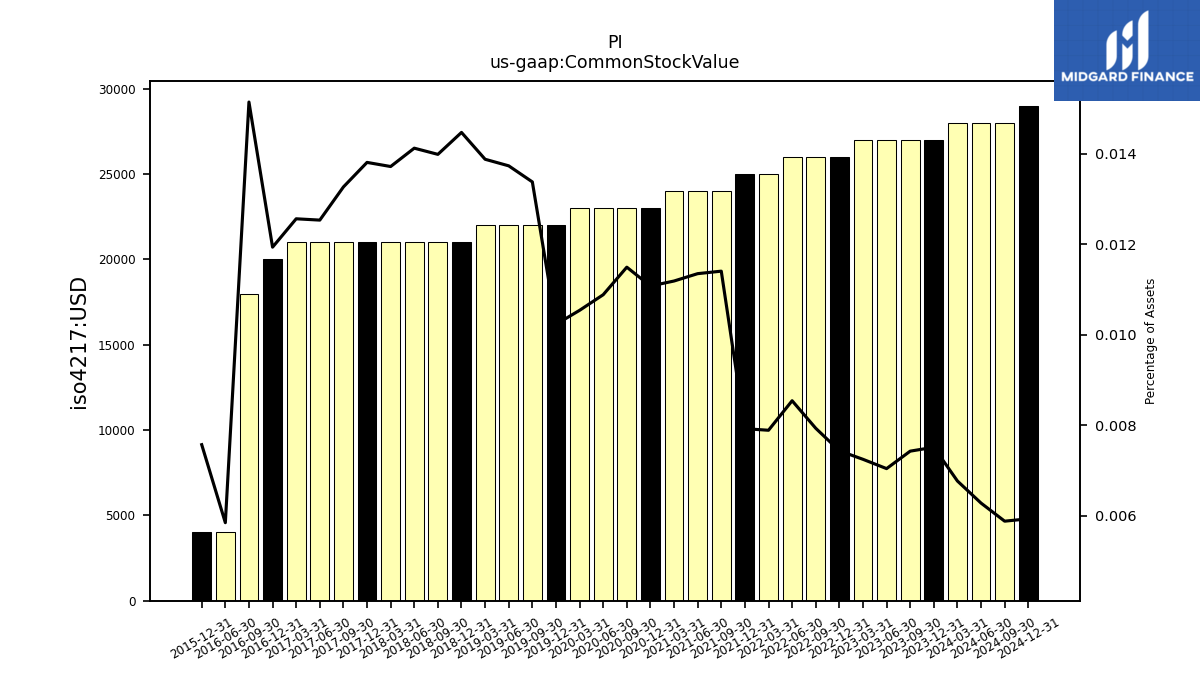
| Common Stock Value | 0.03 | 0.03 | 0.03 | 0.03 | 0.03 | 0.03 | 0.03 | 0.03 | 0.02 | 0.02 | 0.02 | 0.02 | 0.02 | 0.02 | 0.02 | 0.02 | 0.02 | 0.02 | 0.02 | 0.02 | 0.02 | 0.02 | 0.02 | 0.02 | 0.02 | 0.02 | 0.02 | 0.02 | 0.02 | 0.00 | NA | 0.00 | NA | NA | |
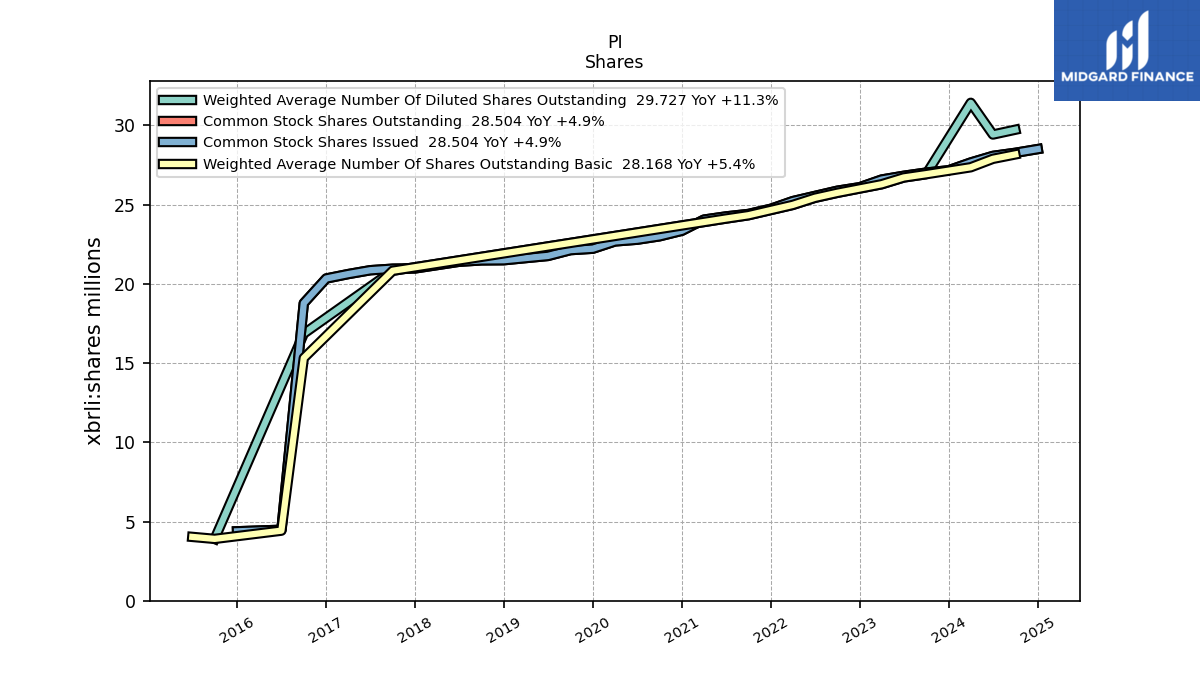
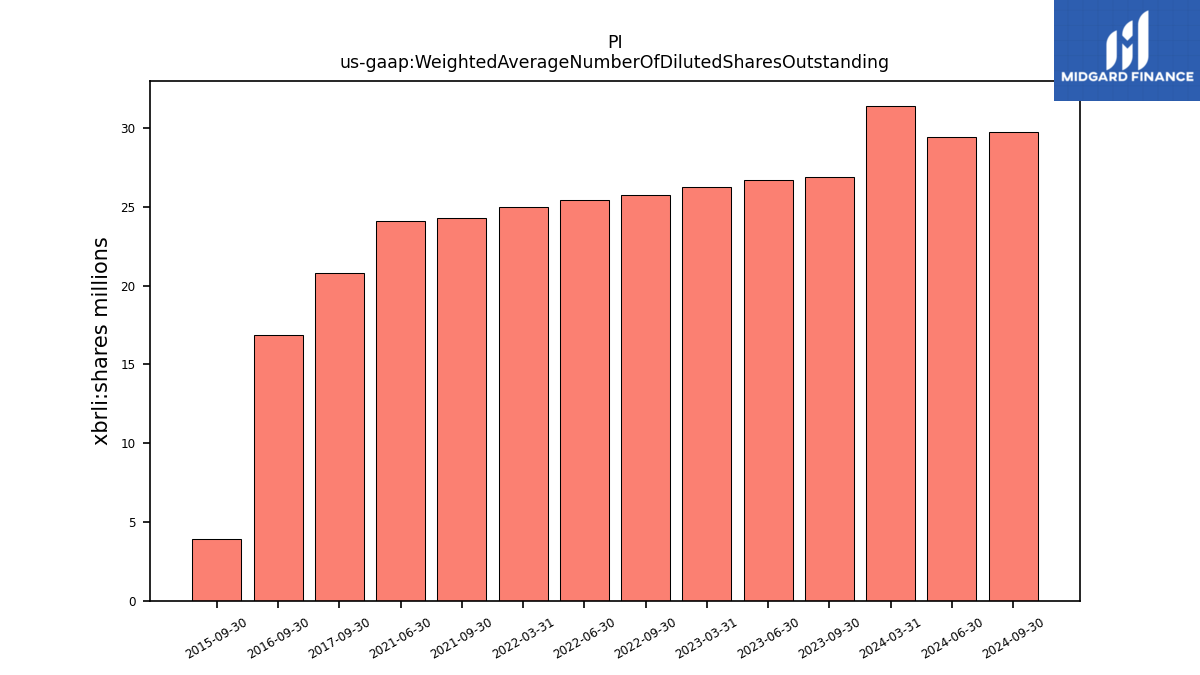
| Weighted Average Number Of Diluted Shares Outstanding | 26.92 | 26.71 | 26.29 | NA | 25.74 | 25.43 | 24.98 | NA | 24.33 | 24.12 | NA | NA | NA | NA | NA | NA | NA | NA | NA | NA | NA | NA | NA | NA | 20.83 | NA | NA | NA | 16.86 | NA | NA | NA | 3.90 | NA | |
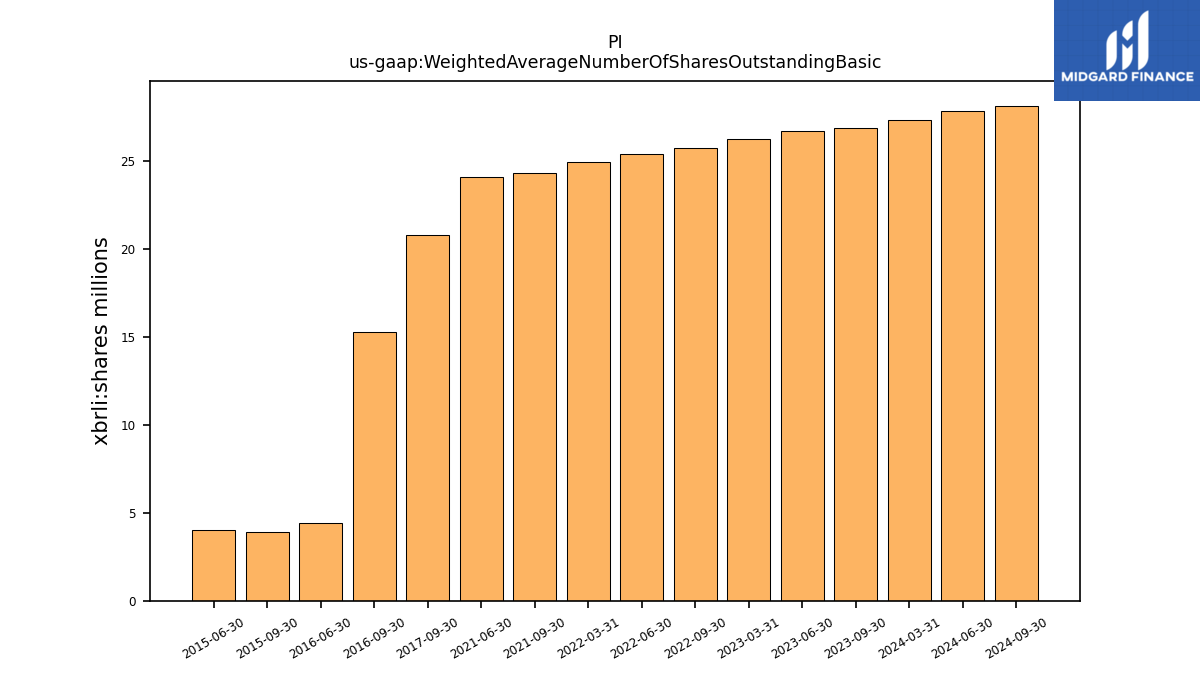
| Weighted Average Number Of Shares Outstanding Basic | 26.92 | 26.71 | 26.29 | NA | 25.74 | 25.43 | 24.98 | NA | 24.33 | 24.12 | NA | NA | NA | NA | NA | NA | NA | NA | NA | NA | NA | NA | NA | NA | 20.83 | NA | NA | NA | 15.32 | 4.42 | NA | NA | 3.90 | 4.03 | |
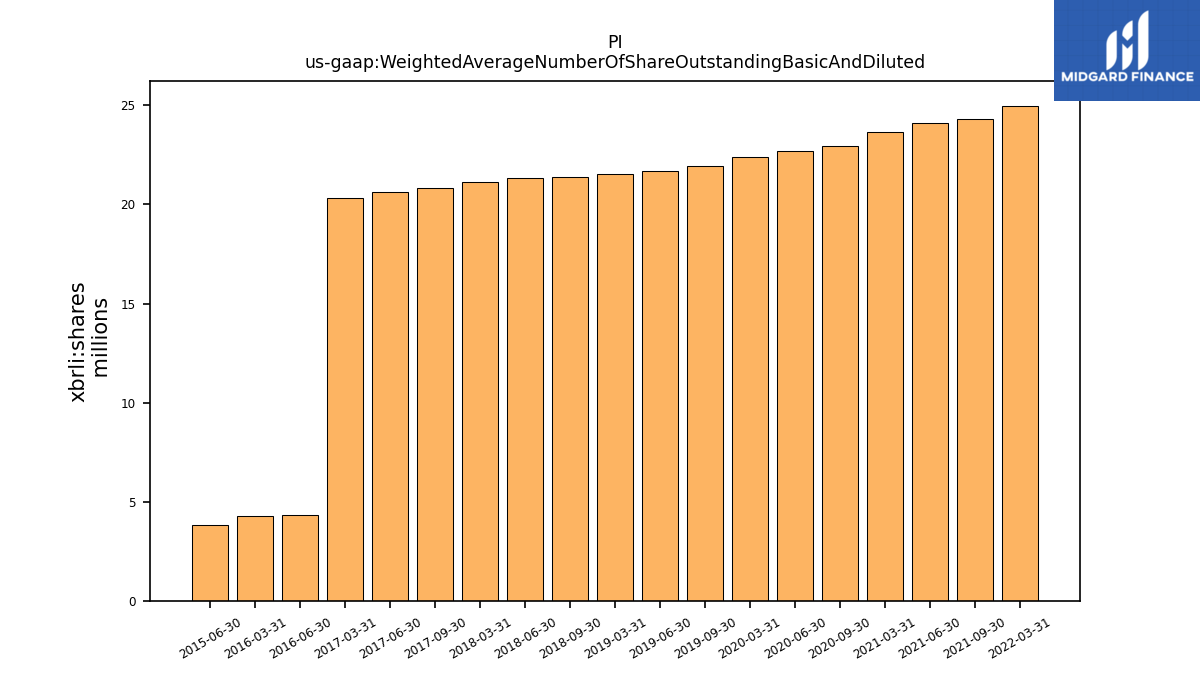
| Weighted Average Number Of Share Outstanding Basic And Diluted | NA | NA | NA | NA | NA | NA | 24.98 | NA | 24.33 | 24.12 | 23.67 | NA | 22.93 | 22.72 | 22.41 | NA | 21.96 | 21.71 | 21.54 | NA | 21.40 | 21.33 | 21.12 | NA | 20.83 | 20.64 | 20.34 | NA | NA | 4.32 | 4.27 | NA | NA | 3.85 | |
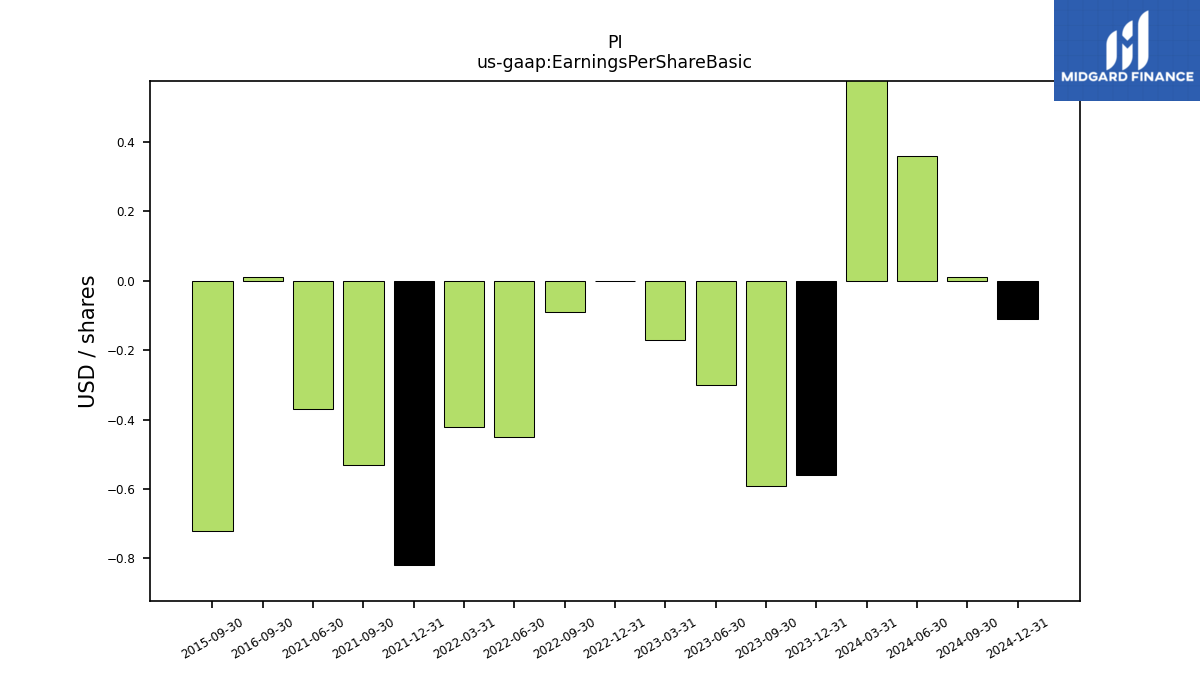
| Earnings Per Share Basic | -0.59 | -0.30 | -0.17 | 0.00 | -0.09 | -0.45 | -0.42 | -0.82 | -0.53 | -0.37 | NA | NA | NA | NA | NA | NA | NA | NA | NA | NA | NA | NA | NA | NA | NA | NA | NA | NA | 0.01 | NA | NA | NA | -0.72 | NA | |
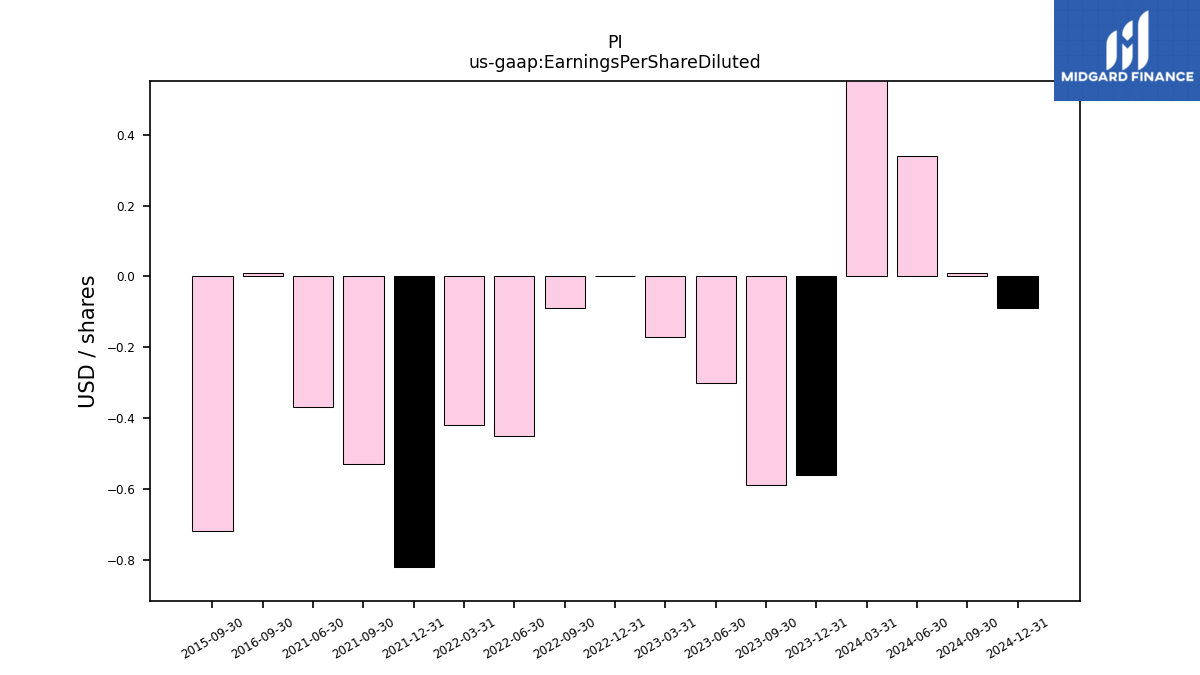
| Earnings Per Share Diluted | -0.59 | -0.30 | -0.17 | 0.00 | -0.09 | -0.45 | -0.42 | -0.82 | -0.53 | -0.37 | NA | NA | NA | NA | NA | NA | NA | NA | NA | NA | NA | NA | NA | NA | NA | NA | NA | NA | 0.01 | NA | NA | NA | -0.72 | NA | |
| Earnings Per Share Basic And Diluted | NA | NA | NA | NA | NA | NA | -0.42 | -0.82 | -0.53 | -0.37 | -0.40 | -0.68 | -0.63 | -0.77 | -0.19 | -0.35 | -0.19 | -0.19 | -0.33 | -0.28 | -0.33 | -0.36 | -0.68 | -0.45 | -0.23 | -0.05 | -0.11 | 0.27 | 0.01 | -0.71 | -1.21 | -0.47 | -0.72 | -0.48 |
| 2023-09-30 | 2023-06-30 | 2023-03-31 | 2022-12-31 | 2022-09-30 | 2022-06-30 | 2022-03-31 | 2021-12-31 | 2021-09-30 | 2021-06-30 | 2021-03-31 | 2020-12-31 | 2020-09-30 | 2020-06-30 | 2020-03-31 | 2019-12-31 | 2019-09-30 | 2019-06-30 | 2019-03-31 | 2018-12-31 | 2018-09-30 | 2018-06-30 | 2018-03-31 | 2017-12-31 | 2017-09-30 | 2017-06-30 | 2017-03-31 | 2016-12-31 | 2016-09-30 | 2016-06-30 | 2016-03-31 | 2015-12-31 | 2015-09-30 | 2015-06-30 | ||
|---|---|---|---|---|---|---|---|---|---|---|---|---|---|---|---|---|---|---|---|---|---|---|---|---|---|---|---|---|---|---|---|---|---|---|---|
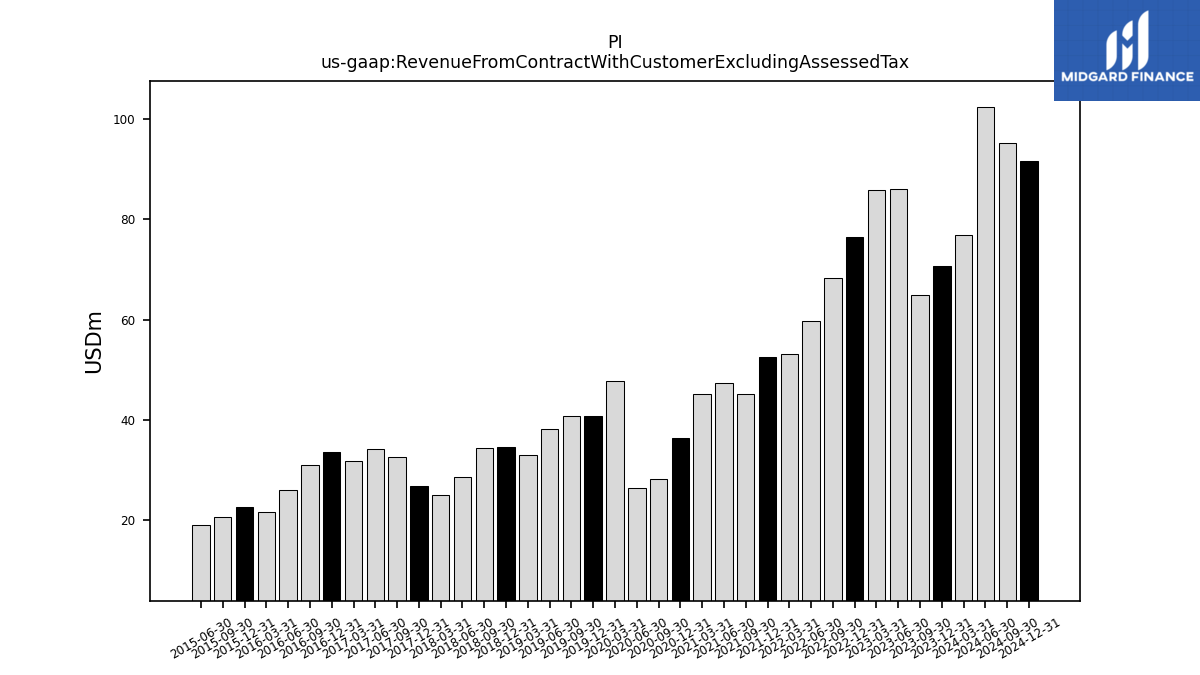
| Revenue From Contract With Customer Excluding Assessed Tax | 65.00 | 85.99 | 85.90 | 76.59 | 68.27 | 59.80 | 53.14 | 52.57 | 45.19 | 47.27 | 45.25 | 36.45 | 28.20 | 26.46 | 47.82 | 40.82 | 40.76 | 38.19 | 33.06 | 34.62 | 34.41 | 28.54 | 25.07 | 26.86 | 32.60 | 34.11 | 31.73 | 33.66 | 31.01 | 25.99 | 21.63 | 22.63 | 20.66 | 19.12 | |
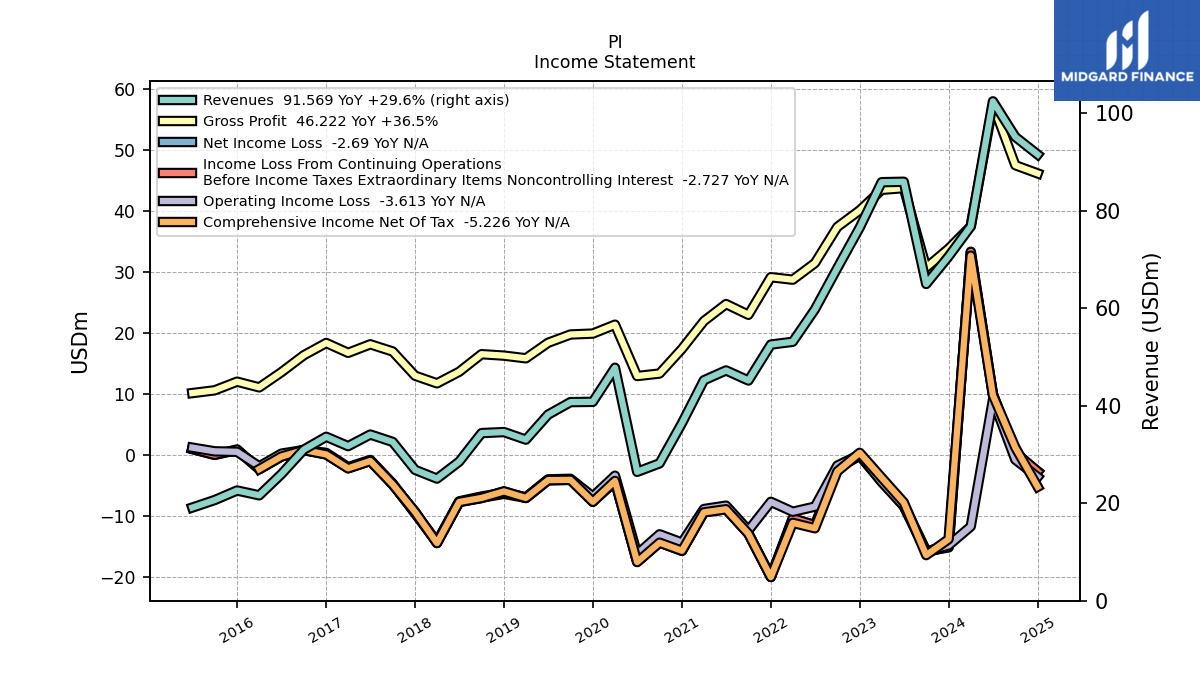
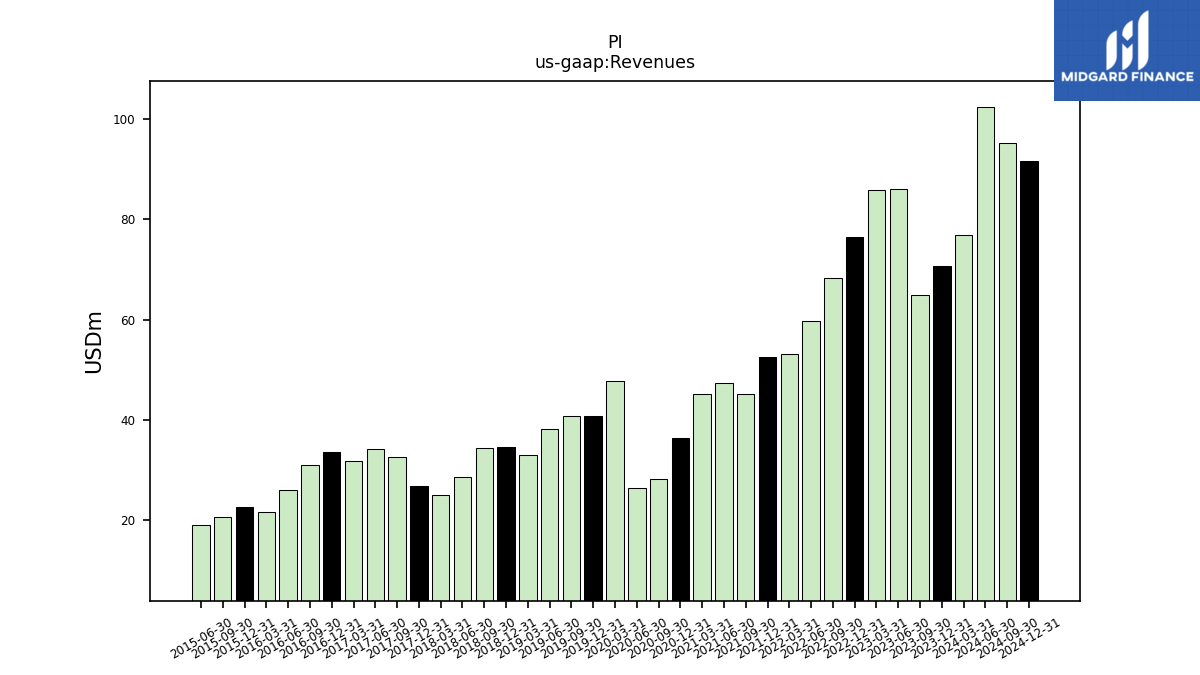
| Revenues | 65.00 | 85.99 | 85.90 | 76.59 | 68.27 | 59.80 | 53.14 | 52.57 | 45.19 | 47.27 | 45.25 | 36.45 | 28.20 | 26.46 | 47.82 | 40.82 | 40.76 | 38.19 | 33.06 | 34.62 | 34.41 | 28.54 | 25.07 | 26.86 | 32.60 | 34.11 | 31.73 | 33.66 | 31.01 | 25.99 | 21.63 | 22.63 | 20.66 | 19.12 | |
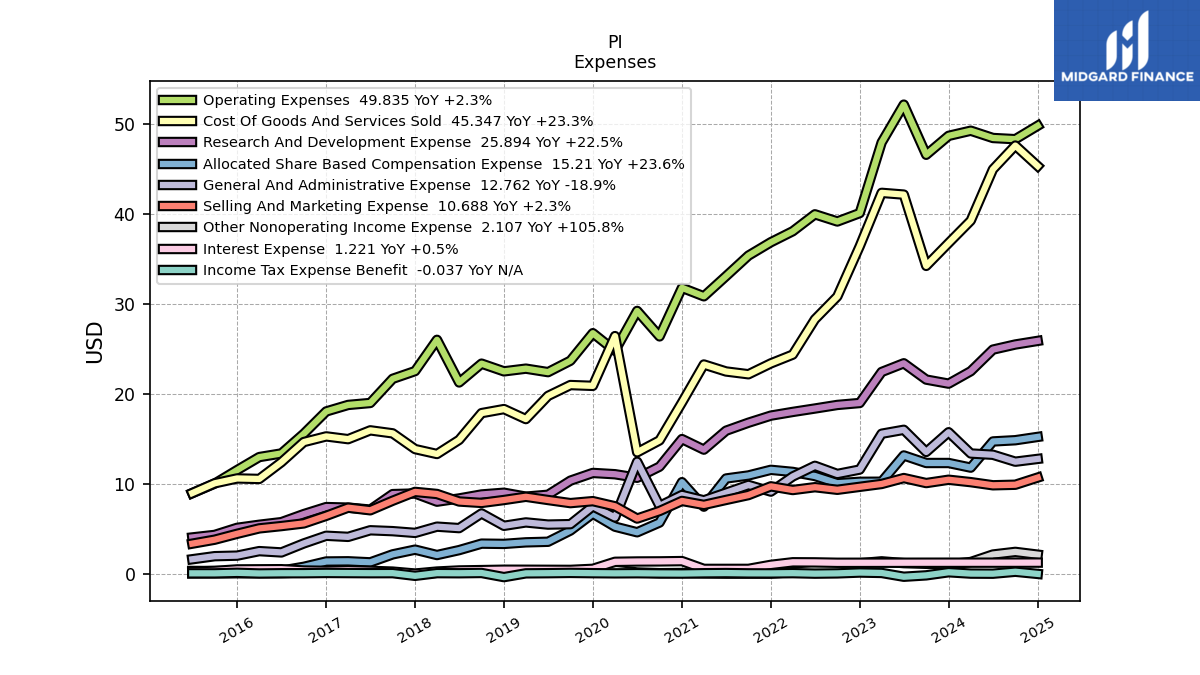
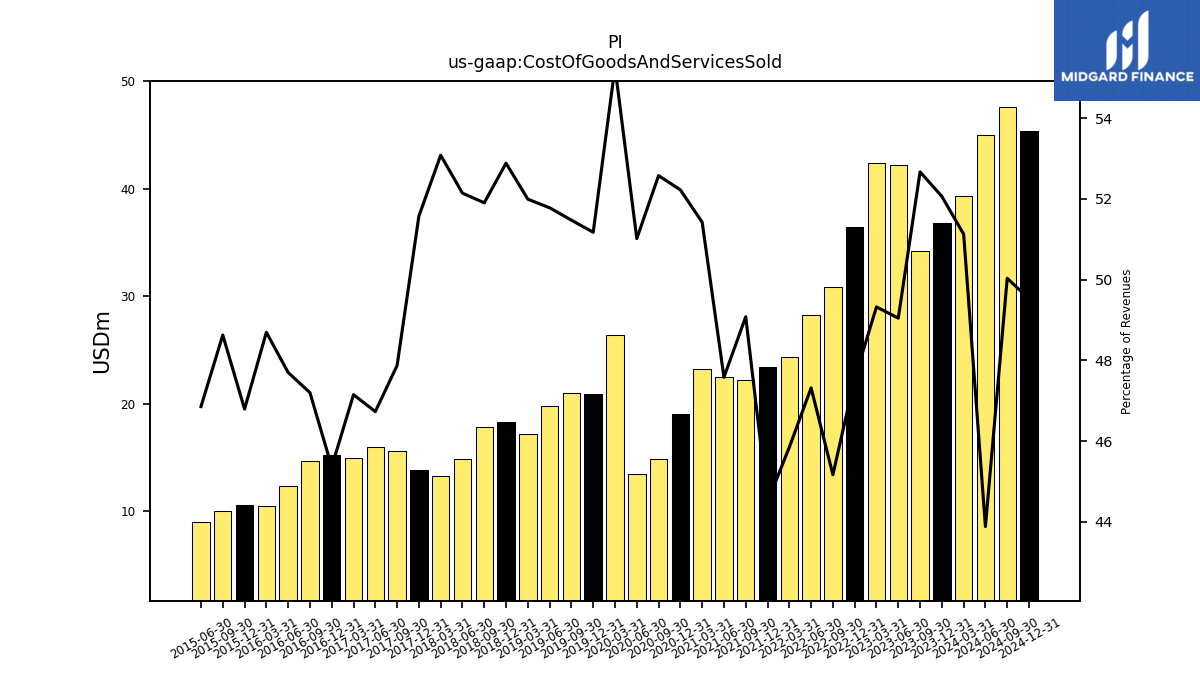
| Cost Of Goods And Services Sold | 34.24 | 42.17 | 42.37 | 36.42 | 30.84 | 28.29 | 24.36 | 23.39 | 22.18 | 22.49 | 23.27 | 19.03 | 14.82 | 13.50 | 26.43 | 20.89 | 20.98 | 19.77 | 17.19 | 18.31 | 17.86 | 14.88 | 13.31 | 13.85 | 15.61 | 15.94 | 14.96 | 15.27 | 14.64 | 12.40 | 10.53 | 10.59 | 10.05 | 8.96 | |
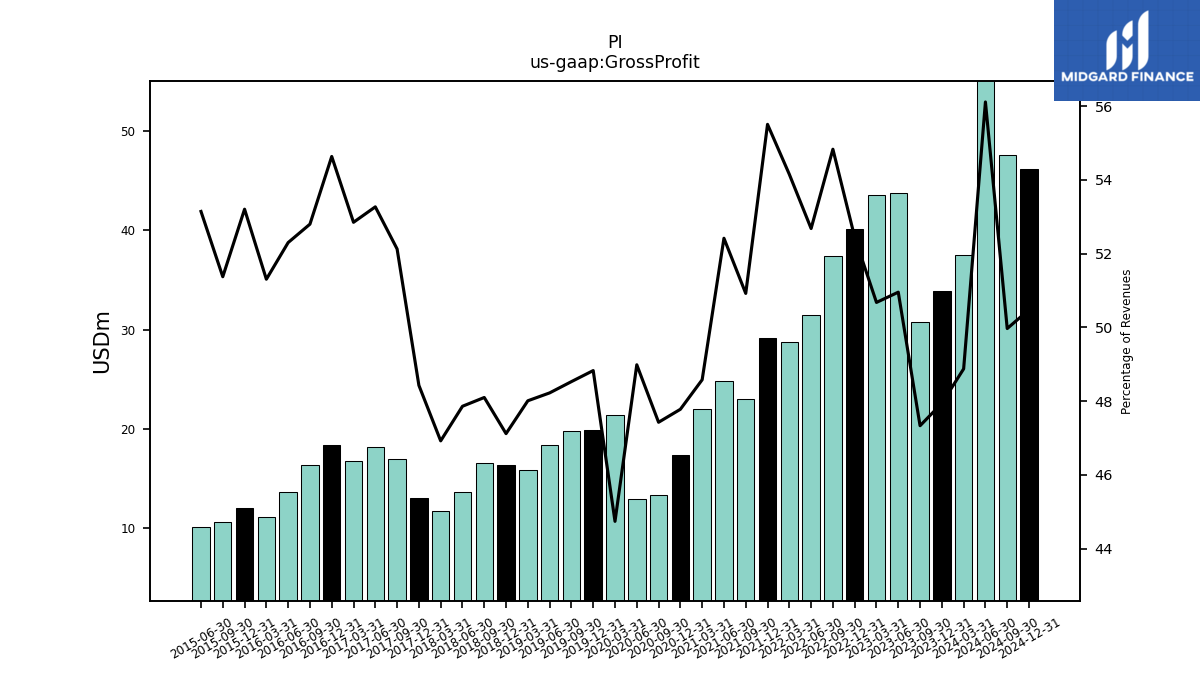
| Gross Profit | 30.77 | 43.81 | 43.53 | 40.17 | 37.44 | 31.50 | 28.78 | 29.18 | 23.01 | 24.78 | 21.98 | 17.41 | 13.37 | 12.96 | 21.39 | 19.93 | 19.78 | 18.42 | 15.87 | 16.31 | 16.55 | 13.66 | 11.76 | 13.01 | 16.99 | 18.17 | 16.77 | 18.39 | 16.38 | 13.59 | 11.10 | 12.04 | 10.62 | 10.16 | |
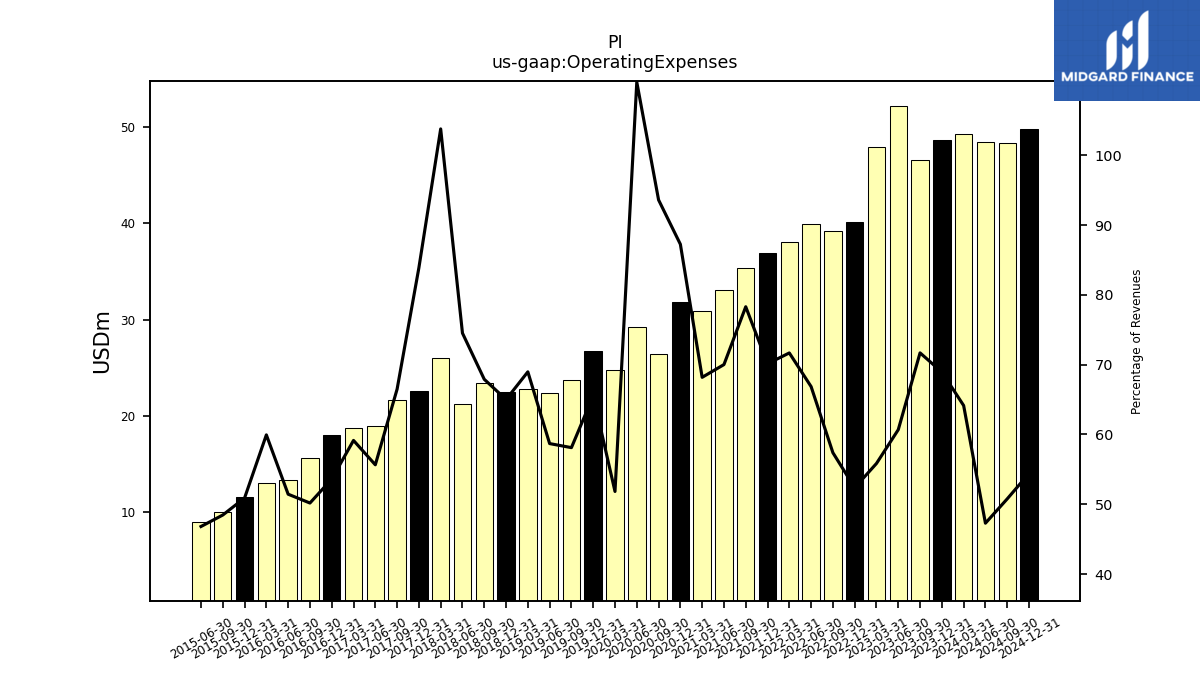
| Operating Expenses | 46.60 | 52.18 | 47.97 | 40.11 | 39.18 | 39.98 | 38.09 | 36.87 | 35.38 | 33.09 | 30.85 | 31.80 | 26.39 | 29.23 | 24.79 | 26.75 | 23.69 | 22.42 | 22.80 | 22.50 | 23.36 | 21.27 | 26.01 | 22.53 | 21.68 | 18.98 | 18.77 | 18.04 | 15.56 | 13.37 | 12.97 | 11.52 | 10.01 | 8.95 | |
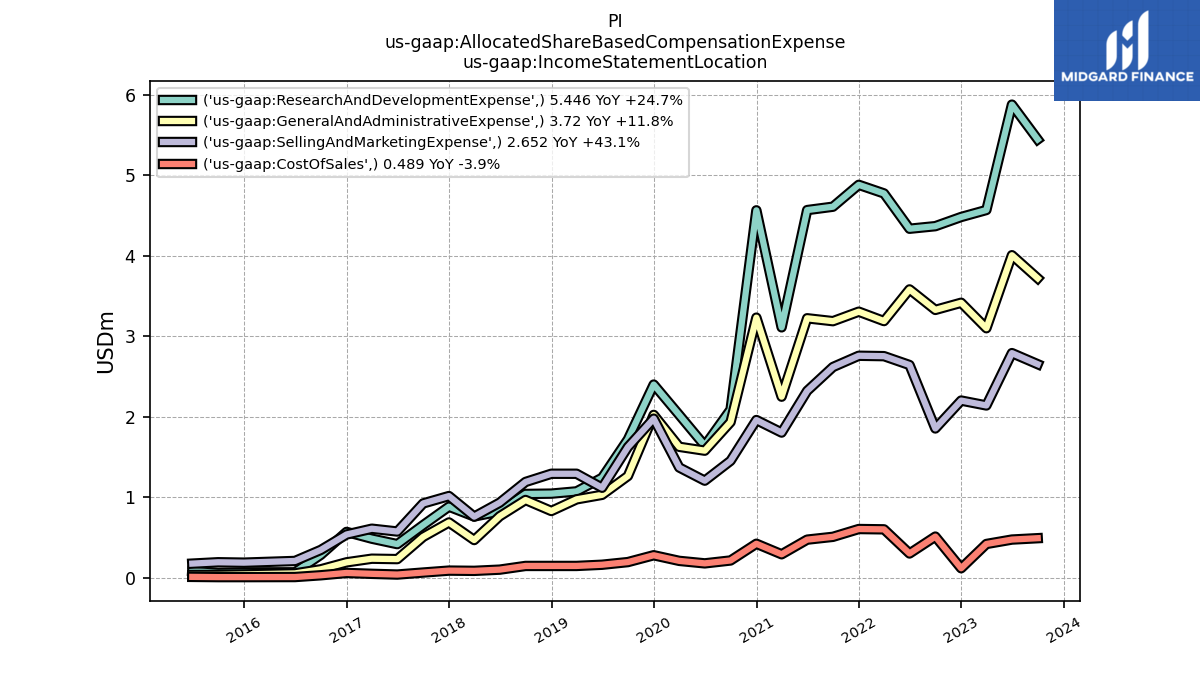
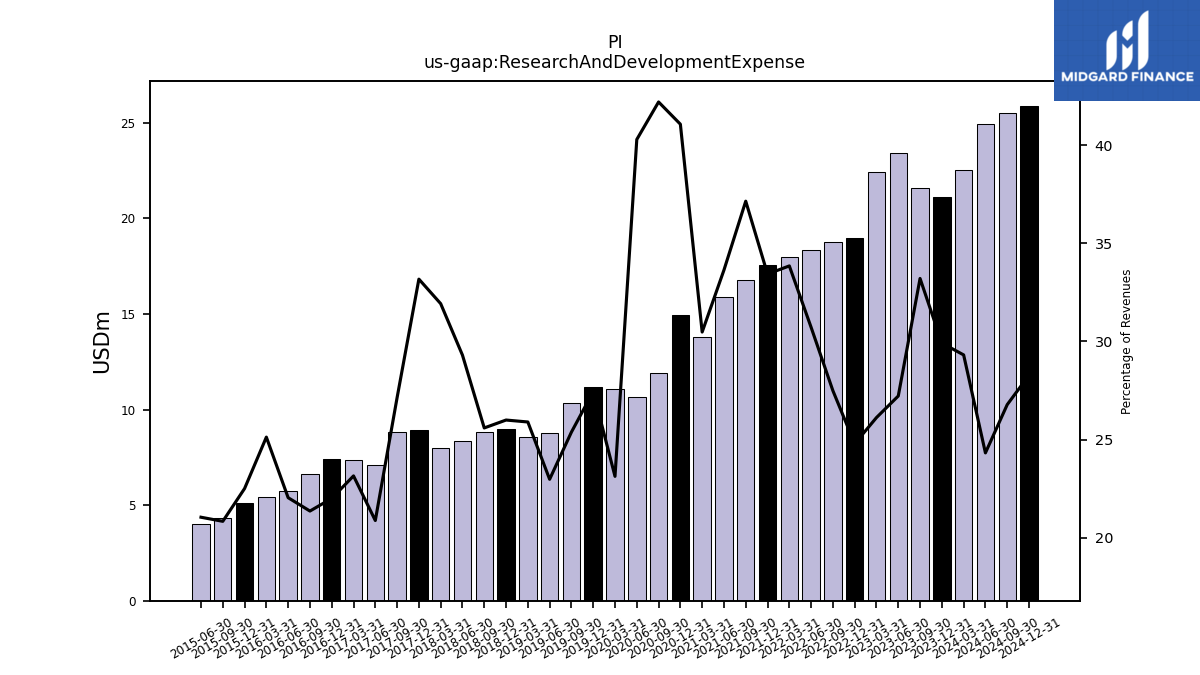
| Research And Development Expense | 21.59 | 23.40 | 22.43 | 18.98 | 18.77 | 18.37 | 17.99 | 17.58 | 16.79 | 15.90 | 13.79 | 14.97 | 11.90 | 10.66 | 11.06 | 11.20 | 10.34 | 8.77 | 8.56 | 9.00 | 8.80 | 8.36 | 8.00 | 8.91 | 8.85 | 7.12 | 7.34 | 7.40 | 6.62 | 5.73 | 5.43 | 5.09 | 4.30 | 4.02 | |
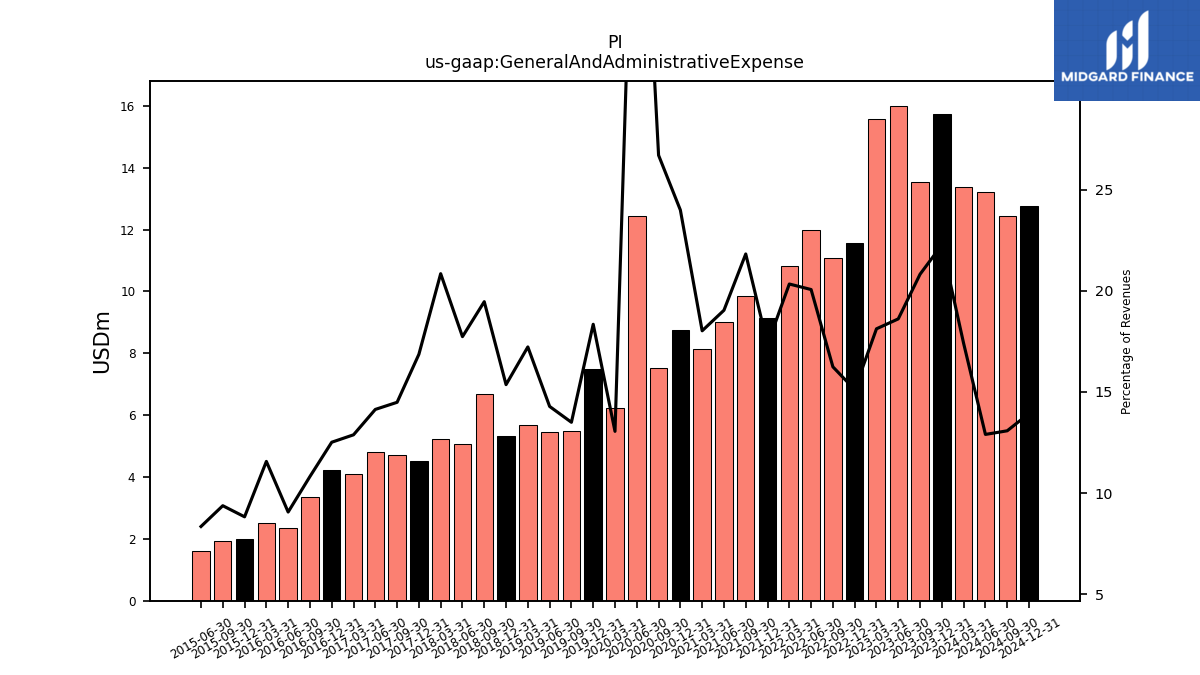
| General And Administrative Expense | 13.53 | 16.00 | 15.56 | 11.58 | 11.09 | 11.99 | 10.81 | 9.12 | 9.86 | 9.00 | 8.15 | 8.74 | 7.53 | 12.45 | 6.24 | 7.49 | 5.50 | 5.46 | 5.70 | 5.32 | 6.70 | 5.06 | 5.22 | 4.53 | 4.72 | 4.82 | 4.09 | 4.21 | 3.36 | 2.36 | 2.50 | 2.00 | 1.94 | 1.60 | |
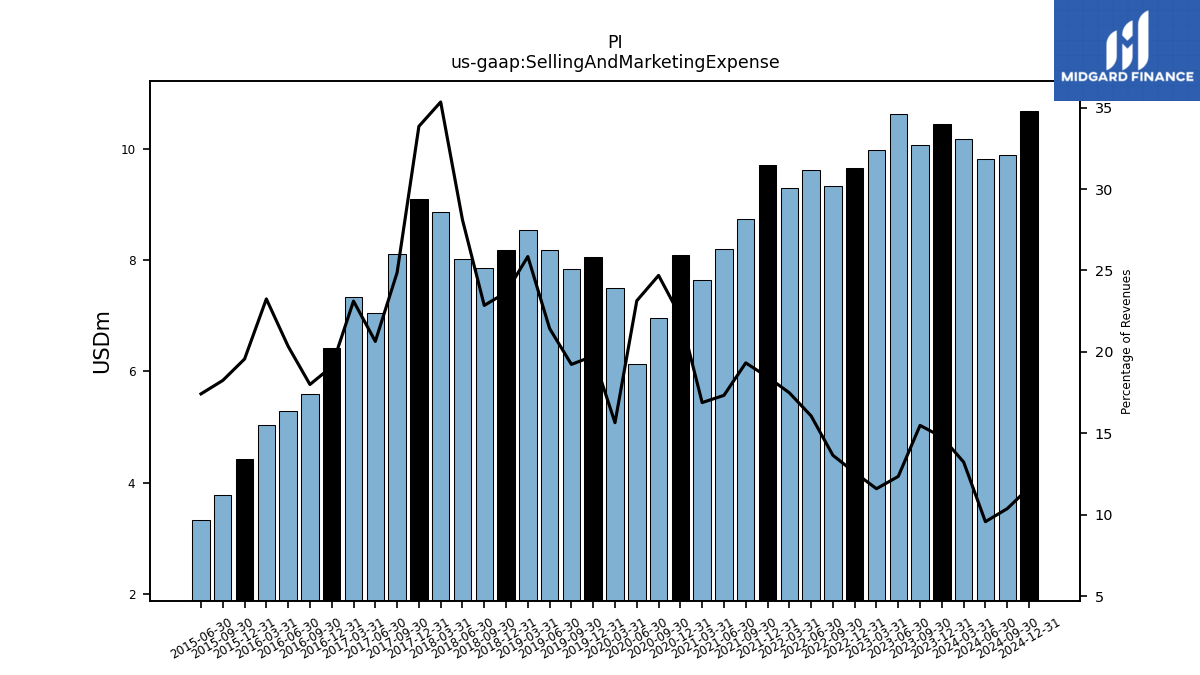
| Selling And Marketing Expense | 10.07 | 10.63 | 9.97 | 9.65 | 9.33 | 9.61 | 9.30 | 9.71 | 8.74 | 8.20 | 7.64 | 8.09 | 6.96 | 6.12 | 7.49 | 8.06 | 7.84 | 8.19 | 8.55 | 8.19 | 7.86 | 8.02 | 8.86 | 9.09 | 8.11 | 7.04 | 7.34 | 6.43 | 5.58 | 5.29 | 5.03 | 4.43 | 3.77 | 3.33 | |
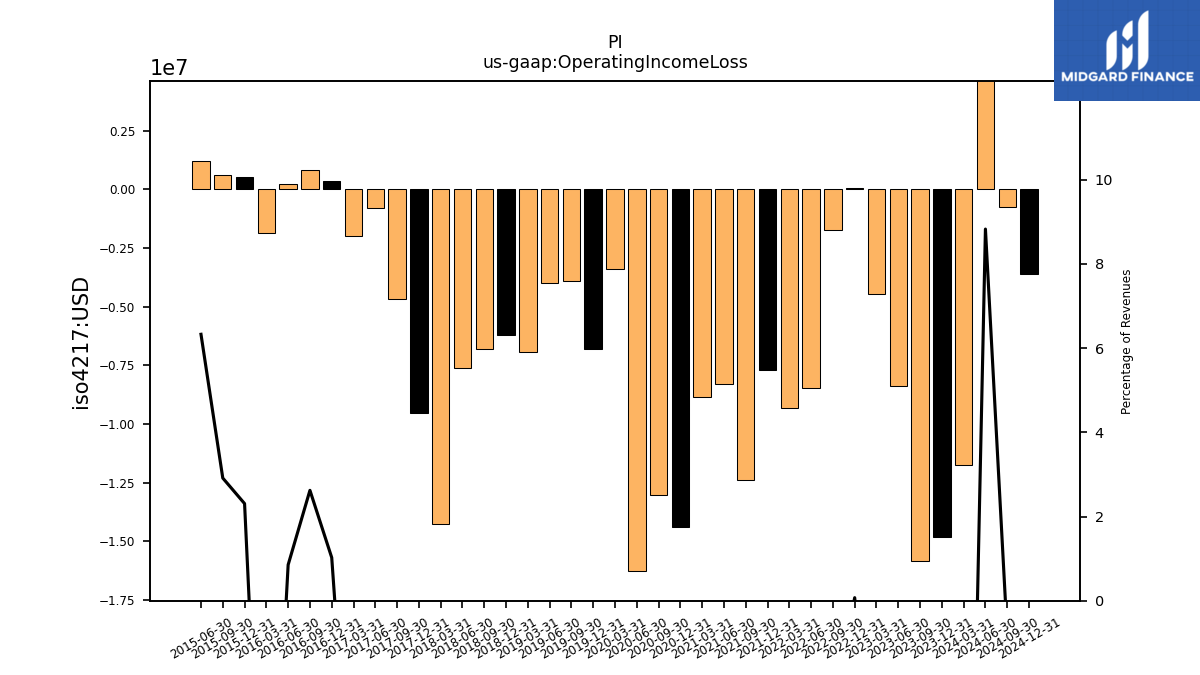
| Operating Income Loss | -15.83 | -8.37 | -4.44 | 0.06 | -1.74 | -8.48 | -9.31 | -7.69 | -12.37 | -8.32 | -8.87 | -14.39 | -13.02 | -16.27 | -3.40 | -6.82 | -3.91 | -4.00 | -6.93 | -6.19 | -6.82 | -7.61 | -14.25 | -9.52 | -4.68 | -0.81 | -2.00 | 0.34 | 0.81 | 0.22 | -1.87 | 0.52 | 0.60 | 1.21 | |
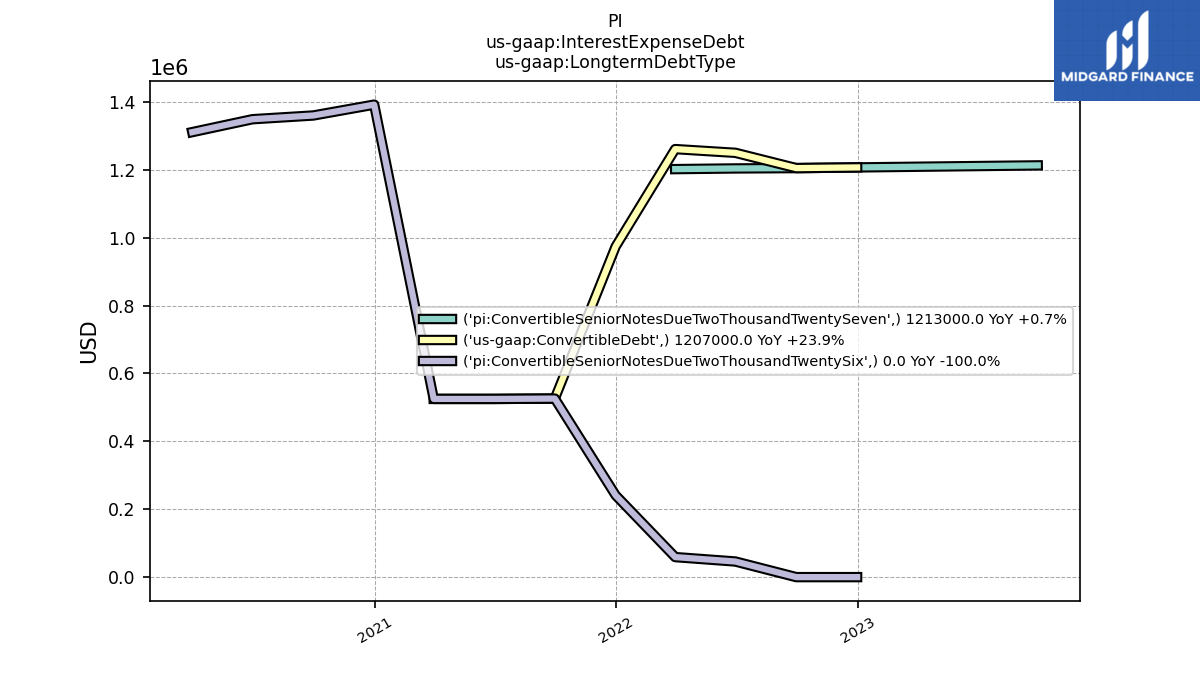
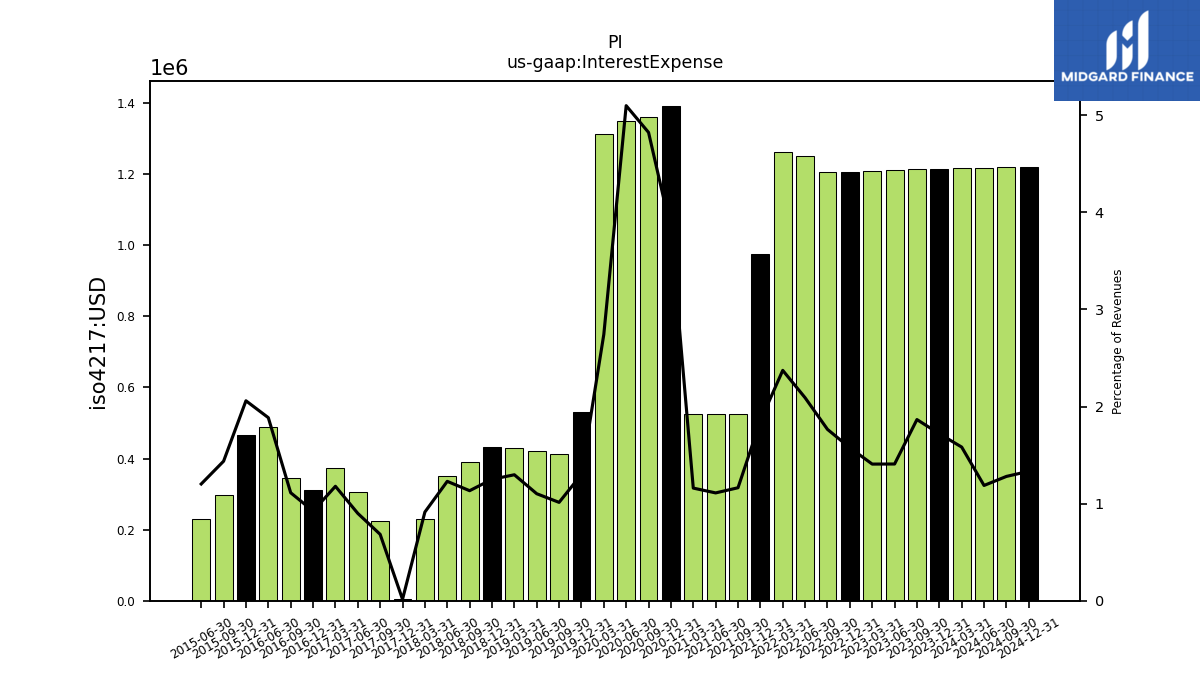
| Interest Expense | 1.21 | 1.21 | 1.21 | 1.21 | 1.21 | 1.25 | 1.26 | 0.97 | 0.53 | 0.53 | 0.53 | 1.39 | 1.36 | 1.35 | 1.31 | 0.53 | 0.41 | 0.42 | 0.43 | 0.43 | 0.39 | 0.35 | 0.23 | 0.00 | 0.22 | 0.31 | 0.37 | 0.31 | 0.34 | 0.49 | NA | 0.47 | 0.30 | 0.23 | |
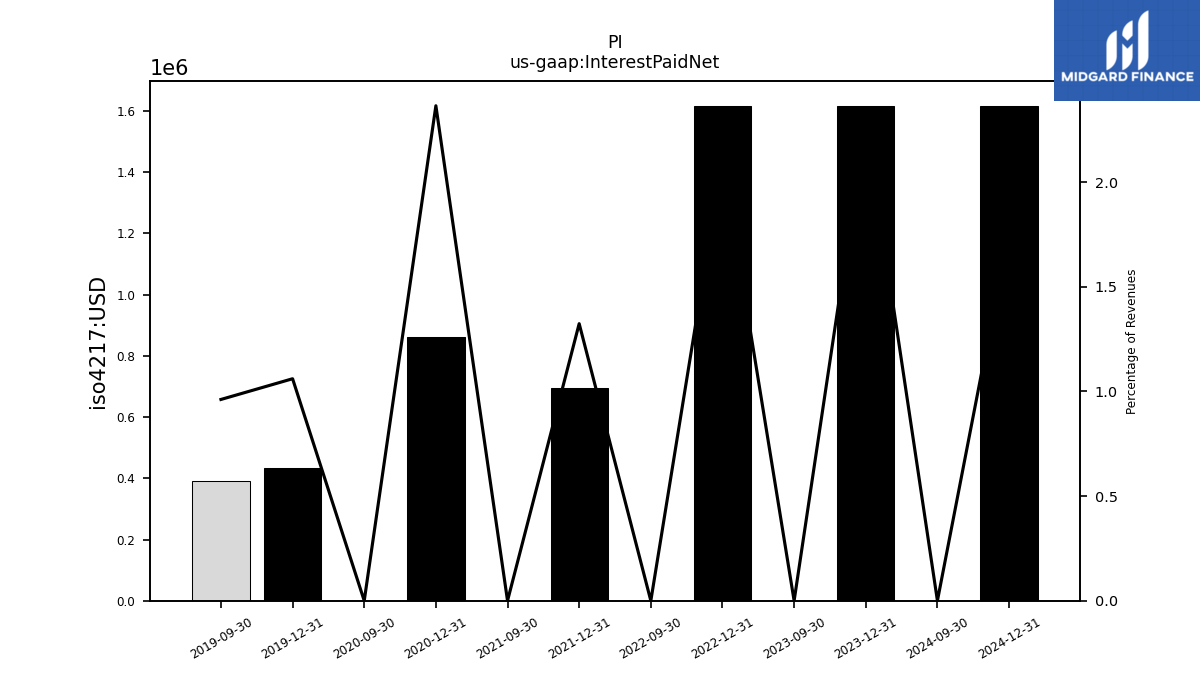
| Interest Paid Net | 0.00 | NA | NA | 1.62 | 0.00 | NA | NA | 0.70 | 0.00 | NA | NA | 0.86 | 0.00 | NA | NA | 0.43 | 0.39 | NA | NA | NA | NA | NA | NA | NA | NA | NA | NA | NA | NA | NA | NA | NA | NA | NA | |
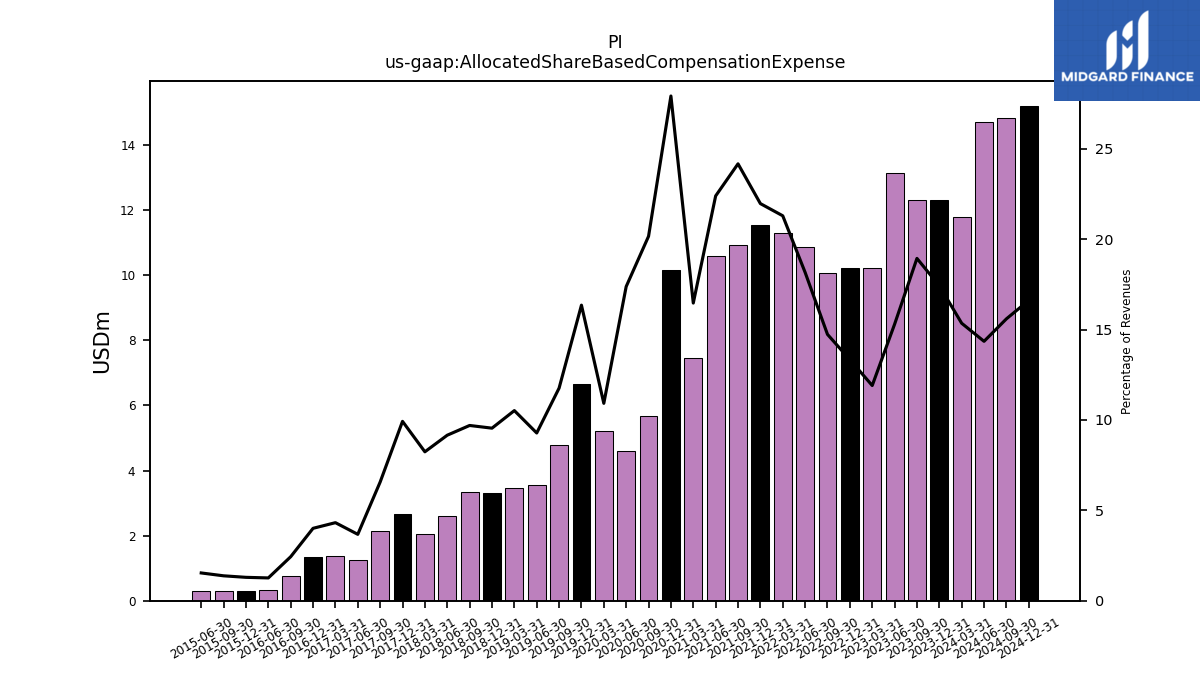
| Allocated Share Based Compensation Expense | 12.31 | 13.15 | 10.22 | 10.21 | 10.06 | 10.86 | 11.31 | 11.55 | 10.92 | 10.58 | 7.45 | 10.17 | 5.68 | 4.60 | 5.22 | 6.67 | 4.79 | 3.54 | 3.48 | 3.30 | 3.33 | 2.61 | 2.06 | 2.67 | 2.14 | 1.25 | 1.37 | 1.35 | 0.76 | 0.33 | NA | 0.29 | 0.28 | 0.29 | |
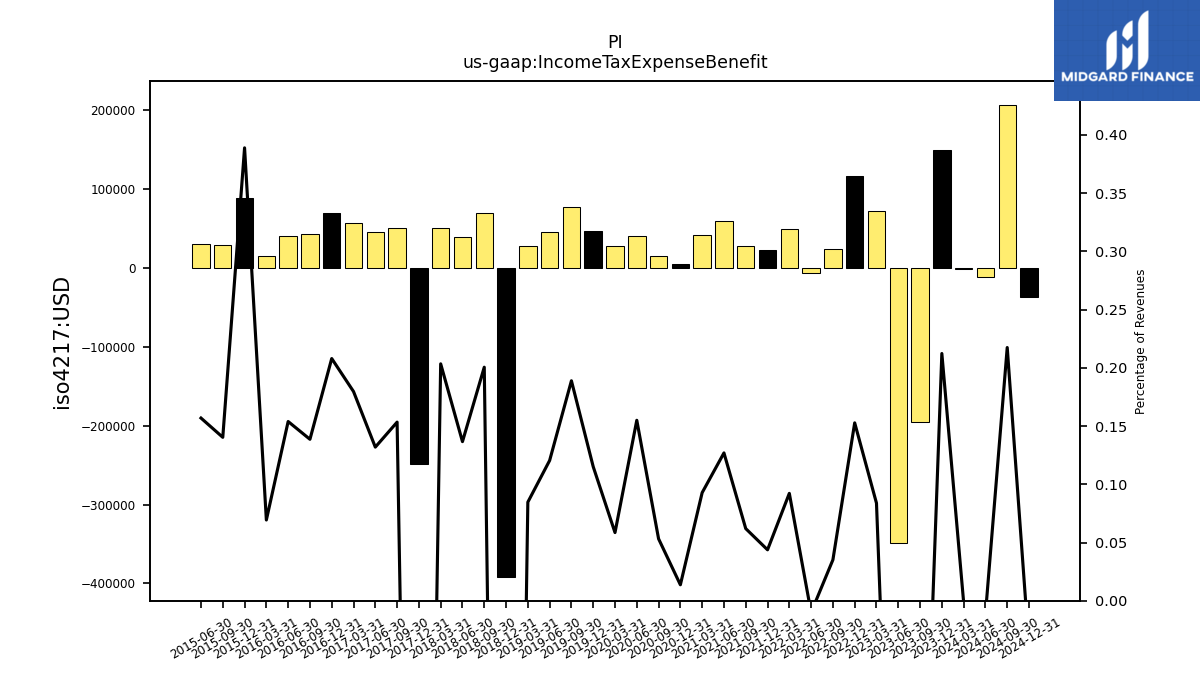
| Income Tax Expense Benefit | -0.20 | -0.35 | 0.07 | 0.12 | 0.02 | -0.01 | 0.05 | 0.02 | 0.03 | 0.06 | 0.04 | 0.01 | 0.01 | 0.04 | 0.03 | 0.05 | 0.08 | 0.05 | 0.03 | -0.39 | 0.07 | 0.04 | 0.05 | -0.25 | 0.05 | 0.04 | 0.06 | 0.07 | 0.04 | 0.04 | 0.01 | 0.09 | 0.03 | 0.03 | |
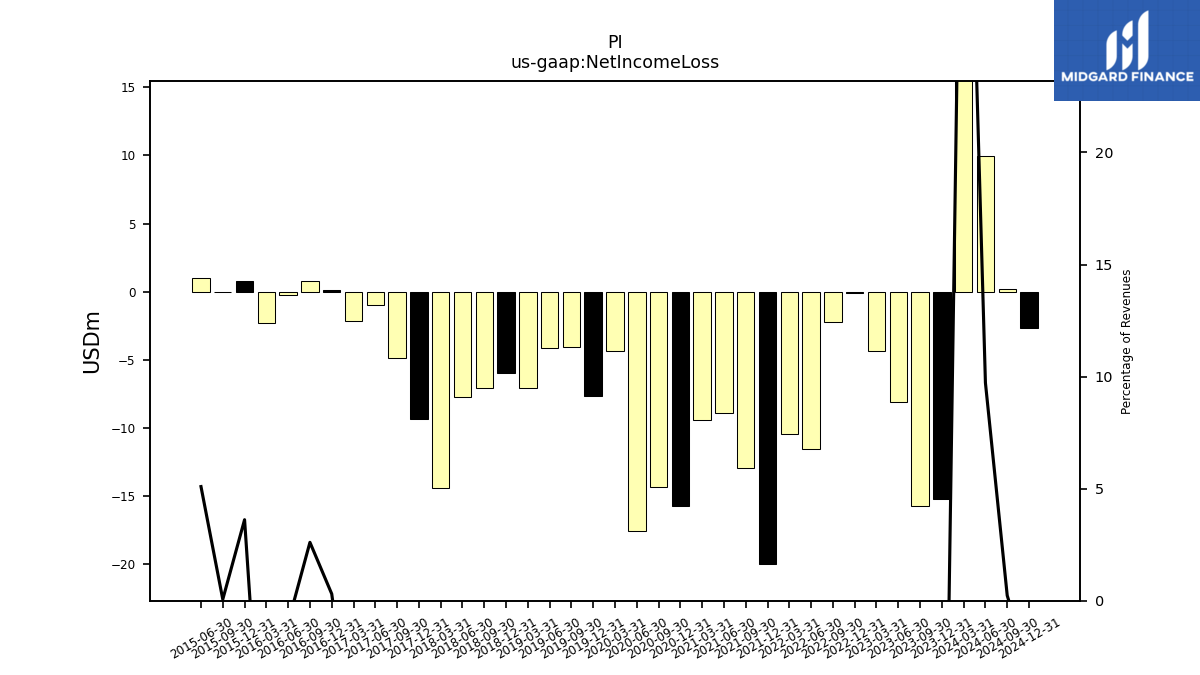
| Net Income Loss | -15.76 | -8.07 | -4.36 | -0.12 | -2.20 | -11.52 | -10.46 | -20.01 | -12.92 | -8.91 | -9.42 | -15.72 | -14.35 | -17.53 | -4.33 | -7.68 | -4.08 | -4.16 | -7.07 | -5.99 | -7.07 | -7.73 | -14.44 | -9.33 | -4.85 | -0.98 | -2.16 | 0.10 | 0.81 | -0.25 | -2.33 | 0.82 | 0.01 | 0.97 | |
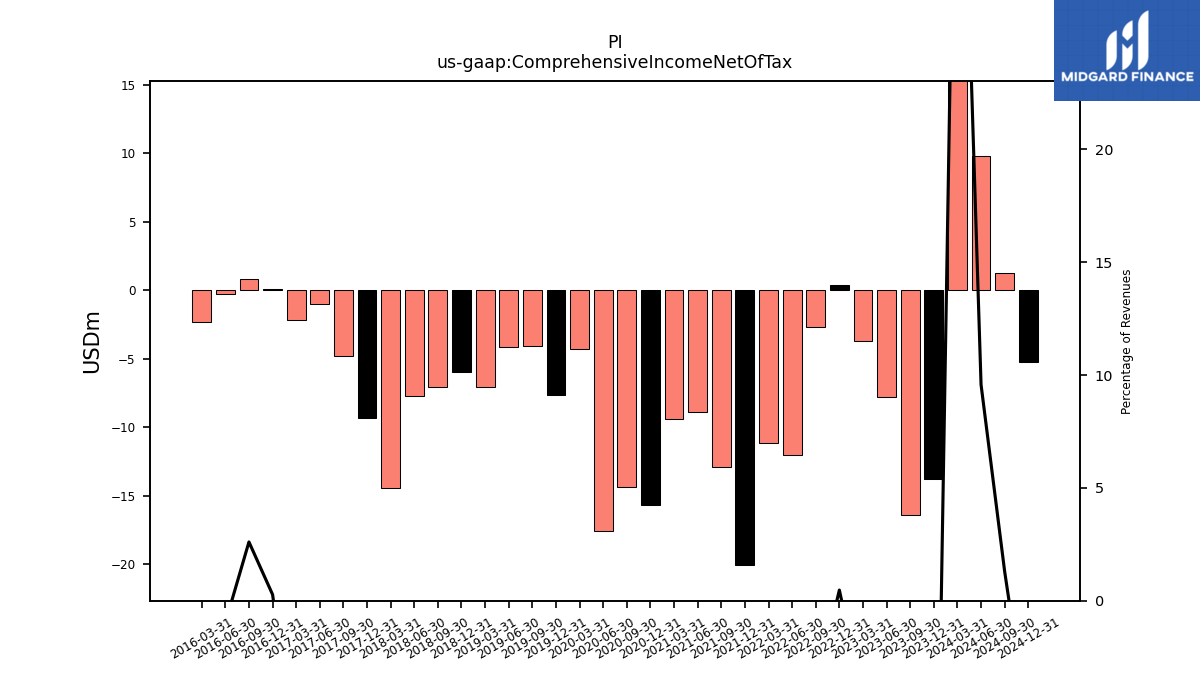
| Comprehensive Income Net Of Tax | -16.44 | -7.79 | -3.71 | 0.36 | -2.70 | -12.03 | -11.14 | -20.05 | -12.93 | -8.90 | -9.42 | -15.73 | -14.39 | -17.58 | -4.25 | -7.68 | -4.08 | -4.13 | -7.05 | -5.98 | -7.05 | -7.71 | -14.46 | -9.35 | -4.82 | -0.98 | -2.20 | 0.09 | 0.81 | -0.25 | -2.33 | NA | NA | NA |
| 2023-09-30 | 2023-06-30 | 2023-03-31 | 2022-12-31 | 2022-09-30 | 2022-06-30 | 2022-03-31 | 2021-12-31 | 2021-09-30 | 2021-06-30 | 2021-03-31 | 2020-12-31 | 2020-09-30 | 2020-06-30 | 2020-03-31 | 2019-12-31 | 2019-09-30 | 2019-06-30 | 2019-03-31 | 2018-12-31 | 2018-09-30 | 2018-06-30 | 2018-03-31 | 2017-12-31 | 2017-09-30 | 2017-06-30 | 2017-03-31 | 2016-12-31 | 2016-09-30 | 2016-06-30 | 2016-03-31 | 2015-12-31 | 2015-09-30 | 2015-06-30 | ||
|---|---|---|---|---|---|---|---|---|---|---|---|---|---|---|---|---|---|---|---|---|---|---|---|---|---|---|---|---|---|---|---|---|---|---|---|
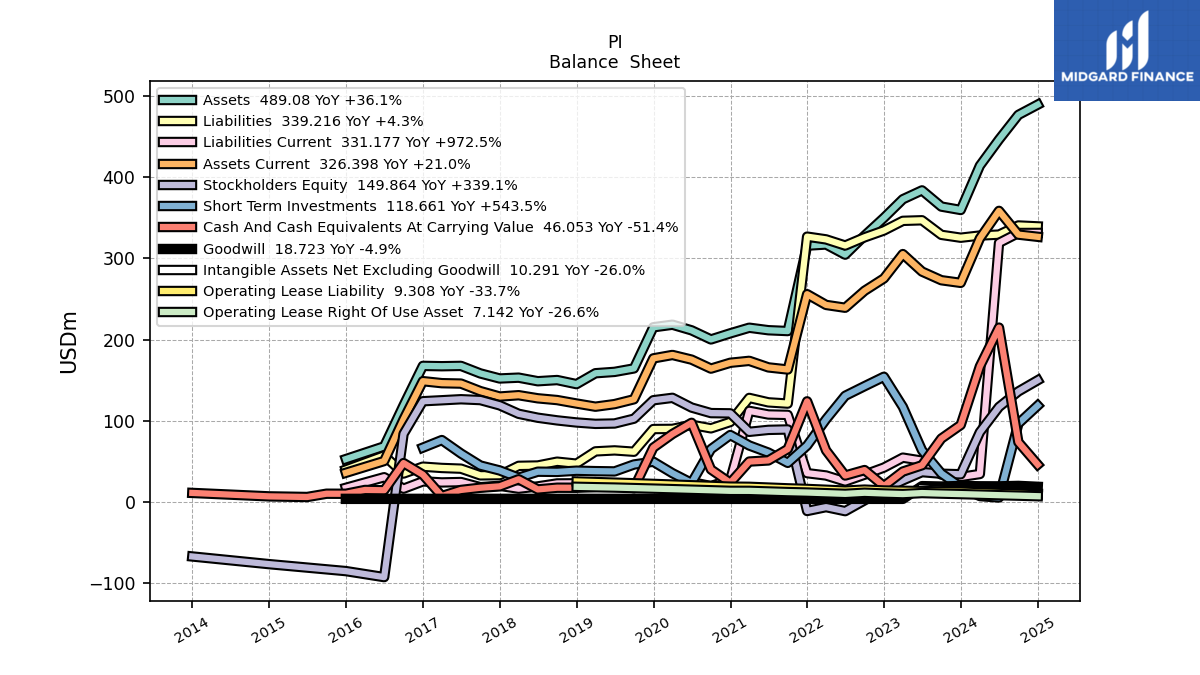
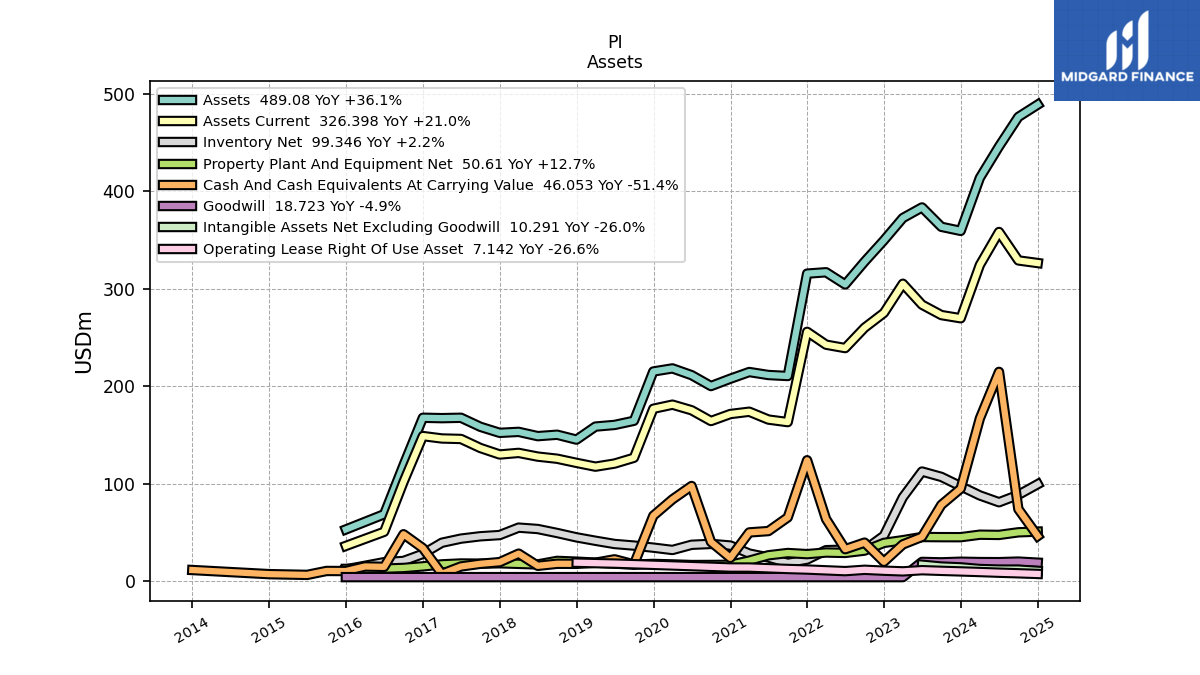
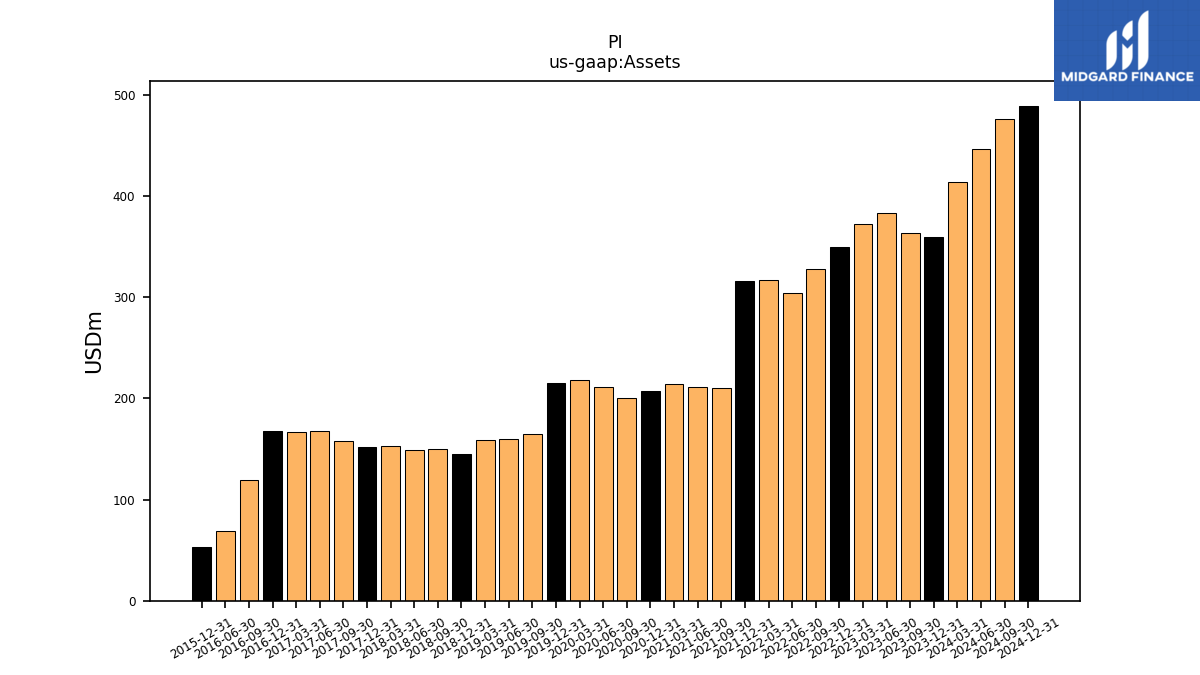
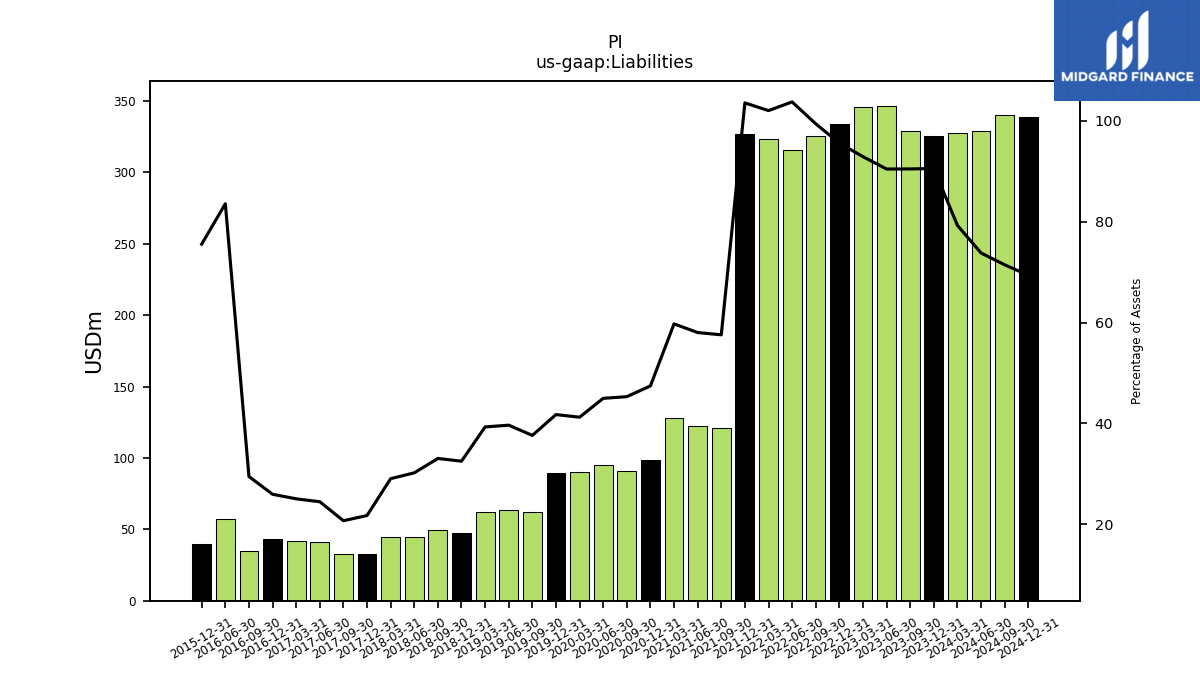
| Assets | 363.60 | 383.55 | 372.65 | 349.74 | 327.79 | 304.41 | 316.94 | 315.54 | 210.39 | 211.42 | 214.49 | 207.62 | 200.08 | 211.28 | 218.21 | 215.05 | 164.41 | 160.16 | 158.48 | 145.07 | 150.10 | 148.65 | 153.04 | 152.03 | 158.25 | 167.51 | 167.13 | 167.54 | 118.83 | 68.45 | NA | 52.85 | NA | NA | |
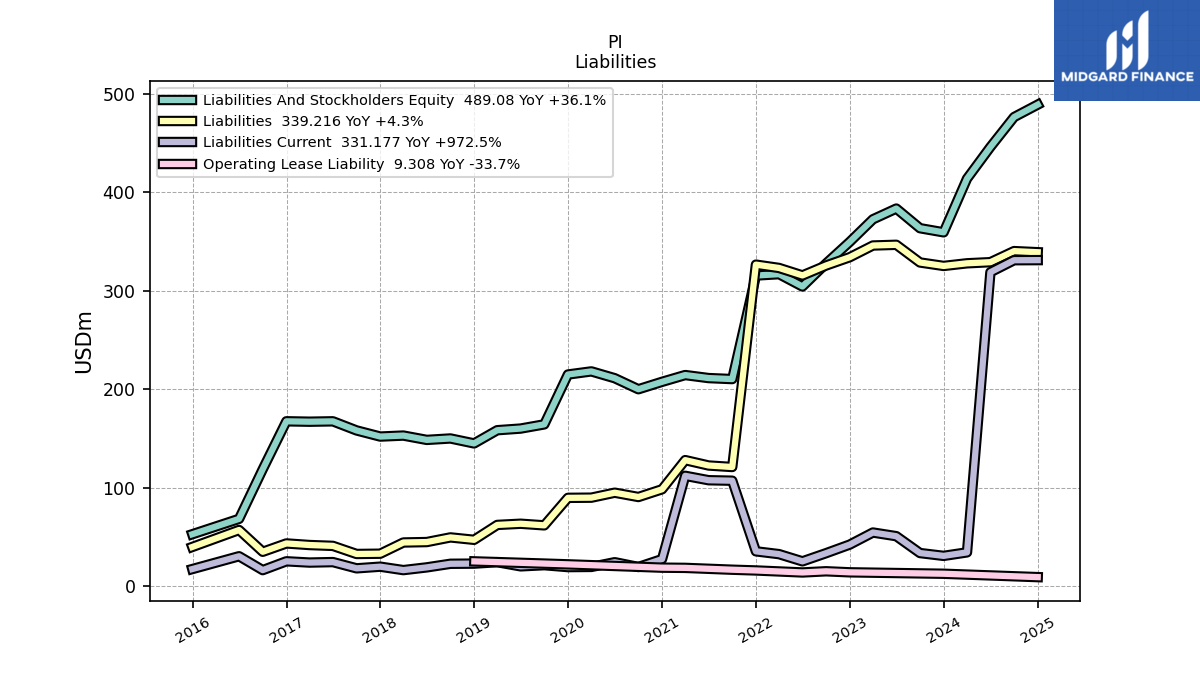
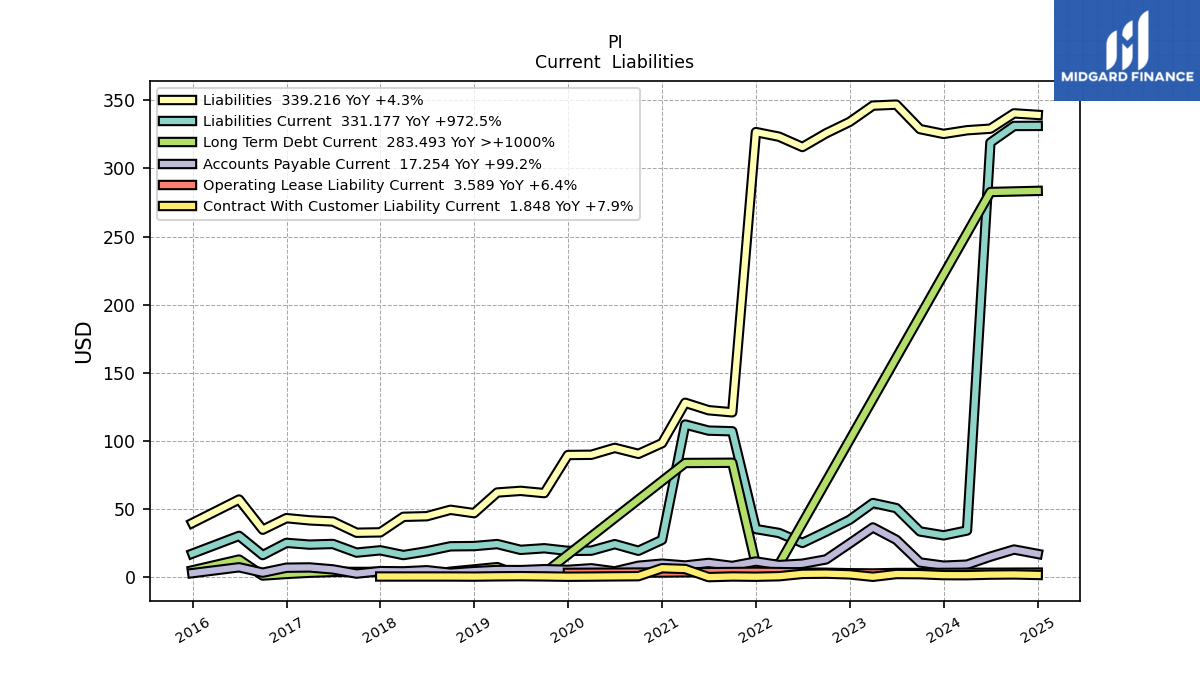
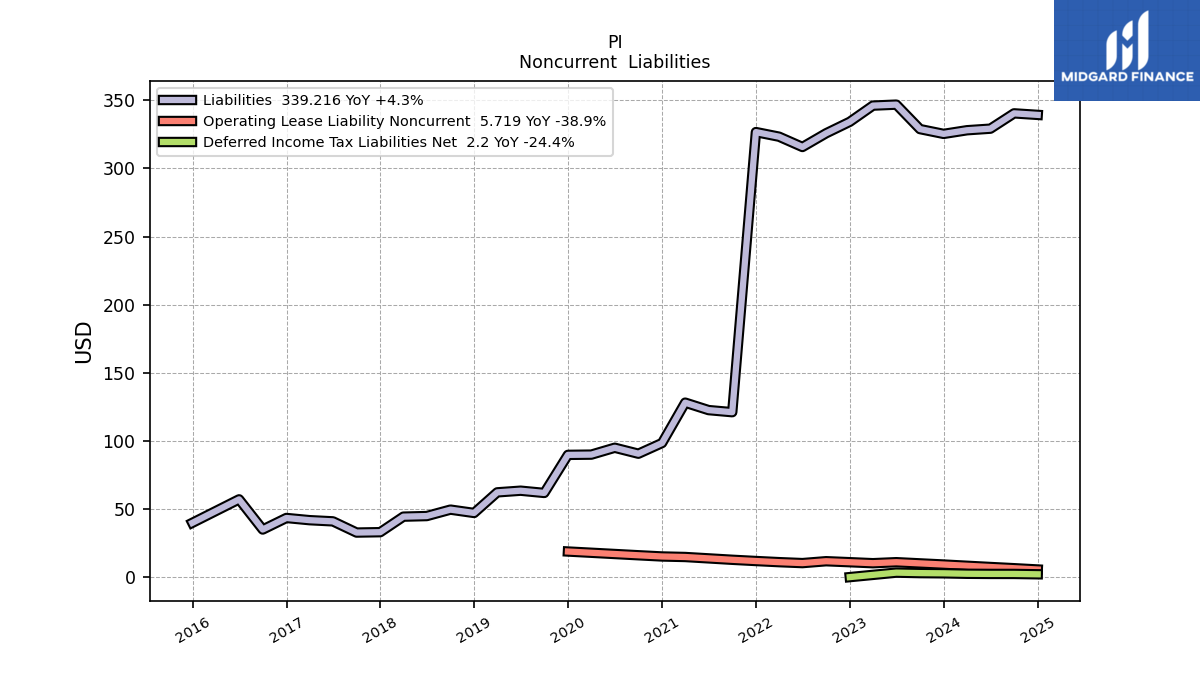
| Liabilities | 328.80 | 346.75 | 346.03 | 334.15 | 325.73 | 315.67 | 323.23 | 326.61 | 121.11 | 122.65 | 128.12 | 98.50 | 90.65 | 95.03 | 89.99 | 89.81 | 61.87 | 63.52 | 62.31 | 47.19 | 49.64 | 44.92 | 44.48 | 33.09 | 32.81 | 41.03 | 41.90 | 43.51 | 35.04 | 57.18 | NA | 39.92 | NA | NA | |
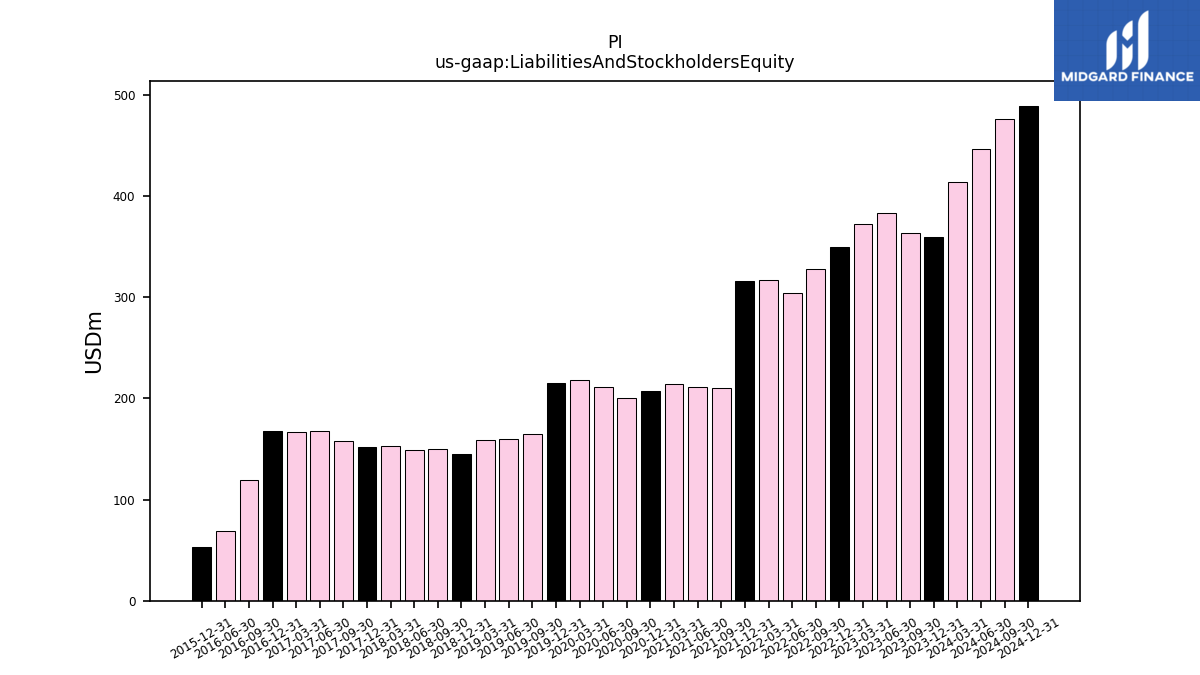
| Liabilities And Stockholders Equity | 363.60 | 383.55 | 372.65 | 349.74 | 327.79 | 304.41 | 316.94 | 315.54 | 210.39 | 211.42 | 214.49 | 207.62 | 200.08 | 211.28 | 218.21 | 215.05 | 164.41 | 160.16 | 158.48 | 145.07 | 150.10 | 148.65 | 153.04 | 152.03 | 158.25 | 167.51 | 167.13 | 167.54 | 118.83 | 68.45 | NA | 52.85 | NA | NA | |
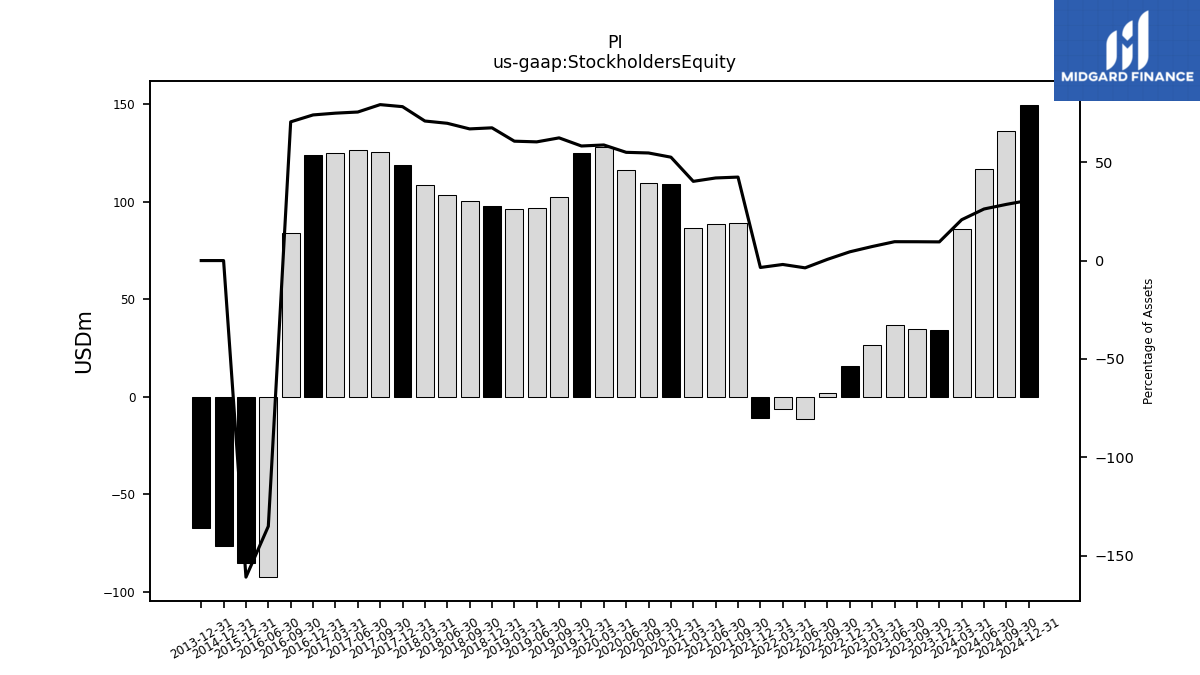
| Stockholders Equity | 34.80 | 36.80 | 26.62 | 15.59 | 2.06 | -11.26 | -6.29 | -11.08 | 89.28 | 88.77 | 86.38 | 109.12 | 109.43 | 116.25 | 128.22 | 125.24 | 102.54 | 96.63 | 96.17 | 97.88 | 100.46 | 103.73 | 108.56 | 118.94 | 125.44 | 126.48 | 125.23 | 124.02 | 83.79 | -92.45 | NA | -85.03 | NA | NA |
| 2023-09-30 | 2023-06-30 | 2023-03-31 | 2022-12-31 | 2022-09-30 | 2022-06-30 | 2022-03-31 | 2021-12-31 | 2021-09-30 | 2021-06-30 | 2021-03-31 | 2020-12-31 | 2020-09-30 | 2020-06-30 | 2020-03-31 | 2019-12-31 | 2019-09-30 | 2019-06-30 | 2019-03-31 | 2018-12-31 | 2018-09-30 | 2018-06-30 | 2018-03-31 | 2017-12-31 | 2017-09-30 | 2017-06-30 | 2017-03-31 | 2016-12-31 | 2016-09-30 | 2016-06-30 | 2016-03-31 | 2015-12-31 | 2015-09-30 | 2015-06-30 | ||
|---|---|---|---|---|---|---|---|---|---|---|---|---|---|---|---|---|---|---|---|---|---|---|---|---|---|---|---|---|---|---|---|---|---|---|---|
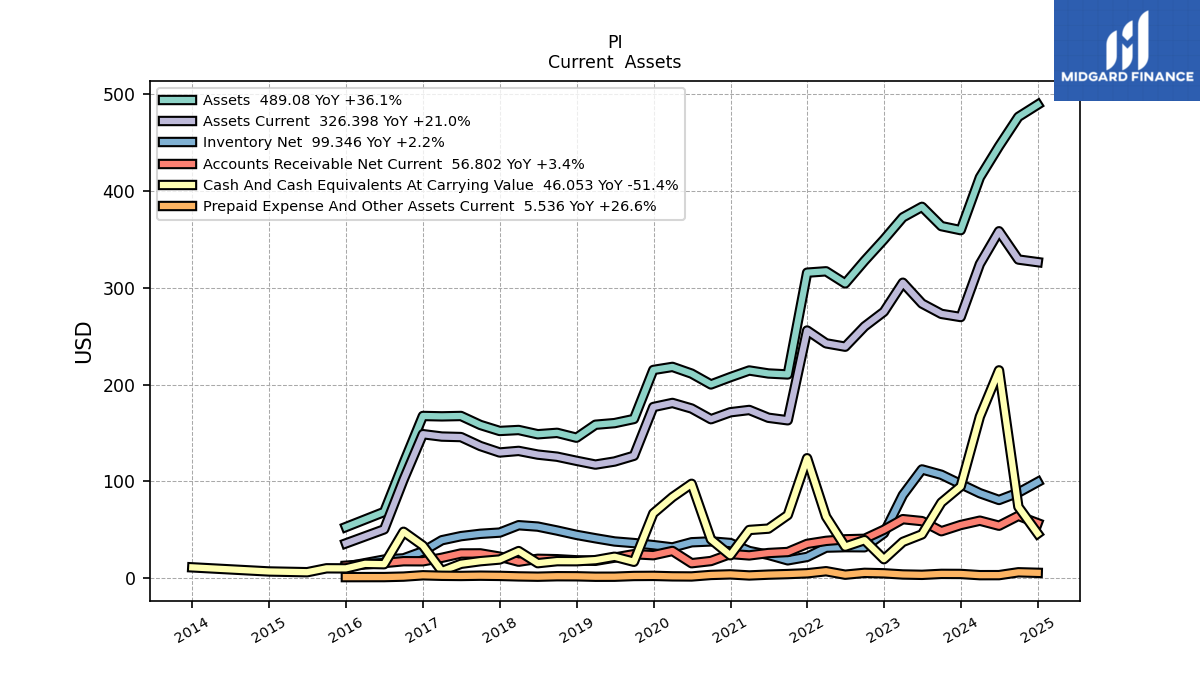
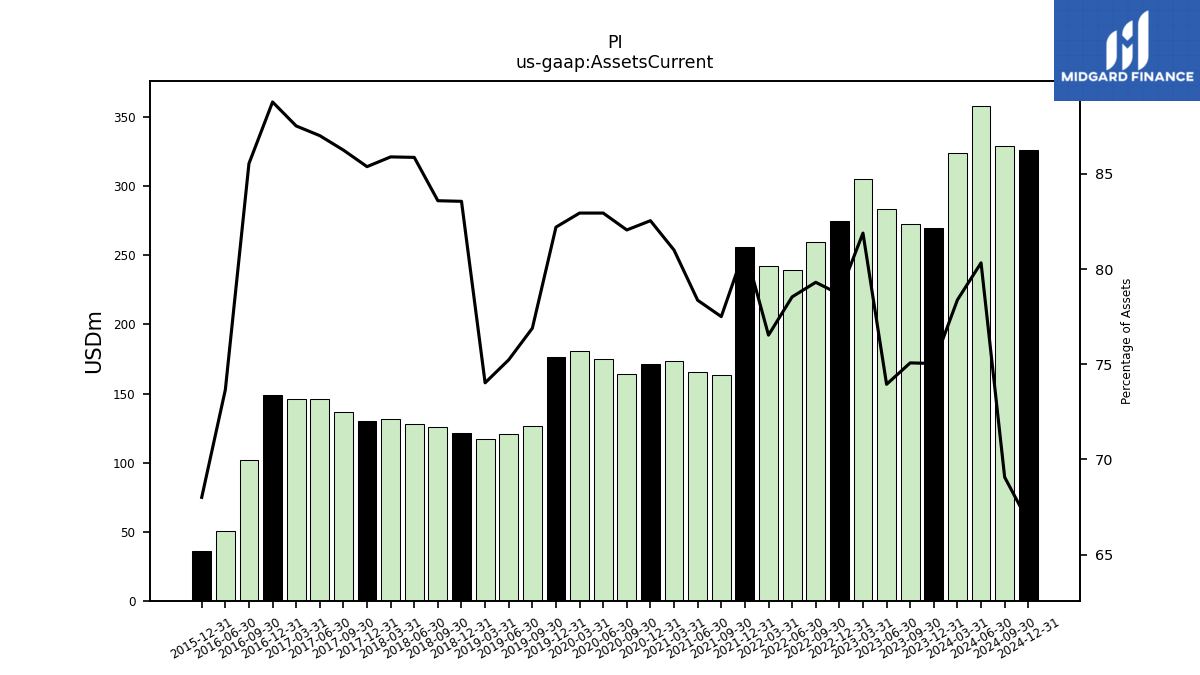
| Assets Current | 272.96 | 283.62 | 305.15 | 275.17 | 259.95 | 239.08 | 242.56 | 255.80 | 163.06 | 165.67 | 173.73 | 171.36 | 164.17 | 175.24 | 180.98 | 176.77 | 126.42 | 120.49 | 117.31 | 121.21 | 125.47 | 127.63 | 131.45 | 129.80 | 136.49 | 145.74 | 146.26 | 148.73 | 101.64 | 50.42 | NA | 35.94 | NA | NA | |
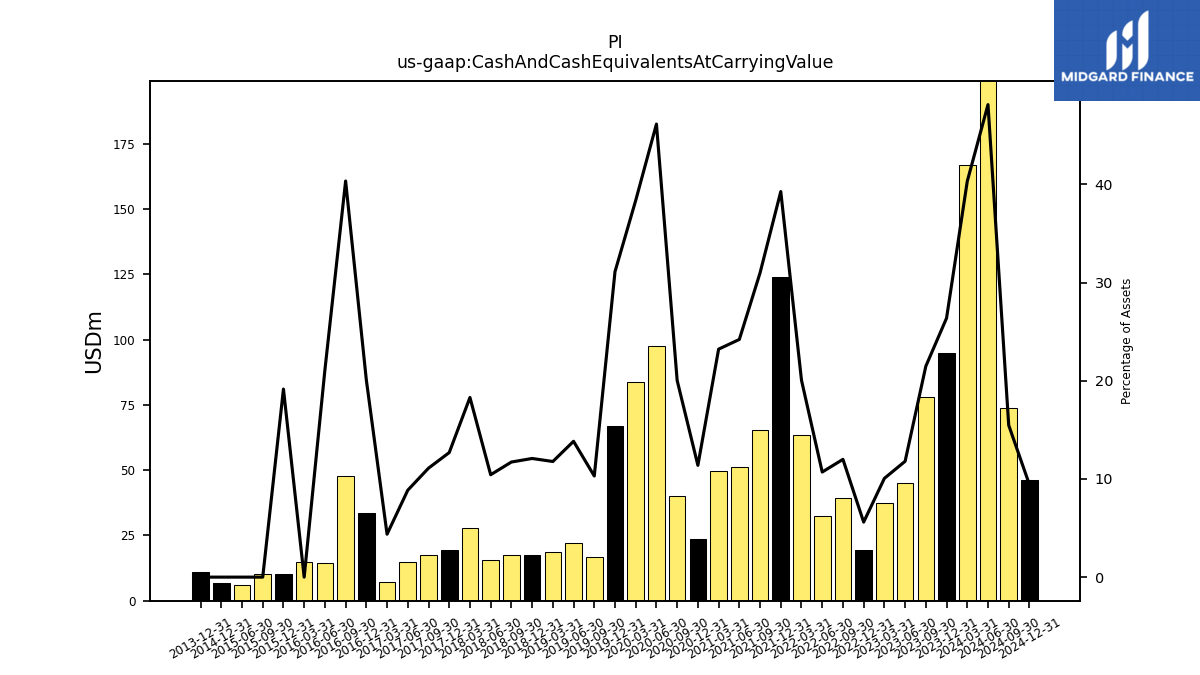
| Cash And Cash Equivalents At Carrying Value | 78.10 | 45.24 | 37.48 | 19.60 | 39.31 | 32.58 | 63.54 | 123.90 | 65.19 | 51.17 | 49.80 | 23.64 | 40.06 | 97.49 | 83.72 | 66.90 | 16.93 | 22.15 | 18.66 | 17.53 | 17.59 | 15.50 | 28.00 | 19.29 | 17.56 | 14.83 | 7.31 | 33.64 | 47.94 | 14.43 | 14.82 | 10.12 | 10.20 | 6.17 | |
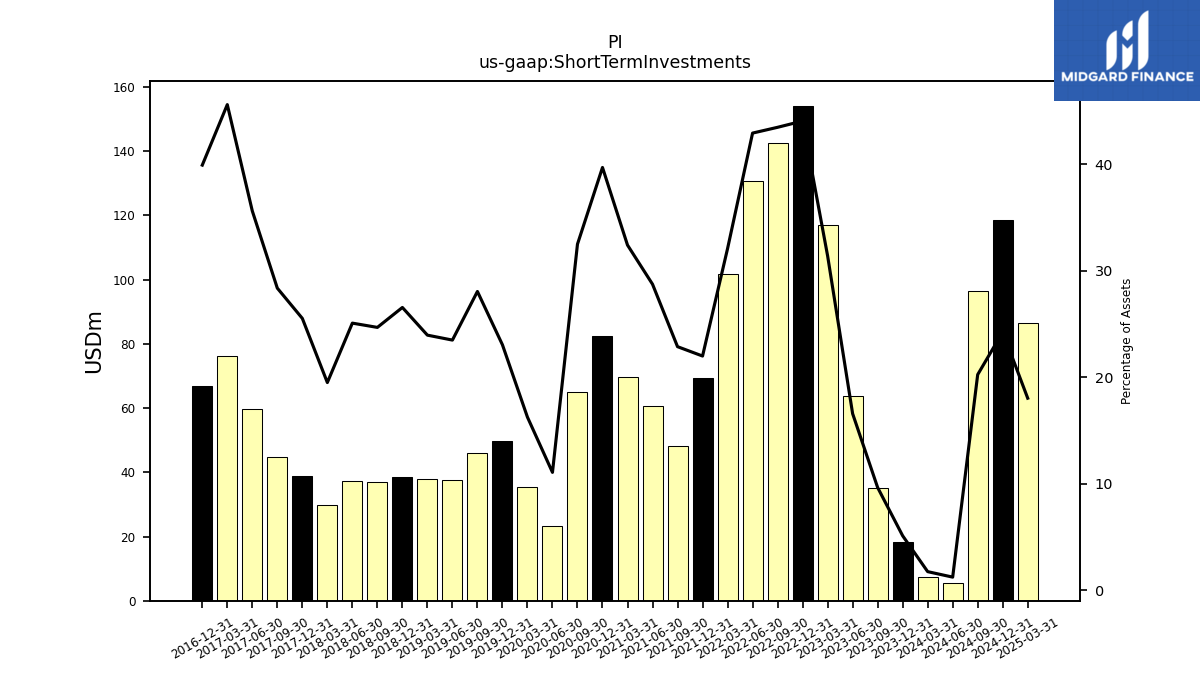
| Short Term Investments | 35.13 | 63.66 | 117.06 | 154.15 | 142.54 | 130.72 | 101.72 | 69.44 | 48.15 | 60.79 | 69.55 | 82.45 | 65.06 | 23.42 | 35.50 | 49.60 | 46.15 | 37.65 | 37.99 | 38.54 | 37.07 | 37.31 | 29.87 | 38.83 | 44.92 | 59.68 | 76.23 | 66.91 | NA | NA | NA | NA | NA | NA | |
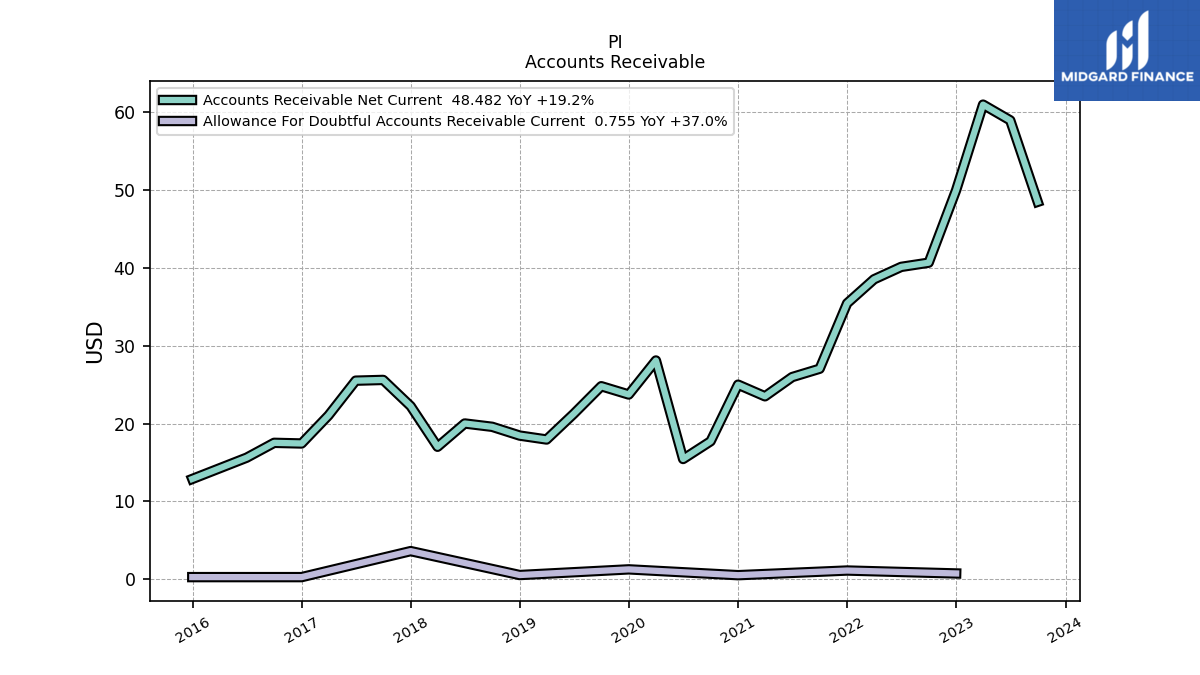
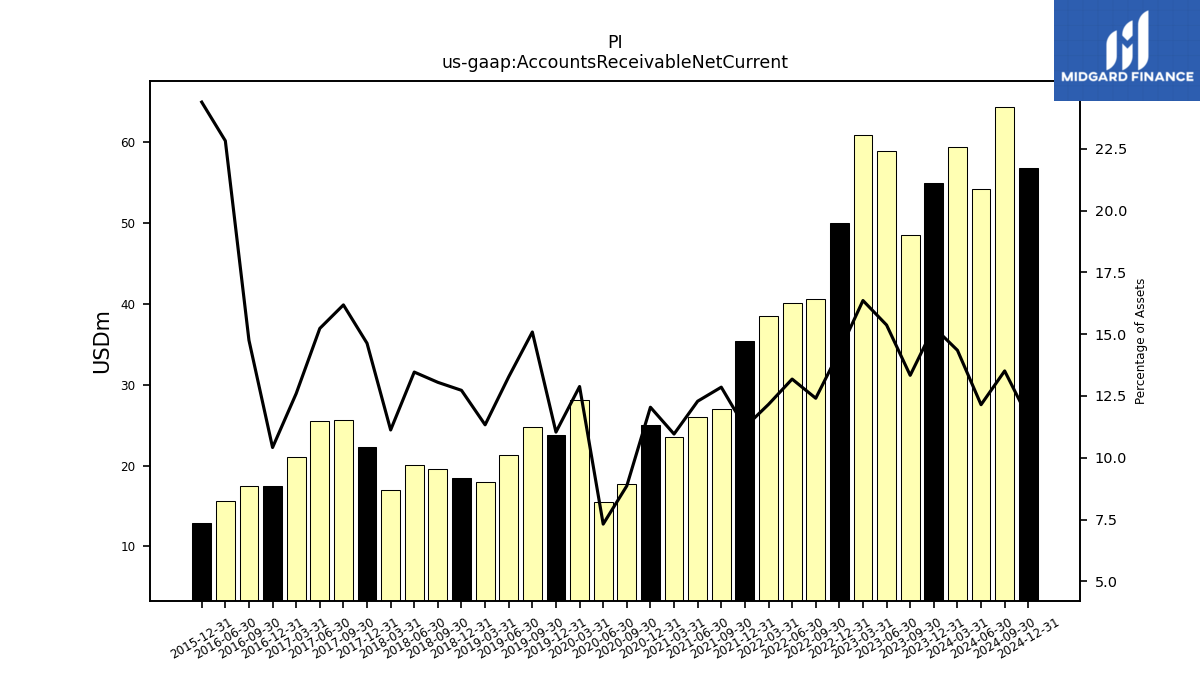
| Accounts Receivable Net Current | 48.48 | 58.95 | 60.97 | 50.00 | 40.67 | 40.13 | 38.53 | 35.45 | 27.05 | 25.98 | 23.50 | 25.00 | 17.73 | 15.45 | 28.11 | 23.73 | 24.80 | 21.26 | 17.96 | 18.46 | 19.59 | 20.02 | 17.02 | 22.24 | 25.61 | 25.51 | 21.05 | 17.45 | 17.53 | 15.62 | NA | 12.89 | NA | NA | |
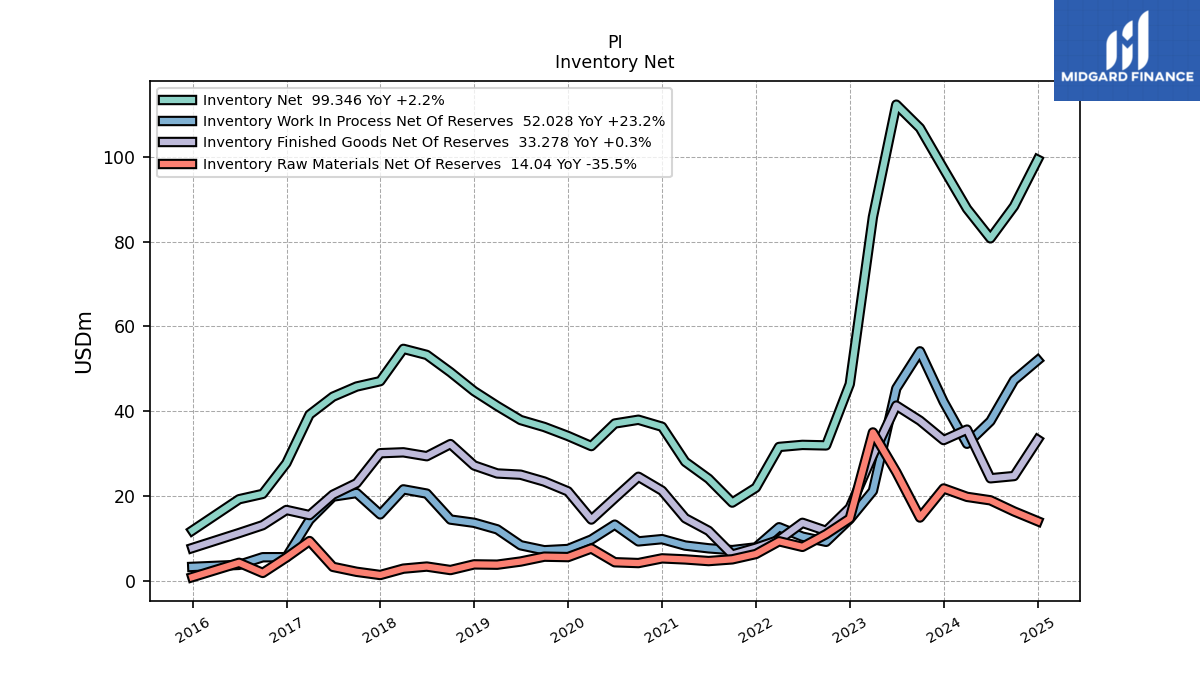
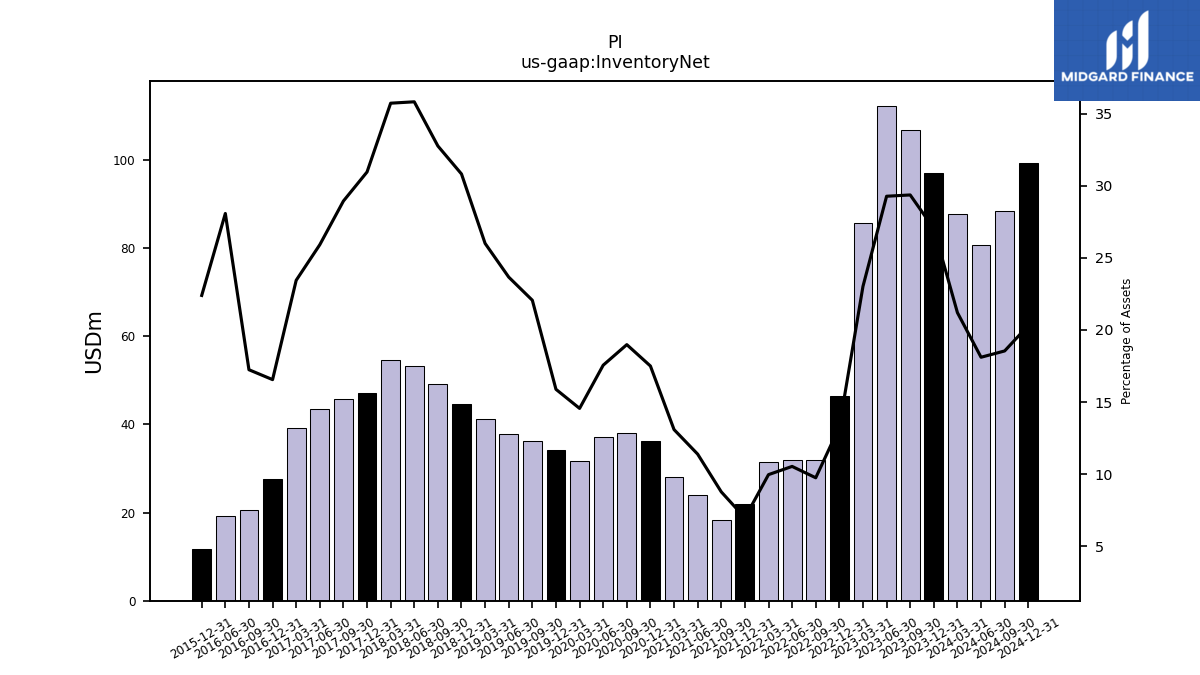
| Inventory Net | 106.81 | 112.32 | 85.81 | 46.40 | 31.93 | 32.05 | 31.56 | 21.96 | 18.43 | 24.06 | 28.07 | 36.33 | 37.98 | 37.09 | 31.76 | 34.15 | 36.27 | 37.91 | 41.22 | 44.73 | 49.20 | 53.28 | 54.71 | 47.08 | 45.82 | 43.42 | 39.19 | 27.73 | 20.49 | 19.23 | NA | 11.84 | NA | NA | |
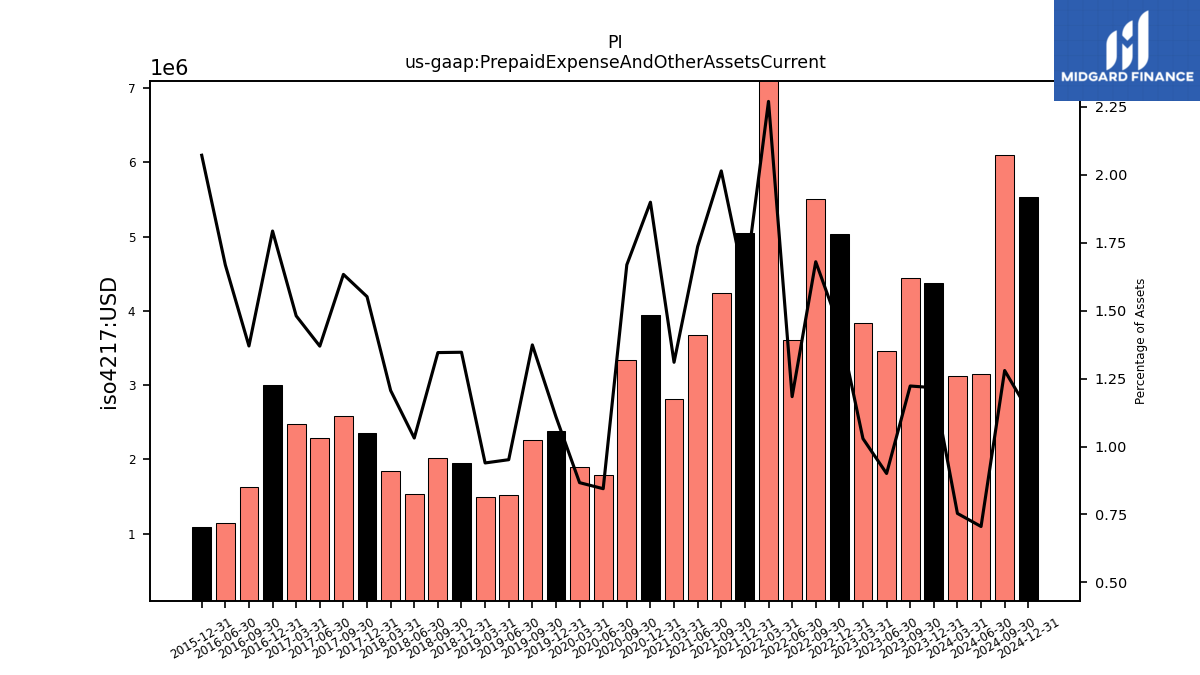
| Prepaid Expense And Other Assets Current | 4.45 | 3.46 | 3.83 | 5.03 | 5.51 | 3.60 | 7.20 | 5.05 | 4.24 | 3.67 | 2.81 | 3.94 | 3.34 | 1.78 | 1.89 | 2.39 | 2.26 | 1.52 | 1.49 | 1.95 | 2.02 | 1.53 | 1.85 | 2.36 | 2.58 | 2.29 | 2.48 | 3.00 | 1.63 | 1.14 | NA | 1.09 | NA | NA |
| 2023-09-30 | 2023-06-30 | 2023-03-31 | 2022-12-31 | 2022-09-30 | 2022-06-30 | 2022-03-31 | 2021-12-31 | 2021-09-30 | 2021-06-30 | 2021-03-31 | 2020-12-31 | 2020-09-30 | 2020-06-30 | 2020-03-31 | 2019-12-31 | 2019-09-30 | 2019-06-30 | 2019-03-31 | 2018-12-31 | 2018-09-30 | 2018-06-30 | 2018-03-31 | 2017-12-31 | 2017-09-30 | 2017-06-30 | 2017-03-31 | 2016-12-31 | 2016-09-30 | 2016-06-30 | 2016-03-31 | 2015-12-31 | 2015-09-30 | 2015-06-30 | ||
|---|---|---|---|---|---|---|---|---|---|---|---|---|---|---|---|---|---|---|---|---|---|---|---|---|---|---|---|---|---|---|---|---|---|---|---|
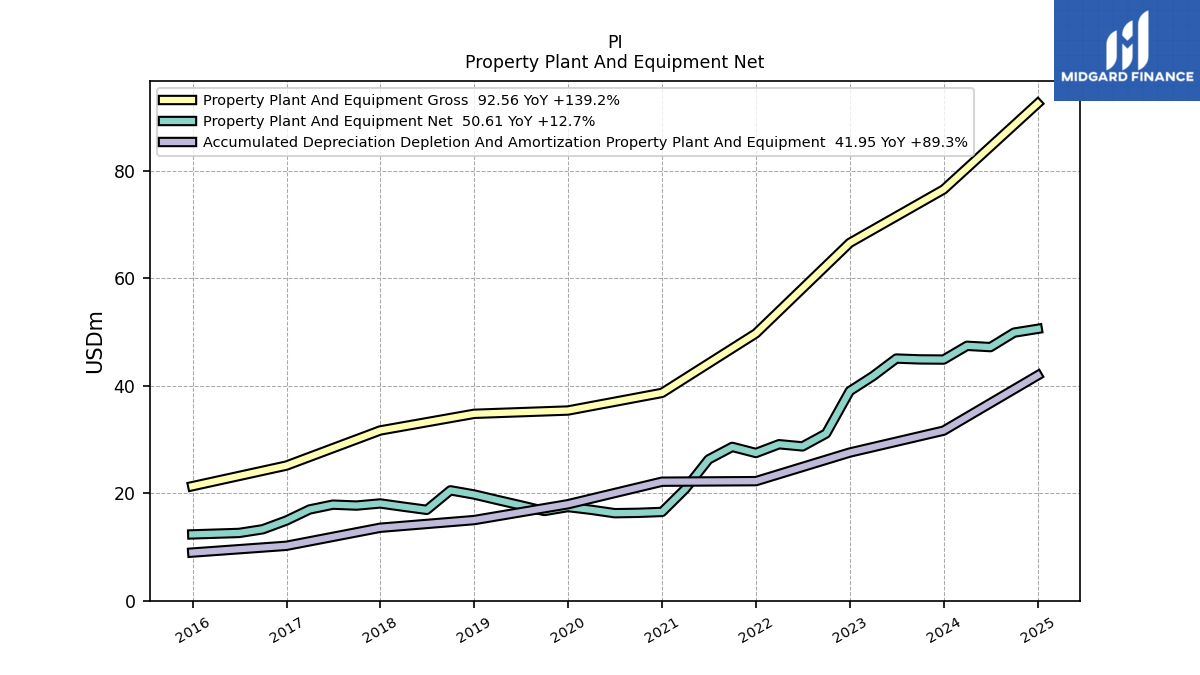
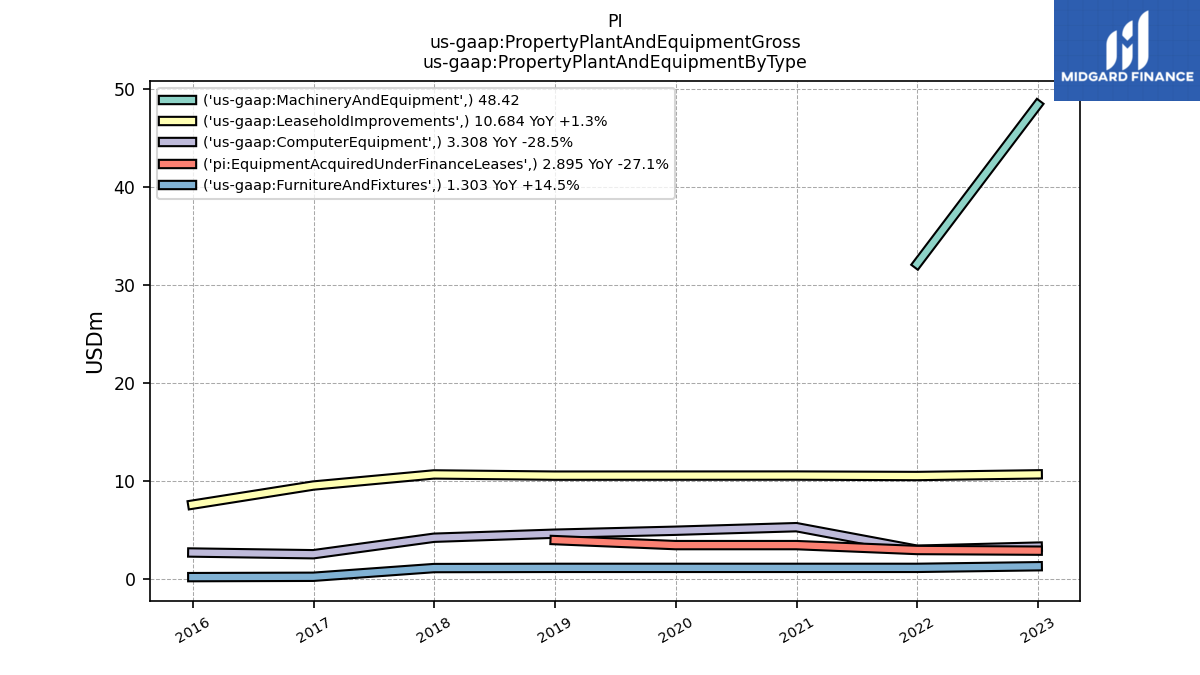
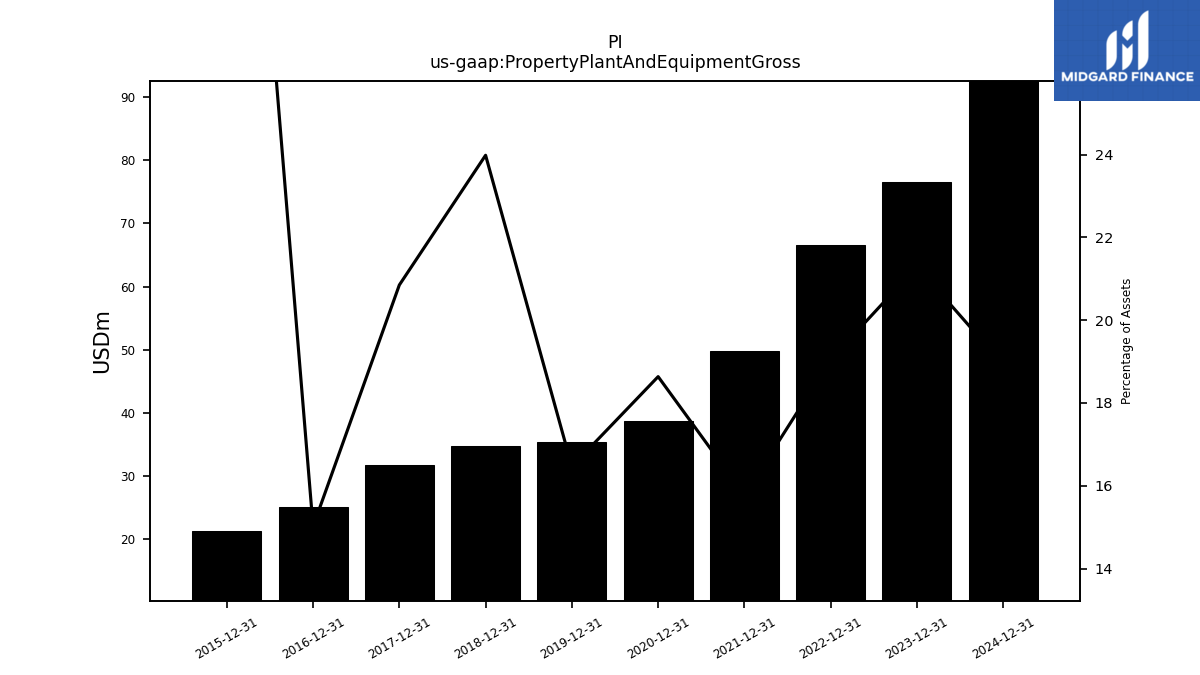
| Property Plant And Equipment Gross | NA | NA | NA | 66.61 | NA | NA | NA | 49.76 | NA | NA | NA | 38.69 | NA | NA | NA | 35.41 | NA | NA | NA | 34.79 | NA | NA | NA | 31.70 | NA | NA | NA | 25.16 | NA | NA | NA | 21.32 | NA | NA | |
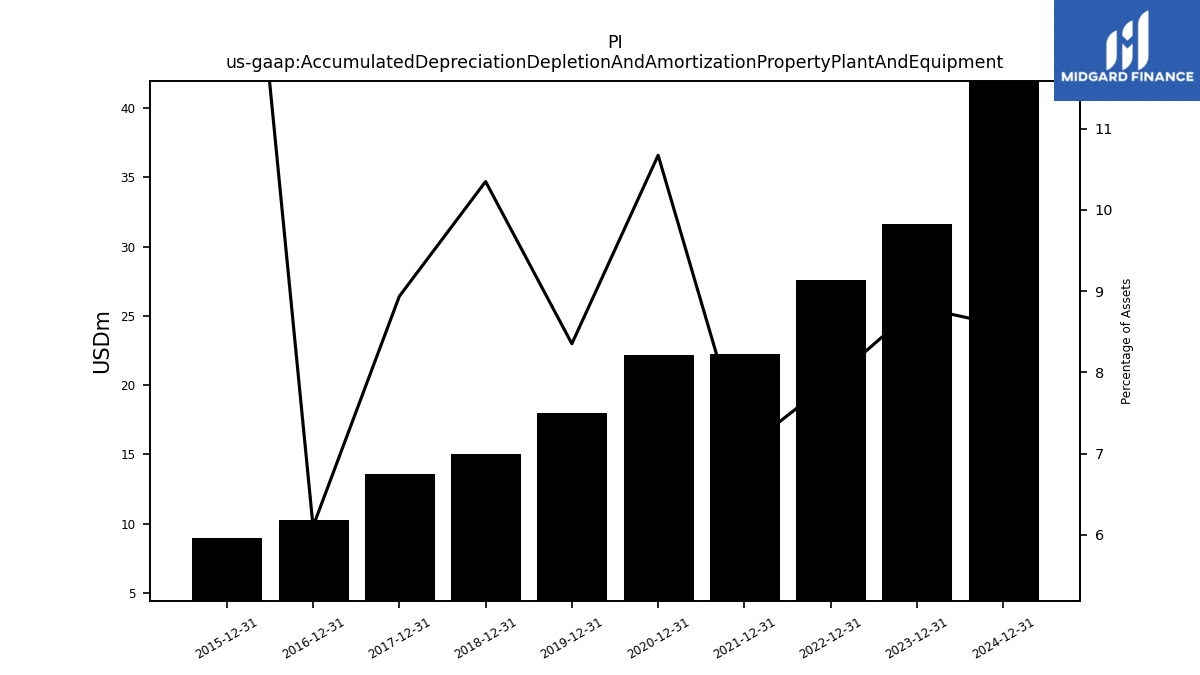
| Accumulated Depreciation Depletion And Amortization Property Plant And Equipment | NA | NA | NA | 27.58 | NA | NA | NA | 22.26 | NA | NA | NA | 22.16 | NA | NA | NA | 17.96 | NA | NA | NA | 15.01 | NA | NA | NA | 13.59 | NA | NA | NA | 10.23 | NA | NA | NA | 8.97 | NA | NA | |
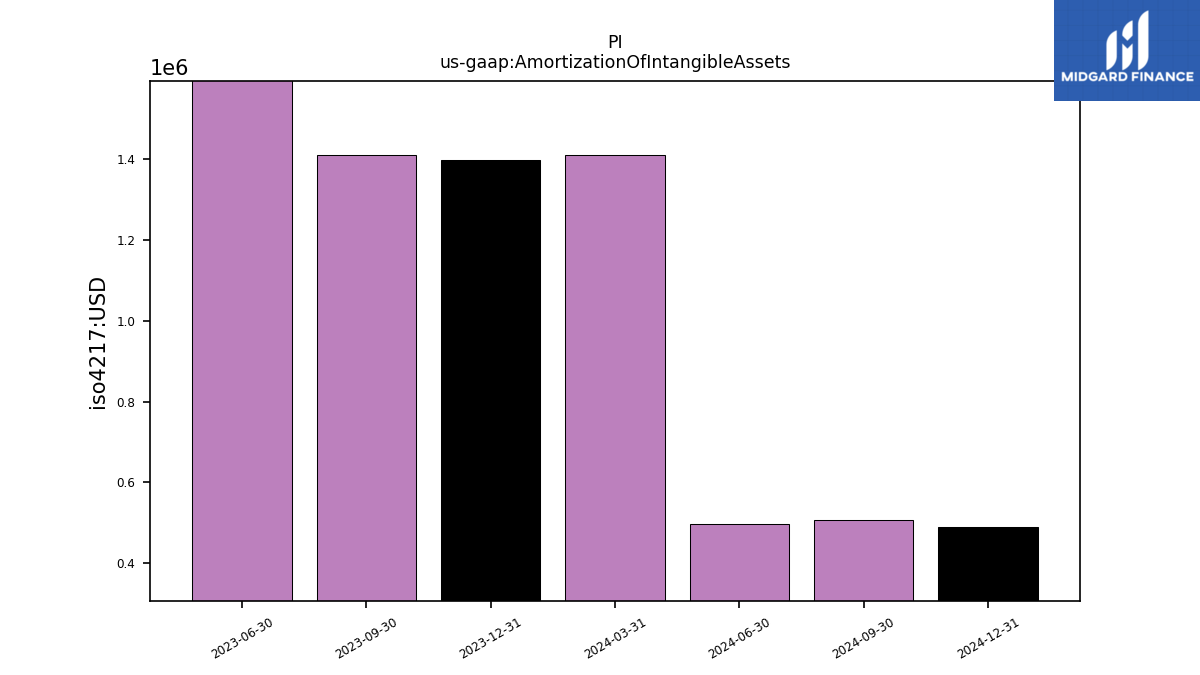
| Amortization Of Intangible Assets | 1.41 | 2.15 | NA | NA | NA | NA | NA | NA | NA | NA | NA | NA | NA | NA | NA | NA | NA | NA | NA | NA | NA | NA | NA | NA | NA | NA | NA | NA | NA | NA | NA | NA | NA | NA | |
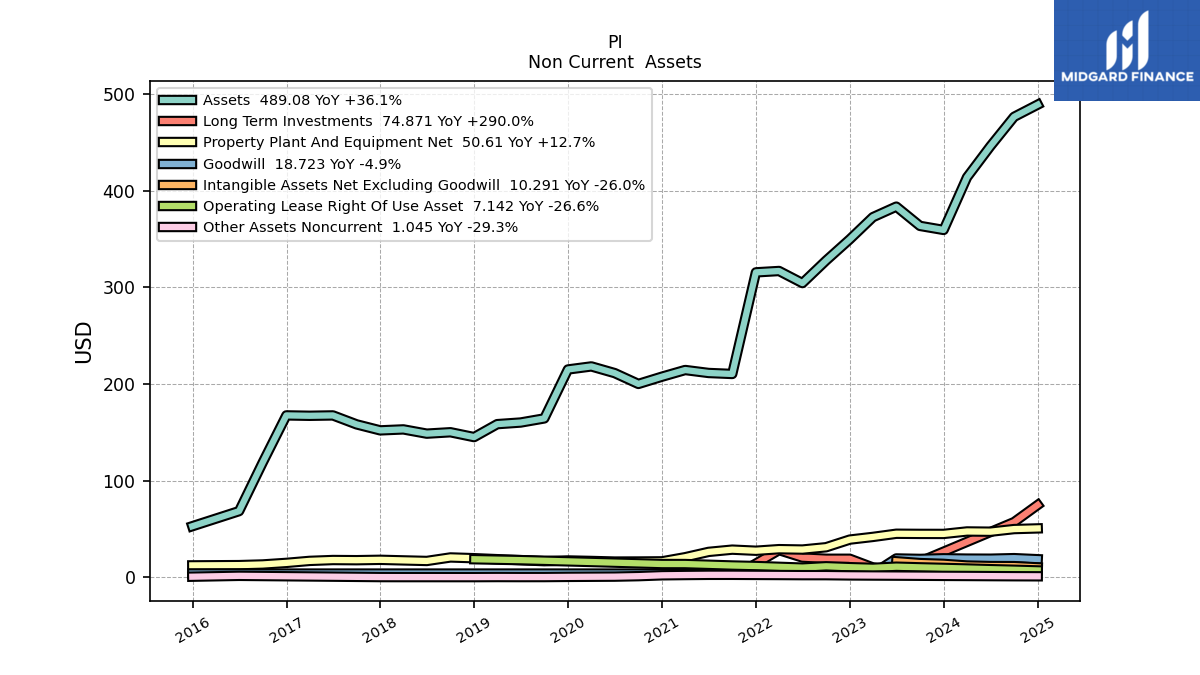
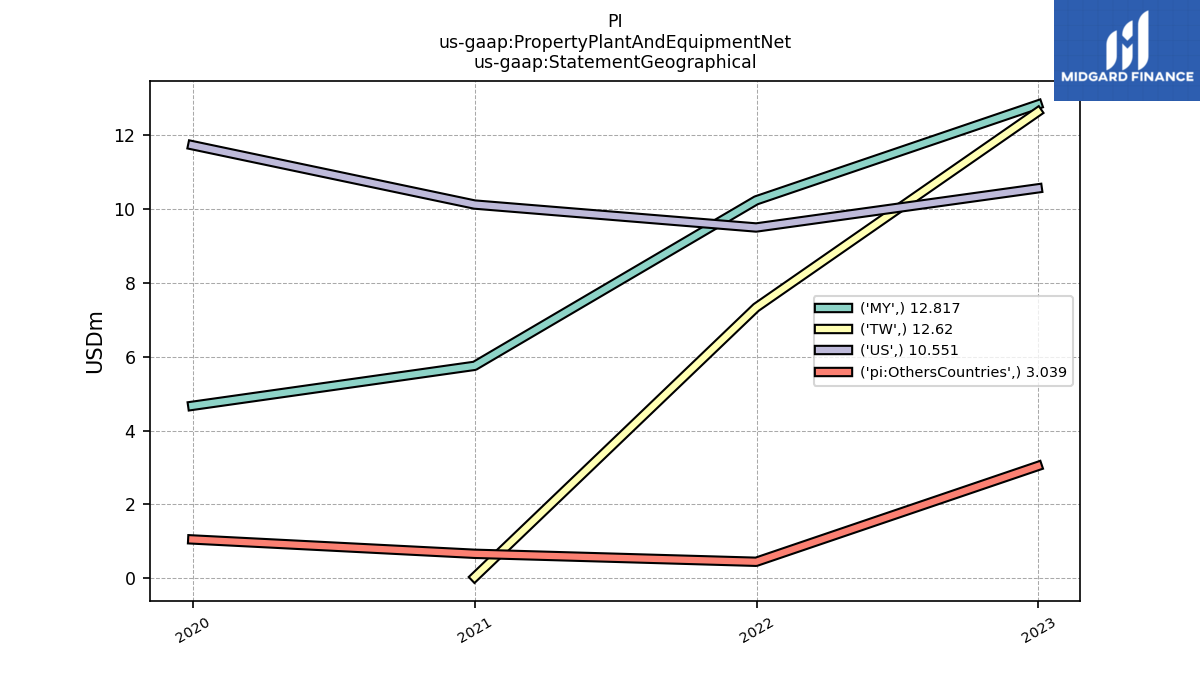
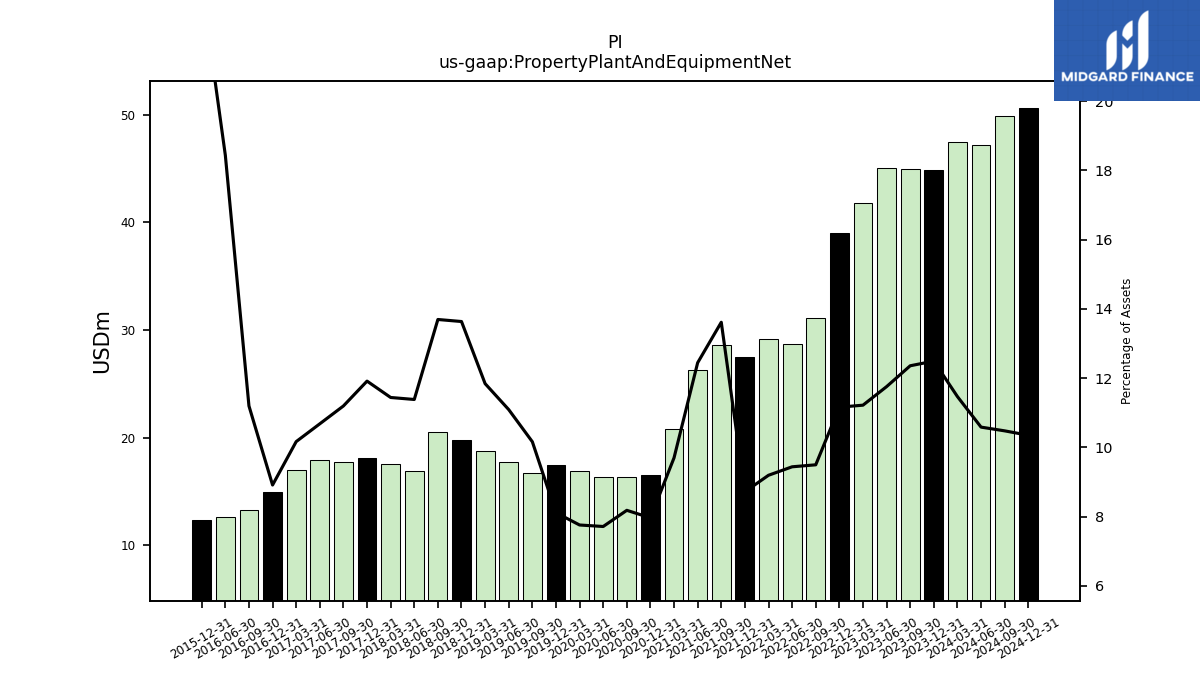
| Property Plant And Equipment Net | 44.92 | 45.08 | 41.80 | 39.03 | 31.12 | 28.73 | 29.13 | 27.50 | 28.64 | 26.31 | 20.80 | 16.53 | 16.36 | 16.29 | 16.92 | 17.44 | 16.70 | 17.76 | 18.76 | 19.78 | 20.55 | 16.92 | 17.51 | 18.11 | 17.71 | 17.89 | 16.99 | 14.93 | 13.30 | 12.62 | NA | 12.35 | NA | NA | |
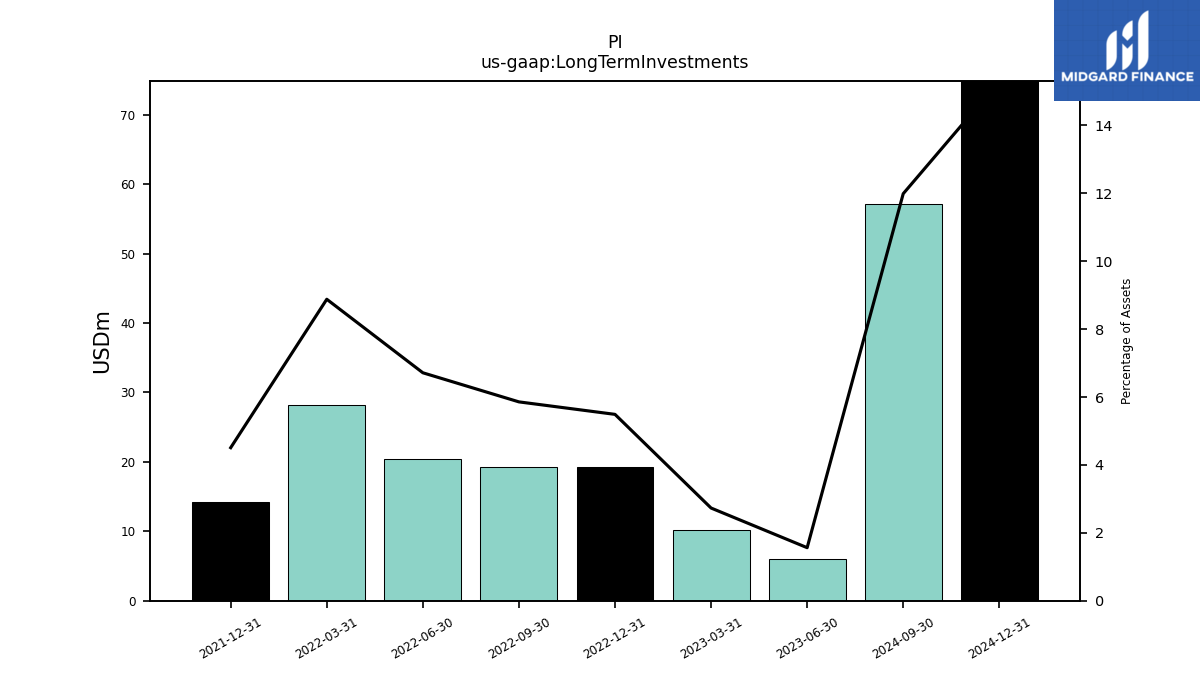
| Long Term Investments | NA | 6.00 | 10.18 | 19.20 | 19.20 | 20.44 | 28.14 | 14.22 | NA | NA | NA | NA | NA | NA | NA | NA | NA | NA | NA | NA | NA | NA | NA | NA | NA | NA | NA | NA | NA | NA | NA | NA | NA | NA | |
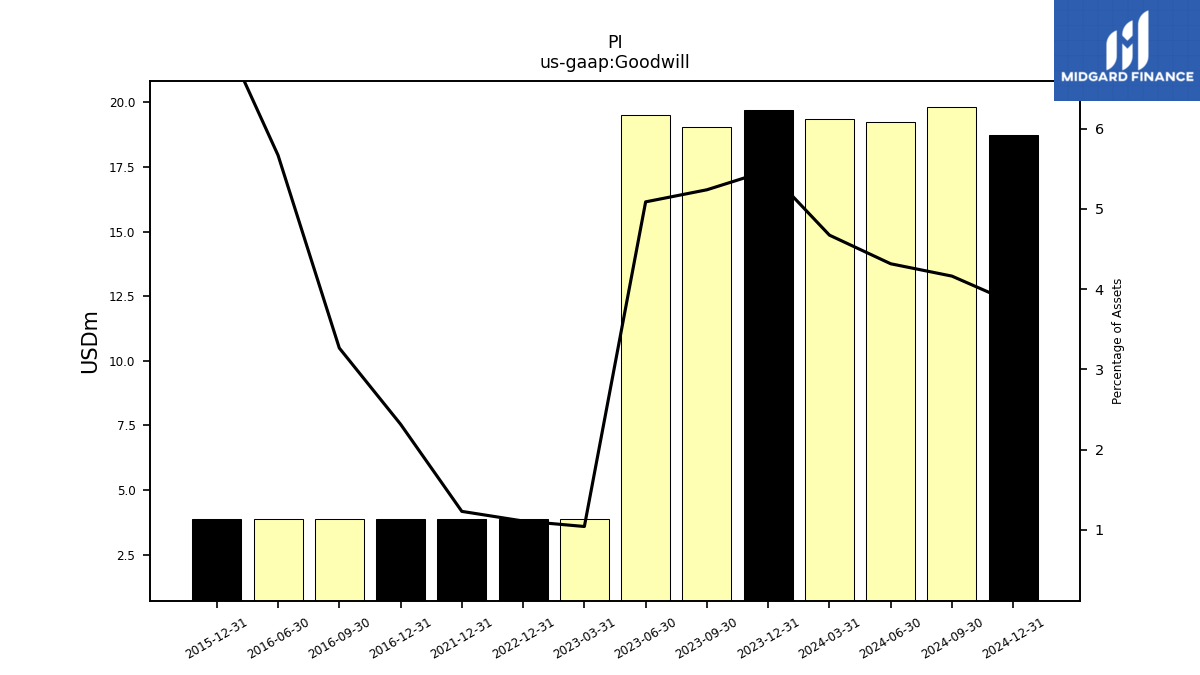
| Goodwill | 19.05 | 19.52 | NA | 3.88 | NA | NA | NA | NA | NA | NA | NA | NA | NA | NA | NA | NA | NA | NA | NA | NA | NA | NA | NA | NA | NA | NA | NA | 3.88 | 3.88 | 3.88 | NA | 3.88 | NA | NA | |
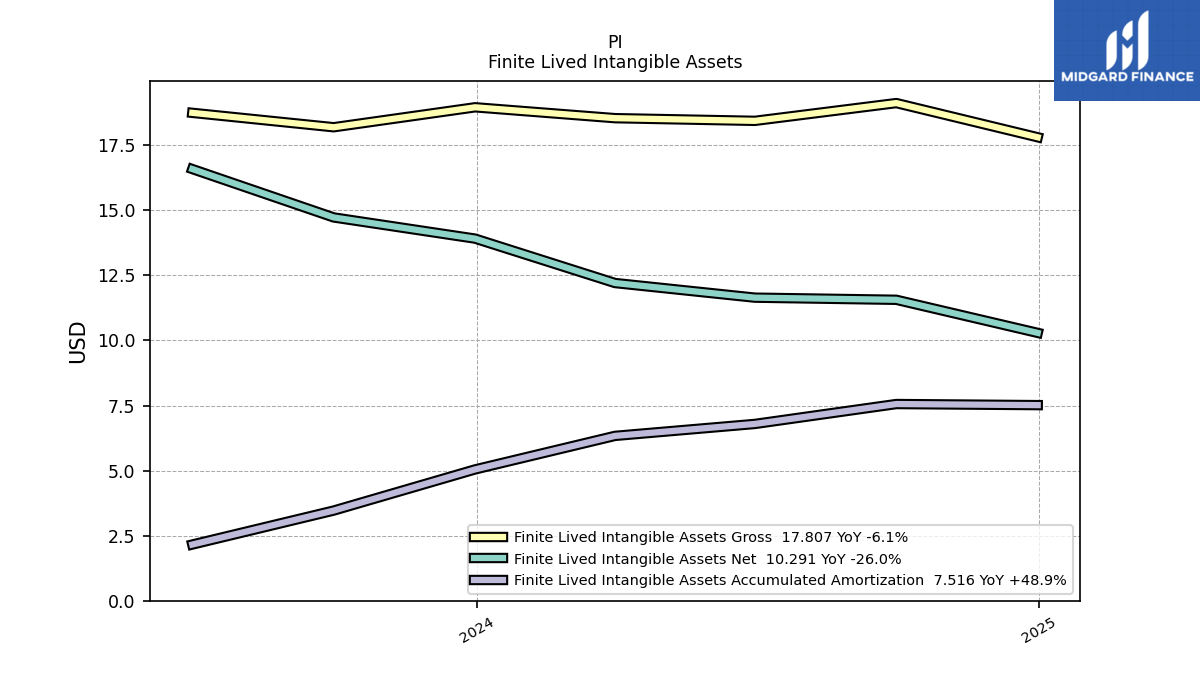
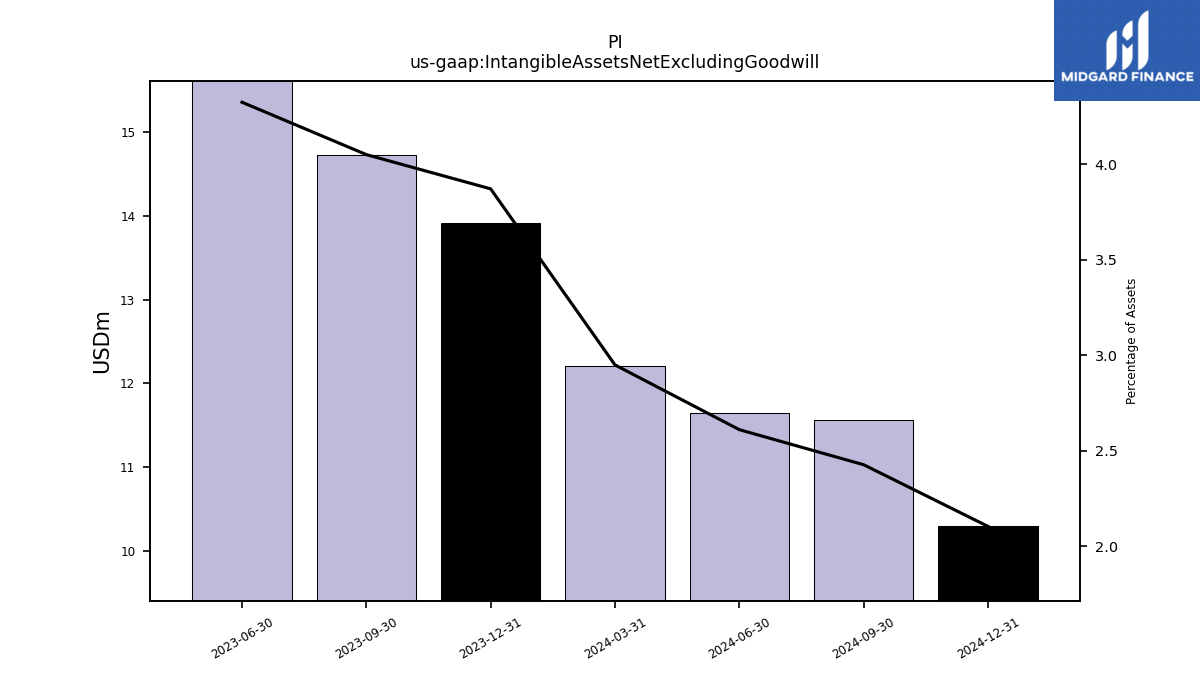
| Intangible Assets Net Excluding Goodwill | 14.73 | 16.59 | NA | NA | NA | NA | NA | NA | NA | NA | NA | NA | NA | NA | NA | NA | NA | NA | NA | NA | NA | NA | NA | NA | NA | NA | NA | NA | NA | NA | NA | NA | NA | NA | |
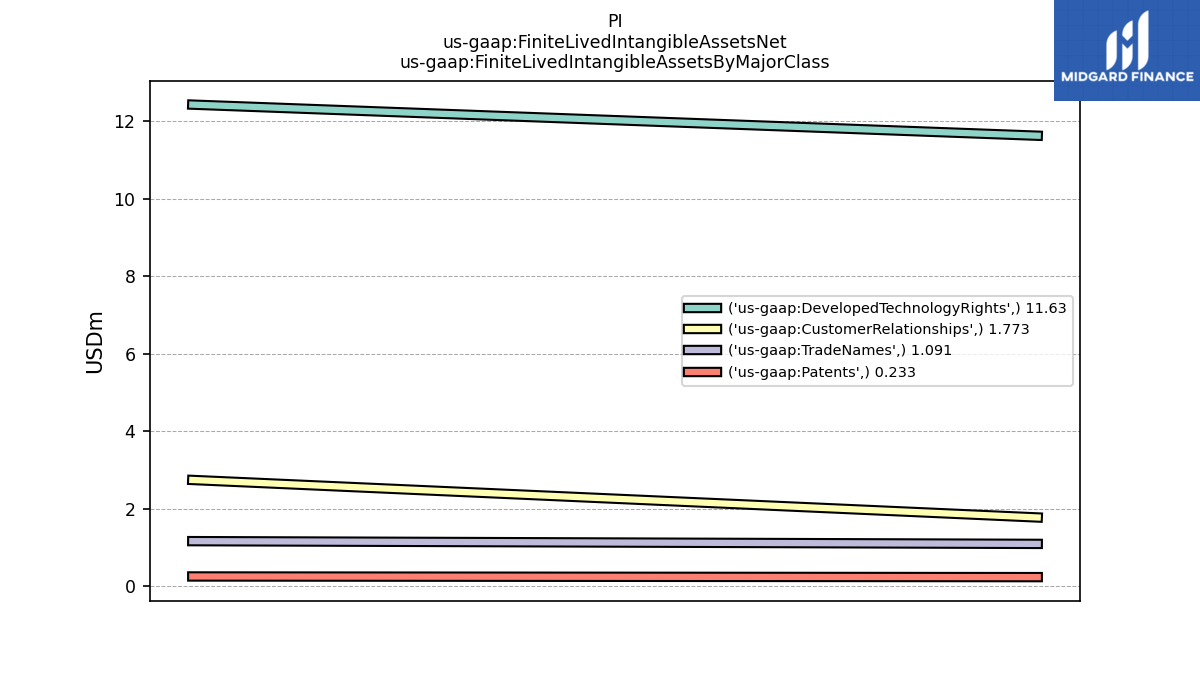
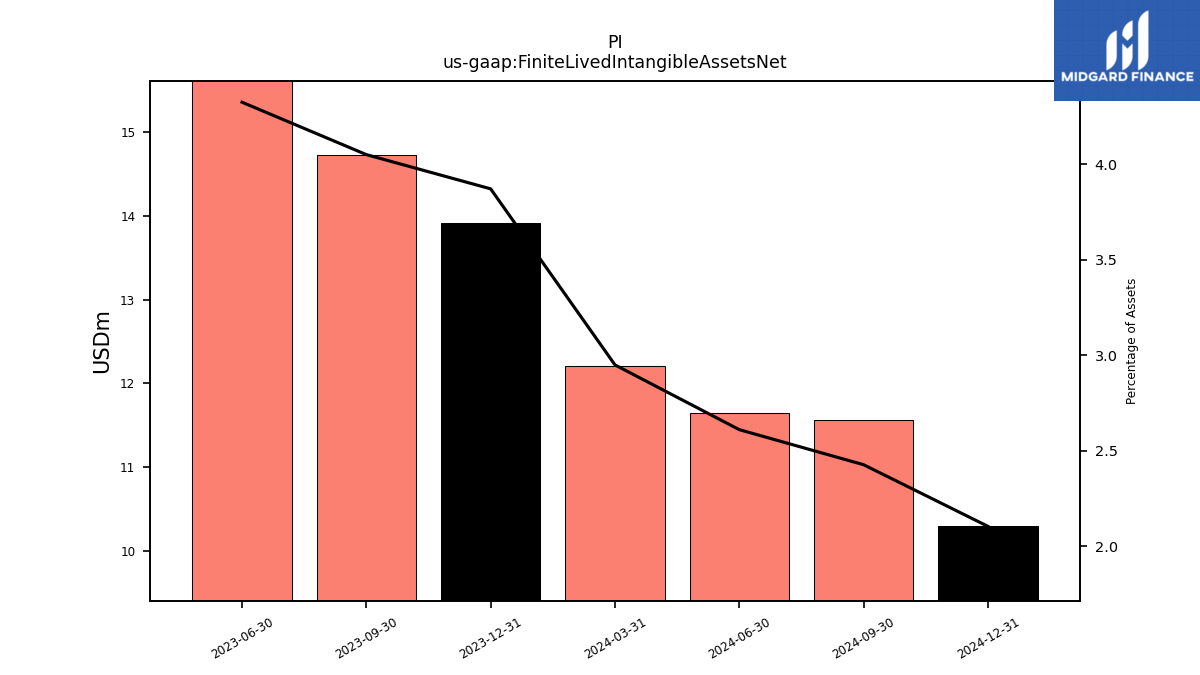
| Finite Lived Intangible Assets Net | 14.73 | 16.59 | NA | NA | NA | NA | NA | NA | NA | NA | NA | NA | NA | NA | NA | NA | NA | NA | NA | NA | NA | NA | NA | NA | NA | NA | NA | NA | NA | NA | NA | NA | NA | NA | |
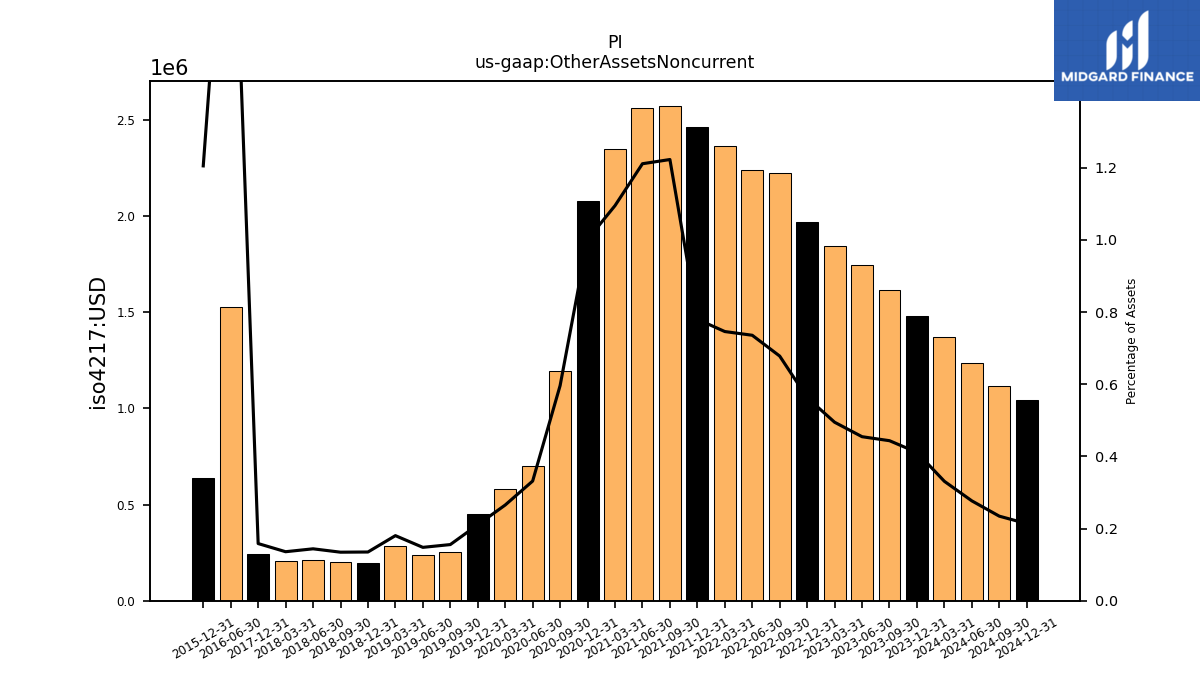
| Other Assets Noncurrent | 1.61 | 1.74 | 1.84 | 1.97 | 2.22 | 2.24 | 2.37 | 2.46 | 2.57 | 2.56 | 2.35 | 2.08 | 1.19 | 0.70 | 0.58 | 0.45 | 0.26 | 0.24 | 0.29 | 0.20 | 0.20 | 0.21 | 0.21 | 0.24 | NA | NA | NA | NA | NA | 1.53 | NA | 0.64 | NA | NA |
| 2023-09-30 | 2023-06-30 | 2023-03-31 | 2022-12-31 | 2022-09-30 | 2022-06-30 | 2022-03-31 | 2021-12-31 | 2021-09-30 | 2021-06-30 | 2021-03-31 | 2020-12-31 | 2020-09-30 | 2020-06-30 | 2020-03-31 | 2019-12-31 | 2019-09-30 | 2019-06-30 | 2019-03-31 | 2018-12-31 | 2018-09-30 | 2018-06-30 | 2018-03-31 | 2017-12-31 | 2017-09-30 | 2017-06-30 | 2017-03-31 | 2016-12-31 | 2016-09-30 | 2016-06-30 | 2016-03-31 | 2015-12-31 | 2015-09-30 | 2015-06-30 | ||
|---|---|---|---|---|---|---|---|---|---|---|---|---|---|---|---|---|---|---|---|---|---|---|---|---|---|---|---|---|---|---|---|---|---|---|---|
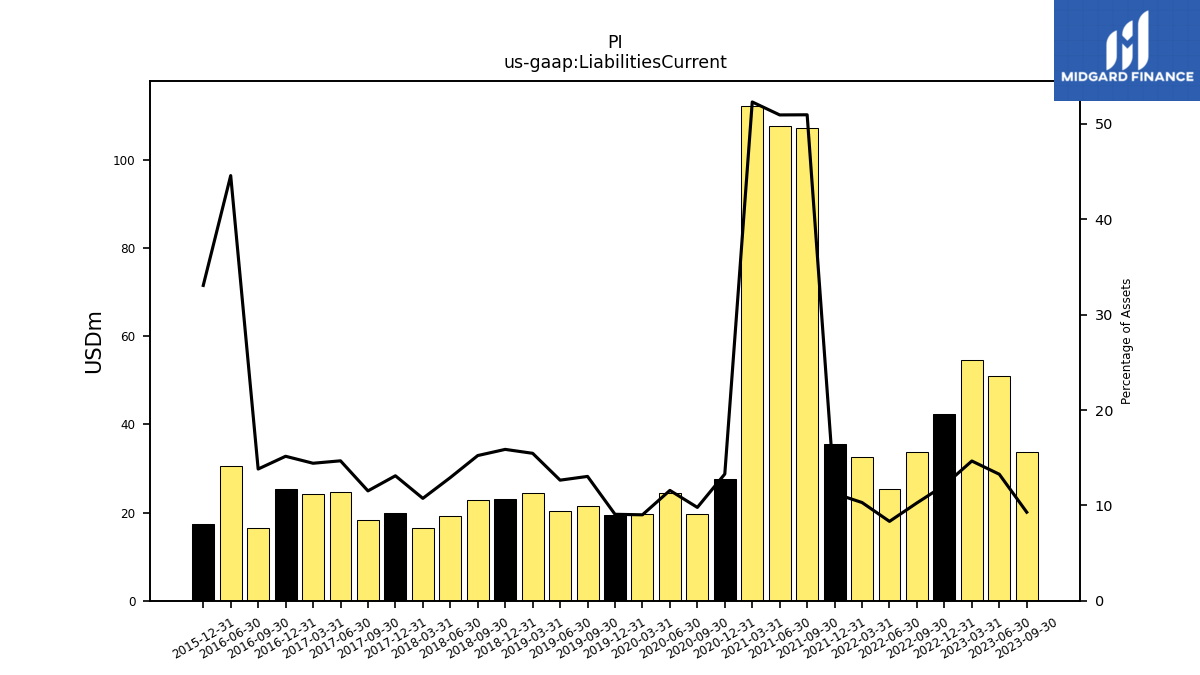
| Liabilities Current | 33.76 | 50.88 | 54.60 | 42.37 | 33.63 | 25.33 | 32.64 | 35.50 | 107.22 | 107.71 | 112.19 | 27.59 | 19.58 | 24.45 | 19.66 | 19.50 | 21.44 | 20.25 | 24.50 | 23.02 | 22.85 | 19.20 | 16.43 | 19.92 | 18.23 | 24.58 | 24.10 | 25.38 | 16.41 | 30.52 | NA | 17.47 | NA | NA | |
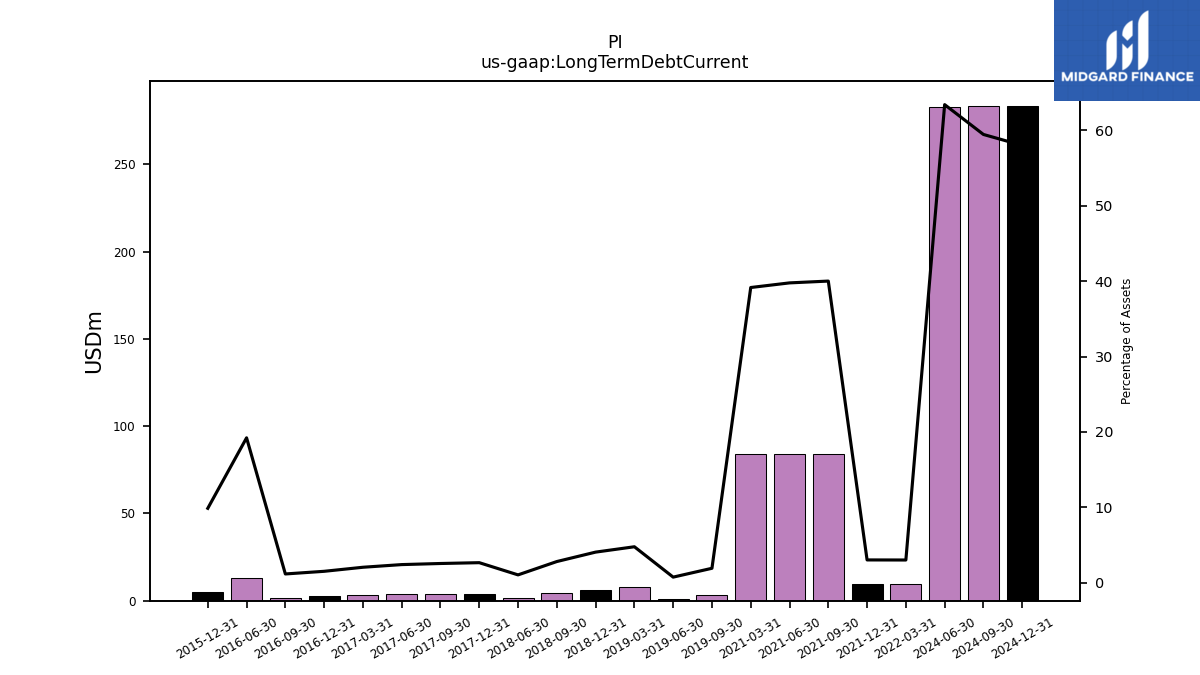
| Long Term Debt Current | NA | NA | NA | NA | NA | NA | 9.64 | 9.63 | 84.14 | 84.05 | 83.95 | NA | NA | NA | NA | NA | 3.20 | 1.24 | 7.60 | 5.93 | 4.26 | 1.59 | NA | 4.09 | 4.08 | 4.08 | 3.48 | 2.59 | 1.42 | 13.16 | NA | 5.23 | NA | NA | |
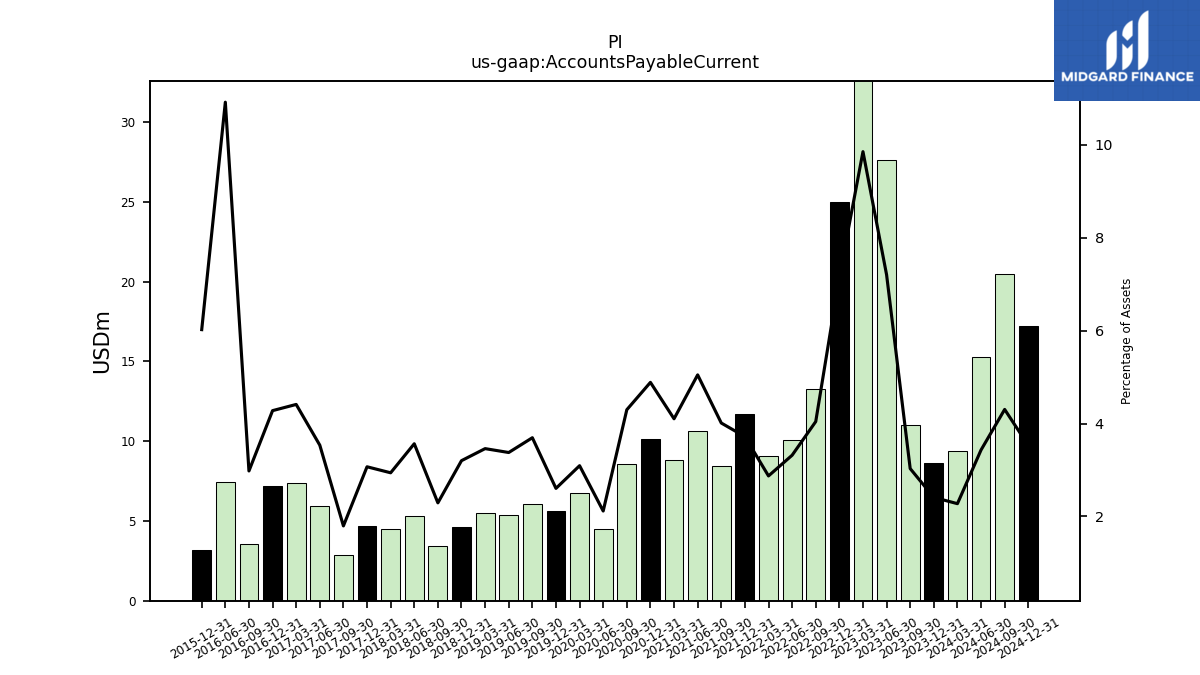
| Accounts Payable Current | 11.02 | 27.63 | 36.71 | 25.02 | 13.25 | 10.10 | 9.10 | 11.73 | 8.44 | 10.67 | 8.80 | 10.14 | 8.60 | 4.47 | 6.75 | 5.60 | 6.07 | 5.41 | 5.48 | 4.64 | 3.44 | 5.30 | 4.50 | 4.67 | 2.84 | 5.92 | 7.37 | 7.17 | 3.54 | 7.47 | NA | 3.18 | NA | NA | |
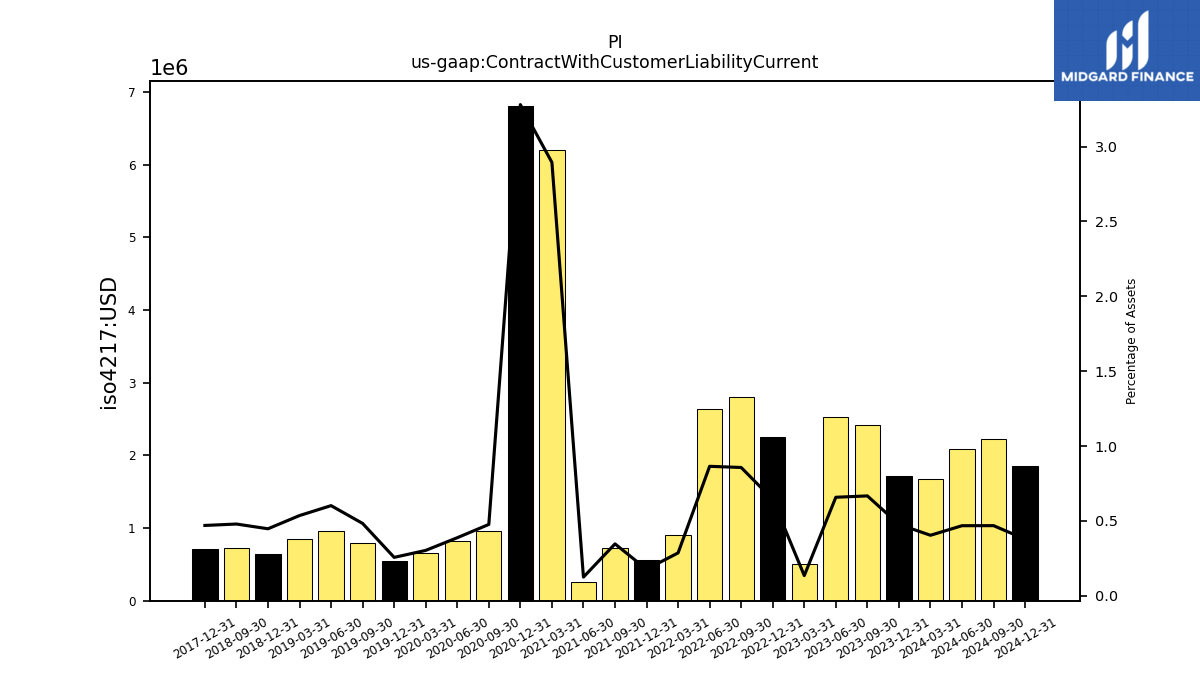
| Contract With Customer Liability Current | 2.42 | 2.52 | 0.50 | 2.25 | 2.81 | 2.63 | 0.91 | 0.56 | 0.73 | 0.26 | 6.21 | 6.81 | 0.95 | 0.82 | 0.66 | 0.55 | 0.79 | 0.96 | 0.85 | 0.65 | 0.72 | NA | NA | 0.71 | NA | NA | NA | NA | NA | NA | NA | NA | NA | NA |
| 2023-09-30 | 2023-06-30 | 2023-03-31 | 2022-12-31 | 2022-09-30 | 2022-06-30 | 2022-03-31 | 2021-12-31 | 2021-09-30 | 2021-06-30 | 2021-03-31 | 2020-12-31 | 2020-09-30 | 2020-06-30 | 2020-03-31 | 2019-12-31 | 2019-09-30 | 2019-06-30 | 2019-03-31 | 2018-12-31 | 2018-09-30 | 2018-06-30 | 2018-03-31 | 2017-12-31 | 2017-09-30 | 2017-06-30 | 2017-03-31 | 2016-12-31 | 2016-09-30 | 2016-06-30 | 2016-03-31 | 2015-12-31 | 2015-09-30 | 2015-06-30 | ||
|---|---|---|---|---|---|---|---|---|---|---|---|---|---|---|---|---|---|---|---|---|---|---|---|---|---|---|---|---|---|---|---|---|---|---|---|
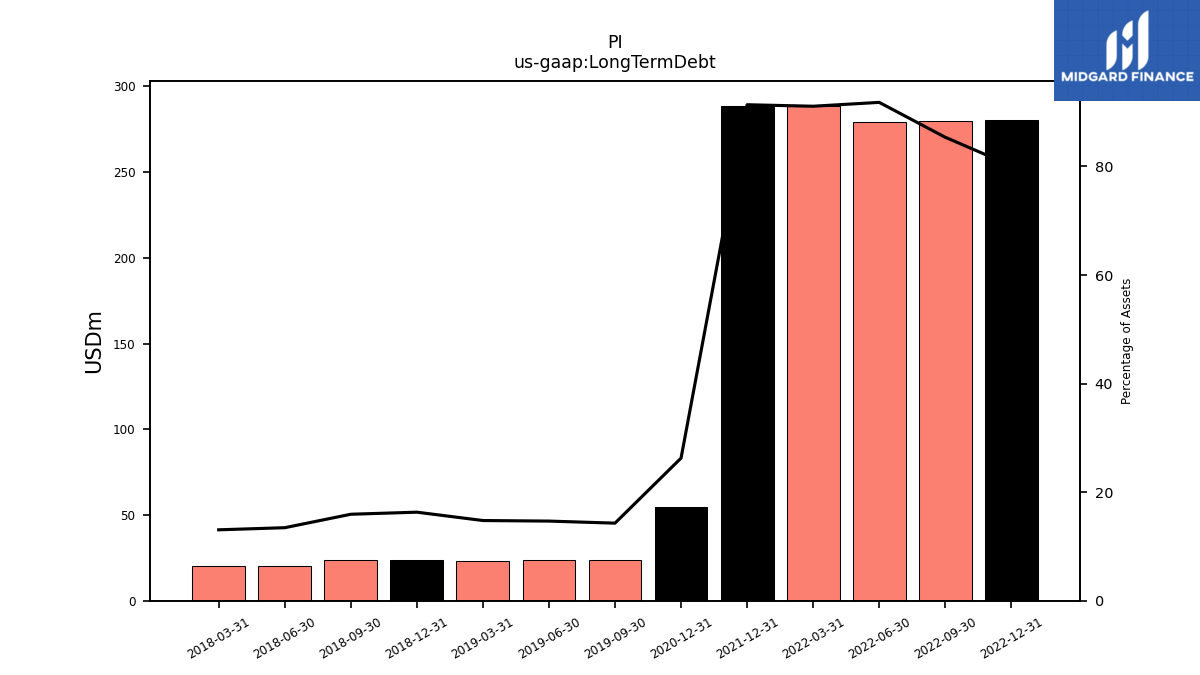
| Long Term Debt | NA | NA | NA | 280.24 | 279.85 | 279.45 | 288.70 | 288.29 | NA | NA | NA | 54.56 | NA | NA | NA | NA | 23.50 | 23.50 | 23.42 | 23.67 | 23.92 | 20.00 | 20.00 | NA | NA | NA | NA | NA | NA | NA | NA | NA | NA | NA | |
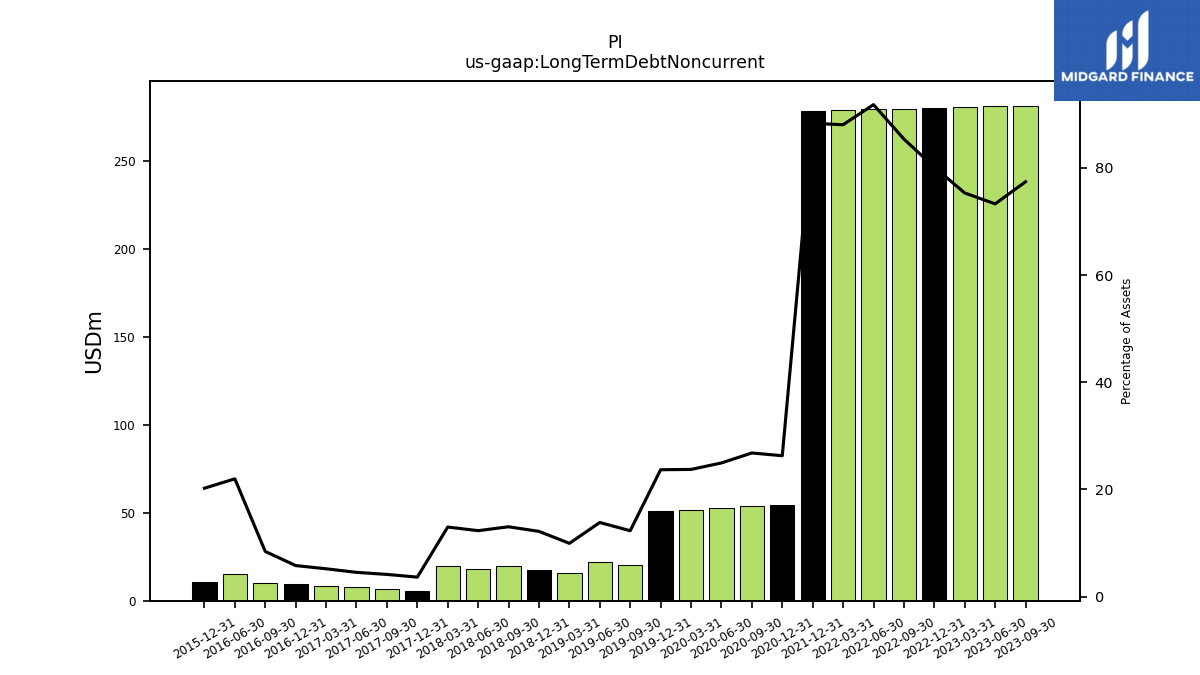
| Long Term Debt Noncurrent | 281.45 | 281.05 | 280.64 | 280.24 | 279.85 | 279.45 | 279.05 | 278.66 | NA | NA | NA | 54.56 | 53.59 | 52.67 | 51.76 | 50.88 | 20.18 | 22.13 | 15.73 | 17.63 | 19.53 | 18.27 | 19.84 | 5.50 | 6.52 | 7.55 | 8.65 | 9.68 | 9.99 | 15.03 | NA | 10.68 | NA | NA | |
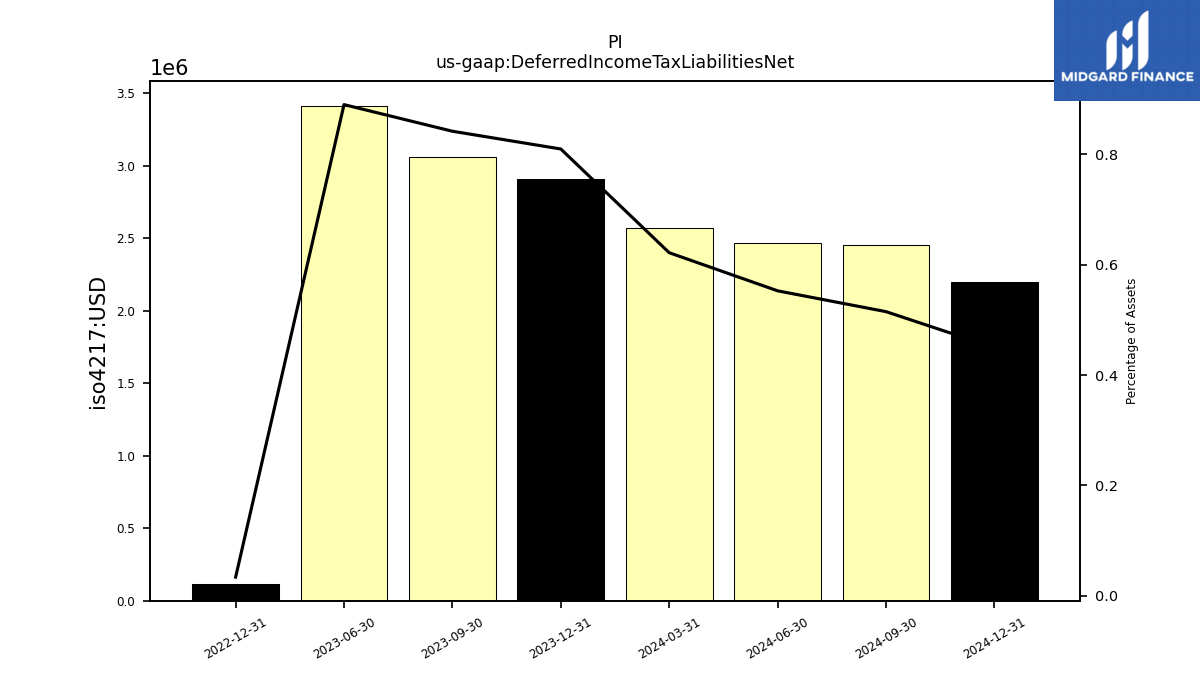
| Deferred Income Tax Liabilities Net | 3.06 | 3.42 | NA | 0.12 | NA | NA | NA | NA | NA | NA | NA | NA | NA | NA | NA | NA | NA | NA | NA | NA | NA | NA | NA | NA | NA | NA | NA | NA | NA | NA | NA | NA | NA | NA | |
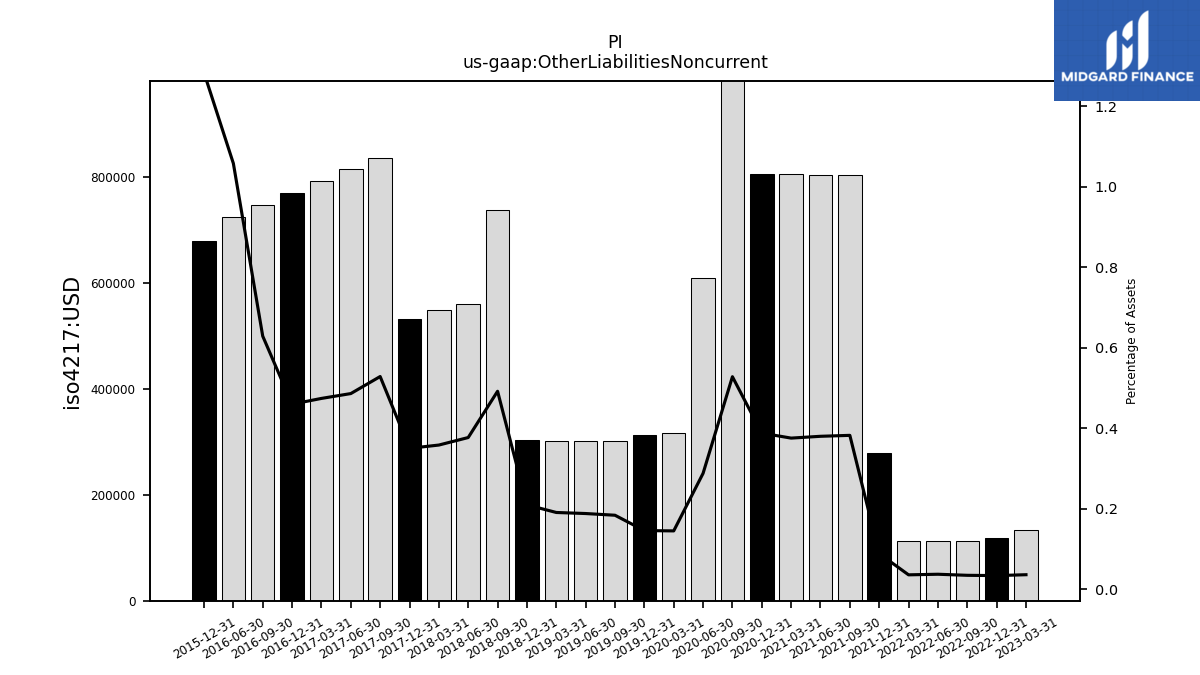
| Other Liabilities Noncurrent | NA | NA | 0.13 | 0.12 | 0.11 | 0.11 | 0.11 | 0.28 | 0.80 | 0.80 | 0.81 | 0.81 | 1.06 | 0.61 | 0.32 | 0.31 | 0.30 | 0.30 | 0.30 | 0.30 | 0.74 | 0.56 | 0.55 | 0.53 | 0.84 | 0.81 | 0.79 | 0.77 | 0.75 | 0.72 | NA | 0.68 | NA | NA | |
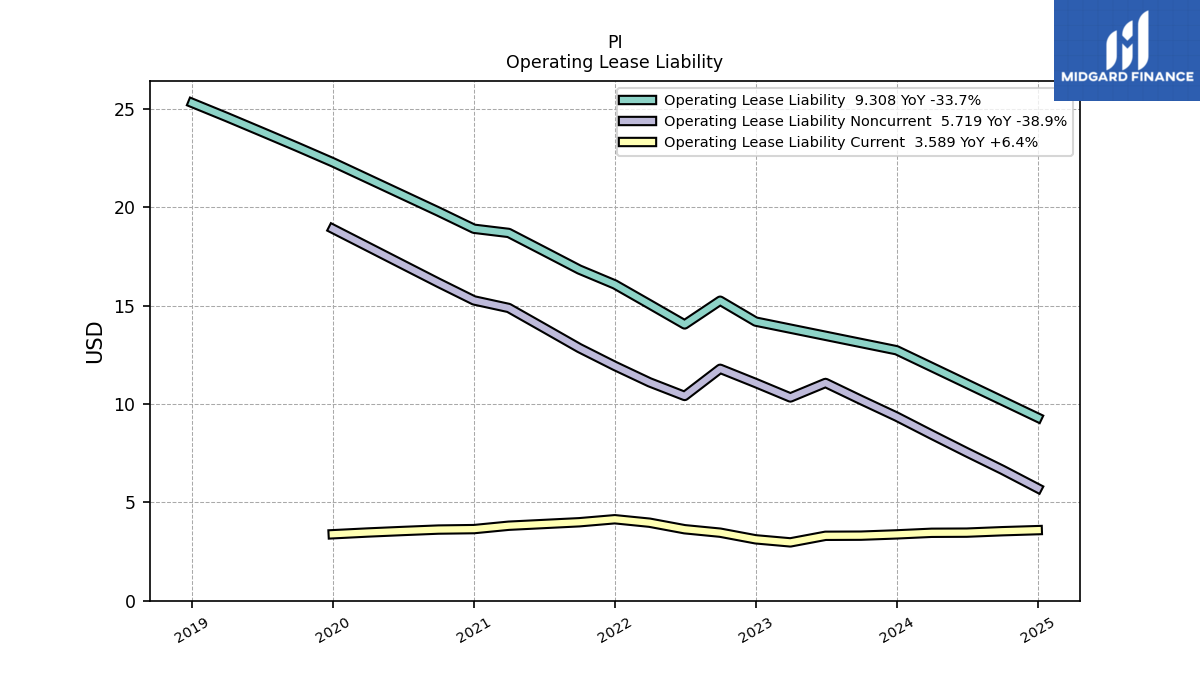
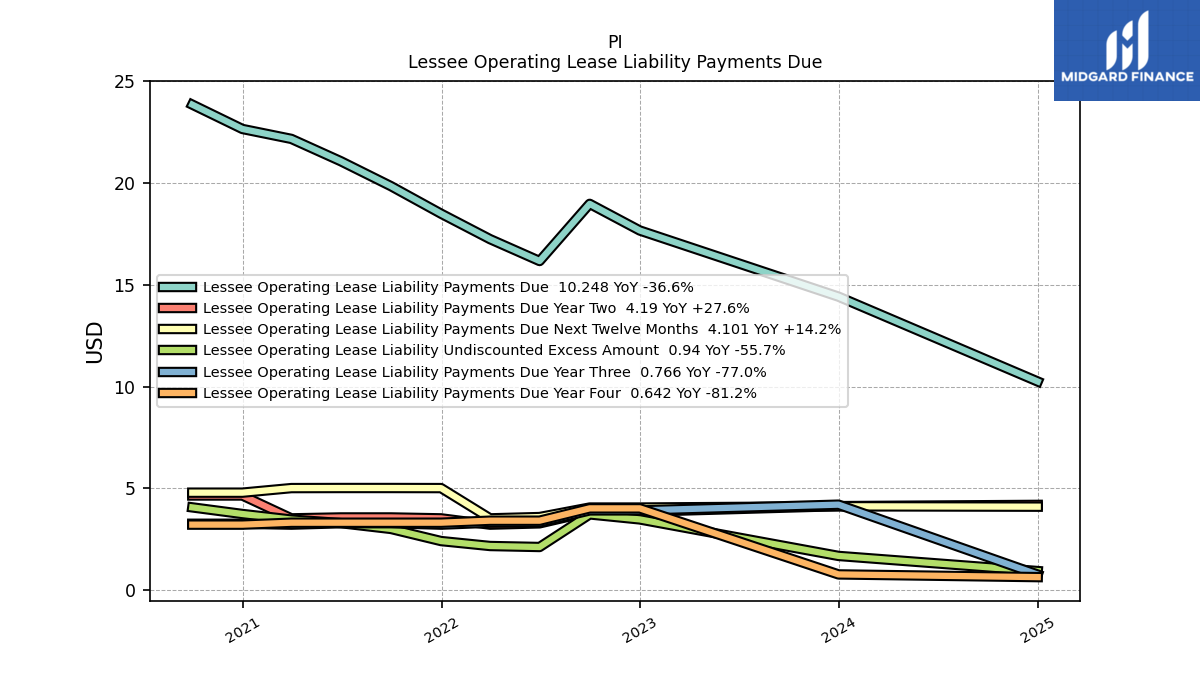
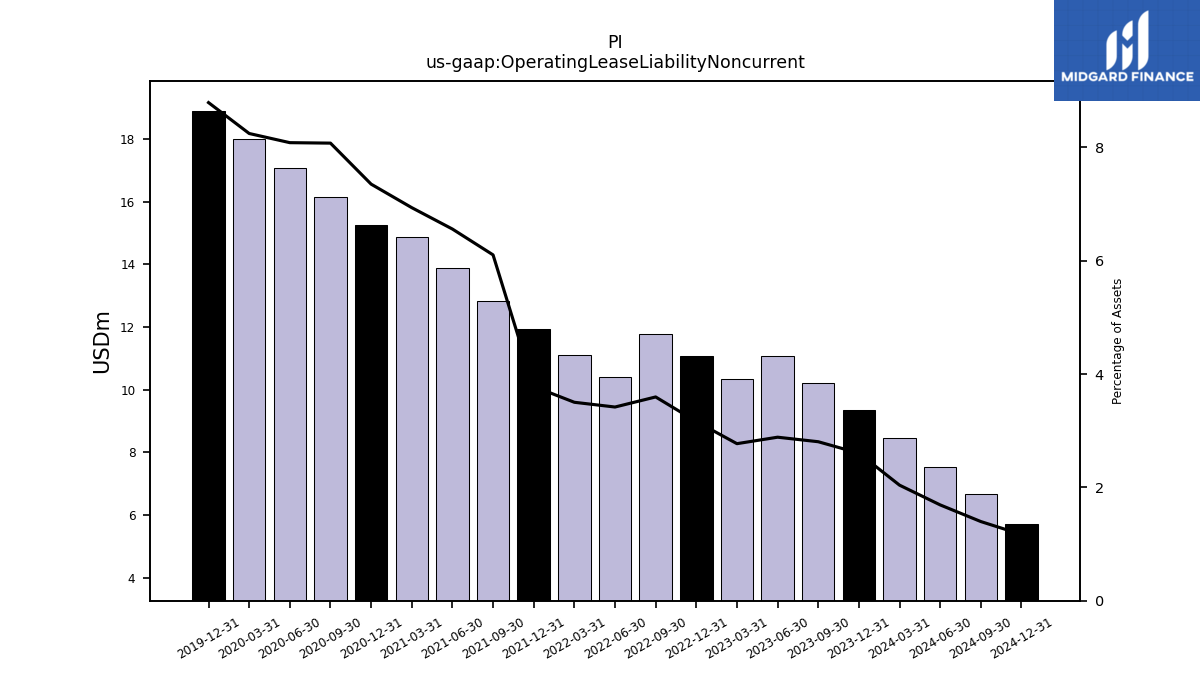
| Operating Lease Liability Noncurrent | 10.21 | 11.07 | 10.33 | 11.07 | 11.79 | 10.41 | 11.10 | 11.93 | 12.84 | 13.87 | 14.88 | 15.27 | 16.16 | 17.08 | 18.00 | 18.91 | NA | NA | NA | NA | NA | NA | NA | NA | NA | NA | NA | NA | NA | NA | NA | NA | NA | NA |
| 2023-09-30 | 2023-06-30 | 2023-03-31 | 2022-12-31 | 2022-09-30 | 2022-06-30 | 2022-03-31 | 2021-12-31 | 2021-09-30 | 2021-06-30 | 2021-03-31 | 2020-12-31 | 2020-09-30 | 2020-06-30 | 2020-03-31 | 2019-12-31 | 2019-09-30 | 2019-06-30 | 2019-03-31 | 2018-12-31 | 2018-09-30 | 2018-06-30 | 2018-03-31 | 2017-12-31 | 2017-09-30 | 2017-06-30 | 2017-03-31 | 2016-12-31 | 2016-09-30 | 2016-06-30 | 2016-03-31 | 2015-12-31 | 2015-09-30 | 2015-06-30 | ||
|---|---|---|---|---|---|---|---|---|---|---|---|---|---|---|---|---|---|---|---|---|---|---|---|---|---|---|---|---|---|---|---|---|---|---|---|
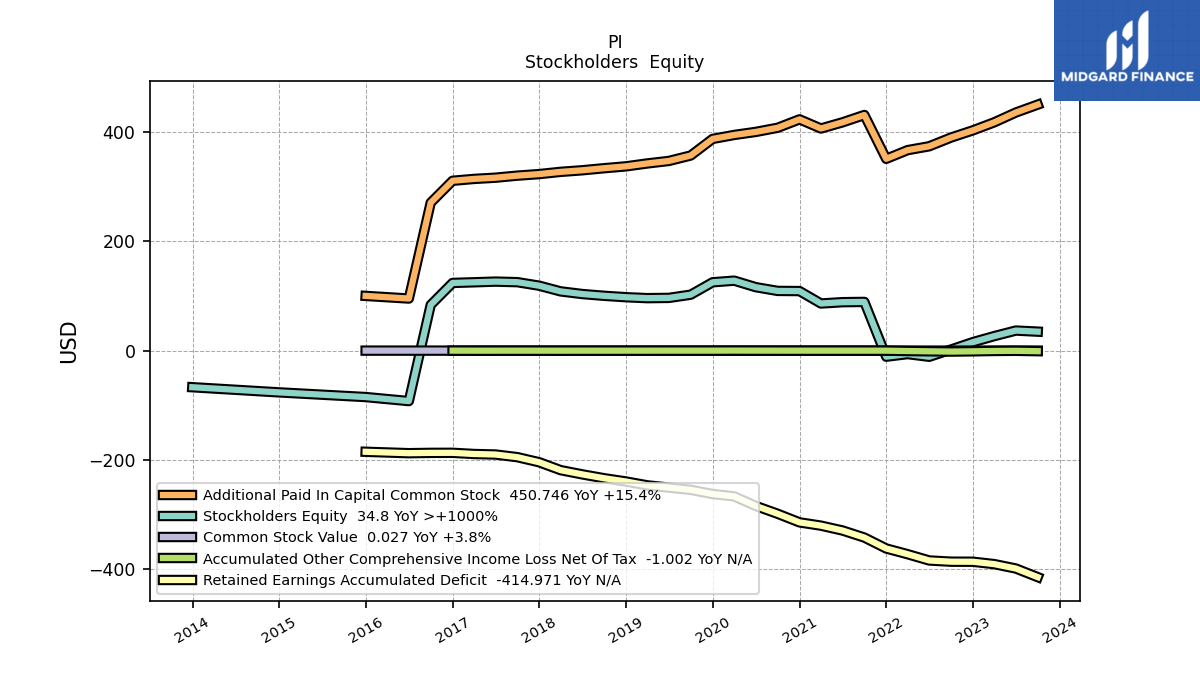
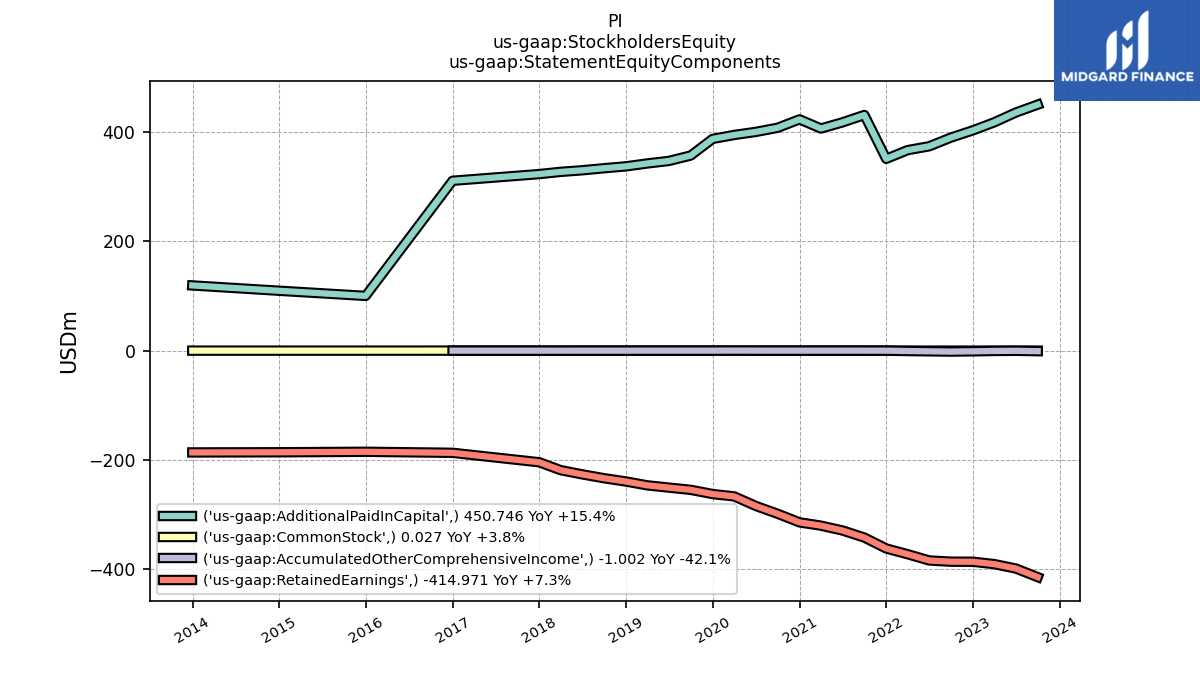
| Stockholders Equity | 34.80 | 36.80 | 26.62 | 15.59 | 2.06 | -11.26 | -6.29 | -11.08 | 89.28 | 88.77 | 86.38 | 109.12 | 109.43 | 116.25 | 128.22 | 125.24 | 102.54 | 96.63 | 96.17 | 97.88 | 100.46 | 103.73 | 108.56 | 118.94 | 125.44 | 126.48 | 125.23 | 124.02 | 83.79 | -92.45 | NA | -85.03 | NA | NA | |
| Common Stock Value | 0.03 | 0.03 | 0.03 | 0.03 | 0.03 | 0.03 | 0.03 | 0.03 | 0.02 | 0.02 | 0.02 | 0.02 | 0.02 | 0.02 | 0.02 | 0.02 | 0.02 | 0.02 | 0.02 | 0.02 | 0.02 | 0.02 | 0.02 | 0.02 | 0.02 | 0.02 | 0.02 | 0.02 | 0.02 | 0.00 | NA | 0.00 | NA | NA | |
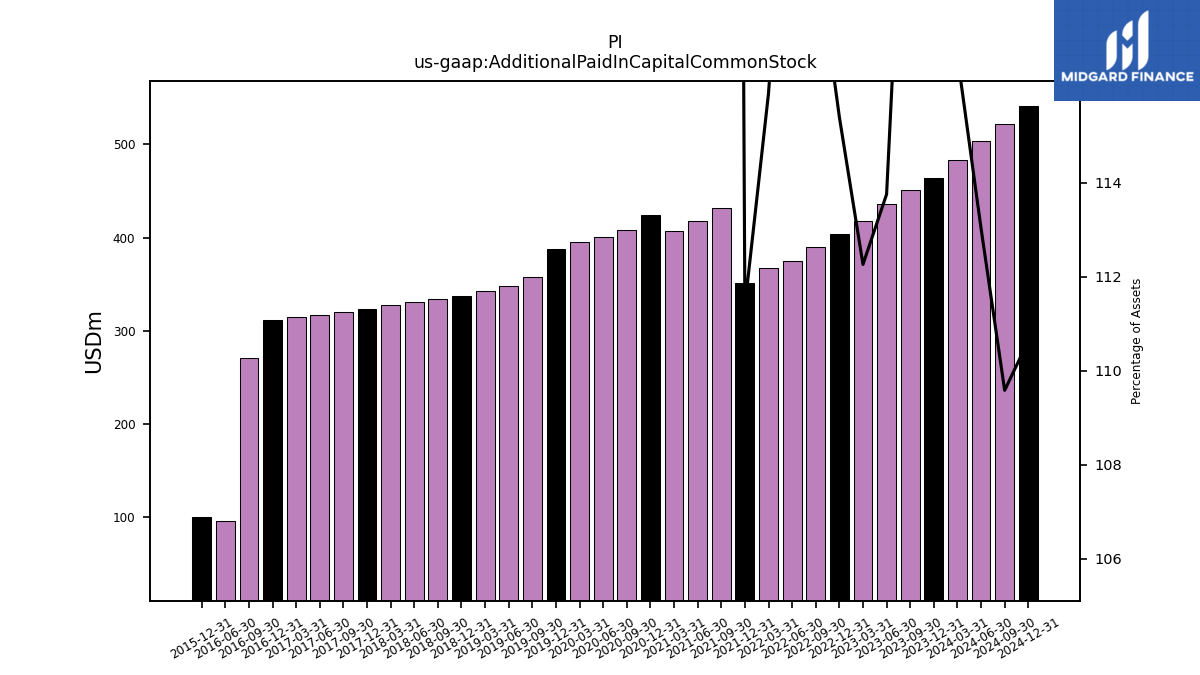
| Additional Paid In Capital Common Stock | 450.75 | 436.30 | 418.34 | 403.60 | 390.43 | 374.41 | 367.35 | 351.42 | 431.73 | 418.29 | 406.99 | 423.76 | 408.34 | 400.77 | 395.16 | 387.93 | 357.54 | 347.56 | 342.97 | 337.63 | 334.23 | 330.44 | 327.56 | 323.48 | 320.63 | 316.85 | 314.61 | 311.22 | 271.07 | 95.44 | NA | 100.28 | NA | NA | |
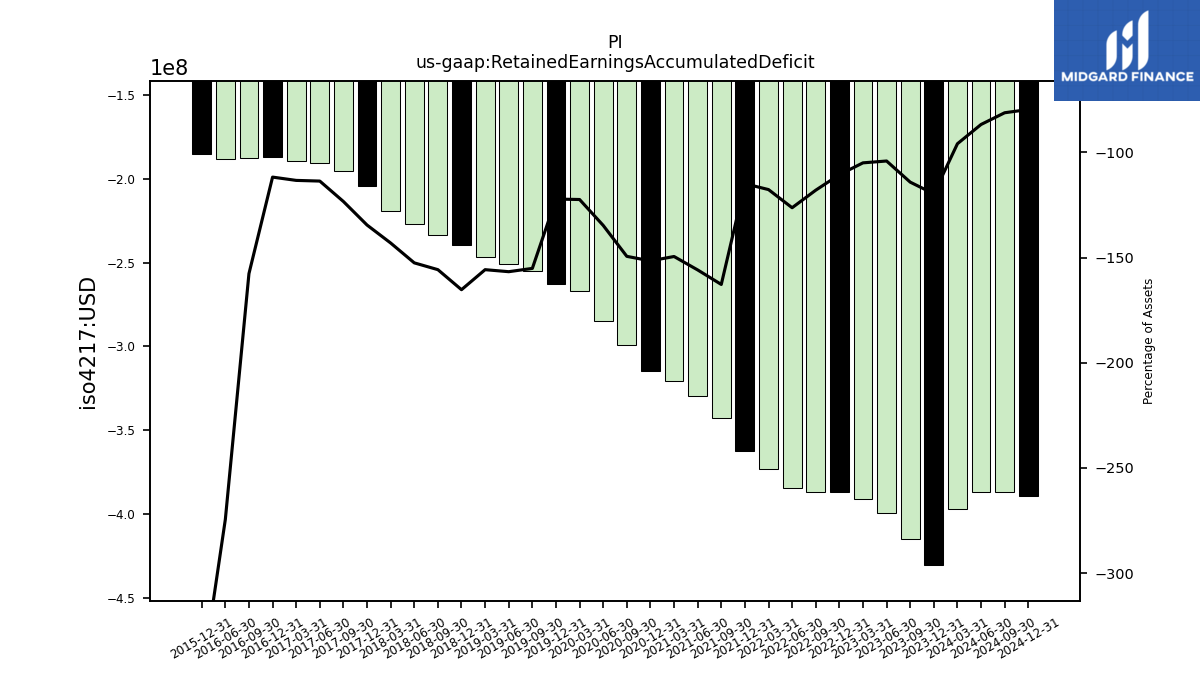
| Retained Earnings Accumulated Deficit | -414.97 | -399.21 | -391.14 | -386.79 | -386.67 | -384.47 | -372.94 | -362.48 | -342.47 | -329.55 | -320.64 | -314.67 | -298.95 | -284.60 | -267.07 | -262.74 | -255.06 | -250.98 | -246.82 | -239.76 | -233.77 | -226.70 | -218.97 | -204.53 | -195.19 | -190.34 | -189.36 | -187.20 | -187.31 | -187.90 | NA | -185.31 | NA | NA | |
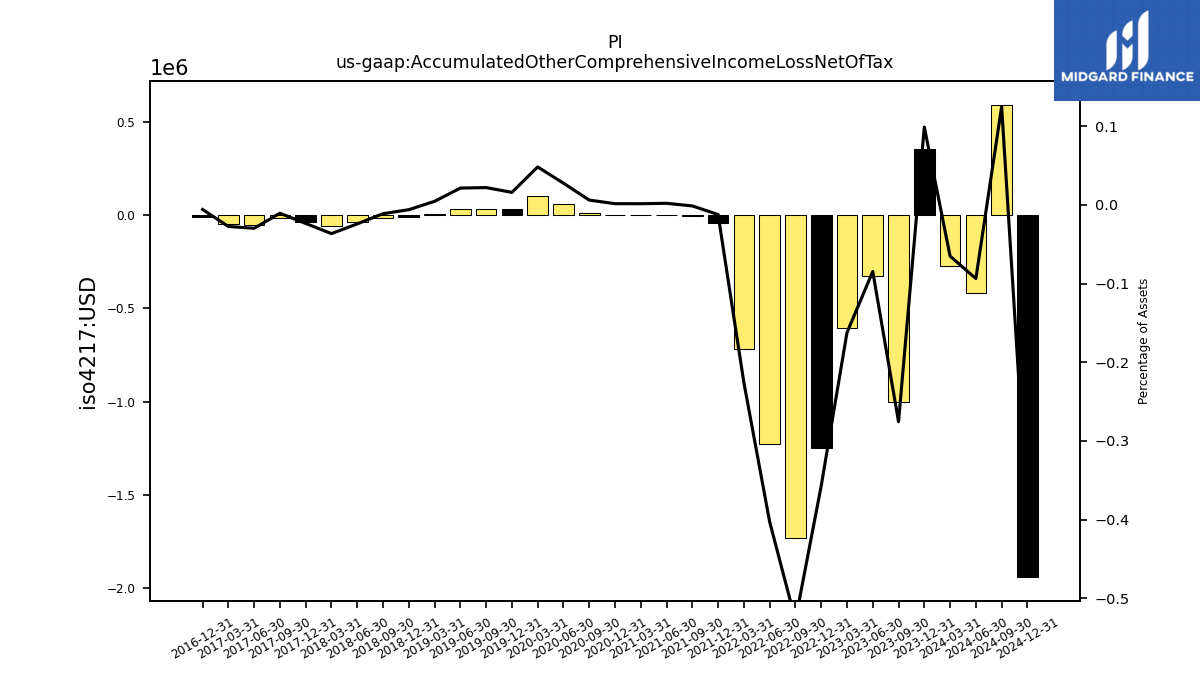
| Accumulated Other Comprehensive Income Loss Net Of Tax | -1.00 | -0.33 | -0.60 | -1.25 | -1.73 | -1.23 | -0.72 | -0.04 | -0.00 | 0.00 | 0.00 | 0.00 | 0.01 | 0.06 | 0.10 | 0.03 | 0.04 | 0.03 | 0.01 | -0.01 | -0.02 | -0.04 | -0.06 | -0.04 | -0.02 | -0.05 | -0.05 | -0.01 | NA | NA | NA | NA | NA | NA | |
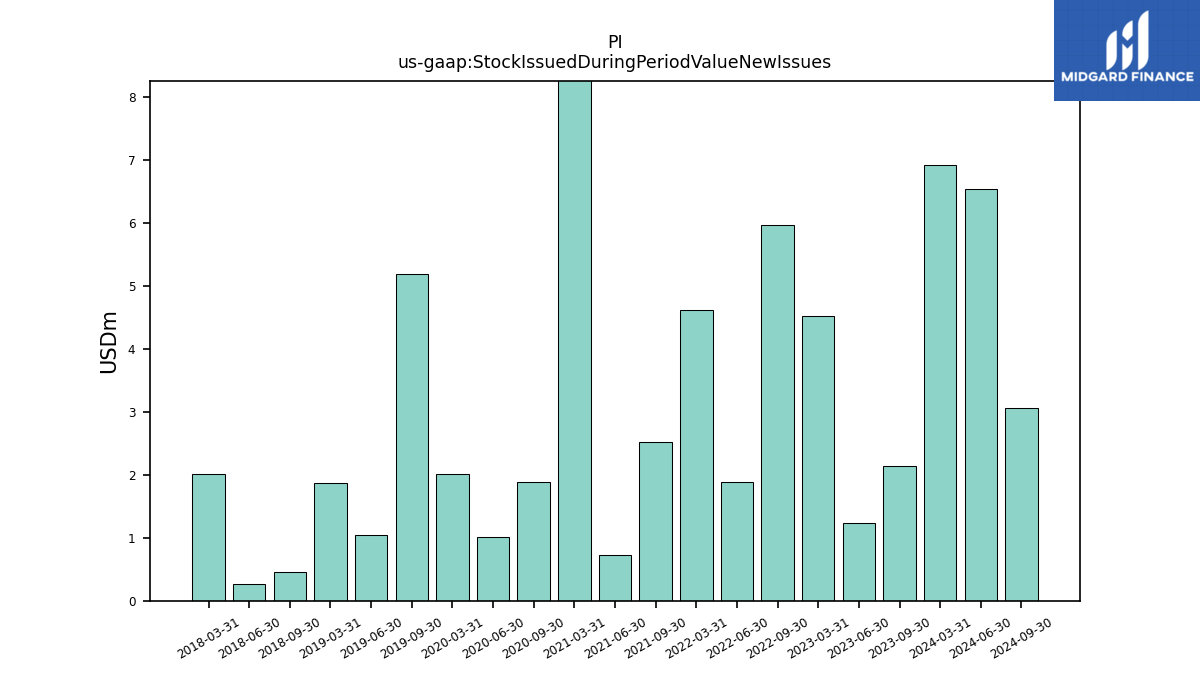
| Stock Issued During Period Value New Issues | 2.14 | 1.23 | 4.52 | NA | 5.97 | 1.89 | 4.61 | NA | 2.52 | 0.72 | 8.52 | NA | 1.89 | 1.01 | 2.01 | NA | 5.19 | 1.05 | 1.86 | NA | 0.45 | 0.27 | 2.02 | NA | NA | NA | NA | NA | NA | NA | NA | NA | NA | NA | |
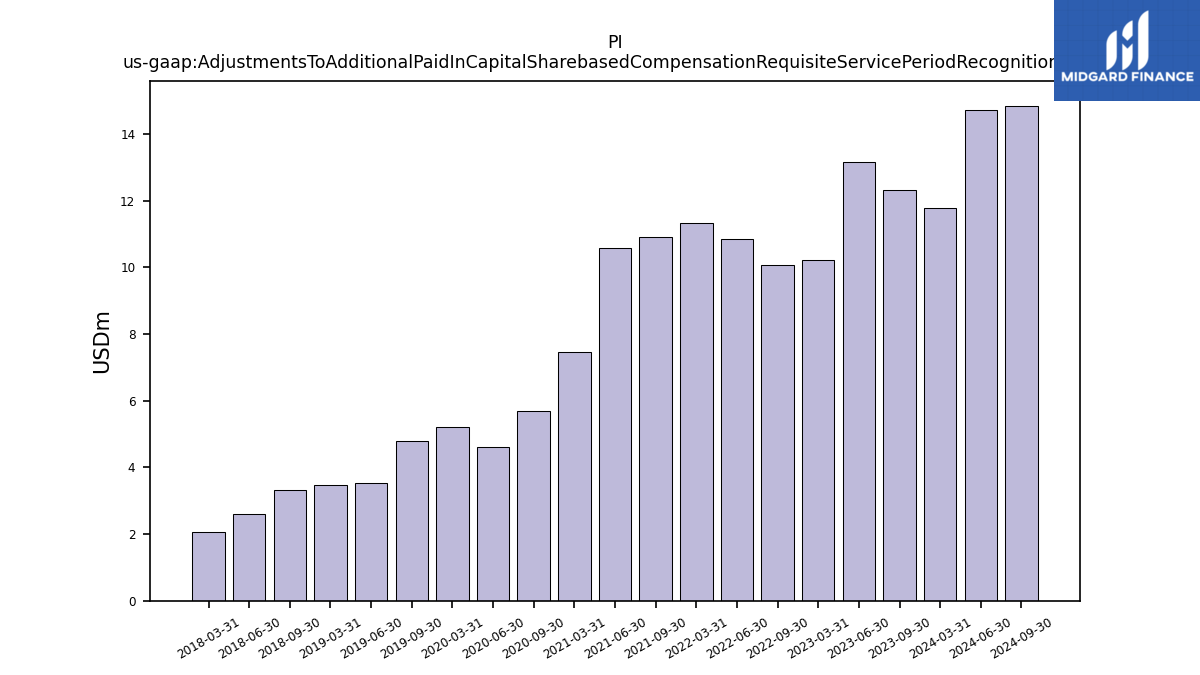
| Adjustments To Additional Paid In Capital Sharebased Compensation Requisite Service Period Recognition Value | 12.31 | 13.15 | 10.22 | NA | 10.06 | 10.86 | 11.31 | NA | 10.92 | 10.58 | 7.45 | NA | 5.68 | 4.60 | 5.22 | NA | 4.79 | 3.54 | 3.48 | NA | 3.33 | 2.61 | 2.06 | NA | NA | NA | NA | NA | NA | NA | NA | NA | NA | NA |
| 2023-09-30 | 2023-06-30 | 2023-03-31 | 2022-12-31 | 2022-09-30 | 2022-06-30 | 2022-03-31 | 2021-12-31 | 2021-09-30 | 2021-06-30 | 2021-03-31 | 2020-12-31 | 2020-09-30 | 2020-06-30 | 2020-03-31 | 2019-12-31 | 2019-09-30 | 2019-06-30 | 2019-03-31 | 2018-12-31 | 2018-09-30 | 2018-06-30 | 2018-03-31 | 2017-12-31 | 2017-09-30 | 2017-06-30 | 2017-03-31 | 2016-12-31 | 2016-09-30 | 2016-06-30 | 2016-03-31 | 2015-12-31 | 2015-09-30 | 2015-06-30 | ||
|---|---|---|---|---|---|---|---|---|---|---|---|---|---|---|---|---|---|---|---|---|---|---|---|---|---|---|---|---|---|---|---|---|---|---|---|
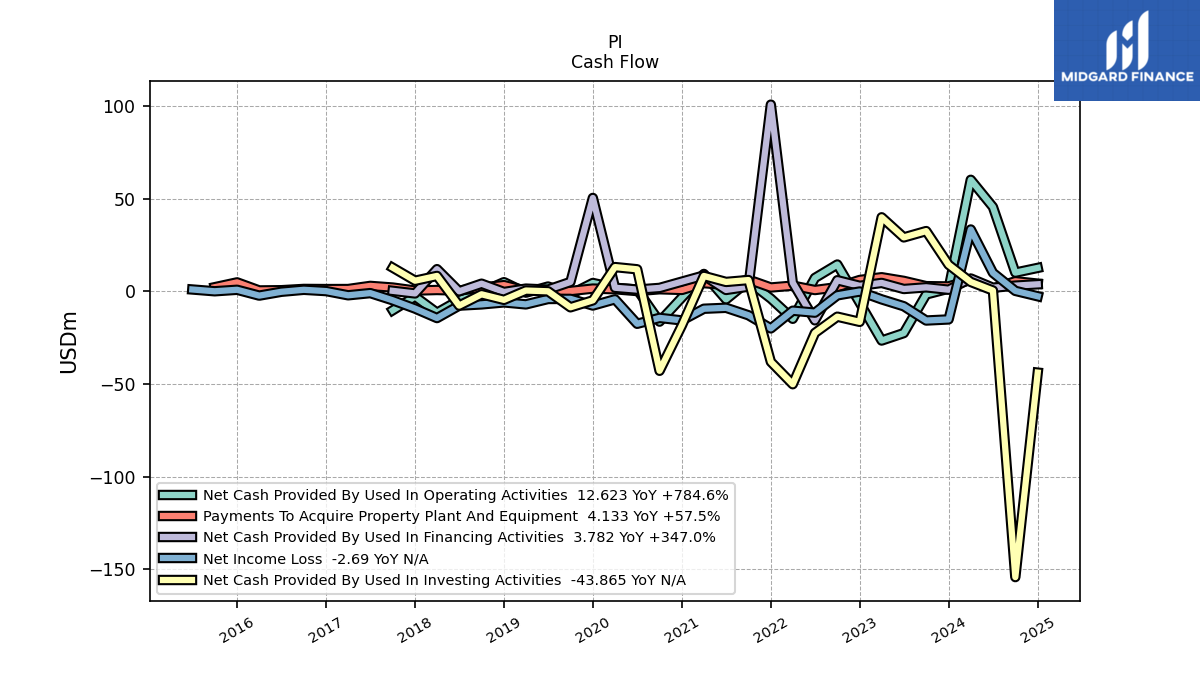
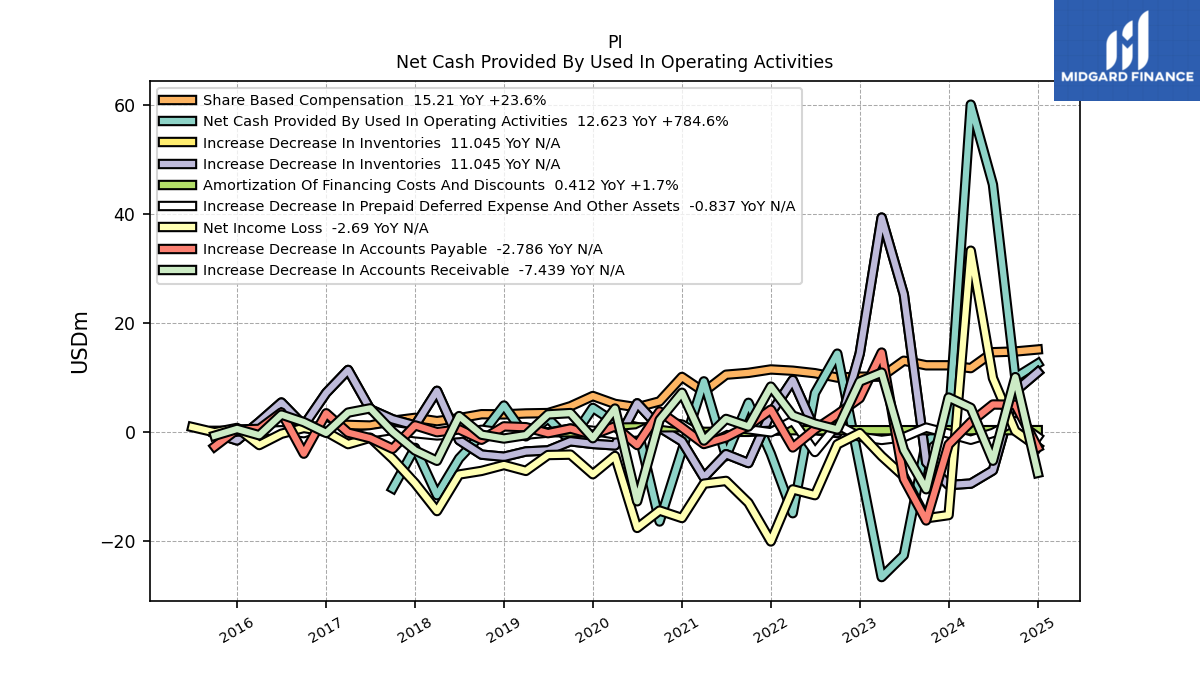
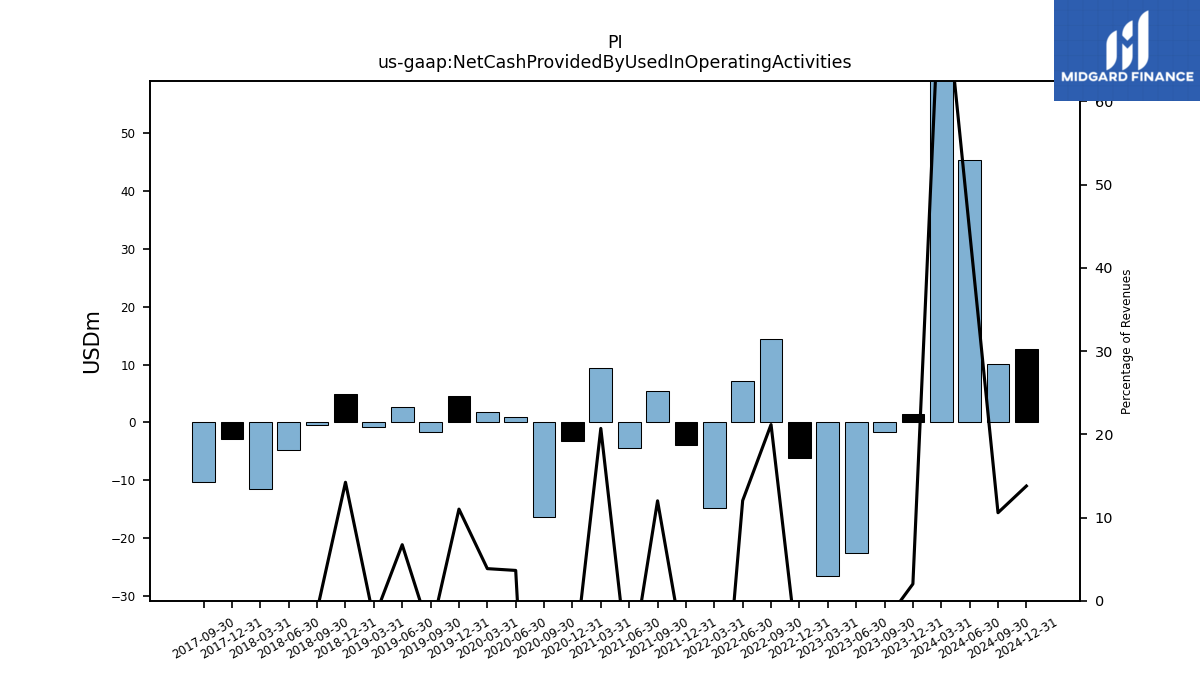
| Net Cash Provided By Used In Operating Activities | -1.71 | -22.54 | -26.56 | -6.17 | 14.45 | 7.20 | -14.84 | -3.94 | 5.43 | -4.39 | 9.37 | -3.33 | -16.36 | 0.96 | 1.84 | 4.49 | -1.63 | 2.57 | -0.73 | 4.93 | -0.39 | -4.78 | -11.54 | -2.83 | -10.27 | NA | NA | NA | NA | NA | NA | NA | NA | NA | |
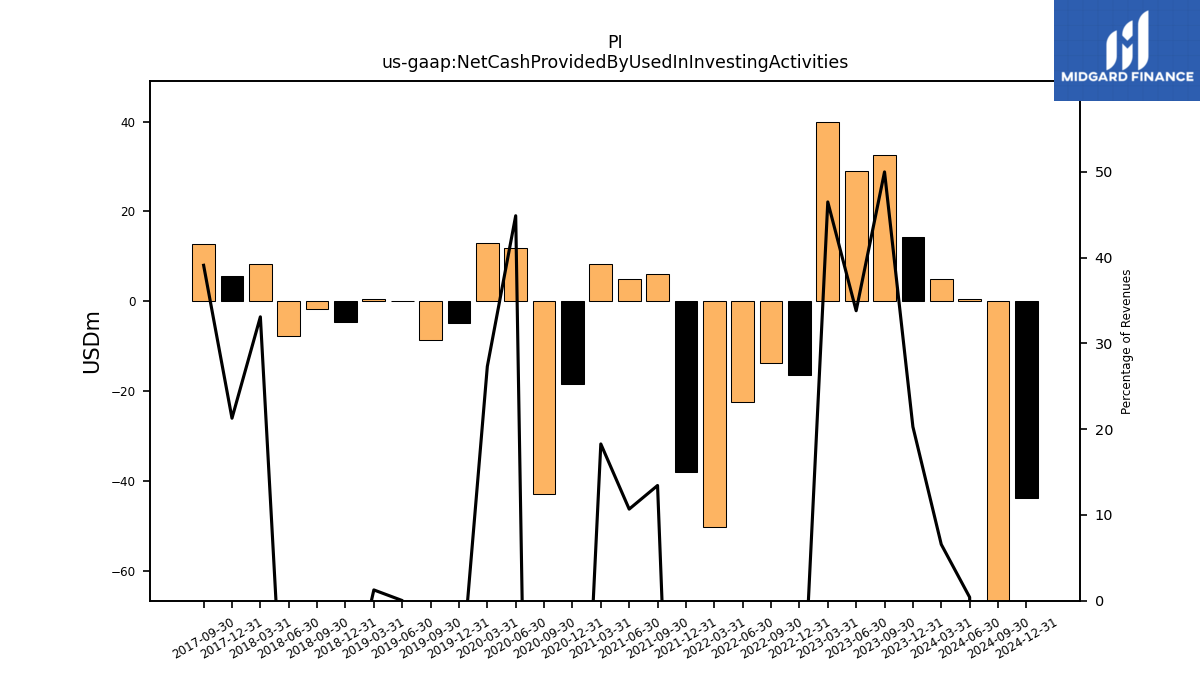
| Net Cash Provided By Used In Investing Activities | 32.49 | 29.07 | 39.93 | -16.50 | -13.69 | -22.48 | -50.13 | -38.03 | 6.07 | 5.05 | 8.27 | -18.33 | -42.89 | 11.87 | 13.06 | -4.89 | -8.64 | 0.01 | 0.42 | -4.62 | -1.62 | -7.72 | 8.29 | 5.71 | 12.74 | NA | NA | NA | NA | NA | NA | NA | NA | NA | |
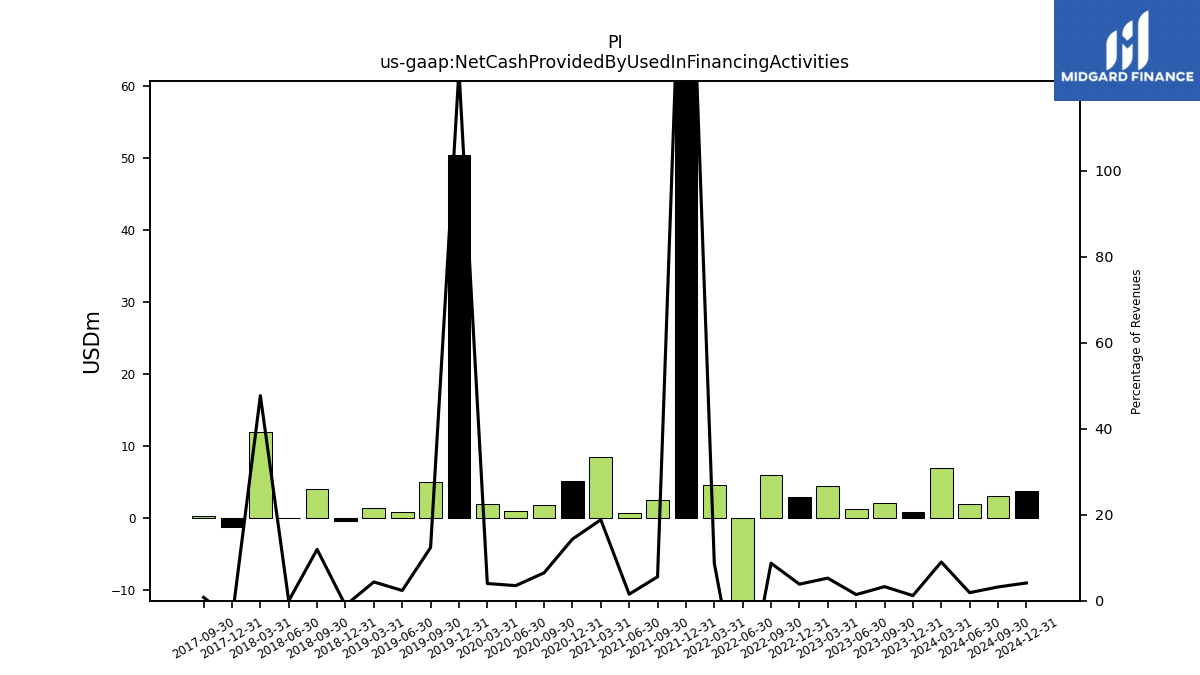
| Net Cash Provided By Used In Financing Activities | 2.14 | 1.23 | 4.52 | 2.95 | 5.97 | -15.68 | 4.61 | 100.69 | 2.52 | 0.72 | 8.52 | 5.23 | 1.83 | 0.93 | 1.92 | 50.36 | 5.04 | 0.91 | 1.45 | -0.37 | 4.11 | -0.00 | 11.96 | -1.16 | 0.26 | NA | NA | NA | NA | NA | NA | NA | NA | NA |
| 2023-09-30 | 2023-06-30 | 2023-03-31 | 2022-12-31 | 2022-09-30 | 2022-06-30 | 2022-03-31 | 2021-12-31 | 2021-09-30 | 2021-06-30 | 2021-03-31 | 2020-12-31 | 2020-09-30 | 2020-06-30 | 2020-03-31 | 2019-12-31 | 2019-09-30 | 2019-06-30 | 2019-03-31 | 2018-12-31 | 2018-09-30 | 2018-06-30 | 2018-03-31 | 2017-12-31 | 2017-09-30 | 2017-06-30 | 2017-03-31 | 2016-12-31 | 2016-09-30 | 2016-06-30 | 2016-03-31 | 2015-12-31 | 2015-09-30 | 2015-06-30 | ||
|---|---|---|---|---|---|---|---|---|---|---|---|---|---|---|---|---|---|---|---|---|---|---|---|---|---|---|---|---|---|---|---|---|---|---|---|
| Net Cash Provided By Used In Operating Activities | -1.71 | -22.54 | -26.56 | -6.17 | 14.45 | 7.20 | -14.84 | -3.94 | 5.43 | -4.39 | 9.37 | -3.33 | -16.36 | 0.96 | 1.84 | 4.49 | -1.63 | 2.57 | -0.73 | 4.93 | -0.39 | -4.78 | -11.54 | -2.83 | -10.27 | NA | NA | NA | NA | NA | NA | NA | NA | NA | |
| Net Income Loss | -15.76 | -8.07 | -4.36 | -0.12 | -2.20 | -11.52 | -10.46 | -20.01 | -12.92 | -8.91 | -9.42 | -15.72 | -14.35 | -17.53 | -4.33 | -7.68 | -4.08 | -4.16 | -7.07 | -5.99 | -7.07 | -7.73 | -14.44 | -9.33 | -4.85 | -0.98 | -2.16 | 0.10 | 0.81 | -0.25 | -2.33 | 0.82 | 0.01 | 0.97 | |
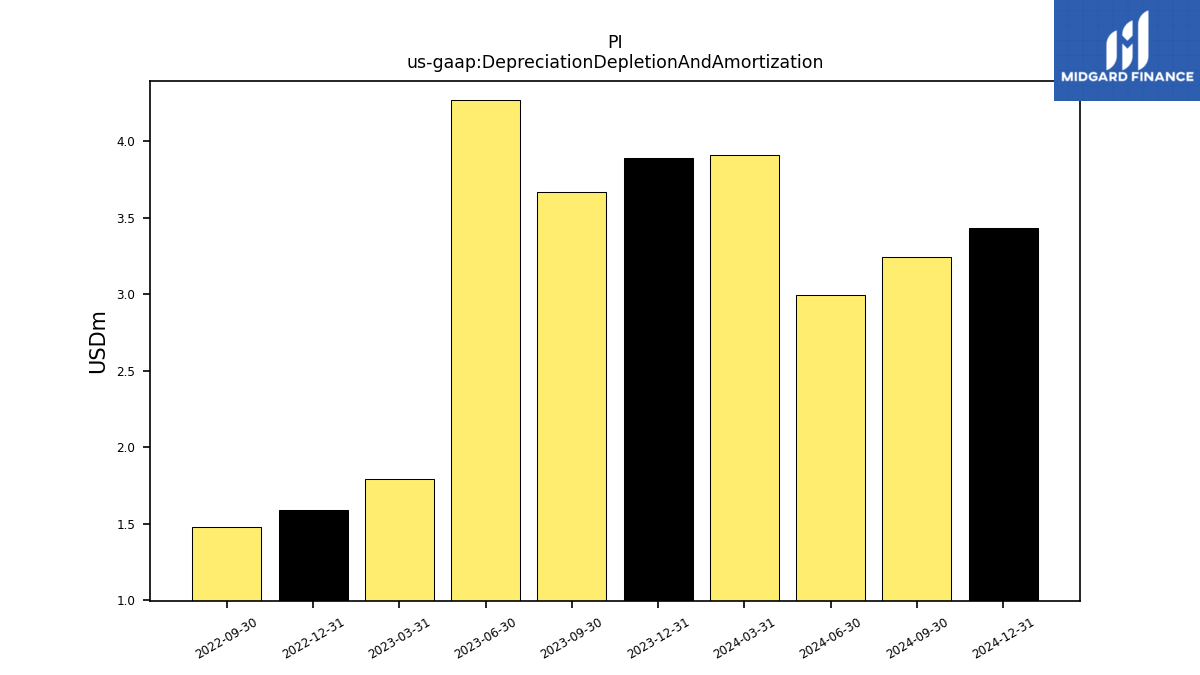
| Depreciation Depletion And Amortization | 3.67 | NA | NA | NA | 1.48 | NA | NA | NA | NA | NA | NA | NA | NA | NA | NA | NA | NA | NA | NA | NA | NA | NA | NA | NA | NA | NA | NA | NA | NA | NA | NA | NA | NA | NA | |
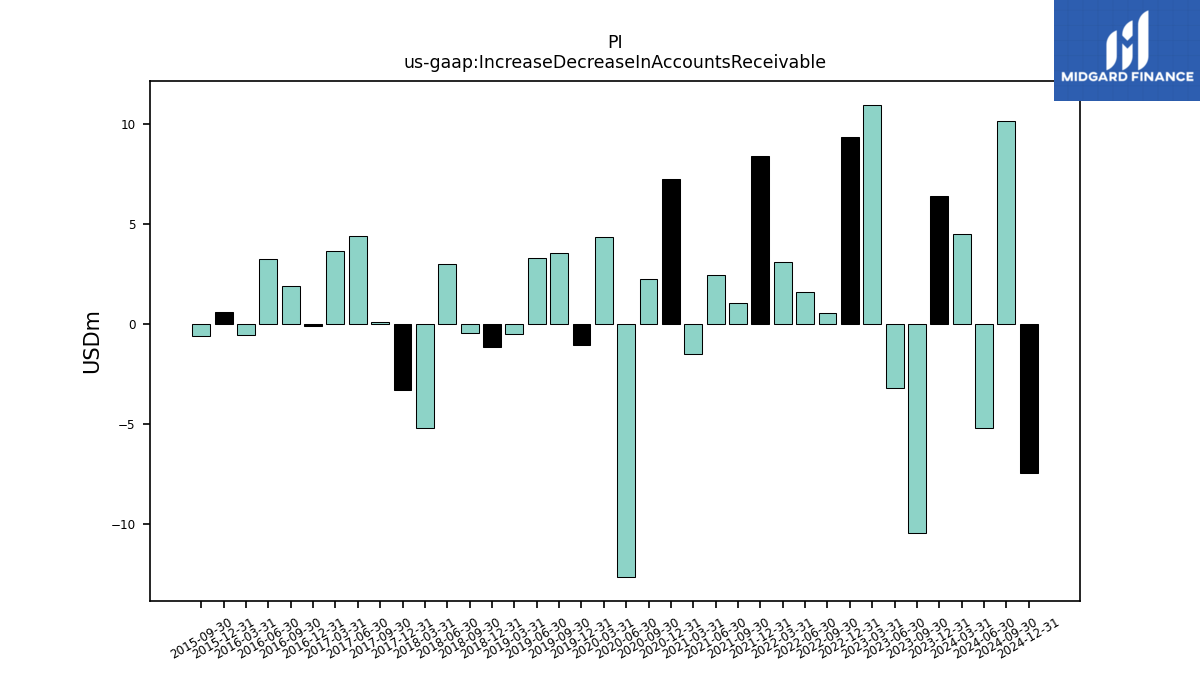
| Increase Decrease In Accounts Receivable | -10.44 | -3.21 | 10.97 | 9.33 | 0.54 | 1.59 | 3.08 | 8.40 | 1.07 | 2.47 | -1.50 | 7.27 | 2.28 | -12.65 | 4.37 | -1.07 | 3.54 | 3.30 | -0.50 | -1.13 | -0.43 | 2.99 | -5.22 | -3.32 | 0.10 | 4.41 | 3.63 | -0.10 | 1.88 | 3.26 | -0.53 | 0.62 | -0.61 | NA | |
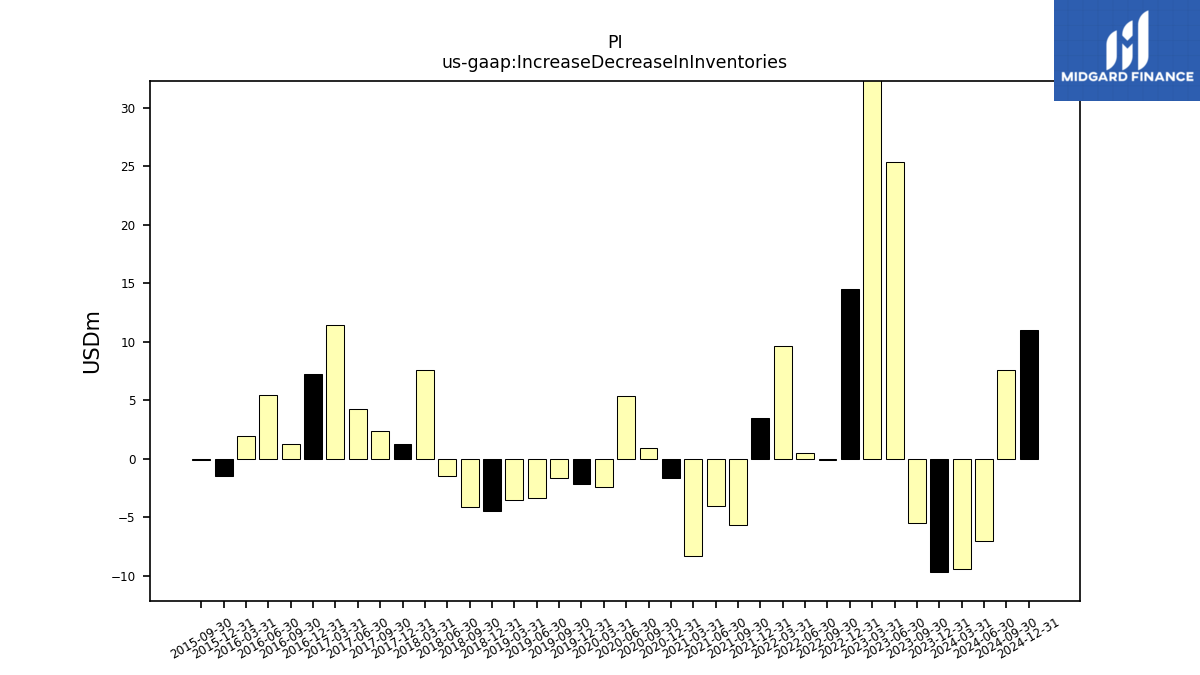
| Increase Decrease In Inventories | -5.49 | 25.32 | 39.41 | 14.47 | -0.12 | 0.49 | 9.60 | 3.52 | -5.63 | -4.00 | -8.26 | -1.65 | 0.89 | 5.33 | -2.39 | -2.12 | -1.64 | -3.31 | -3.51 | -4.47 | -4.08 | -1.43 | 7.62 | 1.27 | 2.40 | 4.23 | 11.46 | 7.25 | 1.26 | 5.48 | 1.91 | -1.47 | -0.14 | NA | |
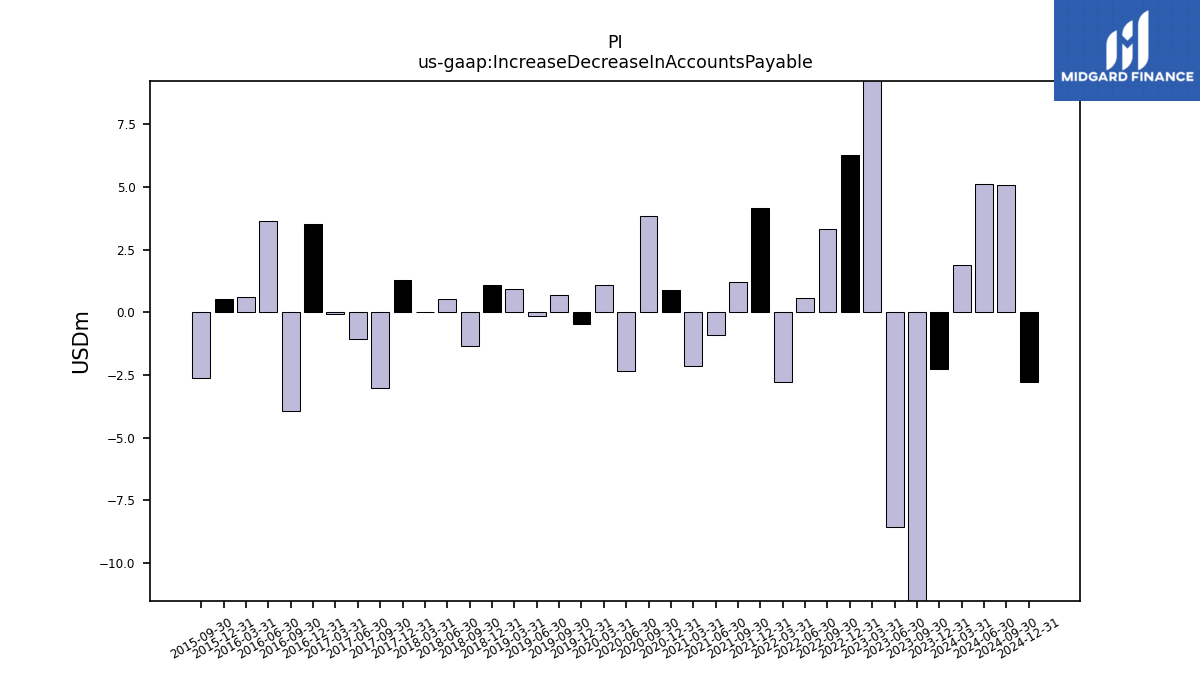
| Increase Decrease In Accounts Payable | -16.17 | -8.54 | 14.65 | 6.26 | 3.31 | 0.57 | -2.77 | 4.17 | 1.22 | -0.92 | -2.14 | 0.88 | 3.84 | -2.33 | 1.10 | -0.46 | 0.71 | -0.15 | 0.95 | 1.10 | -1.35 | 0.55 | 0.03 | 1.29 | -3.00 | -1.07 | -0.05 | 3.51 | -3.91 | 3.66 | 0.63 | 0.54 | -2.60 | NA | |
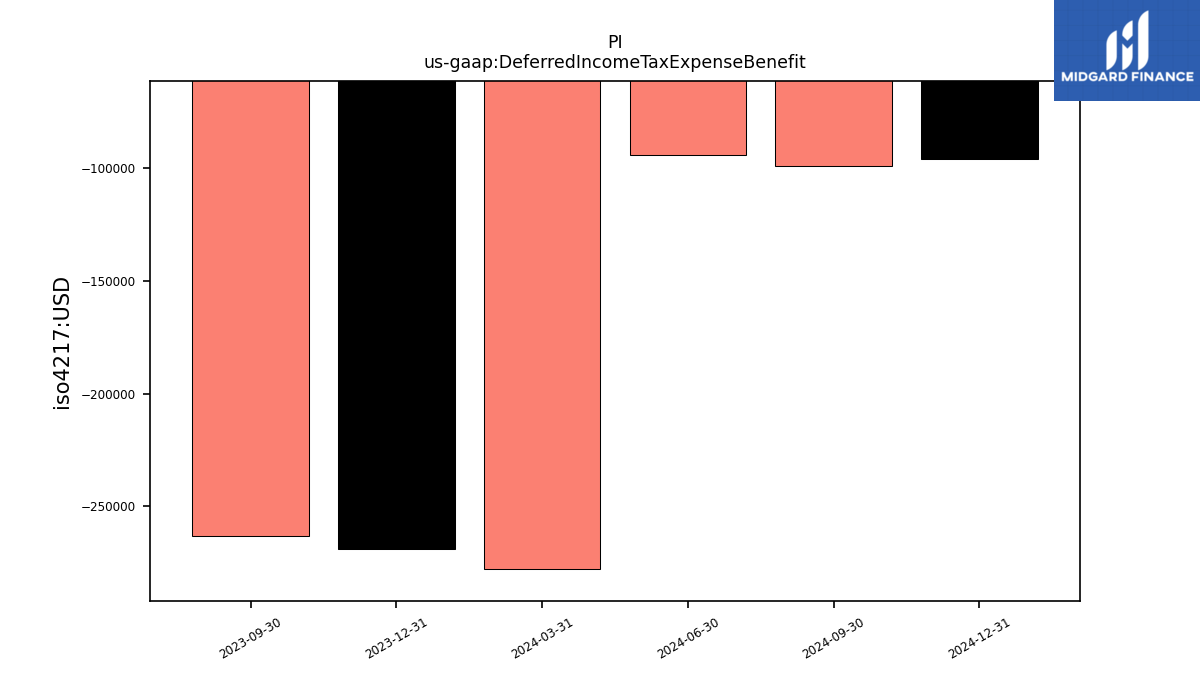
| Deferred Income Tax Expense Benefit | -0.26 | NA | NA | NA | NA | NA | NA | NA | NA | NA | NA | NA | NA | NA | NA | NA | NA | NA | NA | NA | NA | NA | NA | NA | NA | NA | NA | NA | NA | NA | NA | NA | NA | NA | |
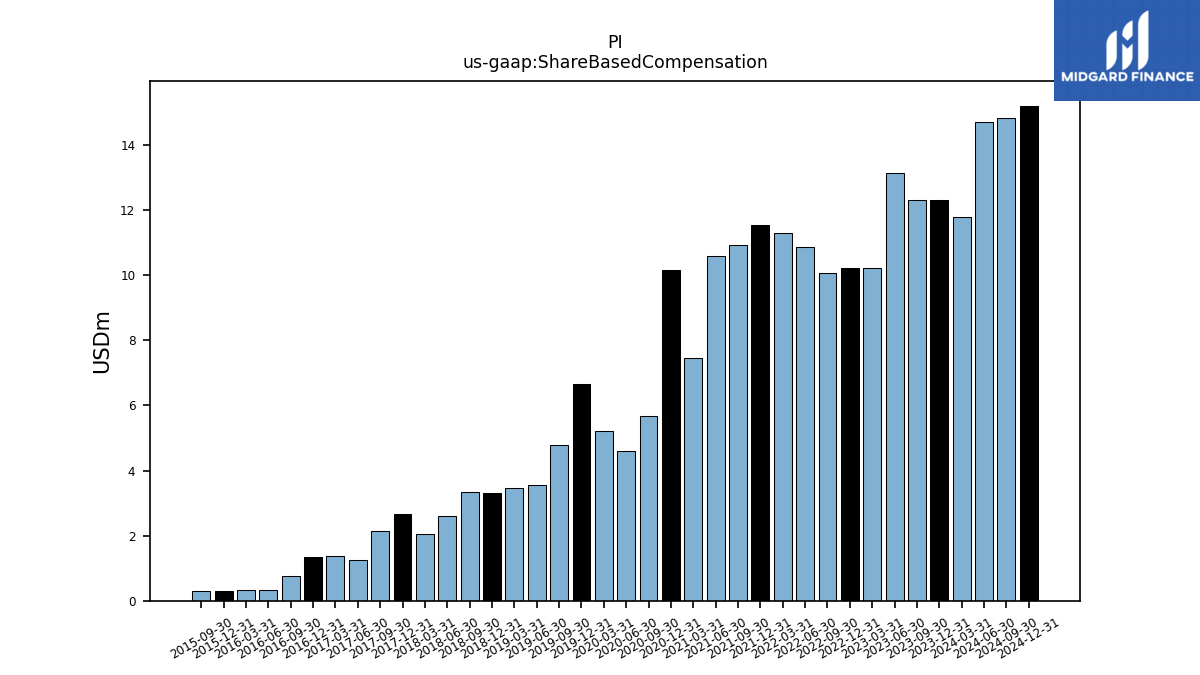
| Share Based Compensation | 12.31 | 13.15 | 10.22 | 10.21 | 10.06 | 10.86 | 11.31 | 11.55 | 10.92 | 10.58 | 7.45 | 10.17 | 5.68 | 4.60 | 5.22 | 6.67 | 4.79 | 3.54 | 3.48 | 3.30 | 3.33 | 2.61 | 2.06 | 2.67 | 2.14 | 1.25 | 1.37 | 1.35 | 0.76 | 0.33 | 0.33 | 0.29 | 0.28 | NA | |
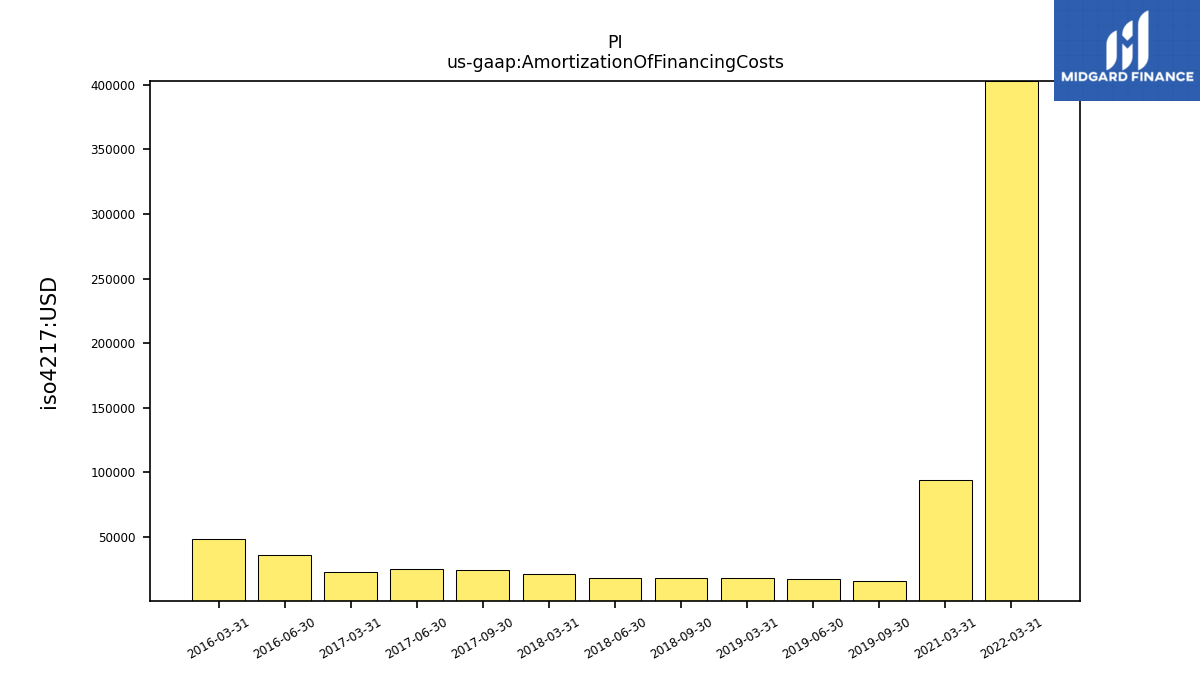
| Amortization Of Financing Costs | NA | NA | NA | NA | NA | NA | 0.40 | NA | NA | NA | 0.09 | NA | NA | NA | NA | NA | 0.02 | 0.02 | 0.02 | NA | 0.02 | 0.02 | 0.02 | NA | 0.02 | 0.03 | 0.02 | NA | NA | 0.04 | 0.05 | NA | NA | NA |
| 2023-09-30 | 2023-06-30 | 2023-03-31 | 2022-12-31 | 2022-09-30 | 2022-06-30 | 2022-03-31 | 2021-12-31 | 2021-09-30 | 2021-06-30 | 2021-03-31 | 2020-12-31 | 2020-09-30 | 2020-06-30 | 2020-03-31 | 2019-12-31 | 2019-09-30 | 2019-06-30 | 2019-03-31 | 2018-12-31 | 2018-09-30 | 2018-06-30 | 2018-03-31 | 2017-12-31 | 2017-09-30 | 2017-06-30 | 2017-03-31 | 2016-12-31 | 2016-09-30 | 2016-06-30 | 2016-03-31 | 2015-12-31 | 2015-09-30 | 2015-06-30 | ||
|---|---|---|---|---|---|---|---|---|---|---|---|---|---|---|---|---|---|---|---|---|---|---|---|---|---|---|---|---|---|---|---|---|---|---|---|
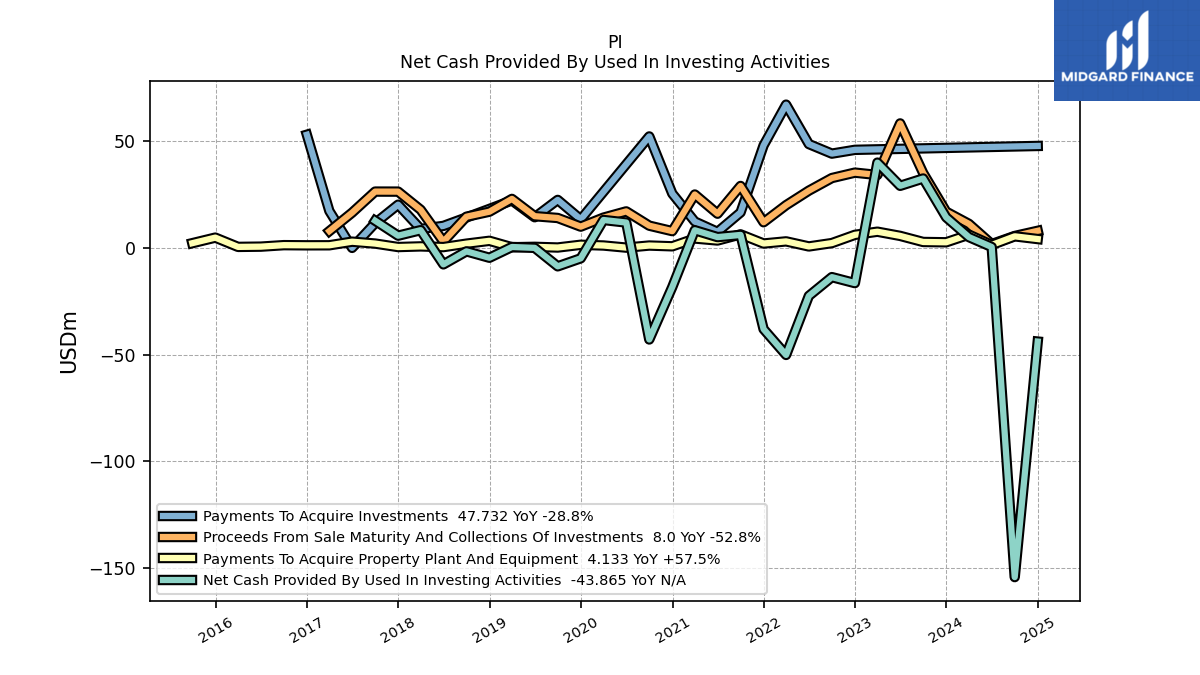
| Net Cash Provided By Used In Investing Activities | 32.49 | 29.07 | 39.93 | -16.50 | -13.69 | -22.48 | -50.13 | -38.03 | 6.07 | 5.05 | 8.27 | -18.33 | -42.89 | 11.87 | 13.06 | -4.89 | -8.64 | 0.01 | 0.42 | -4.62 | -1.62 | -7.72 | 8.29 | 5.71 | 12.74 | NA | NA | NA | NA | NA | NA | NA | NA | NA | |
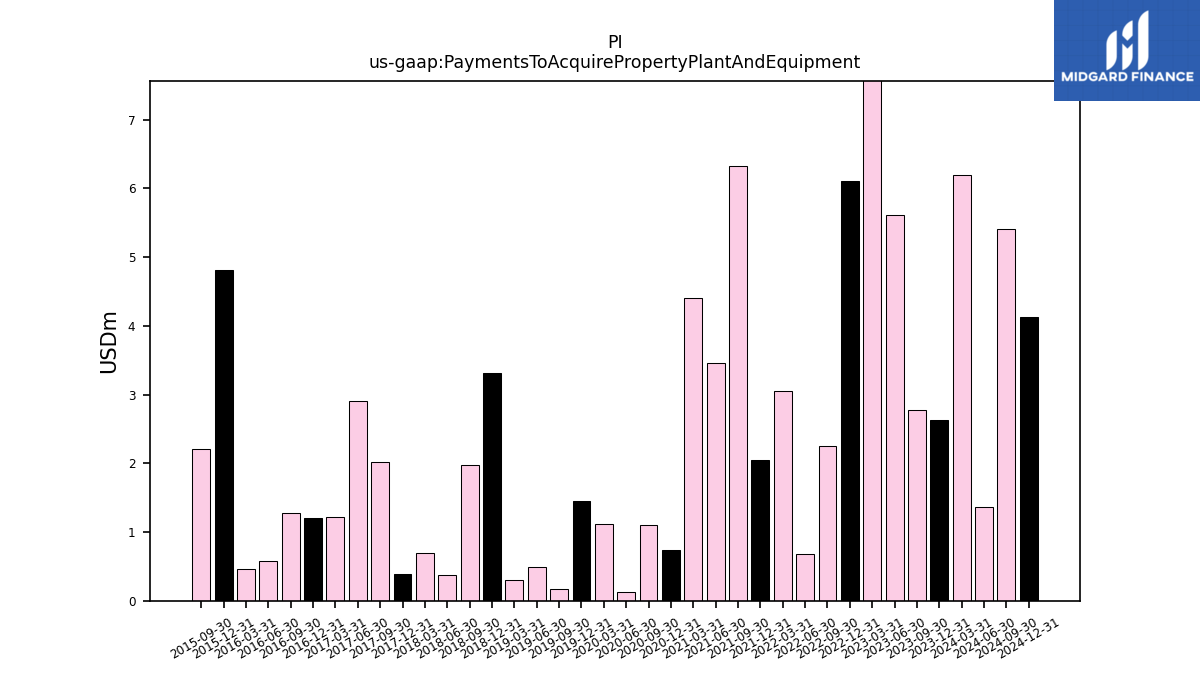
| Payments To Acquire Property Plant And Equipment | 2.77 | 5.62 | 7.58 | 6.10 | 2.25 | 0.67 | 3.05 | 2.05 | 6.32 | 3.46 | 4.40 | 0.74 | 1.10 | 0.12 | 1.11 | 1.46 | 0.17 | 0.49 | 0.30 | 3.32 | 1.98 | 0.37 | 0.70 | 0.40 | 2.02 | 2.91 | 1.22 | 1.20 | 1.28 | 0.58 | 0.46 | 4.81 | 2.20 | NA | |
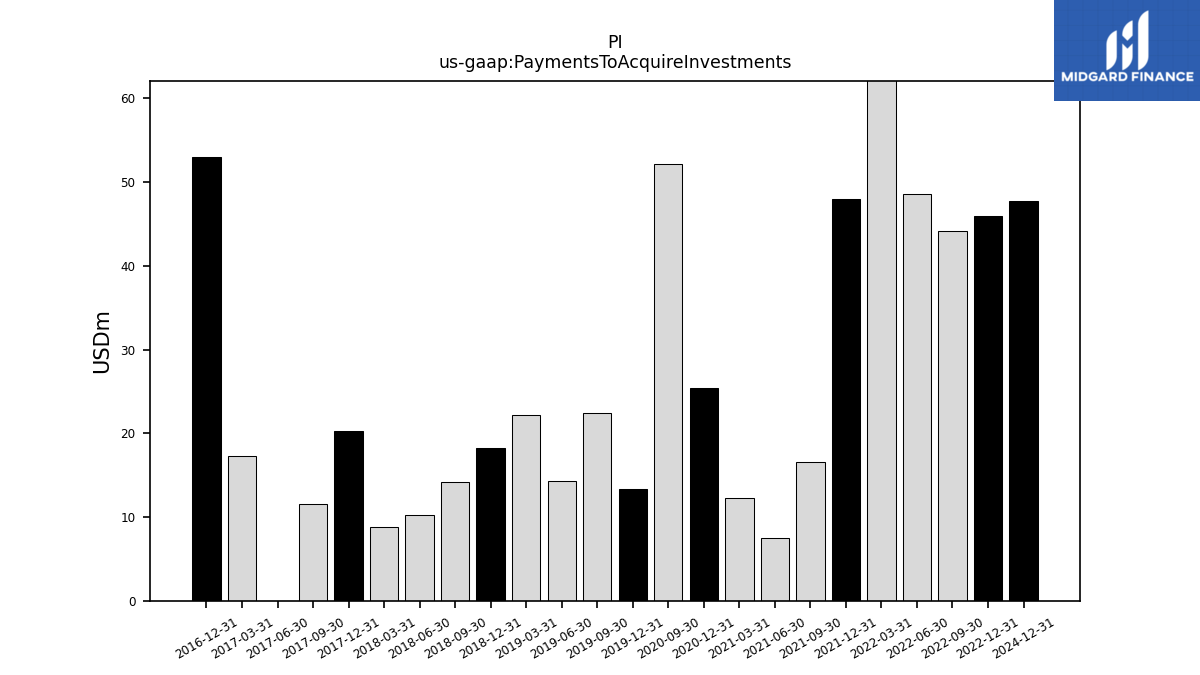
| Payments To Acquire Investments | NA | NA | NA | 45.91 | 44.14 | 48.61 | 67.08 | 47.98 | 16.61 | 7.49 | 12.33 | 25.44 | 52.20 | NA | NA | 13.38 | 22.47 | 14.35 | 22.22 | 18.25 | 14.24 | 10.30 | 8.86 | 20.24 | 11.59 | 0.00 | 17.29 | 52.99 | NA | NA | NA | NA | NA | NA |
| 2023-09-30 | 2023-06-30 | 2023-03-31 | 2022-12-31 | 2022-09-30 | 2022-06-30 | 2022-03-31 | 2021-12-31 | 2021-09-30 | 2021-06-30 | 2021-03-31 | 2020-12-31 | 2020-09-30 | 2020-06-30 | 2020-03-31 | 2019-12-31 | 2019-09-30 | 2019-06-30 | 2019-03-31 | 2018-12-31 | 2018-09-30 | 2018-06-30 | 2018-03-31 | 2017-12-31 | 2017-09-30 | 2017-06-30 | 2017-03-31 | 2016-12-31 | 2016-09-30 | 2016-06-30 | 2016-03-31 | 2015-12-31 | 2015-09-30 | 2015-06-30 | ||
|---|---|---|---|---|---|---|---|---|---|---|---|---|---|---|---|---|---|---|---|---|---|---|---|---|---|---|---|---|---|---|---|---|---|---|---|
| Net Cash Provided By Used In Financing Activities | 2.14 | 1.23 | 4.52 | 2.95 | 5.97 | -15.68 | 4.61 | 100.69 | 2.52 | 0.72 | 8.52 | 5.23 | 1.83 | 0.93 | 1.92 | 50.36 | 5.04 | 0.91 | 1.45 | -0.37 | 4.11 | -0.00 | 11.96 | -1.16 | 0.26 | NA | NA | NA | NA | NA | NA | NA | NA | NA |
| 2023-09-30 | 2023-06-30 | 2023-03-31 | 2022-12-31 | 2022-09-30 | 2022-06-30 | 2022-03-31 | 2021-12-31 | 2021-09-30 | 2021-06-30 | 2021-03-31 | 2020-12-31 | 2020-09-30 | 2020-06-30 | 2020-03-31 | 2019-12-31 | 2019-09-30 | 2019-06-30 | 2019-03-31 | 2018-12-31 | 2018-09-30 | 2018-06-30 | 2018-03-31 | 2017-12-31 | 2017-09-30 | 2017-06-30 | 2017-03-31 | 2016-12-31 | 2016-09-30 | 2016-06-30 | 2016-03-31 | 2015-12-31 | 2015-09-30 | 2015-06-30 | ||
|---|---|---|---|---|---|---|---|---|---|---|---|---|---|---|---|---|---|---|---|---|---|---|---|---|---|---|---|---|---|---|---|---|---|---|---|
| Revenues | 65.00 | 85.99 | 85.90 | 76.59 | 68.27 | 59.80 | 53.14 | 52.57 | 45.19 | 47.27 | 45.25 | 36.45 | 28.20 | 26.46 | 47.82 | 40.82 | 40.76 | 38.19 | 33.06 | 34.62 | 34.41 | 28.54 | 25.07 | 26.86 | 32.60 | 34.11 | 31.73 | 33.66 | 31.01 | 25.99 | 21.63 | 22.63 | 20.66 | 19.12 | |
| Revenue From Contract With Customer Excluding Assessed Tax | 65.00 | 85.99 | 85.90 | 76.59 | 68.27 | 59.80 | 53.14 | 52.57 | 45.19 | 47.27 | 45.25 | 36.45 | 28.20 | 26.46 | 47.82 | 40.82 | 40.76 | 38.19 | 33.06 | 34.62 | 34.41 | 28.54 | 25.07 | 26.86 | 32.60 | 34.11 | 31.73 | 33.66 | 31.01 | 25.99 | 21.63 | 22.63 | 20.66 | 19.12 | |
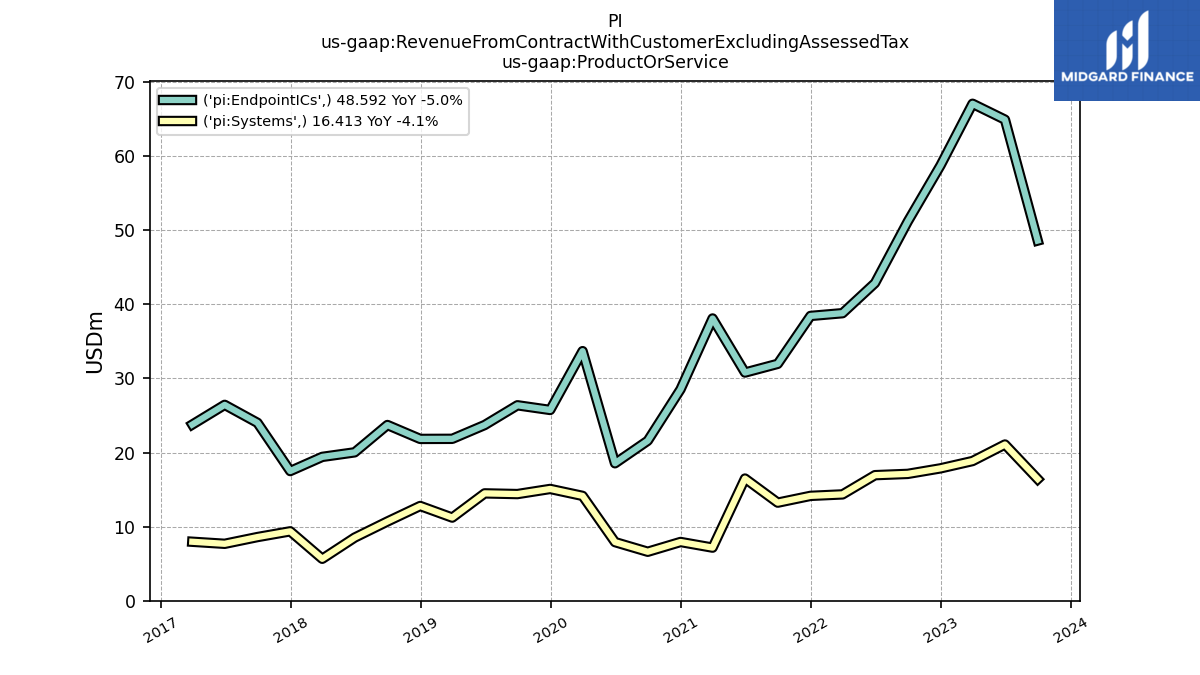
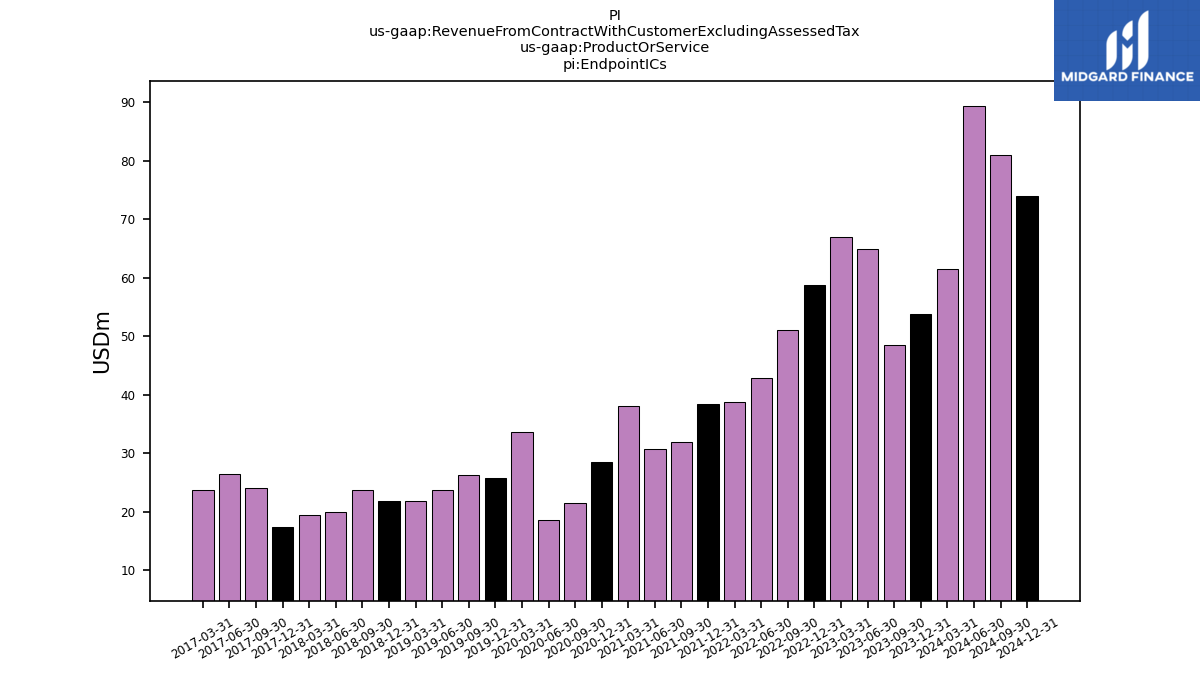
| Endpoint I Cs | 48.59 | 64.91 | 67.05 | 58.73 | 51.16 | 42.85 | 38.80 | 38.42 | 31.96 | 30.78 | 38.08 | 28.52 | 21.59 | 18.55 | 33.67 | 25.74 | 26.37 | 23.70 | 21.84 | 21.83 | 23.71 | 20.02 | 19.41 | 17.50 | 24.01 | 26.43 | 23.77 | NA | NA | NA | NA | NA | NA | NA | |
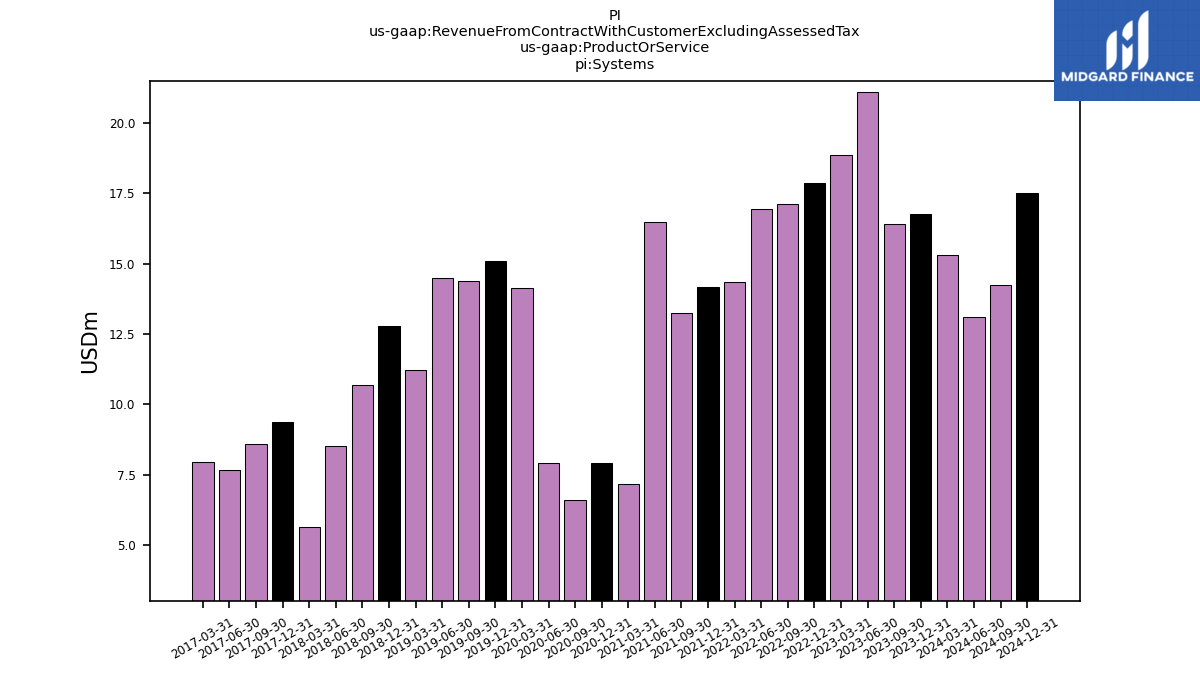
| Systems | 16.41 | 21.08 | 18.85 | 17.86 | 17.11 | 16.94 | 14.35 | 14.15 | 13.23 | 16.48 | 7.17 | 7.93 | 6.61 | 7.91 | 14.15 | 15.08 | 14.39 | 14.49 | 11.22 | 12.79 | 10.69 | 8.52 | 5.66 | 9.37 | 8.59 | 7.68 | 7.96 | NA | NA | NA | NA | NA | NA | NA |
