
| 2023-12-31 | 2023-09-30 | 2023-06-30 | 2023-03-31 | 2022-12-31 | 2022-09-30 | 2022-06-30 | 2022-03-31 | 2021-12-31 | 2021-09-30 | 2021-06-30 | 2021-03-31 | 2020-12-31 | 2020-09-30 | 2020-06-30 | 2020-03-31 | 2019-12-31 | 2019-09-30 | 2019-06-30 | 2019-03-31 | 2018-12-31 | 2018-09-30 | 2018-06-30 | 2018-03-31 | ||
|---|---|---|---|---|---|---|---|---|---|---|---|---|---|---|---|---|---|---|---|---|---|---|---|---|---|
| Common Stock Value | 0.01 | 0.01 | 0.01 | 0.01 | 0.01 | 0.01 | 0.01 | 0.01 | 0.01 | 0.01 | 0.01 | 0.01 | 0.01 | 0.01 | 0.01 | 0.01 | 0.01 | 0.00 | 0.00 | 0.00 | 0.00 | NA | NA | NA | |
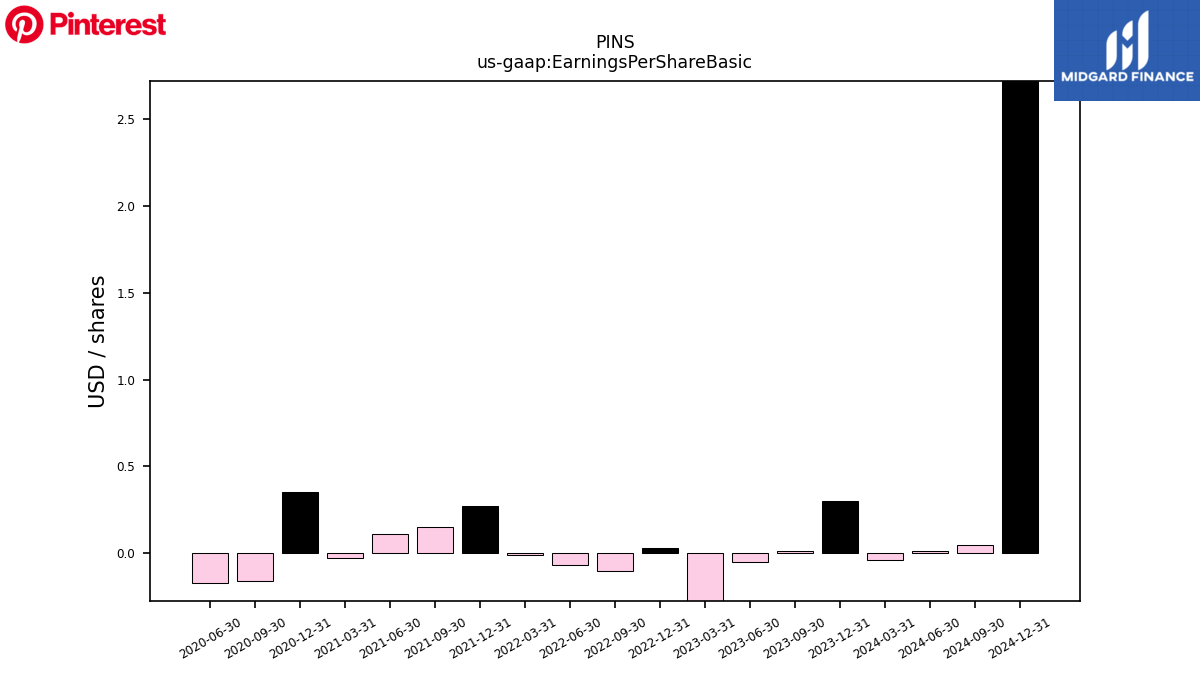
| Earnings Per Share Basic | 0.30 | 0.01 | -0.05 | -0.31 | 0.03 | -0.10 | -0.07 | -0.01 | 0.27 | 0.15 | 0.11 | -0.03 | 0.35 | -0.16 | -0.17 | NA | NA | NA | NA | NA | NA | NA | NA | NA | |
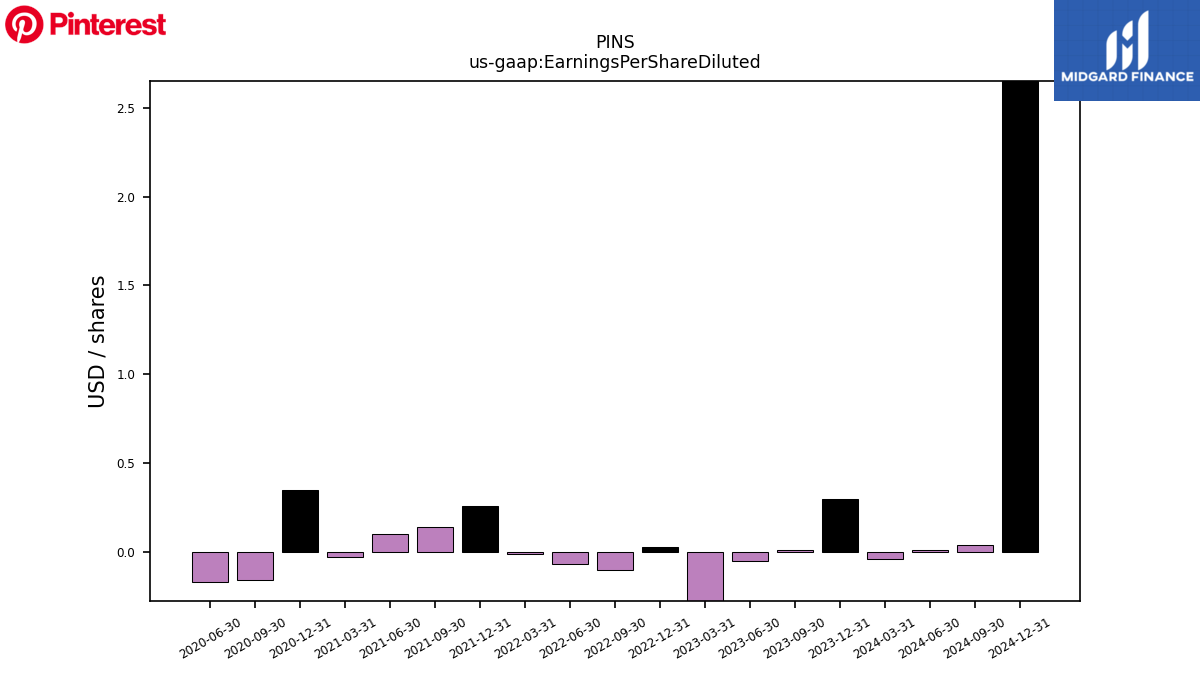
| Earnings Per Share Diluted | 0.30 | 0.01 | -0.05 | -0.31 | 0.03 | -0.10 | -0.07 | -0.01 | 0.26 | 0.14 | 0.10 | -0.03 | 0.35 | -0.16 | -0.17 | NA | NA | NA | NA | NA | NA | NA | NA | NA |
| 2023-12-31 | 2023-09-30 | 2023-06-30 | 2023-03-31 | 2022-12-31 | 2022-09-30 | 2022-06-30 | 2022-03-31 | 2021-12-31 | 2021-09-30 | 2021-06-30 | 2021-03-31 | 2020-12-31 | 2020-09-30 | 2020-06-30 | 2020-03-31 | 2019-12-31 | 2019-09-30 | 2019-06-30 | 2019-03-31 | 2018-12-31 | 2018-09-30 | 2018-06-30 | 2018-03-31 | ||
|---|---|---|---|---|---|---|---|---|---|---|---|---|---|---|---|---|---|---|---|---|---|---|---|---|---|
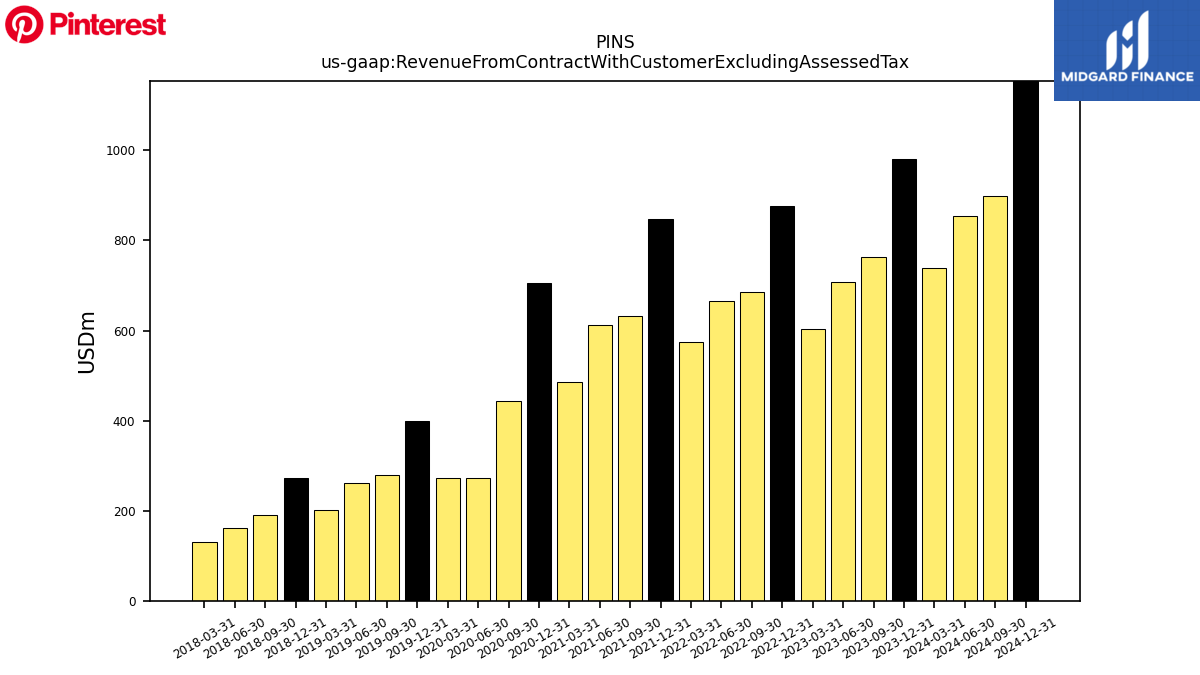
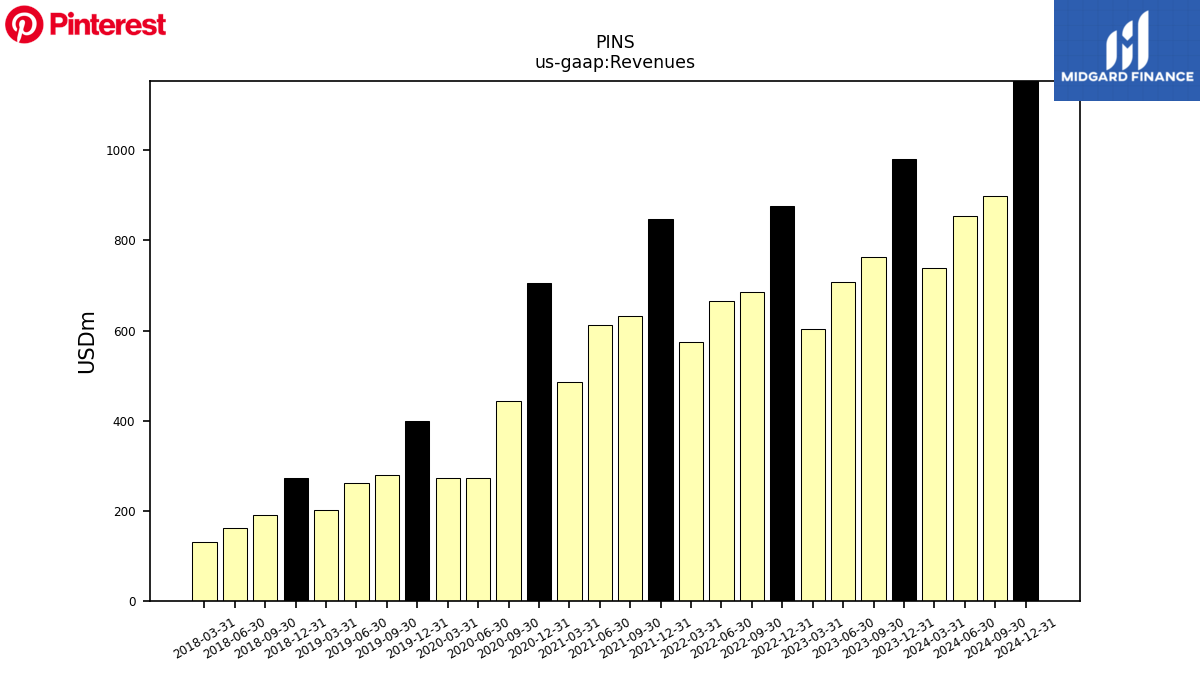
| Revenue From Contract With Customer Excluding Assessed Tax | 981.26 | 763.20 | 708.02 | 602.58 | 877.21 | 684.55 | 665.93 | 574.88 | 846.65 | 632.93 | 613.21 | 485.23 | 705.62 | 442.62 | 272.49 | 271.94 | 399.90 | 279.70 | 261.25 | 201.91 | 273.18 | 190.20 | 161.19 | 131.36 | |
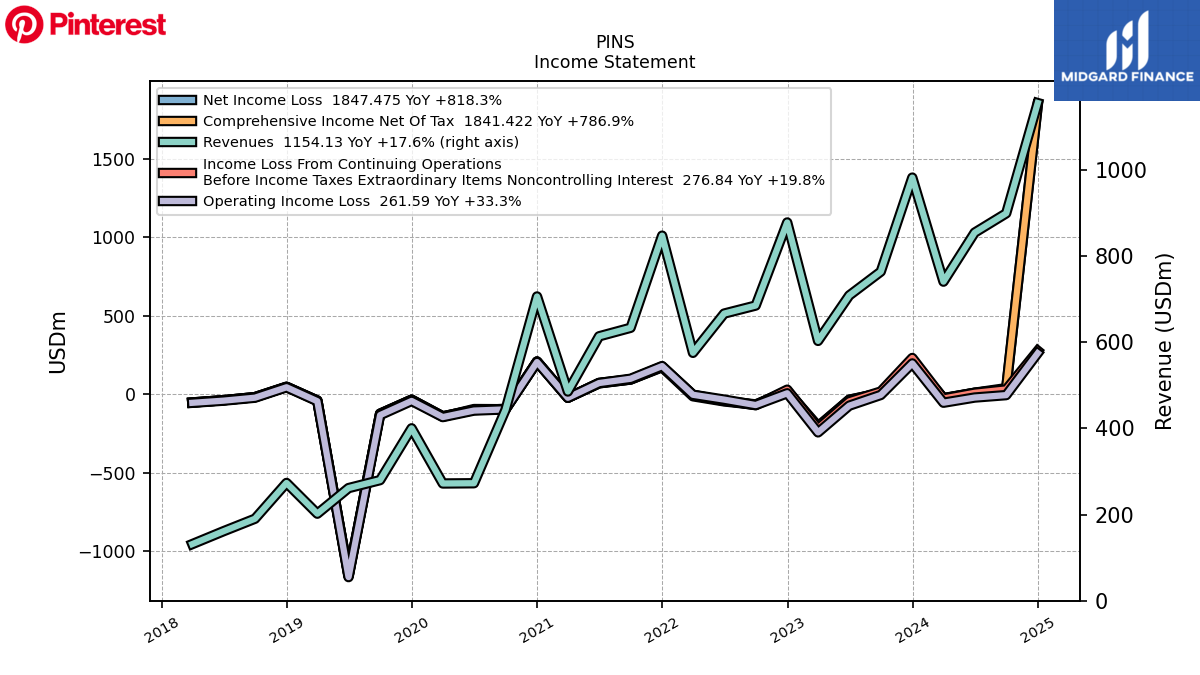
| Revenues | 981.26 | 763.20 | 708.02 | 602.58 | 877.21 | 684.55 | 665.93 | 574.88 | 846.65 | 632.93 | 613.21 | 485.23 | 705.62 | 442.62 | 272.49 | 271.94 | 399.90 | 279.70 | 261.25 | 201.91 | 273.18 | 190.20 | 161.19 | 131.36 | |
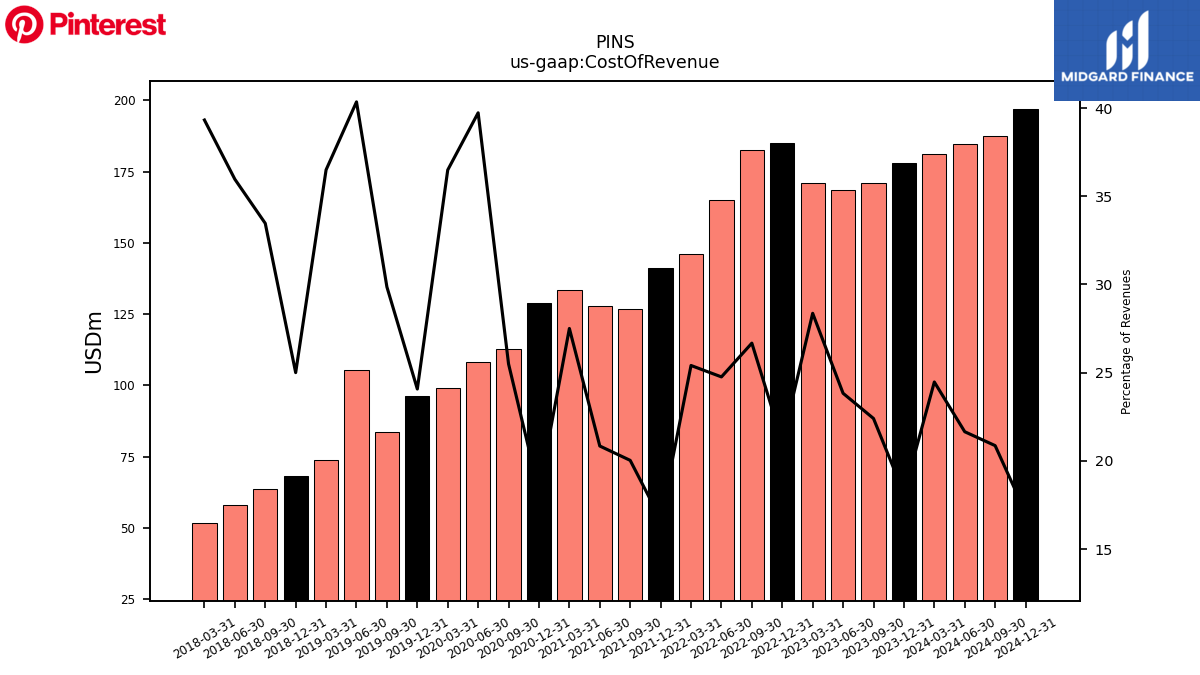
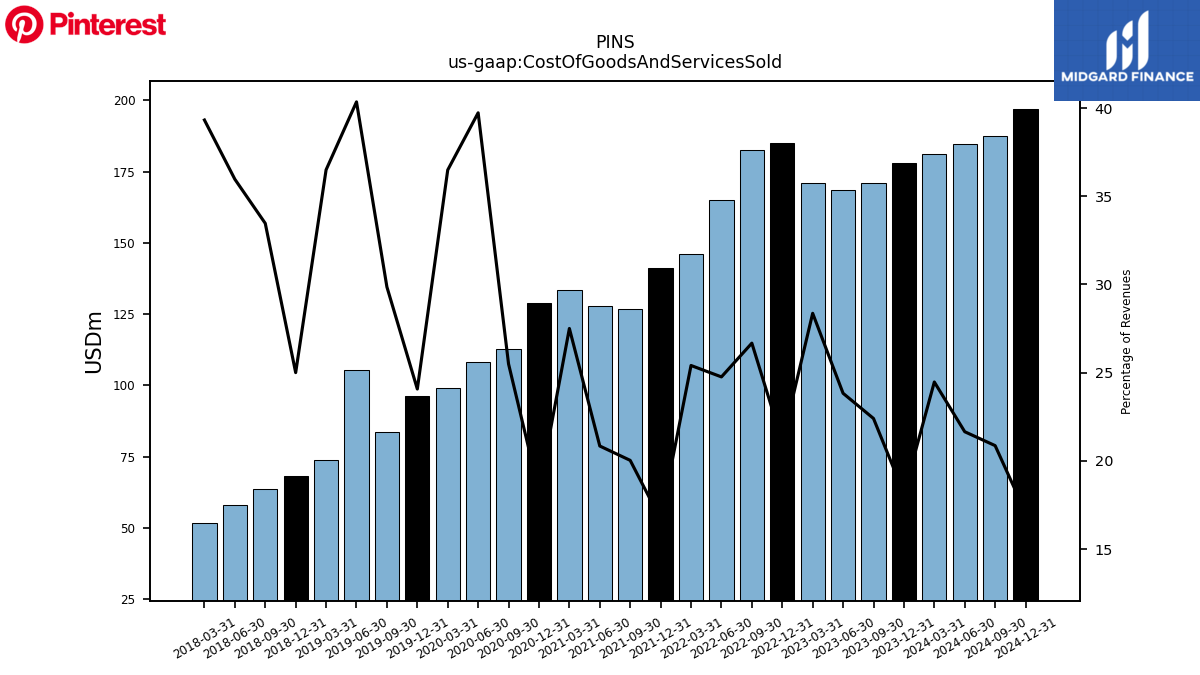
| Cost Of Revenue | 178.10 | 171.00 | 168.74 | 170.93 | 185.03 | 182.60 | 164.90 | 146.07 | 141.25 | 126.78 | 127.82 | 133.47 | 129.02 | 112.84 | 108.26 | 99.23 | 96.27 | 83.52 | 105.42 | 73.69 | 68.31 | 63.65 | 57.97 | 51.65 | |
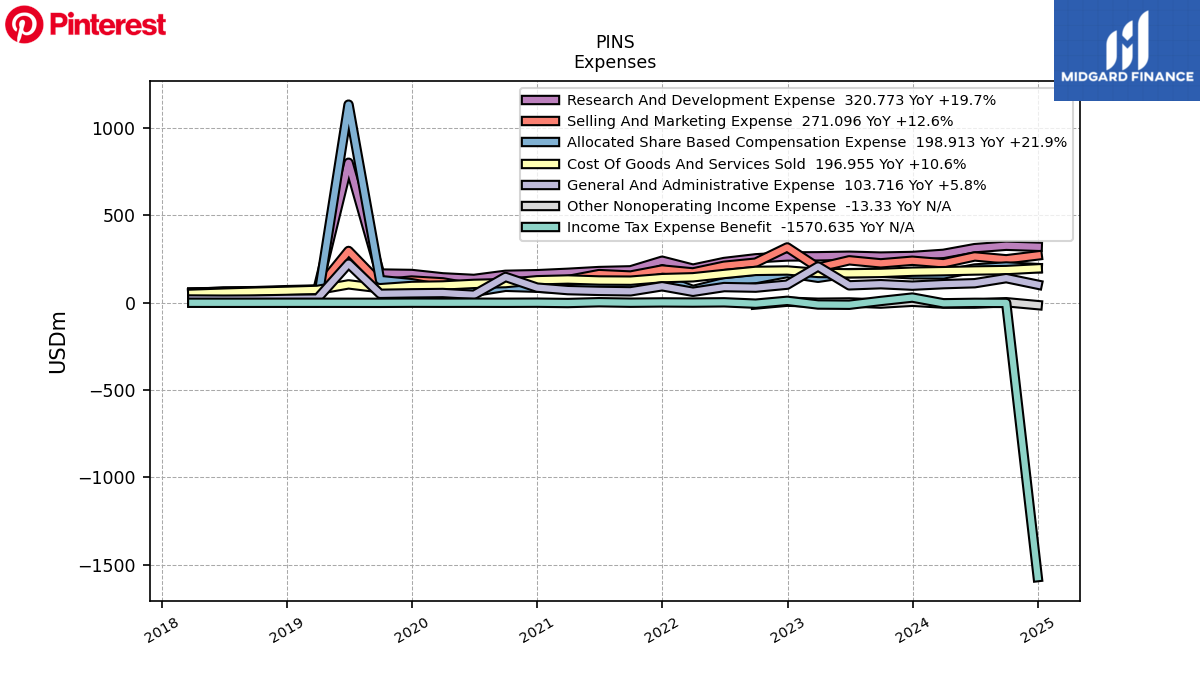
| Cost Of Goods And Services Sold | 178.10 | 171.00 | 168.74 | 170.93 | 185.03 | 182.60 | 164.90 | 146.07 | 141.25 | 126.78 | 127.82 | 133.47 | 129.02 | 112.84 | 108.26 | 99.23 | 96.27 | 83.52 | 105.42 | 73.69 | 68.31 | 63.65 | 57.97 | 51.65 | |
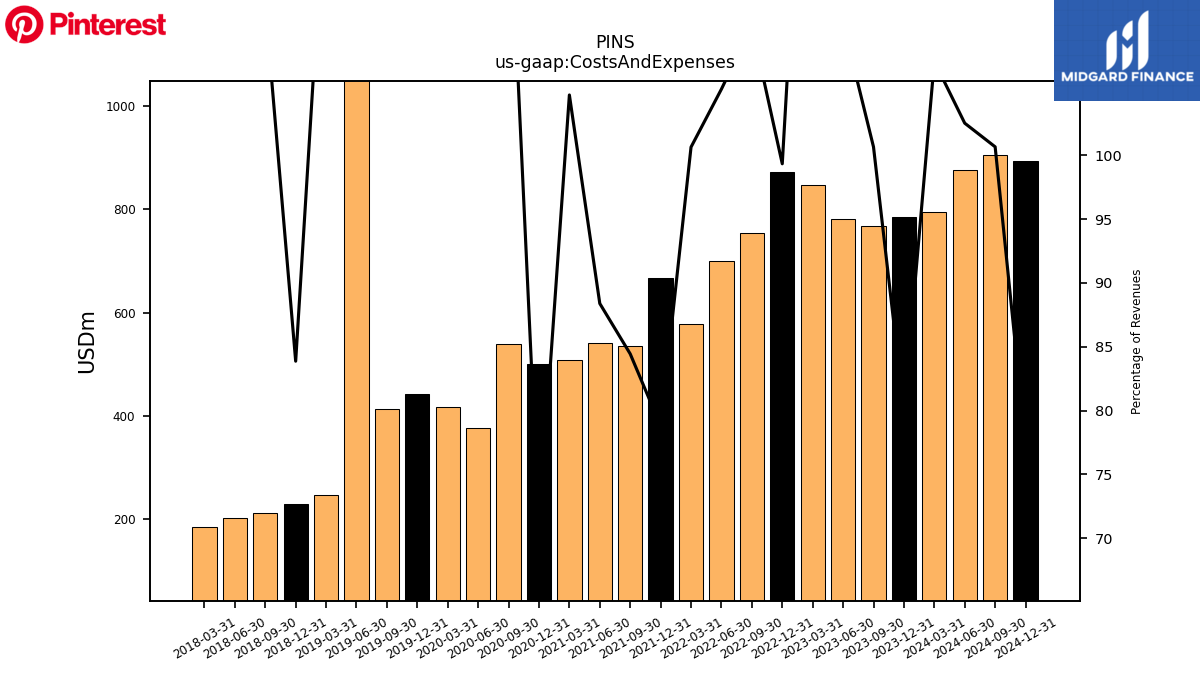
| Costs And Expenses | 785.01 | 768.20 | 781.27 | 846.27 | 871.34 | 753.92 | 700.43 | 578.55 | 667.21 | 534.48 | 542.01 | 508.14 | 500.47 | 539.65 | 377.01 | 418.03 | 443.08 | 413.41 | 1428.39 | 246.74 | 229.12 | 212.63 | 202.56 | 186.34 | |
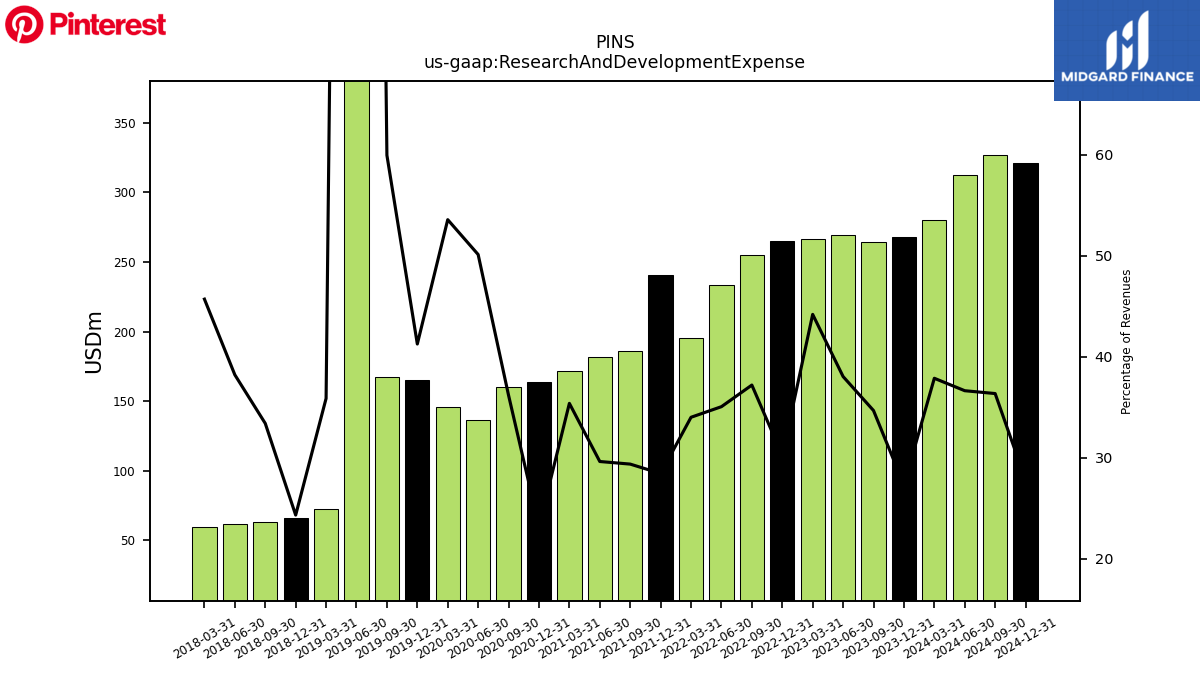
| Research And Development Expense | 267.98 | 264.70 | 269.39 | 266.35 | 265.24 | 254.68 | 233.51 | 195.55 | 240.86 | 185.95 | 181.73 | 171.73 | 163.71 | 160.19 | 136.59 | 145.70 | 165.03 | 167.70 | 801.88 | 72.44 | 66.47 | 63.54 | 61.60 | 60.05 | |
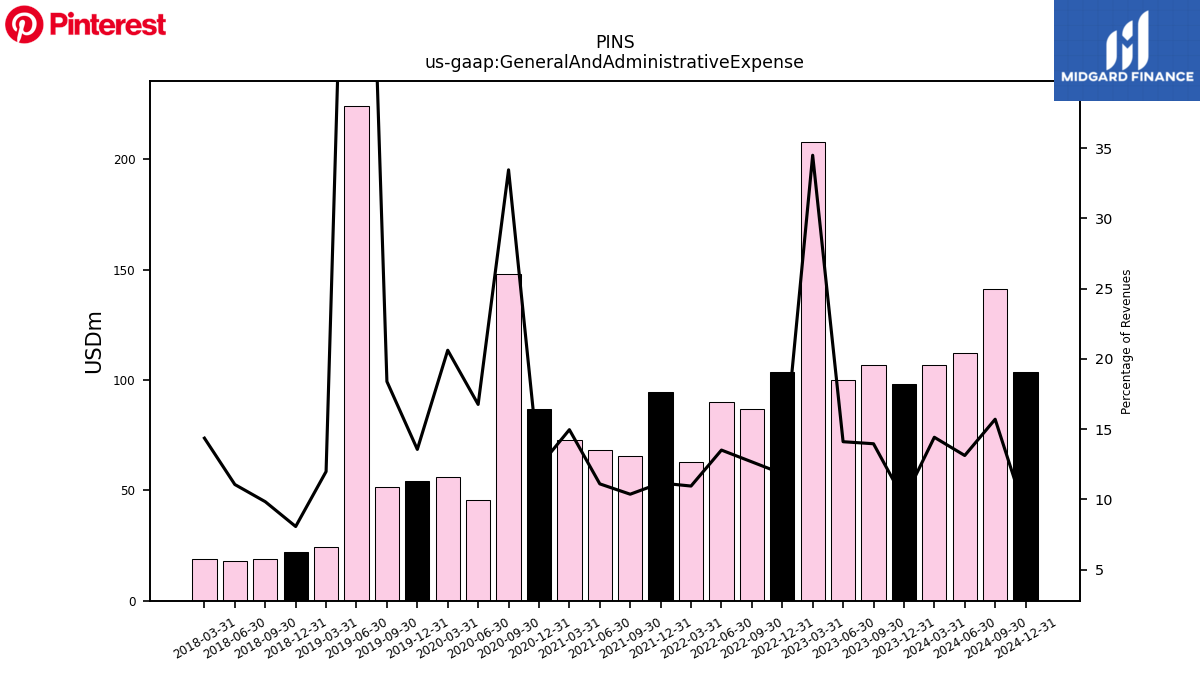
| General And Administrative Expense | 98.07 | 106.58 | 99.90 | 207.86 | 103.80 | 86.77 | 89.99 | 62.98 | 94.58 | 65.66 | 68.12 | 72.62 | 86.97 | 148.09 | 45.68 | 56.07 | 54.24 | 51.45 | 224.18 | 24.20 | 22.06 | 18.72 | 17.83 | 18.87 | |
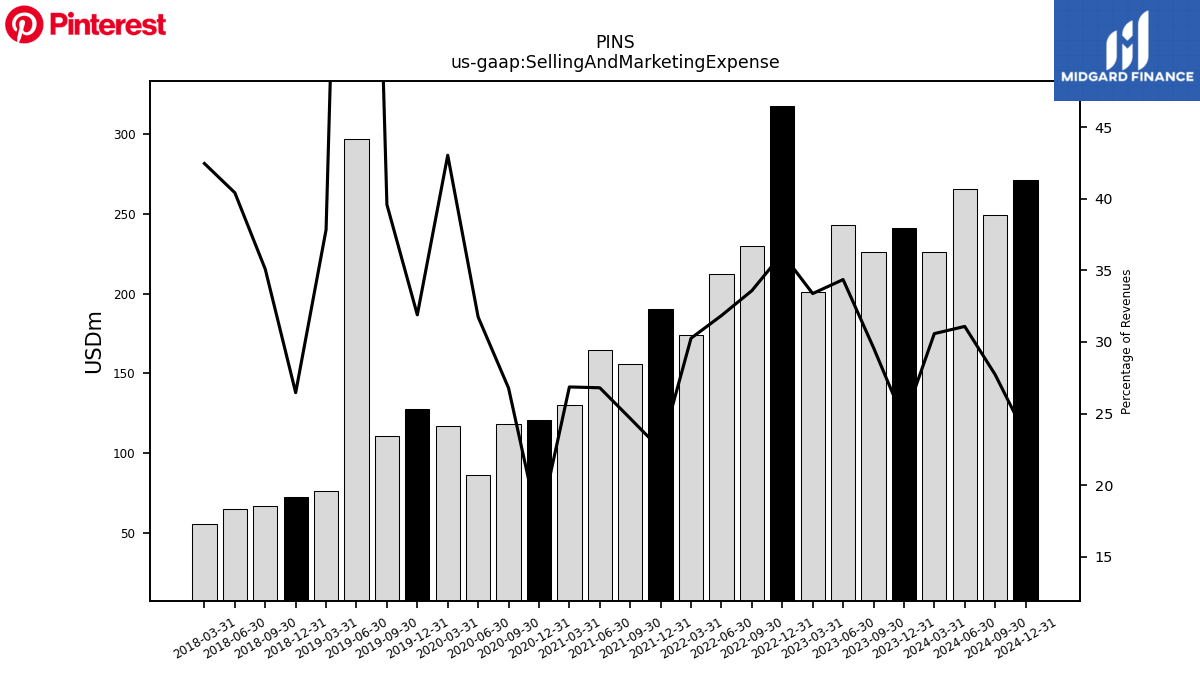
| Selling And Marketing Expense | 240.87 | 225.93 | 243.24 | 201.13 | 317.27 | 229.87 | 212.04 | 173.95 | 190.53 | 156.09 | 164.34 | 130.32 | 120.77 | 118.53 | 86.48 | 117.03 | 127.54 | 110.74 | 296.92 | 76.39 | 72.28 | 66.72 | 65.15 | 55.77 | |
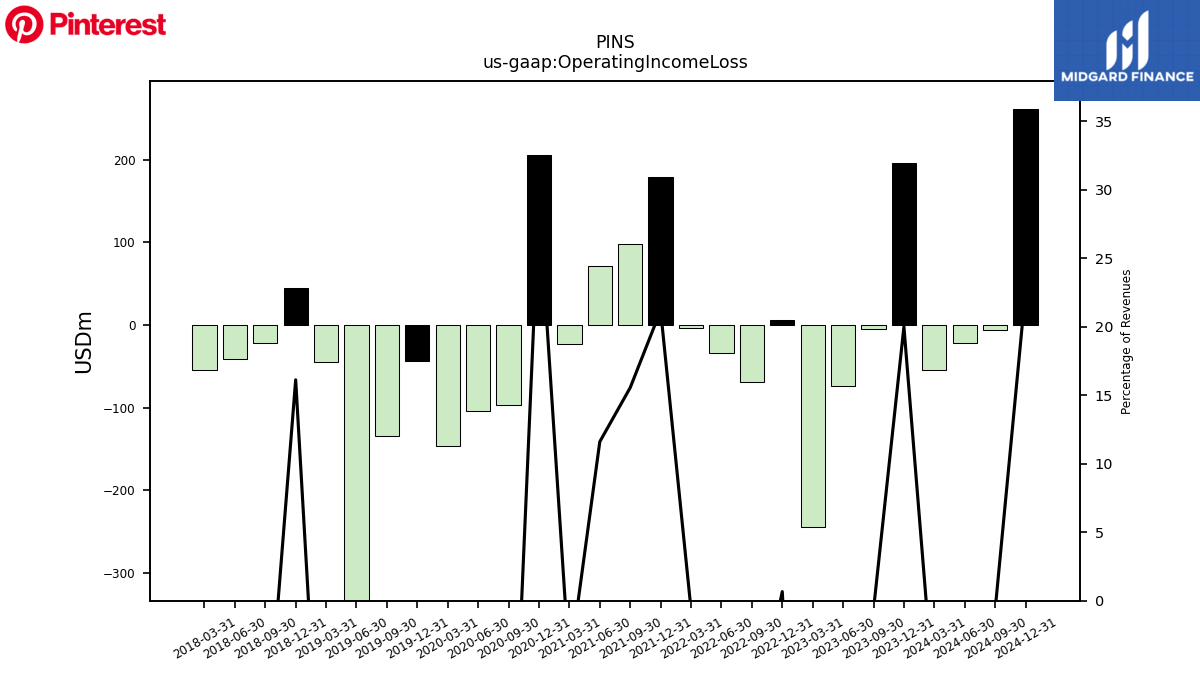
| Operating Income Loss | 196.25 | -5.00 | -73.24 | -243.69 | 5.87 | -69.38 | -34.51 | -3.67 | 179.45 | 98.45 | 71.20 | -22.91 | 205.15 | -97.03 | -104.53 | -146.09 | -43.19 | -133.71 | -1167.14 | -44.83 | 44.06 | -22.43 | -41.37 | -54.98 | |
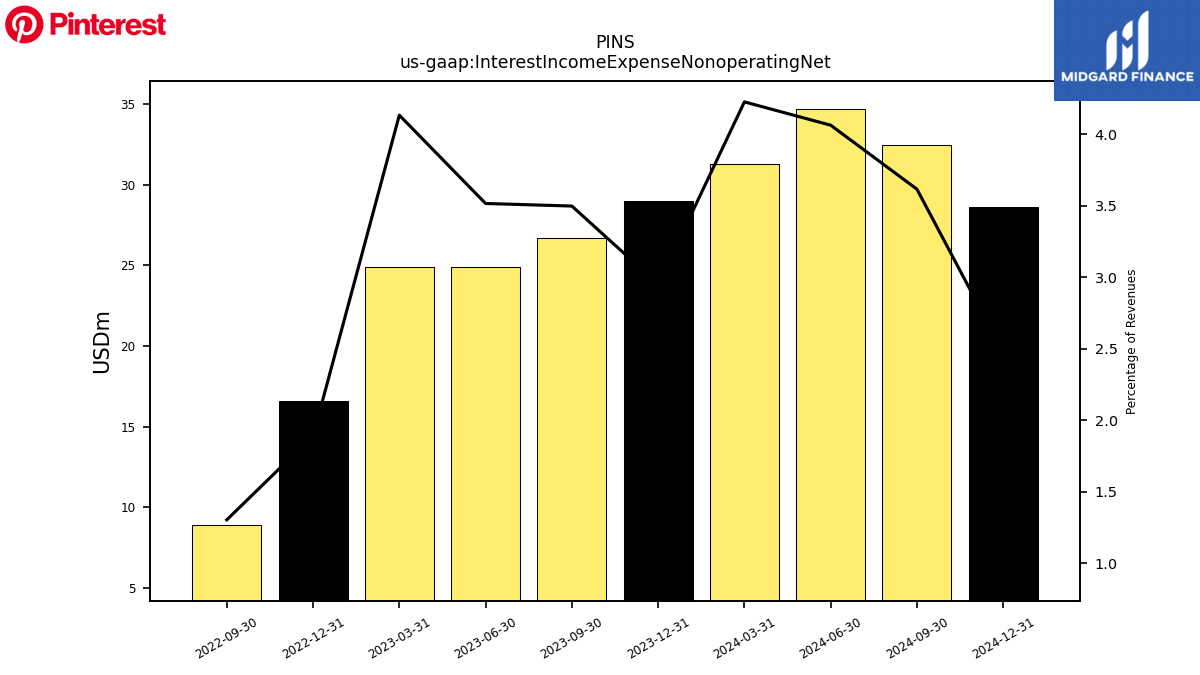
| Interest Income Expense Nonoperating Net | 28.96 | 26.69 | NA | NA | 16.59 | 8.93 | NA | NA | NA | NA | NA | NA | NA | NA | NA | NA | NA | NA | NA | NA | NA | NA | NA | NA | |
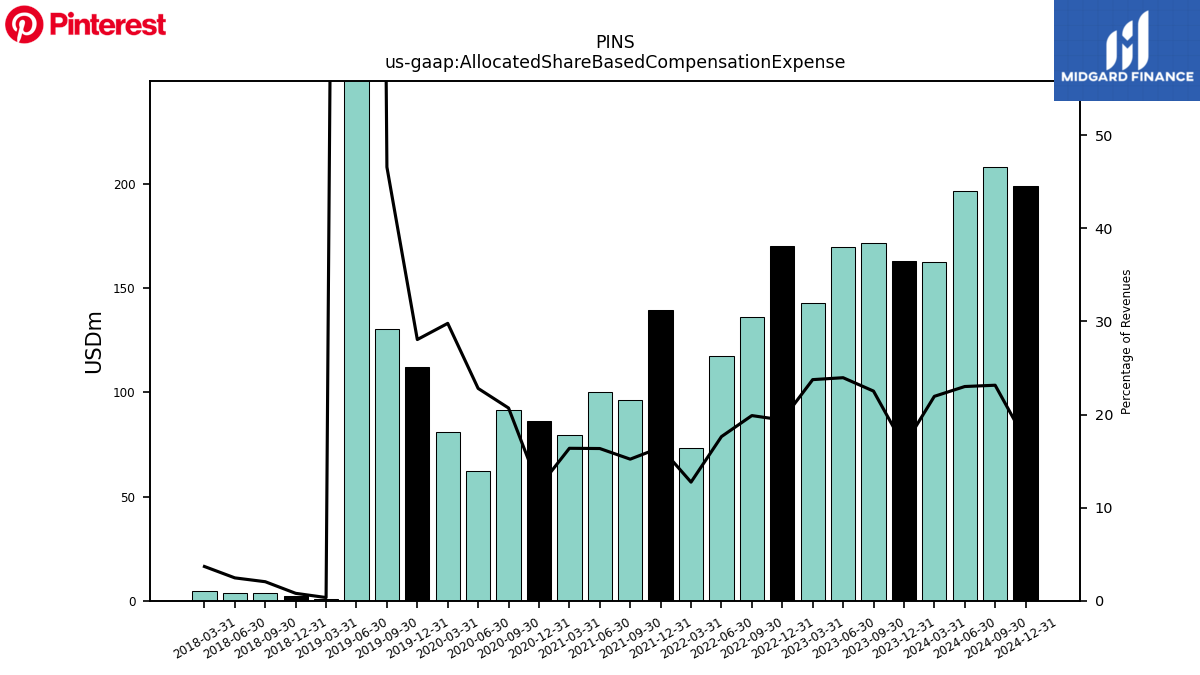
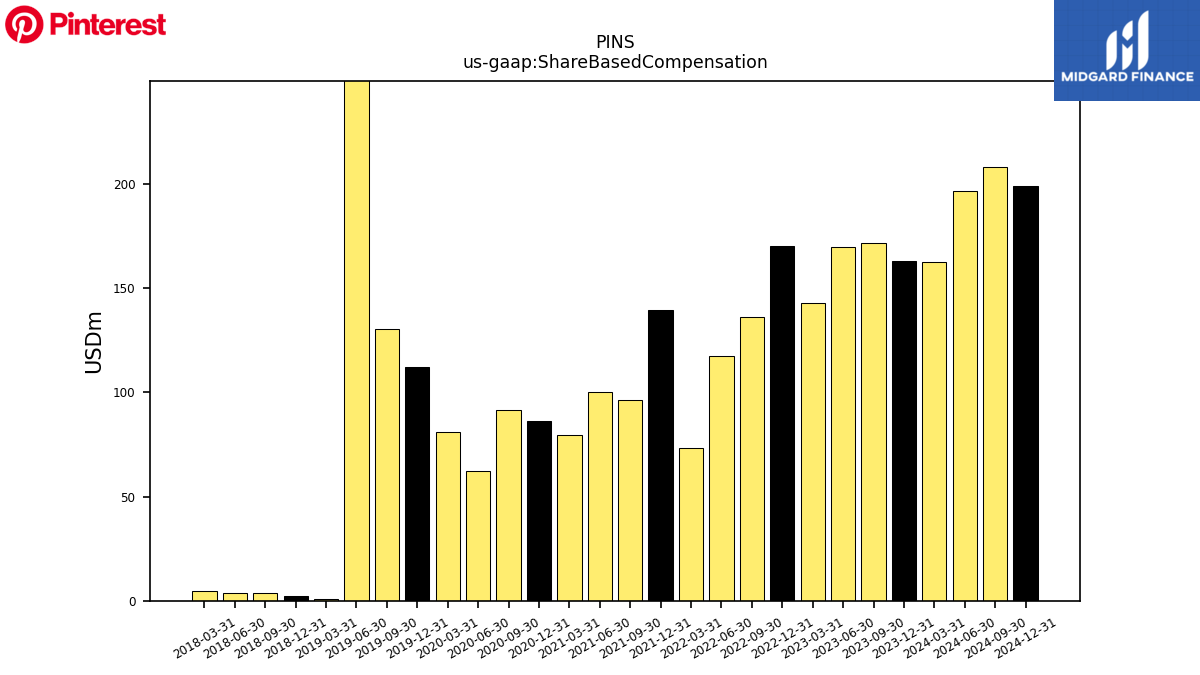
| Allocated Share Based Compensation Expense | 163.23 | 171.88 | 169.63 | 143.12 | 170.31 | 136.16 | 117.41 | 73.24 | 139.40 | 96.26 | 100.26 | 79.46 | 86.20 | 91.63 | 62.15 | 81.02 | 112.20 | 130.29 | 1134.60 | 0.69 | 2.18 | 3.89 | 3.96 | 4.83 | |
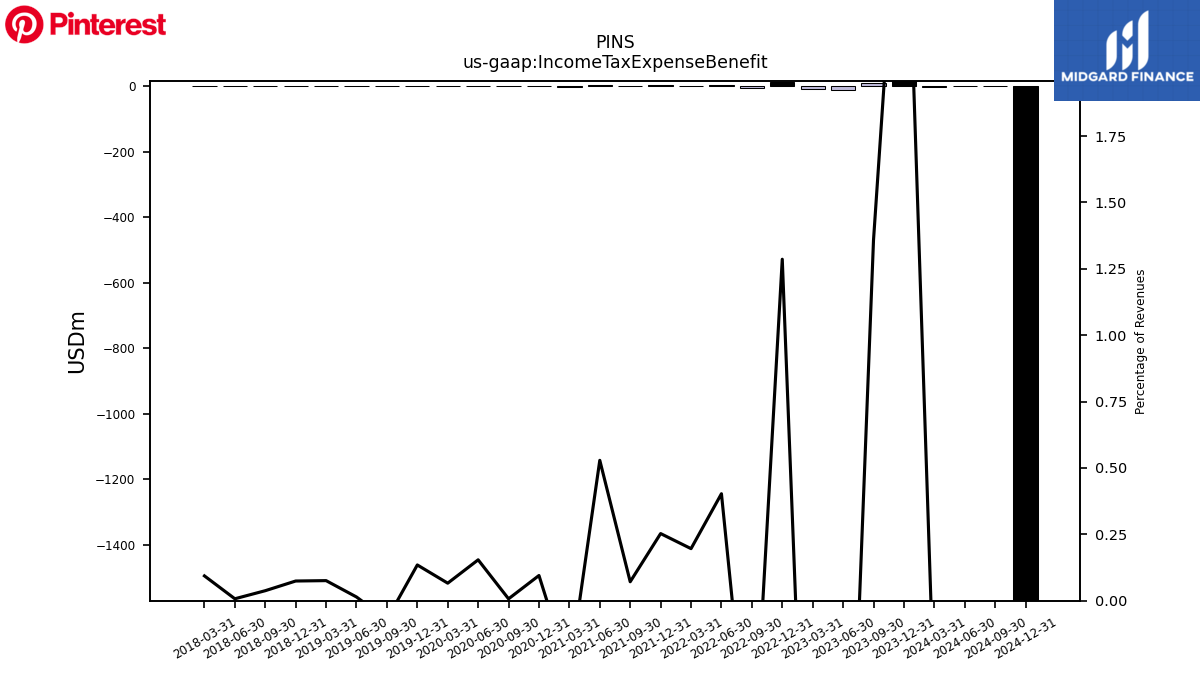
| Income Tax Expense Benefit | 29.92 | 10.36 | -11.23 | -9.88 | 11.28 | -4.99 | 2.68 | 1.13 | 2.14 | 0.45 | 3.24 | -1.30 | 0.67 | 0.03 | 0.42 | 0.18 | 0.54 | -0.20 | 0.04 | 0.15 | 0.20 | 0.07 | 0.01 | 0.12 | |
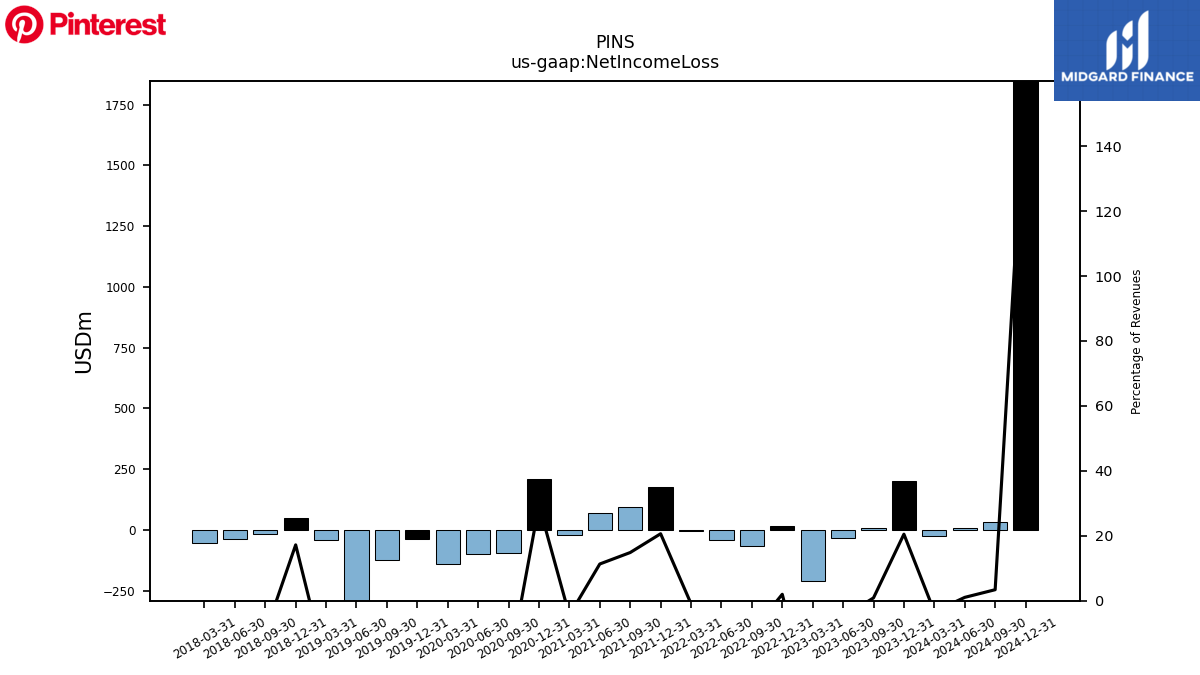
| Net Income Loss | 201.18 | 6.73 | -34.94 | -208.58 | 17.49 | -65.18 | -43.08 | -5.28 | 174.70 | 94.00 | 69.42 | -21.67 | 207.84 | -94.22 | -100.75 | -141.20 | -35.72 | -124.73 | -1159.50 | -41.42 | 47.02 | -18.87 | -38.41 | -52.71 | |
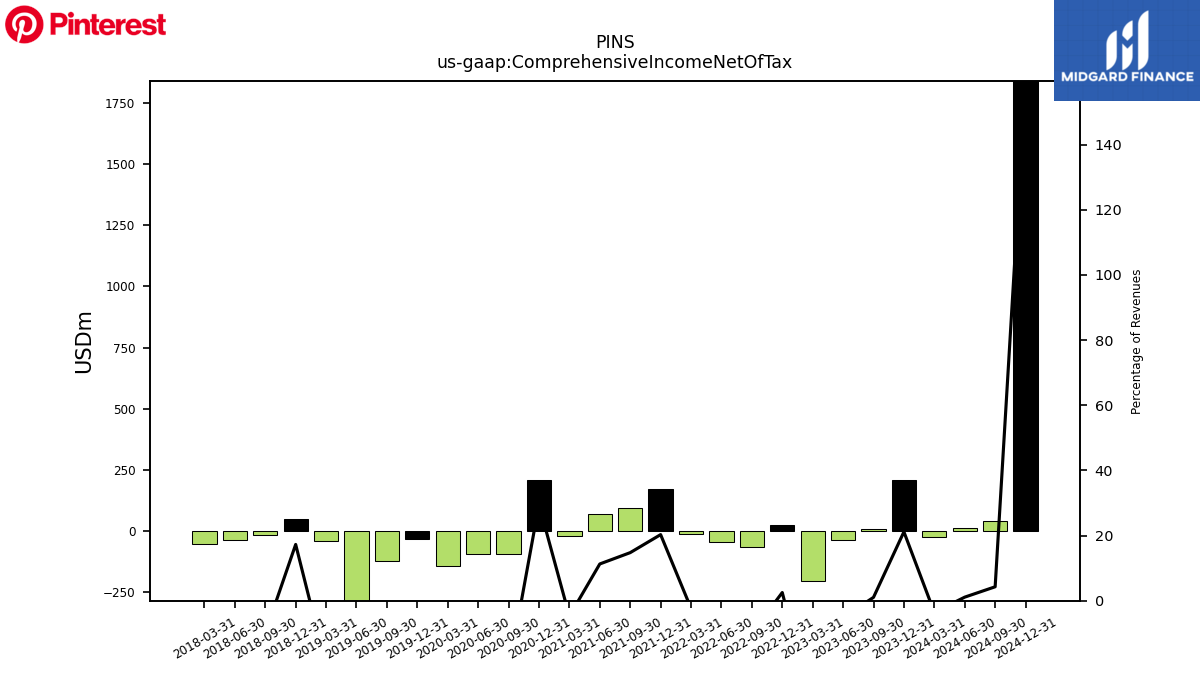
| Comprehensive Income Net Of Tax | 207.61 | 7.99 | -36.52 | -204.29 | 22.18 | -68.03 | -46.08 | -13.36 | 171.89 | 93.47 | 69.25 | -22.84 | 208.26 | -95.89 | -94.80 | -144.05 | -35.45 | -124.88 | -1158.75 | -40.23 | 47.21 | -18.72 | -38.36 | -53.77 |
| 2023-12-31 | 2023-09-30 | 2023-06-30 | 2023-03-31 | 2022-12-31 | 2022-09-30 | 2022-06-30 | 2022-03-31 | 2021-12-31 | 2021-09-30 | 2021-06-30 | 2021-03-31 | 2020-12-31 | 2020-09-30 | 2020-06-30 | 2020-03-31 | 2019-12-31 | 2019-09-30 | 2019-06-30 | 2019-03-31 | 2018-12-31 | 2018-09-30 | 2018-06-30 | 2018-03-31 | ||
|---|---|---|---|---|---|---|---|---|---|---|---|---|---|---|---|---|---|---|---|---|---|---|---|---|---|
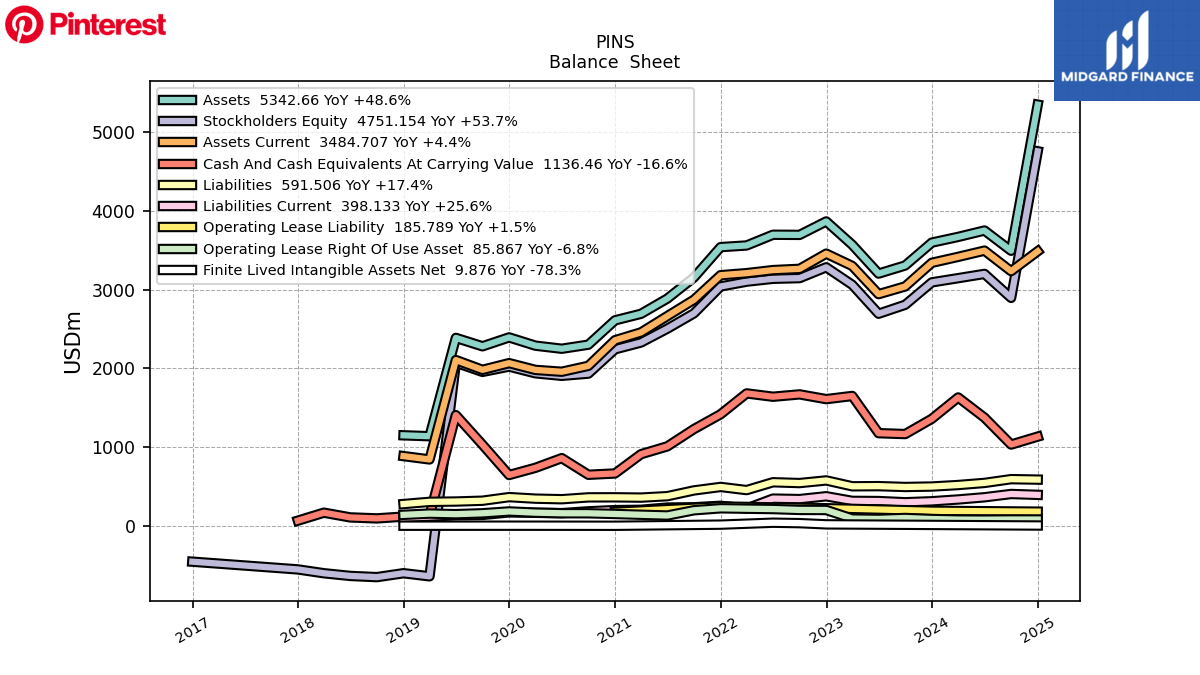
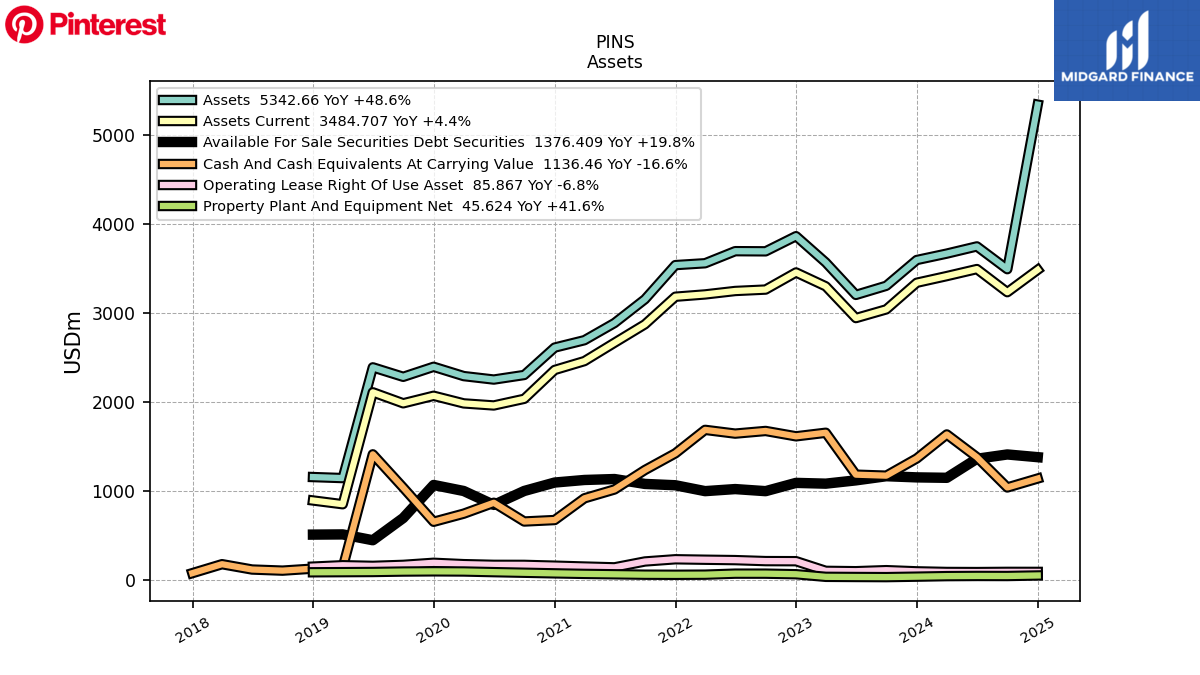
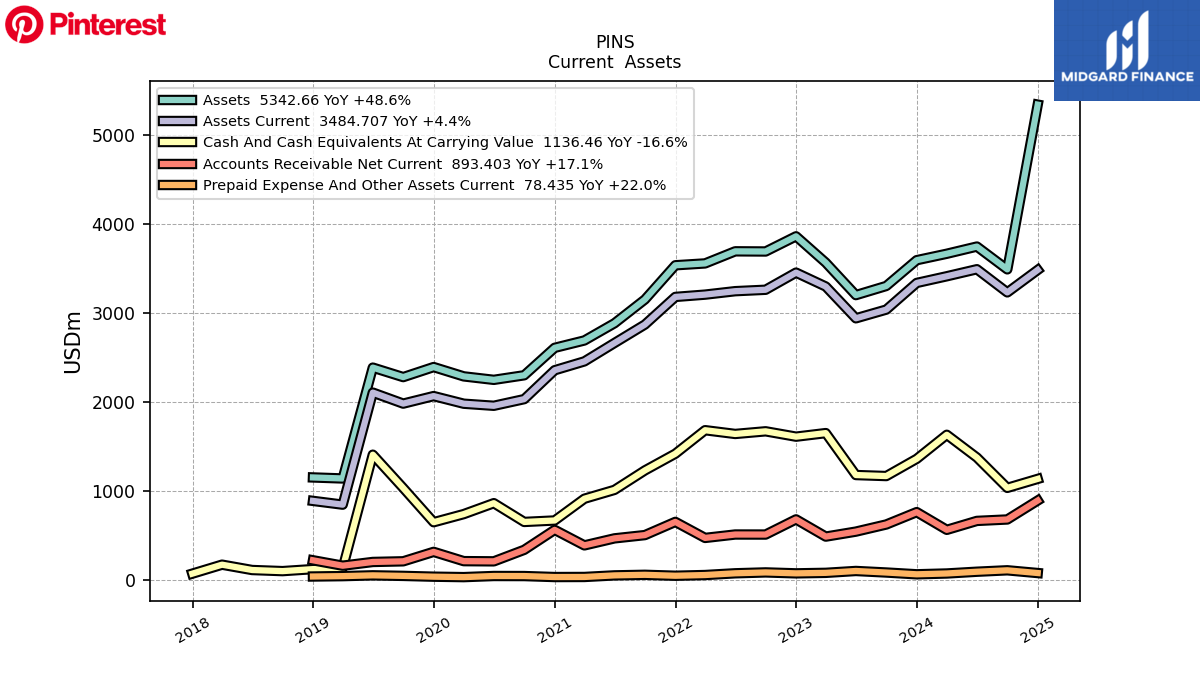
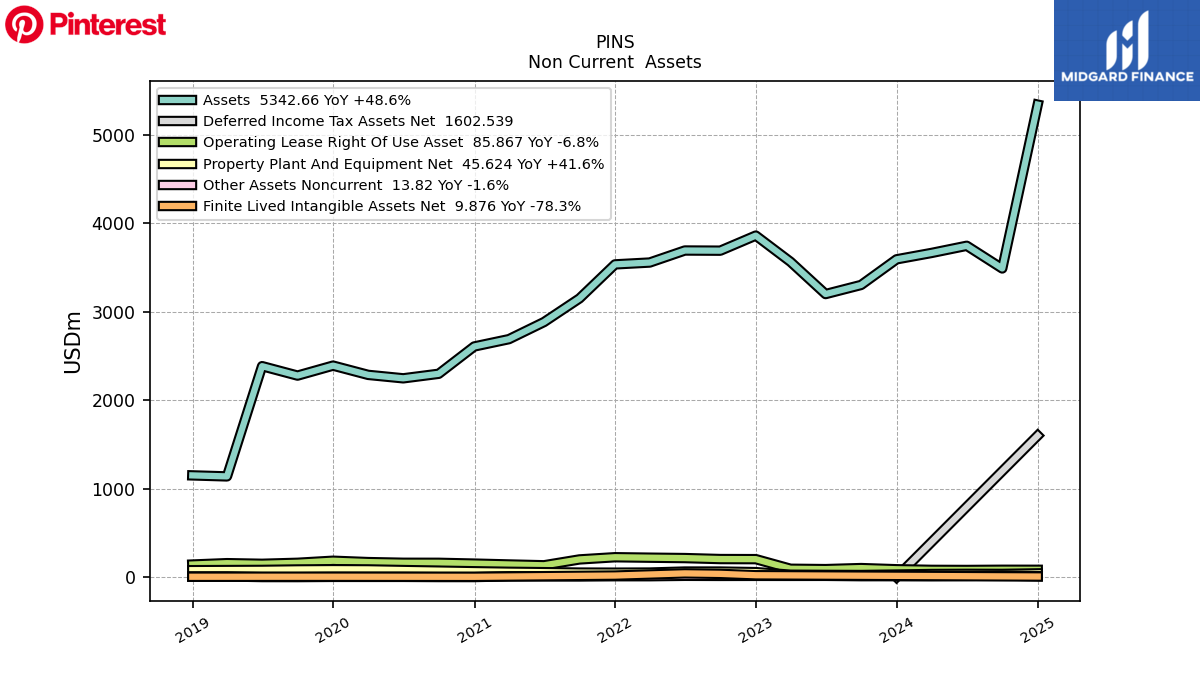
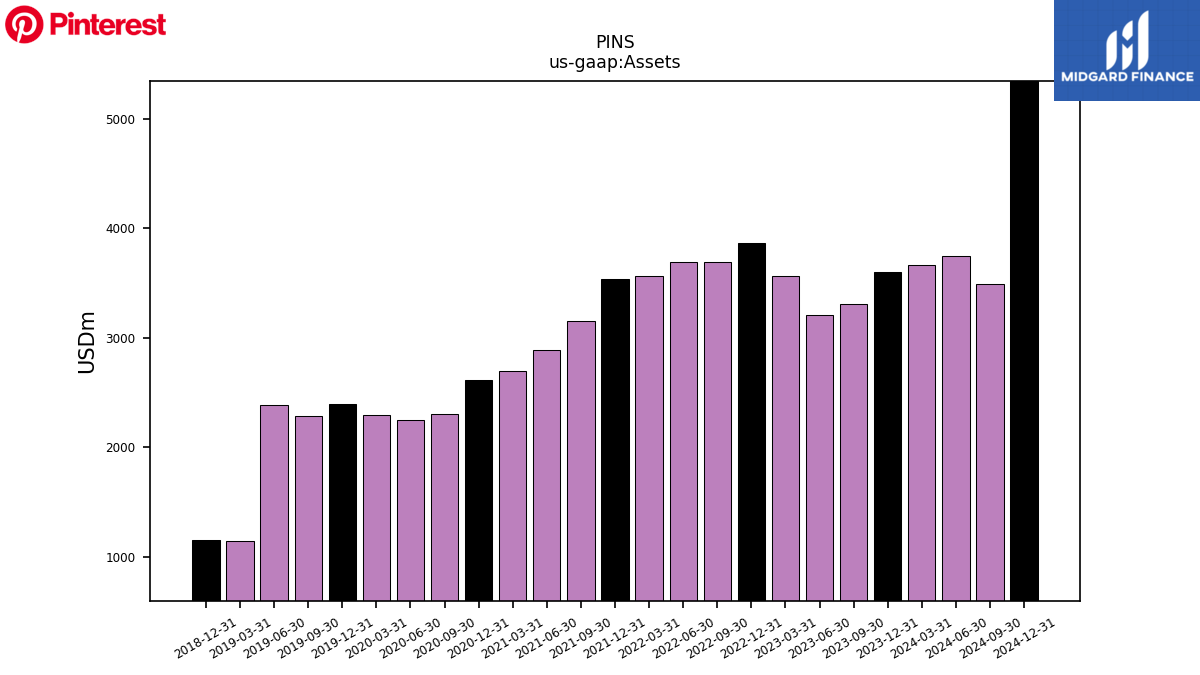
| Assets | 3594.41 | 3304.58 | 3201.80 | 3566.42 | 3862.73 | 3692.21 | 3694.03 | 3558.19 | 3537.24 | 3152.79 | 2885.65 | 2692.29 | 2609.46 | 2301.04 | 2249.62 | 2288.61 | 2393.32 | 2280.47 | 2387.18 | 1141.24 | 1152.73 | NA | NA | NA | |
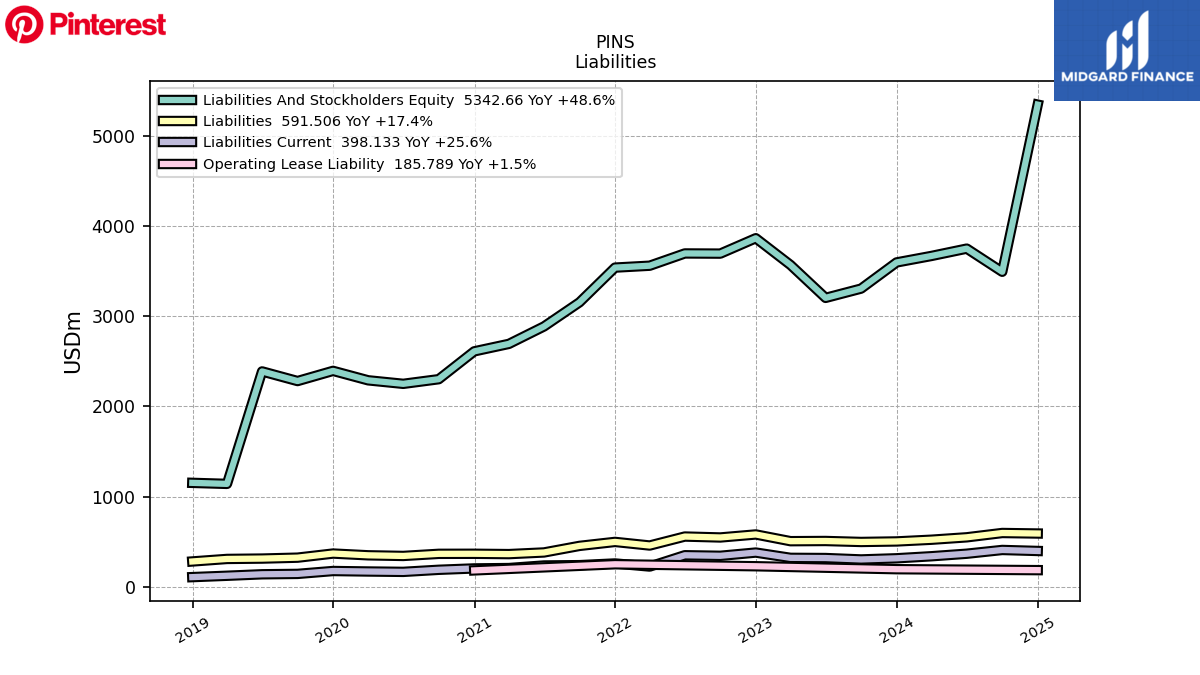
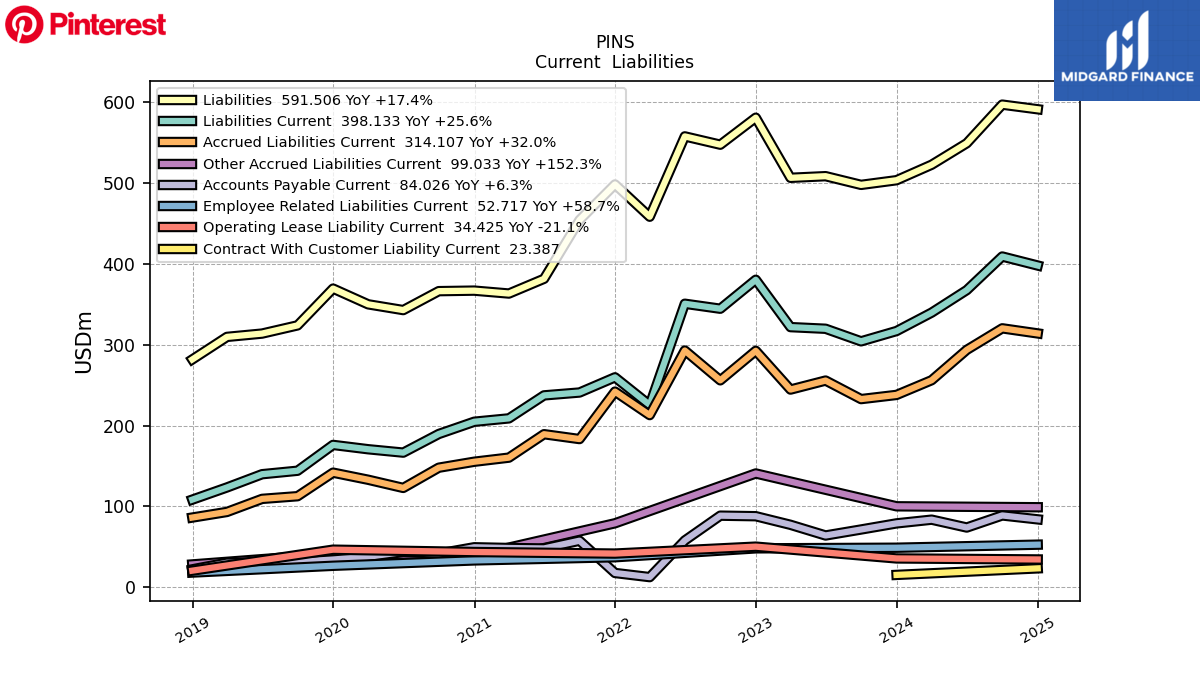
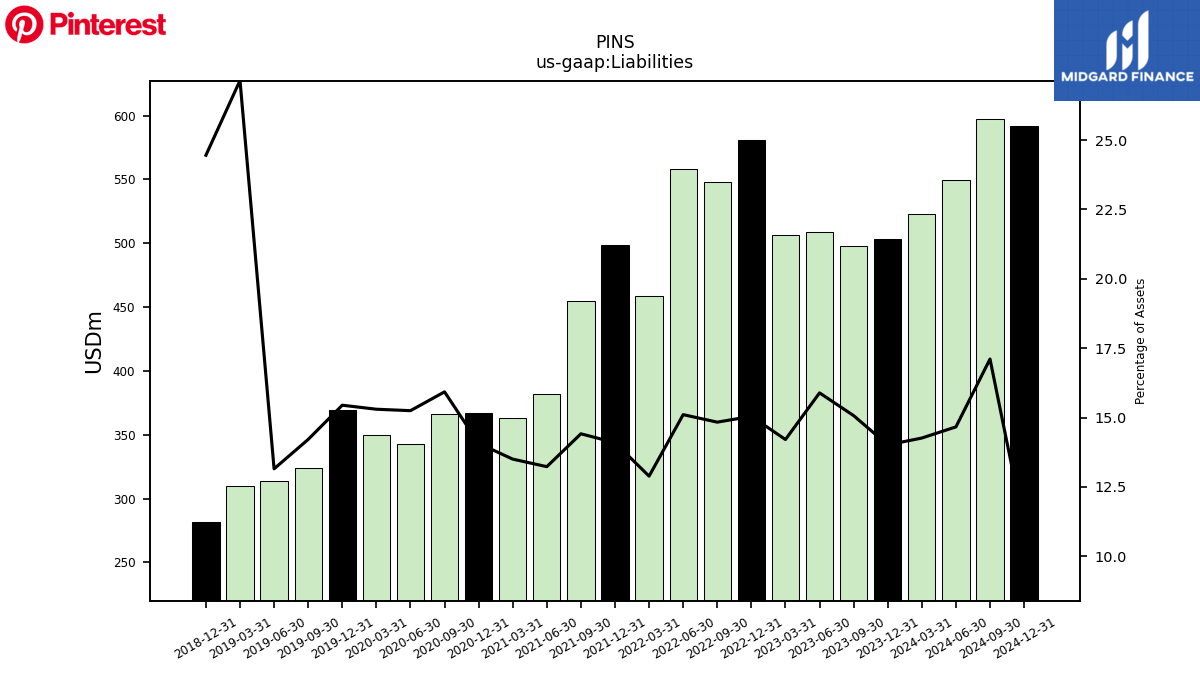
| Liabilities | 503.73 | 497.94 | 508.71 | 506.68 | 581.08 | 547.67 | 557.94 | 458.53 | 498.50 | 454.42 | 381.72 | 363.47 | 367.09 | 366.43 | 342.99 | 350.13 | 369.61 | 324.07 | 313.94 | 309.83 | 281.89 | NA | NA | NA | |
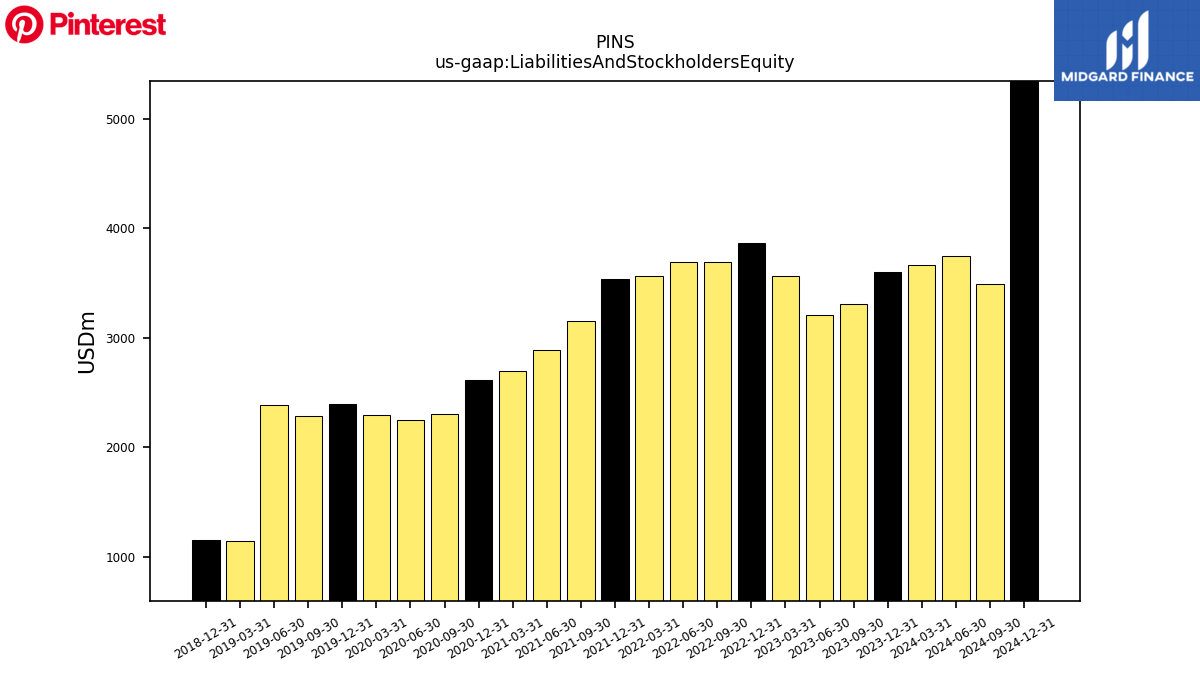
| Liabilities And Stockholders Equity | 3594.41 | 3304.58 | 3201.80 | 3566.42 | 3862.73 | 3692.21 | 3694.03 | 3558.19 | 3537.24 | 3152.79 | 2885.65 | 2692.29 | 2609.46 | 2301.04 | 2249.62 | 2288.61 | 2393.32 | 2280.47 | 2387.18 | 1141.24 | 1152.73 | NA | NA | NA | |
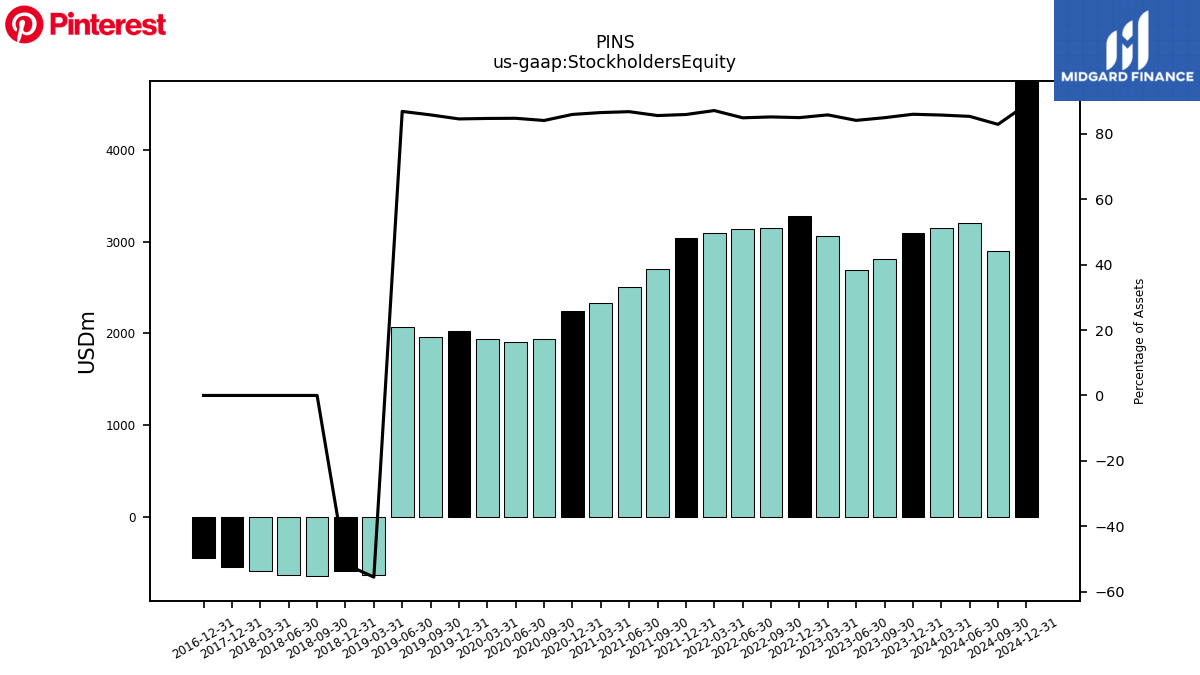
| Stockholders Equity | 3090.68 | 2806.64 | 2693.08 | 3059.74 | 3281.65 | 3144.54 | 3136.09 | 3099.66 | 3038.74 | 2698.37 | 2503.93 | 2328.82 | 2242.37 | 1934.60 | 1906.63 | 1938.48 | 2023.70 | 1956.40 | 2073.24 | -633.99 | -594.56 | -644.08 | -628.94 | -594.96 |
| 2023-12-31 | 2023-09-30 | 2023-06-30 | 2023-03-31 | 2022-12-31 | 2022-09-30 | 2022-06-30 | 2022-03-31 | 2021-12-31 | 2021-09-30 | 2021-06-30 | 2021-03-31 | 2020-12-31 | 2020-09-30 | 2020-06-30 | 2020-03-31 | 2019-12-31 | 2019-09-30 | 2019-06-30 | 2019-03-31 | 2018-12-31 | 2018-09-30 | 2018-06-30 | 2018-03-31 | ||
|---|---|---|---|---|---|---|---|---|---|---|---|---|---|---|---|---|---|---|---|---|---|---|---|---|---|
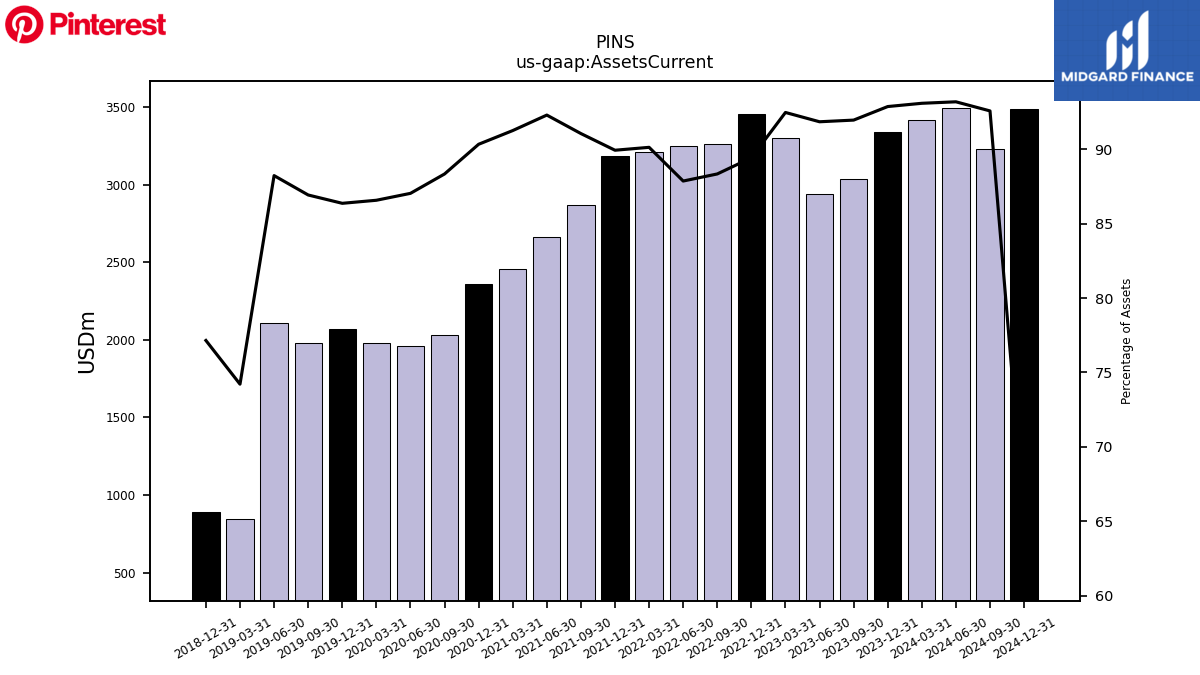
| Assets Current | 3338.56 | 3039.27 | 2941.14 | 3298.39 | 3454.68 | 3262.05 | 3246.07 | 3207.35 | 3181.56 | 2871.12 | 2663.71 | 2457.18 | 2357.54 | 2032.93 | 1958.19 | 1981.49 | 2067.23 | 1982.53 | 2106.42 | 846.95 | 889.35 | NA | NA | NA | |
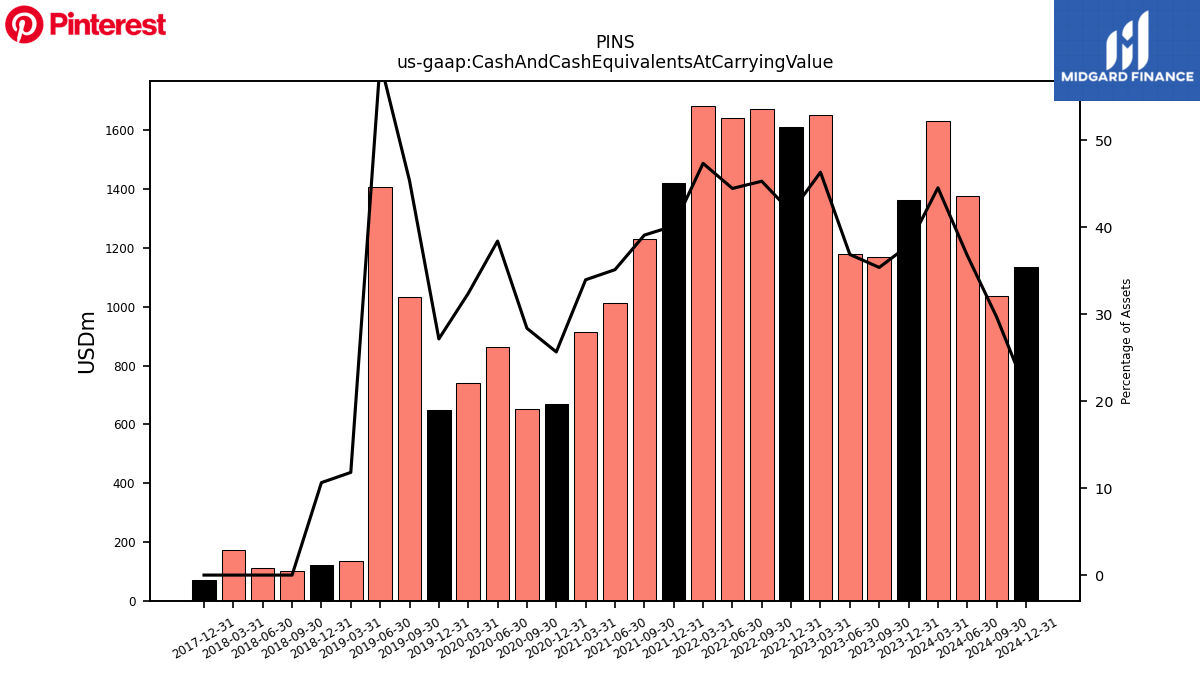
| Cash And Cash Equivalents At Carrying Value | 1361.94 | 1168.42 | 1179.85 | 1651.24 | 1611.06 | 1671.32 | 1641.51 | 1683.79 | 1419.63 | 1231.93 | 1012.93 | 913.74 | 669.23 | 652.72 | 863.62 | 740.83 | 649.67 | 1033.87 | 1408.74 | 134.65 | 122.51 | 100.06 | 112.47 | 172.51 | |
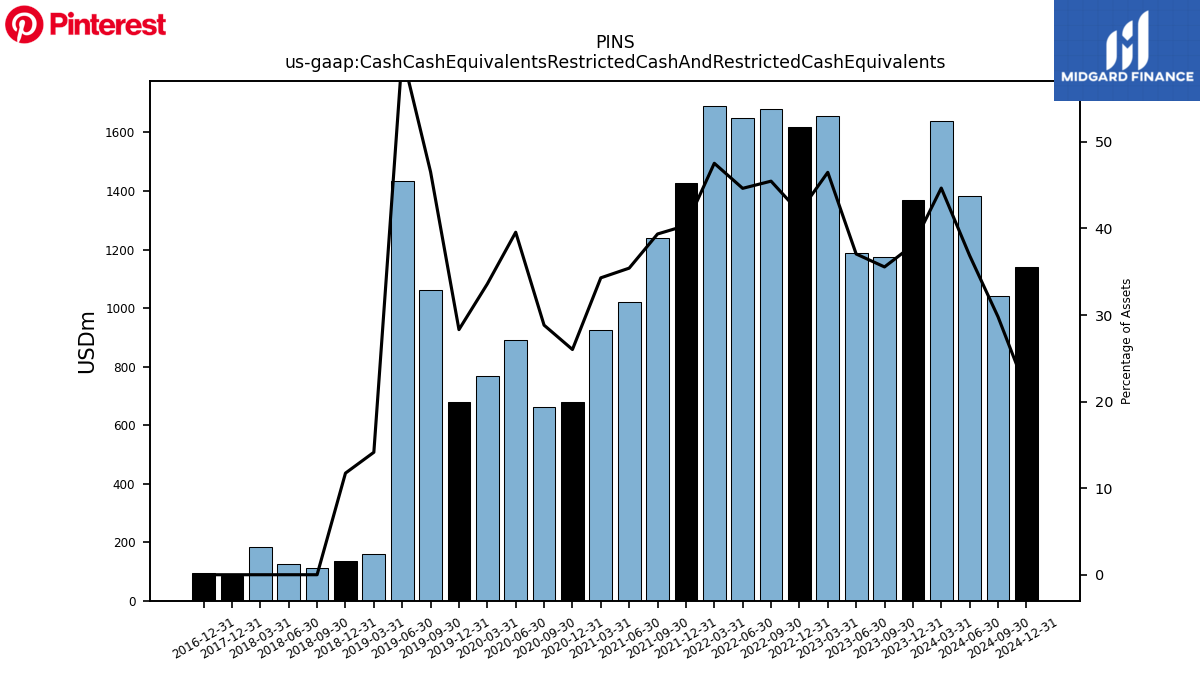
| Cash Cash Equivalents Restricted Cash And Restricted Cash Equivalents | 1368.53 | 1175.02 | 1186.45 | 1657.84 | 1617.66 | 1678.72 | 1648.87 | 1691.23 | 1427.06 | 1241.04 | 1022.04 | 923.42 | 678.91 | 663.41 | 890.05 | 768.91 | 677.74 | 1061.10 | 1435.32 | 161.43 | 135.29 | 112.04 | 124.30 | 185.01 | |
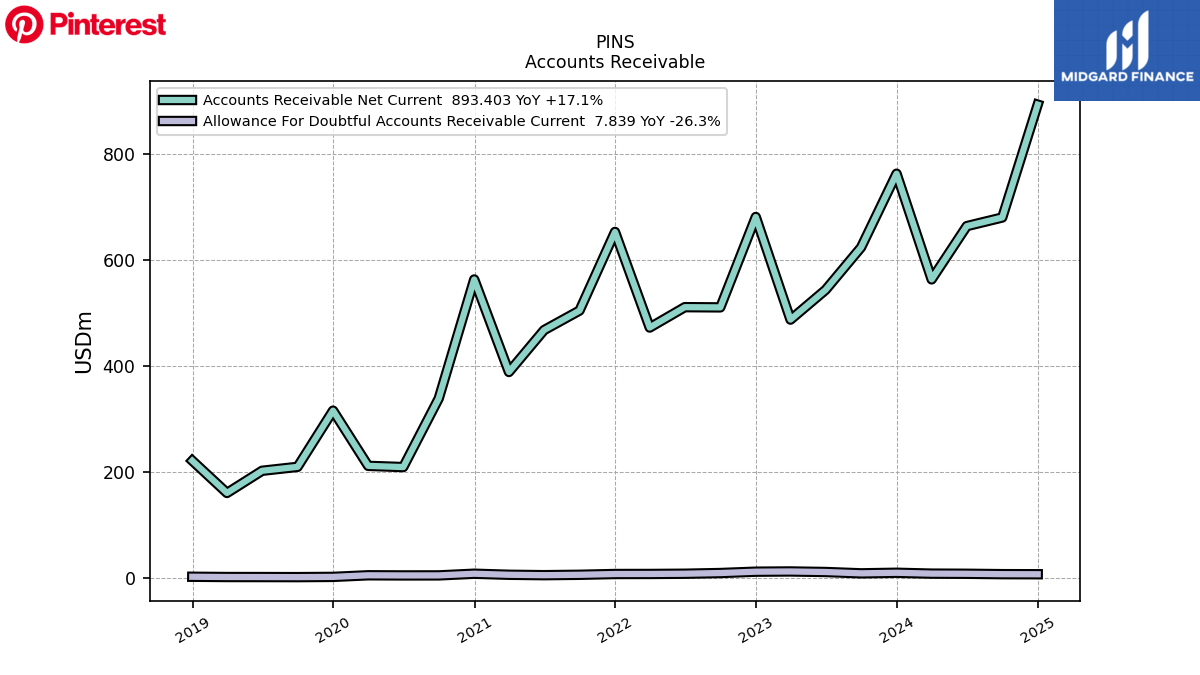
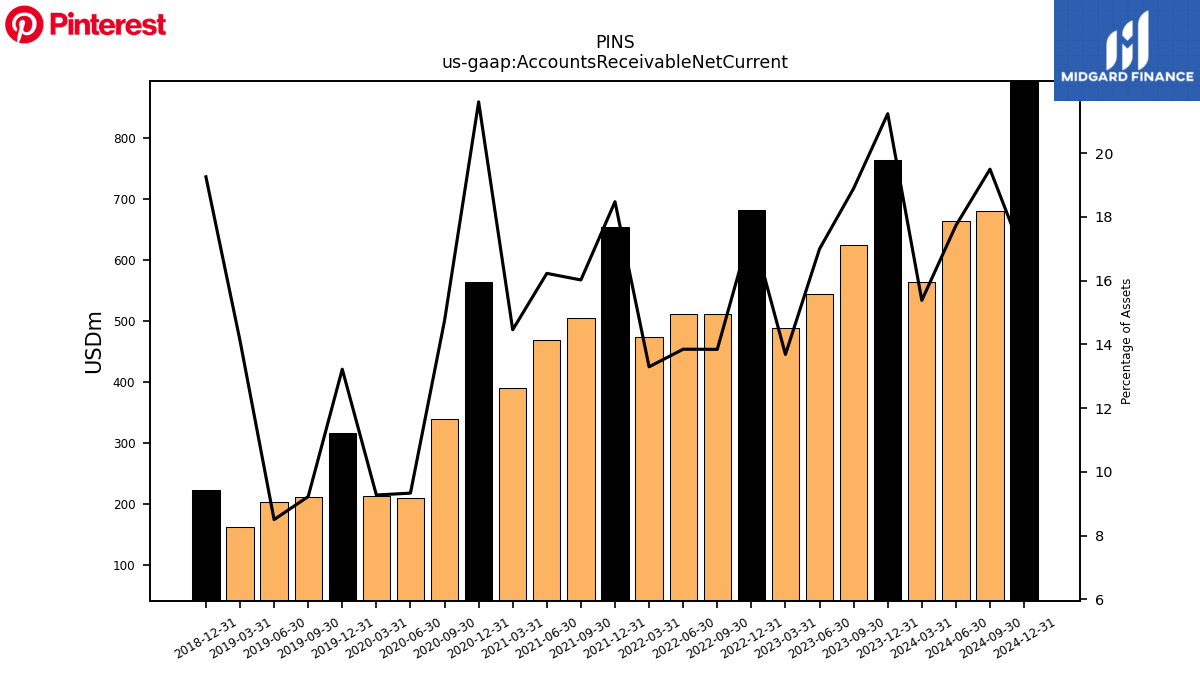
| Accounts Receivable Net Current | 763.16 | 624.22 | 544.05 | 487.96 | 681.53 | 511.05 | 511.47 | 473.03 | 653.36 | 505.02 | 468.18 | 389.21 | 563.73 | 339.27 | 209.93 | 212.22 | 316.37 | 210.34 | 202.96 | 161.11 | 221.93 | NA | NA | NA | |
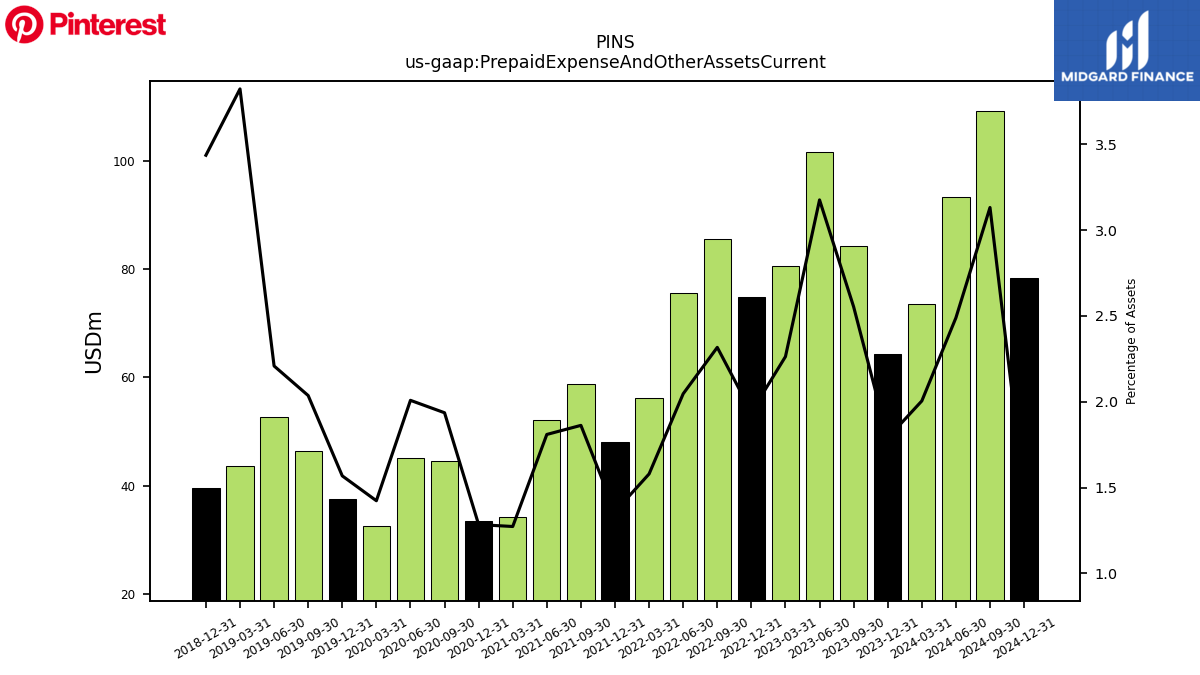
| Prepaid Expense And Other Assets Current | 64.32 | 84.36 | 101.68 | 80.69 | 74.92 | 85.53 | 75.58 | 56.18 | 48.09 | 58.70 | 52.20 | 34.27 | 33.50 | 44.54 | 45.17 | 32.56 | 37.52 | 46.42 | 52.71 | 43.62 | 39.61 | NA | NA | NA | |
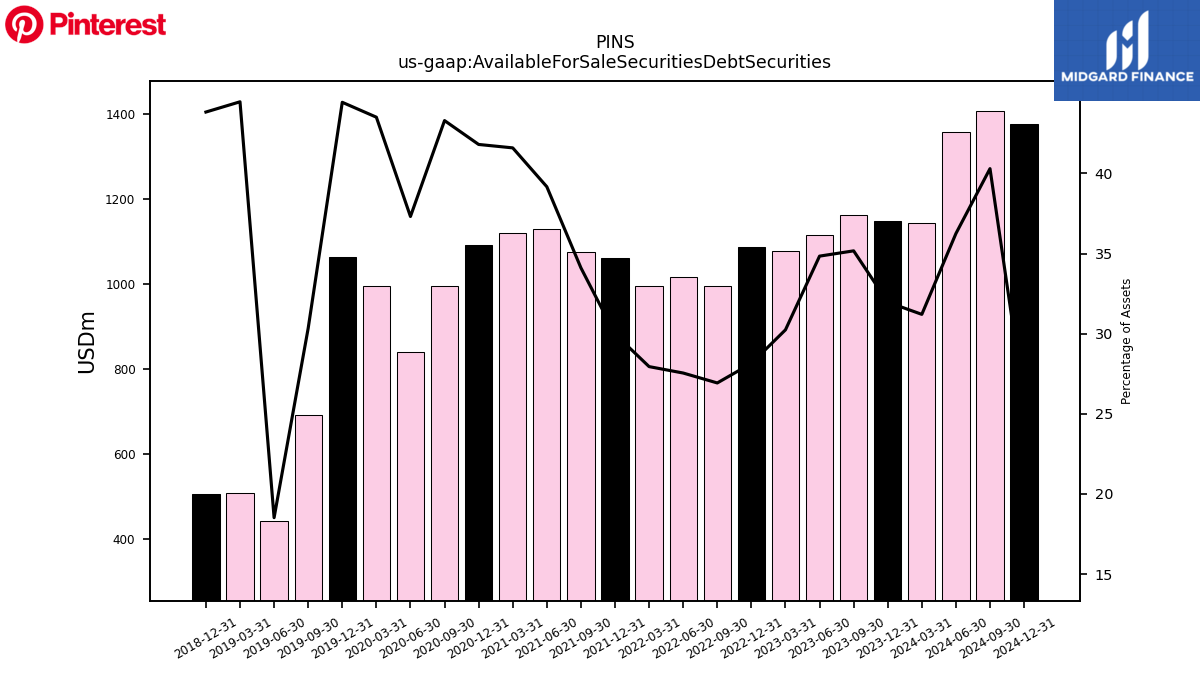
| Available For Sale Securities Debt Securities | 1149.15 | 1162.26 | 1115.56 | 1078.49 | 1087.16 | 994.15 | 1017.51 | 994.35 | 1060.49 | 1075.46 | 1130.40 | 1119.96 | 1091.08 | 996.39 | 839.47 | 995.88 | 1063.68 | 691.89 | 442.01 | 507.57 | 505.30 | NA | NA | NA |
| 2023-12-31 | 2023-09-30 | 2023-06-30 | 2023-03-31 | 2022-12-31 | 2022-09-30 | 2022-06-30 | 2022-03-31 | 2021-12-31 | 2021-09-30 | 2021-06-30 | 2021-03-31 | 2020-12-31 | 2020-09-30 | 2020-06-30 | 2020-03-31 | 2019-12-31 | 2019-09-30 | 2019-06-30 | 2019-03-31 | 2018-12-31 | 2018-09-30 | 2018-06-30 | 2018-03-31 | ||
|---|---|---|---|---|---|---|---|---|---|---|---|---|---|---|---|---|---|---|---|---|---|---|---|---|---|
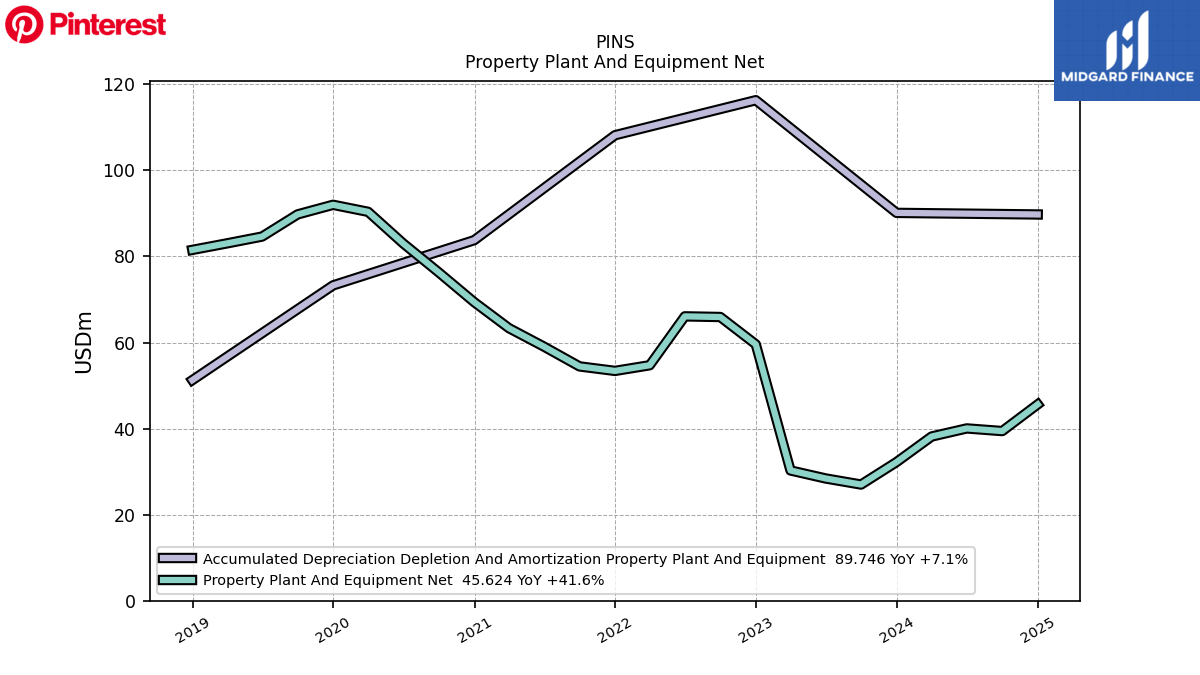
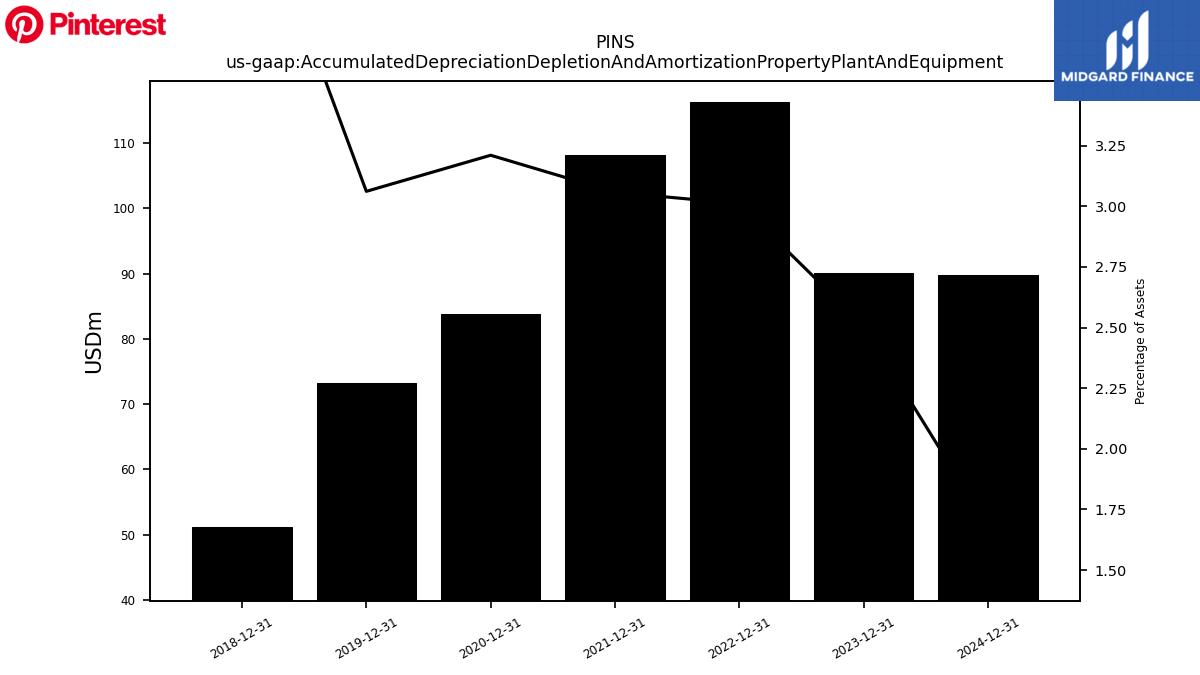
| Accumulated Depreciation Depletion And Amortization Property Plant And Equipment | 90.12 | NA | NA | NA | 116.29 | NA | NA | NA | 108.16 | NA | NA | NA | 83.77 | NA | NA | NA | 73.27 | NA | NA | NA | 51.25 | NA | NA | NA | |
| Property Plant And Equipment Net | 32.23 | 27.00 | 28.41 | 30.27 | 59.58 | 65.92 | 66.07 | 54.71 | 53.40 | 54.45 | 59.03 | 63.34 | 69.38 | 76.29 | 83.01 | 90.36 | 91.99 | 89.76 | 84.61 | 83.03 | 81.51 | NA | NA | NA | |
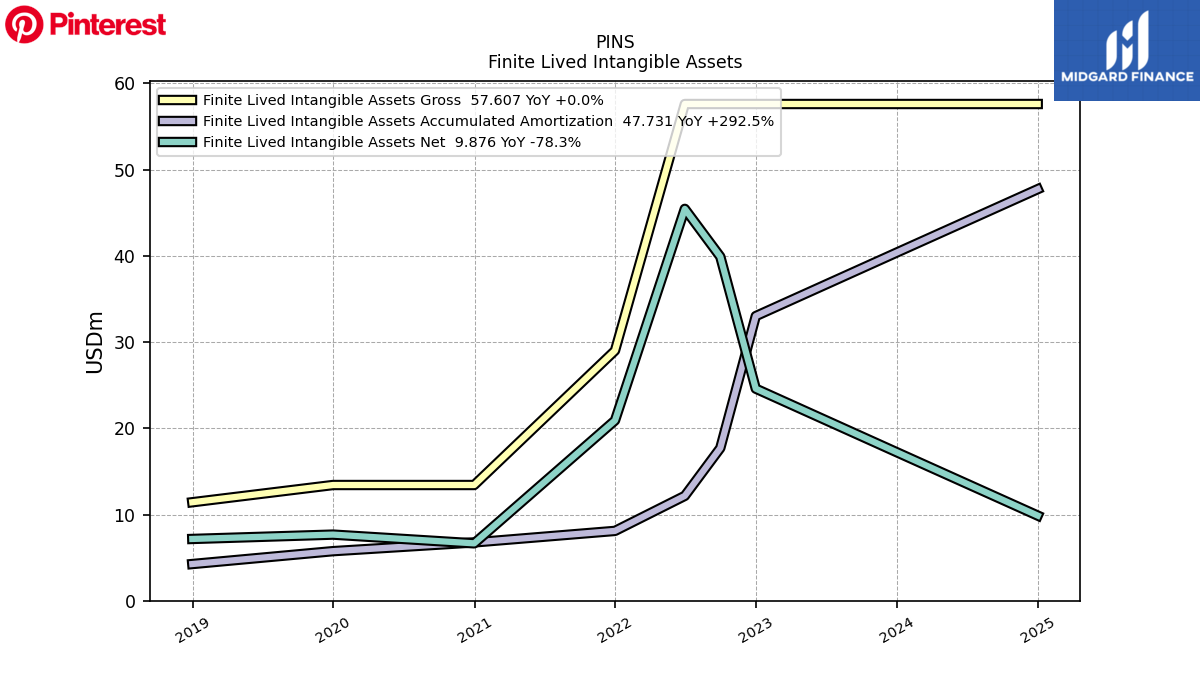
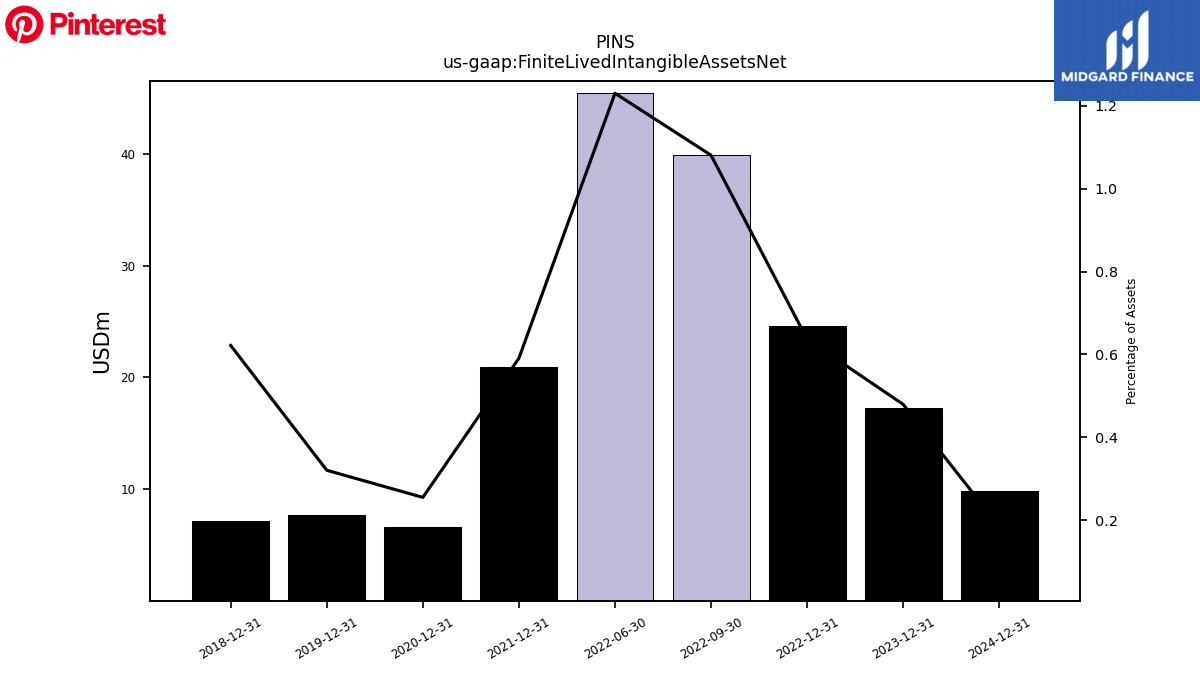
| Finite Lived Intangible Assets Net | 17.23 | NA | NA | NA | 24.59 | 39.90 | 45.45 | NA | 20.91 | NA | NA | NA | 6.66 | NA | NA | NA | 7.67 | NA | NA | NA | 7.17 | NA | NA | NA | |
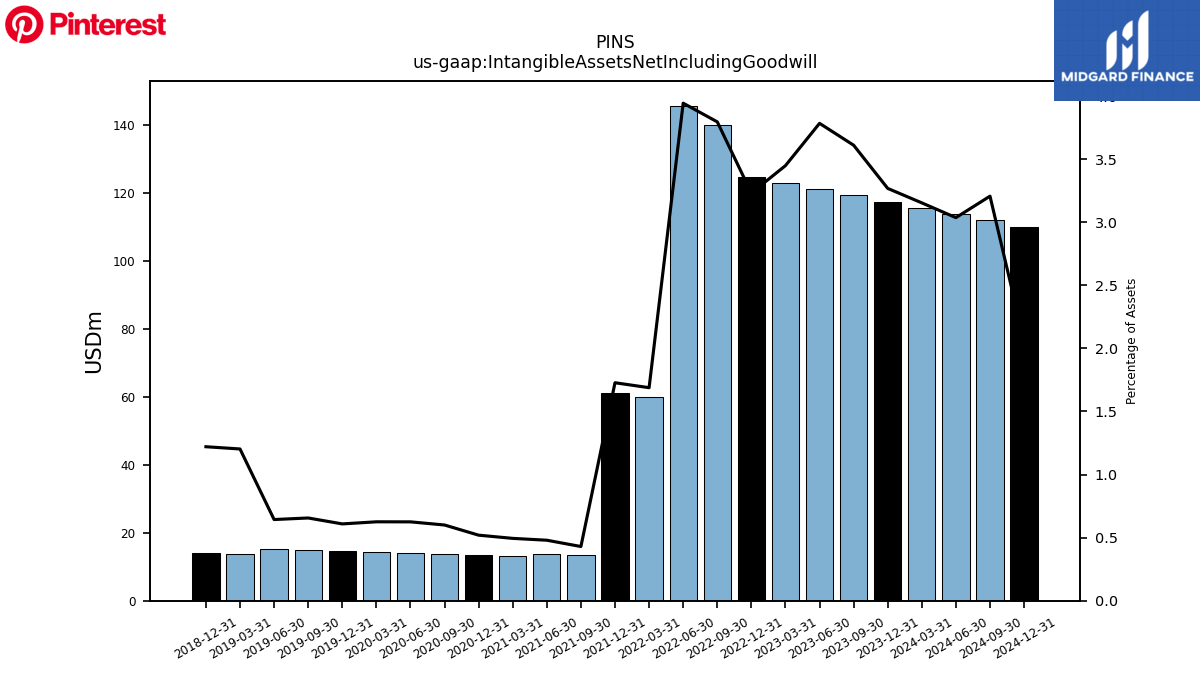
| Intangible Assets Net Including Goodwill | 117.46 | 119.30 | 121.14 | 122.98 | 124.82 | 140.13 | 145.67 | 60.08 | 61.12 | 13.55 | 13.84 | 13.31 | 13.56 | 13.81 | 14.07 | 14.32 | 14.58 | 14.96 | 15.36 | 13.73 | 14.07 | NA | NA | NA | |
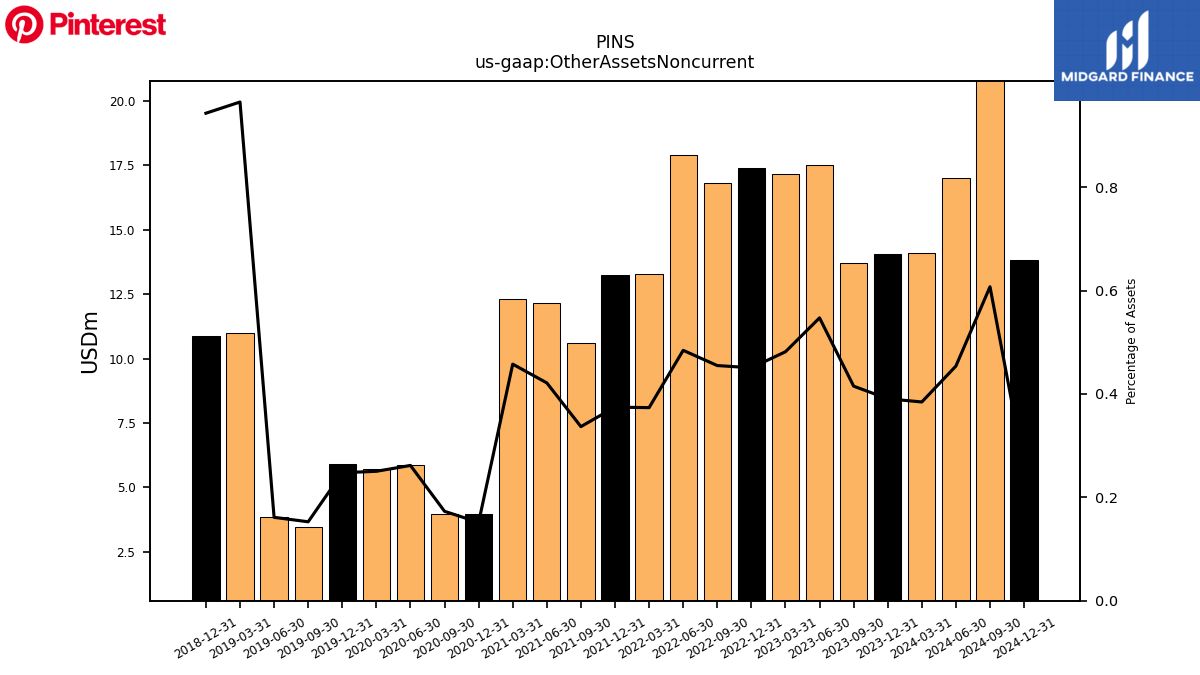
| Other Assets Noncurrent | 14.04 | 13.71 | 17.52 | 17.17 | 17.40 | 16.80 | 17.89 | 13.29 | 13.25 | 10.62 | 12.16 | 12.32 | 3.96 | 3.98 | 5.89 | 5.73 | 5.92 | 3.48 | 3.85 | 11.01 | 10.87 | NA | NA | NA | |
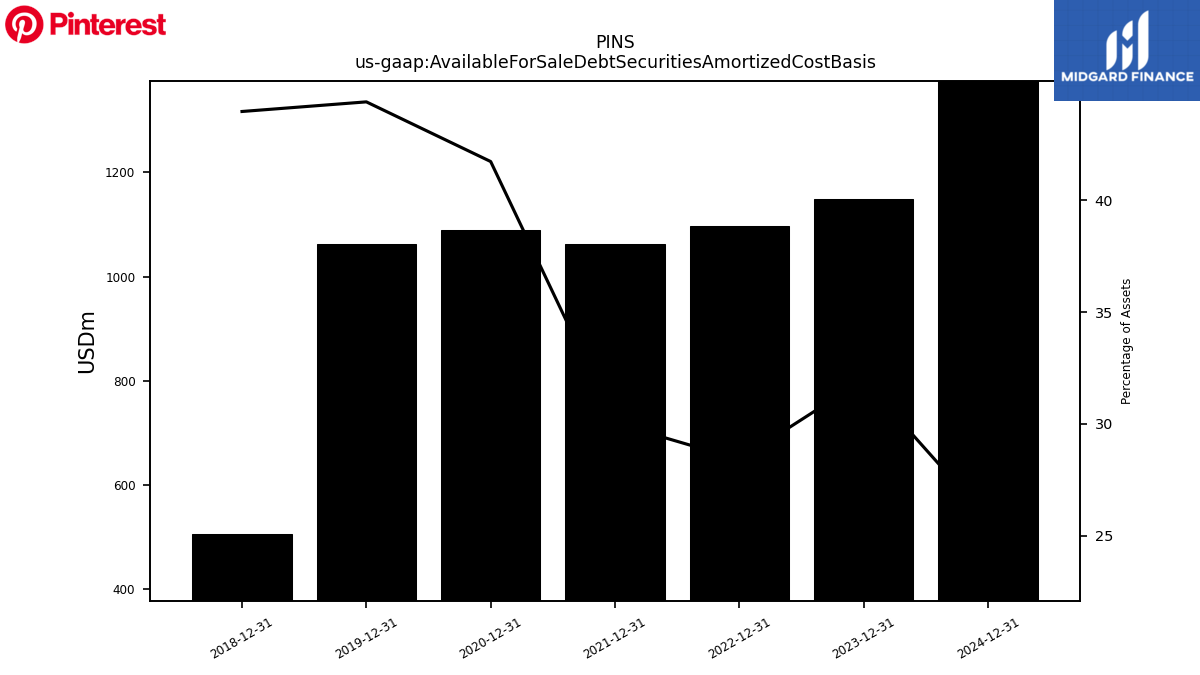
| Available For Sale Debt Securities Amortized Cost Basis | 1149.42 | NA | NA | NA | 1097.47 | NA | NA | NA | 1062.48 | NA | NA | NA | 1088.82 | NA | NA | NA | 1062.43 | NA | NA | NA | 506.76 | NA | NA | NA |
| 2023-12-31 | 2023-09-30 | 2023-06-30 | 2023-03-31 | 2022-12-31 | 2022-09-30 | 2022-06-30 | 2022-03-31 | 2021-12-31 | 2021-09-30 | 2021-06-30 | 2021-03-31 | 2020-12-31 | 2020-09-30 | 2020-06-30 | 2020-03-31 | 2019-12-31 | 2019-09-30 | 2019-06-30 | 2019-03-31 | 2018-12-31 | 2018-09-30 | 2018-06-30 | 2018-03-31 | ||
|---|---|---|---|---|---|---|---|---|---|---|---|---|---|---|---|---|---|---|---|---|---|---|---|---|---|
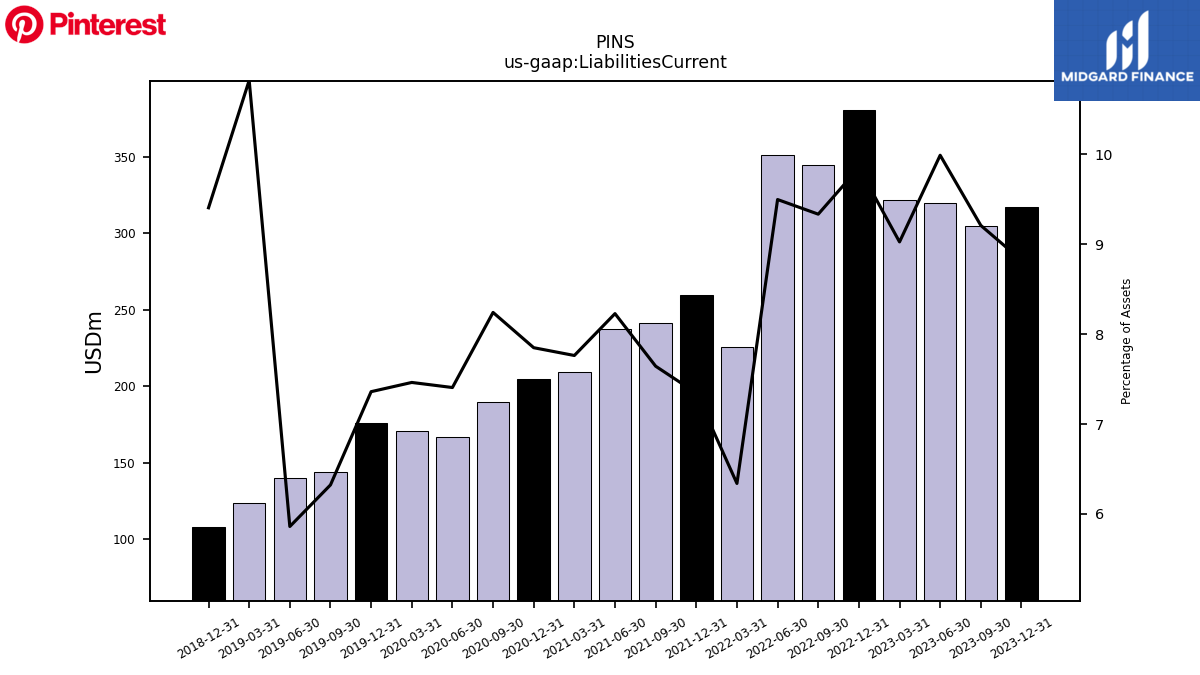
| Liabilities Current | 317.09 | 304.35 | 319.88 | 321.92 | 380.53 | 344.68 | 350.86 | 225.56 | 259.81 | 240.99 | 237.45 | 209.00 | 204.83 | 189.65 | 166.62 | 170.80 | 176.16 | 144.19 | 139.90 | 123.53 | 108.43 | NA | NA | NA | |
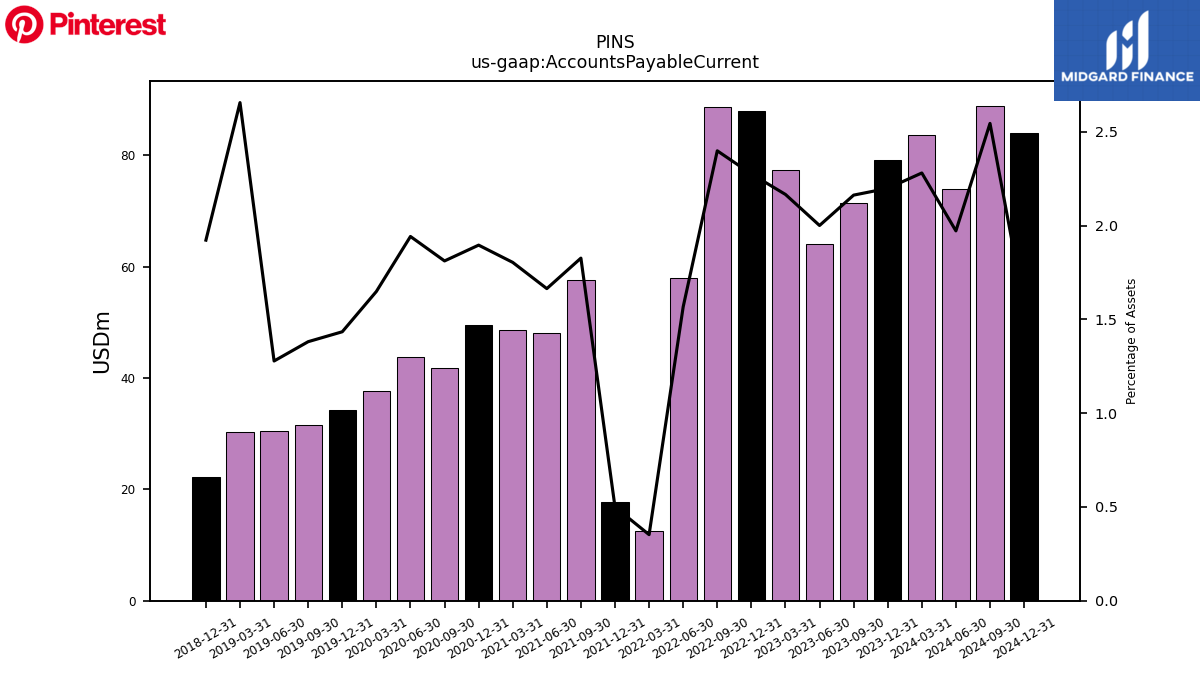
| Accounts Payable Current | 79.06 | 71.49 | 64.08 | 77.28 | 87.92 | 88.60 | 57.91 | 12.55 | 17.68 | 57.61 | 48.04 | 48.59 | 49.49 | 41.70 | 43.70 | 37.75 | 34.33 | 31.51 | 30.52 | 30.32 | 22.17 | NA | NA | NA | |
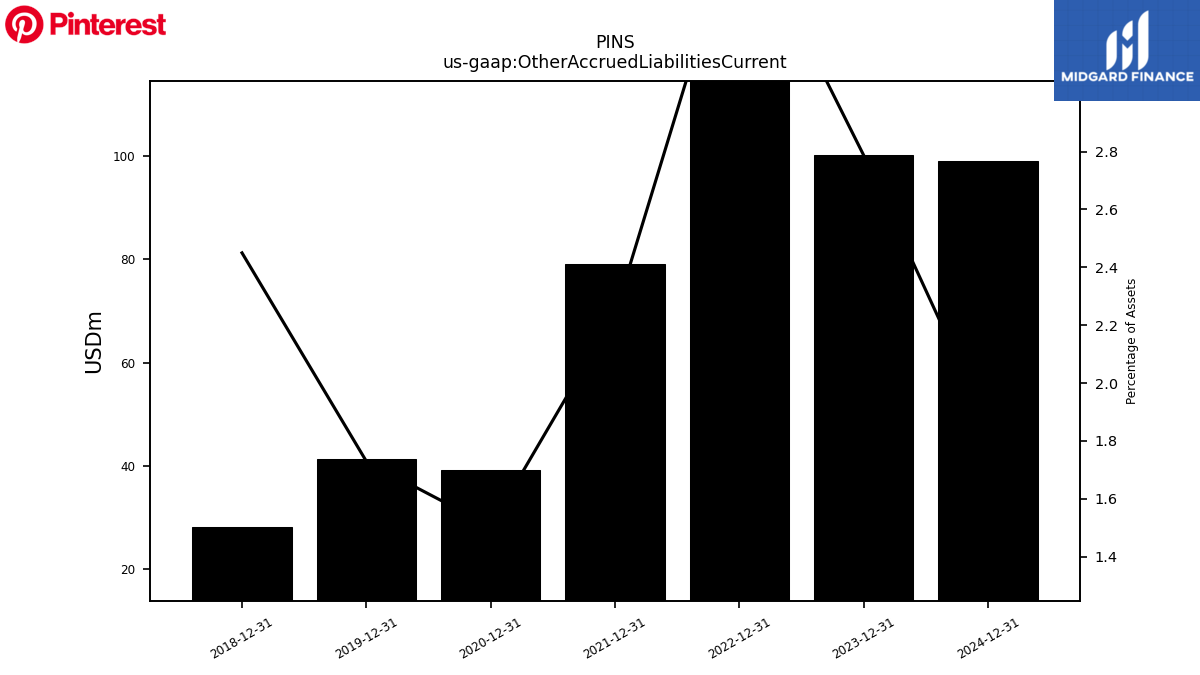
| Other Accrued Liabilities Current | 100.18 | NA | NA | NA | 140.81 | NA | NA | NA | 79.18 | NA | NA | NA | 39.26 | NA | NA | NA | 41.40 | NA | NA | NA | 28.24 | NA | NA | NA | |
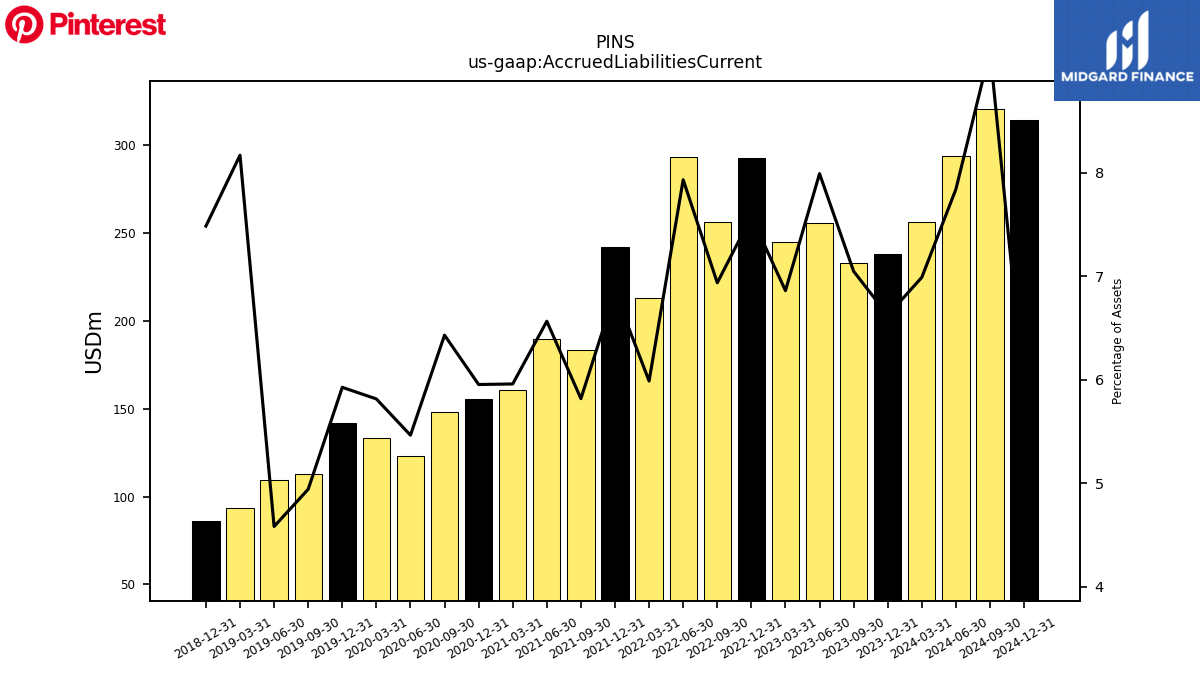
| Accrued Liabilities Current | 238.03 | 232.85 | 255.80 | 244.64 | 292.61 | 256.07 | 292.95 | 213.02 | 242.13 | 183.38 | 189.41 | 160.41 | 155.34 | 147.95 | 122.91 | 133.05 | 141.82 | 112.69 | 109.37 | 93.21 | 86.26 | NA | NA | NA |
| 2023-12-31 | 2023-09-30 | 2023-06-30 | 2023-03-31 | 2022-12-31 | 2022-09-30 | 2022-06-30 | 2022-03-31 | 2021-12-31 | 2021-09-30 | 2021-06-30 | 2021-03-31 | 2020-12-31 | 2020-09-30 | 2020-06-30 | 2020-03-31 | 2019-12-31 | 2019-09-30 | 2019-06-30 | 2019-03-31 | 2018-12-31 | 2018-09-30 | 2018-06-30 | 2018-03-31 | ||
|---|---|---|---|---|---|---|---|---|---|---|---|---|---|---|---|---|---|---|---|---|---|---|---|---|---|
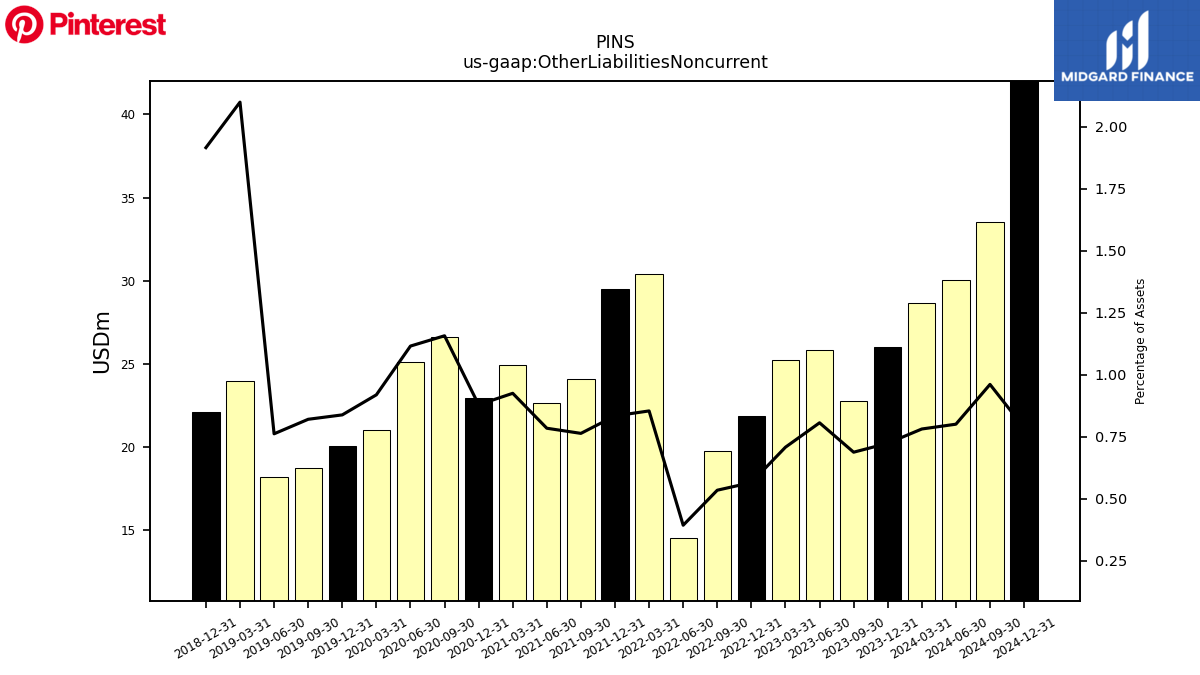
| Other Liabilities Noncurrent | 26.02 | 22.73 | 25.82 | 25.25 | 21.85 | 19.75 | 14.54 | 30.40 | 29.51 | 24.08 | 22.64 | 24.91 | 22.94 | 26.62 | 25.09 | 21.04 | 20.06 | 18.71 | 18.19 | 23.95 | 22.07 | NA | NA | NA | |
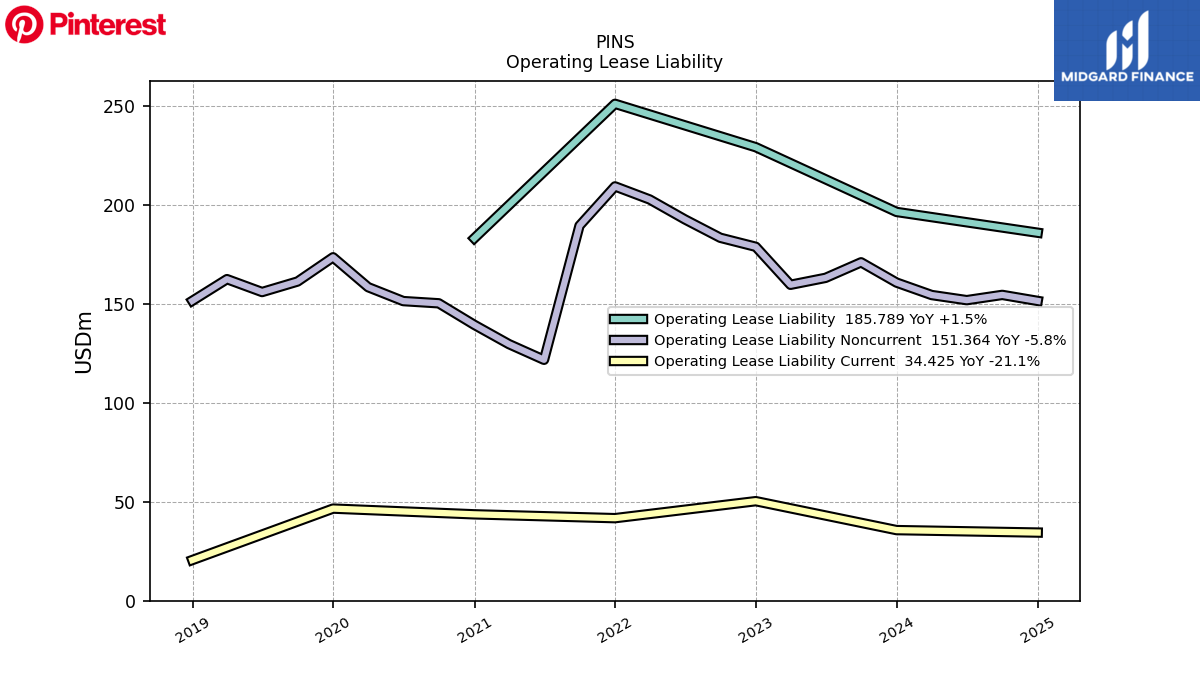
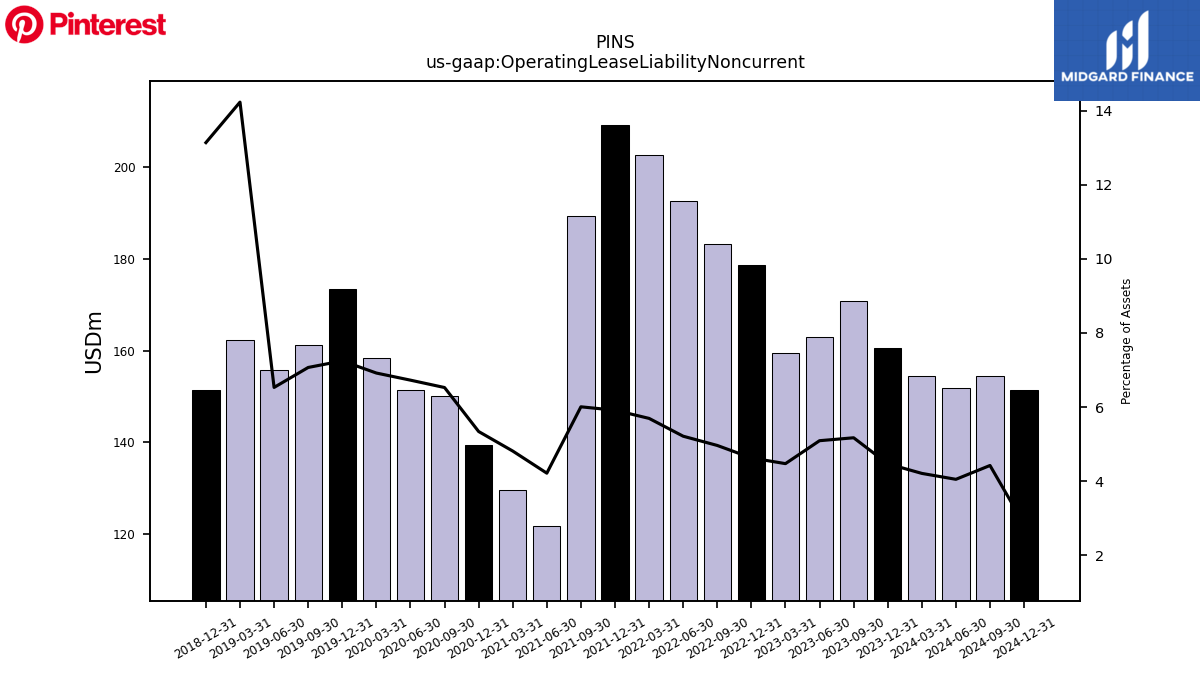
| Operating Lease Liability Noncurrent | 160.62 | 170.86 | 163.01 | 159.51 | 178.69 | 183.24 | 192.54 | 202.57 | 209.18 | 189.35 | 121.63 | 129.56 | 139.32 | 150.16 | 151.28 | 158.30 | 173.39 | 161.16 | 155.85 | 162.36 | 151.40 | NA | NA | NA |
| 2023-12-31 | 2023-09-30 | 2023-06-30 | 2023-03-31 | 2022-12-31 | 2022-09-30 | 2022-06-30 | 2022-03-31 | 2021-12-31 | 2021-09-30 | 2021-06-30 | 2021-03-31 | 2020-12-31 | 2020-09-30 | 2020-06-30 | 2020-03-31 | 2019-12-31 | 2019-09-30 | 2019-06-30 | 2019-03-31 | 2018-12-31 | 2018-09-30 | 2018-06-30 | 2018-03-31 | ||
|---|---|---|---|---|---|---|---|---|---|---|---|---|---|---|---|---|---|---|---|---|---|---|---|---|---|
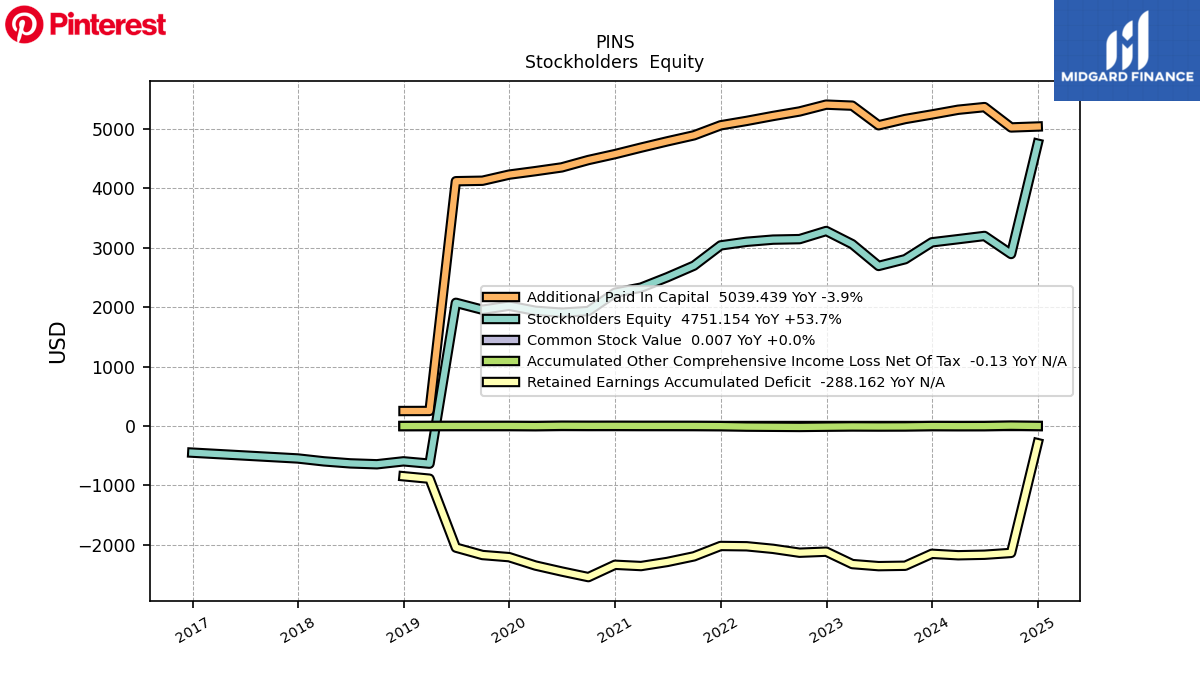
| Stockholders Equity | 3090.68 | 2806.64 | 2693.08 | 3059.74 | 3281.65 | 3144.54 | 3136.09 | 3099.66 | 3038.74 | 2698.37 | 2503.93 | 2328.82 | 2242.37 | 1934.60 | 1906.63 | 1938.48 | 2023.70 | 1956.40 | 2073.24 | -633.99 | -594.56 | -644.08 | -628.94 | -594.96 | |
| Common Stock Value | 0.01 | 0.01 | 0.01 | 0.01 | 0.01 | 0.01 | 0.01 | 0.01 | 0.01 | 0.01 | 0.01 | 0.01 | 0.01 | 0.01 | 0.01 | 0.01 | 0.01 | 0.00 | 0.00 | 0.00 | 0.00 | NA | NA | NA | |
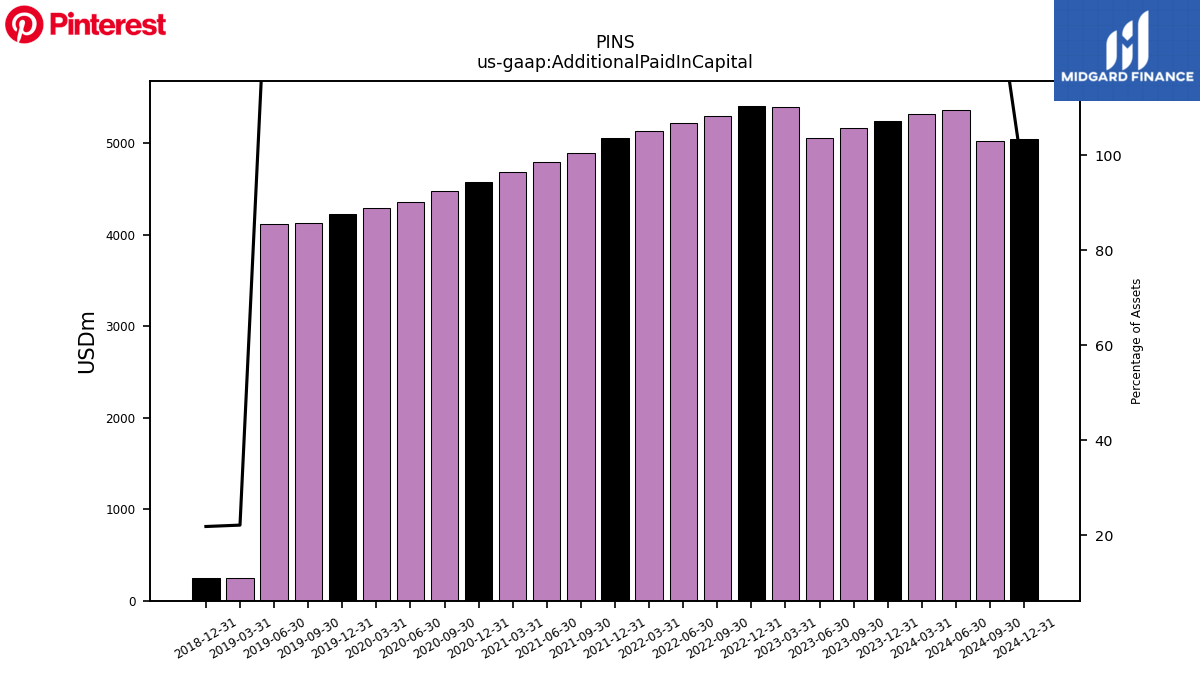
| Additional Paid In Capital | 5241.95 | 5165.53 | 5059.96 | 5390.10 | 5407.72 | 5292.79 | 5216.31 | 5133.80 | 5059.53 | 4891.04 | 4790.08 | 4684.23 | 4574.93 | 4475.43 | 4351.56 | 4288.60 | 4229.78 | 4127.03 | 4118.99 | 253.02 | 252.21 | NA | NA | NA | |
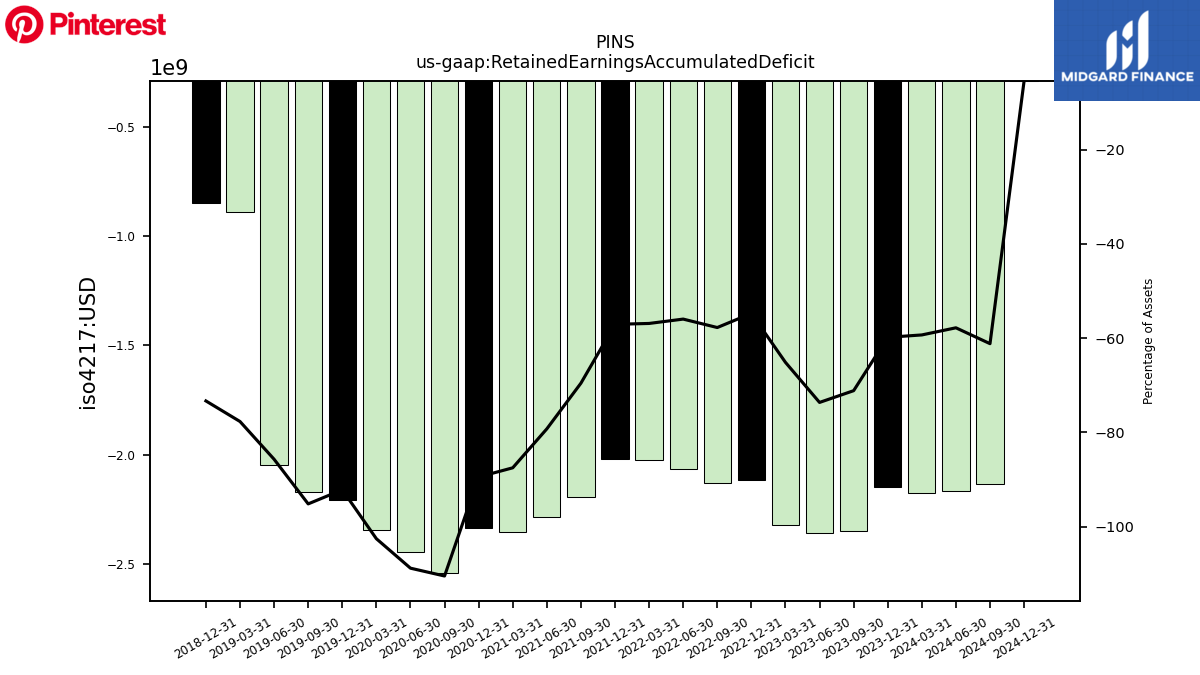
| Retained Earnings Accumulated Deficit | -2150.27 | -2351.45 | -2358.18 | -2323.24 | -2114.66 | -2132.15 | -2066.97 | -2023.89 | -2018.61 | -2193.31 | -2287.31 | -2356.72 | -2335.05 | -2542.89 | -2448.67 | -2347.92 | -2206.73 | -2171.01 | -2046.28 | -886.77 | -845.36 | NA | NA | NA | |
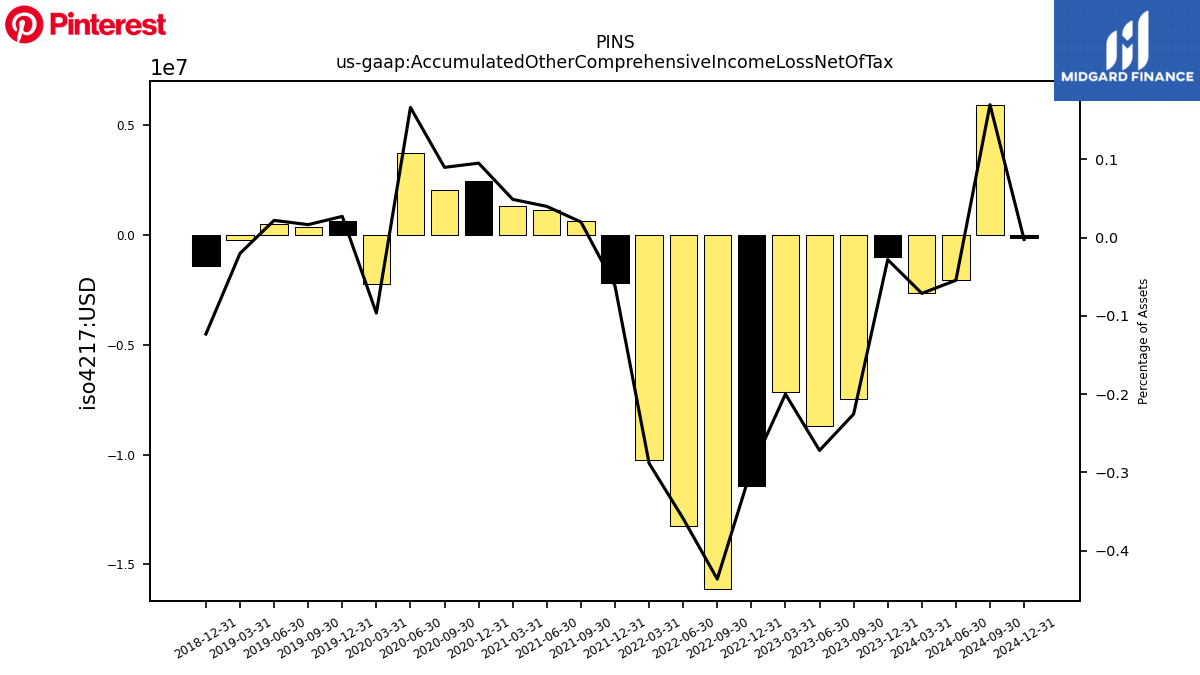
| Accumulated Other Comprehensive Income Loss Net Of Tax | -1.01 | -7.45 | -8.71 | -7.13 | -11.42 | -16.11 | -13.26 | -10.26 | -2.18 | 0.63 | 1.15 | 1.31 | 2.48 | 2.06 | 3.74 | -2.21 | 0.65 | 0.38 | 0.52 | -0.23 | -1.42 | NA | NA | NA | |
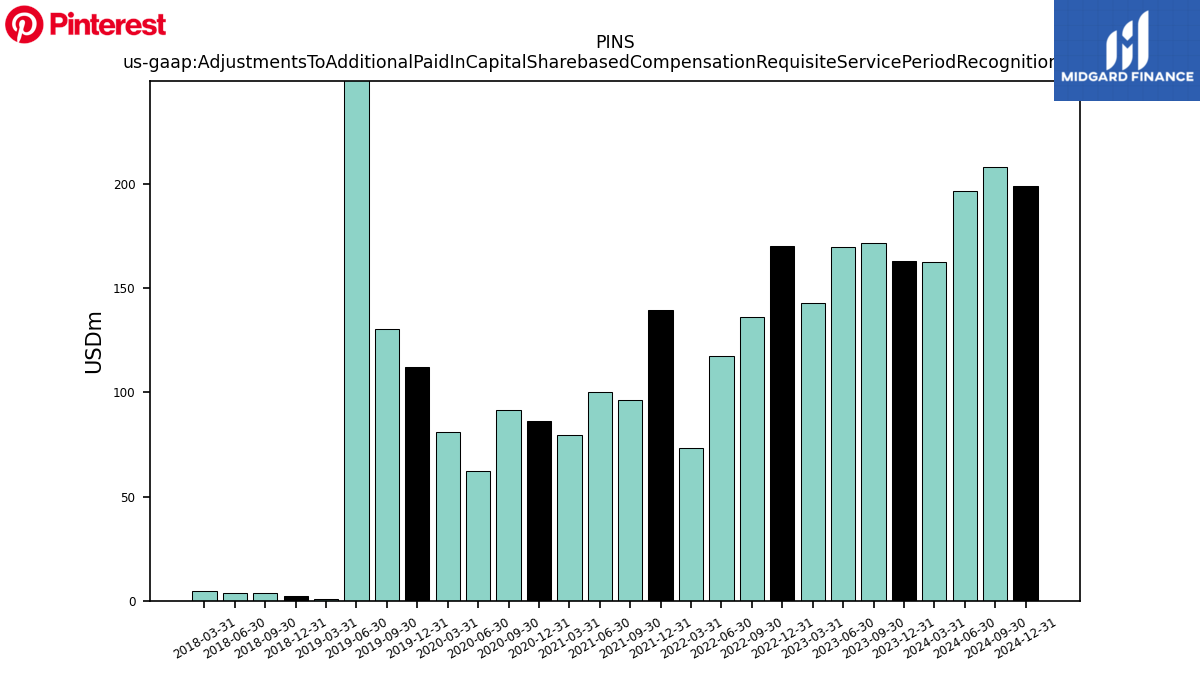
| Adjustments To Additional Paid In Capital Sharebased Compensation Requisite Service Period Recognition Value | 163.23 | 171.88 | 169.63 | 143.12 | 170.31 | 136.16 | 117.41 | 73.24 | 139.40 | 96.26 | 100.26 | 79.46 | 86.22 | 91.63 | 62.15 | 81.02 | 112.20 | 130.29 | 1134.60 | 0.69 | 2.18 | 3.89 | 3.96 | 4.83 |
| 2023-12-31 | 2023-09-30 | 2023-06-30 | 2023-03-31 | 2022-12-31 | 2022-09-30 | 2022-06-30 | 2022-03-31 | 2021-12-31 | 2021-09-30 | 2021-06-30 | 2021-03-31 | 2020-12-31 | 2020-09-30 | 2020-06-30 | 2020-03-31 | 2019-12-31 | 2019-09-30 | 2019-06-30 | 2019-03-31 | 2018-12-31 | 2018-09-30 | 2018-06-30 | 2018-03-31 | ||
|---|---|---|---|---|---|---|---|---|---|---|---|---|---|---|---|---|---|---|---|---|---|---|---|---|---|
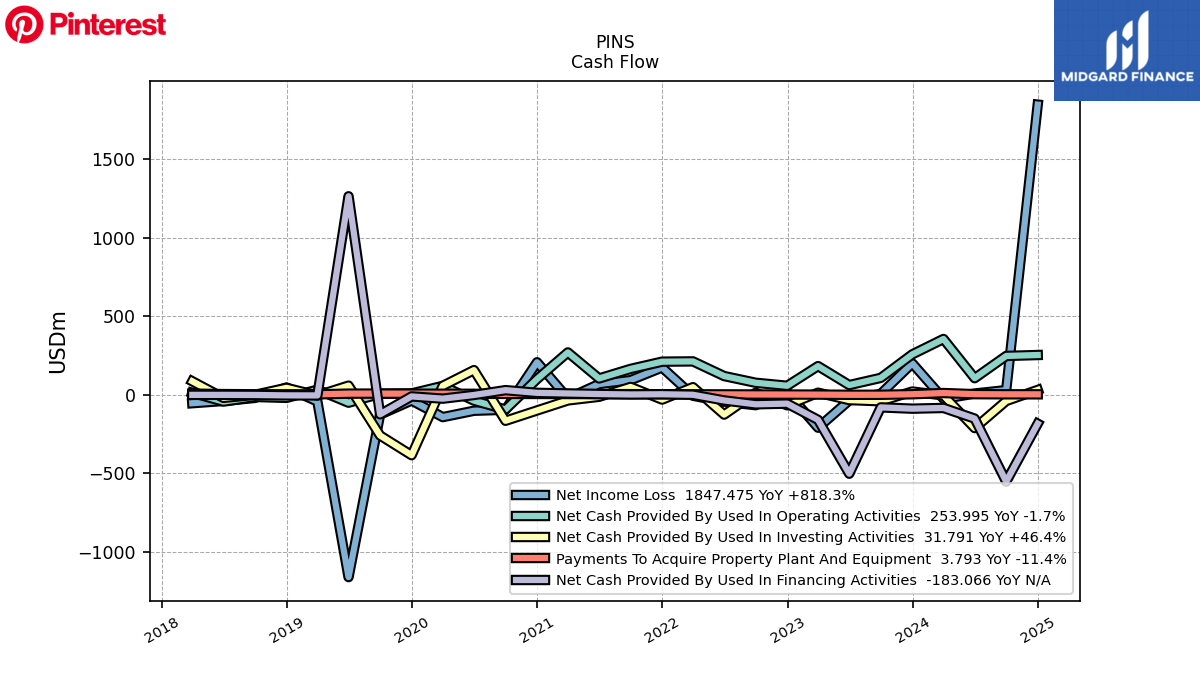
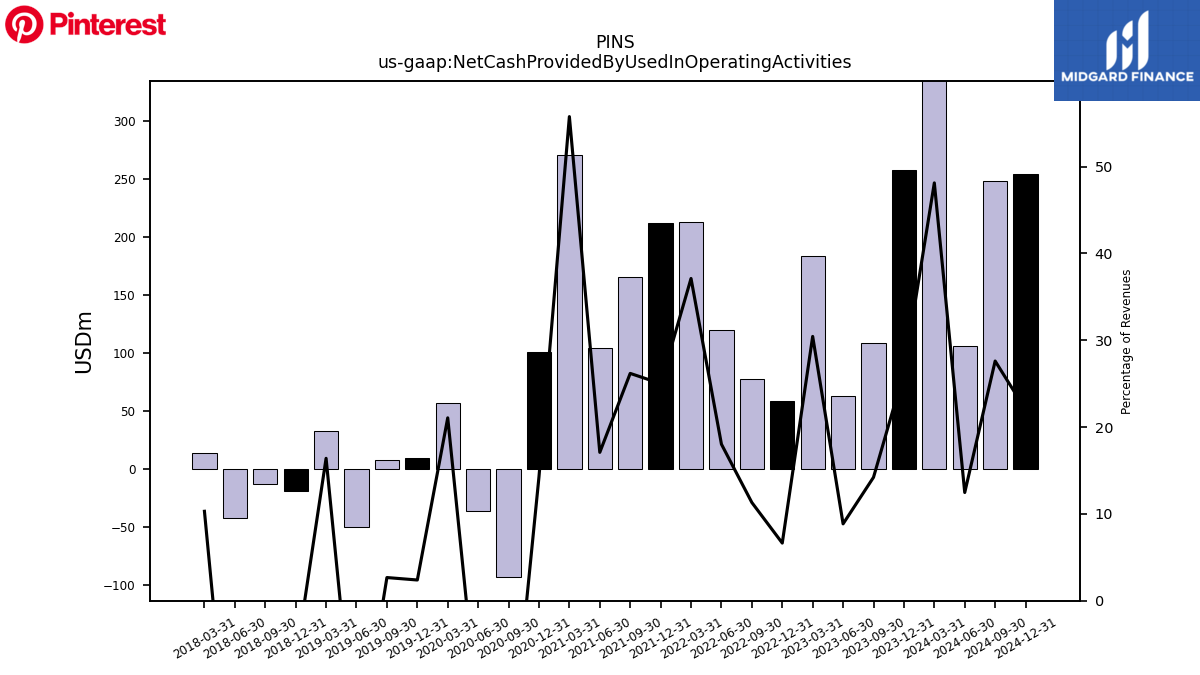
| Net Cash Provided By Used In Operating Activities | 258.28 | 108.50 | 62.72 | 183.46 | 58.29 | 77.45 | 120.07 | 213.39 | 211.77 | 165.74 | 104.81 | 270.58 | 100.70 | -92.64 | -36.52 | 57.29 | 9.56 | 7.47 | -49.50 | 33.12 | -18.82 | -12.72 | -42.36 | 13.53 | |
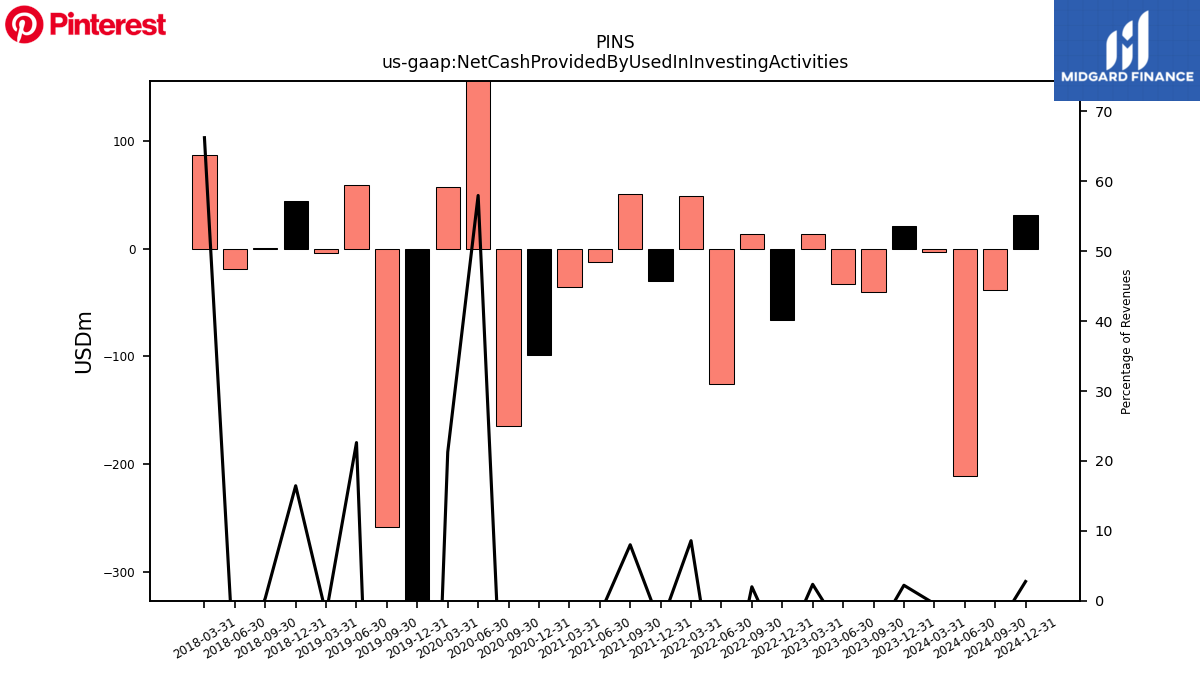
| Net Cash Provided By Used In Investing Activities | 21.72 | -40.24 | -32.64 | 14.16 | -66.10 | 13.68 | -125.23 | 49.40 | -29.66 | 50.70 | -11.84 | -35.06 | -98.90 | -164.55 | 157.99 | 57.84 | -383.72 | -258.08 | 59.12 | -3.82 | 44.95 | 0.70 | -18.62 | 87.03 | |
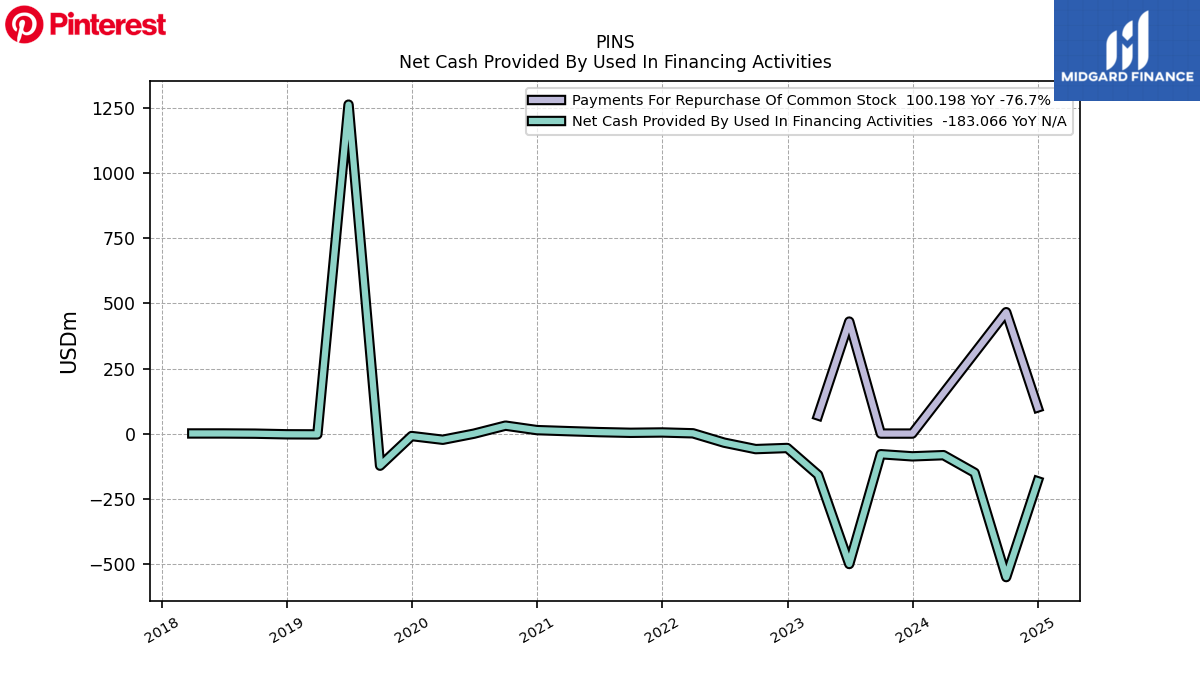
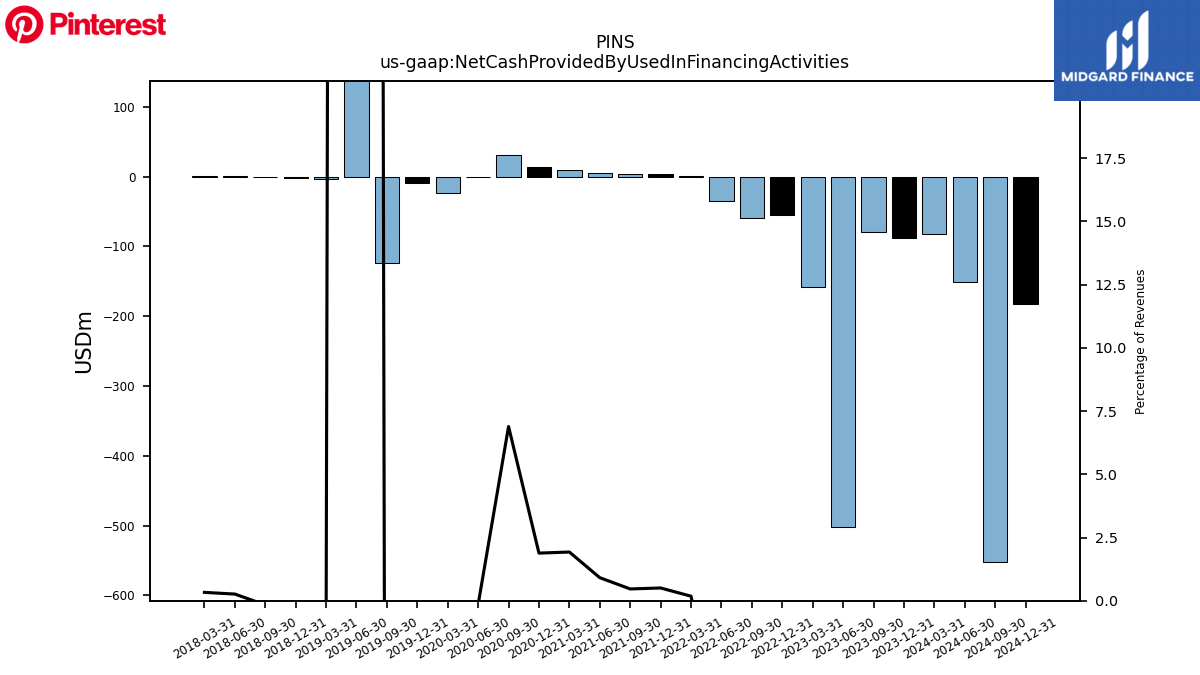
| Net Cash Provided By Used In Financing Activities | -87.50 | -79.28 | -501.40 | -158.58 | -55.38 | -59.68 | -34.91 | 1.04 | 4.28 | 2.95 | 5.59 | 9.34 | 13.29 | 30.49 | -0.40 | -23.74 | -9.48 | -123.45 | 1264.29 | -3.17 | -2.76 | -0.31 | 0.43 | 0.43 |
| 2023-12-31 | 2023-09-30 | 2023-06-30 | 2023-03-31 | 2022-12-31 | 2022-09-30 | 2022-06-30 | 2022-03-31 | 2021-12-31 | 2021-09-30 | 2021-06-30 | 2021-03-31 | 2020-12-31 | 2020-09-30 | 2020-06-30 | 2020-03-31 | 2019-12-31 | 2019-09-30 | 2019-06-30 | 2019-03-31 | 2018-12-31 | 2018-09-30 | 2018-06-30 | 2018-03-31 | ||
|---|---|---|---|---|---|---|---|---|---|---|---|---|---|---|---|---|---|---|---|---|---|---|---|---|---|
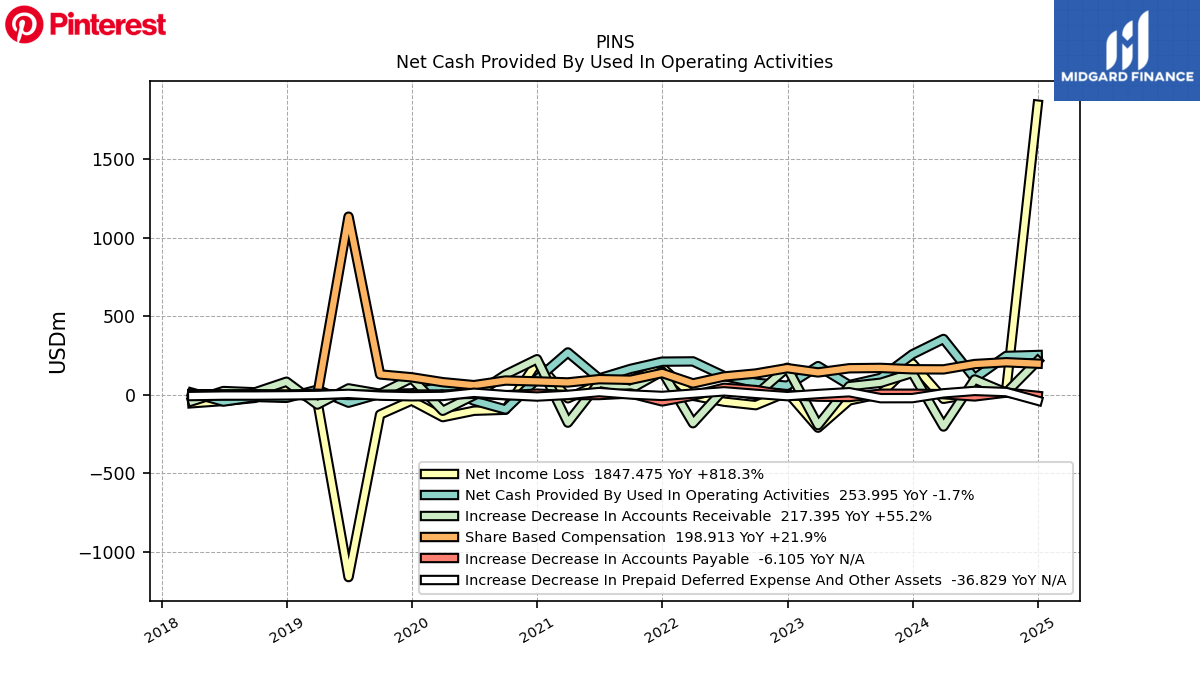
| Net Cash Provided By Used In Operating Activities | 258.28 | 108.50 | 62.72 | 183.46 | 58.29 | 77.45 | 120.07 | 213.39 | 211.77 | 165.74 | 104.81 | 270.58 | 100.70 | -92.64 | -36.52 | 57.29 | 9.56 | 7.47 | -49.50 | 33.12 | -18.82 | -12.72 | -42.36 | 13.53 | |
| Net Income Loss | 201.18 | 6.73 | -34.94 | -208.58 | 17.49 | -65.18 | -43.08 | -5.28 | 174.70 | 94.00 | 69.42 | -21.67 | 207.84 | -94.22 | -100.75 | -141.20 | -35.72 | -124.73 | -1159.50 | -41.42 | 47.02 | -18.87 | -38.41 | -52.71 | |
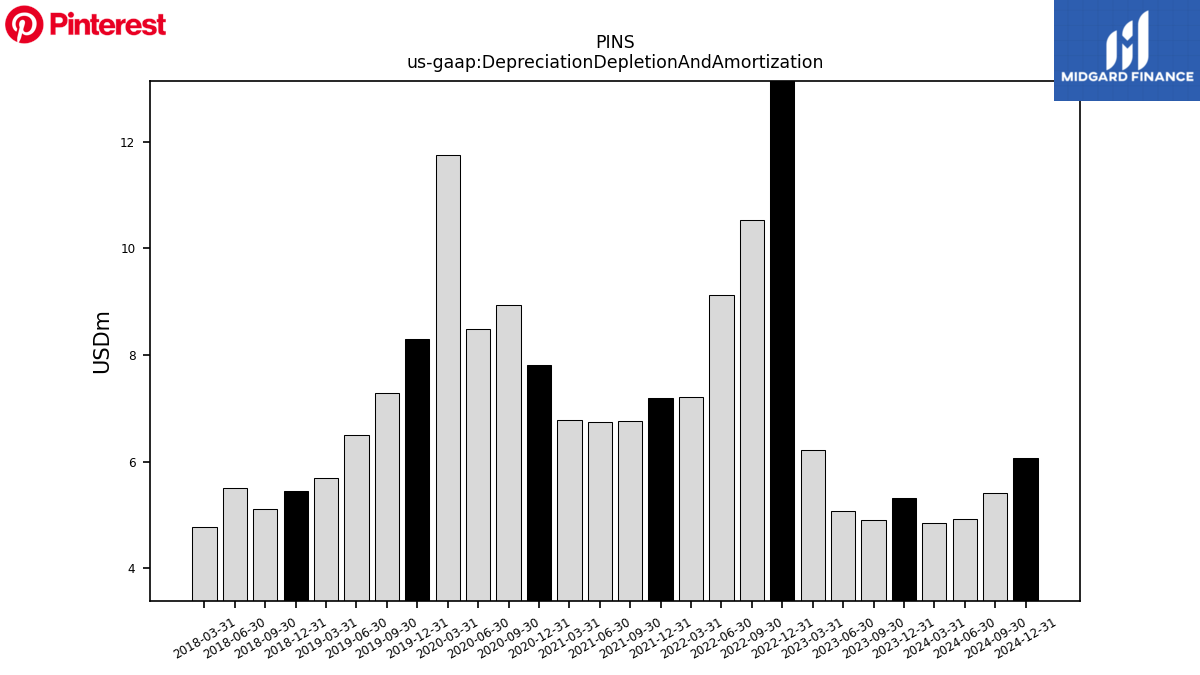
| Depreciation Depletion And Amortization | 5.32 | 4.90 | 5.07 | 6.21 | 19.61 | 10.53 | 9.13 | 7.22 | 7.20 | 6.76 | 6.75 | 6.78 | 7.81 | 8.94 | 8.48 | 11.75 | 8.29 | 7.29 | 6.51 | 5.70 | 5.44 | 5.12 | 5.51 | 4.79 | |
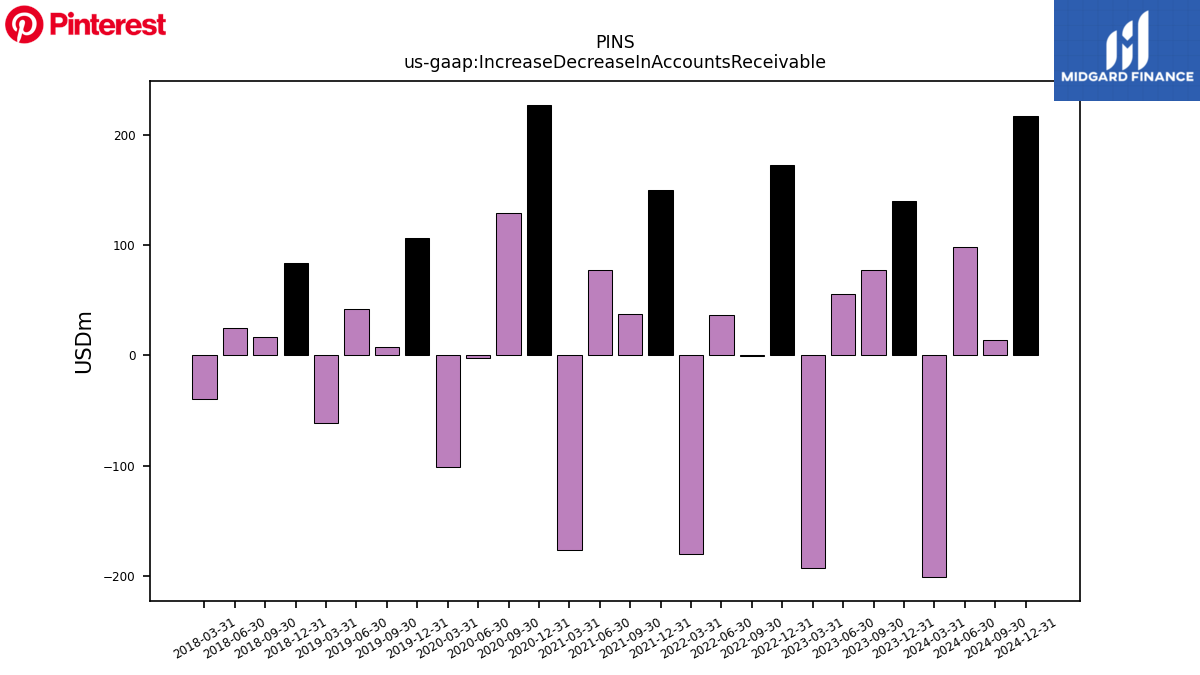
| Increase Decrease In Accounts Receivable | 140.09 | 77.52 | 55.70 | -192.52 | 172.94 | -0.21 | 36.33 | -180.20 | 149.90 | 37.65 | 77.88 | -176.56 | 227.51 | 129.21 | -2.55 | -100.99 | 106.56 | 7.28 | 41.71 | -61.33 | 84.12 | 16.58 | 24.71 | -39.31 | |
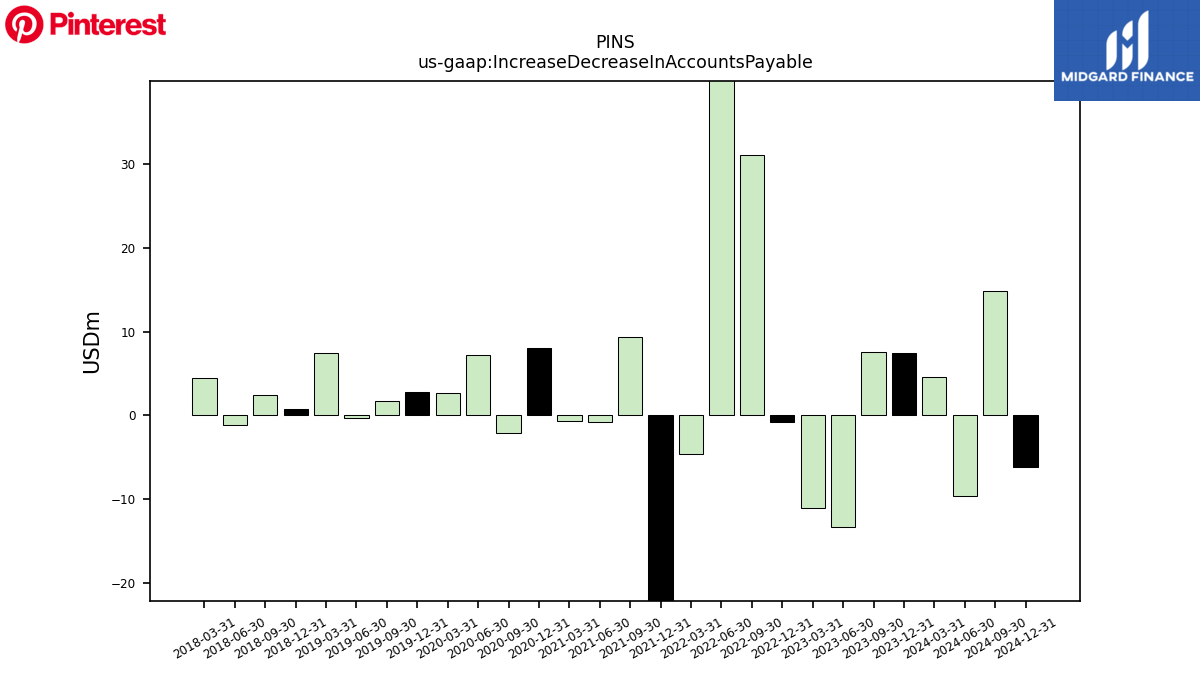
| Increase Decrease In Accounts Payable | 7.45 | 7.58 | -13.26 | -11.03 | -0.83 | 31.05 | 45.20 | -4.64 | -41.31 | 9.36 | -0.78 | -0.72 | 8.03 | -2.09 | 7.17 | 2.61 | 2.74 | 1.71 | -0.29 | 7.48 | 0.81 | 2.44 | -1.20 | 4.48 | |
| Share Based Compensation | 163.23 | 171.88 | 169.63 | 143.12 | 170.31 | 136.16 | 117.41 | 73.24 | 139.40 | 96.26 | 100.26 | 79.46 | 86.22 | 91.63 | 62.15 | 81.02 | 112.20 | 130.29 | 1134.60 | 0.69 | 2.18 | 3.89 | 3.96 | 4.83 |
| 2023-12-31 | 2023-09-30 | 2023-06-30 | 2023-03-31 | 2022-12-31 | 2022-09-30 | 2022-06-30 | 2022-03-31 | 2021-12-31 | 2021-09-30 | 2021-06-30 | 2021-03-31 | 2020-12-31 | 2020-09-30 | 2020-06-30 | 2020-03-31 | 2019-12-31 | 2019-09-30 | 2019-06-30 | 2019-03-31 | 2018-12-31 | 2018-09-30 | 2018-06-30 | 2018-03-31 | ||
|---|---|---|---|---|---|---|---|---|---|---|---|---|---|---|---|---|---|---|---|---|---|---|---|---|---|
| Net Cash Provided By Used In Investing Activities | 21.72 | -40.24 | -32.64 | 14.16 | -66.10 | 13.68 | -125.23 | 49.40 | -29.66 | 50.70 | -11.84 | -35.06 | -98.90 | -164.55 | 157.99 | 57.84 | -383.72 | -258.08 | 59.12 | -3.82 | 44.95 | 0.70 | -18.62 | 87.03 | |
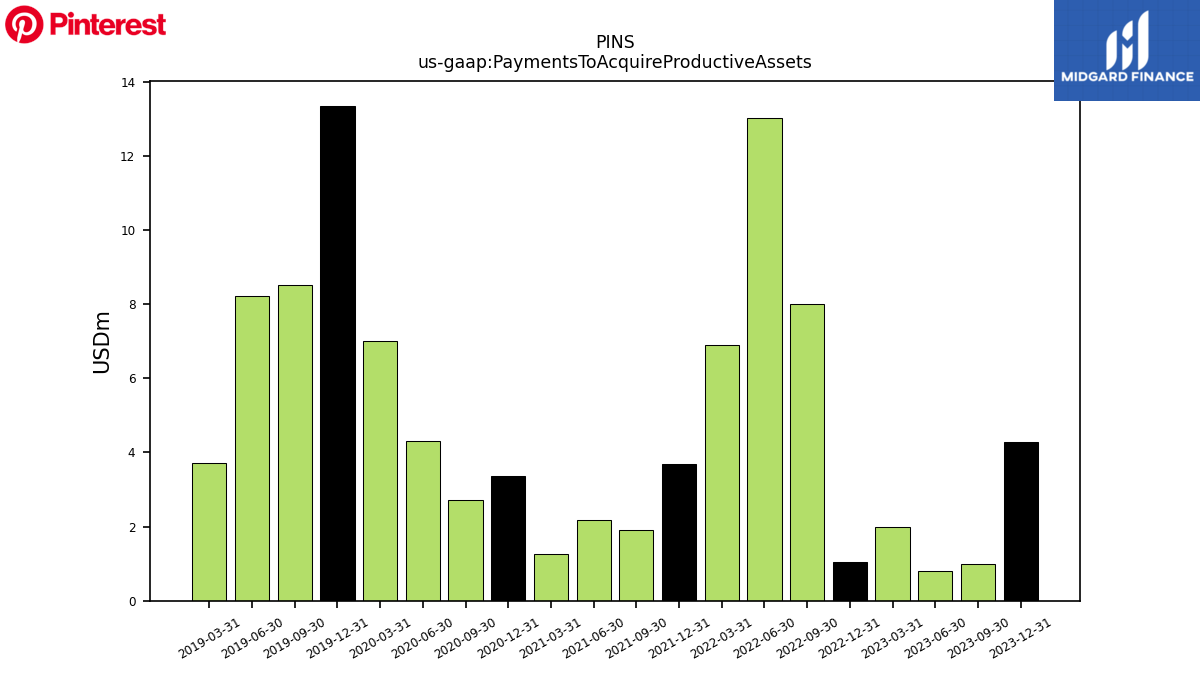
| Payments To Acquire Productive Assets | 4.28 | 0.98 | 0.81 | 1.99 | 1.05 | 8.02 | 13.01 | 6.90 | 3.69 | 1.91 | 2.18 | 1.25 | 3.37 | 2.71 | 4.32 | 7.00 | 13.35 | 8.52 | 8.21 | 3.71 | NA | NA | NA | NA |
| 2023-12-31 | 2023-09-30 | 2023-06-30 | 2023-03-31 | 2022-12-31 | 2022-09-30 | 2022-06-30 | 2022-03-31 | 2021-12-31 | 2021-09-30 | 2021-06-30 | 2021-03-31 | 2020-12-31 | 2020-09-30 | 2020-06-30 | 2020-03-31 | 2019-12-31 | 2019-09-30 | 2019-06-30 | 2019-03-31 | 2018-12-31 | 2018-09-30 | 2018-06-30 | 2018-03-31 | ||
|---|---|---|---|---|---|---|---|---|---|---|---|---|---|---|---|---|---|---|---|---|---|---|---|---|---|
| Net Cash Provided By Used In Financing Activities | -87.50 | -79.28 | -501.40 | -158.58 | -55.38 | -59.68 | -34.91 | 1.04 | 4.28 | 2.95 | 5.59 | 9.34 | 13.29 | 30.49 | -0.40 | -23.74 | -9.48 | -123.45 | 1264.29 | -3.17 | -2.76 | -0.31 | 0.43 | 0.43 | |
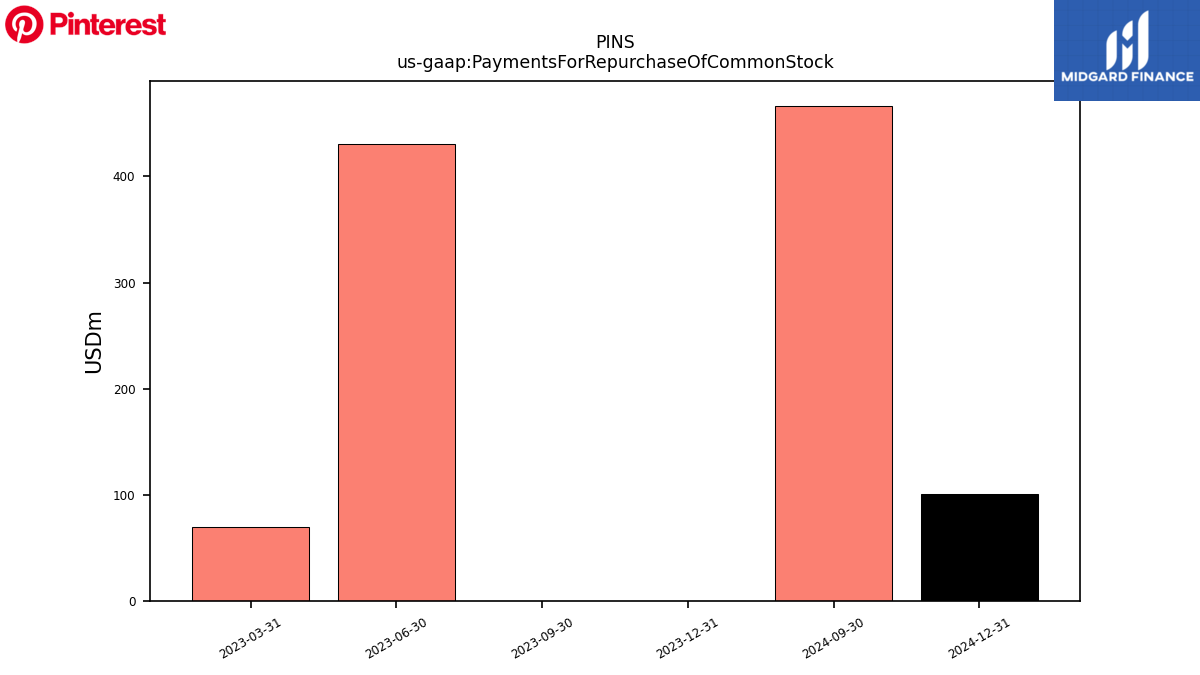
| Payments For Repurchase Of Common Stock | 0.00 | 0.00 | 430.52 | 69.48 | NA | NA | NA | NA | NA | NA | NA | NA | NA | NA | NA | NA | NA | NA | NA | NA | NA | NA | NA | NA |
| 2023-12-31 | 2023-09-30 | 2023-06-30 | 2023-03-31 | 2022-12-31 | 2022-09-30 | 2022-06-30 | 2022-03-31 | 2021-12-31 | 2021-09-30 | 2021-06-30 | 2021-03-31 | 2020-12-31 | 2020-09-30 | 2020-06-30 | 2020-03-31 | 2019-12-31 | 2019-09-30 | 2019-06-30 | 2019-03-31 | 2018-12-31 | 2018-09-30 | 2018-06-30 | 2018-03-31 | ||
|---|---|---|---|---|---|---|---|---|---|---|---|---|---|---|---|---|---|---|---|---|---|---|---|---|---|
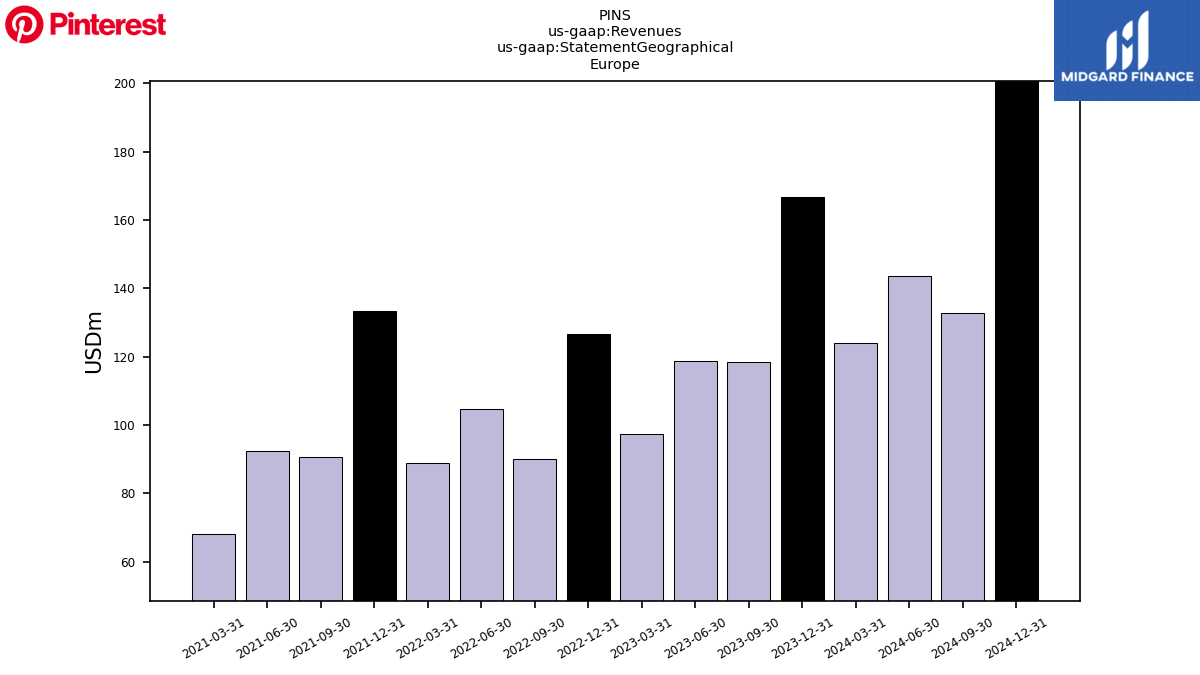
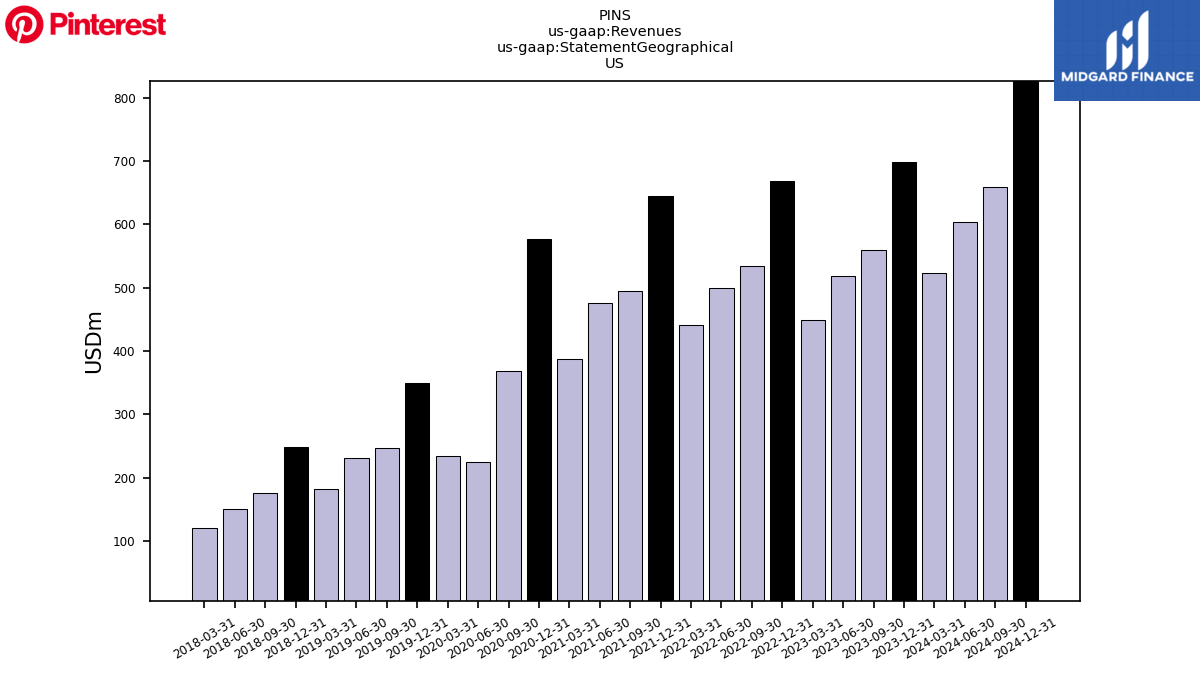
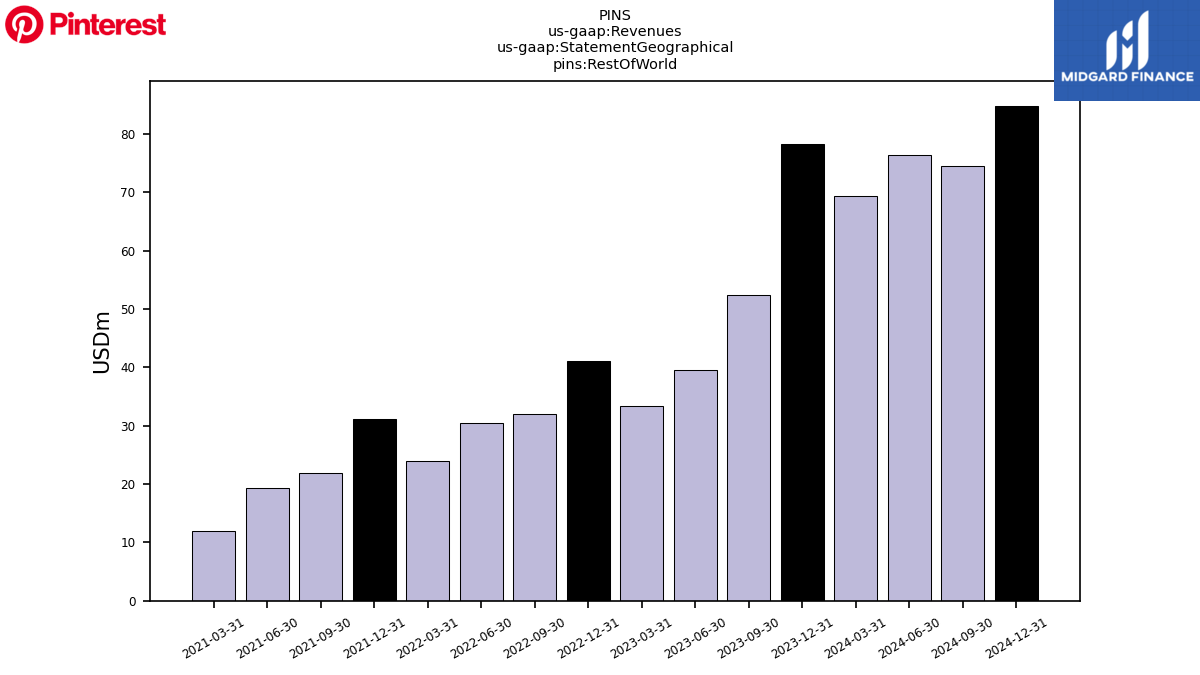
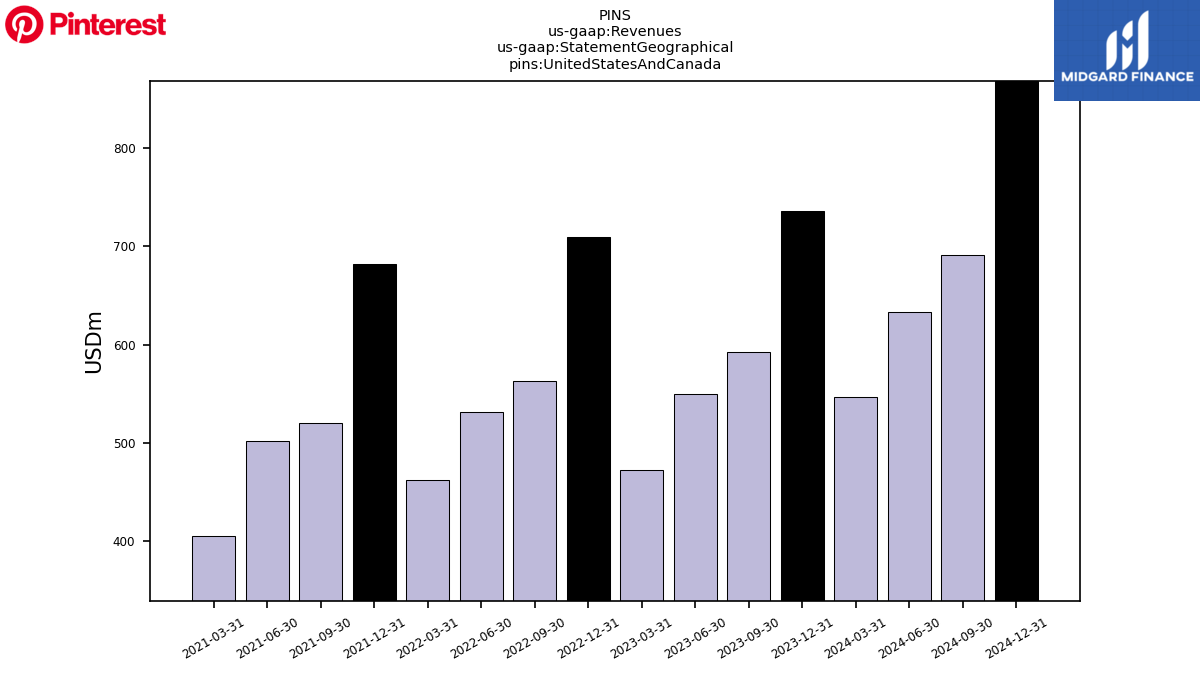
| Revenues | 981.26 | 763.20 | 708.02 | 602.58 | 877.21 | 684.55 | 665.93 | 574.88 | 846.65 | 632.93 | 613.21 | 485.23 | 705.62 | 442.62 | 272.49 | 271.94 | 399.90 | 279.70 | 261.25 | 201.91 | 273.18 | 190.20 | 161.19 | 131.36 | |
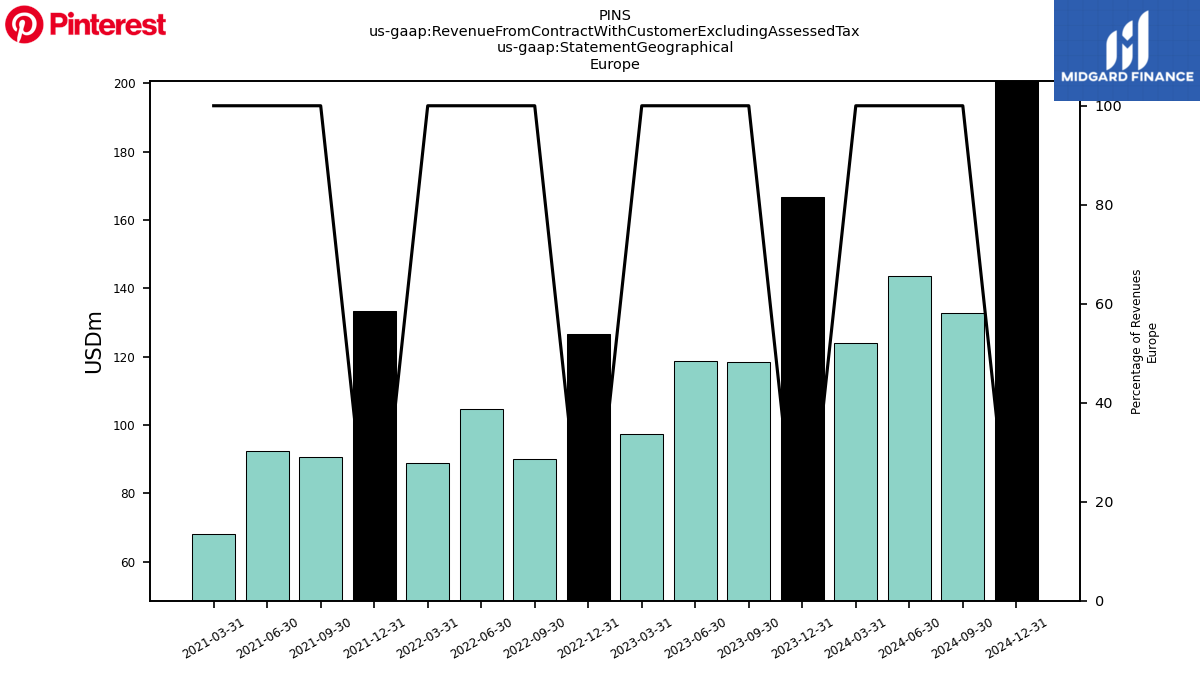
| 166.62 | 118.47 | 118.81 | 97.39 | 126.76 | 90.11 | 104.75 | 88.90 | 133.25 | 90.69 | 92.50 | 68.22 | NA | NA | NA | NA | NA | NA | NA | NA | NA | NA | NA | NA | ||
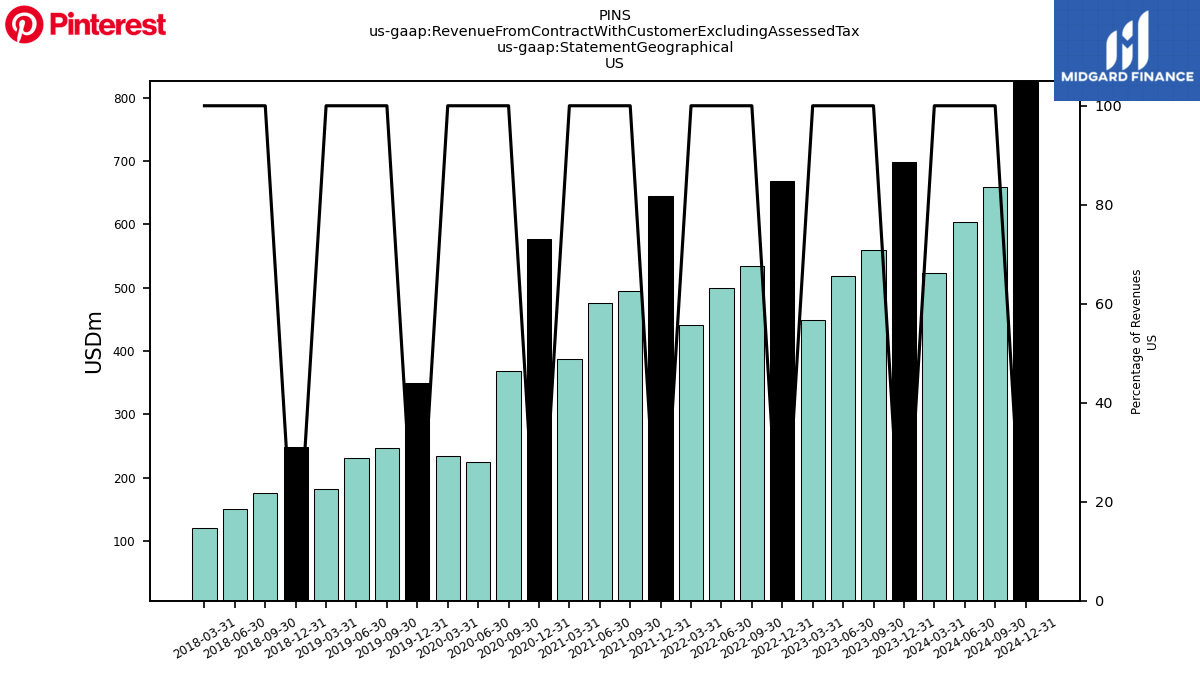
| US | 698.80 | 560.00 | 518.50 | 449.00 | 669.00 | 534.10 | 500.30 | 440.90 | 644.95 | 494.36 | 476.09 | 388.25 | 577.06 | 368.00 | 224.27 | 234.95 | 349.43 | 247.22 | 231.77 | 181.76 | 248.82 | 176.76 | 150.21 | 121.38 | |
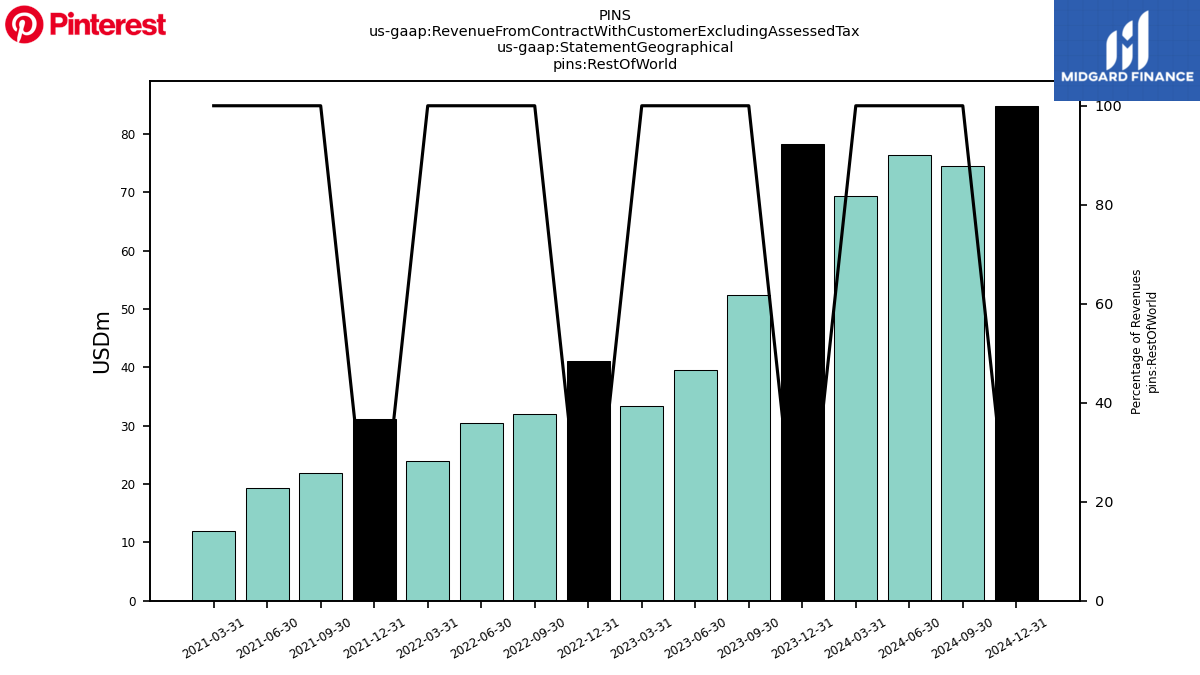
| Rest Of World | 78.29 | 52.37 | 39.56 | 33.37 | 41.04 | 32.01 | 30.45 | 23.91 | 31.17 | 21.93 | 19.24 | 11.94 | NA | NA | NA | NA | NA | NA | NA | NA | NA | NA | NA | NA | |
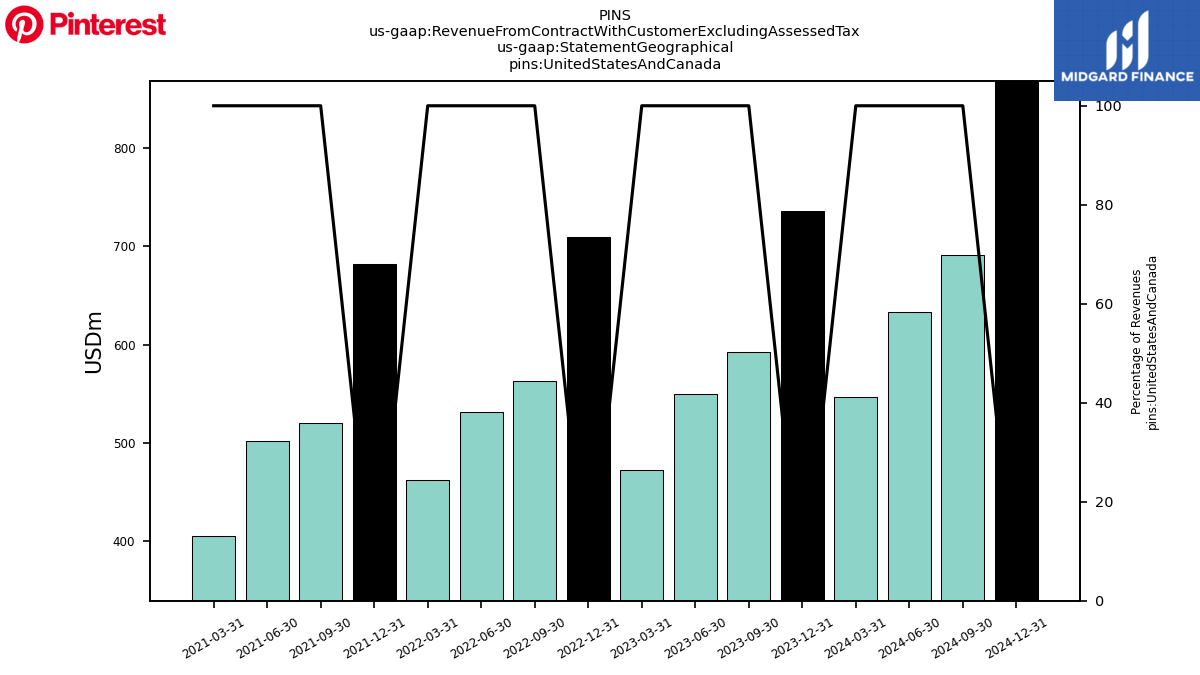
| United States And Canada | 736.35 | 592.37 | 549.65 | 471.82 | 709.41 | 562.43 | 530.73 | 462.07 | 682.23 | 520.32 | 501.47 | 405.07 | NA | NA | NA | NA | NA | NA | NA | NA | NA | NA | NA | NA | |
| Revenue From Contract With Customer Excluding Assessed Tax | 981.26 | 763.20 | 708.02 | 602.58 | 877.21 | 684.55 | 665.93 | 574.88 | 846.65 | 632.93 | 613.21 | 485.23 | 705.62 | 442.62 | 272.49 | 271.94 | 399.90 | 279.70 | 261.25 | 201.91 | 273.18 | 190.20 | 161.19 | 131.36 | |
| 166.62 | 118.47 | 118.81 | 97.39 | 126.76 | 90.11 | 104.75 | 88.90 | 133.25 | 90.69 | 92.50 | 68.22 | NA | NA | NA | NA | NA | NA | NA | NA | NA | NA | NA | NA | ||
| US | 698.80 | 560.00 | 518.50 | 449.00 | 669.00 | 534.10 | 500.30 | 440.90 | 644.95 | 494.36 | 476.09 | 388.25 | 577.06 | 368.00 | 224.27 | 234.95 | 349.43 | 247.22 | 231.77 | 181.76 | 248.82 | 176.76 | 150.21 | 121.38 | |
| Rest Of World | 78.29 | 52.37 | 39.56 | 33.37 | 41.04 | 32.01 | 30.45 | 23.91 | 31.17 | 21.93 | 19.24 | 11.94 | NA | NA | NA | NA | NA | NA | NA | NA | NA | NA | NA | NA | |
| United States And Canada | 736.35 | 592.37 | 549.65 | 471.82 | 709.41 | 562.43 | 530.73 | 462.07 | 682.23 | 520.32 | 501.47 | 405.07 | NA | NA | NA | NA | NA | NA | NA | NA | NA | NA | NA | NA |