
| 2023-12-31 | 2023-09-30 | 2023-06-30 | 2023-03-31 | 2022-12-31 | 2022-09-30 | 2022-06-30 | 2022-03-31 | 2021-12-31 | 2021-09-30 | 2021-06-30 | 2021-03-31 | 2020-12-31 | 2020-09-30 | 2020-06-30 | 2020-03-31 | 2019-12-31 | 2019-09-30 | 2019-06-30 | 2019-03-31 | 2018-12-31 | 2018-09-30 | 2018-06-30 | 2018-03-31 | 2017-12-31 | 2017-09-30 | 2017-06-30 | 2017-03-31 | 2016-12-31 | 2016-09-30 | 2016-06-30 | 2016-03-31 | ||
|---|---|---|---|---|---|---|---|---|---|---|---|---|---|---|---|---|---|---|---|---|---|---|---|---|---|---|---|---|---|---|---|---|---|
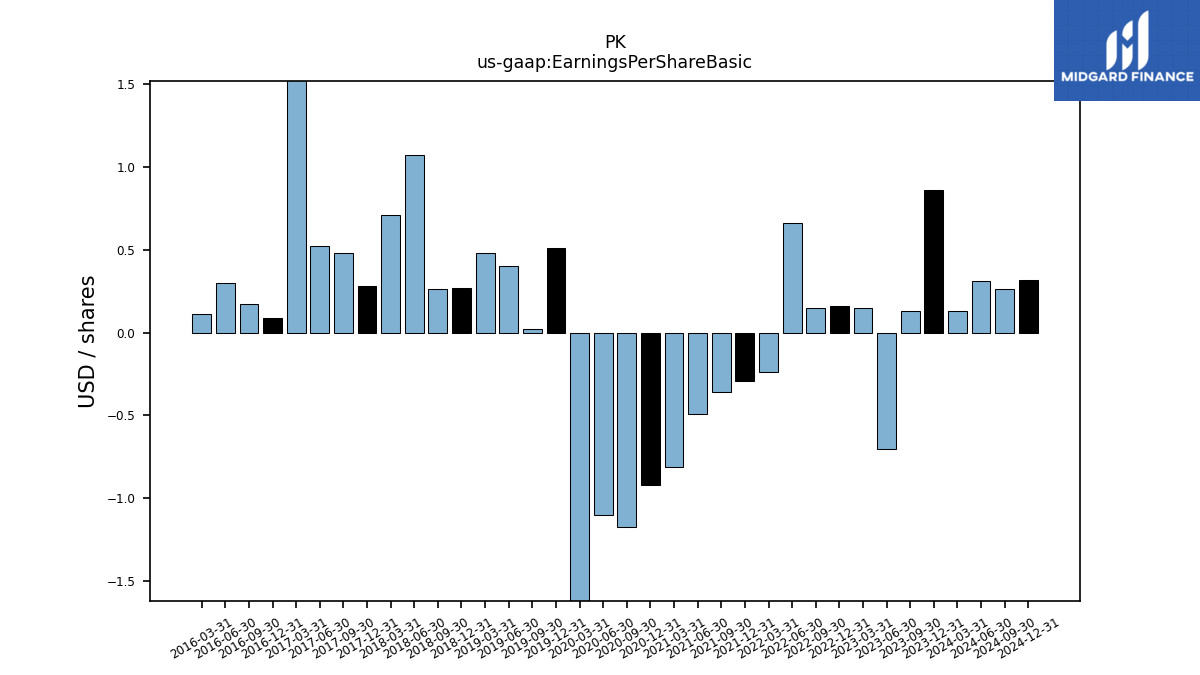
| Earnings Per Share Basic | 0.86 | 0.13 | -0.70 | 0.15 | 0.16 | 0.15 | 0.66 | -0.24 | -0.29 | -0.36 | -0.49 | -0.81 | -0.92 | -1.17 | -1.10 | -2.89 | 0.51 | 0.02 | 0.40 | 0.48 | 0.27 | 0.26 | 1.07 | 0.71 | 0.28 | 0.48 | 0.52 | 11.65 | 0.09 | 0.17 | 0.30 | 0.11 | |
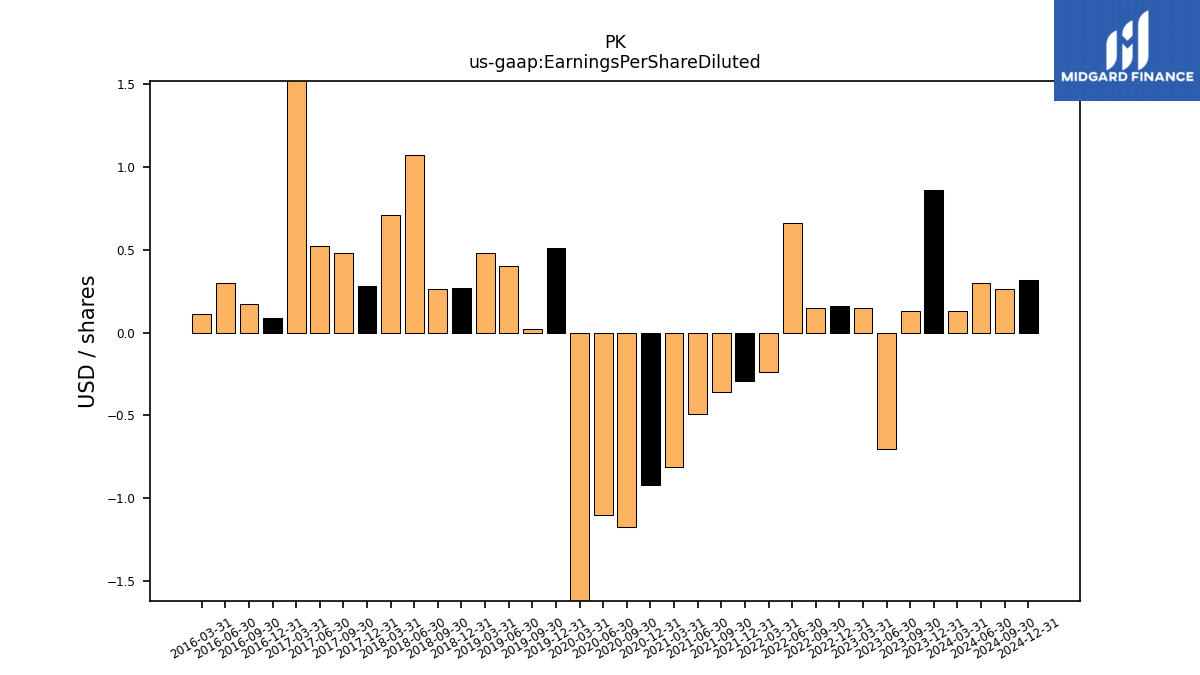
| Earnings Per Share Diluted | 0.86 | 0.13 | -0.70 | 0.15 | 0.16 | 0.15 | 0.66 | -0.24 | -0.29 | -0.36 | -0.49 | -0.81 | -0.92 | -1.17 | -1.10 | -2.89 | 0.51 | 0.02 | 0.40 | 0.48 | 0.27 | 0.26 | 1.07 | 0.71 | 0.28 | 0.48 | 0.52 | 11.02 | 0.09 | 0.17 | 0.30 | 0.11 |
| 2023-12-31 | 2023-09-30 | 2023-06-30 | 2023-03-31 | 2022-12-31 | 2022-09-30 | 2022-06-30 | 2022-03-31 | 2021-12-31 | 2021-09-30 | 2021-06-30 | 2021-03-31 | 2020-12-31 | 2020-09-30 | 2020-06-30 | 2020-03-31 | 2019-12-31 | 2019-09-30 | 2019-06-30 | 2019-03-31 | 2018-12-31 | 2018-09-30 | 2018-06-30 | 2018-03-31 | 2017-12-31 | 2017-09-30 | 2017-06-30 | 2017-03-31 | 2016-12-31 | 2016-09-30 | 2016-06-30 | 2016-03-31 | ||
|---|---|---|---|---|---|---|---|---|---|---|---|---|---|---|---|---|---|---|---|---|---|---|---|---|---|---|---|---|---|---|---|---|---|
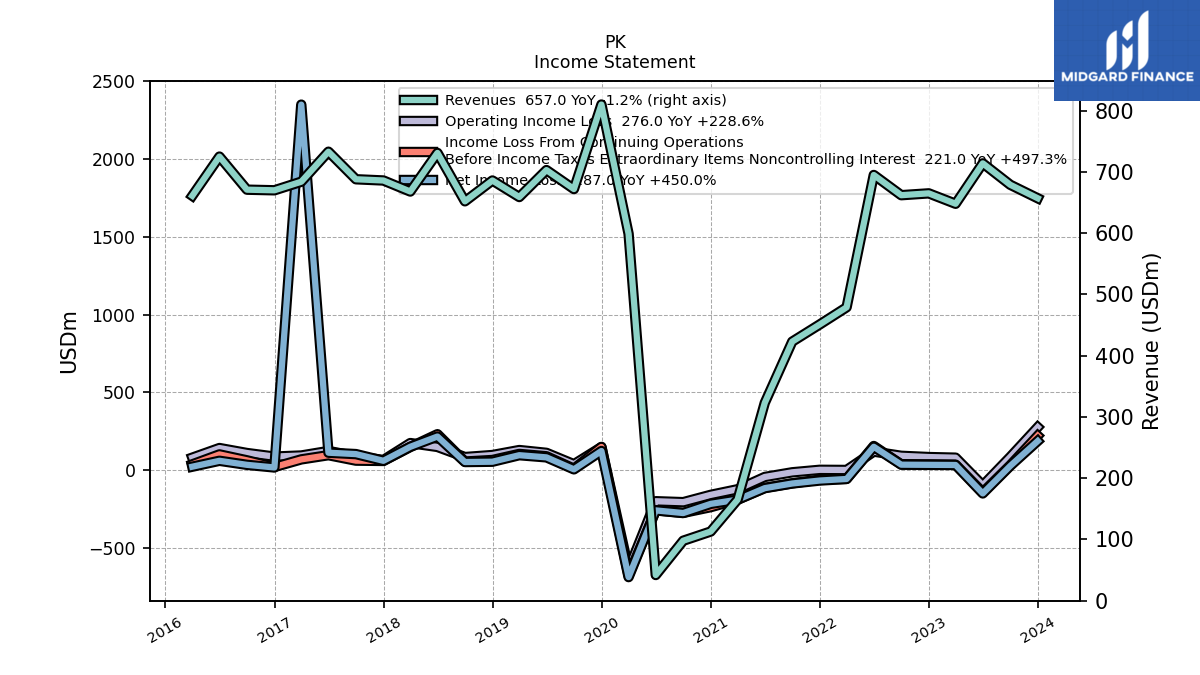
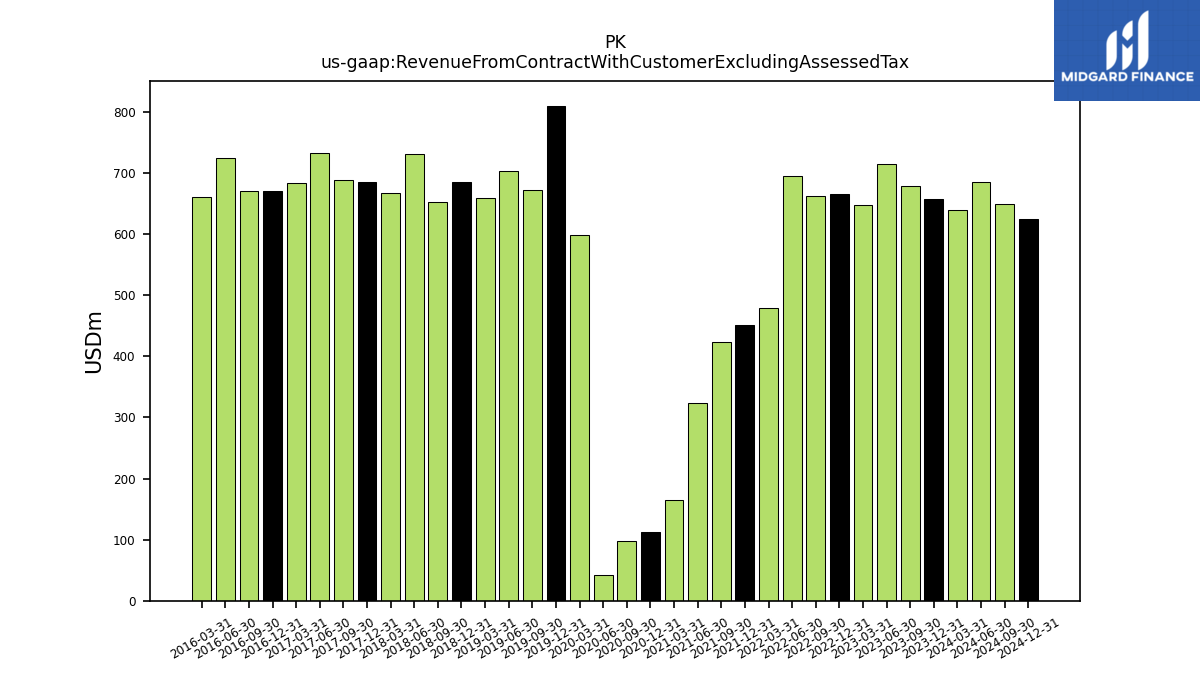
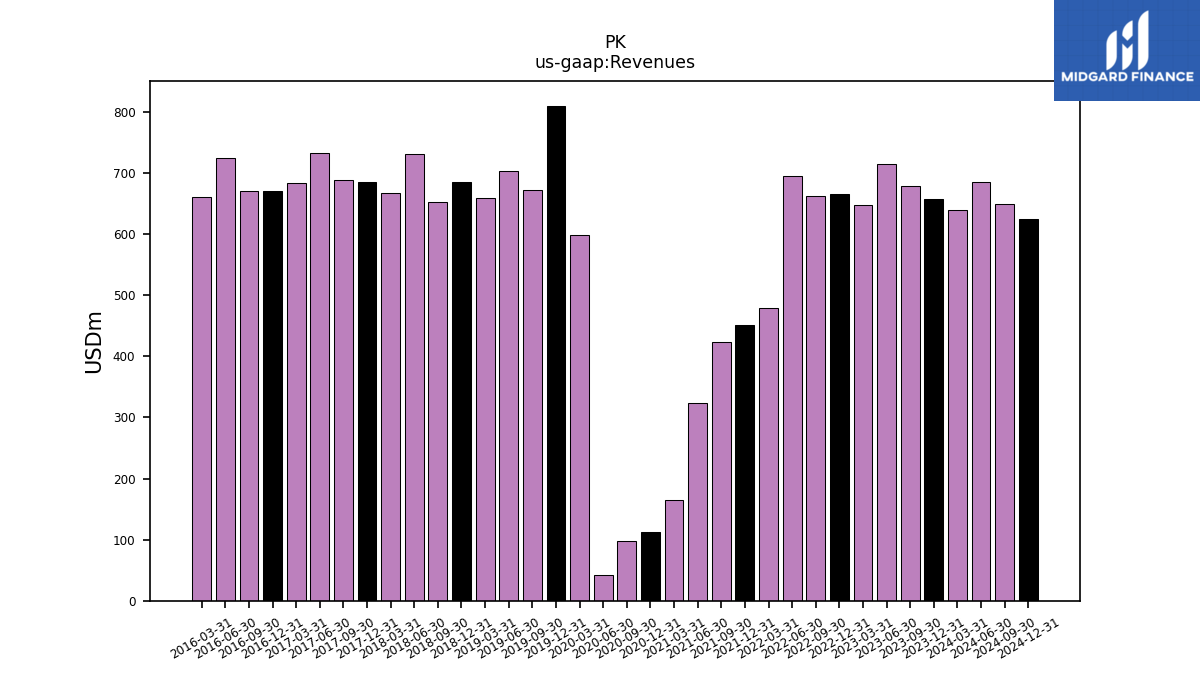
| Revenue From Contract With Customer Excluding Assessed Tax | 657.00 | 679.00 | 714.00 | 648.00 | 665.00 | 662.00 | 695.00 | 479.00 | 451.00 | 423.00 | 323.00 | 165.00 | 113.00 | 98.00 | 42.00 | 599.00 | 810.00 | 672.00 | 703.00 | 659.00 | 686.00 | 652.00 | 731.00 | 668.00 | 686.00 | 688.00 | 733.00 | 684.00 | 670.00 | 671.00 | 725.00 | 661.00 | |
| Revenues | 657.00 | 679.00 | 714.00 | 648.00 | 665.00 | 662.00 | 695.00 | 479.00 | 451.00 | 423.00 | 323.00 | 165.00 | 113.00 | 98.00 | 42.00 | 599.00 | 810.00 | 672.00 | 703.00 | 659.00 | 686.00 | 652.00 | 731.00 | 668.00 | 686.00 | 688.00 | 733.00 | 684.00 | 670.00 | 671.00 | 725.00 | 661.00 | |
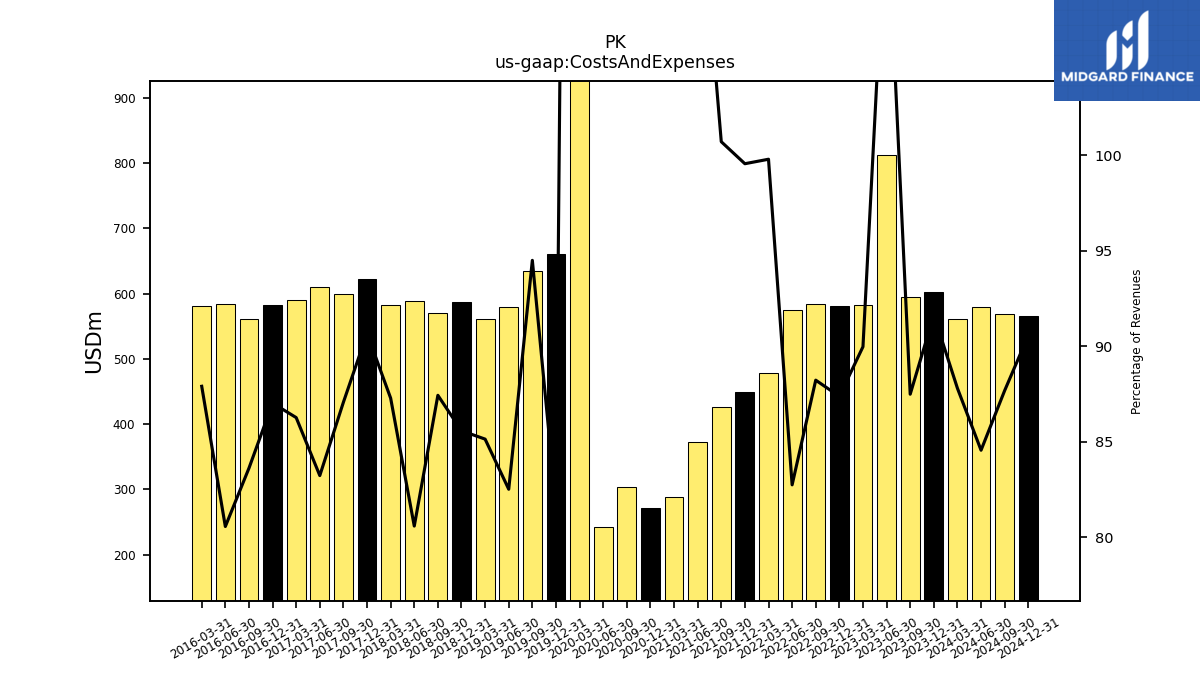
| Costs And Expenses | 602.00 | 594.00 | 812.00 | 583.00 | 581.00 | 584.00 | 575.00 | 478.00 | 449.00 | 426.00 | 373.00 | 288.00 | 272.00 | 303.00 | 243.00 | 1298.00 | 661.00 | 635.00 | 580.00 | 561.00 | 587.00 | 570.00 | 589.00 | 583.00 | 622.00 | 599.00 | 610.00 | 590.00 | 583.00 | 561.00 | 584.00 | 581.00 | |
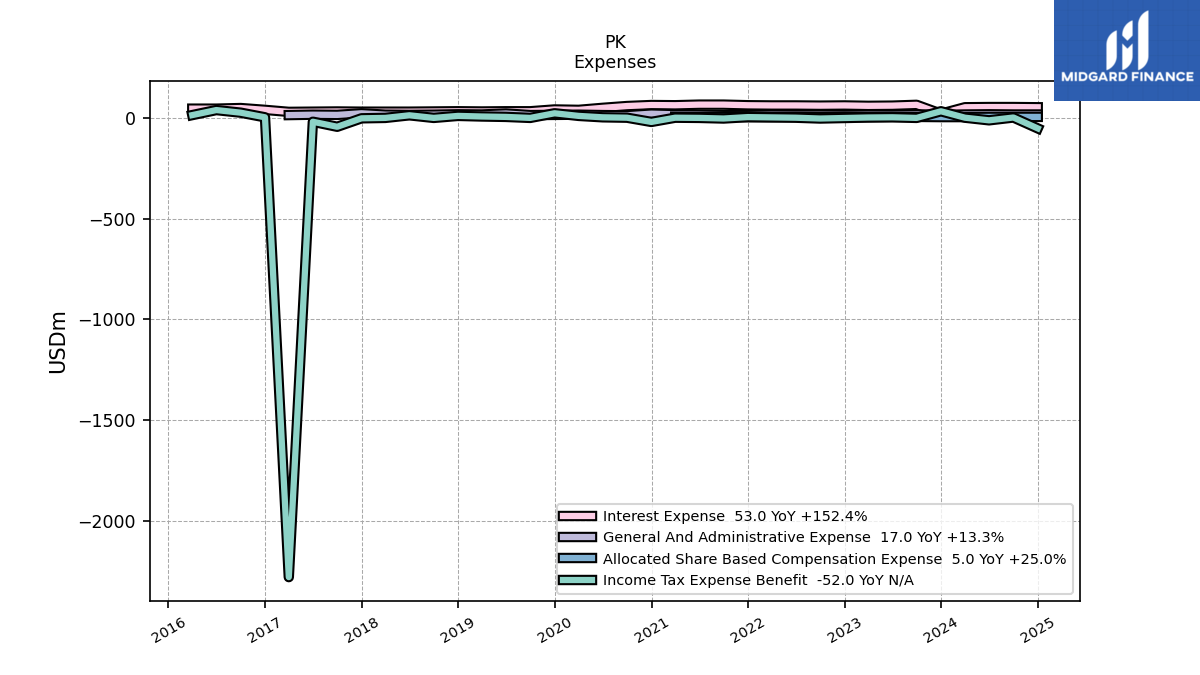
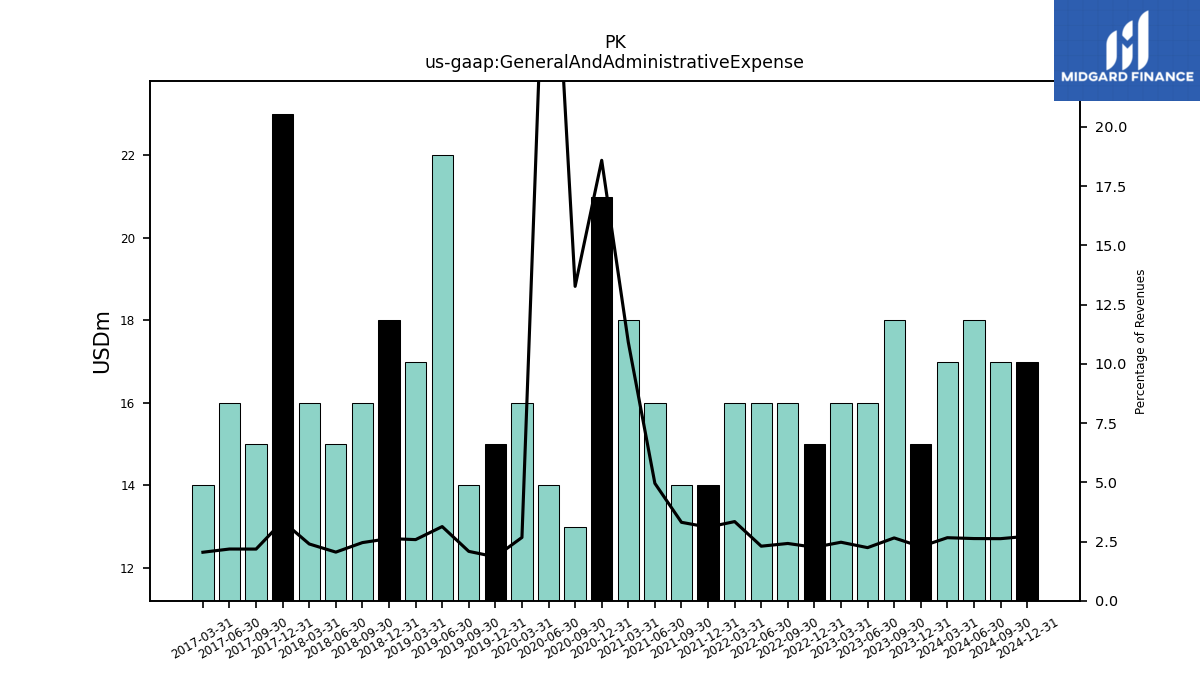
| General And Administrative Expense | 15.00 | 18.00 | 16.00 | 16.00 | 15.00 | 16.00 | 16.00 | 16.00 | 14.00 | 14.00 | 16.00 | 18.00 | 21.00 | 13.00 | 14.00 | 16.00 | 15.00 | 14.00 | 22.00 | 17.00 | 18.00 | 16.00 | 15.00 | 16.00 | 23.00 | 15.00 | 16.00 | 14.00 | NA | NA | NA | NA | |
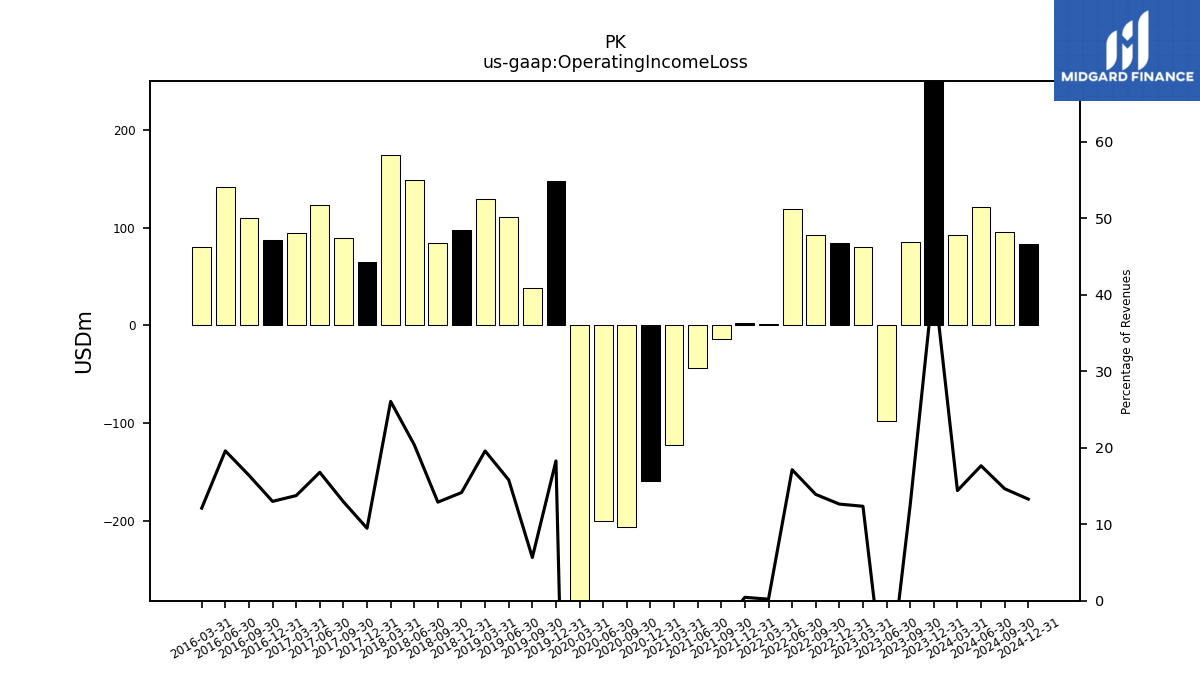
| Operating Income Loss | 276.00 | 85.00 | -98.00 | 80.00 | 84.00 | 92.00 | 119.00 | 1.00 | 2.00 | -14.00 | -44.00 | -123.00 | -159.00 | -206.00 | -200.00 | -637.00 | 148.00 | 38.00 | 111.00 | 129.00 | 97.00 | 84.00 | 149.00 | 174.00 | 65.00 | 89.00 | 123.00 | 94.00 | 87.00 | 110.00 | 142.00 | 80.00 | |
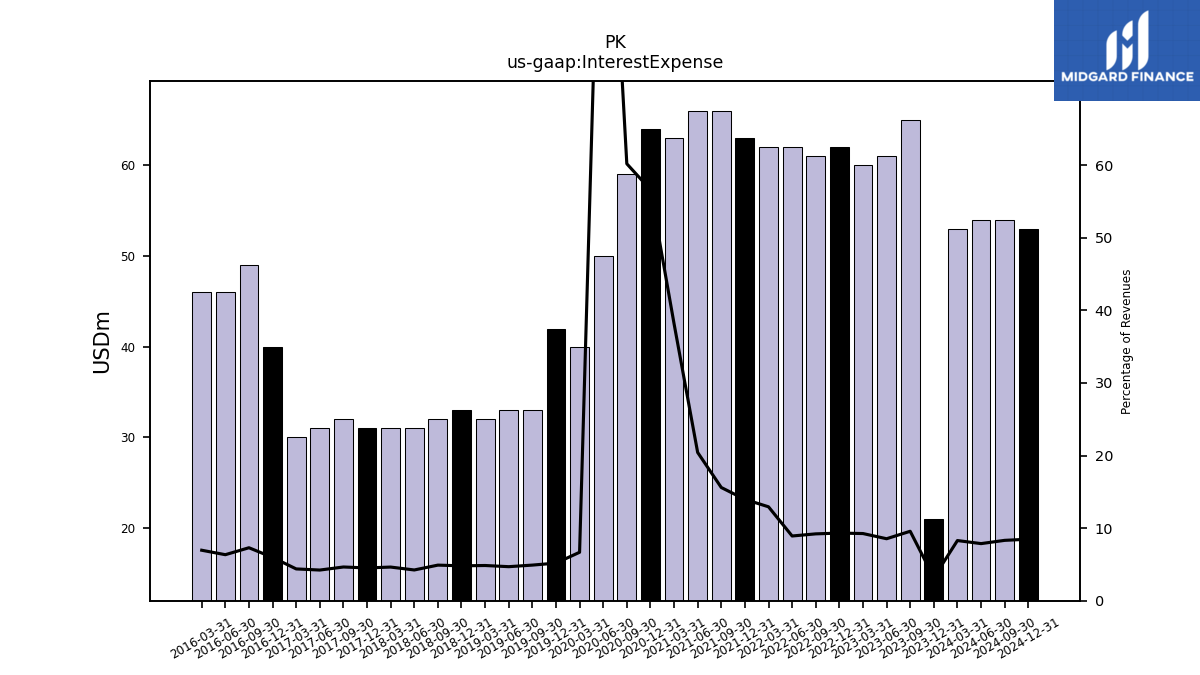
| Interest Expense | 21.00 | 65.00 | 61.00 | 60.00 | 62.00 | 61.00 | 62.00 | 62.00 | 63.00 | 66.00 | 66.00 | 63.00 | 64.00 | 59.00 | 50.00 | 40.00 | 42.00 | 33.00 | 33.00 | 32.00 | 33.00 | 32.00 | 31.00 | 31.00 | 31.00 | 32.00 | 31.00 | 30.00 | 40.00 | 49.00 | 46.00 | 46.00 | |
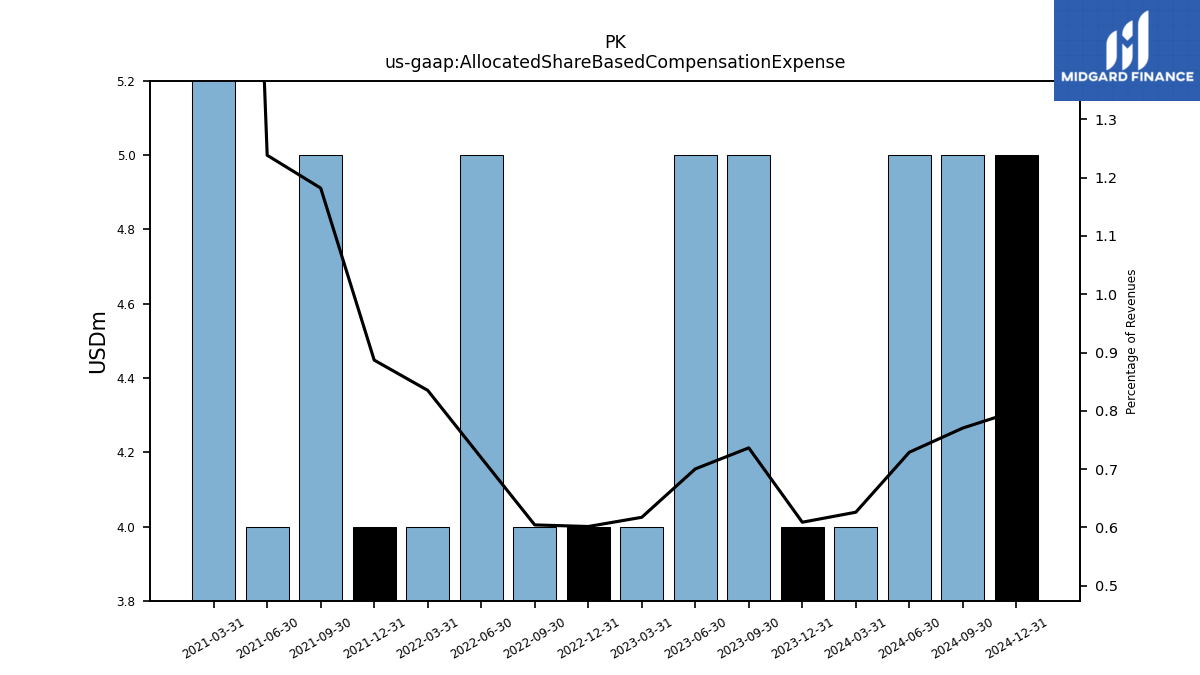
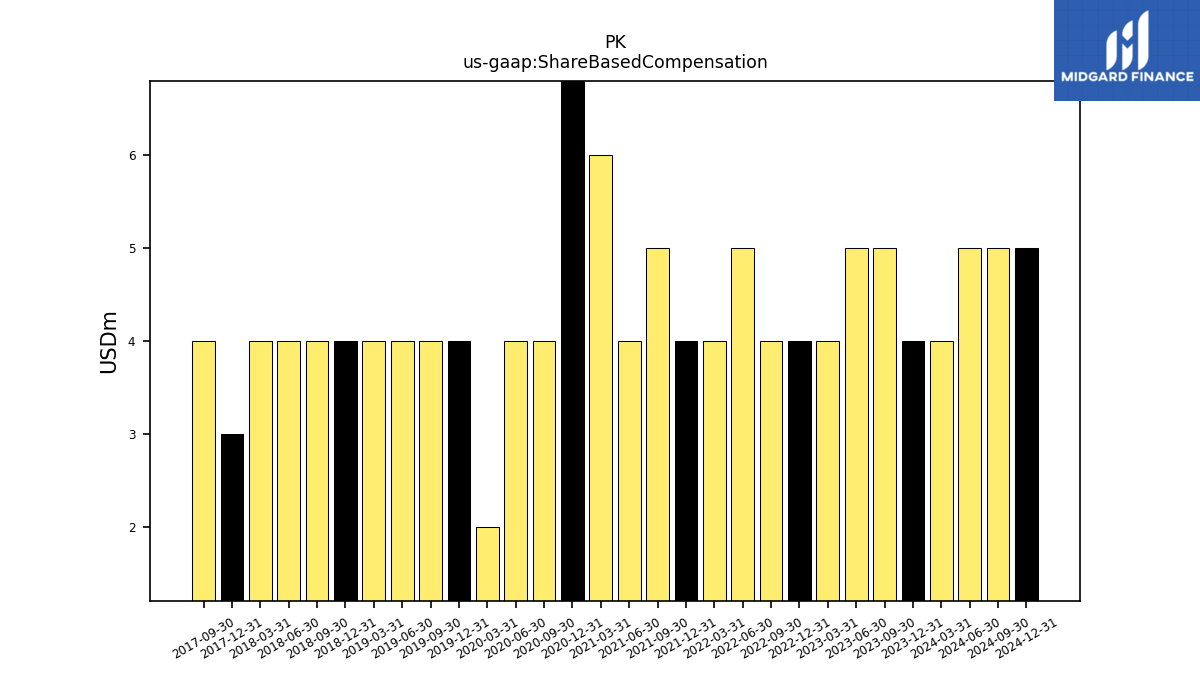
| Allocated Share Based Compensation Expense | 4.00 | 5.00 | 5.00 | 4.00 | 4.00 | 4.00 | 5.00 | 4.00 | 4.00 | 5.00 | 4.00 | 6.00 | NA | NA | NA | NA | NA | NA | NA | NA | NA | NA | NA | NA | NA | NA | NA | NA | NA | NA | NA | NA | |
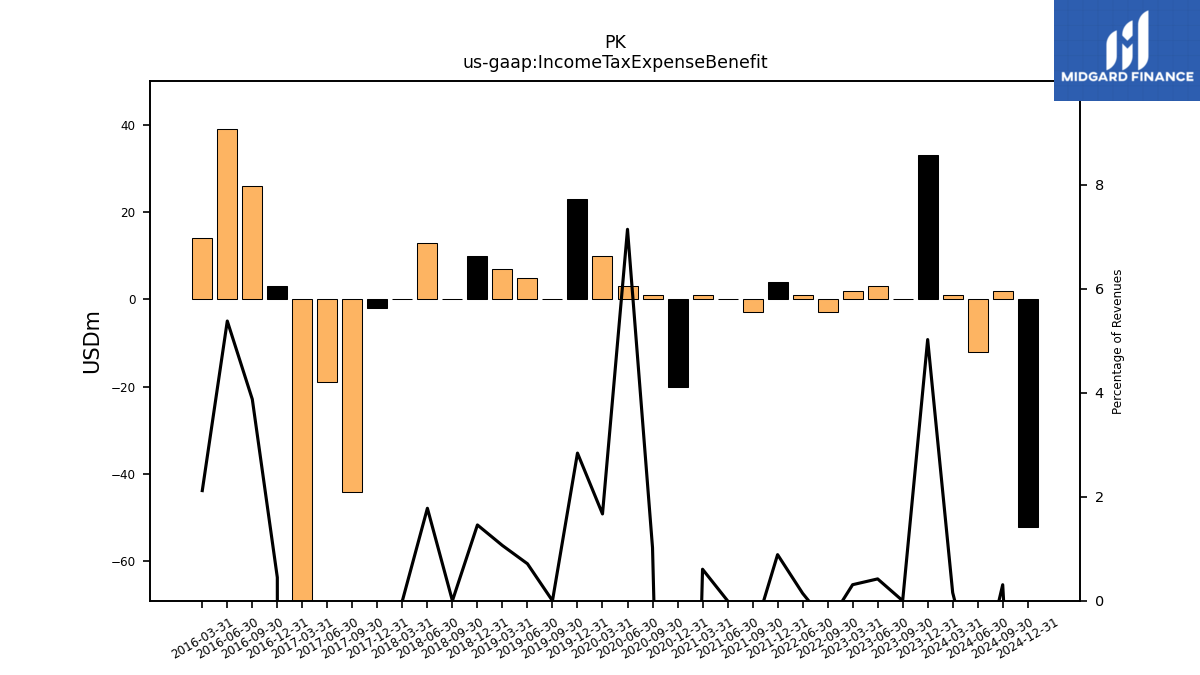
| Income Tax Expense Benefit | 33.00 | 0.00 | 3.00 | 2.00 | NA | -3.00 | 1.00 | NA | 4.00 | -3.00 | 0.00 | 1.00 | -20.00 | 1.00 | 3.00 | 10.00 | 23.00 | 0.00 | 5.00 | 7.00 | 10.00 | 0.00 | 13.00 | 0.00 | -2.00 | -44.00 | -19.00 | -2281.00 | 3.00 | 26.00 | 39.00 | 14.00 | |
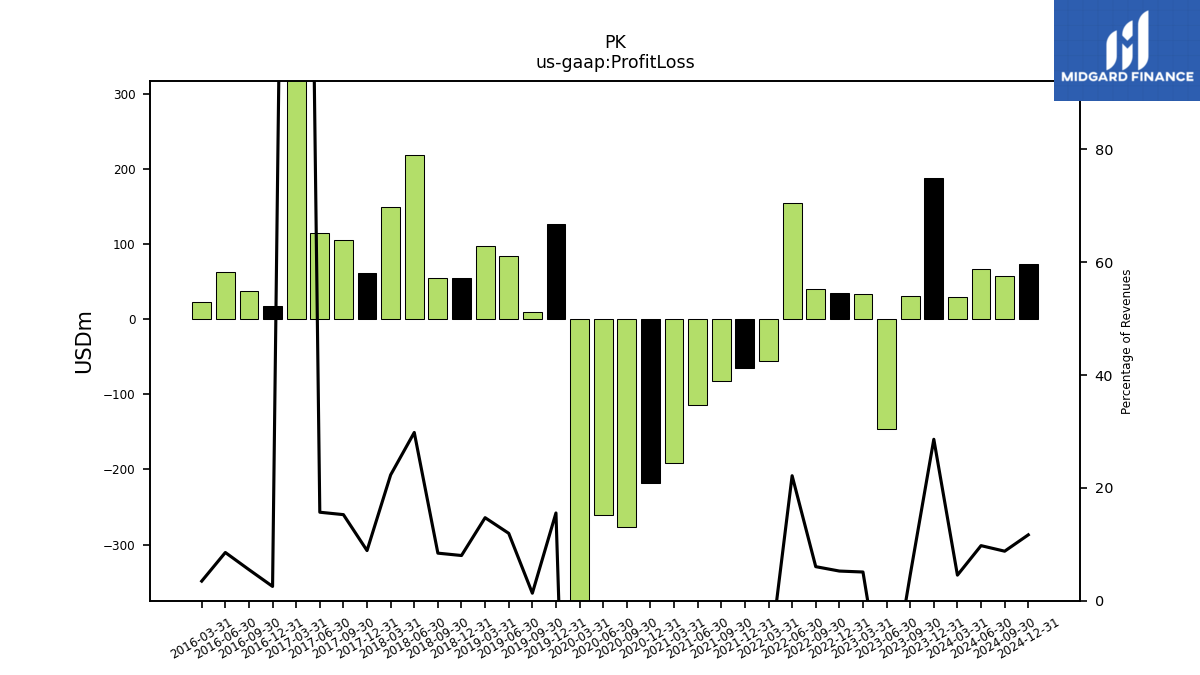
| Profit Loss | 188.00 | 31.00 | -146.00 | 33.00 | 35.00 | 40.00 | 154.00 | -56.00 | -65.00 | -82.00 | -114.00 | -191.00 | -218.00 | -276.00 | -261.00 | -689.00 | 126.00 | 9.00 | 84.00 | 97.00 | 55.00 | 55.00 | 218.00 | 149.00 | 61.00 | 105.00 | 115.00 | 2350.00 | 17.00 | 37.00 | 62.00 | 23.00 | |
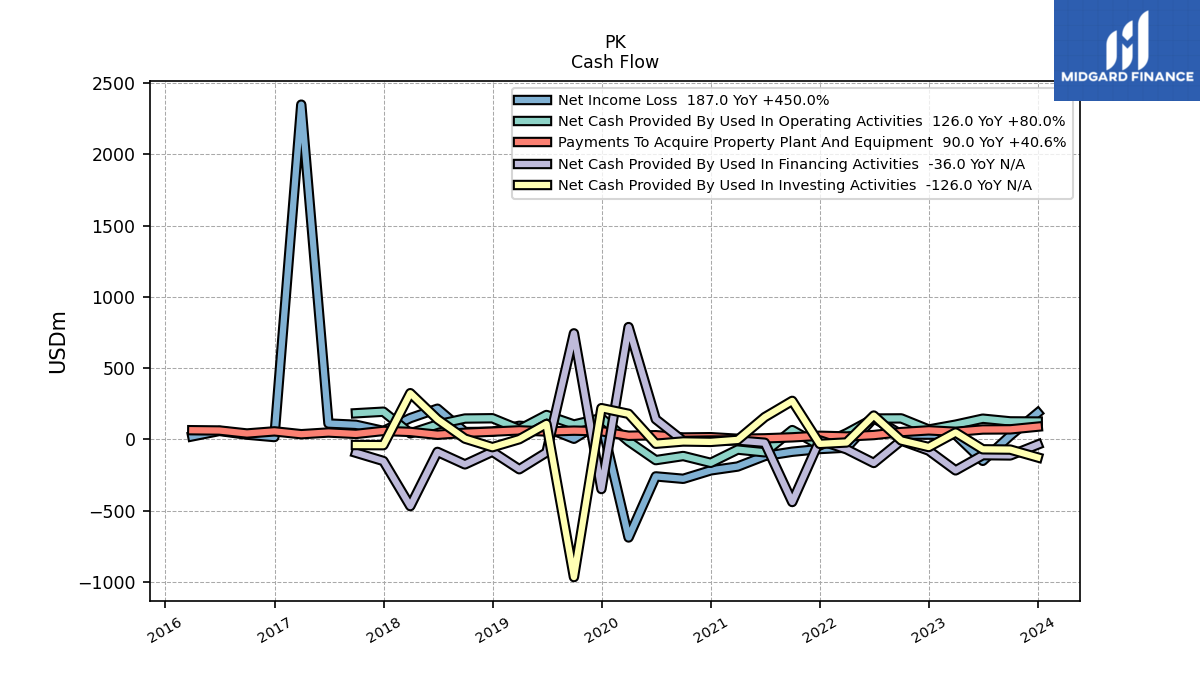
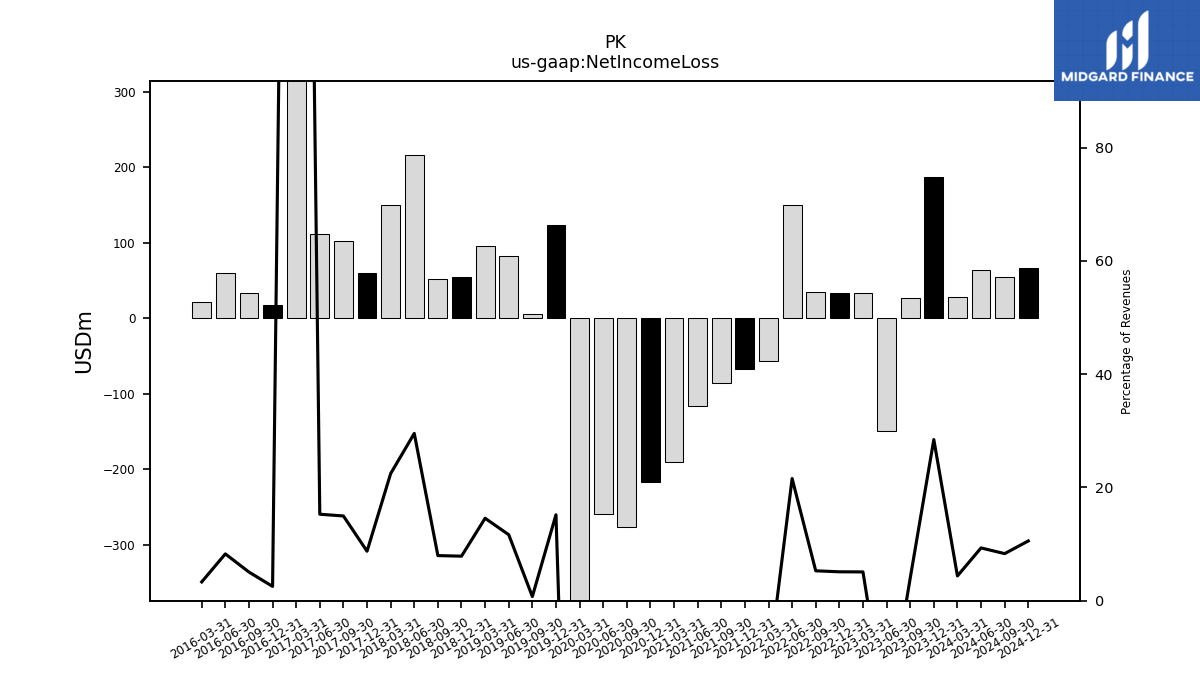
| Net Income Loss | 187.00 | 27.00 | -150.00 | 33.00 | 34.00 | 35.00 | 150.00 | -57.00 | -67.00 | -86.00 | -116.00 | -190.00 | -217.00 | -276.00 | -259.00 | -688.00 | 123.00 | 5.00 | 82.00 | 96.00 | 54.00 | 52.00 | 216.00 | 150.00 | 60.00 | 103.00 | 112.00 | 2350.00 | 17.00 | 34.00 | 60.00 | 22.00 | |
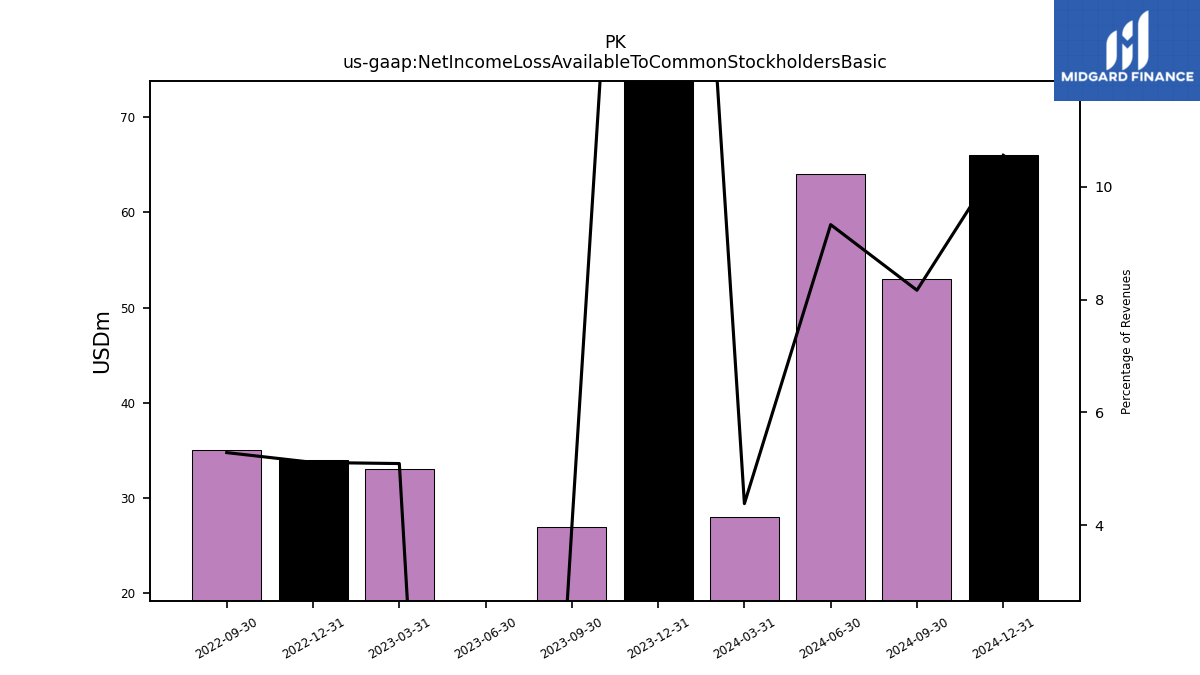
| Net Income Loss Available To Common Stockholders Basic | 185.00 | 27.00 | NA | NA | 34.00 | 35.00 | NA | NA | NA | NA | NA | NA | NA | NA | NA | NA | NA | NA | NA | NA | NA | NA | NA | NA | NA | NA | NA | NA | NA | NA | NA | NA |
| 2023-12-31 | 2023-09-30 | 2023-06-30 | 2023-03-31 | 2022-12-31 | 2022-09-30 | 2022-06-30 | 2022-03-31 | 2021-12-31 | 2021-09-30 | 2021-06-30 | 2021-03-31 | 2020-12-31 | 2020-09-30 | 2020-06-30 | 2020-03-31 | 2019-12-31 | 2019-09-30 | 2019-06-30 | 2019-03-31 | 2018-12-31 | 2018-09-30 | 2018-06-30 | 2018-03-31 | 2017-12-31 | 2017-09-30 | 2017-06-30 | 2017-03-31 | 2016-12-31 | 2016-09-30 | 2016-06-30 | 2016-03-31 | ||
|---|---|---|---|---|---|---|---|---|---|---|---|---|---|---|---|---|---|---|---|---|---|---|---|---|---|---|---|---|---|---|---|---|---|
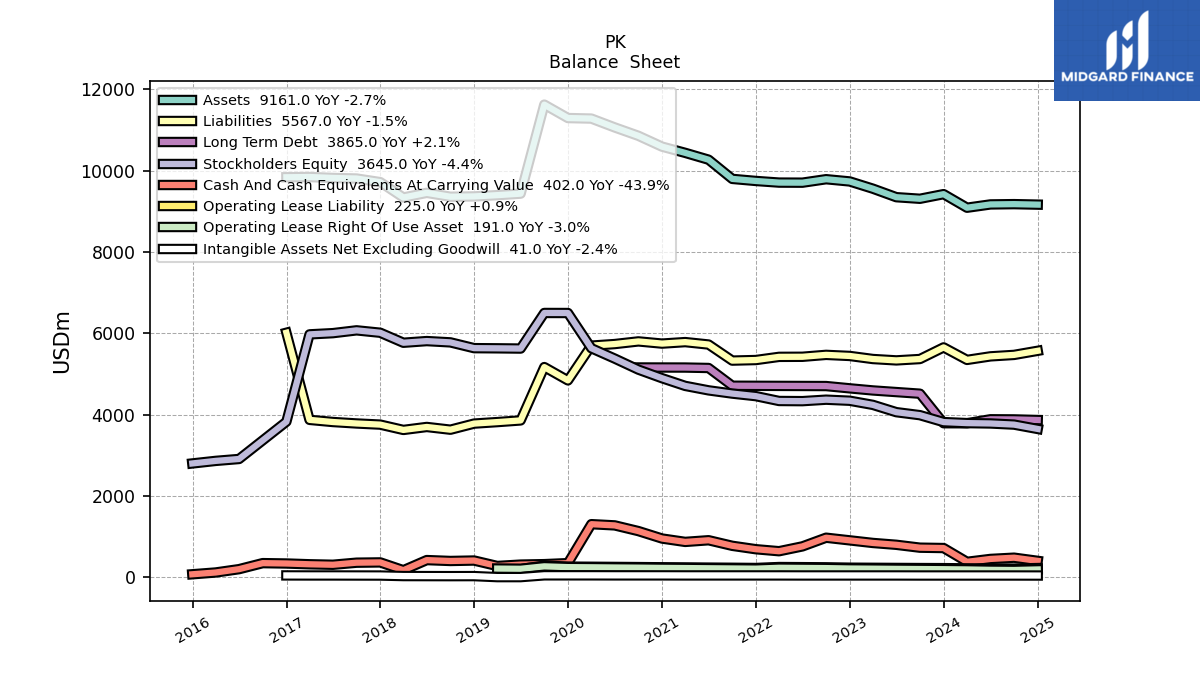
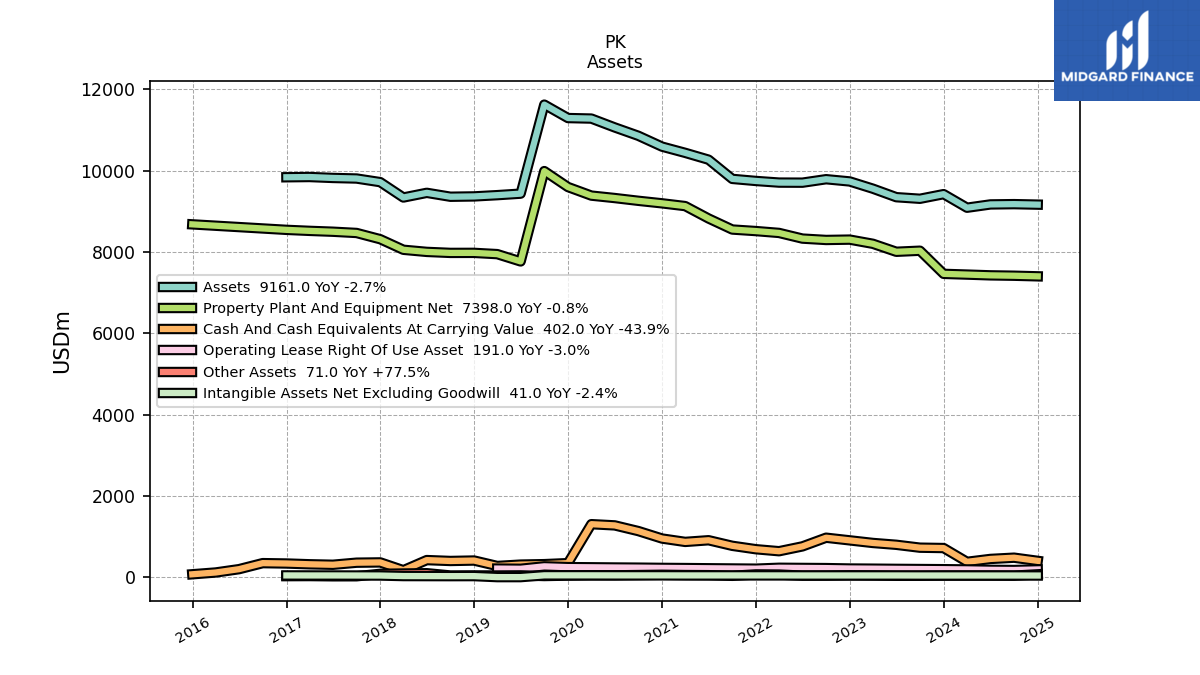
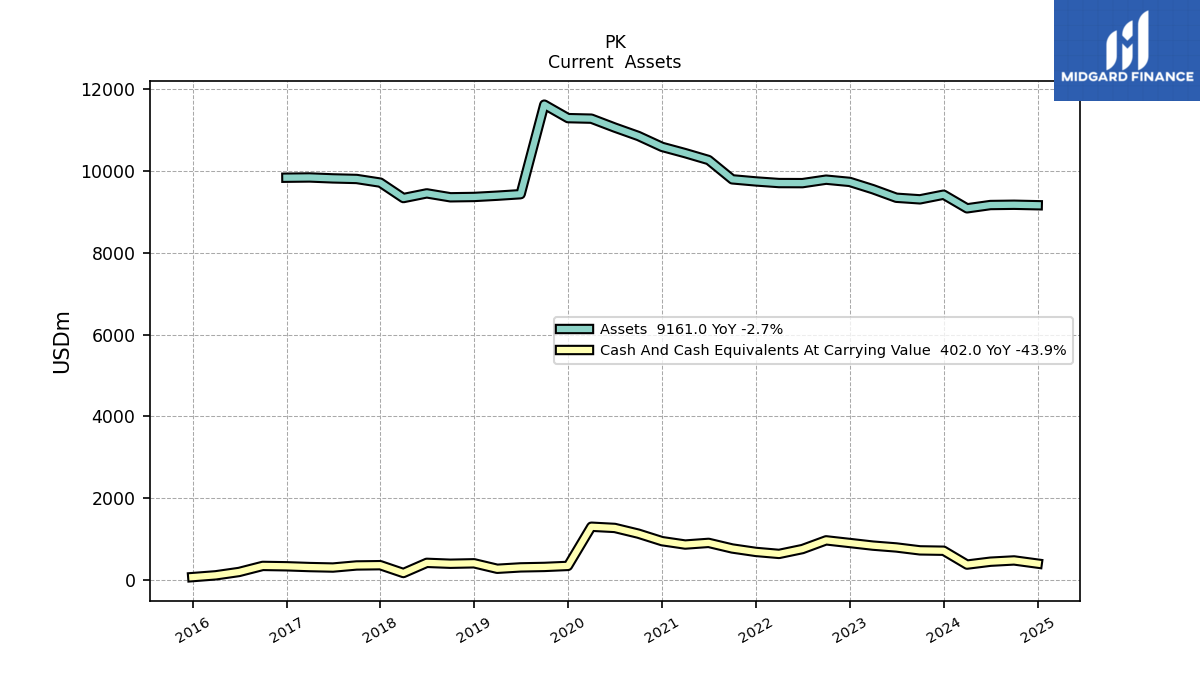
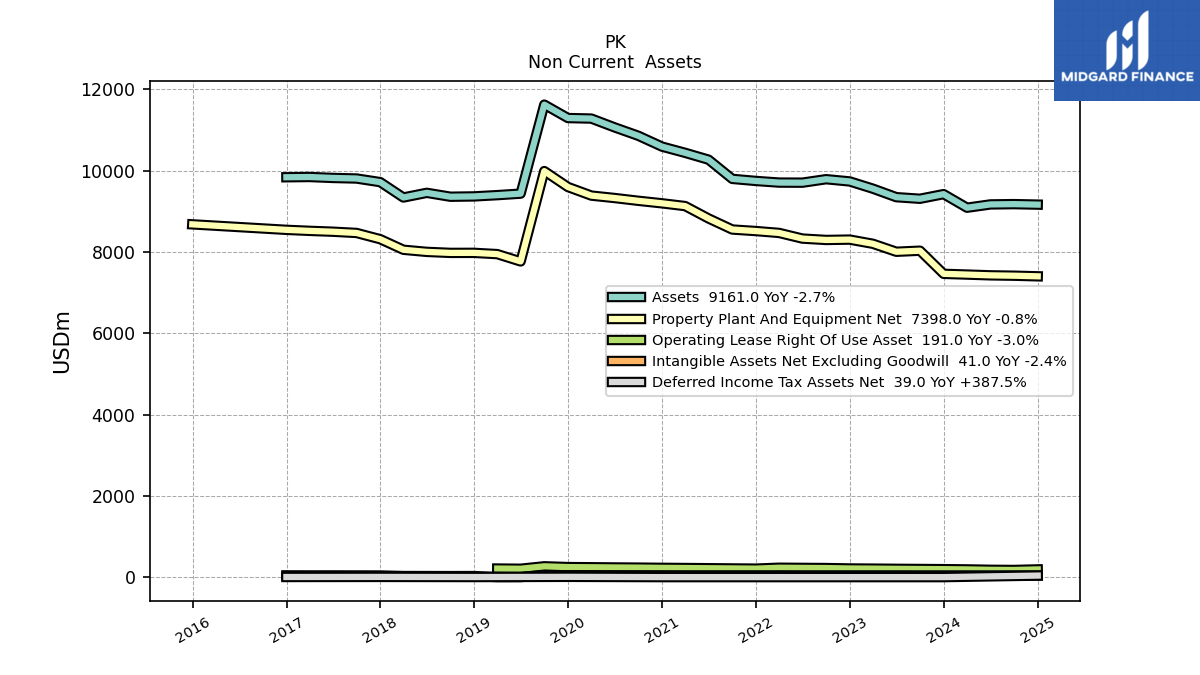
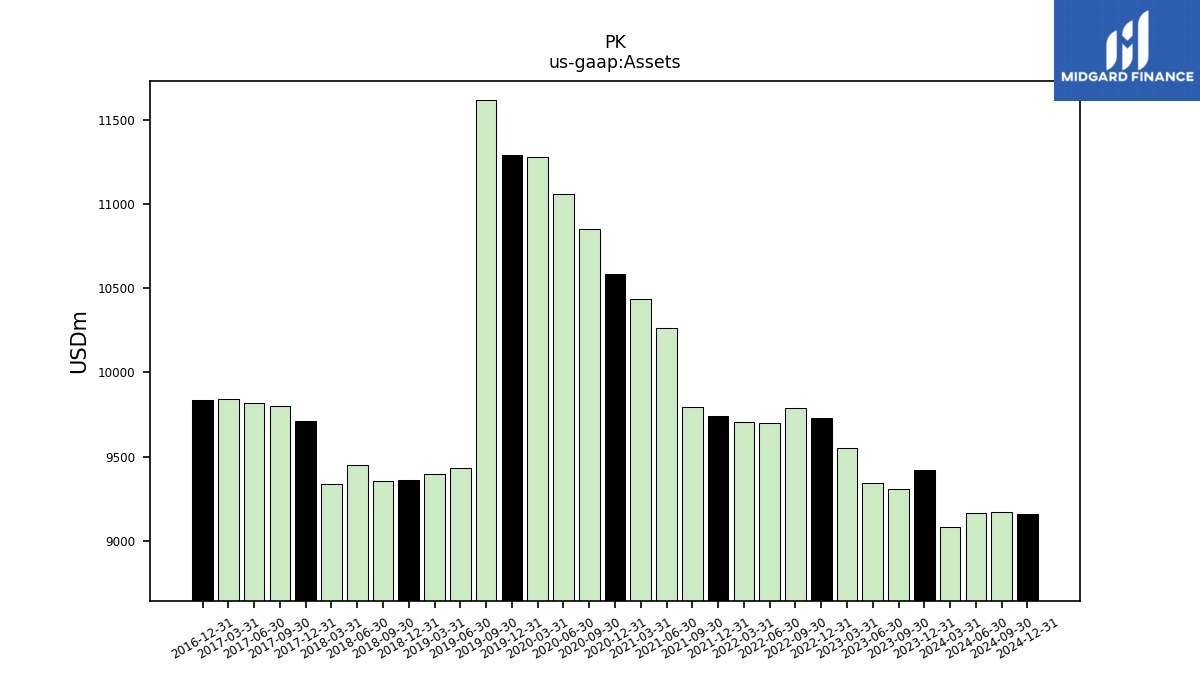
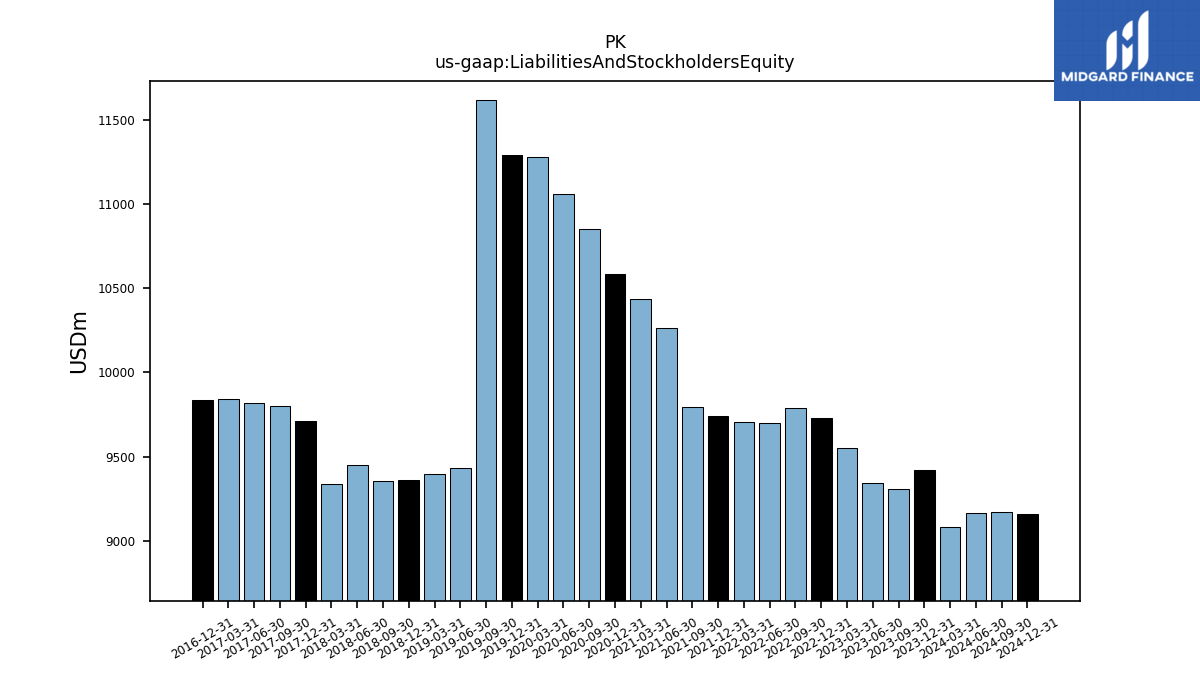
| Assets | 9419.00 | 9305.00 | 9344.00 | 9553.00 | 9731.00 | 9786.00 | 9701.00 | 9703.00 | 9743.00 | 9794.00 | 10266.00 | 10434.00 | 10587.00 | 10853.00 | 11059.00 | 11277.00 | 11290.00 | 11620.00 | 9431.00 | 9394.00 | 9363.00 | 9355.00 | 9451.00 | 9336.00 | 9714.00 | 9803.00 | 9817.00 | 9840.00 | 9834.00 | NA | NA | NA | |
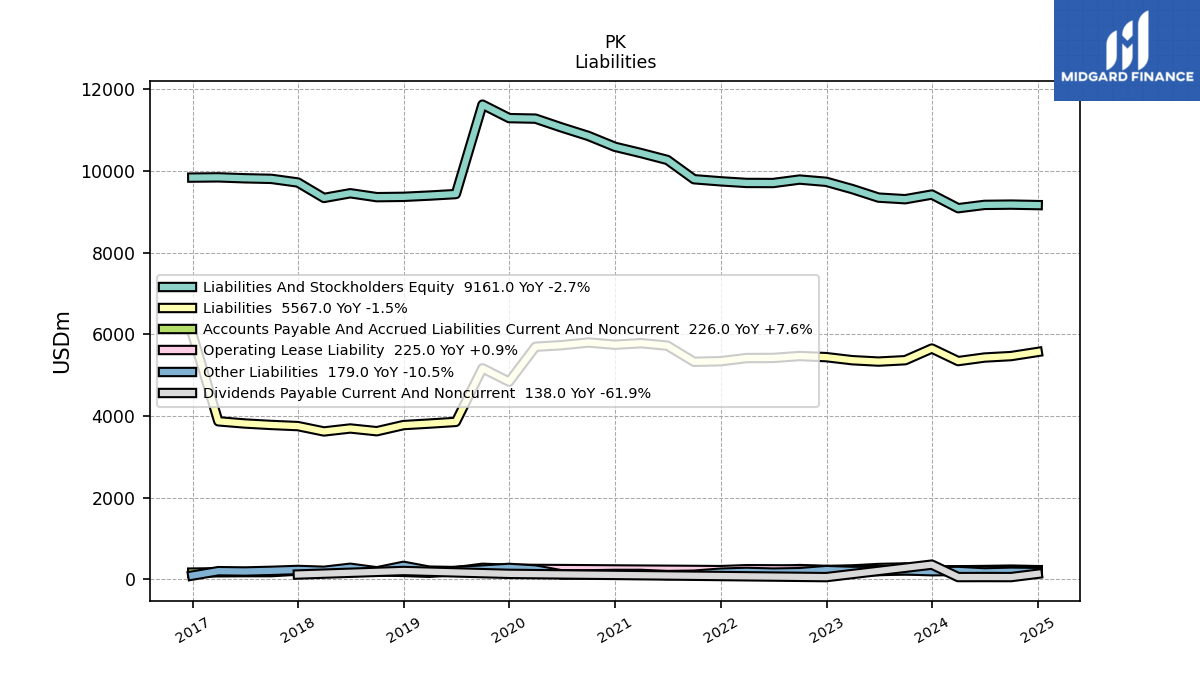
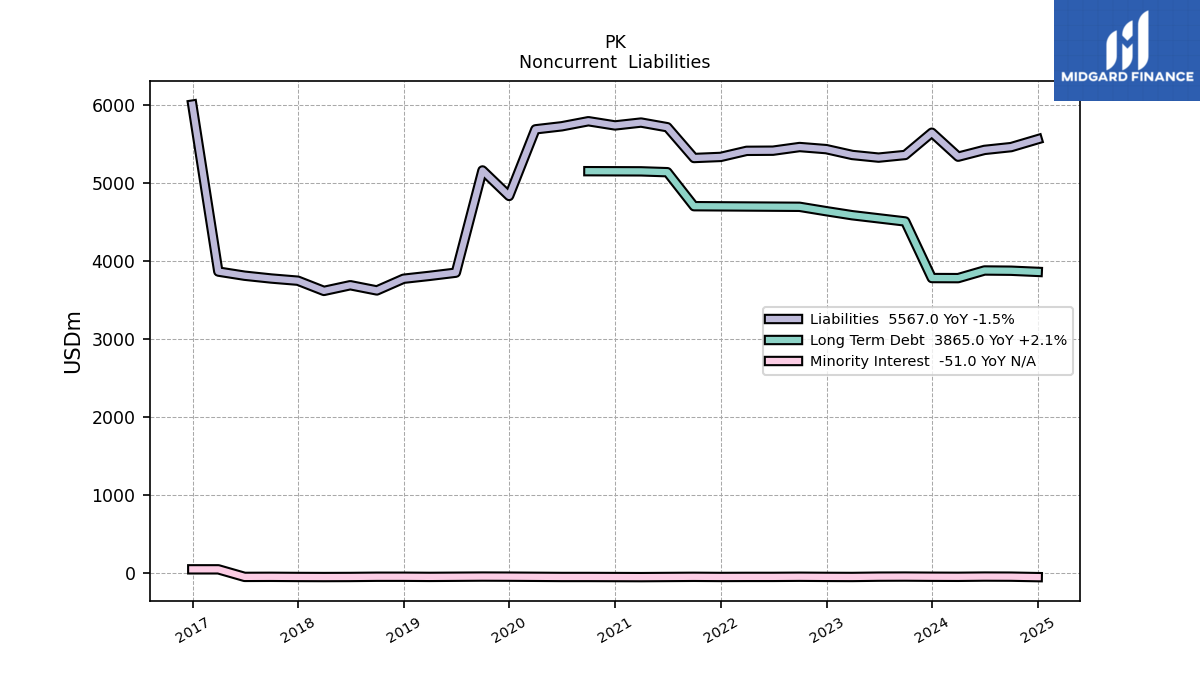
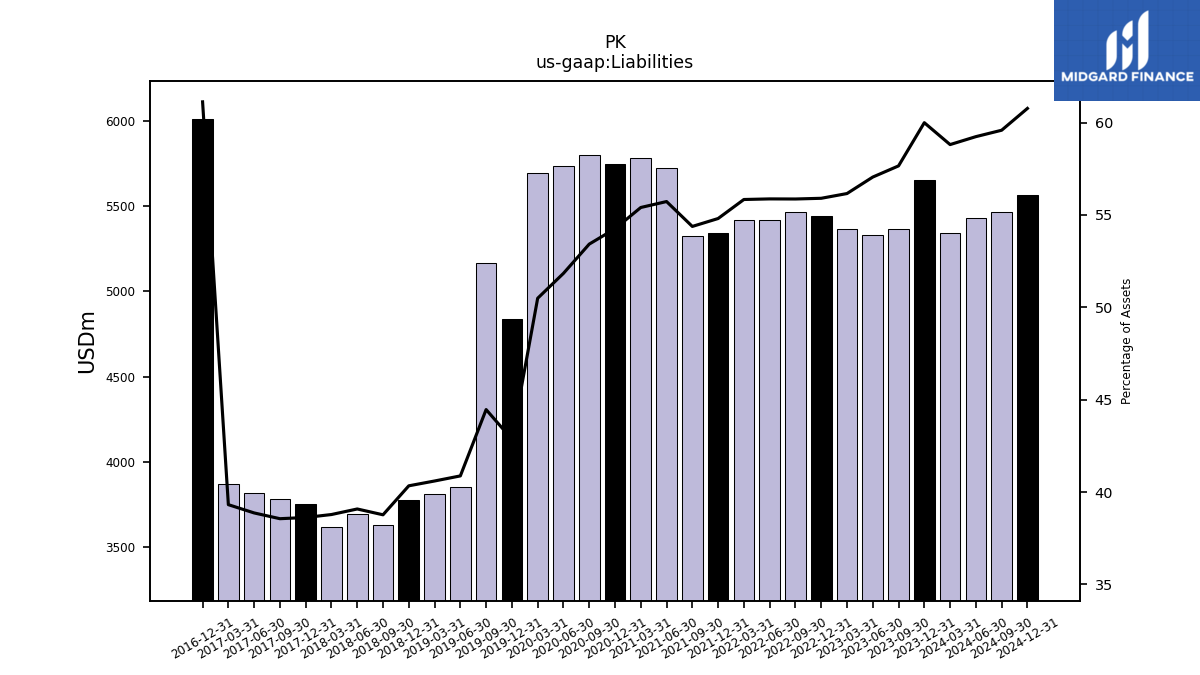
| Liabilities | 5651.00 | 5365.00 | 5331.00 | 5365.00 | 5440.00 | 5467.00 | 5420.00 | 5418.00 | 5340.00 | 5326.00 | 5721.00 | 5781.00 | 5744.00 | 5798.00 | 5733.00 | 5694.00 | 4839.00 | 5167.00 | 3855.00 | 3814.00 | 3777.00 | 3627.00 | 3694.00 | 3621.00 | 3752.00 | 3780.00 | 3816.00 | 3869.00 | 6011.00 | NA | NA | NA | |
| Liabilities And Stockholders Equity | 9419.00 | 9305.00 | 9344.00 | 9553.00 | 9731.00 | 9786.00 | 9701.00 | 9703.00 | 9743.00 | 9794.00 | 10266.00 | 10434.00 | 10587.00 | 10853.00 | 11059.00 | 11277.00 | 11290.00 | 11620.00 | 9431.00 | 9394.00 | 9363.00 | 9355.00 | 9451.00 | 9336.00 | 9714.00 | 9803.00 | 9817.00 | 9840.00 | 9834.00 | NA | NA | NA | |
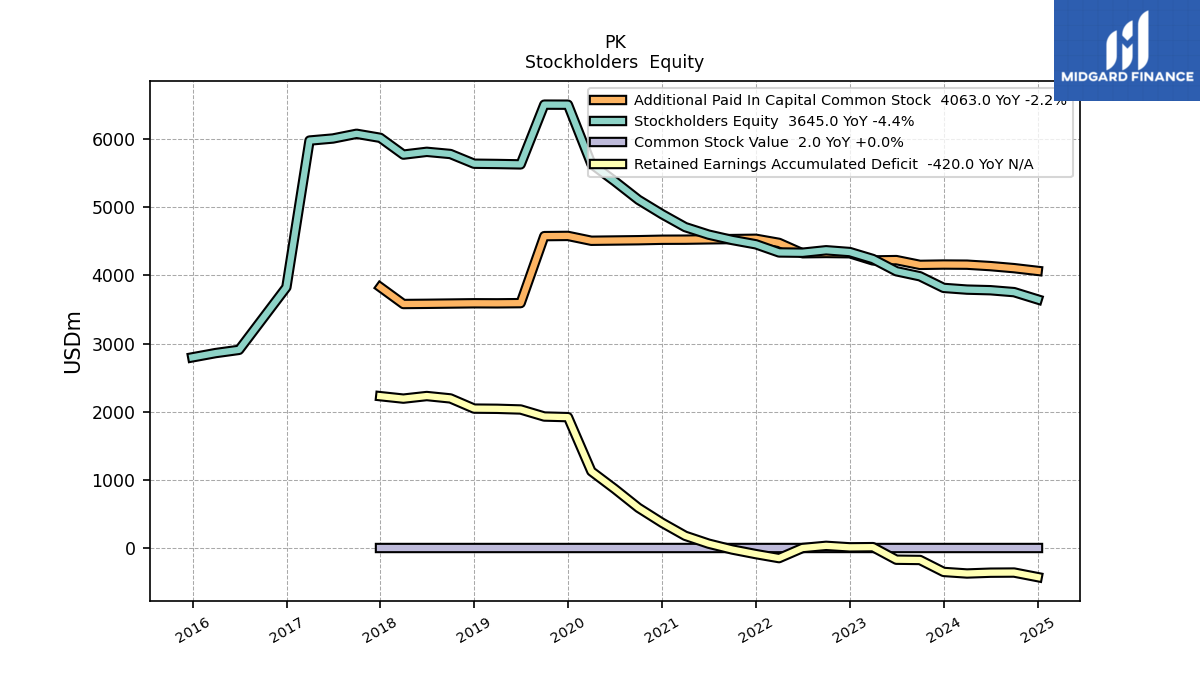
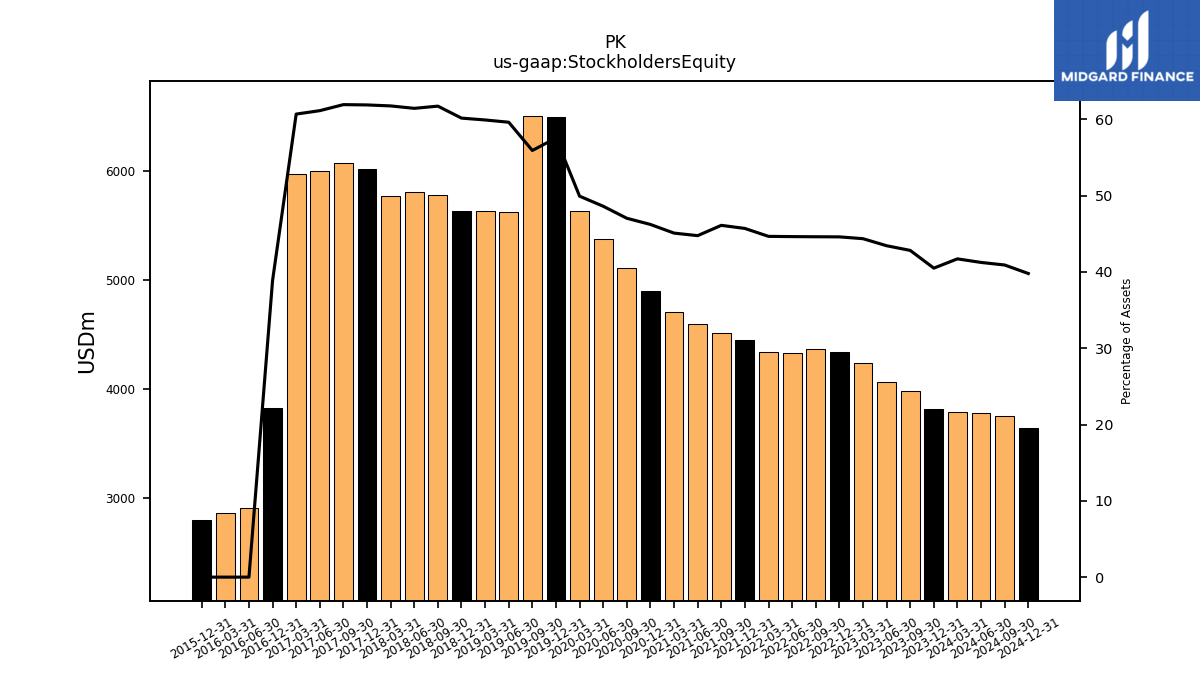
| Stockholders Equity | 3814.00 | 3984.00 | 4058.00 | 4237.00 | 4339.00 | 4365.00 | 4329.00 | 4333.00 | 4452.00 | 4515.00 | 4594.00 | 4704.00 | 4893.00 | 5104.00 | 5375.00 | 5630.00 | 6496.00 | 6497.00 | 5622.00 | 5628.00 | 5632.00 | 5774.00 | 5806.00 | 5765.00 | 6011.00 | 6070.00 | 6001.00 | 5971.00 | 3823.00 | NA | 2907.00 | 2860.00 |
| 2023-12-31 | 2023-09-30 | 2023-06-30 | 2023-03-31 | 2022-12-31 | 2022-09-30 | 2022-06-30 | 2022-03-31 | 2021-12-31 | 2021-09-30 | 2021-06-30 | 2021-03-31 | 2020-12-31 | 2020-09-30 | 2020-06-30 | 2020-03-31 | 2019-12-31 | 2019-09-30 | 2019-06-30 | 2019-03-31 | 2018-12-31 | 2018-09-30 | 2018-06-30 | 2018-03-31 | 2017-12-31 | 2017-09-30 | 2017-06-30 | 2017-03-31 | 2016-12-31 | 2016-09-30 | 2016-06-30 | 2016-03-31 | ||
|---|---|---|---|---|---|---|---|---|---|---|---|---|---|---|---|---|---|---|---|---|---|---|---|---|---|---|---|---|---|---|---|---|---|
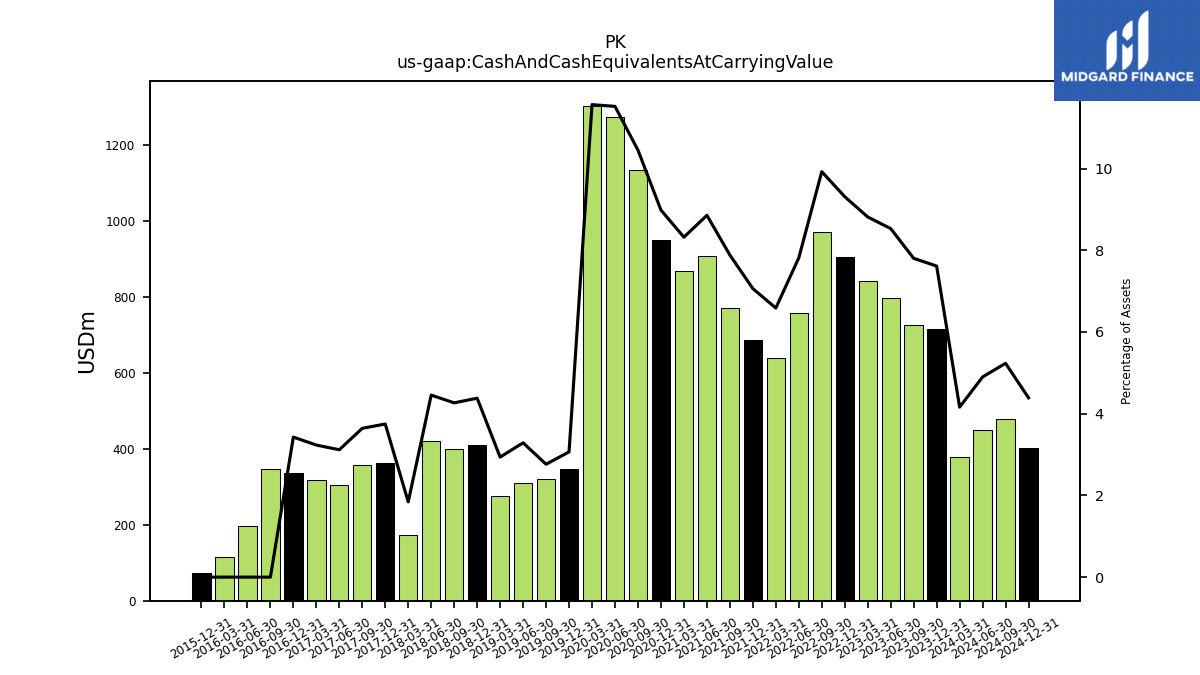
| Cash And Cash Equivalents At Carrying Value | 717.00 | 726.00 | 797.00 | 842.00 | 906.00 | 971.00 | 758.00 | 639.00 | 688.00 | 772.00 | 909.00 | 868.00 | 951.00 | 1134.00 | 1274.00 | 1304.00 | 346.00 | 321.00 | 310.00 | 276.00 | 410.00 | 399.00 | 421.00 | 172.00 | 364.00 | 357.00 | 306.00 | 318.00 | 337.00 | 346.00 | 198.00 | 116.00 | |
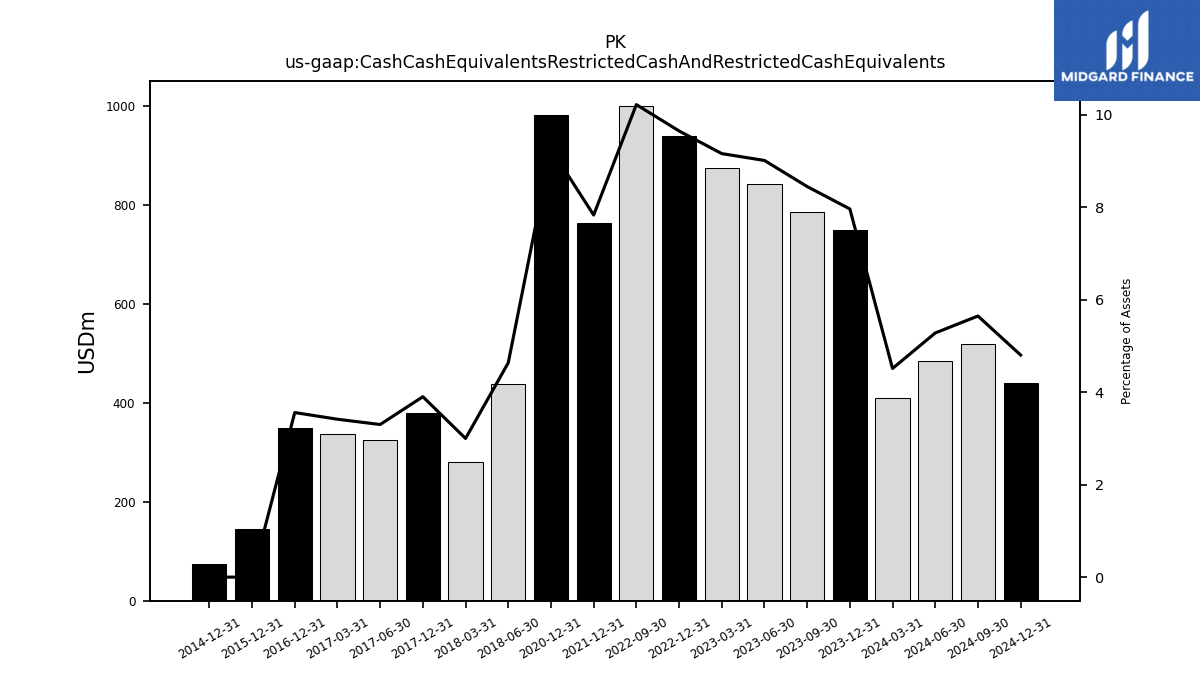
| Cash Cash Equivalents Restricted Cash And Restricted Cash Equivalents | 750.00 | 786.00 | NA | NA | 939.00 | 1000.00 | NA | NA | 763.00 | NA | NA | NA | 981.00 | NA | NA | NA | NA | NA | NA | NA | NA | NA | 438.00 | 280.00 | 379.00 | NA | 324.00 | 336.00 | 350.00 | NA | NA | NA | |
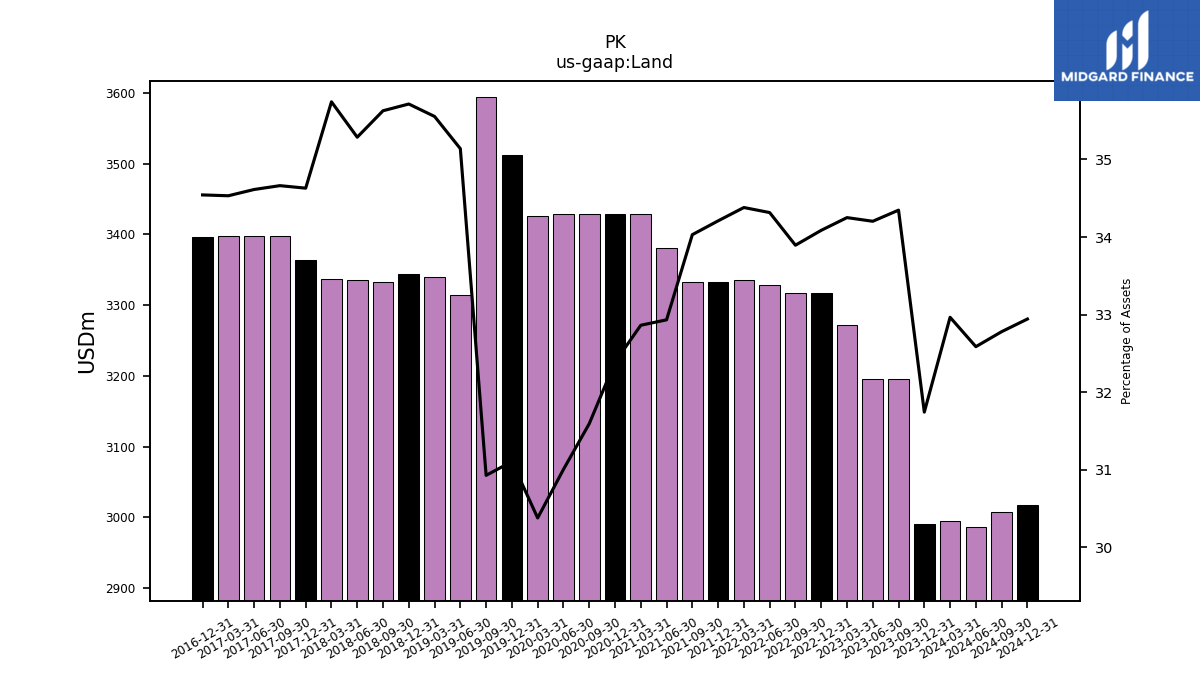
| Land | 2990.00 | 3196.00 | 3196.00 | 3272.00 | 3317.00 | 3317.00 | 3329.00 | 3336.00 | 3333.00 | 3333.00 | 3381.00 | 3429.00 | 3429.00 | 3429.00 | 3429.00 | 3426.00 | 3512.00 | 3594.00 | 3314.00 | 3340.00 | 3344.00 | 3333.00 | 3335.00 | 3337.00 | 3364.00 | 3398.00 | 3398.00 | 3398.00 | 3397.00 | NA | NA | NA |
| 2023-12-31 | 2023-09-30 | 2023-06-30 | 2023-03-31 | 2022-12-31 | 2022-09-30 | 2022-06-30 | 2022-03-31 | 2021-12-31 | 2021-09-30 | 2021-06-30 | 2021-03-31 | 2020-12-31 | 2020-09-30 | 2020-06-30 | 2020-03-31 | 2019-12-31 | 2019-09-30 | 2019-06-30 | 2019-03-31 | 2018-12-31 | 2018-09-30 | 2018-06-30 | 2018-03-31 | 2017-12-31 | 2017-09-30 | 2017-06-30 | 2017-03-31 | 2016-12-31 | 2016-09-30 | 2016-06-30 | 2016-03-31 | ||
|---|---|---|---|---|---|---|---|---|---|---|---|---|---|---|---|---|---|---|---|---|---|---|---|---|---|---|---|---|---|---|---|---|---|
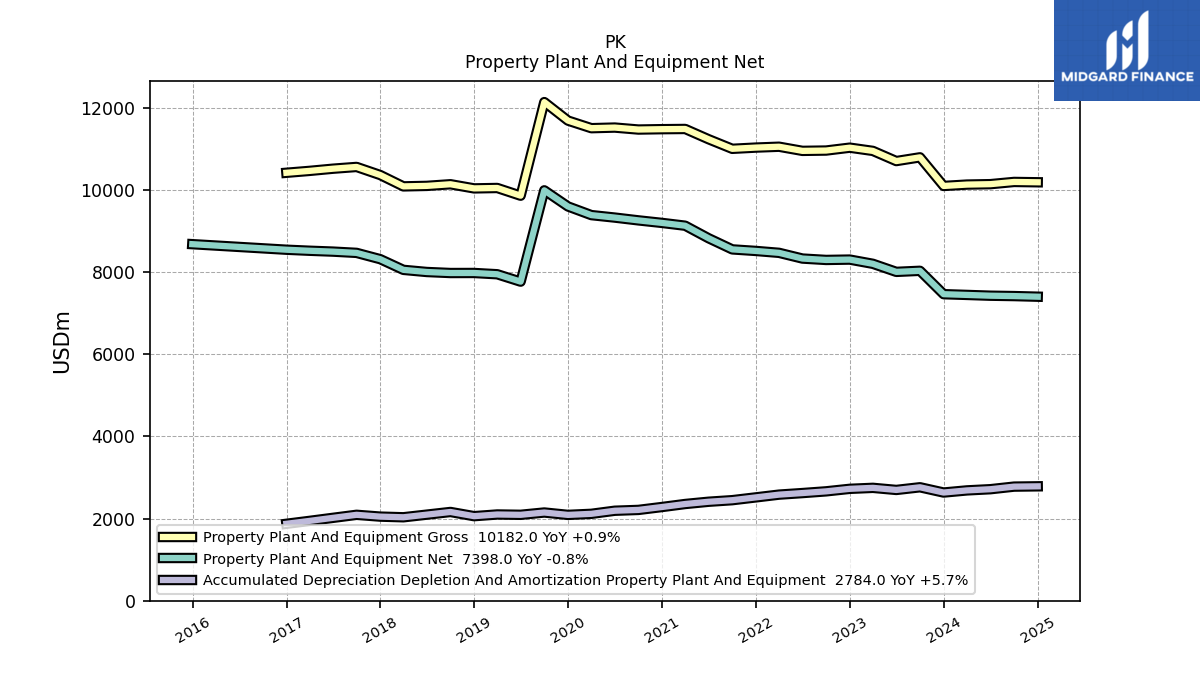
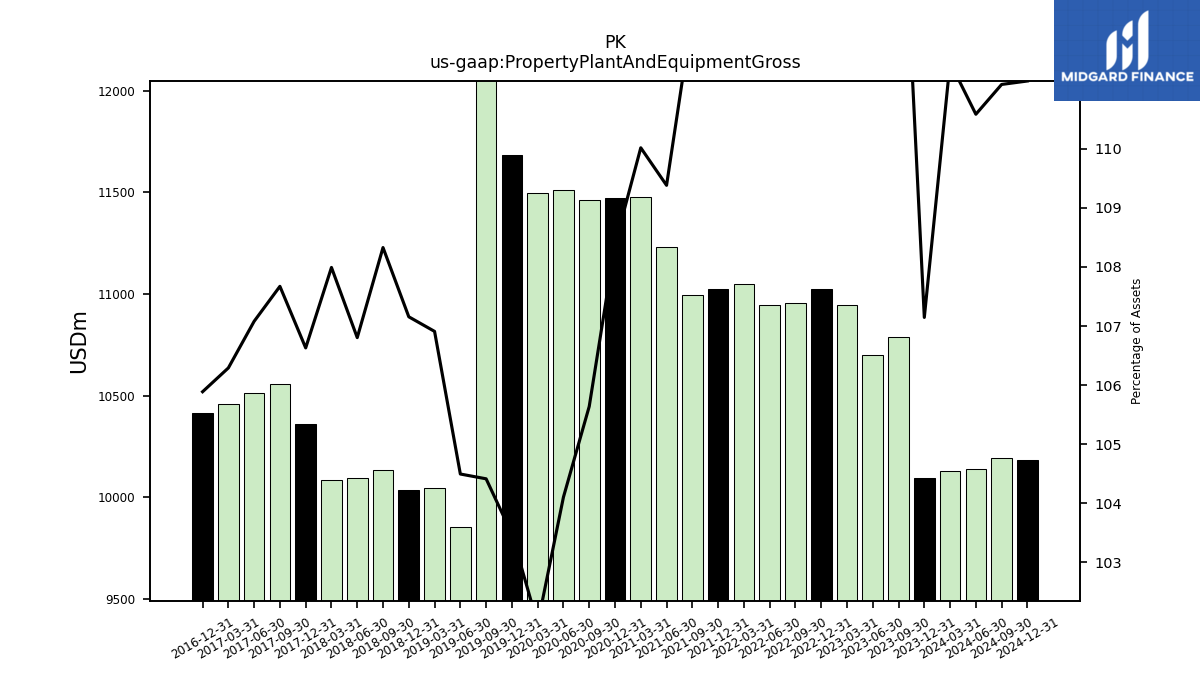
| Property Plant And Equipment Gross | 10092.00 | 10789.00 | 10698.00 | 10945.00 | 11024.00 | 10954.00 | 10946.00 | 11047.00 | 11026.00 | 10996.00 | 11229.00 | 11479.00 | 11474.00 | 11465.00 | 11513.00 | 11498.00 | 11683.00 | 12133.00 | 9855.00 | 10043.00 | 10033.00 | 10134.00 | 10094.00 | 10082.00 | 10358.00 | 10555.00 | 10512.00 | 10459.00 | 10413.00 | NA | NA | NA | |
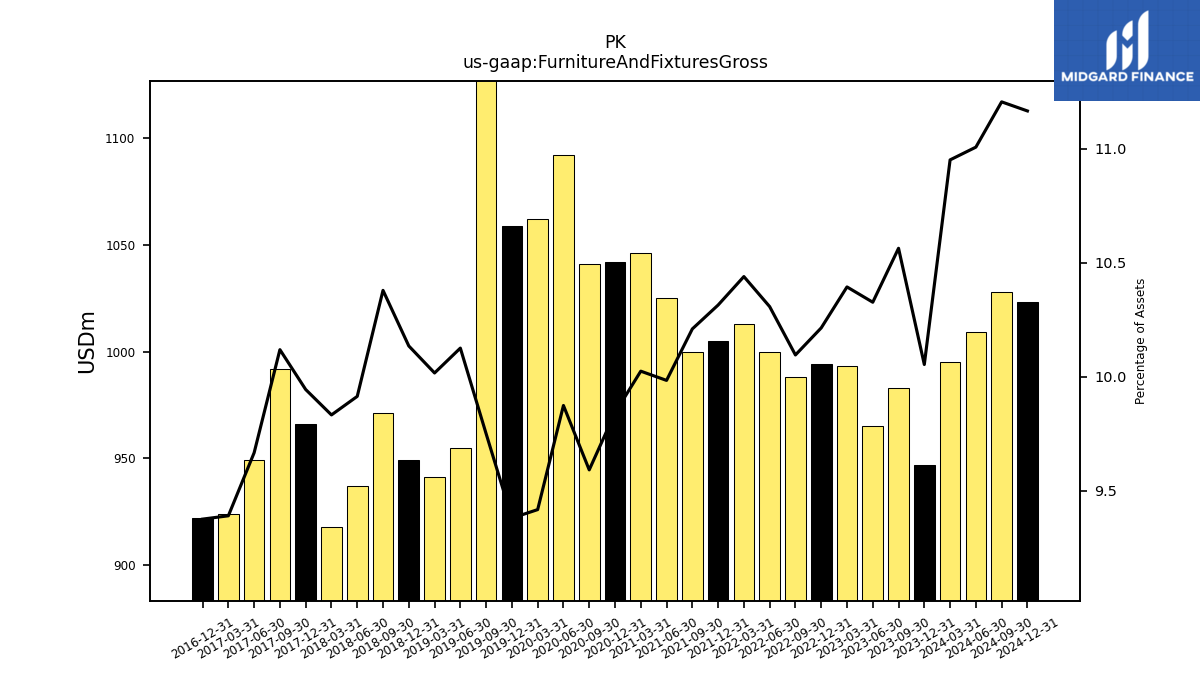
| Furniture And Fixtures Gross | 947.00 | 983.00 | 965.00 | 993.00 | 994.00 | 988.00 | 1000.00 | 1013.00 | 1005.00 | 1000.00 | 1025.00 | 1046.00 | 1042.00 | 1041.00 | 1092.00 | 1062.00 | 1059.00 | 1133.00 | 955.00 | 941.00 | 949.00 | 971.00 | 937.00 | 918.00 | 966.00 | 992.00 | 949.00 | 924.00 | 922.00 | NA | NA | NA | |
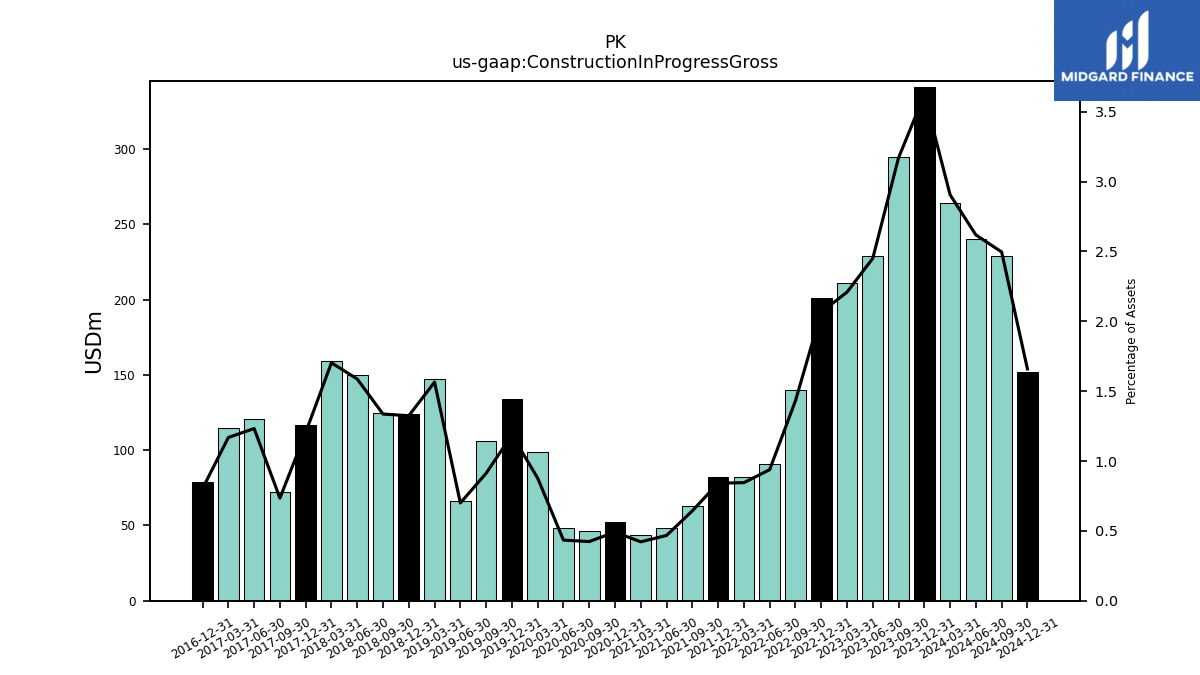
| Construction In Progress Gross | 341.00 | 295.00 | 229.00 | 211.00 | 201.00 | 140.00 | 91.00 | 82.00 | 82.00 | 63.00 | 48.00 | 44.00 | 52.00 | 46.00 | 48.00 | 99.00 | 134.00 | 106.00 | 66.00 | 147.00 | 124.00 | 125.00 | 150.00 | 159.00 | 117.00 | 72.00 | 121.00 | 115.00 | 79.00 | NA | NA | NA | |
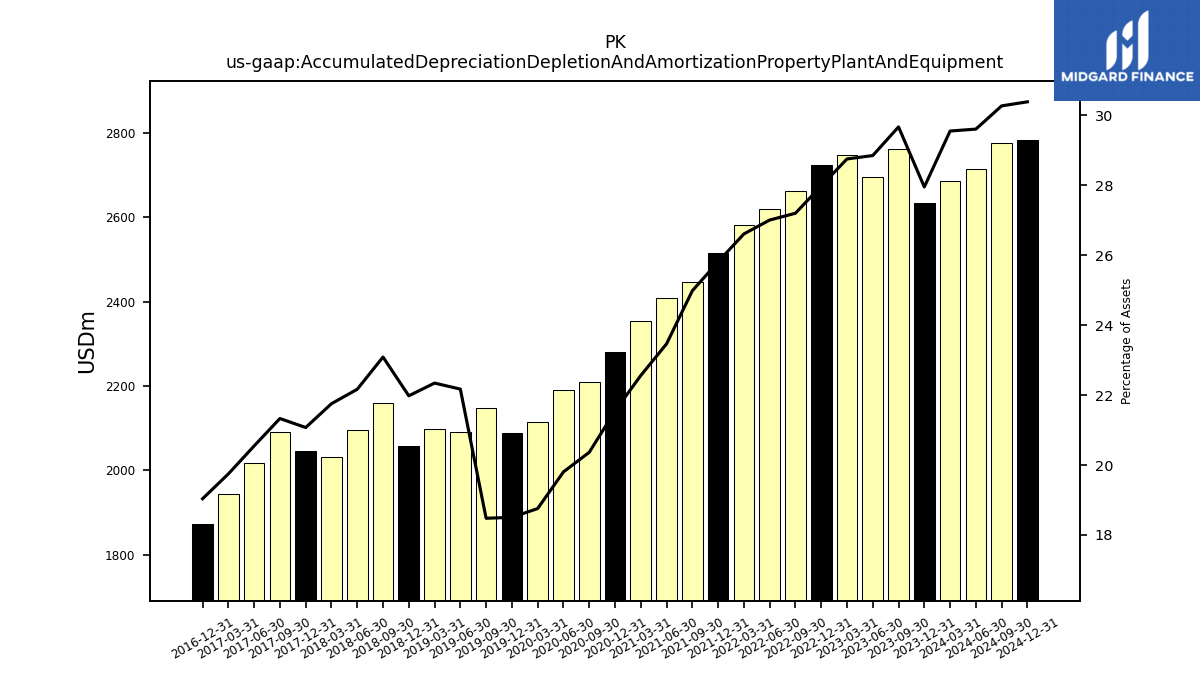
| Accumulated Depreciation Depletion And Amortization Property Plant And Equipment | 2633.00 | 2761.00 | 2696.00 | 2747.00 | 2723.00 | 2662.00 | 2620.00 | 2582.00 | 2515.00 | 2447.00 | 2409.00 | 2354.00 | 2281.00 | 2210.00 | 2190.00 | 2115.00 | 2089.00 | 2147.00 | 2091.00 | 2099.00 | 2058.00 | 2160.00 | 2095.00 | 2031.00 | 2047.00 | 2091.00 | 2017.00 | 1943.00 | 1872.00 | NA | NA | NA | |
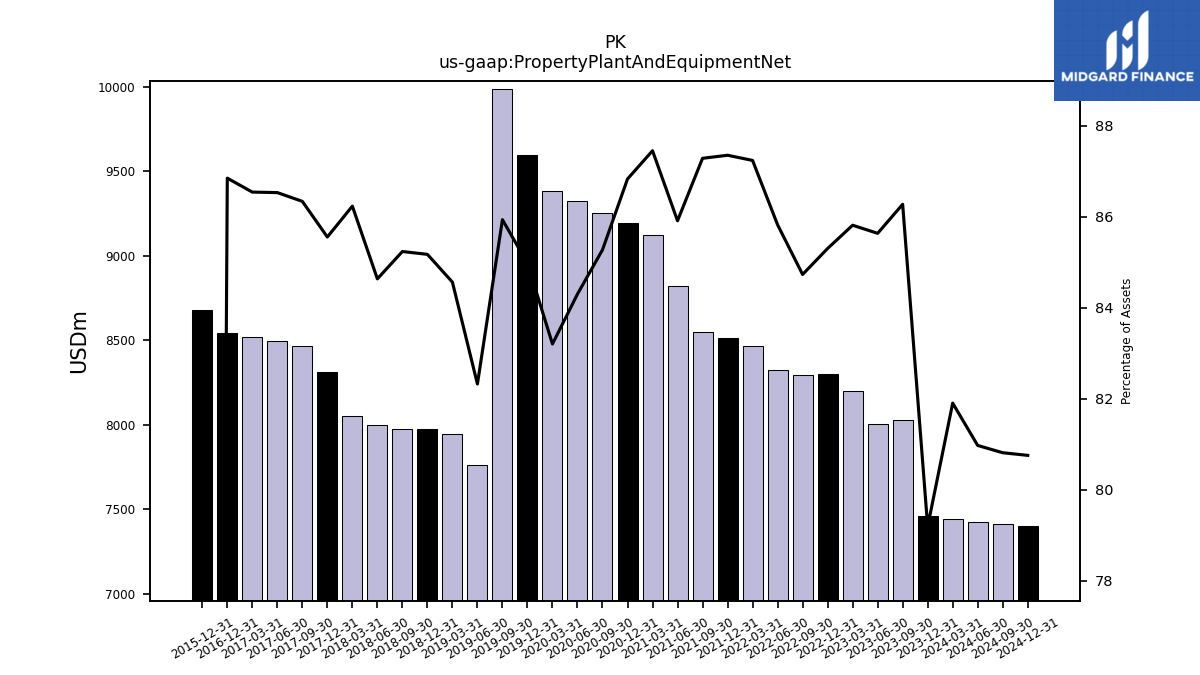
| Property Plant And Equipment Net | 7459.00 | 8028.00 | 8002.00 | 8198.00 | 8301.00 | 8292.00 | 8326.00 | 8465.00 | 8511.00 | 8549.00 | 8820.00 | 9125.00 | 9193.00 | 9255.00 | 9323.00 | 9383.00 | 9594.00 | 9986.00 | 7764.00 | 7944.00 | 7975.00 | 7974.00 | 7999.00 | 8051.00 | 8311.00 | 8464.00 | 8495.00 | 8516.00 | 8541.00 | NA | NA | NA | |
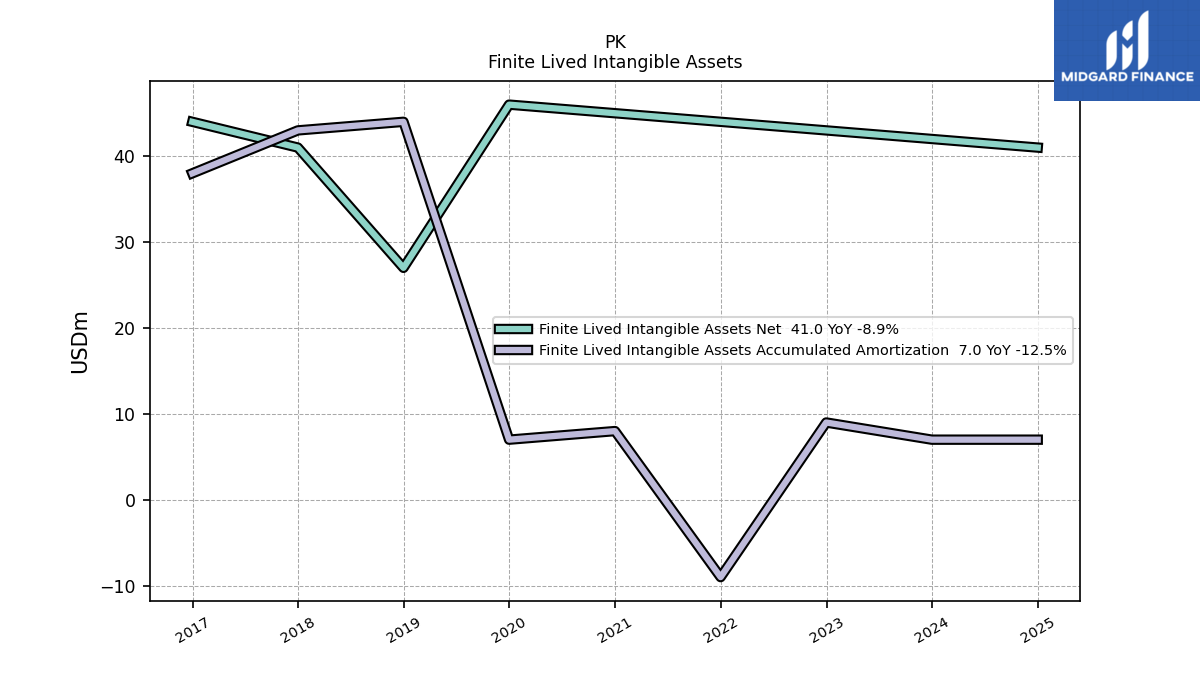
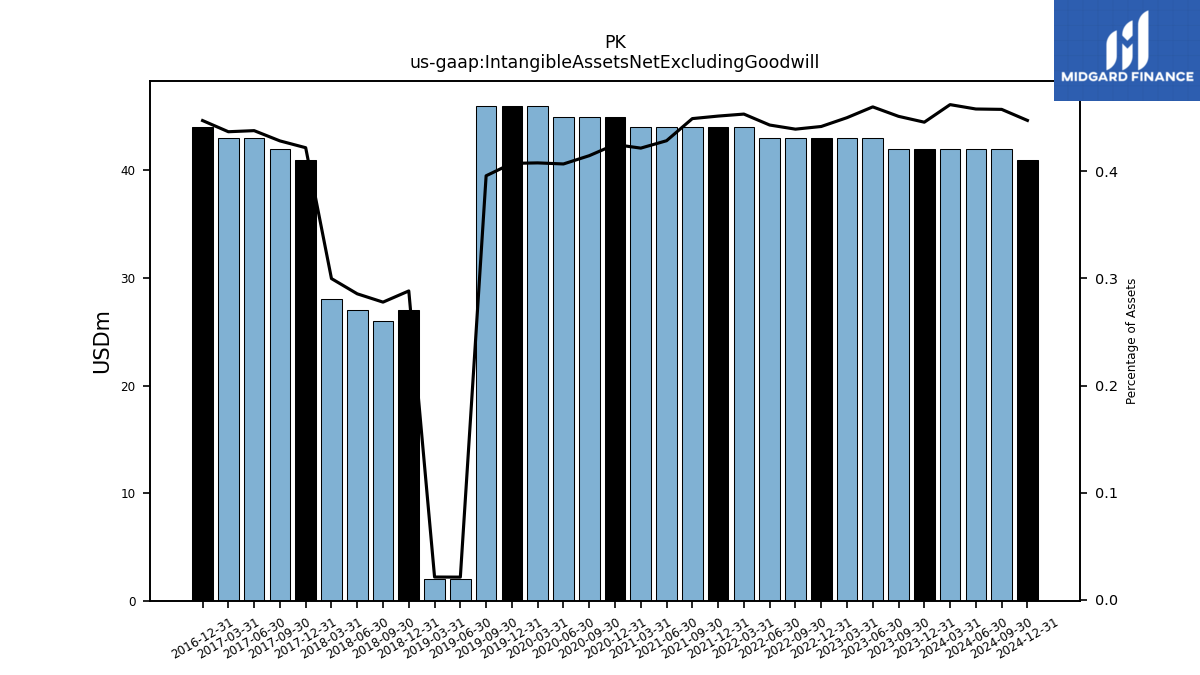
| Intangible Assets Net Excluding Goodwill | 42.00 | 42.00 | 43.00 | 43.00 | 43.00 | 43.00 | 43.00 | 44.00 | 44.00 | 44.00 | 44.00 | 44.00 | 45.00 | 45.00 | 45.00 | 46.00 | 46.00 | 46.00 | 2.00 | 2.00 | 27.00 | 26.00 | 27.00 | 28.00 | 41.00 | 42.00 | 43.00 | 43.00 | 44.00 | NA | NA | NA | |
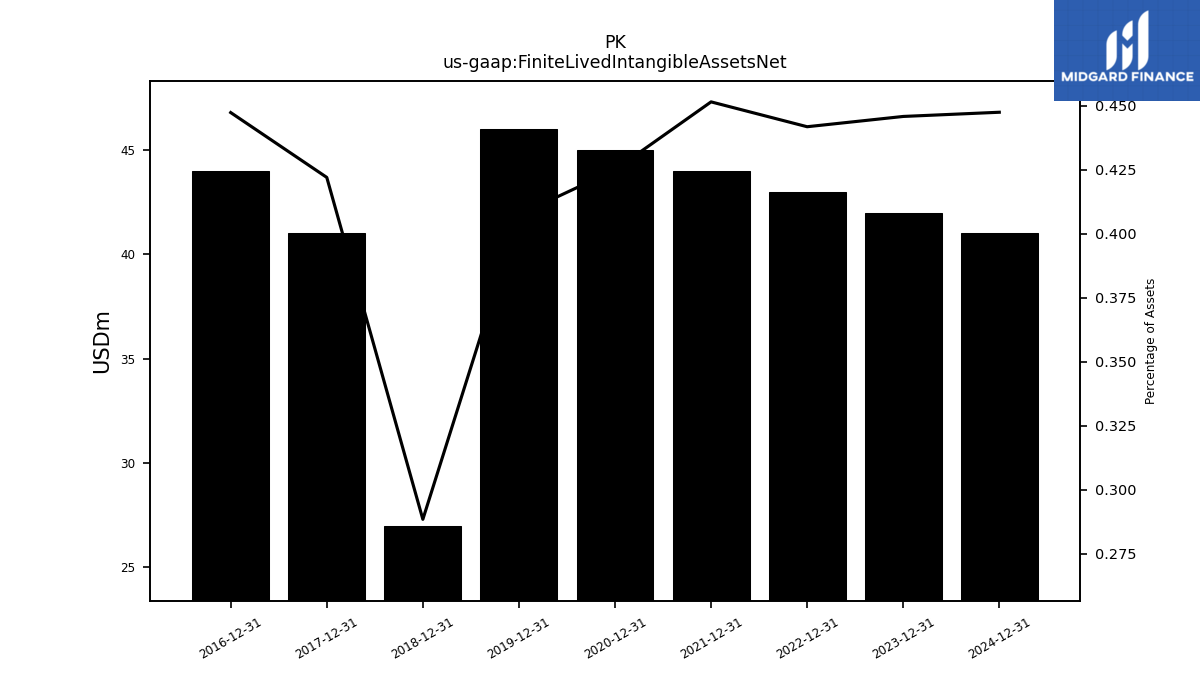
| Finite Lived Intangible Assets Net | 42.00 | NA | NA | NA | 43.00 | NA | NA | NA | 44.00 | NA | NA | NA | 45.00 | NA | NA | NA | 46.00 | NA | NA | NA | 27.00 | NA | NA | NA | 41.00 | NA | NA | NA | 44.00 | NA | NA | NA |
| 2023-12-31 | 2023-09-30 | 2023-06-30 | 2023-03-31 | 2022-12-31 | 2022-09-30 | 2022-06-30 | 2022-03-31 | 2021-12-31 | 2021-09-30 | 2021-06-30 | 2021-03-31 | 2020-12-31 | 2020-09-30 | 2020-06-30 | 2020-03-31 | 2019-12-31 | 2019-09-30 | 2019-06-30 | 2019-03-31 | 2018-12-31 | 2018-09-30 | 2018-06-30 | 2018-03-31 | 2017-12-31 | 2017-09-30 | 2017-06-30 | 2017-03-31 | 2016-12-31 | 2016-09-30 | 2016-06-30 | 2016-03-31 | ||
|---|---|---|---|---|---|---|---|---|---|---|---|---|---|---|---|---|---|---|---|---|---|---|---|---|---|---|---|---|---|---|---|---|---|
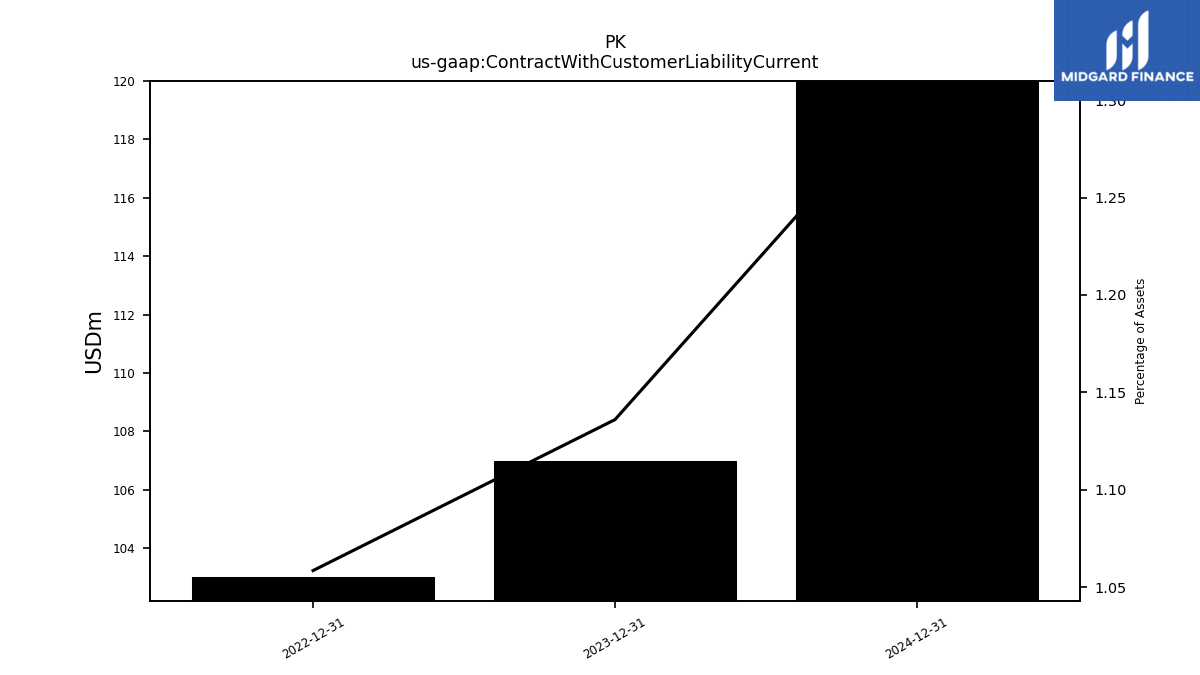
| Contract With Customer Liability Current | 107.00 | NA | NA | NA | 103.00 | NA | NA | NA | NA | NA | NA | NA | NA | NA | NA | NA | NA | NA | NA | NA | NA | NA | NA | NA | NA | NA | NA | NA | NA | NA | NA | NA |
| 2023-12-31 | 2023-09-30 | 2023-06-30 | 2023-03-31 | 2022-12-31 | 2022-09-30 | 2022-06-30 | 2022-03-31 | 2021-12-31 | 2021-09-30 | 2021-06-30 | 2021-03-31 | 2020-12-31 | 2020-09-30 | 2020-06-30 | 2020-03-31 | 2019-12-31 | 2019-09-30 | 2019-06-30 | 2019-03-31 | 2018-12-31 | 2018-09-30 | 2018-06-30 | 2018-03-31 | 2017-12-31 | 2017-09-30 | 2017-06-30 | 2017-03-31 | 2016-12-31 | 2016-09-30 | 2016-06-30 | 2016-03-31 | ||
|---|---|---|---|---|---|---|---|---|---|---|---|---|---|---|---|---|---|---|---|---|---|---|---|---|---|---|---|---|---|---|---|---|---|
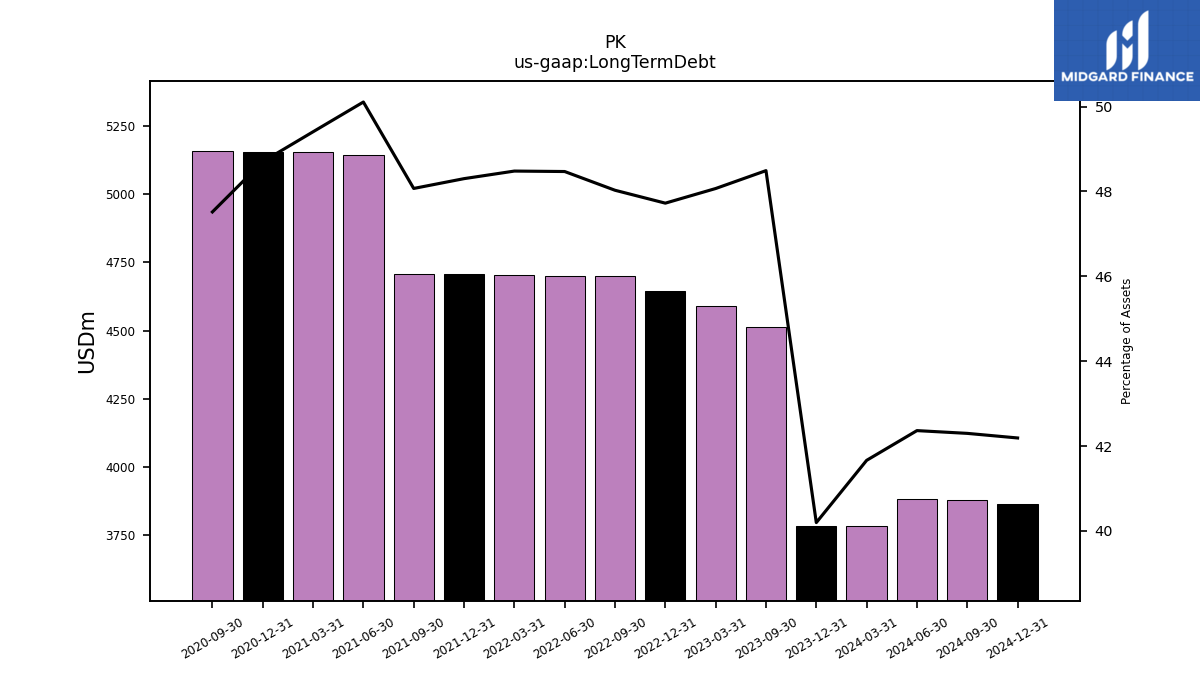
| Long Term Debt | 3786.00 | 4512.00 | NA | 4592.00 | 4644.00 | 4700.00 | 4702.00 | 4704.00 | 4706.00 | 4708.00 | 5144.00 | 5155.00 | 5156.00 | 5157.00 | NA | NA | NA | NA | NA | NA | NA | NA | NA | NA | NA | NA | NA | NA | NA | NA | NA | NA | |
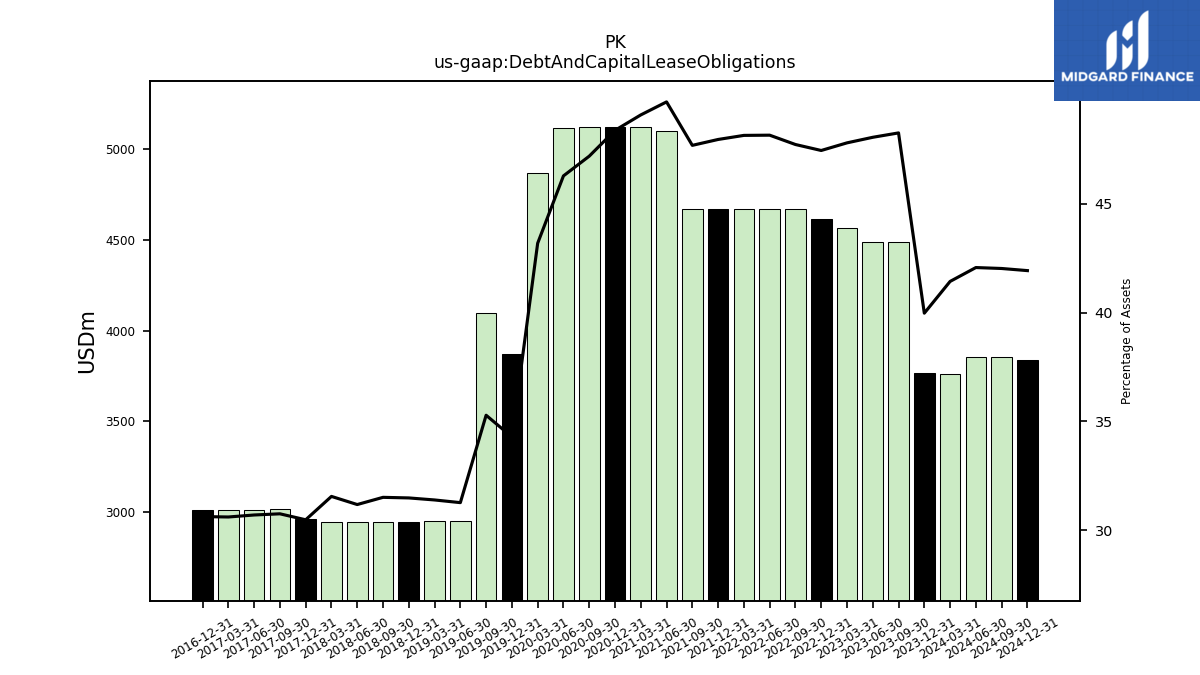
| Debt And Capital Lease Obligations | 3765.00 | 4490.00 | 4490.00 | 4566.00 | 4617.00 | 4670.00 | 4671.00 | 4671.00 | 4672.00 | 4670.00 | 5100.00 | 5121.00 | 5121.00 | 5121.00 | 5118.00 | 4870.00 | 3871.00 | 4100.00 | 2949.00 | 2949.00 | 2948.00 | 2948.00 | 2947.00 | 2946.00 | 2961.00 | 3015.00 | 3014.00 | 3012.00 | 3012.00 | NA | NA | NA | |
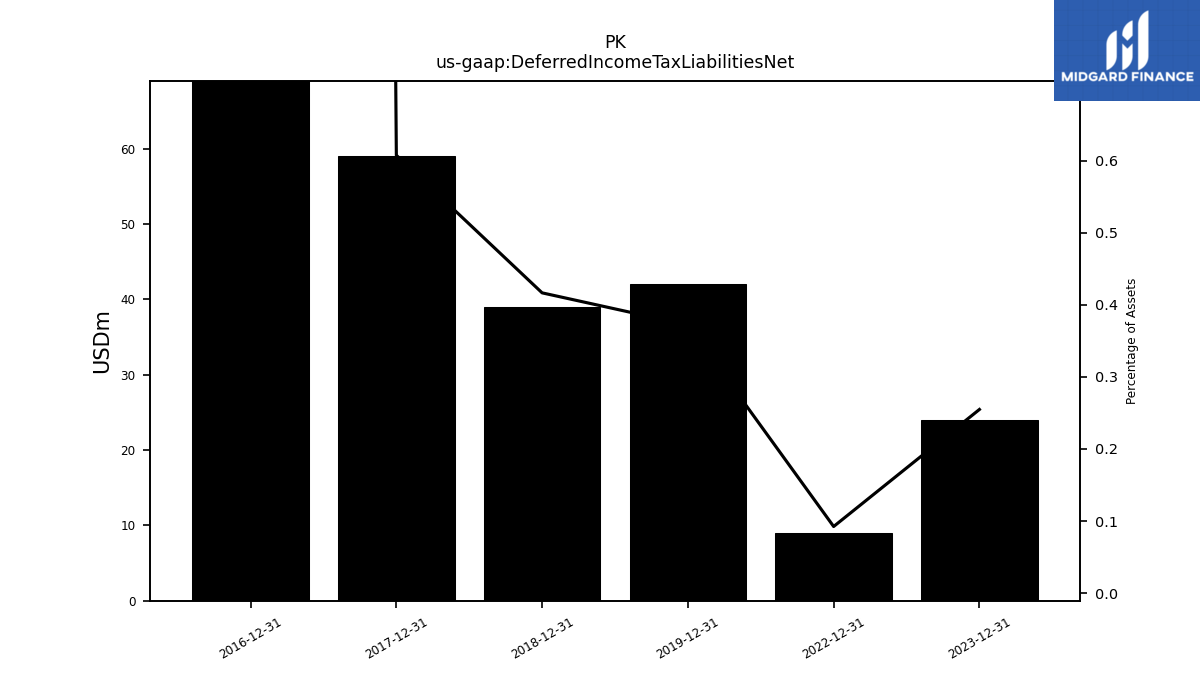
| Deferred Income Tax Liabilities Net | 24.00 | NA | NA | NA | 9.00 | NA | NA | NA | NA | NA | NA | NA | NA | NA | NA | NA | 42.00 | NA | NA | NA | 39.00 | NA | NA | NA | 59.00 | NA | NA | NA | 2433.00 | NA | NA | NA | |
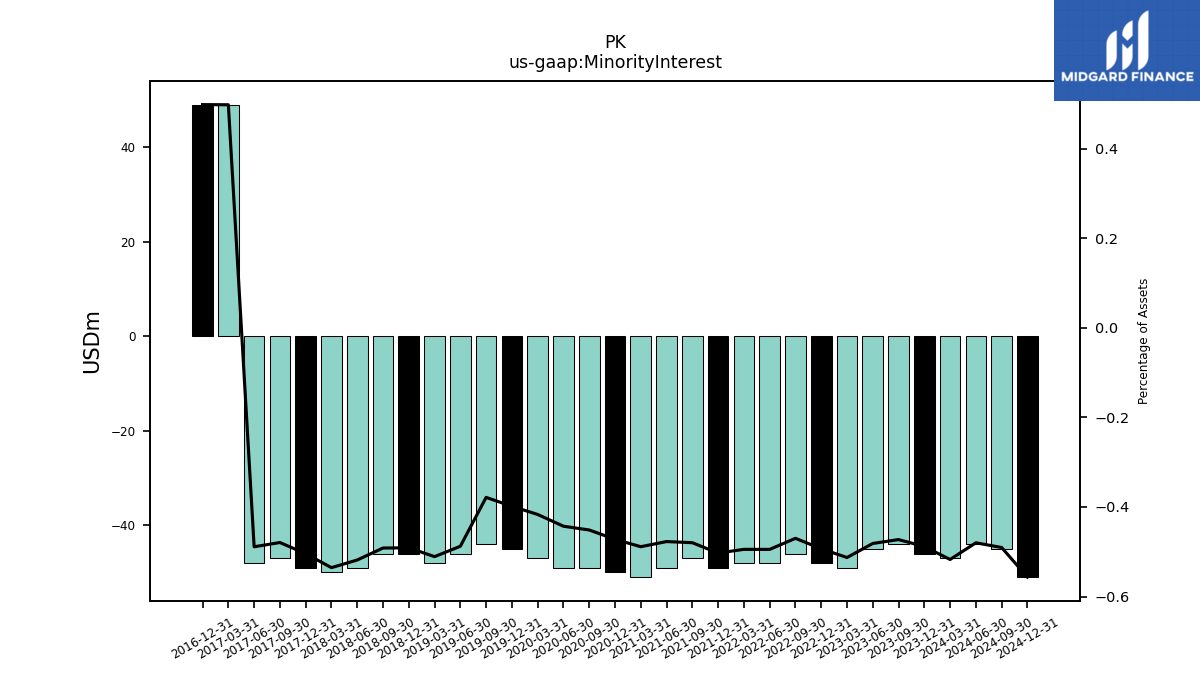
| Minority Interest | -46.00 | -44.00 | -45.00 | -49.00 | -48.00 | -46.00 | -48.00 | -48.00 | -49.00 | -47.00 | -49.00 | -51.00 | -50.00 | -49.00 | -49.00 | -47.00 | -45.00 | -44.00 | -46.00 | -48.00 | -46.00 | -46.00 | -49.00 | -50.00 | -49.00 | -47.00 | -48.00 | 49.00 | 49.00 | NA | NA | NA |
| 2023-12-31 | 2023-09-30 | 2023-06-30 | 2023-03-31 | 2022-12-31 | 2022-09-30 | 2022-06-30 | 2022-03-31 | 2021-12-31 | 2021-09-30 | 2021-06-30 | 2021-03-31 | 2020-12-31 | 2020-09-30 | 2020-06-30 | 2020-03-31 | 2019-12-31 | 2019-09-30 | 2019-06-30 | 2019-03-31 | 2018-12-31 | 2018-09-30 | 2018-06-30 | 2018-03-31 | 2017-12-31 | 2017-09-30 | 2017-06-30 | 2017-03-31 | 2016-12-31 | 2016-09-30 | 2016-06-30 | 2016-03-31 | ||
|---|---|---|---|---|---|---|---|---|---|---|---|---|---|---|---|---|---|---|---|---|---|---|---|---|---|---|---|---|---|---|---|---|---|
| Stockholders Equity | 3814.00 | 3984.00 | 4058.00 | 4237.00 | 4339.00 | 4365.00 | 4329.00 | 4333.00 | 4452.00 | 4515.00 | 4594.00 | 4704.00 | 4893.00 | 5104.00 | 5375.00 | 5630.00 | 6496.00 | 6497.00 | 5622.00 | 5628.00 | 5632.00 | 5774.00 | 5806.00 | 5765.00 | 6011.00 | 6070.00 | 6001.00 | 5971.00 | 3823.00 | NA | 2907.00 | 2860.00 | |
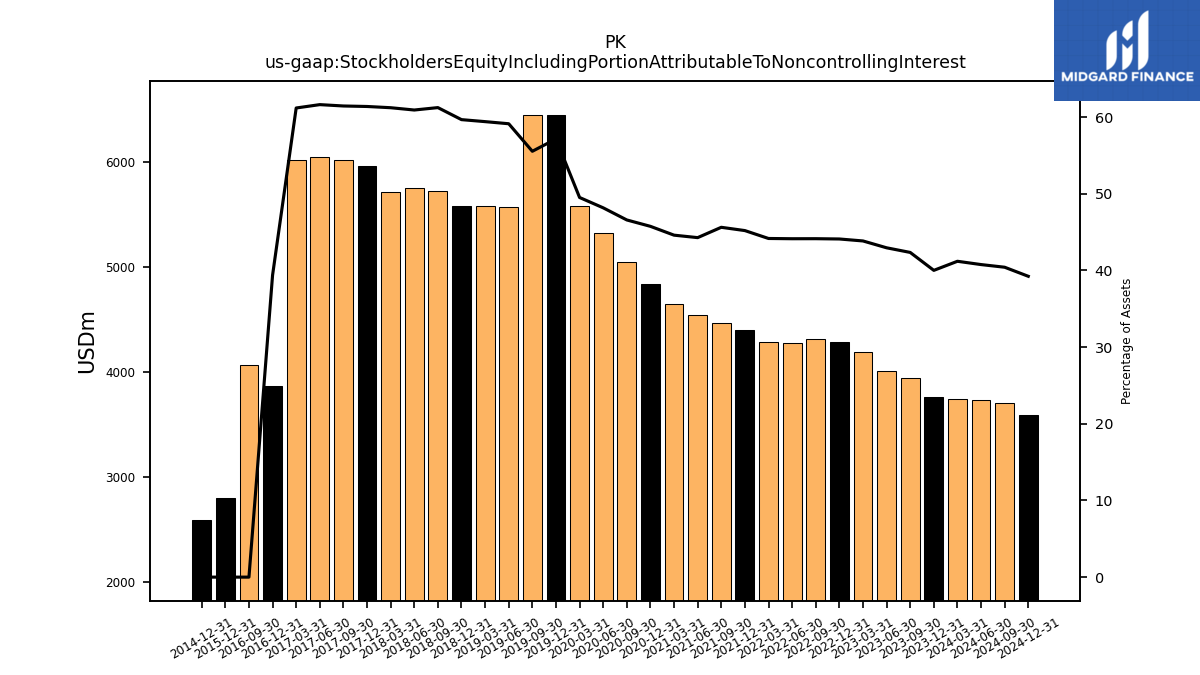
| Stockholders Equity Including Portion Attributable To Noncontrolling Interest | 3768.00 | 3940.00 | 4013.00 | 4188.00 | 4291.00 | 4319.00 | 4281.00 | 4285.00 | 4403.00 | 4468.00 | 4545.00 | 4653.00 | 4843.00 | 5055.00 | 5326.00 | 5583.00 | 6451.00 | 6453.00 | 5576.00 | 5580.00 | 5586.00 | 5728.00 | 5757.00 | 5715.00 | 5962.00 | 6023.00 | 6049.00 | 6020.00 | 3872.00 | 4071.00 | NA | NA | |
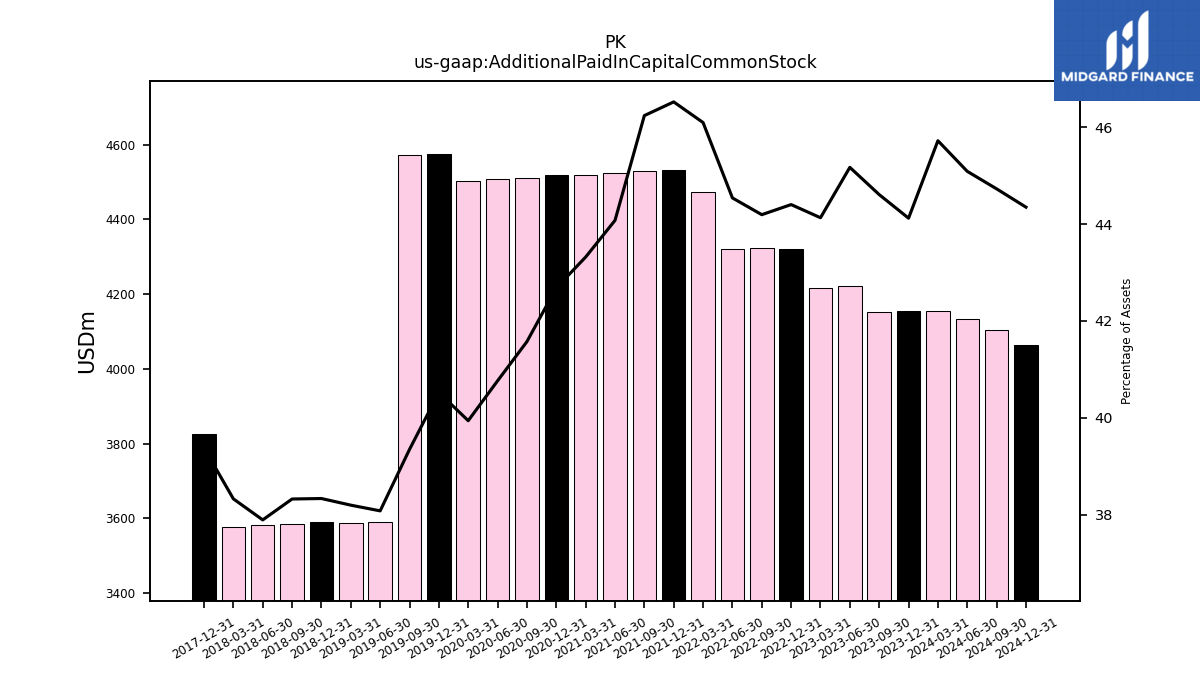
| Additional Paid In Capital Common Stock | 4156.00 | 4151.00 | 4221.00 | 4216.00 | 4321.00 | 4325.00 | 4321.00 | 4473.00 | 4533.00 | 4529.00 | 4525.00 | 4520.00 | 4519.00 | 4512.00 | 4508.00 | 4504.00 | 4575.00 | 4572.00 | 3591.00 | 3588.00 | 3589.00 | 3585.00 | 3581.00 | 3578.00 | 3825.00 | NA | NA | NA | NA | NA | NA | NA | |
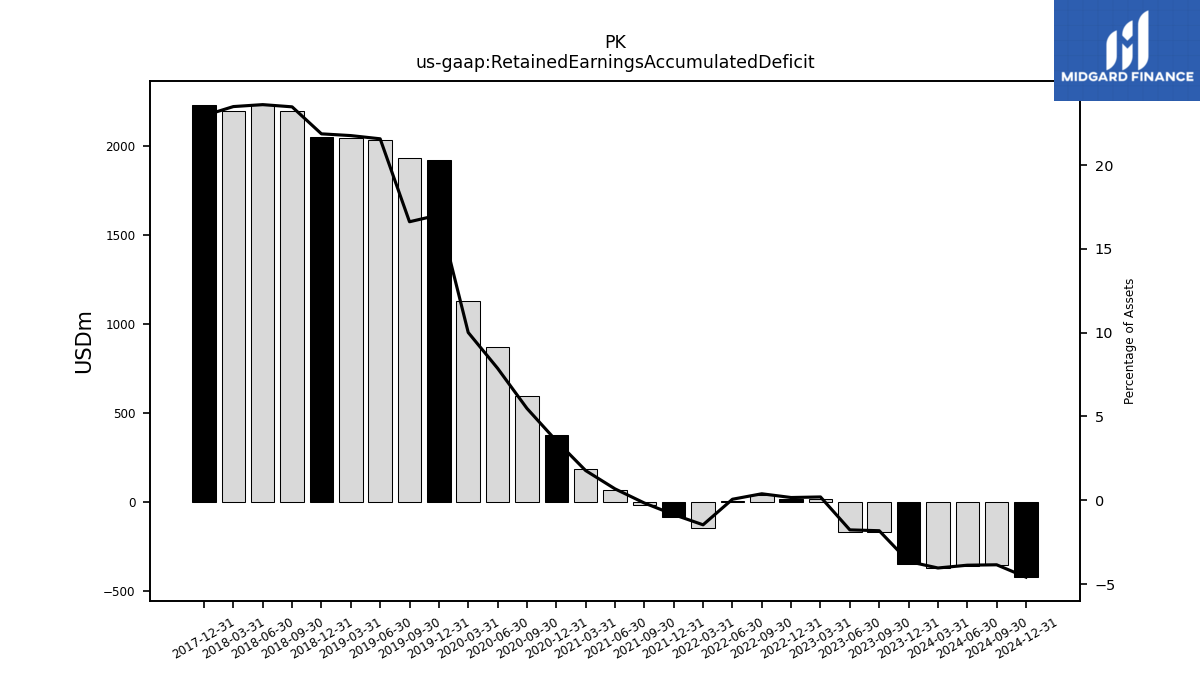
| Retained Earnings Accumulated Deficit | -344.00 | -169.00 | -165.00 | 19.00 | 16.00 | 38.00 | 6.00 | -142.00 | -83.00 | -16.00 | 70.00 | 185.00 | 376.00 | 595.00 | 871.00 | 1129.00 | 1922.00 | 1931.00 | 2034.00 | 2044.00 | 2047.00 | 2196.00 | 2231.00 | 2193.00 | 2229.00 | NA | NA | NA | NA | NA | NA | NA | |
| Minority Interest | -46.00 | -44.00 | -45.00 | -49.00 | -48.00 | -46.00 | -48.00 | -48.00 | -49.00 | -47.00 | -49.00 | -51.00 | -50.00 | -49.00 | -49.00 | -47.00 | -45.00 | -44.00 | -46.00 | -48.00 | -46.00 | -46.00 | -49.00 | -50.00 | -49.00 | -47.00 | -48.00 | 49.00 | 49.00 | NA | NA | NA |
| 2023-12-31 | 2023-09-30 | 2023-06-30 | 2023-03-31 | 2022-12-31 | 2022-09-30 | 2022-06-30 | 2022-03-31 | 2021-12-31 | 2021-09-30 | 2021-06-30 | 2021-03-31 | 2020-12-31 | 2020-09-30 | 2020-06-30 | 2020-03-31 | 2019-12-31 | 2019-09-30 | 2019-06-30 | 2019-03-31 | 2018-12-31 | 2018-09-30 | 2018-06-30 | 2018-03-31 | 2017-12-31 | 2017-09-30 | 2017-06-30 | 2017-03-31 | 2016-12-31 | 2016-09-30 | 2016-06-30 | 2016-03-31 | ||
|---|---|---|---|---|---|---|---|---|---|---|---|---|---|---|---|---|---|---|---|---|---|---|---|---|---|---|---|---|---|---|---|---|---|
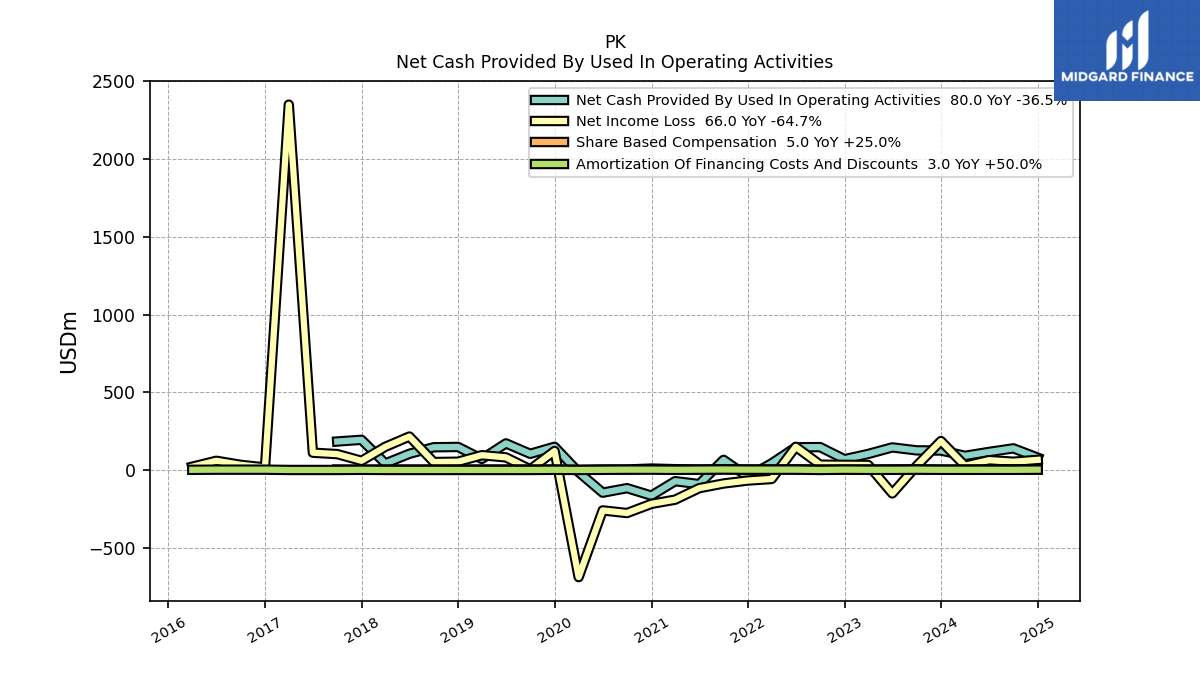
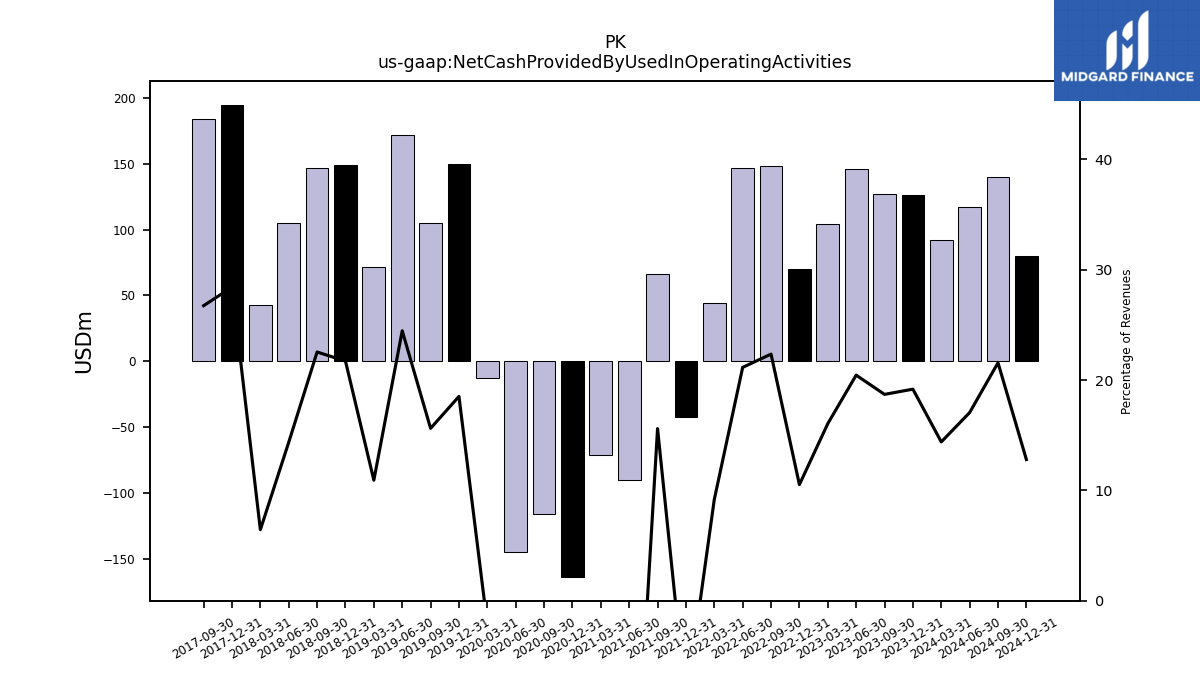
| Net Cash Provided By Used In Operating Activities | 126.00 | 127.00 | 146.00 | 104.00 | 70.00 | 148.00 | 147.00 | 44.00 | -42.00 | 66.00 | -90.00 | -71.00 | -164.00 | -116.00 | -145.00 | -13.00 | 150.00 | 105.00 | 172.00 | 72.00 | 149.00 | 147.00 | 105.00 | 43.00 | 195.00 | 184.00 | NA | NA | NA | NA | NA | NA | |
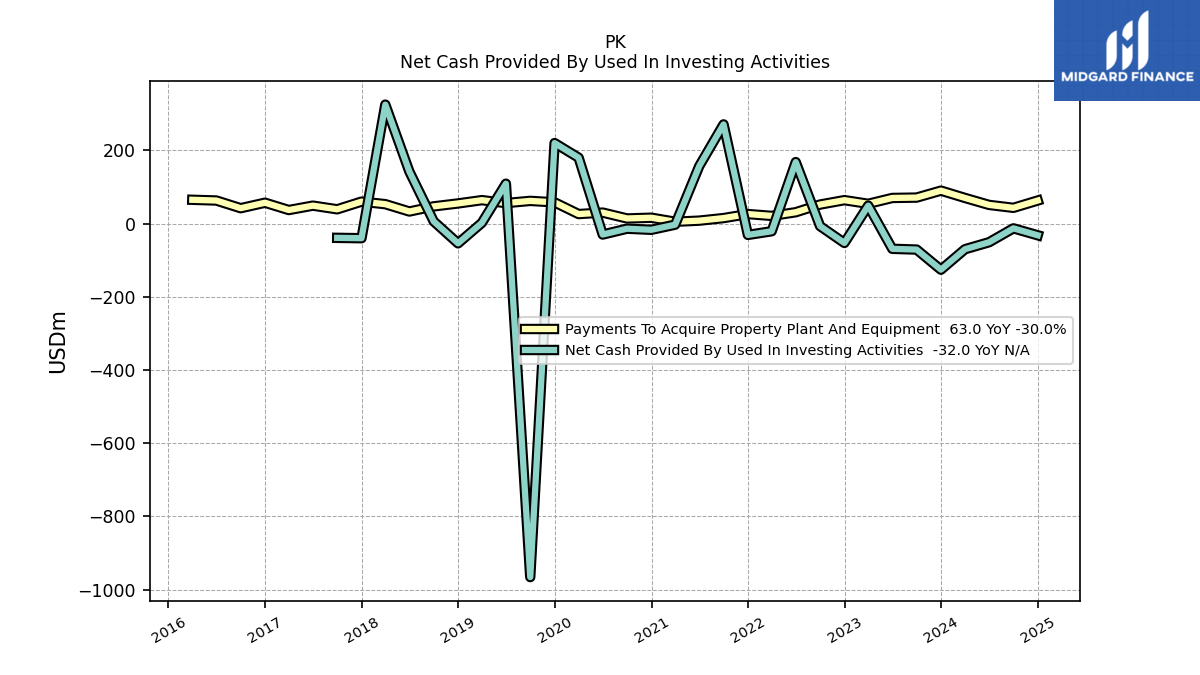
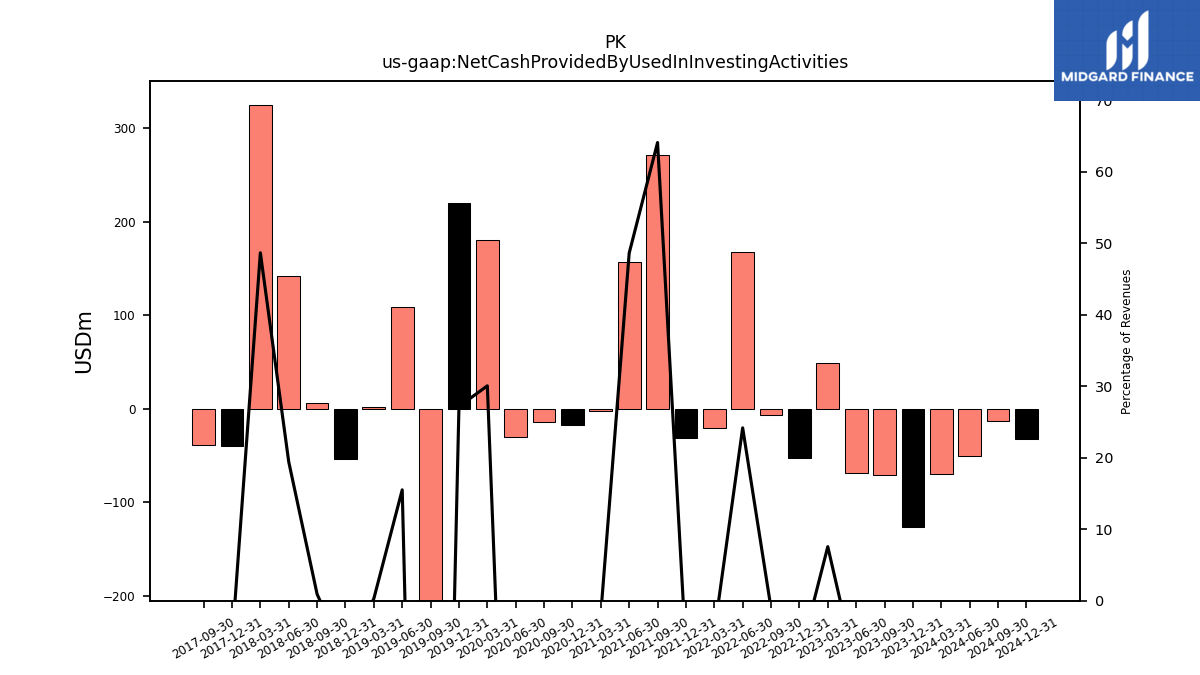
| Net Cash Provided By Used In Investing Activities | -126.00 | -71.00 | -69.00 | 49.00 | -53.00 | -7.00 | 168.00 | -21.00 | -31.00 | 271.00 | 157.00 | -3.00 | -17.00 | -14.00 | -30.00 | 180.00 | 220.00 | -966.00 | 109.00 | 2.00 | -54.00 | 6.00 | 142.00 | 325.00 | -40.00 | -39.00 | NA | NA | NA | NA | NA | NA | |
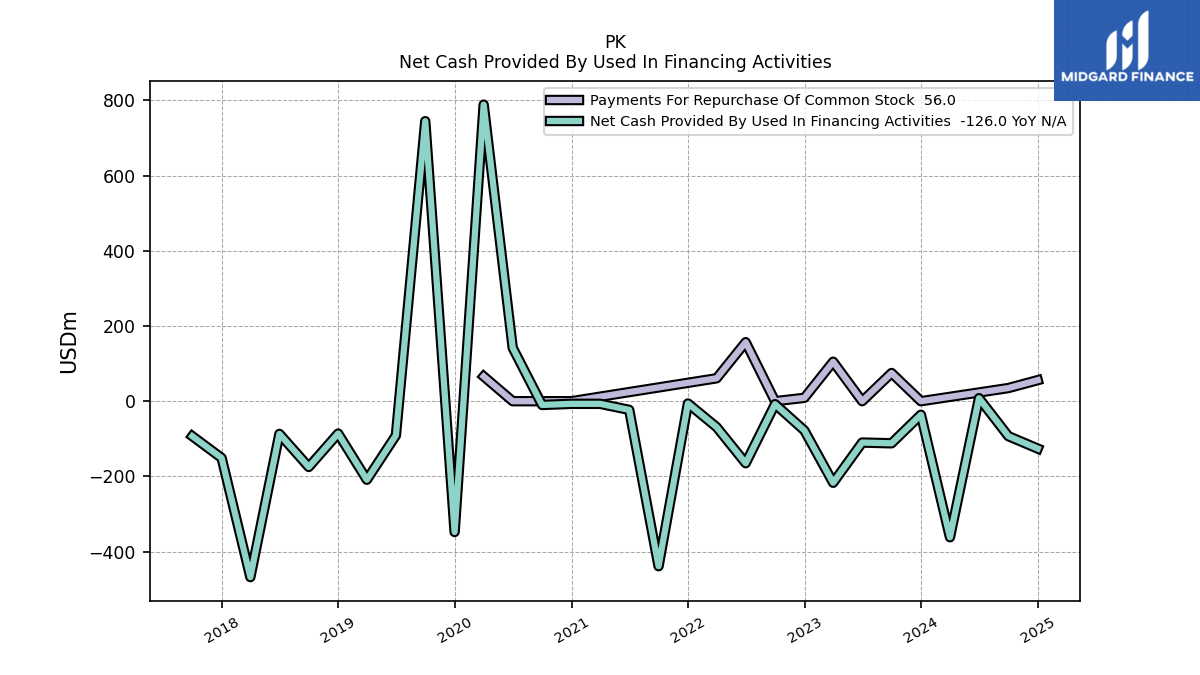
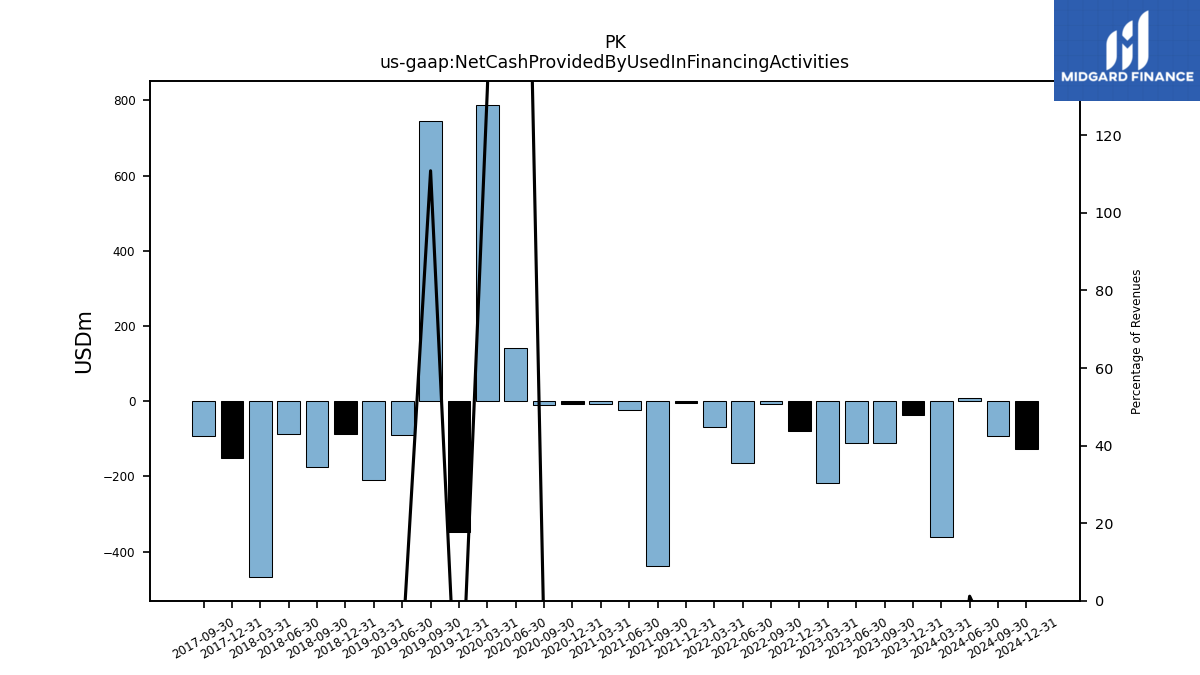
| Net Cash Provided By Used In Financing Activities | -36.00 | -112.00 | -110.00 | -217.00 | -78.00 | -8.00 | -165.00 | -69.00 | -6.00 | -439.00 | -23.00 | -7.00 | -7.00 | -10.00 | 142.00 | 789.00 | -348.00 | 745.00 | -91.00 | -209.00 | -86.00 | -175.00 | -87.00 | -468.00 | -151.00 | -93.00 | NA | NA | NA | NA | NA | NA |
| 2023-12-31 | 2023-09-30 | 2023-06-30 | 2023-03-31 | 2022-12-31 | 2022-09-30 | 2022-06-30 | 2022-03-31 | 2021-12-31 | 2021-09-30 | 2021-06-30 | 2021-03-31 | 2020-12-31 | 2020-09-30 | 2020-06-30 | 2020-03-31 | 2019-12-31 | 2019-09-30 | 2019-06-30 | 2019-03-31 | 2018-12-31 | 2018-09-30 | 2018-06-30 | 2018-03-31 | 2017-12-31 | 2017-09-30 | 2017-06-30 | 2017-03-31 | 2016-12-31 | 2016-09-30 | 2016-06-30 | 2016-03-31 | ||
|---|---|---|---|---|---|---|---|---|---|---|---|---|---|---|---|---|---|---|---|---|---|---|---|---|---|---|---|---|---|---|---|---|---|
| Net Cash Provided By Used In Operating Activities | 126.00 | 127.00 | 146.00 | 104.00 | 70.00 | 148.00 | 147.00 | 44.00 | -42.00 | 66.00 | -90.00 | -71.00 | -164.00 | -116.00 | -145.00 | -13.00 | 150.00 | 105.00 | 172.00 | 72.00 | 149.00 | 147.00 | 105.00 | 43.00 | 195.00 | 184.00 | NA | NA | NA | NA | NA | NA | |
| Net Income Loss | 187.00 | 27.00 | -150.00 | 33.00 | 34.00 | 35.00 | 150.00 | -57.00 | -67.00 | -86.00 | -116.00 | -190.00 | -217.00 | -276.00 | -259.00 | -688.00 | 123.00 | 5.00 | 82.00 | 96.00 | 54.00 | 52.00 | 216.00 | 150.00 | 60.00 | 103.00 | 112.00 | 2350.00 | 17.00 | 34.00 | 60.00 | 22.00 | |
| Profit Loss | 188.00 | 31.00 | -146.00 | 33.00 | 35.00 | 40.00 | 154.00 | -56.00 | -65.00 | -82.00 | -114.00 | -191.00 | -218.00 | -276.00 | -261.00 | -689.00 | 126.00 | 9.00 | 84.00 | 97.00 | 55.00 | 55.00 | 218.00 | 149.00 | 61.00 | 105.00 | 115.00 | 2350.00 | 17.00 | 37.00 | 62.00 | 23.00 | |
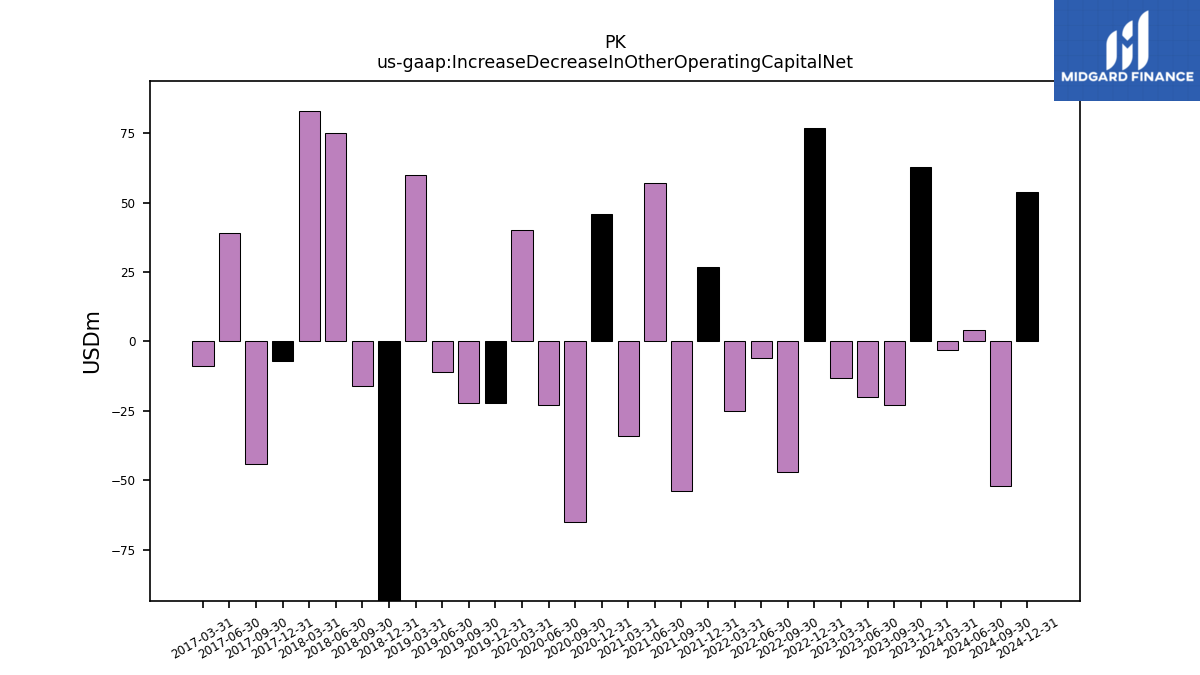
| Increase Decrease In Other Operating Capital Net | 63.00 | -23.00 | -20.00 | -13.00 | 77.00 | -47.00 | -6.00 | -25.00 | 27.00 | -54.00 | 57.00 | -34.00 | 46.00 | -65.00 | -23.00 | 40.00 | -22.00 | -22.00 | -11.00 | 60.00 | -134.00 | -16.00 | 75.00 | 83.00 | -7.00 | -44.00 | 39.00 | -9.00 | NA | NA | NA | NA | |
| Share Based Compensation | 4.00 | 5.00 | 5.00 | 4.00 | 4.00 | 4.00 | 5.00 | 4.00 | 4.00 | 5.00 | 4.00 | 6.00 | 10.00 | 4.00 | 4.00 | 2.00 | 4.00 | 4.00 | 4.00 | 4.00 | 4.00 | 4.00 | 4.00 | 4.00 | 3.00 | 4.00 | NA | NA | NA | NA | NA | NA |
| 2023-12-31 | 2023-09-30 | 2023-06-30 | 2023-03-31 | 2022-12-31 | 2022-09-30 | 2022-06-30 | 2022-03-31 | 2021-12-31 | 2021-09-30 | 2021-06-30 | 2021-03-31 | 2020-12-31 | 2020-09-30 | 2020-06-30 | 2020-03-31 | 2019-12-31 | 2019-09-30 | 2019-06-30 | 2019-03-31 | 2018-12-31 | 2018-09-30 | 2018-06-30 | 2018-03-31 | 2017-12-31 | 2017-09-30 | 2017-06-30 | 2017-03-31 | 2016-12-31 | 2016-09-30 | 2016-06-30 | 2016-03-31 | ||
|---|---|---|---|---|---|---|---|---|---|---|---|---|---|---|---|---|---|---|---|---|---|---|---|---|---|---|---|---|---|---|---|---|---|
| Net Cash Provided By Used In Investing Activities | -126.00 | -71.00 | -69.00 | 49.00 | -53.00 | -7.00 | 168.00 | -21.00 | -31.00 | 271.00 | 157.00 | -3.00 | -17.00 | -14.00 | -30.00 | 180.00 | 220.00 | -966.00 | 109.00 | 2.00 | -54.00 | 6.00 | 142.00 | 325.00 | -40.00 | -39.00 | NA | NA | NA | NA | NA | NA | |
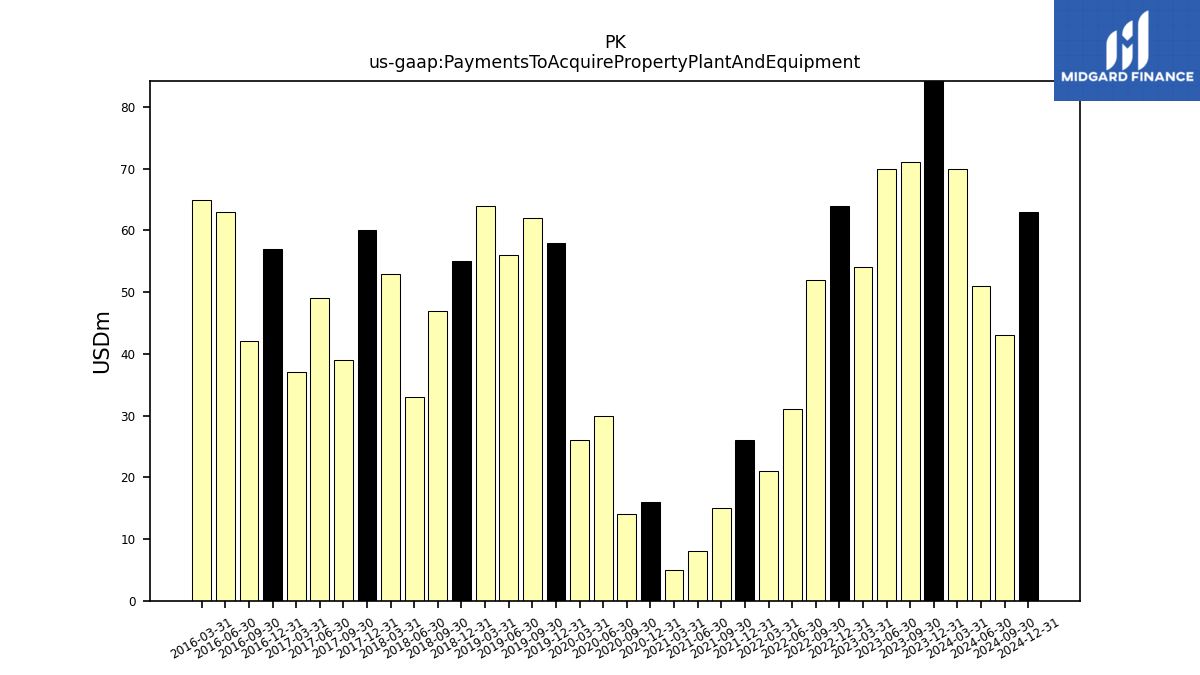
| Payments To Acquire Property Plant And Equipment | 90.00 | 71.00 | 70.00 | 54.00 | 64.00 | 52.00 | 31.00 | 21.00 | 26.00 | 15.00 | 8.00 | 5.00 | 16.00 | 14.00 | 30.00 | 26.00 | 58.00 | 62.00 | 56.00 | 64.00 | 55.00 | 47.00 | 33.00 | 53.00 | 60.00 | 39.00 | 49.00 | 37.00 | 57.00 | 42.00 | 63.00 | 65.00 |
| 2023-12-31 | 2023-09-30 | 2023-06-30 | 2023-03-31 | 2022-12-31 | 2022-09-30 | 2022-06-30 | 2022-03-31 | 2021-12-31 | 2021-09-30 | 2021-06-30 | 2021-03-31 | 2020-12-31 | 2020-09-30 | 2020-06-30 | 2020-03-31 | 2019-12-31 | 2019-09-30 | 2019-06-30 | 2019-03-31 | 2018-12-31 | 2018-09-30 | 2018-06-30 | 2018-03-31 | 2017-12-31 | 2017-09-30 | 2017-06-30 | 2017-03-31 | 2016-12-31 | 2016-09-30 | 2016-06-30 | 2016-03-31 | ||
|---|---|---|---|---|---|---|---|---|---|---|---|---|---|---|---|---|---|---|---|---|---|---|---|---|---|---|---|---|---|---|---|---|---|
| Net Cash Provided By Used In Financing Activities | -36.00 | -112.00 | -110.00 | -217.00 | -78.00 | -8.00 | -165.00 | -69.00 | -6.00 | -439.00 | -23.00 | -7.00 | -7.00 | -10.00 | 142.00 | 789.00 | -348.00 | 745.00 | -91.00 | -209.00 | -86.00 | -175.00 | -87.00 | -468.00 | -151.00 | -93.00 | NA | NA | NA | NA | NA | NA | |
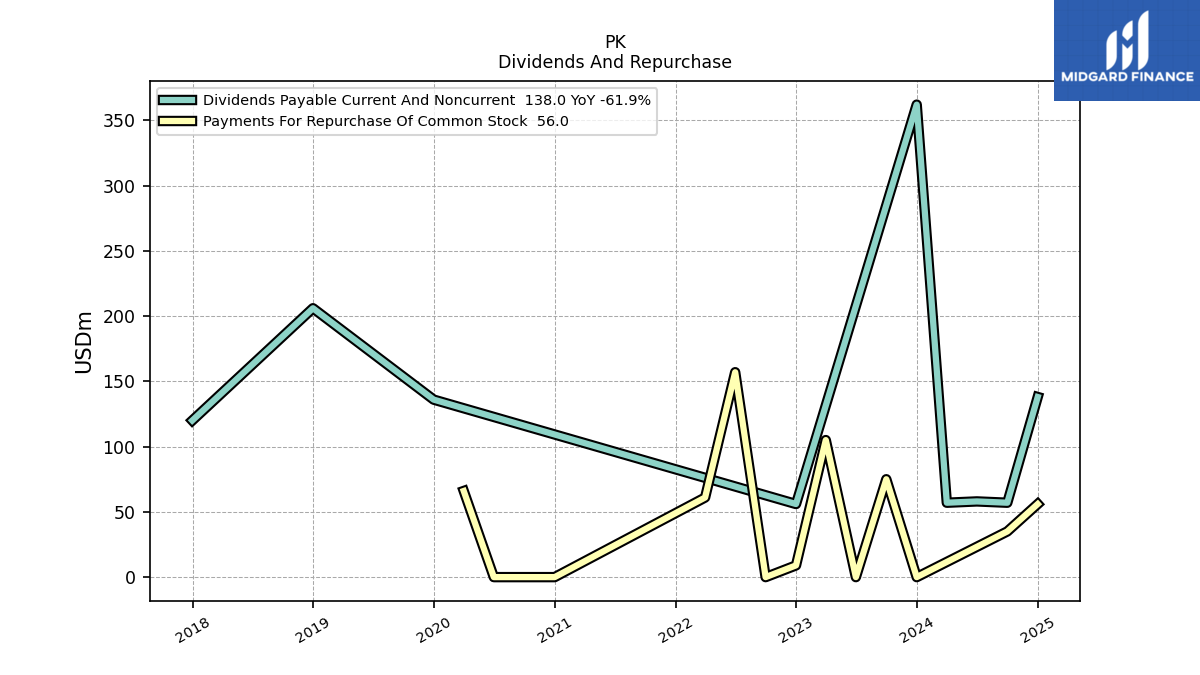
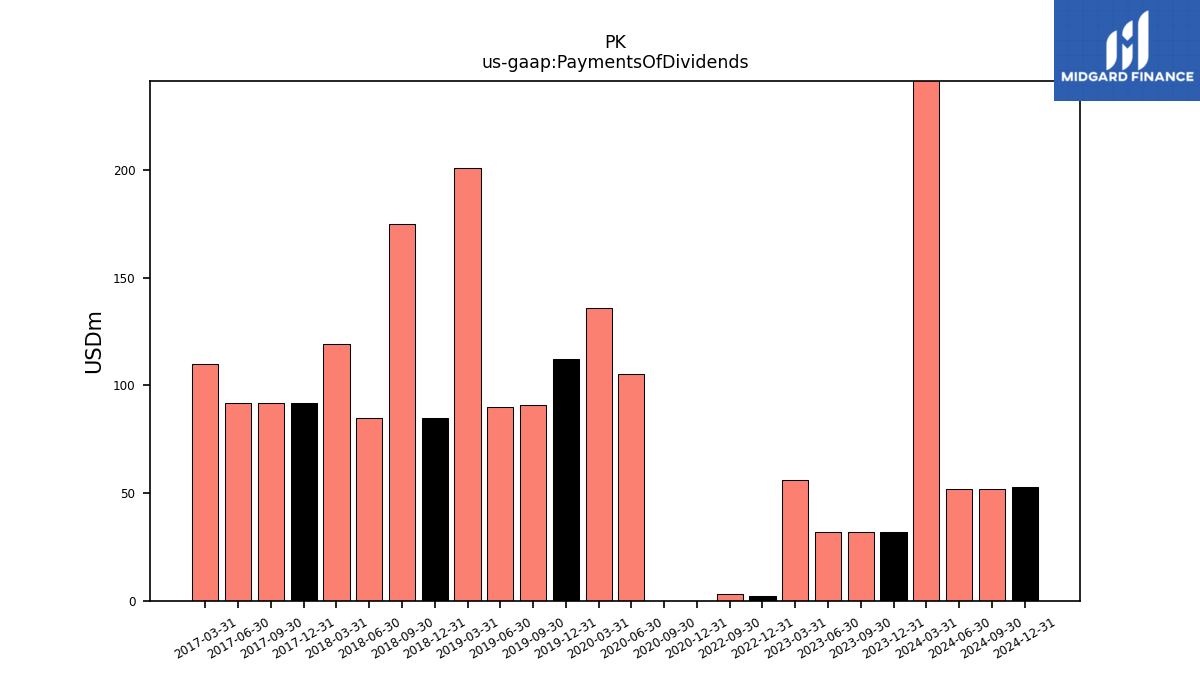
| Payments Of Dividends | 32.00 | 32.00 | 32.00 | 56.00 | 2.00 | 3.00 | NA | NA | NA | NA | NA | NA | 0.00 | 0.00 | 105.00 | 136.00 | 112.00 | 91.00 | 90.00 | 201.00 | 85.00 | 175.00 | 85.00 | 119.00 | 92.00 | 92.00 | 92.00 | 110.00 | NA | NA | NA | NA | |
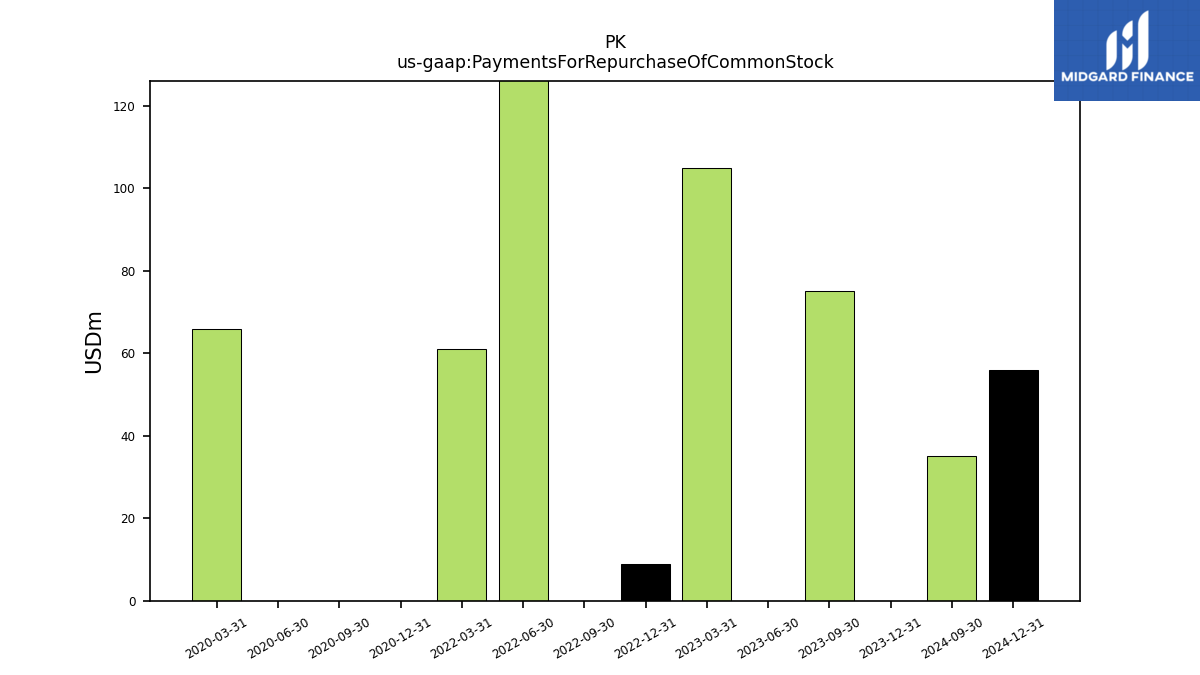
| Payments For Repurchase Of Common Stock | 0.00 | 75.00 | 0.00 | 105.00 | 9.00 | 0.00 | 157.00 | 61.00 | NA | NA | NA | NA | 0.00 | 0.00 | 0.00 | 66.00 | NA | NA | NA | NA | NA | NA | NA | NA | NA | NA | NA | NA | NA | NA | NA | NA |
| 2023-12-31 | 2023-09-30 | 2023-06-30 | 2023-03-31 | 2022-12-31 | 2022-09-30 | 2022-06-30 | 2022-03-31 | 2021-12-31 | 2021-09-30 | 2021-06-30 | 2021-03-31 | 2020-12-31 | 2020-09-30 | 2020-06-30 | 2020-03-31 | 2019-12-31 | 2019-09-30 | 2019-06-30 | 2019-03-31 | 2018-12-31 | 2018-09-30 | 2018-06-30 | 2018-03-31 | 2017-12-31 | 2017-09-30 | 2017-06-30 | 2017-03-31 | 2016-12-31 | 2016-09-30 | 2016-06-30 | 2016-03-31 | ||
|---|---|---|---|---|---|---|---|---|---|---|---|---|---|---|---|---|---|---|---|---|---|---|---|---|---|---|---|---|---|---|---|---|---|
| Revenues | 657.00 | 679.00 | 714.00 | 648.00 | 665.00 | 662.00 | 695.00 | 479.00 | 451.00 | 423.00 | 323.00 | 165.00 | 113.00 | 98.00 | 42.00 | 599.00 | 810.00 | 672.00 | 703.00 | 659.00 | 686.00 | 652.00 | 731.00 | 668.00 | 686.00 | 688.00 | 733.00 | 684.00 | 670.00 | 671.00 | 725.00 | 661.00 | |
| Revenue From Contract With Customer Excluding Assessed Tax | 657.00 | 679.00 | 714.00 | 648.00 | 665.00 | 662.00 | 695.00 | 479.00 | 451.00 | 423.00 | 323.00 | 165.00 | 113.00 | 98.00 | 42.00 | 599.00 | 810.00 | 672.00 | 703.00 | 659.00 | 686.00 | 652.00 | 731.00 | 668.00 | 686.00 | 688.00 | 733.00 | 684.00 | 670.00 | 671.00 | 725.00 | 661.00 | |
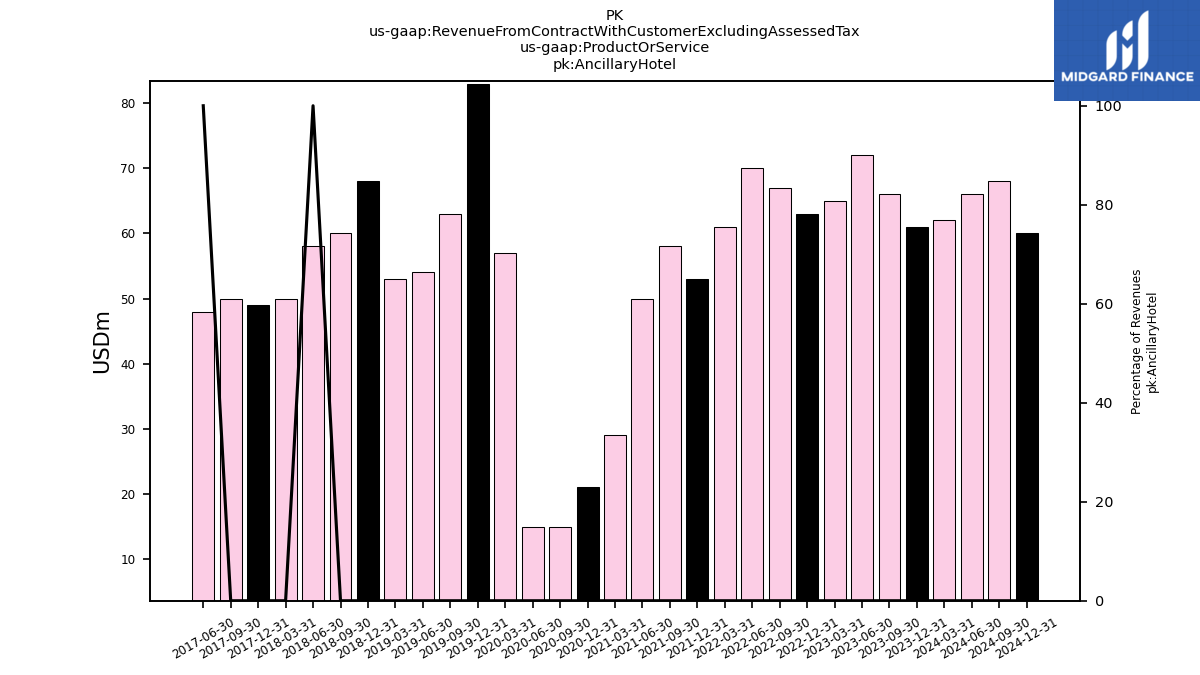
| Ancillary Hotel | 61.00 | 66.00 | 72.00 | 65.00 | 63.00 | 67.00 | 70.00 | 61.00 | 53.00 | 58.00 | 50.00 | 29.00 | 21.00 | 15.00 | 15.00 | 57.00 | 83.00 | 63.00 | 54.00 | 53.00 | 68.00 | 60.00 | 58.00 | 50.00 | 49.00 | 50.00 | 48.00 | NA | NA | NA | NA | NA | |
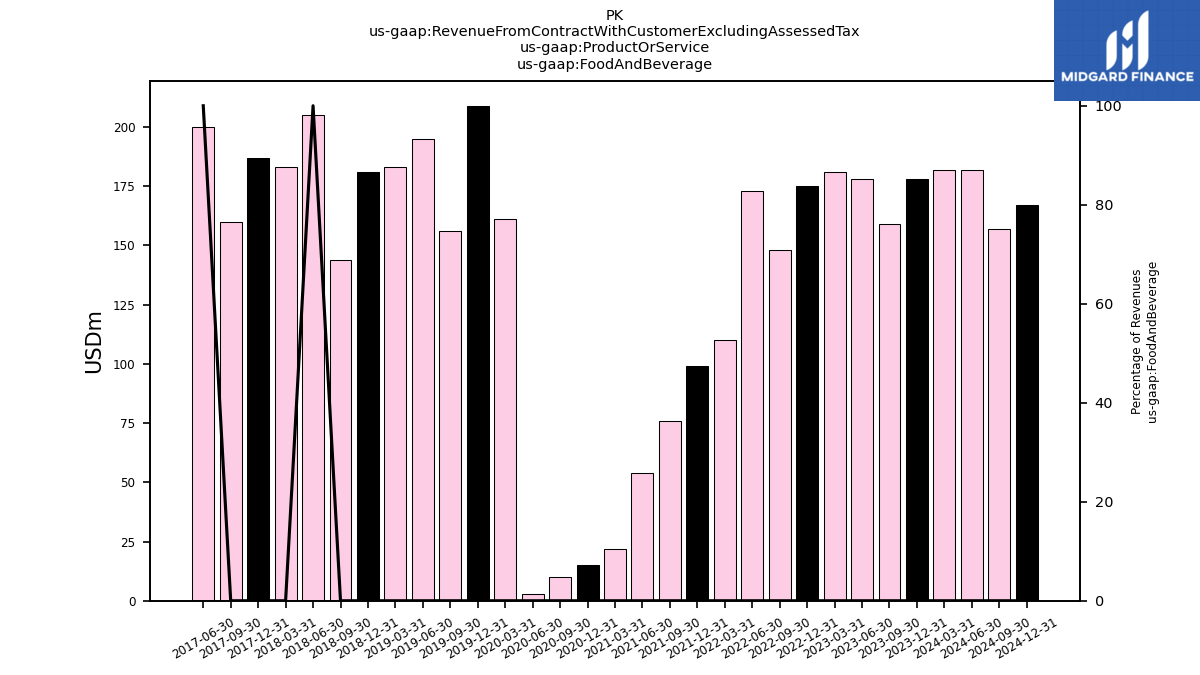
| Food And Beverage | 178.00 | 159.00 | 178.00 | 181.00 | 175.00 | 148.00 | 173.00 | 110.00 | 99.00 | 76.00 | 54.00 | 22.00 | 15.00 | 10.00 | 3.00 | 161.00 | 209.00 | 156.00 | 195.00 | 183.00 | 181.00 | 144.00 | 205.00 | 183.00 | 187.00 | 160.00 | 200.00 | NA | NA | NA | NA | NA | |
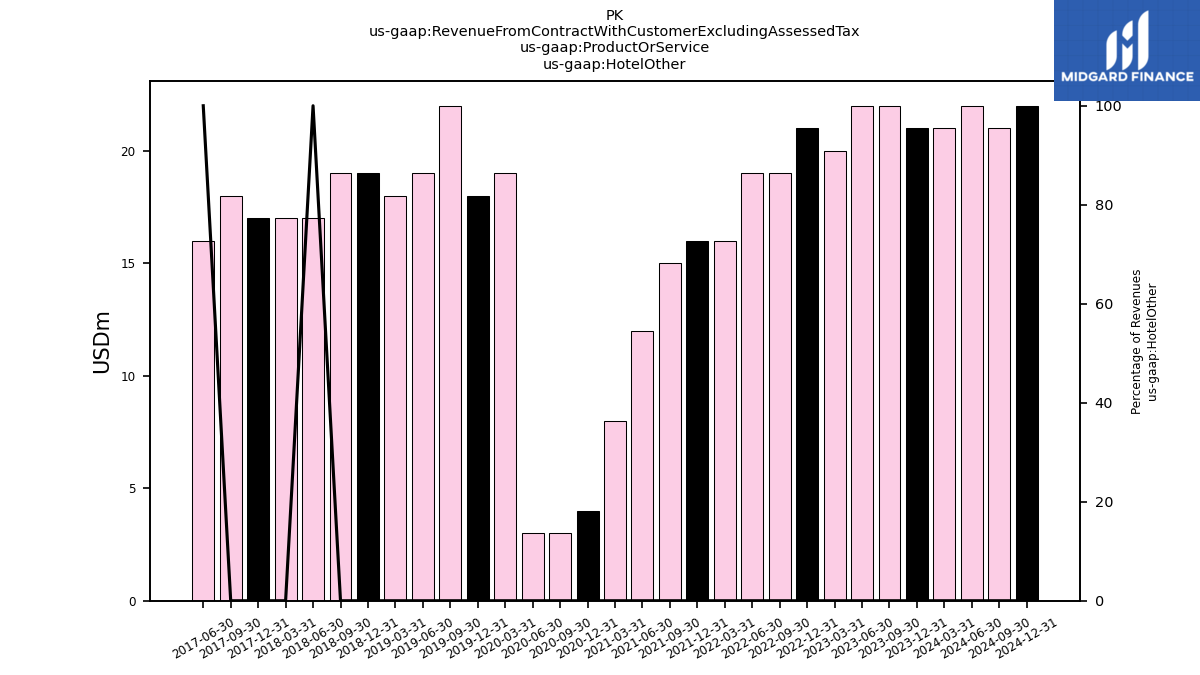
| Hotel Other | 21.00 | 22.00 | 22.00 | 20.00 | 21.00 | 19.00 | 19.00 | 16.00 | 16.00 | 15.00 | 12.00 | 8.00 | 4.00 | 3.00 | 3.00 | 19.00 | 18.00 | 22.00 | 19.00 | 18.00 | 19.00 | 19.00 | 17.00 | 17.00 | 17.00 | 18.00 | 16.00 | NA | NA | NA | NA | NA | |
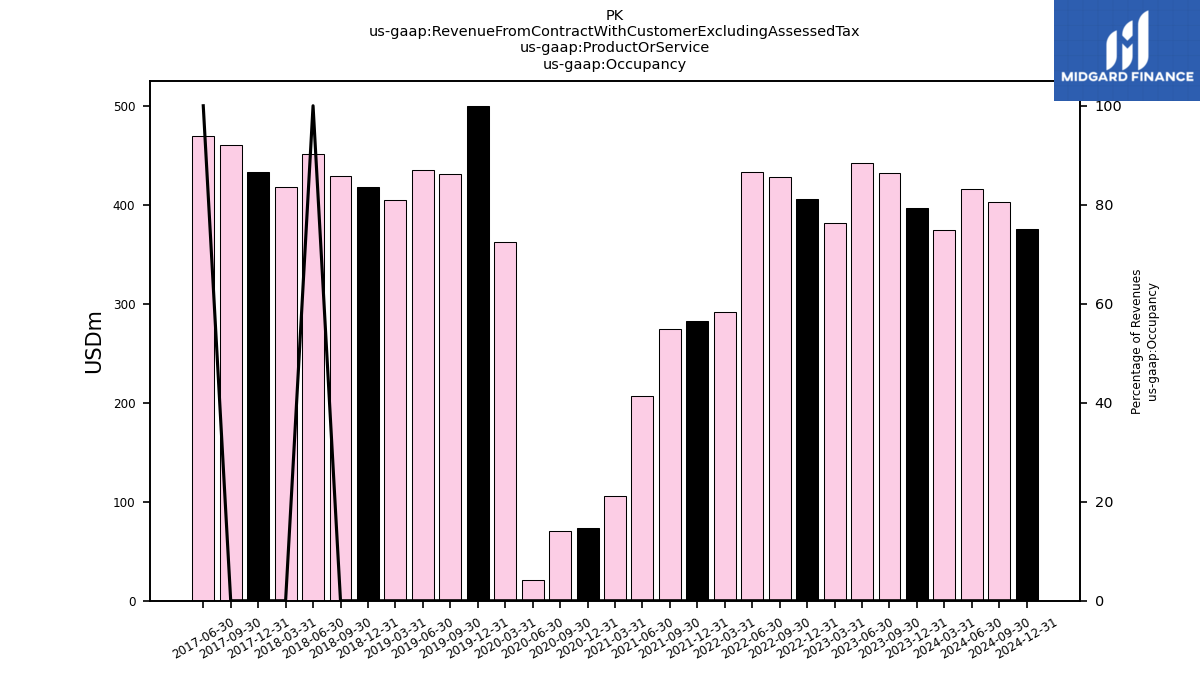
| Occupancy | 397.00 | 432.00 | 442.00 | 382.00 | 406.00 | 428.00 | 433.00 | 292.00 | 283.00 | 274.00 | 207.00 | 106.00 | 73.00 | 70.00 | 21.00 | 362.00 | 500.00 | 431.00 | 435.00 | 405.00 | 418.00 | 429.00 | 451.00 | 418.00 | 433.00 | 460.00 | 469.00 | NA | NA | NA | NA | NA | |
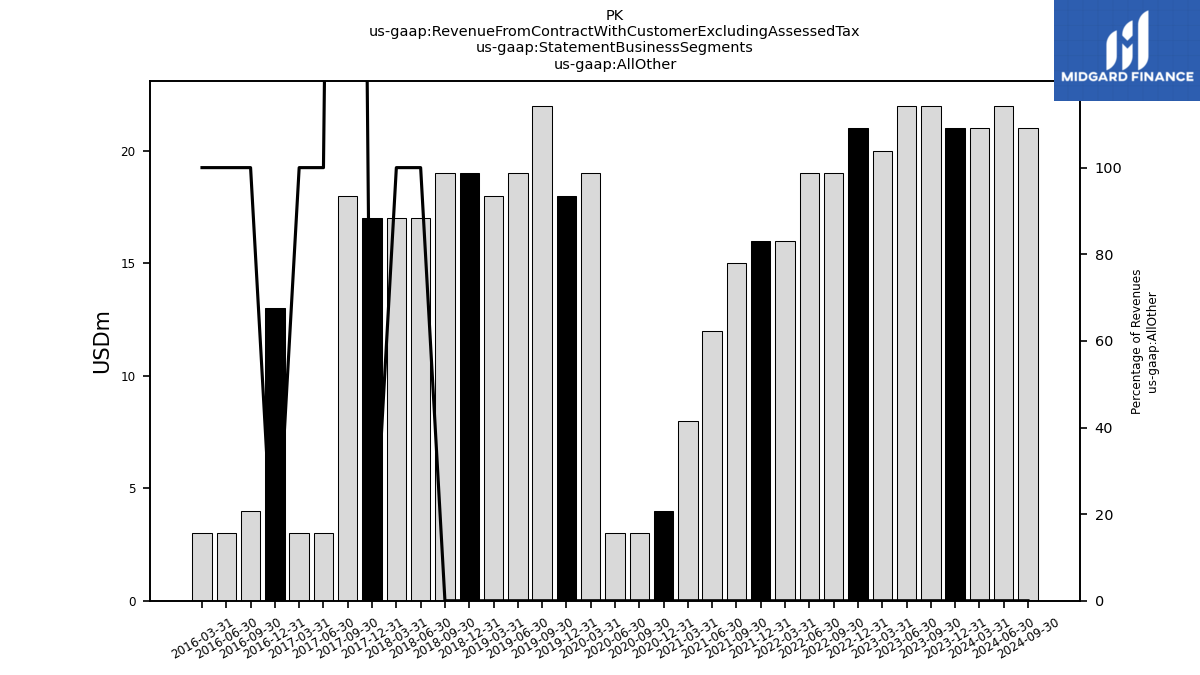
| All Other | 21.00 | 22.00 | 22.00 | 20.00 | 21.00 | 19.00 | 19.00 | 16.00 | 16.00 | 15.00 | 12.00 | 8.00 | 4.00 | 3.00 | 3.00 | 19.00 | 18.00 | 22.00 | 19.00 | 18.00 | 19.00 | 19.00 | 17.00 | 17.00 | 17.00 | 18.00 | 3.00 | 3.00 | 13.00 | 4.00 | 3.00 | 3.00 |