
| 2023-10-28 | 2023-07-29 | 2023-04-29 | 2023-01-28 | 2022-10-29 | 2022-07-30 | 2022-04-30 | 2022-01-29 | 2021-10-30 | 2021-07-31 | 2021-05-01 | 2021-01-30 | 2020-10-31 | 2020-08-01 | 2020-05-02 | 2020-02-01 | 2019-11-02 | 2019-08-03 | 2019-05-04 | 2019-02-02 | 2018-11-03 | 2018-08-04 | 2018-05-05 | 2018-02-03 | 2017-10-28 | 2017-07-29 | 2017-04-29 | 2017-01-28 | 2016-10-29 | 2016-07-30 | 2016-04-30 | 2016-01-30 | 2015-10-31 | 2015-08-01 | 2015-05-02 | 2015-01-31 | 2014-11-01 | 2014-08-02 | 2014-05-03 | 2014-02-01 | 2013-11-02 | 2013-08-03 | 2013-05-04 | 2013-02-02 | 2012-10-27 | 2012-07-28 | 2012-04-28 | 2012-01-28 | 2011-10-29 | 2011-07-30 | 2011-04-30 | 2011-01-29 | 2010-10-30 | 2010-07-31 | 2010-05-01 | ||
|---|---|---|---|---|---|---|---|---|---|---|---|---|---|---|---|---|---|---|---|---|---|---|---|---|---|---|---|---|---|---|---|---|---|---|---|---|---|---|---|---|---|---|---|---|---|---|---|---|---|---|---|---|---|---|---|---|
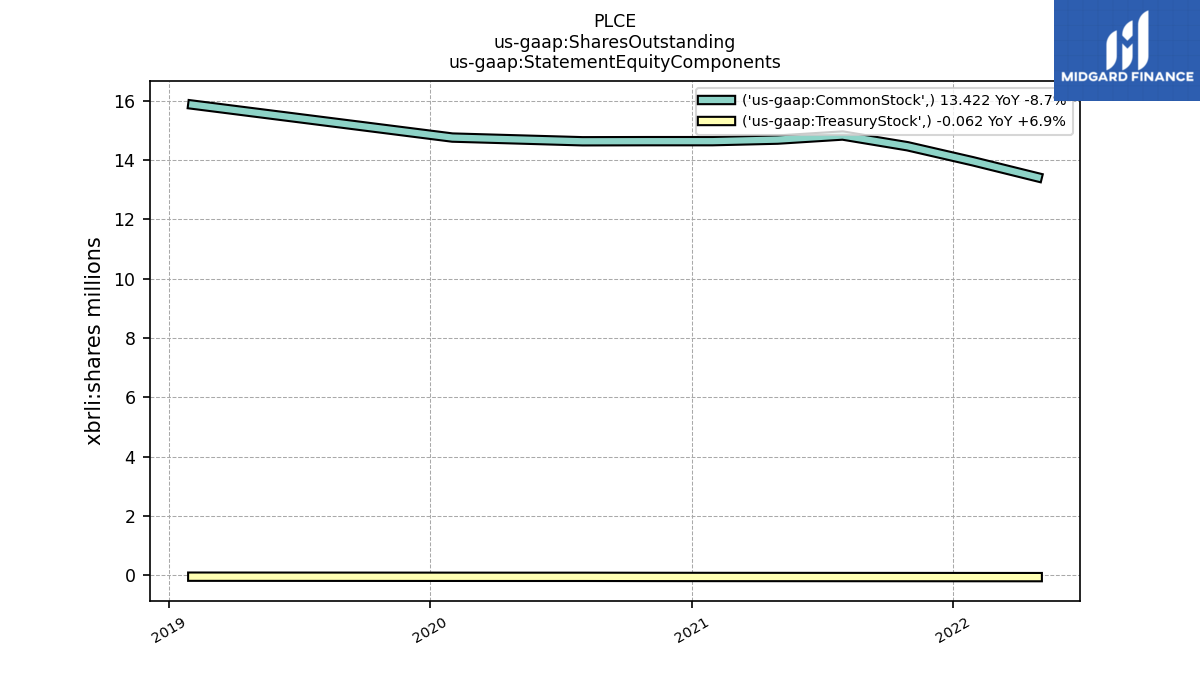
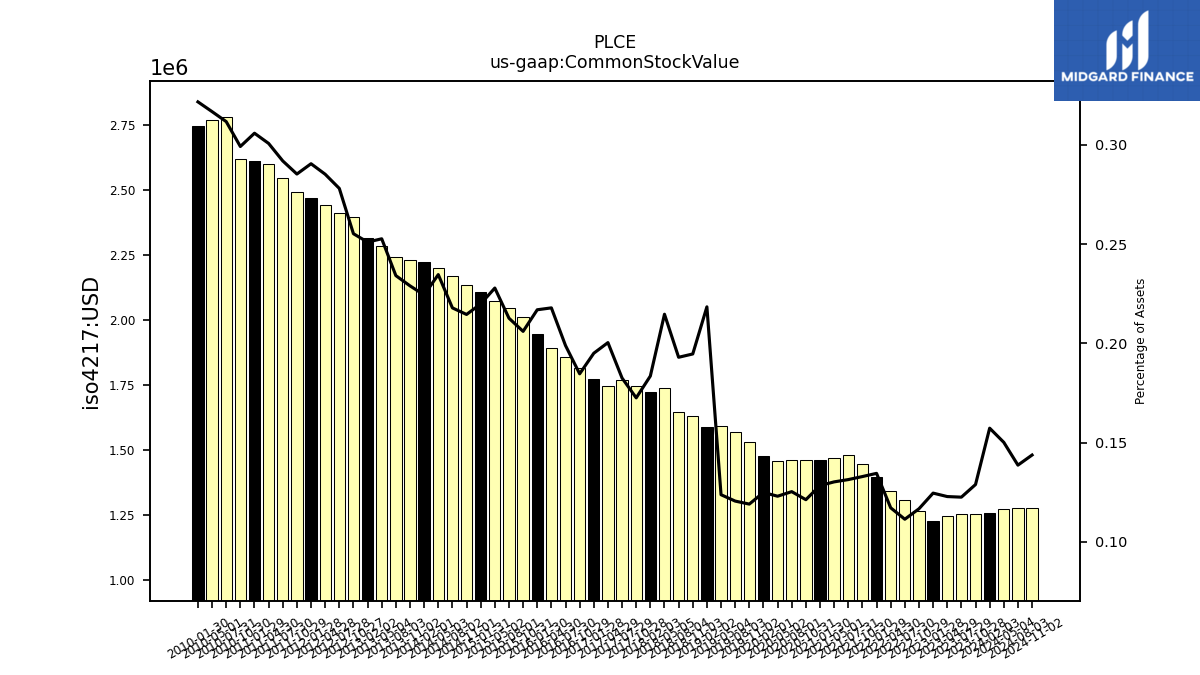
| Common Stock Value | 1.25 | 1.25 | 1.25 | 1.23 | 1.27 | 1.31 | 1.34 | 1.40 | 1.45 | 1.48 | 1.47 | 1.46 | 1.46 | 1.46 | 1.46 | 1.48 | 1.53 | 1.57 | 1.59 | 1.59 | 1.63 | 1.65 | 1.74 | 1.73 | 1.75 | 1.77 | 1.75 | 1.78 | 1.82 | 1.86 | 1.89 | 1.95 | 2.01 | 2.05 | 2.07 | 2.11 | 2.14 | 2.17 | 2.20 | 2.22 | 2.23 | 2.24 | 2.29 | 2.32 | 2.40 | 2.42 | 2.44 | 2.47 | 2.49 | 2.55 | 2.60 | 2.61 | 2.62 | 2.78 | 2.77 | |
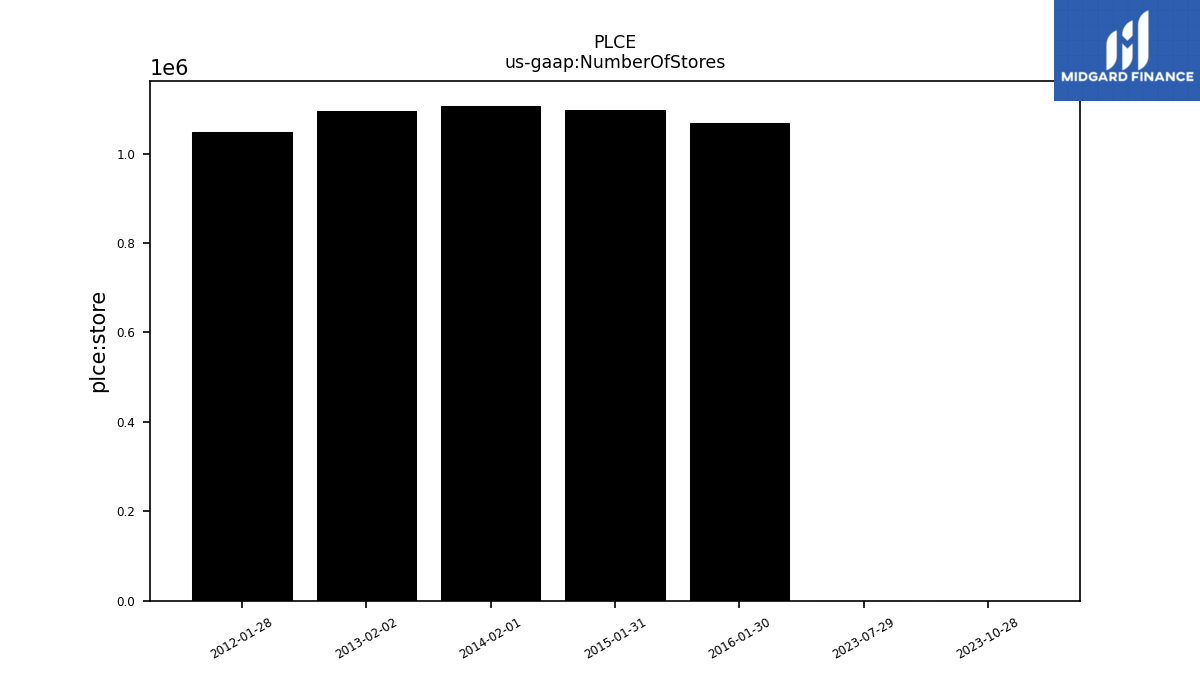
| Number Of Stores | 0.00 | 0.00 | NA | NA | NA | NA | NA | NA | NA | NA | NA | NA | NA | NA | NA | NA | NA | NA | NA | NA | NA | NA | NA | NA | NA | NA | NA | NA | NA | NA | NA | 1.07 | NA | NA | NA | 1.10 | NA | NA | NA | 1.11 | NA | NA | NA | 1.09 | NA | NA | NA | 1.05 | NA | NA | NA | NA | NA | NA | NA | |
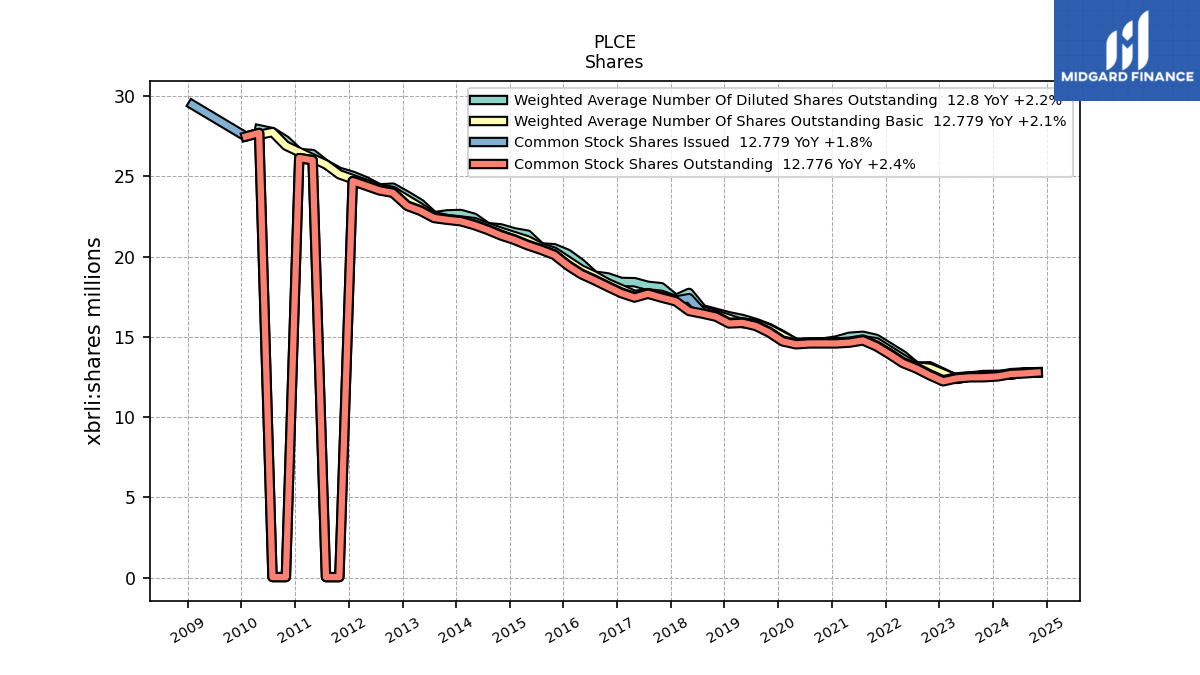
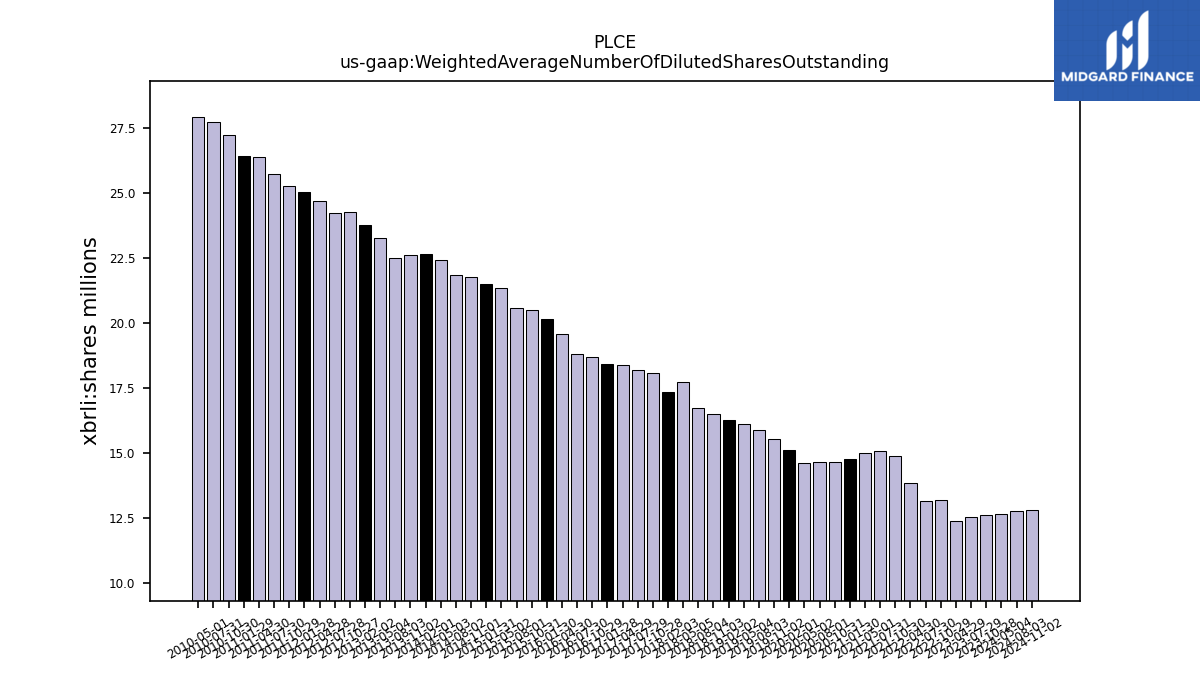
| Weighted Average Number Of Diluted Shares Outstanding | 12.62 | 12.52 | 12.37 | NA | 13.16 | 13.15 | 13.84 | NA | 14.87 | 15.06 | 15.00 | 14.77 | 14.64 | 14.63 | 14.61 | 15.10 | 15.55 | 15.86 | 16.11 | 16.28 | 16.50 | 16.71 | 17.73 | 17.36 | 18.09 | 18.18 | 18.40 | 18.42 | 18.70 | 18.81 | 19.57 | 20.17 | 20.52 | 20.58 | 21.37 | 21.51 | 21.76 | 21.84 | 22.42 | 22.65 | 22.63 | 22.51 | 23.29 | 23.79 | 24.29 | 24.25 | 24.69 | 25.03 | 25.28 | 25.74 | 26.39 | 26.45 | 27.24 | 27.75 | 27.93 | |
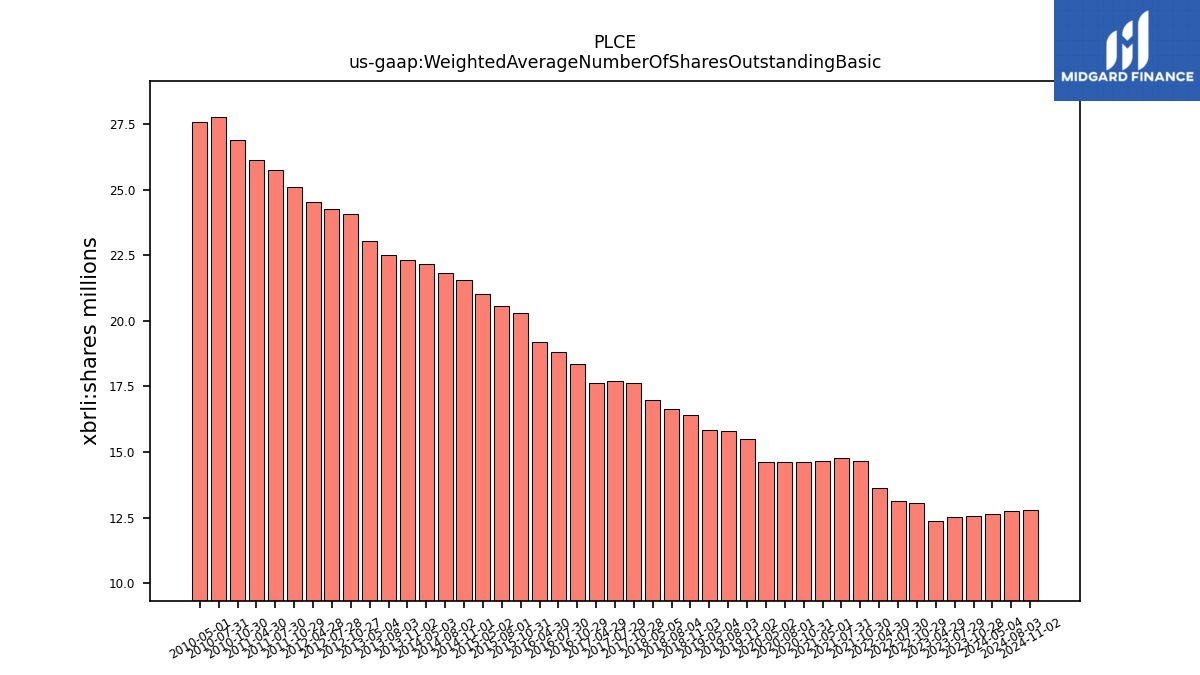
| Weighted Average Number Of Shares Outstanding Basic | 12.55 | 12.52 | 12.37 | NA | 13.06 | 13.15 | 13.62 | NA | 14.67 | 14.78 | 14.67 | NA | 14.64 | 14.63 | 14.61 | NA | 15.50 | 15.82 | 15.85 | NA | 16.39 | 16.64 | 17.00 | NA | 17.62 | 17.70 | 17.61 | NA | 18.34 | 18.81 | 19.20 | NA | 20.30 | 20.58 | 21.01 | NA | 21.54 | 21.84 | 22.15 | NA | 22.34 | 22.51 | 23.04 | NA | 24.09 | 24.25 | 24.54 | NA | 25.12 | 25.74 | 26.12 | NA | 26.91 | 27.75 | 27.58 | |
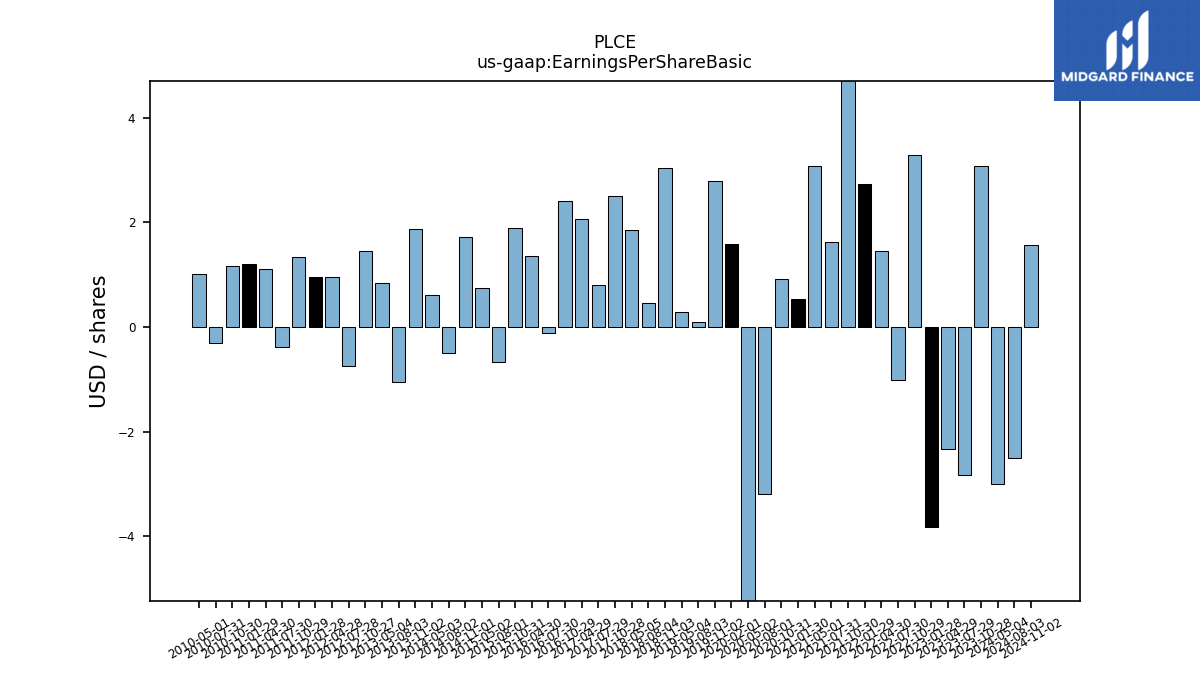
| Earnings Per Share Basic | 3.07 | -2.82 | -2.33 | -3.81 | 3.28 | -1.01 | 1.46 | 2.74 | 5.38 | 1.63 | 3.08 | 0.54 | 0.91 | -3.19 | -7.86 | 1.59 | 2.78 | 0.10 | 0.28 | NA | 3.04 | 0.45 | 1.85 | NA | 2.50 | 0.81 | 2.06 | NA | 2.41 | -0.11 | 1.35 | NA | 1.90 | -0.67 | 0.74 | NA | 1.71 | -0.49 | 0.61 | NA | 1.87 | -1.05 | 0.84 | NA | 1.45 | -0.74 | 0.96 | 0.96 | 1.34 | -0.38 | 1.11 | 1.21 | 1.16 | -0.30 | 1.01 | |
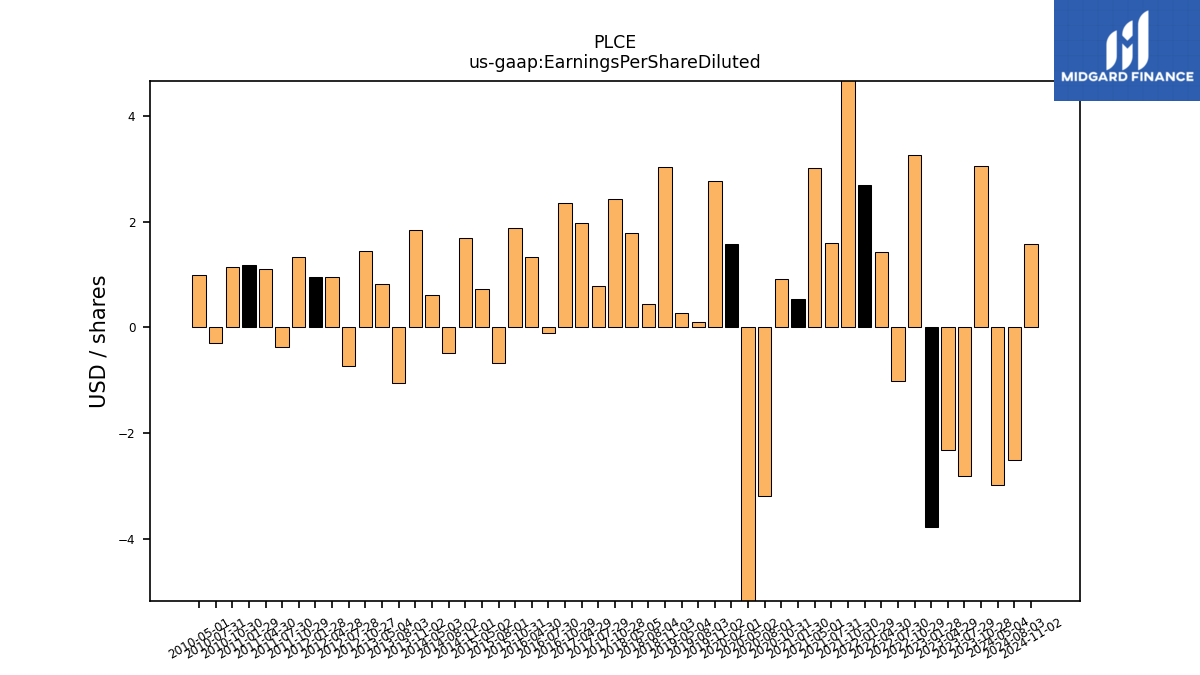
| Earnings Per Share Diluted | 3.05 | -2.82 | -2.33 | -3.77 | 3.26 | -1.01 | 1.43 | 2.70 | 5.30 | 1.60 | 3.01 | 0.54 | 0.91 | -3.19 | -7.86 | 1.58 | 2.77 | 0.10 | 0.28 | NA | 3.03 | 0.45 | 1.78 | NA | 2.44 | 0.79 | 1.97 | NA | 2.36 | -0.11 | 1.33 | NA | 1.88 | -0.67 | 0.73 | NA | 1.70 | -0.49 | 0.61 | NA | 1.84 | -1.05 | 0.83 | NA | 1.44 | -0.74 | 0.96 | 0.96 | 1.33 | -0.38 | 1.10 | 1.19 | 1.15 | -0.30 | 1.00 |
| 2023-10-28 | 2023-07-29 | 2023-04-29 | 2023-01-28 | 2022-10-29 | 2022-07-30 | 2022-04-30 | 2022-01-29 | 2021-10-30 | 2021-07-31 | 2021-05-01 | 2021-01-30 | 2020-10-31 | 2020-08-01 | 2020-05-02 | 2020-02-01 | 2019-11-02 | 2019-08-03 | 2019-05-04 | 2019-02-02 | 2018-11-03 | 2018-08-04 | 2018-05-05 | 2018-02-03 | 2017-10-28 | 2017-07-29 | 2017-04-29 | 2017-01-28 | 2016-10-29 | 2016-07-30 | 2016-04-30 | 2016-01-30 | 2015-10-31 | 2015-08-01 | 2015-05-02 | 2015-01-31 | 2014-11-01 | 2014-08-02 | 2014-05-03 | 2014-02-01 | 2013-11-02 | 2013-08-03 | 2013-05-04 | 2013-02-02 | 2012-10-27 | 2012-07-28 | 2012-04-28 | 2012-01-28 | 2011-10-29 | 2011-07-30 | 2011-04-30 | 2011-01-29 | 2010-10-30 | 2010-07-31 | 2010-05-01 | ||
|---|---|---|---|---|---|---|---|---|---|---|---|---|---|---|---|---|---|---|---|---|---|---|---|---|---|---|---|---|---|---|---|---|---|---|---|---|---|---|---|---|---|---|---|---|---|---|---|---|---|---|---|---|---|---|---|---|
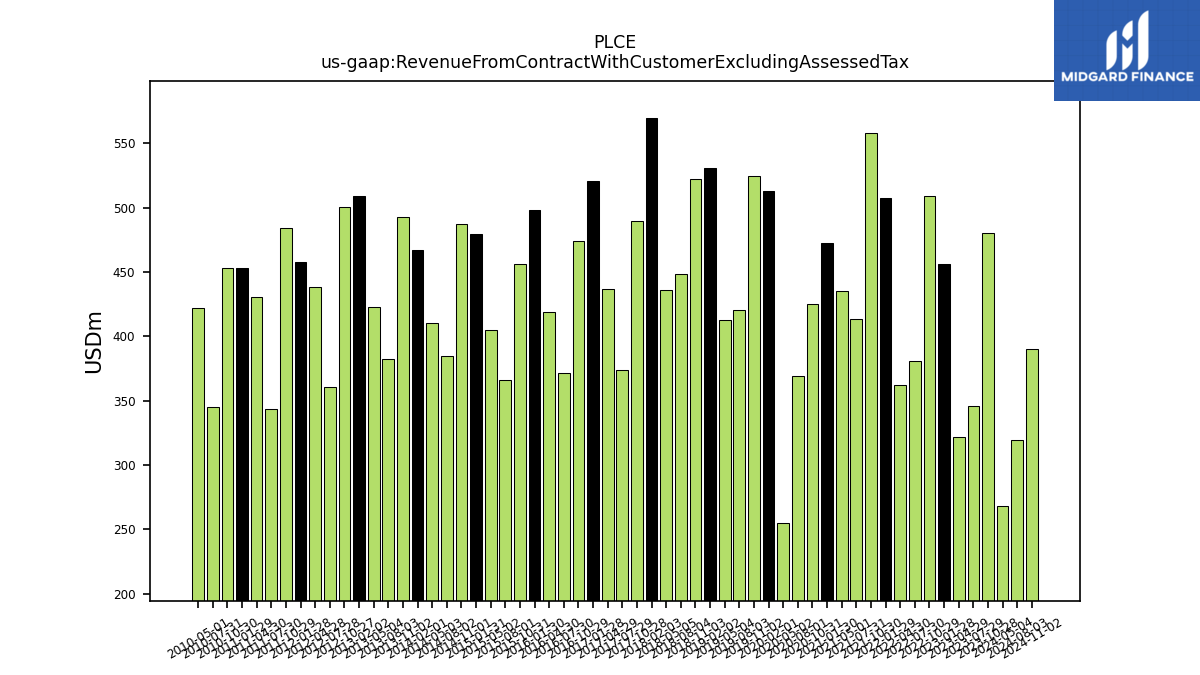
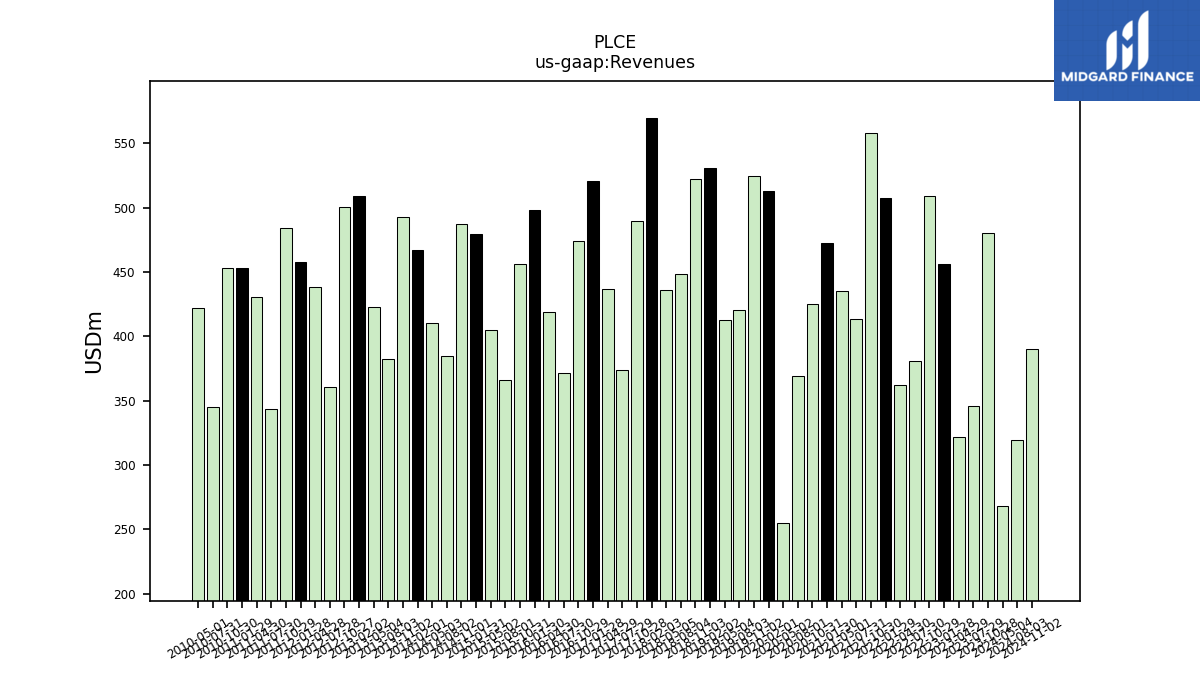
| Revenue From Contract With Customer Excluding Assessed Tax | 480.23 | 345.60 | 321.64 | 456.13 | 509.12 | 380.88 | 362.35 | 507.80 | 558.23 | 413.86 | 435.48 | 472.90 | 425.57 | 368.92 | 255.21 | 513.02 | 524.80 | 420.47 | 412.38 | 530.56 | 522.50 | 448.72 | 436.31 | 569.97 | 490.03 | 373.60 | 436.68 | 520.77 | 473.78 | 371.42 | 419.35 | 498.54 | 455.91 | 366.45 | 404.87 | 479.24 | 487.30 | 384.63 | 410.15 | 467.50 | 492.68 | 382.45 | 423.16 | 509.22 | 500.93 | 360.83 | 438.51 | 457.46 | 484.08 | 343.51 | 430.81 | 453.17 | 453.39 | 345.30 | 422.13 | |
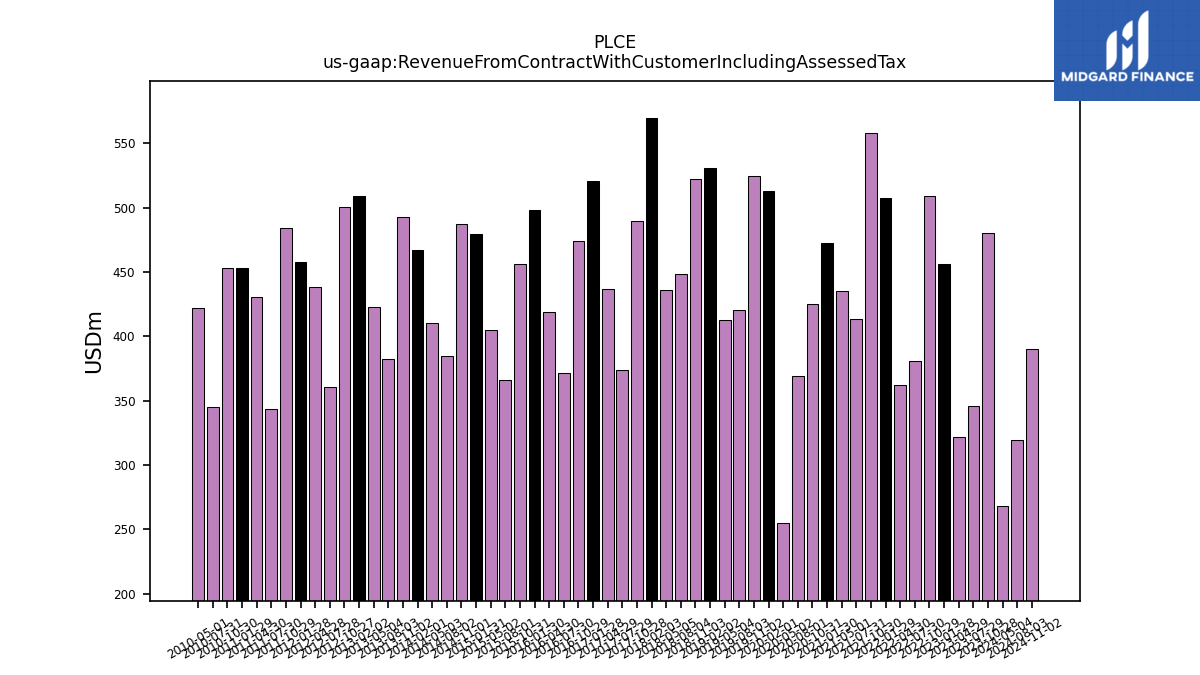
| Revenue From Contract With Customer Including Assessed Tax | 480.23 | 345.60 | 321.64 | 456.13 | 509.12 | 380.88 | 362.35 | 507.80 | 558.23 | 413.86 | 435.48 | 472.90 | 425.57 | 368.92 | 255.21 | 513.02 | 524.80 | 420.47 | 412.38 | 530.56 | 522.50 | 448.72 | 436.31 | 569.97 | 490.03 | 373.60 | 436.68 | 520.77 | 473.78 | 371.42 | 419.35 | 498.54 | 455.91 | 366.45 | 404.87 | 479.24 | 487.30 | 384.63 | 410.15 | 467.50 | 492.68 | 382.45 | 423.16 | 509.22 | 500.93 | 360.83 | 438.51 | 457.46 | 484.08 | 343.51 | 430.81 | 453.17 | 453.39 | 345.30 | 422.13 | |
| Revenues | 480.23 | 345.60 | 321.64 | 456.13 | 509.12 | 380.88 | 362.35 | 507.80 | 558.23 | 413.86 | 435.48 | 472.90 | 425.57 | 368.92 | 255.21 | 513.02 | 524.80 | 420.47 | 412.38 | 530.56 | 522.50 | 448.72 | 436.31 | 569.97 | 490.03 | 373.60 | 436.68 | 520.77 | 473.78 | 371.42 | 419.35 | 498.54 | 455.91 | 366.45 | 404.87 | 479.24 | 487.30 | 384.63 | 410.15 | 467.50 | 492.68 | 382.45 | 423.16 | 509.22 | 500.93 | 360.83 | 438.51 | 457.46 | 484.08 | 343.51 | 430.81 | 453.17 | 453.39 | 345.30 | 422.13 | |
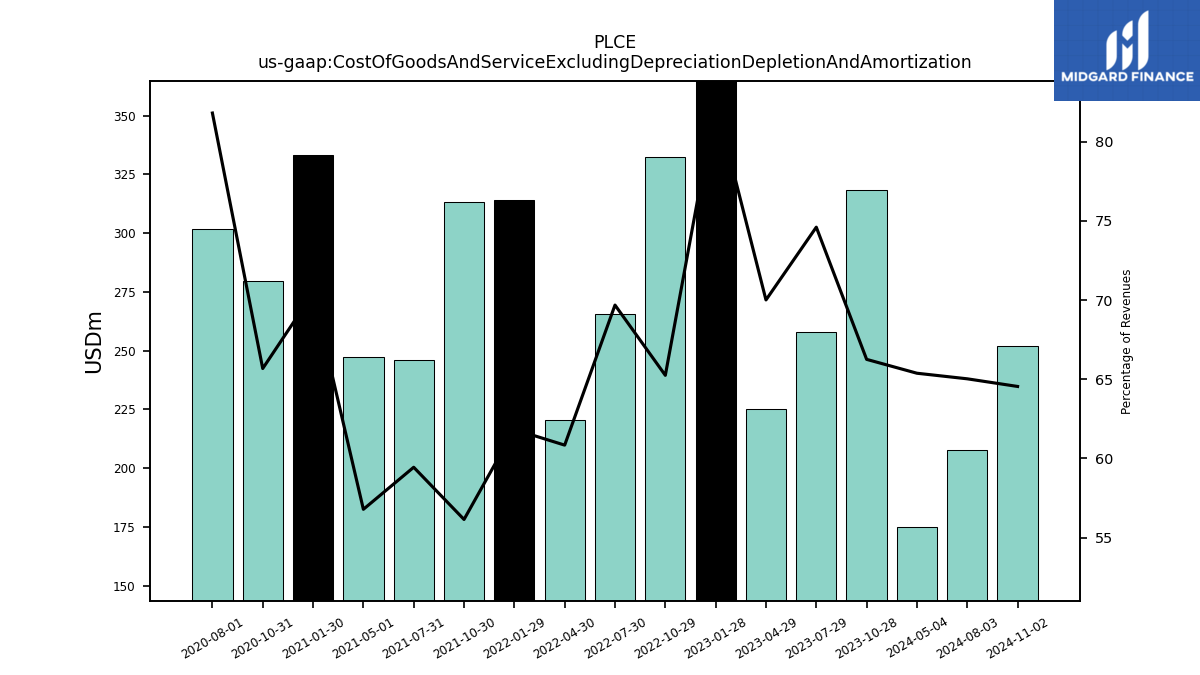
| Cost Of Goods And Service Excluding Depreciation Depletion And Amortization | 318.18 | 257.84 | 225.18 | 376.40 | 332.19 | 265.42 | 220.44 | 313.96 | 313.39 | 245.99 | 247.28 | 333.12 | 279.51 | 301.84 | NA | NA | NA | NA | NA | NA | NA | NA | NA | NA | NA | NA | NA | NA | NA | NA | NA | NA | NA | NA | NA | NA | NA | NA | NA | NA | NA | NA | NA | NA | NA | NA | NA | NA | NA | NA | NA | NA | NA | NA | NA | |
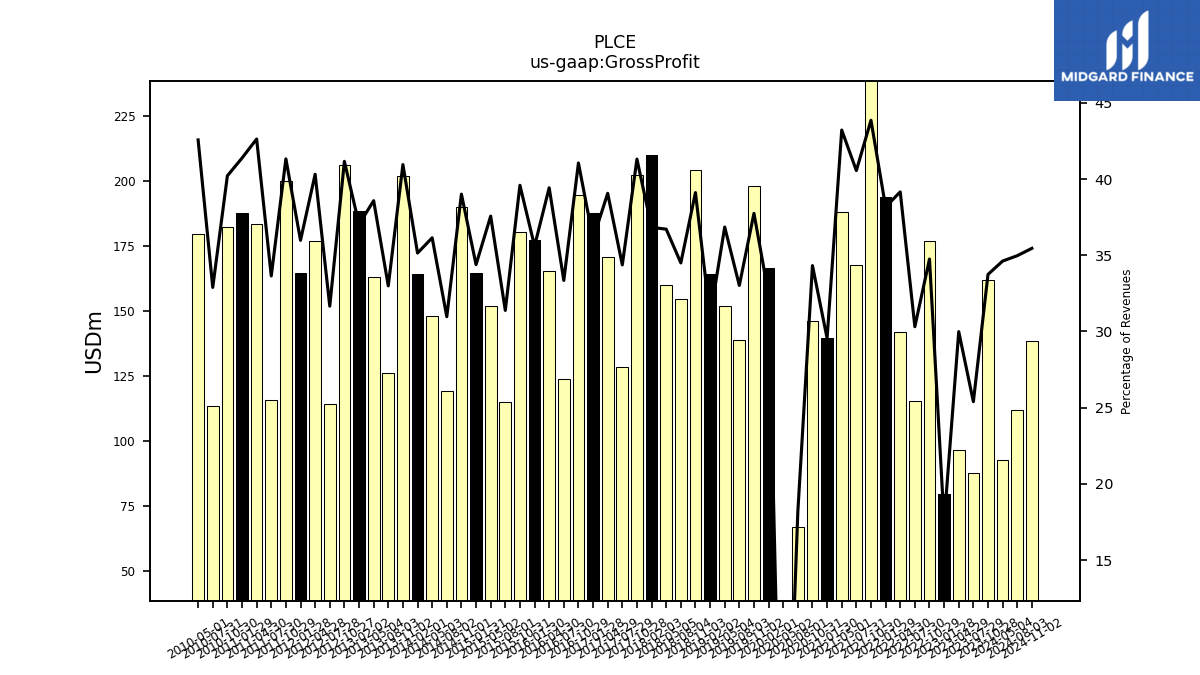
| Gross Profit | 162.05 | 87.76 | 96.46 | 79.72 | 176.93 | 115.46 | 141.91 | 193.84 | 244.83 | 167.86 | 188.21 | 139.78 | 146.06 | 67.08 | -19.67 | 166.36 | 198.12 | 138.85 | 151.98 | 164.23 | 204.37 | 154.81 | 160.19 | 209.93 | 202.43 | 128.41 | 170.59 | 187.85 | 194.52 | 123.87 | 165.35 | 177.51 | 180.51 | 115.00 | 152.11 | 164.81 | 190.11 | 119.12 | 148.26 | 164.31 | 201.76 | 126.18 | 163.27 | 188.56 | 206.20 | 114.24 | 176.79 | 164.60 | 200.05 | 115.56 | 183.65 | 187.53 | 182.34 | 113.57 | 179.70 | |
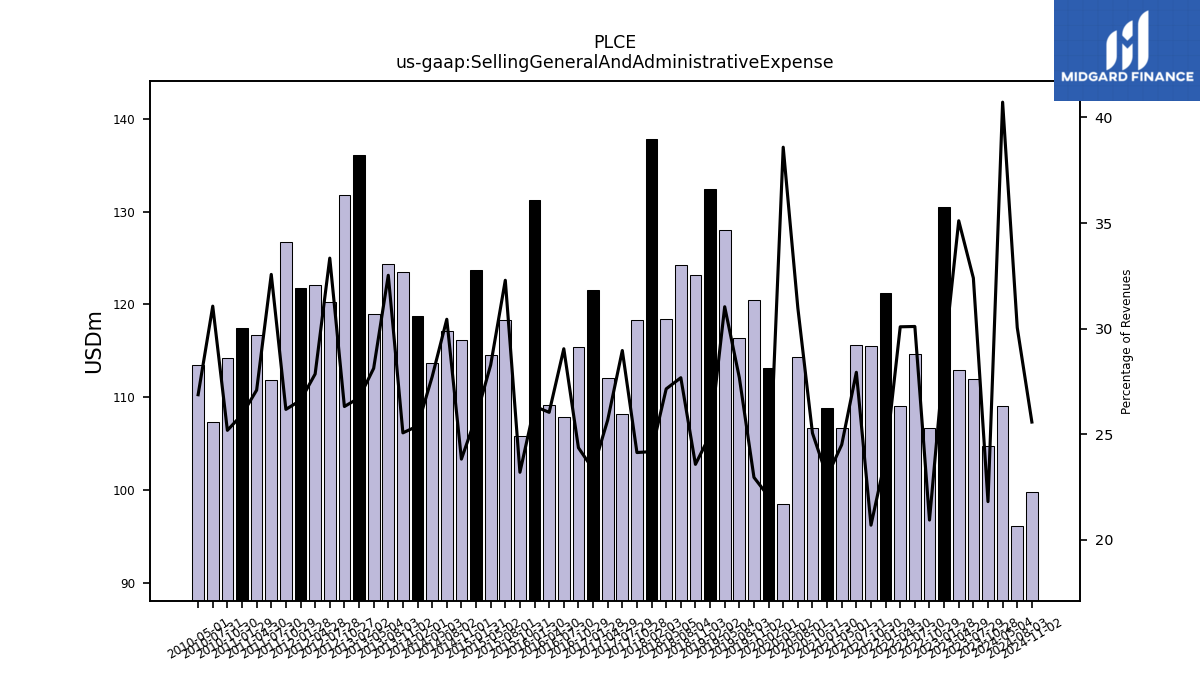
| Selling General And Administrative Expense | 104.77 | 111.97 | 112.93 | 130.49 | 106.63 | 114.67 | 109.04 | 121.25 | 115.56 | 115.62 | 106.74 | 108.79 | 106.64 | 114.31 | 98.49 | 113.18 | 120.51 | 116.42 | 128.01 | 132.46 | 123.21 | 124.21 | 118.47 | 137.84 | 118.29 | 108.23 | 112.13 | 121.59 | 115.44 | 107.90 | 109.21 | 131.25 | 105.80 | 118.34 | 114.51 | 123.73 | 116.12 | 117.11 | 113.72 | 118.72 | 123.52 | 124.41 | 119.01 | 136.09 | 131.83 | 120.31 | 122.15 | 121.73 | 126.74 | 111.89 | 116.72 | 117.51 | 114.21 | 107.28 | 113.45 | |
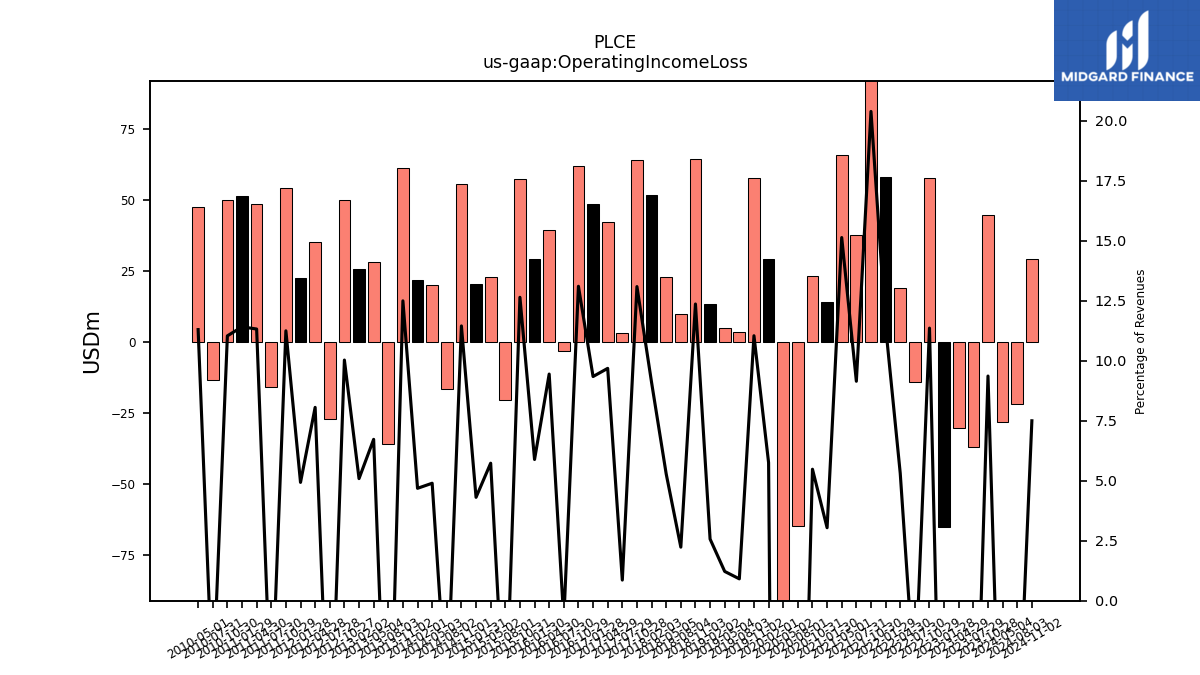
| Operating Income Loss | 44.97 | -36.94 | -30.07 | -64.79 | 57.84 | -13.83 | 19.25 | 58.08 | 113.81 | 37.85 | 65.91 | 14.39 | 23.32 | -64.48 | -173.14 | 29.53 | 57.95 | 3.84 | 5.04 | 13.64 | 64.61 | 10.02 | 23.06 | 51.86 | 64.15 | 3.22 | 42.28 | 48.66 | 62.08 | -2.94 | 39.61 | 29.35 | 57.65 | -20.12 | 23.20 | 20.65 | 55.80 | -16.50 | 20.08 | 21.90 | 61.57 | -35.65 | 28.46 | 25.92 | 50.24 | -26.89 | 35.33 | 22.56 | 54.45 | -15.78 | 48.78 | 51.73 | 50.04 | -13.13 | 47.69 | |
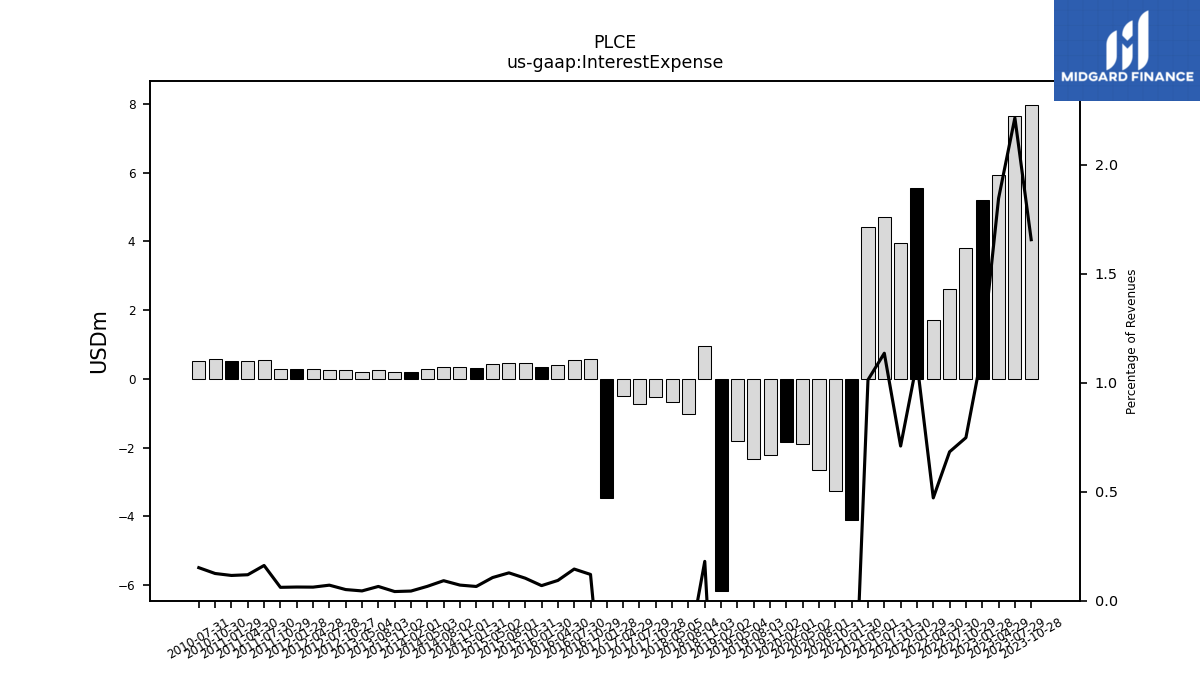
| Interest Expense | 7.96 | 7.66 | 5.94 | 5.20 | 3.81 | 2.60 | 1.71 | 5.56 | 3.96 | 4.70 | 4.41 | -4.10 | -3.27 | -2.65 | -1.89 | -1.85 | -2.22 | -2.32 | -1.80 | -6.17 | 0.94 | -1.03 | -0.66 | NA | -0.52 | -0.74 | -0.51 | -3.46 | 0.57 | 0.54 | 0.39 | 0.35 | 0.47 | 0.47 | 0.43 | 0.31 | 0.35 | 0.35 | 0.27 | 0.21 | 0.21 | 0.25 | 0.19 | NA | 0.26 | 0.26 | 0.27 | 0.29 | 0.30 | 0.56 | 0.51 | 0.53 | 0.57 | 0.52 | NA | |
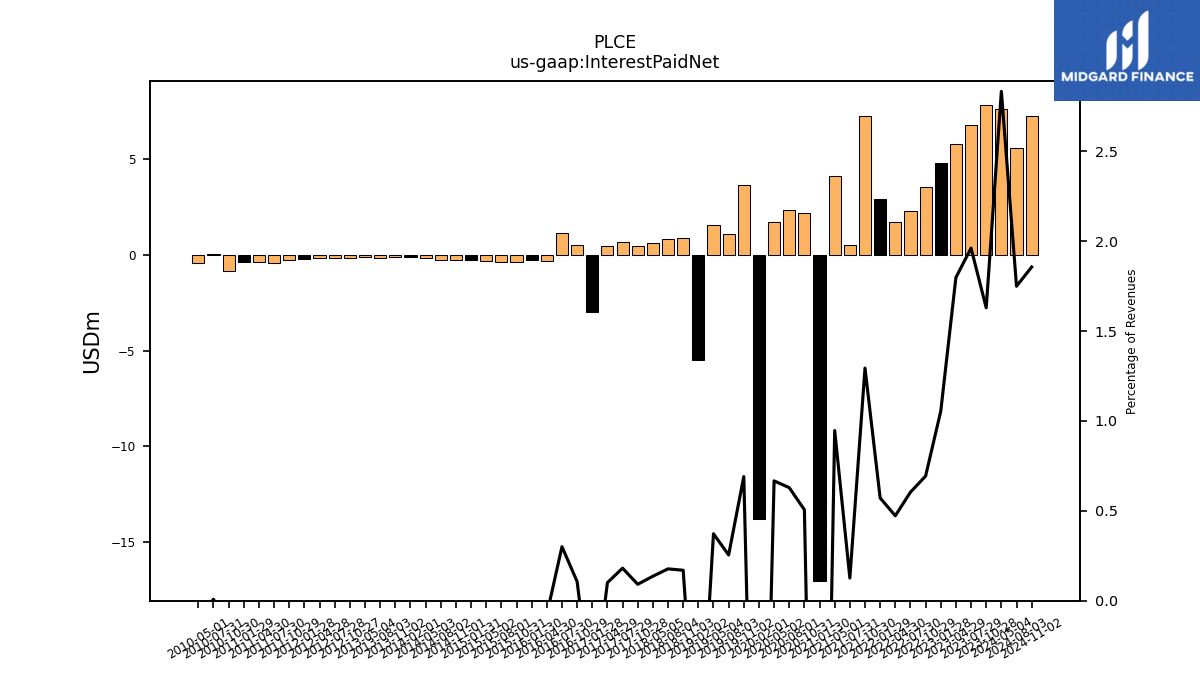
| Interest Paid Net | 7.83 | 6.78 | 5.78 | 4.81 | 3.53 | 2.30 | 1.71 | 2.90 | 7.22 | 0.52 | 4.12 | -17.01 | 2.15 | 2.32 | 1.70 | -13.79 | 3.62 | 1.07 | 1.54 | -5.50 | 0.89 | 0.80 | 0.59 | NA | 0.45 | 0.68 | 0.44 | -2.98 | 0.51 | 1.12 | -0.32 | -0.28 | -0.40 | -0.38 | -0.34 | -0.26 | -0.26 | -0.27 | -0.15 | -0.12 | -0.12 | -0.16 | -0.10 | NA | -0.17 | -0.17 | -0.18 | -0.21 | -0.28 | -0.41 | -0.37 | -0.38 | -0.84 | 0.03 | -0.41 | |
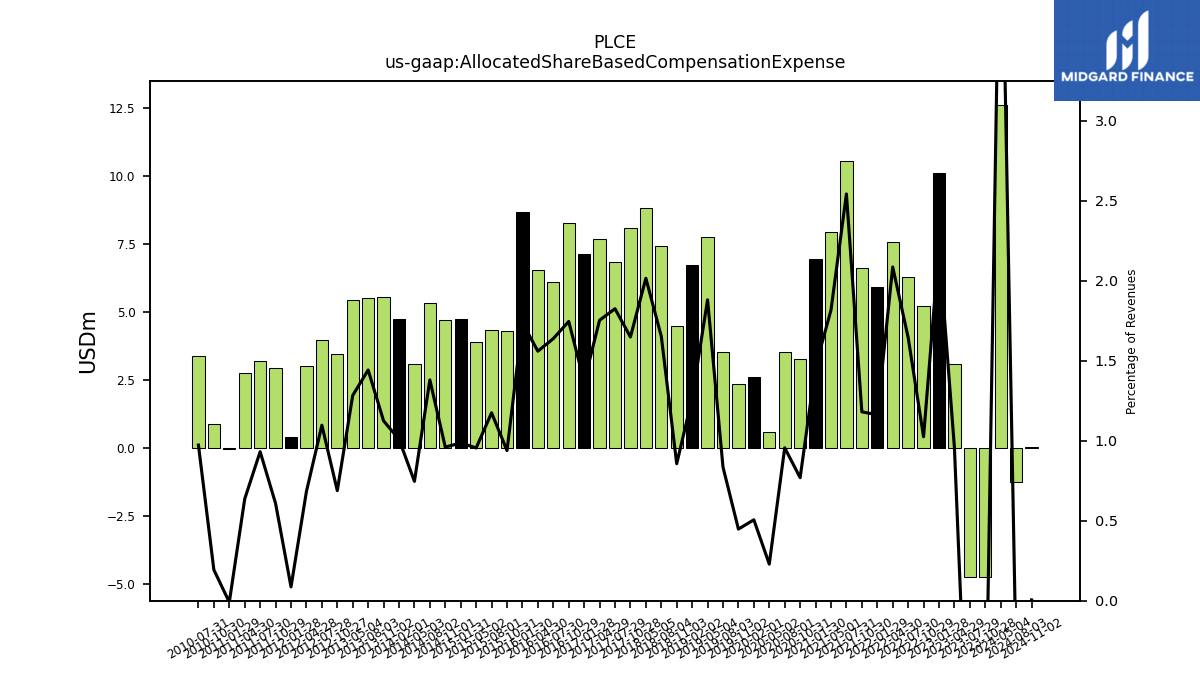
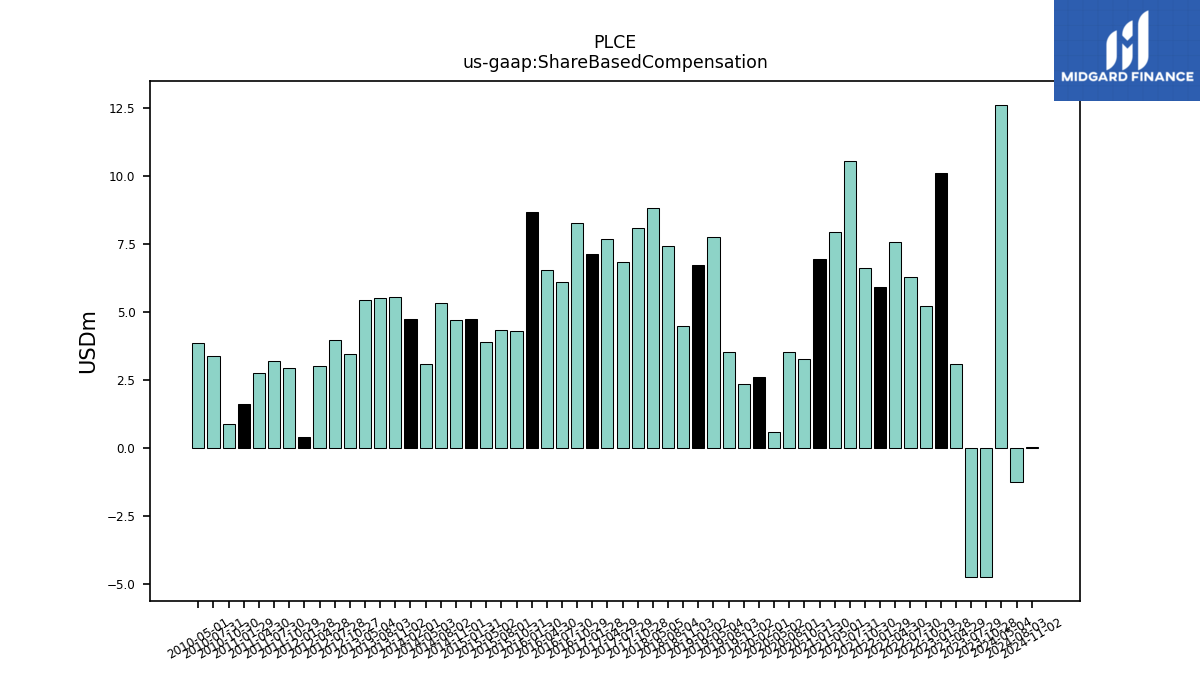
| Allocated Share Based Compensation Expense | -4.75 | -4.76 | 3.08 | 10.10 | 5.22 | 6.27 | 7.56 | 5.91 | 6.59 | 10.53 | 7.92 | 6.93 | 3.27 | 3.53 | 0.58 | 2.60 | 2.35 | 3.51 | 7.76 | 6.72 | 4.48 | 7.42 | 8.80 | NA | 8.08 | 6.82 | 7.66 | 7.14 | 8.28 | 6.09 | 6.54 | 8.66 | 4.28 | 4.31 | 3.87 | 4.73 | 4.68 | 5.31 | 3.06 | 4.72 | 5.54 | 5.52 | 5.43 | NA | 3.45 | 3.96 | 3.00 | 0.40 | 2.94 | 3.20 | 2.74 | -0.04 | 0.88 | 3.36 | NA | |
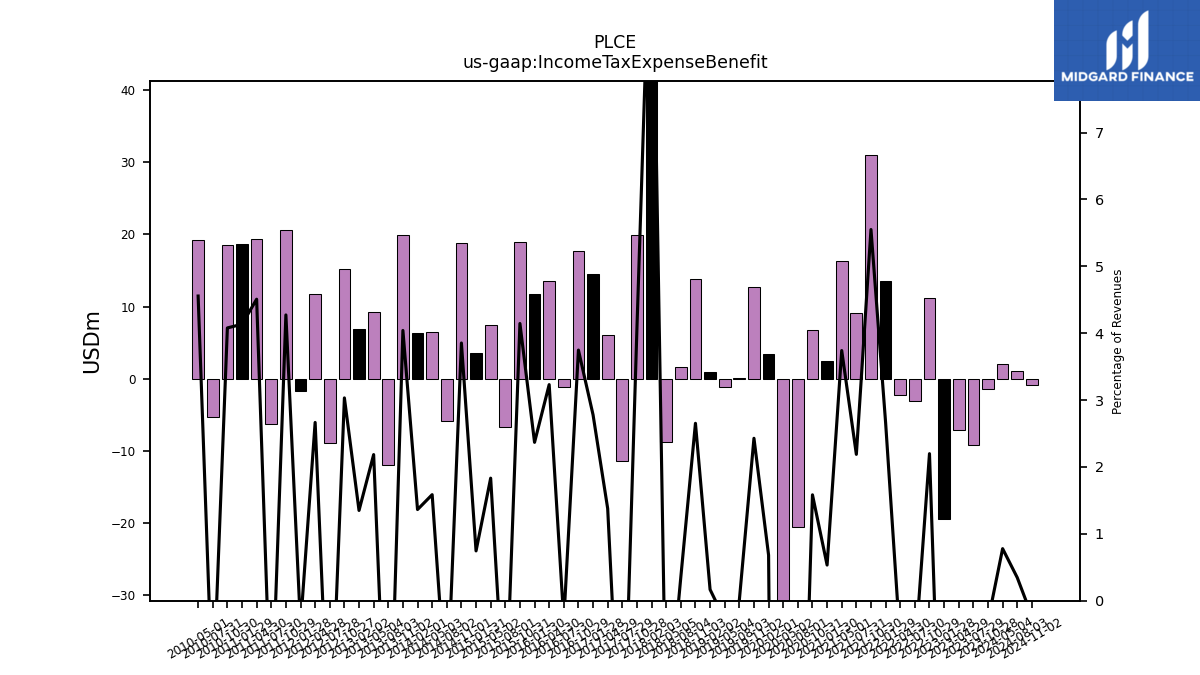
| Income Tax Expense Benefit | -1.45 | -9.23 | -7.14 | -19.42 | 11.20 | -3.12 | -2.28 | 13.53 | 30.98 | 9.06 | 16.29 | 2.52 | 6.74 | -20.48 | -60.17 | 3.50 | 12.75 | 0.04 | -1.16 | 0.89 | 13.86 | 1.59 | -8.78 | 61.88 | 19.97 | -11.36 | 6.02 | 14.47 | 17.76 | -1.10 | 13.55 | 11.81 | 18.90 | -6.63 | 7.42 | 3.57 | 18.78 | -5.87 | 6.51 | 6.38 | 19.91 | -12.01 | 9.25 | 6.88 | 15.19 | -8.93 | 11.69 | -1.70 | 20.69 | -6.32 | 19.42 | 18.74 | 18.49 | -5.24 | 19.23 | |
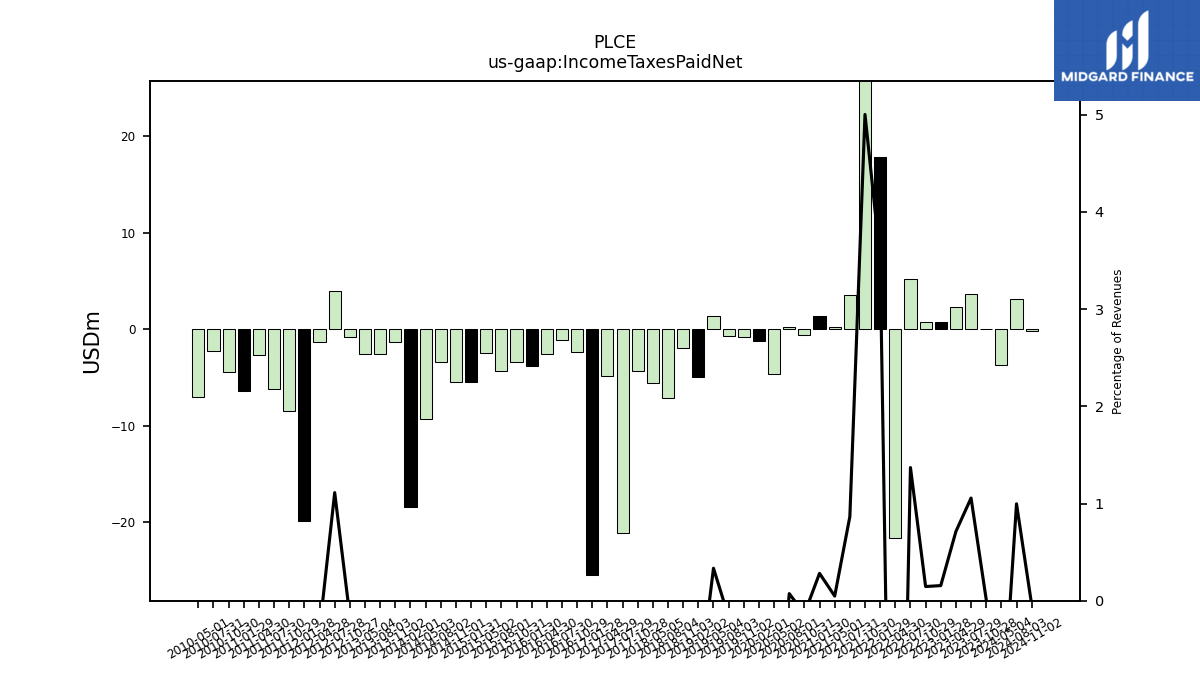
| Income Taxes Paid Net | 0.06 | 3.65 | 2.29 | 0.71 | 0.74 | 5.22 | -21.64 | 17.84 | 27.93 | 3.58 | 0.21 | 1.33 | -0.57 | 0.27 | -4.68 | -1.24 | -0.74 | -0.71 | 1.38 | -4.94 | -1.92 | -7.09 | -5.57 | NA | -4.31 | -21.10 | -4.88 | -25.46 | -2.40 | -1.11 | -2.52 | -3.81 | -3.36 | -4.30 | -2.42 | -5.50 | -5.45 | -3.36 | -9.29 | -18.46 | -1.26 | -2.56 | -2.54 | NA | -0.80 | 4.01 | -1.31 | -19.84 | -8.50 | -6.22 | -2.69 | -6.42 | -4.45 | -2.30 | -6.97 | |
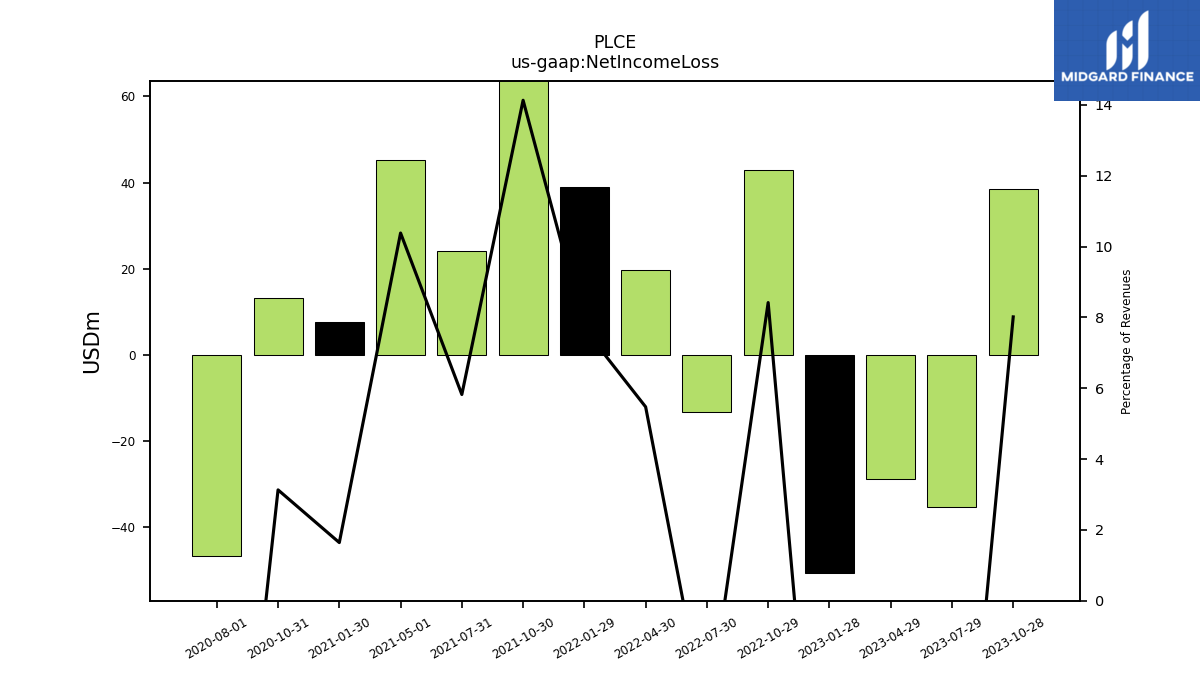
| Net Income Loss | 38.48 | -35.35 | -28.83 | -50.52 | 42.85 | -13.30 | 19.83 | 39.00 | 78.87 | 24.09 | 45.20 | 7.76 | 13.32 | -46.64 | NA | NA | NA | NA | NA | NA | NA | NA | NA | NA | NA | NA | NA | NA | NA | NA | NA | NA | NA | NA | NA | NA | NA | NA | NA | NA | NA | NA | NA | NA | NA | NA | NA | NA | NA | NA | NA | NA | NA | NA | NA | |
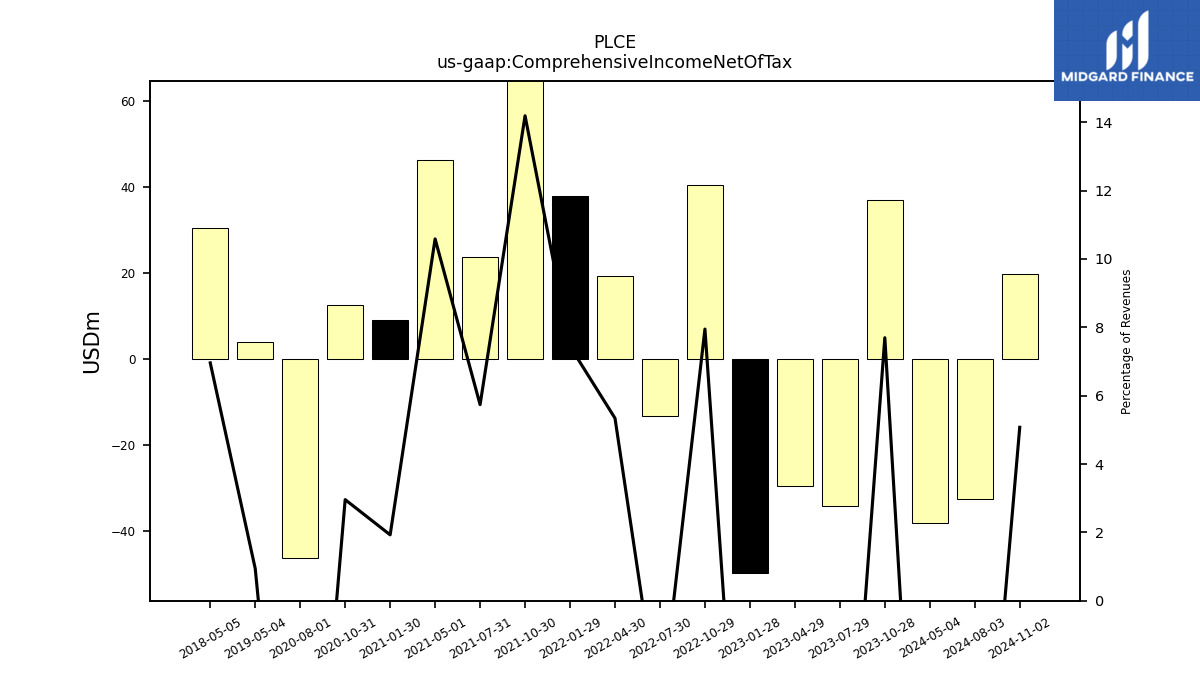
| Comprehensive Income Net Of Tax | 36.95 | -34.25 | -29.65 | -49.76 | 40.46 | -13.24 | 19.35 | 37.78 | 79.19 | 23.74 | 46.09 | 9.12 | 12.59 | -46.16 | NA | NA | NA | NA | 3.88 | NA | NA | NA | 30.36 | NA | NA | NA | NA | NA | NA | NA | NA | NA | NA | NA | NA | NA | NA | NA | NA | NA | NA | NA | NA | NA | NA | NA | NA | NA | NA | NA | NA | NA | NA | NA | NA |
| 2023-10-28 | 2023-07-29 | 2023-04-29 | 2023-01-28 | 2022-10-29 | 2022-07-30 | 2022-04-30 | 2022-01-29 | 2021-10-30 | 2021-07-31 | 2021-05-01 | 2021-01-30 | 2020-10-31 | 2020-08-01 | 2020-05-02 | 2020-02-01 | 2019-11-02 | 2019-08-03 | 2019-05-04 | 2019-02-02 | 2018-11-03 | 2018-08-04 | 2018-05-05 | 2018-02-03 | 2017-10-28 | 2017-07-29 | 2017-04-29 | 2017-01-28 | 2016-10-29 | 2016-07-30 | 2016-04-30 | 2016-01-30 | 2015-10-31 | 2015-08-01 | 2015-05-02 | 2015-01-31 | 2014-11-01 | 2014-08-02 | 2014-05-03 | 2014-02-01 | 2013-11-02 | 2013-08-03 | 2013-05-04 | 2013-02-02 | 2012-10-27 | 2012-07-28 | 2012-04-28 | 2012-01-28 | 2011-10-29 | 2011-07-30 | 2011-04-30 | 2011-01-29 | 2010-10-30 | 2010-07-31 | 2010-05-01 | ||
|---|---|---|---|---|---|---|---|---|---|---|---|---|---|---|---|---|---|---|---|---|---|---|---|---|---|---|---|---|---|---|---|---|---|---|---|---|---|---|---|---|---|---|---|---|---|---|---|---|---|---|---|---|---|---|---|---|
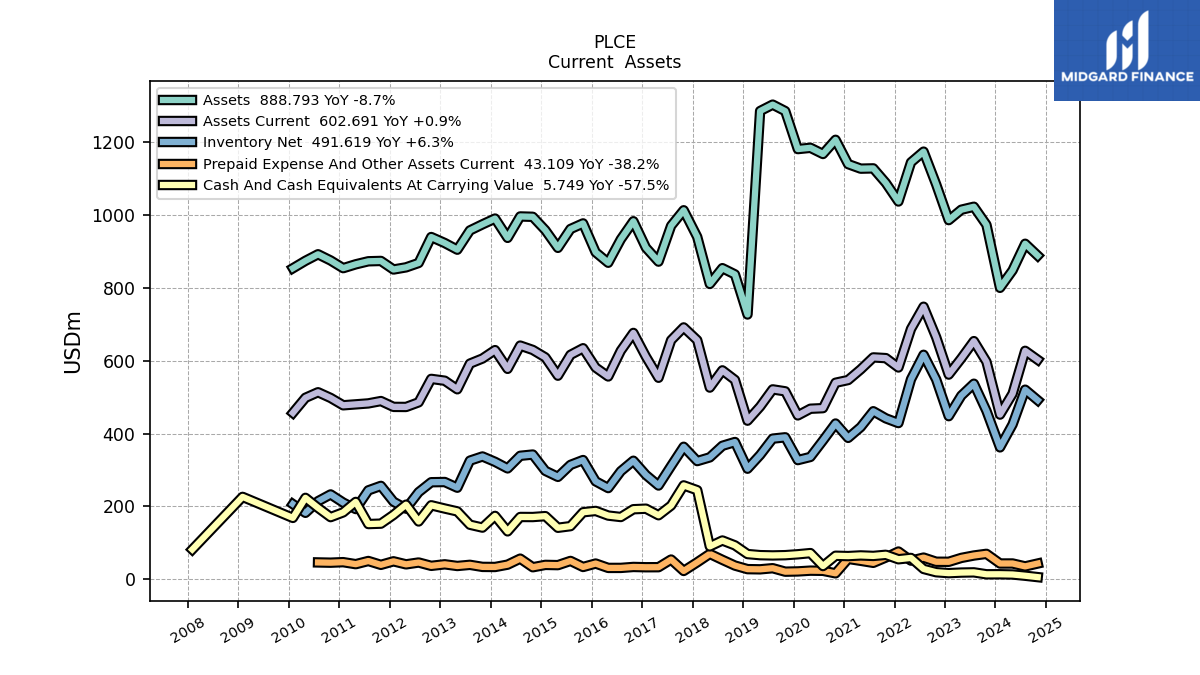
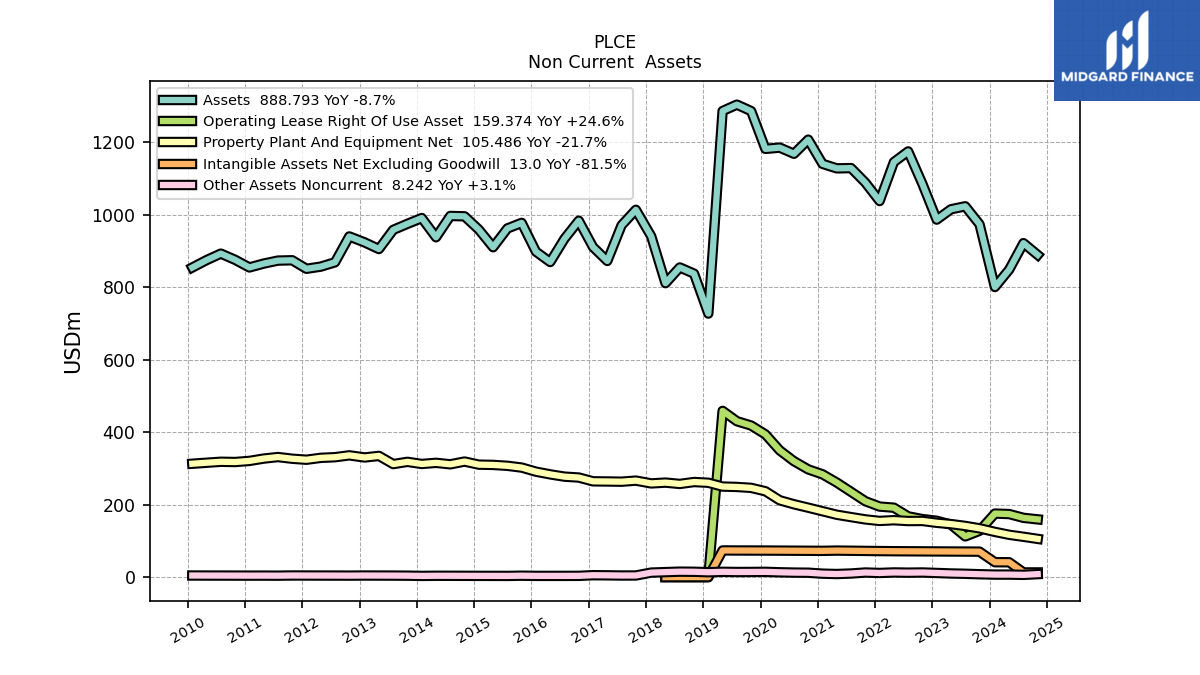
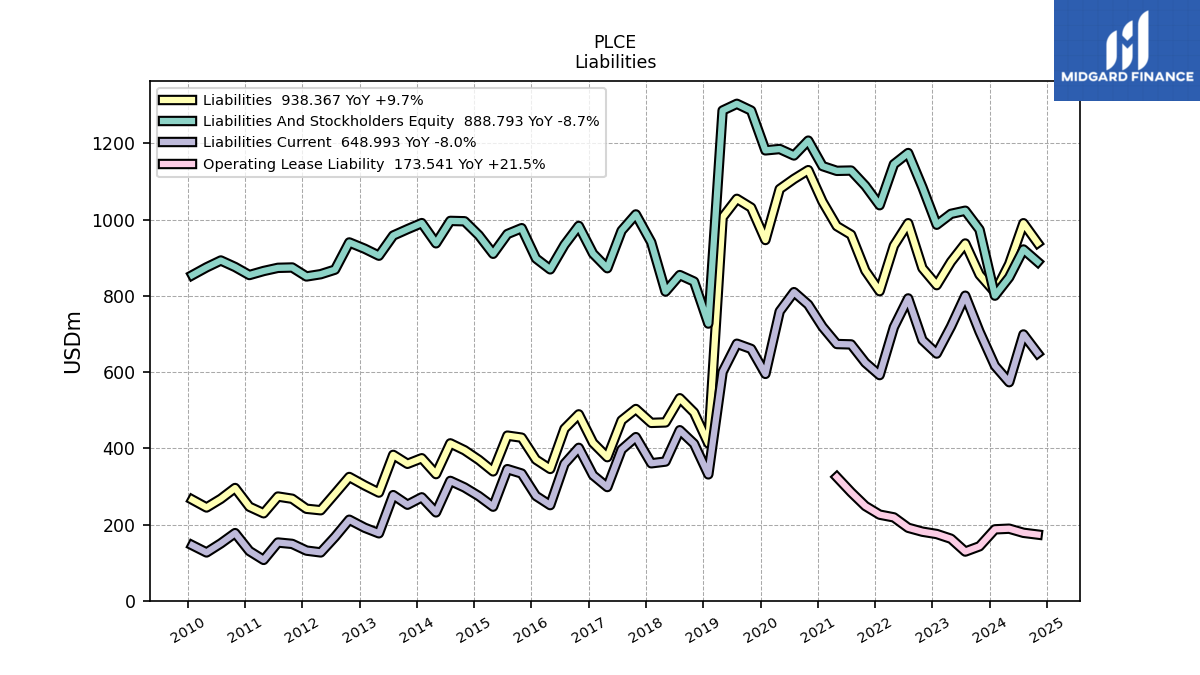
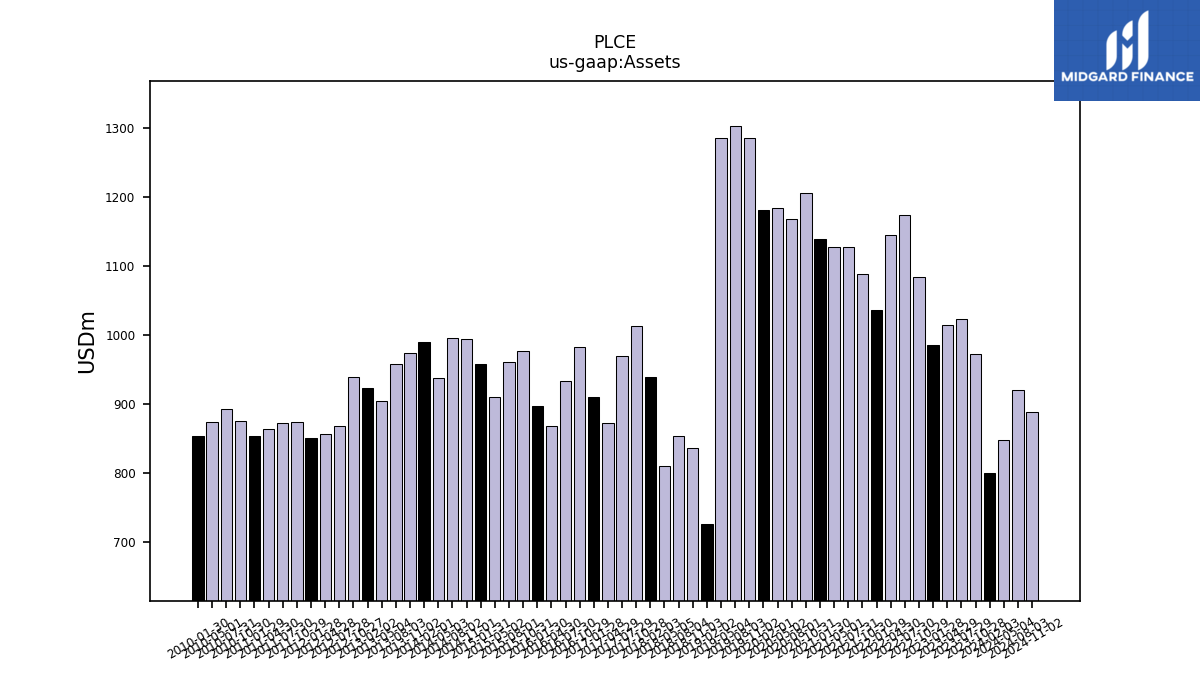
| Assets | 973.38 | 1023.09 | 1014.87 | 986.28 | 1084.62 | 1174.46 | 1145.03 | 1037.46 | 1088.37 | 1128.45 | 1127.67 | 1140.13 | 1206.94 | 1167.94 | 1184.94 | 1181.40 | 1285.72 | 1303.54 | 1285.95 | 727.05 | 837.25 | 854.34 | 810.93 | 940.23 | 1013.42 | 970.67 | 872.26 | 910.50 | 983.28 | 933.54 | 869.22 | 897.95 | 977.36 | 961.95 | 910.10 | 958.62 | 995.42 | 996.39 | 937.54 | 990.63 | 974.72 | 957.98 | 905.07 | 923.41 | 939.90 | 868.55 | 856.60 | 850.65 | 874.18 | 873.25 | 864.96 | 854.33 | 875.44 | 892.52 | 874.58 | |
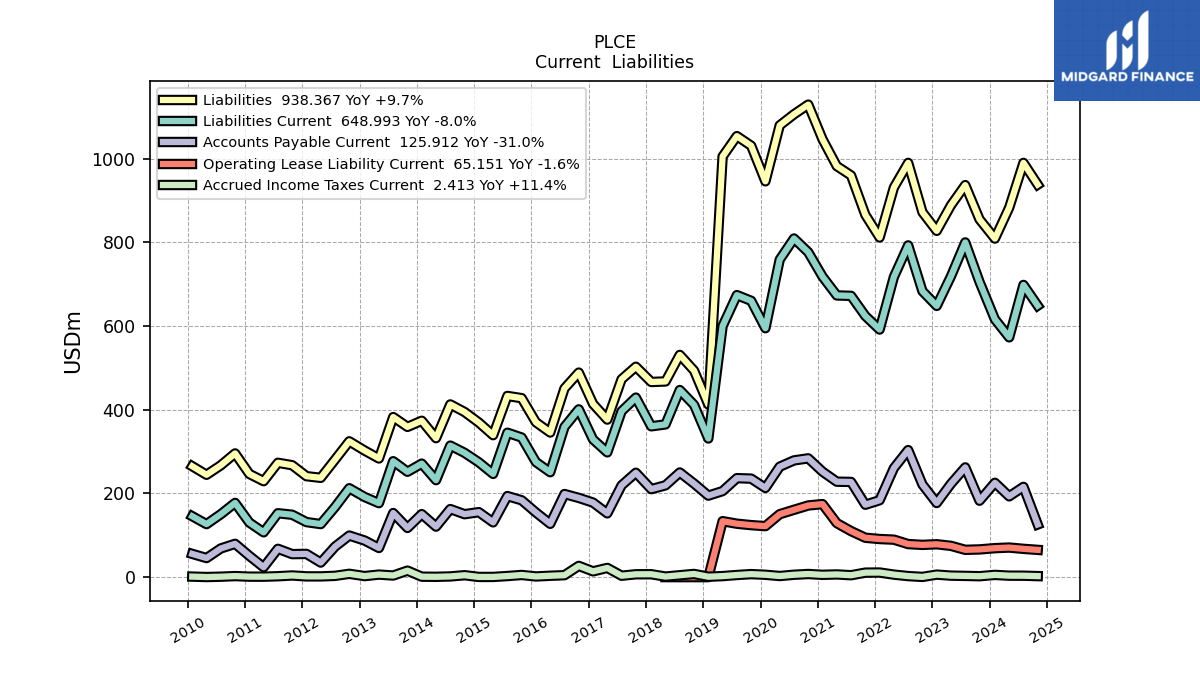
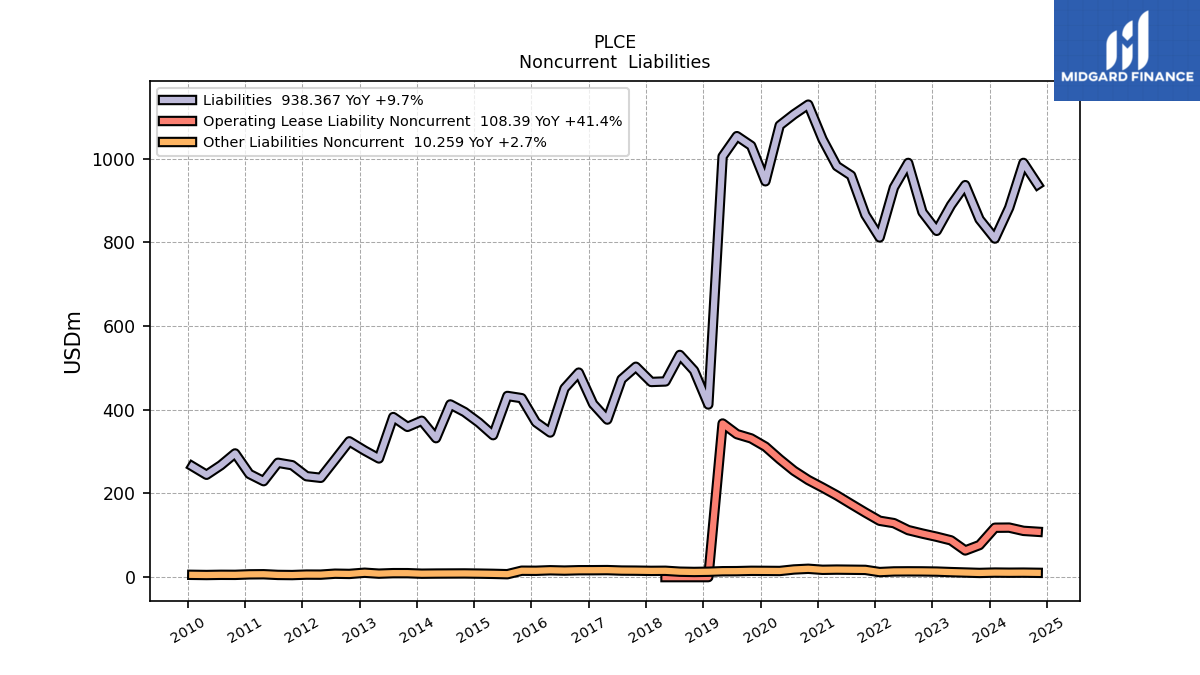
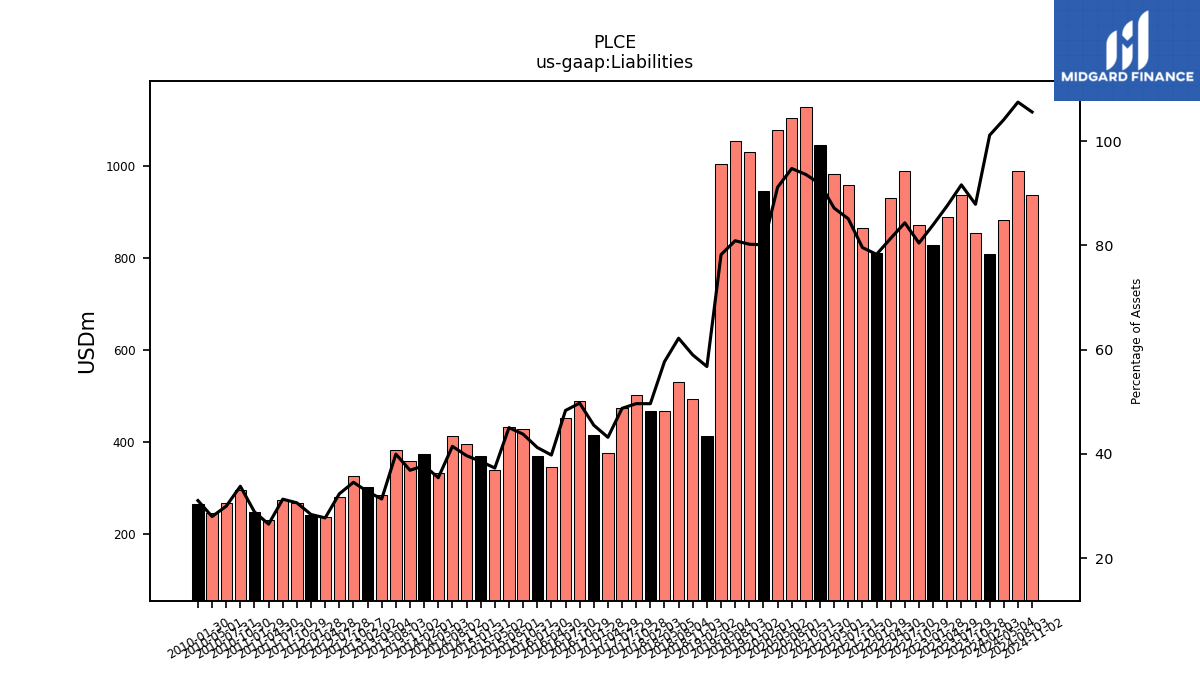
| Liabilities | 855.31 | 937.15 | 889.05 | 827.80 | 872.44 | 990.28 | 931.34 | 811.99 | 866.12 | 960.26 | 982.66 | 1046.75 | 1129.57 | 1106.42 | 1079.90 | 946.21 | 1031.28 | 1054.28 | 1005.58 | 412.61 | 493.80 | 531.22 | 467.79 | 466.53 | 502.96 | 473.01 | 376.57 | 414.21 | 488.97 | 451.12 | 345.72 | 370.15 | 427.83 | 433.13 | 339.31 | 369.50 | 394.75 | 412.90 | 332.13 | 373.85 | 359.18 | 382.67 | 283.66 | 302.46 | 324.68 | 280.81 | 237.38 | 241.28 | 267.54 | 273.37 | 229.36 | 246.60 | 295.77 | 267.37 | 244.65 | |
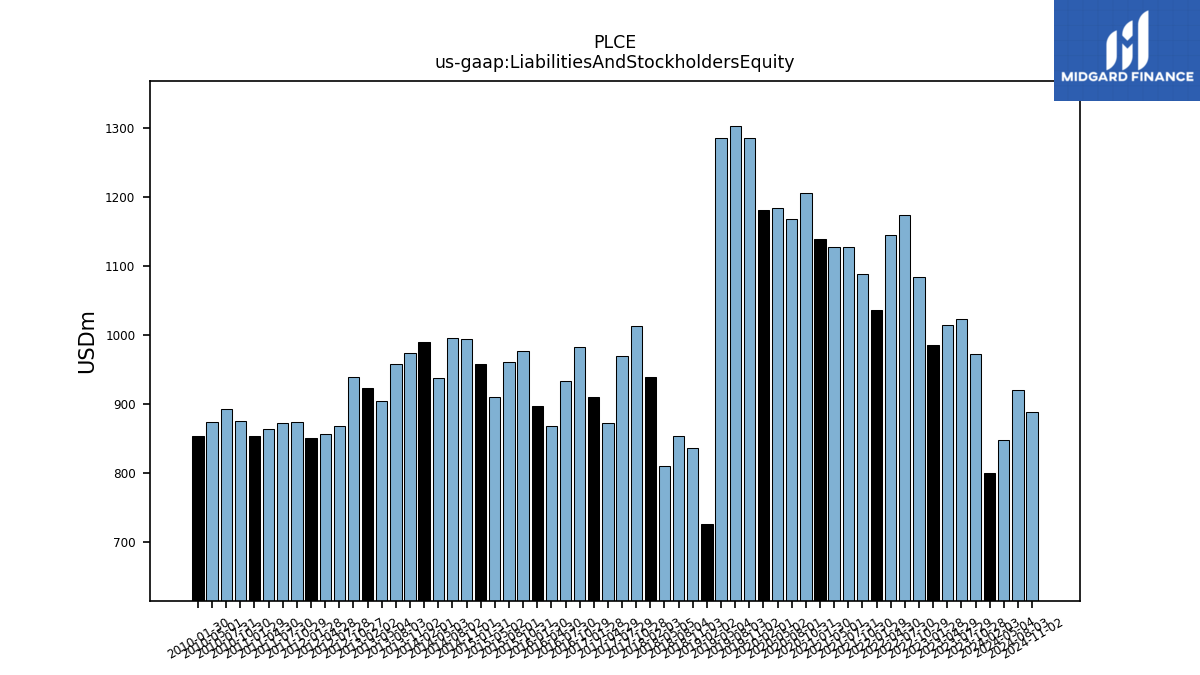
| Liabilities And Stockholders Equity | 973.38 | 1023.09 | 1014.87 | 986.28 | 1084.62 | 1174.46 | 1145.03 | 1037.46 | 1088.37 | 1128.45 | 1127.67 | 1140.13 | 1206.94 | 1167.94 | 1184.94 | 1181.40 | 1285.72 | 1303.54 | 1285.95 | 727.05 | 837.25 | 854.34 | 810.93 | 940.23 | 1013.42 | 970.67 | 872.26 | 910.50 | 983.28 | 933.54 | 869.22 | 897.95 | 977.36 | 961.95 | 910.10 | 958.62 | 995.42 | 996.39 | 937.54 | 990.63 | 974.72 | 957.98 | 905.07 | 923.41 | 939.90 | 868.55 | 856.60 | 850.65 | 874.18 | 873.25 | 864.96 | 854.33 | 875.44 | 892.52 | 874.58 | |
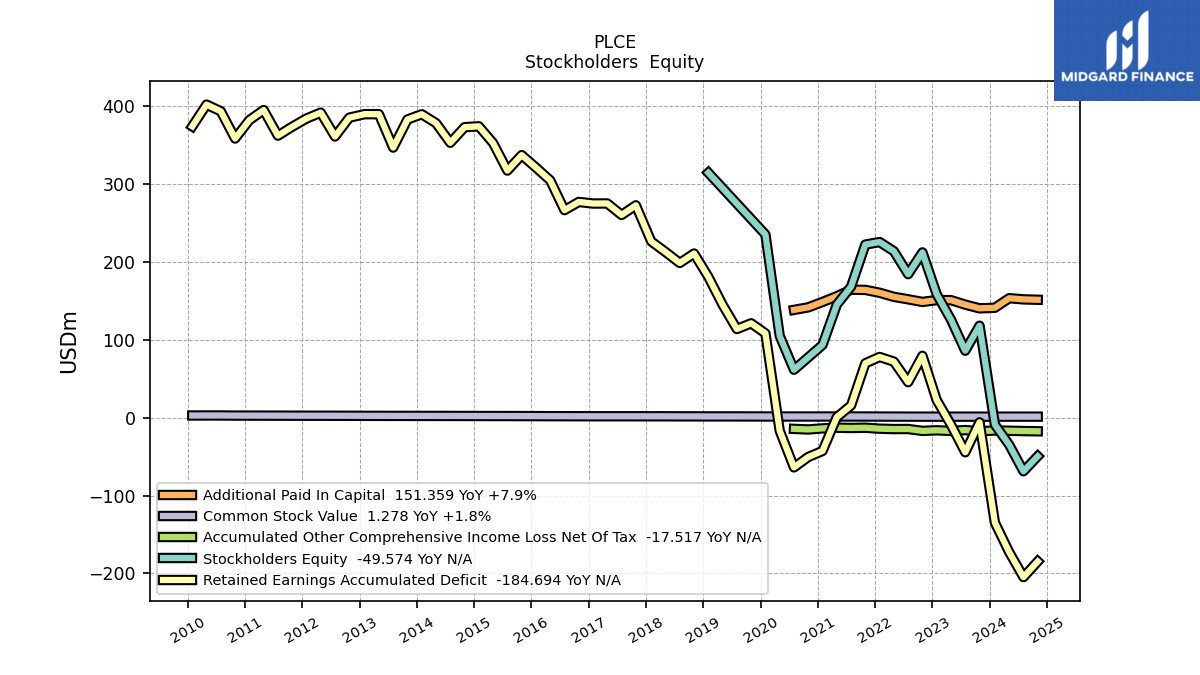
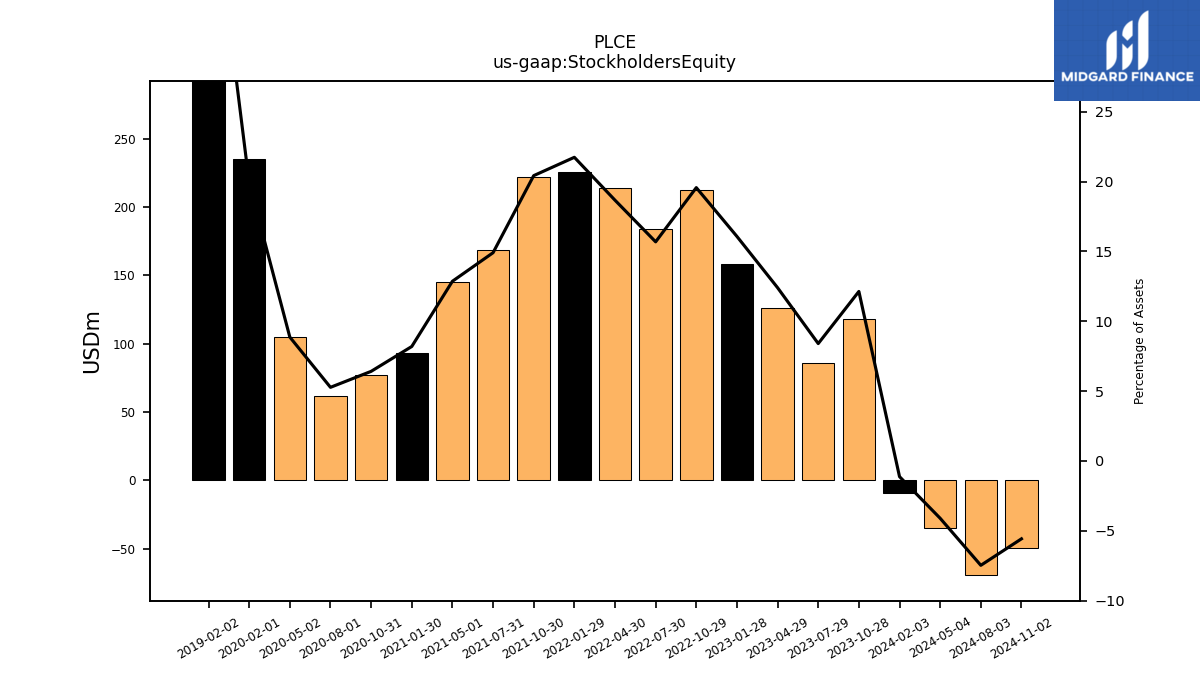
| Stockholders Equity | 118.07 | 85.93 | 125.82 | 158.48 | 212.18 | 184.18 | 213.68 | 225.47 | 222.25 | 168.19 | 145.01 | 93.38 | 77.37 | 61.52 | 105.03 | 235.19 | NA | NA | NA | 314.44 | NA | NA | NA | NA | NA | NA | NA | NA | NA | NA | NA | NA | NA | NA | NA | NA | NA | NA | NA | NA | NA | NA | NA | NA | NA | NA | NA | NA | NA | NA | NA | NA | NA | NA | NA |
| 2023-10-28 | 2023-07-29 | 2023-04-29 | 2023-01-28 | 2022-10-29 | 2022-07-30 | 2022-04-30 | 2022-01-29 | 2021-10-30 | 2021-07-31 | 2021-05-01 | 2021-01-30 | 2020-10-31 | 2020-08-01 | 2020-05-02 | 2020-02-01 | 2019-11-02 | 2019-08-03 | 2019-05-04 | 2019-02-02 | 2018-11-03 | 2018-08-04 | 2018-05-05 | 2018-02-03 | 2017-10-28 | 2017-07-29 | 2017-04-29 | 2017-01-28 | 2016-10-29 | 2016-07-30 | 2016-04-30 | 2016-01-30 | 2015-10-31 | 2015-08-01 | 2015-05-02 | 2015-01-31 | 2014-11-01 | 2014-08-02 | 2014-05-03 | 2014-02-01 | 2013-11-02 | 2013-08-03 | 2013-05-04 | 2013-02-02 | 2012-10-27 | 2012-07-28 | 2012-04-28 | 2012-01-28 | 2011-10-29 | 2011-07-30 | 2011-04-30 | 2011-01-29 | 2010-10-30 | 2010-07-31 | 2010-05-01 | ||
|---|---|---|---|---|---|---|---|---|---|---|---|---|---|---|---|---|---|---|---|---|---|---|---|---|---|---|---|---|---|---|---|---|---|---|---|---|---|---|---|---|---|---|---|---|---|---|---|---|---|---|---|---|---|---|---|---|
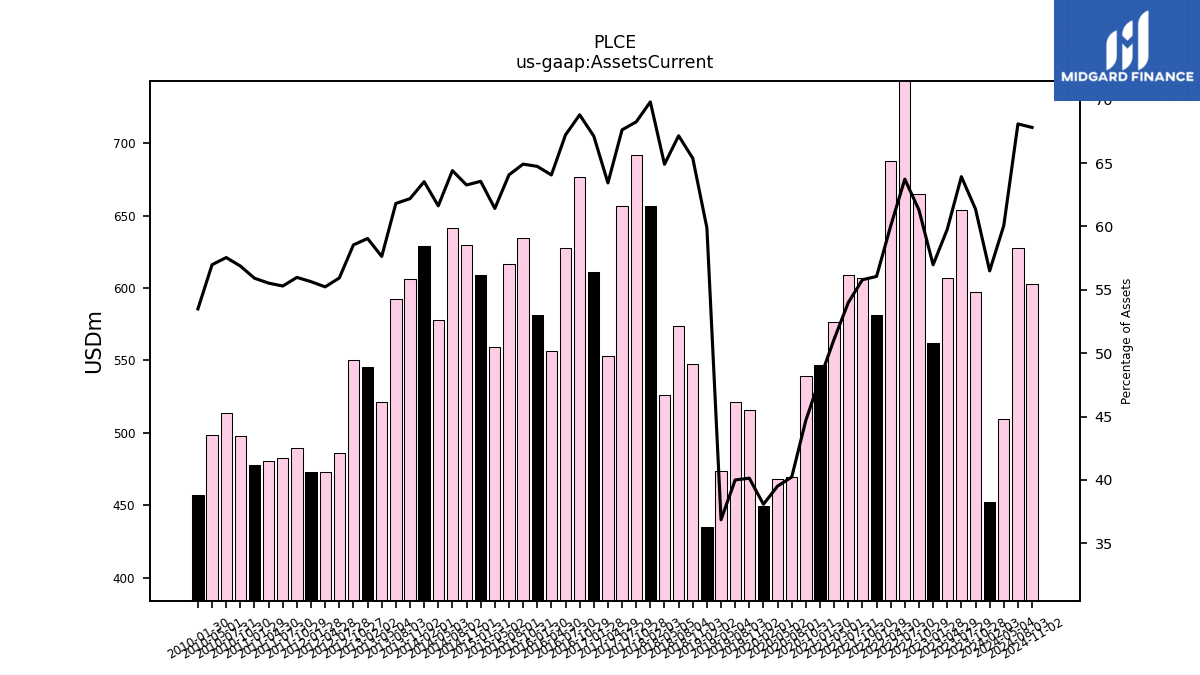
| Assets Current | 597.36 | 654.01 | 606.60 | 561.94 | 664.79 | 748.46 | 687.46 | 581.54 | 607.26 | 609.25 | 576.40 | 547.08 | 539.62 | 469.86 | 468.24 | 449.88 | 516.07 | 521.43 | 474.00 | 435.39 | 547.39 | 573.71 | 526.33 | 656.50 | 691.65 | 656.36 | 553.29 | 611.16 | 676.54 | 627.54 | 556.83 | 581.31 | 634.45 | 616.29 | 558.96 | 609.28 | 629.79 | 641.69 | 577.76 | 629.32 | 606.18 | 592.18 | 521.61 | 545.24 | 550.27 | 485.83 | 473.12 | 473.32 | 489.36 | 482.90 | 480.29 | 477.70 | 497.92 | 513.59 | 498.35 | |
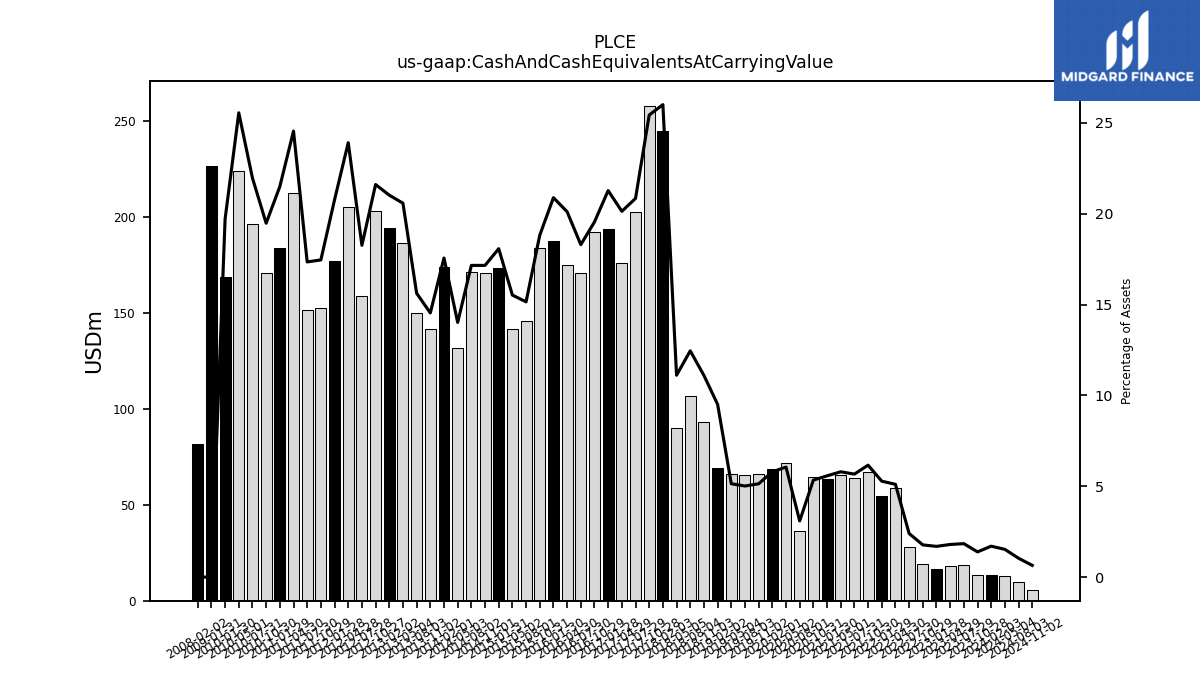
| Cash And Cash Equivalents At Carrying Value | 13.52 | 18.85 | 18.24 | 16.69 | 19.24 | 28.19 | 58.49 | 54.79 | 67.06 | 63.98 | 65.38 | 63.55 | 64.46 | 36.12 | 71.75 | 68.49 | 66.06 | 65.36 | 66.11 | 69.14 | 92.95 | 106.41 | 90.12 | 244.52 | 257.74 | 202.33 | 175.63 | 193.71 | 192.24 | 170.83 | 174.80 | 187.53 | 183.92 | 145.75 | 141.28 | 173.29 | 170.79 | 170.95 | 131.43 | 174.00 | 141.75 | 149.68 | 186.26 | 194.13 | 203.10 | 158.62 | 204.83 | 176.66 | 152.62 | 151.50 | 212.35 | 183.66 | 170.53 | 196.03 | 223.51 | |
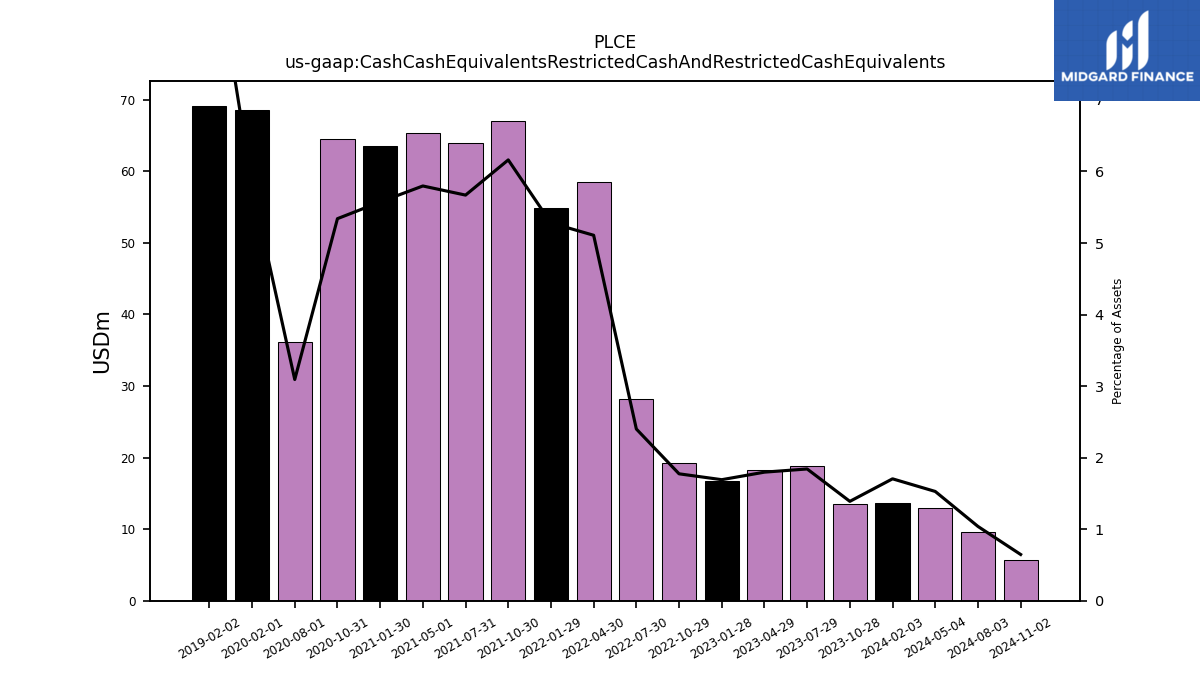
| Cash Cash Equivalents Restricted Cash And Restricted Cash Equivalents | 13.52 | 18.85 | 18.24 | 16.69 | 19.24 | 28.19 | 58.49 | 54.79 | 67.06 | 63.98 | 65.38 | 63.55 | 64.46 | 36.12 | NA | 68.49 | NA | NA | NA | 69.14 | NA | NA | NA | NA | NA | NA | NA | NA | NA | NA | NA | NA | NA | NA | NA | NA | NA | NA | NA | NA | NA | NA | NA | NA | NA | NA | NA | NA | NA | NA | NA | NA | NA | NA | NA | |
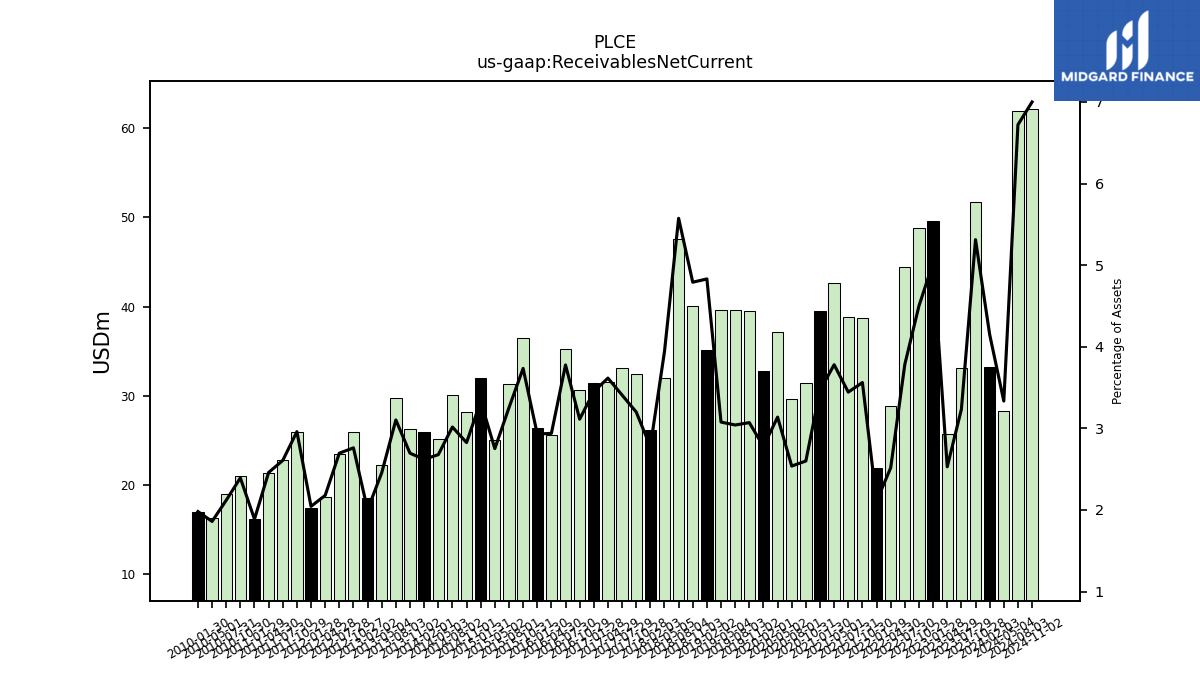
| Receivables Net Current | 51.71 | 33.07 | 25.66 | 49.58 | 48.82 | 44.45 | 28.81 | 21.86 | 38.76 | 38.86 | 42.62 | 39.53 | 31.38 | 29.63 | 37.17 | 32.81 | 39.47 | 39.64 | 39.56 | 35.12 | 40.11 | 47.62 | 31.96 | 26.09 | 32.43 | 33.08 | 31.54 | 31.41 | 30.61 | 35.26 | 25.54 | 26.32 | 36.50 | 31.28 | 25.04 | 31.93 | 28.13 | 30.05 | 25.10 | 25.96 | 26.27 | 29.72 | 22.22 | 18.49 | 25.95 | 23.41 | 18.66 | 17.38 | 25.87 | 22.76 | 21.27 | 16.12 | 20.95 | 18.91 | 16.26 | |
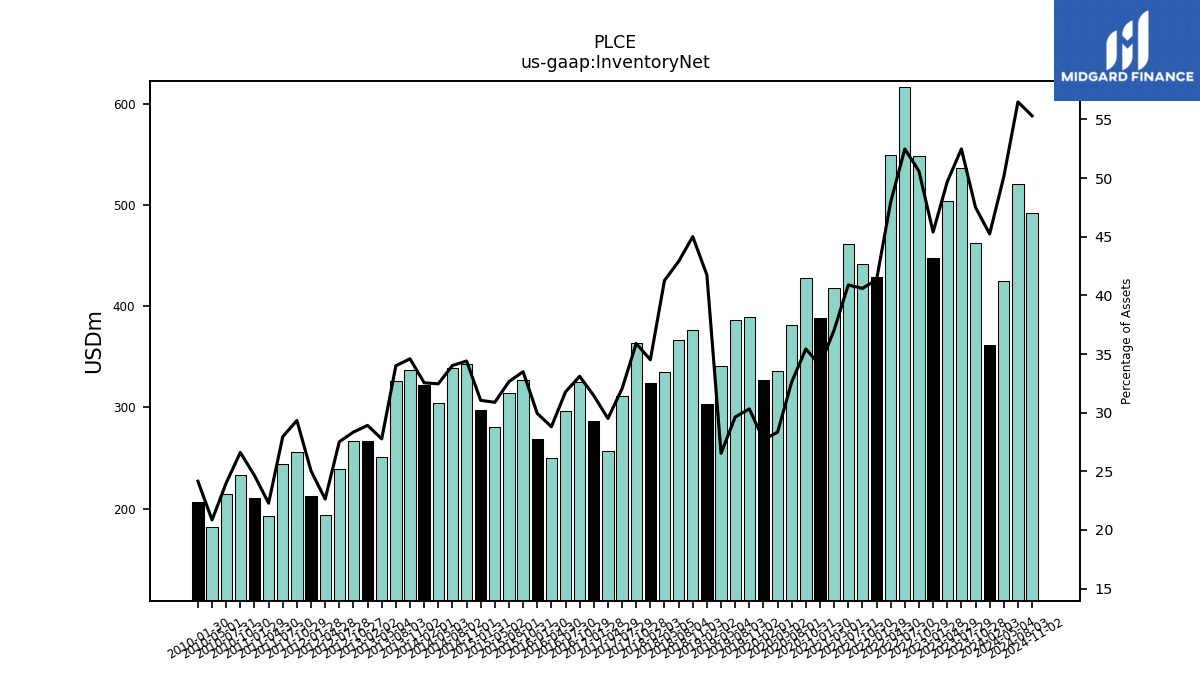
| Inventory Net | 462.41 | 536.98 | 504.19 | 447.80 | 548.72 | 616.44 | 549.17 | 428.81 | 441.82 | 461.39 | 417.81 | 388.14 | 427.63 | 381.02 | 335.80 | 327.17 | 389.81 | 386.17 | 341.17 | 303.47 | 376.86 | 366.46 | 334.68 | 324.44 | 363.79 | 311.05 | 257.30 | 286.34 | 325.46 | 296.58 | 250.28 | 268.83 | 327.32 | 314.03 | 281.06 | 297.63 | 342.45 | 338.98 | 304.29 | 322.42 | 337.17 | 325.69 | 251.28 | 266.98 | 266.40 | 239.01 | 193.85 | 212.92 | 256.43 | 244.06 | 192.71 | 210.52 | 232.90 | 214.30 | 182.36 | |
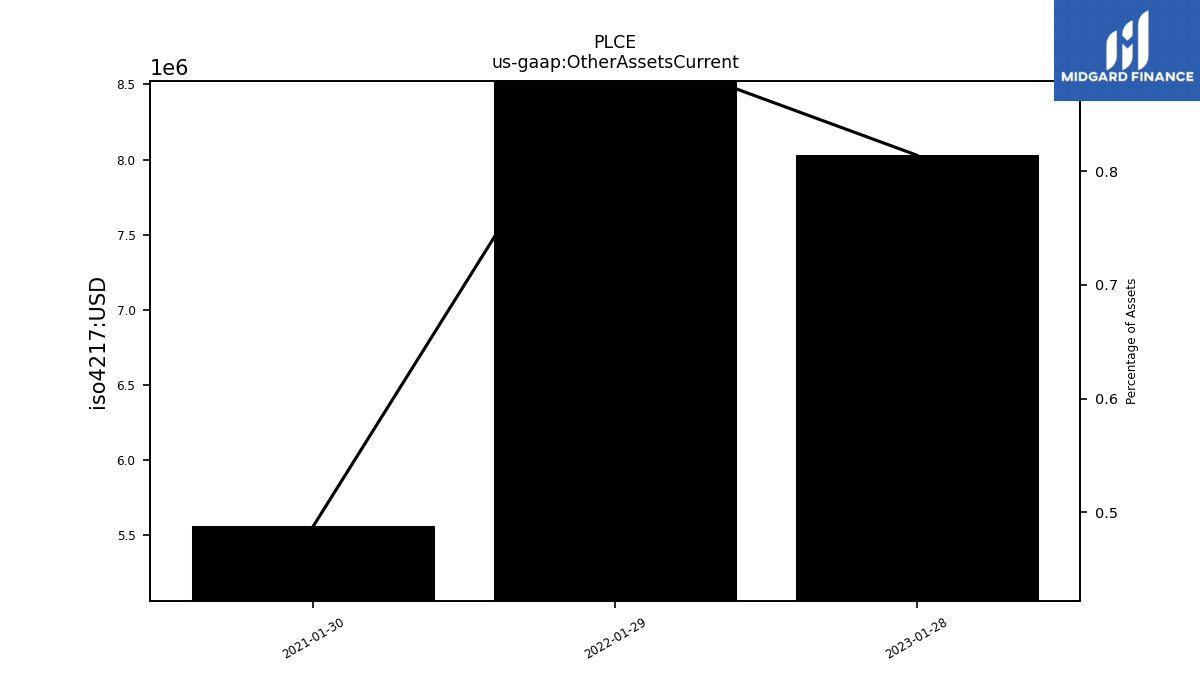
| Other Assets Current | NA | NA | NA | 8.03 | NA | NA | NA | 9.46 | NA | NA | NA | 5.56 | NA | NA | NA | NA | NA | NA | NA | NA | NA | NA | NA | NA | NA | NA | NA | NA | NA | NA | NA | NA | NA | NA | NA | NA | NA | NA | NA | NA | NA | NA | NA | NA | NA | NA | NA | NA | NA | NA | NA | NA | NA | NA | NA | |
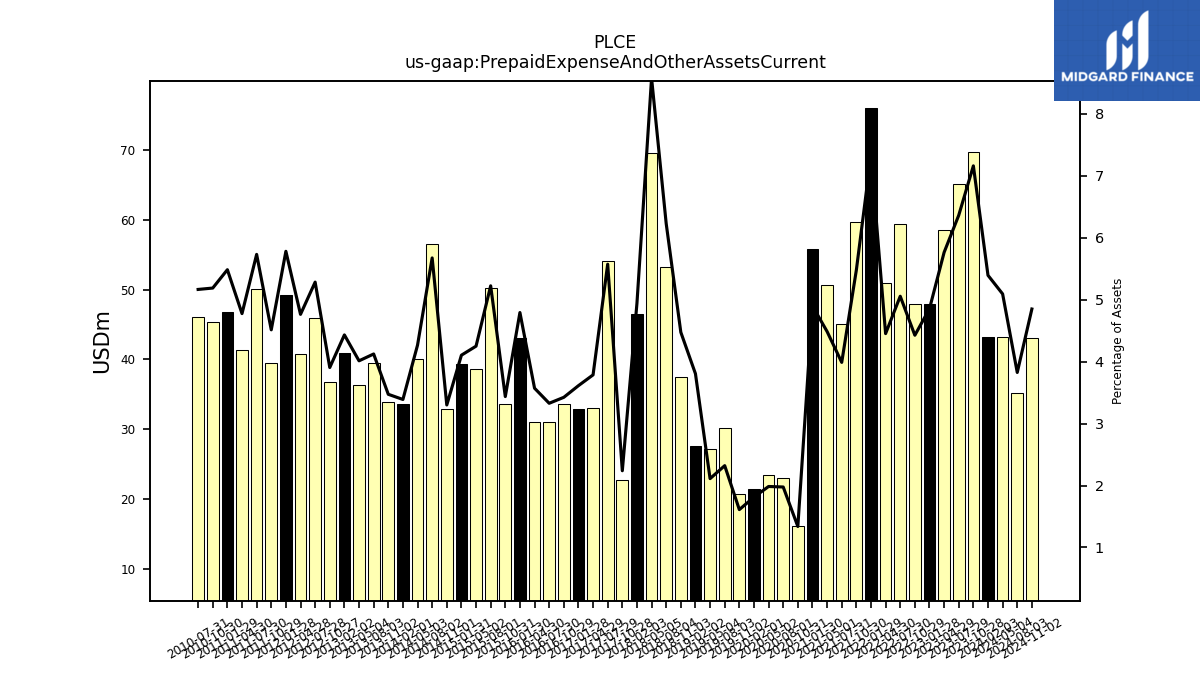
| Prepaid Expense And Other Assets Current | 69.71 | 65.11 | 58.50 | 47.88 | 48.01 | 59.38 | 50.99 | 76.08 | 59.63 | 45.01 | 50.59 | 55.86 | 16.16 | 23.09 | 23.52 | 21.42 | 20.72 | 30.26 | 27.16 | 27.67 | 37.47 | 53.22 | 69.57 | 46.46 | 22.69 | 54.10 | 33.03 | 32.89 | 33.67 | 31.07 | 31.05 | 43.04 | 33.59 | 50.26 | 38.68 | 39.35 | 32.86 | 56.55 | 40.01 | 33.58 | 33.86 | 39.51 | 36.33 | 40.93 | 36.71 | 45.90 | 40.81 | 49.18 | 39.46 | 50.06 | 41.31 | 46.86 | 45.42 | 46.11 | NA |
| 2023-10-28 | 2023-07-29 | 2023-04-29 | 2023-01-28 | 2022-10-29 | 2022-07-30 | 2022-04-30 | 2022-01-29 | 2021-10-30 | 2021-07-31 | 2021-05-01 | 2021-01-30 | 2020-10-31 | 2020-08-01 | 2020-05-02 | 2020-02-01 | 2019-11-02 | 2019-08-03 | 2019-05-04 | 2019-02-02 | 2018-11-03 | 2018-08-04 | 2018-05-05 | 2018-02-03 | 2017-10-28 | 2017-07-29 | 2017-04-29 | 2017-01-28 | 2016-10-29 | 2016-07-30 | 2016-04-30 | 2016-01-30 | 2015-10-31 | 2015-08-01 | 2015-05-02 | 2015-01-31 | 2014-11-01 | 2014-08-02 | 2014-05-03 | 2014-02-01 | 2013-11-02 | 2013-08-03 | 2013-05-04 | 2013-02-02 | 2012-10-27 | 2012-07-28 | 2012-04-28 | 2012-01-28 | 2011-10-29 | 2011-07-30 | 2011-04-30 | 2011-01-29 | 2010-10-30 | 2010-07-31 | 2010-05-01 | ||
|---|---|---|---|---|---|---|---|---|---|---|---|---|---|---|---|---|---|---|---|---|---|---|---|---|---|---|---|---|---|---|---|---|---|---|---|---|---|---|---|---|---|---|---|---|---|---|---|---|---|---|---|---|---|---|---|---|
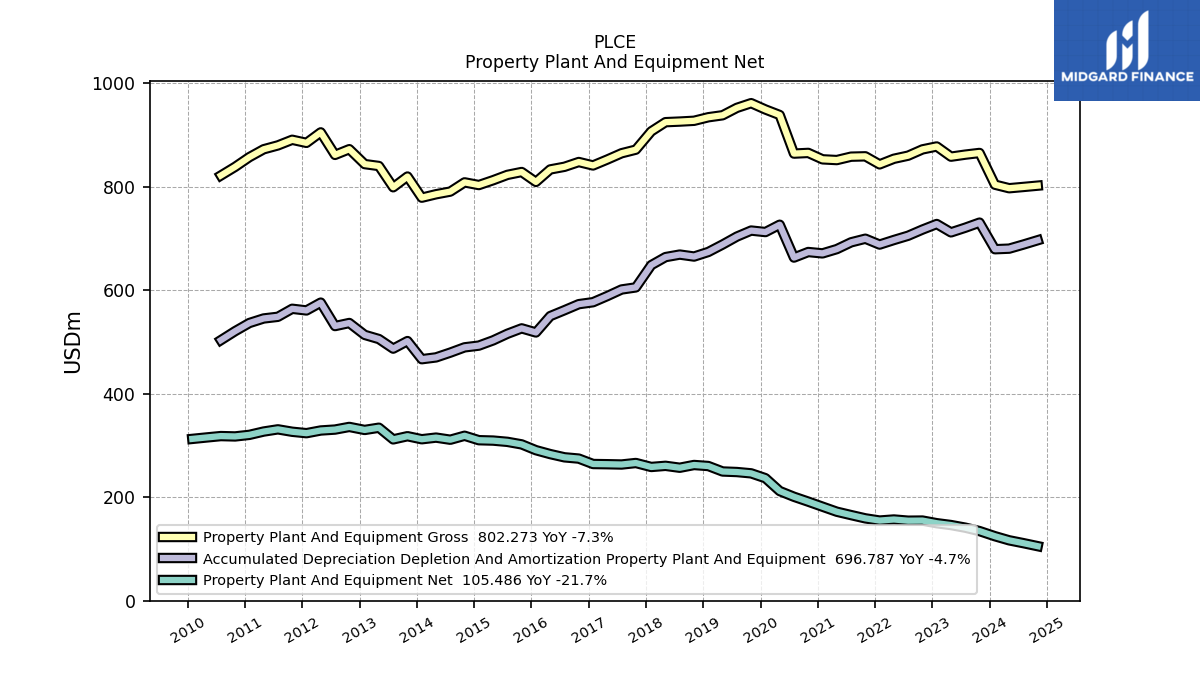
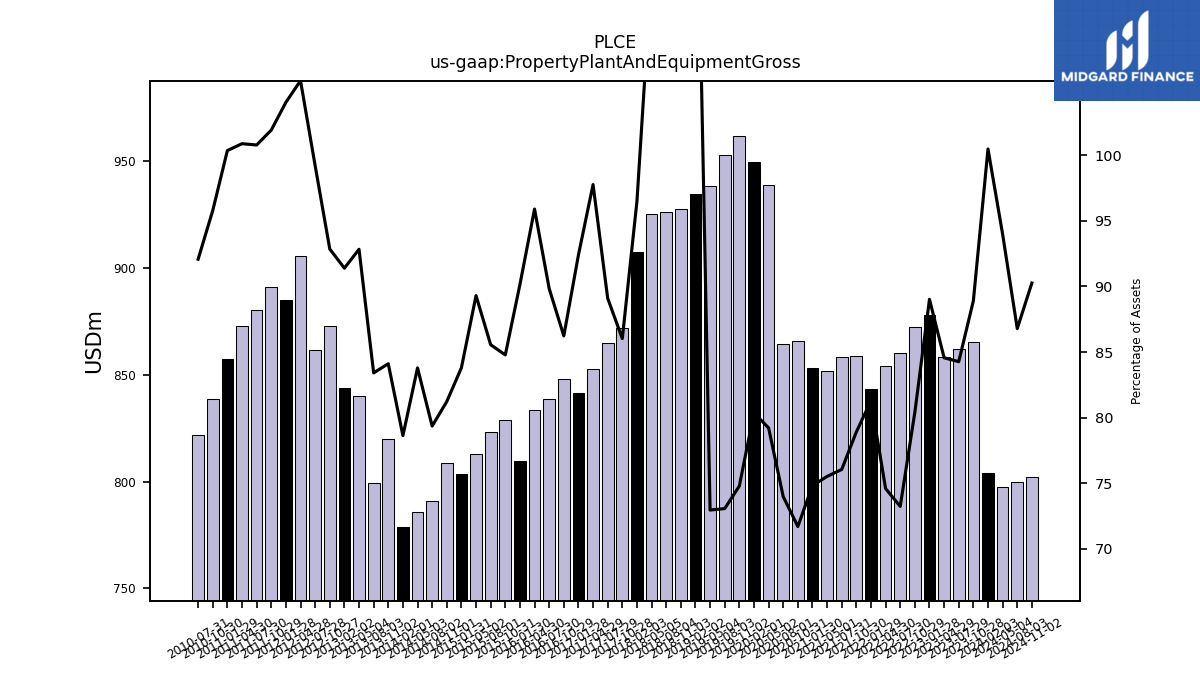
| Property Plant And Equipment Gross | 865.45 | 862.19 | 858.26 | 878.00 | 872.32 | 860.22 | 854.23 | 843.37 | 858.95 | 858.27 | 851.70 | 853.14 | 865.54 | 864.20 | 938.79 | 949.47 | 961.71 | 952.60 | 938.31 | 934.46 | 927.62 | 926.12 | 924.94 | 907.16 | 871.85 | 864.90 | 852.78 | 841.27 | 847.96 | 838.71 | 833.58 | 809.48 | 828.65 | 823.09 | 812.75 | 803.40 | 808.62 | 790.79 | 785.63 | 778.99 | 819.91 | 799.11 | 840.23 | 843.96 | 872.76 | 861.70 | 905.29 | 884.93 | 890.93 | 880.07 | 872.58 | 857.38 | 838.57 | 821.83 | NA | |
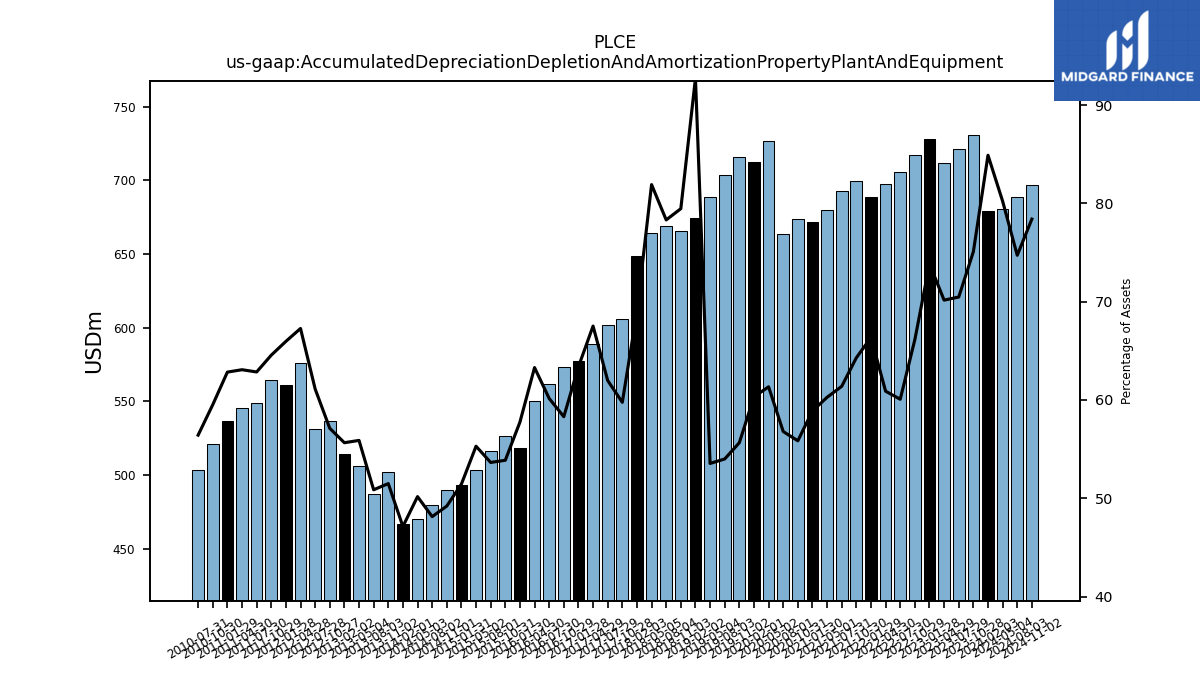
| Accumulated Depreciation Depletion And Amortization Property Plant And Equipment | 730.81 | 720.95 | 711.95 | 728.13 | 717.34 | 705.49 | 697.19 | 688.37 | 699.71 | 692.72 | 679.61 | 671.34 | 673.99 | 663.24 | 726.78 | 712.58 | 715.48 | 703.82 | 688.47 | 674.10 | 665.24 | 669.06 | 664.18 | 648.63 | 605.62 | 601.59 | 588.90 | 576.99 | 573.21 | 561.52 | 550.14 | 518.50 | 526.44 | 515.99 | 503.21 | 493.10 | 489.75 | 479.58 | 470.31 | 466.84 | 501.89 | 487.24 | 505.78 | 513.86 | 536.80 | 530.86 | 576.23 | 561.07 | 564.31 | 548.79 | 545.56 | 536.78 | 521.01 | 503.57 | NA | |
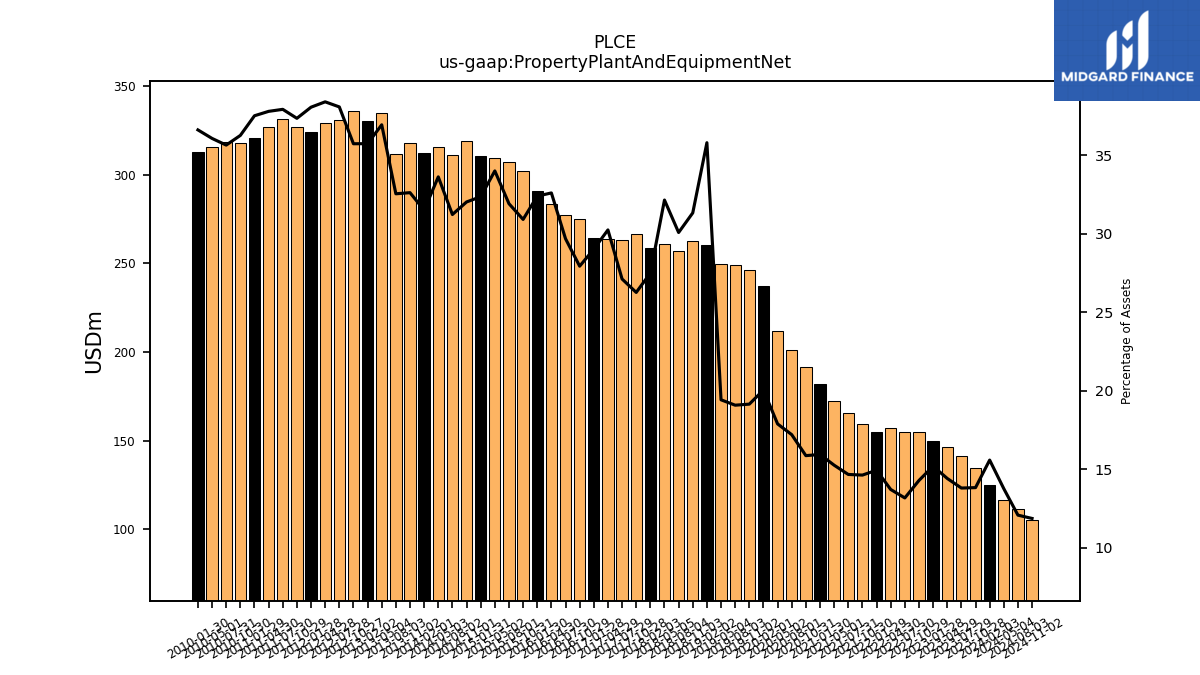
| Property Plant And Equipment Net | 134.64 | 141.24 | 146.31 | 149.87 | 154.97 | 154.74 | 157.03 | 155.01 | 159.24 | 165.56 | 172.09 | 181.80 | 191.54 | 200.96 | 212.01 | 236.90 | 246.23 | 248.78 | 249.84 | 260.36 | 262.38 | 257.06 | 260.76 | 258.54 | 266.23 | 263.31 | 263.88 | 264.28 | 274.75 | 277.19 | 283.45 | 290.98 | 302.22 | 307.10 | 309.55 | 310.30 | 318.87 | 311.21 | 315.31 | 312.15 | 318.02 | 311.87 | 334.44 | 330.10 | 335.95 | 330.84 | 329.06 | 323.86 | 326.62 | 331.28 | 327.02 | 320.60 | 317.56 | 318.25 | 315.57 | |
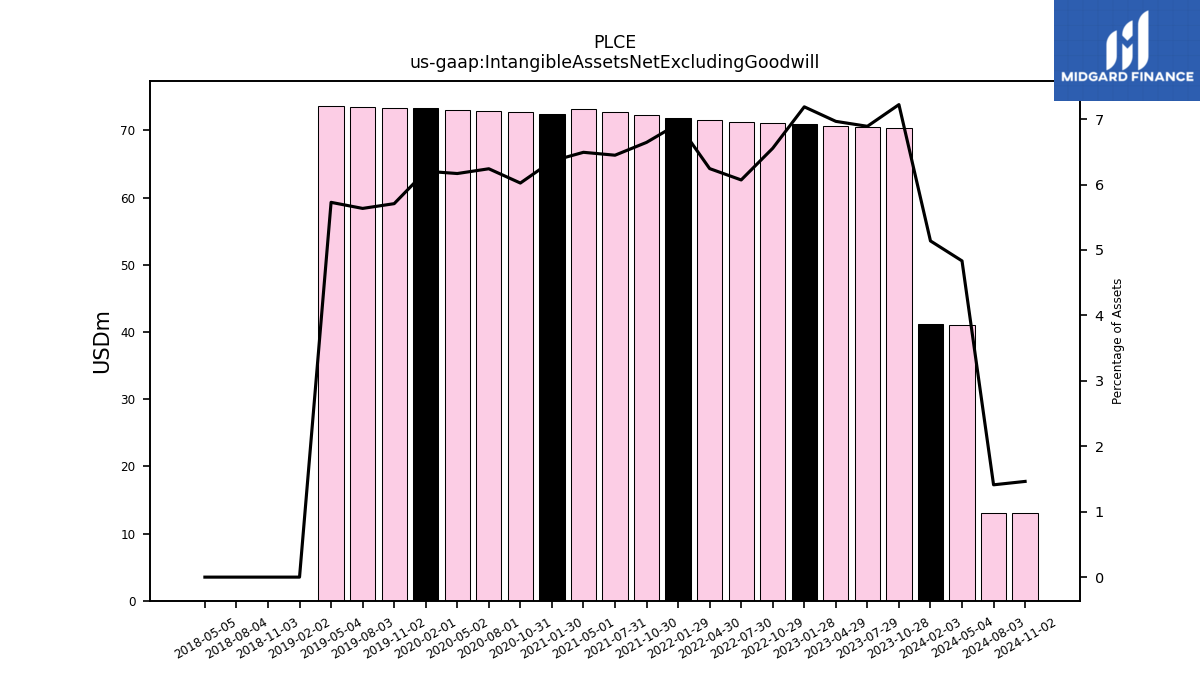
| Intangible Assets Net Excluding Goodwill | 70.29 | 70.49 | 70.69 | 70.89 | 71.09 | 71.29 | 71.49 | 71.86 | 72.31 | 72.76 | 73.22 | 72.49 | 72.69 | 72.89 | 73.09 | 73.29 | 73.39 | 73.46 | 73.66 | 0.00 | 0.00 | 0.00 | 0.00 | NA | NA | NA | NA | NA | NA | NA | NA | NA | NA | NA | NA | NA | NA | NA | NA | NA | NA | NA | NA | NA | NA | NA | NA | NA | NA | NA | NA | NA | NA | NA | NA | |
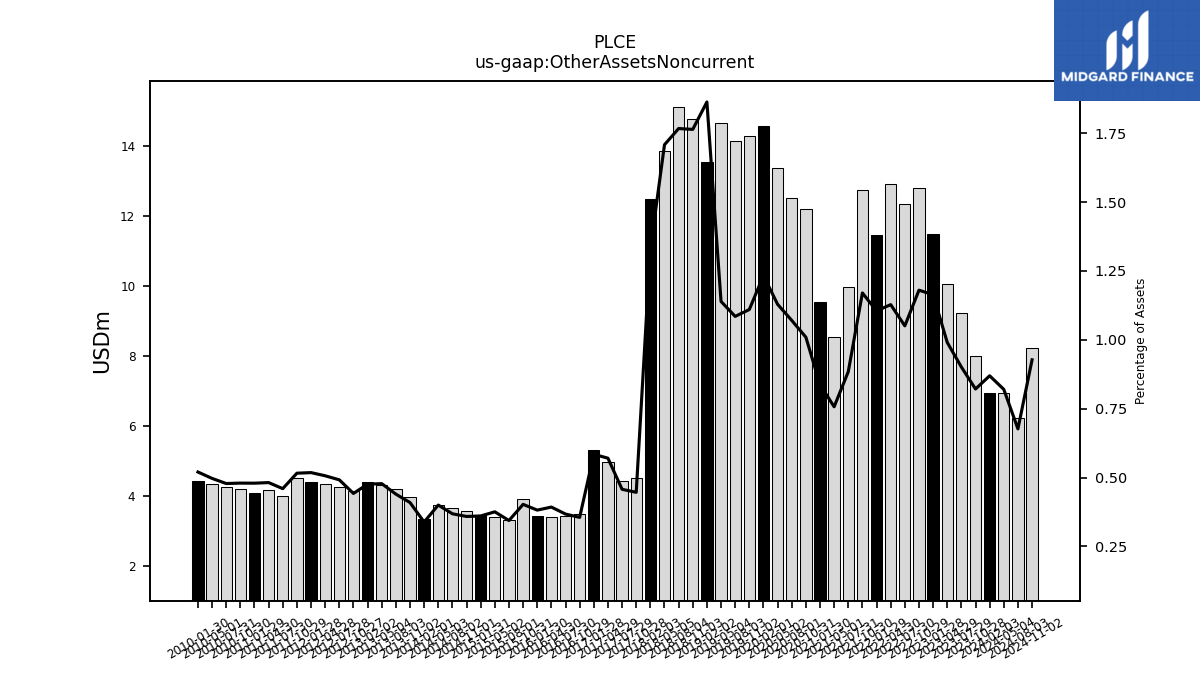
| Other Assets Noncurrent | 8.00 | 9.22 | 10.05 | 11.48 | 12.80 | 12.34 | 12.91 | 11.46 | 12.73 | 9.98 | 8.54 | 9.55 | 12.18 | 12.50 | 13.38 | 14.57 | 14.27 | 14.14 | 14.65 | 13.54 | 14.77 | 15.09 | 13.85 | 12.49 | 4.53 | 4.44 | 4.97 | 5.32 | 3.50 | 3.43 | 3.42 | 3.43 | 3.94 | 3.31 | 3.42 | 3.46 | 3.57 | 3.67 | 3.75 | 3.35 | 3.99 | 4.21 | 4.33 | 4.40 | 4.16 | 4.27 | 4.34 | 4.41 | 4.51 | 4.02 | 4.17 | 4.10 | 4.20 | 4.27 | 4.35 |
| 2023-10-28 | 2023-07-29 | 2023-04-29 | 2023-01-28 | 2022-10-29 | 2022-07-30 | 2022-04-30 | 2022-01-29 | 2021-10-30 | 2021-07-31 | 2021-05-01 | 2021-01-30 | 2020-10-31 | 2020-08-01 | 2020-05-02 | 2020-02-01 | 2019-11-02 | 2019-08-03 | 2019-05-04 | 2019-02-02 | 2018-11-03 | 2018-08-04 | 2018-05-05 | 2018-02-03 | 2017-10-28 | 2017-07-29 | 2017-04-29 | 2017-01-28 | 2016-10-29 | 2016-07-30 | 2016-04-30 | 2016-01-30 | 2015-10-31 | 2015-08-01 | 2015-05-02 | 2015-01-31 | 2014-11-01 | 2014-08-02 | 2014-05-03 | 2014-02-01 | 2013-11-02 | 2013-08-03 | 2013-05-04 | 2013-02-02 | 2012-10-27 | 2012-07-28 | 2012-04-28 | 2012-01-28 | 2011-10-29 | 2011-07-30 | 2011-04-30 | 2011-01-29 | 2010-10-30 | 2010-07-31 | 2010-05-01 | ||
|---|---|---|---|---|---|---|---|---|---|---|---|---|---|---|---|---|---|---|---|---|---|---|---|---|---|---|---|---|---|---|---|---|---|---|---|---|---|---|---|---|---|---|---|---|---|---|---|---|---|---|---|---|---|---|---|---|
| Liabilities Current | 705.74 | 800.15 | 719.29 | 648.38 | 683.67 | 793.10 | 717.67 | 591.83 | 624.40 | 672.39 | 673.43 | 718.50 | 776.76 | 809.54 | 759.00 | 595.01 | 660.60 | 674.20 | 600.20 | 331.40 | 411.79 | 447.31 | 365.10 | 360.52 | 429.18 | 396.49 | 298.21 | 329.20 | 401.12 | 359.16 | 250.79 | 275.02 | 333.70 | 345.24 | 246.76 | 274.47 | 297.13 | 314.46 | 231.79 | 271.35 | 251.89 | 277.09 | 176.81 | 191.51 | 212.52 | 167.49 | 126.77 | 131.56 | 149.12 | 152.75 | 107.12 | 130.40 | 177.48 | 150.44 | 126.69 | |
| Accounts Payable Current | 182.59 | 262.37 | 223.24 | 177.15 | 221.43 | 303.78 | 260.63 | 183.76 | 173.06 | 227.58 | 228.15 | 252.12 | 283.94 | 279.01 | 263.98 | 213.12 | 235.49 | 236.62 | 205.64 | 194.79 | 223.61 | 250.18 | 219.49 | 210.30 | 249.56 | 219.33 | 152.44 | 178.21 | 189.39 | 198.68 | 127.45 | 154.54 | 183.74 | 193.72 | 130.90 | 155.32 | 150.43 | 162.72 | 120.65 | 150.65 | 117.55 | 153.24 | 69.64 | 87.46 | 99.34 | 72.81 | 34.78 | 55.52 | 54.96 | 67.74 | 23.64 | 50.73 | 79.63 | 68.56 | 45.59 | |
| Other Accrued Liabilities Current | NA | NA | NA | 14.19 | NA | NA | NA | 20.32 | NA | NA | NA | 20162.00 | NA | NA | NA | 15.90 | NA | NA | NA | 14.29 | NA | NA | NA | 13.82 | NA | NA | NA | 11.36 | NA | NA | NA | 13.20 | NA | NA | NA | 14.40 | NA | NA | NA | 11.94 | NA | NA | NA | 8.63 | NA | NA | NA | 5.70 | NA | NA | NA | 4.74 | NA | NA | NA | |
| Taxes Payable Current | NA | NA | NA | 5.64 | NA | NA | NA | 4.15 | NA | NA | NA | 13936.00 | NA | NA | NA | 3.54 | NA | NA | NA | 3.33 | NA | NA | NA | 5.43 | NA | NA | NA | 5.16 | NA | NA | NA | 6.19 | NA | NA | NA | 6.37 | NA | NA | NA | 6.69 | NA | NA | NA | 7.80 | NA | NA | NA | 4.78 | NA | NA | NA | 5.78 | NA | NA | NA | |
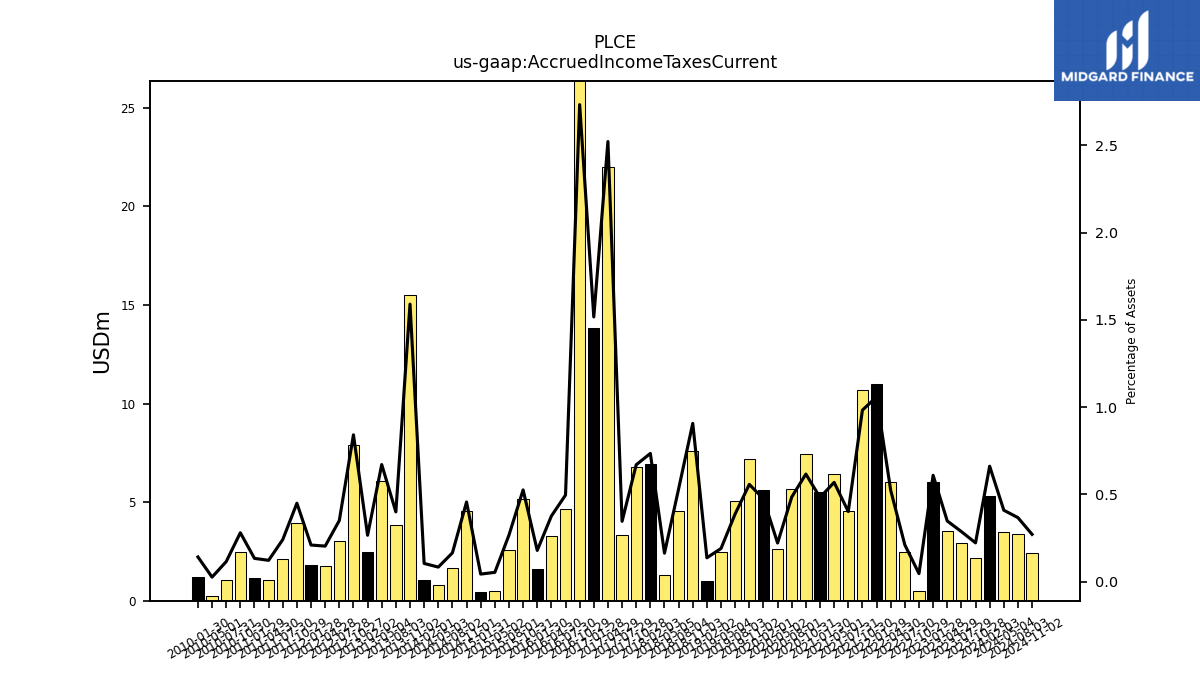
| Accrued Income Taxes Current | 2.17 | 2.94 | 3.53 | 6.01 | 0.51 | 2.48 | 6.00 | 10.98 | 10.70 | 4.54 | 6.42 | 5.51 | 7.45 | 5.67 | 2.63 | 5.61 | 7.17 | 5.07 | 2.45 | 1.00 | 7.60 | 4.54 | 1.33 | 6.91 | 6.79 | 3.36 | 22.00 | 13.81 | 26.88 | 4.63 | 3.27 | 1.61 | 5.14 | 2.57 | 0.49 | 0.42 | 4.55 | 1.65 | 0.79 | 1.04 | 15.50 | 3.83 | 6.08 | 2.46 | 7.91 | 3.05 | 1.75 | 1.79 | 3.93 | 2.11 | 1.06 | 1.14 | 2.46 | 1.03 | 0.23 | |
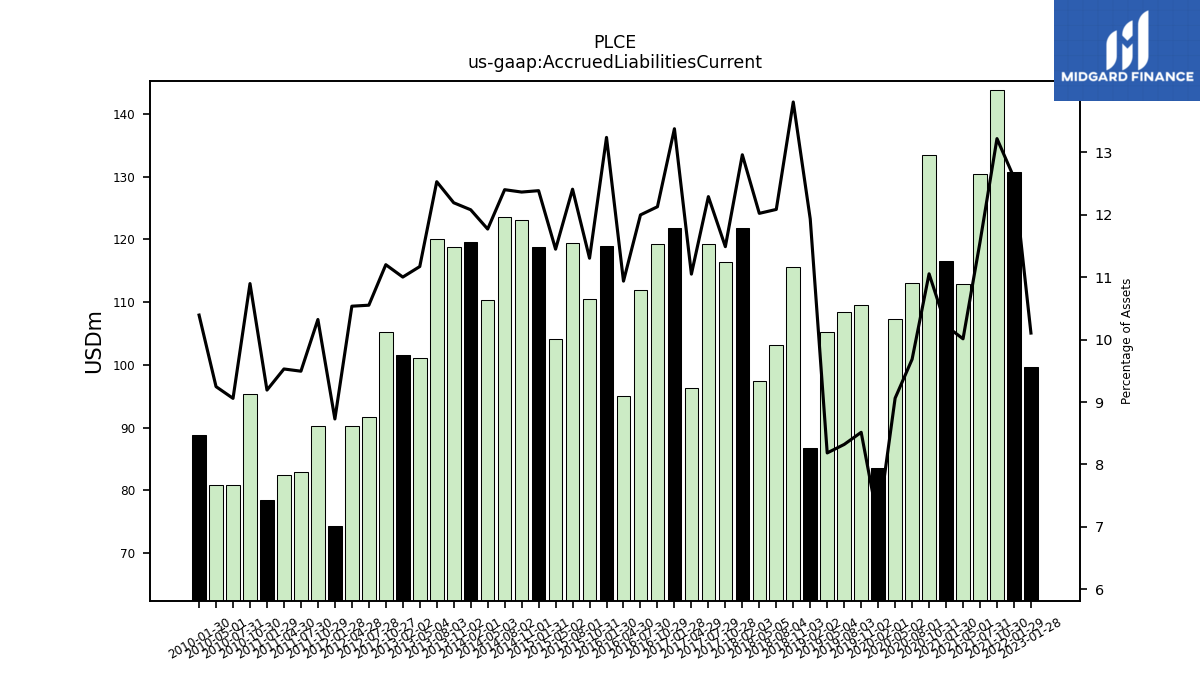
| Accrued Liabilities Current | NA | NA | NA | 99.66 | NA | NA | NA | 130.67 | 143.87 | 130.45 | 112.90 | 116.50 | 133.41 | 113.11 | 107.37 | 83.61 | 109.48 | 108.46 | 105.25 | 86.75 | 115.58 | 103.24 | 97.49 | 121.85 | 116.43 | 119.29 | 96.37 | 121.80 | 119.25 | 111.99 | 95.06 | 118.87 | 110.47 | 119.36 | 104.19 | 118.72 | 123.06 | 123.56 | 110.35 | 119.66 | 118.83 | 120.02 | 101.09 | 101.59 | 105.26 | 91.64 | 90.24 | 74.25 | 90.23 | 82.90 | 82.42 | 78.52 | 95.40 | 80.85 | 80.87 | |
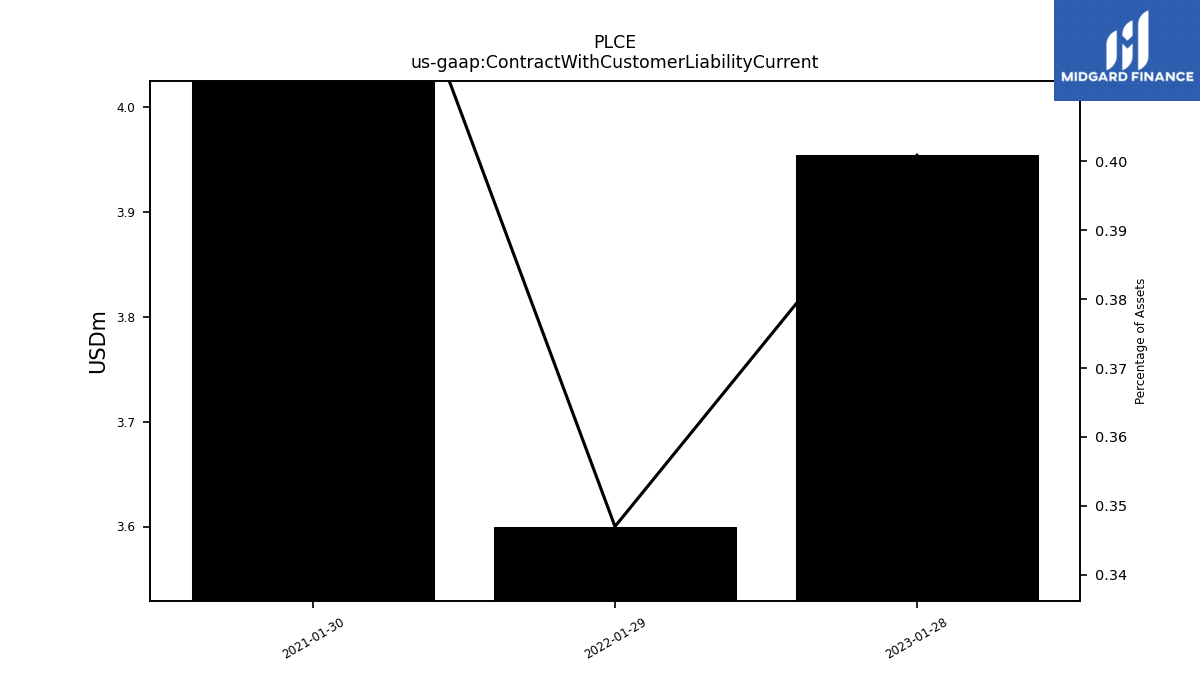
| Contract With Customer Liability Current | NA | NA | NA | 3.95 | NA | NA | NA | 3.60 | NA | NA | NA | 5.30 | NA | NA | NA | NA | NA | NA | NA | NA | NA | NA | NA | NA | NA | NA | NA | NA | NA | NA | NA | NA | NA | NA | NA | NA | NA | NA | NA | NA | NA | NA | NA | NA | NA | NA | NA | NA | NA | NA | NA | NA | NA | NA | NA |
| 2023-10-28 | 2023-07-29 | 2023-04-29 | 2023-01-28 | 2022-10-29 | 2022-07-30 | 2022-04-30 | 2022-01-29 | 2021-10-30 | 2021-07-31 | 2021-05-01 | 2021-01-30 | 2020-10-31 | 2020-08-01 | 2020-05-02 | 2020-02-01 | 2019-11-02 | 2019-08-03 | 2019-05-04 | 2019-02-02 | 2018-11-03 | 2018-08-04 | 2018-05-05 | 2018-02-03 | 2017-10-28 | 2017-07-29 | 2017-04-29 | 2017-01-28 | 2016-10-29 | 2016-07-30 | 2016-04-30 | 2016-01-30 | 2015-10-31 | 2015-08-01 | 2015-05-02 | 2015-01-31 | 2014-11-01 | 2014-08-02 | 2014-05-03 | 2014-02-01 | 2013-11-02 | 2013-08-03 | 2013-05-04 | 2013-02-02 | 2012-10-27 | 2012-07-28 | 2012-04-28 | 2012-01-28 | 2011-10-29 | 2011-07-30 | 2011-04-30 | 2011-01-29 | 2010-10-30 | 2010-07-31 | 2010-05-01 | ||
|---|---|---|---|---|---|---|---|---|---|---|---|---|---|---|---|---|---|---|---|---|---|---|---|---|---|---|---|---|---|---|---|---|---|---|---|---|---|---|---|---|---|---|---|---|---|---|---|---|---|---|---|---|---|---|---|---|
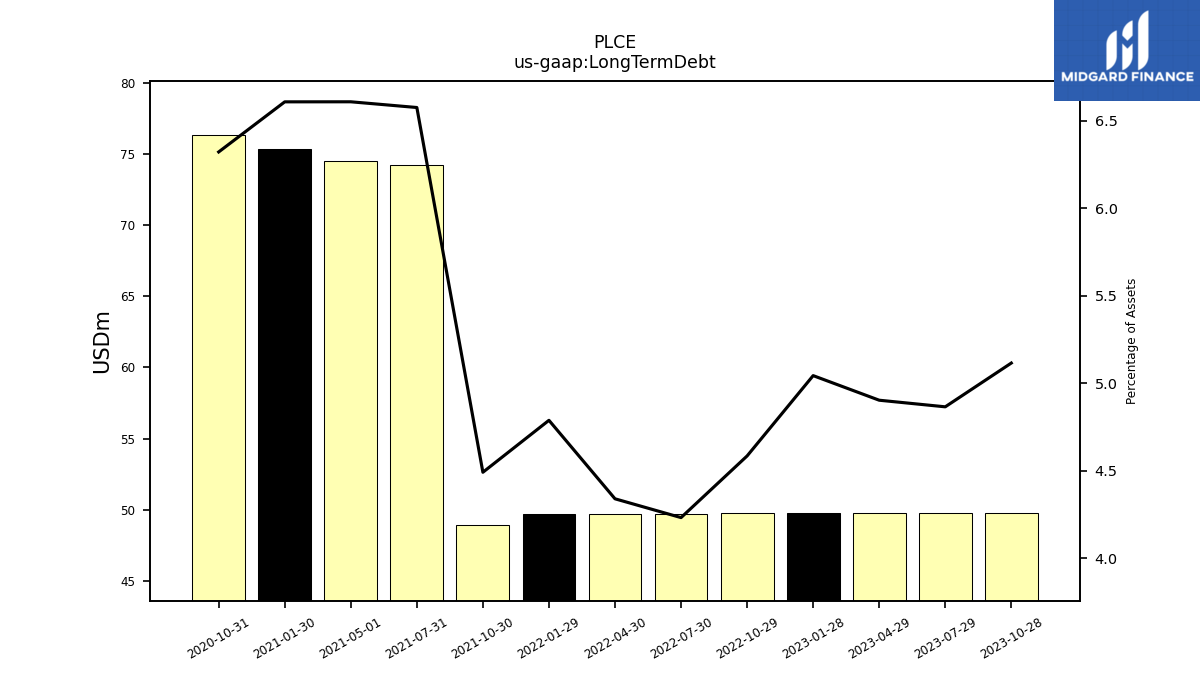
| Long Term Debt | 49.80 | 49.78 | 49.77 | 49.75 | 49.73 | 49.72 | 49.70 | 49.69 | 48.89 | 74.21 | 74.53 | 75.35 | 76.31 | NA | NA | NA | NA | NA | NA | NA | NA | NA | NA | NA | NA | NA | NA | NA | NA | NA | NA | NA | NA | NA | NA | NA | NA | NA | NA | NA | NA | NA | NA | NA | NA | NA | NA | NA | NA | NA | NA | NA | NA | NA | NA | |
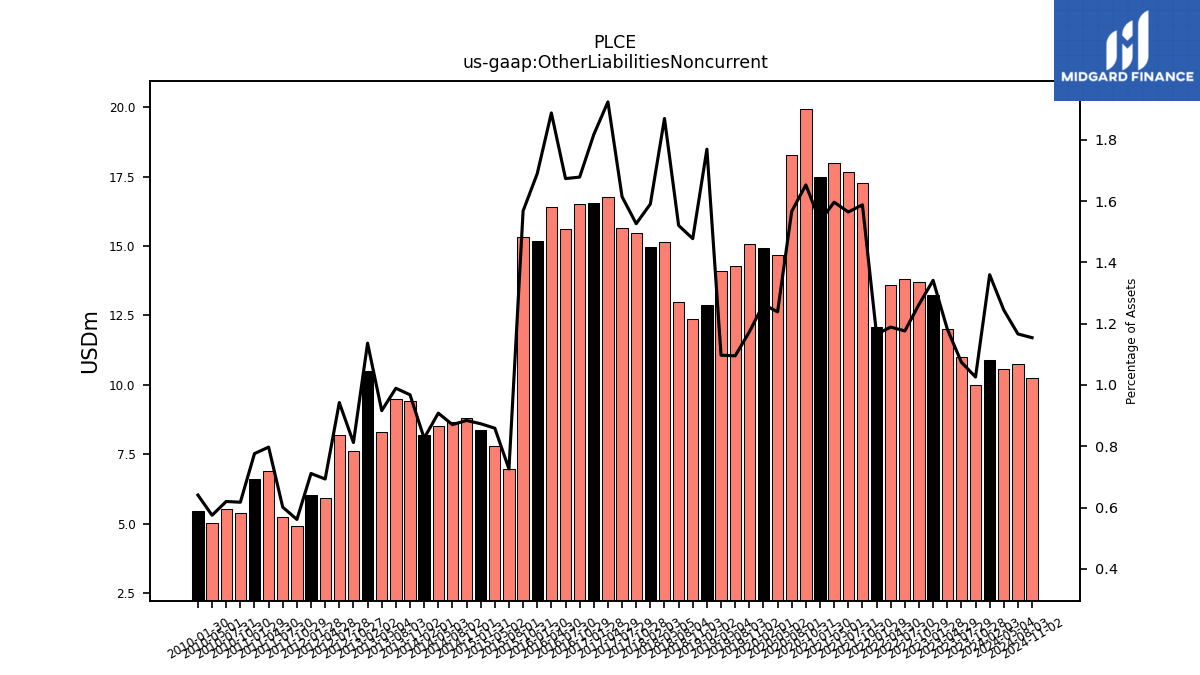
| Other Liabilities Noncurrent | 9.99 | 10.99 | 12.01 | 13.23 | 13.69 | 13.81 | 13.61 | 12.09 | 17.28 | 17.65 | 18.00 | 17.49 | 19.95 | 18.30 | 14.67 | 14.92 | 15.08 | 14.27 | 14.11 | 12.86 | 12.37 | 12.99 | 15.16 | 14.95 | 15.46 | 15.67 | 16.78 | 16.54 | 16.50 | 15.62 | 16.41 | 15.17 | 15.32 | 6.98 | 7.82 | 8.37 | 8.80 | 8.68 | 8.51 | 8.19 | 9.44 | 9.48 | 8.29 | 10.49 | 7.63 | 8.19 | 5.94 | 6.05 | 4.91 | 5.25 | 6.90 | 6.63 | 5.41 | 5.53 | 5.03 | |
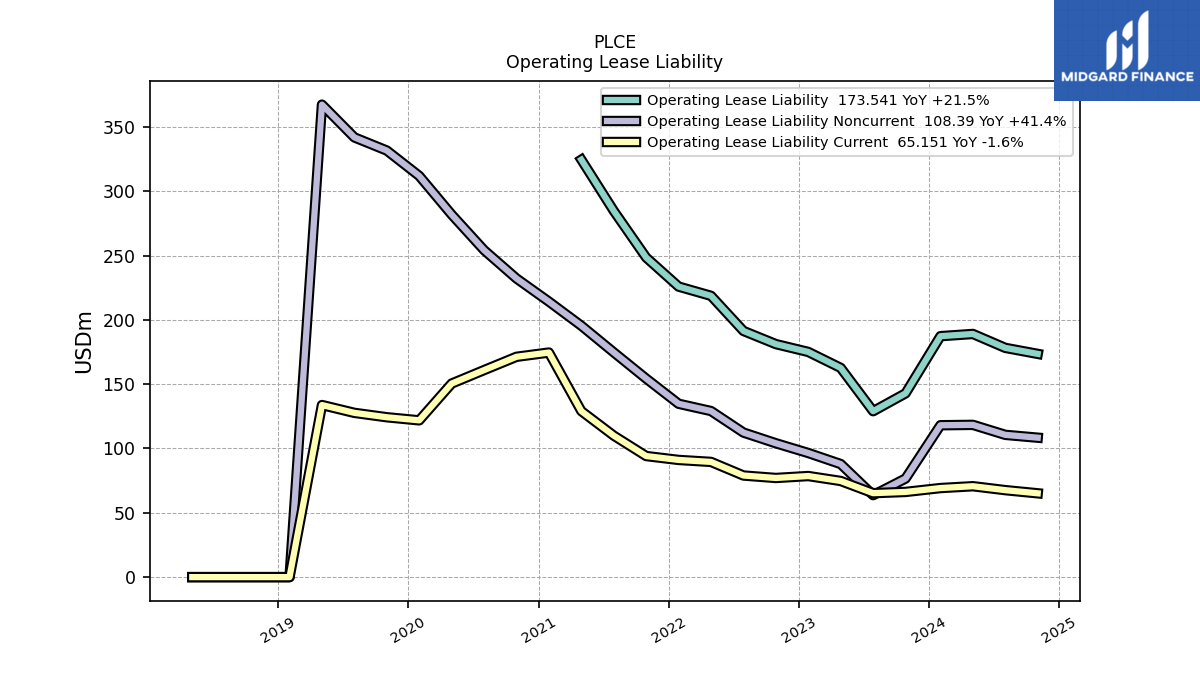
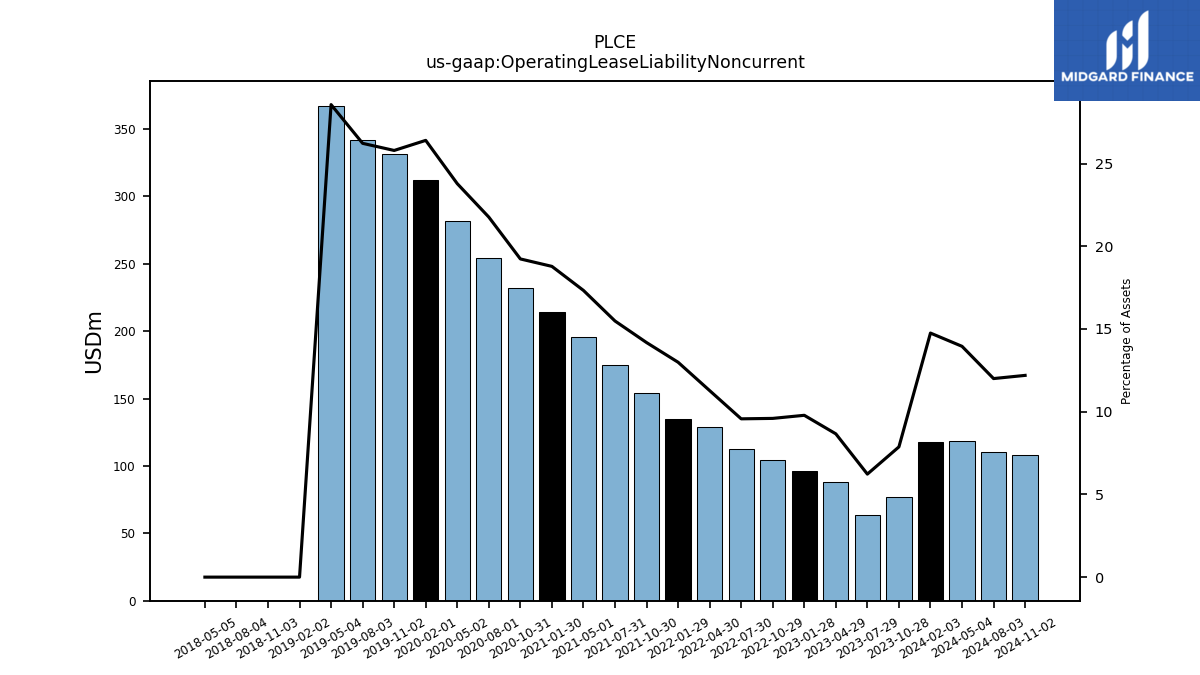
| Operating Lease Liability Noncurrent | 76.64 | 63.71 | 87.91 | 96.48 | 104.07 | 112.39 | 129.11 | 134.76 | 154.32 | 174.72 | 195.44 | 214.17 | 232.15 | 254.19 | 281.84 | 311.91 | 331.62 | 341.83 | 367.31 | 0.00 | 0.00 | 0.00 | 0.00 | NA | NA | NA | NA | NA | NA | NA | NA | NA | NA | NA | NA | NA | NA | NA | NA | NA | NA | NA | NA | NA | NA | NA | NA | NA | NA | NA | NA | NA | NA | NA | NA |
| 2023-10-28 | 2023-07-29 | 2023-04-29 | 2023-01-28 | 2022-10-29 | 2022-07-30 | 2022-04-30 | 2022-01-29 | 2021-10-30 | 2021-07-31 | 2021-05-01 | 2021-01-30 | 2020-10-31 | 2020-08-01 | 2020-05-02 | 2020-02-01 | 2019-11-02 | 2019-08-03 | 2019-05-04 | 2019-02-02 | 2018-11-03 | 2018-08-04 | 2018-05-05 | 2018-02-03 | 2017-10-28 | 2017-07-29 | 2017-04-29 | 2017-01-28 | 2016-10-29 | 2016-07-30 | 2016-04-30 | 2016-01-30 | 2015-10-31 | 2015-08-01 | 2015-05-02 | 2015-01-31 | 2014-11-01 | 2014-08-02 | 2014-05-03 | 2014-02-01 | 2013-11-02 | 2013-08-03 | 2013-05-04 | 2013-02-02 | 2012-10-27 | 2012-07-28 | 2012-04-28 | 2012-01-28 | 2011-10-29 | 2011-07-30 | 2011-04-30 | 2011-01-29 | 2010-10-30 | 2010-07-31 | 2010-05-01 | ||
|---|---|---|---|---|---|---|---|---|---|---|---|---|---|---|---|---|---|---|---|---|---|---|---|---|---|---|---|---|---|---|---|---|---|---|---|---|---|---|---|---|---|---|---|---|---|---|---|---|---|---|---|---|---|---|---|---|
| Stockholders Equity | 118.07 | 85.93 | 125.82 | 158.48 | 212.18 | 184.18 | 213.68 | 225.47 | 222.25 | 168.19 | 145.01 | 93.38 | 77.37 | 61.52 | 105.03 | 235.19 | NA | NA | NA | 314.44 | NA | NA | NA | NA | NA | NA | NA | NA | NA | NA | NA | NA | NA | NA | NA | NA | NA | NA | NA | NA | NA | NA | NA | NA | NA | NA | NA | NA | NA | NA | NA | NA | NA | NA | NA | |
| Common Stock Value | 1.25 | 1.25 | 1.25 | 1.23 | 1.27 | 1.31 | 1.34 | 1.40 | 1.45 | 1.48 | 1.47 | 1.46 | 1.46 | 1.46 | 1.46 | 1.48 | 1.53 | 1.57 | 1.59 | 1.59 | 1.63 | 1.65 | 1.74 | 1.73 | 1.75 | 1.77 | 1.75 | 1.78 | 1.82 | 1.86 | 1.89 | 1.95 | 2.01 | 2.05 | 2.07 | 2.11 | 2.14 | 2.17 | 2.20 | 2.22 | 2.23 | 2.24 | 2.29 | 2.32 | 2.40 | 2.42 | 2.44 | 2.47 | 2.49 | 2.55 | 2.60 | 2.61 | 2.62 | 2.78 | 2.77 | |
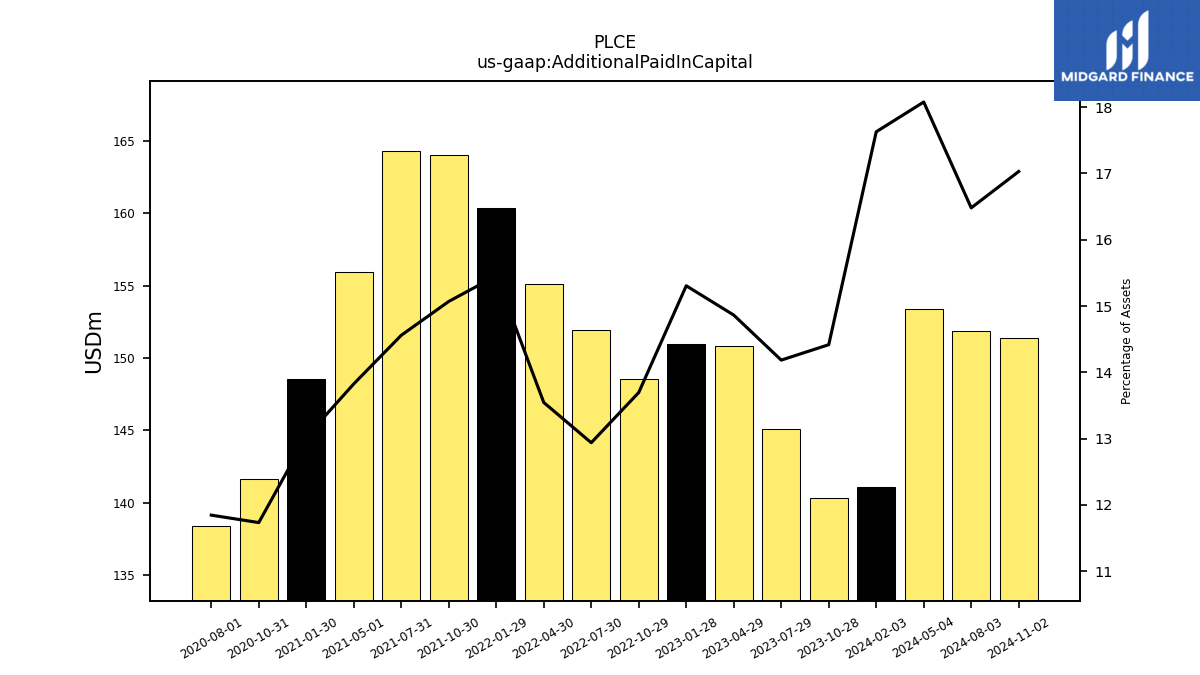
| Additional Paid In Capital | 140.33 | 145.12 | 150.85 | 150.96 | 148.55 | 151.95 | 155.10 | 160.35 | 164.01 | 164.29 | 155.91 | 148.52 | 141.61 | 138.35 | NA | NA | NA | NA | NA | NA | NA | NA | NA | NA | NA | NA | NA | NA | NA | NA | NA | NA | NA | NA | NA | NA | NA | NA | NA | NA | NA | NA | NA | NA | NA | NA | NA | NA | NA | NA | NA | NA | NA | NA | NA | |
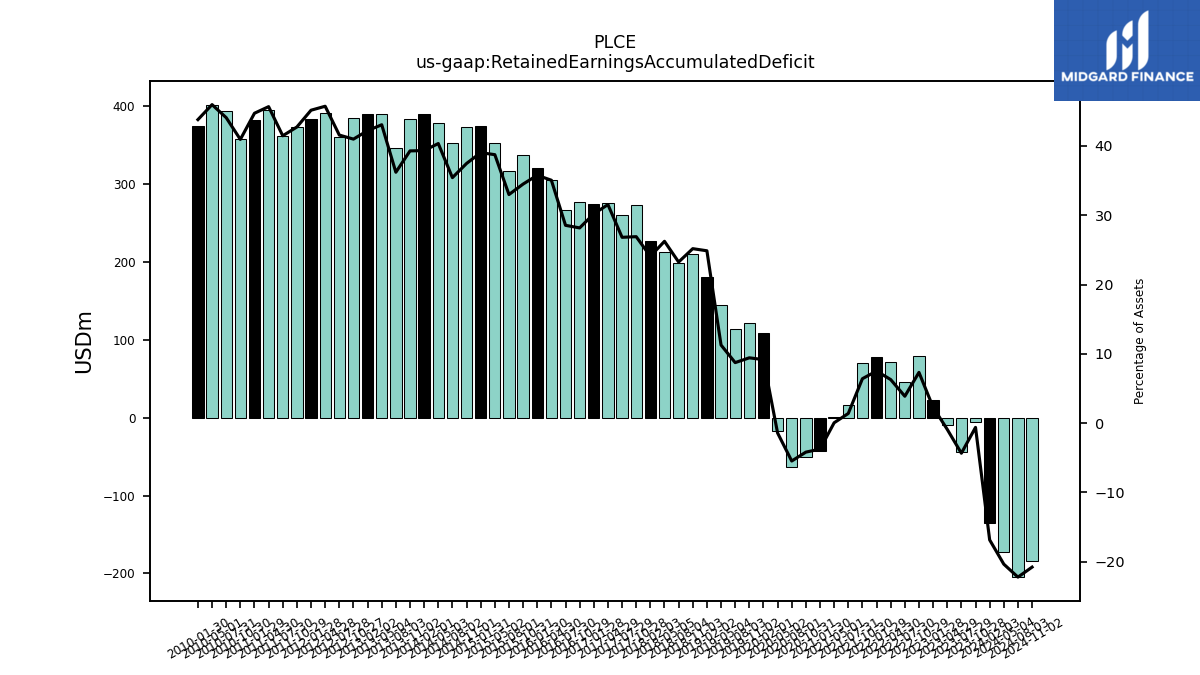
| Retained Earnings Accumulated Deficit | -6.01 | -44.48 | -9.21 | 22.54 | 79.38 | 45.53 | 71.91 | 77.91 | 69.75 | 15.70 | 0.56 | -42.79 | -50.54 | -63.86 | -16.84 | 108.22 | 121.13 | 113.79 | 144.89 | 180.79 | 210.75 | 198.58 | 212.73 | 226.30 | 272.63 | 260.23 | 275.03 | 274.91 | 276.95 | 266.42 | 304.63 | 321.15 | 337.11 | 317.25 | 352.53 | 374.07 | 372.92 | 352.93 | 378.20 | 389.56 | 382.85 | 346.75 | 389.64 | 389.68 | 385.16 | 360.99 | 391.65 | 384.05 | 373.52 | 362.07 | 394.96 | 382.00 | 358.35 | 393.37 | 401.92 | |
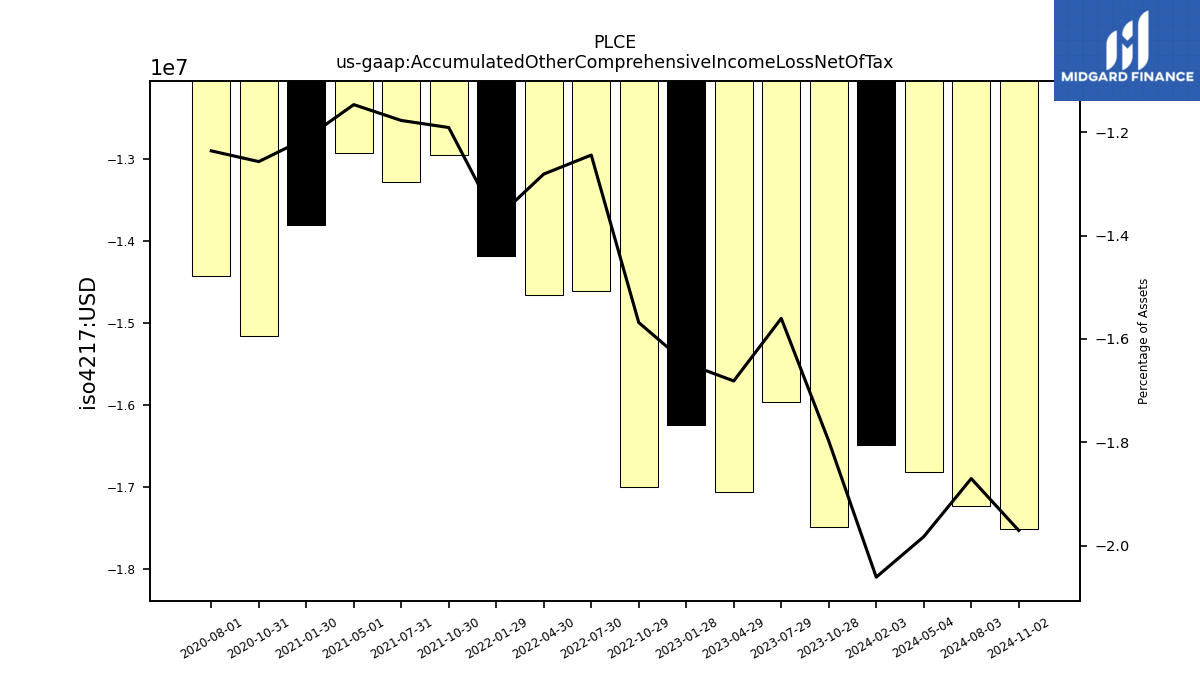
| Accumulated Other Comprehensive Income Loss Net Of Tax | -17.50 | -15.96 | -17.07 | -16.25 | -17.01 | -14.61 | -14.67 | -14.19 | -12.96 | -13.29 | -12.93 | -13.82 | -15.17 | -14.44 | NA | NA | NA | NA | NA | NA | NA | NA | NA | NA | NA | NA | NA | NA | NA | NA | NA | NA | NA | NA | NA | NA | NA | NA | NA | NA | NA | NA | NA | NA | NA | NA | NA | NA | NA | NA | NA | NA | NA | NA | NA | |
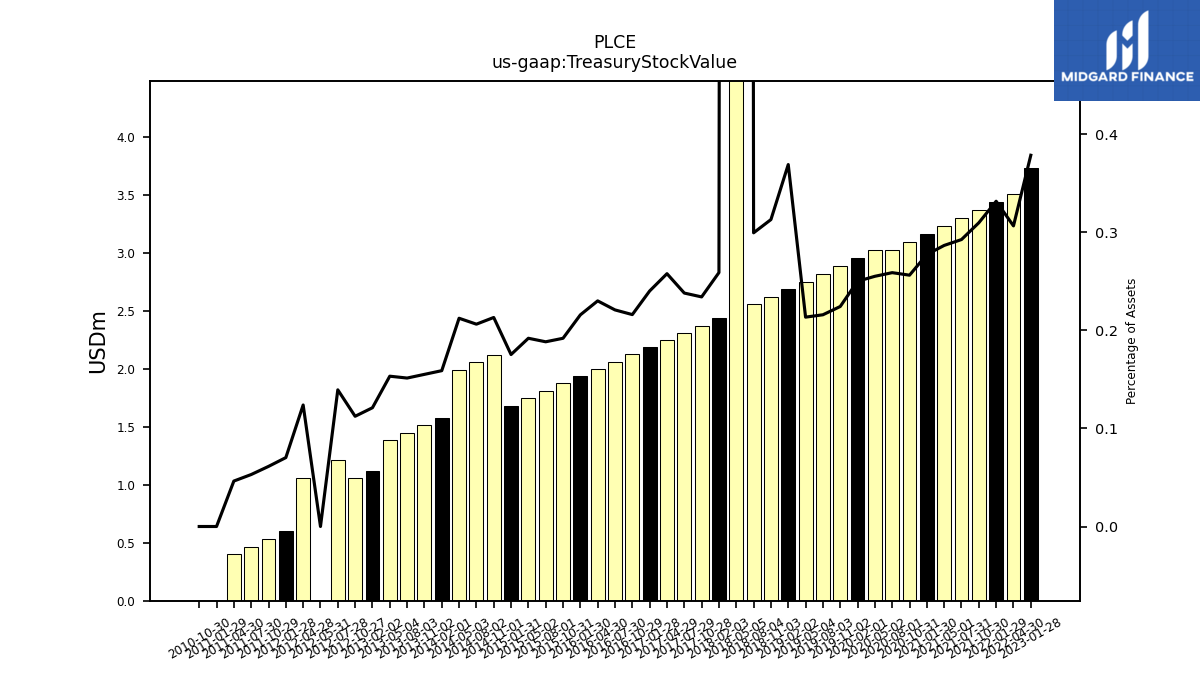
| Treasury Stock Value | NA | NA | NA | 3.74 | NA | NA | 3.51 | 3.44 | 3.37 | 3.30 | 3.23 | 3.16 | 3.10 | 3.02 | 3.02 | 2.96 | 2.89 | 2.82 | 2.75 | 2.69 | 2.62 | 2.56 | 102.50 | 2.44 | 2.37 | 2.31 | 2.25 | 2.19 | 2.13 | 2.06 | 2.00 | 1.94 | 1.88 | 1.81 | 1.75 | 1.68 | 2.12 | 2.06 | 1.99 | 1.57 | 1.51 | 1.45 | 1.39 | 1.12 | 1.06 | 1.21 | 1.06 | 0.60 | 0.54 | 0.46 | 0.40 | 0.00 | 0.00 | NA | NA | |
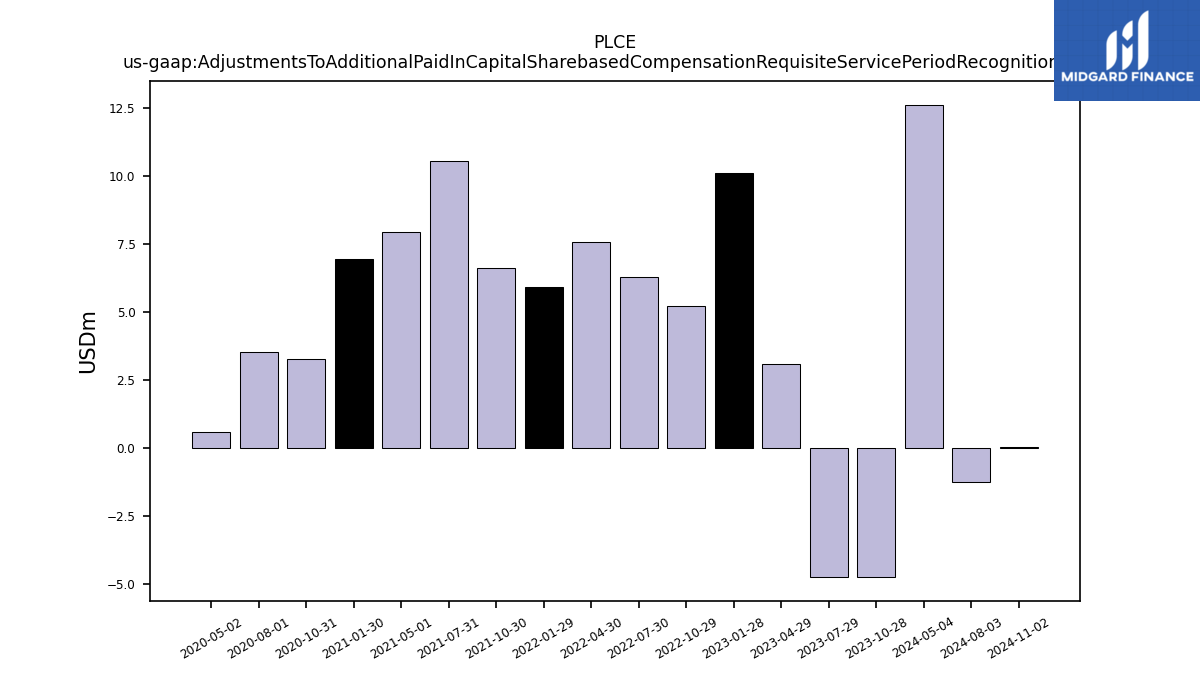
| Adjustments To Additional Paid In Capital Sharebased Compensation Requisite Service Period Recognition Value | NA | NA | 3.08 | 10.10 | 5.22 | 6.27 | 7.56 | 5.91 | 6.59 | 10.53 | 7.92 | 6.93 | 3.27 | 3.53 | 0.58 | NA | NA | NA | NA | NA | NA | NA | NA | NA | NA | NA | NA | NA | NA | NA | NA | NA | NA | NA | NA | NA | NA | NA | NA | NA | NA | NA | NA | NA | NA | NA | NA | NA | NA | NA | NA | NA | NA | NA | NA |
| 2023-10-28 | 2023-07-29 | 2023-04-29 | 2023-01-28 | 2022-10-29 | 2022-07-30 | 2022-04-30 | 2022-01-29 | 2021-10-30 | 2021-07-31 | 2021-05-01 | 2021-01-30 | 2020-10-31 | 2020-08-01 | 2020-05-02 | 2020-02-01 | 2019-11-02 | 2019-08-03 | 2019-05-04 | 2019-02-02 | 2018-11-03 | 2018-08-04 | 2018-05-05 | 2018-02-03 | 2017-10-28 | 2017-07-29 | 2017-04-29 | 2017-01-28 | 2016-10-29 | 2016-07-30 | 2016-04-30 | 2016-01-30 | 2015-10-31 | 2015-08-01 | 2015-05-02 | 2015-01-31 | 2014-11-01 | 2014-08-02 | 2014-05-03 | 2014-02-01 | 2013-11-02 | 2013-08-03 | 2013-05-04 | 2013-02-02 | 2012-10-27 | 2012-07-28 | 2012-04-28 | 2012-01-28 | 2011-10-29 | 2011-07-30 | 2011-04-30 | 2011-01-29 | 2010-10-30 | 2010-07-31 | 2010-05-01 | ||
|---|---|---|---|---|---|---|---|---|---|---|---|---|---|---|---|---|---|---|---|---|---|---|---|---|---|---|---|---|---|---|---|---|---|---|---|---|---|---|---|---|---|---|---|---|---|---|---|---|---|---|---|---|---|---|---|---|
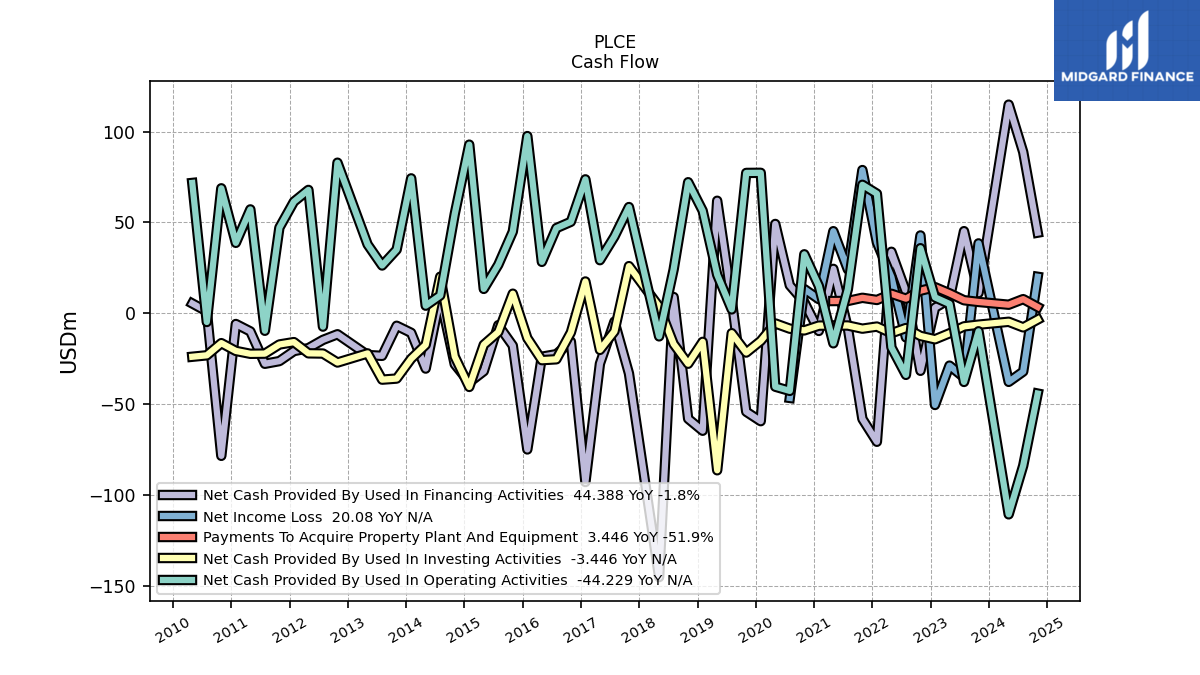
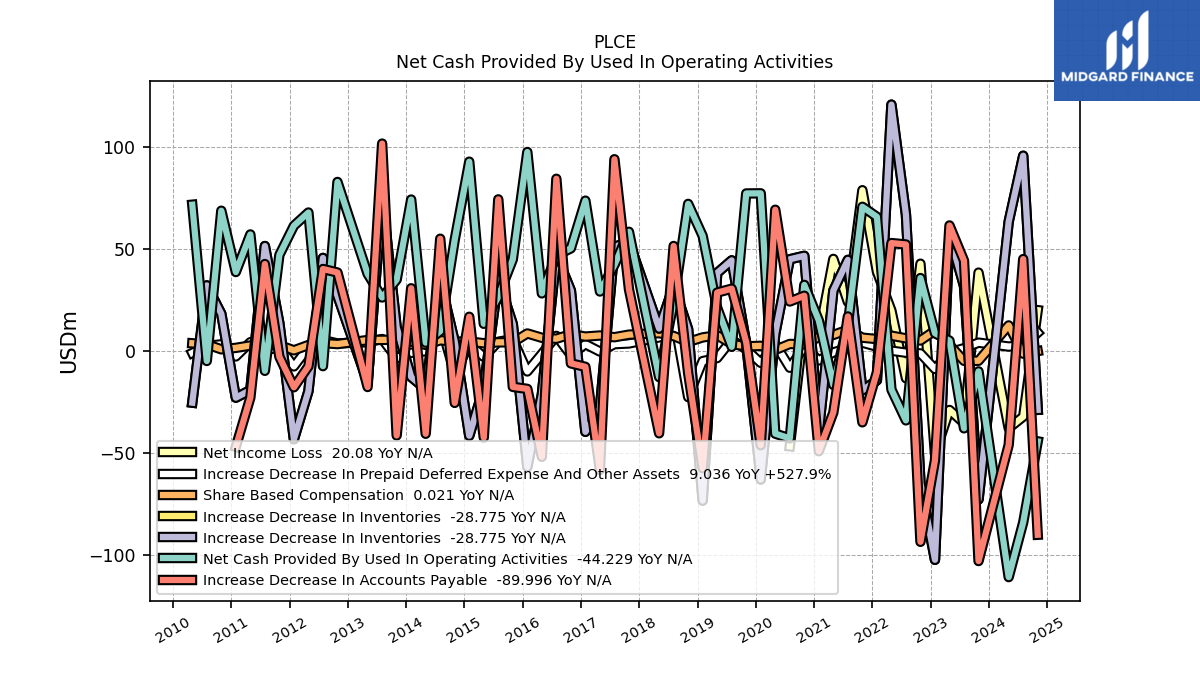
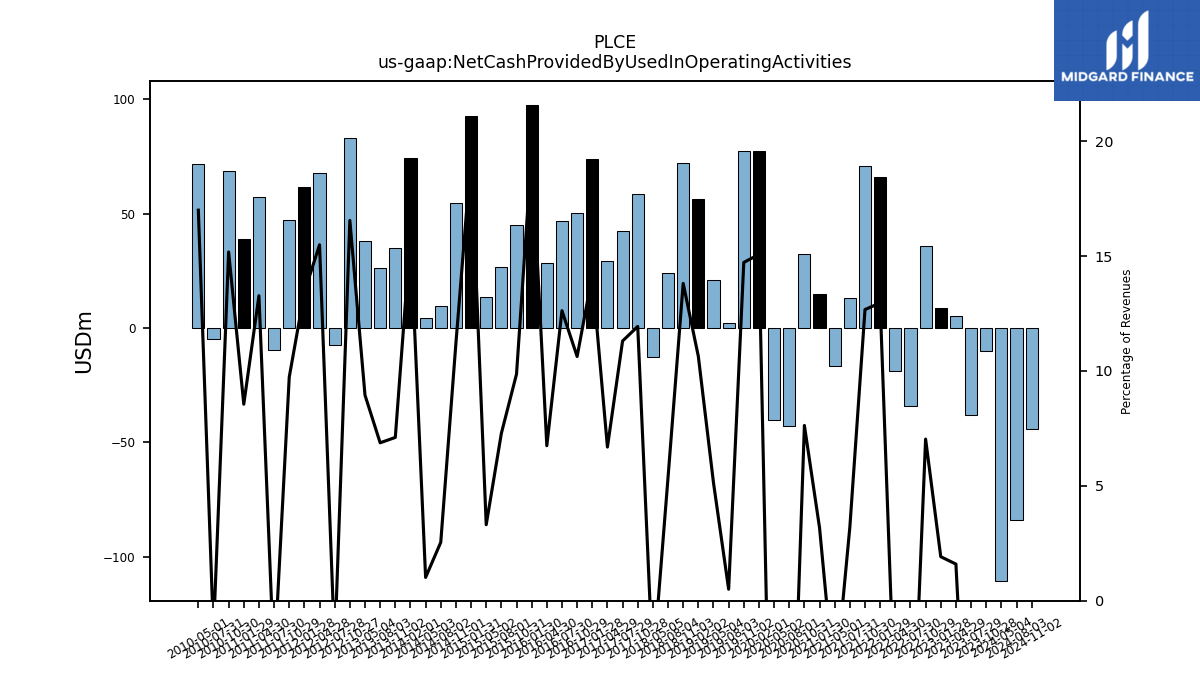
| Net Cash Provided By Used In Operating Activities | -9.93 | -37.84 | 5.13 | 8.75 | 35.82 | -33.95 | -18.84 | 65.83 | 70.75 | 13.27 | -16.56 | 15.01 | 32.47 | -42.75 | -40.45 | 77.34 | 77.27 | 2.11 | 21.18 | 56.44 | 72.17 | 24.06 | -12.74 | NA | 58.50 | 42.24 | 29.21 | 73.74 | 50.37 | 46.89 | 28.30 | 97.59 | 44.96 | 26.70 | 13.40 | 92.85 | 54.61 | 9.78 | 4.16 | 74.29 | 35.02 | 26.29 | 37.86 | NA | 82.92 | -7.38 | 67.93 | 61.45 | 47.12 | -9.66 | 57.20 | 38.76 | 68.82 | -4.83 | 71.76 | |
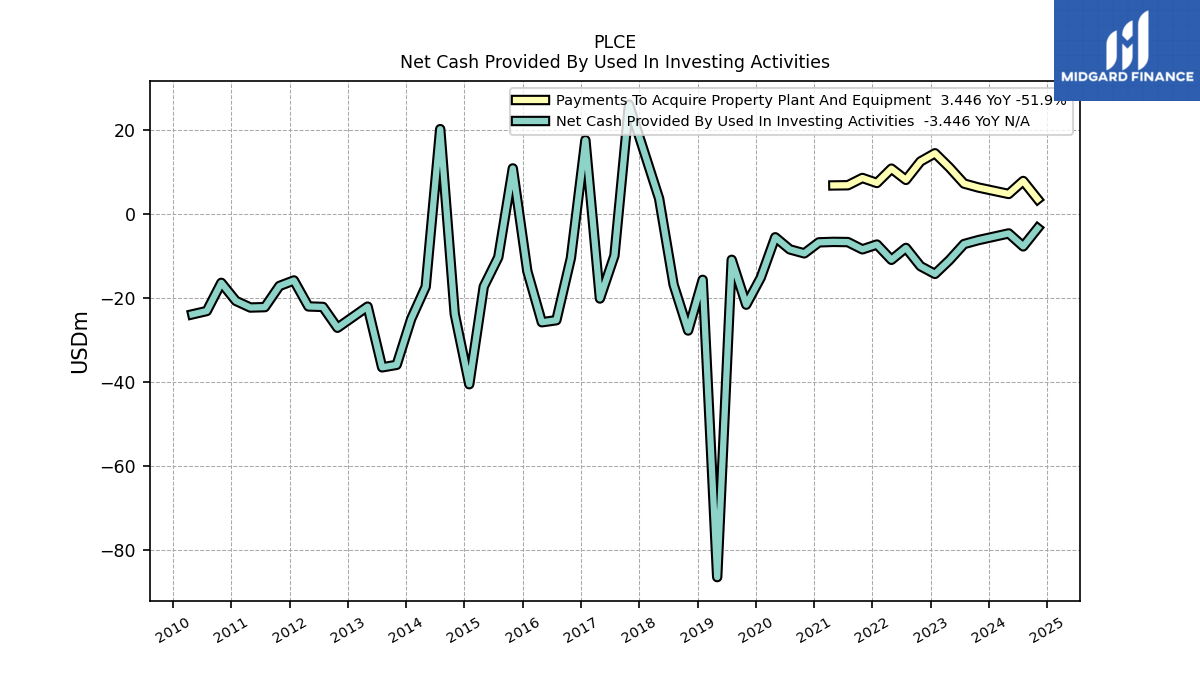
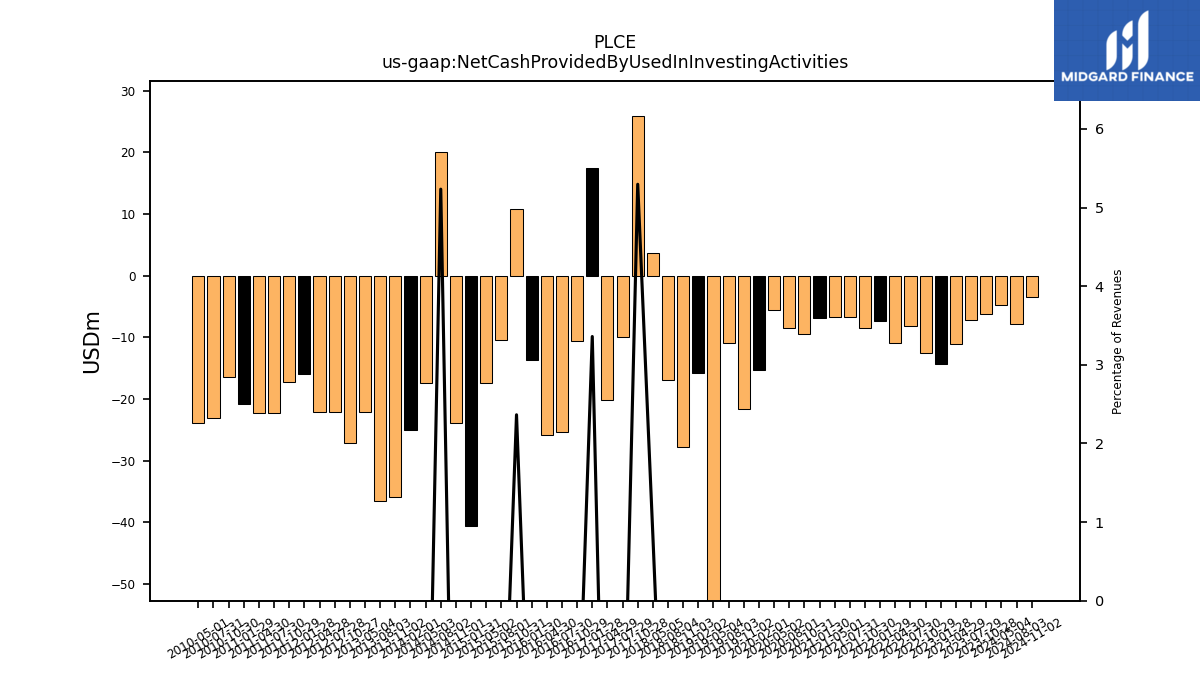
| Net Cash Provided By Used In Investing Activities | -6.28 | -7.22 | -11.04 | -14.33 | -12.49 | -8.14 | -10.98 | -7.34 | -8.49 | -6.76 | -6.71 | -6.82 | -9.44 | -8.50 | -5.61 | -15.22 | -21.66 | -10.98 | -86.49 | -15.74 | -27.81 | -16.92 | 3.60 | NA | 25.96 | -9.98 | -20.19 | 17.50 | -10.57 | -25.35 | -25.83 | -13.69 | 10.78 | -10.37 | -17.35 | -40.59 | -23.86 | 20.13 | -17.40 | -25.05 | -35.97 | -36.57 | -22.11 | NA | -27.15 | -22.19 | -22.07 | -15.88 | -17.20 | -22.24 | -22.33 | -20.75 | -16.45 | -23.16 | -23.96 | |
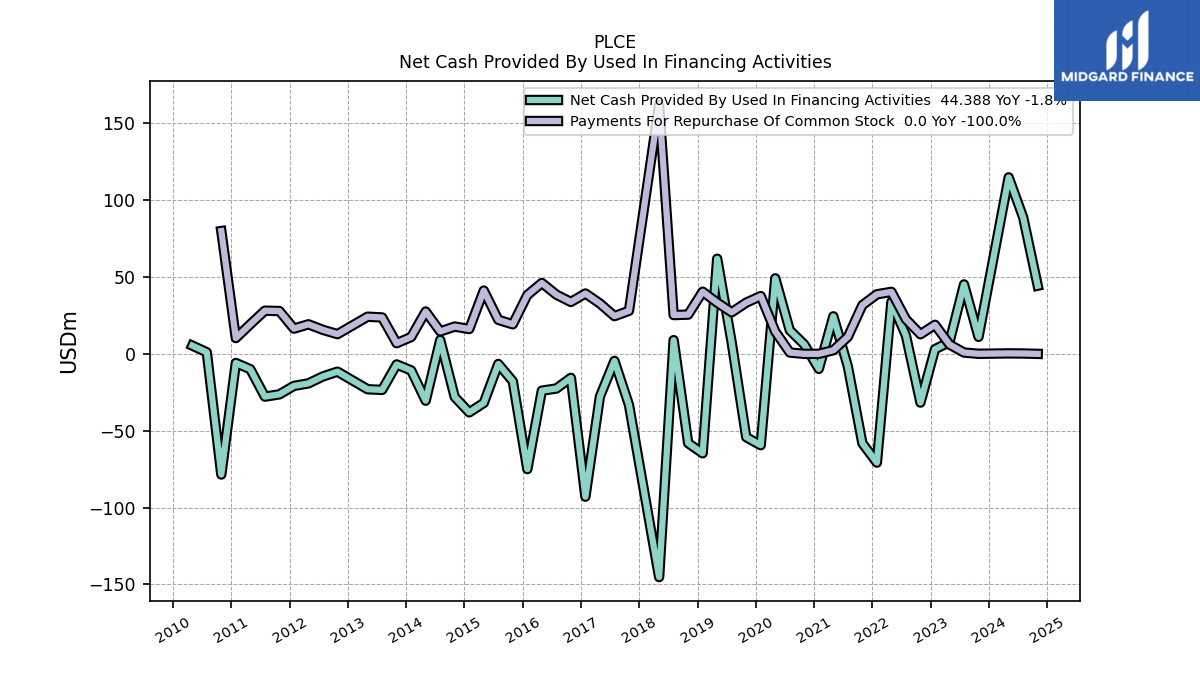
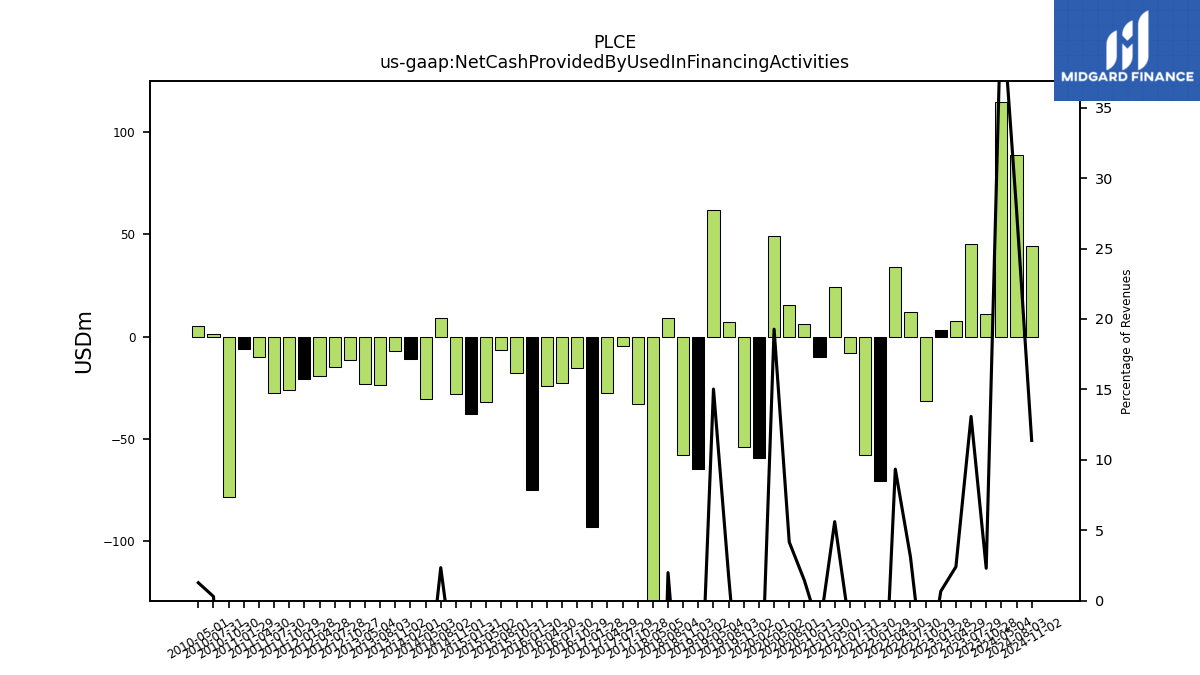
| Net Cash Provided By Used In Financing Activities | 11.07 | 45.21 | 7.76 | 3.05 | -31.70 | 11.86 | 33.86 | -70.79 | -58.18 | -8.21 | 24.45 | -9.76 | 6.12 | 15.38 | 49.19 | -59.45 | -54.23 | 7.34 | 61.96 | -64.71 | -58.11 | 8.95 | -145.32 | NA | -33.16 | -4.56 | -27.79 | -92.96 | -15.61 | -22.54 | -23.95 | -75.02 | -17.85 | -6.56 | -31.93 | -38.07 | -28.08 | 9.03 | -30.48 | -10.78 | -6.88 | -23.45 | -23.02 | NA | -11.56 | -14.68 | -19.21 | -20.84 | -26.36 | -27.83 | -10.01 | -5.91 | -78.53 | 1.04 | 5.39 |
| 2023-10-28 | 2023-07-29 | 2023-04-29 | 2023-01-28 | 2022-10-29 | 2022-07-30 | 2022-04-30 | 2022-01-29 | 2021-10-30 | 2021-07-31 | 2021-05-01 | 2021-01-30 | 2020-10-31 | 2020-08-01 | 2020-05-02 | 2020-02-01 | 2019-11-02 | 2019-08-03 | 2019-05-04 | 2019-02-02 | 2018-11-03 | 2018-08-04 | 2018-05-05 | 2018-02-03 | 2017-10-28 | 2017-07-29 | 2017-04-29 | 2017-01-28 | 2016-10-29 | 2016-07-30 | 2016-04-30 | 2016-01-30 | 2015-10-31 | 2015-08-01 | 2015-05-02 | 2015-01-31 | 2014-11-01 | 2014-08-02 | 2014-05-03 | 2014-02-01 | 2013-11-02 | 2013-08-03 | 2013-05-04 | 2013-02-02 | 2012-10-27 | 2012-07-28 | 2012-04-28 | 2012-01-28 | 2011-10-29 | 2011-07-30 | 2011-04-30 | 2011-01-29 | 2010-10-30 | 2010-07-31 | 2010-05-01 | ||
|---|---|---|---|---|---|---|---|---|---|---|---|---|---|---|---|---|---|---|---|---|---|---|---|---|---|---|---|---|---|---|---|---|---|---|---|---|---|---|---|---|---|---|---|---|---|---|---|---|---|---|---|---|---|---|---|---|
| Net Cash Provided By Used In Operating Activities | -9.93 | -37.84 | 5.13 | 8.75 | 35.82 | -33.95 | -18.84 | 65.83 | 70.75 | 13.27 | -16.56 | 15.01 | 32.47 | -42.75 | -40.45 | 77.34 | 77.27 | 2.11 | 21.18 | 56.44 | 72.17 | 24.06 | -12.74 | NA | 58.50 | 42.24 | 29.21 | 73.74 | 50.37 | 46.89 | 28.30 | 97.59 | 44.96 | 26.70 | 13.40 | 92.85 | 54.61 | 9.78 | 4.16 | 74.29 | 35.02 | 26.29 | 37.86 | NA | 82.92 | -7.38 | 67.93 | 61.45 | 47.12 | -9.66 | 57.20 | 38.76 | 68.82 | -4.83 | 71.76 | |
| Net Income Loss | 38.48 | -35.35 | -28.83 | -50.52 | 42.85 | -13.30 | 19.83 | 39.00 | 78.87 | 24.09 | 45.20 | 7.76 | 13.32 | -46.64 | NA | NA | NA | NA | NA | NA | NA | NA | NA | NA | NA | NA | NA | NA | NA | NA | NA | NA | NA | NA | NA | NA | NA | NA | NA | NA | NA | NA | NA | NA | NA | NA | NA | NA | NA | NA | NA | NA | NA | NA | NA | |
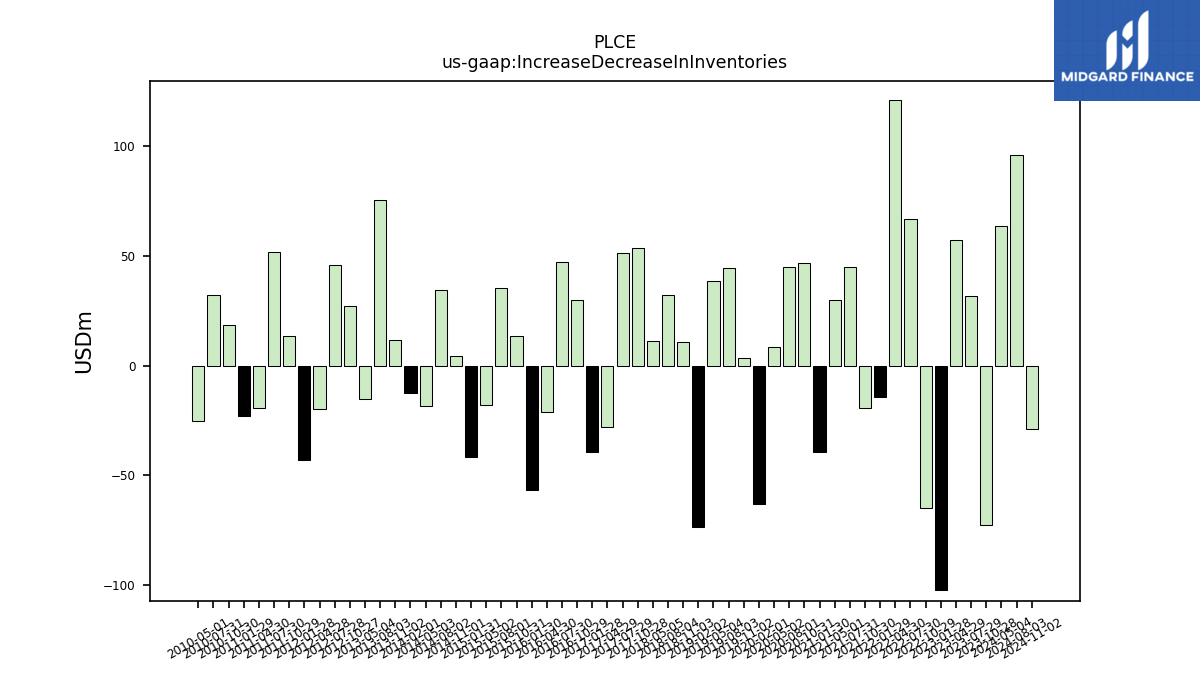
| Increase Decrease In Inventories | -72.72 | 31.87 | 57.09 | -102.27 | -64.75 | 66.96 | 120.81 | -14.31 | -19.22 | 44.72 | 29.69 | -39.27 | 46.70 | 45.02 | 8.63 | -62.90 | 3.63 | 44.48 | 38.32 | -73.27 | 10.74 | 32.08 | 11.07 | NA | 53.67 | 51.06 | -28.18 | -39.55 | 29.66 | 47.30 | -21.33 | -56.78 | 13.25 | 35.23 | -17.82 | -41.49 | 4.57 | 34.52 | -18.63 | -12.66 | 11.59 | 75.34 | -15.33 | NA | 27.16 | 45.68 | -19.65 | -43.18 | 13.53 | 51.51 | -19.11 | -22.82 | 18.32 | 32.22 | -25.24 | |
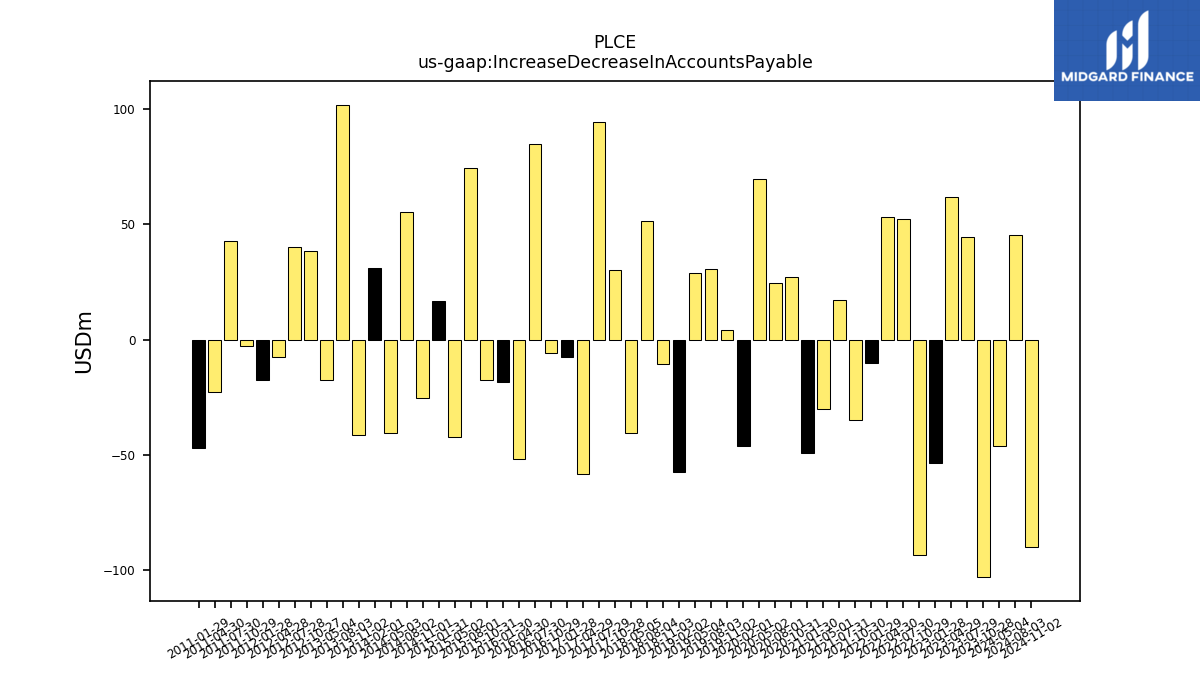
| Increase Decrease In Accounts Payable | -102.89 | 44.31 | 61.60 | -53.50 | -93.46 | 52.27 | 52.96 | -10.35 | -34.89 | 17.00 | -30.09 | -49.06 | 27.15 | 24.33 | 69.31 | -46.14 | 4.34 | 30.60 | 28.70 | -57.39 | -10.76 | 51.54 | -40.28 | NA | 30.30 | 94.05 | -58.23 | -7.69 | -6.00 | 84.48 | -51.81 | -18.50 | -17.52 | 74.39 | -42.41 | 16.84 | -25.38 | 55.10 | -40.51 | 30.81 | -41.34 | 101.72 | -17.59 | NA | 38.53 | 40.26 | -7.45 | -17.72 | -2.79 | 42.69 | -22.80 | -46.91 | NA | NA | NA | |
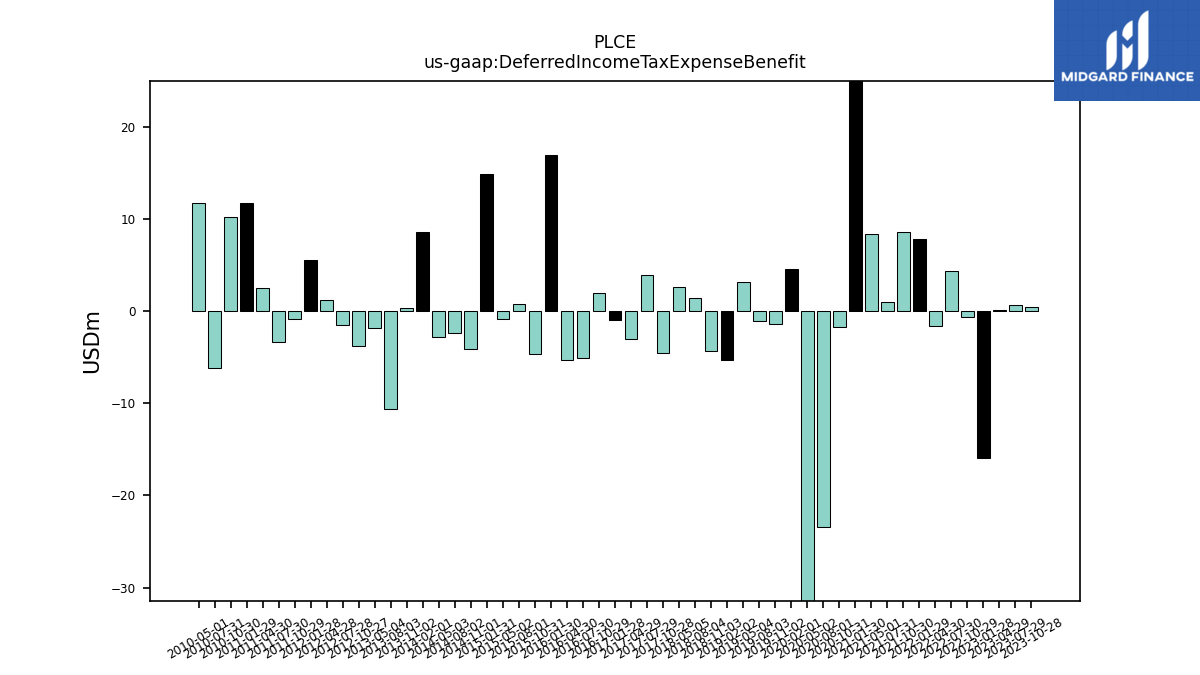
| Deferred Income Tax Expense Benefit | 0.44 | 0.72 | 0.11 | -15.95 | -0.58 | 4.35 | -1.58 | 7.87 | 8.58 | 1.00 | 8.39 | 48.12 | -1.75 | -23.38 | -55.66 | 4.62 | -1.39 | -1.03 | 3.16 | -5.32 | -4.28 | 1.46 | 2.57 | NA | -4.59 | 3.97 | -3.03 | -0.92 | 2.01 | -5.12 | -5.35 | 16.92 | -4.63 | 0.74 | -0.87 | 14.93 | -4.13 | -2.41 | -2.76 | 8.60 | 0.32 | -10.62 | -1.85 | NA | -3.84 | -1.47 | 1.17 | 5.59 | -0.83 | -3.33 | 2.54 | 11.73 | 10.21 | -6.19 | 11.72 | |
| Share Based Compensation | -4.75 | -4.76 | 3.08 | 10.10 | 5.22 | 6.27 | 7.56 | 5.91 | 6.59 | 10.53 | 7.92 | 6.93 | 3.27 | 3.53 | 0.58 | 2.60 | 2.35 | 3.51 | 7.76 | 6.72 | 4.48 | 7.42 | 8.80 | NA | 8.08 | 6.82 | 7.66 | 7.14 | 8.27 | 6.09 | 6.54 | 8.66 | 4.28 | 4.31 | 3.87 | 4.73 | 4.68 | 5.31 | 3.06 | 4.72 | 5.54 | 5.52 | 5.43 | NA | 3.45 | 3.96 | 3.00 | 0.40 | 2.94 | 3.20 | 2.74 | 1.60 | 0.88 | 3.36 | 3.85 |
| 2023-10-28 | 2023-07-29 | 2023-04-29 | 2023-01-28 | 2022-10-29 | 2022-07-30 | 2022-04-30 | 2022-01-29 | 2021-10-30 | 2021-07-31 | 2021-05-01 | 2021-01-30 | 2020-10-31 | 2020-08-01 | 2020-05-02 | 2020-02-01 | 2019-11-02 | 2019-08-03 | 2019-05-04 | 2019-02-02 | 2018-11-03 | 2018-08-04 | 2018-05-05 | 2018-02-03 | 2017-10-28 | 2017-07-29 | 2017-04-29 | 2017-01-28 | 2016-10-29 | 2016-07-30 | 2016-04-30 | 2016-01-30 | 2015-10-31 | 2015-08-01 | 2015-05-02 | 2015-01-31 | 2014-11-01 | 2014-08-02 | 2014-05-03 | 2014-02-01 | 2013-11-02 | 2013-08-03 | 2013-05-04 | 2013-02-02 | 2012-10-27 | 2012-07-28 | 2012-04-28 | 2012-01-28 | 2011-10-29 | 2011-07-30 | 2011-04-30 | 2011-01-29 | 2010-10-30 | 2010-07-31 | 2010-05-01 | ||
|---|---|---|---|---|---|---|---|---|---|---|---|---|---|---|---|---|---|---|---|---|---|---|---|---|---|---|---|---|---|---|---|---|---|---|---|---|---|---|---|---|---|---|---|---|---|---|---|---|---|---|---|---|---|---|---|---|
| Net Cash Provided By Used In Investing Activities | -6.28 | -7.22 | -11.04 | -14.33 | -12.49 | -8.14 | -10.98 | -7.34 | -8.49 | -6.76 | -6.71 | -6.82 | -9.44 | -8.50 | -5.61 | -15.22 | -21.66 | -10.98 | -86.49 | -15.74 | -27.81 | -16.92 | 3.60 | NA | 25.96 | -9.98 | -20.19 | 17.50 | -10.57 | -25.35 | -25.83 | -13.69 | 10.78 | -10.37 | -17.35 | -40.59 | -23.86 | 20.13 | -17.40 | -25.05 | -35.97 | -36.57 | -22.11 | NA | -27.15 | -22.19 | -22.07 | -15.88 | -17.20 | -22.24 | -22.33 | -20.75 | -16.45 | -23.16 | -23.96 | |
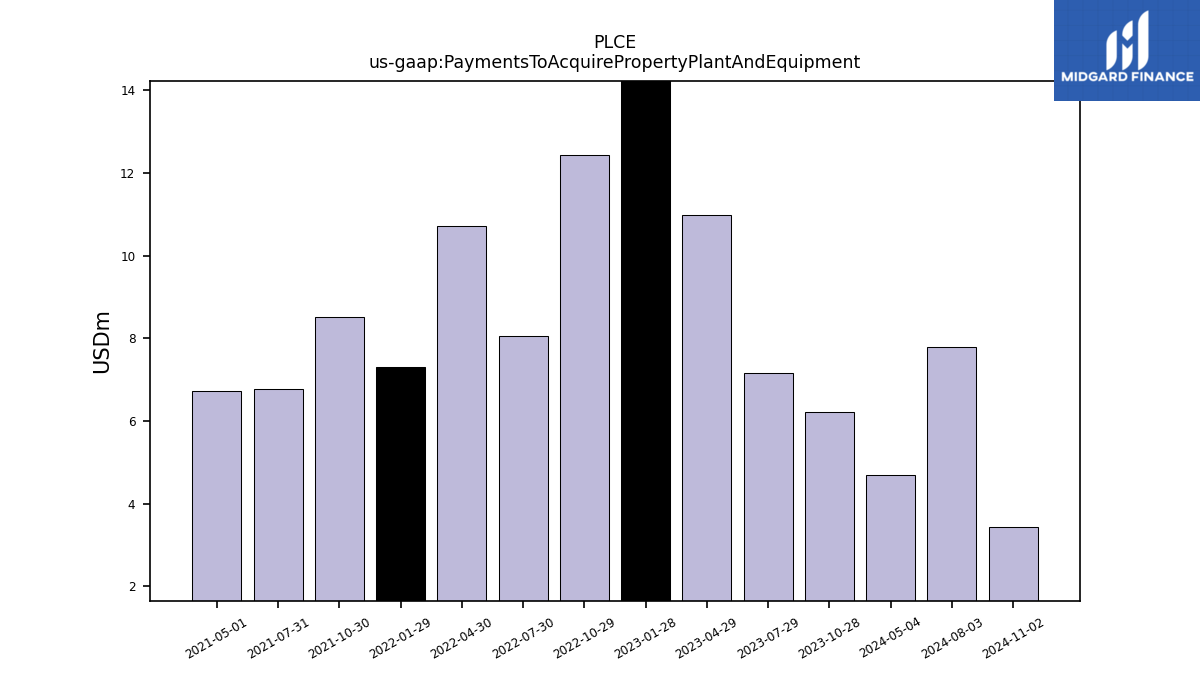
| Payments To Acquire Property Plant And Equipment | 6.22 | 7.17 | 10.98 | 14.38 | 12.43 | 8.04 | 10.72 | 7.31 | 8.50 | 6.77 | 6.73 | NA | NA | NA | NA | NA | NA | NA | NA | NA | NA | NA | NA | NA | NA | NA | NA | NA | NA | NA | NA | NA | NA | NA | NA | NA | NA | NA | NA | NA | NA | NA | NA | NA | NA | NA | NA | NA | NA | NA | NA | NA | NA | NA | NA |
| 2023-10-28 | 2023-07-29 | 2023-04-29 | 2023-01-28 | 2022-10-29 | 2022-07-30 | 2022-04-30 | 2022-01-29 | 2021-10-30 | 2021-07-31 | 2021-05-01 | 2021-01-30 | 2020-10-31 | 2020-08-01 | 2020-05-02 | 2020-02-01 | 2019-11-02 | 2019-08-03 | 2019-05-04 | 2019-02-02 | 2018-11-03 | 2018-08-04 | 2018-05-05 | 2018-02-03 | 2017-10-28 | 2017-07-29 | 2017-04-29 | 2017-01-28 | 2016-10-29 | 2016-07-30 | 2016-04-30 | 2016-01-30 | 2015-10-31 | 2015-08-01 | 2015-05-02 | 2015-01-31 | 2014-11-01 | 2014-08-02 | 2014-05-03 | 2014-02-01 | 2013-11-02 | 2013-08-03 | 2013-05-04 | 2013-02-02 | 2012-10-27 | 2012-07-28 | 2012-04-28 | 2012-01-28 | 2011-10-29 | 2011-07-30 | 2011-04-30 | 2011-01-29 | 2010-10-30 | 2010-07-31 | 2010-05-01 | ||
|---|---|---|---|---|---|---|---|---|---|---|---|---|---|---|---|---|---|---|---|---|---|---|---|---|---|---|---|---|---|---|---|---|---|---|---|---|---|---|---|---|---|---|---|---|---|---|---|---|---|---|---|---|---|---|---|---|
| Net Cash Provided By Used In Financing Activities | 11.07 | 45.21 | 7.76 | 3.05 | -31.70 | 11.86 | 33.86 | -70.79 | -58.18 | -8.21 | 24.45 | -9.76 | 6.12 | 15.38 | 49.19 | -59.45 | -54.23 | 7.34 | 61.96 | -64.71 | -58.11 | 8.95 | -145.32 | NA | -33.16 | -4.56 | -27.79 | -92.96 | -15.61 | -22.54 | -23.95 | -75.02 | -17.85 | -6.56 | -31.93 | -38.07 | -28.08 | 9.03 | -30.48 | -10.78 | -6.88 | -23.45 | -23.02 | NA | -11.56 | -14.68 | -19.21 | -20.84 | -26.36 | -27.83 | -10.01 | -5.91 | -78.53 | 1.04 | 5.39 | |
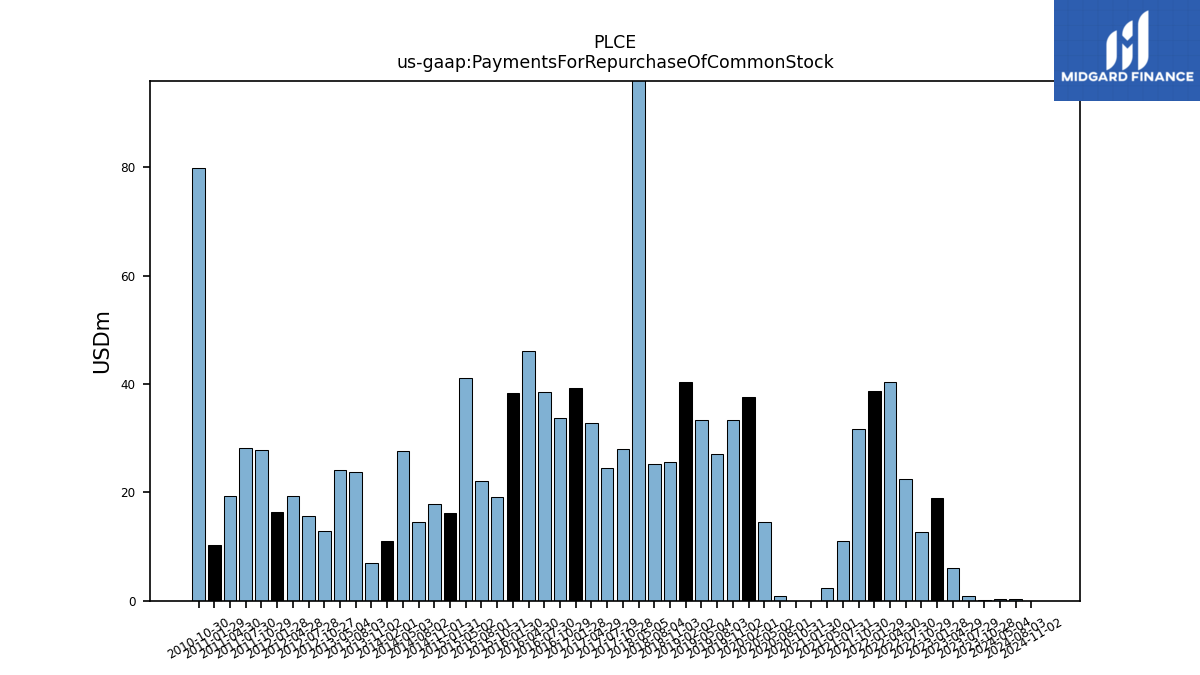
| Payments For Repurchase Of Common Stock | 0.06 | 0.88 | 6.09 | 18.94 | 12.77 | 22.53 | 40.37 | 38.79 | 31.72 | 11.09 | 2.37 | 0.04 | 0.01 | 0.89 | 14.56 | 37.63 | 33.38 | 27.07 | 33.32 | 40.47 | 25.55 | 25.27 | 162.25 | NA | 28.00 | 24.57 | 32.81 | 39.31 | 33.80 | 38.54 | 46.15 | 38.28 | 19.24 | 22.16 | 41.21 | 16.16 | 17.78 | 14.60 | 27.58 | 10.98 | 6.93 | 23.72 | 24.20 | NA | 12.84 | 15.63 | 19.26 | 16.43 | 27.89 | 28.13 | 19.31 | 10.27 | 79.97 | NA | NA |
| 2023-10-28 | 2023-07-29 | 2023-04-29 | 2023-01-28 | 2022-10-29 | 2022-07-30 | 2022-04-30 | 2022-01-29 | 2021-10-30 | 2021-07-31 | 2021-05-01 | 2021-01-30 | 2020-10-31 | 2020-08-01 | 2020-05-02 | 2020-02-01 | 2019-11-02 | 2019-08-03 | 2019-05-04 | 2019-02-02 | 2018-11-03 | 2018-08-04 | 2018-05-05 | 2018-02-03 | 2017-10-28 | 2017-07-29 | 2017-04-29 | 2017-01-28 | 2016-10-29 | 2016-07-30 | 2016-04-30 | 2016-01-30 | 2015-10-31 | 2015-08-01 | 2015-05-02 | 2015-01-31 | 2014-11-01 | 2014-08-02 | 2014-05-03 | 2014-02-01 | 2013-11-02 | 2013-08-03 | 2013-05-04 | 2013-02-02 | 2012-10-27 | 2012-07-28 | 2012-04-28 | 2012-01-28 | 2011-10-29 | 2011-07-30 | 2011-04-30 | 2011-01-29 | 2010-10-30 | 2010-07-31 | 2010-05-01 | ||
|---|---|---|---|---|---|---|---|---|---|---|---|---|---|---|---|---|---|---|---|---|---|---|---|---|---|---|---|---|---|---|---|---|---|---|---|---|---|---|---|---|---|---|---|---|---|---|---|---|---|---|---|---|---|---|---|---|
| Revenues | 480.23 | 345.60 | 321.64 | 456.13 | 509.12 | 380.88 | 362.35 | 507.80 | 558.23 | 413.86 | 435.48 | 472.90 | 425.57 | 368.92 | 255.21 | 513.02 | 524.80 | 420.47 | 412.38 | 530.56 | 522.50 | 448.72 | 436.31 | 569.97 | 490.03 | 373.60 | 436.68 | 520.77 | 473.78 | 371.42 | 419.35 | 498.54 | 455.91 | 366.45 | 404.87 | 479.24 | 487.30 | 384.63 | 410.15 | 467.50 | 492.68 | 382.45 | 423.16 | 509.22 | 500.93 | 360.83 | 438.51 | 457.46 | 484.08 | 343.51 | 430.81 | 453.17 | 453.39 | 345.30 | 422.13 | |
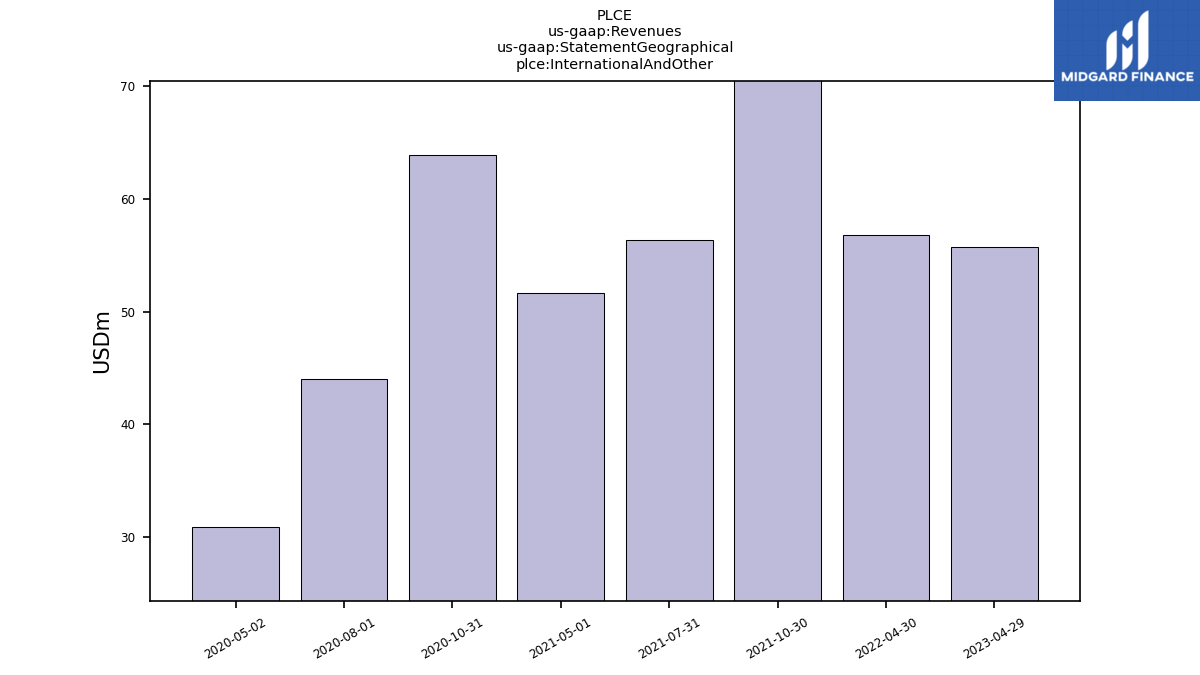
| International And Other | NA | NA | 55.78 | NA | NA | NA | 56.84 | NA | 83.25 | 56.33 | 51.69 | NA | 63.89 | 44.06 | 30.95 | NA | NA | NA | NA | NA | NA | NA | NA | NA | NA | NA | NA | NA | NA | NA | NA | NA | NA | NA | NA | NA | NA | NA | NA | NA | NA | NA | NA | NA | NA | NA | NA | NA | NA | NA | NA | NA | NA | NA | NA | |
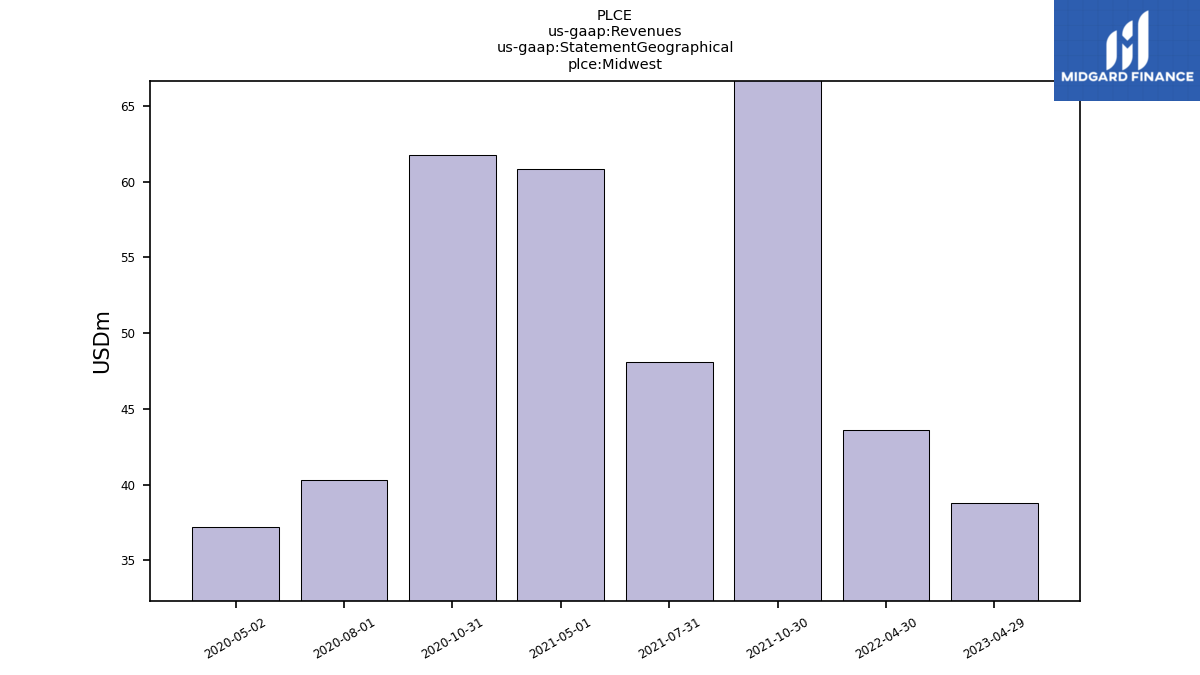
| Midwest | NA | NA | 38.81 | NA | NA | NA | 43.61 | NA | 71.48 | 48.09 | 60.80 | NA | 61.74 | 40.27 | 37.23 | NA | NA | NA | NA | NA | NA | NA | NA | NA | NA | NA | NA | NA | NA | NA | NA | NA | NA | NA | NA | NA | NA | NA | NA | NA | NA | NA | NA | NA | NA | NA | NA | NA | NA | NA | NA | NA | NA | NA | NA | |
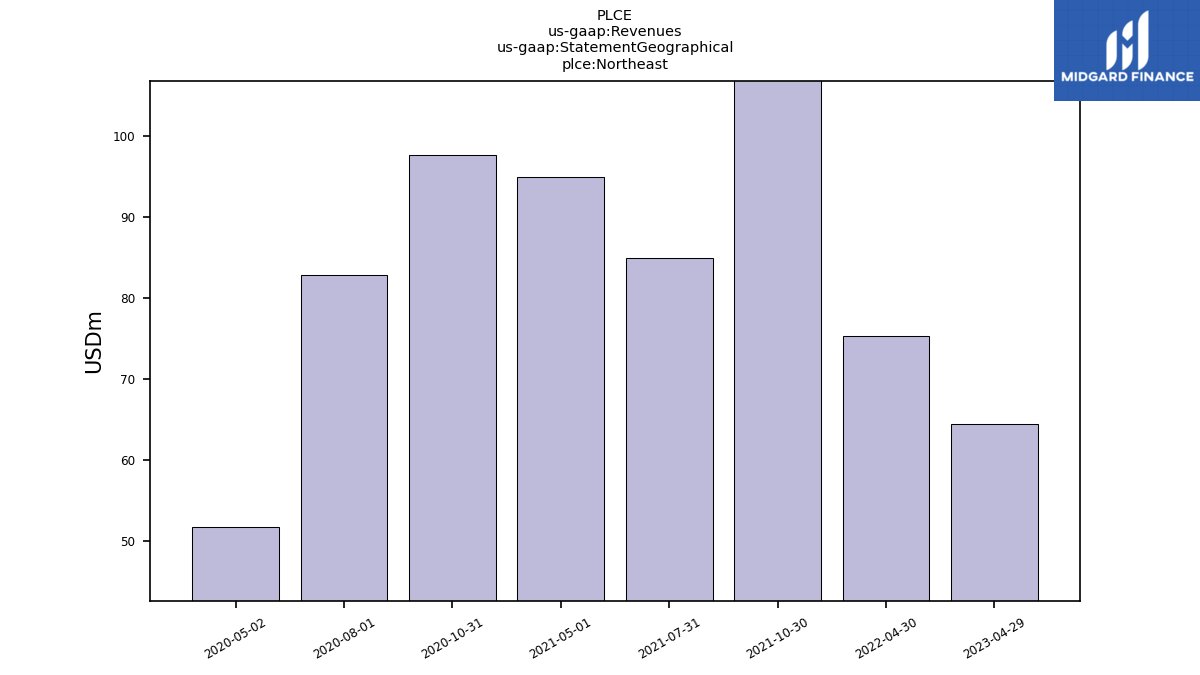
| Northeast | NA | NA | 64.53 | NA | NA | NA | 75.40 | NA | 129.31 | 84.95 | 95.02 | NA | 97.67 | 82.94 | 51.83 | NA | NA | NA | NA | NA | NA | NA | NA | NA | NA | NA | NA | NA | NA | NA | NA | NA | NA | NA | NA | NA | NA | NA | NA | NA | NA | NA | NA | NA | NA | NA | NA | NA | NA | NA | NA | NA | NA | NA | NA | |
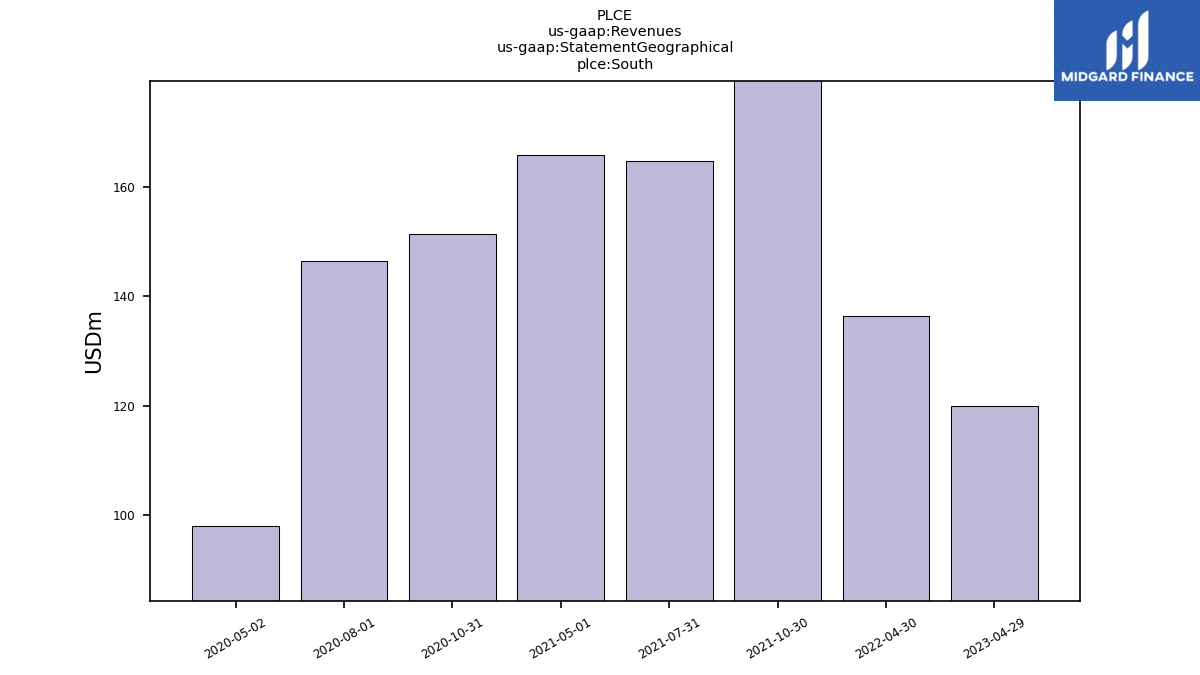
| South | NA | NA | 119.92 | NA | NA | NA | 136.37 | NA | 194.08 | 164.63 | 165.74 | NA | 151.37 | 146.34 | 97.94 | NA | NA | NA | NA | NA | NA | NA | NA | NA | NA | NA | NA | NA | NA | NA | NA | NA | NA | NA | NA | NA | NA | NA | NA | NA | NA | NA | NA | NA | NA | NA | NA | NA | NA | NA | NA | NA | NA | NA | NA | |
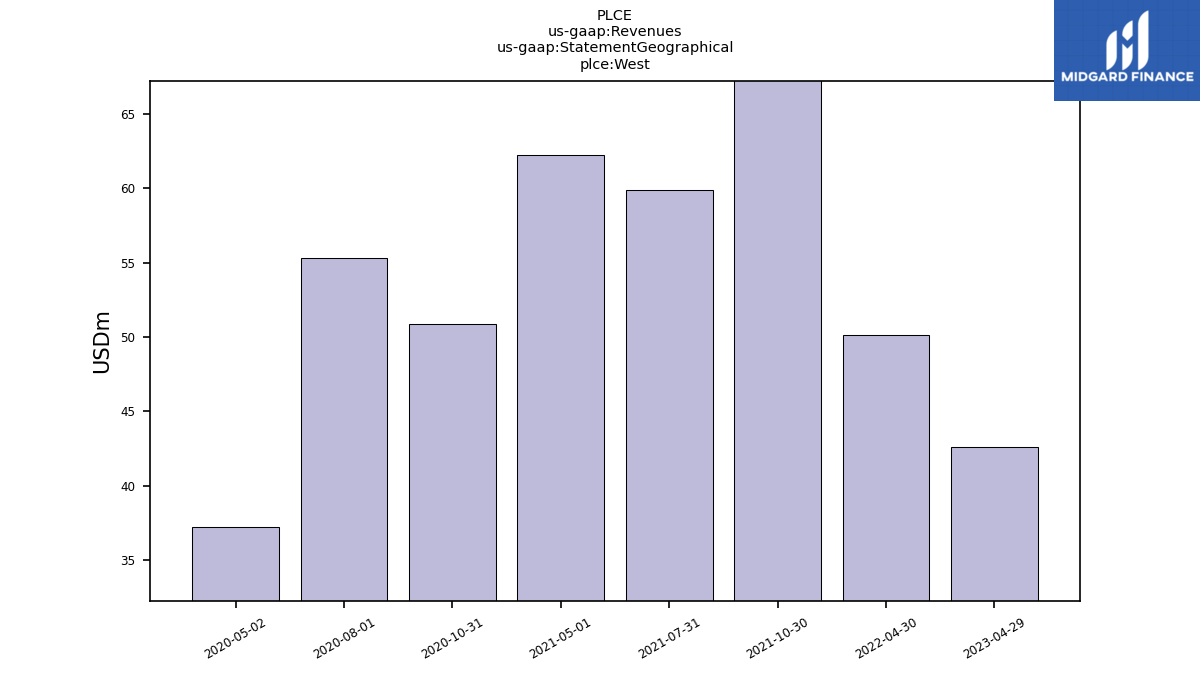
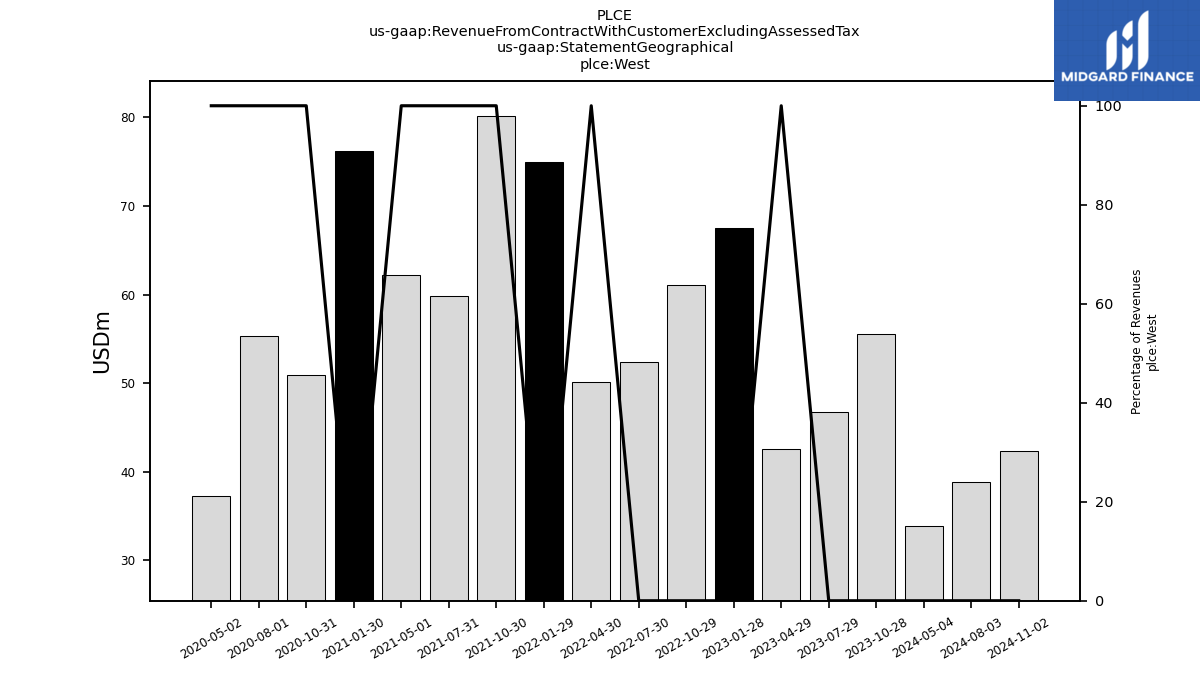
| West | NA | NA | 42.60 | NA | NA | NA | 50.13 | NA | 80.10 | 59.85 | 62.22 | NA | 50.90 | 55.31 | 37.26 | NA | NA | NA | NA | NA | NA | NA | NA | NA | NA | NA | NA | NA | NA | NA | NA | NA | NA | NA | NA | NA | NA | NA | NA | NA | NA | NA | NA | NA | NA | NA | NA | NA | NA | NA | NA | NA | NA | NA | NA | |
| Revenue From Contract With Customer Excluding Assessed Tax | 480.23 | 345.60 | 321.64 | 456.13 | 509.12 | 380.88 | 362.35 | 507.80 | 558.23 | 413.86 | 435.48 | 472.90 | 425.57 | 368.92 | 255.21 | 513.02 | 524.80 | 420.47 | 412.38 | 530.56 | 522.50 | 448.72 | 436.31 | 569.97 | 490.03 | 373.60 | 436.68 | 520.77 | 473.78 | 371.42 | 419.35 | 498.54 | 455.91 | 366.45 | 404.87 | 479.24 | 487.30 | 384.63 | 410.15 | 467.50 | 492.68 | 382.45 | 423.16 | 509.22 | 500.93 | 360.83 | 438.51 | 457.46 | 484.08 | 343.51 | 430.81 | 453.17 | 453.39 | 345.30 | 422.13 | |
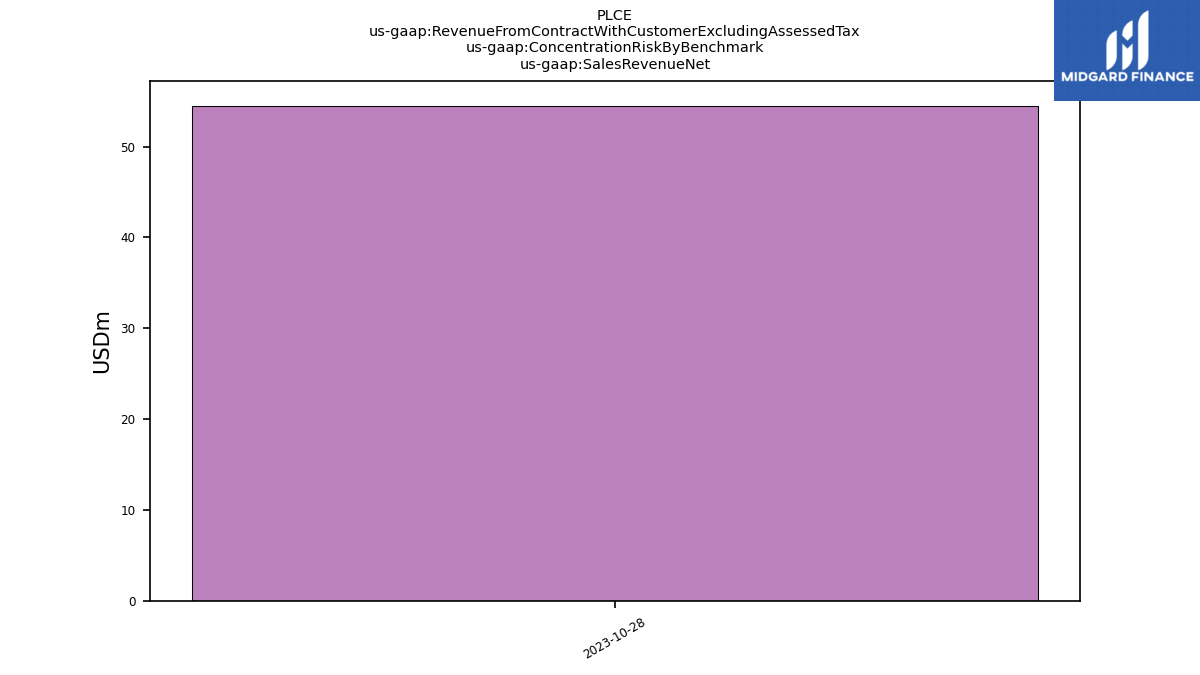
| Sales Revenue Net | 54.50 | NA | NA | NA | NA | NA | NA | NA | NA | NA | NA | NA | NA | NA | NA | NA | NA | NA | NA | NA | NA | NA | NA | NA | NA | NA | NA | NA | NA | NA | NA | NA | NA | NA | NA | NA | NA | NA | NA | NA | NA | NA | NA | NA | NA | NA | NA | NA | NA | NA | NA | NA | NA | NA | NA | |
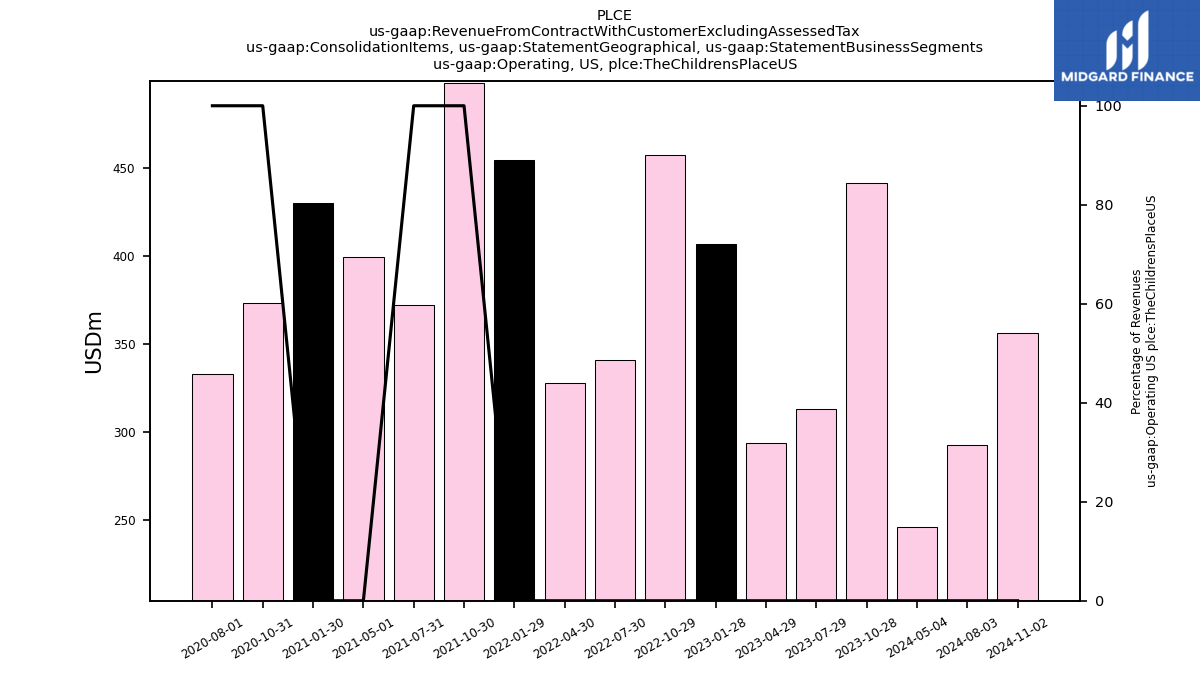
| Operating,US, The Childrens Place U S | 441.87 | 313.22 | 293.49 | 407.24 | 457.51 | 341.22 | 327.96 | 454.69 | 498.84 | 372.32 | 399.66 | 430.47 | 373.62 | 333.03 | NA | NA | NA | NA | NA | NA | NA | NA | NA | NA | NA | NA | NA | NA | NA | NA | NA | NA | NA | NA | NA | NA | NA | NA | NA | NA | NA | NA | NA | NA | NA | NA | NA | NA | NA | NA | NA | NA | NA | NA | NA | |
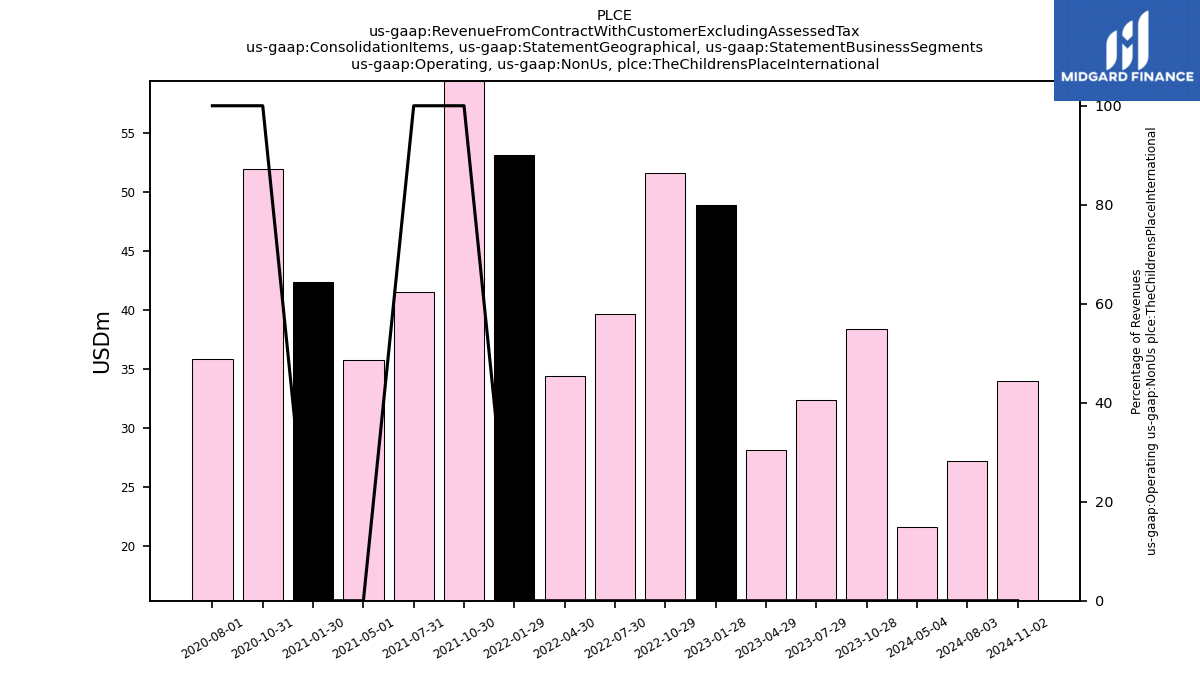
| Operating, Non Us, The Childrens Place International | 38.37 | 32.38 | 28.15 | 48.88 | 51.61 | 39.66 | 34.39 | 53.11 | 59.39 | 41.54 | 35.82 | 42.42 | 51.95 | 35.89 | NA | NA | NA | NA | NA | NA | NA | NA | NA | NA | NA | NA | NA | NA | NA | NA | NA | NA | NA | NA | NA | NA | NA | NA | NA | NA | NA | NA | NA | NA | NA | NA | NA | NA | NA | NA | NA | NA | NA | NA | NA | |
| International And Other | 101.66 | 77.11 | 55.78 | 87.42 | 93.74 | 70.78 | 56.84 | 67.38 | 83.25 | 56.33 | 51.69 | 61.85 | 63.89 | 44.06 | 30.95 | NA | NA | NA | NA | NA | NA | NA | NA | NA | NA | NA | NA | NA | NA | NA | NA | NA | NA | NA | NA | NA | NA | NA | NA | NA | NA | NA | NA | NA | NA | NA | NA | NA | NA | NA | NA | NA | NA | NA | NA | |
| Midwest | 58.33 | 34.09 | 38.81 | 50.91 | 62.34 | 39.22 | 43.61 | 62.02 | 71.48 | 48.09 | 60.80 | 58.45 | 61.74 | 40.27 | 37.23 | NA | NA | NA | NA | NA | NA | NA | NA | NA | NA | NA | NA | NA | NA | NA | NA | NA | NA | NA | NA | NA | NA | NA | NA | NA | NA | NA | NA | NA | NA | NA | NA | NA | NA | NA | NA | NA | NA | NA | NA | |
| Northeast | 96.05 | 59.94 | 64.53 | 83.16 | 108.40 | 72.11 | 75.40 | 103.50 | 129.31 | 84.95 | 95.02 | 92.69 | 97.67 | 82.94 | 51.83 | NA | NA | NA | NA | NA | NA | NA | NA | NA | NA | NA | NA | NA | NA | NA | NA | NA | NA | NA | NA | NA | NA | NA | NA | NA | NA | NA | NA | NA | NA | NA | NA | NA | NA | NA | NA | NA | NA | NA | NA | |
| South | 168.62 | 127.71 | 119.92 | 167.15 | 183.54 | 146.37 | 136.37 | 199.93 | 194.08 | 164.63 | 165.74 | 183.69 | 151.37 | 146.34 | 97.94 | NA | NA | NA | NA | NA | NA | NA | NA | NA | NA | NA | NA | NA | NA | NA | NA | NA | NA | NA | NA | NA | NA | NA | NA | NA | NA | NA | NA | NA | NA | NA | NA | NA | NA | NA | NA | NA | NA | NA | NA | |
| West | 55.57 | 46.75 | 42.60 | 67.49 | 61.10 | 52.41 | 50.13 | 74.98 | 80.10 | 59.85 | 62.22 | 76.21 | 50.90 | 55.31 | 37.26 | NA | NA | NA | NA | NA | NA | NA | NA | NA | NA | NA | NA | NA | NA | NA | NA | NA | NA | NA | NA | NA | NA | NA | NA | NA | NA | NA | NA | NA | NA | NA | NA | NA | NA | NA | NA | NA | NA | NA | NA | |
| Revenue From Contract With Customer Including Assessed Tax | 480.23 | 345.60 | 321.64 | 456.13 | 509.12 | 380.88 | 362.35 | 507.80 | 558.23 | 413.86 | 435.48 | 472.90 | 425.57 | 368.92 | 255.21 | 513.02 | 524.80 | 420.47 | 412.38 | 530.56 | 522.50 | 448.72 | 436.31 | 569.97 | 490.03 | 373.60 | 436.68 | 520.77 | 473.78 | 371.42 | 419.35 | 498.54 | 455.91 | 366.45 | 404.87 | 479.24 | 487.30 | 384.63 | 410.15 | 467.50 | 492.68 | 382.45 | 423.16 | 509.22 | 500.93 | 360.83 | 438.51 | 457.46 | 484.08 | 343.51 | 430.81 | 453.17 | 453.39 | 345.30 | 422.13 |
