
| 2023-12-31 | 2023-09-30 | 2023-06-30 | 2023-03-31 | 2022-12-31 | 2022-09-30 | 2022-06-30 | 2022-03-31 | 2021-12-31 | 2021-09-30 | 2021-06-30 | 2021-03-31 | 2020-12-31 | 2020-09-30 | 2020-06-30 | 2020-03-31 | 2019-12-31 | 2019-09-30 | 2019-06-30 | 2019-03-31 | 2018-12-31 | 2018-09-30 | 2018-06-30 | 2018-03-31 | 2017-12-31 | 2017-09-30 | 2017-06-30 | 2017-03-31 | ||
|---|---|---|---|---|---|---|---|---|---|---|---|---|---|---|---|---|---|---|---|---|---|---|---|---|---|---|---|---|---|
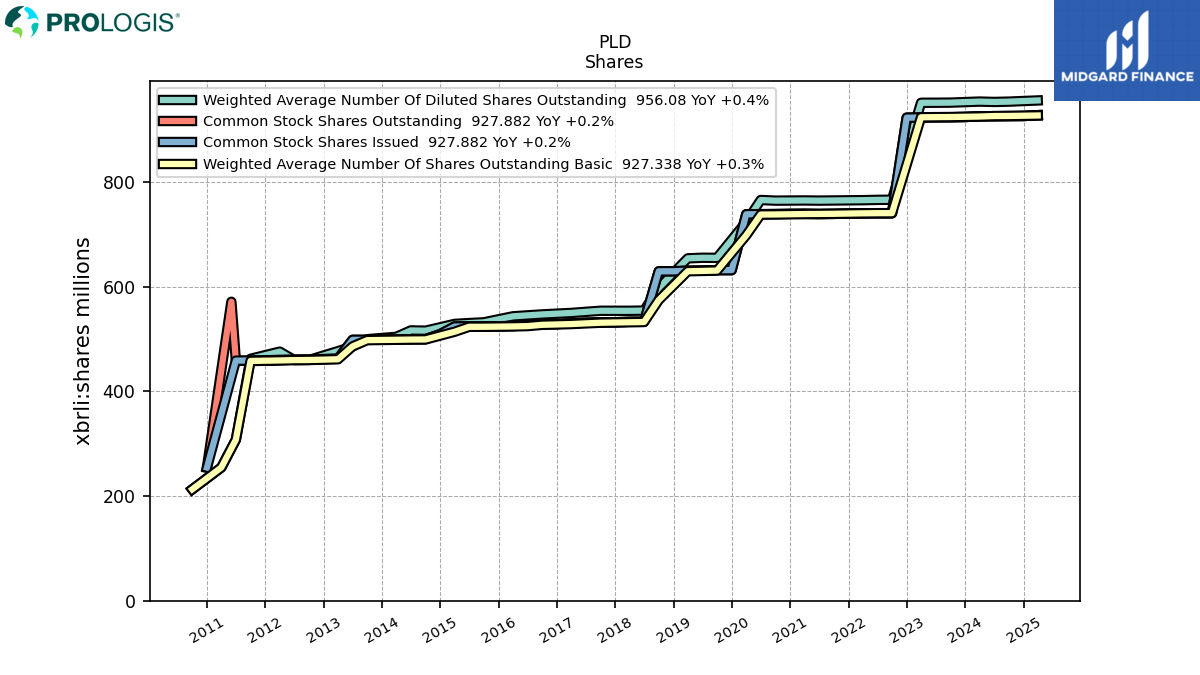
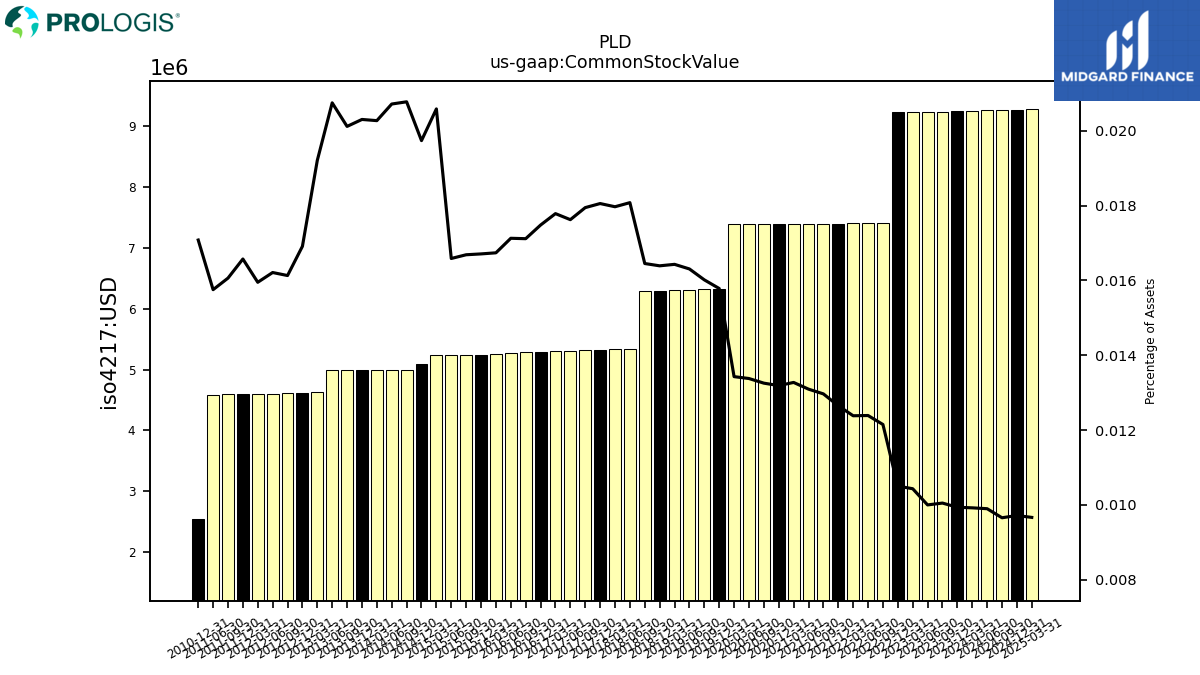
| Common Stock Value | 9.24 | 9.24 | 9.24 | 9.23 | 9.23 | 7.40 | 7.40 | 7.40 | 7.40 | 7.39 | 7.39 | 7.40 | 7.39 | 7.39 | 7.39 | 7.39 | 6.32 | 6.32 | 6.31 | 6.31 | 6.30 | 6.29 | 5.33 | 5.33 | 5.32 | 5.32 | 5.31 | 5.30 | |
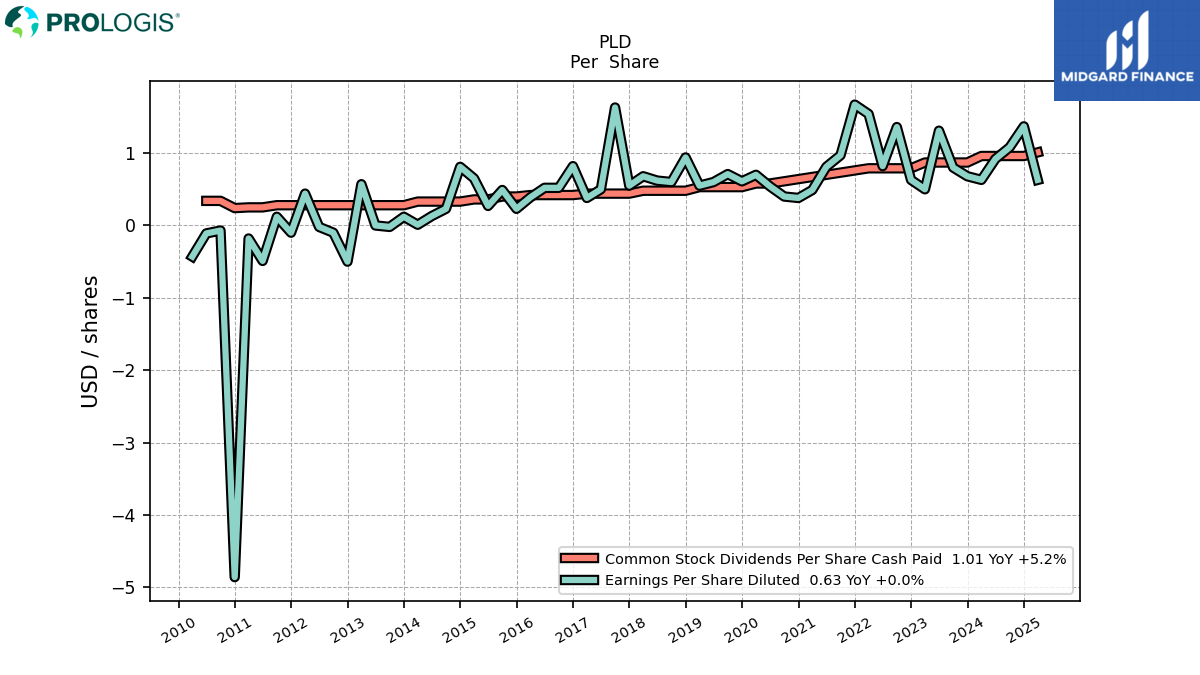
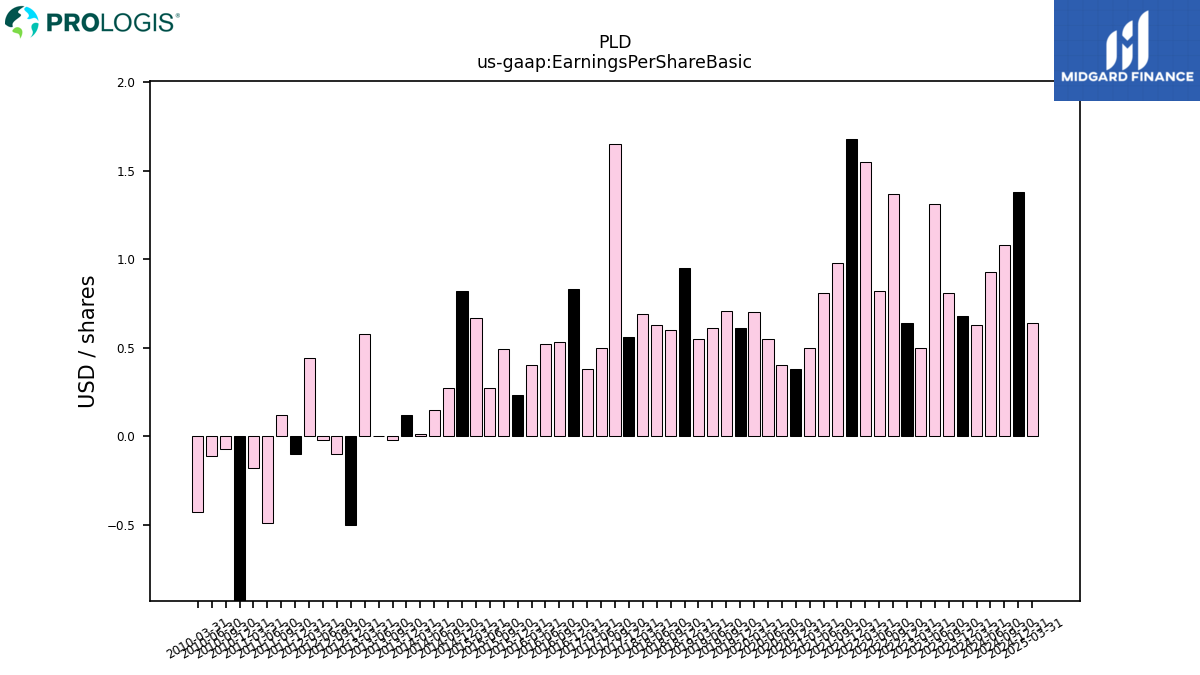
| Earnings Per Share Basic | 0.68 | 0.81 | 1.31 | 0.50 | 0.64 | 1.37 | 0.82 | 1.55 | 1.68 | 0.98 | 0.81 | 0.50 | 0.38 | 0.40 | 0.55 | 0.70 | 0.61 | 0.71 | 0.61 | 0.55 | 0.95 | 0.60 | 0.63 | 0.69 | 0.56 | 1.65 | 0.50 | 0.38 | |
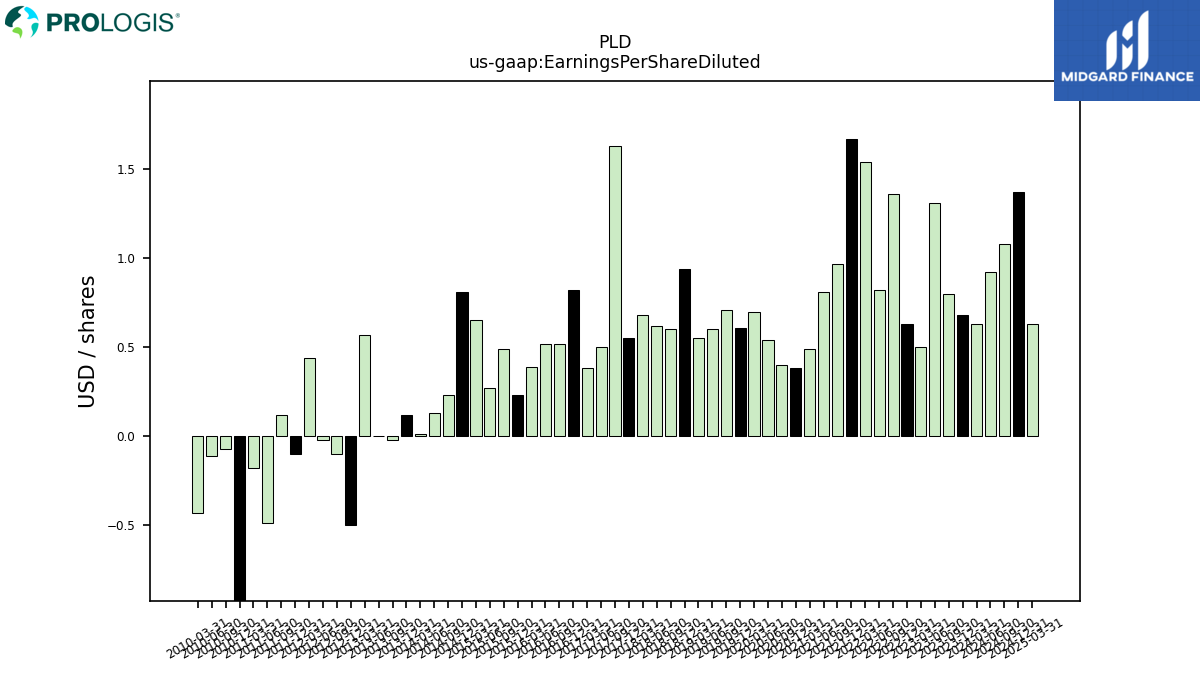
| Earnings Per Share Diluted | 0.68 | 0.80 | 1.31 | 0.50 | 0.63 | 1.36 | 0.82 | 1.54 | 1.67 | 0.97 | 0.81 | 0.49 | 0.38 | 0.40 | 0.54 | 0.70 | 0.61 | 0.71 | 0.60 | 0.55 | 0.94 | 0.60 | 0.62 | 0.68 | 0.55 | 1.63 | 0.50 | 0.38 |
| 2023-12-31 | 2023-09-30 | 2023-06-30 | 2023-03-31 | 2022-12-31 | 2022-09-30 | 2022-06-30 | 2022-03-31 | 2021-12-31 | 2021-09-30 | 2021-06-30 | 2021-03-31 | 2020-12-31 | 2020-09-30 | 2020-06-30 | 2020-03-31 | 2019-12-31 | 2019-09-30 | 2019-06-30 | 2019-03-31 | 2018-12-31 | 2018-09-30 | 2018-06-30 | 2018-03-31 | 2017-12-31 | 2017-09-30 | 2017-06-30 | 2017-03-31 | ||
|---|---|---|---|---|---|---|---|---|---|---|---|---|---|---|---|---|---|---|---|---|---|---|---|---|---|---|---|---|---|
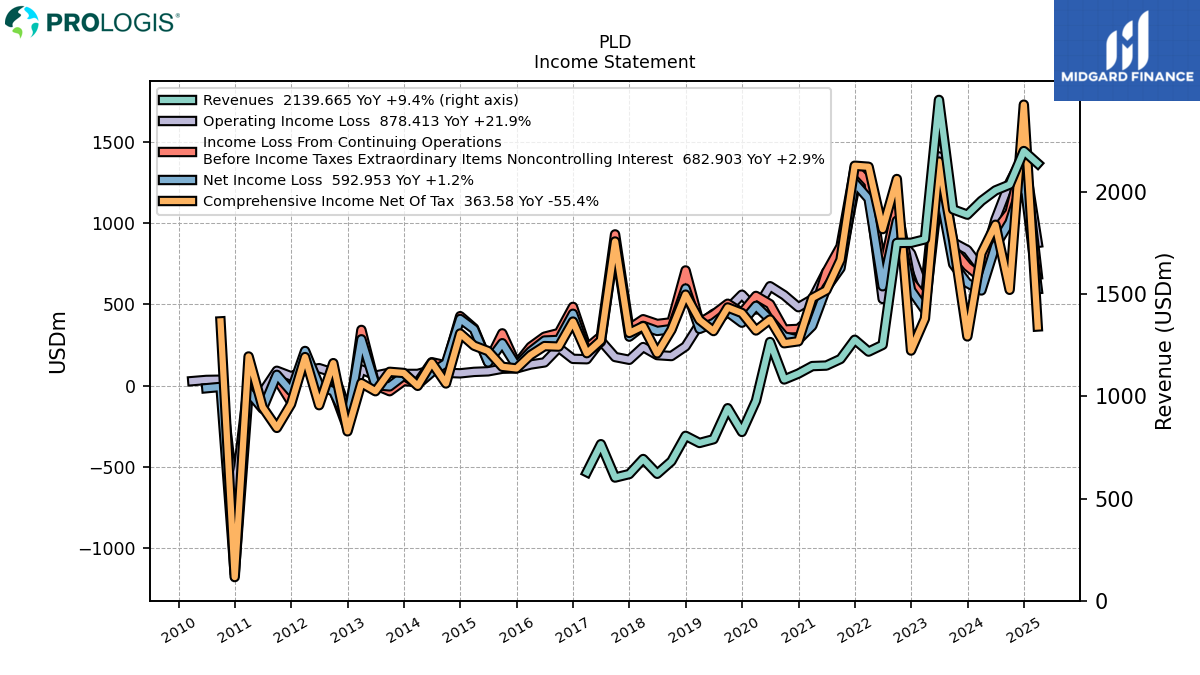
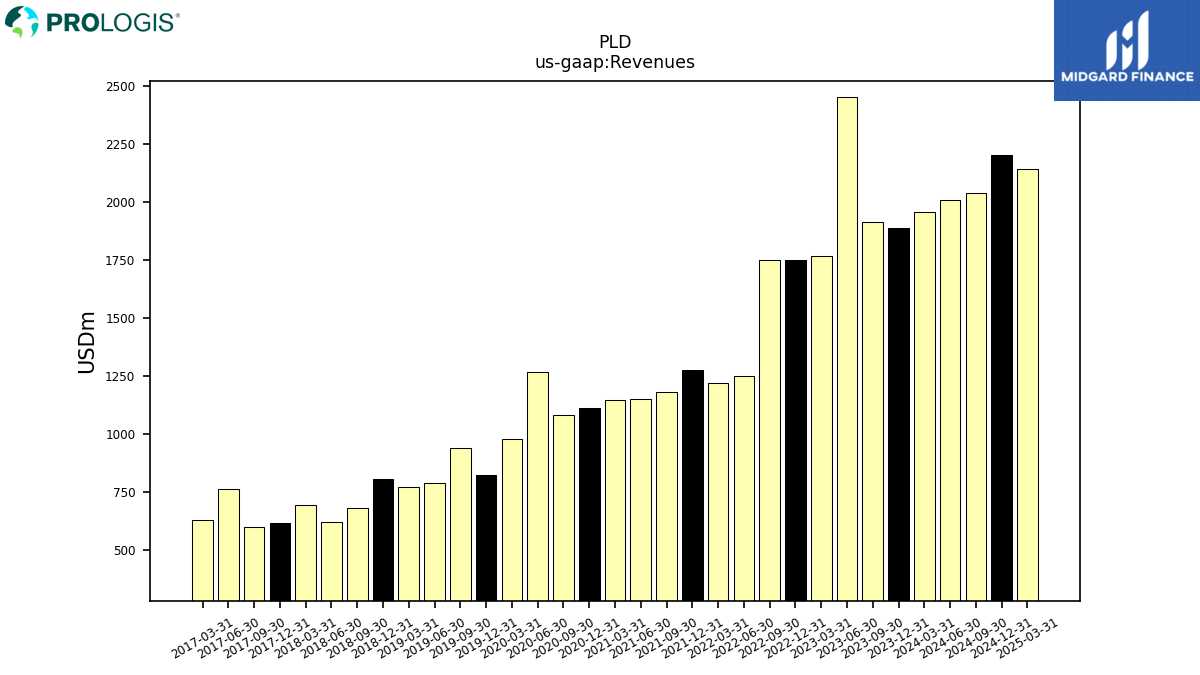
| Revenues | 1889.25 | 1914.66 | 2450.97 | 1768.59 | 1751.59 | 1750.89 | 1252.08 | 1219.13 | 1277.23 | 1183.05 | 1150.84 | 1148.32 | 1111.60 | 1082.77 | 1266.12 | 978.24 | 826.02 | 942.18 | 790.37 | 772.05 | 807.09 | 682.43 | 621.28 | 693.66 | 619.92 | 602.87 | 766.18 | 629.15 | |
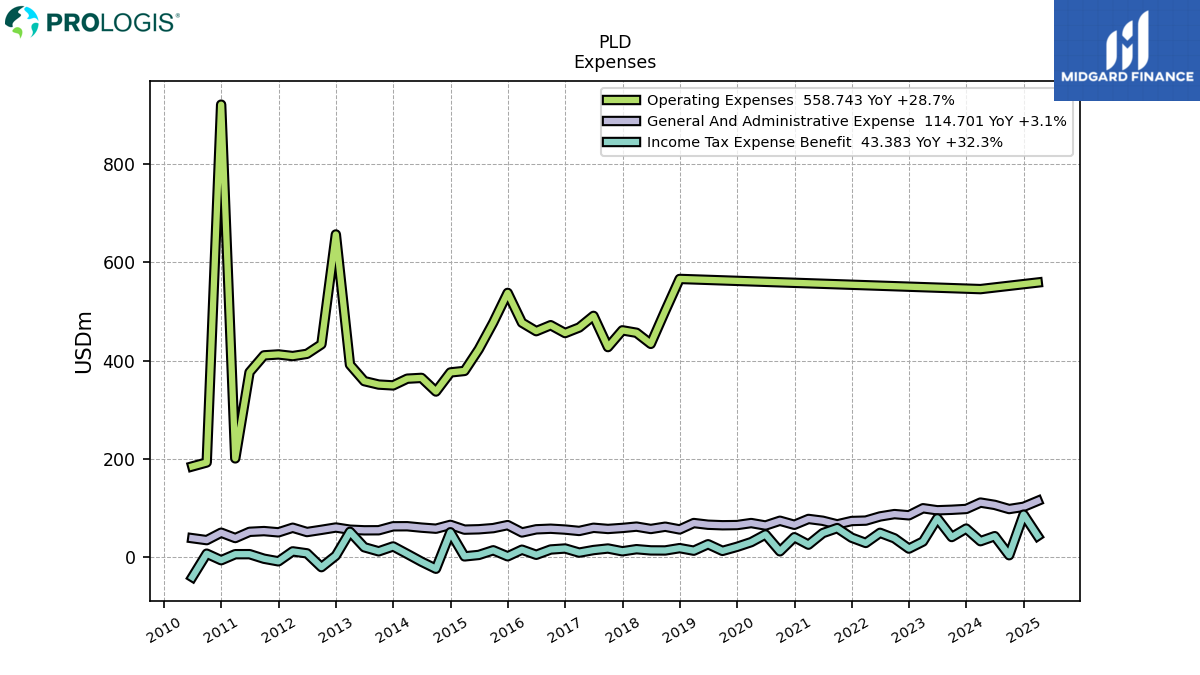
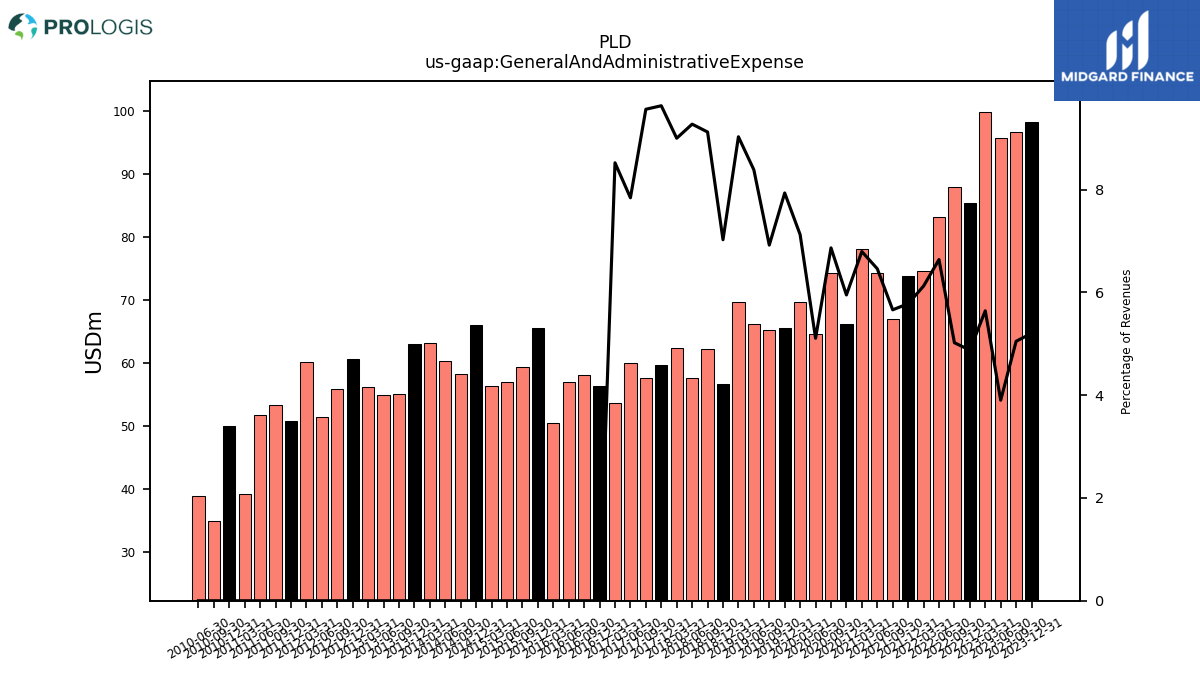
| General And Administrative Expense | 98.31 | 96.67 | 95.65 | 99.78 | 85.42 | 87.90 | 83.11 | 74.65 | 73.82 | 66.97 | 74.34 | 78.03 | 66.14 | 74.35 | 64.66 | 69.69 | 65.54 | 65.20 | 66.28 | 69.70 | 56.70 | 62.24 | 57.62 | 62.43 | 59.71 | 57.66 | 60.08 | 53.62 | |
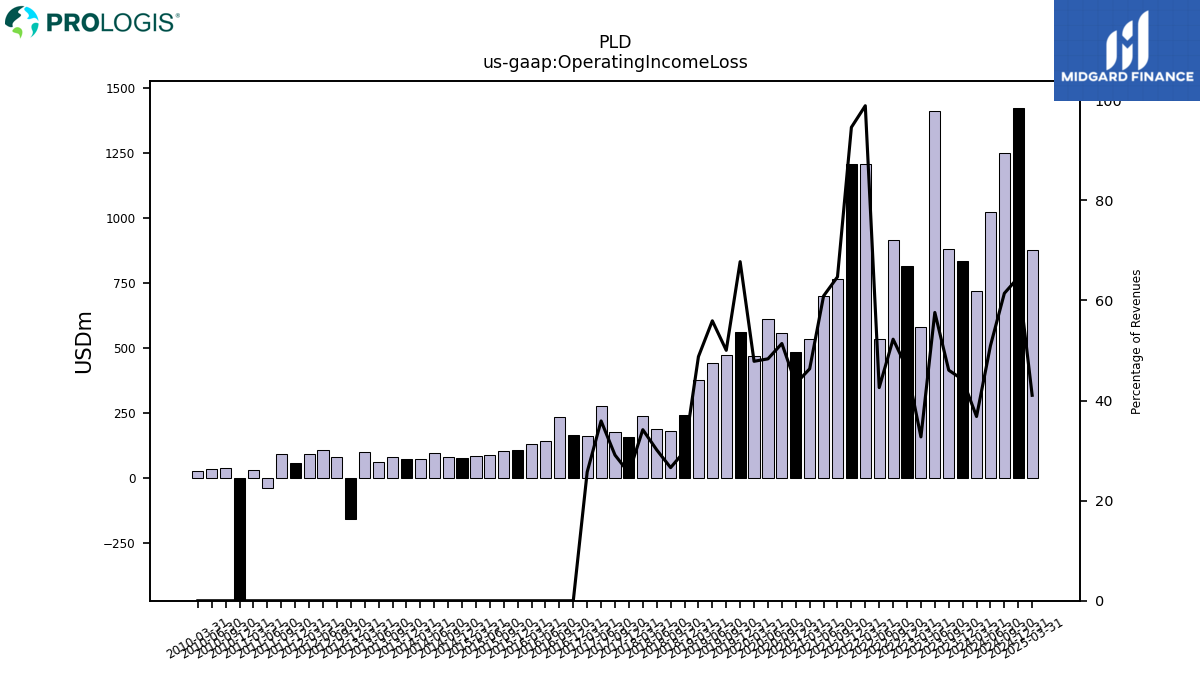
| Operating Income Loss | 834.85 | 882.11 | 1411.79 | 579.04 | 813.45 | 914.97 | 533.32 | 1205.80 | 1208.27 | 765.66 | 700.87 | 532.20 | 482.38 | 556.52 | 611.99 | 468.06 | 559.64 | 471.48 | 442.06 | 376.59 | 241.08 | 181.52 | 187.29 | 237.11 | 158.42 | 175.49 | 275.27 | 161.89 | |
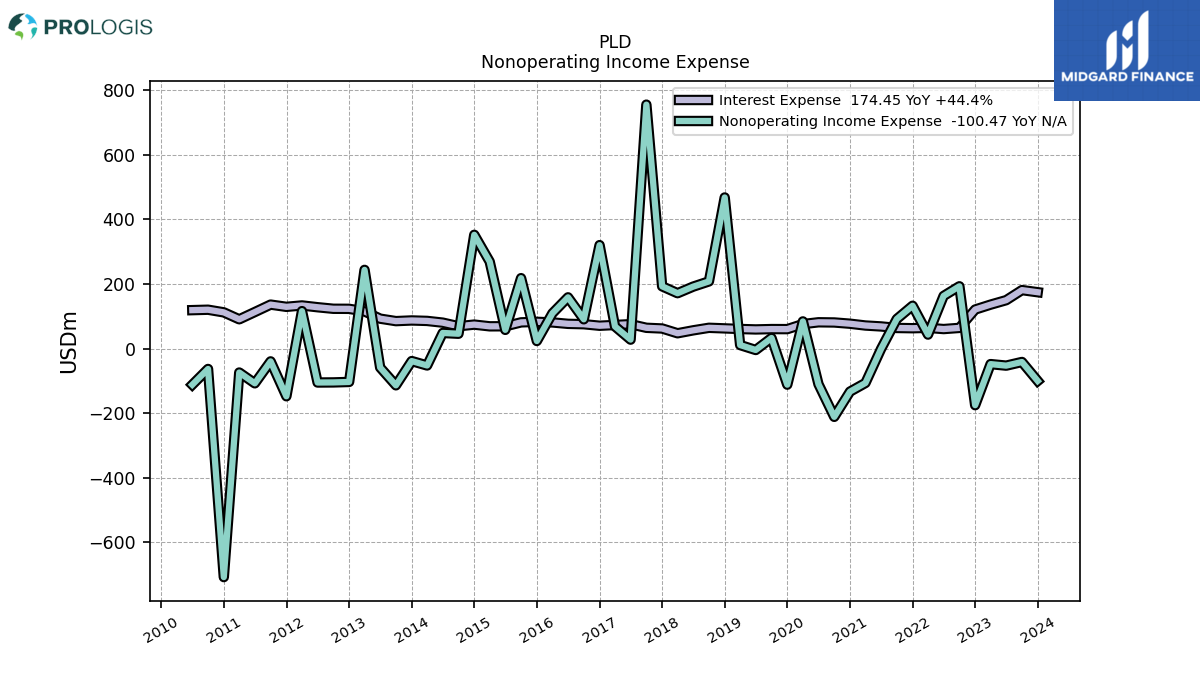
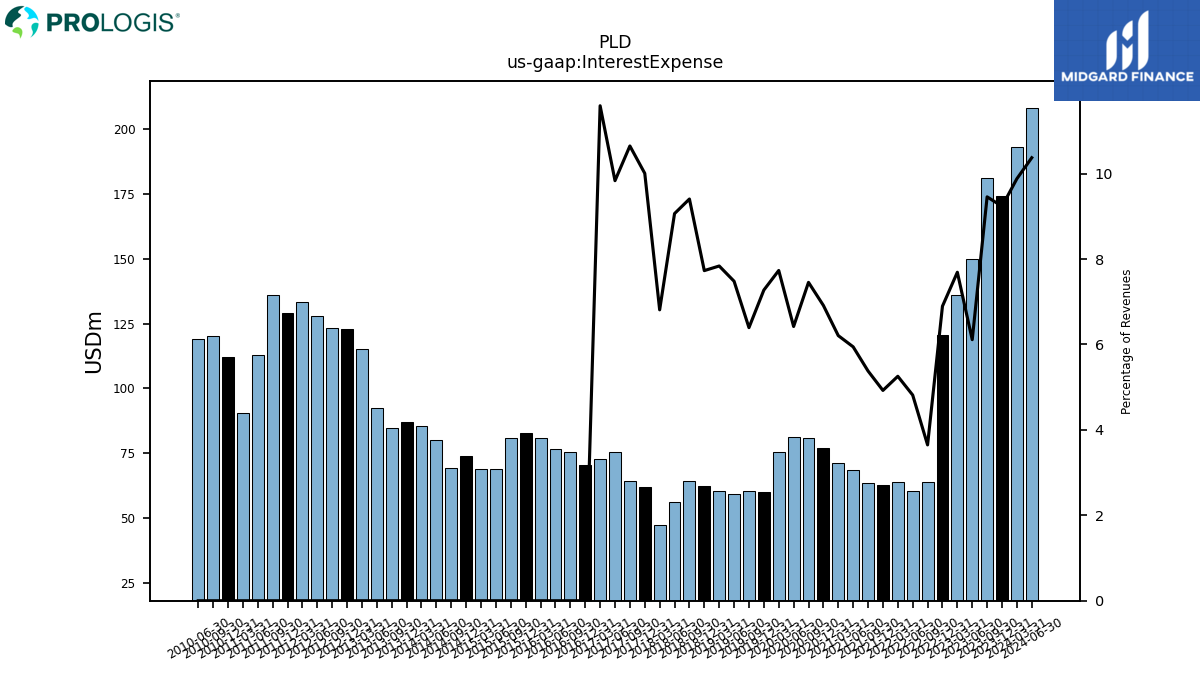
| Interest Expense | 174.45 | 181.05 | 149.82 | 136.01 | 120.80 | 63.88 | 60.29 | 64.06 | 62.90 | 63.64 | 68.41 | 71.28 | 76.86 | 80.71 | 81.30 | 75.64 | 60.08 | 60.24 | 59.12 | 60.51 | 62.38 | 64.19 | 56.31 | 47.24 | 62.03 | 64.19 | 75.35 | 72.91 | |
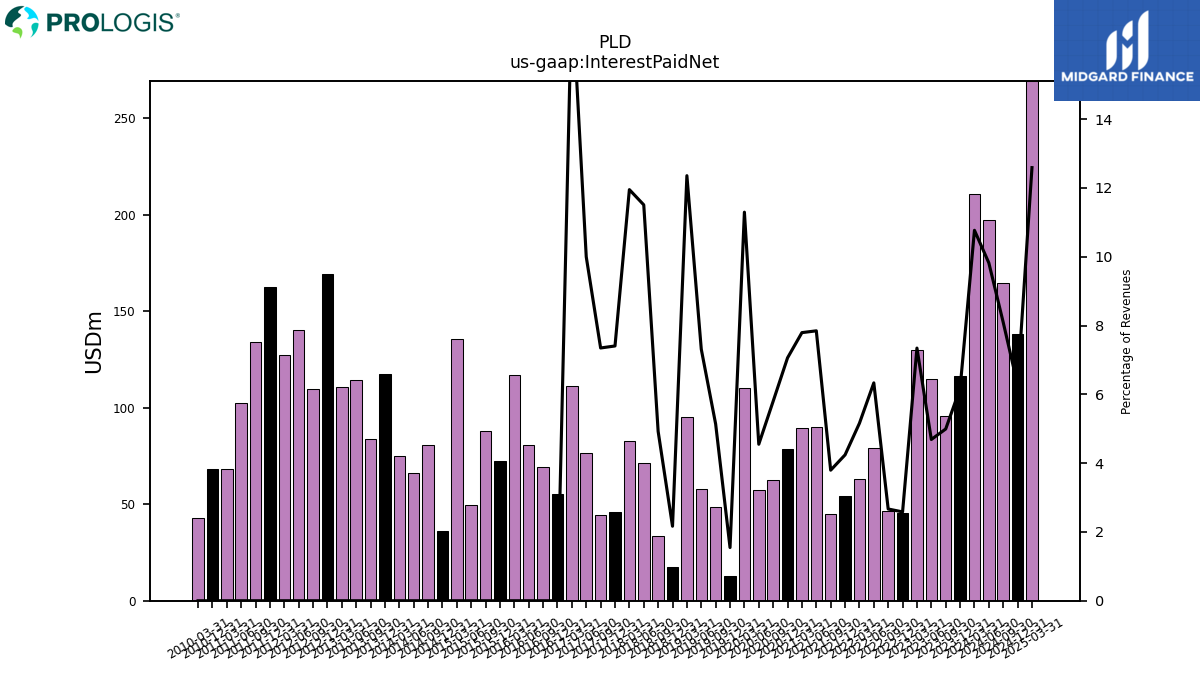
| Interest Paid Net | 116.62 | 95.60 | 114.90 | 129.90 | 45.23 | 46.70 | 79.30 | 62.90 | 54.16 | 44.90 | 90.30 | 89.50 | 78.49 | 62.80 | 57.60 | 110.50 | 12.78 | 48.40 | 57.80 | 95.40 | 17.48 | 33.60 | 71.50 | 82.90 | 45.91 | 44.30 | 76.60 | 111.50 | |
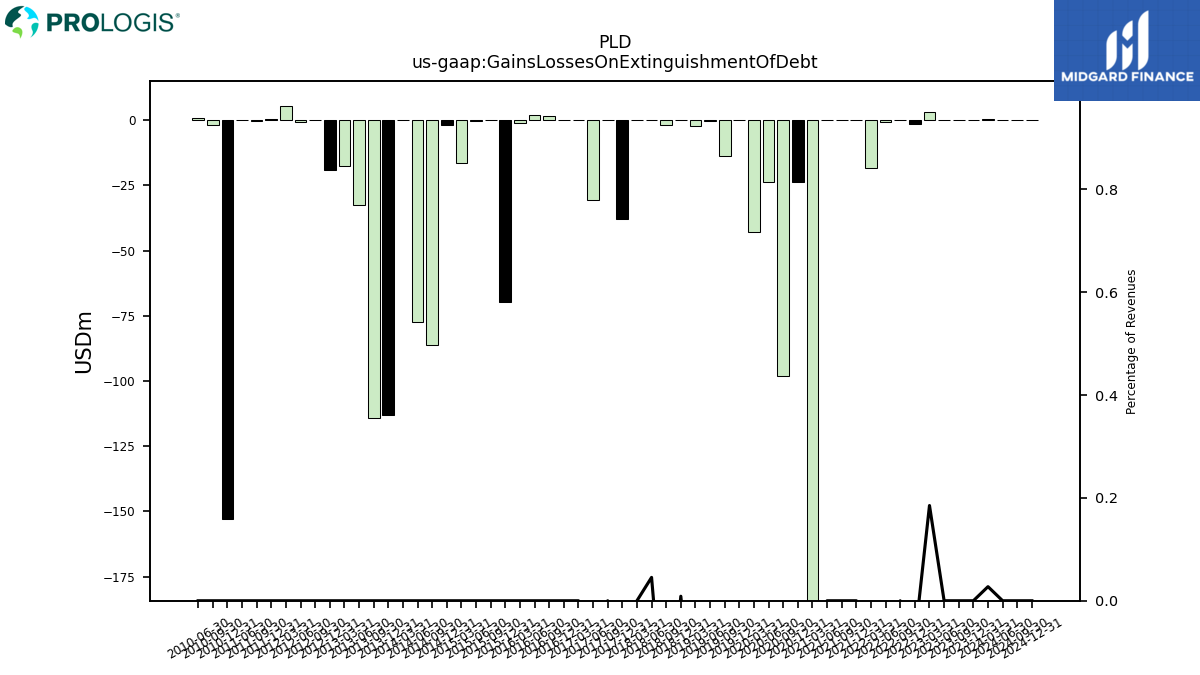
| Gains Losses On Extinguishment Of Debt | 0.00 | 0.00 | 0.00 | 3.27 | -1.29 | 0.00 | -0.73 | -18.16 | 0.00 | 0.00 | 0.00 | -187.45 | -23.68 | -98.27 | -23.57 | -42.77 | -0.04 | -13.59 | -0.39 | -2.12 | 0.07 | -1.96 | 0.28 | 0.00 | -37.78 | 0.00 | -30.60 | 0.00 | |
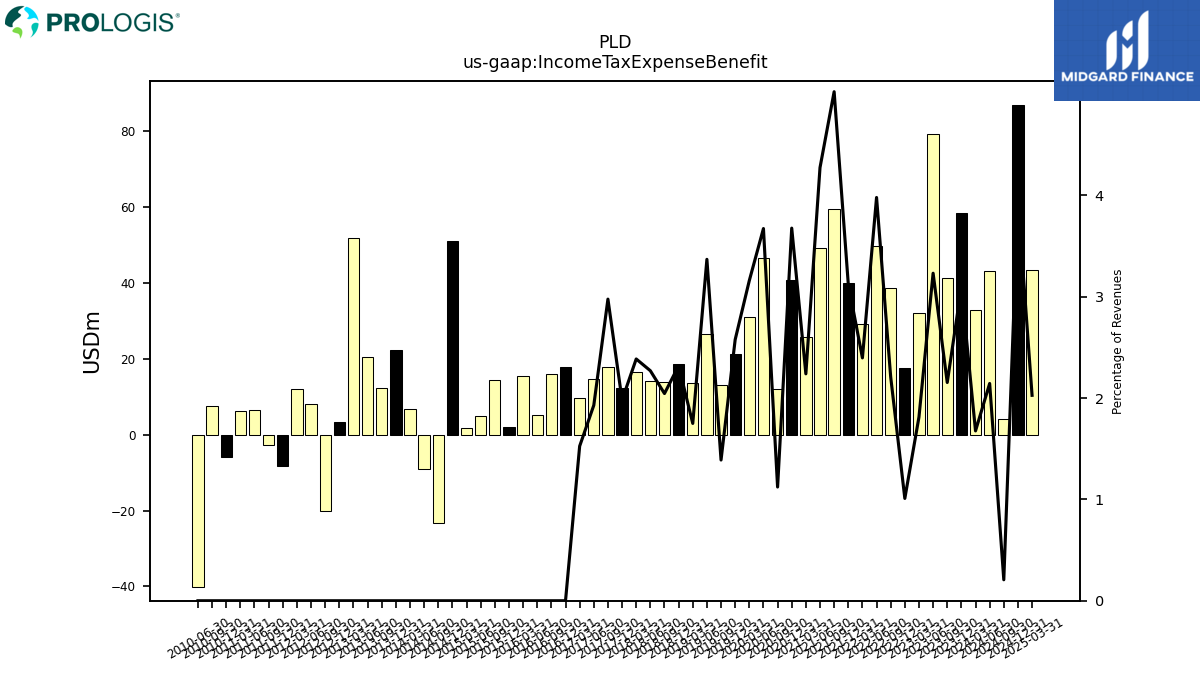
| Income Tax Expense Benefit | 58.50 | 41.24 | 79.23 | 32.07 | 17.69 | 38.67 | 49.83 | 29.22 | 39.91 | 59.44 | 49.20 | 25.72 | 40.88 | 12.15 | 46.51 | 30.91 | 21.29 | 13.09 | 26.63 | 13.51 | 18.72 | 13.96 | 14.10 | 16.55 | 12.28 | 17.95 | 14.78 | 9.60 | |
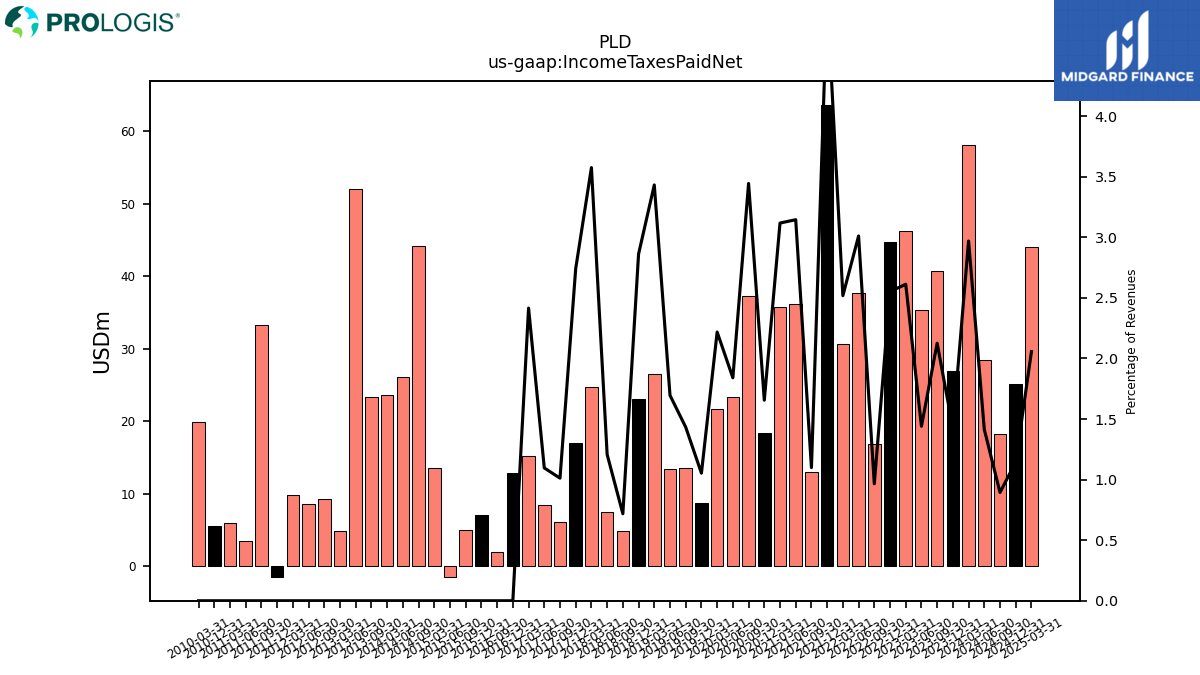
| Income Taxes Paid Net | 26.90 | 40.70 | 35.30 | 46.20 | 44.70 | 16.90 | 37.70 | 30.70 | 63.70 | 13.00 | 36.20 | 35.80 | 18.40 | 37.30 | 23.30 | 21.70 | 8.70 | 13.50 | 13.40 | 26.50 | 23.10 | 4.90 | 7.50 | 24.80 | 17.00 | 6.10 | 8.40 | 15.20 | |
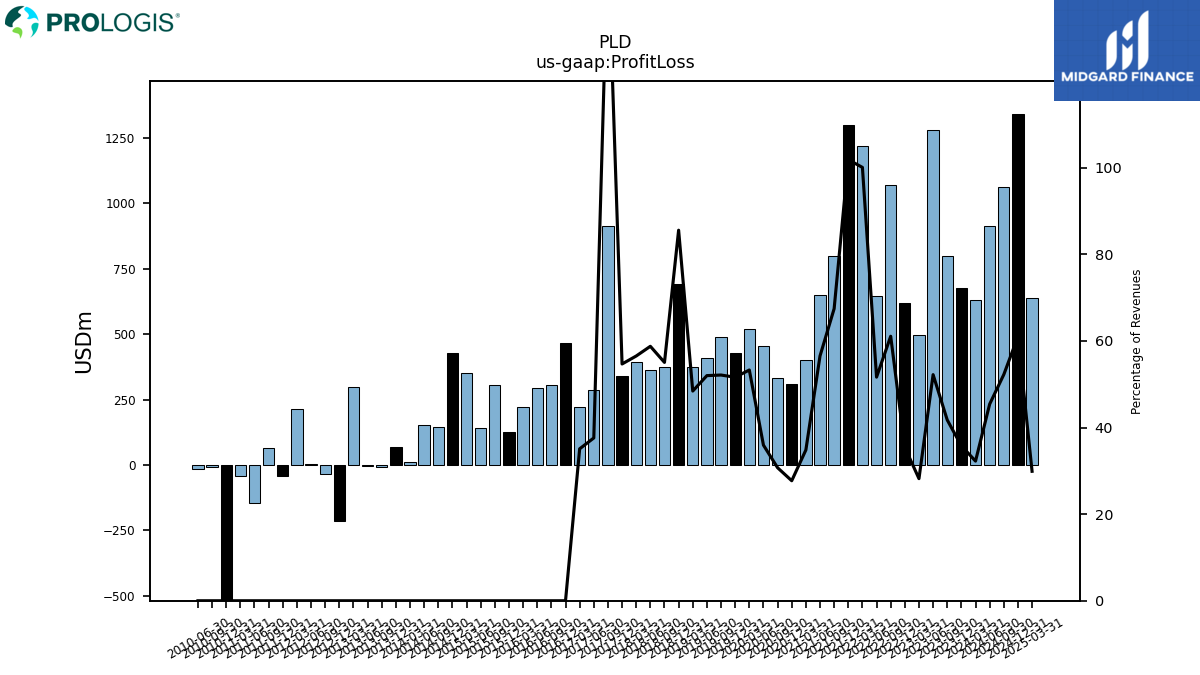
| Profit Loss | 675.88 | 799.14 | 1279.49 | 498.63 | 620.07 | 1069.17 | 646.44 | 1219.72 | 1300.85 | 797.73 | 650.31 | 399.69 | 308.01 | 332.52 | 454.94 | 521.16 | 426.24 | 491.01 | 410.83 | 373.76 | 690.49 | 375.52 | 364.99 | 391.96 | 338.87 | 913.42 | 287.98 | 220.69 | |
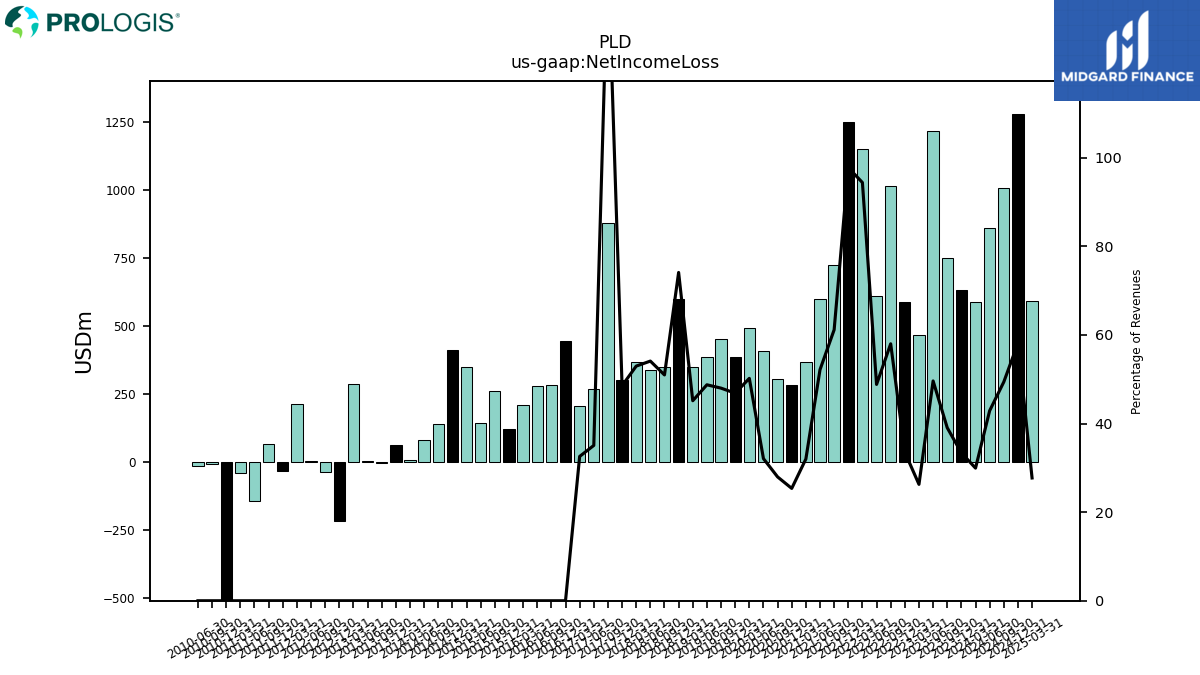
| Net Income Loss | 630.94 | 747.63 | 1216.03 | 464.62 | 587.21 | 1015.46 | 611.39 | 1150.79 | 1248.66 | 723.54 | 600.18 | 367.35 | 281.89 | 302.69 | 406.17 | 491.05 | 386.99 | 452.15 | 385.28 | 348.55 | 598.06 | 347.84 | 336.09 | 367.38 | 300.89 | 877.89 | 268.62 | 204.93 | |
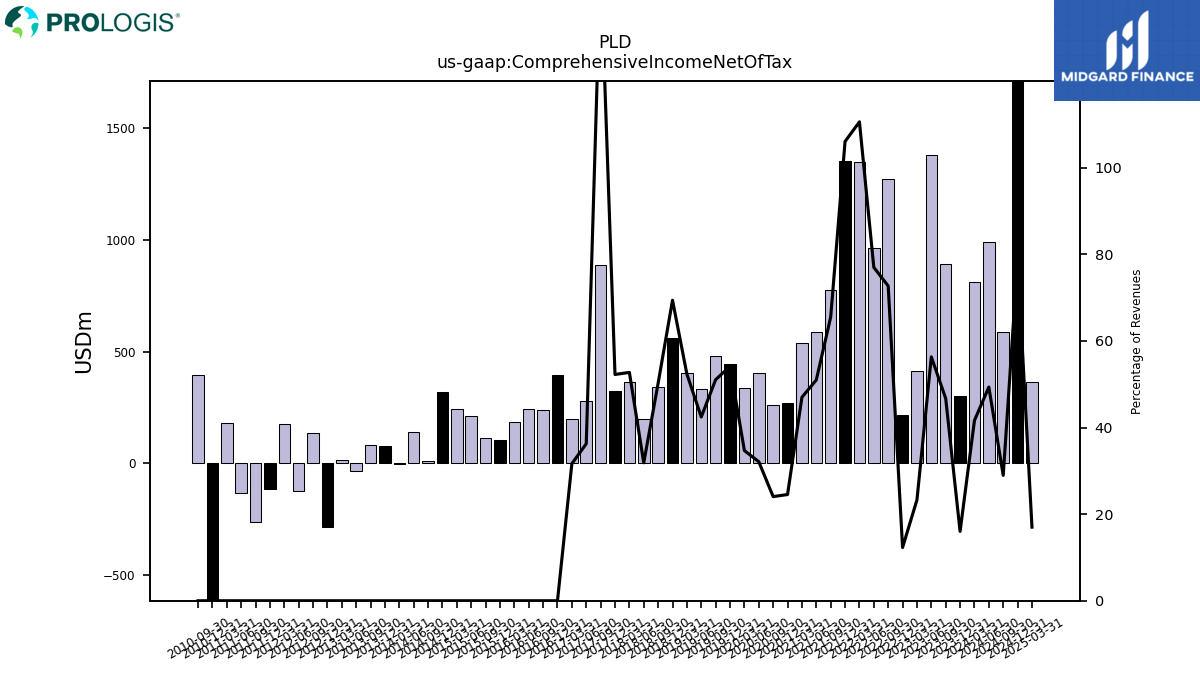
| Comprehensive Income Net Of Tax | 302.52 | 894.21 | 1380.08 | 411.81 | 215.23 | 1272.60 | 963.75 | 1347.92 | 1354.32 | 774.75 | 586.61 | 539.53 | 272.62 | 260.36 | 406.40 | 339.10 | 446.84 | 481.01 | 335.37 | 404.01 | 559.95 | 342.76 | 197.94 | 365.69 | 323.85 | 887.47 | 277.70 | 199.12 | |
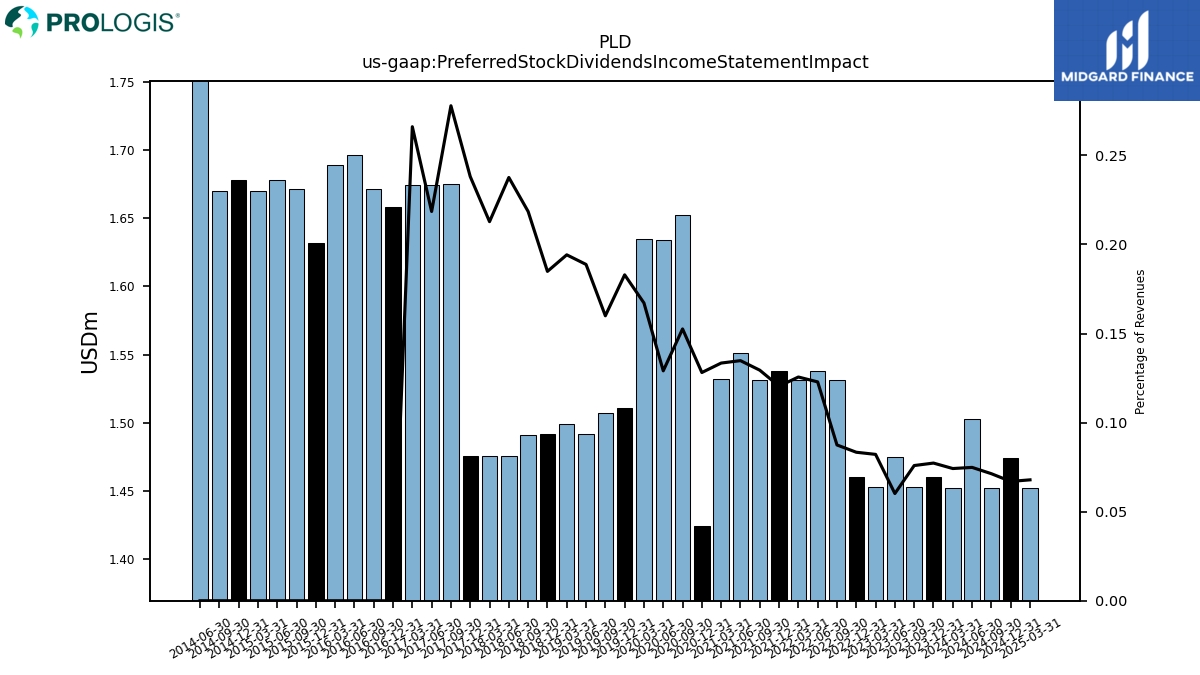
| Preferred Stock Dividends Income Statement Impact | 1.46 | 1.45 | 1.48 | 1.45 | 1.46 | 1.53 | 1.54 | 1.53 | 1.54 | 1.53 | 1.55 | 1.53 | 1.42 | 1.65 | 1.63 | 1.64 | 1.51 | 1.51 | 1.49 | 1.50 | 1.49 | 1.49 | 1.48 | 1.48 | 1.48 | 1.68 | 1.67 | 1.67 | |
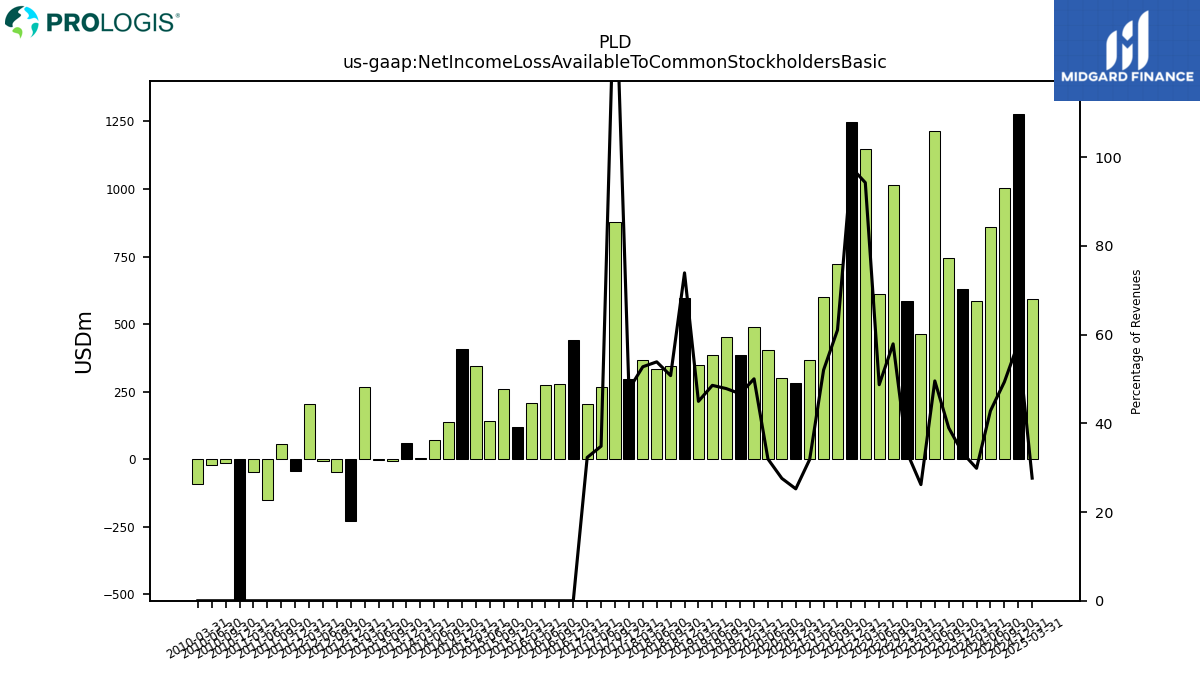
| Net Income Loss Available To Common Stockholders Basic | 629.48 | 746.17 | 1214.55 | 463.17 | 585.75 | 1013.93 | 609.86 | 1149.25 | 1247.12 | 722.01 | 598.62 | 365.81 | 280.47 | 298.69 | 404.54 | 489.42 | 385.48 | 450.64 | 383.78 | 347.05 | 596.57 | 346.35 | 334.61 | 365.90 | 295.51 | 876.22 | 266.94 | 203.25 | |
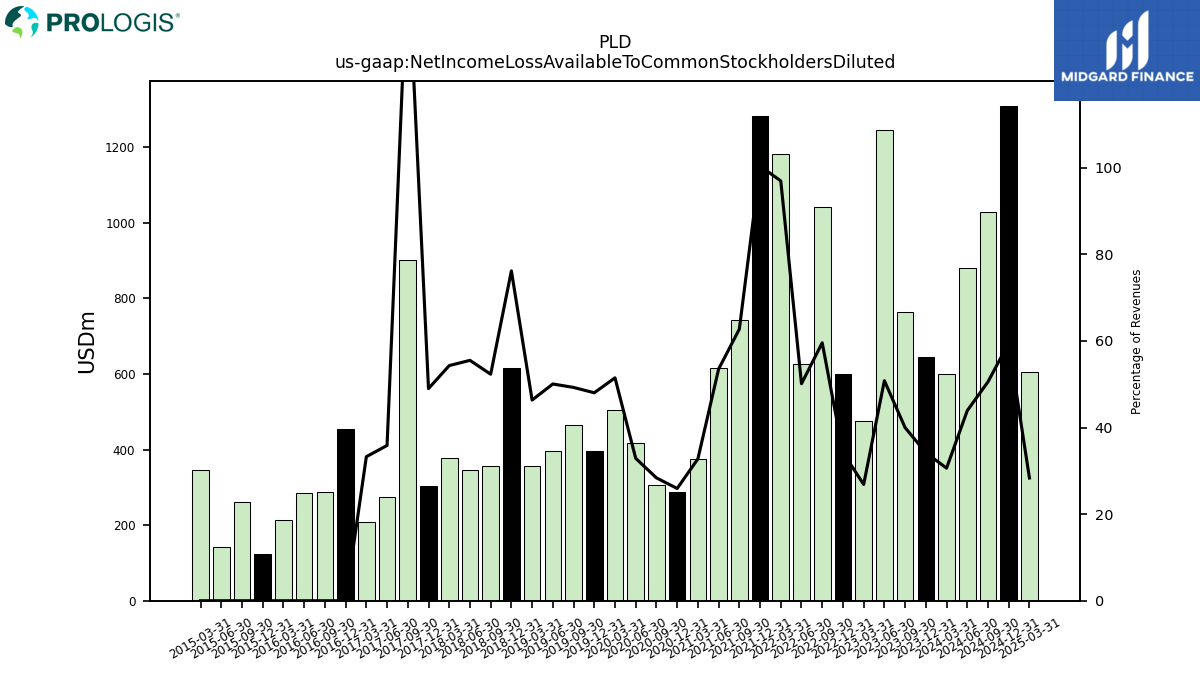
| Net Income Loss Available To Common Stockholders Diluted | 645.78 | 765.23 | 1245.25 | 474.91 | 599.34 | 1042.72 | 627.37 | 1181.59 | 1282.09 | 741.90 | 615.55 | 376.13 | 288.16 | 307.13 | 416.30 | 503.47 | 396.63 | 464.06 | 395.54 | 357.70 | 614.81 | 356.94 | 344.83 | 376.60 | 303.67 | 900.58 | 274.74 | 209.22 |
| 2023-12-31 | 2023-09-30 | 2023-06-30 | 2023-03-31 | 2022-12-31 | 2022-09-30 | 2022-06-30 | 2022-03-31 | 2021-12-31 | 2021-09-30 | 2021-06-30 | 2021-03-31 | 2020-12-31 | 2020-09-30 | 2020-06-30 | 2020-03-31 | 2019-12-31 | 2019-09-30 | 2019-06-30 | 2019-03-31 | 2018-12-31 | 2018-09-30 | 2018-06-30 | 2018-03-31 | 2017-12-31 | 2017-09-30 | 2017-06-30 | 2017-03-31 | ||
|---|---|---|---|---|---|---|---|---|---|---|---|---|---|---|---|---|---|---|---|---|---|---|---|---|---|---|---|---|---|
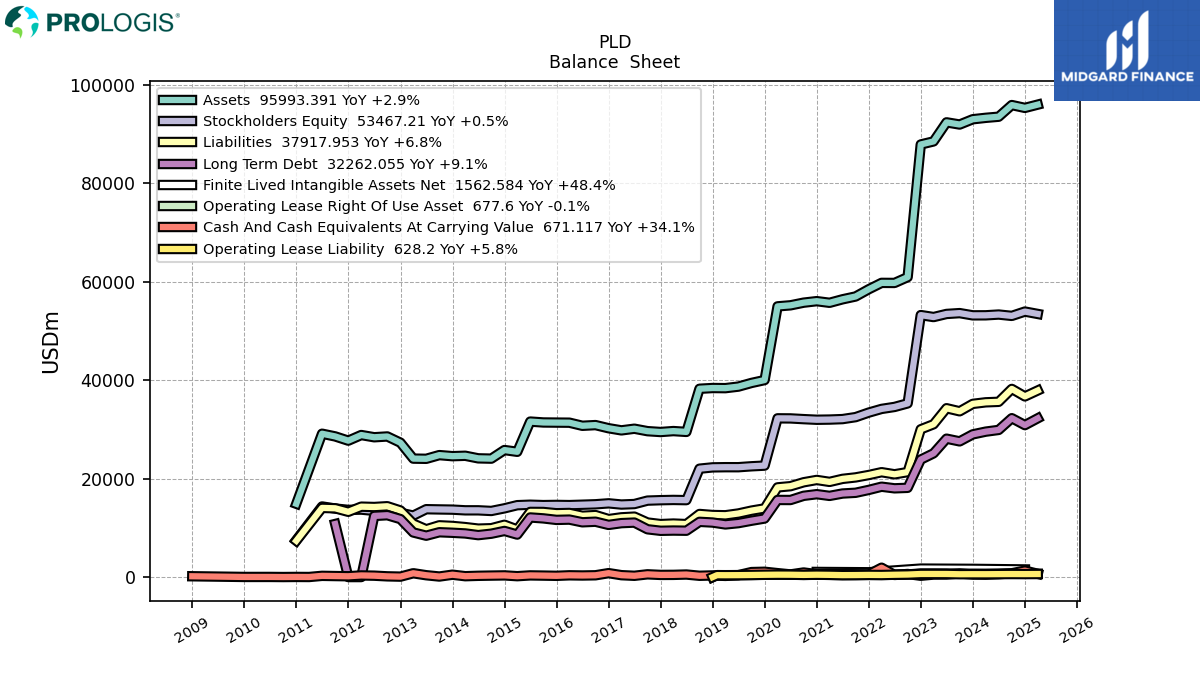
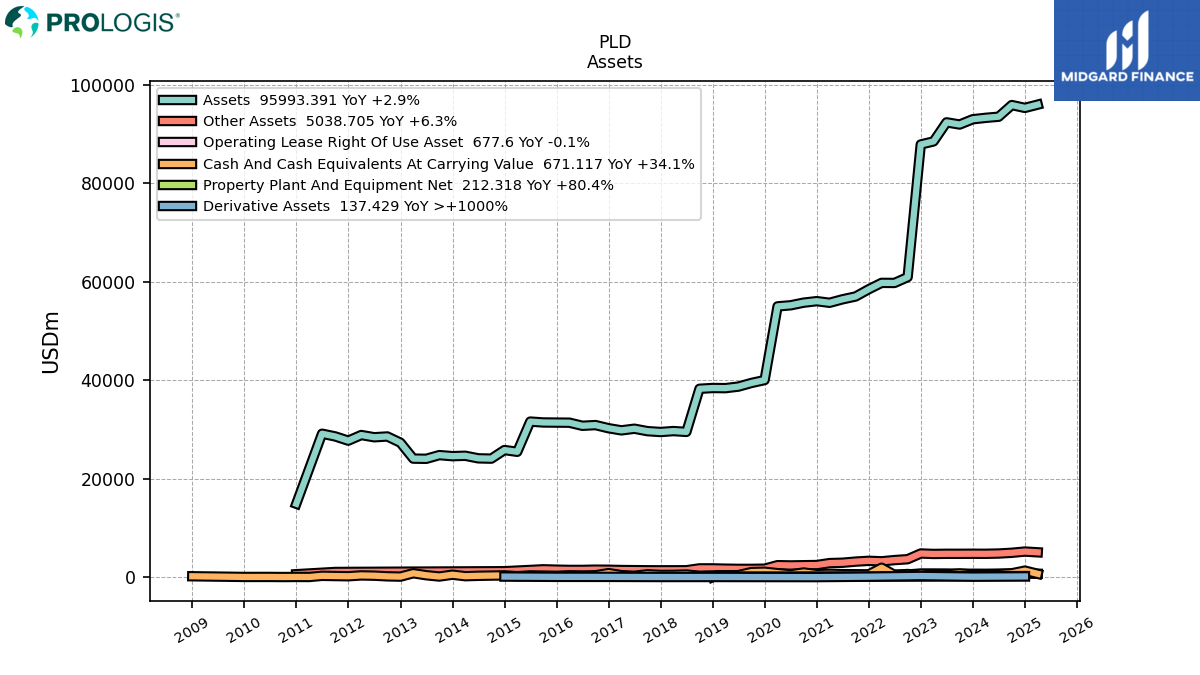
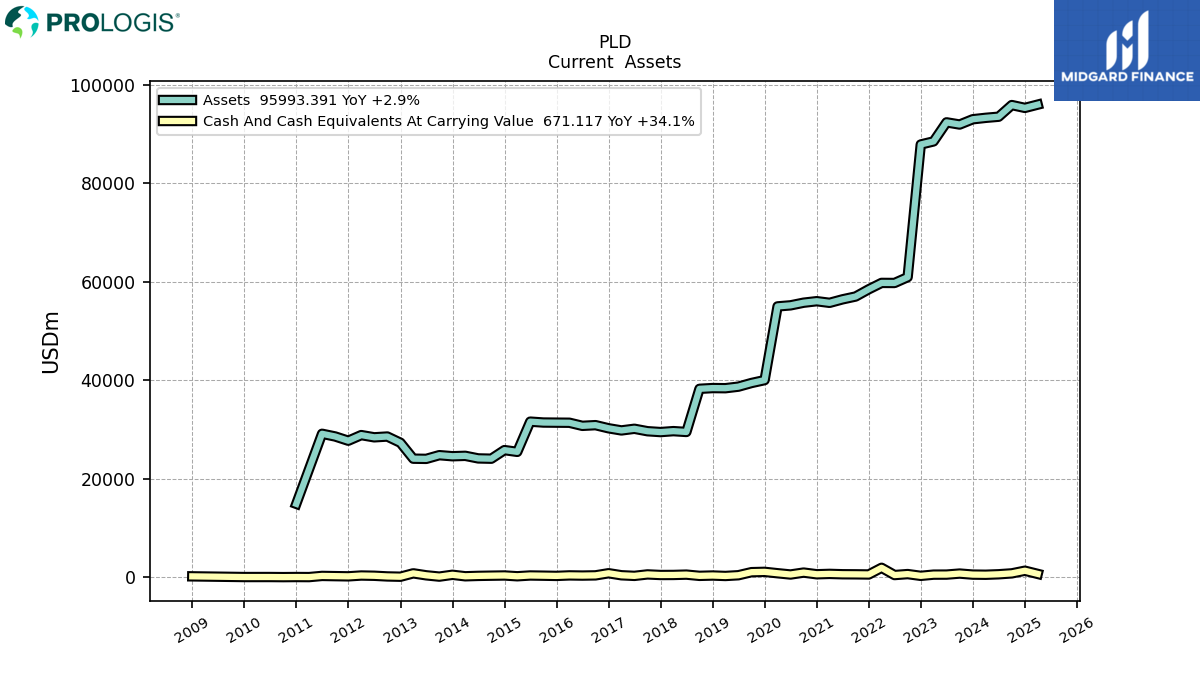
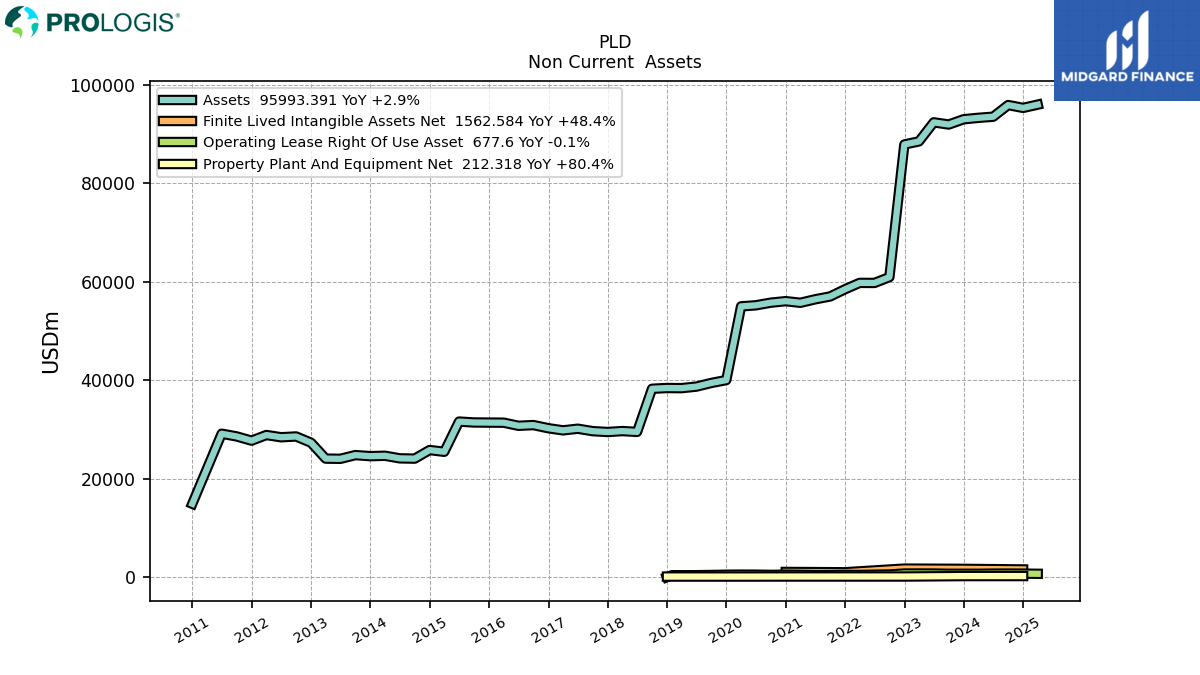
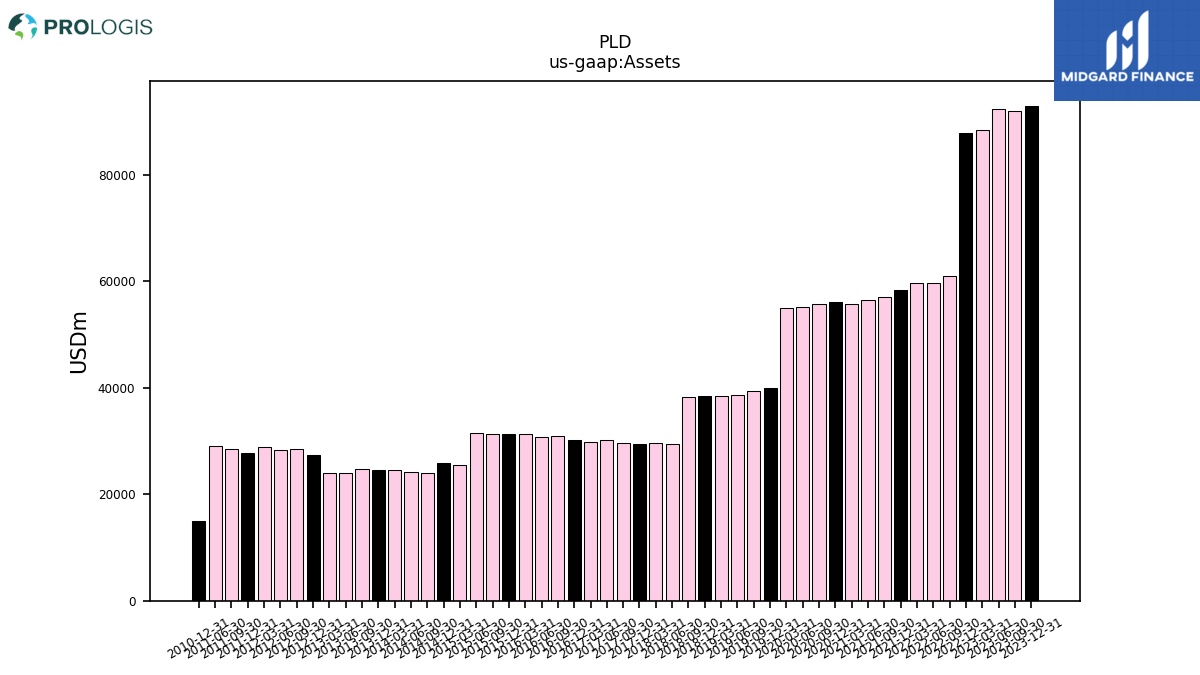
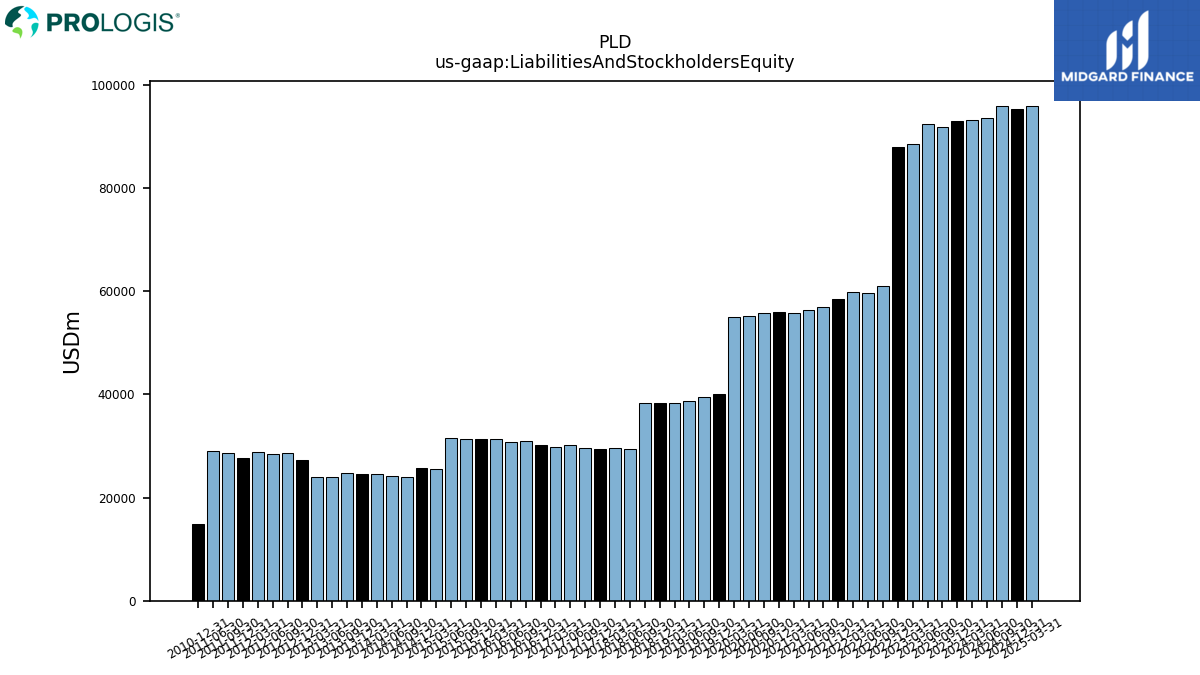
| Assets | 93020.84 | 91949.41 | 92392.04 | 88520.88 | 87897.45 | 60945.53 | 59763.82 | 59779.87 | 58486.22 | 57016.67 | 56441.39 | 55732.81 | 56065.00 | 55759.60 | 55221.86 | 55007.25 | 40031.85 | 39448.18 | 38706.75 | 38392.11 | 38417.66 | 38268.16 | 29502.88 | 29671.49 | 29481.08 | 29654.15 | 30150.40 | 29814.96 | |
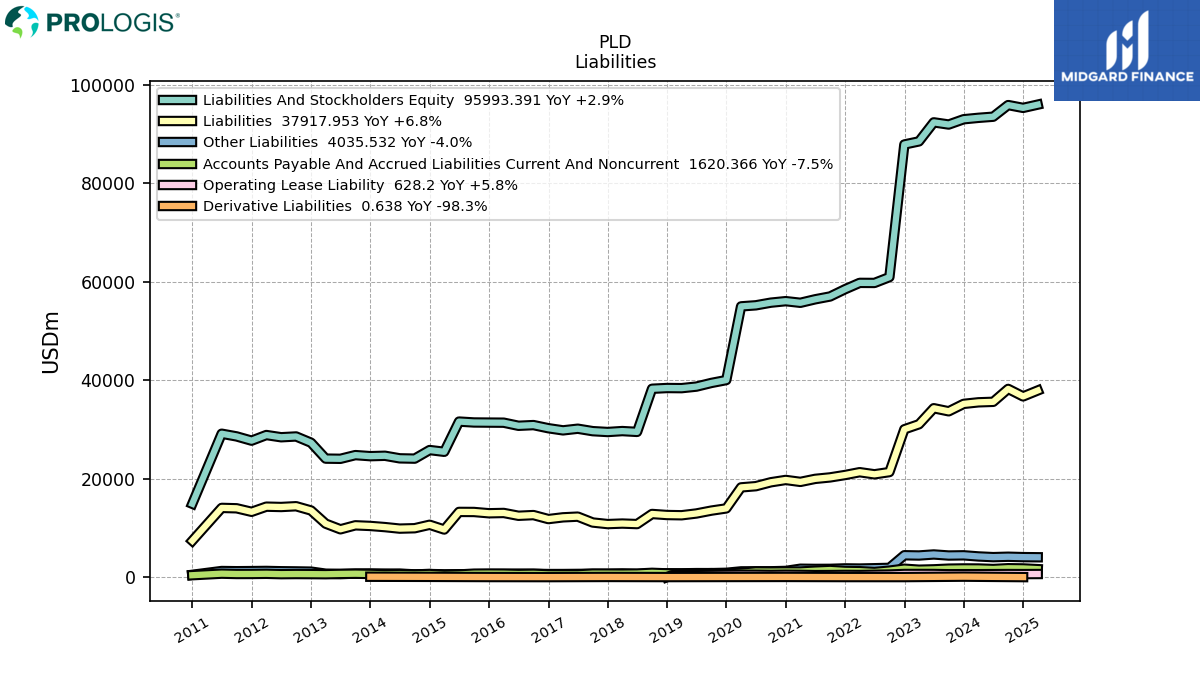
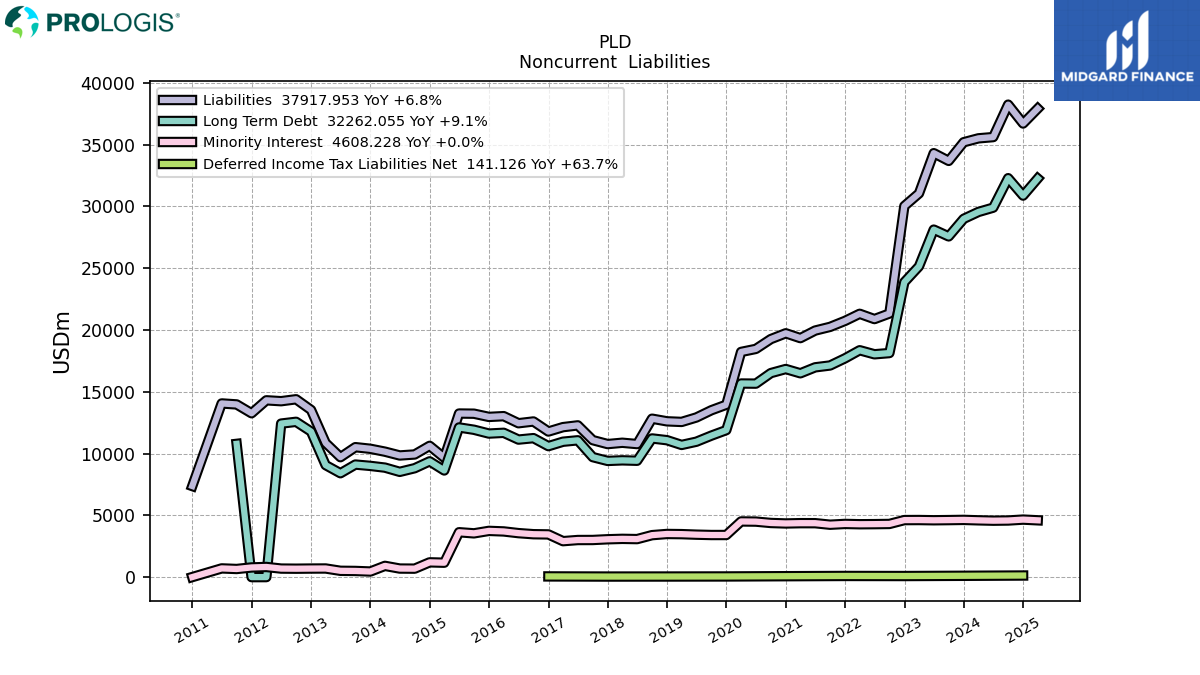
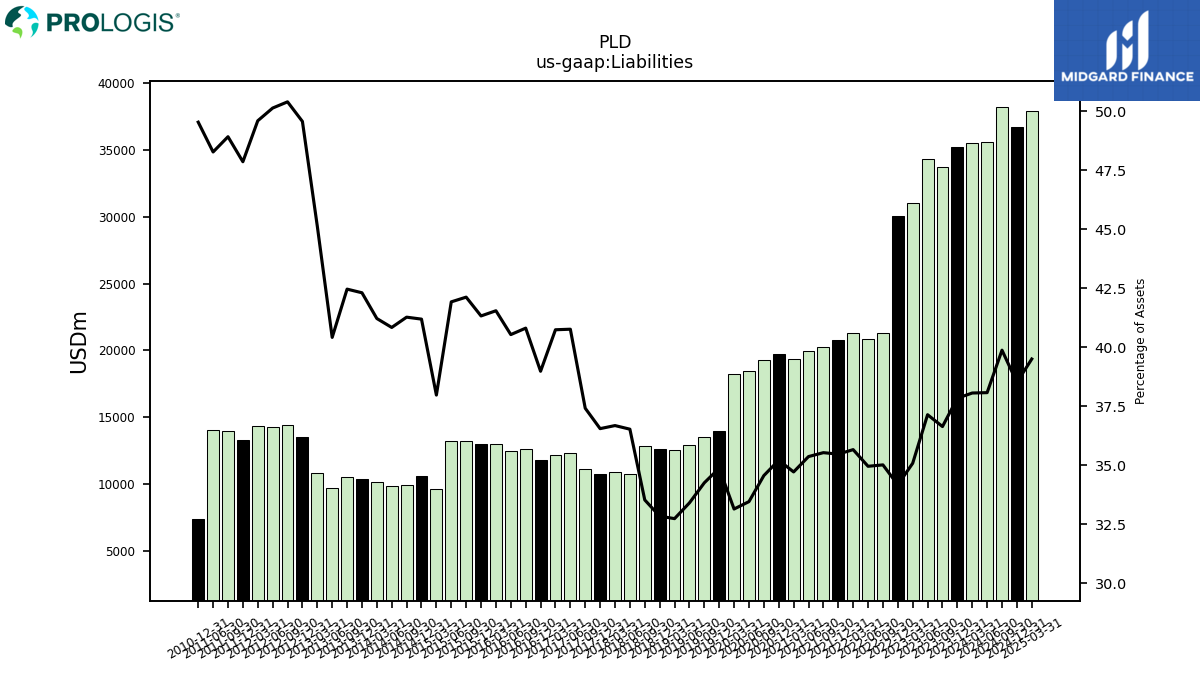
| Liabilities | 35197.12 | 33688.55 | 34314.22 | 31055.65 | 30034.35 | 21339.21 | 20889.88 | 21317.67 | 20744.01 | 20259.20 | 19960.58 | 19347.61 | 19740.42 | 19270.29 | 18475.65 | 18231.38 | 13960.07 | 13512.61 | 12929.32 | 12568.05 | 12616.78 | 12830.51 | 10776.38 | 10883.36 | 10775.33 | 11094.89 | 12290.16 | 12146.54 | |
| Liabilities And Stockholders Equity | 93020.84 | 91949.41 | 92392.04 | 88520.88 | 87897.45 | 60945.53 | 59763.82 | 59779.87 | 58486.22 | 57016.67 | 56441.39 | 55732.81 | 56065.00 | 55759.60 | 55221.86 | 55007.25 | 40031.85 | 39448.18 | 38706.75 | 38392.11 | 38417.66 | 38268.16 | 29502.88 | 29671.49 | 29481.08 | 29654.15 | 30150.40 | 29814.96 | |
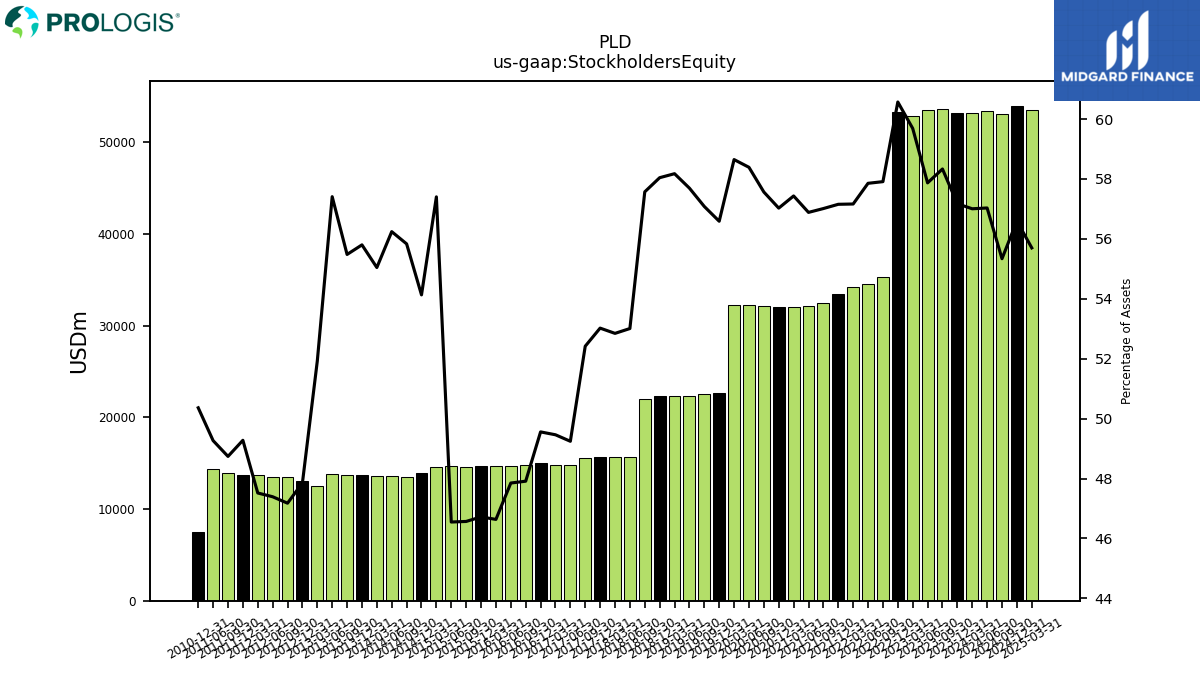
| Stockholders Equity | 53181.72 | 53635.83 | 53465.63 | 52835.22 | 53237.28 | 35293.10 | 34575.77 | 34172.07 | 33426.87 | 32506.12 | 32105.71 | 32008.52 | 31971.55 | 32097.17 | 32242.93 | 32259.44 | 22653.13 | 22517.21 | 22330.81 | 22334.48 | 22298.09 | 22030.60 | 15638.57 | 15680.08 | 15631.16 | 15543.75 | 14847.30 | 14746.87 |
| 2023-12-31 | 2023-09-30 | 2023-06-30 | 2023-03-31 | 2022-12-31 | 2022-09-30 | 2022-06-30 | 2022-03-31 | 2021-12-31 | 2021-09-30 | 2021-06-30 | 2021-03-31 | 2020-12-31 | 2020-09-30 | 2020-06-30 | 2020-03-31 | 2019-12-31 | 2019-09-30 | 2019-06-30 | 2019-03-31 | 2018-12-31 | 2018-09-30 | 2018-06-30 | 2018-03-31 | 2017-12-31 | 2017-09-30 | 2017-06-30 | 2017-03-31 | ||
|---|---|---|---|---|---|---|---|---|---|---|---|---|---|---|---|---|---|---|---|---|---|---|---|---|---|---|---|---|---|
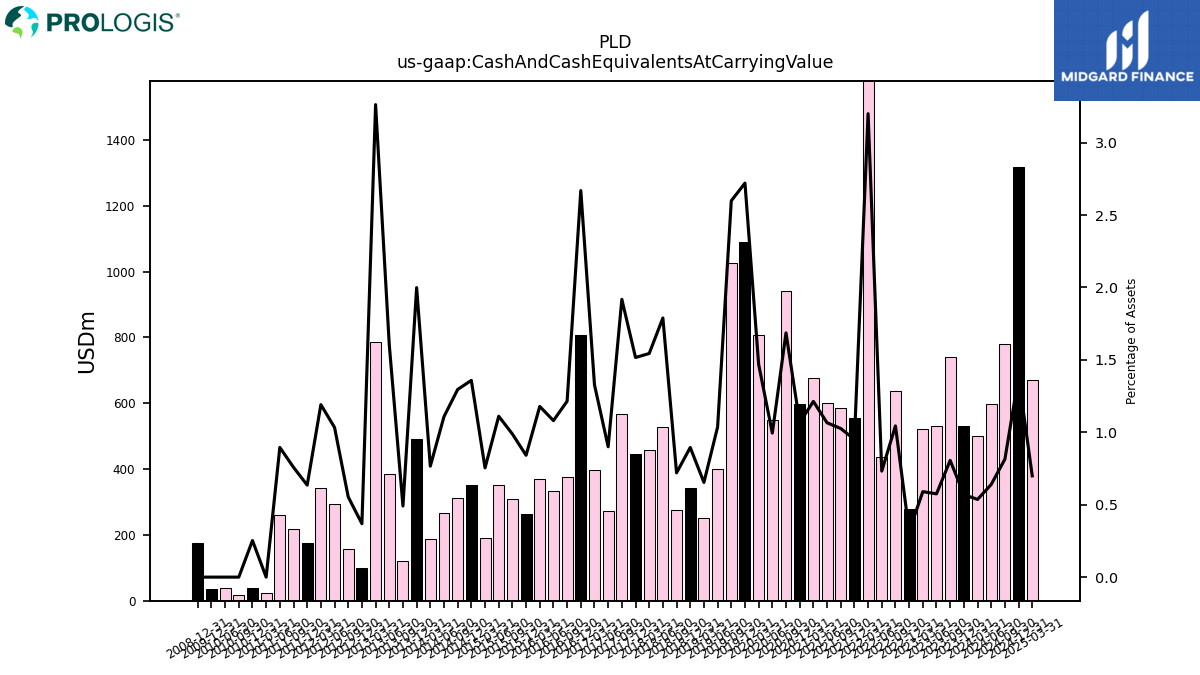
| Cash And Cash Equivalents At Carrying Value | 530.39 | 740.84 | 531.11 | 522.50 | 278.48 | 636.28 | 437.51 | 1912.75 | 556.12 | 585.07 | 601.45 | 676.07 | 598.09 | 940.19 | 549.13 | 807.87 | 1088.86 | 1024.99 | 401.19 | 251.03 | 343.86 | 275.56 | 527.83 | 458.10 | 447.05 | 568.73 | 271.35 | 395.83 |
| 2023-12-31 | 2023-09-30 | 2023-06-30 | 2023-03-31 | 2022-12-31 | 2022-09-30 | 2022-06-30 | 2022-03-31 | 2021-12-31 | 2021-09-30 | 2021-06-30 | 2021-03-31 | 2020-12-31 | 2020-09-30 | 2020-06-30 | 2020-03-31 | 2019-12-31 | 2019-09-30 | 2019-06-30 | 2019-03-31 | 2018-12-31 | 2018-09-30 | 2018-06-30 | 2018-03-31 | 2017-12-31 | 2017-09-30 | 2017-06-30 | 2017-03-31 | ||
|---|---|---|---|---|---|---|---|---|---|---|---|---|---|---|---|---|---|---|---|---|---|---|---|---|---|---|---|---|---|
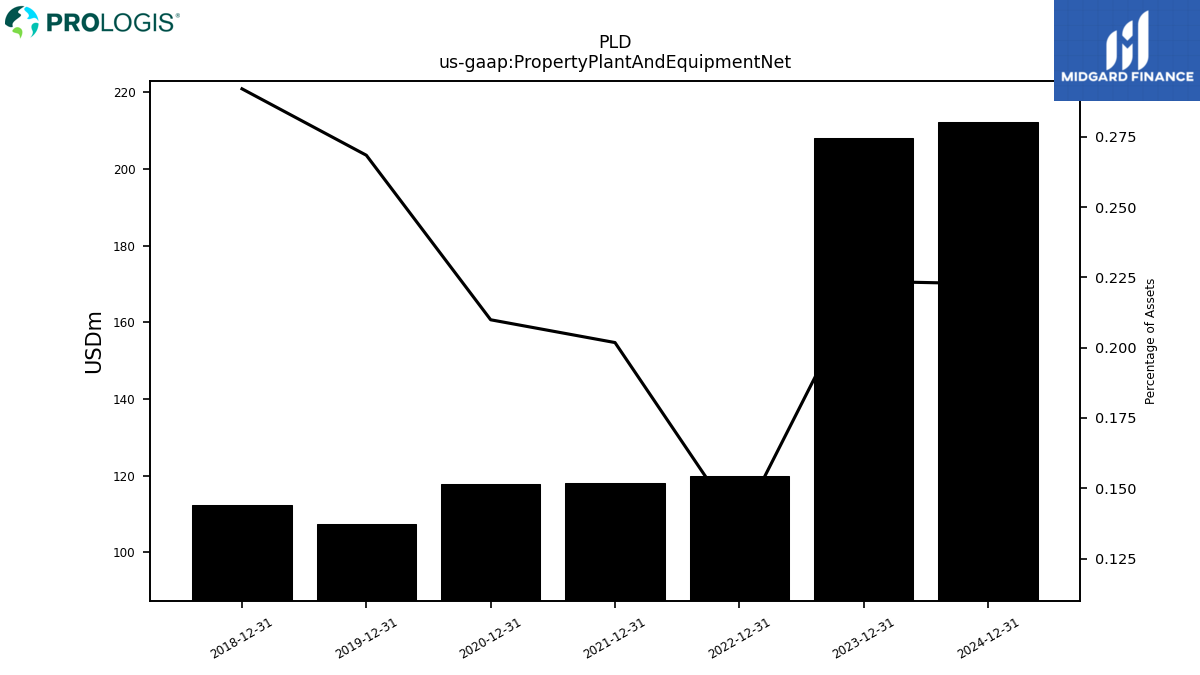
| Property Plant And Equipment Net | 208.03 | NA | NA | NA | 119.90 | NA | NA | NA | 118.04 | NA | NA | NA | 117.70 | NA | NA | NA | 107.47 | NA | NA | NA | 112.21 | NA | NA | NA | NA | NA | NA | NA | |
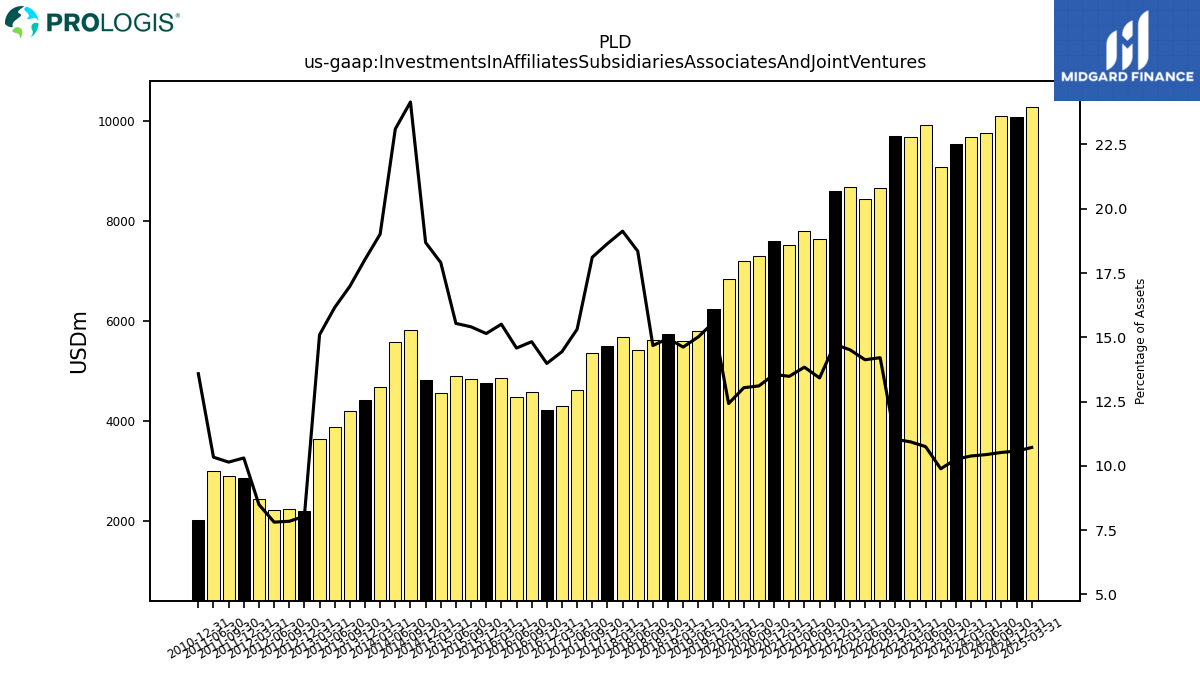
| Investments In Affiliates Subsidiaries Associates And Joint Ventures | 9543.97 | 9091.82 | 9931.26 | 9680.10 | 9698.90 | 8659.13 | 8443.64 | 8679.01 | 8610.96 | 7652.32 | 7811.45 | 7514.84 | 7602.01 | 7310.96 | 7201.01 | 6834.76 | 6237.37 | NA | 5813.58 | 5613.06 | 5745.29 | 5618.18 | 5414.62 | 5676.00 | 5496.45 | 5371.76 | 4617.72 | 4305.88 | |
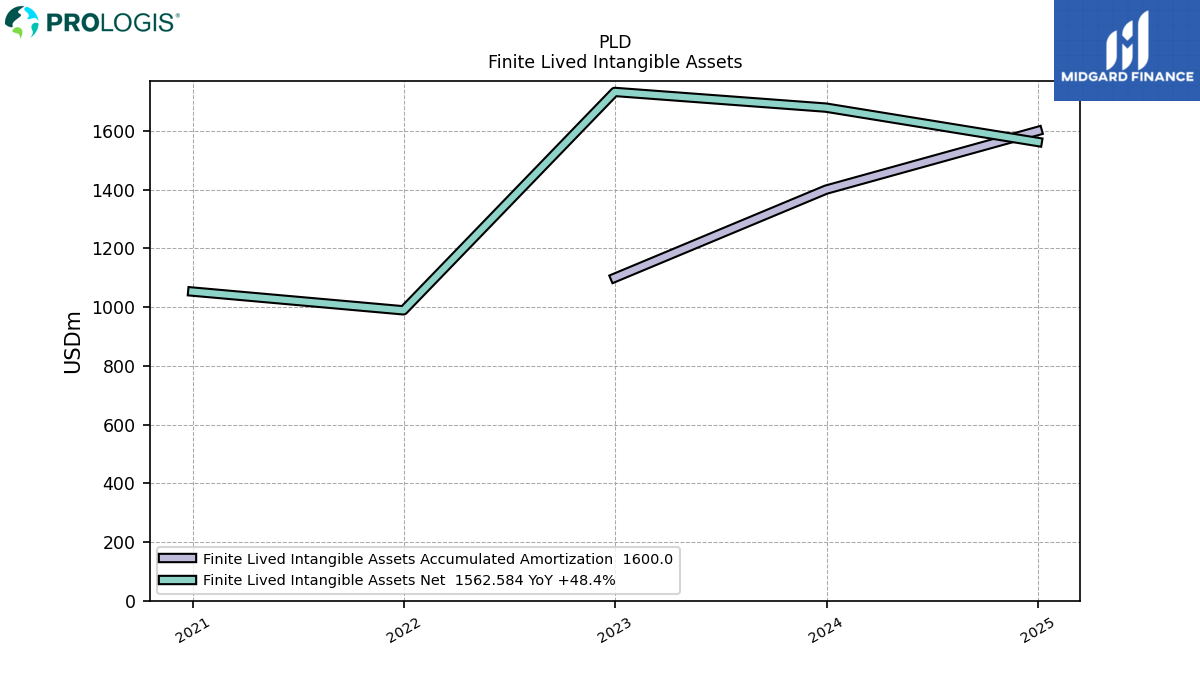
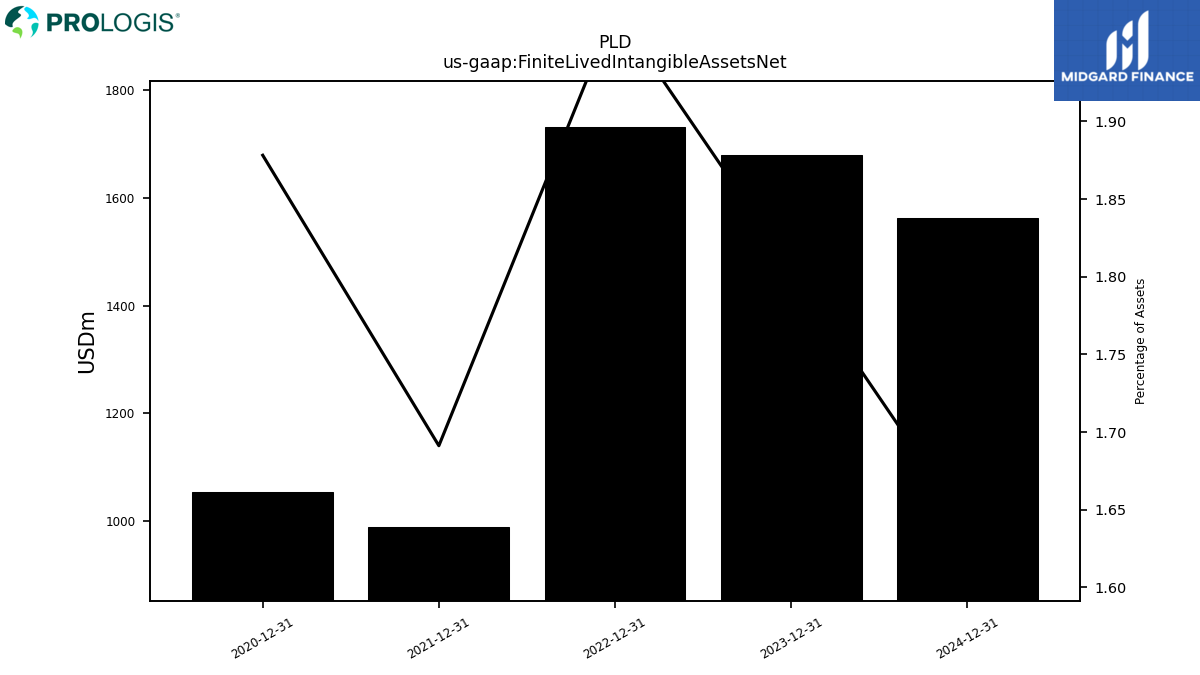
| Finite Lived Intangible Assets Net | 1679.56 | NA | NA | NA | 1733.03 | NA | NA | NA | 989.11 | NA | NA | NA | 1053.04 | NA | NA | NA | NA | NA | NA | NA | NA | NA | NA | NA | NA | NA | NA | NA |
| 2023-12-31 | 2023-09-30 | 2023-06-30 | 2023-03-31 | 2022-12-31 | 2022-09-30 | 2022-06-30 | 2022-03-31 | 2021-12-31 | 2021-09-30 | 2021-06-30 | 2021-03-31 | 2020-12-31 | 2020-09-30 | 2020-06-30 | 2020-03-31 | 2019-12-31 | 2019-09-30 | 2019-06-30 | 2019-03-31 | 2018-12-31 | 2018-09-30 | 2018-06-30 | 2018-03-31 | 2017-12-31 | 2017-09-30 | 2017-06-30 | 2017-03-31 | ||
|---|---|---|---|---|---|---|---|---|---|---|---|---|---|---|---|---|---|---|---|---|---|---|---|---|---|---|---|---|---|
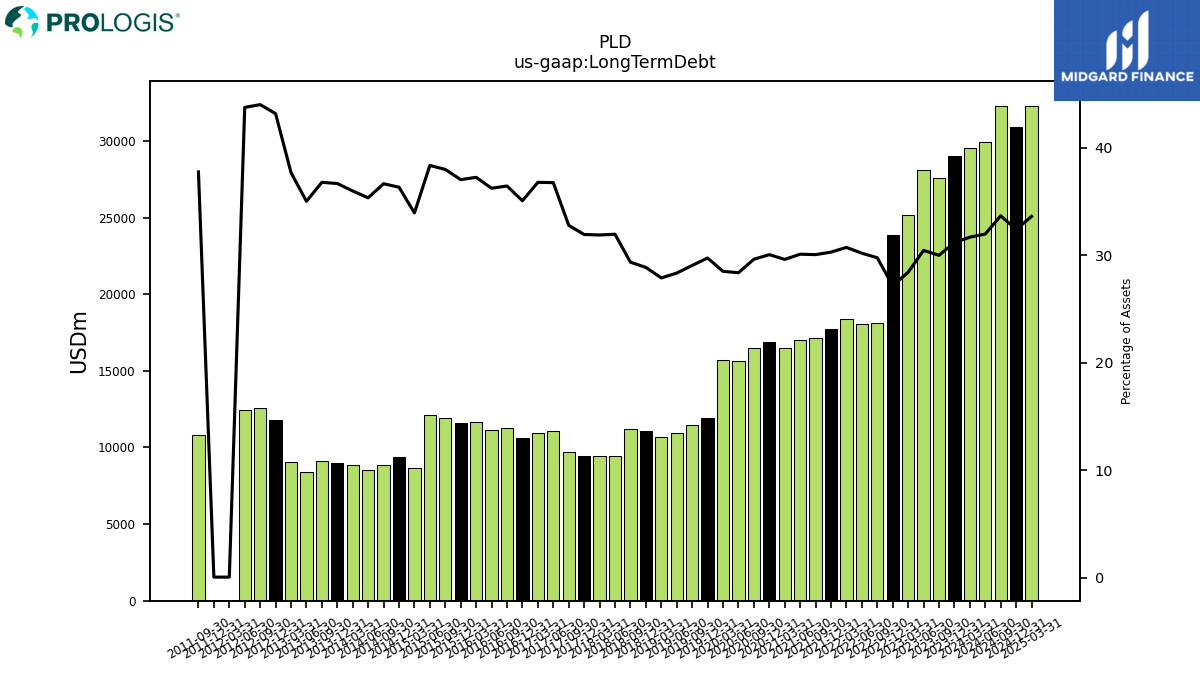
| Long Term Debt | 29000.50 | 27578.20 | 28129.47 | 25153.34 | 23875.96 | 18139.30 | 18040.83 | 18368.54 | 17715.05 | 17135.67 | 16985.31 | 16503.46 | 16849.08 | 16518.13 | 15666.87 | 15676.59 | 11905.88 | 11459.22 | 10968.32 | 10706.14 | 11089.82 | 11232.13 | 9427.12 | 9460.18 | 9412.63 | 9721.07 | 11081.92 | 10966.93 | |
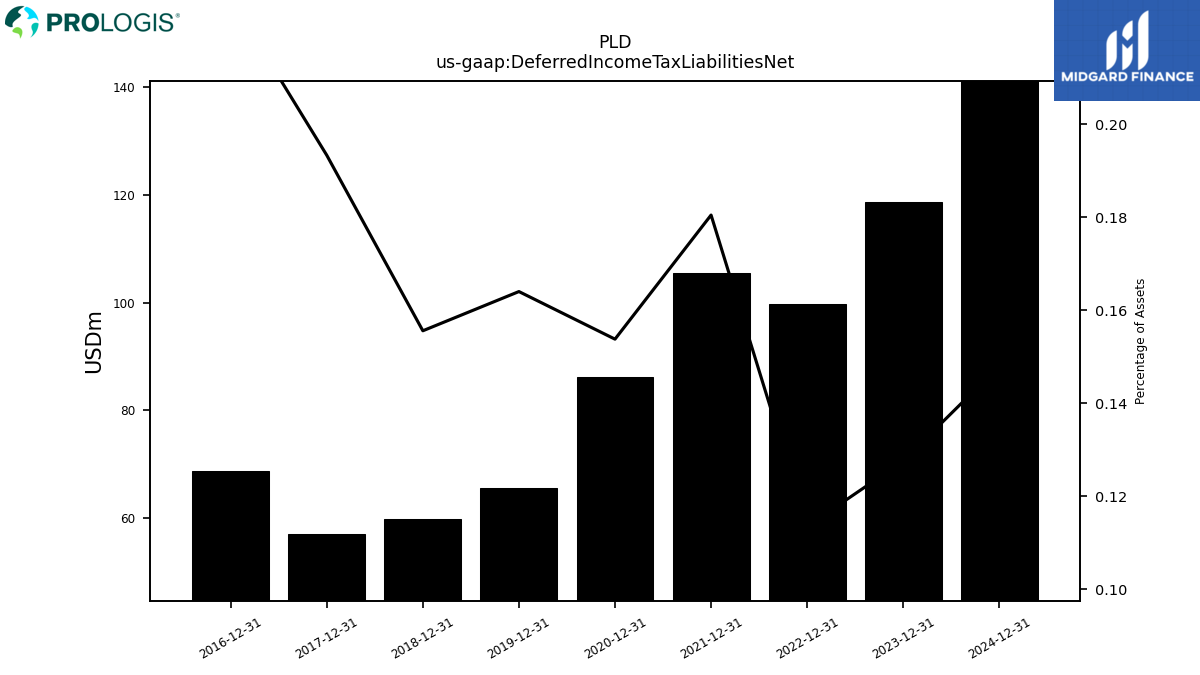
| Deferred Income Tax Liabilities Net | 118.68 | NA | NA | NA | 99.76 | NA | NA | NA | 105.54 | NA | NA | NA | 86.21 | NA | NA | NA | 65.65 | NA | NA | NA | 59.77 | NA | NA | NA | 56.99 | NA | NA | NA | |
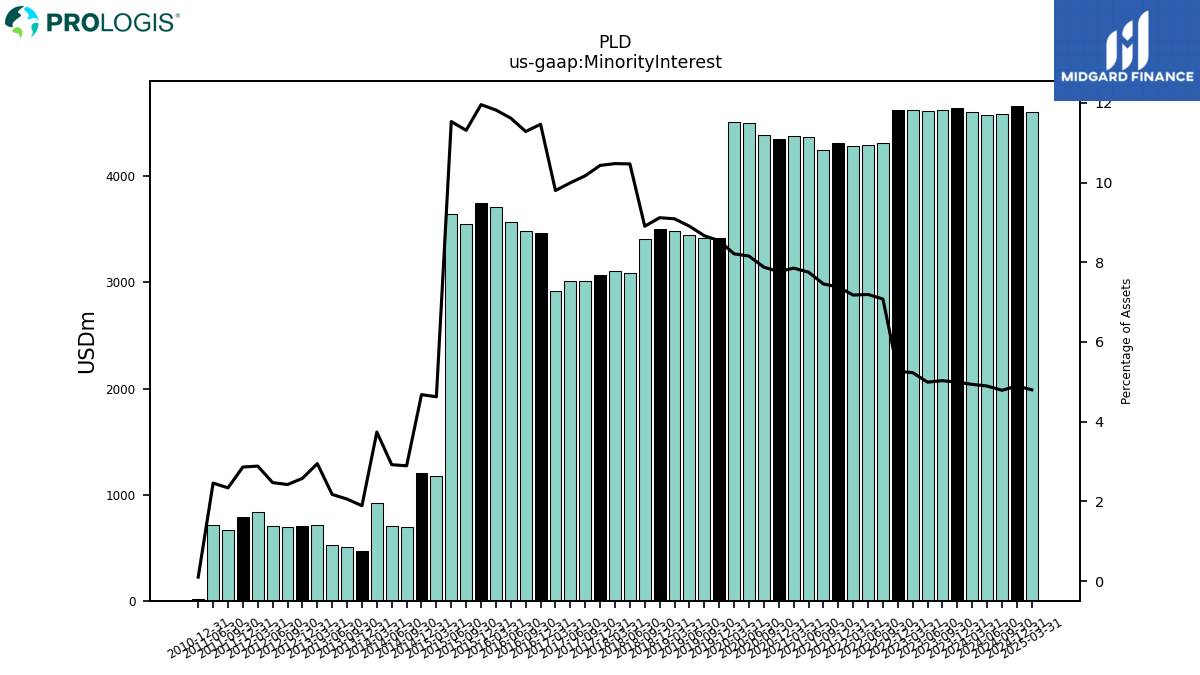
| Minority Interest | 4642.00 | 4625.03 | 4612.19 | 4630.01 | 4625.81 | 4313.22 | 4298.17 | 4290.13 | 4315.34 | 4251.36 | 4375.09 | 4376.69 | 4353.03 | 4392.13 | 4503.28 | 4516.43 | 3418.66 | 3418.37 | 3446.62 | 3489.58 | 3502.80 | 3407.06 | 3087.93 | 3108.05 | 3074.58 | 3015.51 | 3012.94 | 2921.55 |
| 2023-12-31 | 2023-09-30 | 2023-06-30 | 2023-03-31 | 2022-12-31 | 2022-09-30 | 2022-06-30 | 2022-03-31 | 2021-12-31 | 2021-09-30 | 2021-06-30 | 2021-03-31 | 2020-12-31 | 2020-09-30 | 2020-06-30 | 2020-03-31 | 2019-12-31 | 2019-09-30 | 2019-06-30 | 2019-03-31 | 2018-12-31 | 2018-09-30 | 2018-06-30 | 2018-03-31 | 2017-12-31 | 2017-09-30 | 2017-06-30 | 2017-03-31 | ||
|---|---|---|---|---|---|---|---|---|---|---|---|---|---|---|---|---|---|---|---|---|---|---|---|---|---|---|---|---|---|
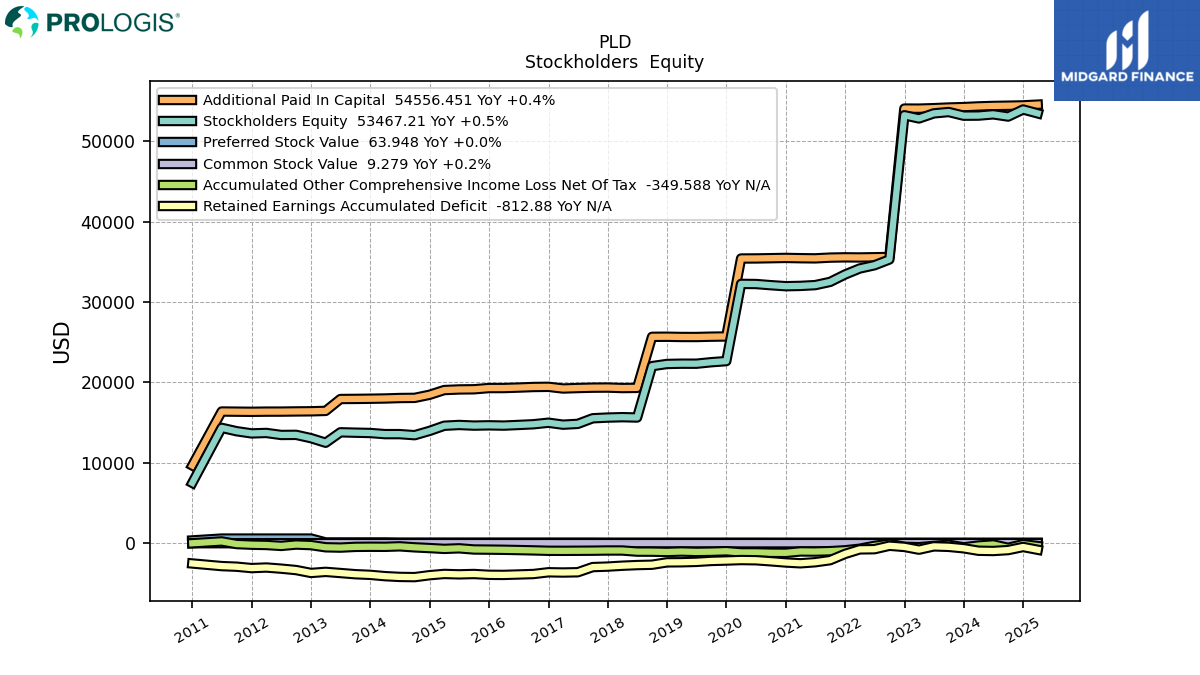
| Stockholders Equity | 53181.72 | 53635.83 | 53465.63 | 52835.22 | 53237.28 | 35293.10 | 34575.77 | 34172.07 | 33426.87 | 32506.12 | 32105.71 | 32008.52 | 31971.55 | 32097.17 | 32242.93 | 32259.44 | 22653.13 | 22517.21 | 22330.81 | 22334.48 | 22298.09 | 22030.60 | 15638.57 | 15680.08 | 15631.16 | 15543.75 | 14847.30 | 14746.87 | |
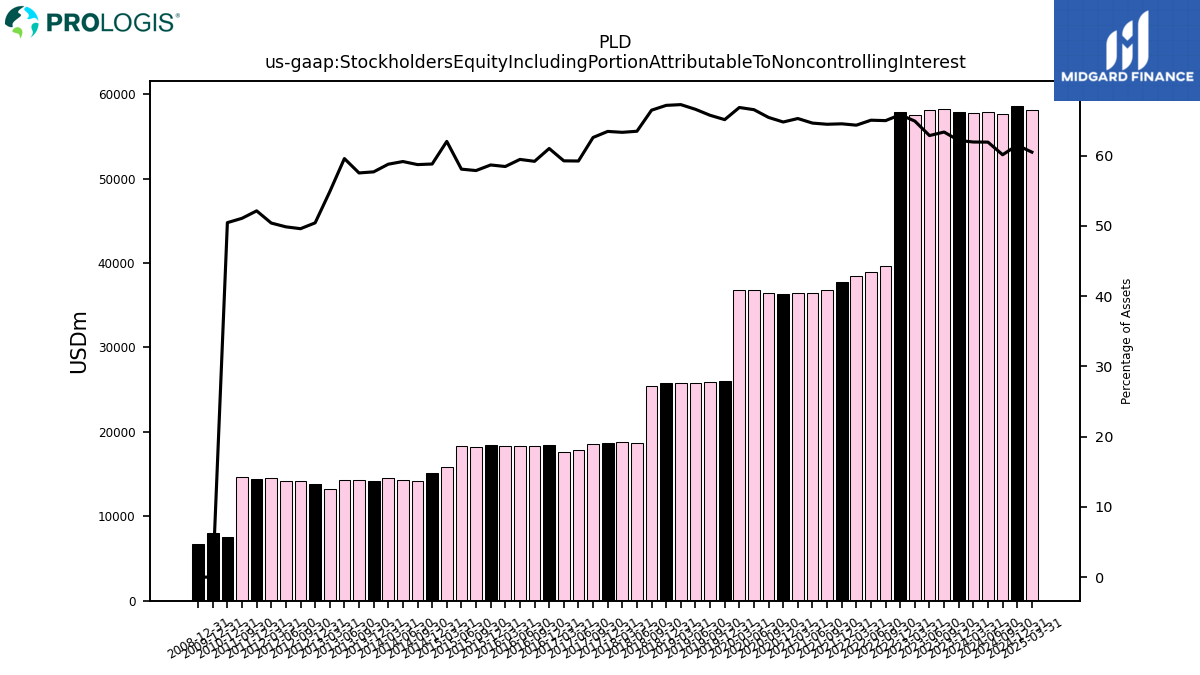
| Stockholders Equity Including Portion Attributable To Noncontrolling Interest | 57823.72 | 58260.86 | 58077.82 | 57465.23 | 57863.09 | 39606.32 | 38873.94 | 38462.20 | 37742.21 | 36757.47 | 36480.80 | 36385.20 | 36324.58 | 36489.31 | 36746.21 | 36775.87 | 26071.78 | 25935.58 | 25777.43 | 25824.06 | 25800.89 | 25437.65 | 18726.50 | 18788.12 | 18705.74 | 18559.26 | 17860.24 | 17668.42 | |
| Common Stock Value | 9.24 | 9.24 | 9.24 | 9.23 | 9.23 | 7.40 | 7.40 | 7.40 | 7.40 | 7.39 | 7.39 | 7.40 | 7.39 | 7.39 | 7.39 | 7.39 | 6.32 | 6.32 | 6.31 | 6.31 | 6.30 | 6.29 | 5.33 | 5.33 | 5.32 | 5.32 | 5.31 | 5.30 | |
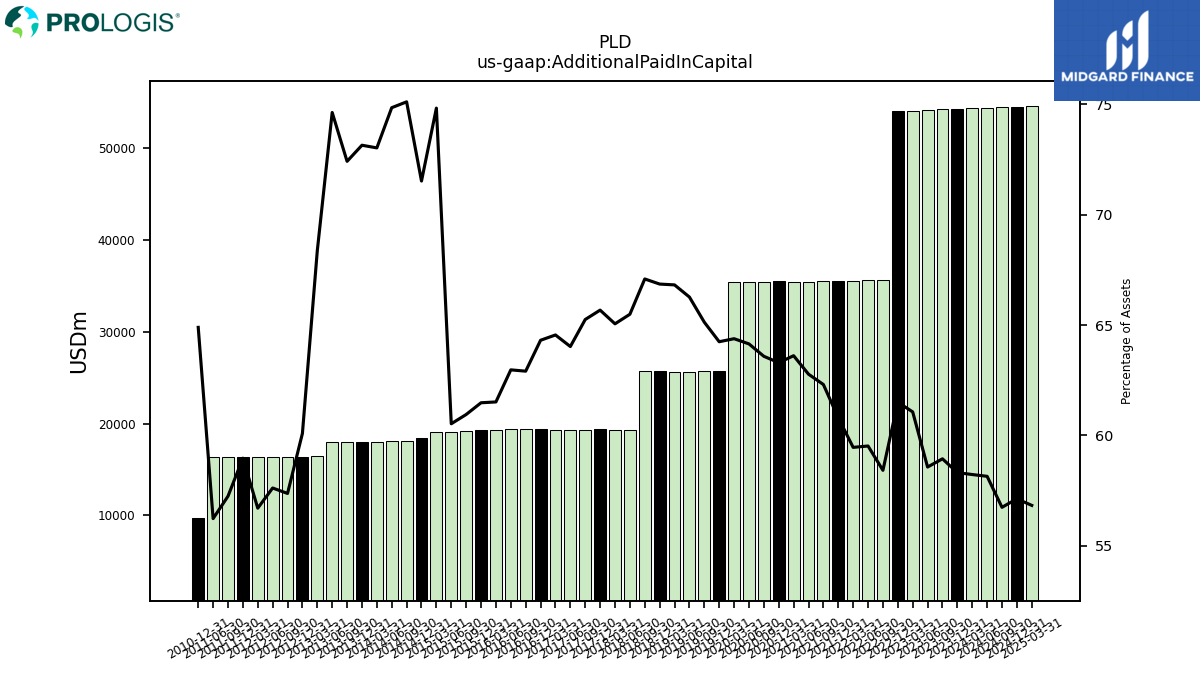
| Additional Paid In Capital | 54249.80 | 54197.86 | 54115.59 | 54058.04 | 54065.41 | 35606.32 | 35573.94 | 35546.26 | 35561.61 | 35526.67 | 35432.84 | 35454.07 | 35488.63 | 35456.22 | 35424.40 | 35416.34 | 25719.43 | 25693.65 | 25651.67 | 25654.45 | 25685.99 | 25674.66 | 19322.02 | 19303.91 | 19363.01 | 19350.64 | 19305.20 | 19246.76 | |
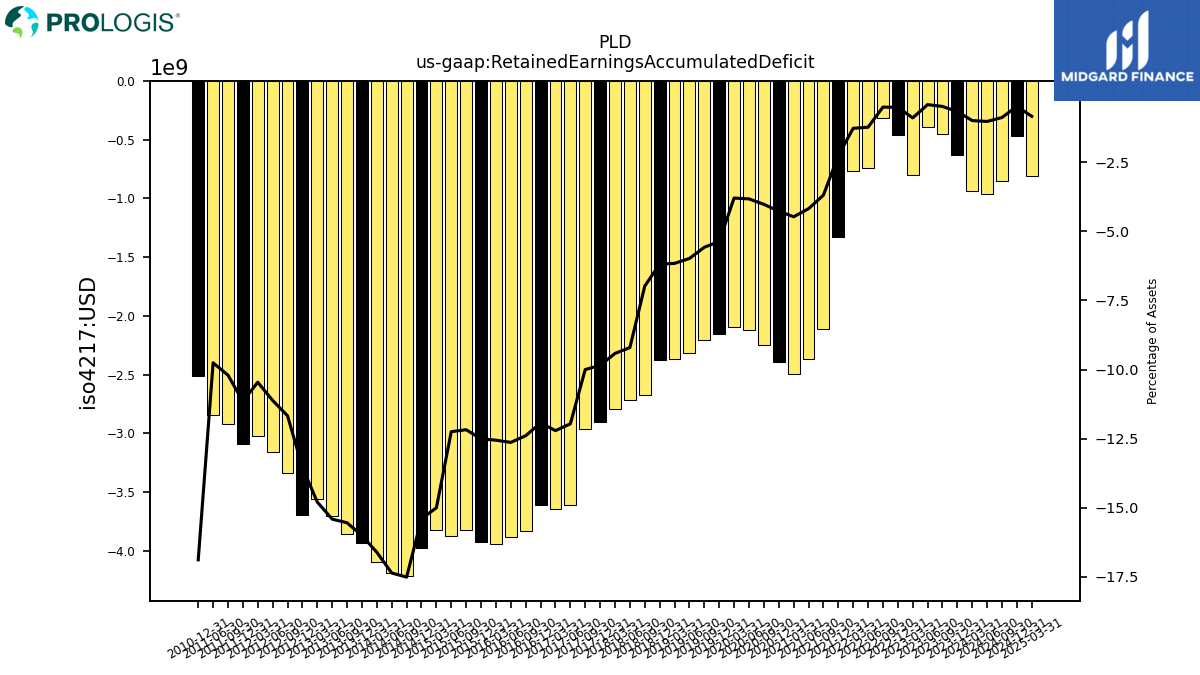
| Retained Earnings Accumulated Deficit | -627.07 | -449.44 | -390.78 | -799.58 | -457.69 | -312.94 | -740.76 | -764.42 | -1327.83 | -2107.99 | -2363.35 | -2495.34 | -2394.69 | -2245.92 | -2115.68 | -2090.88 | -2151.17 | -2201.46 | -2317.01 | -2366.01 | -2378.47 | -2672.74 | -2716.24 | -2794.77 | -2904.46 | -2965.83 | -3607.25 | -3640.15 | |
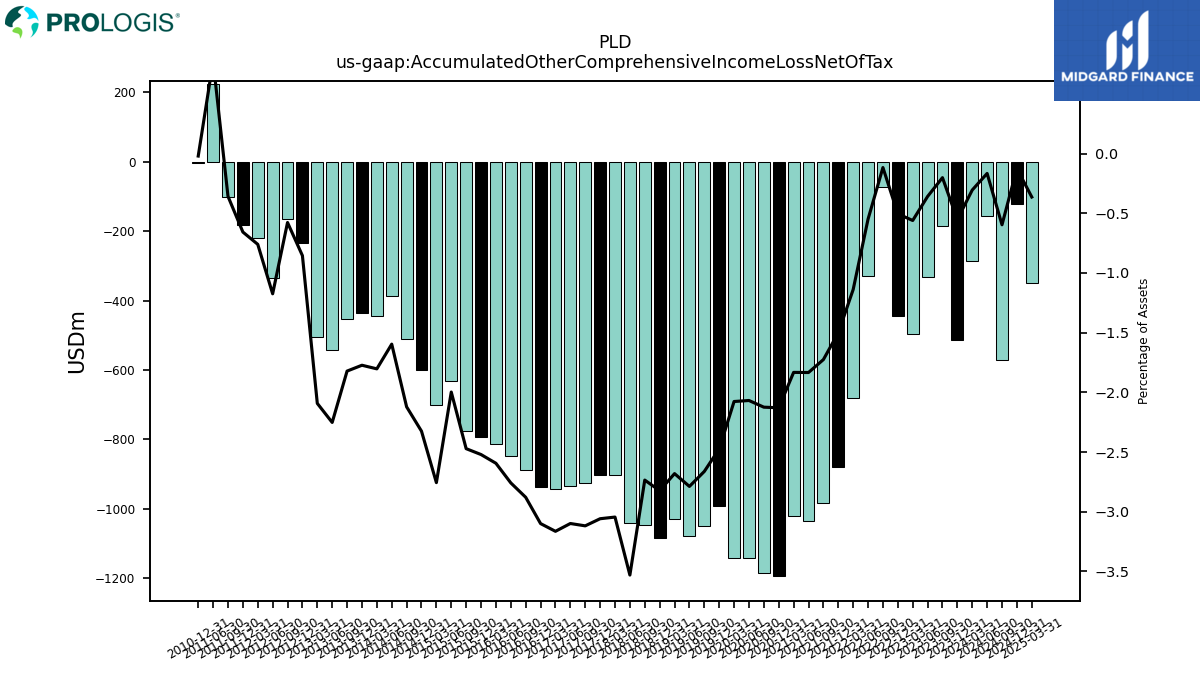
| Accumulated Other Comprehensive Income Loss Net Of Tax | -514.20 | -185.78 | -332.37 | -496.42 | -443.61 | -71.63 | -328.76 | -681.12 | -878.25 | -983.91 | -1035.12 | -1021.55 | -1193.74 | -1184.46 | -1142.13 | -1142.35 | -990.40 | -1050.25 | -1079.11 | -1029.21 | -1084.67 | -1046.57 | -1041.49 | -903.34 | -901.66 | -924.62 | -934.20 | -943.28 | |
| Minority Interest | 4642.00 | 4625.03 | 4612.19 | 4630.01 | 4625.81 | 4313.22 | 4298.17 | 4290.13 | 4315.34 | 4251.36 | 4375.09 | 4376.69 | 4353.03 | 4392.13 | 4503.28 | 4516.43 | 3418.66 | 3418.37 | 3446.62 | 3489.58 | 3502.80 | 3407.06 | 3087.93 | 3108.05 | 3074.58 | 3015.51 | 3012.94 | 2921.55 |
| 2023-12-31 | 2023-09-30 | 2023-06-30 | 2023-03-31 | 2022-12-31 | 2022-09-30 | 2022-06-30 | 2022-03-31 | 2021-12-31 | 2021-09-30 | 2021-06-30 | 2021-03-31 | 2020-12-31 | 2020-09-30 | 2020-06-30 | 2020-03-31 | 2019-12-31 | 2019-09-30 | 2019-06-30 | 2019-03-31 | 2018-12-31 | 2018-09-30 | 2018-06-30 | 2018-03-31 | 2017-12-31 | 2017-09-30 | 2017-06-30 | 2017-03-31 | ||
|---|---|---|---|---|---|---|---|---|---|---|---|---|---|---|---|---|---|---|---|---|---|---|---|---|---|---|---|---|---|
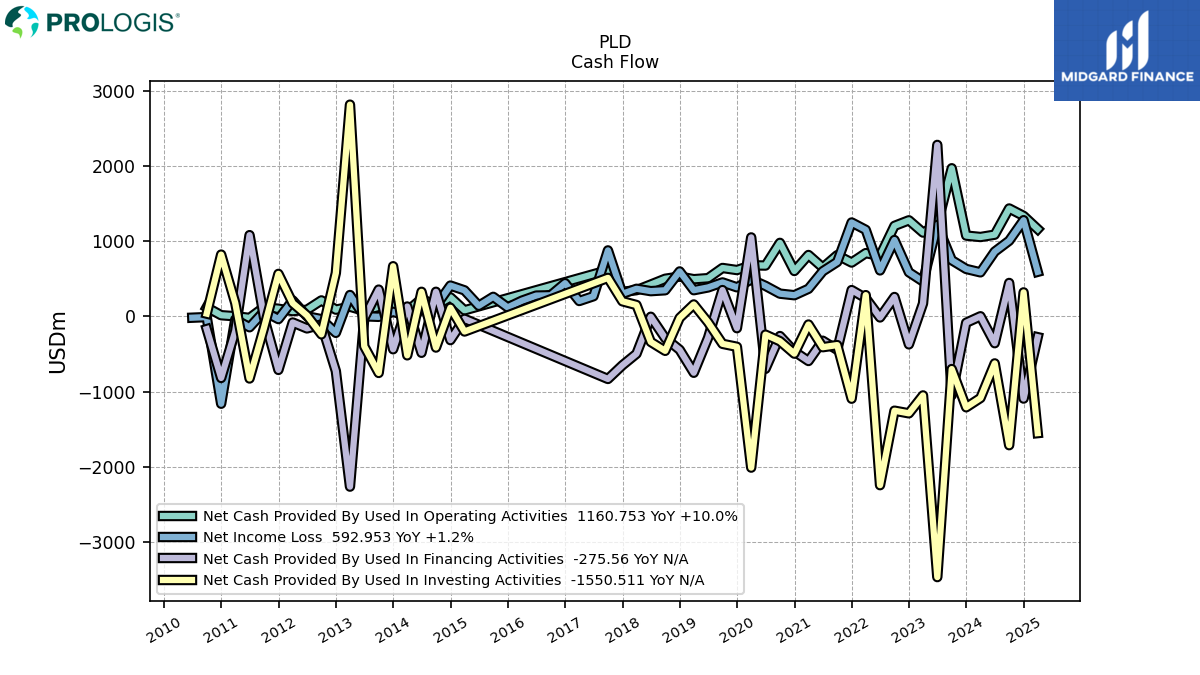
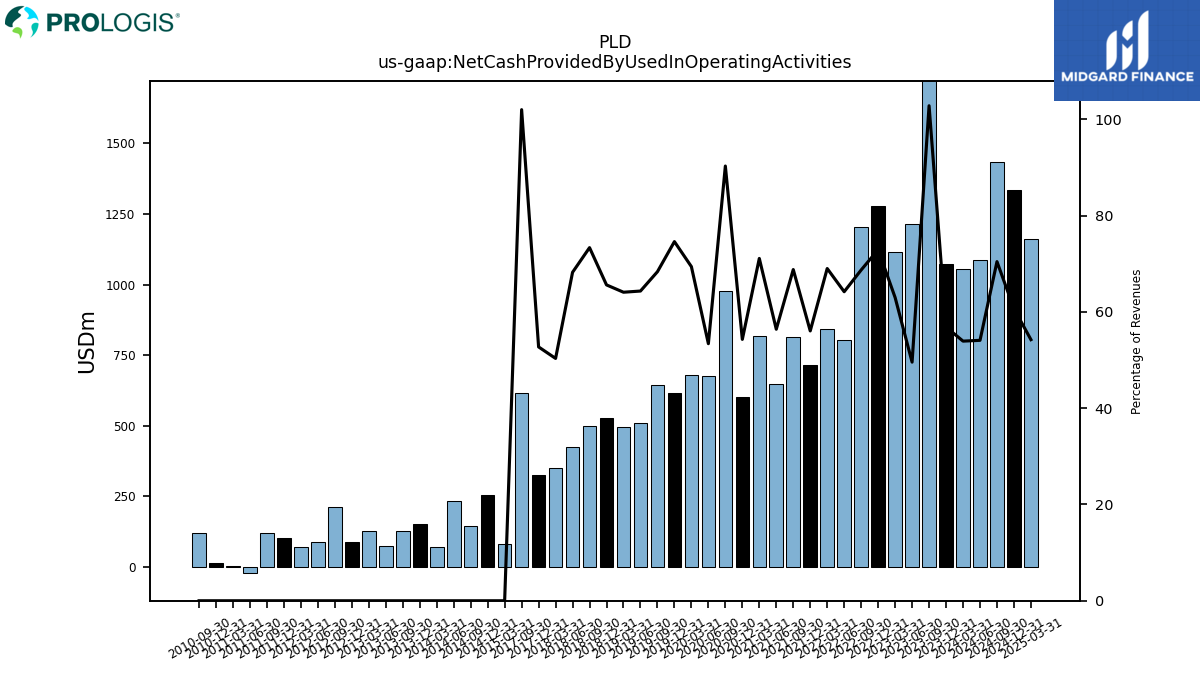
| Net Cash Provided By Used In Operating Activities | 1074.42 | 1969.20 | 1215.14 | 1114.30 | 1277.62 | 1203.34 | 803.95 | 841.53 | 716.07 | 814.07 | 649.21 | 816.69 | 603.67 | 977.99 | 676.26 | 679.09 | 616.37 | 644.14 | 508.61 | 494.91 | 529.64 | 500.69 | 423.98 | 349.24 | 326.93 | 615.15 | NA | NA | |
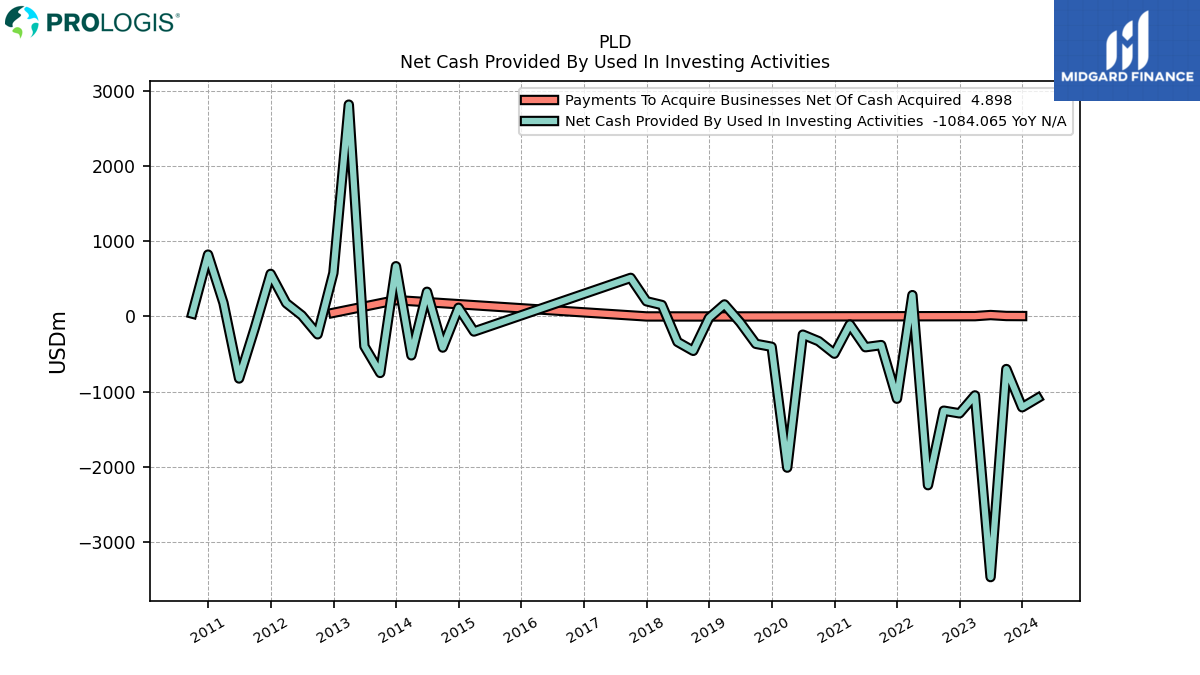
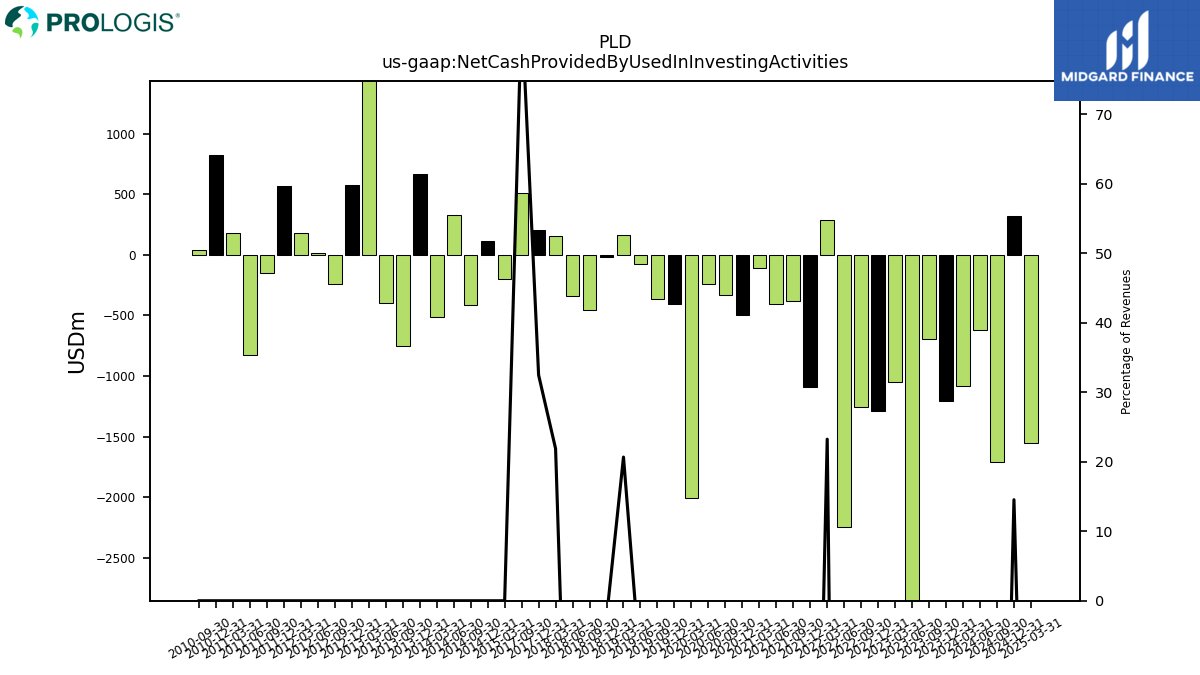
| Net Cash Provided By Used In Investing Activities | -1207.26 | -698.95 | -3464.03 | -1049.15 | -1287.59 | -1252.45 | -2242.44 | 283.43 | -1093.49 | -380.57 | -408.91 | -107.09 | -494.51 | -328.66 | -241.99 | -2009.17 | -403.10 | -364.02 | -77.87 | 159.64 | -19.69 | -457.33 | -338.64 | 151.86 | 201.39 | 512.39 | NA | NA | |
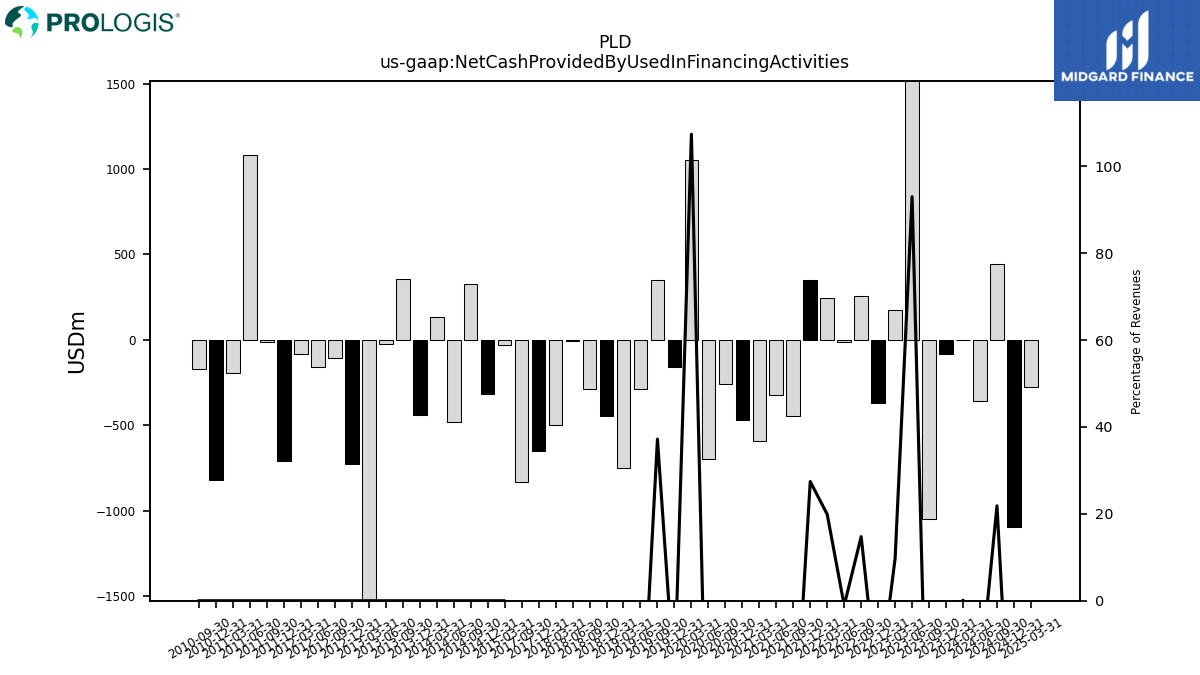
| Net Cash Provided By Used In Financing Activities | -84.00 | -1047.66 | 2279.54 | 172.41 | -371.52 | 258.35 | -13.52 | 242.48 | 350.47 | -443.82 | -322.66 | -592.31 | -466.20 | -260.32 | -696.05 | 1050.41 | -156.22 | 350.52 | -285.27 | -748.63 | -443.01 | -288.85 | -4.28 | -495.97 | -649.30 | -830.94 | NA | NA |
| 2023-12-31 | 2023-09-30 | 2023-06-30 | 2023-03-31 | 2022-12-31 | 2022-09-30 | 2022-06-30 | 2022-03-31 | 2021-12-31 | 2021-09-30 | 2021-06-30 | 2021-03-31 | 2020-12-31 | 2020-09-30 | 2020-06-30 | 2020-03-31 | 2019-12-31 | 2019-09-30 | 2019-06-30 | 2019-03-31 | 2018-12-31 | 2018-09-30 | 2018-06-30 | 2018-03-31 | 2017-12-31 | 2017-09-30 | 2017-06-30 | 2017-03-31 | ||
|---|---|---|---|---|---|---|---|---|---|---|---|---|---|---|---|---|---|---|---|---|---|---|---|---|---|---|---|---|---|
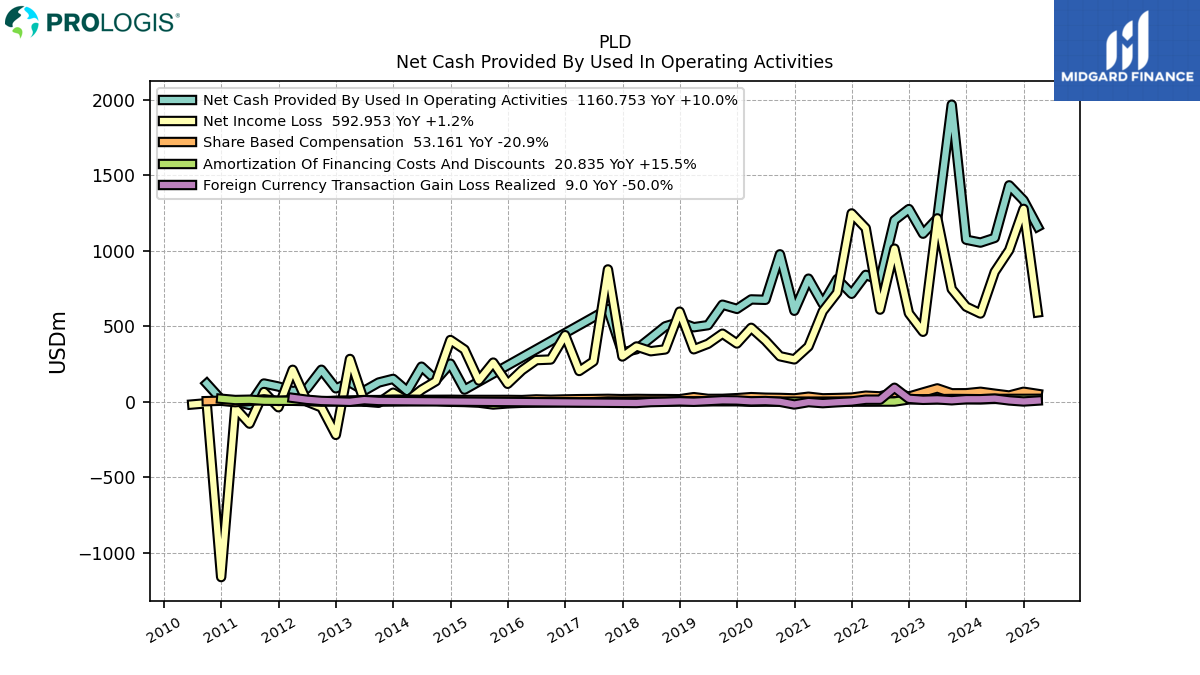
| Net Cash Provided By Used In Operating Activities | 1074.42 | 1969.20 | 1215.14 | 1114.30 | 1277.62 | 1203.34 | 803.95 | 841.53 | 716.07 | 814.07 | 649.21 | 816.69 | 603.67 | 977.99 | 676.26 | 679.09 | 616.37 | 644.14 | 508.61 | 494.91 | 529.64 | 500.69 | 423.98 | 349.24 | 326.93 | 615.15 | NA | NA | |
| Net Income Loss | 630.94 | 747.63 | 1216.03 | 464.62 | 587.21 | 1015.46 | 611.39 | 1150.79 | 1248.66 | 723.54 | 600.18 | 367.35 | 281.89 | 302.69 | 406.17 | 491.05 | 386.99 | 452.15 | 385.28 | 348.55 | 598.06 | 347.84 | 336.09 | 367.38 | 300.89 | 877.89 | 268.62 | 204.93 | |
| Profit Loss | 675.88 | 799.14 | 1279.49 | 498.63 | 620.07 | 1069.17 | 646.44 | 1219.72 | 1300.85 | 797.73 | 650.31 | 399.69 | 308.01 | 332.52 | 454.94 | 521.16 | 426.24 | 491.01 | 410.83 | 373.76 | 690.49 | 375.52 | 364.99 | 391.96 | 338.87 | 913.42 | 287.98 | 220.69 | |
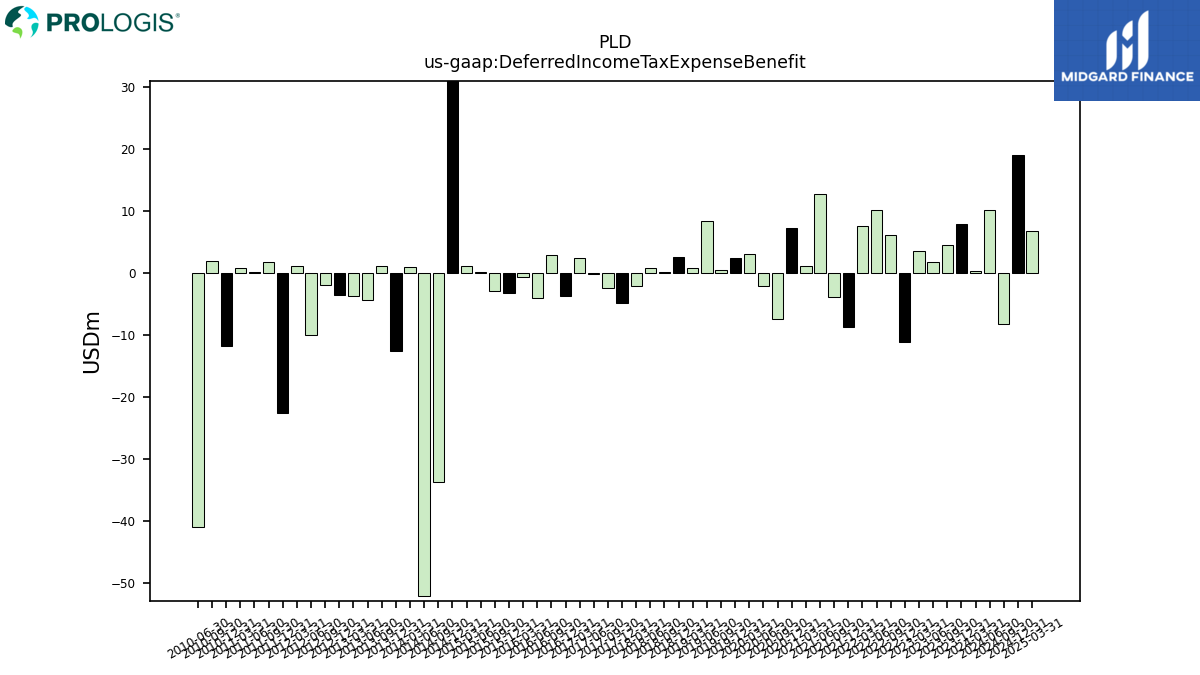
| Deferred Income Tax Expense Benefit | 7.87 | 4.54 | 1.72 | 3.58 | -11.08 | 6.16 | 10.06 | 7.49 | -8.73 | -3.81 | 12.70 | 1.16 | 7.31 | -7.39 | -2.16 | 2.99 | 2.45 | 0.53 | 8.44 | 0.79 | 2.53 | 0.12 | 0.87 | -2.06 | -4.81 | -2.46 | -0.17 | 2.44 | |
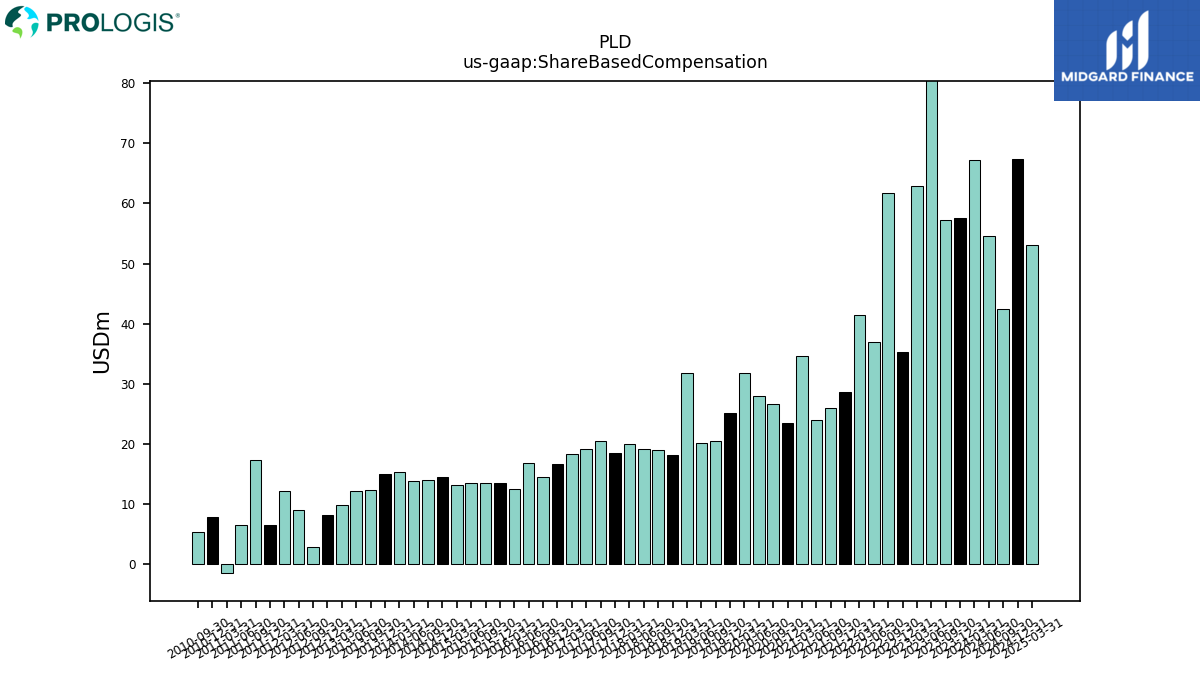
| Share Based Compensation | 57.63 | 57.25 | 89.87 | 62.91 | 35.33 | 61.67 | 36.92 | 41.43 | 28.61 | 25.89 | 23.95 | 34.58 | 23.47 | 26.55 | 28.00 | 31.81 | 25.09 | 20.52 | 20.19 | 31.76 | 18.06 | 18.95 | 19.09 | 20.00 | 18.55 | 20.49 | 19.22 | 18.38 |
| 2023-12-31 | 2023-09-30 | 2023-06-30 | 2023-03-31 | 2022-12-31 | 2022-09-30 | 2022-06-30 | 2022-03-31 | 2021-12-31 | 2021-09-30 | 2021-06-30 | 2021-03-31 | 2020-12-31 | 2020-09-30 | 2020-06-30 | 2020-03-31 | 2019-12-31 | 2019-09-30 | 2019-06-30 | 2019-03-31 | 2018-12-31 | 2018-09-30 | 2018-06-30 | 2018-03-31 | 2017-12-31 | 2017-09-30 | 2017-06-30 | 2017-03-31 | ||
|---|---|---|---|---|---|---|---|---|---|---|---|---|---|---|---|---|---|---|---|---|---|---|---|---|---|---|---|---|---|
| Net Cash Provided By Used In Investing Activities | -1207.26 | -698.95 | -3464.03 | -1049.15 | -1287.59 | -1252.45 | -2242.44 | 283.43 | -1093.49 | -380.57 | -408.91 | -107.09 | -494.51 | -328.66 | -241.99 | -2009.17 | -403.10 | -364.02 | -77.87 | 159.64 | -19.69 | -457.33 | -338.64 | 151.86 | 201.39 | 512.39 | NA | NA |
| 2023-12-31 | 2023-09-30 | 2023-06-30 | 2023-03-31 | 2022-12-31 | 2022-09-30 | 2022-06-30 | 2022-03-31 | 2021-12-31 | 2021-09-30 | 2021-06-30 | 2021-03-31 | 2020-12-31 | 2020-09-30 | 2020-06-30 | 2020-03-31 | 2019-12-31 | 2019-09-30 | 2019-06-30 | 2019-03-31 | 2018-12-31 | 2018-09-30 | 2018-06-30 | 2018-03-31 | 2017-12-31 | 2017-09-30 | 2017-06-30 | 2017-03-31 | ||
|---|---|---|---|---|---|---|---|---|---|---|---|---|---|---|---|---|---|---|---|---|---|---|---|---|---|---|---|---|---|
| Net Cash Provided By Used In Financing Activities | -84.00 | -1047.66 | 2279.54 | 172.41 | -371.52 | 258.35 | -13.52 | 242.48 | 350.47 | -443.82 | -322.66 | -592.31 | -466.20 | -260.32 | -696.05 | 1050.41 | -156.22 | 350.52 | -285.27 | -748.63 | -443.01 | -288.85 | -4.28 | -495.97 | -649.30 | -830.94 | NA | NA | |
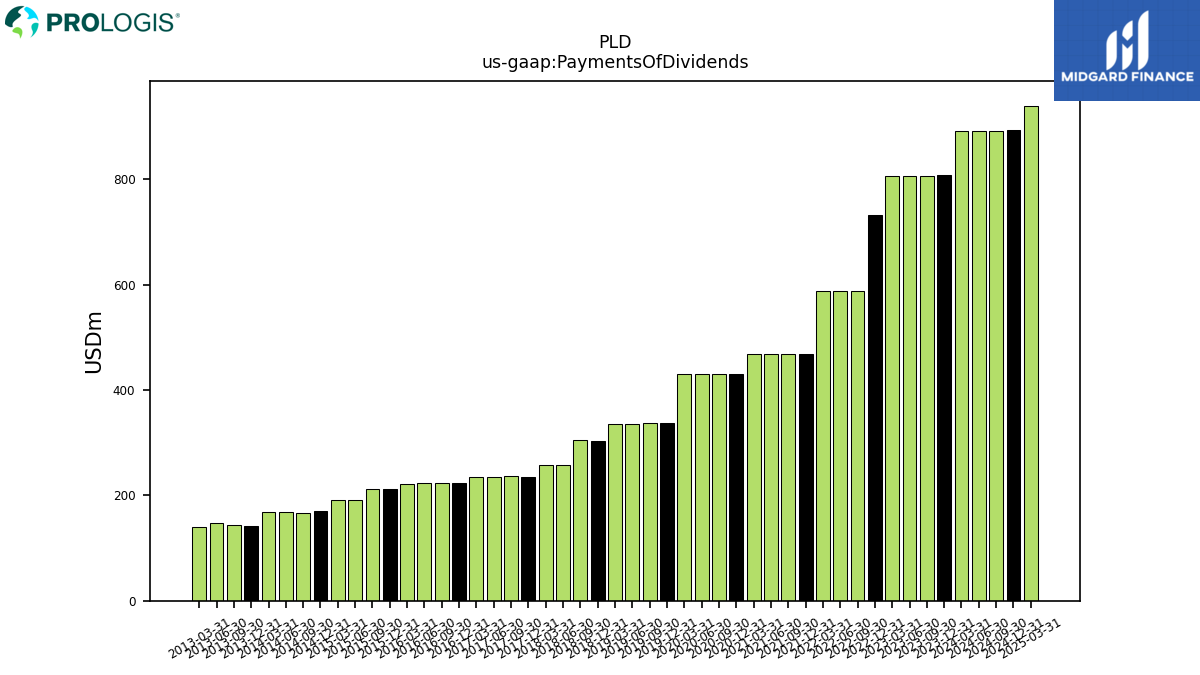
| Payments Of Dividends | 808.57 | 806.29 | 807.23 | 806.50 | 731.96 | 587.64 | 587.73 | 587.38 | 468.50 | 468.18 | 468.18 | 468.00 | 430.66 | 430.59 | 430.97 | 430.77 | 336.70 | 336.60 | 336.27 | 336.09 | 303.79 | 304.33 | 257.56 | 257.69 | 235.62 | 236.47 | 235.72 | 235.07 |
| 2023-12-31 | 2023-09-30 | 2023-06-30 | 2023-03-31 | 2022-12-31 | 2022-09-30 | 2022-06-30 | 2022-03-31 | 2021-12-31 | 2021-09-30 | 2021-06-30 | 2021-03-31 | 2020-12-31 | 2020-09-30 | 2020-06-30 | 2020-03-31 | 2019-12-31 | 2019-09-30 | 2019-06-30 | 2019-03-31 | 2018-12-31 | 2018-09-30 | 2018-06-30 | 2018-03-31 | 2017-12-31 | 2017-09-30 | 2017-06-30 | 2017-03-31 | ||
|---|---|---|---|---|---|---|---|---|---|---|---|---|---|---|---|---|---|---|---|---|---|---|---|---|---|---|---|---|---|
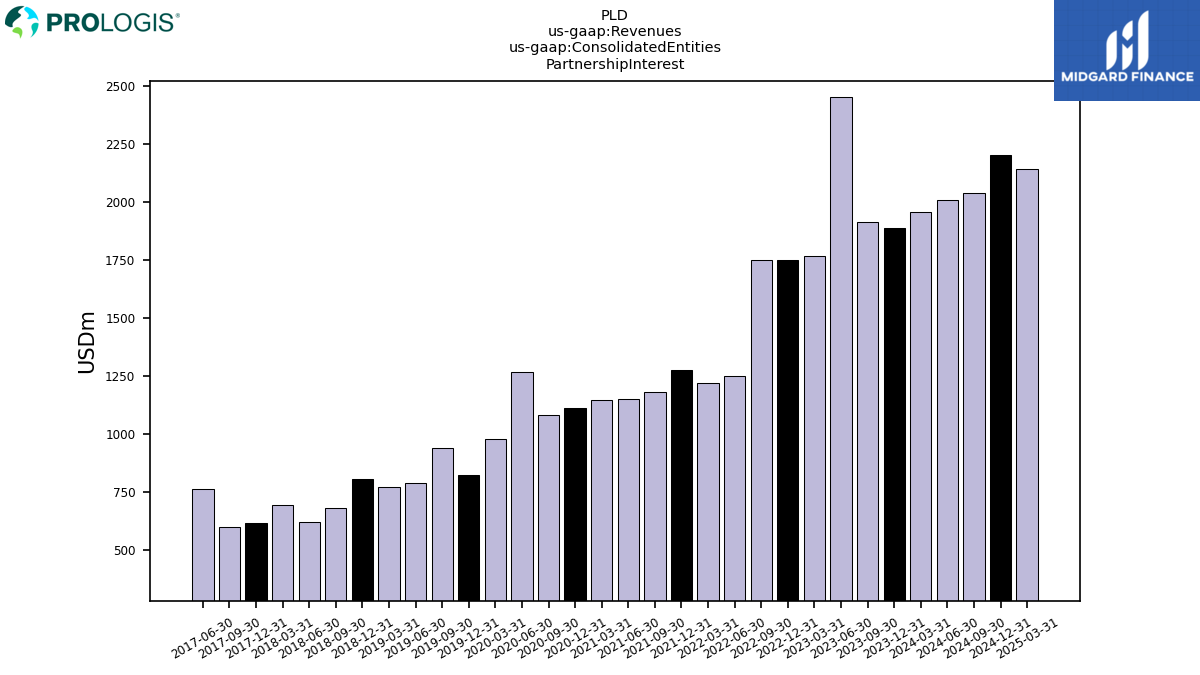
| Revenues | 1889.25 | 1914.66 | 2450.97 | 1768.59 | 1751.59 | 1750.89 | 1252.08 | 1219.13 | 1277.23 | 1183.05 | 1150.84 | 1148.32 | 1111.60 | 1082.77 | 1266.12 | 978.24 | 826.02 | 942.18 | 790.37 | 772.05 | 807.09 | 682.43 | 621.28 | 693.66 | 619.92 | 602.87 | 766.18 | 629.15 | |
| 1889.25 | 1914.66 | 2450.97 | 1768.59 | 1751.59 | 1750.89 | 1252.08 | 1219.13 | 1277.23 | 1183.05 | 1150.84 | 1148.32 | 1111.60 | 1082.77 | 1266.12 | 978.24 | 826.02 | 942.18 | 790.37 | 772.05 | 807.09 | 682.43 | 621.28 | 693.66 | 619.92 | 602.87 | 766.18 | NA | ||
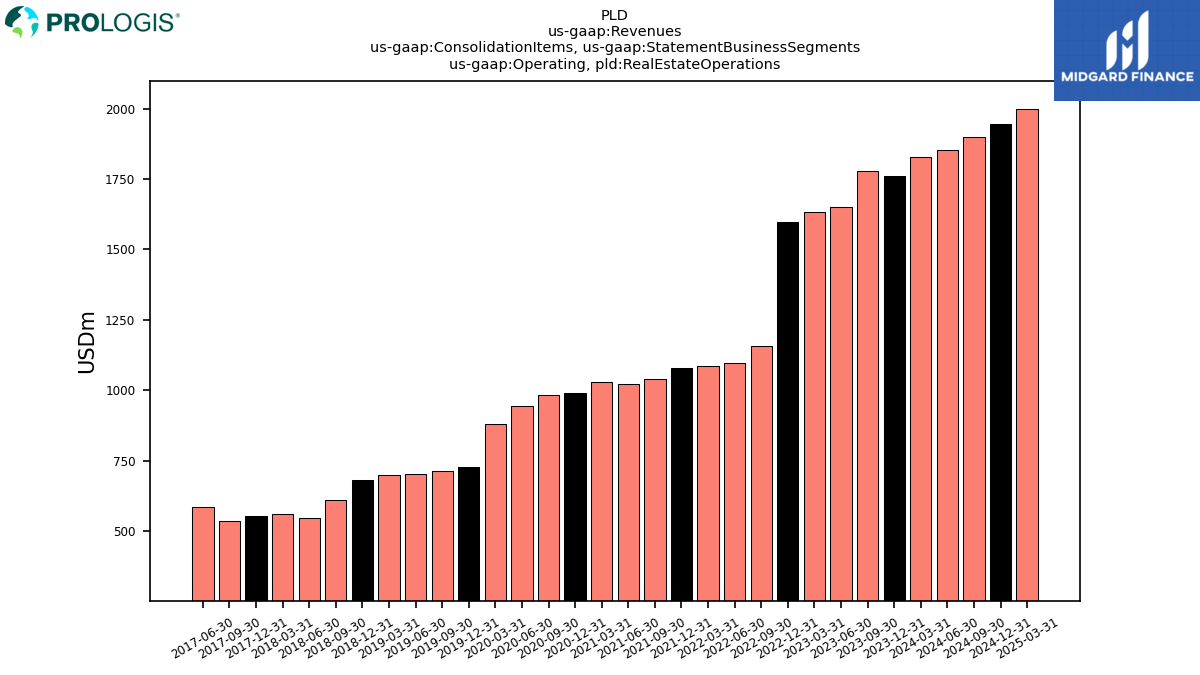
| Operating, Real Estate Operations | 1759.60 | 1777.82 | 1651.94 | 1633.89 | 1596.92 | 1156.14 | 1095.84 | 1085.20 | 1077.28 | 1041.60 | 1021.46 | 1028.36 | 990.85 | 983.78 | 945.47 | 881.65 | 727.55 | 711.71 | 701.23 | 698.25 | 680.59 | 611.29 | 545.58 | 560.70 | 551.77 | 534.83 | 585.53 | NA | |
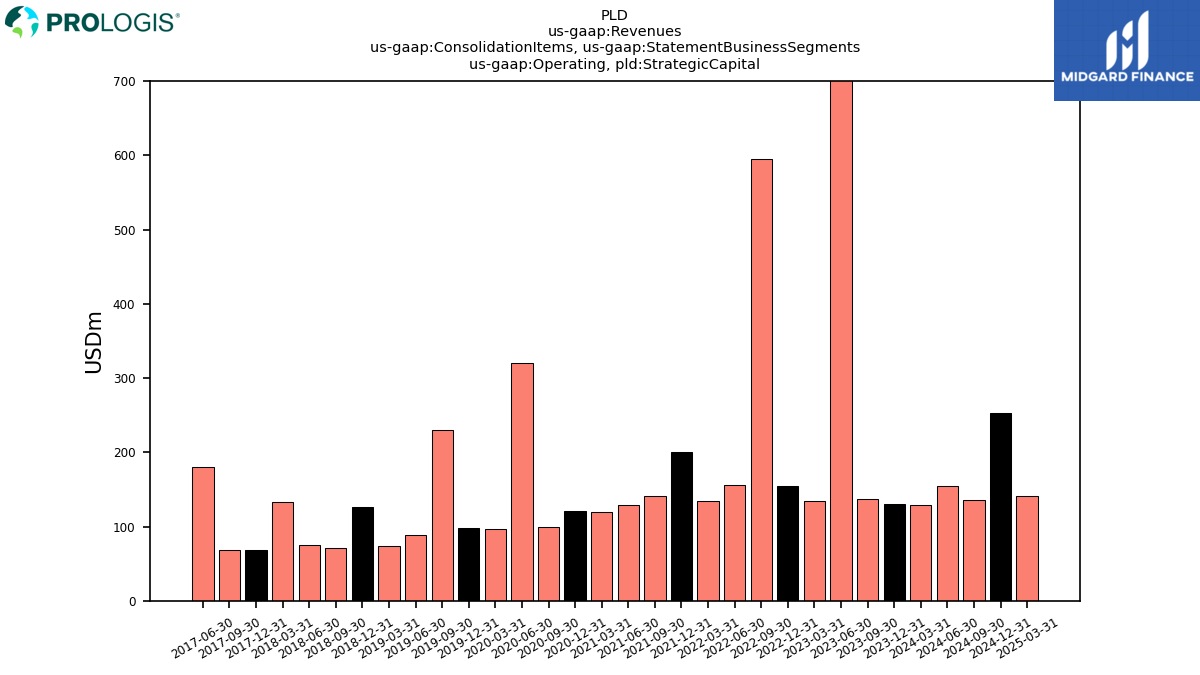
| Operating, Strategic Capital | 129.65 | 136.85 | 799.03 | 134.70 | 154.67 | 594.75 | 156.24 | 133.93 | 199.95 | 141.45 | 129.39 | 119.96 | 120.75 | 98.99 | 320.66 | 96.59 | 98.47 | 230.47 | 89.14 | 73.81 | 126.50 | 71.14 | 75.70 | 132.96 | 68.15 | 68.04 | 180.65 | NA | |
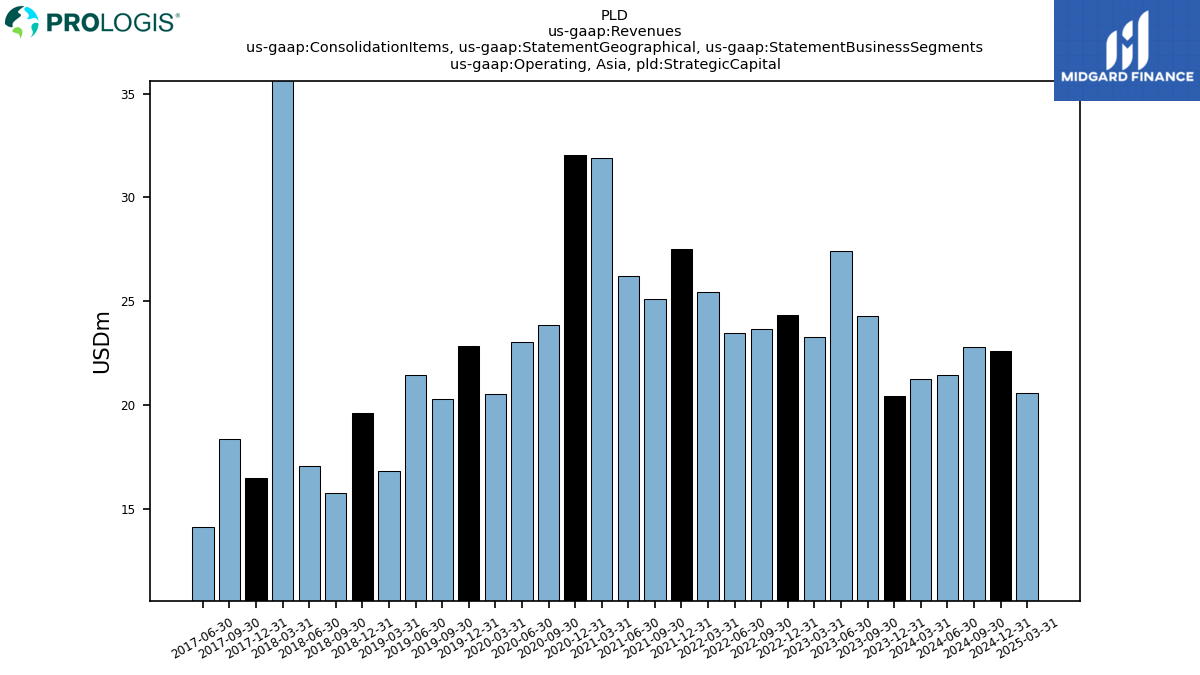
| Operating,, Strategic Capital | 20.44 | 24.26 | 27.42 | 23.28 | 24.32 | 23.67 | 23.45 | 25.44 | 27.52 | 25.12 | 26.21 | 31.89 | 32.03 | 23.86 | 23.01 | 20.55 | 22.83 | 20.29 | 21.45 | 16.80 | 19.63 | 15.75 | 17.05 | 71.92 | 16.50 | 18.35 | 14.14 | NA | |
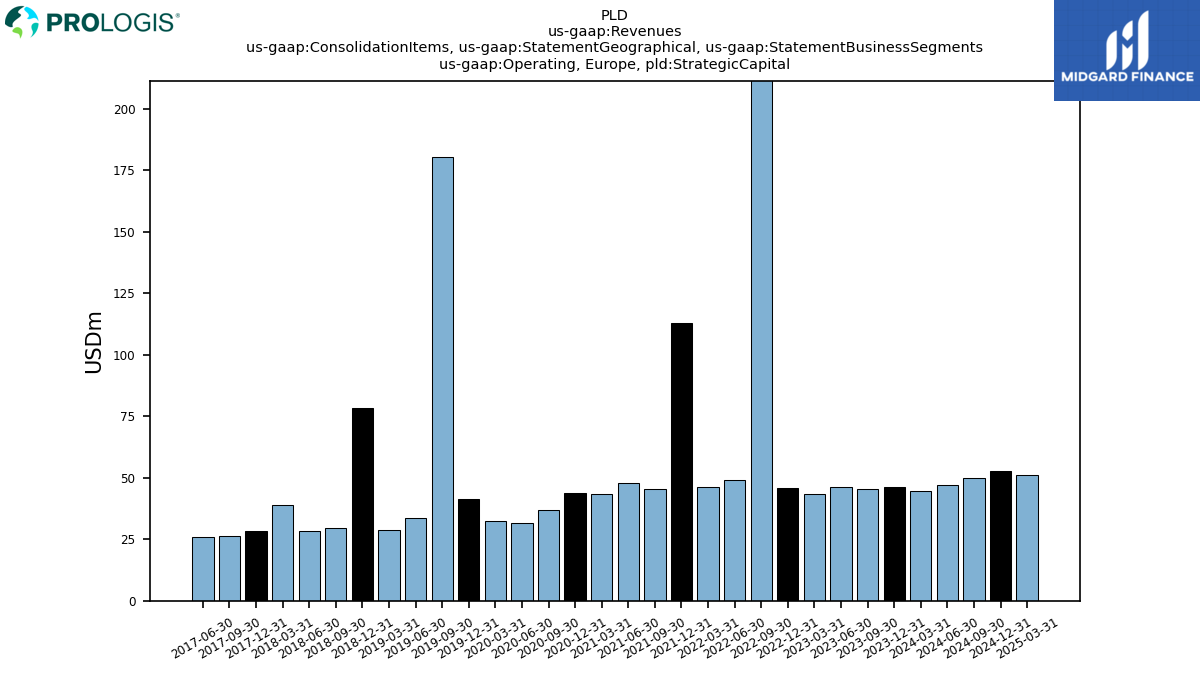
| Operating,, Strategic Capital | 46.38 | 45.46 | 46.28 | 43.53 | 45.76 | 503.76 | 49.12 | 46.20 | 113.01 | 45.33 | 47.84 | 43.43 | 43.94 | 36.96 | 31.53 | 32.59 | 41.17 | 180.37 | 33.54 | 28.84 | 78.22 | 29.37 | 28.49 | 38.82 | 28.34 | 26.29 | 25.97 | NA | |
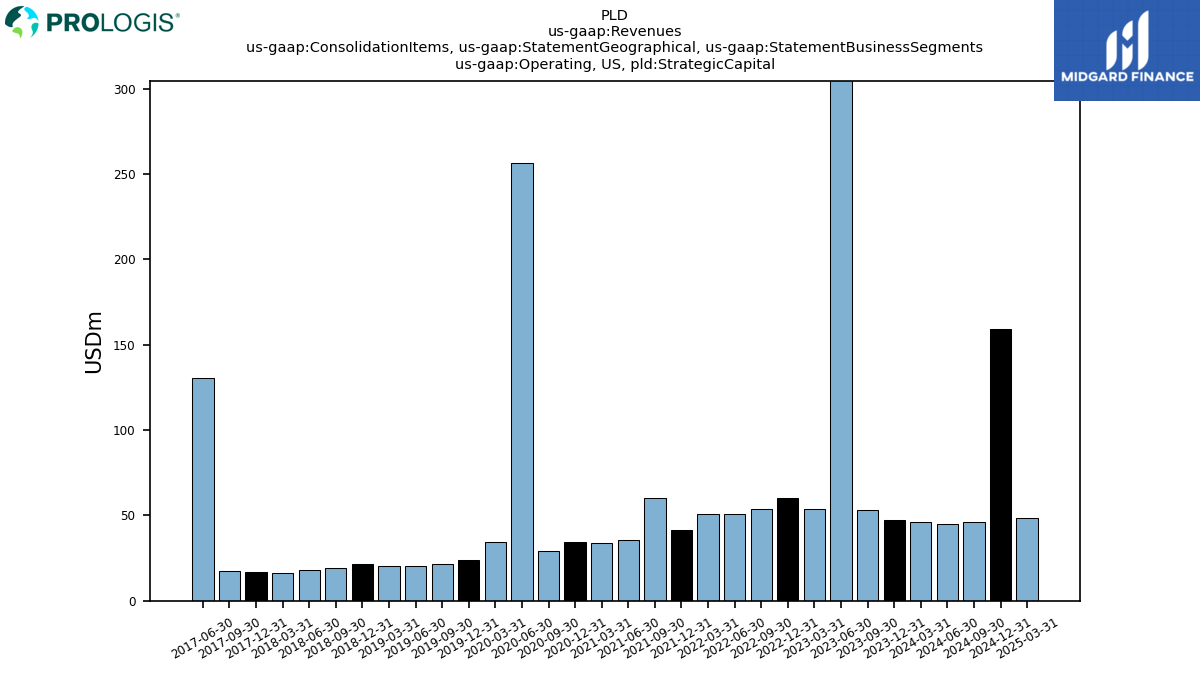
| Operating,US, Strategic Capital | 47.18 | 53.08 | 679.45 | 53.70 | 59.94 | 53.97 | 50.87 | 50.63 | 41.59 | 60.32 | 35.87 | 33.98 | 34.64 | 29.32 | 256.52 | 34.34 | 23.93 | 21.54 | 20.54 | 20.27 | 21.60 | 19.04 | 17.91 | 16.07 | 16.80 | 17.34 | 130.68 | NA | |
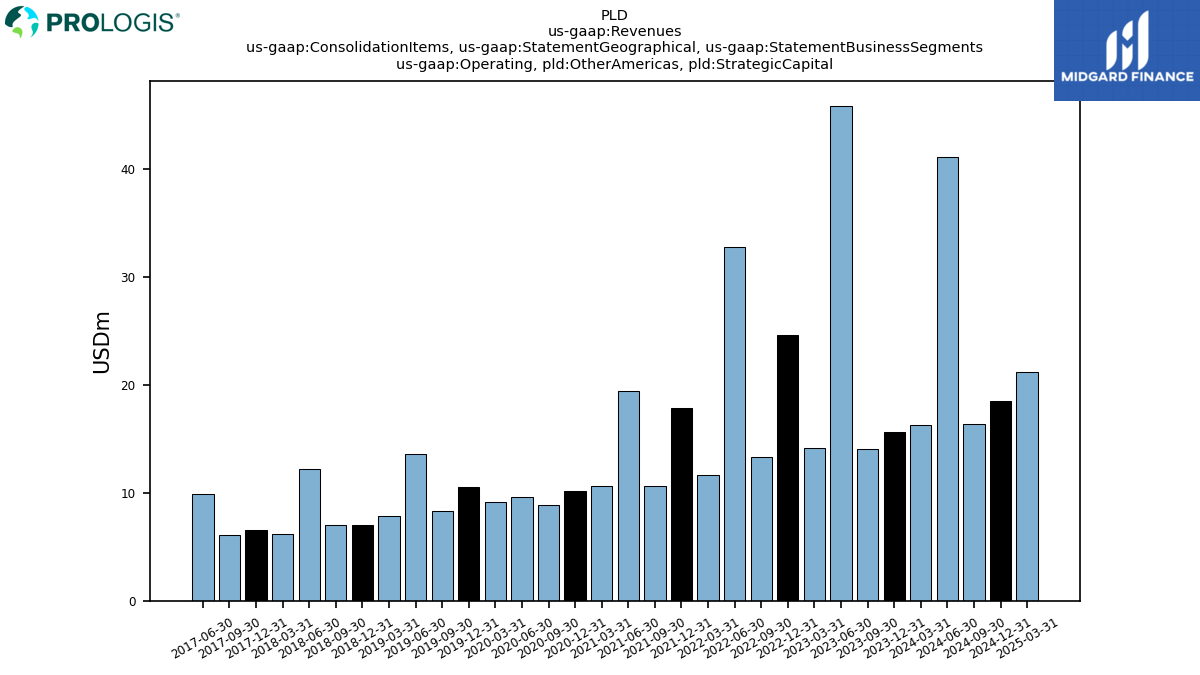
| Operating, Other Americas, Strategic Capital | 15.64 | 14.05 | 45.89 | 14.20 | 24.65 | 13.34 | 32.81 | 11.65 | 17.84 | 10.68 | 19.48 | 10.66 | 10.14 | 8.85 | 9.60 | 9.11 | 10.55 | 8.28 | 13.62 | 7.90 | 7.05 | 6.98 | 12.26 | 6.15 | 6.52 | 6.06 | 9.86 | NA | |
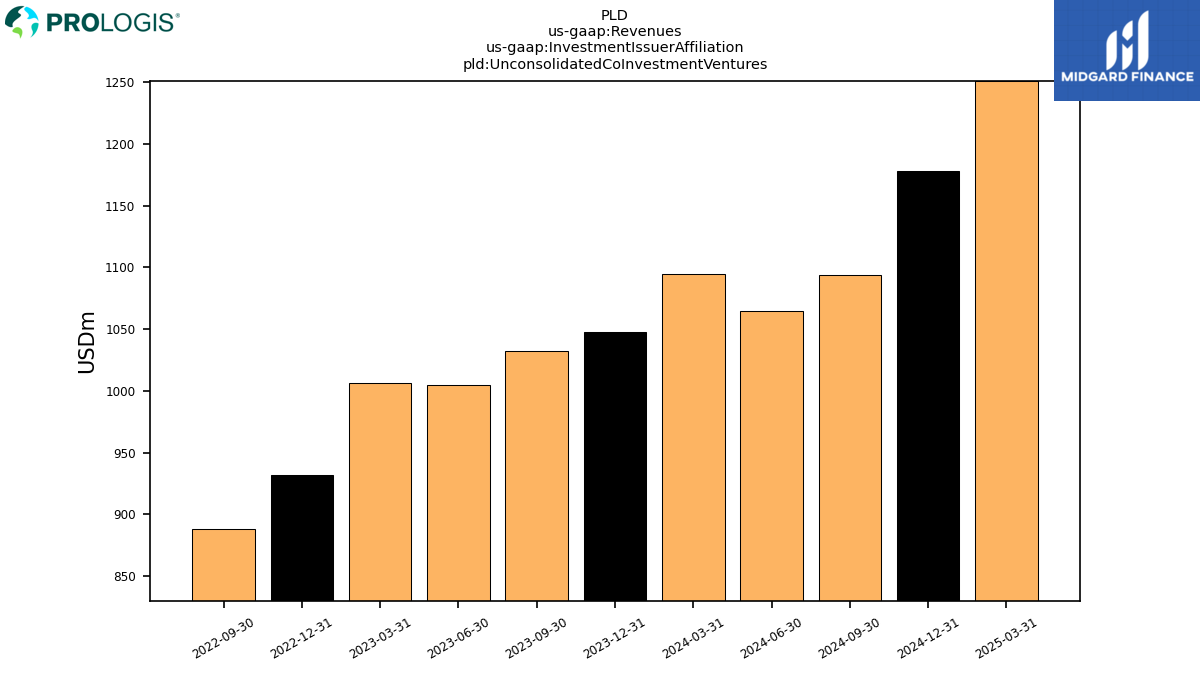
| Unconsolidated Co Investment Ventures | 1048.00 | 1032.00 | NA | NA | 932.00 | 888.00 | NA | NA | NA | NA | NA | NA | NA | NA | NA | NA | NA | NA | NA | NA | NA | NA | NA | NA | NA | NA | NA | NA | |
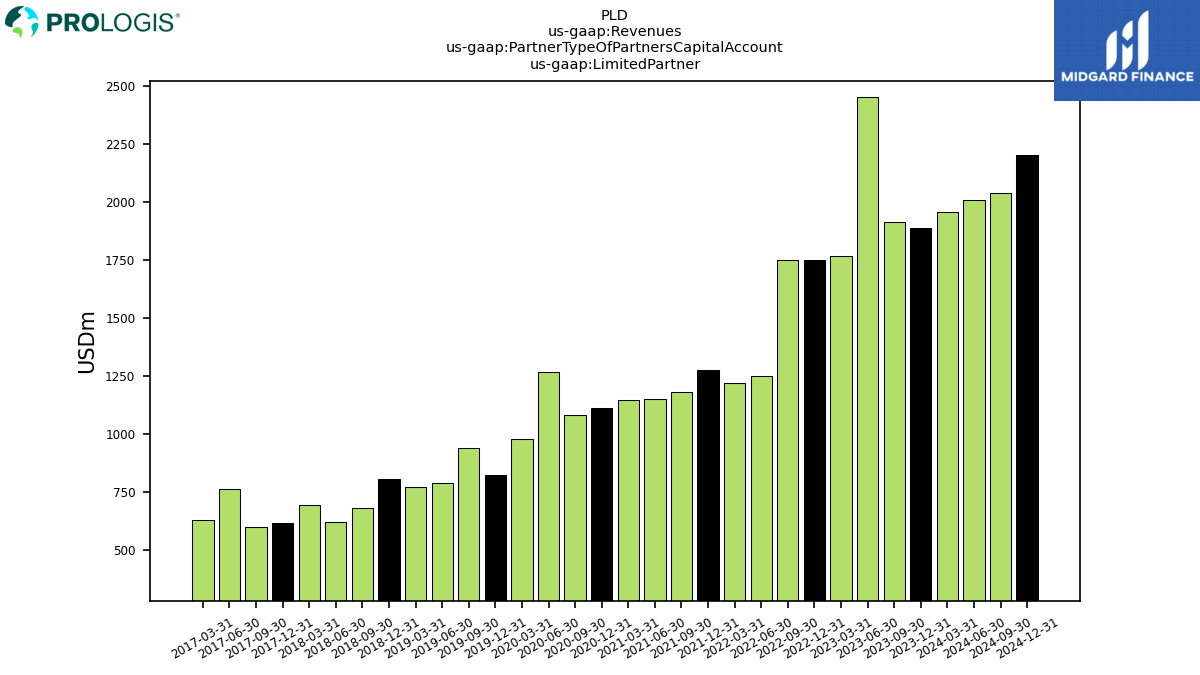
| Limited Partner | 1889.25 | 1914.66 | 2450.97 | 1768.59 | 1751.59 | 1750.89 | 1252.08 | 1219.13 | 1277.23 | 1183.05 | 1150.84 | 1148.32 | 1111.60 | 1082.77 | 1266.12 | 978.24 | 826.02 | 942.18 | 790.37 | 772.05 | 807.09 | 682.43 | 621.28 | 693.66 | 619.92 | 602.87 | 766.18 | 629.15 | |
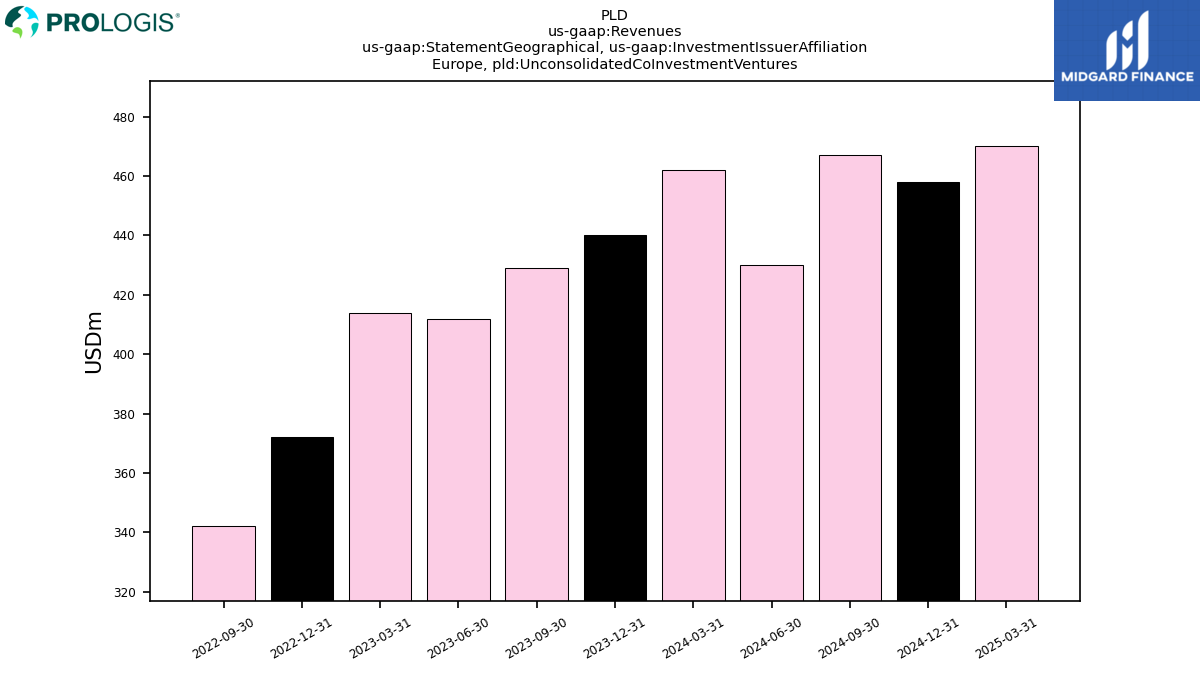
| , Unconsolidated Co Investment Ventures | 440.00 | 429.00 | NA | NA | 372.00 | 342.00 | NA | NA | NA | NA | NA | NA | NA | NA | NA | NA | NA | NA | NA | NA | NA | NA | NA | NA | NA | NA | NA | NA | |
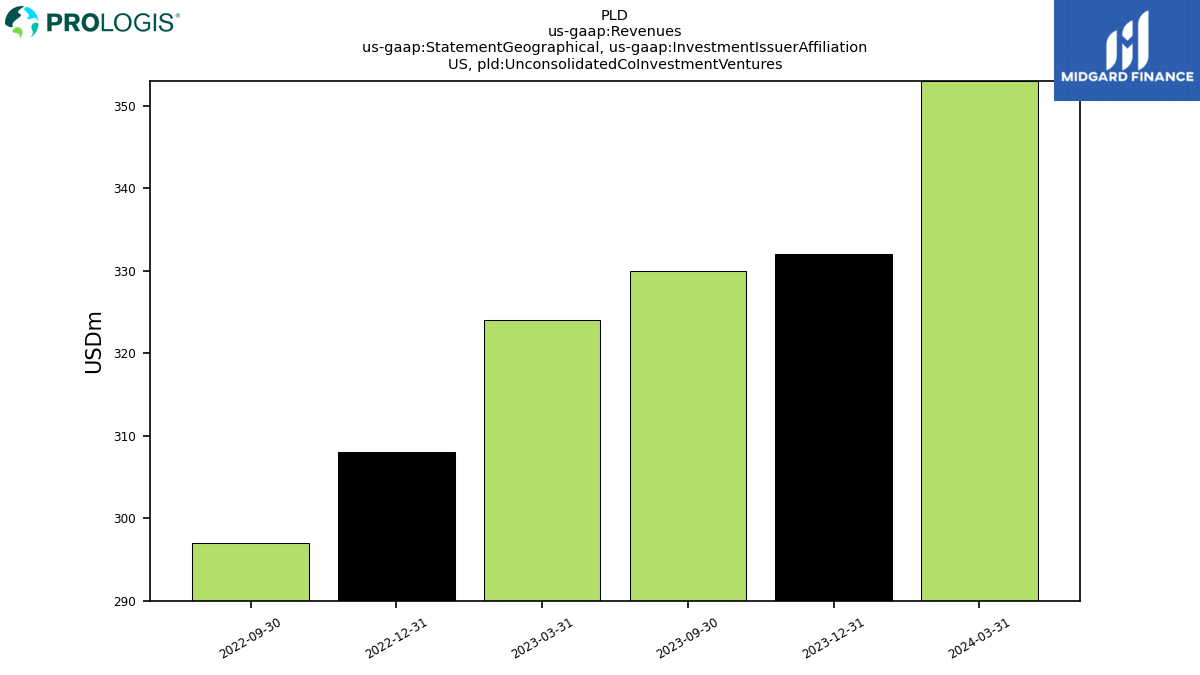
| US, Unconsolidated Co Investment Ventures | 332.00 | 330.00 | NA | NA | 308.00 | 297.00 | NA | NA | NA | NA | NA | NA | NA | NA | NA | NA | NA | NA | NA | NA | NA | NA | NA | NA | NA | NA | NA | NA | |
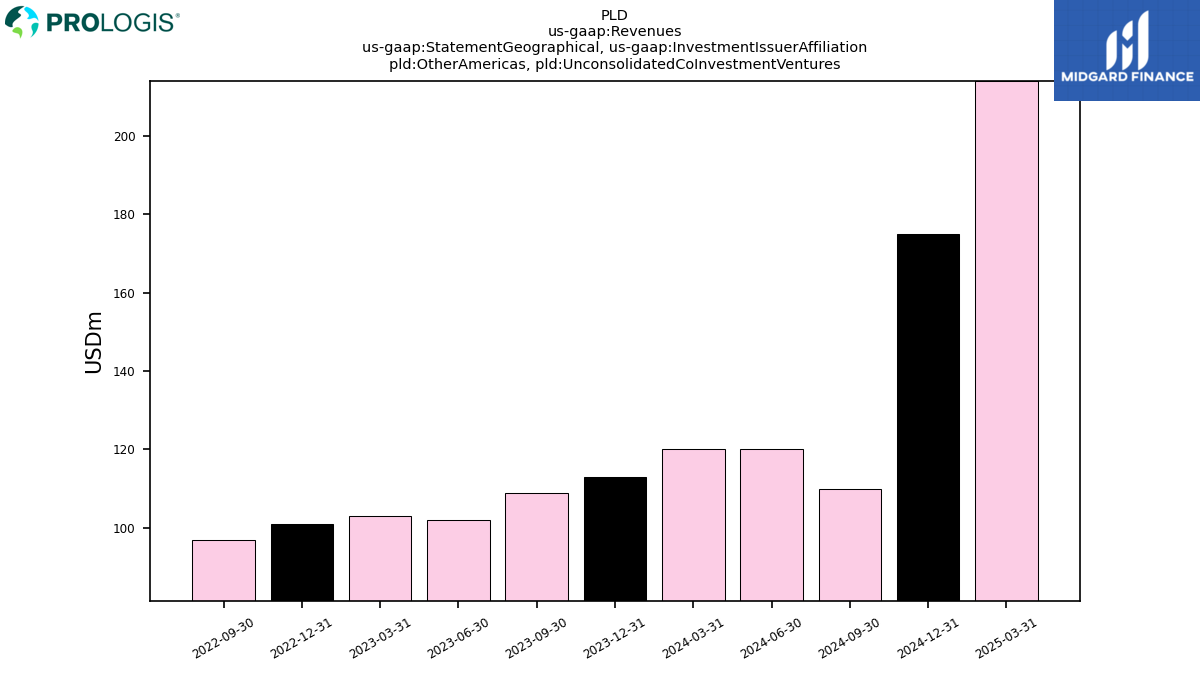
| Other Americas, Unconsolidated Co Investment Ventures | 113.00 | 109.00 | NA | NA | 101.00 | 97.00 | NA | NA | NA | NA | NA | NA | NA | NA | NA | NA | NA | NA | NA | NA | NA | NA | NA | NA | NA | NA | NA | NA |