
| 2023-12-31 | 2023-09-30 | 2023-06-30 | 2023-03-31 | 2022-12-31 | 2022-09-30 | 2022-06-30 | 2022-03-31 | 2021-12-31 | 2021-09-30 | 2021-06-30 | 2021-03-31 | 2020-12-31 | 2020-09-30 | 2020-06-30 | 2020-03-31 | 2019-12-31 | 2019-09-30 | 2019-06-30 | 2019-03-31 | 2018-12-31 | 2018-09-30 | 2018-06-30 | 2018-03-31 | 2017-12-31 | 2017-09-30 | 2017-06-30 | 2017-03-31 | 2016-12-31 | 2016-09-30 | 2016-06-30 | 2016-03-31 | 2015-12-31 | 2015-09-30 | 2015-06-30 | 2015-03-31 | 2014-12-31 | 2014-09-30 | 2014-06-30 | 2014-03-31 | 2013-12-31 | 2013-09-30 | 2013-06-30 | 2013-03-31 | 2012-12-31 | 2012-09-30 | 2012-06-30 | 2012-03-31 | 2011-12-31 | 2011-09-30 | 2011-06-30 | 2011-03-31 | 2010-12-31 | 2010-09-30 | 2010-06-30 | 2010-03-31 | ||
|---|---|---|---|---|---|---|---|---|---|---|---|---|---|---|---|---|---|---|---|---|---|---|---|---|---|---|---|---|---|---|---|---|---|---|---|---|---|---|---|---|---|---|---|---|---|---|---|---|---|---|---|---|---|---|---|---|---|
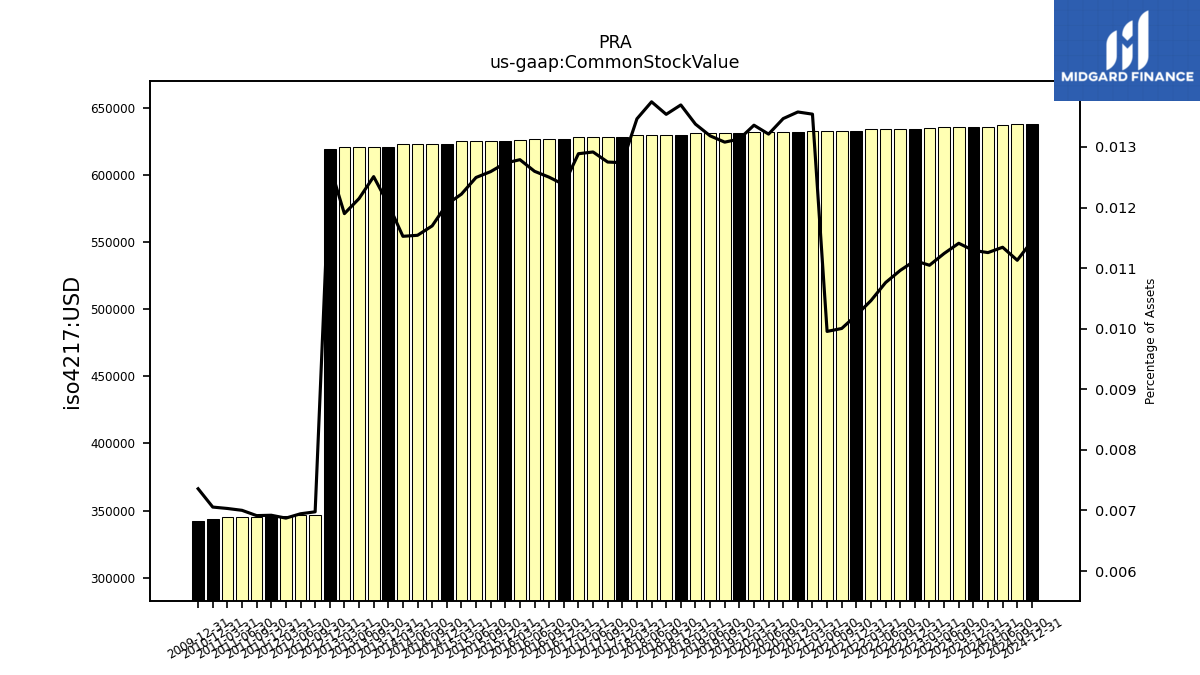
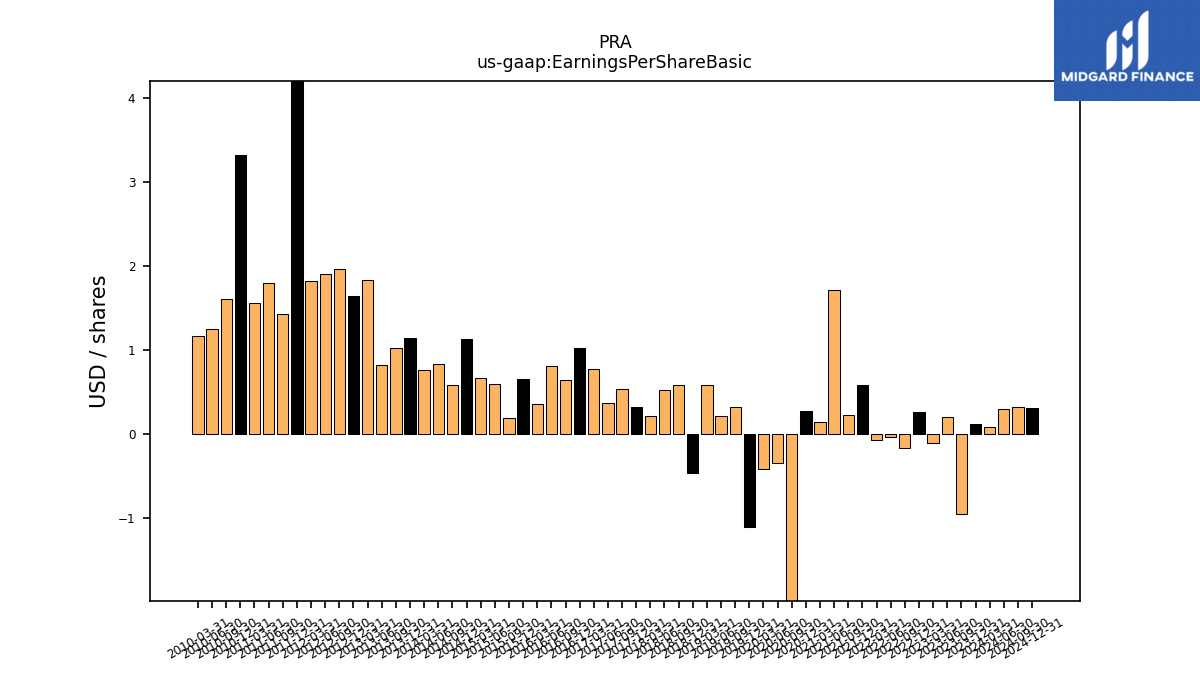
| Common Stock Value | 0.64 | 0.64 | 0.64 | 0.64 | 0.63 | 0.63 | 0.63 | 0.63 | 0.63 | 0.63 | 0.63 | 0.63 | 0.63 | 0.63 | 0.63 | 0.63 | 0.63 | 0.63 | 0.63 | 0.63 | 0.63 | 0.63 | 0.63 | 0.63 | 0.63 | 0.63 | 0.63 | 0.63 | 0.63 | 0.63 | 0.63 | 0.63 | 0.62 | 0.62 | 0.62 | 0.62 | 0.62 | 0.62 | 0.62 | 0.62 | 0.62 | 0.62 | 0.62 | 0.62 | 0.62 | 0.35 | 0.35 | 0.35 | 0.35 | 0.34 | 0.34 | 0.34 | 0.34 | NA | NA | NA | |
| Earnings Per Share Basic | 0.12 | -0.95 | 0.20 | -0.11 | 0.26 | -0.17 | -0.03 | -0.07 | 0.59 | 0.23 | 1.71 | 0.14 | 0.27 | -2.78 | -0.34 | -0.41 | -1.10 | 0.32 | 0.21 | 0.59 | -0.46 | 0.58 | 0.53 | 0.22 | 0.32 | 0.54 | 0.37 | 0.78 | 1.03 | 0.64 | 0.81 | 0.36 | 0.66 | 0.19 | 0.60 | 0.67 | 1.13 | 0.59 | 0.84 | 0.76 | 1.15 | 1.02 | 0.82 | 1.83 | 1.65 | 1.96 | 1.91 | 1.82 | 4.60 | 1.43 | 1.80 | 1.56 | 3.32 | 1.61 | 1.25 | 1.17 | |
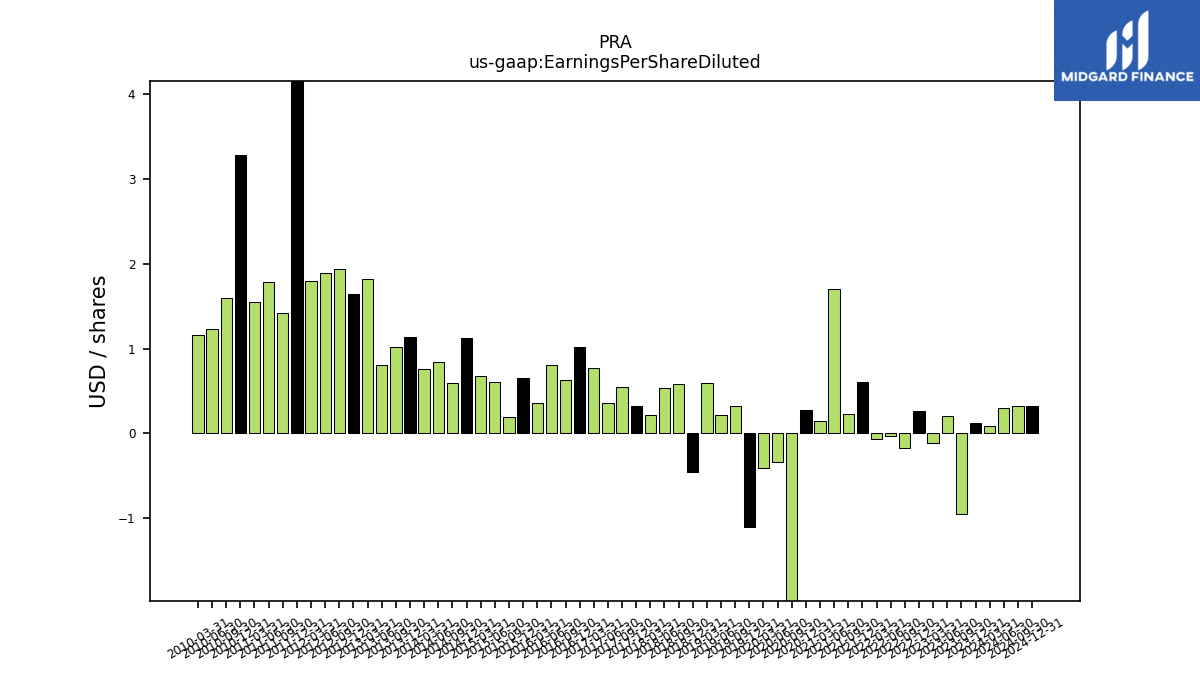
| Earnings Per Share Diluted | 0.12 | -0.95 | 0.20 | -0.11 | 0.26 | -0.17 | -0.03 | -0.07 | 0.60 | 0.23 | 1.70 | 0.14 | 0.27 | -2.78 | -0.34 | -0.41 | -1.10 | 0.32 | 0.21 | 0.59 | -0.46 | 0.58 | 0.53 | 0.22 | 0.32 | 0.54 | 0.36 | 0.77 | 1.02 | 0.63 | 0.81 | 0.36 | 0.65 | 0.19 | 0.60 | 0.67 | 1.12 | 0.59 | 0.84 | 0.76 | 1.14 | 1.02 | 0.81 | 1.82 | 1.64 | 1.94 | 1.89 | 1.80 | 4.56 | 1.42 | 1.79 | 1.55 | 3.28 | 1.59 | 1.23 | 1.16 |
| 2023-12-31 | 2023-09-30 | 2023-06-30 | 2023-03-31 | 2022-12-31 | 2022-09-30 | 2022-06-30 | 2022-03-31 | 2021-12-31 | 2021-09-30 | 2021-06-30 | 2021-03-31 | 2020-12-31 | 2020-09-30 | 2020-06-30 | 2020-03-31 | 2019-12-31 | 2019-09-30 | 2019-06-30 | 2019-03-31 | 2018-12-31 | 2018-09-30 | 2018-06-30 | 2018-03-31 | 2017-12-31 | 2017-09-30 | 2017-06-30 | 2017-03-31 | 2016-12-31 | 2016-09-30 | 2016-06-30 | 2016-03-31 | 2015-12-31 | 2015-09-30 | 2015-06-30 | 2015-03-31 | 2014-12-31 | 2014-09-30 | 2014-06-30 | 2014-03-31 | 2013-12-31 | 2013-09-30 | 2013-06-30 | 2013-03-31 | 2012-12-31 | 2012-09-30 | 2012-06-30 | 2012-03-31 | 2011-12-31 | 2011-09-30 | 2011-06-30 | 2011-03-31 | 2010-12-31 | 2010-09-30 | 2010-06-30 | 2010-03-31 | ||
|---|---|---|---|---|---|---|---|---|---|---|---|---|---|---|---|---|---|---|---|---|---|---|---|---|---|---|---|---|---|---|---|---|---|---|---|---|---|---|---|---|---|---|---|---|---|---|---|---|---|---|---|---|---|---|---|---|---|
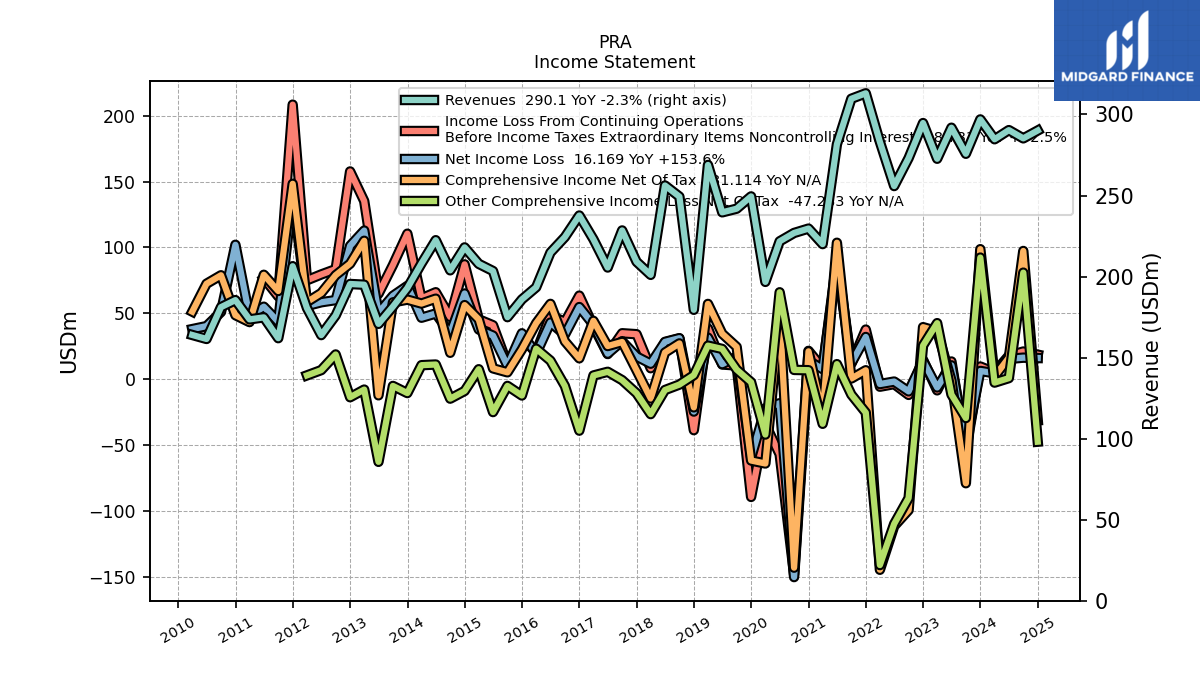
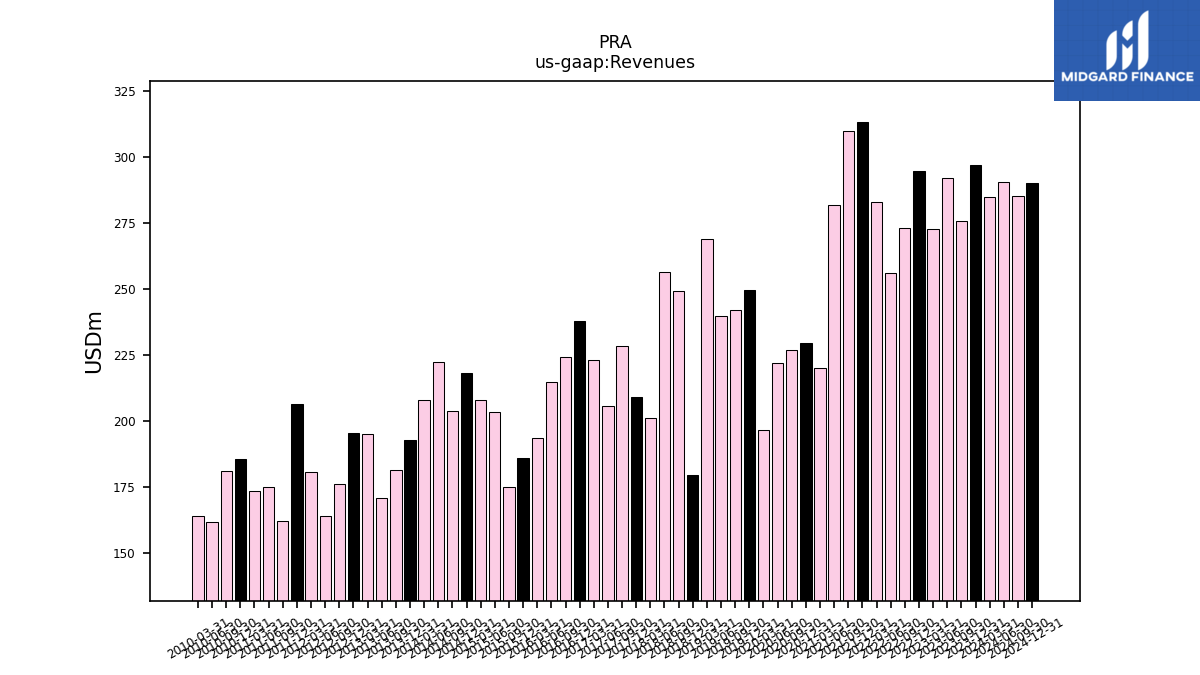
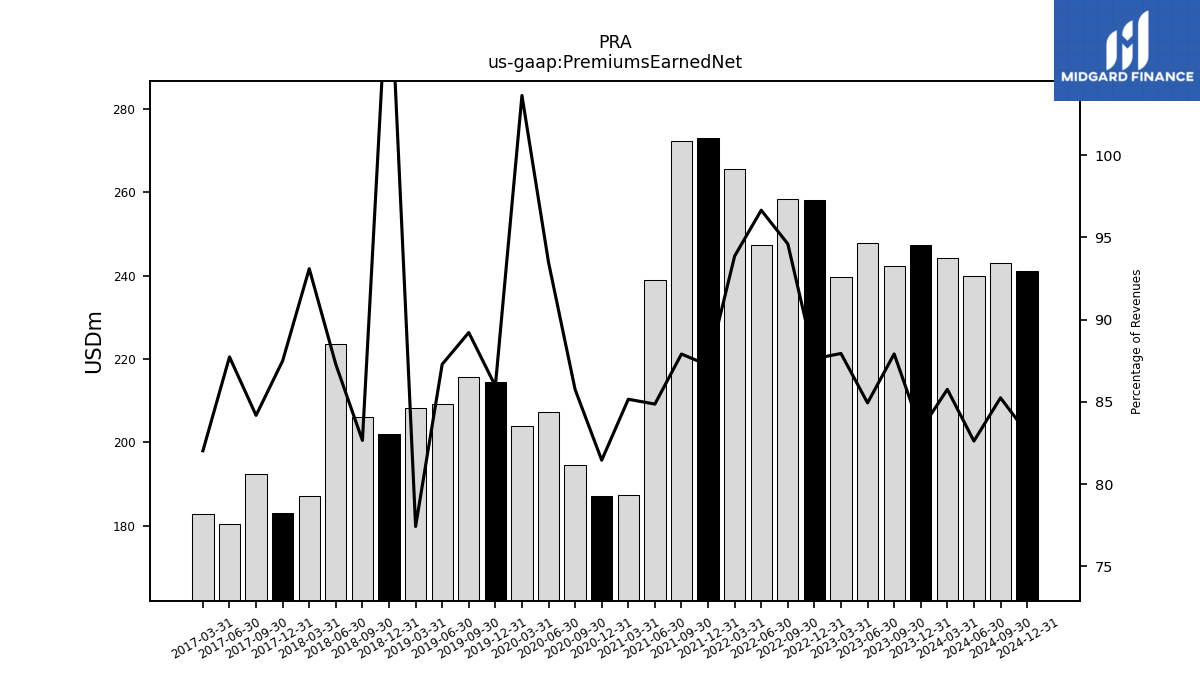
| Revenues | 296.96 | 275.75 | 291.83 | 272.68 | 294.71 | 273.08 | 255.82 | 283.07 | 313.07 | 309.70 | 281.63 | 220.02 | 229.60 | 226.90 | 221.74 | 196.70 | 249.47 | 241.87 | 239.62 | 268.88 | 179.48 | 249.32 | 256.19 | 201.03 | 209.12 | 228.46 | 205.58 | 223.00 | 237.67 | 224.35 | 214.80 | 193.39 | 185.90 | 174.93 | 203.42 | 207.83 | 218.00 | 203.83 | 222.45 | 208.05 | 192.91 | 181.49 | 170.81 | 194.97 | 195.42 | 175.99 | 163.87 | 180.57 | 206.39 | 161.98 | 174.83 | 173.59 | 185.47 | 181.13 | 161.50 | 163.96 | |
| Premiums Earned Net | 247.33 | 242.42 | 247.86 | 239.79 | 258.24 | 258.36 | 247.27 | 265.71 | 273.07 | 272.25 | 238.99 | 187.36 | 187.01 | 194.56 | 207.29 | 203.85 | 214.45 | 215.79 | 209.15 | 208.15 | 202.03 | 206.07 | 223.59 | 187.16 | 182.97 | 192.30 | 180.35 | 182.90 | NA | NA | NA | NA | NA | NA | NA | NA | NA | NA | NA | NA | NA | NA | NA | NA | NA | NA | NA | NA | NA | NA | NA | NA | NA | NA | NA | NA | |
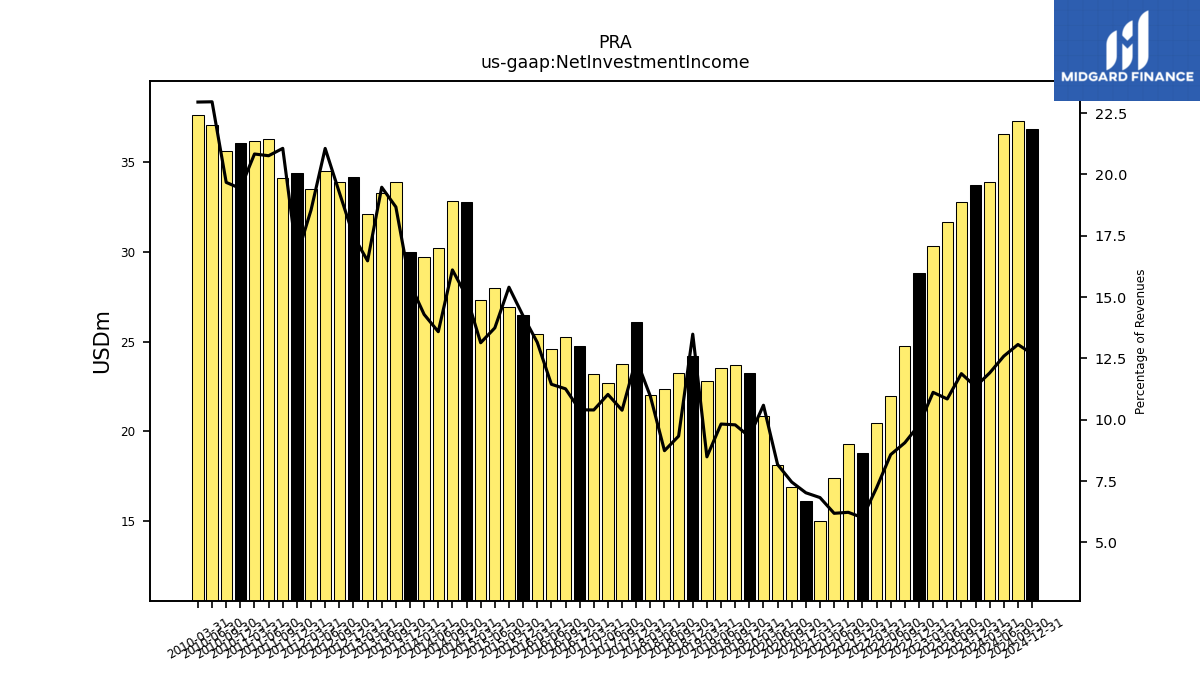
| Net Investment Income | 33.70 | 32.75 | 31.65 | 30.31 | 28.84 | 24.75 | 21.94 | 20.44 | 18.81 | 19.28 | 17.42 | 15.02 | 16.12 | 16.92 | 18.12 | 20.83 | 23.23 | 23.68 | 23.54 | 22.82 | 24.21 | 23.27 | 22.38 | 22.03 | 26.07 | 23.73 | 22.68 | 23.19 | 24.73 | 25.26 | 24.58 | 25.44 | 26.46 | 26.94 | 27.95 | 27.30 | 32.77 | 32.83 | 30.23 | 29.73 | 29.98 | 33.89 | 33.27 | 32.13 | 34.18 | 33.91 | 34.51 | 33.49 | 34.38 | 34.12 | 36.30 | 36.16 | 36.03 | 35.64 | 37.08 | 37.63 | |
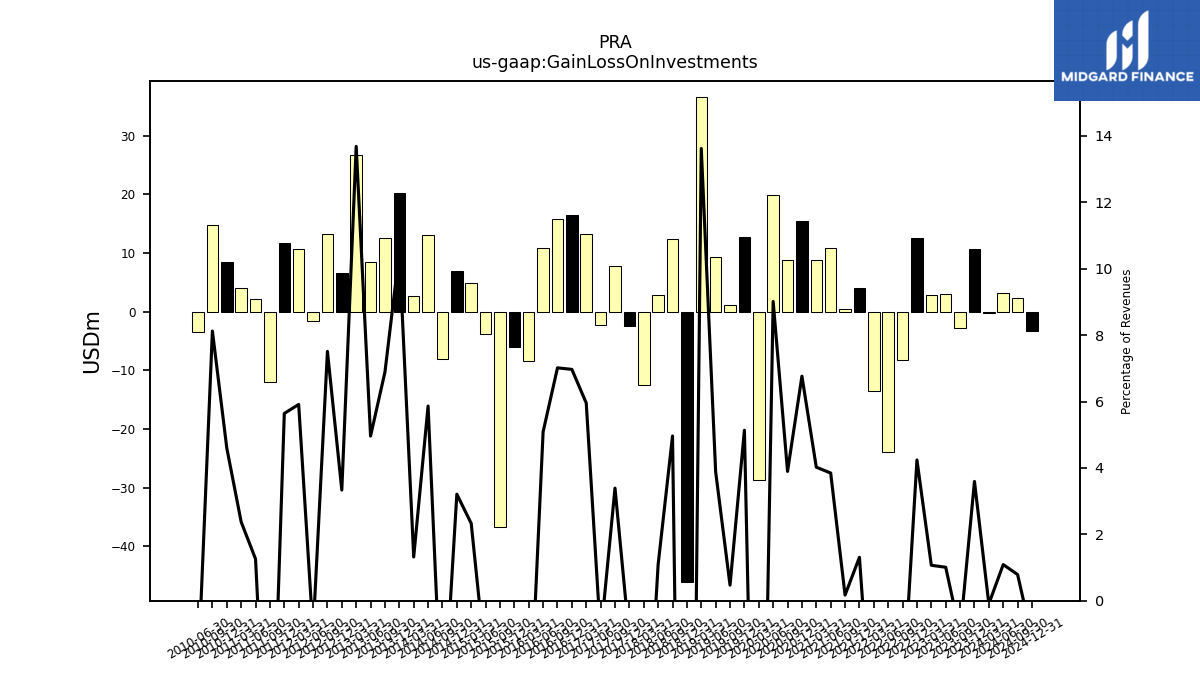
| Gain Loss On Investments | 10.67 | -2.70 | 2.95 | 2.91 | 12.49 | -8.26 | -23.88 | -13.51 | 4.10 | 0.53 | 10.83 | 8.85 | 15.53 | 8.84 | 19.98 | -28.67 | 12.81 | 1.13 | 9.31 | 36.62 | -46.14 | 12.37 | 2.79 | -12.52 | -2.40 | 7.75 | -2.22 | 13.28 | 16.56 | 15.74 | 10.93 | -8.35 | -6.02 | -36.63 | -3.83 | 4.84 | 7.00 | -8.13 | 13.05 | 2.74 | 20.25 | 12.50 | 8.47 | 26.68 | 6.51 | 13.22 | -1.55 | 10.68 | 11.64 | -11.97 | 2.20 | 4.12 | 8.54 | 14.71 | -3.50 | NA | |
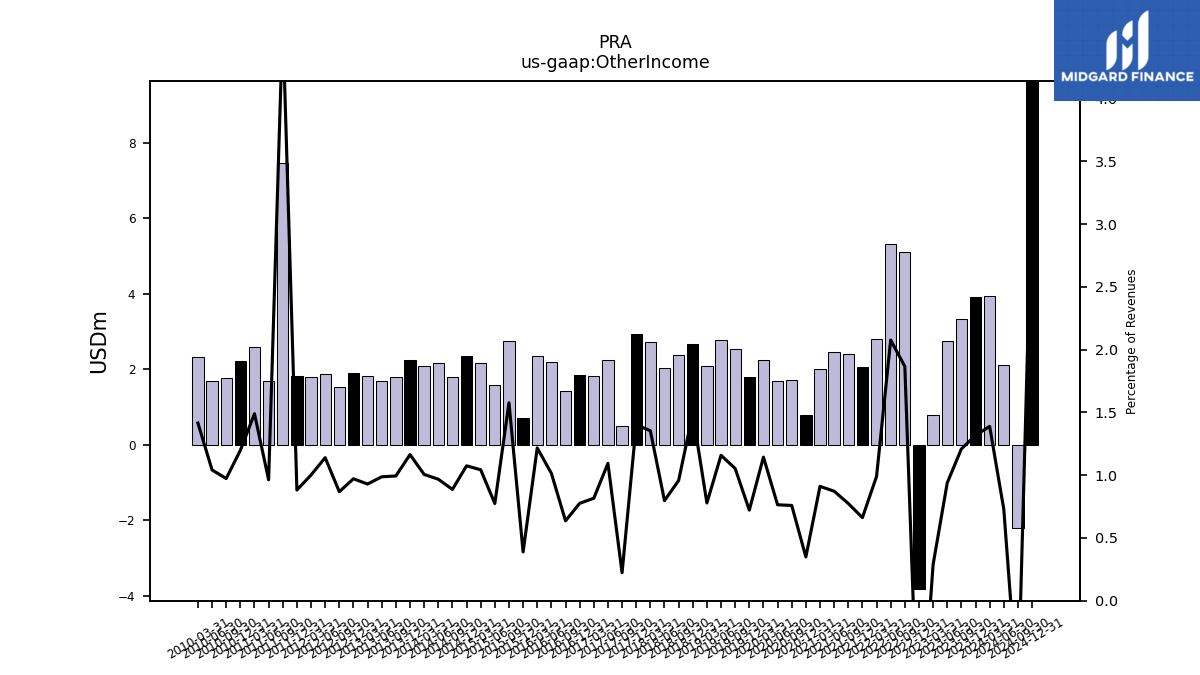
| Other Income | 3.91 | 3.34 | 2.74 | 0.79 | -3.81 | 5.10 | 5.31 | 2.80 | 2.07 | 2.40 | 2.46 | 2.00 | 0.80 | 1.72 | 1.70 | 2.25 | 1.80 | 2.55 | 2.78 | 2.10 | 2.68 | 2.39 | 2.04 | 2.72 | 2.93 | 0.51 | 2.25 | 1.82 | 1.84 | 1.43 | 2.18 | 2.35 | 0.72 | 2.76 | 1.58 | 2.17 | 2.34 | 1.81 | 2.15 | 2.09 | 2.25 | 1.80 | 1.69 | 1.81 | 1.90 | 1.53 | 1.87 | 1.81 | 1.82 | 7.47 | 1.69 | 2.59 | 2.22 | 1.76 | 1.68 | 2.32 | |
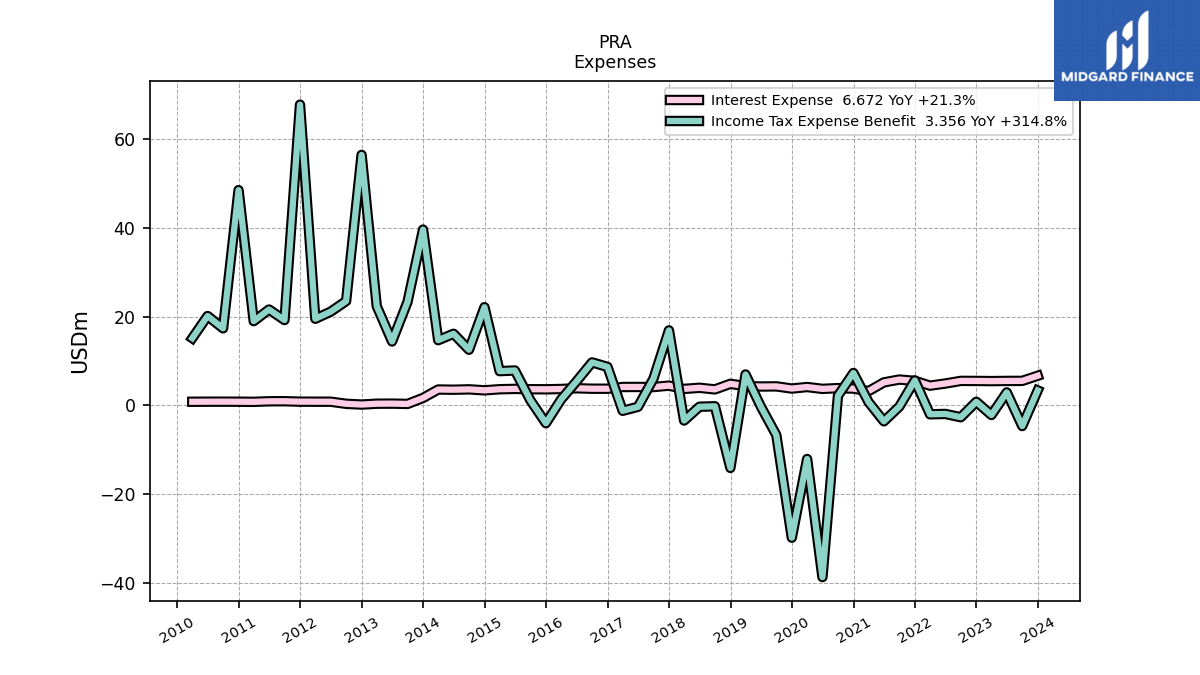
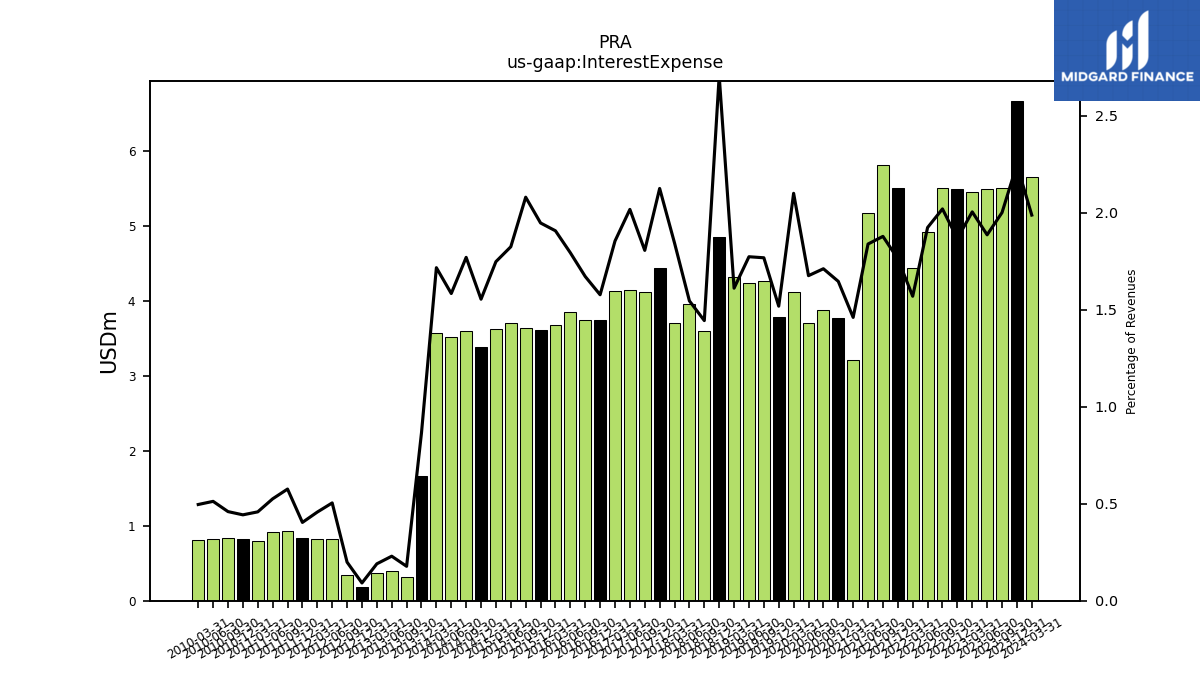
| Interest Expense | 6.67 | 5.51 | 5.50 | 5.46 | 5.50 | 5.51 | 4.92 | 4.44 | 5.52 | 5.81 | 5.18 | 3.21 | 3.78 | 3.88 | 3.71 | 4.13 | 3.79 | 4.27 | 4.25 | 4.33 | 4.86 | 3.60 | 3.96 | 3.71 | 4.44 | 4.12 | 4.14 | 4.13 | 3.75 | 3.75 | 3.85 | 3.69 | 3.62 | 3.64 | 3.71 | 3.63 | 3.39 | 3.61 | 3.52 | 3.57 | 1.67 | 0.32 | 0.39 | 0.37 | 0.18 | 0.35 | 0.83 | 0.82 | 0.83 | 0.93 | 0.92 | 0.80 | 0.82 | 0.83 | 0.83 | 0.81 | |
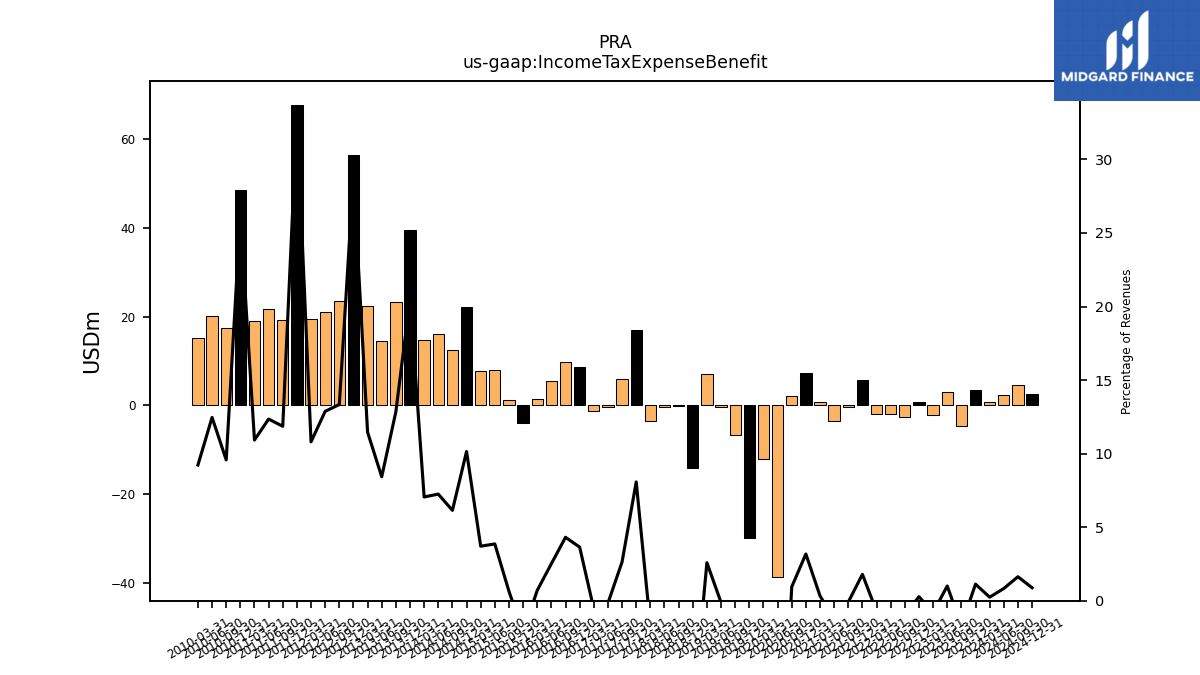
| Income Tax Expense Benefit | 3.36 | -4.66 | 2.93 | -2.17 | 0.81 | -2.67 | -1.93 | -2.02 | 5.62 | -0.27 | -3.60 | 0.74 | 7.29 | 2.14 | -38.69 | -12.08 | -29.80 | -6.69 | -0.28 | 6.96 | -14.09 | -0.21 | -0.31 | -3.42 | 16.89 | 6.02 | -0.33 | -1.22 | 8.66 | 9.68 | 5.41 | 1.36 | -4.03 | 1.12 | 7.85 | 7.71 | 22.11 | 12.53 | 16.12 | 14.68 | 39.59 | 23.32 | 14.39 | 22.33 | 56.42 | 23.47 | 21.10 | 19.50 | 67.73 | 19.21 | 21.59 | 18.96 | 48.48 | 17.34 | 20.13 | 15.13 | |
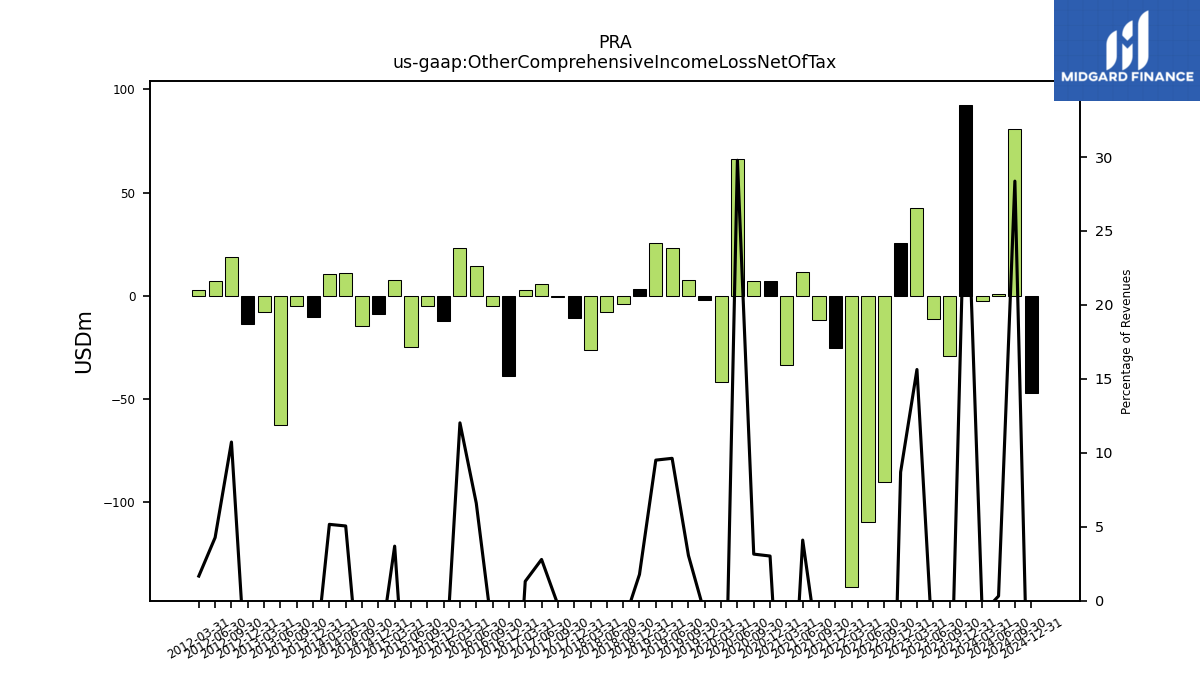
| Other Comprehensive Income Loss Net Of Tax | 92.35 | -29.36 | -11.50 | 42.63 | 25.63 | -90.05 | -109.62 | -140.85 | -25.22 | -11.56 | 11.55 | -33.70 | 6.94 | 7.16 | 66.04 | -41.87 | -2.18 | 7.41 | 23.07 | 25.57 | 3.20 | -3.96 | -8.10 | -26.37 | -10.55 | -0.60 | 5.74 | 2.92 | -38.92 | -4.97 | 14.17 | 23.26 | -12.24 | -4.95 | -24.83 | 7.67 | -8.80 | -14.65 | 11.25 | 10.74 | -10.41 | -4.99 | -62.56 | -7.75 | -13.56 | 18.89 | 7.00 | 3.01 | NA | NA | NA | NA | NA | NA | NA | NA | |
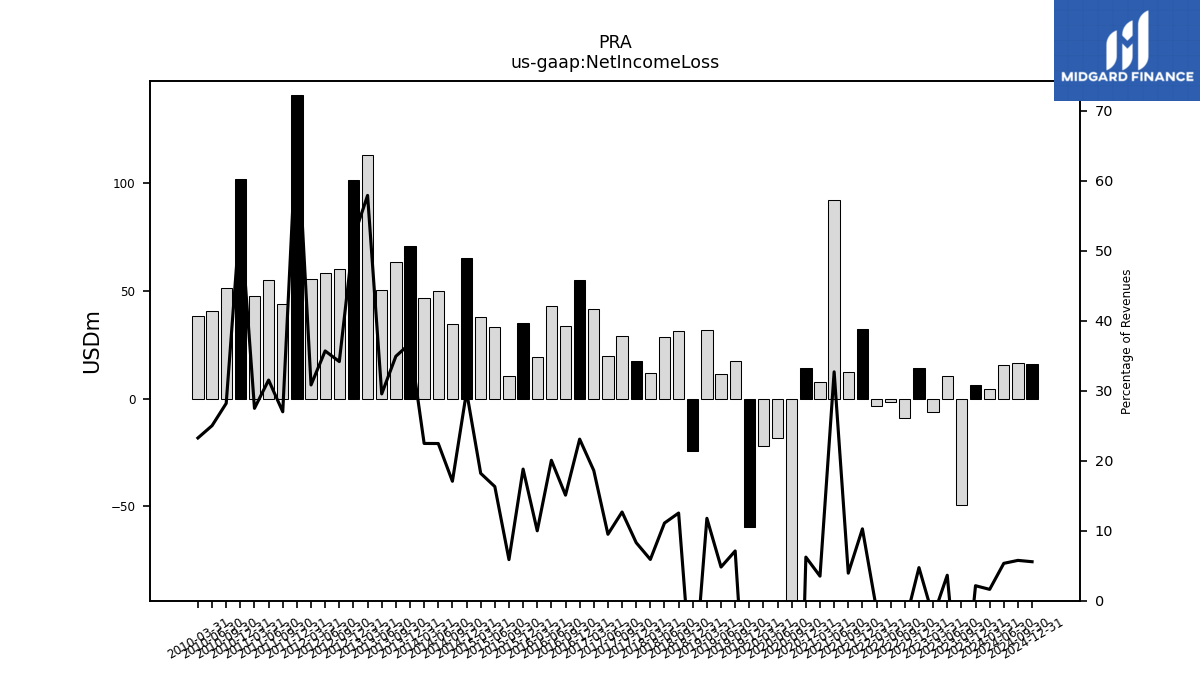
| Net Income Loss | 6.38 | -49.43 | 10.63 | -6.17 | 13.94 | -9.12 | -1.66 | -3.56 | 32.14 | 12.20 | 92.05 | 7.74 | 14.30 | -149.98 | -18.10 | -21.95 | -59.38 | 17.19 | 11.54 | 31.65 | -24.45 | 31.23 | 28.42 | 11.86 | 17.34 | 28.95 | 19.52 | 41.45 | 54.85 | 33.83 | 43.08 | 19.32 | 34.95 | 10.28 | 33.16 | 37.81 | 65.11 | 34.78 | 49.94 | 46.73 | 70.86 | 63.36 | 50.45 | 112.85 | 101.27 | 60.11 | 58.45 | 55.65 | 140.60 | 43.70 | 55.10 | 47.69 | 102.05 | 51.05 | 40.38 | 38.11 | |
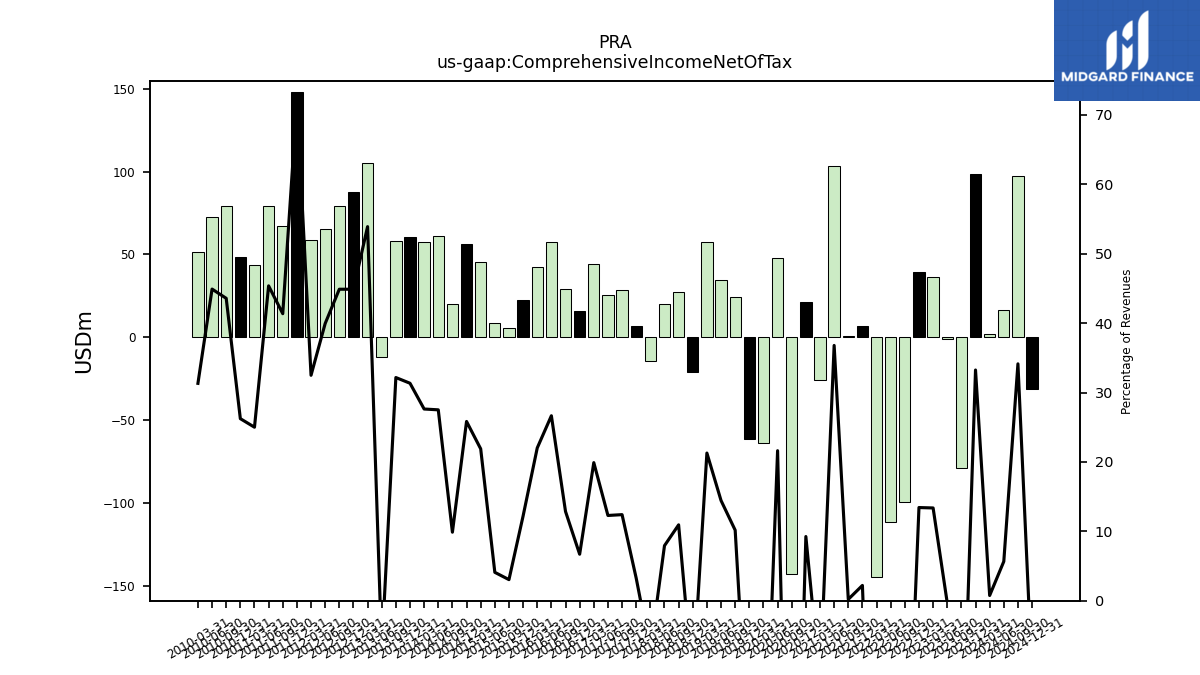
| Comprehensive Income Net Of Tax | 98.73 | -78.79 | -0.88 | 36.45 | 39.58 | -99.18 | -111.28 | -144.41 | 6.92 | 0.64 | 103.60 | -25.97 | 21.25 | -142.82 | 47.94 | -63.82 | -61.55 | 24.60 | 34.61 | 57.22 | -21.25 | 27.26 | 20.33 | -14.52 | 6.79 | 28.34 | 25.26 | 44.38 | 15.93 | 28.86 | 57.26 | 42.58 | 22.71 | 5.32 | 8.33 | 45.49 | 56.31 | 20.13 | 61.19 | 57.48 | 60.45 | 58.37 | -12.11 | 105.10 | 87.71 | 78.99 | 65.45 | 58.66 | 148.29 | 67.00 | 79.32 | 43.40 | 48.66 | 78.93 | 72.52 | 51.36 | |
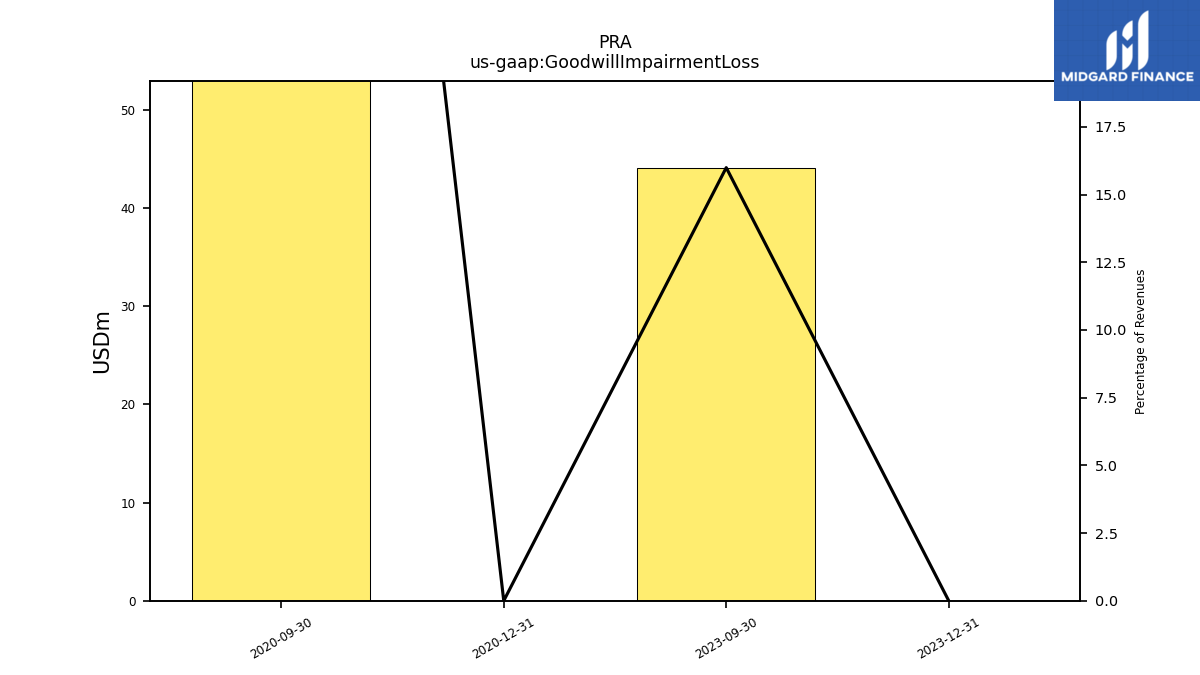
| Goodwill Impairment Loss | 0.00 | 44.11 | NA | NA | NA | NA | NA | NA | NA | NA | NA | NA | 0.00 | 161.12 | NA | NA | NA | NA | NA | NA | NA | NA | NA | NA | NA | NA | NA | NA | NA | NA | NA | NA | NA | NA | NA | NA | NA | NA | NA | NA | NA | NA | NA | NA | NA | NA | NA | NA | NA | NA | NA | NA | NA | NA | NA | NA |
| 2023-12-31 | 2023-09-30 | 2023-06-30 | 2023-03-31 | 2022-12-31 | 2022-09-30 | 2022-06-30 | 2022-03-31 | 2021-12-31 | 2021-09-30 | 2021-06-30 | 2021-03-31 | 2020-12-31 | 2020-09-30 | 2020-06-30 | 2020-03-31 | 2019-12-31 | 2019-09-30 | 2019-06-30 | 2019-03-31 | 2018-12-31 | 2018-09-30 | 2018-06-30 | 2018-03-31 | 2017-12-31 | 2017-09-30 | 2017-06-30 | 2017-03-31 | 2016-12-31 | 2016-09-30 | 2016-06-30 | 2016-03-31 | 2015-12-31 | 2015-09-30 | 2015-06-30 | 2015-03-31 | 2014-12-31 | 2014-09-30 | 2014-06-30 | 2014-03-31 | 2013-12-31 | 2013-09-30 | 2013-06-30 | 2013-03-31 | 2012-12-31 | 2012-09-30 | 2012-06-30 | 2012-03-31 | 2011-12-31 | 2011-09-30 | 2011-06-30 | 2011-03-31 | 2010-12-31 | 2010-09-30 | 2010-06-30 | 2010-03-31 | ||
|---|---|---|---|---|---|---|---|---|---|---|---|---|---|---|---|---|---|---|---|---|---|---|---|---|---|---|---|---|---|---|---|---|---|---|---|---|---|---|---|---|---|---|---|---|---|---|---|---|---|---|---|---|---|---|---|---|---|
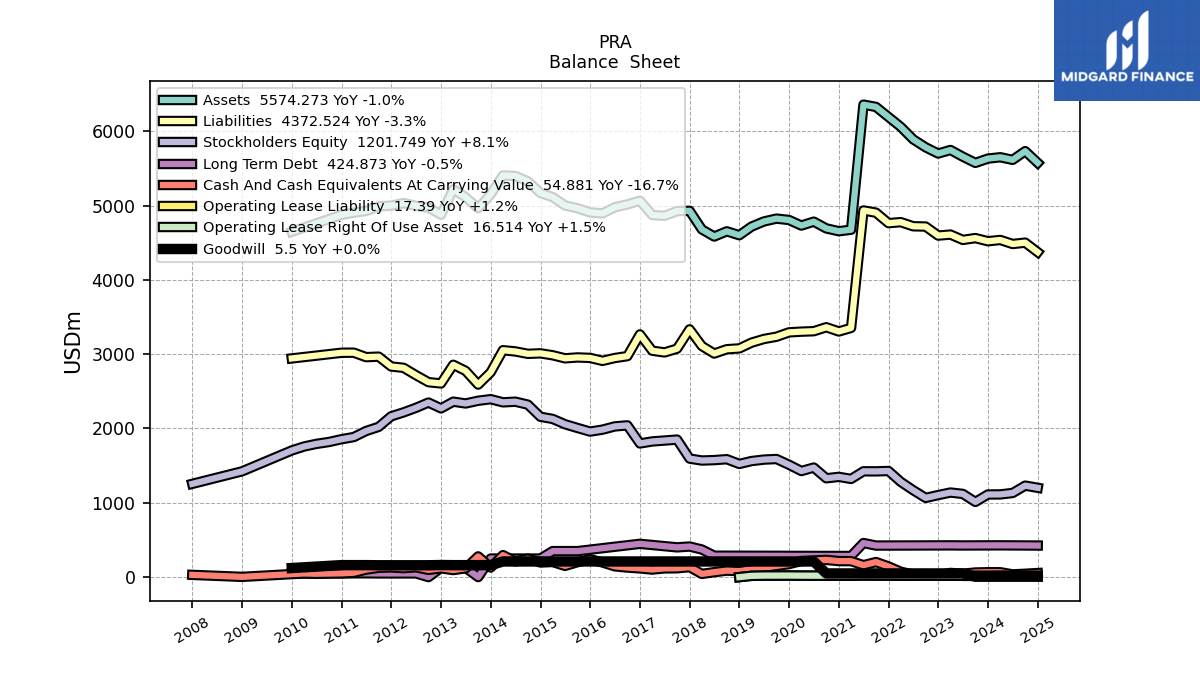
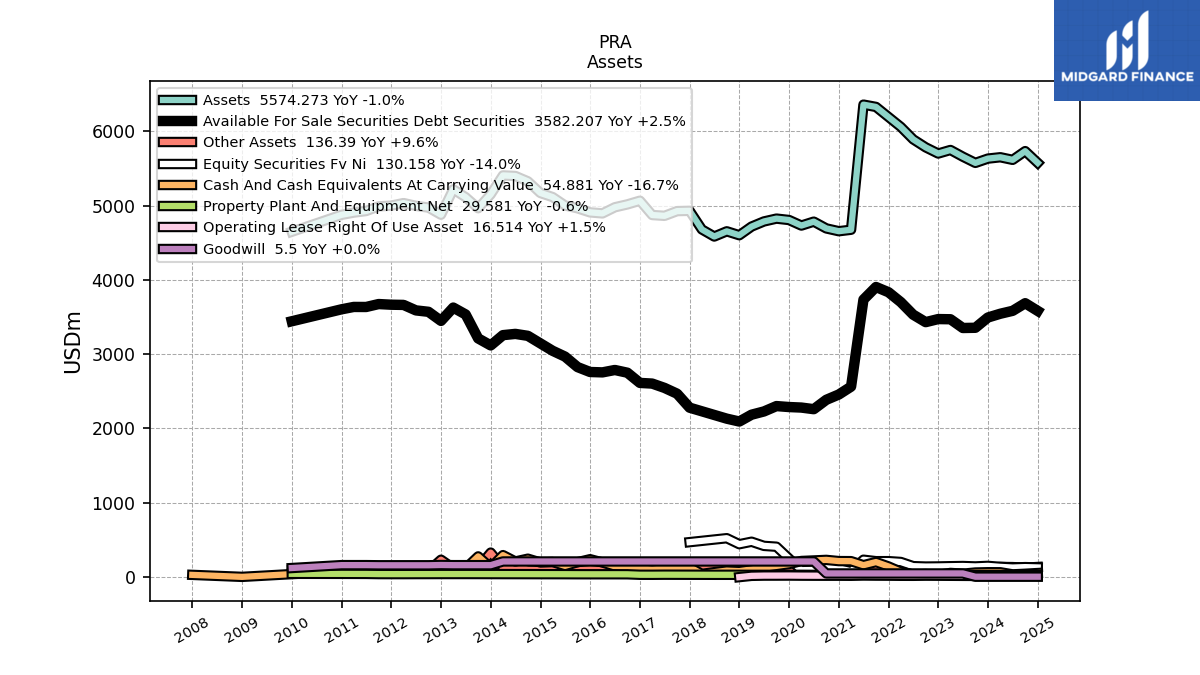
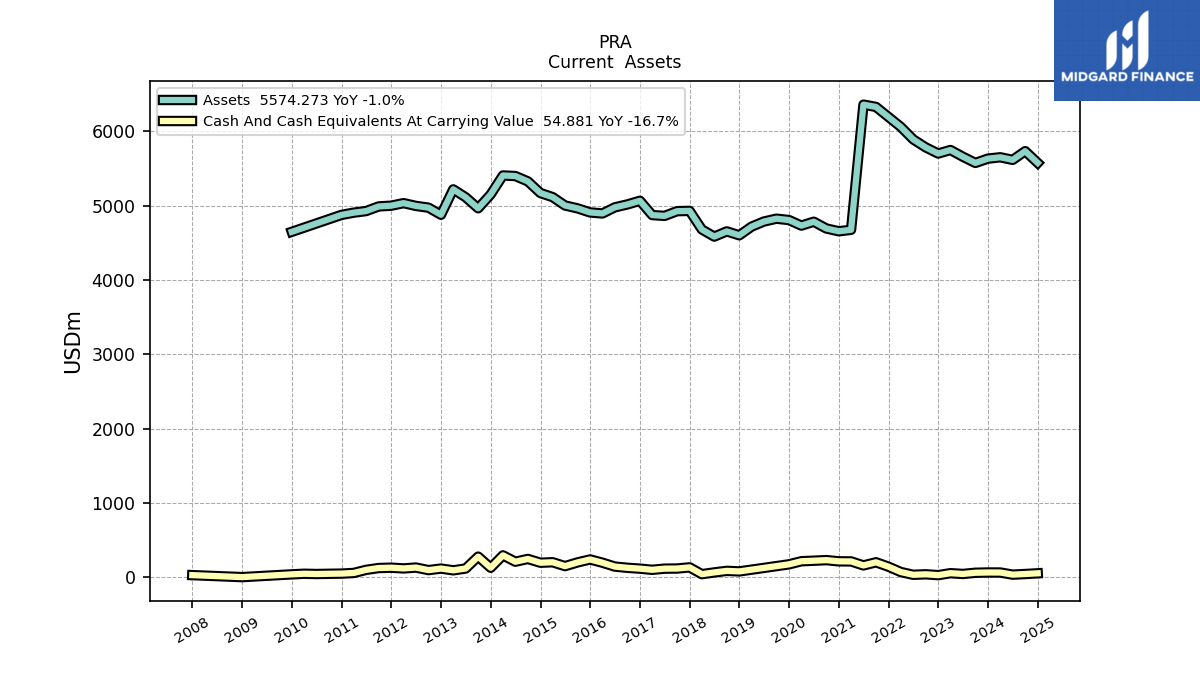
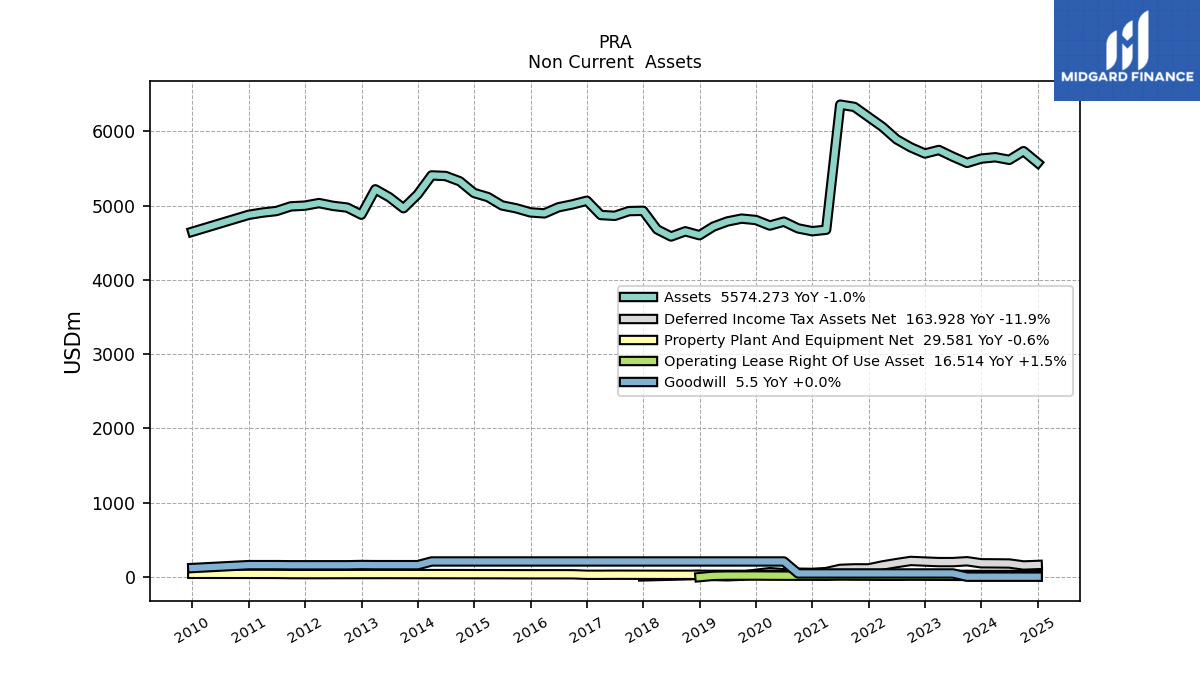
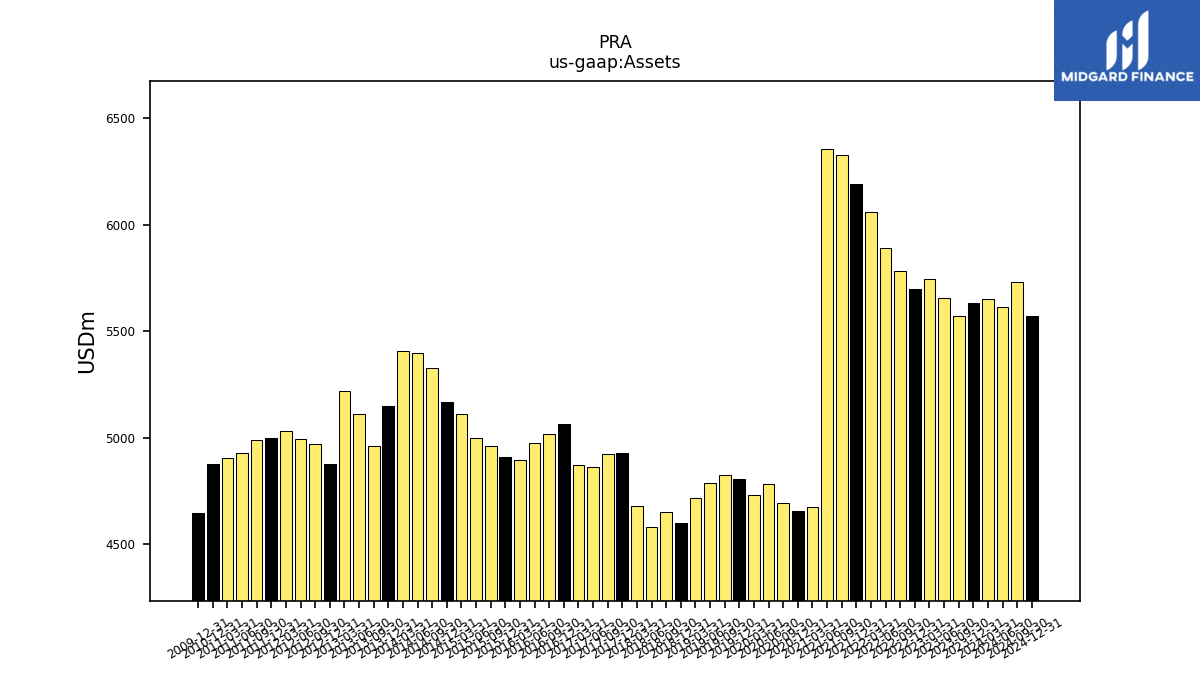
| Assets | 5631.93 | 5573.96 | 5657.41 | 5747.86 | 5700.00 | 5783.32 | 5891.19 | 6058.60 | 6191.48 | 6327.27 | 6358.19 | 4674.54 | 4654.80 | 4692.50 | 4783.56 | 4730.85 | 4805.60 | 4824.36 | 4786.12 | 4717.11 | 4600.73 | 4653.44 | 4583.46 | 4678.92 | 4929.20 | 4925.15 | 4861.72 | 4872.64 | 5065.18 | 5015.77 | 4976.84 | 4894.50 | 4908.16 | 4963.00 | 5001.49 | 5114.08 | 5169.16 | 5326.00 | 5397.69 | 5405.50 | 5150.89 | 4963.83 | 5112.05 | 5218.75 | 4876.58 | 4972.67 | 4995.76 | 5033.33 | 4998.88 | 4988.81 | 4926.61 | 4905.18 | 4875.06 | NA | NA | NA | |
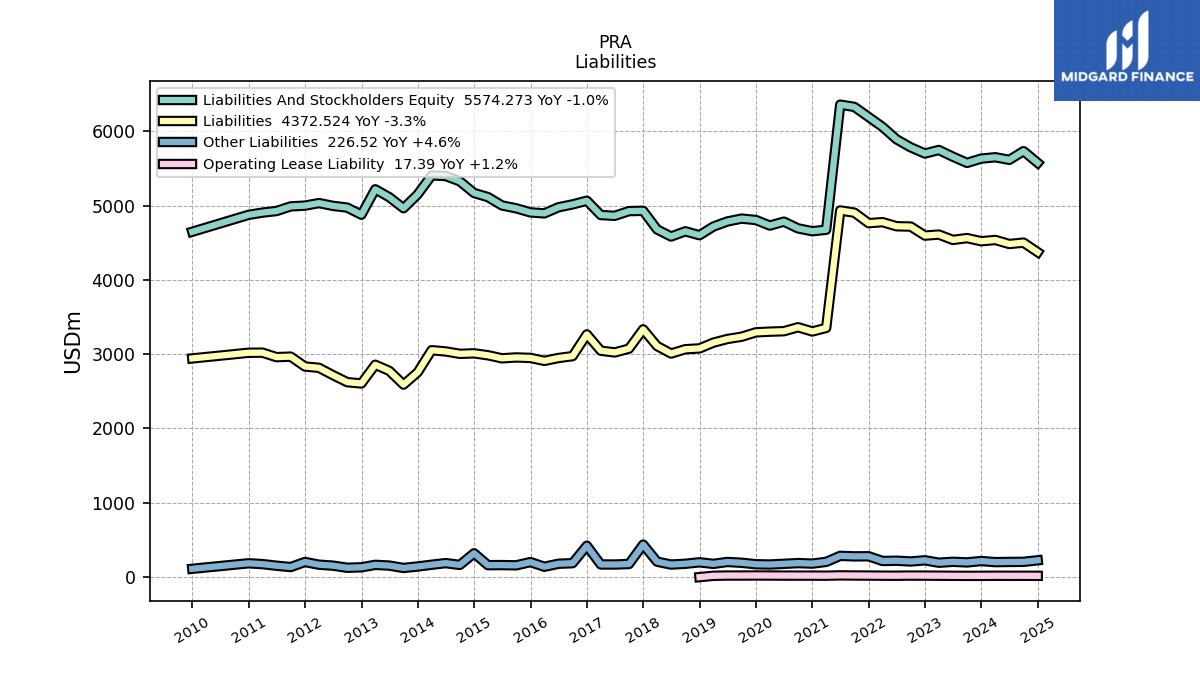
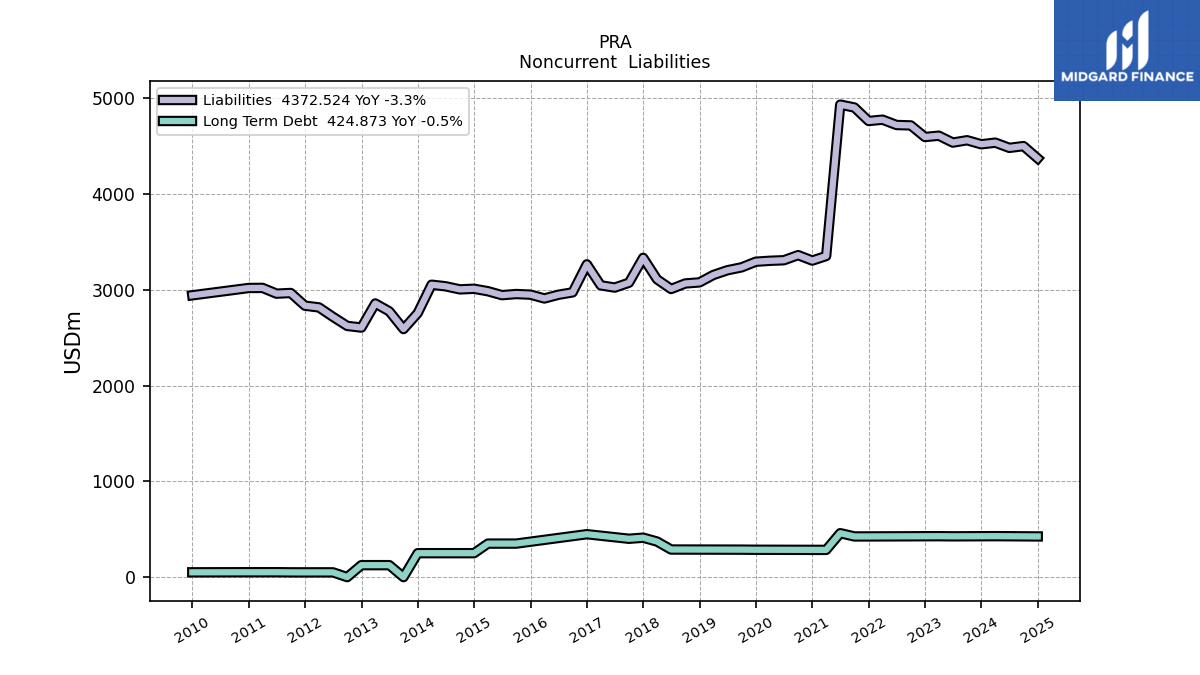
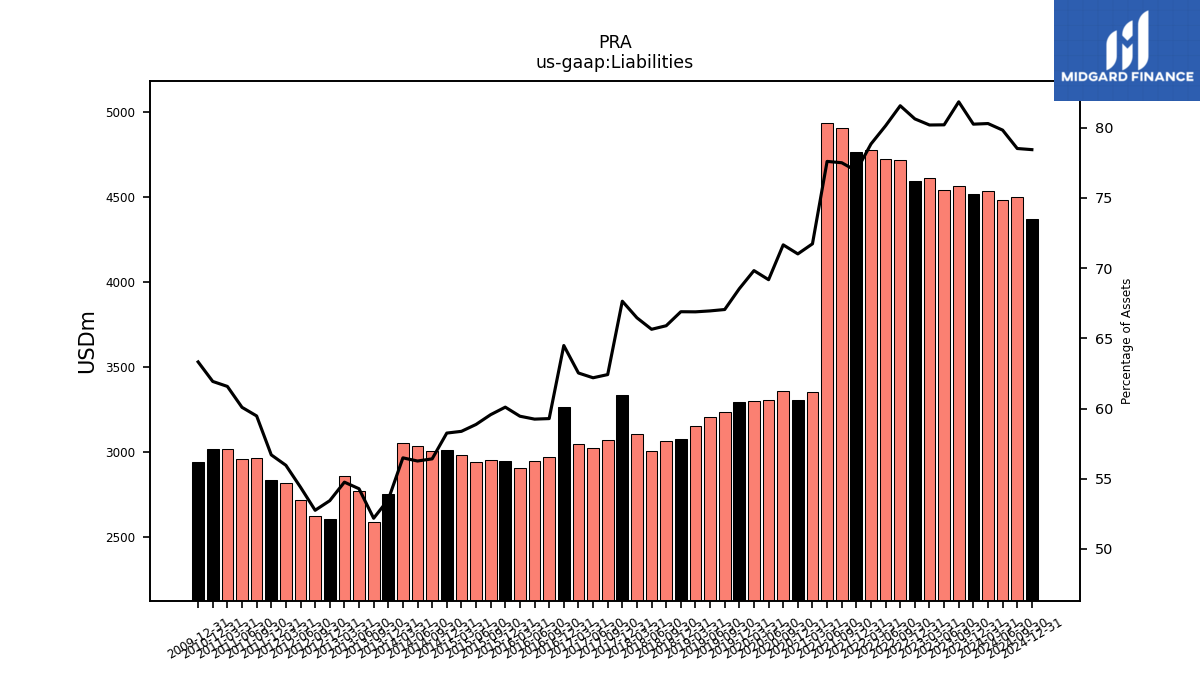
| Liabilities | 4519.94 | 4562.11 | 4537.70 | 4609.57 | 4595.98 | 4717.32 | 4721.30 | 4776.83 | 4763.09 | 4904.17 | 4934.15 | 3353.22 | 3305.59 | 3362.60 | 3309.16 | 3303.34 | 3293.69 | 3234.90 | 3204.56 | 3155.21 | 3077.72 | 3066.55 | 3008.85 | 3109.76 | 3334.40 | 3074.26 | 3023.62 | 3046.95 | 3266.48 | 2973.61 | 2948.64 | 2909.99 | 2949.81 | 2956.21 | 2944.31 | 2985.44 | 3011.22 | 3004.78 | 3036.92 | 3053.52 | 2756.48 | 2590.47 | 2775.26 | 2857.70 | 2606.00 | 2623.27 | 2717.62 | 2816.54 | 2834.43 | 2967.05 | 2960.24 | 3020.44 | 3019.19 | NA | NA | NA | |
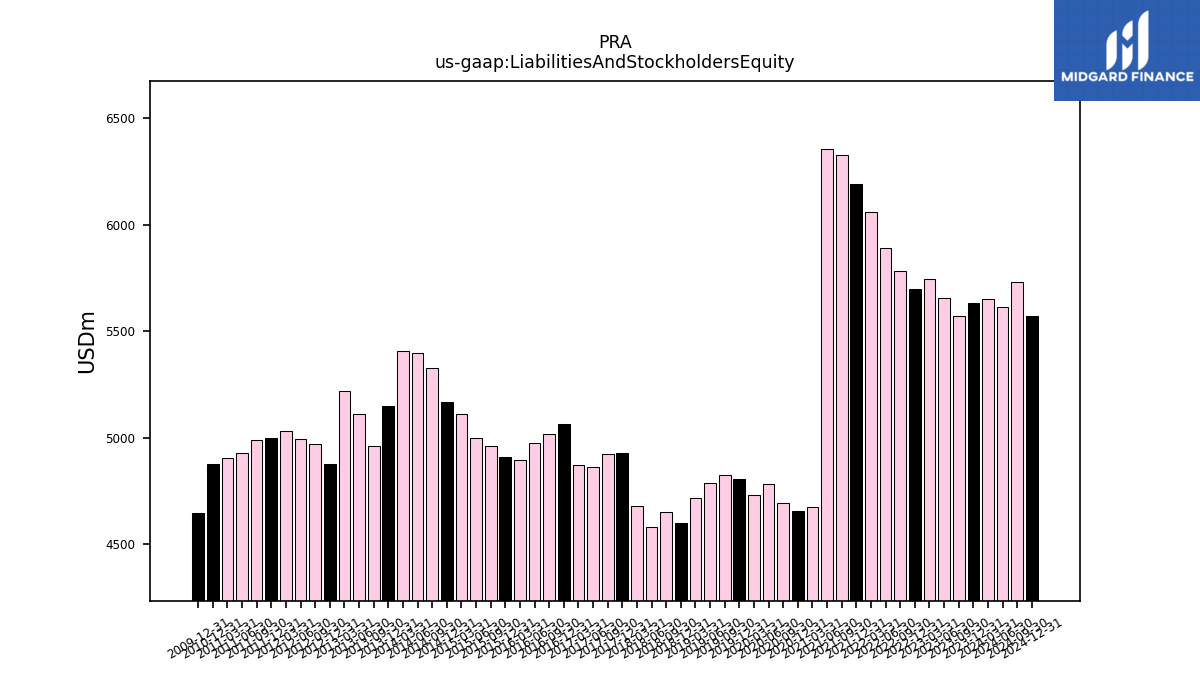
| Liabilities And Stockholders Equity | 5631.93 | 5573.96 | 5657.41 | 5747.86 | 5700.00 | 5783.32 | 5891.19 | 6058.60 | 6191.48 | 6327.27 | 6358.19 | 4674.54 | 4654.80 | 4692.50 | 4783.56 | 4730.85 | 4805.60 | 4824.36 | 4786.12 | 4717.11 | 4600.73 | 4653.44 | 4583.46 | 4678.92 | 4929.20 | 4925.15 | 4861.72 | 4872.64 | 5065.18 | 5015.77 | 4976.84 | 4894.50 | 4908.16 | 4963.00 | 5001.49 | 5114.08 | 5169.16 | 5326.00 | 5397.69 | 5405.50 | 5150.89 | 4963.83 | 5112.05 | 5218.75 | 4876.58 | 4972.67 | 4995.76 | 5033.33 | 4998.88 | 4988.81 | 4926.61 | 4905.18 | 4875.06 | NA | NA | NA | |
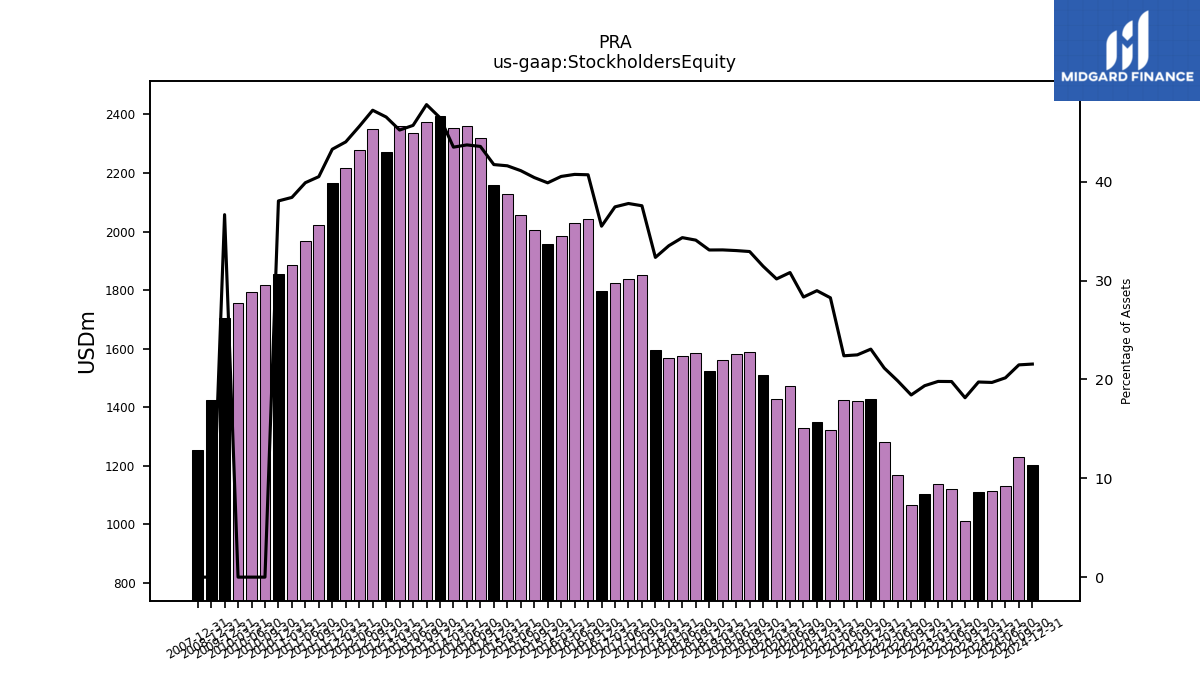
| Stockholders Equity | 1111.98 | 1011.84 | 1119.71 | 1138.29 | 1104.02 | 1066.00 | 1169.89 | 1281.77 | 1428.39 | 1423.10 | 1424.04 | 1321.32 | 1349.21 | 1329.89 | 1474.39 | 1427.51 | 1511.91 | 1589.46 | 1581.56 | 1561.90 | 1523.00 | 1586.89 | 1574.62 | 1569.17 | 1594.80 | 1850.89 | 1838.10 | 1825.69 | 1798.70 | 2042.17 | 2028.19 | 1984.51 | 1958.35 | 2006.79 | 2057.18 | 2128.64 | 2157.94 | 2321.21 | 2360.77 | 2351.98 | 2394.41 | 2373.36 | 2336.79 | 2361.04 | 2270.58 | 2349.40 | 2278.14 | 2216.79 | 2164.45 | 2021.76 | 1966.36 | 1884.74 | 1855.86 | 1818.21 | 1792.98 | 1757.70 |
| 2023-12-31 | 2023-09-30 | 2023-06-30 | 2023-03-31 | 2022-12-31 | 2022-09-30 | 2022-06-30 | 2022-03-31 | 2021-12-31 | 2021-09-30 | 2021-06-30 | 2021-03-31 | 2020-12-31 | 2020-09-30 | 2020-06-30 | 2020-03-31 | 2019-12-31 | 2019-09-30 | 2019-06-30 | 2019-03-31 | 2018-12-31 | 2018-09-30 | 2018-06-30 | 2018-03-31 | 2017-12-31 | 2017-09-30 | 2017-06-30 | 2017-03-31 | 2016-12-31 | 2016-09-30 | 2016-06-30 | 2016-03-31 | 2015-12-31 | 2015-09-30 | 2015-06-30 | 2015-03-31 | 2014-12-31 | 2014-09-30 | 2014-06-30 | 2014-03-31 | 2013-12-31 | 2013-09-30 | 2013-06-30 | 2013-03-31 | 2012-12-31 | 2012-09-30 | 2012-06-30 | 2012-03-31 | 2011-12-31 | 2011-09-30 | 2011-06-30 | 2011-03-31 | 2010-12-31 | 2010-09-30 | 2010-06-30 | 2010-03-31 | ||
|---|---|---|---|---|---|---|---|---|---|---|---|---|---|---|---|---|---|---|---|---|---|---|---|---|---|---|---|---|---|---|---|---|---|---|---|---|---|---|---|---|---|---|---|---|---|---|---|---|---|---|---|---|---|---|---|---|---|
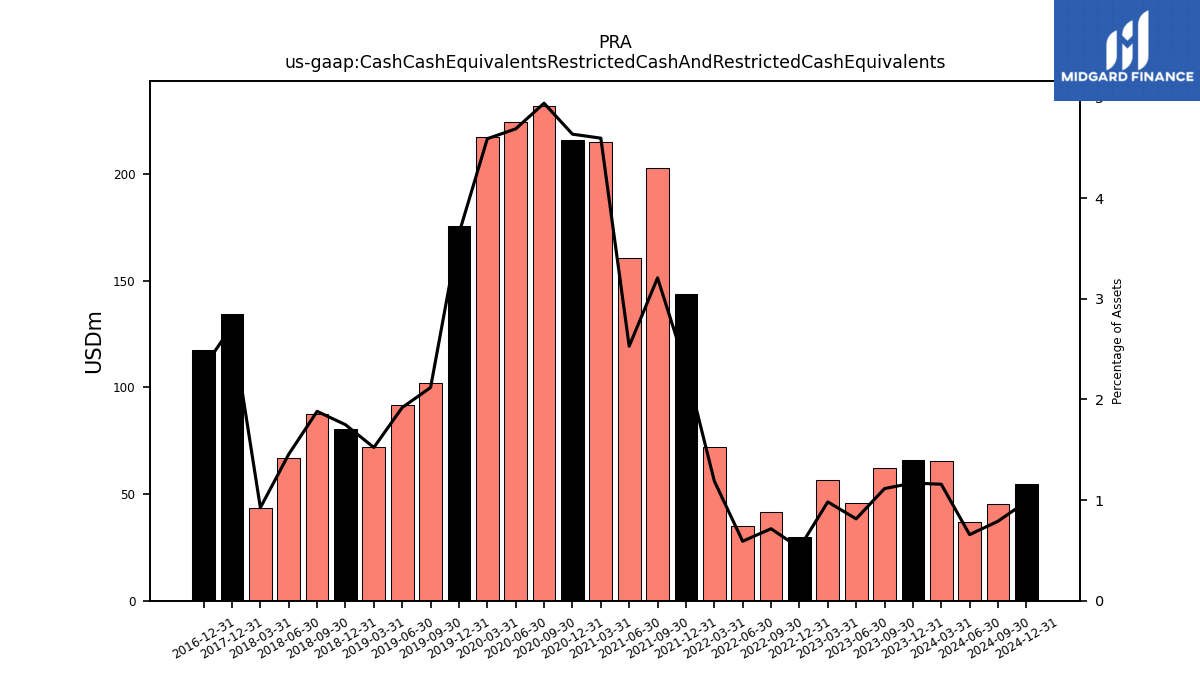
| Cash And Cash Equivalents At Carrying Value | 65.90 | 62.11 | 46.03 | 56.43 | 29.96 | 41.37 | 34.83 | 72.10 | 143.60 | 202.95 | 160.80 | 214.84 | 215.78 | 231.95 | 224.27 | 217.17 | 175.37 | NA | NA | NA | 80.47 | 87.56 | 66.72 | 43.25 | 134.50 | 119.00 | 117.46 | 101.92 | 117.35 | 128.90 | 145.17 | 197.31 | 241.10 | 201.34 | 151.37 | 203.58 | 197.04 | 248.00 | 210.66 | 296.24 | 129.38 | 279.05 | 119.23 | 94.83 | 118.55 | 97.66 | 132.19 | 120.43 | 130.40 | 125.71 | 101.23 | 59.50 | 50.85 | 48.26 | 45.29 | 48.85 | |
| Cash Cash Equivalents Restricted Cash And Restricted Cash Equivalents | 65.90 | 62.11 | 46.03 | 56.43 | 29.96 | 41.37 | 34.83 | 72.10 | 143.60 | 202.95 | 160.80 | 214.84 | 215.78 | 231.95 | 224.27 | 217.17 | 175.37 | 102.21 | 91.88 | 71.83 | 80.47 | 87.56 | 66.72 | 43.25 | 134.50 | NA | NA | NA | 117.35 | NA | NA | NA | NA | NA | NA | NA | NA | NA | NA | NA | NA | NA | NA | NA | NA | NA | NA | NA | NA | NA | NA | NA | NA | NA | NA | NA | |
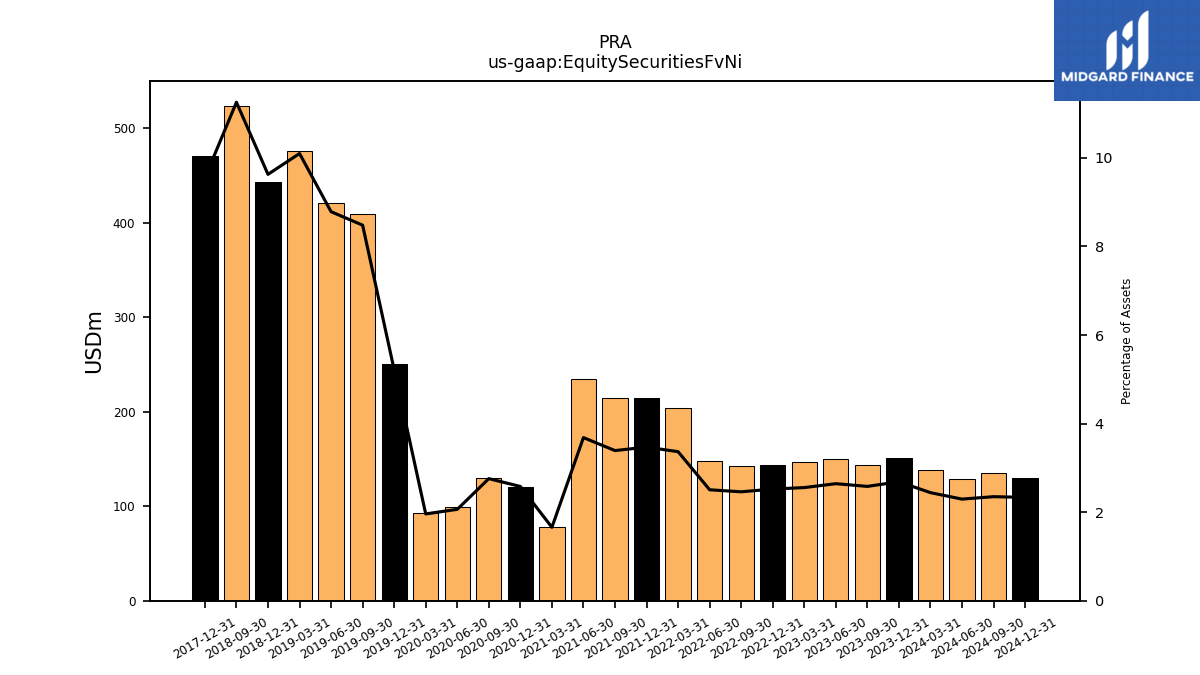
| Equity Securities Fv Ni | 151.29 | 143.92 | 149.53 | 146.87 | 143.74 | 142.25 | 147.61 | 203.93 | 214.81 | 214.53 | 234.21 | 77.54 | 120.10 | 129.38 | 98.72 | 92.75 | 250.55 | 409.10 | 420.43 | 476.32 | 442.94 | 523.77 | NA | NA | 470.61 | NA | NA | NA | NA | NA | NA | NA | NA | NA | NA | NA | NA | NA | NA | NA | NA | NA | NA | NA | NA | NA | NA | NA | NA | NA | NA | NA | NA | NA | NA | NA | |
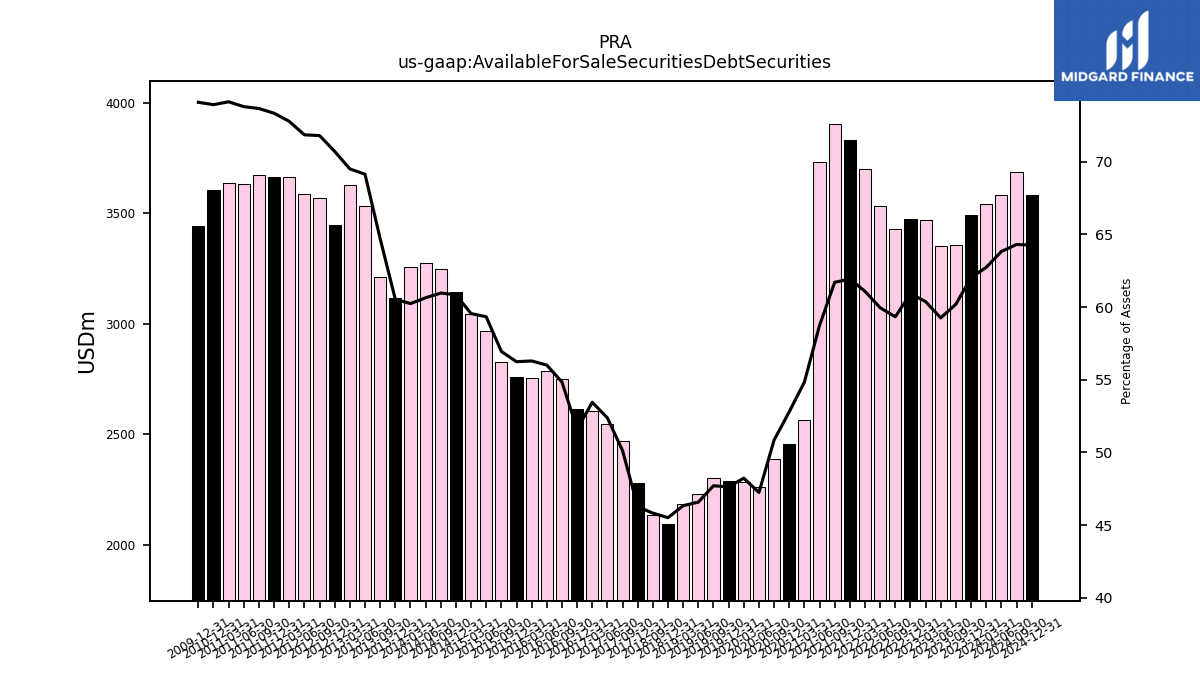
| Available For Sale Securities Debt Securities | 3493.60 | 3355.31 | 3352.33 | 3470.03 | 3472.47 | 3431.14 | 3531.82 | 3700.82 | 3833.72 | 3904.14 | 3734.66 | 2563.27 | 2457.53 | 2386.09 | 2259.95 | 2281.66 | 2288.78 | 2301.53 | 2229.35 | 2185.80 | 2093.80 | 2132.34 | NA | NA | 2280.24 | 2468.35 | 2546.11 | 2604.43 | 2613.41 | 2750.60 | 2787.26 | 2755.21 | 2760.29 | 2826.18 | 2967.35 | 3045.50 | 3145.03 | 3246.82 | 3272.99 | 3256.18 | 3118.05 | 3212.06 | 3534.43 | 3627.08 | 3448.00 | 3570.18 | 3589.27 | 3662.89 | 3665.76 | 3674.57 | 3635.08 | 3635.68 | 3603.75 | NA | NA | NA |
| 2023-12-31 | 2023-09-30 | 2023-06-30 | 2023-03-31 | 2022-12-31 | 2022-09-30 | 2022-06-30 | 2022-03-31 | 2021-12-31 | 2021-09-30 | 2021-06-30 | 2021-03-31 | 2020-12-31 | 2020-09-30 | 2020-06-30 | 2020-03-31 | 2019-12-31 | 2019-09-30 | 2019-06-30 | 2019-03-31 | 2018-12-31 | 2018-09-30 | 2018-06-30 | 2018-03-31 | 2017-12-31 | 2017-09-30 | 2017-06-30 | 2017-03-31 | 2016-12-31 | 2016-09-30 | 2016-06-30 | 2016-03-31 | 2015-12-31 | 2015-09-30 | 2015-06-30 | 2015-03-31 | 2014-12-31 | 2014-09-30 | 2014-06-30 | 2014-03-31 | 2013-12-31 | 2013-09-30 | 2013-06-30 | 2013-03-31 | 2012-12-31 | 2012-09-30 | 2012-06-30 | 2012-03-31 | 2011-12-31 | 2011-09-30 | 2011-06-30 | 2011-03-31 | 2010-12-31 | 2010-09-30 | 2010-06-30 | 2010-03-31 | ||
|---|---|---|---|---|---|---|---|---|---|---|---|---|---|---|---|---|---|---|---|---|---|---|---|---|---|---|---|---|---|---|---|---|---|---|---|---|---|---|---|---|---|---|---|---|---|---|---|---|---|---|---|---|---|---|---|---|---|
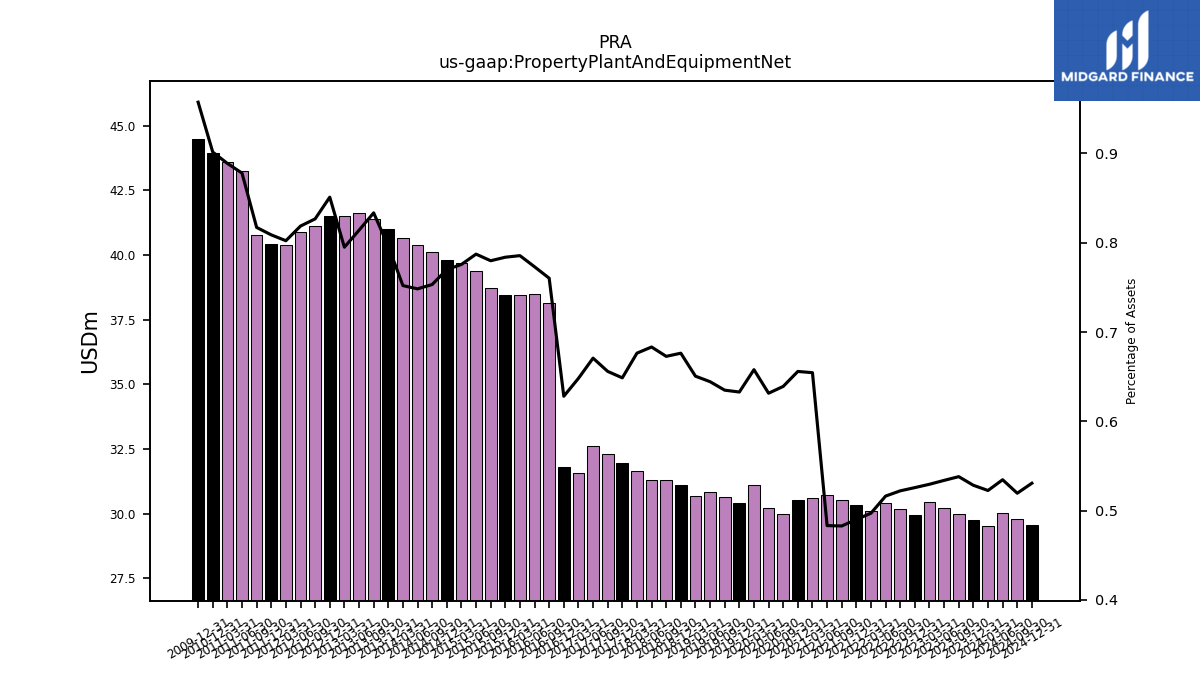
| Property Plant And Equipment Net | 29.76 | 29.99 | 30.20 | 30.43 | 29.97 | 30.20 | 30.41 | 30.12 | 30.34 | 30.55 | 30.72 | 30.59 | 30.53 | 29.99 | 30.21 | 31.12 | 30.41 | 30.63 | 30.84 | 30.69 | 31.11 | 31.31 | 31.32 | 31.65 | 31.98 | 32.30 | 32.61 | 31.58 | 31.81 | 38.13 | 38.48 | 38.45 | 38.47 | 38.70 | 39.37 | 39.67 | 39.80 | 40.12 | 40.39 | 40.65 | 41.01 | 41.37 | 41.61 | 41.49 | 41.50 | 41.11 | 40.90 | 40.38 | 40.43 | 40.77 | 43.26 | 43.60 | 43.95 | NA | NA | NA | |
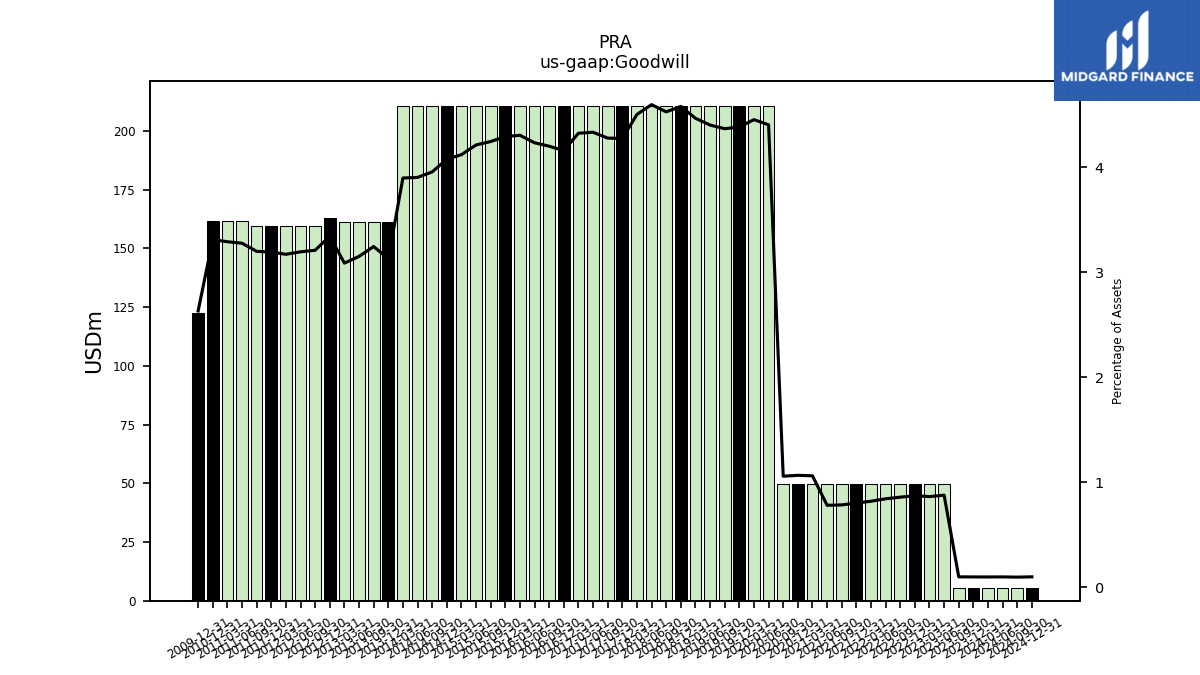
| Goodwill | 5.50 | 5.50 | 49.61 | 49.61 | 49.61 | 49.61 | 49.61 | 49.61 | 49.61 | 49.61 | 49.61 | 49.61 | 49.61 | 49.61 | 210.72 | 210.72 | 210.72 | 210.72 | 210.72 | 210.72 | 210.72 | 210.72 | 210.72 | 210.72 | 210.72 | 210.72 | 210.72 | 210.72 | 210.72 | 210.72 | 210.72 | 210.72 | 210.72 | 210.72 | 210.72 | 210.72 | 210.72 | 210.72 | 210.72 | 210.72 | 161.12 | 161.12 | 161.12 | 161.12 | 163.06 | 159.62 | 159.62 | 159.62 | 159.62 | 159.62 | 161.45 | 161.45 | 161.45 | NA | NA | NA | |
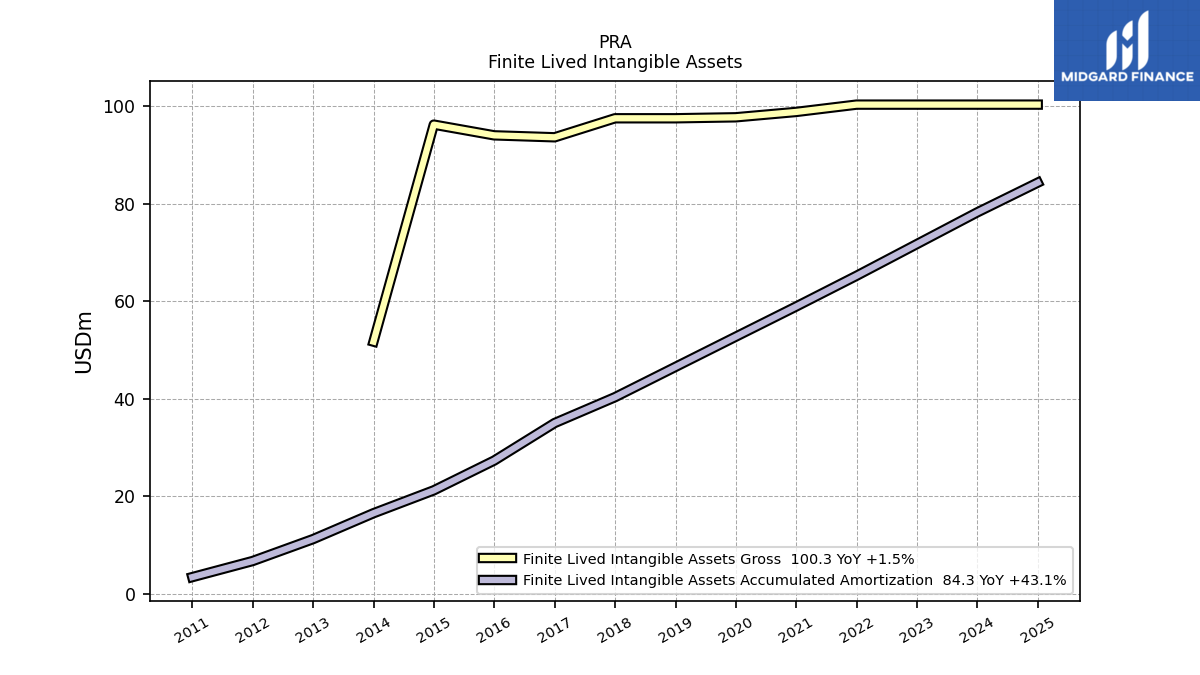
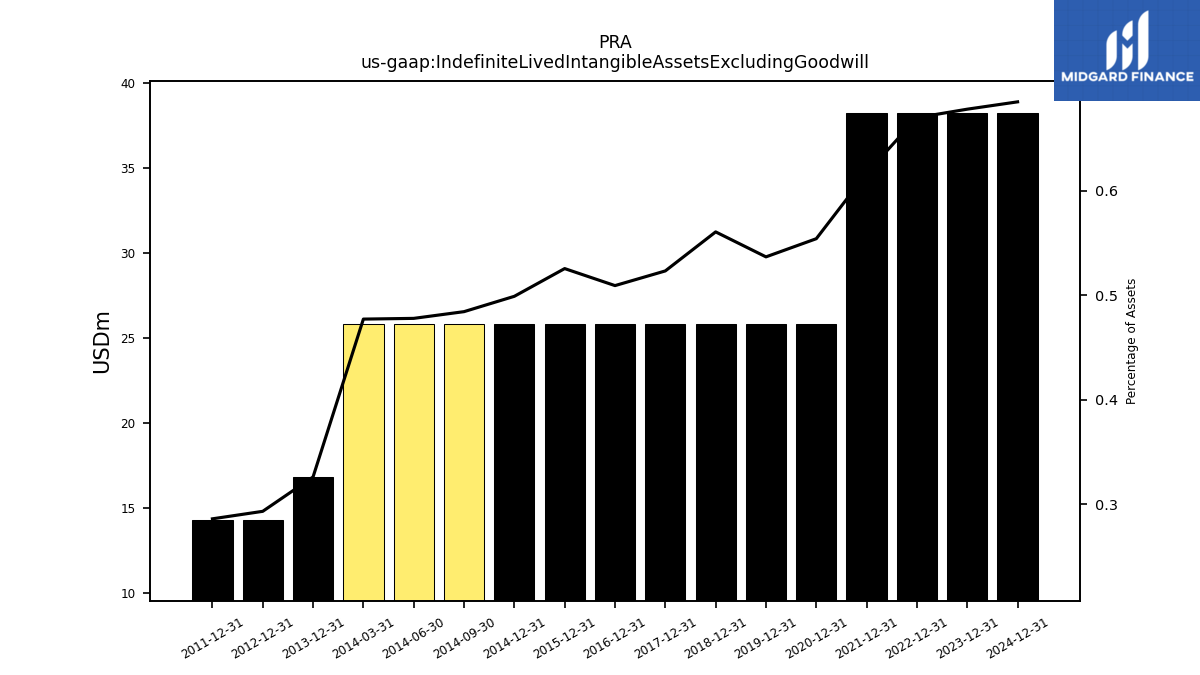
| Indefinite Lived Intangible Assets Excluding Goodwill | 38.20 | NA | NA | NA | 38.20 | NA | NA | NA | 38.20 | NA | NA | NA | 25.80 | NA | NA | NA | 25.80 | NA | NA | NA | 25.80 | NA | NA | NA | 25.80 | NA | NA | NA | 25.80 | NA | NA | NA | 25.80 | NA | NA | NA | 25.80 | 25.80 | 25.80 | 25.80 | 16.80 | NA | NA | NA | 14.30 | NA | NA | NA | 14.30 | NA | NA | NA | NA | NA | NA | NA | |
| Equity Securities Fv Ni | 151.29 | 143.92 | 149.53 | 146.87 | 143.74 | 142.25 | 147.61 | 203.93 | 214.81 | 214.53 | 234.21 | 77.54 | 120.10 | 129.38 | 98.72 | 92.75 | 250.55 | 409.10 | 420.43 | 476.32 | 442.94 | 523.77 | NA | NA | 470.61 | NA | NA | NA | NA | NA | NA | NA | NA | NA | NA | NA | NA | NA | NA | NA | NA | NA | NA | NA | NA | NA | NA | NA | NA | NA | NA | NA | NA | NA | NA | NA | |
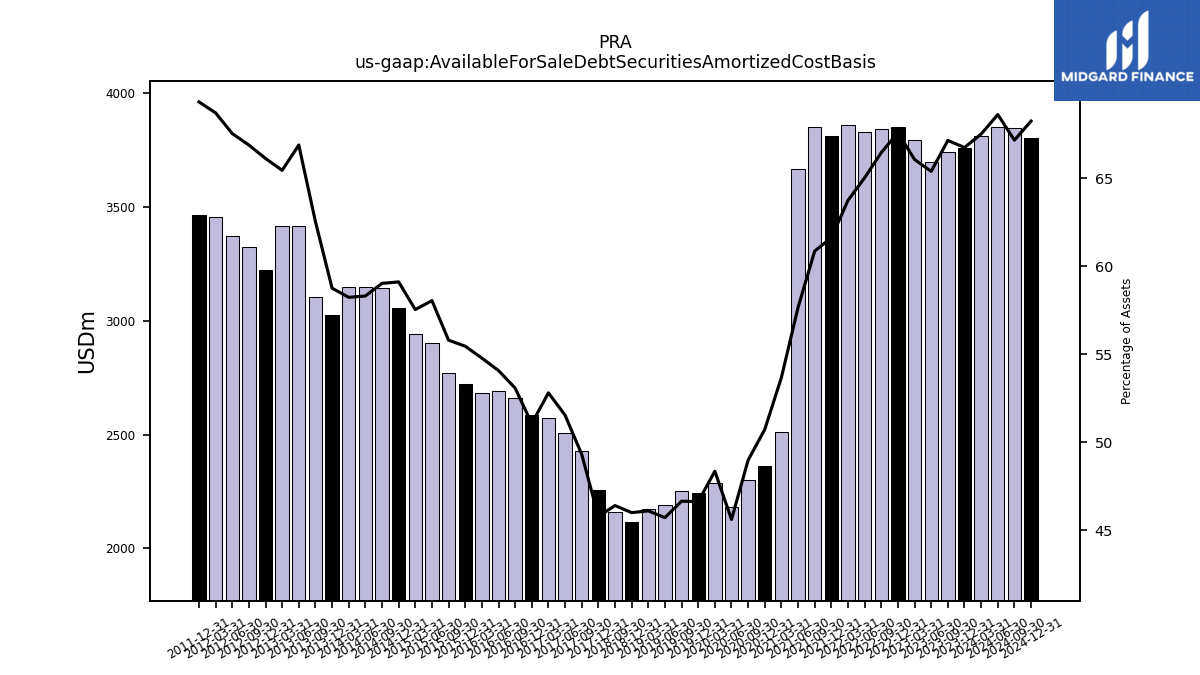
| Available For Sale Debt Securities Amortized Cost Basis | 3758.72 | 3742.23 | 3699.05 | 3796.87 | 3852.41 | 3843.04 | 3830.74 | 3861.57 | 3814.85 | 3850.89 | 3666.30 | 2509.62 | 2361.57 | 2298.91 | 2182.47 | 2287.96 | 2241.30 | 2251.04 | 2188.55 | 2175.11 | 2116.82 | 2159.72 | NA | NA | 2257.19 | 2429.09 | 2505.95 | 2573.27 | 2586.82 | 2662.43 | 2691.34 | 2681.39 | 2722.06 | 2769.43 | 2903.15 | 2942.64 | 3055.48 | 3143.73 | 3147.33 | 3147.86 | 3026.26 | 3104.25 | 3418.95 | 3415.34 | 3224.33 | 3325.66 | 3373.80 | 3458.21 | 3465.72 | NA | NA | NA | NA | NA | NA | NA |
| 2023-12-31 | 2023-09-30 | 2023-06-30 | 2023-03-31 | 2022-12-31 | 2022-09-30 | 2022-06-30 | 2022-03-31 | 2021-12-31 | 2021-09-30 | 2021-06-30 | 2021-03-31 | 2020-12-31 | 2020-09-30 | 2020-06-30 | 2020-03-31 | 2019-12-31 | 2019-09-30 | 2019-06-30 | 2019-03-31 | 2018-12-31 | 2018-09-30 | 2018-06-30 | 2018-03-31 | 2017-12-31 | 2017-09-30 | 2017-06-30 | 2017-03-31 | 2016-12-31 | 2016-09-30 | 2016-06-30 | 2016-03-31 | 2015-12-31 | 2015-09-30 | 2015-06-30 | 2015-03-31 | 2014-12-31 | 2014-09-30 | 2014-06-30 | 2014-03-31 | 2013-12-31 | 2013-09-30 | 2013-06-30 | 2013-03-31 | 2012-12-31 | 2012-09-30 | 2012-06-30 | 2012-03-31 | 2011-12-31 | 2011-09-30 | 2011-06-30 | 2011-03-31 | 2010-12-31 | 2010-09-30 | 2010-06-30 | 2010-03-31 | ||
|---|---|---|---|---|---|---|---|---|---|---|---|---|---|---|---|---|---|---|---|---|---|---|---|---|---|---|---|---|---|---|---|---|---|---|---|---|---|---|---|---|---|---|---|---|---|---|---|---|---|---|---|---|---|---|---|---|---|
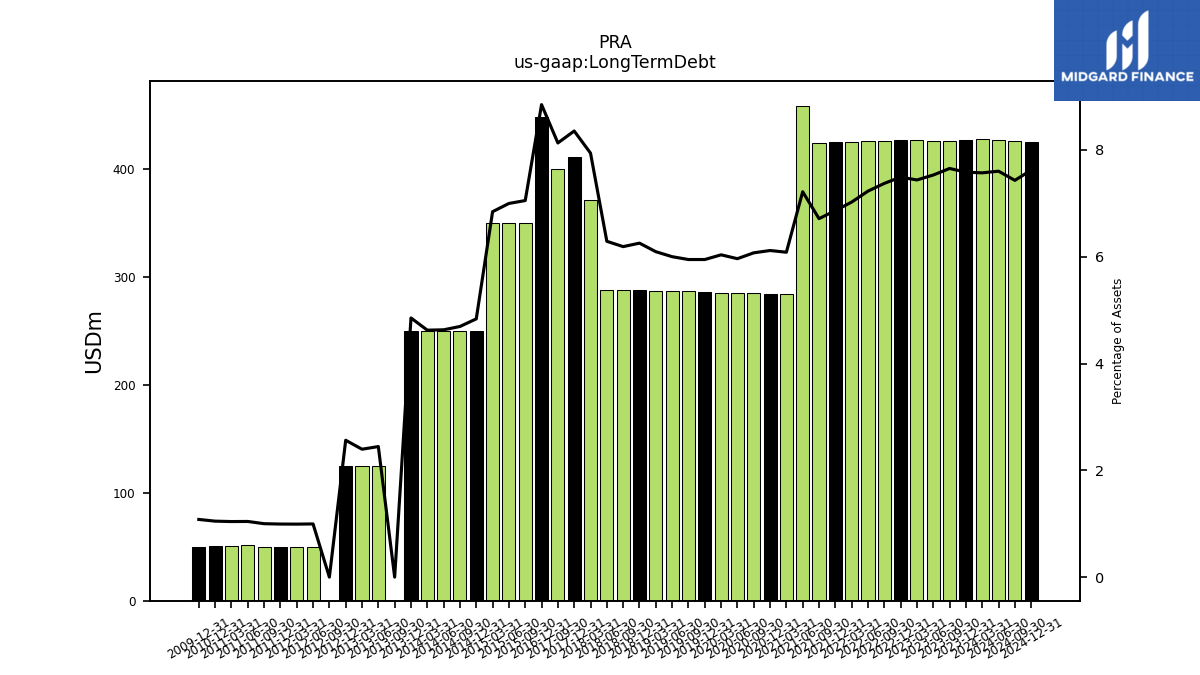
| Long Term Debt | 427.13 | 426.58 | 426.03 | 427.53 | 426.98 | 426.44 | 425.88 | 425.53 | 424.99 | 424.76 | 458.86 | 284.42 | 284.71 | 284.99 | 285.27 | 285.54 | 285.82 | 286.95 | 287.22 | 287.49 | 287.76 | 288.01 | 288.27 | 371.53 | 411.81 | 400.46 | NA | NA | 448.20 | NA | NA | NA | NA | 350.00 | 350.00 | 350.00 | 250.00 | 250.00 | 250.00 | 250.00 | 250.00 | 0.00 | 125.00 | 125.00 | 125.00 | 0.00 | 49.77 | 49.95 | 49.69 | 49.91 | 51.36 | 51.05 | 51.10 | NA | NA | NA |
| 2023-12-31 | 2023-09-30 | 2023-06-30 | 2023-03-31 | 2022-12-31 | 2022-09-30 | 2022-06-30 | 2022-03-31 | 2021-12-31 | 2021-09-30 | 2021-06-30 | 2021-03-31 | 2020-12-31 | 2020-09-30 | 2020-06-30 | 2020-03-31 | 2019-12-31 | 2019-09-30 | 2019-06-30 | 2019-03-31 | 2018-12-31 | 2018-09-30 | 2018-06-30 | 2018-03-31 | 2017-12-31 | 2017-09-30 | 2017-06-30 | 2017-03-31 | 2016-12-31 | 2016-09-30 | 2016-06-30 | 2016-03-31 | 2015-12-31 | 2015-09-30 | 2015-06-30 | 2015-03-31 | 2014-12-31 | 2014-09-30 | 2014-06-30 | 2014-03-31 | 2013-12-31 | 2013-09-30 | 2013-06-30 | 2013-03-31 | 2012-12-31 | 2012-09-30 | 2012-06-30 | 2012-03-31 | 2011-12-31 | 2011-09-30 | 2011-06-30 | 2011-03-31 | 2010-12-31 | 2010-09-30 | 2010-06-30 | 2010-03-31 | ||
|---|---|---|---|---|---|---|---|---|---|---|---|---|---|---|---|---|---|---|---|---|---|---|---|---|---|---|---|---|---|---|---|---|---|---|---|---|---|---|---|---|---|---|---|---|---|---|---|---|---|---|---|---|---|---|---|---|---|
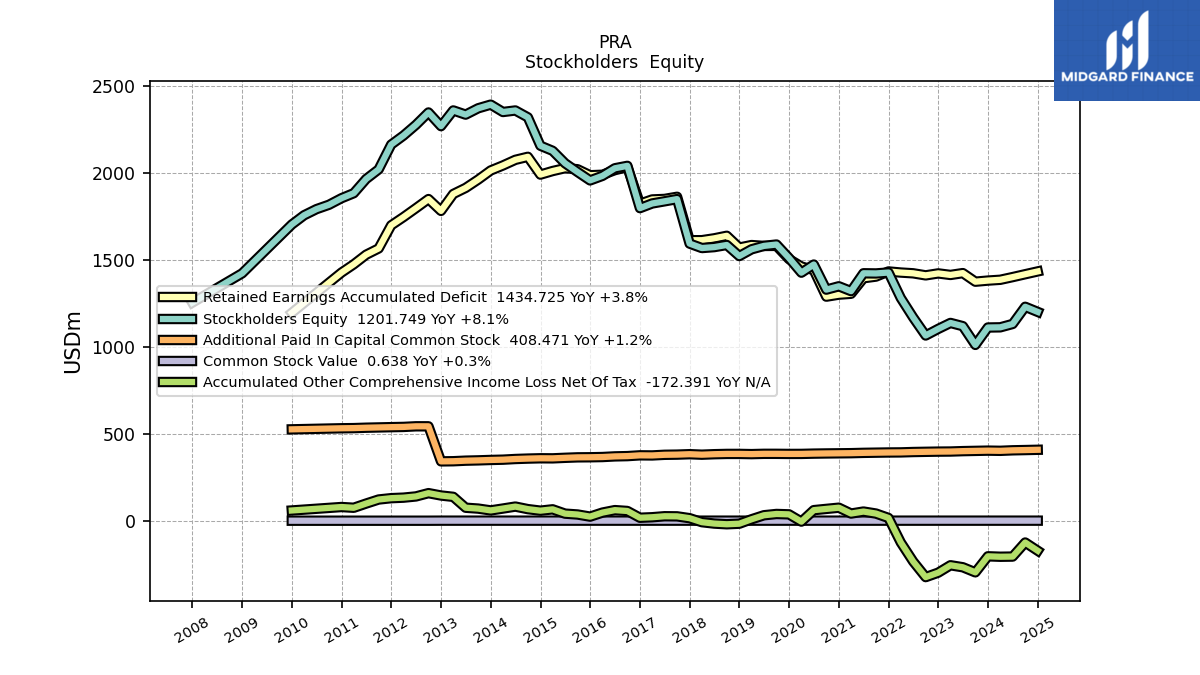
| Stockholders Equity | 1111.98 | 1011.84 | 1119.71 | 1138.29 | 1104.02 | 1066.00 | 1169.89 | 1281.77 | 1428.39 | 1423.10 | 1424.04 | 1321.32 | 1349.21 | 1329.89 | 1474.39 | 1427.51 | 1511.91 | 1589.46 | 1581.56 | 1561.90 | 1523.00 | 1586.89 | 1574.62 | 1569.17 | 1594.80 | 1850.89 | 1838.10 | 1825.69 | 1798.70 | 2042.17 | 2028.19 | 1984.51 | 1958.35 | 2006.79 | 2057.18 | 2128.64 | 2157.94 | 2321.21 | 2360.77 | 2351.98 | 2394.41 | 2373.36 | 2336.79 | 2361.04 | 2270.58 | 2349.40 | 2278.14 | 2216.79 | 2164.45 | 2021.76 | 1966.36 | 1884.74 | 1855.86 | 1818.21 | 1792.98 | 1757.70 | |
| Common Stock Value | 0.64 | 0.64 | 0.64 | 0.64 | 0.63 | 0.63 | 0.63 | 0.63 | 0.63 | 0.63 | 0.63 | 0.63 | 0.63 | 0.63 | 0.63 | 0.63 | 0.63 | 0.63 | 0.63 | 0.63 | 0.63 | 0.63 | 0.63 | 0.63 | 0.63 | 0.63 | 0.63 | 0.63 | 0.63 | 0.63 | 0.63 | 0.63 | 0.62 | 0.62 | 0.62 | 0.62 | 0.62 | 0.62 | 0.62 | 0.62 | 0.62 | 0.62 | 0.62 | 0.62 | 0.62 | 0.35 | 0.35 | 0.35 | 0.35 | 0.34 | 0.34 | 0.34 | 0.34 | NA | NA | NA | |
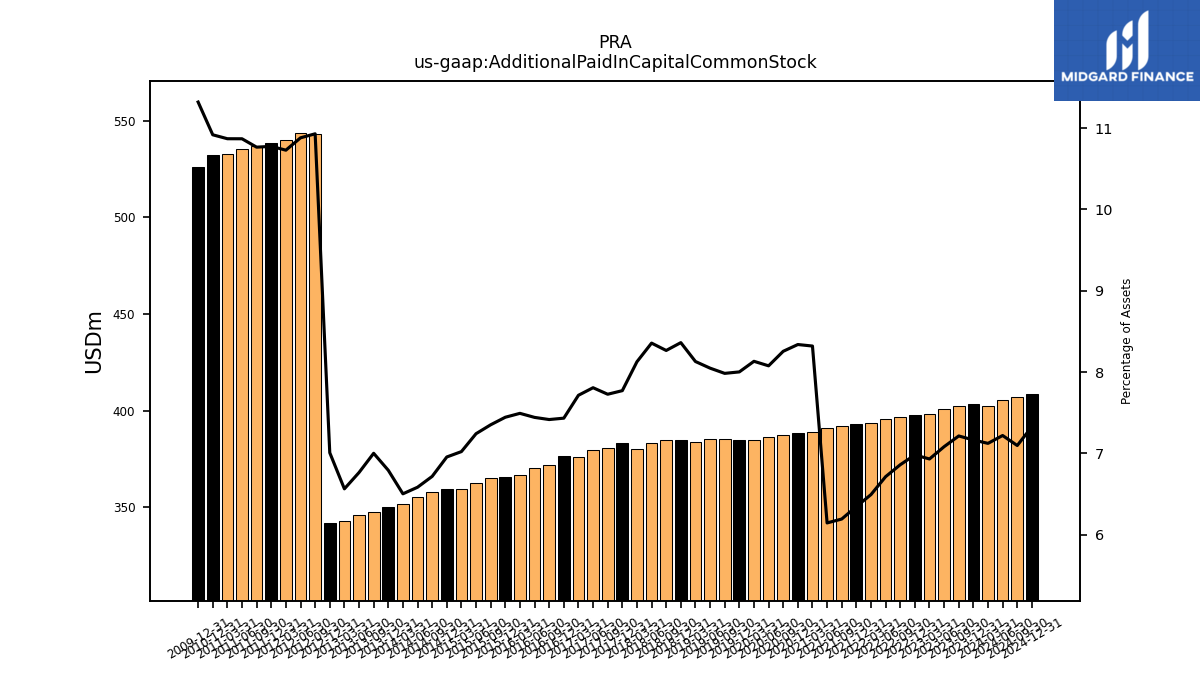
| Additional Paid In Capital Common Stock | 403.55 | 402.14 | 400.70 | 398.44 | 397.92 | 396.77 | 395.54 | 393.43 | 392.94 | 391.88 | 390.75 | 388.92 | 388.15 | 387.39 | 386.37 | 384.73 | 384.55 | 385.18 | 385.20 | 383.49 | 384.71 | 384.64 | 383.00 | 380.25 | 383.08 | 380.60 | 379.59 | 375.91 | 376.52 | 371.99 | 370.42 | 366.73 | 365.40 | 364.88 | 362.23 | 359.13 | 359.58 | 357.78 | 355.40 | 351.55 | 349.89 | 347.55 | 345.85 | 342.59 | 341.78 | 543.47 | 543.53 | 539.97 | 538.62 | 537.04 | 535.43 | 533.12 | 532.21 | NA | NA | NA | |
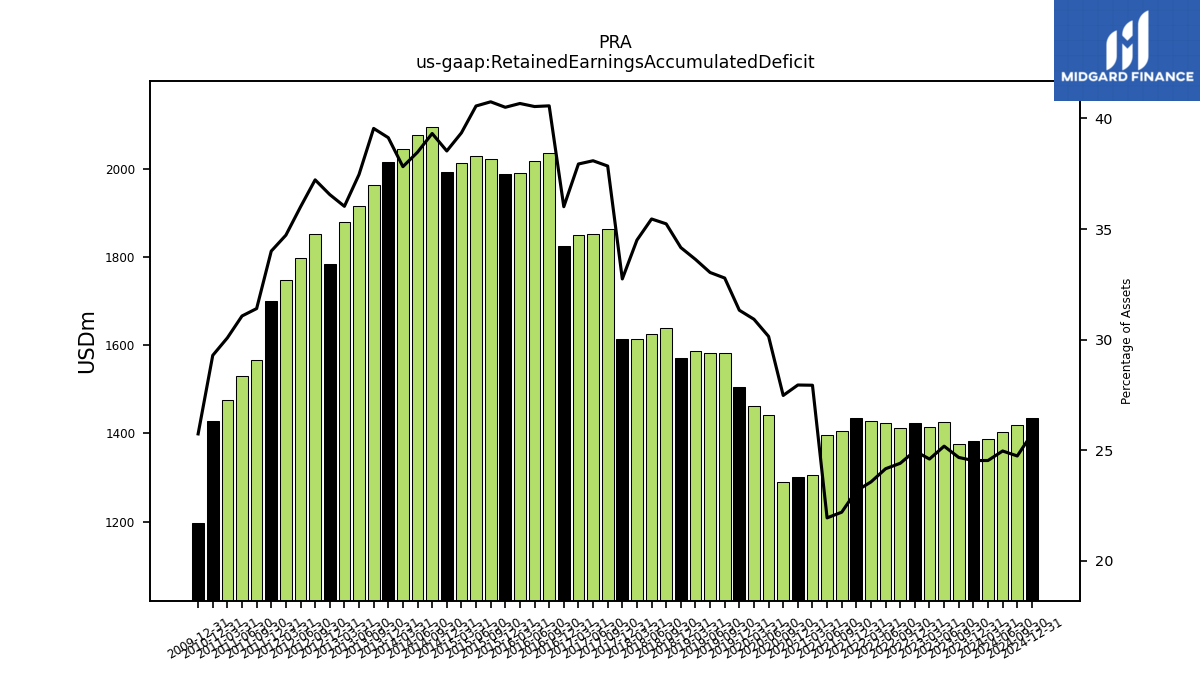
| Retained Earnings Accumulated Deficit | 1381.98 | 1375.60 | 1425.04 | 1414.41 | 1423.29 | 1412.04 | 1423.87 | 1428.23 | 1434.49 | 1405.05 | 1395.55 | 1306.20 | 1301.16 | 1289.55 | 1442.22 | 1463.02 | 1505.74 | 1581.79 | 1581.27 | 1586.39 | 1571.85 | 1639.74 | 1625.14 | 1614.34 | 1614.19 | 1864.14 | 1851.74 | 1848.75 | 1824.09 | 2034.90 | 2017.52 | 1990.91 | 1988.04 | 2022.53 | 2028.74 | 2012.33 | 1991.70 | 2094.18 | 2076.74 | 2044.43 | 2015.60 | 1963.14 | 1915.32 | 1880.26 | 1782.86 | 1851.05 | 1798.62 | 1747.84 | 1699.85 | 1566.89 | 1530.82 | 1475.72 | 1428.03 | NA | NA | NA | |
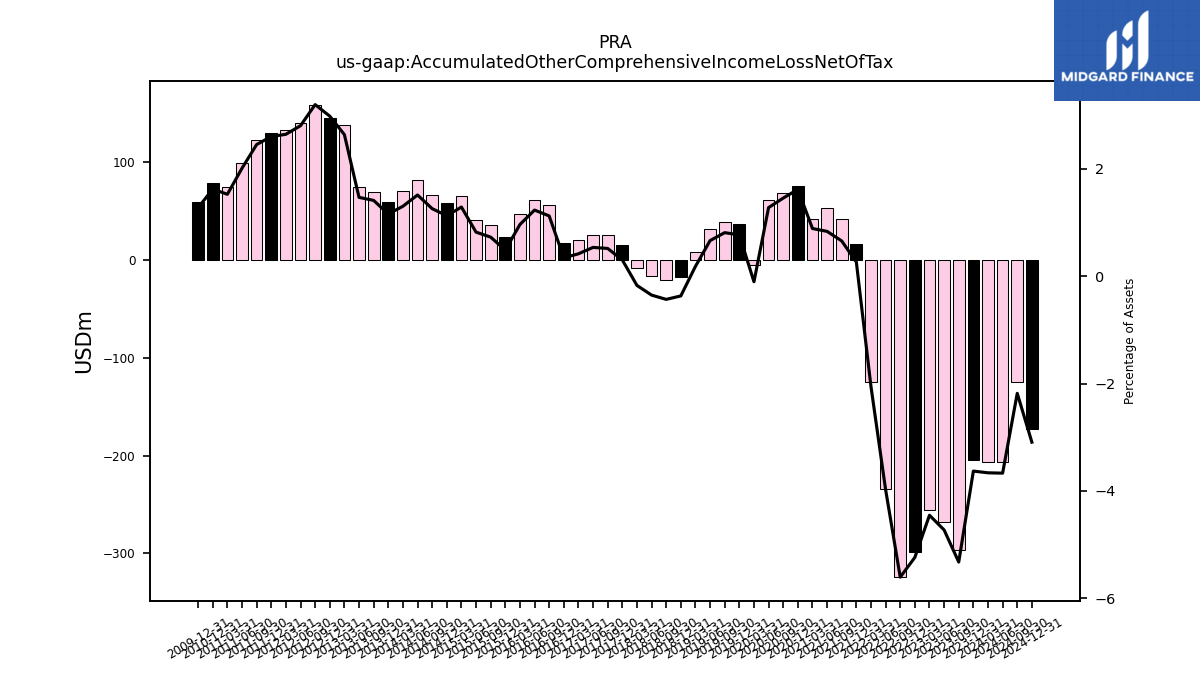
| Accumulated Other Comprehensive Income Loss Net Of Tax | -204.49 | -296.84 | -267.48 | -255.98 | -298.61 | -324.24 | -234.19 | -124.57 | 16.28 | 41.51 | 53.07 | 41.52 | 75.23 | 68.28 | 61.13 | -4.91 | 36.95 | 39.13 | 31.73 | 8.65 | -16.91 | -20.11 | -16.14 | -8.05 | 14.91 | 25.46 | 26.06 | 20.32 | 17.40 | 56.31 | 61.29 | 47.12 | 23.86 | 36.10 | 41.05 | 65.88 | 58.20 | 67.01 | 81.65 | 70.41 | 59.66 | 70.07 | 75.06 | 137.63 | 145.38 | 158.94 | 140.05 | 133.05 | 130.04 | 122.35 | 99.06 | 74.83 | 79.12 | NA | NA | NA | |
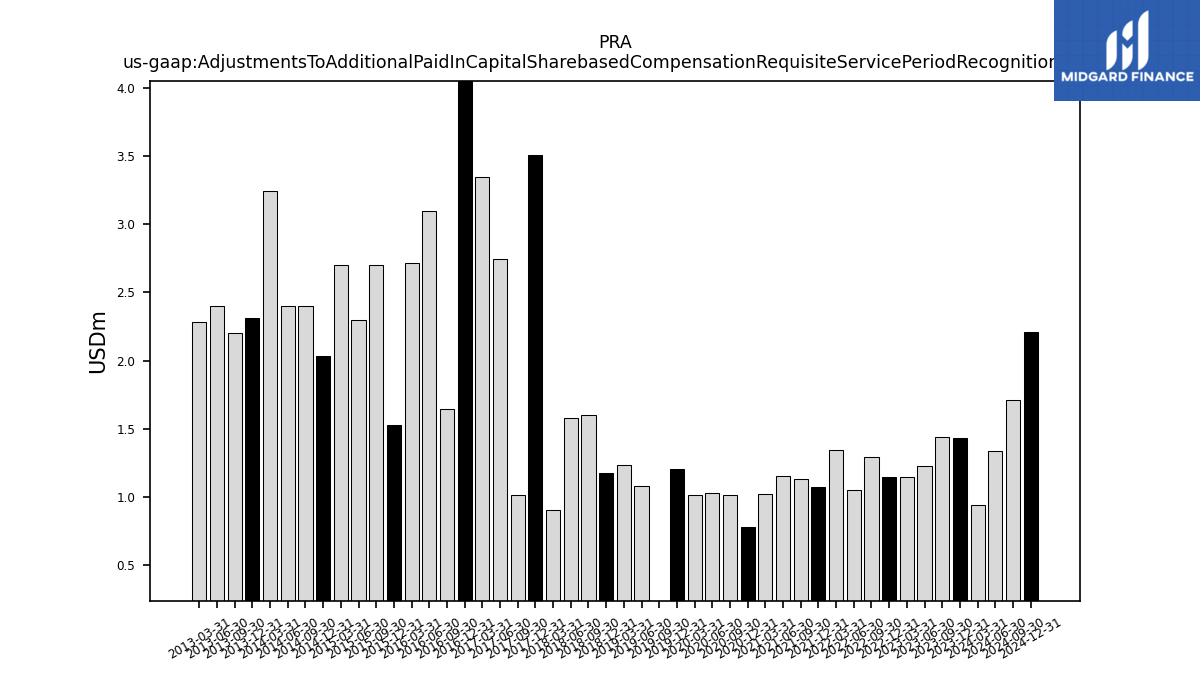
| Adjustments To Additional Paid In Capital Sharebased Compensation Requisite Service Period Recognition Value | 1.43 | 1.44 | 1.23 | 1.15 | 1.15 | 1.29 | 1.05 | 1.34 | 1.07 | 1.13 | 1.15 | 1.02 | 0.78 | 1.02 | 1.03 | 1.02 | 1.20 | -0.01 | 1.08 | 1.24 | 1.18 | 1.60 | 1.58 | 0.90 | 3.50 | 1.02 | 2.75 | 3.35 | 5.00 | 1.65 | 3.10 | 2.71 | 1.53 | 2.70 | 2.30 | 2.70 | 2.03 | 2.40 | 2.40 | 3.24 | 2.31 | 2.20 | 2.40 | 2.28 | NA | NA | NA | NA | NA | NA | NA | NA | NA | NA | NA | NA |
| 2023-12-31 | 2023-09-30 | 2023-06-30 | 2023-03-31 | 2022-12-31 | 2022-09-30 | 2022-06-30 | 2022-03-31 | 2021-12-31 | 2021-09-30 | 2021-06-30 | 2021-03-31 | 2020-12-31 | 2020-09-30 | 2020-06-30 | 2020-03-31 | 2019-12-31 | 2019-09-30 | 2019-06-30 | 2019-03-31 | 2018-12-31 | 2018-09-30 | 2018-06-30 | 2018-03-31 | 2017-12-31 | 2017-09-30 | 2017-06-30 | 2017-03-31 | 2016-12-31 | 2016-09-30 | 2016-06-30 | 2016-03-31 | 2015-12-31 | 2015-09-30 | 2015-06-30 | 2015-03-31 | 2014-12-31 | 2014-09-30 | 2014-06-30 | 2014-03-31 | 2013-12-31 | 2013-09-30 | 2013-06-30 | 2013-03-31 | 2012-12-31 | 2012-09-30 | 2012-06-30 | 2012-03-31 | 2011-12-31 | 2011-09-30 | 2011-06-30 | 2011-03-31 | 2010-12-31 | 2010-09-30 | 2010-06-30 | 2010-03-31 | ||
|---|---|---|---|---|---|---|---|---|---|---|---|---|---|---|---|---|---|---|---|---|---|---|---|---|---|---|---|---|---|---|---|---|---|---|---|---|---|---|---|---|---|---|---|---|---|---|---|---|---|---|---|---|---|---|---|---|---|
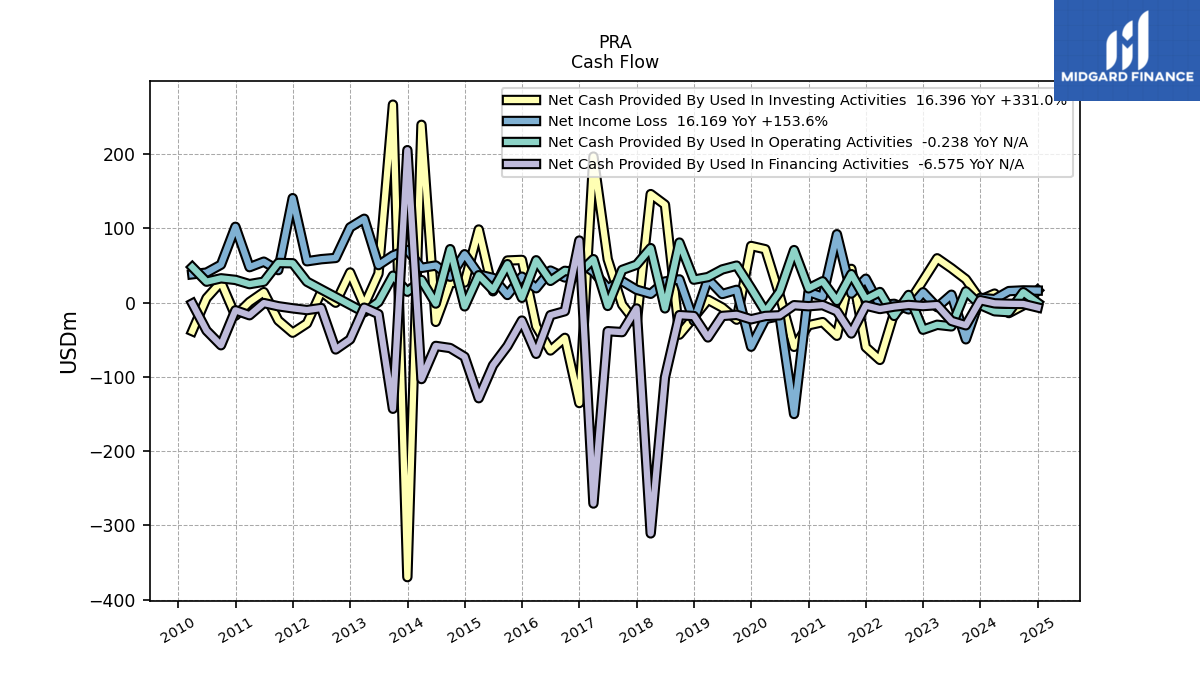
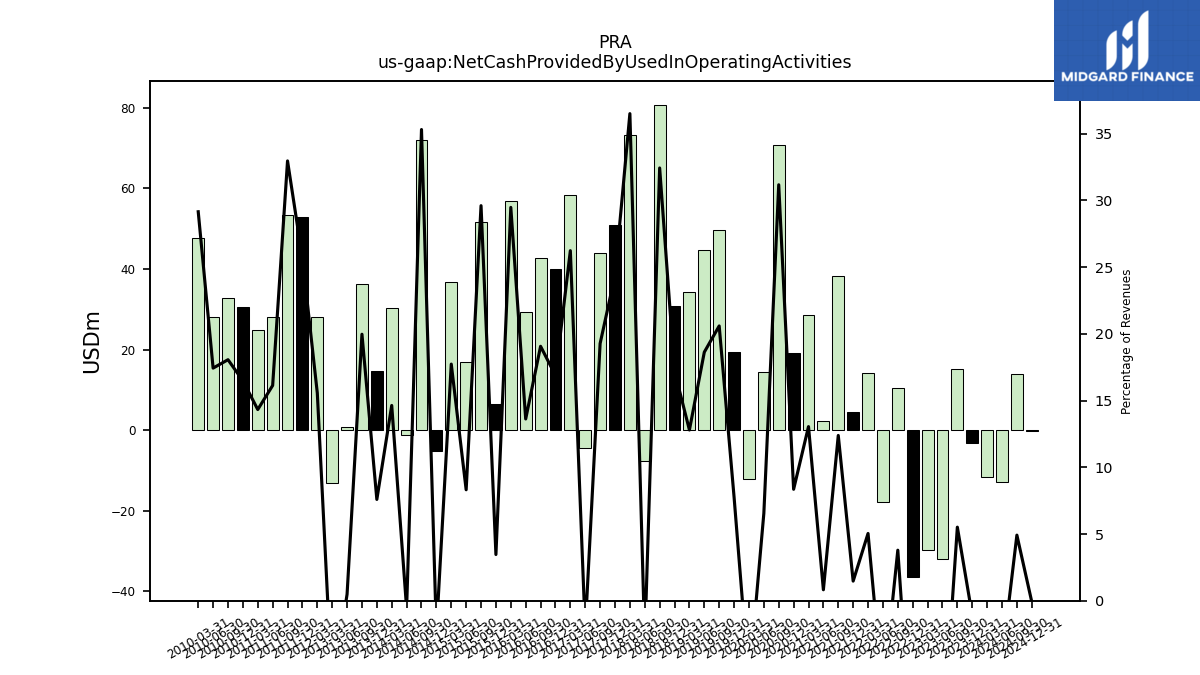
| Net Cash Provided By Used In Operating Activities | -3.24 | 15.20 | -32.00 | -29.84 | -36.51 | 10.34 | -17.94 | 14.27 | 4.61 | 38.35 | 2.31 | 28.70 | 19.17 | 70.70 | 14.52 | -12.05 | 19.36 | 49.79 | 44.62 | 34.39 | 30.87 | 80.83 | -7.79 | 73.35 | 50.97 | 44.02 | -4.46 | 58.48 | 40.13 | 42.76 | 29.25 | 56.98 | 6.44 | 51.77 | 16.91 | 36.84 | -5.08 | 71.95 | -1.30 | 30.43 | 14.64 | 36.23 | 0.83 | -13.11 | NA | NA | NA | 28.10 | 52.95 | 53.37 | 28.19 | 24.86 | 30.57 | 32.71 | 28.14 | 47.78 | |
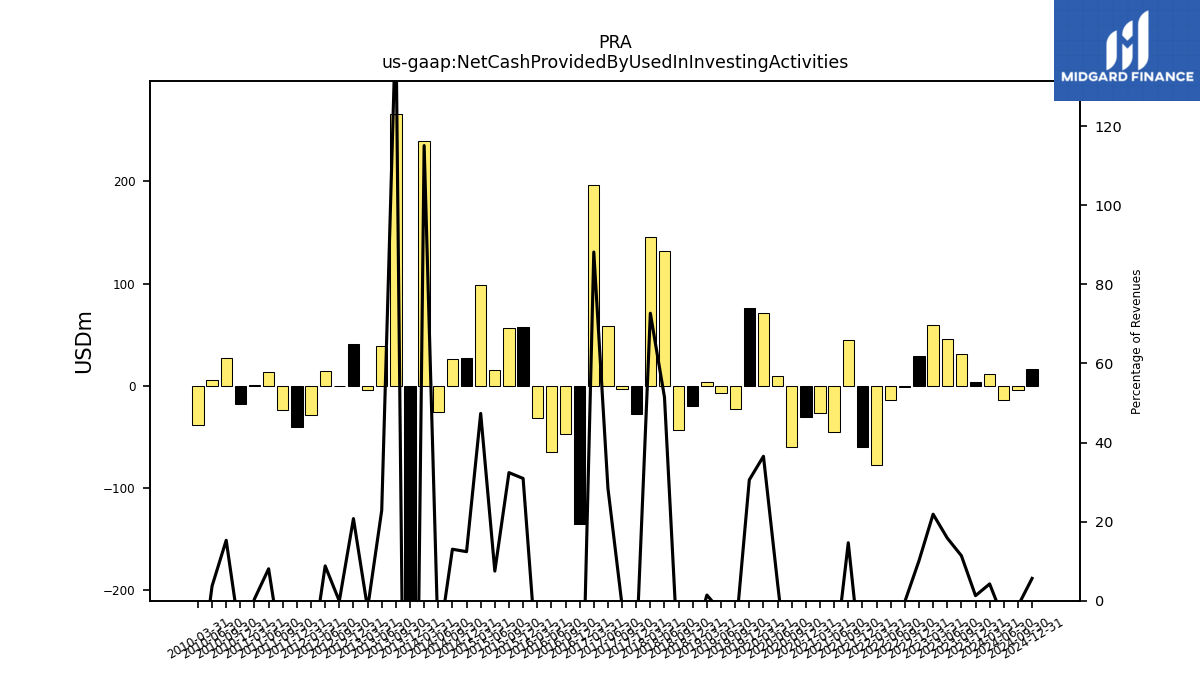
| Net Cash Provided By Used In Investing Activities | 3.80 | 31.41 | 46.26 | 59.66 | 29.75 | -0.64 | -13.98 | -77.13 | -59.99 | 45.40 | -44.67 | -26.26 | -30.48 | -59.52 | 9.69 | 71.83 | 76.24 | -23.00 | -6.59 | 3.87 | -19.89 | -43.12 | 131.79 | 146.11 | -27.64 | -2.77 | 58.50 | 196.57 | -135.21 | -47.45 | -64.44 | -31.84 | 57.47 | 56.66 | 15.26 | 98.41 | 27.05 | 26.55 | -25.95 | 239.34 | -369.53 | 266.51 | 39.03 | -3.81 | 40.58 | -0.13 | 14.43 | -28.03 | -40.56 | -23.98 | 14.12 | 0.80 | -17.64 | 27.69 | 5.99 | -38.39 | |
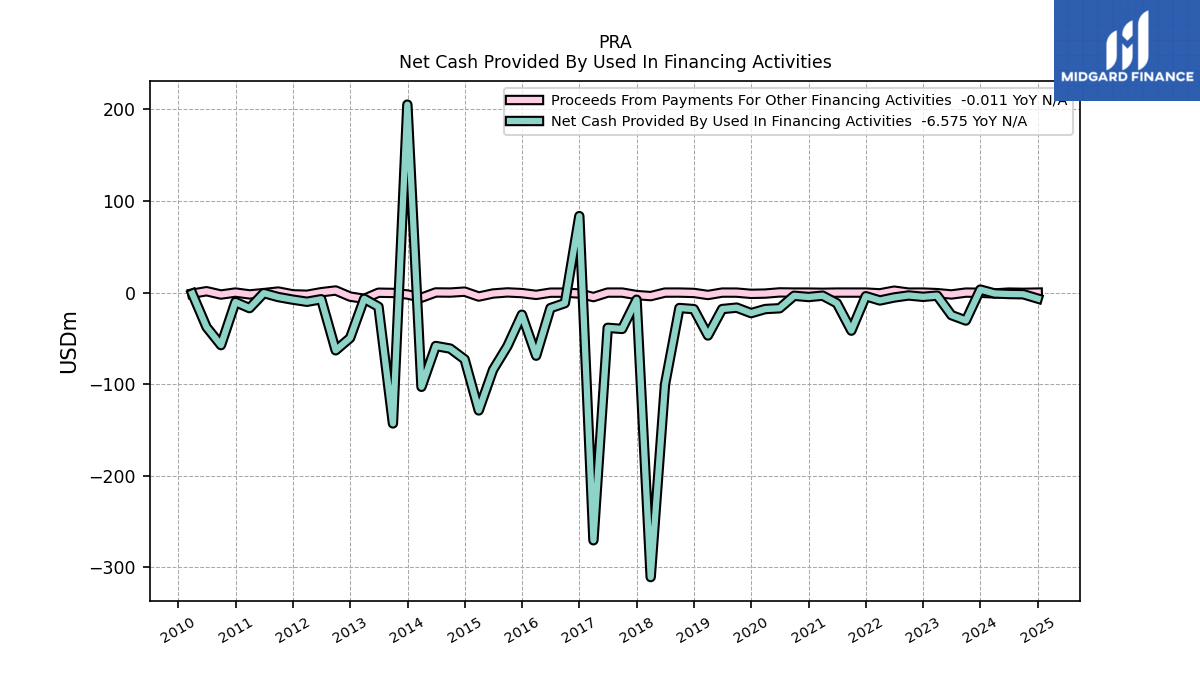
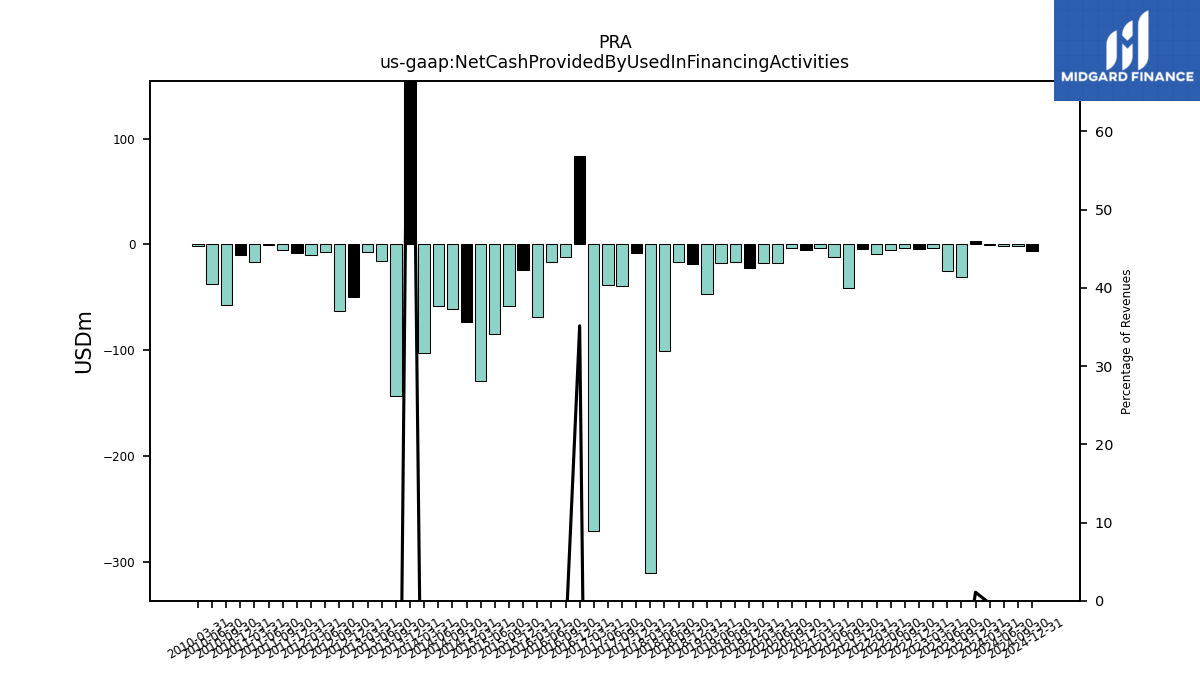
| Net Cash Provided By Used In Financing Activities | 3.23 | -30.53 | -24.66 | -3.35 | -4.65 | -3.17 | -5.35 | -8.63 | -3.96 | -41.59 | -11.69 | -3.39 | -4.85 | -3.50 | -17.12 | -17.98 | -22.44 | -16.46 | -17.99 | -46.90 | -18.07 | -16.87 | -100.53 | -310.71 | -7.84 | -39.71 | -38.49 | -270.48 | 83.53 | -11.57 | -16.95 | -68.94 | -24.15 | -58.45 | -84.37 | -128.71 | -72.93 | -61.15 | -58.33 | -102.91 | 205.22 | -142.92 | -15.46 | -6.80 | -49.58 | -63.05 | -7.28 | -10.04 | -7.70 | -4.90 | -0.59 | -17.01 | -10.34 | -57.42 | -37.70 | -1.18 |
| 2023-12-31 | 2023-09-30 | 2023-06-30 | 2023-03-31 | 2022-12-31 | 2022-09-30 | 2022-06-30 | 2022-03-31 | 2021-12-31 | 2021-09-30 | 2021-06-30 | 2021-03-31 | 2020-12-31 | 2020-09-30 | 2020-06-30 | 2020-03-31 | 2019-12-31 | 2019-09-30 | 2019-06-30 | 2019-03-31 | 2018-12-31 | 2018-09-30 | 2018-06-30 | 2018-03-31 | 2017-12-31 | 2017-09-30 | 2017-06-30 | 2017-03-31 | 2016-12-31 | 2016-09-30 | 2016-06-30 | 2016-03-31 | 2015-12-31 | 2015-09-30 | 2015-06-30 | 2015-03-31 | 2014-12-31 | 2014-09-30 | 2014-06-30 | 2014-03-31 | 2013-12-31 | 2013-09-30 | 2013-06-30 | 2013-03-31 | 2012-12-31 | 2012-09-30 | 2012-06-30 | 2012-03-31 | 2011-12-31 | 2011-09-30 | 2011-06-30 | 2011-03-31 | 2010-12-31 | 2010-09-30 | 2010-06-30 | 2010-03-31 | ||
|---|---|---|---|---|---|---|---|---|---|---|---|---|---|---|---|---|---|---|---|---|---|---|---|---|---|---|---|---|---|---|---|---|---|---|---|---|---|---|---|---|---|---|---|---|---|---|---|---|---|---|---|---|---|---|---|---|---|
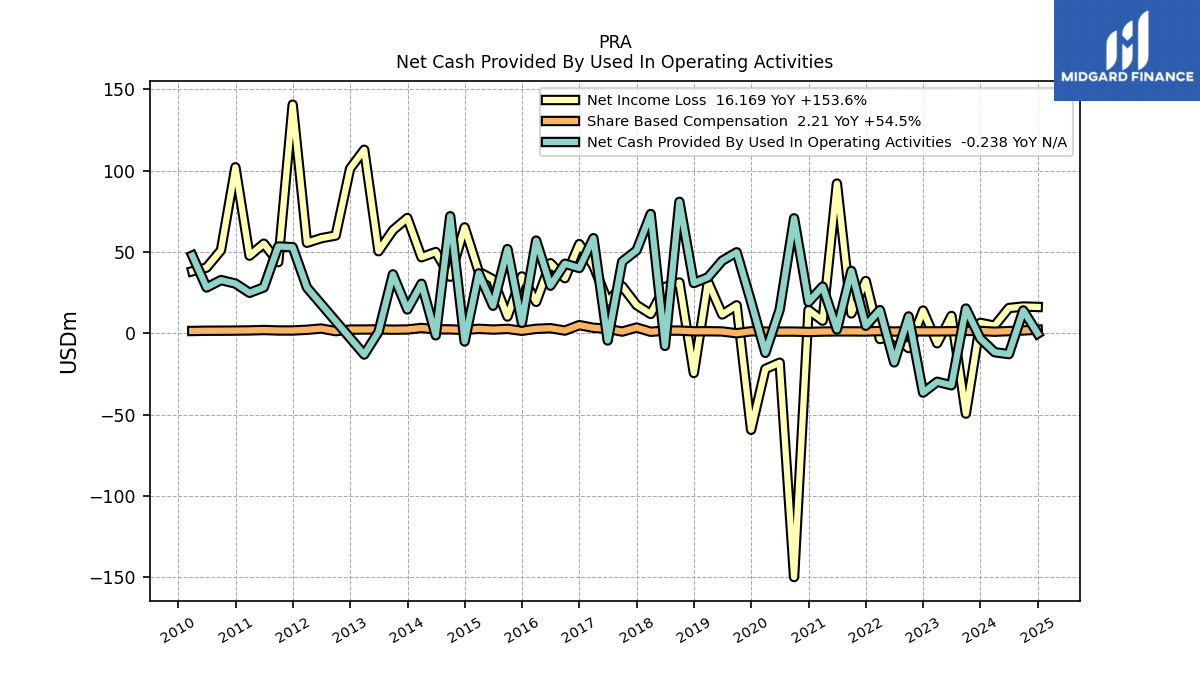
| Net Cash Provided By Used In Operating Activities | -3.24 | 15.20 | -32.00 | -29.84 | -36.51 | 10.34 | -17.94 | 14.27 | 4.61 | 38.35 | 2.31 | 28.70 | 19.17 | 70.70 | 14.52 | -12.05 | 19.36 | 49.79 | 44.62 | 34.39 | 30.87 | 80.83 | -7.79 | 73.35 | 50.97 | 44.02 | -4.46 | 58.48 | 40.13 | 42.76 | 29.25 | 56.98 | 6.44 | 51.77 | 16.91 | 36.84 | -5.08 | 71.95 | -1.30 | 30.43 | 14.64 | 36.23 | 0.83 | -13.11 | NA | NA | NA | 28.10 | 52.95 | 53.37 | 28.19 | 24.86 | 30.57 | 32.71 | 28.14 | 47.78 | |
| Net Income Loss | 6.38 | -49.43 | 10.63 | -6.17 | 13.94 | -9.12 | -1.66 | -3.56 | 32.14 | 12.20 | 92.05 | 7.74 | 14.30 | -149.98 | -18.10 | -21.95 | -59.38 | 17.19 | 11.54 | 31.65 | -24.45 | 31.23 | 28.42 | 11.86 | 17.34 | 28.95 | 19.52 | 41.45 | 54.85 | 33.83 | 43.08 | 19.32 | 34.95 | 10.28 | 33.16 | 37.81 | 65.11 | 34.78 | 49.94 | 46.73 | 70.86 | 63.36 | 50.45 | 112.85 | 101.27 | 60.11 | 58.45 | 55.65 | 140.60 | 43.70 | 55.10 | 47.69 | 102.05 | 51.05 | 40.38 | 38.11 | |
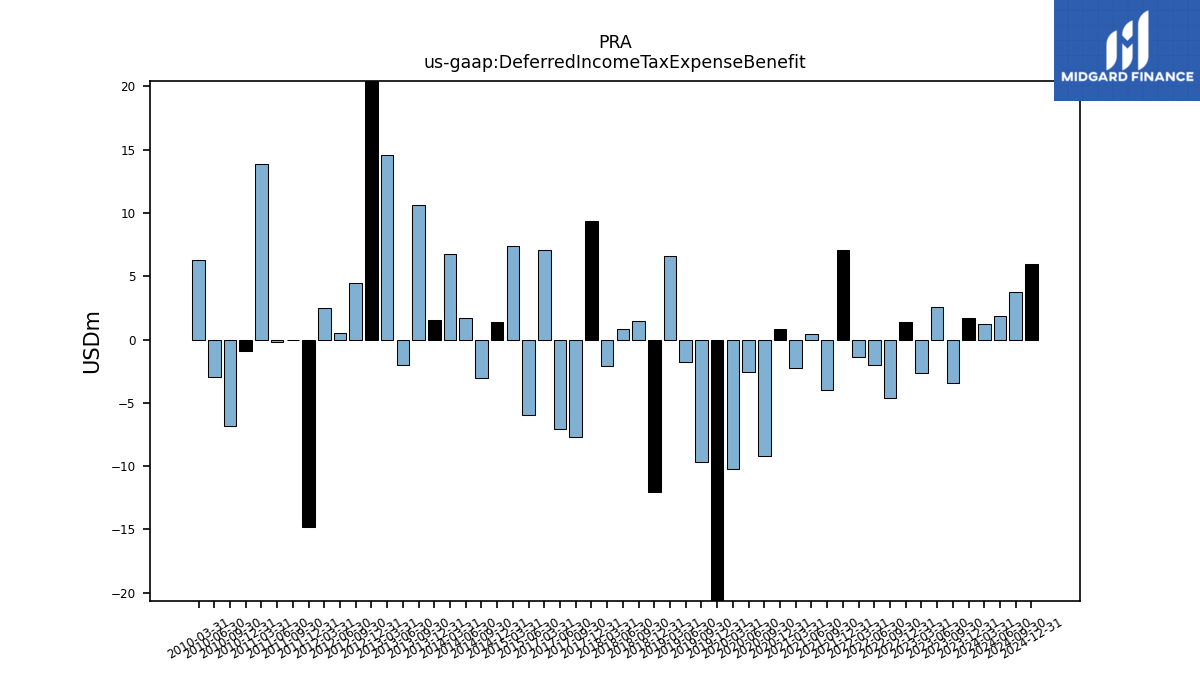
| Deferred Income Tax Expense Benefit | 1.68 | -3.43 | 2.61 | -2.63 | 1.41 | -4.63 | -2.00 | -1.41 | 7.09 | -3.96 | 0.46 | -2.27 | 0.85 | -9.17 | -2.60 | -10.22 | -23.77 | -9.70 | -1.78 | 6.62 | -12.03 | 1.43 | 0.86 | -2.09 | 9.34 | -7.67 | -7.03 | 7.05 | NA | NA | NA | NA | NA | NA | -5.92 | 7.36 | 1.35 | -3.07 | 1.74 | 6.77 | 1.52 | 10.63 | -2.05 | 14.56 | 30.28 | 4.46 | 0.49 | 2.52 | -14.77 | -0.01 | -0.18 | 13.91 | -0.92 | -6.81 | -2.98 | 6.31 | |
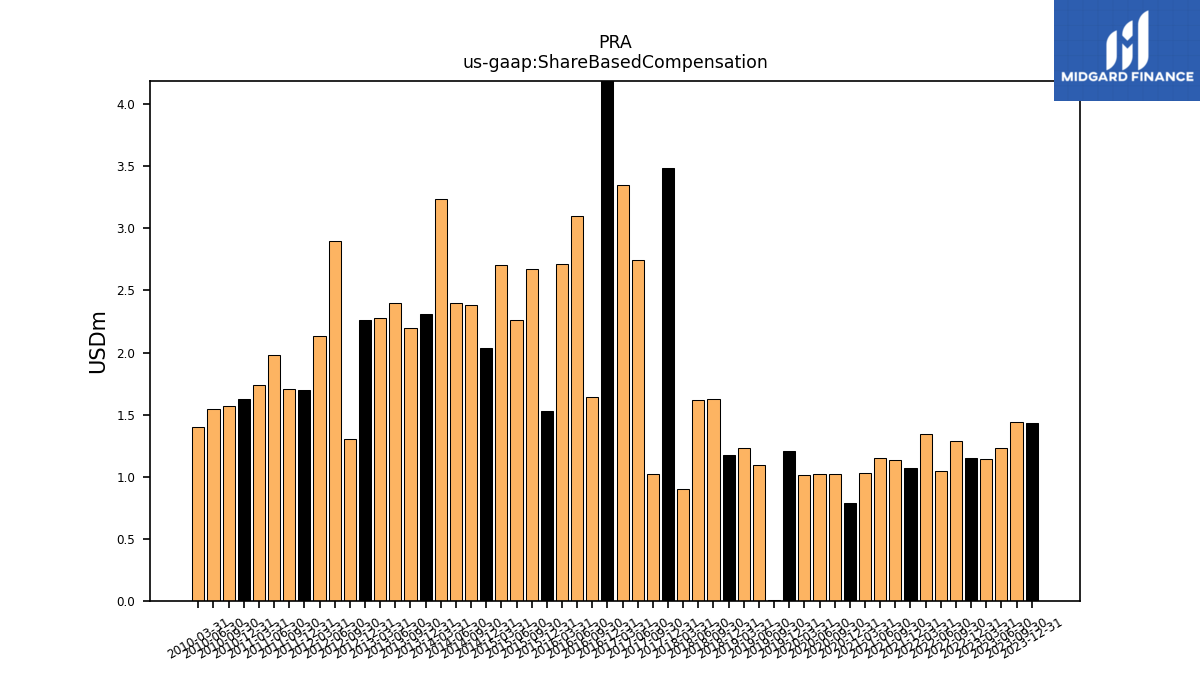
| Share Based Compensation | 1.43 | 1.44 | 1.23 | 1.15 | 1.15 | 1.29 | 1.05 | 1.34 | 1.07 | 1.13 | 1.15 | 1.03 | 0.79 | 1.02 | 1.02 | 1.01 | 1.20 | 0.00 | 1.09 | 1.23 | 1.18 | 1.63 | 1.61 | 0.90 | 3.49 | 1.02 | 2.75 | 3.35 | 5.00 | 1.65 | 3.10 | 2.71 | 1.53 | 2.67 | 2.26 | 2.70 | 2.03 | 2.38 | 2.40 | 3.24 | 2.31 | 2.20 | 2.40 | 2.28 | 2.26 | 1.30 | 2.90 | 2.13 | 1.70 | 1.71 | 1.98 | 1.74 | 1.63 | 1.57 | 1.54 | 1.40 |
| 2023-12-31 | 2023-09-30 | 2023-06-30 | 2023-03-31 | 2022-12-31 | 2022-09-30 | 2022-06-30 | 2022-03-31 | 2021-12-31 | 2021-09-30 | 2021-06-30 | 2021-03-31 | 2020-12-31 | 2020-09-30 | 2020-06-30 | 2020-03-31 | 2019-12-31 | 2019-09-30 | 2019-06-30 | 2019-03-31 | 2018-12-31 | 2018-09-30 | 2018-06-30 | 2018-03-31 | 2017-12-31 | 2017-09-30 | 2017-06-30 | 2017-03-31 | 2016-12-31 | 2016-09-30 | 2016-06-30 | 2016-03-31 | 2015-12-31 | 2015-09-30 | 2015-06-30 | 2015-03-31 | 2014-12-31 | 2014-09-30 | 2014-06-30 | 2014-03-31 | 2013-12-31 | 2013-09-30 | 2013-06-30 | 2013-03-31 | 2012-12-31 | 2012-09-30 | 2012-06-30 | 2012-03-31 | 2011-12-31 | 2011-09-30 | 2011-06-30 | 2011-03-31 | 2010-12-31 | 2010-09-30 | 2010-06-30 | 2010-03-31 | ||
|---|---|---|---|---|---|---|---|---|---|---|---|---|---|---|---|---|---|---|---|---|---|---|---|---|---|---|---|---|---|---|---|---|---|---|---|---|---|---|---|---|---|---|---|---|---|---|---|---|---|---|---|---|---|---|---|---|---|
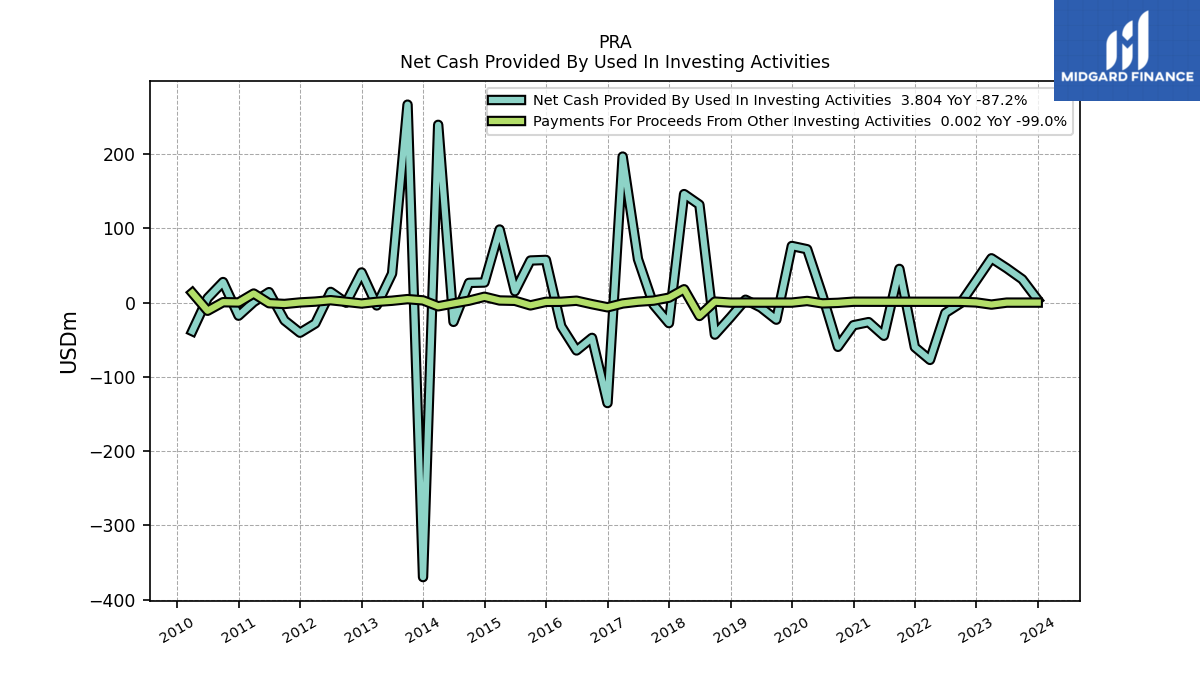
| Net Cash Provided By Used In Investing Activities | 3.80 | 31.41 | 46.26 | 59.66 | 29.75 | -0.64 | -13.98 | -77.13 | -59.99 | 45.40 | -44.67 | -26.26 | -30.48 | -59.52 | 9.69 | 71.83 | 76.24 | -23.00 | -6.59 | 3.87 | -19.89 | -43.12 | 131.79 | 146.11 | -27.64 | -2.77 | 58.50 | 196.57 | -135.21 | -47.45 | -64.44 | -31.84 | 57.47 | 56.66 | 15.26 | 98.41 | 27.05 | 26.55 | -25.95 | 239.34 | -369.53 | 266.51 | 39.03 | -3.81 | 40.58 | -0.13 | 14.43 | -28.03 | -40.56 | -23.98 | 14.12 | 0.80 | -17.64 | 27.69 | 5.99 | -38.39 |
| 2023-12-31 | 2023-09-30 | 2023-06-30 | 2023-03-31 | 2022-12-31 | 2022-09-30 | 2022-06-30 | 2022-03-31 | 2021-12-31 | 2021-09-30 | 2021-06-30 | 2021-03-31 | 2020-12-31 | 2020-09-30 | 2020-06-30 | 2020-03-31 | 2019-12-31 | 2019-09-30 | 2019-06-30 | 2019-03-31 | 2018-12-31 | 2018-09-30 | 2018-06-30 | 2018-03-31 | 2017-12-31 | 2017-09-30 | 2017-06-30 | 2017-03-31 | 2016-12-31 | 2016-09-30 | 2016-06-30 | 2016-03-31 | 2015-12-31 | 2015-09-30 | 2015-06-30 | 2015-03-31 | 2014-12-31 | 2014-09-30 | 2014-06-30 | 2014-03-31 | 2013-12-31 | 2013-09-30 | 2013-06-30 | 2013-03-31 | 2012-12-31 | 2012-09-30 | 2012-06-30 | 2012-03-31 | 2011-12-31 | 2011-09-30 | 2011-06-30 | 2011-03-31 | 2010-12-31 | 2010-09-30 | 2010-06-30 | 2010-03-31 | ||
|---|---|---|---|---|---|---|---|---|---|---|---|---|---|---|---|---|---|---|---|---|---|---|---|---|---|---|---|---|---|---|---|---|---|---|---|---|---|---|---|---|---|---|---|---|---|---|---|---|---|---|---|---|---|---|---|---|---|
| Net Cash Provided By Used In Financing Activities | 3.23 | -30.53 | -24.66 | -3.35 | -4.65 | -3.17 | -5.35 | -8.63 | -3.96 | -41.59 | -11.69 | -3.39 | -4.85 | -3.50 | -17.12 | -17.98 | -22.44 | -16.46 | -17.99 | -46.90 | -18.07 | -16.87 | -100.53 | -310.71 | -7.84 | -39.71 | -38.49 | -270.48 | 83.53 | -11.57 | -16.95 | -68.94 | -24.15 | -58.45 | -84.37 | -128.71 | -72.93 | -61.15 | -58.33 | -102.91 | 205.22 | -142.92 | -15.46 | -6.80 | -49.58 | -63.05 | -7.28 | -10.04 | -7.70 | -4.90 | -0.59 | -17.01 | -10.34 | -57.42 | -37.70 | -1.18 | |
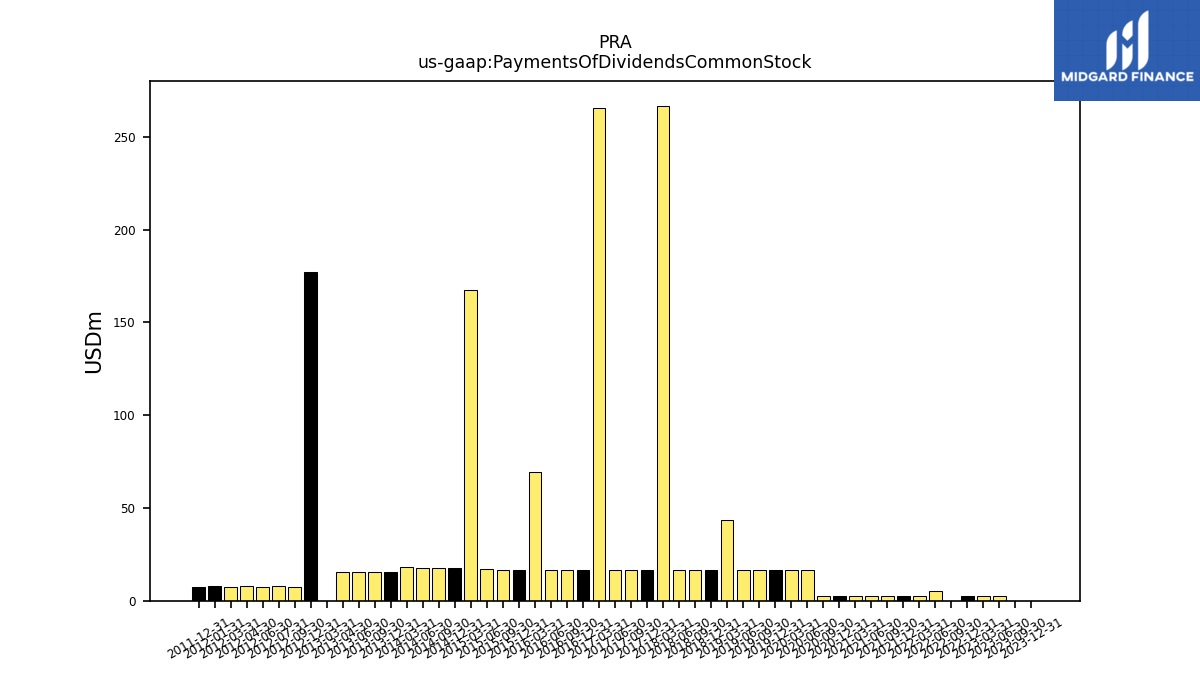
| Payments Of Dividends Common Stock | 0.00 | 0.00 | 2.69 | 2.69 | 2.69 | 0.00 | 5.39 | 2.69 | 2.69 | 2.69 | 2.69 | 2.69 | 2.69 | 2.69 | 16.58 | 16.71 | 16.63 | 16.62 | 16.62 | 43.34 | 16.58 | 16.58 | 16.58 | 266.73 | 16.52 | 16.52 | 16.52 | 265.66 | 16.46 | 16.46 | 16.45 | 69.44 | 16.47 | 16.75 | 17.20 | 167.21 | 17.43 | 17.60 | 17.86 | 18.36 | 15.53 | 15.52 | 15.32 | 0.00 | 177.20 | 7.65 | 7.65 | 7.62 | 7.62 | NA | NA | NA | NA | NA | NA | NA | |
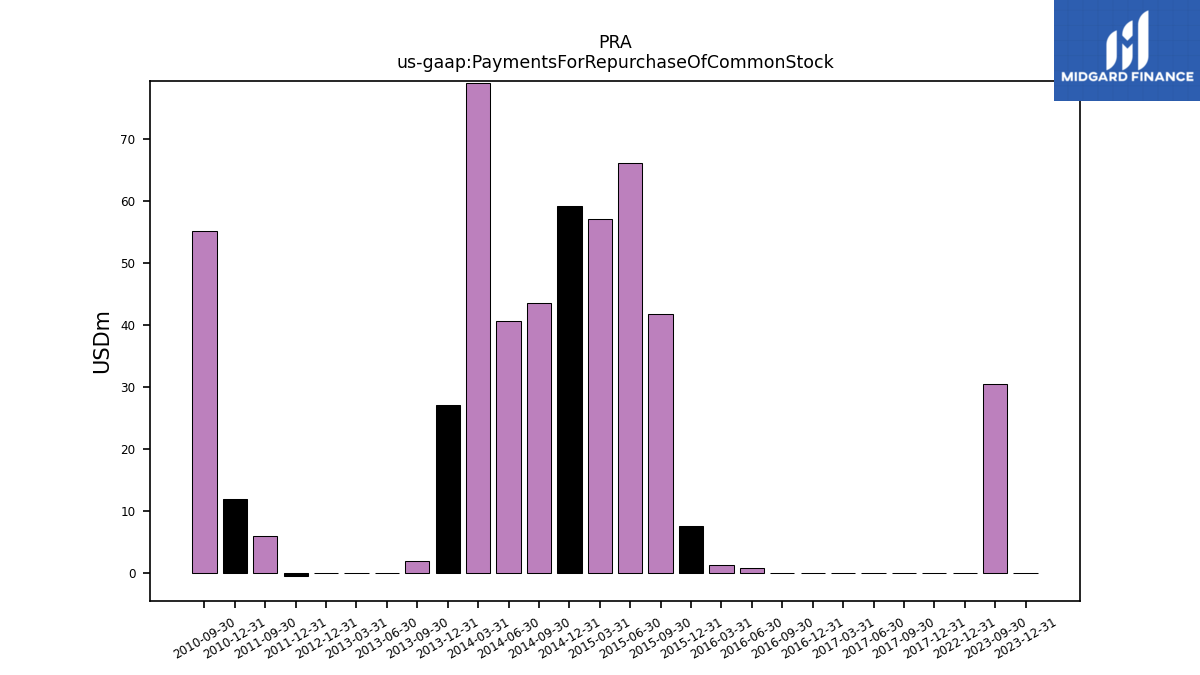
| Payments For Repurchase Of Common Stock | 0.00 | 30.52 | NA | NA | 0.00 | NA | NA | NA | NA | NA | NA | NA | NA | NA | NA | NA | NA | NA | NA | NA | NA | NA | NA | NA | 0.00 | 0.00 | 0.00 | 0.00 | 0.00 | 0.00 | 0.81 | 1.30 | 7.59 | 41.88 | 66.14 | 57.16 | 59.21 | 43.55 | 40.62 | 78.98 | 27.10 | 1.99 | 0.00 | 0.00 | 0.00 | NA | NA | NA | -0.44 | 6.02 | NA | NA | 11.92 | 55.26 | NA | NA |
| 2023-12-31 | 2023-09-30 | 2023-06-30 | 2023-03-31 | 2022-12-31 | 2022-09-30 | 2022-06-30 | 2022-03-31 | 2021-12-31 | 2021-09-30 | 2021-06-30 | 2021-03-31 | 2020-12-31 | 2020-09-30 | 2020-06-30 | 2020-03-31 | 2019-12-31 | 2019-09-30 | 2019-06-30 | 2019-03-31 | 2018-12-31 | 2018-09-30 | 2018-06-30 | 2018-03-31 | 2017-12-31 | 2017-09-30 | 2017-06-30 | 2017-03-31 | 2016-12-31 | 2016-09-30 | 2016-06-30 | 2016-03-31 | 2015-12-31 | 2015-09-30 | 2015-06-30 | 2015-03-31 | 2014-12-31 | 2014-09-30 | 2014-06-30 | 2014-03-31 | 2013-12-31 | 2013-09-30 | 2013-06-30 | 2013-03-31 | 2012-12-31 | 2012-09-30 | 2012-06-30 | 2012-03-31 | 2011-12-31 | 2011-09-30 | 2011-06-30 | 2011-03-31 | 2010-12-31 | 2010-09-30 | 2010-06-30 | 2010-03-31 | ||
|---|---|---|---|---|---|---|---|---|---|---|---|---|---|---|---|---|---|---|---|---|---|---|---|---|---|---|---|---|---|---|---|---|---|---|---|---|---|---|---|---|---|---|---|---|---|---|---|---|---|---|---|---|---|---|---|---|---|
| Revenues | 296.96 | 275.75 | 291.83 | 272.68 | 294.71 | 273.08 | 255.82 | 283.07 | 313.07 | 309.70 | 281.63 | 220.02 | 229.60 | 226.90 | 221.74 | 196.70 | 249.47 | 241.87 | 239.62 | 268.88 | 179.48 | 249.32 | 256.19 | 201.03 | 209.12 | 228.46 | 205.58 | 223.00 | 237.67 | 224.35 | 214.80 | 193.39 | 185.90 | 174.93 | 203.42 | 207.83 | 218.00 | 203.83 | 222.45 | 208.05 | 192.91 | 181.49 | 170.81 | 194.97 | 195.42 | 175.99 | 163.87 | 180.57 | 206.39 | 161.98 | 174.83 | 173.59 | 185.47 | 181.13 | 161.50 | 163.96 |