
| 2023-12-31 | 2023-09-30 | 2023-06-30 | 2023-03-31 | 2022-12-31 | 2022-09-30 | 2022-06-30 | 2022-03-31 | 2021-12-31 | 2021-09-30 | 2021-06-30 | 2021-03-31 | 2020-12-31 | 2020-09-30 | 2020-06-30 | 2020-03-31 | 2019-12-31 | 2019-09-30 | 2019-06-30 | 2019-03-31 | 2018-12-31 | 2018-09-30 | 2018-06-30 | 2018-03-31 | 2017-12-31 | 2017-09-30 | 2017-06-30 | 2017-03-31 | 2016-12-31 | 2016-09-30 | 2016-06-30 | 2016-03-31 | 2015-12-31 | 2015-09-30 | 2015-06-30 | 2015-03-31 | 2014-12-31 | 2014-09-30 | 2014-06-30 | 2014-03-31 | 2013-12-31 | 2013-09-30 | 2013-06-30 | 2013-03-31 | 2012-12-31 | 2012-09-30 | 2012-06-30 | 2012-03-31 | 2011-12-31 | 2011-09-30 | 2011-06-30 | 2011-03-31 | 2010-12-31 | 2010-09-30 | 2010-06-30 | ||
|---|---|---|---|---|---|---|---|---|---|---|---|---|---|---|---|---|---|---|---|---|---|---|---|---|---|---|---|---|---|---|---|---|---|---|---|---|---|---|---|---|---|---|---|---|---|---|---|---|---|---|---|---|---|---|---|---|
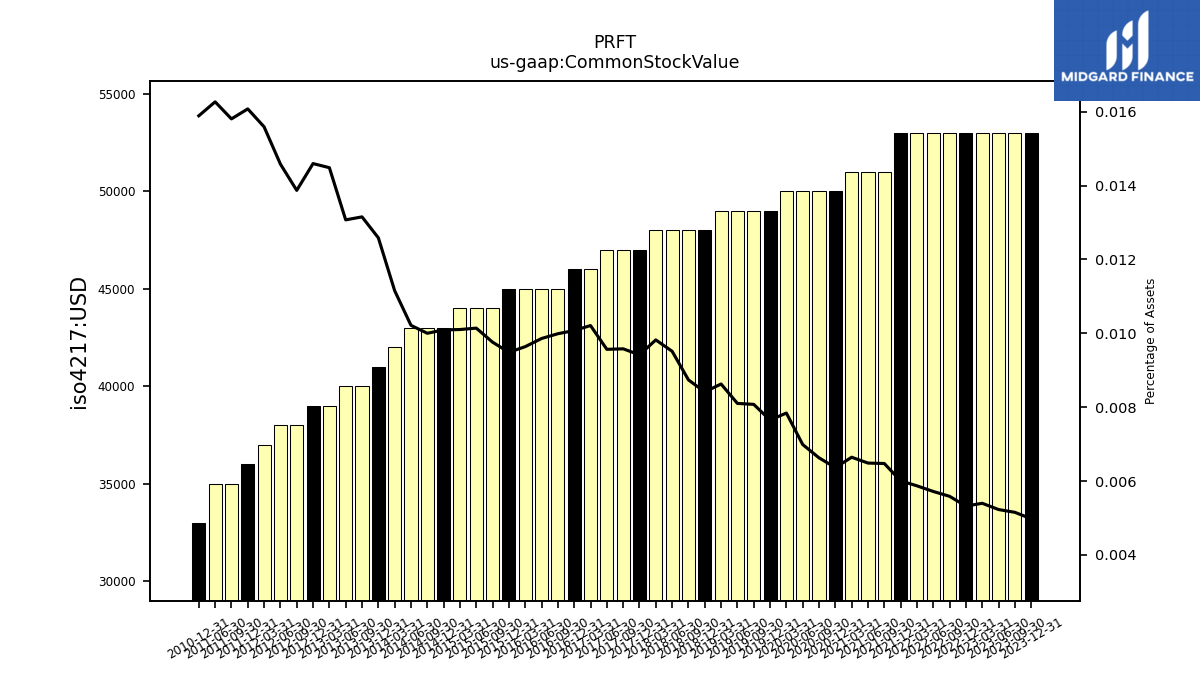
| Common Stock Value | 0.05 | 0.05 | 0.05 | 0.05 | 0.05 | 0.05 | 0.05 | 0.05 | 0.05 | 0.05 | 0.05 | 0.05 | 0.05 | 0.05 | 0.05 | 0.05 | 0.05 | 0.05 | 0.05 | 0.05 | 0.05 | 0.05 | 0.05 | 0.05 | 0.05 | 0.05 | 0.05 | 0.05 | 0.05 | 0.04 | 0.04 | 0.04 | 0.04 | 0.04 | 0.04 | 0.04 | 0.04 | 0.04 | 0.04 | 0.04 | 0.04 | 0.04 | 0.04 | 0.04 | 0.04 | 0.04 | 0.04 | 0.04 | 0.04 | 0.04 | 0.04 | NA | 0.03 | NA | NA | |
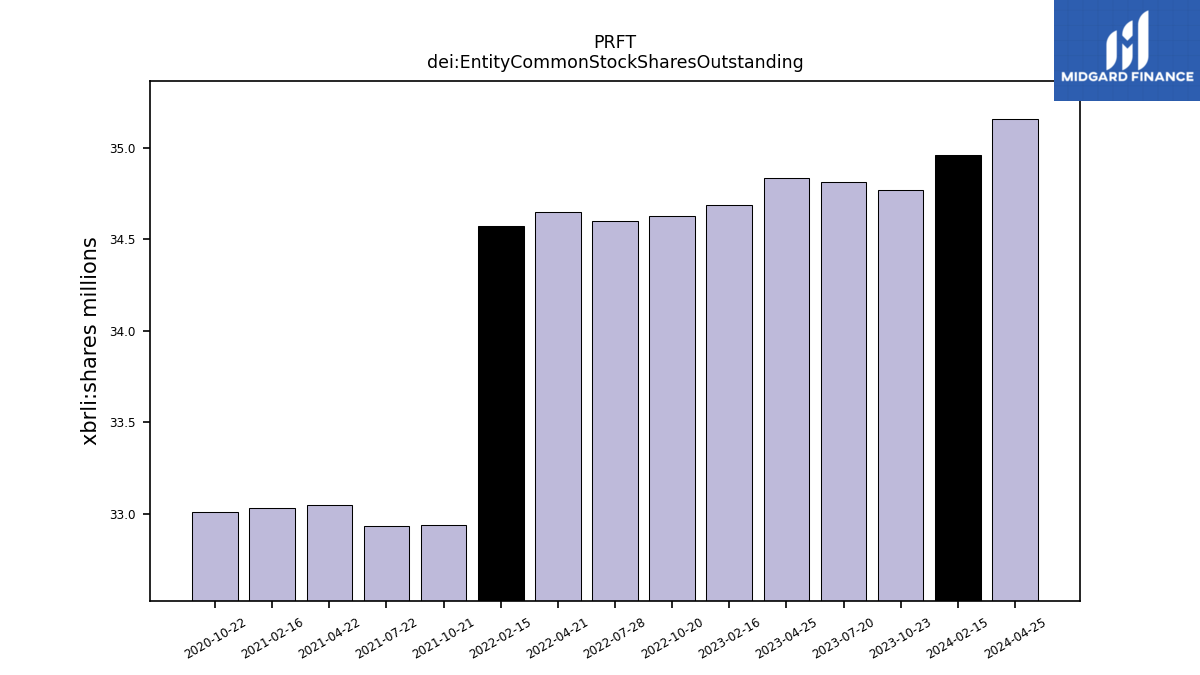
| dei: Entity Common Stock Shares Outstanding | NA | NA | NA | NA | NA | NA | NA | NA | NA | NA | NA | NA | NA | NA | NA | NA | NA | NA | NA | NA | NA | NA | NA | NA | NA | NA | NA | NA | NA | NA | NA | NA | NA | NA | NA | NA | NA | NA | NA | NA | NA | NA | NA | NA | NA | NA | NA | NA | NA | NA | NA | NA | NA | NA | NA | |
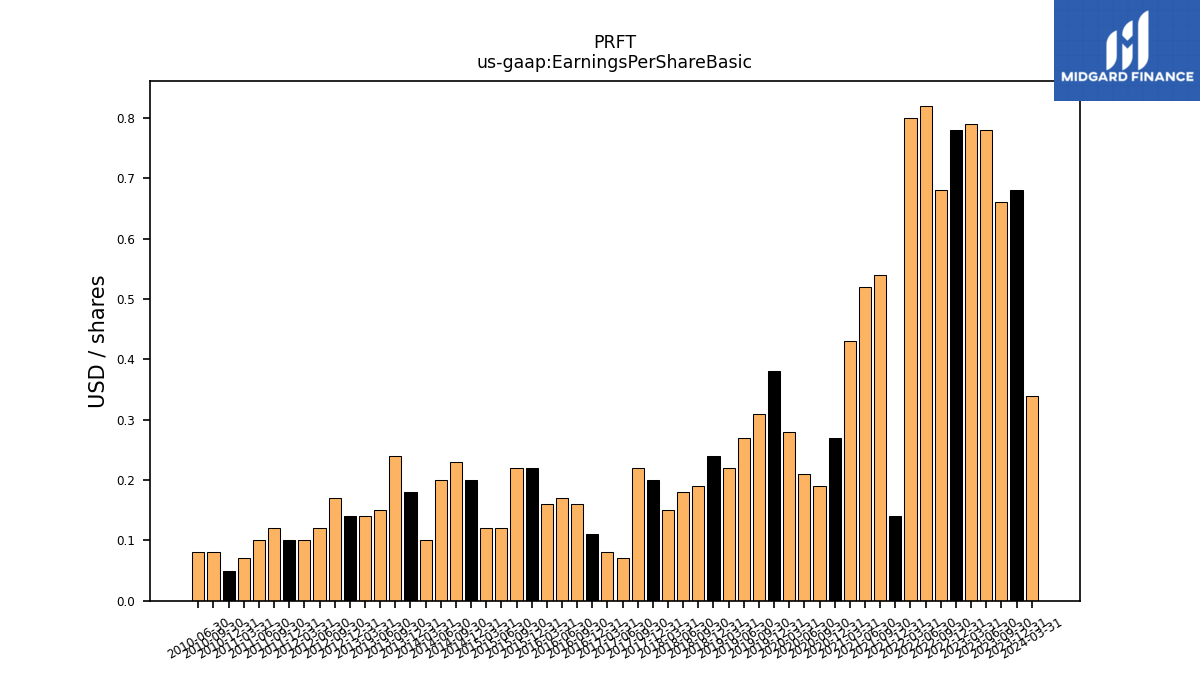
| Earnings Per Share Basic | 0.68 | 0.66 | 0.78 | 0.79 | 0.78 | 0.68 | 0.82 | 0.80 | 0.14 | 0.54 | 0.52 | 0.43 | 0.27 | 0.19 | 0.21 | 0.28 | 0.38 | 0.31 | 0.27 | 0.22 | 0.24 | 0.19 | 0.18 | 0.15 | 0.20 | 0.22 | 0.07 | 0.08 | 0.11 | 0.16 | 0.17 | 0.16 | 0.22 | 0.22 | 0.12 | 0.12 | 0.20 | 0.23 | 0.20 | 0.10 | 0.18 | 0.24 | 0.15 | 0.14 | 0.14 | 0.17 | 0.12 | 0.10 | 0.10 | 0.12 | 0.10 | 0.07 | 0.05 | 0.08 | 0.08 | |
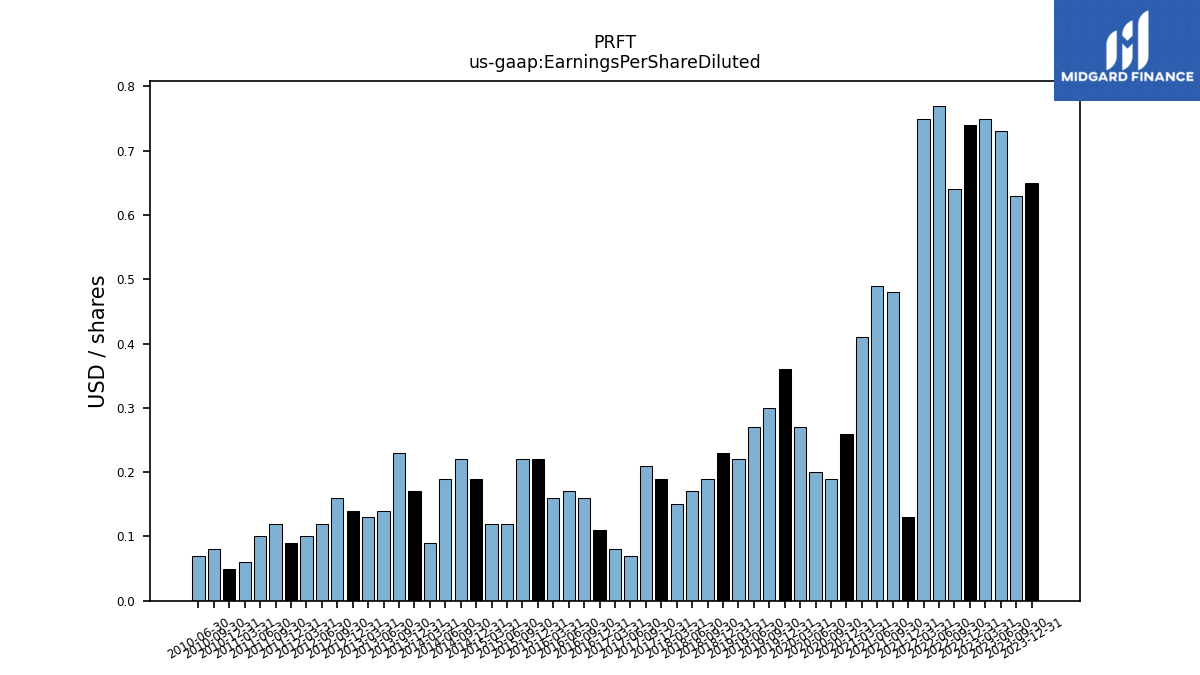
| Earnings Per Share Diluted | 0.65 | 0.63 | 0.73 | 0.75 | 0.74 | 0.64 | 0.77 | 0.75 | 0.13 | 0.48 | 0.49 | 0.41 | 0.26 | 0.19 | 0.20 | 0.27 | 0.36 | 0.30 | 0.27 | 0.22 | 0.23 | 0.19 | 0.17 | 0.15 | 0.19 | 0.21 | 0.07 | 0.08 | 0.11 | 0.16 | 0.17 | 0.16 | 0.22 | 0.22 | 0.12 | 0.12 | 0.19 | 0.22 | 0.19 | 0.09 | 0.17 | 0.23 | 0.14 | 0.13 | 0.14 | 0.16 | 0.12 | 0.10 | 0.09 | 0.12 | 0.10 | 0.06 | 0.05 | 0.08 | 0.07 |
| 2023-12-31 | 2023-09-30 | 2023-06-30 | 2023-03-31 | 2022-12-31 | 2022-09-30 | 2022-06-30 | 2022-03-31 | 2021-12-31 | 2021-09-30 | 2021-06-30 | 2021-03-31 | 2020-12-31 | 2020-09-30 | 2020-06-30 | 2020-03-31 | 2019-12-31 | 2019-09-30 | 2019-06-30 | 2019-03-31 | 2018-12-31 | 2018-09-30 | 2018-06-30 | 2018-03-31 | 2017-12-31 | 2017-09-30 | 2017-06-30 | 2017-03-31 | 2016-12-31 | 2016-09-30 | 2016-06-30 | 2016-03-31 | 2015-12-31 | 2015-09-30 | 2015-06-30 | 2015-03-31 | 2014-12-31 | 2014-09-30 | 2014-06-30 | 2014-03-31 | 2013-12-31 | 2013-09-30 | 2013-06-30 | 2013-03-31 | 2012-12-31 | 2012-09-30 | 2012-06-30 | 2012-03-31 | 2011-12-31 | 2011-09-30 | 2011-06-30 | 2011-03-31 | 2010-12-31 | 2010-09-30 | 2010-06-30 | ||
|---|---|---|---|---|---|---|---|---|---|---|---|---|---|---|---|---|---|---|---|---|---|---|---|---|---|---|---|---|---|---|---|---|---|---|---|---|---|---|---|---|---|---|---|---|---|---|---|---|---|---|---|---|---|---|---|---|
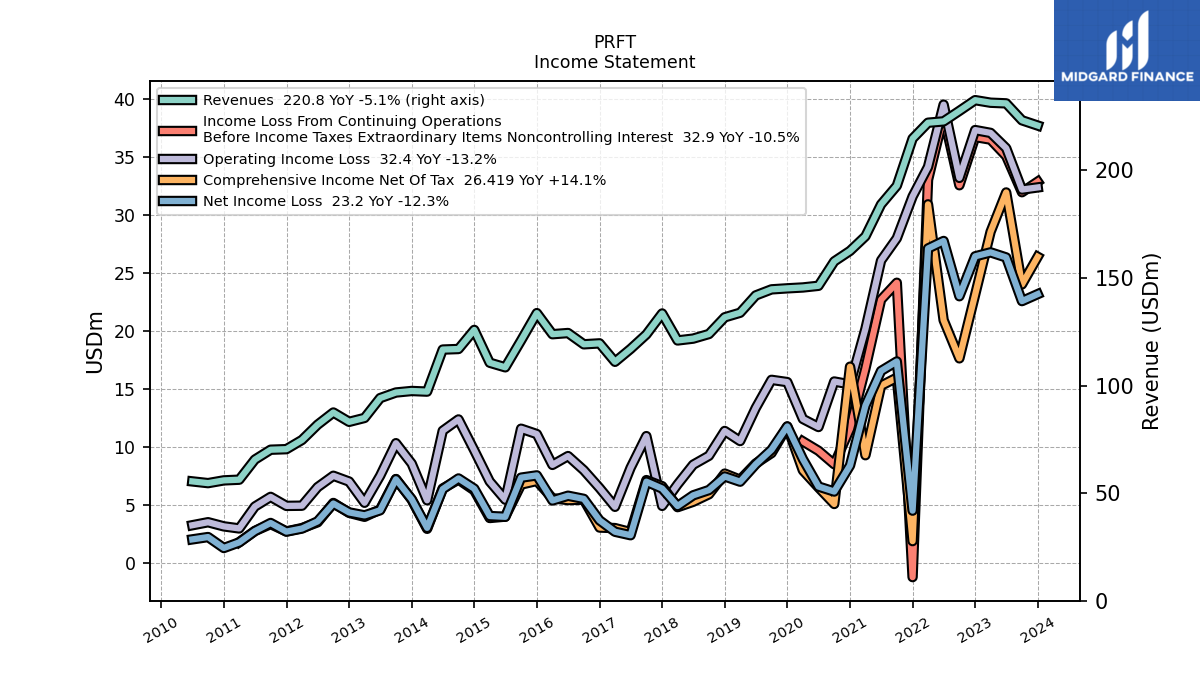
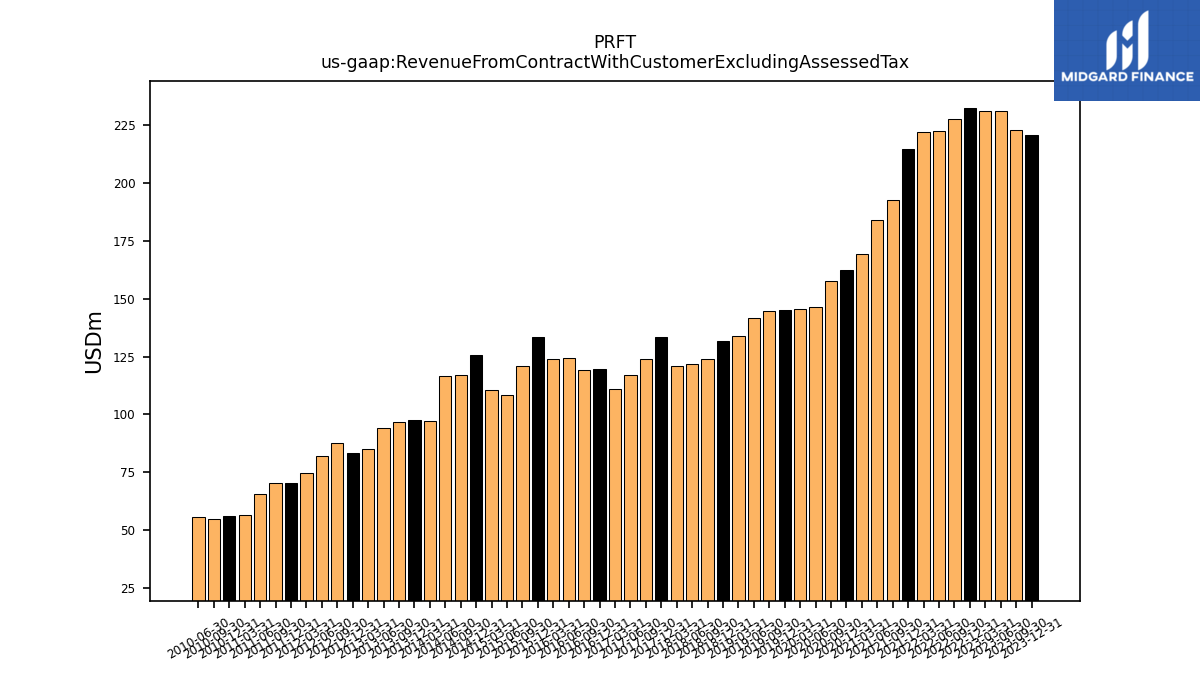
| Revenue From Contract With Customer Excluding Assessed Tax | 220.80 | 223.24 | 231.10 | 231.41 | 232.60 | 227.61 | 222.74 | 222.11 | 214.73 | 192.82 | 184.14 | 169.34 | 162.55 | 157.68 | 146.34 | 145.56 | 145.16 | 144.68 | 141.87 | 133.81 | 131.70 | 123.93 | 121.80 | 120.94 | 133.48 | 123.74 | 117.03 | 111.02 | 119.59 | 119.15 | 124.40 | 123.84 | 133.65 | 120.91 | 108.46 | 110.60 | 125.84 | 116.97 | 116.71 | 97.17 | 97.47 | 96.76 | 94.17 | 84.94 | 83.13 | 87.47 | 81.80 | 74.70 | 70.43 | 70.17 | 65.59 | 56.24 | 55.93 | 54.65 | 55.46 | |
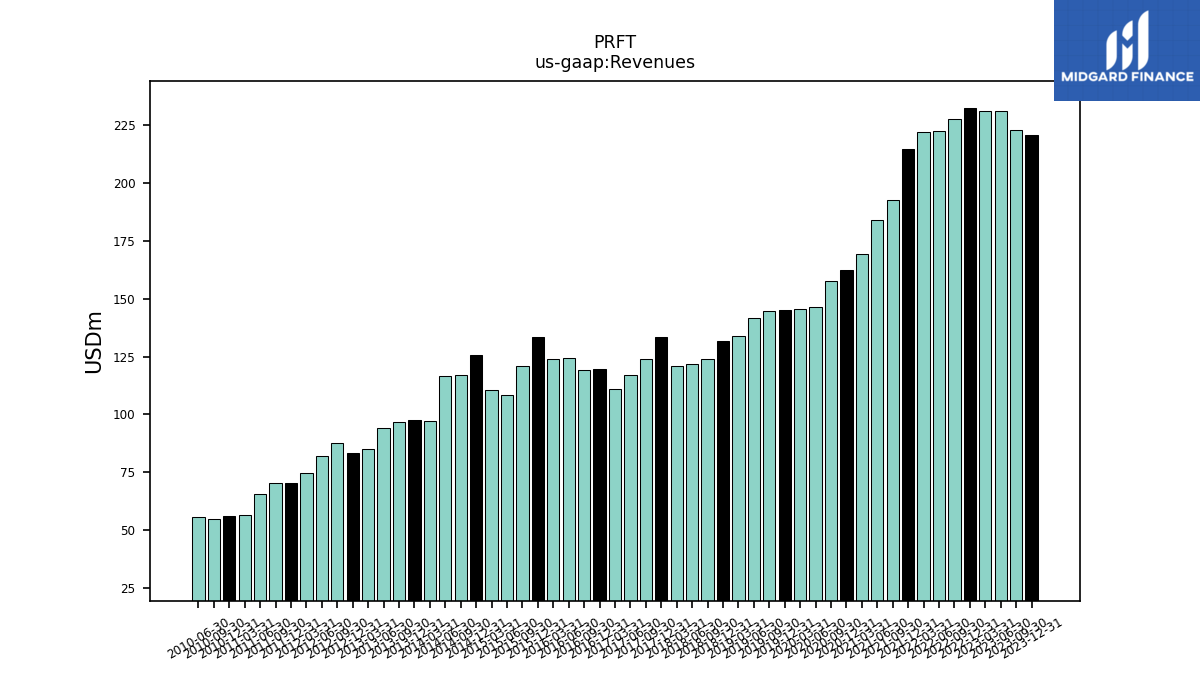
| Revenues | 220.80 | 223.24 | 231.10 | 231.41 | 232.60 | 227.61 | 222.74 | 222.11 | 214.73 | 192.82 | 184.14 | 169.34 | 162.55 | 157.68 | 146.34 | 145.56 | 145.16 | 144.68 | 141.87 | 133.81 | 131.70 | 123.93 | 121.80 | 120.94 | 133.48 | 123.74 | 117.03 | 111.02 | 119.59 | 119.15 | 124.40 | 123.84 | 133.65 | 120.91 | 108.46 | 110.60 | 125.84 | 116.97 | 116.71 | 97.17 | 97.47 | 96.76 | 94.17 | 84.94 | 83.13 | 87.47 | 81.80 | 74.70 | 70.43 | 70.17 | 65.59 | 56.24 | 55.93 | 54.65 | 55.46 | |
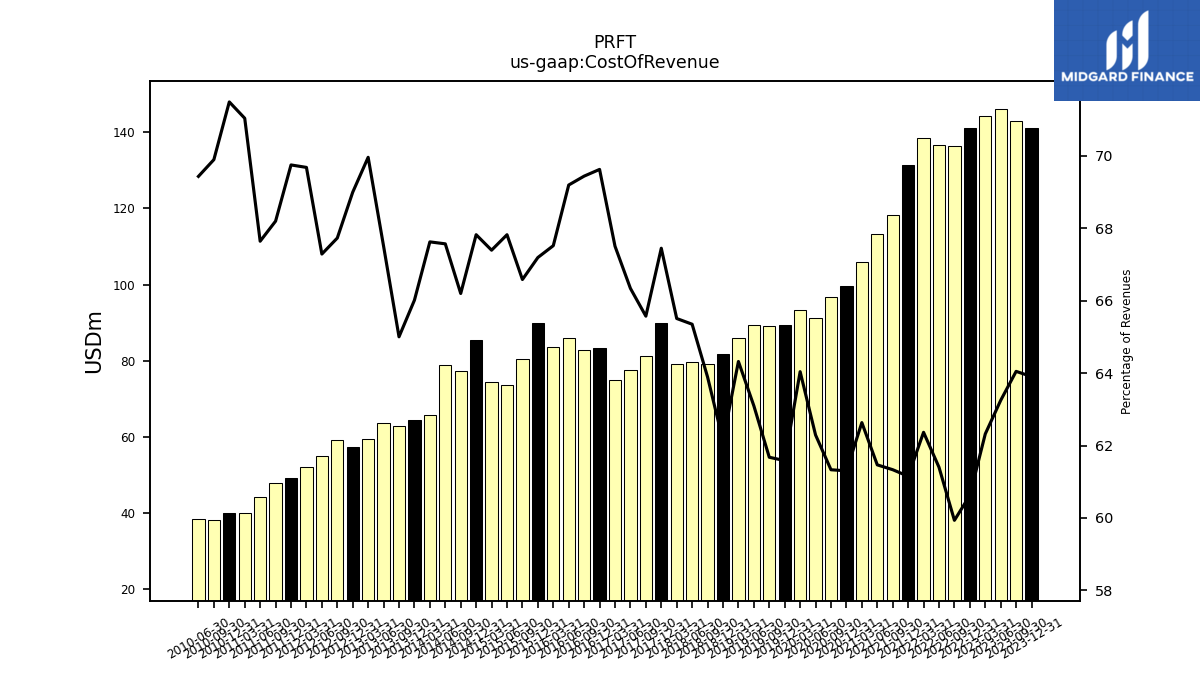
| Cost Of Revenue | 141.10 | 142.98 | 146.17 | 144.21 | 141.01 | 136.42 | 136.76 | 138.52 | 131.31 | 118.26 | 113.18 | 106.06 | 99.65 | 96.70 | 91.16 | 93.22 | 89.39 | 89.23 | 89.52 | 86.07 | 81.83 | 79.18 | 79.59 | 79.23 | 90.03 | 81.14 | 77.64 | 74.94 | 83.27 | 82.74 | 86.08 | 83.62 | 89.80 | 80.51 | 73.56 | 74.54 | 85.35 | 77.43 | 78.86 | 65.71 | 64.34 | 62.90 | 63.57 | 59.42 | 57.36 | 59.25 | 55.04 | 52.05 | 49.13 | 47.86 | 44.37 | 39.96 | 39.98 | 38.20 | 38.51 | |
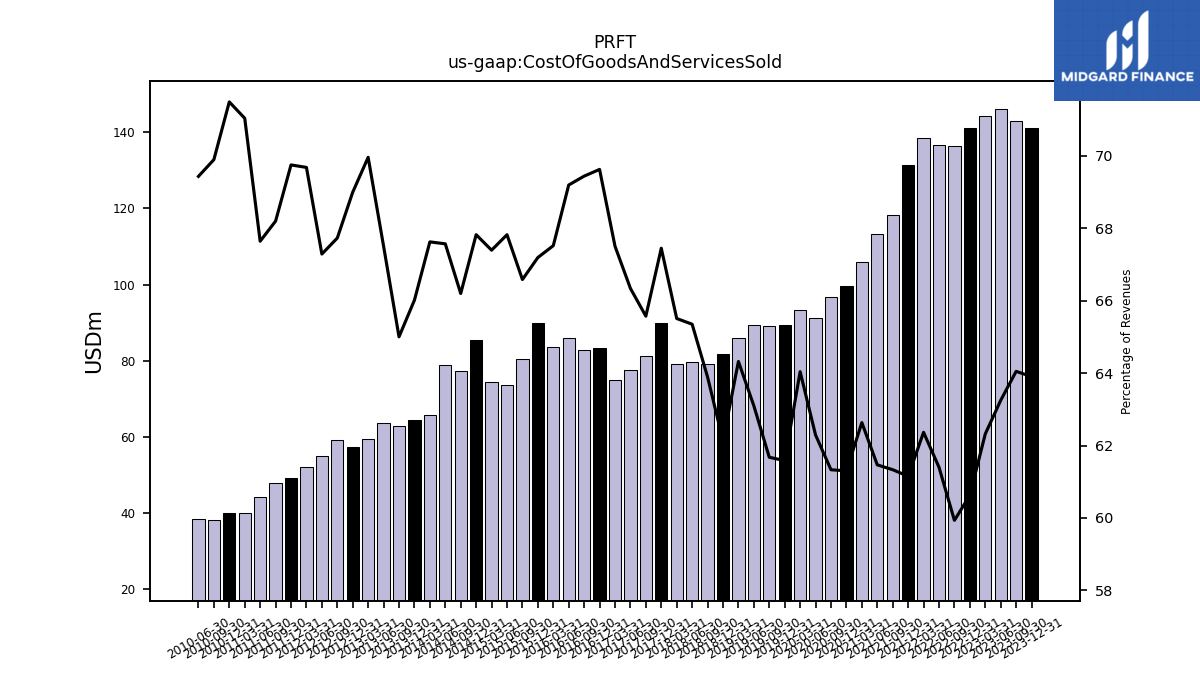
| Cost Of Goods And Services Sold | 141.10 | 142.98 | 146.17 | 144.21 | 141.01 | 136.42 | 136.76 | 138.52 | 131.31 | 118.26 | 113.18 | 106.06 | 99.65 | 96.70 | 91.16 | 93.22 | 89.39 | 89.23 | 89.52 | 86.07 | 81.83 | 79.18 | 79.59 | 79.23 | 90.03 | 81.14 | 77.64 | 74.94 | 83.27 | 82.74 | 86.08 | 83.62 | 89.80 | 80.51 | 73.56 | 74.54 | 85.35 | 77.43 | 78.86 | 65.71 | 64.34 | 62.90 | 63.57 | 59.42 | 57.36 | 59.25 | 55.04 | 52.05 | 49.13 | 47.86 | 44.37 | 39.96 | 39.98 | 38.20 | 38.51 | |
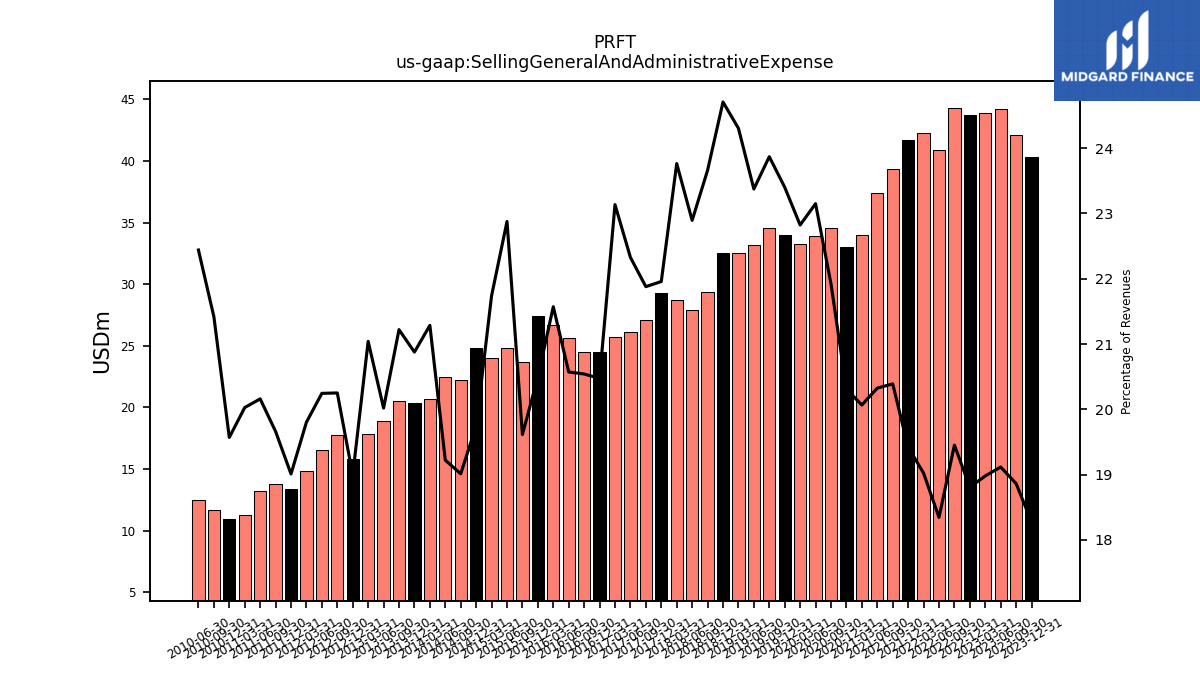
| Selling General And Administrative Expense | 40.35 | 42.11 | 44.18 | 43.92 | 43.74 | 44.27 | 40.86 | 42.25 | 41.70 | 39.32 | 37.42 | 33.98 | 33.01 | 34.57 | 33.88 | 33.22 | 33.97 | 34.53 | 33.16 | 32.52 | 32.54 | 29.32 | 27.88 | 28.74 | 29.31 | 27.07 | 26.13 | 25.68 | 24.48 | 24.48 | 25.59 | 26.71 | 27.39 | 23.71 | 24.81 | 24.04 | 24.85 | 22.24 | 22.43 | 20.68 | 20.35 | 20.53 | 18.85 | 17.87 | 15.79 | 17.71 | 16.56 | 14.79 | 13.39 | 13.80 | 13.22 | 11.26 | 10.95 | 11.71 | 12.45 | |
| Operating Income Loss | 32.40 | 32.22 | 35.78 | 37.10 | 37.35 | 33.22 | 39.54 | 34.17 | 31.62 | 28.01 | 26.09 | 20.21 | 15.41 | 15.66 | 11.74 | 12.44 | 15.61 | 15.81 | 13.38 | 10.53 | 11.40 | 9.26 | 8.49 | 6.79 | 4.94 | 10.96 | 8.22 | 4.86 | 6.48 | 8.01 | 9.24 | 8.47 | 11.13 | 11.60 | 5.47 | 7.05 | 9.73 | 12.39 | 11.42 | 5.42 | 8.59 | 10.35 | 7.54 | 5.21 | 7.04 | 7.54 | 6.55 | 4.96 | 4.94 | 5.72 | 4.88 | 2.99 | 3.17 | 3.53 | 3.27 | |
| Interest Paid Net | 0.37 | 0.14 | 0.28 | 0.14 | 0.34 | 0.17 | 0.30 | 0.23 | 0.85 | 1.68 | 0.01 | 1.45 | 0.09 | 1.51 | 0.05 | 1.76 | 0.07 | 1.76 | 0.05 | 1.80 | 0.12 | 0.47 | 0.51 | 0.29 | 0.63 | 0.21 | 0.48 | 0.23 | 0.28 | 0.35 | 0.49 | 0.37 | 0.52 | 0.76 | 0.52 | 0.20 | NA | 0.41 | 0.30 | 0.12 | NA | 0.12 | 0.04 | 0.00 | NA | 0.00 | NA | NA | NA | NA | NA | NA | NA | NA | NA | |
| Allocated Share Based Compensation Expense | 7.40 | 6.70 | 7.40 | 6.80 | 6.50 | 6.10 | 6.10 | 5.90 | 6.00 | 6.30 | 5.50 | 5.30 | 5.10 | 4.70 | 5.10 | 4.60 | 4.70 | 4.30 | 4.40 | 4.50 | 4.30 | 4.10 | 4.10 | 3.90 | 3.70 | 3.60 | 3.60 | 3.70 | 3.60 | 3.20 | 3.70 | 3.70 | 3.40 | 3.20 | 3.40 | 3.50 | 3.40 | 3.40 | 3.40 | 3.20 | 2.90 | 2.80 | 2.80 | 2.60 | 2.60 | 2.50 | 2.30 | NA | 2.40 | 2.40 | 2.30 | NA | NA | NA | NA | |
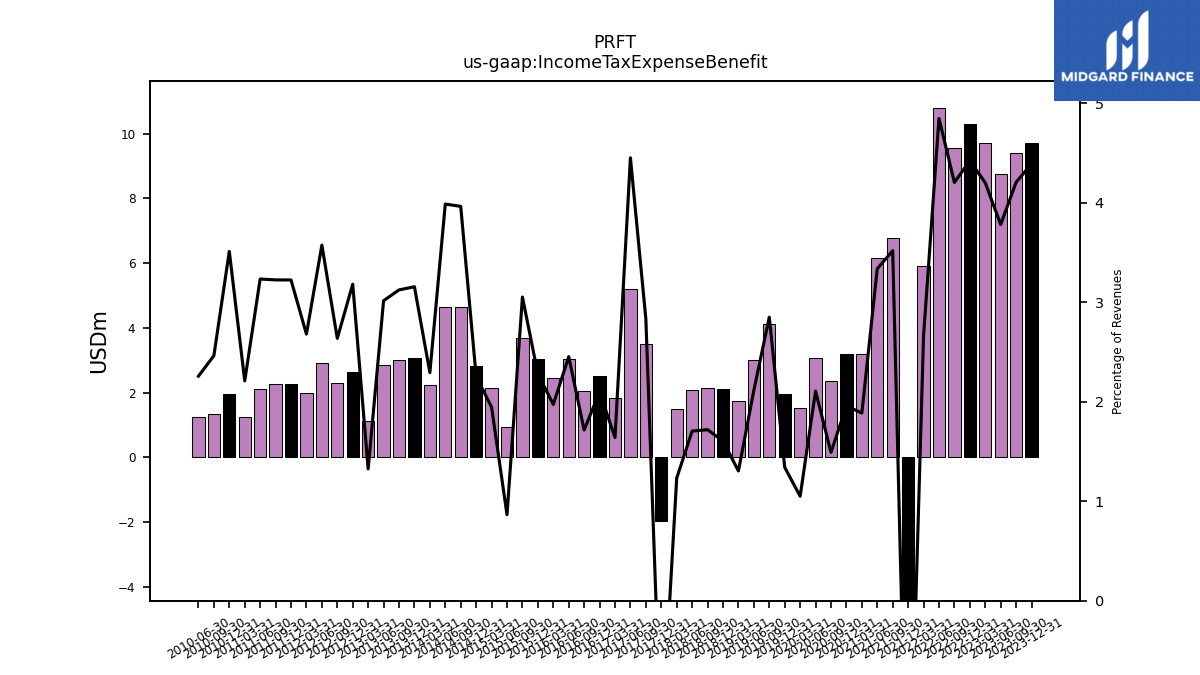
| Income Tax Expense Benefit | 9.70 | 9.39 | 8.74 | 9.72 | 10.29 | 9.57 | 10.80 | 5.91 | -5.73 | 6.78 | 6.14 | 3.19 | 3.18 | 2.35 | 3.08 | 1.53 | 1.95 | 4.12 | 3.00 | 1.75 | 2.11 | 2.13 | 2.08 | 1.49 | -1.97 | 3.50 | 5.21 | 1.82 | 2.51 | 2.04 | 3.05 | 2.44 | 3.05 | 3.69 | 0.94 | 2.15 | 2.84 | 4.64 | 4.65 | 2.23 | 3.08 | 3.02 | 2.84 | 1.13 | 2.65 | 2.31 | 2.92 | 2.00 | 2.27 | 2.26 | 2.12 | 1.24 | 1.96 | 1.35 | 1.25 | |
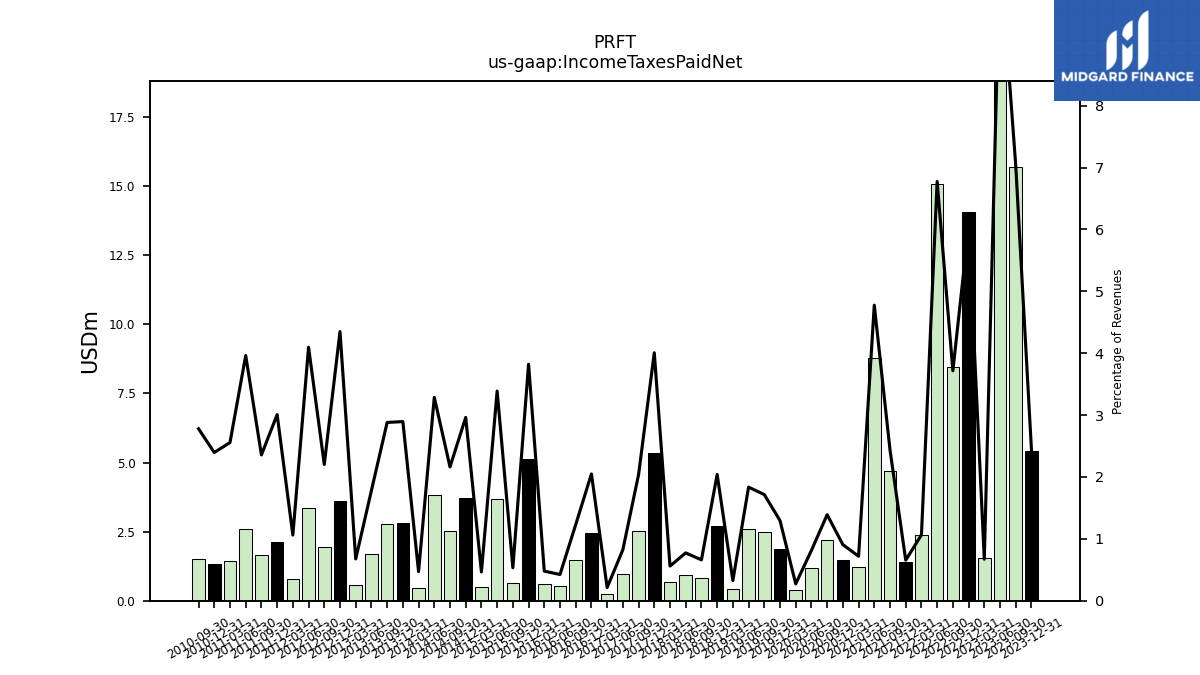
| Income Taxes Paid Net | 5.40 | 15.71 | 24.21 | 1.55 | 14.06 | 8.46 | 15.09 | 2.36 | 1.41 | 4.70 | 8.80 | 1.22 | 1.47 | 2.19 | 1.19 | 0.40 | 1.88 | 2.48 | 2.60 | 0.44 | 2.69 | 0.82 | 0.94 | 0.68 | 5.35 | 2.52 | 0.96 | 0.24 | 2.45 | 1.47 | 0.53 | 0.59 | 5.11 | 0.65 | 3.68 | 0.51 | 3.73 | 2.53 | 3.84 | 0.46 | 2.82 | 2.79 | 1.68 | 0.57 | 3.62 | 1.93 | 3.35 | 0.79 | 2.12 | 1.65 | 2.60 | 1.44 | 1.34 | 1.52 | NA | |
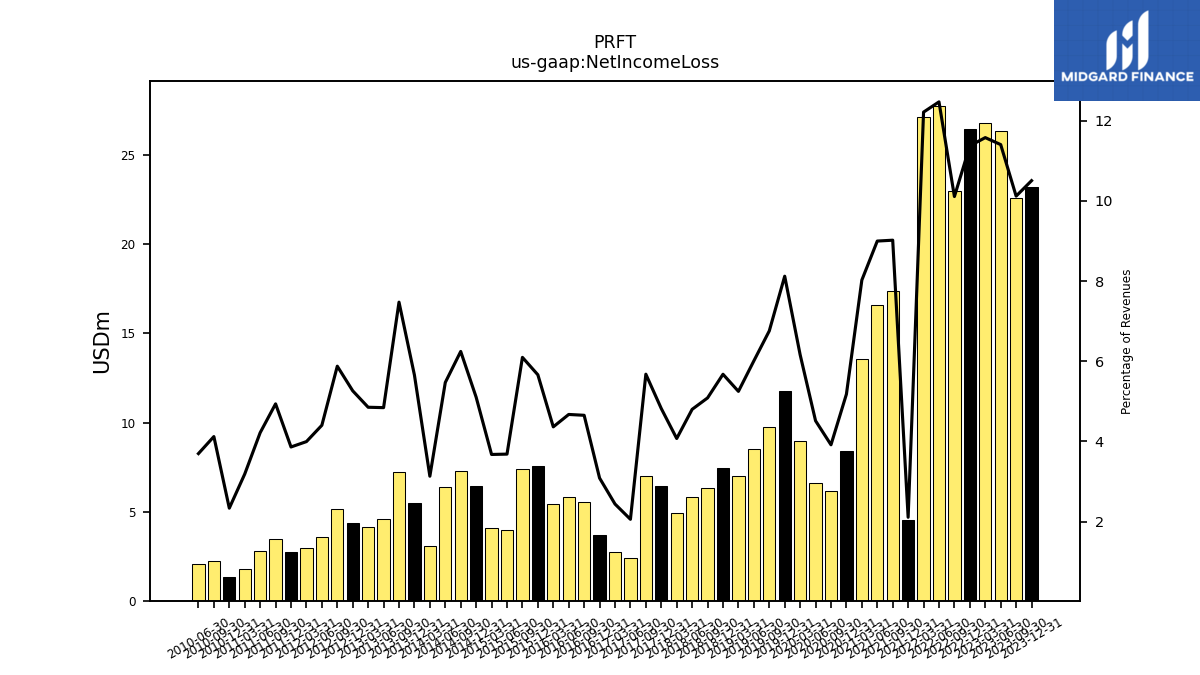
| Net Income Loss | 23.20 | 22.60 | 26.36 | 26.80 | 26.46 | 23.02 | 27.78 | 27.14 | 4.53 | 17.40 | 16.57 | 13.59 | 8.42 | 6.18 | 6.61 | 8.97 | 11.79 | 9.78 | 8.53 | 7.03 | 7.48 | 6.30 | 5.85 | 4.93 | 6.44 | 7.03 | 2.41 | 2.71 | 3.69 | 5.54 | 5.82 | 5.41 | 7.57 | 7.37 | 4.00 | 4.07 | 6.42 | 7.31 | 6.39 | 3.04 | 5.51 | 7.23 | 4.56 | 4.12 | 4.38 | 5.14 | 3.60 | 2.99 | 2.72 | 3.47 | 2.77 | 1.79 | 1.31 | 2.25 | 2.05 | |
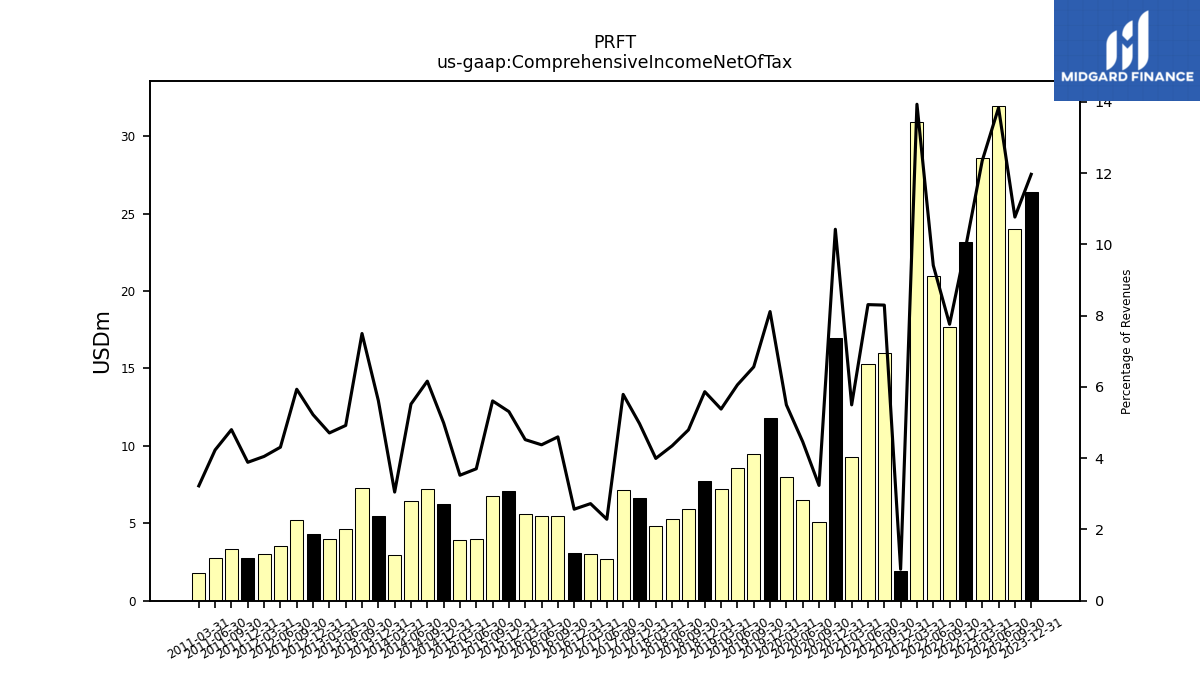
| Comprehensive Income Net Of Tax | 26.42 | 24.03 | 31.97 | 28.57 | 23.16 | 17.66 | 20.96 | 30.94 | 1.90 | 15.99 | 15.30 | 9.31 | 16.94 | 5.10 | 6.53 | 8.00 | 11.78 | 9.49 | 8.59 | 7.20 | 7.72 | 5.94 | 5.29 | 4.83 | 6.64 | 7.16 | 2.68 | 3.02 | 3.07 | 5.48 | 5.44 | 5.60 | 7.09 | 6.78 | 4.02 | 3.90 | 6.28 | 7.21 | 6.44 | 2.96 | 5.47 | 7.25 | 4.63 | 4.00 | 4.34 | 5.19 | 3.52 | 3.02 | 2.74 | 3.37 | 2.77 | 1.81 | NA | NA | NA |
| 2023-12-31 | 2023-09-30 | 2023-06-30 | 2023-03-31 | 2022-12-31 | 2022-09-30 | 2022-06-30 | 2022-03-31 | 2021-12-31 | 2021-09-30 | 2021-06-30 | 2021-03-31 | 2020-12-31 | 2020-09-30 | 2020-06-30 | 2020-03-31 | 2019-12-31 | 2019-09-30 | 2019-06-30 | 2019-03-31 | 2018-12-31 | 2018-09-30 | 2018-06-30 | 2018-03-31 | 2017-12-31 | 2017-09-30 | 2017-06-30 | 2017-03-31 | 2016-12-31 | 2016-09-30 | 2016-06-30 | 2016-03-31 | 2015-12-31 | 2015-09-30 | 2015-06-30 | 2015-03-31 | 2014-12-31 | 2014-09-30 | 2014-06-30 | 2014-03-31 | 2013-12-31 | 2013-09-30 | 2013-06-30 | 2013-03-31 | 2012-12-31 | 2012-09-30 | 2012-06-30 | 2012-03-31 | 2011-12-31 | 2011-09-30 | 2011-06-30 | 2011-03-31 | 2010-12-31 | 2010-09-30 | 2010-06-30 | ||
|---|---|---|---|---|---|---|---|---|---|---|---|---|---|---|---|---|---|---|---|---|---|---|---|---|---|---|---|---|---|---|---|---|---|---|---|---|---|---|---|---|---|---|---|---|---|---|---|---|---|---|---|---|---|---|---|---|
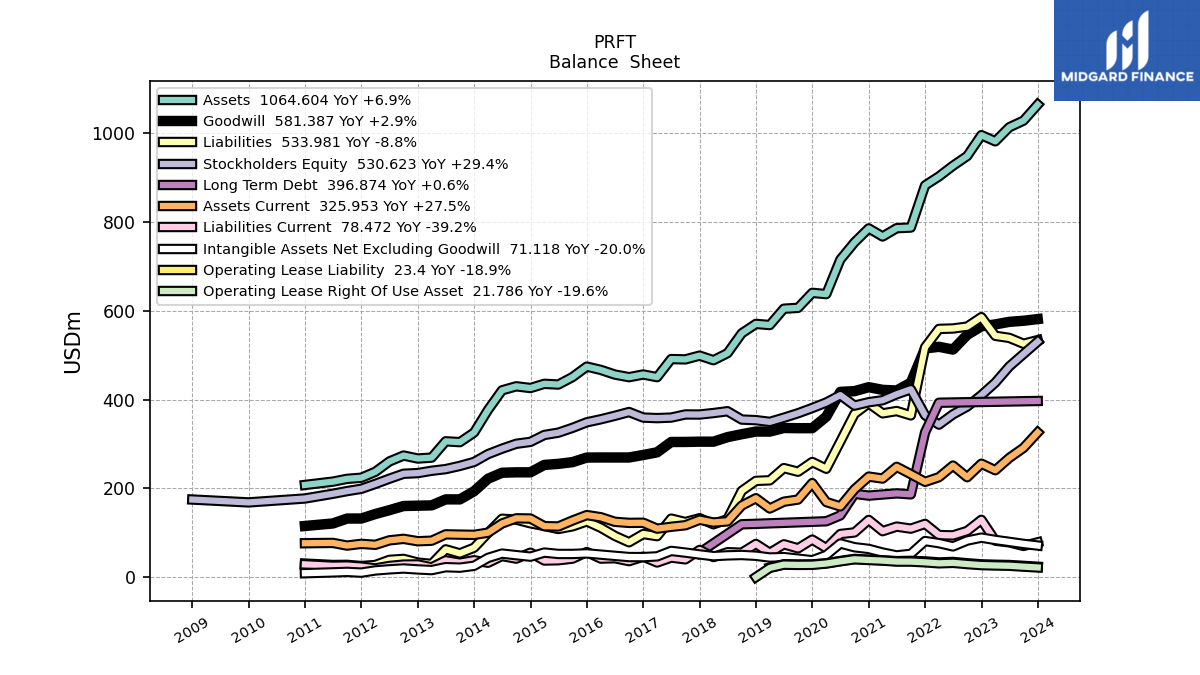
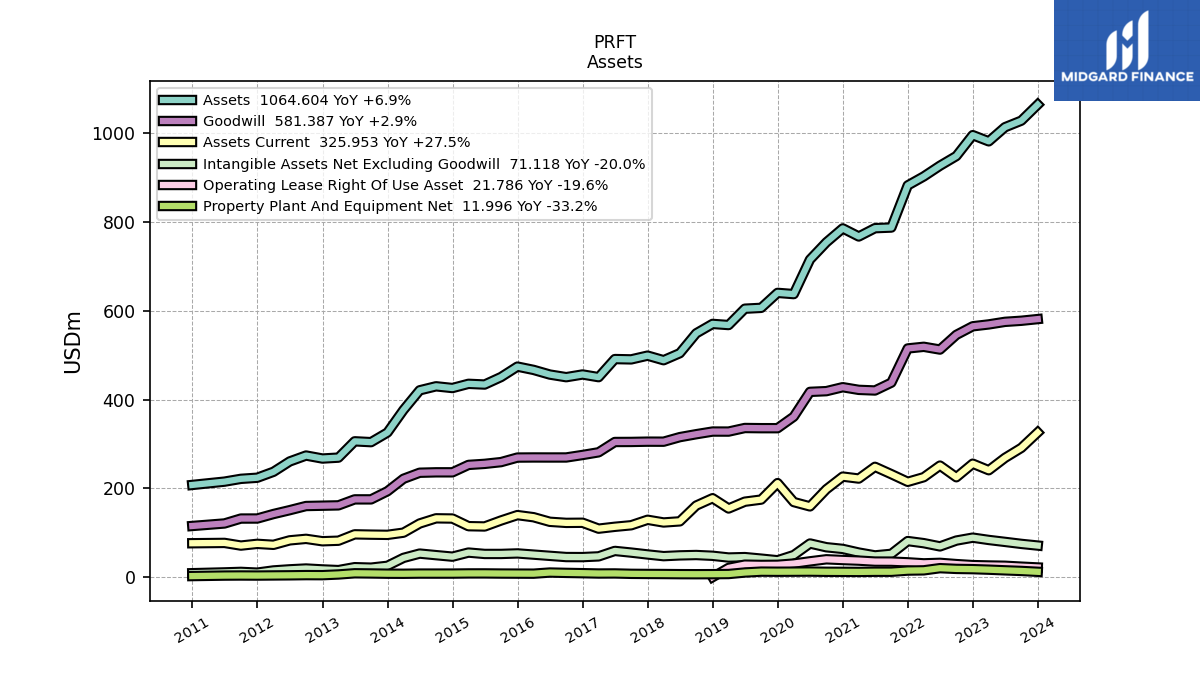
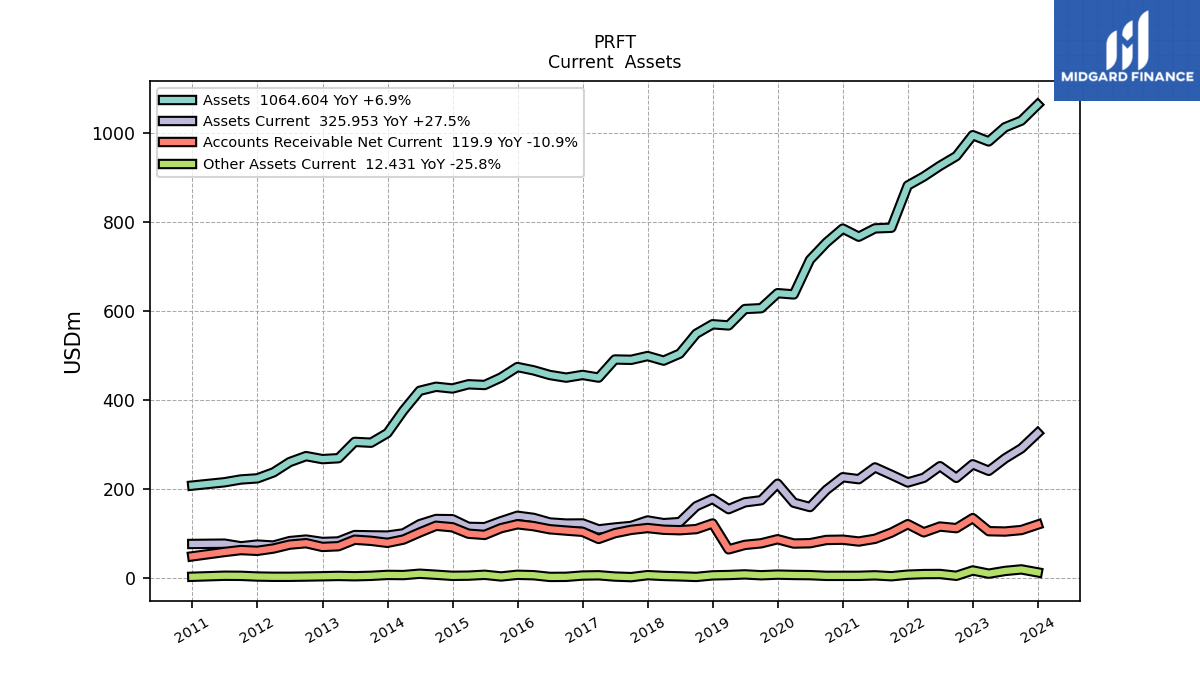
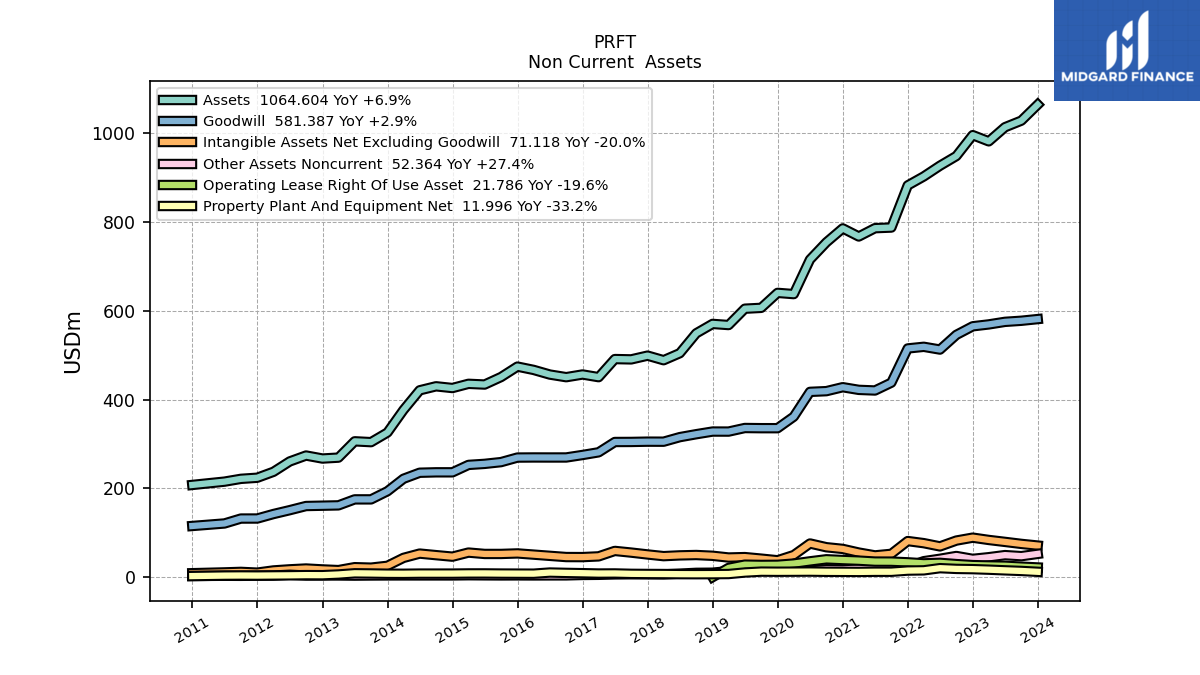
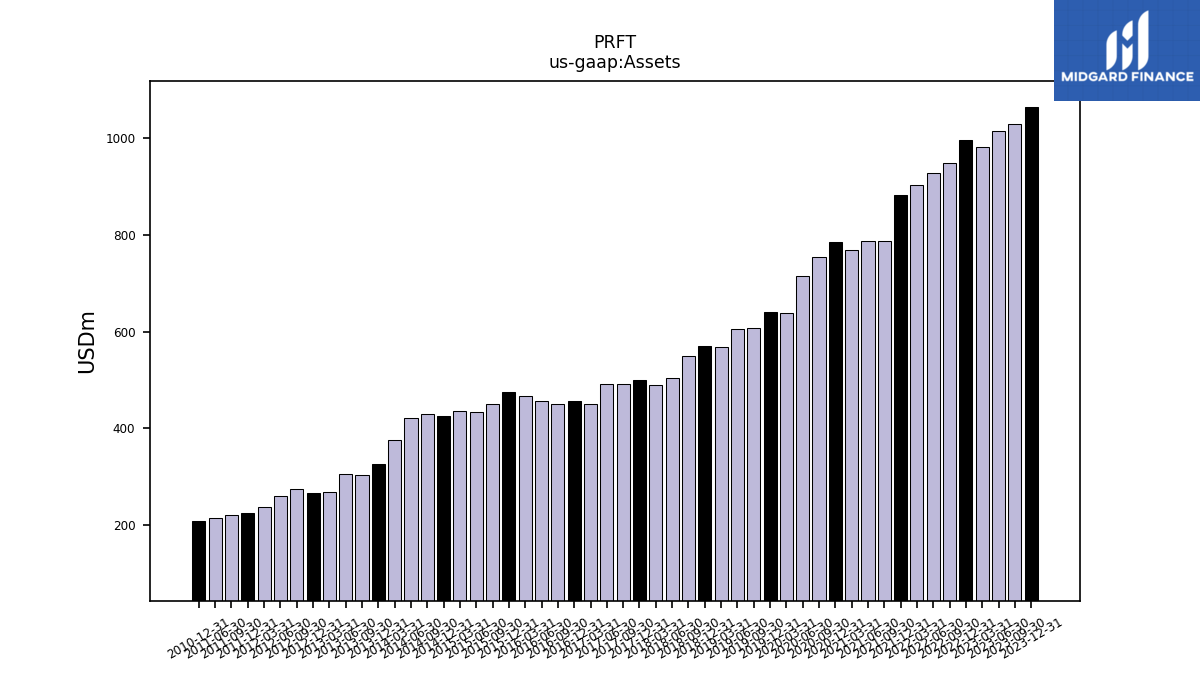
| Assets | 1064.60 | 1028.50 | 1013.69 | 981.86 | 995.89 | 948.74 | 926.94 | 902.82 | 882.57 | 787.63 | 786.20 | 767.51 | 785.76 | 754.29 | 715.45 | 637.66 | 640.49 | 606.70 | 604.79 | 567.94 | 570.54 | 549.27 | 504.54 | 488.72 | 499.06 | 490.59 | 491.32 | 450.53 | 456.58 | 450.50 | 456.41 | 466.87 | 474.36 | 450.82 | 433.91 | 435.53 | 426.04 | 429.95 | 420.91 | 376.52 | 325.75 | 304.12 | 306.00 | 269.25 | 267.19 | 273.97 | 260.59 | 237.31 | 223.93 | 221.43 | 215.15 | NA | 207.68 | NA | NA | |
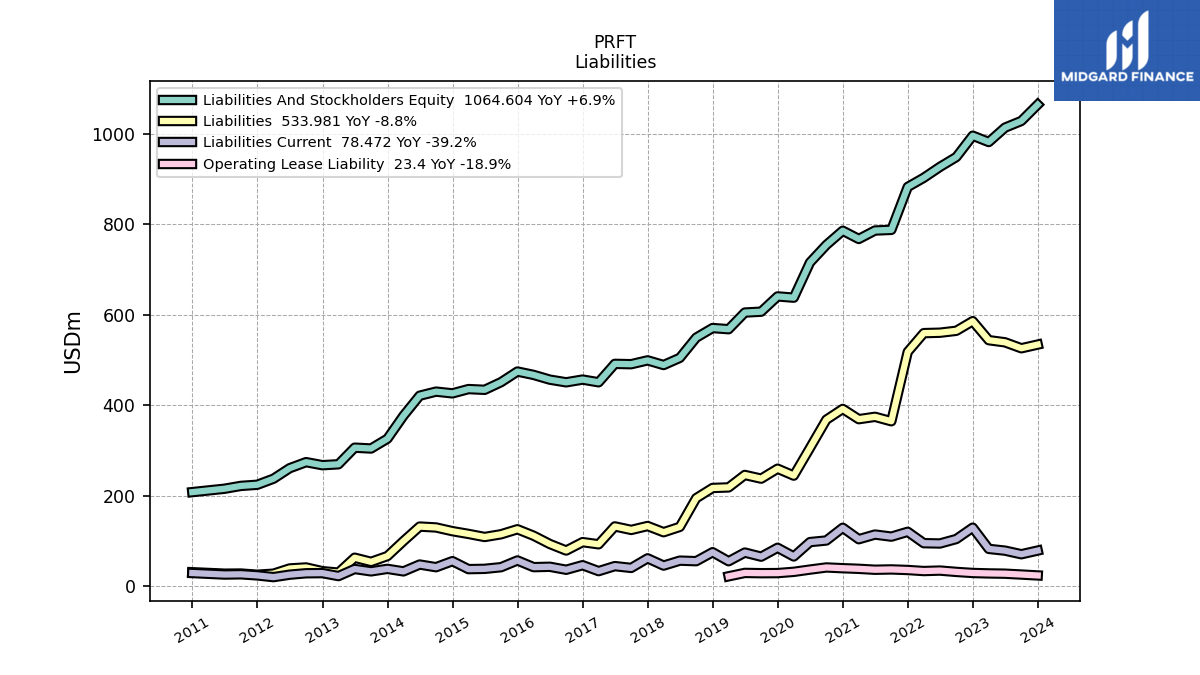
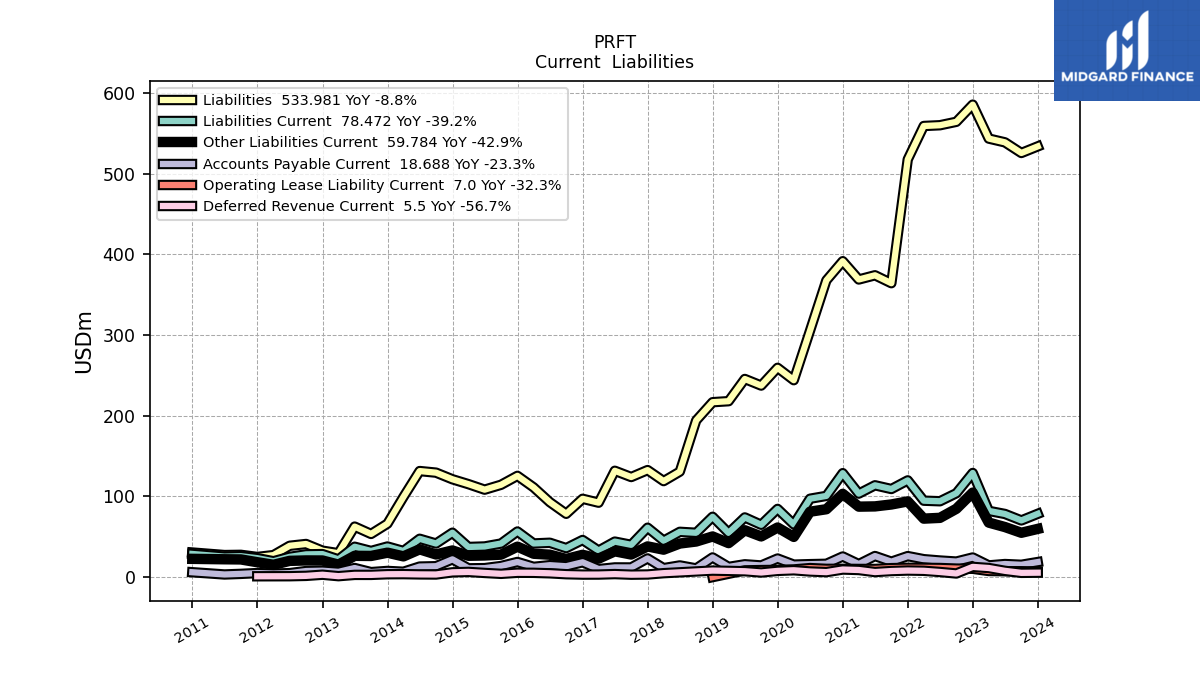
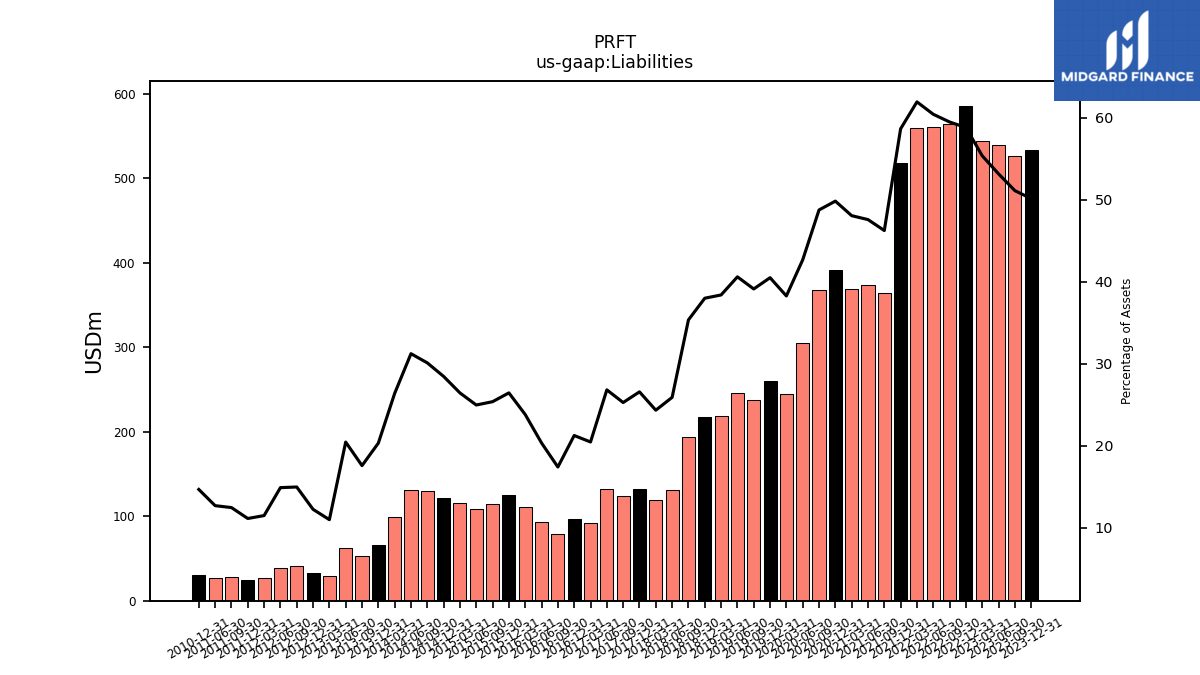
| Liabilities | 533.98 | 525.81 | 539.00 | 543.68 | 585.76 | 564.47 | 560.21 | 559.27 | 517.81 | 364.38 | 374.20 | 368.98 | 391.68 | 367.87 | 305.40 | 244.13 | 259.48 | 237.46 | 245.64 | 218.12 | 216.86 | 194.26 | 130.79 | 119.03 | 132.71 | 124.07 | 131.85 | 92.28 | 97.11 | 78.51 | 92.93 | 111.24 | 125.55 | 114.48 | 108.43 | 115.25 | 121.31 | 129.52 | 131.51 | 99.41 | 66.26 | 53.53 | 62.63 | 29.64 | 32.78 | 41.08 | 38.86 | 27.30 | 24.97 | 27.64 | 27.36 | NA | 30.51 | NA | NA | |
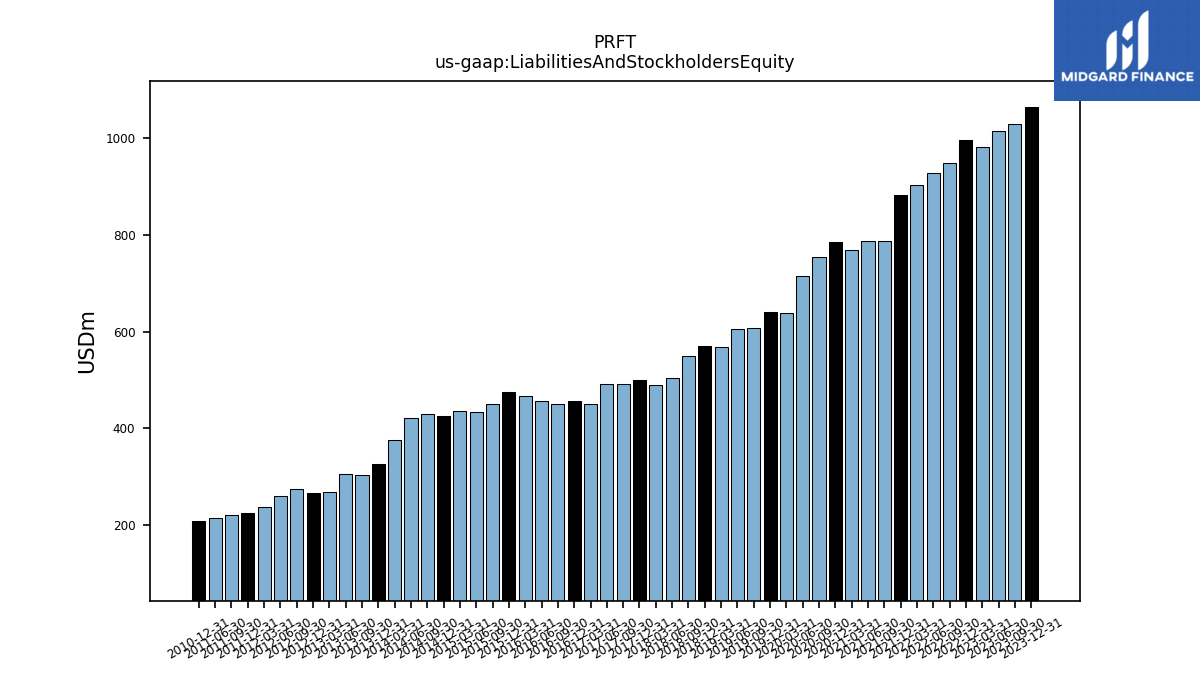
| Liabilities And Stockholders Equity | 1064.60 | 1028.50 | 1013.69 | 981.86 | 995.89 | 948.74 | 926.94 | 902.82 | 882.57 | 787.63 | 786.20 | 767.51 | 785.76 | 754.29 | 715.45 | 637.66 | 640.49 | 606.70 | 604.79 | 567.94 | 570.54 | 549.27 | 504.54 | 488.72 | 499.06 | 490.59 | 491.32 | 450.53 | 456.58 | 450.50 | 456.41 | 466.87 | 474.36 | 450.82 | 433.91 | 435.53 | 426.04 | 429.95 | 420.91 | 376.52 | 325.75 | 304.12 | 306.00 | 269.25 | 267.19 | 273.97 | 260.59 | 237.31 | 223.93 | 221.43 | 215.15 | NA | 207.68 | NA | NA | |
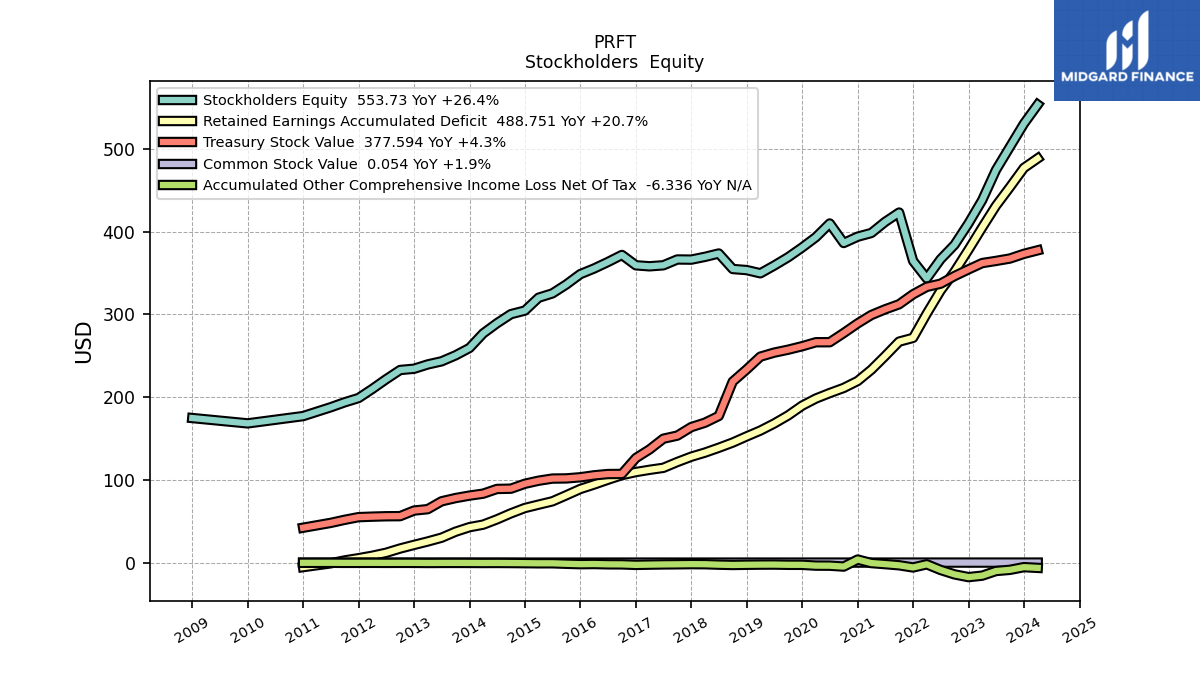
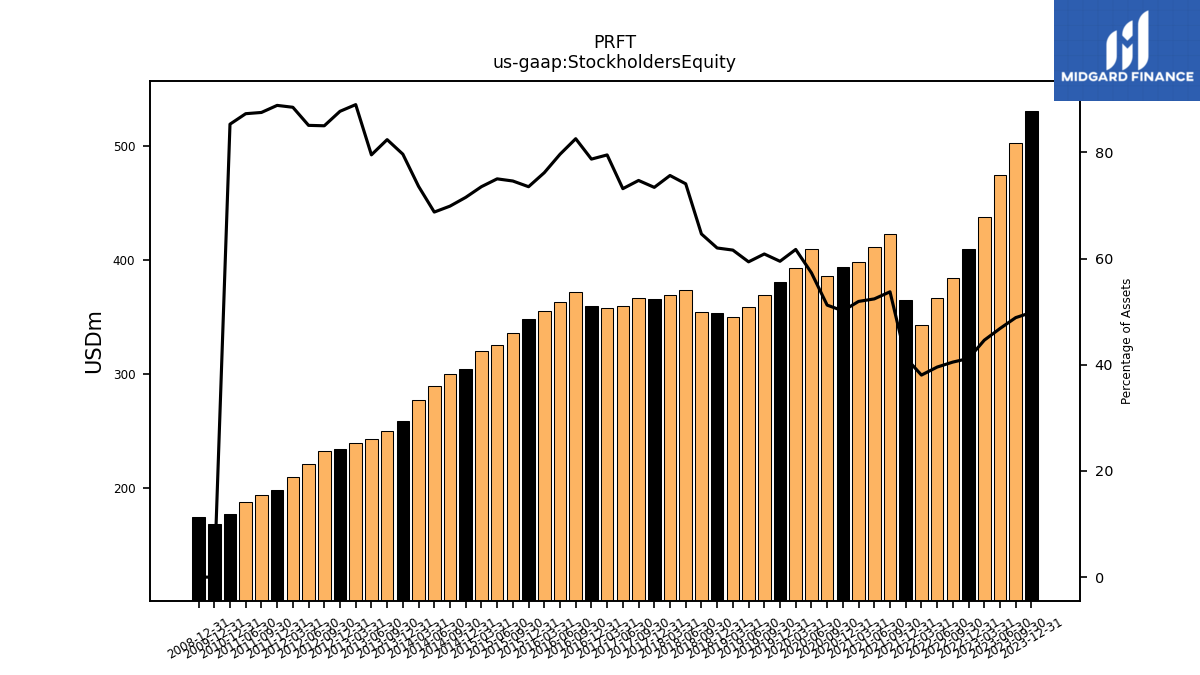
| Stockholders Equity | 530.62 | 502.69 | 474.69 | 438.18 | 410.13 | 384.27 | 366.73 | 343.55 | 364.76 | 423.25 | 411.99 | 398.53 | 394.08 | 386.43 | 410.05 | 393.52 | 381.01 | 369.25 | 359.15 | 349.81 | 353.68 | 355.00 | 373.75 | 369.69 | 366.35 | 366.52 | 359.48 | 358.26 | 359.46 | 371.99 | 363.48 | 355.63 | 348.81 | 336.34 | 325.48 | 320.28 | 304.73 | 300.43 | 289.40 | 277.12 | 259.49 | 250.59 | 243.37 | 239.61 | 234.41 | 232.89 | 221.73 | 210.01 | 198.96 | 193.79 | 187.79 | NA | 177.16 | NA | NA |
| 2023-12-31 | 2023-09-30 | 2023-06-30 | 2023-03-31 | 2022-12-31 | 2022-09-30 | 2022-06-30 | 2022-03-31 | 2021-12-31 | 2021-09-30 | 2021-06-30 | 2021-03-31 | 2020-12-31 | 2020-09-30 | 2020-06-30 | 2020-03-31 | 2019-12-31 | 2019-09-30 | 2019-06-30 | 2019-03-31 | 2018-12-31 | 2018-09-30 | 2018-06-30 | 2018-03-31 | 2017-12-31 | 2017-09-30 | 2017-06-30 | 2017-03-31 | 2016-12-31 | 2016-09-30 | 2016-06-30 | 2016-03-31 | 2015-12-31 | 2015-09-30 | 2015-06-30 | 2015-03-31 | 2014-12-31 | 2014-09-30 | 2014-06-30 | 2014-03-31 | 2013-12-31 | 2013-09-30 | 2013-06-30 | 2013-03-31 | 2012-12-31 | 2012-09-30 | 2012-06-30 | 2012-03-31 | 2011-12-31 | 2011-09-30 | 2011-06-30 | 2011-03-31 | 2010-12-31 | 2010-09-30 | 2010-06-30 | ||
|---|---|---|---|---|---|---|---|---|---|---|---|---|---|---|---|---|---|---|---|---|---|---|---|---|---|---|---|---|---|---|---|---|---|---|---|---|---|---|---|---|---|---|---|---|---|---|---|---|---|---|---|---|---|---|---|---|
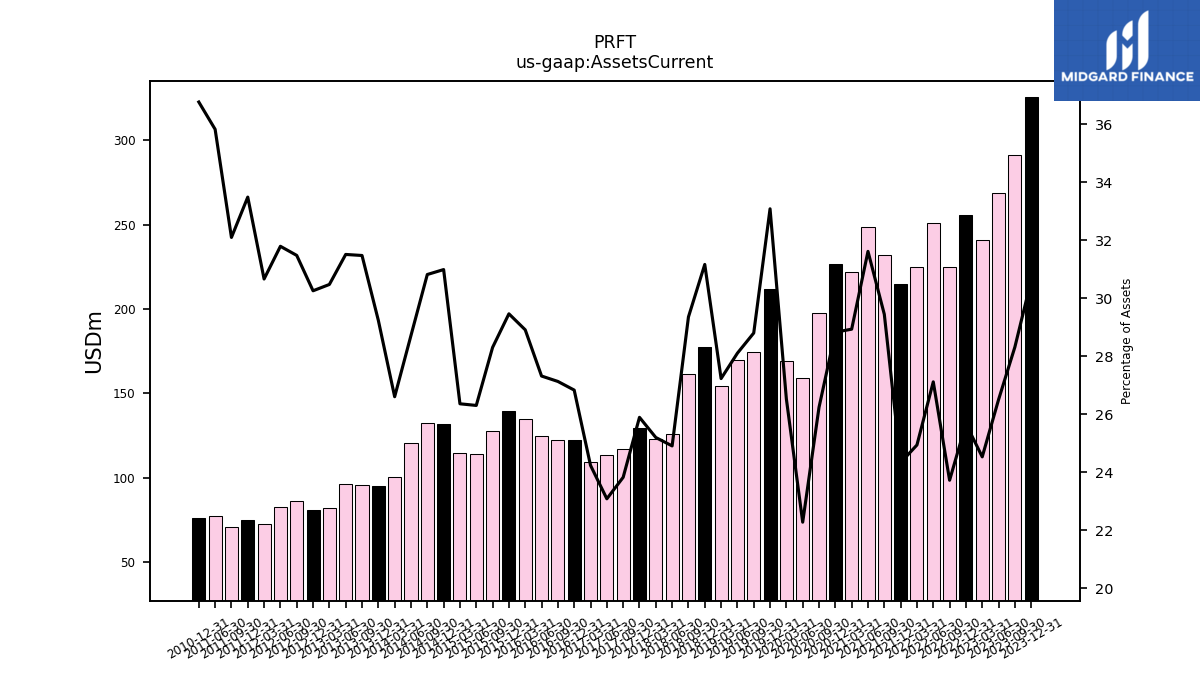
| Assets Current | 325.95 | 291.21 | 268.63 | 240.82 | 255.62 | 225.04 | 251.33 | 225.13 | 214.71 | 231.92 | 248.55 | 222.05 | 226.51 | 197.89 | 159.36 | 169.12 | 211.90 | 174.72 | 169.97 | 154.64 | 177.80 | 161.23 | 125.65 | 123.13 | 129.21 | 116.86 | 113.39 | 109.18 | 122.50 | 122.21 | 124.67 | 134.97 | 139.75 | 127.59 | 114.12 | 114.80 | 132.02 | 132.50 | 120.86 | 100.16 | 95.23 | 95.72 | 96.42 | 82.05 | 80.84 | 86.23 | 82.84 | 72.77 | 74.99 | 71.07 | 77.08 | NA | 76.36 | NA | NA | |
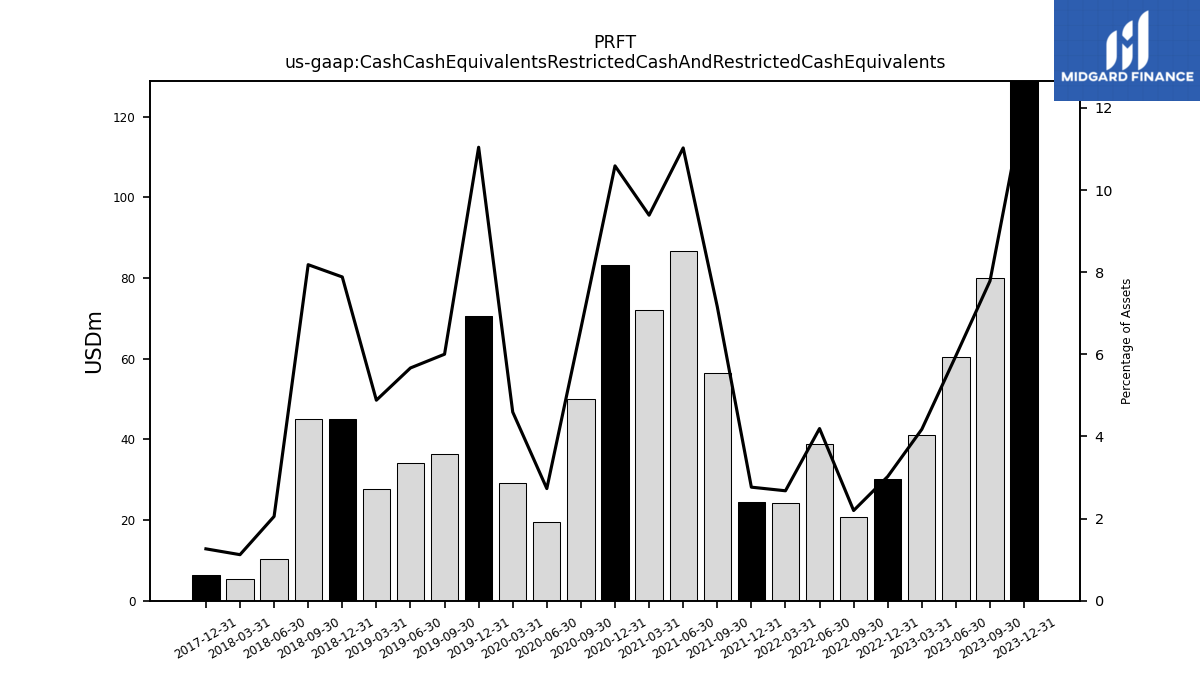
| Cash Cash Equivalents Restricted Cash And Restricted Cash Equivalents | 128.89 | 80.09 | 60.47 | 40.99 | 30.13 | 20.84 | 38.87 | 24.18 | 24.41 | 56.41 | 86.69 | 72.06 | 83.20 | 50.03 | 19.54 | 29.30 | 70.73 | 36.42 | 34.28 | 27.73 | 44.98 | 44.95 | 10.36 | 5.48 | 6.31 | NA | NA | NA | NA | NA | NA | NA | NA | NA | NA | NA | NA | NA | NA | NA | NA | NA | NA | NA | NA | NA | NA | NA | NA | NA | NA | NA | NA | NA | NA | |
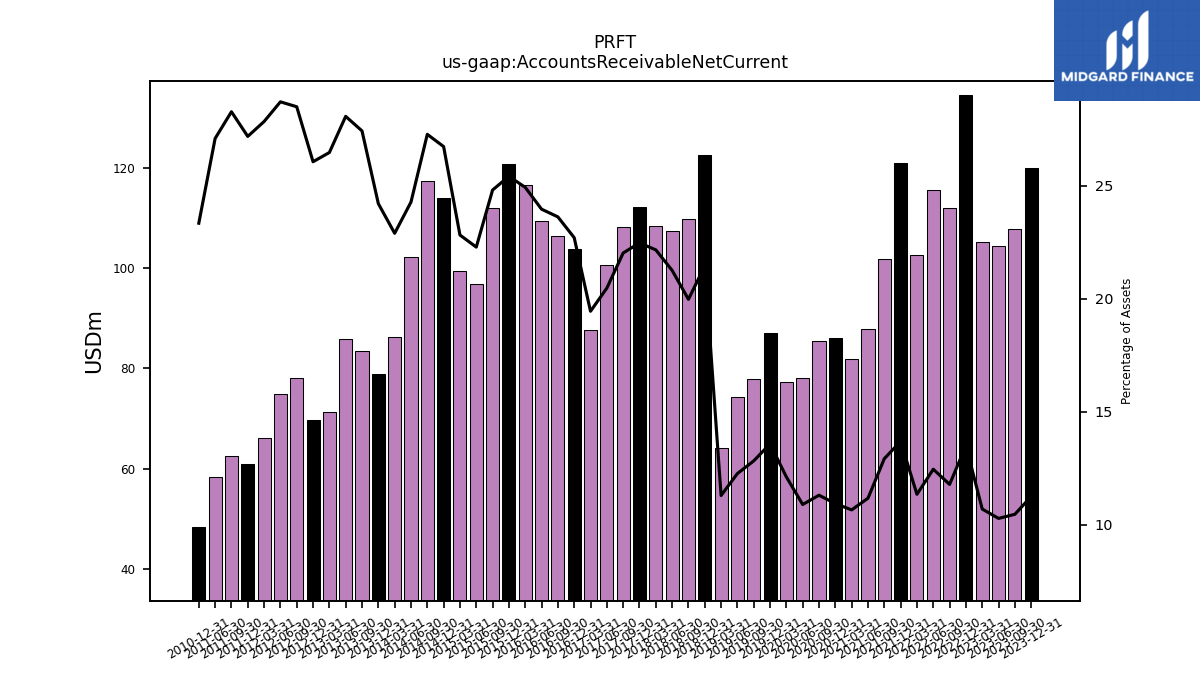
| Accounts Receivable Net Current | 119.90 | 107.70 | 104.30 | 105.10 | 134.52 | 111.90 | 115.55 | 102.52 | 120.89 | 101.86 | 87.92 | 81.87 | 86.00 | 85.35 | 78.02 | 77.31 | 87.02 | 77.87 | 74.23 | 64.19 | 122.45 | 109.76 | 107.29 | 108.36 | 112.19 | 108.09 | 100.62 | 87.65 | 103.70 | 106.45 | 109.41 | 116.43 | 120.61 | 111.89 | 96.73 | 99.43 | 113.93 | 117.30 | 102.23 | 86.24 | 78.89 | 83.44 | 85.92 | 71.30 | 69.66 | 78.09 | 74.85 | 66.09 | 60.89 | 62.63 | 58.31 | NA | 48.50 | NA | NA | |
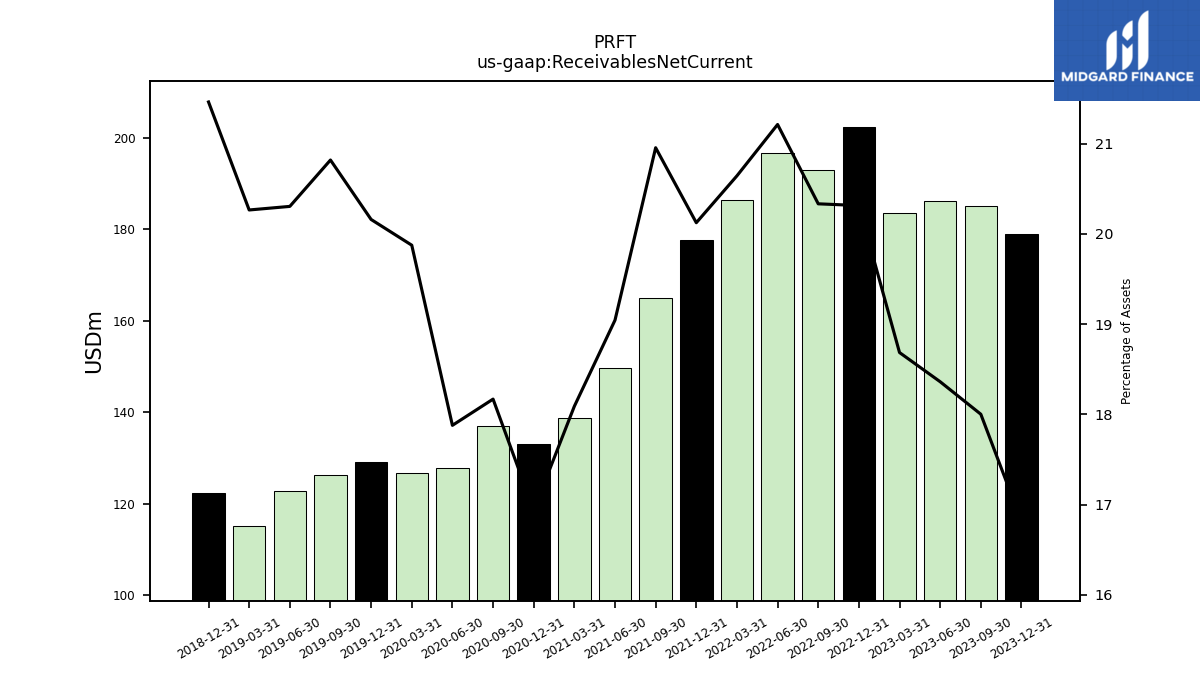
| Receivables Net Current | 179.00 | 185.14 | 186.12 | 183.46 | 202.30 | 192.90 | 196.62 | 186.37 | 177.60 | 165.04 | 149.72 | 138.84 | 133.09 | 137.04 | 127.91 | 126.73 | 129.12 | 126.30 | 122.80 | 115.09 | 122.45 | NA | NA | NA | NA | NA | NA | NA | NA | NA | NA | NA | NA | NA | NA | NA | NA | NA | NA | NA | NA | NA | NA | NA | NA | NA | NA | NA | NA | NA | NA | NA | NA | NA | NA | |
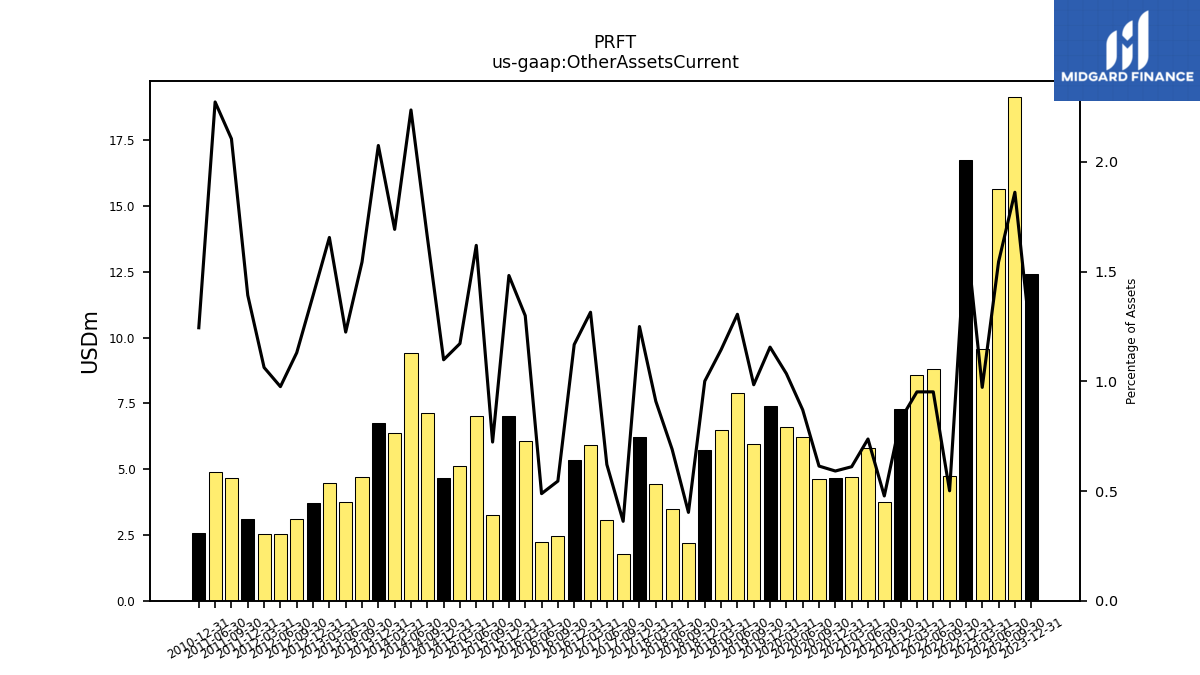
| Other Assets Current | 12.43 | 19.15 | 15.65 | 9.55 | 16.76 | 4.75 | 8.82 | 8.59 | 7.30 | 3.76 | 5.79 | 4.69 | 4.65 | 4.63 | 6.23 | 6.60 | 7.40 | 5.97 | 7.90 | 6.50 | 5.71 | 2.21 | 3.48 | 4.44 | 6.24 | 1.78 | 3.05 | 5.92 | 5.33 | 2.46 | 2.23 | 6.07 | 7.03 | 3.26 | 7.03 | 5.11 | 4.68 | 7.13 | 9.41 | 6.37 | 6.76 | 4.70 | 3.75 | 4.46 | 3.72 | 3.10 | 2.54 | 2.52 | 3.12 | 4.66 | 4.89 | NA | 2.58 | NA | NA |
| 2023-12-31 | 2023-09-30 | 2023-06-30 | 2023-03-31 | 2022-12-31 | 2022-09-30 | 2022-06-30 | 2022-03-31 | 2021-12-31 | 2021-09-30 | 2021-06-30 | 2021-03-31 | 2020-12-31 | 2020-09-30 | 2020-06-30 | 2020-03-31 | 2019-12-31 | 2019-09-30 | 2019-06-30 | 2019-03-31 | 2018-12-31 | 2018-09-30 | 2018-06-30 | 2018-03-31 | 2017-12-31 | 2017-09-30 | 2017-06-30 | 2017-03-31 | 2016-12-31 | 2016-09-30 | 2016-06-30 | 2016-03-31 | 2015-12-31 | 2015-09-30 | 2015-06-30 | 2015-03-31 | 2014-12-31 | 2014-09-30 | 2014-06-30 | 2014-03-31 | 2013-12-31 | 2013-09-30 | 2013-06-30 | 2013-03-31 | 2012-12-31 | 2012-09-30 | 2012-06-30 | 2012-03-31 | 2011-12-31 | 2011-09-30 | 2011-06-30 | 2011-03-31 | 2010-12-31 | 2010-09-30 | 2010-06-30 | ||
|---|---|---|---|---|---|---|---|---|---|---|---|---|---|---|---|---|---|---|---|---|---|---|---|---|---|---|---|---|---|---|---|---|---|---|---|---|---|---|---|---|---|---|---|---|---|---|---|---|---|---|---|---|---|---|---|---|
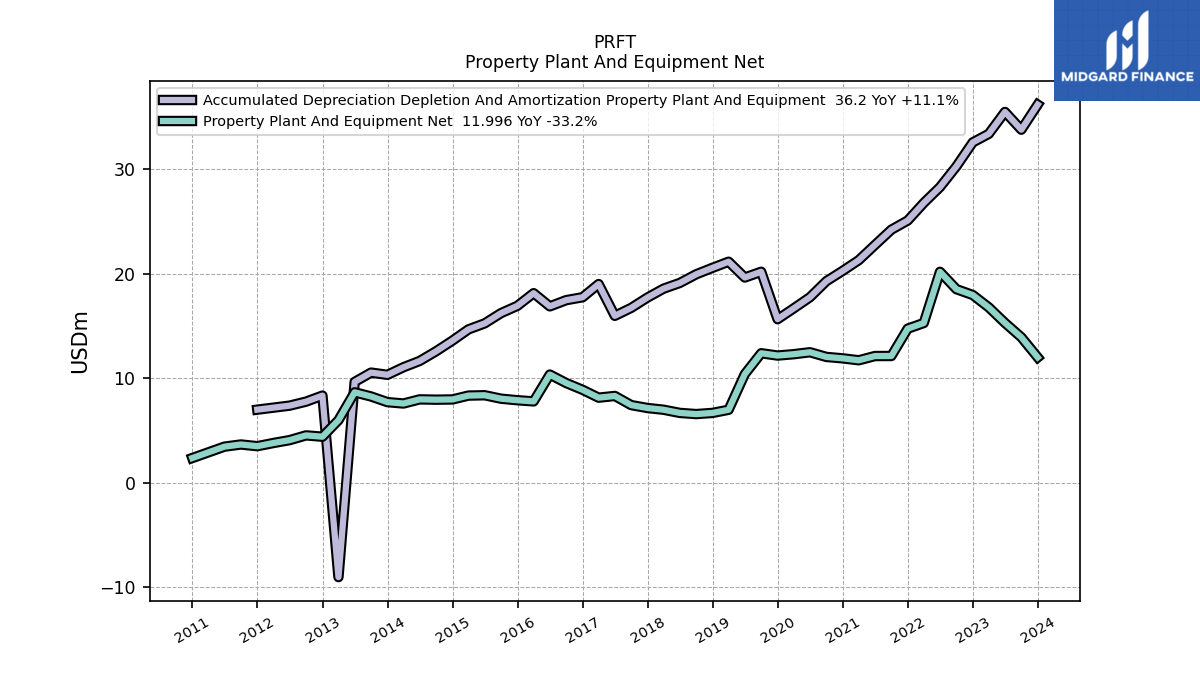
| Accumulated Depreciation Depletion And Amortization Property Plant And Equipment | 36.20 | 33.80 | 35.50 | 33.40 | 32.58 | 30.28 | 28.30 | 26.79 | 25.10 | 24.22 | 22.76 | 21.30 | 20.28 | 19.29 | 17.76 | 16.69 | 15.65 | 20.20 | 19.64 | 21.16 | 20.57 | 19.95 | 19.12 | 18.58 | 17.73 | 16.74 | 15.97 | 19.02 | 17.75 | 17.48 | 16.88 | 18.14 | 16.93 | 16.23 | 15.25 | 14.68 | 13.60 | 12.58 | 11.65 | 11.05 | 10.32 | 10.54 | 9.65 | -9.05 | 8.34 | 7.76 | 7.37 | NA | 6.99 | NA | NA | NA | NA | NA | NA | |
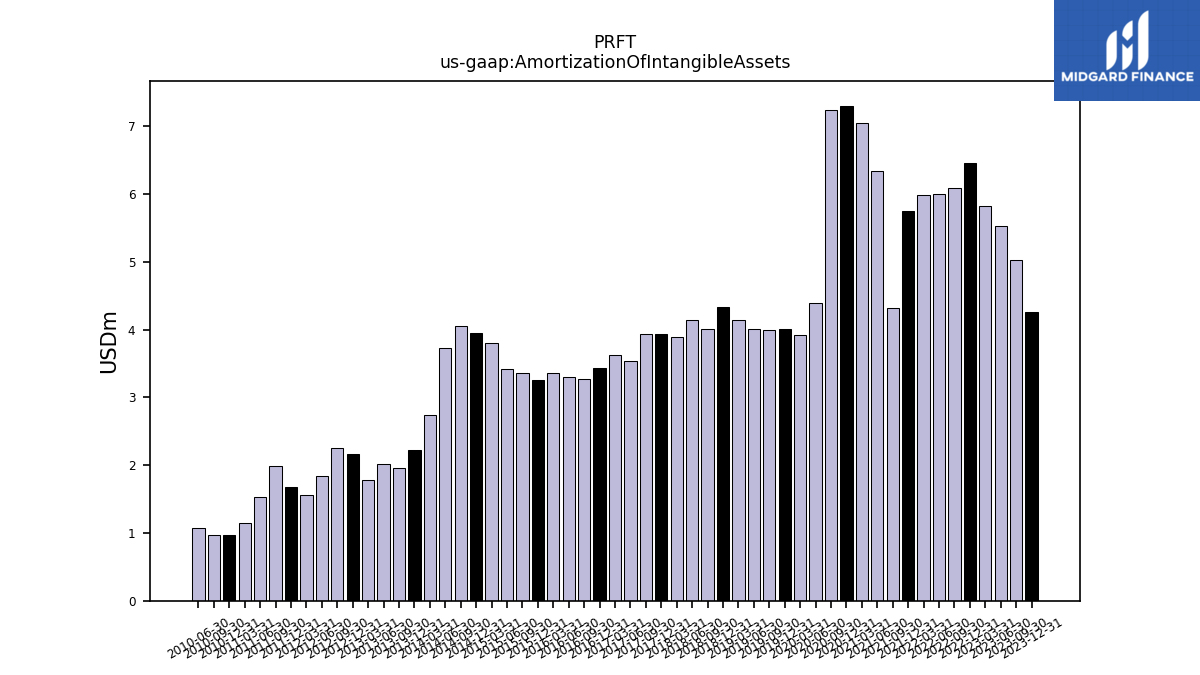
| Amortization Of Intangible Assets | 4.26 | 5.03 | 5.52 | 5.82 | 6.45 | 6.09 | 6.00 | 5.98 | 5.75 | 4.32 | 6.33 | 7.05 | 7.30 | 7.24 | 4.40 | 3.92 | 4.01 | 4.00 | 4.01 | 4.14 | 4.33 | 4.01 | 4.14 | 3.88 | 3.93 | 3.94 | 3.54 | 3.62 | 3.43 | 3.27 | 3.31 | 3.37 | 3.25 | 3.36 | 3.41 | 3.80 | 3.94 | 4.04 | 3.73 | 2.74 | 2.22 | 1.96 | 2.02 | 1.78 | 2.16 | 2.26 | 1.84 | 1.56 | 1.68 | 1.98 | 1.54 | 1.14 | 0.96 | 0.97 | 1.07 | |
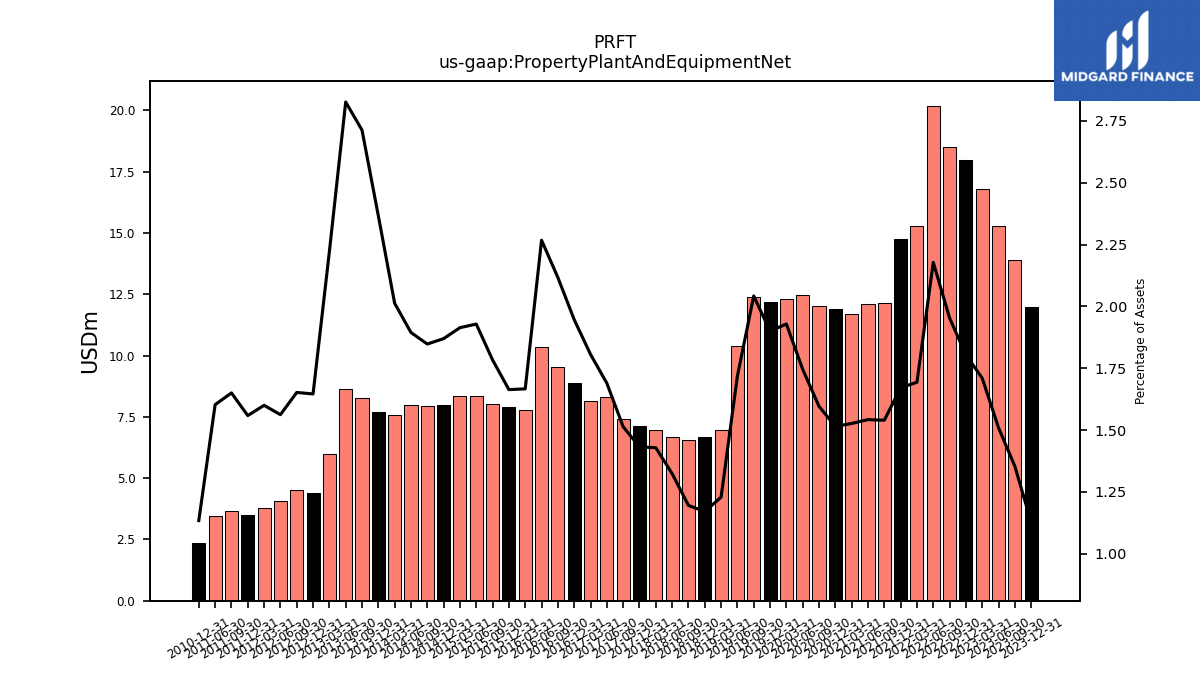
| Property Plant And Equipment Net | 12.00 | 13.92 | 15.30 | 16.79 | 17.97 | 18.53 | 20.19 | 15.29 | 14.75 | 12.13 | 12.12 | 11.72 | 11.90 | 12.04 | 12.49 | 12.30 | 12.17 | 12.39 | 10.39 | 6.98 | 6.68 | 6.57 | 6.68 | 6.98 | 7.14 | 7.42 | 8.30 | 8.14 | 8.89 | 9.54 | 10.35 | 7.78 | 7.89 | 8.04 | 8.37 | 8.34 | 7.97 | 7.95 | 7.97 | 7.58 | 7.71 | 8.25 | 8.65 | 5.98 | 4.40 | 4.53 | 4.07 | 3.80 | 3.49 | 3.65 | 3.45 | NA | 2.35 | NA | NA | |
| Goodwill | 581.39 | 577.63 | 575.17 | 569.39 | 565.16 | 545.84 | 512.72 | 518.95 | 515.23 | 438.17 | 420.51 | 421.93 | 427.93 | 419.03 | 417.40 | 361.54 | 335.56 | 335.59 | 335.98 | 327.93 | 327.99 | 322.00 | 315.40 | 305.14 | 305.24 | 304.58 | 304.46 | 281.24 | 275.20 | 269.57 | 269.54 | 269.61 | 269.38 | 259.14 | 255.19 | 252.82 | 236.13 | 236.14 | 235.20 | 221.60 | 193.51 | 175.16 | 175.17 | 161.69 | 160.94 | 160.20 | 150.82 | 142.17 | 132.04 | 131.96 | 120.90 | NA | 115.23 | NA | NA | |
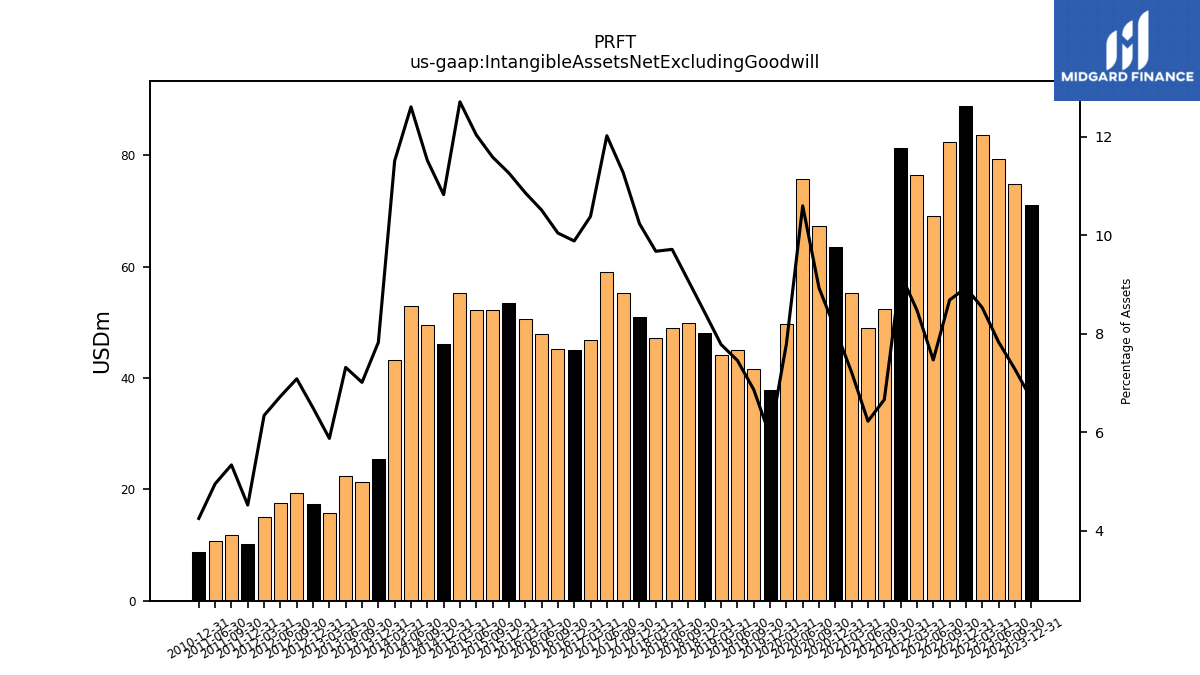
| Intangible Assets Net Excluding Goodwill | 71.12 | 74.88 | 79.39 | 83.75 | 88.94 | 82.38 | 69.21 | 76.53 | 81.28 | 52.48 | 48.94 | 55.37 | 63.57 | 67.35 | 75.80 | 49.67 | 37.95 | 41.65 | 45.10 | 44.19 | 48.09 | 49.82 | 48.99 | 47.27 | 51.07 | 55.28 | 59.04 | 46.76 | 45.12 | 45.24 | 47.97 | 50.71 | 53.41 | 52.22 | 52.22 | 55.33 | 46.10 | 49.52 | 53.05 | 43.33 | 25.49 | 21.33 | 22.39 | 15.82 | 17.35 | 19.41 | 17.53 | 15.05 | 10.13 | 11.82 | 10.66 | NA | 8.83 | NA | NA | |
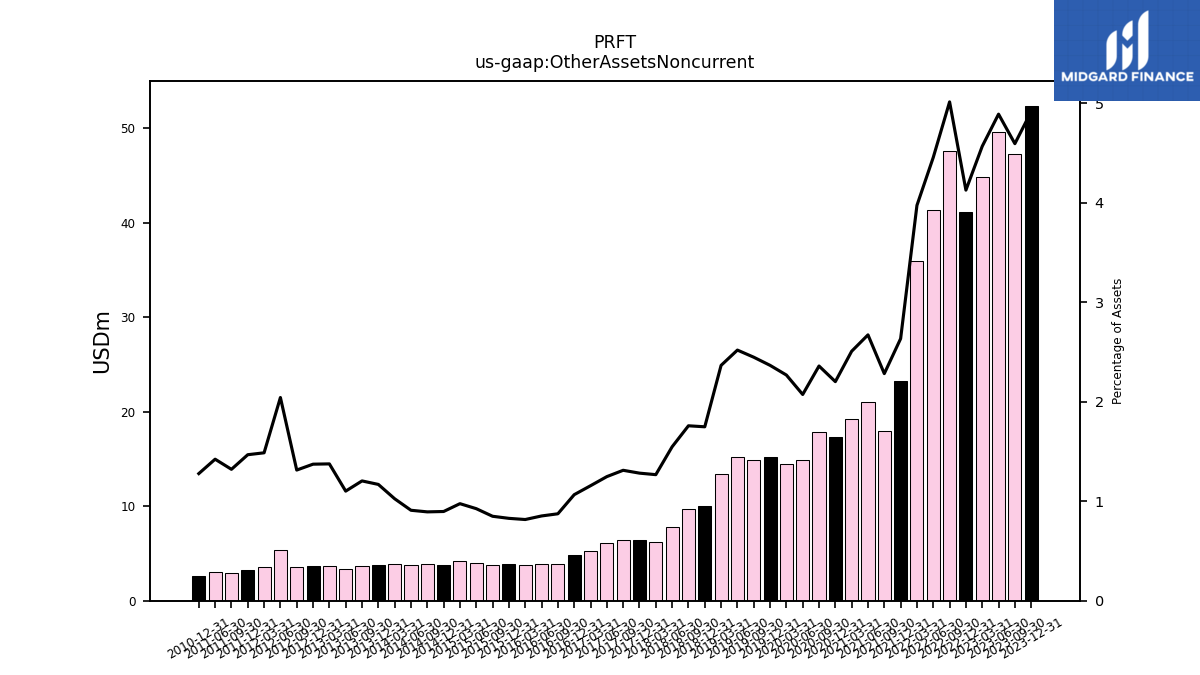
| Other Assets Noncurrent | 52.36 | 47.27 | 49.59 | 44.86 | 41.12 | 47.59 | 41.32 | 35.89 | 23.26 | 17.99 | 21.02 | 19.25 | 17.31 | 17.80 | 14.84 | 14.47 | 15.16 | 14.86 | 15.24 | 13.44 | 9.98 | 9.66 | 7.81 | 6.20 | 6.40 | 6.43 | 6.13 | 5.21 | 4.87 | 3.94 | 3.89 | 3.81 | 3.93 | 3.83 | 4.02 | 4.25 | 3.82 | 3.84 | 3.83 | 3.86 | 3.81 | 3.66 | 3.37 | 3.71 | 3.67 | 3.60 | 5.33 | 3.53 | 3.29 | 2.93 | 3.06 | NA | 2.65 | NA | NA |
| 2023-12-31 | 2023-09-30 | 2023-06-30 | 2023-03-31 | 2022-12-31 | 2022-09-30 | 2022-06-30 | 2022-03-31 | 2021-12-31 | 2021-09-30 | 2021-06-30 | 2021-03-31 | 2020-12-31 | 2020-09-30 | 2020-06-30 | 2020-03-31 | 2019-12-31 | 2019-09-30 | 2019-06-30 | 2019-03-31 | 2018-12-31 | 2018-09-30 | 2018-06-30 | 2018-03-31 | 2017-12-31 | 2017-09-30 | 2017-06-30 | 2017-03-31 | 2016-12-31 | 2016-09-30 | 2016-06-30 | 2016-03-31 | 2015-12-31 | 2015-09-30 | 2015-06-30 | 2015-03-31 | 2014-12-31 | 2014-09-30 | 2014-06-30 | 2014-03-31 | 2013-12-31 | 2013-09-30 | 2013-06-30 | 2013-03-31 | 2012-12-31 | 2012-09-30 | 2012-06-30 | 2012-03-31 | 2011-12-31 | 2011-09-30 | 2011-06-30 | 2011-03-31 | 2010-12-31 | 2010-09-30 | 2010-06-30 | ||
|---|---|---|---|---|---|---|---|---|---|---|---|---|---|---|---|---|---|---|---|---|---|---|---|---|---|---|---|---|---|---|---|---|---|---|---|---|---|---|---|---|---|---|---|---|---|---|---|---|---|---|---|---|---|---|---|---|
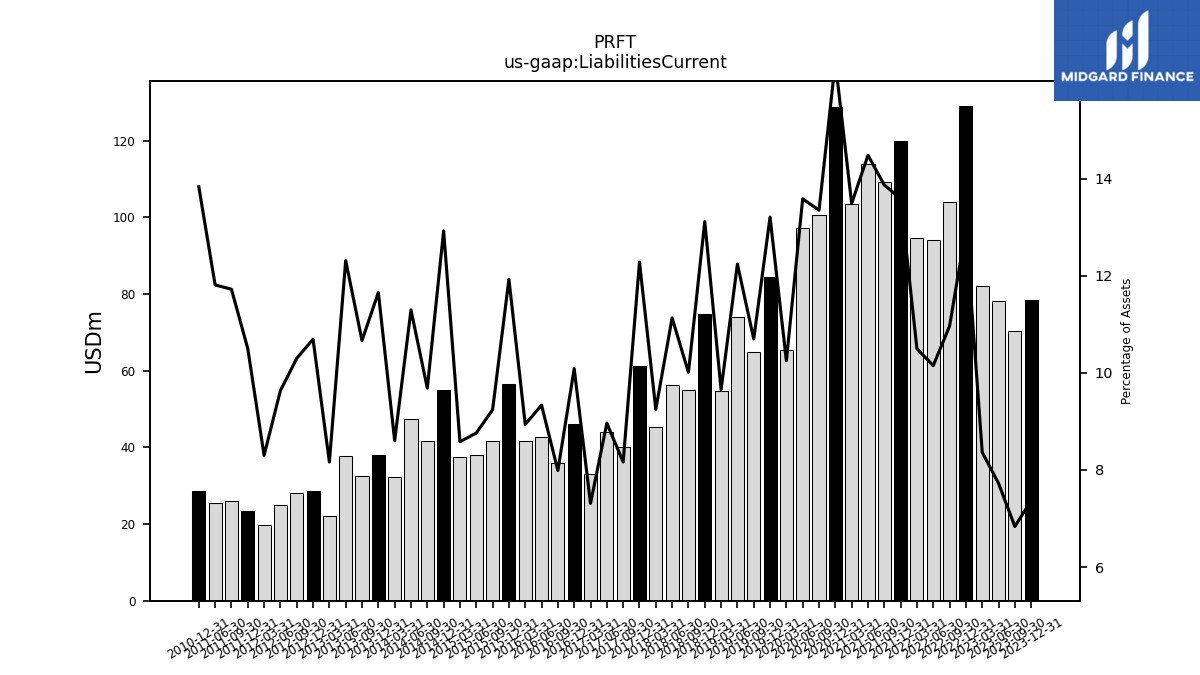
| Liabilities Current | 78.47 | 70.30 | 78.29 | 82.12 | 129.13 | 104.02 | 94.07 | 94.76 | 119.95 | 109.22 | 113.85 | 103.52 | 128.88 | 100.70 | 97.18 | 65.36 | 84.58 | 64.90 | 74.02 | 54.83 | 74.82 | 54.97 | 56.16 | 45.20 | 61.27 | 40.04 | 44.04 | 32.94 | 46.05 | 35.99 | 42.60 | 41.73 | 56.58 | 41.65 | 38.01 | 37.38 | 55.06 | 41.64 | 47.54 | 32.39 | 37.97 | 32.43 | 37.67 | 21.98 | 28.56 | 28.22 | 25.10 | 19.70 | 23.51 | 25.95 | 25.41 | NA | 28.73 | NA | NA | |
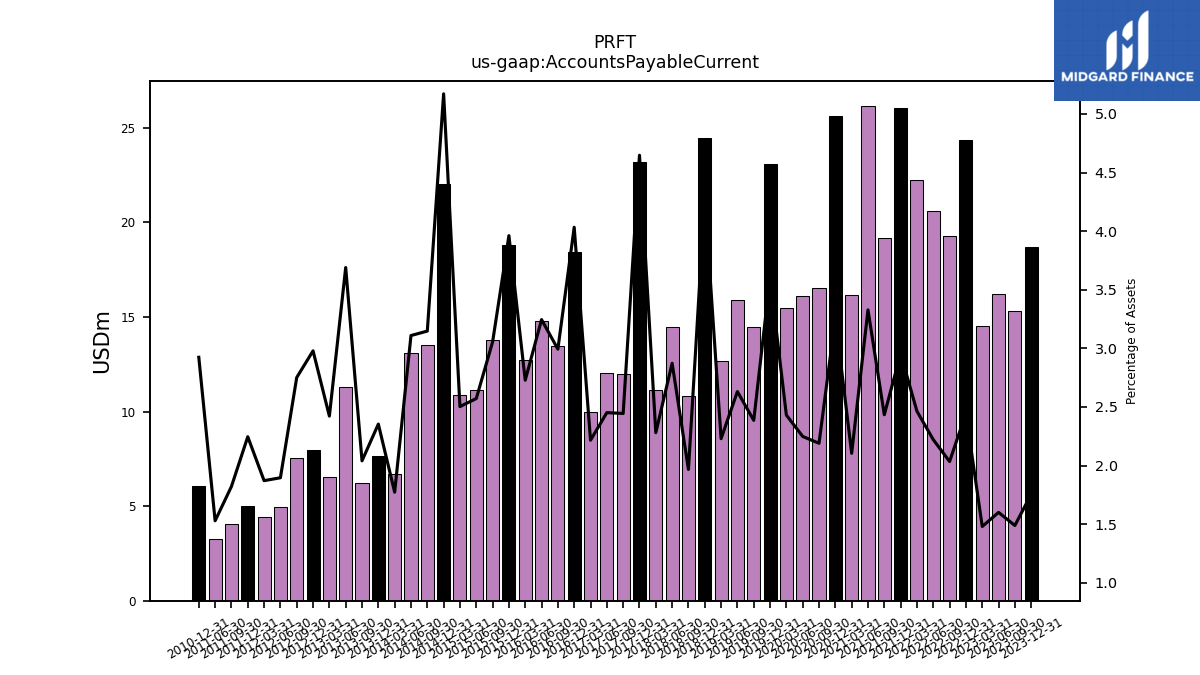
| Accounts Payable Current | 18.69 | 15.31 | 16.22 | 14.53 | 24.35 | 19.30 | 20.59 | 22.24 | 26.07 | 19.17 | 26.17 | 16.15 | 25.61 | 16.52 | 16.09 | 15.50 | 23.08 | 14.47 | 15.91 | 12.66 | 24.44 | 10.80 | 14.49 | 11.15 | 23.20 | 11.99 | 12.04 | 9.98 | 18.42 | 13.48 | 14.81 | 12.74 | 18.79 | 13.77 | 11.16 | 10.90 | 22.04 | 13.53 | 13.09 | 6.67 | 7.67 | 6.21 | 11.29 | 6.52 | 7.96 | 7.54 | 4.94 | 4.44 | 5.03 | 4.03 | 3.29 | NA | 6.07 | NA | NA | |
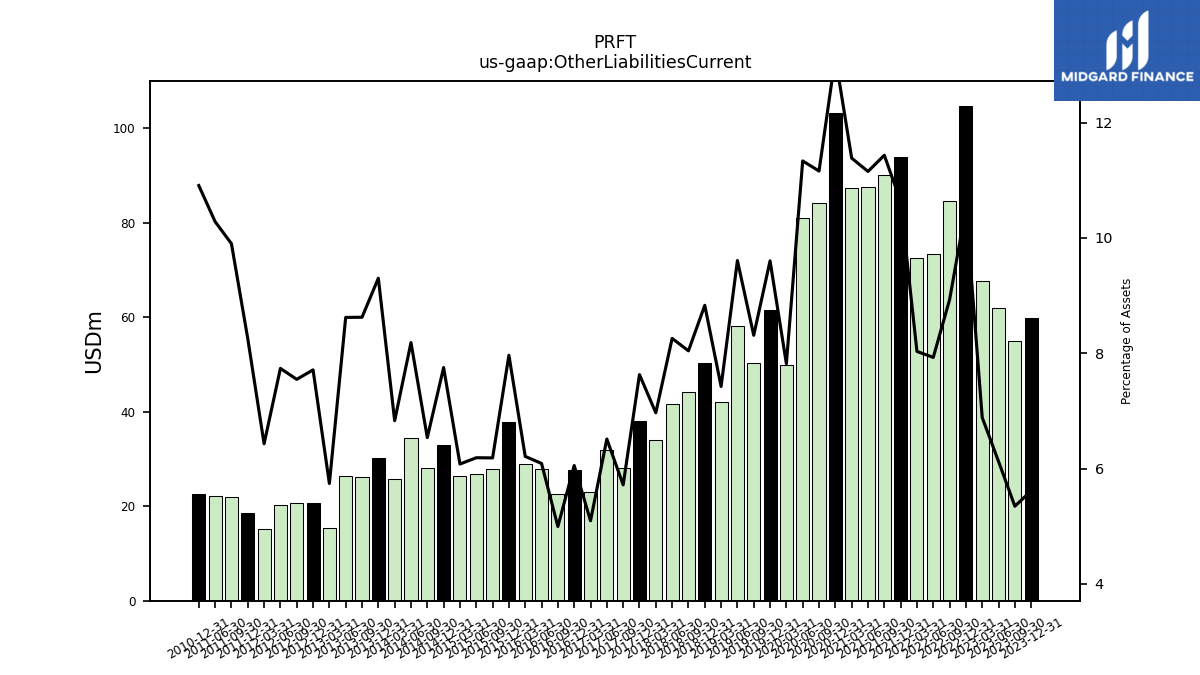
| Other Liabilities Current | 59.78 | 54.99 | 62.07 | 67.59 | 104.78 | 84.72 | 73.48 | 72.52 | 93.88 | 90.06 | 87.68 | 87.37 | 103.27 | 84.18 | 81.10 | 49.86 | 61.50 | 50.43 | 58.11 | 42.17 | 50.39 | 44.17 | 41.66 | 34.05 | 38.08 | 28.05 | 32.00 | 22.96 | 27.64 | 22.50 | 27.79 | 29.00 | 37.78 | 27.88 | 26.85 | 26.48 | 33.03 | 28.11 | 34.45 | 25.72 | 30.30 | 26.23 | 26.38 | 15.46 | 20.61 | 20.68 | 20.16 | 15.26 | 18.48 | 21.92 | 22.12 | NA | 22.65 | NA | NA |
| 2023-12-31 | 2023-09-30 | 2023-06-30 | 2023-03-31 | 2022-12-31 | 2022-09-30 | 2022-06-30 | 2022-03-31 | 2021-12-31 | 2021-09-30 | 2021-06-30 | 2021-03-31 | 2020-12-31 | 2020-09-30 | 2020-06-30 | 2020-03-31 | 2019-12-31 | 2019-09-30 | 2019-06-30 | 2019-03-31 | 2018-12-31 | 2018-09-30 | 2018-06-30 | 2018-03-31 | 2017-12-31 | 2017-09-30 | 2017-06-30 | 2017-03-31 | 2016-12-31 | 2016-09-30 | 2016-06-30 | 2016-03-31 | 2015-12-31 | 2015-09-30 | 2015-06-30 | 2015-03-31 | 2014-12-31 | 2014-09-30 | 2014-06-30 | 2014-03-31 | 2013-12-31 | 2013-09-30 | 2013-06-30 | 2013-03-31 | 2012-12-31 | 2012-09-30 | 2012-06-30 | 2012-03-31 | 2011-12-31 | 2011-09-30 | 2011-06-30 | 2011-03-31 | 2010-12-31 | 2010-09-30 | 2010-06-30 | ||
|---|---|---|---|---|---|---|---|---|---|---|---|---|---|---|---|---|---|---|---|---|---|---|---|---|---|---|---|---|---|---|---|---|---|---|---|---|---|---|---|---|---|---|---|---|---|---|---|---|---|---|---|---|---|---|---|---|
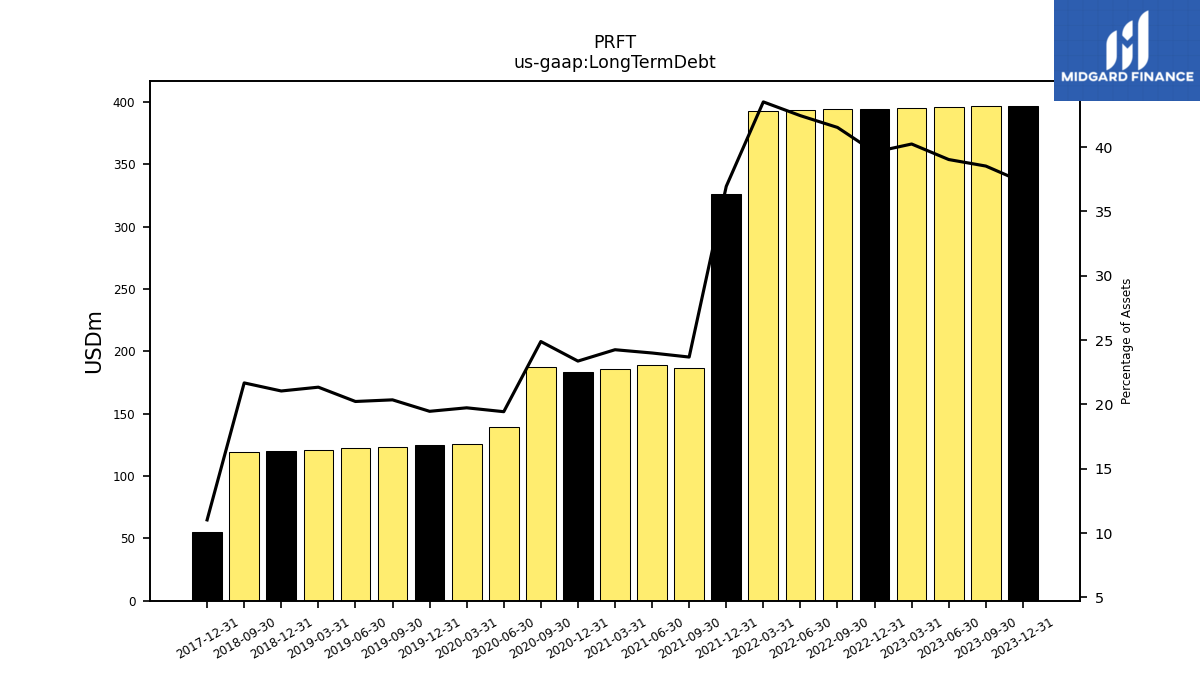
| Long Term Debt | 396.87 | 396.30 | 395.73 | 395.16 | 394.59 | 394.05 | 393.48 | 392.91 | 326.13 | 186.53 | 188.67 | 186.13 | 183.62 | 187.74 | 139.04 | 125.85 | 124.66 | 123.49 | 122.34 | 121.20 | 120.07 | 119.04 | NA | NA | 55.00 | NA | NA | NA | NA | NA | NA | NA | NA | NA | NA | NA | NA | NA | NA | NA | NA | NA | NA | NA | NA | NA | NA | NA | NA | NA | NA | NA | NA | NA | NA | |
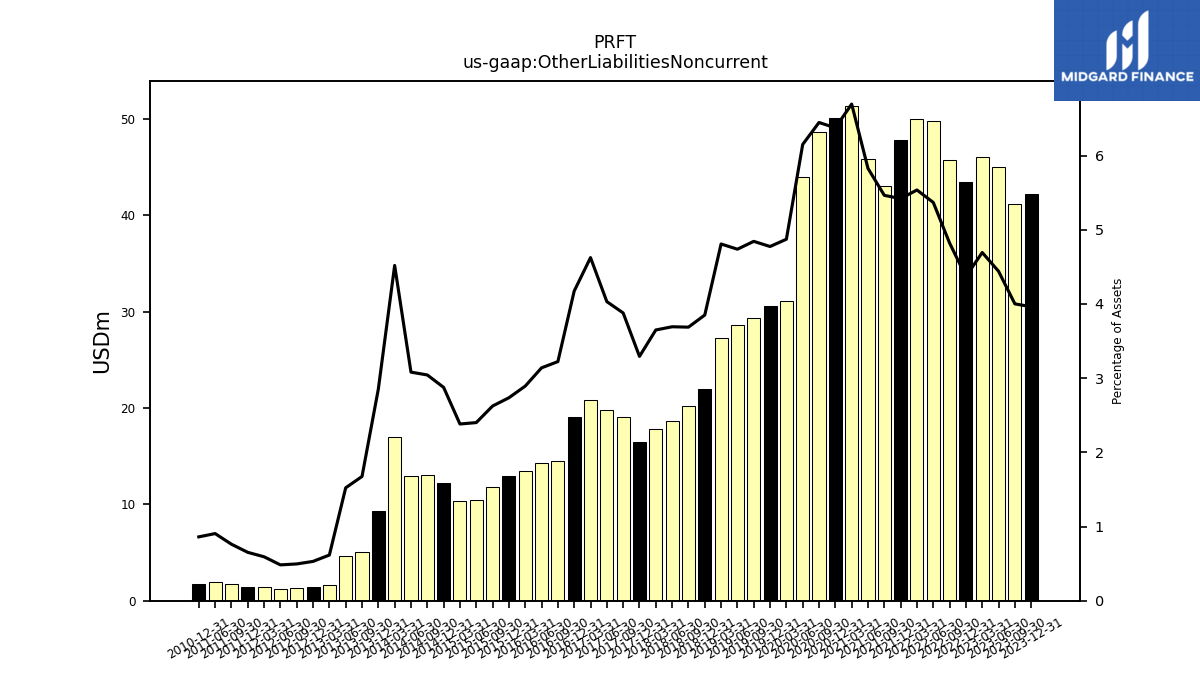
| Other Liabilities Noncurrent | 42.19 | 41.15 | 45.02 | 46.08 | 43.52 | 45.74 | 49.76 | 49.98 | 47.83 | 43.04 | 45.81 | 51.38 | 50.08 | 48.62 | 44.00 | 31.07 | 30.58 | 29.39 | 28.66 | 27.31 | 21.97 | 20.25 | 18.63 | 17.84 | 16.44 | 19.03 | 19.81 | 20.84 | 19.06 | 14.52 | 14.33 | 13.51 | 12.98 | 11.83 | 10.42 | 10.38 | 12.25 | 13.08 | 12.97 | 17.02 | 9.29 | 5.09 | 4.66 | 1.66 | 1.42 | 1.36 | 1.26 | 1.41 | 1.46 | 1.69 | 1.95 | NA | 1.79 | NA | NA | |
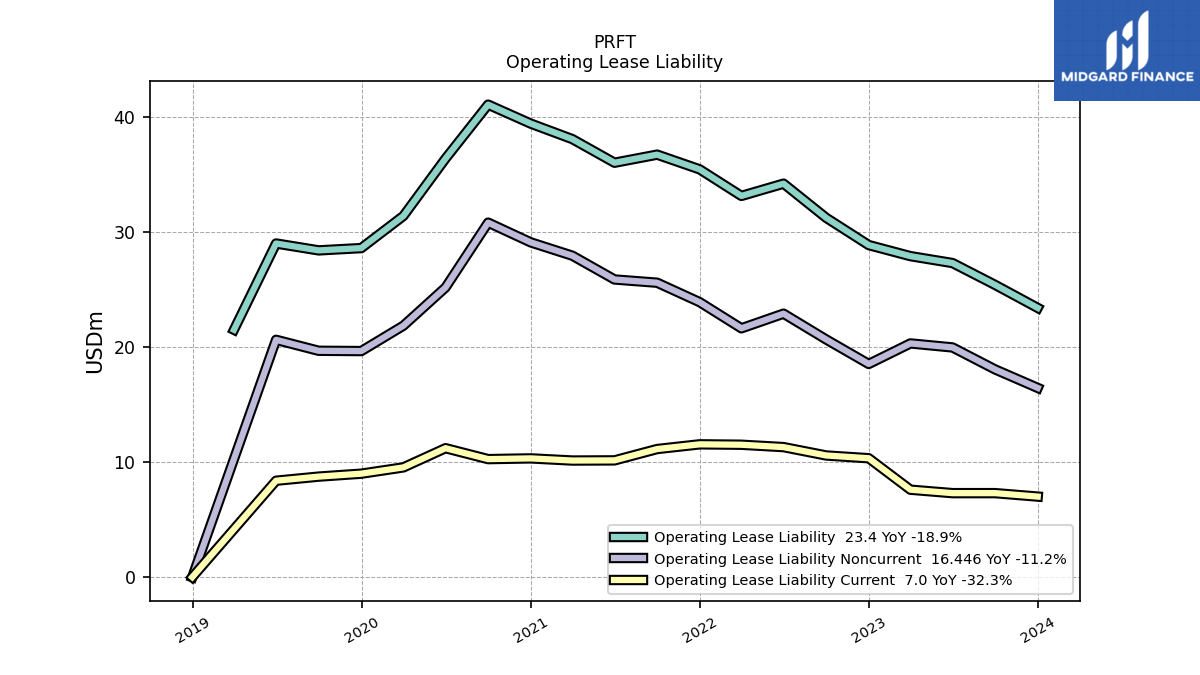
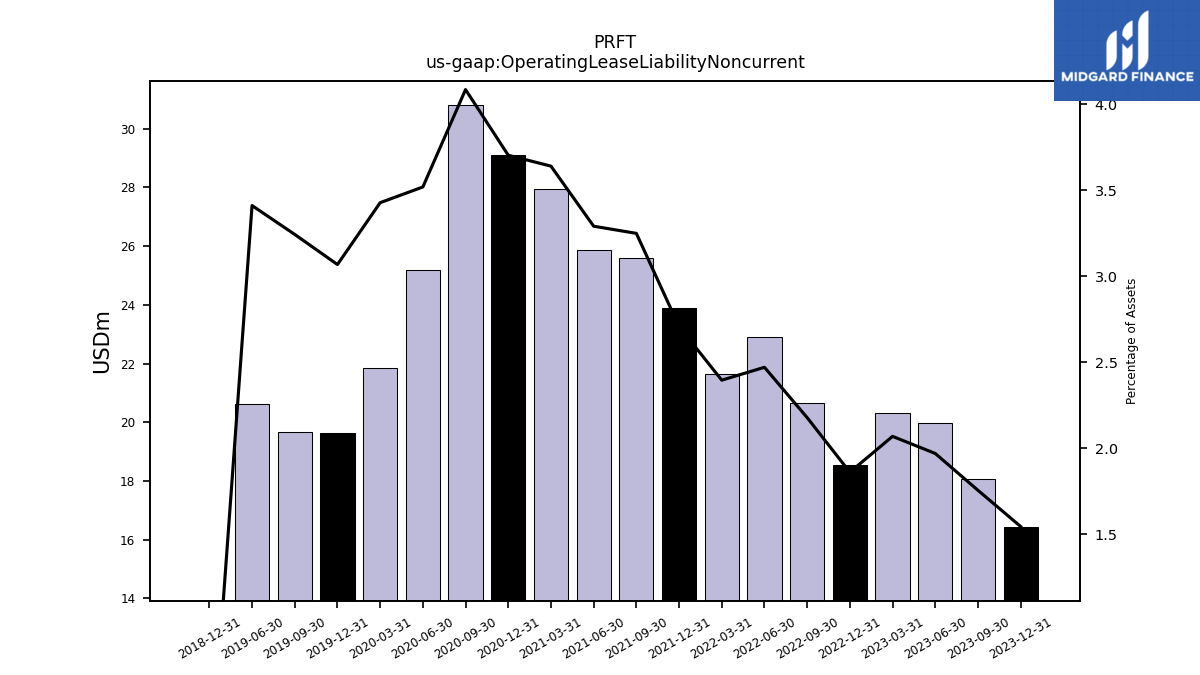
| Operating Lease Liability Noncurrent | 16.45 | 18.05 | 19.96 | 20.31 | 18.53 | 20.66 | 22.90 | 21.63 | 23.90 | 25.59 | 25.87 | 27.94 | 29.10 | 30.81 | 25.18 | 21.86 | 19.65 | 19.67 | 20.63 | NA | 0.00 | NA | NA | NA | NA | NA | NA | NA | NA | NA | NA | NA | NA | NA | NA | NA | NA | NA | NA | NA | NA | NA | NA | NA | NA | NA | NA | NA | NA | NA | NA | NA | NA | NA | NA |
| 2023-12-31 | 2023-09-30 | 2023-06-30 | 2023-03-31 | 2022-12-31 | 2022-09-30 | 2022-06-30 | 2022-03-31 | 2021-12-31 | 2021-09-30 | 2021-06-30 | 2021-03-31 | 2020-12-31 | 2020-09-30 | 2020-06-30 | 2020-03-31 | 2019-12-31 | 2019-09-30 | 2019-06-30 | 2019-03-31 | 2018-12-31 | 2018-09-30 | 2018-06-30 | 2018-03-31 | 2017-12-31 | 2017-09-30 | 2017-06-30 | 2017-03-31 | 2016-12-31 | 2016-09-30 | 2016-06-30 | 2016-03-31 | 2015-12-31 | 2015-09-30 | 2015-06-30 | 2015-03-31 | 2014-12-31 | 2014-09-30 | 2014-06-30 | 2014-03-31 | 2013-12-31 | 2013-09-30 | 2013-06-30 | 2013-03-31 | 2012-12-31 | 2012-09-30 | 2012-06-30 | 2012-03-31 | 2011-12-31 | 2011-09-30 | 2011-06-30 | 2011-03-31 | 2010-12-31 | 2010-09-30 | 2010-06-30 | ||
|---|---|---|---|---|---|---|---|---|---|---|---|---|---|---|---|---|---|---|---|---|---|---|---|---|---|---|---|---|---|---|---|---|---|---|---|---|---|---|---|---|---|---|---|---|---|---|---|---|---|---|---|---|---|---|---|---|
| Stockholders Equity | 530.62 | 502.69 | 474.69 | 438.18 | 410.13 | 384.27 | 366.73 | 343.55 | 364.76 | 423.25 | 411.99 | 398.53 | 394.08 | 386.43 | 410.05 | 393.52 | 381.01 | 369.25 | 359.15 | 349.81 | 353.68 | 355.00 | 373.75 | 369.69 | 366.35 | 366.52 | 359.48 | 358.26 | 359.46 | 371.99 | 363.48 | 355.63 | 348.81 | 336.34 | 325.48 | 320.28 | 304.73 | 300.43 | 289.40 | 277.12 | 259.49 | 250.59 | 243.37 | 239.61 | 234.41 | 232.89 | 221.73 | 210.01 | 198.96 | 193.79 | 187.79 | NA | 177.16 | NA | NA | |
| Common Stock Value | 0.05 | 0.05 | 0.05 | 0.05 | 0.05 | 0.05 | 0.05 | 0.05 | 0.05 | 0.05 | 0.05 | 0.05 | 0.05 | 0.05 | 0.05 | 0.05 | 0.05 | 0.05 | 0.05 | 0.05 | 0.05 | 0.05 | 0.05 | 0.05 | 0.05 | 0.05 | 0.05 | 0.05 | 0.05 | 0.04 | 0.04 | 0.04 | 0.04 | 0.04 | 0.04 | 0.04 | 0.04 | 0.04 | 0.04 | 0.04 | 0.04 | 0.04 | 0.04 | 0.04 | 0.04 | 0.04 | 0.04 | 0.04 | 0.04 | 0.04 | 0.04 | NA | 0.03 | NA | NA | |
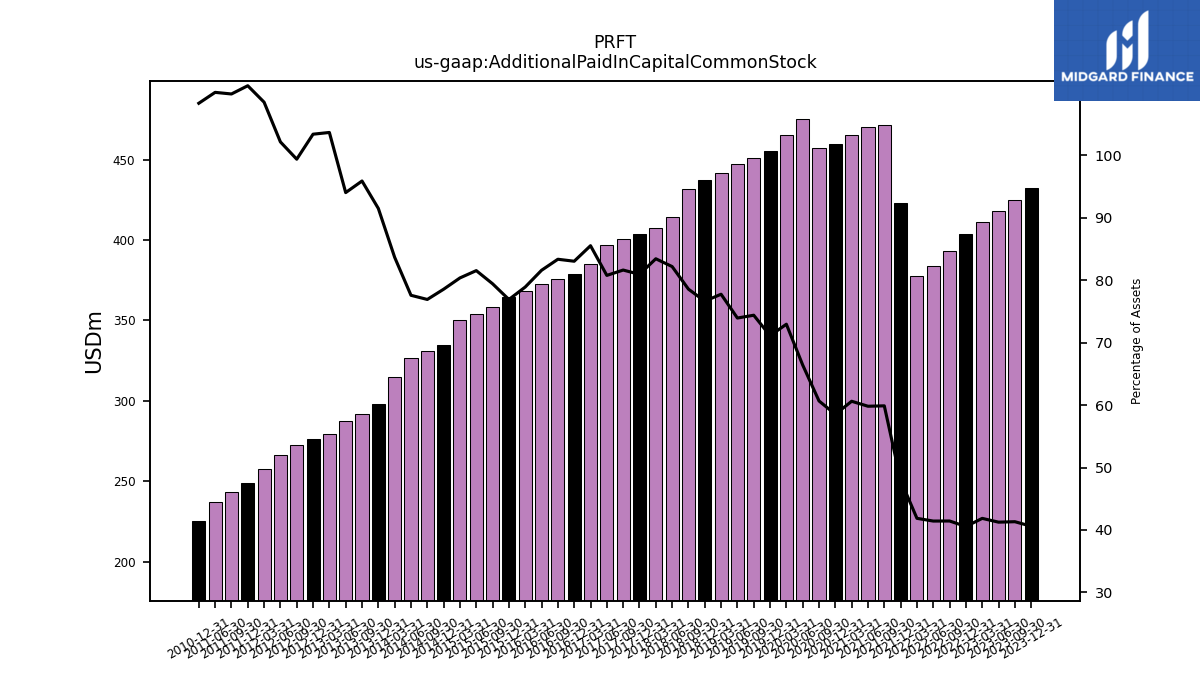
| Additional Paid In Capital Common Stock | 432.16 | 424.99 | 418.12 | 410.96 | 403.87 | 393.10 | 383.99 | 377.93 | 423.24 | 471.59 | 470.22 | 465.16 | 459.87 | 457.53 | 475.15 | 465.12 | 455.46 | 451.29 | 447.15 | 441.54 | 437.25 | 431.51 | 414.61 | 407.71 | 403.91 | 400.40 | 396.80 | 385.28 | 379.09 | 375.47 | 372.34 | 368.36 | 364.79 | 358.05 | 353.76 | 349.98 | 334.64 | 330.67 | 326.52 | 314.99 | 298.00 | 291.57 | 287.70 | 279.07 | 276.20 | 272.23 | 266.16 | 257.48 | 248.85 | 243.16 | 236.82 | NA | 224.97 | NA | NA | |
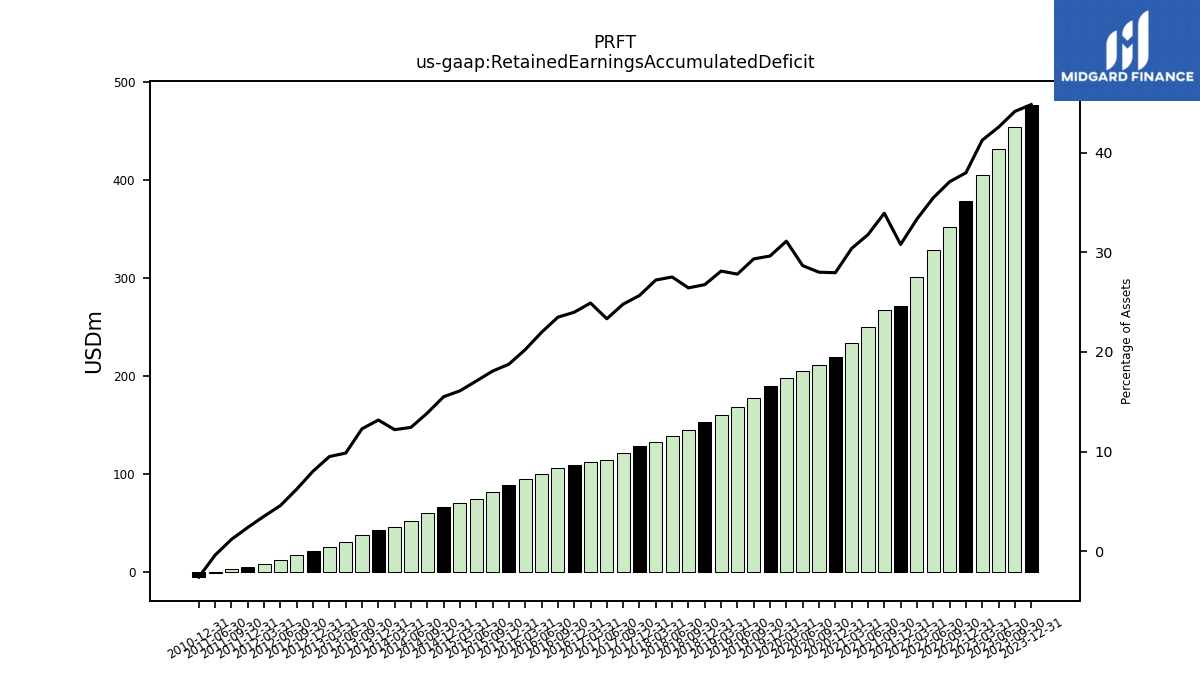
| Retained Earnings Accumulated Deficit | 477.20 | 454.02 | 431.43 | 405.06 | 378.26 | 351.80 | 328.79 | 301.01 | 271.73 | 267.20 | 249.81 | 233.23 | 219.64 | 211.22 | 205.04 | 198.43 | 189.78 | 177.98 | 168.20 | 159.68 | 152.65 | 145.17 | 138.87 | 133.02 | 128.09 | 121.66 | 114.63 | 112.22 | 109.51 | 105.82 | 100.27 | 94.46 | 89.05 | 81.48 | 74.11 | 70.11 | 66.04 | 59.62 | 52.31 | 45.93 | 42.88 | 37.37 | 30.13 | 25.57 | 21.45 | 17.07 | 11.93 | 8.33 | 5.34 | 2.62 | -0.84 | NA | -5.41 | NA | NA | |
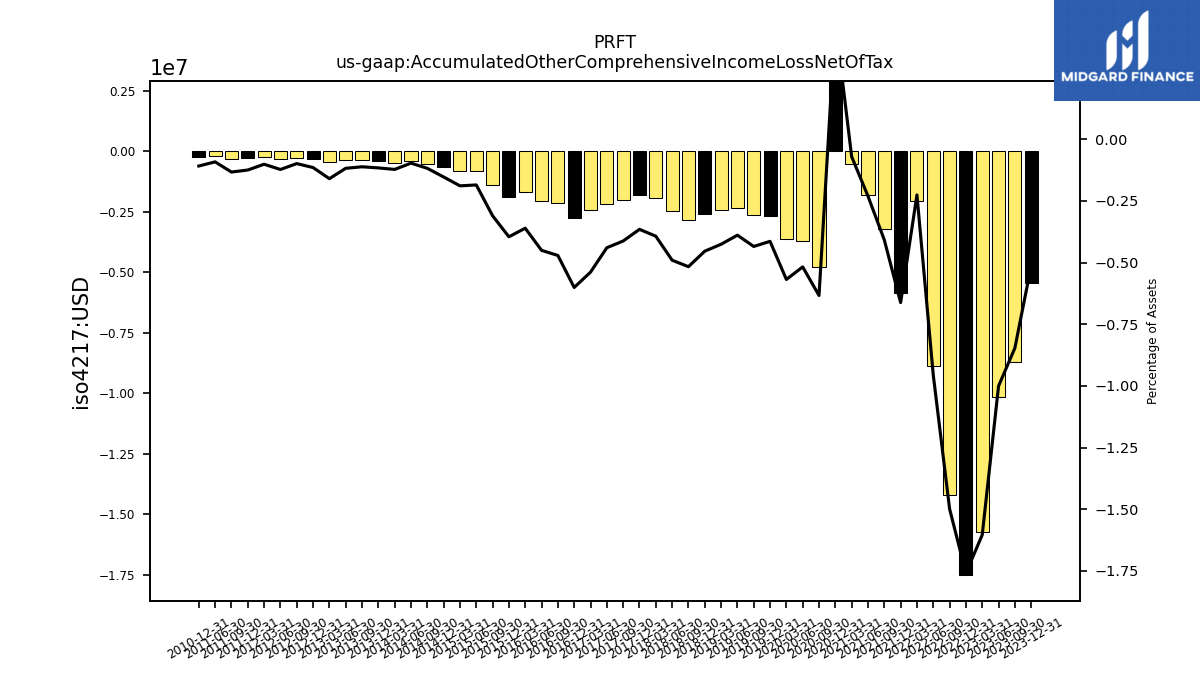
| Accumulated Other Comprehensive Income Loss Net Of Tax | -5.46 | -8.71 | -10.14 | -15.75 | -17.52 | -14.22 | -8.86 | -2.04 | -5.84 | -3.21 | -1.81 | -0.54 | 3.75 | -4.78 | -3.70 | -3.62 | -2.65 | -2.64 | -2.35 | -2.42 | -2.59 | -2.84 | -2.47 | -1.92 | -1.82 | -2.02 | -2.16 | -2.43 | -2.74 | -2.12 | -2.06 | -1.68 | -1.88 | -1.40 | -0.80 | -0.82 | -0.65 | -0.51 | -0.41 | -0.46 | -0.38 | -0.34 | -0.36 | -0.43 | -0.31 | -0.27 | -0.32 | -0.24 | -0.28 | -0.29 | -0.20 | NA | -0.23 | NA | NA |
| 2023-12-31 | 2023-09-30 | 2023-06-30 | 2023-03-31 | 2022-12-31 | 2022-09-30 | 2022-06-30 | 2022-03-31 | 2021-12-31 | 2021-09-30 | 2021-06-30 | 2021-03-31 | 2020-12-31 | 2020-09-30 | 2020-06-30 | 2020-03-31 | 2019-12-31 | 2019-09-30 | 2019-06-30 | 2019-03-31 | 2018-12-31 | 2018-09-30 | 2018-06-30 | 2018-03-31 | 2017-12-31 | 2017-09-30 | 2017-06-30 | 2017-03-31 | 2016-12-31 | 2016-09-30 | 2016-06-30 | 2016-03-31 | 2015-12-31 | 2015-09-30 | 2015-06-30 | 2015-03-31 | 2014-12-31 | 2014-09-30 | 2014-06-30 | 2014-03-31 | 2013-12-31 | 2013-09-30 | 2013-06-30 | 2013-03-31 | 2012-12-31 | 2012-09-30 | 2012-06-30 | 2012-03-31 | 2011-12-31 | 2011-09-30 | 2011-06-30 | 2011-03-31 | 2010-12-31 | 2010-09-30 | 2010-06-30 | ||
|---|---|---|---|---|---|---|---|---|---|---|---|---|---|---|---|---|---|---|---|---|---|---|---|---|---|---|---|---|---|---|---|---|---|---|---|---|---|---|---|---|---|---|---|---|---|---|---|---|---|---|---|---|---|---|---|---|
| Net Cash Provided By Used In Operating Activities | 54.48 | 23.37 | 23.78 | 41.33 | 46.63 | 37.46 | 22.81 | 11.17 | 46.78 | 8.26 | 28.72 | 1.16 | 58.34 | 22.12 | 41.88 | -4.38 | 40.28 | 13.88 | 24.16 | -0.34 | 25.79 | 13.24 | 25.41 | 4.14 | 25.10 | 5.24 | 11.43 | 13.45 | 23.40 | 10.51 | 24.95 | 4.44 | 18.47 | 5.21 | 12.67 | 8.37 | 33.41 | -2.28 | 6.09 | -3.19 | 21.10 | 10.40 | 15.88 | -0.52 | 18.36 | 11.38 | 7.61 | 1.86 | 12.45 | 6.00 | 2.75 | -6.87 | 3.95 | 5.07 | NA | |
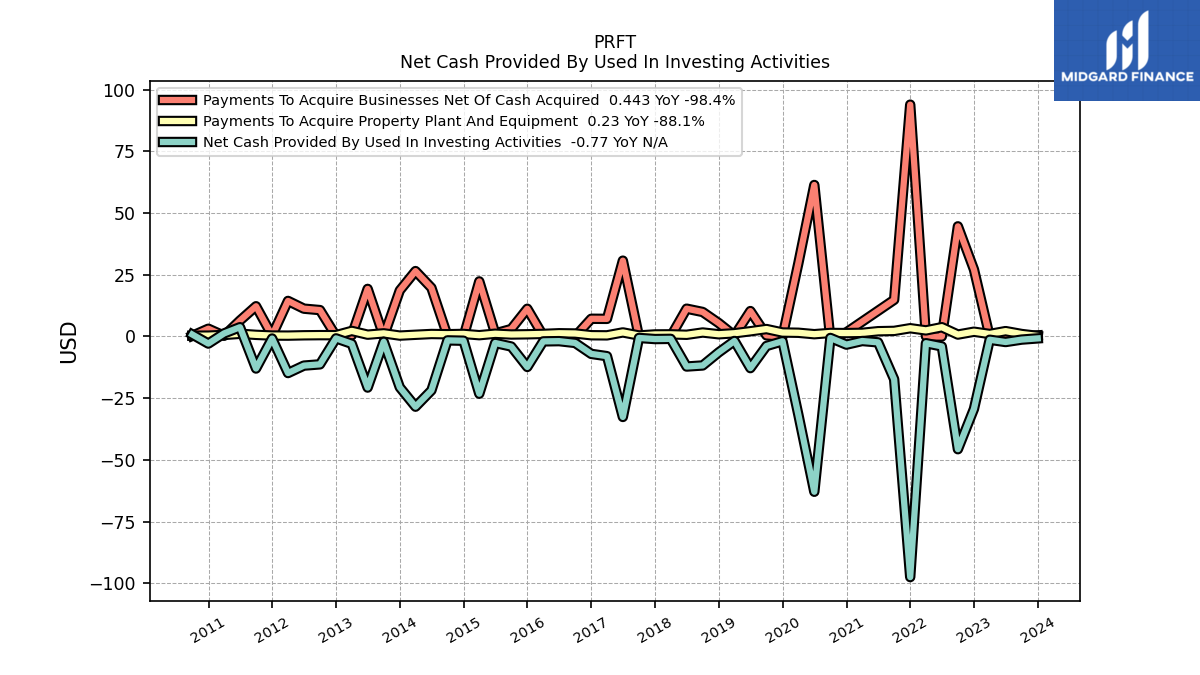
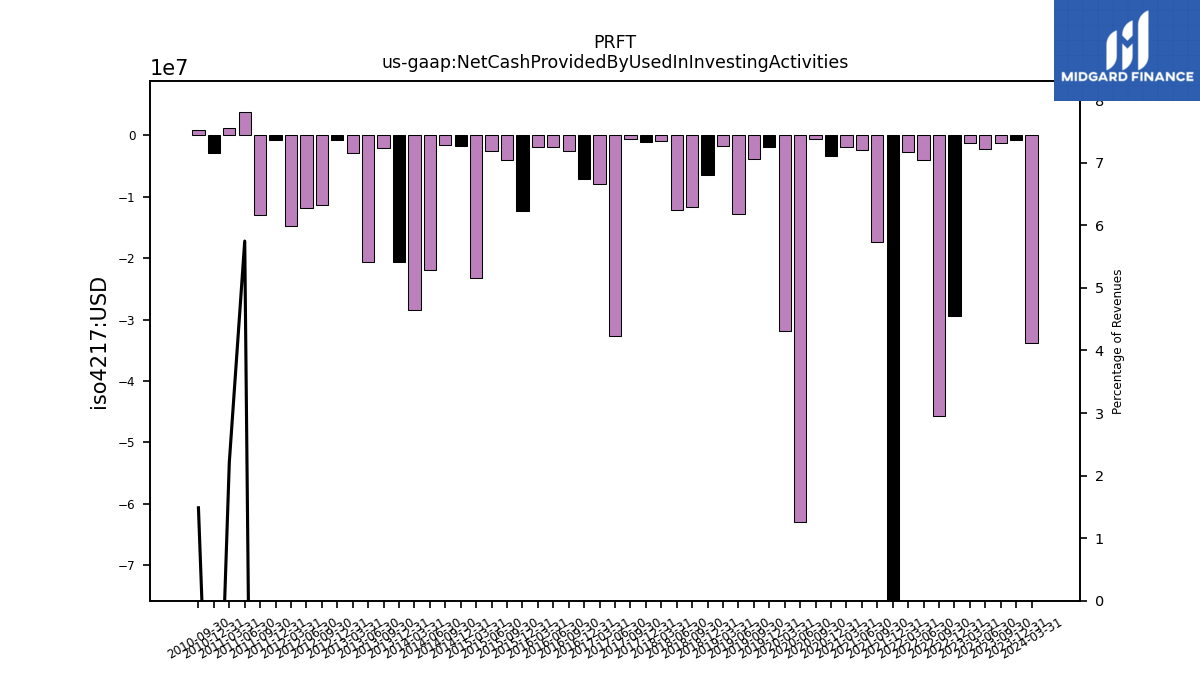
| Net Cash Provided By Used In Investing Activities | -0.77 | -1.26 | -2.24 | -1.31 | -29.34 | -45.69 | -4.01 | -2.71 | -97.53 | -17.32 | -2.38 | -1.83 | -3.30 | -0.59 | -62.93 | -31.80 | -1.92 | -3.85 | -12.83 | -1.80 | -6.42 | -11.74 | -12.17 | -0.96 | -1.04 | -0.59 | -32.62 | -7.97 | -7.05 | -2.62 | -1.88 | -1.98 | -12.35 | -4.06 | -2.62 | -23.20 | -1.71 | -1.57 | -21.85 | -28.46 | -20.60 | -2.14 | -20.71 | -2.96 | -0.76 | -11.29 | -11.80 | -14.82 | -0.82 | -12.98 | 3.77 | 1.24 | -2.88 | 0.81 | NA | |
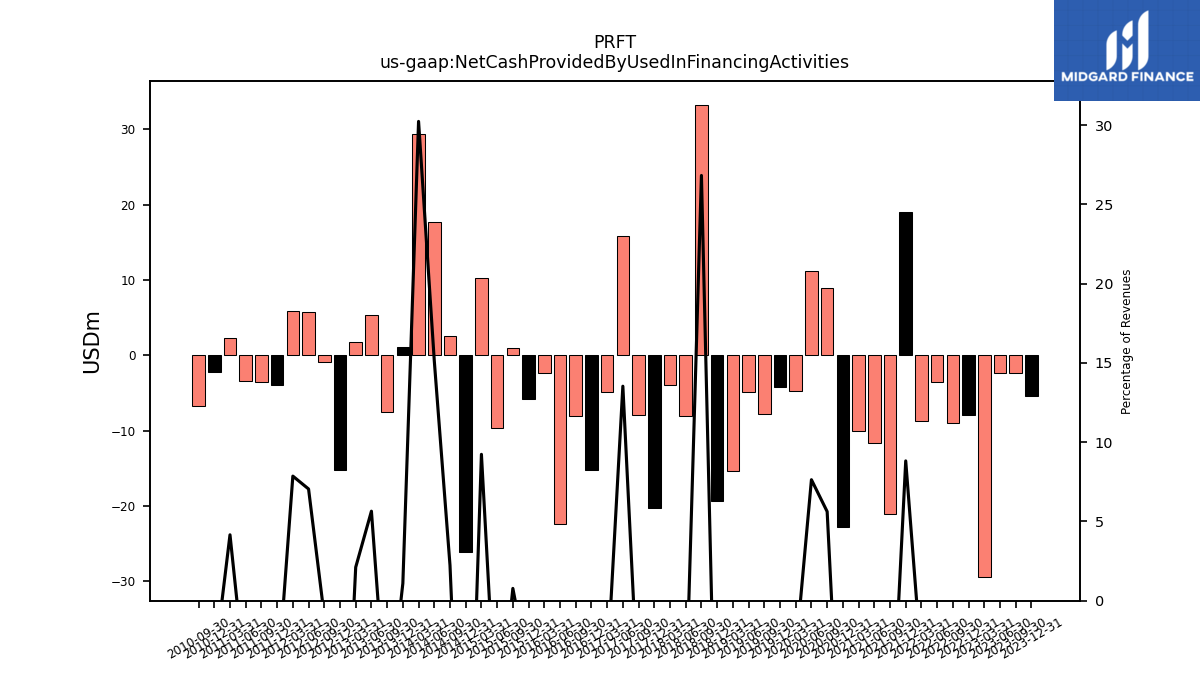
| Net Cash Provided By Used In Financing Activities | -5.45 | -2.39 | -2.41 | -29.42 | -7.85 | -8.98 | -3.54 | -8.71 | 18.95 | -21.11 | -11.64 | -10.04 | -22.73 | 8.87 | 11.17 | -4.79 | -4.14 | -7.77 | -4.82 | -15.32 | -19.29 | 33.25 | -8.09 | -3.95 | -20.30 | -7.97 | 15.84 | -4.85 | -15.17 | -8.05 | -22.36 | -2.30 | -5.85 | 0.94 | -9.58 | 10.22 | -26.12 | 2.62 | 17.67 | 29.39 | 1.07 | -7.52 | 5.32 | 1.80 | -15.27 | -0.84 | 5.77 | 5.87 | -3.87 | -3.56 | -3.44 | 2.34 | -2.24 | -6.70 | NA |
| 2023-12-31 | 2023-09-30 | 2023-06-30 | 2023-03-31 | 2022-12-31 | 2022-09-30 | 2022-06-30 | 2022-03-31 | 2021-12-31 | 2021-09-30 | 2021-06-30 | 2021-03-31 | 2020-12-31 | 2020-09-30 | 2020-06-30 | 2020-03-31 | 2019-12-31 | 2019-09-30 | 2019-06-30 | 2019-03-31 | 2018-12-31 | 2018-09-30 | 2018-06-30 | 2018-03-31 | 2017-12-31 | 2017-09-30 | 2017-06-30 | 2017-03-31 | 2016-12-31 | 2016-09-30 | 2016-06-30 | 2016-03-31 | 2015-12-31 | 2015-09-30 | 2015-06-30 | 2015-03-31 | 2014-12-31 | 2014-09-30 | 2014-06-30 | 2014-03-31 | 2013-12-31 | 2013-09-30 | 2013-06-30 | 2013-03-31 | 2012-12-31 | 2012-09-30 | 2012-06-30 | 2012-03-31 | 2011-12-31 | 2011-09-30 | 2011-06-30 | 2011-03-31 | 2010-12-31 | 2010-09-30 | 2010-06-30 | ||
|---|---|---|---|---|---|---|---|---|---|---|---|---|---|---|---|---|---|---|---|---|---|---|---|---|---|---|---|---|---|---|---|---|---|---|---|---|---|---|---|---|---|---|---|---|---|---|---|---|---|---|---|---|---|---|---|---|
| Net Cash Provided By Used In Operating Activities | 54.48 | 23.37 | 23.78 | 41.33 | 46.63 | 37.46 | 22.81 | 11.17 | 46.78 | 8.26 | 28.72 | 1.16 | 58.34 | 22.12 | 41.88 | -4.38 | 40.28 | 13.88 | 24.16 | -0.34 | 25.79 | 13.24 | 25.41 | 4.14 | 25.10 | 5.24 | 11.43 | 13.45 | 23.40 | 10.51 | 24.95 | 4.44 | 18.47 | 5.21 | 12.67 | 8.37 | 33.41 | -2.28 | 6.09 | -3.19 | 21.10 | 10.40 | 15.88 | -0.52 | 18.36 | 11.38 | 7.61 | 1.86 | 12.45 | 6.00 | 2.75 | -6.87 | 3.95 | 5.07 | NA | |
| Net Income Loss | 23.20 | 22.60 | 26.36 | 26.80 | 26.46 | 23.02 | 27.78 | 27.14 | 4.53 | 17.40 | 16.57 | 13.59 | 8.42 | 6.18 | 6.61 | 8.97 | 11.79 | 9.78 | 8.53 | 7.03 | 7.48 | 6.30 | 5.85 | 4.93 | 6.44 | 7.03 | 2.41 | 2.71 | 3.69 | 5.54 | 5.82 | 5.41 | 7.57 | 7.37 | 4.00 | 4.07 | 6.42 | 7.31 | 6.39 | 3.04 | 5.51 | 7.23 | 4.56 | 4.12 | 4.38 | 5.14 | 3.60 | 2.99 | 2.72 | 3.47 | 2.77 | 1.79 | 1.31 | 2.25 | 2.05 | |
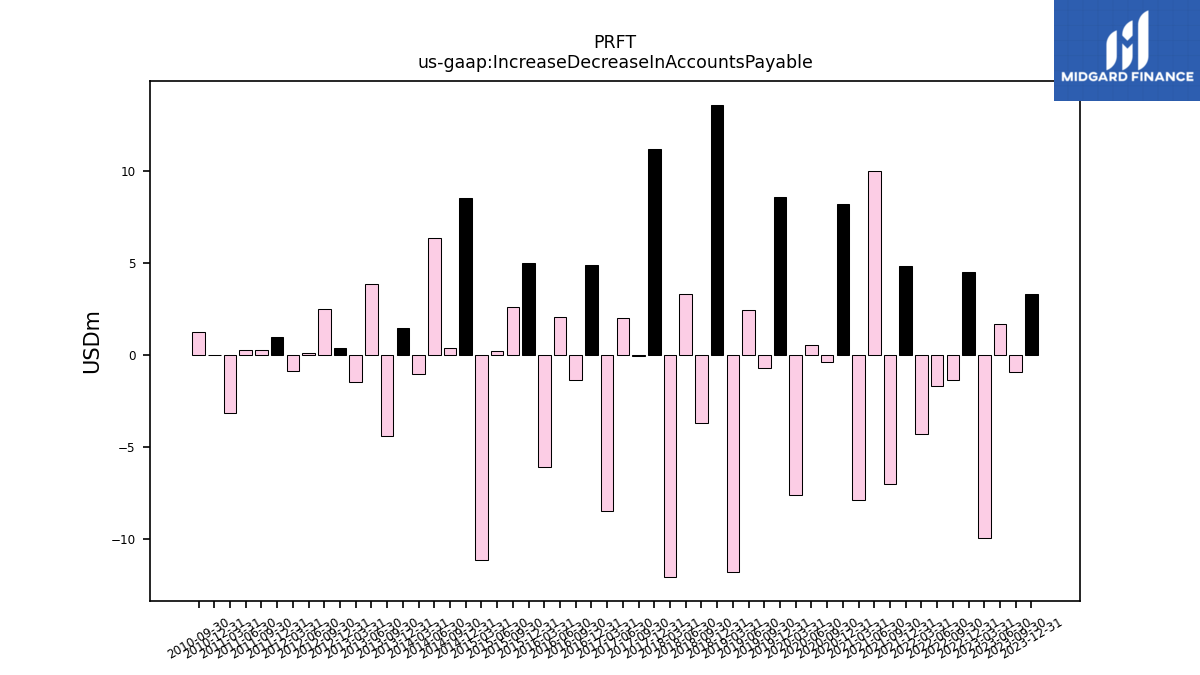
| Increase Decrease In Accounts Payable | 3.34 | -0.89 | 1.69 | -9.91 | 4.55 | -1.31 | -1.68 | -4.29 | 4.89 | -7.00 | 10.02 | -7.84 | 8.23 | -0.38 | 0.59 | -7.58 | 8.61 | -0.68 | 2.49 | -11.78 | 13.63 | -3.69 | 3.35 | -12.05 | 11.20 | -0.05 | 2.06 | -8.43 | 4.93 | -1.33 | 2.08 | -6.06 | 5.03 | 2.61 | 0.25 | -11.13 | 8.54 | 0.41 | 6.38 | -0.99 | 1.51 | -4.36 | 3.91 | -1.43 | 0.42 | 2.53 | 0.11 | -0.87 | 1.01 | 0.32 | 0.27 | -3.12 | 0.03 | 1.28 | NA | |
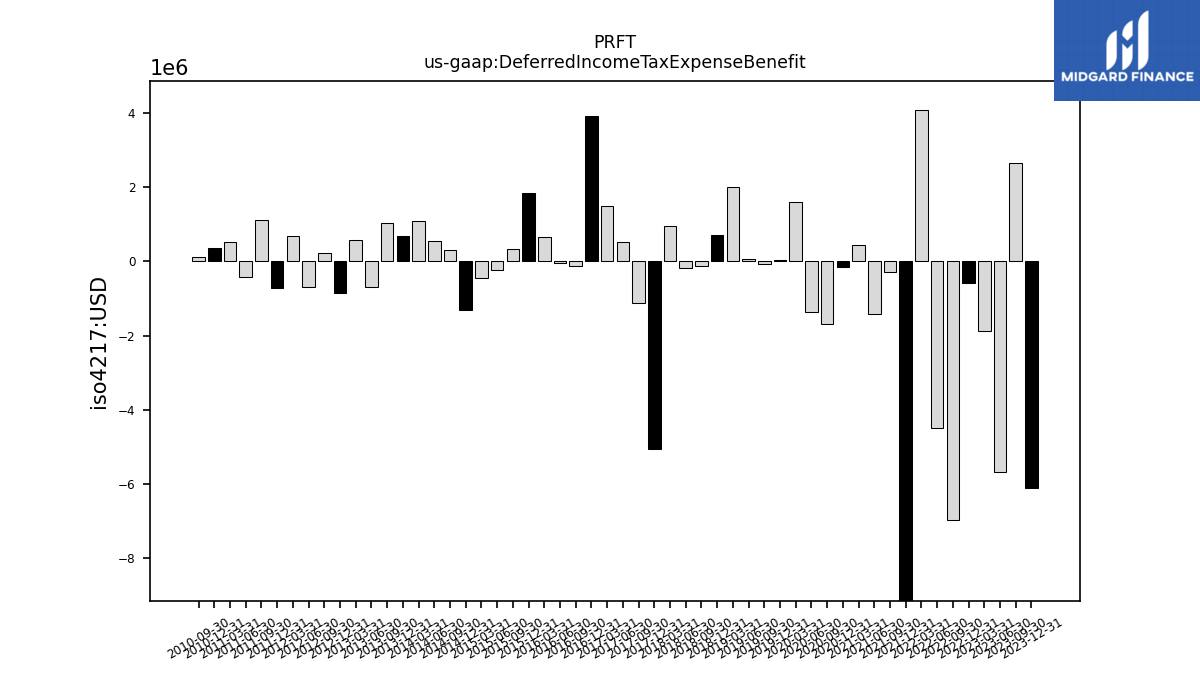
| Deferred Income Tax Expense Benefit | -6.10 | 2.65 | -5.66 | -1.89 | -0.59 | -6.96 | -4.48 | 4.09 | -11.40 | -0.29 | -1.42 | 0.46 | -0.15 | -1.69 | -1.36 | 1.61 | 0.04 | -0.07 | 0.08 | 1.99 | 0.72 | -0.12 | -0.18 | 0.95 | -5.06 | -1.12 | 0.53 | 1.50 | 3.91 | -0.13 | -0.04 | 0.65 | 1.85 | 0.34 | -0.24 | -0.45 | -1.29 | 0.31 | 0.55 | 1.10 | 0.69 | 1.03 | -0.70 | 0.58 | -0.86 | 0.22 | -0.68 | 0.70 | -0.72 | 1.13 | -0.41 | 0.53 | 0.36 | 0.11 | NA | |
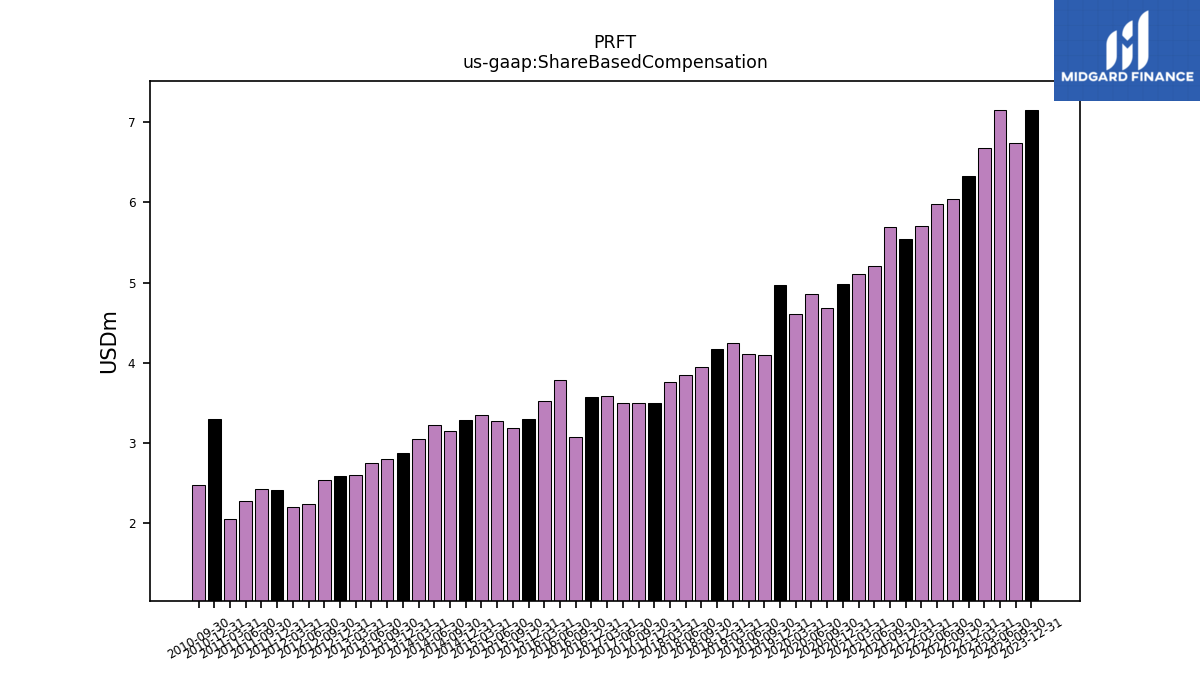
| Share Based Compensation | 7.15 | 6.75 | 7.16 | 6.67 | 6.33 | 6.05 | 5.98 | 5.71 | 5.55 | 5.69 | 5.21 | 5.11 | 4.99 | 4.69 | 4.87 | 4.61 | 4.97 | 4.10 | 4.11 | 4.25 | 4.17 | 3.94 | 3.85 | 3.76 | 3.50 | 3.50 | 3.51 | 3.59 | 3.58 | 3.08 | 3.79 | 3.52 | 3.30 | 3.19 | 3.27 | 3.35 | 3.29 | 3.16 | 3.22 | 3.05 | 2.88 | 2.80 | 2.75 | 2.61 | 2.60 | 2.55 | 2.24 | 2.21 | 2.42 | 2.43 | 2.28 | 2.06 | 3.30 | 2.48 | NA |
| 2023-12-31 | 2023-09-30 | 2023-06-30 | 2023-03-31 | 2022-12-31 | 2022-09-30 | 2022-06-30 | 2022-03-31 | 2021-12-31 | 2021-09-30 | 2021-06-30 | 2021-03-31 | 2020-12-31 | 2020-09-30 | 2020-06-30 | 2020-03-31 | 2019-12-31 | 2019-09-30 | 2019-06-30 | 2019-03-31 | 2018-12-31 | 2018-09-30 | 2018-06-30 | 2018-03-31 | 2017-12-31 | 2017-09-30 | 2017-06-30 | 2017-03-31 | 2016-12-31 | 2016-09-30 | 2016-06-30 | 2016-03-31 | 2015-12-31 | 2015-09-30 | 2015-06-30 | 2015-03-31 | 2014-12-31 | 2014-09-30 | 2014-06-30 | 2014-03-31 | 2013-12-31 | 2013-09-30 | 2013-06-30 | 2013-03-31 | 2012-12-31 | 2012-09-30 | 2012-06-30 | 2012-03-31 | 2011-12-31 | 2011-09-30 | 2011-06-30 | 2011-03-31 | 2010-12-31 | 2010-09-30 | 2010-06-30 | ||
|---|---|---|---|---|---|---|---|---|---|---|---|---|---|---|---|---|---|---|---|---|---|---|---|---|---|---|---|---|---|---|---|---|---|---|---|---|---|---|---|---|---|---|---|---|---|---|---|---|---|---|---|---|---|---|---|---|
| Net Cash Provided By Used In Investing Activities | -0.77 | -1.26 | -2.24 | -1.31 | -29.34 | -45.69 | -4.01 | -2.71 | -97.53 | -17.32 | -2.38 | -1.83 | -3.30 | -0.59 | -62.93 | -31.80 | -1.92 | -3.85 | -12.83 | -1.80 | -6.42 | -11.74 | -12.17 | -0.96 | -1.04 | -0.59 | -32.62 | -7.97 | -7.05 | -2.62 | -1.88 | -1.98 | -12.35 | -4.06 | -2.62 | -23.20 | -1.71 | -1.57 | -21.85 | -28.46 | -20.60 | -2.14 | -20.71 | -2.96 | -0.76 | -11.29 | -11.80 | -14.82 | -0.82 | -12.98 | 3.77 | 1.24 | -2.88 | 0.81 | NA | |
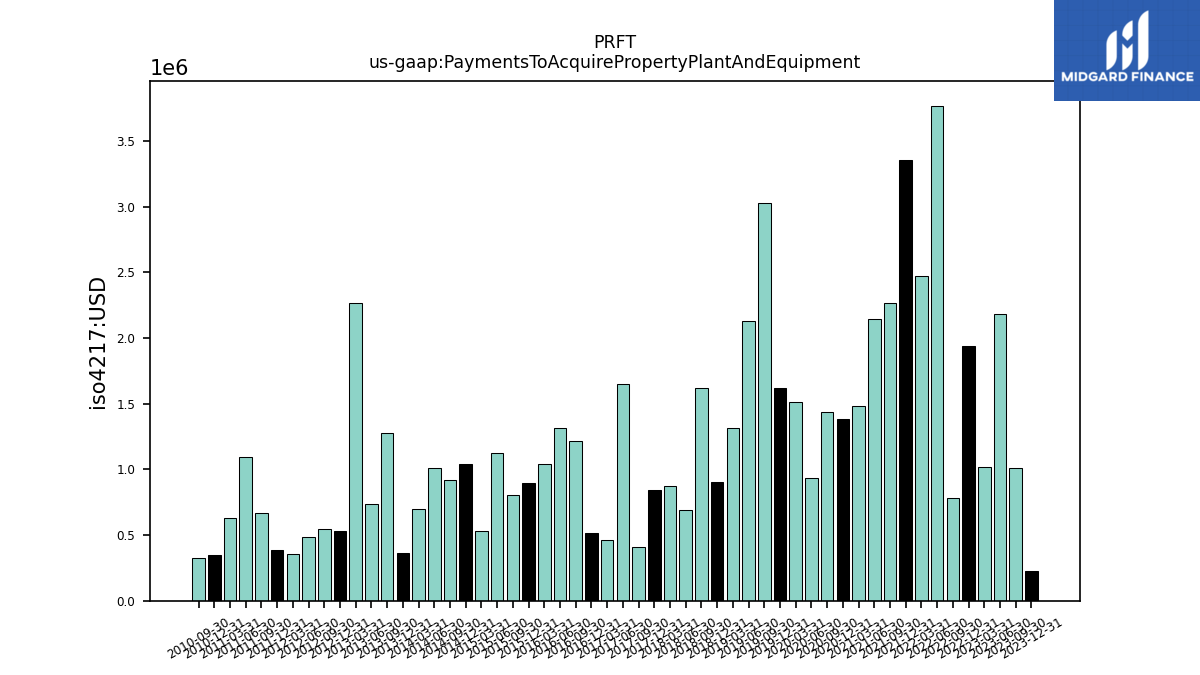
| Payments To Acquire Property Plant And Equipment | 0.23 | 1.01 | 2.19 | 1.01 | 1.94 | 0.78 | 3.77 | 2.47 | 3.35 | 2.27 | 2.14 | 1.48 | 1.39 | 1.43 | 0.93 | 1.51 | 1.62 | 3.03 | 2.13 | 1.31 | 0.90 | 1.62 | 0.69 | 0.87 | 0.84 | 0.41 | 1.65 | 0.46 | 0.51 | 1.22 | 1.31 | 1.04 | 0.89 | 0.81 | 1.12 | 0.53 | 1.04 | 0.92 | 1.01 | 0.70 | 0.37 | 1.28 | 0.74 | 2.26 | 0.53 | 0.55 | 0.49 | 0.35 | 0.38 | 0.67 | 1.10 | 0.63 | 0.34 | 0.32 | NA |
| 2023-12-31 | 2023-09-30 | 2023-06-30 | 2023-03-31 | 2022-12-31 | 2022-09-30 | 2022-06-30 | 2022-03-31 | 2021-12-31 | 2021-09-30 | 2021-06-30 | 2021-03-31 | 2020-12-31 | 2020-09-30 | 2020-06-30 | 2020-03-31 | 2019-12-31 | 2019-09-30 | 2019-06-30 | 2019-03-31 | 2018-12-31 | 2018-09-30 | 2018-06-30 | 2018-03-31 | 2017-12-31 | 2017-09-30 | 2017-06-30 | 2017-03-31 | 2016-12-31 | 2016-09-30 | 2016-06-30 | 2016-03-31 | 2015-12-31 | 2015-09-30 | 2015-06-30 | 2015-03-31 | 2014-12-31 | 2014-09-30 | 2014-06-30 | 2014-03-31 | 2013-12-31 | 2013-09-30 | 2013-06-30 | 2013-03-31 | 2012-12-31 | 2012-09-30 | 2012-06-30 | 2012-03-31 | 2011-12-31 | 2011-09-30 | 2011-06-30 | 2011-03-31 | 2010-12-31 | 2010-09-30 | 2010-06-30 | ||
|---|---|---|---|---|---|---|---|---|---|---|---|---|---|---|---|---|---|---|---|---|---|---|---|---|---|---|---|---|---|---|---|---|---|---|---|---|---|---|---|---|---|---|---|---|---|---|---|---|---|---|---|---|---|---|---|---|
| Net Cash Provided By Used In Financing Activities | -5.45 | -2.39 | -2.41 | -29.42 | -7.85 | -8.98 | -3.54 | -8.71 | 18.95 | -21.11 | -11.64 | -10.04 | -22.73 | 8.87 | 11.17 | -4.79 | -4.14 | -7.77 | -4.82 | -15.32 | -19.29 | 33.25 | -8.09 | -3.95 | -20.30 | -7.97 | 15.84 | -4.85 | -15.17 | -8.05 | -22.36 | -2.30 | -5.85 | 0.94 | -9.58 | 10.22 | -26.12 | 2.62 | 17.67 | 29.39 | 1.07 | -7.52 | 5.32 | 1.80 | -15.27 | -0.84 | 5.77 | 5.87 | -3.87 | -3.56 | -3.44 | 2.34 | -2.24 | -6.70 | NA |
| 2023-12-31 | 2023-09-30 | 2023-06-30 | 2023-03-31 | 2022-12-31 | 2022-09-30 | 2022-06-30 | 2022-03-31 | 2021-12-31 | 2021-09-30 | 2021-06-30 | 2021-03-31 | 2020-12-31 | 2020-09-30 | 2020-06-30 | 2020-03-31 | 2019-12-31 | 2019-09-30 | 2019-06-30 | 2019-03-31 | 2018-12-31 | 2018-09-30 | 2018-06-30 | 2018-03-31 | 2017-12-31 | 2017-09-30 | 2017-06-30 | 2017-03-31 | 2016-12-31 | 2016-09-30 | 2016-06-30 | 2016-03-31 | 2015-12-31 | 2015-09-30 | 2015-06-30 | 2015-03-31 | 2014-12-31 | 2014-09-30 | 2014-06-30 | 2014-03-31 | 2013-12-31 | 2013-09-30 | 2013-06-30 | 2013-03-31 | 2012-12-31 | 2012-09-30 | 2012-06-30 | 2012-03-31 | 2011-12-31 | 2011-09-30 | 2011-06-30 | 2011-03-31 | 2010-12-31 | 2010-09-30 | 2010-06-30 | ||
|---|---|---|---|---|---|---|---|---|---|---|---|---|---|---|---|---|---|---|---|---|---|---|---|---|---|---|---|---|---|---|---|---|---|---|---|---|---|---|---|---|---|---|---|---|---|---|---|---|---|---|---|---|---|---|---|---|
| Revenues | 220.80 | 223.24 | 231.10 | 231.41 | 232.60 | 227.61 | 222.74 | 222.11 | 214.73 | 192.82 | 184.14 | 169.34 | 162.55 | 157.68 | 146.34 | 145.56 | 145.16 | 144.68 | 141.87 | 133.81 | 131.70 | 123.93 | 121.80 | 120.94 | 133.48 | 123.74 | 117.03 | 111.02 | 119.59 | 119.15 | 124.40 | 123.84 | 133.65 | 120.91 | 108.46 | 110.60 | 125.84 | 116.97 | 116.71 | 97.17 | 97.47 | 96.76 | 94.17 | 84.94 | 83.13 | 87.47 | 81.80 | 74.70 | 70.43 | 70.17 | 65.59 | 56.24 | 55.93 | 54.65 | 55.46 | |
| Revenue From Contract With Customer Excluding Assessed Tax | 220.80 | 223.24 | 231.10 | 231.41 | 232.60 | 227.61 | 222.74 | 222.11 | 214.73 | 192.82 | 184.14 | 169.34 | 162.55 | 157.68 | 146.34 | 145.56 | 145.16 | 144.68 | 141.87 | 133.81 | 131.70 | 123.93 | 121.80 | 120.94 | 133.48 | 123.74 | 117.03 | 111.02 | 119.59 | 119.15 | 124.40 | 123.84 | 133.65 | 120.91 | 108.46 | 110.60 | 125.84 | 116.97 | 116.71 | 97.17 | 97.47 | 96.76 | 94.17 | 84.94 | 83.13 | 87.47 | 81.80 | 74.70 | 70.43 | 70.17 | 65.59 | 56.24 | 55.93 | 54.65 | 55.46 | |
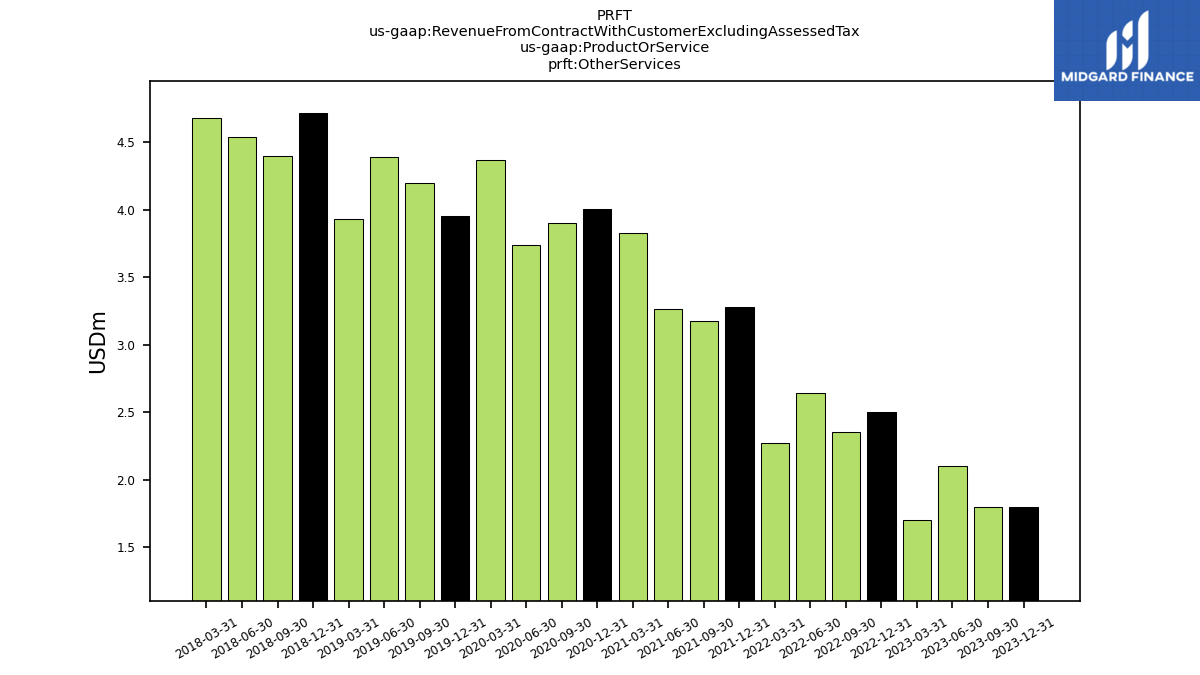
| Other Services | 1.80 | 1.80 | 2.10 | 1.70 | 2.50 | 2.36 | 2.65 | 2.27 | 3.28 | 3.18 | 3.27 | 3.83 | 4.01 | 3.90 | 3.74 | 4.37 | 3.96 | 4.20 | 4.39 | 3.94 | 4.72 | 4.40 | 4.54 | 4.68 | NA | NA | NA | NA | NA | NA | NA | NA | NA | NA | NA | NA | NA | NA | NA | NA | NA | NA | NA | NA | NA | NA | NA | NA | NA | NA | NA | NA | NA | NA | NA | |
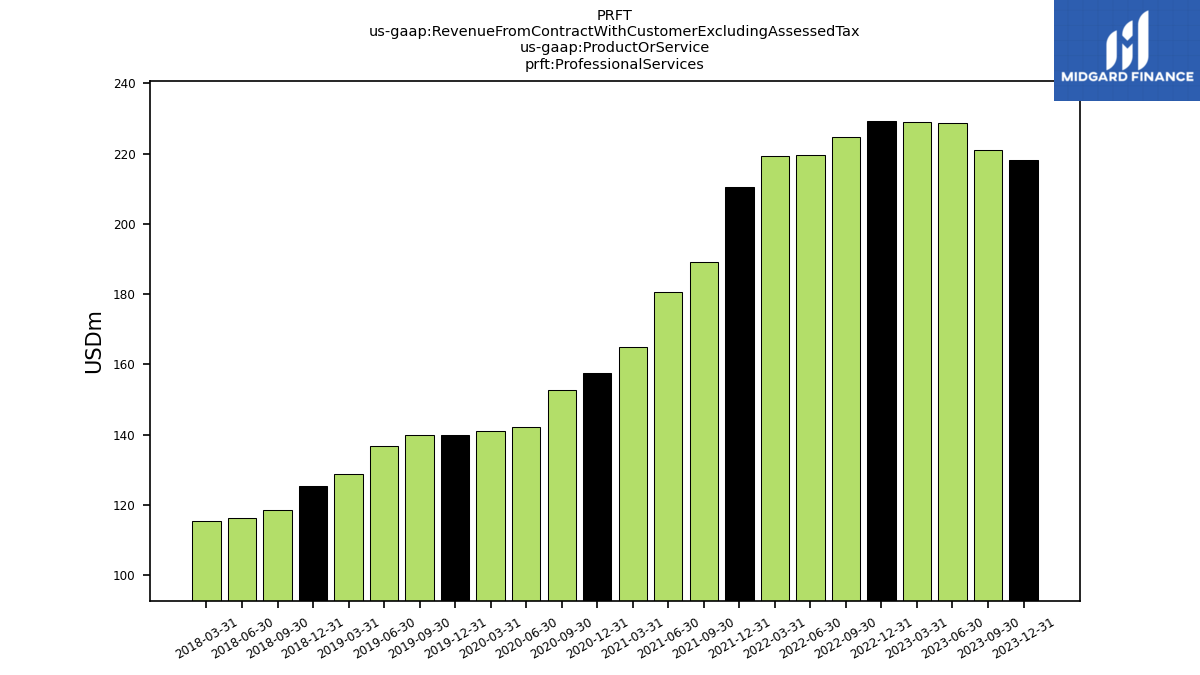
| Professional Services | 218.20 | 220.90 | 228.60 | 229.10 | 229.18 | 224.69 | 219.62 | 219.16 | 210.52 | 189.24 | 180.51 | 164.90 | 157.58 | 152.85 | 142.10 | 141.03 | 139.80 | 139.86 | 136.84 | 128.93 | 125.30 | 118.48 | 116.37 | 115.51 | NA | NA | NA | NA | NA | NA | NA | NA | NA | NA | NA | NA | NA | NA | NA | NA | NA | NA | NA | NA | NA | NA | NA | NA | NA | NA | NA | NA | NA | NA | NA | |
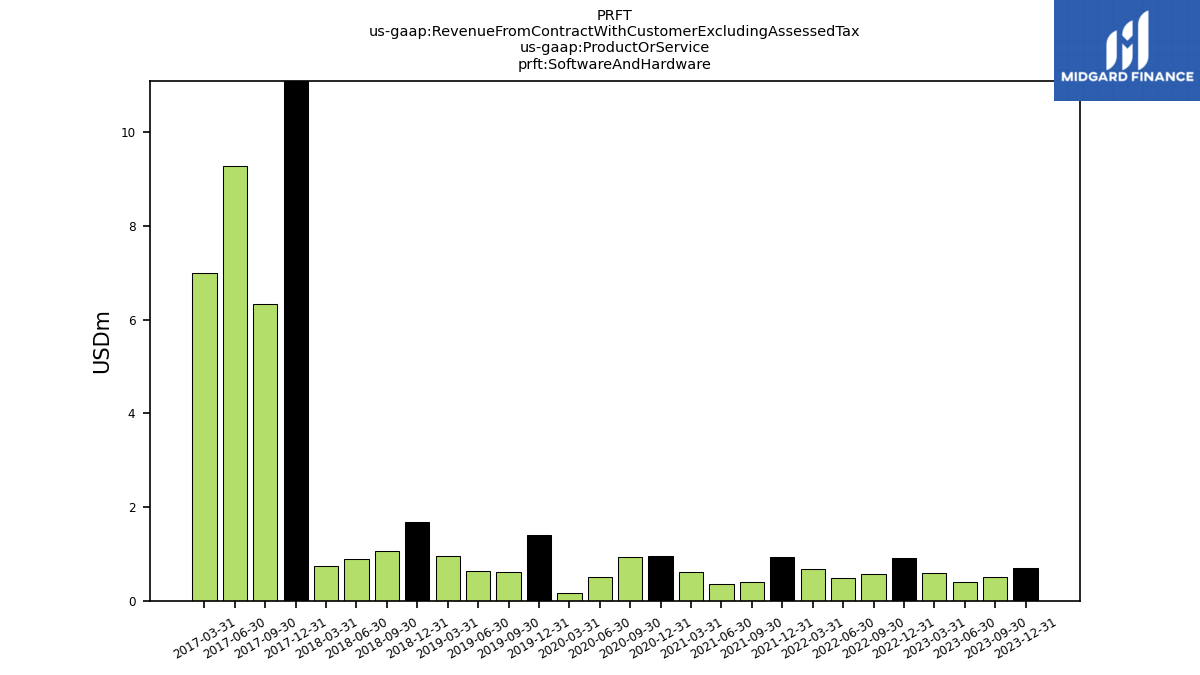
| Software And Hardware | 0.70 | 0.50 | 0.40 | 0.60 | 0.92 | 0.57 | 0.47 | 0.68 | 0.93 | 0.40 | 0.36 | 0.61 | 0.96 | 0.92 | 0.50 | 0.16 | 1.40 | 0.62 | 0.64 | 0.95 | 1.69 | 1.05 | 0.89 | 0.75 | 16.05 | 6.32 | 9.27 | 7.00 | NA | NA | NA | NA | NA | NA | NA | NA | NA | NA | NA | NA | NA | NA | NA | NA | NA | NA | NA | NA | NA | NA | NA | NA | NA | NA | NA | |
| Technology Service | 220.00 | 222.70 | 230.70 | 230.80 | 231.68 | 227.04 | 222.26 | 221.43 | 213.80 | 192.42 | 183.78 | 168.73 | 161.59 | 156.75 | 145.84 | 145.40 | 143.76 | 144.06 | 141.23 | 132.87 | 130.01 | 122.88 | 120.91 | 120.20 | NA | 117.42 | NA | NA | NA | NA | NA | NA | NA | NA | NA | NA | NA | NA | NA | NA | NA | NA | NA | NA | NA | NA | NA | NA | NA | NA | NA | NA | NA | NA | NA | |
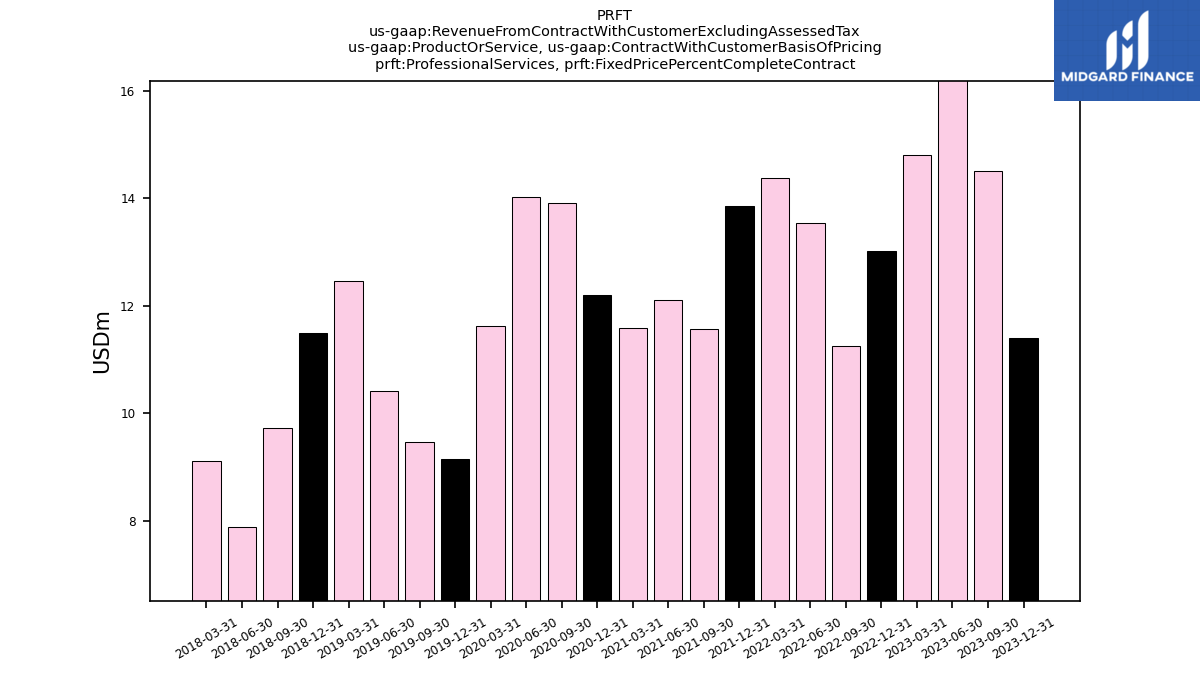
| Professional Services, Fixed Price Percent Complete Contract | 11.40 | 14.50 | 16.20 | 14.80 | 13.03 | 11.25 | 13.54 | 14.37 | 13.87 | 11.57 | 12.10 | 11.58 | 12.20 | 13.92 | 14.02 | 11.62 | 9.15 | 9.46 | 10.41 | 12.46 | 11.49 | 9.73 | 7.90 | 9.11 | NA | NA | NA | NA | NA | NA | NA | NA | NA | NA | NA | NA | NA | NA | NA | NA | NA | NA | NA | NA | NA | NA | NA | NA | NA | NA | NA | NA | NA | NA | NA | |
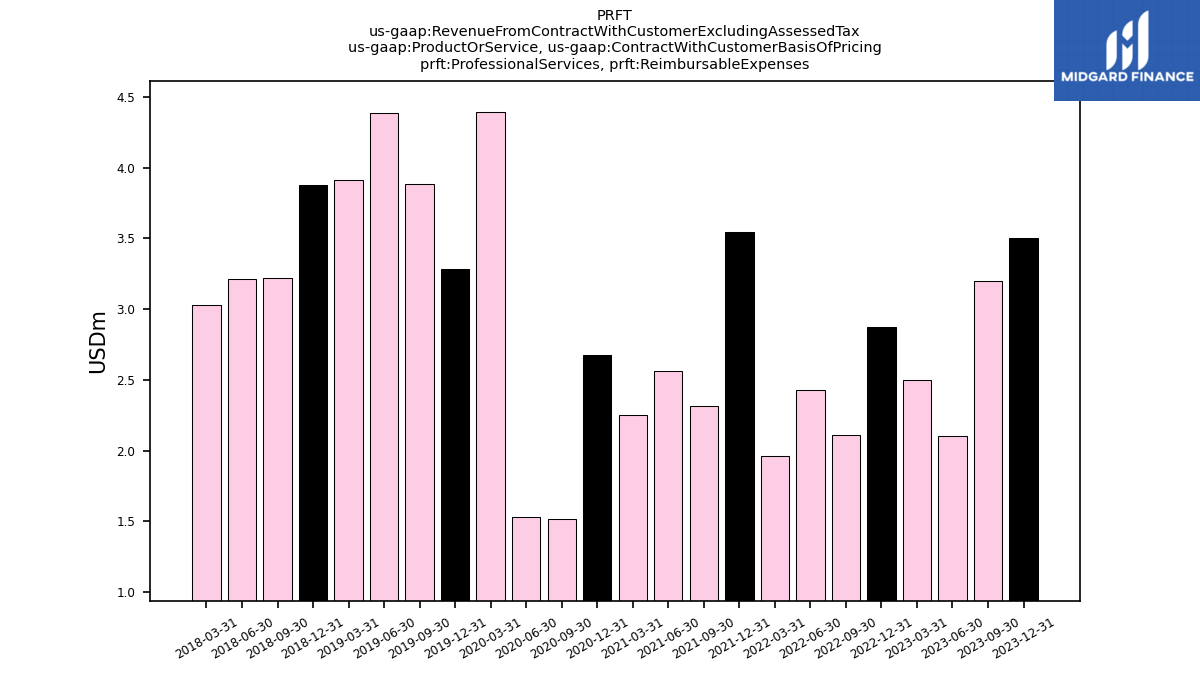
| Professional Services, Reimbursable Expenses | 3.50 | 3.20 | 2.10 | 2.50 | 2.87 | 2.11 | 2.43 | 1.96 | 3.54 | 2.32 | 2.56 | 2.25 | 2.67 | 1.51 | 1.53 | 4.39 | 3.28 | 3.89 | 4.39 | 3.91 | 3.88 | 3.22 | 3.21 | 3.03 | NA | NA | NA | NA | NA | NA | NA | NA | NA | NA | NA | NA | NA | NA | NA | NA | NA | NA | NA | NA | NA | NA | NA | NA | NA | NA | NA | NA | NA | NA | NA | |
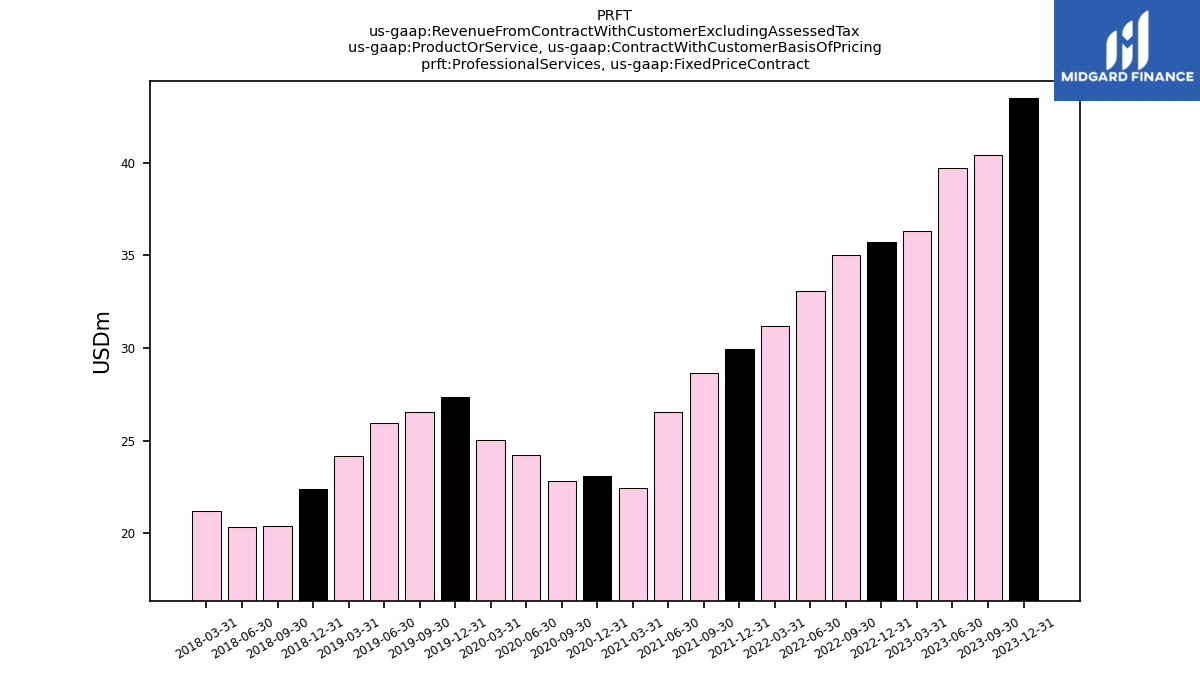
| Professional Services, Fixed Price Contract | 43.50 | 40.40 | 39.70 | 36.30 | 35.72 | 35.03 | 33.09 | 31.21 | 29.97 | 28.68 | 26.57 | 22.48 | 23.11 | 22.84 | 24.26 | 25.03 | 27.37 | 26.55 | 25.95 | 24.18 | 22.37 | 20.40 | 20.38 | 21.22 | NA | NA | NA | NA | NA | NA | NA | NA | NA | NA | NA | NA | NA | NA | NA | NA | NA | NA | NA | NA | NA | NA | NA | NA | NA | NA | NA | NA | NA | NA | NA | |
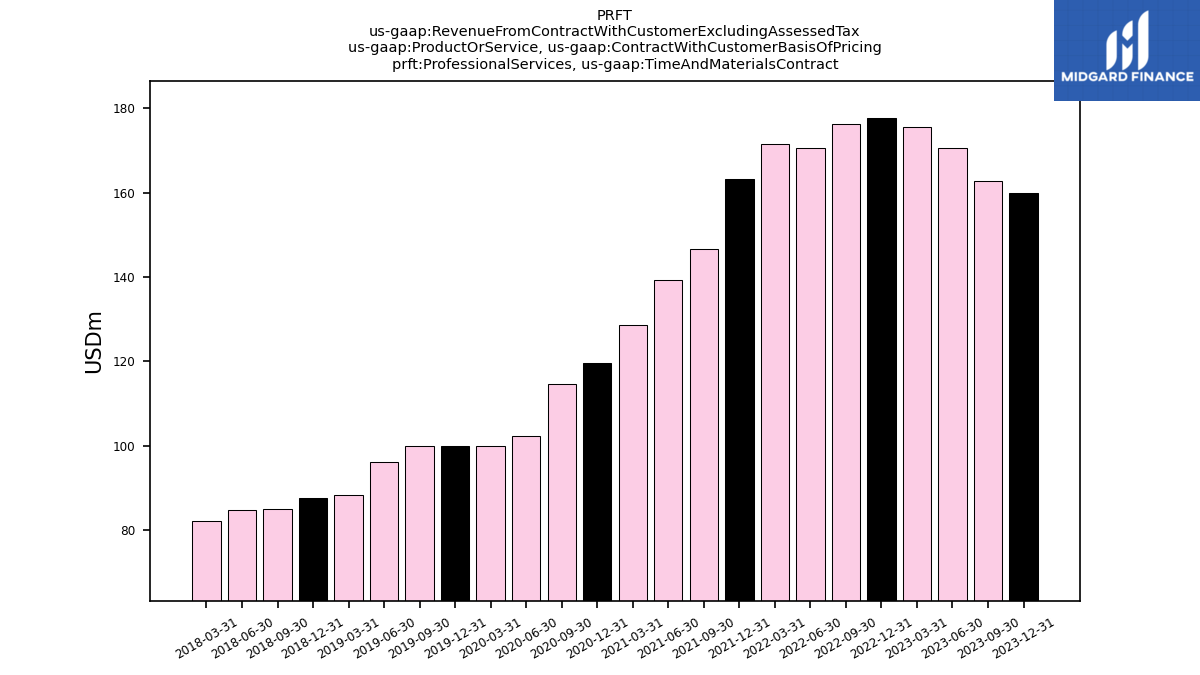
| Professional Services, Time And Materials Contract | 159.80 | 162.80 | 170.60 | 175.50 | 177.56 | 176.30 | 170.56 | 171.63 | 163.13 | 146.68 | 139.27 | 128.59 | 119.60 | 114.58 | 102.29 | 99.99 | 100.00 | 99.96 | 96.08 | 88.38 | 87.55 | 85.13 | 84.88 | 82.15 | NA | NA | NA | NA | NA | NA | NA | NA | NA | NA | NA | NA | NA | NA | NA | NA | NA | NA | NA | NA | NA | NA | NA | NA | NA | NA | NA | NA | NA | NA | NA | |
| Professional Services, Fixed Price Percent Complete Contract, Transferred Over Time | 11.40 | 14.50 | 16.20 | 14.80 | 13.03 | 11.25 | 13.54 | 14.37 | 13.87 | 11.57 | 12.10 | 11.58 | 12.20 | 13.92 | 14.02 | 11.62 | 9.15 | 9.46 | 10.41 | 12.46 | 11.49 | 9.73 | 7.90 | 9.11 | NA | NA | NA | NA | NA | NA | NA | NA | NA | NA | NA | NA | NA | NA | NA | NA | NA | NA | NA | NA | NA | NA | NA | NA | NA | NA | NA | NA | NA | NA | NA | |
| Professional Services, Reimbursable Expenses, Transferred Over Time | 3.50 | 3.20 | 2.10 | 2.50 | 2.87 | 2.11 | 2.43 | 1.96 | 3.54 | 2.32 | 2.56 | 2.25 | 2.67 | 1.51 | 1.53 | 4.39 | 3.28 | 3.89 | 4.39 | 3.91 | 3.88 | 3.22 | 3.21 | 3.03 | NA | NA | NA | NA | NA | NA | NA | NA | NA | NA | NA | NA | NA | NA | NA | NA | NA | NA | NA | NA | NA | NA | NA | NA | NA | NA | NA | NA | NA | NA | NA | |
| Professional Services, Fixed Price Contract, Transferred Over Time | 43.50 | 40.40 | 39.70 | 36.30 | 35.72 | 35.03 | 33.09 | 31.21 | 29.97 | 28.68 | 26.57 | 22.48 | 23.11 | 22.84 | 24.26 | 25.03 | 27.37 | 26.55 | 25.95 | 24.18 | 22.37 | 20.40 | 20.38 | 21.22 | NA | NA | NA | NA | NA | NA | NA | NA | NA | NA | NA | NA | NA | NA | NA | NA | NA | NA | NA | NA | NA | NA | NA | NA | NA | NA | NA | NA | NA | NA | NA | |
| Professional Services, Time And Materials Contract, Transferred Over Time | 159.80 | 162.80 | 170.60 | 175.50 | 177.56 | 176.30 | 170.56 | 171.63 | 163.13 | 146.68 | 139.27 | 128.59 | 119.60 | 114.58 | 102.29 | 99.99 | 100.00 | 99.96 | 96.08 | 88.38 | 87.55 | 85.13 | 84.88 | 82.15 | NA | NA | NA | NA | NA | NA | NA | NA | NA | NA | NA | NA | NA | NA | NA | NA | NA | NA | NA | NA | NA | NA | NA | NA | NA | NA | NA | NA | NA | NA | NA | |
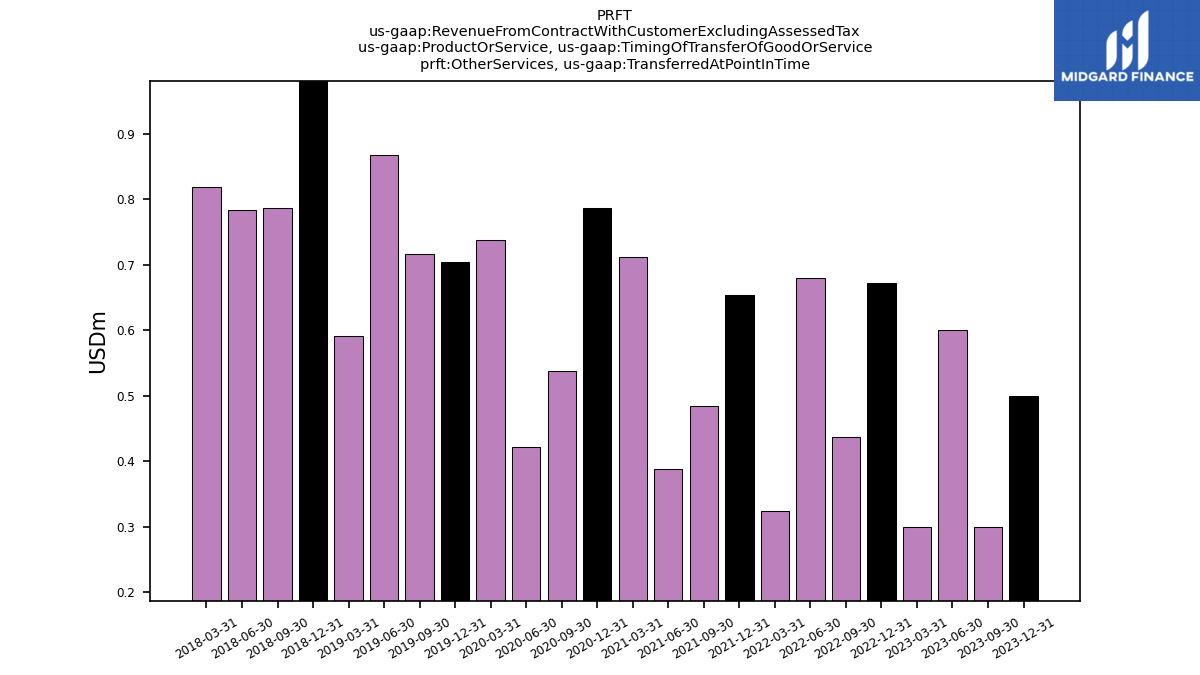
| Other Services, Transferred At Point In Time | 0.50 | 0.30 | 0.60 | 0.30 | 0.67 | 0.44 | 0.68 | 0.32 | 0.65 | 0.48 | 0.39 | 0.71 | 0.79 | 0.54 | 0.42 | 0.74 | 0.70 | 0.72 | 0.87 | 0.59 | 1.13 | 0.79 | 0.78 | 0.82 | NA | NA | NA | NA | NA | NA | NA | NA | NA | NA | NA | NA | NA | NA | NA | NA | NA | NA | NA | NA | NA | NA | NA | NA | NA | NA | NA | NA | NA | NA | NA | |
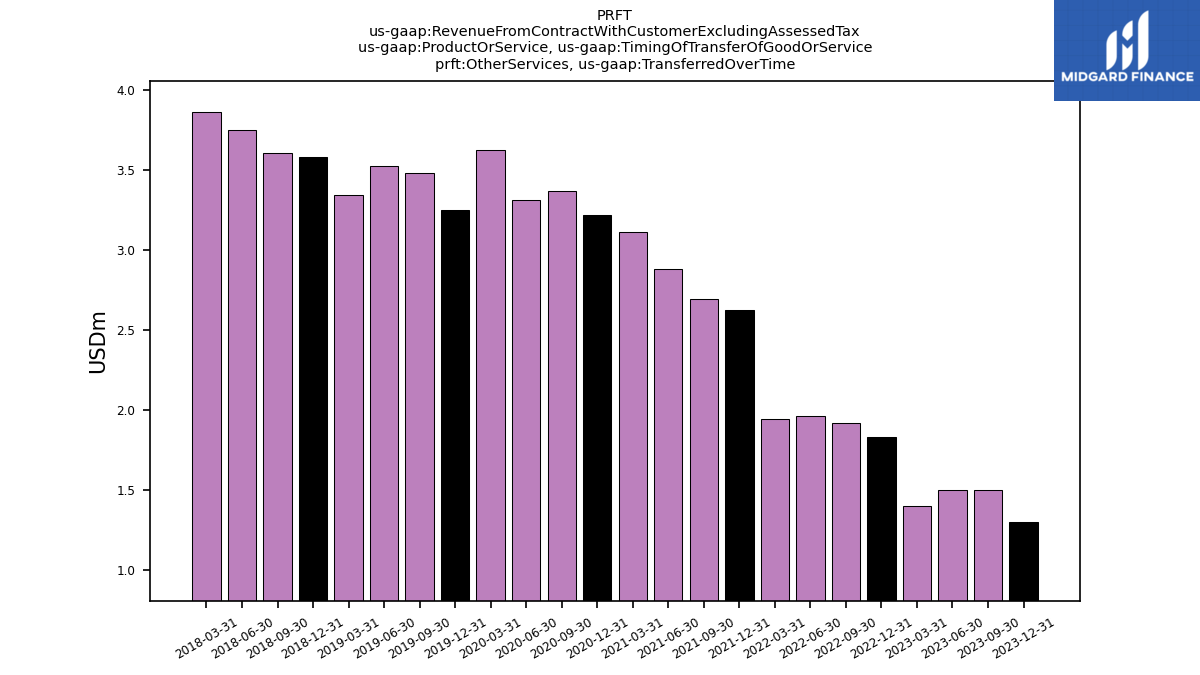
| Other Services, Transferred Over Time | 1.30 | 1.50 | 1.50 | 1.40 | 1.83 | 1.92 | 1.97 | 1.95 | 2.63 | 2.69 | 2.88 | 3.12 | 3.22 | 3.37 | 3.32 | 3.63 | 3.25 | 3.48 | 3.52 | 3.35 | 3.58 | 3.61 | 3.75 | 3.87 | NA | NA | NA | NA | NA | NA | NA | NA | NA | NA | NA | NA | NA | NA | NA | NA | NA | NA | NA | NA | NA | NA | NA | NA | NA | NA | NA | NA | NA | NA | NA | |
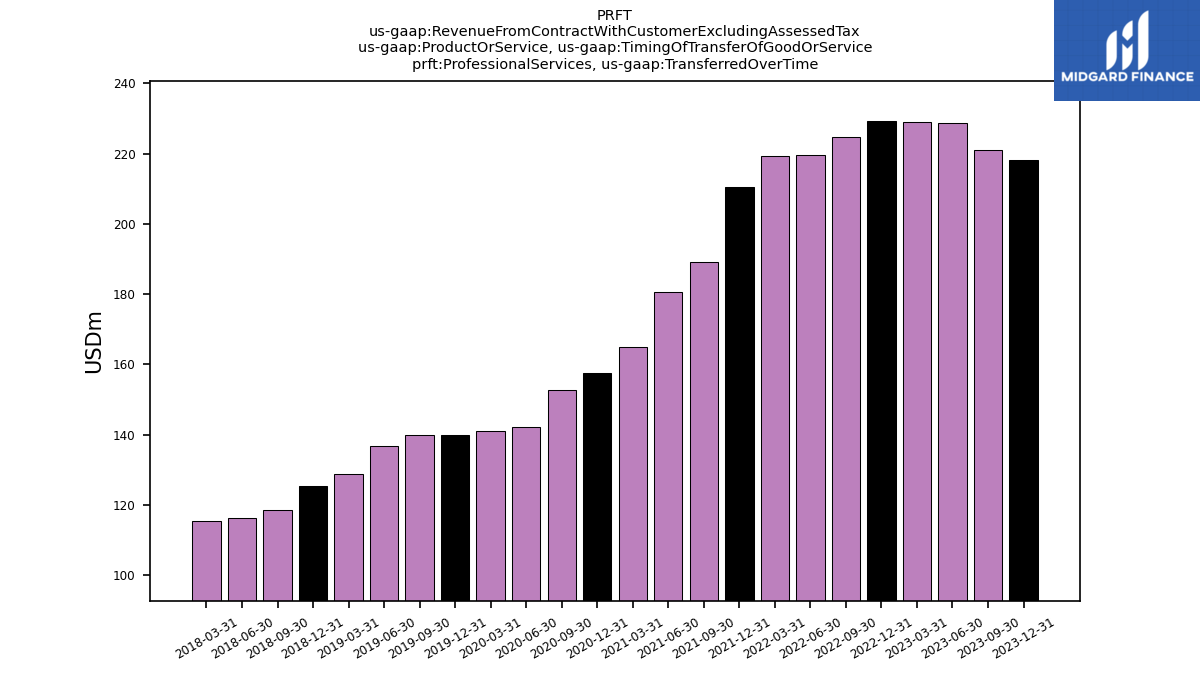
| Professional Services, Transferred Over Time | 218.20 | 220.90 | 228.60 | 229.10 | 229.18 | 224.69 | 219.62 | 219.16 | 210.52 | 189.24 | 180.51 | 164.90 | 157.58 | 152.85 | 142.10 | 141.03 | 139.80 | 139.86 | 136.84 | 128.93 | 125.30 | 118.48 | 116.37 | 115.51 | NA | NA | NA | NA | NA | NA | NA | NA | NA | NA | NA | NA | NA | NA | NA | NA | NA | NA | NA | NA | NA | NA | NA | NA | NA | NA | NA | NA | NA | NA | NA | |
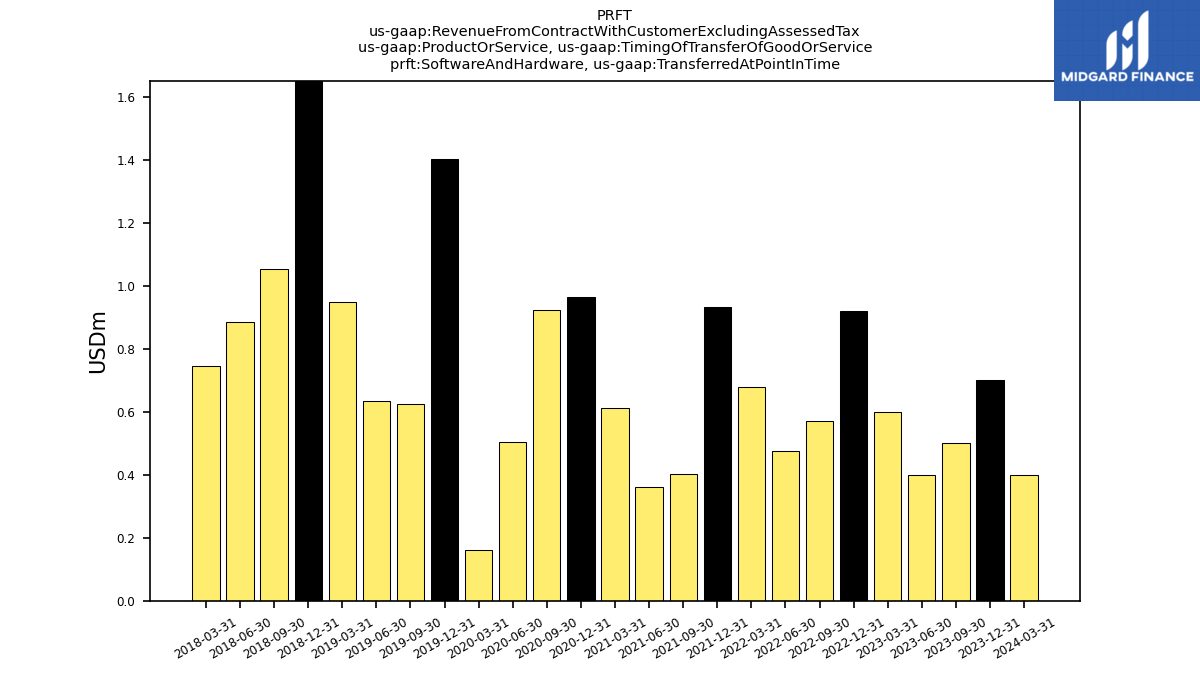
| Software And Hardware, Transferred At Point In Time | 0.70 | 0.50 | 0.40 | 0.60 | 0.92 | 0.57 | 0.47 | 0.68 | 0.93 | 0.40 | 0.36 | 0.61 | 0.96 | 0.92 | 0.50 | 0.16 | 1.40 | 0.62 | 0.64 | 0.95 | 1.69 | 1.05 | 0.89 | 0.75 | NA | NA | NA | NA | NA | NA | NA | NA | NA | NA | NA | NA | NA | NA | NA | NA | NA | NA | NA | NA | NA | NA | NA | NA | NA | NA | NA | NA | NA | NA | NA | |
| Technology Service, Transferred At Point In Time | 0.50 | 0.30 | 0.60 | 0.30 | 0.67 | 0.44 | 0.68 | 0.32 | 0.65 | 0.48 | 0.39 | 0.71 | 0.79 | 0.54 | 0.42 | 0.74 | 0.70 | 0.72 | 0.87 | 0.59 | 1.13 | 0.79 | 0.78 | 0.82 | NA | NA | NA | NA | NA | NA | NA | NA | NA | NA | NA | NA | NA | NA | NA | NA | NA | NA | NA | NA | NA | NA | NA | NA | NA | NA | NA | NA | NA | NA | NA | |
| Technology Service, Transferred Over Time | 219.50 | 222.40 | 230.10 | 230.50 | 231.01 | 226.61 | 221.58 | 221.11 | 213.15 | 191.94 | 183.39 | 168.02 | 160.80 | 156.22 | 145.41 | 144.66 | 143.05 | 143.34 | 140.37 | 132.28 | 128.88 | 122.09 | 120.13 | 119.38 | NA | NA | NA | NA | NA | NA | NA | NA | NA | NA | NA | NA | NA | NA | NA | NA | NA | NA | NA | NA | NA | NA | NA | NA | NA | NA | NA | NA | NA | NA | NA | |
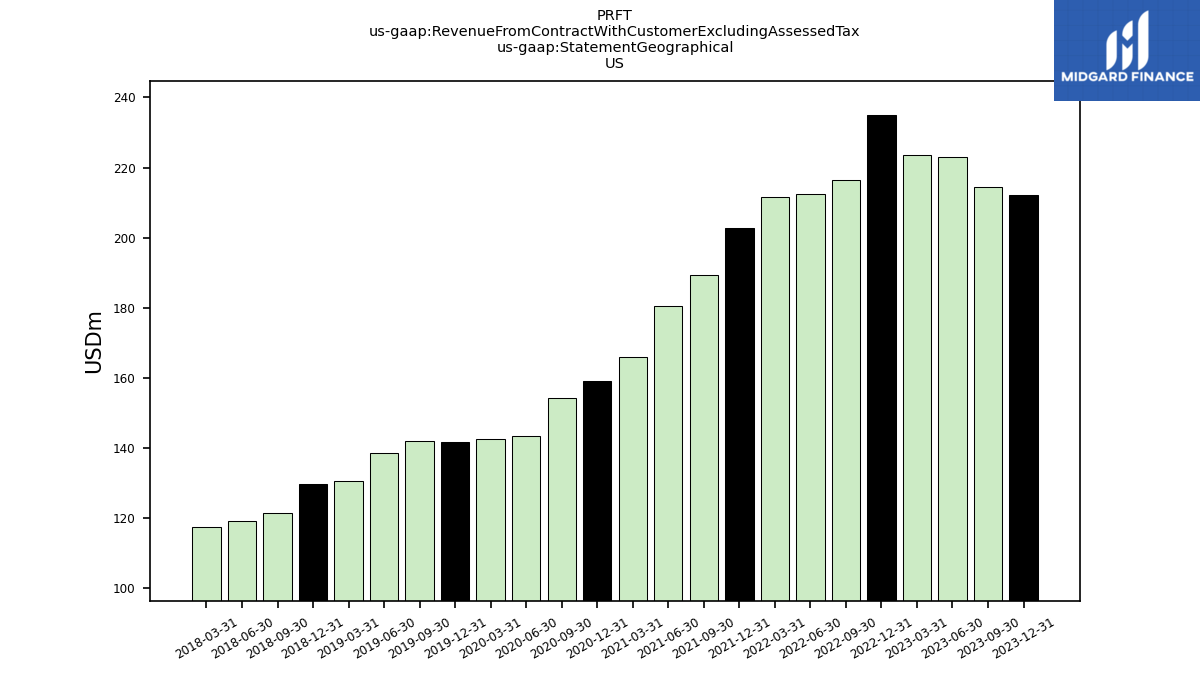
| US | 212.10 | 214.40 | 223.00 | 223.50 | 235.01 | 216.36 | 212.30 | 211.62 | 202.81 | 189.33 | 180.35 | 165.81 | 159.10 | 154.08 | 143.49 | 142.57 | 141.54 | 141.85 | 138.52 | 130.45 | 129.67 | 121.44 | 119.21 | 117.53 | NA | NA | NA | NA | NA | NA | NA | NA | NA | NA | NA | NA | NA | NA | NA | NA | NA | NA | NA | NA | NA | NA | NA | NA | NA | NA | NA | NA | NA | NA | NA | |
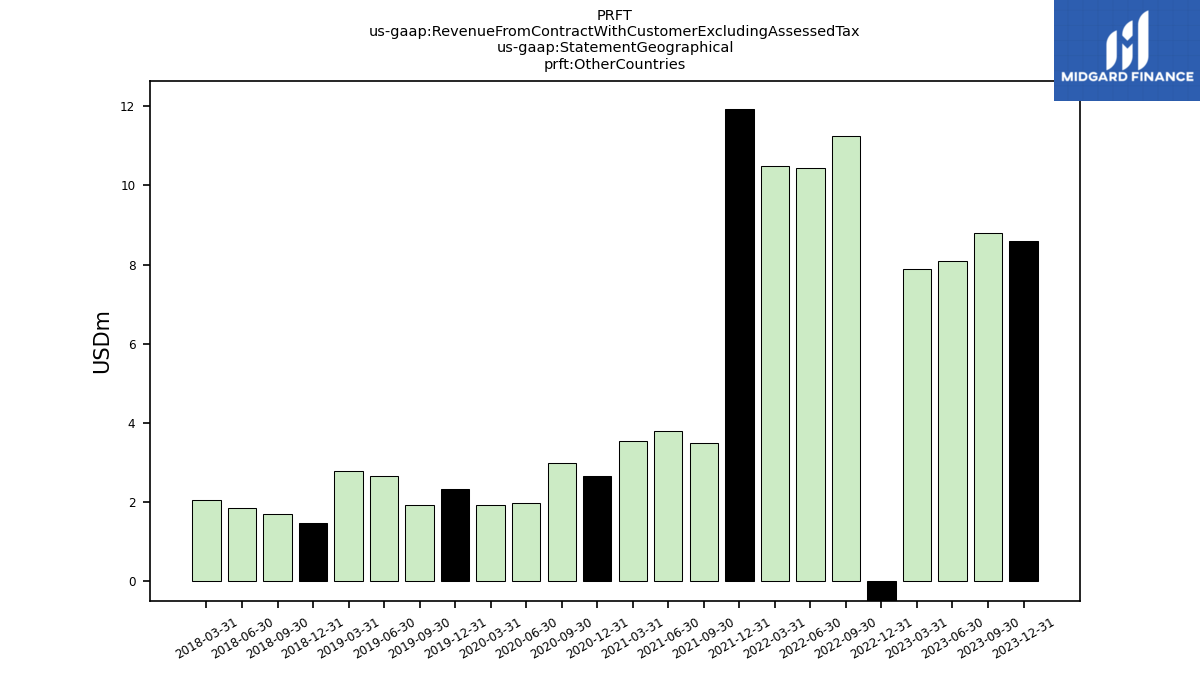
| Other Countries | 8.60 | 8.80 | 8.10 | 7.90 | -2.41 | 11.25 | 10.44 | 10.49 | 11.92 | 3.49 | 3.79 | 3.53 | 2.65 | 3.00 | 1.96 | 1.91 | 2.33 | 1.92 | 2.65 | 2.79 | 1.46 | 1.69 | 1.85 | 2.04 | NA | NA | NA | NA | NA | NA | NA | NA | NA | NA | NA | NA | NA | NA | NA | NA | NA | NA | NA | NA | NA | NA | NA | NA | NA | NA | NA | NA | NA | NA | NA | |
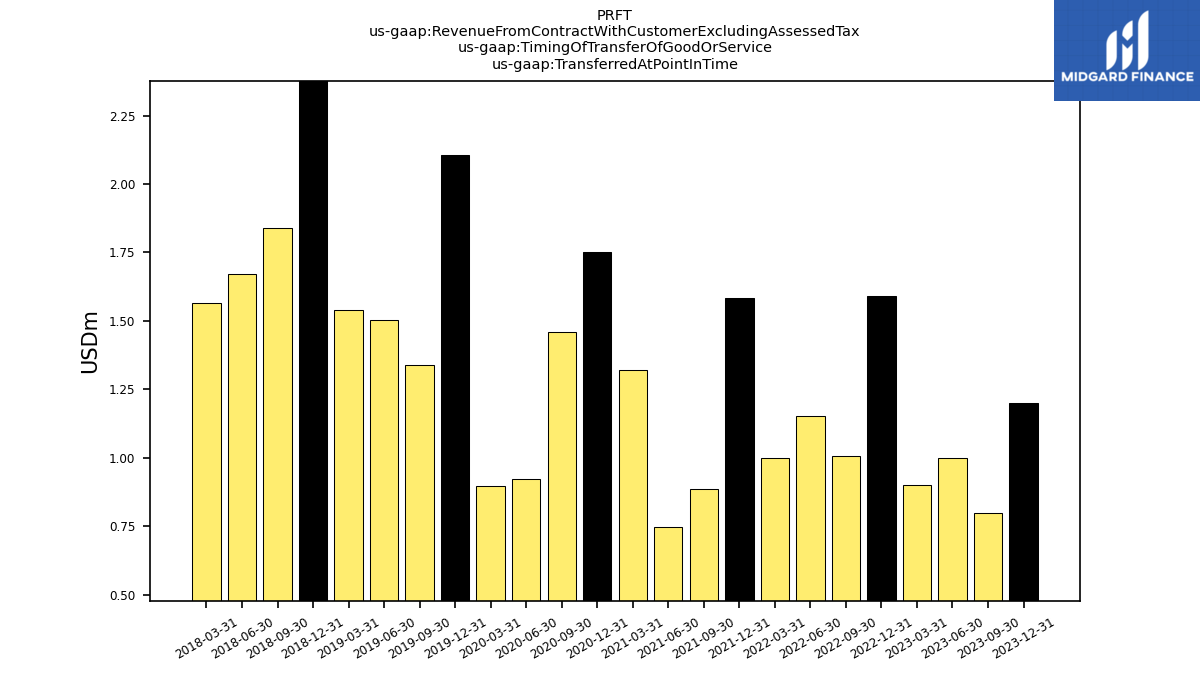
| Transferred At Point In Time | 1.20 | 0.80 | 1.00 | 0.90 | 1.59 | 1.01 | 1.15 | 1.00 | 1.58 | 0.89 | 0.75 | 1.32 | 1.75 | 1.46 | 0.92 | 0.90 | 2.10 | 1.34 | 1.50 | 1.54 | 2.82 | 1.84 | 1.67 | 1.56 | NA | NA | NA | NA | NA | NA | NA | NA | NA | NA | NA | NA | NA | NA | NA | NA | NA | NA | NA | NA | NA | NA | NA | NA | NA | NA | NA | NA | NA | NA | NA | |
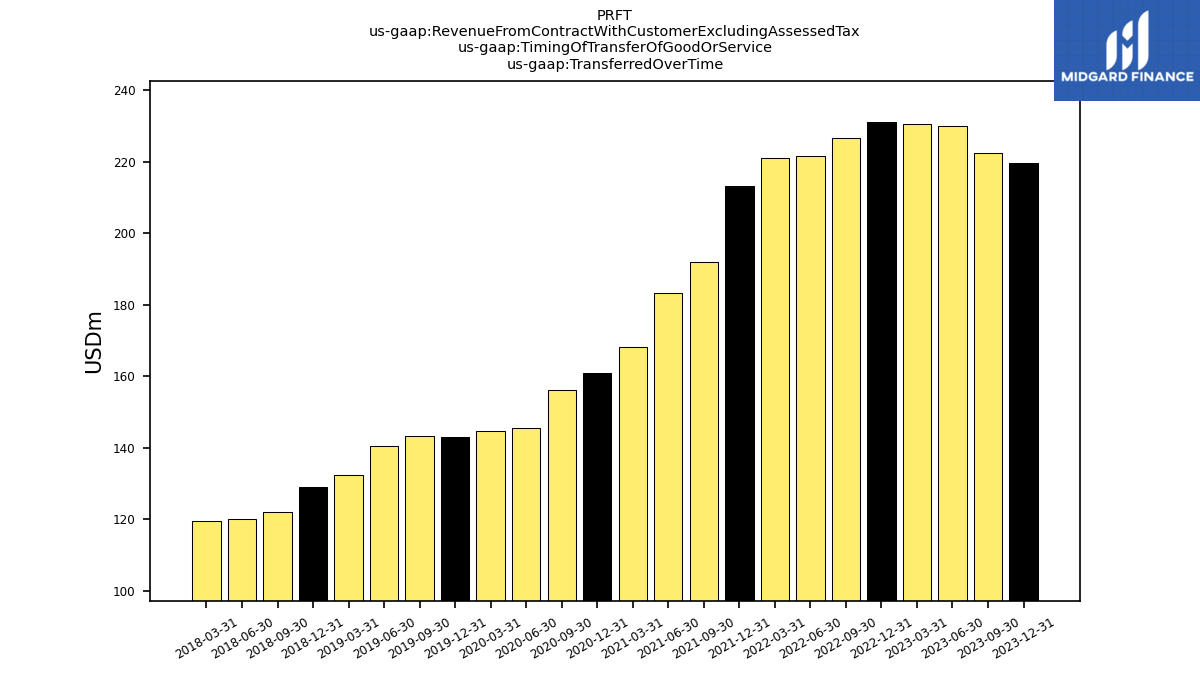
| Transferred Over Time | 219.50 | 222.40 | 230.10 | 230.50 | 231.01 | 226.61 | 221.58 | 221.11 | 213.15 | 191.94 | 183.39 | 168.02 | 160.80 | 156.22 | 145.41 | 144.66 | 143.05 | 143.34 | 140.37 | 132.28 | 128.88 | 122.09 | 120.13 | 119.38 | NA | NA | NA | NA | NA | NA | NA | NA | NA | NA | NA | NA | NA | NA | NA | NA | NA | NA | NA | NA | NA | NA | NA | NA | NA | NA | NA | NA | NA | NA | NA |


