
| 2023-11-30 | 2023-08-31 | 2023-05-31 | 2023-02-28 | 2022-11-30 | 2022-08-31 | 2022-05-31 | 2022-02-28 | 2021-11-30 | 2021-08-31 | 2021-05-31 | 2021-02-28 | 2020-11-30 | 2020-08-31 | 2020-05-31 | 2020-02-29 | 2019-11-30 | 2019-08-31 | 2019-05-31 | 2019-02-28 | 2018-11-30 | 2018-08-31 | 2018-05-31 | 2018-02-28 | 2017-11-30 | 2017-08-31 | 2017-05-31 | 2017-02-28 | 2016-11-30 | 2016-08-31 | 2016-05-31 | 2016-02-29 | 2015-11-30 | 2015-08-31 | 2015-05-31 | 2015-02-28 | 2014-11-30 | 2014-08-31 | 2014-05-31 | 2014-02-28 | 2013-11-30 | 2013-08-31 | 2013-05-31 | 2013-02-28 | 2012-11-30 | 2012-08-31 | 2012-05-31 | 2012-02-29 | 2011-11-30 | 2011-08-31 | 2011-05-31 | 2011-02-28 | 2010-11-30 | 2010-08-31 | 2010-05-31 | 2010-02-28 | ||
|---|---|---|---|---|---|---|---|---|---|---|---|---|---|---|---|---|---|---|---|---|---|---|---|---|---|---|---|---|---|---|---|---|---|---|---|---|---|---|---|---|---|---|---|---|---|---|---|---|---|---|---|---|---|---|---|---|---|
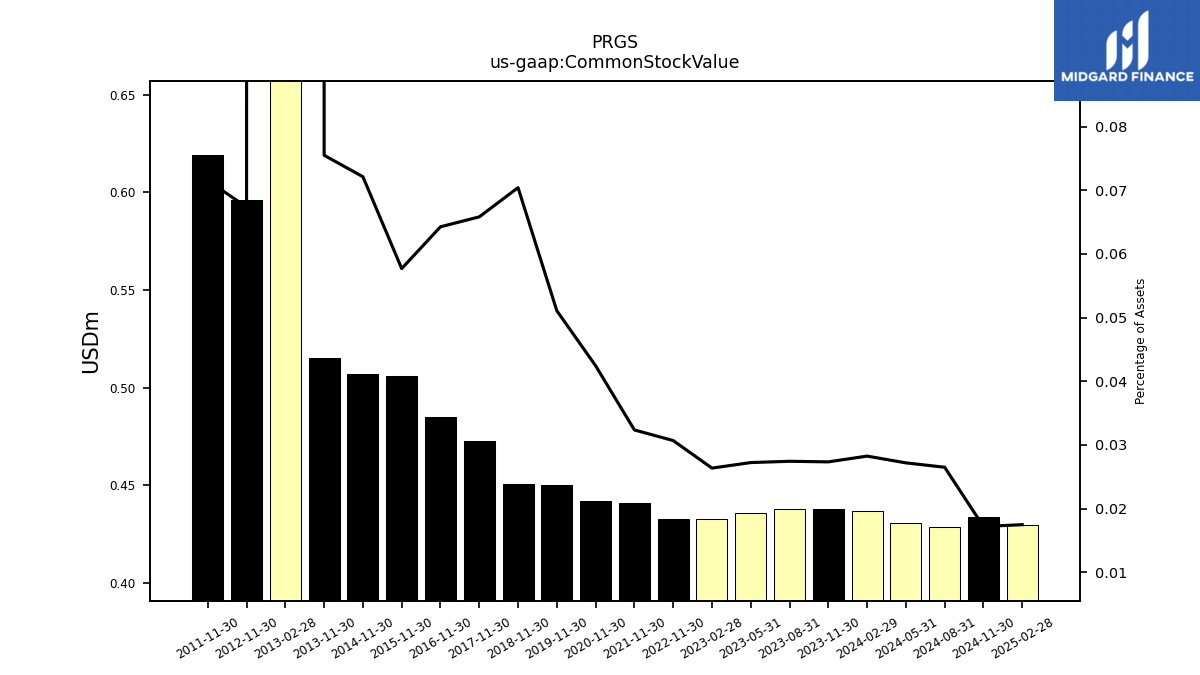
| Common Stock Value | 0.44 | 0.44 | 0.44 | 0.43 | 0.43 | NA | NA | NA | 0.44 | NA | NA | NA | 0.44 | NA | NA | NA | 0.45 | NA | NA | NA | 0.45 | NA | NA | NA | 0.47 | NA | NA | NA | 0.48 | NA | NA | NA | 0.51 | NA | NA | NA | 0.51 | NA | NA | NA | 0.52 | NA | NA | 264.81 | 0.60 | NA | NA | NA | 0.62 | NA | NA | NA | NA | NA | NA | NA | |
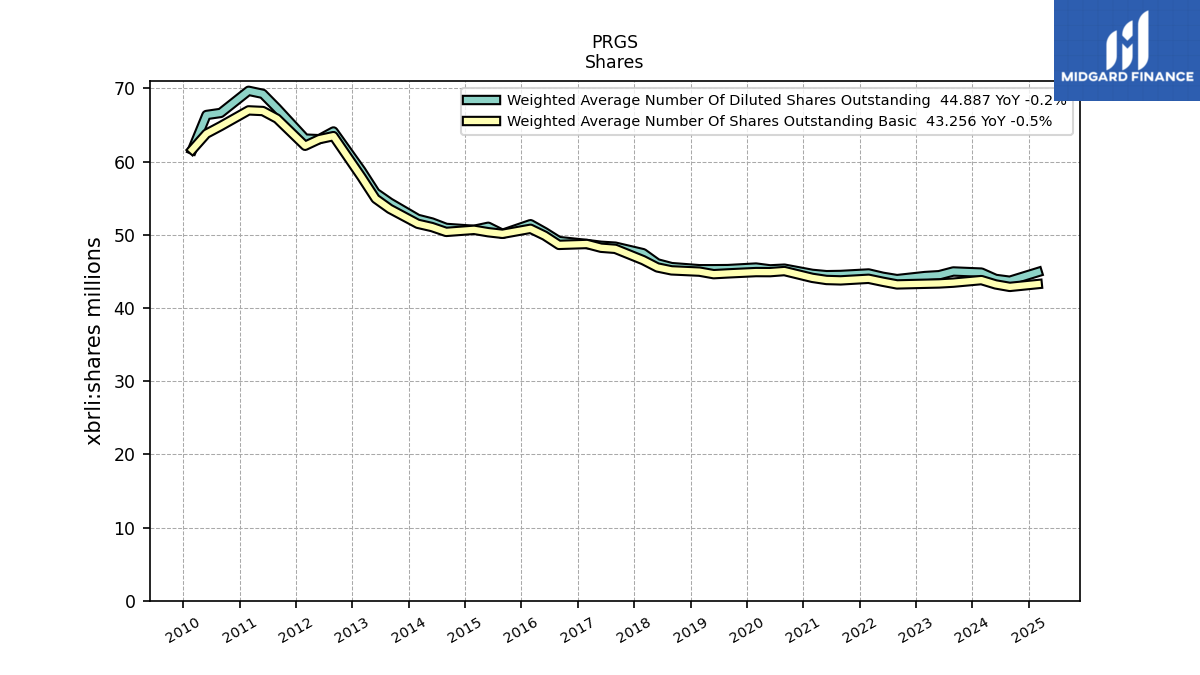
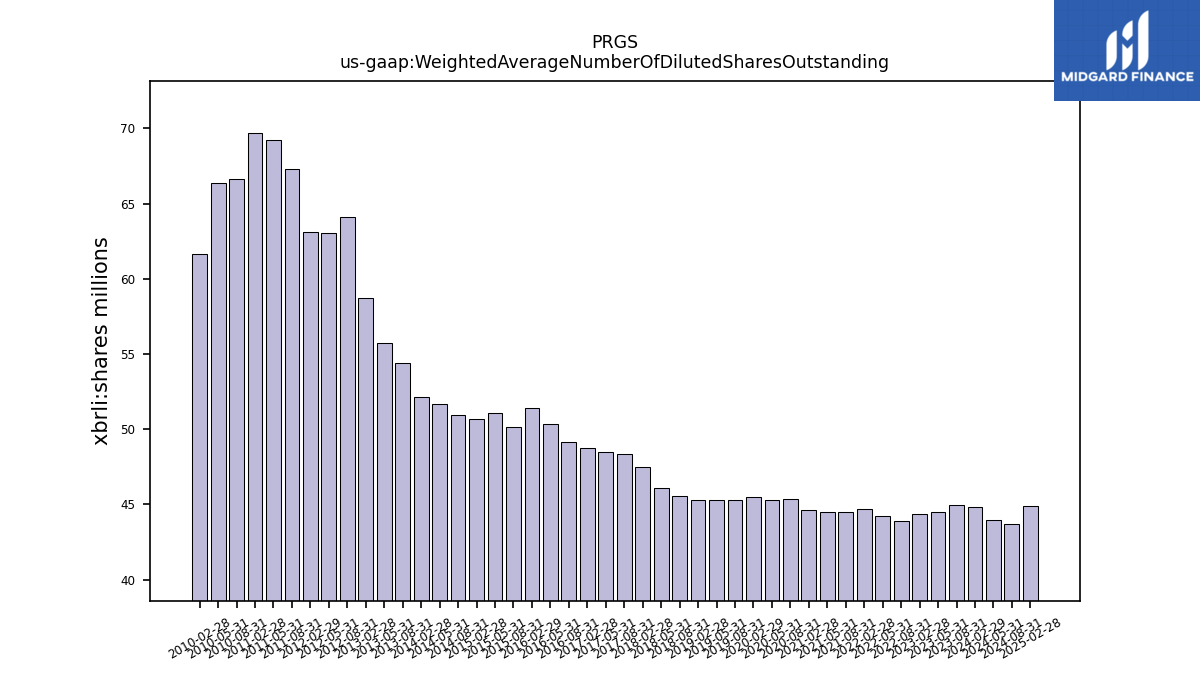
| Weighted Average Number Of Diluted Shares Outstanding | NA | 44.98 | 44.47 | 44.35 | NA | 43.94 | 44.25 | 44.71 | NA | 44.50 | 44.47 | 44.65 | NA | 45.36 | 45.27 | 45.52 | NA | 45.30 | 45.29 | 45.29 | NA | 45.58 | 46.09 | 47.48 | NA | 48.37 | 48.49 | 48.73 | NA | 49.13 | 50.35 | 51.44 | NA | 50.12 | 51.09 | 50.67 | NA | 50.93 | 51.67 | 52.16 | NA | 54.39 | 55.74 | 58.75 | NA | 64.11 | 63.05 | 63.13 | NA | 67.28 | 69.25 | 69.66 | NA | 66.64 | 66.36 | 61.62 | |
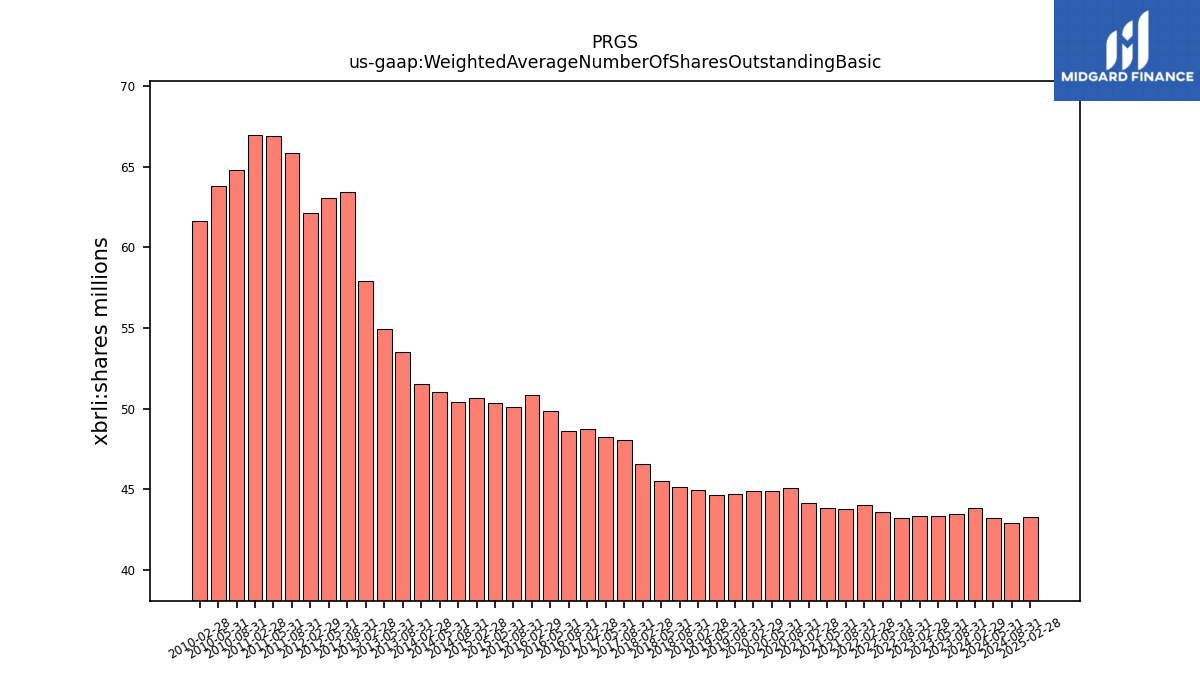
| Weighted Average Number Of Shares Outstanding Basic | NA | 43.45 | 43.34 | 43.30 | NA | 43.21 | 43.58 | 43.98 | NA | 43.76 | 43.82 | 44.11 | NA | 45.04 | 44.89 | 44.90 | NA | 44.72 | 44.61 | 44.96 | NA | 45.13 | 45.53 | 46.53 | NA | 48.07 | 48.22 | 48.73 | NA | 48.61 | 49.87 | 50.81 | NA | 50.12 | 50.34 | 50.67 | NA | 50.38 | 51.05 | 51.49 | NA | 53.53 | 54.92 | 57.90 | NA | 63.47 | 63.05 | 62.15 | NA | 65.86 | 66.90 | 66.99 | NA | 64.84 | 63.80 | 61.62 | |
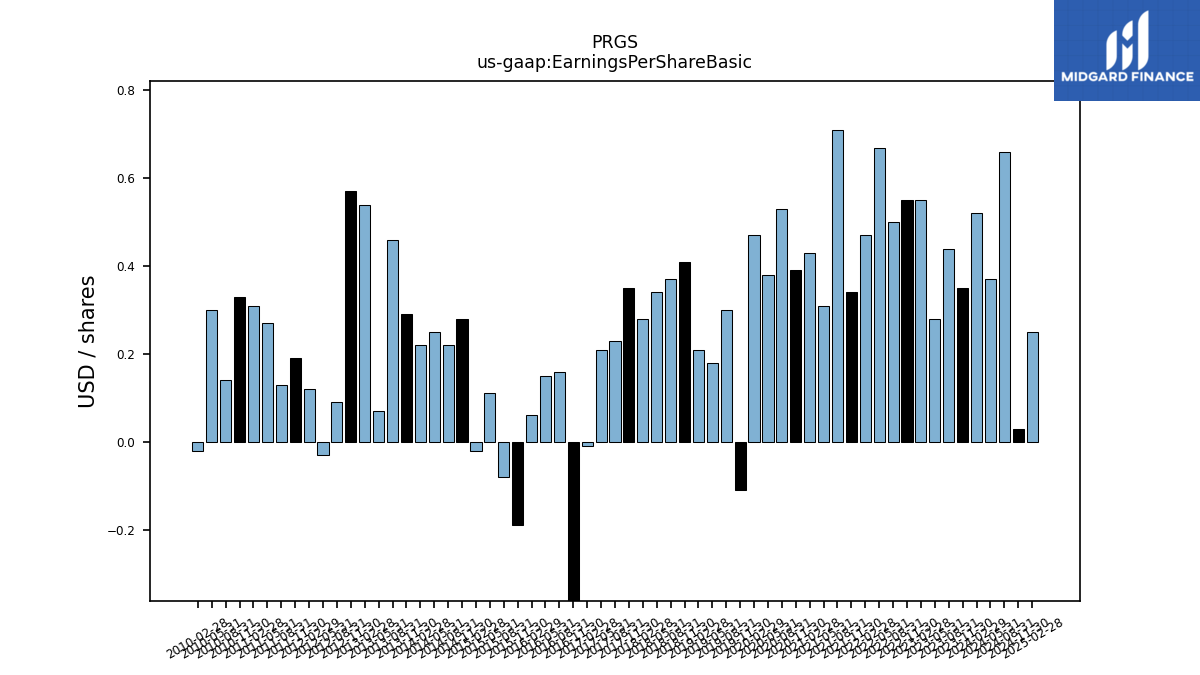
| Earnings Per Share Basic | 0.35 | 0.44 | 0.28 | 0.55 | 0.55 | 0.50 | 0.67 | 0.47 | 0.34 | 0.71 | 0.31 | 0.43 | 0.39 | 0.53 | 0.38 | 0.47 | -0.11 | 0.30 | 0.18 | 0.21 | 0.41 | 0.37 | 0.34 | 0.28 | 0.35 | 0.23 | 0.21 | -0.01 | -1.52 | 0.16 | 0.15 | 0.06 | -0.19 | -0.08 | 0.11 | -0.02 | 0.28 | 0.22 | 0.25 | 0.22 | 0.29 | 0.46 | 0.07 | 0.54 | 0.57 | 0.09 | -0.03 | 0.12 | 0.19 | 0.13 | 0.27 | 0.31 | 0.33 | 0.14 | 0.30 | -0.02 | |
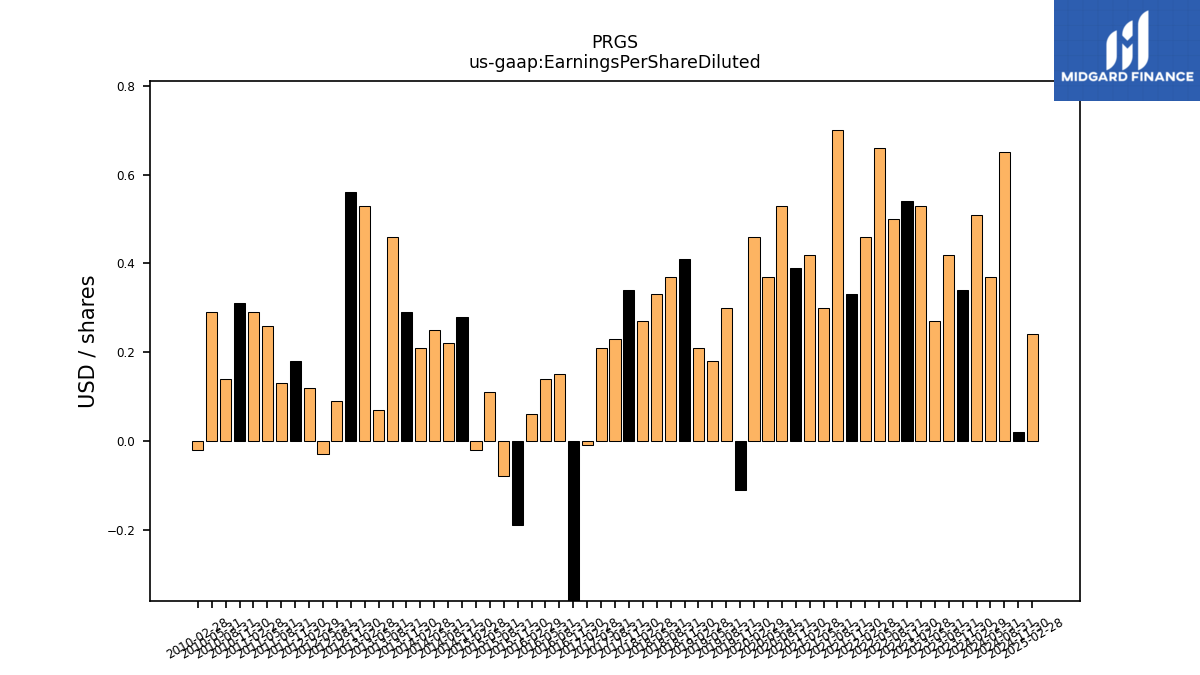
| Earnings Per Share Diluted | 0.34 | 0.42 | 0.27 | 0.53 | 0.54 | 0.50 | 0.66 | 0.46 | 0.33 | 0.70 | 0.30 | 0.42 | 0.39 | 0.53 | 0.37 | 0.46 | -0.11 | 0.30 | 0.18 | 0.21 | 0.41 | 0.37 | 0.33 | 0.27 | 0.34 | 0.23 | 0.21 | -0.01 | -1.52 | 0.15 | 0.14 | 0.06 | -0.19 | -0.08 | 0.11 | -0.02 | 0.28 | 0.22 | 0.25 | 0.21 | 0.29 | 0.46 | 0.07 | 0.53 | 0.56 | 0.09 | -0.03 | 0.12 | 0.18 | 0.13 | 0.26 | 0.29 | 0.31 | 0.14 | 0.29 | -0.02 |
| 2023-11-30 | 2023-08-31 | 2023-05-31 | 2023-02-28 | 2022-11-30 | 2022-08-31 | 2022-05-31 | 2022-02-28 | 2021-11-30 | 2021-08-31 | 2021-05-31 | 2021-02-28 | 2020-11-30 | 2020-08-31 | 2020-05-31 | 2020-02-29 | 2019-11-30 | 2019-08-31 | 2019-05-31 | 2019-02-28 | 2018-11-30 | 2018-08-31 | 2018-05-31 | 2018-02-28 | 2017-11-30 | 2017-08-31 | 2017-05-31 | 2017-02-28 | 2016-11-30 | 2016-08-31 | 2016-05-31 | 2016-02-29 | 2015-11-30 | 2015-08-31 | 2015-05-31 | 2015-02-28 | 2014-11-30 | 2014-08-31 | 2014-05-31 | 2014-02-28 | 2013-11-30 | 2013-08-31 | 2013-05-31 | 2013-02-28 | 2012-11-30 | 2012-08-31 | 2012-05-31 | 2012-02-29 | 2011-11-30 | 2011-08-31 | 2011-05-31 | 2011-02-28 | 2010-11-30 | 2010-08-31 | 2010-05-31 | 2010-02-28 | ||
|---|---|---|---|---|---|---|---|---|---|---|---|---|---|---|---|---|---|---|---|---|---|---|---|---|---|---|---|---|---|---|---|---|---|---|---|---|---|---|---|---|---|---|---|---|---|---|---|---|---|---|---|---|---|---|---|---|---|
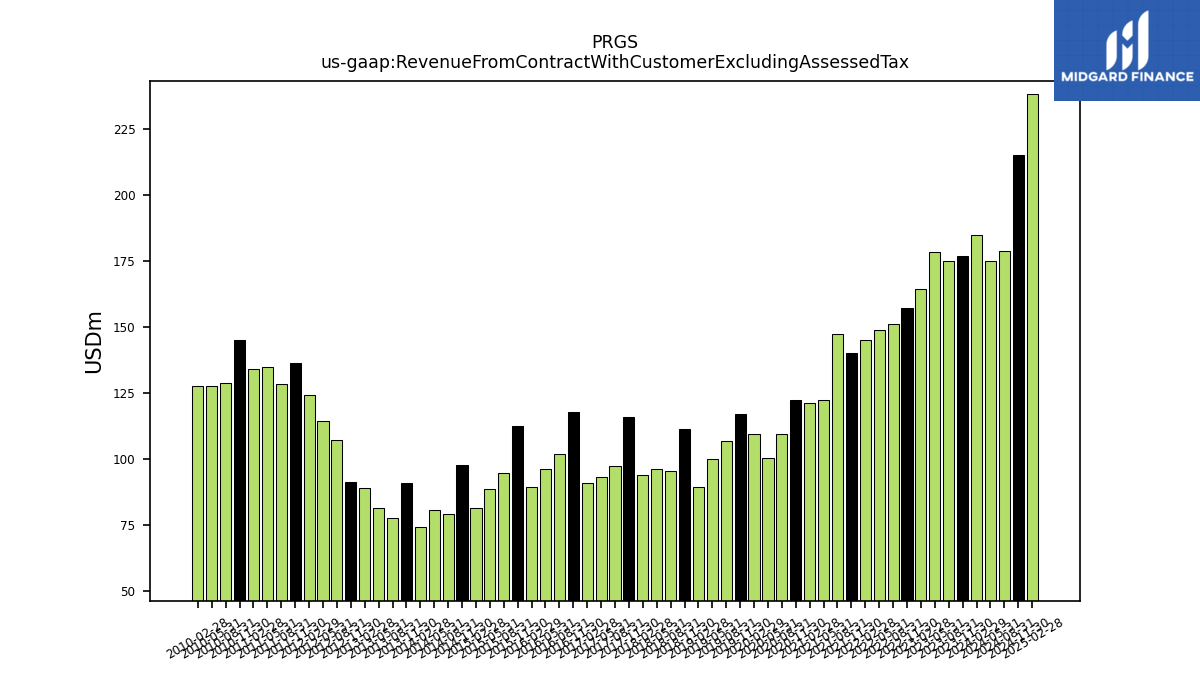
| Revenue From Contract With Customer Excluding Assessed Tax | 176.97 | 174.99 | 178.25 | 164.23 | 157.13 | 151.22 | 148.75 | 144.92 | 140.13 | 147.42 | 122.49 | 121.28 | 122.39 | 109.70 | 100.38 | 109.68 | 117.04 | 106.72 | 100.00 | 89.55 | 111.33 | 95.68 | 96.10 | 94.05 | 116.08 | 97.31 | 93.21 | 90.97 | 117.72 | 102.02 | 96.12 | 89.48 | 112.72 | 94.64 | 88.82 | 81.38 | 97.89 | 79.27 | 80.83 | 74.54 | 90.98 | 77.58 | 81.70 | 89.27 | 91.27 | 107.17 | 114.60 | 124.43 | 136.34 | 128.33 | 134.68 | 134.24 | 145.18 | 128.74 | 127.66 | 127.55 | |
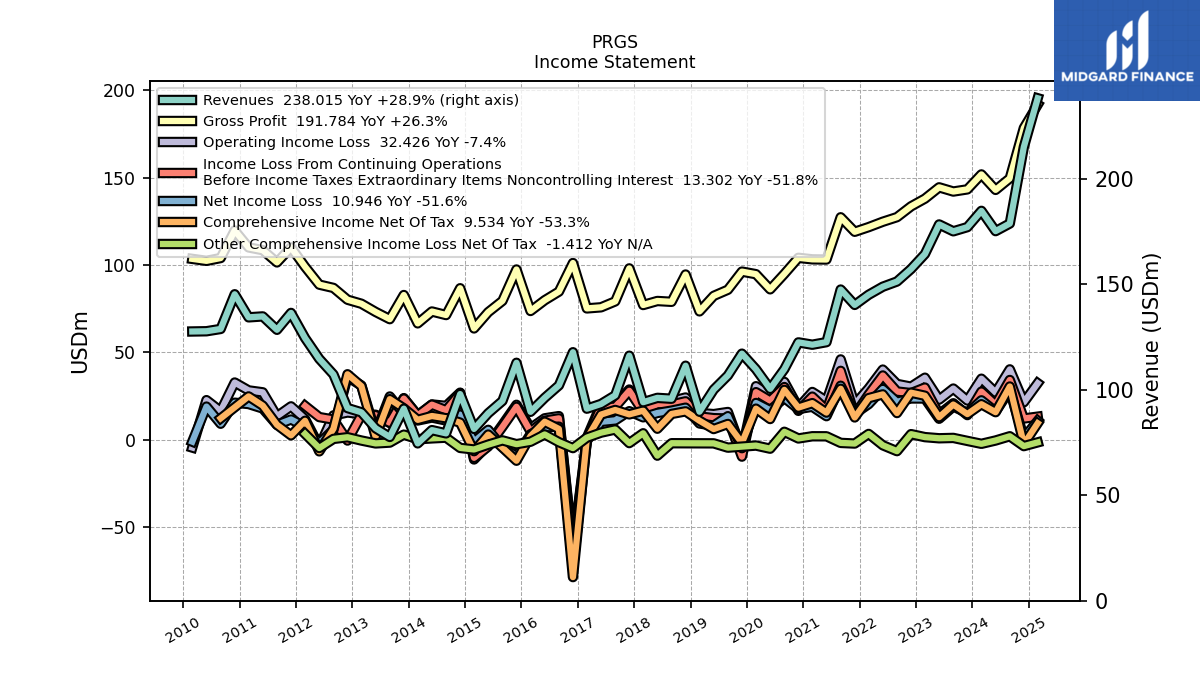
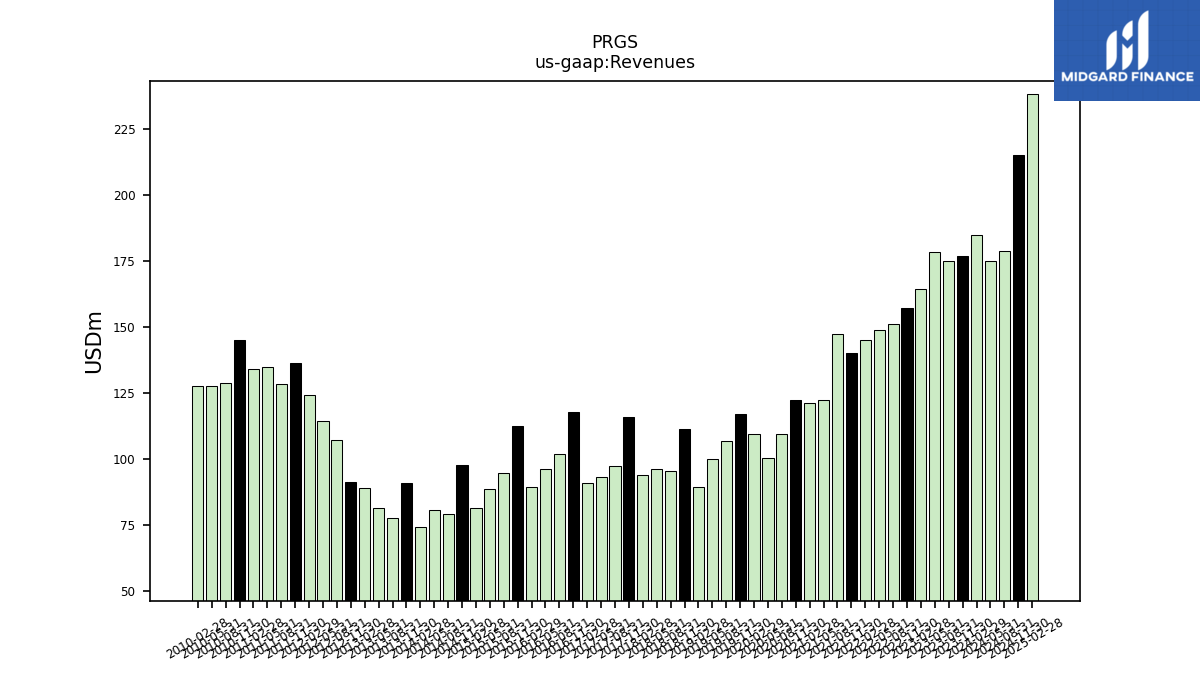
| Revenues | 176.97 | 174.99 | 178.25 | 164.23 | 157.13 | 151.22 | 148.75 | 144.92 | 140.13 | 147.42 | 122.49 | 121.28 | 122.39 | 109.70 | 100.38 | 109.68 | 117.04 | 106.72 | 100.00 | 89.55 | 111.33 | 95.68 | 96.10 | 94.05 | 116.08 | 97.31 | 93.21 | 90.97 | 117.72 | 102.02 | 96.12 | 89.48 | 112.72 | 94.64 | 88.82 | 81.38 | 97.89 | 79.27 | 80.83 | 74.54 | 90.98 | 77.58 | 81.70 | 89.27 | 91.27 | 107.17 | 114.60 | 124.43 | 136.34 | 128.33 | 134.68 | 134.24 | 145.18 | 128.74 | 127.66 | 127.55 | |
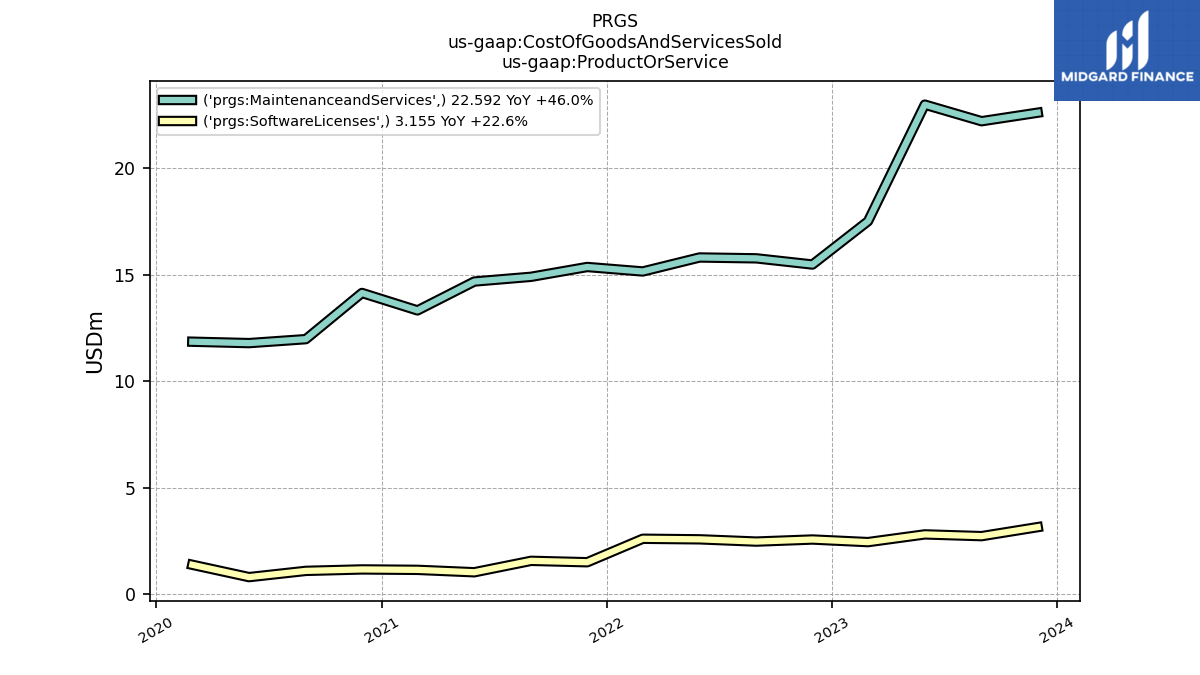
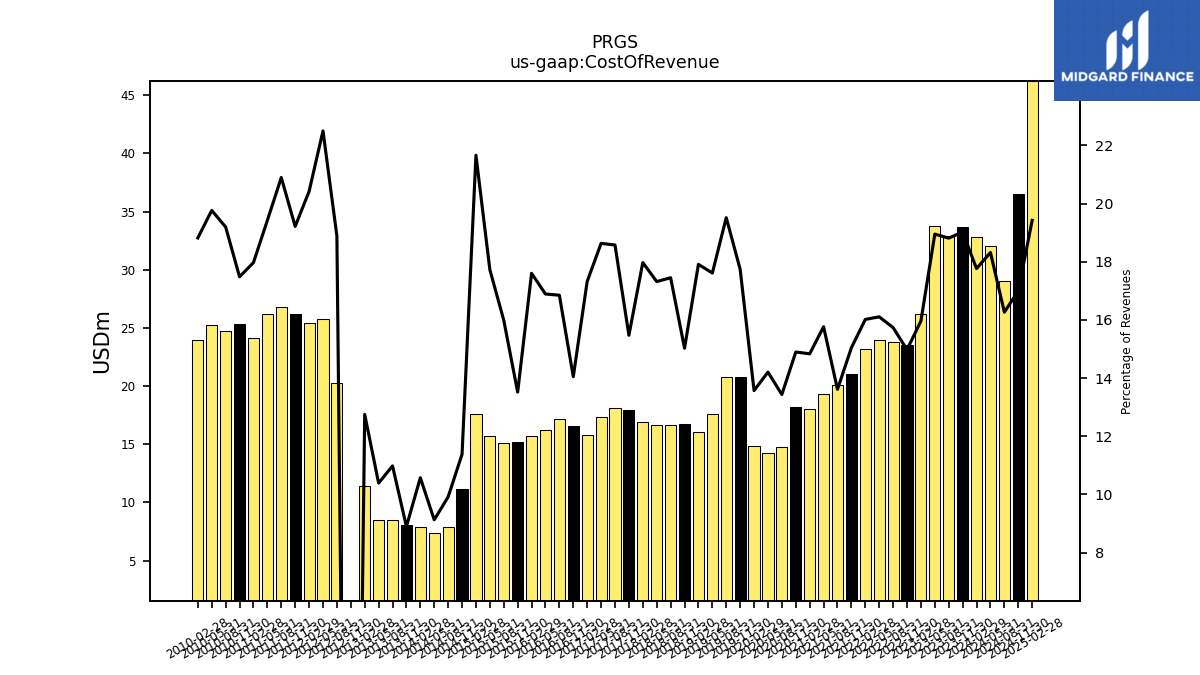
| Cost Of Revenue | 33.66 | 32.92 | 33.78 | 26.22 | 23.53 | 23.80 | 23.96 | 23.21 | 21.08 | 20.07 | 19.31 | 17.99 | 18.23 | 14.74 | 14.26 | 14.89 | 20.77 | 20.82 | 17.61 | 16.04 | 16.73 | 16.70 | 16.64 | 16.90 | 17.96 | 18.07 | 17.37 | 15.76 | 16.54 | 17.19 | 16.23 | 15.75 | 15.24 | 15.13 | 15.75 | 17.63 | 11.14 | 7.86 | 7.38 | 7.88 | 8.10 | 8.52 | 8.49 | 11.38 | -23.20 | 20.24 | 25.78 | 25.40 | 26.20 | 26.82 | 26.16 | 24.12 | 25.38 | 24.71 | 25.23 | 24.00 | |
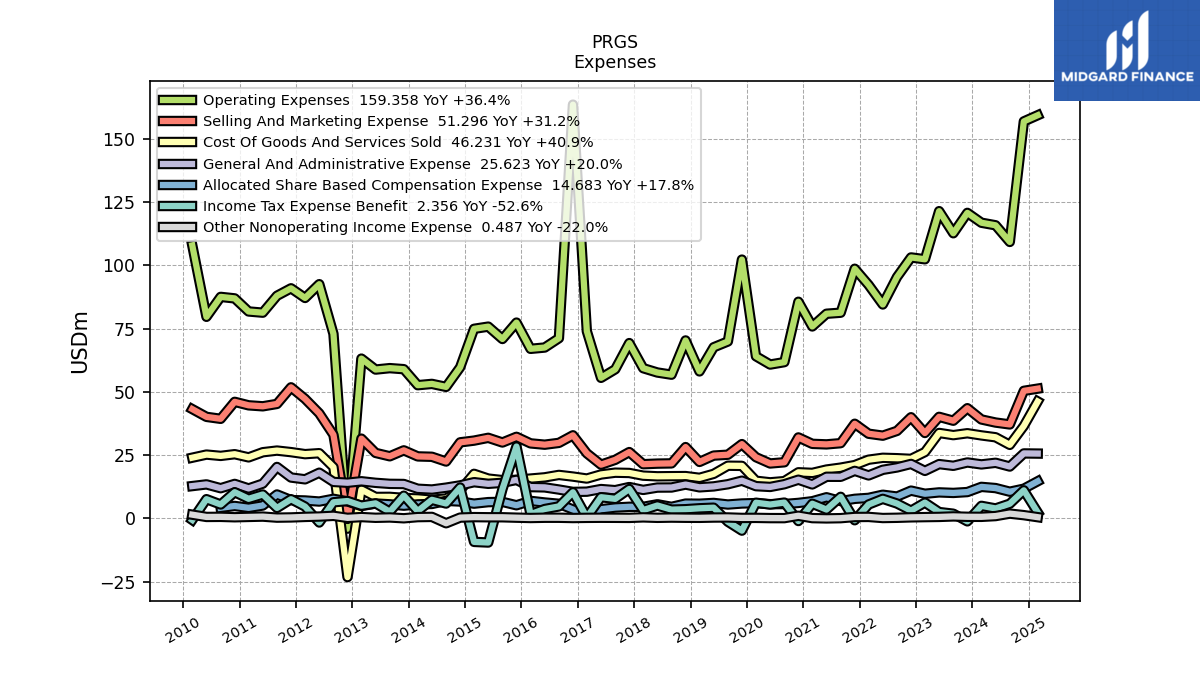
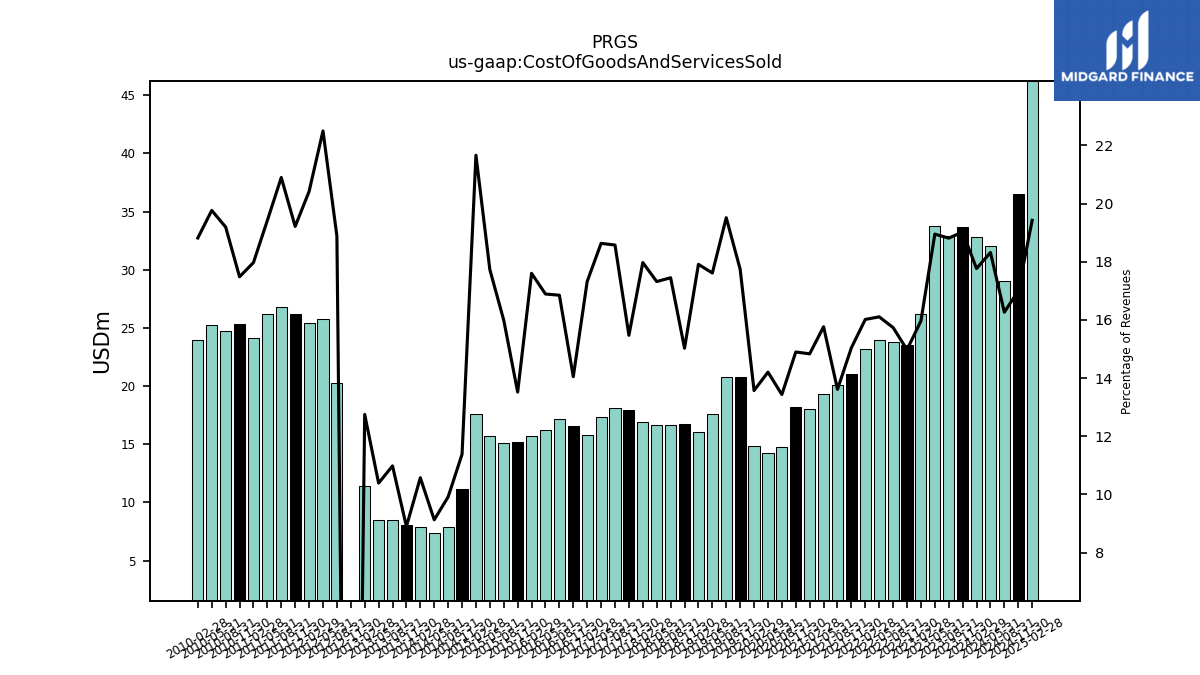
| Cost Of Goods And Services Sold | 33.66 | 32.92 | 33.78 | 26.22 | 23.53 | 23.80 | 23.96 | 23.21 | 21.08 | 20.07 | 19.31 | 17.99 | 18.23 | 14.74 | 14.26 | 14.89 | 20.77 | 20.82 | 17.61 | 16.04 | 16.73 | 16.70 | 16.64 | 16.90 | 17.96 | 18.07 | 17.37 | 15.76 | 16.54 | 17.19 | 16.23 | 15.75 | 15.24 | 15.13 | 15.75 | 17.63 | 11.14 | 7.86 | 7.38 | 7.88 | 8.10 | 8.52 | 8.49 | 11.38 | -23.20 | 20.24 | 25.78 | 25.40 | 26.20 | 26.82 | 26.16 | 24.12 | 25.38 | 24.71 | 25.23 | 24.00 | |
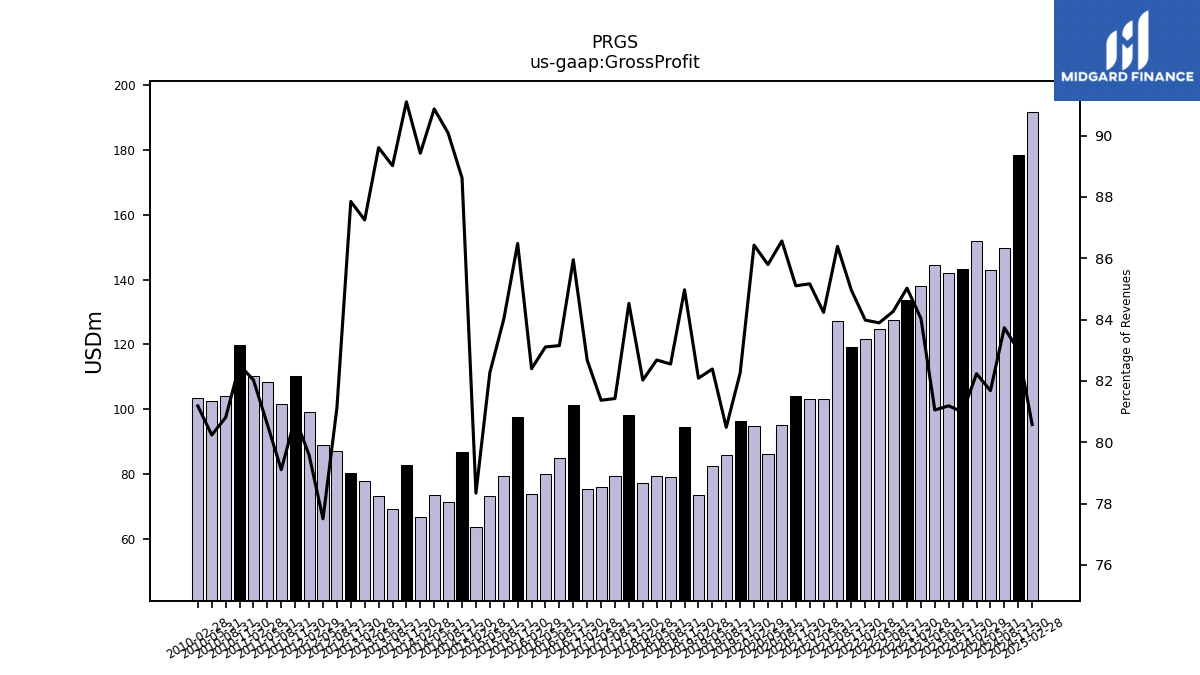
| Gross Profit | 143.31 | 142.07 | 144.47 | 138.01 | 133.60 | 127.42 | 124.79 | 121.71 | 119.05 | 127.35 | 103.18 | 103.29 | 104.15 | 94.96 | 86.12 | 94.80 | 96.27 | 85.89 | 82.38 | 73.51 | 94.60 | 78.99 | 79.46 | 77.14 | 98.12 | 79.23 | 75.85 | 75.21 | 101.19 | 84.83 | 79.88 | 73.73 | 97.48 | 79.50 | 73.07 | 63.75 | 86.75 | 71.41 | 73.45 | 66.66 | 82.89 | 69.06 | 73.22 | 77.89 | 80.18 | 86.93 | 88.81 | 99.02 | 110.14 | 101.52 | 108.53 | 110.11 | 119.80 | 104.03 | 102.42 | 103.55 | |
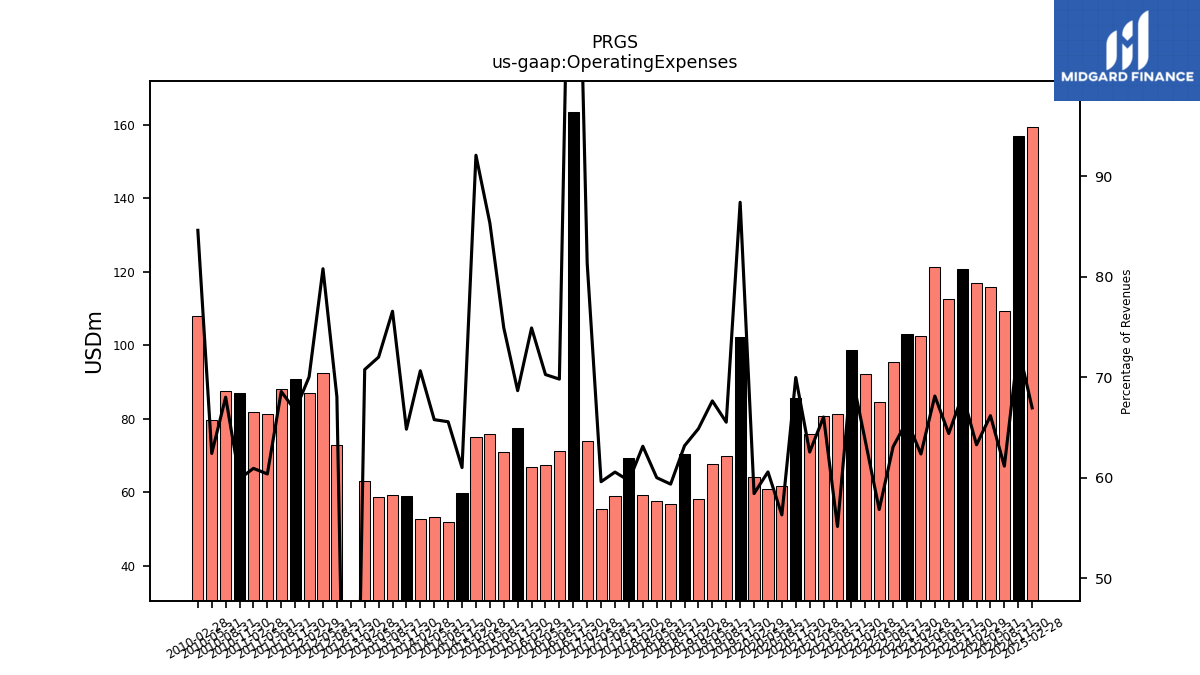
| Operating Expenses | 120.77 | 112.70 | 121.45 | 102.42 | 103.15 | 95.40 | 84.56 | 92.28 | 98.69 | 81.30 | 80.90 | 75.87 | 85.64 | 61.77 | 60.81 | 64.08 | 102.30 | 69.93 | 67.64 | 58.10 | 70.34 | 56.80 | 57.67 | 59.38 | 69.31 | 58.94 | 55.56 | 73.99 | 163.55 | 71.22 | 67.54 | 67.03 | 77.40 | 70.91 | 75.81 | 74.94 | 59.73 | 51.98 | 53.17 | 52.66 | 58.98 | 59.40 | 58.83 | 63.17 | -4.06 | 72.94 | 92.59 | 87.13 | 90.96 | 88.01 | 81.32 | 81.80 | 86.96 | 87.56 | 79.68 | 107.92 | |
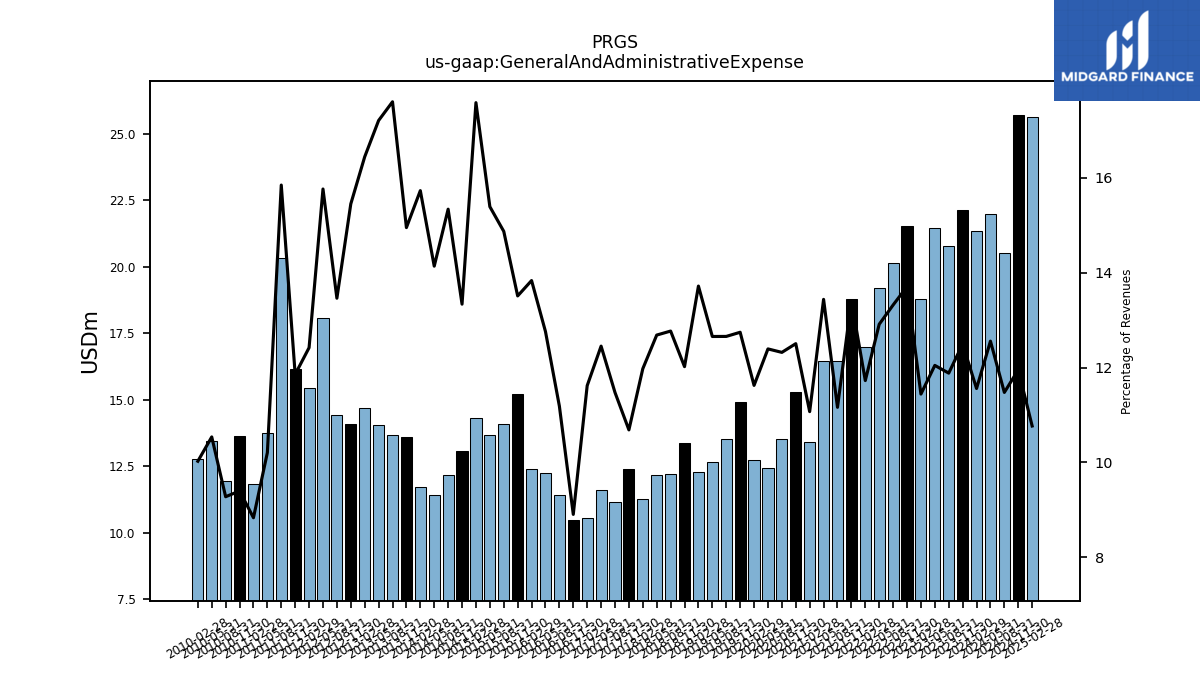
| General And Administrative Expense | 22.11 | 20.79 | 21.47 | 18.79 | 21.54 | 20.14 | 19.21 | 16.99 | 18.79 | 16.45 | 16.46 | 13.42 | 15.30 | 13.51 | 12.44 | 12.75 | 14.91 | 13.51 | 12.65 | 12.29 | 13.38 | 12.22 | 12.19 | 11.26 | 12.40 | 11.16 | 11.61 | 10.57 | 10.48 | 11.41 | 12.26 | 12.38 | 15.23 | 14.08 | 13.67 | 14.31 | 13.06 | 12.16 | 11.43 | 11.73 | 13.60 | 13.66 | 14.06 | 14.68 | 14.10 | 14.43 | 18.07 | 15.45 | 16.16 | 20.34 | 13.74 | 11.85 | 13.64 | 11.94 | 13.45 | 12.78 | |
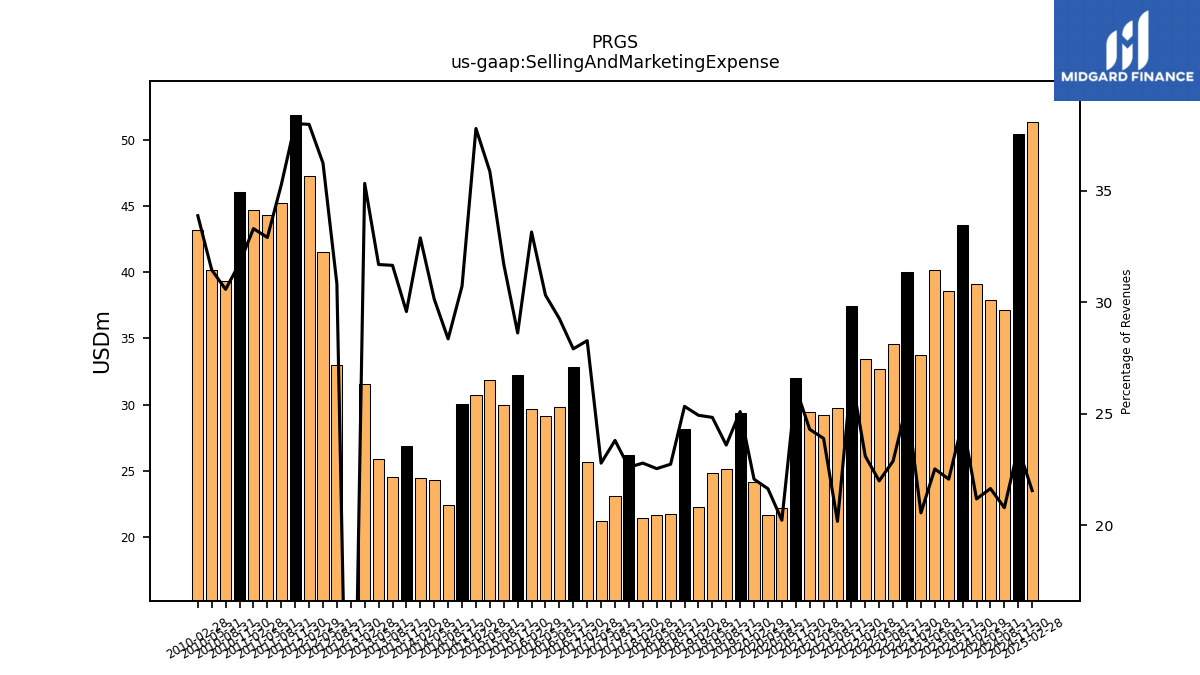
| Selling And Marketing Expense | 43.56 | 38.61 | 40.15 | 33.75 | 39.99 | 34.59 | 32.70 | 33.47 | 37.42 | 29.74 | 29.26 | 29.47 | 32.01 | 22.19 | 21.72 | 24.20 | 29.37 | 25.18 | 24.83 | 22.32 | 28.20 | 21.75 | 21.66 | 21.43 | 26.23 | 23.16 | 21.24 | 25.72 | 32.85 | 29.85 | 29.14 | 29.66 | 32.26 | 30.00 | 31.85 | 30.75 | 30.07 | 22.48 | 24.36 | 24.51 | 26.91 | 24.55 | 25.89 | 31.54 | -0.20 | 33.03 | 41.53 | 47.25 | 51.82 | 45.25 | 44.31 | 44.70 | 46.08 | 39.36 | 40.14 | 43.21 | |
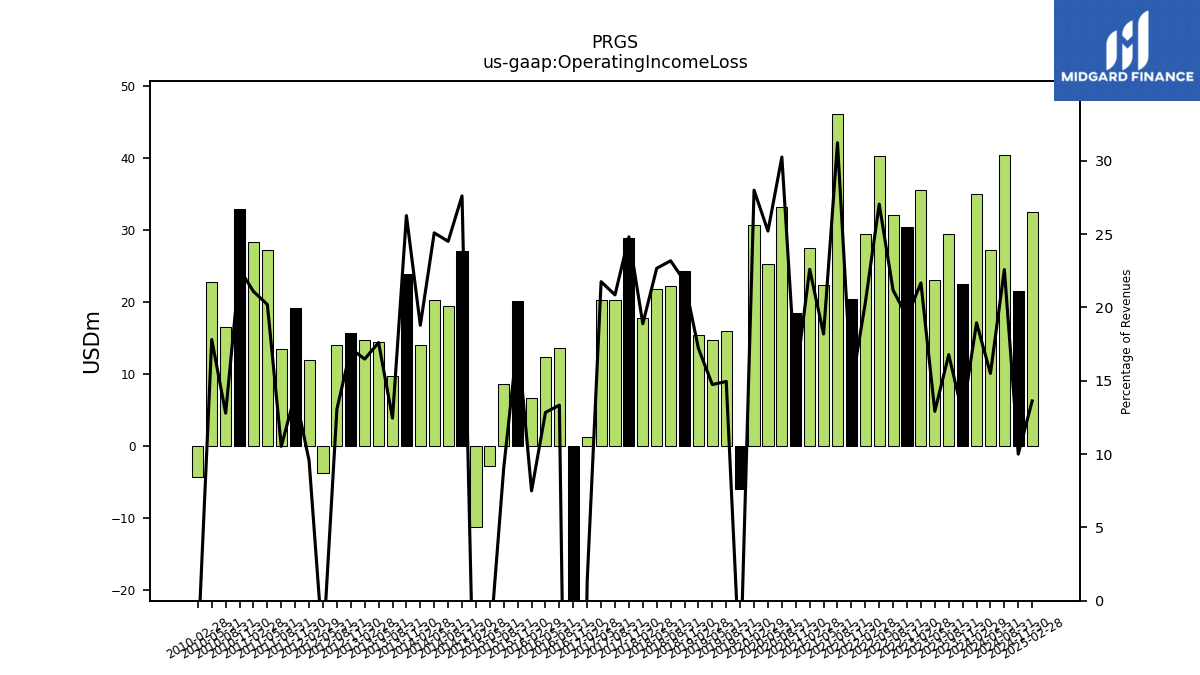
| Operating Income Loss | 22.54 | 29.37 | 23.03 | 35.59 | 30.44 | 32.02 | 40.23 | 29.43 | 20.36 | 46.05 | 22.28 | 27.42 | 18.51 | 33.19 | 25.31 | 30.71 | -6.03 | 15.96 | 14.74 | 15.41 | 24.26 | 22.18 | 21.79 | 17.77 | 28.81 | 20.30 | 20.28 | 1.22 | -62.36 | 13.61 | 12.34 | 6.71 | 20.08 | 8.59 | -2.73 | -11.19 | 27.03 | 19.43 | 20.28 | 14.00 | 23.90 | 9.66 | 14.39 | 14.71 | 15.69 | 14.00 | -3.77 | 11.89 | 19.18 | 13.51 | 27.21 | 28.32 | 32.84 | 16.47 | 22.75 | -4.38 | |
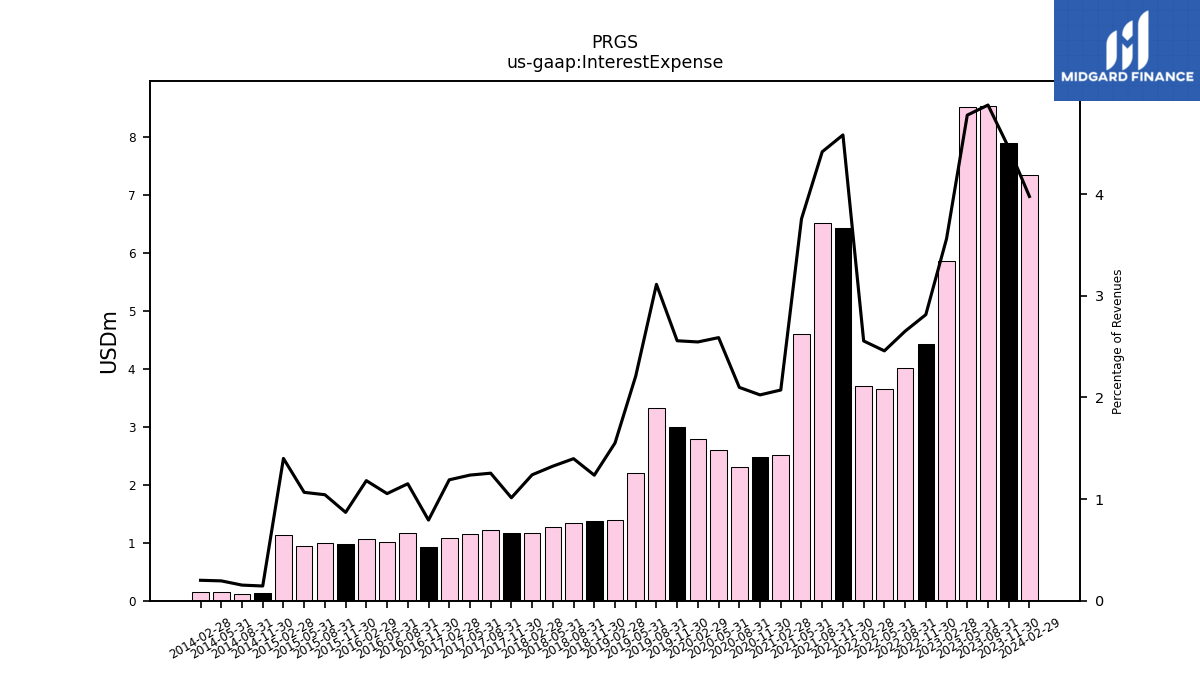
| Interest Expense | 7.89 | 8.53 | 8.51 | 5.85 | 4.42 | 4.01 | 3.66 | 3.70 | 6.42 | 6.51 | 4.60 | 2.51 | 2.48 | 2.30 | 2.60 | 2.79 | 2.99 | 3.32 | 2.21 | 1.39 | 1.38 | 1.34 | 1.27 | 1.17 | 1.18 | 1.22 | 1.15 | 1.08 | 0.93 | 1.17 | 1.01 | 1.06 | 0.98 | 0.99 | 0.95 | 1.14 | 0.14 | 0.12 | 0.16 | 0.15 | NA | NA | NA | NA | NA | NA | NA | NA | NA | NA | NA | NA | NA | NA | NA | NA | |
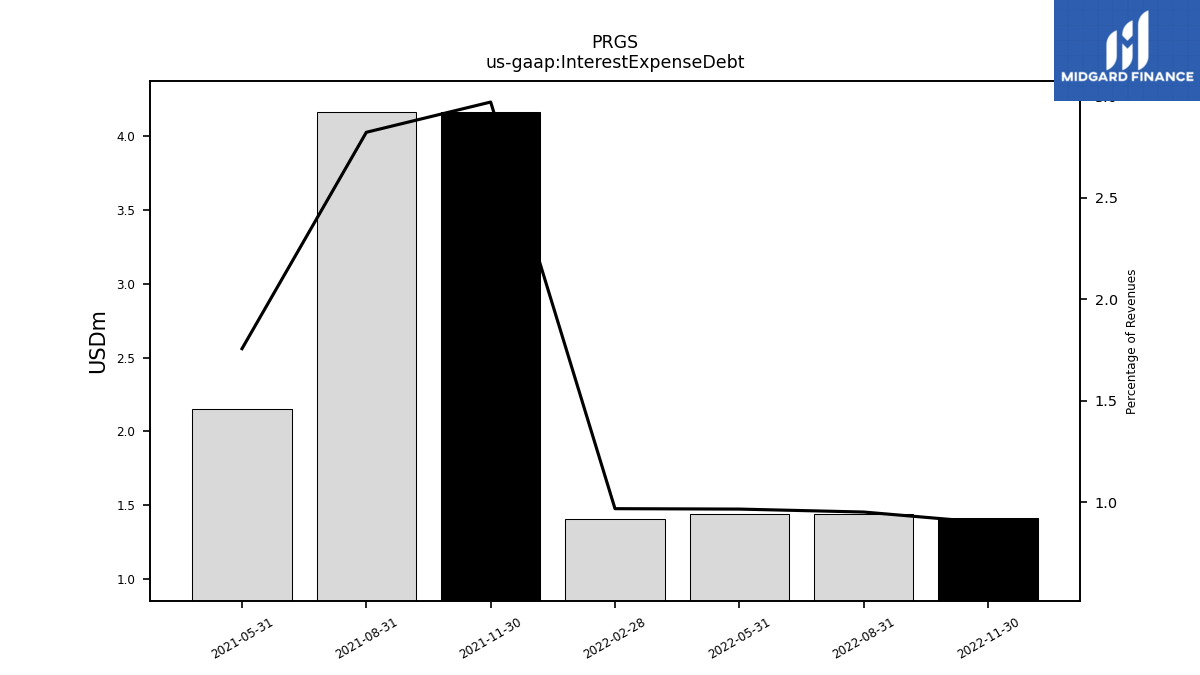
| Interest Expense Debt | NA | NA | NA | NA | 1.42 | 1.44 | 1.44 | 1.41 | 4.16 | 4.16 | 2.15 | NA | NA | NA | NA | NA | NA | NA | NA | NA | NA | NA | NA | NA | NA | NA | NA | NA | NA | NA | NA | NA | NA | NA | NA | NA | NA | NA | NA | NA | NA | NA | NA | NA | NA | NA | NA | NA | NA | NA | NA | NA | NA | NA | NA | NA | |
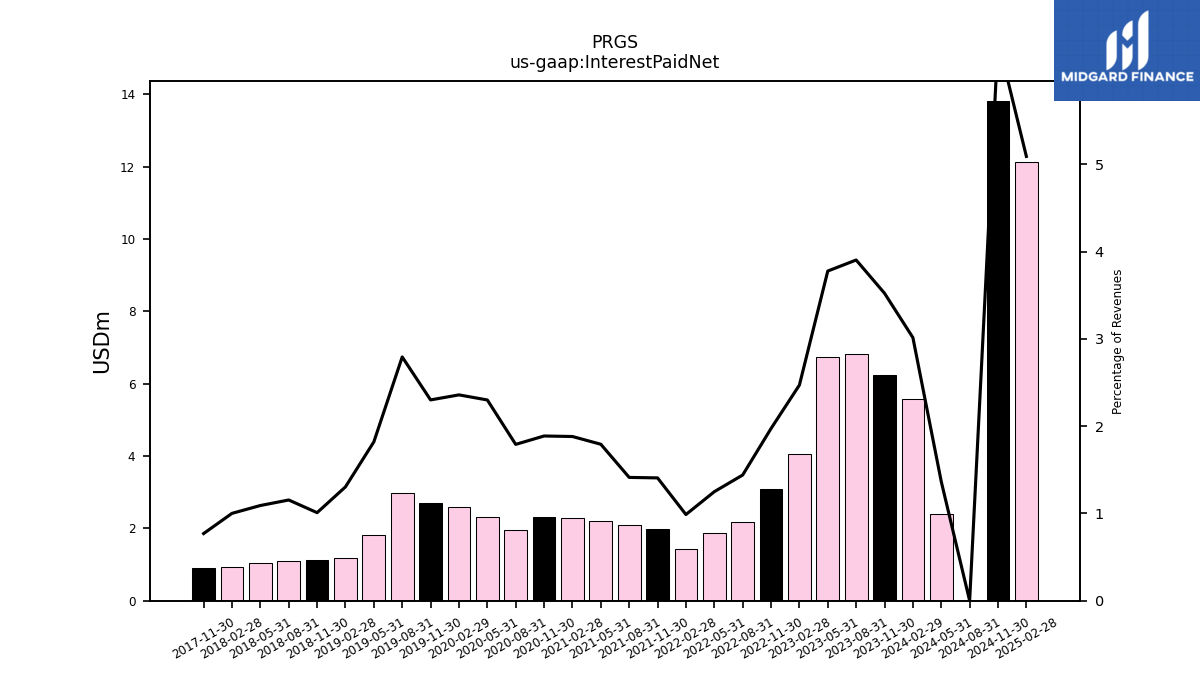
| Interest Paid Net | 6.24 | 6.83 | 6.74 | 4.06 | 3.10 | 2.18 | 1.86 | 1.43 | 1.97 | 2.08 | 2.20 | 2.28 | 2.31 | 1.97 | 2.31 | 2.59 | 2.69 | 2.98 | 1.82 | 1.17 | 1.12 | 1.10 | 1.05 | 0.94 | 0.89 | NA | NA | NA | NA | NA | NA | NA | NA | NA | NA | NA | NA | NA | NA | NA | NA | NA | NA | NA | NA | NA | NA | NA | NA | NA | NA | NA | NA | NA | NA | NA | |
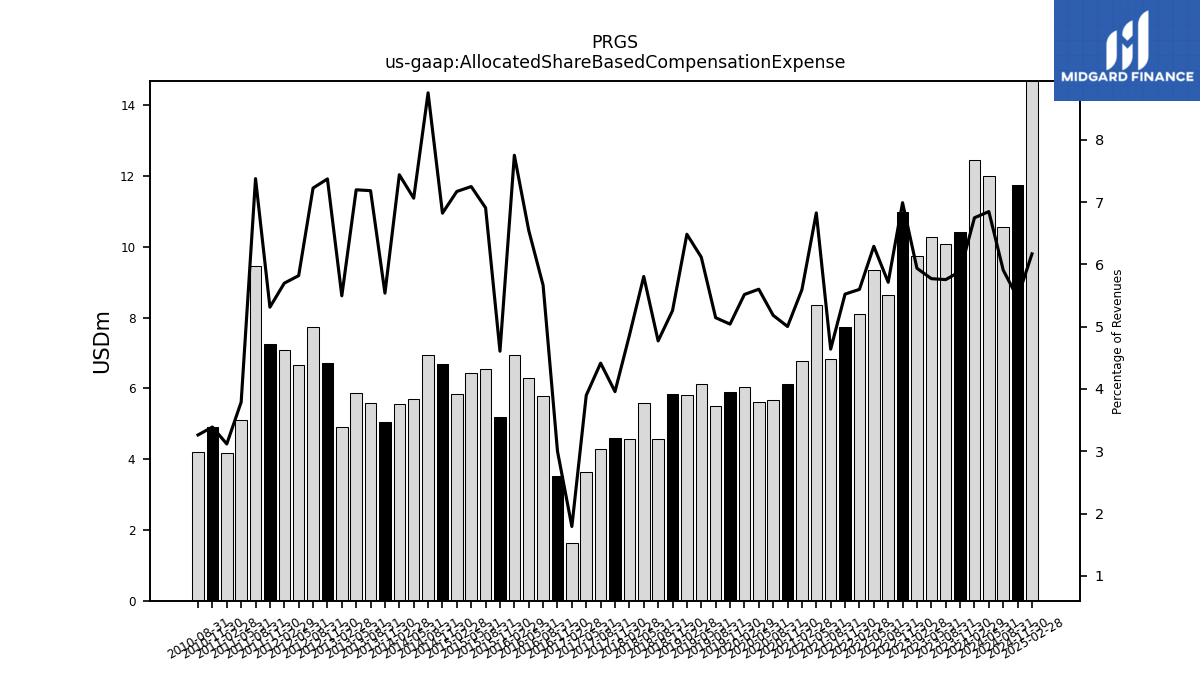
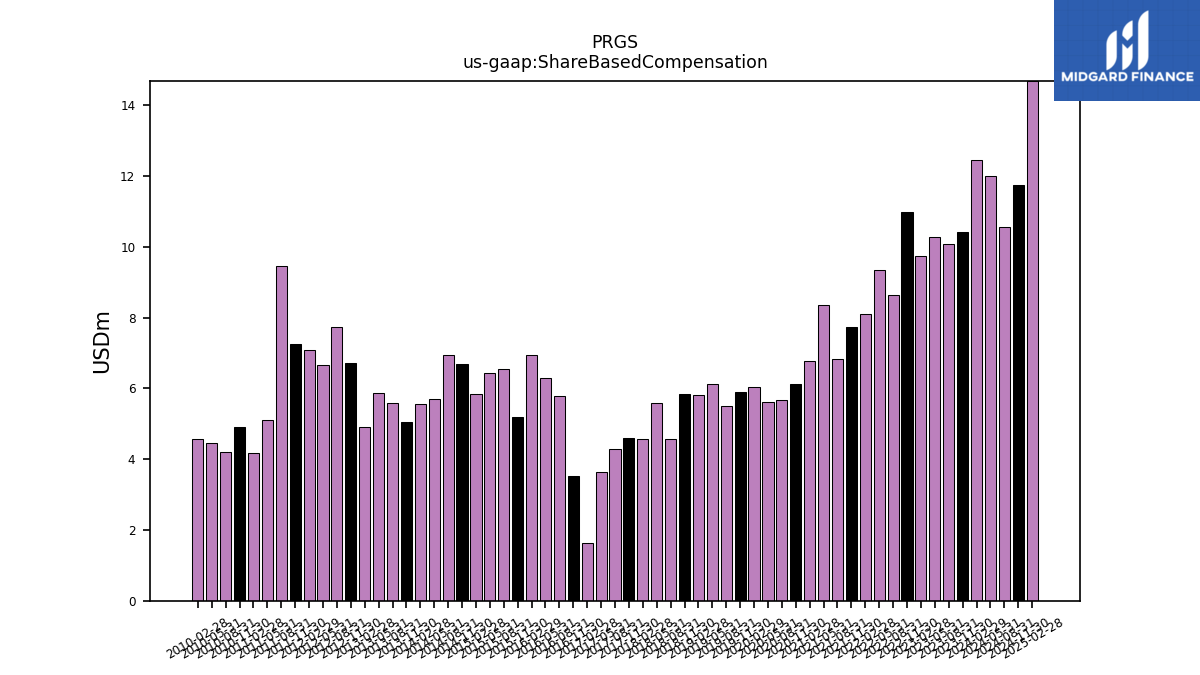
| Allocated Share Based Compensation Expense | 10.42 | 10.07 | 10.29 | 9.75 | 10.98 | 8.64 | 9.36 | 8.11 | 7.74 | 6.84 | 8.36 | 6.78 | 6.12 | 5.68 | 5.62 | 6.05 | 5.90 | 5.49 | 6.12 | 5.81 | 5.85 | 4.57 | 5.58 | 4.57 | 4.59 | 4.30 | 3.63 | 1.63 | 3.53 | 5.78 | 6.29 | 6.94 | 5.19 | 6.54 | 6.44 | 5.84 | 6.68 | 6.94 | 5.71 | 5.54 | 5.04 | 5.57 | 5.88 | 4.91 | 6.73 | 7.74 | 6.67 | 7.09 | 7.24 | 9.47 | 5.10 | 4.18 | 4.92 | 4.20 | NA | NA | |
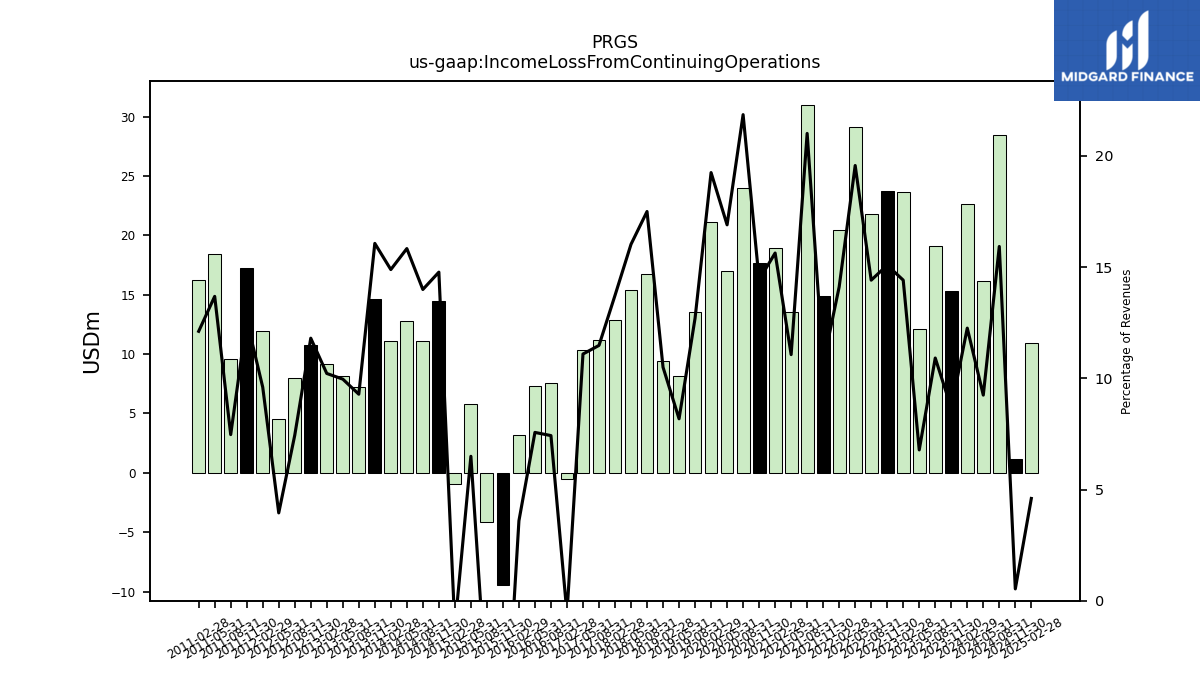
| Income Loss From Continuing Operations | 15.34 | 19.10 | 12.09 | 23.67 | 23.71 | 21.80 | 29.11 | 20.45 | 14.93 | 30.98 | 13.56 | 18.96 | 17.66 | 23.98 | 16.97 | 21.12 | NA | 13.56 | 8.18 | 9.40 | NA | 16.75 | 15.40 | 12.91 | NA | 11.17 | 10.34 | -0.53 | NA | 7.58 | 7.28 | 3.22 | -9.47 | -4.13 | 5.77 | -0.97 | 14.46 | 11.10 | 12.80 | 11.10 | 14.62 | 7.20 | 8.14 | 9.12 | 10.78 | 7.98 | 4.53 | 11.95 | 17.22 | 9.59 | 18.43 | 16.26 | NA | NA | NA | NA | |
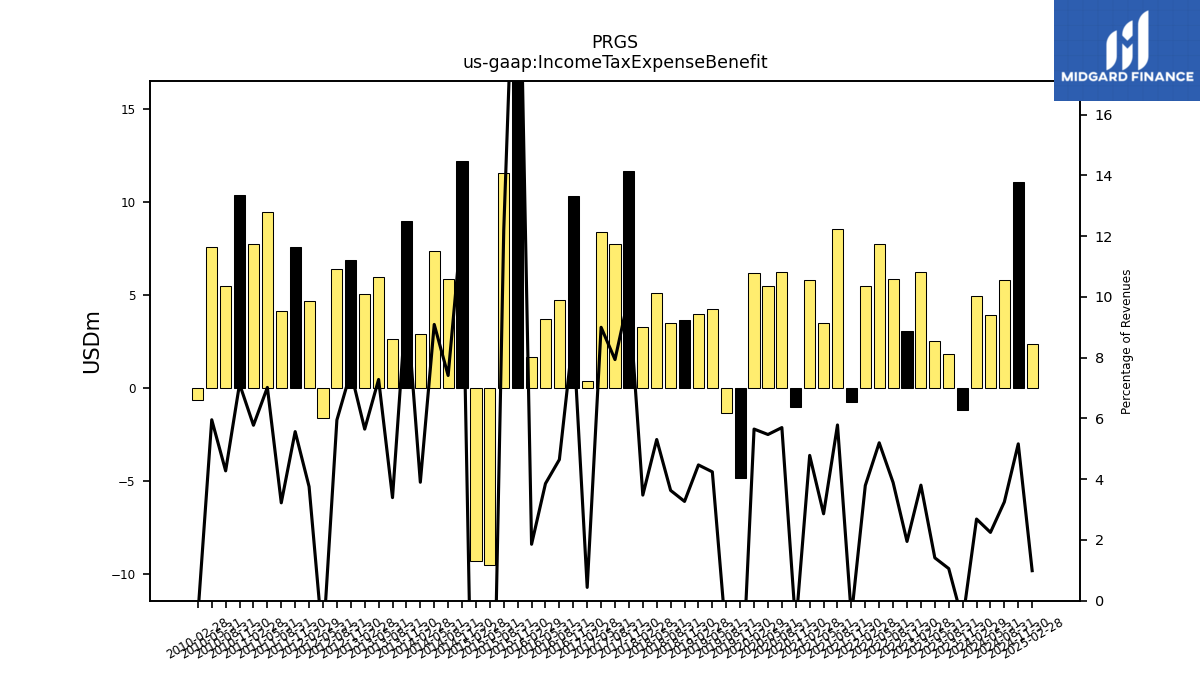
| Income Tax Expense Benefit | -1.16 | 1.85 | 2.52 | 6.25 | 3.07 | 5.88 | 7.74 | 5.50 | -0.73 | 8.53 | 3.51 | 5.80 | -1.03 | 6.25 | 5.49 | 6.20 | -4.84 | -1.31 | 4.24 | 4.00 | 3.64 | 3.48 | 5.10 | 3.27 | 11.65 | 7.73 | 8.39 | 0.40 | 10.33 | 4.74 | 3.71 | 1.66 | 28.41 | 11.55 | -9.53 | -9.28 | 12.21 | 5.88 | 7.35 | 2.91 | 8.99 | 2.63 | 5.95 | 5.04 | 6.88 | 6.38 | -1.61 | 4.67 | 7.59 | 4.14 | 9.46 | 7.76 | 10.36 | 5.50 | 7.61 | -0.62 | |
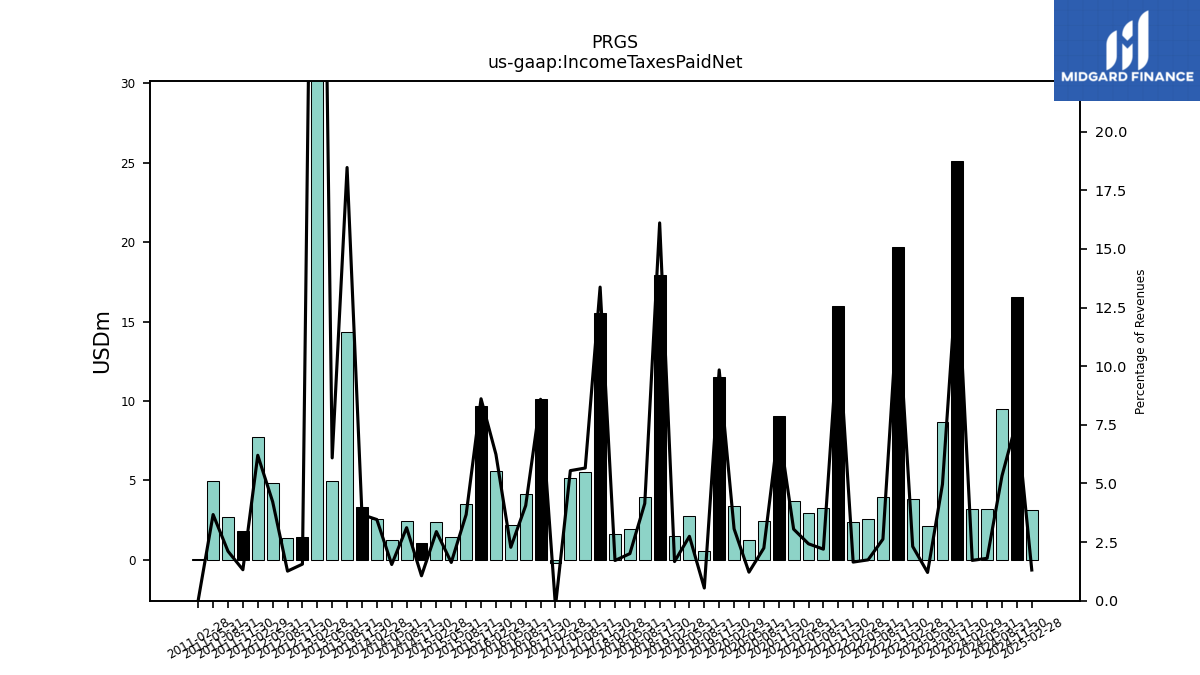
| Income Taxes Paid Net | 25.13 | 8.69 | 2.15 | 3.80 | 19.73 | 3.97 | 2.59 | 2.39 | 15.99 | 3.24 | 2.97 | 3.70 | 9.05 | 2.46 | 1.22 | 3.36 | 11.52 | 0.58 | 2.75 | 1.50 | 17.94 | 3.97 | 1.93 | 1.61 | 15.52 | 5.51 | 5.17 | -0.21 | 10.11 | 4.14 | 2.19 | 5.59 | 9.71 | 3.48 | 1.45 | 2.40 | 1.04 | 2.47 | 1.25 | 2.58 | 3.34 | 14.33 | 4.98 | 47.29 | 1.43 | 1.35 | 4.84 | 7.72 | 1.80 | 2.71 | 4.95 | 0.04 | NA | NA | NA | NA | |
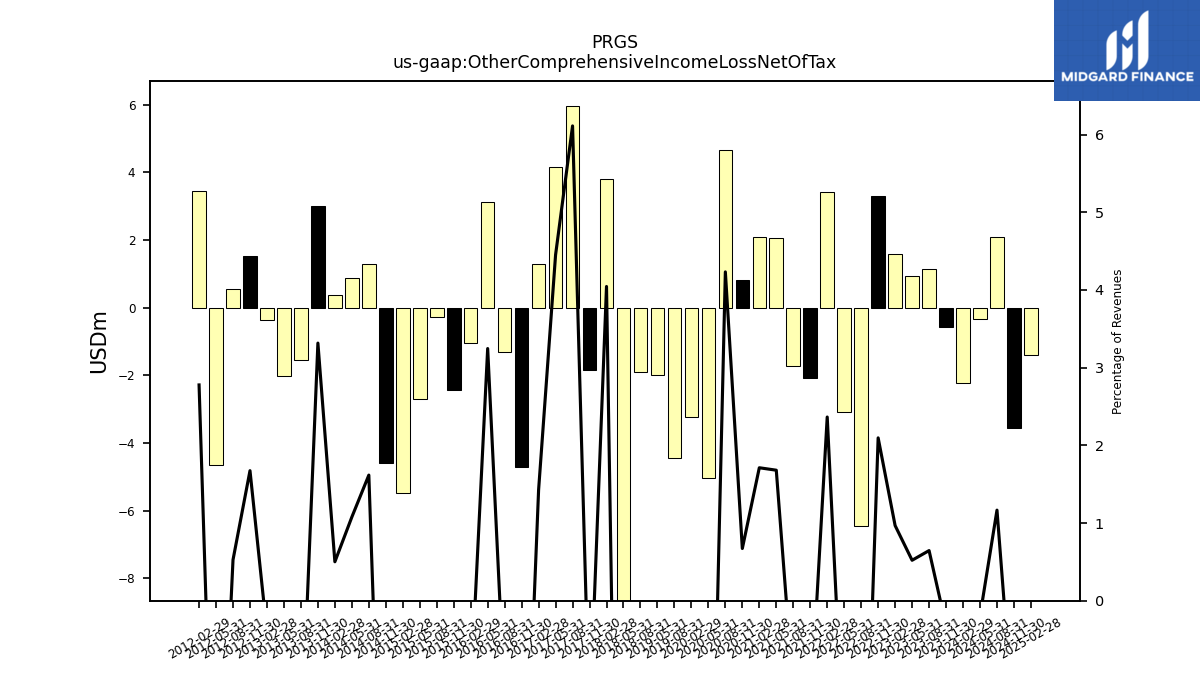
| Other Comprehensive Income Loss Net Of Tax | -0.57 | 1.13 | 0.93 | 1.59 | 3.29 | -6.44 | -3.07 | 3.43 | -2.08 | -1.72 | 2.06 | 2.08 | 0.82 | 4.64 | -5.03 | -3.24 | NA | -4.43 | -1.98 | NA | NA | -1.90 | -9.02 | 3.80 | -1.83 | 5.95 | 4.15 | 1.30 | -4.70 | -1.30 | 3.12 | -1.05 | -2.44 | -0.27 | -2.71 | -5.48 | -4.59 | 1.28 | 0.87 | 0.37 | 3.02 | -1.54 | -2.01 | -0.36 | 1.53 | 0.56 | -4.66 | 3.46 | NA | NA | NA | NA | NA | NA | NA | NA | |
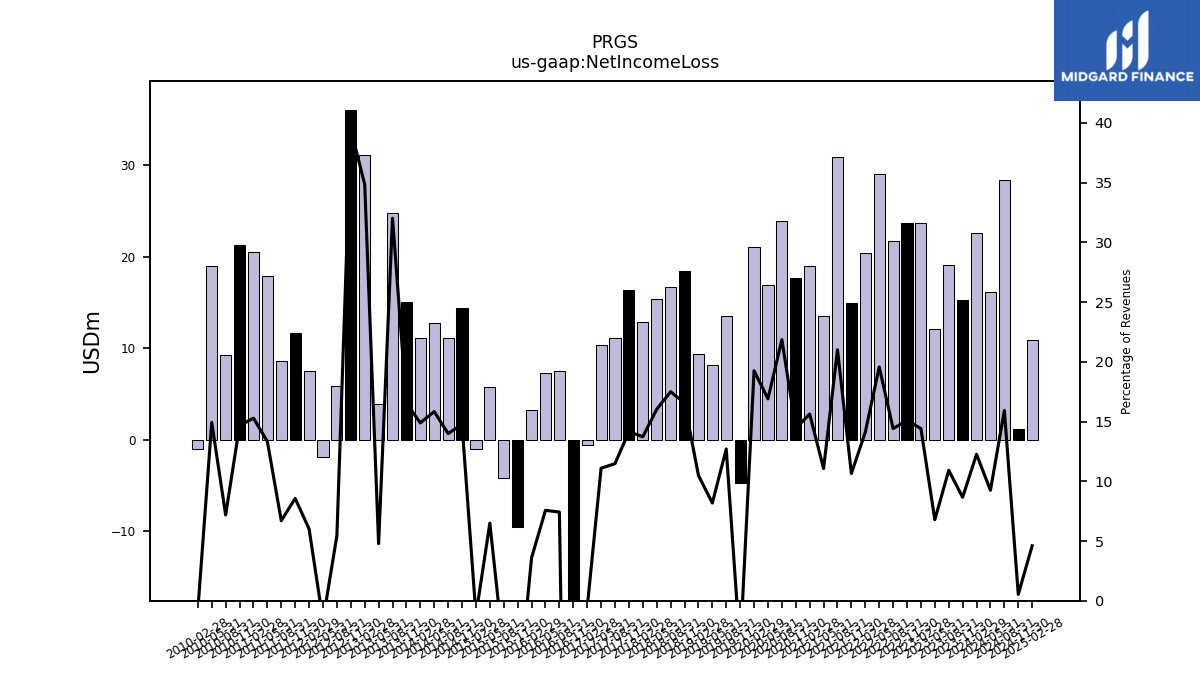
| Net Income Loss | 15.34 | 19.10 | 12.09 | 23.67 | 23.71 | 21.80 | 29.11 | 20.45 | 14.93 | 30.98 | 13.56 | 18.96 | 17.66 | 23.98 | 16.97 | 21.12 | -4.74 | 13.56 | 8.18 | 9.40 | 18.43 | 16.75 | 15.40 | 12.91 | 16.43 | 11.17 | 10.34 | -0.53 | -73.79 | 7.58 | 7.28 | 3.22 | -9.47 | -4.13 | 5.77 | -0.97 | 14.46 | 11.10 | 12.80 | 11.10 | 15.04 | 24.84 | 3.91 | 31.12 | 36.02 | 5.84 | -1.91 | 7.49 | 11.68 | 8.60 | 17.96 | 20.52 | 21.27 | 9.24 | 19.06 | -1.01 | |
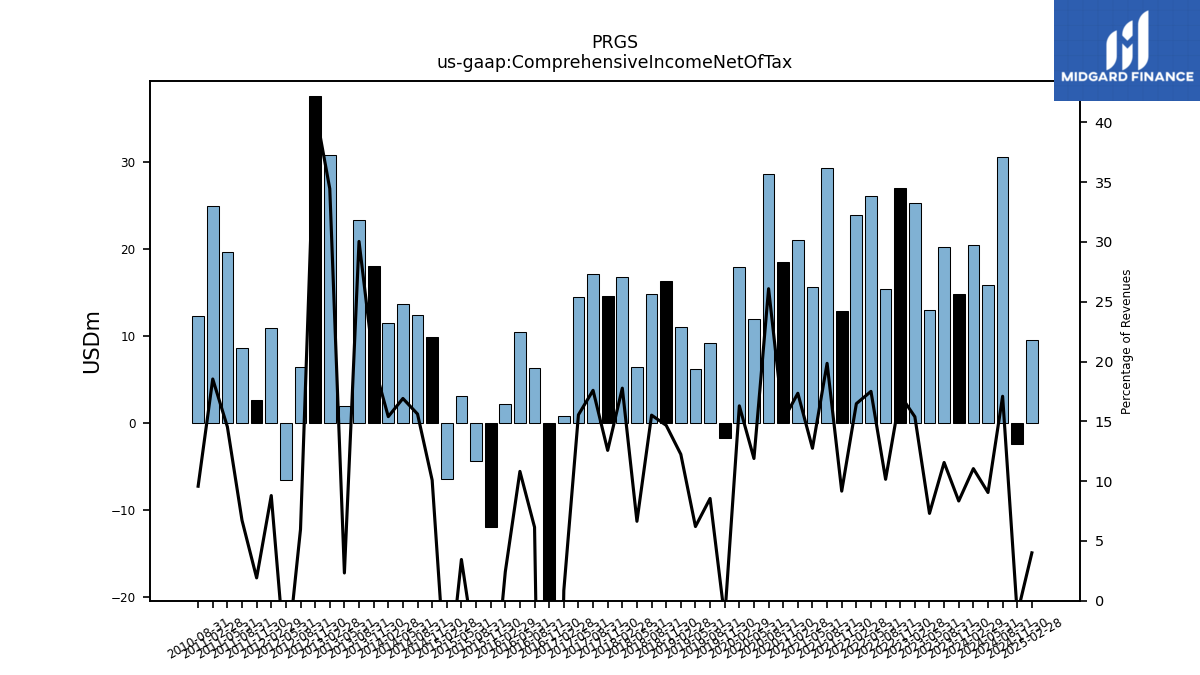
| Comprehensive Income Net Of Tax | 14.76 | 20.23 | 13.02 | 25.26 | 27.00 | 15.36 | 26.04 | 23.88 | 12.84 | 29.26 | 15.62 | 21.04 | 18.48 | 28.62 | 11.94 | 17.87 | -1.69 | 9.12 | 6.21 | 10.96 | 16.33 | 14.85 | 6.38 | 16.72 | 14.60 | 17.12 | 14.49 | 0.77 | -78.49 | 6.27 | 10.39 | 2.17 | -11.91 | -4.40 | 3.06 | -6.45 | 9.87 | 12.38 | 13.67 | 11.47 | 18.05 | 23.31 | 1.90 | 30.75 | 37.55 | 6.40 | -6.57 | 10.95 | 2.61 | 8.63 | 19.59 | 24.89 | NA | 12.33 | NA | NA | |
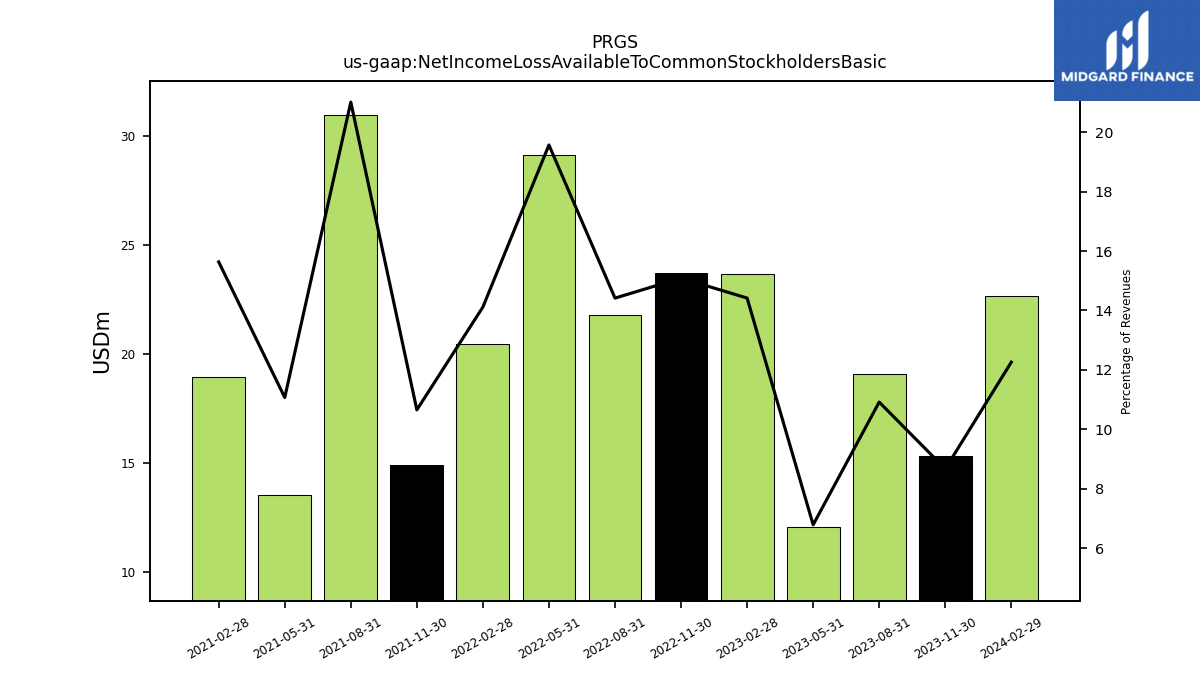
| Net Income Loss Available To Common Stockholders Basic | 15.34 | 19.10 | 12.09 | 23.67 | 23.71 | 21.80 | 29.11 | 20.45 | 14.93 | 30.98 | 13.56 | 18.96 | NA | NA | NA | NA | NA | NA | NA | NA | NA | NA | NA | NA | NA | NA | NA | NA | NA | NA | NA | NA | NA | NA | NA | NA | NA | NA | NA | NA | NA | NA | NA | NA | NA | NA | NA | NA | NA | NA | NA | NA | NA | NA | NA | NA | |
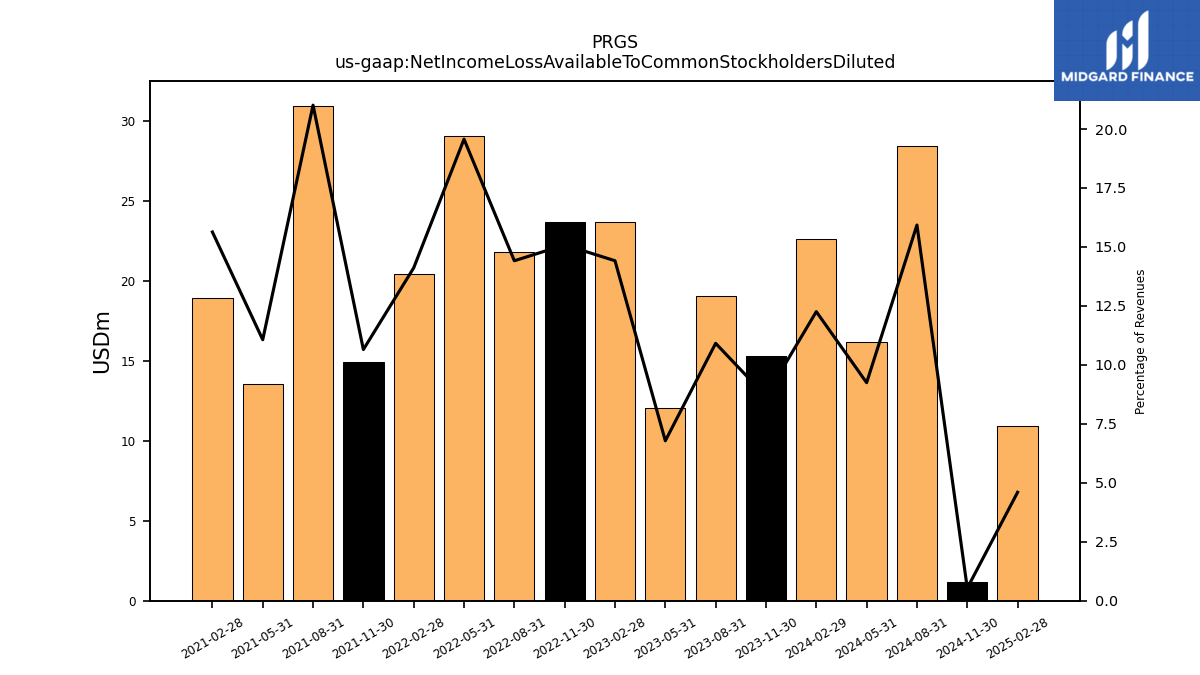
| Net Income Loss Available To Common Stockholders Diluted | 15.34 | 19.10 | 12.09 | 23.67 | 23.71 | 21.80 | 29.11 | 20.45 | 14.93 | 30.98 | 13.56 | 18.96 | NA | NA | NA | NA | NA | NA | NA | NA | NA | NA | NA | NA | NA | NA | NA | NA | NA | NA | NA | NA | NA | NA | NA | NA | NA | NA | NA | NA | NA | NA | NA | NA | NA | NA | NA | NA | NA | NA | NA | NA | NA | NA | NA | NA |
| 2023-11-30 | 2023-08-31 | 2023-05-31 | 2023-02-28 | 2022-11-30 | 2022-08-31 | 2022-05-31 | 2022-02-28 | 2021-11-30 | 2021-08-31 | 2021-05-31 | 2021-02-28 | 2020-11-30 | 2020-08-31 | 2020-05-31 | 2020-02-29 | 2019-11-30 | 2019-08-31 | 2019-05-31 | 2019-02-28 | 2018-11-30 | 2018-08-31 | 2018-05-31 | 2018-02-28 | 2017-11-30 | 2017-08-31 | 2017-05-31 | 2017-02-28 | 2016-11-30 | 2016-08-31 | 2016-05-31 | 2016-02-29 | 2015-11-30 | 2015-08-31 | 2015-05-31 | 2015-02-28 | 2014-11-30 | 2014-08-31 | 2014-05-31 | 2014-02-28 | 2013-11-30 | 2013-08-31 | 2013-05-31 | 2013-02-28 | 2012-11-30 | 2012-08-31 | 2012-05-31 | 2012-02-29 | 2011-11-30 | 2011-08-31 | 2011-05-31 | 2011-02-28 | 2010-11-30 | 2010-08-31 | 2010-05-31 | 2010-02-28 | ||
|---|---|---|---|---|---|---|---|---|---|---|---|---|---|---|---|---|---|---|---|---|---|---|---|---|---|---|---|---|---|---|---|---|---|---|---|---|---|---|---|---|---|---|---|---|---|---|---|---|---|---|---|---|---|---|---|---|---|
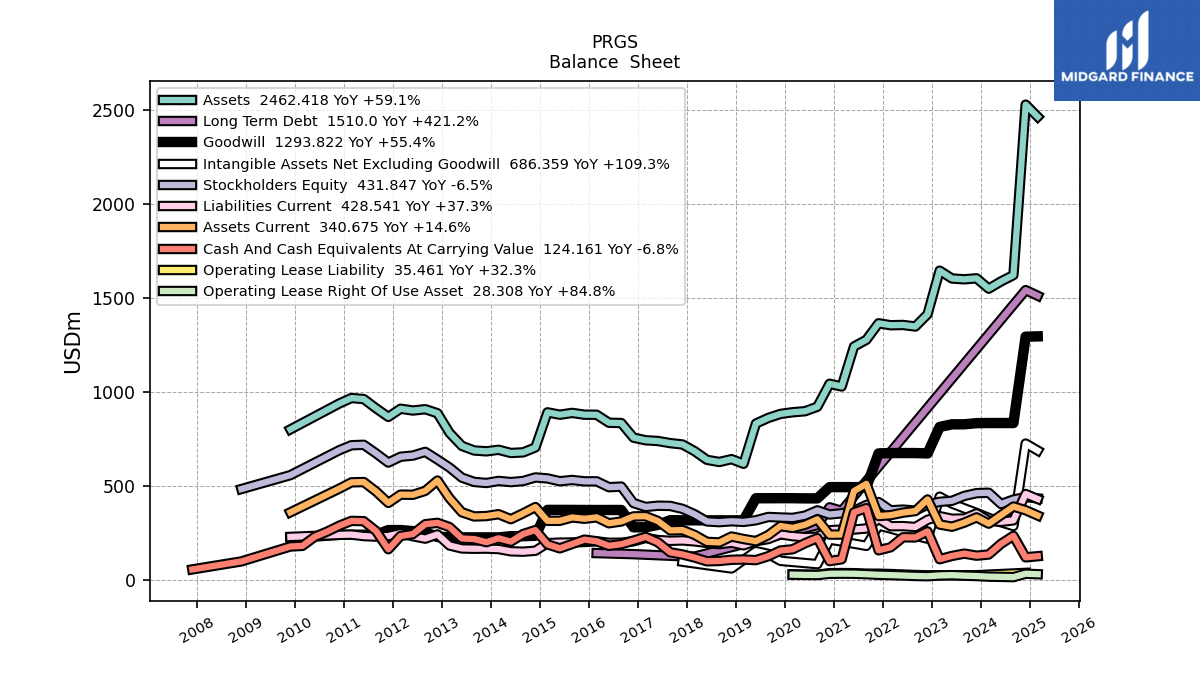
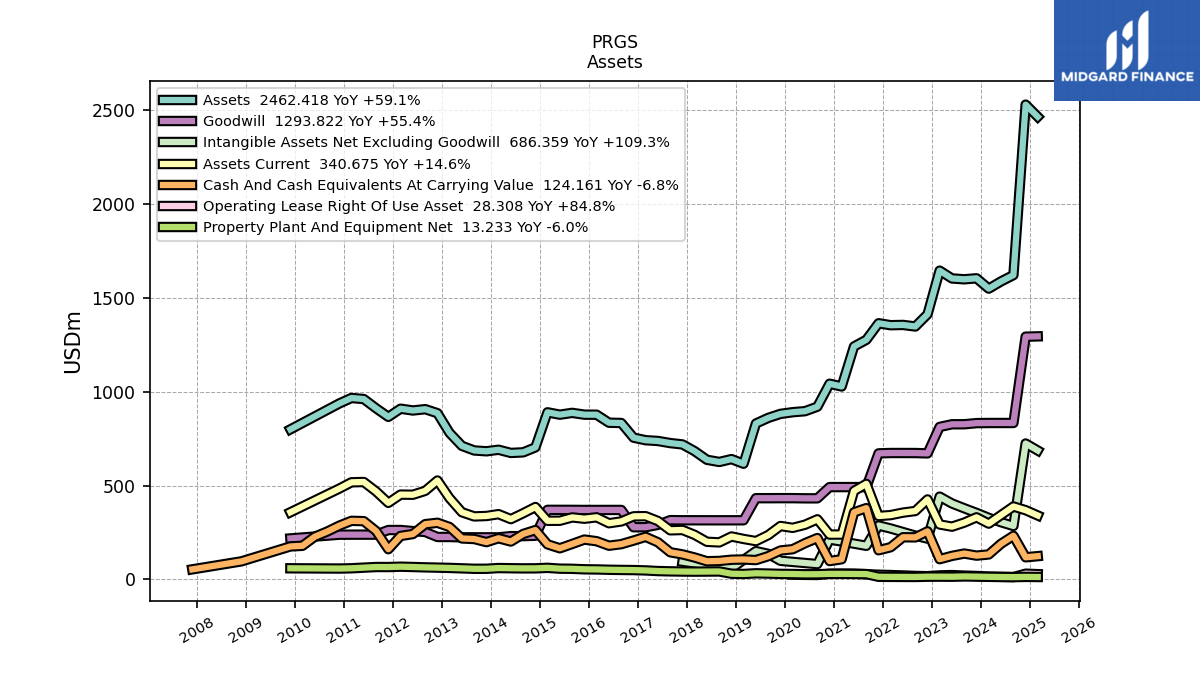
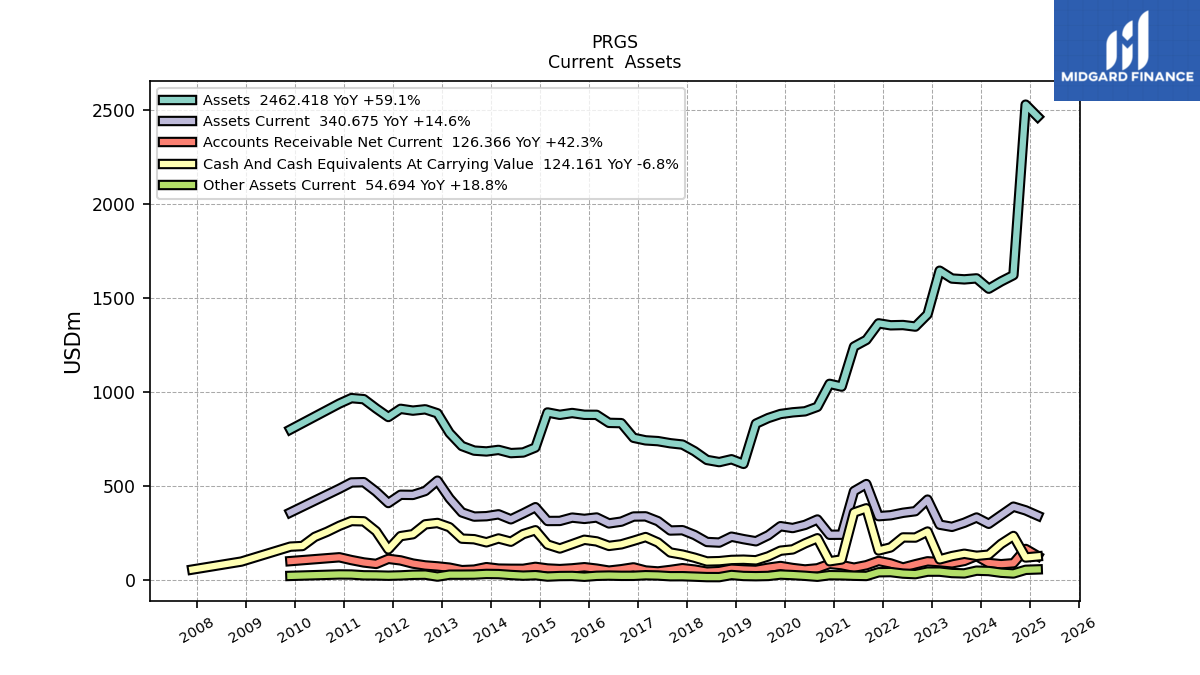
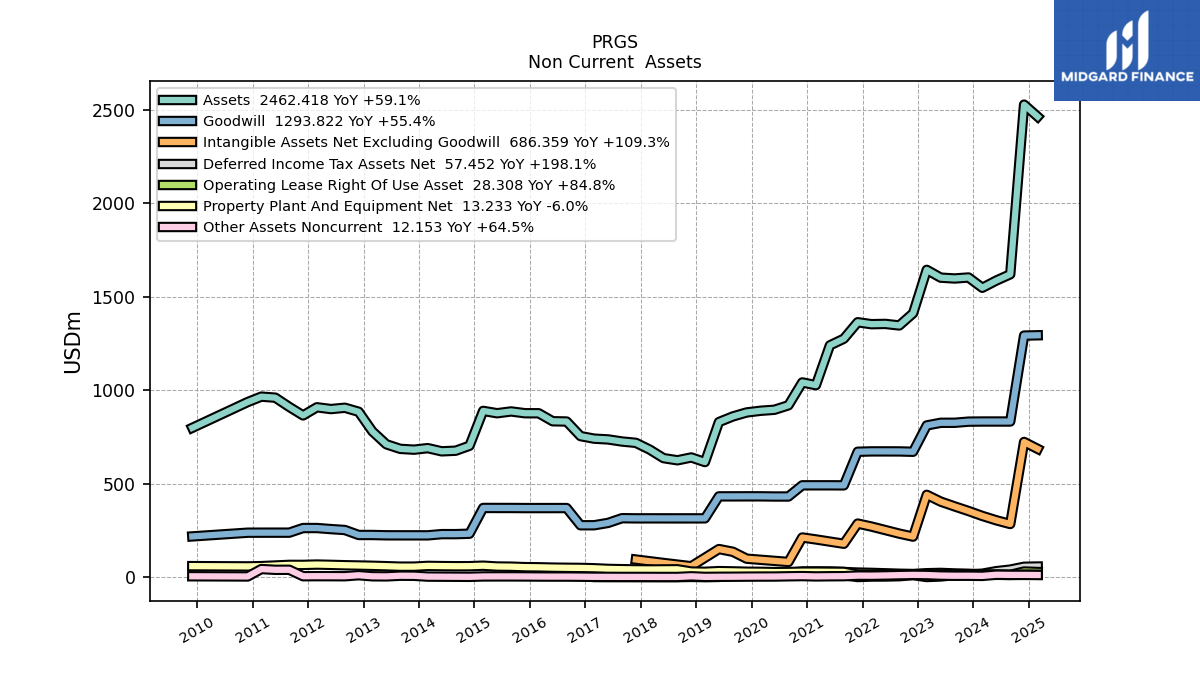
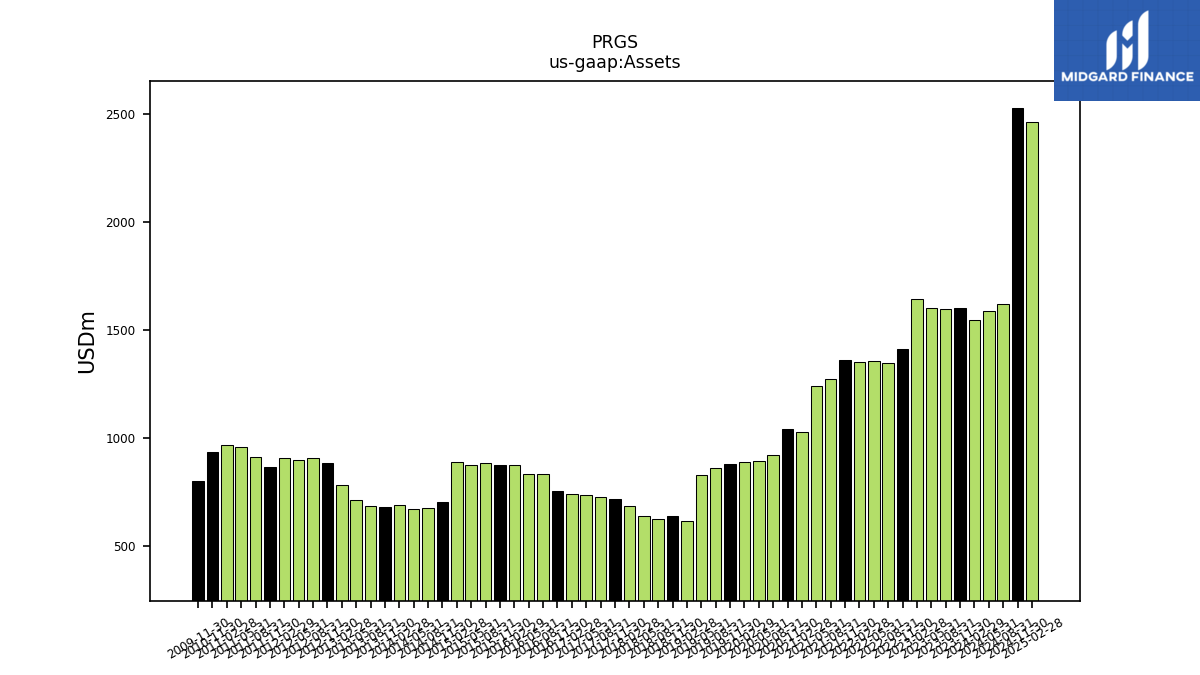
| Assets | 1602.78 | 1597.47 | 1601.88 | 1643.61 | 1411.48 | 1346.29 | 1354.58 | 1353.12 | 1363.54 | 1275.49 | 1239.99 | 1027.06 | 1041.78 | 919.47 | 895.60 | 890.18 | 881.27 | 859.92 | 829.90 | 615.89 | 640.61 | 625.43 | 636.97 | 683.14 | 718.72 | 725.82 | 737.06 | 741.13 | 754.83 | 832.78 | 834.23 | 876.87 | 877.12 | 886.63 | 877.02 | 889.59 | 703.06 | 676.64 | 673.35 | 690.43 | 682.19 | 686.59 | 711.09 | 780.37 | 884.98 | 906.33 | 899.31 | 908.88 | 865.31 | 910.76 | 960.23 | 965.83 | 936.82 | NA | NA | NA | |
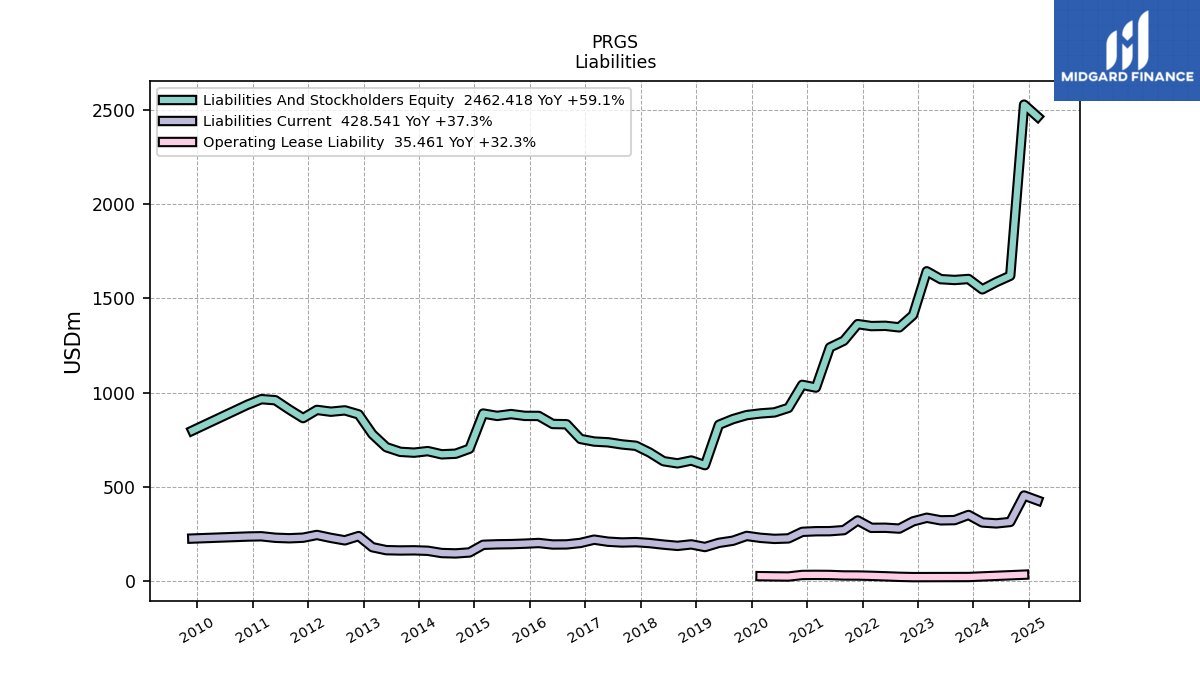
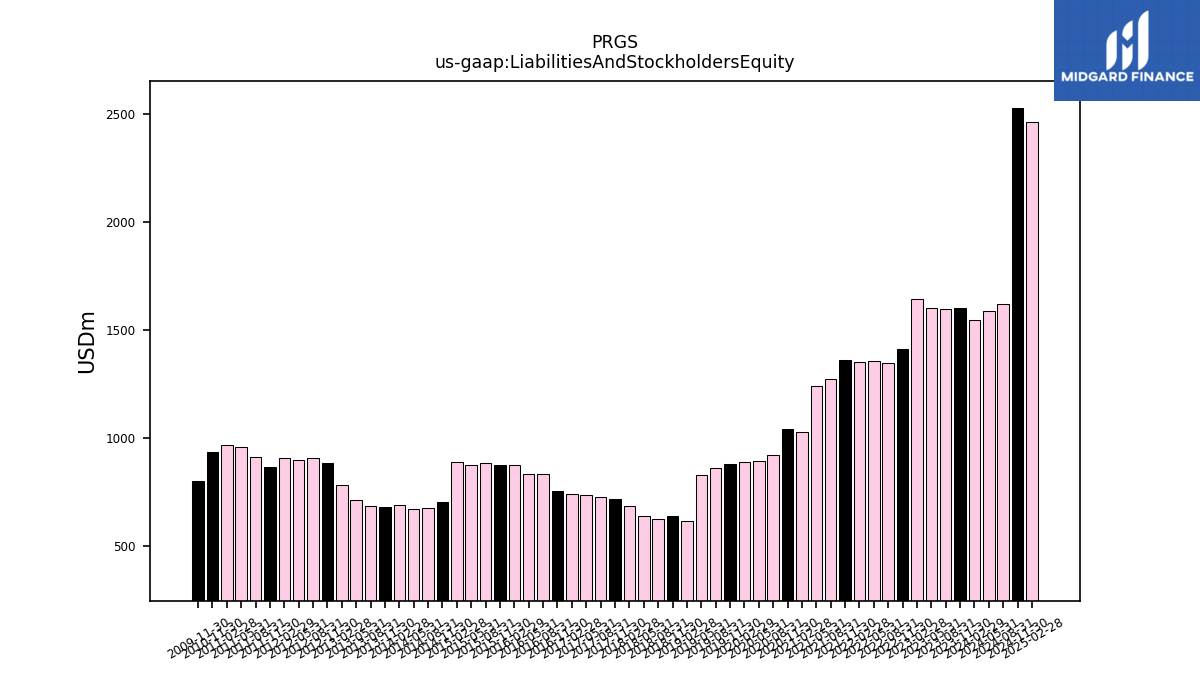
| Liabilities And Stockholders Equity | 1602.78 | 1597.47 | 1601.88 | 1643.61 | 1411.48 | 1346.29 | 1354.58 | 1353.12 | 1363.54 | 1275.49 | 1239.99 | 1027.06 | 1041.78 | 919.47 | 895.60 | 890.18 | 881.27 | 859.92 | 829.90 | 615.89 | 640.61 | 625.43 | 636.97 | 683.14 | 718.72 | 725.82 | 737.06 | 741.13 | 754.83 | 832.78 | 834.23 | 876.87 | 877.12 | 886.63 | 877.02 | 889.59 | 703.06 | 676.64 | 673.35 | 690.43 | 682.19 | 686.59 | 711.09 | 780.37 | 884.98 | 906.33 | 899.31 | 908.88 | 865.31 | 910.76 | 960.23 | 965.83 | 936.82 | NA | NA | NA | |
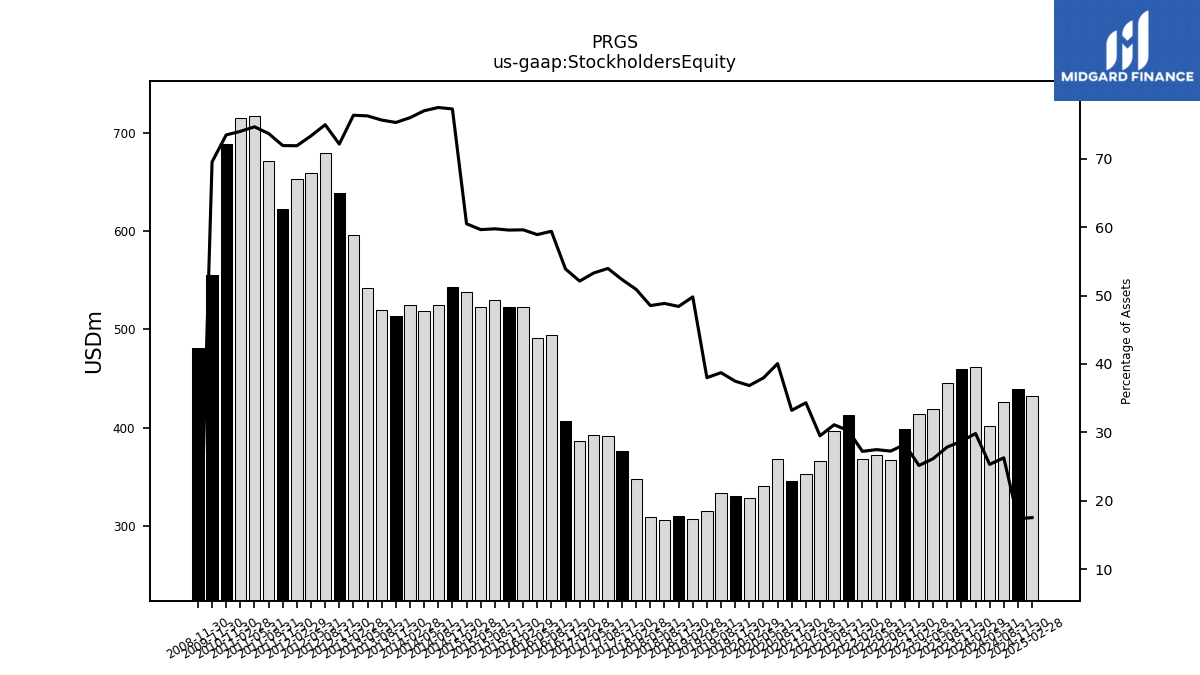
| Stockholders Equity | 459.71 | 445.05 | 418.81 | 413.44 | 398.50 | 366.97 | 372.15 | 368.32 | 412.49 | 396.77 | 365.72 | 352.55 | 346.01 | 368.17 | 339.96 | 327.96 | 330.28 | 332.95 | 315.35 | 306.70 | 310.08 | 305.47 | 309.14 | 347.65 | 376.08 | 391.60 | 392.84 | 386.19 | 406.63 | 494.58 | 491.40 | 522.64 | 522.46 | 529.74 | 523.00 | 538.07 | 543.25 | 524.28 | 518.53 | 524.67 | 513.65 | 519.36 | 542.24 | 595.82 | 638.40 | 679.44 | 659.54 | 653.43 | 622.30 | 671.03 | 716.92 | 714.65 | 688.33 | NA | NA | NA |
| 2023-11-30 | 2023-08-31 | 2023-05-31 | 2023-02-28 | 2022-11-30 | 2022-08-31 | 2022-05-31 | 2022-02-28 | 2021-11-30 | 2021-08-31 | 2021-05-31 | 2021-02-28 | 2020-11-30 | 2020-08-31 | 2020-05-31 | 2020-02-29 | 2019-11-30 | 2019-08-31 | 2019-05-31 | 2019-02-28 | 2018-11-30 | 2018-08-31 | 2018-05-31 | 2018-02-28 | 2017-11-30 | 2017-08-31 | 2017-05-31 | 2017-02-28 | 2016-11-30 | 2016-08-31 | 2016-05-31 | 2016-02-29 | 2015-11-30 | 2015-08-31 | 2015-05-31 | 2015-02-28 | 2014-11-30 | 2014-08-31 | 2014-05-31 | 2014-02-28 | 2013-11-30 | 2013-08-31 | 2013-05-31 | 2013-02-28 | 2012-11-30 | 2012-08-31 | 2012-05-31 | 2012-02-29 | 2011-11-30 | 2011-08-31 | 2011-05-31 | 2011-02-28 | 2010-11-30 | 2010-08-31 | 2010-05-31 | 2010-02-28 | ||
|---|---|---|---|---|---|---|---|---|---|---|---|---|---|---|---|---|---|---|---|---|---|---|---|---|---|---|---|---|---|---|---|---|---|---|---|---|---|---|---|---|---|---|---|---|---|---|---|---|---|---|---|---|---|---|---|---|---|
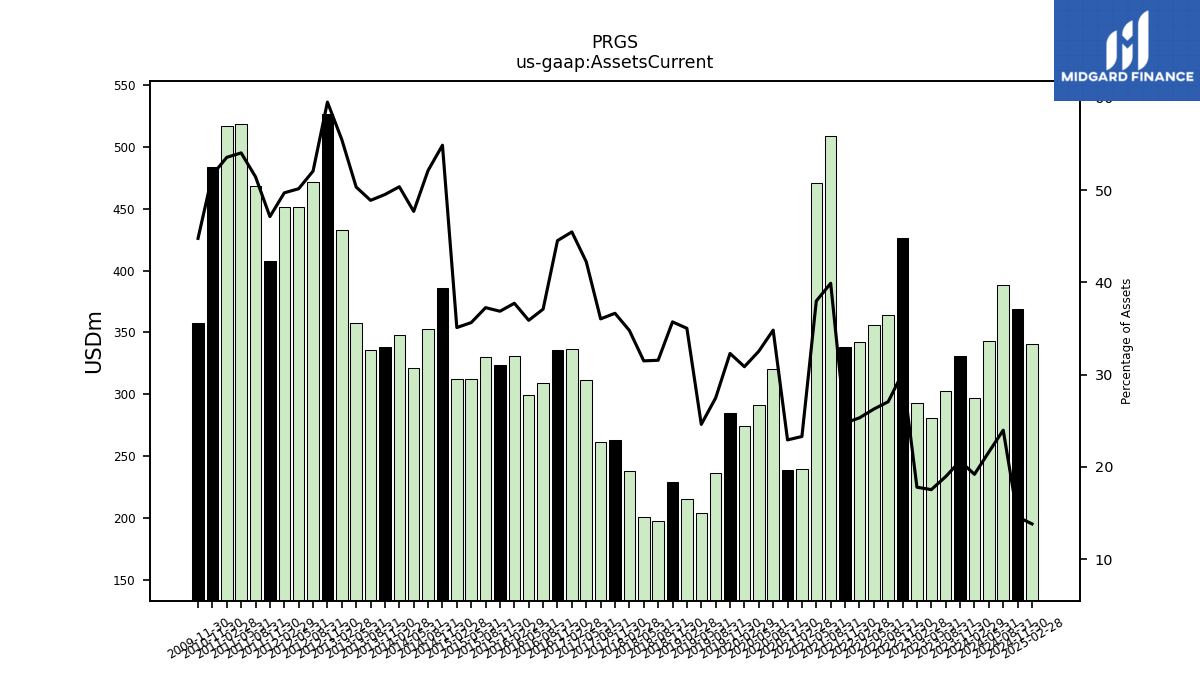
| Assets Current | 330.79 | 302.84 | 281.08 | 292.70 | 426.05 | 364.43 | 355.87 | 342.62 | 337.81 | 508.90 | 470.97 | 239.31 | 238.94 | 320.21 | 291.40 | 274.74 | 284.67 | 236.29 | 204.31 | 215.68 | 228.82 | 197.39 | 200.62 | 237.65 | 263.41 | 261.63 | 311.31 | 336.94 | 336.05 | 308.96 | 299.37 | 330.89 | 323.41 | 330.37 | 312.58 | 312.30 | 385.67 | 352.68 | 321.11 | 347.69 | 337.81 | 335.64 | 357.85 | 432.84 | 526.82 | 471.75 | 450.95 | 451.72 | 407.78 | 468.42 | 518.76 | 517.15 | 483.86 | NA | NA | NA | |
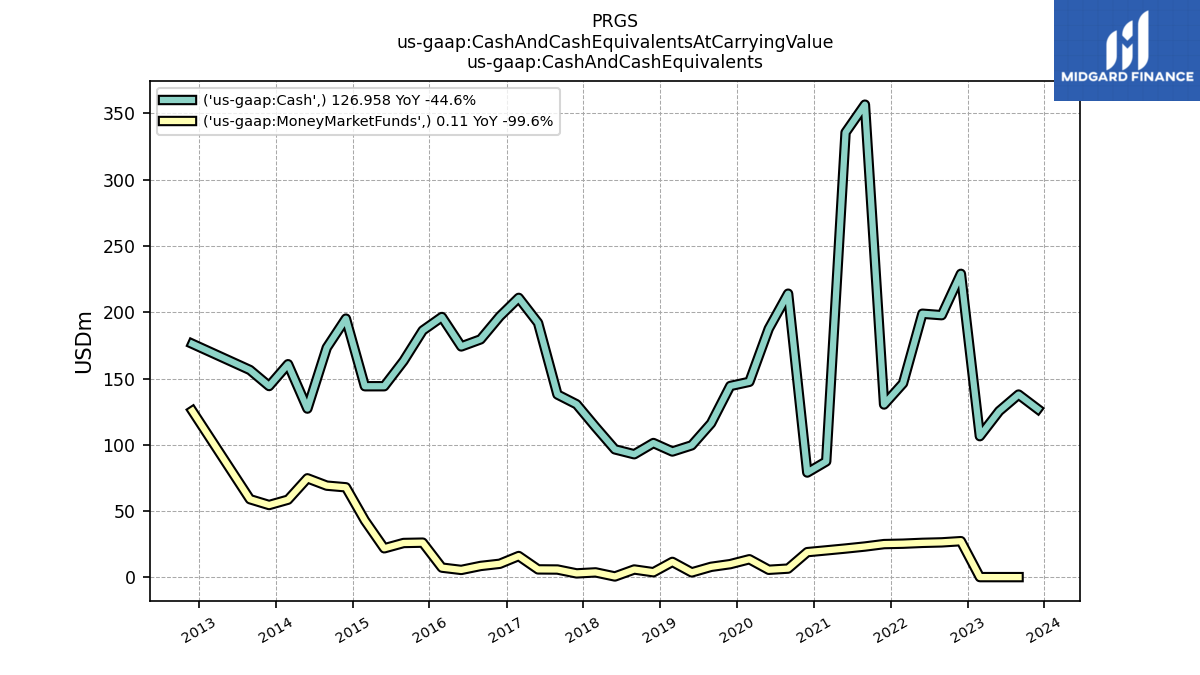
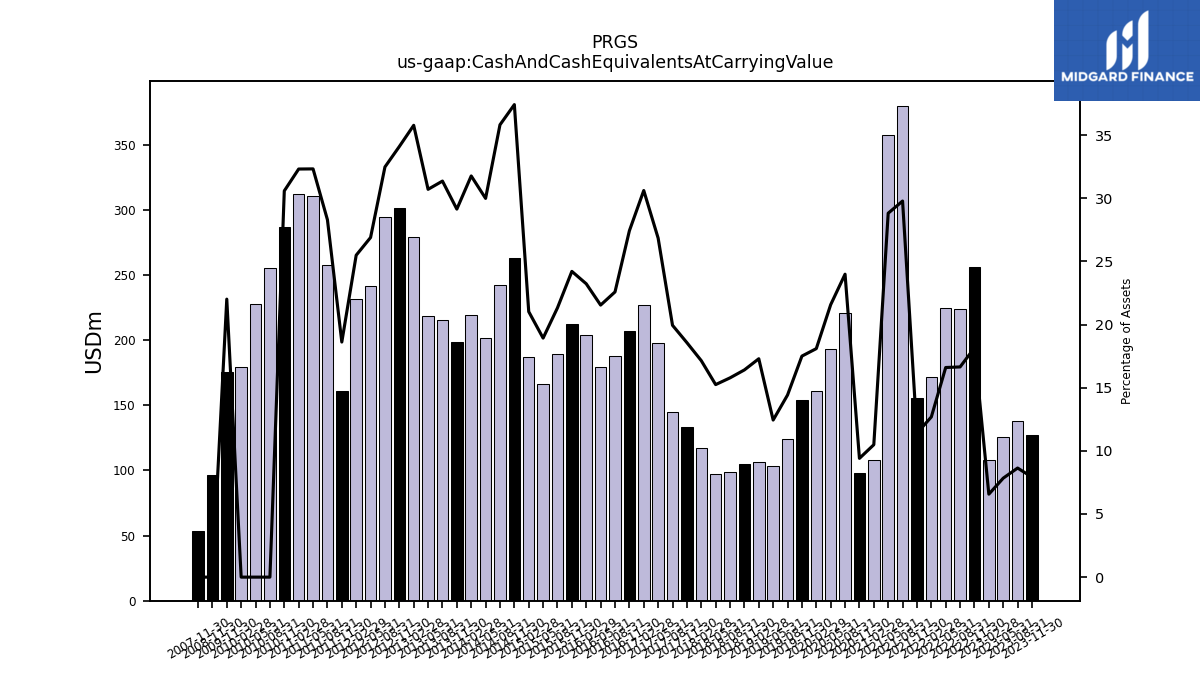
| Cash And Cash Equivalents At Carrying Value | 126.96 | 138.00 | 125.53 | 107.98 | 256.28 | 224.12 | 224.86 | 171.67 | 155.41 | 379.89 | 357.36 | 107.70 | 97.99 | 220.57 | 193.22 | 161.09 | 154.26 | 124.02 | 103.25 | 106.52 | 105.13 | 98.70 | 97.12 | 117.11 | 133.46 | 144.76 | 197.89 | 226.91 | 207.04 | 188.08 | 179.73 | 203.70 | 212.38 | 189.11 | 166.02 | 187.03 | 263.08 | 242.38 | 201.97 | 219.36 | 198.82 | 215.34 | 218.39 | 279.22 | 301.79 | 294.40 | 241.88 | 231.69 | 161.09 | 257.77 | 310.44 | 312.15 | 286.56 | 255.05 | 227.73 | 179.16 | |
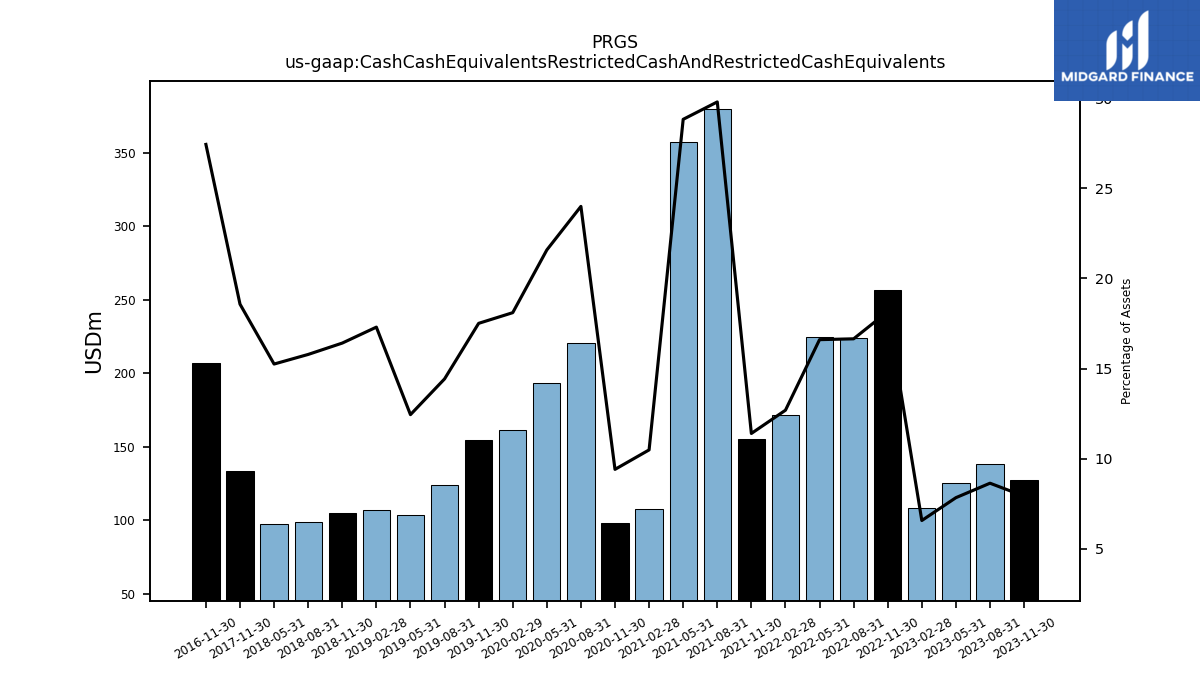
| Cash Cash Equivalents Restricted Cash And Restricted Cash Equivalents | 126.96 | 138.00 | 125.53 | 107.98 | 256.28 | 224.12 | 224.86 | 171.67 | 155.41 | 379.89 | 357.36 | 107.70 | 97.99 | 220.57 | 193.22 | 161.09 | 154.26 | 124.02 | 103.25 | 106.52 | 105.13 | 98.70 | 97.12 | NA | 133.46 | NA | NA | NA | 207.04 | NA | NA | NA | NA | NA | NA | NA | NA | NA | NA | NA | NA | NA | NA | NA | NA | NA | NA | NA | NA | NA | NA | NA | NA | NA | NA | NA | |
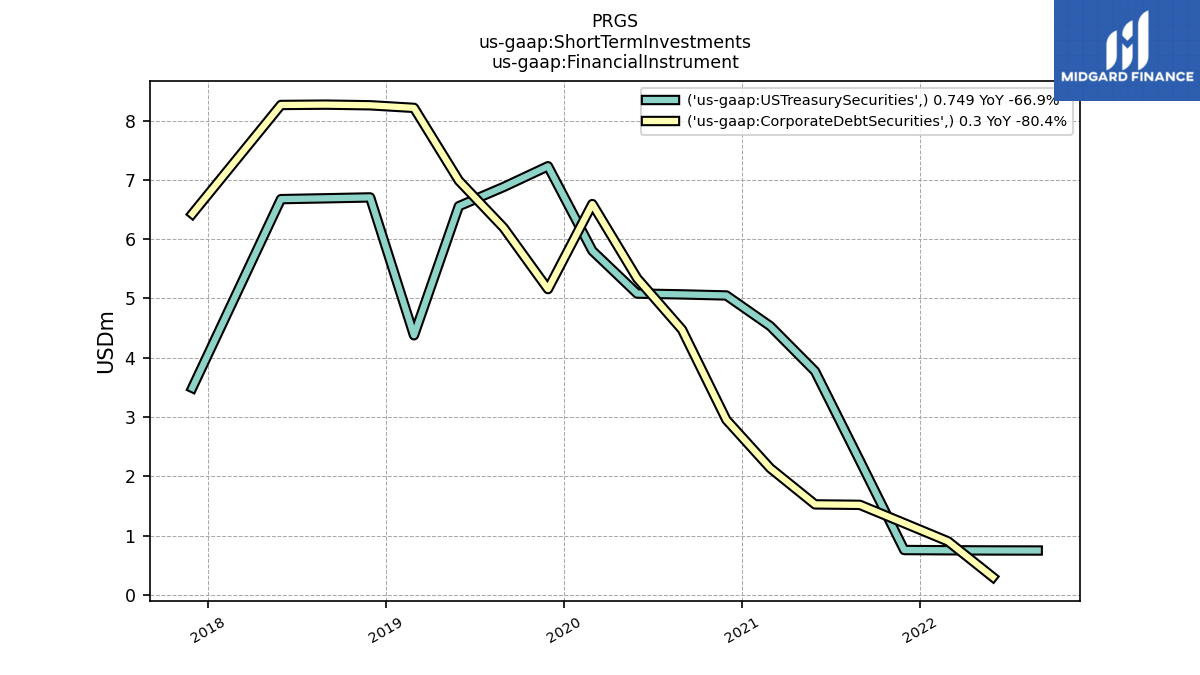
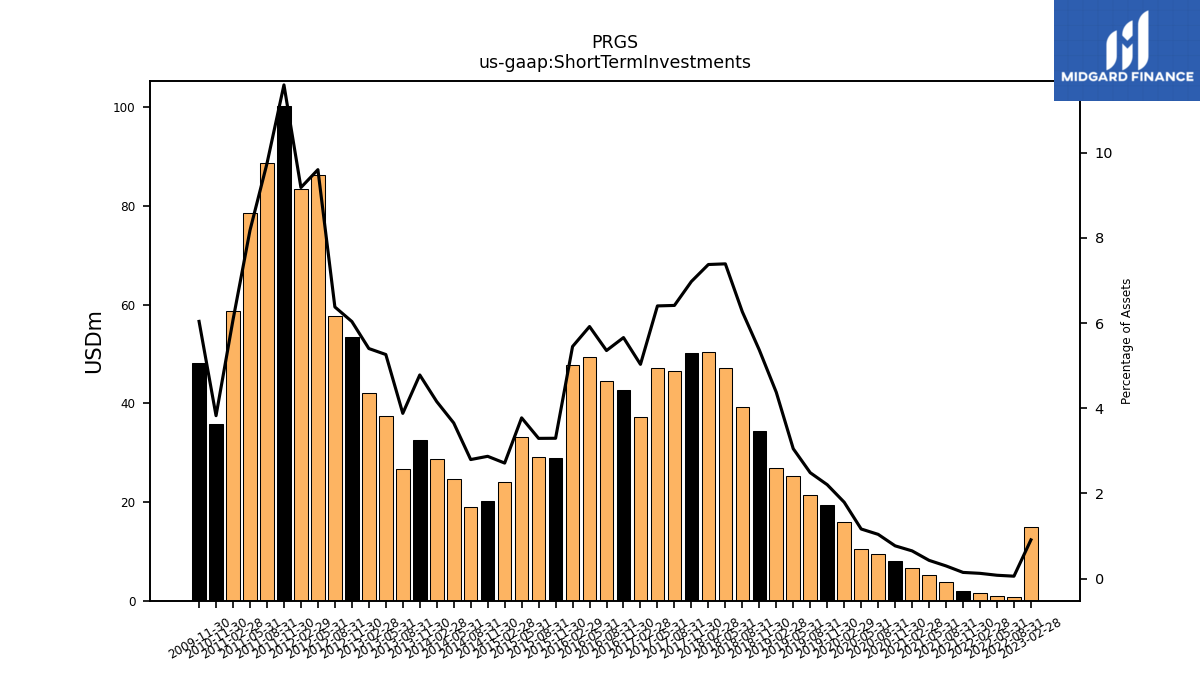
| Short Term Investments | NA | NA | NA | 14.94 | NA | 0.75 | 1.05 | 1.66 | 1.97 | 3.78 | 5.30 | 6.67 | 8.01 | 9.54 | 10.42 | 15.96 | 19.43 | 21.38 | 25.30 | 26.94 | 34.39 | 39.18 | 47.08 | 50.39 | 50.15 | 46.56 | 47.20 | 37.28 | 42.72 | 44.60 | 49.38 | 47.79 | 28.90 | 29.19 | 33.10 | 24.13 | 20.19 | 18.91 | 24.61 | 28.69 | 32.62 | 26.64 | 37.42 | 42.16 | 53.42 | 57.81 | 86.36 | 83.47 | 100.32 | 88.77 | 78.54 | 58.69 | 35.84 | NA | NA | NA | |
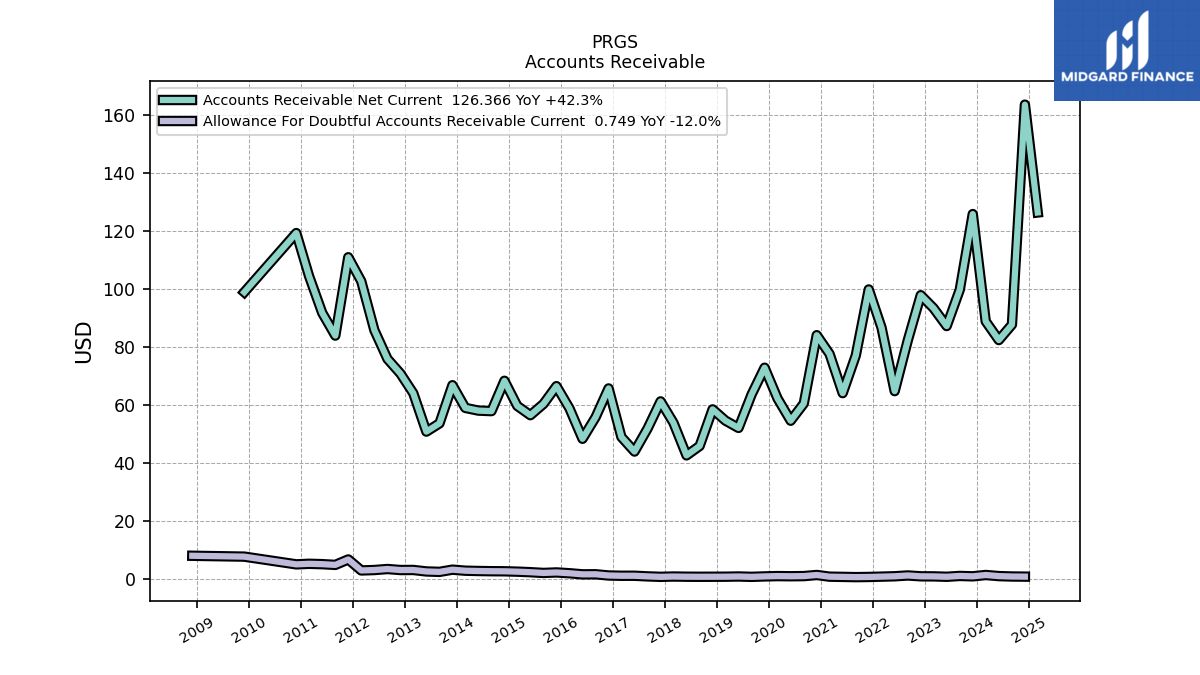
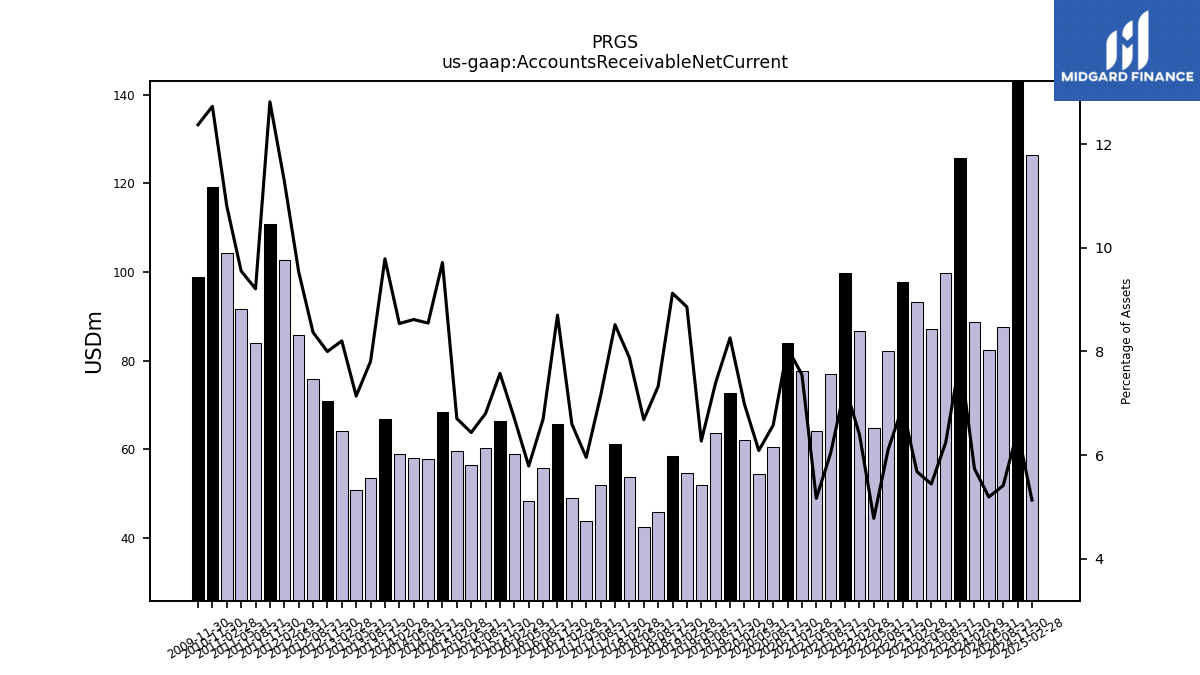
| Accounts Receivable Net Current | 125.83 | 99.73 | 87.18 | 93.35 | 97.83 | 82.26 | 64.73 | 86.60 | 99.81 | 77.03 | 64.05 | 77.57 | 84.04 | 60.46 | 54.53 | 62.18 | 72.82 | 63.62 | 52.04 | 54.57 | 58.45 | 45.82 | 42.58 | 53.84 | 61.21 | 51.86 | 43.89 | 48.91 | 65.68 | 55.76 | 48.29 | 58.83 | 66.46 | 60.34 | 56.44 | 59.65 | 68.31 | 57.84 | 58.02 | 58.96 | 66.78 | 53.62 | 50.77 | 64.03 | 70.79 | 75.85 | 85.79 | 102.64 | 110.93 | 83.89 | 91.74 | 104.38 | 119.27 | NA | NA | NA | |
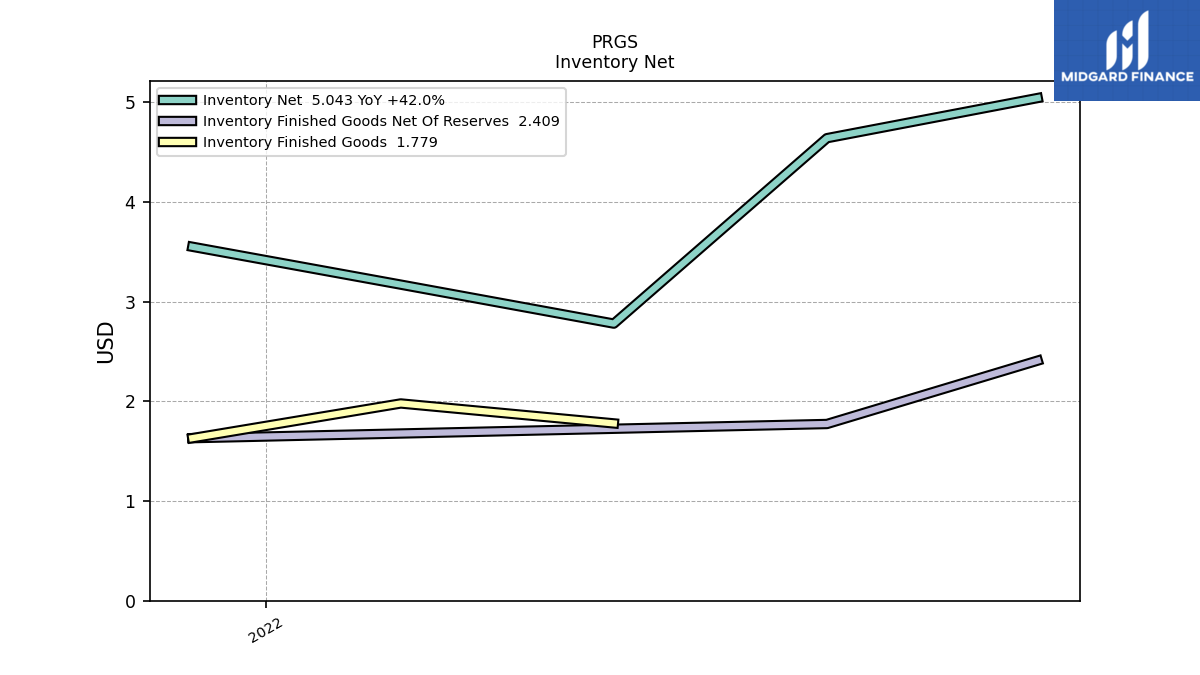
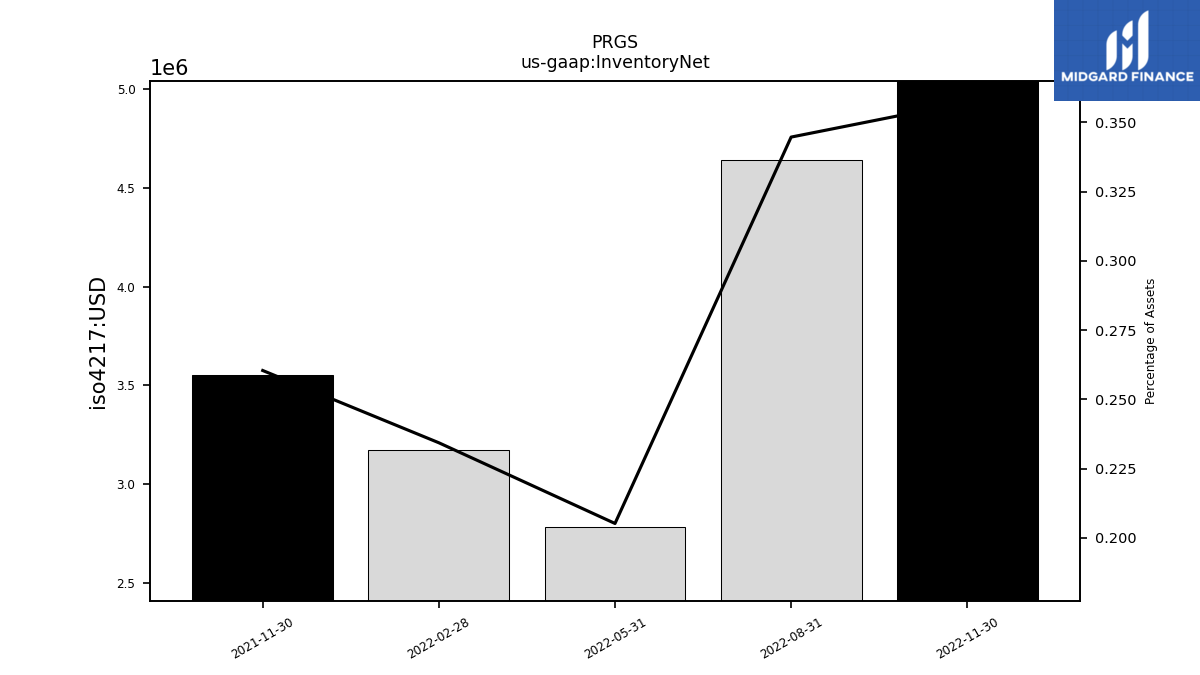
| Inventory Net | NA | NA | NA | NA | 5.04 | 4.64 | 2.78 | 3.17 | 3.55 | NA | NA | NA | NA | NA | NA | NA | NA | NA | NA | NA | NA | NA | NA | NA | NA | NA | NA | NA | NA | NA | NA | NA | NA | NA | NA | NA | NA | NA | NA | NA | NA | NA | NA | NA | NA | NA | NA | NA | NA | NA | NA | NA | NA | NA | NA | NA | |
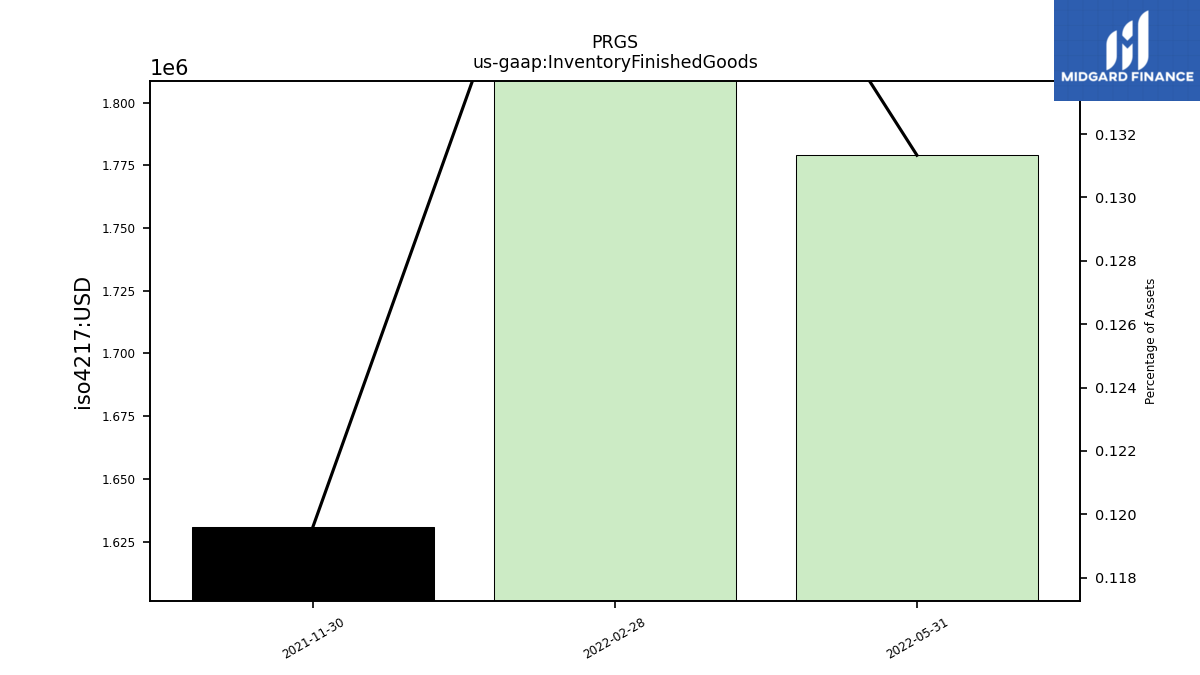
| Inventory Finished Goods | NA | NA | NA | NA | NA | NA | 1.78 | 1.98 | 1.63 | NA | NA | NA | NA | NA | NA | NA | NA | NA | NA | NA | NA | NA | NA | NA | NA | NA | NA | NA | NA | NA | NA | NA | NA | NA | NA | NA | NA | NA | NA | NA | NA | NA | NA | NA | NA | NA | NA | NA | NA | NA | NA | NA | NA | NA | NA | NA | |
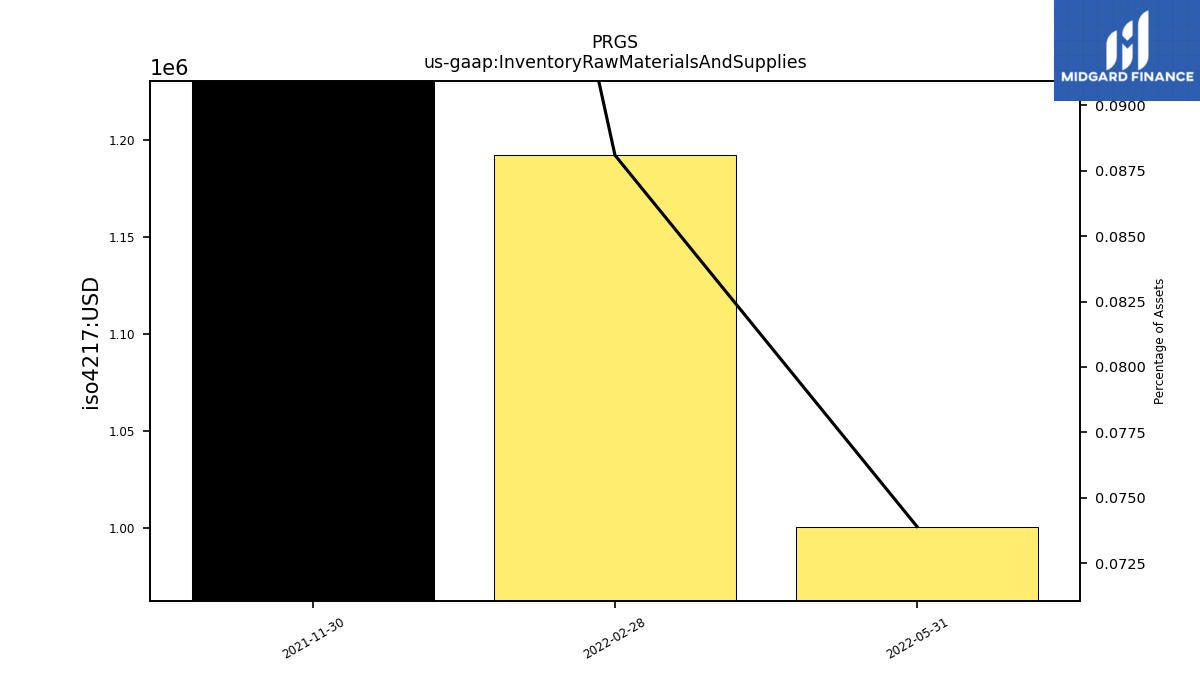
| Inventory Raw Materials And Supplies | NA | NA | NA | NA | NA | NA | 1.00 | 1.19 | 1.92 | NA | NA | NA | NA | NA | NA | NA | NA | NA | NA | NA | NA | NA | NA | NA | NA | NA | NA | NA | NA | NA | NA | NA | NA | NA | NA | NA | NA | NA | NA | NA | NA | NA | NA | NA | NA | NA | NA | NA | NA | NA | NA | NA | NA | NA | NA | NA | |
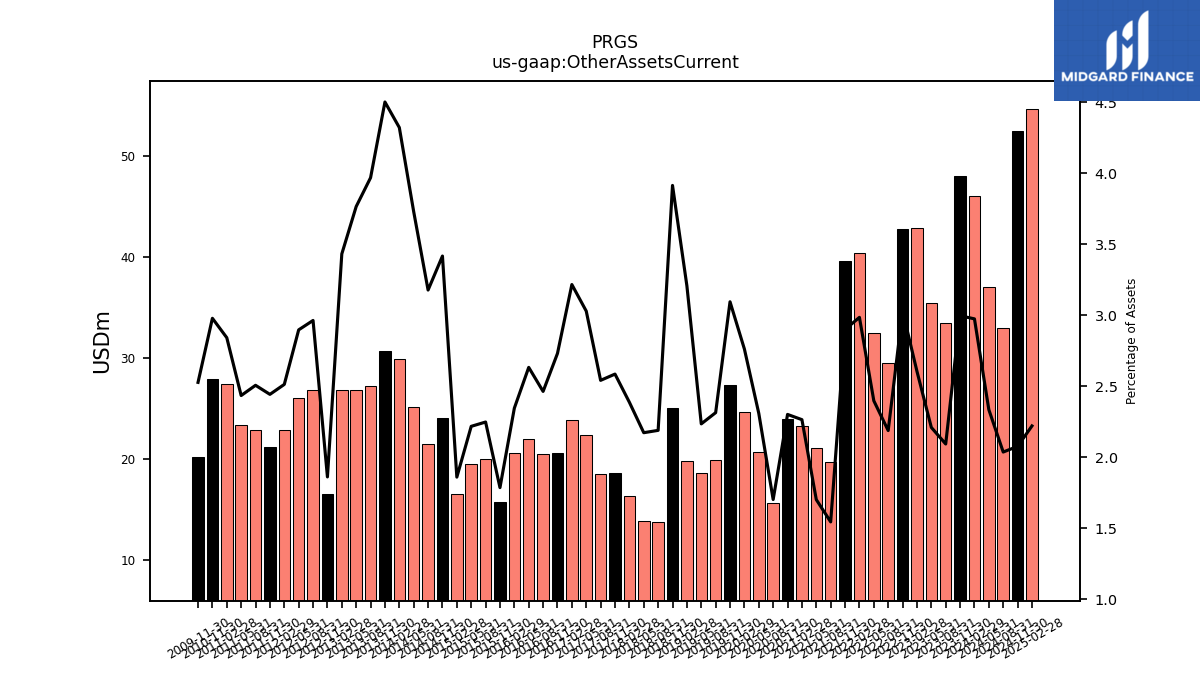
| Other Assets Current | 48.04 | 33.45 | 35.41 | 42.83 | 42.78 | 29.46 | 32.49 | 40.40 | 39.55 | 19.71 | 21.11 | 23.27 | 23.98 | 15.66 | 20.69 | 24.59 | 27.28 | 19.90 | 18.55 | 19.76 | 25.08 | 13.70 | 13.84 | 16.31 | 18.59 | 18.45 | 22.33 | 23.84 | 20.62 | 20.52 | 21.97 | 20.57 | 15.67 | 19.94 | 19.45 | 16.55 | 24.03 | 21.50 | 25.12 | 29.84 | 30.72 | 27.25 | 26.78 | 26.79 | 16.48 | 26.86 | 26.06 | 22.84 | 21.14 | 22.84 | 23.38 | 27.45 | 27.91 | NA | NA | NA |
| 2023-11-30 | 2023-08-31 | 2023-05-31 | 2023-02-28 | 2022-11-30 | 2022-08-31 | 2022-05-31 | 2022-02-28 | 2021-11-30 | 2021-08-31 | 2021-05-31 | 2021-02-28 | 2020-11-30 | 2020-08-31 | 2020-05-31 | 2020-02-29 | 2019-11-30 | 2019-08-31 | 2019-05-31 | 2019-02-28 | 2018-11-30 | 2018-08-31 | 2018-05-31 | 2018-02-28 | 2017-11-30 | 2017-08-31 | 2017-05-31 | 2017-02-28 | 2016-11-30 | 2016-08-31 | 2016-05-31 | 2016-02-29 | 2015-11-30 | 2015-08-31 | 2015-05-31 | 2015-02-28 | 2014-11-30 | 2014-08-31 | 2014-05-31 | 2014-02-28 | 2013-11-30 | 2013-08-31 | 2013-05-31 | 2013-02-28 | 2012-11-30 | 2012-08-31 | 2012-05-31 | 2012-02-29 | 2011-11-30 | 2011-08-31 | 2011-05-31 | 2011-02-28 | 2010-11-30 | 2010-08-31 | 2010-05-31 | 2010-02-28 | ||
|---|---|---|---|---|---|---|---|---|---|---|---|---|---|---|---|---|---|---|---|---|---|---|---|---|---|---|---|---|---|---|---|---|---|---|---|---|---|---|---|---|---|---|---|---|---|---|---|---|---|---|---|---|---|---|---|---|---|
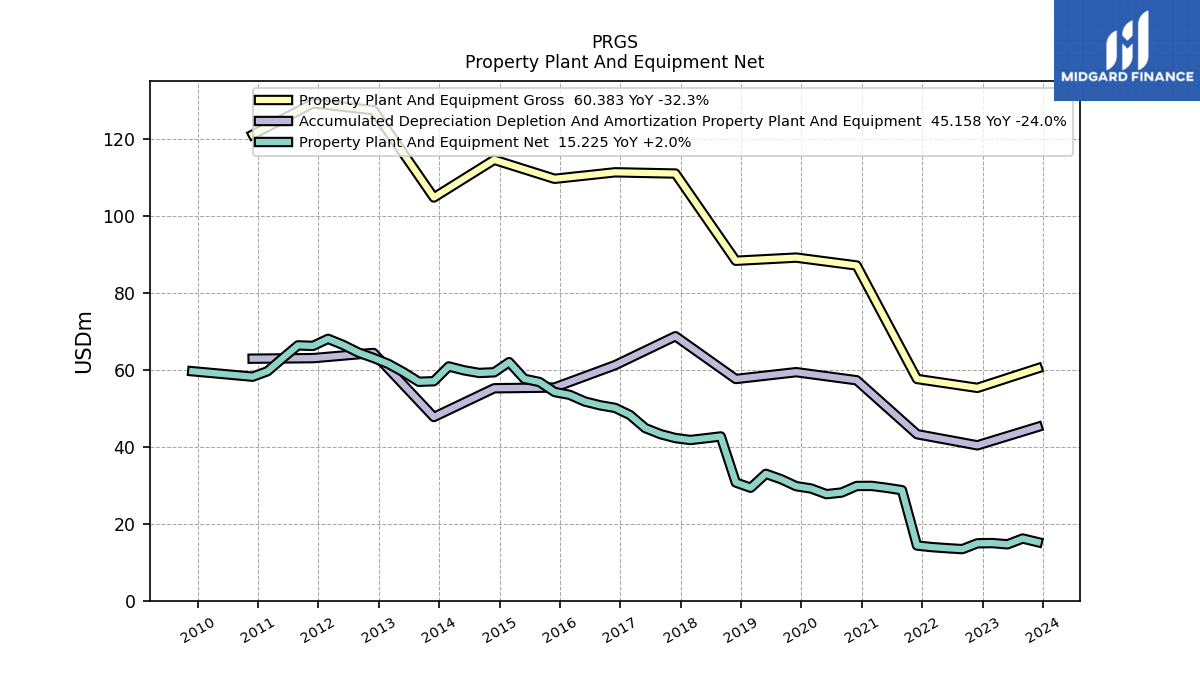
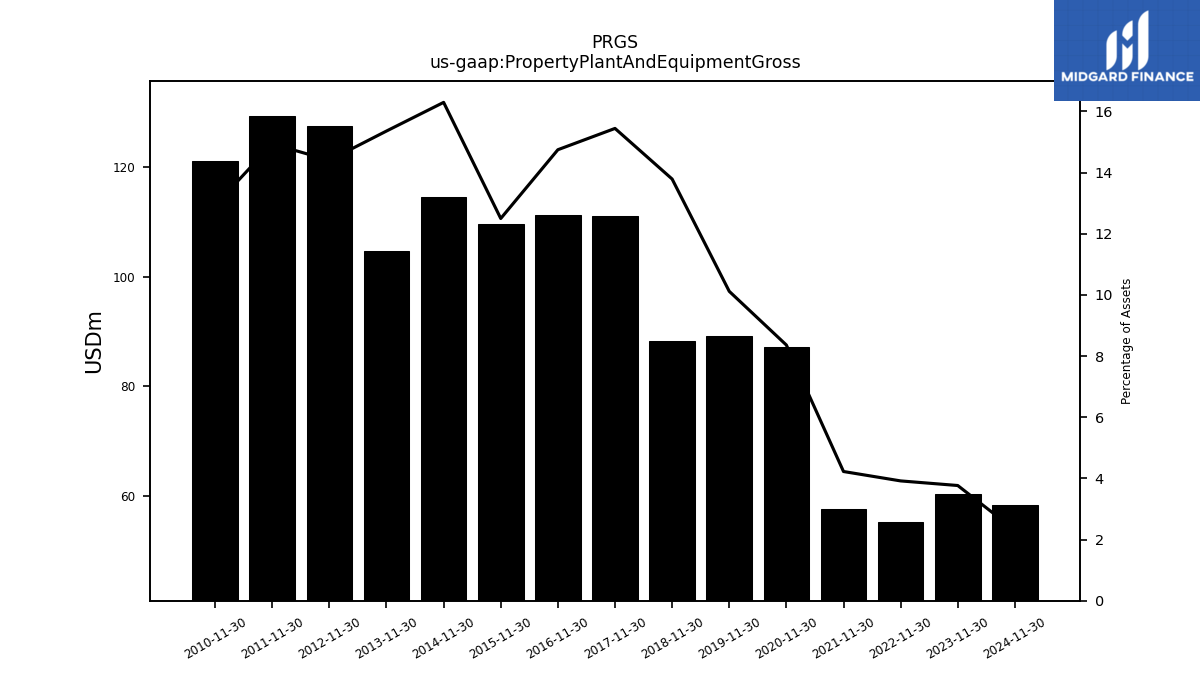
| Property Plant And Equipment Gross | 60.38 | NA | NA | NA | 55.30 | NA | NA | NA | 57.61 | NA | NA | NA | 87.10 | NA | NA | NA | 89.15 | NA | NA | NA | 88.32 | NA | NA | NA | 110.98 | NA | NA | NA | 111.30 | NA | NA | NA | 109.62 | NA | NA | NA | 114.55 | NA | NA | NA | 104.76 | NA | NA | NA | 127.45 | NA | NA | NA | 129.23 | NA | NA | NA | 121.09 | NA | NA | NA | |
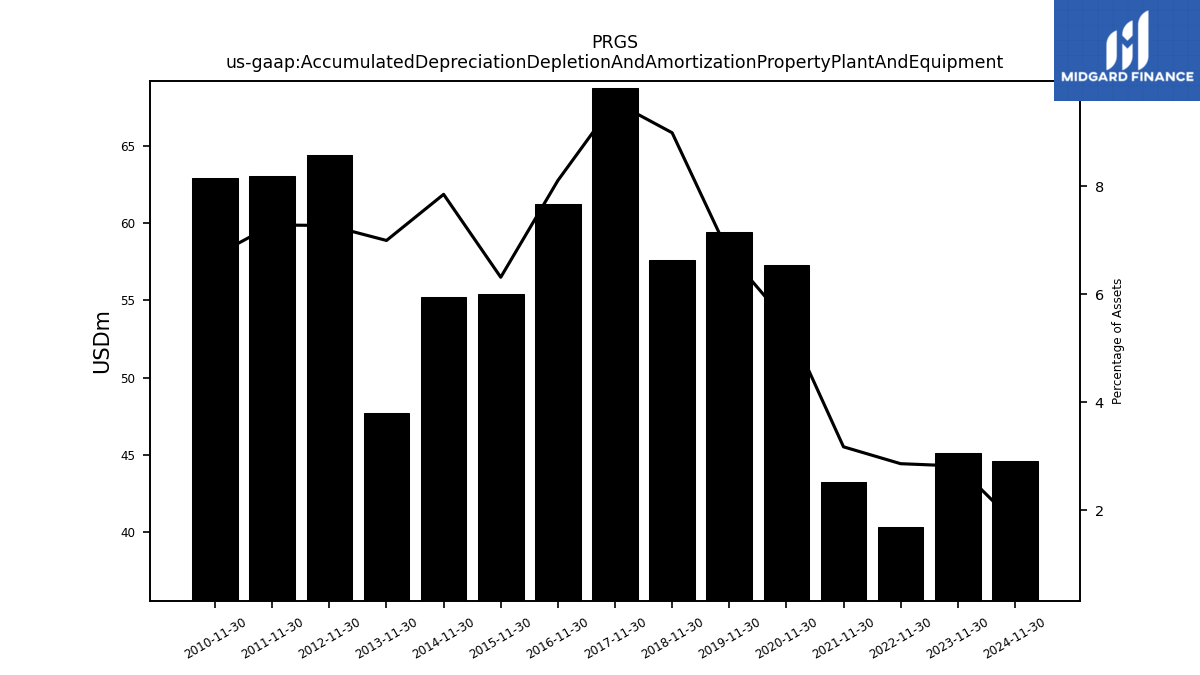
| Accumulated Depreciation Depletion And Amortization Property Plant And Equipment | 45.16 | NA | NA | NA | 40.37 | NA | NA | NA | 43.27 | NA | NA | NA | 57.28 | NA | NA | NA | 59.38 | NA | NA | NA | 57.61 | NA | NA | NA | 68.72 | NA | NA | NA | 61.20 | NA | NA | NA | 55.39 | NA | NA | NA | 55.20 | NA | NA | NA | 47.73 | NA | NA | NA | 64.38 | NA | NA | NA | 63.03 | NA | NA | NA | 62.89 | NA | NA | NA | |
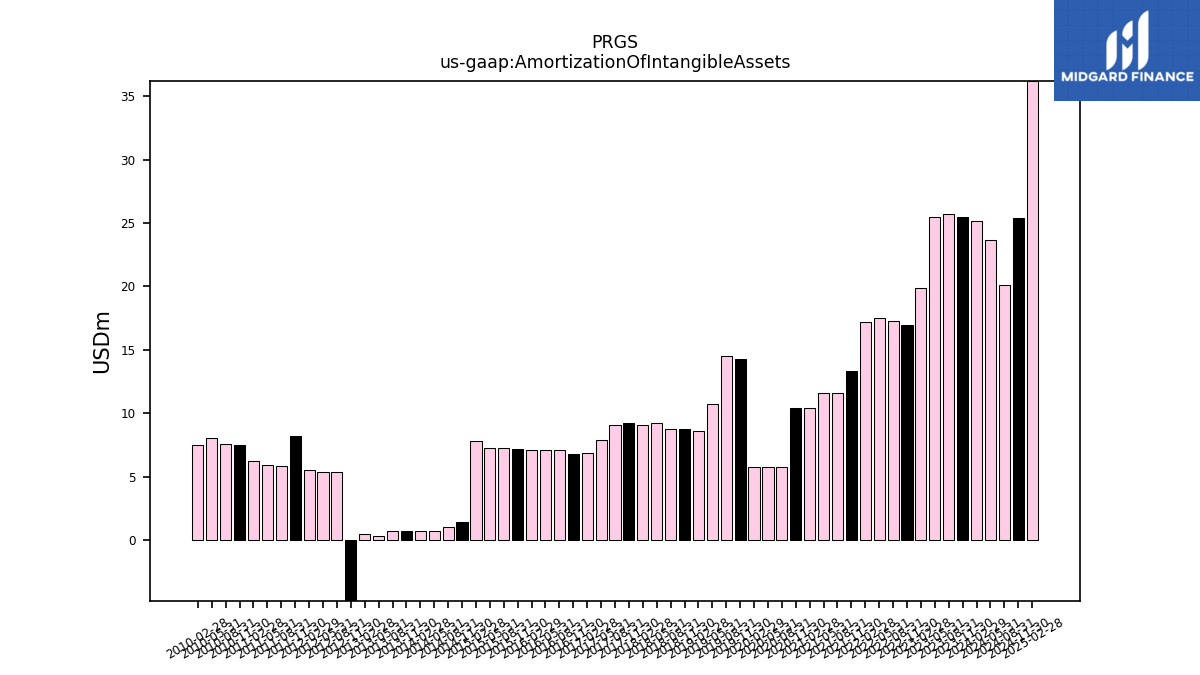
| Amortization Of Intangible Assets | 25.50 | 25.70 | 25.50 | 19.90 | 17.00 | 17.30 | 17.50 | 17.20 | 13.30 | 11.60 | 11.60 | 10.40 | 10.40 | 5.80 | 5.80 | 5.80 | 14.30 | 14.50 | 10.70 | 8.60 | 8.80 | 8.80 | 9.20 | 9.10 | 9.20 | 9.10 | 7.90 | 6.90 | 6.80 | 7.10 | 7.10 | 7.10 | 7.20 | 7.30 | 7.30 | 7.80 | 1.40 | 1.00 | 0.70 | 0.70 | 0.70 | 0.70 | 0.30 | 0.50 | -14.06 | 5.38 | 5.40 | 5.55 | 8.18 | 5.88 | 5.91 | 6.25 | 7.50 | 7.57 | 8.02 | 7.46 | |
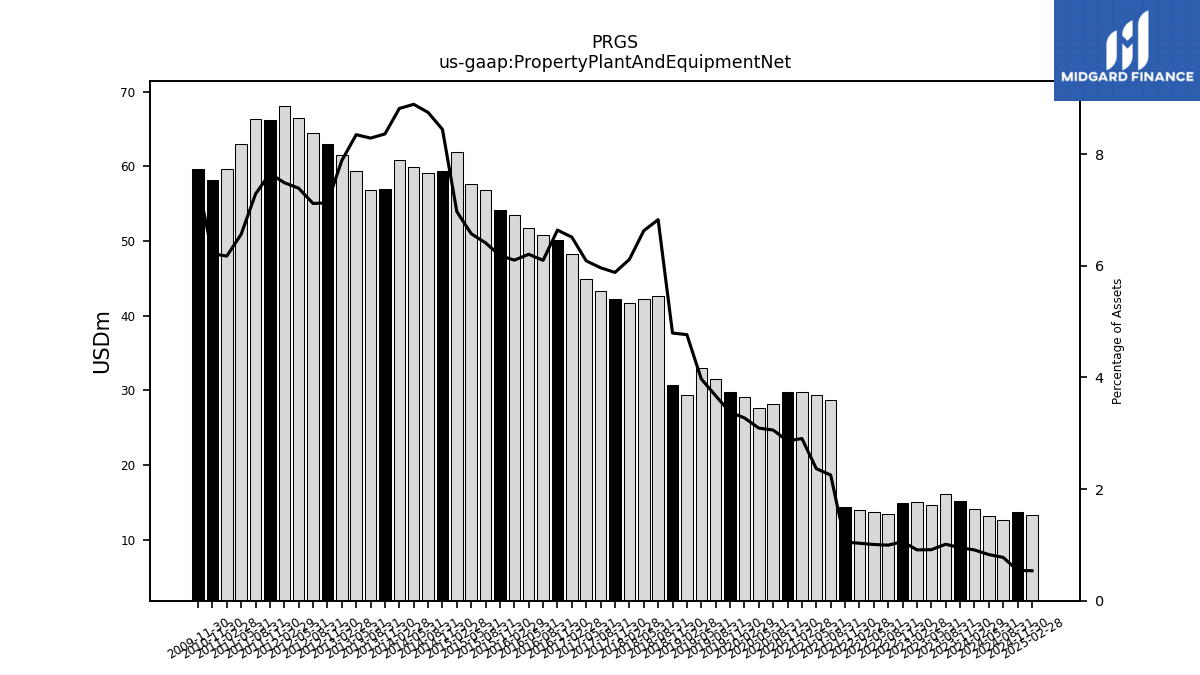
| Property Plant And Equipment Net | 15.22 | 16.17 | 14.65 | 14.98 | 14.93 | 13.41 | 13.65 | 13.93 | 14.35 | 28.72 | 29.33 | 29.84 | 29.82 | 28.11 | 27.69 | 29.15 | 29.77 | 31.57 | 32.97 | 29.35 | 30.71 | 42.69 | 42.21 | 41.76 | 42.26 | 43.28 | 44.86 | 48.26 | 50.10 | 50.78 | 51.76 | 53.49 | 54.23 | 56.83 | 57.65 | 61.99 | 59.35 | 59.18 | 59.87 | 60.87 | 57.03 | 56.89 | 59.35 | 61.53 | 63.07 | 64.48 | 66.44 | 68.05 | 66.21 | 66.34 | 63.02 | 59.62 | 58.21 | NA | NA | NA | |
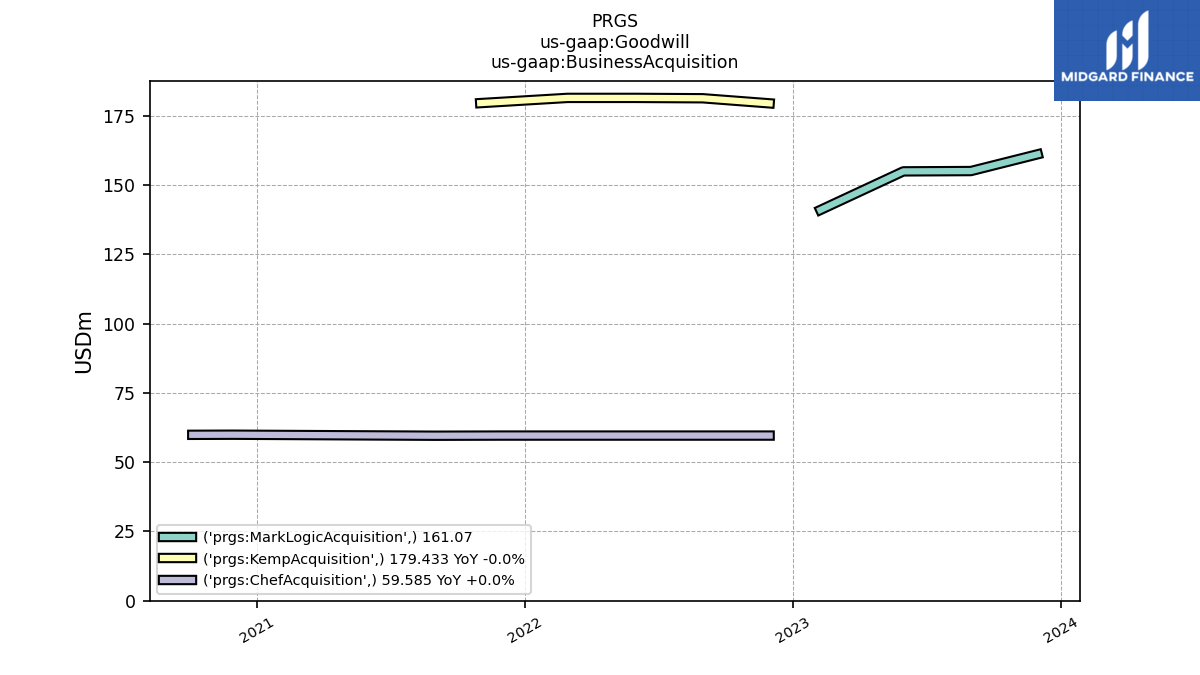
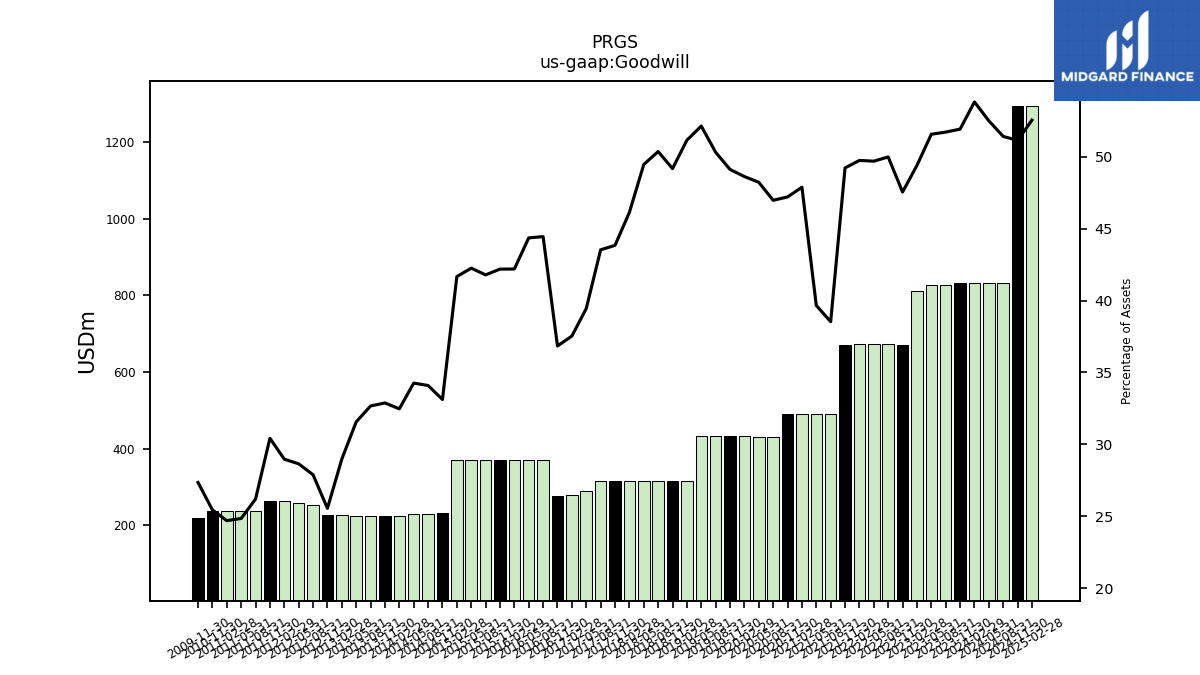
| Goodwill | 832.10 | 826.05 | 825.94 | 811.86 | 671.04 | 672.90 | 673.07 | 673.04 | 671.15 | 491.41 | 491.73 | 491.70 | 491.73 | 431.86 | 431.87 | 432.79 | 432.82 | 432.60 | 432.62 | 315.01 | 314.99 | 314.95 | 315.01 | 315.11 | 315.04 | 315.91 | 290.70 | 278.13 | 278.07 | 370.10 | 370.02 | 369.96 | 369.99 | 370.46 | 370.53 | 370.62 | 232.84 | 230.68 | 230.68 | 224.19 | 224.29 | 224.29 | 224.44 | 226.10 | 226.11 | 252.74 | 257.62 | 263.28 | 263.24 | 238.59 | 238.59 | 238.51 | 238.34 | NA | NA | NA | |
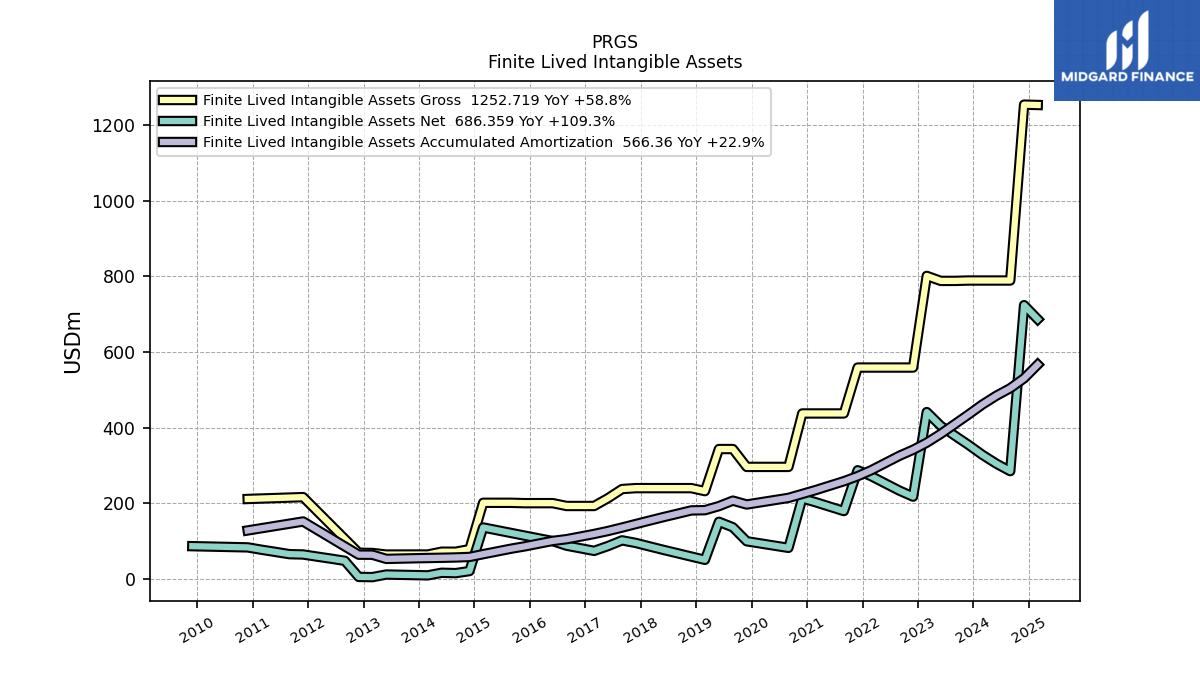
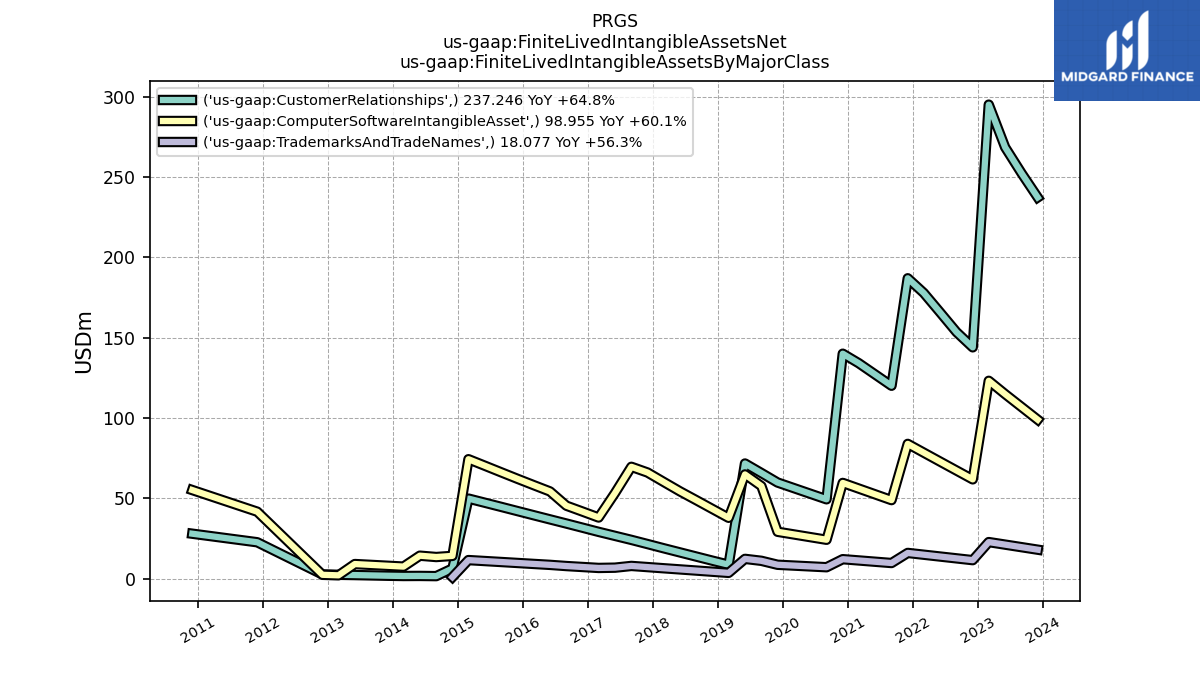
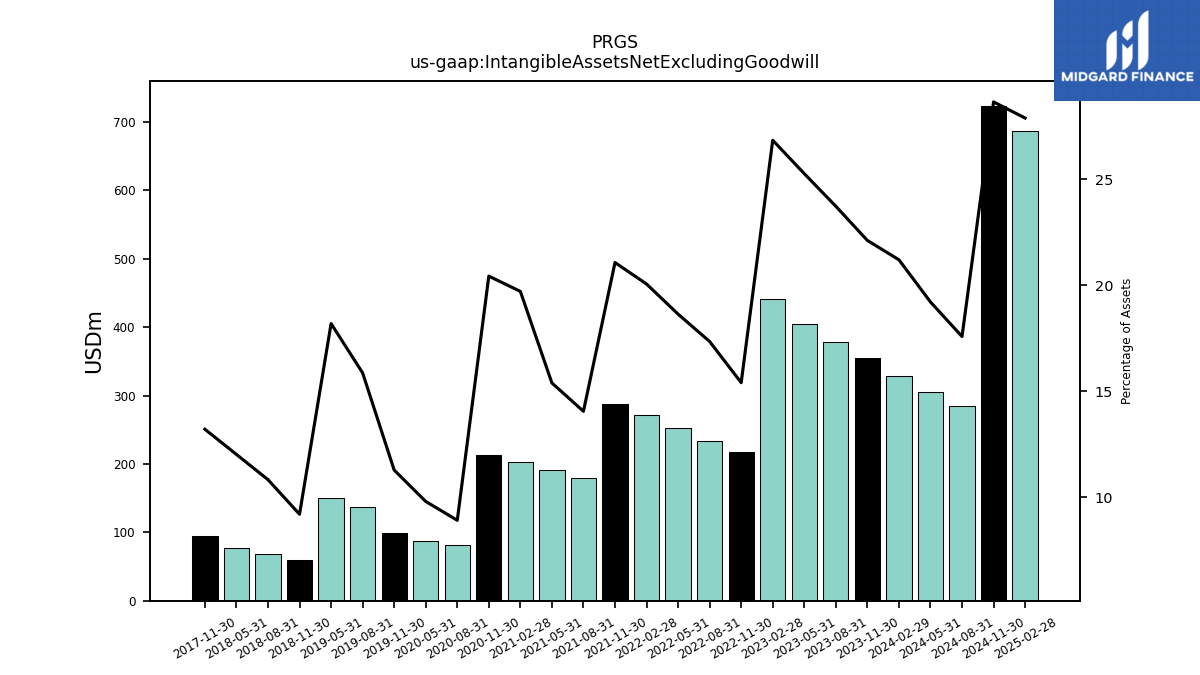
| Intangible Assets Net Excluding Goodwill | 354.28 | 378.82 | 404.51 | 440.94 | 217.35 | 233.44 | 252.36 | 271.29 | 287.19 | 179.19 | 190.77 | 202.35 | 212.75 | 81.93 | 87.77 | NA | 99.39 | 136.38 | 150.91 | NA | 58.92 | 67.71 | 76.54 | NA | 94.89 | NA | NA | NA | NA | NA | NA | NA | NA | NA | NA | NA | NA | NA | NA | NA | NA | NA | NA | NA | NA | NA | NA | NA | NA | NA | NA | NA | NA | NA | NA | NA | |
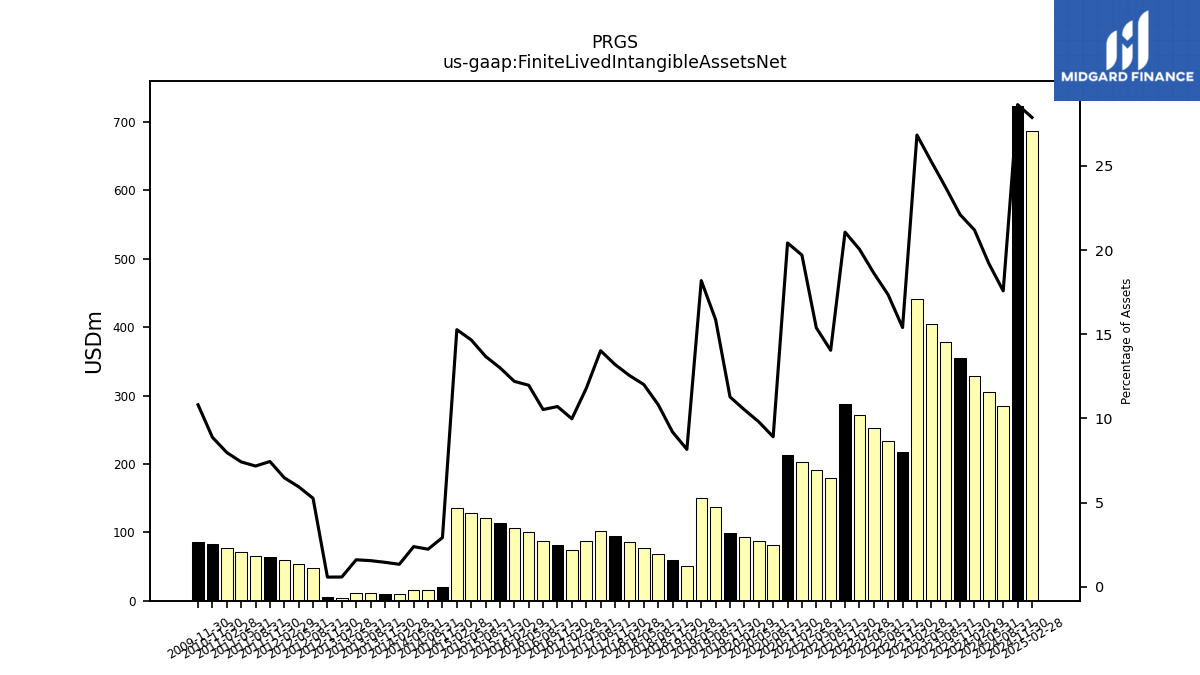
| Finite Lived Intangible Assets Net | 354.28 | 378.82 | 404.51 | 440.94 | 217.35 | 233.44 | 252.36 | 271.29 | 287.19 | 179.19 | 190.77 | 202.35 | 212.75 | 81.93 | 87.77 | 93.61 | 99.39 | 136.38 | 150.91 | 50.30 | 58.92 | 67.71 | 76.54 | 85.76 | 94.89 | 101.78 | 86.86 | 73.97 | 80.83 | 87.68 | 99.86 | 106.99 | 114.11 | 121.32 | 128.60 | 135.85 | 20.58 | 15.14 | 16.09 | 9.26 | 9.95 | 10.69 | 11.43 | 4.57 | 5.12 | 47.68 | 53.44 | 58.88 | 64.41 | 65.34 | 71.25 | 77.05 | 83.21 | NA | NA | NA | |
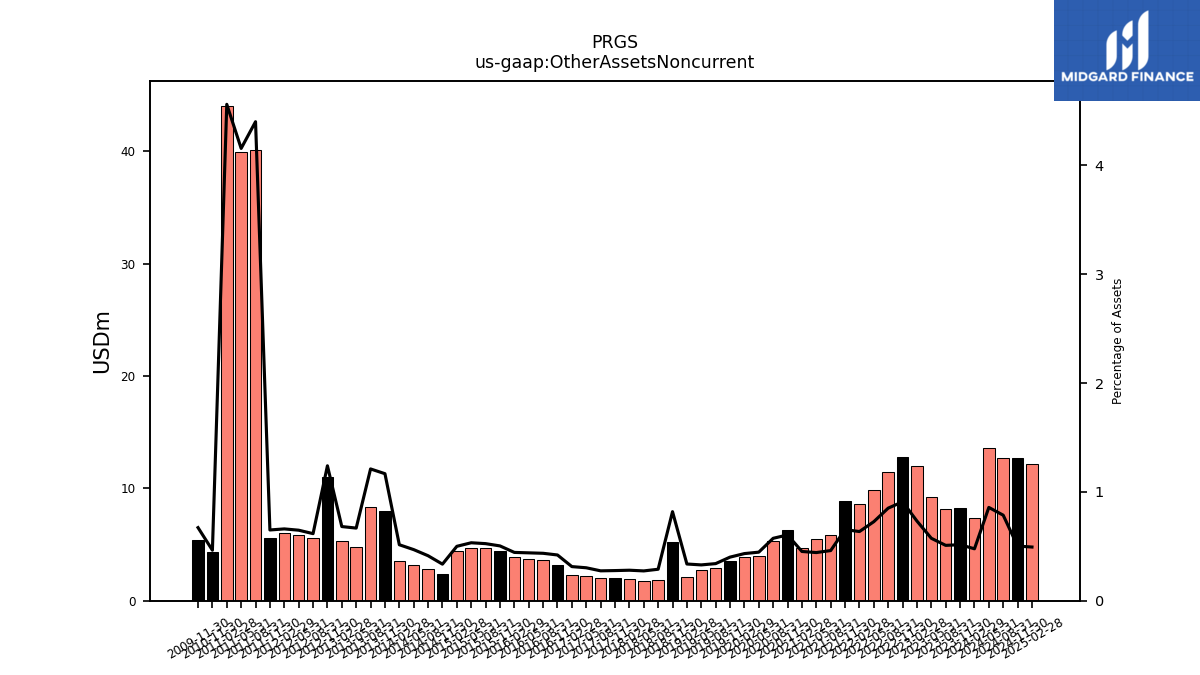
| Other Assets Noncurrent | 8.26 | 8.13 | 9.19 | 12.03 | 12.83 | 11.46 | 9.84 | 8.60 | 8.91 | 5.88 | 5.49 | 4.65 | 6.30 | 5.28 | 4.00 | 3.86 | 3.53 | 2.93 | 2.73 | 2.08 | 5.24 | 1.81 | 1.75 | 1.92 | 1.99 | 2.00 | 2.23 | 2.33 | 3.17 | 3.63 | 3.67 | 3.89 | 4.42 | 4.65 | 4.67 | 4.45 | 2.36 | 2.80 | 3.16 | 3.55 | 7.96 | 8.31 | 4.75 | 5.32 | 10.97 | 5.59 | 5.83 | 6.00 | 5.63 | 40.08 | 39.91 | 44.05 | 4.35 | NA | NA | NA |
| 2023-11-30 | 2023-08-31 | 2023-05-31 | 2023-02-28 | 2022-11-30 | 2022-08-31 | 2022-05-31 | 2022-02-28 | 2021-11-30 | 2021-08-31 | 2021-05-31 | 2021-02-28 | 2020-11-30 | 2020-08-31 | 2020-05-31 | 2020-02-29 | 2019-11-30 | 2019-08-31 | 2019-05-31 | 2019-02-28 | 2018-11-30 | 2018-08-31 | 2018-05-31 | 2018-02-28 | 2017-11-30 | 2017-08-31 | 2017-05-31 | 2017-02-28 | 2016-11-30 | 2016-08-31 | 2016-05-31 | 2016-02-29 | 2015-11-30 | 2015-08-31 | 2015-05-31 | 2015-02-28 | 2014-11-30 | 2014-08-31 | 2014-05-31 | 2014-02-28 | 2013-11-30 | 2013-08-31 | 2013-05-31 | 2013-02-28 | 2012-11-30 | 2012-08-31 | 2012-05-31 | 2012-02-29 | 2011-11-30 | 2011-08-31 | 2011-05-31 | 2011-02-28 | 2010-11-30 | 2010-08-31 | 2010-05-31 | 2010-02-28 | ||
|---|---|---|---|---|---|---|---|---|---|---|---|---|---|---|---|---|---|---|---|---|---|---|---|---|---|---|---|---|---|---|---|---|---|---|---|---|---|---|---|---|---|---|---|---|---|---|---|---|---|---|---|---|---|---|---|---|---|
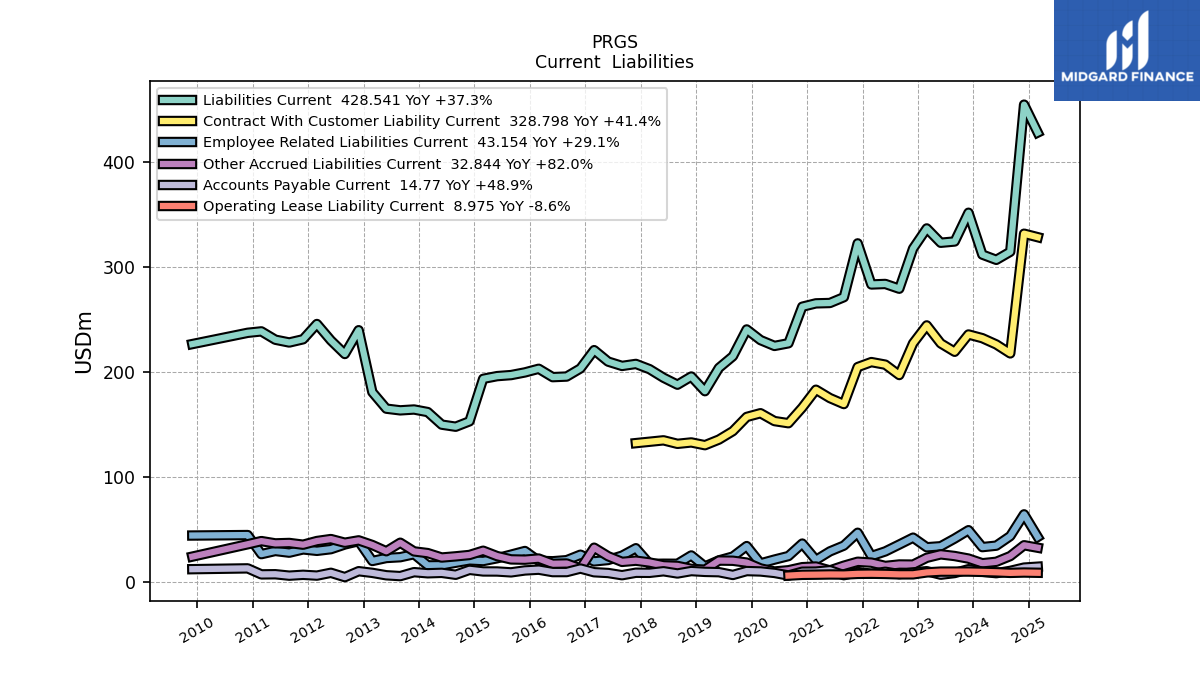
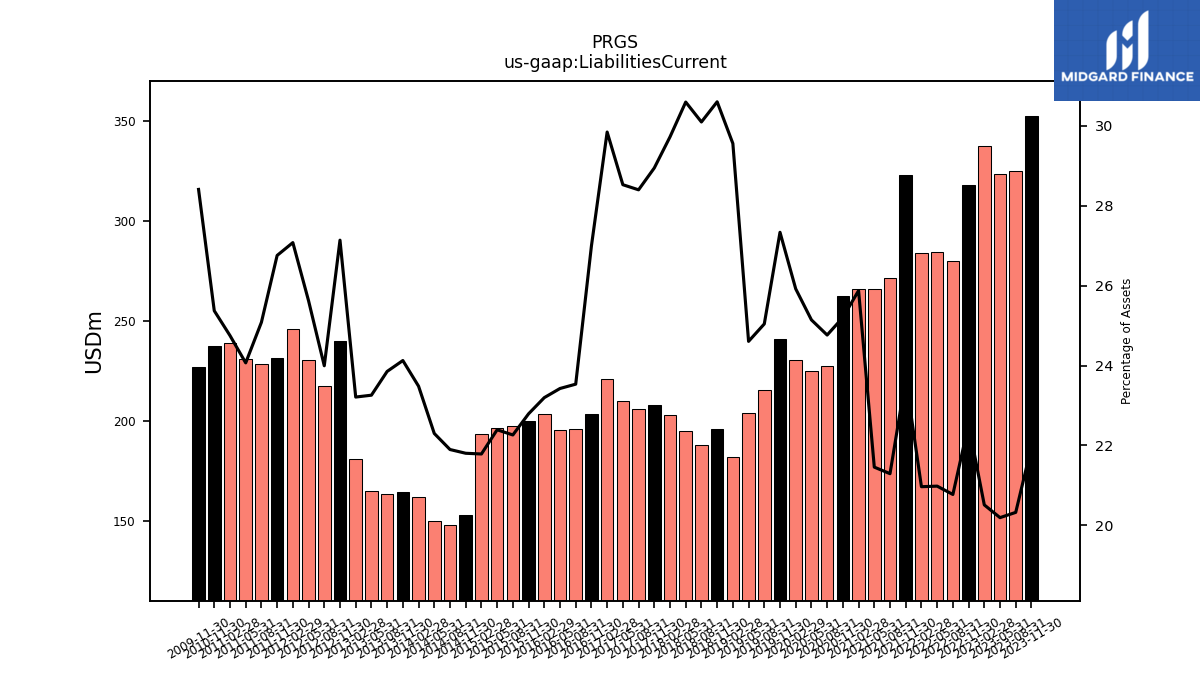
| Liabilities Current | 352.12 | 324.70 | 323.49 | 337.16 | 318.00 | 279.68 | 284.23 | 283.73 | 322.93 | 271.61 | 266.08 | 265.74 | 262.54 | 227.69 | 225.17 | 230.72 | 240.88 | 215.33 | 204.20 | 182.03 | 196.02 | 188.22 | 194.86 | 203.03 | 208.02 | 206.10 | 210.24 | 221.17 | 203.74 | 195.99 | 195.42 | 203.41 | 199.92 | 197.39 | 196.39 | 193.81 | 153.30 | 148.18 | 150.16 | 162.13 | 164.58 | 163.77 | 165.39 | 181.14 | 240.15 | 217.47 | 230.41 | 246.09 | 231.51 | 228.44 | 231.10 | 239.04 | 237.68 | NA | NA | NA | |
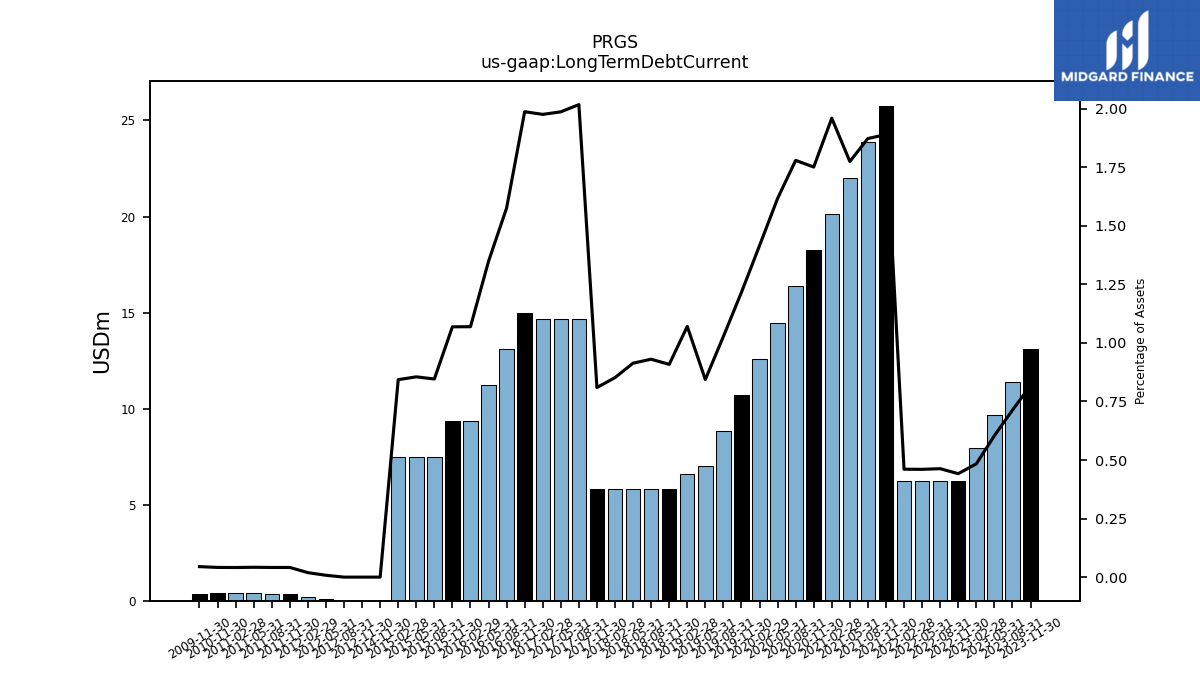
| Long Term Debt Current | 13.11 | 11.39 | 9.67 | 7.95 | 6.23 | 6.23 | 6.23 | 6.23 | 25.77 | 23.89 | 22.00 | 20.12 | 18.24 | 16.36 | 14.48 | 12.60 | 10.72 | 8.84 | 7.00 | 6.59 | 5.82 | 5.82 | 5.82 | 5.82 | 5.82 | 14.64 | 14.64 | 14.64 | 15.00 | 13.12 | 11.25 | 9.38 | 9.38 | 7.50 | 7.50 | 7.50 | 0.00 | NA | NA | NA | NA | NA | NA | NA | 0.00 | 0.00 | 0.07 | 0.17 | 0.36 | 0.38 | 0.40 | 0.40 | 0.39 | NA | NA | NA | |
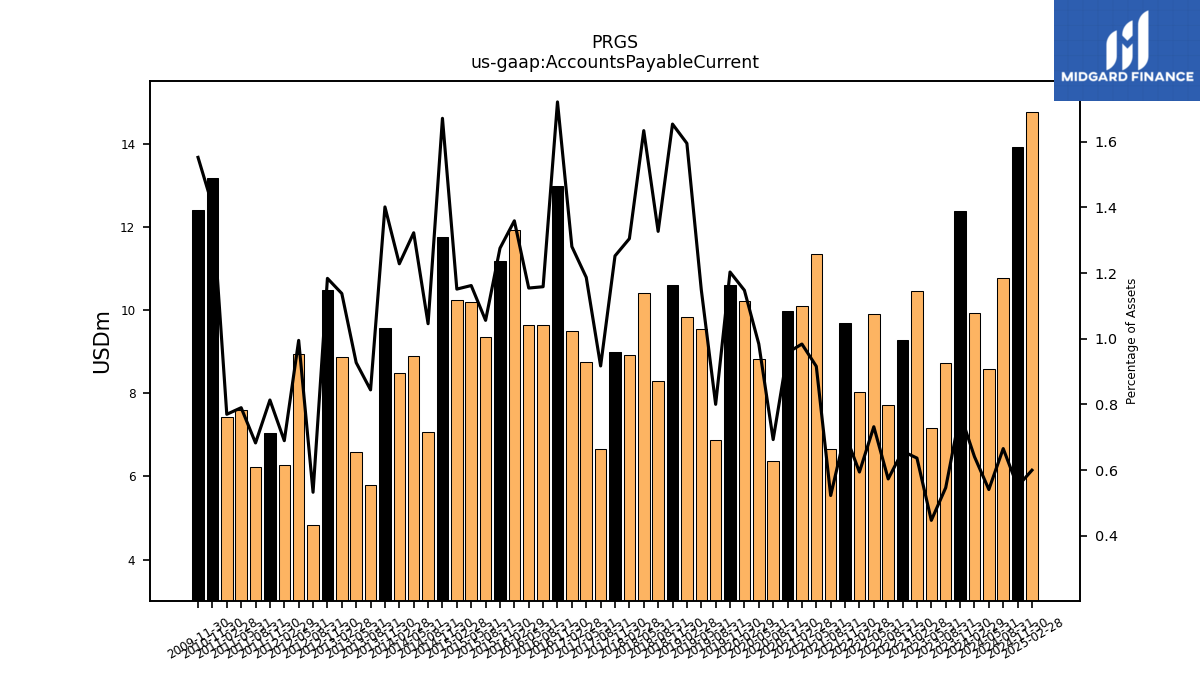
| Accounts Payable Current | 12.37 | 8.73 | 7.16 | 10.46 | 9.28 | 7.72 | 9.92 | 8.04 | 9.68 | 6.67 | 11.36 | 10.11 | 9.98 | 6.37 | 8.81 | 10.21 | 10.60 | 6.88 | 9.54 | 9.82 | 10.59 | 8.30 | 10.41 | 8.91 | 9.00 | 6.66 | 8.75 | 9.49 | 12.99 | 9.65 | 9.63 | 11.92 | 11.19 | 9.36 | 10.19 | 10.24 | 11.75 | 7.08 | 8.91 | 8.48 | 9.56 | 5.80 | 6.59 | 8.88 | 10.48 | 4.83 | 8.95 | 6.27 | 7.04 | 6.22 | 7.59 | 7.44 | 13.18 | NA | NA | NA | |
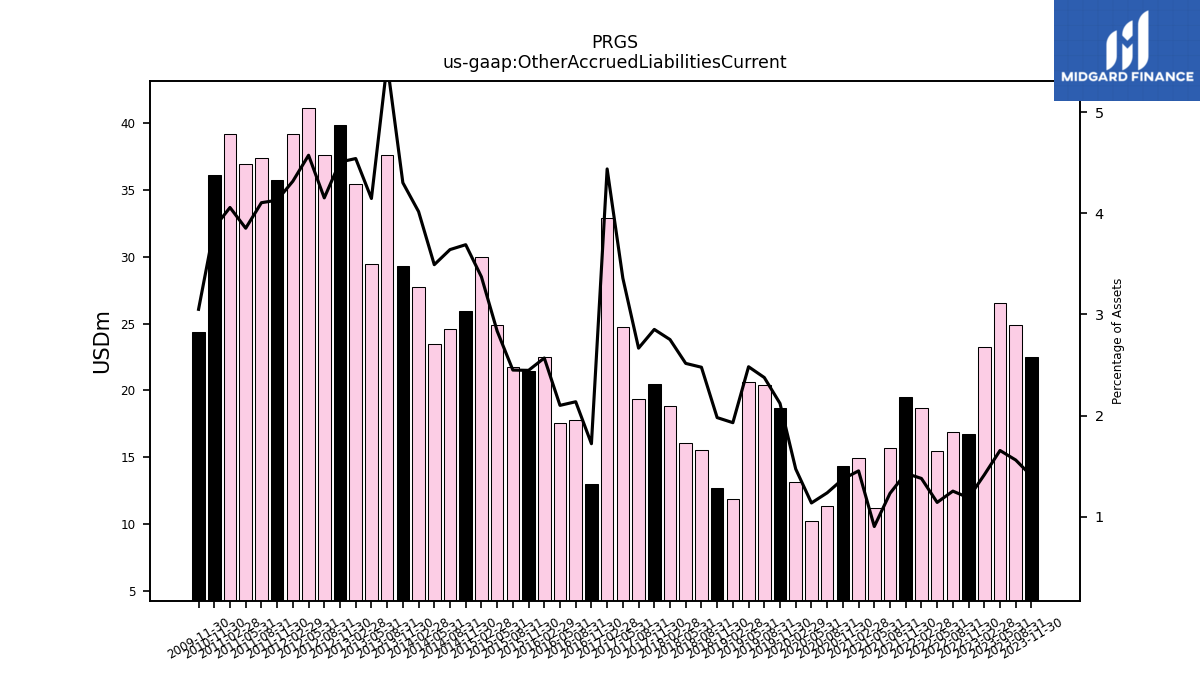
| Other Accrued Liabilities Current | 22.50 | 24.93 | 26.51 | 23.25 | 16.77 | 16.88 | 15.47 | 18.66 | 19.49 | 15.71 | 11.21 | 14.93 | 14.30 | 11.37 | 10.18 | 13.11 | 18.68 | 20.43 | 20.61 | 11.89 | 12.69 | 15.50 | 16.03 | 18.80 | 20.50 | 19.35 | 24.75 | 32.89 | 13.00 | 17.80 | 17.53 | 22.53 | 21.46 | 21.72 | 24.87 | 29.99 | 25.94 | 24.63 | 23.51 | 27.73 | 29.34 | 37.63 | 29.48 | 35.43 | 39.88 | 37.63 | 41.13 | 39.23 | 35.73 | 37.38 | 36.99 | 39.18 | 36.15 | NA | NA | NA | |
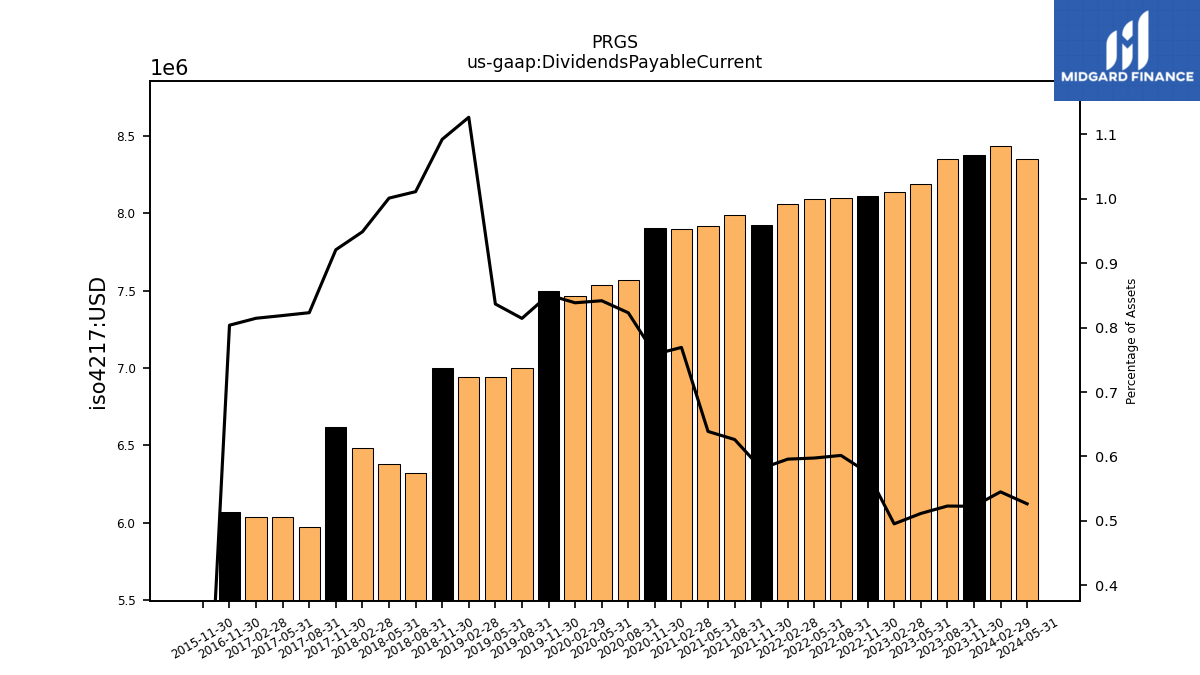
| Dividends Payable Current | 8.38 | 8.35 | 8.19 | 8.14 | 8.12 | 8.10 | 8.09 | 8.06 | 7.92 | 7.99 | 7.92 | 7.90 | 7.90 | 7.57 | 7.54 | 7.46 | 7.50 | 7.00 | 6.94 | 6.94 | 7.00 | 6.32 | 6.38 | 6.48 | 6.62 | 5.97 | 6.04 | 6.04 | 6.07 | NA | NA | NA | 0.00 | NA | NA | NA | NA | NA | NA | NA | NA | NA | NA | NA | NA | NA | NA | NA | NA | NA | NA | NA | NA | NA | NA | NA | |
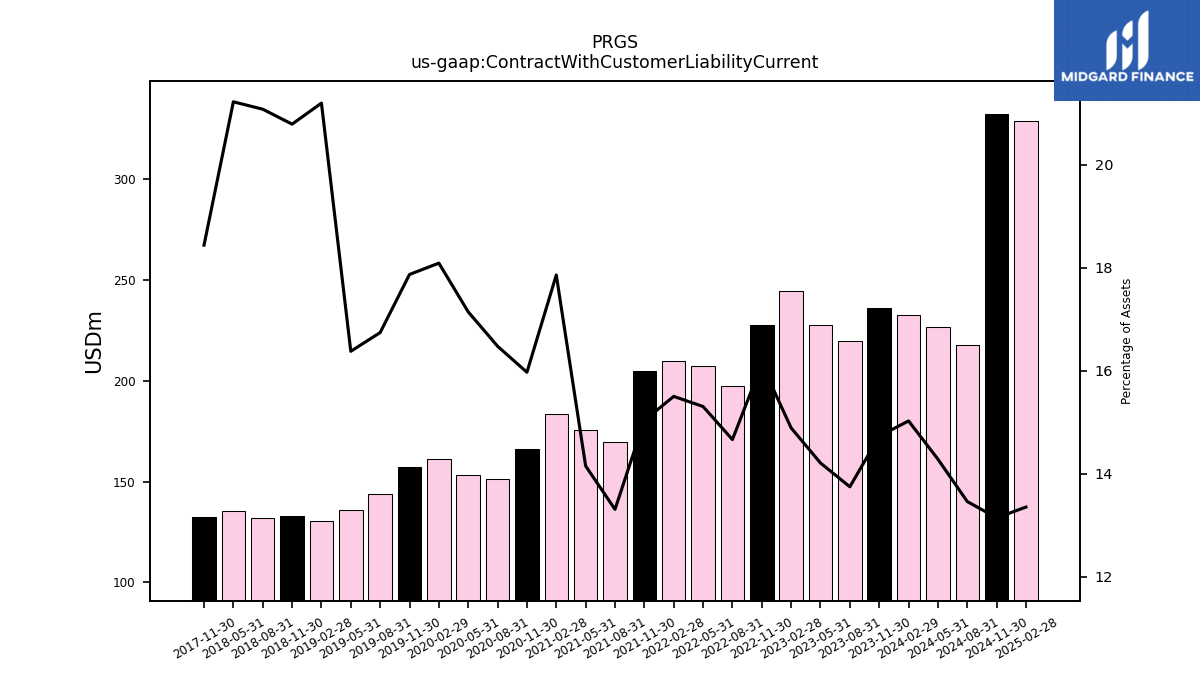
| Contract With Customer Liability Current | 236.09 | 219.60 | 227.61 | 244.73 | 227.67 | 197.43 | 207.33 | 209.77 | 205.02 | 169.74 | 175.47 | 183.44 | 166.39 | 151.50 | 153.55 | 161.05 | 157.49 | 143.97 | 135.93 | 130.57 | 133.19 | 131.85 | 135.20 | NA | 132.54 | NA | NA | NA | NA | NA | NA | NA | NA | NA | NA | NA | NA | NA | NA | NA | NA | NA | NA | NA | NA | NA | NA | NA | NA | NA | NA | NA | NA | NA | NA | NA |
| 2023-11-30 | 2023-08-31 | 2023-05-31 | 2023-02-28 | 2022-11-30 | 2022-08-31 | 2022-05-31 | 2022-02-28 | 2021-11-30 | 2021-08-31 | 2021-05-31 | 2021-02-28 | 2020-11-30 | 2020-08-31 | 2020-05-31 | 2020-02-29 | 2019-11-30 | 2019-08-31 | 2019-05-31 | 2019-02-28 | 2018-11-30 | 2018-08-31 | 2018-05-31 | 2018-02-28 | 2017-11-30 | 2017-08-31 | 2017-05-31 | 2017-02-28 | 2016-11-30 | 2016-08-31 | 2016-05-31 | 2016-02-29 | 2015-11-30 | 2015-08-31 | 2015-05-31 | 2015-02-28 | 2014-11-30 | 2014-08-31 | 2014-05-31 | 2014-02-28 | 2013-11-30 | 2013-08-31 | 2013-05-31 | 2013-02-28 | 2012-11-30 | 2012-08-31 | 2012-05-31 | 2012-02-29 | 2011-11-30 | 2011-08-31 | 2011-05-31 | 2011-02-28 | 2010-11-30 | 2010-08-31 | 2010-05-31 | 2010-02-28 | ||
|---|---|---|---|---|---|---|---|---|---|---|---|---|---|---|---|---|---|---|---|---|---|---|---|---|---|---|---|---|---|---|---|---|---|---|---|---|---|---|---|---|---|---|---|---|---|---|---|---|---|---|---|---|---|---|---|---|---|
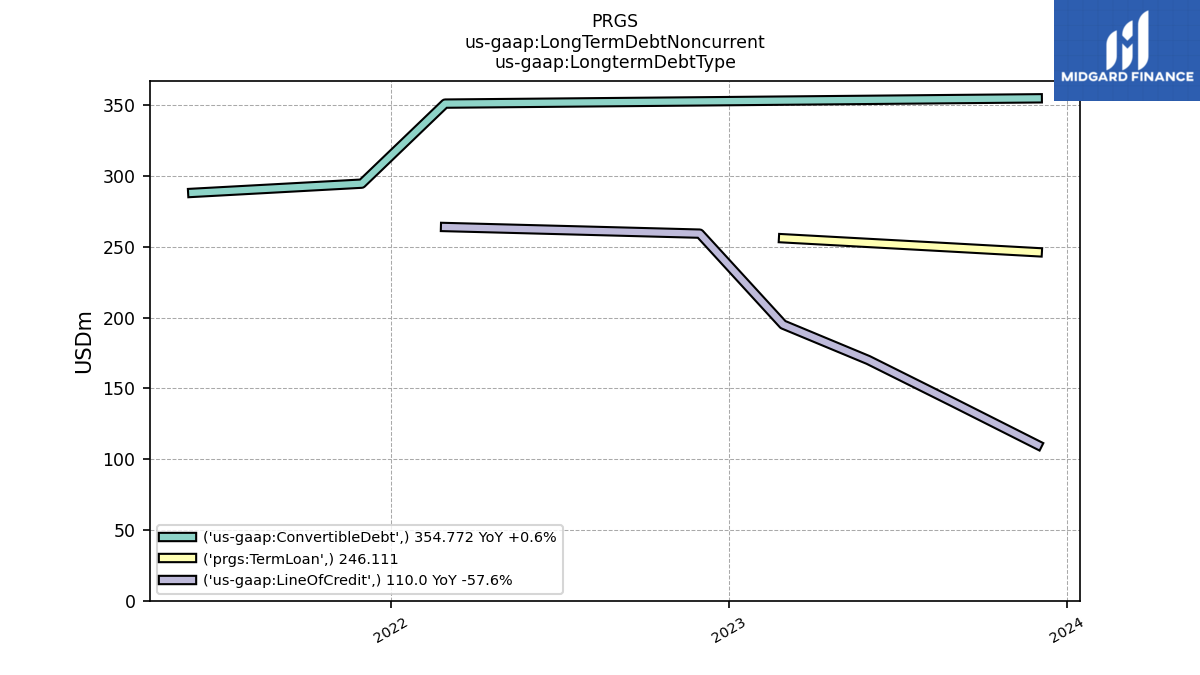
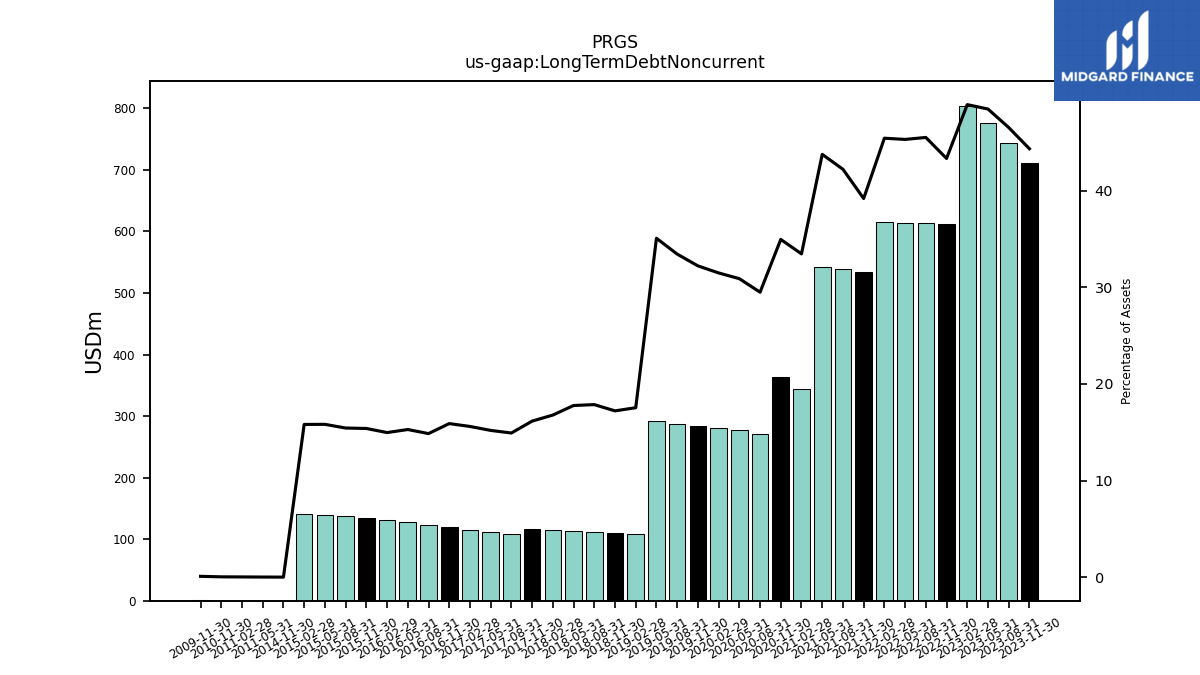
| Long Term Debt Noncurrent | 710.88 | 743.63 | 776.36 | 804.10 | 611.85 | 612.89 | 613.90 | 614.93 | 534.53 | 538.66 | 542.78 | 343.76 | 364.26 | 271.26 | 276.76 | 280.38 | 284.00 | 287.62 | 291.19 | 108.04 | 110.27 | 111.72 | 113.18 | 114.64 | 116.09 | 108.30 | 111.96 | 115.62 | 120.00 | 123.75 | 127.50 | 131.25 | 135.00 | 136.88 | 138.75 | 140.62 | 0.00 | NA | NA | NA | NA | NA | NA | NA | NA | NA | NA | NA | NA | NA | 0.07 | 0.18 | 0.28 | NA | NA | NA | |
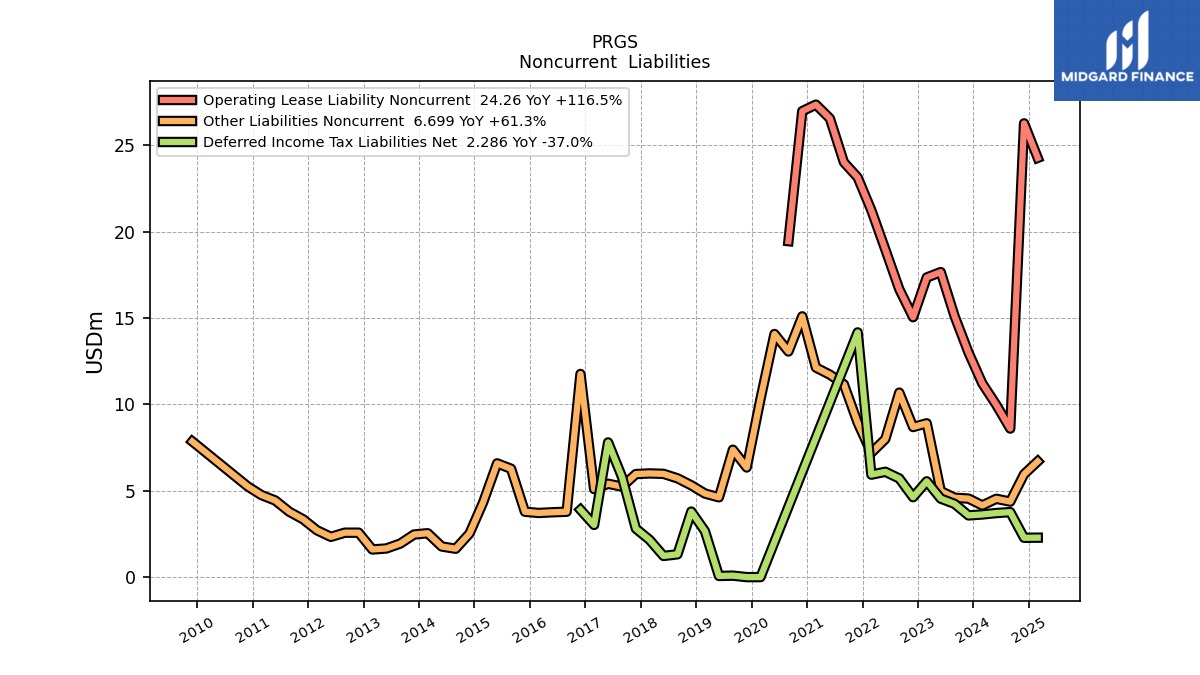
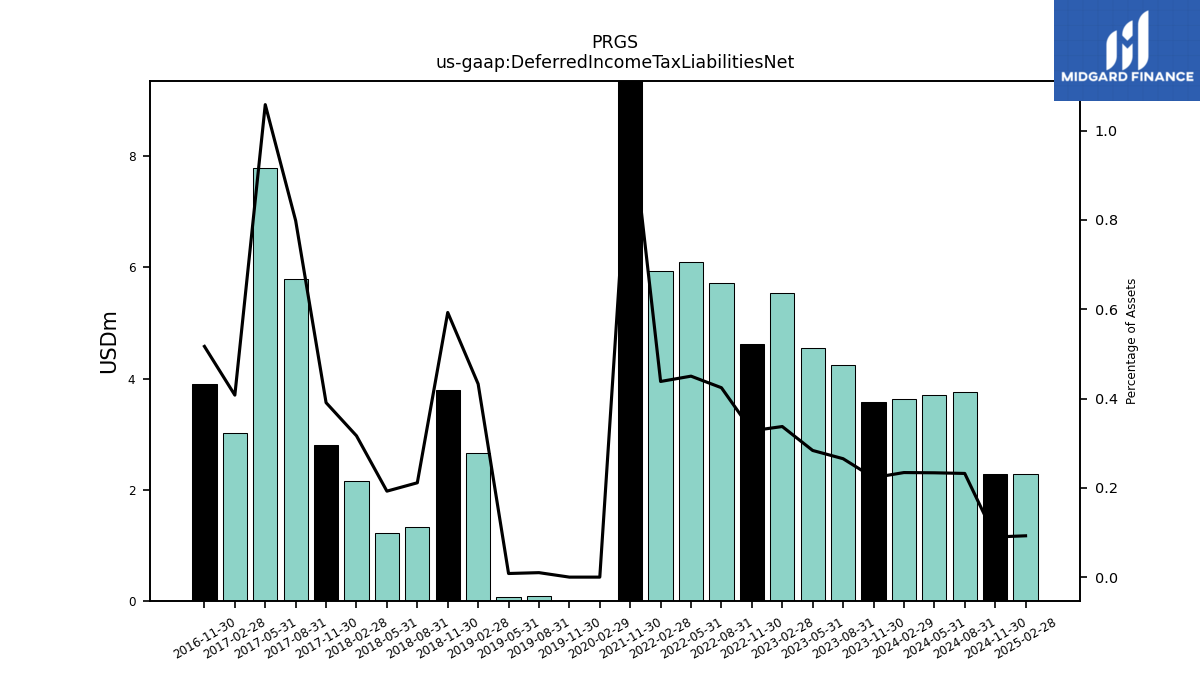
| Deferred Income Tax Liabilities Net | 3.57 | 4.24 | 4.55 | 5.55 | 4.63 | 5.71 | 6.10 | 5.93 | 14.16 | NA | NA | NA | NA | NA | NA | 0.00 | 0.00 | 0.09 | 0.07 | 2.67 | 3.80 | 1.32 | 1.23 | 2.16 | 2.81 | 5.79 | 7.80 | 3.02 | 3.90 | NA | NA | NA | NA | NA | NA | NA | NA | NA | NA | NA | NA | NA | NA | NA | NA | NA | NA | NA | NA | NA | NA | NA | NA | NA | NA | NA | |
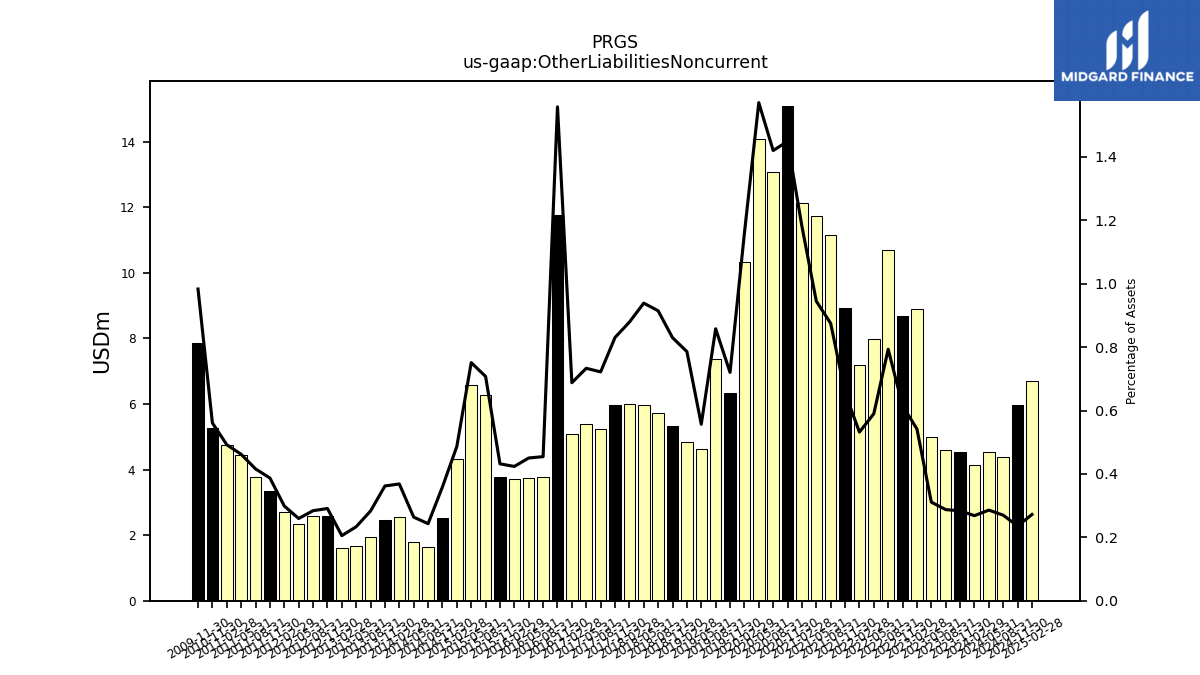
| Other Liabilities Noncurrent | 4.55 | 4.59 | 4.98 | 8.90 | 8.69 | 10.68 | 7.99 | 7.20 | 8.94 | 11.16 | 11.72 | 12.13 | 15.09 | 13.06 | 14.07 | 10.32 | 6.35 | 7.38 | 4.62 | 4.84 | 5.32 | 5.72 | 5.98 | 6.00 | 5.97 | 5.24 | 5.40 | 5.10 | 11.76 | 3.79 | 3.76 | 3.71 | 3.79 | 6.27 | 6.59 | 4.33 | 2.52 | 1.65 | 1.78 | 2.54 | 2.47 | 1.94 | 1.66 | 1.60 | 2.58 | 2.57 | 2.33 | 2.71 | 3.35 | 3.79 | 4.43 | 4.75 | 5.25 | NA | NA | NA | |
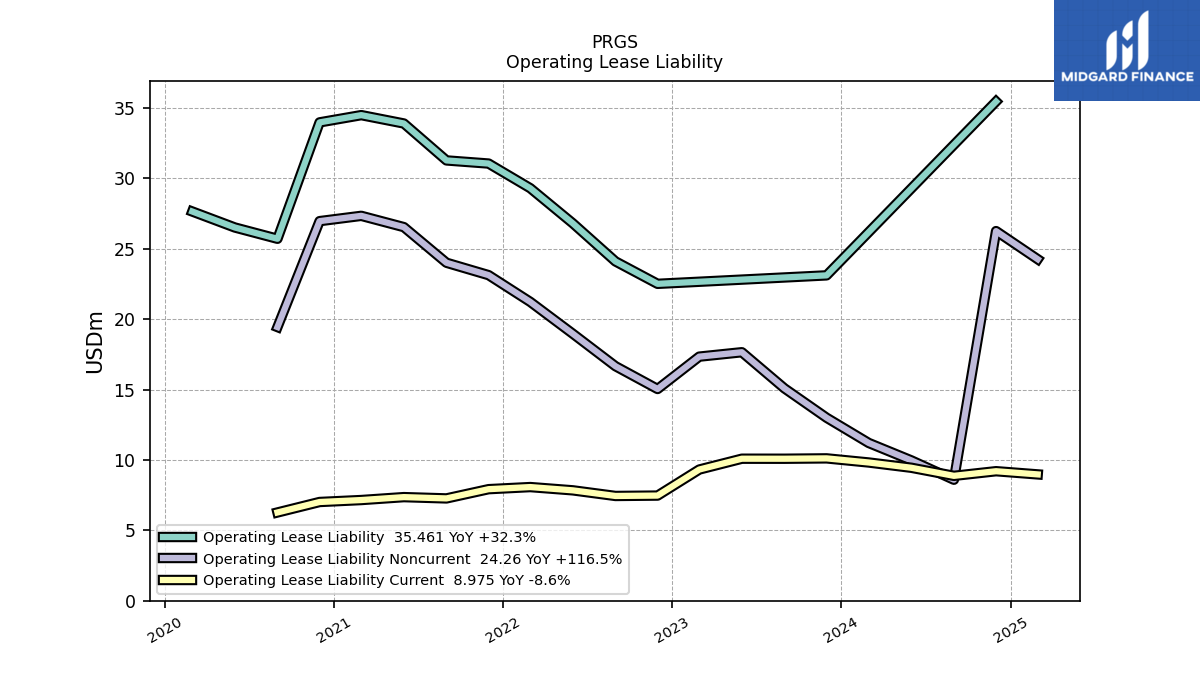
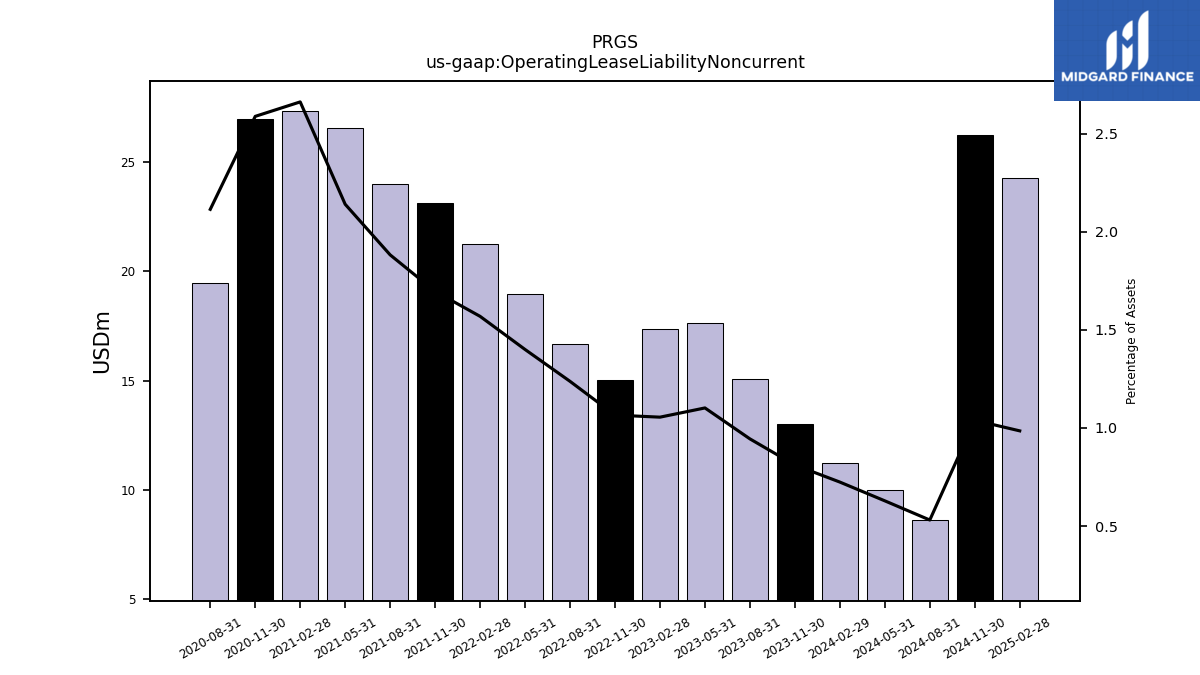
| Operating Lease Liability Noncurrent | 13.00 | 15.09 | 17.65 | 17.34 | 15.04 | 16.66 | 18.96 | 21.23 | 23.13 | 24.01 | 26.54 | 27.34 | 26.97 | 19.44 | NA | NA | NA | NA | NA | NA | NA | NA | NA | NA | NA | NA | NA | NA | NA | NA | NA | NA | NA | NA | NA | NA | NA | NA | NA | NA | NA | NA | NA | NA | NA | NA | NA | NA | NA | NA | NA | NA | NA | NA | NA | NA |
| 2023-11-30 | 2023-08-31 | 2023-05-31 | 2023-02-28 | 2022-11-30 | 2022-08-31 | 2022-05-31 | 2022-02-28 | 2021-11-30 | 2021-08-31 | 2021-05-31 | 2021-02-28 | 2020-11-30 | 2020-08-31 | 2020-05-31 | 2020-02-29 | 2019-11-30 | 2019-08-31 | 2019-05-31 | 2019-02-28 | 2018-11-30 | 2018-08-31 | 2018-05-31 | 2018-02-28 | 2017-11-30 | 2017-08-31 | 2017-05-31 | 2017-02-28 | 2016-11-30 | 2016-08-31 | 2016-05-31 | 2016-02-29 | 2015-11-30 | 2015-08-31 | 2015-05-31 | 2015-02-28 | 2014-11-30 | 2014-08-31 | 2014-05-31 | 2014-02-28 | 2013-11-30 | 2013-08-31 | 2013-05-31 | 2013-02-28 | 2012-11-30 | 2012-08-31 | 2012-05-31 | 2012-02-29 | 2011-11-30 | 2011-08-31 | 2011-05-31 | 2011-02-28 | 2010-11-30 | 2010-08-31 | 2010-05-31 | 2010-02-28 | ||
|---|---|---|---|---|---|---|---|---|---|---|---|---|---|---|---|---|---|---|---|---|---|---|---|---|---|---|---|---|---|---|---|---|---|---|---|---|---|---|---|---|---|---|---|---|---|---|---|---|---|---|---|---|---|---|---|---|---|
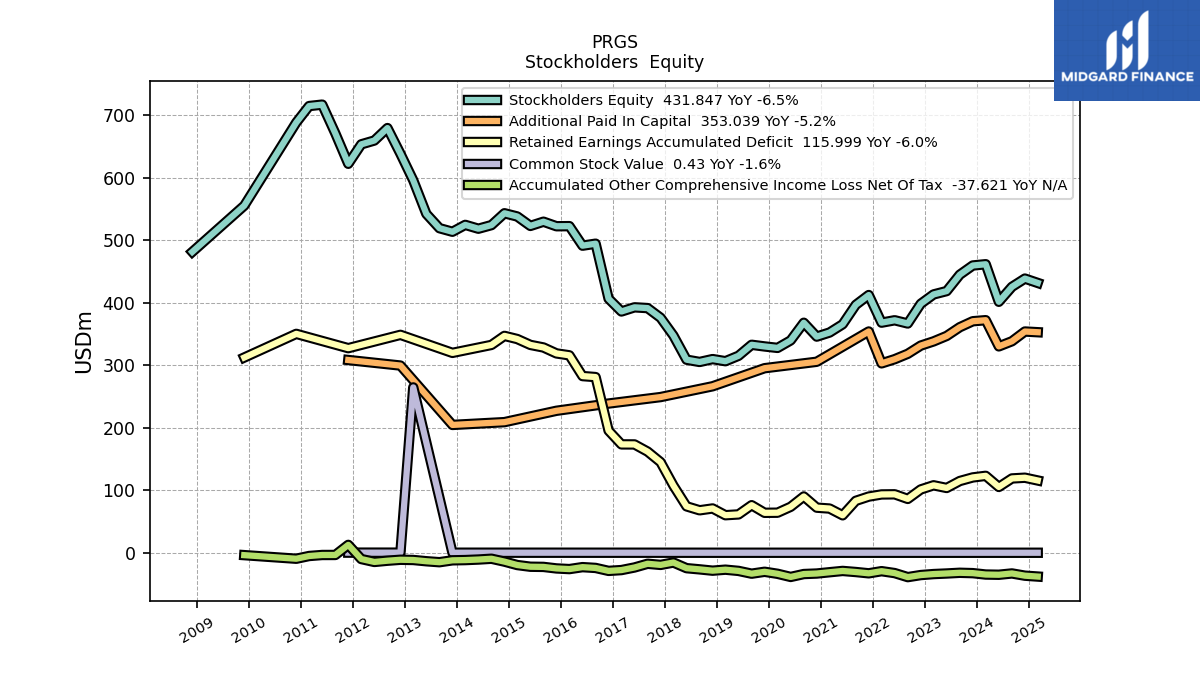
| Stockholders Equity | 459.71 | 445.05 | 418.81 | 413.44 | 398.50 | 366.97 | 372.15 | 368.32 | 412.49 | 396.77 | 365.72 | 352.55 | 346.01 | 368.17 | 339.96 | 327.96 | 330.28 | 332.95 | 315.35 | 306.70 | 310.08 | 305.47 | 309.14 | 347.65 | 376.08 | 391.60 | 392.84 | 386.19 | 406.63 | 494.58 | 491.40 | 522.64 | 522.46 | 529.74 | 523.00 | 538.07 | 543.25 | 524.28 | 518.53 | 524.67 | 513.65 | 519.36 | 542.24 | 595.82 | 638.40 | 679.44 | 659.54 | 653.43 | 622.30 | 671.03 | 716.92 | 714.65 | 688.33 | NA | NA | NA | |
| Common Stock Value | 0.44 | 0.44 | 0.44 | 0.43 | 0.43 | NA | NA | NA | 0.44 | NA | NA | NA | 0.44 | NA | NA | NA | 0.45 | NA | NA | NA | 0.45 | NA | NA | NA | 0.47 | NA | NA | NA | 0.48 | NA | NA | NA | 0.51 | NA | NA | NA | 0.51 | NA | NA | NA | 0.52 | NA | NA | 264.81 | 0.60 | NA | NA | NA | 0.62 | NA | NA | NA | NA | NA | NA | NA | |
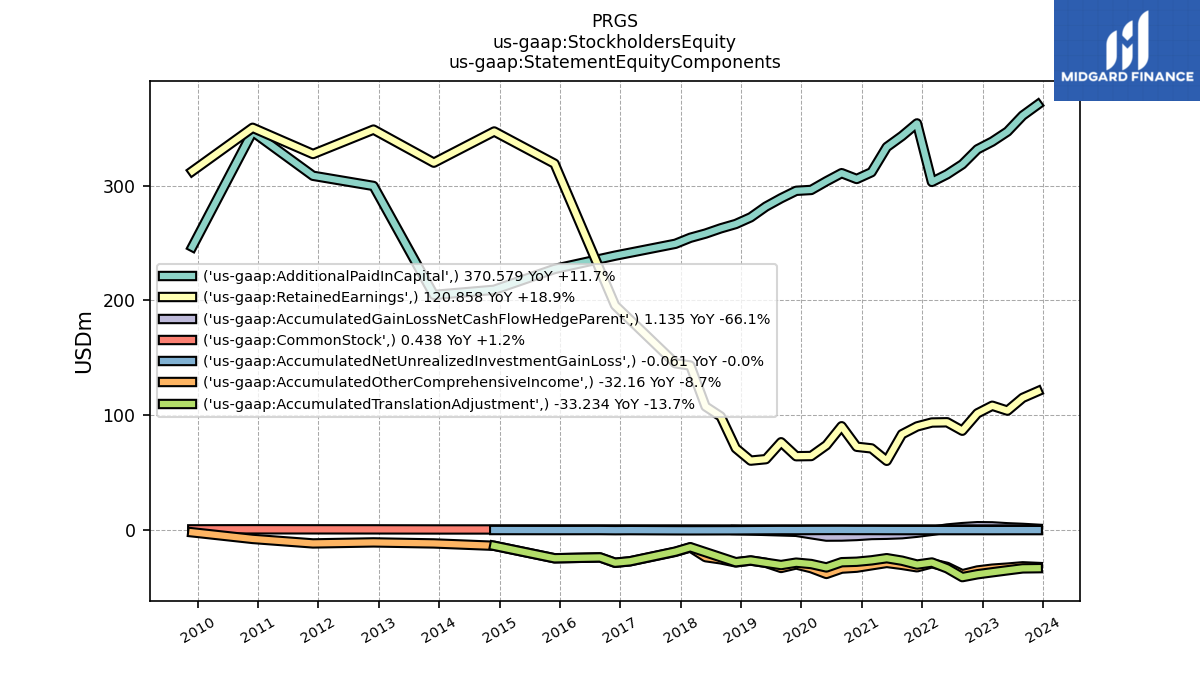
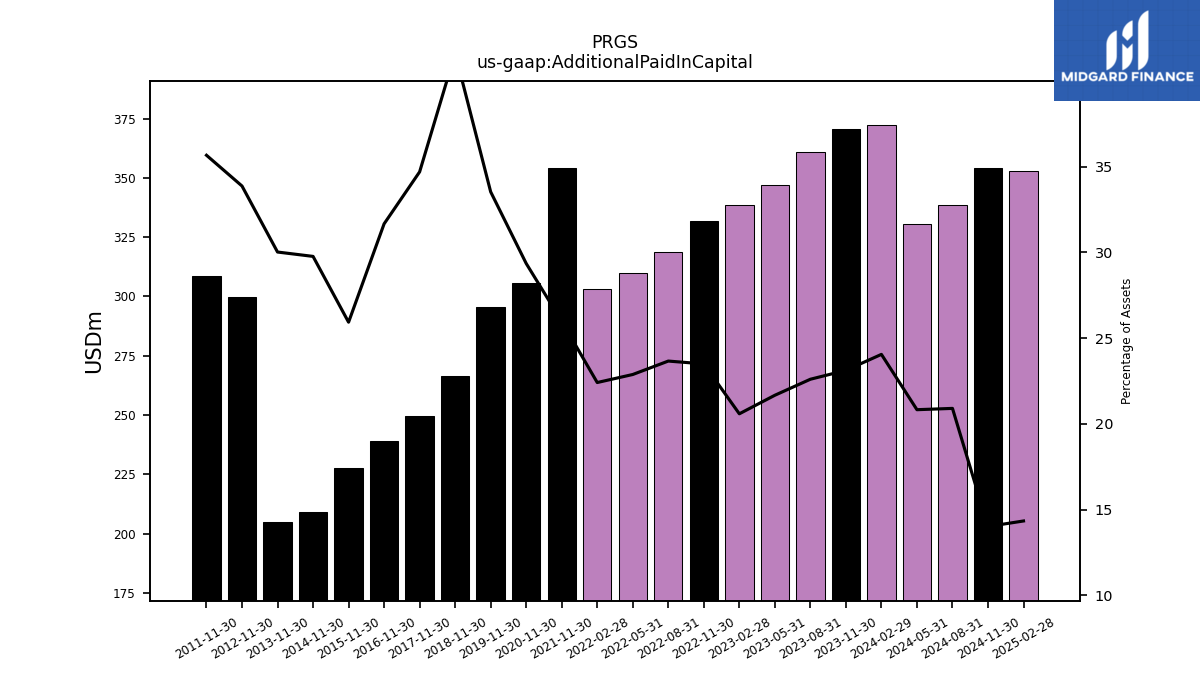
| Additional Paid In Capital | 370.58 | 361.06 | 347.10 | 338.37 | 331.65 | 318.56 | 309.91 | 303.24 | 354.24 | NA | NA | NA | 305.80 | NA | NA | NA | 295.50 | NA | NA | NA | 266.60 | NA | NA | NA | 249.36 | NA | NA | NA | 239.01 | NA | NA | NA | 227.42 | NA | NA | NA | 209.27 | NA | NA | NA | 204.79 | NA | NA | NA | 299.74 | NA | NA | NA | 308.60 | NA | NA | NA | NA | NA | NA | NA | |
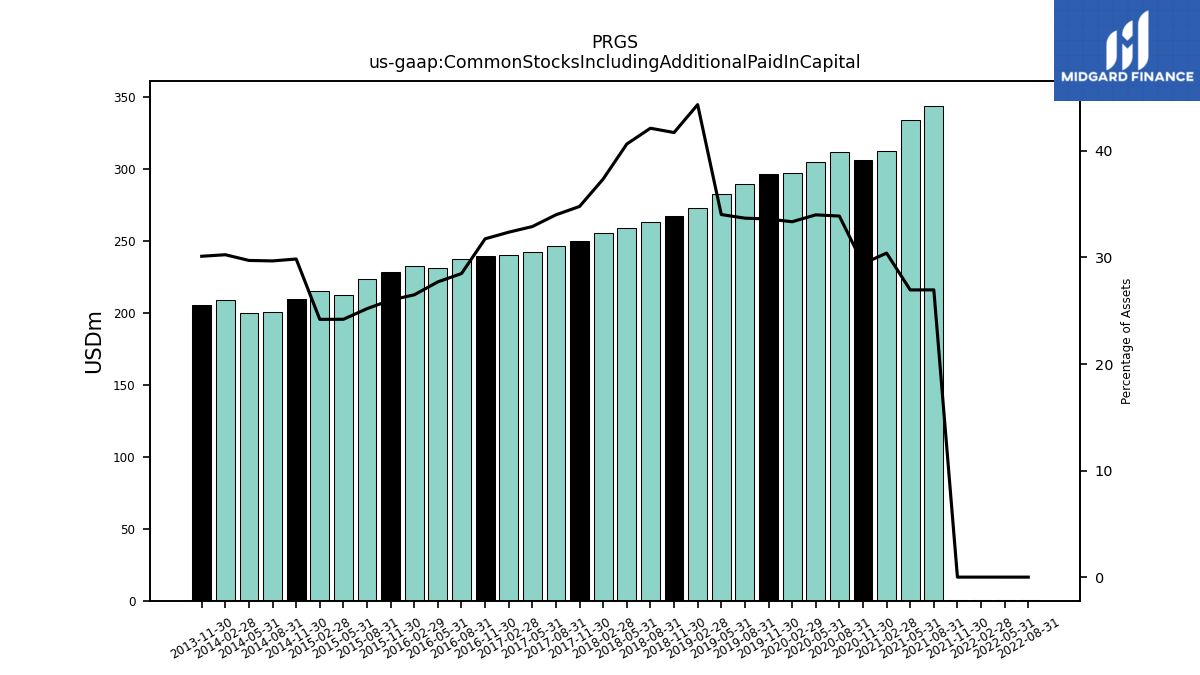
| Common Stocks Including Additional Paid In Capital | NA | NA | NA | NA | NA | 0.43 | 0.43 | 0.44 | 0.44 | 343.68 | 334.06 | 312.14 | 306.24 | 311.34 | 304.28 | 296.70 | 295.95 | 289.49 | 282.19 | 272.85 | 267.05 | 263.25 | 258.70 | 255.05 | 249.84 | 246.63 | 242.33 | 239.76 | 239.50 | 237.14 | 231.04 | 232.23 | 227.93 | 223.30 | 212.16 | 215.14 | 209.78 | 200.68 | 200.00 | 208.77 | 205.31 | NA | NA | NA | NA | NA | NA | NA | NA | NA | NA | NA | NA | NA | NA | NA | |
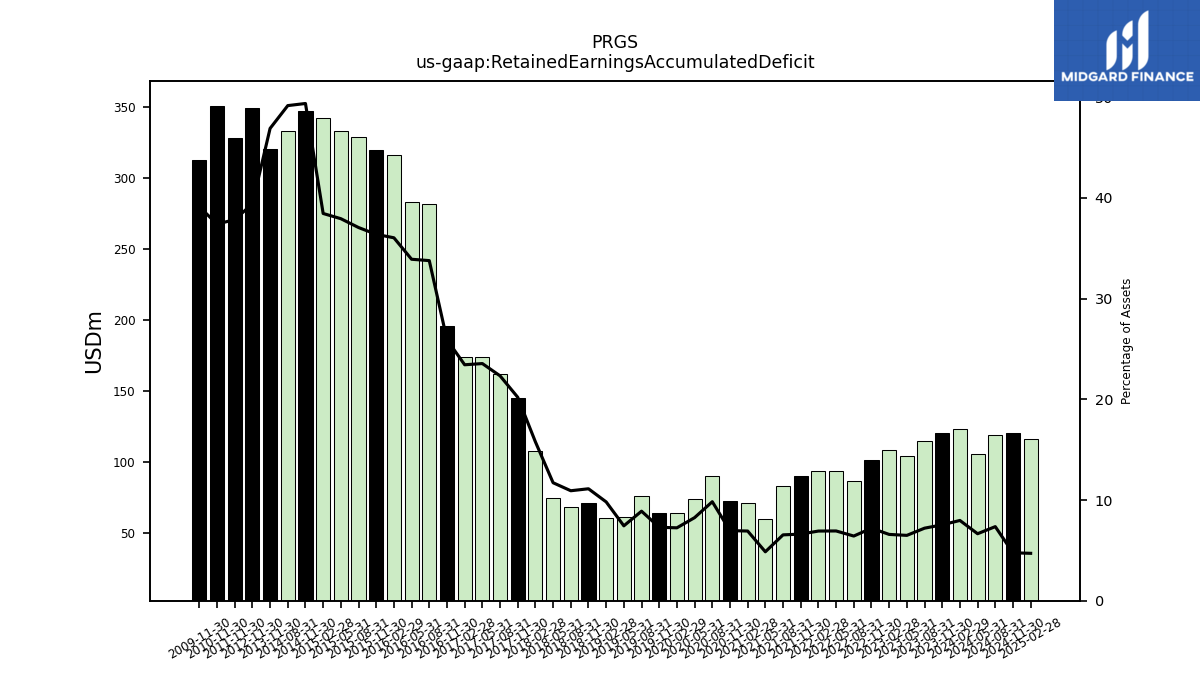
| Retained Earnings Accumulated Deficit | 120.86 | 115.13 | 104.00 | 108.29 | 101.66 | 86.51 | 93.89 | 93.66 | 90.26 | 83.45 | 60.30 | 71.12 | 72.55 | 90.42 | 73.92 | 64.47 | 64.30 | 76.49 | 61.74 | 60.46 | 71.24 | 68.33 | 74.66 | 107.80 | 145.25 | 162.14 | 173.62 | 173.69 | 195.69 | 281.30 | 282.92 | 316.08 | 319.16 | 328.63 | 332.76 | 342.14 | 347.19 | 332.73 | NA | NA | 320.01 | NA | NA | NA | 348.83 | NA | NA | NA | 327.54 | NA | NA | NA | 350.41 | NA | NA | NA | |
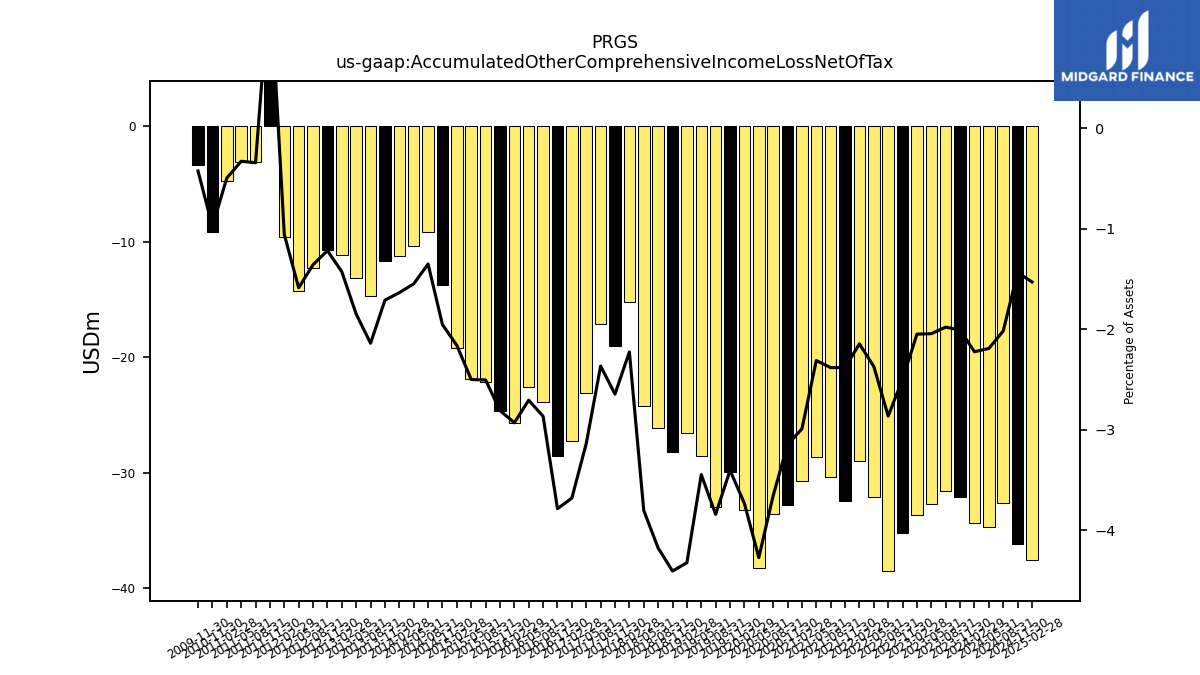
| Accumulated Other Comprehensive Income Loss Net Of Tax | -32.16 | -31.59 | -32.72 | -33.65 | -35.23 | -38.53 | -32.09 | -29.02 | -32.44 | -30.36 | -28.64 | -30.70 | -32.78 | -33.60 | -38.24 | -33.22 | -29.97 | -33.02 | -28.59 | -26.61 | -28.21 | -26.11 | -24.21 | -15.20 | -19.00 | -17.16 | -23.11 | -27.26 | -28.56 | -23.86 | -22.56 | -25.68 | -24.63 | -22.19 | -21.91 | -19.21 | -13.73 | -9.13 | -10.41 | -11.29 | -11.66 | -14.68 | -13.14 | -11.13 | -10.76 | -12.29 | -14.26 | -9.60 | 13.06 | -3.11 | -3.14 | -4.77 | -9.14 | NA | NA | NA | |
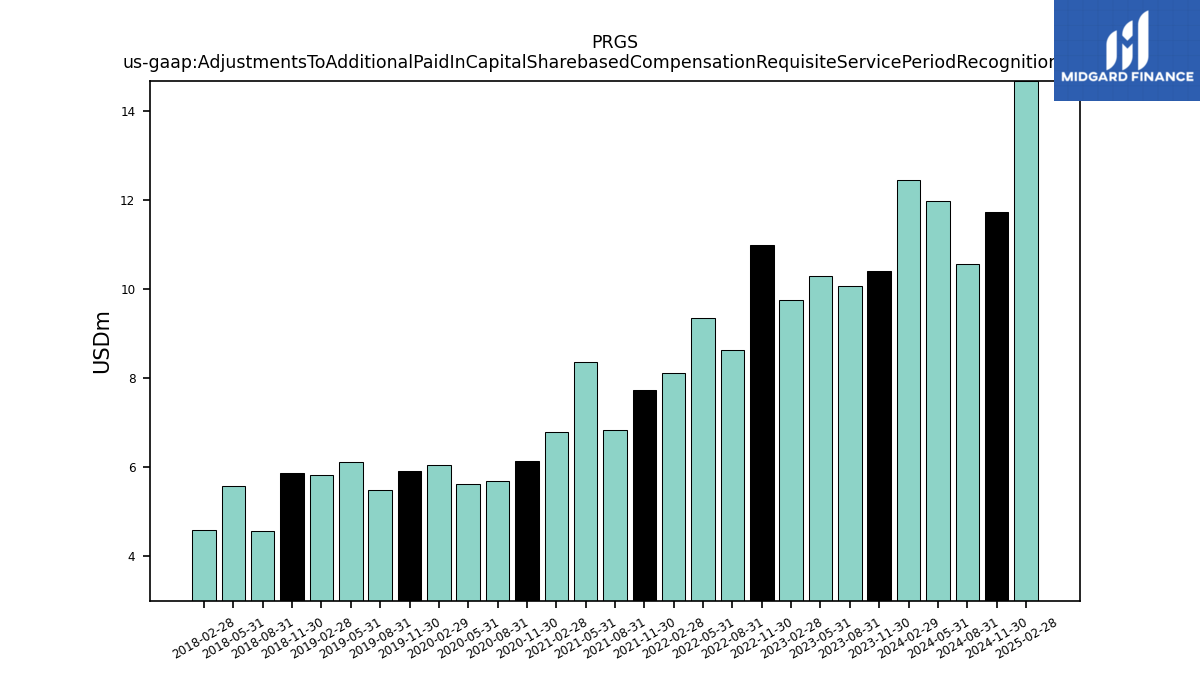
| Adjustments To Additional Paid In Capital Sharebased Compensation Requisite Service Period Recognition Value | 10.42 | 10.07 | 10.29 | 9.75 | 10.98 | 8.64 | 9.36 | 8.11 | 7.74 | 6.84 | 8.36 | 6.78 | 6.12 | 5.68 | 5.62 | 6.05 | 5.90 | 5.49 | 6.12 | 5.81 | 5.85 | 4.57 | 5.58 | 4.57 | NA | NA | NA | NA | NA | NA | NA | NA | NA | NA | NA | NA | NA | NA | NA | NA | NA | NA | NA | NA | NA | NA | NA | NA | NA | NA | NA | NA | NA | NA | NA | NA |
| 2023-11-30 | 2023-08-31 | 2023-05-31 | 2023-02-28 | 2022-11-30 | 2022-08-31 | 2022-05-31 | 2022-02-28 | 2021-11-30 | 2021-08-31 | 2021-05-31 | 2021-02-28 | 2020-11-30 | 2020-08-31 | 2020-05-31 | 2020-02-29 | 2019-11-30 | 2019-08-31 | 2019-05-31 | 2019-02-28 | 2018-11-30 | 2018-08-31 | 2018-05-31 | 2018-02-28 | 2017-11-30 | 2017-08-31 | 2017-05-31 | 2017-02-28 | 2016-11-30 | 2016-08-31 | 2016-05-31 | 2016-02-29 | 2015-11-30 | 2015-08-31 | 2015-05-31 | 2015-02-28 | 2014-11-30 | 2014-08-31 | 2014-05-31 | 2014-02-28 | 2013-11-30 | 2013-08-31 | 2013-05-31 | 2013-02-28 | 2012-11-30 | 2012-08-31 | 2012-05-31 | 2012-02-29 | 2011-11-30 | 2011-08-31 | 2011-05-31 | 2011-02-28 | 2010-11-30 | 2010-08-31 | 2010-05-31 | 2010-02-28 | ||
|---|---|---|---|---|---|---|---|---|---|---|---|---|---|---|---|---|---|---|---|---|---|---|---|---|---|---|---|---|---|---|---|---|---|---|---|---|---|---|---|---|---|---|---|---|---|---|---|---|---|---|---|---|---|---|---|---|---|
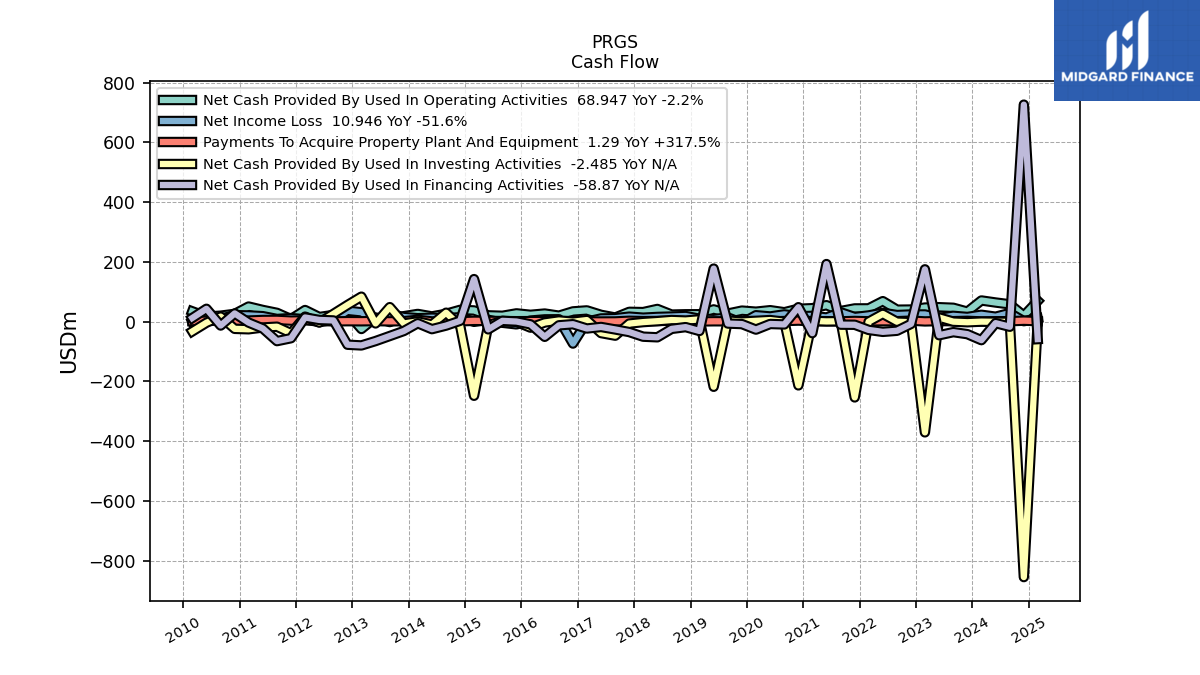
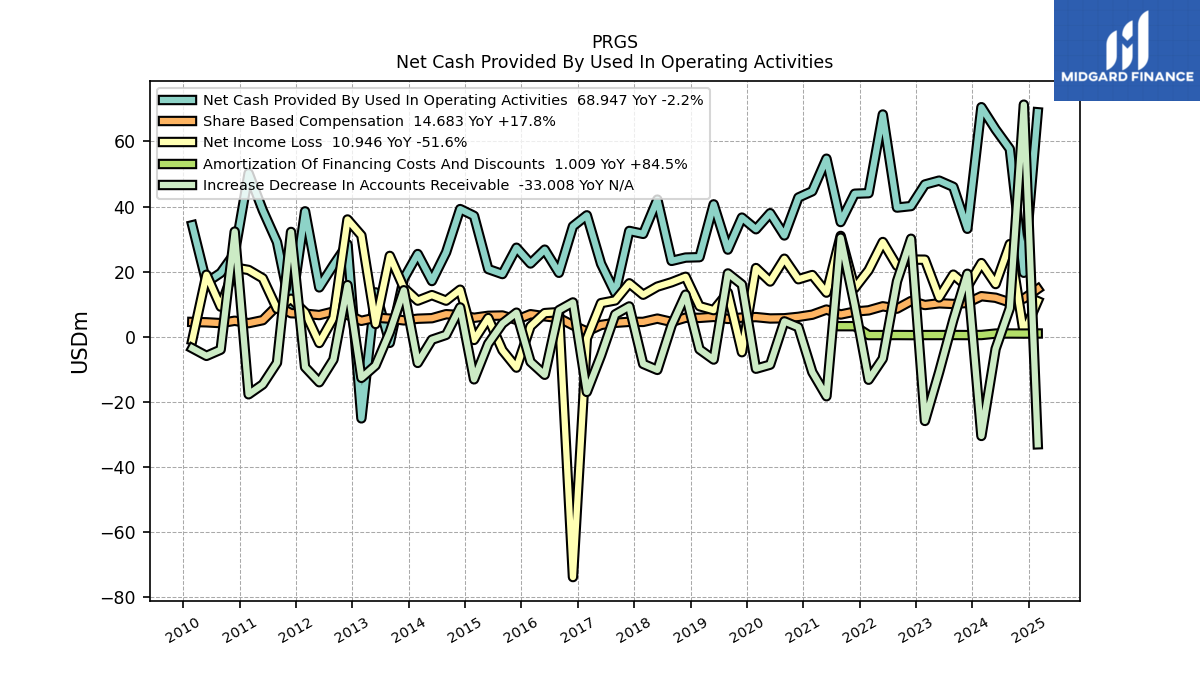
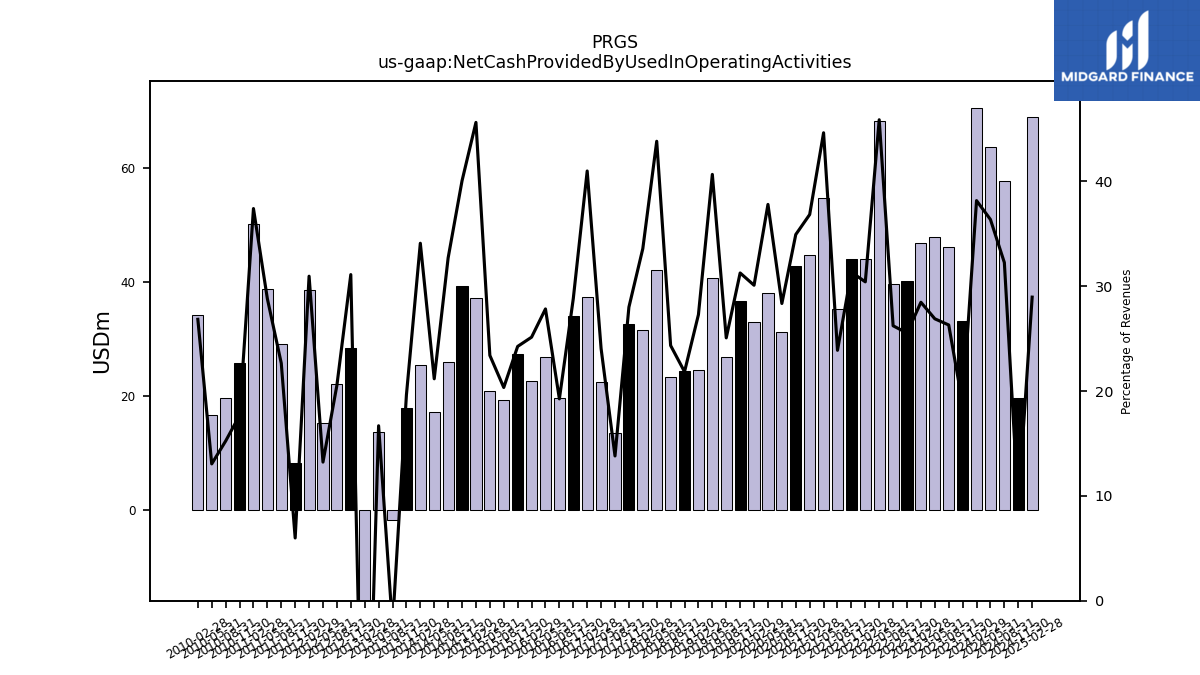
| Net Cash Provided By Used In Operating Activities | 33.16 | 46.04 | 47.95 | 46.77 | 40.14 | 39.67 | 68.26 | 44.09 | 43.93 | 35.22 | 54.69 | 44.69 | 42.76 | 31.11 | 37.96 | 33.02 | 36.60 | 26.77 | 40.67 | 24.44 | 24.33 | 23.30 | 42.13 | 31.59 | 32.52 | 13.44 | 22.43 | 37.30 | 33.94 | 19.65 | 26.76 | 22.50 | 27.35 | 19.26 | 20.79 | 37.14 | 39.23 | 25.93 | 17.12 | 25.42 | 17.86 | -1.86 | 13.64 | -25.06 | 28.40 | 22.02 | 15.16 | 38.53 | 8.17 | 29.09 | 38.81 | 50.23 | 25.67 | 19.62 | 16.67 | 34.25 | |
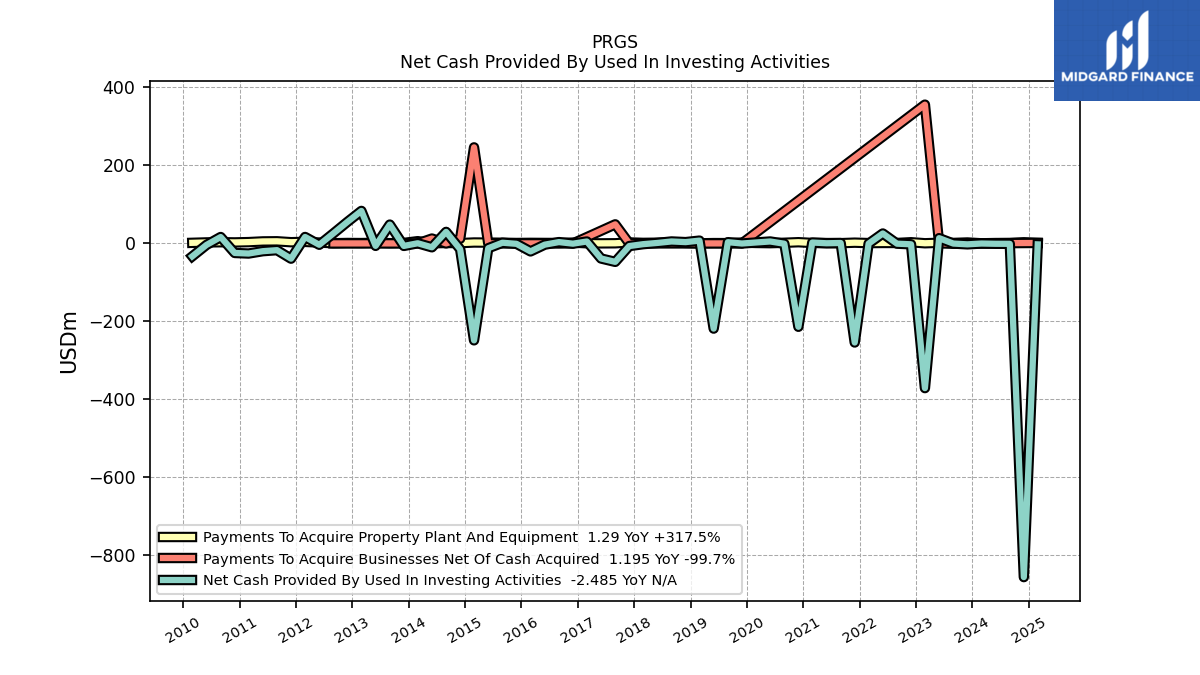
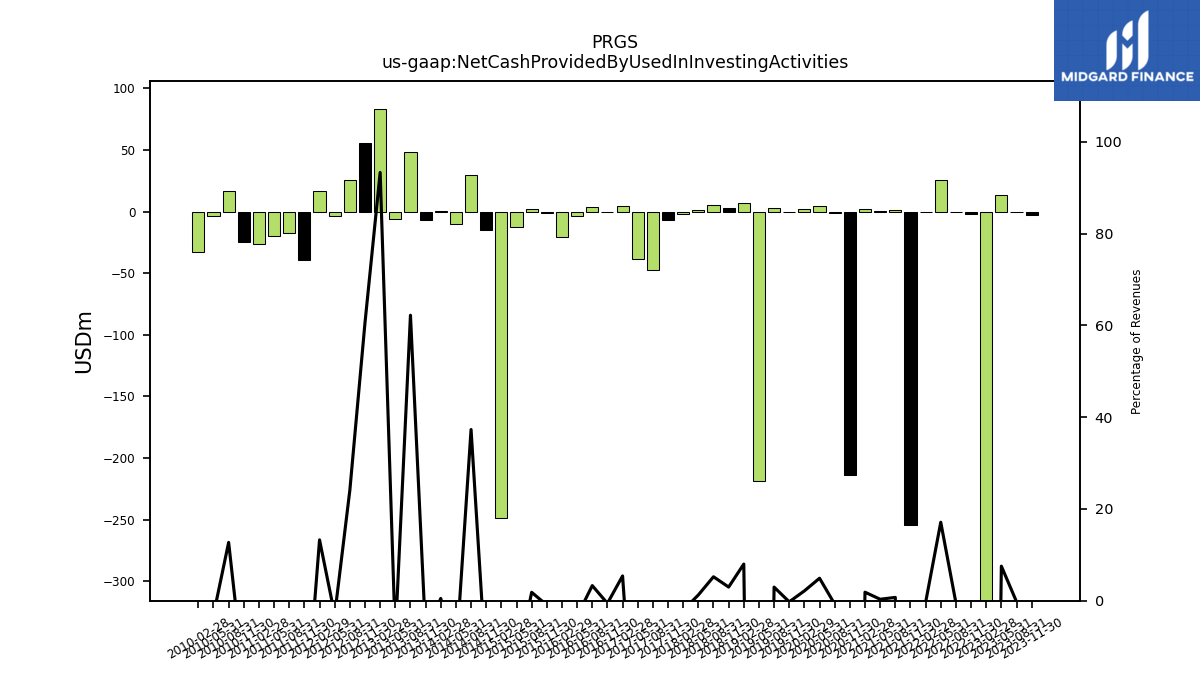
| Net Cash Provided By Used In Investing Activities | -2.39 | -0.37 | 13.44 | -371.07 | -2.25 | -0.67 | 25.45 | -0.53 | -254.07 | 1.07 | 0.40 | 2.26 | -213.77 | -0.81 | 4.92 | 2.36 | -0.28 | 3.17 | -218.43 | 7.16 | 3.32 | 5.00 | 1.21 | -1.94 | -6.76 | -47.31 | -38.65 | 4.92 | -0.67 | 3.37 | -3.21 | -20.49 | -1.06 | 1.74 | -12.35 | -248.54 | -14.86 | 29.58 | -9.96 | 0.37 | -6.46 | 48.27 | -6.36 | 83.31 | 55.31 | 25.83 | -3.50 | 16.50 | -39.14 | -17.28 | -19.94 | -25.94 | -24.50 | 16.37 | -3.93 | -33.10 | |
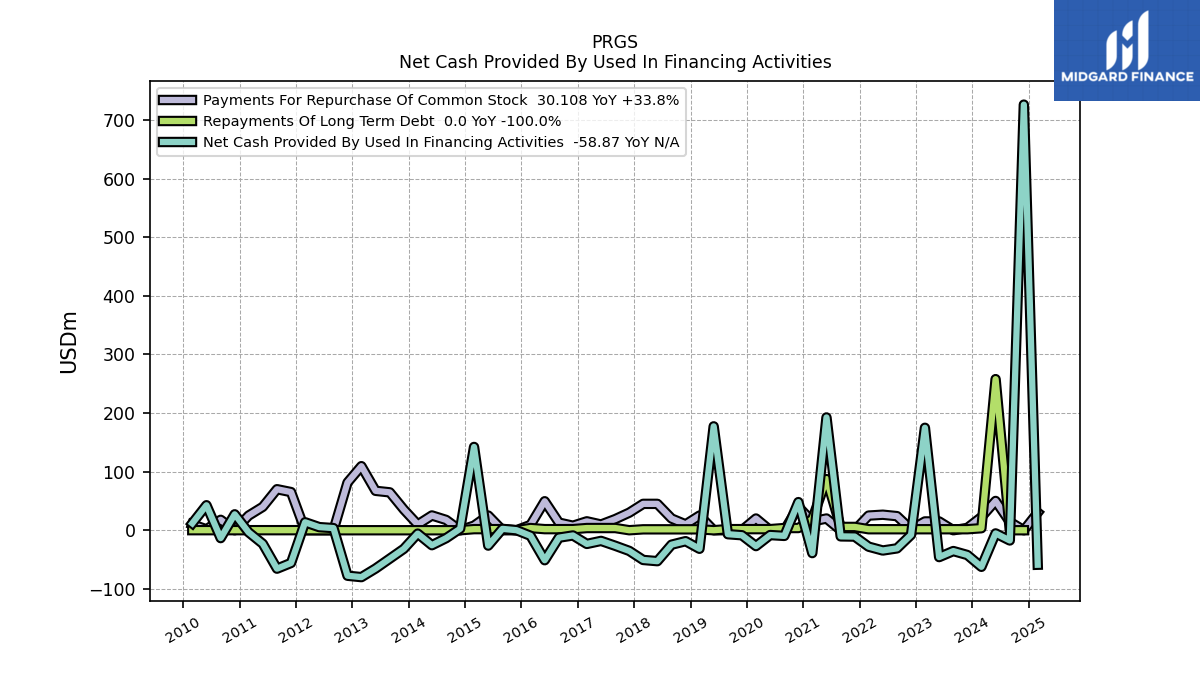
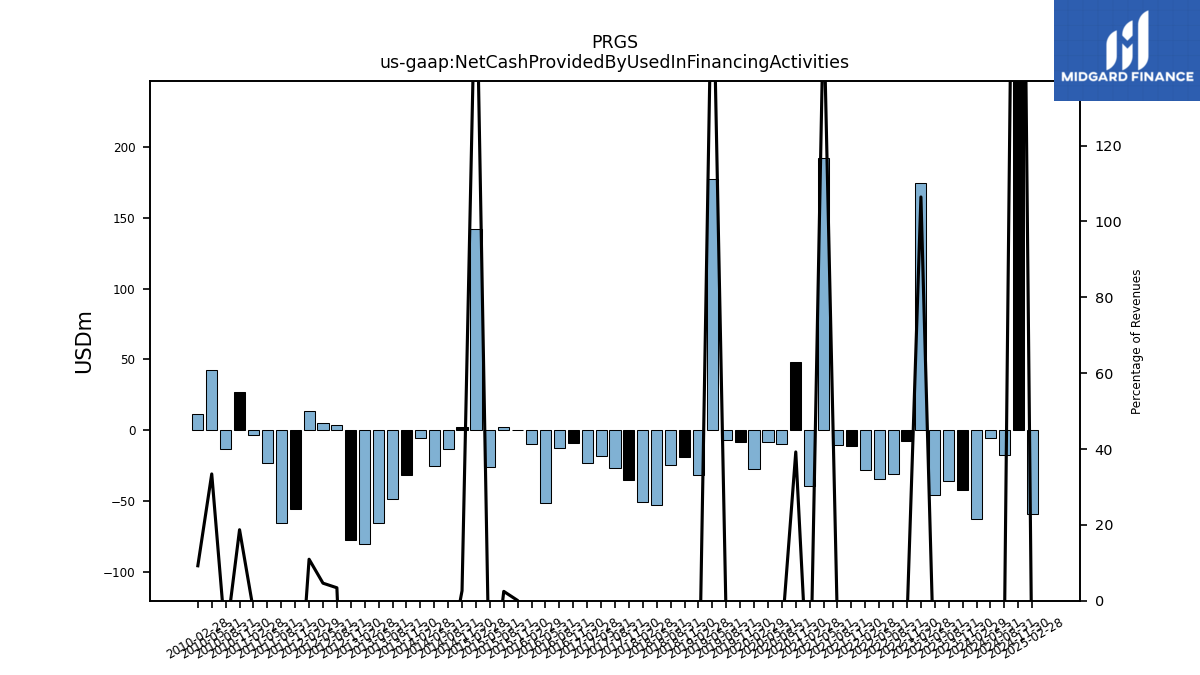
| Net Cash Provided By Used In Financing Activities | -42.26 | -35.51 | -45.84 | 174.80 | -7.89 | -30.93 | -34.57 | -28.03 | -10.84 | -10.48 | 192.45 | -39.02 | 48.01 | -9.67 | -8.20 | -27.05 | -8.54 | -6.77 | 177.25 | -31.64 | -18.66 | -24.66 | -52.76 | -50.70 | -35.26 | -26.50 | -18.19 | -23.36 | -8.91 | -12.66 | -51.16 | -9.47 | 0.07 | 2.34 | -26.22 | 142.11 | 2.58 | -13.52 | -25.53 | -5.75 | -31.69 | -48.42 | -65.30 | -79.99 | -77.61 | 3.66 | 5.31 | 13.61 | -55.84 | -65.56 | -23.10 | -3.48 | 27.18 | -13.45 | 42.67 | 11.76 |
| 2023-11-30 | 2023-08-31 | 2023-05-31 | 2023-02-28 | 2022-11-30 | 2022-08-31 | 2022-05-31 | 2022-02-28 | 2021-11-30 | 2021-08-31 | 2021-05-31 | 2021-02-28 | 2020-11-30 | 2020-08-31 | 2020-05-31 | 2020-02-29 | 2019-11-30 | 2019-08-31 | 2019-05-31 | 2019-02-28 | 2018-11-30 | 2018-08-31 | 2018-05-31 | 2018-02-28 | 2017-11-30 | 2017-08-31 | 2017-05-31 | 2017-02-28 | 2016-11-30 | 2016-08-31 | 2016-05-31 | 2016-02-29 | 2015-11-30 | 2015-08-31 | 2015-05-31 | 2015-02-28 | 2014-11-30 | 2014-08-31 | 2014-05-31 | 2014-02-28 | 2013-11-30 | 2013-08-31 | 2013-05-31 | 2013-02-28 | 2012-11-30 | 2012-08-31 | 2012-05-31 | 2012-02-29 | 2011-11-30 | 2011-08-31 | 2011-05-31 | 2011-02-28 | 2010-11-30 | 2010-08-31 | 2010-05-31 | 2010-02-28 | ||
|---|---|---|---|---|---|---|---|---|---|---|---|---|---|---|---|---|---|---|---|---|---|---|---|---|---|---|---|---|---|---|---|---|---|---|---|---|---|---|---|---|---|---|---|---|---|---|---|---|---|---|---|---|---|---|---|---|---|
| Net Cash Provided By Used In Operating Activities | 33.16 | 46.04 | 47.95 | 46.77 | 40.14 | 39.67 | 68.26 | 44.09 | 43.93 | 35.22 | 54.69 | 44.69 | 42.76 | 31.11 | 37.96 | 33.02 | 36.60 | 26.77 | 40.67 | 24.44 | 24.33 | 23.30 | 42.13 | 31.59 | 32.52 | 13.44 | 22.43 | 37.30 | 33.94 | 19.65 | 26.76 | 22.50 | 27.35 | 19.26 | 20.79 | 37.14 | 39.23 | 25.93 | 17.12 | 25.42 | 17.86 | -1.86 | 13.64 | -25.06 | 28.40 | 22.02 | 15.16 | 38.53 | 8.17 | 29.09 | 38.81 | 50.23 | 25.67 | 19.62 | 16.67 | 34.25 | |
| Net Income Loss | 15.34 | 19.10 | 12.09 | 23.67 | 23.71 | 21.80 | 29.11 | 20.45 | 14.93 | 30.98 | 13.56 | 18.96 | 17.66 | 23.98 | 16.97 | 21.12 | -4.74 | 13.56 | 8.18 | 9.40 | 18.43 | 16.75 | 15.40 | 12.91 | 16.43 | 11.17 | 10.34 | -0.53 | -73.79 | 7.58 | 7.28 | 3.22 | -9.47 | -4.13 | 5.77 | -0.97 | 14.46 | 11.10 | 12.80 | 11.10 | 15.04 | 24.84 | 3.91 | 31.12 | 36.02 | 5.84 | -1.91 | 7.49 | 11.68 | 8.60 | 17.96 | 20.52 | 21.27 | 9.24 | 19.06 | -1.01 | |
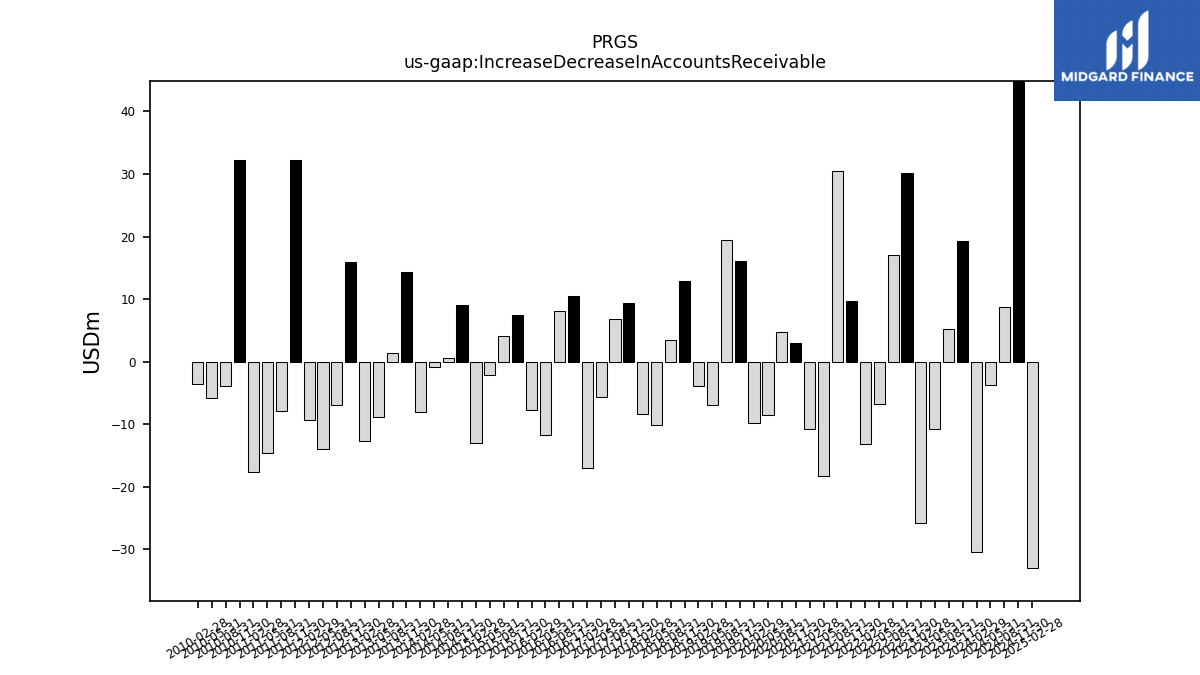
| Increase Decrease In Accounts Receivable | 19.36 | 5.21 | -10.85 | -25.84 | 30.11 | 17.04 | -6.70 | -13.19 | 9.68 | 30.42 | -18.26 | -10.84 | 2.94 | 4.75 | -8.56 | -9.81 | 16.05 | 19.46 | -7.00 | -3.86 | 12.95 | 3.48 | -10.17 | -8.33 | 9.33 | 6.88 | -5.71 | -16.94 | 10.56 | 8.15 | -11.67 | -7.70 | 7.41 | 4.07 | -2.15 | -13.08 | 9.03 | 0.59 | -0.89 | -8.03 | 14.29 | 1.44 | -8.79 | -12.62 | 15.88 | -6.99 | -13.96 | -9.31 | 32.20 | -7.96 | -14.62 | -17.67 | 32.31 | -3.96 | -5.86 | -3.52 | |
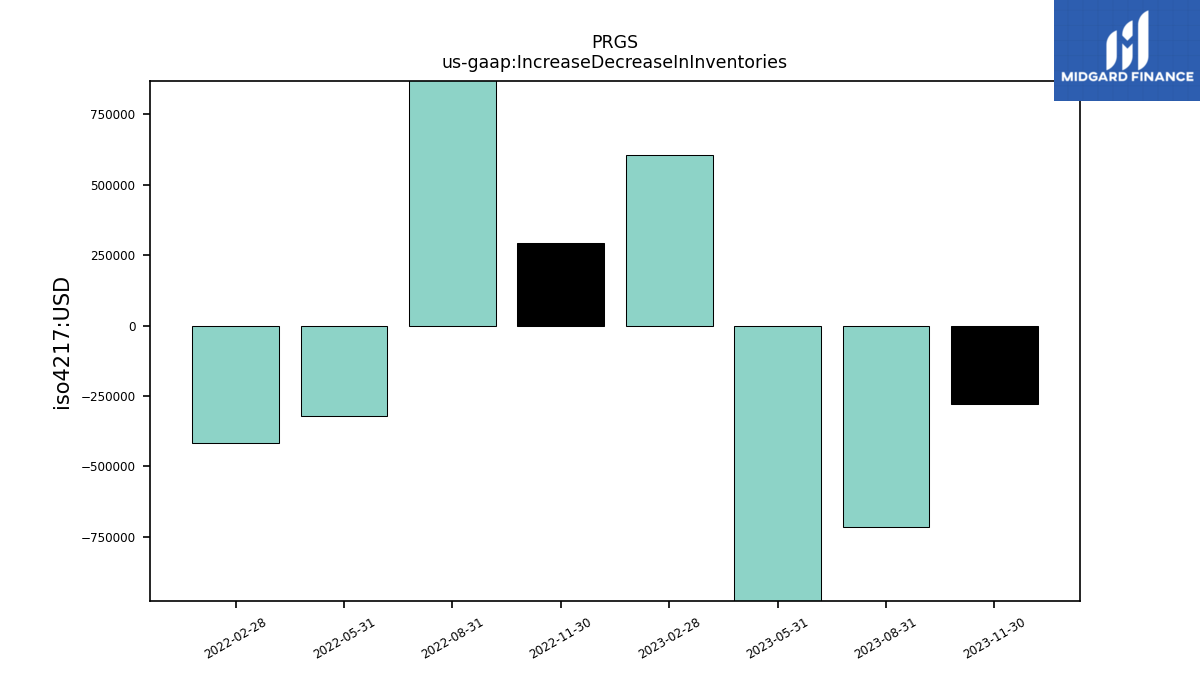
| Increase Decrease In Inventories | -0.28 | -0.71 | -2.10 | 0.60 | 0.29 | 2.00 | -0.32 | -0.42 | NA | NA | NA | NA | NA | NA | NA | NA | NA | NA | NA | NA | NA | NA | NA | NA | NA | NA | NA | NA | NA | NA | NA | NA | NA | NA | NA | NA | NA | NA | NA | NA | NA | NA | NA | NA | NA | NA | NA | NA | NA | NA | NA | NA | NA | NA | NA | NA | |
| Share Based Compensation | 10.42 | 10.07 | 10.29 | 9.75 | 10.98 | 8.64 | 9.36 | 8.11 | 7.74 | 6.84 | 8.36 | 6.78 | 6.12 | 5.68 | 5.62 | 6.05 | 5.90 | 5.49 | 6.12 | 5.81 | 5.85 | 4.57 | 5.58 | 4.57 | 4.59 | 4.30 | 3.63 | 1.63 | 3.53 | 5.78 | 6.29 | 6.94 | 5.19 | 6.54 | 6.44 | 5.84 | 6.68 | 6.94 | 5.71 | 5.54 | 5.04 | 5.57 | 5.88 | 4.91 | 6.73 | 7.74 | 6.67 | 7.09 | 7.24 | 9.47 | 5.10 | 4.18 | 4.92 | 4.20 | 4.45 | 4.56 |
| 2023-11-30 | 2023-08-31 | 2023-05-31 | 2023-02-28 | 2022-11-30 | 2022-08-31 | 2022-05-31 | 2022-02-28 | 2021-11-30 | 2021-08-31 | 2021-05-31 | 2021-02-28 | 2020-11-30 | 2020-08-31 | 2020-05-31 | 2020-02-29 | 2019-11-30 | 2019-08-31 | 2019-05-31 | 2019-02-28 | 2018-11-30 | 2018-08-31 | 2018-05-31 | 2018-02-28 | 2017-11-30 | 2017-08-31 | 2017-05-31 | 2017-02-28 | 2016-11-30 | 2016-08-31 | 2016-05-31 | 2016-02-29 | 2015-11-30 | 2015-08-31 | 2015-05-31 | 2015-02-28 | 2014-11-30 | 2014-08-31 | 2014-05-31 | 2014-02-28 | 2013-11-30 | 2013-08-31 | 2013-05-31 | 2013-02-28 | 2012-11-30 | 2012-08-31 | 2012-05-31 | 2012-02-29 | 2011-11-30 | 2011-08-31 | 2011-05-31 | 2011-02-28 | 2010-11-30 | 2010-08-31 | 2010-05-31 | 2010-02-28 | ||
|---|---|---|---|---|---|---|---|---|---|---|---|---|---|---|---|---|---|---|---|---|---|---|---|---|---|---|---|---|---|---|---|---|---|---|---|---|---|---|---|---|---|---|---|---|---|---|---|---|---|---|---|---|---|---|---|---|---|
| Net Cash Provided By Used In Investing Activities | -2.39 | -0.37 | 13.44 | -371.07 | -2.25 | -0.67 | 25.45 | -0.53 | -254.07 | 1.07 | 0.40 | 2.26 | -213.77 | -0.81 | 4.92 | 2.36 | -0.28 | 3.17 | -218.43 | 7.16 | 3.32 | 5.00 | 1.21 | -1.94 | -6.76 | -47.31 | -38.65 | 4.92 | -0.67 | 3.37 | -3.21 | -20.49 | -1.06 | 1.74 | -12.35 | -248.54 | -14.86 | 29.58 | -9.96 | 0.37 | -6.46 | 48.27 | -6.36 | 83.31 | 55.31 | 25.83 | -3.50 | 16.50 | -39.14 | -17.28 | -19.94 | -25.94 | -24.50 | 16.37 | -3.93 | -33.10 | |
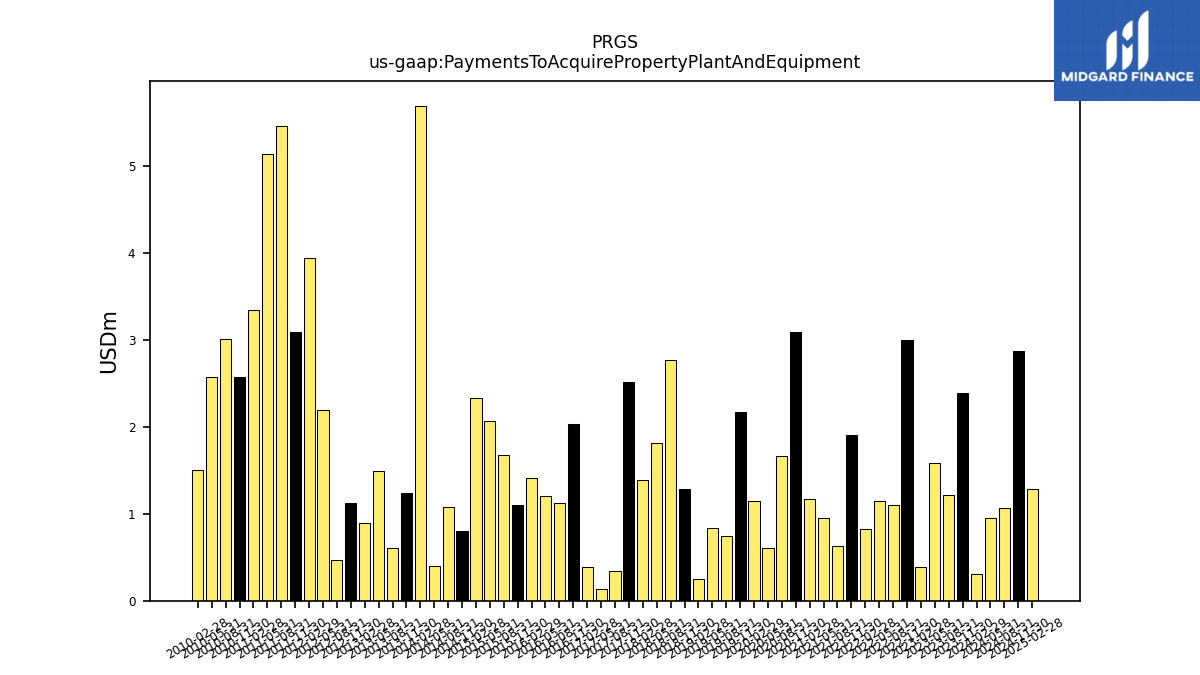
| Payments To Acquire Property Plant And Equipment | 2.39 | 1.21 | 1.58 | 0.39 | 3.00 | 1.11 | 1.15 | 0.83 | 1.91 | 0.62 | 0.95 | 1.17 | 3.10 | 1.66 | 0.61 | 1.15 | 2.17 | 0.75 | 0.83 | 0.25 | 1.28 | 2.77 | 1.81 | 1.39 | 2.51 | 0.34 | 0.14 | 0.38 | 2.04 | 1.13 | 1.20 | 1.41 | 1.10 | 1.67 | 2.07 | 2.33 | 0.80 | 1.08 | 0.40 | 5.70 | 1.24 | 0.60 | 1.49 | 0.90 | 1.13 | 0.47 | 2.20 | 3.94 | 3.09 | 5.46 | 5.14 | 3.35 | 2.57 | 3.02 | 2.57 | 1.50 | |
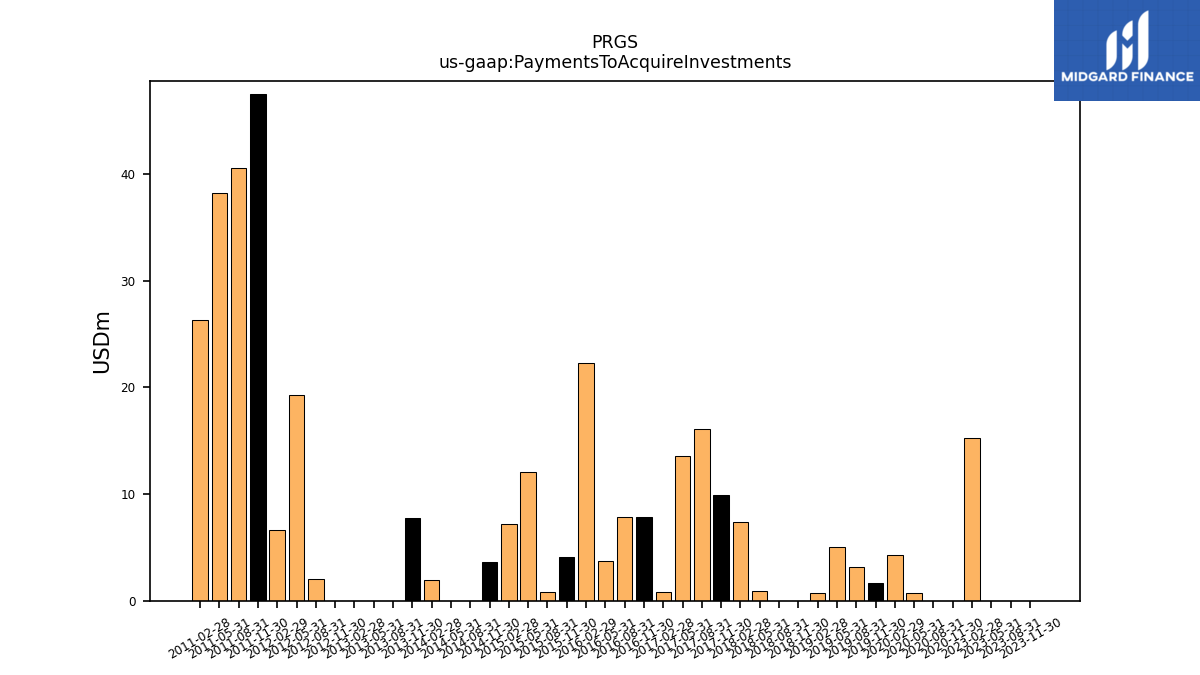
| Payments To Acquire Investments | 0.00 | 0.00 | 0.00 | 15.26 | NA | NA | NA | NA | NA | NA | NA | NA | 0.00 | 0.00 | 0.75 | 4.26 | 1.65 | 3.15 | 5.00 | 0.75 | 0.00 | 0.00 | 0.88 | 7.37 | 9.90 | 16.11 | 13.52 | 0.85 | 7.83 | 7.89 | 3.71 | 22.26 | 4.11 | 0.80 | 12.04 | 7.22 | 3.64 | 0.00 | 0.00 | 1.90 | 7.75 | 0.00 | 0.00 | 0.00 | 0.00 | 2.04 | 19.26 | 6.62 | 47.53 | 40.60 | 38.24 | 26.29 | NA | NA | NA | NA |
| 2023-11-30 | 2023-08-31 | 2023-05-31 | 2023-02-28 | 2022-11-30 | 2022-08-31 | 2022-05-31 | 2022-02-28 | 2021-11-30 | 2021-08-31 | 2021-05-31 | 2021-02-28 | 2020-11-30 | 2020-08-31 | 2020-05-31 | 2020-02-29 | 2019-11-30 | 2019-08-31 | 2019-05-31 | 2019-02-28 | 2018-11-30 | 2018-08-31 | 2018-05-31 | 2018-02-28 | 2017-11-30 | 2017-08-31 | 2017-05-31 | 2017-02-28 | 2016-11-30 | 2016-08-31 | 2016-05-31 | 2016-02-29 | 2015-11-30 | 2015-08-31 | 2015-05-31 | 2015-02-28 | 2014-11-30 | 2014-08-31 | 2014-05-31 | 2014-02-28 | 2013-11-30 | 2013-08-31 | 2013-05-31 | 2013-02-28 | 2012-11-30 | 2012-08-31 | 2012-05-31 | 2012-02-29 | 2011-11-30 | 2011-08-31 | 2011-05-31 | 2011-02-28 | 2010-11-30 | 2010-08-31 | 2010-05-31 | 2010-02-28 | ||
|---|---|---|---|---|---|---|---|---|---|---|---|---|---|---|---|---|---|---|---|---|---|---|---|---|---|---|---|---|---|---|---|---|---|---|---|---|---|---|---|---|---|---|---|---|---|---|---|---|---|---|---|---|---|---|---|---|---|
| Net Cash Provided By Used In Financing Activities | -42.26 | -35.51 | -45.84 | 174.80 | -7.89 | -30.93 | -34.57 | -28.03 | -10.84 | -10.48 | 192.45 | -39.02 | 48.01 | -9.67 | -8.20 | -27.05 | -8.54 | -6.77 | 177.25 | -31.64 | -18.66 | -24.66 | -52.76 | -50.70 | -35.26 | -26.50 | -18.19 | -23.36 | -8.91 | -12.66 | -51.16 | -9.47 | 0.07 | 2.34 | -26.22 | 142.11 | 2.58 | -13.52 | -25.53 | -5.75 | -31.69 | -48.42 | -65.30 | -79.99 | -77.61 | 3.66 | 5.31 | 13.61 | -55.84 | -65.56 | -23.10 | -3.48 | 27.18 | -13.45 | 42.67 | 11.76 | |
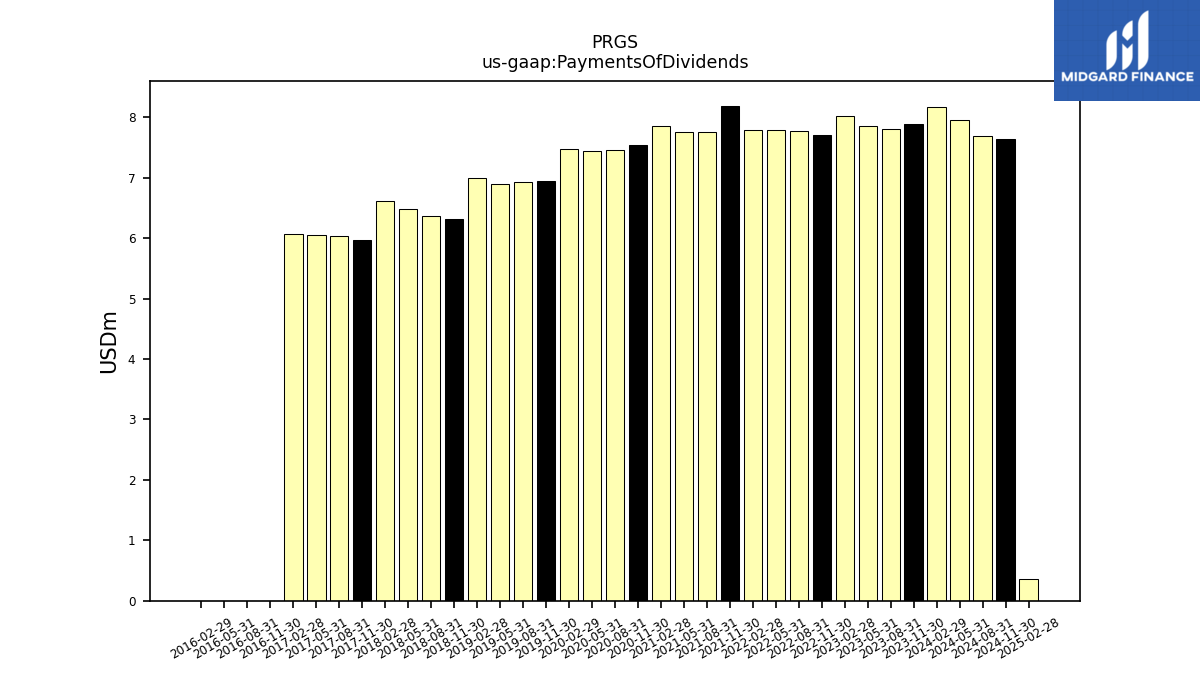
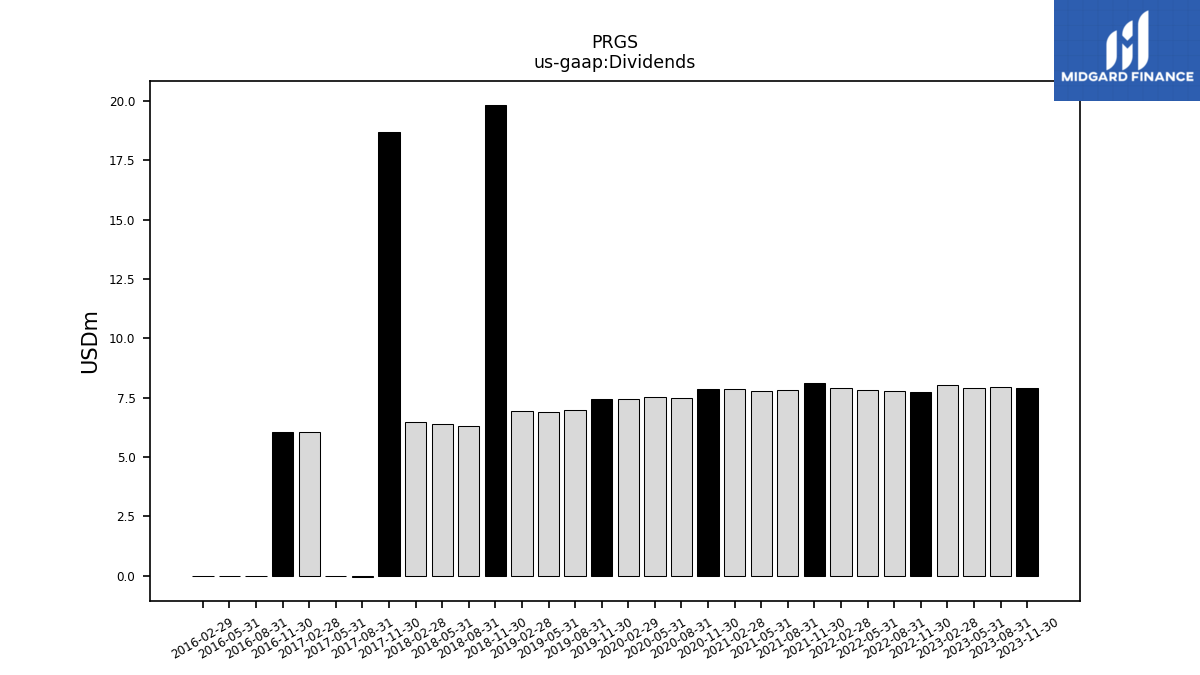
| Payments Of Dividends | 7.88 | 7.80 | 7.85 | 8.02 | 7.71 | 7.78 | 7.79 | 7.78 | 8.19 | 7.75 | 7.76 | 7.85 | 7.54 | 7.45 | 7.44 | 7.47 | 6.94 | 6.93 | 6.89 | 6.99 | 6.32 | 6.37 | 6.48 | 6.62 | 5.98 | 6.04 | 6.04 | 6.07 | 0.00 | 0.00 | 0.00 | 0.00 | NA | NA | NA | NA | NA | NA | NA | NA | NA | NA | NA | NA | NA | NA | NA | NA | NA | NA | NA | NA | NA | NA | NA | NA | |
| Dividends | 7.91 | 7.96 | 7.90 | 8.05 | 7.73 | 7.78 | 7.82 | 7.92 | 8.12 | 7.82 | 7.78 | 7.85 | 7.88 | 7.47 | 7.52 | 7.43 | 7.44 | 6.99 | 6.90 | 6.93 | 19.84 | 6.32 | 6.38 | 6.48 | 18.70 | -0.06 | -0.00 | 6.04 | 6.07 | 0.00 | 0.00 | 0.00 | NA | NA | NA | NA | NA | NA | NA | NA | NA | NA | NA | NA | NA | NA | NA | NA | NA | NA | NA | NA | NA | NA | NA | NA | |
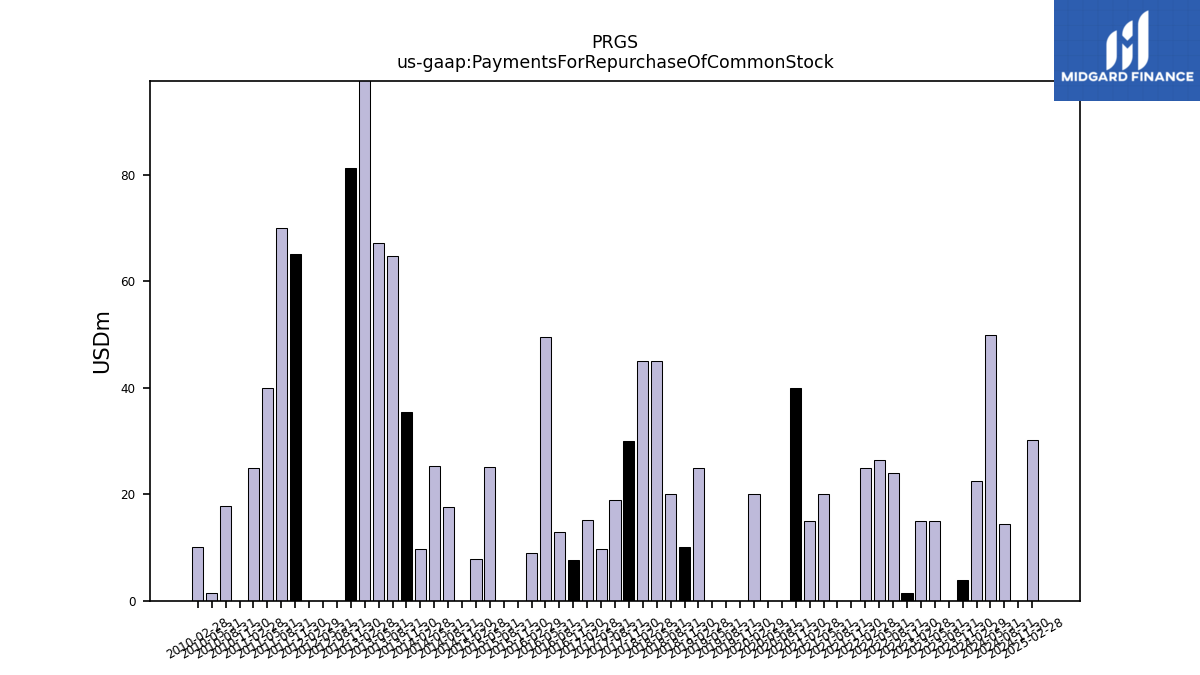
| Payments For Repurchase Of Common Stock | 3.96 | 0.00 | 15.00 | 15.00 | 1.52 | 24.05 | 26.47 | 25.00 | 0.00 | 0.00 | 20.00 | 15.00 | 40.00 | 0.00 | 0.00 | 20.00 | 0.00 | 0.00 | 0.00 | 25.00 | 10.00 | 20.00 | 45.00 | 45.00 | 30.00 | 18.98 | 9.76 | 15.19 | 7.68 | 12.99 | 49.48 | 9.04 | 0.00 | 0.00 | 25.04 | 7.83 | 0.00 | 17.61 | 25.21 | 9.79 | 35.35 | 64.65 | 67.23 | 109.30 | 81.32 | 0.00 | 0.00 | 0.00 | 65.12 | 69.99 | 39.92 | 24.98 | 0.00 | 17.80 | 1.53 | 10.01 |
| 2023-11-30 | 2023-08-31 | 2023-05-31 | 2023-02-28 | 2022-11-30 | 2022-08-31 | 2022-05-31 | 2022-02-28 | 2021-11-30 | 2021-08-31 | 2021-05-31 | 2021-02-28 | 2020-11-30 | 2020-08-31 | 2020-05-31 | 2020-02-29 | 2019-11-30 | 2019-08-31 | 2019-05-31 | 2019-02-28 | 2018-11-30 | 2018-08-31 | 2018-05-31 | 2018-02-28 | 2017-11-30 | 2017-08-31 | 2017-05-31 | 2017-02-28 | 2016-11-30 | 2016-08-31 | 2016-05-31 | 2016-02-29 | 2015-11-30 | 2015-08-31 | 2015-05-31 | 2015-02-28 | 2014-11-30 | 2014-08-31 | 2014-05-31 | 2014-02-28 | 2013-11-30 | 2013-08-31 | 2013-05-31 | 2013-02-28 | 2012-11-30 | 2012-08-31 | 2012-05-31 | 2012-02-29 | 2011-11-30 | 2011-08-31 | 2011-05-31 | 2011-02-28 | 2010-11-30 | 2010-08-31 | 2010-05-31 | 2010-02-28 | ||
|---|---|---|---|---|---|---|---|---|---|---|---|---|---|---|---|---|---|---|---|---|---|---|---|---|---|---|---|---|---|---|---|---|---|---|---|---|---|---|---|---|---|---|---|---|---|---|---|---|---|---|---|---|---|---|---|---|---|
| Revenues | 176.97 | 174.99 | 178.25 | 164.23 | 157.13 | 151.22 | 148.75 | 144.92 | 140.13 | 147.42 | 122.49 | 121.28 | 122.39 | 109.70 | 100.38 | 109.68 | 117.04 | 106.72 | 100.00 | 89.55 | 111.33 | 95.68 | 96.10 | 94.05 | 116.08 | 97.31 | 93.21 | 90.97 | 117.72 | 102.02 | 96.12 | 89.48 | 112.72 | 94.64 | 88.82 | 81.38 | 97.89 | 79.27 | 80.83 | 74.54 | 90.98 | 77.58 | 81.70 | 89.27 | 91.27 | 107.17 | 114.60 | 124.43 | 136.34 | 128.33 | 134.68 | 134.24 | 145.18 | 128.74 | 127.66 | 127.55 | |
| Revenue From Contract With Customer Excluding Assessed Tax | 176.97 | 174.99 | 178.25 | 164.23 | 157.13 | 151.22 | 148.75 | 144.92 | 140.13 | 147.42 | 122.49 | 121.28 | 122.39 | 109.70 | 100.38 | 109.68 | 117.04 | 106.72 | 100.00 | 89.55 | 111.33 | 95.68 | 96.10 | 94.05 | 116.08 | 97.31 | 93.21 | 90.97 | 117.72 | 102.02 | 96.12 | 89.48 | 112.72 | 94.64 | 88.82 | 81.38 | 97.89 | 79.27 | 80.83 | 74.54 | 90.98 | 77.58 | 81.70 | 89.27 | 91.27 | 107.17 | 114.60 | 124.43 | 136.34 | 128.33 | 134.68 | 134.24 | 145.18 | 128.74 | 127.66 | 127.55 | |
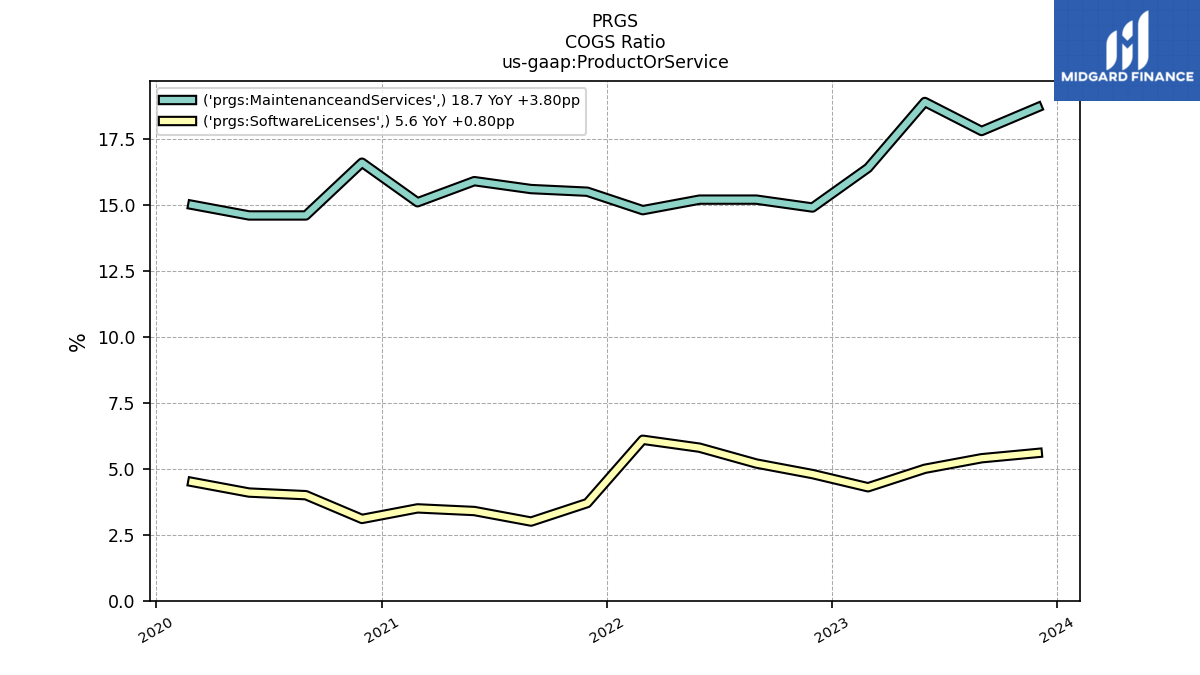
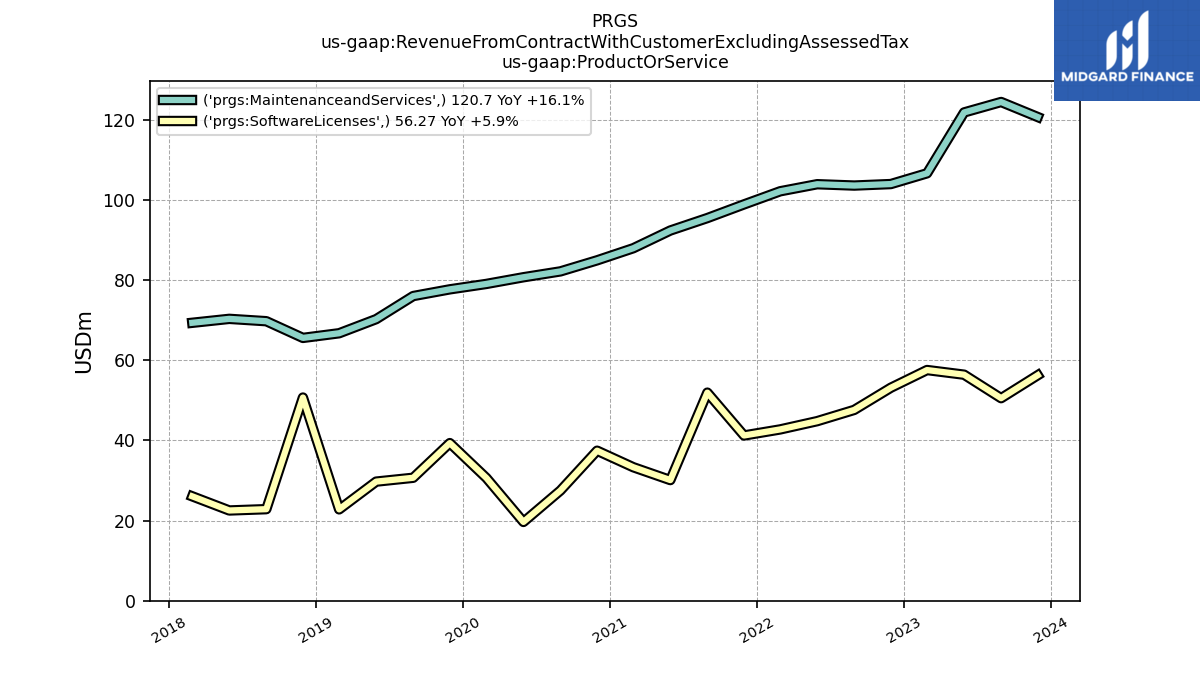
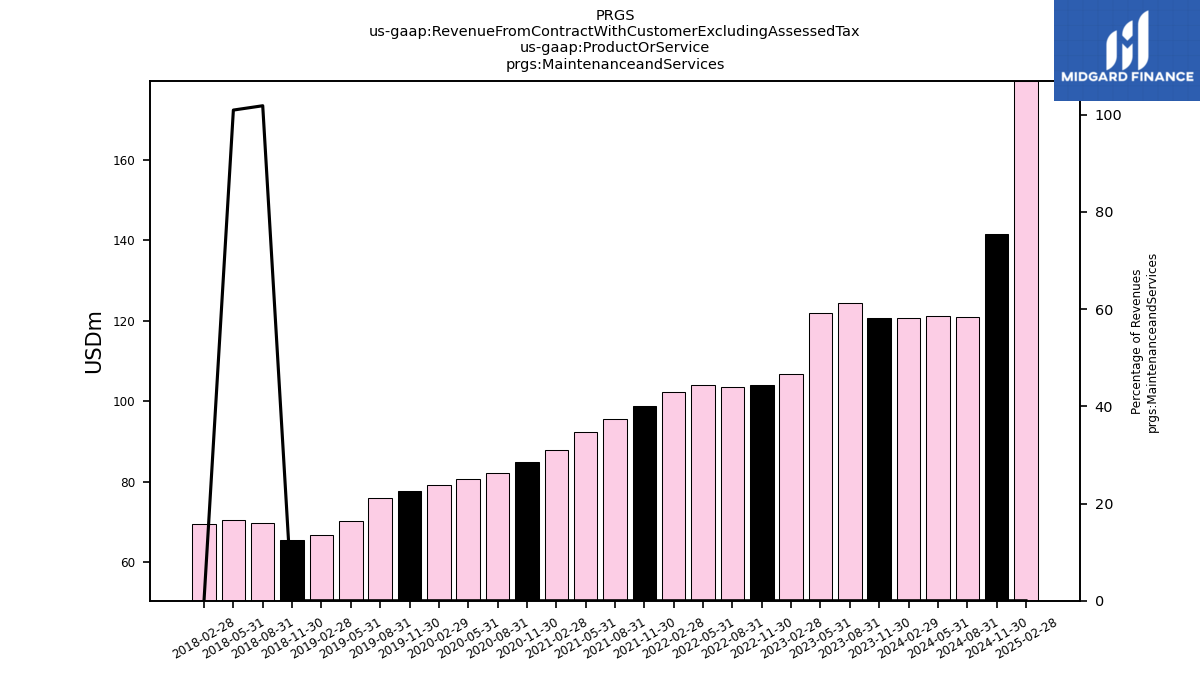
| Maintenanceand Services | 120.70 | 124.45 | 121.84 | 106.66 | 103.97 | 103.60 | 103.93 | 102.17 | 98.89 | 95.49 | 92.38 | 87.96 | 84.94 | 82.19 | 80.72 | 79.05 | 77.70 | 76.03 | 70.27 | 66.75 | 65.58 | 69.75 | 70.34 | 69.36 | NA | NA | NA | NA | NA | NA | NA | NA | NA | NA | NA | NA | NA | NA | NA | NA | NA | NA | NA | NA | NA | NA | NA | NA | NA | NA | NA | NA | NA | NA | NA | NA | |
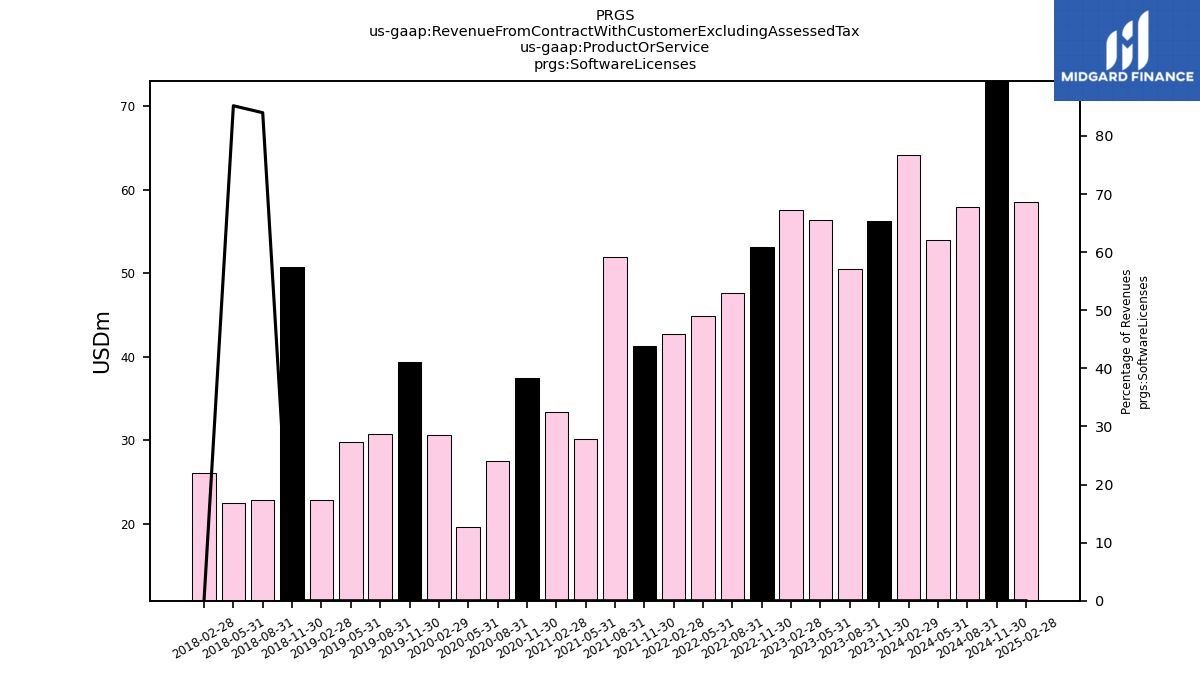
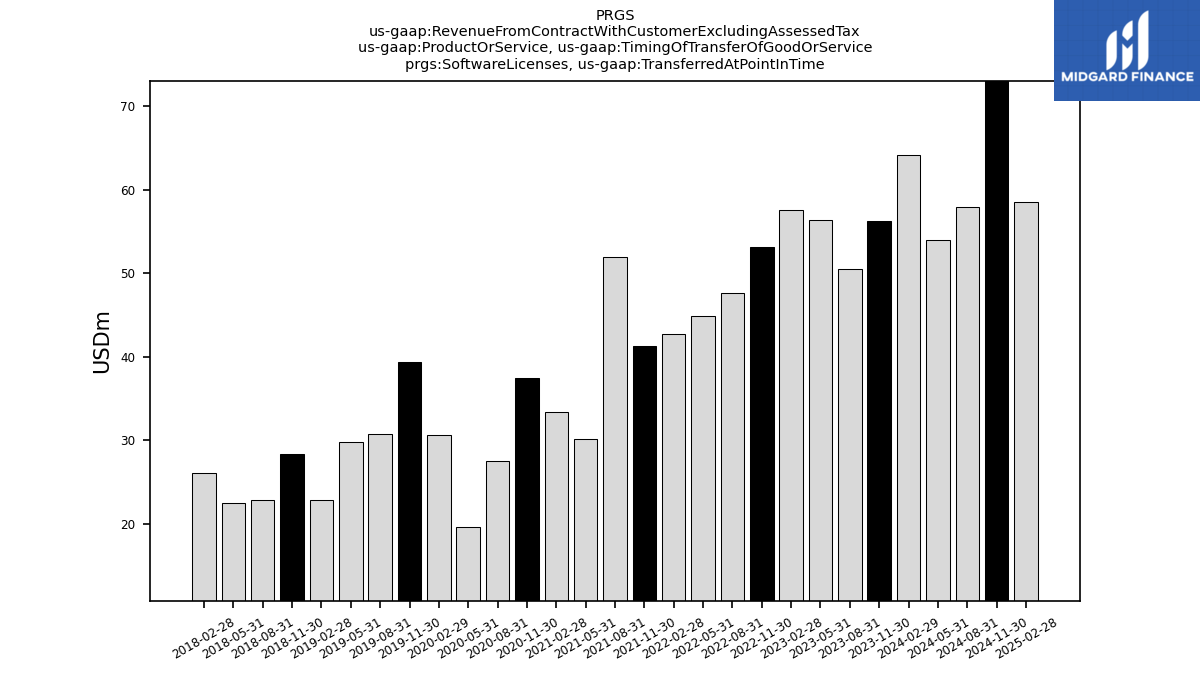
| Software Licenses | 56.27 | 50.54 | 56.41 | 57.57 | 53.15 | 47.62 | 44.81 | 42.75 | 41.24 | 51.93 | 30.11 | 33.32 | 37.44 | 27.51 | 19.66 | 30.63 | 39.34 | 30.69 | 29.73 | 22.80 | 50.70 | 22.85 | 22.53 | 26.05 | NA | NA | NA | NA | NA | NA | NA | NA | NA | NA | NA | NA | NA | NA | NA | NA | NA | NA | NA | NA | NA | NA | NA | NA | NA | NA | NA | NA | NA | NA | NA | NA | |
| Software Licenses, Transferred At Point In Time | 56.27 | 50.54 | 56.41 | 57.57 | 53.15 | 47.62 | 44.81 | 42.75 | 41.24 | 51.93 | 30.11 | 33.32 | 37.44 | 27.51 | 19.66 | 30.63 | 39.34 | 30.69 | 29.73 | 22.80 | 28.37 | 22.85 | 22.53 | 26.05 | NA | NA | NA | NA | NA | NA | NA | NA | NA | NA | NA | NA | NA | NA | NA | NA | NA | NA | NA | NA | NA | NA | NA | NA | NA | NA | NA | NA | NA | NA | NA | NA | |
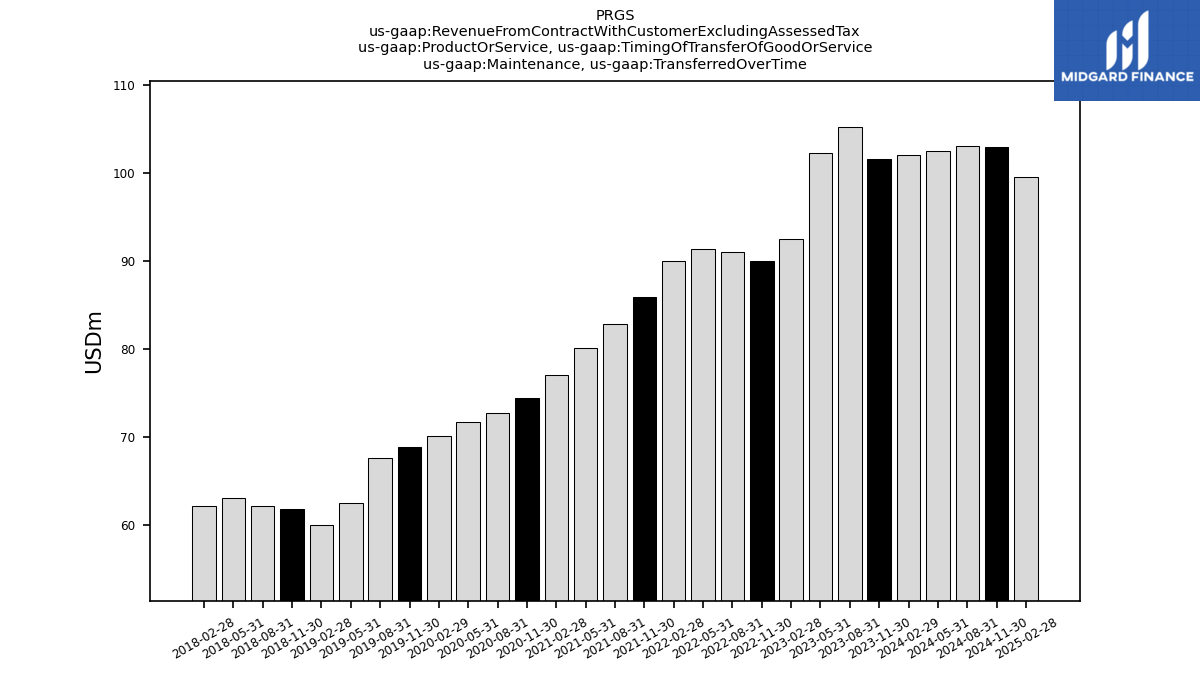
| Maintenance, Transferred Over Time | 101.58 | 105.16 | 102.24 | 92.51 | 90.00 | 91.04 | 91.33 | 89.96 | 85.94 | 82.88 | 80.07 | 76.98 | 74.38 | 72.76 | 71.69 | 70.06 | 68.87 | 67.61 | 62.53 | 60.00 | 61.76 | 62.17 | 63.06 | 62.18 | NA | NA | NA | NA | NA | NA | NA | NA | NA | NA | NA | NA | NA | NA | NA | NA | NA | NA | NA | NA | NA | NA | NA | NA | NA | NA | NA | NA | NA | NA | NA | NA | |
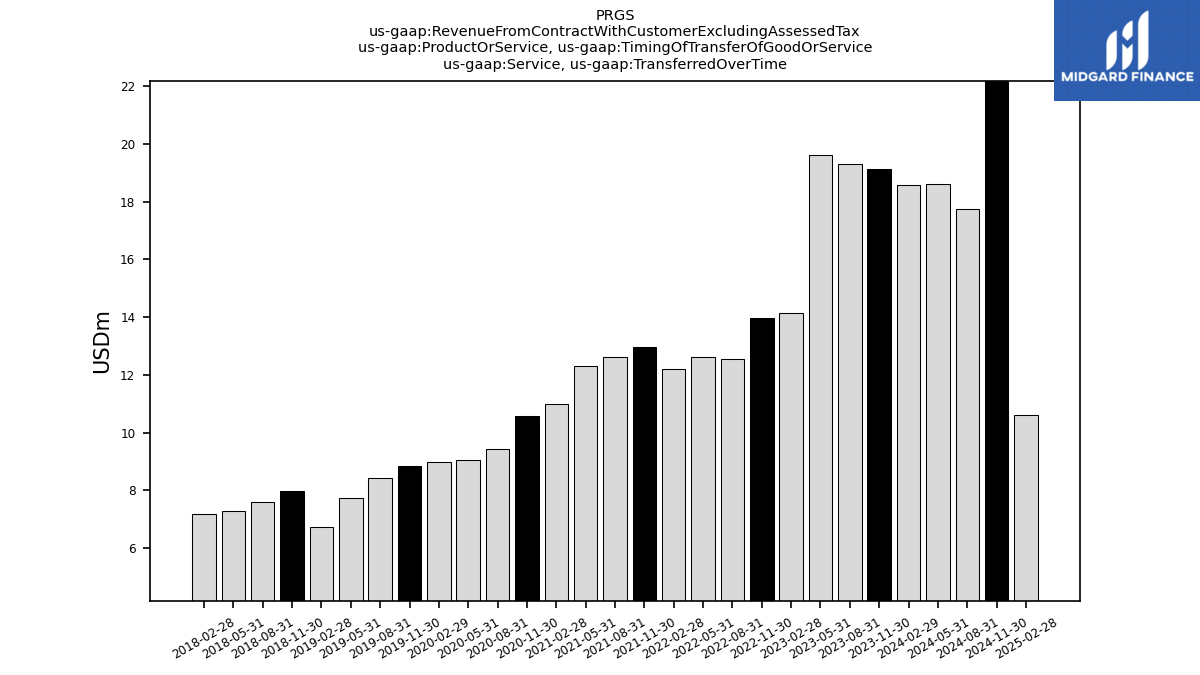
| Service, Transferred Over Time | 19.12 | 19.28 | 19.60 | 14.14 | 13.97 | 12.56 | 12.60 | 12.21 | 12.95 | 12.61 | 12.31 | 10.99 | 10.56 | 9.42 | 9.03 | 9.00 | 8.83 | 8.42 | 7.74 | 6.75 | 7.98 | 7.58 | 7.28 | 7.17 | NA | NA | NA | NA | NA | NA | NA | NA | NA | NA | NA | NA | NA | NA | NA | NA | NA | NA | NA | NA | NA | NA | NA | NA | NA | NA | NA | NA | NA | NA | NA | NA | |
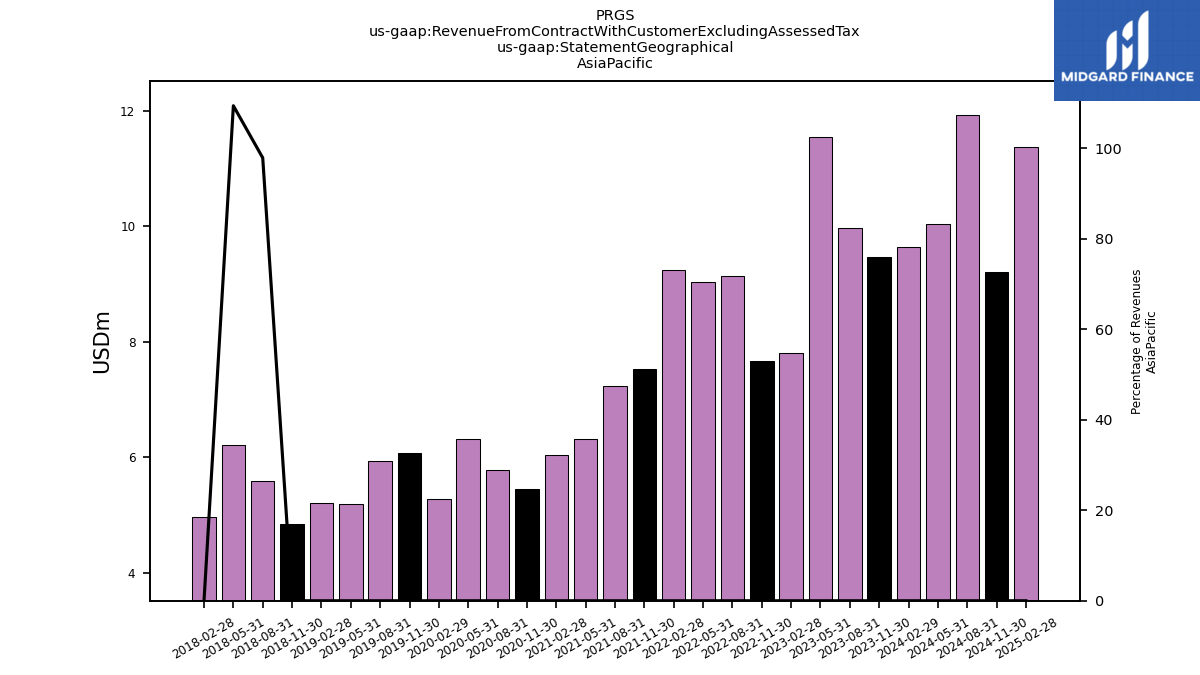
| 9.47 | 9.97 | 11.54 | 7.80 | 7.67 | 9.14 | 9.04 | 9.24 | 7.53 | 7.24 | 6.32 | 6.04 | 5.45 | 5.78 | 6.32 | 5.28 | 6.08 | 5.93 | 5.19 | 5.22 | 4.86 | 5.58 | 6.22 | 4.97 | NA | NA | NA | NA | NA | NA | NA | NA | NA | NA | NA | NA | NA | NA | NA | NA | NA | NA | NA | NA | NA | NA | NA | NA | NA | NA | NA | NA | NA | NA | NA | NA | ||
| 5.82 | 6.32 | 4.79 | 4.19 | 4.92 | 4.58 | 4.68 | 3.88 | 4.49 | 5.30 | 3.75 | 3.49 | 3.68 | 3.55 | 3.35 | 4.00 | 7.23 | 3.86 | 4.11 | 4.46 | 3.85 | 4.60 | 4.24 | 4.94 | NA | NA | NA | NA | NA | NA | NA | NA | NA | NA | NA | NA | NA | NA | NA | NA | NA | NA | NA | NA | NA | NA | NA | NA | NA | NA | NA | NA | NA | NA | NA | NA | ||
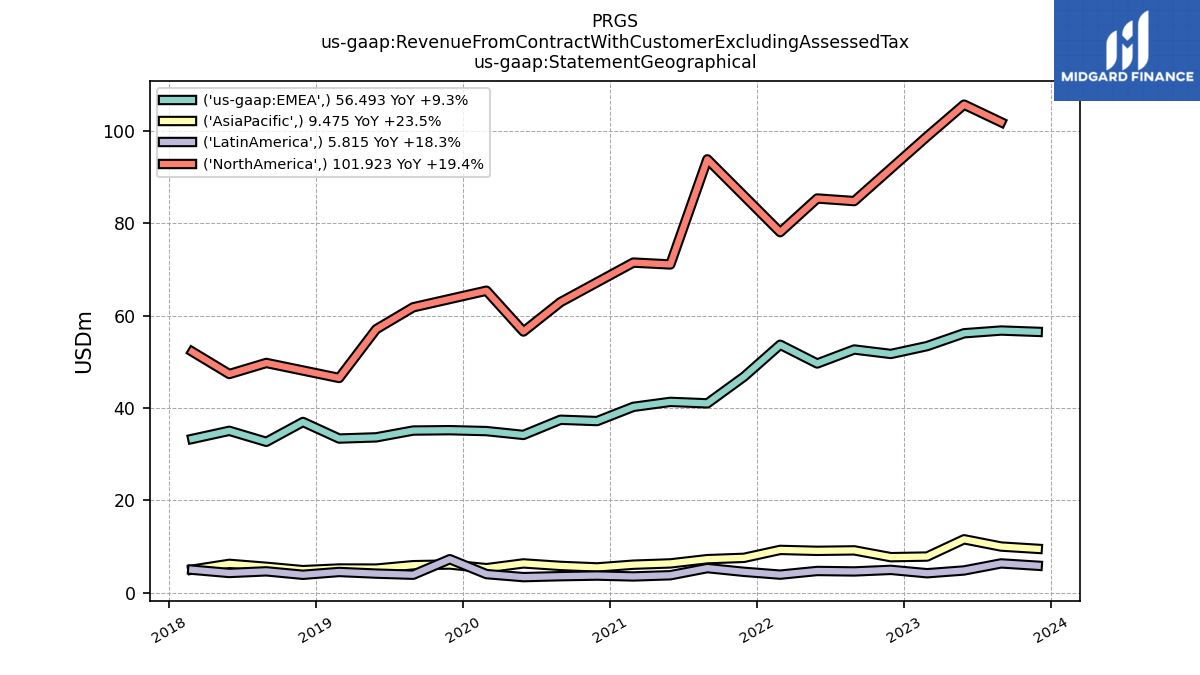
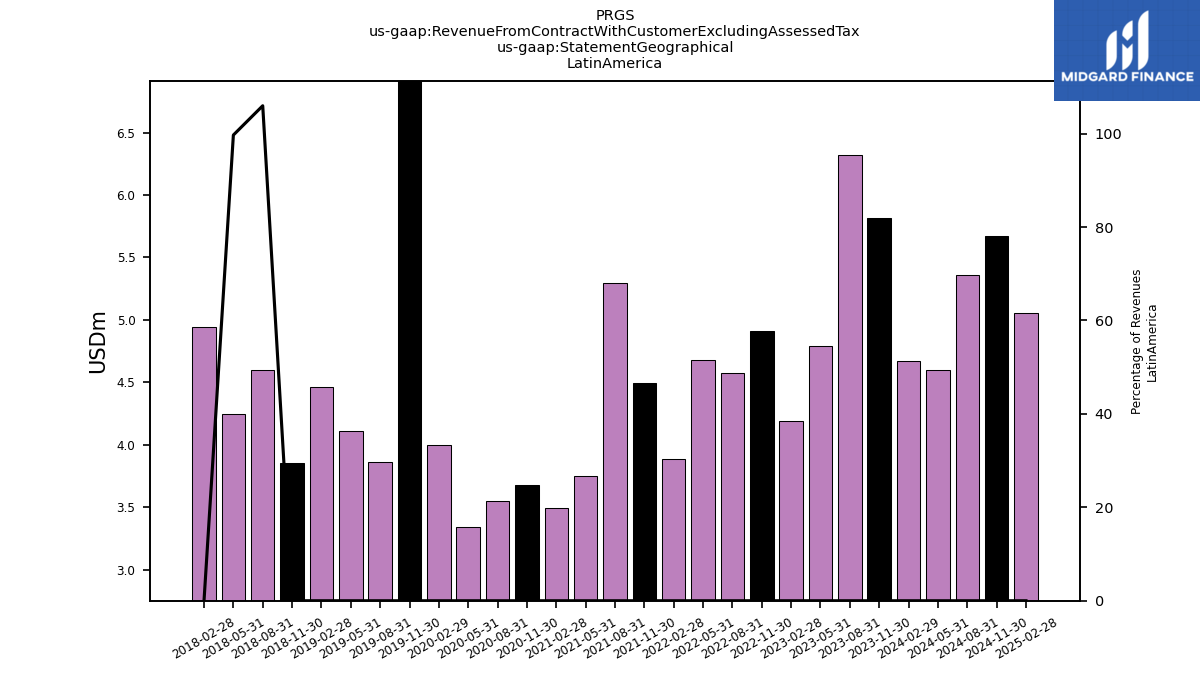
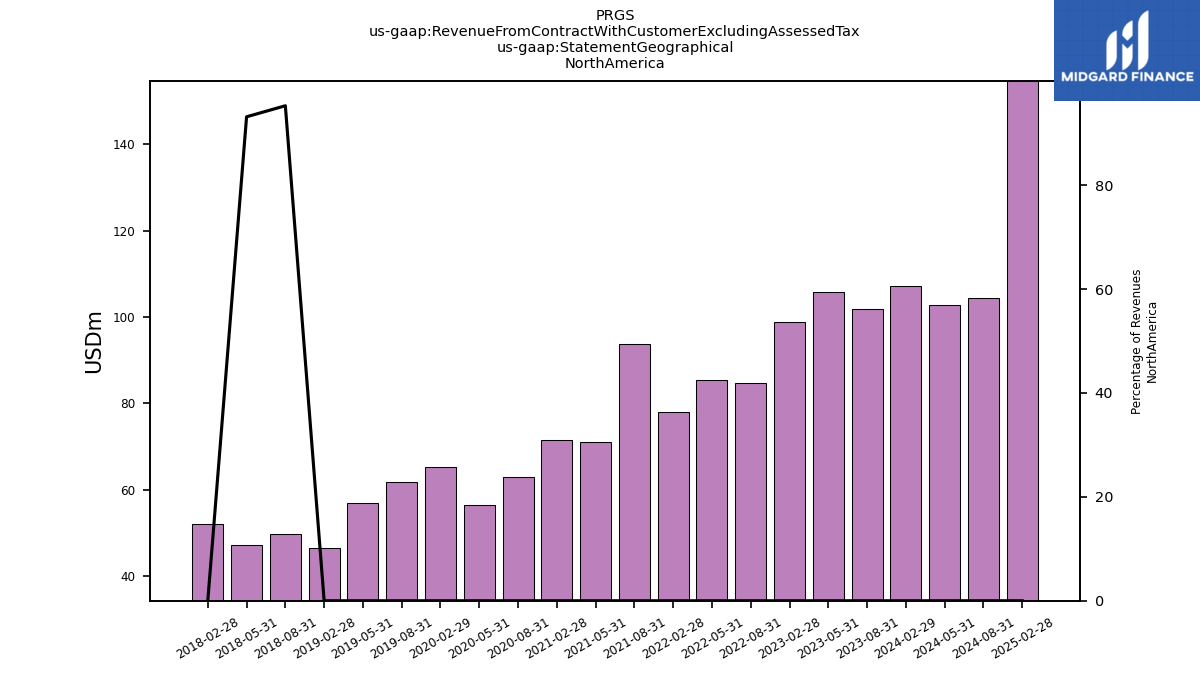
| NA | 101.92 | 105.73 | 98.83 | NA | 84.83 | 85.39 | 78.09 | NA | 93.88 | 71.09 | 71.50 | NA | 62.93 | 56.56 | 65.41 | NA | 61.82 | 57.06 | 46.50 | NA | 49.76 | 47.35 | 52.20 | NA | NA | NA | NA | NA | NA | NA | NA | NA | NA | NA | NA | NA | NA | NA | NA | NA | NA | NA | NA | NA | NA | NA | NA | NA | NA | NA | NA | NA | NA | NA | NA | ||
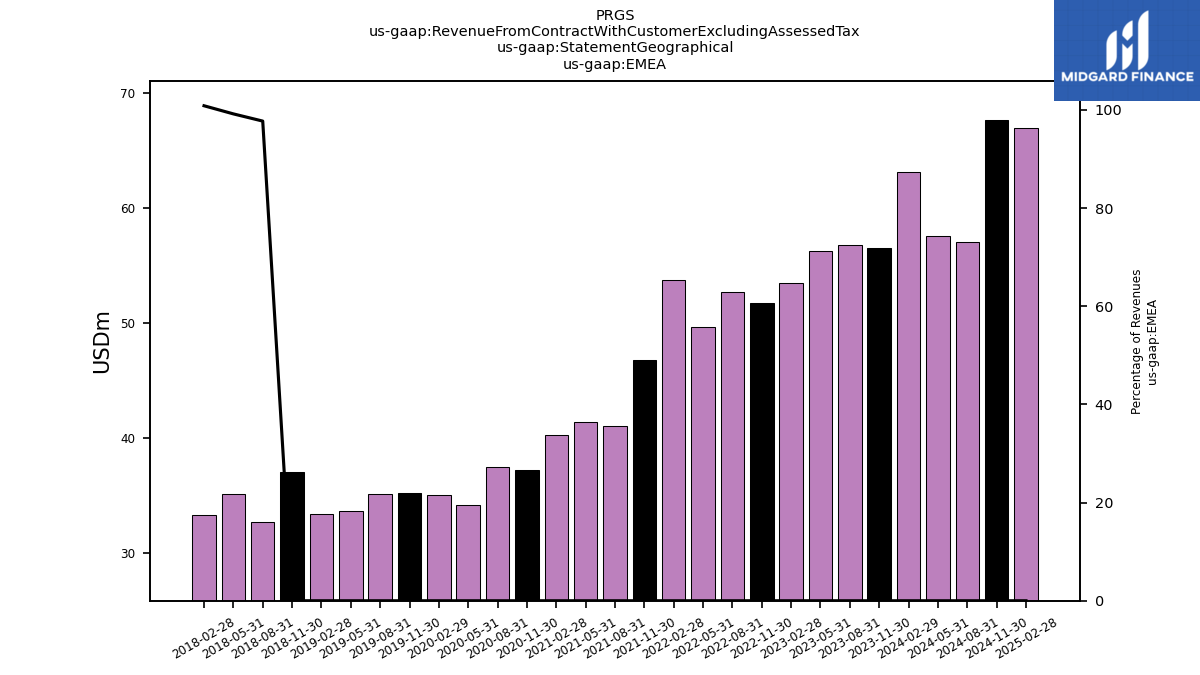
| EMEA | 56.49 | 56.78 | 56.19 | 53.41 | 51.70 | 52.67 | 49.63 | 53.70 | 46.77 | 41.00 | 41.32 | 40.24 | 37.16 | 37.45 | 34.16 | 34.99 | 35.19 | 35.11 | 33.63 | 33.37 | 36.96 | 32.66 | 35.05 | 33.30 | NA | NA | NA | NA | NA | NA | NA | NA | NA | NA | NA | NA | NA | NA | NA | NA | NA | NA | NA | NA | NA | NA | NA | NA | NA | NA | NA | NA | NA | NA | NA | NA |


