
| 2023-12-31 | 2023-09-30 | 2023-06-30 | 2023-03-31 | 2022-12-31 | 2022-09-30 | 2022-06-30 | 2022-03-31 | 2021-12-31 | 2021-09-30 | 2021-06-30 | 2021-03-31 | 2020-12-31 | 2020-09-30 | 2020-06-30 | 2020-03-31 | 2019-12-31 | 2019-09-30 | 2019-06-30 | 2019-03-31 | 2018-12-31 | 2018-09-30 | 2018-06-30 | 2018-03-31 | 2017-12-31 | 2017-09-30 | 2017-06-30 | 2017-03-31 | 2016-12-31 | 2016-09-30 | 2016-06-30 | 2016-03-31 | 2015-12-31 | 2015-09-30 | 2015-06-30 | 2015-03-31 | 2014-12-31 | 2014-09-30 | 2014-06-30 | 2014-03-31 | 2013-12-31 | 2013-09-30 | 2013-06-30 | 2013-03-31 | 2012-12-31 | 2012-09-30 | 2012-06-30 | 2012-03-31 | 2011-12-31 | 2011-09-30 | 2011-06-30 | 2011-03-31 | 2010-12-31 | 2010-09-30 | 2010-06-30 | ||
|---|---|---|---|---|---|---|---|---|---|---|---|---|---|---|---|---|---|---|---|---|---|---|---|---|---|---|---|---|---|---|---|---|---|---|---|---|---|---|---|---|---|---|---|---|---|---|---|---|---|---|---|---|---|---|---|---|
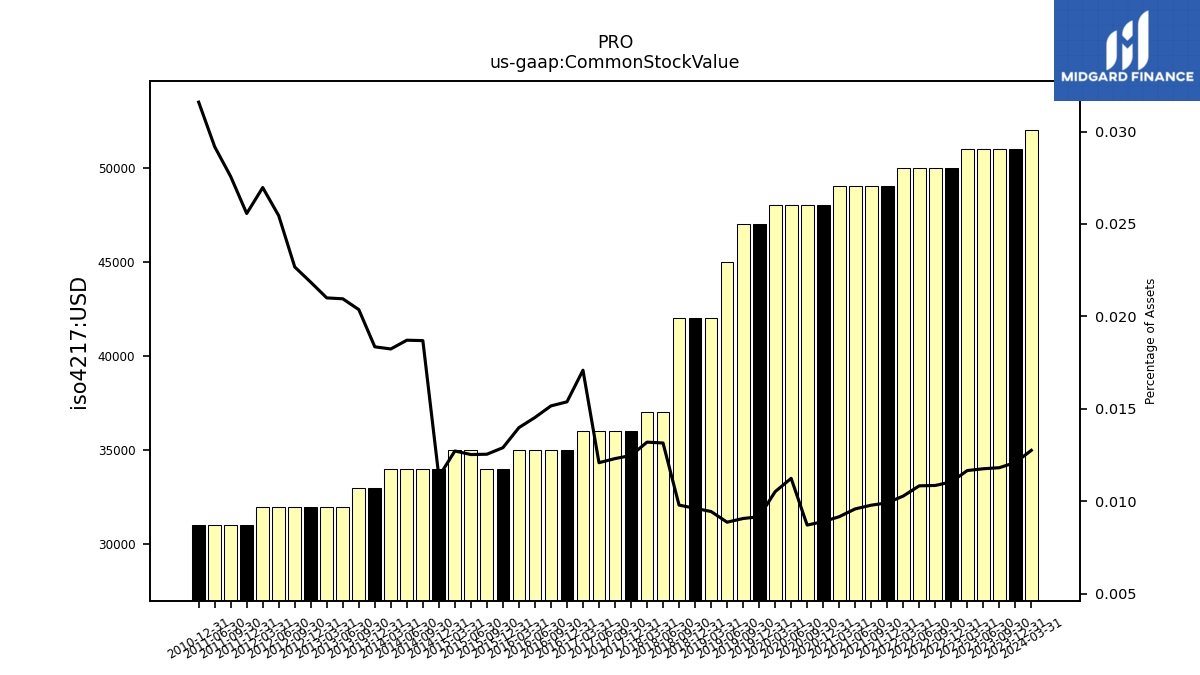
| Common Stock Value | 0.05 | 0.05 | 0.05 | 0.05 | 0.05 | 0.05 | 0.05 | 0.05 | 0.05 | 0.05 | 0.05 | 0.05 | 0.05 | 0.05 | 0.05 | 0.05 | 0.05 | 0.05 | 0.04 | 0.04 | 0.04 | 0.04 | 0.04 | 0.04 | 0.04 | 0.04 | 0.04 | 0.04 | 0.04 | 0.04 | 0.04 | 0.04 | 0.03 | 0.03 | 0.04 | 0.04 | 0.03 | 0.03 | 0.03 | 0.03 | 0.03 | 0.03 | 0.03 | 0.03 | 0.03 | 0.03 | 0.03 | 0.03 | 0.03 | 0.03 | 0.03 | NA | 0.03 | NA | NA | |
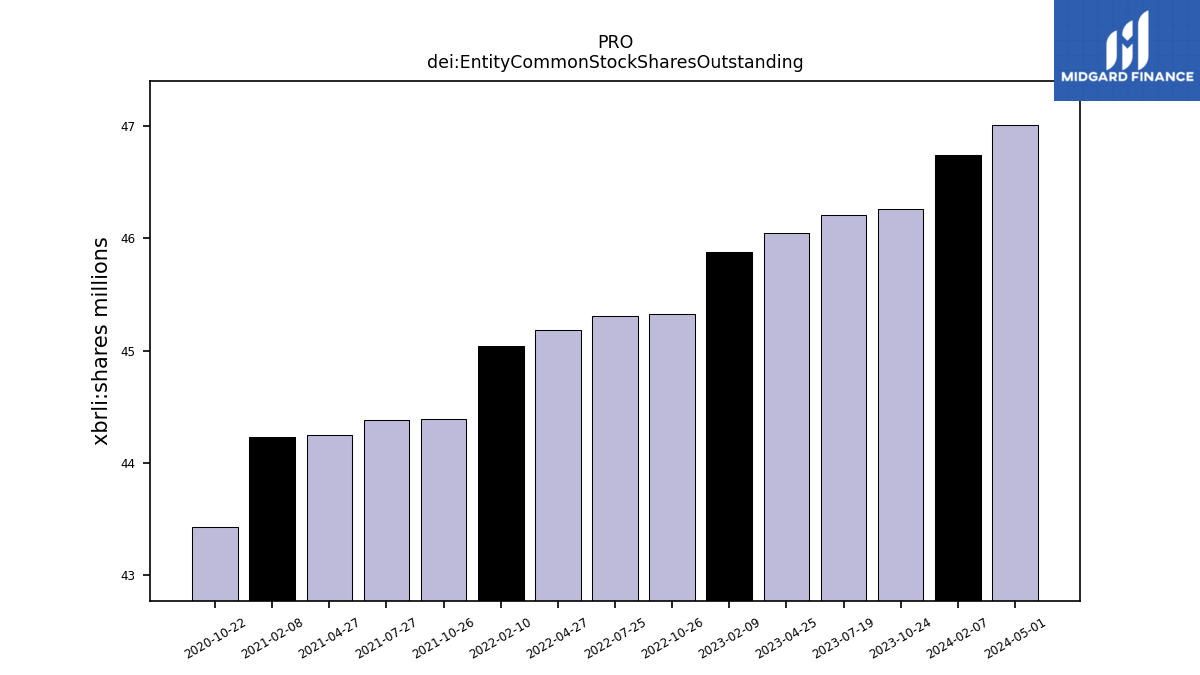
| dei: Entity Common Stock Shares Outstanding | NA | NA | NA | NA | NA | NA | NA | NA | NA | NA | NA | NA | NA | NA | NA | NA | NA | NA | NA | NA | NA | NA | NA | NA | NA | NA | NA | NA | NA | NA | NA | NA | NA | NA | NA | NA | NA | NA | NA | NA | NA | NA | NA | NA | NA | NA | NA | NA | NA | NA | NA | NA | NA | NA | NA | |
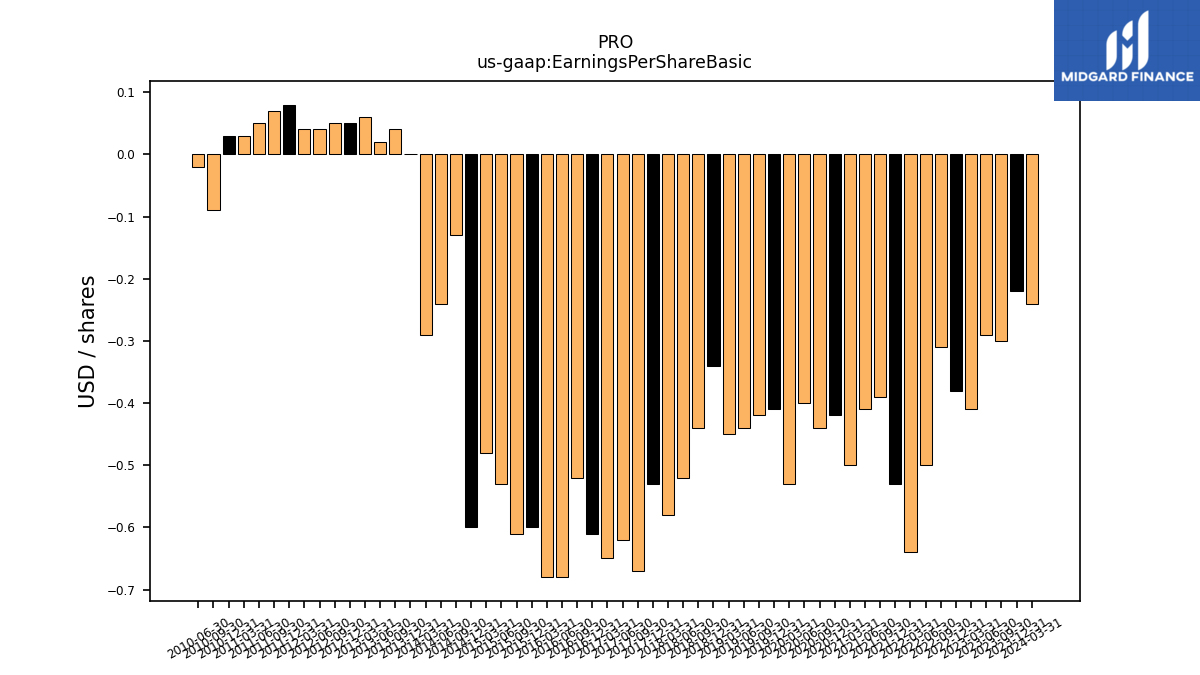
| Earnings Per Share Basic | -0.22 | -0.30 | -0.29 | -0.41 | -0.38 | -0.31 | -0.50 | -0.64 | -0.53 | -0.39 | -0.41 | -0.50 | -0.42 | -0.44 | -0.40 | -0.53 | -0.41 | -0.42 | -0.44 | -0.45 | -0.34 | -0.44 | -0.52 | -0.58 | -0.53 | -0.67 | -0.62 | -0.65 | -0.61 | -0.52 | -0.68 | -0.68 | -0.60 | -0.61 | -0.53 | -0.48 | -0.60 | -0.13 | -0.24 | -0.29 | 0.00 | 0.04 | 0.02 | 0.06 | 0.05 | 0.05 | 0.04 | 0.04 | 0.08 | 0.07 | 0.05 | 0.03 | 0.03 | -0.09 | -0.02 | |
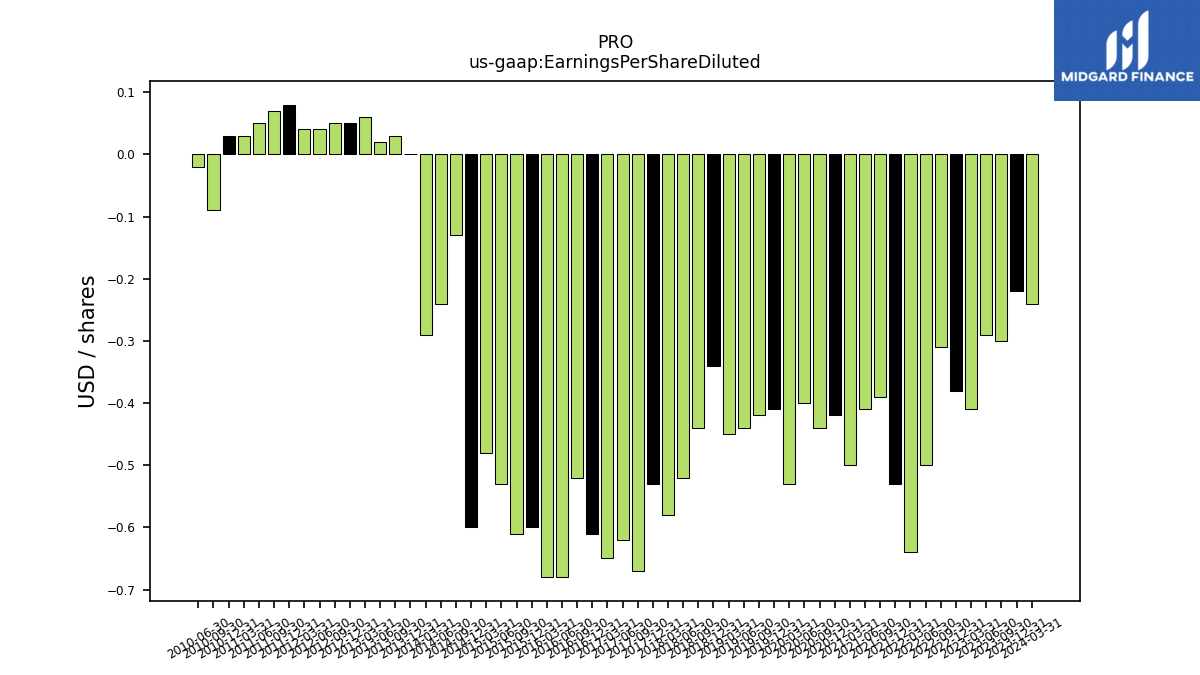
| Earnings Per Share Diluted | -0.22 | -0.30 | -0.29 | -0.41 | -0.38 | -0.31 | -0.50 | -0.64 | -0.53 | -0.39 | -0.41 | -0.50 | -0.42 | -0.44 | -0.40 | -0.53 | -0.41 | -0.42 | -0.44 | -0.45 | -0.34 | -0.44 | -0.52 | -0.58 | -0.53 | -0.67 | -0.62 | -0.65 | -0.61 | -0.52 | -0.68 | -0.68 | -0.60 | -0.61 | -0.53 | -0.48 | -0.60 | -0.13 | -0.24 | -0.29 | 0.00 | 0.03 | 0.02 | 0.06 | 0.05 | 0.05 | 0.04 | 0.04 | 0.08 | 0.07 | 0.05 | 0.03 | 0.03 | -0.09 | -0.02 |
| 2023-12-31 | 2023-09-30 | 2023-06-30 | 2023-03-31 | 2022-12-31 | 2022-09-30 | 2022-06-30 | 2022-03-31 | 2021-12-31 | 2021-09-30 | 2021-06-30 | 2021-03-31 | 2020-12-31 | 2020-09-30 | 2020-06-30 | 2020-03-31 | 2019-12-31 | 2019-09-30 | 2019-06-30 | 2019-03-31 | 2018-12-31 | 2018-09-30 | 2018-06-30 | 2018-03-31 | 2017-12-31 | 2017-09-30 | 2017-06-30 | 2017-03-31 | 2016-12-31 | 2016-09-30 | 2016-06-30 | 2016-03-31 | 2015-12-31 | 2015-09-30 | 2015-06-30 | 2015-03-31 | 2014-12-31 | 2014-09-30 | 2014-06-30 | 2014-03-31 | 2013-12-31 | 2013-09-30 | 2013-06-30 | 2013-03-31 | 2012-12-31 | 2012-09-30 | 2012-06-30 | 2012-03-31 | 2011-12-31 | 2011-09-30 | 2011-06-30 | 2011-03-31 | 2010-12-31 | 2010-09-30 | 2010-06-30 | ||
|---|---|---|---|---|---|---|---|---|---|---|---|---|---|---|---|---|---|---|---|---|---|---|---|---|---|---|---|---|---|---|---|---|---|---|---|---|---|---|---|---|---|---|---|---|---|---|---|---|---|---|---|---|---|---|---|---|
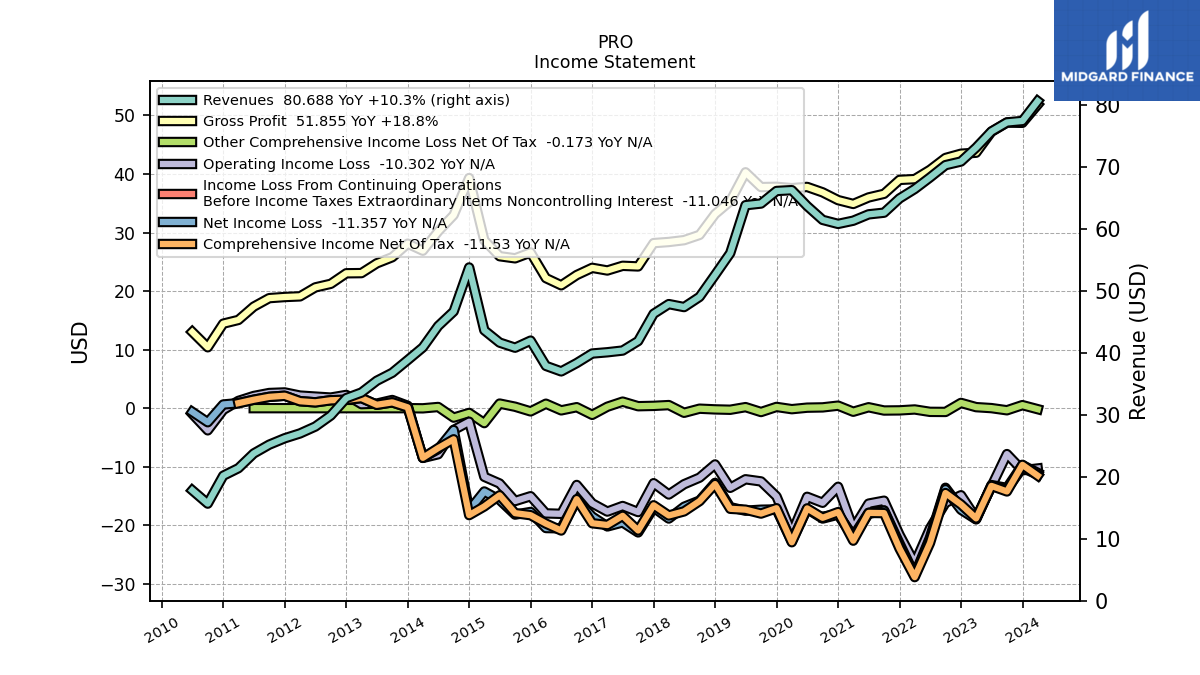
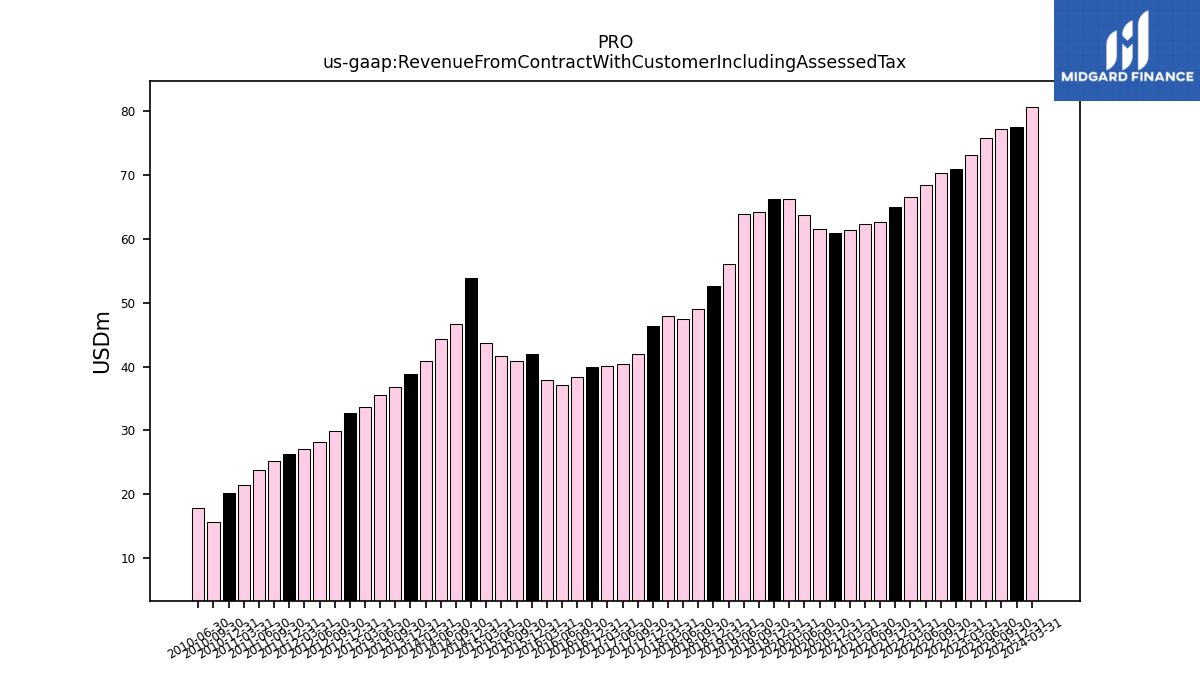
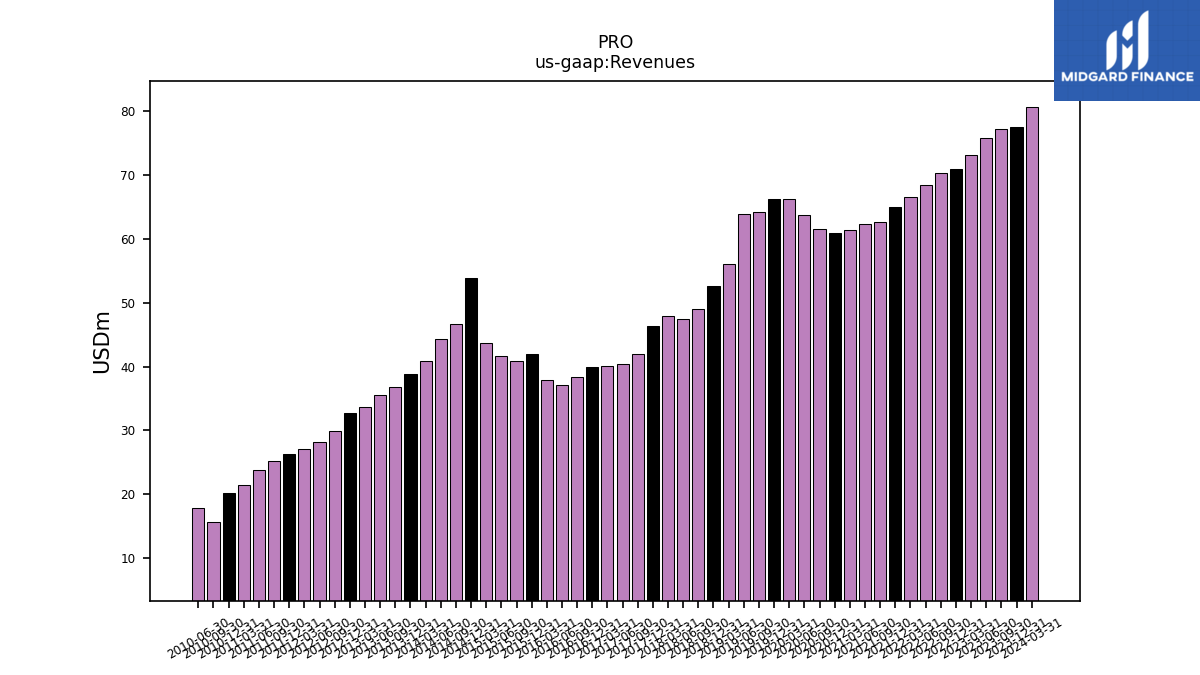
| Revenue From Contract With Customer Including Assessed Tax | 77.48 | 77.25 | 75.79 | 73.18 | 70.94 | 70.35 | 68.36 | 66.49 | 64.97 | 62.67 | 62.40 | 61.38 | 60.86 | 61.51 | 63.75 | 66.31 | 66.17 | 64.15 | 63.88 | 56.13 | 52.61 | 49.08 | 47.43 | 47.91 | 46.34 | 41.94 | 40.41 | 40.13 | 39.93 | 38.38 | 37.04 | 37.93 | 42.01 | 40.87 | 41.69 | 43.68 | 53.83 | 46.72 | 44.37 | 40.91 | 38.87 | 36.81 | 35.53 | 33.63 | 32.72 | 29.91 | 28.13 | 27.02 | 26.24 | 25.21 | 23.79 | 21.41 | 20.19 | 15.69 | 17.84 | |
| Revenues | 77.48 | 77.25 | 75.79 | 73.18 | 70.94 | 70.35 | 68.36 | 66.49 | 64.97 | 62.67 | 62.40 | 61.38 | 60.86 | 61.51 | 63.75 | 66.31 | 66.17 | 64.15 | 63.88 | 56.13 | 52.61 | 49.08 | 47.43 | 47.91 | 46.34 | 41.94 | 40.41 | 40.13 | 39.93 | 38.38 | 37.04 | 37.93 | 42.01 | 40.87 | 41.69 | 43.68 | 53.83 | 46.72 | 44.37 | 40.91 | 38.87 | 36.81 | 35.53 | 33.63 | 32.72 | 29.91 | 28.13 | 27.02 | 26.24 | 25.21 | 23.79 | 21.41 | 20.19 | 15.69 | 17.84 | |
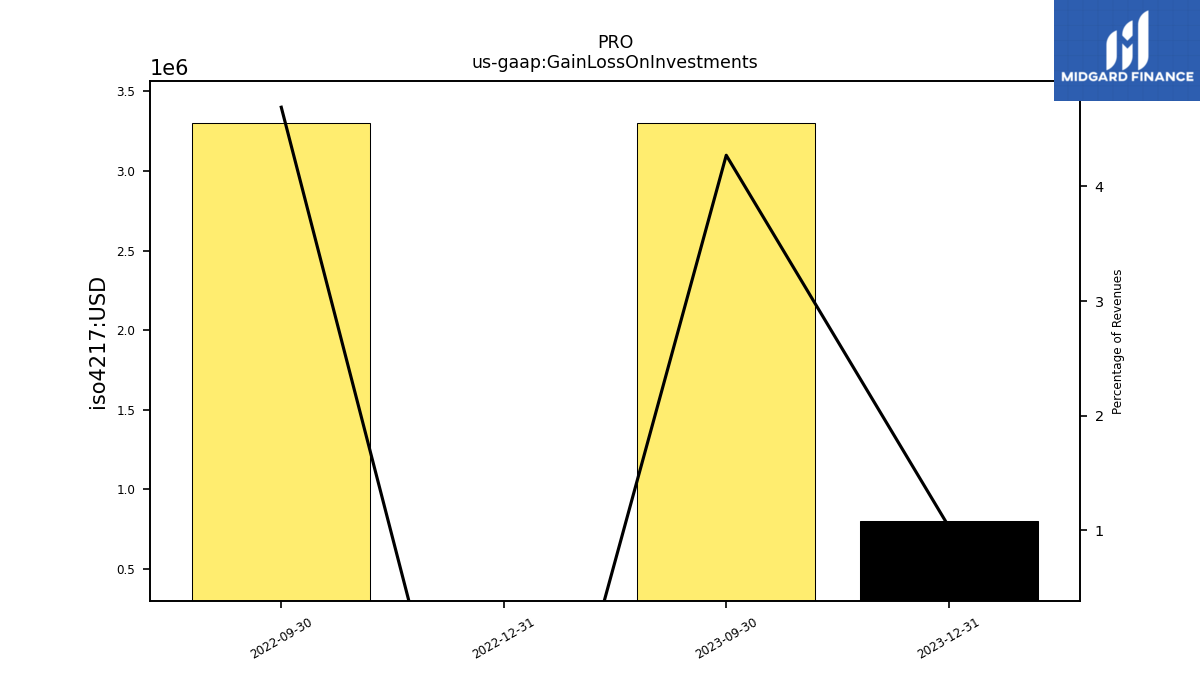
| Gain Loss On Investments | 0.80 | 3.30 | NA | NA | -2.00 | 3.30 | NA | NA | NA | NA | NA | NA | NA | NA | NA | NA | NA | NA | NA | NA | NA | NA | NA | NA | NA | NA | NA | NA | NA | NA | NA | NA | NA | NA | NA | NA | NA | NA | NA | NA | NA | NA | NA | NA | NA | NA | NA | NA | NA | NA | NA | NA | NA | NA | NA | |
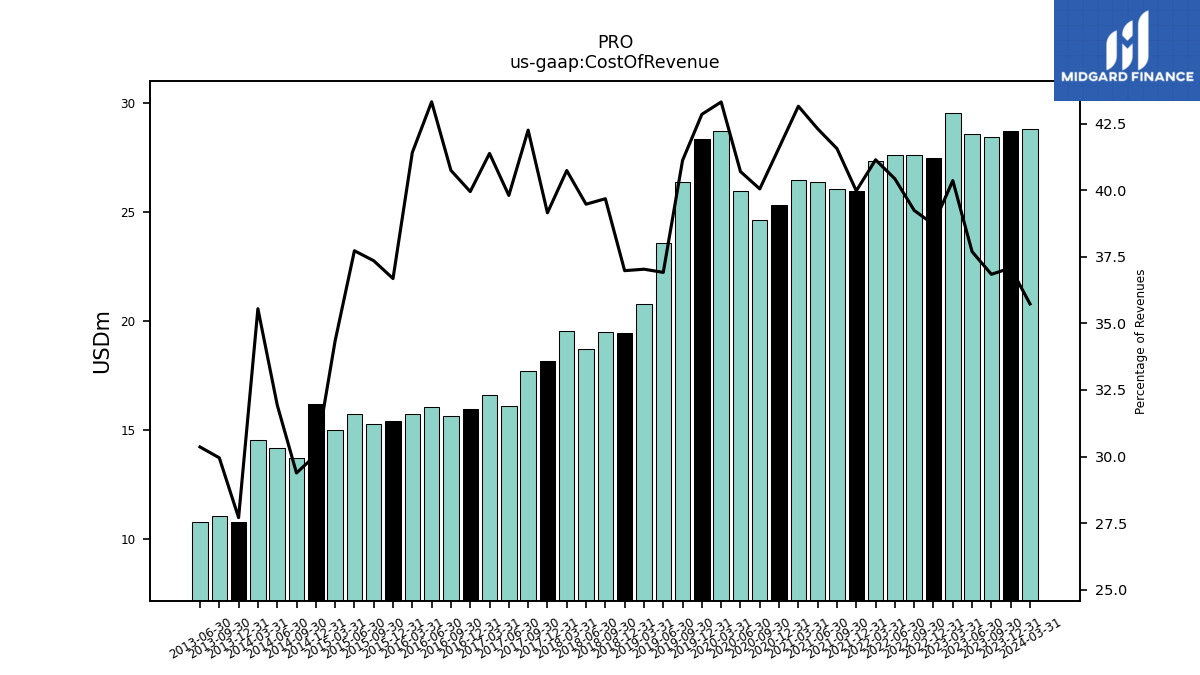
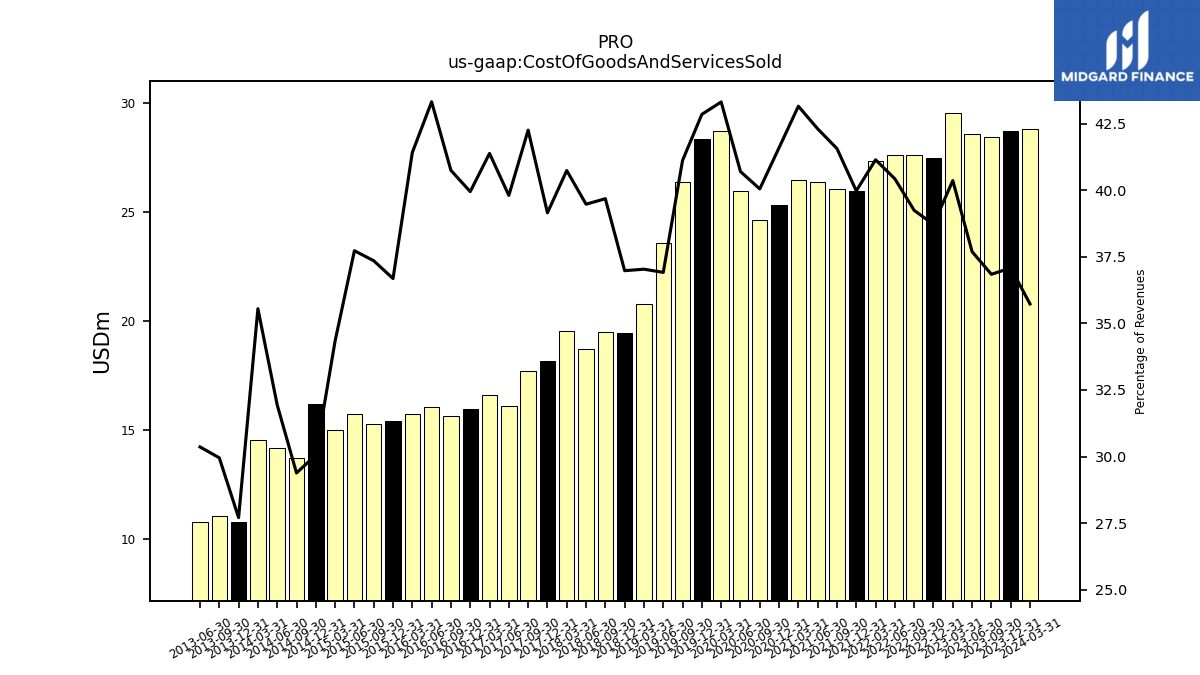
| Cost Of Revenue | 28.74 | 28.46 | 28.57 | 29.54 | 27.47 | 27.61 | 27.64 | 27.36 | 25.98 | 26.05 | 26.40 | 26.49 | 25.32 | 24.64 | 25.95 | 28.73 | 28.36 | 26.38 | 23.58 | 20.79 | 19.46 | 19.48 | 18.72 | 19.52 | 18.15 | 17.72 | 16.09 | 16.61 | 15.95 | 15.64 | 16.05 | 15.71 | 15.41 | 15.27 | 15.73 | 15.00 | 16.18 | 13.73 | 14.17 | 14.55 | 10.77 | 11.03 | 10.79 | NA | NA | NA | NA | NA | NA | NA | NA | NA | NA | NA | NA | |
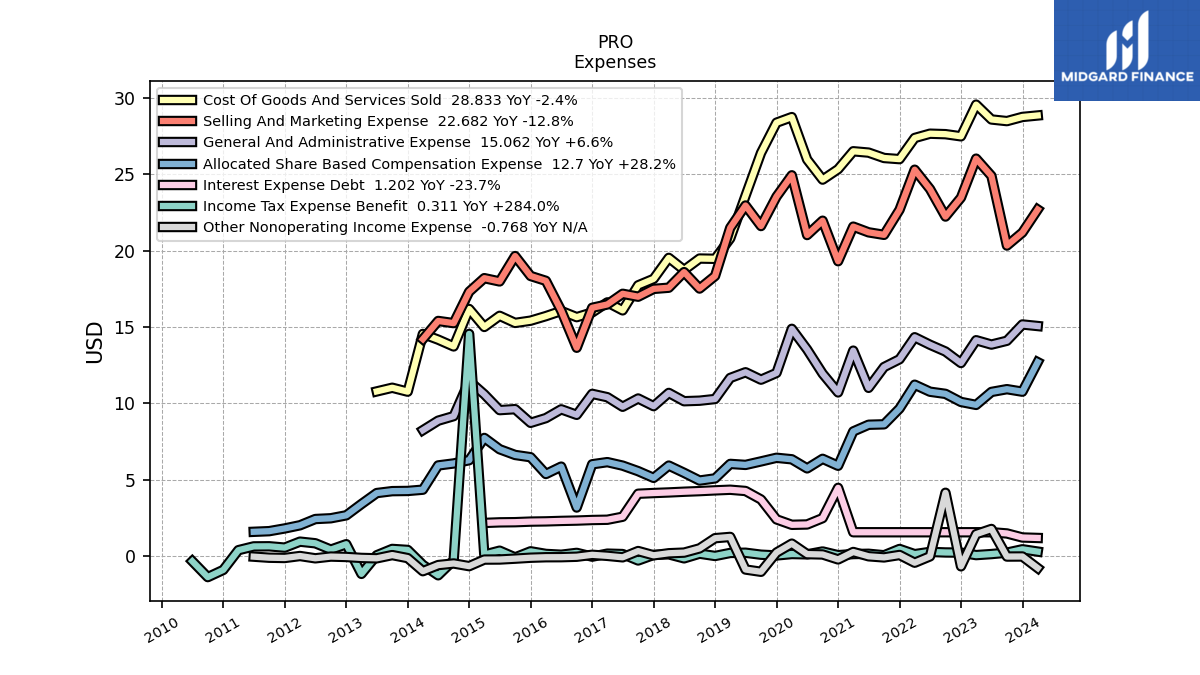
| Cost Of Goods And Services Sold | 28.74 | 28.46 | 28.57 | 29.54 | 27.47 | 27.61 | 27.64 | 27.36 | 25.98 | 26.05 | 26.40 | 26.49 | 25.32 | 24.64 | 25.95 | 28.73 | 28.36 | 26.38 | 23.58 | 20.79 | 19.46 | 19.48 | 18.72 | 19.52 | 18.15 | 17.72 | 16.09 | 16.61 | 15.95 | 15.64 | 16.05 | 15.71 | 15.41 | 15.27 | 15.73 | 15.00 | 16.18 | 13.73 | 14.17 | 14.55 | 10.77 | 11.03 | 10.79 | NA | NA | NA | NA | NA | NA | NA | NA | NA | NA | NA | NA | |
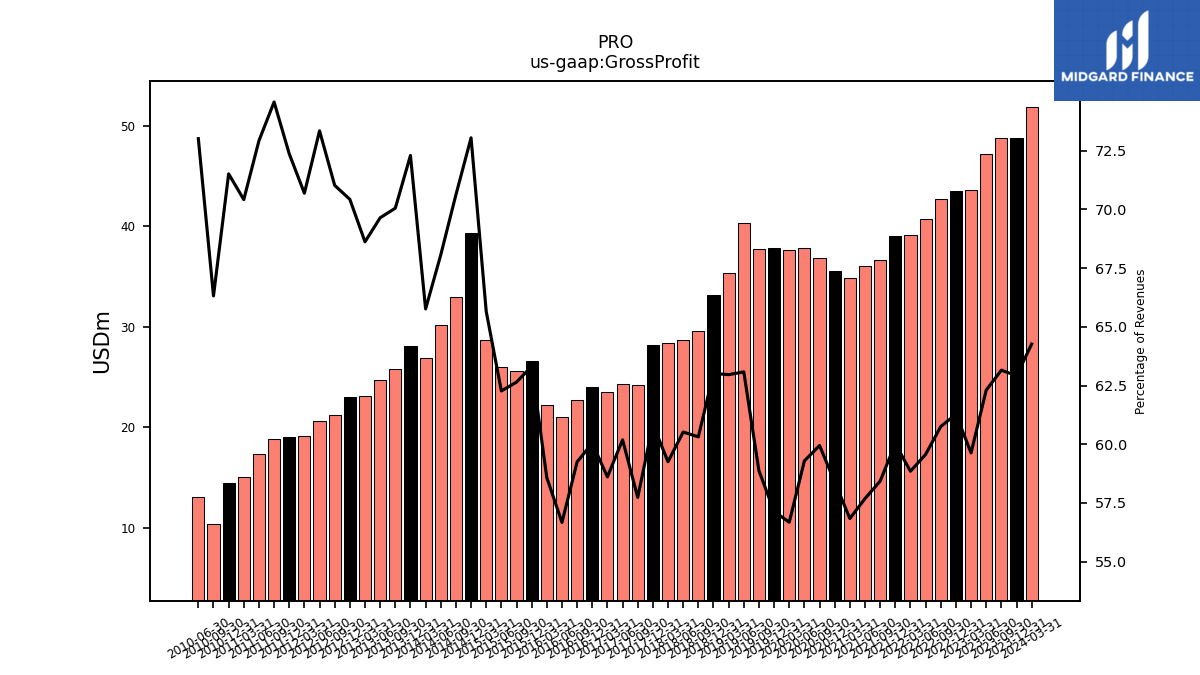
| Gross Profit | 48.75 | 48.79 | 47.22 | 43.64 | 43.47 | 42.74 | 40.72 | 39.13 | 39.00 | 36.62 | 36.00 | 34.89 | 35.54 | 36.87 | 37.80 | 37.58 | 37.81 | 37.77 | 40.30 | 35.34 | 33.16 | 29.60 | 28.70 | 28.39 | 28.20 | 24.21 | 24.32 | 23.52 | 23.97 | 22.74 | 20.99 | 22.22 | 26.60 | 25.60 | 25.96 | 28.68 | 39.32 | 32.99 | 30.20 | 26.90 | 28.10 | 25.79 | 24.74 | 23.07 | 23.05 | 21.24 | 20.63 | 19.10 | 18.99 | 18.80 | 17.34 | 15.07 | 14.44 | 10.40 | 13.02 | |
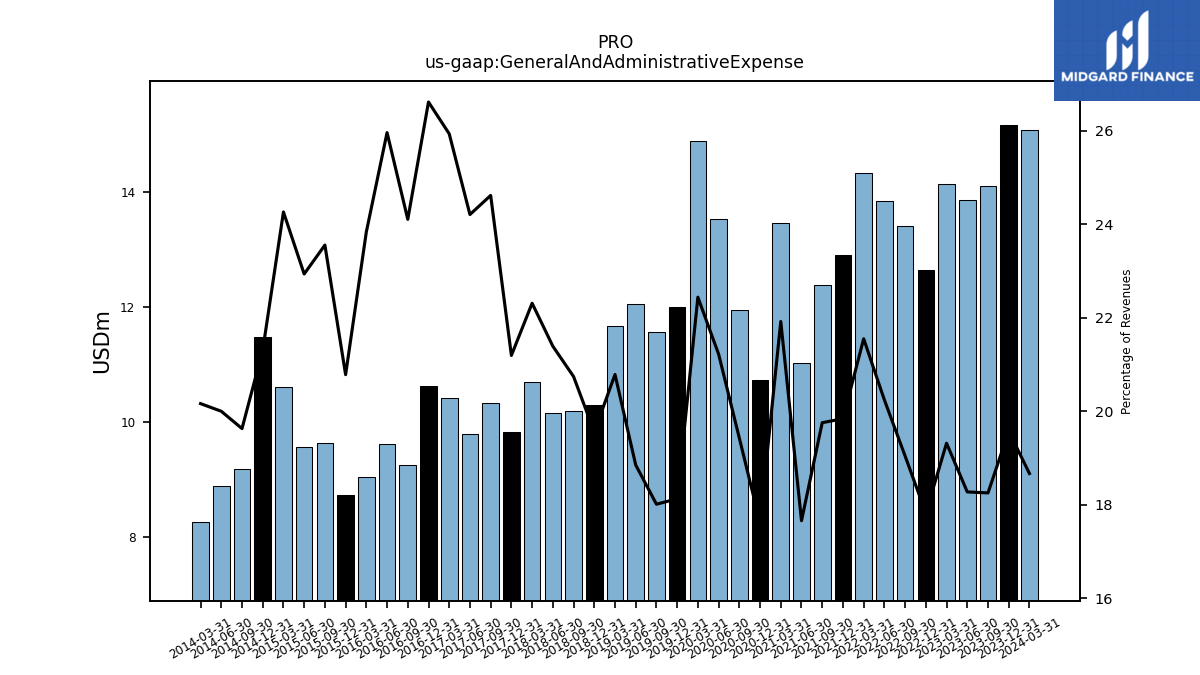
| General And Administrative Expense | 15.16 | 14.10 | 13.85 | 14.13 | 12.64 | 13.39 | 13.84 | 14.33 | 12.89 | 12.38 | 11.02 | 13.45 | 10.72 | 11.95 | 13.53 | 14.88 | 11.99 | 11.55 | 12.04 | 11.67 | 10.29 | 10.18 | 10.14 | 10.69 | 9.82 | 10.32 | 9.78 | 10.41 | 10.63 | 9.25 | 9.62 | 9.04 | 8.73 | 9.63 | 9.56 | 10.60 | 11.47 | 9.17 | 8.87 | 8.25 | NA | NA | NA | NA | NA | NA | NA | NA | NA | NA | NA | NA | NA | NA | NA | |
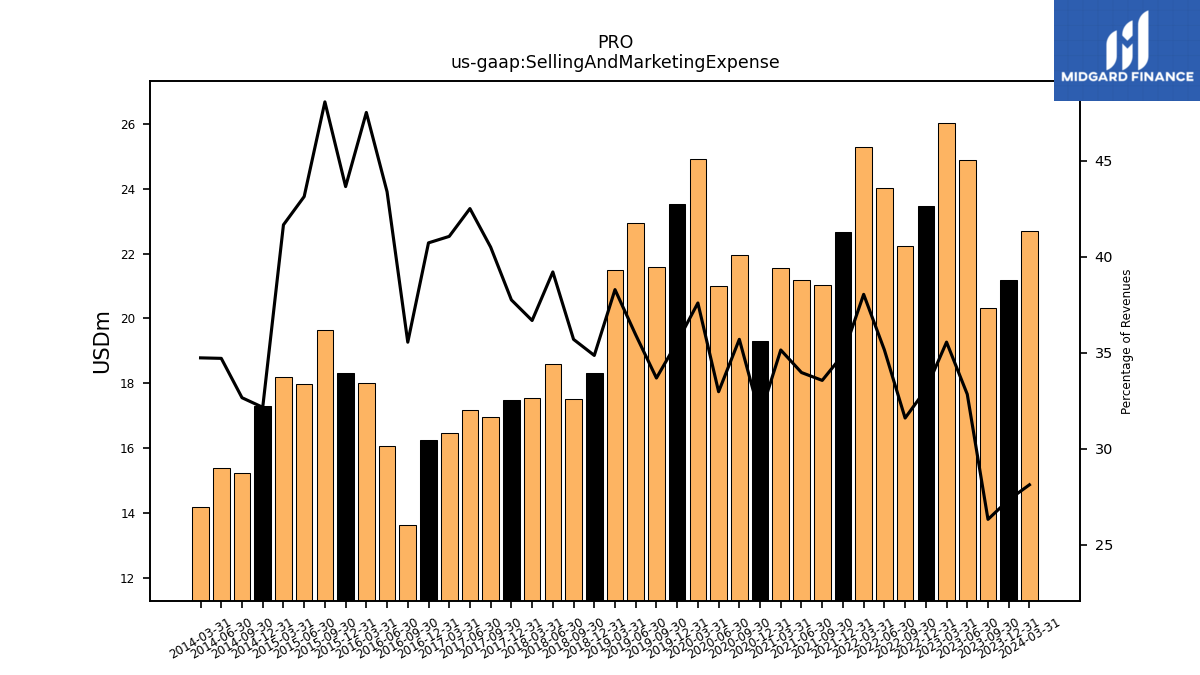
| Selling And Marketing Expense | 21.18 | 20.32 | 24.88 | 26.01 | 23.46 | 22.22 | 24.02 | 25.29 | 22.67 | 21.02 | 21.19 | 21.56 | 19.30 | 21.95 | 21.01 | 24.92 | 23.52 | 21.60 | 22.95 | 21.48 | 18.34 | 17.51 | 18.59 | 17.57 | 17.49 | 16.98 | 17.17 | 16.47 | 16.25 | 13.64 | 16.07 | 18.02 | 18.34 | 19.64 | 17.98 | 18.19 | 17.30 | 15.25 | 15.39 | 14.21 | NA | NA | NA | NA | NA | NA | NA | NA | NA | NA | NA | NA | NA | NA | NA | |
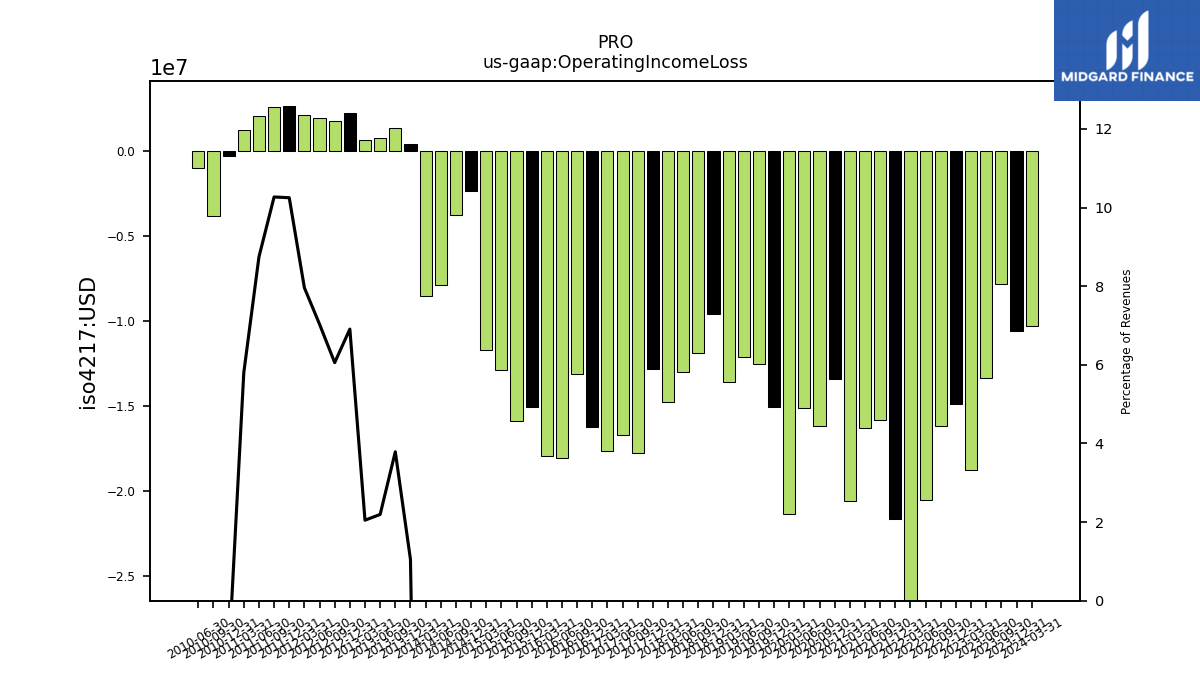
| Operating Income Loss | -10.61 | -7.84 | -13.36 | -18.80 | -14.87 | -16.18 | -20.54 | -26.50 | -21.64 | -15.81 | -16.31 | -20.59 | -13.43 | -16.16 | -15.14 | -21.35 | -15.07 | -12.51 | -12.14 | -13.61 | -9.61 | -11.87 | -12.99 | -14.75 | -12.81 | -17.75 | -16.71 | -17.67 | -16.26 | -13.12 | -18.05 | -17.97 | -15.04 | -15.87 | -12.87 | -11.72 | -2.32 | -3.72 | -7.87 | -8.50 | 0.41 | 1.40 | 0.78 | 0.69 | 2.26 | 1.81 | 1.98 | 2.15 | 2.69 | 2.59 | 2.08 | 1.24 | -0.30 | -3.79 | -0.96 | |
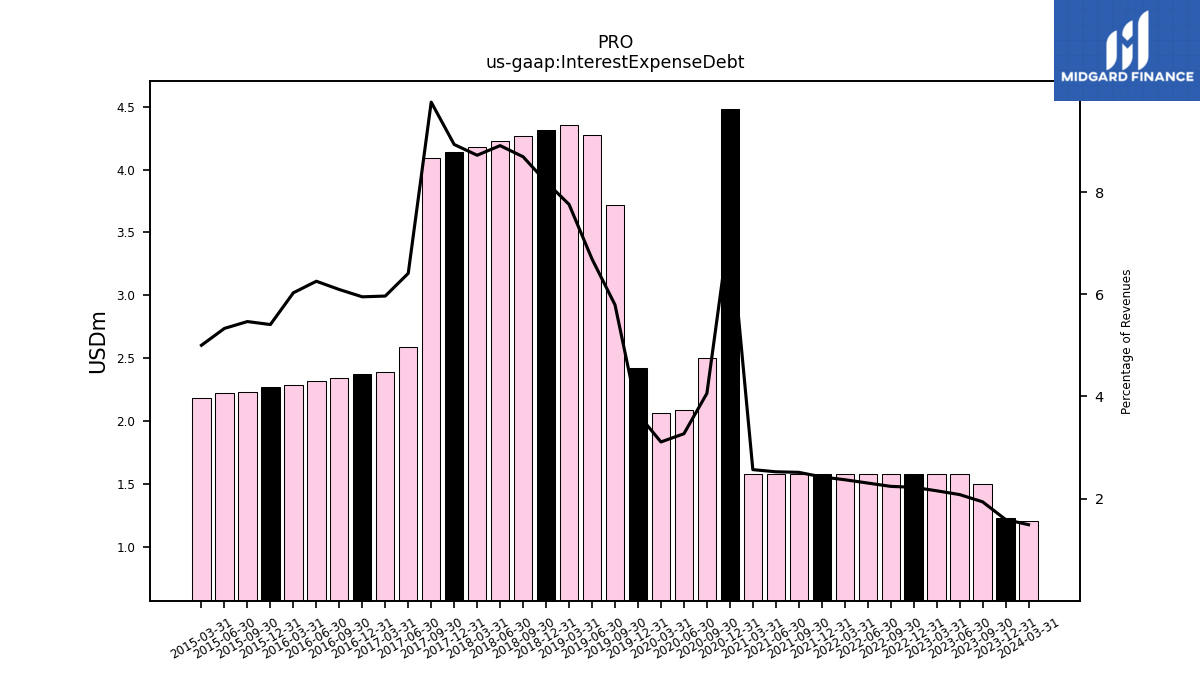
| Interest Expense Debt | 1.23 | 1.50 | 1.58 | 1.58 | 1.58 | 1.58 | 1.58 | 1.58 | 1.58 | 1.58 | 1.58 | 1.58 | 4.48 | 2.50 | 2.08 | 2.06 | 2.42 | 3.72 | 4.27 | 4.36 | 4.32 | 4.27 | 4.23 | 4.18 | 4.14 | 4.09 | 2.59 | 2.39 | 2.38 | 2.34 | 2.32 | 2.29 | 2.27 | 2.23 | 2.22 | 2.19 | NA | NA | NA | NA | NA | NA | NA | NA | NA | NA | NA | NA | NA | NA | NA | NA | NA | NA | NA | |
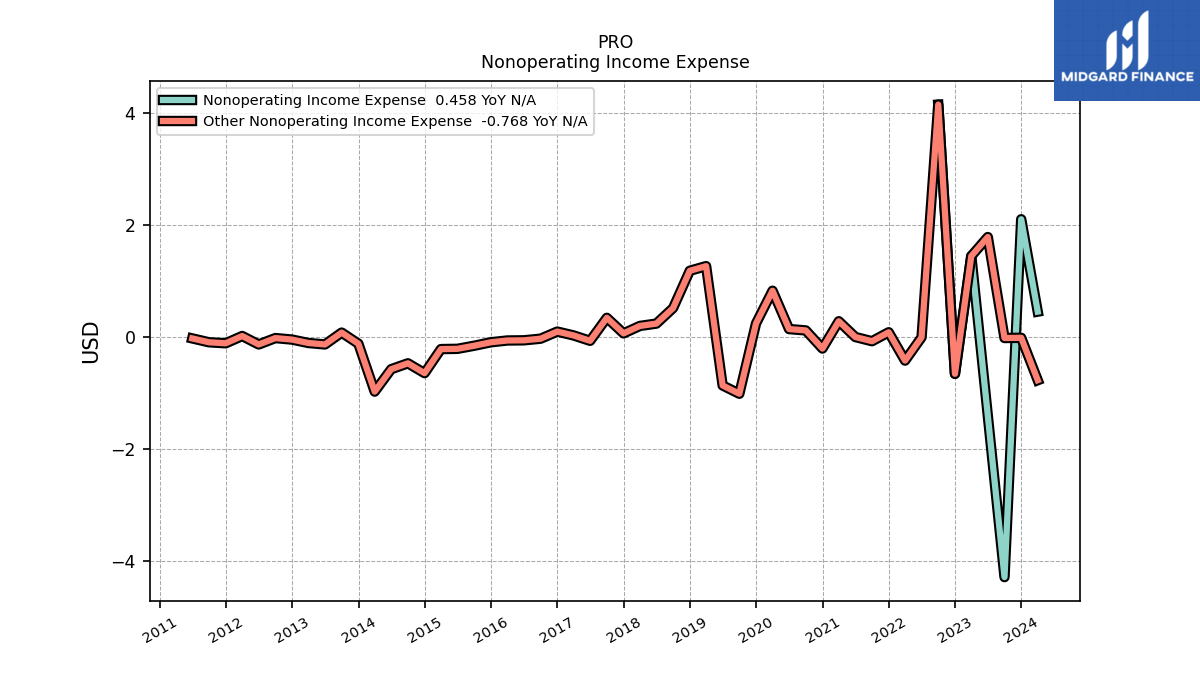
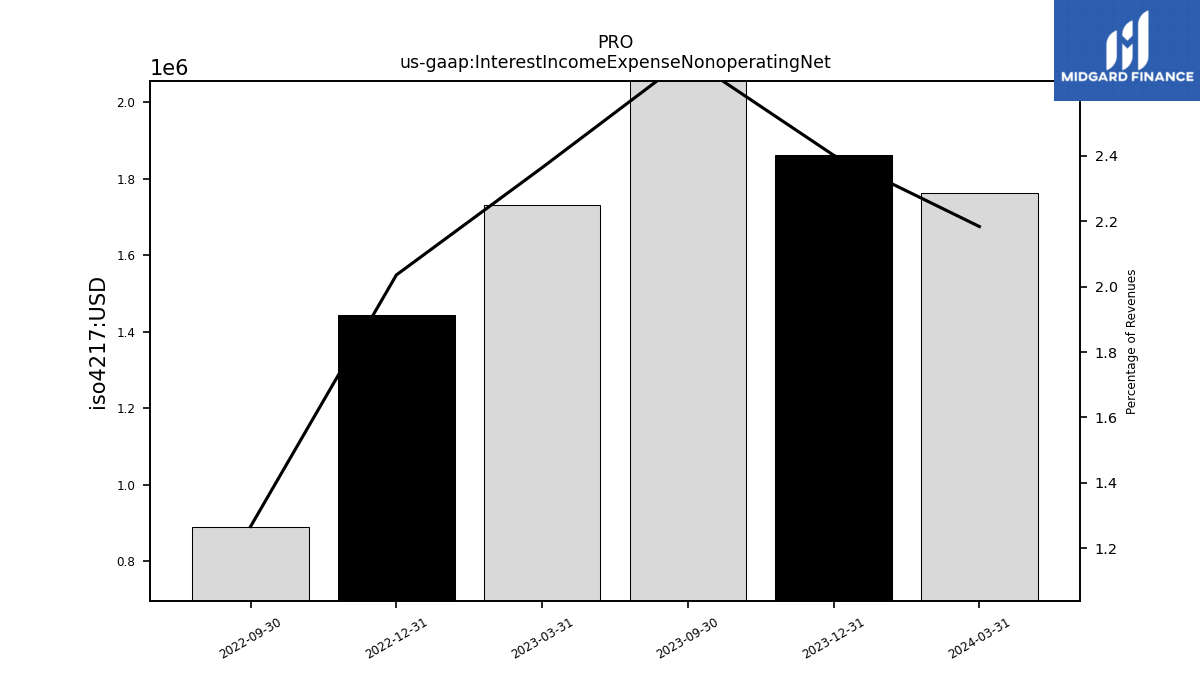
| Interest Income Expense Nonoperating Net | 1.86 | 2.09 | NA | NA | 1.44 | 0.89 | NA | NA | NA | NA | NA | NA | NA | NA | NA | NA | NA | NA | NA | NA | NA | NA | NA | NA | NA | NA | NA | NA | NA | NA | NA | NA | NA | NA | NA | NA | NA | NA | NA | NA | NA | NA | NA | NA | NA | NA | NA | NA | NA | NA | NA | NA | NA | NA | NA | |
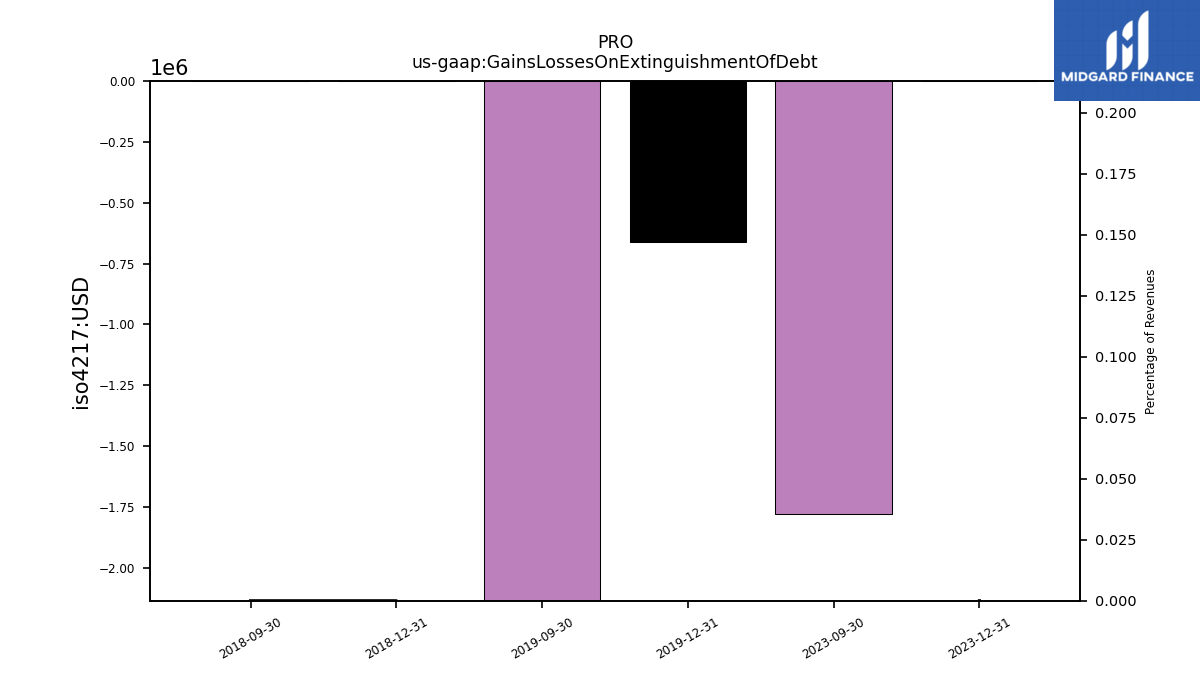
| Gains Losses On Extinguishment Of Debt | 0.00 | -1.78 | NA | NA | NA | NA | NA | NA | NA | NA | NA | NA | NA | NA | NA | NA | -0.66 | -2.73 | NA | NA | 0.00 | 0.00 | NA | NA | NA | NA | NA | NA | NA | NA | NA | NA | NA | NA | NA | NA | NA | NA | NA | NA | NA | NA | NA | NA | NA | NA | NA | NA | NA | NA | NA | NA | NA | NA | NA | |
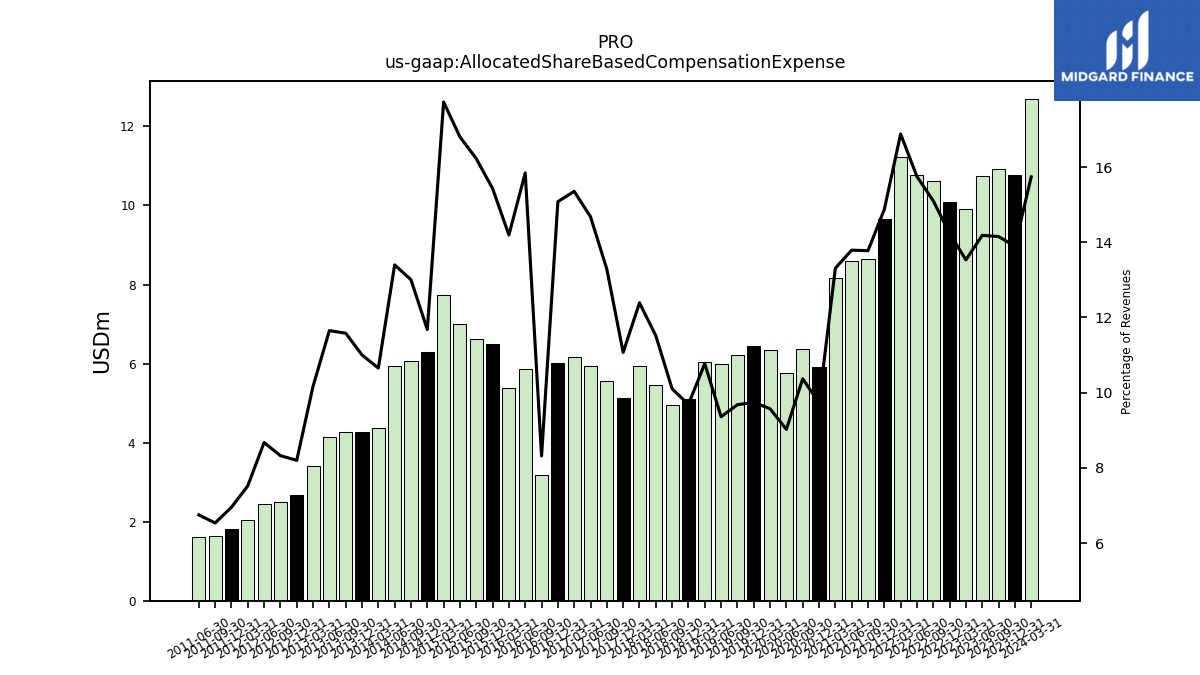
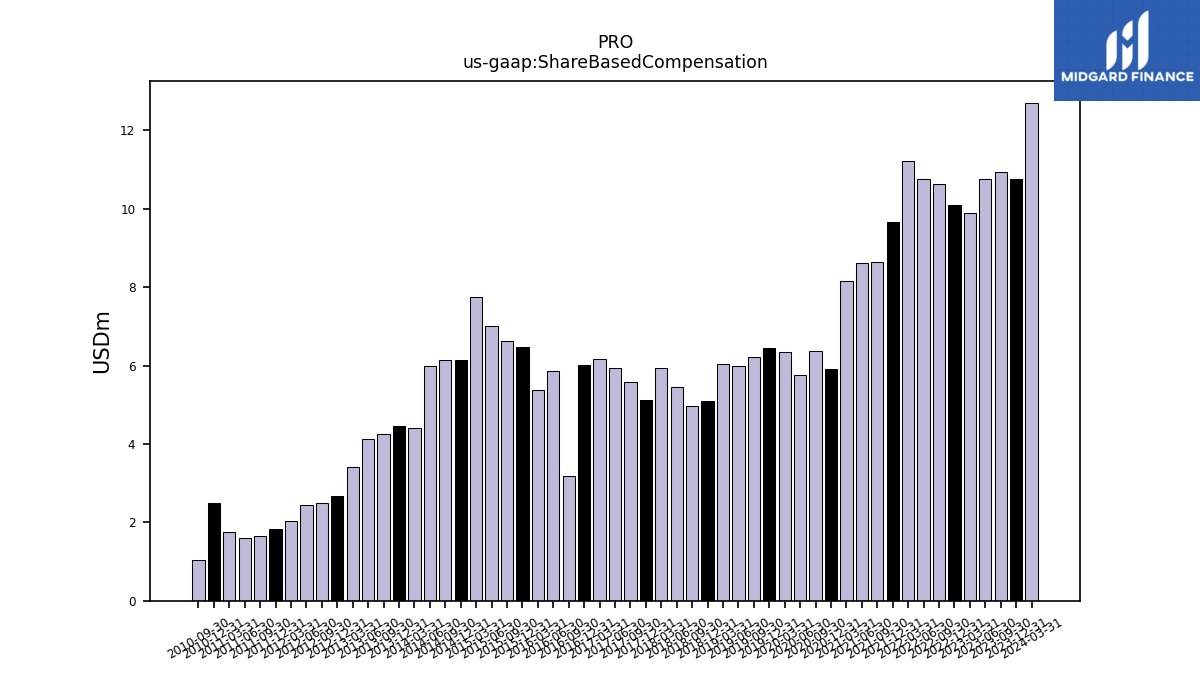
| Allocated Share Based Compensation Expense | 10.77 | 10.93 | 10.75 | 9.90 | 10.10 | 10.63 | 10.77 | 11.22 | 9.66 | 8.63 | 8.61 | 8.17 | 5.92 | 6.38 | 5.75 | 6.35 | 6.45 | 6.21 | 5.98 | 6.05 | 5.10 | 4.96 | 5.46 | 5.94 | 5.13 | 5.57 | 5.93 | 6.16 | 6.02 | 3.19 | 5.87 | 5.38 | 6.48 | 6.63 | 7.00 | 7.75 | 6.29 | 6.08 | 5.95 | 4.36 | 4.28 | 4.26 | 4.14 | 3.42 | 2.68 | 2.49 | 2.44 | 2.03 | 1.82 | 1.65 | 1.60 | NA | NA | NA | NA | |
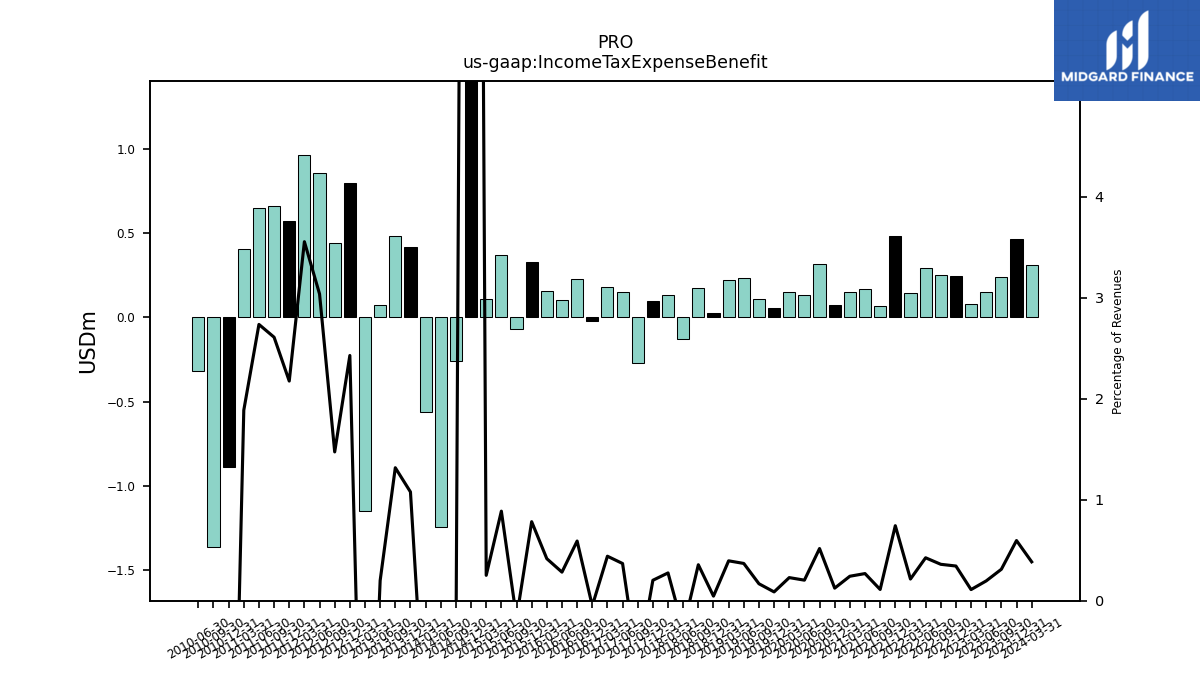
| Income Tax Expense Benefit | 0.46 | 0.24 | 0.15 | 0.08 | 0.24 | 0.25 | 0.29 | 0.14 | 0.48 | 0.07 | 0.17 | 0.15 | 0.08 | 0.32 | 0.13 | 0.15 | 0.06 | 0.11 | 0.24 | 0.22 | 0.02 | 0.17 | -0.13 | 0.13 | 0.09 | -0.27 | 0.15 | 0.18 | -0.02 | 0.23 | 0.10 | 0.16 | 0.33 | -0.07 | 0.37 | 0.11 | 14.55 | -0.26 | -1.24 | -0.56 | 0.42 | 0.48 | 0.07 | -1.15 | 0.80 | 0.44 | 0.85 | 0.96 | 0.57 | 0.66 | 0.65 | 0.40 | -0.89 | -1.36 | -0.32 | |
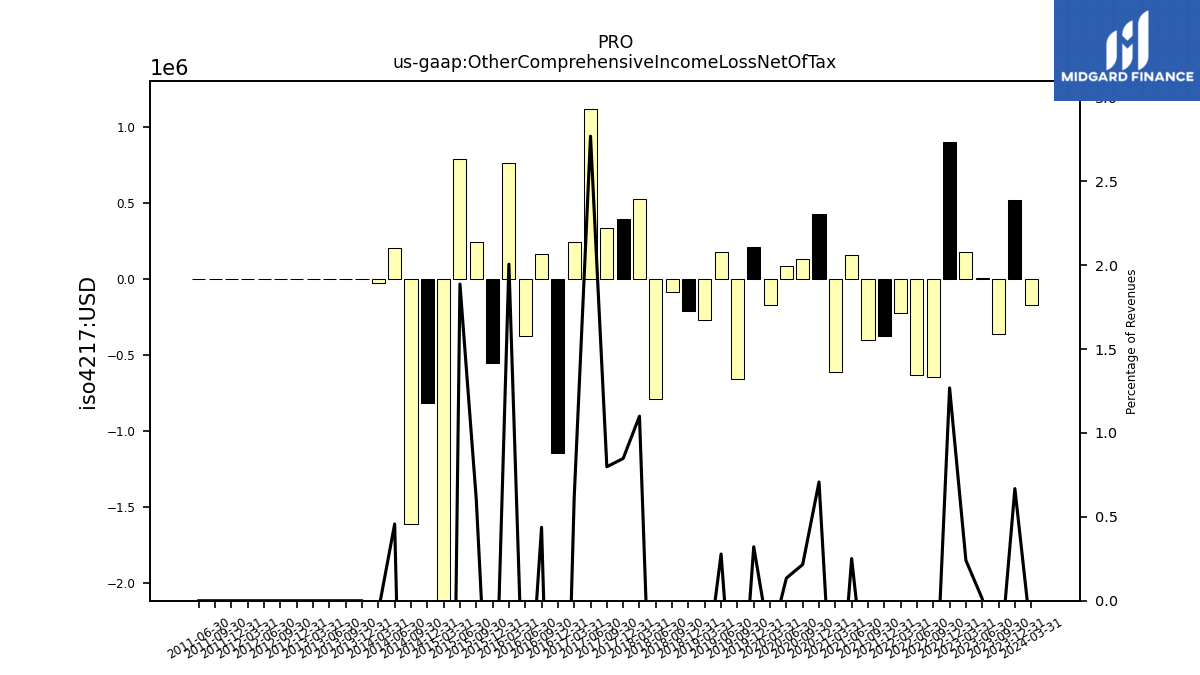
| Other Comprehensive Income Loss Net Of Tax | 0.52 | -0.36 | 0.01 | 0.18 | 0.90 | -0.64 | -0.63 | -0.22 | -0.38 | -0.40 | 0.16 | -0.61 | 0.43 | 0.13 | 0.09 | -0.17 | 0.21 | -0.66 | 0.18 | -0.27 | -0.21 | -0.09 | -0.79 | 0.53 | 0.39 | 0.34 | 1.12 | 0.25 | -1.14 | 0.17 | -0.37 | 0.76 | -0.55 | 0.25 | 0.79 | -2.56 | -0.81 | -1.61 | 0.20 | -0.03 | 0.00 | 0.00 | 0.00 | 0.00 | 0.00 | 0.00 | 0.00 | 0.00 | 0.00 | 0.00 | 0.00 | NA | NA | NA | NA | |
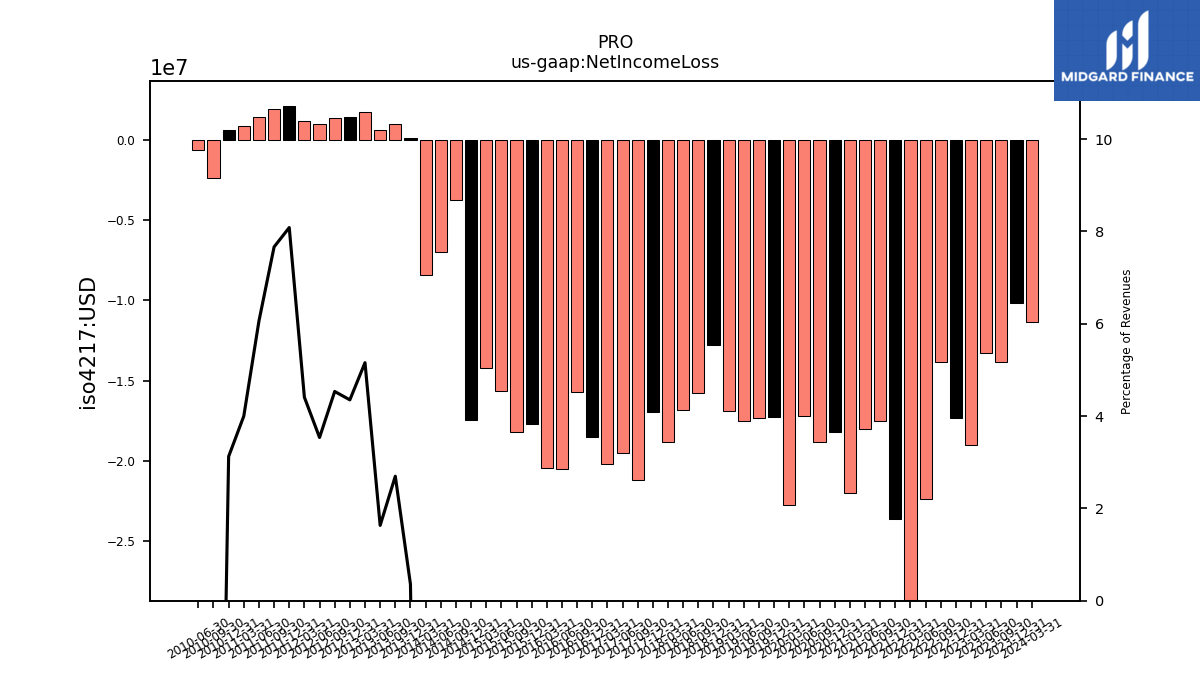
| Net Income Loss | -10.20 | -13.87 | -13.29 | -19.00 | -17.35 | -13.85 | -22.41 | -28.64 | -23.61 | -17.52 | -18.05 | -22.03 | -18.18 | -18.86 | -17.21 | -22.73 | -17.30 | -17.35 | -17.52 | -16.92 | -12.76 | -15.79 | -16.84 | -18.86 | -16.98 | -21.23 | -19.51 | -20.21 | -18.51 | -15.71 | -20.53 | -20.48 | -17.73 | -18.18 | -15.67 | -14.23 | -17.46 | -3.73 | -7.00 | -8.46 | 0.14 | 0.99 | 0.58 | 1.73 | 1.42 | 1.36 | 0.99 | 1.19 | 2.12 | 1.93 | 1.44 | 0.86 | 0.63 | -2.40 | -0.63 | |
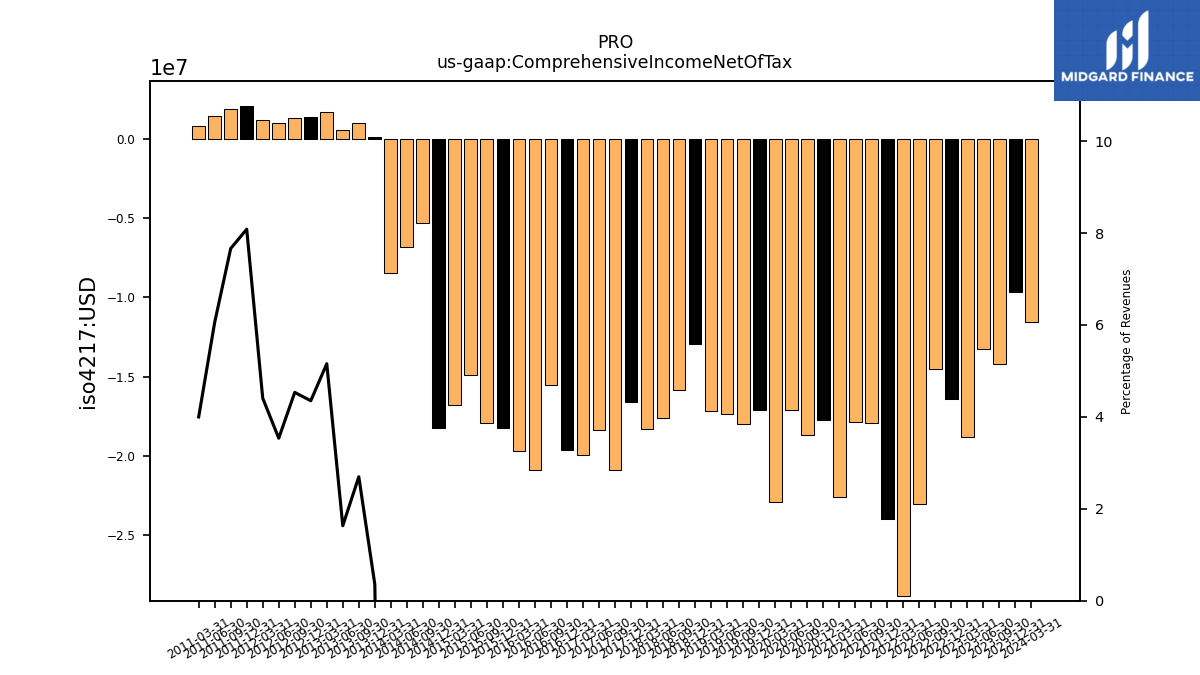
| Comprehensive Income Net Of Tax | -9.68 | -14.23 | -13.28 | -18.83 | -16.45 | -14.50 | -23.03 | -28.86 | -23.98 | -17.93 | -17.89 | -22.64 | -17.75 | -18.72 | -17.12 | -22.91 | -17.09 | -18.00 | -17.34 | -17.19 | -12.97 | -15.87 | -17.63 | -18.33 | -16.59 | -20.89 | -18.39 | -19.96 | -19.66 | -15.54 | -20.90 | -19.72 | -18.28 | -17.93 | -14.88 | -16.79 | -18.27 | -5.31 | -6.81 | -8.48 | 0.14 | 0.99 | 0.58 | 1.73 | 1.42 | 1.36 | 0.99 | 1.19 | 2.12 | 1.93 | 1.44 | 0.86 | NA | NA | NA |
| 2023-12-31 | 2023-09-30 | 2023-06-30 | 2023-03-31 | 2022-12-31 | 2022-09-30 | 2022-06-30 | 2022-03-31 | 2021-12-31 | 2021-09-30 | 2021-06-30 | 2021-03-31 | 2020-12-31 | 2020-09-30 | 2020-06-30 | 2020-03-31 | 2019-12-31 | 2019-09-30 | 2019-06-30 | 2019-03-31 | 2018-12-31 | 2018-09-30 | 2018-06-30 | 2018-03-31 | 2017-12-31 | 2017-09-30 | 2017-06-30 | 2017-03-31 | 2016-12-31 | 2016-09-30 | 2016-06-30 | 2016-03-31 | 2015-12-31 | 2015-09-30 | 2015-06-30 | 2015-03-31 | 2014-12-31 | 2014-09-30 | 2014-06-30 | 2014-03-31 | 2013-12-31 | 2013-09-30 | 2013-06-30 | 2013-03-31 | 2012-12-31 | 2012-09-30 | 2012-06-30 | 2012-03-31 | 2011-12-31 | 2011-09-30 | 2011-06-30 | 2011-03-31 | 2010-12-31 | 2010-09-30 | 2010-06-30 | ||
|---|---|---|---|---|---|---|---|---|---|---|---|---|---|---|---|---|---|---|---|---|---|---|---|---|---|---|---|---|---|---|---|---|---|---|---|---|---|---|---|---|---|---|---|---|---|---|---|---|---|---|---|---|---|---|---|---|
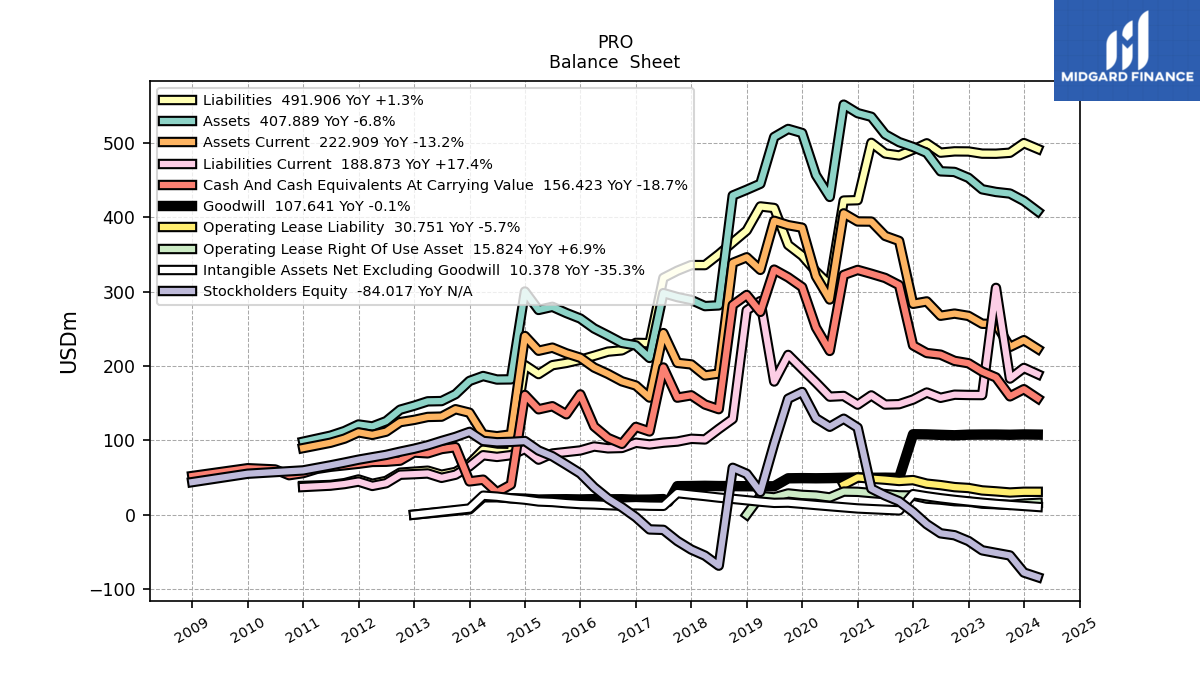
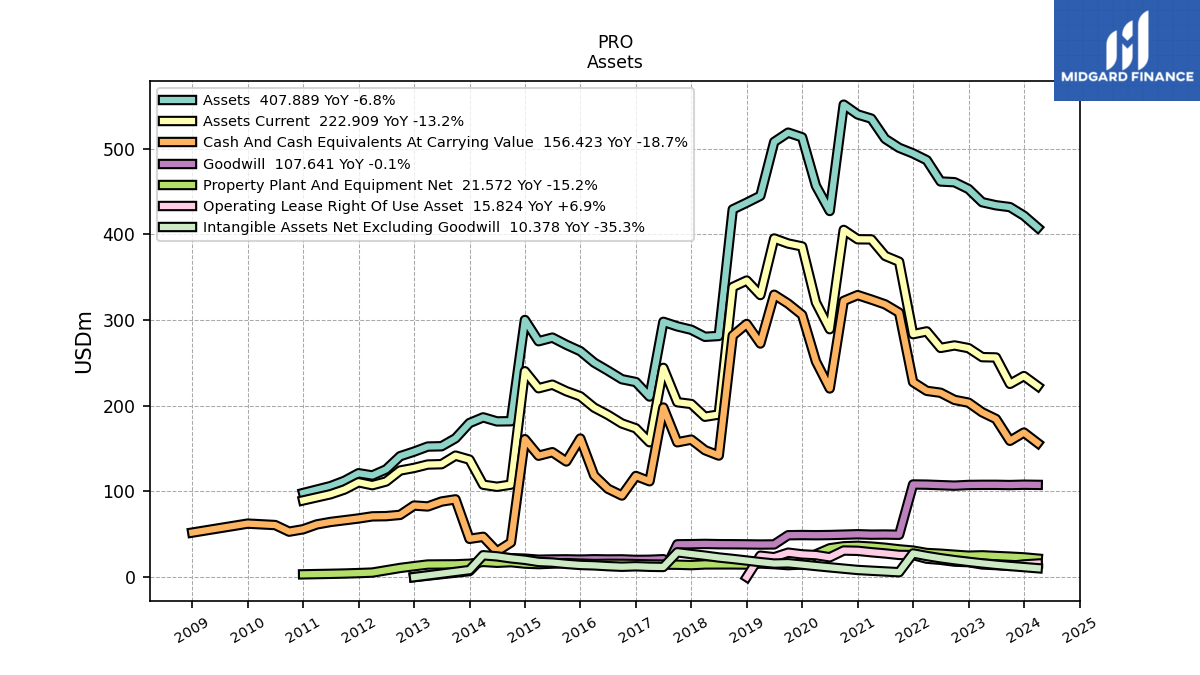
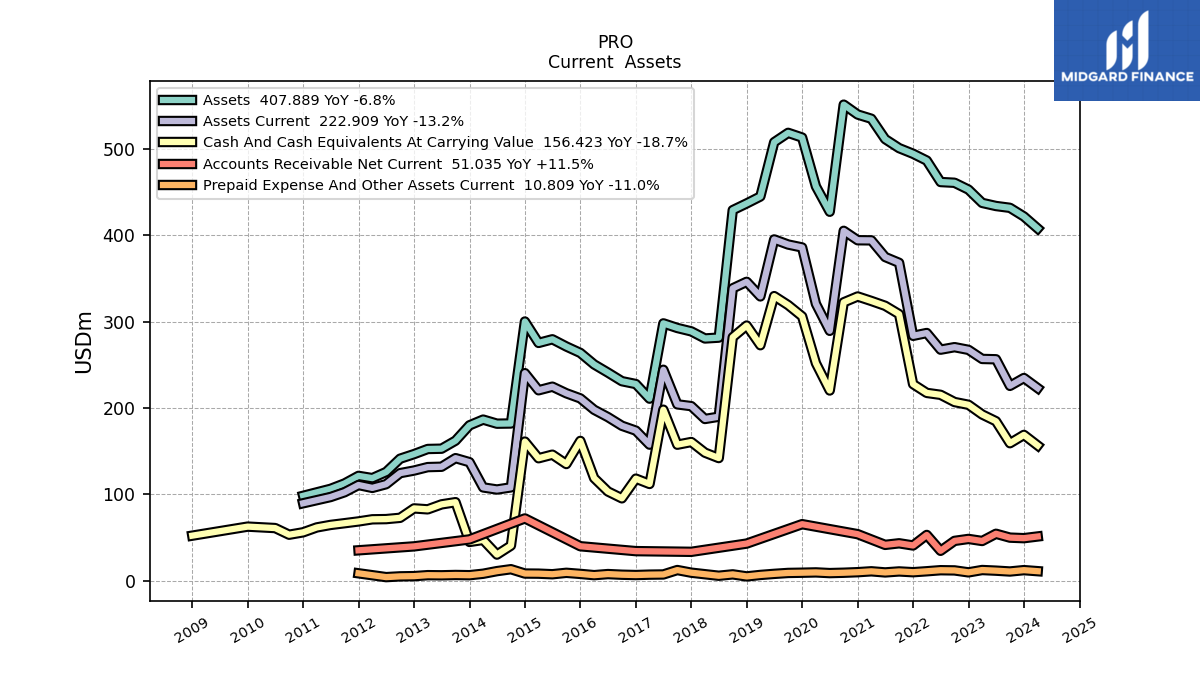
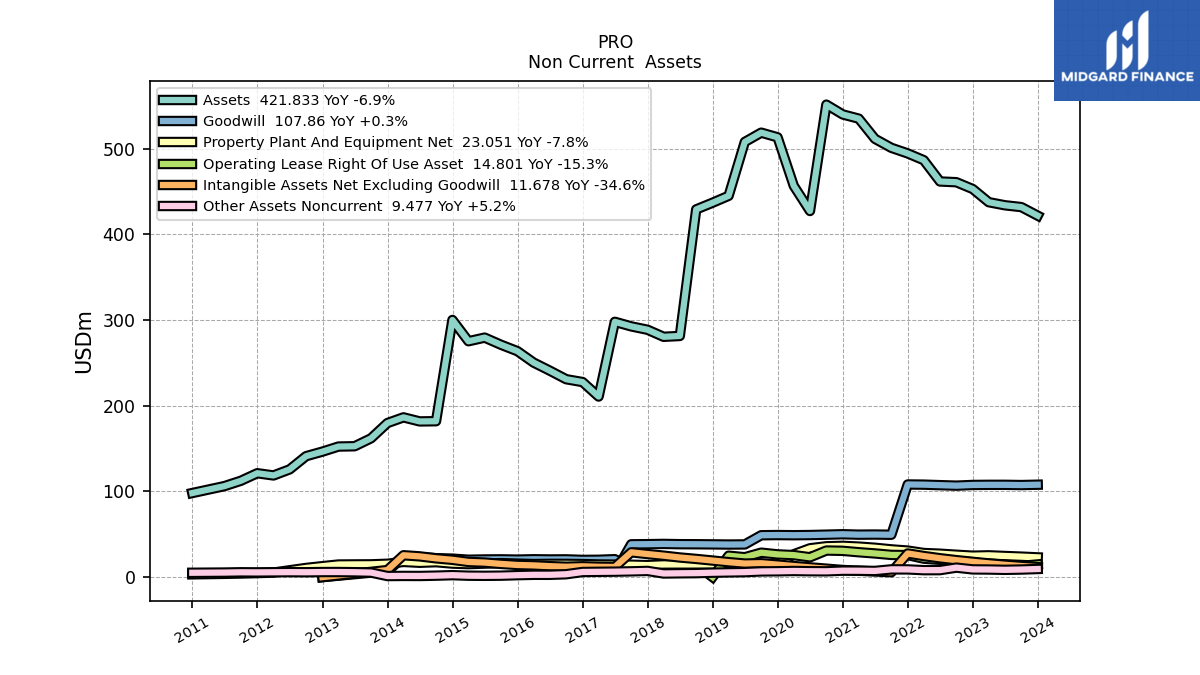
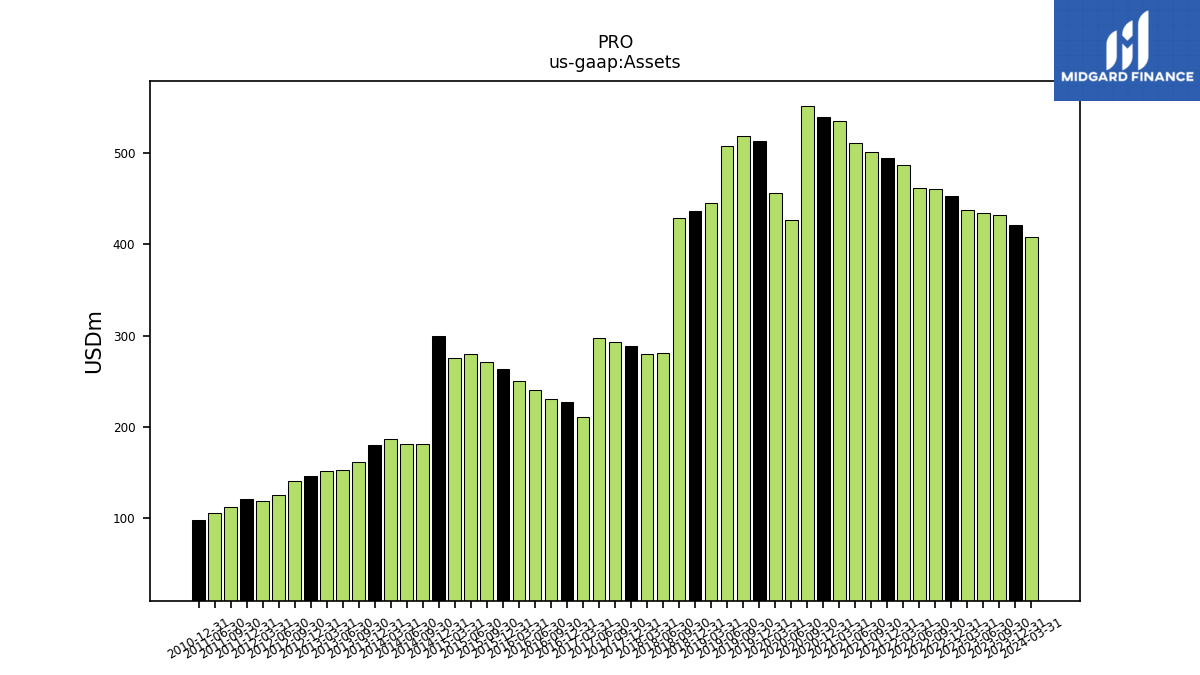
| Assets | 421.83 | 431.85 | 433.96 | 437.56 | 452.95 | 460.89 | 461.75 | 486.61 | 494.48 | 501.02 | 511.50 | 535.09 | 539.97 | 551.44 | 427.28 | 456.68 | 513.31 | 518.74 | 507.90 | 444.99 | 436.97 | 429.18 | 281.44 | 280.47 | 288.68 | 292.63 | 297.98 | 210.73 | 227.65 | 230.96 | 240.93 | 250.38 | 263.72 | 271.15 | 279.52 | 275.29 | 300.12 | 181.95 | 181.73 | 186.46 | 179.83 | 162.04 | 152.75 | 152.40 | 146.48 | 141.15 | 125.76 | 118.65 | 121.26 | 112.46 | 106.24 | NA | 98.13 | NA | NA | |
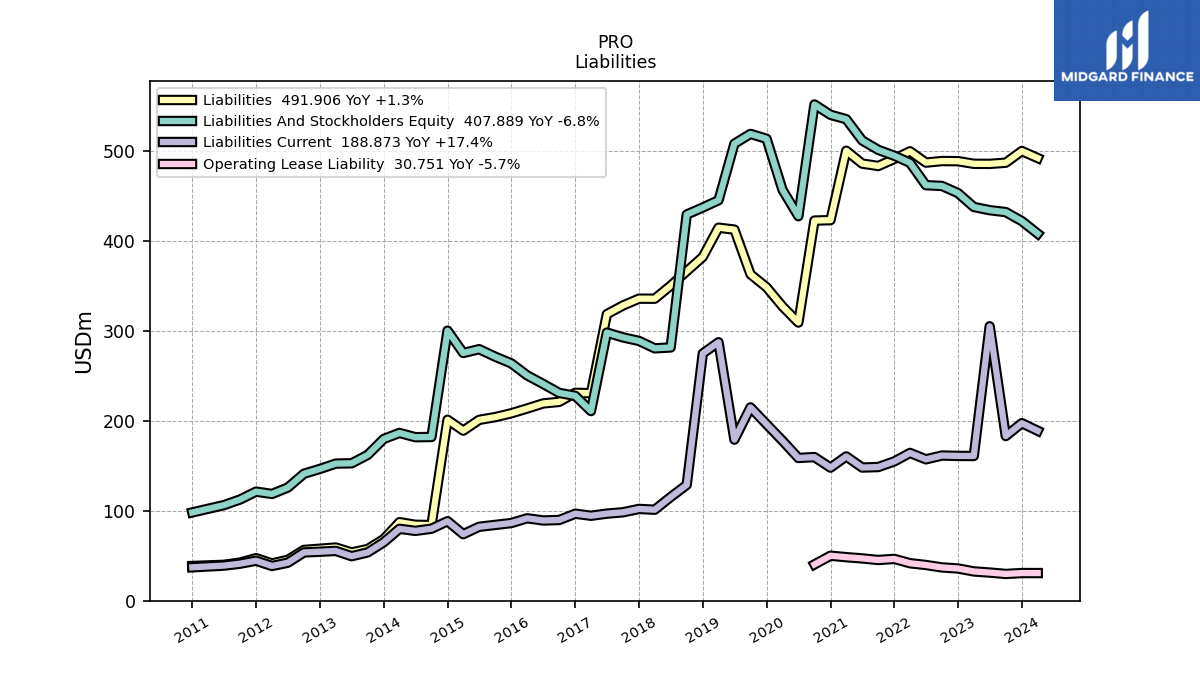
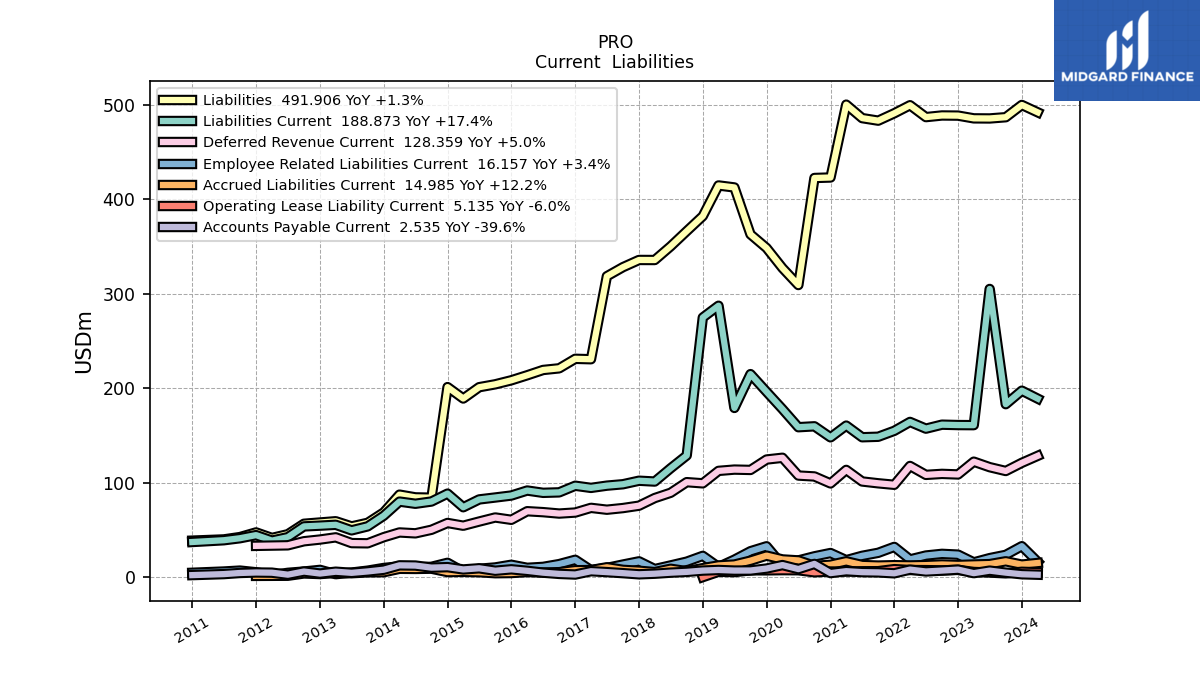
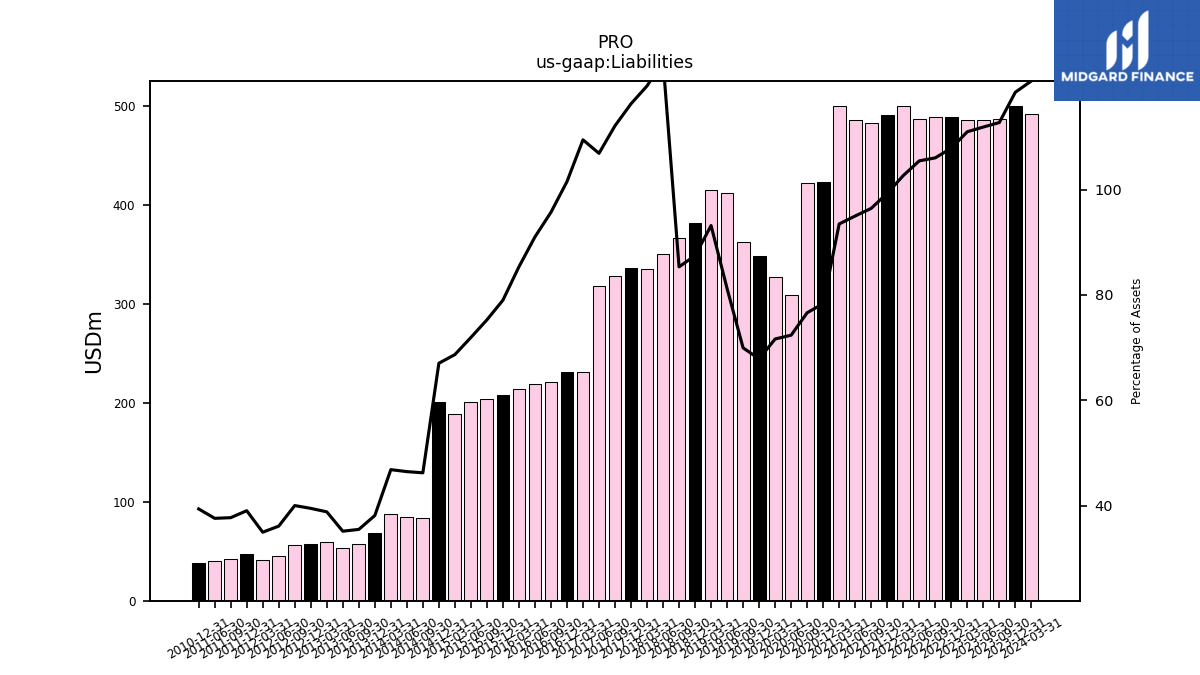
| Liabilities | 499.71 | 486.73 | 485.42 | 485.52 | 488.43 | 488.57 | 486.84 | 499.43 | 490.90 | 483.09 | 485.77 | 500.06 | 422.93 | 422.41 | 309.11 | 327.07 | 348.31 | 362.79 | 412.40 | 414.52 | 382.07 | 366.17 | 350.10 | 335.61 | 335.66 | 328.04 | 318.44 | 230.60 | 231.05 | 220.98 | 219.23 | 213.63 | 208.31 | 204.06 | 201.00 | 189.01 | 201.13 | 84.10 | 84.40 | 87.30 | 68.53 | 57.48 | 53.66 | 59.14 | 57.81 | 56.46 | 45.40 | 41.46 | 47.32 | 42.40 | 39.92 | NA | 38.62 | NA | NA | |
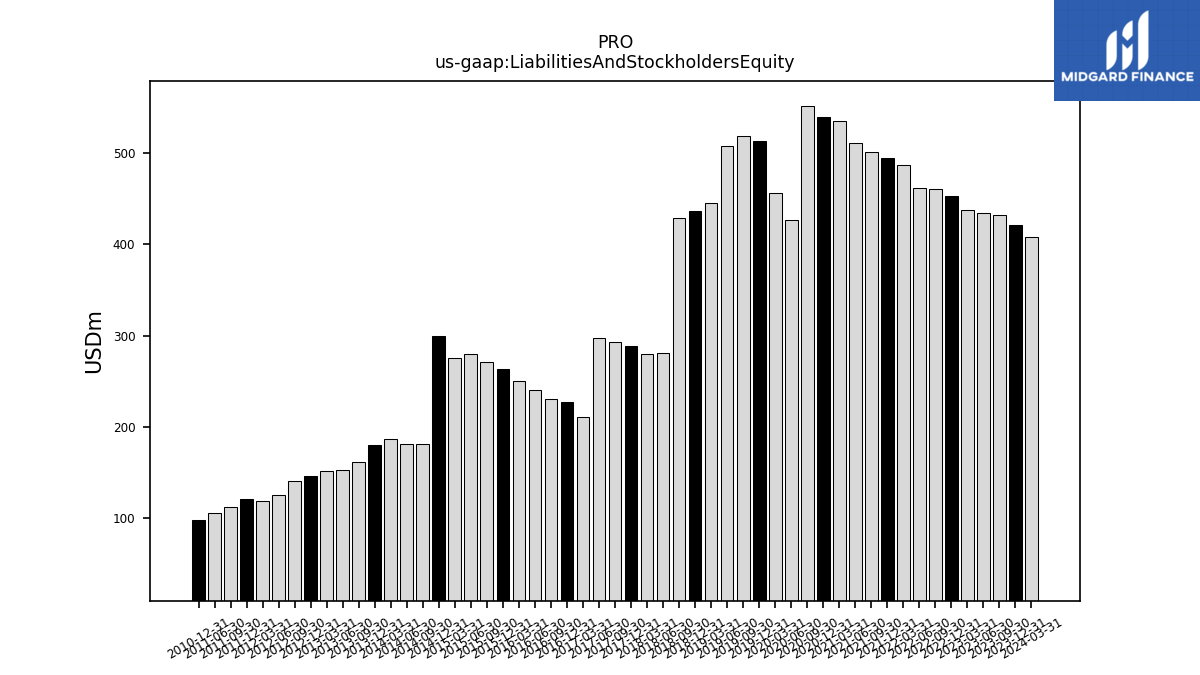
| Liabilities And Stockholders Equity | 421.83 | 431.85 | 433.96 | 437.56 | 452.95 | 460.89 | 461.75 | 486.61 | 494.48 | 501.02 | 511.50 | 535.09 | 539.97 | 551.44 | 427.28 | 456.68 | 513.31 | 518.74 | 507.90 | 444.99 | 436.97 | 429.18 | 281.44 | 280.47 | 288.68 | 292.63 | 297.98 | 210.73 | 227.65 | 230.96 | 240.93 | 250.38 | 263.72 | 271.15 | 279.52 | 275.29 | 300.12 | 181.95 | 181.73 | 186.46 | 179.83 | 162.04 | 152.75 | 152.40 | 146.48 | 141.15 | 125.76 | 118.65 | 121.26 | 112.46 | 106.24 | NA | 98.13 | NA | NA | |
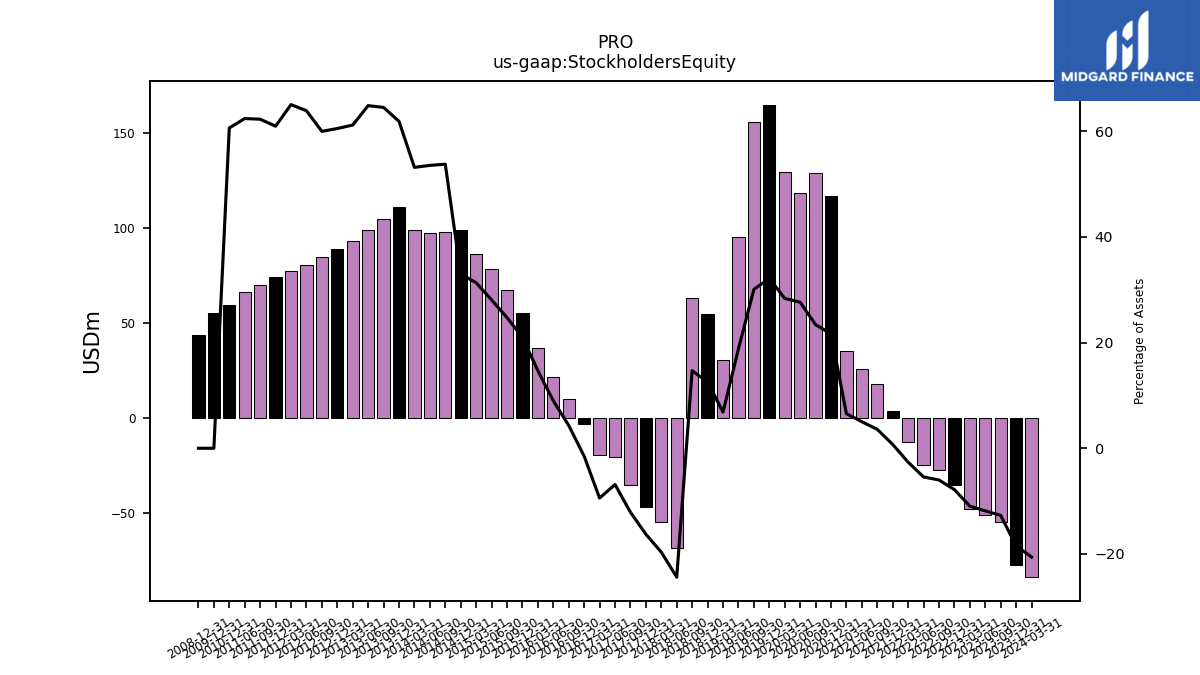
| Stockholders Equity | -77.87 | -54.88 | -51.45 | -47.97 | -35.47 | -27.68 | -25.09 | -12.82 | 3.58 | 17.93 | 25.73 | 35.03 | 117.04 | 129.03 | 118.17 | 129.61 | 165.00 | 155.95 | 95.49 | 30.47 | 54.90 | 63.01 | -68.66 | -55.14 | -46.98 | -35.41 | -20.46 | -19.87 | -3.39 | 9.98 | 21.70 | 36.76 | 55.41 | 67.10 | 78.52 | 86.28 | 99.00 | 97.86 | 97.33 | 99.16 | 111.30 | 104.56 | 99.09 | 93.26 | 88.67 | 84.69 | 80.36 | 77.19 | 73.94 | 70.06 | 66.32 | NA | 59.50 | NA | NA |
| 2023-12-31 | 2023-09-30 | 2023-06-30 | 2023-03-31 | 2022-12-31 | 2022-09-30 | 2022-06-30 | 2022-03-31 | 2021-12-31 | 2021-09-30 | 2021-06-30 | 2021-03-31 | 2020-12-31 | 2020-09-30 | 2020-06-30 | 2020-03-31 | 2019-12-31 | 2019-09-30 | 2019-06-30 | 2019-03-31 | 2018-12-31 | 2018-09-30 | 2018-06-30 | 2018-03-31 | 2017-12-31 | 2017-09-30 | 2017-06-30 | 2017-03-31 | 2016-12-31 | 2016-09-30 | 2016-06-30 | 2016-03-31 | 2015-12-31 | 2015-09-30 | 2015-06-30 | 2015-03-31 | 2014-12-31 | 2014-09-30 | 2014-06-30 | 2014-03-31 | 2013-12-31 | 2013-09-30 | 2013-06-30 | 2013-03-31 | 2012-12-31 | 2012-09-30 | 2012-06-30 | 2012-03-31 | 2011-12-31 | 2011-09-30 | 2011-06-30 | 2011-03-31 | 2010-12-31 | 2010-09-30 | 2010-06-30 | ||
|---|---|---|---|---|---|---|---|---|---|---|---|---|---|---|---|---|---|---|---|---|---|---|---|---|---|---|---|---|---|---|---|---|---|---|---|---|---|---|---|---|---|---|---|---|---|---|---|---|---|---|---|---|---|---|---|---|
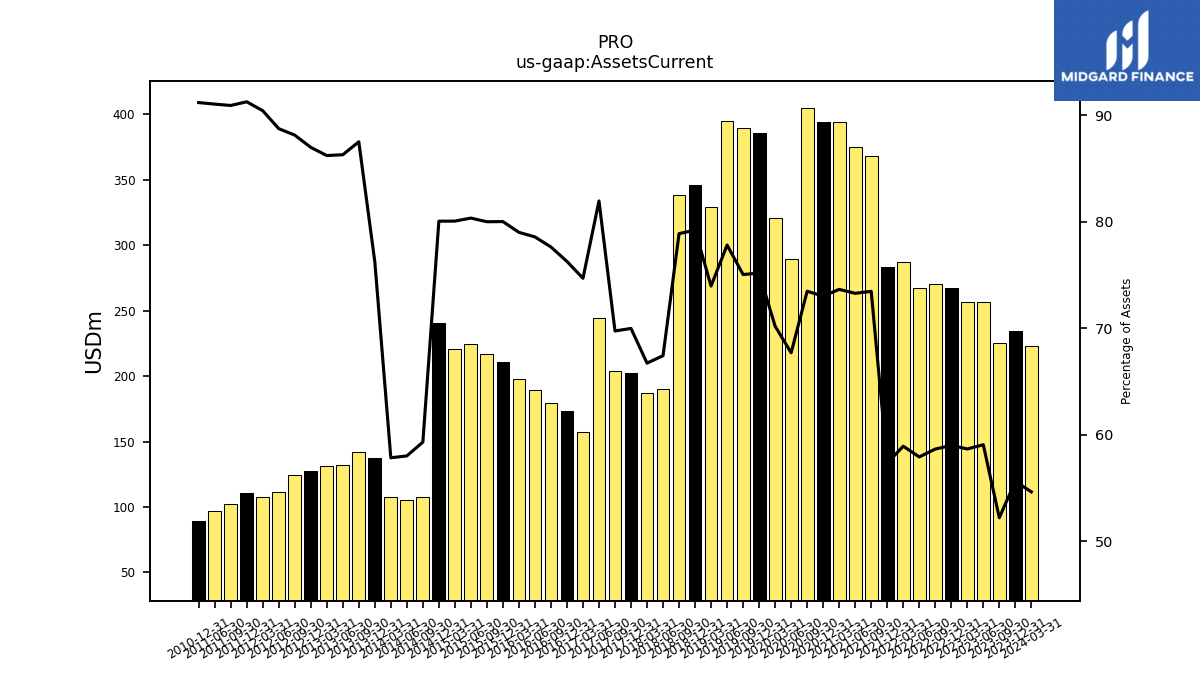
| Assets Current | 234.67 | 225.52 | 256.36 | 256.75 | 267.28 | 270.39 | 267.49 | 286.80 | 283.53 | 368.13 | 374.88 | 394.14 | 394.30 | 405.22 | 289.31 | 320.60 | 385.94 | 389.33 | 395.25 | 329.17 | 346.14 | 338.60 | 189.79 | 187.18 | 202.06 | 204.12 | 244.24 | 157.42 | 173.66 | 179.31 | 189.33 | 197.84 | 211.04 | 216.95 | 224.60 | 220.42 | 240.29 | 107.94 | 105.45 | 107.86 | 137.13 | 141.81 | 131.82 | 131.40 | 127.43 | 124.41 | 111.61 | 107.30 | 110.67 | 102.26 | 96.73 | NA | 89.49 | NA | NA | |
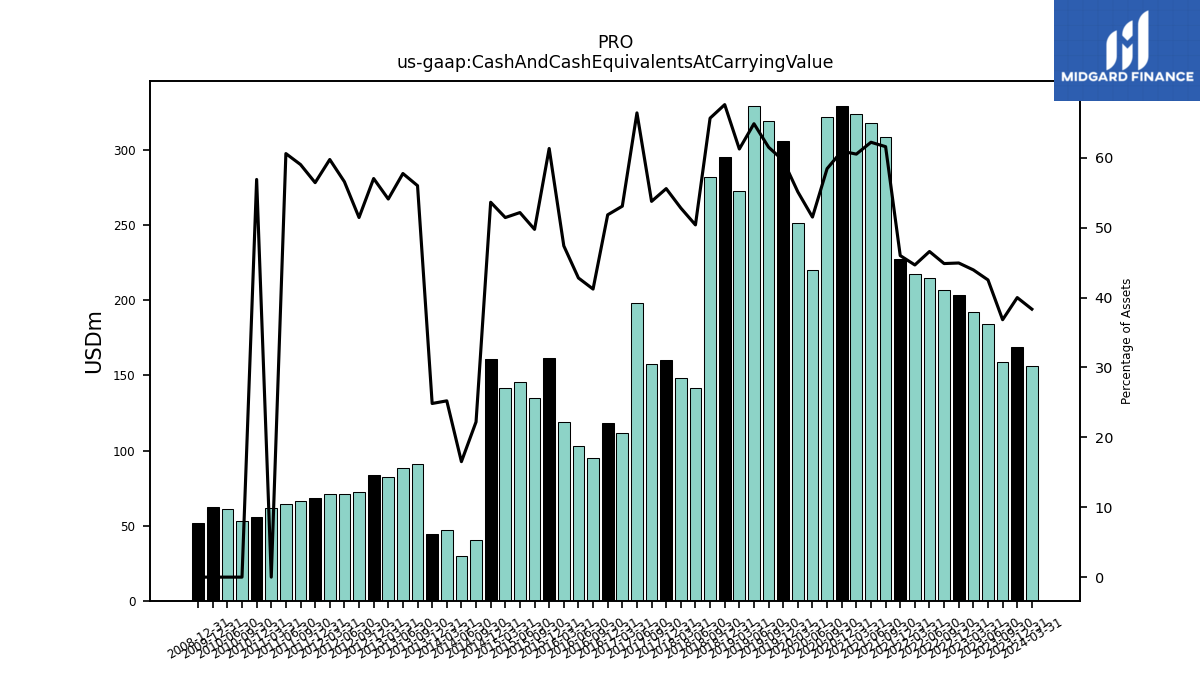
| Cash And Cash Equivalents At Carrying Value | 168.75 | 159.08 | 184.57 | 192.38 | 203.63 | 206.82 | 215.18 | 217.39 | 227.55 | 308.64 | 318.33 | 323.93 | 329.13 | 322.35 | 220.16 | 251.78 | 306.08 | 319.16 | 329.56 | 272.64 | 295.48 | 281.89 | 141.87 | 148.15 | 160.50 | 157.36 | 197.97 | 111.87 | 118.04 | 95.21 | 103.15 | 118.70 | 161.77 | 134.95 | 145.83 | 141.66 | 161.02 | 40.41 | 30.03 | 47.04 | 44.69 | 90.77 | 88.23 | 82.46 | 83.56 | 72.64 | 71.16 | 70.91 | 68.46 | 66.40 | 64.40 | 61.50 | 55.84 | 53.06 | 60.77 | |
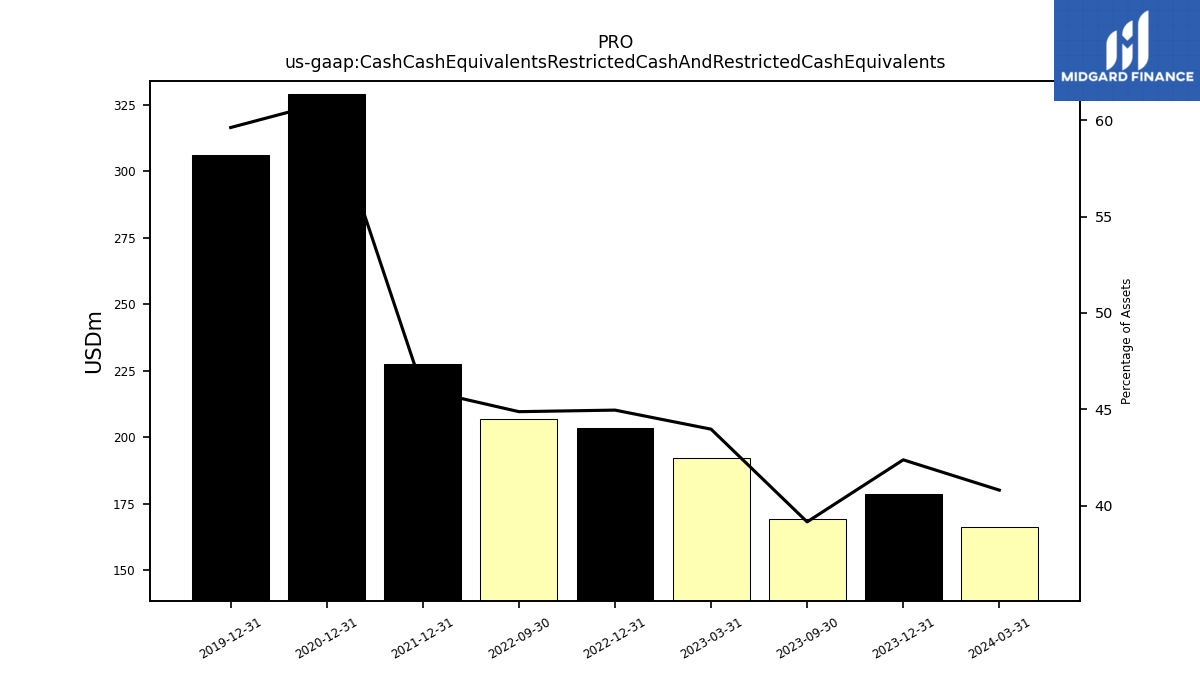
| Cash Cash Equivalents Restricted Cash And Restricted Cash Equivalents | 178.75 | 169.08 | NA | NA | 203.63 | 206.82 | NA | NA | 227.55 | NA | NA | NA | 329.13 | NA | NA | NA | 306.08 | NA | NA | NA | NA | NA | NA | NA | NA | NA | NA | NA | NA | NA | NA | NA | NA | NA | NA | NA | NA | NA | NA | NA | NA | NA | NA | NA | NA | NA | NA | NA | NA | NA | NA | NA | NA | NA | NA | |
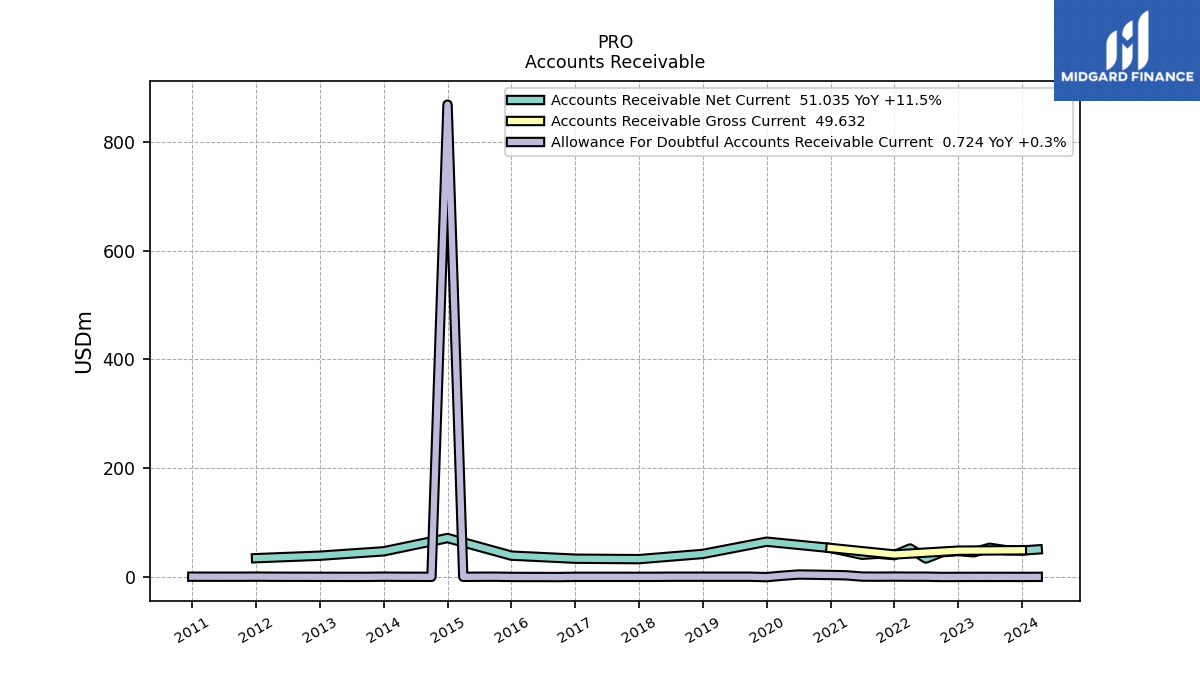
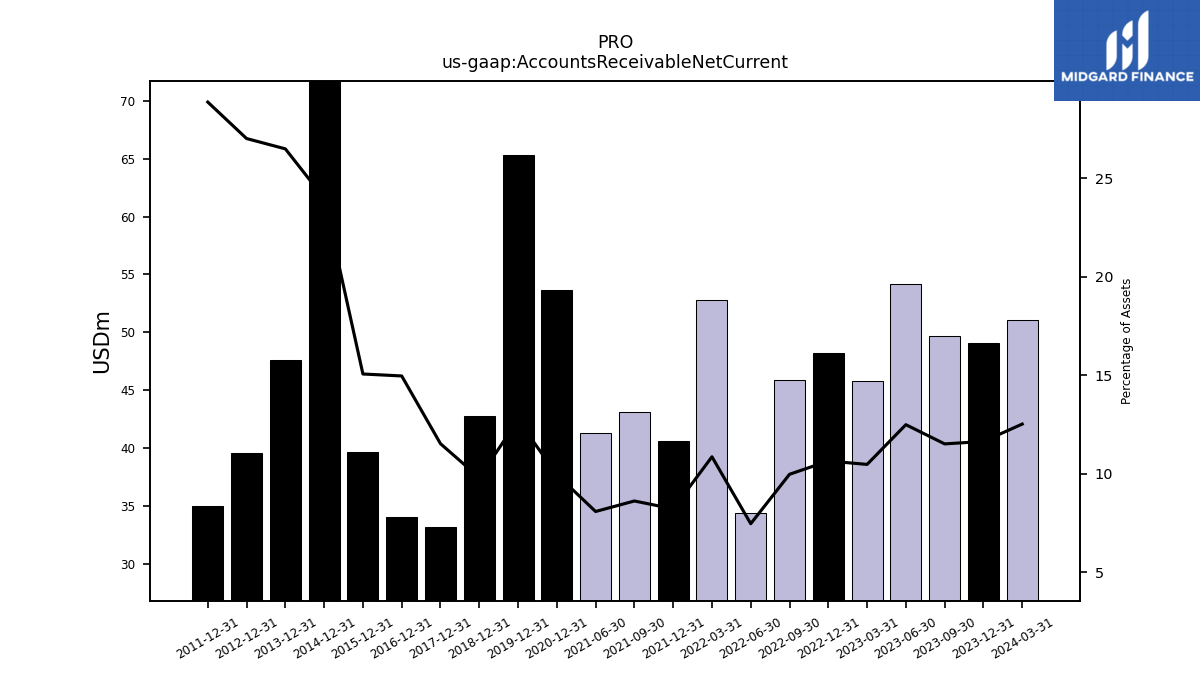
| Accounts Receivable Net Current | 49.06 | 49.69 | 54.16 | 45.79 | 48.18 | 45.92 | 34.41 | 52.80 | 40.58 | 43.12 | 41.30 | NA | 53.70 | NA | NA | NA | 65.29 | NA | NA | NA | 42.80 | NA | NA | NA | 33.24 | NA | NA | NA | 34.05 | NA | NA | NA | 39.70 | NA | NA | NA | 71.96 | NA | NA | NA | 47.63 | NA | NA | NA | 39.56 | NA | NA | NA | 34.99 | NA | NA | NA | NA | NA | NA | |
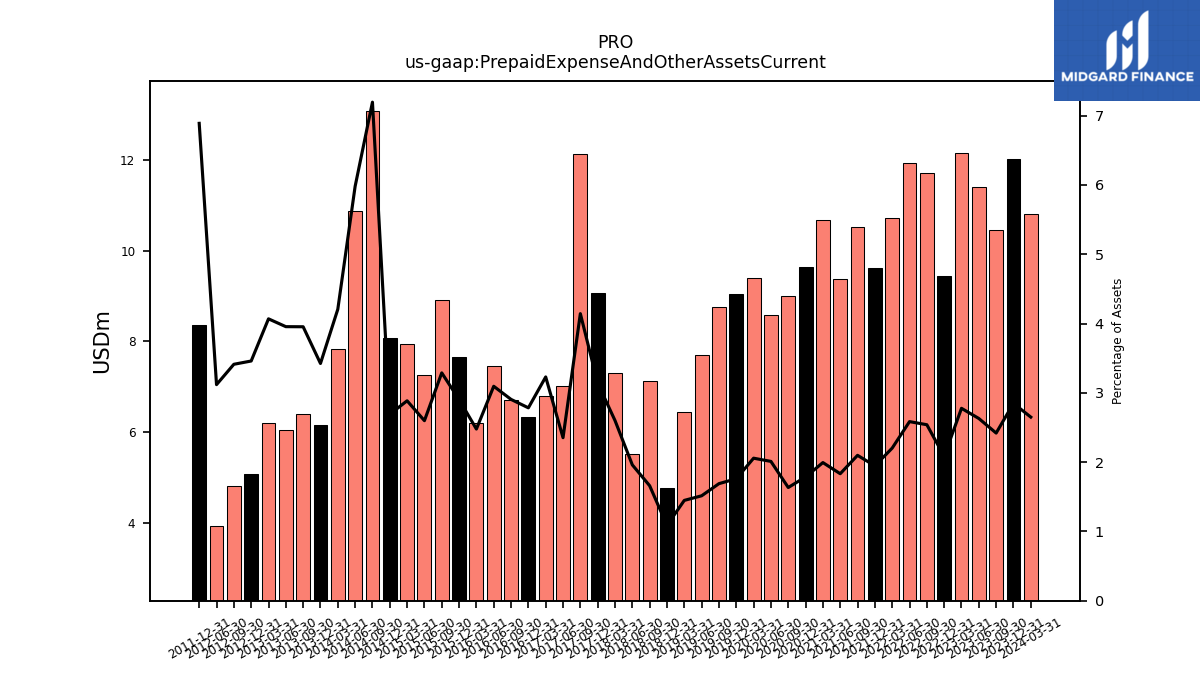
| Prepaid Expense And Other Assets Current | 12.01 | 10.45 | 11.41 | 12.15 | 9.44 | 11.71 | 11.94 | 10.72 | 9.62 | 10.51 | 9.38 | 10.67 | 9.65 | 9.01 | 8.59 | 9.39 | 9.04 | 8.76 | 7.69 | 6.44 | 4.76 | 7.12 | 5.52 | 7.29 | 9.07 | 12.12 | 7.01 | 6.80 | 6.34 | 6.71 | 7.46 | 6.20 | 7.66 | 8.92 | 7.26 | 7.94 | 8.07 | 13.09 | 10.87 | 7.84 | 6.16 | 6.41 | 6.04 | 6.20 | 5.07 | 4.82 | 3.92 | NA | 8.35 | NA | NA | NA | NA | NA | NA |
| 2023-12-31 | 2023-09-30 | 2023-06-30 | 2023-03-31 | 2022-12-31 | 2022-09-30 | 2022-06-30 | 2022-03-31 | 2021-12-31 | 2021-09-30 | 2021-06-30 | 2021-03-31 | 2020-12-31 | 2020-09-30 | 2020-06-30 | 2020-03-31 | 2019-12-31 | 2019-09-30 | 2019-06-30 | 2019-03-31 | 2018-12-31 | 2018-09-30 | 2018-06-30 | 2018-03-31 | 2017-12-31 | 2017-09-30 | 2017-06-30 | 2017-03-31 | 2016-12-31 | 2016-09-30 | 2016-06-30 | 2016-03-31 | 2015-12-31 | 2015-09-30 | 2015-06-30 | 2015-03-31 | 2014-12-31 | 2014-09-30 | 2014-06-30 | 2014-03-31 | 2013-12-31 | 2013-09-30 | 2013-06-30 | 2013-03-31 | 2012-12-31 | 2012-09-30 | 2012-06-30 | 2012-03-31 | 2011-12-31 | 2011-09-30 | 2011-06-30 | 2011-03-31 | 2010-12-31 | 2010-09-30 | 2010-06-30 | ||
|---|---|---|---|---|---|---|---|---|---|---|---|---|---|---|---|---|---|---|---|---|---|---|---|---|---|---|---|---|---|---|---|---|---|---|---|---|---|---|---|---|---|---|---|---|---|---|---|---|---|---|---|---|---|---|---|---|
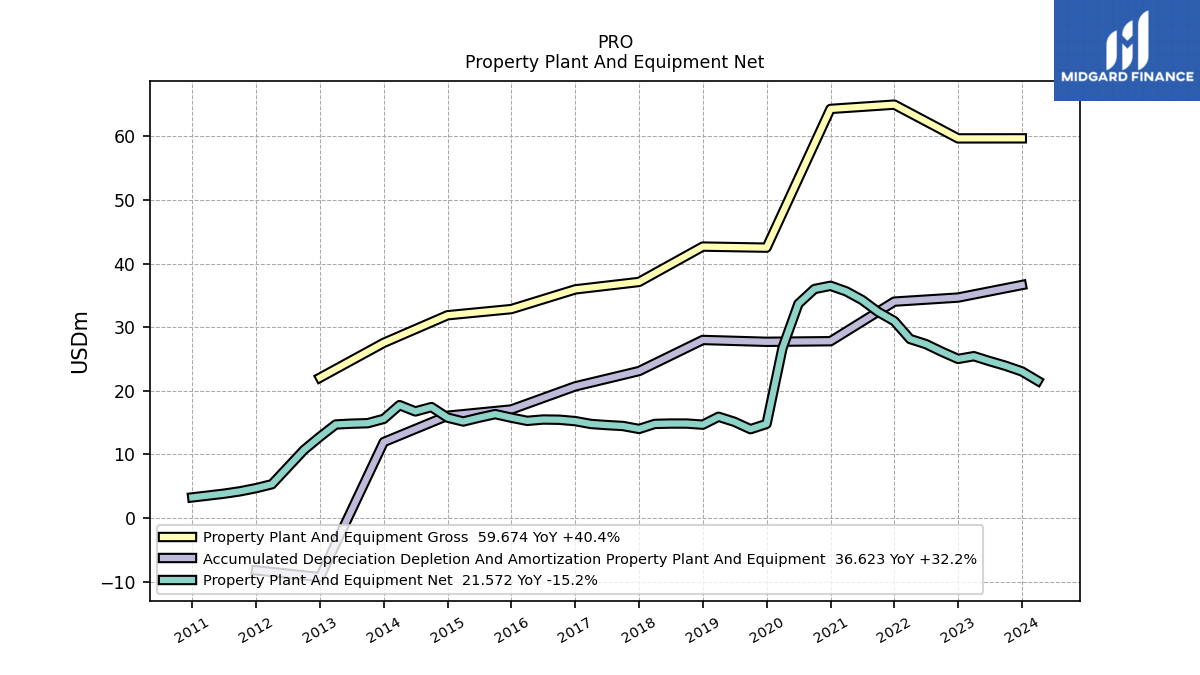
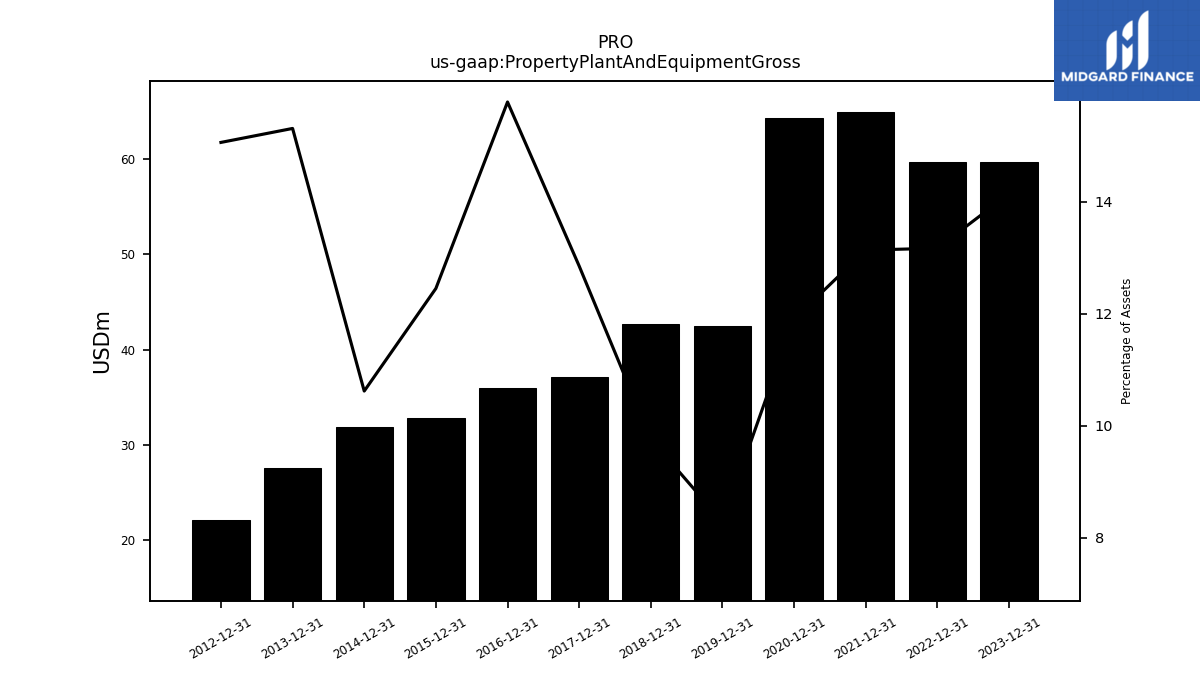
| Property Plant And Equipment Gross | 59.67 | NA | NA | NA | 59.67 | NA | NA | NA | 64.97 | NA | NA | NA | 64.30 | NA | NA | NA | 42.50 | NA | NA | NA | 42.67 | NA | NA | NA | 37.11 | NA | NA | NA | 35.94 | NA | NA | NA | 32.84 | NA | NA | NA | 31.87 | NA | NA | NA | 27.54 | NA | NA | NA | 22.07 | NA | NA | NA | NA | NA | NA | NA | NA | NA | NA | |
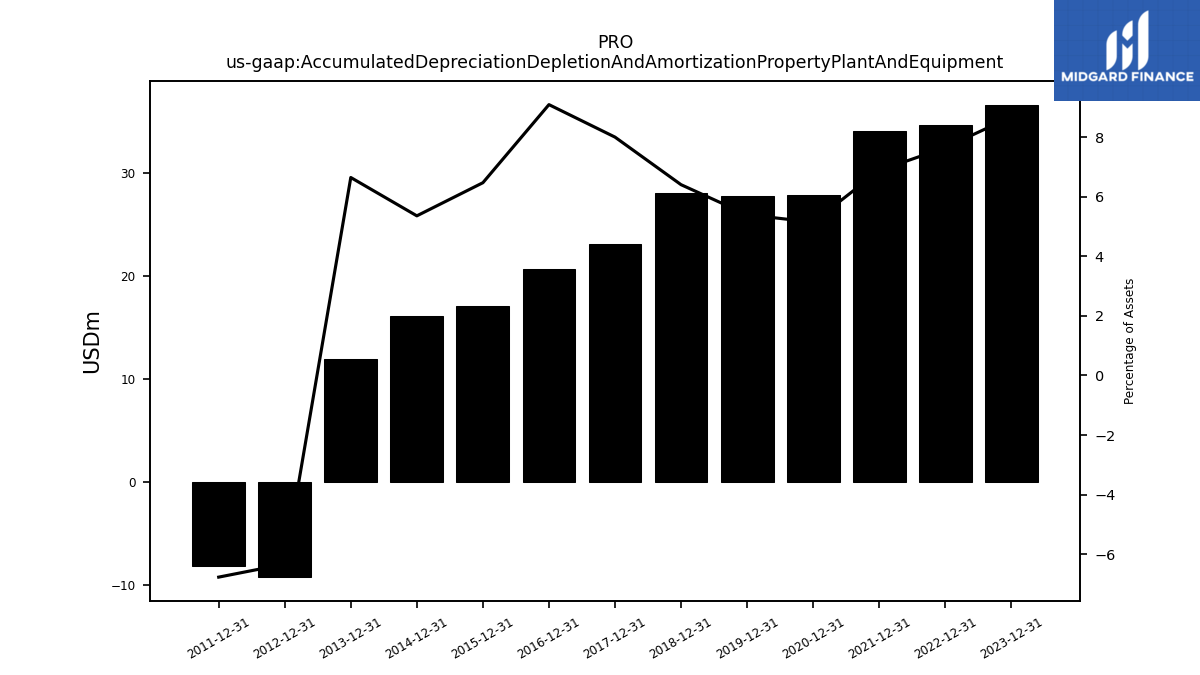
| Accumulated Depreciation Depletion And Amortization Property Plant And Equipment | 36.62 | NA | NA | NA | 34.65 | NA | NA | NA | 34.02 | NA | NA | NA | 27.80 | NA | NA | NA | 27.70 | NA | NA | NA | 27.99 | NA | NA | NA | 23.10 | NA | NA | NA | 20.70 | NA | NA | NA | 17.07 | NA | NA | NA | 16.09 | NA | NA | NA | 11.95 | NA | NA | NA | -9.28 | NA | NA | NA | -8.21 | NA | NA | NA | NA | NA | NA | |
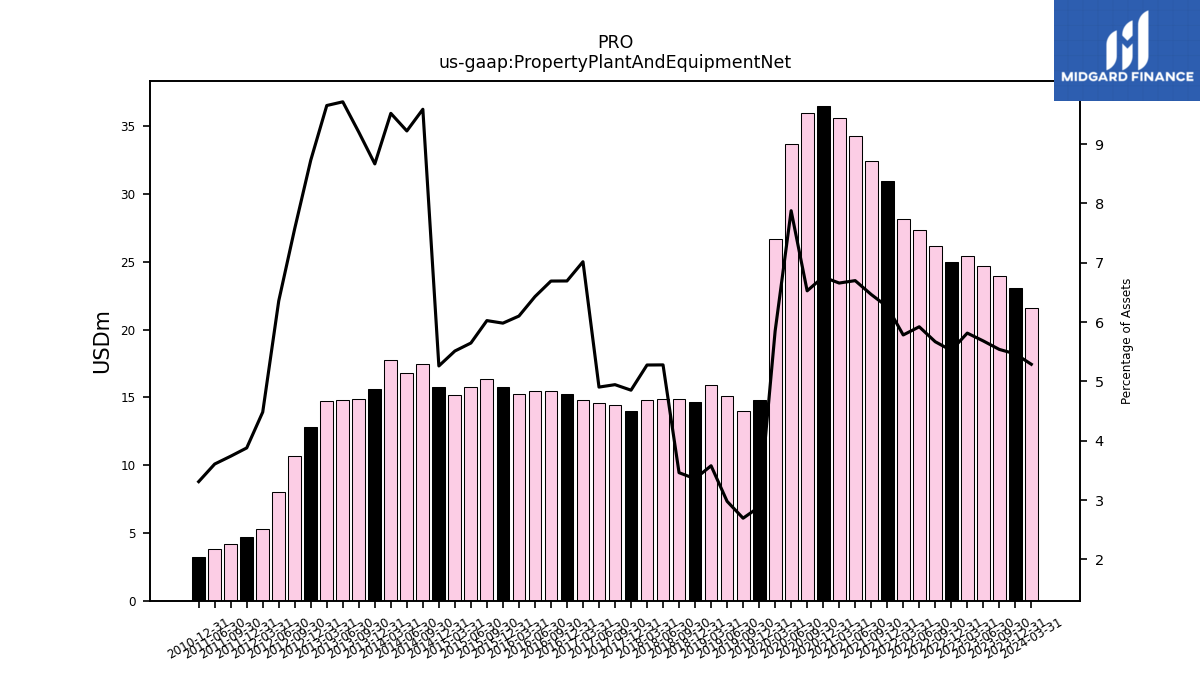
| Property Plant And Equipment Net | 23.05 | 23.92 | 24.66 | 25.44 | 25.01 | 26.13 | 27.34 | 28.14 | 30.96 | 32.40 | 34.27 | 35.63 | 36.50 | 35.99 | 33.66 | 26.70 | 14.79 | 13.97 | 15.13 | 15.92 | 14.68 | 14.86 | 14.86 | 14.80 | 14.01 | 14.47 | 14.61 | 14.79 | 15.24 | 15.46 | 15.49 | 15.28 | 15.78 | 16.34 | 15.79 | 15.18 | 15.79 | 17.45 | 16.76 | 17.75 | 15.59 | 14.91 | 14.84 | 14.71 | 12.79 | 10.70 | 8.00 | 5.32 | 4.70 | 4.21 | 3.83 | NA | 3.25 | NA | NA | |
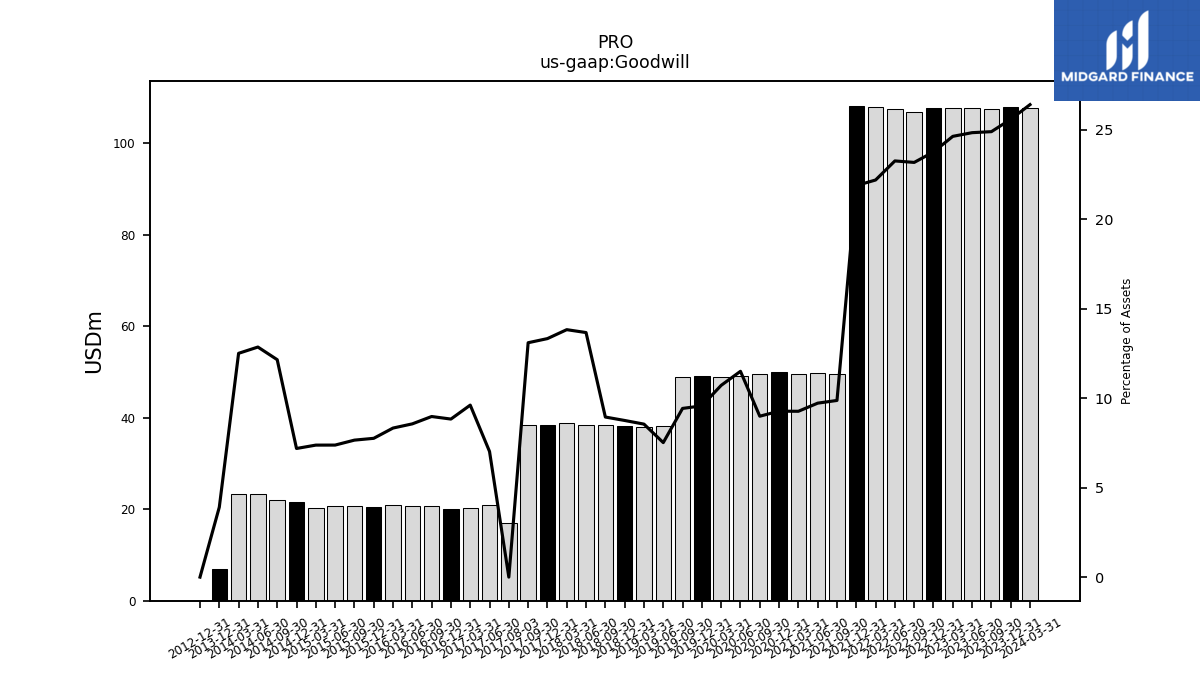
| Goodwill | 107.86 | 107.44 | 107.72 | 107.72 | 107.56 | 106.75 | 107.33 | 107.93 | 108.13 | 49.44 | 49.70 | 49.56 | 50.04 | 49.56 | 49.12 | 48.91 | 49.10 | 48.88 | 38.16 | 38.03 | 38.23 | 38.37 | 38.44 | 38.76 | 38.46 | 38.31 | 20.91 | 20.25 | 20.10 | 20.72 | 20.62 | 20.85 | 20.45 | 20.75 | 20.61 | 20.30 | 21.56 | 22.10 | 23.35 | 23.31 | 7.02 | NA | NA | NA | 0.00 | NA | NA | NA | NA | NA | NA | NA | NA | NA | NA | |
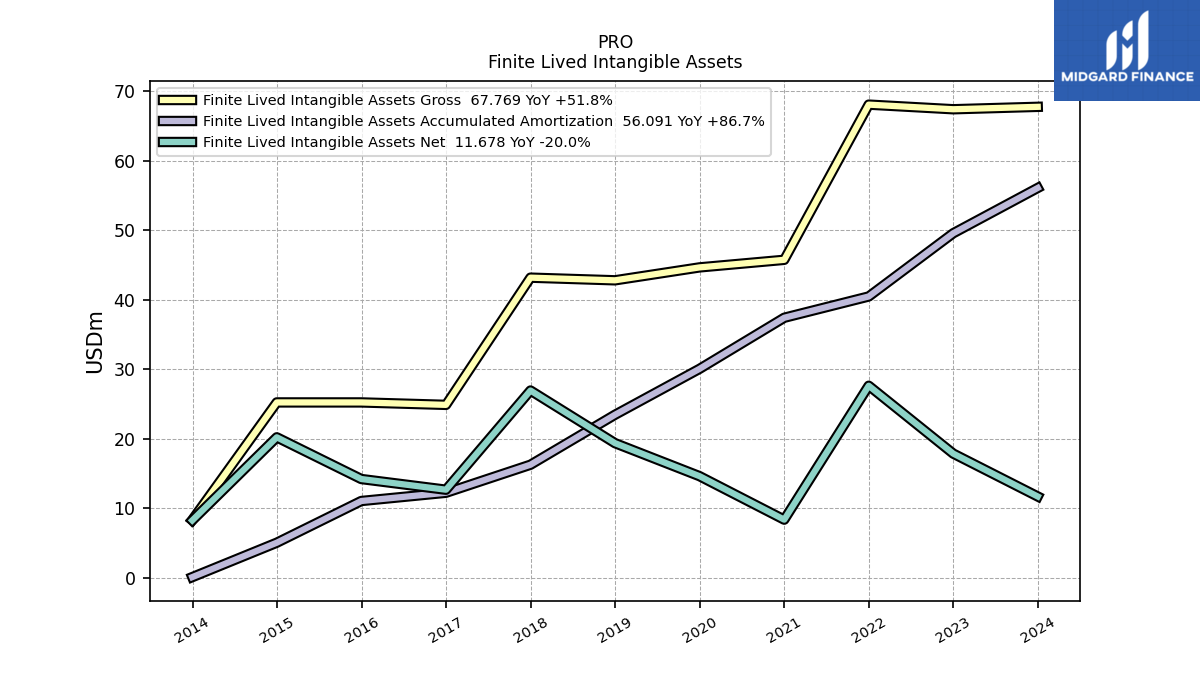
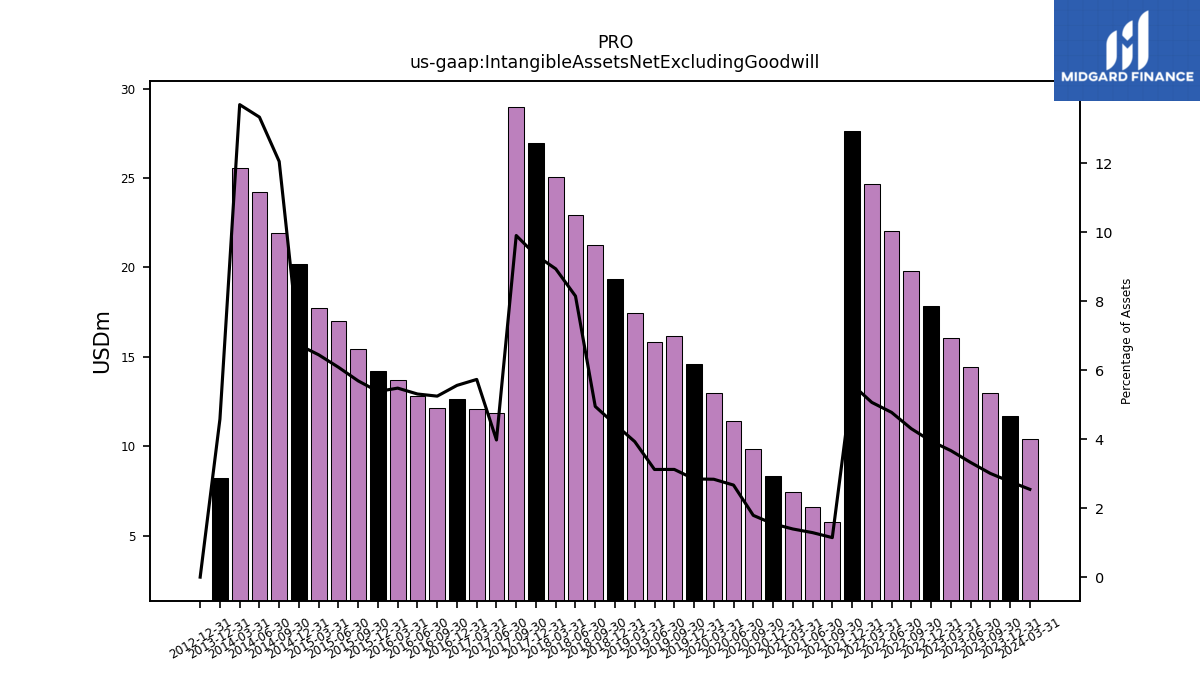
| Intangible Assets Net Excluding Goodwill | 11.68 | 12.98 | 14.43 | 16.05 | 17.85 | 19.82 | 22.05 | 24.64 | 27.62 | 5.74 | 6.60 | 7.47 | 8.34 | 9.87 | 11.40 | 12.95 | 14.61 | 16.19 | 15.85 | 17.48 | 19.35 | 21.23 | 22.92 | 25.06 | 26.93 | 28.97 | 11.84 | 12.07 | 12.65 | 12.11 | 12.79 | 13.71 | 14.19 | 15.42 | 17.00 | 17.74 | 20.20 | 21.92 | 24.23 | 25.53 | 8.23 | NA | NA | NA | 0.00 | NA | NA | NA | NA | NA | NA | NA | NA | NA | NA | |
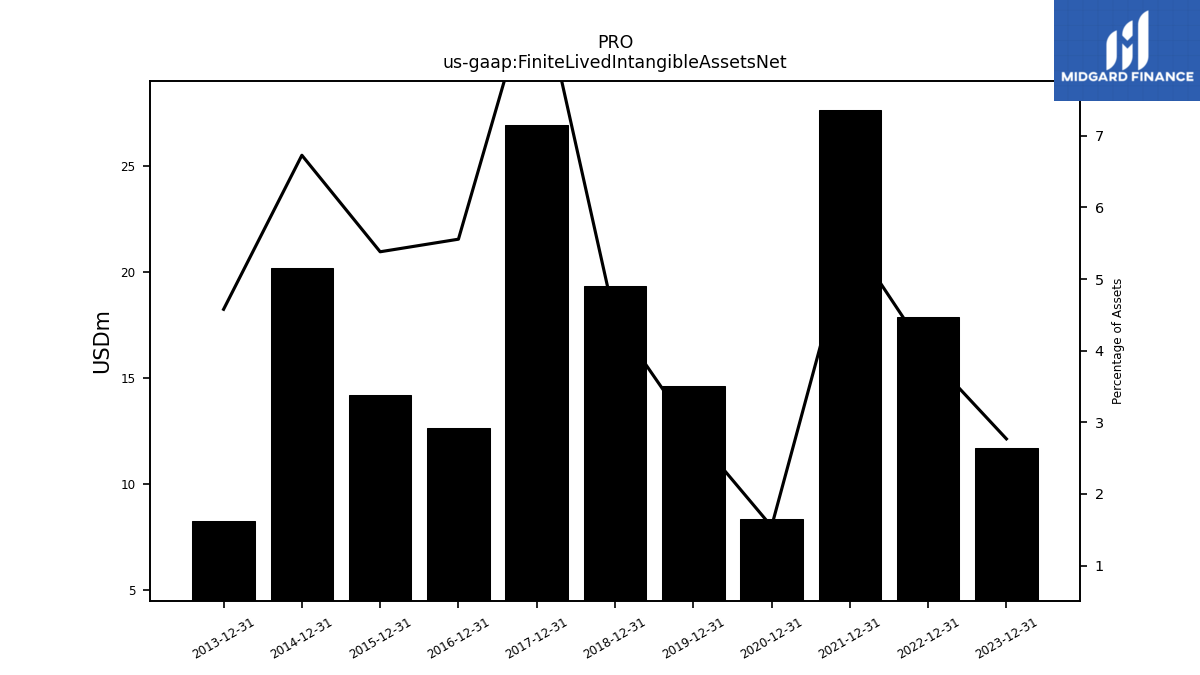
| Finite Lived Intangible Assets Net | 11.68 | NA | NA | NA | 17.85 | NA | NA | NA | 27.62 | NA | NA | NA | 8.34 | NA | NA | NA | 14.61 | NA | NA | NA | 19.35 | NA | NA | NA | 26.93 | NA | NA | NA | 12.65 | NA | NA | NA | 14.19 | NA | NA | NA | 20.20 | NA | NA | NA | 8.23 | NA | NA | NA | NA | NA | NA | NA | NA | NA | NA | NA | NA | NA | NA | |
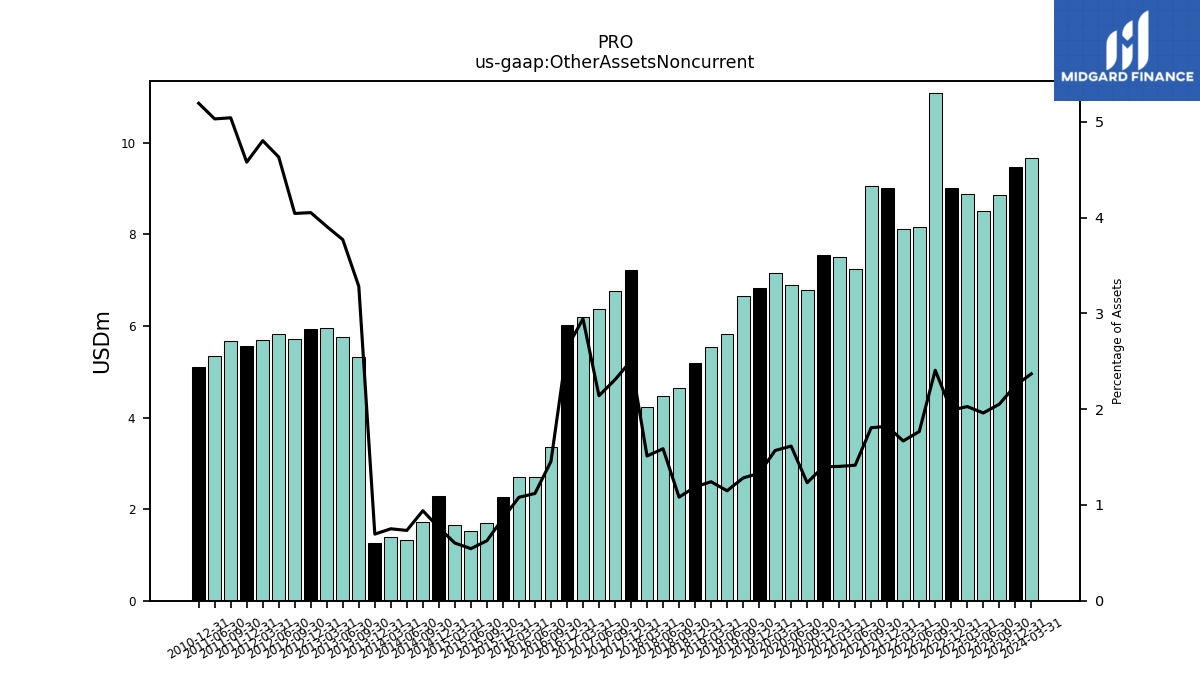
| Other Assets Noncurrent | 9.48 | 8.86 | 8.51 | 8.87 | 9.01 | 11.09 | 8.16 | 8.12 | 9.00 | 9.05 | 7.24 | 7.50 | 7.55 | 6.80 | 6.90 | 7.16 | 6.83 | 6.65 | 5.83 | 5.53 | 5.19 | 4.64 | 4.47 | 4.24 | 7.23 | 6.75 | 6.38 | 6.20 | 6.01 | 3.36 | 2.70 | 2.71 | 2.27 | 1.70 | 1.52 | 1.66 | 2.29 | 1.71 | 1.33 | 1.40 | 1.25 | 5.32 | 5.76 | 5.96 | 5.94 | 5.71 | 5.83 | 5.70 | 5.55 | 5.67 | 5.34 | NA | 5.10 | NA | NA |
| 2023-12-31 | 2023-09-30 | 2023-06-30 | 2023-03-31 | 2022-12-31 | 2022-09-30 | 2022-06-30 | 2022-03-31 | 2021-12-31 | 2021-09-30 | 2021-06-30 | 2021-03-31 | 2020-12-31 | 2020-09-30 | 2020-06-30 | 2020-03-31 | 2019-12-31 | 2019-09-30 | 2019-06-30 | 2019-03-31 | 2018-12-31 | 2018-09-30 | 2018-06-30 | 2018-03-31 | 2017-12-31 | 2017-09-30 | 2017-06-30 | 2017-03-31 | 2016-12-31 | 2016-09-30 | 2016-06-30 | 2016-03-31 | 2015-12-31 | 2015-09-30 | 2015-06-30 | 2015-03-31 | 2014-12-31 | 2014-09-30 | 2014-06-30 | 2014-03-31 | 2013-12-31 | 2013-09-30 | 2013-06-30 | 2013-03-31 | 2012-12-31 | 2012-09-30 | 2012-06-30 | 2012-03-31 | 2011-12-31 | 2011-09-30 | 2011-06-30 | 2011-03-31 | 2010-12-31 | 2010-09-30 | 2010-06-30 | ||
|---|---|---|---|---|---|---|---|---|---|---|---|---|---|---|---|---|---|---|---|---|---|---|---|---|---|---|---|---|---|---|---|---|---|---|---|---|---|---|---|---|---|---|---|---|---|---|---|---|---|---|---|---|---|---|---|---|
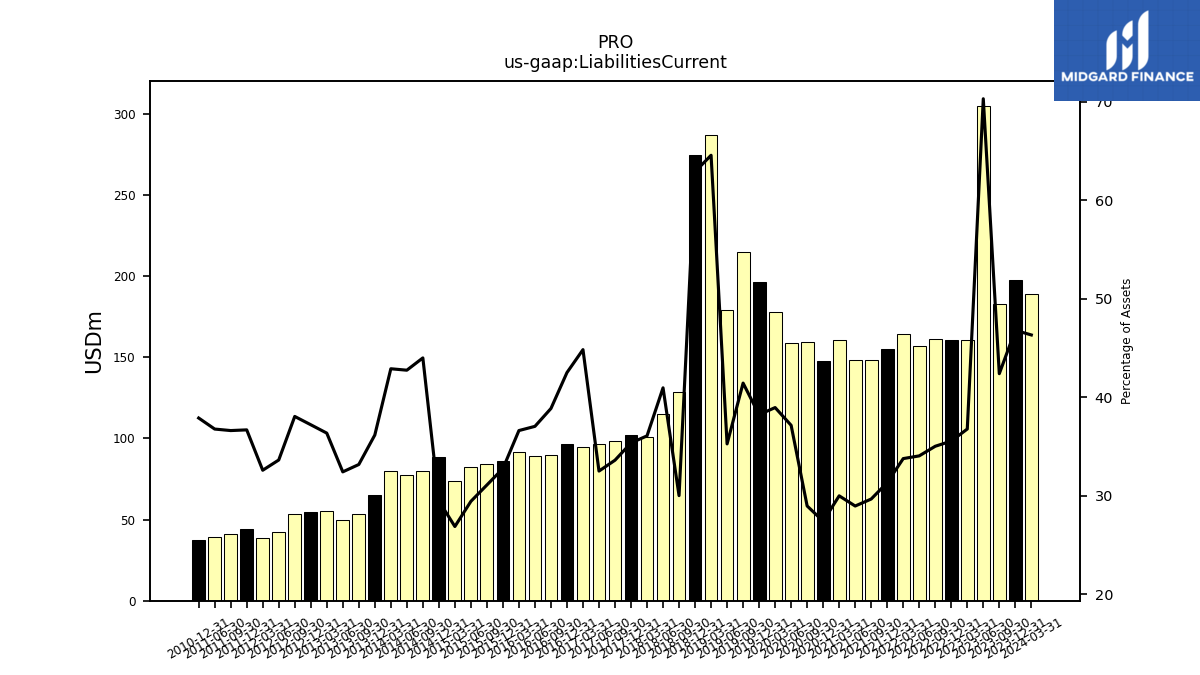
| Liabilities Current | 197.33 | 183.00 | 305.00 | 160.83 | 160.94 | 161.34 | 157.14 | 164.25 | 154.83 | 148.56 | 148.03 | 160.38 | 147.92 | 159.62 | 158.66 | 177.80 | 196.13 | 214.85 | 179.02 | 287.23 | 274.75 | 128.73 | 115.22 | 101.15 | 102.03 | 98.30 | 96.81 | 94.43 | 96.72 | 89.71 | 89.21 | 91.64 | 86.35 | 84.26 | 82.22 | 73.95 | 88.39 | 80.01 | 77.65 | 79.94 | 65.00 | 53.72 | 49.50 | 55.38 | 54.48 | 53.68 | 42.27 | 38.65 | 44.47 | 41.16 | 39.05 | NA | 37.16 | NA | NA | |
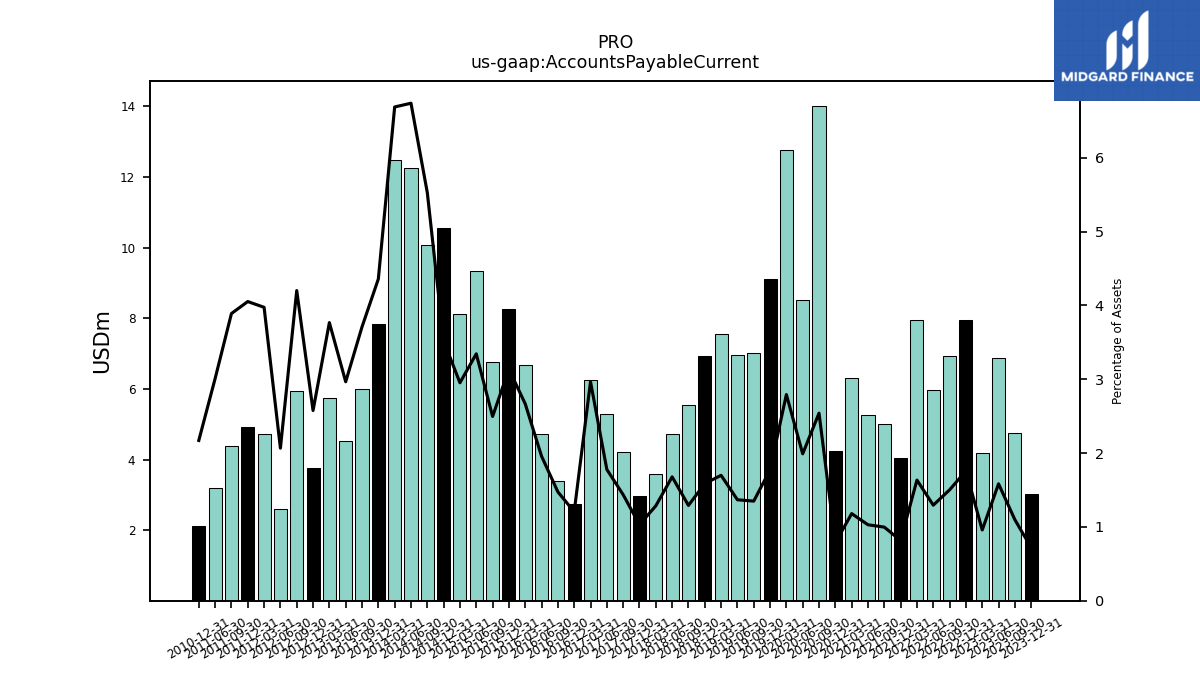
| Accounts Payable Current | 3.03 | 4.74 | 6.87 | 4.20 | 7.96 | 6.93 | 5.98 | 7.96 | 4.03 | 5.00 | 5.26 | 6.32 | 4.25 | 14.01 | 8.51 | 12.76 | 9.10 | 7.00 | 6.95 | 7.56 | 6.93 | 5.54 | 4.72 | 3.61 | 2.98 | 4.20 | 5.30 | 6.25 | 2.74 | 3.41 | 4.72 | 6.68 | 8.27 | 6.77 | 9.35 | 8.13 | 10.56 | 10.06 | 12.25 | 12.47 | 7.84 | 6.01 | 4.53 | 5.74 | 3.77 | 5.93 | 2.60 | 4.72 | 4.92 | 4.38 | 3.20 | NA | 2.13 | NA | NA | |
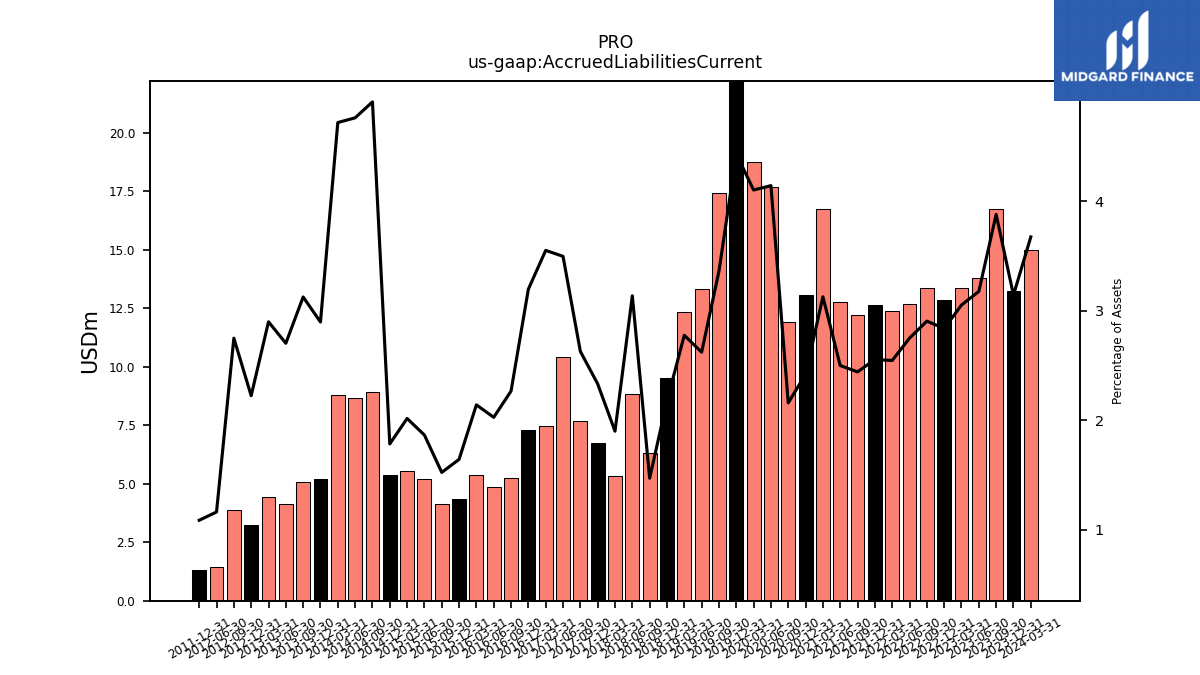
| Accrued Liabilities Current | 13.26 | 16.75 | 13.78 | 13.36 | 12.85 | 13.39 | 12.70 | 12.39 | 12.63 | 12.23 | 12.79 | 16.73 | 13.06 | 11.91 | 17.70 | 18.73 | 22.75 | 17.43 | 13.31 | 12.35 | 9.51 | 6.31 | 8.83 | 5.33 | 6.73 | 7.69 | 10.42 | 7.48 | 7.28 | 5.24 | 4.88 | 5.36 | 4.33 | 4.13 | 5.21 | 5.55 | 5.36 | 8.93 | 8.65 | 8.80 | 5.21 | 5.07 | 4.13 | 4.42 | 3.26 | 3.88 | 1.46 | NA | 1.32 | NA | NA | NA | NA | NA | NA |
| 2023-12-31 | 2023-09-30 | 2023-06-30 | 2023-03-31 | 2022-12-31 | 2022-09-30 | 2022-06-30 | 2022-03-31 | 2021-12-31 | 2021-09-30 | 2021-06-30 | 2021-03-31 | 2020-12-31 | 2020-09-30 | 2020-06-30 | 2020-03-31 | 2019-12-31 | 2019-09-30 | 2019-06-30 | 2019-03-31 | 2018-12-31 | 2018-09-30 | 2018-06-30 | 2018-03-31 | 2017-12-31 | 2017-09-30 | 2017-06-30 | 2017-03-31 | 2016-12-31 | 2016-09-30 | 2016-06-30 | 2016-03-31 | 2015-12-31 | 2015-09-30 | 2015-06-30 | 2015-03-31 | 2014-12-31 | 2014-09-30 | 2014-06-30 | 2014-03-31 | 2013-12-31 | 2013-09-30 | 2013-06-30 | 2013-03-31 | 2012-12-31 | 2012-09-30 | 2012-06-30 | 2012-03-31 | 2011-12-31 | 2011-09-30 | 2011-06-30 | 2011-03-31 | 2010-12-31 | 2010-09-30 | 2010-06-30 | ||
|---|---|---|---|---|---|---|---|---|---|---|---|---|---|---|---|---|---|---|---|---|---|---|---|---|---|---|---|---|---|---|---|---|---|---|---|---|---|---|---|---|---|---|---|---|---|---|---|---|---|---|---|---|---|---|---|---|
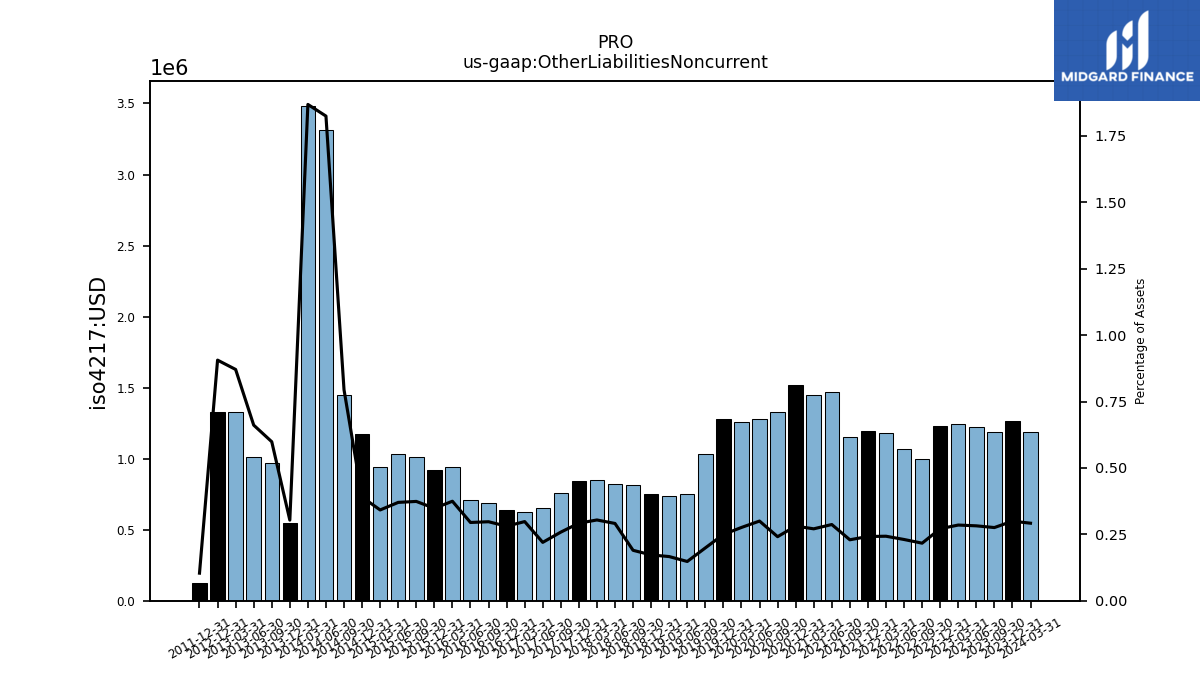
| Other Liabilities Noncurrent | 1.26 | 1.19 | 1.22 | 1.25 | 1.23 | 1.00 | 1.06 | 1.18 | 1.20 | 1.15 | 1.47 | 1.45 | 1.52 | 1.33 | 1.28 | 1.26 | 1.28 | 1.03 | 0.75 | 0.74 | 0.75 | 0.81 | 0.82 | 0.85 | 0.84 | 0.76 | 0.66 | 0.63 | 0.64 | 0.69 | 0.71 | 0.94 | 0.92 | 1.01 | 1.03 | 0.94 | 1.17 | 1.45 | 3.32 | 3.48 | 0.55 | 0.97 | 1.01 | 1.33 | 1.33 | NA | NA | NA | 0.13 | NA | NA | NA | NA | NA | NA | |
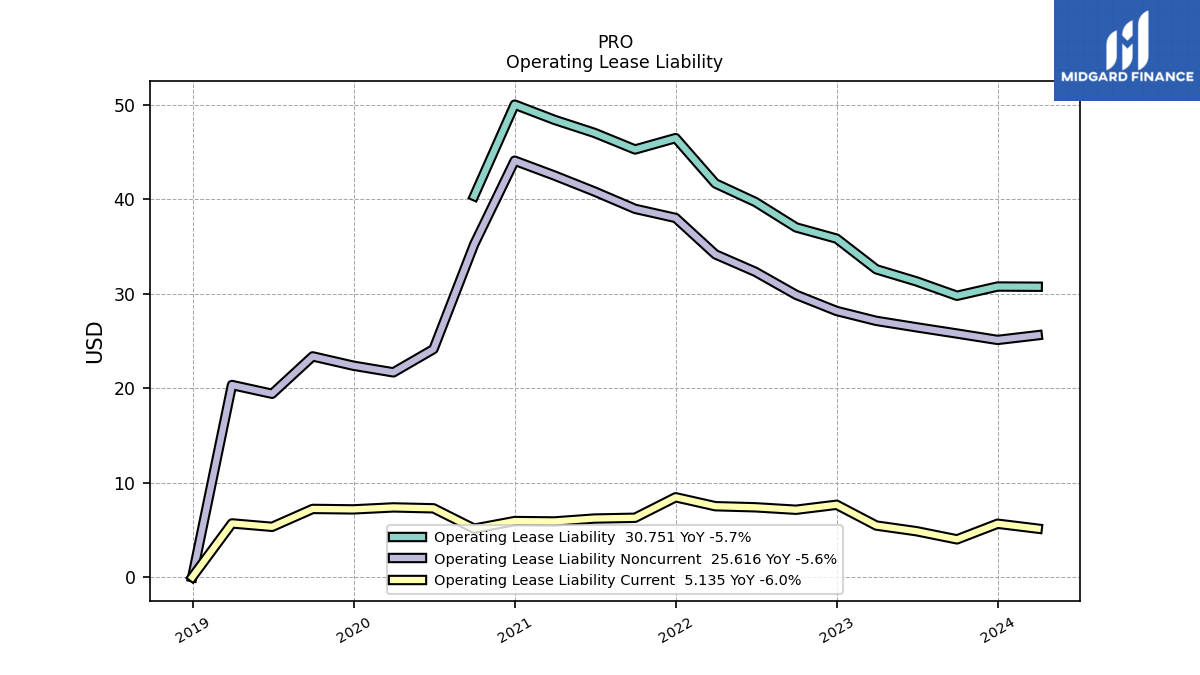
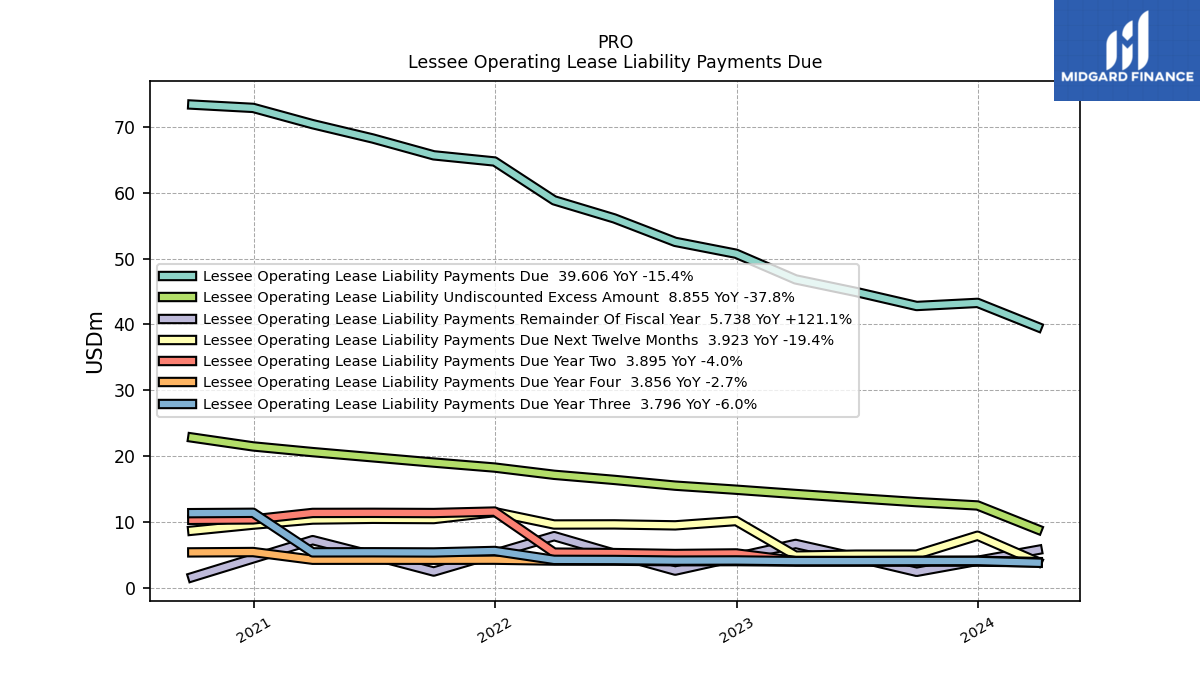
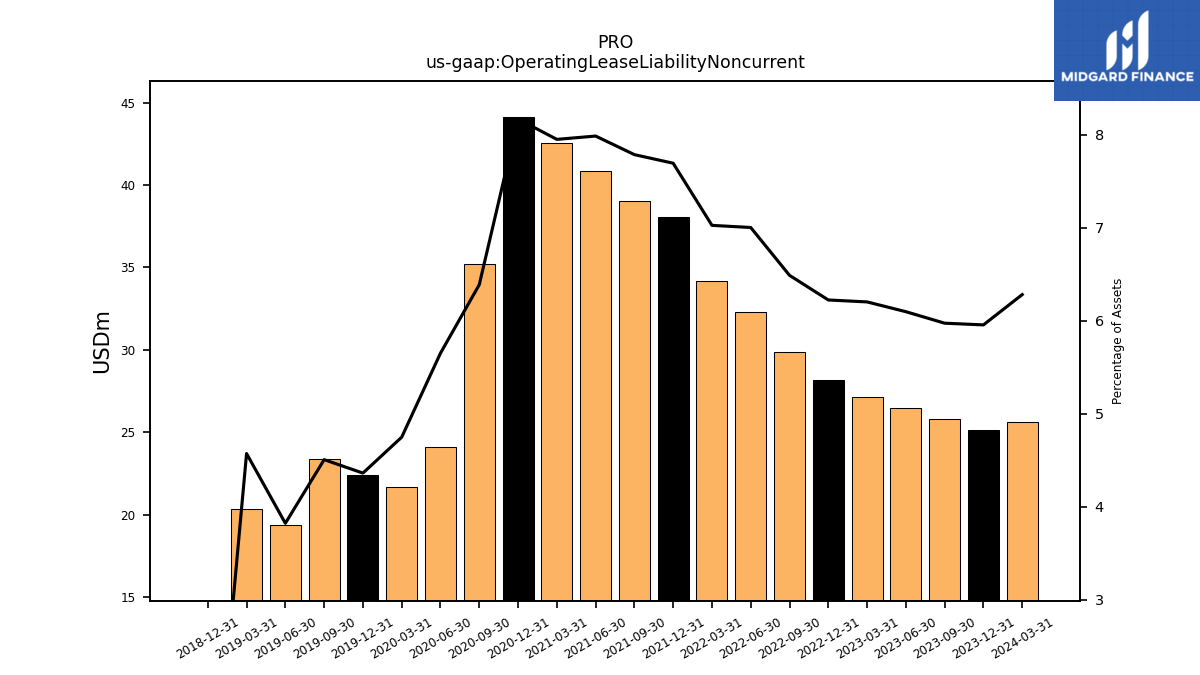
| Operating Lease Liability Noncurrent | 25.12 | 25.79 | 26.46 | 27.14 | 28.18 | 29.90 | 32.33 | 34.18 | 38.03 | 39.00 | 40.84 | 42.53 | 44.10 | 35.22 | 24.14 | 21.68 | 22.39 | 23.38 | 19.41 | 20.35 | 0.00 | NA | NA | NA | NA | NA | NA | NA | NA | NA | NA | NA | NA | NA | NA | NA | NA | NA | NA | NA | NA | NA | NA | NA | NA | NA | NA | NA | NA | NA | NA | NA | NA | NA | NA |
| 2023-12-31 | 2023-09-30 | 2023-06-30 | 2023-03-31 | 2022-12-31 | 2022-09-30 | 2022-06-30 | 2022-03-31 | 2021-12-31 | 2021-09-30 | 2021-06-30 | 2021-03-31 | 2020-12-31 | 2020-09-30 | 2020-06-30 | 2020-03-31 | 2019-12-31 | 2019-09-30 | 2019-06-30 | 2019-03-31 | 2018-12-31 | 2018-09-30 | 2018-06-30 | 2018-03-31 | 2017-12-31 | 2017-09-30 | 2017-06-30 | 2017-03-31 | 2016-12-31 | 2016-09-30 | 2016-06-30 | 2016-03-31 | 2015-12-31 | 2015-09-30 | 2015-06-30 | 2015-03-31 | 2014-12-31 | 2014-09-30 | 2014-06-30 | 2014-03-31 | 2013-12-31 | 2013-09-30 | 2013-06-30 | 2013-03-31 | 2012-12-31 | 2012-09-30 | 2012-06-30 | 2012-03-31 | 2011-12-31 | 2011-09-30 | 2011-06-30 | 2011-03-31 | 2010-12-31 | 2010-09-30 | 2010-06-30 | ||
|---|---|---|---|---|---|---|---|---|---|---|---|---|---|---|---|---|---|---|---|---|---|---|---|---|---|---|---|---|---|---|---|---|---|---|---|---|---|---|---|---|---|---|---|---|---|---|---|---|---|---|---|---|---|---|---|---|
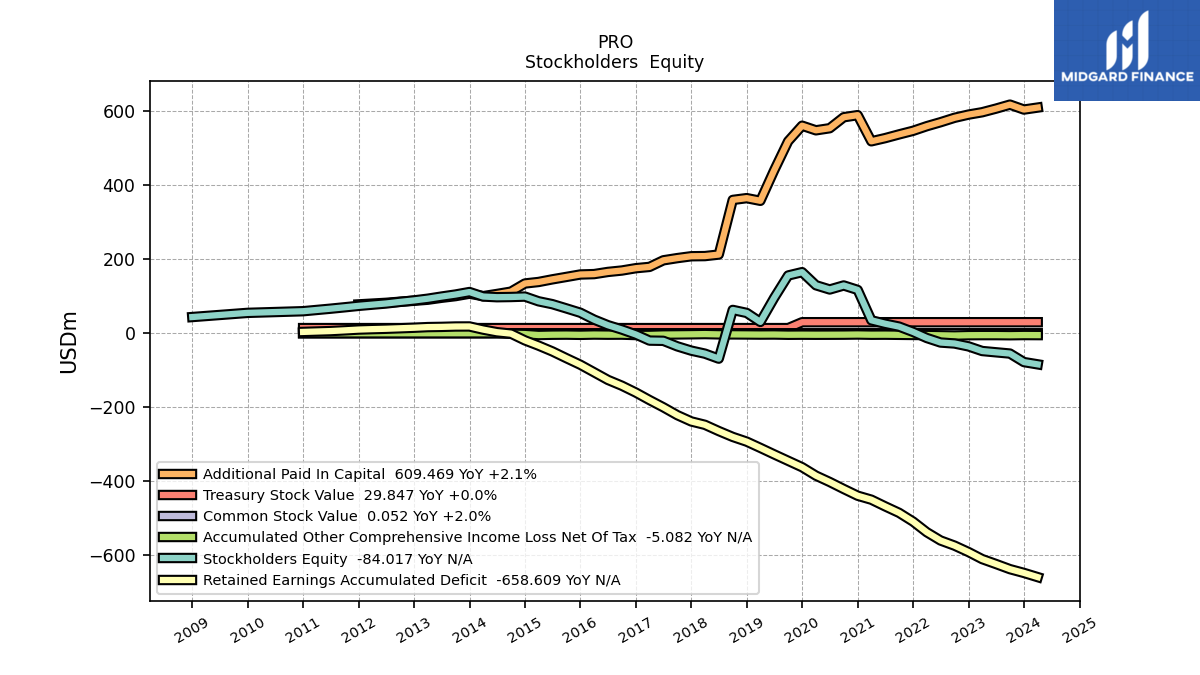
| Stockholders Equity | -77.87 | -54.88 | -51.45 | -47.97 | -35.47 | -27.68 | -25.09 | -12.82 | 3.58 | 17.93 | 25.73 | 35.03 | 117.04 | 129.03 | 118.17 | 129.61 | 165.00 | 155.95 | 95.49 | 30.47 | 54.90 | 63.01 | -68.66 | -55.14 | -46.98 | -35.41 | -20.46 | -19.87 | -3.39 | 9.98 | 21.70 | 36.76 | 55.41 | 67.10 | 78.52 | 86.28 | 99.00 | 97.86 | 97.33 | 99.16 | 111.30 | 104.56 | 99.09 | 93.26 | 88.67 | 84.69 | 80.36 | 77.19 | 73.94 | 70.06 | 66.32 | NA | 59.50 | NA | NA | |
| Common Stock Value | 0.05 | 0.05 | 0.05 | 0.05 | 0.05 | 0.05 | 0.05 | 0.05 | 0.05 | 0.05 | 0.05 | 0.05 | 0.05 | 0.05 | 0.05 | 0.05 | 0.05 | 0.05 | 0.04 | 0.04 | 0.04 | 0.04 | 0.04 | 0.04 | 0.04 | 0.04 | 0.04 | 0.04 | 0.04 | 0.04 | 0.04 | 0.04 | 0.03 | 0.03 | 0.04 | 0.04 | 0.03 | 0.03 | 0.03 | 0.03 | 0.03 | 0.03 | 0.03 | 0.03 | 0.03 | 0.03 | 0.03 | 0.03 | 0.03 | 0.03 | 0.03 | NA | 0.03 | NA | NA | |
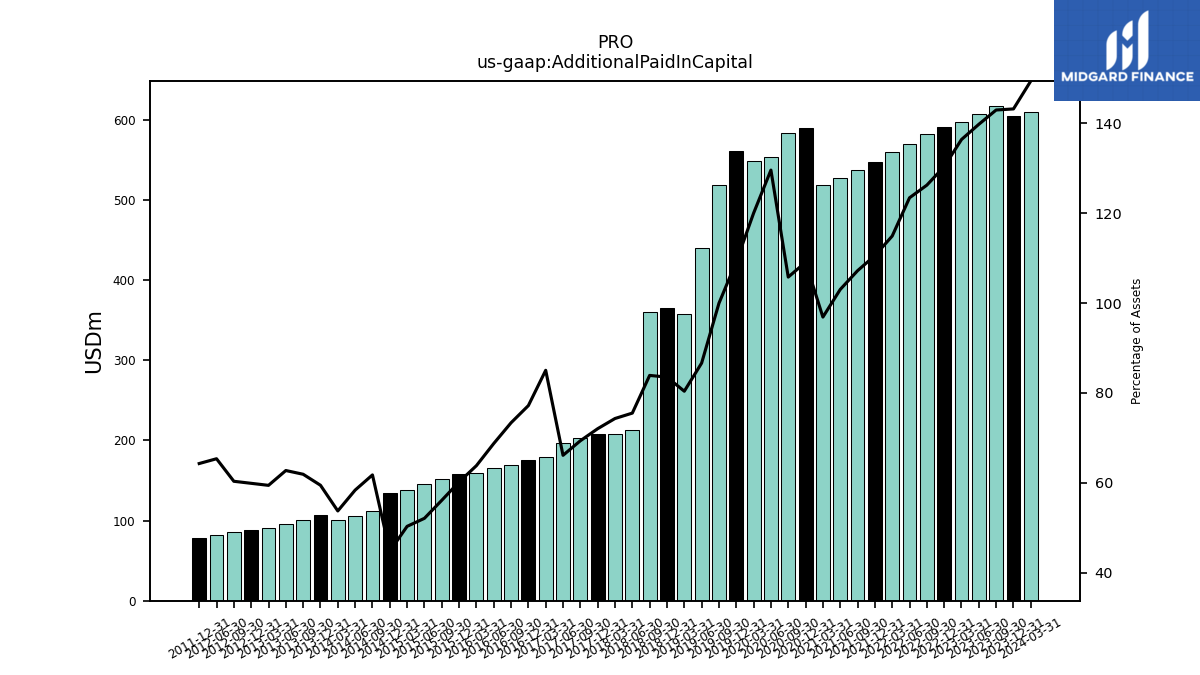
| Additional Paid In Capital | 604.08 | 617.40 | 606.60 | 596.80 | 590.48 | 581.82 | 569.91 | 559.15 | 546.69 | 537.06 | 526.93 | 518.34 | 589.04 | 583.28 | 553.70 | 548.01 | 560.50 | 518.46 | 440.00 | 357.63 | 364.88 | 360.02 | 212.48 | 208.37 | 207.92 | 202.91 | 196.96 | 179.16 | 175.68 | 169.40 | 165.57 | 159.73 | 158.67 | 152.08 | 145.56 | 138.44 | 134.38 | 112.33 | 106.04 | 100.16 | 106.88 | 100.27 | 95.80 | 90.54 | 87.69 | 85.14 | 82.17 | NA | 77.93 | NA | NA | NA | NA | NA | NA | |
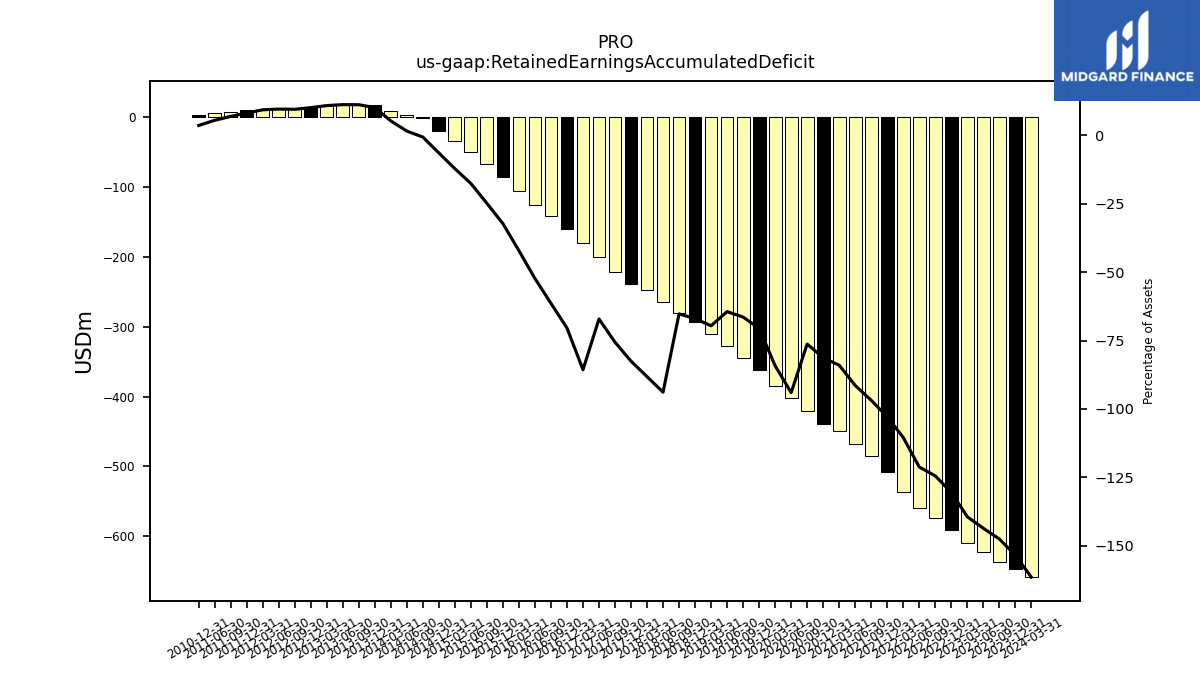
| Retained Earnings Accumulated Deficit | -647.25 | -637.06 | -623.19 | -609.90 | -590.90 | -573.55 | -559.70 | -537.29 | -508.65 | -485.04 | -467.52 | -449.47 | -438.77 | -420.59 | -401.73 | -384.52 | -361.79 | -344.49 | -327.14 | -309.62 | -292.71 | -279.95 | -264.16 | -247.32 | -238.19 | -221.21 | -199.98 | -180.47 | -160.26 | -141.75 | -126.04 | -105.51 | -85.03 | -67.30 | -49.12 | -33.45 | -19.22 | -1.08 | 2.88 | 9.87 | 18.33 | 18.19 | 17.20 | 16.62 | 14.88 | 13.47 | 12.11 | 11.12 | 9.93 | 7.81 | 5.87 | NA | 3.58 | NA | NA | |
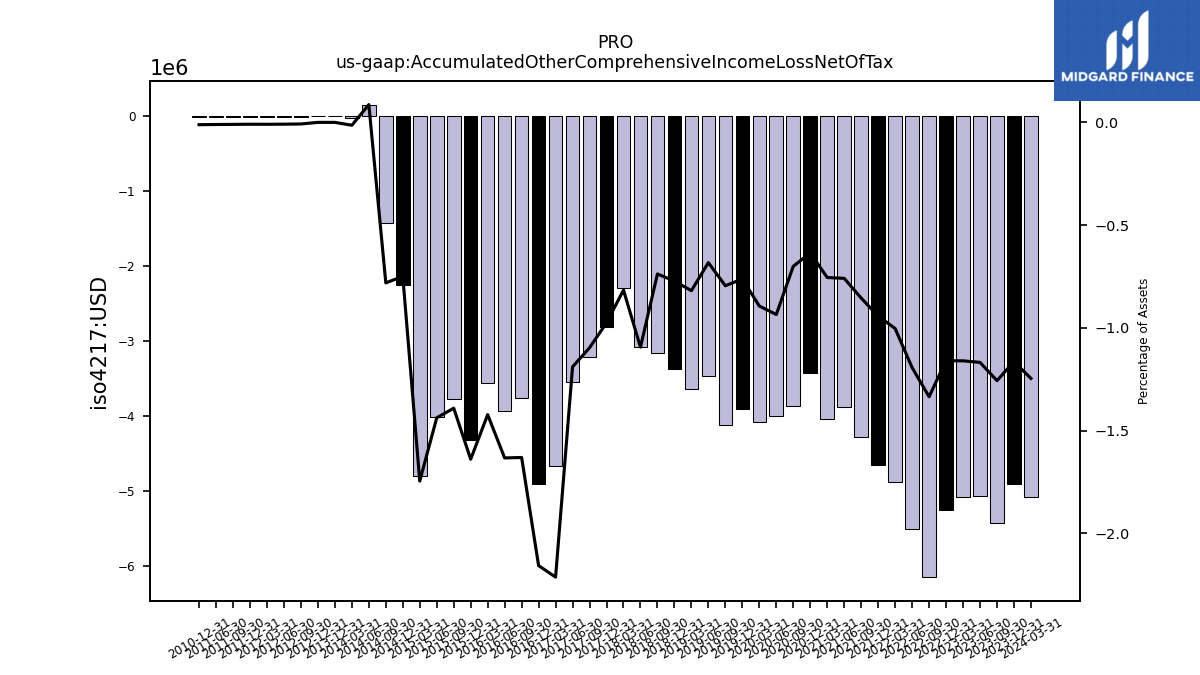
| Accumulated Other Comprehensive Income Loss Net Of Tax | -4.91 | -5.43 | -5.07 | -5.08 | -5.25 | -6.15 | -5.51 | -4.88 | -4.66 | -4.28 | -3.88 | -4.04 | -3.43 | -3.86 | -4.00 | -4.08 | -3.91 | -4.12 | -3.47 | -3.64 | -3.37 | -3.17 | -3.08 | -2.29 | -2.82 | -3.21 | -3.54 | -4.66 | -4.91 | -3.77 | -3.93 | -3.56 | -4.32 | -3.77 | -4.02 | -4.80 | -2.25 | -1.42 | 0.16 | -0.03 | 0.00 | NA | NA | NA | 0.00 | -0.01 | -0.01 | -0.01 | -0.01 | -0.01 | -0.01 | NA | -0.01 | NA | NA | |
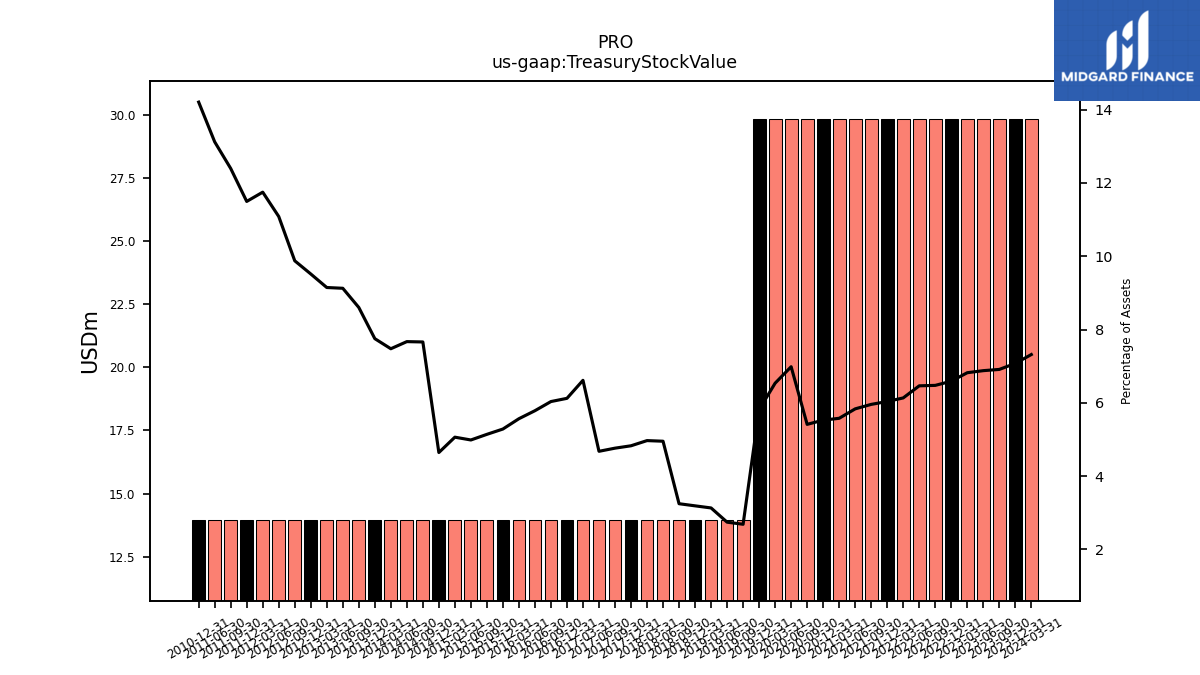
| Treasury Stock Value | 29.85 | 29.85 | 29.85 | 29.85 | 29.85 | 29.85 | 29.85 | 29.85 | 29.85 | 29.85 | 29.85 | 29.85 | 29.85 | 29.85 | 29.85 | 29.85 | 29.85 | 13.94 | 13.94 | 13.94 | 13.94 | 13.94 | 13.94 | 13.94 | 13.94 | 13.94 | 13.94 | 13.94 | 13.94 | 13.94 | 13.94 | 13.94 | 13.94 | 13.94 | 13.94 | 13.94 | 13.94 | 13.94 | 13.94 | 13.94 | 13.94 | 13.94 | 13.94 | 13.94 | 13.94 | 13.94 | 13.94 | 13.94 | 13.94 | 13.94 | 13.94 | NA | 13.94 | NA | NA | |
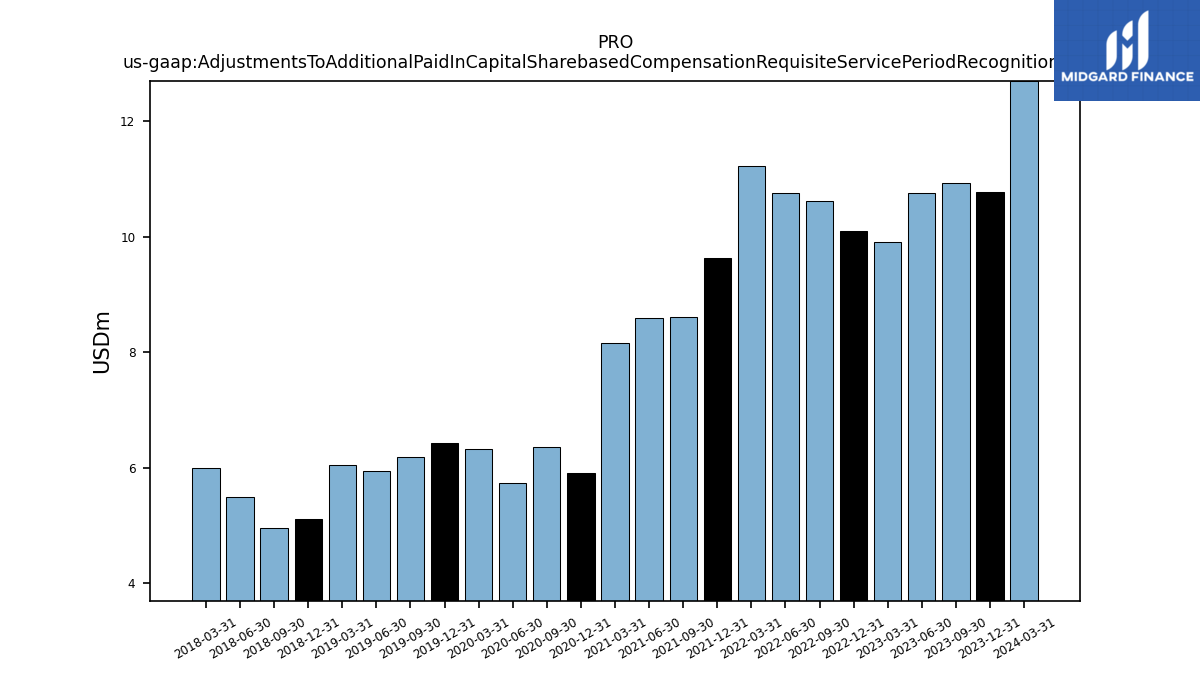
| Adjustments To Additional Paid In Capital Sharebased Compensation Requisite Service Period Recognition Value | 10.77 | 10.93 | 10.75 | 9.90 | 10.10 | 10.63 | 10.77 | 11.22 | 9.63 | 8.62 | 8.59 | 8.15 | 5.90 | 6.36 | 5.73 | 6.33 | 6.42 | 6.19 | 5.94 | 6.05 | 5.11 | 4.95 | 5.50 | 5.99 | NA | NA | NA | NA | NA | NA | NA | NA | NA | NA | NA | NA | NA | NA | NA | NA | NA | NA | NA | NA | NA | NA | NA | NA | NA | NA | NA | NA | NA | NA | NA |
| 2023-12-31 | 2023-09-30 | 2023-06-30 | 2023-03-31 | 2022-12-31 | 2022-09-30 | 2022-06-30 | 2022-03-31 | 2021-12-31 | 2021-09-30 | 2021-06-30 | 2021-03-31 | 2020-12-31 | 2020-09-30 | 2020-06-30 | 2020-03-31 | 2019-12-31 | 2019-09-30 | 2019-06-30 | 2019-03-31 | 2018-12-31 | 2018-09-30 | 2018-06-30 | 2018-03-31 | 2017-12-31 | 2017-09-30 | 2017-06-30 | 2017-03-31 | 2016-12-31 | 2016-09-30 | 2016-06-30 | 2016-03-31 | 2015-12-31 | 2015-09-30 | 2015-06-30 | 2015-03-31 | 2014-12-31 | 2014-09-30 | 2014-06-30 | 2014-03-31 | 2013-12-31 | 2013-09-30 | 2013-06-30 | 2013-03-31 | 2012-12-31 | 2012-09-30 | 2012-06-30 | 2012-03-31 | 2011-12-31 | 2011-09-30 | 2011-06-30 | 2011-03-31 | 2010-12-31 | 2010-09-30 | 2010-06-30 | ||
|---|---|---|---|---|---|---|---|---|---|---|---|---|---|---|---|---|---|---|---|---|---|---|---|---|---|---|---|---|---|---|---|---|---|---|---|---|---|---|---|---|---|---|---|---|---|---|---|---|---|---|---|---|---|---|---|---|
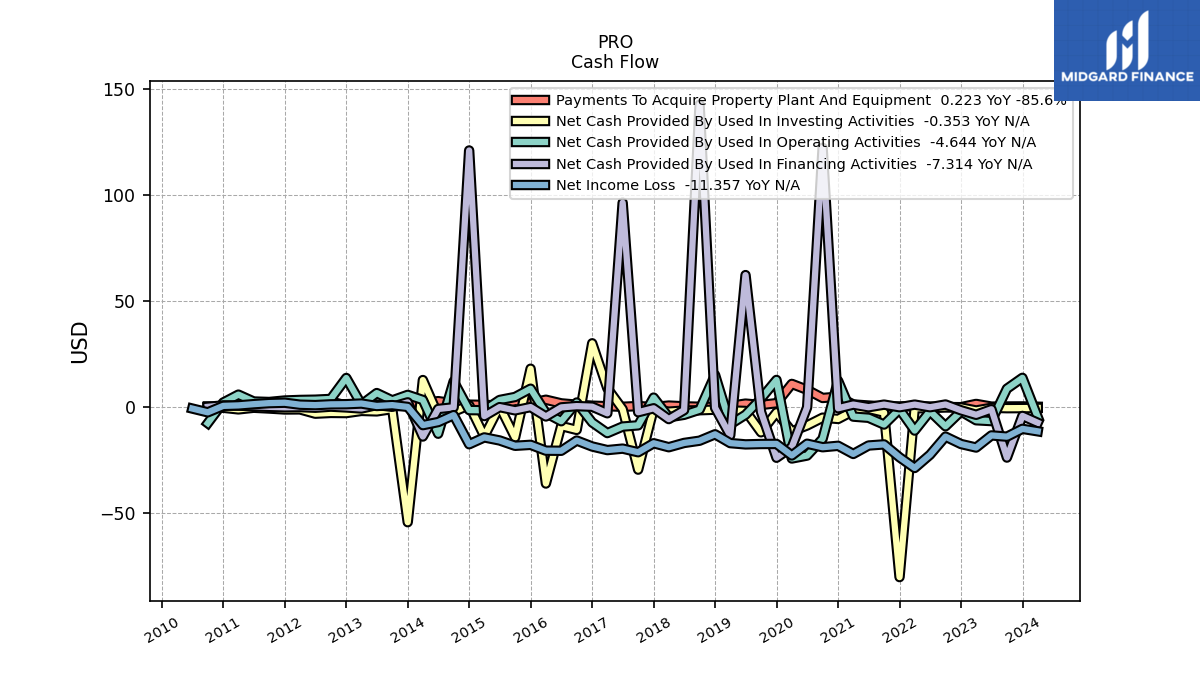
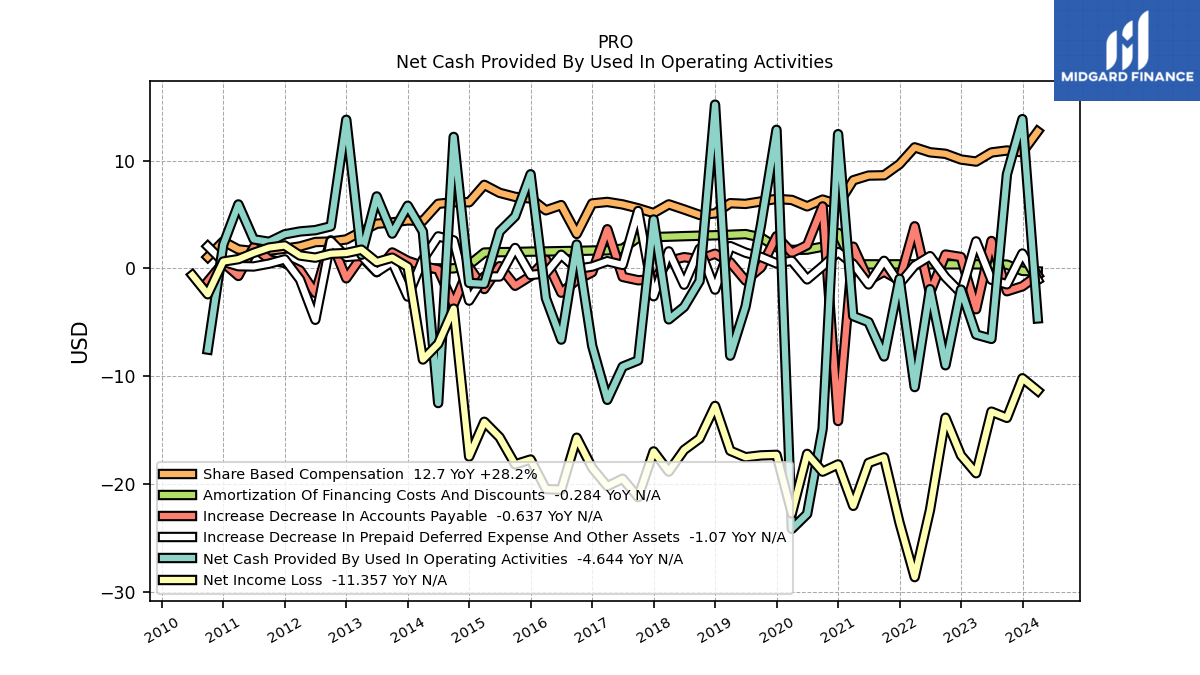
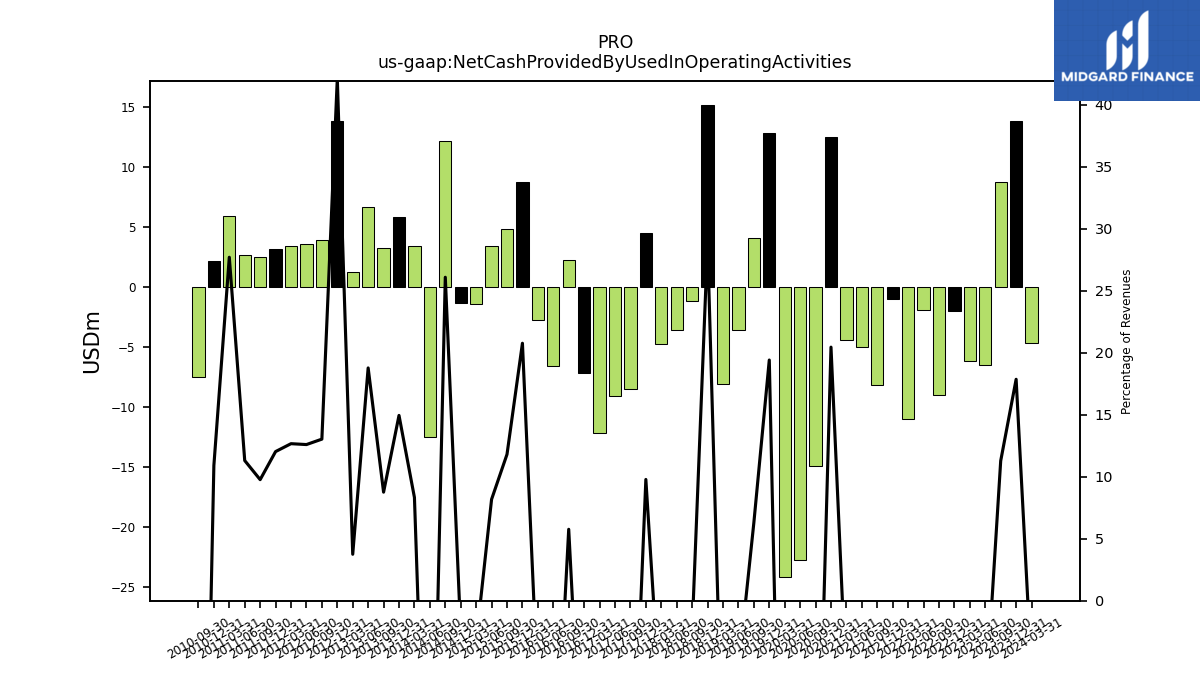
| Net Cash Provided By Used In Operating Activities | 13.84 | 8.72 | -6.54 | -6.14 | -1.97 | -8.99 | -1.93 | -11.01 | -0.97 | -8.17 | -4.99 | -4.43 | 12.45 | -14.89 | -22.78 | -24.17 | 12.85 | 4.04 | -3.55 | -8.10 | 15.19 | -1.18 | -3.58 | -4.73 | 4.54 | -8.54 | -9.12 | -12.19 | -7.19 | 2.21 | -6.61 | -2.76 | 8.73 | 4.83 | 3.41 | -1.43 | -1.35 | 12.19 | -12.49 | 3.41 | 5.81 | 3.23 | 6.67 | 1.26 | 13.78 | 3.90 | 3.54 | 3.42 | 3.16 | 2.46 | 2.69 | 5.93 | 2.20 | -7.53 | NA | |
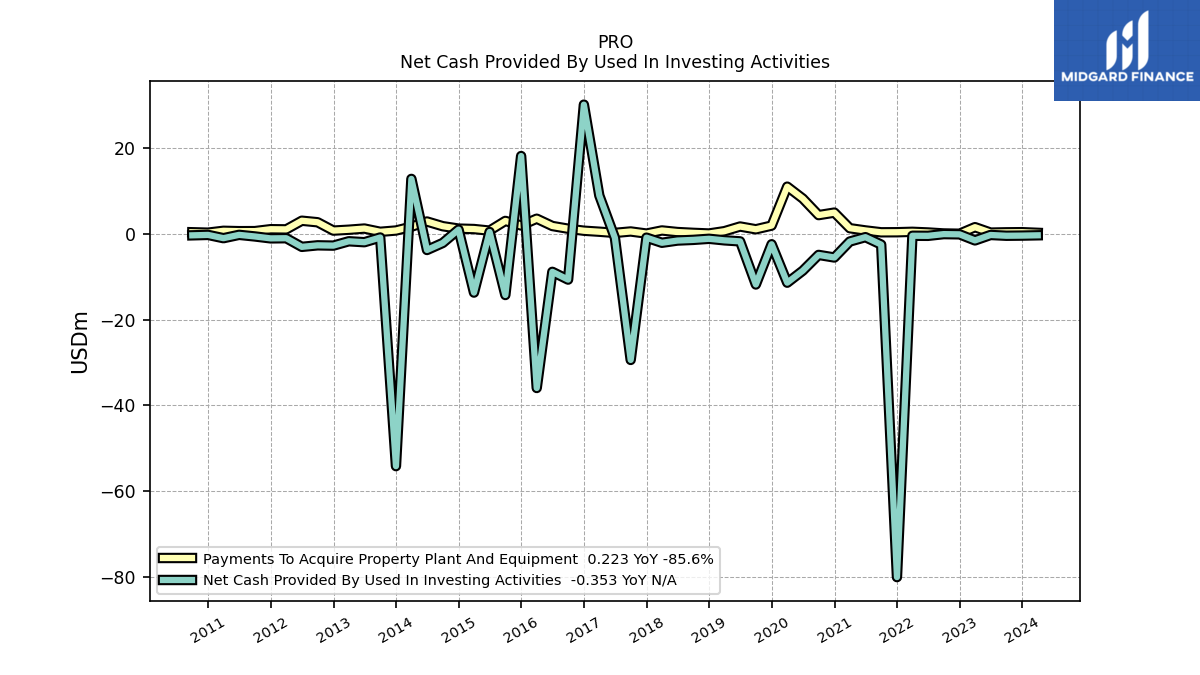
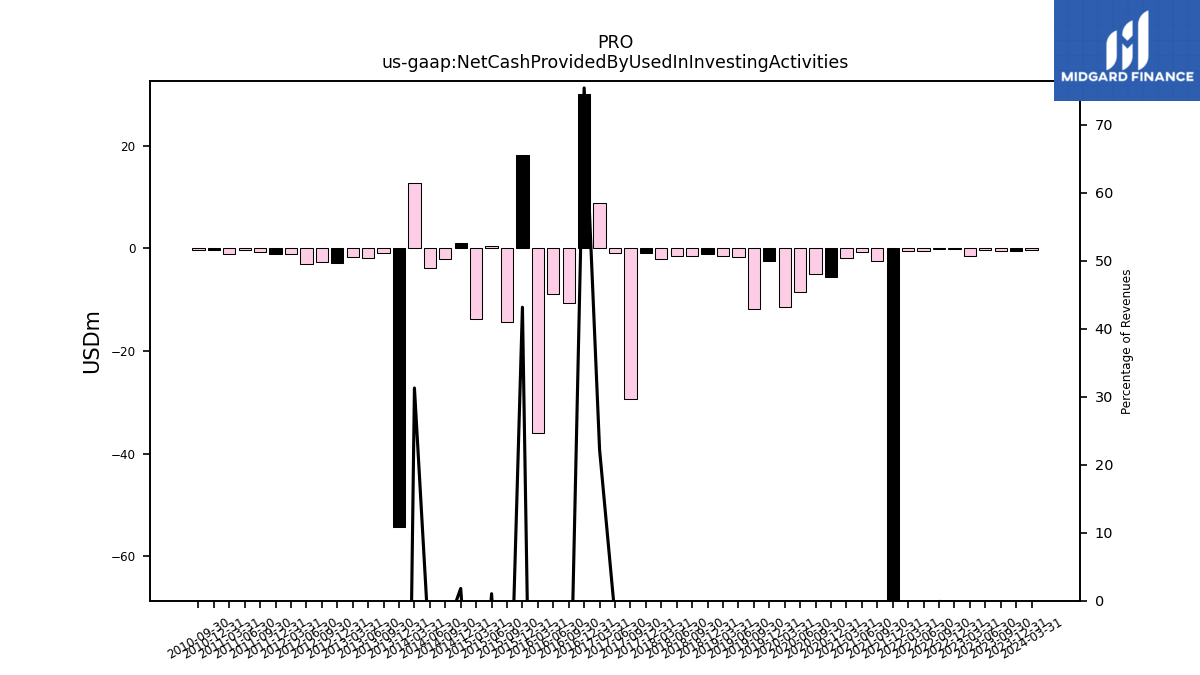
| Net Cash Provided By Used In Investing Activities | -0.42 | -0.46 | -0.28 | -1.55 | -0.13 | -0.08 | -0.48 | -0.46 | -80.07 | -2.52 | -0.79 | -1.80 | -5.53 | -4.92 | -8.60 | -11.40 | -2.44 | -11.83 | -1.76 | -1.53 | -1.17 | -1.42 | -1.58 | -2.09 | -0.90 | -29.42 | -0.95 | 8.93 | 30.12 | -10.69 | -8.87 | -35.97 | 18.14 | -14.28 | 0.43 | -13.71 | 0.97 | -2.13 | -3.78 | 12.81 | -54.19 | -0.87 | -1.96 | -1.74 | -2.76 | -2.69 | -3.05 | -1.03 | -1.07 | -0.62 | -0.25 | -1.02 | -0.26 | -0.36 | NA | |
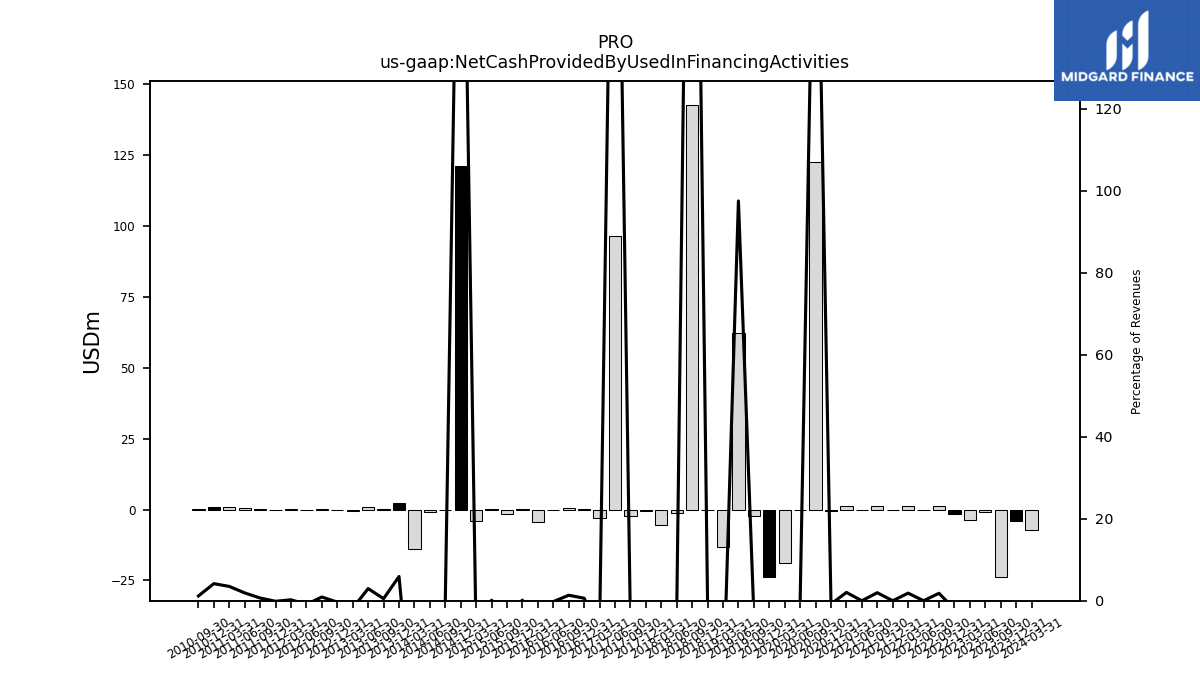
| Net Cash Provided By Used In Financing Activities | -4.09 | -23.74 | -0.96 | -3.57 | -1.44 | 1.28 | 0.00 | 1.23 | 0.00 | 1.23 | 0.00 | 1.24 | -0.49 | 122.26 | -0.05 | -18.81 | -23.82 | -2.18 | 62.28 | -13.30 | -0.26 | 142.60 | -1.38 | -5.60 | -0.51 | -2.36 | 96.38 | -2.87 | 0.25 | 0.52 | -0.08 | -4.37 | 0.06 | -1.47 | 0.05 | -4.20 | 121.00 | -0.06 | -0.83 | -13.81 | 2.30 | 0.19 | 1.05 | -0.61 | -0.11 | 0.27 | -0.25 | 0.06 | -0.03 | 0.17 | 0.46 | 0.75 | 0.84 | 0.18 | NA |
| 2023-12-31 | 2023-09-30 | 2023-06-30 | 2023-03-31 | 2022-12-31 | 2022-09-30 | 2022-06-30 | 2022-03-31 | 2021-12-31 | 2021-09-30 | 2021-06-30 | 2021-03-31 | 2020-12-31 | 2020-09-30 | 2020-06-30 | 2020-03-31 | 2019-12-31 | 2019-09-30 | 2019-06-30 | 2019-03-31 | 2018-12-31 | 2018-09-30 | 2018-06-30 | 2018-03-31 | 2017-12-31 | 2017-09-30 | 2017-06-30 | 2017-03-31 | 2016-12-31 | 2016-09-30 | 2016-06-30 | 2016-03-31 | 2015-12-31 | 2015-09-30 | 2015-06-30 | 2015-03-31 | 2014-12-31 | 2014-09-30 | 2014-06-30 | 2014-03-31 | 2013-12-31 | 2013-09-30 | 2013-06-30 | 2013-03-31 | 2012-12-31 | 2012-09-30 | 2012-06-30 | 2012-03-31 | 2011-12-31 | 2011-09-30 | 2011-06-30 | 2011-03-31 | 2010-12-31 | 2010-09-30 | 2010-06-30 | ||
|---|---|---|---|---|---|---|---|---|---|---|---|---|---|---|---|---|---|---|---|---|---|---|---|---|---|---|---|---|---|---|---|---|---|---|---|---|---|---|---|---|---|---|---|---|---|---|---|---|---|---|---|---|---|---|---|---|
| Net Cash Provided By Used In Operating Activities | 13.84 | 8.72 | -6.54 | -6.14 | -1.97 | -8.99 | -1.93 | -11.01 | -0.97 | -8.17 | -4.99 | -4.43 | 12.45 | -14.89 | -22.78 | -24.17 | 12.85 | 4.04 | -3.55 | -8.10 | 15.19 | -1.18 | -3.58 | -4.73 | 4.54 | -8.54 | -9.12 | -12.19 | -7.19 | 2.21 | -6.61 | -2.76 | 8.73 | 4.83 | 3.41 | -1.43 | -1.35 | 12.19 | -12.49 | 3.41 | 5.81 | 3.23 | 6.67 | 1.26 | 13.78 | 3.90 | 3.54 | 3.42 | 3.16 | 2.46 | 2.69 | 5.93 | 2.20 | -7.53 | NA | |
| Net Income Loss | -10.20 | -13.87 | -13.29 | -19.00 | -17.35 | -13.85 | -22.41 | -28.64 | -23.61 | -17.52 | -18.05 | -22.03 | -18.18 | -18.86 | -17.21 | -22.73 | -17.30 | -17.35 | -17.52 | -16.92 | -12.76 | -15.79 | -16.84 | -18.86 | -16.98 | -21.23 | -19.51 | -20.21 | -18.51 | -15.71 | -20.53 | -20.48 | -17.73 | -18.18 | -15.67 | -14.23 | -17.46 | -3.73 | -7.00 | -8.46 | 0.14 | 0.99 | 0.58 | 1.73 | 1.42 | 1.36 | 0.99 | 1.19 | 2.12 | 1.93 | 1.44 | 0.86 | 0.63 | -2.40 | -0.63 | |
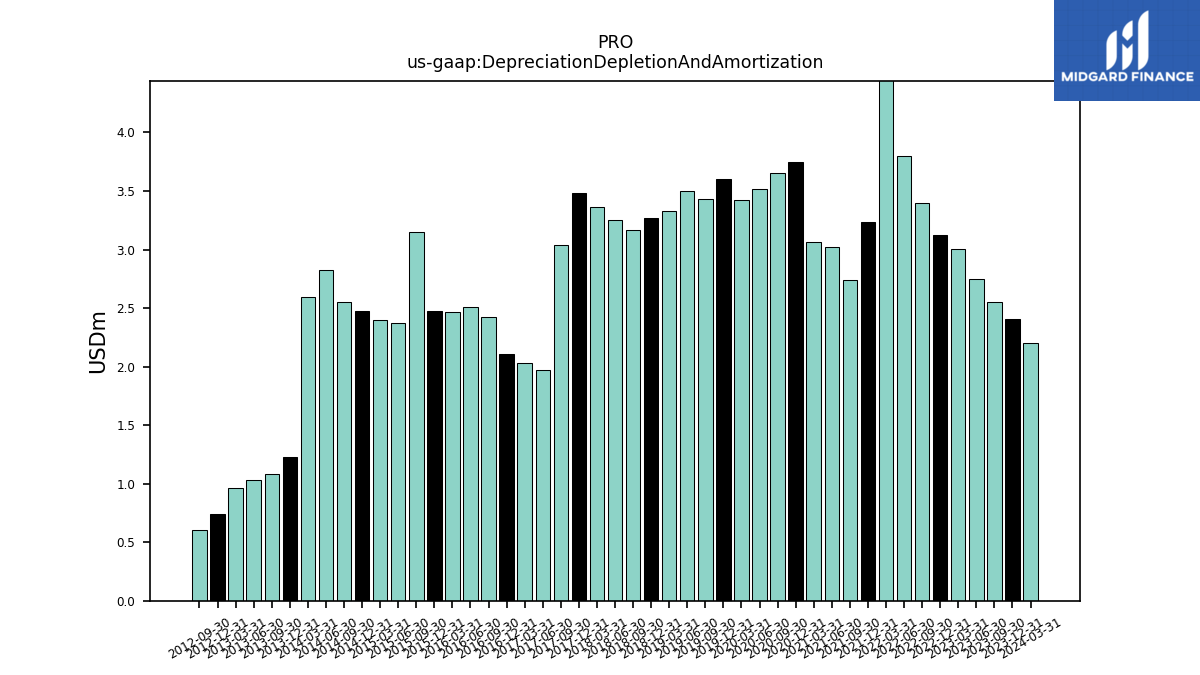
| Depreciation Depletion And Amortization | 2.41 | 2.55 | 2.75 | 3.00 | 3.12 | 3.40 | 3.80 | 4.65 | 3.23 | 2.74 | 3.02 | 3.07 | 3.75 | 3.65 | 3.51 | 3.42 | 3.61 | 3.44 | 3.50 | 3.33 | 3.27 | 3.17 | 3.26 | 3.36 | 3.48 | 3.04 | 1.97 | 2.03 | 2.11 | 2.42 | 2.51 | 2.46 | 2.47 | 3.15 | 2.38 | 2.40 | 2.48 | 2.55 | 2.83 | 2.59 | 1.23 | 1.08 | 1.03 | 0.97 | 0.74 | 0.61 | NA | NA | NA | NA | NA | NA | NA | NA | NA | |
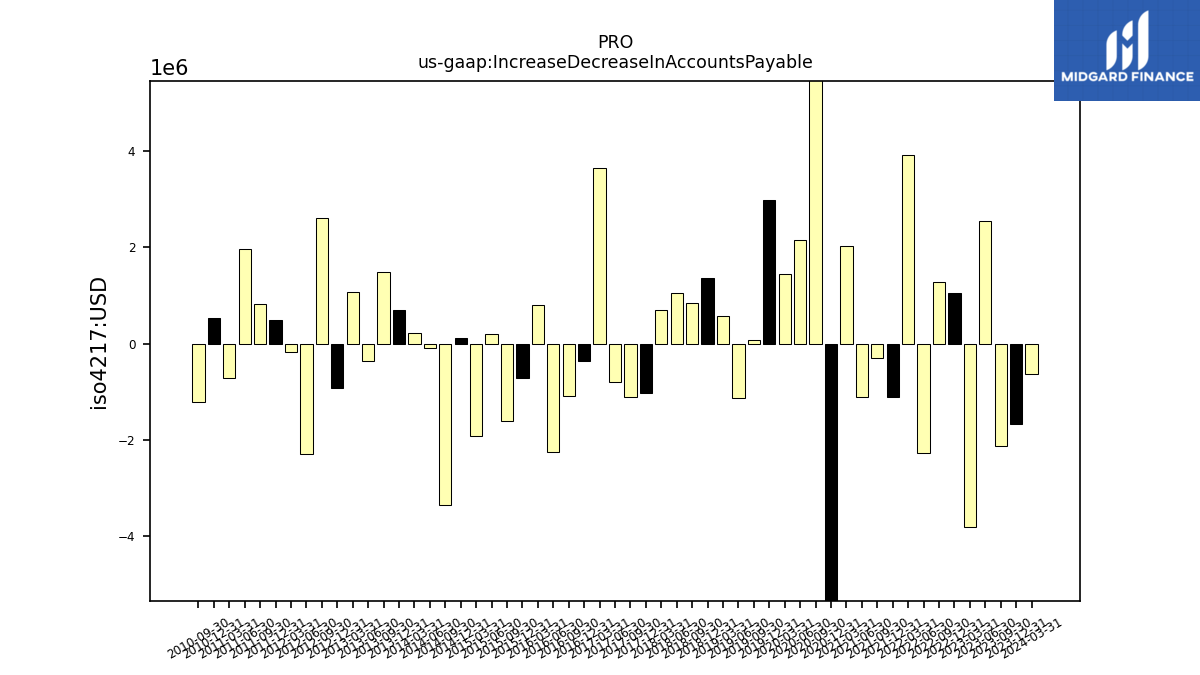
| Increase Decrease In Accounts Payable | -1.66 | -2.12 | 2.54 | -3.79 | 1.05 | 1.28 | -2.27 | 3.90 | -1.11 | -0.31 | -1.11 | 2.01 | -14.16 | 5.75 | 2.15 | 1.45 | 2.98 | 0.08 | -1.13 | 0.56 | 1.36 | 0.84 | 1.04 | 0.69 | -1.03 | -1.10 | -0.79 | 3.63 | -0.36 | -1.09 | -2.25 | 0.80 | -0.72 | -1.61 | 0.20 | -1.92 | 0.12 | -3.34 | -0.10 | 0.22 | 0.69 | 1.48 | -0.35 | 1.07 | -0.93 | 2.60 | -2.28 | -0.18 | 0.49 | 0.82 | 1.97 | -0.71 | 0.52 | -1.22 | NA | |
| Share Based Compensation | 10.77 | 10.93 | 10.75 | 9.90 | 10.10 | 10.63 | 10.77 | 11.22 | 9.66 | 8.63 | 8.61 | 8.17 | 5.92 | 6.38 | 5.75 | 6.35 | 6.45 | 6.21 | 5.98 | 6.05 | 5.10 | 4.96 | 5.46 | 5.94 | 5.13 | 5.57 | 5.93 | 6.16 | 6.02 | 3.19 | 5.87 | 5.38 | 6.48 | 6.63 | 7.00 | 7.75 | 6.13 | 6.13 | 5.99 | 4.41 | 4.45 | 4.26 | 4.14 | 3.42 | 2.68 | 2.49 | 2.44 | 2.03 | 1.82 | 1.65 | 1.60 | 1.76 | 2.50 | 1.05 | NA | |
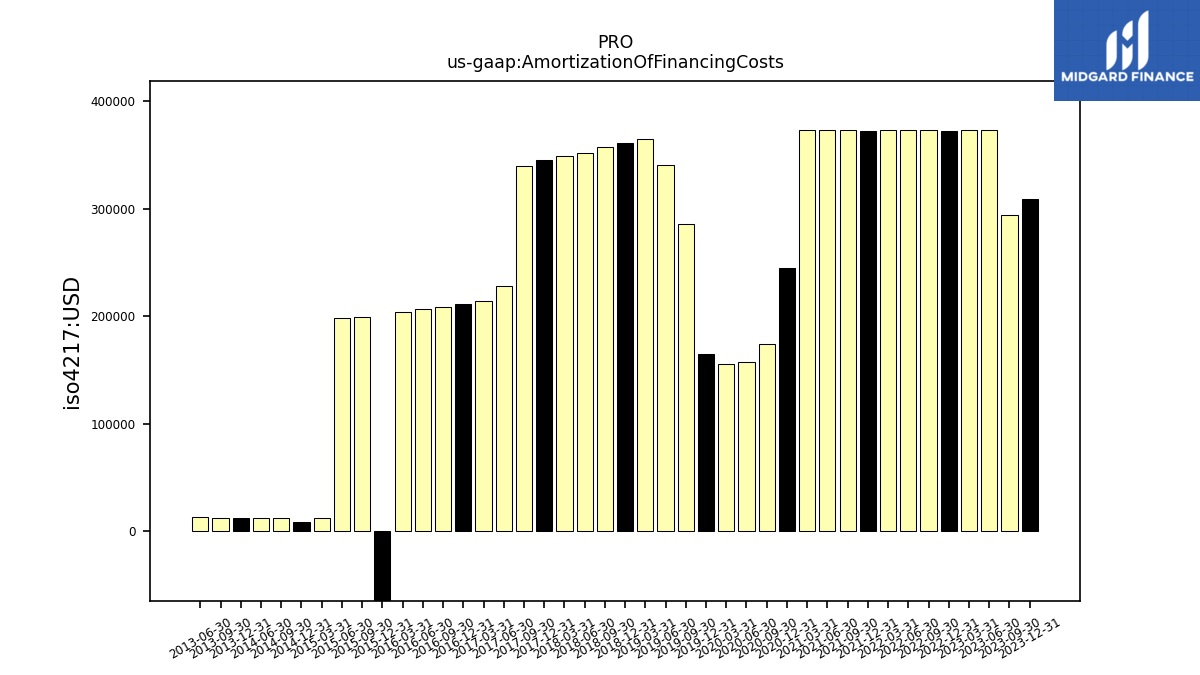
| Amortization Of Financing Costs | 0.31 | 0.29 | 0.37 | 0.37 | 0.37 | 0.37 | 0.37 | 0.37 | 0.37 | 0.37 | 0.37 | 0.37 | 0.24 | 0.17 | 0.16 | 0.16 | 0.17 | 0.29 | 0.34 | 0.36 | 0.36 | 0.36 | 0.35 | 0.35 | 0.34 | 0.34 | 0.23 | 0.21 | 0.21 | 0.21 | 0.21 | 0.20 | -0.54 | 0.20 | 0.20 | 0.01 | 0.01 | 0.01 | 0.01 | NA | 0.01 | 0.01 | 0.01 | NA | NA | NA | NA | NA | NA | NA | NA | NA | NA | NA | NA |
| 2023-12-31 | 2023-09-30 | 2023-06-30 | 2023-03-31 | 2022-12-31 | 2022-09-30 | 2022-06-30 | 2022-03-31 | 2021-12-31 | 2021-09-30 | 2021-06-30 | 2021-03-31 | 2020-12-31 | 2020-09-30 | 2020-06-30 | 2020-03-31 | 2019-12-31 | 2019-09-30 | 2019-06-30 | 2019-03-31 | 2018-12-31 | 2018-09-30 | 2018-06-30 | 2018-03-31 | 2017-12-31 | 2017-09-30 | 2017-06-30 | 2017-03-31 | 2016-12-31 | 2016-09-30 | 2016-06-30 | 2016-03-31 | 2015-12-31 | 2015-09-30 | 2015-06-30 | 2015-03-31 | 2014-12-31 | 2014-09-30 | 2014-06-30 | 2014-03-31 | 2013-12-31 | 2013-09-30 | 2013-06-30 | 2013-03-31 | 2012-12-31 | 2012-09-30 | 2012-06-30 | 2012-03-31 | 2011-12-31 | 2011-09-30 | 2011-06-30 | 2011-03-31 | 2010-12-31 | 2010-09-30 | 2010-06-30 | ||
|---|---|---|---|---|---|---|---|---|---|---|---|---|---|---|---|---|---|---|---|---|---|---|---|---|---|---|---|---|---|---|---|---|---|---|---|---|---|---|---|---|---|---|---|---|---|---|---|---|---|---|---|---|---|---|---|---|
| Net Cash Provided By Used In Investing Activities | -0.42 | -0.46 | -0.28 | -1.55 | -0.13 | -0.08 | -0.48 | -0.46 | -80.07 | -2.52 | -0.79 | -1.80 | -5.53 | -4.92 | -8.60 | -11.40 | -2.44 | -11.83 | -1.76 | -1.53 | -1.17 | -1.42 | -1.58 | -2.09 | -0.90 | -29.42 | -0.95 | 8.93 | 30.12 | -10.69 | -8.87 | -35.97 | 18.14 | -14.28 | 0.43 | -13.71 | 0.97 | -2.13 | -3.78 | 12.81 | -54.19 | -0.87 | -1.96 | -1.74 | -2.76 | -2.69 | -3.05 | -1.03 | -1.07 | -0.62 | -0.25 | -1.02 | -0.26 | -0.36 | NA | |
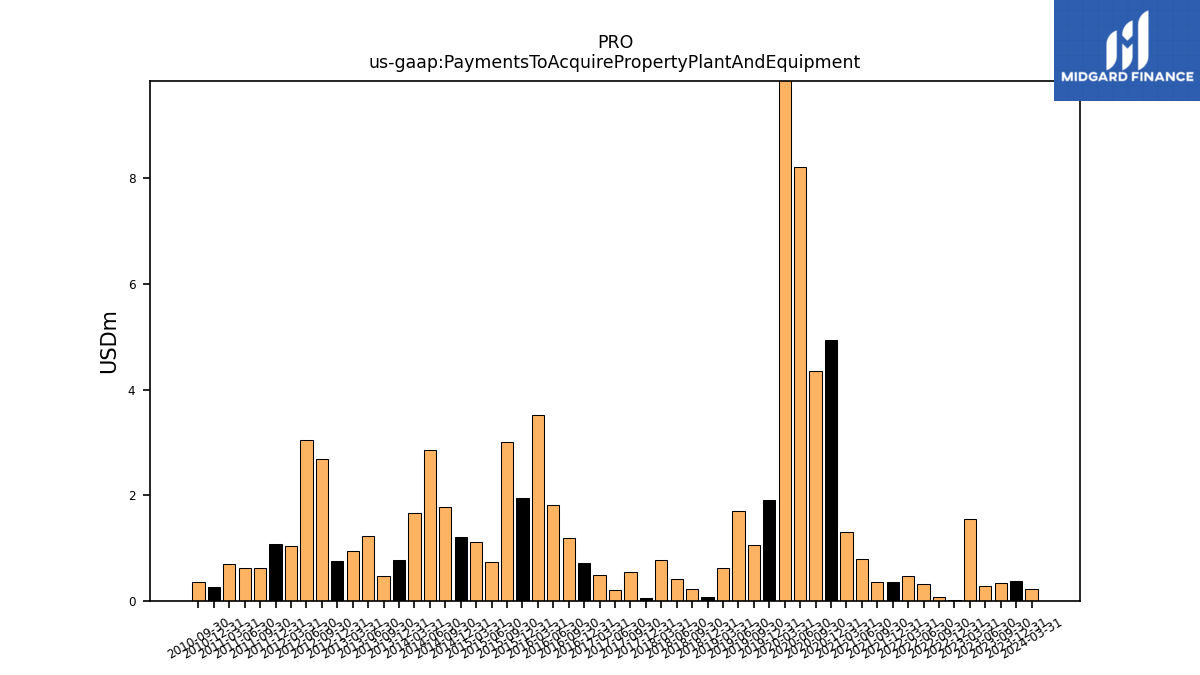
| Payments To Acquire Property Plant And Equipment | 0.38 | 0.34 | 0.28 | 1.55 | 0.02 | 0.08 | 0.31 | 0.46 | 0.36 | 0.35 | 0.79 | 1.30 | 4.94 | 4.35 | 8.21 | 10.99 | 1.91 | 1.05 | 1.70 | 0.61 | 0.07 | 0.22 | 0.41 | 0.78 | 0.05 | 0.54 | 0.21 | 0.48 | 0.72 | 1.19 | 1.82 | 3.52 | 1.94 | 3.01 | 0.74 | 1.11 | 1.21 | 1.77 | 2.86 | 1.66 | 0.77 | 0.46 | 1.22 | 0.95 | 0.74 | 2.69 | 3.05 | 1.03 | 1.07 | 0.62 | 0.61 | 0.70 | 0.26 | 0.36 | NA |
| 2023-12-31 | 2023-09-30 | 2023-06-30 | 2023-03-31 | 2022-12-31 | 2022-09-30 | 2022-06-30 | 2022-03-31 | 2021-12-31 | 2021-09-30 | 2021-06-30 | 2021-03-31 | 2020-12-31 | 2020-09-30 | 2020-06-30 | 2020-03-31 | 2019-12-31 | 2019-09-30 | 2019-06-30 | 2019-03-31 | 2018-12-31 | 2018-09-30 | 2018-06-30 | 2018-03-31 | 2017-12-31 | 2017-09-30 | 2017-06-30 | 2017-03-31 | 2016-12-31 | 2016-09-30 | 2016-06-30 | 2016-03-31 | 2015-12-31 | 2015-09-30 | 2015-06-30 | 2015-03-31 | 2014-12-31 | 2014-09-30 | 2014-06-30 | 2014-03-31 | 2013-12-31 | 2013-09-30 | 2013-06-30 | 2013-03-31 | 2012-12-31 | 2012-09-30 | 2012-06-30 | 2012-03-31 | 2011-12-31 | 2011-09-30 | 2011-06-30 | 2011-03-31 | 2010-12-31 | 2010-09-30 | 2010-06-30 | ||
|---|---|---|---|---|---|---|---|---|---|---|---|---|---|---|---|---|---|---|---|---|---|---|---|---|---|---|---|---|---|---|---|---|---|---|---|---|---|---|---|---|---|---|---|---|---|---|---|---|---|---|---|---|---|---|---|---|
| Net Cash Provided By Used In Financing Activities | -4.09 | -23.74 | -0.96 | -3.57 | -1.44 | 1.28 | 0.00 | 1.23 | 0.00 | 1.23 | 0.00 | 1.24 | -0.49 | 122.26 | -0.05 | -18.81 | -23.82 | -2.18 | 62.28 | -13.30 | -0.26 | 142.60 | -1.38 | -5.60 | -0.51 | -2.36 | 96.38 | -2.87 | 0.25 | 0.52 | -0.08 | -4.37 | 0.06 | -1.47 | 0.05 | -4.20 | 121.00 | -0.06 | -0.83 | -13.81 | 2.30 | 0.19 | 1.05 | -0.61 | -0.11 | 0.27 | -0.25 | 0.06 | -0.03 | 0.17 | 0.46 | 0.75 | 0.84 | 0.18 | NA |
| 2023-12-31 | 2023-09-30 | 2023-06-30 | 2023-03-31 | 2022-12-31 | 2022-09-30 | 2022-06-30 | 2022-03-31 | 2021-12-31 | 2021-09-30 | 2021-06-30 | 2021-03-31 | 2020-12-31 | 2020-09-30 | 2020-06-30 | 2020-03-31 | 2019-12-31 | 2019-09-30 | 2019-06-30 | 2019-03-31 | 2018-12-31 | 2018-09-30 | 2018-06-30 | 2018-03-31 | 2017-12-31 | 2017-09-30 | 2017-06-30 | 2017-03-31 | 2016-12-31 | 2016-09-30 | 2016-06-30 | 2016-03-31 | 2015-12-31 | 2015-09-30 | 2015-06-30 | 2015-03-31 | 2014-12-31 | 2014-09-30 | 2014-06-30 | 2014-03-31 | 2013-12-31 | 2013-09-30 | 2013-06-30 | 2013-03-31 | 2012-12-31 | 2012-09-30 | 2012-06-30 | 2012-03-31 | 2011-12-31 | 2011-09-30 | 2011-06-30 | 2011-03-31 | 2010-12-31 | 2010-09-30 | 2010-06-30 | ||
|---|---|---|---|---|---|---|---|---|---|---|---|---|---|---|---|---|---|---|---|---|---|---|---|---|---|---|---|---|---|---|---|---|---|---|---|---|---|---|---|---|---|---|---|---|---|---|---|---|---|---|---|---|---|---|---|---|
| Revenues | 77.48 | 77.25 | 75.79 | 73.18 | 70.94 | 70.35 | 68.36 | 66.49 | 64.97 | 62.67 | 62.40 | 61.38 | 60.86 | 61.51 | 63.75 | 66.31 | 66.17 | 64.15 | 63.88 | 56.13 | 52.61 | 49.08 | 47.43 | 47.91 | 46.34 | 41.94 | 40.41 | 40.13 | 39.93 | 38.38 | 37.04 | 37.93 | 42.01 | 40.87 | 41.69 | 43.68 | 53.83 | 46.72 | 44.37 | 40.91 | 38.87 | 36.81 | 35.53 | 33.63 | 32.72 | 29.91 | 28.13 | 27.02 | 26.24 | 25.21 | 23.79 | 21.41 | 20.19 | 15.69 | 17.84 | |
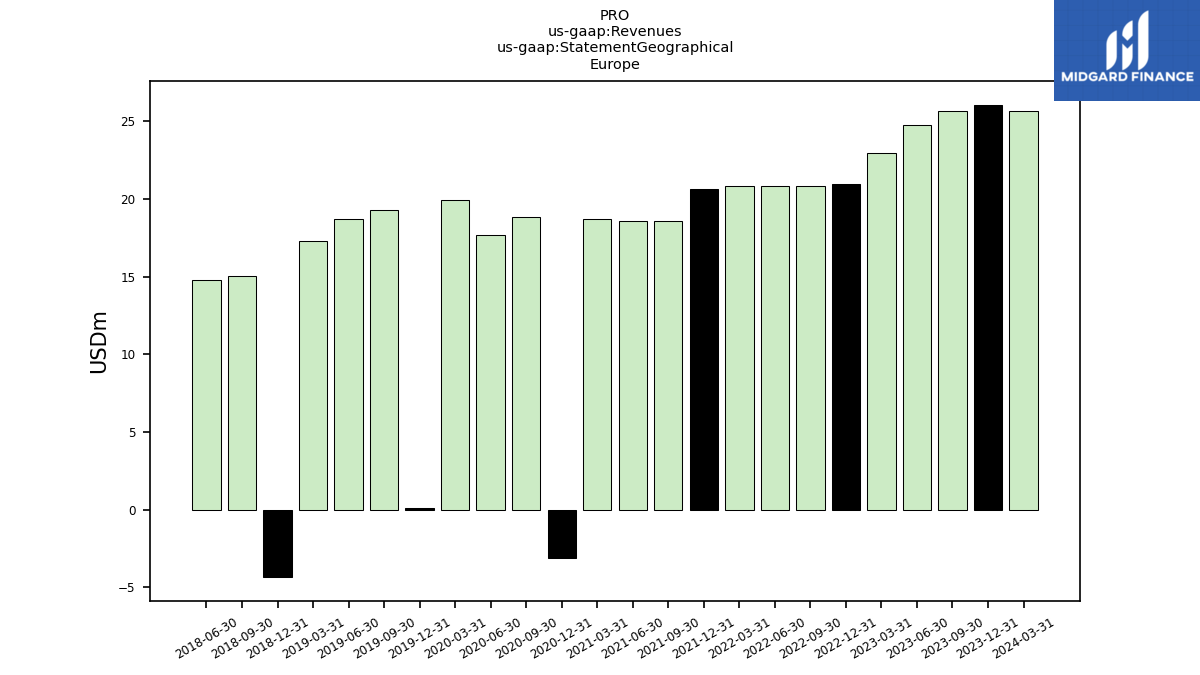
| 26.08 | 25.69 | 24.75 | 22.95 | 20.98 | 20.82 | 20.86 | 20.82 | 20.66 | 18.57 | 18.56 | 18.69 | -3.09 | 18.83 | 17.68 | 19.93 | 0.10 | 19.28 | 18.72 | 17.29 | -4.33 | 15.02 | 14.81 | NA | NA | NA | NA | NA | NA | NA | NA | NA | NA | NA | NA | NA | NA | NA | NA | NA | NA | NA | NA | NA | NA | NA | NA | NA | NA | NA | NA | NA | NA | NA | NA | ||
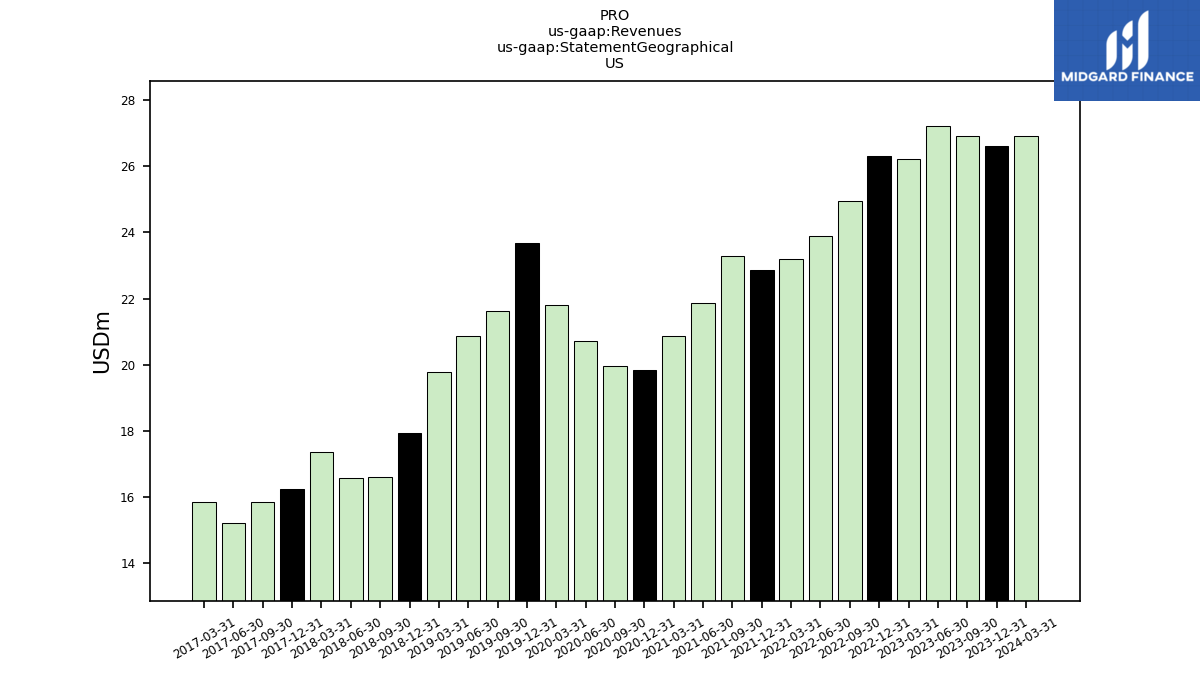
| US | 26.62 | 26.93 | 27.22 | 26.23 | 26.31 | 24.95 | 23.91 | 23.19 | 22.87 | 23.27 | 21.88 | 20.88 | 19.82 | 19.96 | 20.71 | 21.80 | 23.69 | 21.63 | 20.86 | 19.78 | 17.94 | 16.61 | 16.57 | 17.36 | 16.24 | 15.83 | 15.20 | 15.83 | NA | NA | NA | NA | NA | NA | NA | NA | NA | NA | NA | NA | NA | NA | NA | NA | NA | NA | NA | NA | NA | NA | NA | NA | NA | NA | NA | |
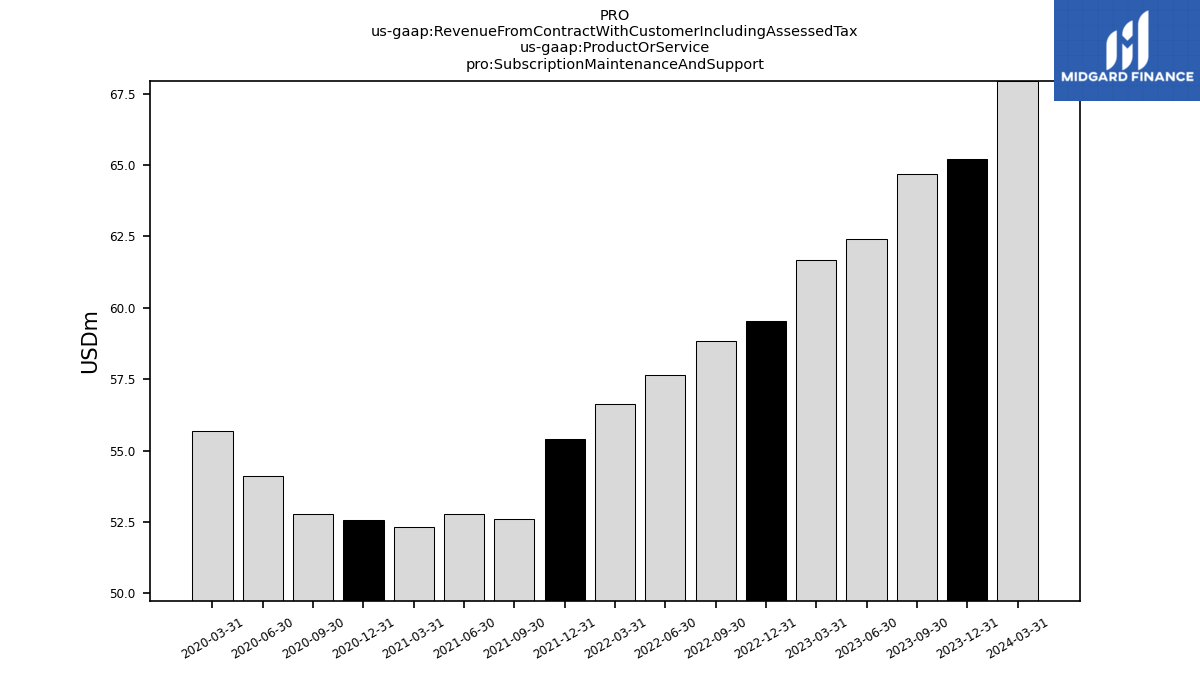
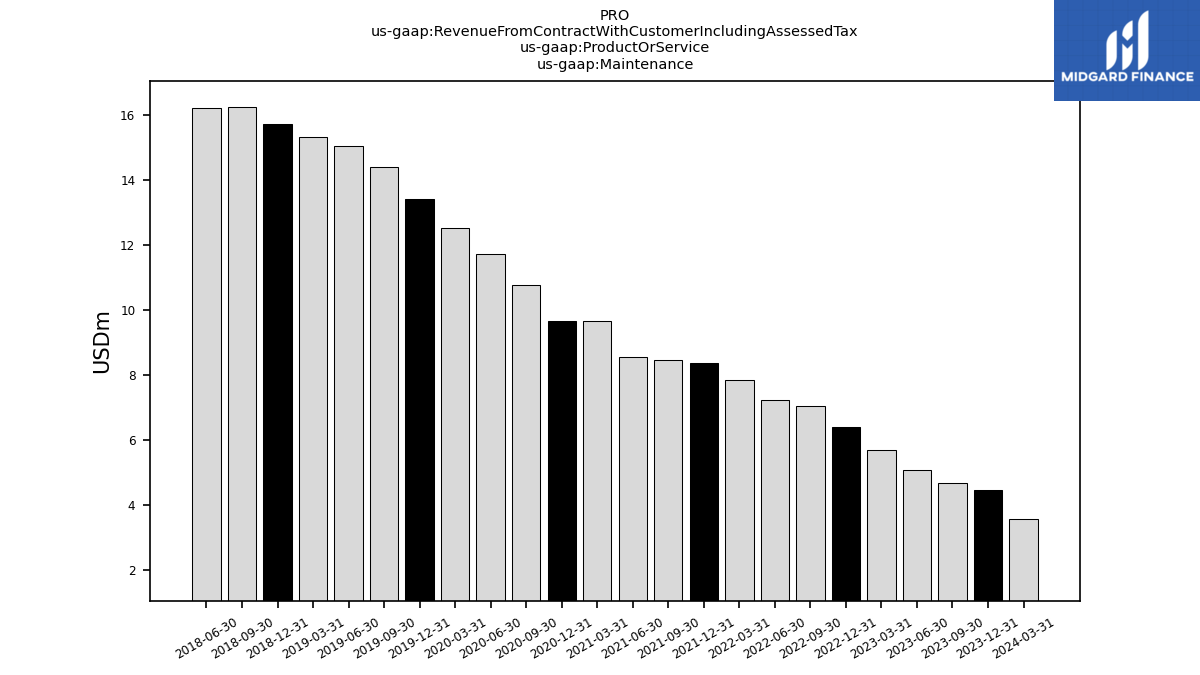
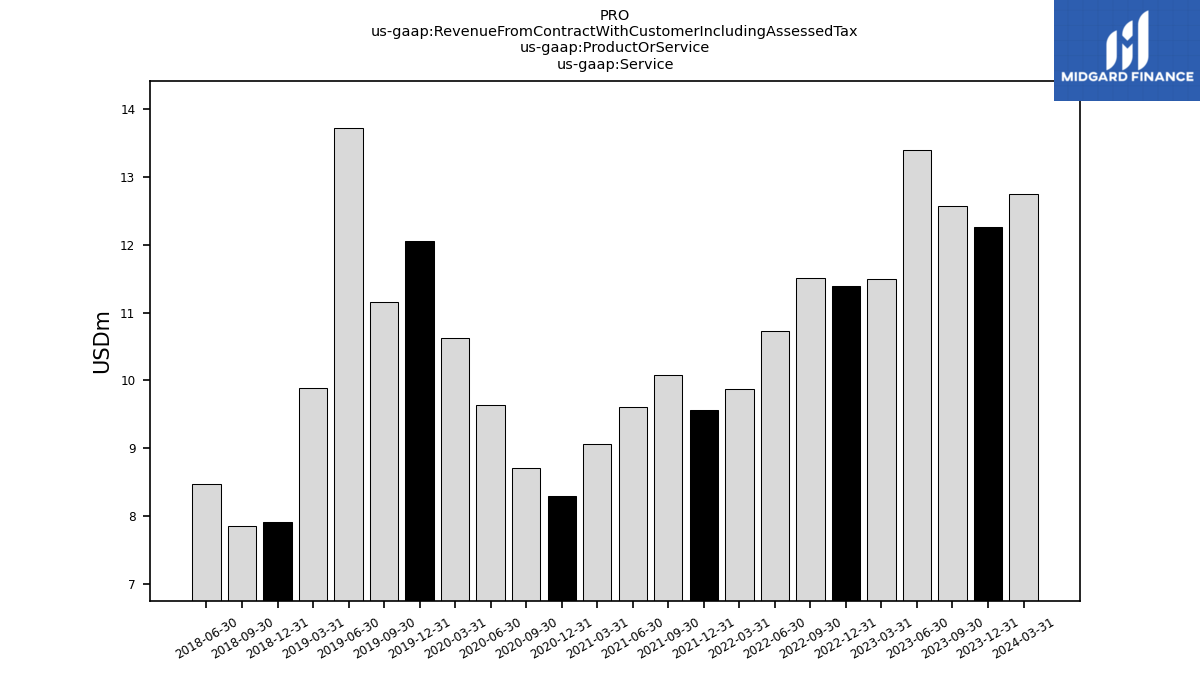
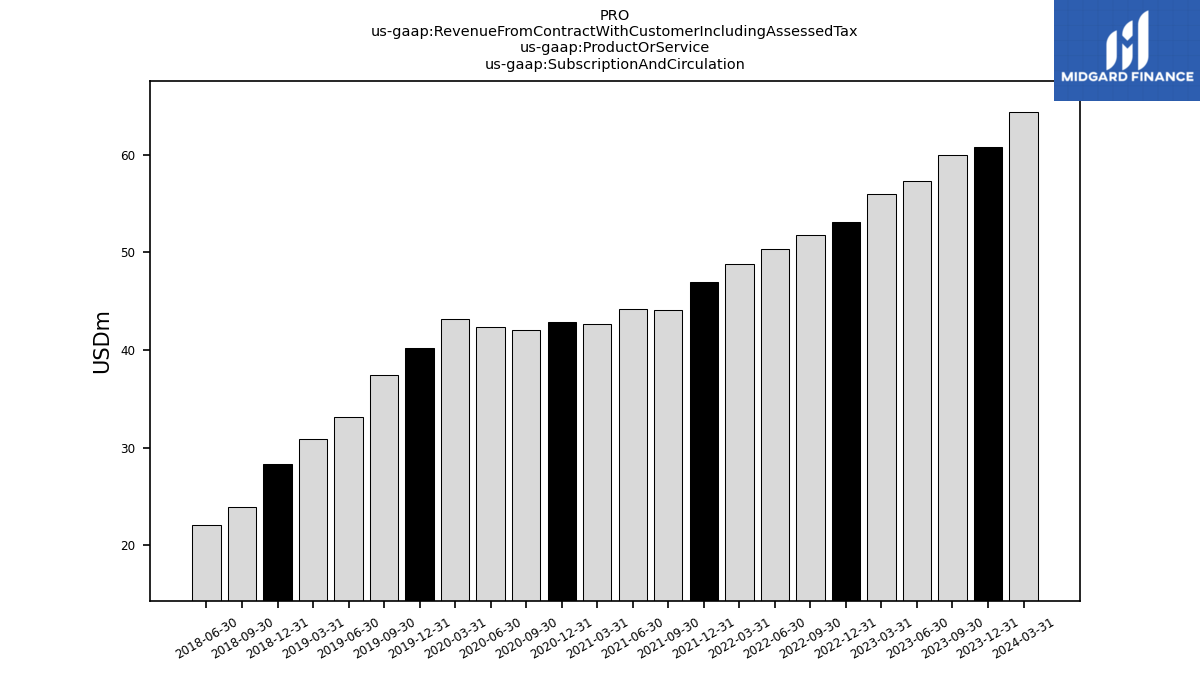
| Revenue From Contract With Customer Including Assessed Tax | 77.48 | 77.25 | 75.79 | 73.18 | 70.94 | 70.35 | 68.36 | 66.49 | 64.97 | 62.67 | 62.40 | 61.38 | 60.86 | 61.51 | 63.75 | 66.31 | 66.17 | 64.15 | 63.88 | 56.13 | 52.61 | 49.08 | 47.43 | 47.91 | 46.34 | 41.94 | 40.41 | 40.13 | 39.93 | 38.38 | 37.04 | 37.93 | 42.01 | 40.87 | 41.69 | 43.68 | 53.83 | 46.72 | 44.37 | 40.91 | 38.87 | 36.81 | 35.53 | 33.63 | 32.72 | 29.91 | 28.13 | 27.02 | 26.24 | 25.21 | 23.79 | 21.41 | 20.19 | 15.69 | 17.84 | |
| Subscription Maintenance And Support | 65.22 | 64.68 | 62.40 | 61.68 | 59.54 | 58.83 | 57.63 | 56.62 | 55.41 | 52.60 | 52.79 | 52.32 | 52.56 | 52.79 | 54.12 | 55.69 | NA | NA | NA | NA | NA | NA | NA | NA | NA | NA | NA | NA | NA | NA | NA | NA | NA | NA | NA | NA | NA | NA | NA | NA | NA | NA | NA | NA | NA | NA | NA | NA | NA | NA | NA | NA | NA | NA | NA | |
| Maintenance | 4.46 | 4.69 | 5.09 | 5.71 | 6.42 | 7.07 | 7.25 | 7.86 | 8.39 | 8.48 | 8.57 | 9.67 | 9.66 | 10.77 | 11.74 | 12.52 | 13.41 | 14.40 | 15.04 | 15.33 | 15.72 | 16.24 | 16.23 | NA | NA | NA | NA | NA | NA | NA | NA | NA | NA | NA | NA | NA | NA | NA | NA | NA | NA | NA | NA | NA | NA | NA | NA | NA | NA | NA | NA | NA | NA | NA | NA | |
| Service | 12.26 | 12.57 | 13.39 | 11.50 | 11.39 | 11.51 | 10.73 | 9.87 | 9.57 | 10.07 | 9.61 | 9.06 | 8.30 | 8.71 | 9.63 | 10.62 | 12.06 | 11.15 | 13.73 | 9.88 | 7.91 | 7.86 | 8.47 | NA | NA | NA | NA | NA | NA | NA | NA | NA | NA | NA | NA | NA | NA | NA | NA | NA | NA | NA | NA | NA | NA | NA | NA | NA | NA | NA | NA | NA | NA | NA | NA | |
| Subscription And Circulation | 60.76 | 59.99 | 57.30 | 55.97 | 53.13 | 51.76 | 50.39 | 48.77 | 47.02 | 44.12 | 44.22 | 42.65 | 42.90 | 42.03 | 42.38 | 43.17 | 40.21 | 37.46 | 33.08 | 30.92 | 28.32 | 23.89 | 22.04 | NA | NA | NA | NA | NA | NA | NA | NA | NA | NA | NA | NA | NA | NA | NA | NA | NA | NA | NA | NA | NA | NA | NA | NA | NA | NA | NA | NA | NA | NA | NA | NA |