
| 2023-12-31 | 2023-09-30 | 2023-06-30 | 2023-03-31 | 2022-12-31 | 2022-09-30 | 2022-06-30 | 2022-03-31 | 2021-12-31 | 2021-09-30 | 2021-06-30 | 2021-03-31 | 2020-12-31 | 2020-09-30 | 2020-06-30 | 2020-03-31 | 2019-12-31 | 2019-09-30 | 2019-06-30 | 2019-03-31 | 2018-12-31 | 2018-09-30 | 2018-06-30 | 2018-03-31 | 2017-12-31 | 2017-09-30 | 2017-06-30 | 2017-03-31 | 2016-12-31 | 2016-09-30 | 2016-06-30 | 2016-03-31 | 2015-12-31 | 2015-09-30 | 2015-06-30 | 2015-03-31 | 2014-12-31 | 2014-09-30 | 2014-06-30 | 2014-03-31 | 2013-12-31 | 2013-09-30 | 2013-06-30 | 2013-03-31 | 2012-12-31 | 2012-09-30 | 2012-06-30 | 2012-03-31 | ||
|---|---|---|---|---|---|---|---|---|---|---|---|---|---|---|---|---|---|---|---|---|---|---|---|---|---|---|---|---|---|---|---|---|---|---|---|---|---|---|---|---|---|---|---|---|---|---|---|---|---|
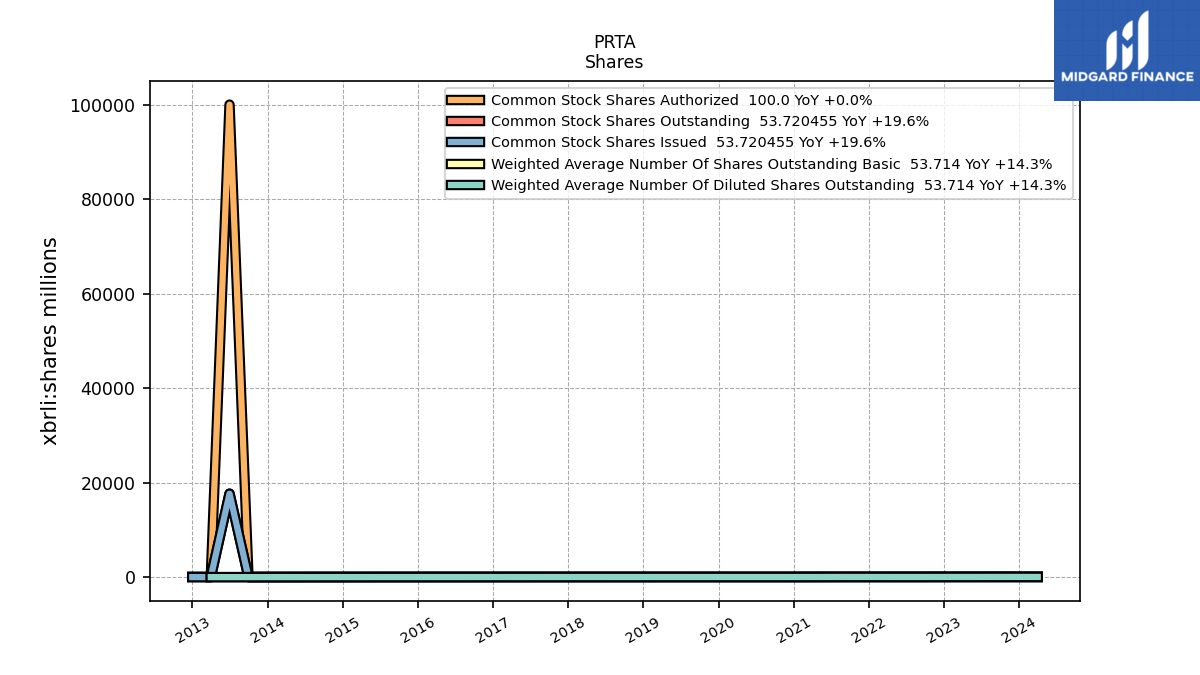
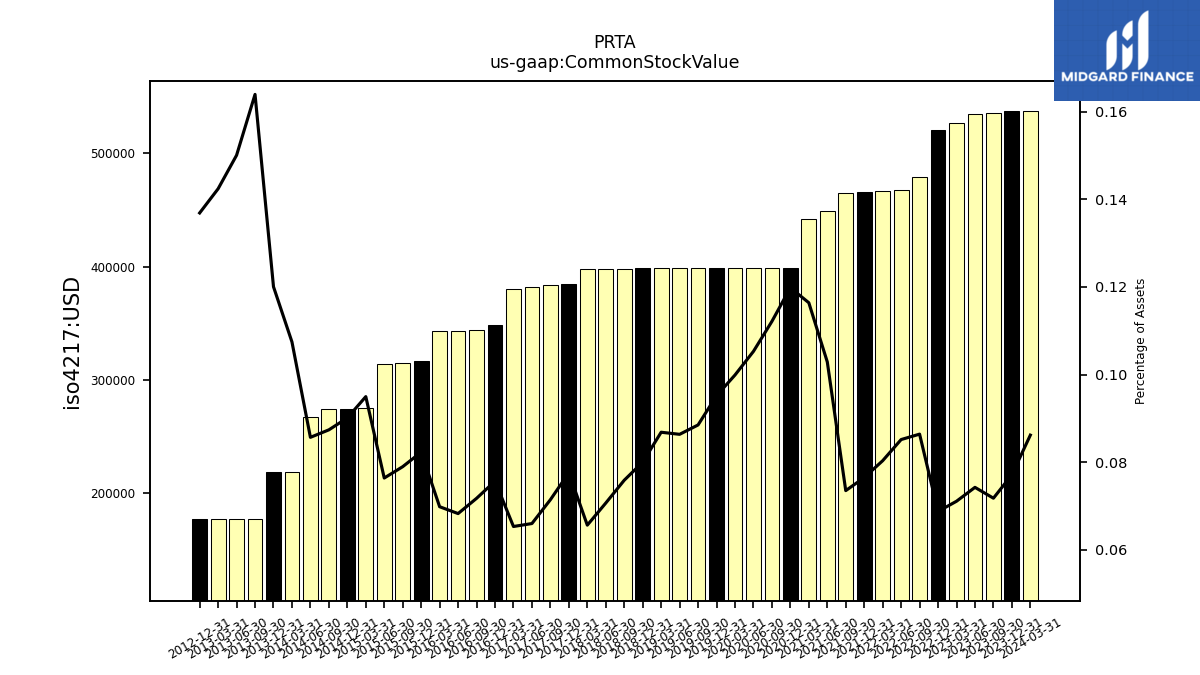
| Common Stock Value | 0.54 | 0.54 | 0.54 | 0.53 | 0.52 | 0.48 | 0.47 | 0.47 | 0.47 | 0.47 | 0.45 | 0.44 | 0.40 | 0.40 | 0.40 | 0.40 | 0.40 | 0.40 | 0.40 | 0.40 | 0.40 | 0.40 | 0.40 | 0.40 | 0.39 | 0.38 | 0.38 | 0.38 | 0.35 | 0.34 | 0.34 | 0.34 | 0.32 | 0.32 | 0.31 | 0.28 | 0.27 | 0.27 | 0.27 | 0.22 | 0.22 | 0.18 | 0.18 | 0.18 | 0.18 | NA | NA | NA | |
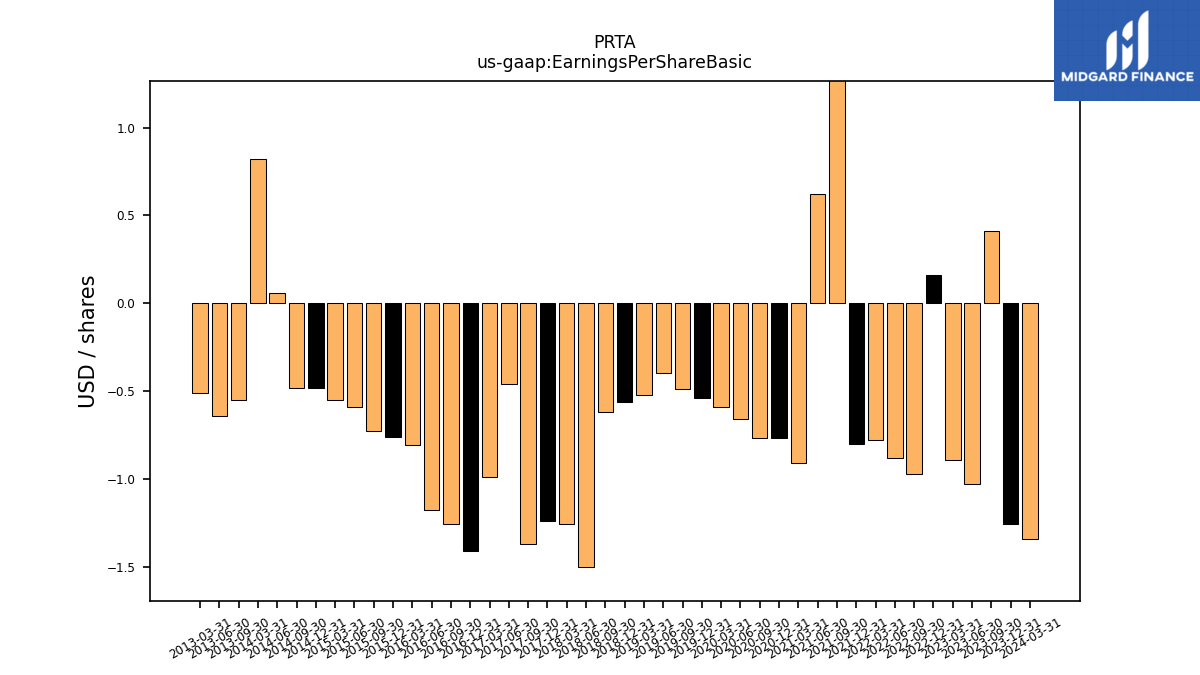
| Earnings Per Share Basic | -1.26 | 0.41 | -1.03 | -0.89 | 0.16 | -0.97 | -0.88 | -0.78 | -0.80 | 2.39 | 0.62 | -0.91 | -0.77 | -0.77 | -0.66 | -0.59 | -0.54 | -0.49 | -0.40 | -0.52 | -0.56 | -0.62 | -1.50 | -1.26 | -1.24 | -1.37 | -0.46 | -0.99 | -1.41 | -1.26 | -1.18 | -0.81 | -0.76 | -0.73 | -0.59 | -0.55 | -0.48 | -0.48 | 0.06 | 0.82 | NA | -0.55 | -0.64 | -0.51 | NA | NA | NA | NA | |
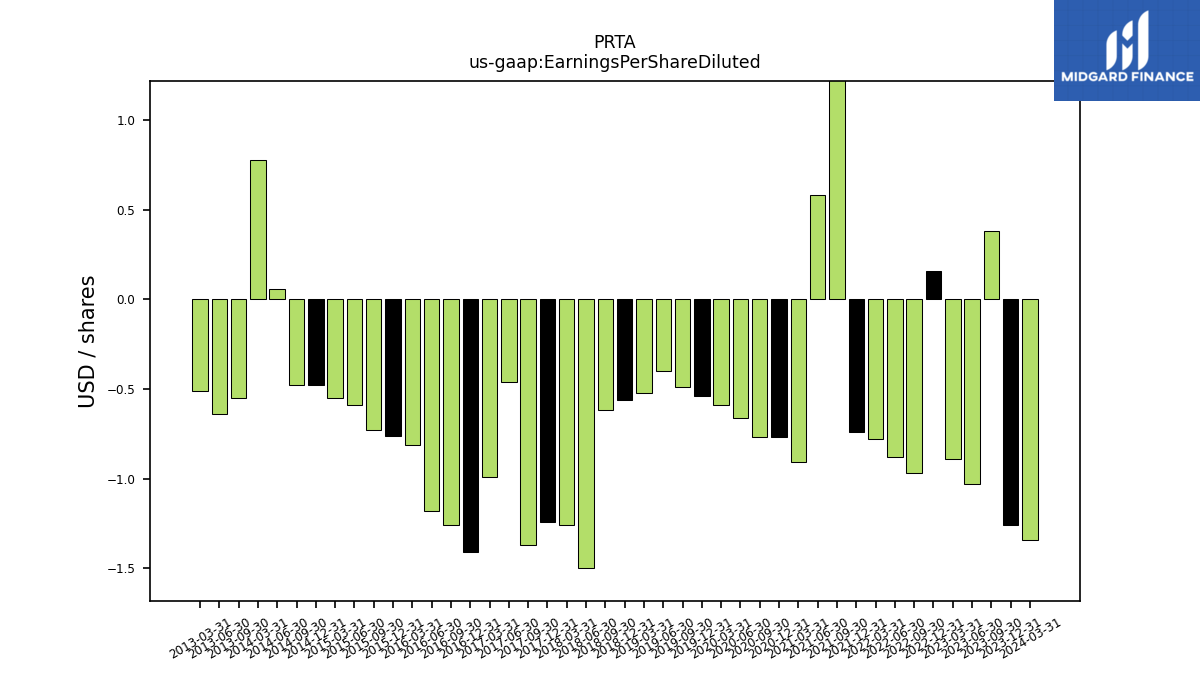
| Earnings Per Share Diluted | -1.26 | 0.38 | -1.03 | -0.89 | 0.16 | -0.97 | -0.88 | -0.78 | -0.74 | 2.13 | 0.58 | -0.91 | -0.77 | -0.77 | -0.66 | -0.59 | -0.54 | -0.49 | -0.40 | -0.52 | -0.56 | -0.62 | -1.50 | -1.26 | -1.24 | -1.37 | -0.46 | -0.99 | -1.41 | -1.26 | -1.18 | -0.81 | -0.76 | -0.73 | -0.59 | -0.55 | -0.48 | -0.48 | 0.06 | 0.78 | NA | -0.55 | -0.64 | -0.51 | NA | NA | NA | NA |
| 2023-12-31 | 2023-09-30 | 2023-06-30 | 2023-03-31 | 2022-12-31 | 2022-09-30 | 2022-06-30 | 2022-03-31 | 2021-12-31 | 2021-09-30 | 2021-06-30 | 2021-03-31 | 2020-12-31 | 2020-09-30 | 2020-06-30 | 2020-03-31 | 2019-12-31 | 2019-09-30 | 2019-06-30 | 2019-03-31 | 2018-12-31 | 2018-09-30 | 2018-06-30 | 2018-03-31 | 2017-12-31 | 2017-09-30 | 2017-06-30 | 2017-03-31 | 2016-12-31 | 2016-09-30 | 2016-06-30 | 2016-03-31 | 2015-12-31 | 2015-09-30 | 2015-06-30 | 2015-03-31 | 2014-12-31 | 2014-09-30 | 2014-06-30 | 2014-03-31 | 2013-12-31 | 2013-09-30 | 2013-06-30 | 2013-03-31 | 2012-12-31 | 2012-09-30 | 2012-06-30 | 2012-03-31 | ||
|---|---|---|---|---|---|---|---|---|---|---|---|---|---|---|---|---|---|---|---|---|---|---|---|---|---|---|---|---|---|---|---|---|---|---|---|---|---|---|---|---|---|---|---|---|---|---|---|---|---|
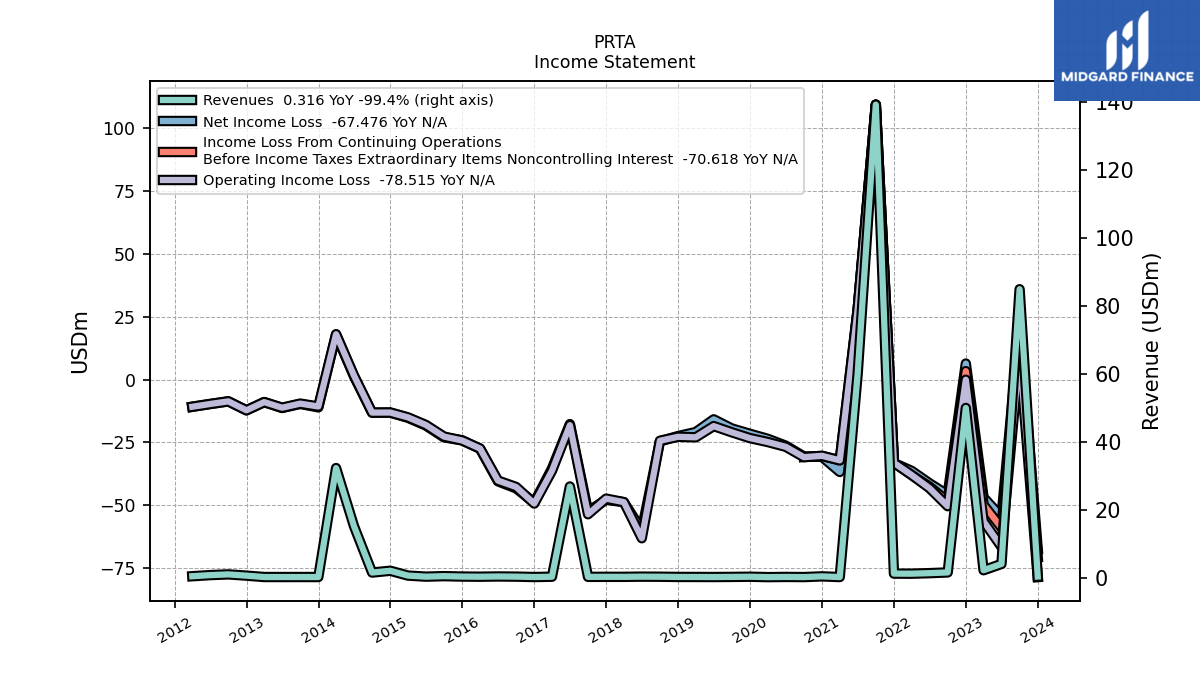
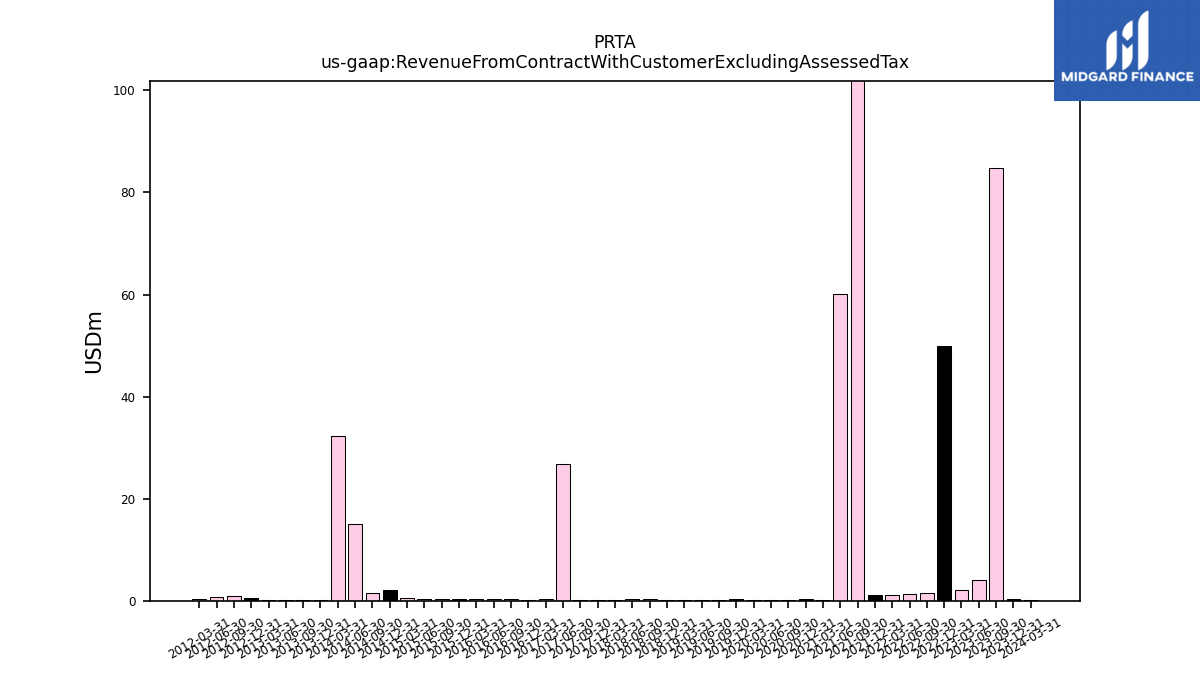
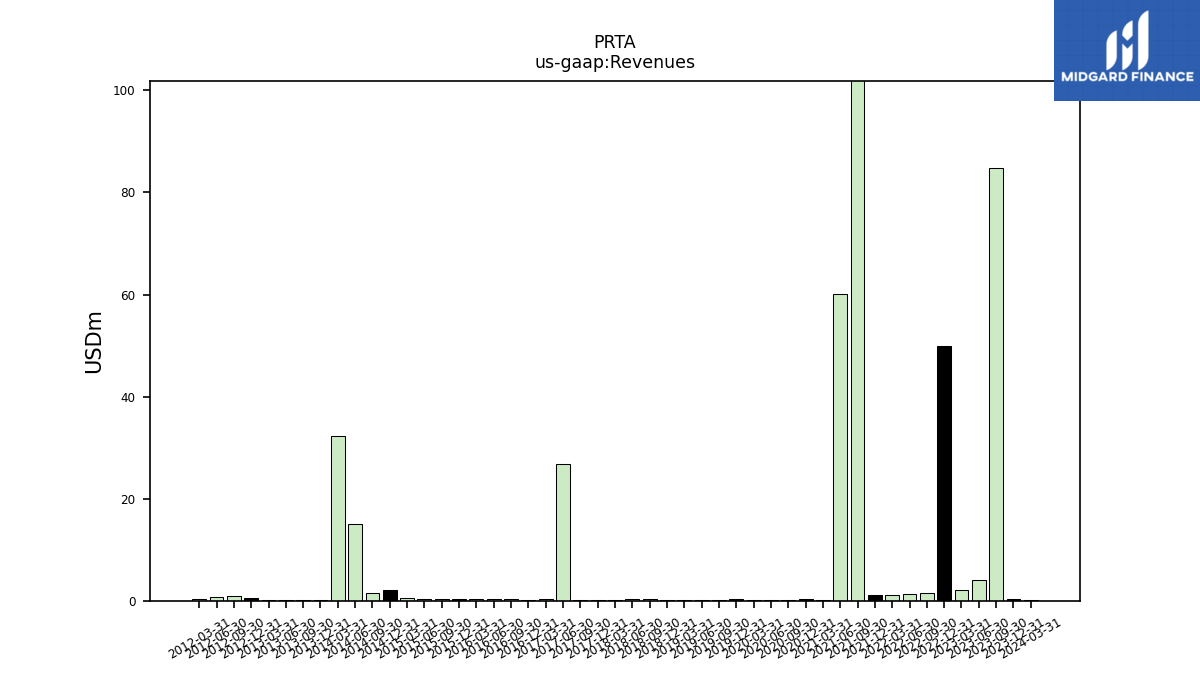
| Revenue From Contract With Customer Excluding Assessed Tax | 0.32 | 84.87 | 4.02 | 2.17 | 49.92 | 1.52 | 1.31 | 1.15 | 1.17 | 139.17 | 60.07 | 0.16 | 0.36 | 0.16 | 0.20 | 0.14 | 0.26 | 0.20 | 0.17 | 0.19 | 0.19 | 0.26 | 0.28 | 0.23 | 0.23 | 0.22 | 26.81 | 0.26 | 0.17 | 0.29 | 0.33 | 0.27 | 0.31 | 0.43 | 0.28 | 0.59 | 2.01 | 1.49 | 15.12 | 32.23 | 0.17 | 0.17 | 0.17 | 0.17 | 0.57 | 0.94 | 0.73 | 0.40 | |
| Revenues | 0.32 | 84.87 | 4.02 | 2.17 | 49.92 | 1.52 | 1.31 | 1.15 | 1.17 | 139.17 | 60.07 | 0.16 | 0.36 | 0.16 | 0.20 | 0.14 | 0.26 | 0.20 | 0.17 | 0.19 | 0.19 | 0.26 | 0.28 | 0.23 | 0.23 | 0.22 | 26.81 | 0.26 | 0.17 | 0.29 | 0.33 | 0.27 | 0.31 | 0.43 | 0.28 | 0.59 | 2.01 | 1.49 | 15.12 | 32.23 | 0.17 | 0.17 | 0.17 | 0.17 | 0.57 | 0.94 | 0.73 | 0.40 | |
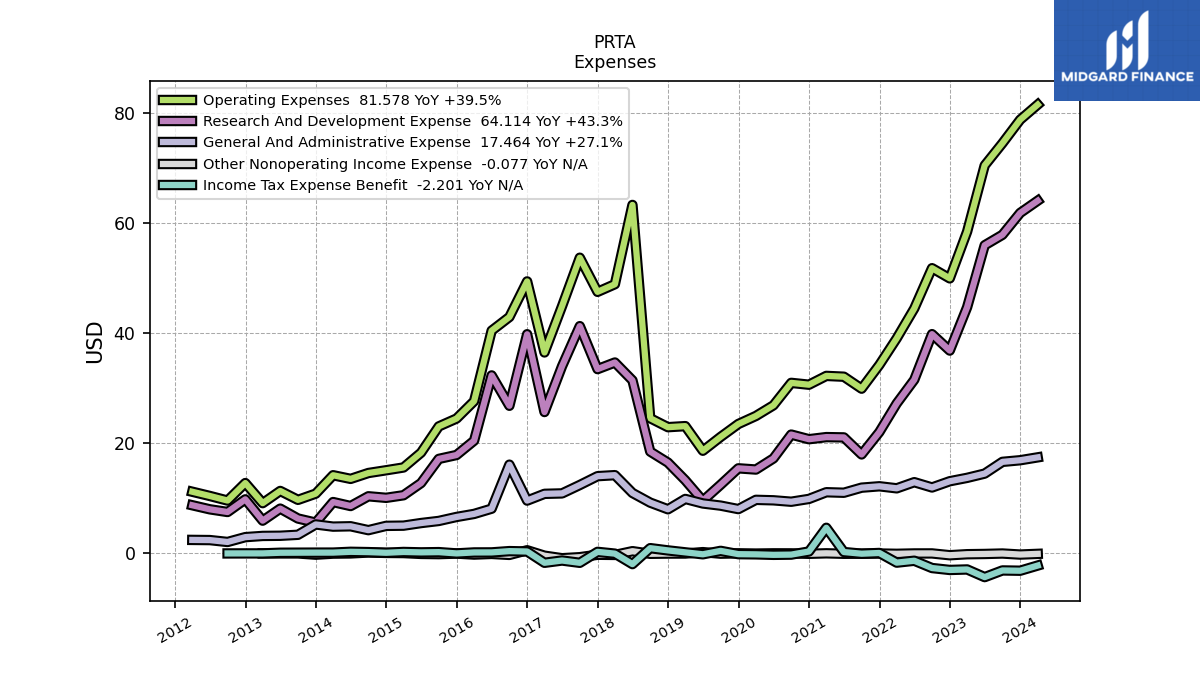
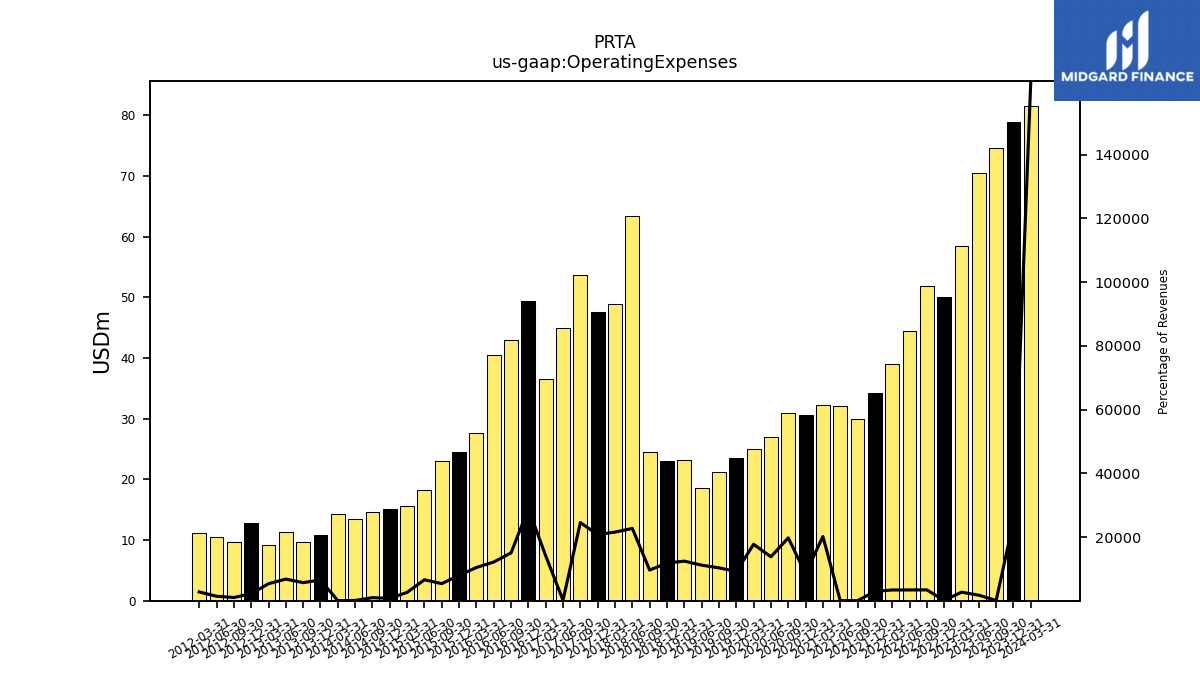
| Operating Expenses | 78.83 | 74.56 | 70.52 | 58.49 | 49.99 | 51.85 | 44.52 | 39.10 | 34.26 | 29.95 | 32.12 | 32.27 | 30.67 | 31.00 | 26.93 | 24.99 | 23.53 | 21.18 | 18.66 | 23.14 | 22.95 | 24.58 | 63.35 | 48.94 | 47.55 | 53.75 | 44.94 | 36.53 | 49.45 | 42.97 | 40.49 | 27.68 | 24.52 | 23.09 | 18.31 | 15.62 | 15.12 | 14.62 | 13.55 | 14.21 | 10.87 | 9.74 | 11.36 | 9.14 | 12.79 | 9.61 | 10.45 | 11.21 | |
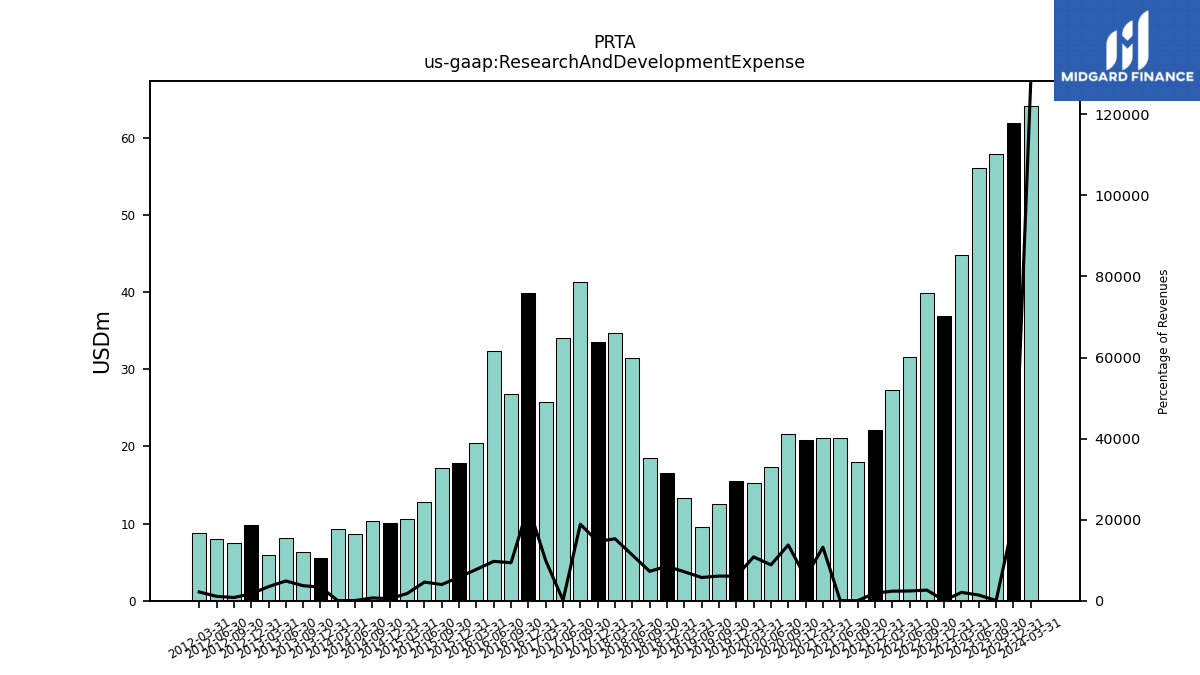
| Research And Development Expense | 61.89 | 57.91 | 56.01 | 44.76 | 36.87 | 39.86 | 31.57 | 27.26 | 22.06 | 17.99 | 21.09 | 21.14 | 20.76 | 21.61 | 17.27 | 15.25 | 15.47 | 12.49 | 9.58 | 13.30 | 16.51 | 18.52 | 31.45 | 34.71 | 33.50 | 41.31 | 34.03 | 25.70 | 39.84 | 26.84 | 32.36 | 20.49 | 17.89 | 17.18 | 12.79 | 10.57 | 10.11 | 10.39 | 8.62 | 9.34 | 5.60 | 6.35 | 8.15 | 5.96 | 9.83 | 7.53 | 8.02 | 8.76 | |
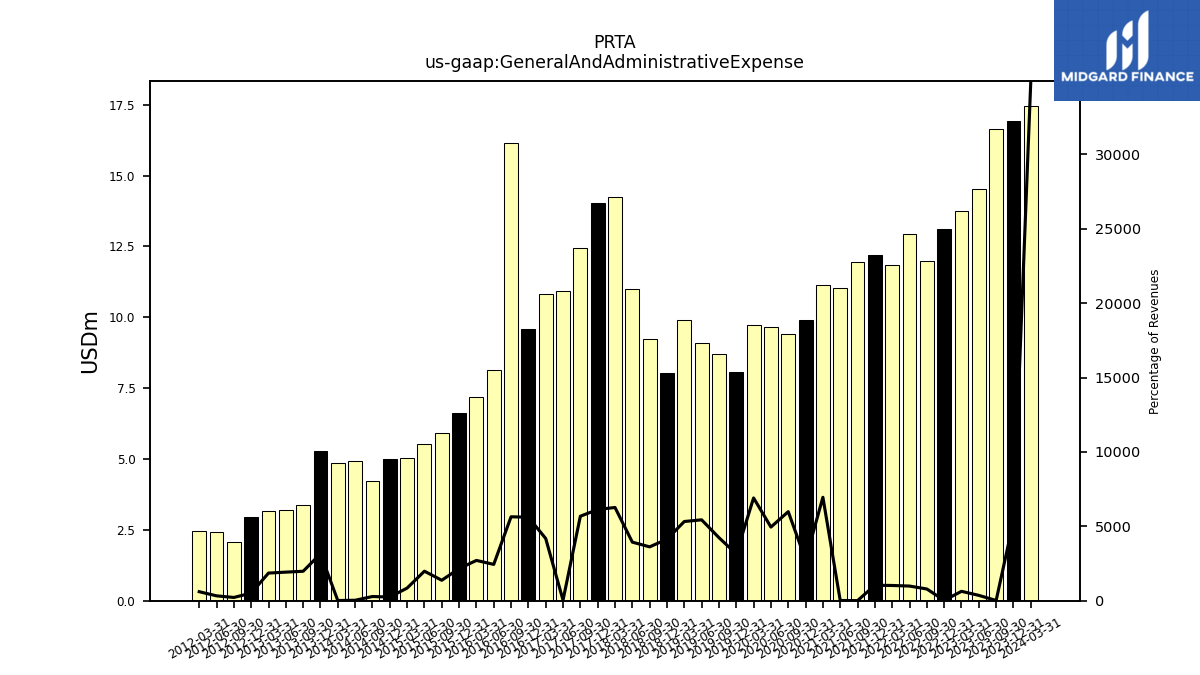
| General And Administrative Expense | 16.94 | 16.64 | 14.51 | 13.74 | 13.12 | 11.99 | 12.95 | 11.84 | 12.21 | 11.96 | 11.03 | 11.12 | 9.91 | 9.40 | 9.66 | 9.74 | 8.06 | 8.69 | 9.08 | 9.90 | 8.03 | 9.23 | 10.99 | 14.23 | 14.04 | 12.44 | 10.91 | 10.83 | 9.60 | 16.14 | 8.13 | 7.18 | 6.63 | 5.91 | 5.52 | 5.05 | 5.01 | 4.23 | 4.94 | 4.87 | 5.27 | 3.39 | 3.21 | 3.18 | 2.96 | 2.08 | 2.43 | 2.46 | |
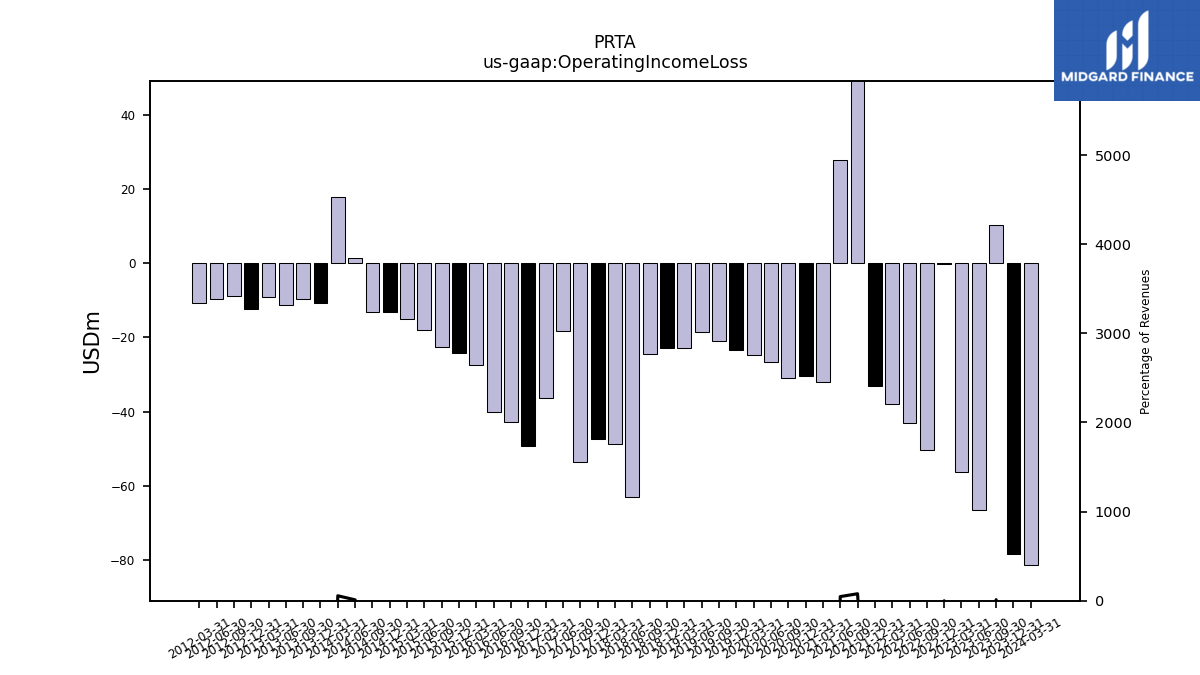
| Operating Income Loss | -78.52 | 10.31 | -66.50 | -56.33 | -0.07 | -50.33 | -43.21 | -37.94 | -33.09 | 109.23 | 27.95 | -32.11 | -30.31 | -30.85 | -26.73 | -24.85 | -23.27 | -20.97 | -18.50 | -22.95 | -22.75 | -24.32 | -63.07 | -48.71 | -47.32 | -53.53 | -18.13 | -36.27 | -49.28 | -42.69 | -40.16 | -27.41 | -24.21 | -22.66 | -18.04 | -15.03 | -13.11 | -13.13 | 1.57 | 18.02 | -10.70 | -9.57 | -11.19 | -8.97 | -12.22 | -8.67 | -9.71 | -10.81 | |
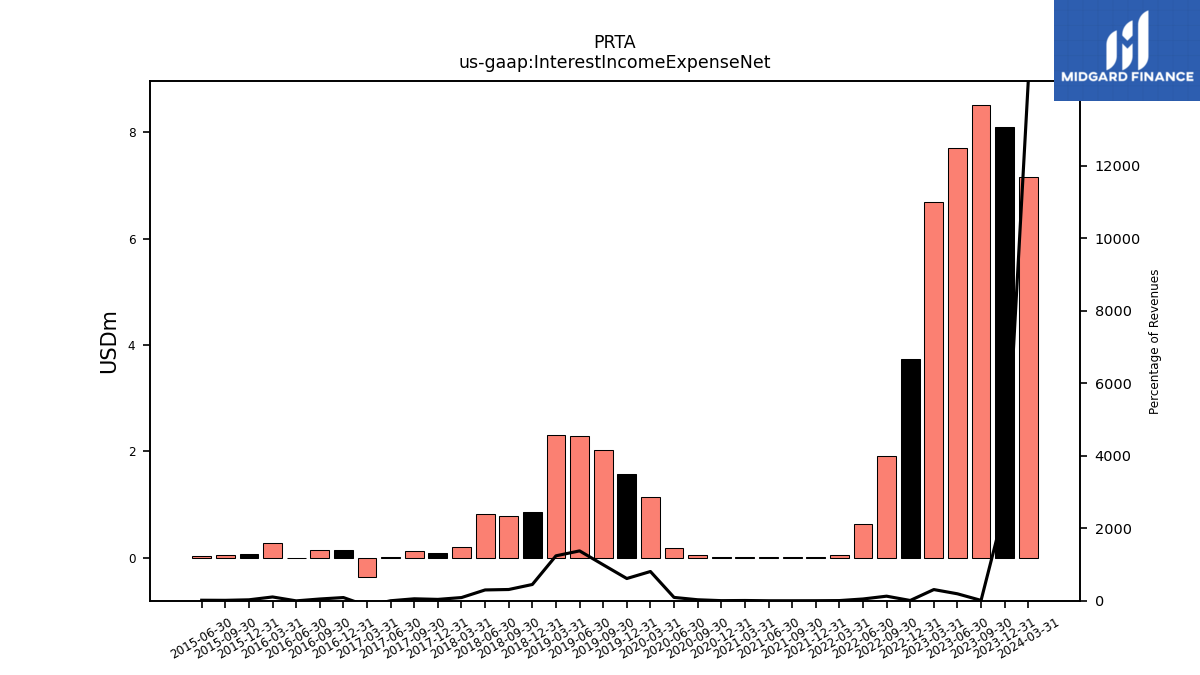
| Interest Income Expense Net | 8.10 | 8.52 | 7.70 | 6.69 | 3.74 | 1.91 | 0.64 | 0.05 | 0.01 | 0.01 | 0.01 | 0.01 | 0.01 | 0.04 | 0.18 | 1.14 | 1.57 | 2.03 | 2.30 | 2.30 | 0.87 | 0.79 | 0.83 | 0.20 | 0.09 | 0.12 | 0.02 | -0.36 | 0.15 | 0.14 | -0.01 | 0.28 | 0.08 | 0.05 | 0.04 | NA | NA | NA | NA | NA | NA | NA | NA | NA | NA | NA | NA | NA | |
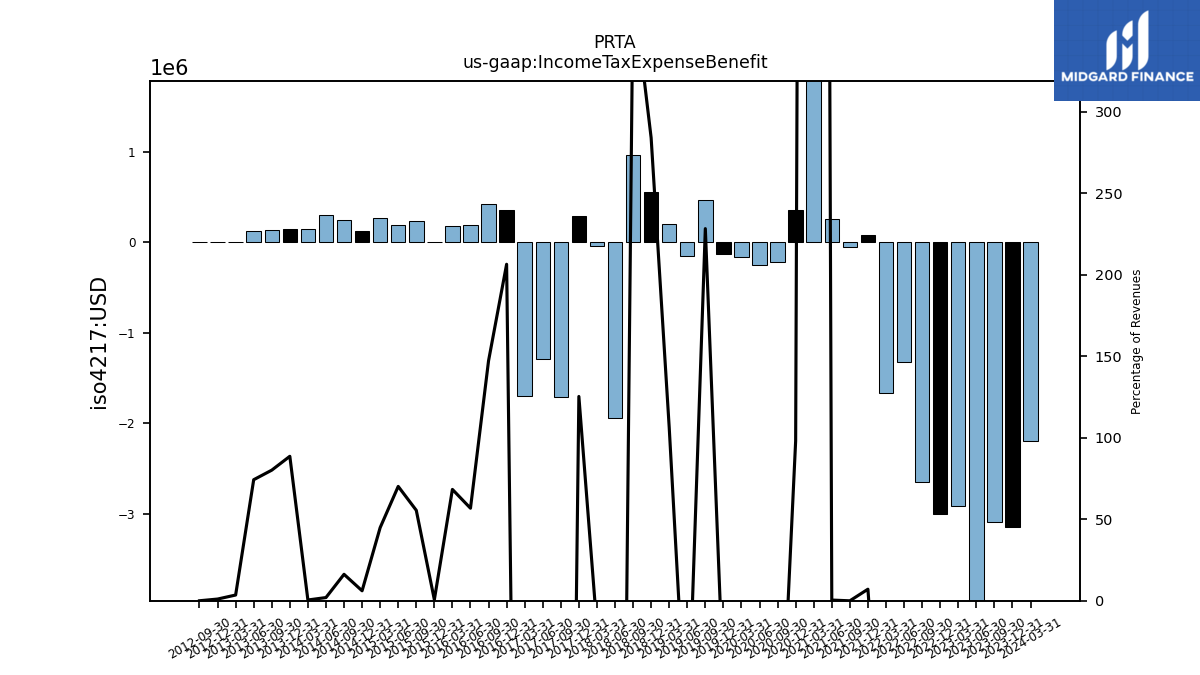
| Income Tax Expense Benefit | -3.14 | -3.09 | -4.31 | -2.91 | -3.00 | -2.65 | -1.33 | -1.67 | 0.08 | -0.05 | 0.25 | 4.66 | 0.35 | -0.21 | -0.26 | -0.17 | -0.13 | 0.47 | -0.16 | 0.20 | 0.55 | 0.96 | -1.95 | -0.04 | 0.29 | -1.71 | -1.29 | -1.70 | 0.35 | 0.42 | 0.19 | 0.18 | 0.00 | 0.24 | 0.20 | 0.27 | 0.12 | 0.24 | 0.30 | 0.15 | 0.15 | 0.14 | 0.12 | 0.01 | 0.01 | 0.00 | NA | NA | |
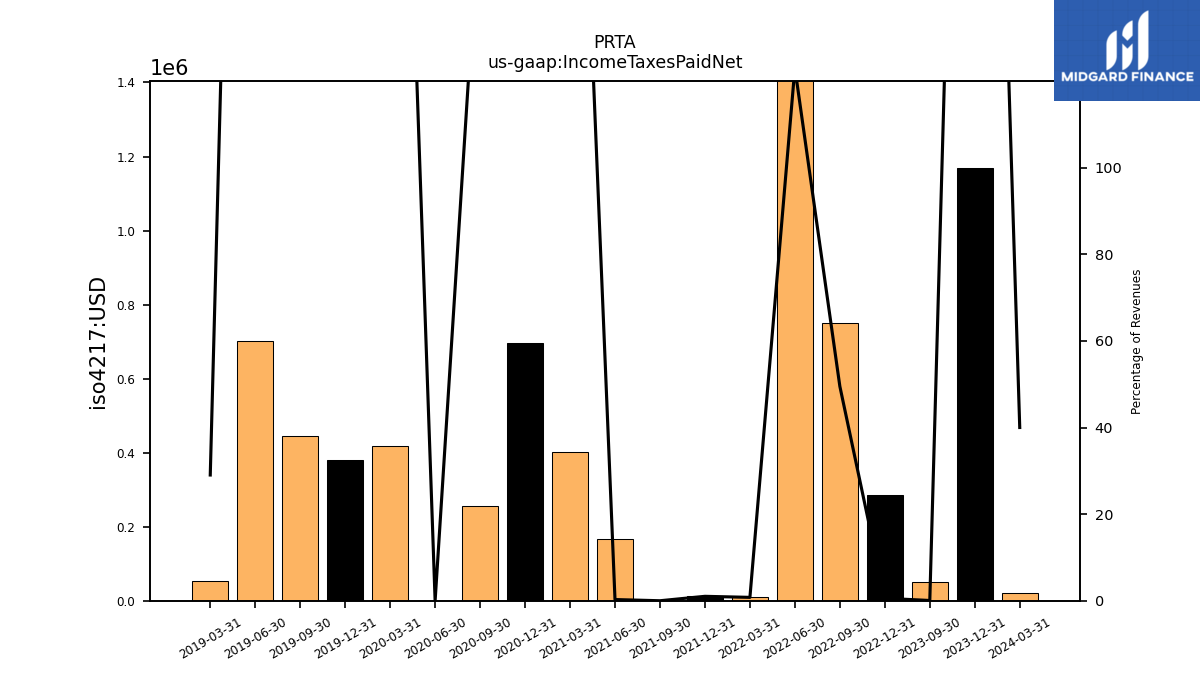
| Income Taxes Paid Net | 1.17 | 0.05 | NA | NA | 0.28 | 0.75 | 1.61 | 0.01 | 0.01 | 0.00 | 0.17 | 0.40 | 0.69 | 0.26 | 0.00 | 0.42 | 0.38 | 0.45 | 0.70 | 0.05 | NA | NA | NA | NA | NA | NA | NA | NA | NA | NA | NA | NA | NA | NA | NA | NA | NA | NA | NA | NA | NA | NA | NA | NA | NA | NA | NA | NA | |
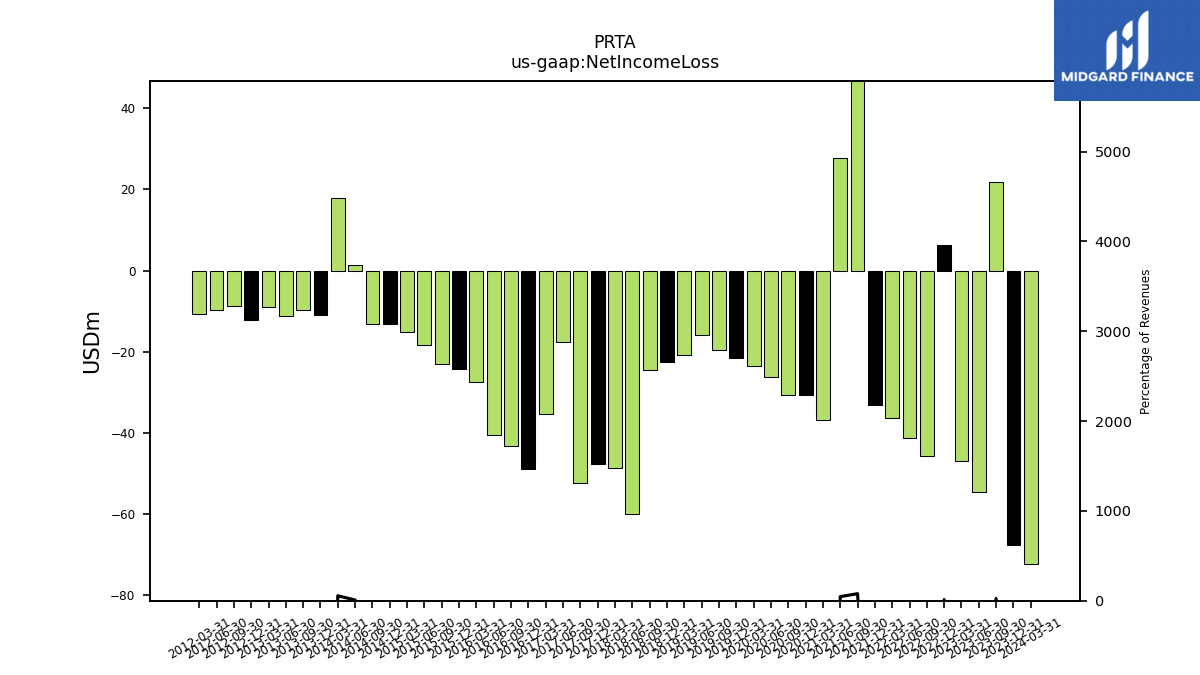
| Net Income Loss | -67.48 | 21.91 | -54.59 | -46.86 | 6.35 | -45.76 | -41.24 | -36.29 | -33.18 | 109.25 | 27.64 | -36.73 | -30.72 | -30.58 | -26.28 | -23.57 | -21.55 | -19.45 | -15.81 | -20.86 | -22.46 | -24.56 | -59.88 | -48.74 | -47.76 | -52.39 | -17.70 | -35.38 | -48.90 | -43.24 | -40.45 | -27.52 | -24.16 | -22.98 | -18.28 | -15.20 | -13.11 | -13.18 | 1.29 | 17.85 | -11.05 | -9.69 | -11.30 | -8.95 | -12.22 | -8.67 | -9.71 | -10.81 |
| 2023-12-31 | 2023-09-30 | 2023-06-30 | 2023-03-31 | 2022-12-31 | 2022-09-30 | 2022-06-30 | 2022-03-31 | 2021-12-31 | 2021-09-30 | 2021-06-30 | 2021-03-31 | 2020-12-31 | 2020-09-30 | 2020-06-30 | 2020-03-31 | 2019-12-31 | 2019-09-30 | 2019-06-30 | 2019-03-31 | 2018-12-31 | 2018-09-30 | 2018-06-30 | 2018-03-31 | 2017-12-31 | 2017-09-30 | 2017-06-30 | 2017-03-31 | 2016-12-31 | 2016-09-30 | 2016-06-30 | 2016-03-31 | 2015-12-31 | 2015-09-30 | 2015-06-30 | 2015-03-31 | 2014-12-31 | 2014-09-30 | 2014-06-30 | 2014-03-31 | 2013-12-31 | 2013-09-30 | 2013-06-30 | 2013-03-31 | 2012-12-31 | 2012-09-30 | 2012-06-30 | 2012-03-31 | ||
|---|---|---|---|---|---|---|---|---|---|---|---|---|---|---|---|---|---|---|---|---|---|---|---|---|---|---|---|---|---|---|---|---|---|---|---|---|---|---|---|---|---|---|---|---|---|---|---|---|---|
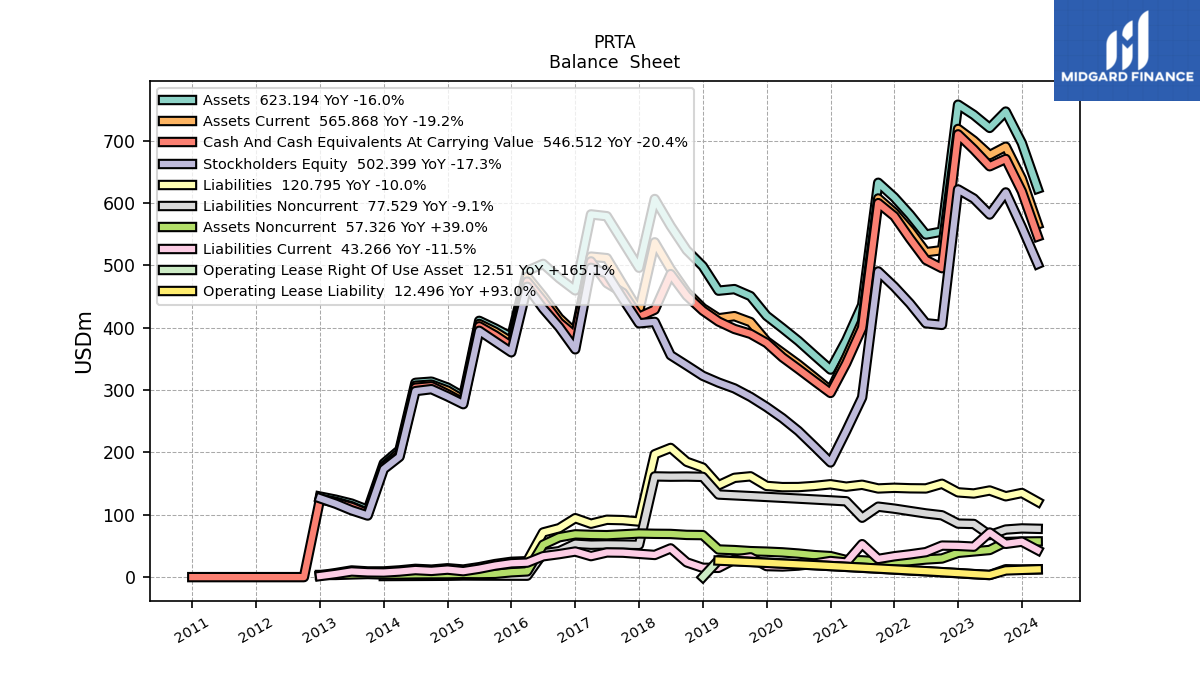
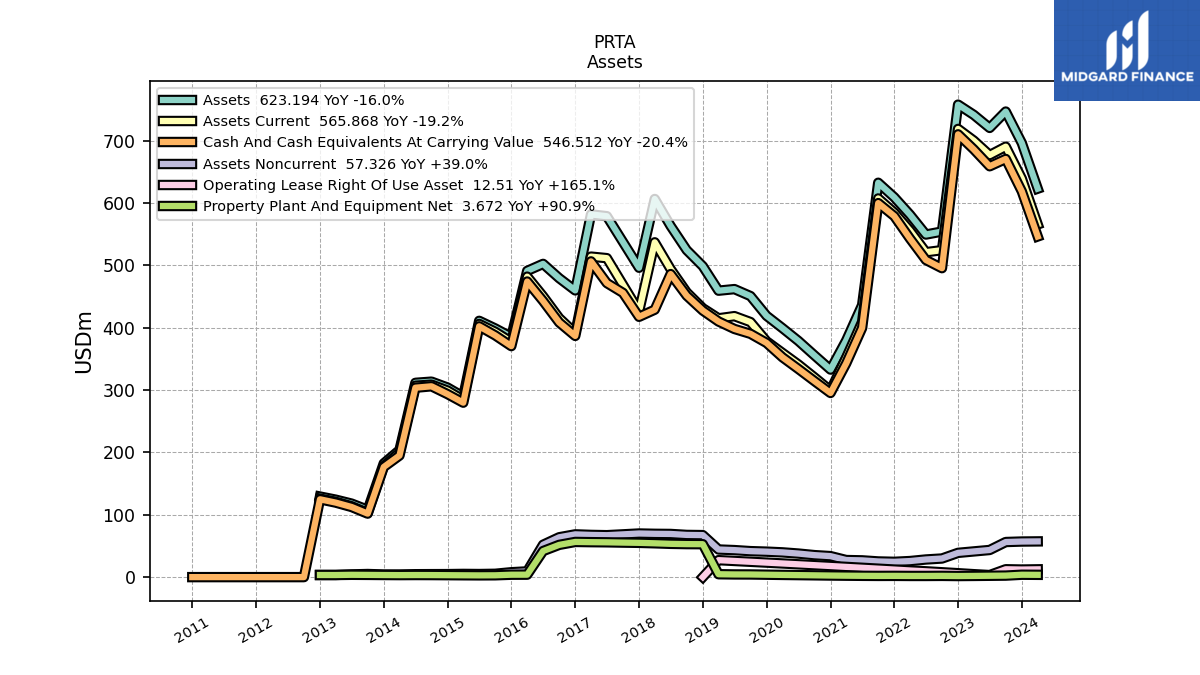
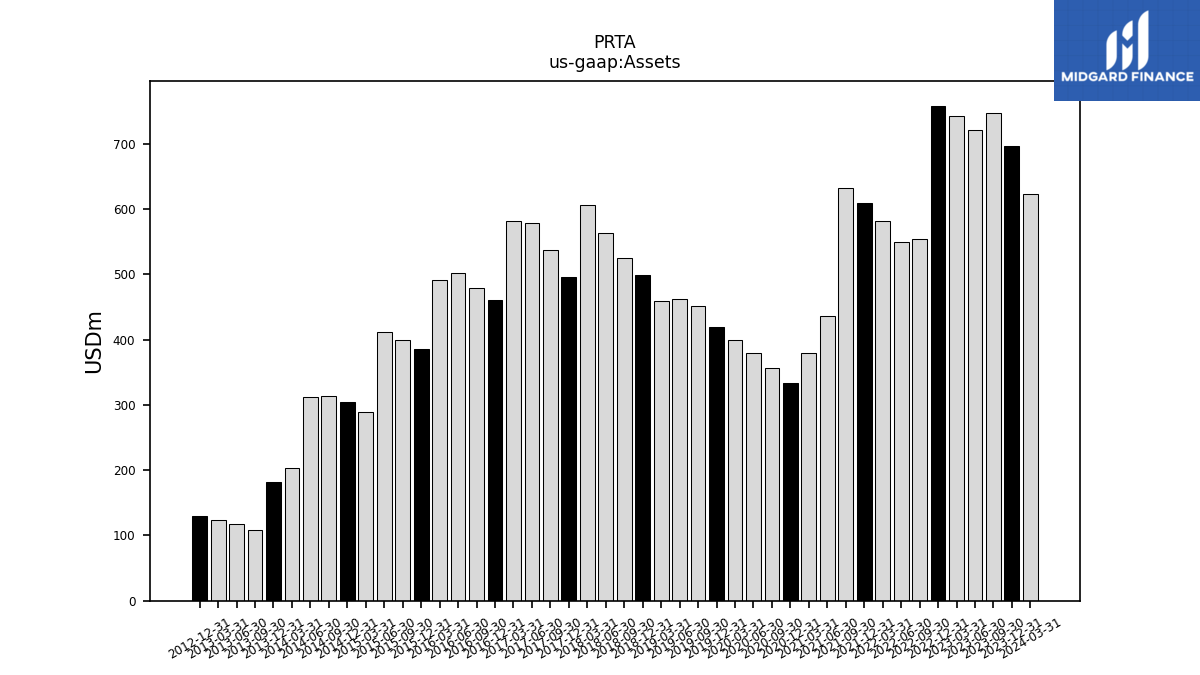
| Assets | 696.38 | 746.92 | 720.65 | 741.59 | 758.03 | 554.44 | 549.59 | 581.41 | 609.37 | 632.70 | 436.38 | 379.72 | 332.98 | 355.78 | 378.93 | 399.42 | 419.27 | 450.89 | 462.07 | 459.53 | 498.80 | 524.63 | 563.30 | 606.65 | 496.33 | 537.68 | 579.00 | 581.95 | 459.98 | 479.58 | 502.56 | 491.31 | 385.24 | 398.93 | 411.16 | 289.58 | 304.12 | 313.60 | 311.69 | 203.81 | 182.41 | 107.94 | 117.93 | 124.27 | 129.28 | NA | NA | NA | |
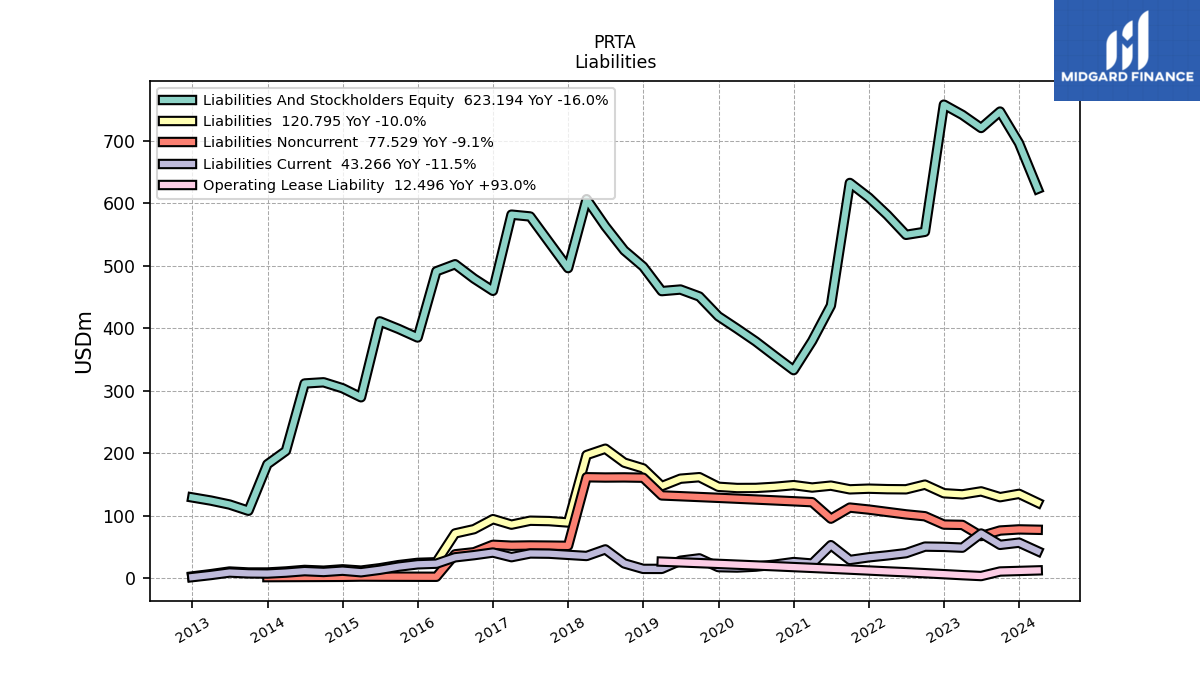
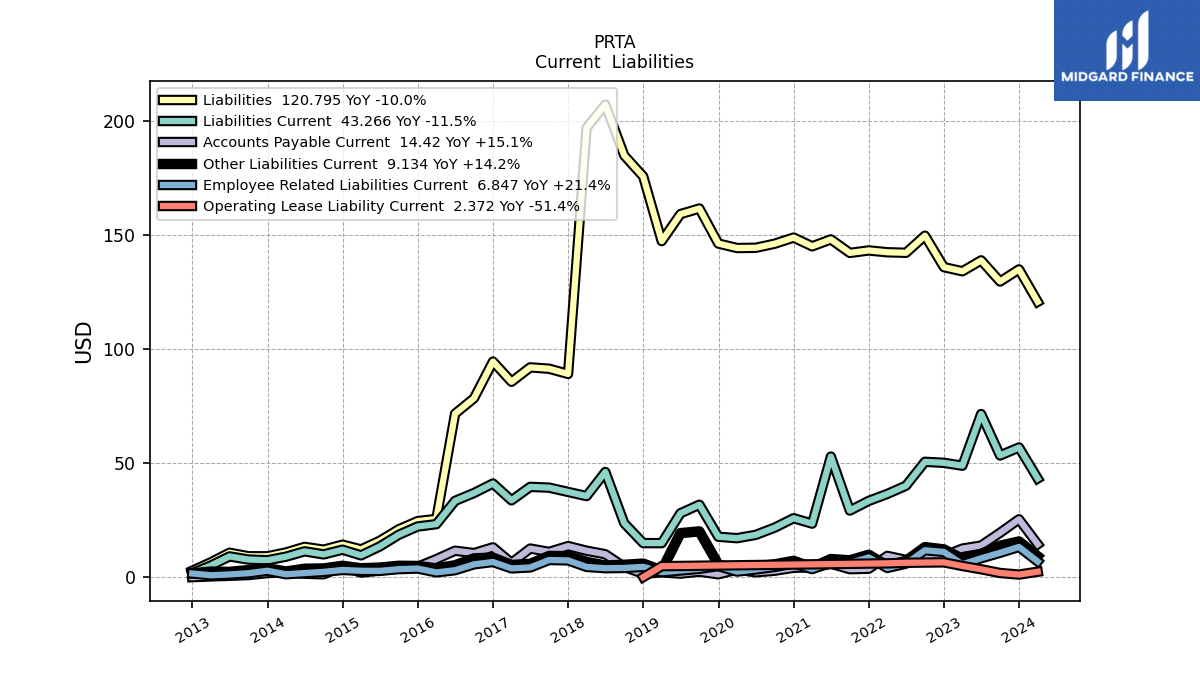
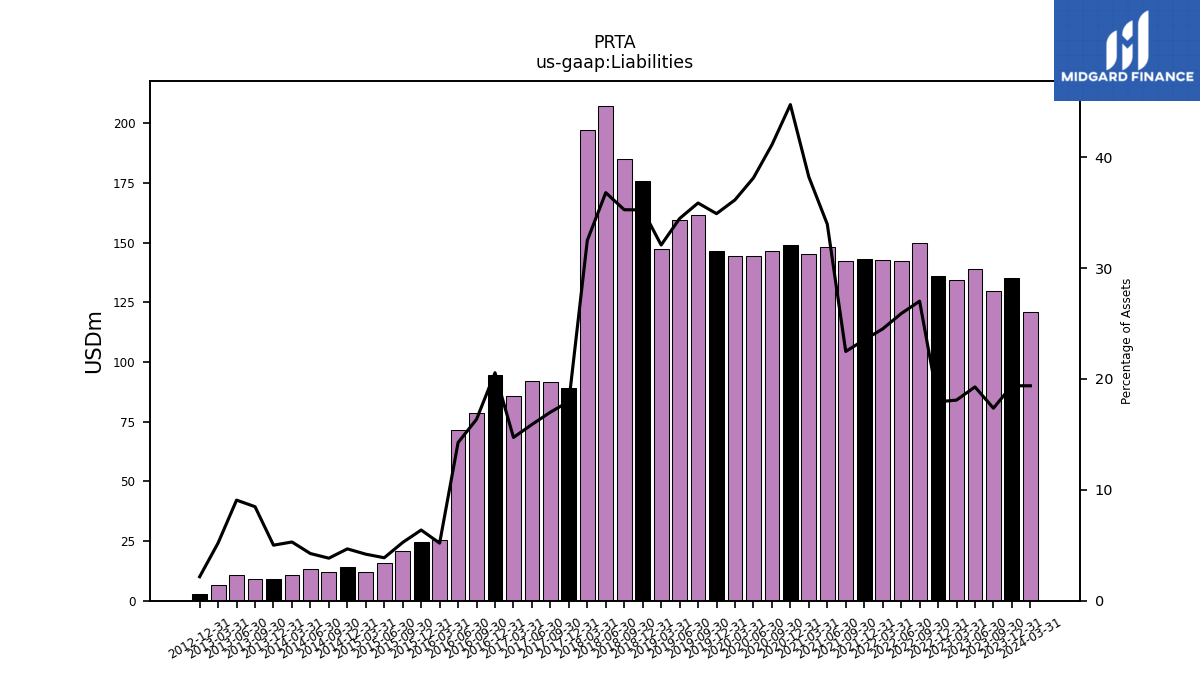
| Liabilities | 135.02 | 129.69 | 138.97 | 134.18 | 135.99 | 149.79 | 142.29 | 142.53 | 143.32 | 142.23 | 148.17 | 145.13 | 148.97 | 146.27 | 144.49 | 144.38 | 146.35 | 161.72 | 159.26 | 147.40 | 175.80 | 184.98 | 207.29 | 197.14 | 89.14 | 91.43 | 92.02 | 85.70 | 94.57 | 78.48 | 71.70 | 25.53 | 24.57 | 20.98 | 15.94 | 12.16 | 14.23 | 12.04 | 13.27 | 10.80 | 9.14 | 9.15 | 10.70 | 6.48 | 2.80 | NA | NA | NA | |
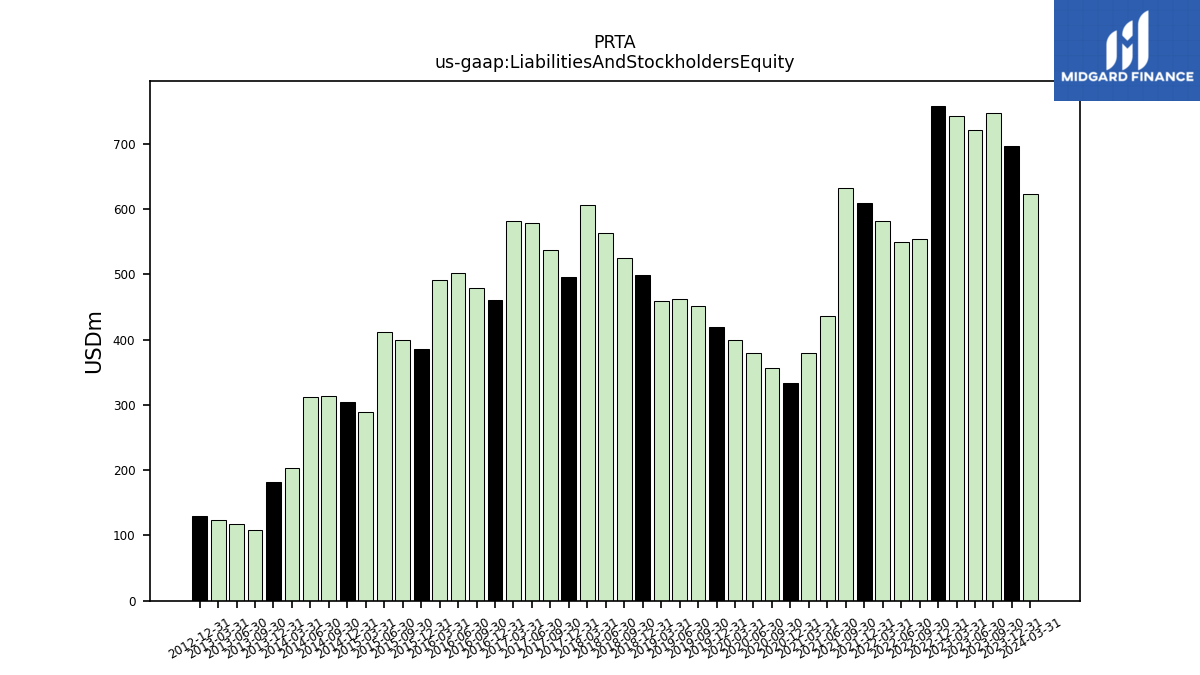
| Liabilities And Stockholders Equity | 696.38 | 746.92 | 720.65 | 741.59 | 758.03 | 554.44 | 549.59 | 581.41 | 609.37 | 632.70 | 436.38 | 379.72 | 332.98 | 355.78 | 378.93 | 399.42 | 419.27 | 450.89 | 462.07 | 459.53 | 498.80 | 524.63 | 563.30 | 606.65 | 496.33 | 537.68 | 579.00 | 581.95 | 459.98 | 479.58 | 502.56 | 491.31 | 385.24 | 398.93 | 411.16 | 289.58 | 304.12 | 313.60 | 311.69 | 203.81 | 182.41 | 107.94 | 117.93 | 124.27 | 129.28 | NA | NA | NA | |
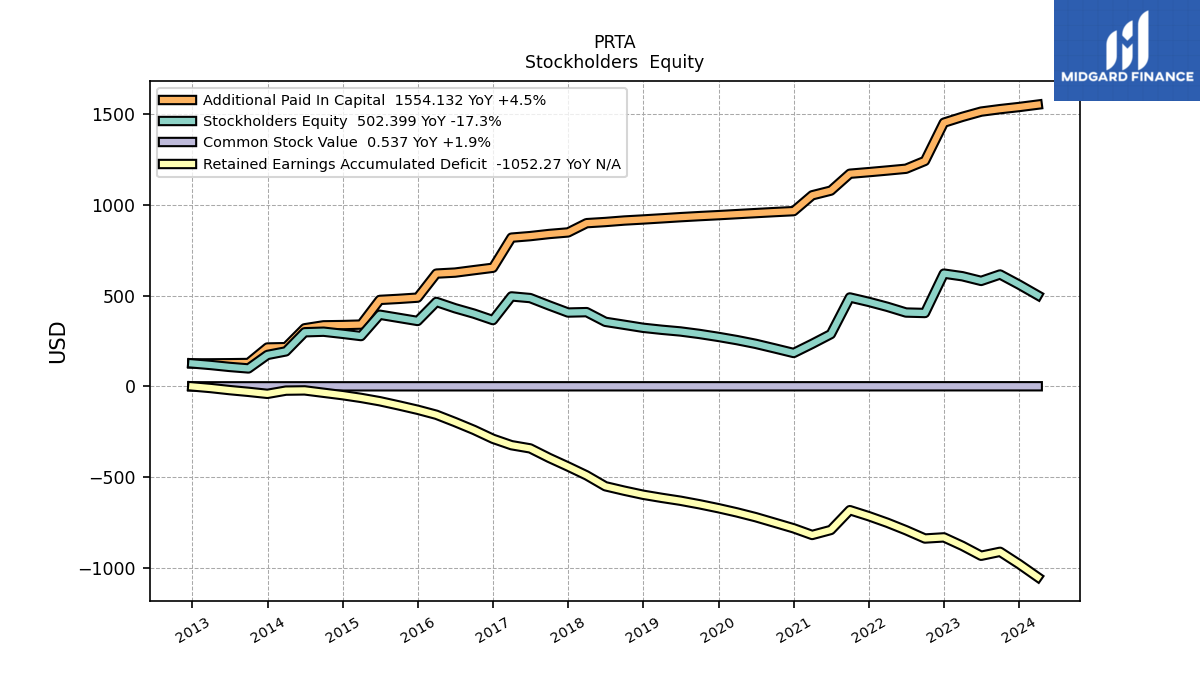
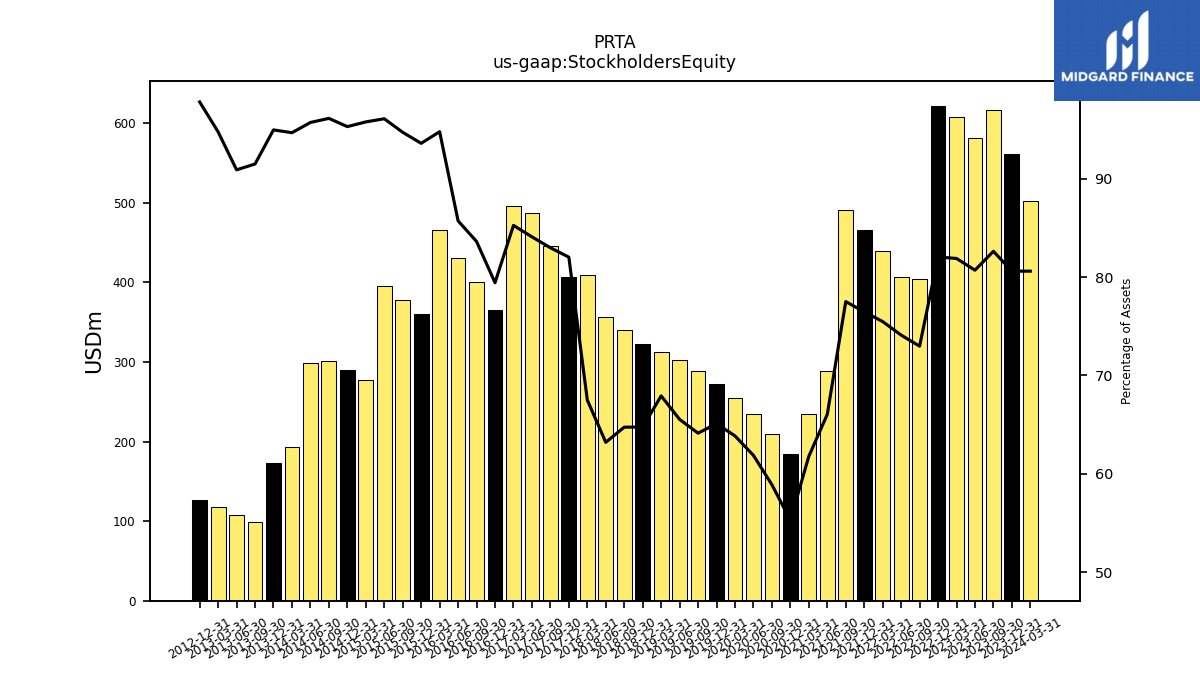
| Stockholders Equity | 561.37 | 617.23 | 581.68 | 607.41 | 622.04 | 404.65 | 407.30 | 438.89 | 466.04 | 490.47 | 288.21 | 234.58 | 184.01 | 209.51 | 234.44 | 255.04 | 272.92 | 289.18 | 302.81 | 312.13 | 323.00 | 339.65 | 356.01 | 409.50 | 407.19 | 446.25 | 486.98 | 496.25 | 365.40 | 401.10 | 430.87 | 465.78 | 360.67 | 377.95 | 395.22 | 277.43 | 289.89 | 301.56 | 298.42 | 193.01 | 173.27 | 98.78 | 107.23 | 117.79 | 126.48 | NA | NA | NA |
| 2023-12-31 | 2023-09-30 | 2023-06-30 | 2023-03-31 | 2022-12-31 | 2022-09-30 | 2022-06-30 | 2022-03-31 | 2021-12-31 | 2021-09-30 | 2021-06-30 | 2021-03-31 | 2020-12-31 | 2020-09-30 | 2020-06-30 | 2020-03-31 | 2019-12-31 | 2019-09-30 | 2019-06-30 | 2019-03-31 | 2018-12-31 | 2018-09-30 | 2018-06-30 | 2018-03-31 | 2017-12-31 | 2017-09-30 | 2017-06-30 | 2017-03-31 | 2016-12-31 | 2016-09-30 | 2016-06-30 | 2016-03-31 | 2015-12-31 | 2015-09-30 | 2015-06-30 | 2015-03-31 | 2014-12-31 | 2014-09-30 | 2014-06-30 | 2014-03-31 | 2013-12-31 | 2013-09-30 | 2013-06-30 | 2013-03-31 | 2012-12-31 | 2012-09-30 | 2012-06-30 | 2012-03-31 | ||
|---|---|---|---|---|---|---|---|---|---|---|---|---|---|---|---|---|---|---|---|---|---|---|---|---|---|---|---|---|---|---|---|---|---|---|---|---|---|---|---|---|---|---|---|---|---|---|---|---|---|
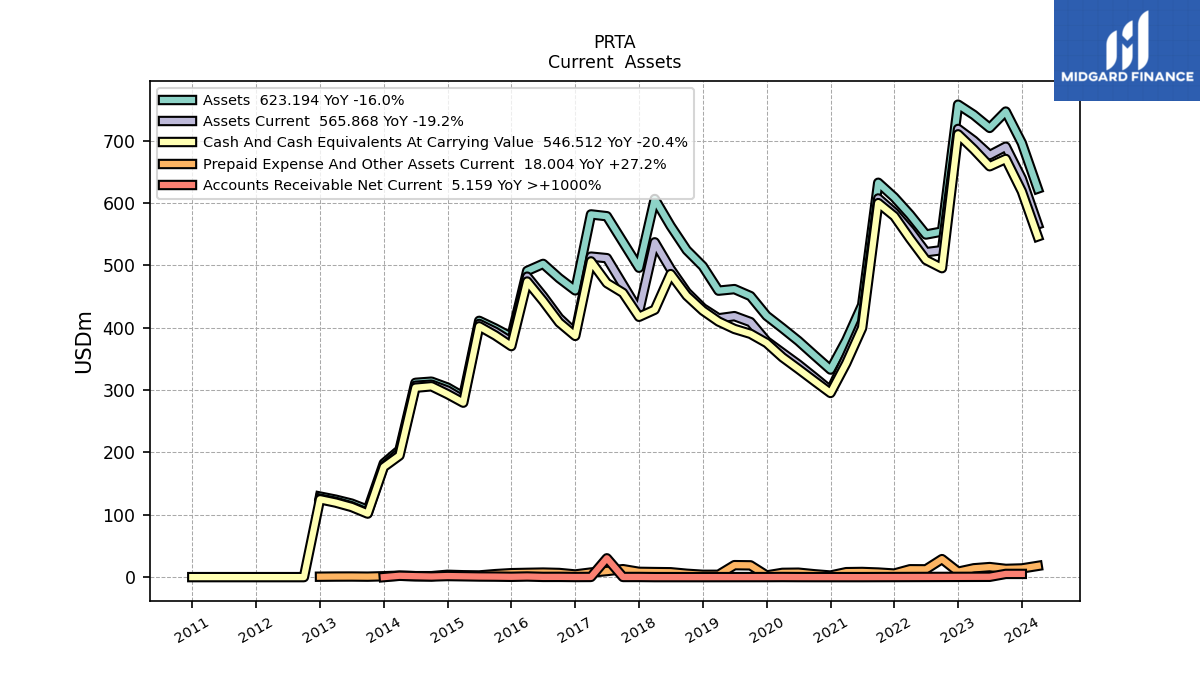
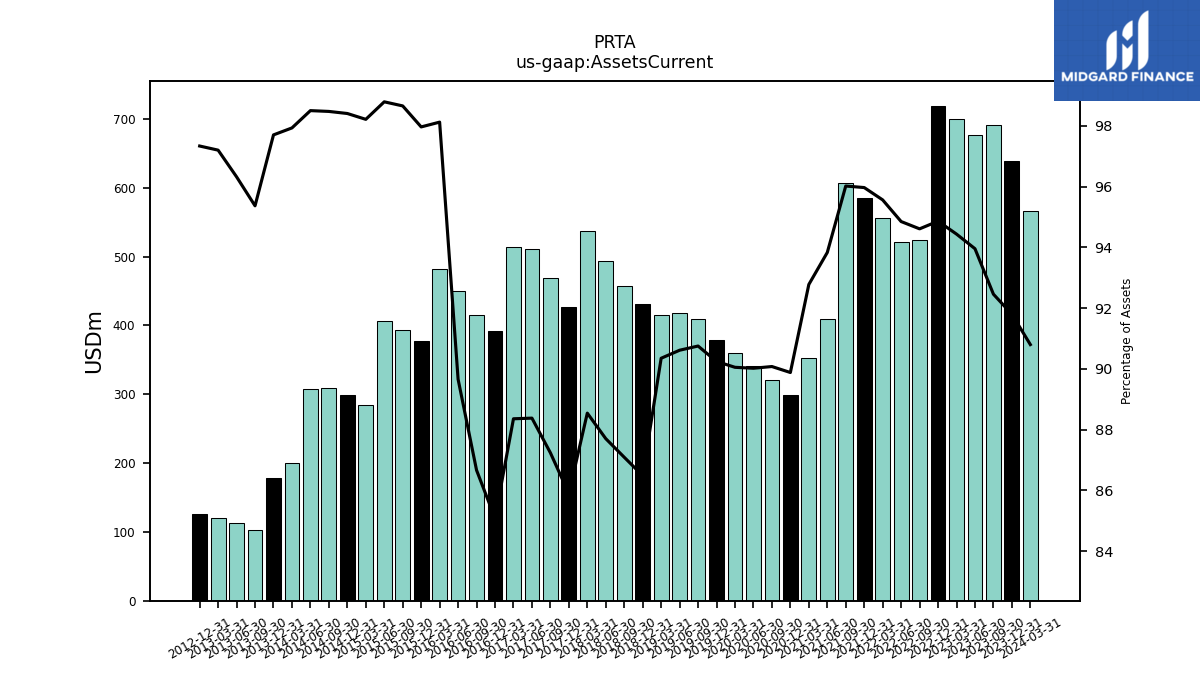
| Assets Current | 639.28 | 690.60 | 677.10 | 700.34 | 719.10 | 524.56 | 521.29 | 555.62 | 584.81 | 607.53 | 409.47 | 352.30 | 299.28 | 320.49 | 341.12 | 359.69 | 378.38 | 409.20 | 418.71 | 415.19 | 431.39 | 456.91 | 494.04 | 537.15 | 426.33 | 469.06 | 511.72 | 514.20 | 391.36 | 415.64 | 450.60 | 482.09 | 377.40 | 393.58 | 406.20 | 284.42 | 299.27 | 308.82 | 307.02 | 199.60 | 178.22 | 102.94 | 113.59 | 120.79 | 125.84 | NA | NA | NA | |
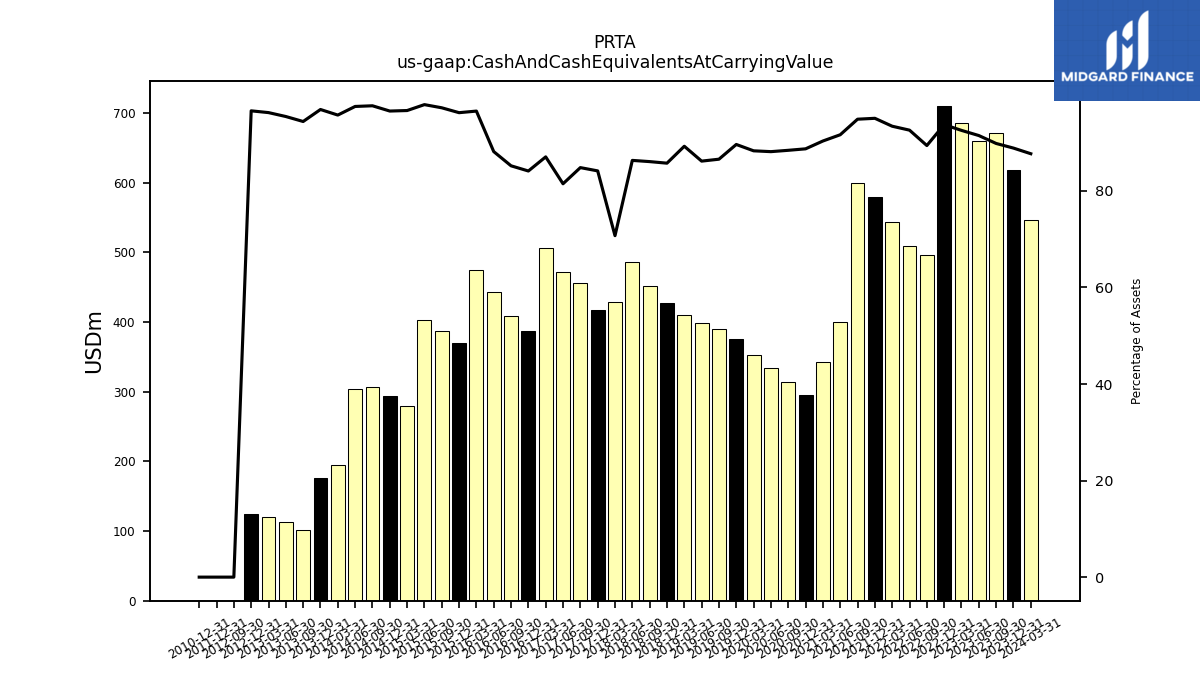
| Cash And Cash Equivalents At Carrying Value | 618.83 | 670.90 | 659.11 | 686.18 | 710.41 | 495.63 | 508.80 | 542.99 | 579.09 | 600.10 | 399.83 | 342.99 | 295.38 | 314.52 | 333.94 | 352.69 | 375.72 | 390.30 | 398.14 | 410.11 | 427.66 | 451.51 | 486.21 | 429.04 | 417.62 | 456.06 | 471.73 | 506.55 | 386.92 | 408.57 | 442.95 | 474.25 | 370.59 | 387.80 | 402.39 | 279.86 | 293.58 | 306.15 | 303.85 | 195.05 | 176.68 | 101.86 | 112.51 | 119.56 | 124.86 | 0.00 | NA | NA | |
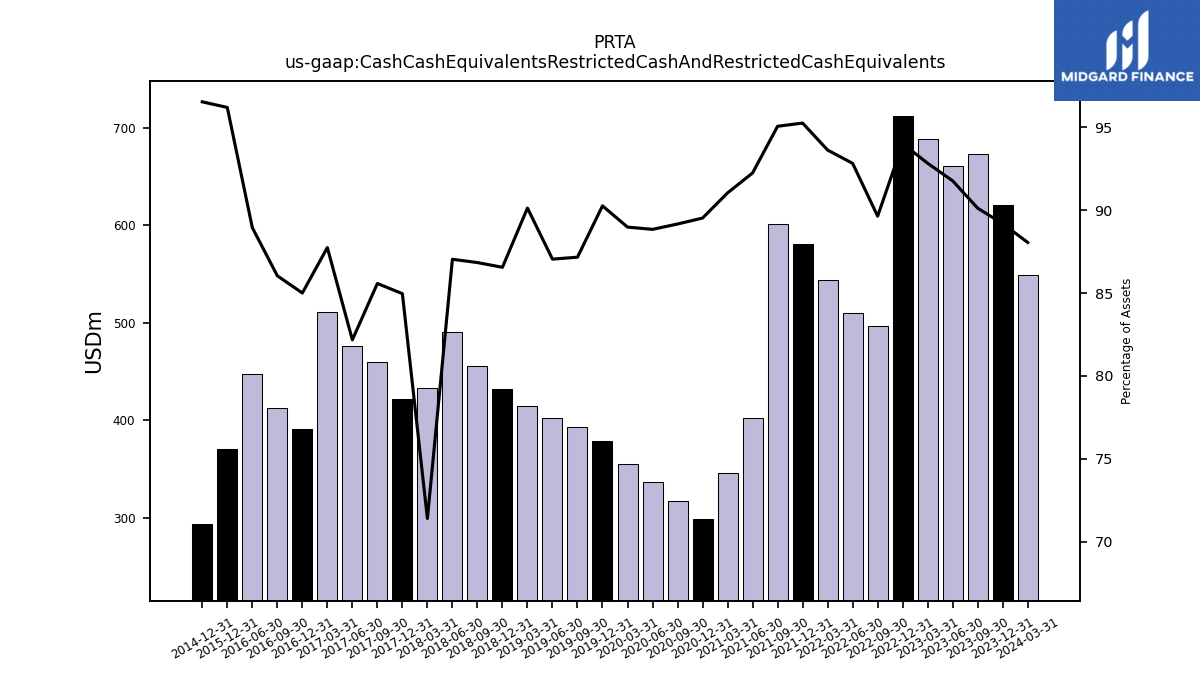
| Cash Cash Equivalents Restricted Cash And Restricted Cash Equivalents | 621.04 | 673.11 | 661.32 | 688.40 | 712.62 | 496.98 | 510.15 | 544.35 | 580.45 | 601.45 | 402.54 | 345.70 | 298.08 | 317.23 | 336.65 | 355.39 | 378.43 | 393.01 | 402.20 | 414.16 | 431.71 | 455.57 | 490.27 | 433.10 | 421.68 | 460.12 | 475.79 | 510.61 | 390.98 | 412.63 | 447.00 | NA | 370.59 | NA | NA | NA | 293.58 | NA | NA | NA | NA | NA | NA | NA | NA | NA | NA | NA | |
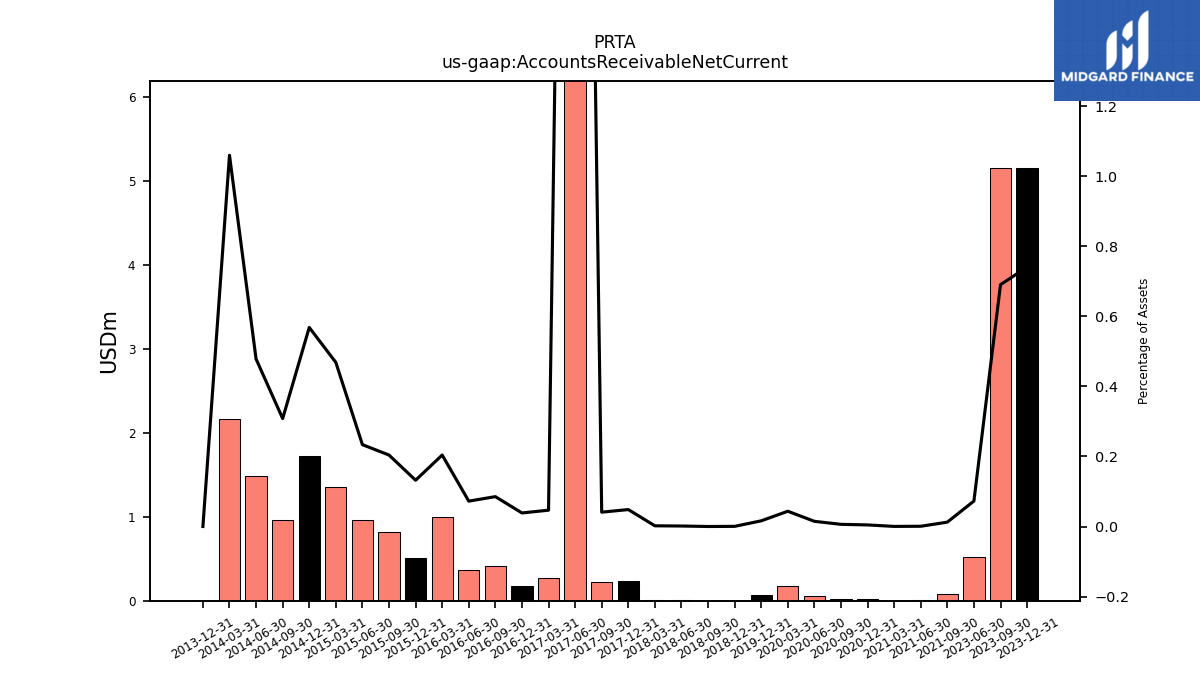
| Accounts Receivable Net Current | 5.16 | 5.16 | 0.52 | NA | NA | NA | NA | NA | NA | 0.08 | 0.00 | 0.00 | 0.01 | 0.02 | 0.06 | 0.17 | 0.07 | NA | NA | NA | 0.00 | 0.00 | 0.01 | 0.01 | 0.24 | 0.22 | 30.24 | 0.27 | 0.18 | 0.41 | 0.36 | 1.00 | 0.51 | 0.81 | 0.96 | 1.36 | 1.73 | 0.97 | 1.49 | 2.16 | 0.00 | NA | NA | NA | NA | NA | NA | NA | |
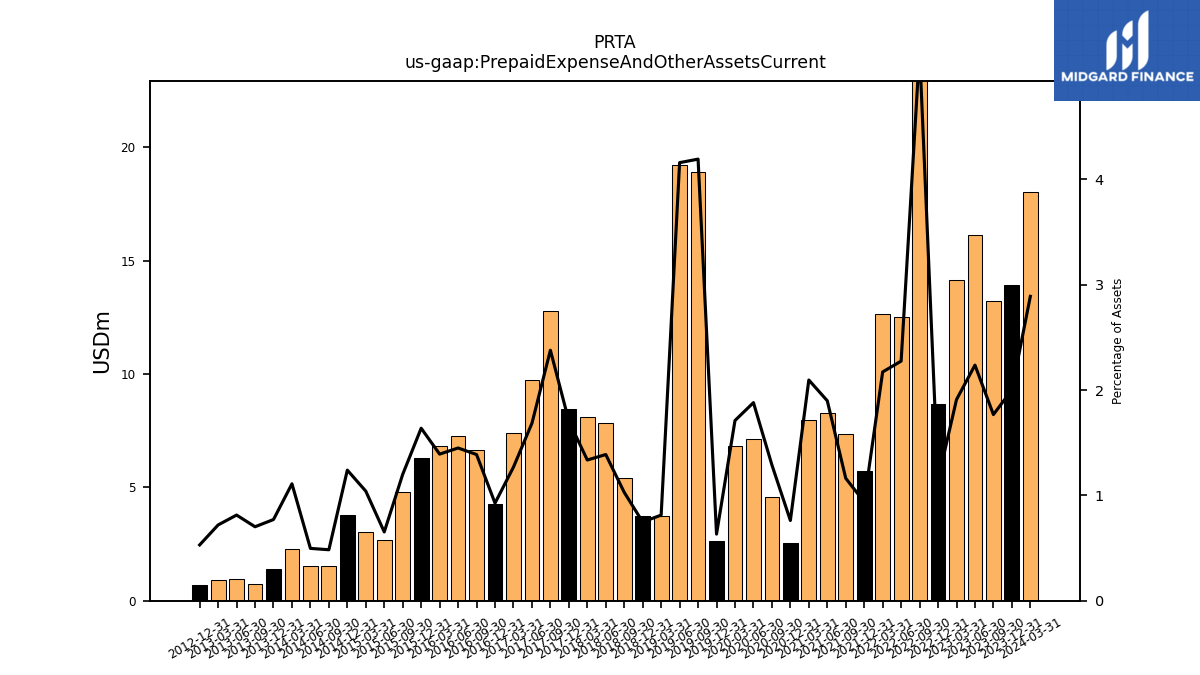
| Prepaid Expense And Other Assets Current | 13.94 | 13.20 | 16.12 | 14.16 | 8.69 | 28.93 | 12.50 | 12.63 | 5.71 | 7.35 | 8.28 | 7.96 | 2.54 | 4.59 | 7.12 | 6.83 | 2.65 | 18.90 | 19.21 | 3.73 | 3.73 | 5.40 | 7.82 | 8.10 | 8.47 | 12.78 | 9.75 | 7.38 | 4.26 | 6.66 | 7.29 | 6.84 | 6.31 | 4.79 | 2.69 | 3.01 | 3.77 | 1.52 | 1.55 | 2.26 | 1.41 | 0.76 | 0.96 | 0.89 | 0.69 | NA | NA | NA | |
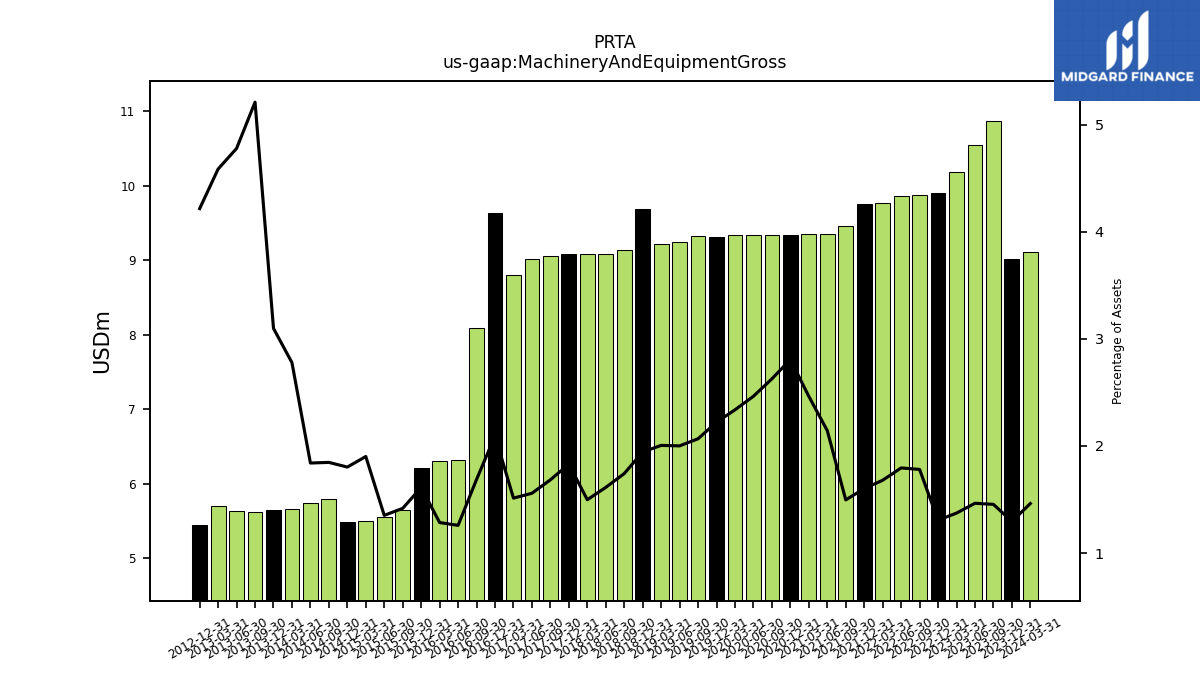
| Machinery And Equipment Gross | 9.02 | 10.86 | 10.55 | 10.18 | 9.90 | 9.87 | 9.86 | 9.76 | 9.76 | 9.46 | 9.35 | 9.35 | 9.34 | 9.34 | 9.33 | 9.33 | 9.31 | 9.32 | 9.24 | 9.21 | 9.69 | 9.14 | 9.08 | 9.08 | 9.08 | 9.05 | 9.02 | 8.80 | 9.63 | 8.09 | 6.32 | 6.31 | 6.21 | 5.65 | 5.56 | 5.50 | 5.48 | 5.79 | 5.74 | 5.66 | 5.65 | 5.62 | 5.63 | 5.70 | 5.45 | NA | NA | NA |
| 2023-12-31 | 2023-09-30 | 2023-06-30 | 2023-03-31 | 2022-12-31 | 2022-09-30 | 2022-06-30 | 2022-03-31 | 2021-12-31 | 2021-09-30 | 2021-06-30 | 2021-03-31 | 2020-12-31 | 2020-09-30 | 2020-06-30 | 2020-03-31 | 2019-12-31 | 2019-09-30 | 2019-06-30 | 2019-03-31 | 2018-12-31 | 2018-09-30 | 2018-06-30 | 2018-03-31 | 2017-12-31 | 2017-09-30 | 2017-06-30 | 2017-03-31 | 2016-12-31 | 2016-09-30 | 2016-06-30 | 2016-03-31 | 2015-12-31 | 2015-09-30 | 2015-06-30 | 2015-03-31 | 2014-12-31 | 2014-09-30 | 2014-06-30 | 2014-03-31 | 2013-12-31 | 2013-09-30 | 2013-06-30 | 2013-03-31 | 2012-12-31 | 2012-09-30 | 2012-06-30 | 2012-03-31 | ||
|---|---|---|---|---|---|---|---|---|---|---|---|---|---|---|---|---|---|---|---|---|---|---|---|---|---|---|---|---|---|---|---|---|---|---|---|---|---|---|---|---|---|---|---|---|---|---|---|---|---|
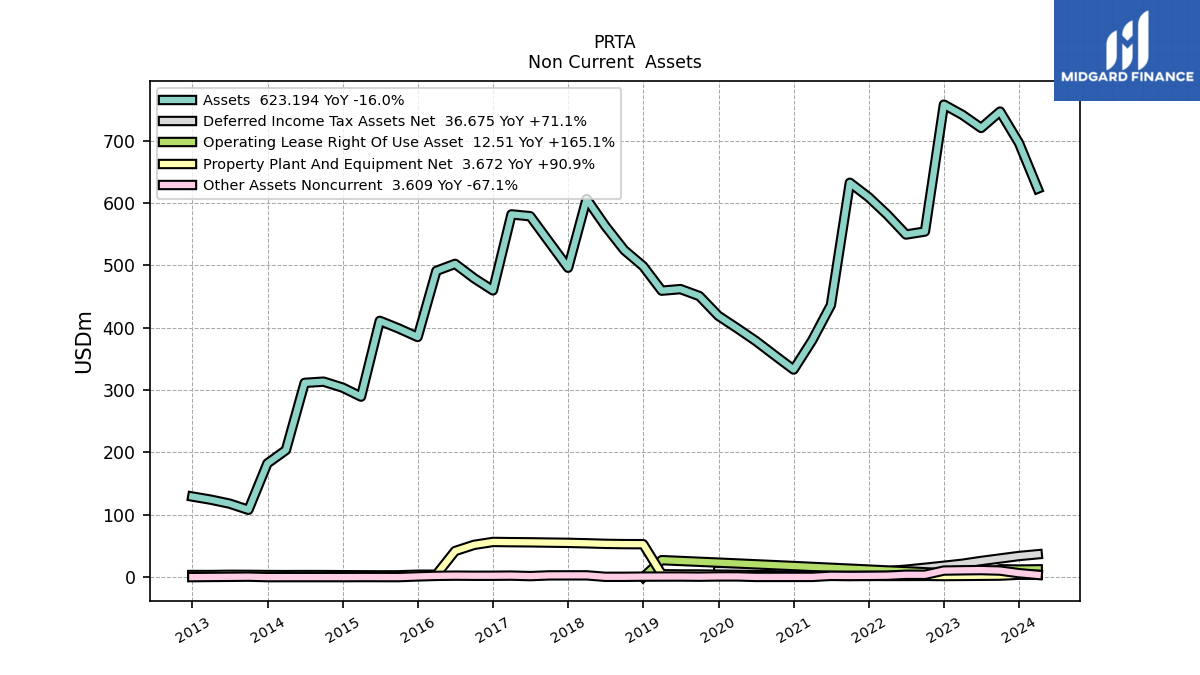
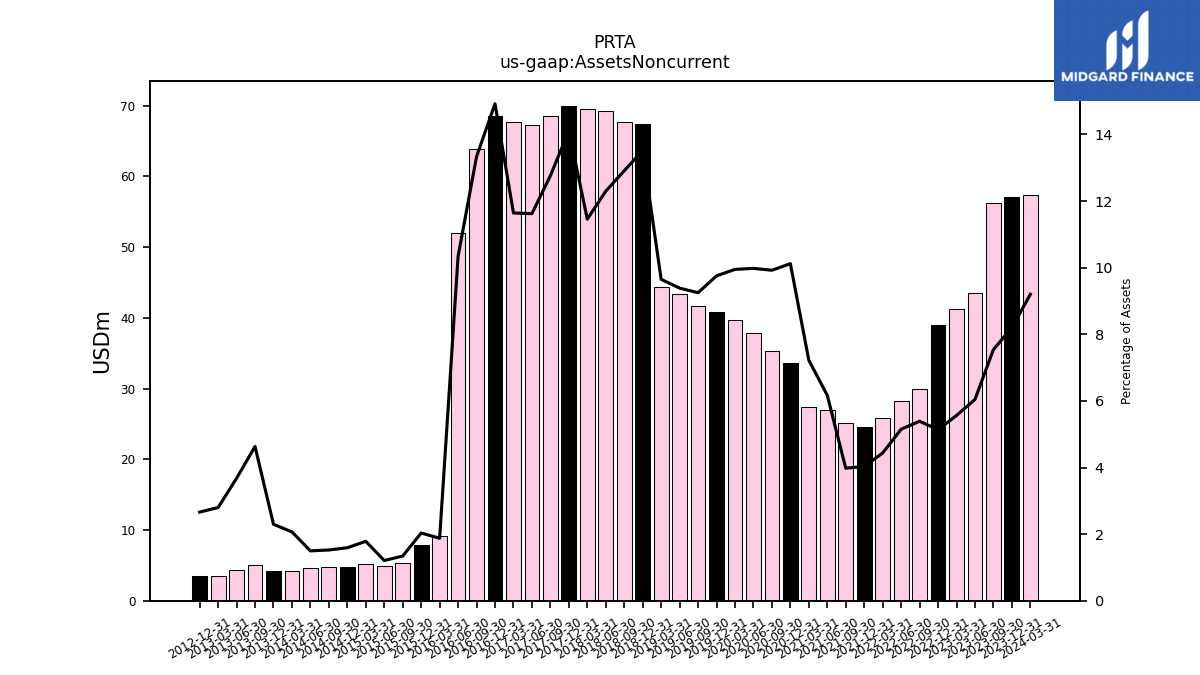
| Assets Noncurrent | 57.10 | 56.32 | 43.55 | 41.24 | 38.94 | 29.88 | 28.30 | 25.79 | 24.56 | 25.17 | 26.91 | 27.42 | 33.69 | 35.30 | 37.81 | 39.73 | 40.89 | 41.69 | 43.36 | 44.34 | 67.41 | 67.72 | 69.26 | 69.49 | 70.00 | 68.62 | 67.28 | 67.75 | 68.61 | 63.94 | 51.96 | 9.22 | 7.83 | 5.35 | 4.96 | 5.17 | 4.84 | 4.78 | 4.67 | 4.21 | 4.19 | 5.00 | 4.34 | 3.48 | 3.44 | NA | NA | NA | |
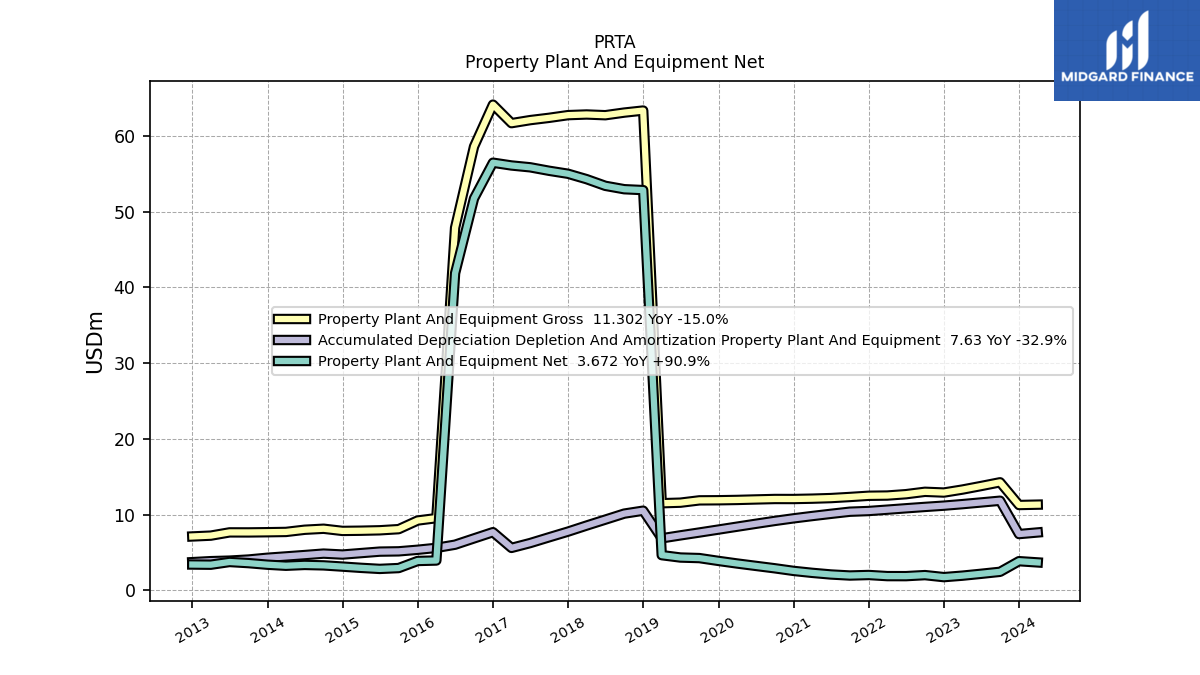
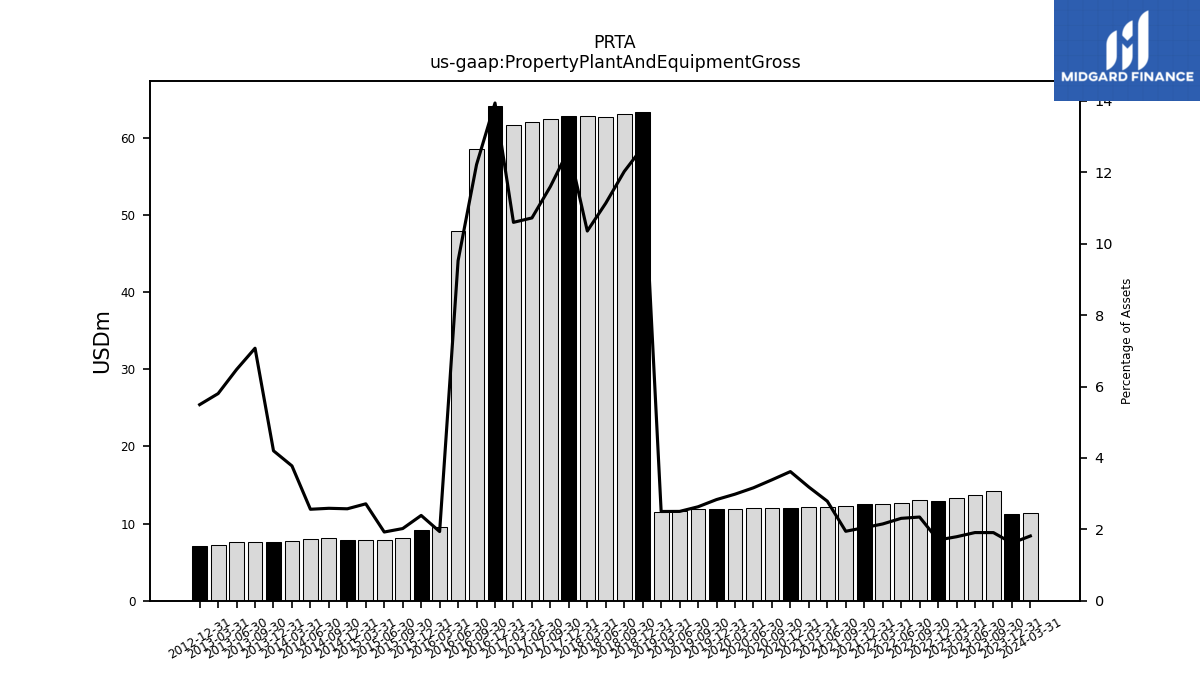
| Property Plant And Equipment Gross | 11.25 | 14.25 | 13.76 | 13.29 | 12.90 | 13.00 | 12.68 | 12.50 | 12.47 | 12.31 | 12.17 | 12.09 | 12.04 | 12.05 | 11.99 | 11.92 | 11.88 | 11.87 | 11.56 | 11.49 | 63.34 | 63.07 | 62.72 | 62.82 | 62.73 | 62.38 | 62.07 | 61.67 | 64.12 | 58.58 | 47.87 | 9.52 | 9.21 | 8.07 | 7.92 | 7.86 | 7.83 | 8.12 | 7.99 | 7.70 | 7.66 | 7.63 | 7.64 | 7.21 | 7.10 | NA | NA | NA | |
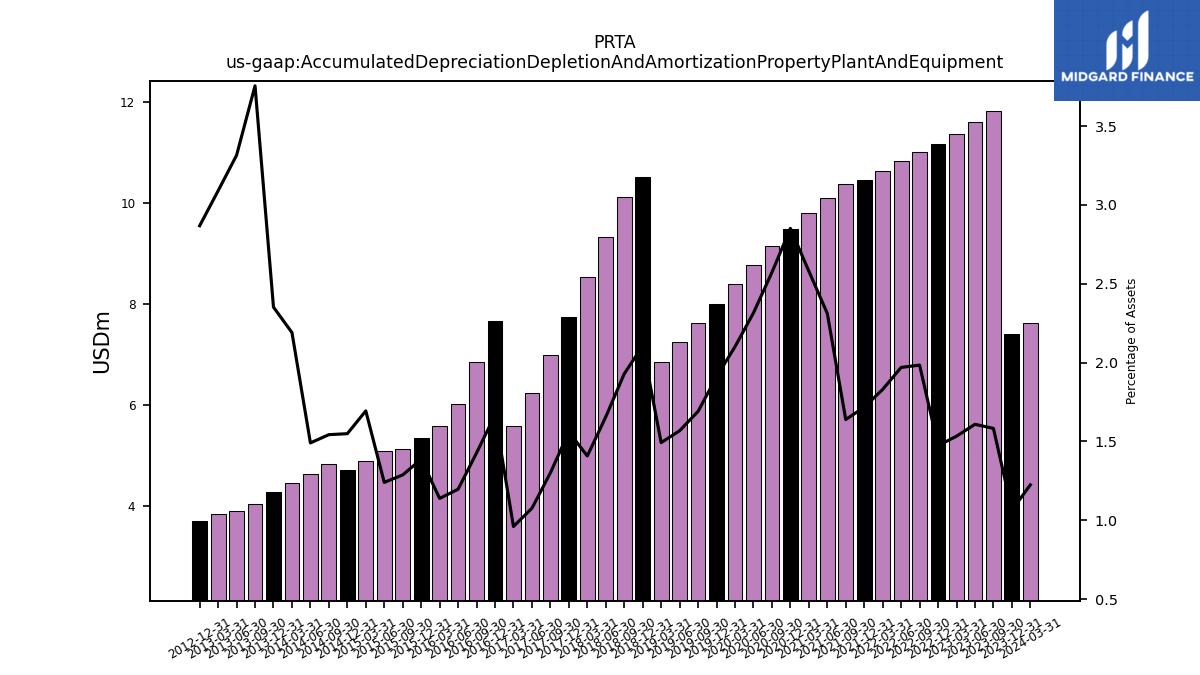
| Accumulated Depreciation Depletion And Amortization Property Plant And Equipment | 7.42 | 11.82 | 11.59 | 11.37 | 11.17 | 11.00 | 10.82 | 10.64 | 10.46 | 10.37 | 10.09 | 9.80 | 9.49 | 9.15 | 8.77 | 8.39 | 8.01 | 7.62 | 7.24 | 6.86 | 10.50 | 10.12 | 9.32 | 8.54 | 7.74 | 6.99 | 6.23 | 5.59 | 7.67 | 6.84 | 6.01 | 5.59 | 5.34 | 5.14 | 5.10 | 4.90 | 4.71 | 4.84 | 4.65 | 4.46 | 4.29 | 4.05 | 3.91 | 3.84 | 3.71 | NA | NA | NA | |
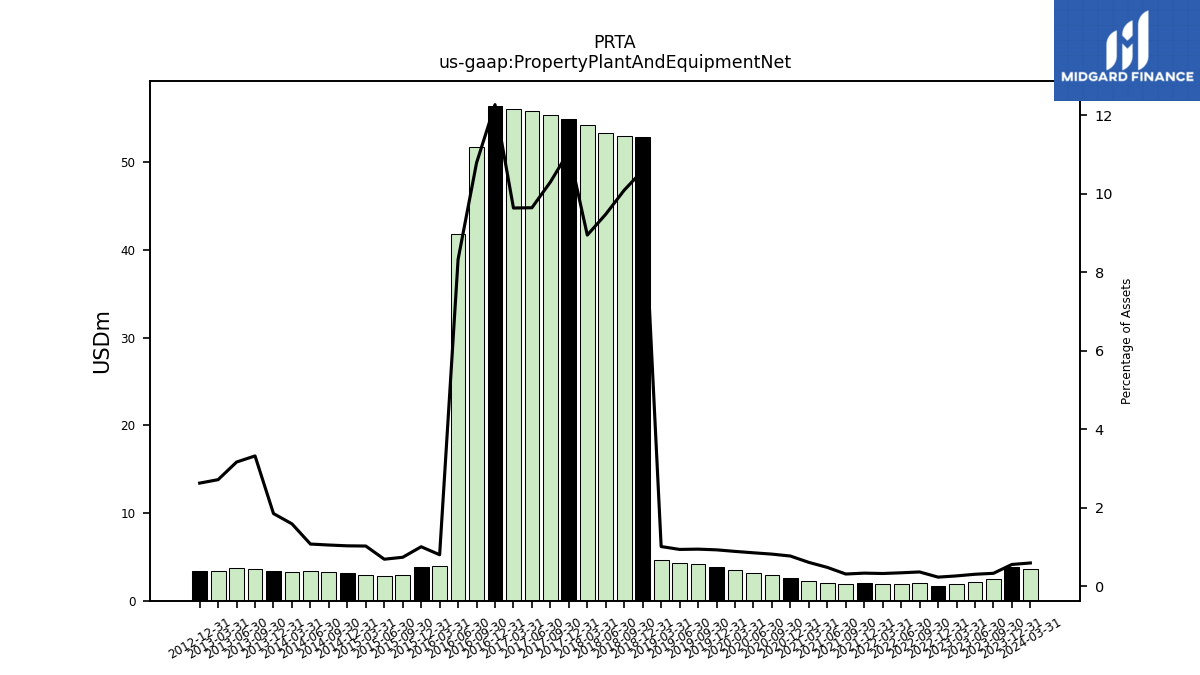
| Property Plant And Equipment Net | 3.84 | 2.43 | 2.17 | 1.92 | 1.73 | 2.00 | 1.86 | 1.86 | 2.01 | 1.94 | 2.08 | 2.29 | 2.55 | 2.90 | 3.21 | 3.53 | 3.87 | 4.25 | 4.32 | 4.63 | 52.84 | 52.95 | 53.40 | 54.28 | 54.99 | 55.38 | 55.84 | 56.08 | 56.45 | 51.74 | 41.85 | 3.92 | 3.86 | 2.93 | 2.82 | 2.96 | 3.12 | 3.28 | 3.34 | 3.23 | 3.37 | 3.58 | 3.73 | 3.37 | 3.39 | NA | NA | NA | |
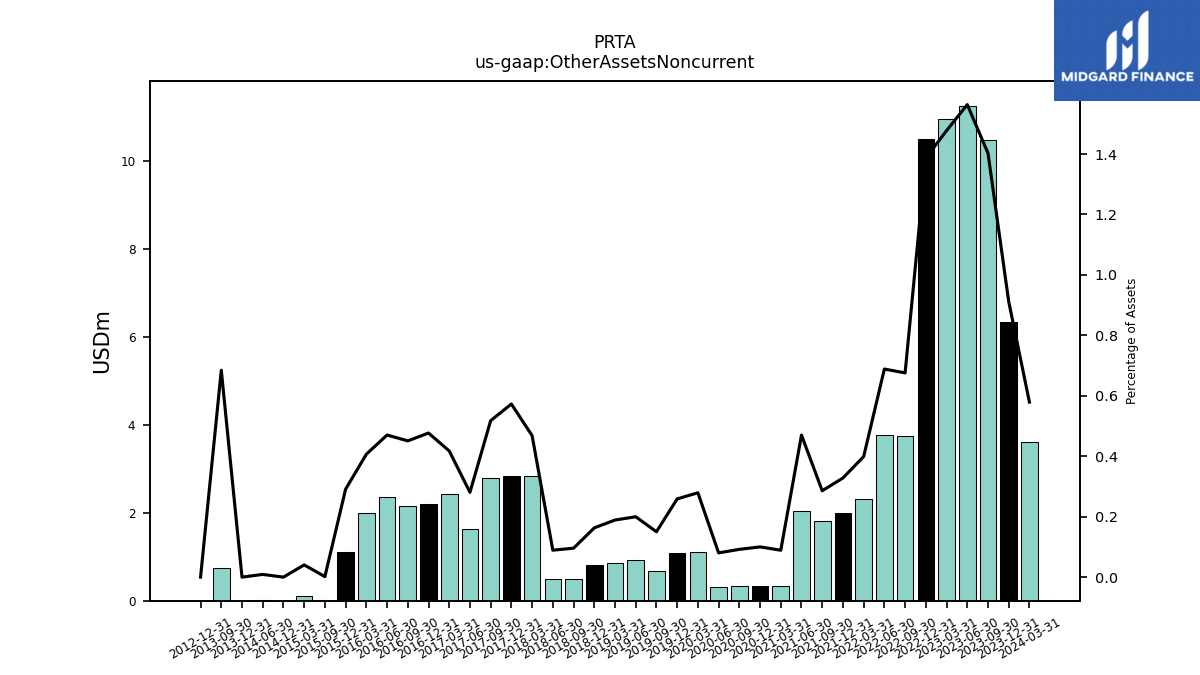
| Other Assets Noncurrent | 6.35 | 10.48 | 11.27 | 10.96 | 10.51 | 3.75 | 3.78 | 2.32 | 2.00 | 1.81 | 2.05 | 0.34 | 0.33 | 0.33 | 0.30 | 1.11 | 1.08 | 0.68 | 0.92 | 0.87 | 0.81 | 0.50 | 0.50 | 2.84 | 2.84 | 2.78 | 1.62 | 2.43 | 2.19 | 2.16 | 2.36 | 2.00 | 1.12 | 0.01 | NA | 0.12 | 0.00 | NA | 0.03 | NA | 0.00 | 0.74 | NA | NA | 0.00 | NA | NA | NA |
| 2023-12-31 | 2023-09-30 | 2023-06-30 | 2023-03-31 | 2022-12-31 | 2022-09-30 | 2022-06-30 | 2022-03-31 | 2021-12-31 | 2021-09-30 | 2021-06-30 | 2021-03-31 | 2020-12-31 | 2020-09-30 | 2020-06-30 | 2020-03-31 | 2019-12-31 | 2019-09-30 | 2019-06-30 | 2019-03-31 | 2018-12-31 | 2018-09-30 | 2018-06-30 | 2018-03-31 | 2017-12-31 | 2017-09-30 | 2017-06-30 | 2017-03-31 | 2016-12-31 | 2016-09-30 | 2016-06-30 | 2016-03-31 | 2015-12-31 | 2015-09-30 | 2015-06-30 | 2015-03-31 | 2014-12-31 | 2014-09-30 | 2014-06-30 | 2014-03-31 | 2013-12-31 | 2013-09-30 | 2013-06-30 | 2013-03-31 | 2012-12-31 | 2012-09-30 | 2012-06-30 | 2012-03-31 | ||
|---|---|---|---|---|---|---|---|---|---|---|---|---|---|---|---|---|---|---|---|---|---|---|---|---|---|---|---|---|---|---|---|---|---|---|---|---|---|---|---|---|---|---|---|---|---|---|---|---|---|
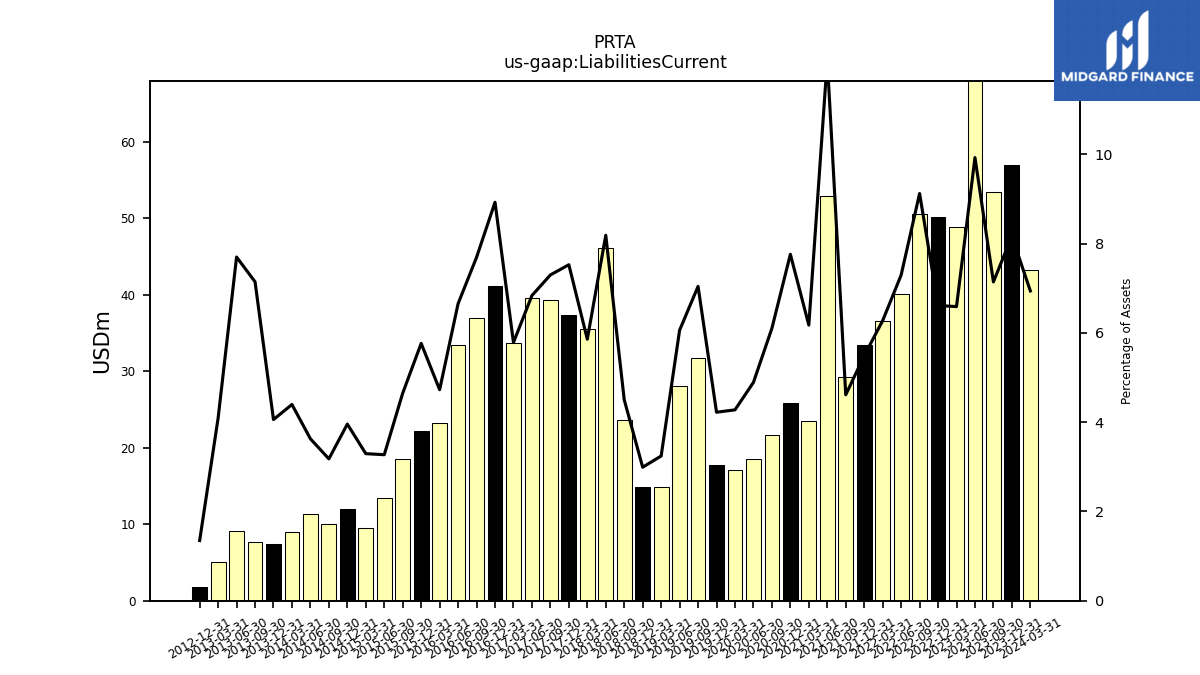
| Liabilities Current | 56.89 | 53.37 | 71.56 | 48.88 | 50.15 | 50.60 | 40.11 | 36.50 | 33.45 | 29.20 | 52.90 | 23.46 | 25.85 | 21.72 | 18.54 | 17.09 | 17.71 | 31.76 | 28.02 | 14.91 | 14.93 | 23.63 | 46.13 | 35.55 | 37.37 | 39.26 | 39.60 | 33.68 | 41.08 | 36.91 | 33.46 | 23.23 | 22.22 | 18.56 | 13.46 | 9.54 | 12.04 | 9.97 | 11.31 | 8.96 | 7.41 | 7.71 | 9.08 | 5.09 | 1.74 | NA | NA | NA | |
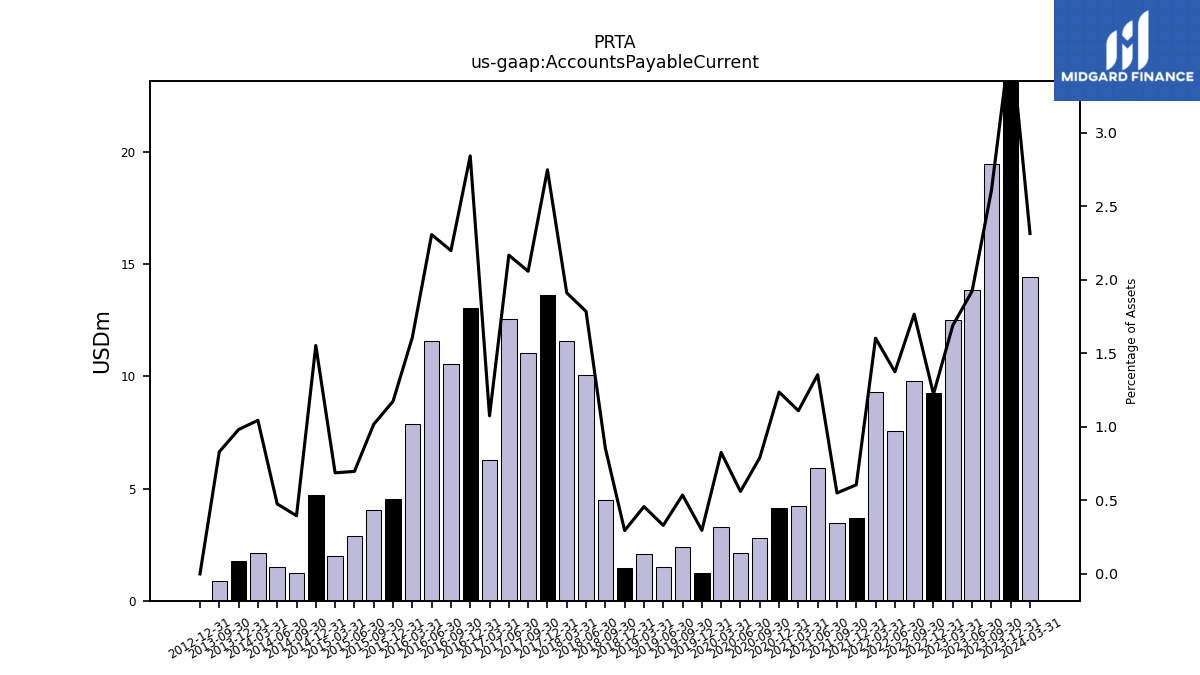
| Accounts Payable Current | 25.39 | 19.46 | 13.85 | 12.52 | 9.27 | 9.79 | 7.55 | 9.32 | 3.69 | 3.48 | 5.91 | 4.21 | 4.12 | 2.81 | 2.12 | 3.30 | 1.24 | 2.42 | 1.52 | 2.10 | 1.47 | 4.49 | 10.05 | 11.59 | 13.63 | 11.06 | 12.54 | 6.25 | 13.07 | 10.54 | 11.59 | 7.90 | 4.52 | 4.06 | 2.87 | 1.99 | 4.72 | 1.24 | 1.48 | 2.13 | 1.79 | 0.90 | NA | NA | 0.00 | NA | NA | NA | |
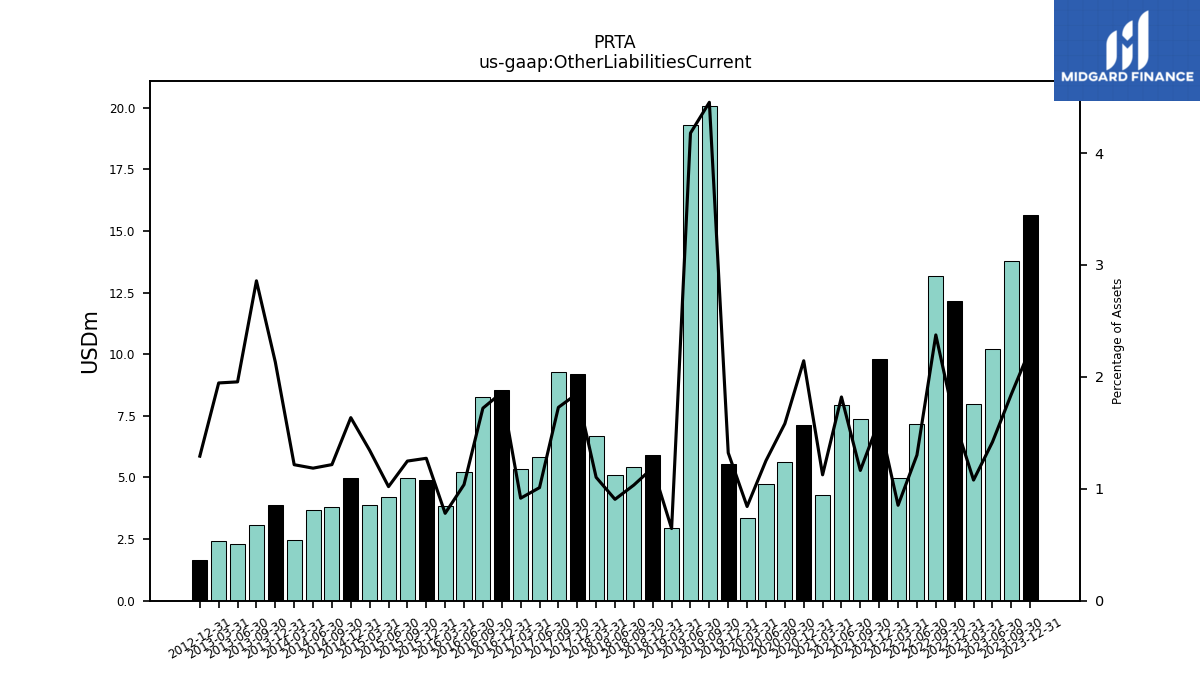
| Other Liabilities Current | 15.66 | 13.78 | 10.22 | 8.00 | 12.17 | 13.17 | 7.15 | 4.96 | 9.81 | 7.37 | 7.94 | 4.27 | 7.14 | 5.63 | 4.74 | 3.36 | 5.54 | 20.08 | 19.30 | 2.96 | 5.93 | 5.42 | 5.10 | 6.69 | 9.19 | 9.29 | 5.85 | 5.33 | 8.55 | 8.25 | 5.21 | 3.84 | 4.90 | 4.98 | 4.19 | 3.89 | 4.97 | 3.81 | 3.69 | 2.48 | 3.89 | 3.08 | 2.31 | 2.42 | 1.67 | NA | NA | NA |
| 2023-12-31 | 2023-09-30 | 2023-06-30 | 2023-03-31 | 2022-12-31 | 2022-09-30 | 2022-06-30 | 2022-03-31 | 2021-12-31 | 2021-09-30 | 2021-06-30 | 2021-03-31 | 2020-12-31 | 2020-09-30 | 2020-06-30 | 2020-03-31 | 2019-12-31 | 2019-09-30 | 2019-06-30 | 2019-03-31 | 2018-12-31 | 2018-09-30 | 2018-06-30 | 2018-03-31 | 2017-12-31 | 2017-09-30 | 2017-06-30 | 2017-03-31 | 2016-12-31 | 2016-09-30 | 2016-06-30 | 2016-03-31 | 2015-12-31 | 2015-09-30 | 2015-06-30 | 2015-03-31 | 2014-12-31 | 2014-09-30 | 2014-06-30 | 2014-03-31 | 2013-12-31 | 2013-09-30 | 2013-06-30 | 2013-03-31 | 2012-12-31 | 2012-09-30 | 2012-06-30 | 2012-03-31 | ||
|---|---|---|---|---|---|---|---|---|---|---|---|---|---|---|---|---|---|---|---|---|---|---|---|---|---|---|---|---|---|---|---|---|---|---|---|---|---|---|---|---|---|---|---|---|---|---|---|---|---|
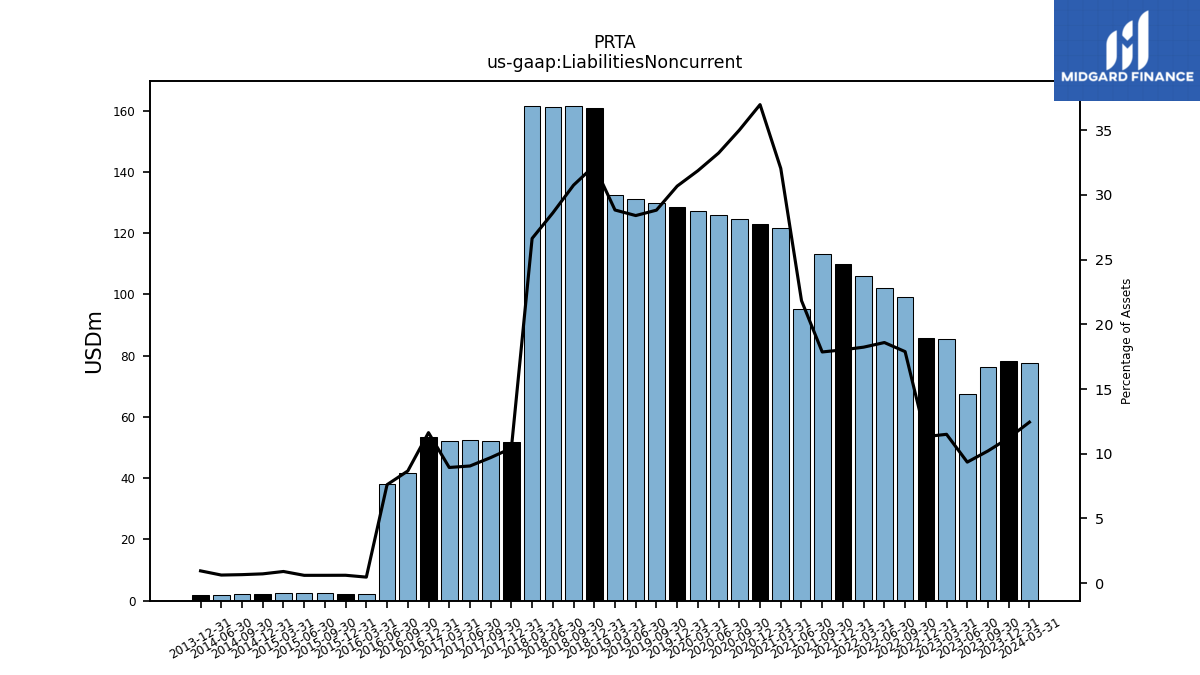
| Liabilities Noncurrent | 78.13 | 76.32 | 67.41 | 85.29 | 85.85 | 99.19 | 102.18 | 106.03 | 109.87 | 113.03 | 95.27 | 121.68 | 123.12 | 124.55 | 125.94 | 127.30 | 128.63 | 129.96 | 131.25 | 132.50 | 160.87 | 161.35 | 161.16 | 161.59 | 51.77 | 52.17 | 52.42 | 52.02 | 53.50 | 41.57 | 38.24 | 2.29 | 2.35 | 2.42 | 2.49 | 2.62 | 2.19 | 2.06 | 1.96 | NA | 1.73 | NA | NA | NA | NA | NA | NA | NA | |
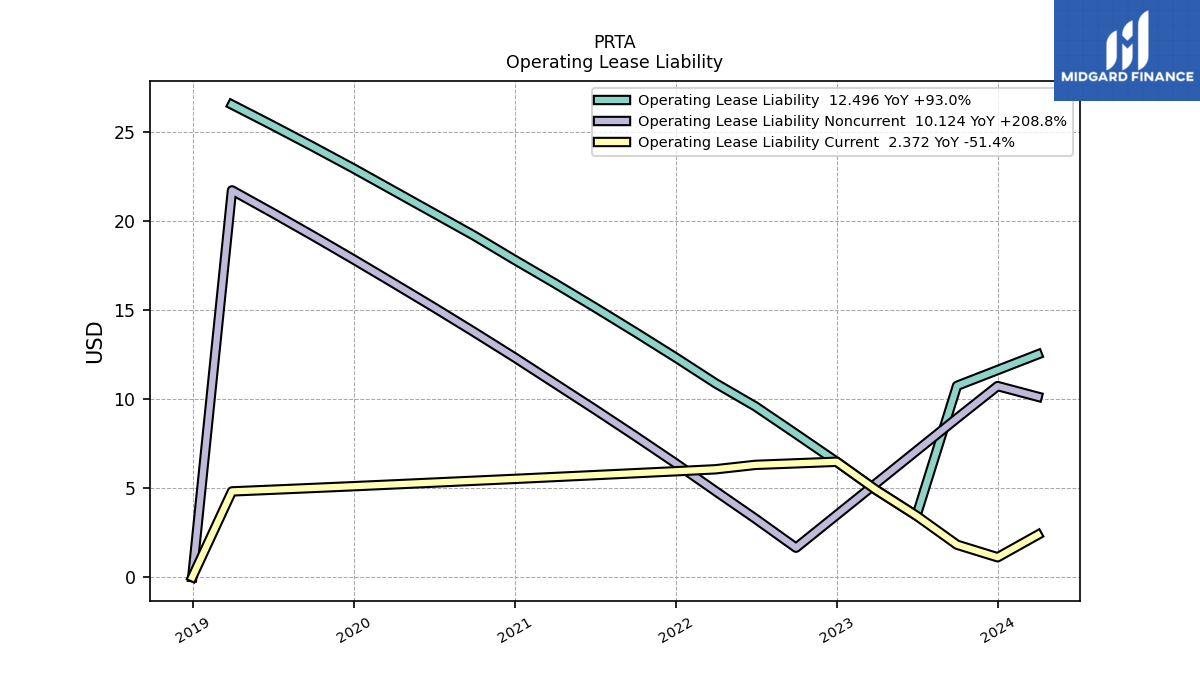
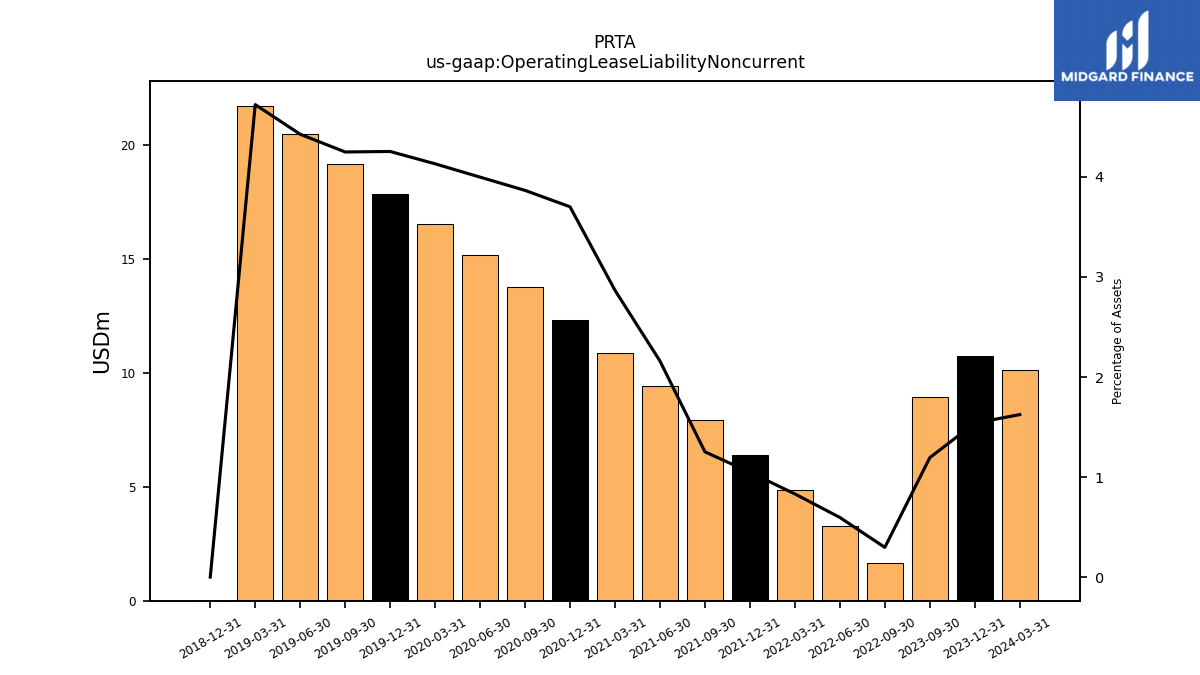
| Operating Lease Liability Noncurrent | 10.72 | 8.92 | NA | NA | NA | 1.65 | 3.28 | 4.83 | 6.39 | 7.92 | 9.43 | 10.88 | 12.33 | 13.75 | 15.15 | 16.50 | 17.84 | 19.16 | 20.45 | 21.70 | 0.00 | NA | NA | NA | NA | NA | NA | NA | NA | NA | NA | NA | NA | NA | NA | NA | NA | NA | NA | NA | NA | NA | NA | NA | NA | NA | NA | NA |
| 2023-12-31 | 2023-09-30 | 2023-06-30 | 2023-03-31 | 2022-12-31 | 2022-09-30 | 2022-06-30 | 2022-03-31 | 2021-12-31 | 2021-09-30 | 2021-06-30 | 2021-03-31 | 2020-12-31 | 2020-09-30 | 2020-06-30 | 2020-03-31 | 2019-12-31 | 2019-09-30 | 2019-06-30 | 2019-03-31 | 2018-12-31 | 2018-09-30 | 2018-06-30 | 2018-03-31 | 2017-12-31 | 2017-09-30 | 2017-06-30 | 2017-03-31 | 2016-12-31 | 2016-09-30 | 2016-06-30 | 2016-03-31 | 2015-12-31 | 2015-09-30 | 2015-06-30 | 2015-03-31 | 2014-12-31 | 2014-09-30 | 2014-06-30 | 2014-03-31 | 2013-12-31 | 2013-09-30 | 2013-06-30 | 2013-03-31 | 2012-12-31 | 2012-09-30 | 2012-06-30 | 2012-03-31 | ||
|---|---|---|---|---|---|---|---|---|---|---|---|---|---|---|---|---|---|---|---|---|---|---|---|---|---|---|---|---|---|---|---|---|---|---|---|---|---|---|---|---|---|---|---|---|---|---|---|---|---|
| Stockholders Equity | 561.37 | 617.23 | 581.68 | 607.41 | 622.04 | 404.65 | 407.30 | 438.89 | 466.04 | 490.47 | 288.21 | 234.58 | 184.01 | 209.51 | 234.44 | 255.04 | 272.92 | 289.18 | 302.81 | 312.13 | 323.00 | 339.65 | 356.01 | 409.50 | 407.19 | 446.25 | 486.98 | 496.25 | 365.40 | 401.10 | 430.87 | 465.78 | 360.67 | 377.95 | 395.22 | 277.43 | 289.89 | 301.56 | 298.42 | 193.01 | 173.27 | 98.78 | 107.23 | 117.79 | 126.48 | NA | NA | NA | |
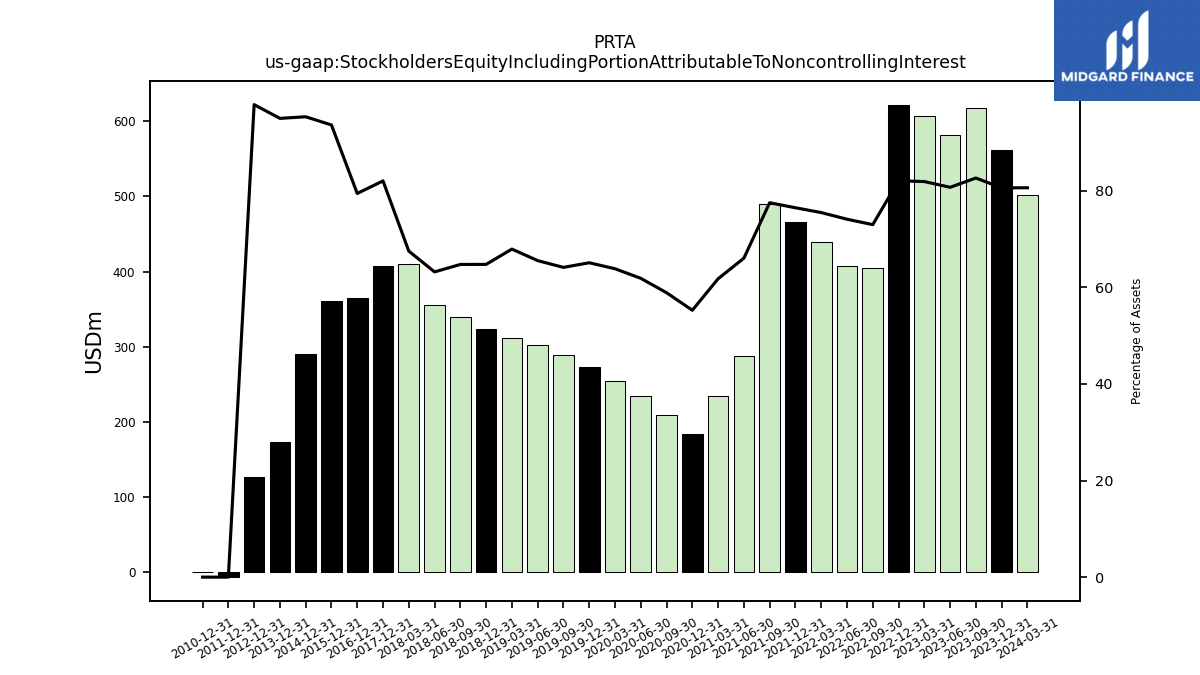
| Stockholders Equity Including Portion Attributable To Noncontrolling Interest | 561.37 | 617.23 | 581.68 | 607.41 | 622.04 | 404.65 | 407.30 | 438.89 | 466.04 | 490.47 | 288.21 | 234.58 | 184.01 | 209.51 | 234.44 | 255.04 | 272.92 | 289.18 | 302.81 | 312.13 | 323.00 | 339.65 | 356.01 | 409.50 | 407.19 | NA | NA | NA | 365.40 | NA | NA | NA | 360.67 | NA | NA | NA | 289.89 | NA | NA | NA | 173.27 | NA | NA | NA | 126.48 | NA | NA | NA | |
| Common Stock Value | 0.54 | 0.54 | 0.54 | 0.53 | 0.52 | 0.48 | 0.47 | 0.47 | 0.47 | 0.47 | 0.45 | 0.44 | 0.40 | 0.40 | 0.40 | 0.40 | 0.40 | 0.40 | 0.40 | 0.40 | 0.40 | 0.40 | 0.40 | 0.40 | 0.39 | 0.38 | 0.38 | 0.38 | 0.35 | 0.34 | 0.34 | 0.34 | 0.32 | 0.32 | 0.31 | 0.28 | 0.27 | 0.27 | 0.27 | 0.22 | 0.22 | 0.18 | 0.18 | 0.18 | 0.18 | NA | NA | NA | |
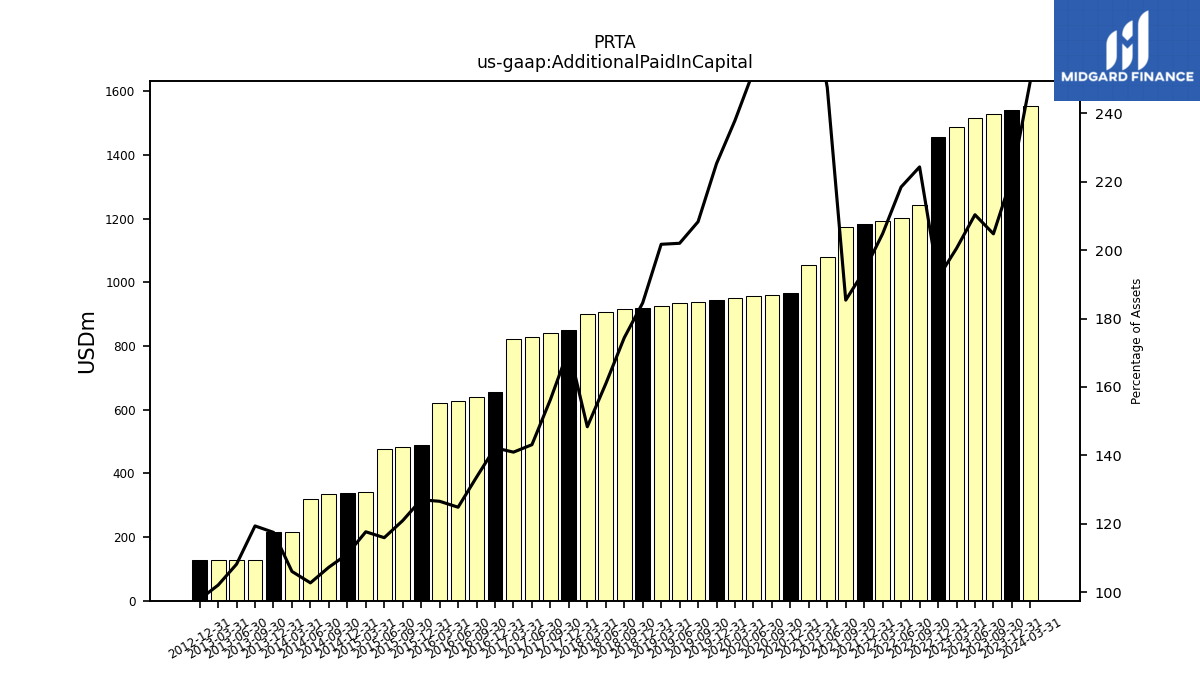
| Additional Paid In Capital | 1540.86 | 1529.25 | 1515.61 | 1486.75 | 1454.52 | 1243.52 | 1200.42 | 1190.76 | 1181.63 | 1172.88 | 1079.88 | 1053.91 | 966.64 | 961.43 | 955.78 | 950.09 | 944.41 | 939.11 | 933.29 | 926.80 | 920.59 | 914.79 | 906.58 | 900.20 | 849.15 | 840.46 | 828.79 | 820.37 | 654.27 | 641.06 | 627.59 | 622.06 | 489.45 | 482.58 | 476.88 | 340.84 | 338.11 | 336.67 | 320.35 | 216.28 | 214.39 | 128.89 | 127.65 | 126.91 | 126.65 | NA | NA | NA | |
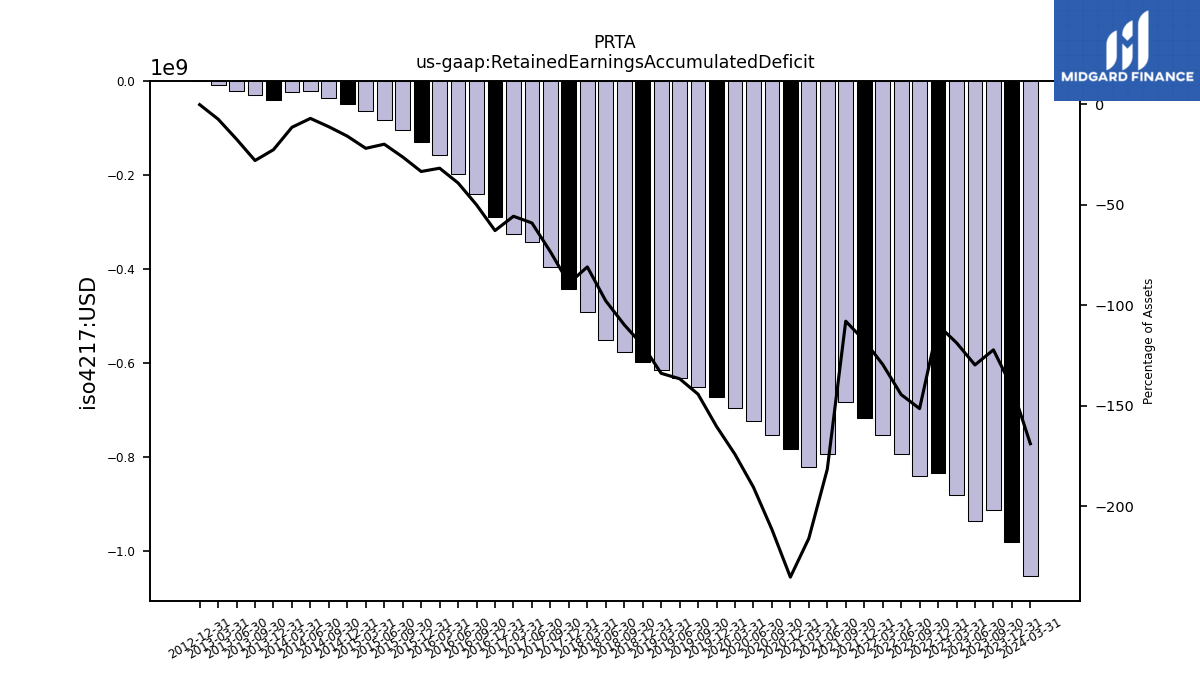
| Retained Earnings Accumulated Deficit | -980.03 | -912.55 | -934.46 | -879.87 | -833.00 | -839.35 | -793.59 | -752.34 | -716.05 | -682.88 | -792.12 | -819.76 | -783.03 | -752.31 | -721.74 | -695.45 | -671.88 | -650.33 | -630.88 | -615.07 | -598.00 | -575.53 | -550.98 | -491.09 | -442.35 | -394.59 | -342.20 | -324.50 | -289.21 | -240.31 | -197.07 | -156.62 | -129.10 | -104.95 | -81.97 | -63.69 | -48.49 | -35.38 | -22.20 | -23.49 | -41.34 | -30.29 | -20.60 | -9.30 | -0.34 | NA | NA | NA |
| 2023-12-31 | 2023-09-30 | 2023-06-30 | 2023-03-31 | 2022-12-31 | 2022-09-30 | 2022-06-30 | 2022-03-31 | 2021-12-31 | 2021-09-30 | 2021-06-30 | 2021-03-31 | 2020-12-31 | 2020-09-30 | 2020-06-30 | 2020-03-31 | 2019-12-31 | 2019-09-30 | 2019-06-30 | 2019-03-31 | 2018-12-31 | 2018-09-30 | 2018-06-30 | 2018-03-31 | 2017-12-31 | 2017-09-30 | 2017-06-30 | 2017-03-31 | 2016-12-31 | 2016-09-30 | 2016-06-30 | 2016-03-31 | 2015-12-31 | 2015-09-30 | 2015-06-30 | 2015-03-31 | 2014-12-31 | 2014-09-30 | 2014-06-30 | 2014-03-31 | 2013-12-31 | 2013-09-30 | 2013-06-30 | 2013-03-31 | 2012-12-31 | 2012-09-30 | 2012-06-30 | 2012-03-31 | ||
|---|---|---|---|---|---|---|---|---|---|---|---|---|---|---|---|---|---|---|---|---|---|---|---|---|---|---|---|---|---|---|---|---|---|---|---|---|---|---|---|---|---|---|---|---|---|---|---|---|---|
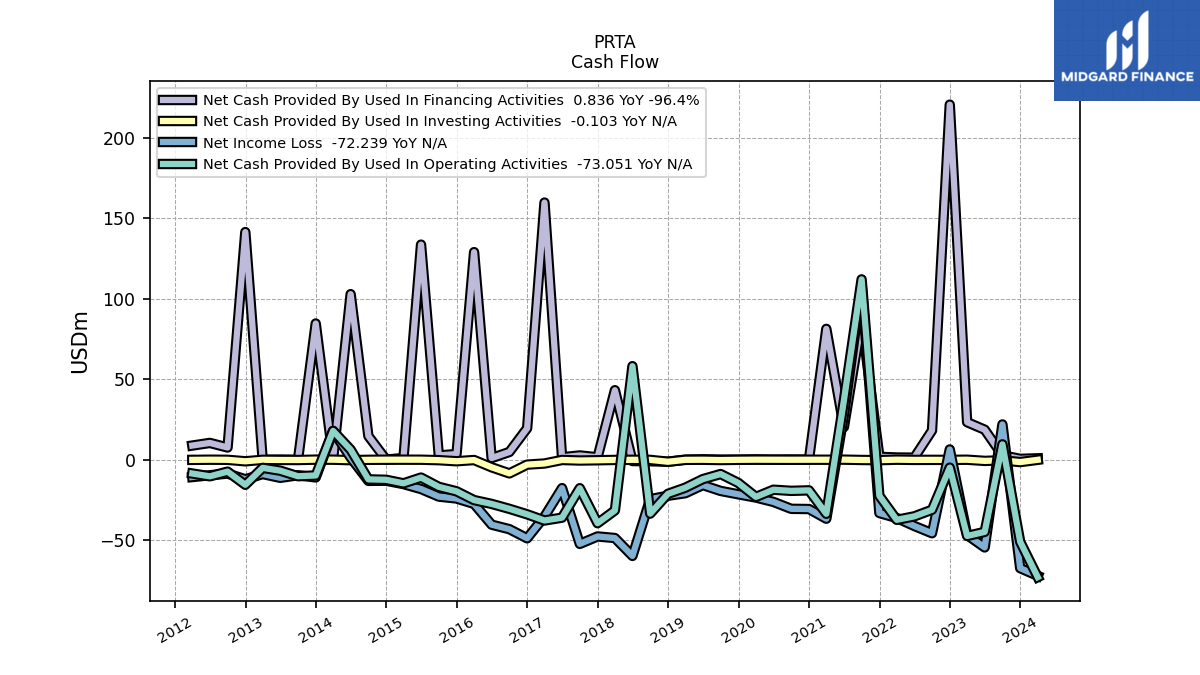
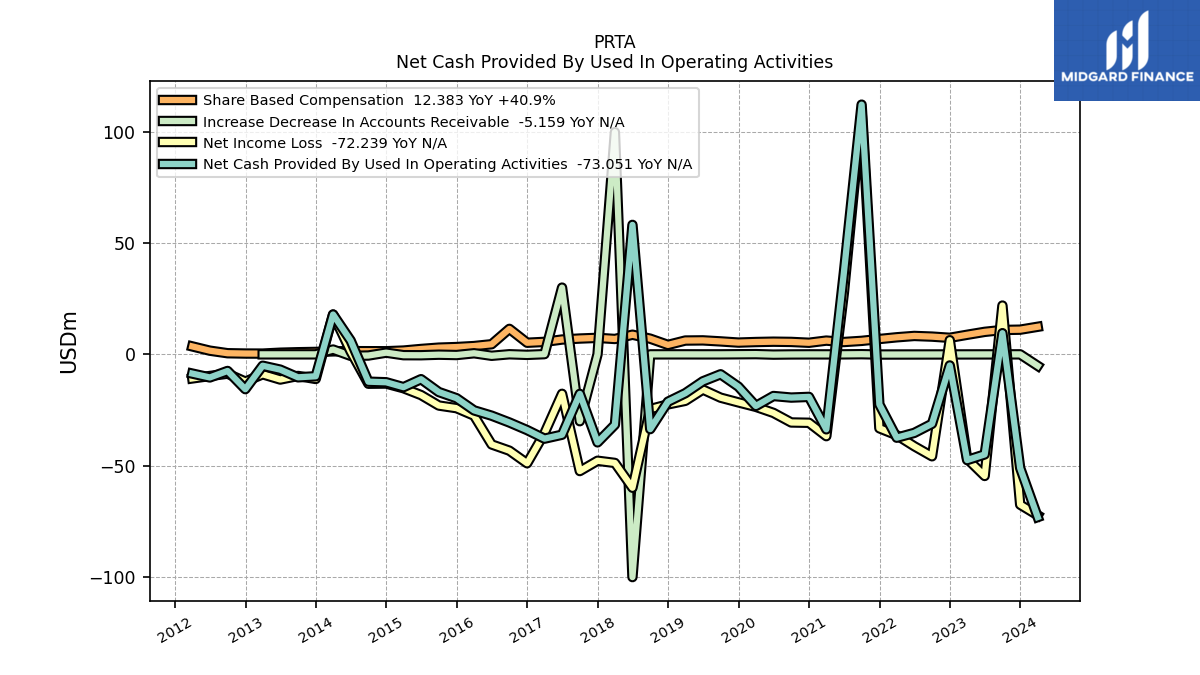
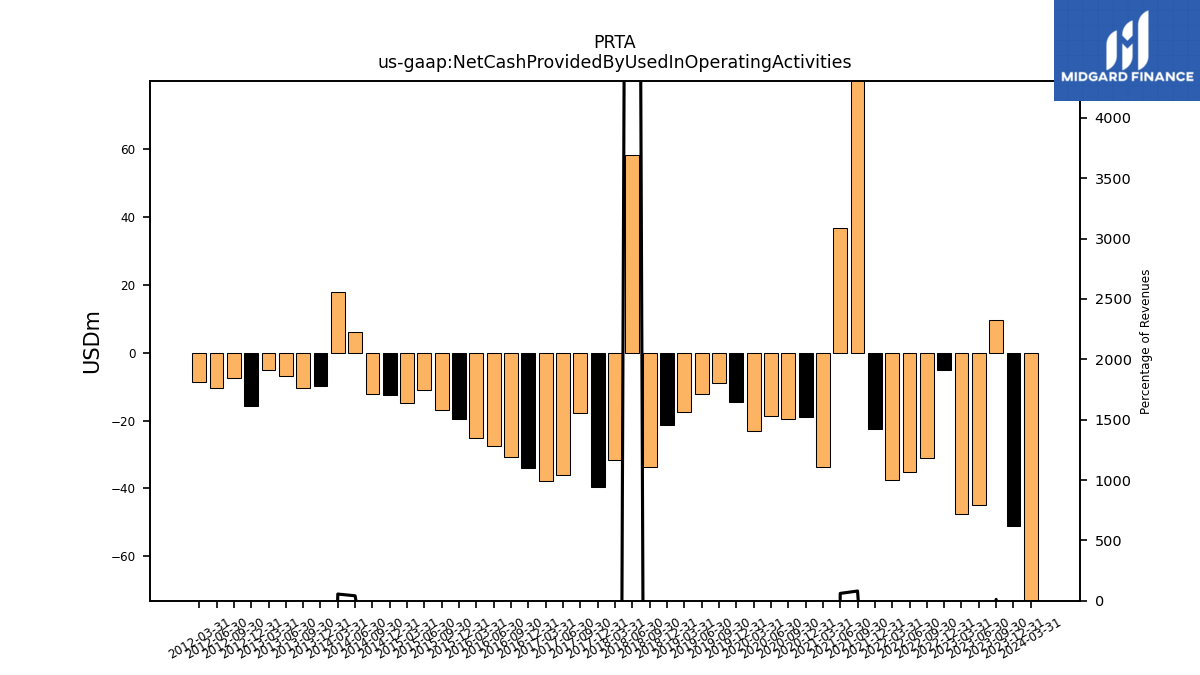
| Net Cash Provided By Used In Operating Activities | -51.04 | 9.52 | -44.93 | -47.46 | -4.98 | -31.17 | -35.26 | -37.41 | -22.46 | 112.11 | 36.62 | -33.67 | -19.09 | -19.40 | -18.70 | -23.17 | -14.49 | -8.94 | -12.10 | -17.43 | -21.25 | -33.57 | 58.13 | -31.58 | -39.52 | -17.74 | -36.08 | -37.84 | -34.00 | -30.59 | -27.53 | -25.15 | -19.68 | -16.91 | -11.14 | -14.72 | -12.52 | -12.27 | 6.21 | 17.89 | -9.84 | -10.30 | -6.86 | -5.10 | -15.63 | -7.45 | -10.36 | -8.62 | |
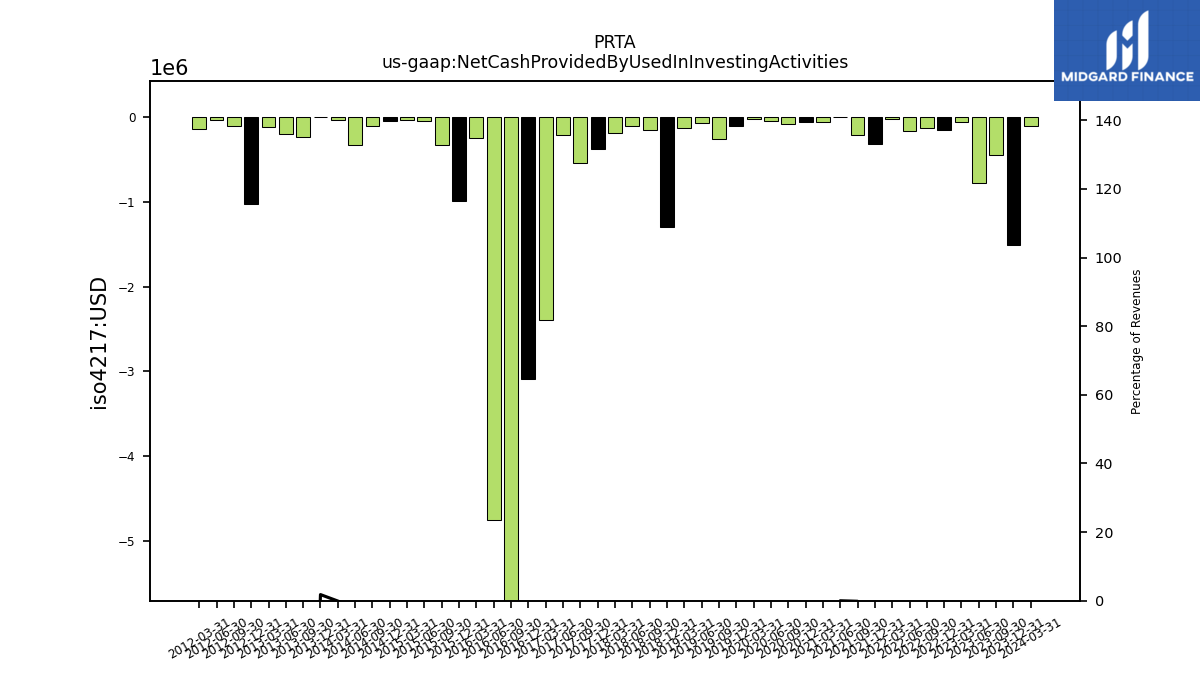
| Net Cash Provided By Used In Investing Activities | -1.51 | -0.44 | -0.77 | -0.05 | -0.15 | -0.13 | -0.16 | -0.02 | -0.32 | -0.21 | 0.00 | -0.05 | -0.05 | -0.08 | -0.05 | -0.02 | -0.11 | -0.25 | -0.07 | -0.12 | -1.30 | -0.15 | -0.10 | -0.18 | -0.38 | -0.54 | -0.21 | -2.40 | -3.09 | -8.55 | -4.76 | -0.24 | -0.98 | -0.33 | -0.04 | -0.03 | -0.04 | -0.11 | -0.33 | -0.03 | 0.00 | -0.23 | -0.20 | -0.11 | -1.03 | -0.10 | -0.03 | -0.14 | |
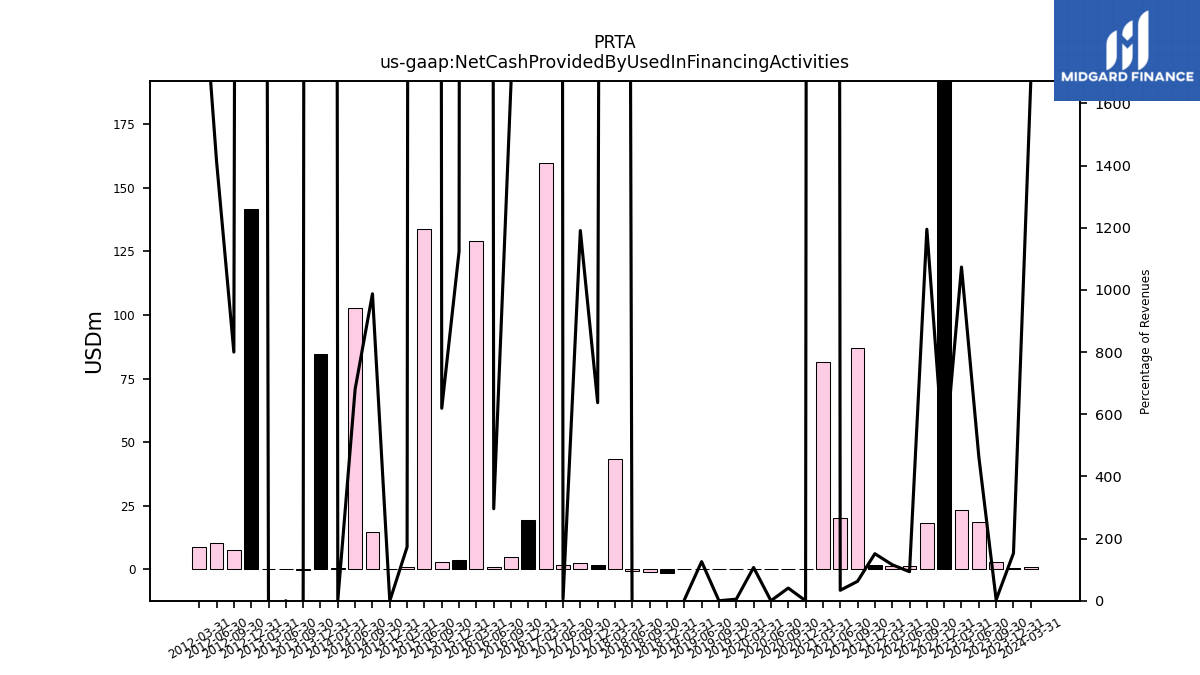
| Net Cash Provided By Used In Financing Activities | 0.48 | 2.71 | 18.62 | 23.28 | 220.76 | 18.13 | 1.23 | 1.34 | 1.77 | 87.01 | 20.22 | 81.33 | 0.00 | 0.06 | 0.00 | 0.15 | 0.01 | 0.00 | 0.21 | 0.01 | -1.30 | -0.97 | -0.86 | 43.18 | 1.46 | 2.61 | 1.47 | 159.87 | 19.49 | 4.77 | 0.99 | 129.06 | 3.45 | 2.66 | 133.71 | 1.03 | -0.01 | 14.67 | 102.92 | 0.51 | 84.65 | -0.12 | 0.00 | -0.08 | 141.52 | 7.55 | 10.40 | 8.76 |
| 2023-12-31 | 2023-09-30 | 2023-06-30 | 2023-03-31 | 2022-12-31 | 2022-09-30 | 2022-06-30 | 2022-03-31 | 2021-12-31 | 2021-09-30 | 2021-06-30 | 2021-03-31 | 2020-12-31 | 2020-09-30 | 2020-06-30 | 2020-03-31 | 2019-12-31 | 2019-09-30 | 2019-06-30 | 2019-03-31 | 2018-12-31 | 2018-09-30 | 2018-06-30 | 2018-03-31 | 2017-12-31 | 2017-09-30 | 2017-06-30 | 2017-03-31 | 2016-12-31 | 2016-09-30 | 2016-06-30 | 2016-03-31 | 2015-12-31 | 2015-09-30 | 2015-06-30 | 2015-03-31 | 2014-12-31 | 2014-09-30 | 2014-06-30 | 2014-03-31 | 2013-12-31 | 2013-09-30 | 2013-06-30 | 2013-03-31 | 2012-12-31 | 2012-09-30 | 2012-06-30 | 2012-03-31 | ||
|---|---|---|---|---|---|---|---|---|---|---|---|---|---|---|---|---|---|---|---|---|---|---|---|---|---|---|---|---|---|---|---|---|---|---|---|---|---|---|---|---|---|---|---|---|---|---|---|---|---|
| Net Cash Provided By Used In Operating Activities | -51.04 | 9.52 | -44.93 | -47.46 | -4.98 | -31.17 | -35.26 | -37.41 | -22.46 | 112.11 | 36.62 | -33.67 | -19.09 | -19.40 | -18.70 | -23.17 | -14.49 | -8.94 | -12.10 | -17.43 | -21.25 | -33.57 | 58.13 | -31.58 | -39.52 | -17.74 | -36.08 | -37.84 | -34.00 | -30.59 | -27.53 | -25.15 | -19.68 | -16.91 | -11.14 | -14.72 | -12.52 | -12.27 | 6.21 | 17.89 | -9.84 | -10.30 | -6.86 | -5.10 | -15.63 | -7.45 | -10.36 | -8.62 | |
| Net Income Loss | -67.48 | 21.91 | -54.59 | -46.86 | 6.35 | -45.76 | -41.24 | -36.29 | -33.18 | 109.25 | 27.64 | -36.73 | -30.72 | -30.58 | -26.28 | -23.57 | -21.55 | -19.45 | -15.81 | -20.86 | -22.46 | -24.56 | -59.88 | -48.74 | -47.76 | -52.39 | -17.70 | -35.38 | -48.90 | -43.24 | -40.45 | -27.52 | -24.16 | -22.98 | -18.28 | -15.20 | -13.11 | -13.18 | 1.29 | 17.85 | -11.05 | -9.69 | -11.30 | -8.95 | -12.22 | -8.67 | -9.71 | -10.81 | |
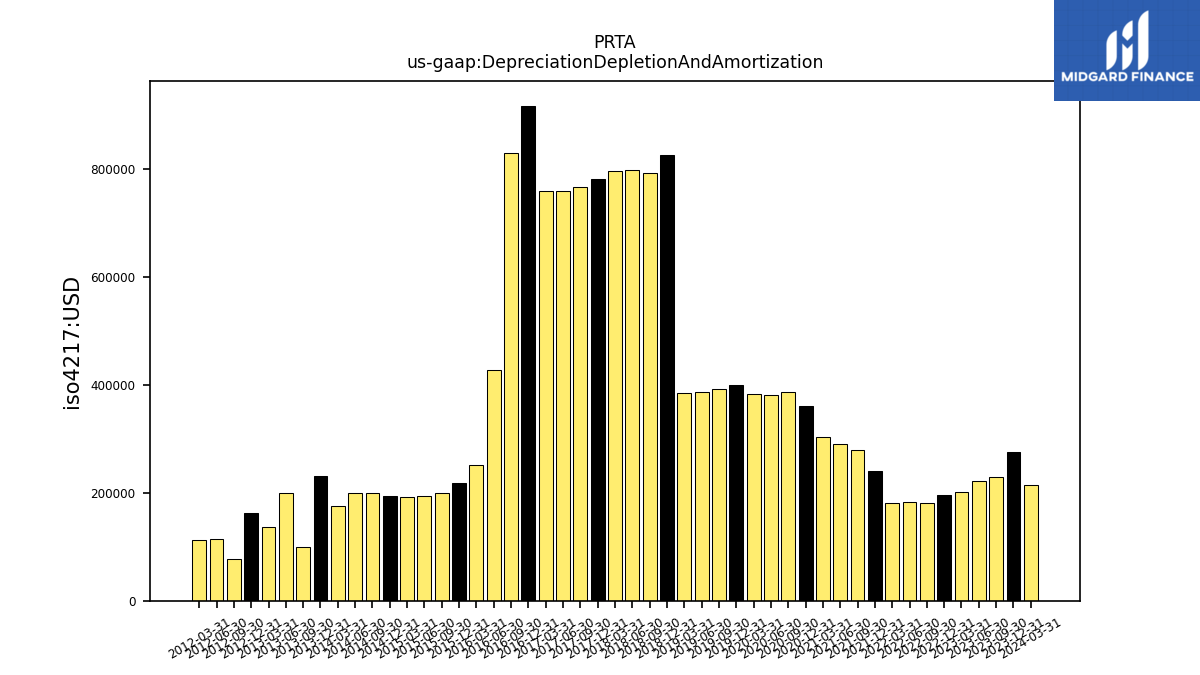
| Depreciation Depletion And Amortization | 0.28 | 0.23 | 0.22 | 0.20 | 0.20 | 0.18 | 0.18 | 0.18 | 0.24 | 0.28 | 0.29 | 0.30 | 0.36 | 0.39 | 0.38 | 0.38 | 0.40 | 0.39 | 0.39 | 0.39 | 0.83 | 0.79 | 0.80 | 0.80 | 0.78 | 0.77 | 0.76 | 0.76 | 0.92 | 0.83 | 0.43 | 0.25 | 0.22 | 0.20 | 0.20 | 0.19 | 0.19 | 0.20 | 0.20 | 0.17 | 0.23 | 0.10 | 0.20 | 0.14 | 0.16 | 0.08 | 0.12 | 0.11 | |
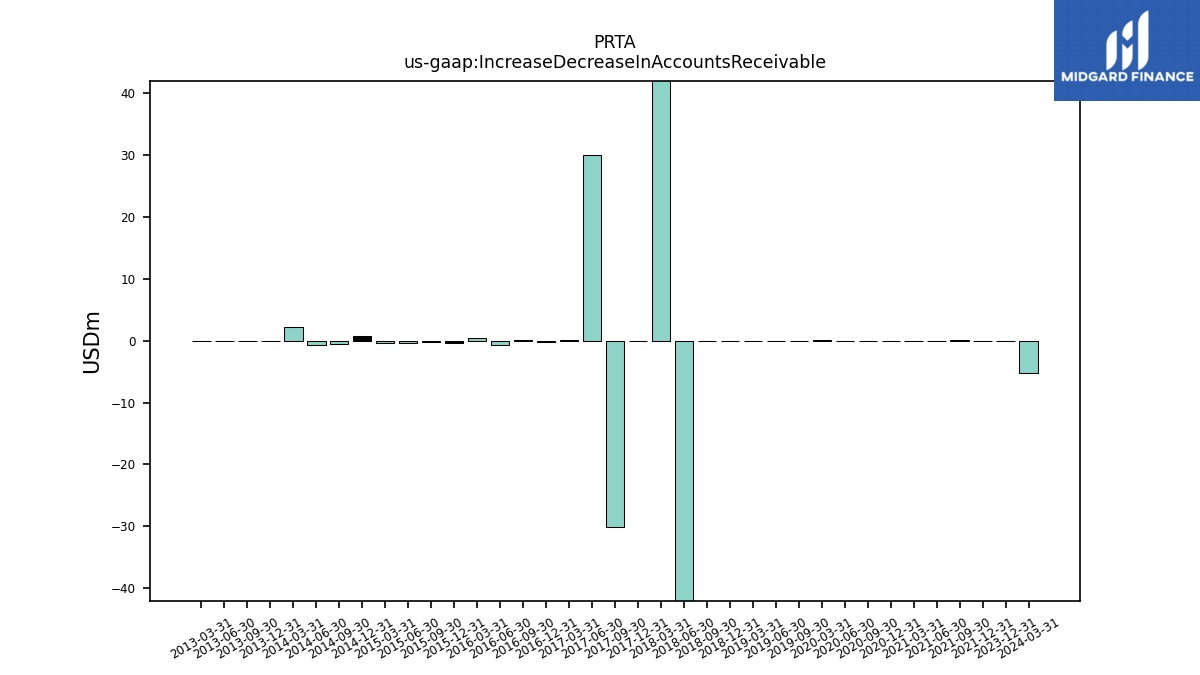
| Increase Decrease In Accounts Receivable | 0.00 | NA | NA | NA | NA | NA | NA | NA | -0.08 | 0.08 | 0.00 | -0.01 | -0.01 | -0.03 | -0.12 | 0.11 | NA | 0.00 | -0.01 | 0.01 | 0.00 | -0.01 | -100.00 | 99.77 | 0.02 | -30.02 | 29.97 | 0.09 | -0.23 | 0.04 | -0.64 | 0.49 | -0.30 | -0.15 | -0.40 | -0.37 | 0.76 | -0.52 | -0.67 | 2.16 | 0.00 | 0.00 | 0.00 | 0.00 | NA | NA | NA | NA | |
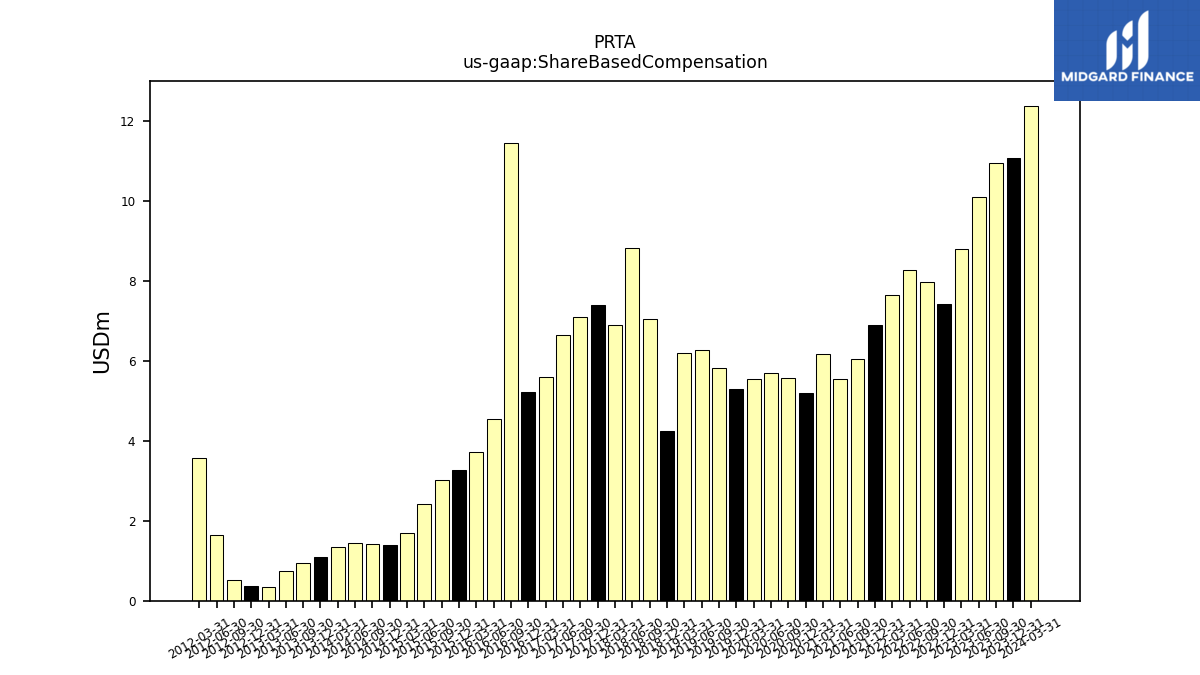
| Share Based Compensation | 11.08 | 10.94 | 10.10 | 8.79 | 7.43 | 7.97 | 8.26 | 7.66 | 6.89 | 6.05 | 5.54 | 6.18 | 5.21 | 5.58 | 5.69 | 5.54 | 5.29 | 5.82 | 6.28 | 6.21 | 4.25 | 7.04 | 8.82 | 6.90 | 7.41 | 7.10 | 6.65 | 5.60 | 5.21 | 11.45 | 4.55 | 3.72 | 3.28 | 3.02 | 2.42 | 1.70 | 1.40 | 1.42 | 1.44 | 1.34 | 1.09 | 0.95 | 0.74 | 0.34 | 0.36 | 0.51 | 1.66 | 3.57 |
| 2023-12-31 | 2023-09-30 | 2023-06-30 | 2023-03-31 | 2022-12-31 | 2022-09-30 | 2022-06-30 | 2022-03-31 | 2021-12-31 | 2021-09-30 | 2021-06-30 | 2021-03-31 | 2020-12-31 | 2020-09-30 | 2020-06-30 | 2020-03-31 | 2019-12-31 | 2019-09-30 | 2019-06-30 | 2019-03-31 | 2018-12-31 | 2018-09-30 | 2018-06-30 | 2018-03-31 | 2017-12-31 | 2017-09-30 | 2017-06-30 | 2017-03-31 | 2016-12-31 | 2016-09-30 | 2016-06-30 | 2016-03-31 | 2015-12-31 | 2015-09-30 | 2015-06-30 | 2015-03-31 | 2014-12-31 | 2014-09-30 | 2014-06-30 | 2014-03-31 | 2013-12-31 | 2013-09-30 | 2013-06-30 | 2013-03-31 | 2012-12-31 | 2012-09-30 | 2012-06-30 | 2012-03-31 | ||
|---|---|---|---|---|---|---|---|---|---|---|---|---|---|---|---|---|---|---|---|---|---|---|---|---|---|---|---|---|---|---|---|---|---|---|---|---|---|---|---|---|---|---|---|---|---|---|---|---|---|
| Net Cash Provided By Used In Investing Activities | -1.51 | -0.44 | -0.77 | -0.05 | -0.15 | -0.13 | -0.16 | -0.02 | -0.32 | -0.21 | 0.00 | -0.05 | -0.05 | -0.08 | -0.05 | -0.02 | -0.11 | -0.25 | -0.07 | -0.12 | -1.30 | -0.15 | -0.10 | -0.18 | -0.38 | -0.54 | -0.21 | -2.40 | -3.09 | -8.55 | -4.76 | -0.24 | -0.98 | -0.33 | -0.04 | -0.03 | -0.04 | -0.11 | -0.33 | -0.03 | 0.00 | -0.23 | -0.20 | -0.11 | -1.03 | -0.10 | -0.03 | -0.14 |
| 2023-12-31 | 2023-09-30 | 2023-06-30 | 2023-03-31 | 2022-12-31 | 2022-09-30 | 2022-06-30 | 2022-03-31 | 2021-12-31 | 2021-09-30 | 2021-06-30 | 2021-03-31 | 2020-12-31 | 2020-09-30 | 2020-06-30 | 2020-03-31 | 2019-12-31 | 2019-09-30 | 2019-06-30 | 2019-03-31 | 2018-12-31 | 2018-09-30 | 2018-06-30 | 2018-03-31 | 2017-12-31 | 2017-09-30 | 2017-06-30 | 2017-03-31 | 2016-12-31 | 2016-09-30 | 2016-06-30 | 2016-03-31 | 2015-12-31 | 2015-09-30 | 2015-06-30 | 2015-03-31 | 2014-12-31 | 2014-09-30 | 2014-06-30 | 2014-03-31 | 2013-12-31 | 2013-09-30 | 2013-06-30 | 2013-03-31 | 2012-12-31 | 2012-09-30 | 2012-06-30 | 2012-03-31 | ||
|---|---|---|---|---|---|---|---|---|---|---|---|---|---|---|---|---|---|---|---|---|---|---|---|---|---|---|---|---|---|---|---|---|---|---|---|---|---|---|---|---|---|---|---|---|---|---|---|---|---|
| Net Cash Provided By Used In Financing Activities | 0.48 | 2.71 | 18.62 | 23.28 | 220.76 | 18.13 | 1.23 | 1.34 | 1.77 | 87.01 | 20.22 | 81.33 | 0.00 | 0.06 | 0.00 | 0.15 | 0.01 | 0.00 | 0.21 | 0.01 | -1.30 | -0.97 | -0.86 | 43.18 | 1.46 | 2.61 | 1.47 | 159.87 | 19.49 | 4.77 | 0.99 | 129.06 | 3.45 | 2.66 | 133.71 | 1.03 | -0.01 | 14.67 | 102.92 | 0.51 | 84.65 | -0.12 | 0.00 | -0.08 | 141.52 | 7.55 | 10.40 | 8.76 |
| 2023-12-31 | 2023-09-30 | 2023-06-30 | 2023-03-31 | 2022-12-31 | 2022-09-30 | 2022-06-30 | 2022-03-31 | 2021-12-31 | 2021-09-30 | 2021-06-30 | 2021-03-31 | 2020-12-31 | 2020-09-30 | 2020-06-30 | 2020-03-31 | 2019-12-31 | 2019-09-30 | 2019-06-30 | 2019-03-31 | 2018-12-31 | 2018-09-30 | 2018-06-30 | 2018-03-31 | 2017-12-31 | 2017-09-30 | 2017-06-30 | 2017-03-31 | 2016-12-31 | 2016-09-30 | 2016-06-30 | 2016-03-31 | 2015-12-31 | 2015-09-30 | 2015-06-30 | 2015-03-31 | 2014-12-31 | 2014-09-30 | 2014-06-30 | 2014-03-31 | 2013-12-31 | 2013-09-30 | 2013-06-30 | 2013-03-31 | 2012-12-31 | 2012-09-30 | 2012-06-30 | 2012-03-31 | ||
|---|---|---|---|---|---|---|---|---|---|---|---|---|---|---|---|---|---|---|---|---|---|---|---|---|---|---|---|---|---|---|---|---|---|---|---|---|---|---|---|---|---|---|---|---|---|---|---|---|---|
| Revenues | 0.32 | 84.87 | 4.02 | 2.17 | 49.92 | 1.52 | 1.31 | 1.15 | 1.17 | 139.17 | 60.07 | 0.16 | 0.36 | 0.16 | 0.20 | 0.14 | 0.26 | 0.20 | 0.17 | 0.19 | 0.19 | 0.26 | 0.28 | 0.23 | 0.23 | 0.22 | 26.81 | 0.26 | 0.17 | 0.29 | 0.33 | 0.27 | 0.31 | 0.43 | 0.28 | 0.59 | 2.01 | 1.49 | 15.12 | 32.23 | 0.17 | 0.17 | 0.17 | 0.17 | 0.57 | 0.94 | 0.73 | 0.40 | |
| Revenue From Contract With Customer Excluding Assessed Tax | 0.32 | 84.87 | 4.02 | 2.17 | 49.92 | 1.52 | 1.31 | 1.15 | 1.17 | 139.17 | 60.07 | 0.16 | 0.36 | 0.16 | 0.20 | 0.14 | 0.26 | 0.20 | 0.17 | 0.19 | 0.19 | 0.26 | 0.28 | 0.23 | 0.23 | 0.22 | 26.81 | 0.26 | 0.17 | 0.29 | 0.33 | 0.27 | 0.31 | 0.43 | 0.28 | 0.59 | 2.01 | 1.49 | 15.12 | 32.23 | 0.17 | 0.17 | 0.17 | 0.17 | 0.57 | 0.94 | 0.73 | 0.40 | |
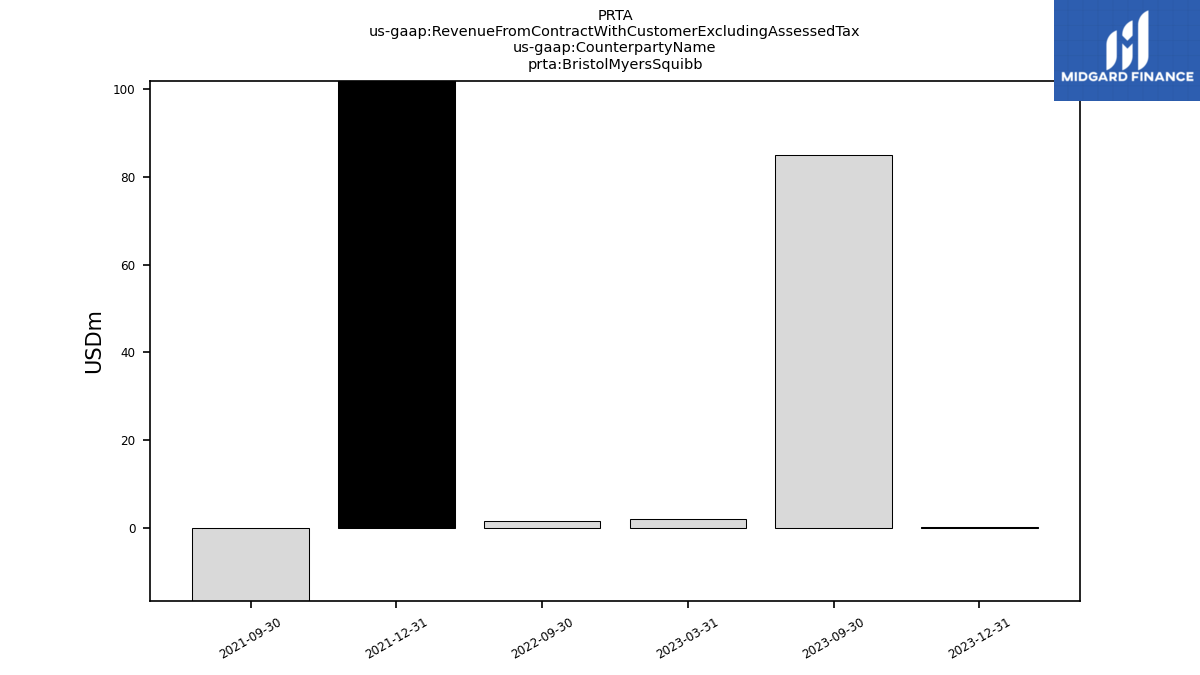
| Bristol Myers Squibb | 0.30 | 84.90 | NA | NA | NA | 1.50 | NA | NA | 158.20 | -78.50 | NA | NA | NA | NA | NA | NA | NA | NA | NA | NA | NA | NA | NA | NA | NA | NA | NA | NA | NA | NA | NA | NA | NA | NA | NA | NA | NA | NA | NA | NA | NA | NA | NA | NA | NA | NA | NA | NA | |
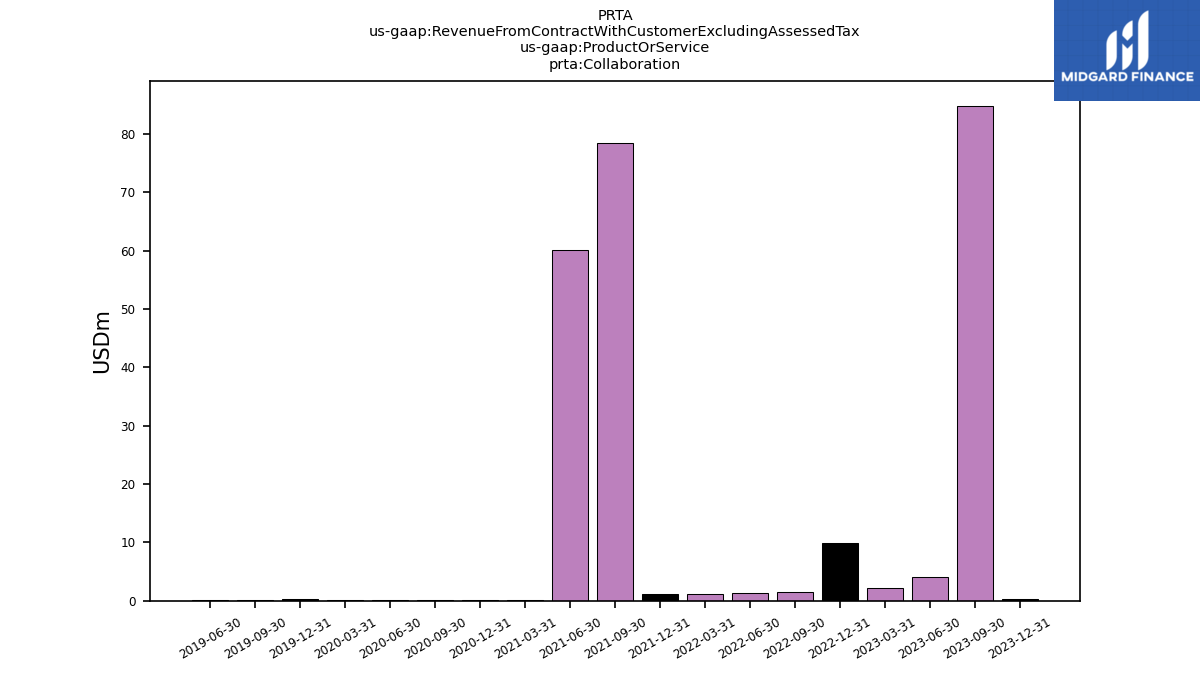
| Collaboration | 0.32 | 84.87 | 4.02 | 2.12 | 9.92 | 1.52 | 1.31 | 1.10 | 1.17 | 78.48 | 60.07 | 0.11 | 0.12 | 0.16 | 0.14 | 0.14 | 0.26 | 0.20 | 0.17 | NA | NA | NA | NA | NA | NA | NA | NA | NA | NA | NA | NA | NA | NA | NA | NA | NA | NA | NA | NA | NA | NA | NA | NA | NA | NA | NA | NA | NA | |
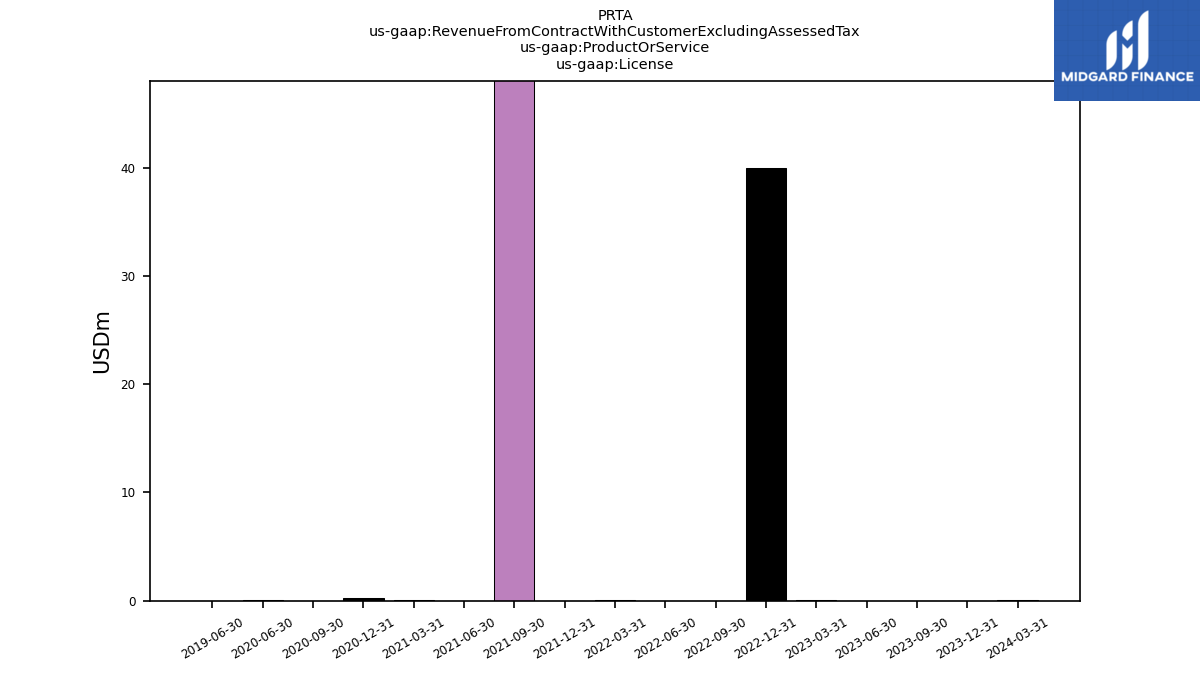
| License | 0.00 | 0.00 | 0.00 | 0.05 | 40.00 | 0.00 | 0.00 | 0.05 | 0.00 | 60.69 | 0.00 | 0.05 | 0.24 | 0.00 | 0.05 | NA | NA | NA | 0.00 | NA | NA | NA | NA | NA | NA | NA | NA | NA | NA | NA | NA | NA | NA | NA | NA | NA | NA | NA | NA | NA | NA | NA | NA | NA | NA | NA | NA | NA |