
| 2023-12-31 | 2023-09-30 | 2023-06-30 | 2023-03-31 | 2022-12-31 | 2022-09-30 | 2022-06-30 | 2022-03-31 | 2021-12-31 | 2021-09-30 | 2021-06-30 | 2021-03-31 | 2020-12-31 | 2020-09-30 | 2020-06-30 | 2020-03-31 | 2019-12-31 | 2019-09-30 | 2019-06-30 | 2019-03-31 | 2018-12-31 | 2018-09-30 | 2018-06-30 | 2018-03-31 | 2017-12-31 | 2017-09-30 | 2017-06-30 | 2017-03-31 | 2016-12-31 | 2016-09-30 | 2016-06-30 | 2016-03-31 | 2015-12-31 | 2015-09-30 | 2015-06-30 | 2015-03-31 | 2014-12-31 | 2014-09-30 | 2014-06-30 | 2014-03-31 | 2013-12-31 | 2013-09-30 | 2013-06-30 | 2013-03-31 | 2012-12-31 | 2012-09-30 | 2012-06-30 | 2012-03-31 | 2011-12-31 | 2011-09-30 | 2011-06-30 | 2011-03-31 | 2010-12-31 | 2010-09-30 | 2010-06-30 | 2010-03-31 | ||
|---|---|---|---|---|---|---|---|---|---|---|---|---|---|---|---|---|---|---|---|---|---|---|---|---|---|---|---|---|---|---|---|---|---|---|---|---|---|---|---|---|---|---|---|---|---|---|---|---|---|---|---|---|---|---|---|---|---|
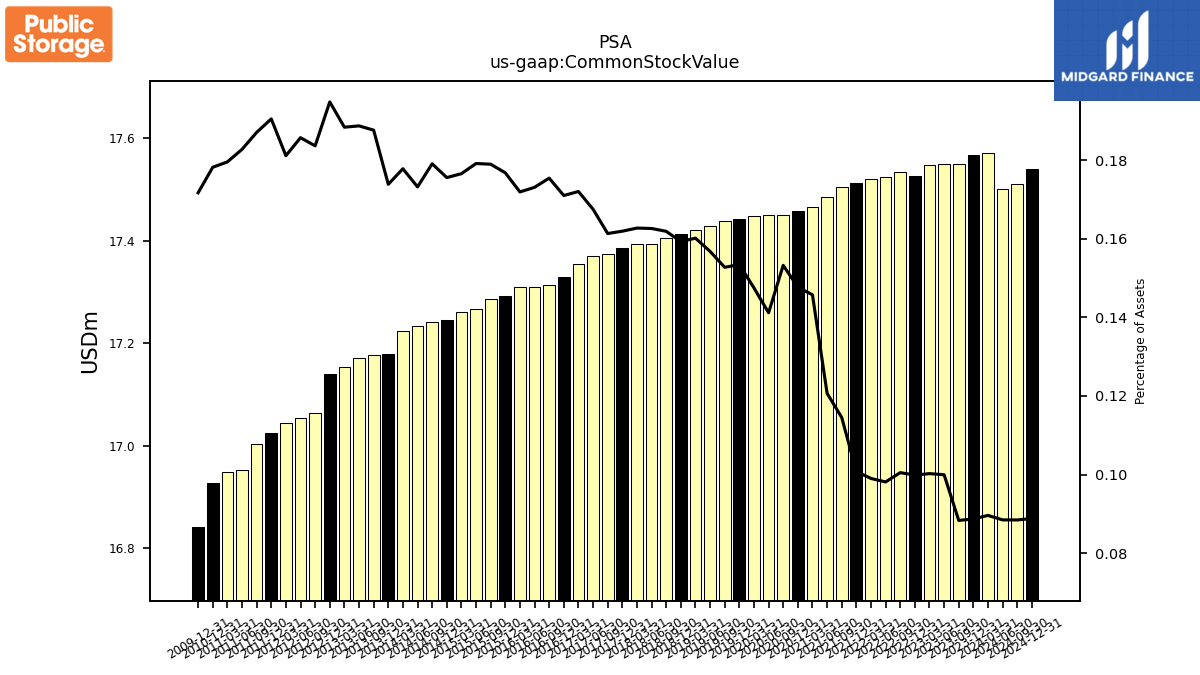
| Common Stock Value | 17.57 | 17.55 | 17.55 | 17.55 | 17.53 | 17.53 | 17.52 | 17.52 | 17.51 | 17.50 | 17.49 | 17.46 | 17.46 | 17.45 | 17.45 | 17.45 | 17.44 | 17.44 | 17.43 | 17.42 | 17.41 | 17.41 | 17.39 | 17.39 | 17.39 | 17.37 | 17.37 | 17.35 | 17.33 | 17.31 | 17.31 | 17.31 | 17.29 | 17.29 | 17.27 | 17.26 | 17.25 | 17.24 | 17.23 | 17.22 | 17.18 | 17.18 | 17.17 | 17.15 | 17.14 | 17.06 | 17.05 | 17.05 | 17.02 | 17.00 | 16.95 | 16.95 | 16.93 | NA | NA | NA | |
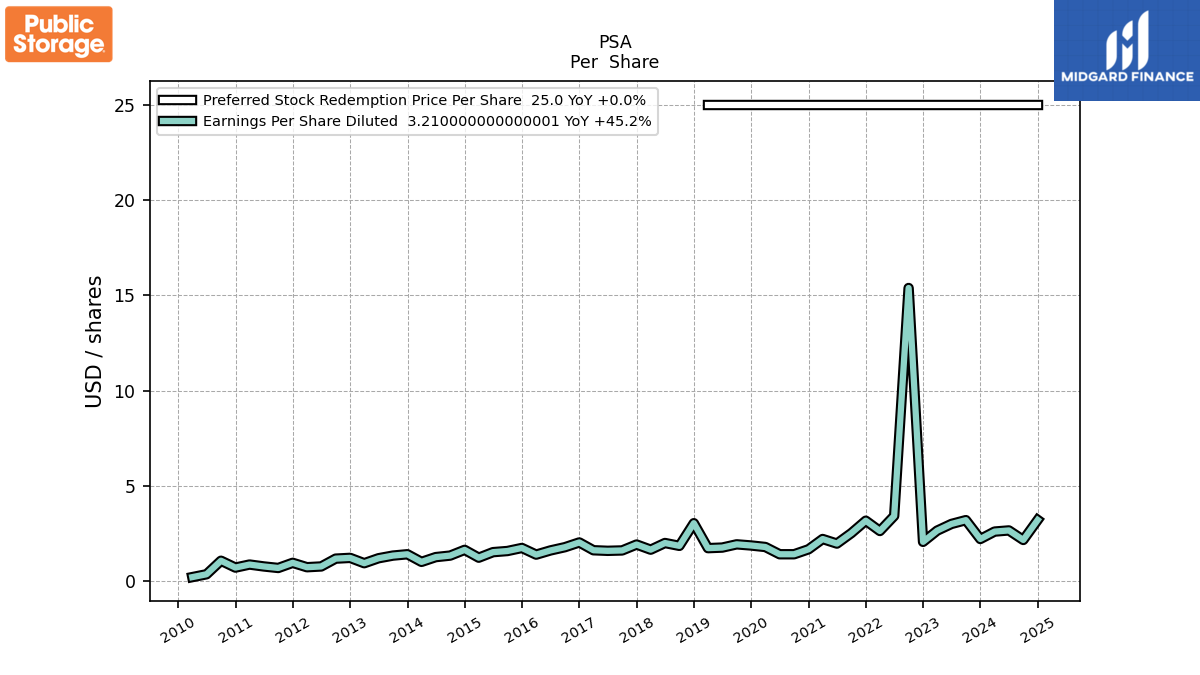
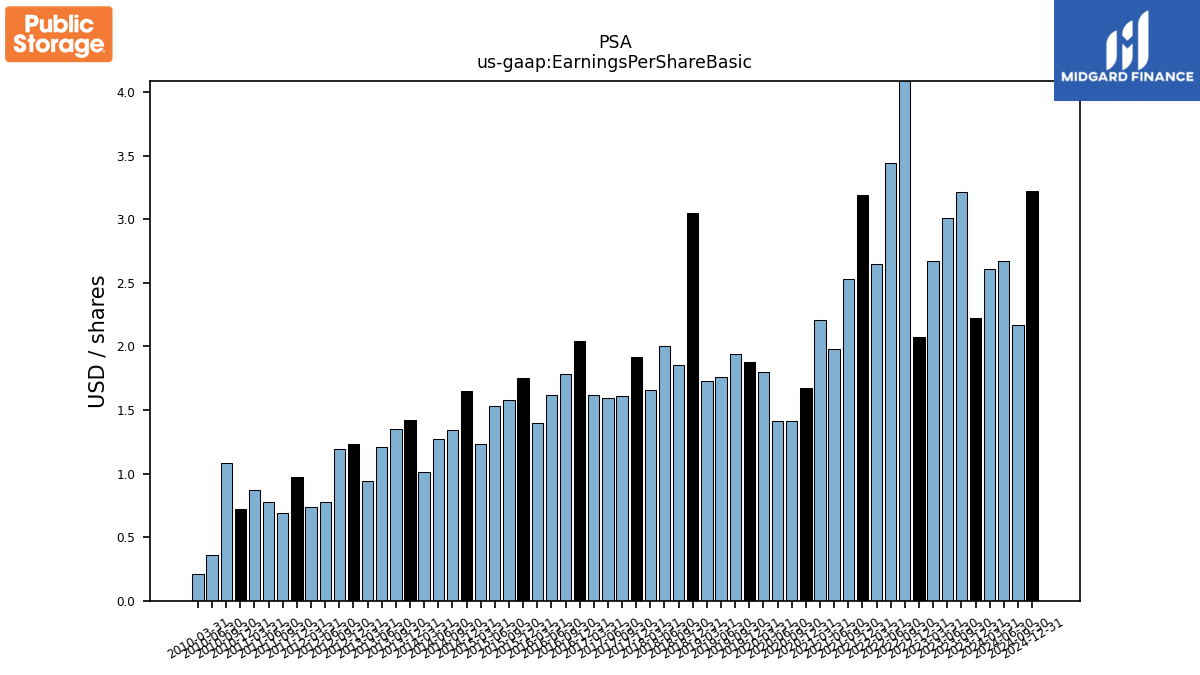
| Earnings Per Share Basic | 2.22 | 3.21 | 3.01 | 2.67 | 2.07 | 15.47 | 3.44 | 2.65 | 3.19 | 2.53 | 1.98 | 2.21 | 1.67 | 1.41 | 1.41 | 1.80 | 1.88 | 1.94 | 1.76 | 1.73 | 3.05 | 1.85 | 2.00 | 1.66 | 1.92 | 1.61 | 1.59 | 1.62 | 2.04 | 1.78 | 1.62 | 1.40 | 1.75 | 1.58 | 1.53 | 1.23 | 1.65 | 1.34 | 1.27 | 1.01 | 1.42 | 1.35 | 1.21 | 0.94 | 1.23 | 1.19 | 0.78 | 0.74 | 0.97 | 0.69 | 0.78 | 0.87 | 0.72 | 1.08 | 0.36 | 0.21 | |
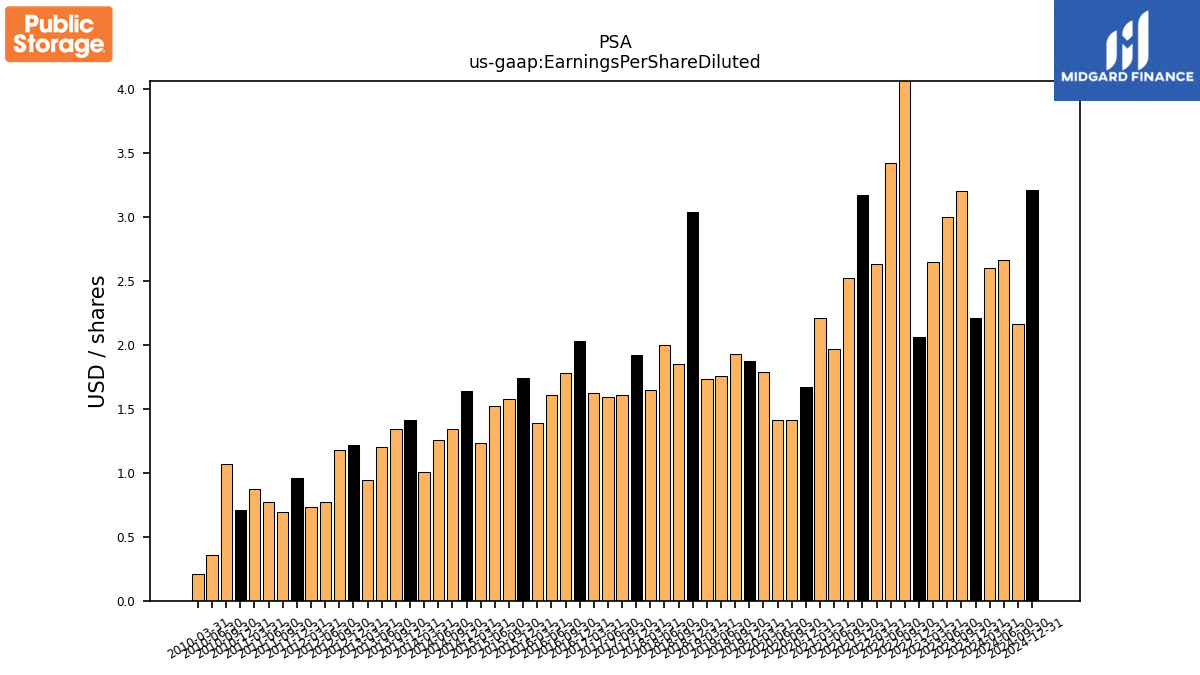
| Earnings Per Share Diluted | 2.21 | 3.20 | 3.00 | 2.65 | 2.06 | 15.38 | 3.42 | 2.63 | 3.17 | 2.52 | 1.97 | 2.21 | 1.67 | 1.41 | 1.41 | 1.79 | 1.87 | 1.93 | 1.76 | 1.73 | 3.04 | 1.85 | 2.00 | 1.65 | 1.92 | 1.61 | 1.59 | 1.62 | 2.03 | 1.78 | 1.61 | 1.39 | 1.74 | 1.58 | 1.52 | 1.23 | 1.64 | 1.34 | 1.26 | 1.01 | 1.41 | 1.34 | 1.20 | 0.94 | 1.22 | 1.18 | 0.77 | 0.73 | 0.96 | 0.69 | 0.77 | 0.87 | 0.71 | 1.07 | 0.36 | 0.21 |
| 2023-12-31 | 2023-09-30 | 2023-06-30 | 2023-03-31 | 2022-12-31 | 2022-09-30 | 2022-06-30 | 2022-03-31 | 2021-12-31 | 2021-09-30 | 2021-06-30 | 2021-03-31 | 2020-12-31 | 2020-09-30 | 2020-06-30 | 2020-03-31 | 2019-12-31 | 2019-09-30 | 2019-06-30 | 2019-03-31 | 2018-12-31 | 2018-09-30 | 2018-06-30 | 2018-03-31 | 2017-12-31 | 2017-09-30 | 2017-06-30 | 2017-03-31 | 2016-12-31 | 2016-09-30 | 2016-06-30 | 2016-03-31 | 2015-12-31 | 2015-09-30 | 2015-06-30 | 2015-03-31 | 2014-12-31 | 2014-09-30 | 2014-06-30 | 2014-03-31 | 2013-12-31 | 2013-09-30 | 2013-06-30 | 2013-03-31 | 2012-12-31 | 2012-09-30 | 2012-06-30 | 2012-03-31 | 2011-12-31 | 2011-09-30 | 2011-06-30 | 2011-03-31 | 2010-12-31 | 2010-09-30 | 2010-06-30 | 2010-03-31 | ||
|---|---|---|---|---|---|---|---|---|---|---|---|---|---|---|---|---|---|---|---|---|---|---|---|---|---|---|---|---|---|---|---|---|---|---|---|---|---|---|---|---|---|---|---|---|---|---|---|---|---|---|---|---|---|---|---|---|---|
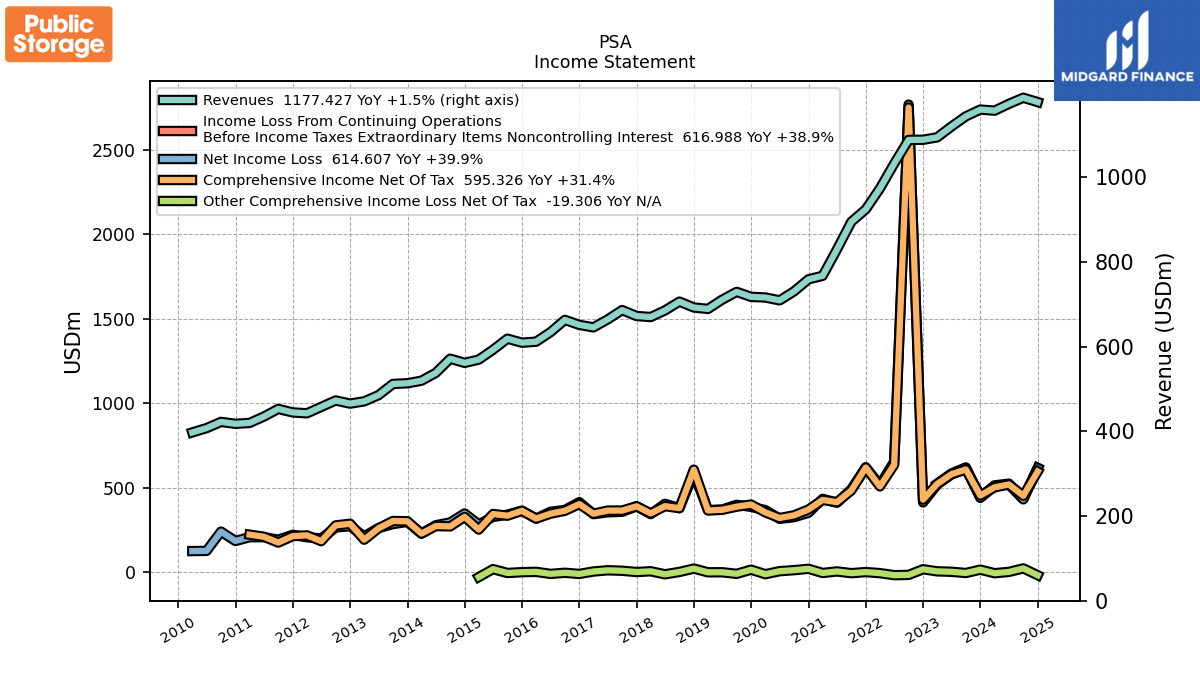
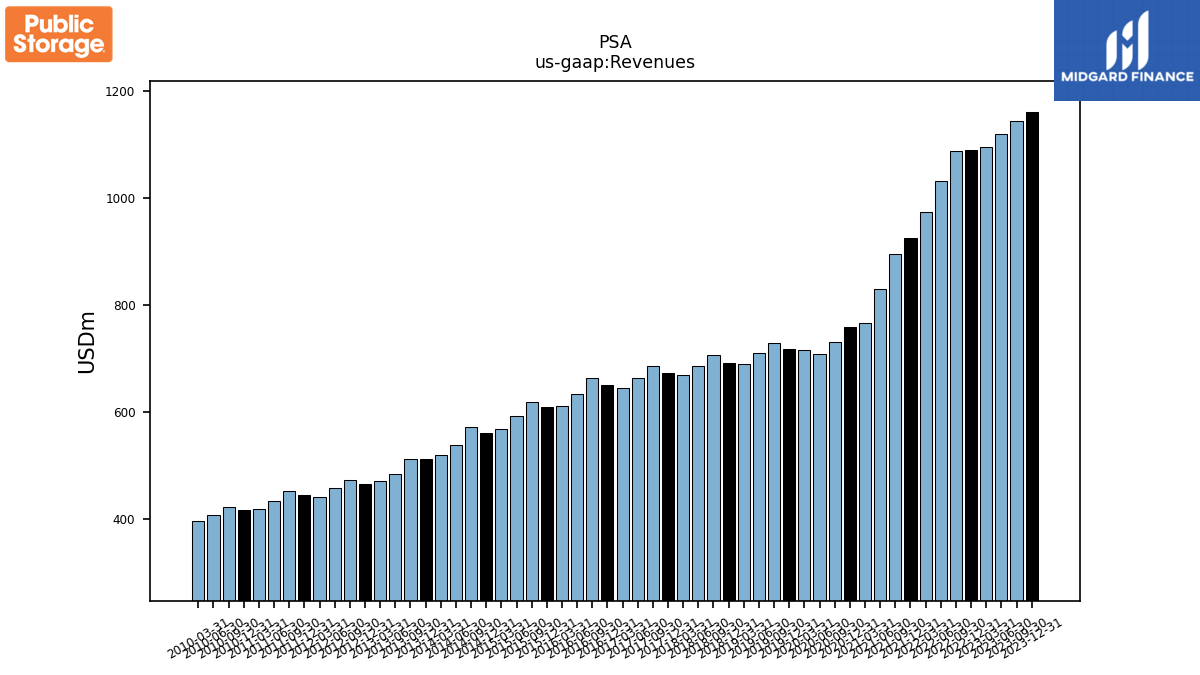
| Revenues | 1159.87 | 1143.82 | 1119.77 | 1094.23 | 1088.54 | 1088.13 | 1032.05 | 973.45 | 924.32 | 894.93 | 829.32 | 767.26 | 759.04 | 730.66 | 709.28 | 716.08 | 717.50 | 729.34 | 710.95 | 689.04 | 692.46 | 706.37 | 685.53 | 669.92 | 672.31 | 686.36 | 664.31 | 645.55 | 651.43 | 663.15 | 634.19 | 611.79 | 609.33 | 618.87 | 592.63 | 569.39 | 561.68 | 571.60 | 538.04 | 519.62 | 513.51 | 511.96 | 485.38 | 470.90 | 465.45 | 472.93 | 457.74 | 442.62 | 444.71 | 452.99 | 434.84 | 419.82 | 417.78 | 422.30 | 407.64 | 397.45 | |
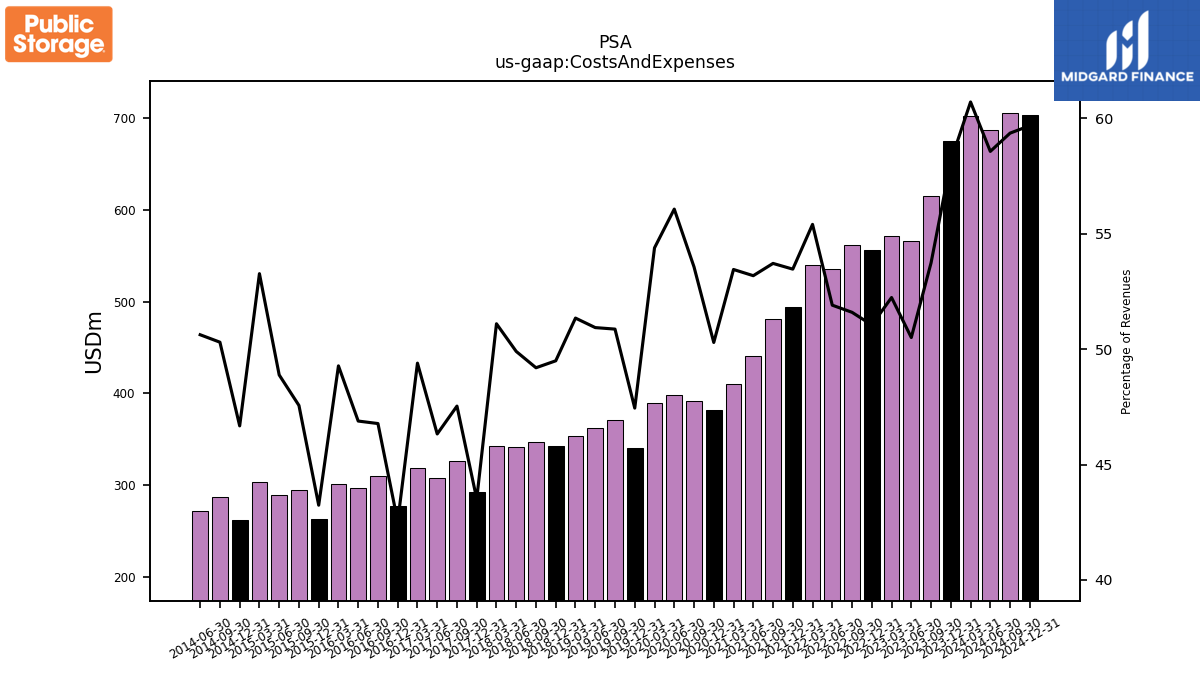
| Costs And Expenses | 674.44 | 614.67 | 565.53 | 571.59 | 555.68 | 561.43 | 535.68 | 539.33 | 494.20 | 480.70 | 441.05 | 410.11 | 381.72 | 391.36 | 397.66 | 389.45 | 340.42 | 371.00 | 362.11 | 353.79 | 342.73 | 347.49 | 342.08 | 342.33 | 292.53 | 326.25 | 307.75 | 318.86 | 277.06 | 310.20 | 297.34 | 301.46 | 263.47 | 294.34 | 289.69 | 303.32 | 262.17 | 287.52 | 272.37 | NA | NA | NA | NA | NA | NA | NA | NA | NA | NA | NA | NA | NA | NA | NA | NA | NA | |
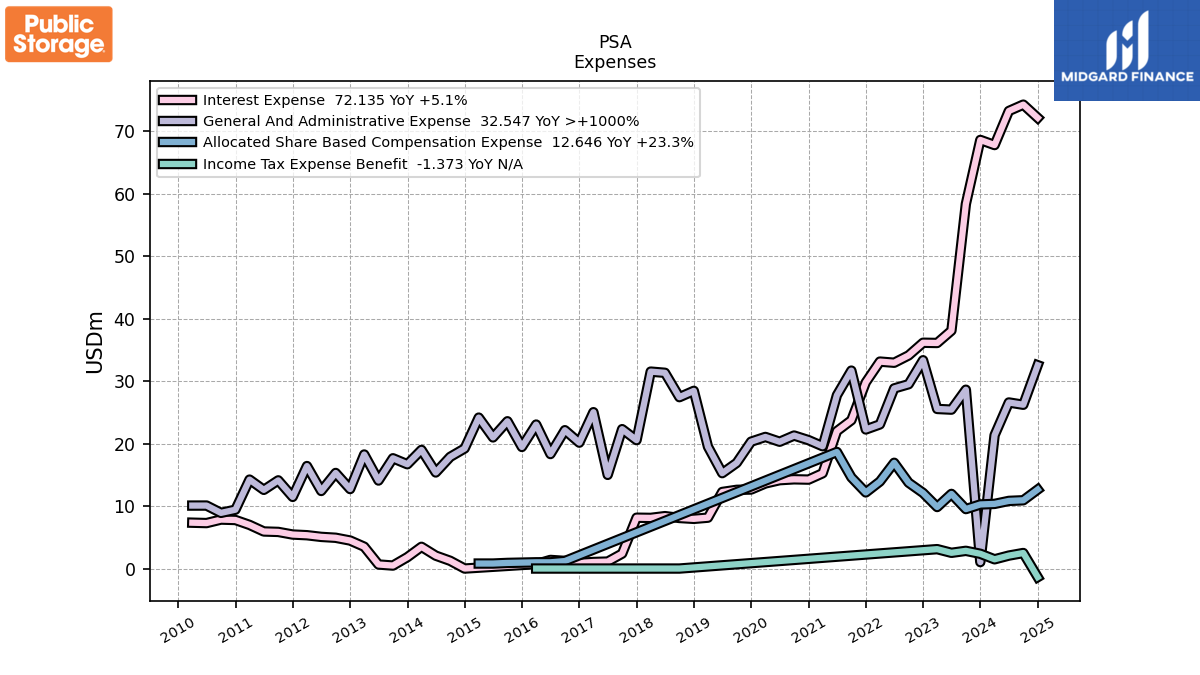
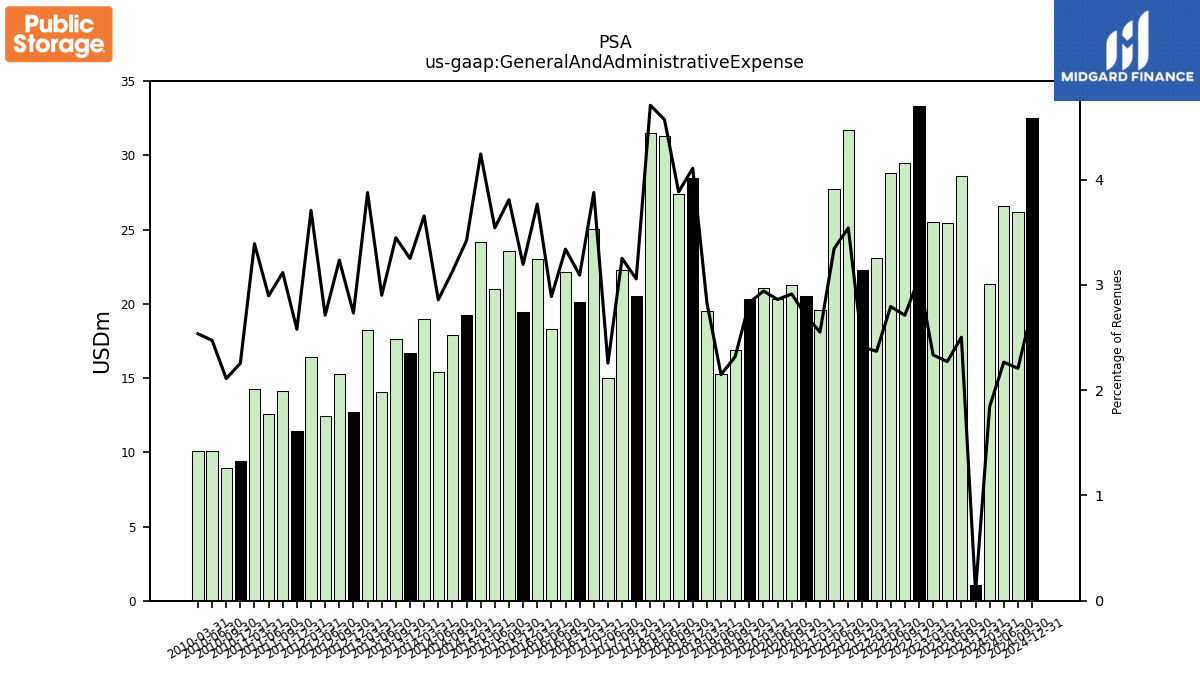
| General And Administrative Expense | 1.03 | 28.62 | 25.43 | 25.54 | 33.34 | 29.50 | 28.83 | 23.07 | 22.26 | 31.68 | 27.74 | 19.57 | 20.55 | 21.29 | 20.29 | 21.06 | 20.31 | 16.91 | 15.26 | 19.50 | 28.44 | 27.43 | 31.33 | 31.52 | 20.55 | 22.31 | 14.99 | 25.03 | 20.15 | 22.14 | 18.32 | 23.05 | 19.46 | 23.57 | 20.99 | 24.16 | 19.22 | 17.87 | 15.38 | 18.99 | 16.69 | 17.65 | 14.09 | 18.25 | 12.72 | 15.30 | 12.41 | 16.41 | 11.47 | 14.12 | 12.59 | 14.23 | 9.42 | 8.91 | 10.08 | 10.08 | |
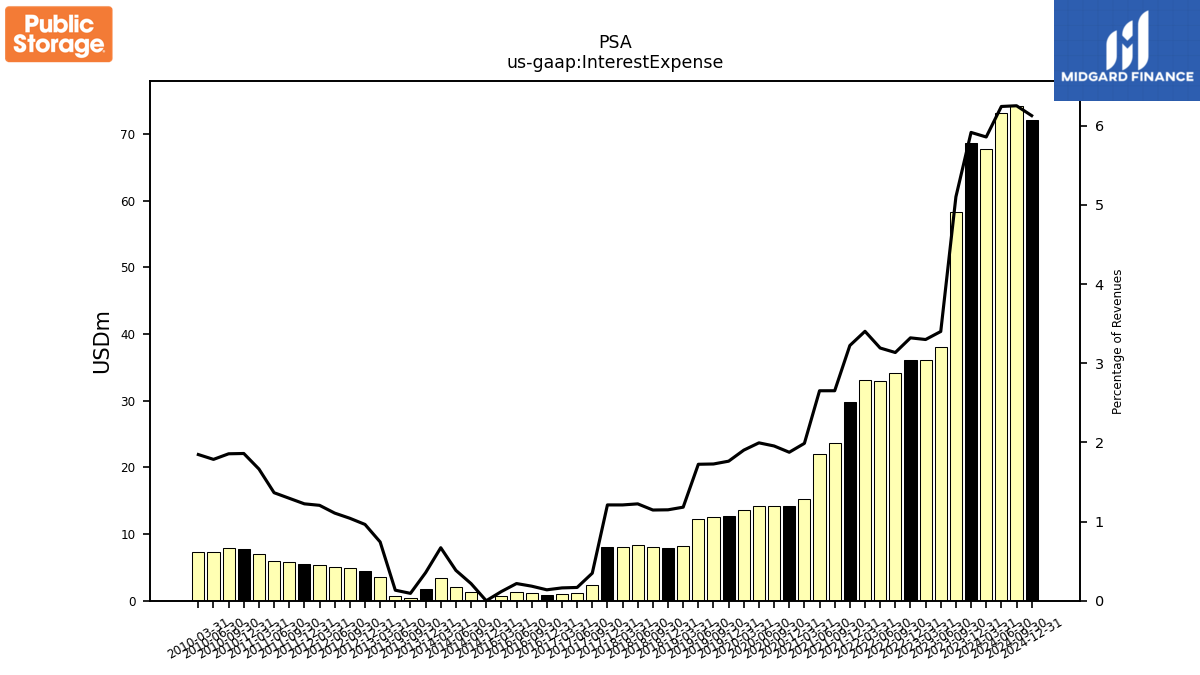
| Interest Expense | 68.60 | 58.35 | 38.08 | 36.10 | 36.14 | 34.11 | 32.94 | 33.12 | 29.79 | 23.74 | 21.99 | 15.25 | 14.23 | 14.28 | 14.14 | 13.62 | 12.65 | 12.60 | 12.25 | 8.14 | 7.95 | 8.09 | 8.39 | 8.11 | 8.14 | 2.39 | 1.12 | 1.05 | 0.90 | 1.22 | 1.38 | 0.71 | NA | NA | NA | NA | 0.00 | 1.24 | 2.06 | 3.48 | 1.82 | 0.48 | 0.65 | 3.50 | 4.49 | 4.93 | 5.07 | 5.33 | 5.44 | 5.86 | 5.93 | 6.98 | 7.77 | 7.84 | 7.28 | 7.34 | |
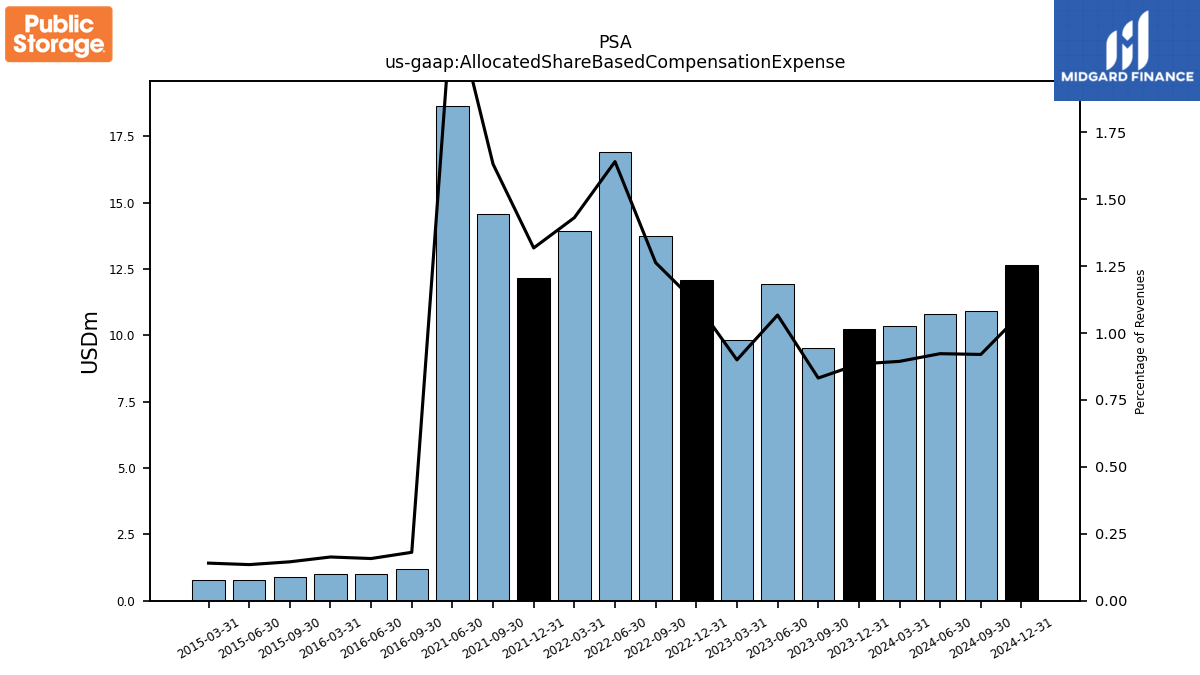
| Allocated Share Based Compensation Expense | 10.26 | 9.52 | 11.95 | 9.85 | 12.11 | 13.74 | 16.93 | 13.93 | 12.18 | 14.60 | 18.66 | NA | NA | NA | NA | NA | NA | NA | NA | NA | NA | NA | NA | NA | NA | NA | NA | NA | NA | 1.20 | 1.00 | 1.00 | NA | 0.90 | 0.80 | 0.80 | NA | NA | NA | NA | NA | NA | NA | NA | NA | NA | NA | NA | NA | NA | NA | NA | NA | NA | NA | NA | |
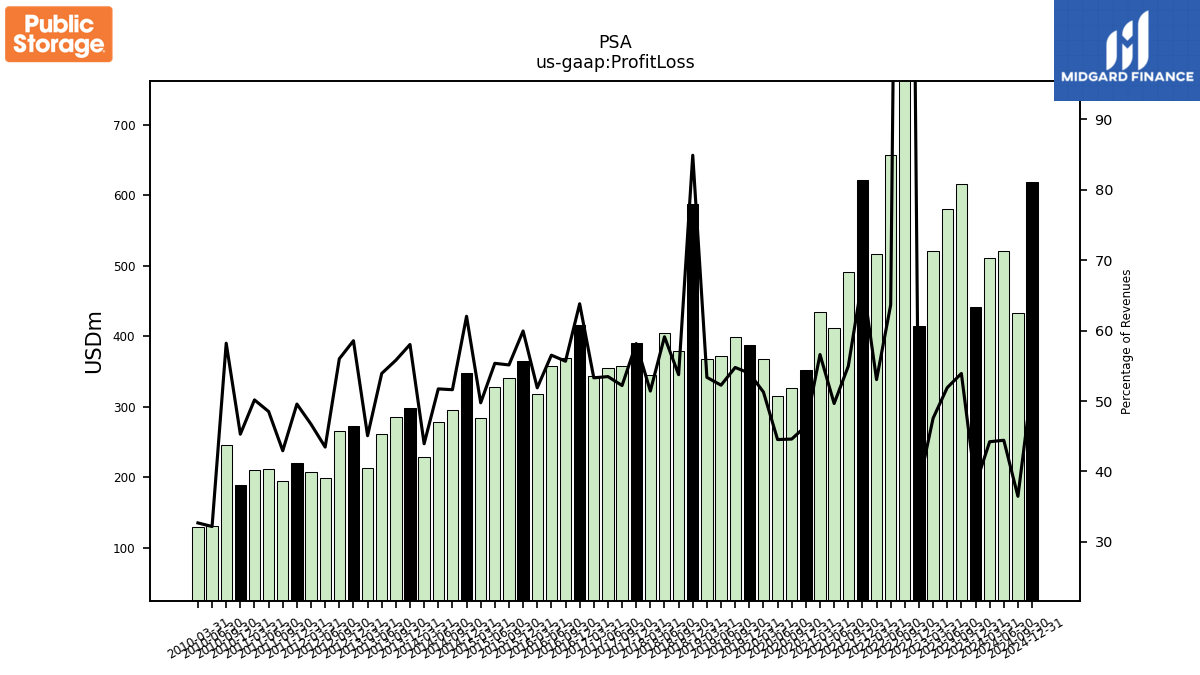
| Profit Loss | 441.90 | 616.64 | 581.16 | 520.41 | 414.93 | 2778.15 | 656.89 | 516.29 | 622.02 | 491.63 | 411.73 | 434.26 | 352.43 | 325.85 | 315.81 | 367.14 | 387.10 | 399.42 | 371.46 | 367.68 | 587.91 | 379.59 | 405.29 | 344.44 | 390.96 | 358.27 | 355.21 | 344.02 | 415.68 | 369.05 | 358.36 | 317.35 | 365.26 | 341.14 | 328.04 | 283.25 | 348.43 | 294.98 | 278.28 | 228.27 | 297.98 | 285.63 | 261.68 | 212.25 | 272.56 | 264.82 | 198.93 | 206.72 | 220.44 | 194.51 | 210.94 | 210.57 | 189.21 | 245.81 | 131.18 | 129.92 | |
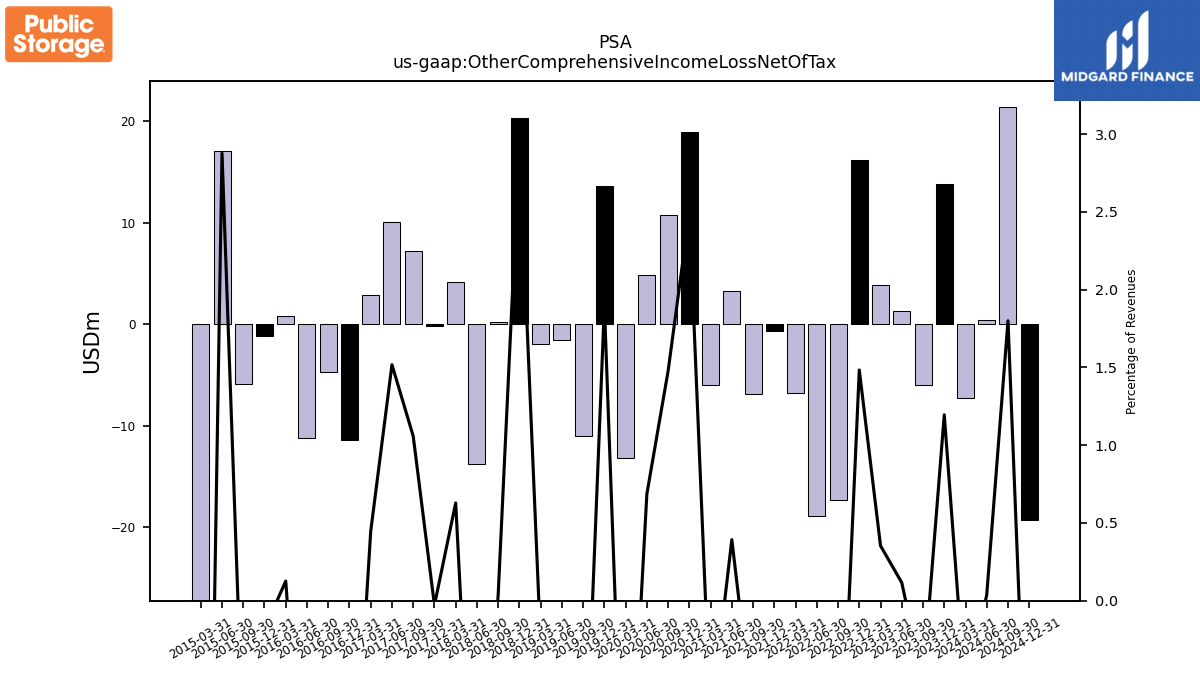
| Other Comprehensive Income Loss Net Of Tax | 13.87 | -5.96 | 1.30 | 3.87 | 16.15 | -17.25 | -18.84 | -6.79 | -0.61 | -6.90 | 3.26 | -5.94 | 18.94 | 10.79 | 4.87 | -13.12 | 13.62 | -10.96 | -1.58 | -1.91 | 20.28 | 0.26 | -13.75 | 4.21 | -0.19 | 7.27 | 10.08 | 2.88 | -11.44 | -4.68 | -11.22 | 0.78 | -1.11 | -5.91 | 17.05 | -30.42 | NA | NA | NA | NA | NA | NA | NA | NA | NA | NA | NA | NA | NA | NA | NA | NA | NA | NA | NA | NA | |
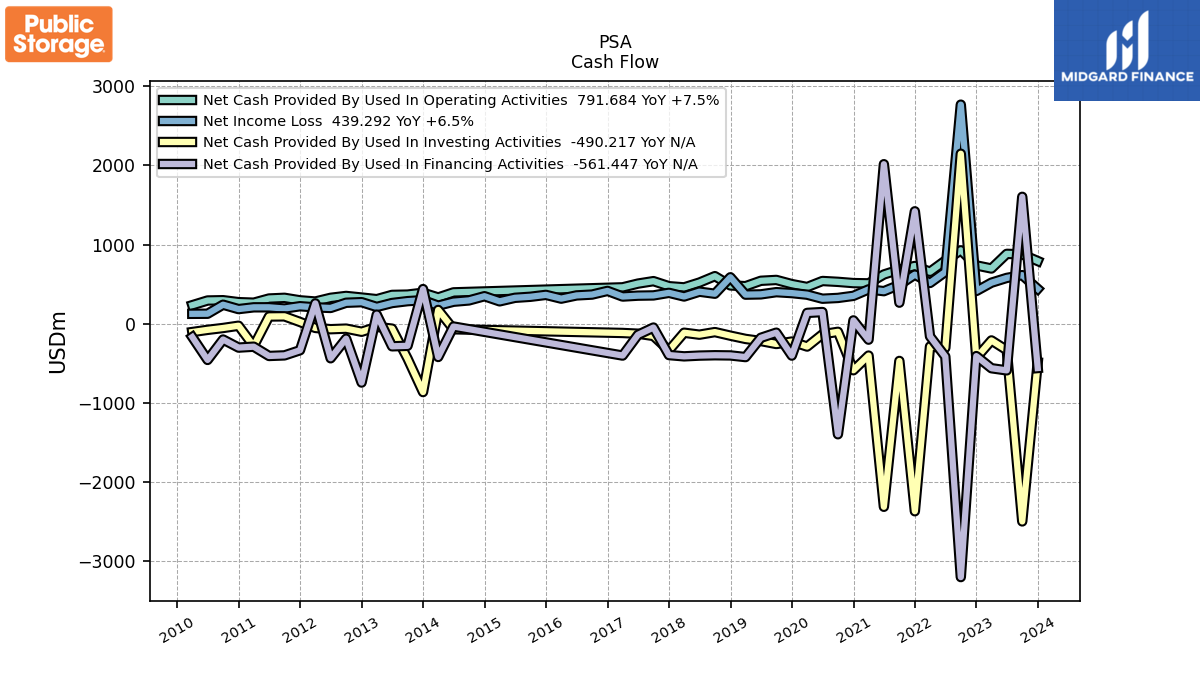
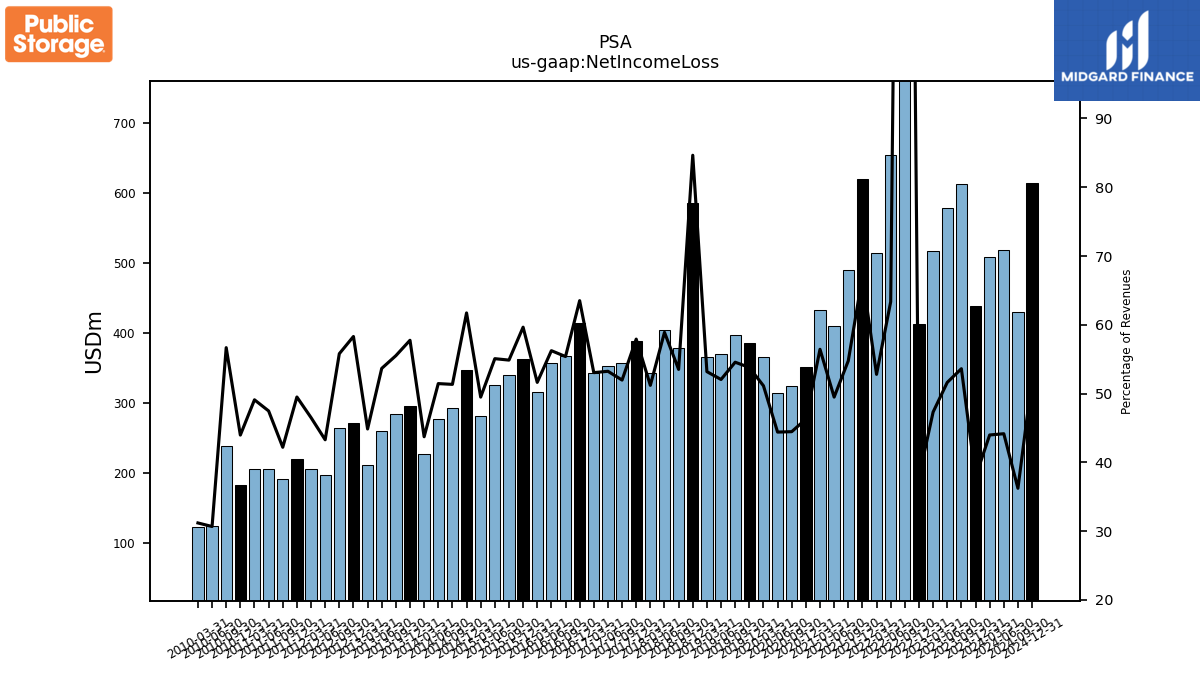
| Net Income Loss | 439.29 | 613.30 | 578.03 | 517.71 | 412.36 | 2768.99 | 653.85 | 513.94 | 619.71 | 490.09 | 410.43 | 433.04 | 351.27 | 324.87 | 314.92 | 366.16 | 386.01 | 397.94 | 370.06 | 366.52 | 586.21 | 378.03 | 403.80 | 343.00 | 389.40 | 356.67 | 353.70 | 342.44 | 413.74 | 367.31 | 356.66 | 315.87 | 363.49 | 339.57 | 326.40 | 281.78 | 346.71 | 293.46 | 276.83 | 227.20 | 296.57 | 284.20 | 260.46 | 211.22 | 271.37 | 263.89 | 198.14 | 205.85 | 220.15 | 191.14 | 206.44 | 206.11 | 183.69 | 239.35 | 125.04 | 123.96 | |
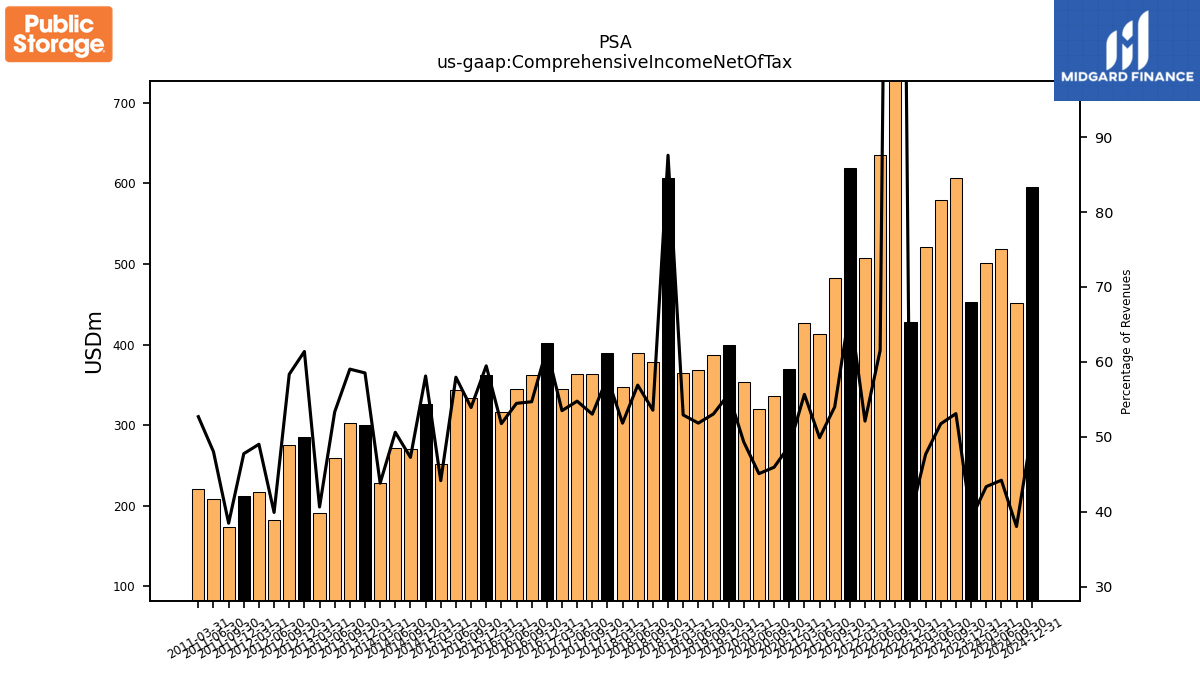
| Comprehensive Income Net Of Tax | 453.16 | 607.34 | 579.33 | 521.58 | 428.51 | 2751.74 | 635.01 | 507.15 | 619.10 | 483.19 | 413.69 | 427.10 | 370.21 | 335.66 | 319.79 | 353.04 | 399.64 | 386.98 | 368.48 | 364.61 | 606.48 | 378.29 | 390.05 | 347.21 | 389.21 | 363.94 | 363.78 | 345.32 | 402.30 | 362.63 | 345.44 | 316.65 | 362.38 | 333.65 | 343.45 | 251.37 | 326.45 | 270.13 | 272.28 | 227.68 | 300.55 | 302.24 | 258.83 | 191.34 | 285.74 | 275.95 | 182.66 | 216.92 | 212.35 | 174.25 | 208.79 | 221.20 | NA | NA | NA | NA | |
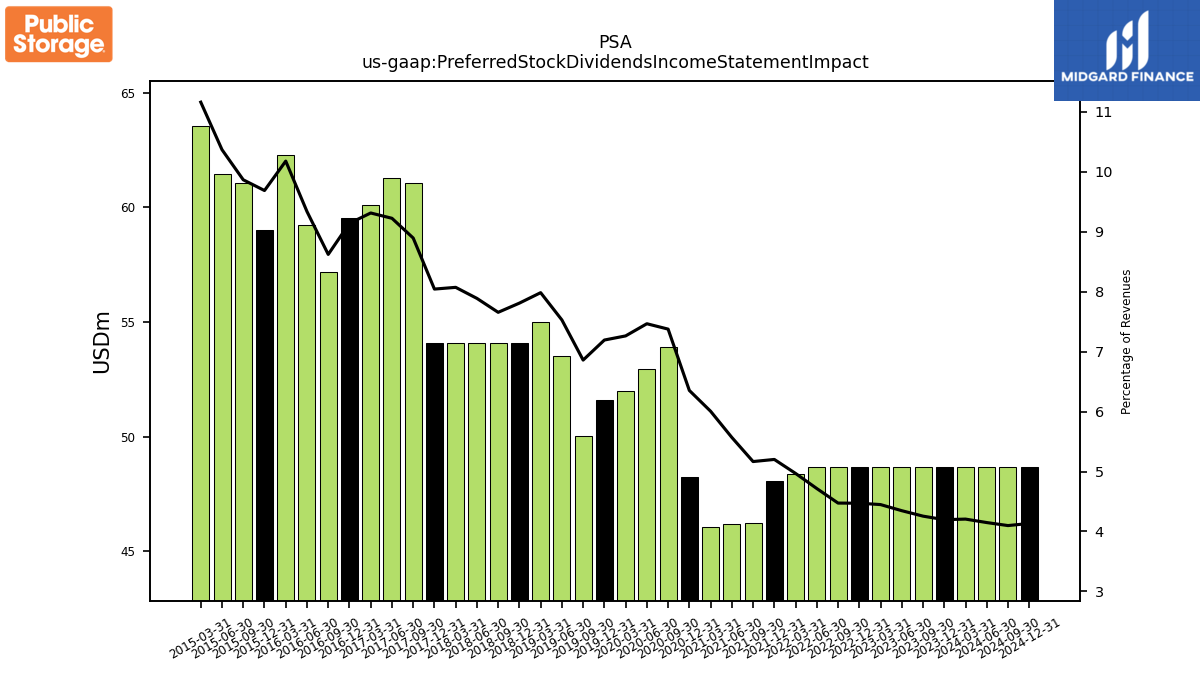
| Preferred Stock Dividends Income Statement Impact | 48.67 | 48.68 | 48.67 | 48.68 | 48.67 | 48.68 | 48.67 | 48.37 | 48.08 | 46.24 | 46.18 | 46.08 | 48.22 | 53.89 | 52.95 | 52.01 | 51.61 | 50.03 | 53.52 | 55.01 | 54.08 | 54.08 | 54.08 | 54.08 | 54.08 | 61.05 | 61.28 | 60.12 | 59.55 | 57.18 | 59.22 | 62.27 | 59.03 | 61.06 | 61.45 | 63.55 | NA | NA | NA | NA | NA | NA | NA | NA | NA | NA | NA | NA | NA | NA | NA | NA | NA | NA | NA | NA | |
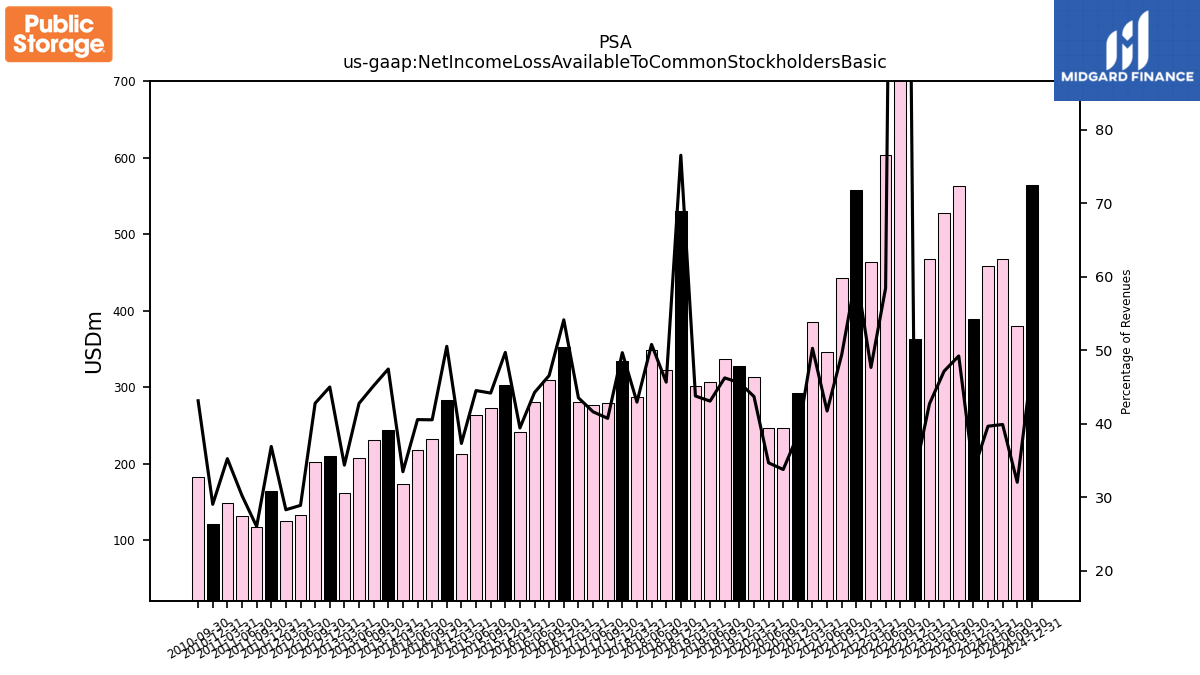
| Net Income Loss Available To Common Stockholders Basic | 389.66 | 563.24 | 528.26 | 467.59 | 362.62 | 2712.16 | 603.38 | 464.12 | 558.06 | 442.33 | 346.25 | 385.81 | 292.17 | 246.92 | 246.12 | 313.13 | 327.25 | 337.36 | 306.41 | 301.74 | 530.10 | 322.68 | 348.30 | 287.82 | 334.08 | 279.72 | 276.68 | 281.13 | 352.81 | 308.96 | 280.77 | 241.34 | 303.00 | 273.51 | 263.93 | 212.61 | 283.96 | 231.81 | 218.35 | 174.05 | 243.75 | 231.36 | 207.69 | 161.94 | 209.54 | 202.47 | 132.34 | 125.34 | 164.22 | 117.95 | 131.51 | 148.06 | 121.40 | 182.21 | NA | NA |
| 2023-12-31 | 2023-09-30 | 2023-06-30 | 2023-03-31 | 2022-12-31 | 2022-09-30 | 2022-06-30 | 2022-03-31 | 2021-12-31 | 2021-09-30 | 2021-06-30 | 2021-03-31 | 2020-12-31 | 2020-09-30 | 2020-06-30 | 2020-03-31 | 2019-12-31 | 2019-09-30 | 2019-06-30 | 2019-03-31 | 2018-12-31 | 2018-09-30 | 2018-06-30 | 2018-03-31 | 2017-12-31 | 2017-09-30 | 2017-06-30 | 2017-03-31 | 2016-12-31 | 2016-09-30 | 2016-06-30 | 2016-03-31 | 2015-12-31 | 2015-09-30 | 2015-06-30 | 2015-03-31 | 2014-12-31 | 2014-09-30 | 2014-06-30 | 2014-03-31 | 2013-12-31 | 2013-09-30 | 2013-06-30 | 2013-03-31 | 2012-12-31 | 2012-09-30 | 2012-06-30 | 2012-03-31 | 2011-12-31 | 2011-09-30 | 2011-06-30 | 2011-03-31 | 2010-12-31 | 2010-09-30 | 2010-06-30 | 2010-03-31 | ||
|---|---|---|---|---|---|---|---|---|---|---|---|---|---|---|---|---|---|---|---|---|---|---|---|---|---|---|---|---|---|---|---|---|---|---|---|---|---|---|---|---|---|---|---|---|---|---|---|---|---|---|---|---|---|---|---|---|---|
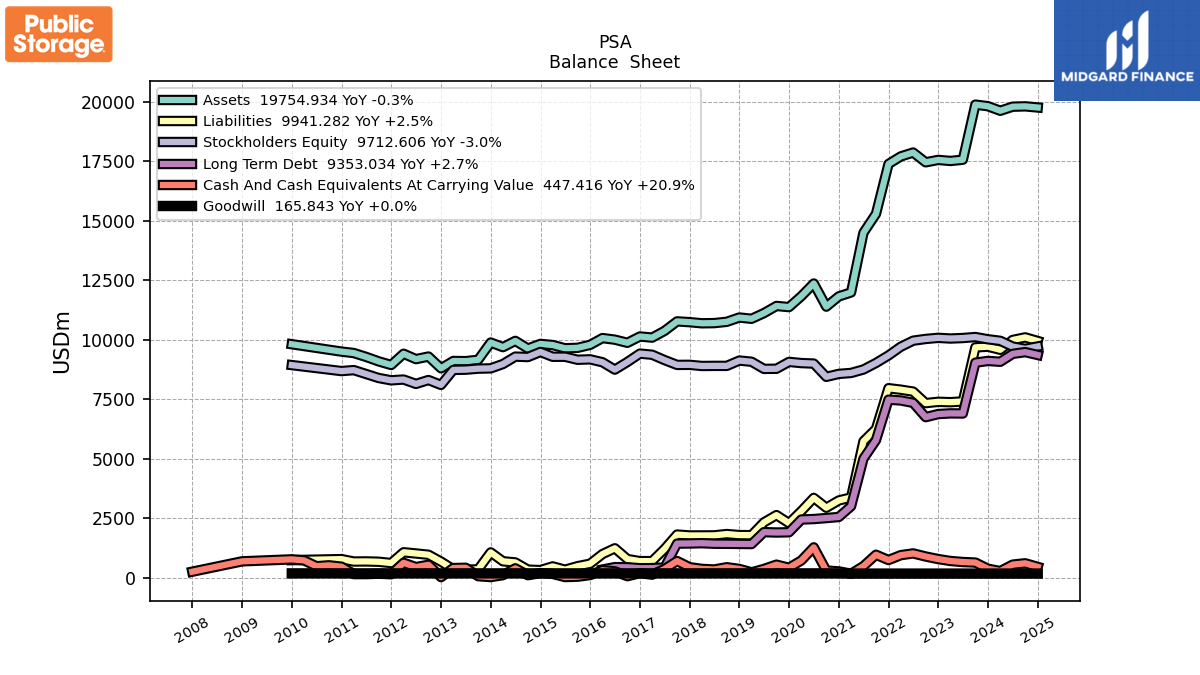
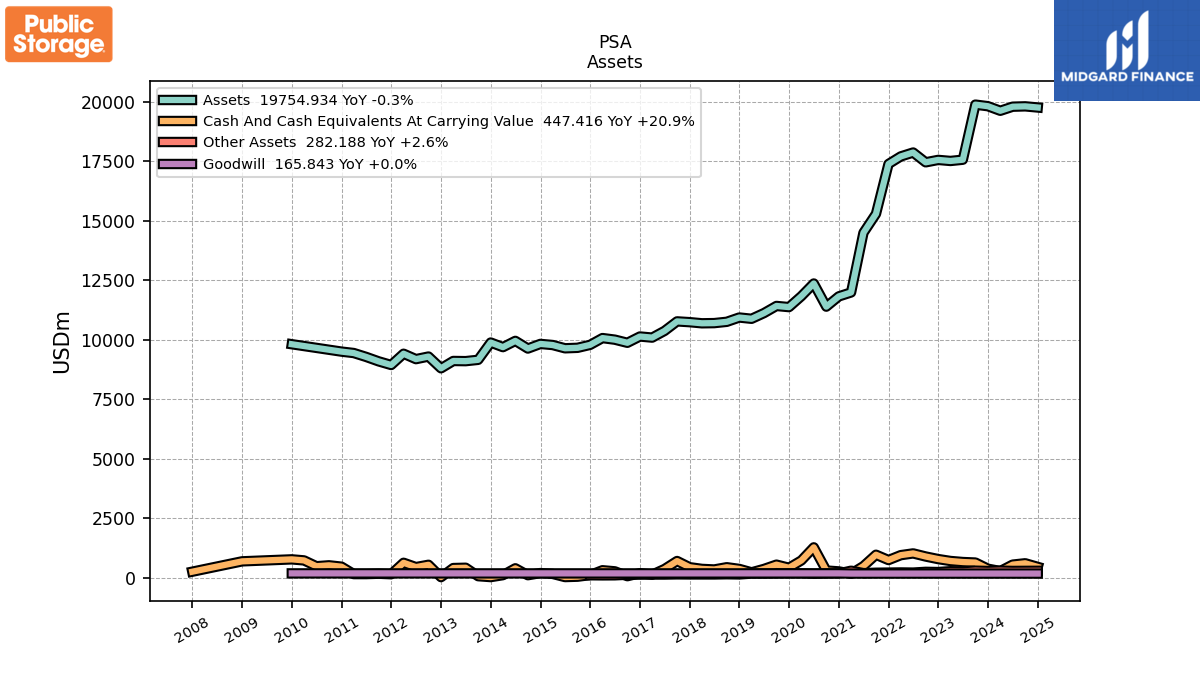
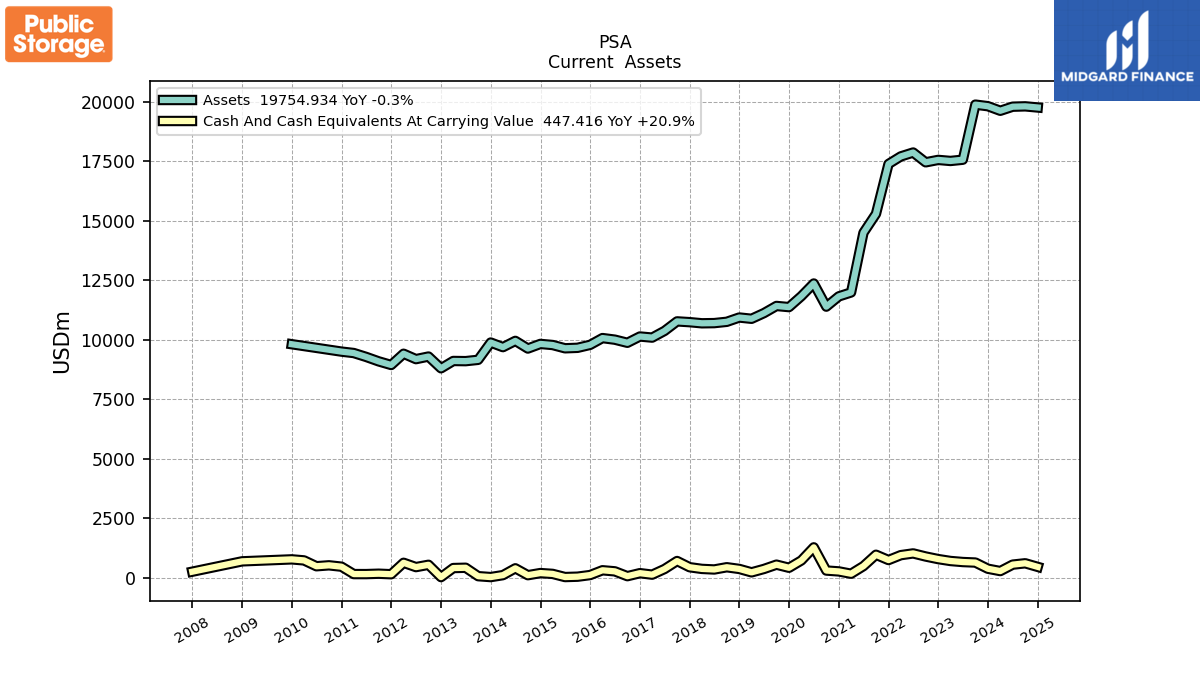
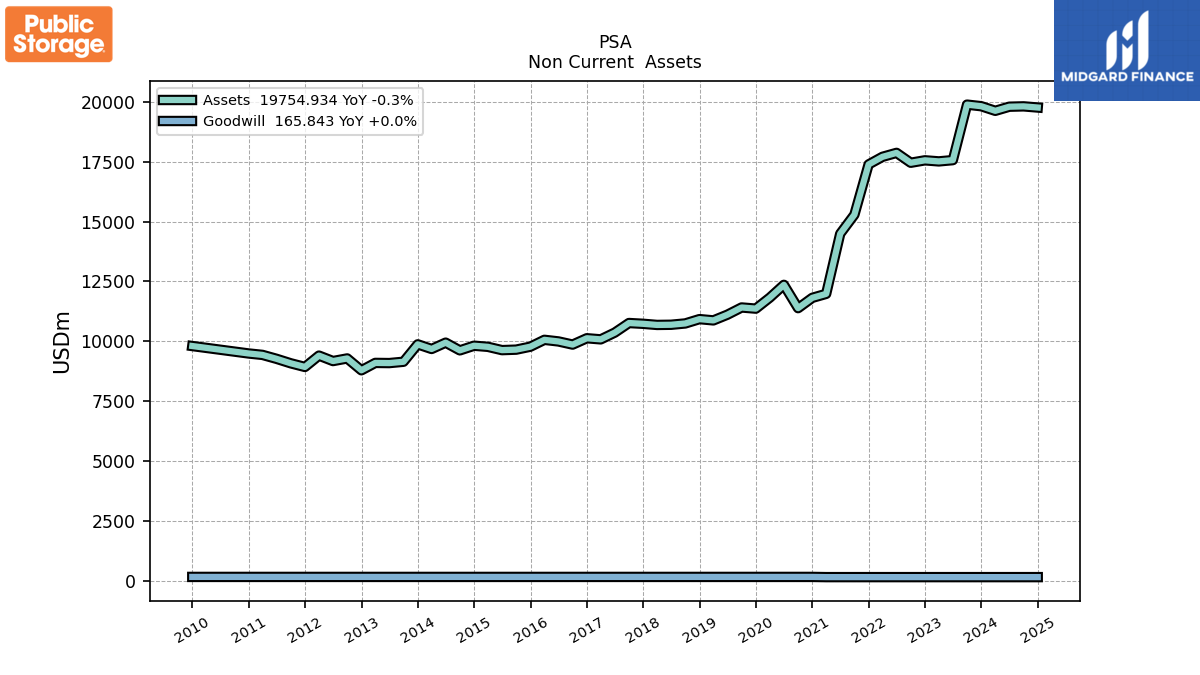
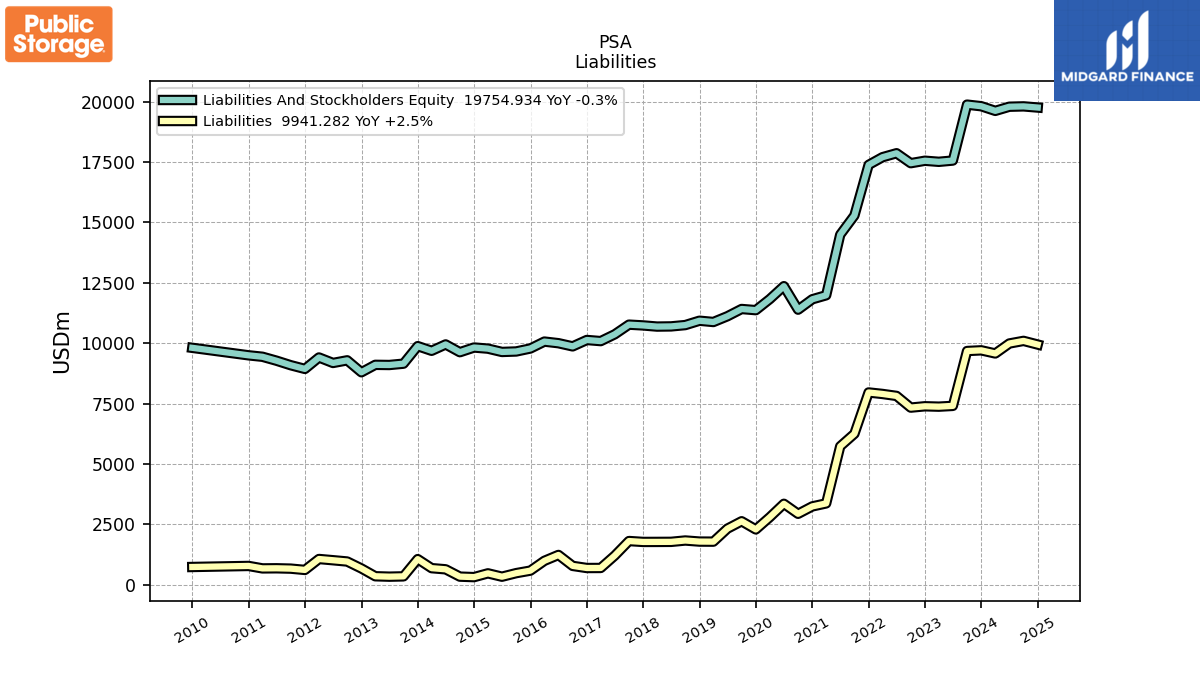
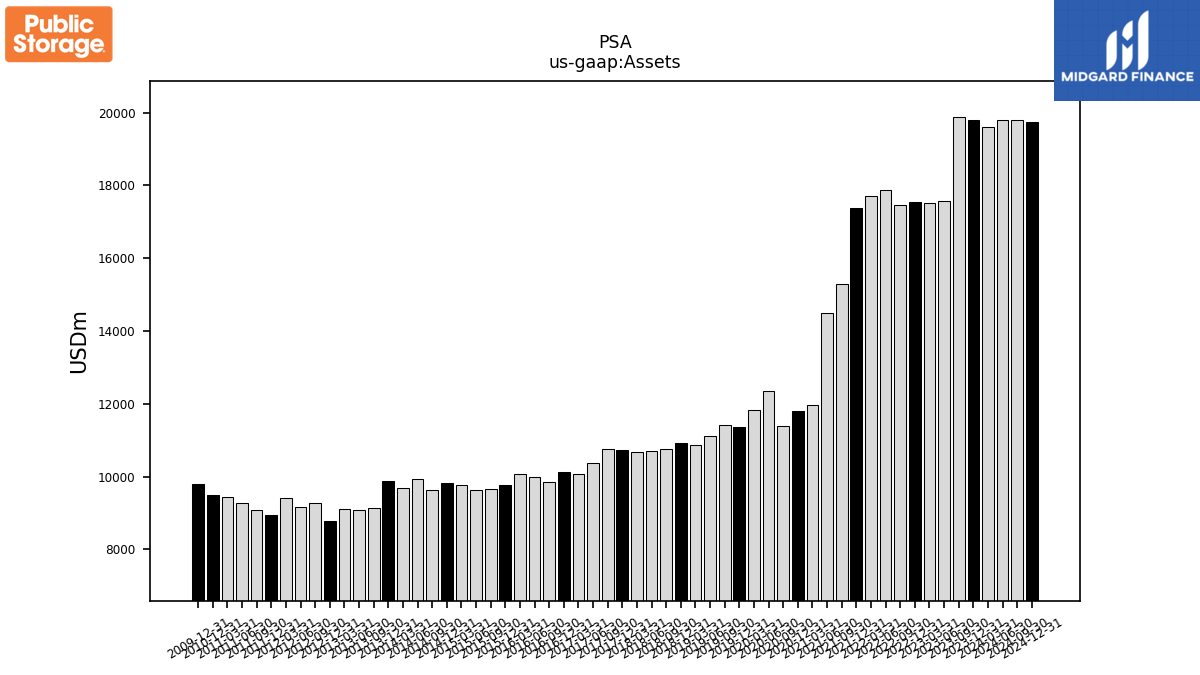
| Assets | 19809.22 | 19875.75 | 17560.33 | 17507.78 | 17552.31 | 17450.92 | 17862.85 | 17698.78 | 17380.91 | 15284.69 | 14490.36 | 11981.74 | 11816.55 | 11385.15 | 12358.06 | 11825.92 | 11365.44 | 11413.86 | 11113.29 | 10875.02 | 10928.27 | 10747.94 | 10692.96 | 10685.52 | 10732.89 | 10765.69 | 10365.73 | 10083.91 | 10130.34 | 9865.77 | 9997.14 | 10064.35 | 9778.23 | 9654.82 | 9634.76 | 9772.02 | 9818.68 | 9624.47 | 9946.46 | 9682.58 | 9876.27 | 9149.94 | 9094.60 | 9101.55 | 8793.40 | 9288.12 | 9178.95 | 9406.31 | 8932.56 | 9085.54 | 9272.34 | 9435.52 | 9495.33 | NA | NA | NA | |
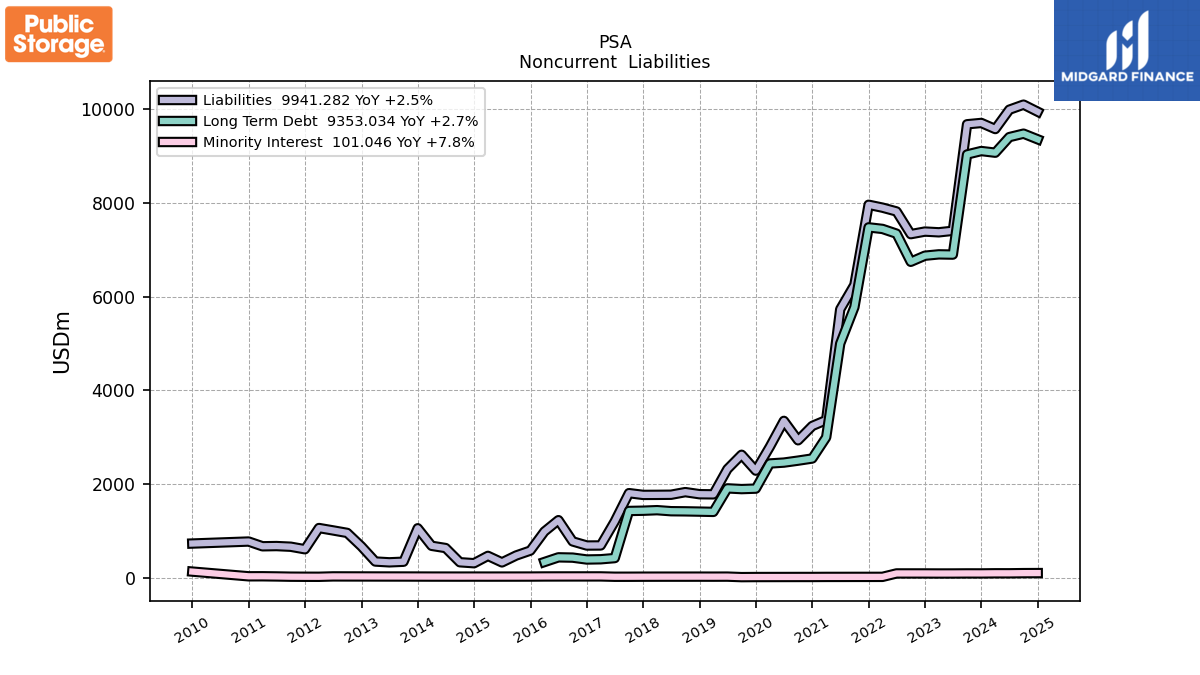
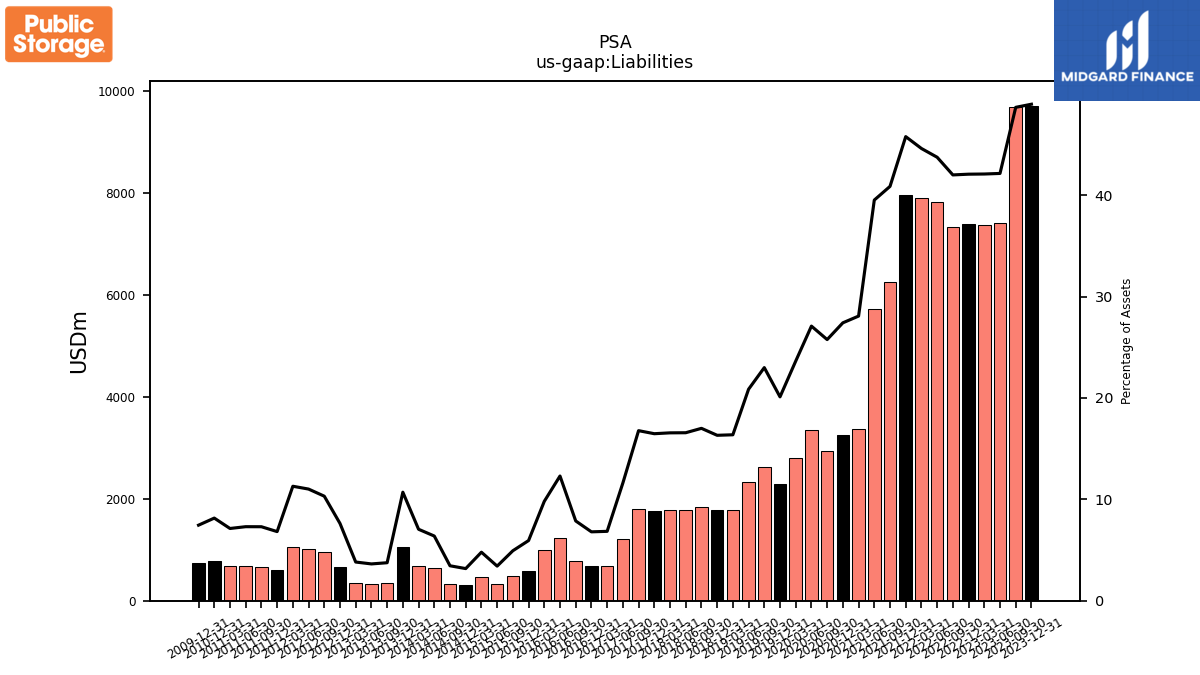
| Liabilities | 9702.27 | 9673.86 | 7401.76 | 7369.73 | 7385.51 | 7330.16 | 7814.50 | 7895.69 | 7957.37 | 6247.39 | 5727.26 | 3364.42 | 3239.65 | 2933.09 | 3347.86 | 2795.71 | 2285.78 | 2624.90 | 2318.78 | 1780.39 | 1783.54 | 1827.92 | 1772.17 | 1769.73 | 1768.52 | 1806.27 | 1203.70 | 690.40 | 688.68 | 776.63 | 1230.10 | 986.83 | 580.59 | 476.21 | 329.10 | 468.10 | 311.50 | 332.09 | 634.97 | 682.76 | 1057.41 | 343.15 | 330.39 | 347.55 | 670.54 | 957.97 | 1011.18 | 1062.38 | 609.28 | 663.31 | 677.39 | 672.65 | 774.19 | NA | NA | NA | |
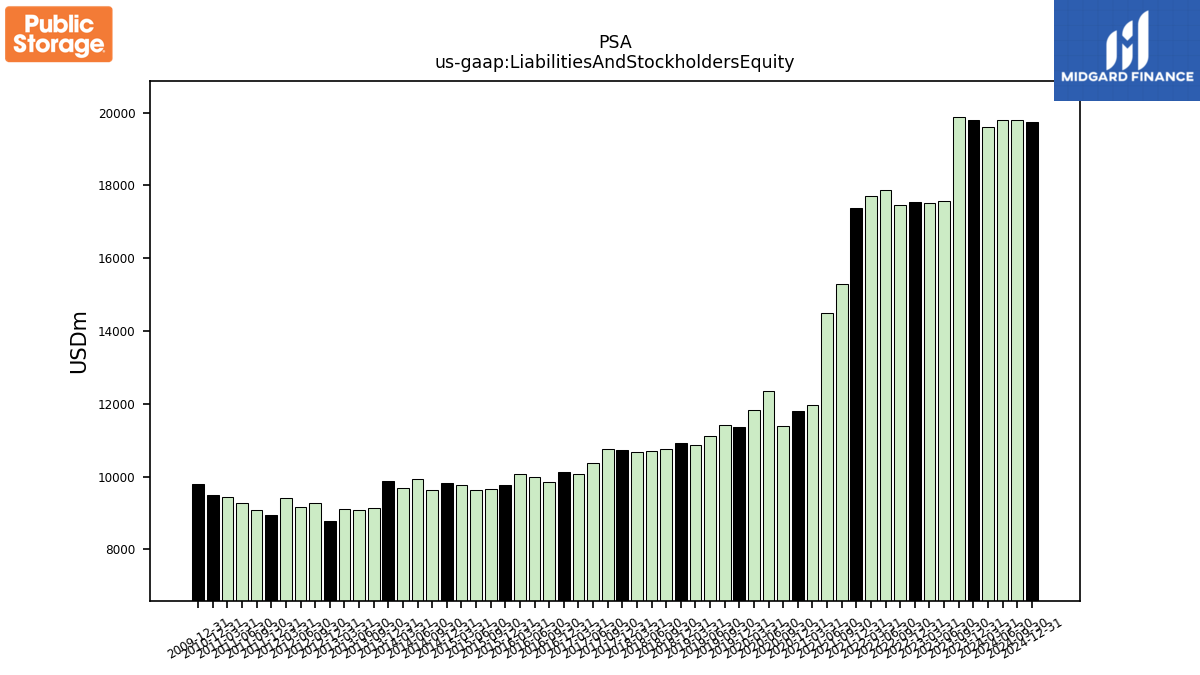
| Liabilities And Stockholders Equity | 19809.22 | 19875.75 | 17560.33 | 17507.78 | 17552.31 | 17450.92 | 17862.85 | 17698.78 | 17380.91 | 15284.69 | 14490.36 | 11981.74 | 11816.55 | 11385.15 | 12358.06 | 11825.92 | 11365.44 | 11413.86 | 11113.29 | 10875.02 | 10928.27 | 10747.94 | 10692.96 | 10685.52 | 10732.89 | 10765.69 | 10365.73 | 10083.91 | 10130.34 | 9865.77 | 9997.14 | 10064.35 | 9778.23 | 9654.82 | 9634.76 | 9772.02 | 9818.68 | 9624.47 | 9946.46 | 9682.58 | 9876.27 | 9149.94 | 9094.60 | 9101.55 | 8793.40 | 9288.12 | 9178.95 | 9406.31 | 8932.56 | 9085.54 | 9272.34 | 9435.52 | 9495.33 | NA | NA | NA | |
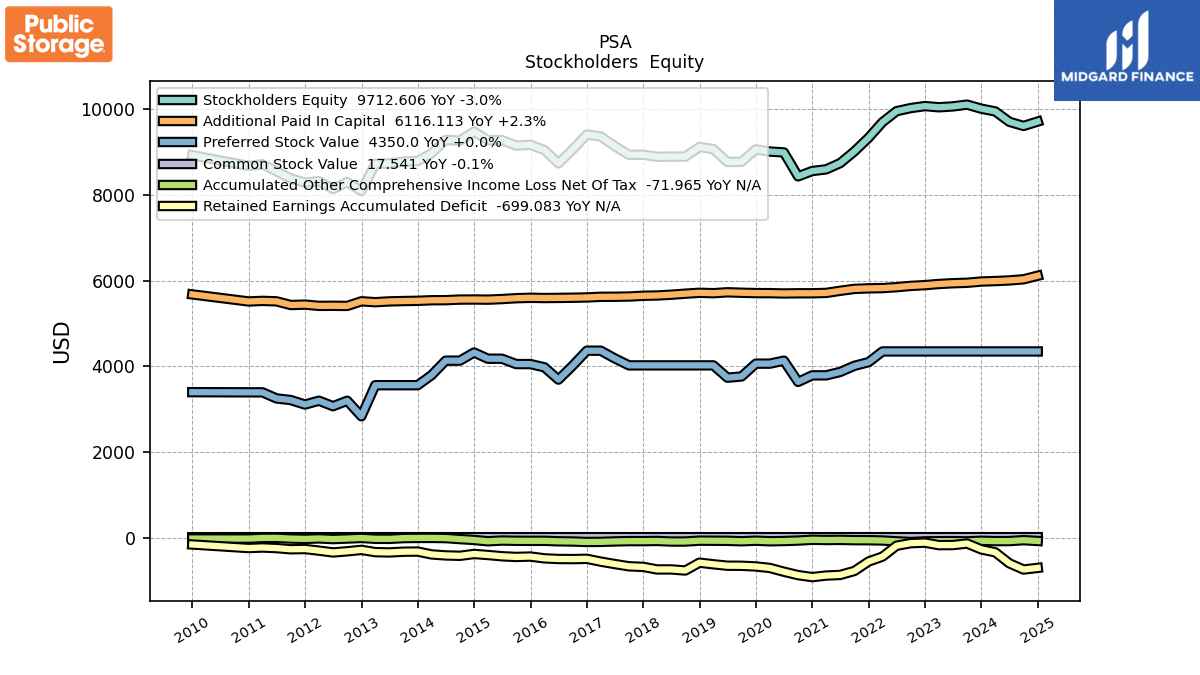
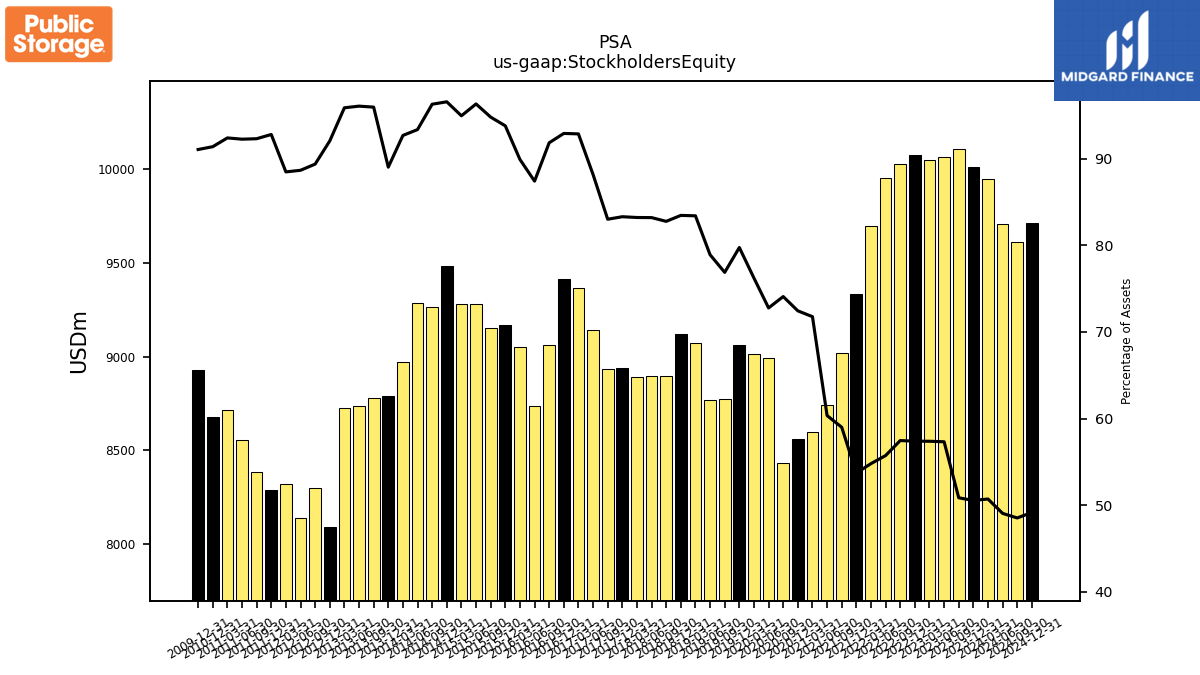
| Stockholders Equity | 10013.18 | 10107.66 | 10065.94 | 10045.71 | 10073.40 | 10027.17 | 9954.73 | 9698.71 | 9335.18 | 9017.35 | 8743.58 | 8597.95 | 8558.87 | 8434.13 | 8992.69 | 9013.08 | 9062.91 | 8774.14 | 8768.93 | 9069.82 | 9119.48 | 8895.09 | 8895.81 | 8891.00 | 8940.01 | 8936.19 | 9139.09 | 9363.51 | 9411.91 | 9059.66 | 8737.75 | 9048.77 | 9170.64 | 9152.12 | 9279.37 | 9277.90 | 9480.80 | 9266.43 | 9285.24 | 8973.40 | 8791.73 | 8778.94 | 8736.11 | 8725.56 | 8093.76 | 8300.63 | 8137.61 | 8321.73 | 8288.21 | 8385.76 | 8553.19 | 8717.57 | 8676.60 | NA | NA | NA |
| 2023-12-31 | 2023-09-30 | 2023-06-30 | 2023-03-31 | 2022-12-31 | 2022-09-30 | 2022-06-30 | 2022-03-31 | 2021-12-31 | 2021-09-30 | 2021-06-30 | 2021-03-31 | 2020-12-31 | 2020-09-30 | 2020-06-30 | 2020-03-31 | 2019-12-31 | 2019-09-30 | 2019-06-30 | 2019-03-31 | 2018-12-31 | 2018-09-30 | 2018-06-30 | 2018-03-31 | 2017-12-31 | 2017-09-30 | 2017-06-30 | 2017-03-31 | 2016-12-31 | 2016-09-30 | 2016-06-30 | 2016-03-31 | 2015-12-31 | 2015-09-30 | 2015-06-30 | 2015-03-31 | 2014-12-31 | 2014-09-30 | 2014-06-30 | 2014-03-31 | 2013-12-31 | 2013-09-30 | 2013-06-30 | 2013-03-31 | 2012-12-31 | 2012-09-30 | 2012-06-30 | 2012-03-31 | 2011-12-31 | 2011-09-30 | 2011-06-30 | 2011-03-31 | 2010-12-31 | 2010-09-30 | 2010-06-30 | 2010-03-31 | ||
|---|---|---|---|---|---|---|---|---|---|---|---|---|---|---|---|---|---|---|---|---|---|---|---|---|---|---|---|---|---|---|---|---|---|---|---|---|---|---|---|---|---|---|---|---|---|---|---|---|---|---|---|---|---|---|---|---|---|
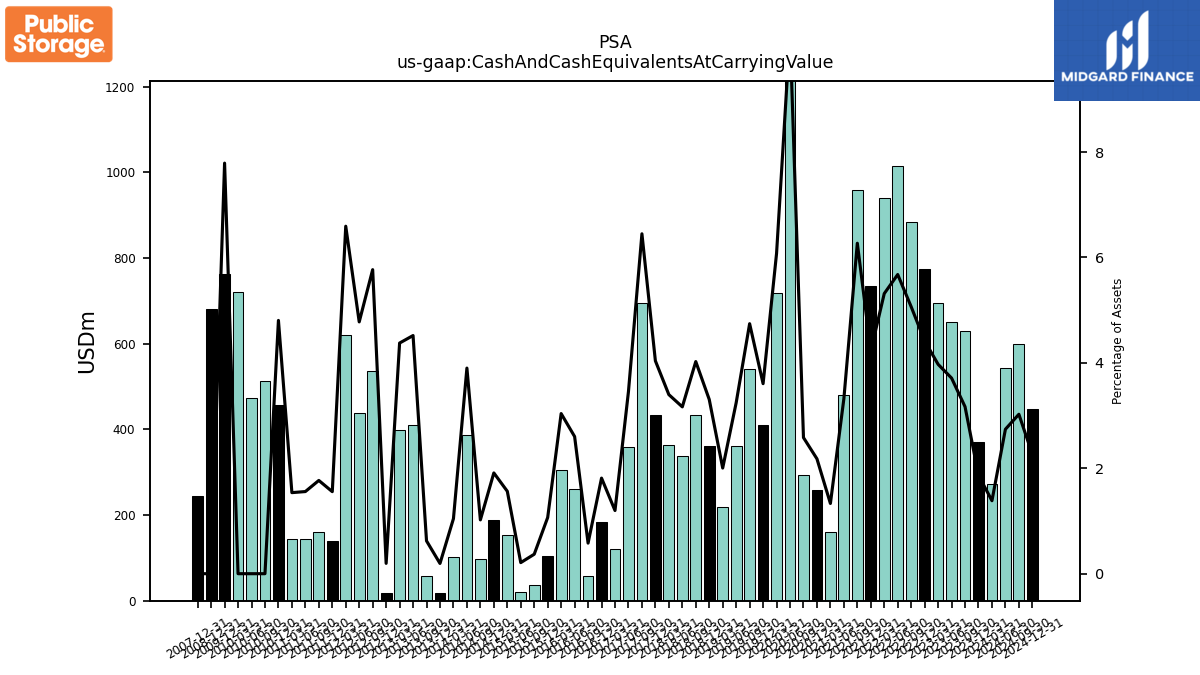
| Cash And Cash Equivalents At Carrying Value | 370.00 | 629.77 | 651.66 | 695.42 | 775.25 | 883.79 | 1013.89 | 940.52 | 734.60 | 958.25 | 480.81 | 159.62 | 257.56 | 293.95 | 1268.47 | 718.43 | 409.74 | 541.36 | 360.33 | 217.97 | 361.22 | 432.52 | 338.42 | 363.03 | 433.38 | 694.23 | 358.27 | 120.86 | 183.69 | 57.21 | 260.12 | 305.70 | 104.28 | 35.67 | 20.26 | 152.80 | 187.71 | 98.25 | 387.98 | 101.11 | 19.17 | 56.97 | 410.91 | 398.25 | 17.24 | 535.75 | 438.48 | 620.08 | 139.01 | 160.73 | 144.49 | 145.10 | 456.25 | 513.48 | 474.34 | 719.98 | |
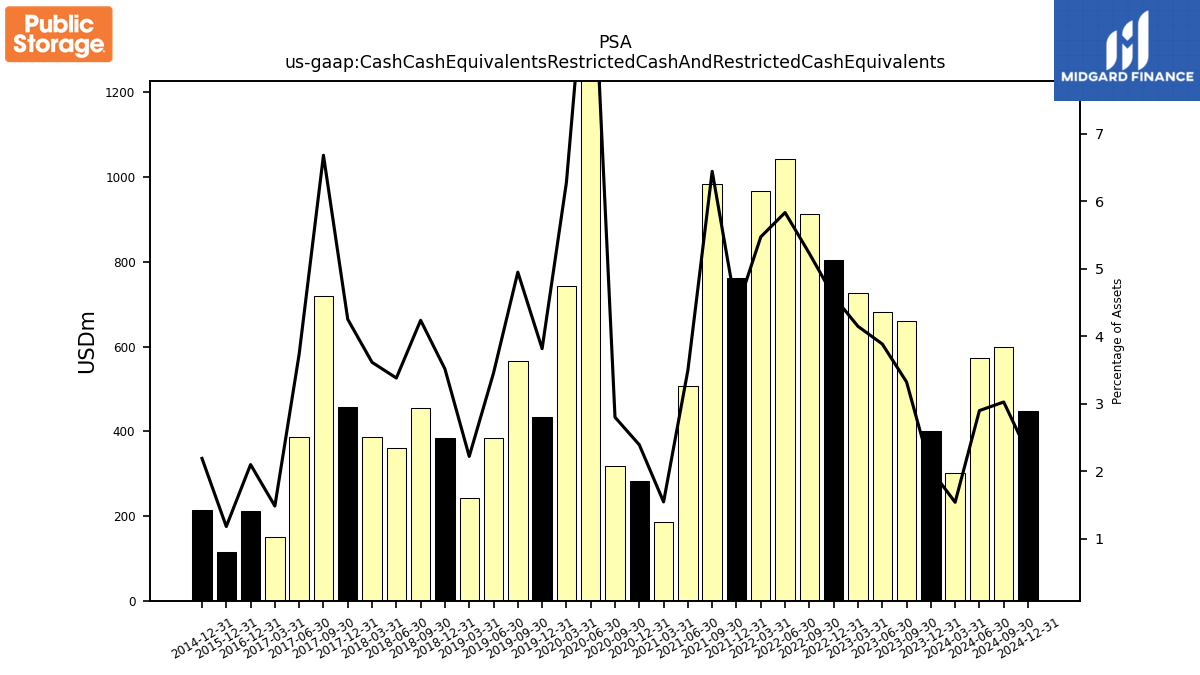
| Cash Cash Equivalents Restricted Cash And Restricted Cash Equivalents | 400.38 | 660.36 | 682.09 | 725.77 | 805.16 | 911.68 | 1041.39 | 967.92 | 761.29 | 984.35 | 506.44 | 185.24 | 282.60 | 318.71 | 1292.94 | 742.13 | 433.55 | 564.69 | 383.83 | 241.40 | 384.02 | 455.11 | 361.43 | 386.00 | 456.05 | 718.96 | 387.12 | 149.76 | 212.57 | NA | NA | NA | 115.56 | NA | NA | NA | 215.01 | NA | NA | NA | NA | NA | NA | NA | NA | NA | NA | NA | NA | NA | NA | NA | NA | NA | NA | NA | |
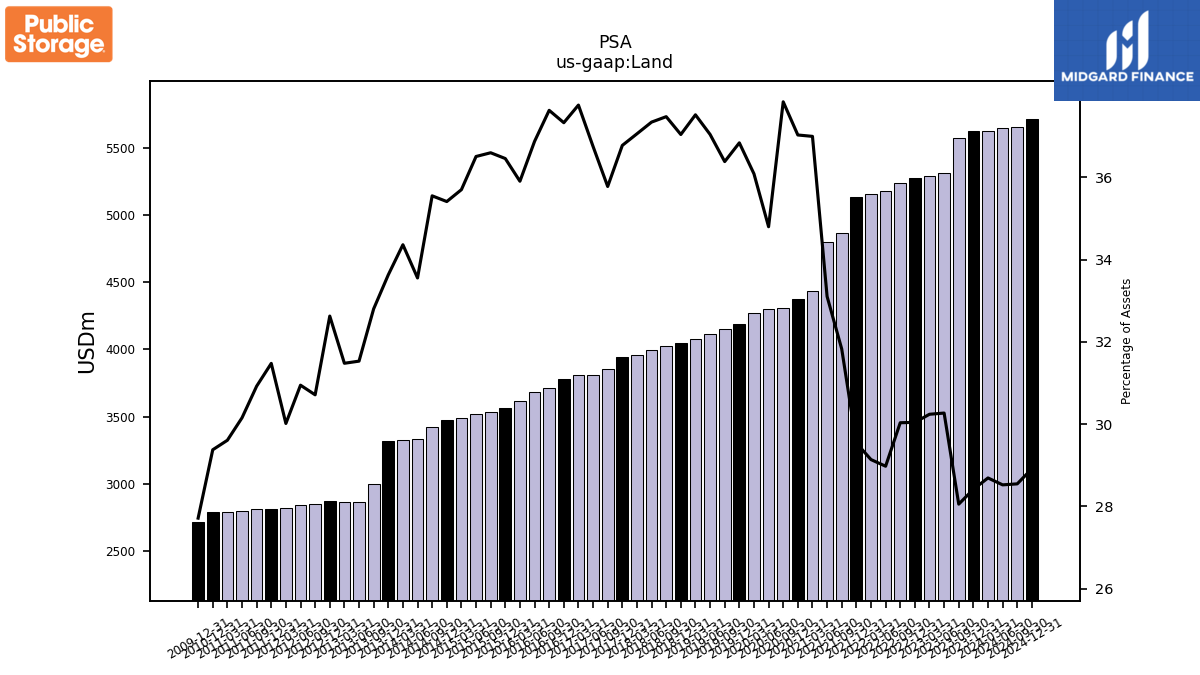
| Land | 5628.49 | 5575.64 | 5315.10 | 5293.99 | 5273.07 | 5240.84 | 5175.74 | 5156.80 | 5134.06 | 4864.52 | 4796.68 | 4432.75 | 4375.59 | 4307.69 | 4300.41 | 4267.47 | 4186.87 | 4152.66 | 4116.72 | 4080.30 | 4047.98 | 4027.76 | 3993.03 | 3959.87 | 3947.12 | 3851.68 | 3809.49 | 3807.34 | 3781.48 | 3712.38 | 3686.29 | 3613.58 | 3564.81 | 3533.39 | 3517.31 | 3488.61 | 3476.88 | 3421.47 | 3337.32 | 3327.01 | 3321.24 | 3001.27 | 2867.52 | 2865.00 | 2868.93 | 2852.48 | 2840.44 | 2823.26 | 2811.51 | 2809.34 | 2795.77 | 2793.49 | 2789.23 | NA | NA | NA |
| 2023-12-31 | 2023-09-30 | 2023-06-30 | 2023-03-31 | 2022-12-31 | 2022-09-30 | 2022-06-30 | 2022-03-31 | 2021-12-31 | 2021-09-30 | 2021-06-30 | 2021-03-31 | 2020-12-31 | 2020-09-30 | 2020-06-30 | 2020-03-31 | 2019-12-31 | 2019-09-30 | 2019-06-30 | 2019-03-31 | 2018-12-31 | 2018-09-30 | 2018-06-30 | 2018-03-31 | 2017-12-31 | 2017-09-30 | 2017-06-30 | 2017-03-31 | 2016-12-31 | 2016-09-30 | 2016-06-30 | 2016-03-31 | 2015-12-31 | 2015-09-30 | 2015-06-30 | 2015-03-31 | 2014-12-31 | 2014-09-30 | 2014-06-30 | 2014-03-31 | 2013-12-31 | 2013-09-30 | 2013-06-30 | 2013-03-31 | 2012-12-31 | 2012-09-30 | 2012-06-30 | 2012-03-31 | 2011-12-31 | 2011-09-30 | 2011-06-30 | 2011-03-31 | 2010-12-31 | 2010-09-30 | 2010-06-30 | 2010-03-31 | ||
|---|---|---|---|---|---|---|---|---|---|---|---|---|---|---|---|---|---|---|---|---|---|---|---|---|---|---|---|---|---|---|---|---|---|---|---|---|---|---|---|---|---|---|---|---|---|---|---|---|---|---|---|---|---|---|---|---|---|
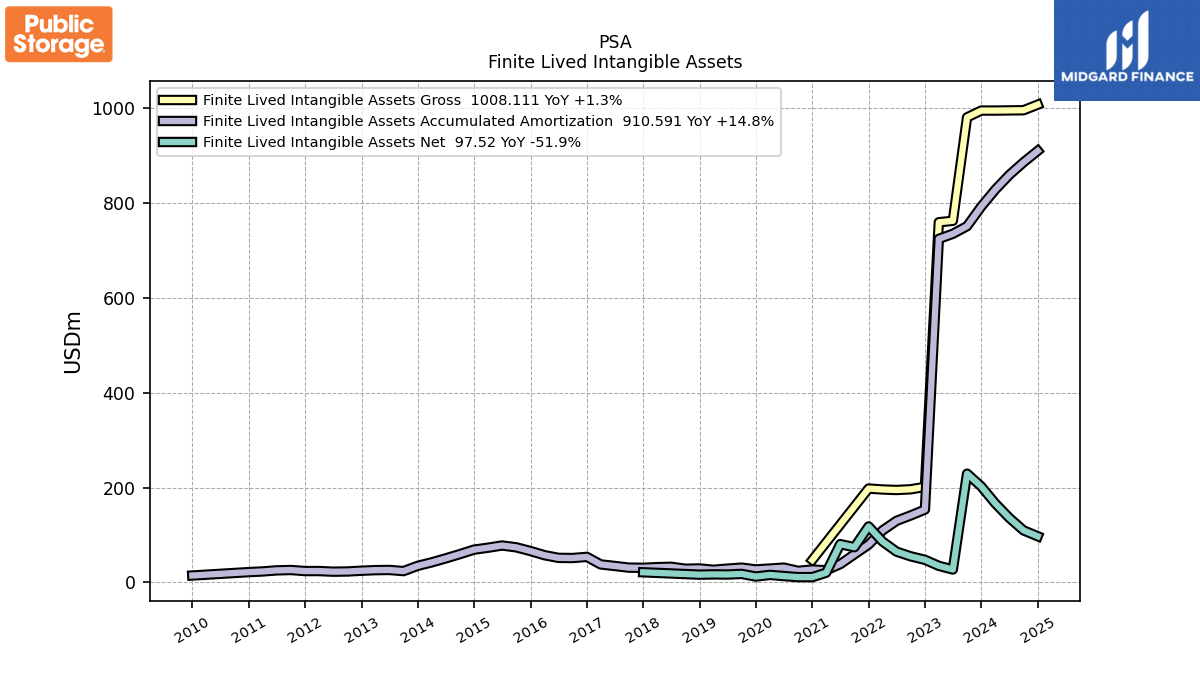
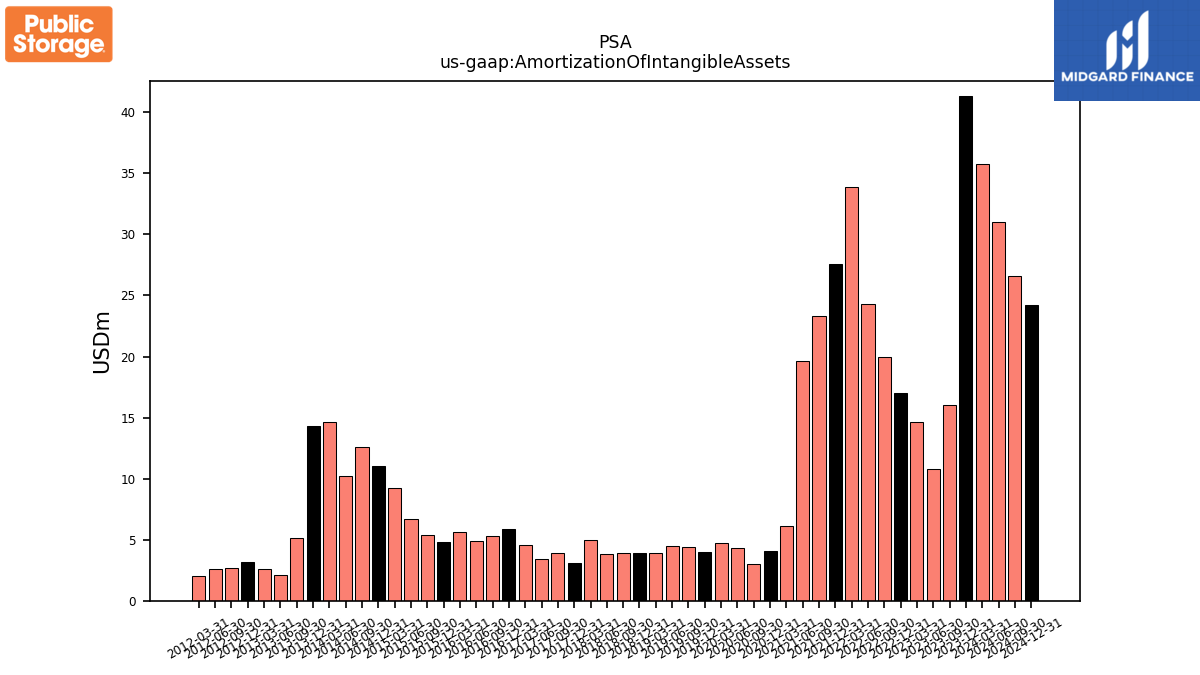
| Amortization Of Intangible Assets | 41.30 | 16.00 | 10.80 | 14.60 | 17.00 | 20.00 | 24.30 | 33.90 | 27.60 | 23.30 | 19.60 | 6.10 | 4.10 | 3.00 | 4.30 | 4.70 | 4.00 | 4.40 | 4.50 | 3.90 | 3.90 | 3.90 | 3.80 | 5.00 | 3.10 | 3.90 | 3.40 | 4.60 | 5.90 | 5.30 | 4.90 | 5.60 | 4.80 | 5.40 | 6.70 | 9.20 | 11.00 | 12.60 | 10.20 | 14.60 | 14.30 | 5.10 | 2.10 | 2.60 | 3.20 | 2.70 | 2.60 | 2.00 | NA | NA | NA | NA | NA | NA | NA | NA | |
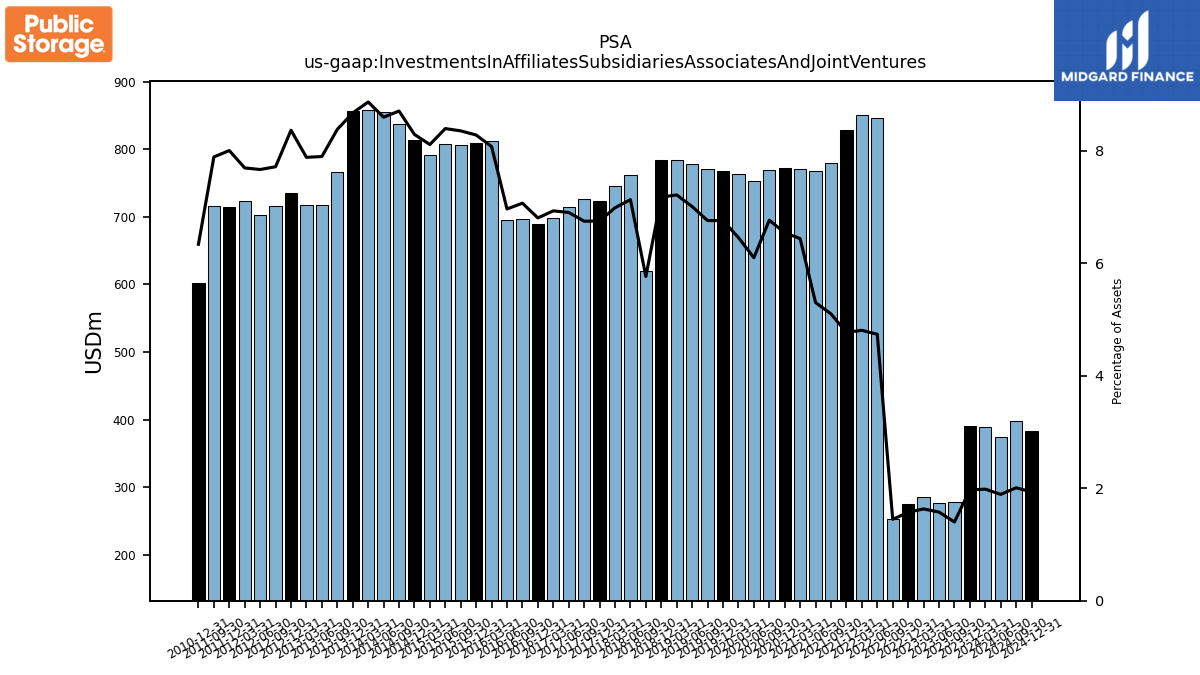
| Investments In Affiliates Subsidiaries Associates And Joint Ventures | 390.18 | 278.13 | 276.78 | 285.69 | 275.75 | 252.65 | 845.89 | 850.65 | 828.76 | 779.27 | 767.91 | 771.08 | 773.05 | 769.92 | 753.36 | 763.23 | 767.82 | 771.17 | 778.52 | 784.31 | 783.99 | 619.40 | 762.25 | 746.25 | 724.17 | 726.17 | 715.27 | 698.70 | 689.21 | 697.04 | 696.07 | 812.41 | 809.31 | 806.20 | 808.46 | 792.28 | 813.74 | 837.62 | 854.76 | 858.22 | 856.18 | 766.49 | 717.94 | 717.26 | 735.32 | 716.40 | 703.46 | 723.53 | 714.63 | 716.59 | NA | NA | 601.57 | NA | NA | NA | |
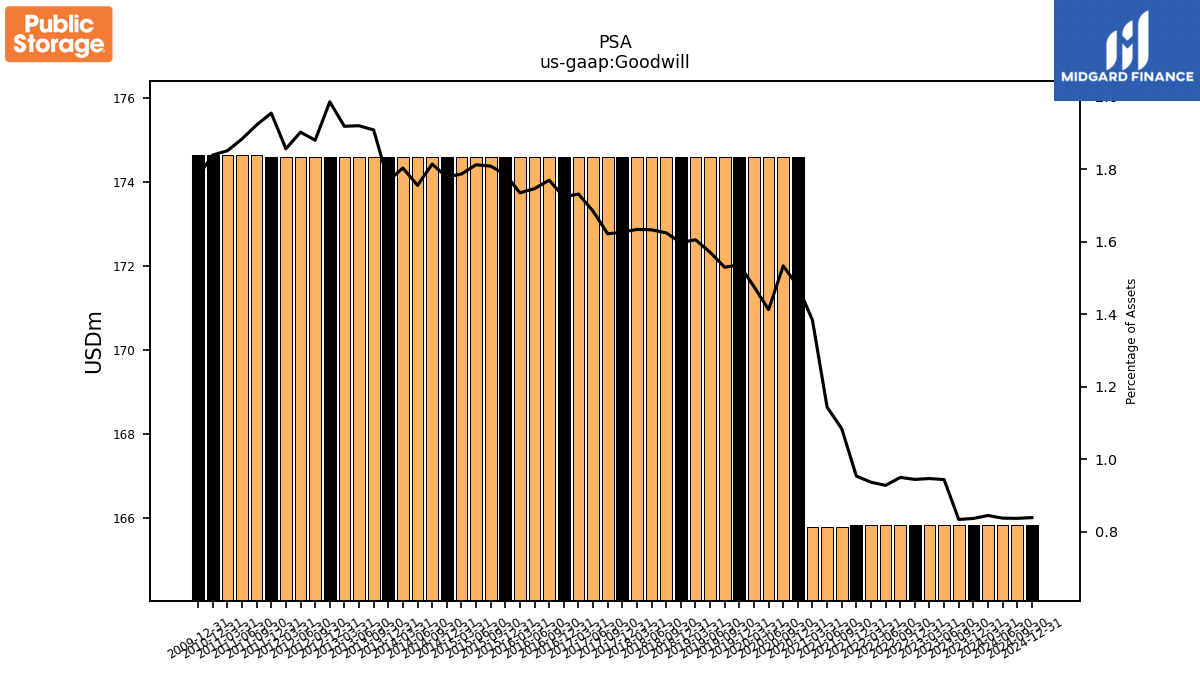
| Goodwill | 165.84 | 165.84 | 165.84 | 165.84 | 165.84 | 165.84 | 165.84 | 165.84 | 165.84 | 165.80 | 165.80 | 165.80 | 174.60 | 174.60 | 174.60 | 174.60 | 174.60 | 174.60 | 174.60 | 174.60 | 174.60 | 174.60 | 174.60 | 174.60 | 174.60 | 174.60 | 174.60 | 174.60 | 174.60 | 174.60 | 174.60 | 174.60 | 174.60 | 174.60 | 174.60 | 174.60 | 174.60 | 174.60 | 174.60 | 174.60 | 174.60 | 174.60 | 174.60 | 174.60 | 174.60 | 174.60 | 174.60 | 174.60 | 174.60 | 174.63 | 174.63 | 174.63 | 174.63 | NA | NA | NA | |
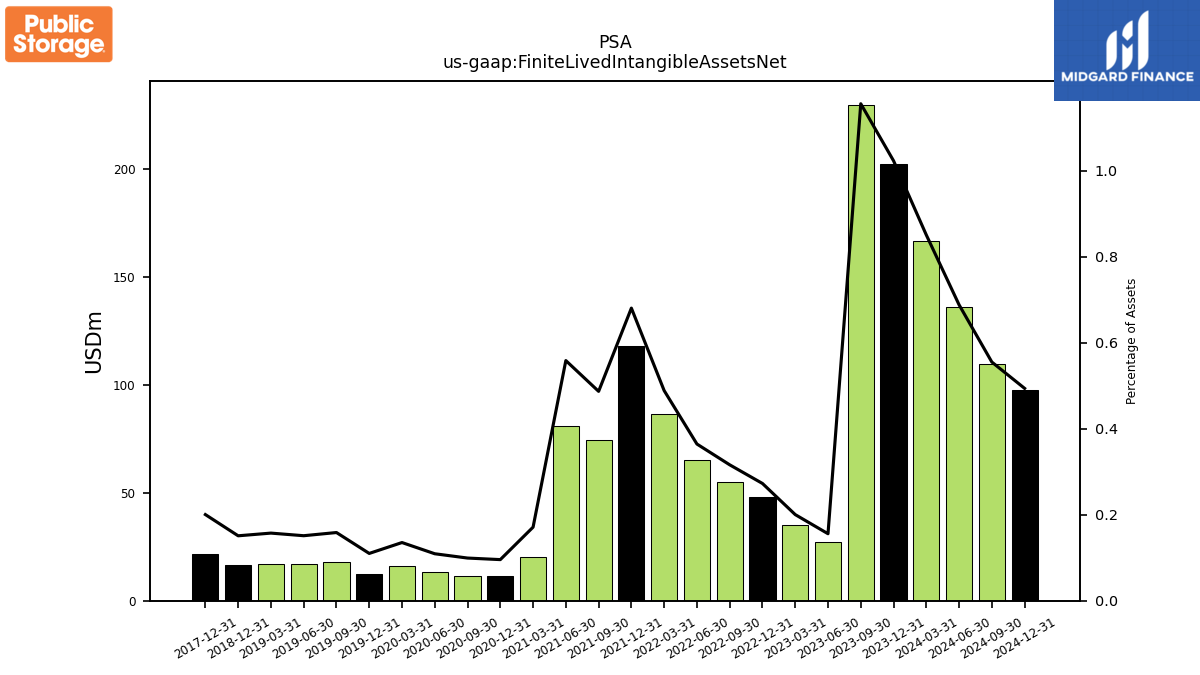
| Finite Lived Intangible Assets Net | 202.60 | 229.62 | 27.36 | 35.06 | 47.85 | 55.14 | 65.08 | 86.46 | 118.23 | 74.40 | 80.90 | 20.50 | 11.30 | 11.30 | 13.50 | 16.00 | 12.50 | 18.10 | 16.80 | 17.10 | 16.50 | NA | NA | NA | 21.50 | NA | NA | NA | NA | NA | NA | NA | NA | NA | NA | NA | NA | NA | NA | NA | NA | NA | NA | NA | NA | NA | NA | NA | NA | NA | NA | NA | NA | NA | NA | NA | |
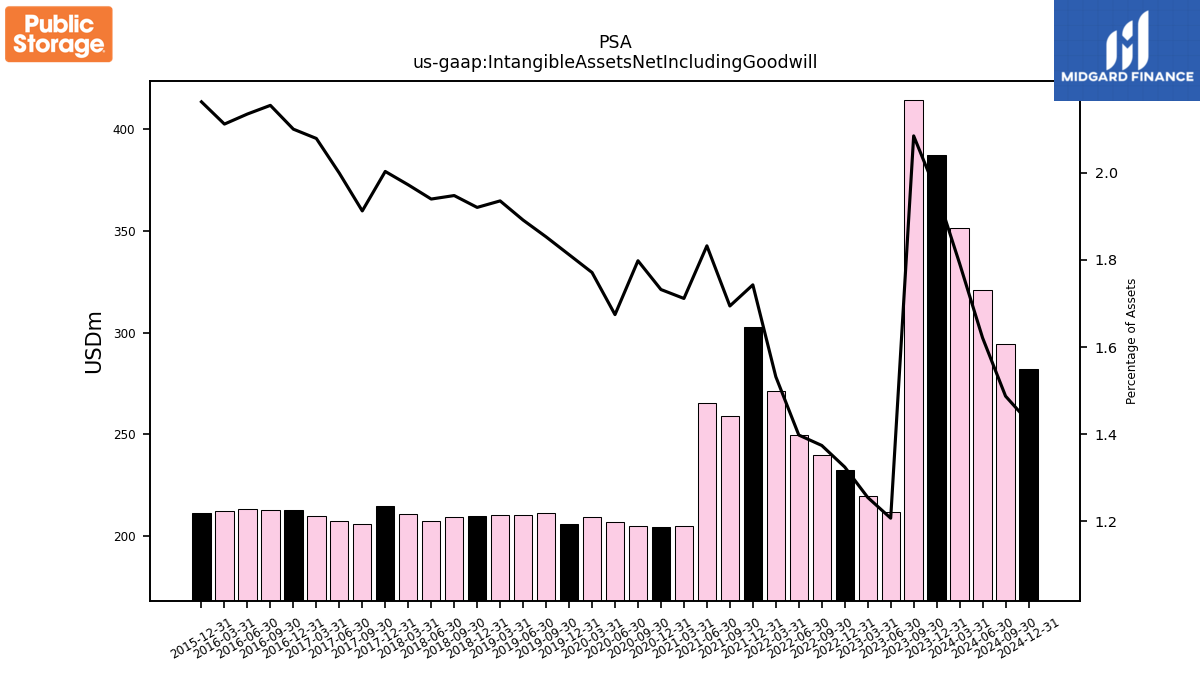
| Intangible Assets Net Including Goodwill | 387.27 | 414.29 | 212.02 | 219.73 | 232.52 | 239.81 | 249.74 | 271.13 | 302.89 | 258.95 | 265.49 | 205.06 | 204.65 | 204.70 | 206.92 | 209.44 | 205.94 | 211.48 | 210.18 | 210.46 | 209.86 | 209.32 | 207.39 | 210.73 | 214.96 | 205.87 | 207.20 | 209.59 | 212.72 | 212.55 | 213.40 | 212.51 | 211.46 | NA | NA | NA | NA | NA | NA | NA | NA | NA | NA | NA | NA | NA | NA | NA | NA | NA | NA | NA | NA | NA | NA | NA |
| 2023-12-31 | 2023-09-30 | 2023-06-30 | 2023-03-31 | 2022-12-31 | 2022-09-30 | 2022-06-30 | 2022-03-31 | 2021-12-31 | 2021-09-30 | 2021-06-30 | 2021-03-31 | 2020-12-31 | 2020-09-30 | 2020-06-30 | 2020-03-31 | 2019-12-31 | 2019-09-30 | 2019-06-30 | 2019-03-31 | 2018-12-31 | 2018-09-30 | 2018-06-30 | 2018-03-31 | 2017-12-31 | 2017-09-30 | 2017-06-30 | 2017-03-31 | 2016-12-31 | 2016-09-30 | 2016-06-30 | 2016-03-31 | 2015-12-31 | 2015-09-30 | 2015-06-30 | 2015-03-31 | 2014-12-31 | 2014-09-30 | 2014-06-30 | 2014-03-31 | 2013-12-31 | 2013-09-30 | 2013-06-30 | 2013-03-31 | 2012-12-31 | 2012-09-30 | 2012-06-30 | 2012-03-31 | 2011-12-31 | 2011-09-30 | 2011-06-30 | 2011-03-31 | 2010-12-31 | 2010-09-30 | 2010-06-30 | 2010-03-31 | ||
|---|---|---|---|---|---|---|---|---|---|---|---|---|---|---|---|---|---|---|---|---|---|---|---|---|---|---|---|---|---|---|---|---|---|---|---|---|---|---|---|---|---|---|---|---|---|---|---|---|---|---|---|---|---|---|---|---|---|
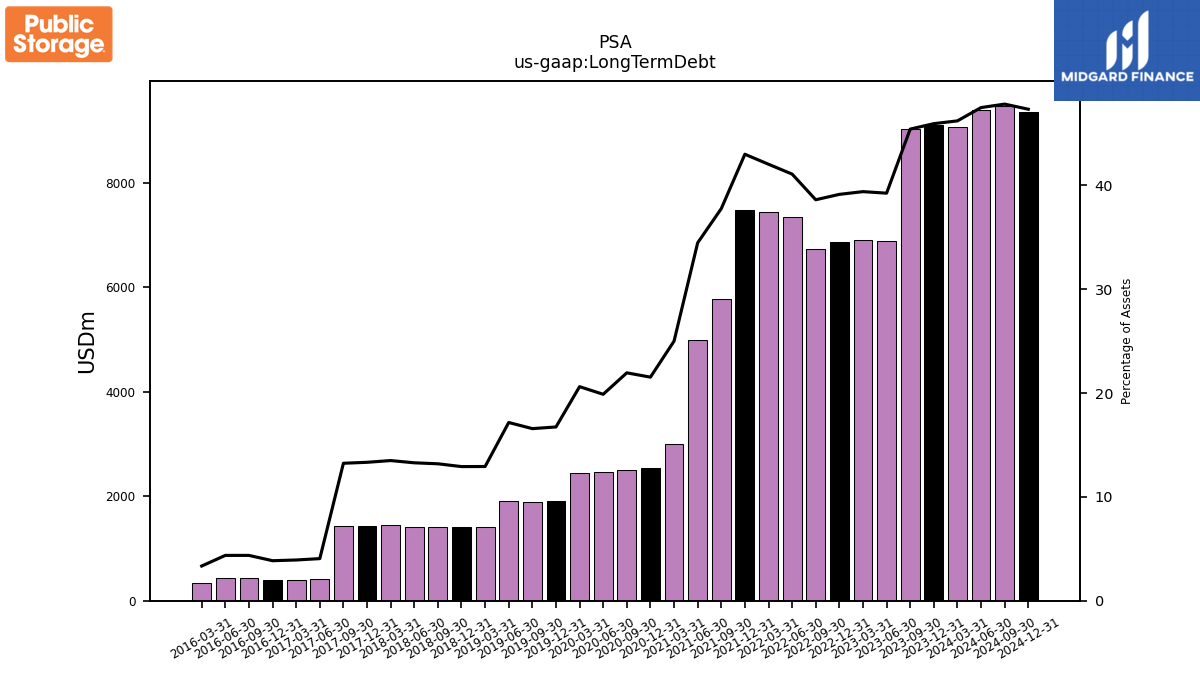
| Long Term Debt | 9103.28 | 9029.62 | 6894.17 | 6899.34 | 6870.83 | 6740.45 | 7340.90 | 7441.72 | 7475.28 | 5773.19 | 4995.62 | 2996.11 | 2544.99 | 2499.57 | 2457.87 | 2438.67 | 1902.49 | 1892.43 | 1908.11 | 1406.15 | 1412.28 | 1417.94 | 1420.83 | 1442.91 | 1431.32 | 1425.85 | 420.78 | 395.86 | 390.75 | 430.89 | 436.83 | 336.66 | NA | NA | NA | NA | NA | NA | NA | NA | NA | NA | NA | NA | NA | NA | NA | NA | NA | NA | NA | NA | NA | NA | NA | NA | |
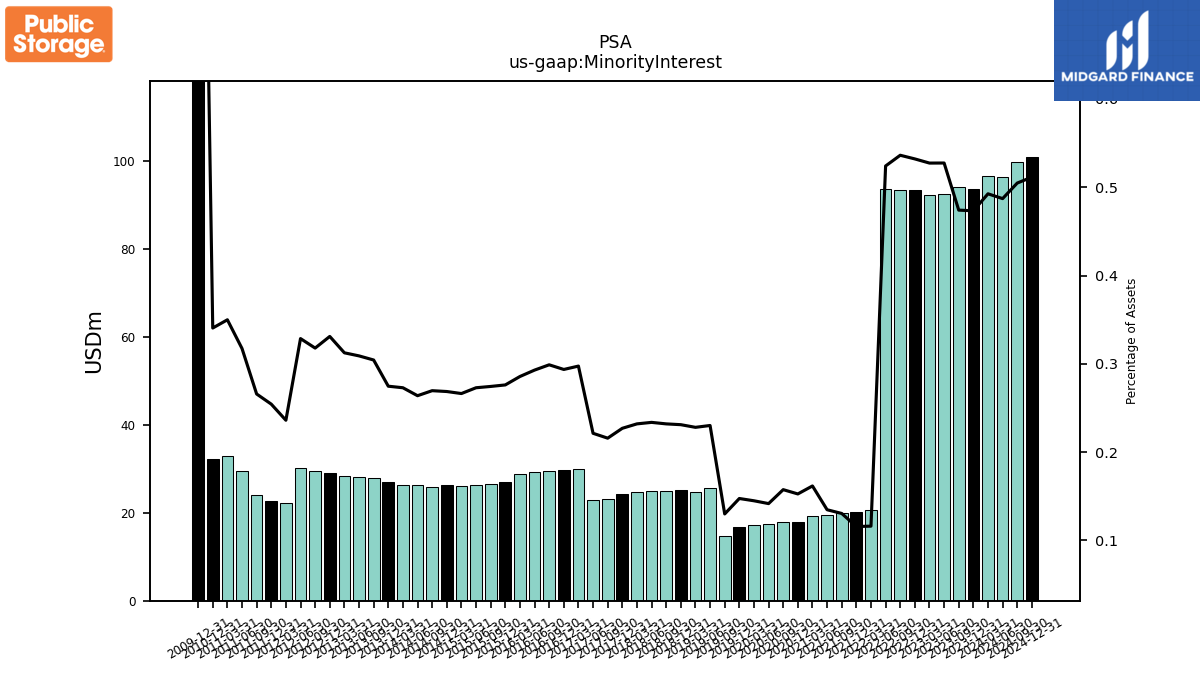
| Minority Interest | 93.77 | 94.23 | 92.63 | 92.34 | 93.40 | 93.58 | 93.62 | 20.55 | 20.11 | 19.94 | 19.52 | 19.37 | 18.03 | 17.93 | 17.51 | 17.13 | 16.76 | 14.83 | 25.58 | 24.80 | 25.25 | 24.93 | 24.99 | 24.79 | 24.36 | 23.23 | 22.94 | 29.99 | 29.74 | 29.49 | 29.28 | 28.75 | 27.00 | 26.49 | 26.29 | 26.03 | 26.38 | 25.95 | 26.25 | 26.42 | 27.12 | 27.84 | 28.10 | 28.44 | 29.11 | 29.52 | 30.16 | 22.21 | 22.72 | 24.15 | 29.43 | 33.01 | 32.34 | NA | NA | NA |
| 2023-12-31 | 2023-09-30 | 2023-06-30 | 2023-03-31 | 2022-12-31 | 2022-09-30 | 2022-06-30 | 2022-03-31 | 2021-12-31 | 2021-09-30 | 2021-06-30 | 2021-03-31 | 2020-12-31 | 2020-09-30 | 2020-06-30 | 2020-03-31 | 2019-12-31 | 2019-09-30 | 2019-06-30 | 2019-03-31 | 2018-12-31 | 2018-09-30 | 2018-06-30 | 2018-03-31 | 2017-12-31 | 2017-09-30 | 2017-06-30 | 2017-03-31 | 2016-12-31 | 2016-09-30 | 2016-06-30 | 2016-03-31 | 2015-12-31 | 2015-09-30 | 2015-06-30 | 2015-03-31 | 2014-12-31 | 2014-09-30 | 2014-06-30 | 2014-03-31 | 2013-12-31 | 2013-09-30 | 2013-06-30 | 2013-03-31 | 2012-12-31 | 2012-09-30 | 2012-06-30 | 2012-03-31 | 2011-12-31 | 2011-09-30 | 2011-06-30 | 2011-03-31 | 2010-12-31 | 2010-09-30 | 2010-06-30 | 2010-03-31 | ||
|---|---|---|---|---|---|---|---|---|---|---|---|---|---|---|---|---|---|---|---|---|---|---|---|---|---|---|---|---|---|---|---|---|---|---|---|---|---|---|---|---|---|---|---|---|---|---|---|---|---|---|---|---|---|---|---|---|---|
| Stockholders Equity | 10013.18 | 10107.66 | 10065.94 | 10045.71 | 10073.40 | 10027.17 | 9954.73 | 9698.71 | 9335.18 | 9017.35 | 8743.58 | 8597.95 | 8558.87 | 8434.13 | 8992.69 | 9013.08 | 9062.91 | 8774.14 | 8768.93 | 9069.82 | 9119.48 | 8895.09 | 8895.81 | 8891.00 | 8940.01 | 8936.19 | 9139.09 | 9363.51 | 9411.91 | 9059.66 | 8737.75 | 9048.77 | 9170.64 | 9152.12 | 9279.37 | 9277.90 | 9480.80 | 9266.43 | 9285.24 | 8973.40 | 8791.73 | 8778.94 | 8736.11 | 8725.56 | 8093.76 | 8300.63 | 8137.61 | 8321.73 | 8288.21 | 8385.76 | 8553.19 | 8717.57 | 8676.60 | NA | NA | NA | |
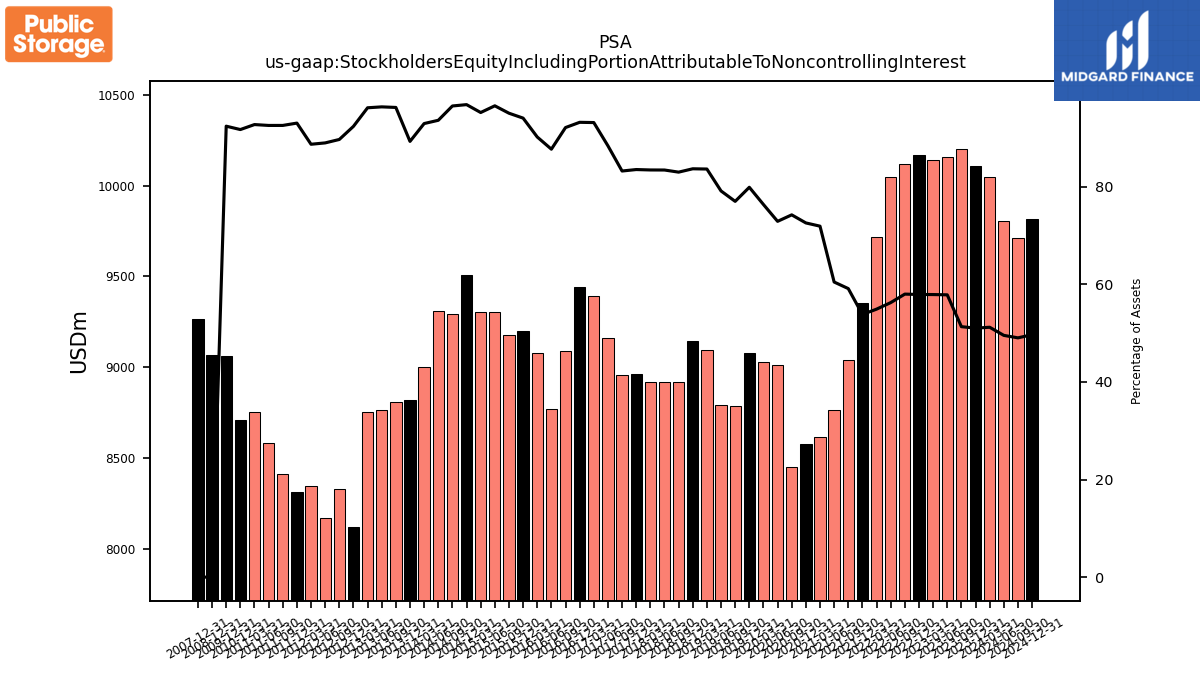
| Stockholders Equity Including Portion Attributable To Noncontrolling Interest | 10106.95 | 10201.89 | 10158.57 | 10138.05 | 10166.80 | 10120.76 | 10048.35 | 9719.26 | 9355.29 | 9037.30 | 8763.10 | 8617.32 | 8576.90 | 8452.05 | 9010.20 | 9030.21 | 9079.67 | 8788.96 | 8794.51 | 9094.62 | 9144.73 | 8920.02 | 8920.79 | 8915.79 | 8964.37 | 8959.42 | 9162.03 | 9393.51 | 9441.65 | 9089.14 | 8767.03 | 9077.51 | 9197.64 | 9178.61 | 9305.66 | 9303.92 | 9507.17 | 9292.38 | 9311.49 | 8999.82 | 8818.85 | 8806.79 | 8764.21 | 8754.00 | 8122.86 | 8330.15 | 8167.77 | 8343.93 | 8310.93 | 8409.91 | 8582.62 | 8750.58 | 8708.93 | NA | NA | NA | |
| Common Stock Value | 17.57 | 17.55 | 17.55 | 17.55 | 17.53 | 17.53 | 17.52 | 17.52 | 17.51 | 17.50 | 17.49 | 17.46 | 17.46 | 17.45 | 17.45 | 17.45 | 17.44 | 17.44 | 17.43 | 17.42 | 17.41 | 17.41 | 17.39 | 17.39 | 17.39 | 17.37 | 17.37 | 17.35 | 17.33 | 17.31 | 17.31 | 17.31 | 17.29 | 17.29 | 17.27 | 17.26 | 17.25 | 17.24 | 17.23 | 17.22 | 17.18 | 17.18 | 17.17 | 17.15 | 17.14 | 17.06 | 17.05 | 17.05 | 17.02 | 17.00 | 16.95 | 16.95 | 16.93 | NA | NA | NA | |
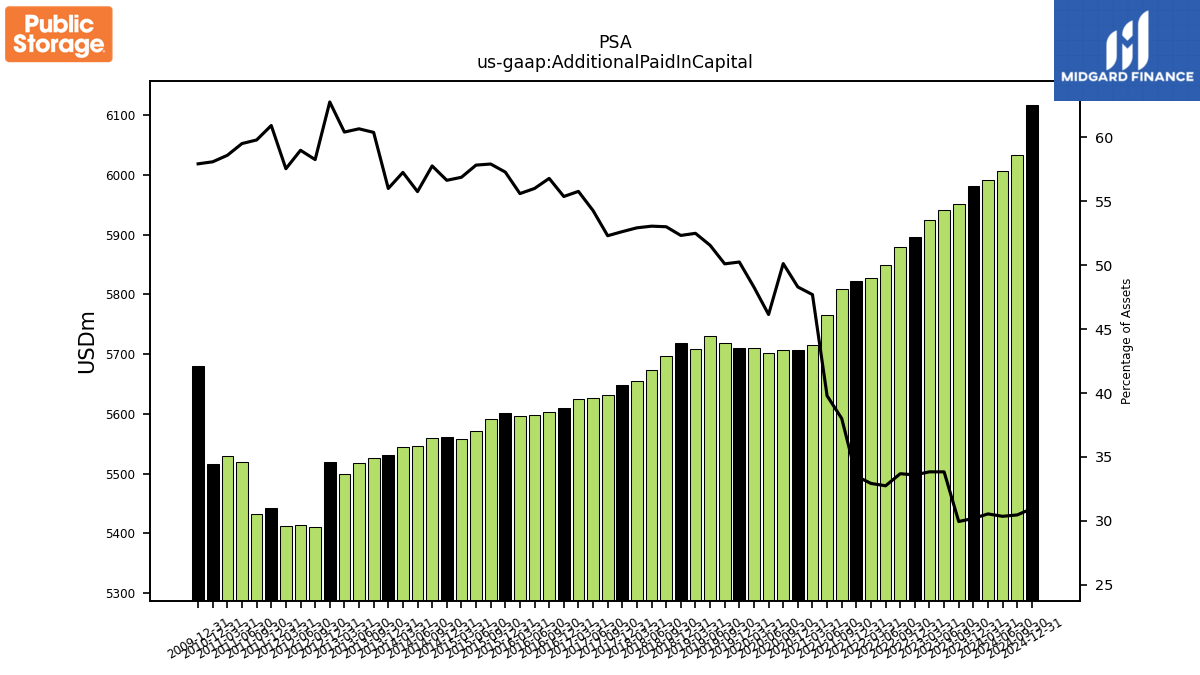
| Additional Paid In Capital | 5980.76 | 5951.79 | 5940.94 | 5923.56 | 5896.42 | 5878.74 | 5848.63 | 5827.67 | 5821.67 | 5808.94 | 5764.67 | 5715.25 | 5707.10 | 5706.97 | 5702.47 | 5709.86 | 5710.93 | 5719.18 | 5729.94 | 5708.70 | 5718.48 | 5697.31 | 5673.08 | 5655.27 | 5648.40 | 5631.05 | 5625.78 | 5624.36 | 5609.77 | 5602.83 | 5598.85 | 5596.09 | 5601.51 | 5591.66 | 5571.90 | 5558.11 | 5561.53 | 5559.75 | 5545.95 | 5544.20 | 5531.03 | 5525.64 | 5517.74 | 5498.78 | 5519.60 | 5411.62 | 5414.68 | 5413.15 | 5442.51 | 5432.93 | 5518.74 | 5529.23 | 5515.83 | NA | NA | NA | |
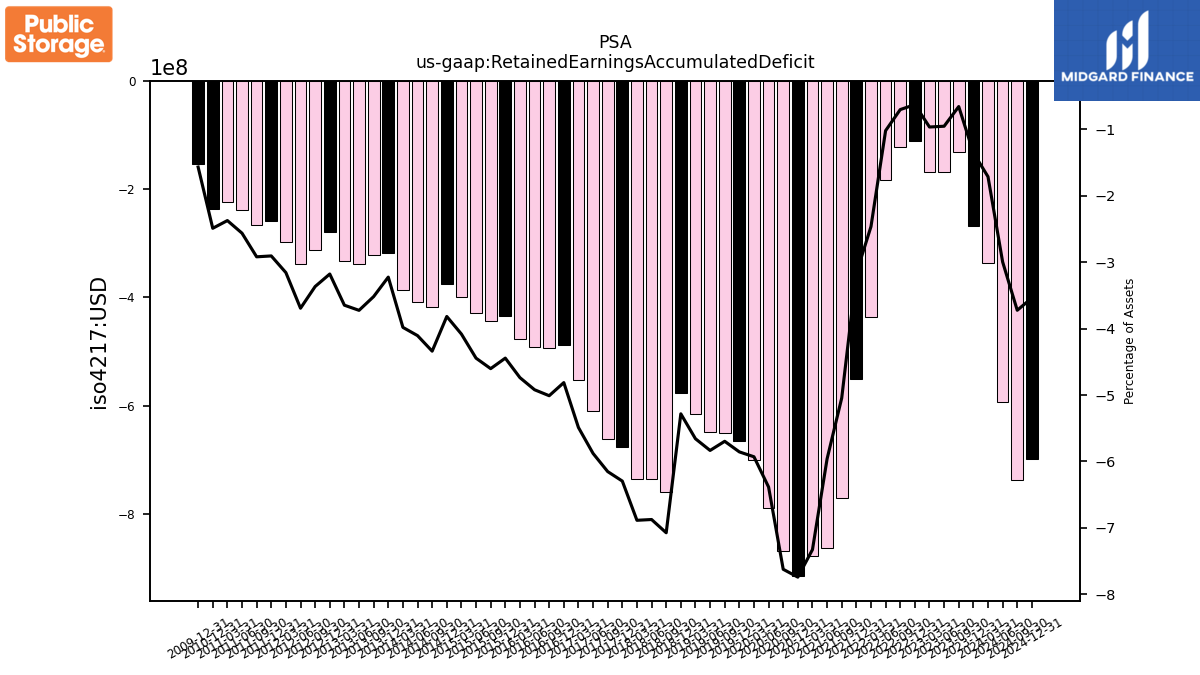
| Retained Earnings Accumulated Deficit | -267.91 | -130.58 | -167.40 | -168.95 | -110.23 | -122.63 | -182.21 | -436.10 | -550.42 | -771.11 | -863.74 | -877.93 | -914.79 | -867.95 | -789.09 | -701.23 | -665.58 | -650.22 | -648.39 | -615.33 | -577.36 | -760.28 | -735.07 | -735.81 | -675.71 | -662.36 | -609.42 | -553.47 | -487.58 | -494.32 | -491.91 | -476.86 | -434.61 | -444.39 | -428.27 | -398.90 | -374.82 | -417.66 | -408.38 | -385.51 | -318.48 | -321.89 | -338.79 | -331.98 | -279.47 | -312.69 | -339.02 | -296.97 | -259.58 | -265.23 | -237.69 | -223.96 | -236.41 | NA | NA | NA | |
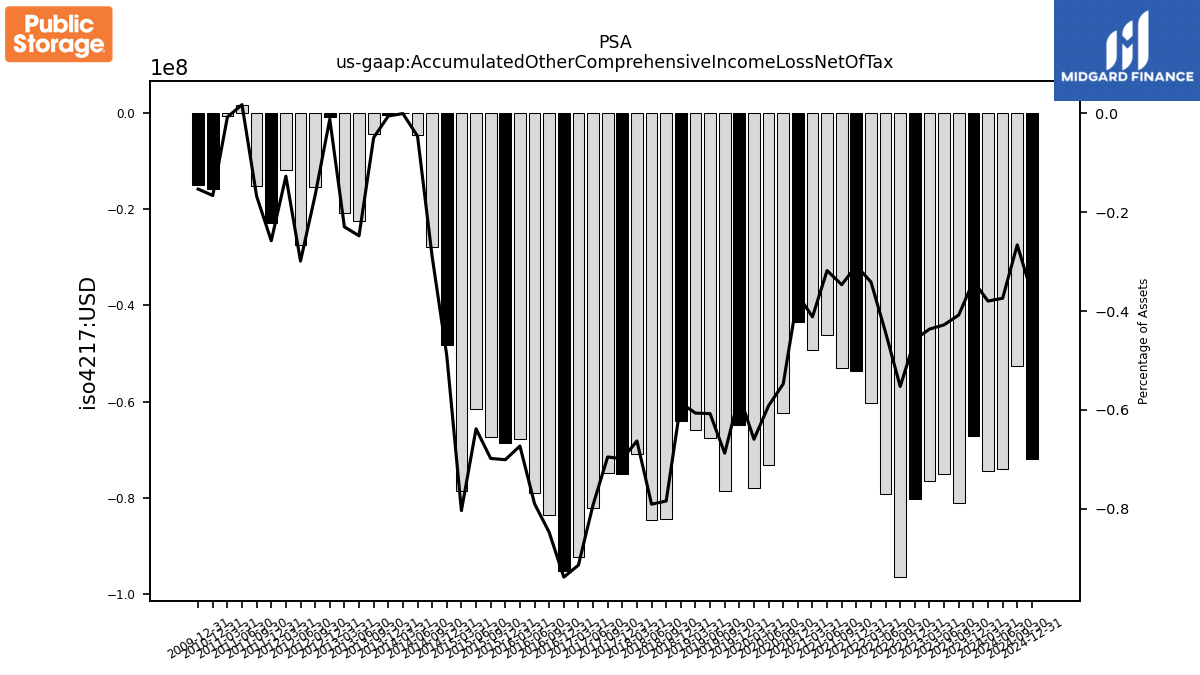
| Accumulated Other Comprehensive Income Loss Net Of Tax | -67.24 | -81.10 | -75.15 | -76.45 | -80.32 | -96.47 | -79.22 | -60.38 | -53.59 | -52.98 | -46.08 | -49.34 | -43.40 | -62.34 | -73.14 | -78.00 | -64.89 | -78.51 | -67.55 | -65.97 | -64.06 | -84.34 | -84.60 | -70.85 | -75.06 | -74.87 | -82.14 | -92.22 | -95.11 | -83.67 | -78.99 | -67.77 | -68.55 | -67.44 | -61.52 | -78.57 | -48.16 | -27.89 | -4.57 | -0.01 | -0.50 | -4.48 | -22.52 | -20.89 | -1.00 | -15.37 | -27.43 | -11.95 | -23.01 | -15.22 | 1.67 | -0.68 | -15.77 | NA | NA | NA | |
| Minority Interest | 93.77 | 94.23 | 92.63 | 92.34 | 93.40 | 93.58 | 93.62 | 20.55 | 20.11 | 19.94 | 19.52 | 19.37 | 18.03 | 17.93 | 17.51 | 17.13 | 16.76 | 14.83 | 25.58 | 24.80 | 25.25 | 24.93 | 24.99 | 24.79 | 24.36 | 23.23 | 22.94 | 29.99 | 29.74 | 29.49 | 29.28 | 28.75 | 27.00 | 26.49 | 26.29 | 26.03 | 26.38 | 25.95 | 26.25 | 26.42 | 27.12 | 27.84 | 28.10 | 28.44 | 29.11 | 29.52 | 30.16 | 22.21 | 22.72 | 24.15 | 29.43 | 33.01 | 32.34 | NA | NA | NA | |
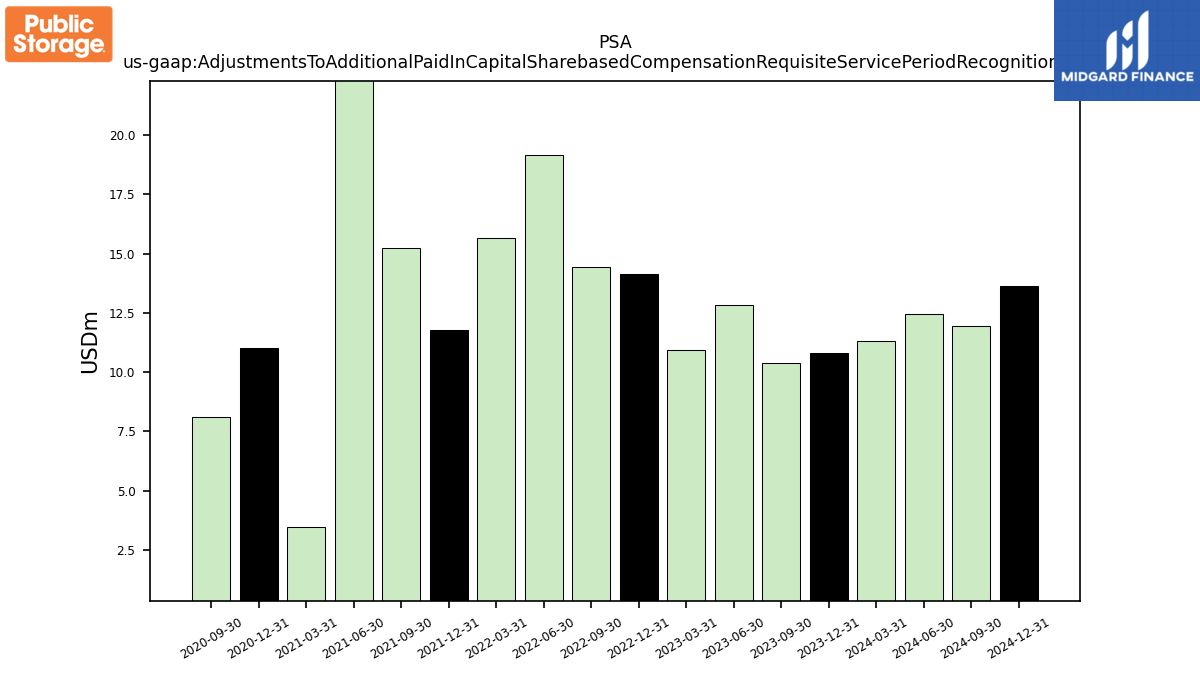
| Adjustments To Additional Paid In Capital Sharebased Compensation Requisite Service Period Recognition Value | 10.80 | 10.39 | 12.84 | 10.91 | 14.12 | 14.44 | 19.14 | 15.65 | 11.79 | 15.25 | 23.96 | 3.49 | 11.01 | 8.12 | NA | NA | NA | NA | NA | NA | NA | NA | NA | NA | NA | NA | NA | NA | NA | NA | NA | NA | NA | NA | NA | NA | NA | NA | NA | NA | NA | NA | NA | NA | NA | NA | NA | NA | NA | NA | NA | NA | NA | NA | NA | NA | |
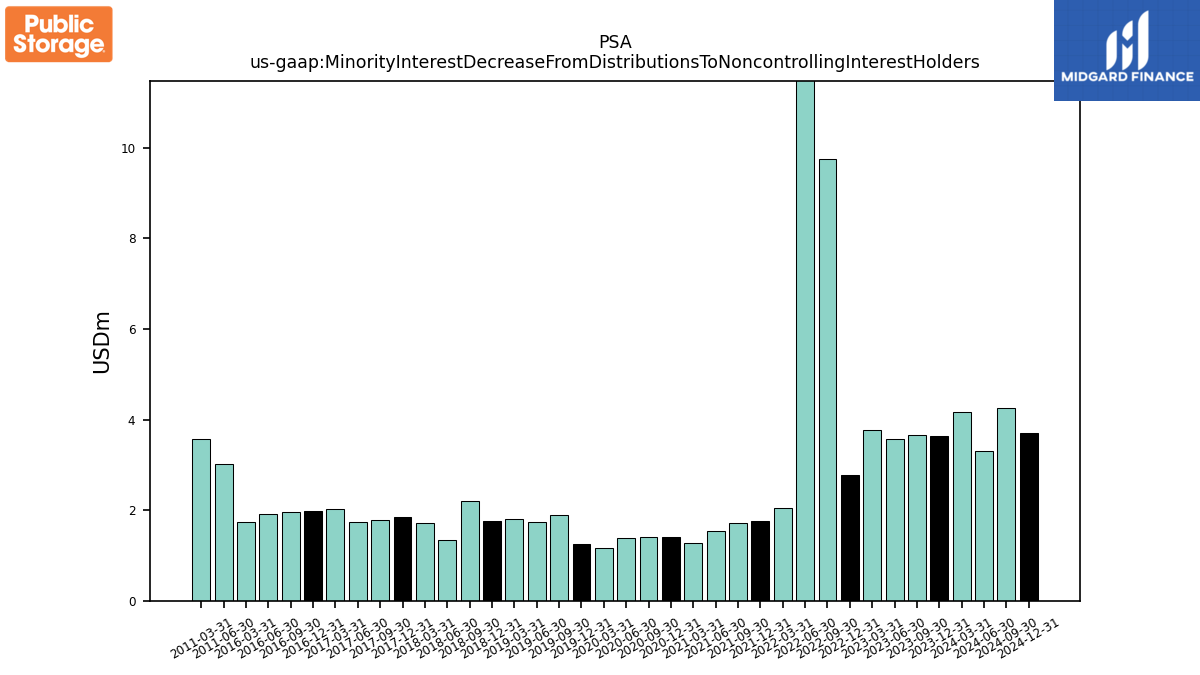
| Minority Interest Decrease From Distributions To Noncontrolling Interest Holders | 3.63 | 3.65 | 3.58 | 3.77 | 2.77 | 9.76 | 19.14 | 2.05 | 1.76 | 1.71 | 1.54 | 1.27 | 1.40 | 1.42 | 1.38 | 1.17 | 1.25 | 1.89 | 1.73 | 1.80 | 1.76 | 2.21 | 1.34 | 1.72 | 1.85 | 1.79 | 1.73 | 2.02 | 1.98 | 1.97 | 1.91 | 1.73 | NA | NA | NA | NA | NA | NA | NA | NA | NA | NA | NA | NA | NA | NA | NA | NA | NA | NA | 3.02 | 3.56 | NA | NA | NA | NA |
| 2023-12-31 | 2023-09-30 | 2023-06-30 | 2023-03-31 | 2022-12-31 | 2022-09-30 | 2022-06-30 | 2022-03-31 | 2021-12-31 | 2021-09-30 | 2021-06-30 | 2021-03-31 | 2020-12-31 | 2020-09-30 | 2020-06-30 | 2020-03-31 | 2019-12-31 | 2019-09-30 | 2019-06-30 | 2019-03-31 | 2018-12-31 | 2018-09-30 | 2018-06-30 | 2018-03-31 | 2017-12-31 | 2017-09-30 | 2017-06-30 | 2017-03-31 | 2016-12-31 | 2016-09-30 | 2016-06-30 | 2016-03-31 | 2015-12-31 | 2015-09-30 | 2015-06-30 | 2015-03-31 | 2014-12-31 | 2014-09-30 | 2014-06-30 | 2014-03-31 | 2013-12-31 | 2013-09-30 | 2013-06-30 | 2013-03-31 | 2012-12-31 | 2012-09-30 | 2012-06-30 | 2012-03-31 | 2011-12-31 | 2011-09-30 | 2011-06-30 | 2011-03-31 | 2010-12-31 | 2010-09-30 | 2010-06-30 | 2010-03-31 | ||
|---|---|---|---|---|---|---|---|---|---|---|---|---|---|---|---|---|---|---|---|---|---|---|---|---|---|---|---|---|---|---|---|---|---|---|---|---|---|---|---|---|---|---|---|---|---|---|---|---|---|---|---|---|---|---|---|---|---|
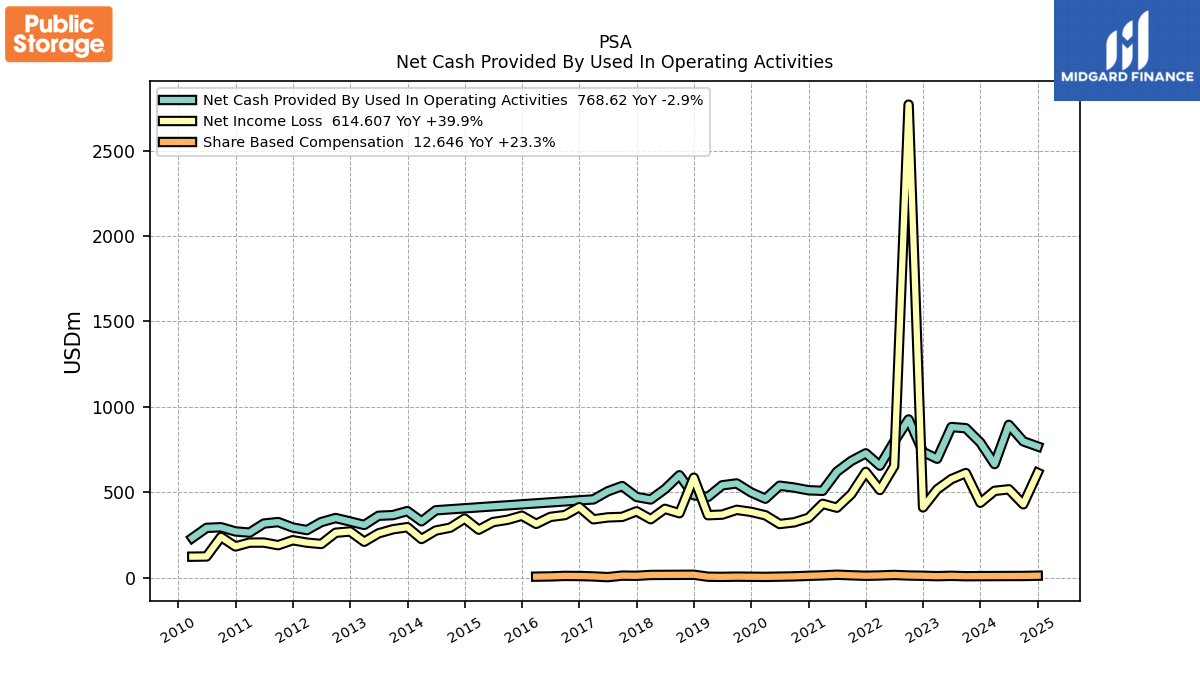
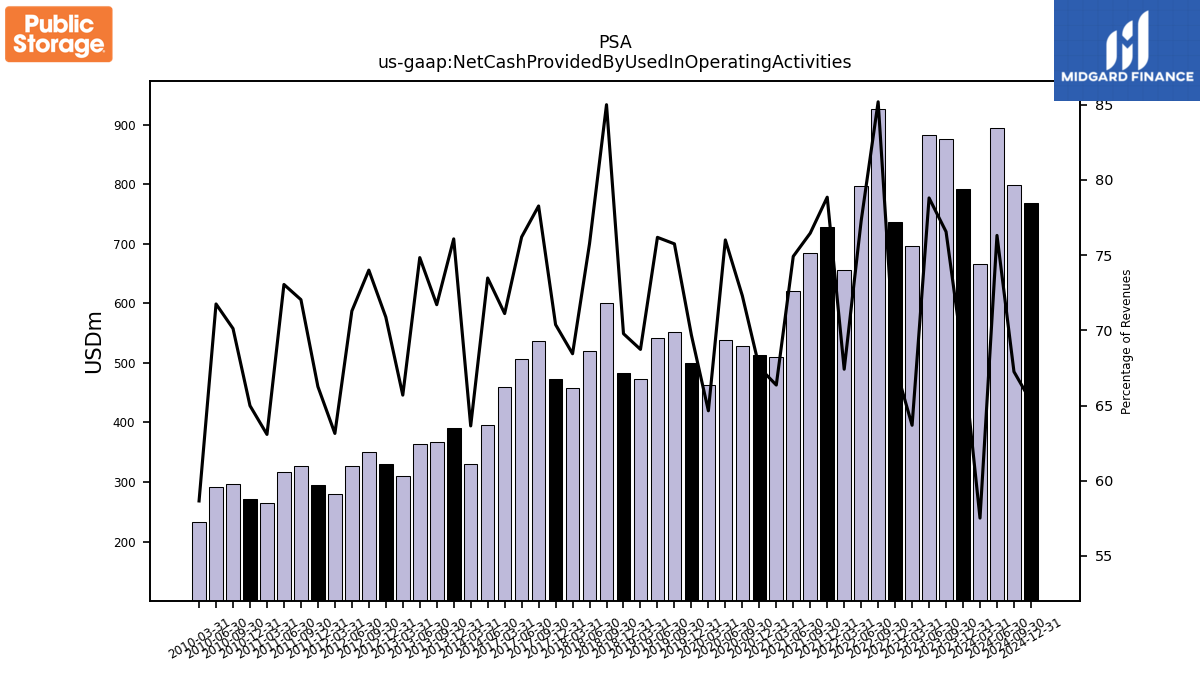
| Net Cash Provided By Used In Operating Activities | 791.68 | 875.67 | 882.40 | 696.89 | 736.35 | 927.02 | 797.53 | 656.24 | 728.84 | 684.26 | 621.29 | 509.16 | 512.56 | 528.27 | 539.12 | 462.95 | 499.99 | 552.46 | 541.61 | 473.58 | 483.17 | 600.43 | 519.39 | 458.52 | 473.16 | 537.19 | 506.24 | 459.08 | NA | NA | NA | NA | NA | NA | NA | NA | NA | NA | 395.34 | 330.71 | 390.68 | 367.09 | 363.23 | 309.34 | 329.90 | 349.98 | 326.29 | 279.49 | 294.66 | 326.33 | 317.64 | 264.82 | 271.51 | 296.10 | 292.49 | 233.12 | |
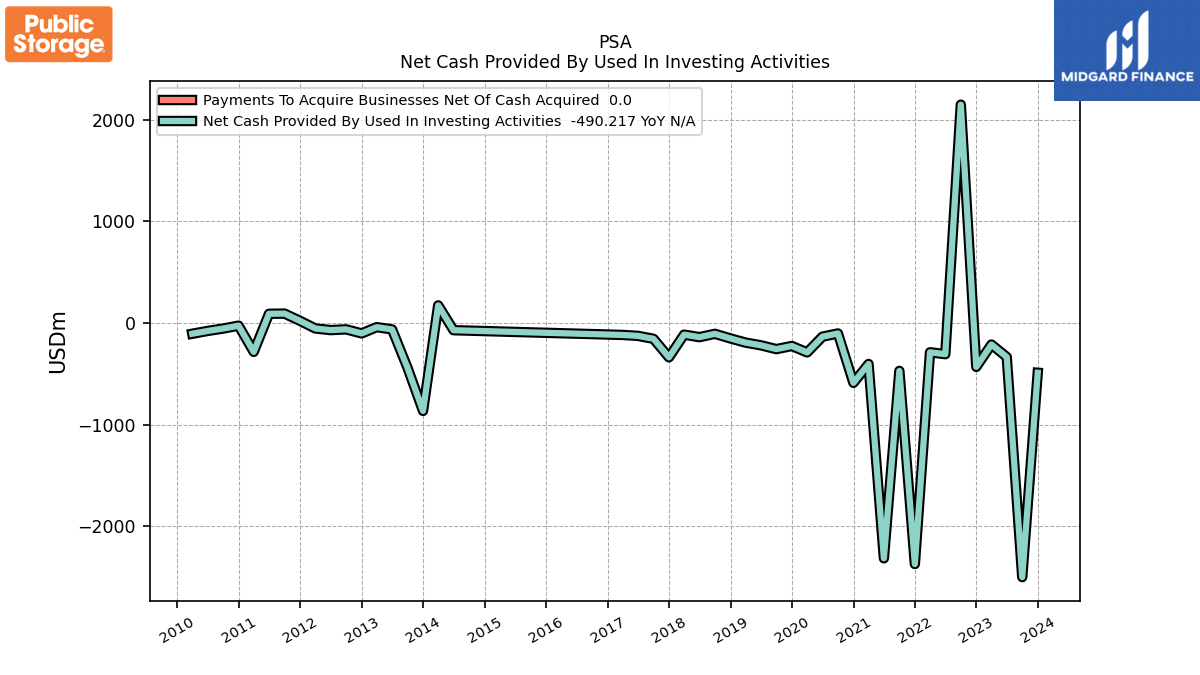
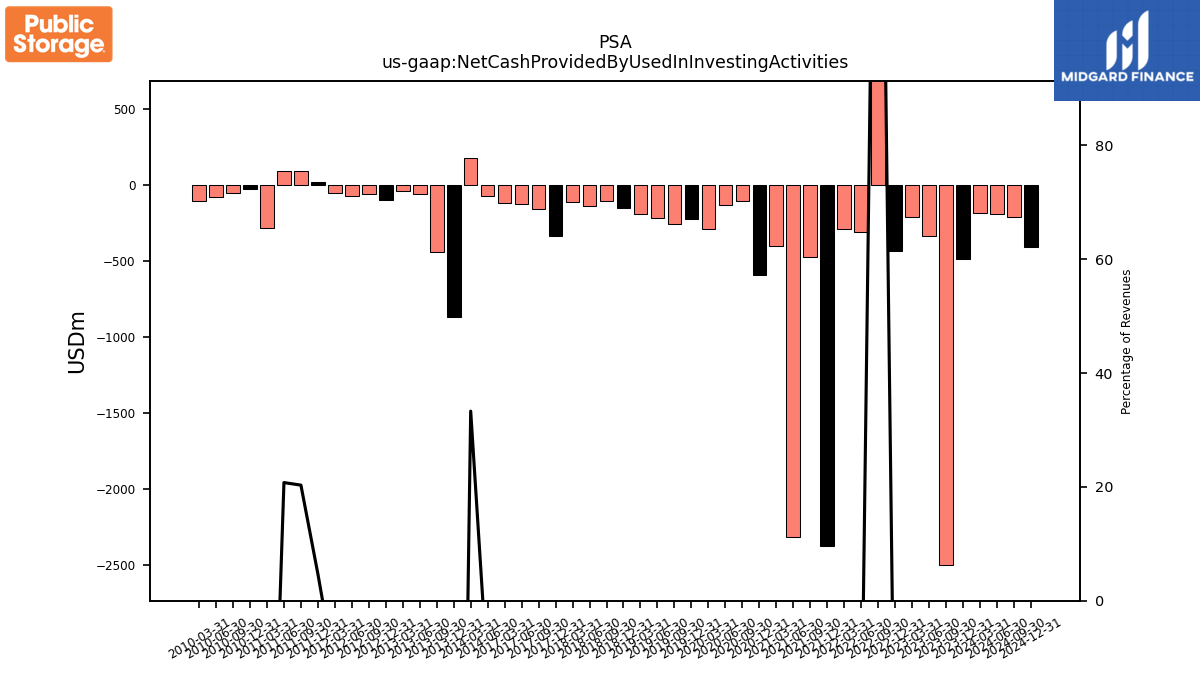
| Net Cash Provided By Used In Investing Activities | -490.22 | -2501.01 | -334.96 | -212.31 | -432.49 | 2148.30 | -307.29 | -288.53 | -2372.43 | -471.38 | -2315.98 | -403.73 | -589.56 | -103.32 | -134.93 | -289.90 | -226.67 | -257.54 | -219.90 | -193.25 | -152.20 | -106.92 | -139.76 | -114.90 | -338.50 | -155.91 | -127.33 | -118.12 | NA | NA | NA | NA | NA | NA | NA | NA | NA | NA | -71.35 | 173.07 | -865.73 | -441.90 | -63.35 | -41.42 | -102.73 | -63.09 | -70.35 | -54.30 | 20.90 | 92.00 | 90.27 | -284.53 | -26.56 | -55.14 | -78.70 | -106.20 | |
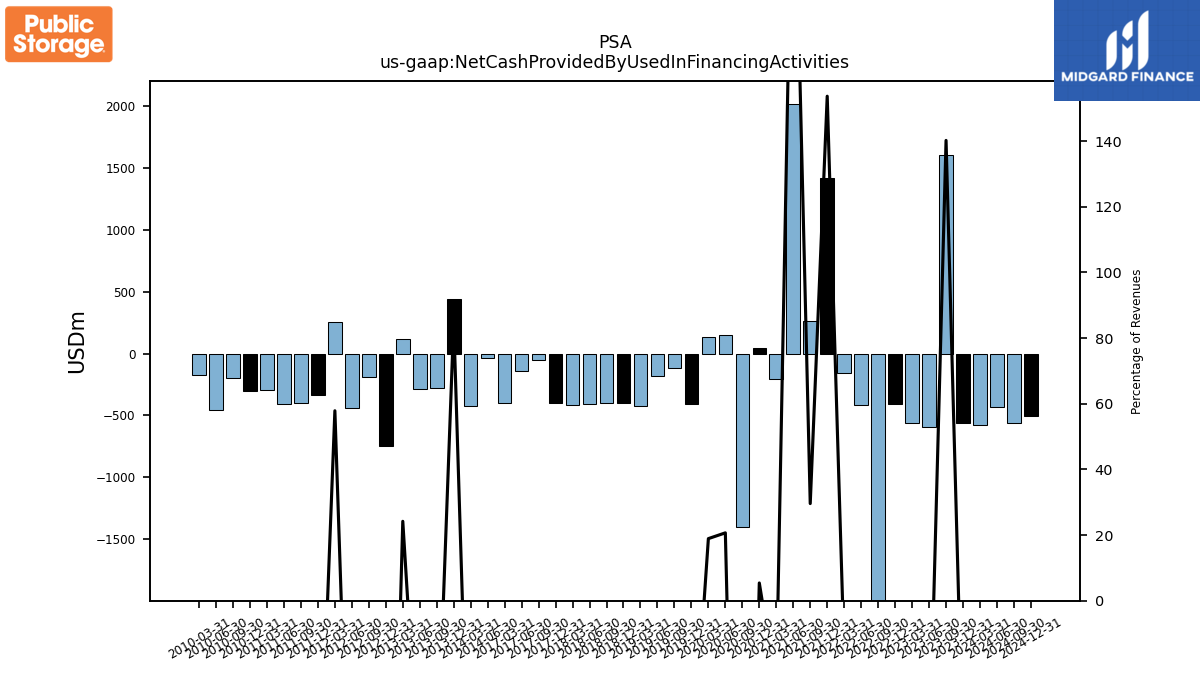
| Net Cash Provided By Used In Financing Activities | -561.45 | 1603.61 | -591.12 | -563.97 | -410.38 | -3205.03 | -416.61 | -161.25 | 1420.34 | 264.89 | 2015.88 | -202.97 | 41.13 | -1399.02 | 146.68 | 135.50 | -404.35 | -114.10 | -179.28 | -423.00 | -402.03 | -399.67 | -404.24 | -413.65 | -397.61 | -49.39 | -141.44 | -403.79 | NA | NA | NA | NA | NA | NA | NA | NA | NA | NA | -36.69 | -421.91 | 437.23 | -280.56 | -286.77 | 113.94 | -745.32 | -189.88 | -438.22 | 256.12 | -336.63 | -401.45 | -408.94 | -291.52 | -302.99 | -200.78 | -459.08 | -169.86 |
| 2023-12-31 | 2023-09-30 | 2023-06-30 | 2023-03-31 | 2022-12-31 | 2022-09-30 | 2022-06-30 | 2022-03-31 | 2021-12-31 | 2021-09-30 | 2021-06-30 | 2021-03-31 | 2020-12-31 | 2020-09-30 | 2020-06-30 | 2020-03-31 | 2019-12-31 | 2019-09-30 | 2019-06-30 | 2019-03-31 | 2018-12-31 | 2018-09-30 | 2018-06-30 | 2018-03-31 | 2017-12-31 | 2017-09-30 | 2017-06-30 | 2017-03-31 | 2016-12-31 | 2016-09-30 | 2016-06-30 | 2016-03-31 | 2015-12-31 | 2015-09-30 | 2015-06-30 | 2015-03-31 | 2014-12-31 | 2014-09-30 | 2014-06-30 | 2014-03-31 | 2013-12-31 | 2013-09-30 | 2013-06-30 | 2013-03-31 | 2012-12-31 | 2012-09-30 | 2012-06-30 | 2012-03-31 | 2011-12-31 | 2011-09-30 | 2011-06-30 | 2011-03-31 | 2010-12-31 | 2010-09-30 | 2010-06-30 | 2010-03-31 | ||
|---|---|---|---|---|---|---|---|---|---|---|---|---|---|---|---|---|---|---|---|---|---|---|---|---|---|---|---|---|---|---|---|---|---|---|---|---|---|---|---|---|---|---|---|---|---|---|---|---|---|---|---|---|---|---|---|---|---|
| Net Cash Provided By Used In Operating Activities | 791.68 | 875.67 | 882.40 | 696.89 | 736.35 | 927.02 | 797.53 | 656.24 | 728.84 | 684.26 | 621.29 | 509.16 | 512.56 | 528.27 | 539.12 | 462.95 | 499.99 | 552.46 | 541.61 | 473.58 | 483.17 | 600.43 | 519.39 | 458.52 | 473.16 | 537.19 | 506.24 | 459.08 | NA | NA | NA | NA | NA | NA | NA | NA | NA | NA | 395.34 | 330.71 | 390.68 | 367.09 | 363.23 | 309.34 | 329.90 | 349.98 | 326.29 | 279.49 | 294.66 | 326.33 | 317.64 | 264.82 | 271.51 | 296.10 | 292.49 | 233.12 | |
| Net Income Loss | 439.29 | 613.30 | 578.03 | 517.71 | 412.36 | 2768.99 | 653.85 | 513.94 | 619.71 | 490.09 | 410.43 | 433.04 | 351.27 | 324.87 | 314.92 | 366.16 | 386.01 | 397.94 | 370.06 | 366.52 | 586.21 | 378.03 | 403.80 | 343.00 | 389.40 | 356.67 | 353.70 | 342.44 | 413.74 | 367.31 | 356.66 | 315.87 | 363.49 | 339.57 | 326.40 | 281.78 | 346.71 | 293.46 | 276.83 | 227.20 | 296.57 | 284.20 | 260.46 | 211.22 | 271.37 | 263.89 | 198.14 | 205.85 | 220.15 | 191.14 | 206.44 | 206.11 | 183.69 | 239.35 | 125.04 | 123.96 | |
| Profit Loss | 441.90 | 616.64 | 581.16 | 520.41 | 414.93 | 2778.15 | 656.89 | 516.29 | 622.02 | 491.63 | 411.73 | 434.26 | 352.43 | 325.85 | 315.81 | 367.14 | 387.10 | 399.42 | 371.46 | 367.68 | 587.91 | 379.59 | 405.29 | 344.44 | 390.96 | 358.27 | 355.21 | 344.02 | 415.68 | 369.05 | 358.36 | 317.35 | 365.26 | 341.14 | 328.04 | 283.25 | 348.43 | 294.98 | 278.28 | 228.27 | 297.98 | 285.63 | 261.68 | 212.25 | 272.56 | 264.82 | 198.93 | 206.72 | 220.44 | 194.51 | 210.94 | 210.57 | 189.21 | 245.81 | 131.18 | 129.92 | |
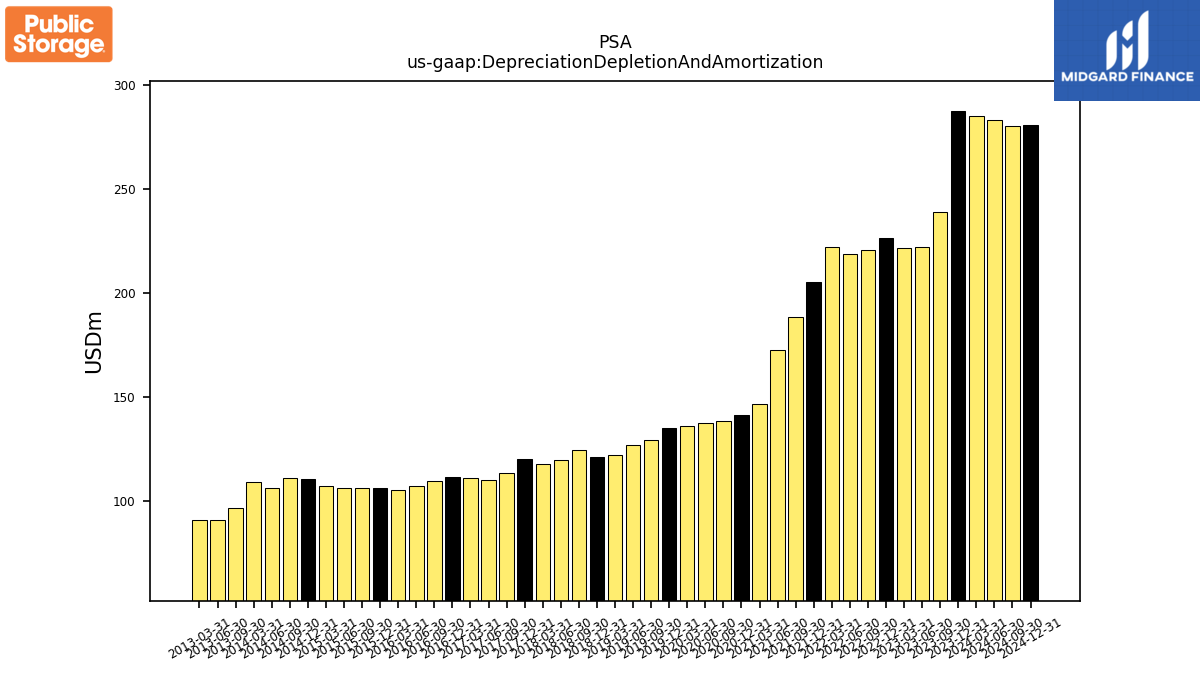
| Depreciation Depletion And Amortization | 287.52 | 238.75 | 222.13 | 221.65 | 226.54 | 220.77 | 218.71 | 222.13 | 205.29 | 188.55 | 172.73 | 146.86 | 141.41 | 138.33 | 137.62 | 135.90 | 134.88 | 129.23 | 126.86 | 121.94 | 121.37 | 124.52 | 119.78 | 117.98 | 120.10 | 113.32 | 110.18 | 110.93 | 111.74 | 109.43 | 107.01 | 105.13 | 106.31 | 106.08 | 106.47 | 107.15 | 110.57 | 111.08 | 106.44 | 109.02 | NA | 96.54 | 90.94 | 91.00 | NA | NA | NA | NA | NA | NA | NA | NA | NA | NA | NA | NA | |
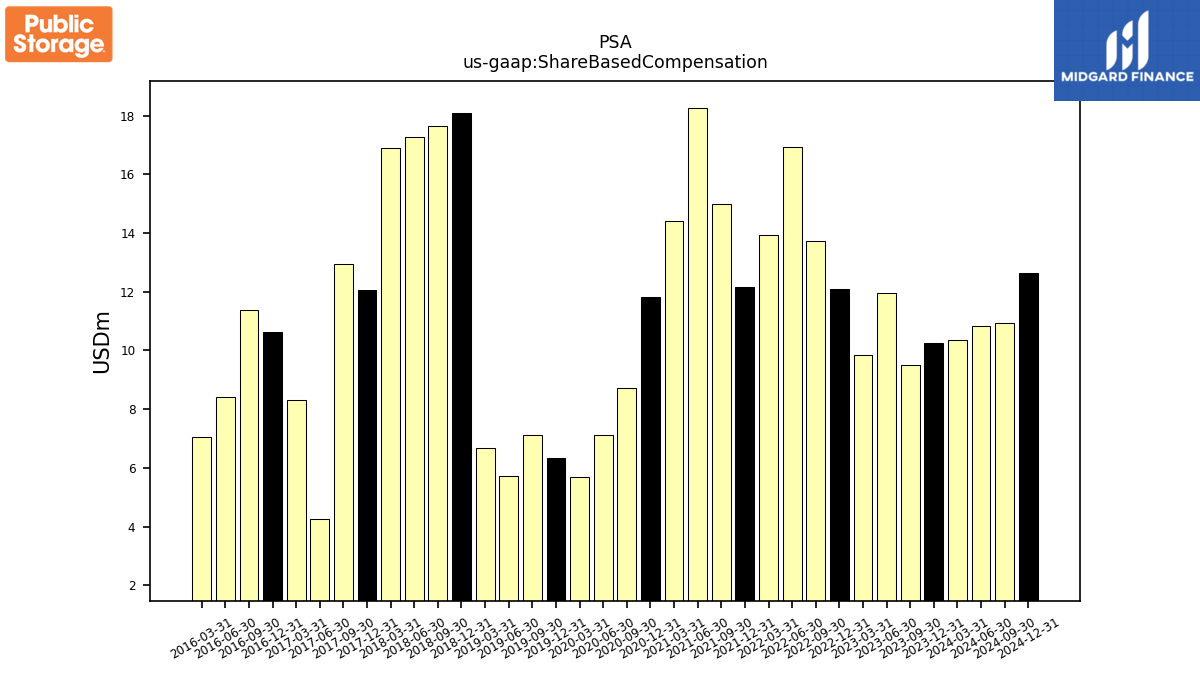
| Share Based Compensation | 10.26 | 9.52 | 11.95 | 9.85 | 12.11 | 13.74 | 16.93 | 13.93 | 12.17 | 14.97 | 18.27 | 14.41 | 11.83 | 8.73 | 7.12 | 5.68 | 6.34 | 7.11 | 5.71 | 6.66 | 18.10 | 17.65 | 17.28 | 16.91 | 12.04 | 12.94 | 4.24 | 8.32 | 10.64 | 11.38 | 8.40 | 7.07 | NA | NA | NA | NA | NA | NA | NA | NA | NA | NA | NA | NA | NA | NA | NA | NA | NA | NA | NA | NA | NA | NA | NA | NA |
| 2023-12-31 | 2023-09-30 | 2023-06-30 | 2023-03-31 | 2022-12-31 | 2022-09-30 | 2022-06-30 | 2022-03-31 | 2021-12-31 | 2021-09-30 | 2021-06-30 | 2021-03-31 | 2020-12-31 | 2020-09-30 | 2020-06-30 | 2020-03-31 | 2019-12-31 | 2019-09-30 | 2019-06-30 | 2019-03-31 | 2018-12-31 | 2018-09-30 | 2018-06-30 | 2018-03-31 | 2017-12-31 | 2017-09-30 | 2017-06-30 | 2017-03-31 | 2016-12-31 | 2016-09-30 | 2016-06-30 | 2016-03-31 | 2015-12-31 | 2015-09-30 | 2015-06-30 | 2015-03-31 | 2014-12-31 | 2014-09-30 | 2014-06-30 | 2014-03-31 | 2013-12-31 | 2013-09-30 | 2013-06-30 | 2013-03-31 | 2012-12-31 | 2012-09-30 | 2012-06-30 | 2012-03-31 | 2011-12-31 | 2011-09-30 | 2011-06-30 | 2011-03-31 | 2010-12-31 | 2010-09-30 | 2010-06-30 | 2010-03-31 | ||
|---|---|---|---|---|---|---|---|---|---|---|---|---|---|---|---|---|---|---|---|---|---|---|---|---|---|---|---|---|---|---|---|---|---|---|---|---|---|---|---|---|---|---|---|---|---|---|---|---|---|---|---|---|---|---|---|---|---|
| Net Cash Provided By Used In Investing Activities | -490.22 | -2501.01 | -334.96 | -212.31 | -432.49 | 2148.30 | -307.29 | -288.53 | -2372.43 | -471.38 | -2315.98 | -403.73 | -589.56 | -103.32 | -134.93 | -289.90 | -226.67 | -257.54 | -219.90 | -193.25 | -152.20 | -106.92 | -139.76 | -114.90 | -338.50 | -155.91 | -127.33 | -118.12 | NA | NA | NA | NA | NA | NA | NA | NA | NA | NA | -71.35 | 173.07 | -865.73 | -441.90 | -63.35 | -41.42 | -102.73 | -63.09 | -70.35 | -54.30 | 20.90 | 92.00 | 90.27 | -284.53 | -26.56 | -55.14 | -78.70 | -106.20 |
| 2023-12-31 | 2023-09-30 | 2023-06-30 | 2023-03-31 | 2022-12-31 | 2022-09-30 | 2022-06-30 | 2022-03-31 | 2021-12-31 | 2021-09-30 | 2021-06-30 | 2021-03-31 | 2020-12-31 | 2020-09-30 | 2020-06-30 | 2020-03-31 | 2019-12-31 | 2019-09-30 | 2019-06-30 | 2019-03-31 | 2018-12-31 | 2018-09-30 | 2018-06-30 | 2018-03-31 | 2017-12-31 | 2017-09-30 | 2017-06-30 | 2017-03-31 | 2016-12-31 | 2016-09-30 | 2016-06-30 | 2016-03-31 | 2015-12-31 | 2015-09-30 | 2015-06-30 | 2015-03-31 | 2014-12-31 | 2014-09-30 | 2014-06-30 | 2014-03-31 | 2013-12-31 | 2013-09-30 | 2013-06-30 | 2013-03-31 | 2012-12-31 | 2012-09-30 | 2012-06-30 | 2012-03-31 | 2011-12-31 | 2011-09-30 | 2011-06-30 | 2011-03-31 | 2010-12-31 | 2010-09-30 | 2010-06-30 | 2010-03-31 | ||
|---|---|---|---|---|---|---|---|---|---|---|---|---|---|---|---|---|---|---|---|---|---|---|---|---|---|---|---|---|---|---|---|---|---|---|---|---|---|---|---|---|---|---|---|---|---|---|---|---|---|---|---|---|---|---|---|---|---|
| Net Cash Provided By Used In Financing Activities | -561.45 | 1603.61 | -591.12 | -563.97 | -410.38 | -3205.03 | -416.61 | -161.25 | 1420.34 | 264.89 | 2015.88 | -202.97 | 41.13 | -1399.02 | 146.68 | 135.50 | -404.35 | -114.10 | -179.28 | -423.00 | -402.03 | -399.67 | -404.24 | -413.65 | -397.61 | -49.39 | -141.44 | -403.79 | NA | NA | NA | NA | NA | NA | NA | NA | NA | NA | -36.69 | -421.91 | 437.23 | -280.56 | -286.77 | 113.94 | -745.32 | -189.88 | -438.22 | 256.12 | -336.63 | -401.45 | -408.94 | -291.52 | -302.99 | -200.78 | -459.08 | -169.86 |
| 2023-12-31 | 2023-09-30 | 2023-06-30 | 2023-03-31 | 2022-12-31 | 2022-09-30 | 2022-06-30 | 2022-03-31 | 2021-12-31 | 2021-09-30 | 2021-06-30 | 2021-03-31 | 2020-12-31 | 2020-09-30 | 2020-06-30 | 2020-03-31 | 2019-12-31 | 2019-09-30 | 2019-06-30 | 2019-03-31 | 2018-12-31 | 2018-09-30 | 2018-06-30 | 2018-03-31 | 2017-12-31 | 2017-09-30 | 2017-06-30 | 2017-03-31 | 2016-12-31 | 2016-09-30 | 2016-06-30 | 2016-03-31 | 2015-12-31 | 2015-09-30 | 2015-06-30 | 2015-03-31 | 2014-12-31 | 2014-09-30 | 2014-06-30 | 2014-03-31 | 2013-12-31 | 2013-09-30 | 2013-06-30 | 2013-03-31 | 2012-12-31 | 2012-09-30 | 2012-06-30 | 2012-03-31 | 2011-12-31 | 2011-09-30 | 2011-06-30 | 2011-03-31 | 2010-12-31 | 2010-09-30 | 2010-06-30 | 2010-03-31 | ||
|---|---|---|---|---|---|---|---|---|---|---|---|---|---|---|---|---|---|---|---|---|---|---|---|---|---|---|---|---|---|---|---|---|---|---|---|---|---|---|---|---|---|---|---|---|---|---|---|---|---|---|---|---|---|---|---|---|---|
| Revenues | 1159.87 | 1143.82 | 1119.77 | 1094.23 | 1088.54 | 1088.13 | 1032.05 | 973.45 | 924.32 | 894.93 | 829.32 | 767.26 | 759.04 | 730.66 | 709.28 | 716.08 | 717.50 | 729.34 | 710.95 | 689.04 | 692.46 | 706.37 | 685.53 | 669.92 | 672.31 | 686.36 | 664.31 | 645.55 | 651.43 | 663.15 | 634.19 | 611.79 | 609.33 | 618.87 | 592.63 | 569.39 | 561.68 | 571.60 | 538.04 | 519.62 | 513.51 | 511.96 | 485.38 | 470.90 | 465.45 | 472.93 | 457.74 | 442.62 | 444.71 | 452.99 | 434.84 | 419.82 | 417.78 | 422.30 | 407.64 | 397.45 | |
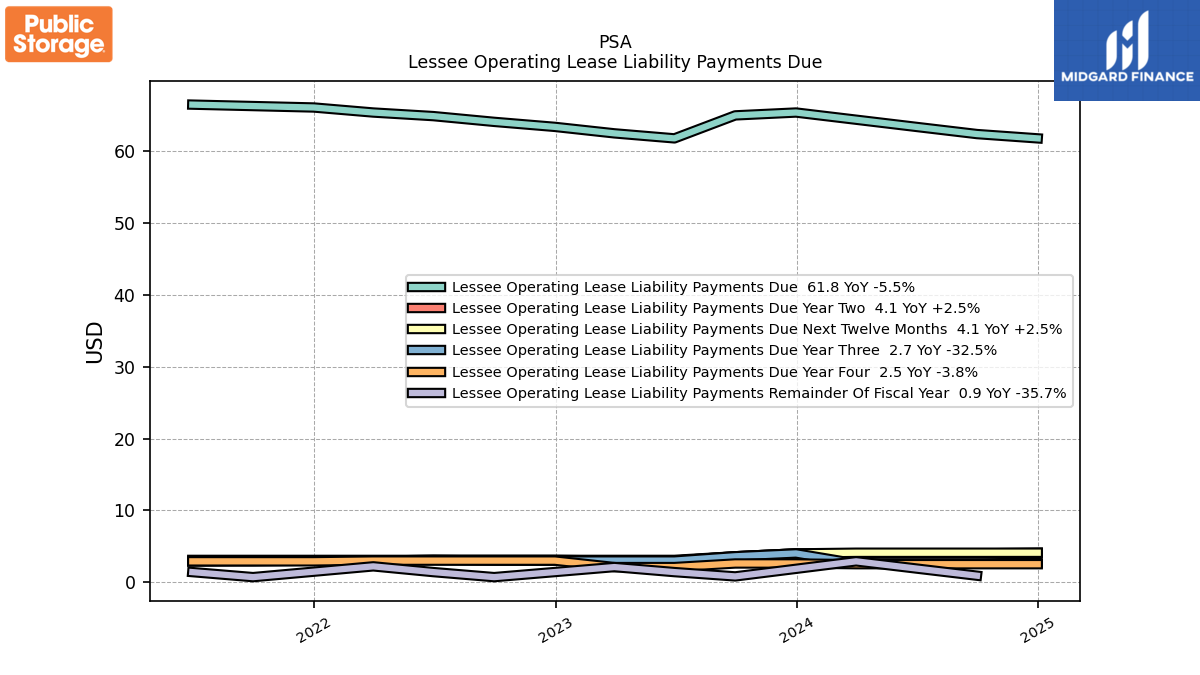
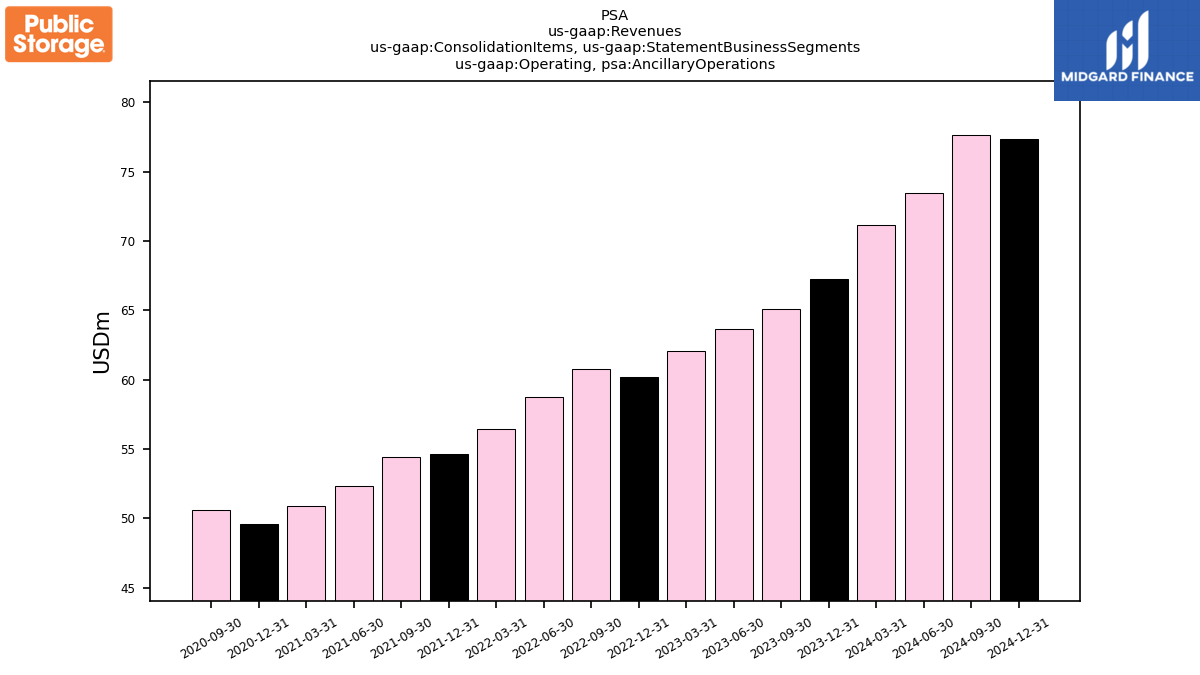
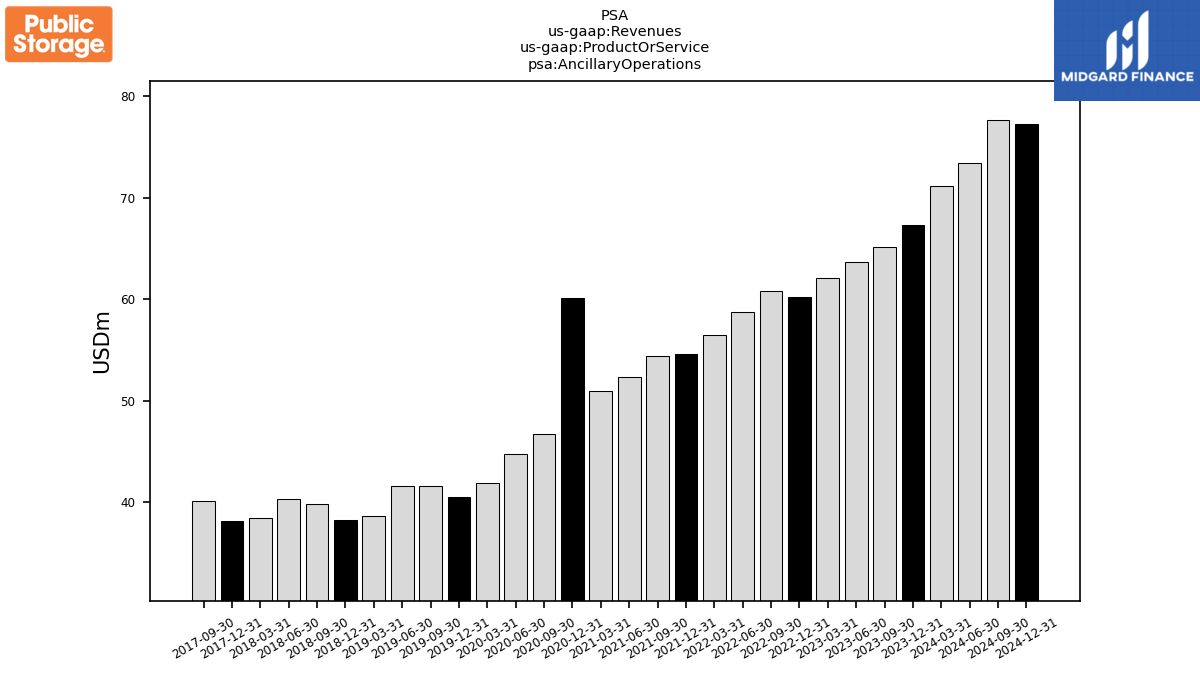
| Operating, Ancillary Operations | 67.28 | 65.10 | 63.65 | 62.05 | 60.19 | 60.76 | 58.76 | 56.43 | 54.60 | 54.42 | 52.32 | 50.91 | 49.60 | 50.60 | NA | NA | NA | NA | NA | NA | NA | NA | NA | NA | NA | NA | NA | NA | NA | NA | NA | NA | NA | NA | NA | NA | NA | NA | NA | NA | NA | NA | NA | NA | NA | NA | NA | NA | NA | NA | NA | NA | NA | NA | NA | NA | |
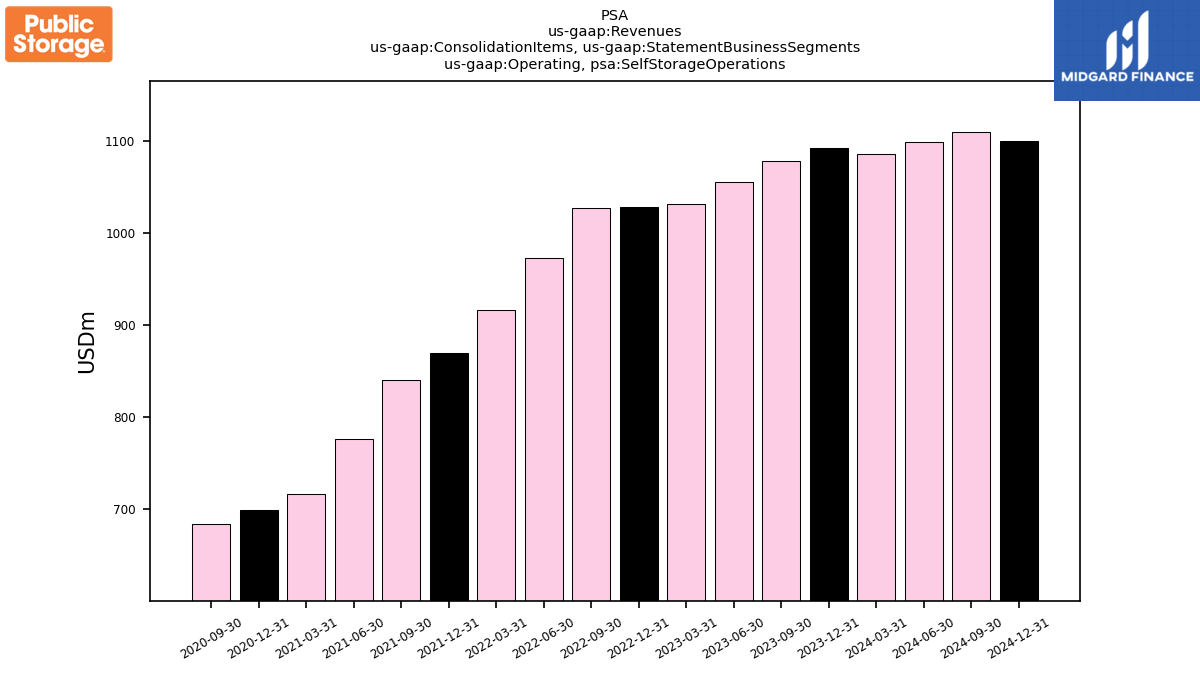
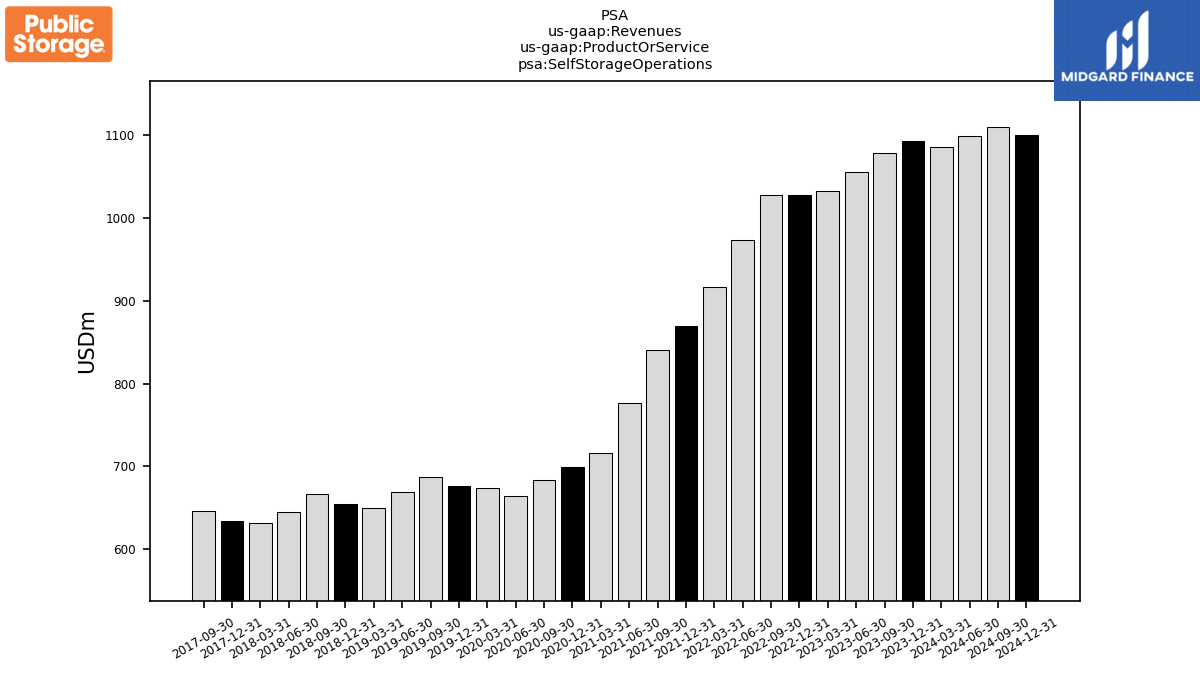
| Operating, Self Storage Operations | 1092.59 | 1078.72 | 1056.12 | 1032.18 | 1028.35 | 1027.37 | 973.29 | 917.01 | 869.72 | 840.51 | 776.99 | 716.35 | 698.94 | 683.95 | NA | NA | NA | NA | NA | NA | NA | NA | NA | NA | NA | NA | NA | NA | NA | NA | NA | NA | NA | NA | NA | NA | NA | NA | NA | NA | NA | NA | NA | NA | NA | NA | NA | NA | NA | NA | NA | NA | NA | NA | NA | NA | |
| Ancillary Operations | 67.28 | 65.10 | 63.65 | 62.05 | 60.19 | 60.76 | 58.76 | 56.43 | 54.60 | 54.42 | 52.32 | 50.91 | 60.11 | 46.71 | 44.74 | 41.88 | 40.47 | 41.56 | 41.61 | 38.63 | 38.21 | 39.75 | 40.32 | 38.39 | 38.09 | 40.12 | NA | NA | NA | NA | NA | NA | NA | NA | NA | NA | NA | NA | NA | NA | NA | NA | NA | NA | NA | NA | NA | NA | NA | NA | NA | NA | NA | NA | NA | NA | |
| Self Storage Operations | 1092.59 | 1078.72 | 1056.12 | 1032.18 | 1028.35 | 1027.37 | 973.29 | 917.01 | 869.72 | 840.51 | 776.99 | 716.35 | 698.94 | 683.95 | 664.54 | 674.20 | 677.03 | 687.78 | 669.34 | 650.41 | 654.25 | 666.62 | 645.21 | 631.54 | 634.22 | 646.24 | NA | NA | NA | NA | NA | NA | NA | NA | NA | NA | NA | NA | NA | NA | NA | NA | NA | NA | NA | NA | NA | NA | NA | NA | NA | NA | NA | NA | NA | NA |