
| 2023-09-30 | 2023-06-30 | 2023-03-31 | 2022-12-31 | 2022-09-30 | 2022-06-30 | 2022-03-31 | 2021-12-31 | 2021-09-30 | 2021-06-30 | 2021-03-31 | 2020-12-31 | 2020-09-30 | 2020-06-30 | 2020-03-31 | 2019-12-31 | 2019-09-30 | 2019-06-30 | 2019-03-31 | 2018-12-31 | 2018-09-30 | ||
|---|---|---|---|---|---|---|---|---|---|---|---|---|---|---|---|---|---|---|---|---|---|---|
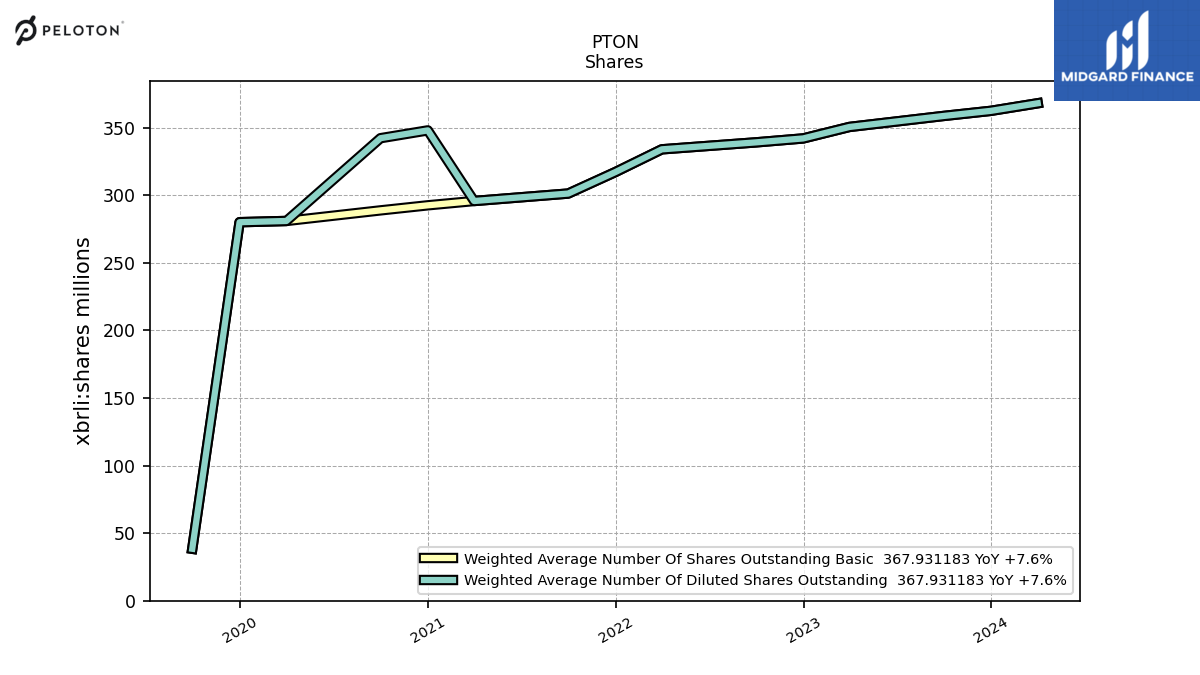
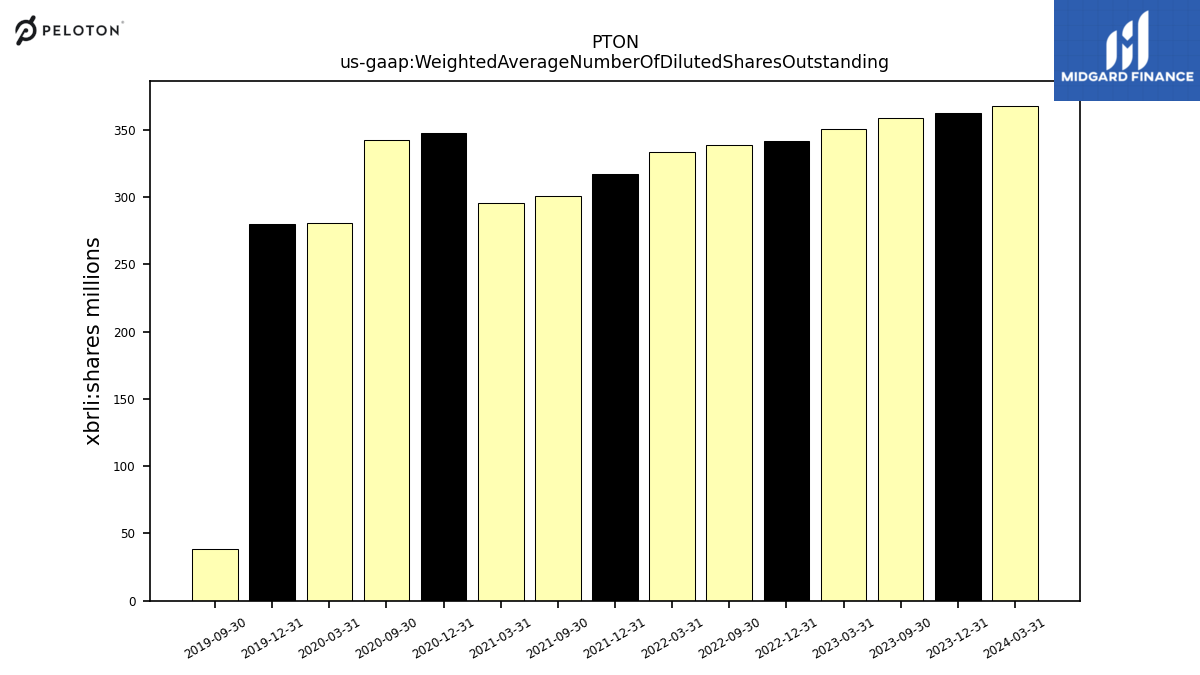
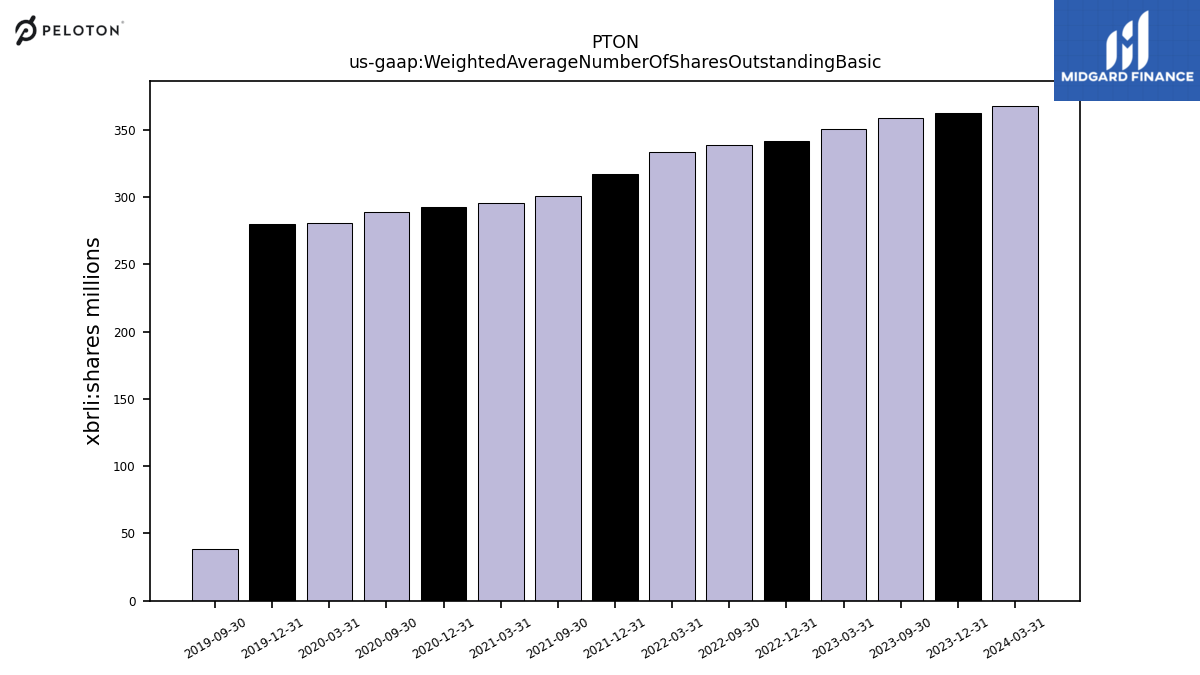
| Weighted Average Number Of Diluted Shares Outstanding | 358.55 | NA | 350.43 | 341.93 | 339.01 | NA | 333.86 | 317.11 | 301.16 | NA | 295.65 | 347.89 | 342.10 | NA | 280.88 | 279.97 | 38.45 | NA | NA | NA | NA | |
| Weighted Average Number Of Shares Outstanding Basic | 358.55 | NA | 350.43 | 341.93 | 339.01 | NA | 333.86 | 317.11 | 301.16 | NA | 295.65 | 292.46 | 288.72 | NA | 280.88 | 279.97 | 38.45 | NA | NA | NA | NA | |
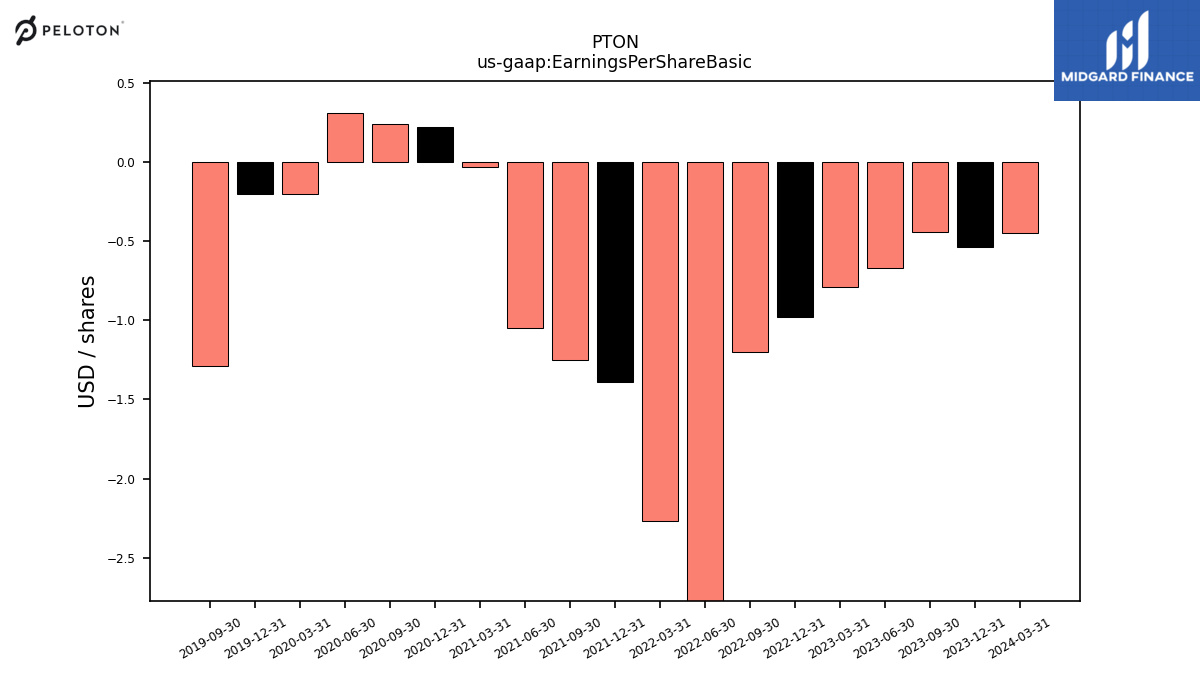
| Earnings Per Share Basic | -0.44 | -0.67 | -0.79 | -0.98 | -1.20 | -3.72 | -2.27 | -1.39 | -1.25 | -1.05 | -0.03 | 0.22 | 0.24 | 0.31 | -0.20 | -0.20 | -1.29 | NA | NA | NA | NA | |
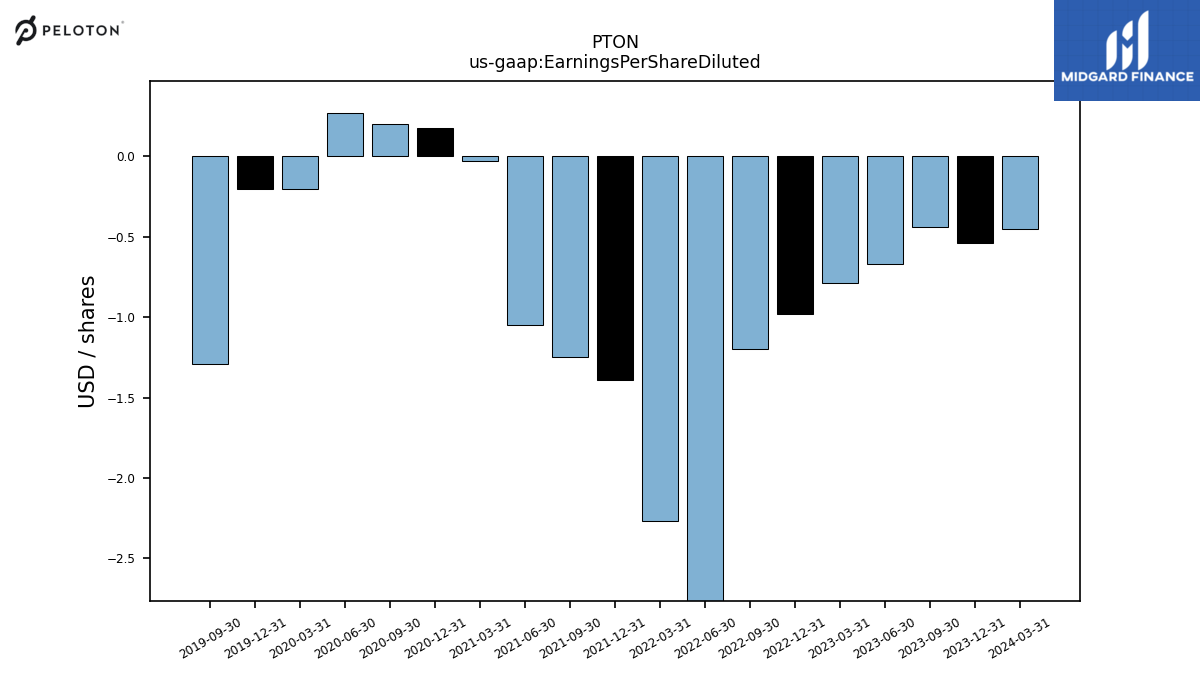
| Earnings Per Share Diluted | -0.44 | -0.67 | -0.79 | -0.98 | -1.20 | -3.72 | -2.27 | -1.39 | -1.25 | -1.05 | -0.03 | 0.18 | 0.20 | 0.27 | -0.20 | -0.20 | -1.29 | NA | NA | NA | NA |
| 2023-09-30 | 2023-06-30 | 2023-03-31 | 2022-12-31 | 2022-09-30 | 2022-06-30 | 2022-03-31 | 2021-12-31 | 2021-09-30 | 2021-06-30 | 2021-03-31 | 2020-12-31 | 2020-09-30 | 2020-06-30 | 2020-03-31 | 2019-12-31 | 2019-09-30 | 2019-06-30 | 2019-03-31 | 2018-12-31 | 2018-09-30 | ||
|---|---|---|---|---|---|---|---|---|---|---|---|---|---|---|---|---|---|---|---|---|---|---|
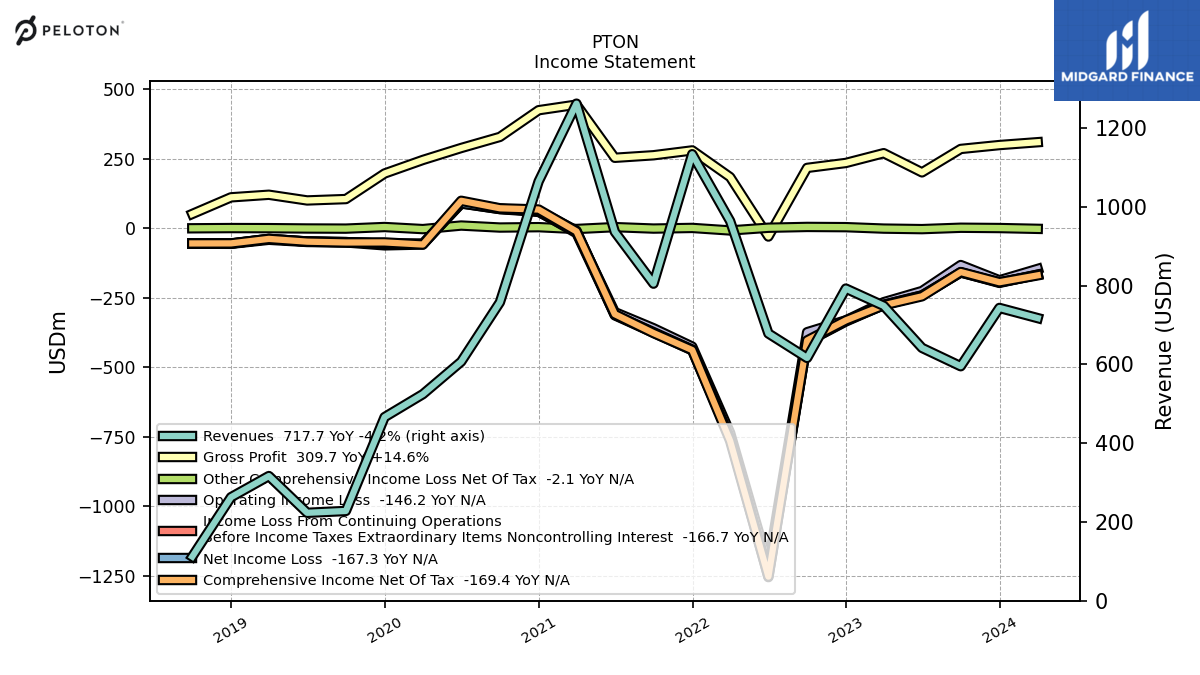
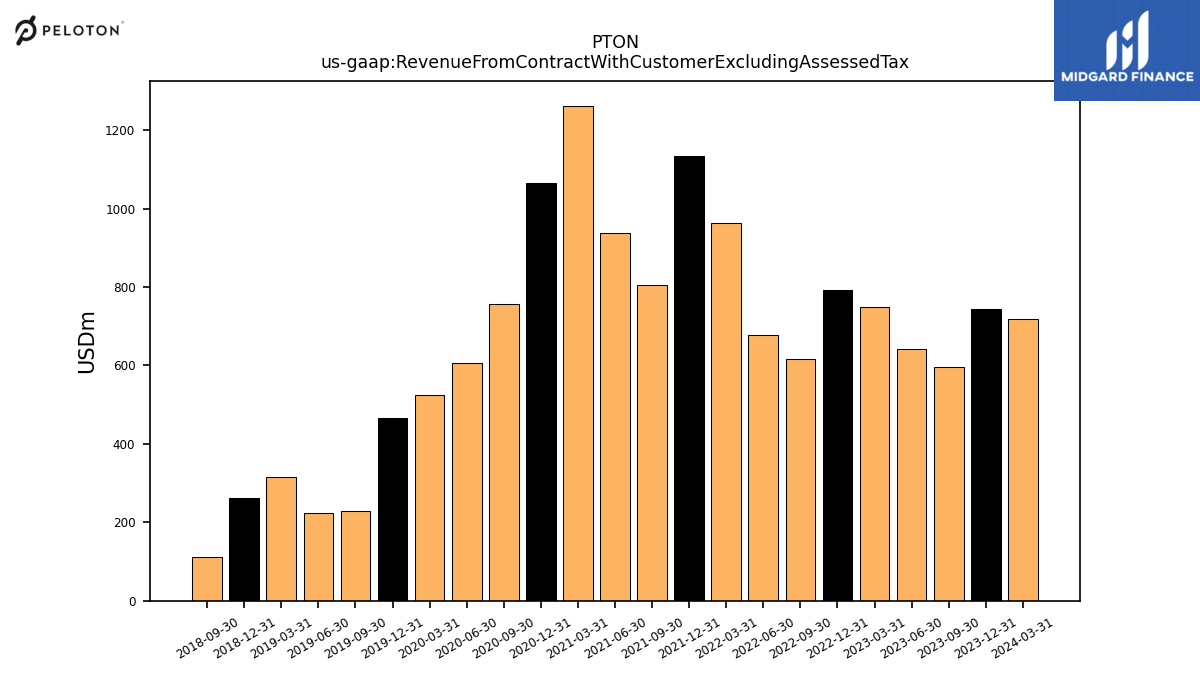
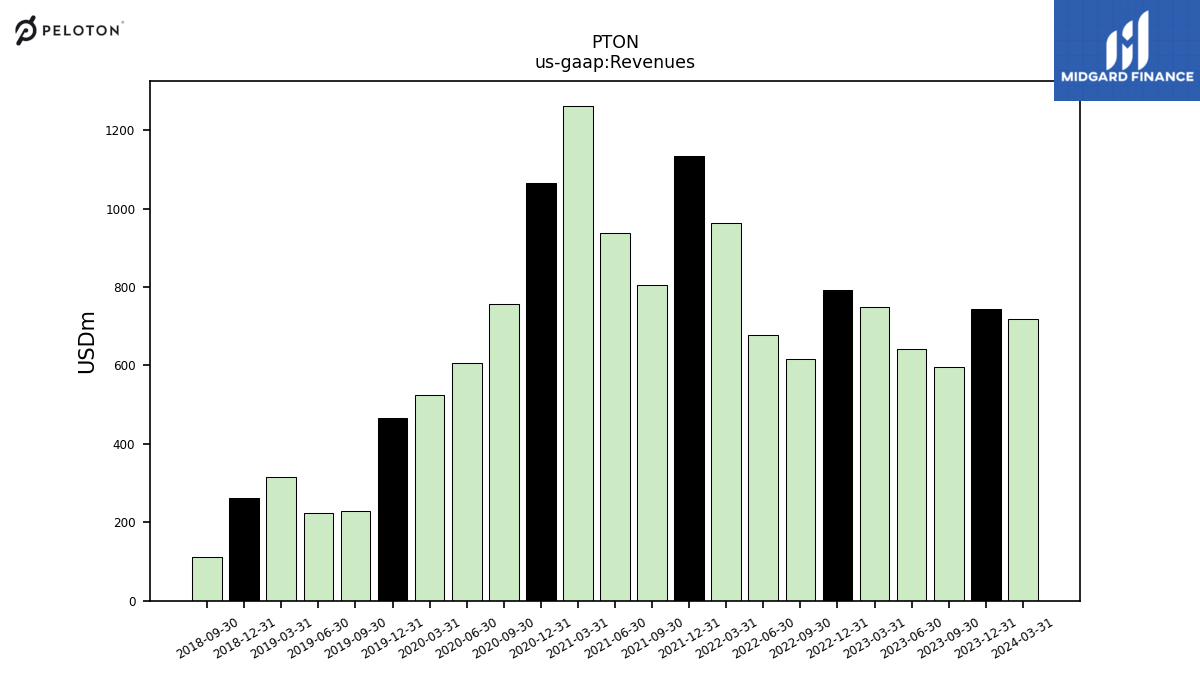
| Revenue From Contract With Customer Excluding Assessed Tax | 595.50 | 642.10 | 748.90 | 792.70 | 616.50 | 678.70 | 964.30 | 1133.90 | 805.20 | 936.90 | 1262.30 | 1064.80 | 757.90 | 607.10 | 524.60 | 466.30 | 228.00 | 223.30 | 316.70 | 262.90 | 112.10 | |
| Revenues | 595.50 | 642.10 | 748.90 | 792.70 | 616.50 | 678.70 | 964.30 | 1133.90 | 805.20 | 936.90 | 1262.30 | 1064.80 | 757.90 | 607.10 | 524.60 | 466.30 | 228.00 | 223.30 | 316.70 | 262.90 | 112.10 | |
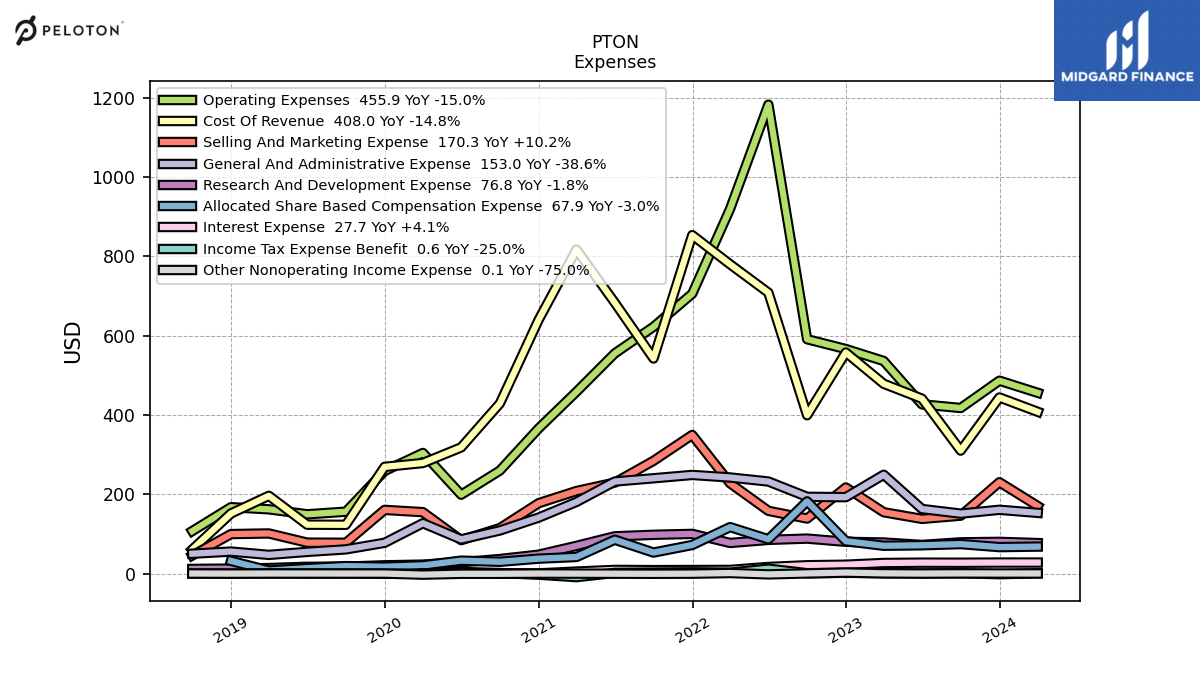
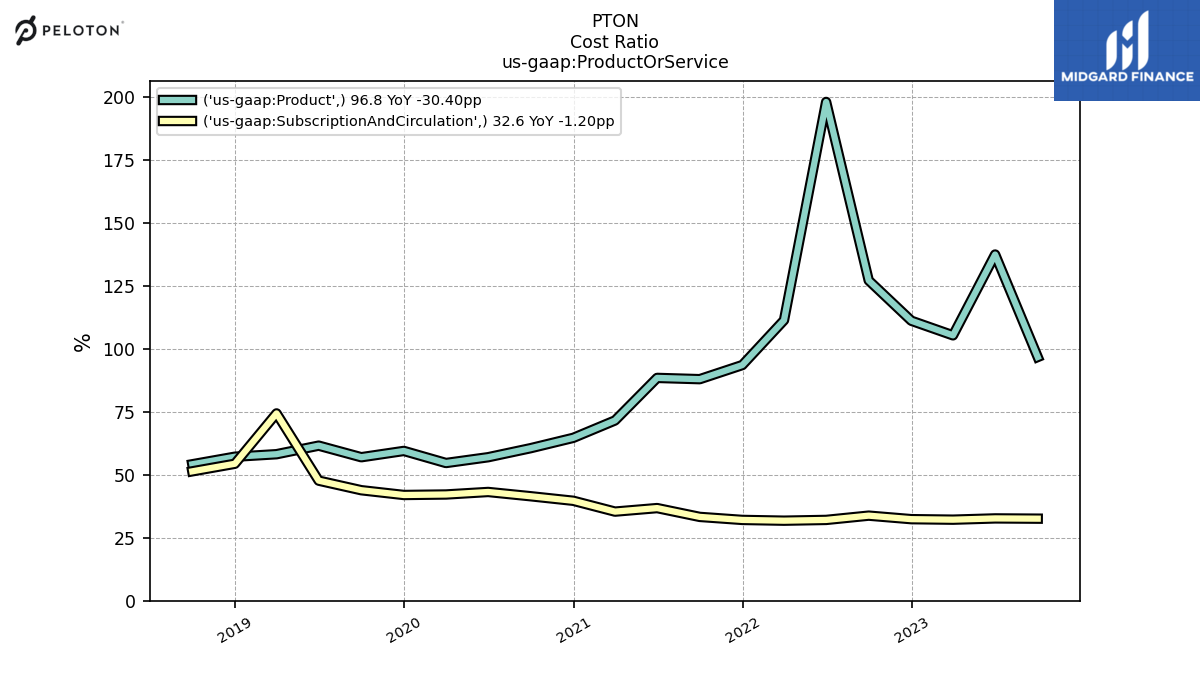
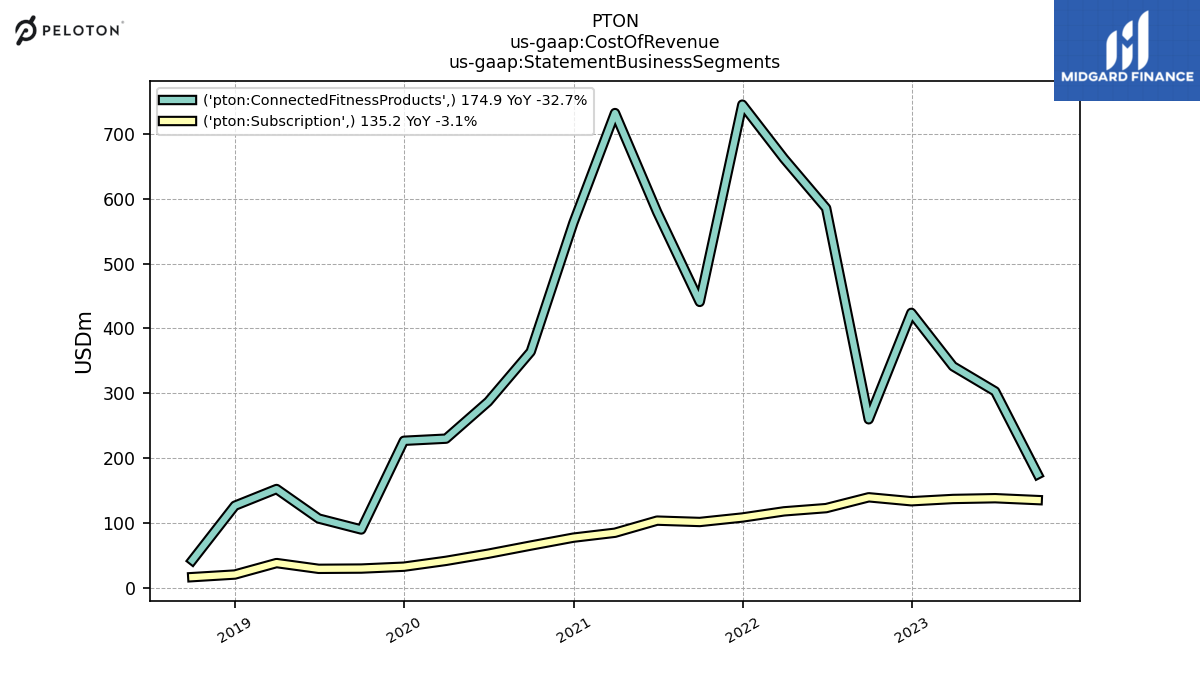
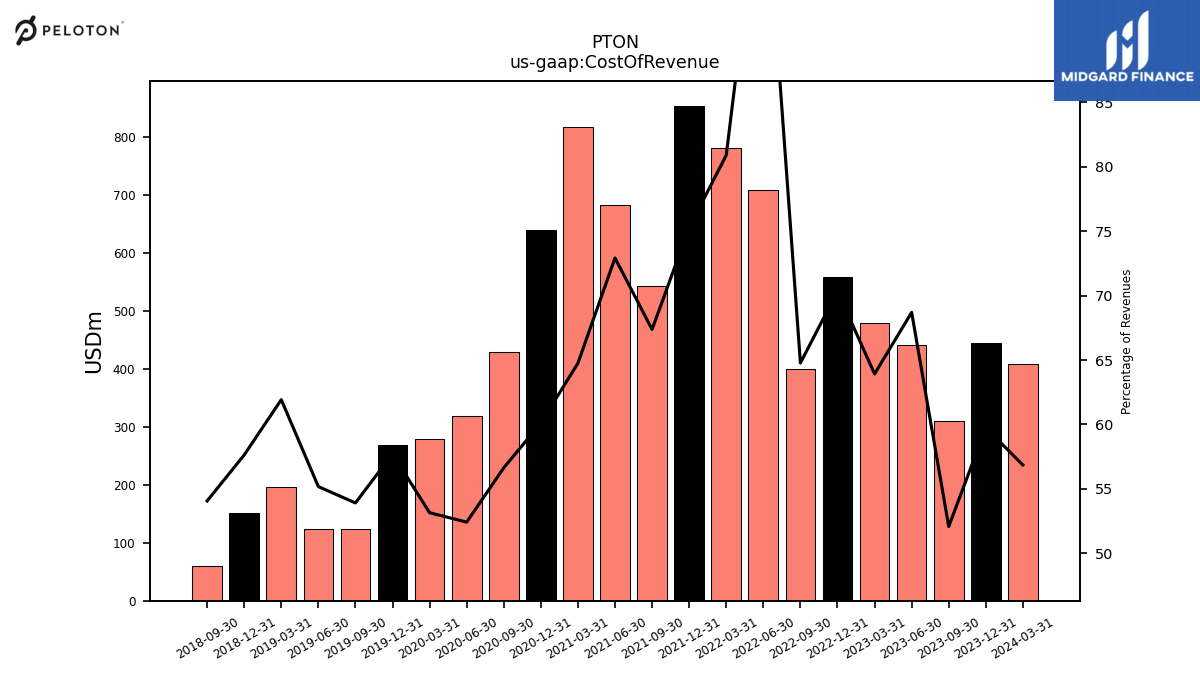
| Cost Of Revenue | 310.10 | 441.10 | 478.70 | 557.60 | 399.30 | 708.50 | 780.10 | 853.70 | 542.50 | 683.20 | 817.40 | 640.00 | 429.20 | 318.20 | 278.80 | 269.10 | 122.90 | 123.20 | 196.10 | 151.50 | 60.60 | |
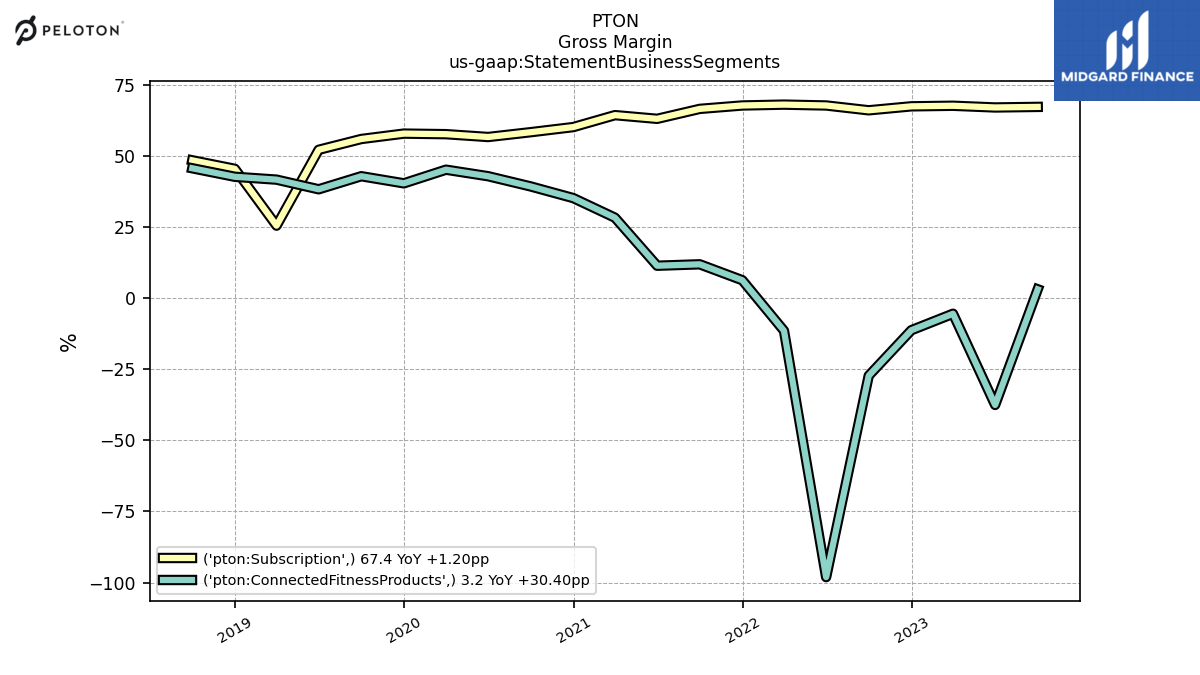
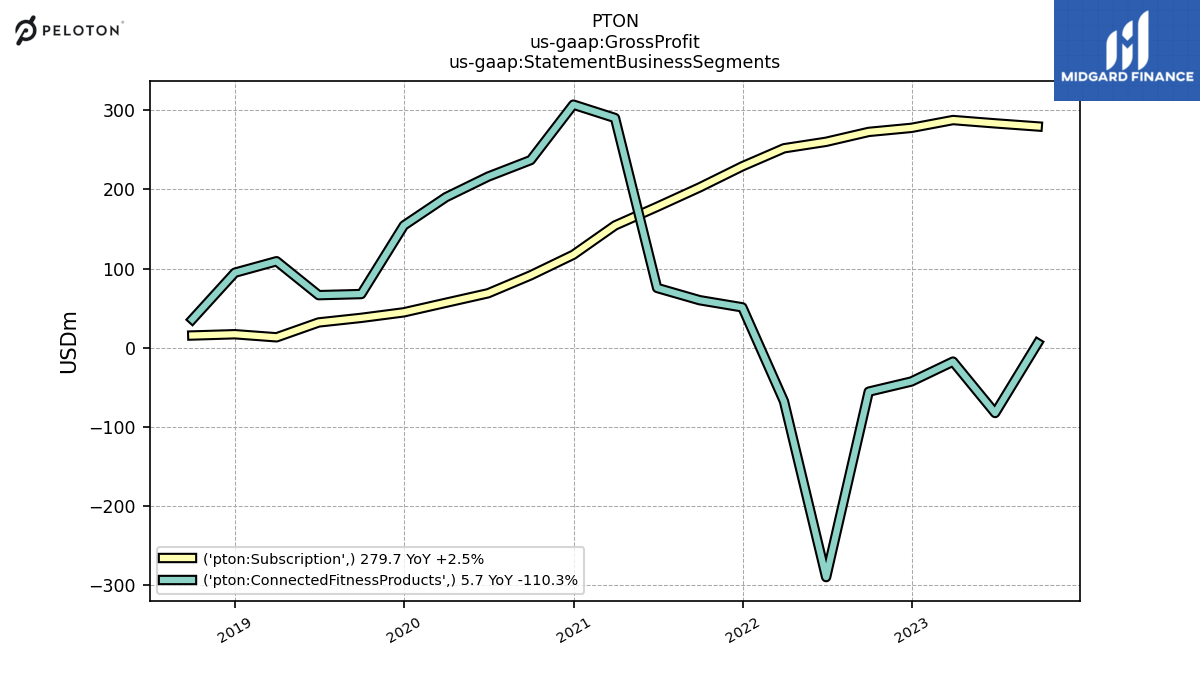
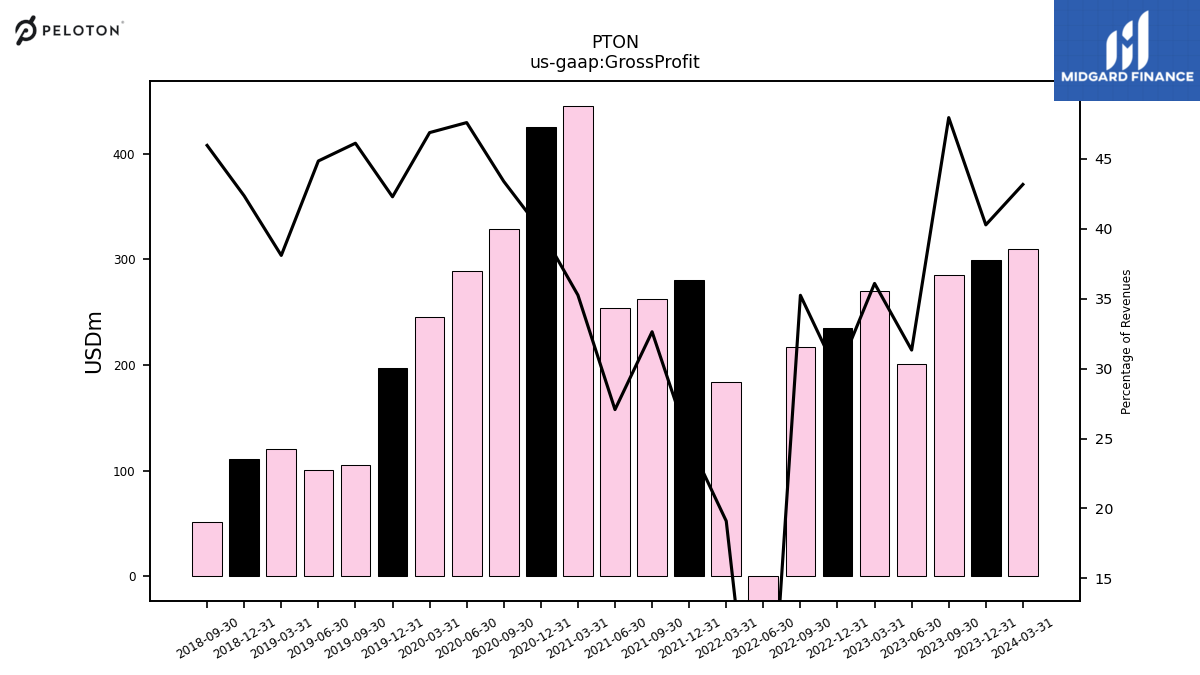
| Gross Profit | 285.40 | 201.10 | 270.20 | 235.00 | 217.20 | -29.80 | 184.20 | 280.20 | 262.70 | 253.60 | 444.90 | 424.80 | 328.70 | 288.80 | 245.80 | 197.10 | 105.10 | 100.10 | 120.60 | 111.30 | 51.50 | |
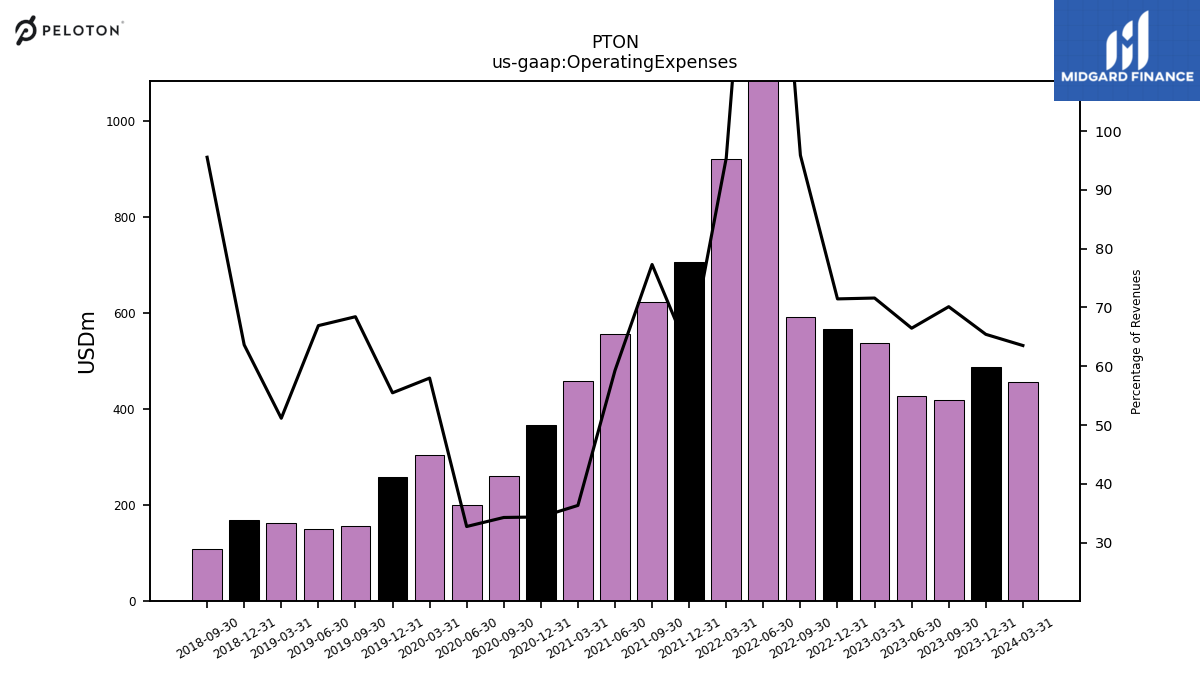
| Operating Expenses | 417.60 | 426.80 | 536.20 | 566.40 | 591.10 | 1183.00 | 920.00 | 705.90 | 622.40 | 555.40 | 458.60 | 366.00 | 259.80 | 198.80 | 304.20 | 258.70 | 156.00 | 149.40 | 162.00 | 167.30 | 107.10 | |
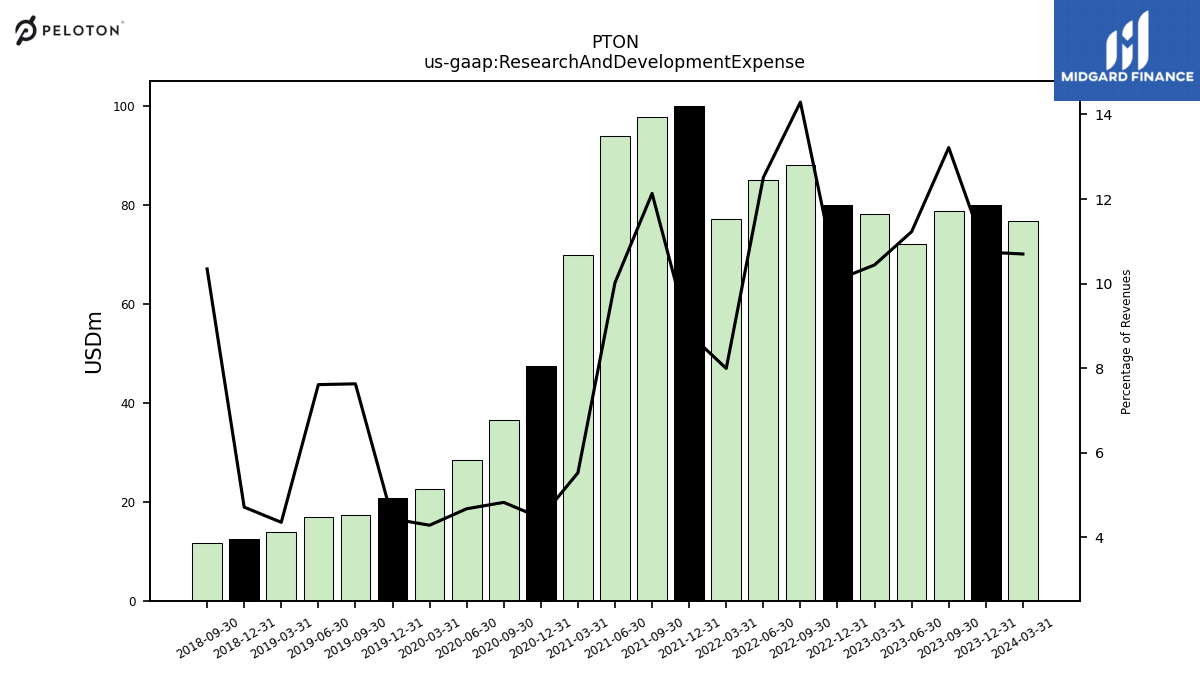
| Research And Development Expense | 78.70 | 72.10 | 78.20 | 80.00 | 88.10 | 84.90 | 77.10 | 100.00 | 97.70 | 93.90 | 69.80 | 47.50 | 36.60 | 28.40 | 22.50 | 20.70 | 17.40 | 17.00 | 13.80 | 12.40 | 11.60 | |
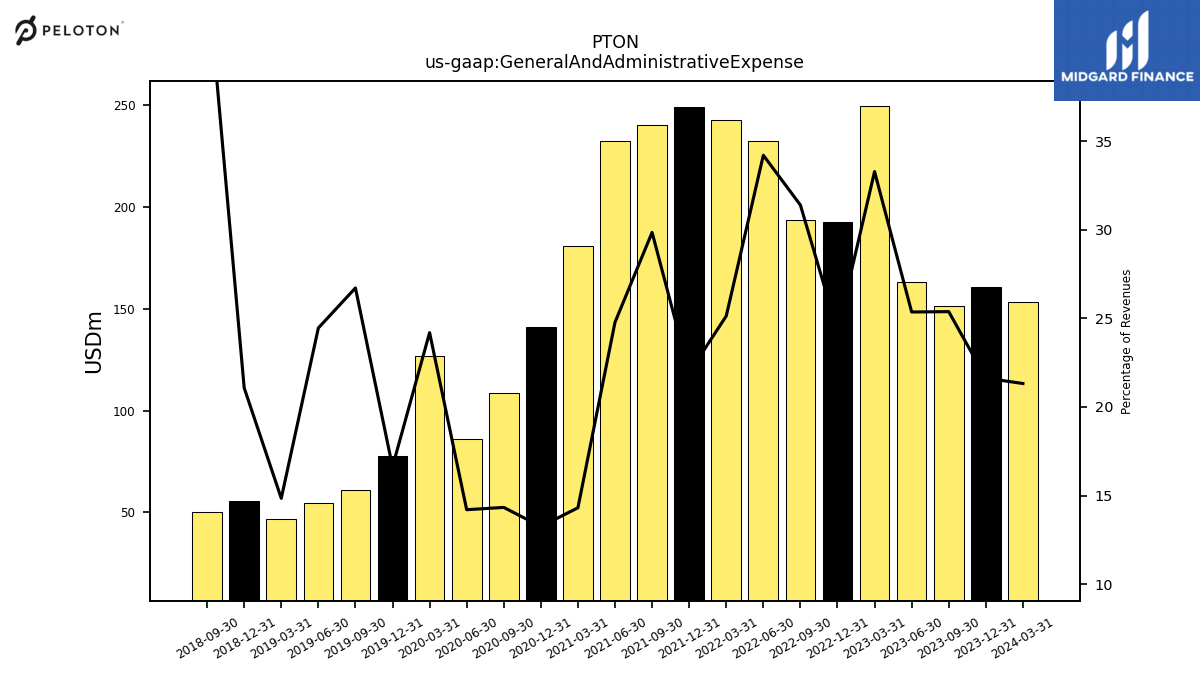
| General And Administrative Expense | 151.10 | 162.80 | 249.20 | 192.60 | 193.50 | 232.10 | 242.30 | 248.70 | 240.30 | 232.10 | 180.60 | 141.10 | 108.60 | 86.20 | 126.90 | 77.50 | 60.90 | 54.60 | 47.00 | 55.40 | 50.00 | |
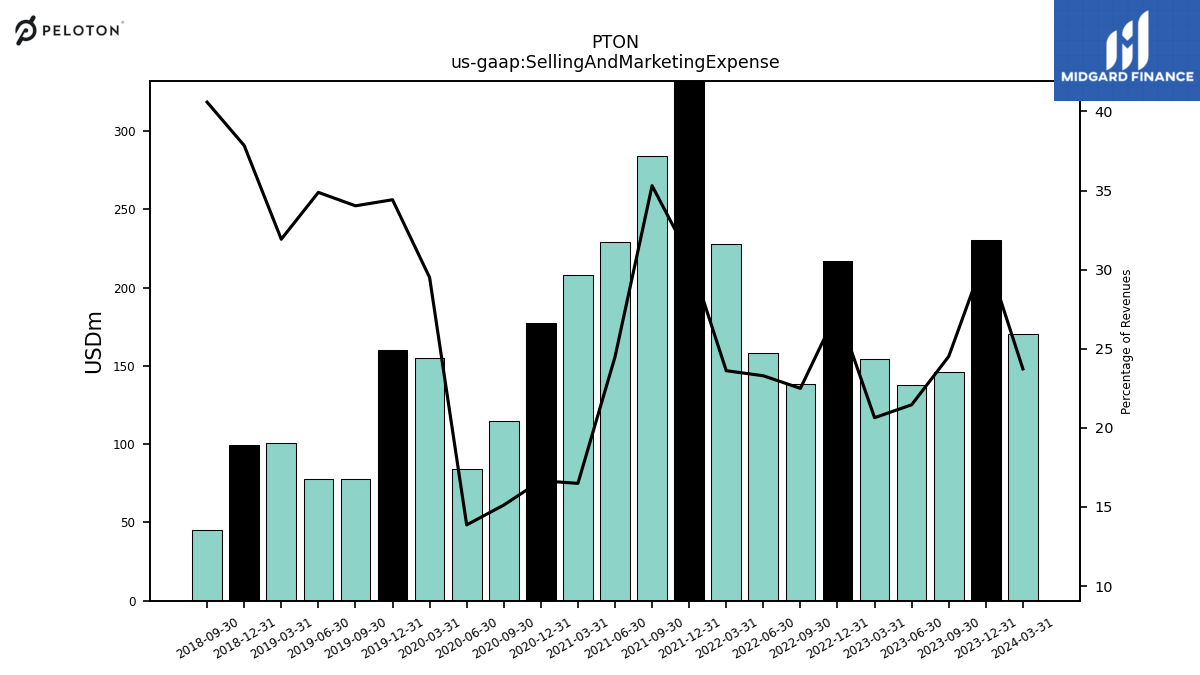
| Selling And Marketing Expense | 146.00 | 137.80 | 154.60 | 217.10 | 138.70 | 158.10 | 227.70 | 349.60 | 284.30 | 229.40 | 208.20 | 177.40 | 114.60 | 84.20 | 154.80 | 160.50 | 77.60 | 77.90 | 101.10 | 99.50 | 45.50 | |
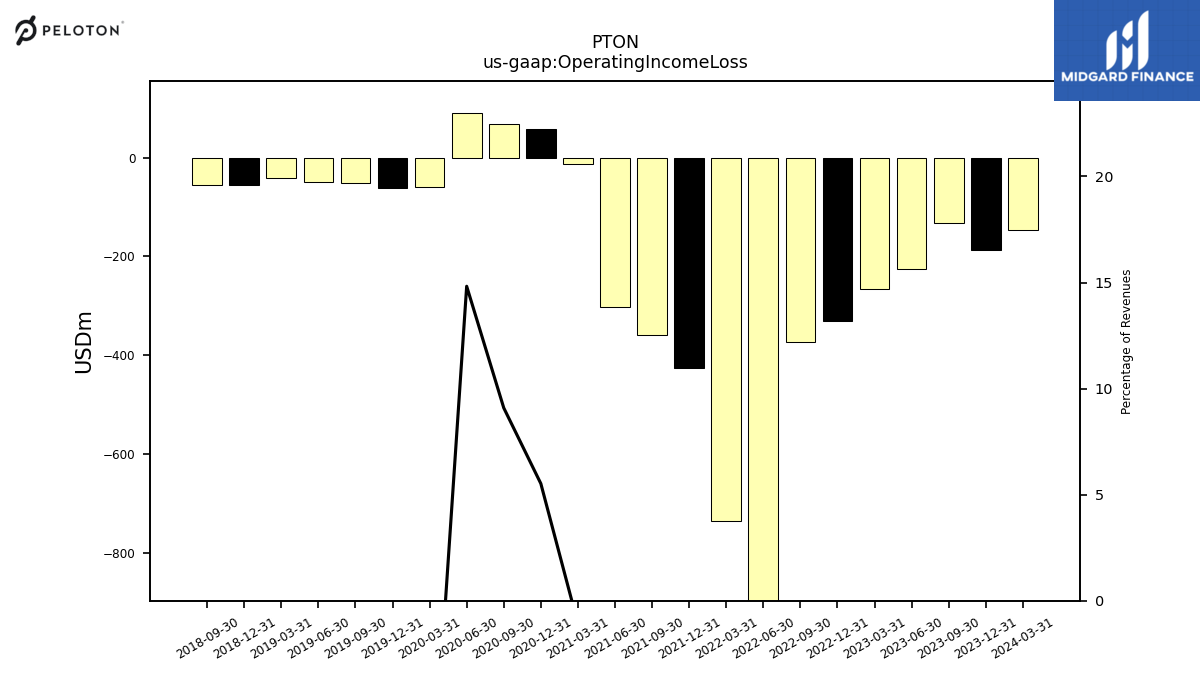
| Operating Income Loss | -132.30 | -225.80 | -266.00 | -331.30 | -374.00 | -1212.80 | -735.80 | -425.70 | -359.70 | -301.70 | -13.70 | 58.80 | 68.90 | 90.00 | -58.40 | -61.50 | -50.90 | -49.40 | -41.40 | -56.00 | -55.60 | |
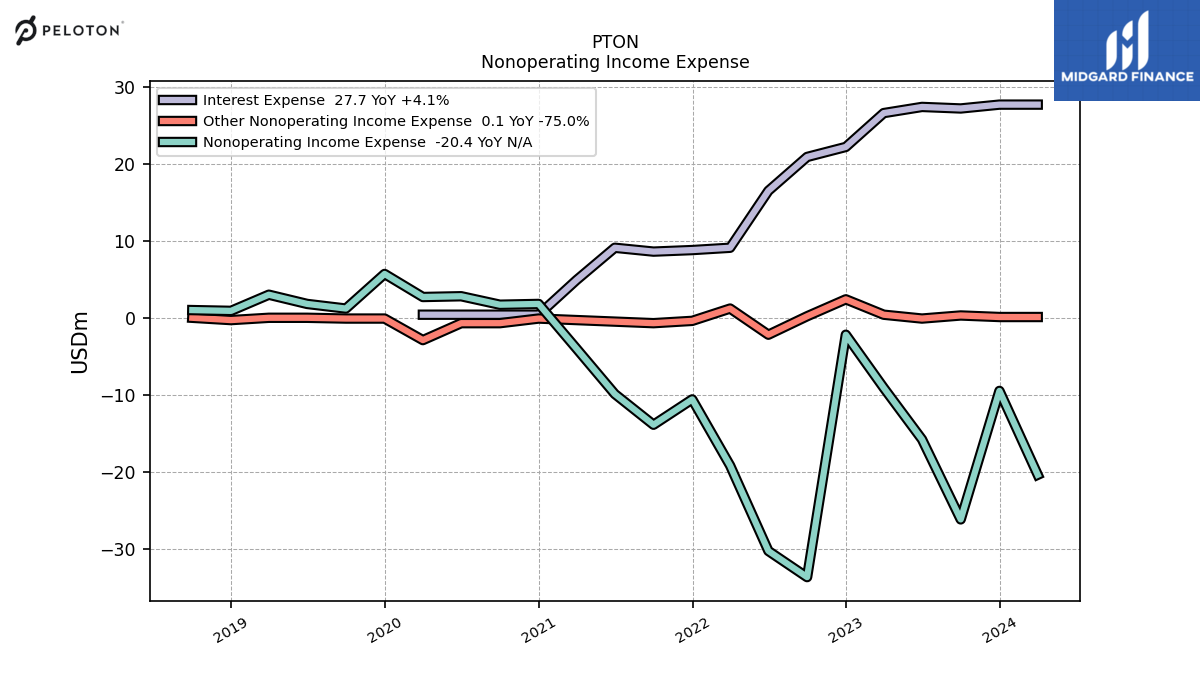
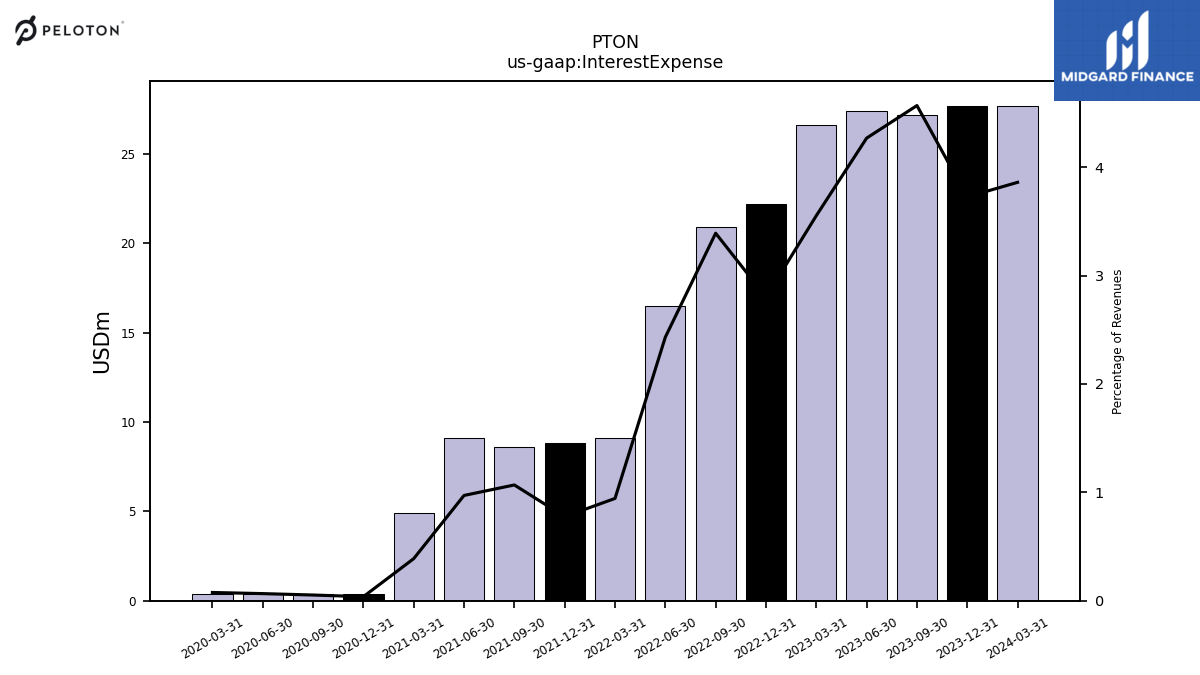
| Interest Expense | 27.20 | 27.40 | 26.60 | 22.20 | 20.90 | 16.50 | 9.10 | 8.80 | 8.60 | 9.10 | 4.90 | 0.40 | 0.40 | 0.40 | 0.40 | NA | NA | NA | NA | NA | NA | |
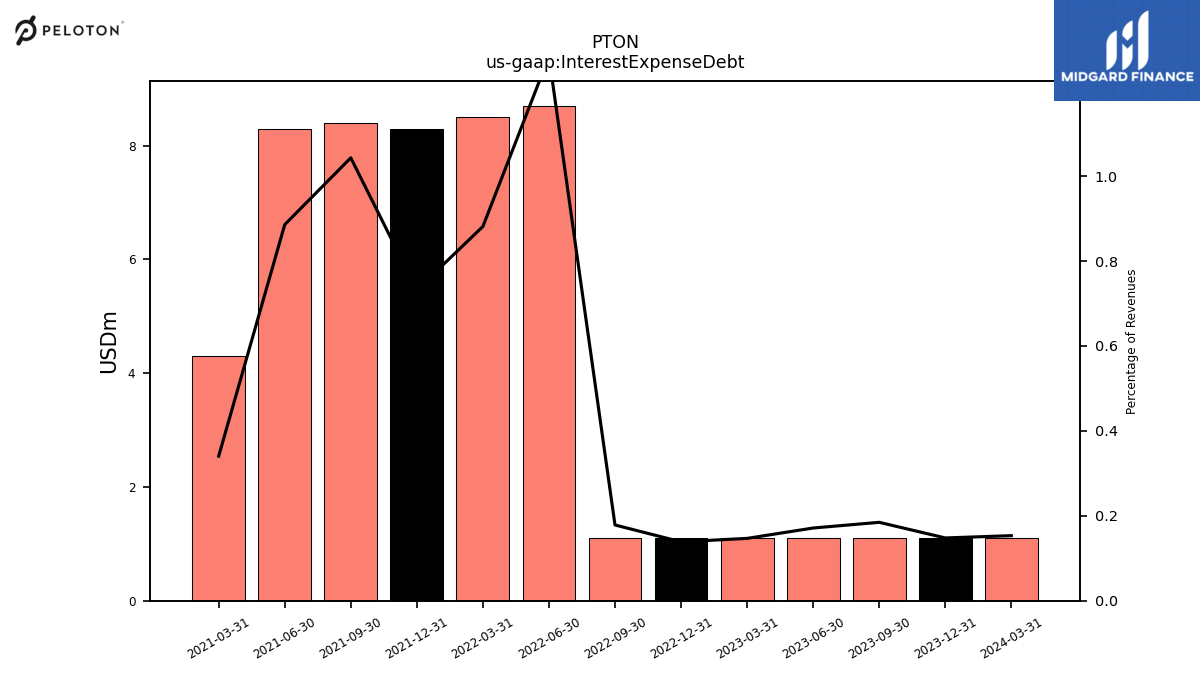
| Interest Expense Debt | 1.10 | 1.10 | 1.10 | 1.10 | 1.10 | 8.70 | 8.50 | 8.30 | 8.40 | 8.30 | 4.30 | NA | NA | NA | NA | NA | NA | NA | NA | NA | NA | |
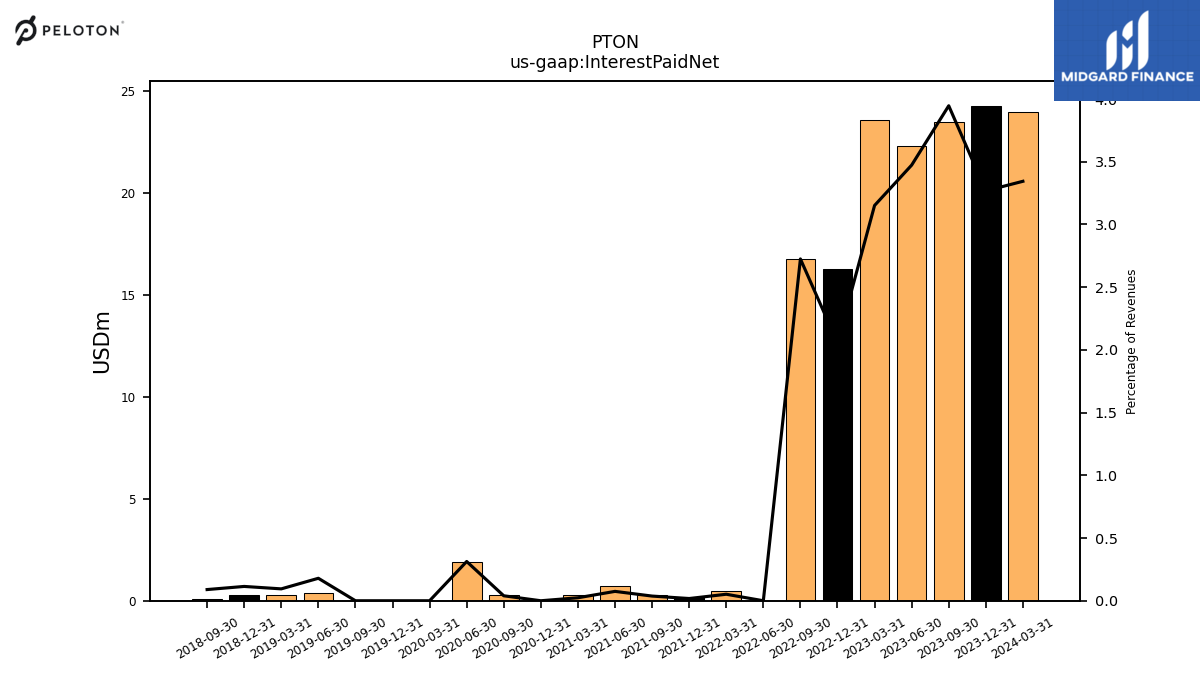
| Interest Paid Net | 23.50 | 22.30 | 23.60 | 16.30 | 16.80 | 0.00 | 0.50 | 0.20 | 0.30 | 0.70 | 0.30 | 0.00 | 0.30 | 1.90 | 0.00 | 0.00 | 0.00 | 0.40 | 0.30 | 0.30 | 0.10 | |
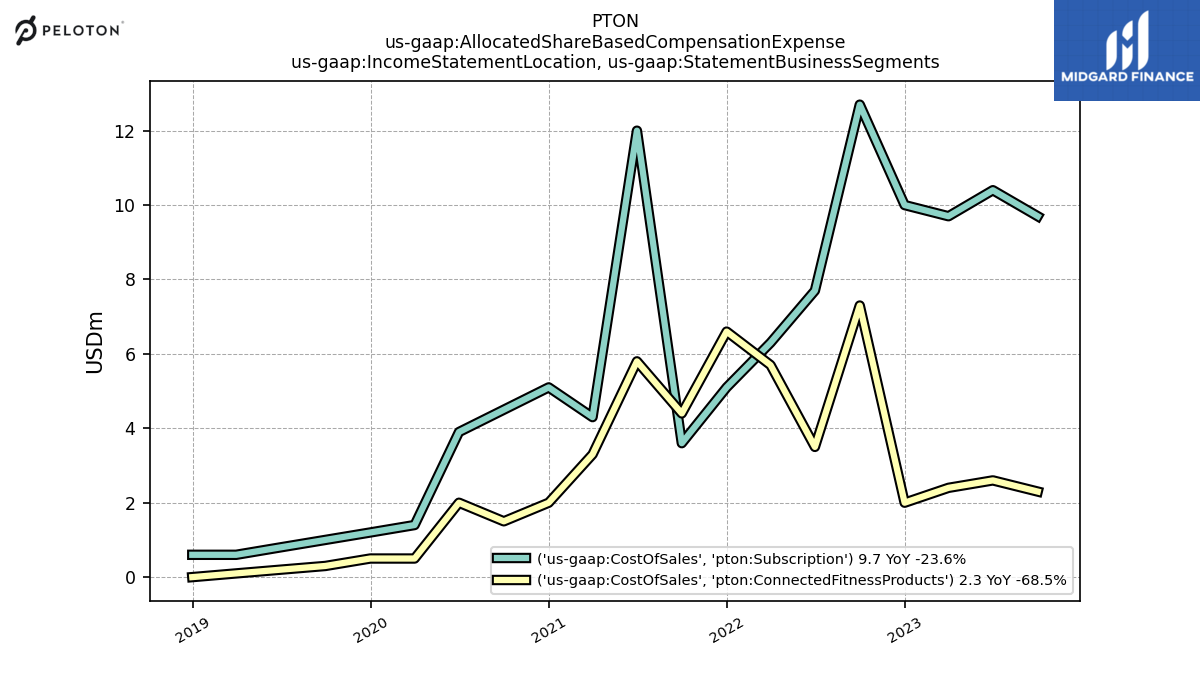
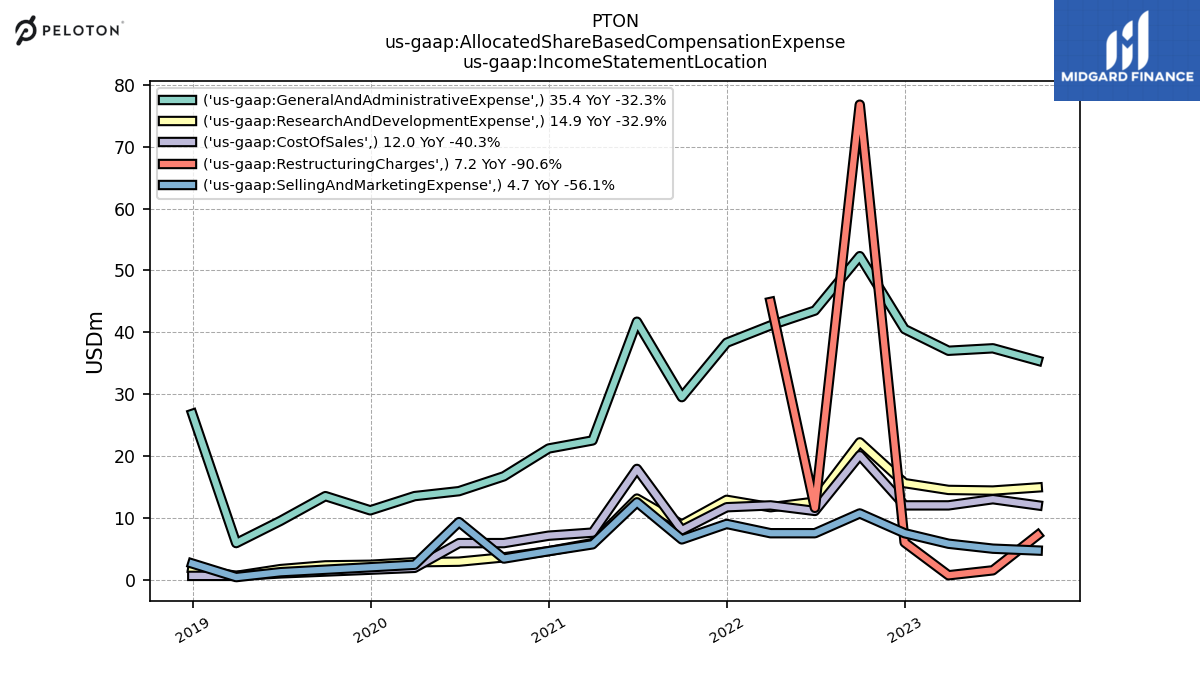
| Allocated Share Based Compensation Expense | 74.20 | 71.30 | 70.00 | 81.60 | 182.10 | 86.50 | 117.10 | 71.90 | 52.90 | 85.20 | 41.70 | 37.50 | 29.60 | 32.50 | 20.50 | 17.10 | 18.70 | 13.50 | 7.50 | 31.80 | NA | |
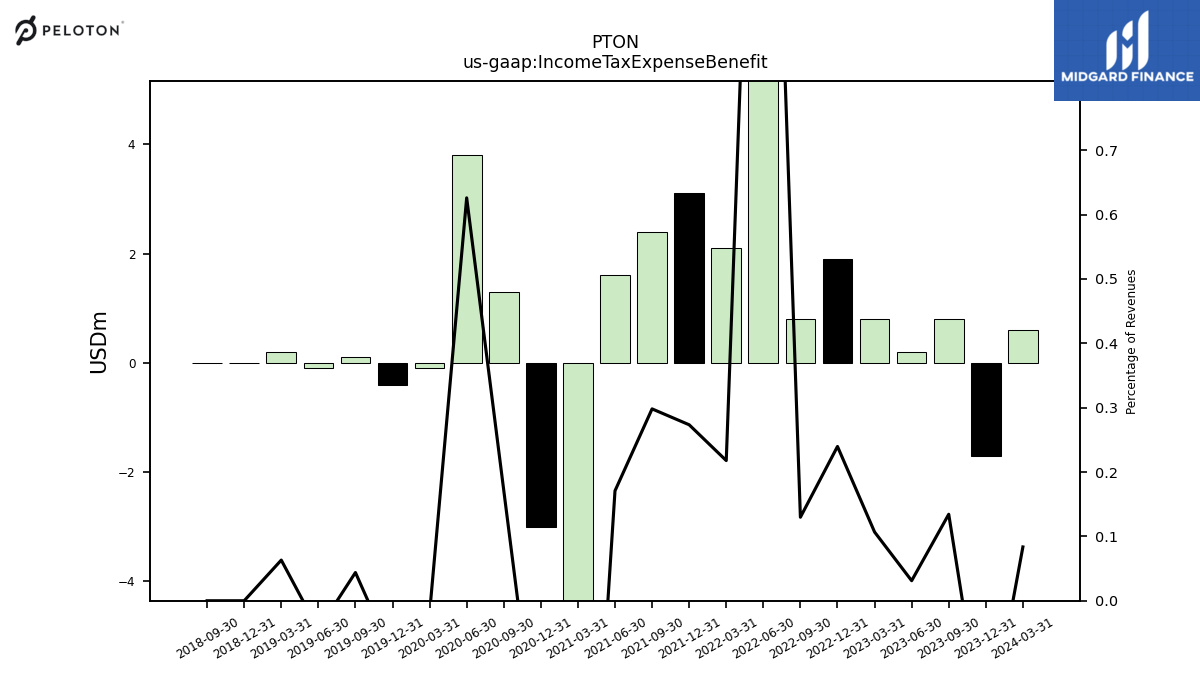
| Income Tax Expense Benefit | 0.80 | 0.20 | 0.80 | 1.90 | 0.80 | 12.10 | 2.10 | 3.10 | 2.40 | 1.60 | -9.10 | -3.00 | 1.30 | 3.80 | -0.10 | -0.40 | 0.10 | -0.10 | 0.20 | 0.00 | 0.00 | |
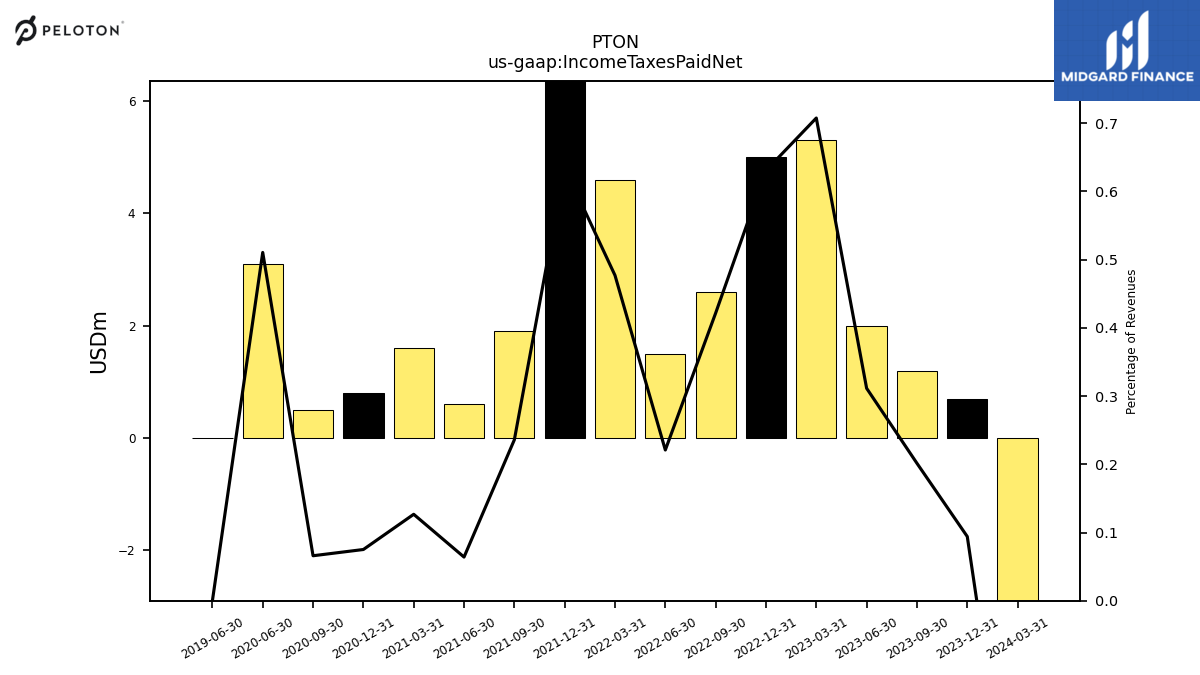
| Income Taxes Paid Net | 1.20 | 2.00 | 5.30 | 5.00 | 2.60 | 1.50 | 4.60 | 7.20 | 1.90 | 0.60 | 1.60 | 0.80 | 0.50 | 3.10 | NA | NA | NA | 0.00 | NA | NA | NA | |
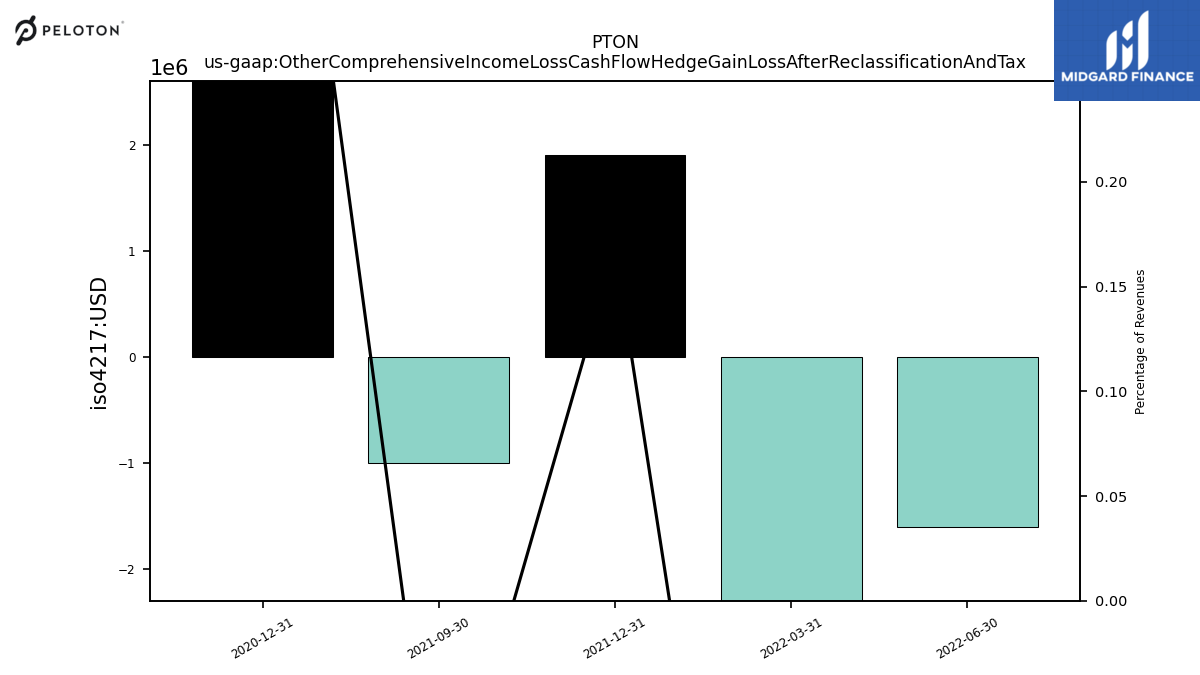
| Other Comprehensive Income Loss Cash Flow Hedge Gain Loss After Reclassification And Tax | NA | NA | NA | NA | NA | -1.60 | -3.60 | 1.90 | -1.00 | NA | NA | 5.30 | NA | NA | NA | NA | NA | NA | NA | NA | NA | |
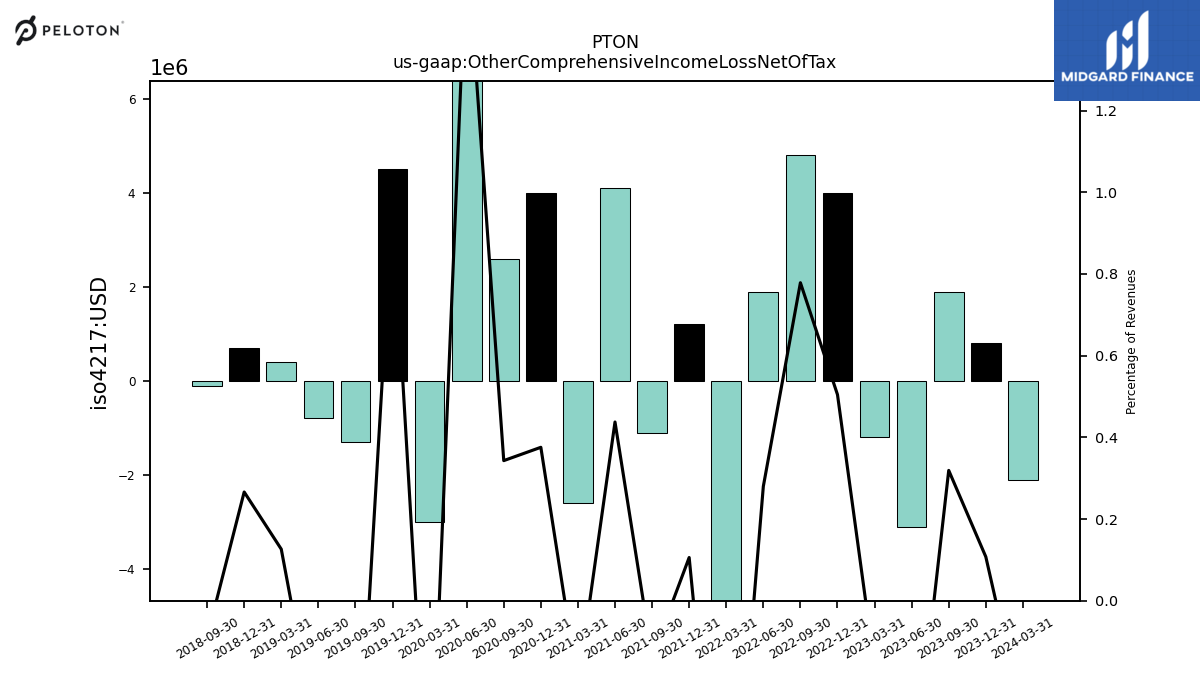
| Other Comprehensive Income Loss Net Of Tax | 1.90 | -3.10 | -1.20 | 4.00 | 4.80 | 1.90 | -7.90 | 1.20 | -1.10 | 4.10 | -2.60 | 4.00 | 2.60 | 9.80 | -3.00 | 4.50 | -1.30 | -0.80 | 0.40 | 0.70 | -0.10 | |
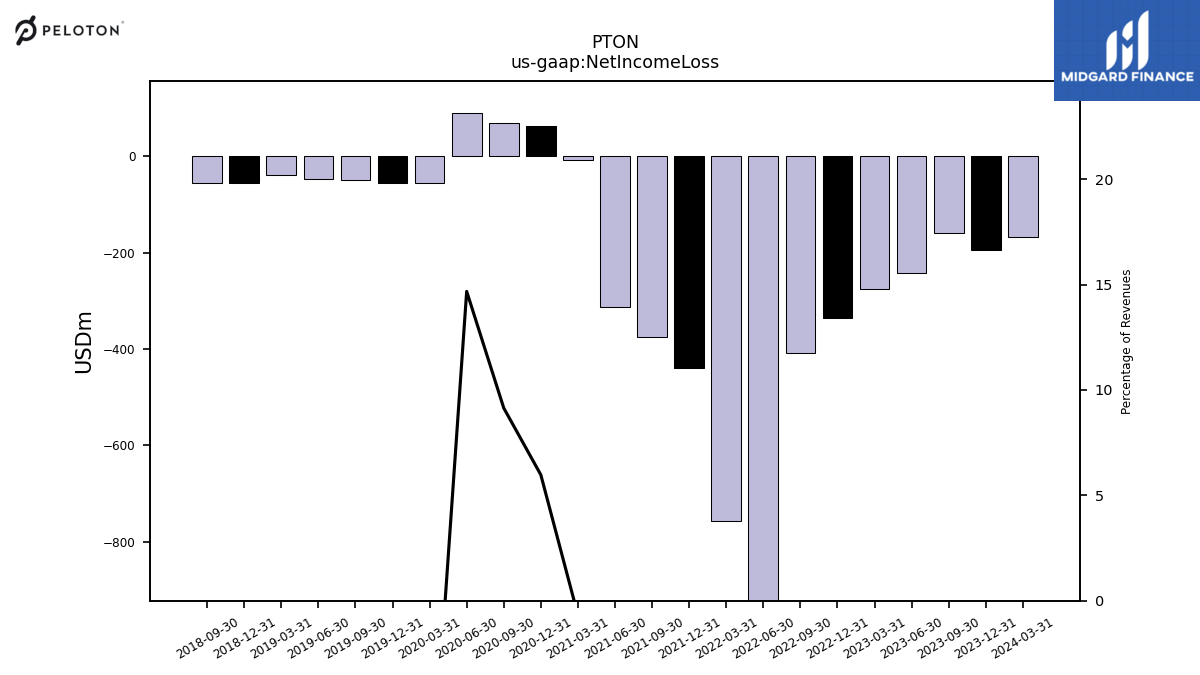
| Net Income Loss | -159.30 | -241.80 | -275.90 | -335.40 | -408.50 | -1255.30 | -757.10 | -439.40 | -376.00 | -313.20 | -8.60 | 63.60 | 69.30 | 89.10 | -55.60 | -55.40 | -49.80 | -47.40 | -38.60 | -55.10 | -54.50 | |
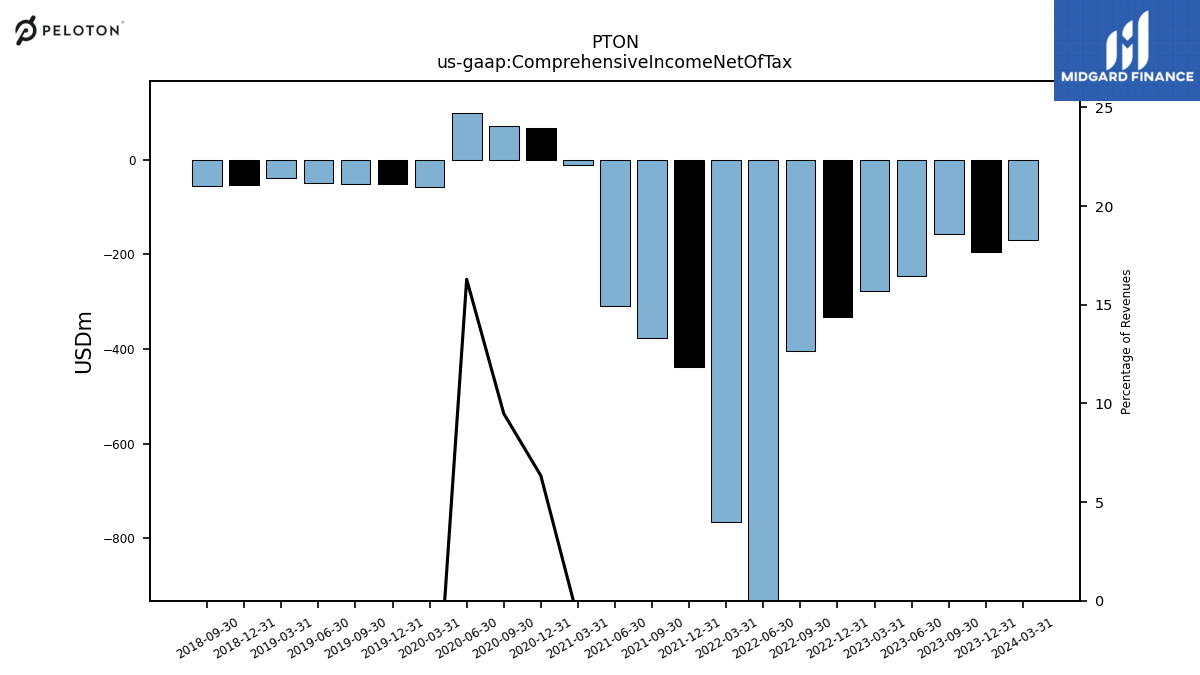
| Comprehensive Income Net Of Tax | -157.40 | -244.90 | -277.10 | -331.40 | -403.60 | -1253.50 | -765.00 | -438.20 | -377.10 | -309.10 | -11.20 | 67.50 | 71.90 | 98.90 | -58.60 | -50.90 | -51.10 | -48.20 | -38.20 | -54.40 | -54.60 | |
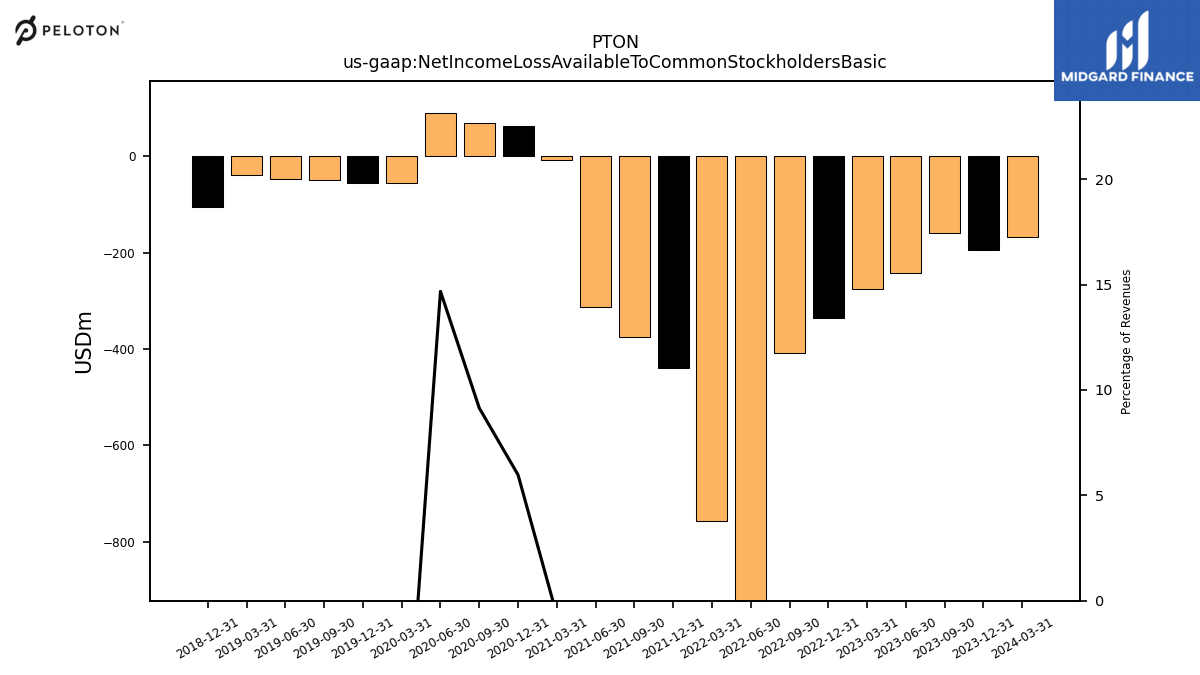
| Net Income Loss Available To Common Stockholders Basic | -159.30 | -241.80 | -275.90 | -335.40 | -408.50 | -1255.30 | -757.10 | -439.40 | -376.00 | -313.20 | -8.60 | 63.60 | 69.30 | 89.10 | -55.60 | -55.40 | -49.80 | -47.40 | -38.60 | -105.20 | NA | |
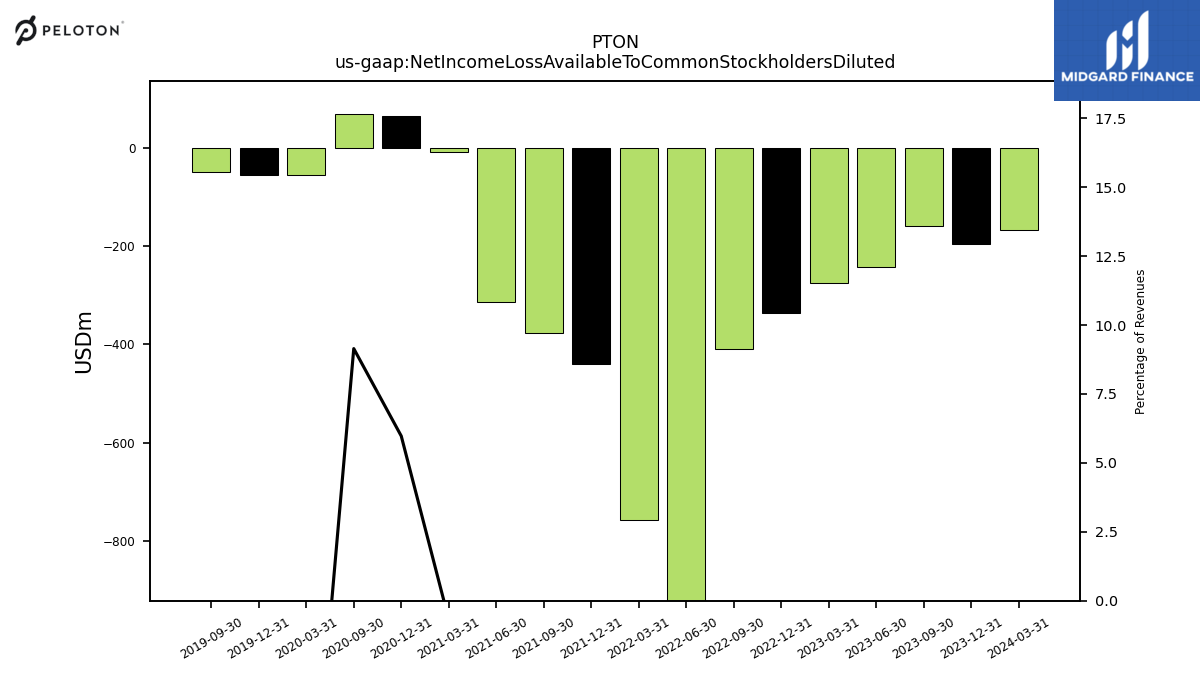
| Net Income Loss Available To Common Stockholders Diluted | -159.30 | -241.80 | -275.90 | -335.40 | -408.50 | -1255.30 | -757.10 | -439.40 | -376.00 | -313.20 | -8.60 | 63.60 | 69.30 | NA | -55.60 | -55.40 | -49.80 | NA | NA | NA | NA | |
| Goodwill Impairment Loss | NA | NA | NA | NA | NA | 0.00 | 181.90 | NA | NA | NA | NA | NA | NA | NA | NA | NA | NA | NA | NA | NA | NA |
| 2023-09-30 | 2023-06-30 | 2023-03-31 | 2022-12-31 | 2022-09-30 | 2022-06-30 | 2022-03-31 | 2021-12-31 | 2021-09-30 | 2021-06-30 | 2021-03-31 | 2020-12-31 | 2020-09-30 | 2020-06-30 | 2020-03-31 | 2019-12-31 | 2019-09-30 | 2019-06-30 | 2019-03-31 | 2018-12-31 | 2018-09-30 | ||
|---|---|---|---|---|---|---|---|---|---|---|---|---|---|---|---|---|---|---|---|---|---|---|
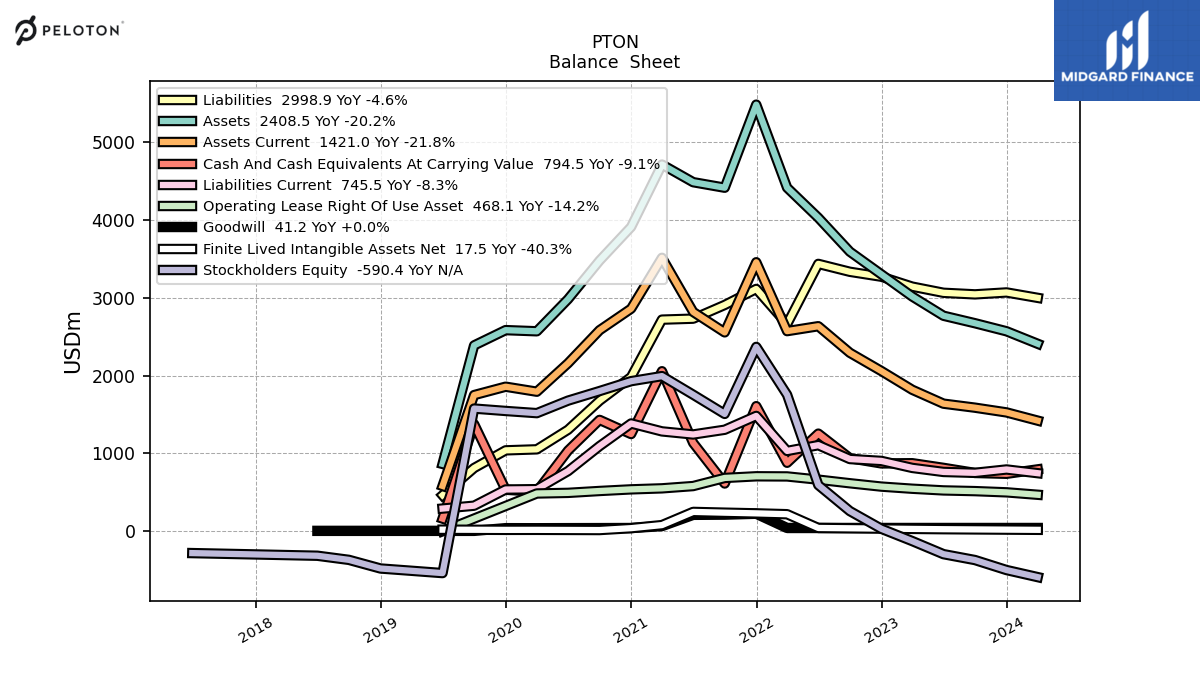
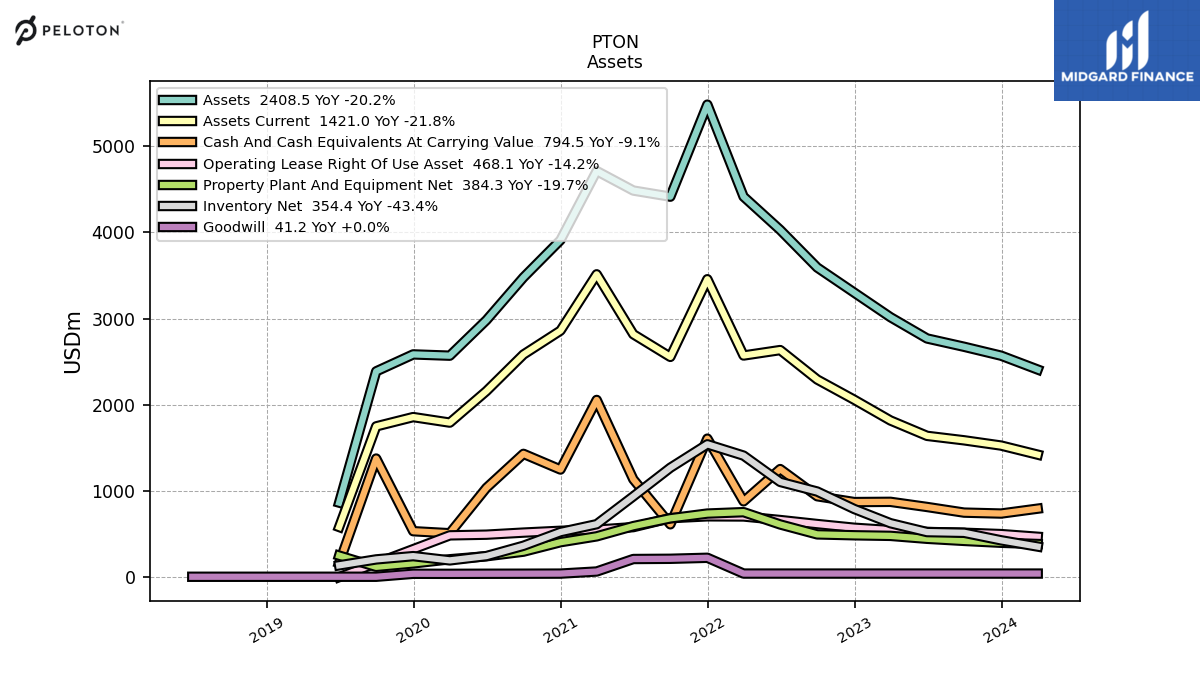
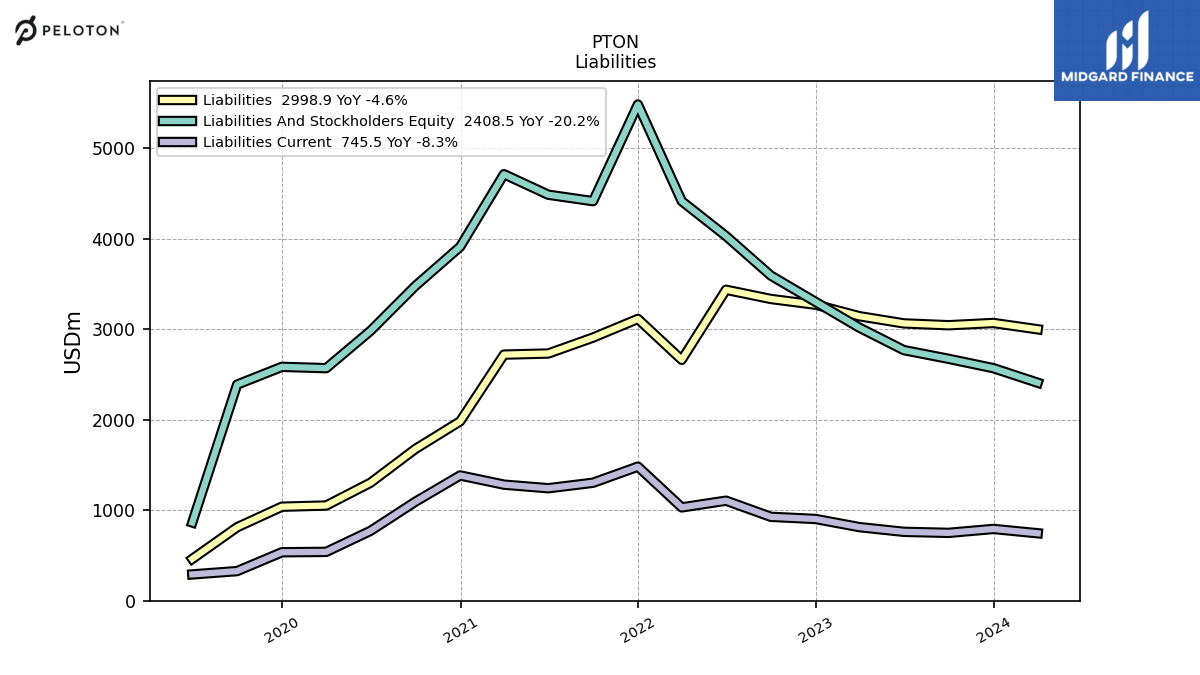
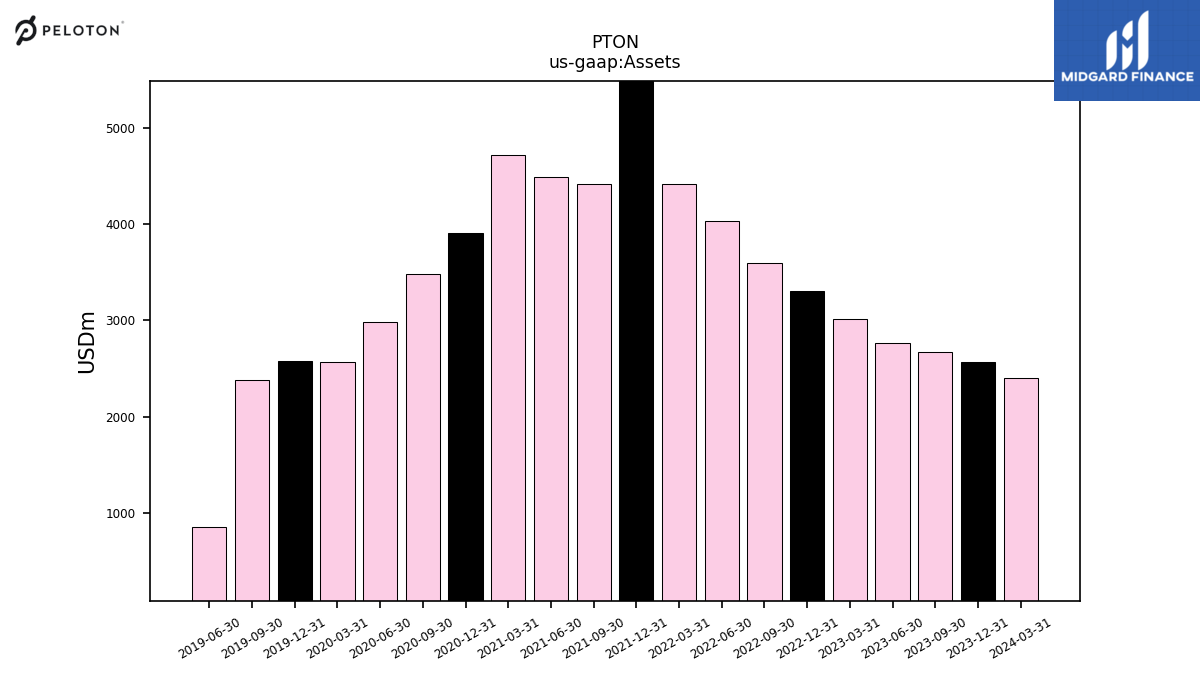
| Assets | 2672.80 | 2769.10 | 3016.30 | 3301.10 | 3592.50 | 4028.50 | 4414.80 | 5482.50 | 4414.50 | 4485.60 | 4712.40 | 3910.50 | 3477.50 | 2981.80 | 2569.40 | 2584.20 | 2387.70 | 864.50 | NA | NA | NA | |
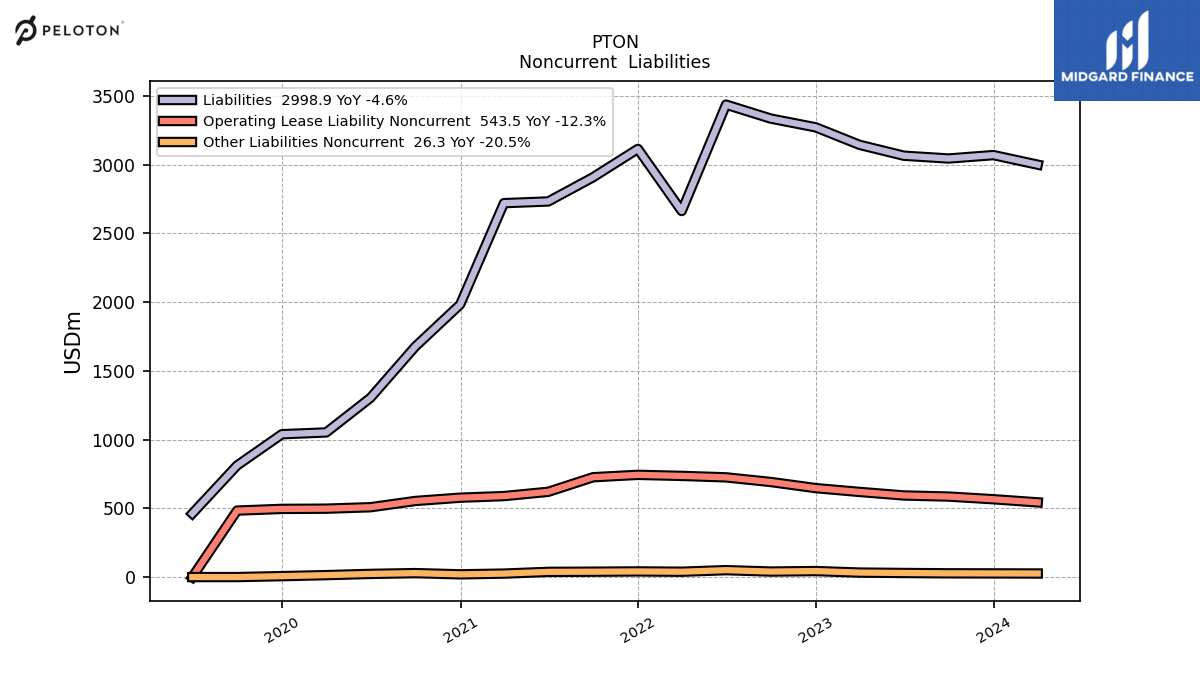
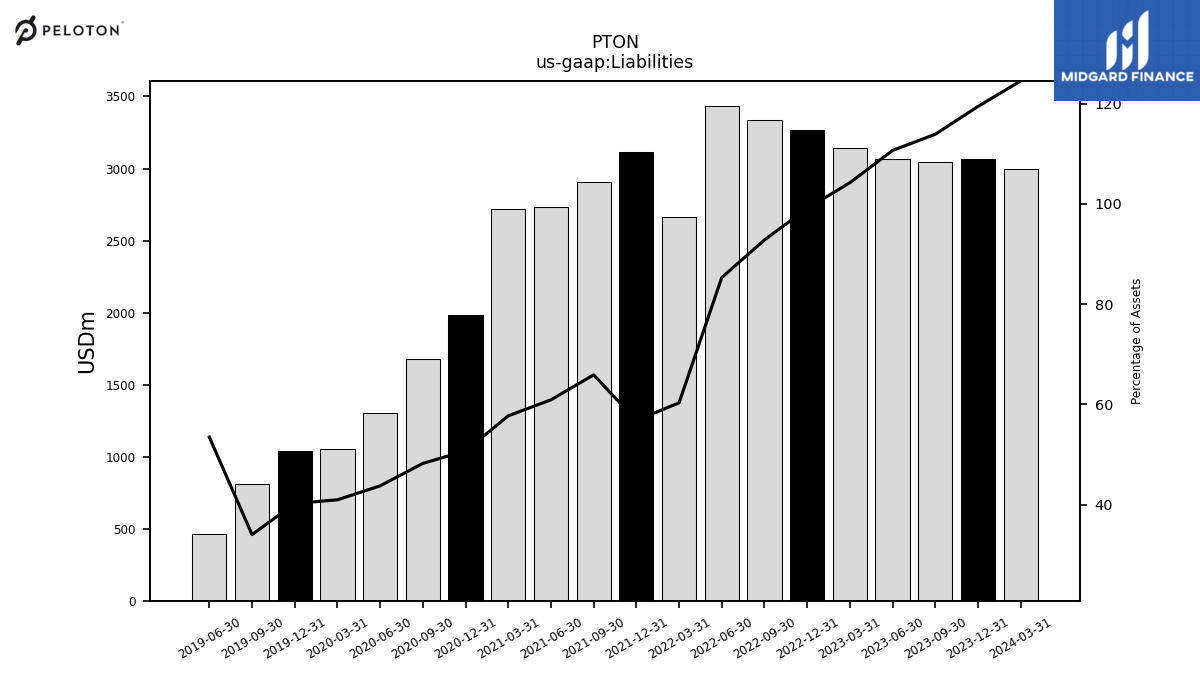
| Liabilities | 3043.80 | 3064.20 | 3143.30 | 3270.60 | 3334.00 | 3435.60 | 2661.80 | 3113.60 | 2907.60 | 2731.50 | 2719.10 | 1982.10 | 1676.50 | 1303.80 | 1052.10 | 1039.00 | 811.80 | 462.00 | NA | NA | NA | |
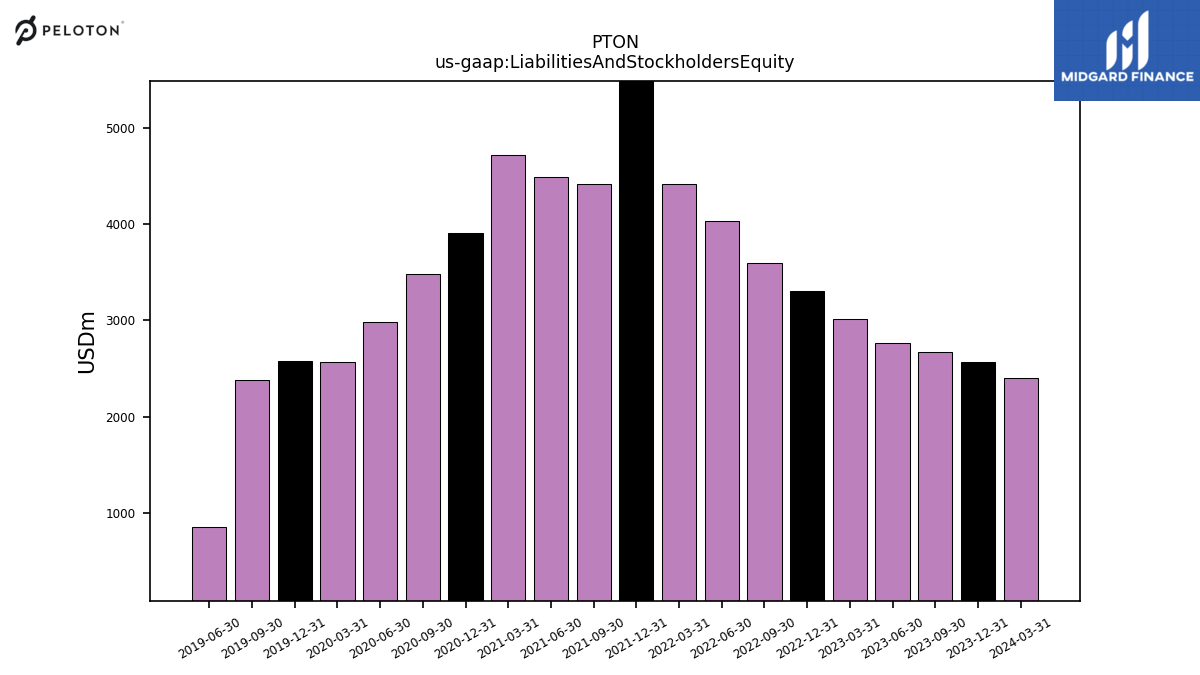
| Liabilities And Stockholders Equity | 2672.80 | 2769.10 | 3016.30 | 3301.10 | 3592.50 | 4028.50 | 4414.80 | 5482.50 | 4414.50 | 4485.60 | 4712.40 | 3910.50 | 3477.50 | 2981.80 | 2569.40 | 2584.20 | 2387.70 | 864.50 | NA | NA | NA | |
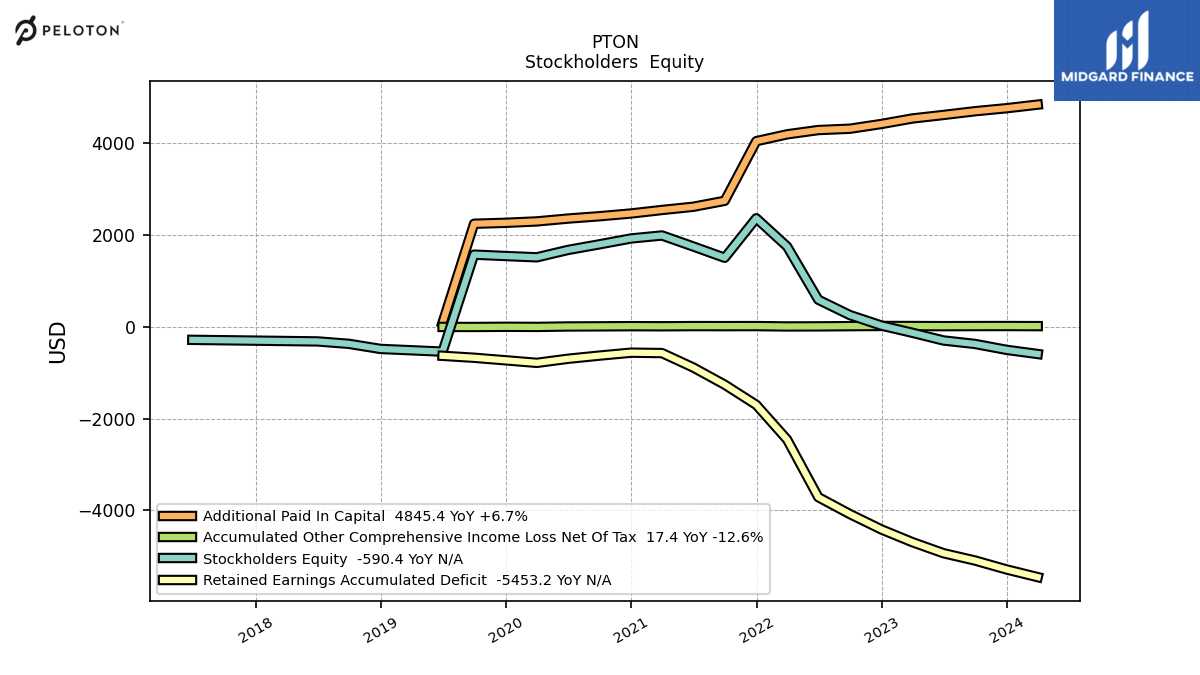
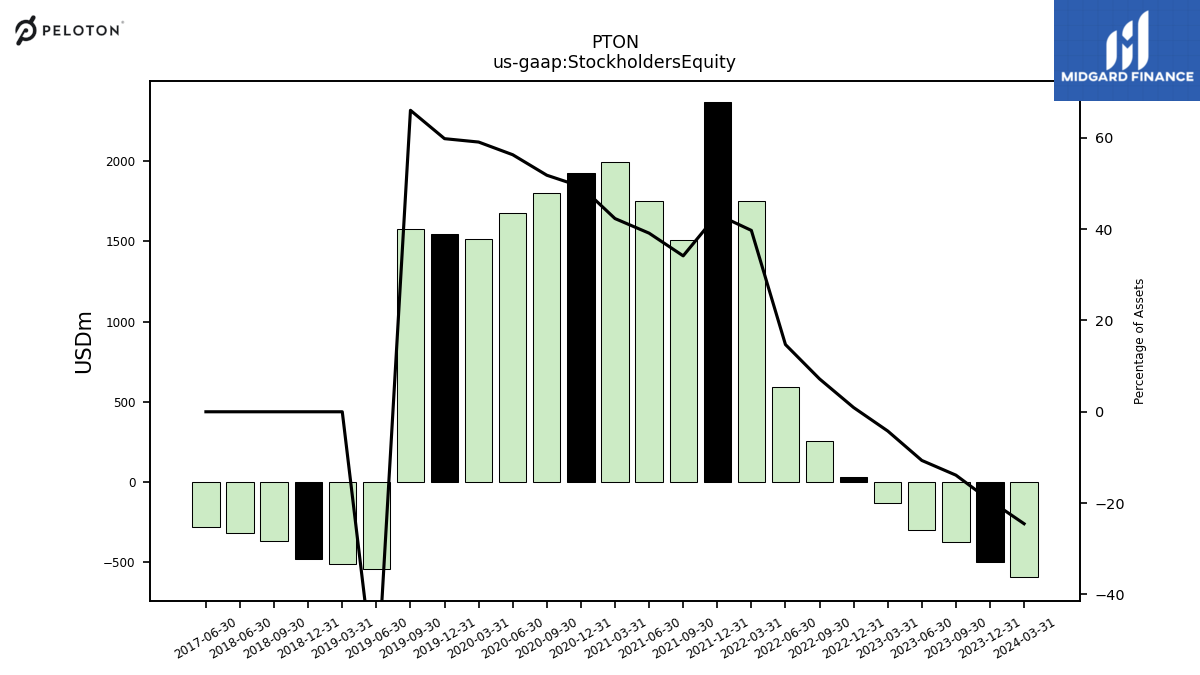
| Stockholders Equity | -370.90 | -295.10 | -127.00 | 30.50 | 258.50 | 592.90 | 1753.00 | 2368.90 | 1506.90 | 1754.10 | 1993.40 | 1928.30 | 1801.00 | 1678.00 | 1517.30 | 1545.20 | 1576.00 | -538.60 | -508.70 | -479.50 | -368.70 |
| 2023-09-30 | 2023-06-30 | 2023-03-31 | 2022-12-31 | 2022-09-30 | 2022-06-30 | 2022-03-31 | 2021-12-31 | 2021-09-30 | 2021-06-30 | 2021-03-31 | 2020-12-31 | 2020-09-30 | 2020-06-30 | 2020-03-31 | 2019-12-31 | 2019-09-30 | 2019-06-30 | 2019-03-31 | 2018-12-31 | 2018-09-30 | ||
|---|---|---|---|---|---|---|---|---|---|---|---|---|---|---|---|---|---|---|---|---|---|---|
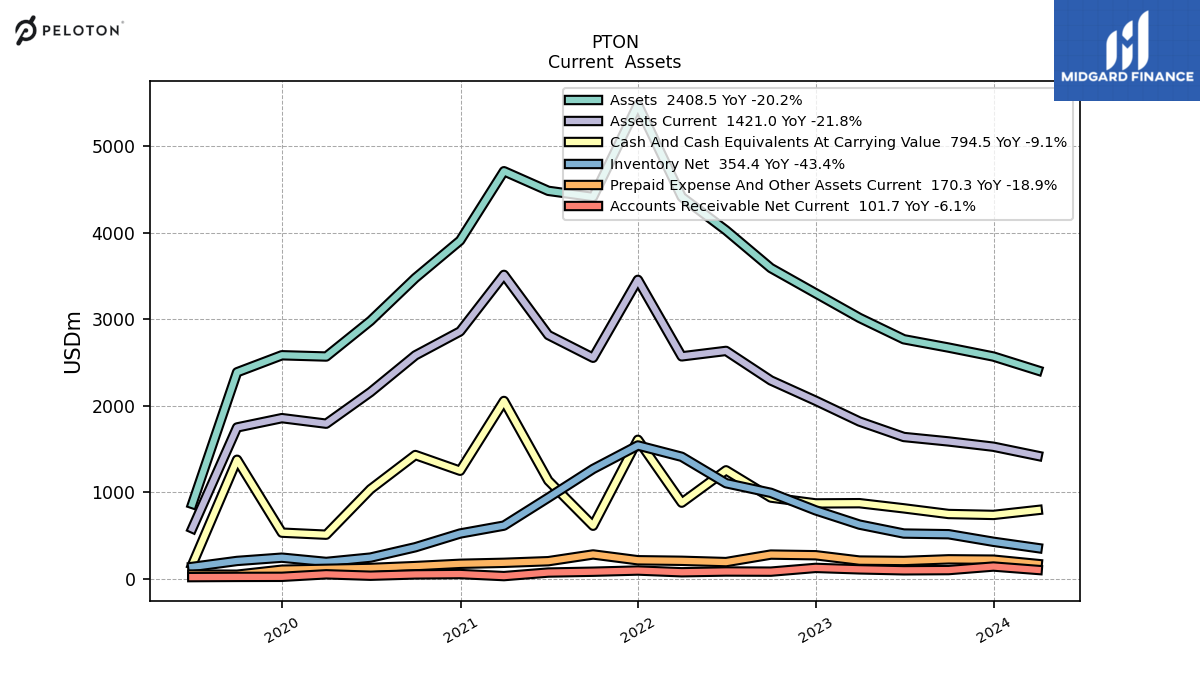
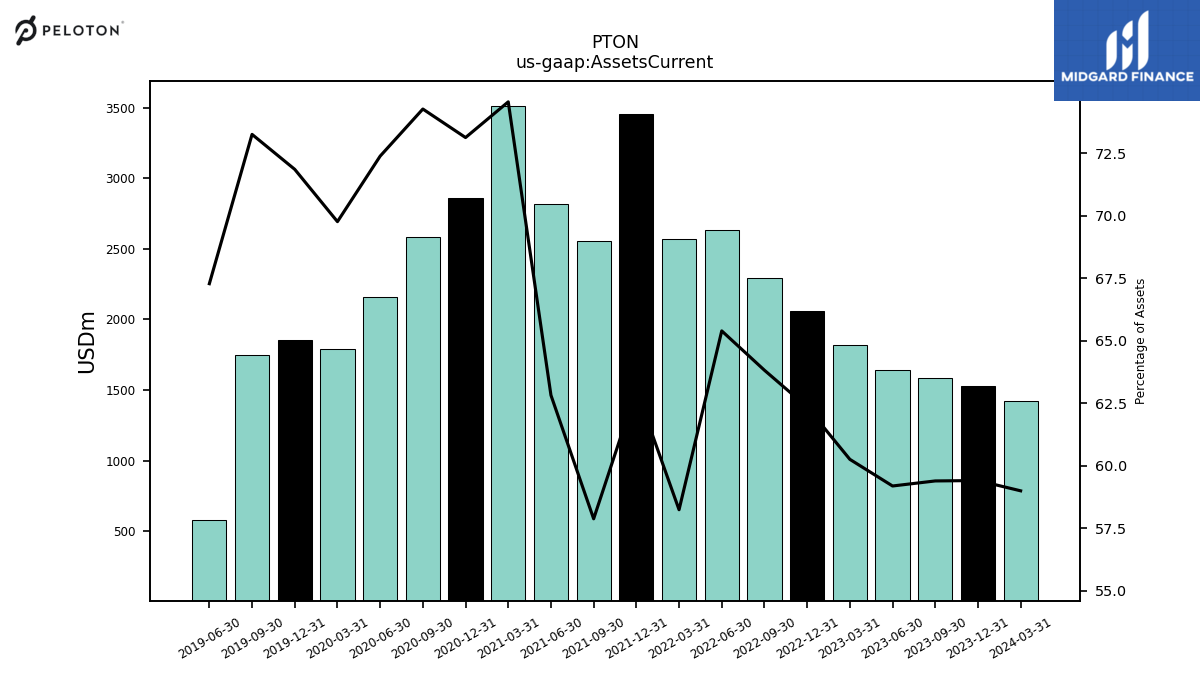
| Assets Current | 1587.50 | 1639.10 | 1817.60 | 2058.30 | 2292.90 | 2634.60 | 2571.30 | 3456.60 | 2555.10 | 2818.10 | 3513.80 | 2860.00 | 2583.00 | 2158.60 | 1792.70 | 1857.10 | 1749.30 | 581.70 | NA | NA | NA | |
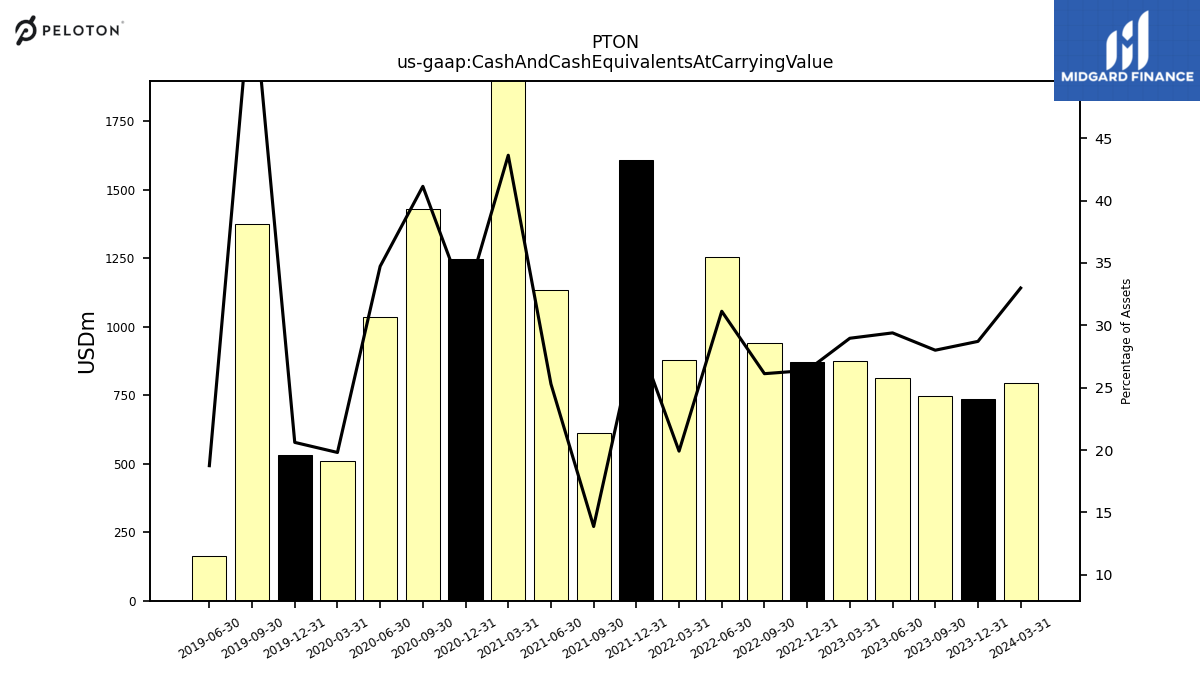
| Cash And Cash Equivalents At Carrying Value | 748.50 | 813.90 | 873.60 | 871.00 | 938.50 | 1253.90 | 879.30 | 1606.90 | 612.60 | 1134.80 | 2055.90 | 1248.40 | 1430.50 | 1035.50 | 509.00 | 532.80 | 1375.90 | 162.10 | NA | NA | NA | |
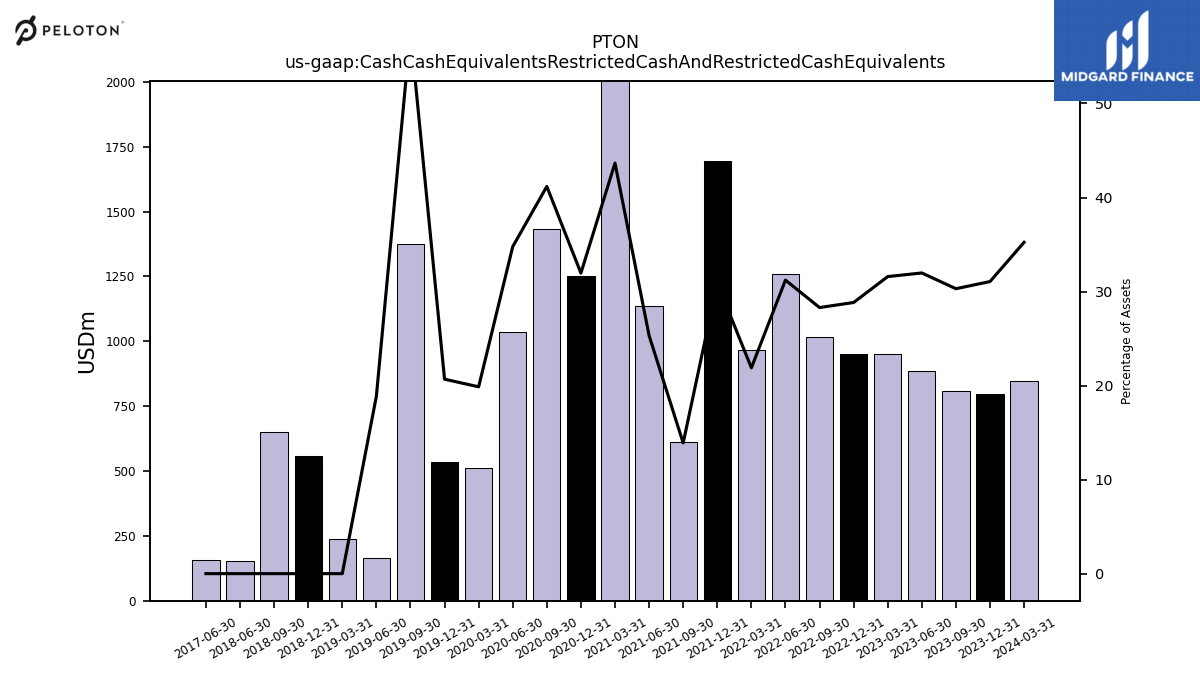
| Cash Cash Equivalents Restricted Cash And Restricted Cash Equivalents | 809.90 | 885.50 | 952.90 | 951.90 | 1016.60 | 1257.60 | 966.20 | 1694.60 | 613.50 | 1135.70 | 2057.40 | 1249.90 | 1432.00 | 1037.00 | 510.50 | 534.40 | 1376.70 | 163.00 | 236.20 | 557.50 | 649.50 | |
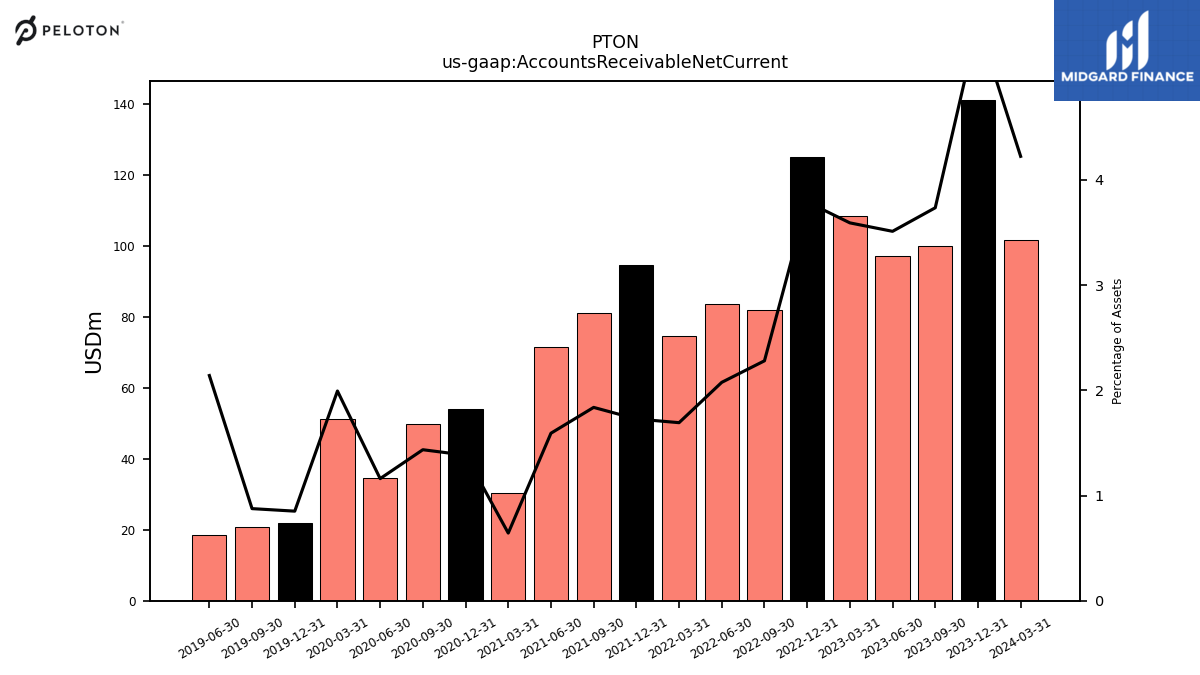
| Accounts Receivable Net Current | 99.80 | 97.20 | 108.30 | 125.10 | 81.90 | 83.60 | 74.70 | 94.70 | 81.10 | 71.40 | 30.30 | 54.10 | 49.90 | 34.60 | 51.20 | 22.00 | 20.90 | 18.50 | NA | NA | NA | |
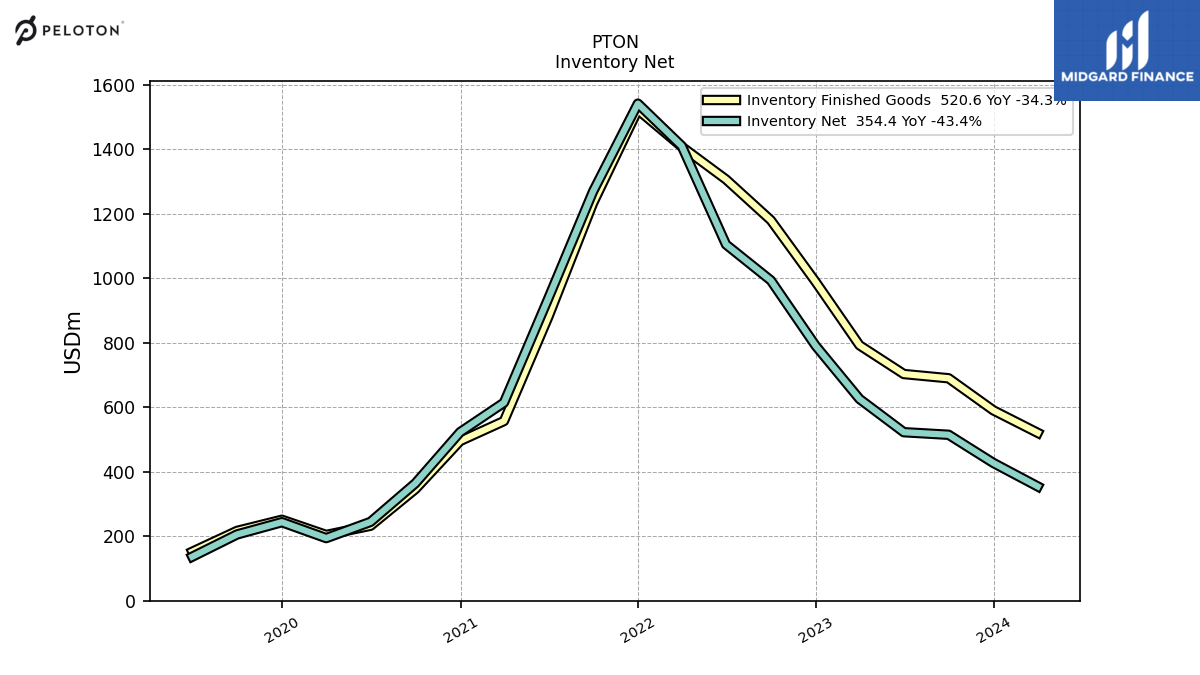
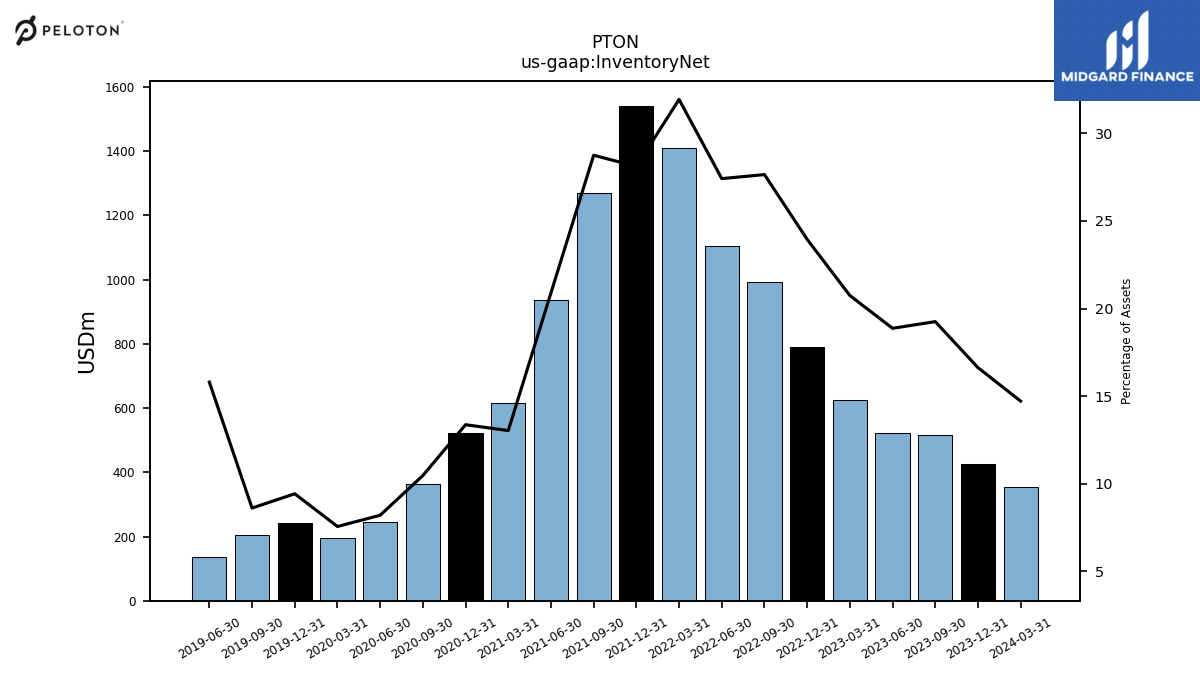
| Inventory Net | 514.60 | 522.60 | 625.70 | 790.60 | 993.20 | 1104.50 | 1410.00 | 1541.30 | 1269.20 | 937.10 | 614.20 | 522.80 | 364.00 | 244.50 | 194.20 | 243.60 | 205.60 | 136.60 | NA | NA | NA | |
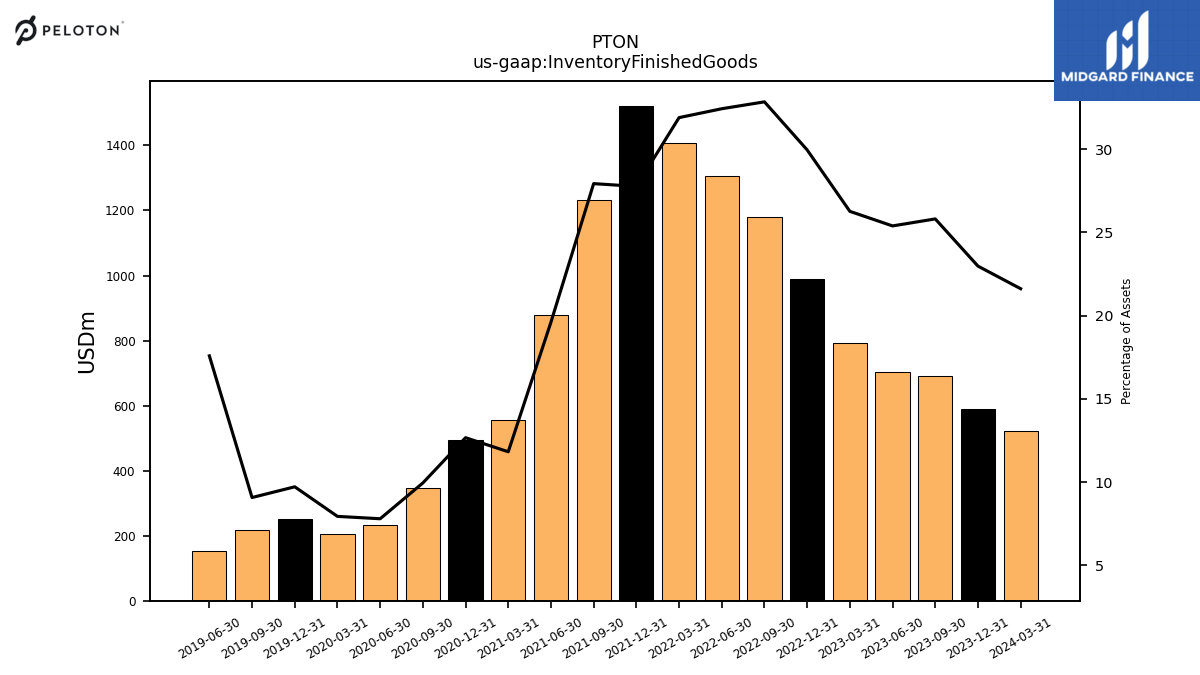
| Inventory Finished Goods | 689.80 | 703.00 | 792.20 | 988.80 | 1179.80 | 1306.30 | 1408.00 | 1522.00 | 1232.90 | 879.50 | 557.10 | 495.30 | 345.90 | 232.50 | 204.00 | 251.10 | 216.60 | 152.00 | NA | NA | NA | |
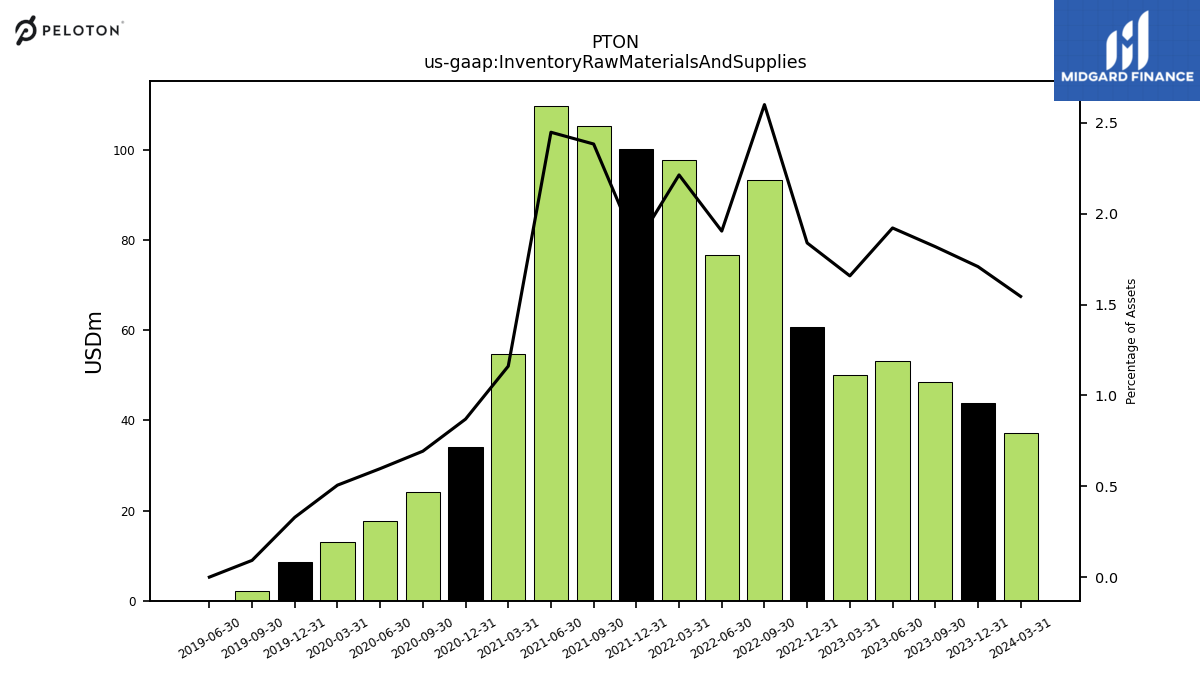
| Inventory Raw Materials And Supplies | 48.60 | 53.20 | 50.00 | 60.70 | 93.40 | 76.70 | 97.70 | 100.30 | 105.20 | 109.80 | 54.70 | 34.00 | 24.10 | 17.80 | 13.00 | 8.50 | 2.20 | 0.00 | NA | NA | NA | |
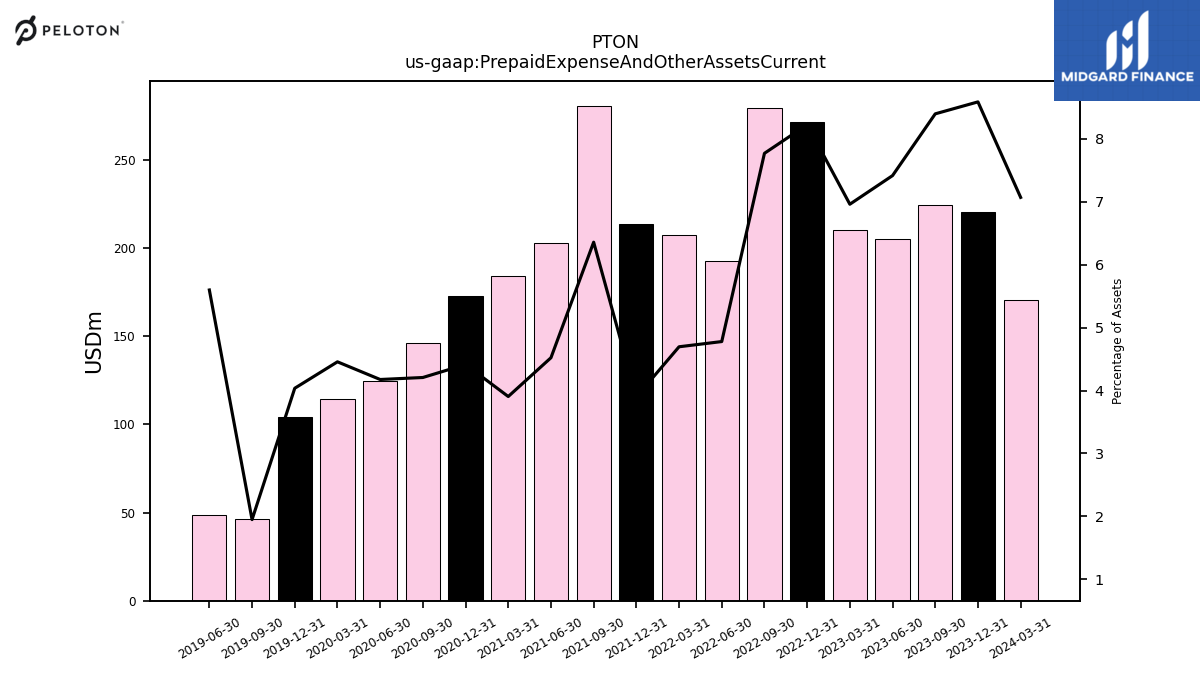
| Prepaid Expense And Other Assets Current | 224.50 | 205.40 | 210.00 | 271.60 | 279.20 | 192.50 | 207.30 | 213.70 | 280.70 | 202.80 | 184.00 | 172.60 | 146.30 | 124.50 | 114.50 | 104.30 | 46.50 | 48.40 | NA | NA | NA |
| 2023-09-30 | 2023-06-30 | 2023-03-31 | 2022-12-31 | 2022-09-30 | 2022-06-30 | 2022-03-31 | 2021-12-31 | 2021-09-30 | 2021-06-30 | 2021-03-31 | 2020-12-31 | 2020-09-30 | 2020-06-30 | 2020-03-31 | 2019-12-31 | 2019-09-30 | 2019-06-30 | 2019-03-31 | 2018-12-31 | 2018-09-30 | ||
|---|---|---|---|---|---|---|---|---|---|---|---|---|---|---|---|---|---|---|---|---|---|---|
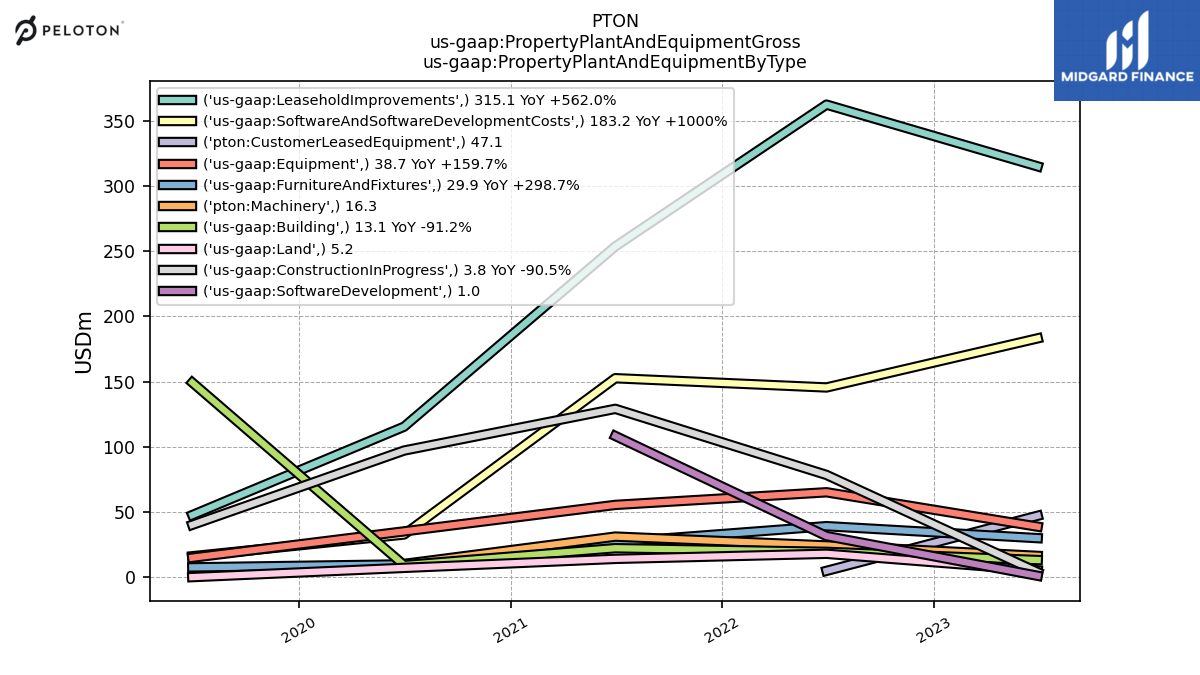
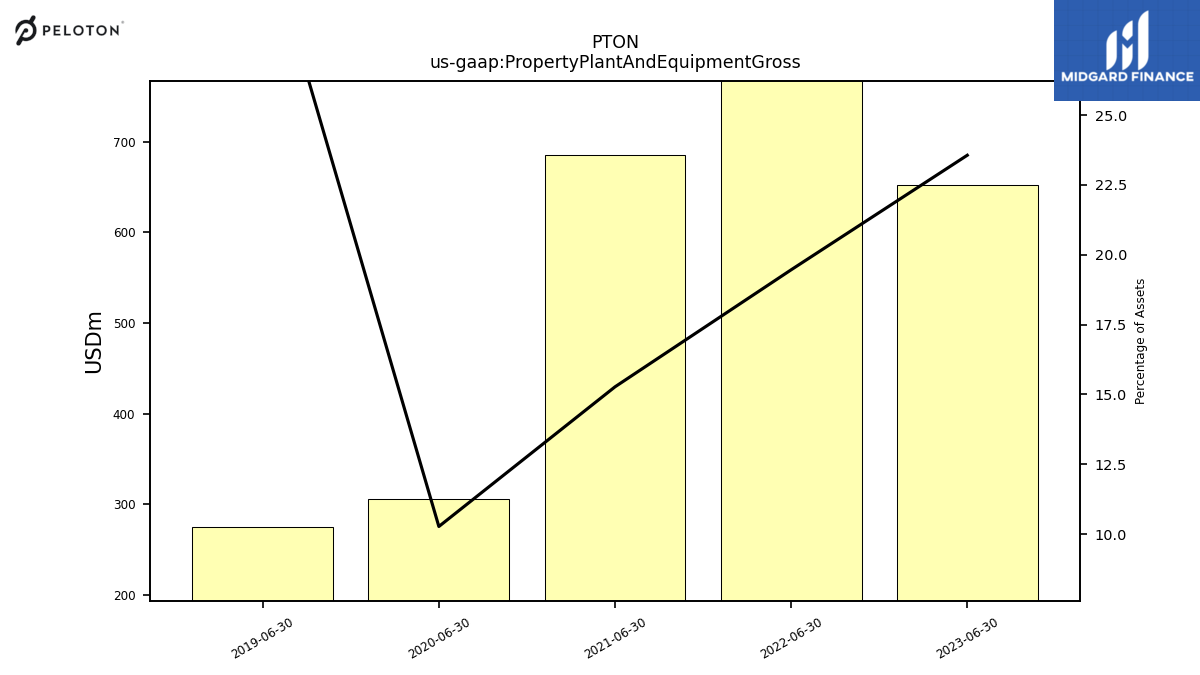
| Property Plant And Equipment Gross | NA | 652.40 | NA | NA | NA | 783.90 | NA | NA | NA | 684.90 | NA | NA | NA | 306.20 | NA | NA | NA | 275.40 | NA | NA | NA | |
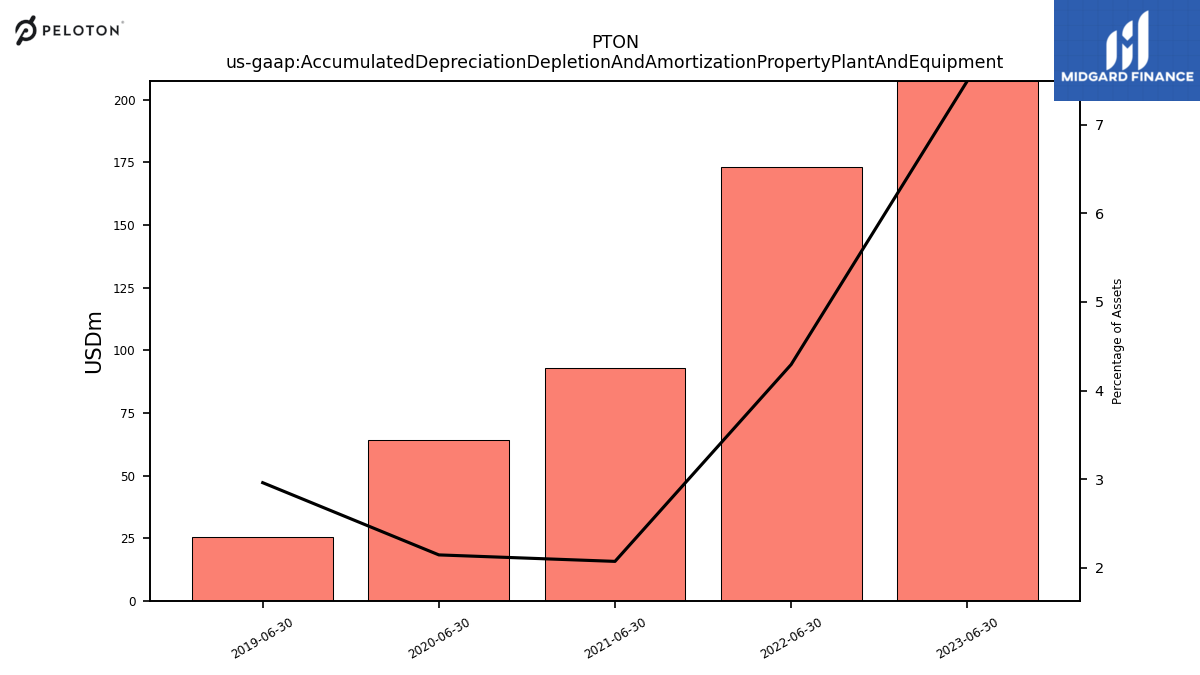
| Accumulated Depreciation Depletion And Amortization Property Plant And Equipment | NA | 207.50 | NA | NA | NA | 173.00 | NA | NA | NA | 93.00 | NA | NA | NA | 64.00 | NA | NA | NA | 25.60 | NA | NA | NA | |
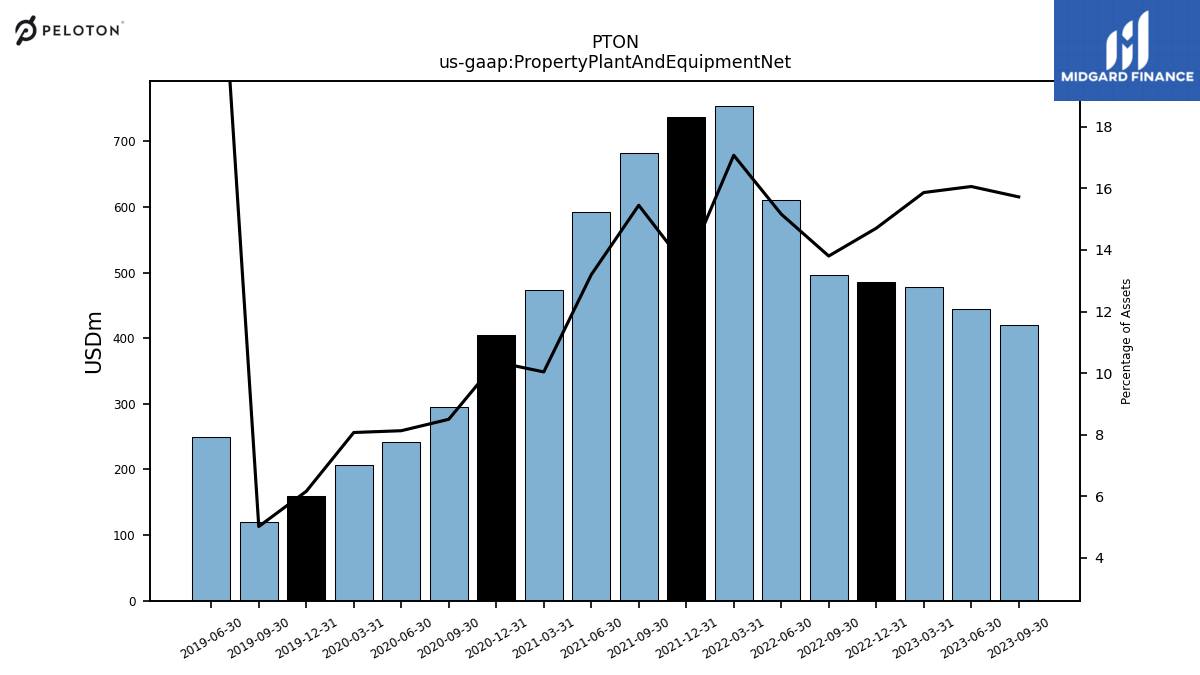
| Property Plant And Equipment Net | 420.30 | 444.80 | 478.60 | 485.50 | 495.90 | 610.90 | 754.00 | 737.60 | 682.20 | 591.90 | 473.00 | 405.10 | 295.50 | 242.30 | 207.30 | 159.10 | 119.70 | 249.70 | NA | NA | NA | |
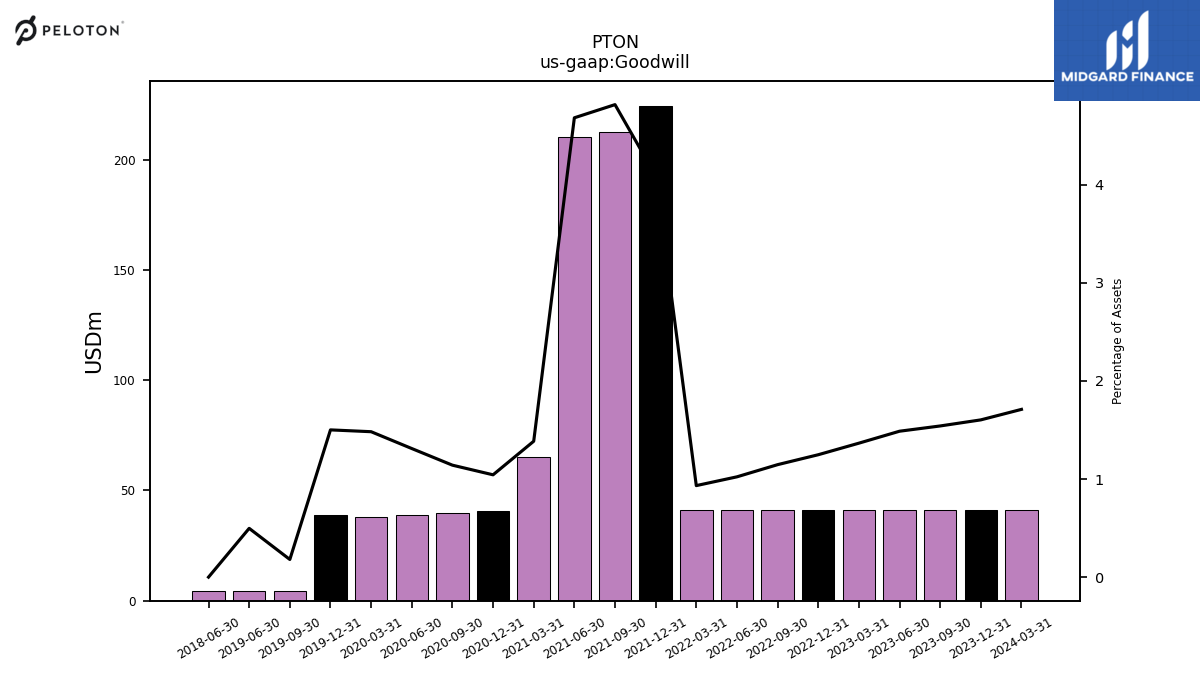
| Goodwill | 41.20 | 41.20 | 41.20 | 41.20 | 41.20 | 41.20 | 41.20 | 224.40 | 212.70 | 210.10 | 65.30 | 40.80 | 39.70 | 39.10 | 38.10 | 38.80 | 4.30 | 4.30 | NA | NA | NA | |
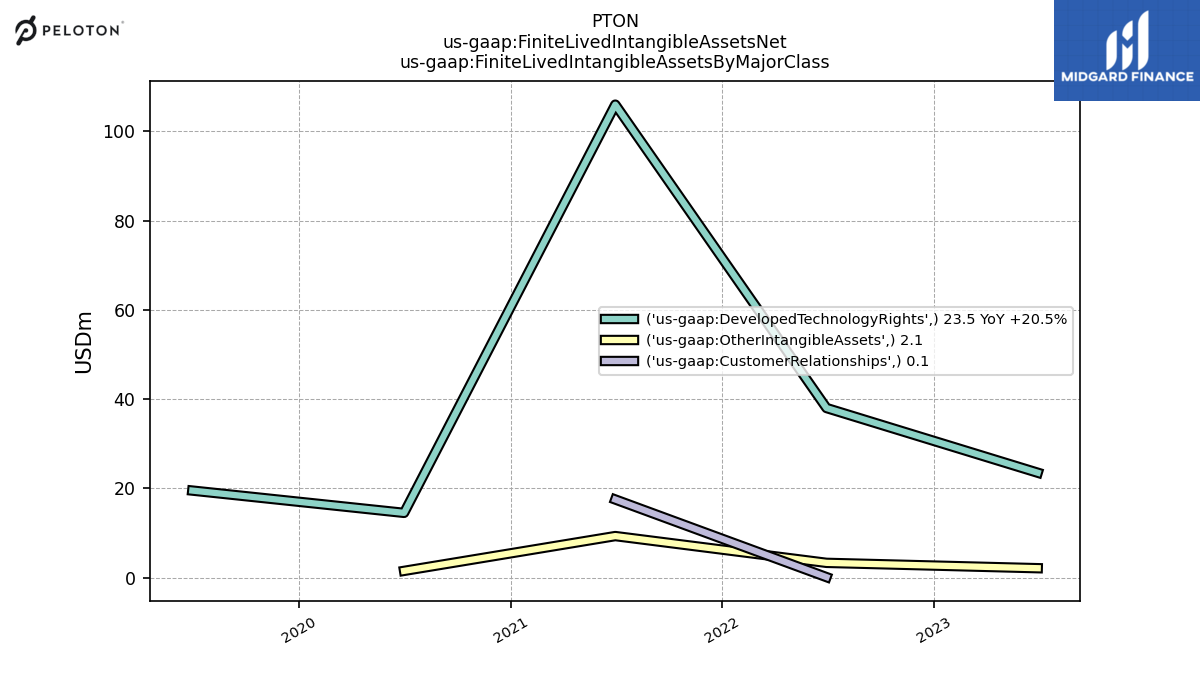
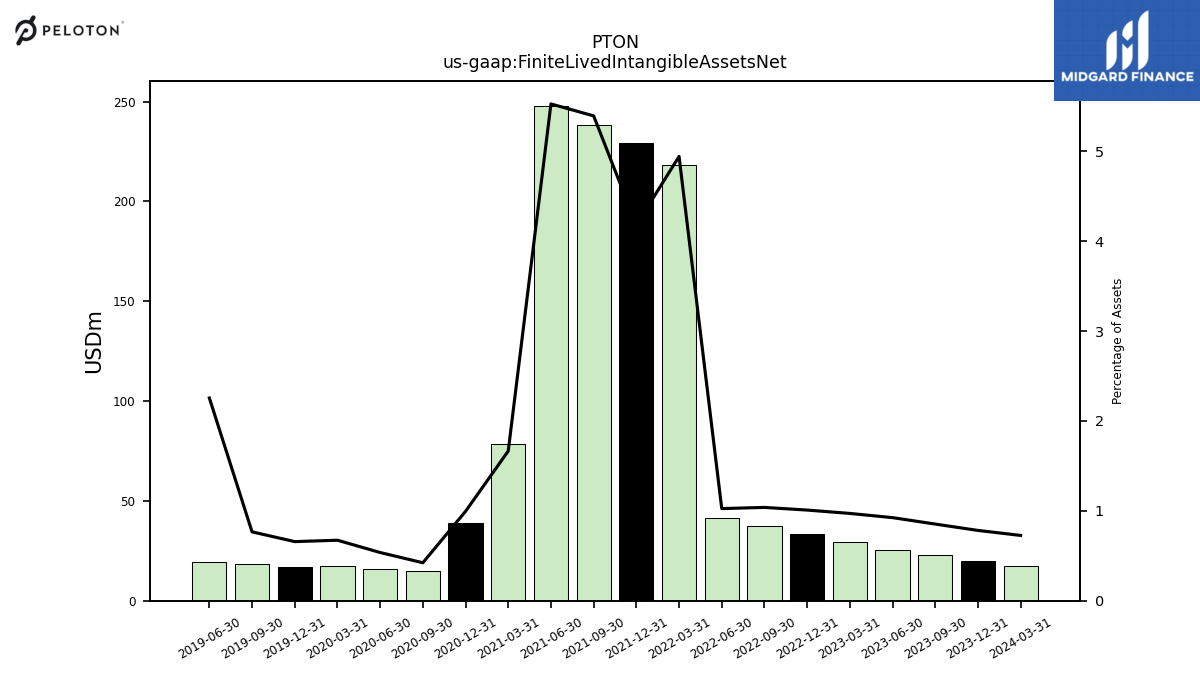
| Finite Lived Intangible Assets Net | 22.80 | 25.60 | 29.30 | 33.30 | 37.30 | 41.30 | 218.20 | 229.20 | 238.10 | 247.90 | 78.50 | 38.90 | 14.70 | 16.00 | 17.30 | 17.00 | 18.30 | 19.50 | NA | NA | NA | |
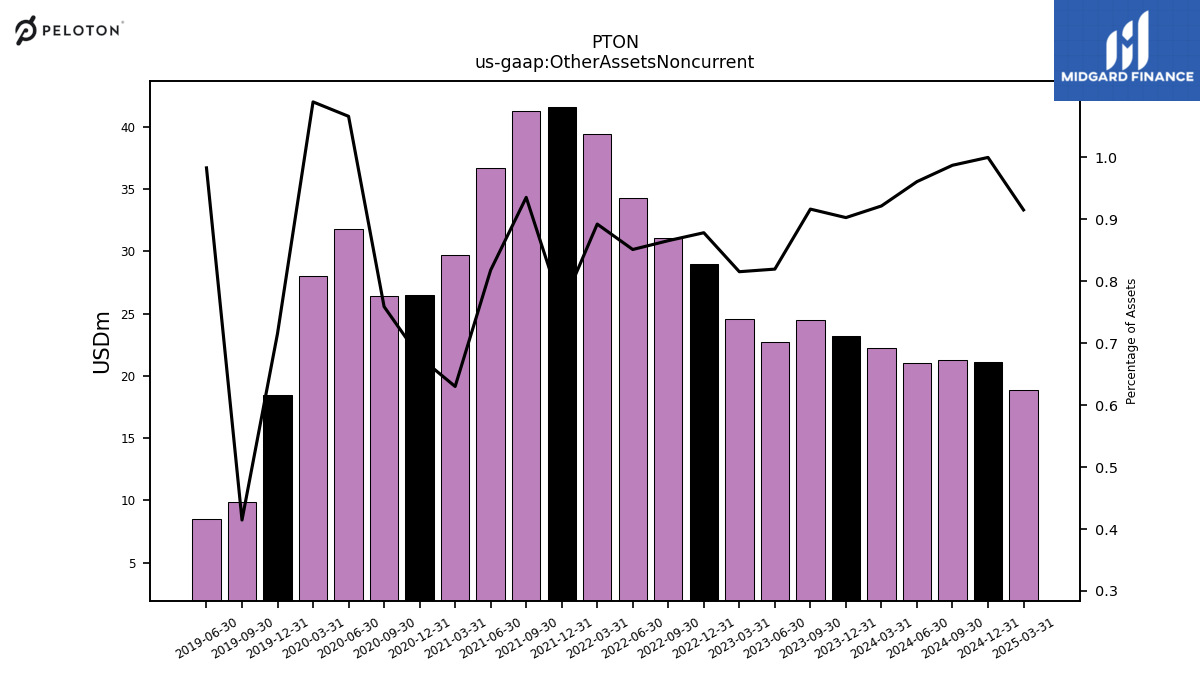
| Other Assets Noncurrent | 24.50 | 22.70 | 24.60 | 29.00 | 31.10 | 34.30 | 39.40 | 41.60 | 41.30 | 36.70 | 29.70 | 26.50 | 26.40 | 31.80 | 28.00 | 18.50 | 9.90 | 8.50 | NA | NA | NA |
| 2023-09-30 | 2023-06-30 | 2023-03-31 | 2022-12-31 | 2022-09-30 | 2022-06-30 | 2022-03-31 | 2021-12-31 | 2021-09-30 | 2021-06-30 | 2021-03-31 | 2020-12-31 | 2020-09-30 | 2020-06-30 | 2020-03-31 | 2019-12-31 | 2019-09-30 | 2019-06-30 | 2019-03-31 | 2018-12-31 | 2018-09-30 | ||
|---|---|---|---|---|---|---|---|---|---|---|---|---|---|---|---|---|---|---|---|---|---|---|
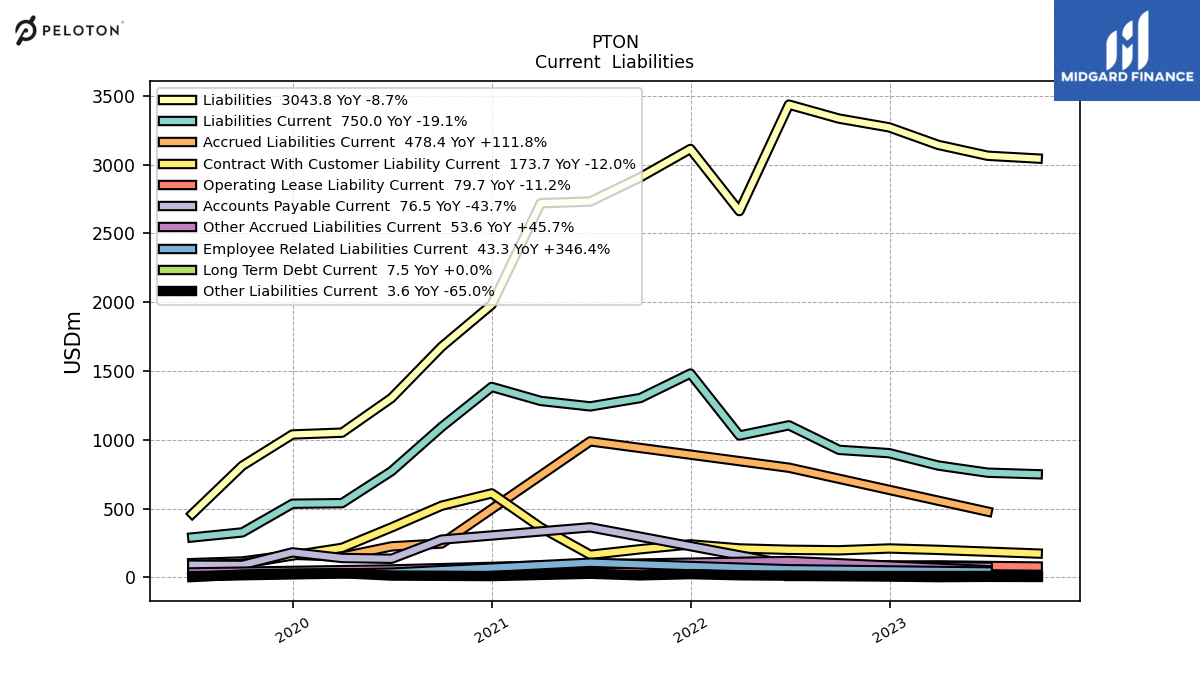
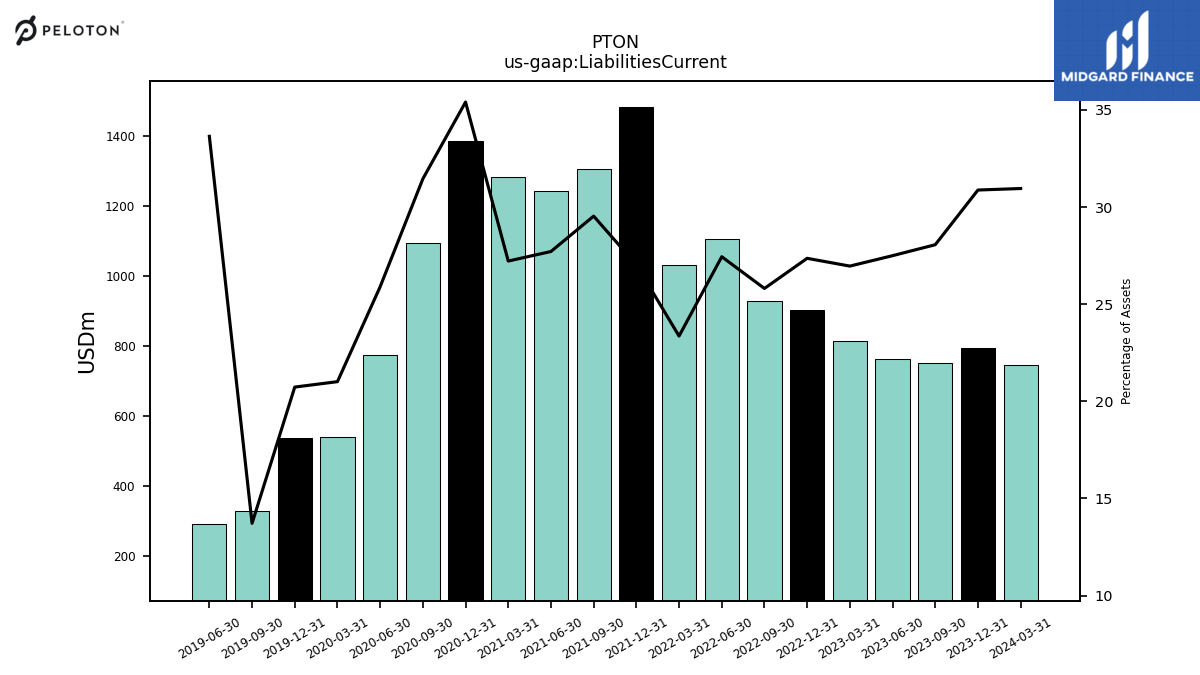
| Liabilities Current | 750.00 | 761.40 | 813.20 | 903.20 | 927.20 | 1105.50 | 1031.30 | 1481.70 | 1303.70 | 1243.00 | 1282.70 | 1384.40 | 1093.70 | 772.20 | 539.90 | 535.80 | 327.60 | 290.80 | NA | NA | NA | |
| Accounts Payable Current | NA | 76.50 | NA | NA | NA | 93.00 | NA | NA | NA | 364.40 | NA | NA | 275.00 | 135.80 | 141.50 | 182.50 | 90.70 | 92.20 | NA | NA | NA | |
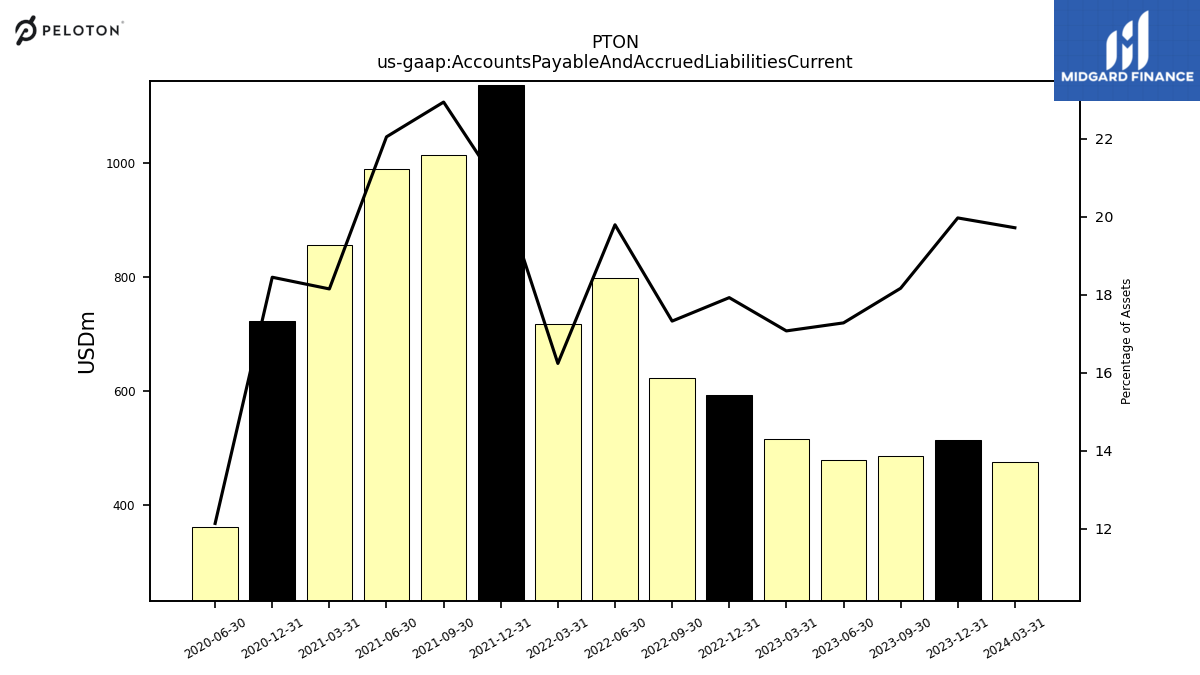
| Accounts Payable And Accrued Liabilities Current | 485.50 | 478.40 | 514.90 | 591.70 | 622.30 | 797.40 | 716.80 | 1136.00 | 1012.80 | 989.10 | 855.20 | 721.40 | NA | 361.70 | NA | NA | NA | NA | NA | NA | NA | |
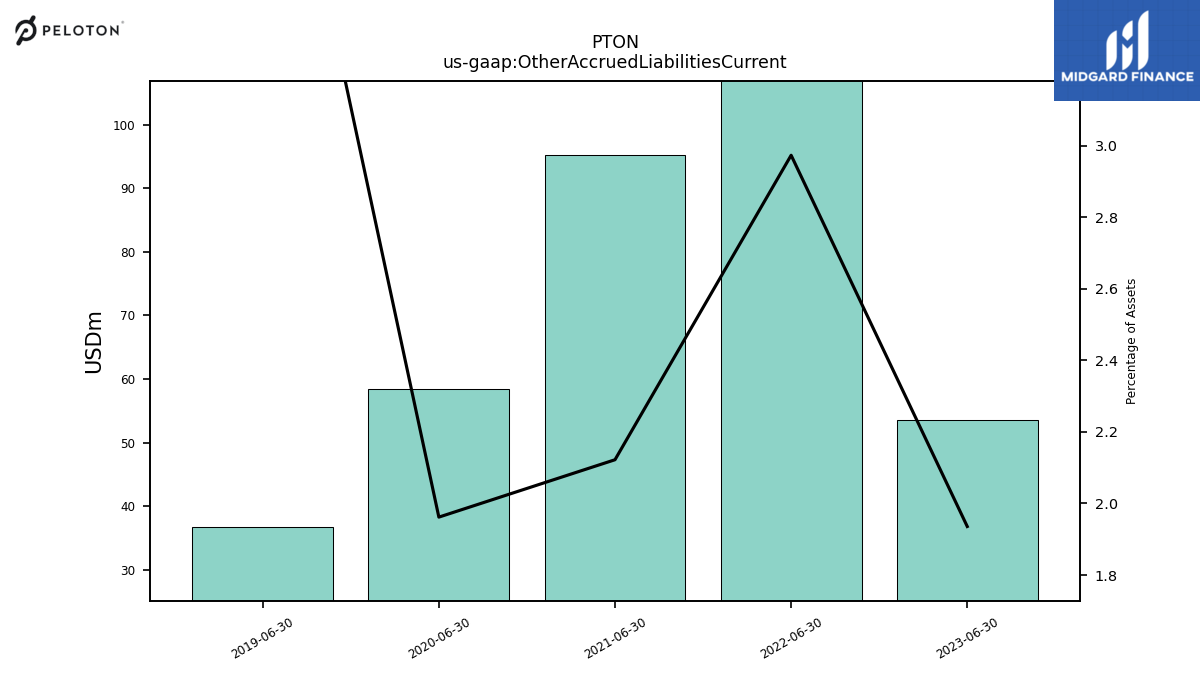
| Other Accrued Liabilities Current | NA | 53.60 | NA | NA | NA | 119.80 | NA | NA | NA | 95.20 | NA | NA | NA | 58.50 | NA | NA | NA | 36.80 | NA | NA | NA | |
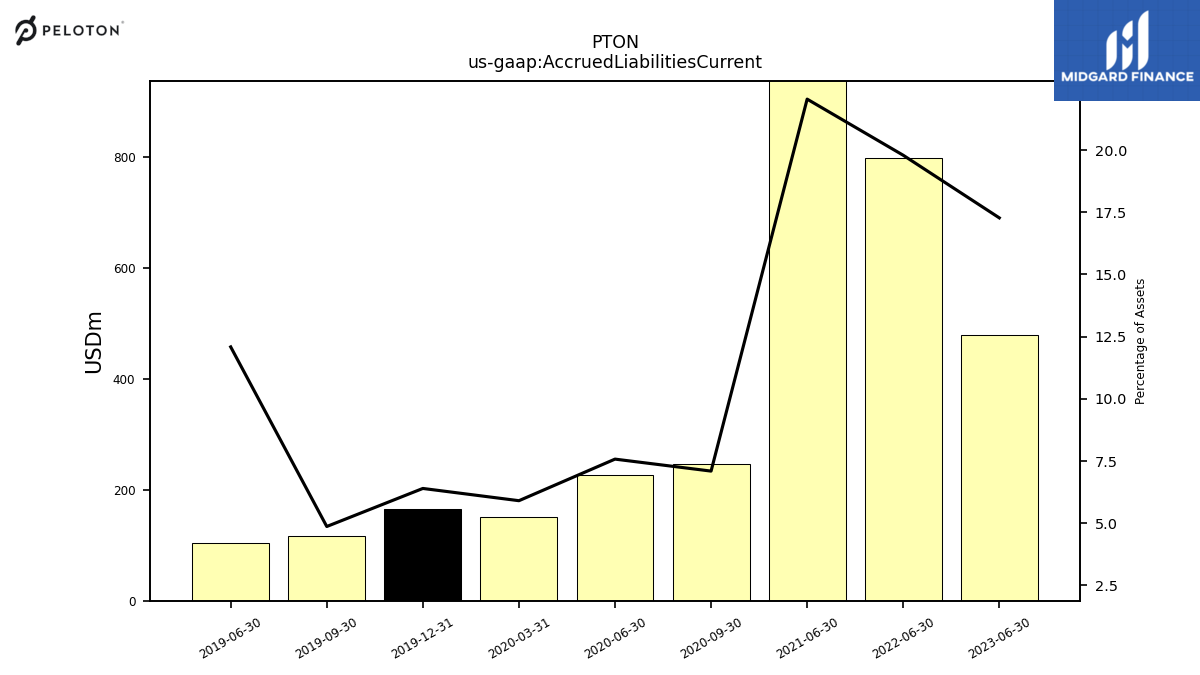
| Accrued Liabilities Current | NA | 478.40 | NA | NA | NA | 797.40 | NA | NA | NA | 989.10 | NA | NA | 246.70 | 225.90 | 151.70 | 165.30 | 116.20 | 104.50 | NA | NA | NA | |
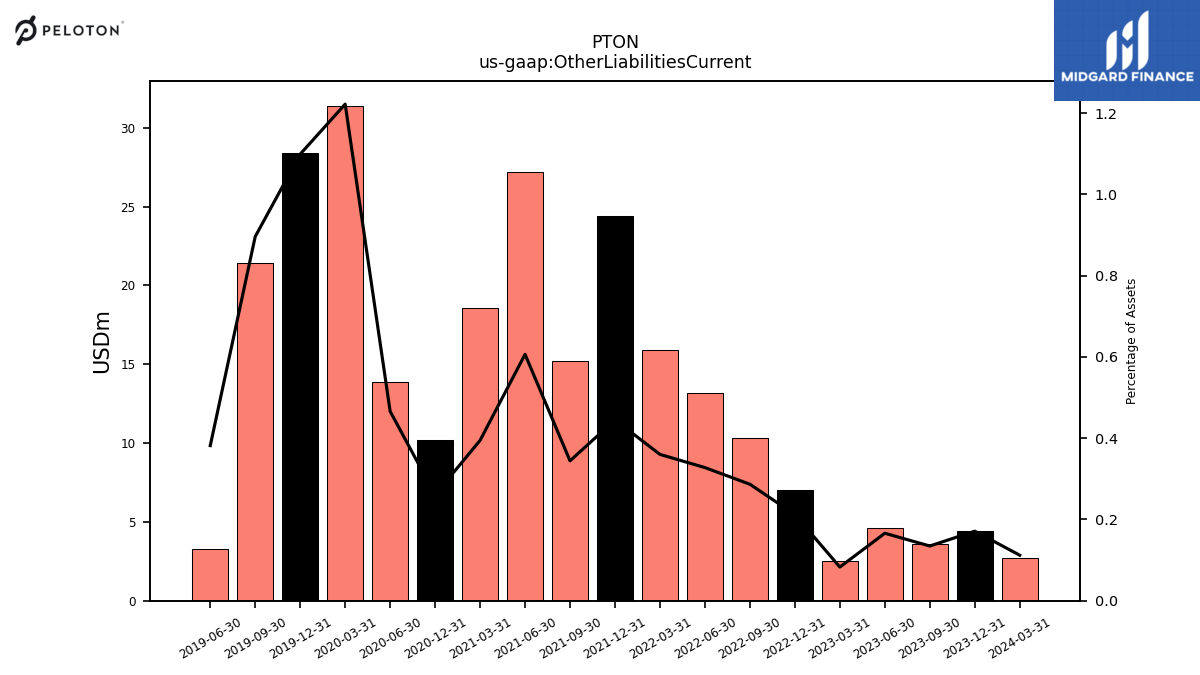
| Other Liabilities Current | 3.60 | 4.60 | 2.50 | 7.00 | 10.30 | 13.20 | 15.90 | 24.40 | 15.20 | 27.20 | 18.60 | 10.20 | NA | 13.90 | 31.40 | 28.40 | 21.40 | 3.30 | NA | NA | NA | |
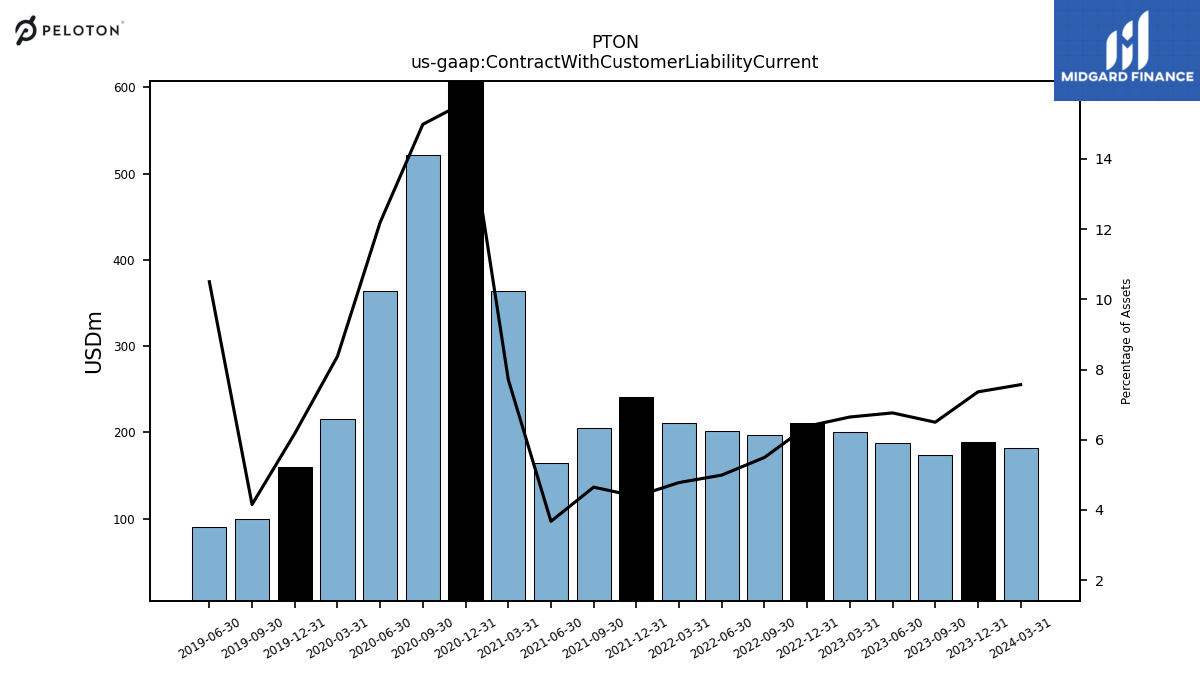
| Contract With Customer Liability Current | 173.70 | 187.30 | 200.50 | 210.70 | 197.40 | 201.10 | 211.00 | 240.50 | 205.20 | 164.80 | 363.70 | 611.00 | 521.20 | 363.60 | 215.20 | 159.60 | 99.20 | 90.80 | NA | NA | NA |
| 2023-09-30 | 2023-06-30 | 2023-03-31 | 2022-12-31 | 2022-09-30 | 2022-06-30 | 2022-03-31 | 2021-12-31 | 2021-09-30 | 2021-06-30 | 2021-03-31 | 2020-12-31 | 2020-09-30 | 2020-06-30 | 2020-03-31 | 2019-12-31 | 2019-09-30 | 2019-06-30 | 2019-03-31 | 2018-12-31 | 2018-09-30 | ||
|---|---|---|---|---|---|---|---|---|---|---|---|---|---|---|---|---|---|---|---|---|---|---|
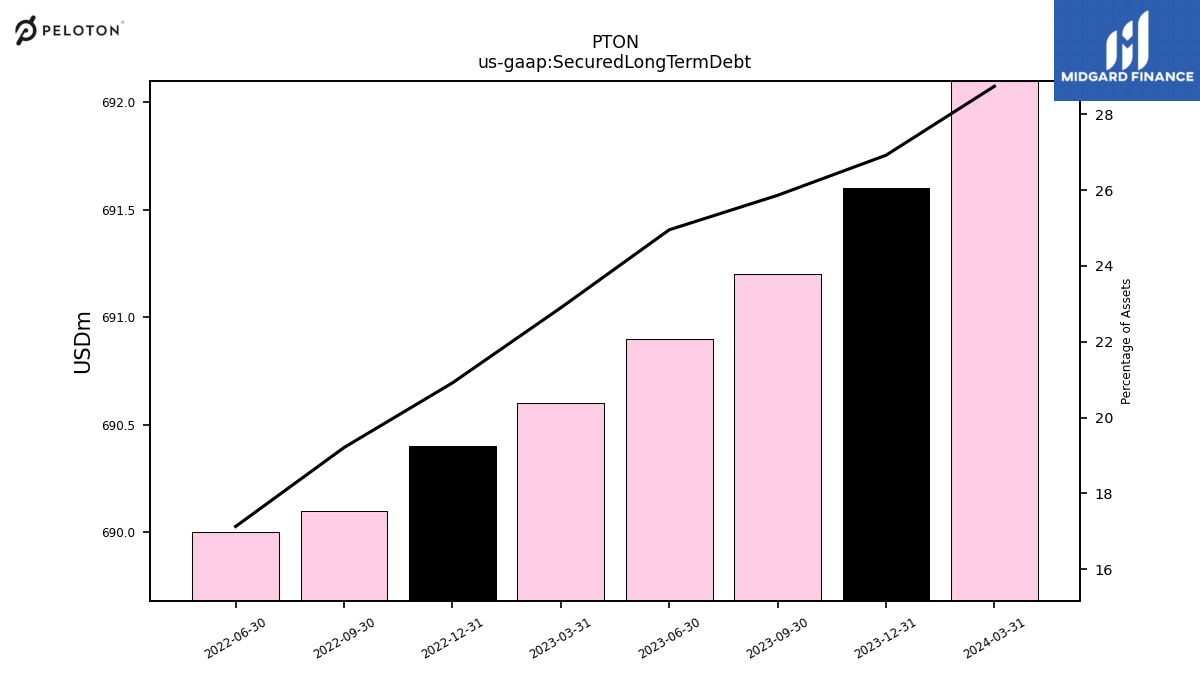
| Secured Long Term Debt | 691.20 | 690.90 | 690.60 | 690.40 | 690.10 | 690.00 | NA | NA | NA | NA | NA | NA | NA | NA | NA | NA | NA | NA | NA | NA | NA | |
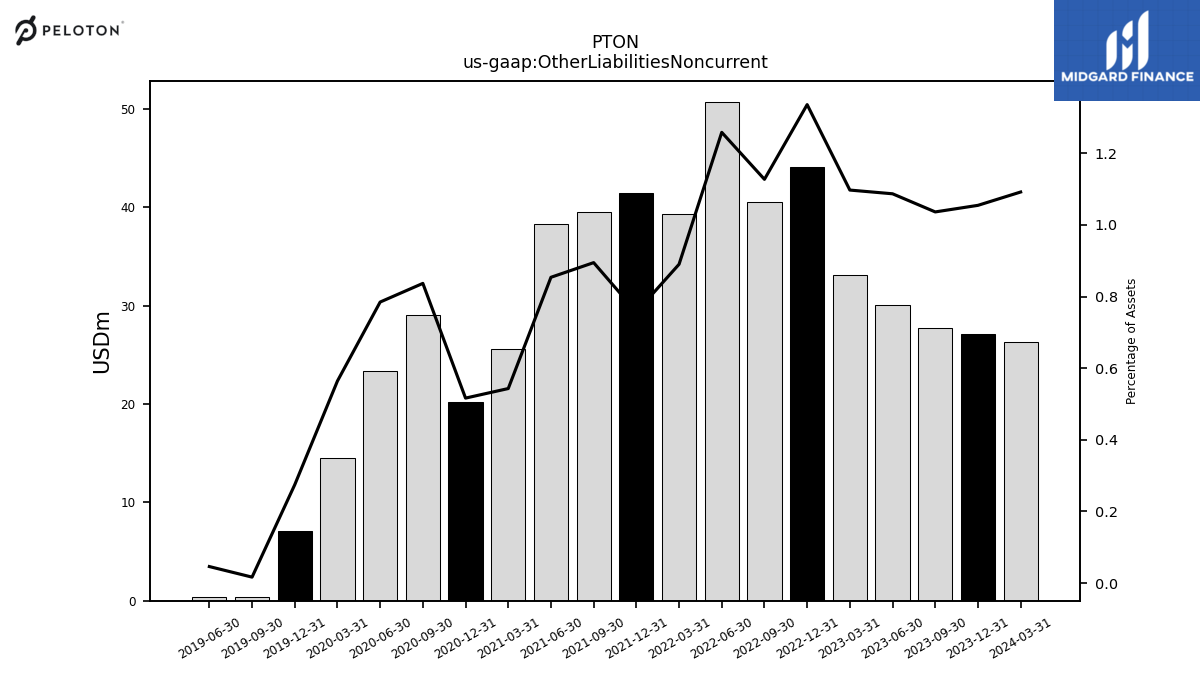
| Other Liabilities Noncurrent | 27.70 | 30.10 | 33.10 | 44.10 | 40.50 | 50.70 | 39.30 | 41.50 | 39.50 | 38.30 | 25.60 | 20.20 | 29.10 | 23.40 | 14.50 | 7.10 | 0.40 | 0.40 | NA | NA | NA | |
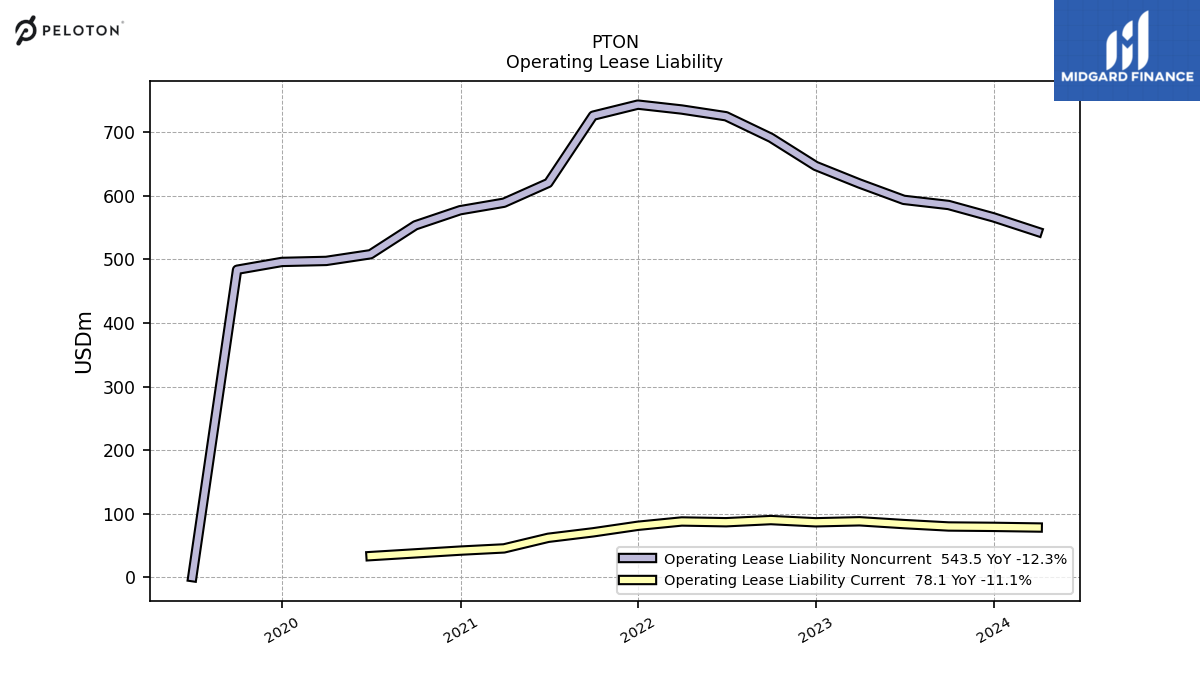
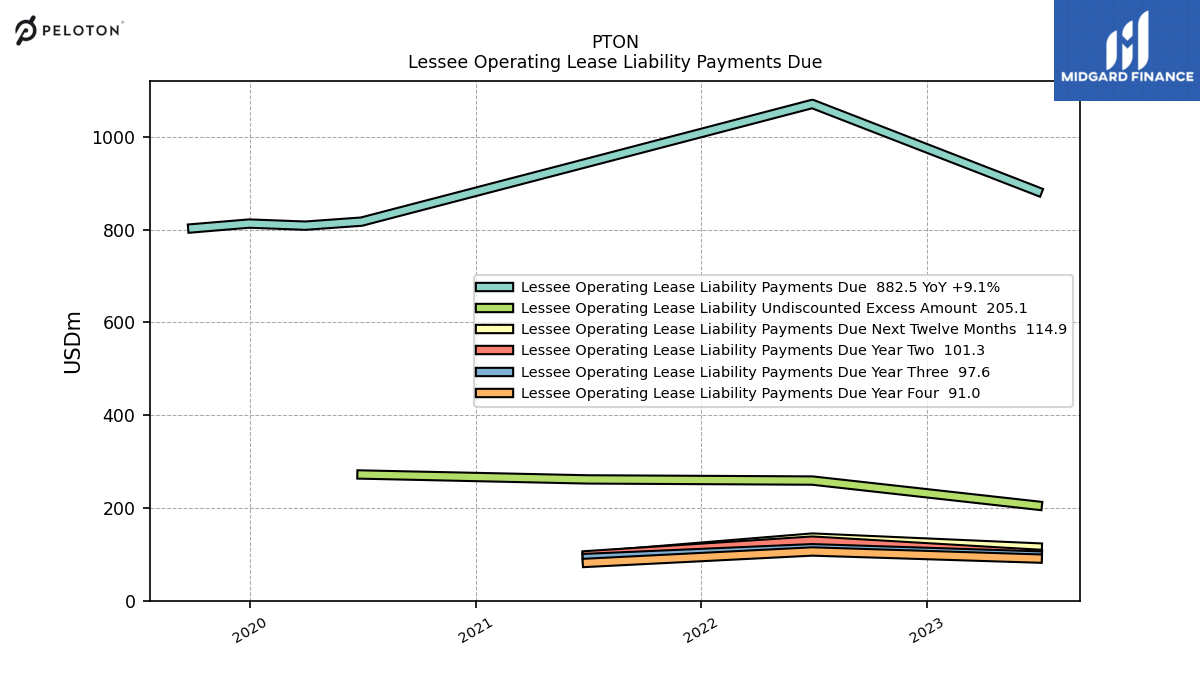
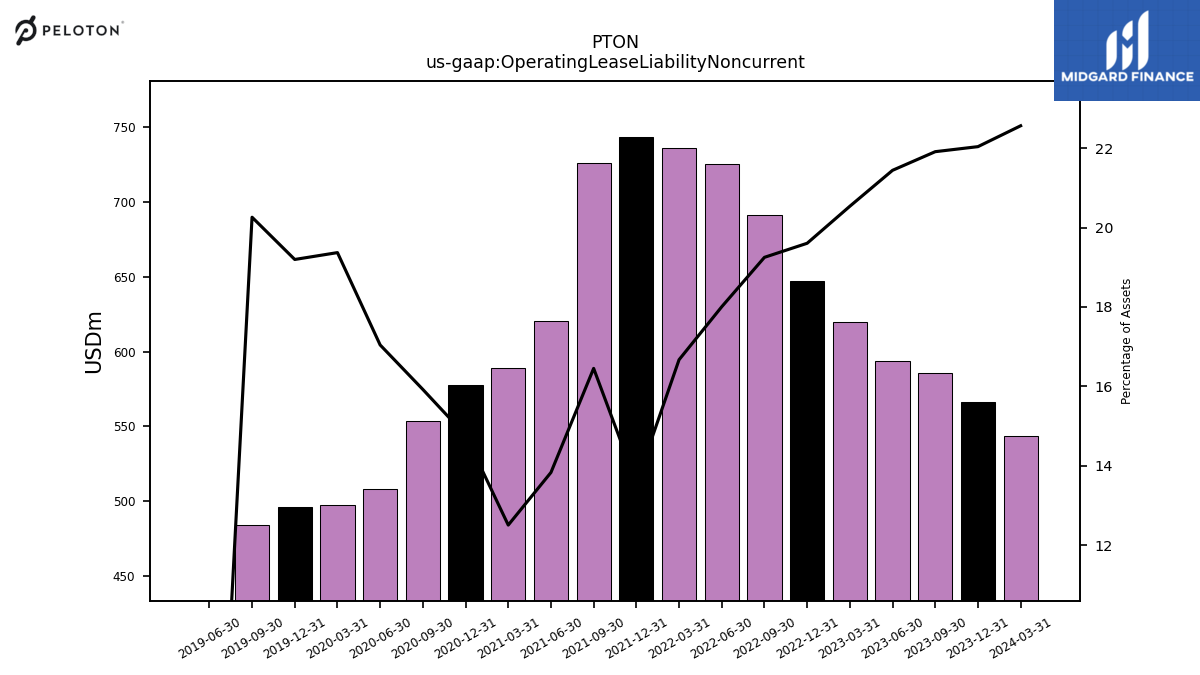
| Operating Lease Liability Noncurrent | 585.70 | 593.80 | 619.50 | 647.20 | 691.60 | 725.40 | 736.00 | 743.70 | 726.30 | 620.40 | 589.30 | 577.50 | 553.70 | 508.20 | 497.70 | 496.10 | 483.80 | 0.00 | NA | NA | NA |
| 2023-09-30 | 2023-06-30 | 2023-03-31 | 2022-12-31 | 2022-09-30 | 2022-06-30 | 2022-03-31 | 2021-12-31 | 2021-09-30 | 2021-06-30 | 2021-03-31 | 2020-12-31 | 2020-09-30 | 2020-06-30 | 2020-03-31 | 2019-12-31 | 2019-09-30 | 2019-06-30 | 2019-03-31 | 2018-12-31 | 2018-09-30 | ||
|---|---|---|---|---|---|---|---|---|---|---|---|---|---|---|---|---|---|---|---|---|---|---|
| Stockholders Equity | -370.90 | -295.10 | -127.00 | 30.50 | 258.50 | 592.90 | 1753.00 | 2368.90 | 1506.90 | 1754.10 | 1993.40 | 1928.30 | 1801.00 | 1678.00 | 1517.30 | 1545.20 | 1576.00 | -538.60 | -508.70 | -479.50 | -368.70 | |
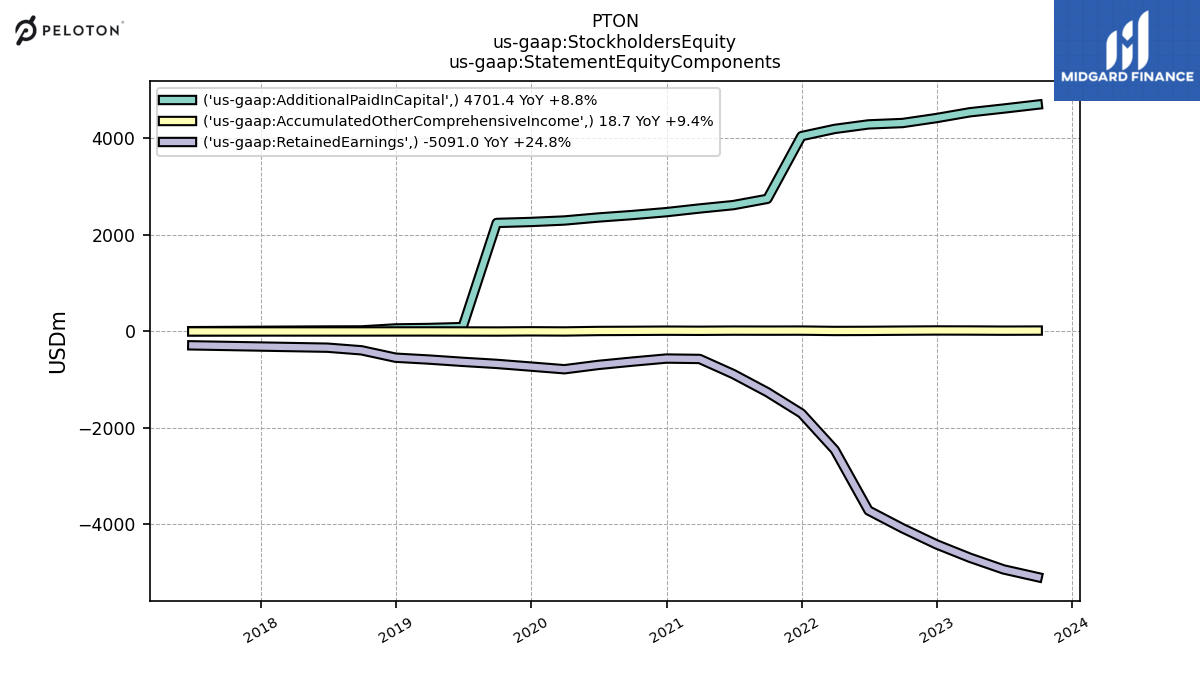
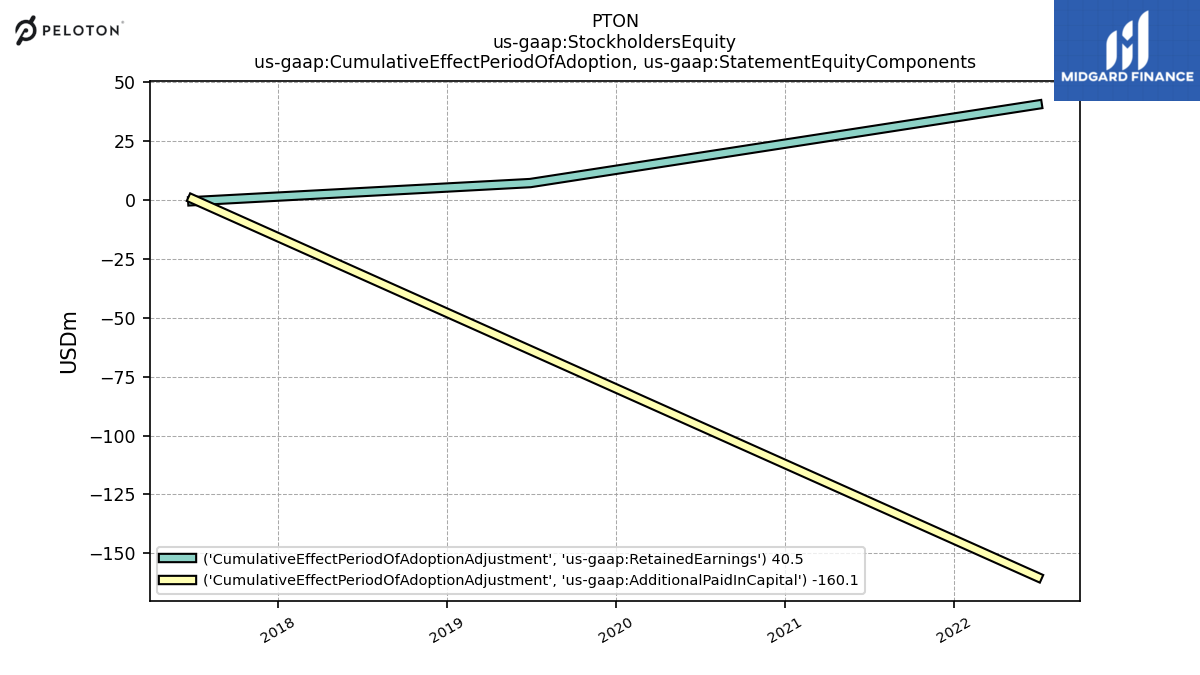
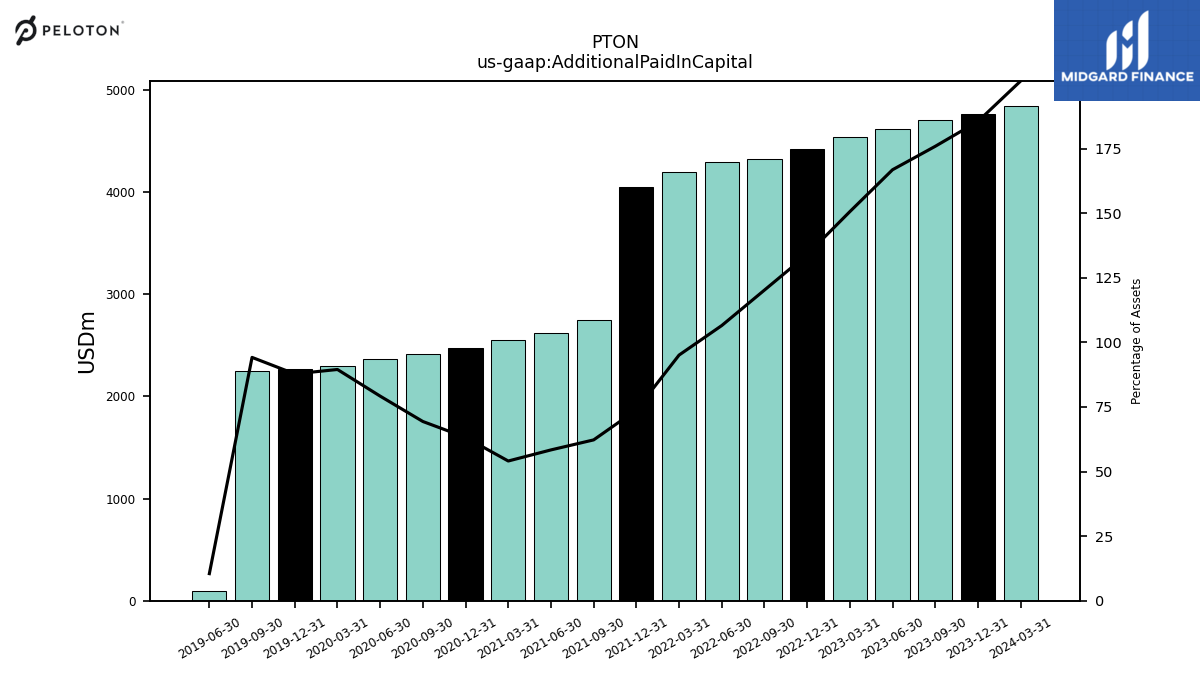
| Additional Paid In Capital | 4701.40 | 4619.80 | 4543.00 | 4423.40 | 4320.00 | 4291.30 | 4197.90 | 4048.80 | 2748.60 | 2618.90 | 2548.90 | 2472.70 | 2412.90 | 2361.80 | 2300.00 | 2269.30 | 2249.10 | 90.70 | NA | NA | NA | |
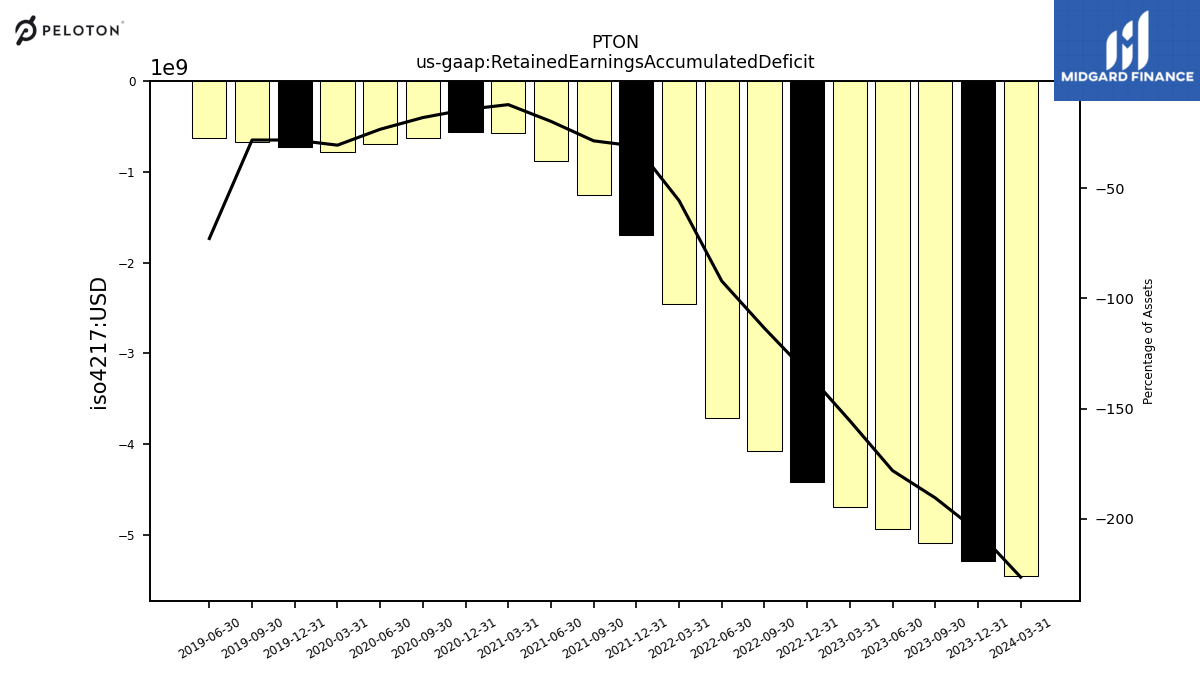
| Retained Earnings Accumulated Deficit | -5091.00 | -4931.80 | -4690.00 | -4414.00 | -4078.60 | -3710.60 | -2455.30 | -1698.20 | -1258.80 | -883.00 | -569.60 | -561.00 | -624.60 | -693.90 | -783.00 | -727.40 | -672.00 | -629.50 | NA | NA | NA | |
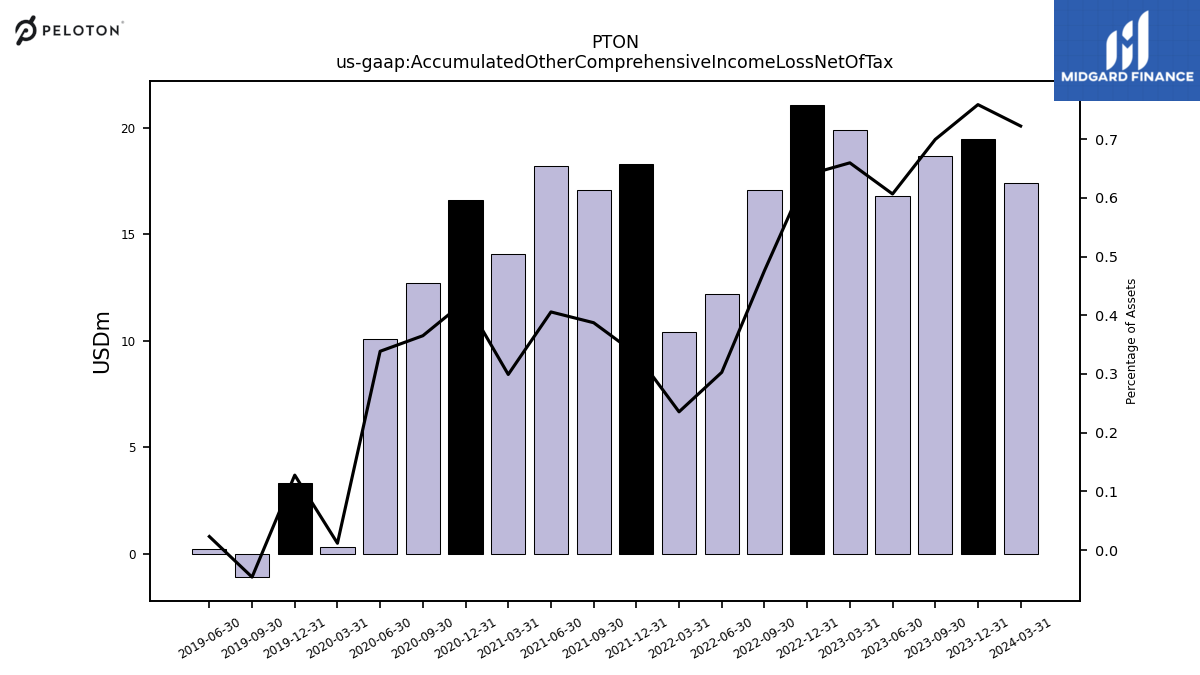
| Accumulated Other Comprehensive Income Loss Net Of Tax | 18.70 | 16.80 | 19.90 | 21.10 | 17.10 | 12.20 | 10.40 | 18.30 | 17.10 | 18.20 | 14.10 | 16.60 | 12.70 | 10.10 | 0.30 | 3.30 | -1.10 | 0.20 | NA | NA | NA | |
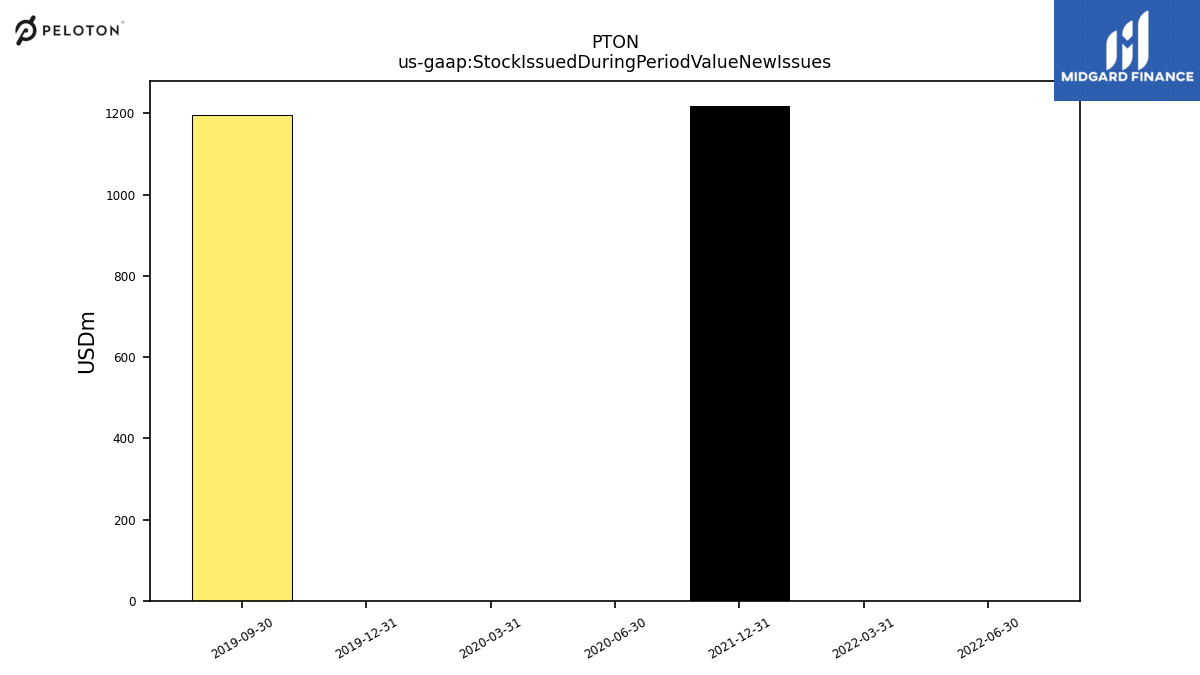
| Stock Issued During Period Value New Issues | NA | NA | NA | NA | NA | 0.00 | 0.00 | 1218.70 | NA | NA | NA | NA | NA | 0.00 | 0.00 | 0.00 | 1195.70 | NA | NA | NA | NA | |
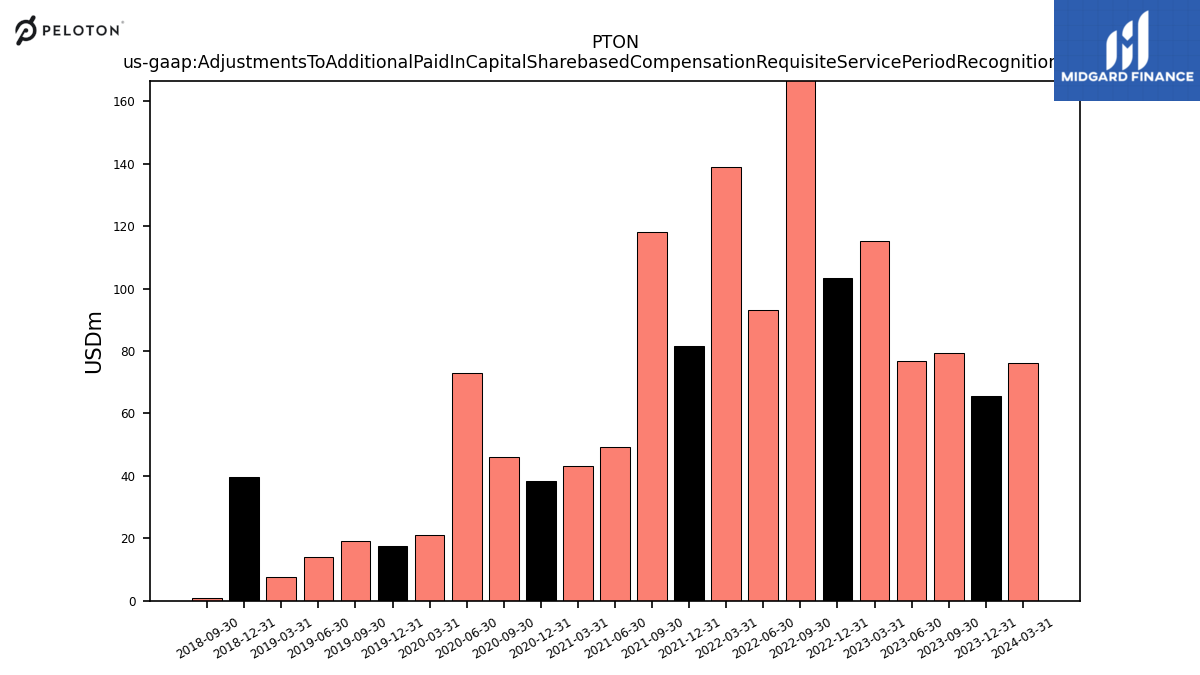
| Adjustments To Additional Paid In Capital Sharebased Compensation Requisite Service Period Recognition Value | 79.50 | 76.80 | 115.10 | 103.40 | 185.40 | 93.30 | 138.90 | 81.50 | 118.00 | 49.30 | 43.10 | 38.50 | 45.90 | 72.90 | 21.10 | 17.60 | 19.00 | 14.00 | 7.60 | 39.70 | 0.80 |
| 2023-09-30 | 2023-06-30 | 2023-03-31 | 2022-12-31 | 2022-09-30 | 2022-06-30 | 2022-03-31 | 2021-12-31 | 2021-09-30 | 2021-06-30 | 2021-03-31 | 2020-12-31 | 2020-09-30 | 2020-06-30 | 2020-03-31 | 2019-12-31 | 2019-09-30 | 2019-06-30 | 2019-03-31 | 2018-12-31 | 2018-09-30 | ||
|---|---|---|---|---|---|---|---|---|---|---|---|---|---|---|---|---|---|---|---|---|---|---|
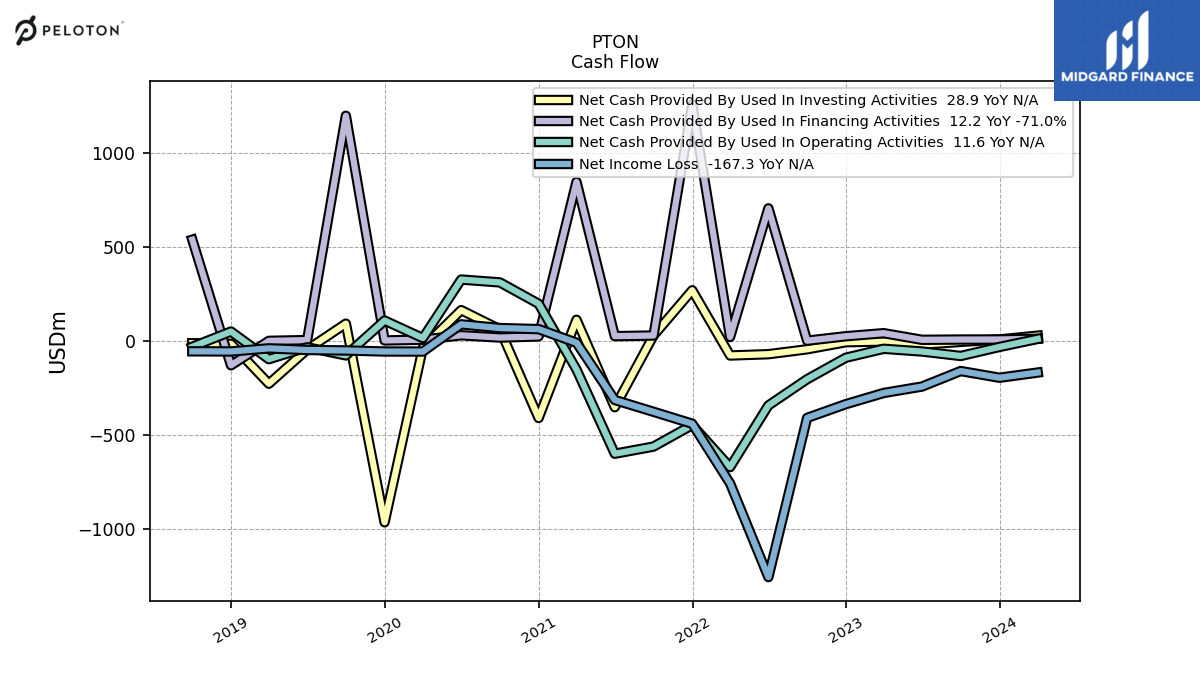
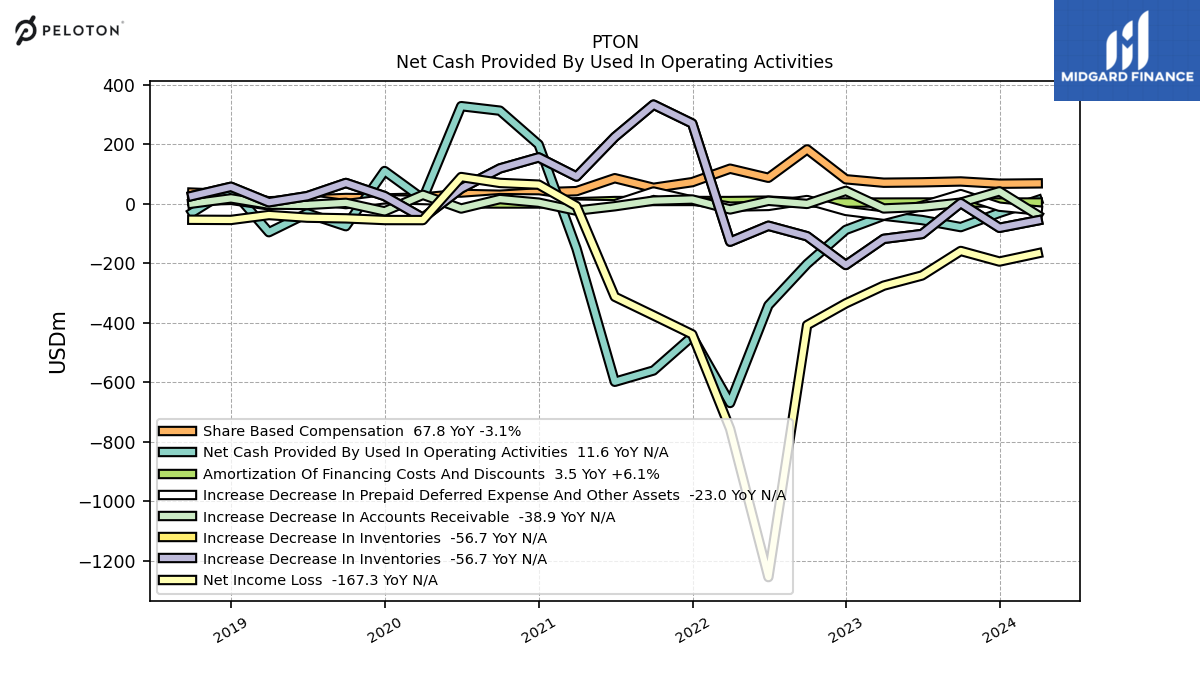
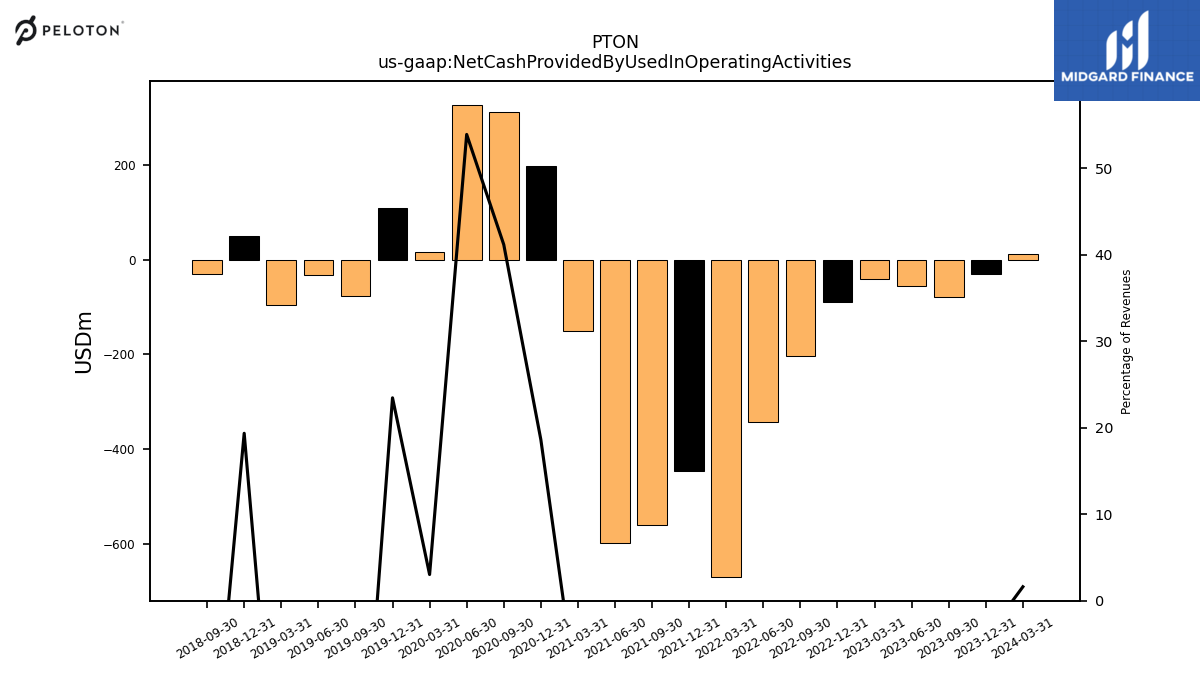
| Net Cash Provided By Used In Operating Activities | -79.20 | -55.40 | -40.90 | -88.50 | -202.80 | -342.20 | -670.20 | -446.60 | -561.00 | -599.00 | -151.20 | 198.40 | 312.10 | 327.30 | 15.90 | 109.40 | -76.20 | -33.00 | -96.30 | 50.90 | -30.20 | |
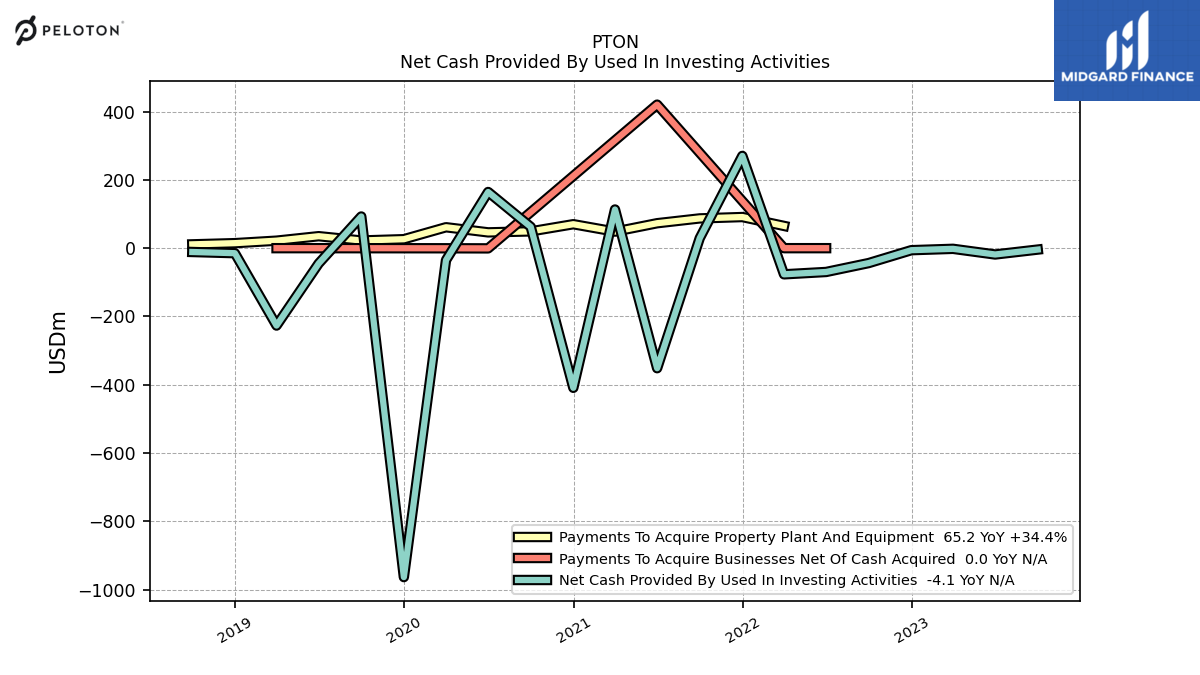
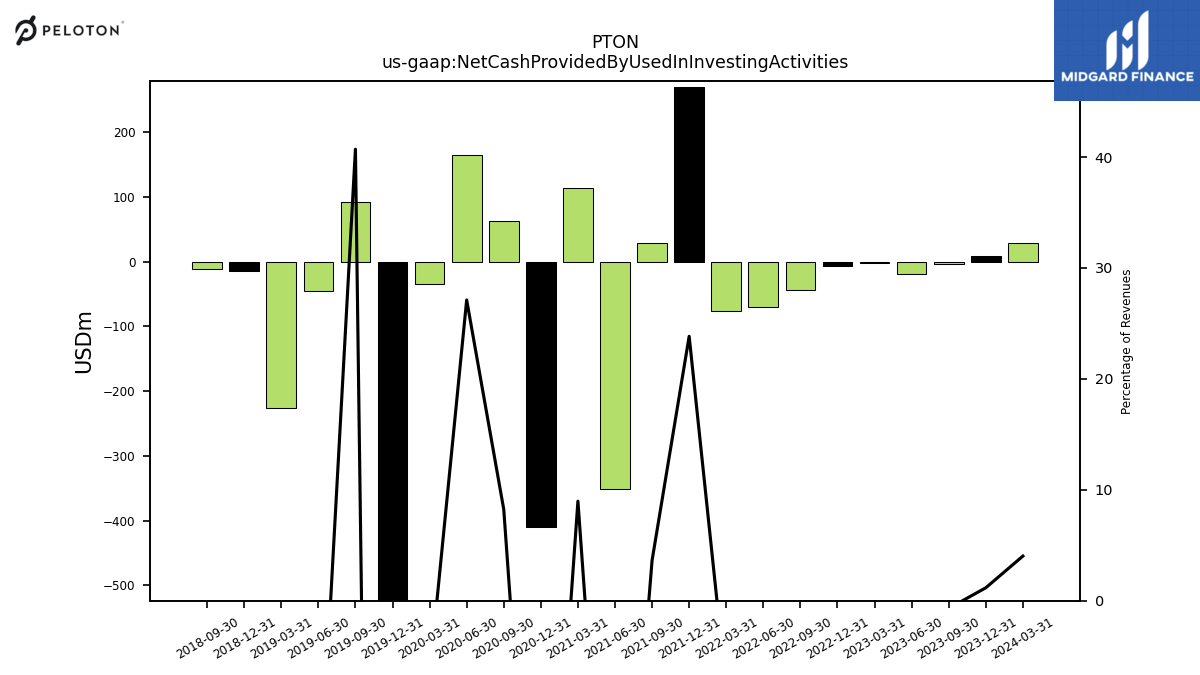
| Net Cash Provided By Used In Investing Activities | -4.10 | -18.50 | -1.90 | -5.90 | -43.60 | -69.70 | -76.60 | 270.30 | 29.30 | -351.70 | 113.30 | -409.10 | 62.40 | 164.60 | -35.10 | -963.60 | 92.80 | -44.90 | -226.70 | -14.70 | -11.20 | |
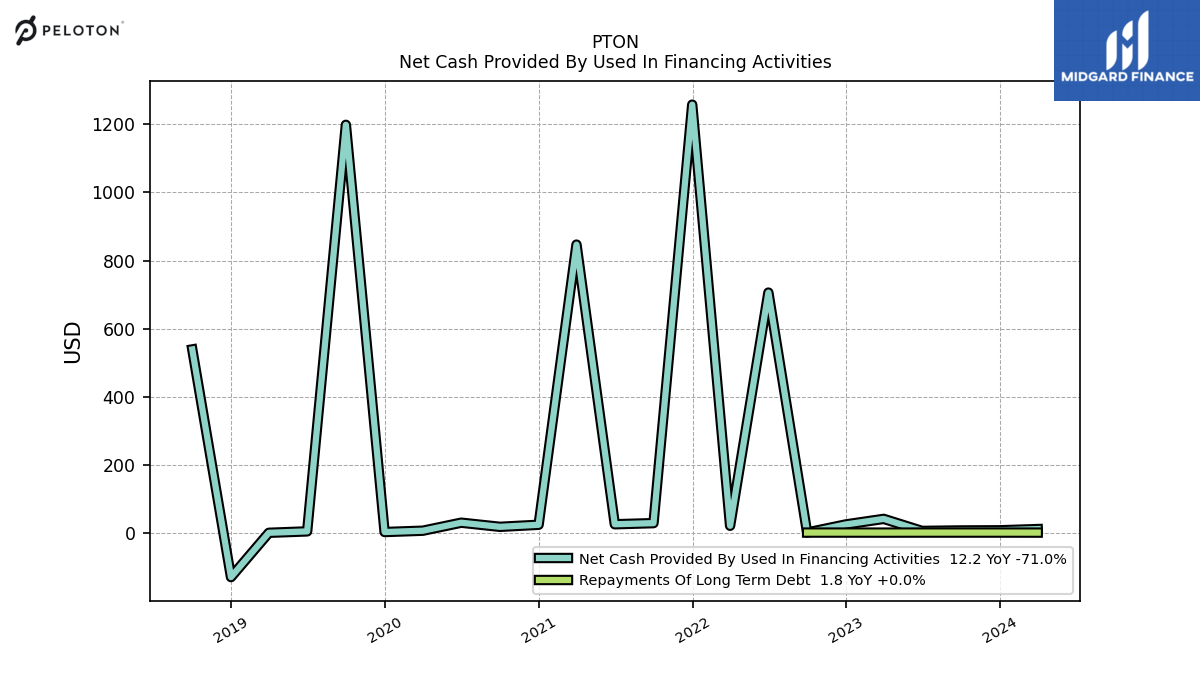
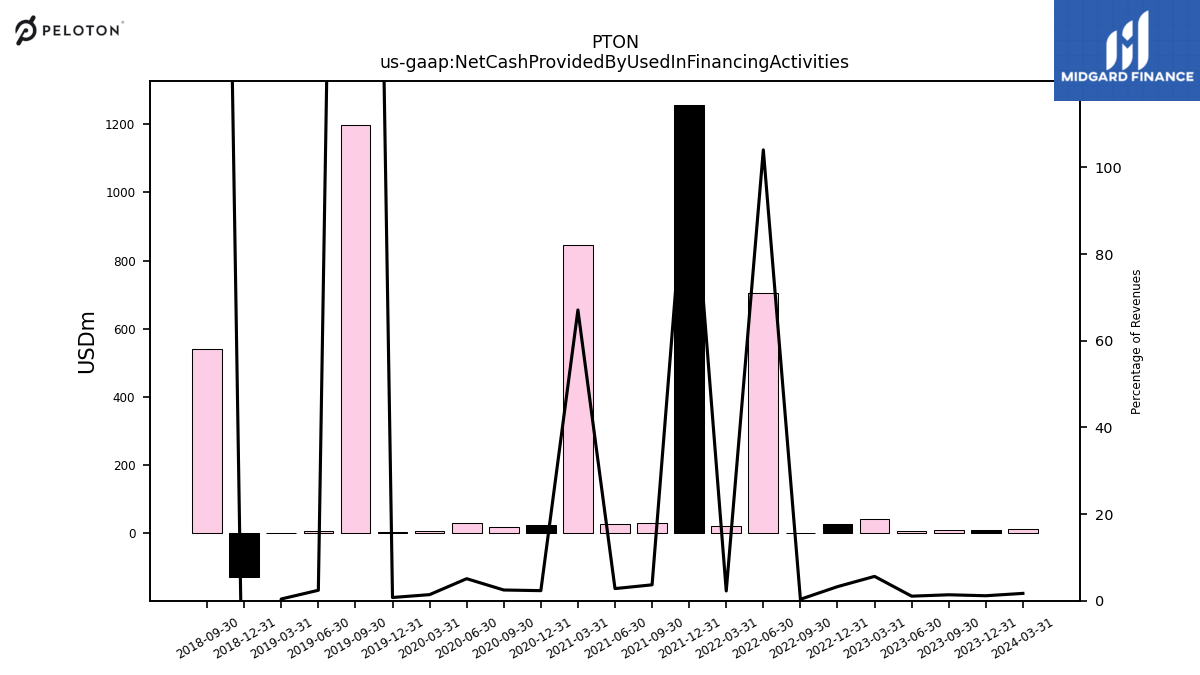
| Net Cash Provided By Used In Financing Activities | 8.20 | 6.80 | 42.10 | 25.80 | 2.10 | 706.10 | 21.80 | 1257.60 | 29.60 | 26.30 | 846.90 | 24.80 | 18.80 | 30.90 | 7.40 | 3.50 | 1198.40 | 5.40 | 1.30 | -128.80 | 539.30 |
| 2023-09-30 | 2023-06-30 | 2023-03-31 | 2022-12-31 | 2022-09-30 | 2022-06-30 | 2022-03-31 | 2021-12-31 | 2021-09-30 | 2021-06-30 | 2021-03-31 | 2020-12-31 | 2020-09-30 | 2020-06-30 | 2020-03-31 | 2019-12-31 | 2019-09-30 | 2019-06-30 | 2019-03-31 | 2018-12-31 | 2018-09-30 | ||
|---|---|---|---|---|---|---|---|---|---|---|---|---|---|---|---|---|---|---|---|---|---|---|
| Net Cash Provided By Used In Operating Activities | -79.20 | -55.40 | -40.90 | -88.50 | -202.80 | -342.20 | -670.20 | -446.60 | -561.00 | -599.00 | -151.20 | 198.40 | 312.10 | 327.30 | 15.90 | 109.40 | -76.20 | -33.00 | -96.30 | 50.90 | -30.20 | |
| Net Income Loss | -159.30 | -241.80 | -275.90 | -335.40 | -408.50 | -1255.30 | -757.10 | -439.40 | -376.00 | -313.20 | -8.60 | 63.60 | 69.30 | 89.10 | -55.60 | -55.40 | -49.80 | -47.40 | -38.60 | -55.10 | -54.50 | |
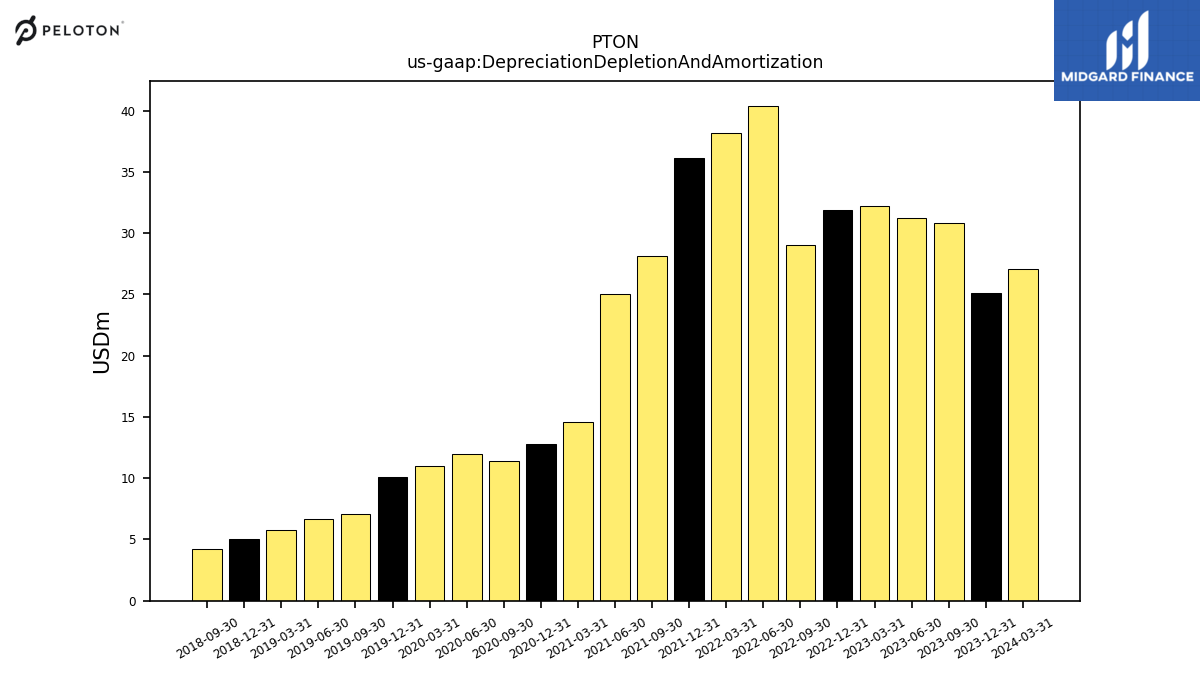
| Depreciation Depletion And Amortization | 30.80 | 31.20 | 32.20 | 31.90 | 29.00 | 40.40 | 38.20 | 36.10 | 28.10 | 25.00 | 14.60 | 12.80 | 11.40 | 12.00 | 11.00 | 10.10 | 7.10 | 6.70 | 5.80 | 5.00 | 4.20 | |
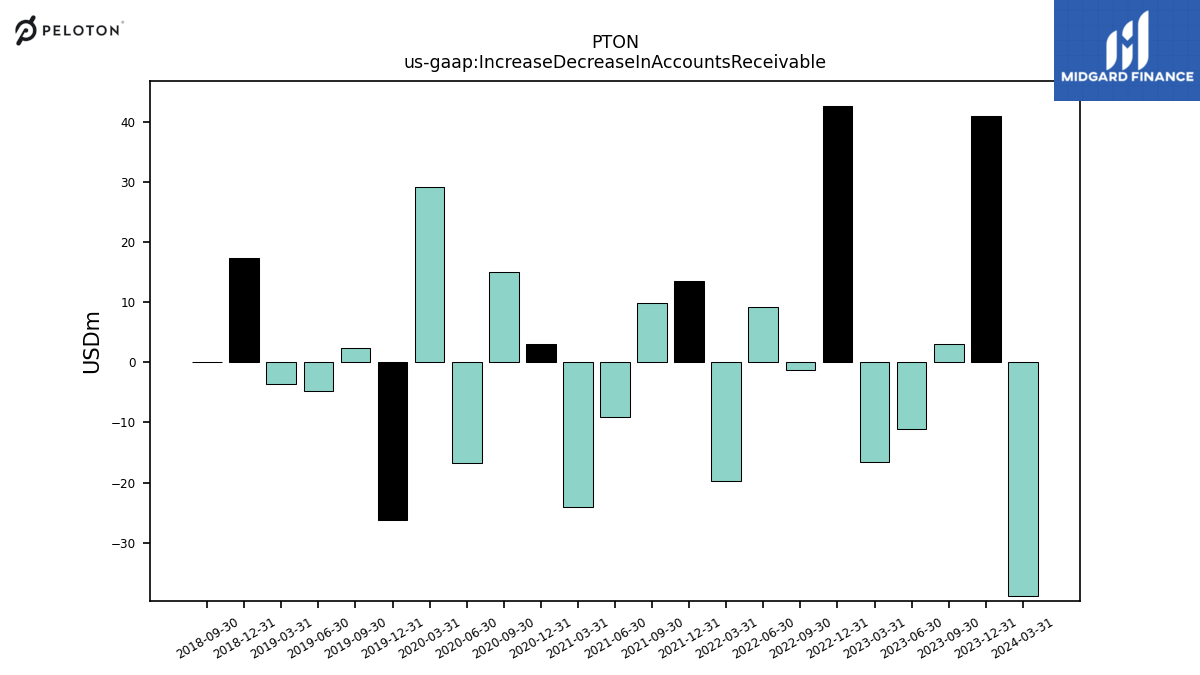
| Increase Decrease In Accounts Receivable | 3.00 | -11.10 | -16.50 | 42.70 | -1.30 | 9.20 | -19.80 | 13.60 | 9.80 | -9.10 | -24.00 | 3.00 | 15.00 | -16.70 | 29.20 | -26.20 | 2.40 | -4.70 | -3.60 | 17.30 | 0.10 | |
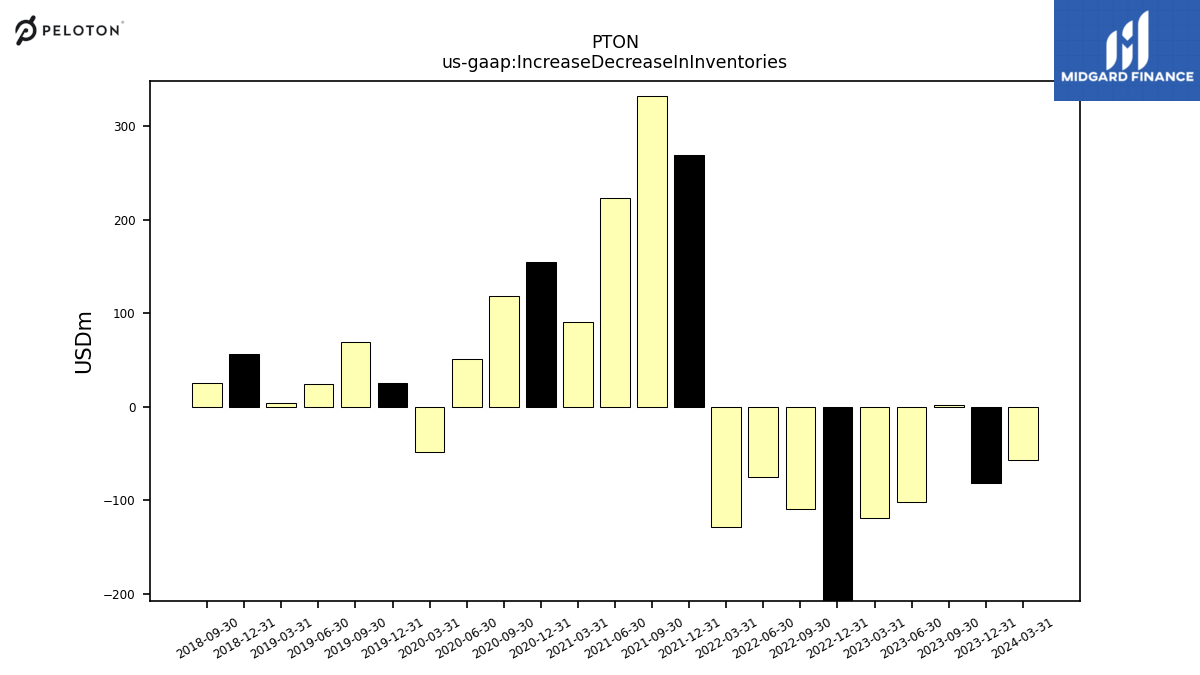
| Increase Decrease In Inventories | 1.40 | -102.40 | -118.70 | -206.50 | -109.90 | -74.70 | -128.20 | 269.10 | 332.40 | 223.50 | 90.70 | 155.00 | 118.00 | 50.60 | -48.00 | 25.10 | 69.10 | 24.80 | 4.40 | 56.30 | 25.80 | |
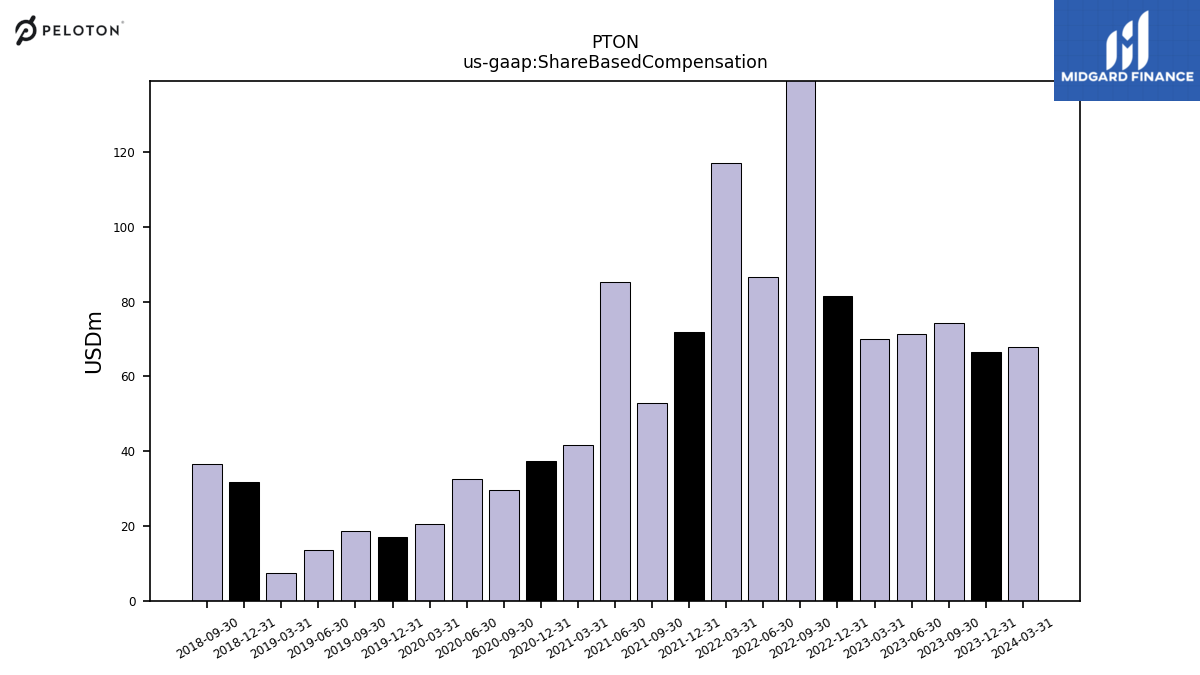
| Share Based Compensation | 74.20 | 71.30 | 70.00 | 81.60 | 182.10 | 86.50 | 117.10 | 71.90 | 52.90 | 85.20 | 41.70 | 37.50 | 29.60 | 32.50 | 20.50 | 17.10 | 18.70 | 13.50 | 7.50 | 31.80 | 36.70 | |
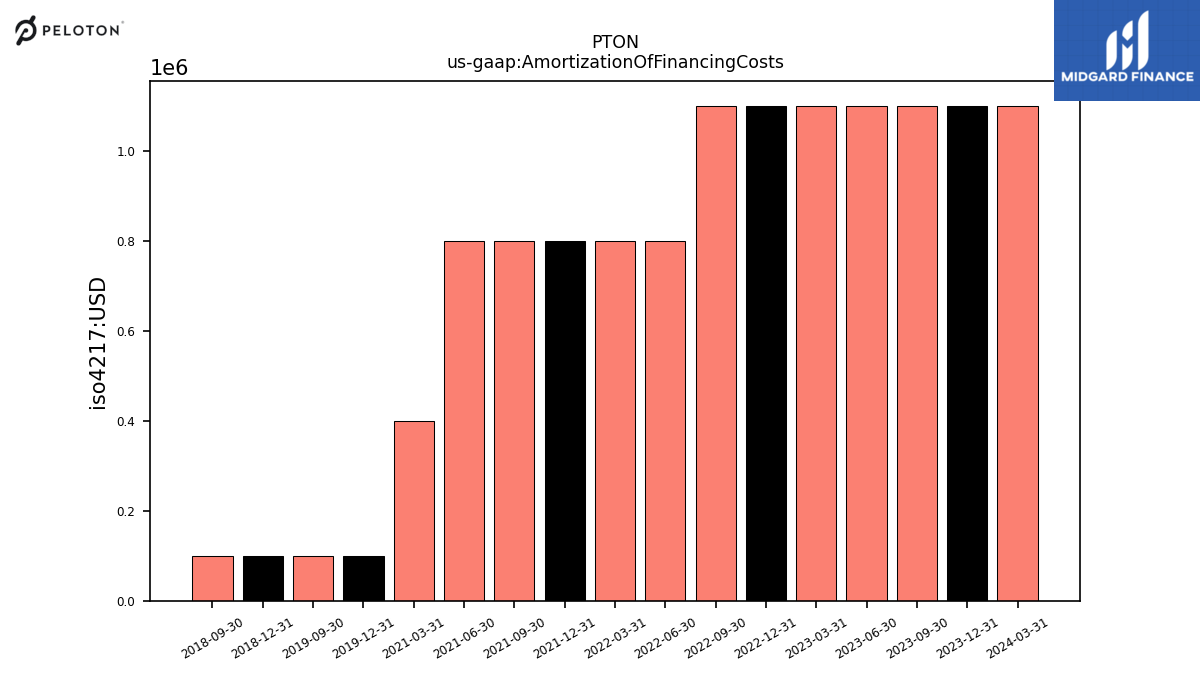
| Amortization Of Financing Costs | 1.10 | 1.10 | 1.10 | 1.10 | 1.10 | 0.80 | 0.80 | 0.80 | 0.80 | 0.80 | 0.40 | NA | NA | NA | NA | 0.10 | 0.10 | NA | NA | 0.10 | 0.10 |
| 2023-09-30 | 2023-06-30 | 2023-03-31 | 2022-12-31 | 2022-09-30 | 2022-06-30 | 2022-03-31 | 2021-12-31 | 2021-09-30 | 2021-06-30 | 2021-03-31 | 2020-12-31 | 2020-09-30 | 2020-06-30 | 2020-03-31 | 2019-12-31 | 2019-09-30 | 2019-06-30 | 2019-03-31 | 2018-12-31 | 2018-09-30 | ||
|---|---|---|---|---|---|---|---|---|---|---|---|---|---|---|---|---|---|---|---|---|---|---|
| Net Cash Provided By Used In Investing Activities | -4.10 | -18.50 | -1.90 | -5.90 | -43.60 | -69.70 | -76.60 | 270.30 | 29.30 | -351.70 | 113.30 | -409.10 | 62.40 | 164.60 | -35.10 | -963.60 | 92.80 | -44.90 | -226.70 | -14.70 | -11.20 | |
| Payments To Acquire Property Plant And Equipment | NA | NA | NA | NA | NA | NA | 65.20 | 91.20 | 87.20 | 73.10 | 48.50 | 70.20 | 49.20 | 46.30 | 61.30 | 26.30 | 22.50 | 35.10 | 22.00 | 14.70 | 11.20 | |
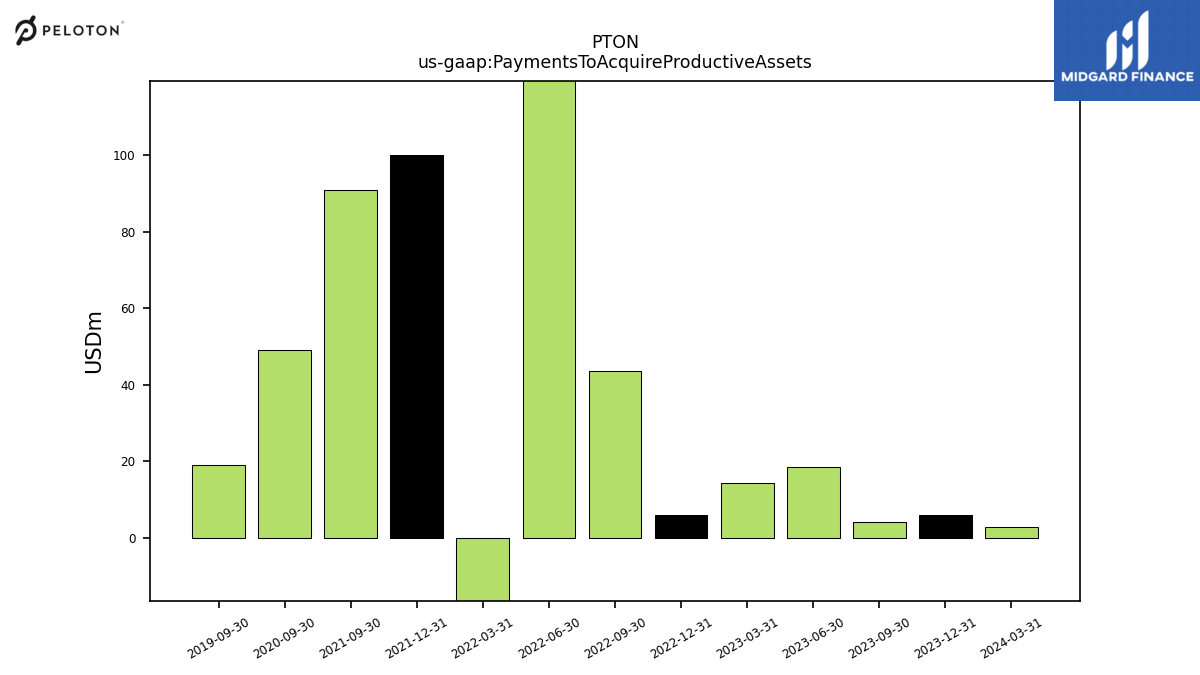
| Payments To Acquire Productive Assets | 4.10 | 18.60 | 14.30 | 5.90 | 43.60 | 253.30 | -107.00 | 100.00 | 91.00 | NA | NA | NA | 49.20 | NA | NA | NA | 19.10 | NA | NA | NA | NA |
| 2023-09-30 | 2023-06-30 | 2023-03-31 | 2022-12-31 | 2022-09-30 | 2022-06-30 | 2022-03-31 | 2021-12-31 | 2021-09-30 | 2021-06-30 | 2021-03-31 | 2020-12-31 | 2020-09-30 | 2020-06-30 | 2020-03-31 | 2019-12-31 | 2019-09-30 | 2019-06-30 | 2019-03-31 | 2018-12-31 | 2018-09-30 | ||
|---|---|---|---|---|---|---|---|---|---|---|---|---|---|---|---|---|---|---|---|---|---|---|
| Net Cash Provided By Used In Financing Activities | 8.20 | 6.80 | 42.10 | 25.80 | 2.10 | 706.10 | 21.80 | 1257.60 | 29.60 | 26.30 | 846.90 | 24.80 | 18.80 | 30.90 | 7.40 | 3.50 | 1198.40 | 5.40 | 1.30 | -128.80 | 539.30 |
| 2023-09-30 | 2023-06-30 | 2023-03-31 | 2022-12-31 | 2022-09-30 | 2022-06-30 | 2022-03-31 | 2021-12-31 | 2021-09-30 | 2021-06-30 | 2021-03-31 | 2020-12-31 | 2020-09-30 | 2020-06-30 | 2020-03-31 | 2019-12-31 | 2019-09-30 | 2019-06-30 | 2019-03-31 | 2018-12-31 | 2018-09-30 | ||
|---|---|---|---|---|---|---|---|---|---|---|---|---|---|---|---|---|---|---|---|---|---|---|
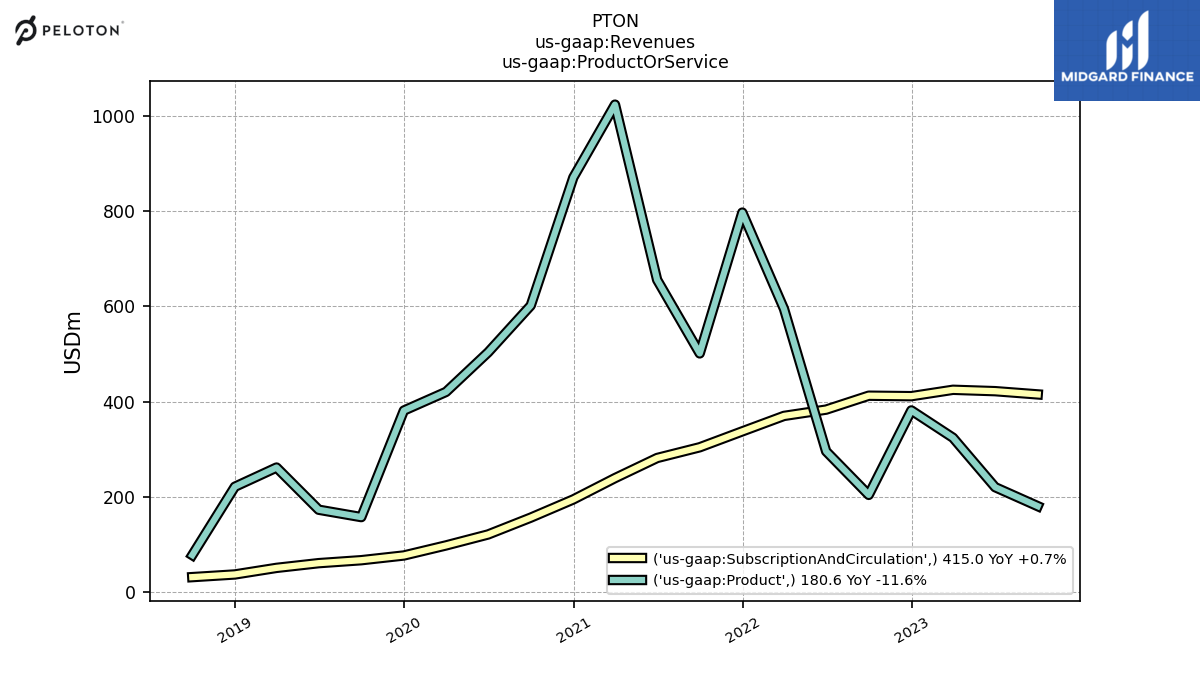
| Revenues | 595.50 | 642.10 | 748.90 | 792.70 | 616.50 | 678.70 | 964.30 | 1133.90 | 805.20 | 936.90 | 1262.30 | 1064.80 | 757.90 | 607.10 | 524.60 | 466.30 | 228.00 | 223.30 | 316.70 | 262.90 | 112.10 | |
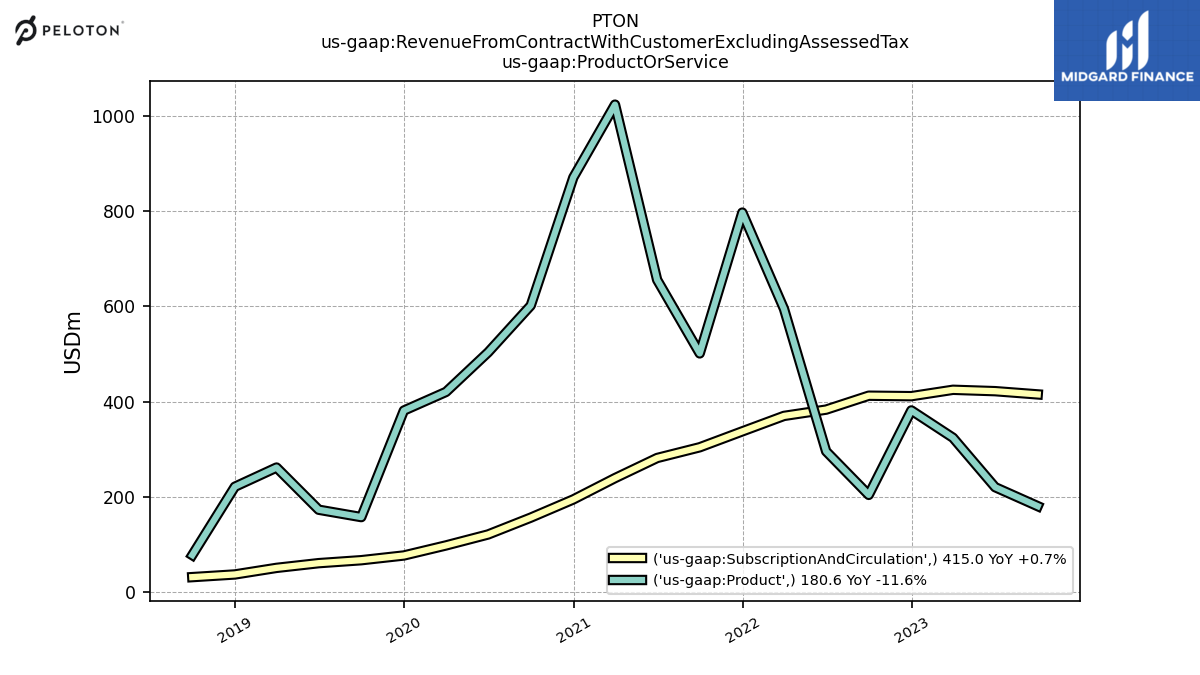
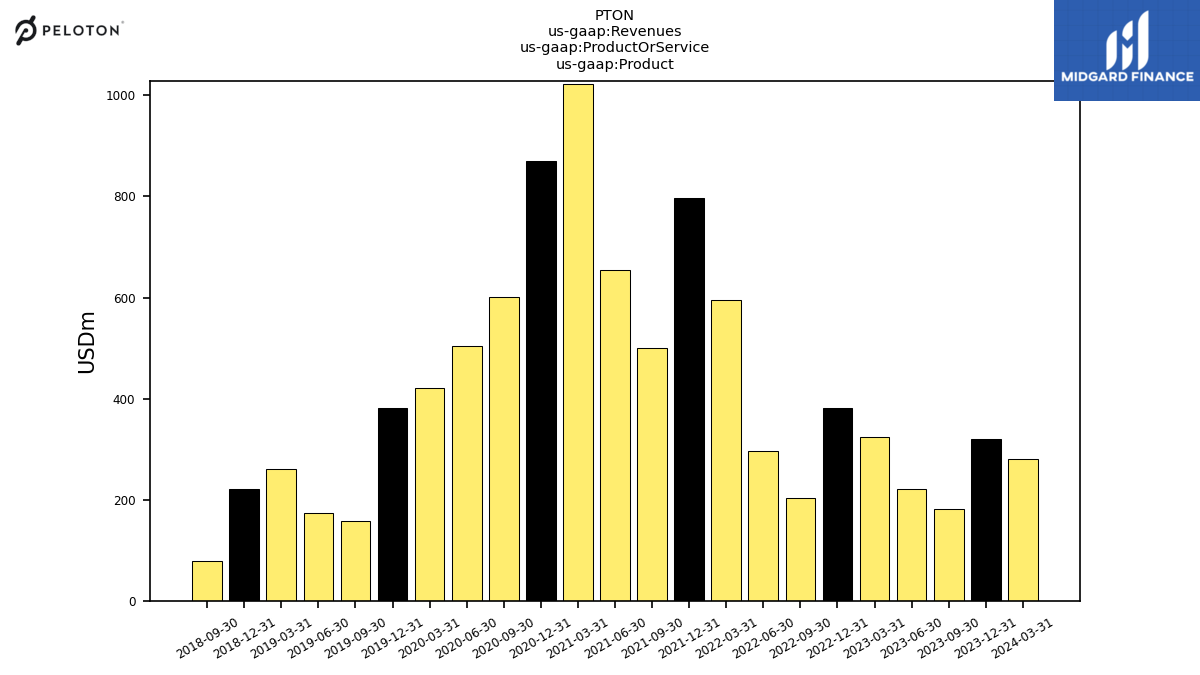
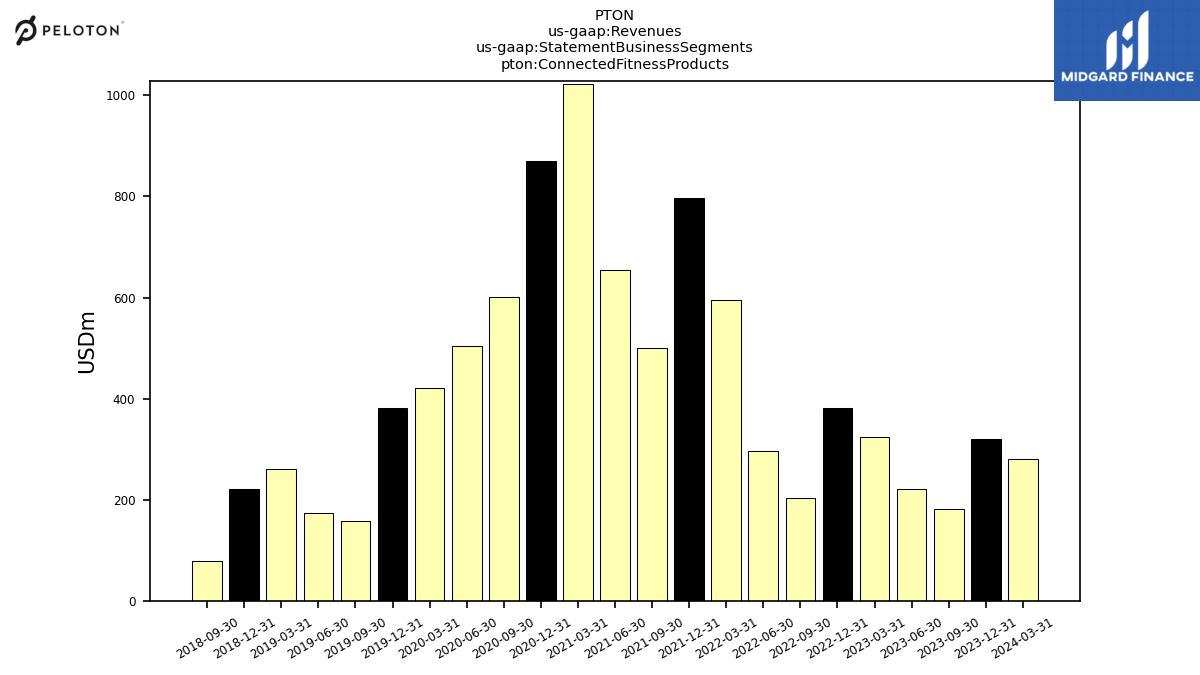
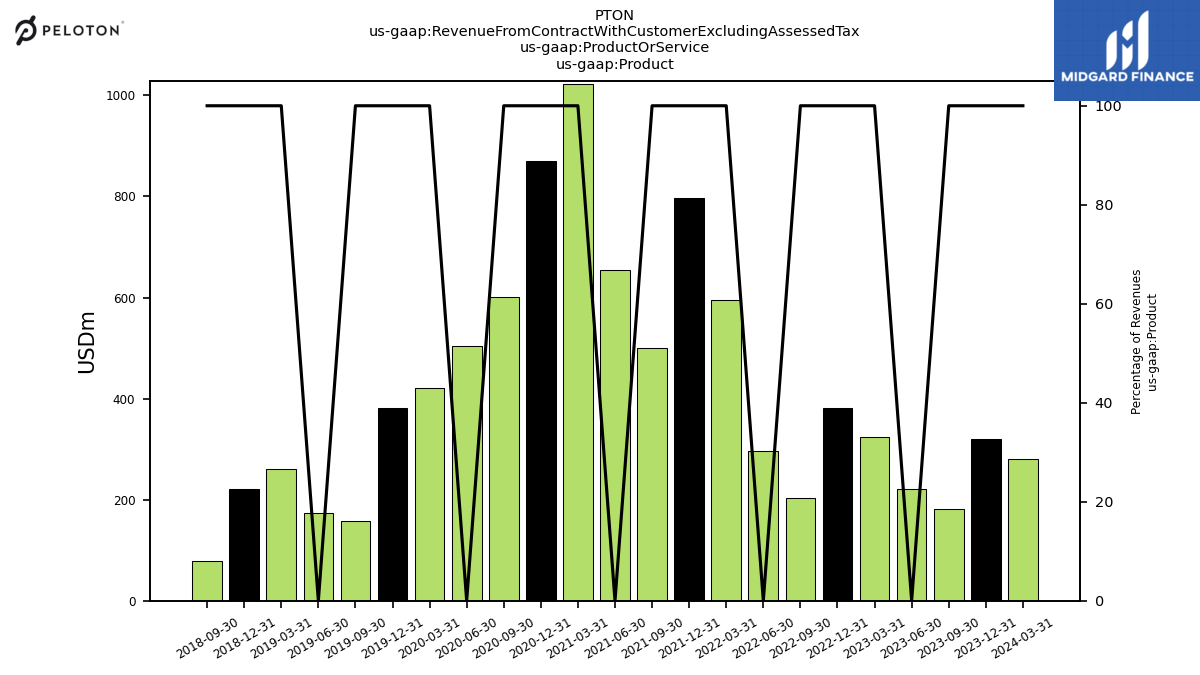
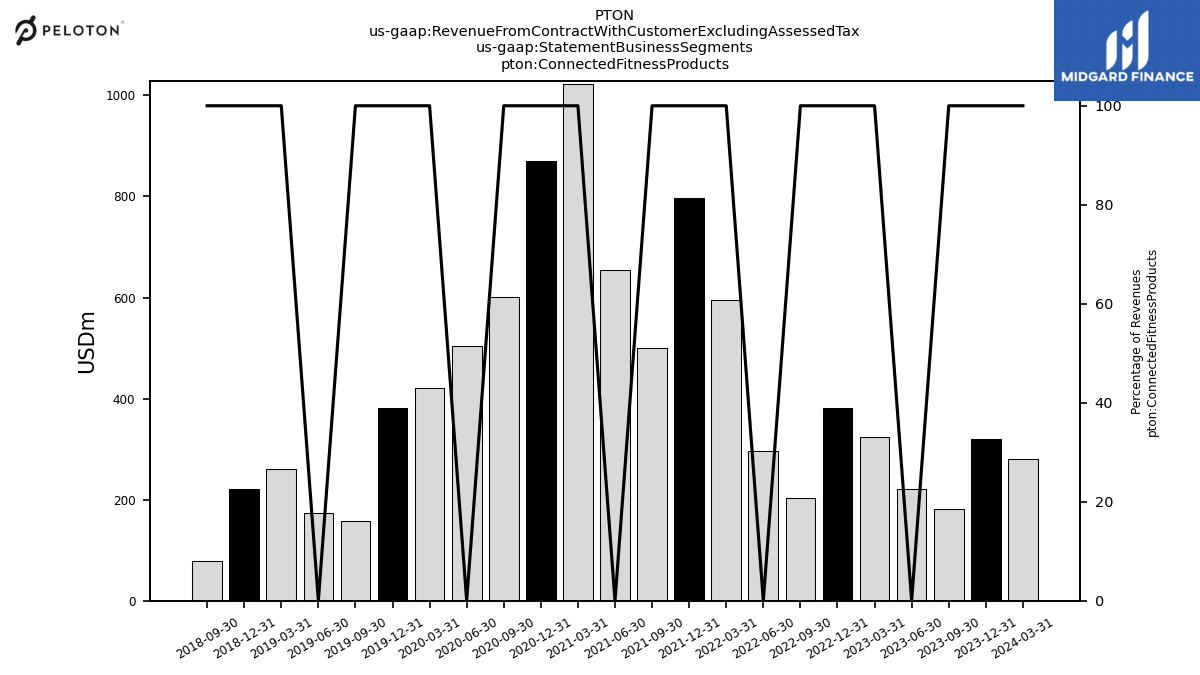
| Product | 180.60 | 220.40 | 324.10 | 381.40 | 204.20 | 295.60 | 594.40 | 796.40 | 501.00 | 655.30 | 1022.90 | 870.10 | 601.40 | 503.30 | 420.20 | 381.10 | 157.60 | 173.10 | 261.60 | 221.30 | 77.90 | |
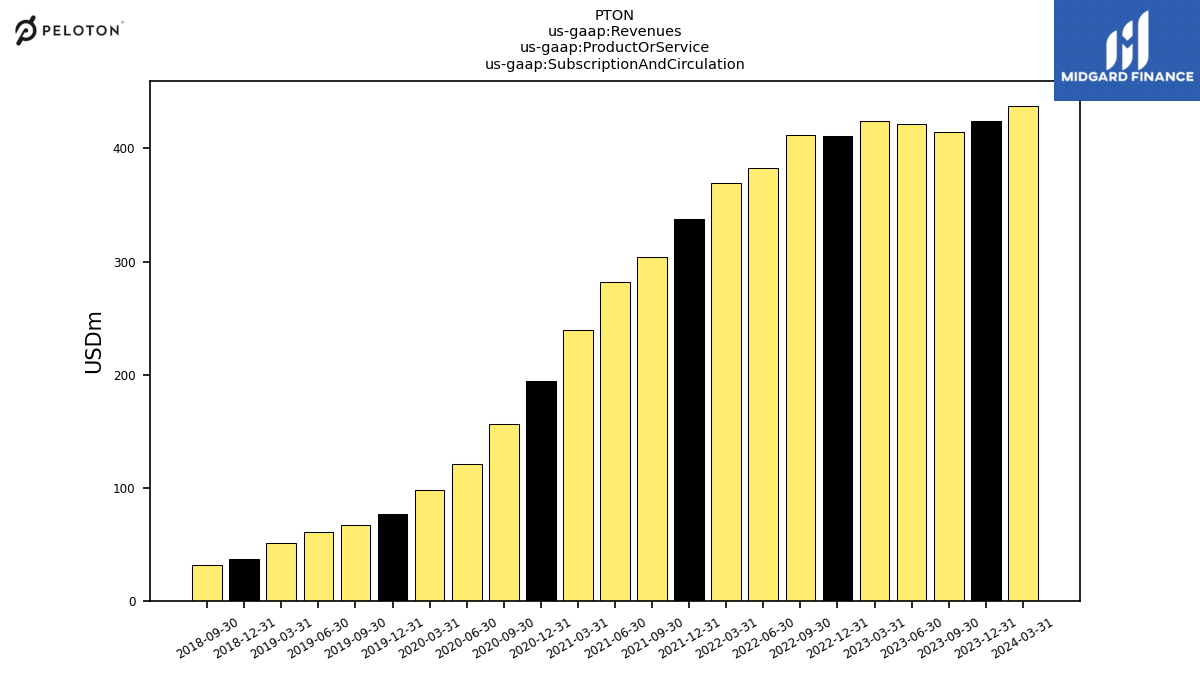
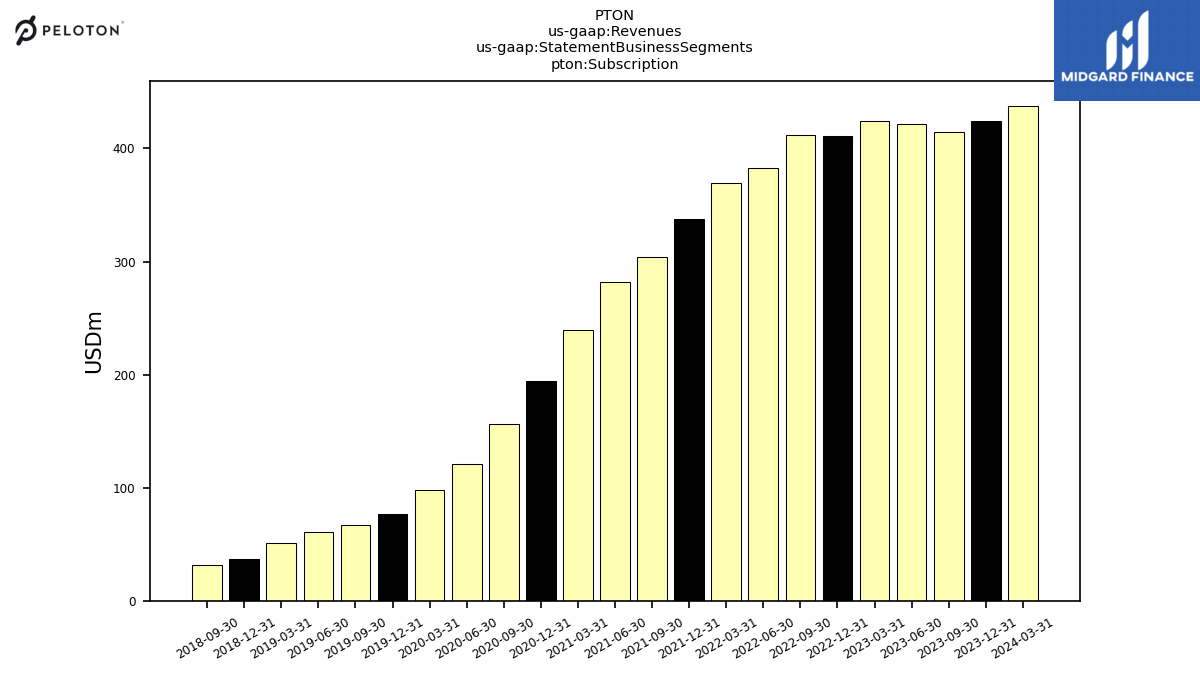
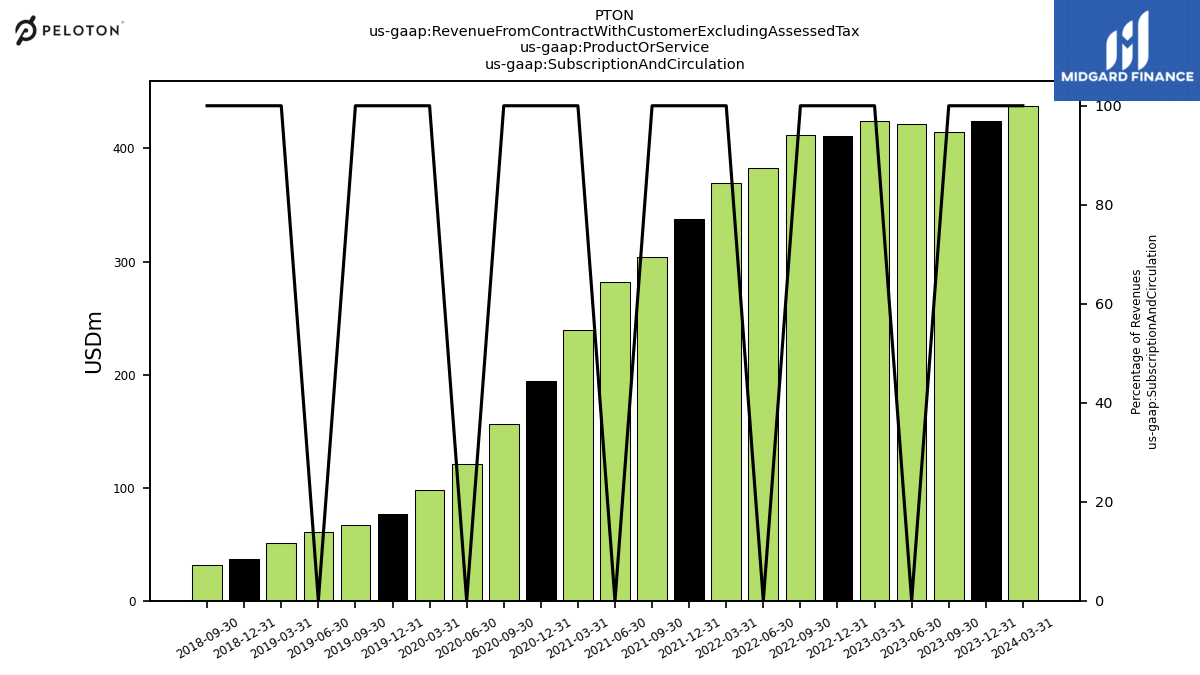
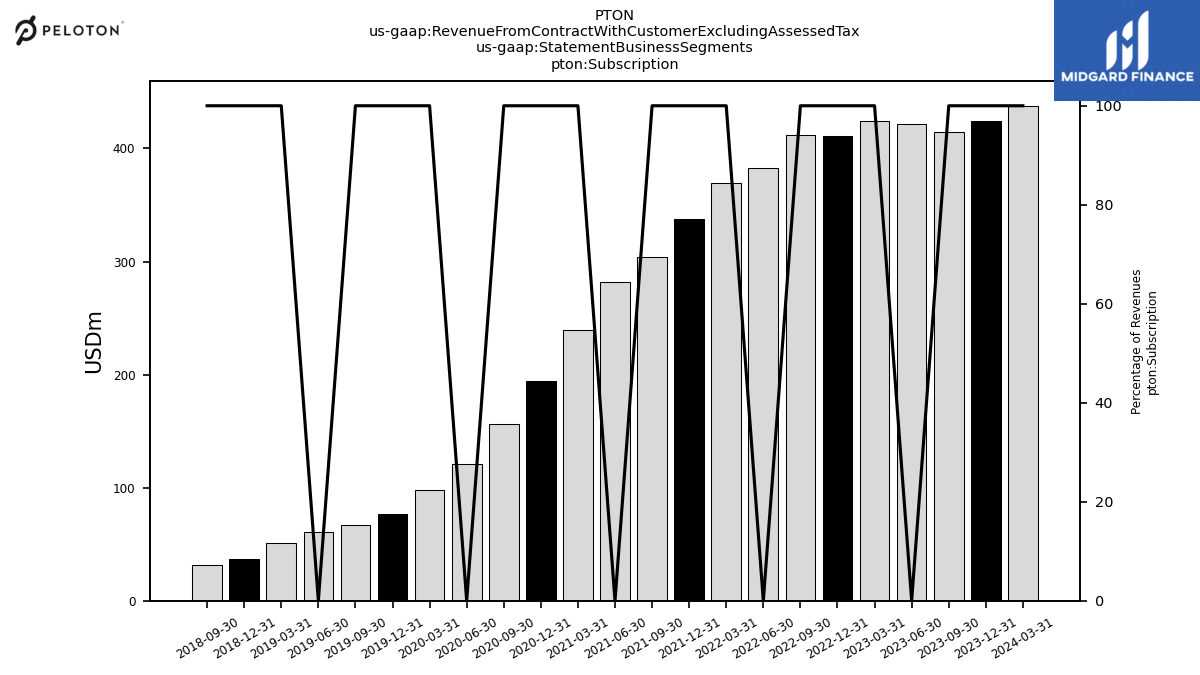
| Subscription And Circulation | 415.00 | 421.80 | 424.70 | 411.30 | 412.30 | 383.10 | 369.90 | 337.50 | 304.10 | 281.60 | 239.40 | 194.70 | 156.50 | 121.20 | 98.20 | 77.10 | 67.20 | 61.00 | 51.10 | 37.30 | 31.70 | |
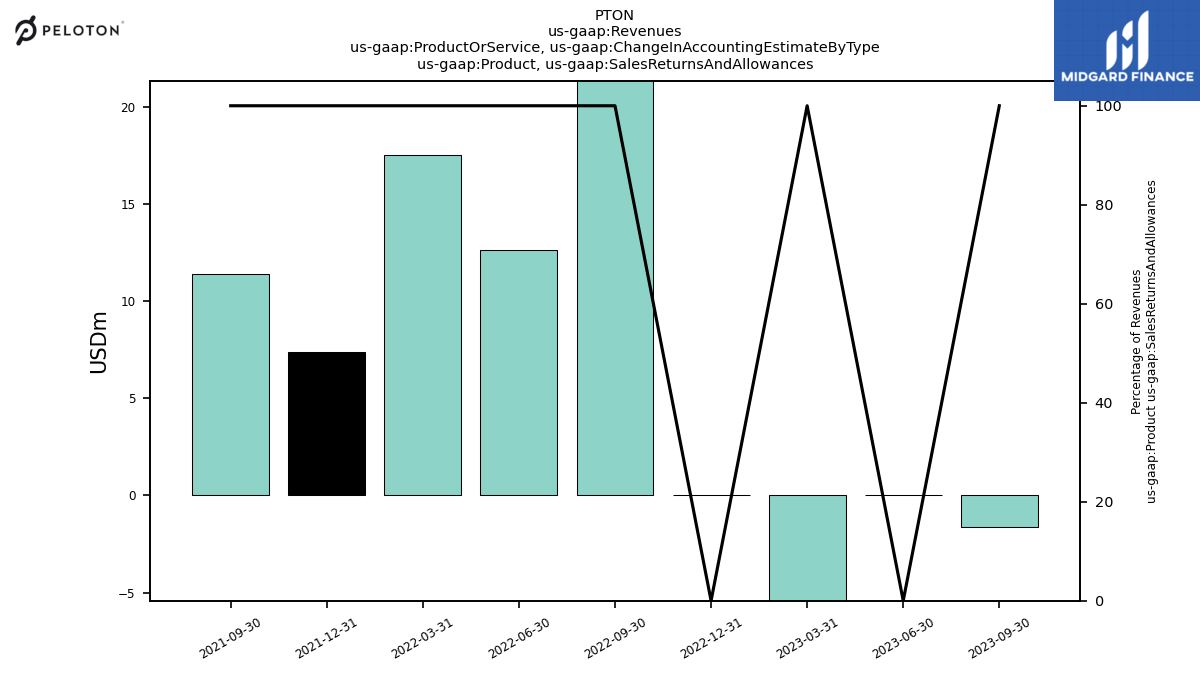
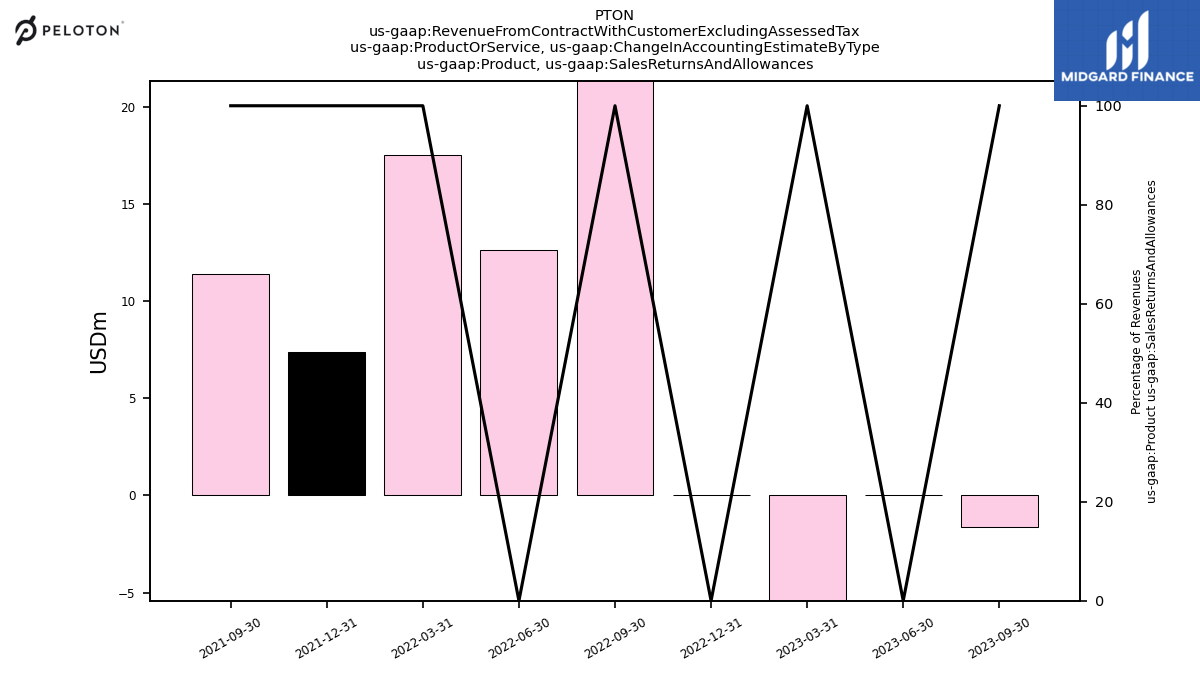
| Product, Sales Returns And Allowances | -1.60 | 0.00 | -11.90 | 0.00 | 26.50 | 12.60 | 17.50 | 7.40 | 11.40 | NA | NA | NA | NA | NA | NA | NA | NA | NA | NA | NA | NA | |
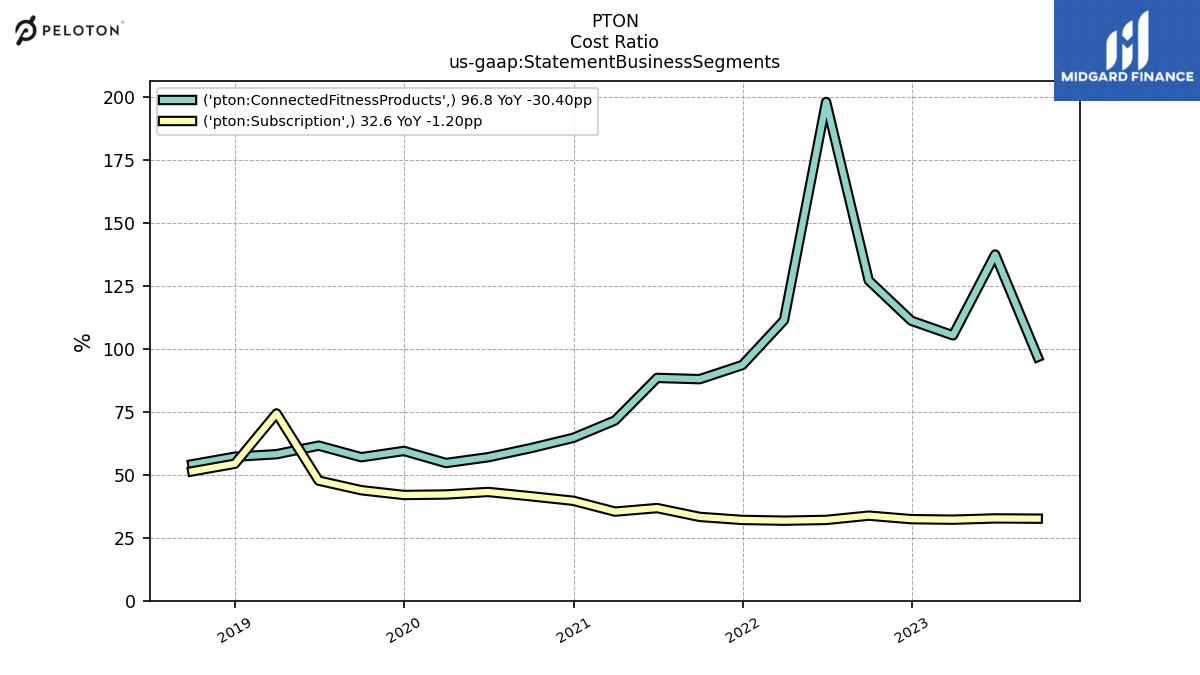
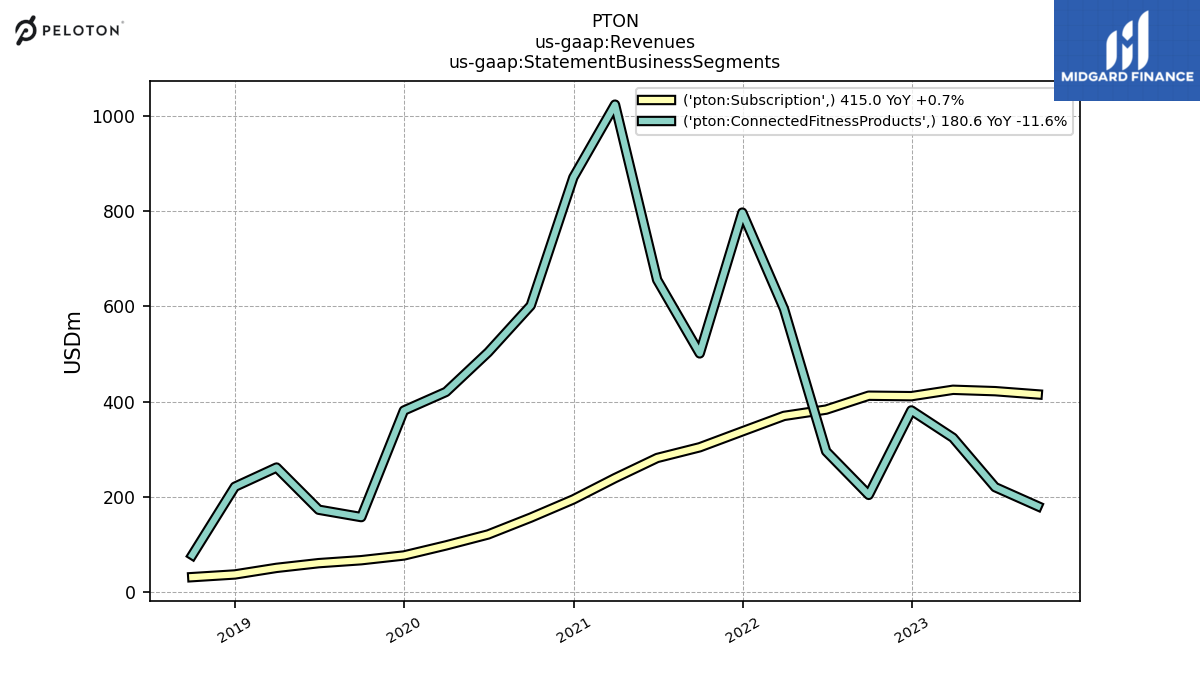
| Connected Fitness Products | 180.60 | 220.40 | 324.10 | 381.40 | 204.20 | 295.60 | 594.40 | 796.40 | 501.00 | 655.30 | 1022.90 | 870.10 | 601.40 | 503.30 | 420.20 | 381.10 | 157.60 | 173.10 | 261.60 | 221.30 | 77.90 | |
| Subscription | 415.00 | 421.80 | 424.70 | 411.30 | 412.30 | 383.10 | 369.90 | 337.50 | 304.10 | 281.60 | 239.40 | 194.70 | 156.50 | 121.20 | 98.20 | 77.10 | 67.20 | 61.00 | 51.10 | 37.30 | 31.70 | |
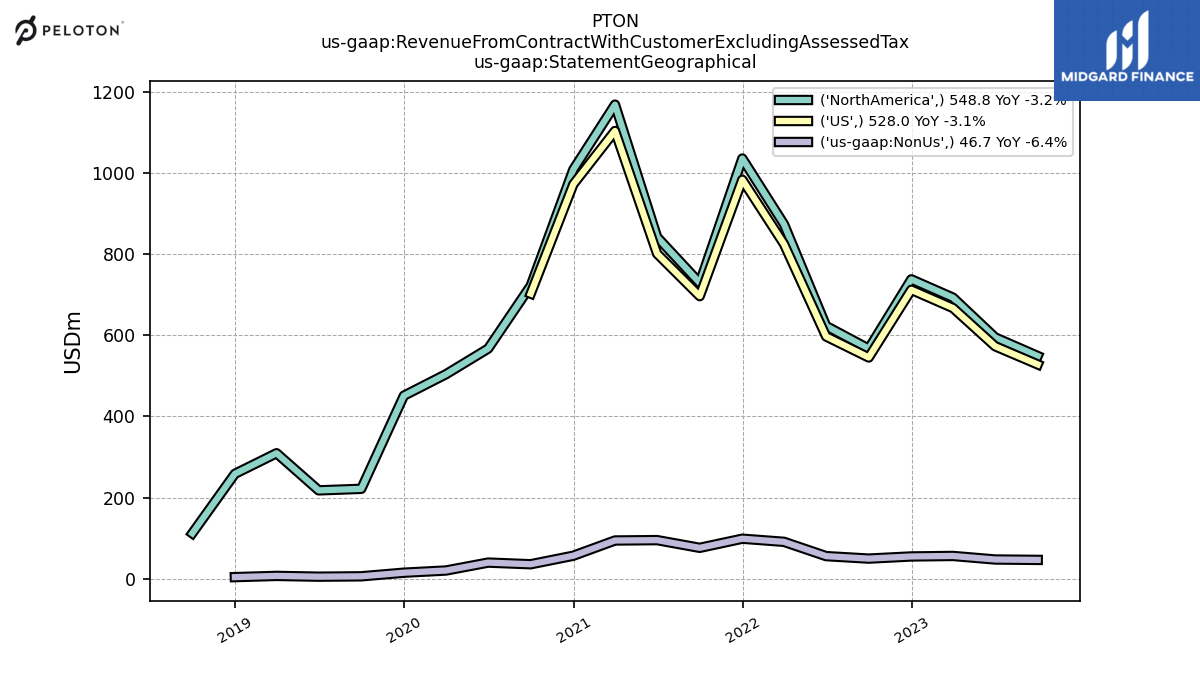
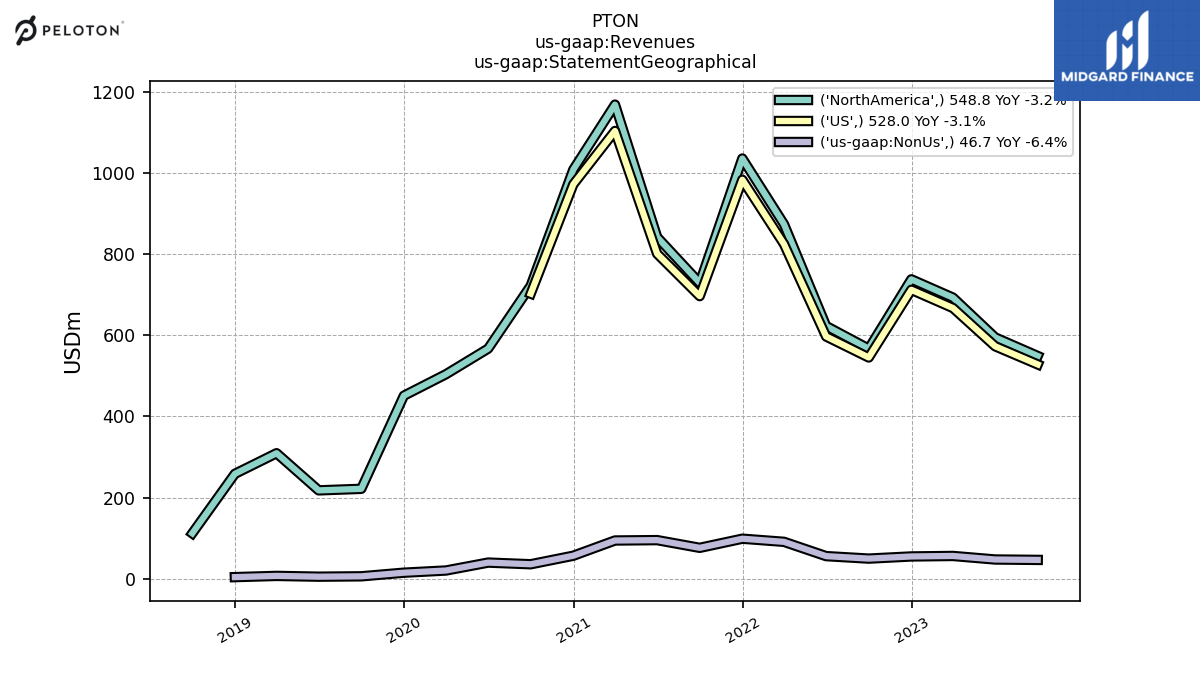
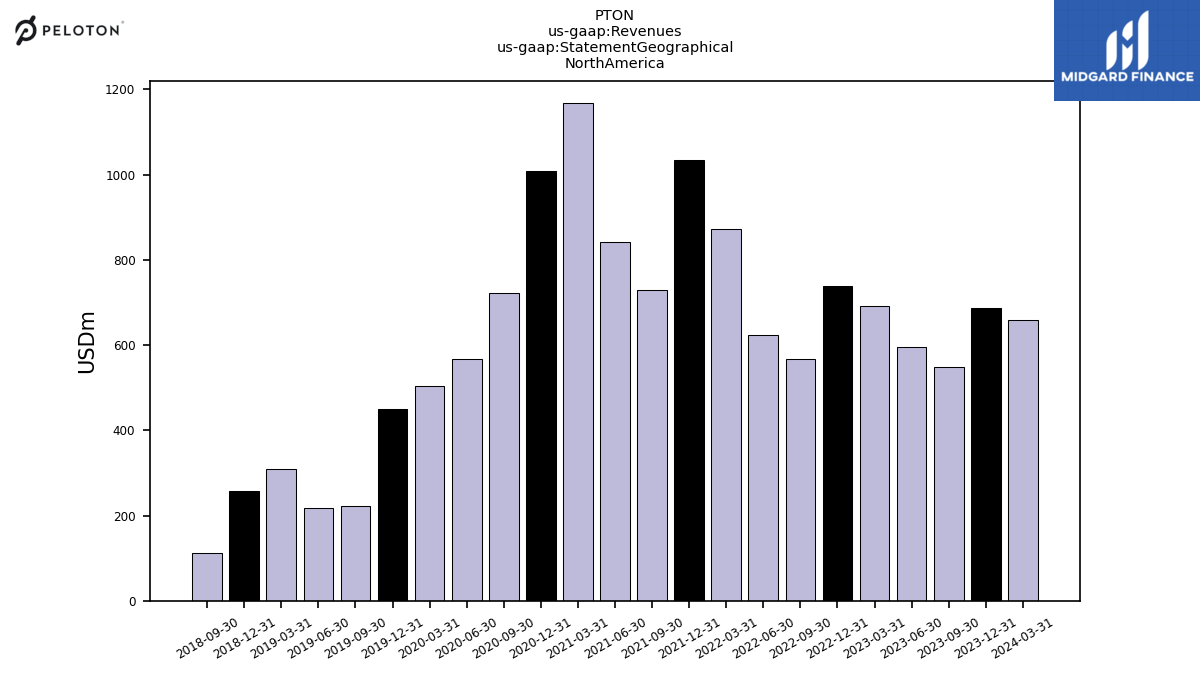
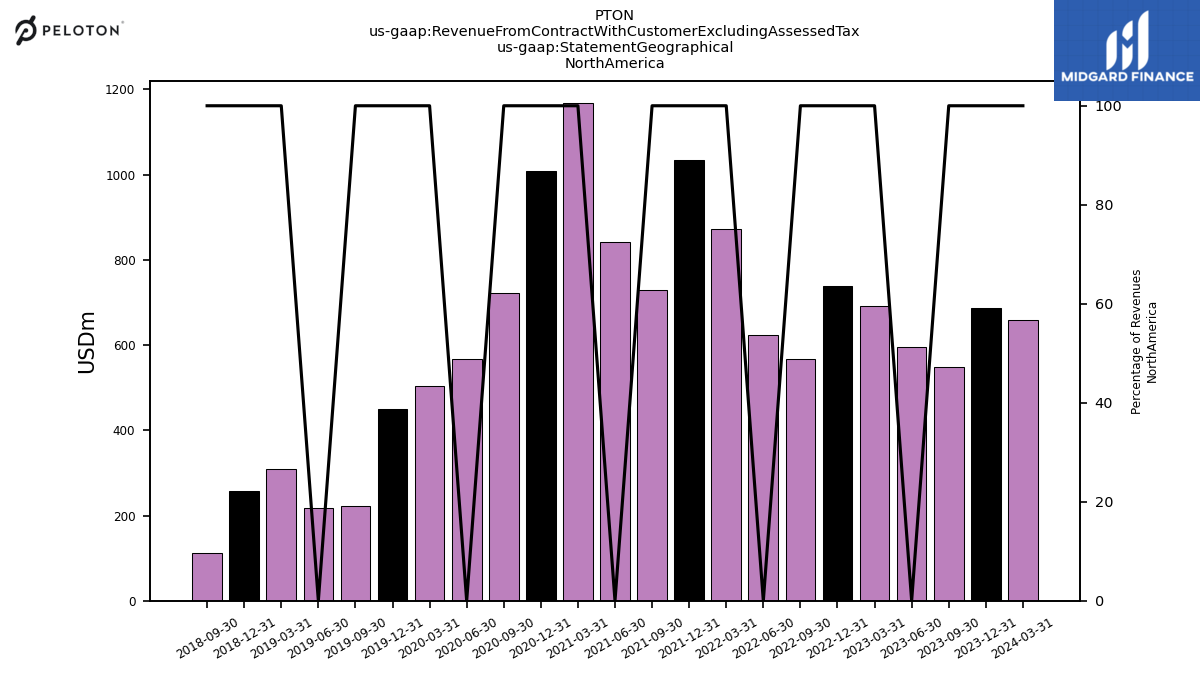
| 548.80 | 594.50 | 692.50 | 737.50 | 566.70 | 622.60 | 873.20 | 1035.00 | 728.80 | 841.50 | 1167.70 | 1007.80 | 721.90 | 566.90 | 503.90 | 451.00 | 221.70 | 217.90 | 309.40 | 258.60 | 112.10 | ||
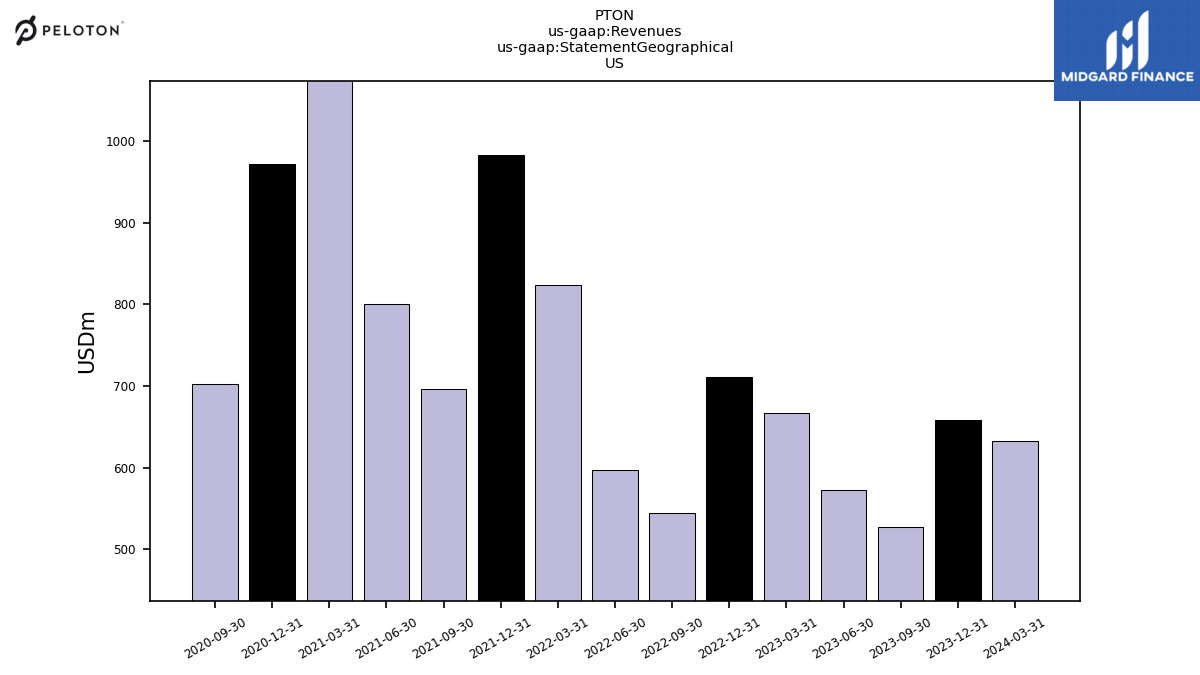
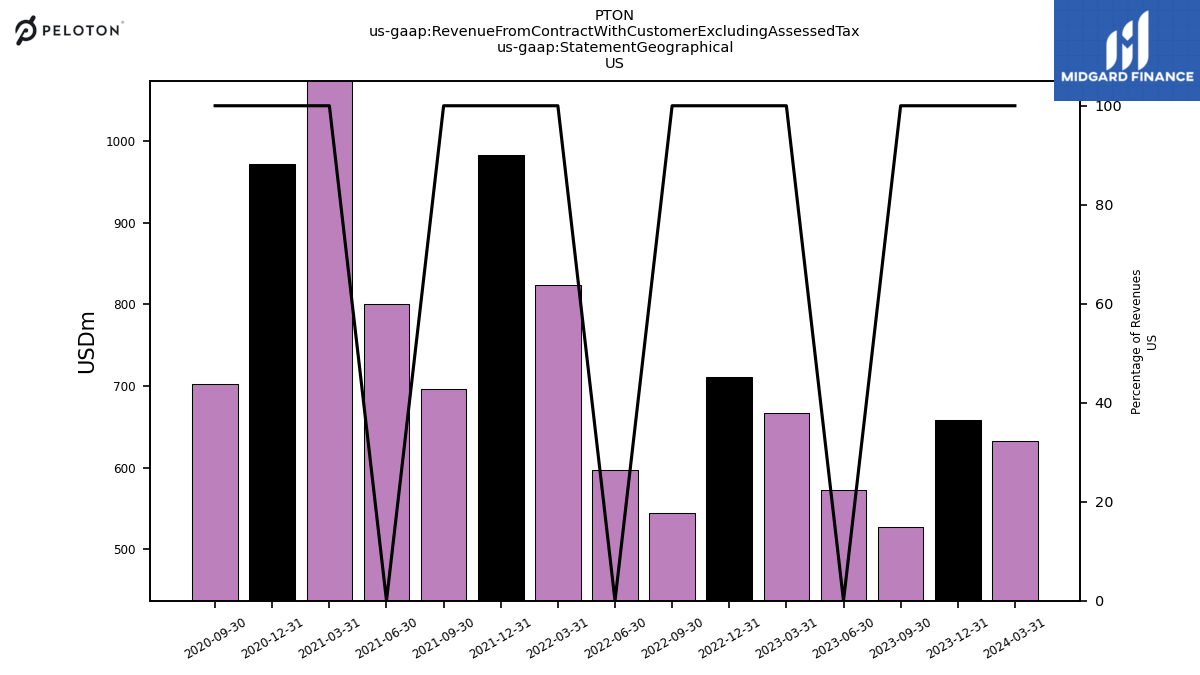
| US | 528.00 | 572.70 | 666.80 | 711.70 | 545.10 | 596.80 | 824.30 | 982.70 | 696.10 | 800.50 | 1102.90 | 971.40 | 702.30 | NA | NA | NA | NA | NA | NA | NA | NA | |
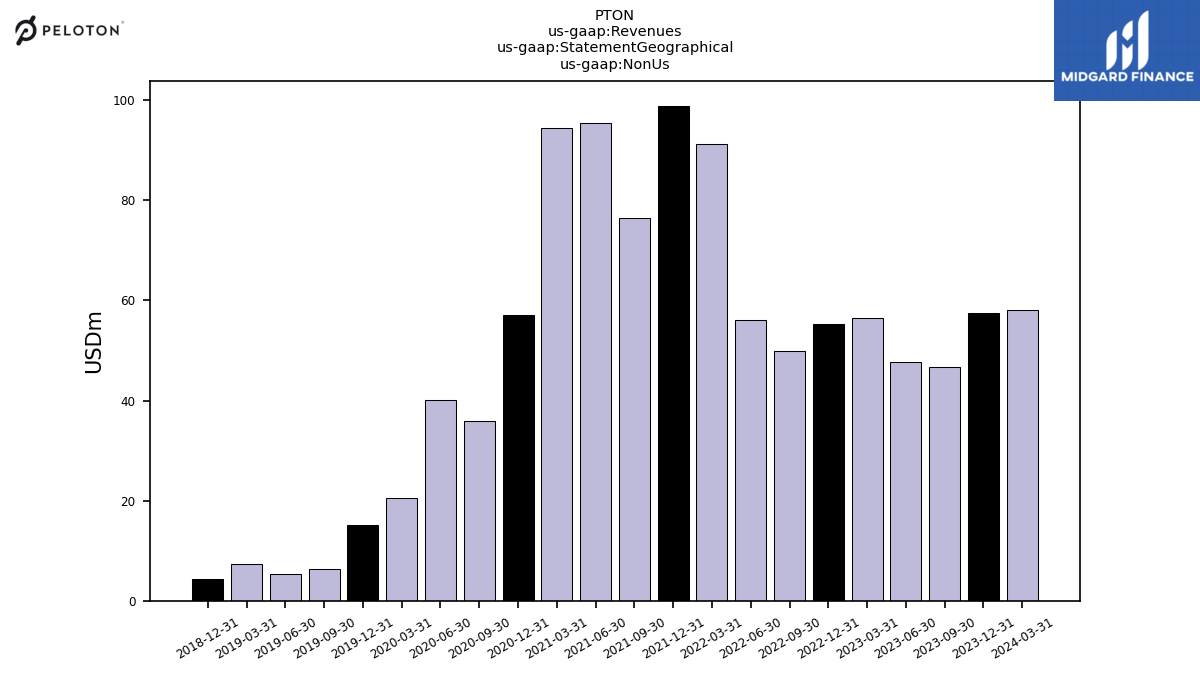
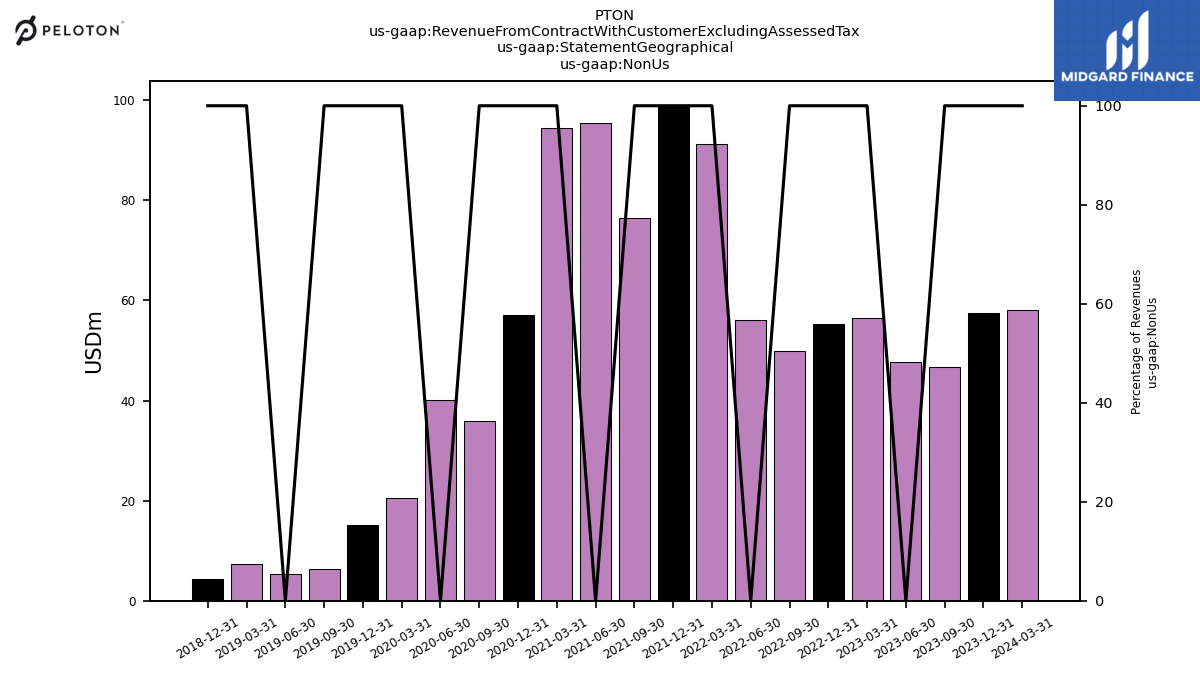
| Non Us | 46.70 | 47.70 | 56.40 | 55.20 | 49.90 | 56.00 | 91.20 | 98.90 | 76.40 | 95.40 | 94.50 | 57.00 | 36.00 | 40.10 | 20.60 | 15.20 | 6.30 | 5.40 | 7.30 | 4.30 | NA | |
| Revenue From Contract With Customer Excluding Assessed Tax | 595.50 | 642.10 | 748.90 | 792.70 | 616.50 | 678.70 | 964.30 | 1133.90 | 805.20 | 936.90 | 1262.30 | 1064.80 | 757.90 | 607.10 | 524.60 | 466.30 | 228.00 | 223.30 | 316.70 | 262.90 | 112.10 | |
| Product | 180.60 | 220.40 | 324.10 | 381.40 | 204.20 | 295.60 | 594.40 | 796.40 | 501.00 | 655.30 | 1022.90 | 870.10 | 601.40 | 503.30 | 420.20 | 381.10 | 157.60 | 173.10 | 261.60 | 221.30 | 77.90 | |
| Subscription And Circulation | 415.00 | 421.80 | 424.70 | 411.30 | 412.30 | 383.10 | 369.90 | 337.50 | 304.10 | 281.60 | 239.40 | 194.70 | 156.50 | 121.20 | 98.20 | 77.10 | 67.20 | 61.00 | 51.10 | 37.30 | 31.70 | |
| Product, Sales Returns And Allowances | -1.60 | 0.00 | -11.90 | 0.00 | 26.50 | 12.60 | 17.50 | 7.40 | 11.40 | NA | NA | NA | NA | NA | NA | NA | NA | NA | NA | NA | NA | |
| Connected Fitness Products | 180.60 | 220.40 | 324.10 | 381.40 | 204.20 | 295.60 | 594.40 | 796.40 | 501.00 | 655.30 | 1022.90 | 870.10 | 601.40 | 503.30 | 420.20 | 381.10 | 157.60 | 173.10 | 261.60 | 221.30 | 77.90 | |
| Subscription | 415.00 | 421.80 | 424.70 | 411.30 | 412.30 | 383.10 | 369.90 | 337.50 | 304.10 | 281.60 | 239.40 | 194.70 | 156.50 | 121.20 | 98.20 | 77.10 | 67.20 | 61.00 | 51.10 | 37.30 | 31.70 | |
| 548.80 | 594.50 | 692.50 | 737.50 | 566.70 | 622.60 | 873.20 | 1035.00 | 728.80 | 841.50 | 1167.70 | 1007.80 | 721.90 | 566.90 | 503.90 | 451.00 | 221.70 | 217.90 | 309.40 | 258.60 | 112.10 | ||
| US | 528.00 | 572.70 | 666.80 | 711.70 | 545.10 | 596.80 | 824.30 | 982.70 | 696.10 | 800.50 | 1102.90 | 971.40 | 702.30 | NA | NA | NA | NA | NA | NA | NA | NA | |
| Non Us | 46.70 | 47.70 | 56.40 | 55.20 | 49.90 | 56.00 | 91.20 | 98.90 | 76.40 | 95.40 | 94.50 | 57.00 | 36.00 | 40.10 | 20.60 | 15.20 | 6.30 | 5.40 | 7.30 | 4.30 | NA |


