
| 2023-12-31 | 2023-09-30 | 2023-06-30 | 2023-03-31 | 2022-12-31 | 2022-09-30 | 2022-06-30 | 2022-03-31 | 2021-12-31 | 2021-09-30 | 2021-06-30 | 2021-03-31 | 2020-12-31 | 2020-09-30 | 2020-06-30 | 2020-03-31 | 2019-12-31 | 2019-09-30 | 2019-06-30 | 2019-03-31 | 2018-12-31 | 2018-09-30 | 2018-06-30 | 2018-03-31 | 2017-12-31 | 2017-09-30 | 2017-06-30 | 2017-03-31 | 2016-12-31 | 2016-09-30 | 2016-06-30 | 2016-03-31 | 2015-12-31 | 2015-09-30 | 2015-06-30 | 2015-03-31 | 2014-12-31 | 2014-09-30 | 2014-06-30 | 2014-03-31 | 2013-12-31 | 2013-09-30 | 2013-06-30 | 2013-03-31 | 2012-12-31 | 2012-09-30 | 2012-06-30 | 2012-03-31 | 2011-12-31 | 2011-09-30 | 2011-06-30 | 2011-03-31 | 2010-12-31 | 2010-09-30 | 2010-06-30 | 2010-03-31 | 2009-12-31 | ||
|---|---|---|---|---|---|---|---|---|---|---|---|---|---|---|---|---|---|---|---|---|---|---|---|---|---|---|---|---|---|---|---|---|---|---|---|---|---|---|---|---|---|---|---|---|---|---|---|---|---|---|---|---|---|---|---|---|---|---|
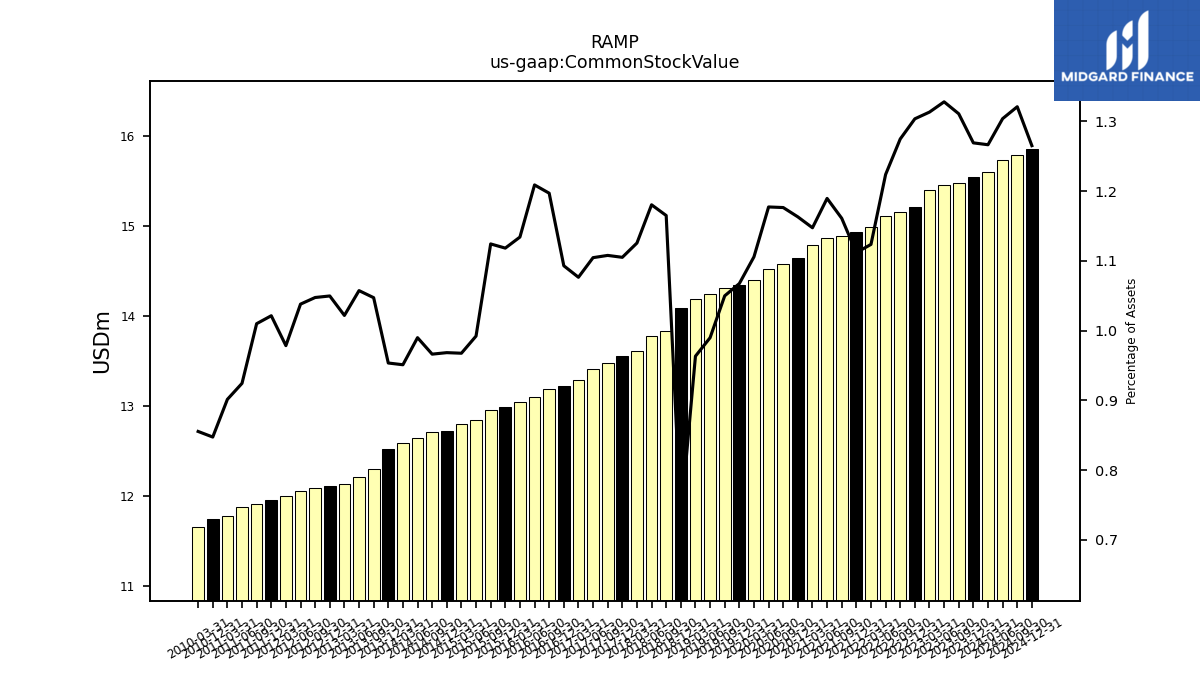
| Common Stock Value | 15.54 | 15.47 | 15.46 | 15.40 | 15.21 | 15.15 | 15.10 | 14.98 | 14.93 | 14.89 | 14.87 | 14.78 | 14.65 | 14.57 | 14.53 | 14.39 | 14.34 | 14.31 | 14.24 | 14.19 | 14.08 | 13.84 | 13.77 | 13.61 | 13.55 | 13.48 | 13.41 | 13.29 | 13.22 | 13.19 | 13.10 | 13.04 | 12.99 | 12.96 | 12.85 | 12.79 | 12.72 | 12.71 | 12.64 | 12.58 | 12.53 | 12.29 | 12.21 | 12.13 | 12.11 | 12.09 | 12.05 | 12.00 | 11.95 | 11.91 | 11.88 | 11.78 | 11.75 | NA | NA | 11.66 | NA | |
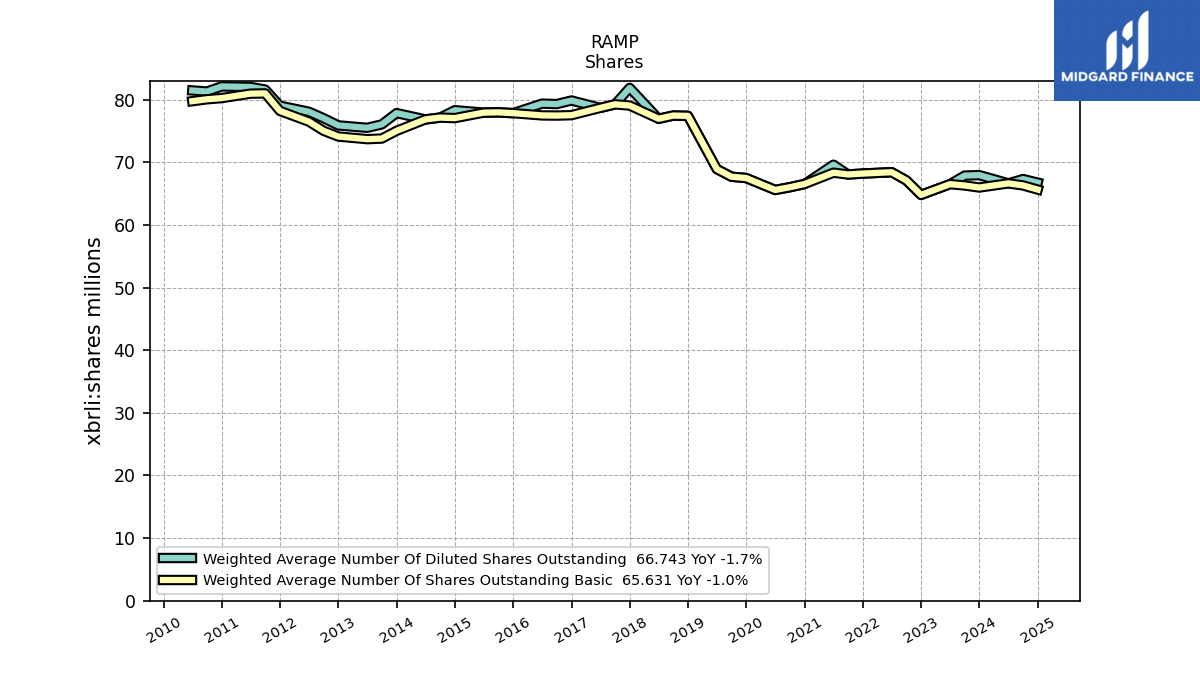
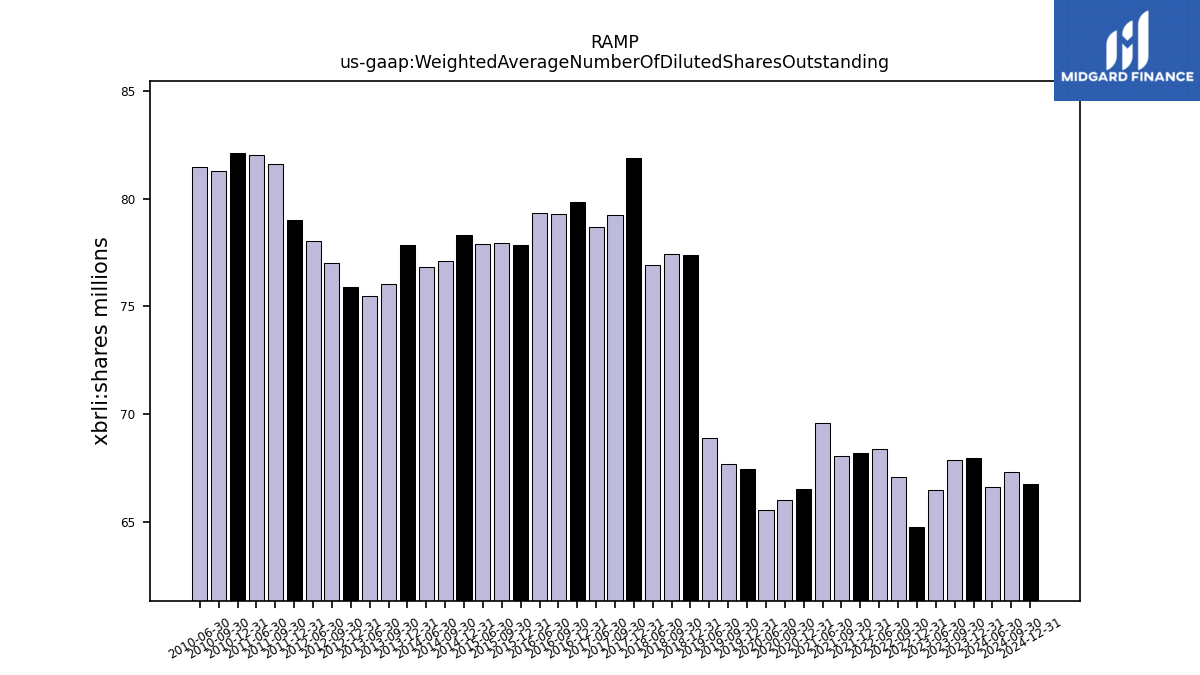
| Weighted Average Number Of Diluted Shares Outstanding | 67.94 | 67.87 | 66.50 | NA | 64.78 | 67.10 | 68.40 | NA | 68.19 | 68.04 | 69.61 | NA | 66.52 | 66.01 | 65.57 | NA | 67.47 | 67.68 | 68.91 | NA | 77.40 | 77.45 | 76.94 | NA | 81.87 | 79.23 | 78.67 | NA | 79.85 | 79.28 | 79.35 | NA | 77.83 | 77.96 | 77.92 | NA | 78.30 | 77.12 | 76.83 | NA | 77.84 | 76.04 | 75.49 | NA | 75.88 | 77.03 | 78.06 | NA | 79.02 | 81.60 | 82.01 | NA | 82.10 | 81.28 | 81.46 | NA | NA | |
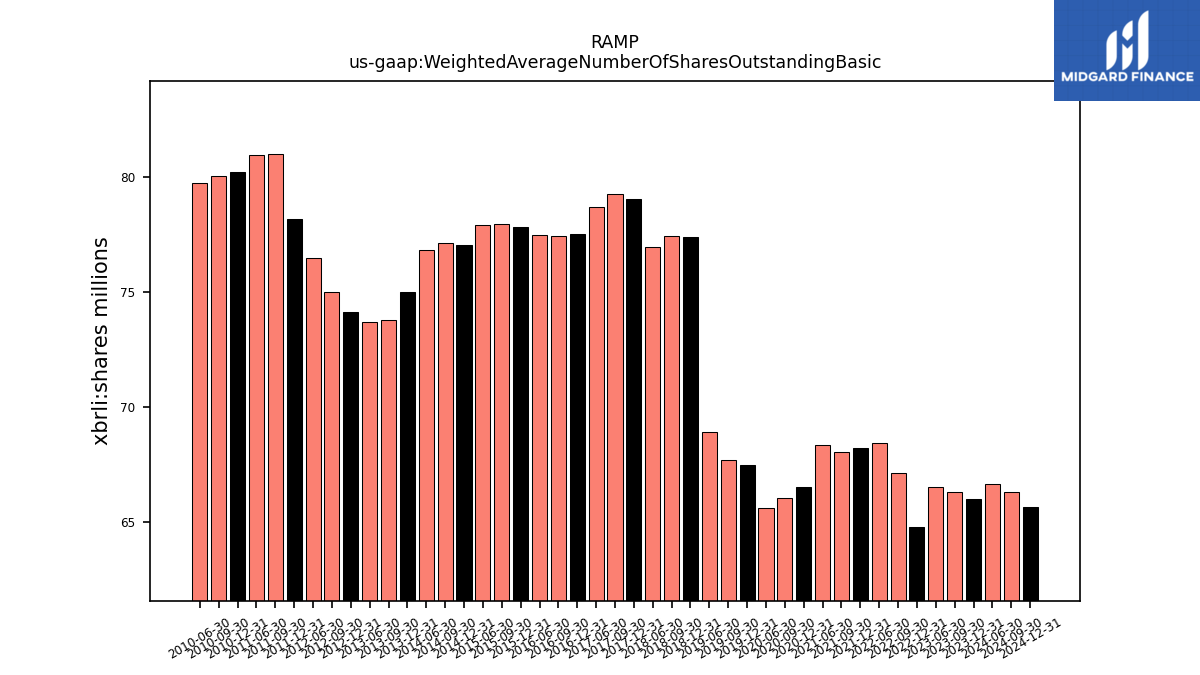
| Weighted Average Number Of Shares Outstanding Basic | 65.96 | 66.28 | 66.50 | NA | 64.78 | 67.10 | 68.40 | NA | 68.19 | 68.04 | 68.33 | NA | 66.52 | 66.01 | 65.57 | NA | 67.47 | 67.68 | 68.91 | NA | 77.40 | 77.45 | 76.94 | NA | 79.04 | 79.23 | 78.67 | NA | 77.51 | 77.45 | 77.47 | NA | 77.83 | 77.96 | 77.92 | NA | 77.04 | 77.12 | 76.83 | NA | 75.01 | 73.78 | 73.68 | NA | 74.10 | 75.01 | 76.47 | NA | 78.19 | 80.98 | 80.94 | NA | 80.23 | 80.05 | 79.74 | NA | NA | |
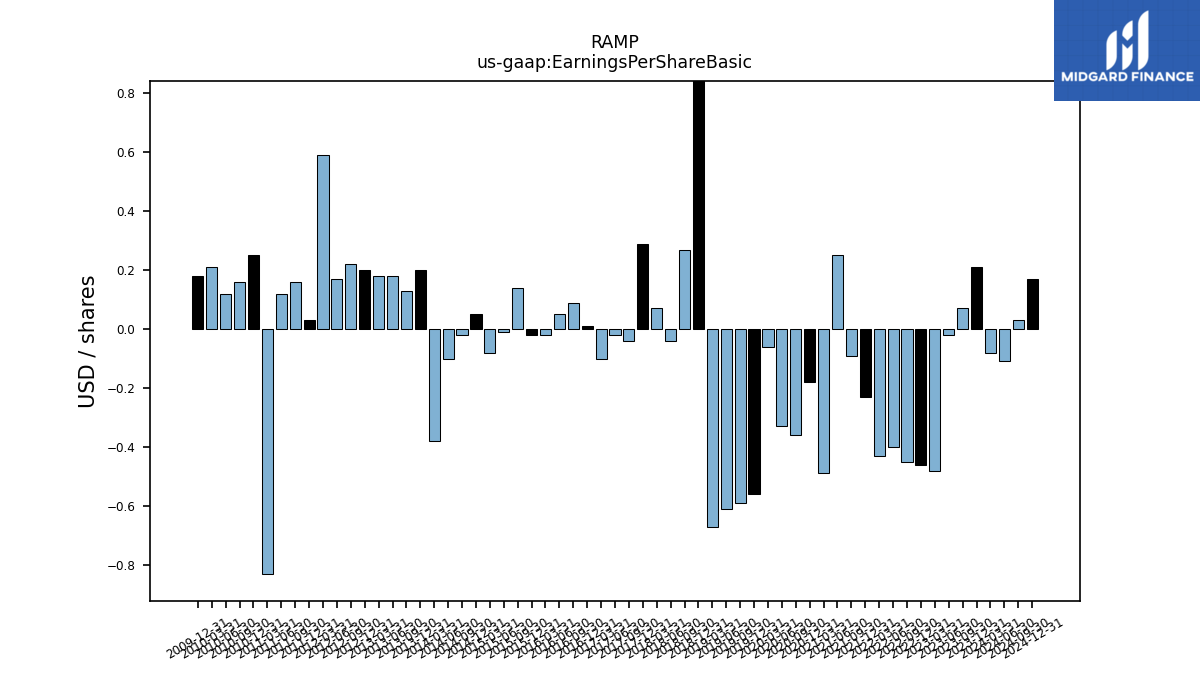
| Earnings Per Share Basic | 0.21 | 0.07 | -0.02 | -0.48 | -0.46 | -0.45 | -0.40 | -0.43 | -0.23 | -0.09 | 0.25 | -0.49 | -0.18 | -0.36 | -0.33 | -0.06 | -0.56 | -0.59 | -0.61 | -0.67 | 13.65 | 0.27 | -0.04 | 0.07 | 0.29 | -0.04 | -0.02 | -0.10 | 0.01 | 0.09 | 0.05 | -0.02 | -0.02 | 0.14 | -0.01 | -0.08 | 0.05 | -0.02 | -0.10 | -0.38 | 0.20 | 0.13 | 0.18 | 0.18 | 0.20 | 0.22 | 0.17 | 0.59 | 0.03 | 0.16 | 0.12 | -0.83 | 0.25 | 0.16 | 0.12 | 0.21 | 0.18 | |
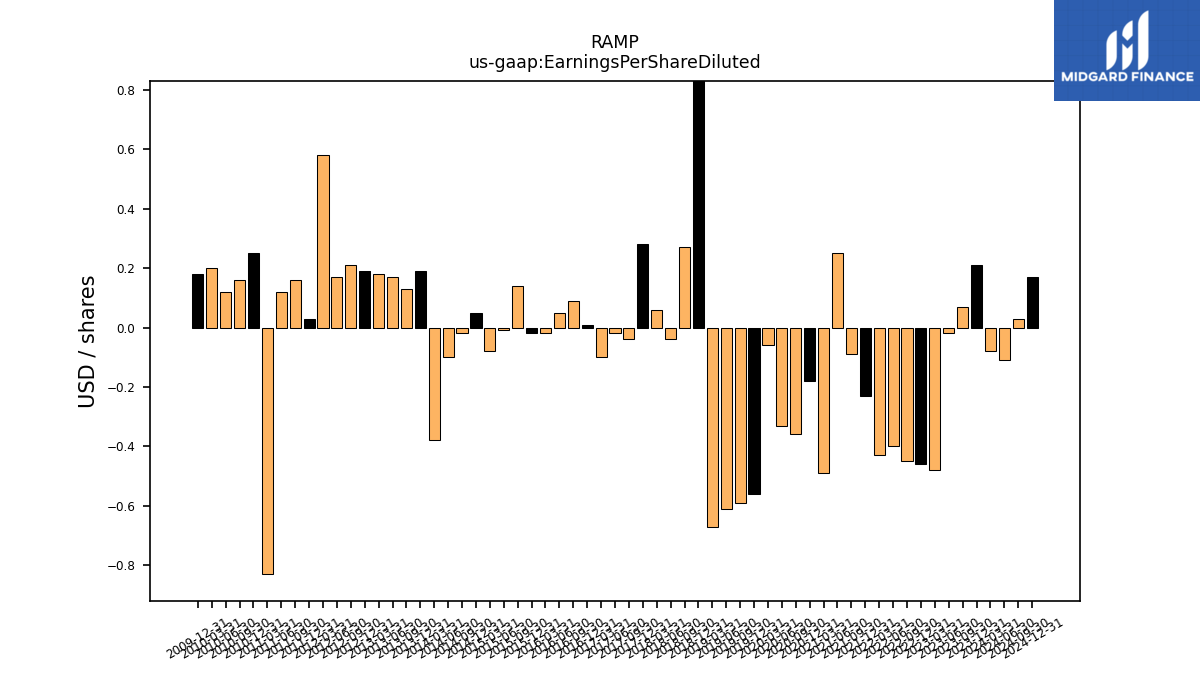
| Earnings Per Share Diluted | 0.21 | 0.07 | -0.02 | -0.48 | -0.46 | -0.45 | -0.40 | -0.43 | -0.23 | -0.09 | 0.25 | -0.49 | -0.18 | -0.36 | -0.33 | -0.06 | -0.56 | -0.59 | -0.61 | -0.67 | 13.65 | 0.27 | -0.04 | 0.06 | 0.28 | -0.04 | -0.02 | -0.10 | 0.01 | 0.09 | 0.05 | -0.02 | -0.02 | 0.14 | -0.01 | -0.08 | 0.05 | -0.02 | -0.10 | -0.38 | 0.19 | 0.13 | 0.17 | 0.18 | 0.19 | 0.21 | 0.17 | 0.58 | 0.03 | 0.16 | 0.12 | -0.83 | 0.25 | 0.16 | 0.12 | 0.20 | 0.18 | |
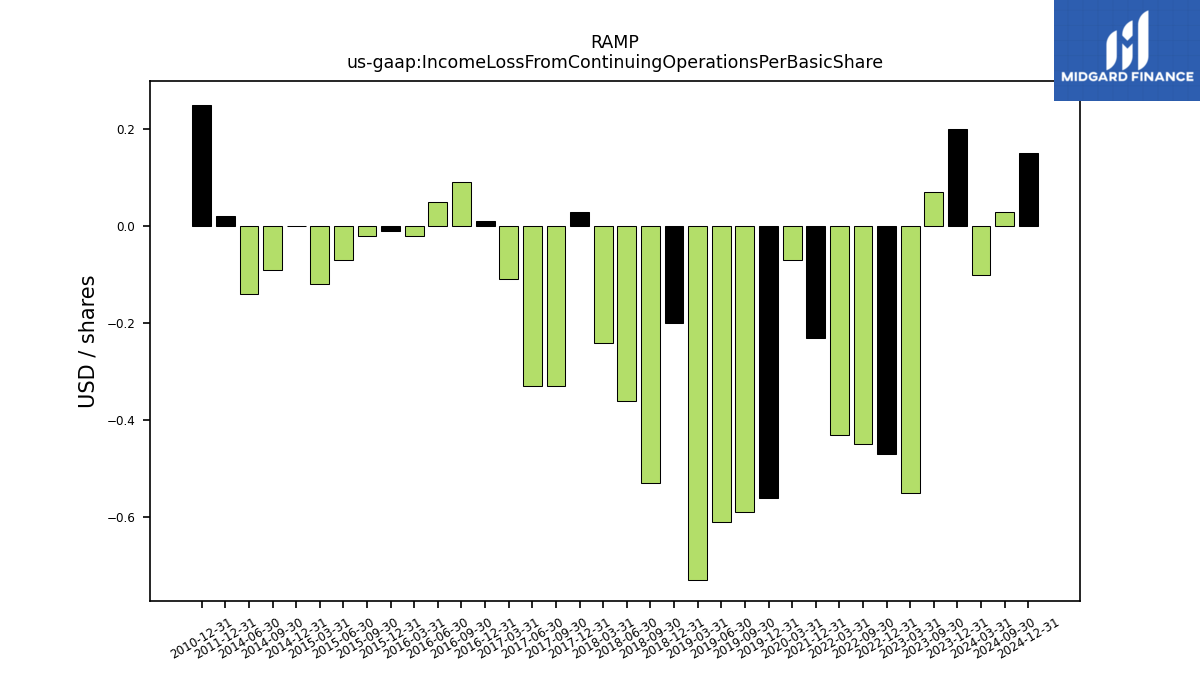
| Income Loss From Continuing Operations Per Basic Share | 0.00 | 0.00 | NA | -0.00 | -0.00 | -0.00 | NA | -0.00 | -0.00 | NA | NA | NA | NA | NA | NA | -0.00 | -0.00 | -0.00 | -0.00 | -0.00 | -0.00 | -0.00 | -0.00 | -0.00 | 0.00 | -0.00 | -0.00 | -0.00 | 0.00 | 0.00 | 0.00 | -0.00 | -0.00 | -0.00 | -0.00 | -0.00 | 0.00 | -0.00 | -0.00 | NA | NA | NA | NA | NA | NA | NA | NA | NA | 0.00 | NA | NA | NA | 0.00 | NA | NA | NA | NA | |
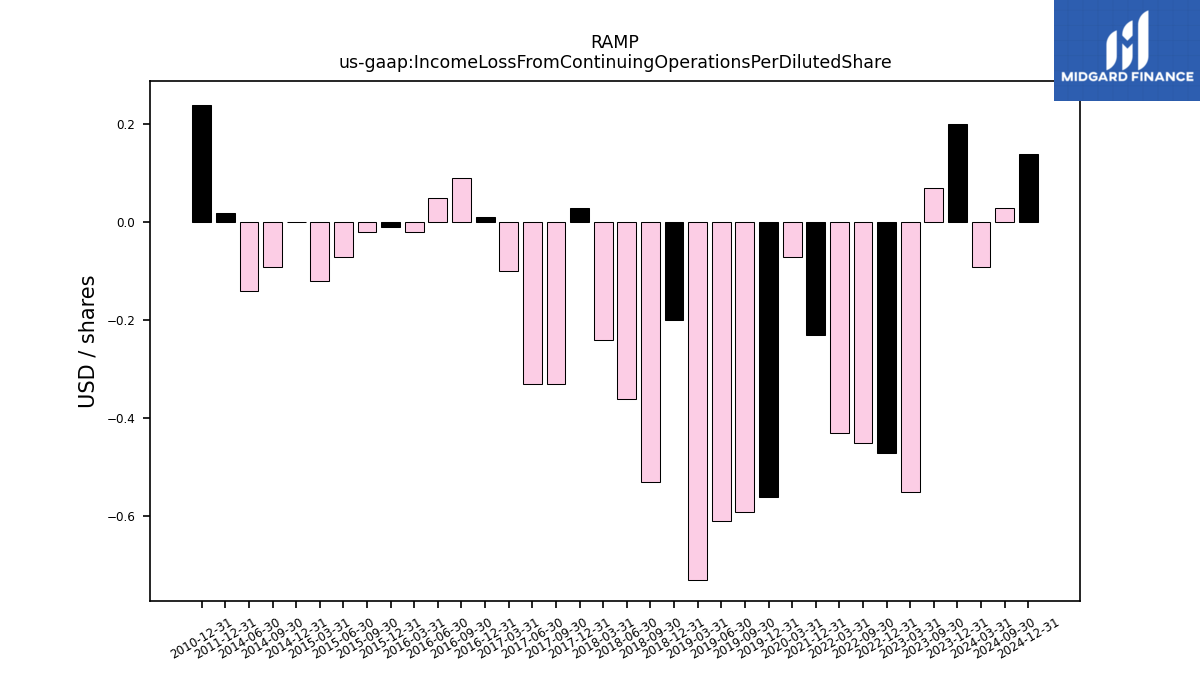
| Income Loss From Continuing Operations Per Diluted Share | 0.00 | 0.00 | NA | -0.00 | -0.00 | -0.00 | NA | -0.00 | -0.00 | NA | NA | NA | NA | NA | NA | -0.00 | -0.00 | -0.00 | -0.00 | -0.00 | -0.00 | -0.00 | -0.00 | -0.00 | 0.00 | -0.00 | -0.00 | -0.00 | 0.00 | 0.00 | 0.00 | -0.00 | -0.00 | -0.00 | -0.00 | -0.00 | 0.00 | -0.00 | -0.00 | NA | NA | NA | NA | NA | NA | NA | NA | NA | 0.00 | NA | NA | NA | 0.00 | NA | NA | NA | NA |
| 2023-12-31 | 2023-09-30 | 2023-06-30 | 2023-03-31 | 2022-12-31 | 2022-09-30 | 2022-06-30 | 2022-03-31 | 2021-12-31 | 2021-09-30 | 2021-06-30 | 2021-03-31 | 2020-12-31 | 2020-09-30 | 2020-06-30 | 2020-03-31 | 2019-12-31 | 2019-09-30 | 2019-06-30 | 2019-03-31 | 2018-12-31 | 2018-09-30 | 2018-06-30 | 2018-03-31 | 2017-12-31 | 2017-09-30 | 2017-06-30 | 2017-03-31 | 2016-12-31 | 2016-09-30 | 2016-06-30 | 2016-03-31 | 2015-12-31 | 2015-09-30 | 2015-06-30 | 2015-03-31 | 2014-12-31 | 2014-09-30 | 2014-06-30 | 2014-03-31 | 2013-12-31 | 2013-09-30 | 2013-06-30 | 2013-03-31 | 2012-12-31 | 2012-09-30 | 2012-06-30 | 2012-03-31 | 2011-12-31 | 2011-09-30 | 2011-06-30 | 2011-03-31 | 2010-12-31 | 2010-09-30 | 2010-06-30 | 2010-03-31 | 2009-12-31 | ||
|---|---|---|---|---|---|---|---|---|---|---|---|---|---|---|---|---|---|---|---|---|---|---|---|---|---|---|---|---|---|---|---|---|---|---|---|---|---|---|---|---|---|---|---|---|---|---|---|---|---|---|---|---|---|---|---|---|---|---|
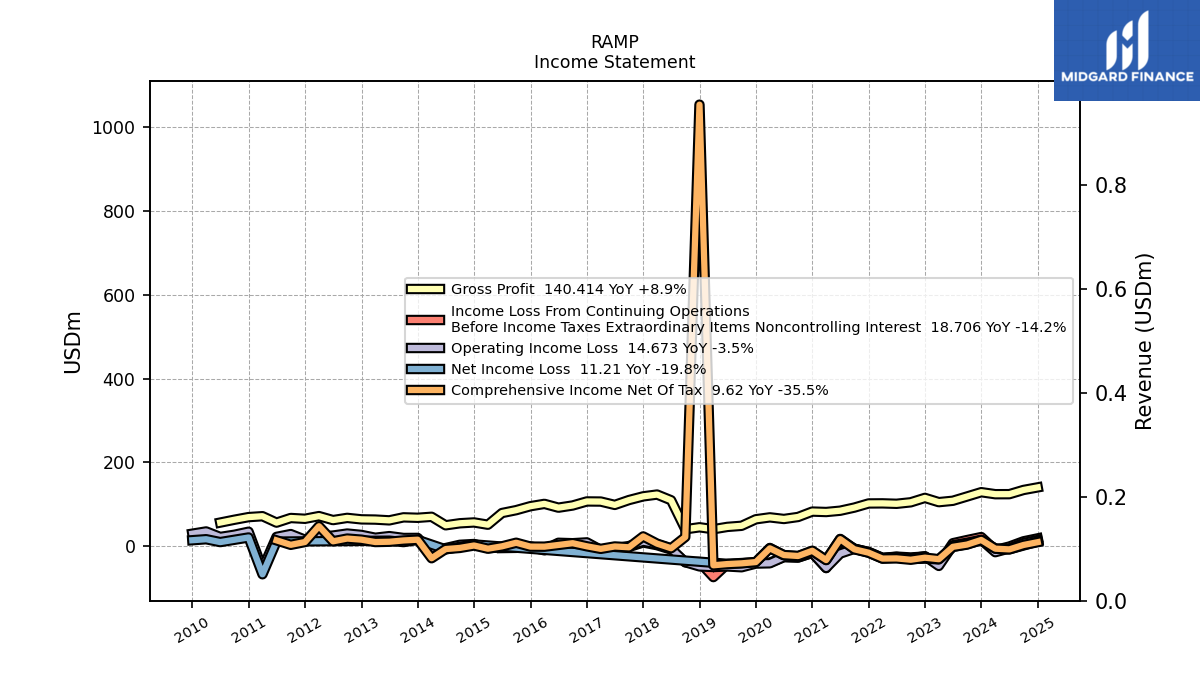
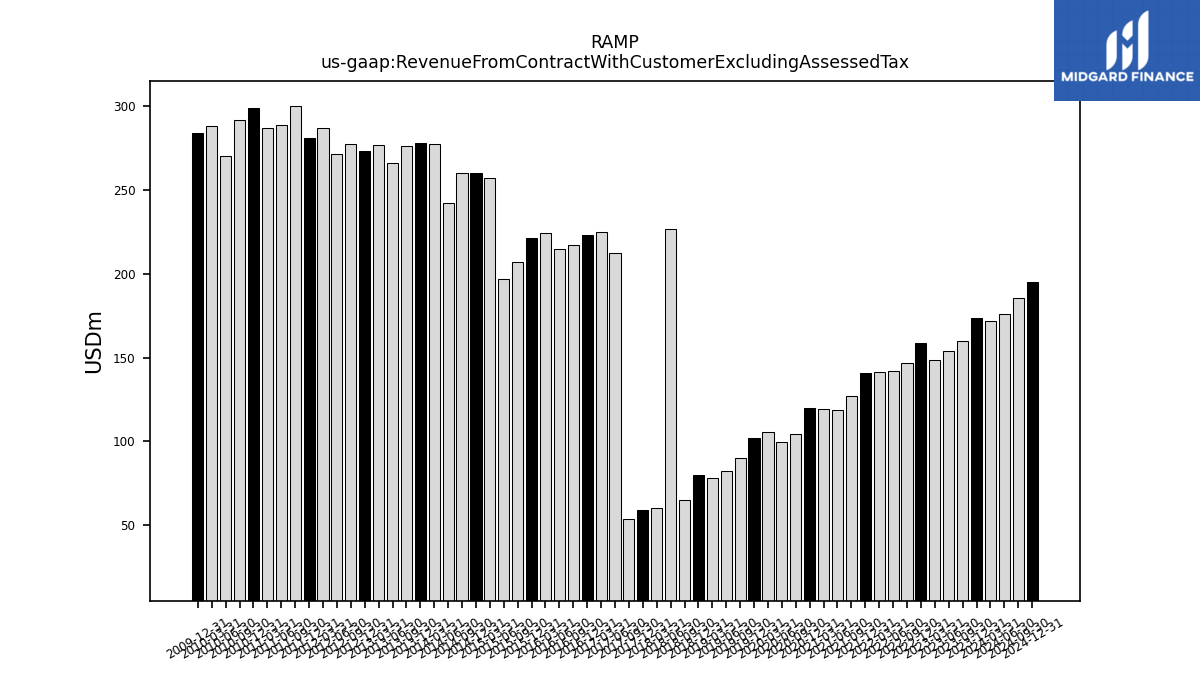
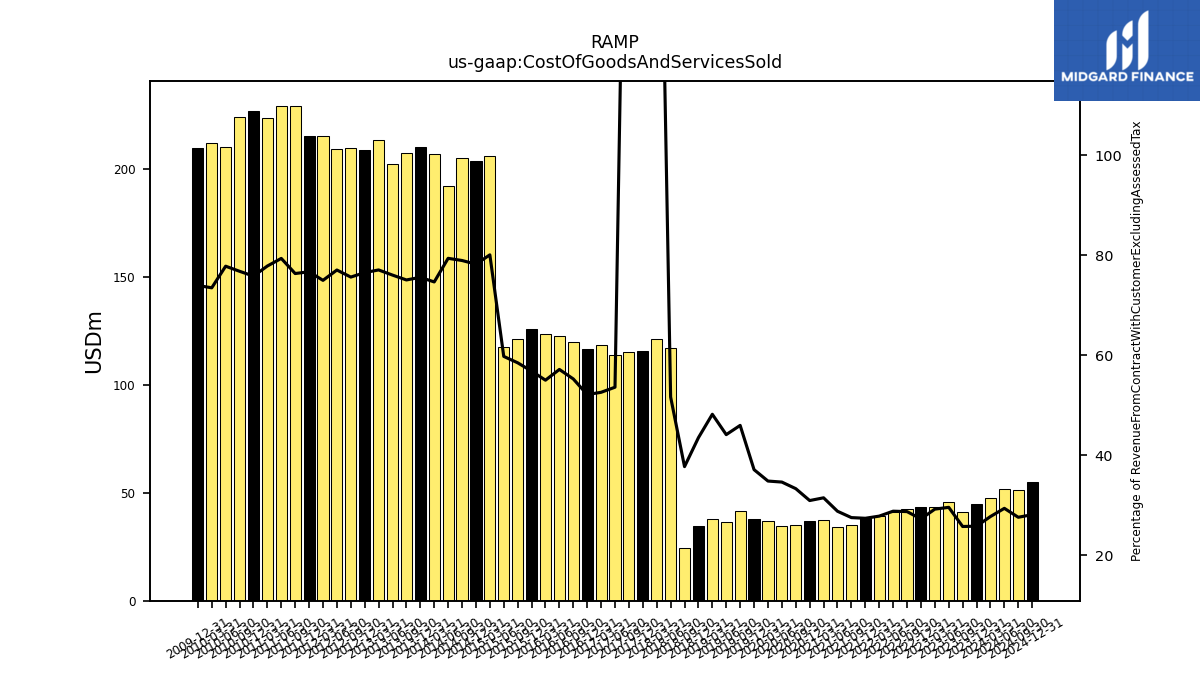
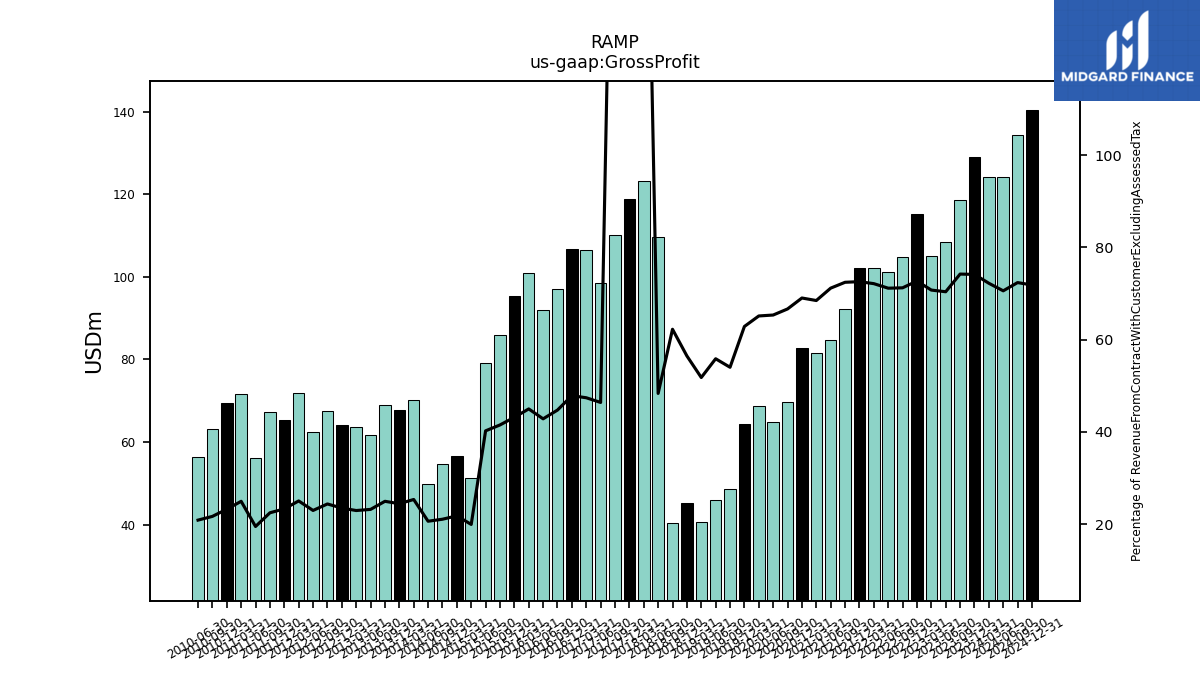
| Revenue From Contract With Customer Excluding Assessed Tax | 173.87 | 159.87 | 154.07 | 148.63 | 158.62 | 147.10 | 142.24 | 141.72 | 140.60 | 127.29 | 119.04 | 119.17 | 119.75 | 104.66 | 99.44 | 105.70 | 102.22 | 90.14 | 82.51 | 78.32 | 80.02 | 64.81 | 226.96 | 60.21 | 59.12 | 54.01 | 212.51 | 224.87 | 223.31 | 217.27 | 214.80 | 224.66 | 221.19 | 207.34 | 196.90 | 257.37 | 260.44 | 260.04 | 242.22 | 277.21 | 277.87 | 276.27 | 266.19 | 277.13 | 273.10 | 277.47 | 271.66 | 287.25 | 280.89 | 300.03 | 288.93 | 287.23 | 299.11 | 291.67 | 270.39 | 288.34 | 283.81 | |
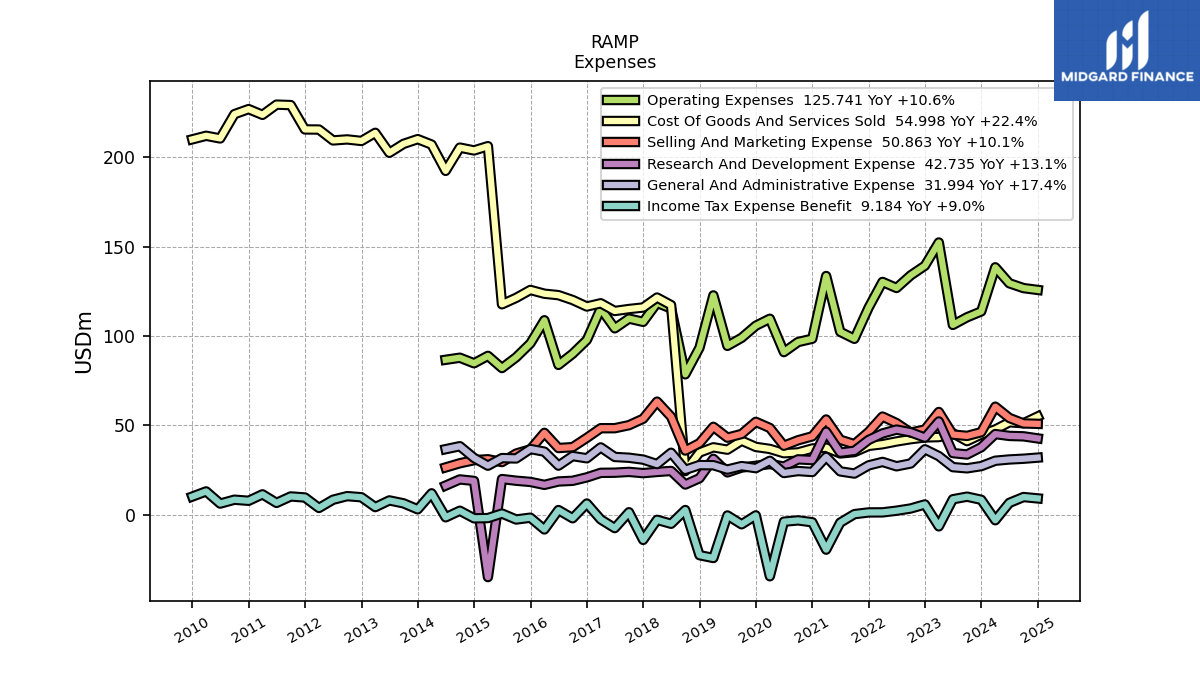
| Cost Of Goods And Services Sold | 44.93 | 41.21 | 45.62 | 43.47 | 43.29 | 42.30 | 41.02 | 39.48 | 38.56 | 35.08 | 34.31 | 37.56 | 37.09 | 34.90 | 34.47 | 36.85 | 37.97 | 41.46 | 36.43 | 37.76 | 34.84 | 24.47 | 117.27 | 121.48 | 115.92 | 115.07 | 113.96 | 118.29 | 116.47 | 120.11 | 122.82 | 123.63 | 125.73 | 121.31 | 117.71 | 206.12 | 203.73 | 205.32 | 192.30 | 207.00 | 210.05 | 207.39 | 202.41 | 213.59 | 209.03 | 209.89 | 209.33 | 215.41 | 215.47 | 229.08 | 229.34 | 223.62 | 226.84 | 224.01 | 210.42 | 211.92 | 209.93 | |
| Gross Profit | 128.94 | 118.66 | 108.45 | 105.15 | 115.33 | 104.80 | 101.22 | 102.25 | 102.05 | 92.21 | 84.72 | 81.62 | 82.67 | 69.76 | 64.97 | 68.85 | 64.25 | 48.68 | 46.09 | 40.56 | 45.18 | 40.35 | 109.69 | 123.30 | 118.95 | 110.17 | 98.55 | 106.57 | 106.84 | 97.16 | 91.98 | 101.03 | 95.46 | 86.03 | 79.19 | 51.25 | 56.71 | 54.72 | 49.91 | 70.21 | 67.82 | 68.88 | 61.69 | 63.54 | 64.08 | 67.58 | 62.33 | 71.84 | 65.42 | 67.32 | 56.24 | 71.61 | 69.43 | 63.17 | 56.38 | NA | NA | |
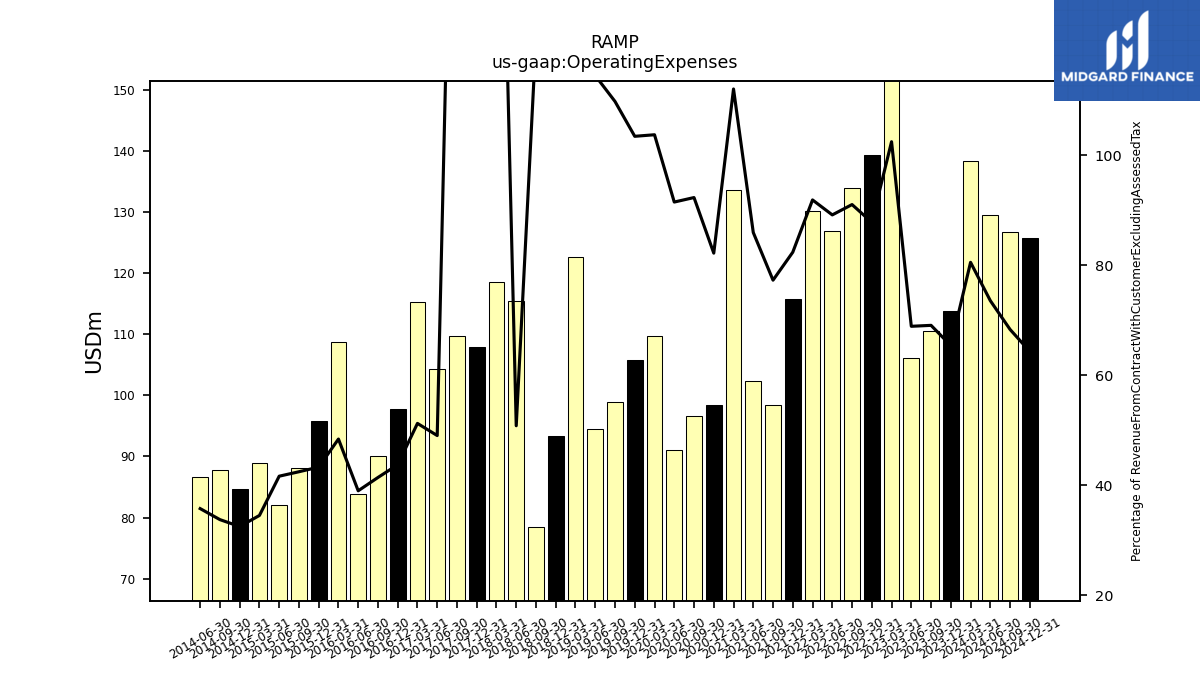
| Operating Expenses | 113.73 | 110.45 | 106.18 | 152.28 | 139.28 | 133.92 | 126.82 | 130.22 | 115.83 | 98.39 | 102.32 | 133.53 | 98.45 | 96.62 | 90.98 | 109.64 | 105.74 | 98.96 | 94.46 | 122.69 | 93.39 | 78.55 | 115.39 | 118.50 | 107.89 | 109.72 | 104.26 | 115.28 | 97.73 | 90.04 | 83.82 | 108.79 | 95.83 | 88.09 | 82.06 | 88.89 | 84.73 | 87.85 | 86.68 | NA | NA | NA | NA | NA | NA | NA | NA | NA | NA | NA | NA | NA | NA | NA | NA | NA | NA | |
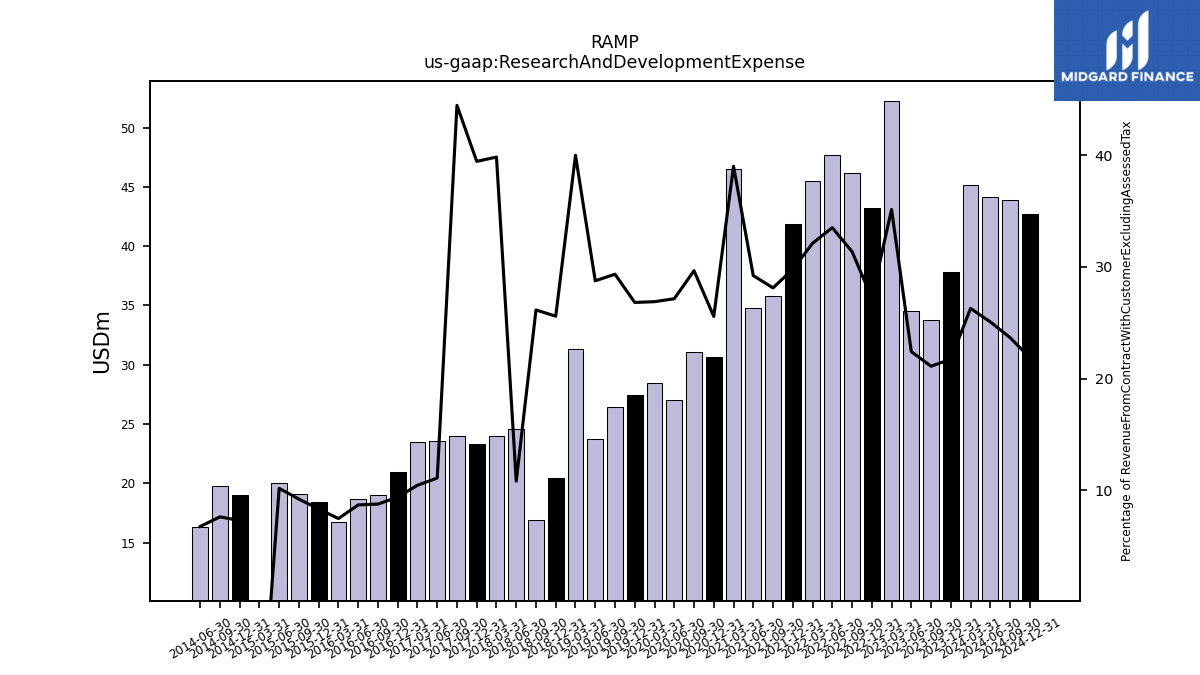
| Research And Development Expense | 37.79 | 33.73 | 34.52 | 52.22 | 43.17 | 46.14 | 47.66 | 45.50 | 41.87 | 35.79 | 34.78 | 46.48 | 30.61 | 31.04 | 26.99 | 28.41 | 27.40 | 26.45 | 23.72 | 31.32 | 20.47 | 16.94 | 24.54 | 23.98 | 23.32 | 24.01 | 23.56 | 23.48 | 20.95 | 19.03 | 18.65 | 16.76 | 18.40 | 19.08 | 20.01 | -34.82 | 18.97 | 19.80 | 16.35 | NA | NA | NA | NA | NA | NA | NA | NA | NA | NA | NA | NA | NA | NA | NA | NA | NA | NA | |
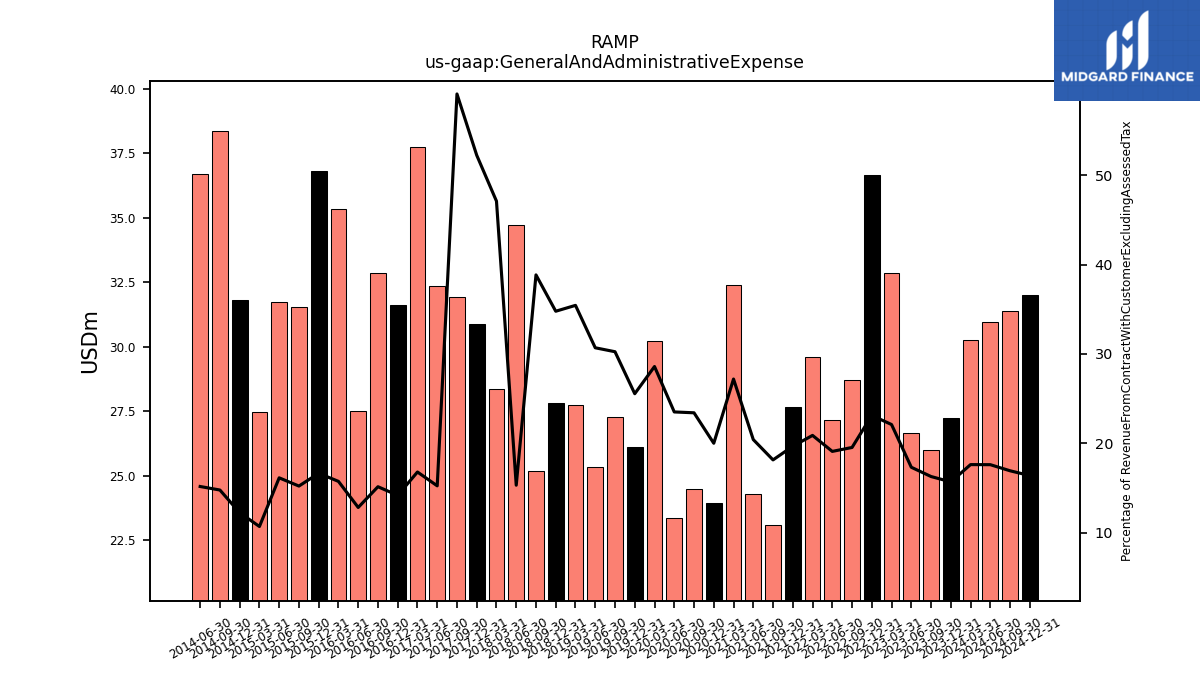
| General And Administrative Expense | 27.24 | 26.01 | 26.66 | 32.83 | 36.66 | 28.72 | 27.14 | 29.58 | 27.64 | 23.08 | 24.29 | 32.40 | 23.94 | 24.50 | 23.37 | 30.22 | 26.11 | 27.26 | 25.32 | 27.75 | 27.83 | 25.18 | 34.72 | 28.36 | 30.89 | 31.92 | 32.36 | 37.72 | 31.62 | 32.87 | 27.51 | 35.33 | 36.79 | 31.52 | 31.74 | 27.47 | 31.82 | 38.37 | 36.70 | NA | NA | NA | NA | NA | NA | NA | NA | NA | NA | NA | NA | NA | NA | NA | NA | NA | NA | |
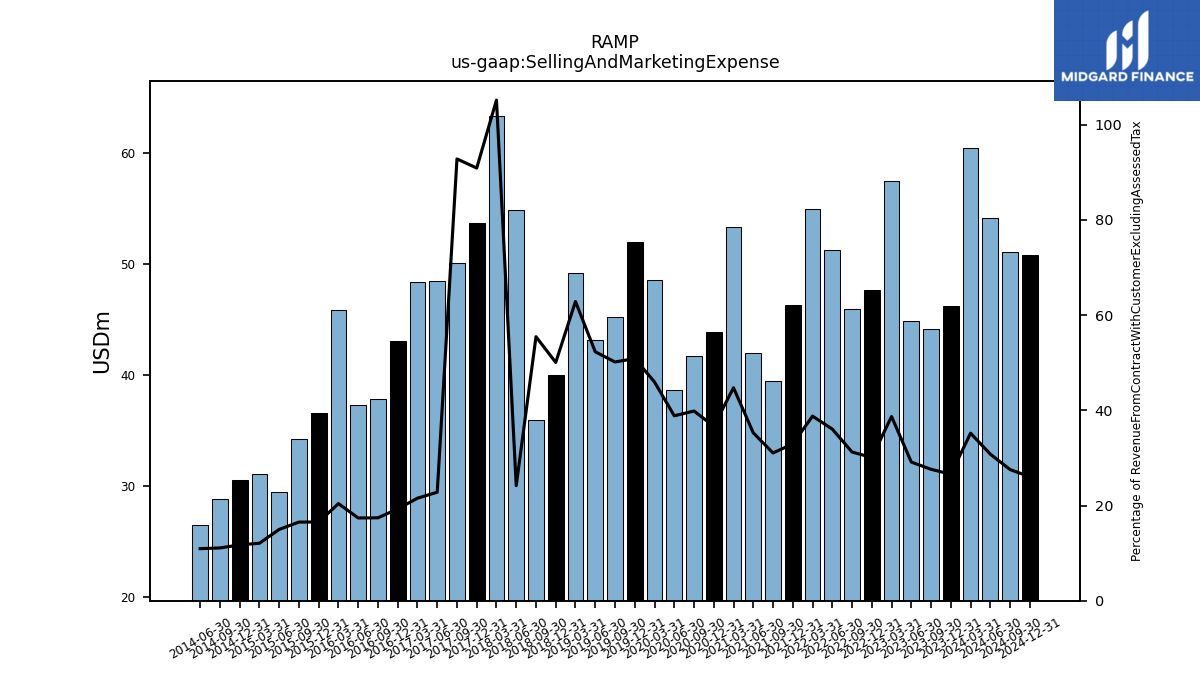
| Selling And Marketing Expense | 46.20 | 44.13 | 44.88 | 57.51 | 47.70 | 45.95 | 51.28 | 54.95 | 46.32 | 39.51 | 41.98 | 53.31 | 43.90 | 41.70 | 38.63 | 48.56 | 51.99 | 45.20 | 43.14 | 49.22 | 40.05 | 35.94 | 54.85 | 63.31 | 53.73 | 50.12 | 48.44 | 48.43 | 43.05 | 37.85 | 37.35 | 45.84 | 36.58 | 34.26 | 29.49 | 31.08 | 30.55 | 28.84 | 26.50 | NA | NA | NA | NA | NA | NA | NA | NA | NA | NA | NA | NA | NA | NA | NA | NA | NA | NA | |
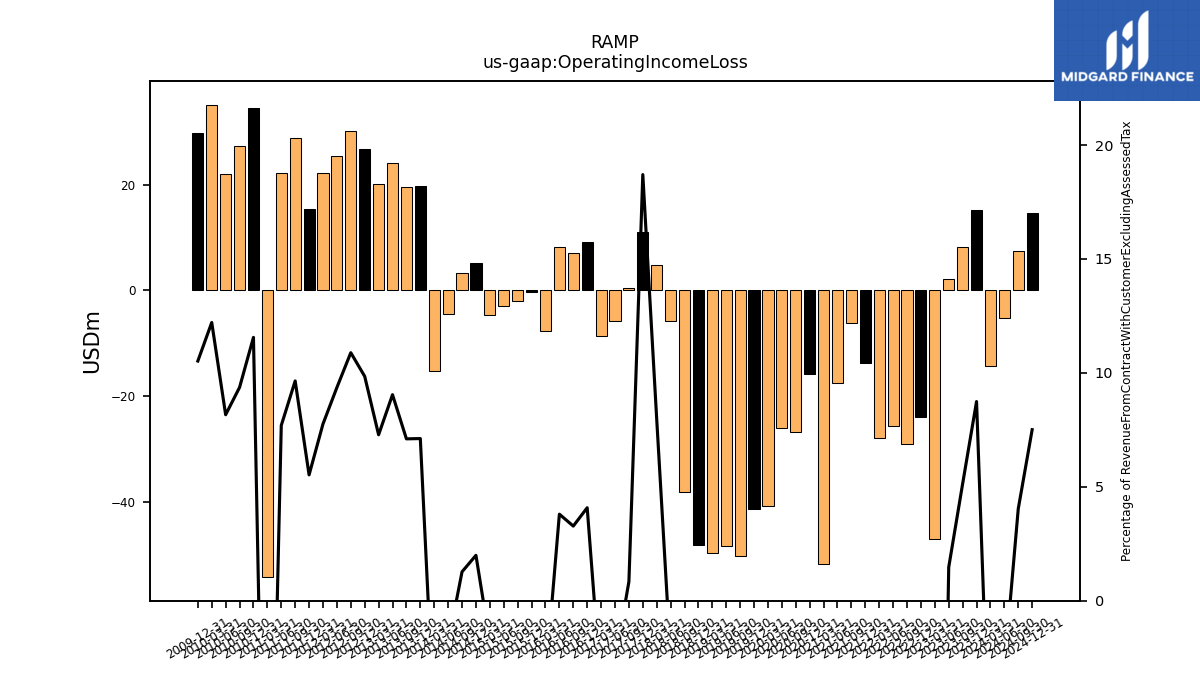
| Operating Income Loss | 15.20 | 8.21 | 2.27 | -47.13 | -23.95 | -29.12 | -25.60 | -27.97 | -13.79 | -6.18 | -17.60 | -51.91 | -15.78 | -26.85 | -26.01 | -40.79 | -41.48 | -50.27 | -48.38 | -49.69 | -48.21 | -38.20 | -5.70 | 4.79 | 11.06 | 0.45 | -5.71 | -8.71 | 9.12 | 7.12 | 8.16 | -7.76 | -0.37 | -2.06 | -2.87 | -4.62 | 5.19 | 3.31 | -4.48 | -15.20 | 19.78 | 19.63 | 24.07 | 20.19 | 26.90 | 30.21 | 25.42 | 22.29 | 15.52 | 28.95 | 22.23 | -54.30 | 34.58 | 27.31 | 22.08 | 35.21 | 29.86 | |
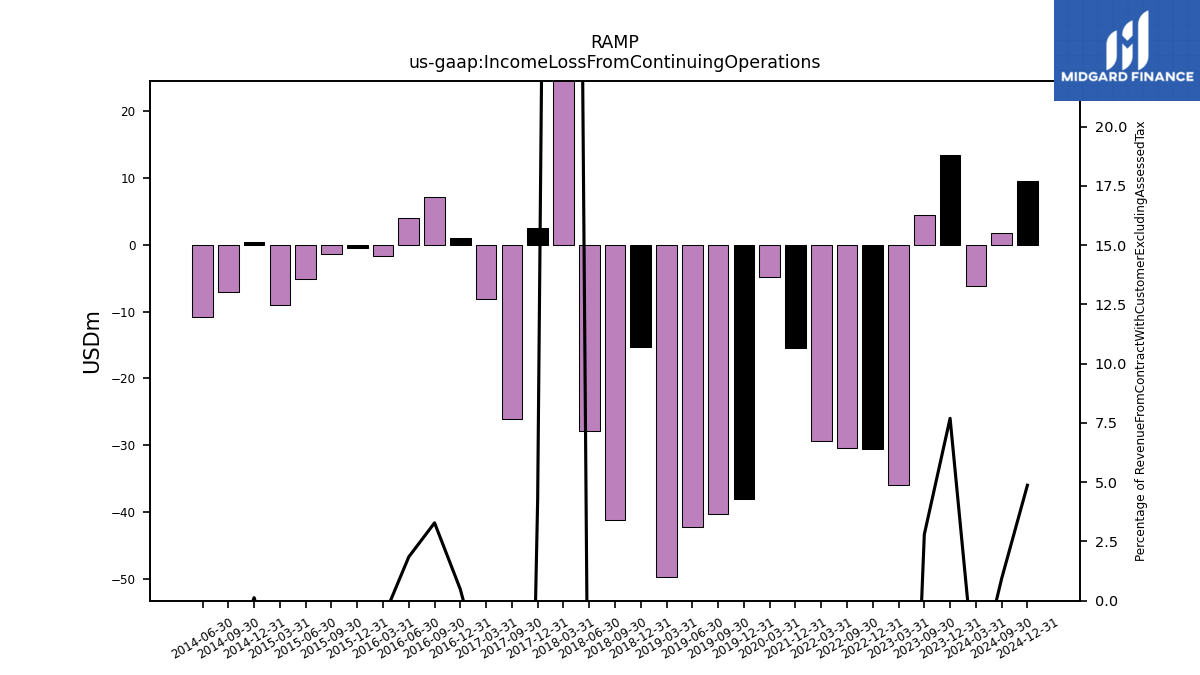
| Income Loss From Continuing Operations | 13.38 | 4.48 | NA | -35.93 | -30.52 | -30.44 | NA | -29.39 | -15.38 | NA | NA | NA | NA | NA | NA | -4.88 | -38.04 | -40.20 | -42.14 | -49.69 | -15.26 | -41.18 | -27.82 | 74.03 | 2.53 | -26.00 | NA | -8.08 | 1.07 | 7.14 | 3.98 | -1.68 | -0.44 | -1.34 | -5.18 | -9.04 | 0.34 | -7.10 | -10.74 | NA | NA | NA | NA | NA | NA | NA | NA | NA | NA | NA | NA | NA | NA | NA | NA | NA | NA | |
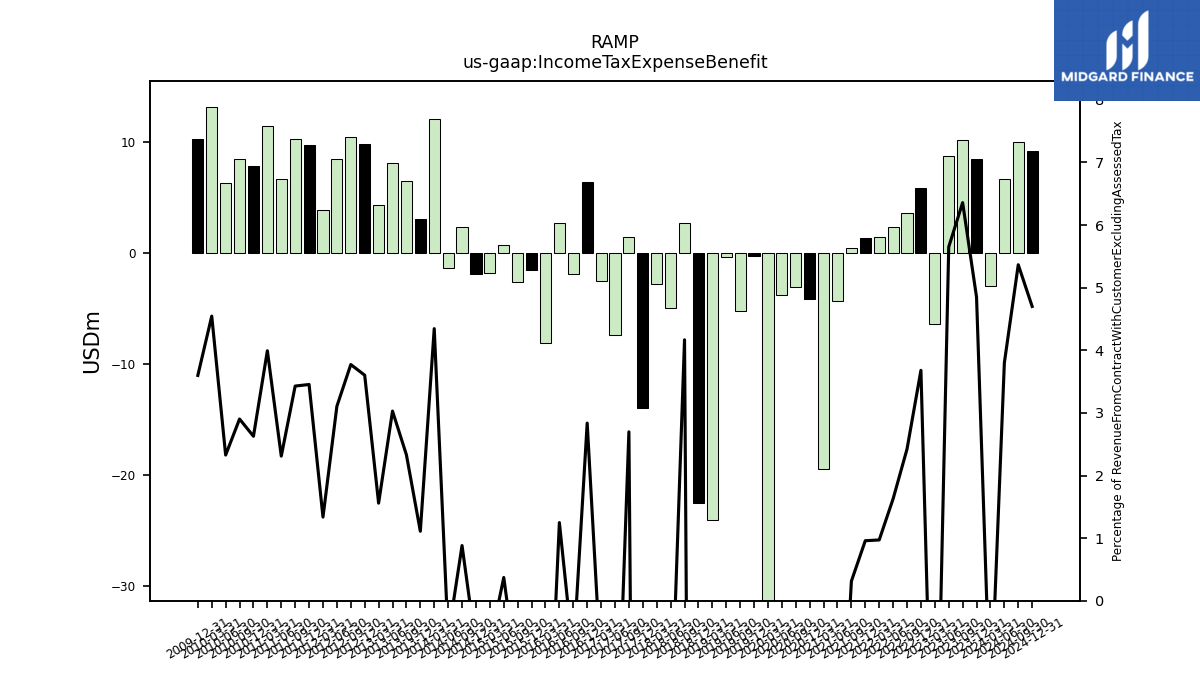
| Income Tax Expense Benefit | 8.43 | 10.16 | 8.71 | -6.46 | 5.83 | 3.56 | 2.31 | 1.38 | 1.35 | 0.40 | -4.37 | -19.46 | -4.14 | -3.11 | -3.82 | -34.34 | -0.29 | -5.29 | -0.35 | -24.14 | -22.55 | 2.70 | -5.00 | -2.78 | -14.03 | 1.46 | -7.42 | -2.56 | 6.33 | -1.92 | 2.68 | -8.18 | -1.58 | -2.61 | 0.73 | -1.81 | -1.93 | 2.29 | -1.39 | 12.04 | 3.08 | 6.44 | 8.06 | 4.32 | 9.84 | 10.46 | 8.44 | 3.84 | 9.70 | 10.29 | 6.67 | 11.47 | 7.86 | 8.46 | 6.29 | 13.11 | 10.21 | |
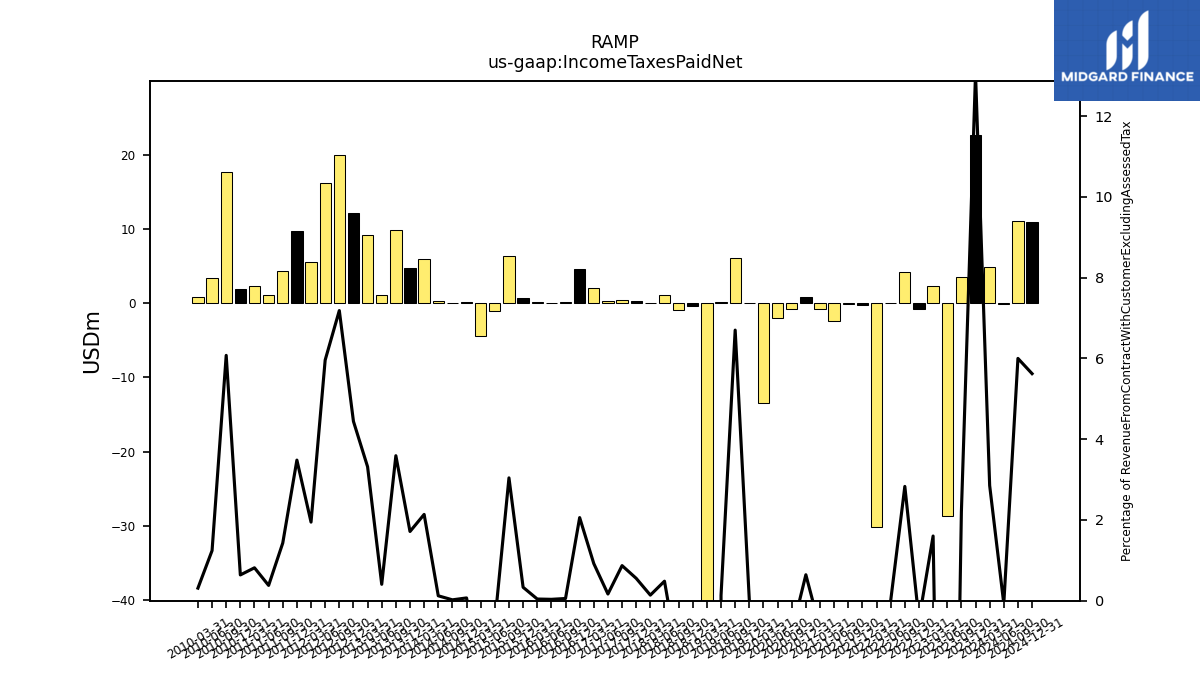
| Income Taxes Paid Net | 22.70 | 3.51 | -28.65 | 2.38 | -0.75 | 4.17 | 0.00 | -30.10 | -0.25 | -0.12 | -2.45 | -0.82 | 0.77 | -0.82 | -2.04 | -13.52 | 0.02 | 6.04 | 0.11 | -439.30 | -0.35 | -0.98 | 1.10 | 0.08 | 0.33 | 0.47 | 0.35 | 2.07 | 4.60 | 0.12 | 0.08 | 0.10 | 0.74 | 6.31 | -1.04 | -4.38 | 0.18 | 0.06 | 0.30 | 5.93 | 4.77 | 9.92 | 1.08 | 9.20 | 12.13 | 19.94 | 16.19 | 5.59 | 9.78 | 4.29 | 1.10 | 2.34 | 1.91 | 17.72 | 3.36 | 0.90 | NA | |
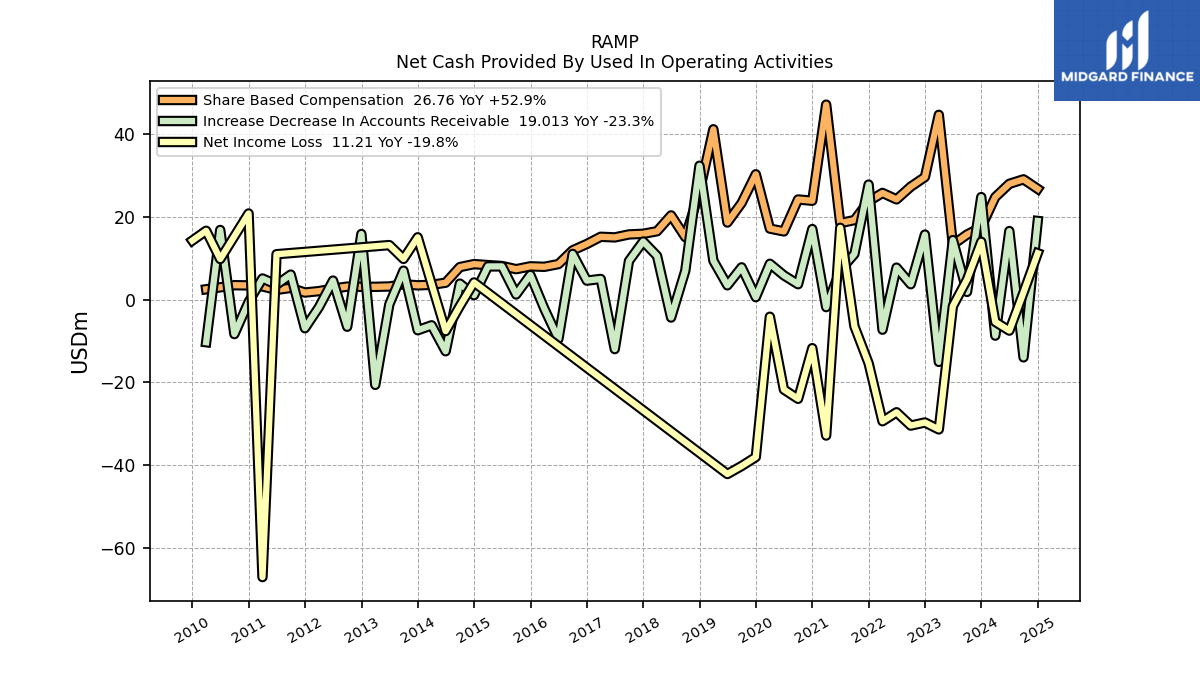
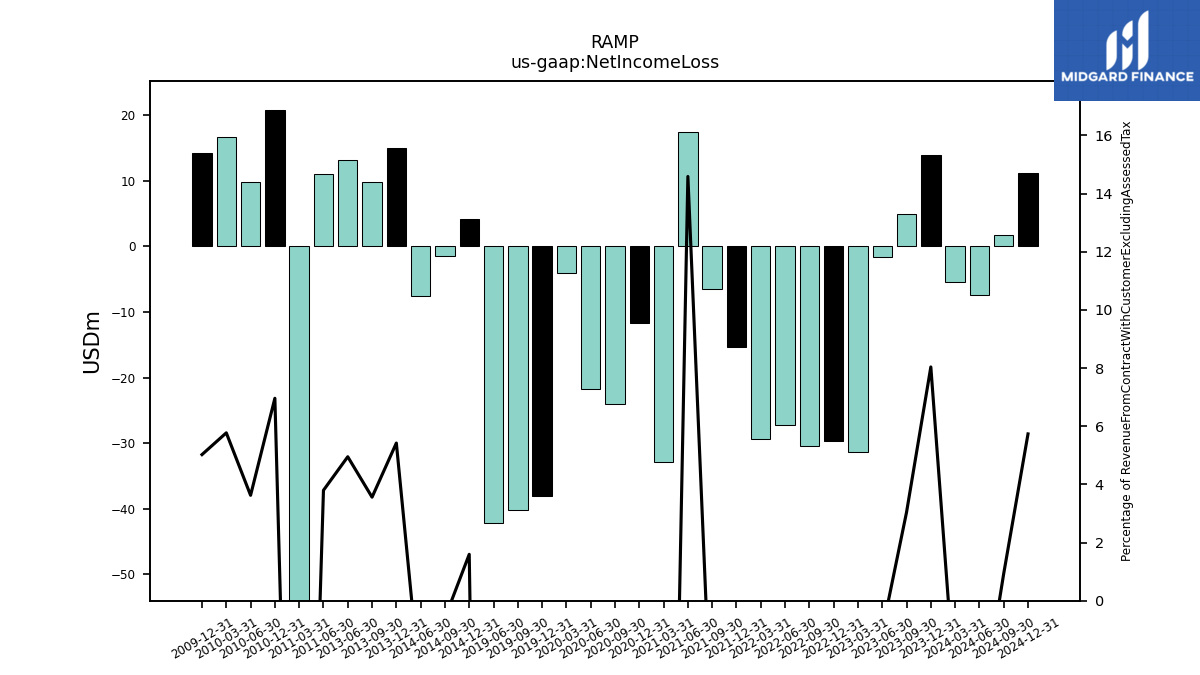
| Net Income Loss | 13.98 | 4.86 | -1.59 | -31.36 | -29.68 | -30.44 | -27.22 | -29.39 | -15.38 | -6.43 | 17.36 | -32.85 | -11.72 | -23.97 | -21.73 | -4.13 | -38.04 | -40.20 | -42.14 | NA | NA | NA | NA | NA | NA | NA | NA | NA | NA | NA | NA | NA | NA | NA | NA | NA | 4.16 | -1.54 | -7.60 | NA | 15.07 | 9.84 | 13.18 | NA | NA | NA | NA | NA | NA | NA | 10.97 | -67.06 | 20.82 | NA | 9.80 | 16.65 | 14.26 | |
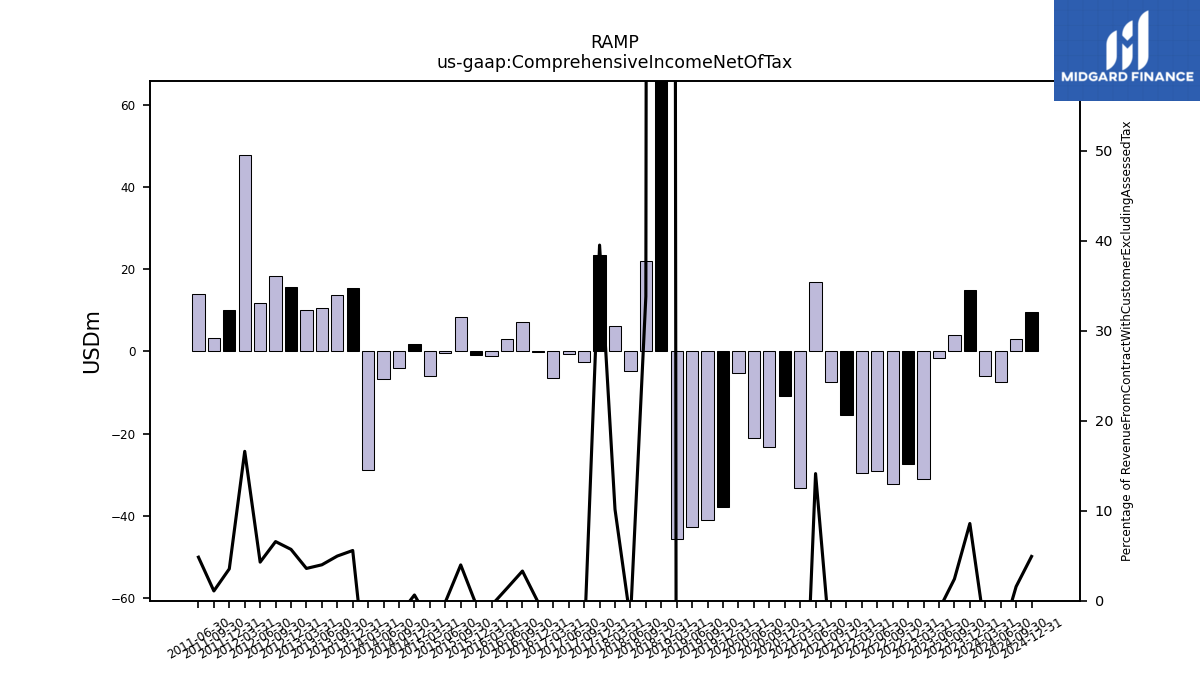
| Comprehensive Income Net Of Tax | 14.92 | 3.87 | -1.52 | -31.04 | -27.43 | -32.31 | -29.15 | -29.55 | -15.46 | -7.42 | 16.81 | -33.14 | -10.86 | -23.37 | -21.13 | -5.16 | -37.88 | -40.92 | -42.61 | -45.55 | 1054.10 | 21.92 | -4.88 | 6.12 | 23.36 | -2.58 | -0.65 | -6.38 | -0.25 | 7.17 | 2.98 | -1.12 | -0.94 | 8.25 | -0.31 | -5.99 | 1.66 | -4.12 | -6.84 | -28.76 | 15.51 | 13.72 | 10.63 | 9.95 | 15.59 | 18.23 | 11.66 | 47.67 | 9.95 | 3.27 | 13.98 | NA | NA | NA | NA | NA | NA | |
| Goodwill Impairment Loss | 0.00 | 2.88 | NA | NA | NA | NA | NA | NA | NA | NA | NA | NA | NA | NA | NA | NA | NA | NA | NA | NA | NA | NA | NA | NA | NA | NA | NA | NA | NA | NA | 0.00 | NA | 0.00 | NA | NA | NA | NA | NA | NA | NA | NA | NA | 0.00 | NA | NA | NA | 0.00 | 0.00 | NA | NA | NA | NA | NA | NA | NA | NA | NA |
| 2023-12-31 | 2023-09-30 | 2023-06-30 | 2023-03-31 | 2022-12-31 | 2022-09-30 | 2022-06-30 | 2022-03-31 | 2021-12-31 | 2021-09-30 | 2021-06-30 | 2021-03-31 | 2020-12-31 | 2020-09-30 | 2020-06-30 | 2020-03-31 | 2019-12-31 | 2019-09-30 | 2019-06-30 | 2019-03-31 | 2018-12-31 | 2018-09-30 | 2018-06-30 | 2018-03-31 | 2017-12-31 | 2017-09-30 | 2017-06-30 | 2017-03-31 | 2016-12-31 | 2016-09-30 | 2016-06-30 | 2016-03-31 | 2015-12-31 | 2015-09-30 | 2015-06-30 | 2015-03-31 | 2014-12-31 | 2014-09-30 | 2014-06-30 | 2014-03-31 | 2013-12-31 | 2013-09-30 | 2013-06-30 | 2013-03-31 | 2012-12-31 | 2012-09-30 | 2012-06-30 | 2012-03-31 | 2011-12-31 | 2011-09-30 | 2011-06-30 | 2011-03-31 | 2010-12-31 | 2010-09-30 | 2010-06-30 | 2010-03-31 | 2009-12-31 | ||
|---|---|---|---|---|---|---|---|---|---|---|---|---|---|---|---|---|---|---|---|---|---|---|---|---|---|---|---|---|---|---|---|---|---|---|---|---|---|---|---|---|---|---|---|---|---|---|---|---|---|---|---|---|---|---|---|---|---|---|
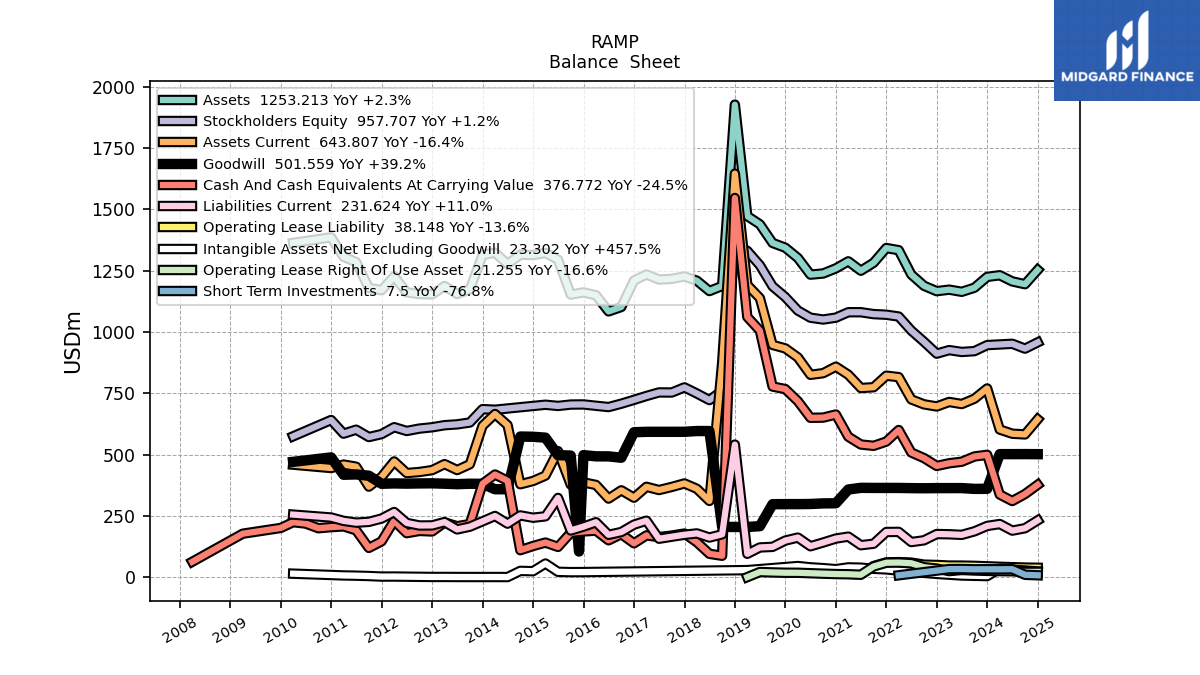
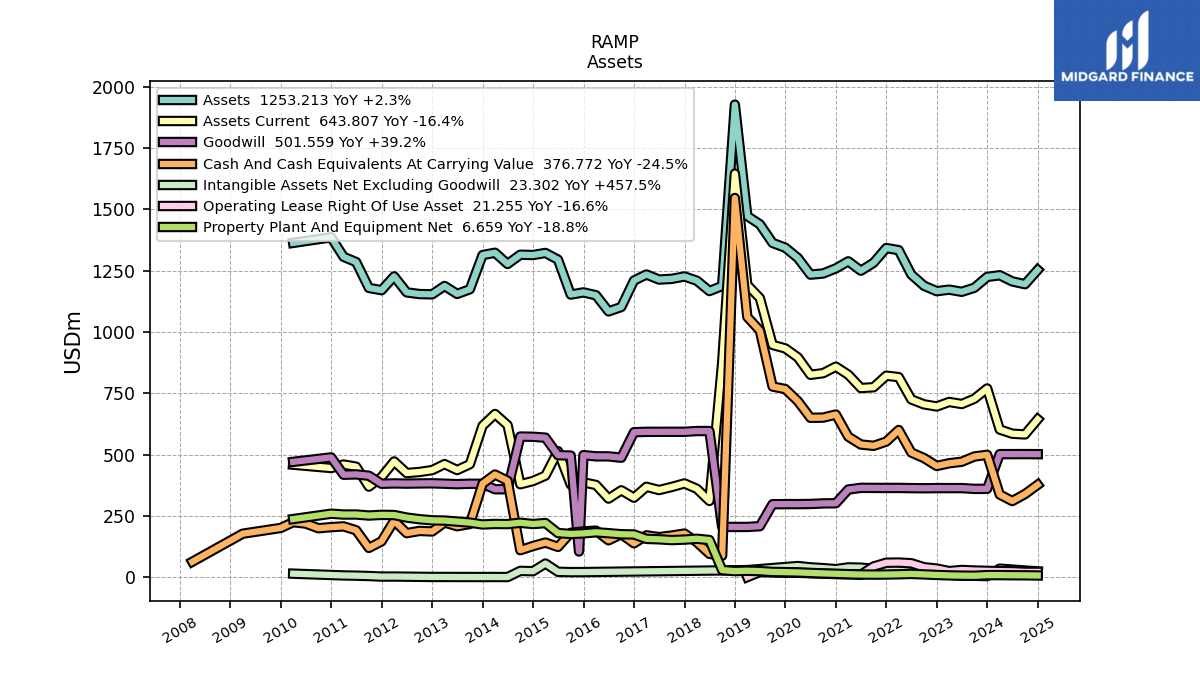
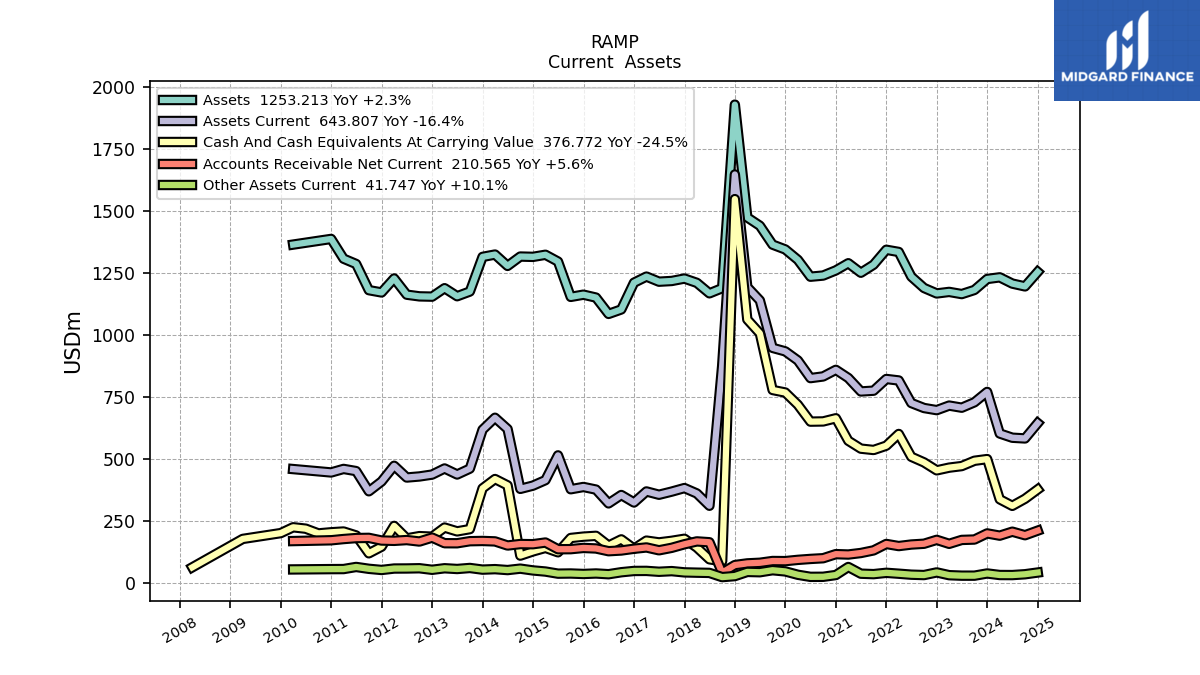
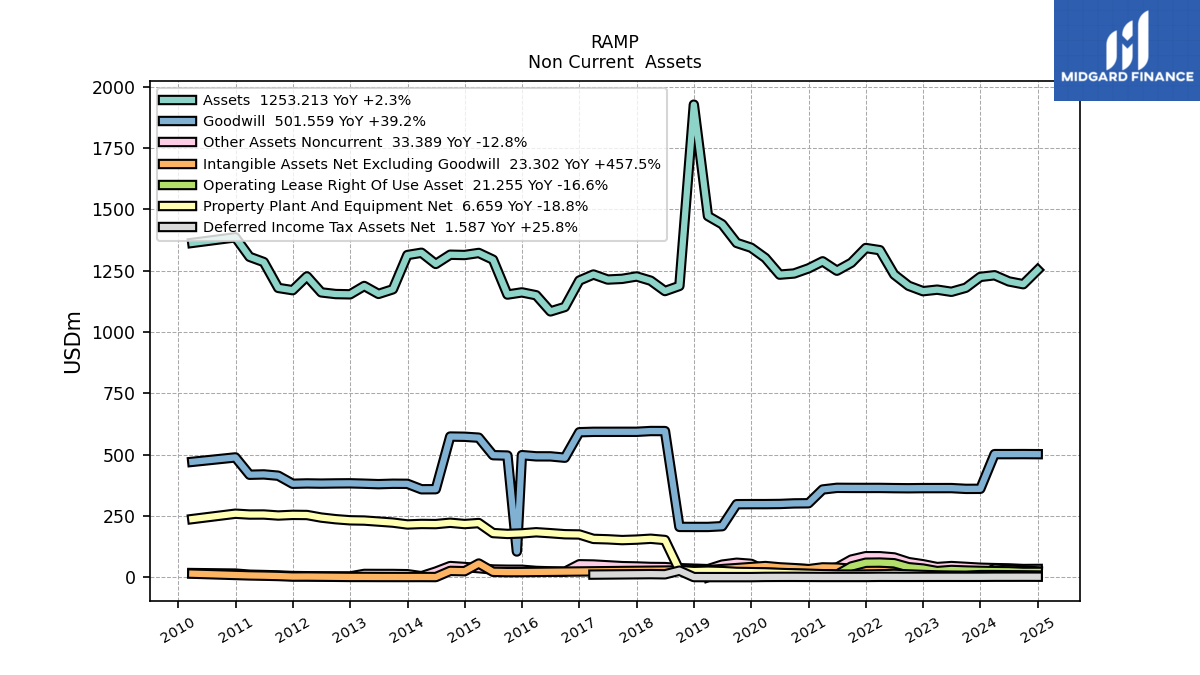
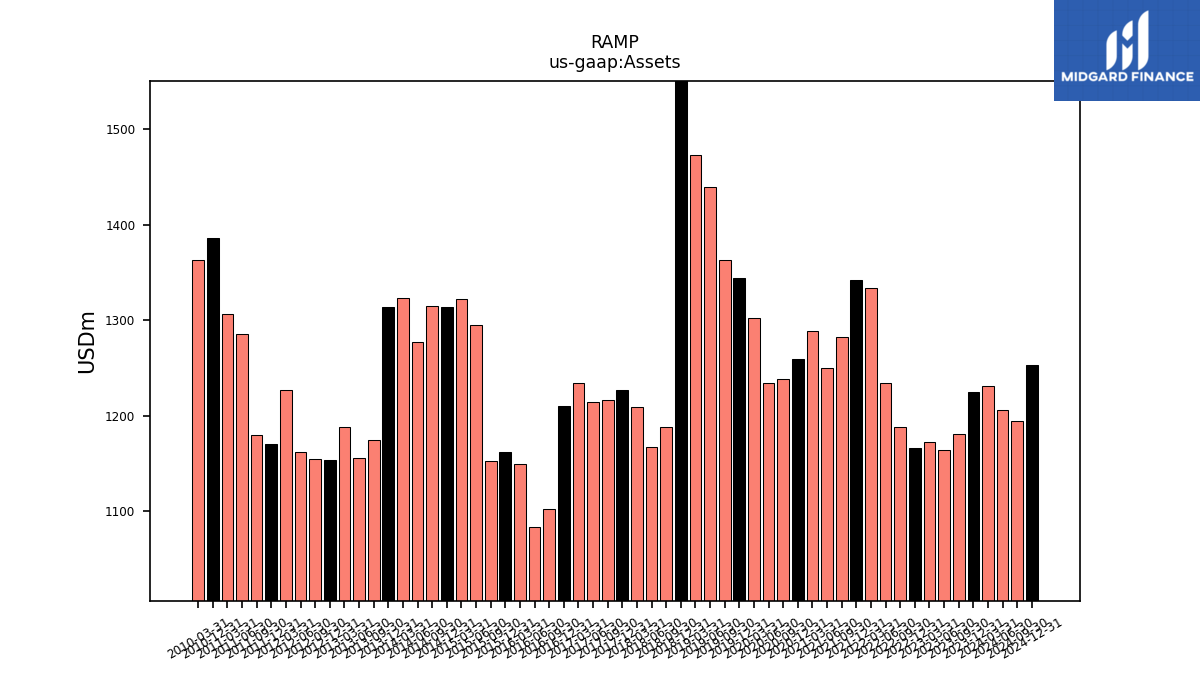
| Assets | 1224.74 | 1180.52 | 1163.93 | 1172.70 | 1166.48 | 1188.50 | 1234.26 | 1333.74 | 1342.54 | 1282.37 | 1249.90 | 1288.32 | 1259.50 | 1238.64 | 1233.93 | 1301.89 | 1343.85 | 1363.23 | 1439.30 | 1472.91 | 1927.52 | 1187.79 | 1166.97 | 1209.25 | 1226.49 | 1216.77 | 1213.90 | 1234.54 | 1209.87 | 1102.06 | 1083.96 | 1149.85 | 1161.56 | 1152.62 | 1295.03 | 1322.42 | 1313.95 | 1315.23 | 1277.47 | 1323.30 | 1313.88 | 1174.21 | 1155.29 | 1187.71 | 1153.64 | 1154.73 | 1161.55 | 1226.85 | 1170.49 | 1179.73 | 1285.22 | 1306.62 | 1386.25 | NA | NA | 1363.42 | NA | |
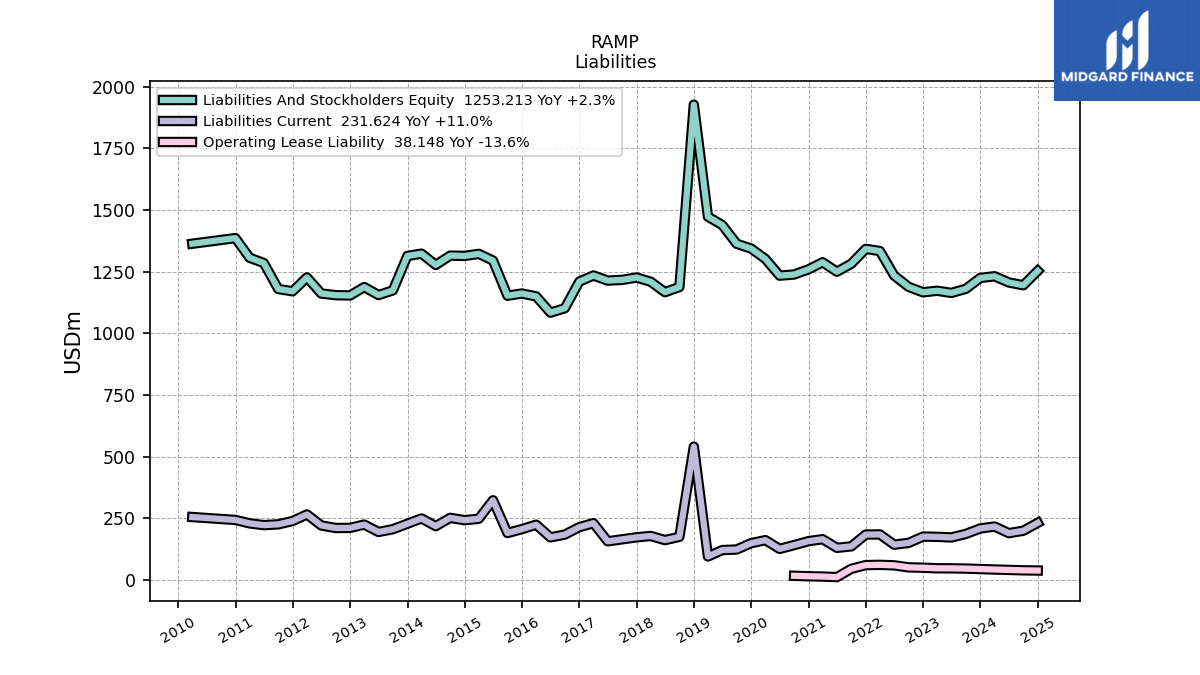
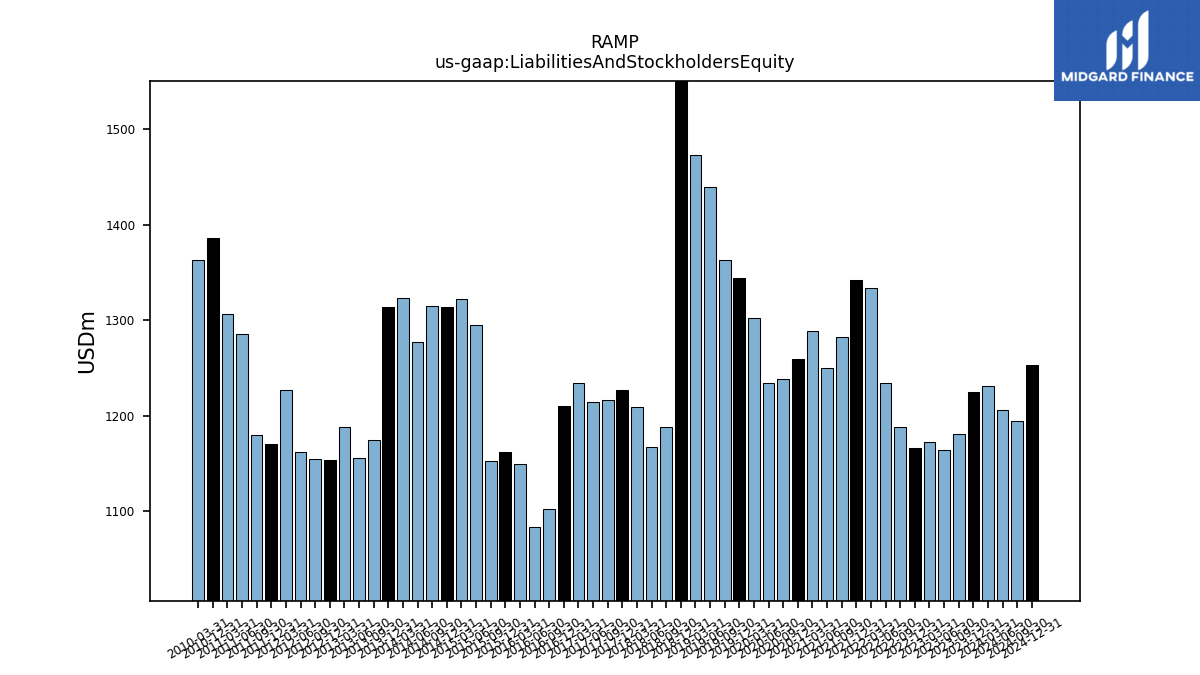
| Liabilities And Stockholders Equity | 1224.74 | 1180.52 | 1163.93 | 1172.70 | 1166.48 | 1188.50 | 1234.26 | 1333.74 | 1342.54 | 1282.37 | 1249.90 | 1288.32 | 1259.50 | 1238.64 | 1233.93 | 1301.89 | 1343.85 | 1363.23 | 1439.30 | 1472.91 | 1927.52 | 1187.79 | 1166.97 | 1209.25 | 1226.49 | 1216.77 | 1213.90 | 1234.54 | 1209.87 | 1102.06 | 1083.96 | 1149.85 | 1161.56 | 1152.62 | 1295.03 | 1322.42 | 1313.95 | 1315.23 | 1277.47 | 1323.30 | 1313.88 | 1174.21 | 1155.29 | 1187.71 | 1153.64 | 1154.73 | 1161.55 | 1226.85 | 1170.49 | 1179.73 | 1285.22 | 1306.62 | 1386.25 | NA | NA | 1363.42 | NA | |
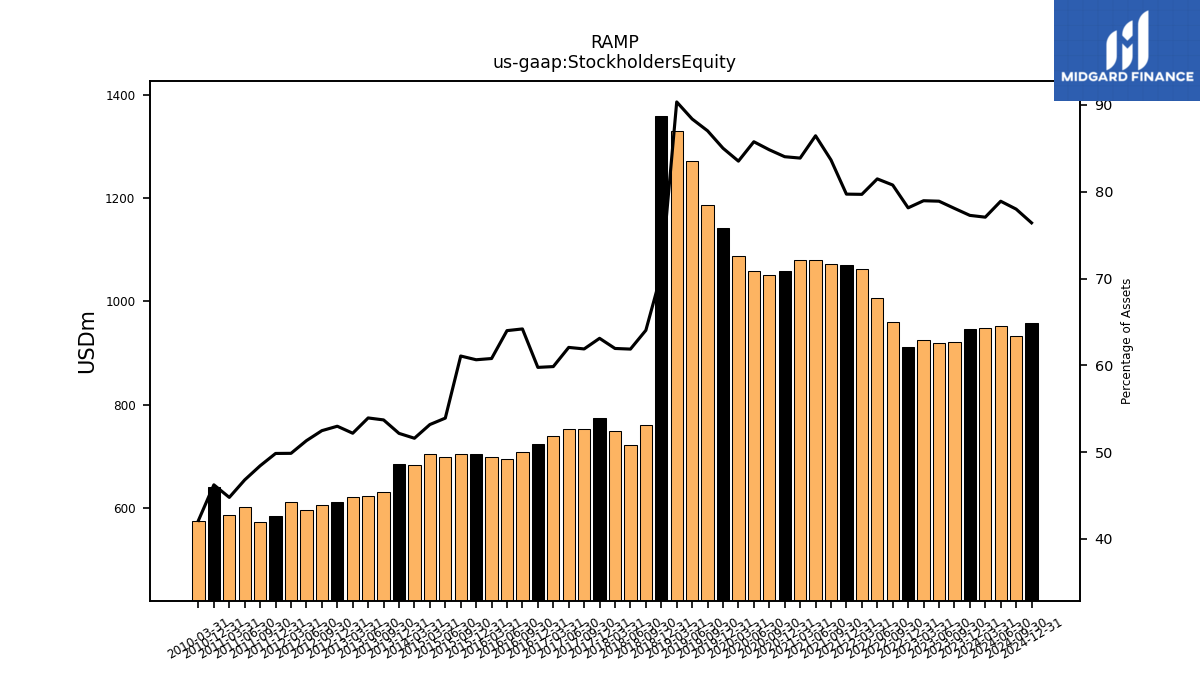
| Stockholders Equity | 946.49 | 921.86 | 918.53 | 926.08 | 911.61 | 960.07 | 1005.75 | 1063.06 | 1070.41 | 1072.95 | 1080.60 | 1080.68 | 1058.50 | 1050.86 | 1058.29 | 1087.51 | 1142.54 | 1186.36 | 1272.16 | 1330.83 | 1359.62 | 760.68 | 722.06 | 749.10 | 774.11 | 753.10 | 753.46 | 738.98 | 723.11 | 707.49 | 693.76 | 698.97 | 704.44 | 703.98 | 698.30 | 703.26 | NA | NA | NA | 682.86 | 685.36 | 630.71 | 623.18 | 619.75 | 611.28 | 605.96 | 596.17 | 611.75 | 583.48 | 571.36 | 601.55 | 585.18 | 640.92 | NA | NA | 574.40 | NA |
| 2023-12-31 | 2023-09-30 | 2023-06-30 | 2023-03-31 | 2022-12-31 | 2022-09-30 | 2022-06-30 | 2022-03-31 | 2021-12-31 | 2021-09-30 | 2021-06-30 | 2021-03-31 | 2020-12-31 | 2020-09-30 | 2020-06-30 | 2020-03-31 | 2019-12-31 | 2019-09-30 | 2019-06-30 | 2019-03-31 | 2018-12-31 | 2018-09-30 | 2018-06-30 | 2018-03-31 | 2017-12-31 | 2017-09-30 | 2017-06-30 | 2017-03-31 | 2016-12-31 | 2016-09-30 | 2016-06-30 | 2016-03-31 | 2015-12-31 | 2015-09-30 | 2015-06-30 | 2015-03-31 | 2014-12-31 | 2014-09-30 | 2014-06-30 | 2014-03-31 | 2013-12-31 | 2013-09-30 | 2013-06-30 | 2013-03-31 | 2012-12-31 | 2012-09-30 | 2012-06-30 | 2012-03-31 | 2011-12-31 | 2011-09-30 | 2011-06-30 | 2011-03-31 | 2010-12-31 | 2010-09-30 | 2010-06-30 | 2010-03-31 | 2009-12-31 | ||
|---|---|---|---|---|---|---|---|---|---|---|---|---|---|---|---|---|---|---|---|---|---|---|---|---|---|---|---|---|---|---|---|---|---|---|---|---|---|---|---|---|---|---|---|---|---|---|---|---|---|---|---|---|---|---|---|---|---|---|
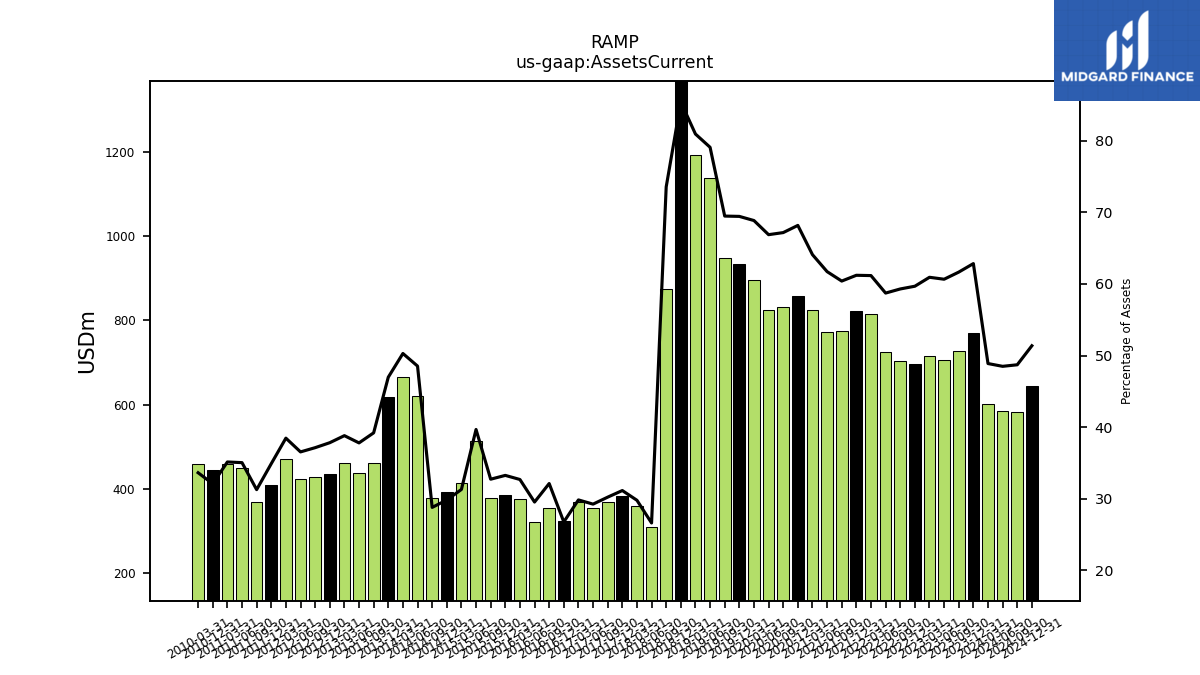
| Assets Current | 769.66 | 727.85 | 706.05 | 714.56 | 696.19 | 704.80 | 724.85 | 815.83 | 821.78 | 774.59 | 771.46 | 825.72 | 858.65 | 832.01 | 825.27 | 896.39 | 933.07 | 947.14 | 1138.21 | 1192.08 | 1646.05 | 873.64 | 310.79 | 360.35 | 382.16 | 367.90 | 355.22 | 368.52 | 323.93 | 354.18 | 320.34 | 376.01 | 386.50 | 377.38 | 513.90 | 414.05 | 392.03 | 378.85 | 620.03 | 665.52 | 617.30 | 460.47 | 436.81 | 461.10 | 436.51 | 428.91 | 424.58 | 472.00 | 408.60 | 369.08 | 450.53 | 459.25 | 445.03 | NA | NA | 458.70 | NA | |
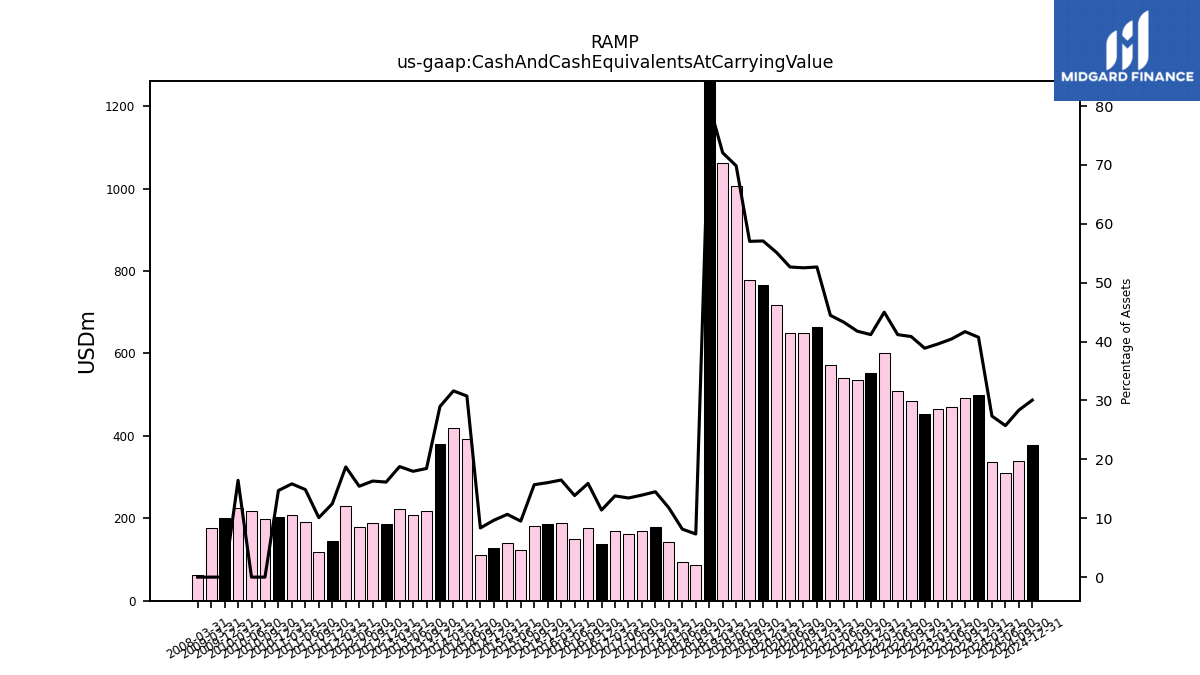
| Cash And Cash Equivalents At Carrying Value | 498.95 | 492.17 | 470.77 | 464.45 | 453.52 | 485.60 | 508.25 | 600.16 | 552.96 | 535.59 | 541.02 | 572.79 | 663.40 | 650.69 | 649.89 | 717.81 | 767.20 | 777.44 | 1005.48 | 1061.47 | 1546.77 | 87.05 | 95.10 | 142.28 | 177.81 | 169.51 | 163.15 | 170.34 | 137.85 | 175.41 | 150.16 | 189.63 | 186.39 | 180.94 | 123.19 | 141.01 | 126.89 | 109.81 | 392.92 | 418.59 | 380.91 | 216.62 | 207.63 | 222.97 | 186.22 | 188.40 | 179.28 | 229.65 | 145.86 | 119.16 | 191.09 | 207.02 | 203.94 | 199.38 | 218.46 | 224.10 | 200.58 | |
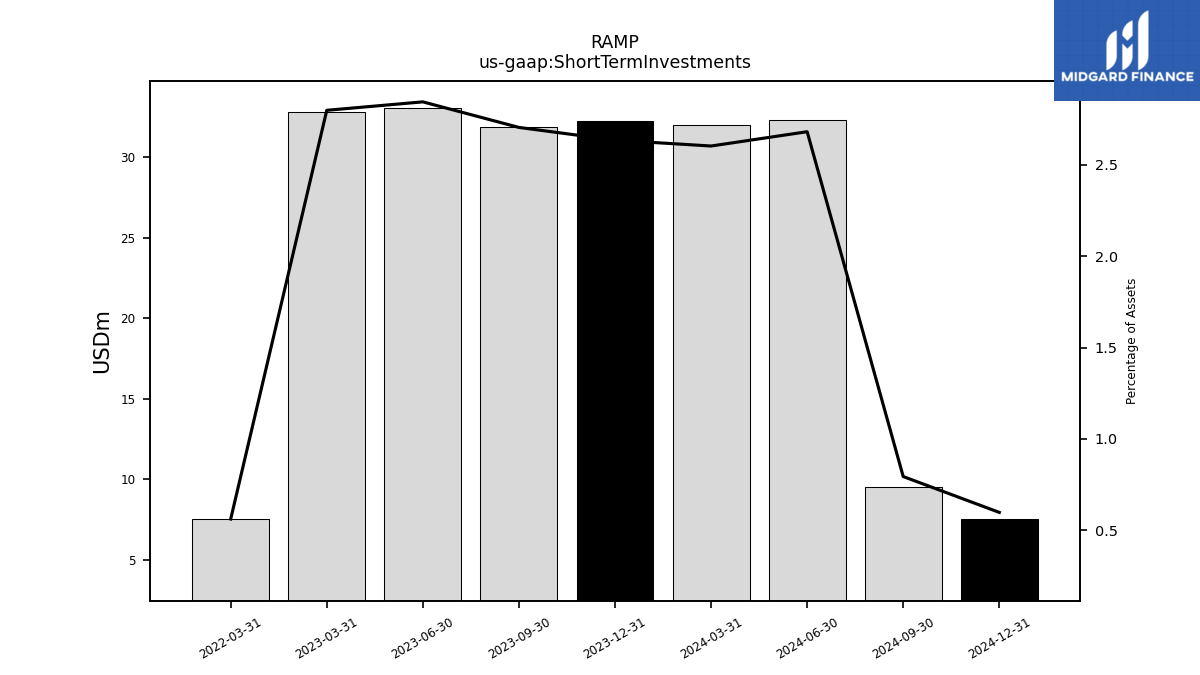
| Short Term Investments | 32.26 | 31.92 | 33.10 | 32.81 | NA | NA | NA | 7.50 | NA | NA | NA | NA | NA | NA | NA | NA | NA | NA | NA | NA | NA | NA | NA | NA | NA | NA | NA | NA | NA | NA | NA | NA | NA | NA | NA | NA | NA | NA | NA | NA | NA | NA | NA | NA | NA | NA | NA | NA | NA | NA | NA | NA | NA | NA | NA | NA | NA | |
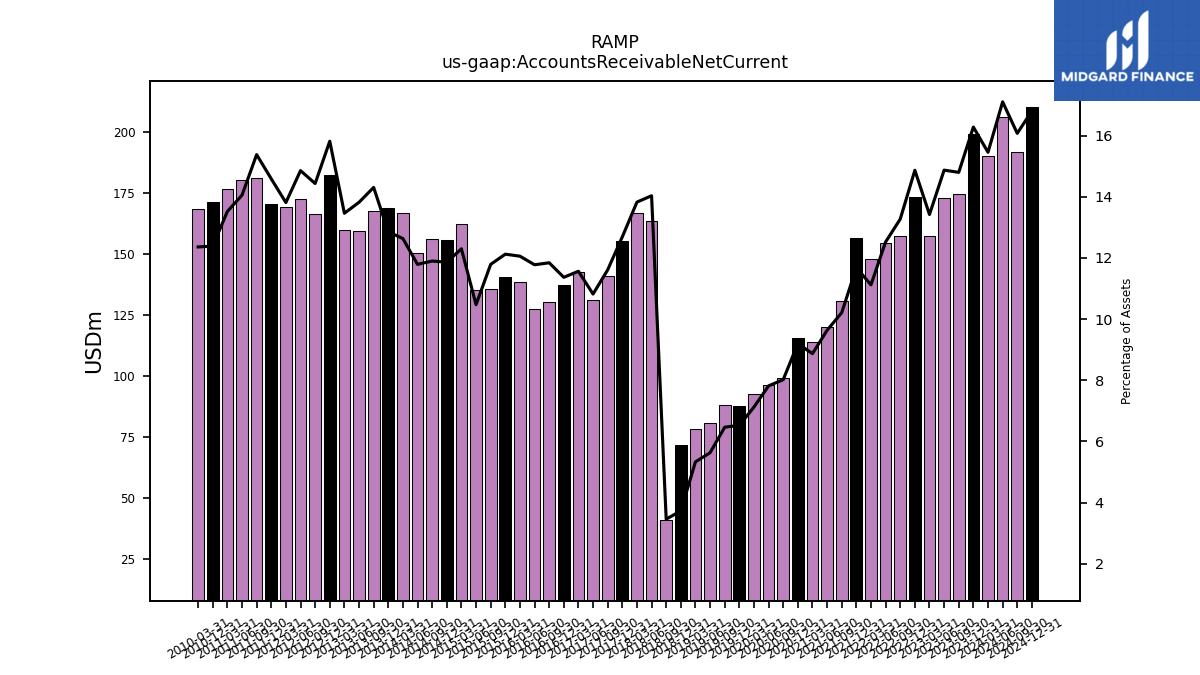
| Accounts Receivable Net Current | 199.38 | 174.70 | 173.08 | 157.38 | 173.41 | 157.71 | 154.57 | 148.34 | 156.83 | 130.95 | 120.43 | 114.28 | 115.86 | 99.36 | 96.47 | 92.76 | 87.71 | 88.15 | 81.06 | 78.56 | 71.91 | 41.11 | 163.77 | 167.19 | 155.63 | 141.28 | 131.34 | 142.77 | 137.52 | 130.51 | 127.66 | 138.65 | 140.82 | 135.89 | 135.63 | 162.64 | 155.87 | 156.50 | 150.60 | 167.17 | 168.93 | 167.98 | 159.65 | 159.88 | 182.46 | 166.68 | 172.55 | 169.45 | 170.74 | 181.42 | 180.61 | 176.65 | 171.69 | NA | NA | 168.52 | NA | |
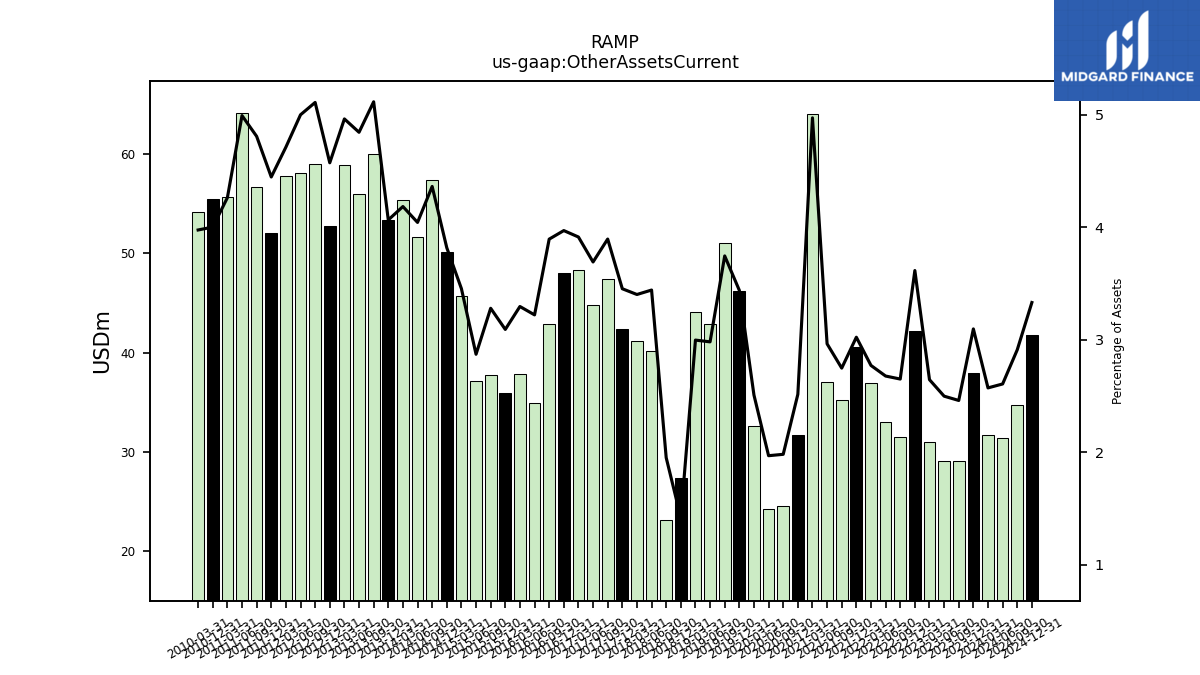
| Other Assets Current | 37.93 | 29.05 | 29.09 | 31.03 | 42.17 | 31.51 | 33.05 | 36.98 | 40.58 | 35.25 | 37.05 | 64.05 | 31.68 | 24.56 | 24.31 | 32.67 | 46.22 | 51.05 | 42.92 | 44.15 | 27.37 | 23.20 | 40.17 | 41.15 | 42.36 | 47.39 | 44.81 | 48.31 | 48.03 | 42.92 | 34.92 | 37.90 | 35.92 | 37.81 | 37.19 | 45.68 | 50.16 | 57.37 | 51.64 | 55.37 | 53.41 | 60.05 | 55.95 | 58.94 | 52.75 | 58.99 | 58.06 | 57.80 | 52.05 | 56.72 | 64.16 | 55.69 | 55.47 | NA | NA | 54.20 | NA |
| 2023-12-31 | 2023-09-30 | 2023-06-30 | 2023-03-31 | 2022-12-31 | 2022-09-30 | 2022-06-30 | 2022-03-31 | 2021-12-31 | 2021-09-30 | 2021-06-30 | 2021-03-31 | 2020-12-31 | 2020-09-30 | 2020-06-30 | 2020-03-31 | 2019-12-31 | 2019-09-30 | 2019-06-30 | 2019-03-31 | 2018-12-31 | 2018-09-30 | 2018-06-30 | 2018-03-31 | 2017-12-31 | 2017-09-30 | 2017-06-30 | 2017-03-31 | 2016-12-31 | 2016-09-30 | 2016-06-30 | 2016-03-31 | 2015-12-31 | 2015-09-30 | 2015-06-30 | 2015-03-31 | 2014-12-31 | 2014-09-30 | 2014-06-30 | 2014-03-31 | 2013-12-31 | 2013-09-30 | 2013-06-30 | 2013-03-31 | 2012-12-31 | 2012-09-30 | 2012-06-30 | 2012-03-31 | 2011-12-31 | 2011-09-30 | 2011-06-30 | 2011-03-31 | 2010-12-31 | 2010-09-30 | 2010-06-30 | 2010-03-31 | 2009-12-31 | ||
|---|---|---|---|---|---|---|---|---|---|---|---|---|---|---|---|---|---|---|---|---|---|---|---|---|---|---|---|---|---|---|---|---|---|---|---|---|---|---|---|---|---|---|---|---|---|---|---|---|---|---|---|---|---|---|---|---|---|---|
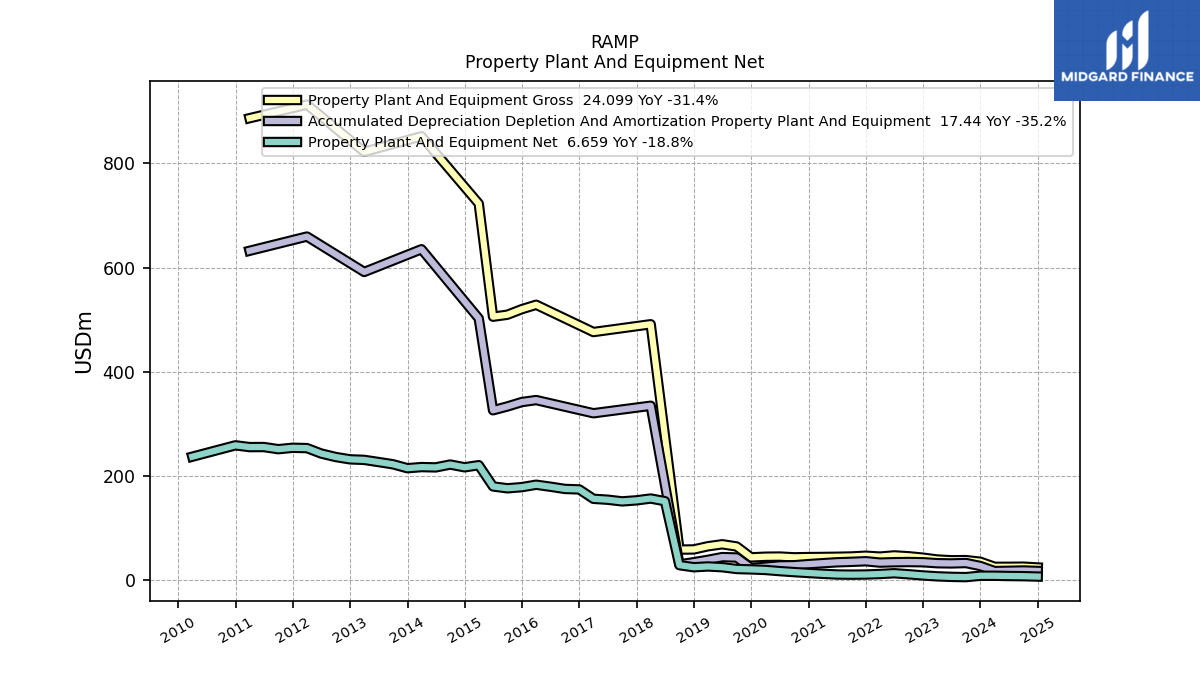
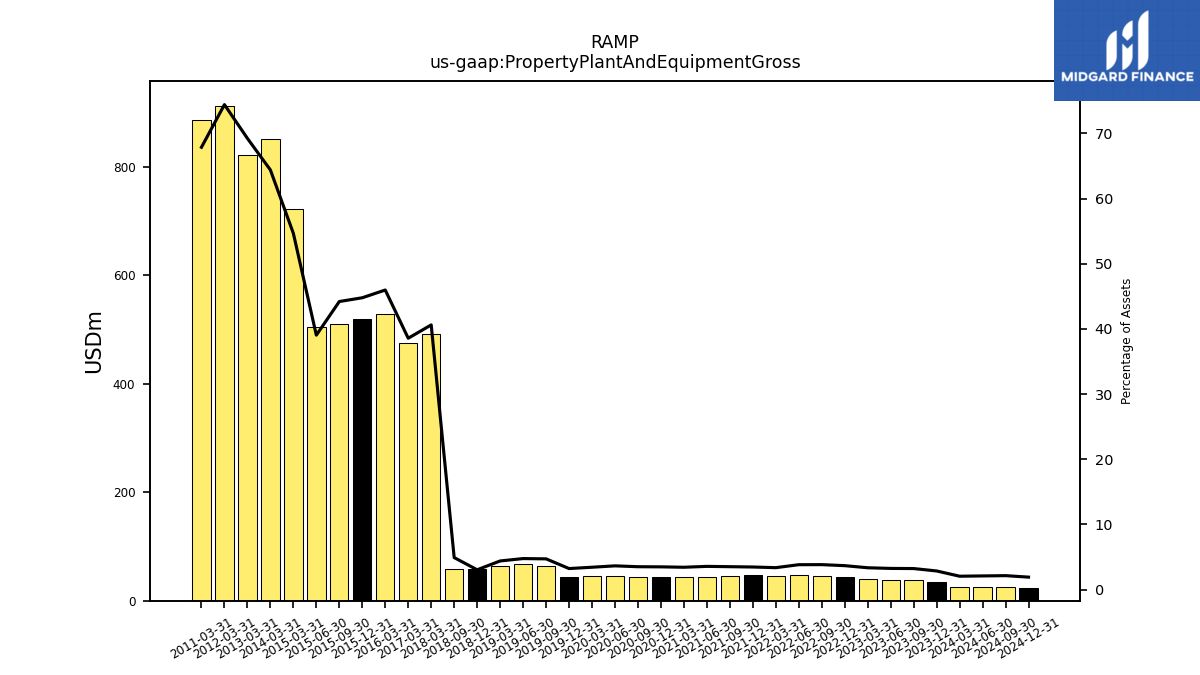
| Property Plant And Equipment Gross | 35.12 | 38.22 | 37.93 | 39.39 | 42.95 | 45.61 | 47.27 | 45.00 | 46.67 | 45.21 | 44.66 | 44.28 | 44.08 | 43.60 | 45.08 | 44.79 | 43.52 | 64.44 | 68.65 | 64.85 | 58.78 | 58.45 | NA | 491.27 | NA | NA | NA | 476.28 | NA | NA | NA | 528.67 | 520.26 | 509.57 | 505.74 | 723.01 | NA | NA | NA | 852.24 | NA | NA | NA | 822.44 | NA | NA | NA | 913.07 | NA | NA | NA | 886.97 | NA | NA | NA | NA | NA | |
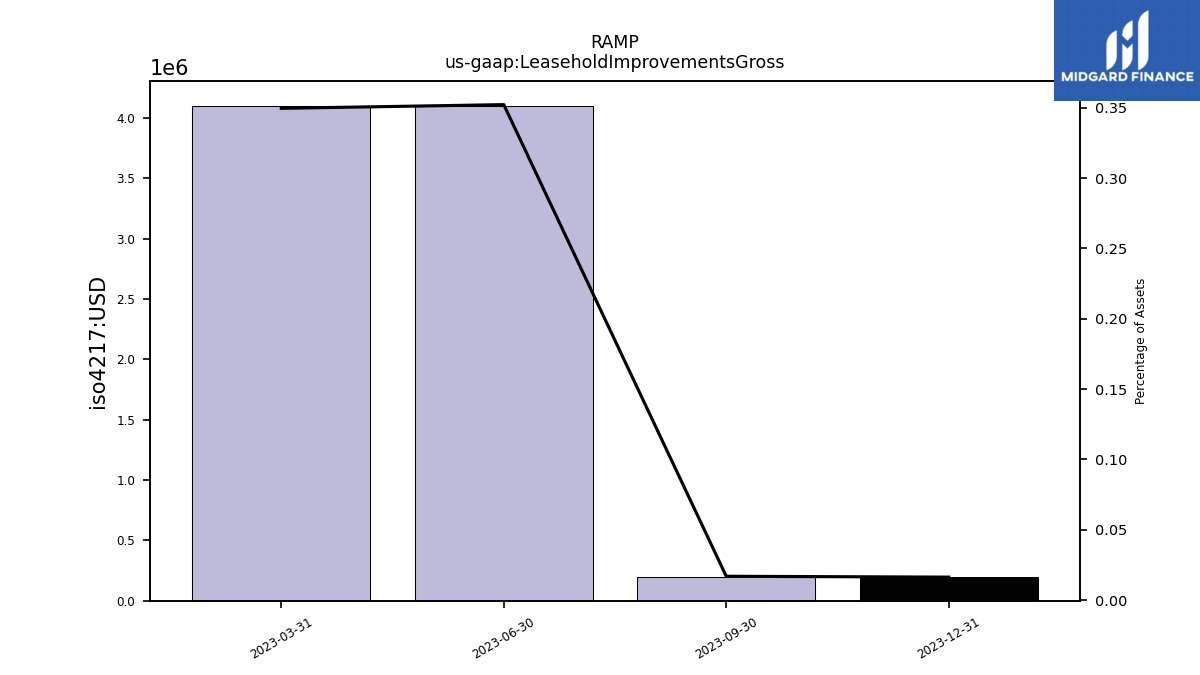
| Leasehold Improvements Gross | 0.20 | 0.20 | 4.10 | 4.10 | NA | NA | NA | NA | NA | NA | NA | NA | NA | NA | NA | NA | NA | NA | NA | NA | NA | NA | NA | NA | NA | NA | NA | NA | NA | NA | NA | NA | NA | NA | NA | NA | NA | NA | NA | NA | NA | NA | NA | NA | NA | NA | NA | NA | NA | NA | NA | NA | NA | NA | NA | NA | NA | |
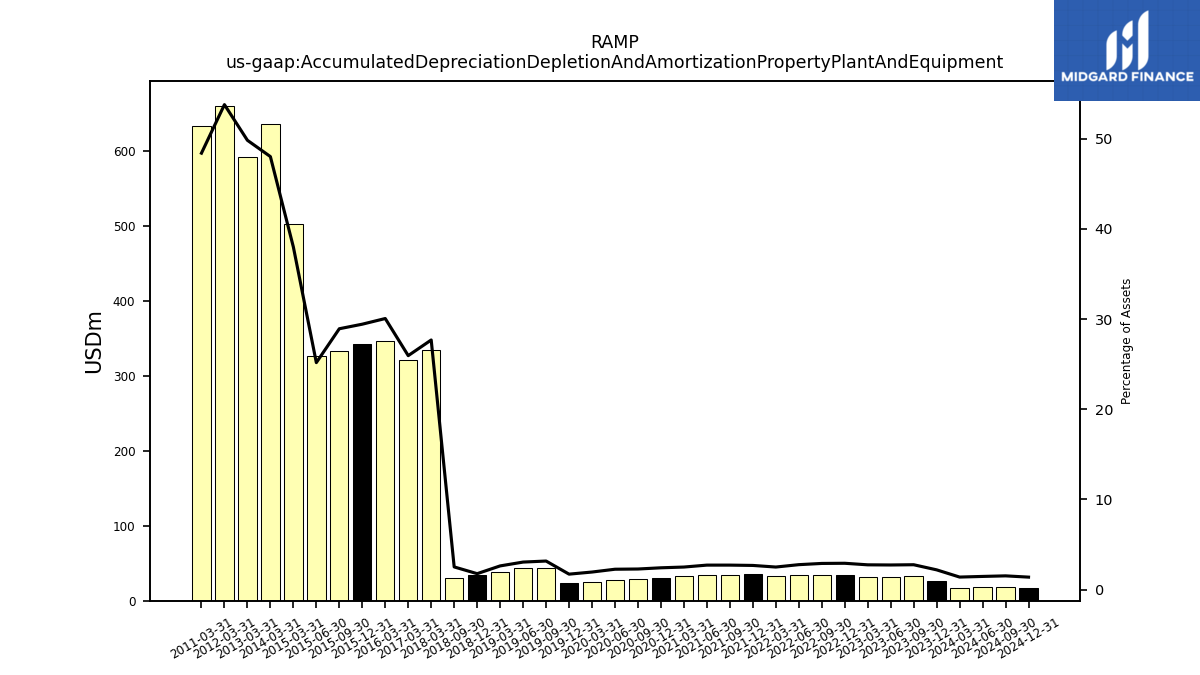
| Accumulated Depreciation Depletion And Amortization Property Plant And Equipment | 26.92 | 32.65 | 31.87 | 32.31 | 34.15 | 34.57 | 34.23 | 33.47 | 36.08 | 34.92 | 34.03 | 32.33 | 30.55 | 28.38 | 27.97 | 25.46 | 23.14 | 43.28 | 44.05 | 38.81 | 34.20 | 29.97 | NA | 334.73 | NA | NA | NA | 320.31 | NA | NA | NA | 345.63 | 341.87 | 333.40 | 326.00 | 502.42 | NA | NA | NA | 635.33 | NA | NA | NA | 591.69 | NA | NA | NA | 659.70 | NA | NA | NA | 632.30 | NA | NA | NA | NA | NA | |
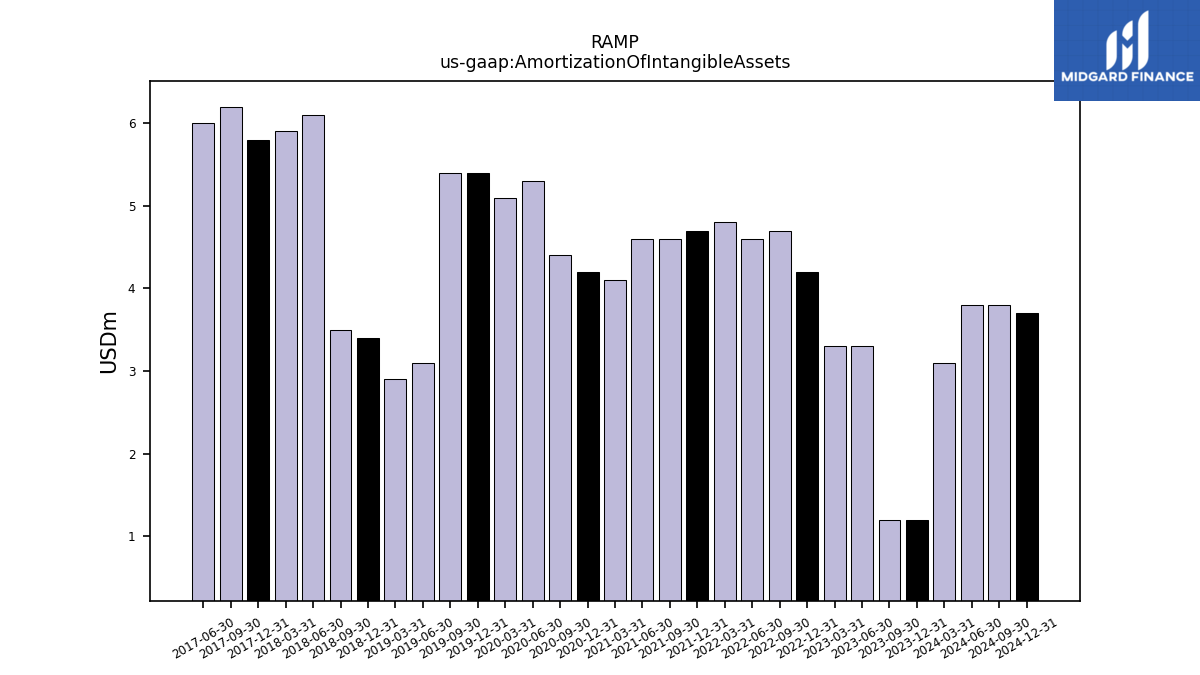
| Amortization Of Intangible Assets | 1.20 | 1.20 | 3.30 | 3.30 | 4.20 | 4.70 | 4.60 | 4.80 | 4.70 | 4.60 | 4.60 | 4.10 | 4.20 | 4.40 | 5.30 | 5.10 | 5.40 | 5.40 | 3.10 | 2.90 | 3.40 | 3.50 | 6.10 | 5.90 | 5.80 | 6.20 | 6.00 | NA | NA | NA | NA | NA | NA | NA | NA | NA | NA | NA | NA | NA | NA | NA | NA | NA | NA | NA | NA | NA | NA | NA | NA | NA | NA | NA | NA | NA | NA | |
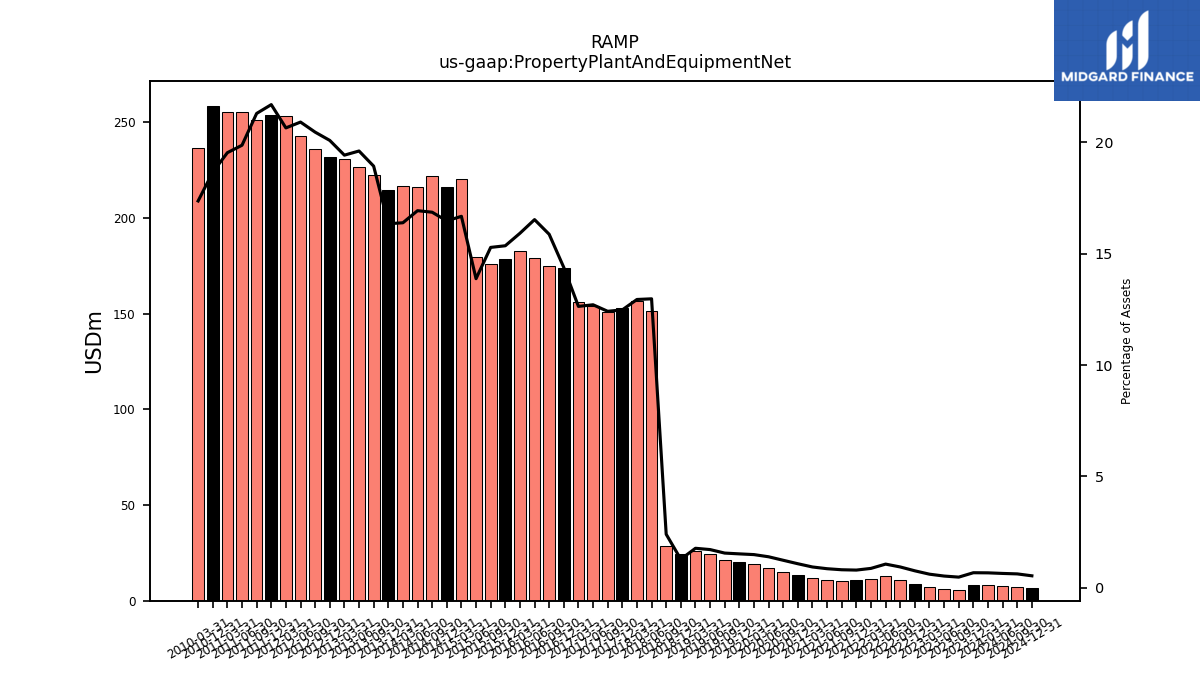
| Property Plant And Equipment Net | 8.20 | 5.57 | 6.05 | 7.08 | 8.81 | 11.04 | 13.04 | 11.53 | 10.59 | 10.30 | 10.62 | 11.96 | 13.52 | 15.22 | 17.11 | 19.32 | 20.38 | 21.16 | 24.61 | 26.04 | 24.59 | 28.48 | 151.41 | 156.53 | 153.04 | 151.06 | 154.25 | 155.97 | 174.00 | 174.94 | 179.21 | 183.04 | 178.39 | 176.17 | 179.74 | 220.59 | 216.49 | 221.81 | 216.32 | 216.91 | 214.78 | 222.34 | 226.61 | 230.75 | 231.77 | 236.28 | 242.94 | 253.37 | 253.97 | 251.30 | 255.43 | 255.31 | 258.70 | NA | NA | 236.84 | NA | |
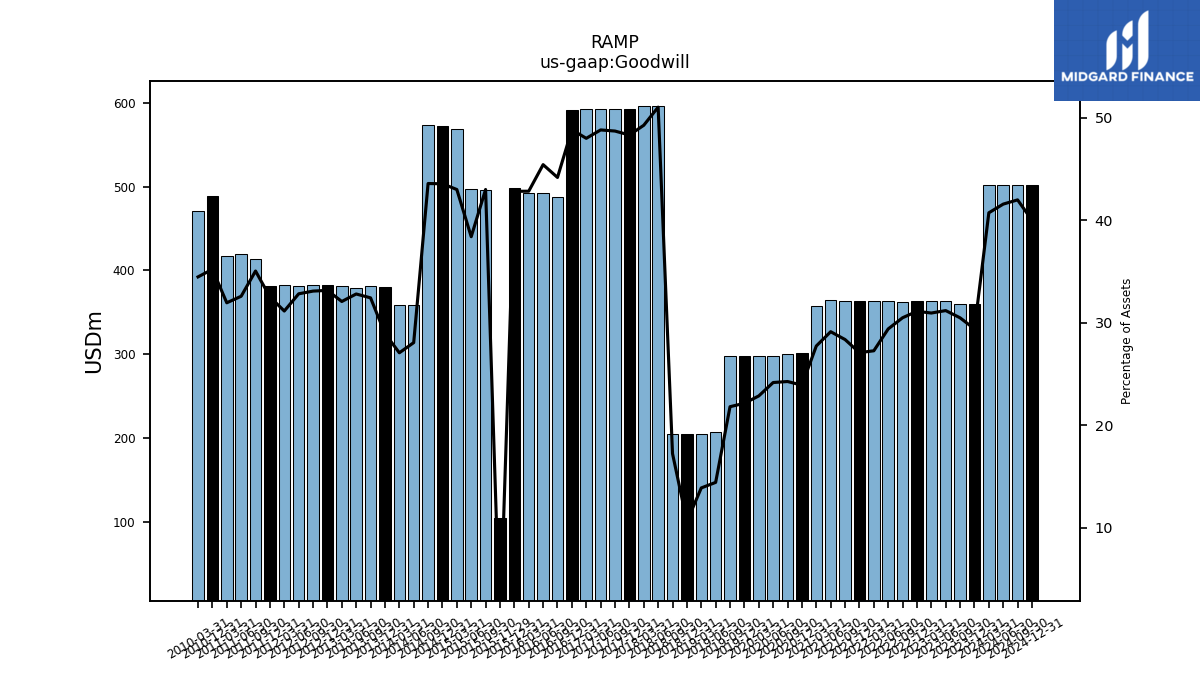
| Goodwill | 360.23 | 360.02 | 363.18 | 363.12 | 363.13 | 362.52 | 363.01 | 363.85 | 363.79 | 363.89 | 364.24 | 357.45 | 301.32 | 300.74 | 298.39 | 297.80 | 297.78 | 297.48 | 207.78 | 204.66 | 204.67 | 204.87 | 595.79 | 596.00 | 592.83 | 592.85 | 592.76 | 592.73 | 591.10 | 487.06 | 492.60 | 492.75 | 497.63 | 495.84 | 497.46 | 568.87 | 572.59 | 573.47 | 358.67 | 358.38 | 380.59 | 380.96 | 379.20 | 381.13 | 382.70 | 382.27 | 381.44 | 382.29 | 380.83 | 413.66 | 418.99 | 417.65 | 488.38 | NA | NA | 470.26 | NA | |
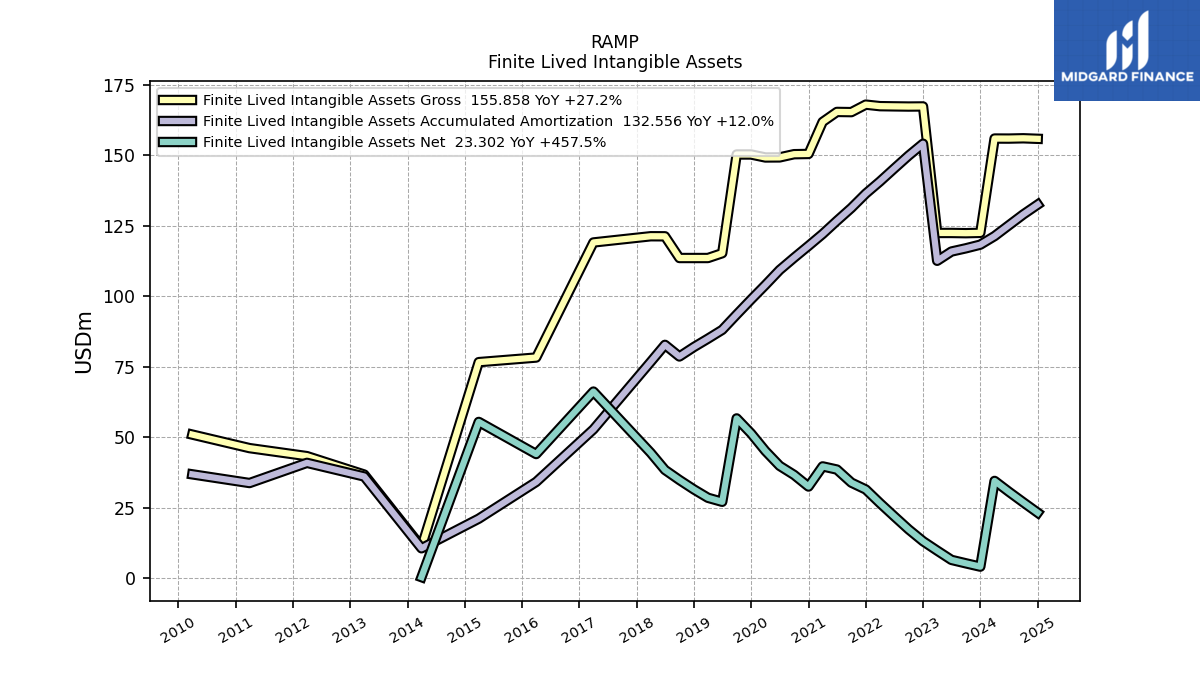
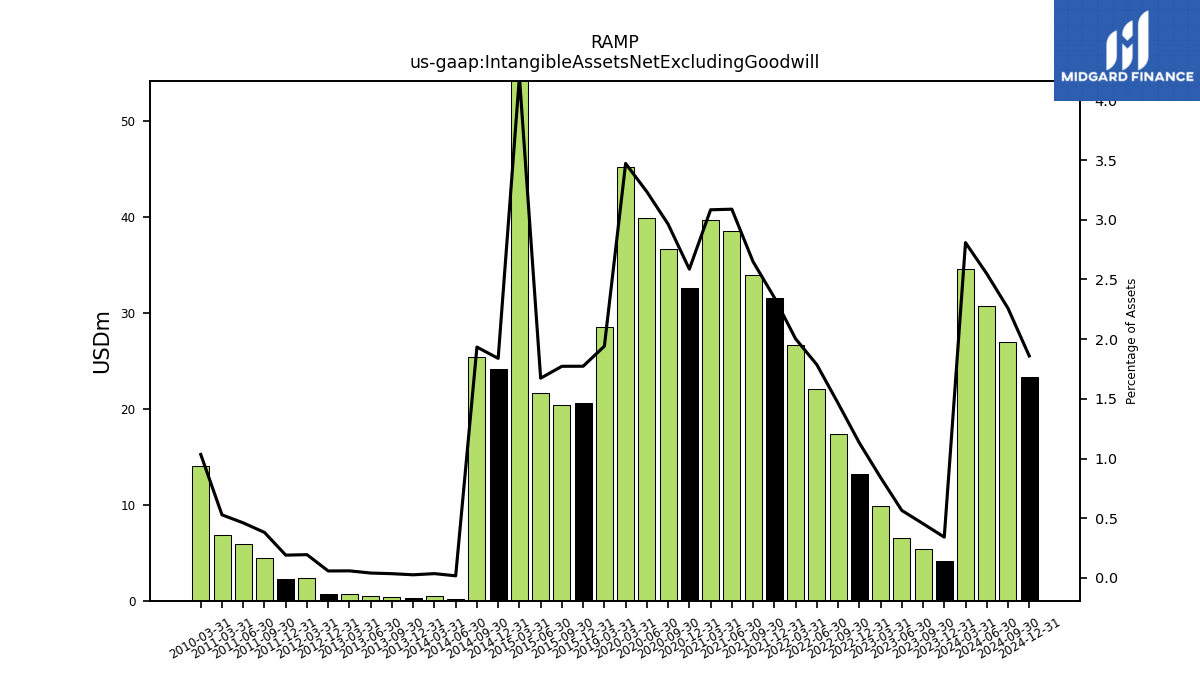
| Intangible Assets Net Excluding Goodwill | 4.18 | 5.36 | 6.58 | 9.87 | 13.20 | 17.39 | 22.05 | 26.72 | 31.54 | 33.97 | 38.61 | 39.73 | 32.58 | 36.71 | 39.91 | 45.20 | NA | NA | NA | 28.59 | NA | NA | NA | NA | NA | NA | NA | NA | NA | NA | NA | NA | 20.59 | 20.43 | 21.67 | 55.50 | 24.16 | 25.43 | 0.22 | 0.47 | 0.34 | 0.41 | 0.47 | 0.70 | 0.67 | NA | NA | 2.38 | 2.23 | 4.49 | 5.92 | 6.90 | NA | NA | NA | 14.10 | NA | |
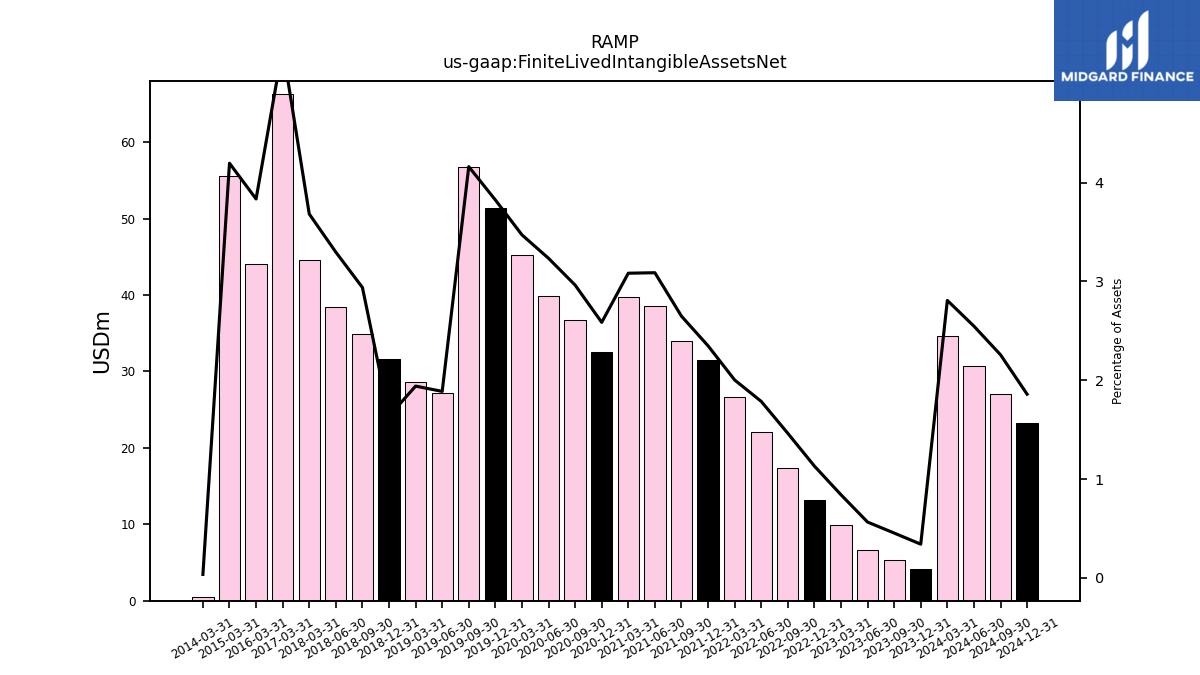
| Finite Lived Intangible Assets Net | 4.18 | 5.36 | 6.58 | 9.87 | 13.20 | 17.39 | 22.05 | 26.72 | 31.54 | 33.97 | 38.61 | 39.73 | 32.58 | 36.71 | 39.91 | 45.20 | 51.41 | 56.74 | 27.17 | 28.59 | 31.57 | 34.91 | 38.48 | 44.54 | NA | NA | NA | 66.26 | NA | NA | NA | 44.10 | NA | NA | NA | 55.50 | NA | NA | NA | 0.47 | NA | NA | NA | NA | NA | NA | NA | NA | NA | NA | NA | NA | NA | NA | NA | NA | NA | |
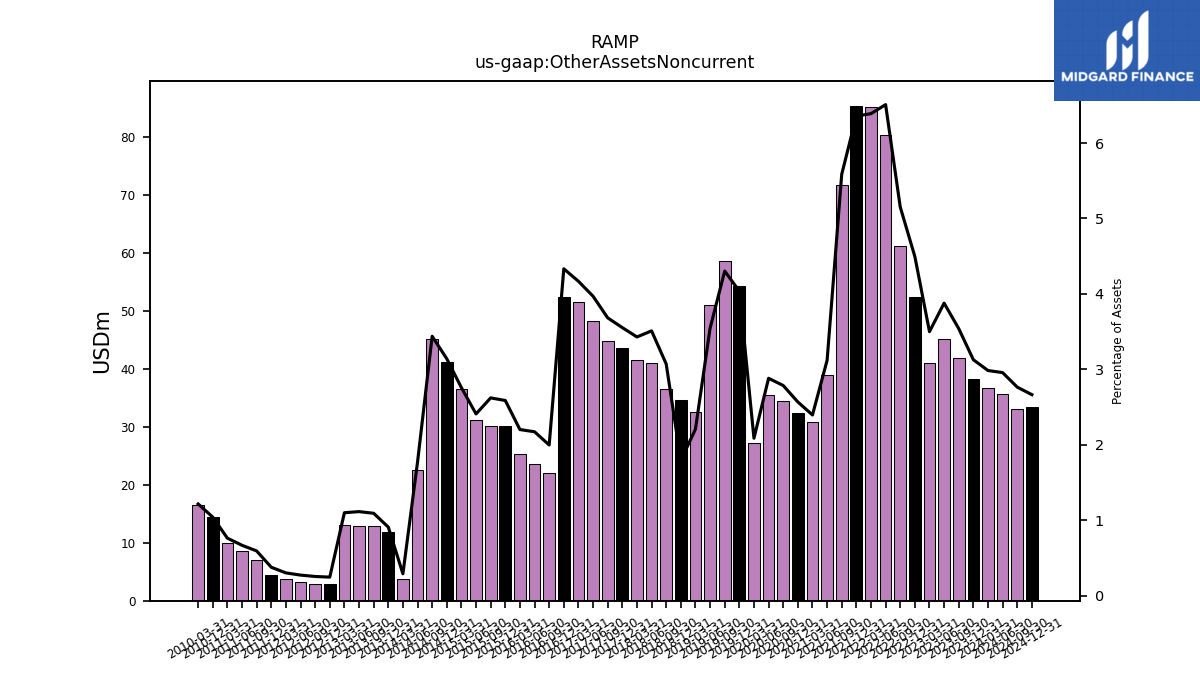
| Other Assets Noncurrent | 38.30 | 41.78 | 45.13 | 41.05 | 52.43 | 61.24 | 80.34 | 85.21 | 85.36 | 71.63 | 38.97 | 30.85 | 32.33 | 34.50 | 35.55 | 27.16 | 54.24 | 58.66 | 51.01 | 32.50 | 34.56 | 36.48 | 40.96 | 41.47 | 43.58 | 44.81 | 48.18 | 51.44 | 52.42 | 22.01 | 23.55 | 25.32 | 30.05 | 30.21 | 31.20 | 36.45 | 41.26 | 45.22 | 22.61 | 3.83 | 11.94 | 12.82 | 12.87 | 13.05 | 2.83 | 2.93 | 3.16 | 3.70 | 4.41 | 6.99 | 8.58 | 9.96 | 14.43 | NA | NA | 16.57 | NA |
| 2023-12-31 | 2023-09-30 | 2023-06-30 | 2023-03-31 | 2022-12-31 | 2022-09-30 | 2022-06-30 | 2022-03-31 | 2021-12-31 | 2021-09-30 | 2021-06-30 | 2021-03-31 | 2020-12-31 | 2020-09-30 | 2020-06-30 | 2020-03-31 | 2019-12-31 | 2019-09-30 | 2019-06-30 | 2019-03-31 | 2018-12-31 | 2018-09-30 | 2018-06-30 | 2018-03-31 | 2017-12-31 | 2017-09-30 | 2017-06-30 | 2017-03-31 | 2016-12-31 | 2016-09-30 | 2016-06-30 | 2016-03-31 | 2015-12-31 | 2015-09-30 | 2015-06-30 | 2015-03-31 | 2014-12-31 | 2014-09-30 | 2014-06-30 | 2014-03-31 | 2013-12-31 | 2013-09-30 | 2013-06-30 | 2013-03-31 | 2012-12-31 | 2012-09-30 | 2012-06-30 | 2012-03-31 | 2011-12-31 | 2011-09-30 | 2011-06-30 | 2011-03-31 | 2010-12-31 | 2010-09-30 | 2010-06-30 | 2010-03-31 | 2009-12-31 | ||
|---|---|---|---|---|---|---|---|---|---|---|---|---|---|---|---|---|---|---|---|---|---|---|---|---|---|---|---|---|---|---|---|---|---|---|---|---|---|---|---|---|---|---|---|---|---|---|---|---|---|---|---|---|---|---|---|---|---|---|
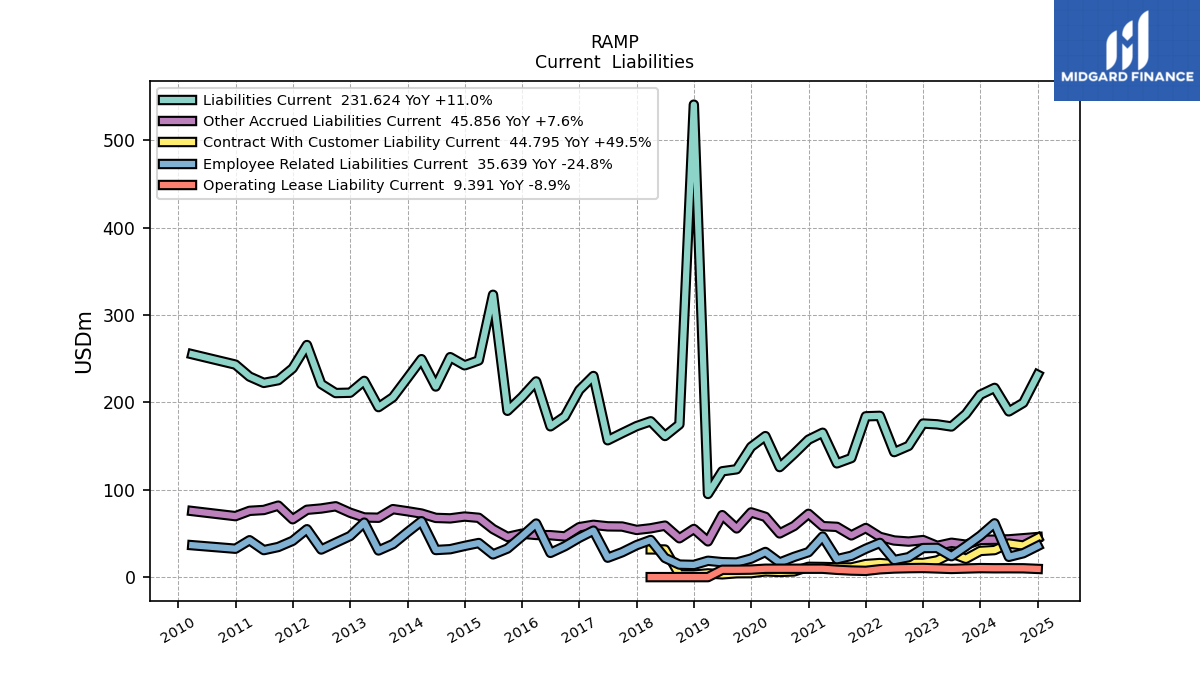
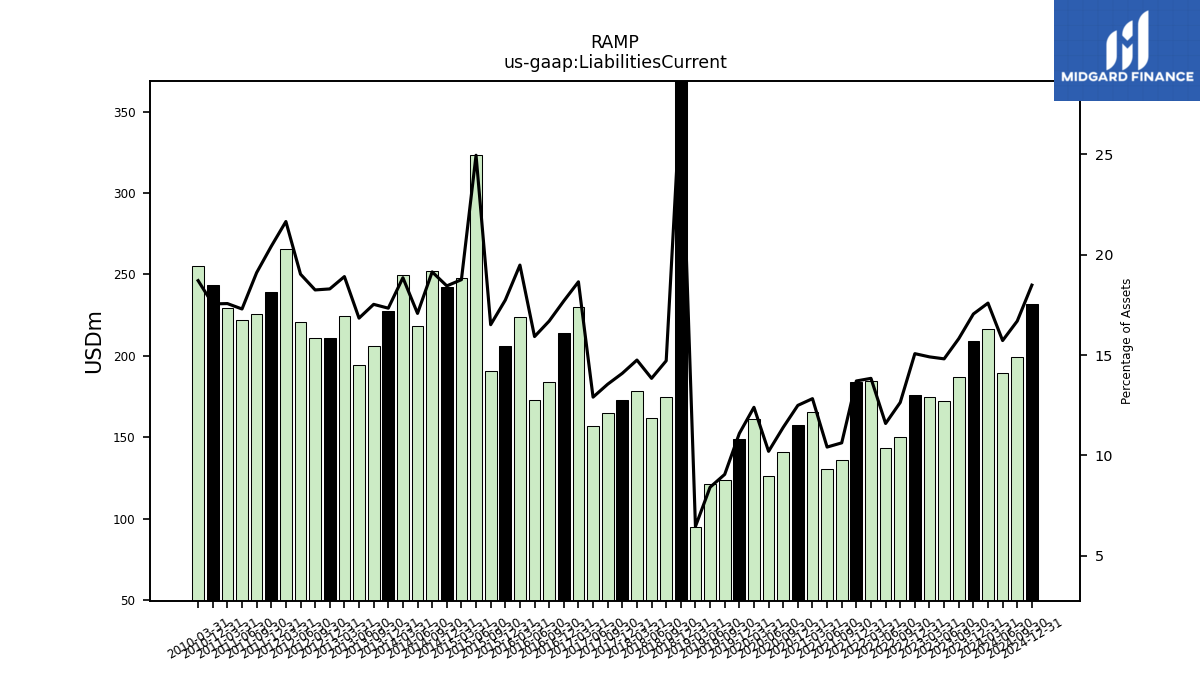
| Liabilities Current | 208.75 | 186.70 | 172.38 | 174.83 | 175.78 | 150.20 | 143.04 | 184.57 | 184.04 | 136.25 | 130.18 | 165.25 | 157.33 | 141.17 | 125.88 | 161.38 | 149.07 | 123.42 | 121.11 | 95.12 | 540.74 | 174.76 | 161.49 | 178.35 | 172.81 | 164.84 | 156.62 | 230.21 | 214.08 | 183.97 | 172.57 | 224.00 | 206.03 | 190.32 | 323.15 | 248.01 | 242.34 | 251.76 | 218.12 | 249.47 | 227.75 | 205.78 | 194.53 | 224.58 | 211.04 | 210.66 | 221.02 | 265.62 | 238.98 | 225.37 | 222.26 | 229.49 | 243.23 | NA | NA | 255.06 | NA | |
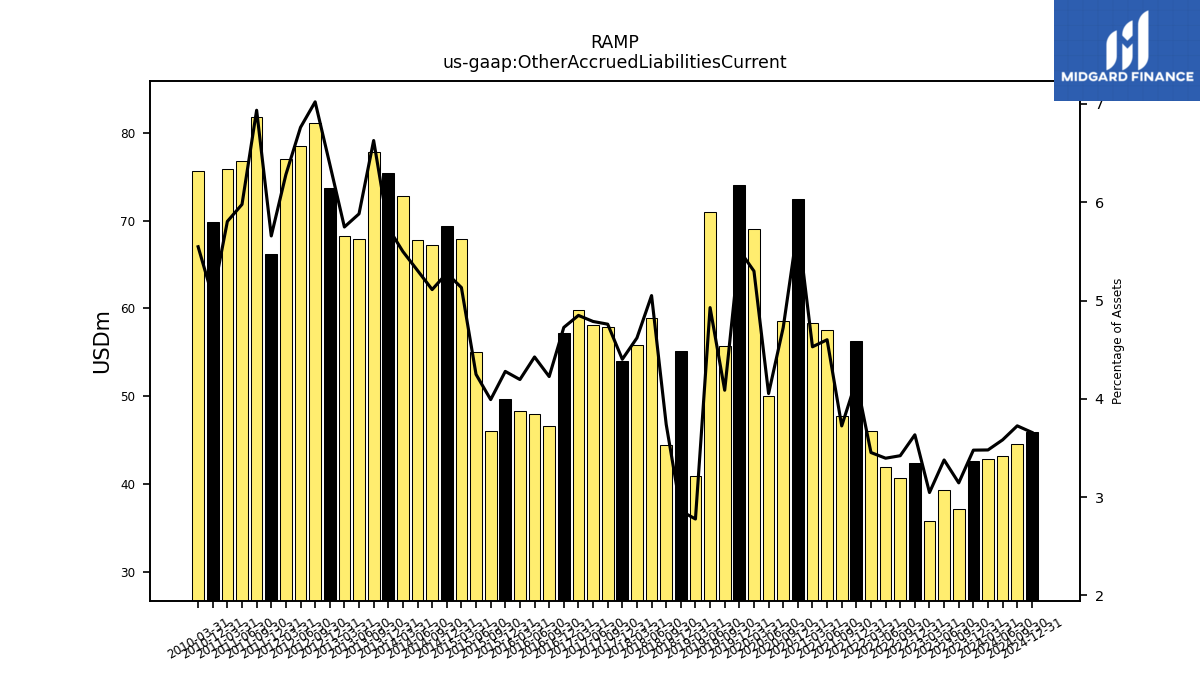
| Other Accrued Liabilities Current | 42.60 | 37.13 | 39.32 | 35.74 | 42.39 | 40.67 | 41.92 | 46.07 | 56.22 | 47.77 | 57.51 | 58.35 | 72.48 | 58.53 | 50.02 | 68.99 | 74.08 | 55.72 | 70.93 | 40.92 | 55.13 | 44.43 | 58.94 | 55.87 | 54.00 | 57.91 | 58.11 | 59.86 | 57.19 | 46.58 | 47.98 | 48.25 | 49.70 | 46.02 | 55.02 | 67.87 | 69.34 | 67.23 | 67.78 | 72.76 | 75.39 | 77.82 | 67.95 | 68.27 | 73.70 | 81.07 | 78.53 | 77.06 | 66.22 | 81.82 | 76.83 | 75.85 | 69.79 | NA | NA | 75.63 | NA | |
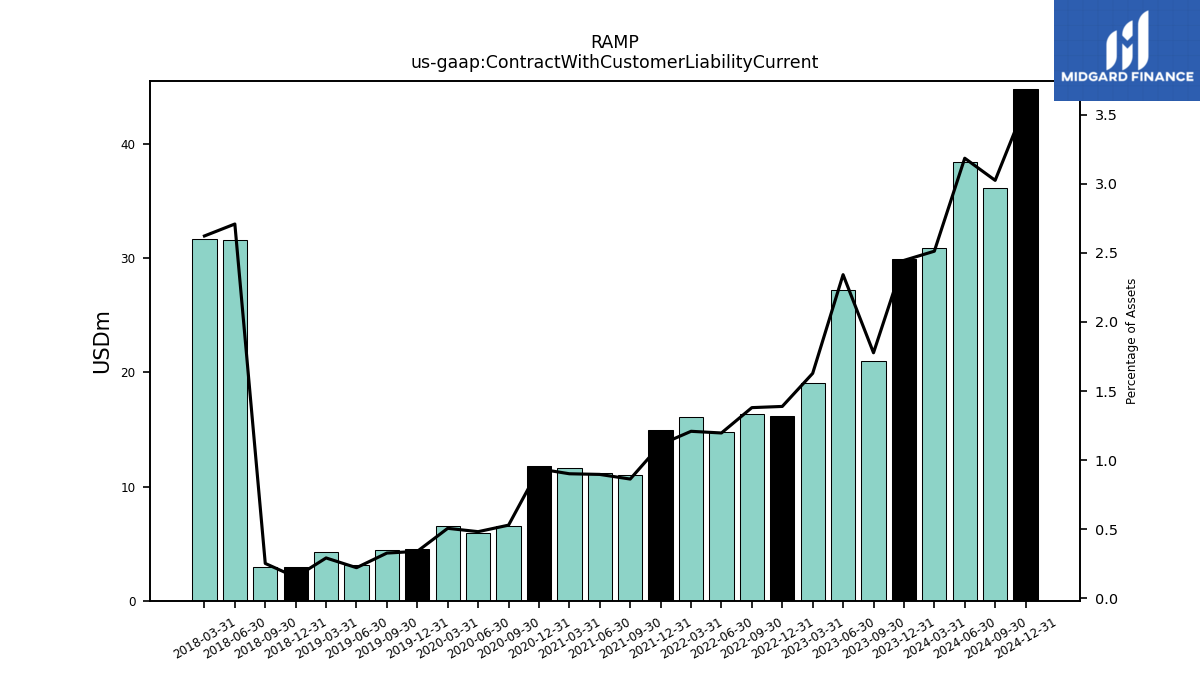
| Contract With Customer Liability Current | 29.96 | 20.98 | 27.27 | 19.09 | 16.20 | 16.40 | 14.76 | 16.11 | 14.93 | 11.06 | 11.20 | 11.60 | 11.79 | 6.55 | 5.94 | 6.58 | 4.55 | 4.45 | 3.17 | 4.28 | 2.93 | 2.98 | 31.62 | 31.72 | NA | NA | NA | NA | NA | NA | NA | NA | NA | NA | NA | NA | NA | NA | NA | NA | NA | NA | NA | NA | NA | NA | NA | NA | NA | NA | NA | NA | NA | NA | NA | NA | NA |
| 2023-12-31 | 2023-09-30 | 2023-06-30 | 2023-03-31 | 2022-12-31 | 2022-09-30 | 2022-06-30 | 2022-03-31 | 2021-12-31 | 2021-09-30 | 2021-06-30 | 2021-03-31 | 2020-12-31 | 2020-09-30 | 2020-06-30 | 2020-03-31 | 2019-12-31 | 2019-09-30 | 2019-06-30 | 2019-03-31 | 2018-12-31 | 2018-09-30 | 2018-06-30 | 2018-03-31 | 2017-12-31 | 2017-09-30 | 2017-06-30 | 2017-03-31 | 2016-12-31 | 2016-09-30 | 2016-06-30 | 2016-03-31 | 2015-12-31 | 2015-09-30 | 2015-06-30 | 2015-03-31 | 2014-12-31 | 2014-09-30 | 2014-06-30 | 2014-03-31 | 2013-12-31 | 2013-09-30 | 2013-06-30 | 2013-03-31 | 2012-12-31 | 2012-09-30 | 2012-06-30 | 2012-03-31 | 2011-12-31 | 2011-09-30 | 2011-06-30 | 2011-03-31 | 2010-12-31 | 2010-09-30 | 2010-06-30 | 2010-03-31 | 2009-12-31 | ||
|---|---|---|---|---|---|---|---|---|---|---|---|---|---|---|---|---|---|---|---|---|---|---|---|---|---|---|---|---|---|---|---|---|---|---|---|---|---|---|---|---|---|---|---|---|---|---|---|---|---|---|---|---|---|---|---|---|---|---|
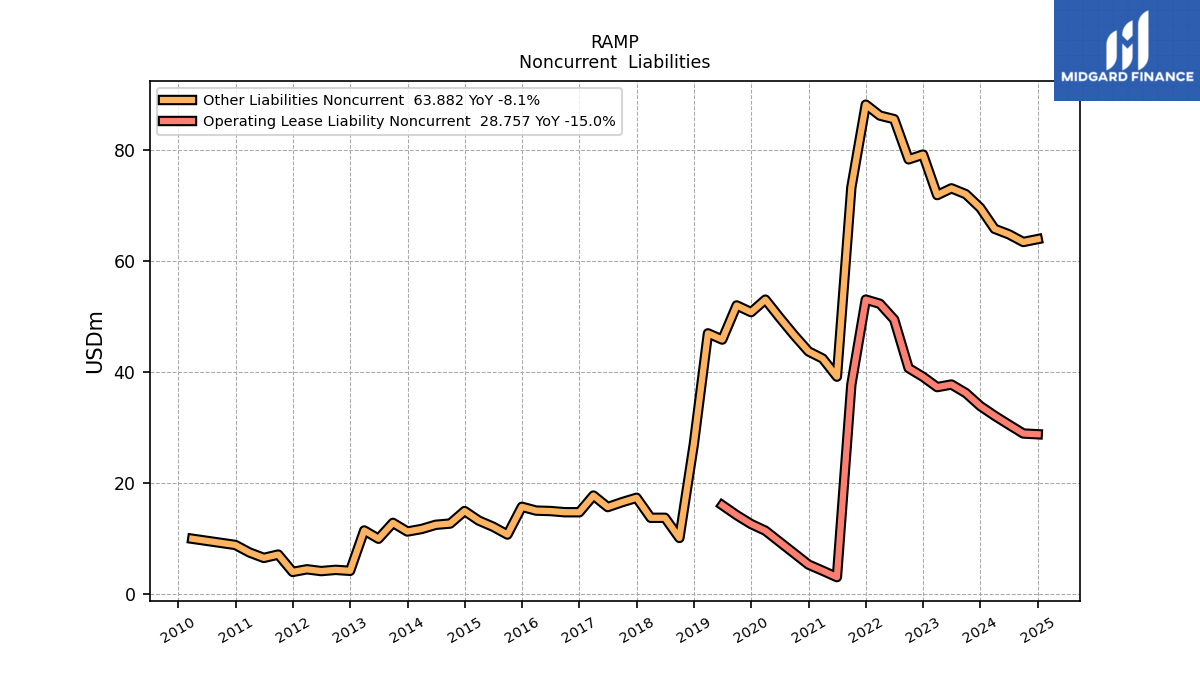
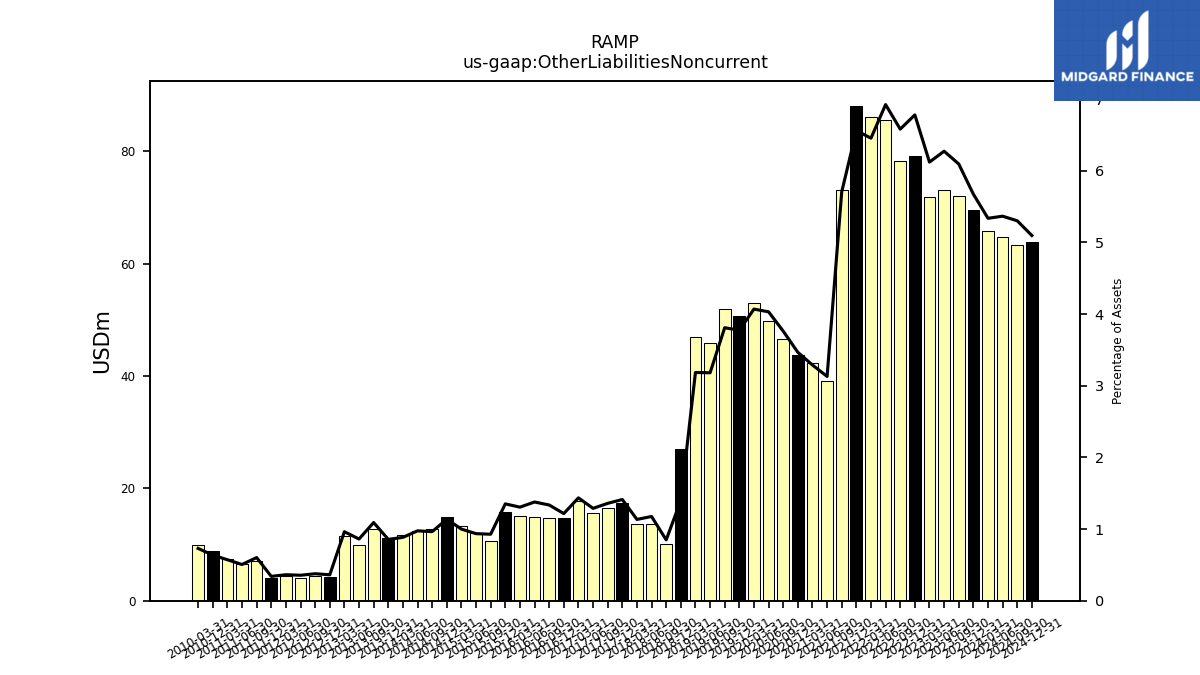
| Other Liabilities Noncurrent | 69.50 | 71.96 | 73.02 | 71.80 | 79.10 | 78.23 | 85.47 | 86.11 | 88.08 | 73.18 | 39.13 | 42.39 | 43.67 | 46.61 | 49.76 | 52.99 | 50.73 | 51.95 | 45.80 | 46.92 | 26.98 | 10.09 | 13.73 | 13.72 | 17.33 | 16.54 | 15.65 | 17.73 | 14.72 | 14.73 | 14.94 | 15.02 | 15.71 | 10.70 | 12.12 | 13.22 | 14.94 | 12.69 | 12.46 | 11.71 | 11.25 | 12.81 | 9.95 | 11.44 | 4.18 | 4.35 | 4.13 | 4.46 | 3.98 | 7.11 | 6.50 | 7.48 | 8.83 | NA | NA | 9.95 | NA | |
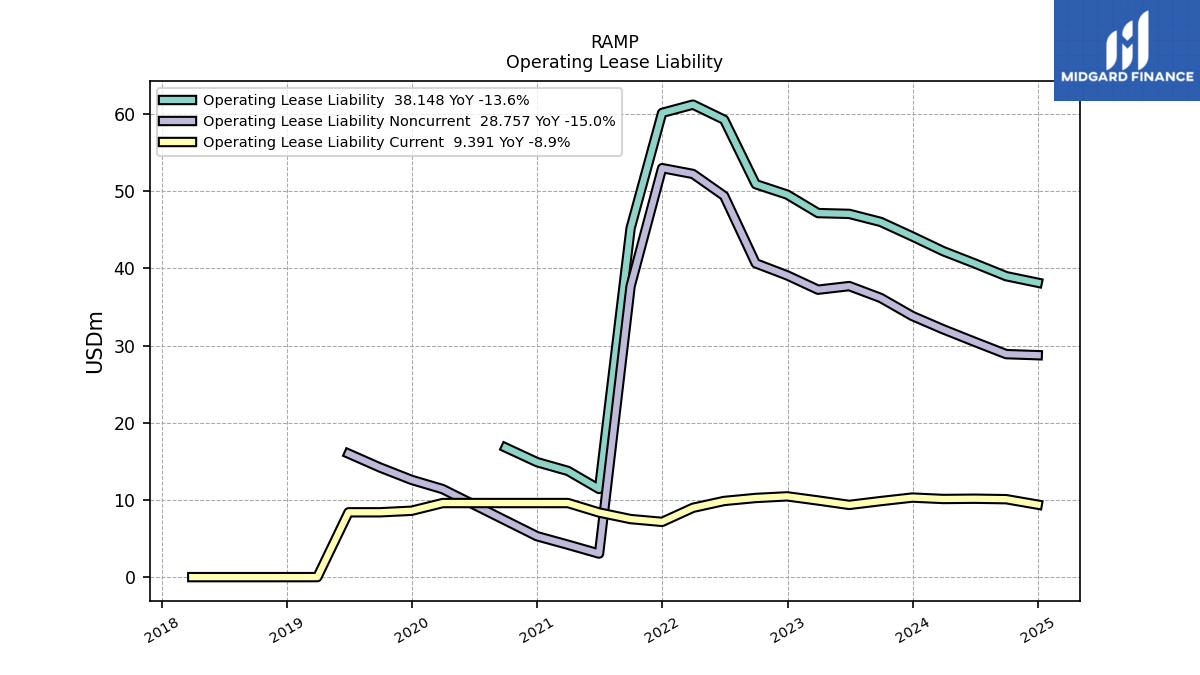
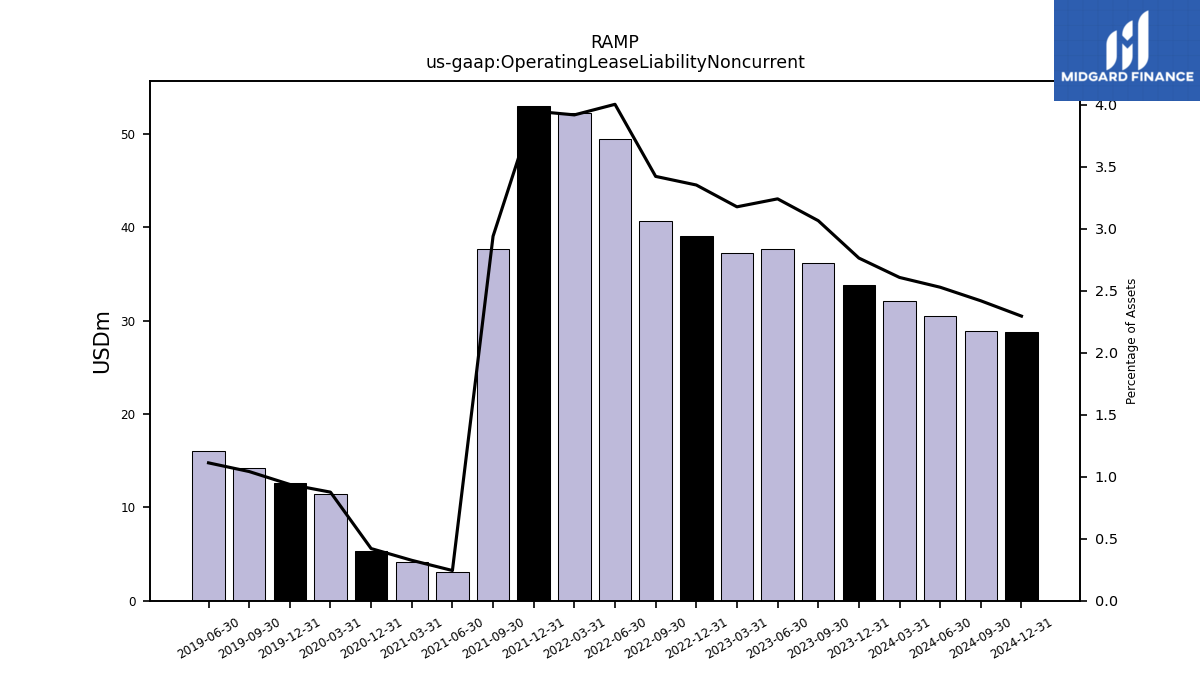
| Operating Lease Liability Noncurrent | 33.84 | 36.17 | 37.71 | 37.24 | 39.10 | 40.66 | 49.40 | 52.24 | 53.00 | 37.69 | 3.05 | 4.20 | 5.30 | NA | NA | 11.40 | 12.60 | 14.20 | 16.00 | NA | NA | NA | NA | NA | NA | NA | NA | NA | NA | NA | NA | NA | NA | NA | NA | NA | NA | NA | NA | NA | NA | NA | NA | NA | NA | NA | NA | NA | NA | NA | NA | NA | NA | NA | NA | NA | NA |
| 2023-12-31 | 2023-09-30 | 2023-06-30 | 2023-03-31 | 2022-12-31 | 2022-09-30 | 2022-06-30 | 2022-03-31 | 2021-12-31 | 2021-09-30 | 2021-06-30 | 2021-03-31 | 2020-12-31 | 2020-09-30 | 2020-06-30 | 2020-03-31 | 2019-12-31 | 2019-09-30 | 2019-06-30 | 2019-03-31 | 2018-12-31 | 2018-09-30 | 2018-06-30 | 2018-03-31 | 2017-12-31 | 2017-09-30 | 2017-06-30 | 2017-03-31 | 2016-12-31 | 2016-09-30 | 2016-06-30 | 2016-03-31 | 2015-12-31 | 2015-09-30 | 2015-06-30 | 2015-03-31 | 2014-12-31 | 2014-09-30 | 2014-06-30 | 2014-03-31 | 2013-12-31 | 2013-09-30 | 2013-06-30 | 2013-03-31 | 2012-12-31 | 2012-09-30 | 2012-06-30 | 2012-03-31 | 2011-12-31 | 2011-09-30 | 2011-06-30 | 2011-03-31 | 2010-12-31 | 2010-09-30 | 2010-06-30 | 2010-03-31 | 2009-12-31 | ||
|---|---|---|---|---|---|---|---|---|---|---|---|---|---|---|---|---|---|---|---|---|---|---|---|---|---|---|---|---|---|---|---|---|---|---|---|---|---|---|---|---|---|---|---|---|---|---|---|---|---|---|---|---|---|---|---|---|---|---|
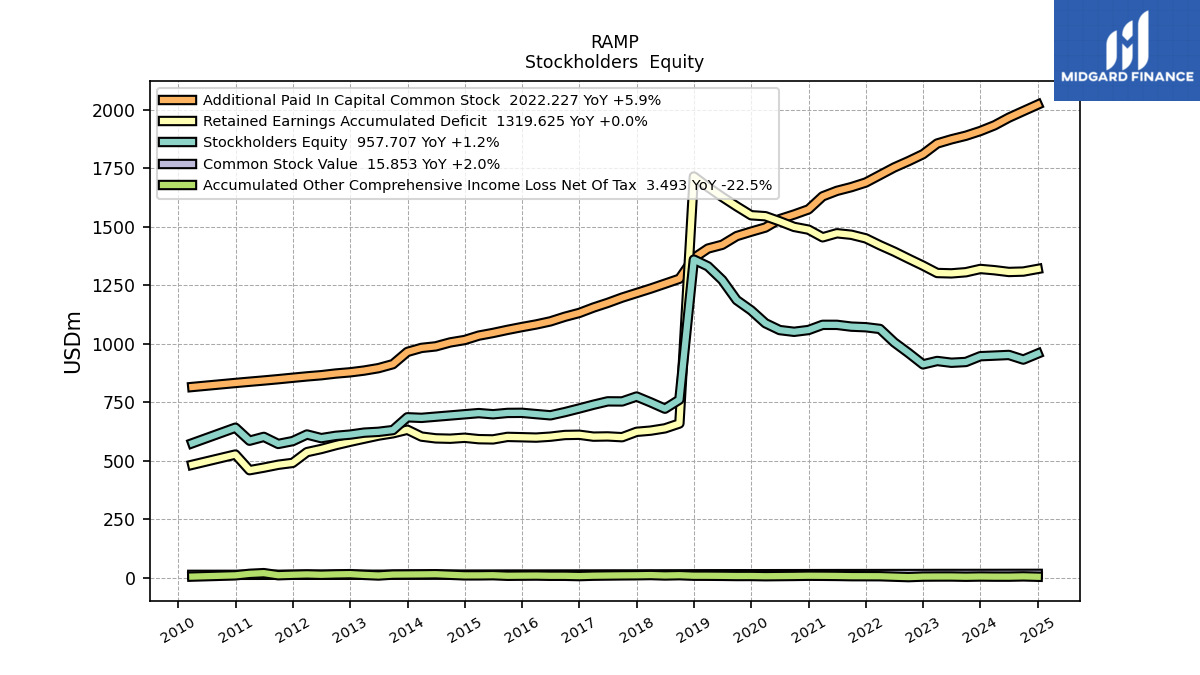
| Stockholders Equity | 946.49 | 921.86 | 918.53 | 926.08 | 911.61 | 960.07 | 1005.75 | 1063.06 | 1070.41 | 1072.95 | 1080.60 | 1080.68 | 1058.50 | 1050.86 | 1058.29 | 1087.51 | 1142.54 | 1186.36 | 1272.16 | 1330.83 | 1359.62 | 760.68 | 722.06 | 749.10 | 774.11 | 753.10 | 753.46 | 738.98 | 723.11 | 707.49 | 693.76 | 698.97 | 704.44 | 703.98 | 698.30 | 703.26 | NA | NA | NA | 682.86 | 685.36 | 630.71 | 623.18 | 619.75 | 611.28 | 605.96 | 596.17 | 611.75 | 583.48 | 571.36 | 601.55 | 585.18 | 640.92 | NA | NA | 574.40 | NA | |
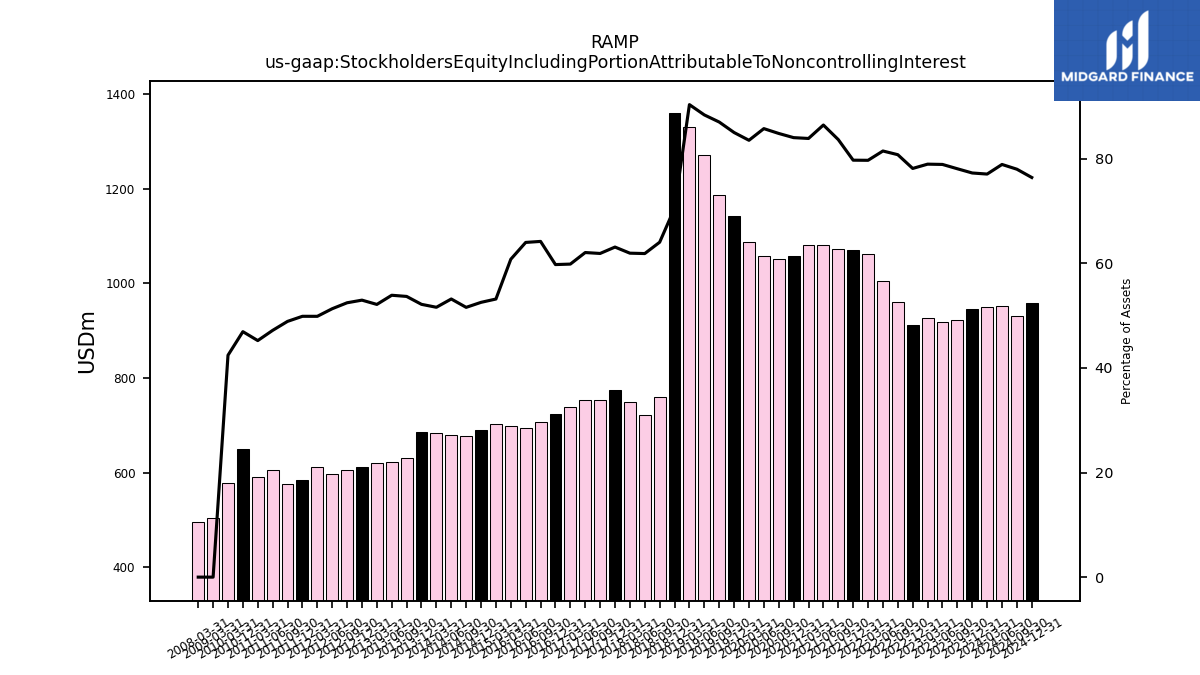
| Stockholders Equity Including Portion Attributable To Noncontrolling Interest | 946.49 | 921.86 | 918.53 | 926.08 | 911.61 | 960.07 | 1005.75 | 1063.06 | 1070.41 | 1072.95 | 1080.60 | 1080.68 | 1058.50 | 1050.86 | 1058.29 | 1087.51 | 1142.54 | 1186.36 | 1272.16 | 1330.83 | 1359.62 | 760.68 | 722.06 | 749.10 | 774.11 | 753.10 | 753.46 | 738.98 | 723.11 | 707.49 | 693.76 | 698.97 | NA | NA | NA | 703.26 | 690.41 | 678.48 | 679.43 | 682.86 | 685.36 | 630.27 | 622.71 | 619.37 | 611.03 | 605.79 | 596.14 | 611.86 | 583.78 | 576.94 | 606.45 | 591.03 | 650.70 | NA | NA | 578.50 | NA | |
| Common Stock Value | 15.54 | 15.47 | 15.46 | 15.40 | 15.21 | 15.15 | 15.10 | 14.98 | 14.93 | 14.89 | 14.87 | 14.78 | 14.65 | 14.57 | 14.53 | 14.39 | 14.34 | 14.31 | 14.24 | 14.19 | 14.08 | 13.84 | 13.77 | 13.61 | 13.55 | 13.48 | 13.41 | 13.29 | 13.22 | 13.19 | 13.10 | 13.04 | 12.99 | 12.96 | 12.85 | 12.79 | 12.72 | 12.71 | 12.64 | 12.58 | 12.53 | 12.29 | 12.21 | 12.13 | 12.11 | 12.09 | 12.05 | 12.00 | 11.95 | 11.91 | 11.88 | 11.78 | 11.75 | NA | NA | 11.66 | NA | |
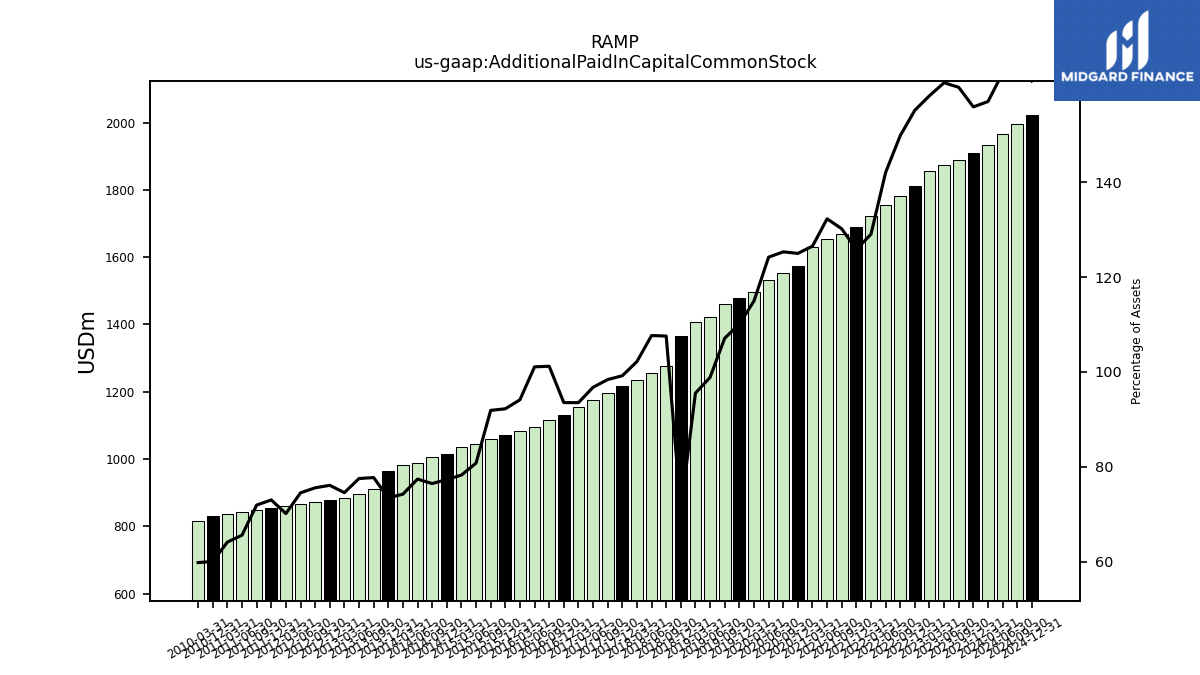
| Additional Paid In Capital Common Stock | 1909.37 | 1889.18 | 1873.93 | 1855.92 | 1810.38 | 1780.80 | 1753.47 | 1721.12 | 1689.17 | 1669.46 | 1653.53 | 1630.07 | 1574.35 | 1552.30 | 1532.48 | 1496.57 | 1479.02 | 1460.12 | 1422.88 | 1406.81 | 1366.22 | 1277.61 | 1256.44 | 1235.68 | 1216.57 | 1197.08 | 1174.50 | 1154.43 | 1131.55 | 1115.19 | 1095.51 | 1082.22 | 1071.14 | 1059.09 | 1045.90 | 1034.53 | 1015.70 | 1005.44 | 988.61 | 981.99 | 964.91 | 912.45 | 895.45 | 885.18 | 877.62 | 872.39 | 865.23 | 860.16 | 854.33 | 848.28 | 842.65 | 837.44 | 832.07 | NA | NA | 814.93 | NA | |
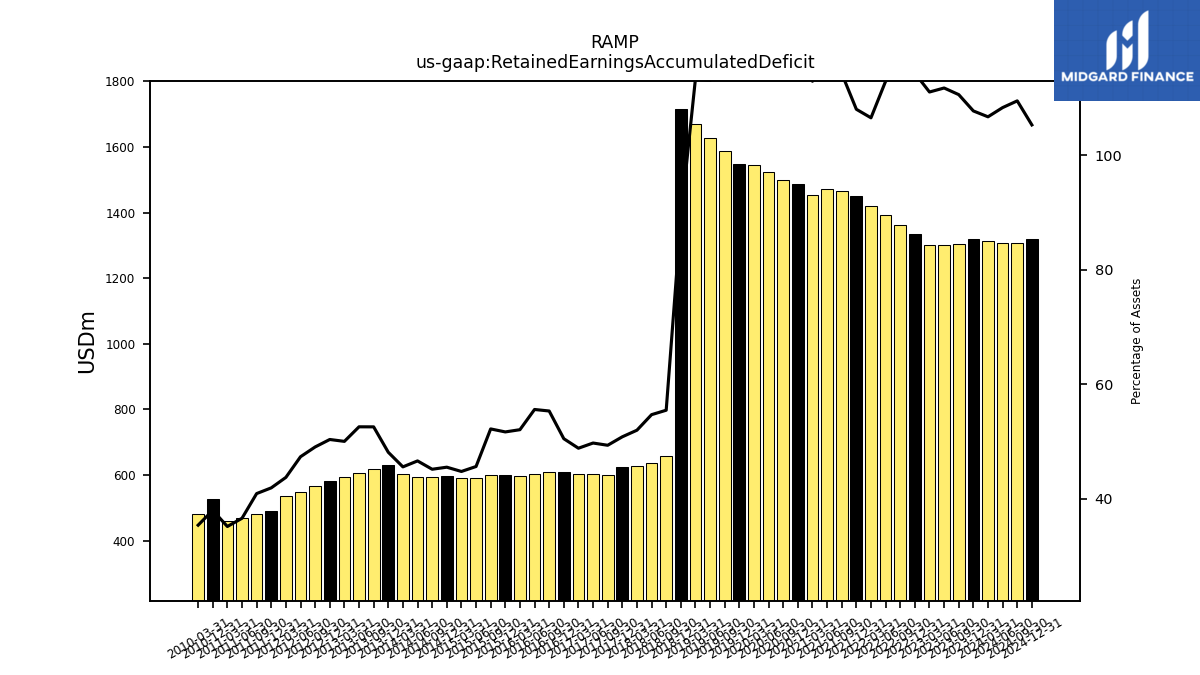
| Retained Earnings Accumulated Deficit | 1319.55 | 1305.57 | 1300.70 | 1302.29 | 1333.65 | 1363.34 | 1393.78 | 1420.99 | 1450.38 | 1465.76 | 1472.19 | 1454.83 | 1487.67 | 1499.40 | 1523.37 | 1545.09 | 1549.22 | 1587.26 | 1627.46 | 1669.61 | 1715.07 | 658.67 | 638.04 | 628.33 | 623.16 | 600.22 | 603.55 | 602.61 | 610.69 | 609.62 | 602.48 | 598.50 | 600.07 | 601.48 | 590.76 | 591.80 | 597.84 | 593.68 | 595.23 | 602.83 | 632.05 | 616.99 | 607.15 | 593.97 | 580.73 | 566.20 | 549.69 | 536.36 | 490.29 | 482.36 | 470.07 | 459.10 | 526.15 | NA | NA | 482.24 | NA | |
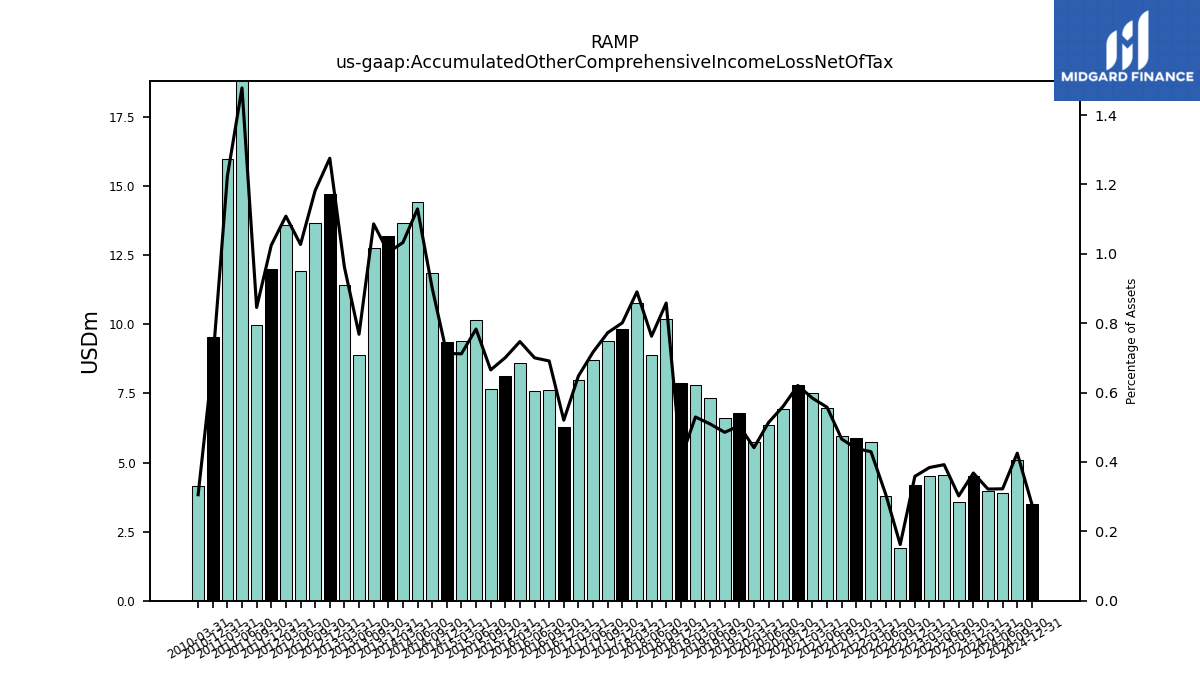
| Accumulated Other Comprehensive Income Loss Net Of Tax | 4.51 | 3.57 | 4.57 | 4.50 | 4.18 | 1.93 | 3.80 | 5.73 | 5.89 | 5.98 | 6.97 | 7.52 | 7.81 | 6.94 | 6.34 | 5.75 | 6.78 | 6.62 | 7.33 | 7.80 | 7.89 | 10.19 | 8.90 | 10.77 | 9.83 | 9.40 | 8.70 | 8.00 | 6.30 | 7.62 | 7.59 | 8.59 | 8.14 | 7.67 | 10.14 | 9.41 | 9.36 | 11.86 | 14.43 | 13.66 | 13.20 | 12.75 | 8.87 | 11.42 | 14.71 | 13.65 | 11.93 | 13.60 | 11.99 | 9.97 | 19.00 | 15.99 | 9.55 | NA | NA | 4.17 | NA | |
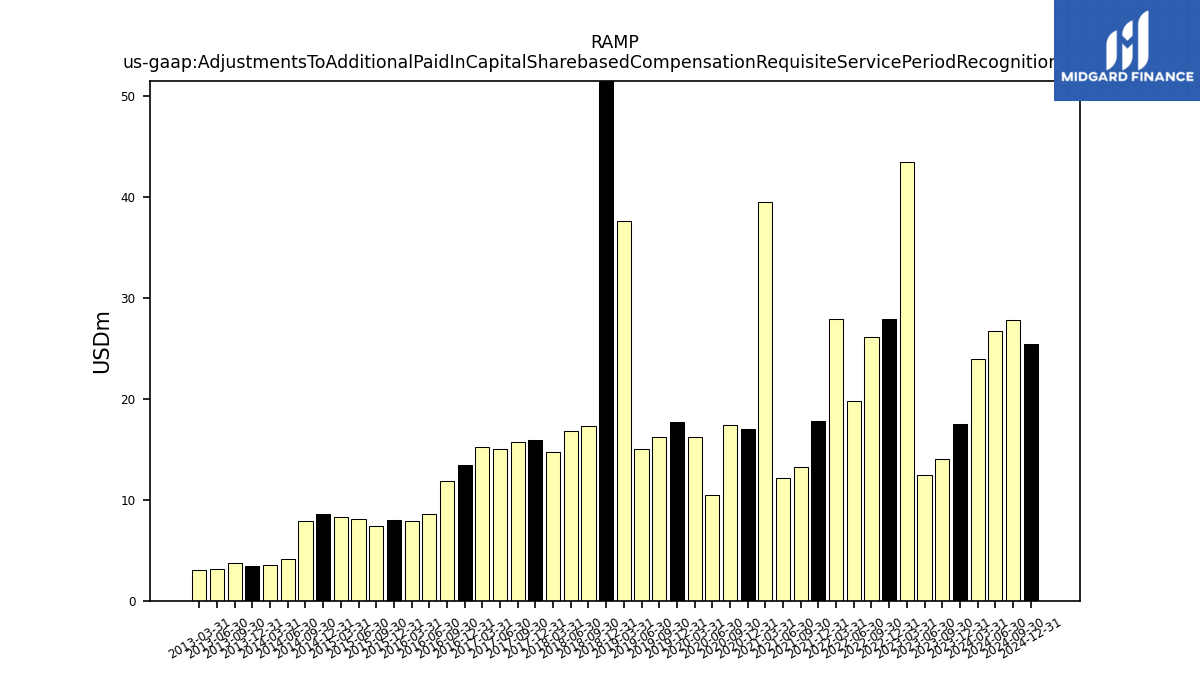
| Adjustments To Additional Paid In Capital Sharebased Compensation Requisite Service Period Recognition Value | 17.50 | 14.09 | 12.50 | 43.45 | 27.97 | 26.18 | 19.76 | 27.94 | 17.84 | 13.26 | 12.13 | 39.50 | 17.00 | 17.40 | 10.50 | 16.20 | 17.70 | 16.27 | 15.06 | 37.63 | 79.62 | 17.28 | 16.81 | 14.75 | 15.91 | 15.76 | 15.04 | 15.19 | 13.45 | 11.91 | 8.59 | 7.93 | 8.05 | 7.36 | 8.12 | 8.35 | 8.58 | 7.87 | 4.09 | 3.58 | 3.46 | 3.71 | 3.18 | 3.10 | NA | NA | NA | NA | NA | NA | NA | NA | NA | NA | NA | NA | NA |
| 2023-12-31 | 2023-09-30 | 2023-06-30 | 2023-03-31 | 2022-12-31 | 2022-09-30 | 2022-06-30 | 2022-03-31 | 2021-12-31 | 2021-09-30 | 2021-06-30 | 2021-03-31 | 2020-12-31 | 2020-09-30 | 2020-06-30 | 2020-03-31 | 2019-12-31 | 2019-09-30 | 2019-06-30 | 2019-03-31 | 2018-12-31 | 2018-09-30 | 2018-06-30 | 2018-03-31 | 2017-12-31 | 2017-09-30 | 2017-06-30 | 2017-03-31 | 2016-12-31 | 2016-09-30 | 2016-06-30 | 2016-03-31 | 2015-12-31 | 2015-09-30 | 2015-06-30 | 2015-03-31 | 2014-12-31 | 2014-09-30 | 2014-06-30 | 2014-03-31 | 2013-12-31 | 2013-09-30 | 2013-06-30 | 2013-03-31 | 2012-12-31 | 2012-09-30 | 2012-06-30 | 2012-03-31 | 2011-12-31 | 2011-09-30 | 2011-06-30 | 2011-03-31 | 2010-12-31 | 2010-09-30 | 2010-06-30 | 2010-03-31 | 2009-12-31 | ||
|---|---|---|---|---|---|---|---|---|---|---|---|---|---|---|---|---|---|---|---|---|---|---|---|---|---|---|---|---|---|---|---|---|---|---|---|---|---|---|---|---|---|---|---|---|---|---|---|---|---|---|---|---|---|---|---|---|---|---|
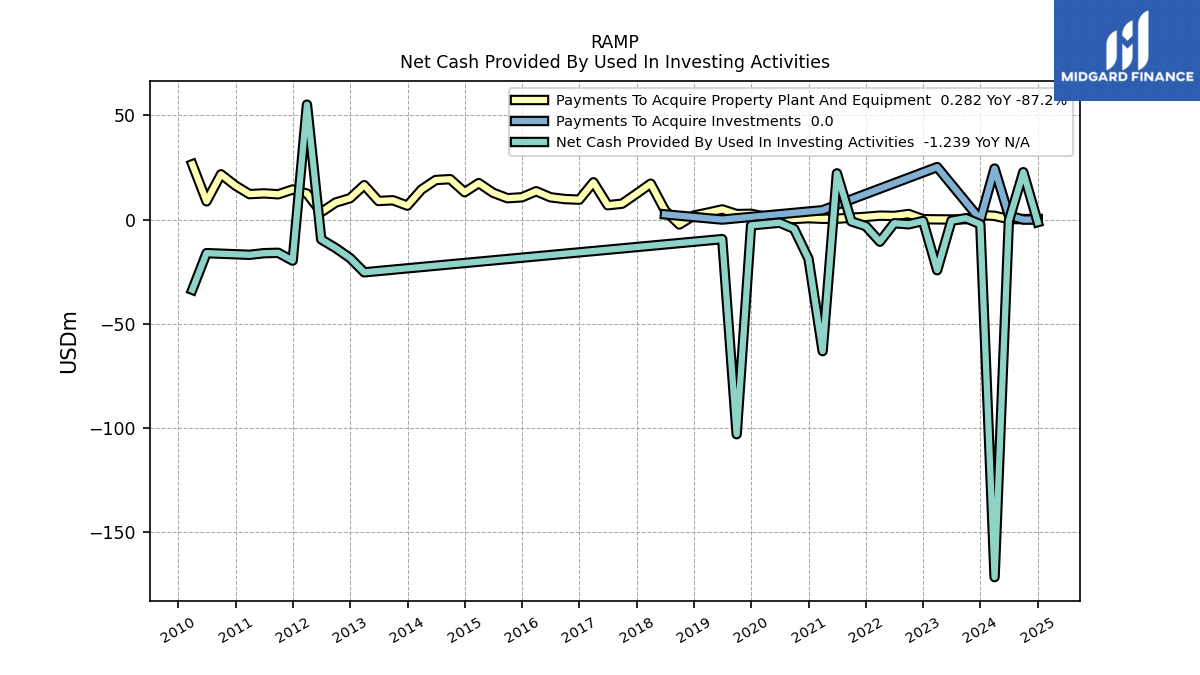
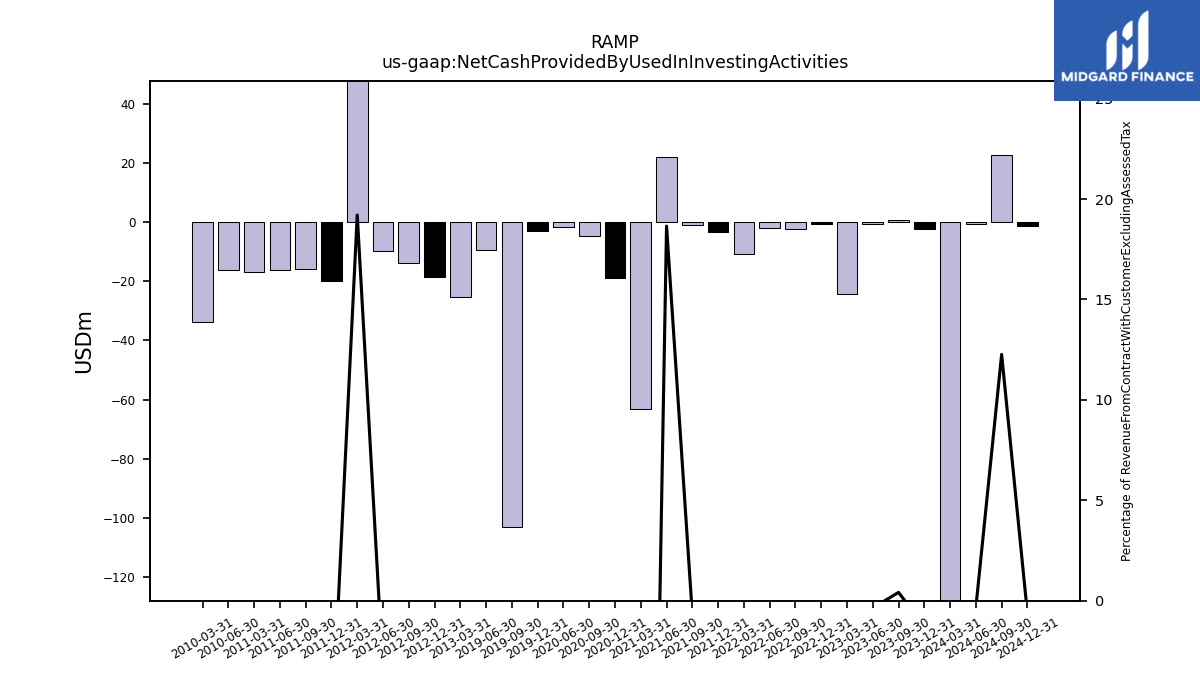
| Net Cash Provided By Used In Investing Activities | -2.21 | 0.67 | -0.55 | -24.31 | -0.68 | -2.27 | -1.74 | -10.61 | -3.14 | -0.88 | 22.20 | -63.14 | -18.82 | -4.43 | -1.50 | NA | -2.77 | -103.01 | -9.37 | NA | NA | NA | NA | NA | NA | NA | NA | NA | NA | NA | NA | NA | NA | NA | NA | NA | NA | NA | NA | NA | NA | NA | NA | -25.31 | -18.47 | -13.65 | -9.51 | 55.17 | -19.71 | -15.94 | -16.14 | -16.91 | NA | NA | -16.11 | -33.71 | NA | |
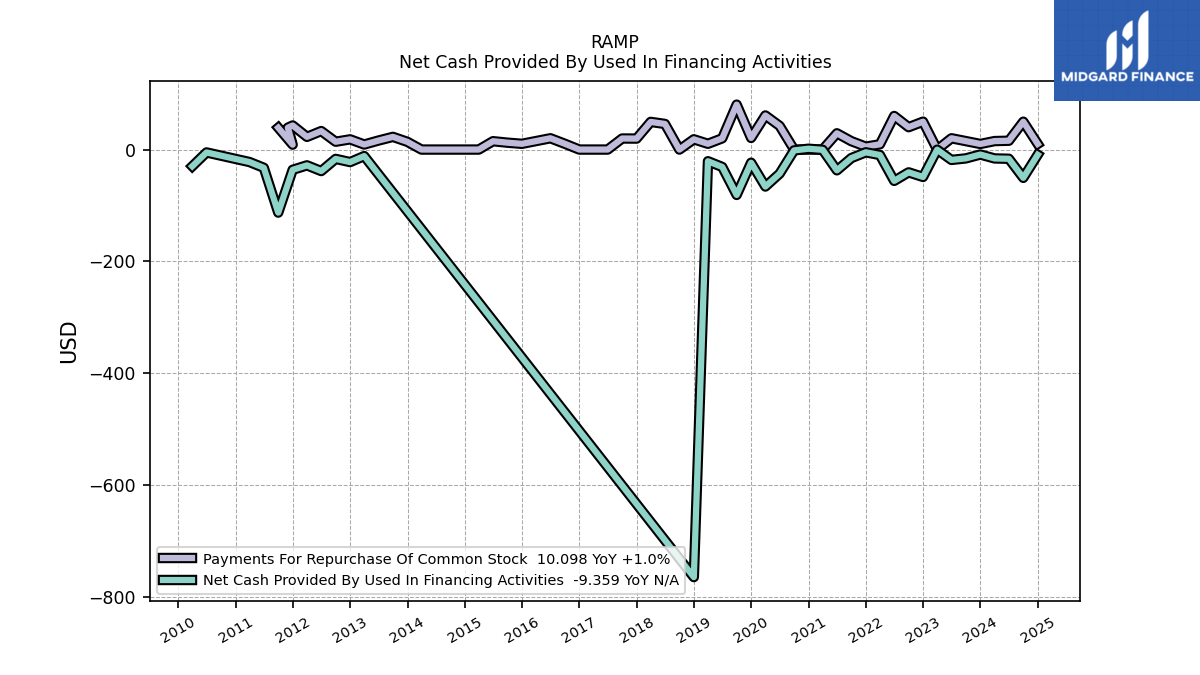
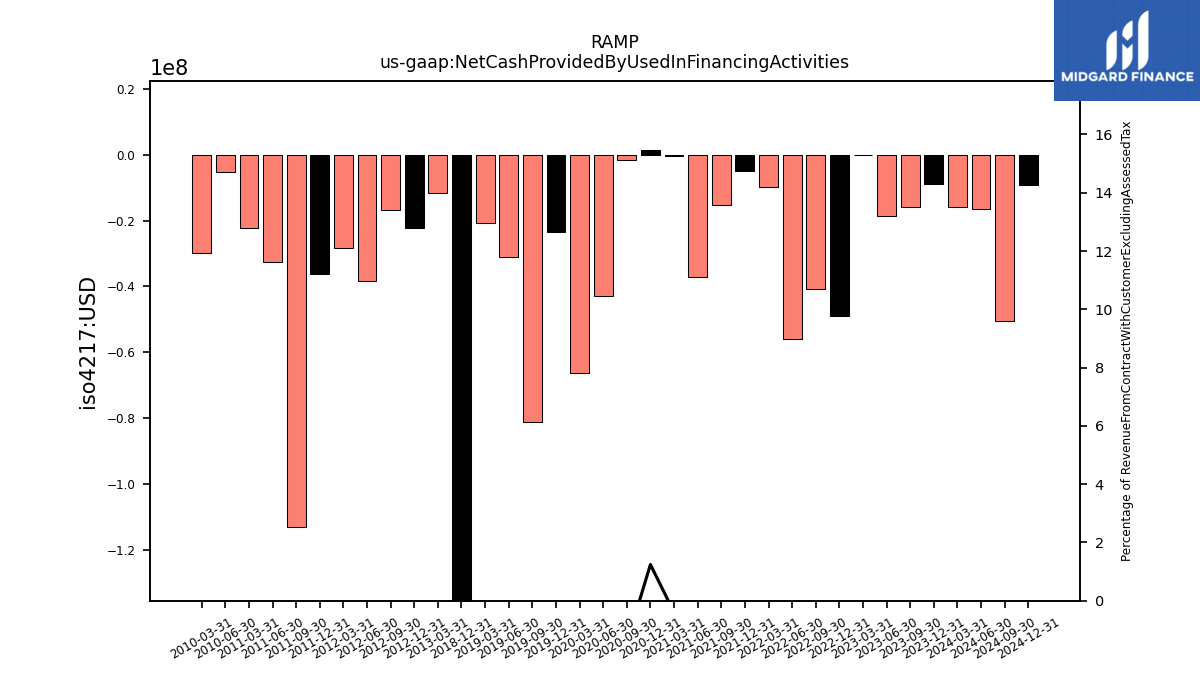
| Net Cash Provided By Used In Financing Activities | -8.90 | -15.80 | -18.52 | -0.21 | -49.01 | -40.74 | -56.05 | -9.72 | -4.92 | -15.18 | -37.16 | -0.48 | 1.49 | -1.50 | -43.00 | -66.14 | -23.55 | -81.16 | -31.13 | -20.86 | -764.78 | NA | NA | NA | NA | NA | NA | NA | NA | NA | NA | NA | NA | NA | NA | NA | NA | NA | NA | NA | NA | NA | NA | -11.65 | -22.38 | -16.71 | -38.48 | -28.24 | -36.22 | -112.78 | -32.60 | -22.33 | NA | NA | -5.16 | -29.85 | NA |
| 2023-12-31 | 2023-09-30 | 2023-06-30 | 2023-03-31 | 2022-12-31 | 2022-09-30 | 2022-06-30 | 2022-03-31 | 2021-12-31 | 2021-09-30 | 2021-06-30 | 2021-03-31 | 2020-12-31 | 2020-09-30 | 2020-06-30 | 2020-03-31 | 2019-12-31 | 2019-09-30 | 2019-06-30 | 2019-03-31 | 2018-12-31 | 2018-09-30 | 2018-06-30 | 2018-03-31 | 2017-12-31 | 2017-09-30 | 2017-06-30 | 2017-03-31 | 2016-12-31 | 2016-09-30 | 2016-06-30 | 2016-03-31 | 2015-12-31 | 2015-09-30 | 2015-06-30 | 2015-03-31 | 2014-12-31 | 2014-09-30 | 2014-06-30 | 2014-03-31 | 2013-12-31 | 2013-09-30 | 2013-06-30 | 2013-03-31 | 2012-12-31 | 2012-09-30 | 2012-06-30 | 2012-03-31 | 2011-12-31 | 2011-09-30 | 2011-06-30 | 2011-03-31 | 2010-12-31 | 2010-09-30 | 2010-06-30 | 2010-03-31 | 2009-12-31 | ||
|---|---|---|---|---|---|---|---|---|---|---|---|---|---|---|---|---|---|---|---|---|---|---|---|---|---|---|---|---|---|---|---|---|---|---|---|---|---|---|---|---|---|---|---|---|---|---|---|---|---|---|---|---|---|---|---|---|---|---|
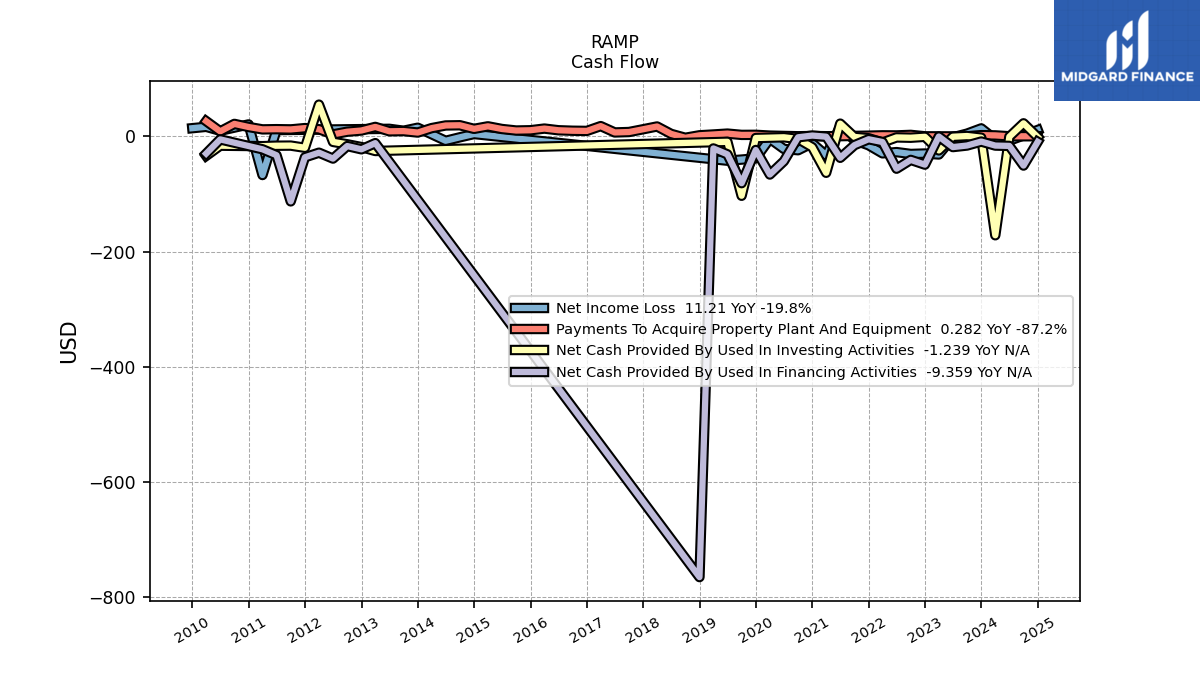
| Net Income Loss | 13.98 | 4.86 | -1.59 | -31.36 | -29.68 | -30.44 | -27.22 | -29.39 | -15.38 | -6.43 | 17.36 | -32.85 | -11.72 | -23.97 | -21.73 | -4.13 | -38.04 | -40.20 | -42.14 | NA | NA | NA | NA | NA | NA | NA | NA | NA | NA | NA | NA | NA | NA | NA | NA | NA | 4.16 | -1.54 | -7.60 | NA | 15.07 | 9.84 | 13.18 | NA | NA | NA | NA | NA | NA | NA | 10.97 | -67.06 | 20.82 | NA | 9.80 | 16.65 | 14.26 | |
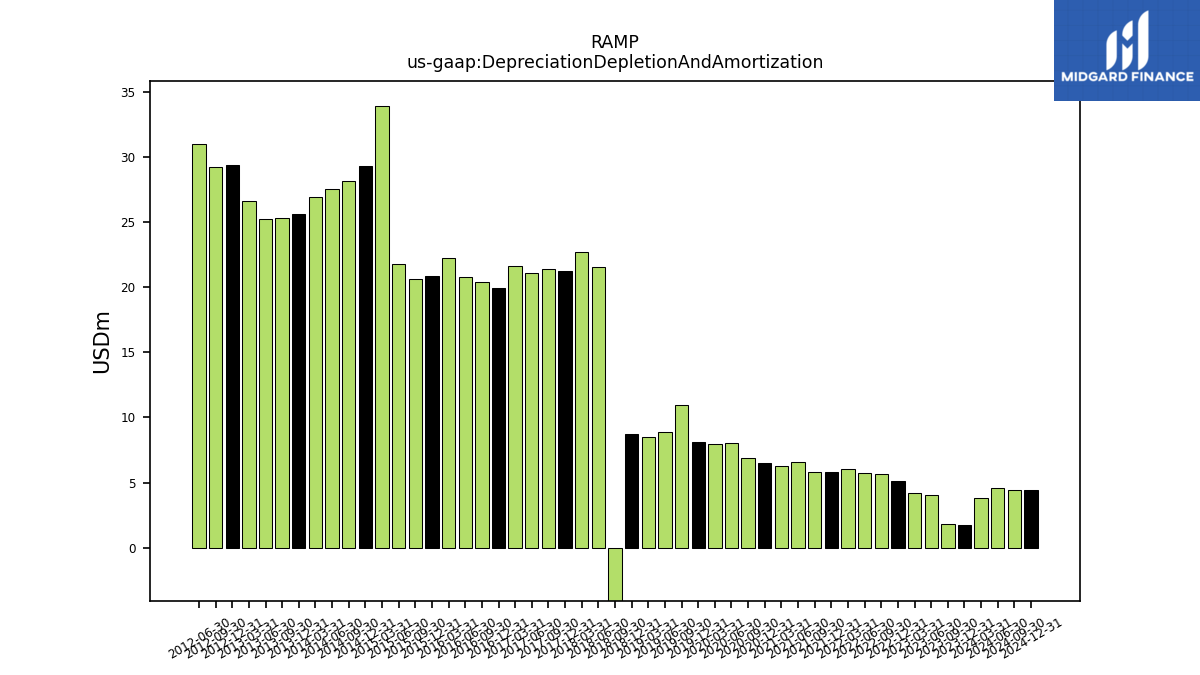
| Depreciation Depletion And Amortization | 1.78 | 1.86 | 4.04 | 4.23 | 5.13 | 5.69 | 5.74 | 6.02 | 5.83 | 5.82 | 6.58 | 6.28 | 6.51 | 6.90 | 8.05 | 7.94 | 8.10 | 10.98 | 8.88 | 8.51 | 8.73 | -4.99 | 21.53 | 22.65 | 21.20 | 21.41 | 21.11 | 21.59 | 19.95 | 20.36 | 20.79 | 22.24 | 20.81 | 20.64 | 21.77 | 33.86 | 29.29 | 28.16 | 27.52 | 26.88 | 25.61 | 25.33 | 25.18 | 26.61 | 29.36 | 29.24 | 31.00 | NA | NA | NA | NA | NA | NA | NA | NA | NA | NA | |
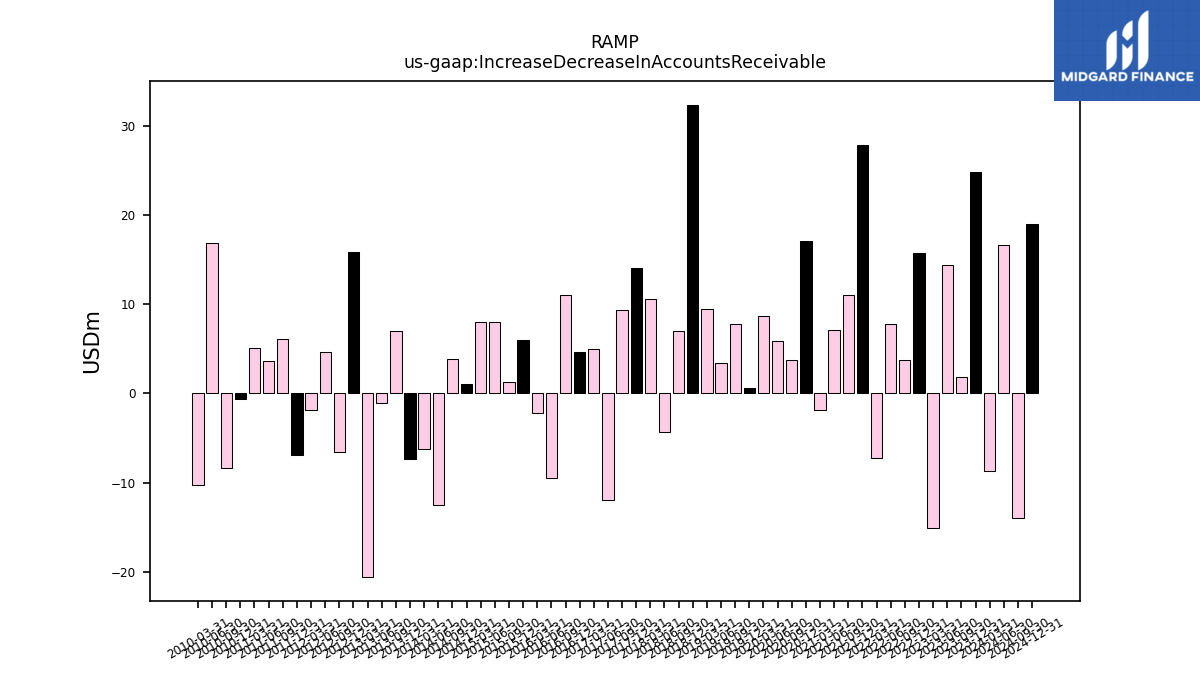
| Increase Decrease In Accounts Receivable | 24.78 | 1.87 | 14.39 | -15.05 | 15.72 | 3.72 | 7.73 | -7.26 | 27.80 | 11.02 | 7.05 | -1.82 | 17.06 | 3.72 | 5.86 | 8.67 | 0.59 | 7.81 | 3.45 | 9.40 | 32.36 | 6.98 | -4.33 | 10.57 | 14.05 | 9.34 | -11.96 | 5.00 | 4.60 | 11.05 | -9.49 | -2.22 | 5.96 | 1.24 | 8.04 | 8.03 | 1.08 | 3.87 | -12.48 | -6.20 | -7.39 | 7.00 | -1.14 | -20.60 | 15.87 | -6.55 | 4.61 | -1.82 | -6.91 | 6.05 | 3.62 | 5.11 | -0.58 | -8.34 | 16.84 | -10.29 | NA | |
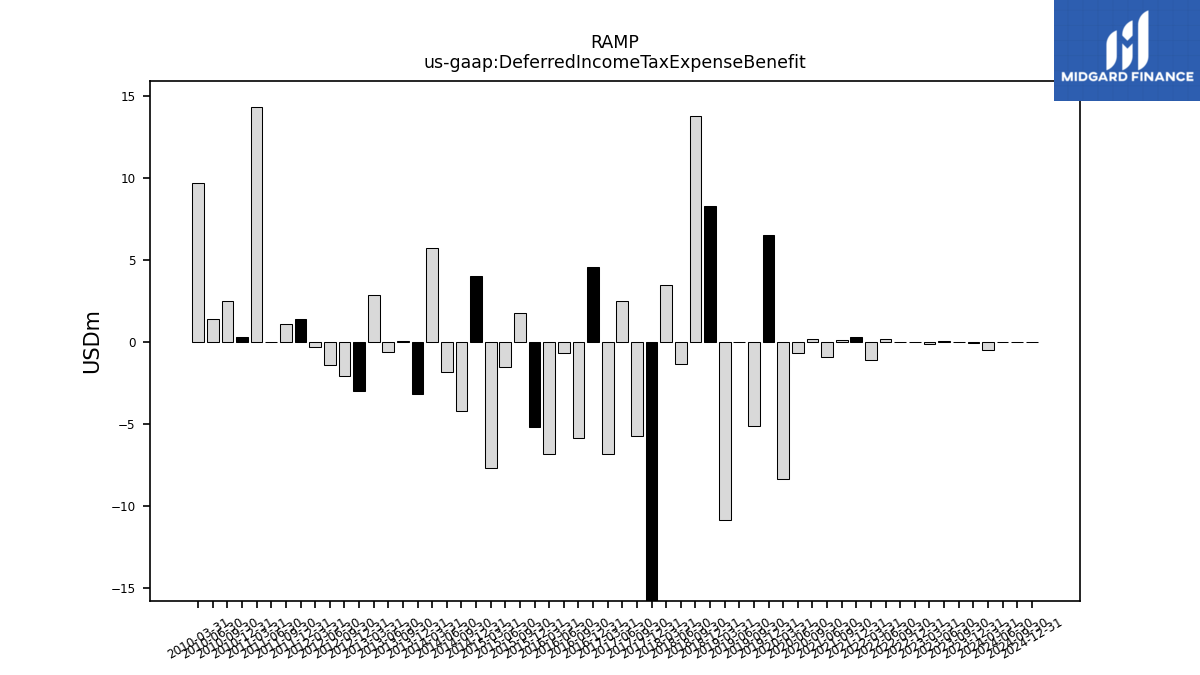
| Deferred Income Tax Expense Benefit | -0.05 | 0.04 | 0.05 | -0.09 | -0.01 | 0.03 | 0.19 | -1.08 | 0.32 | 0.14 | -0.91 | NA | NA | 0.19 | -0.67 | -8.34 | 6.55 | -5.09 | 0.01 | -10.83 | 8.28 | 13.78 | -1.33 | 3.48 | -17.21 | -5.74 | 2.50 | -6.84 | 4.56 | -5.86 | -0.68 | -6.81 | -5.14 | 1.81 | -1.52 | -7.67 | 4.00 | -4.18 | -1.84 | 5.76 | -3.14 | 0.06 | -0.59 | 2.85 | -2.96 | -2.06 | -1.40 | -0.31 | 1.40 | 1.10 | 0.04 | 14.33 | 0.30 | 2.51 | 1.44 | 9.71 | NA | |
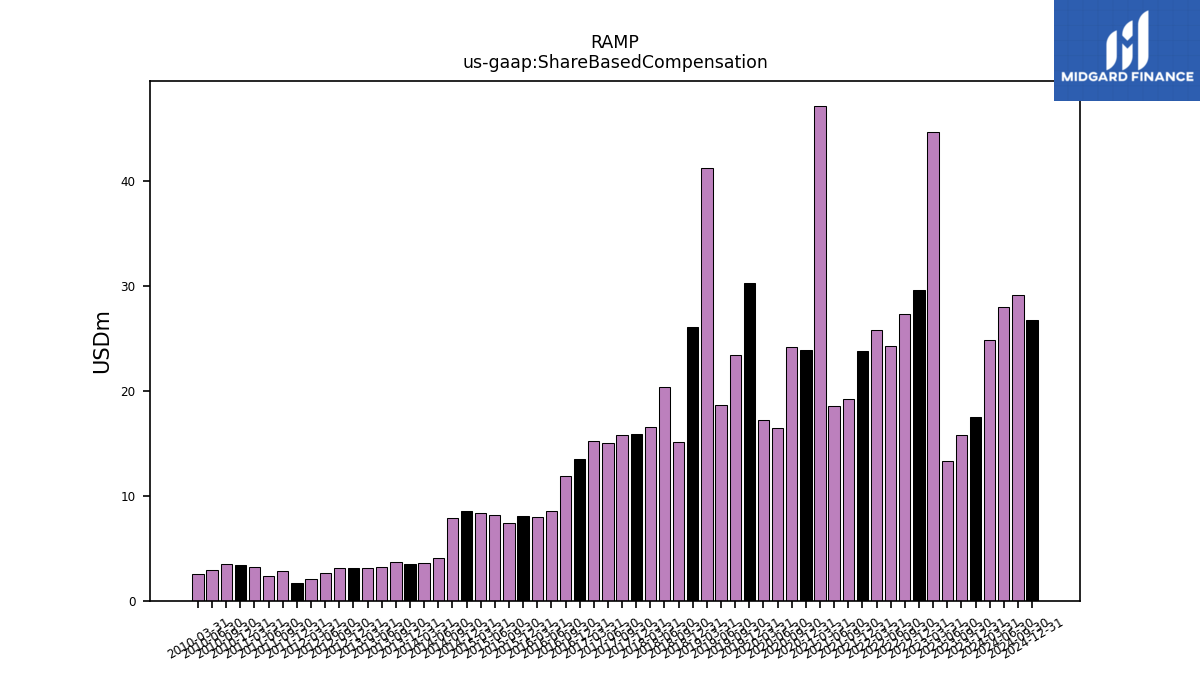
| Share Based Compensation | 17.50 | 15.73 | 13.29 | 44.66 | 29.62 | 27.29 | 24.23 | 25.78 | 23.76 | 19.22 | 18.50 | 47.12 | 23.89 | 24.20 | 16.48 | 17.17 | 30.30 | 23.35 | 18.63 | 41.17 | 26.08 | 15.11 | 20.36 | 16.53 | 15.91 | 15.76 | 15.04 | 15.19 | 13.45 | 11.91 | 8.59 | 7.93 | 8.05 | 7.36 | 8.12 | 8.35 | 8.58 | 7.87 | 4.09 | 3.58 | 3.46 | 3.71 | 3.18 | 3.10 | 3.10 | 3.15 | 2.65 | 2.06 | 1.71 | 2.85 | 2.35 | 3.20 | 3.44 | 3.49 | 2.97 | 2.50 | NA |
| 2023-12-31 | 2023-09-30 | 2023-06-30 | 2023-03-31 | 2022-12-31 | 2022-09-30 | 2022-06-30 | 2022-03-31 | 2021-12-31 | 2021-09-30 | 2021-06-30 | 2021-03-31 | 2020-12-31 | 2020-09-30 | 2020-06-30 | 2020-03-31 | 2019-12-31 | 2019-09-30 | 2019-06-30 | 2019-03-31 | 2018-12-31 | 2018-09-30 | 2018-06-30 | 2018-03-31 | 2017-12-31 | 2017-09-30 | 2017-06-30 | 2017-03-31 | 2016-12-31 | 2016-09-30 | 2016-06-30 | 2016-03-31 | 2015-12-31 | 2015-09-30 | 2015-06-30 | 2015-03-31 | 2014-12-31 | 2014-09-30 | 2014-06-30 | 2014-03-31 | 2013-12-31 | 2013-09-30 | 2013-06-30 | 2013-03-31 | 2012-12-31 | 2012-09-30 | 2012-06-30 | 2012-03-31 | 2011-12-31 | 2011-09-30 | 2011-06-30 | 2011-03-31 | 2010-12-31 | 2010-09-30 | 2010-06-30 | 2010-03-31 | 2009-12-31 | ||
|---|---|---|---|---|---|---|---|---|---|---|---|---|---|---|---|---|---|---|---|---|---|---|---|---|---|---|---|---|---|---|---|---|---|---|---|---|---|---|---|---|---|---|---|---|---|---|---|---|---|---|---|---|---|---|---|---|---|---|
| Net Cash Provided By Used In Investing Activities | -2.21 | 0.67 | -0.55 | -24.31 | -0.68 | -2.27 | -1.74 | -10.61 | -3.14 | -0.88 | 22.20 | -63.14 | -18.82 | -4.43 | -1.50 | NA | -2.77 | -103.01 | -9.37 | NA | NA | NA | NA | NA | NA | NA | NA | NA | NA | NA | NA | NA | NA | NA | NA | NA | NA | NA | NA | NA | NA | NA | NA | -25.31 | -18.47 | -13.65 | -9.51 | 55.17 | -19.71 | -15.94 | -16.14 | -16.91 | NA | NA | -16.11 | -33.71 | NA | |
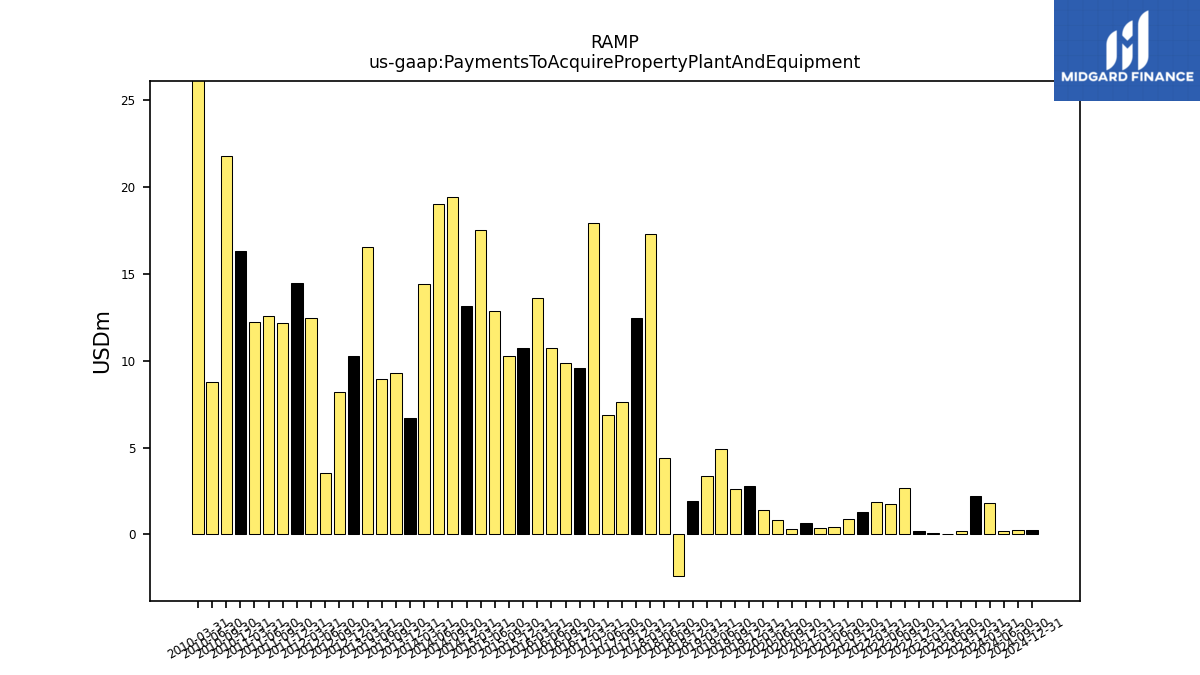
| Payments To Acquire Property Plant And Equipment | 2.21 | 0.20 | 0.05 | 0.10 | 0.18 | 2.67 | 1.74 | 1.88 | 1.32 | 0.88 | 0.43 | 0.38 | 0.68 | 0.30 | 0.83 | 1.41 | 2.77 | 2.64 | 4.89 | 3.35 | 1.94 | -2.36 | 4.40 | 17.25 | 12.43 | 7.63 | 6.89 | 17.90 | 9.56 | 9.85 | 10.69 | 13.60 | 10.70 | 10.24 | 12.88 | 17.51 | 13.13 | 19.40 | 19.00 | 14.41 | 6.70 | 9.27 | 8.92 | 16.52 | 10.26 | 8.18 | 3.54 | 12.44 | 14.44 | 12.13 | 12.58 | 12.21 | 16.32 | 21.73 | 8.75 | 26.54 | NA | |
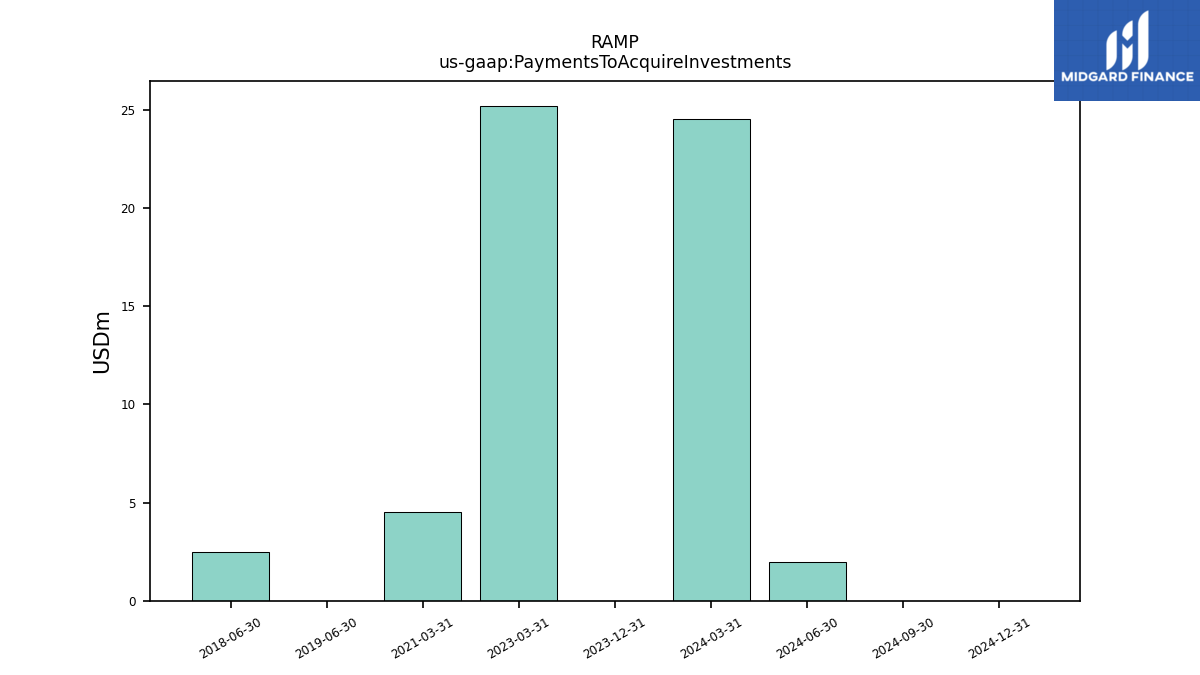
| Payments To Acquire Investments | 0.00 | NA | NA | 25.20 | NA | NA | NA | NA | NA | NA | NA | 4.50 | NA | NA | NA | NA | NA | NA | 0.00 | NA | NA | NA | 2.50 | NA | NA | NA | NA | NA | NA | NA | NA | NA | NA | NA | NA | NA | NA | NA | NA | NA | NA | NA | NA | NA | NA | NA | NA | NA | NA | NA | NA | NA | NA | NA | NA | NA | NA |
| 2023-12-31 | 2023-09-30 | 2023-06-30 | 2023-03-31 | 2022-12-31 | 2022-09-30 | 2022-06-30 | 2022-03-31 | 2021-12-31 | 2021-09-30 | 2021-06-30 | 2021-03-31 | 2020-12-31 | 2020-09-30 | 2020-06-30 | 2020-03-31 | 2019-12-31 | 2019-09-30 | 2019-06-30 | 2019-03-31 | 2018-12-31 | 2018-09-30 | 2018-06-30 | 2018-03-31 | 2017-12-31 | 2017-09-30 | 2017-06-30 | 2017-03-31 | 2016-12-31 | 2016-09-30 | 2016-06-30 | 2016-03-31 | 2015-12-31 | 2015-09-30 | 2015-06-30 | 2015-03-31 | 2014-12-31 | 2014-09-30 | 2014-06-30 | 2014-03-31 | 2013-12-31 | 2013-09-30 | 2013-06-30 | 2013-03-31 | 2012-12-31 | 2012-09-30 | 2012-06-30 | 2012-03-31 | 2011-12-31 | 2011-09-30 | 2011-06-30 | 2011-03-31 | 2010-12-31 | 2010-09-30 | 2010-06-30 | 2010-03-31 | 2009-12-31 | ||
|---|---|---|---|---|---|---|---|---|---|---|---|---|---|---|---|---|---|---|---|---|---|---|---|---|---|---|---|---|---|---|---|---|---|---|---|---|---|---|---|---|---|---|---|---|---|---|---|---|---|---|---|---|---|---|---|---|---|---|
| Net Cash Provided By Used In Financing Activities | -8.90 | -15.80 | -18.52 | -0.21 | -49.01 | -40.74 | -56.05 | -9.72 | -4.92 | -15.18 | -37.16 | -0.48 | 1.49 | -1.50 | -43.00 | -66.14 | -23.55 | -81.16 | -31.13 | -20.86 | -764.78 | NA | NA | NA | NA | NA | NA | NA | NA | NA | NA | NA | NA | NA | NA | NA | NA | NA | NA | NA | NA | NA | NA | -11.65 | -22.38 | -16.71 | -38.48 | -28.24 | -36.22 | -112.78 | -32.60 | -22.33 | NA | NA | -5.16 | -29.85 | NA | |
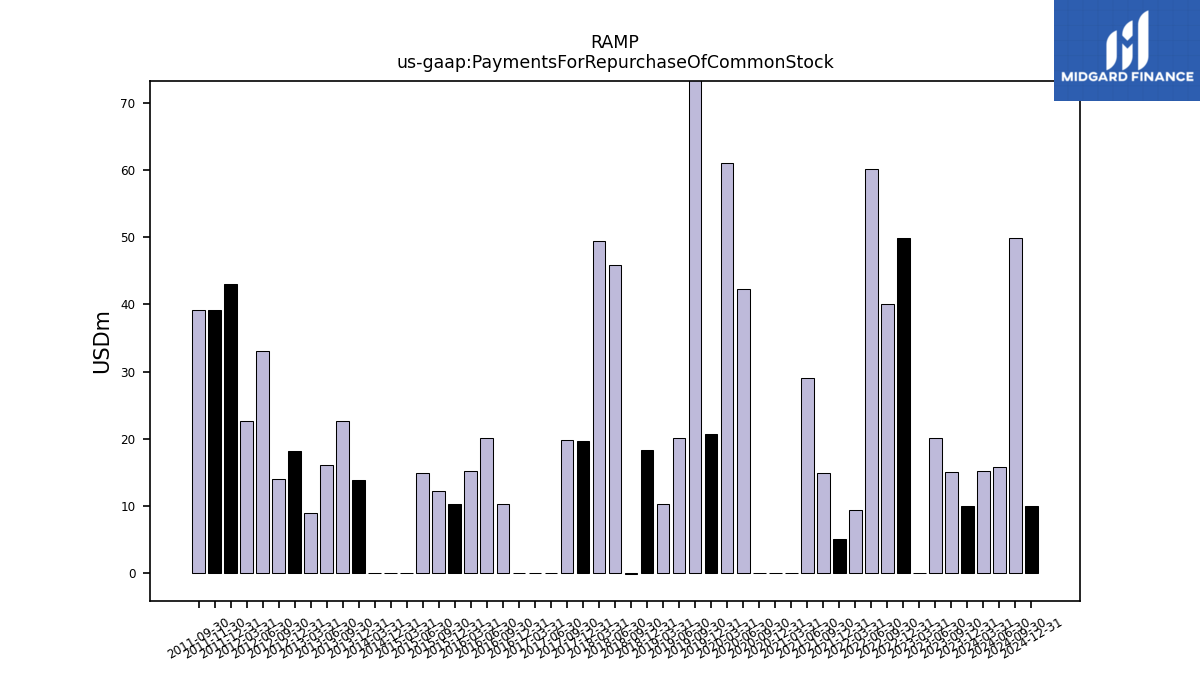
| Payments For Repurchase Of Common Stock | 10.00 | 15.12 | 20.20 | 0.00 | 49.91 | 40.04 | 60.05 | 9.40 | 5.15 | 15.00 | 29.08 | 0.00 | 0.00 | 0.00 | 42.31 | 61.00 | 20.71 | 80.37 | 20.10 | 10.31 | 18.34 | -0.03 | 45.80 | 49.48 | 19.62 | 19.78 | 0.00 | 0.00 | 0.00 | 10.34 | 20.21 | 15.23 | 10.27 | 12.31 | 14.95 | 0.00 | 0.00 | NA | NA | 0.00 | 13.83 | 22.70 | 16.14 | 9.02 | 18.26 | 14.00 | 33.10 | 22.71 | 43.10 | 39.10 | NA | NA | NA | NA | NA | NA | NA |
| 2023-12-31 | 2023-09-30 | 2023-06-30 | 2023-03-31 | 2022-12-31 | 2022-09-30 | 2022-06-30 | 2022-03-31 | 2021-12-31 | 2021-09-30 | 2021-06-30 | 2021-03-31 | 2020-12-31 | 2020-09-30 | 2020-06-30 | 2020-03-31 | 2019-12-31 | 2019-09-30 | 2019-06-30 | 2019-03-31 | 2018-12-31 | 2018-09-30 | 2018-06-30 | 2018-03-31 | 2017-12-31 | 2017-09-30 | 2017-06-30 | 2017-03-31 | 2016-12-31 | 2016-09-30 | 2016-06-30 | 2016-03-31 | 2015-12-31 | 2015-09-30 | 2015-06-30 | 2015-03-31 | 2014-12-31 | 2014-09-30 | 2014-06-30 | 2014-03-31 | 2013-12-31 | 2013-09-30 | 2013-06-30 | 2013-03-31 | 2012-12-31 | 2012-09-30 | 2012-06-30 | 2012-03-31 | 2011-12-31 | 2011-09-30 | 2011-06-30 | 2011-03-31 | 2010-12-31 | 2010-09-30 | 2010-06-30 | 2010-03-31 | 2009-12-31 | ||
|---|---|---|---|---|---|---|---|---|---|---|---|---|---|---|---|---|---|---|---|---|---|---|---|---|---|---|---|---|---|---|---|---|---|---|---|---|---|---|---|---|---|---|---|---|---|---|---|---|---|---|---|---|---|---|---|---|---|---|
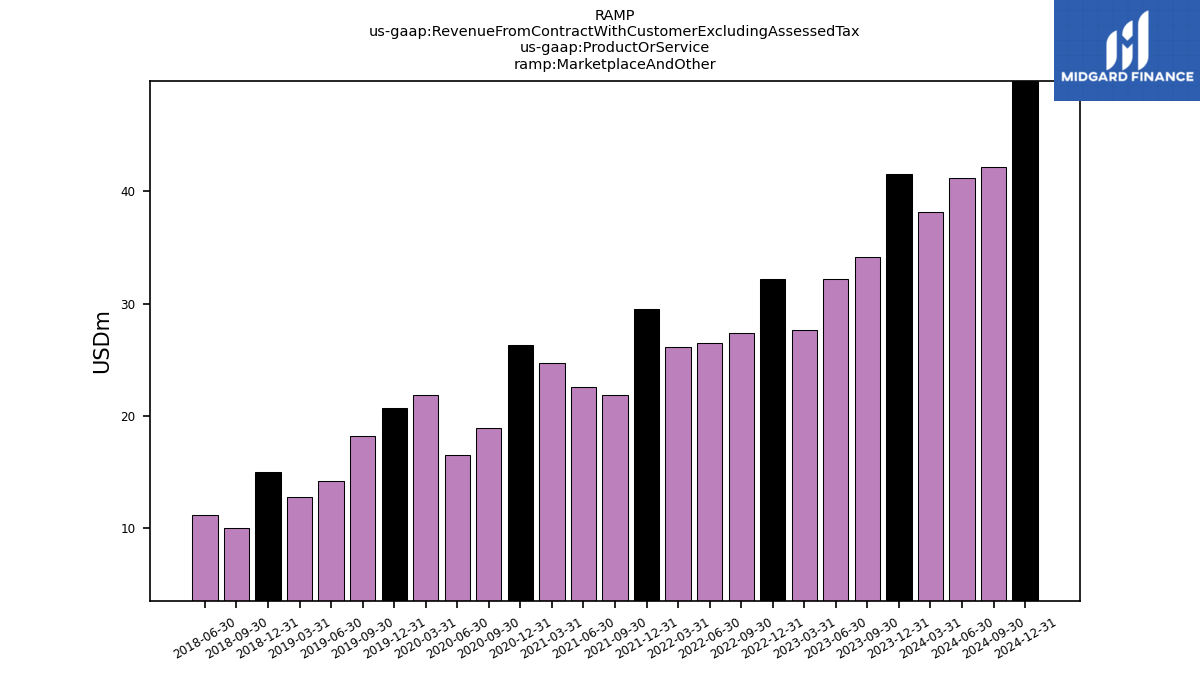
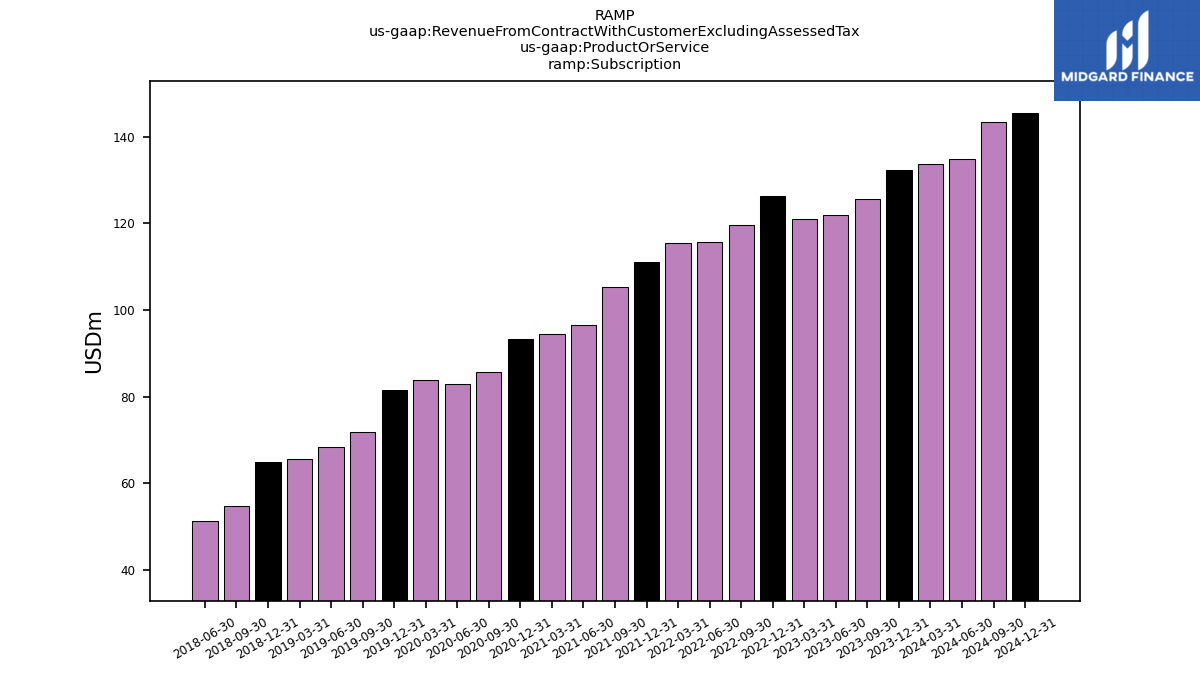
| Revenue From Contract With Customer Excluding Assessed Tax | 173.87 | 159.87 | 154.07 | 148.63 | 158.62 | 147.10 | 142.24 | 141.72 | 140.60 | 127.29 | 119.04 | 119.17 | 119.75 | 104.66 | 99.44 | 105.70 | 102.22 | 90.14 | 82.51 | 78.32 | 80.02 | 64.81 | 226.96 | 60.21 | 59.12 | 54.01 | 212.51 | 224.87 | 223.31 | 217.27 | 214.80 | 224.66 | 221.19 | 207.34 | 196.90 | 257.37 | 260.44 | 260.04 | 242.22 | 277.21 | 277.87 | 276.27 | 266.19 | 277.13 | 273.10 | 277.47 | 271.66 | 287.25 | 280.89 | 300.03 | 288.93 | 287.23 | 299.11 | 291.67 | 270.39 | 288.34 | 283.81 | |
| Marketplace And Other | 41.52 | 34.17 | 32.19 | 27.68 | 32.19 | 27.40 | 26.51 | 26.15 | 29.49 | 21.87 | 22.53 | 24.71 | 26.32 | 18.88 | 16.52 | 21.87 | 20.66 | 18.18 | 14.19 | 12.78 | 15.01 | 9.96 | 11.14 | NA | NA | NA | NA | NA | NA | NA | NA | NA | NA | NA | NA | NA | NA | NA | NA | NA | NA | NA | NA | NA | NA | NA | NA | NA | NA | NA | NA | NA | NA | NA | NA | NA | NA | |
| Subscription | 132.35 | 125.70 | 121.88 | 120.94 | 126.43 | 119.70 | 115.73 | 115.57 | 111.12 | 105.42 | 96.51 | 94.47 | 93.43 | 85.78 | 82.92 | 83.83 | 81.55 | 71.97 | 68.33 | 65.53 | 65.01 | 54.85 | 51.33 | NA | NA | NA | NA | NA | NA | NA | NA | NA | NA | NA | NA | NA | NA | NA | NA | NA | NA | NA | NA | NA | NA | NA | NA | NA | NA | NA | NA | NA | NA | NA | NA | NA | NA | |
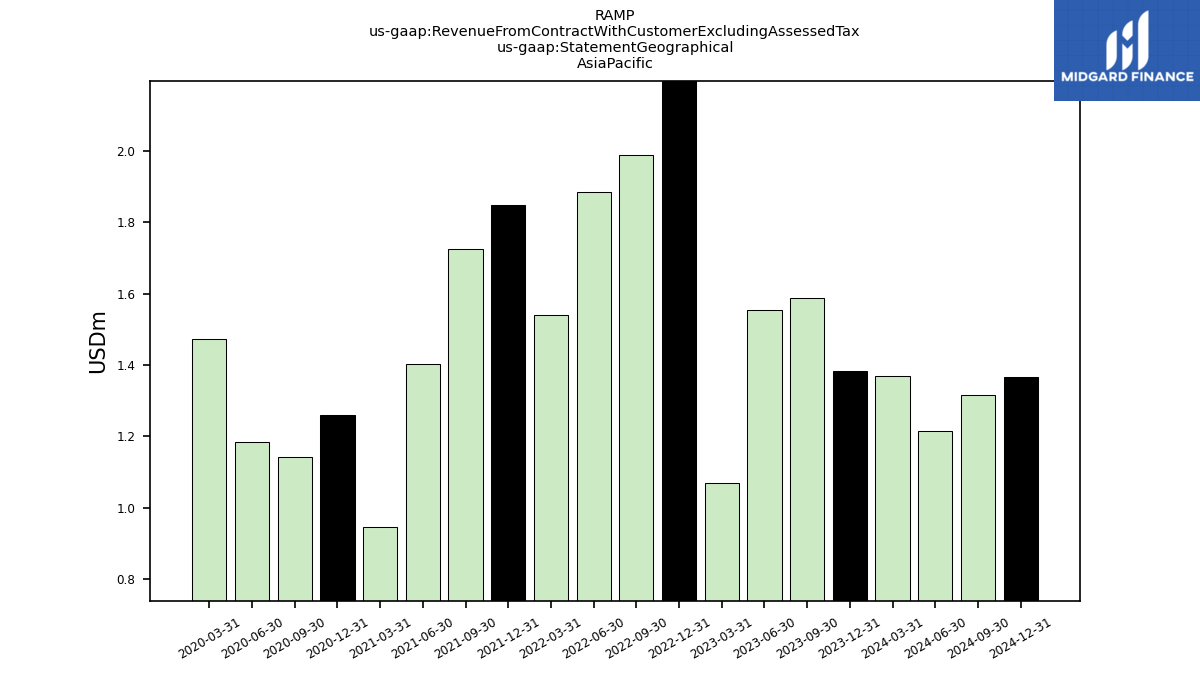
| 1.38 | 1.59 | 1.55 | 1.07 | 2.53 | 1.99 | 1.89 | 1.54 | 1.85 | 1.73 | 1.40 | 0.95 | 1.26 | 1.14 | 1.19 | 1.47 | NA | NA | NA | NA | NA | NA | NA | NA | NA | NA | NA | NA | NA | NA | NA | NA | NA | NA | NA | NA | NA | NA | NA | NA | NA | NA | NA | NA | NA | NA | NA | NA | NA | NA | NA | NA | NA | NA | NA | NA | NA | ||
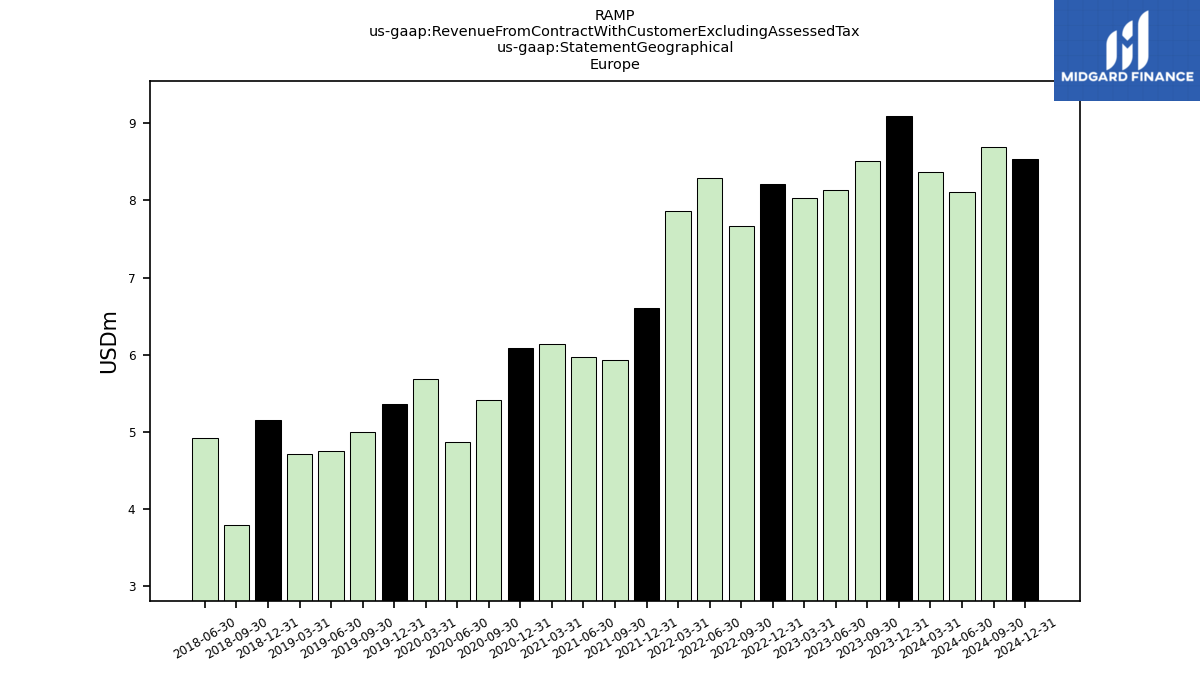
| 9.09 | 8.51 | 8.14 | 8.04 | 8.22 | 7.67 | 8.29 | 7.87 | 6.61 | 5.93 | 5.96 | 6.14 | 6.09 | 5.41 | 4.87 | 5.69 | 5.36 | 4.99 | 4.75 | 4.71 | 5.15 | 3.79 | 4.92 | NA | NA | NA | NA | NA | NA | NA | NA | NA | NA | NA | NA | NA | NA | NA | NA | NA | NA | NA | NA | NA | NA | NA | NA | NA | NA | NA | NA | NA | NA | NA | NA | NA | NA | ||
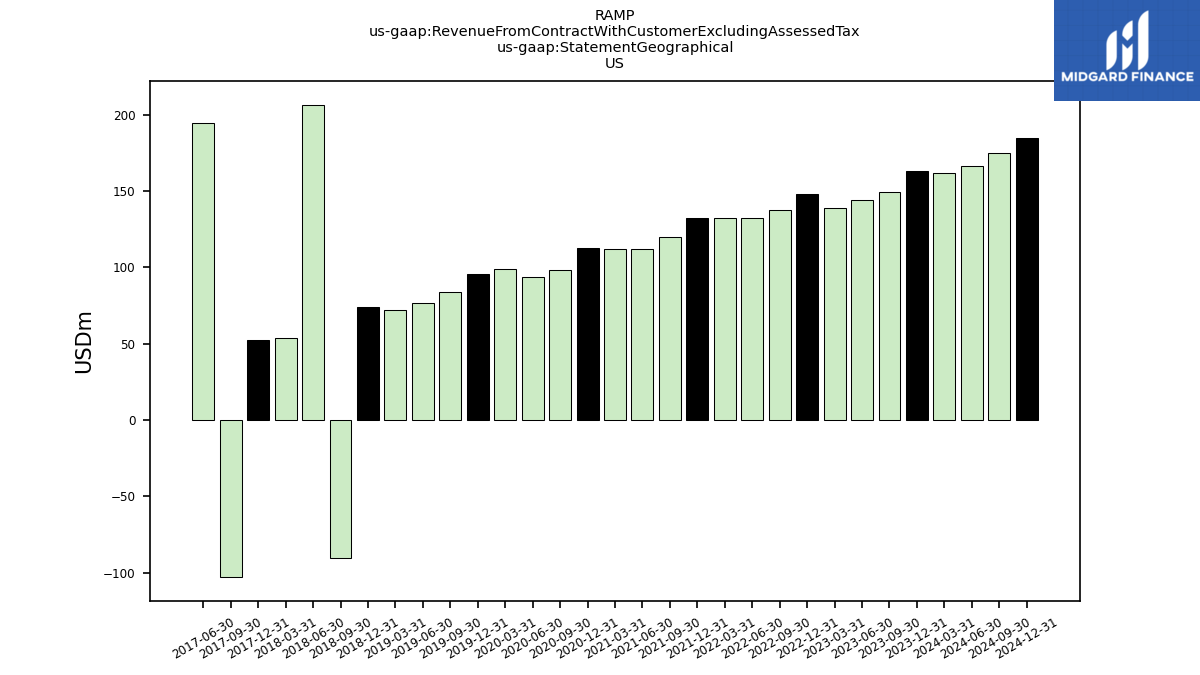
| US | 163.08 | 149.40 | 144.17 | 138.83 | 147.87 | 137.44 | 132.07 | 132.32 | 132.15 | 119.63 | 111.67 | 112.08 | 112.41 | 98.11 | 93.38 | 98.54 | 95.45 | 83.91 | 76.54 | 72.14 | 73.80 | -90.33 | 206.53 | 53.68 | 52.67 | -102.98 | 194.25 | NA | NA | NA | NA | NA | NA | NA | NA | NA | NA | NA | NA | NA | NA | NA | NA | NA | NA | NA | NA | NA | NA | NA | NA | NA | NA | NA | NA | NA | NA | |
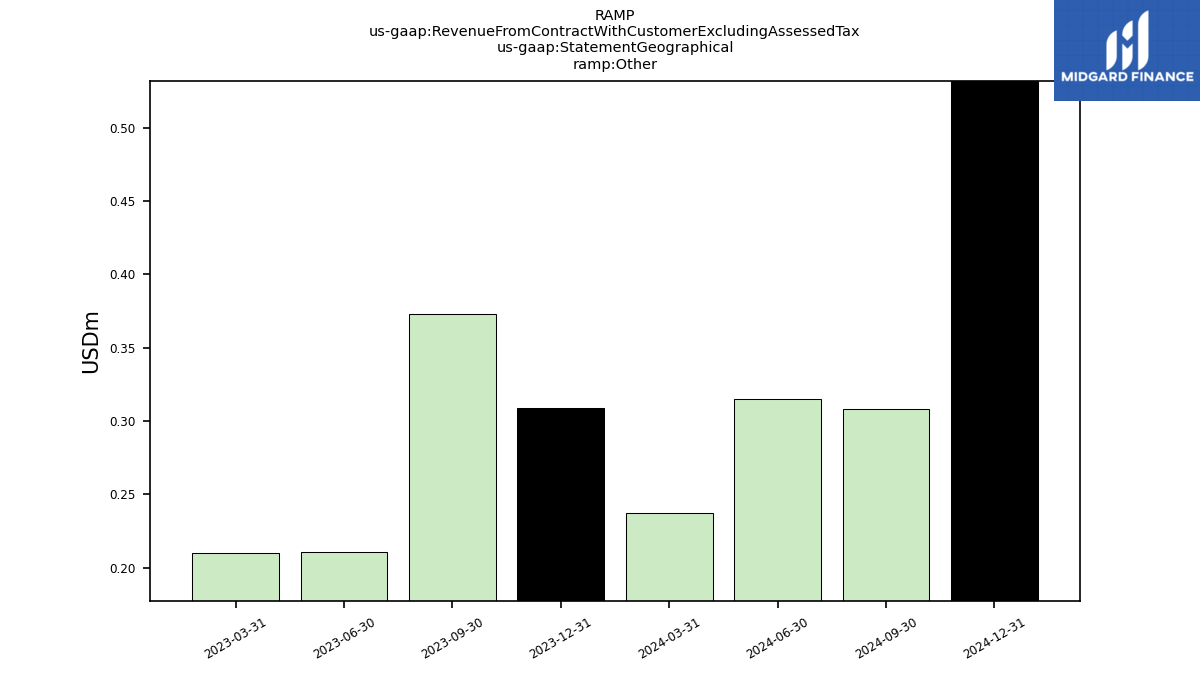
| Other | 0.31 | 0.37 | 0.21 | 0.21 | NA | NA | NA | NA | NA | NA | NA | NA | NA | NA | NA | NA | NA | NA | NA | NA | NA | NA | NA | NA | NA | NA | NA | NA | NA | NA | NA | NA | NA | NA | NA | NA | NA | NA | NA | NA | NA | NA | NA | NA | NA | NA | NA | NA | NA | NA | NA | NA | NA | NA | NA | NA | NA |