
| 2023-09-30 | 2023-06-30 | 2023-03-31 | 2022-12-31 | 2022-09-30 | 2022-06-30 | 2022-03-31 | 2021-12-31 | 2021-09-30 | 2021-06-30 | 2021-03-31 | 2020-12-31 | 2020-09-30 | 2020-06-30 | 2020-03-31 | 2019-12-31 | 2019-09-30 | 2019-06-30 | 2019-03-31 | 2018-12-31 | 2018-09-30 | 2018-06-30 | 2018-03-31 | 2017-12-31 | 2017-09-30 | 2017-06-30 | 2017-03-31 | 2016-12-31 | 2016-09-30 | 2016-06-30 | 2016-03-31 | 2015-12-31 | 2015-09-30 | 2015-06-30 | 2015-03-31 | 2014-12-31 | ||
|---|---|---|---|---|---|---|---|---|---|---|---|---|---|---|---|---|---|---|---|---|---|---|---|---|---|---|---|---|---|---|---|---|---|---|---|---|---|
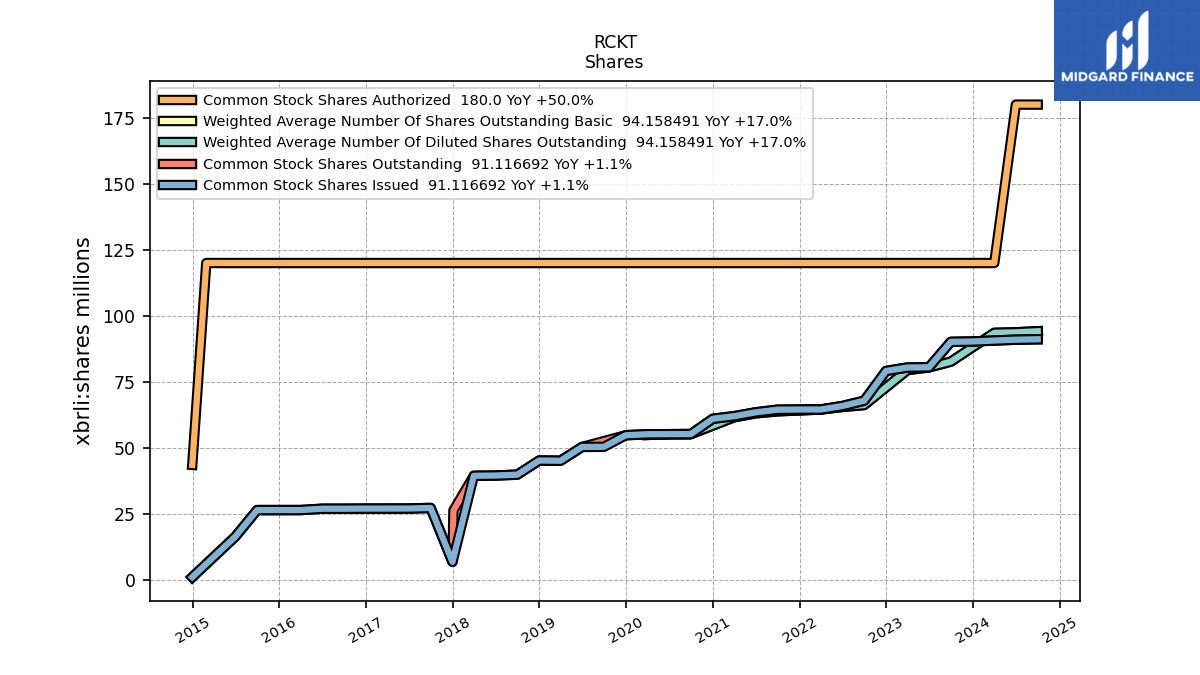
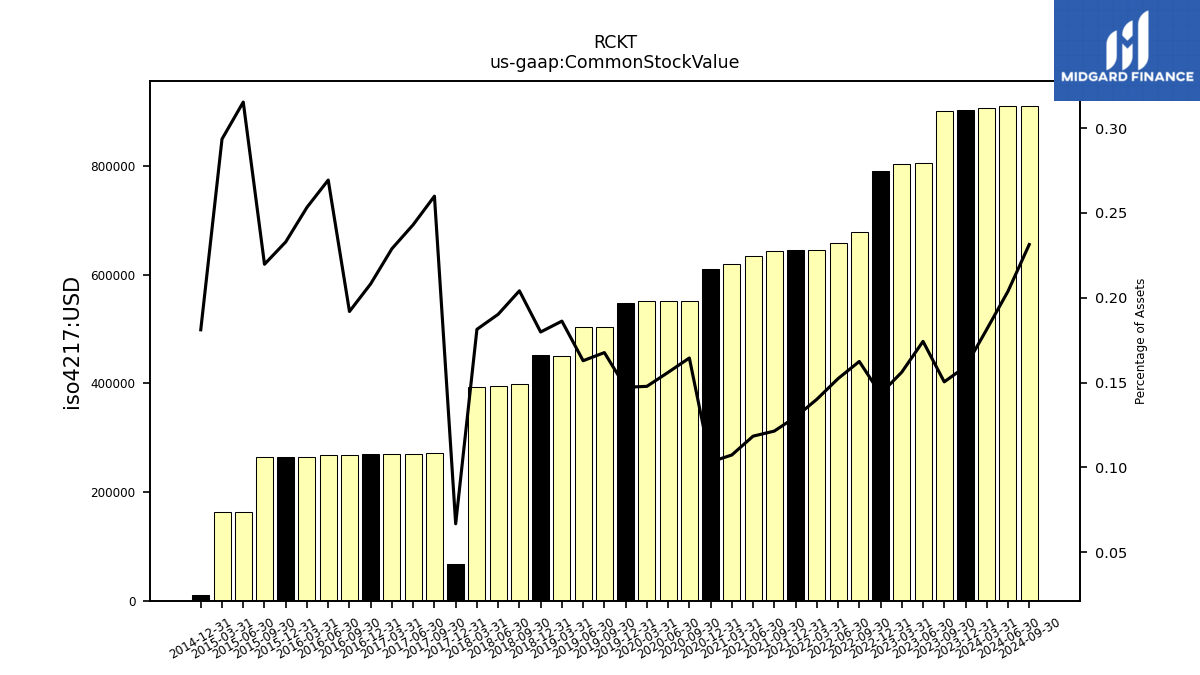
| Common Stock Value | 0.90 | 0.81 | 0.80 | 0.79 | 0.68 | 0.66 | 0.65 | 0.65 | 0.64 | 0.63 | 0.62 | 0.61 | 0.55 | 0.55 | 0.55 | 0.55 | 0.50 | 0.50 | 0.45 | 0.45 | 0.40 | 0.40 | 0.39 | 0.07 | 0.27 | 0.27 | 0.27 | 0.27 | 0.27 | 0.27 | 0.26 | 0.26 | 0.26 | 0.16 | 0.16 | 0.01 | |
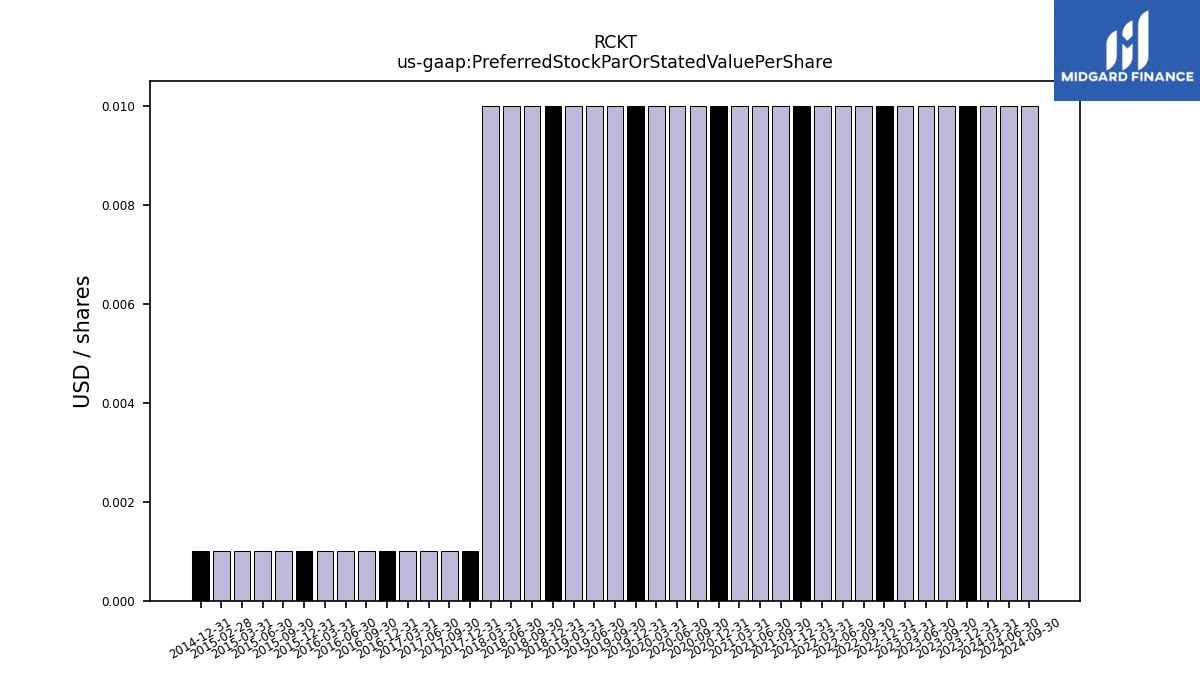
| Preferred Stock Par Or Stated Value Per Share | 0.00 | 0.00 | 0.00 | 0.00 | 0.00 | 0.00 | 0.00 | 0.00 | 0.00 | 0.00 | 0.00 | 0.00 | 0.00 | 0.00 | 0.00 | 0.00 | 0.00 | 0.00 | 0.00 | 0.00 | 0.00 | 0.00 | 0.00 | 0.00 | 0.00 | 0.00 | 0.00 | 0.00 | 0.00 | 0.00 | 0.00 | 0.00 | 0.00 | 0.00 | 0.00 | 0.00 | |
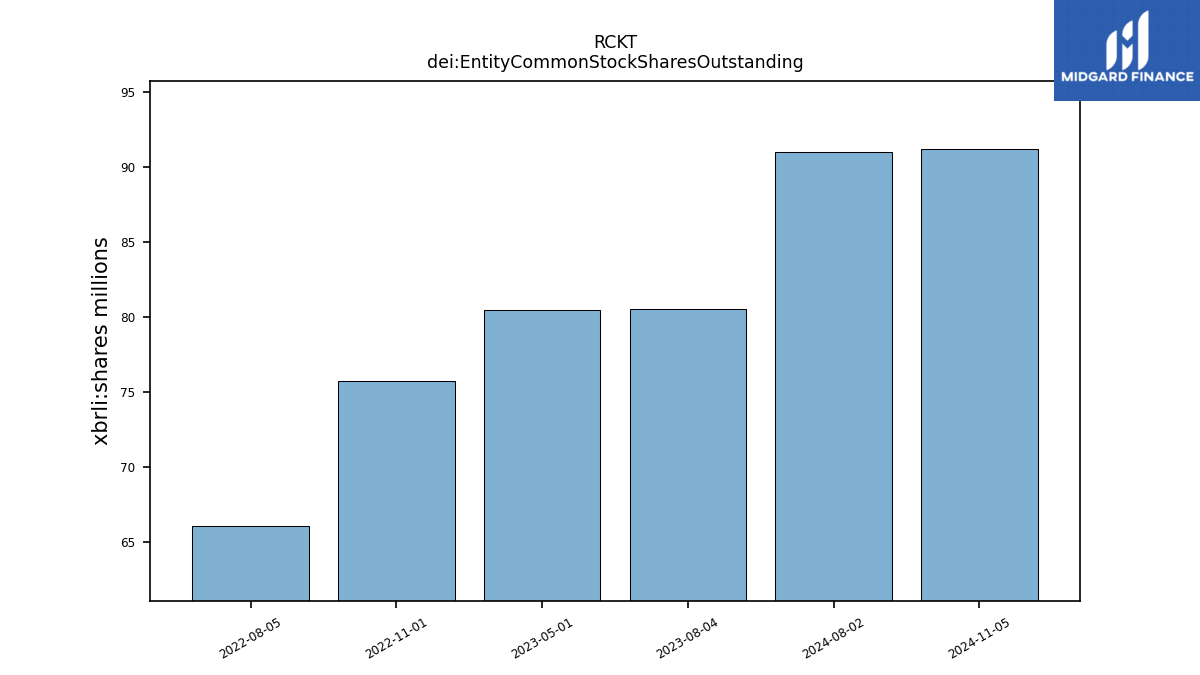
| dei: Entity Common Stock Shares Outstanding | NA | NA | NA | NA | NA | NA | NA | NA | NA | NA | NA | NA | NA | NA | NA | NA | NA | NA | NA | NA | NA | NA | NA | NA | NA | NA | NA | NA | NA | NA | NA | NA | NA | NA | NA | NA | |
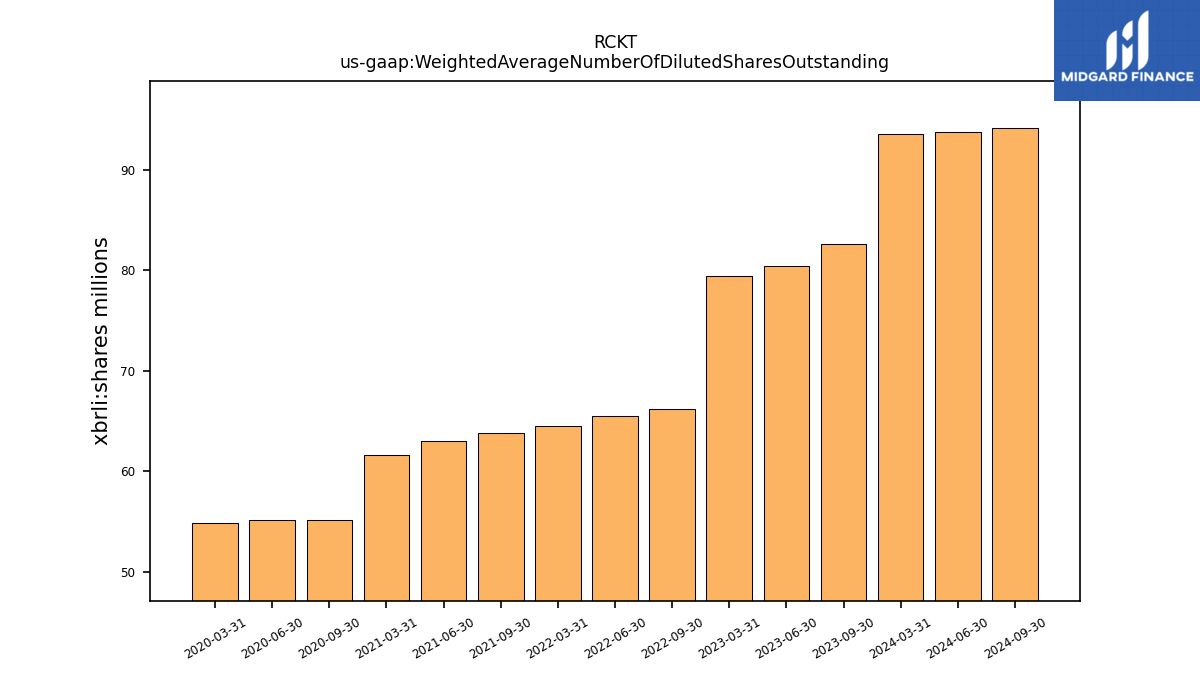
| Weighted Average Number Of Diluted Shares Outstanding | 82.64 | 80.47 | 79.45 | NA | 66.22 | 65.48 | 64.51 | NA | 63.83 | 63.06 | 61.57 | NA | 55.19 | 55.16 | 54.88 | NA | NA | NA | NA | NA | NA | NA | NA | NA | NA | NA | NA | NA | NA | NA | NA | NA | NA | NA | NA | NA | |
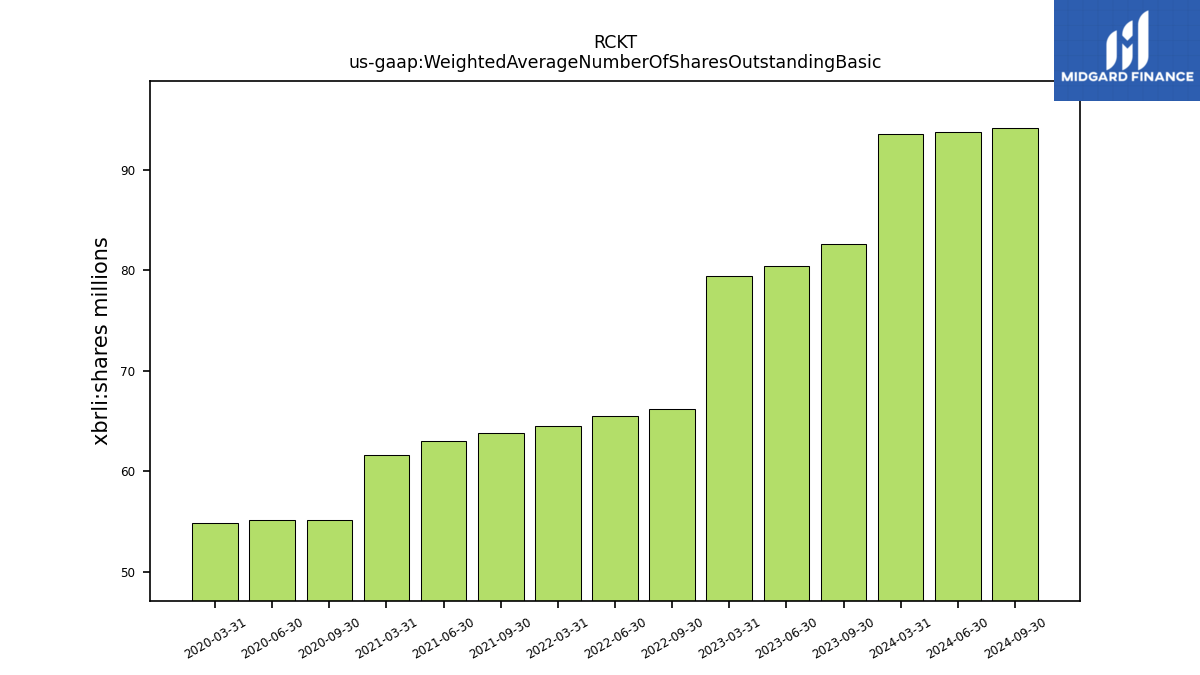
| Weighted Average Number Of Shares Outstanding Basic | 82.64 | 80.47 | 79.45 | NA | 66.22 | 65.48 | 64.51 | NA | 63.83 | 63.06 | 61.57 | NA | 55.19 | 55.16 | 54.88 | NA | NA | NA | NA | NA | NA | NA | NA | NA | NA | NA | NA | NA | NA | NA | NA | NA | NA | NA | NA | NA | |
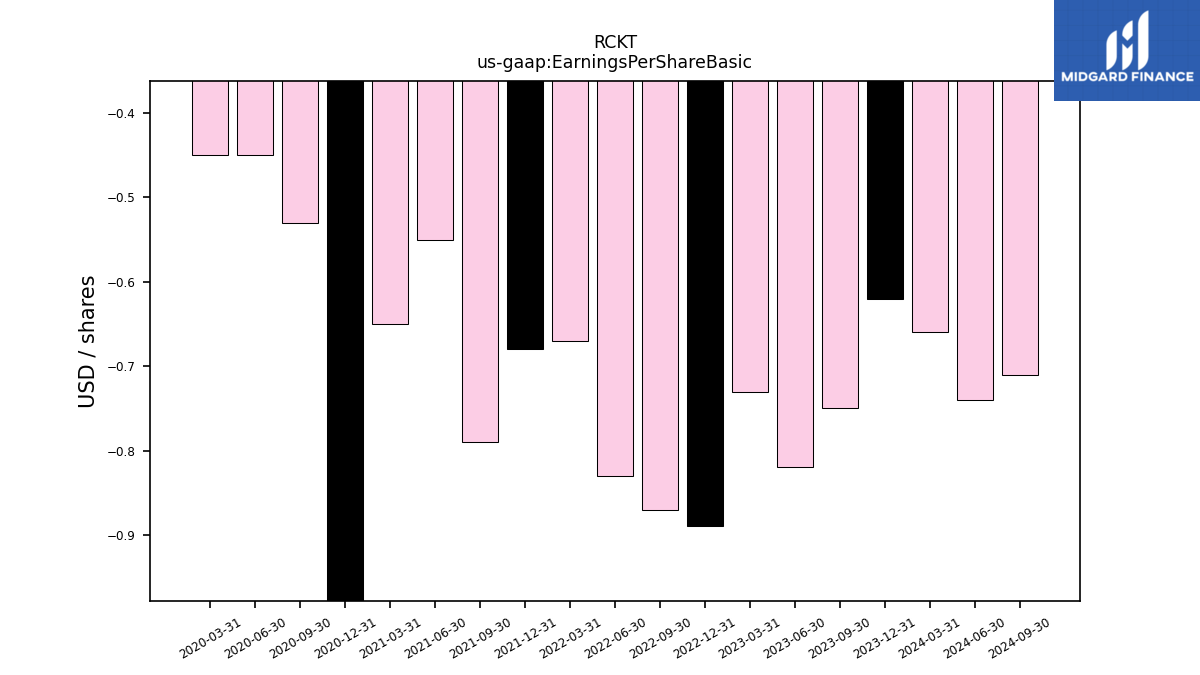
| Earnings Per Share Basic | -0.75 | -0.82 | -0.73 | -0.89 | -0.87 | -0.83 | -0.67 | -0.68 | -0.79 | -0.55 | -0.65 | -1.09 | -0.53 | -0.45 | -0.45 | NA | NA | NA | NA | NA | NA | NA | NA | NA | NA | NA | NA | NA | NA | NA | NA | NA | NA | NA | NA | NA | |
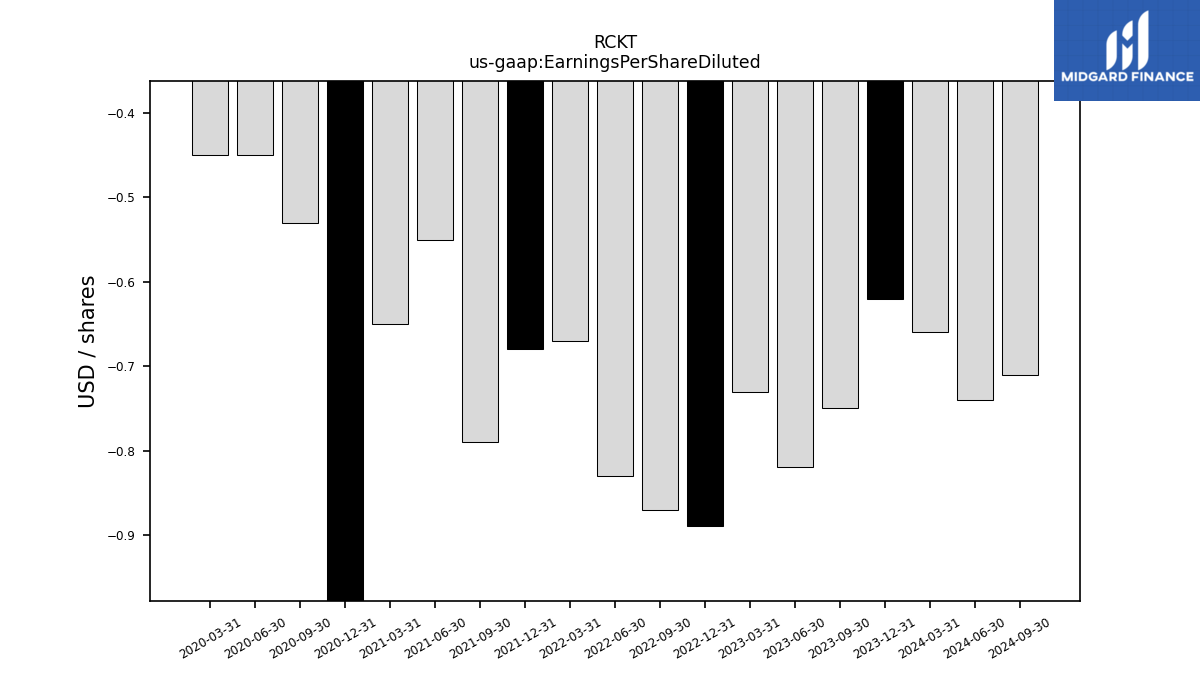
| Earnings Per Share Diluted | -0.75 | -0.82 | -0.73 | -0.89 | -0.87 | -0.83 | -0.67 | -0.68 | -0.79 | -0.55 | -0.65 | -1.09 | -0.53 | -0.45 | -0.45 | NA | NA | NA | NA | NA | NA | NA | NA | NA | NA | NA | NA | NA | NA | NA | NA | NA | NA | NA | NA | NA |
| 2023-09-30 | 2023-06-30 | 2023-03-31 | 2022-12-31 | 2022-09-30 | 2022-06-30 | 2022-03-31 | 2021-12-31 | 2021-09-30 | 2021-06-30 | 2021-03-31 | 2020-12-31 | 2020-09-30 | 2020-06-30 | 2020-03-31 | 2019-12-31 | 2019-09-30 | 2019-06-30 | 2019-03-31 | 2018-12-31 | 2018-09-30 | 2018-06-30 | 2018-03-31 | 2017-12-31 | 2017-09-30 | 2017-06-30 | 2017-03-31 | 2016-12-31 | 2016-09-30 | 2016-06-30 | 2016-03-31 | 2015-12-31 | 2015-09-30 | 2015-06-30 | 2015-03-31 | 2014-12-31 | ||
|---|---|---|---|---|---|---|---|---|---|---|---|---|---|---|---|---|---|---|---|---|---|---|---|---|---|---|---|---|---|---|---|---|---|---|---|---|---|
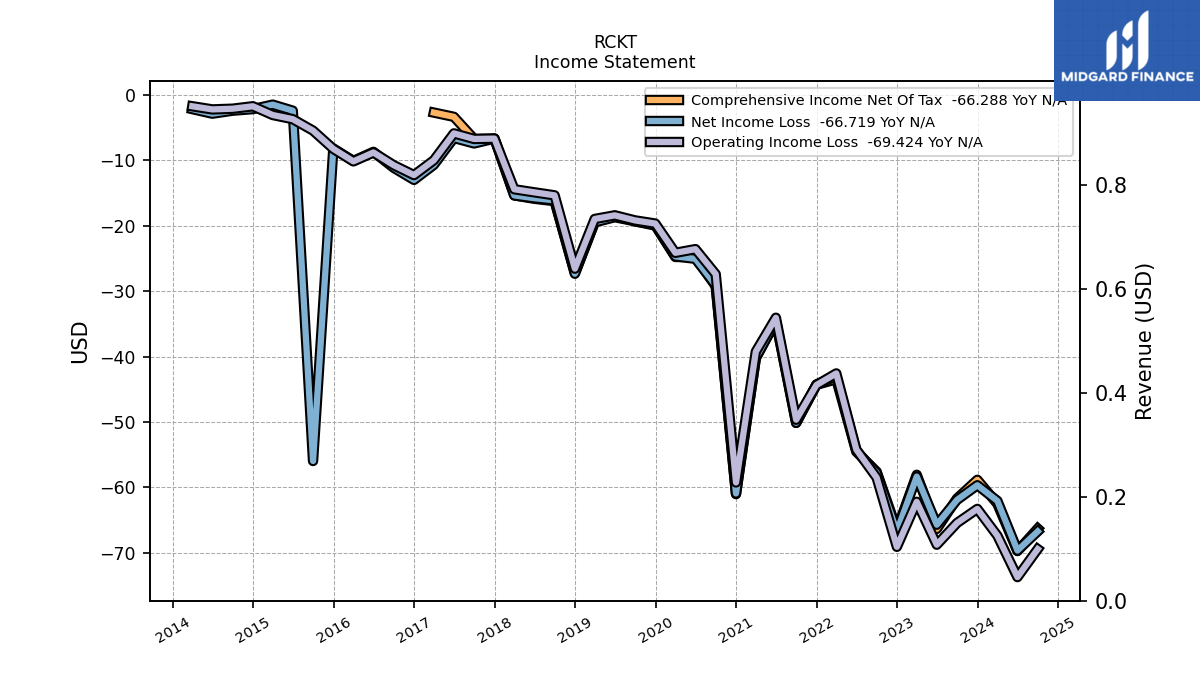
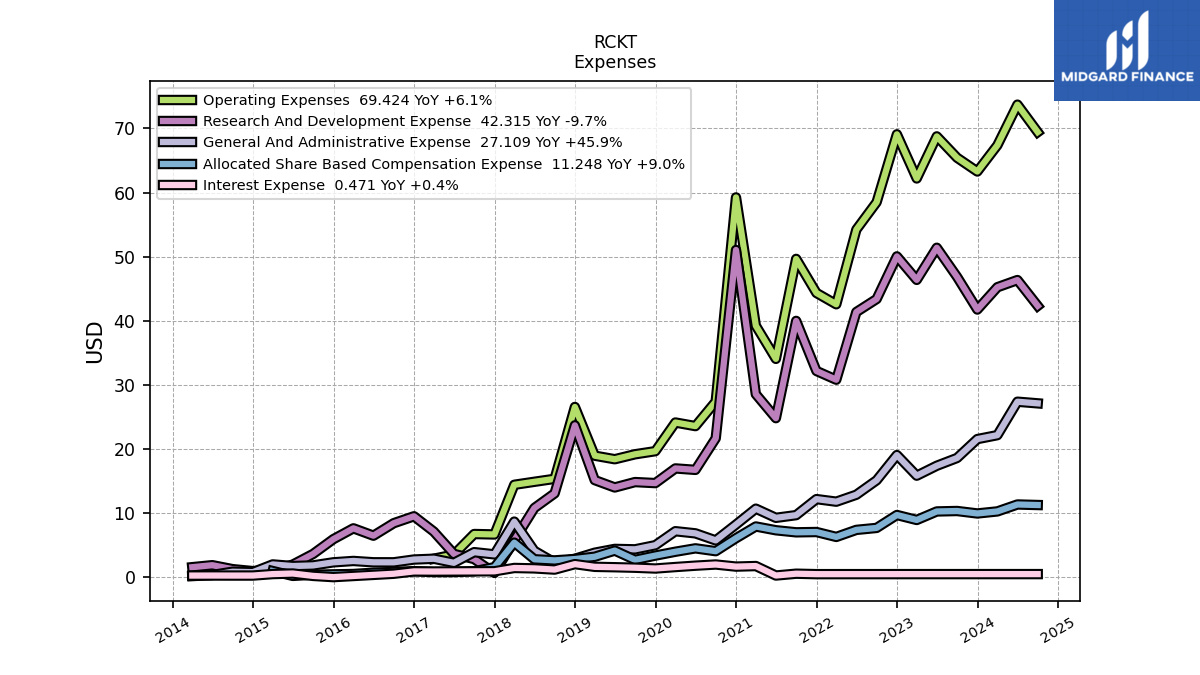
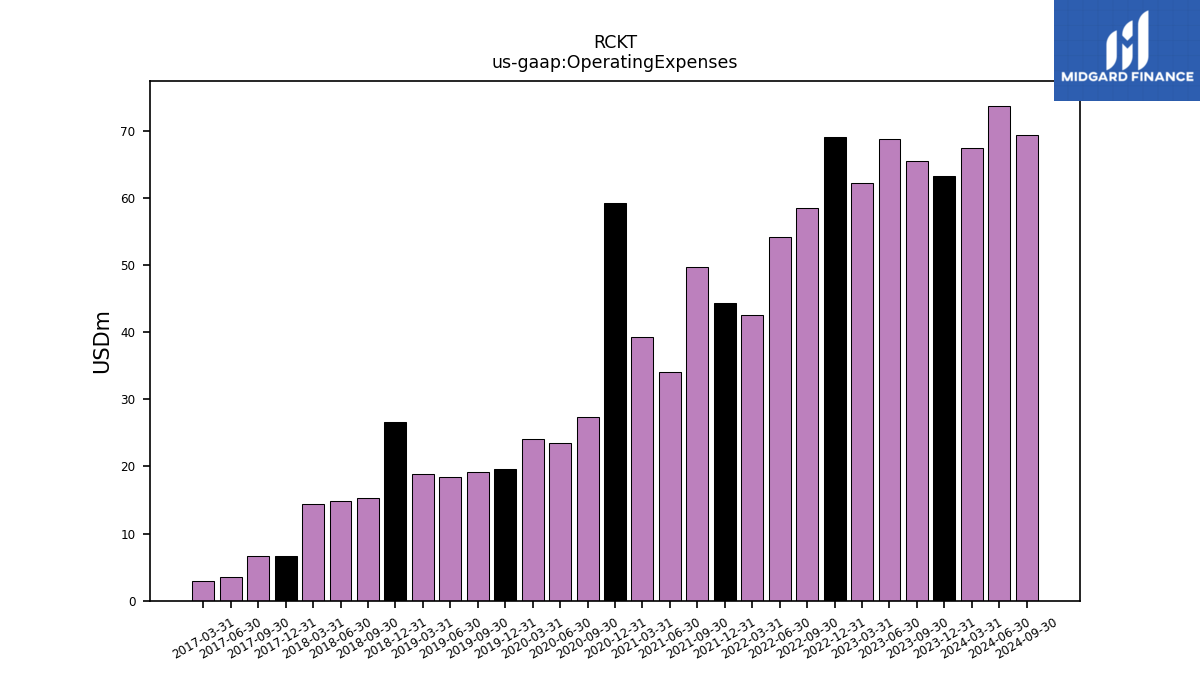
| Operating Expenses | 65.43 | 68.76 | 62.19 | 69.08 | 58.49 | 54.21 | 42.56 | 44.33 | 49.65 | 34.05 | 39.22 | 59.24 | 27.39 | 23.56 | 24.12 | 19.65 | 19.16 | 18.39 | 18.95 | 26.55 | 15.33 | 14.87 | 14.40 | 6.66 | 6.72 | 3.52 | 2.87 | NA | NA | NA | NA | NA | NA | NA | NA | NA | |
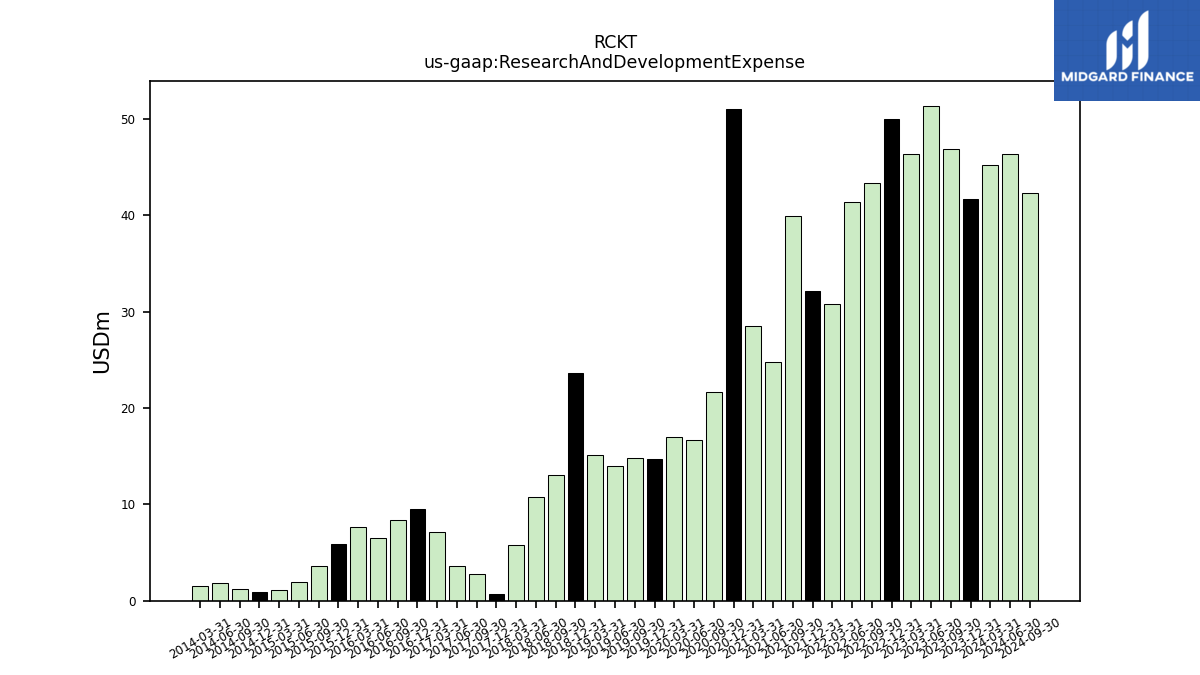
| Research And Development Expense | 46.84 | 51.38 | 46.37 | 50.04 | 43.38 | 41.36 | 30.79 | 32.16 | 39.98 | 24.80 | 28.54 | 51.04 | 21.66 | 16.73 | 16.96 | 14.67 | 14.83 | 13.99 | 15.14 | 23.68 | 13.06 | 10.77 | 5.74 | 0.65 | 2.82 | 3.62 | 7.10 | 9.49 | 8.41 | 6.46 | 7.62 | 5.92 | 3.61 | 1.95 | 1.07 | 0.94 | |
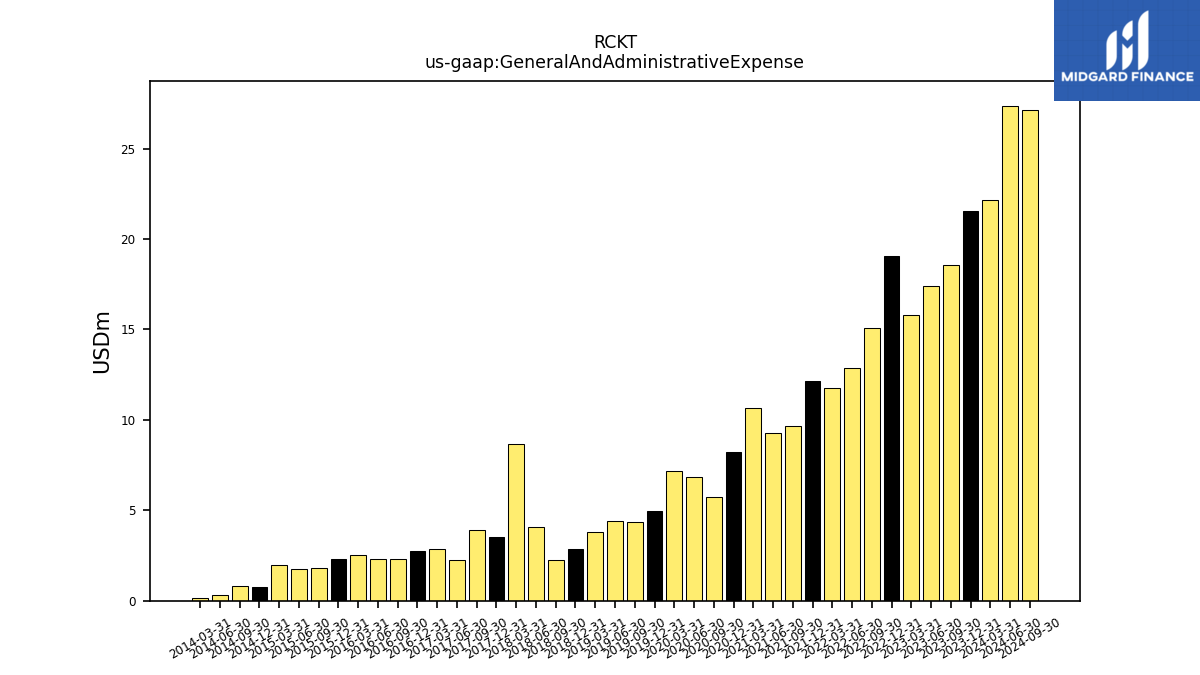
| General And Administrative Expense | 18.59 | 17.37 | 15.82 | 19.05 | 15.11 | 12.85 | 11.77 | 12.17 | 9.67 | 9.25 | 10.68 | 8.20 | 5.73 | 6.83 | 7.16 | 4.98 | 4.34 | 4.40 | 3.81 | 2.87 | 2.27 | 4.10 | 8.66 | 3.55 | 3.90 | 2.23 | 2.87 | 2.75 | 2.31 | 2.31 | 2.52 | 2.31 | 1.82 | 1.73 | 1.98 | 0.78 | |
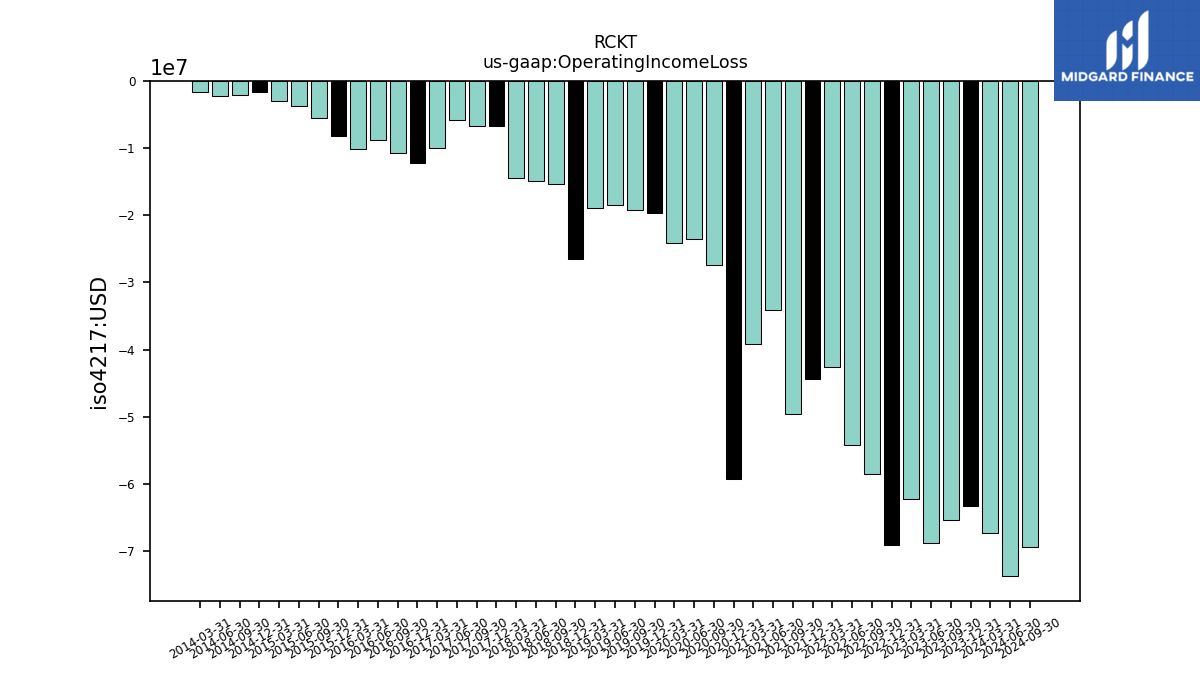
| Operating Income Loss | -65.43 | -68.76 | -62.19 | -69.08 | -58.49 | -54.21 | -42.56 | -44.33 | -49.65 | -34.05 | -39.22 | -59.24 | -27.39 | -23.56 | -24.12 | -19.65 | -19.16 | -18.39 | -18.95 | -26.55 | -15.33 | -14.87 | -14.40 | -6.66 | -6.71 | -5.86 | -9.97 | -12.24 | -10.72 | -8.78 | -10.14 | -8.23 | -5.44 | -3.68 | -3.05 | -1.71 | |
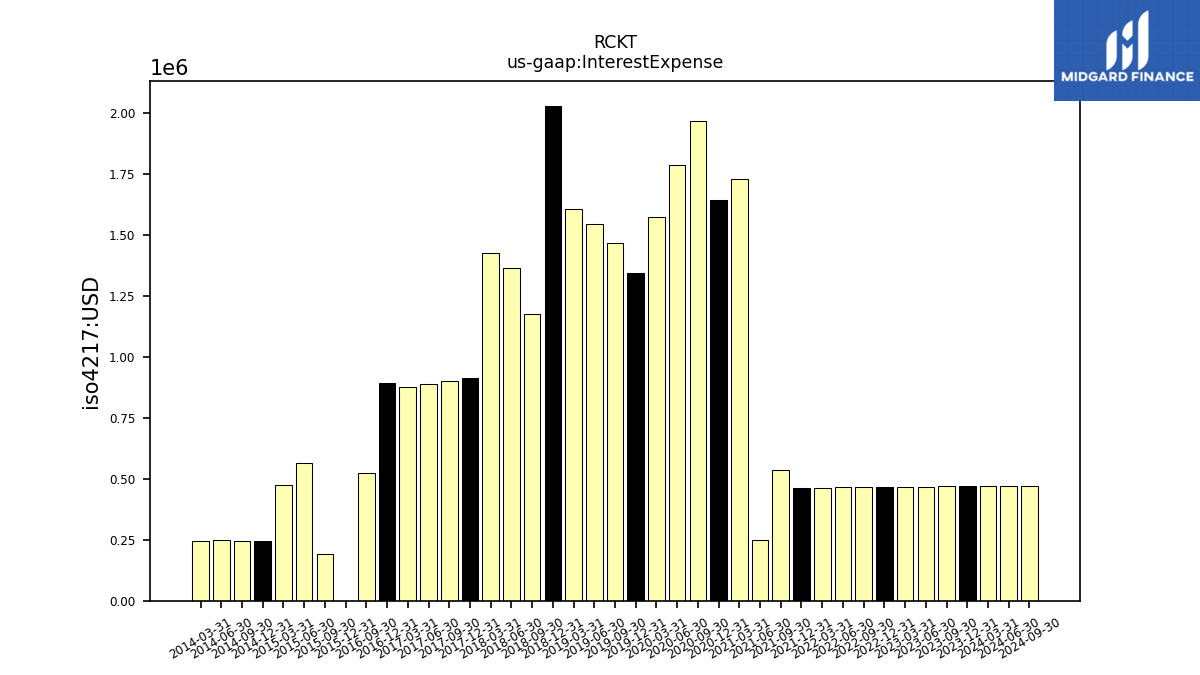
| Interest Expense | 0.47 | 0.47 | 0.47 | 0.47 | 0.47 | 0.47 | 0.46 | 0.46 | 0.53 | 0.25 | 1.73 | 1.64 | 1.97 | 1.79 | 1.57 | 1.34 | 1.47 | 1.54 | 1.60 | 2.03 | 1.18 | 1.36 | 1.43 | 0.91 | 0.90 | 0.89 | 0.88 | 0.89 | 0.53 | NA | NA | 0.00 | 0.19 | 0.56 | 0.47 | 0.24 | |
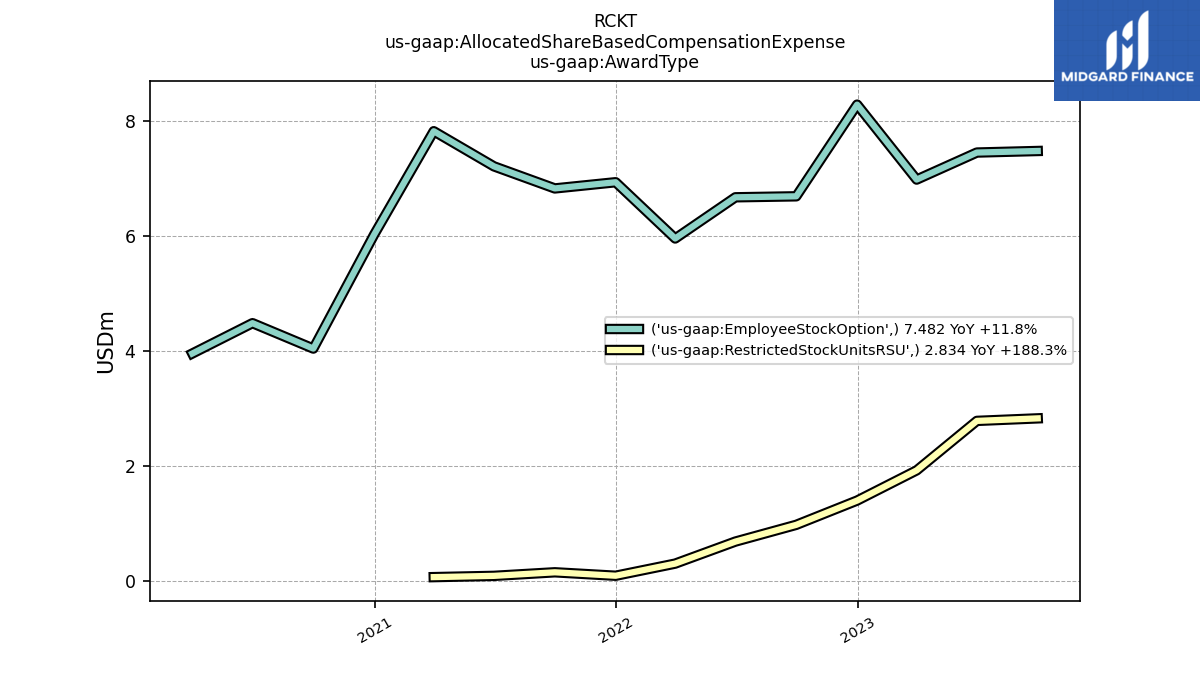
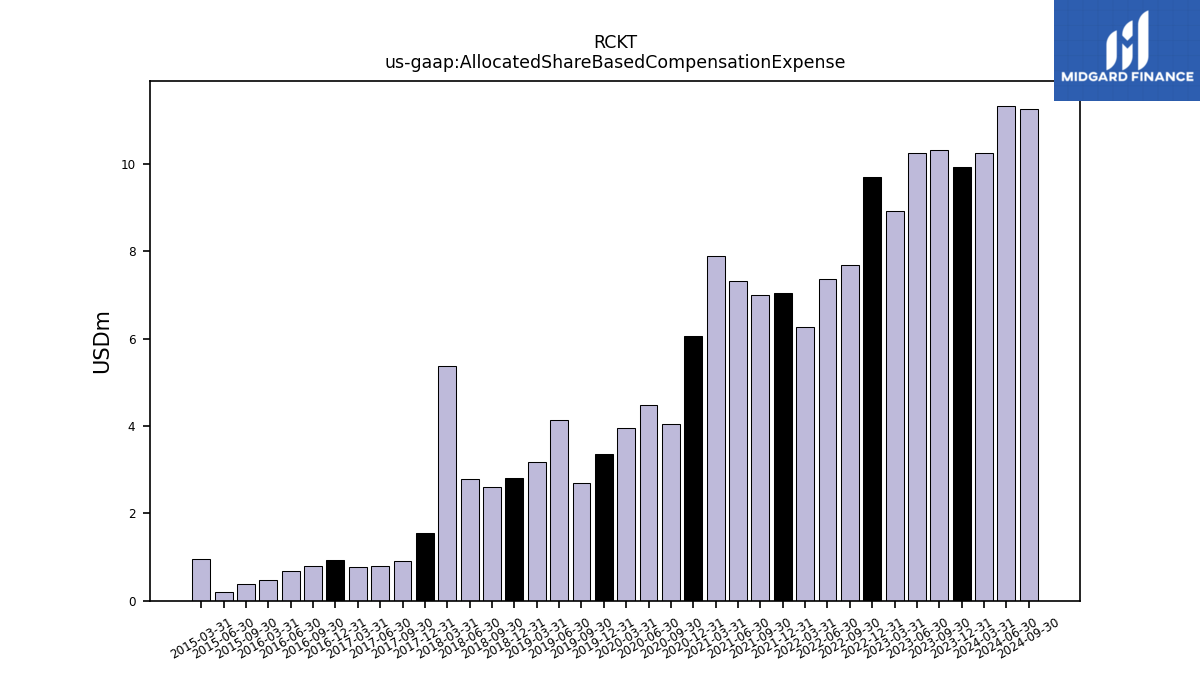
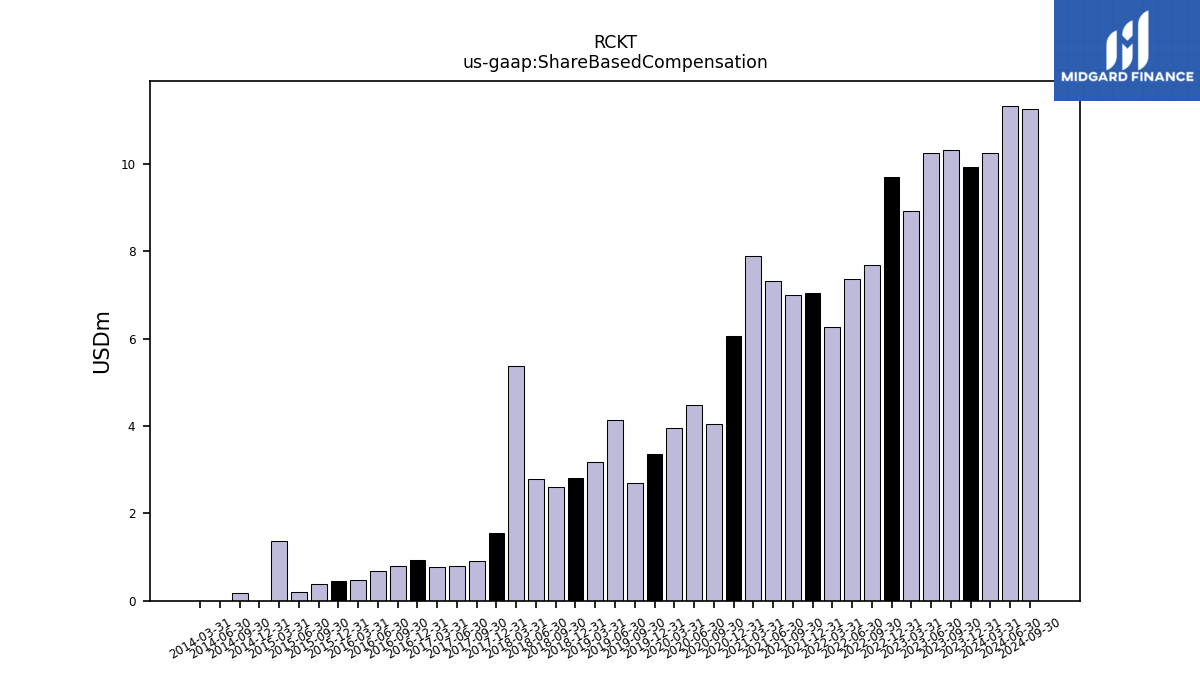
| Allocated Share Based Compensation Expense | 10.32 | 10.24 | 8.91 | 9.69 | 7.68 | 7.37 | 6.27 | 7.04 | 6.99 | 7.31 | 7.90 | 6.07 | 4.05 | 4.49 | 3.96 | 3.36 | 2.69 | 4.14 | 3.18 | 2.82 | 2.61 | 2.79 | 5.38 | 1.55 | 0.91 | 0.79 | 0.78 | 0.93 | 0.81 | 0.69 | 0.49 | NA | 0.37 | 0.19 | 0.95 | NA | |
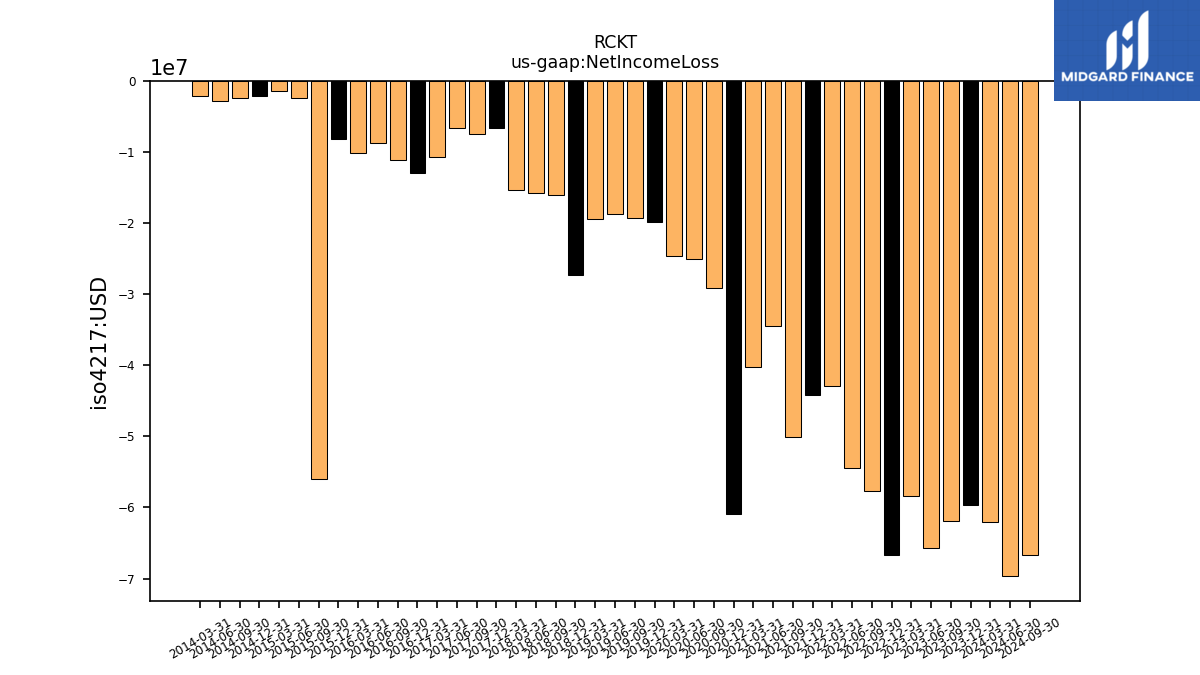
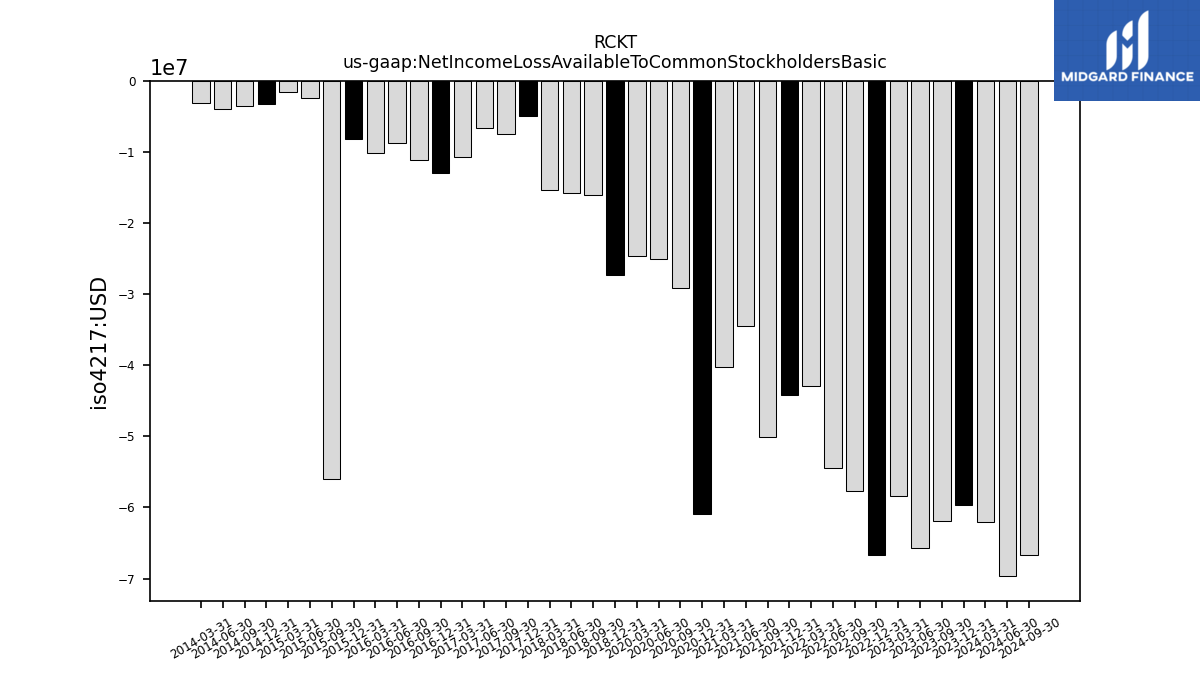
| Net Income Loss | -61.90 | -65.70 | -58.34 | -66.72 | -57.76 | -54.40 | -42.98 | -44.25 | -50.12 | -34.52 | -40.18 | -60.92 | -29.08 | -25.04 | -24.66 | -19.86 | -19.28 | -18.68 | -19.45 | -27.32 | -16.09 | -15.77 | -15.34 | -6.66 | -7.39 | -6.56 | -10.67 | -12.97 | -11.13 | -8.68 | -10.07 | -8.17 | -55.96 | -2.39 | -1.46 | -2.15 | |
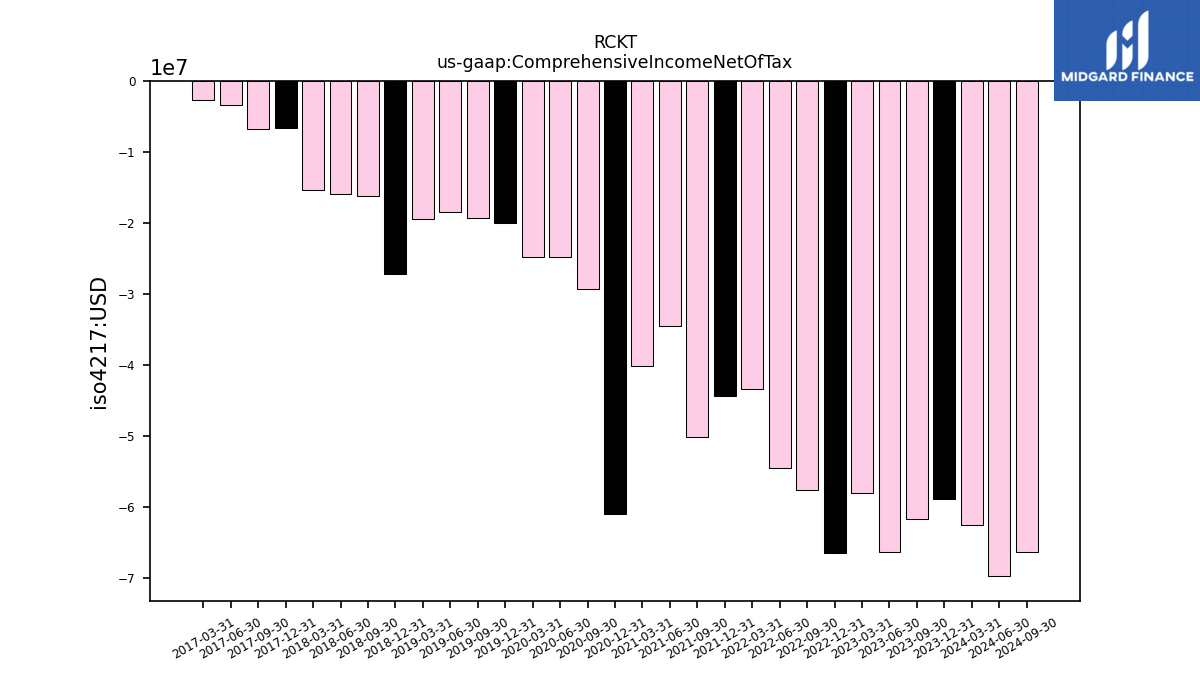
| Comprehensive Income Net Of Tax | -61.68 | -66.34 | -58.06 | -66.48 | -57.59 | -54.54 | -43.45 | -44.31 | -50.13 | -34.53 | -40.21 | -61.03 | -29.24 | -24.74 | -24.76 | -19.95 | -19.31 | -18.45 | -19.41 | -27.24 | -16.22 | -15.86 | -15.33 | -6.66 | -6.72 | -3.33 | -2.68 | NA | NA | NA | NA | NA | NA | NA | NA | NA | |
| Net Income Loss Available To Common Stockholders Basic | -61.90 | -65.70 | -58.34 | -66.72 | -57.76 | -54.40 | -42.98 | -44.25 | -50.12 | -34.52 | -40.18 | -60.92 | -29.08 | -25.04 | -24.66 | NA | NA | NA | NA | -27.32 | -16.09 | -15.77 | -15.34 | -4.87 | -7.39 | -6.56 | -10.67 | -12.97 | -11.13 | -8.68 | -10.07 | -8.17 | -55.96 | -2.39 | -1.59 | -3.29 |
| 2023-09-30 | 2023-06-30 | 2023-03-31 | 2022-12-31 | 2022-09-30 | 2022-06-30 | 2022-03-31 | 2021-12-31 | 2021-09-30 | 2021-06-30 | 2021-03-31 | 2020-12-31 | 2020-09-30 | 2020-06-30 | 2020-03-31 | 2019-12-31 | 2019-09-30 | 2019-06-30 | 2019-03-31 | 2018-12-31 | 2018-09-30 | 2018-06-30 | 2018-03-31 | 2017-12-31 | 2017-09-30 | 2017-06-30 | 2017-03-31 | 2016-12-31 | 2016-09-30 | 2016-06-30 | 2016-03-31 | 2015-12-31 | 2015-09-30 | 2015-06-30 | 2015-03-31 | 2014-12-31 | ||
|---|---|---|---|---|---|---|---|---|---|---|---|---|---|---|---|---|---|---|---|---|---|---|---|---|---|---|---|---|---|---|---|---|---|---|---|---|---|
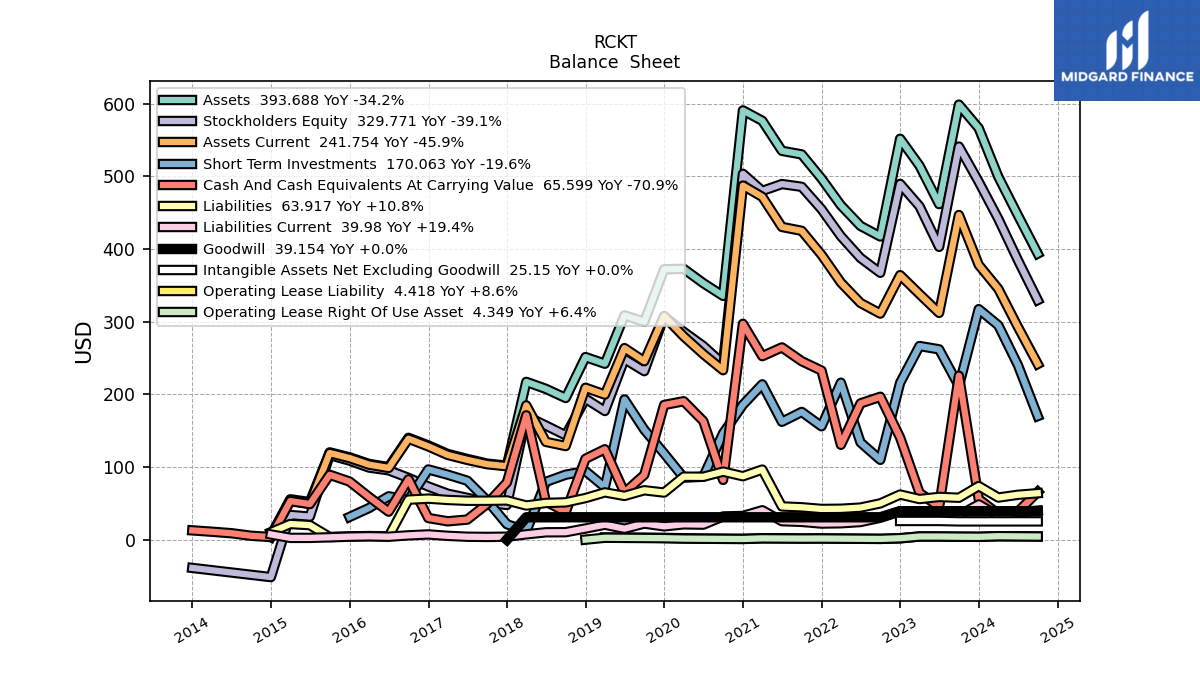
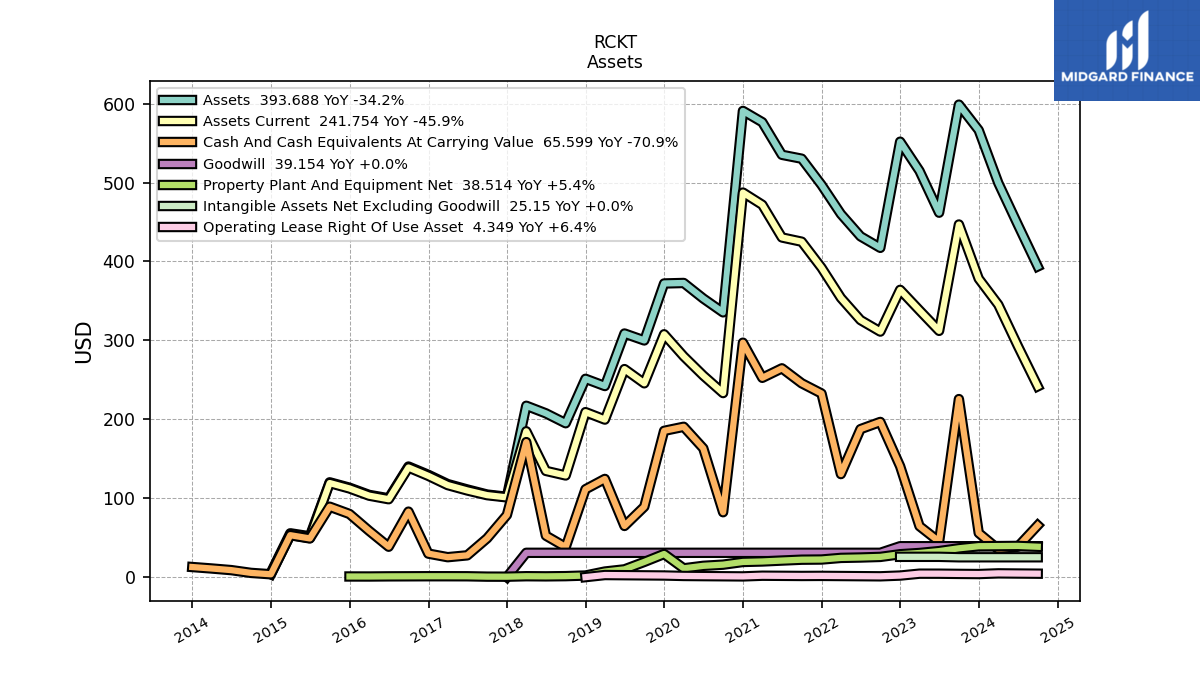
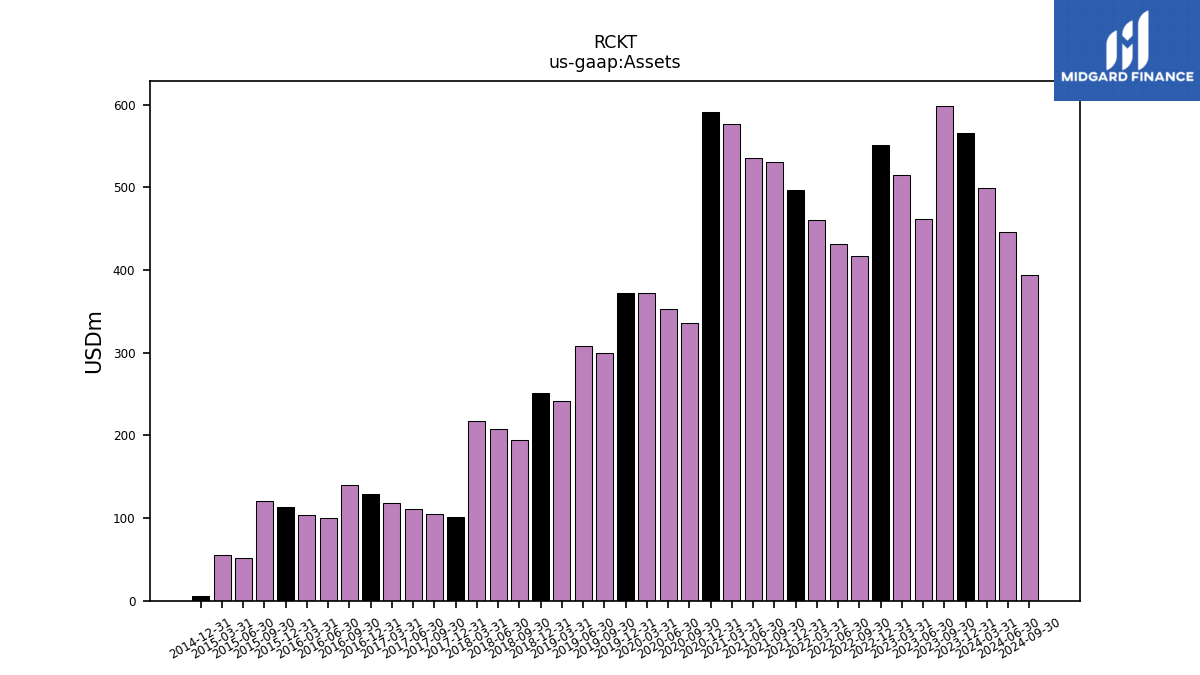
| Assets | 598.76 | 461.78 | 514.76 | 551.81 | 417.26 | 431.85 | 460.15 | 497.02 | 530.24 | 535.15 | 576.48 | 590.82 | 335.50 | 353.06 | 372.75 | 372.12 | 299.91 | 308.72 | 242.14 | 251.31 | 194.98 | 207.57 | 217.16 | 101.78 | 104.66 | 111.06 | 117.92 | 129.65 | 140.14 | 99.85 | 104.21 | 113.32 | 120.12 | 51.69 | 55.53 | 5.52 | |
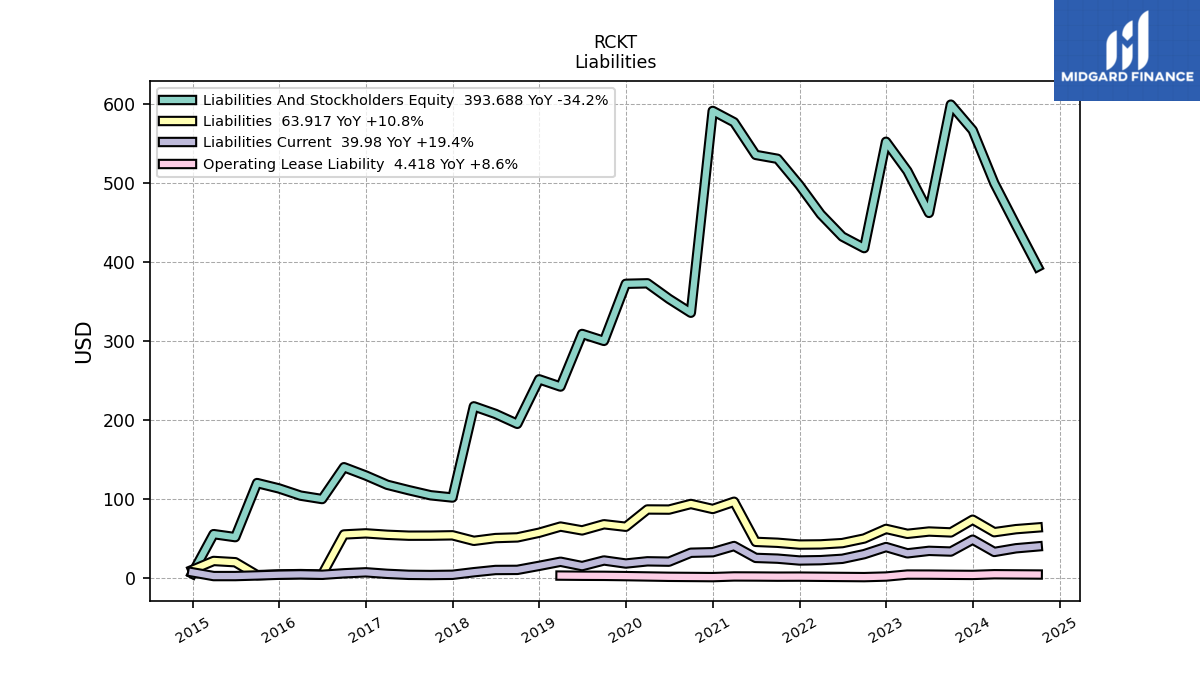
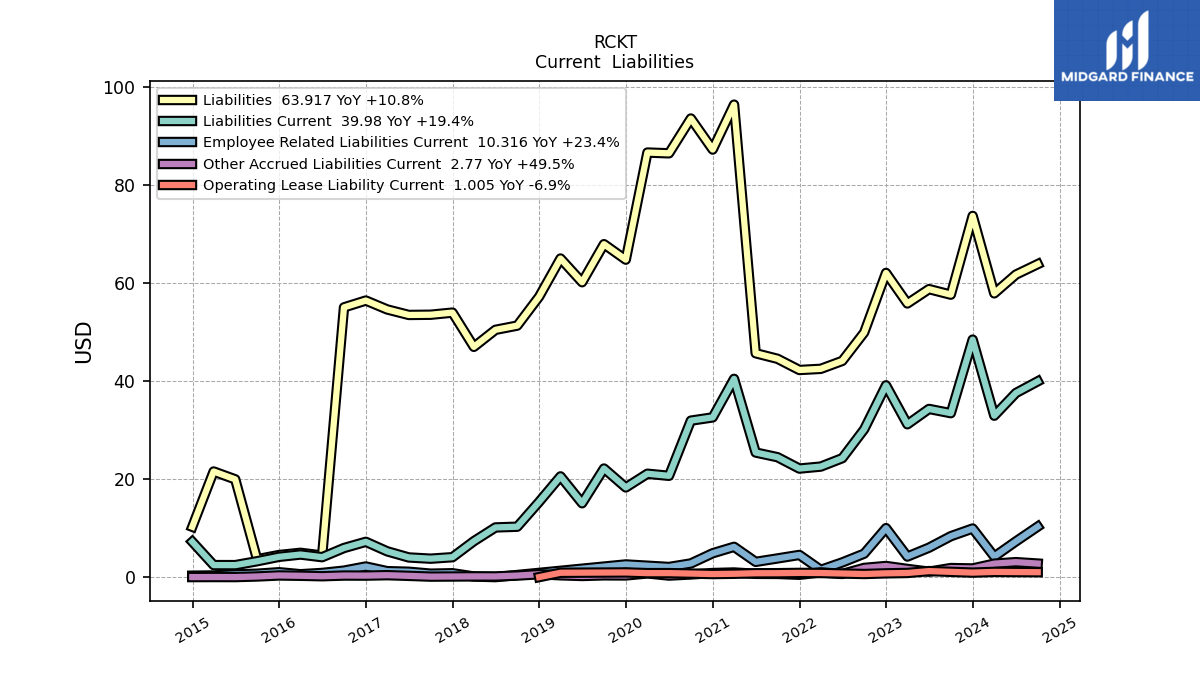
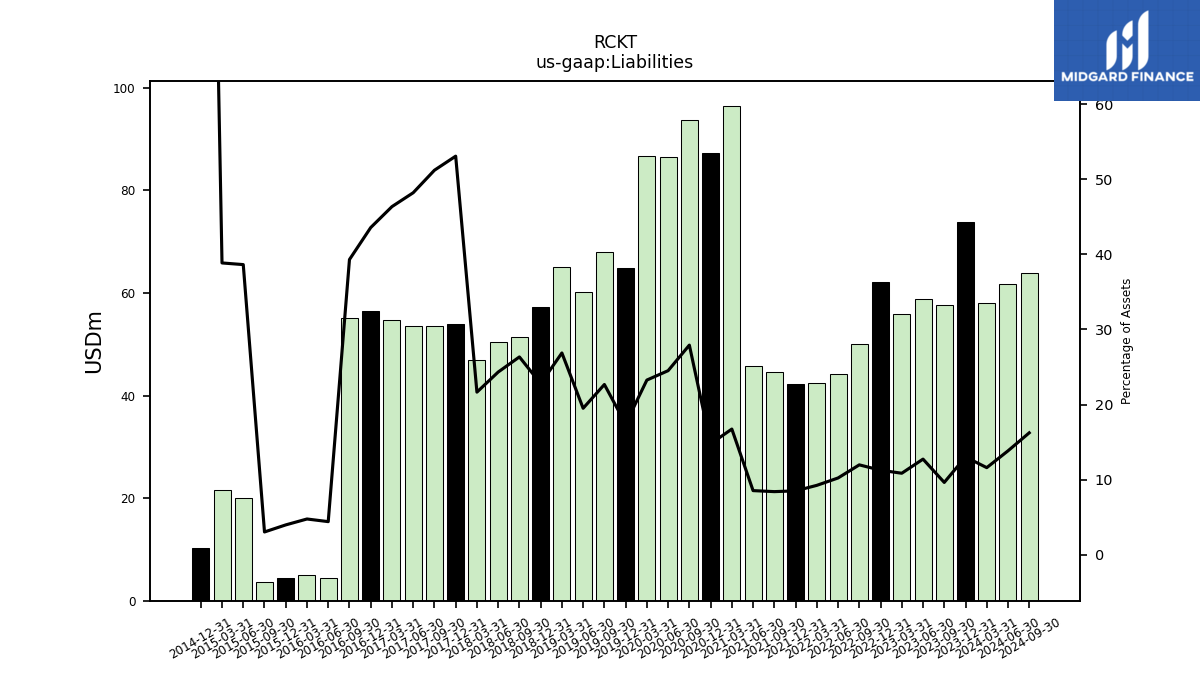
| Liabilities | 57.68 | 58.81 | 55.88 | 62.12 | 49.95 | 44.16 | 42.53 | 42.30 | 44.58 | 45.72 | 96.48 | 87.31 | 93.66 | 86.54 | 86.70 | 64.82 | 67.99 | 60.22 | 65.06 | 57.28 | 51.36 | 50.50 | 47.02 | 54.01 | 53.58 | 53.53 | 54.66 | 56.48 | 55.09 | 4.41 | 4.96 | 4.51 | 3.65 | 19.97 | 21.57 | 10.28 | |
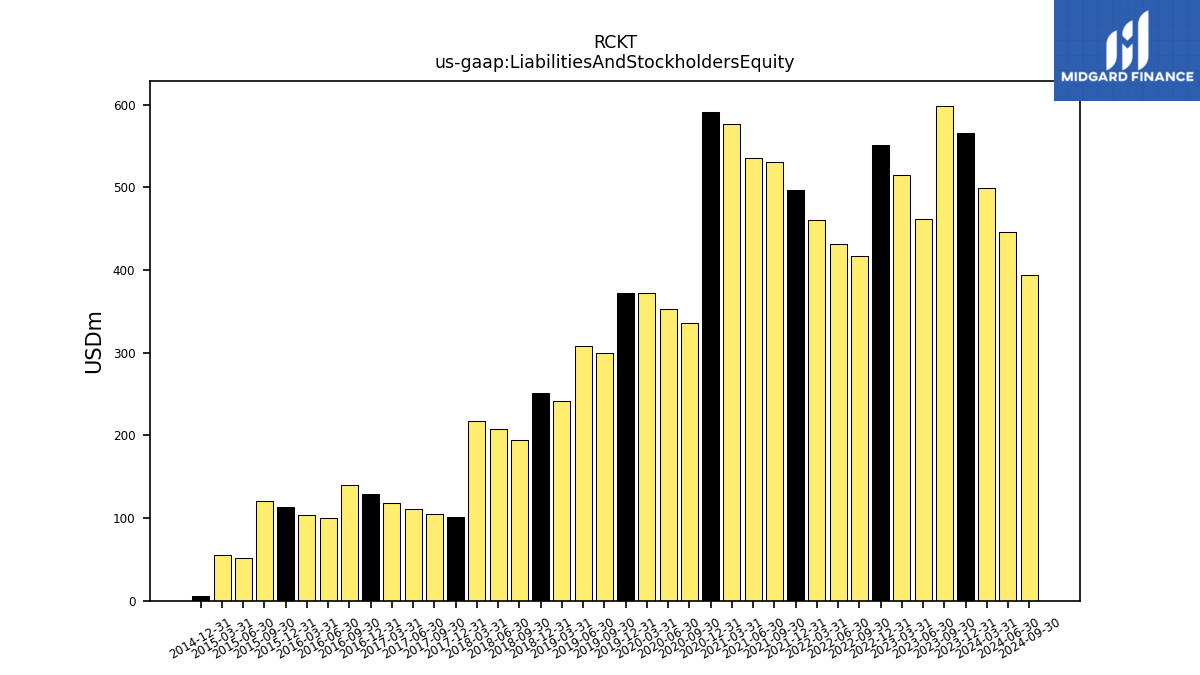
| Liabilities And Stockholders Equity | 598.76 | 461.78 | 514.76 | 551.81 | 417.26 | 431.85 | 460.15 | 497.02 | 530.24 | 535.15 | 576.48 | 590.82 | 335.50 | 353.06 | 372.75 | 372.12 | 299.91 | 308.72 | 242.14 | 251.31 | 194.98 | 207.57 | 217.16 | 101.78 | 104.66 | 111.06 | 117.92 | 129.65 | 140.14 | 99.85 | 104.21 | 113.32 | 120.12 | 51.69 | 55.53 | 5.52 | |
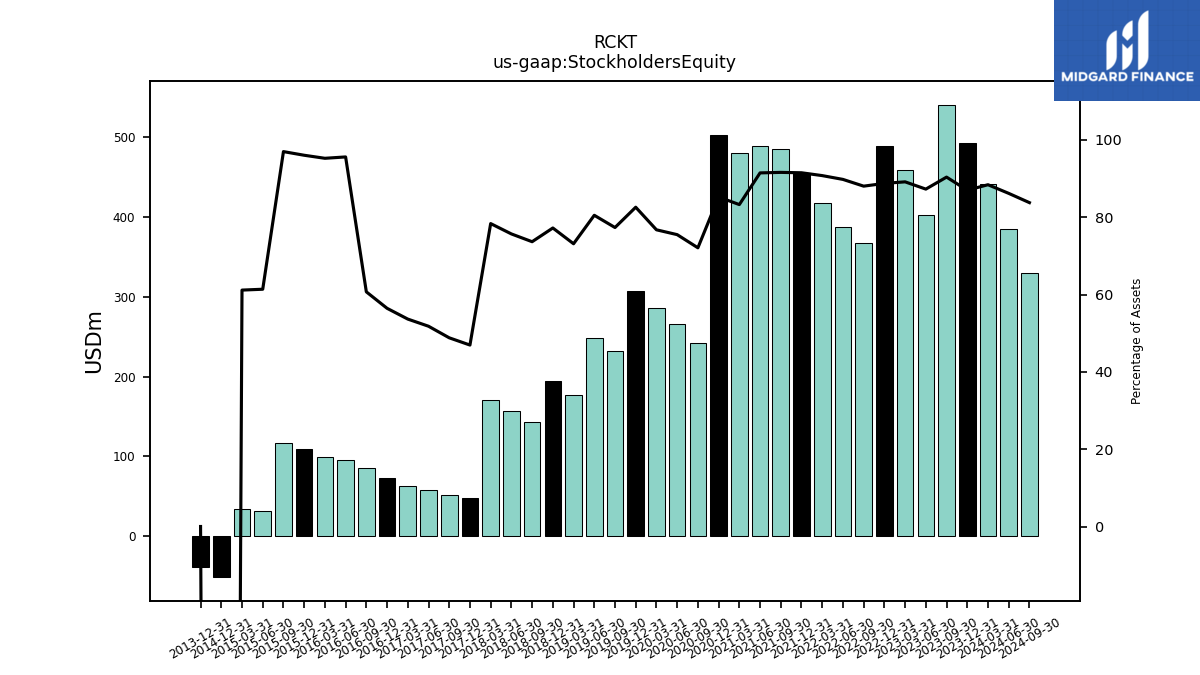
| Stockholders Equity | 541.09 | 402.97 | 458.88 | 489.69 | 367.31 | 387.70 | 417.62 | 454.72 | 485.66 | 489.44 | 480.00 | 503.52 | 241.84 | 266.52 | 286.05 | 307.30 | 231.92 | 248.50 | 177.08 | 194.04 | 143.62 | 157.08 | 170.15 | 47.76 | 51.08 | 57.53 | 63.26 | 73.17 | 85.05 | 95.44 | 99.24 | 108.81 | 116.47 | 31.72 | 33.95 | -51.56 |
| 2023-09-30 | 2023-06-30 | 2023-03-31 | 2022-12-31 | 2022-09-30 | 2022-06-30 | 2022-03-31 | 2021-12-31 | 2021-09-30 | 2021-06-30 | 2021-03-31 | 2020-12-31 | 2020-09-30 | 2020-06-30 | 2020-03-31 | 2019-12-31 | 2019-09-30 | 2019-06-30 | 2019-03-31 | 2018-12-31 | 2018-09-30 | 2018-06-30 | 2018-03-31 | 2017-12-31 | 2017-09-30 | 2017-06-30 | 2017-03-31 | 2016-12-31 | 2016-09-30 | 2016-06-30 | 2016-03-31 | 2015-12-31 | 2015-09-30 | 2015-06-30 | 2015-03-31 | 2014-12-31 | ||
|---|---|---|---|---|---|---|---|---|---|---|---|---|---|---|---|---|---|---|---|---|---|---|---|---|---|---|---|---|---|---|---|---|---|---|---|---|---|
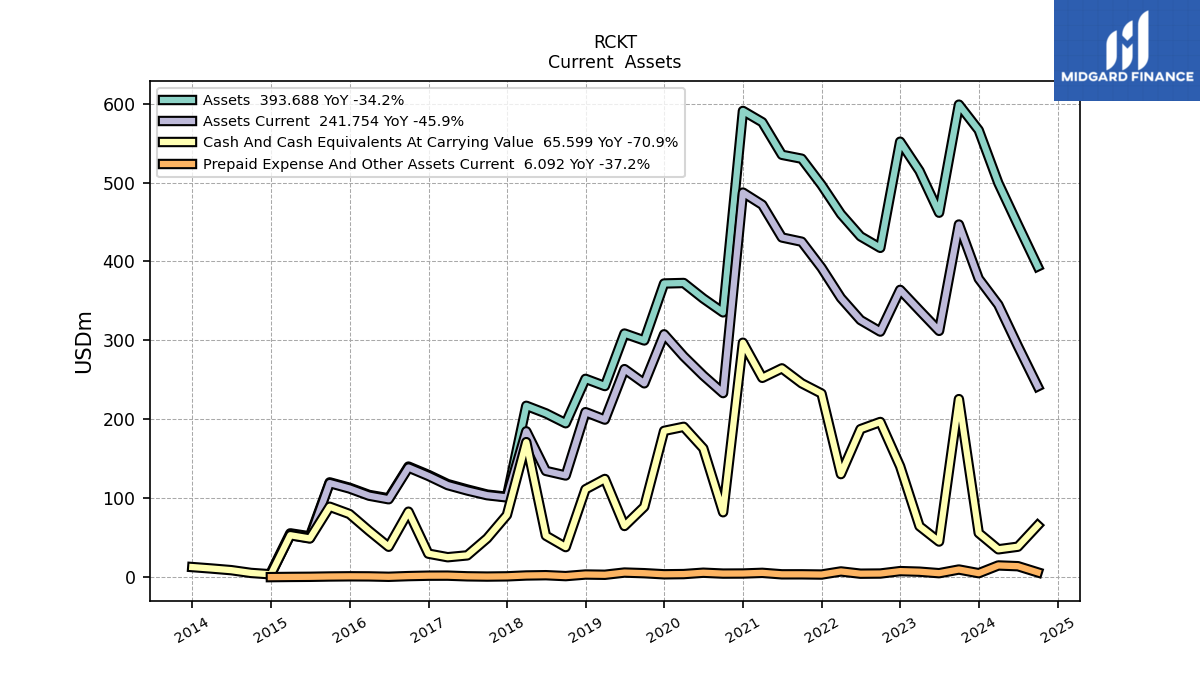
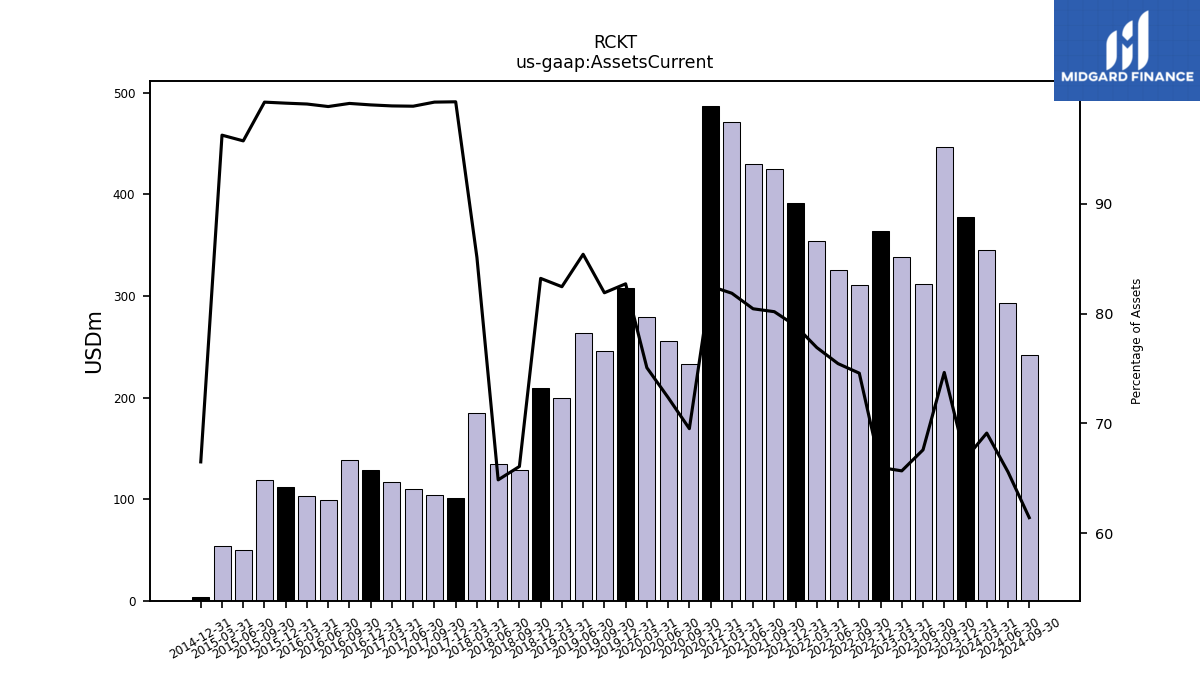
| Assets Current | 446.87 | 312.07 | 338.03 | 364.06 | 311.13 | 325.77 | 353.85 | 392.06 | 425.07 | 430.43 | 471.82 | 487.35 | 233.21 | 255.44 | 279.81 | 307.75 | 245.59 | 263.63 | 199.62 | 209.09 | 128.82 | 134.61 | 184.83 | 101.05 | 103.87 | 109.82 | 116.63 | 128.35 | 138.92 | 98.70 | 103.25 | 112.37 | 119.22 | 49.48 | 53.44 | 3.67 | |
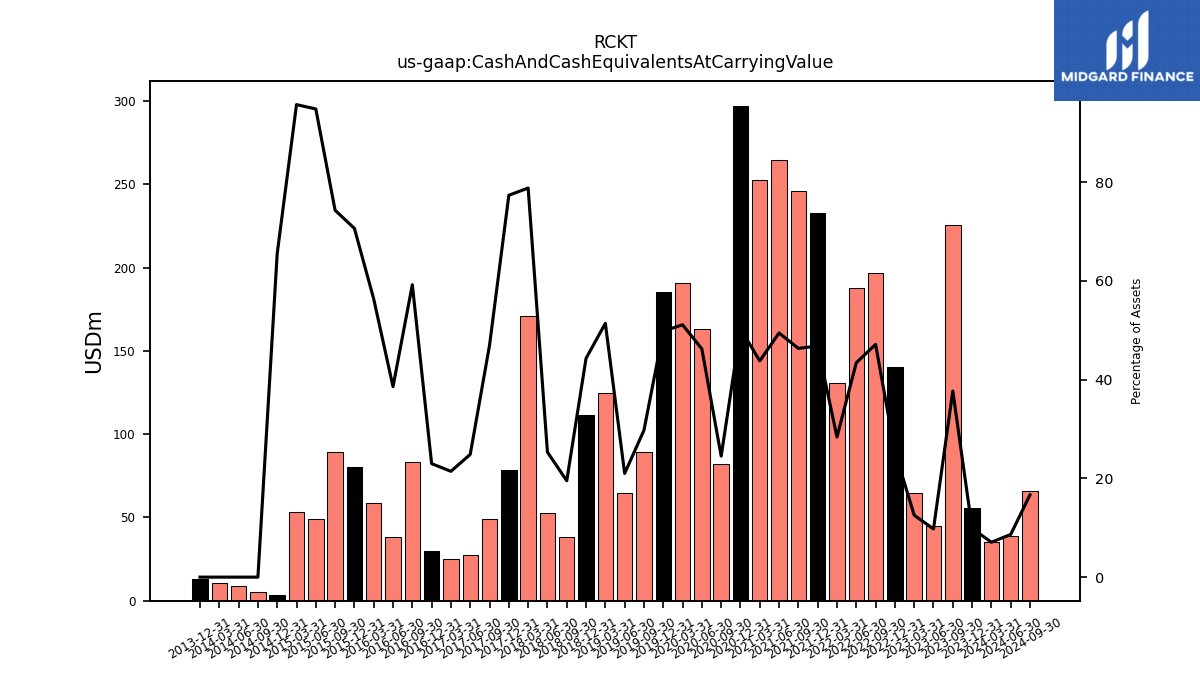
| Cash And Cash Equivalents At Carrying Value | 225.66 | 45.08 | 64.58 | 140.52 | 196.67 | 187.55 | 130.55 | 232.69 | 245.64 | 264.61 | 252.54 | 297.10 | 82.23 | 163.20 | 190.52 | 185.38 | 89.19 | 64.83 | 124.46 | 111.36 | 38.08 | 52.55 | 171.14 | 78.72 | 49.15 | 27.61 | 25.27 | 29.80 | 83.00 | 38.52 | 58.71 | 80.04 | 89.25 | 49.01 | 53.14 | 3.62 | |
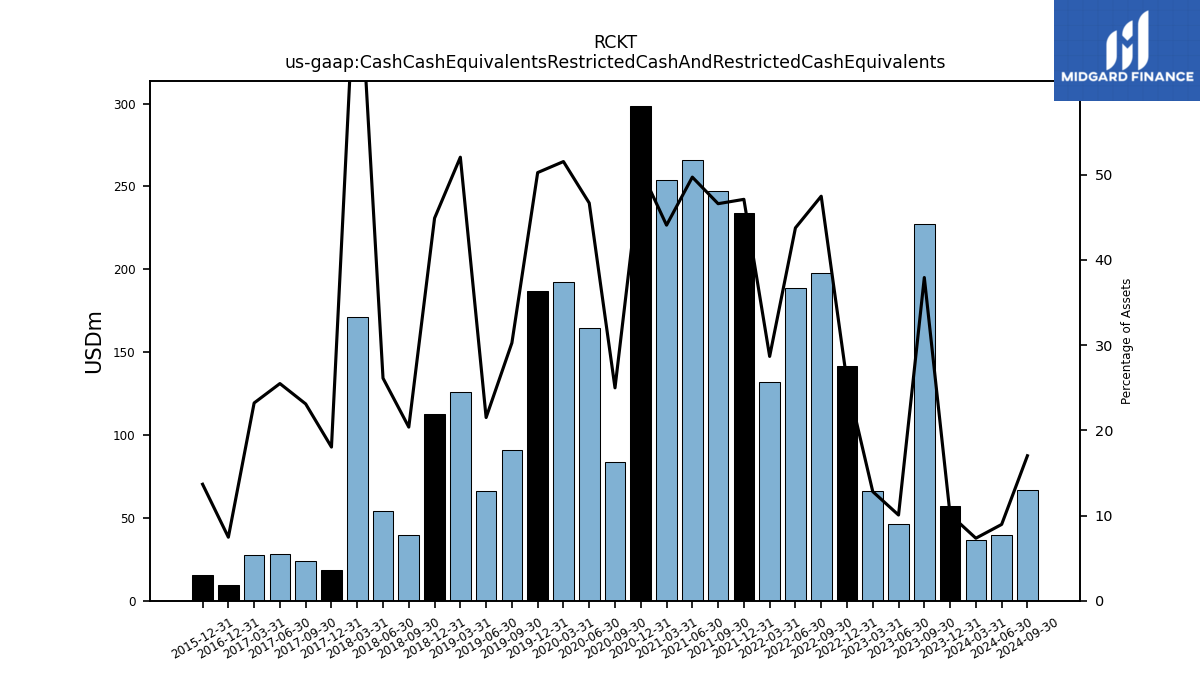
| Cash Cash Equivalents Restricted Cash And Restricted Cash Equivalents | 227.03 | 46.44 | 65.92 | 141.86 | 198.02 | 188.89 | 131.90 | 234.04 | 246.98 | 265.94 | 254.00 | 298.67 | 83.79 | 164.73 | 192.04 | 186.91 | 90.72 | 66.36 | 125.99 | 112.79 | 39.72 | 54.19 | 171.34 | 18.35 | 24.16 | 28.30 | 27.36 | 9.66 | NA | NA | NA | 15.49 | NA | NA | NA | NA | |
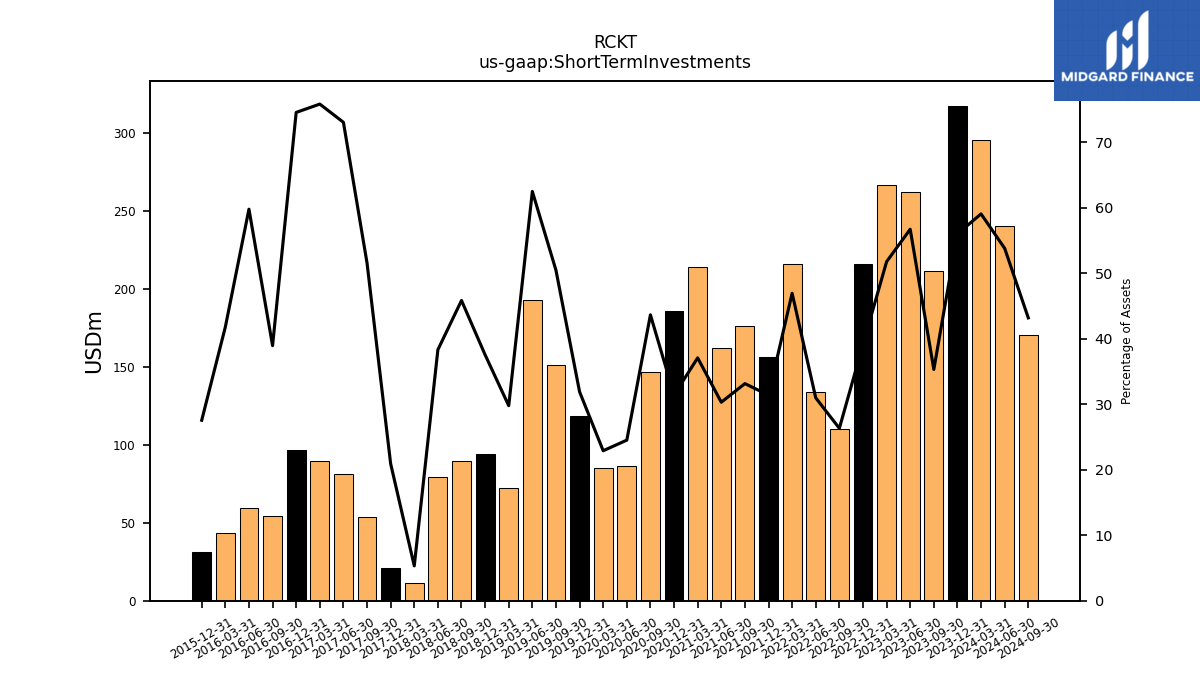
| Short Term Investments | 211.51 | 261.96 | 266.50 | 215.88 | 109.86 | 133.82 | 216.04 | 156.05 | 175.81 | 162.22 | 213.81 | 185.62 | 146.46 | 86.60 | 85.38 | 118.73 | 151.37 | 192.95 | 72.13 | 94.38 | 89.40 | 79.56 | 11.56 | 21.29 | 53.98 | 81.14 | 89.43 | 96.67 | 54.58 | 59.70 | 43.56 | 31.24 | NA | NA | NA | NA | |
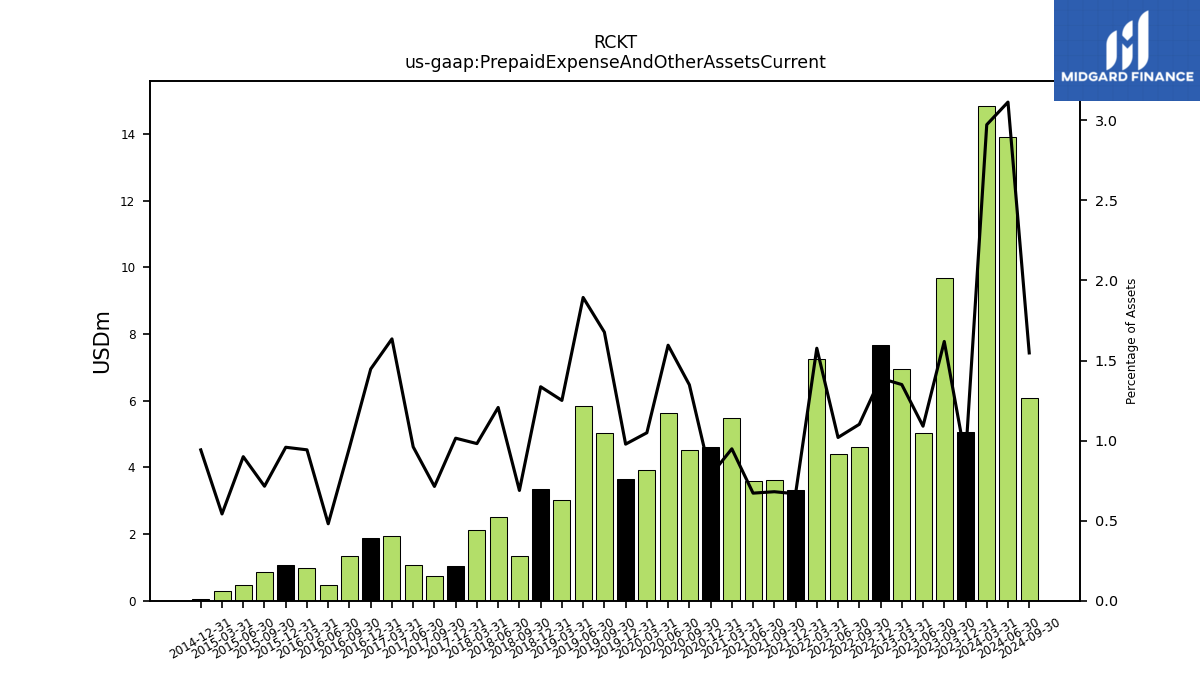
| Prepaid Expense And Other Assets Current | 9.69 | 5.03 | 6.95 | 7.67 | 4.60 | 4.40 | 7.25 | 3.32 | 3.61 | 3.60 | 5.47 | 4.63 | 4.52 | 5.63 | 3.91 | 3.64 | 5.03 | 5.85 | 3.03 | 3.36 | 1.34 | 2.50 | 2.13 | 1.03 | 0.75 | 1.07 | 1.93 | 1.88 | 1.34 | 0.48 | 0.98 | 1.09 | 0.86 | 0.47 | 0.30 | 0.05 |
| 2023-09-30 | 2023-06-30 | 2023-03-31 | 2022-12-31 | 2022-09-30 | 2022-06-30 | 2022-03-31 | 2021-12-31 | 2021-09-30 | 2021-06-30 | 2021-03-31 | 2020-12-31 | 2020-09-30 | 2020-06-30 | 2020-03-31 | 2019-12-31 | 2019-09-30 | 2019-06-30 | 2019-03-31 | 2018-12-31 | 2018-09-30 | 2018-06-30 | 2018-03-31 | 2017-12-31 | 2017-09-30 | 2017-06-30 | 2017-03-31 | 2016-12-31 | 2016-09-30 | 2016-06-30 | 2016-03-31 | 2015-12-31 | 2015-09-30 | 2015-06-30 | 2015-03-31 | 2014-12-31 | ||
|---|---|---|---|---|---|---|---|---|---|---|---|---|---|---|---|---|---|---|---|---|---|---|---|---|---|---|---|---|---|---|---|---|---|---|---|---|---|
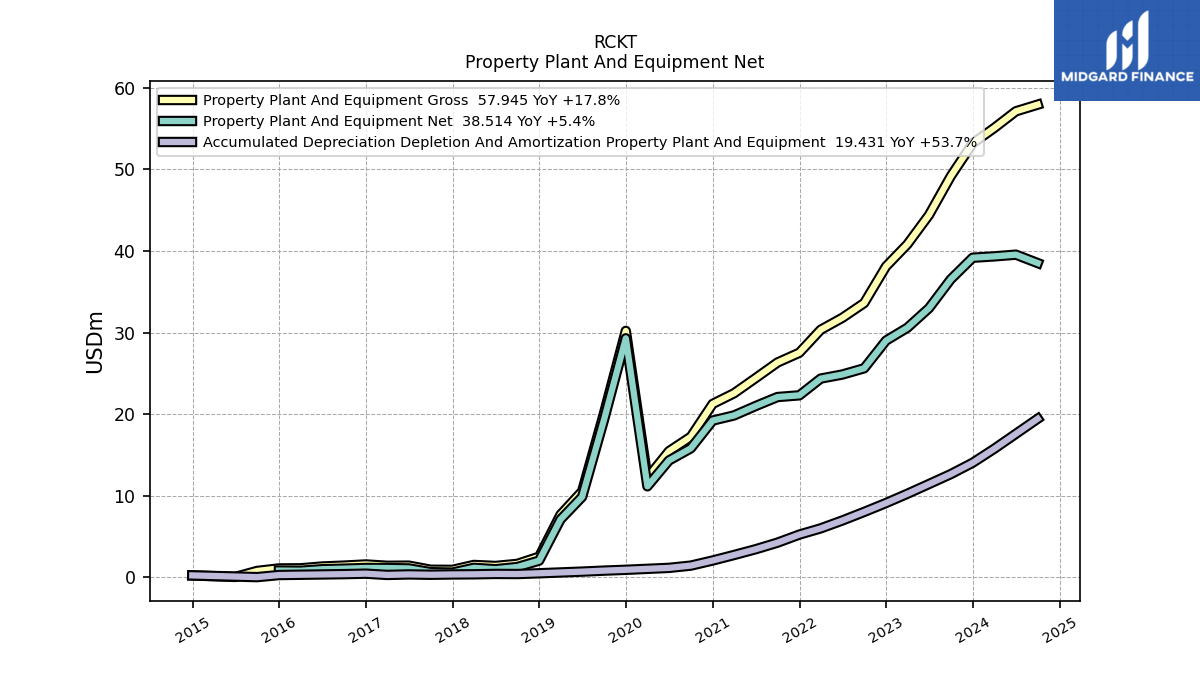
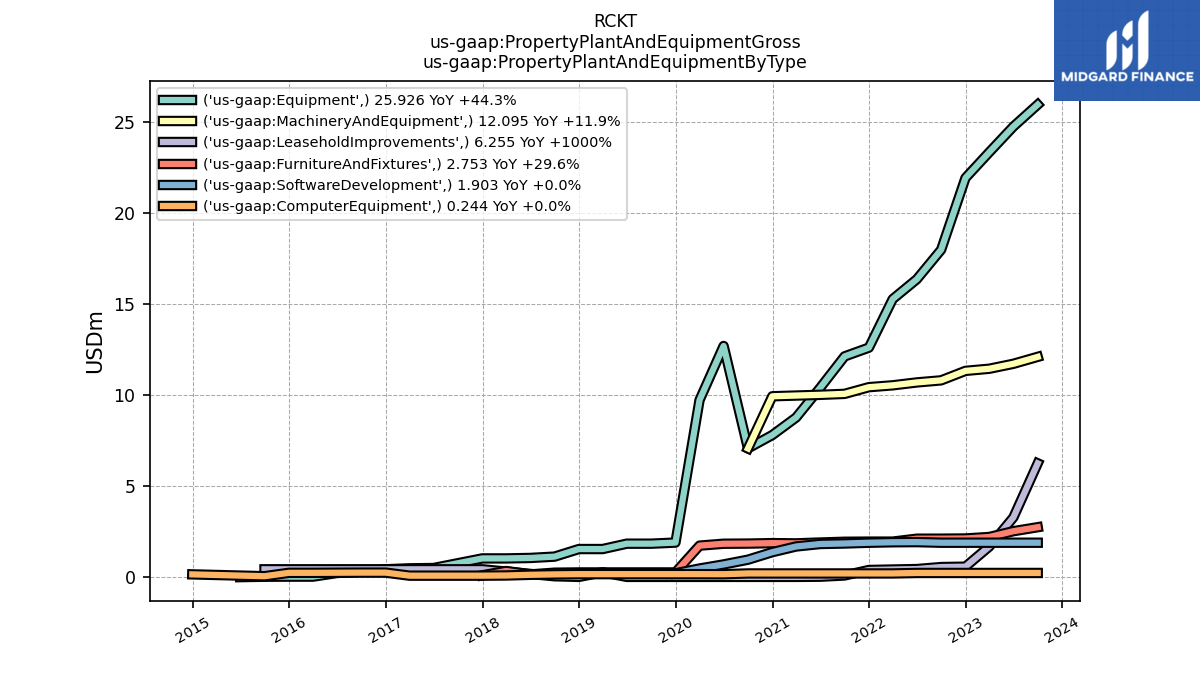
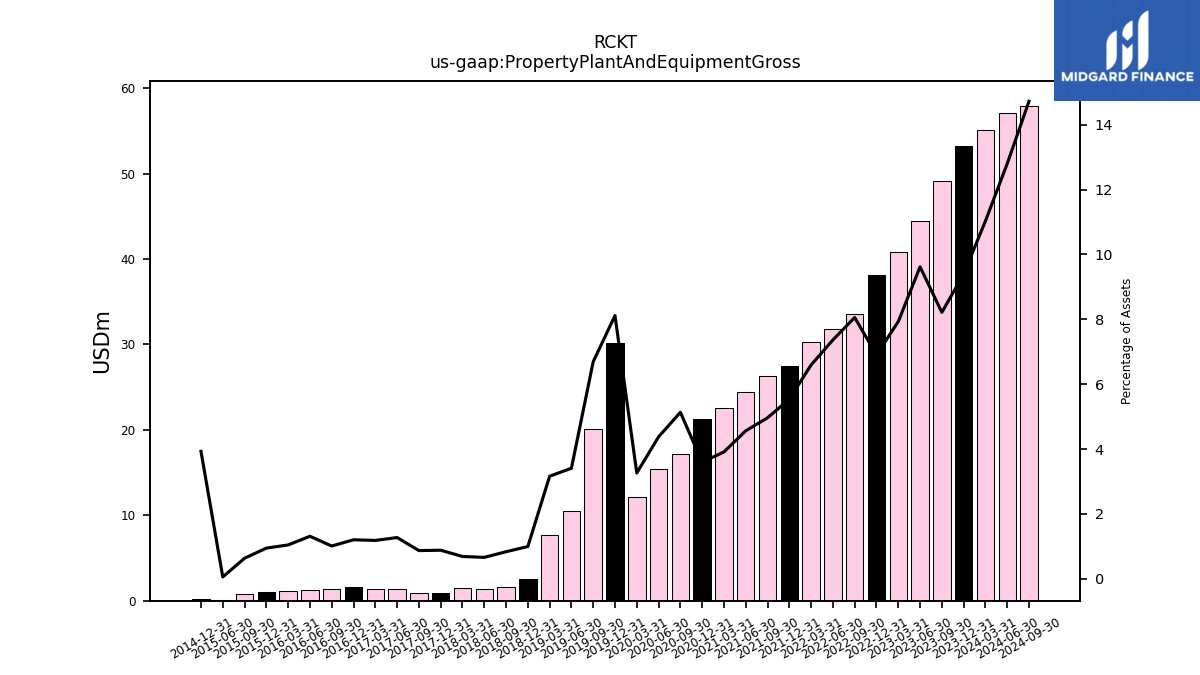
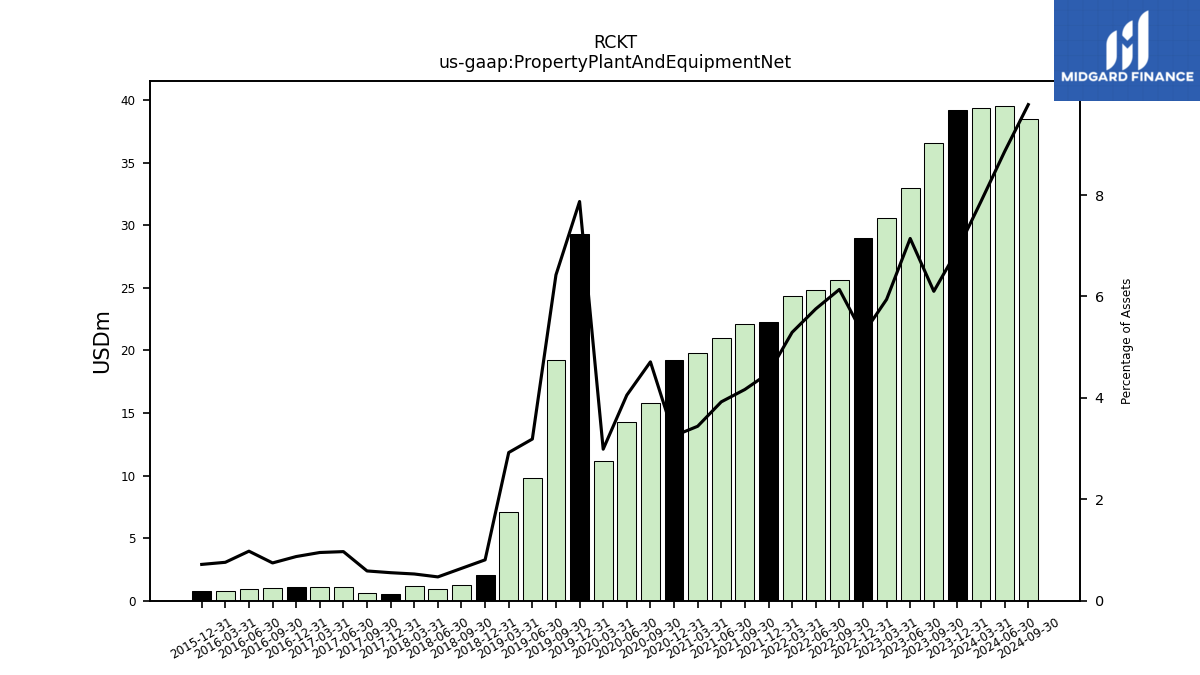
| Property Plant And Equipment Gross | 49.18 | 44.41 | 40.82 | 38.10 | 33.62 | 31.80 | 30.34 | 27.52 | 26.32 | 24.42 | 22.55 | 21.25 | 17.22 | 15.46 | 12.16 | 30.20 | 20.07 | 10.53 | 7.66 | 2.51 | 1.63 | 1.37 | 1.50 | 0.90 | 0.91 | 1.41 | 1.40 | 1.56 | 1.42 | 1.31 | 1.09 | 1.07 | 0.76 | 0.03 | NA | 0.22 | |
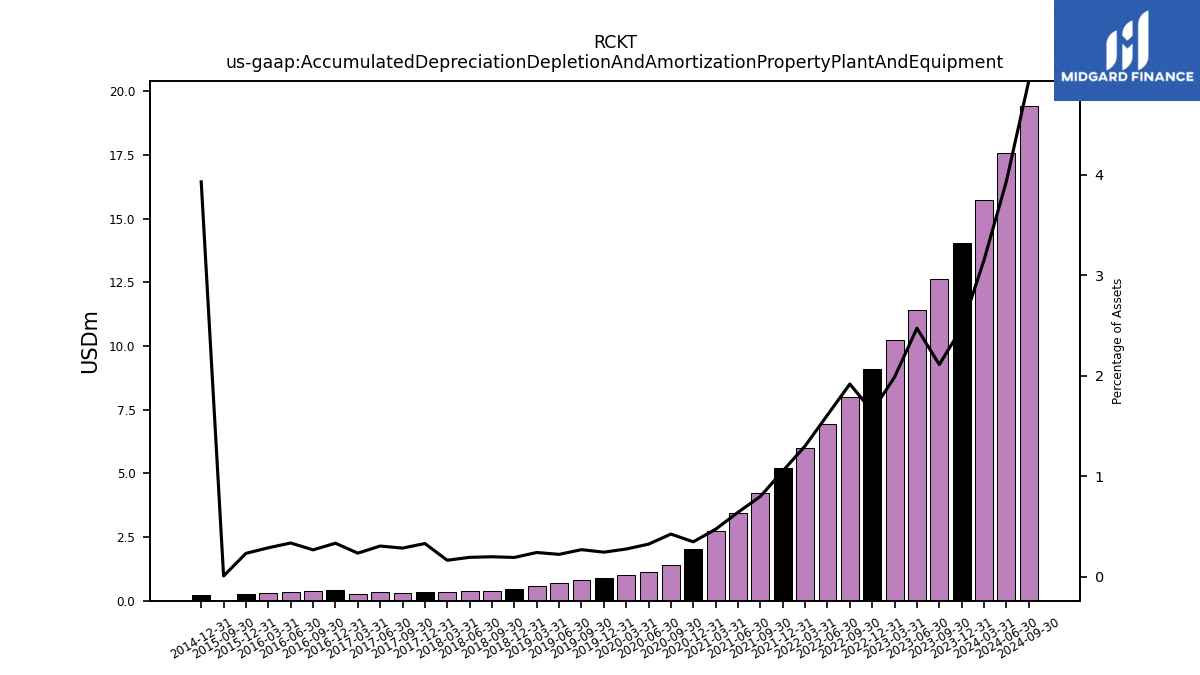
| Accumulated Depreciation Depletion And Amortization Property Plant And Equipment | 12.64 | 11.42 | 10.23 | 9.09 | 8.00 | 6.95 | 5.99 | 5.22 | 4.23 | 3.43 | 2.72 | 2.05 | 1.42 | 1.14 | 1.02 | 0.91 | 0.80 | 0.68 | 0.58 | 0.48 | 0.39 | 0.40 | 0.35 | 0.34 | 0.30 | 0.34 | 0.28 | 0.43 | 0.37 | 0.33 | 0.30 | 0.26 | 0.01 | NA | NA | 0.22 | |
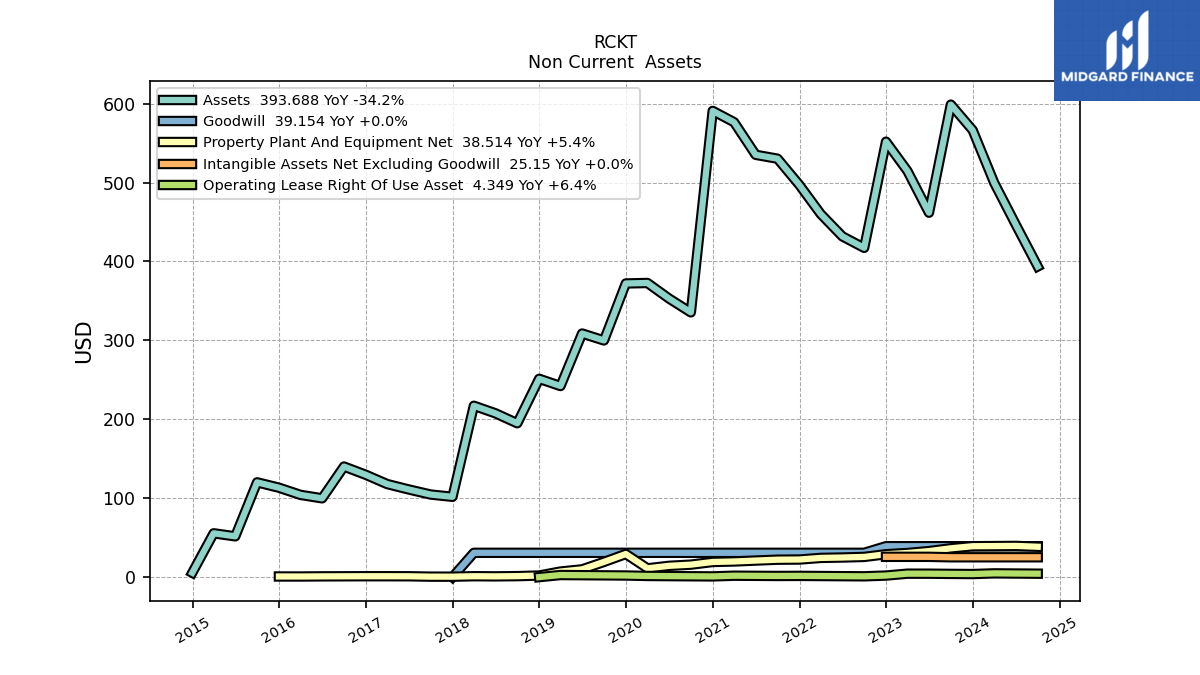
| Property Plant And Equipment Net | 36.53 | 32.99 | 30.59 | 29.01 | 25.61 | 24.85 | 24.35 | 22.30 | 22.09 | 20.99 | 19.83 | 19.21 | 15.80 | 14.31 | 11.14 | 29.30 | 19.27 | 9.84 | 7.08 | 2.03 | 1.25 | 0.98 | 1.15 | 0.56 | 0.61 | 1.08 | 1.12 | 1.13 | 1.04 | 0.98 | 0.79 | 0.81 | NA | NA | NA | NA | |
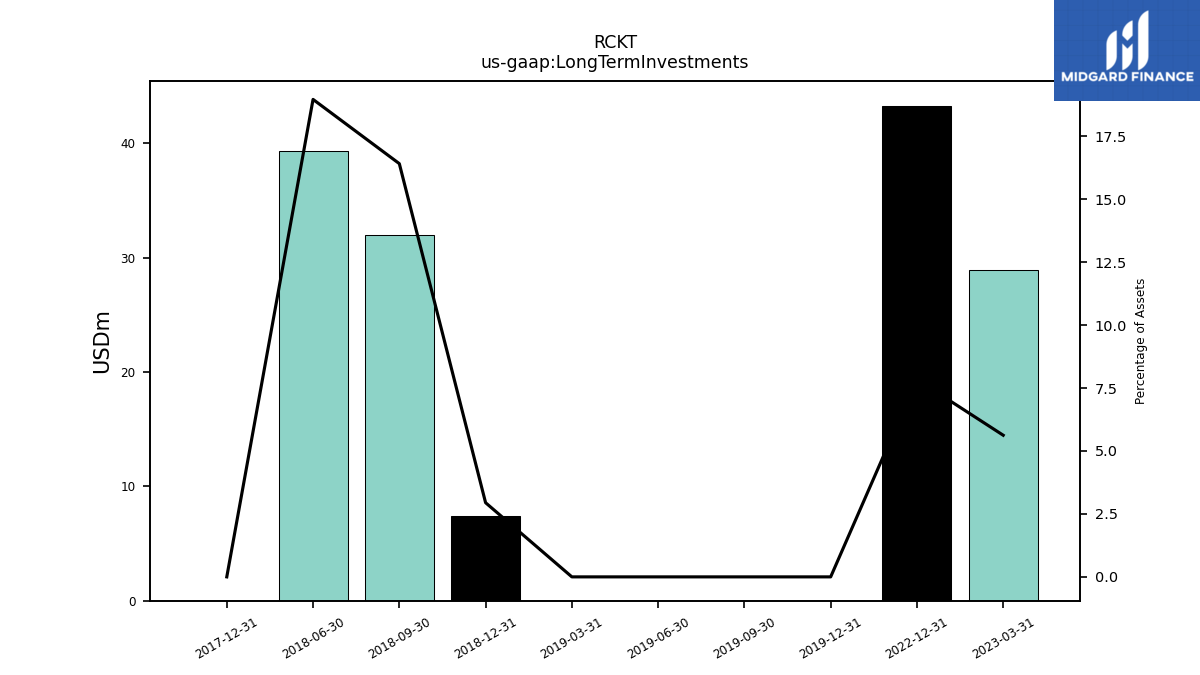
| Long Term Investments | NA | NA | 28.96 | 43.28 | NA | NA | NA | NA | NA | NA | NA | NA | NA | NA | NA | 0.00 | 0.00 | 0.00 | 0.00 | 7.40 | 32.00 | 39.36 | NA | 0.00 | NA | NA | NA | NA | NA | NA | NA | NA | NA | NA | NA | NA | |
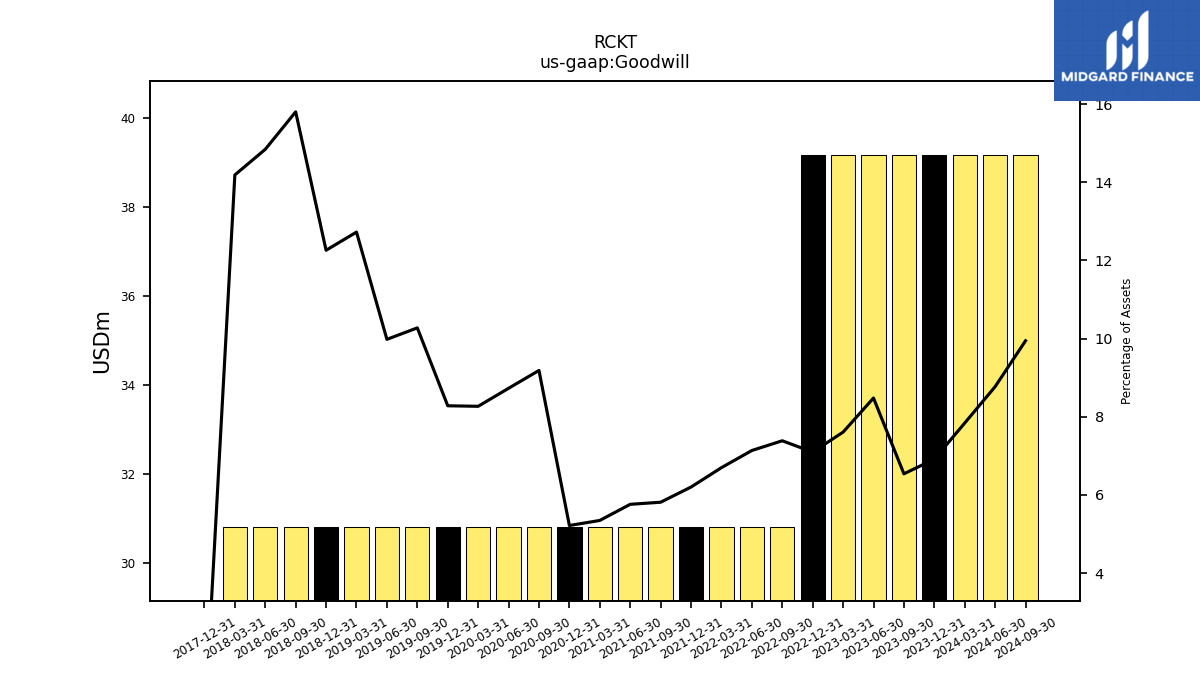
| Goodwill | 39.15 | 39.15 | 39.15 | 39.15 | 30.82 | 30.82 | 30.82 | 30.82 | 30.82 | 30.82 | 30.82 | 30.82 | 30.82 | 30.82 | 30.82 | 30.82 | 30.82 | 30.82 | 30.82 | 30.82 | 30.82 | 30.82 | 30.82 | 0.00 | NA | NA | NA | NA | NA | NA | NA | NA | NA | NA | NA | NA | |
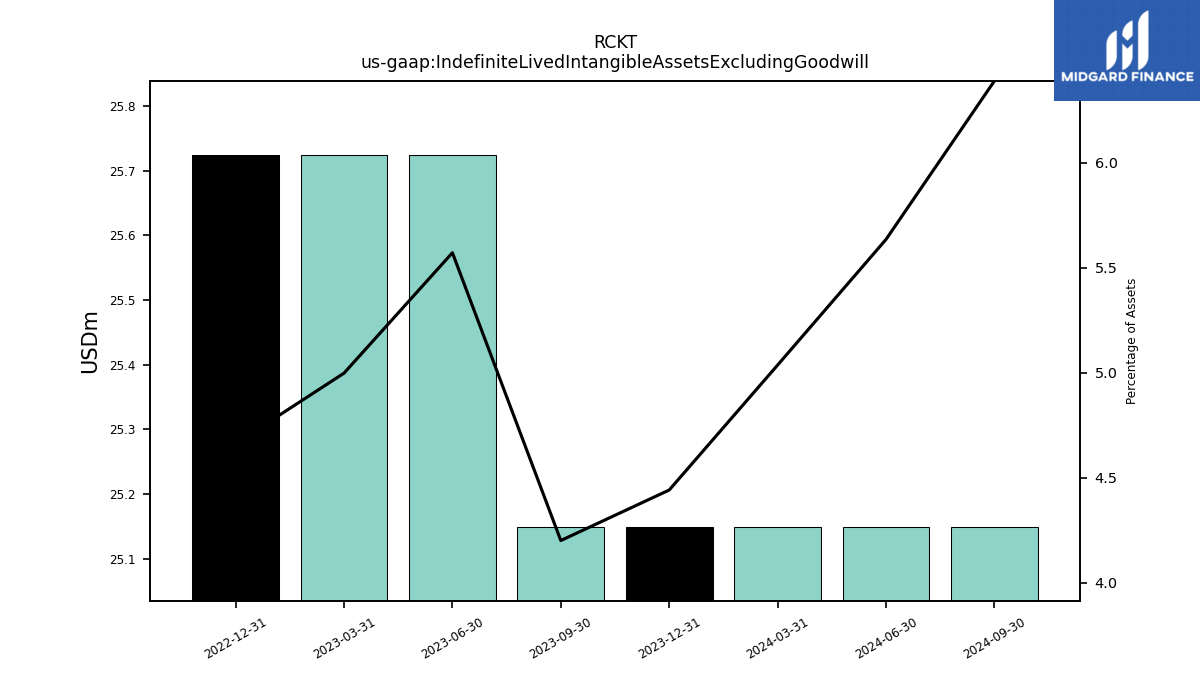
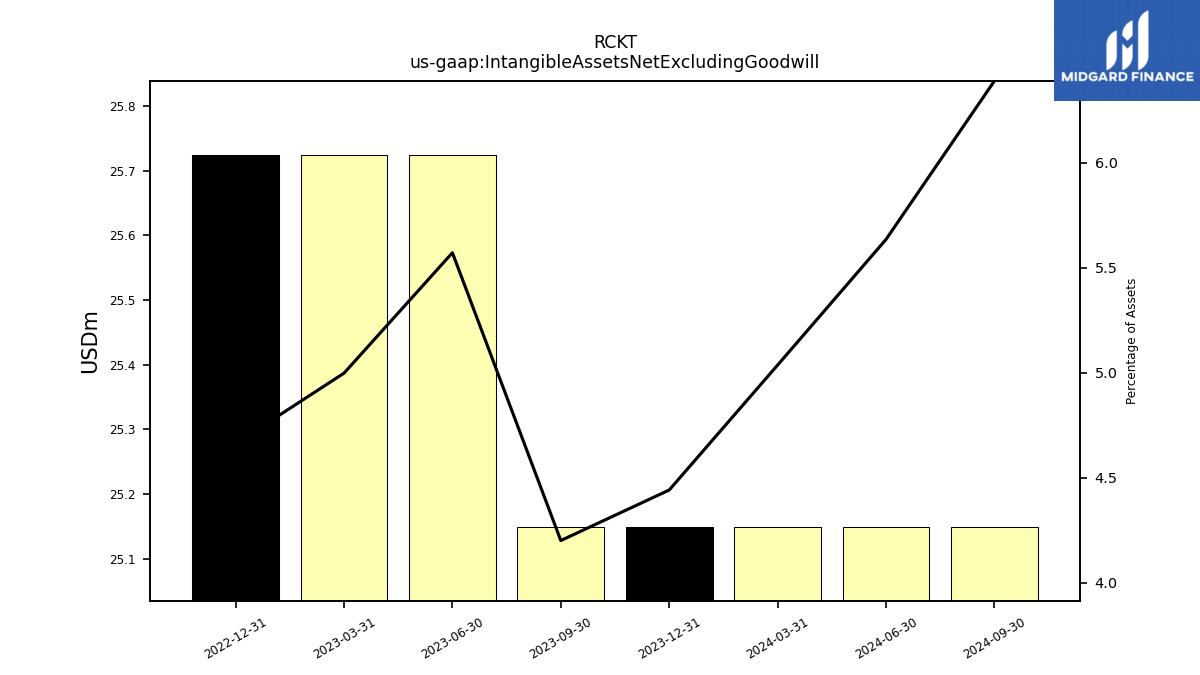
| Indefinite Lived Intangible Assets Excluding Goodwill | 25.15 | 25.72 | 25.72 | 25.72 | NA | NA | NA | NA | NA | NA | NA | NA | NA | NA | NA | NA | NA | NA | NA | NA | NA | NA | NA | NA | NA | NA | NA | NA | NA | NA | NA | NA | NA | NA | NA | NA | |
| Intangible Assets Net Excluding Goodwill | 25.15 | 25.72 | 25.72 | 25.72 | NA | NA | NA | NA | NA | NA | NA | NA | NA | NA | NA | NA | NA | NA | NA | NA | NA | NA | NA | NA | NA | NA | NA | NA | NA | NA | NA | NA | NA | NA | NA | NA |
| 2023-09-30 | 2023-06-30 | 2023-03-31 | 2022-12-31 | 2022-09-30 | 2022-06-30 | 2022-03-31 | 2021-12-31 | 2021-09-30 | 2021-06-30 | 2021-03-31 | 2020-12-31 | 2020-09-30 | 2020-06-30 | 2020-03-31 | 2019-12-31 | 2019-09-30 | 2019-06-30 | 2019-03-31 | 2018-12-31 | 2018-09-30 | 2018-06-30 | 2018-03-31 | 2017-12-31 | 2017-09-30 | 2017-06-30 | 2017-03-31 | 2016-12-31 | 2016-09-30 | 2016-06-30 | 2016-03-31 | 2015-12-31 | 2015-09-30 | 2015-06-30 | 2015-03-31 | 2014-12-31 | ||
|---|---|---|---|---|---|---|---|---|---|---|---|---|---|---|---|---|---|---|---|---|---|---|---|---|---|---|---|---|---|---|---|---|---|---|---|---|---|
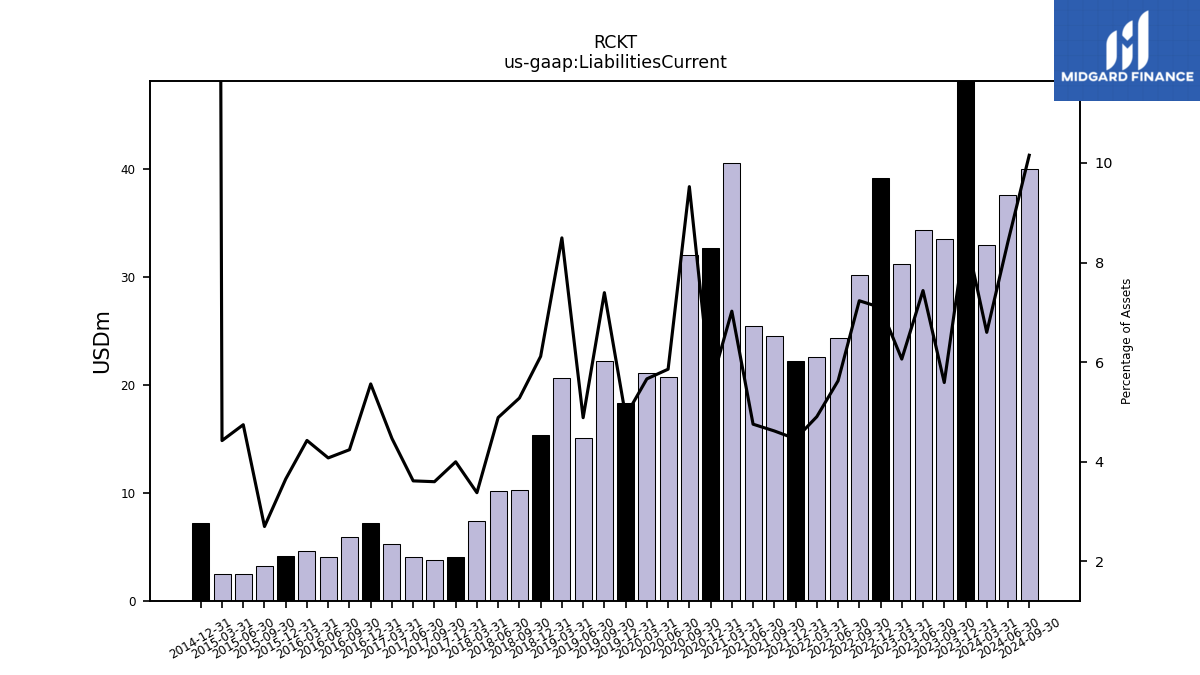
| Liabilities Current | 33.48 | 34.35 | 31.21 | 39.17 | 30.18 | 24.29 | 22.57 | 22.17 | 24.49 | 25.44 | 40.49 | 32.62 | 31.95 | 20.68 | 21.11 | 18.31 | 22.18 | 15.08 | 20.57 | 15.37 | 10.29 | 10.15 | 7.34 | 4.07 | 3.77 | 4.02 | 5.27 | 7.21 | 5.94 | 4.07 | 4.61 | 4.14 | 3.24 | 2.45 | 2.46 | 7.22 | |
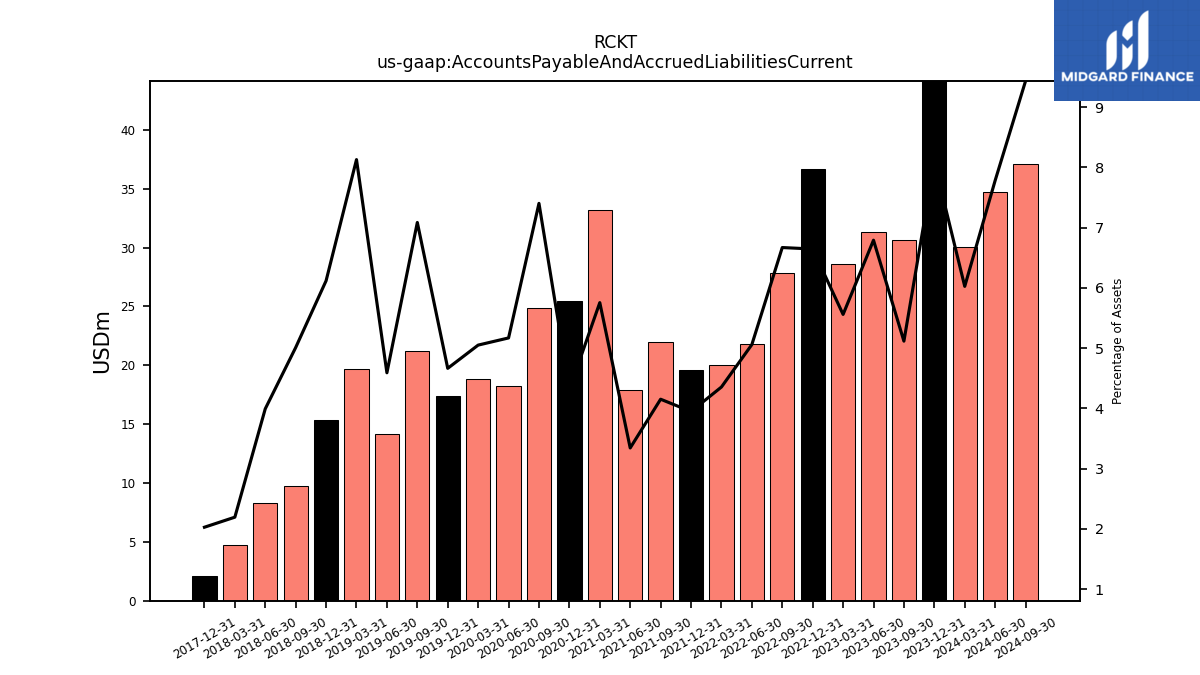
| Accounts Payable And Accrued Liabilities Current | 30.62 | 31.35 | 28.61 | 36.66 | 27.82 | 21.84 | 20.03 | 19.61 | 22.01 | 17.88 | 33.17 | 25.47 | 24.83 | 18.25 | 18.82 | 17.35 | 21.25 | 14.17 | 19.68 | 15.37 | 9.77 | 8.29 | 4.76 | 2.06 | NA | NA | NA | NA | NA | NA | NA | NA | NA | NA | NA | NA | |
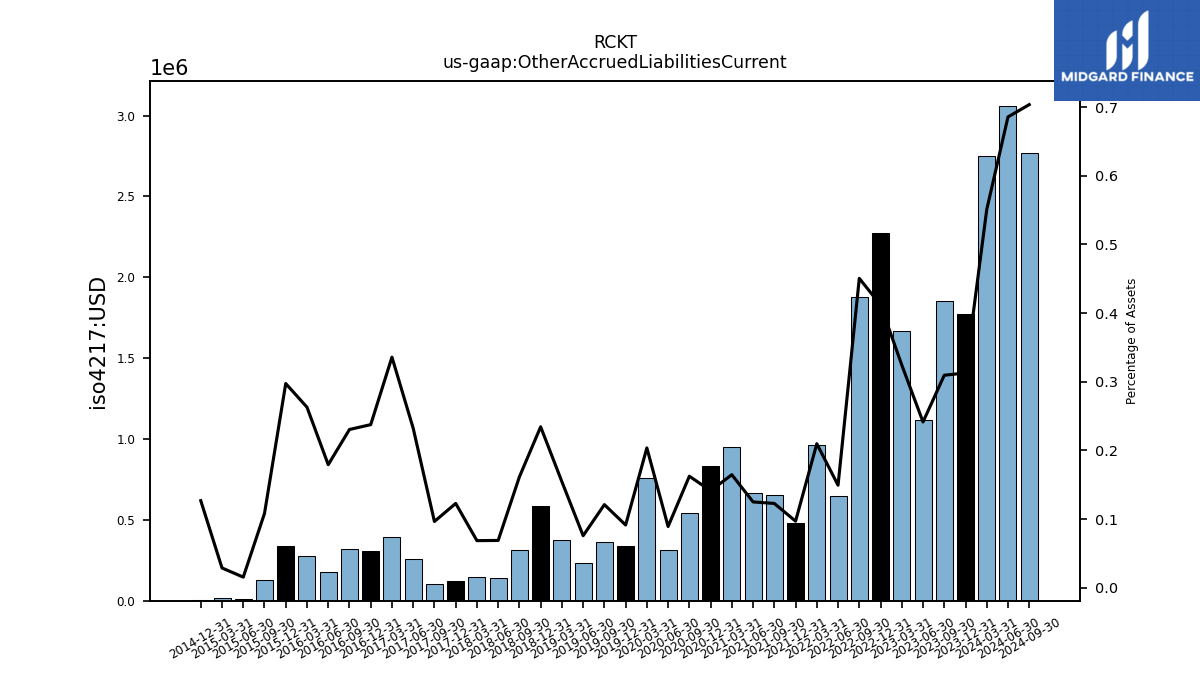
| Other Accrued Liabilities Current | 1.85 | 1.11 | 1.67 | 2.27 | 1.88 | 0.65 | 0.96 | 0.48 | 0.65 | 0.67 | 0.95 | 0.83 | 0.55 | 0.32 | 0.76 | 0.34 | 0.36 | 0.23 | 0.37 | 0.59 | 0.32 | 0.14 | 0.15 | 0.12 | 0.10 | 0.26 | 0.40 | 0.31 | 0.32 | 0.18 | 0.27 | 0.34 | 0.13 | 0.01 | 0.02 | 0.01 |
| 2023-09-30 | 2023-06-30 | 2023-03-31 | 2022-12-31 | 2022-09-30 | 2022-06-30 | 2022-03-31 | 2021-12-31 | 2021-09-30 | 2021-06-30 | 2021-03-31 | 2020-12-31 | 2020-09-30 | 2020-06-30 | 2020-03-31 | 2019-12-31 | 2019-09-30 | 2019-06-30 | 2019-03-31 | 2018-12-31 | 2018-09-30 | 2018-06-30 | 2018-03-31 | 2017-12-31 | 2017-09-30 | 2017-06-30 | 2017-03-31 | 2016-12-31 | 2016-09-30 | 2016-06-30 | 2016-03-31 | 2015-12-31 | 2015-09-30 | 2015-06-30 | 2015-03-31 | 2014-12-31 | ||
|---|---|---|---|---|---|---|---|---|---|---|---|---|---|---|---|---|---|---|---|---|---|---|---|---|---|---|---|---|---|---|---|---|---|---|---|---|---|
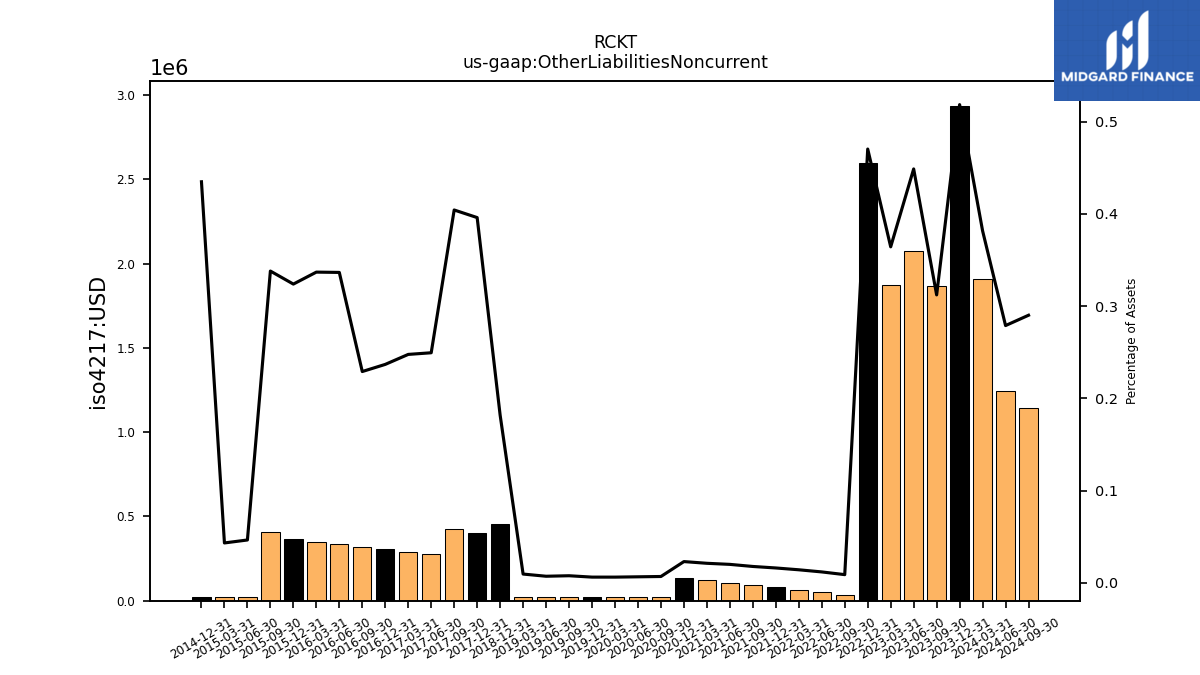
| Other Liabilities Noncurrent | 1.87 | 2.07 | 1.88 | 2.60 | 0.04 | 0.05 | 0.07 | 0.08 | 0.09 | 0.11 | 0.12 | 0.14 | 0.02 | 0.02 | 0.02 | 0.02 | 0.02 | 0.02 | 0.02 | 0.46 | NA | NA | NA | 0.40 | 0.42 | 0.28 | 0.29 | 0.31 | 0.32 | 0.34 | 0.35 | 0.37 | 0.41 | 0.02 | 0.02 | 0.02 | |
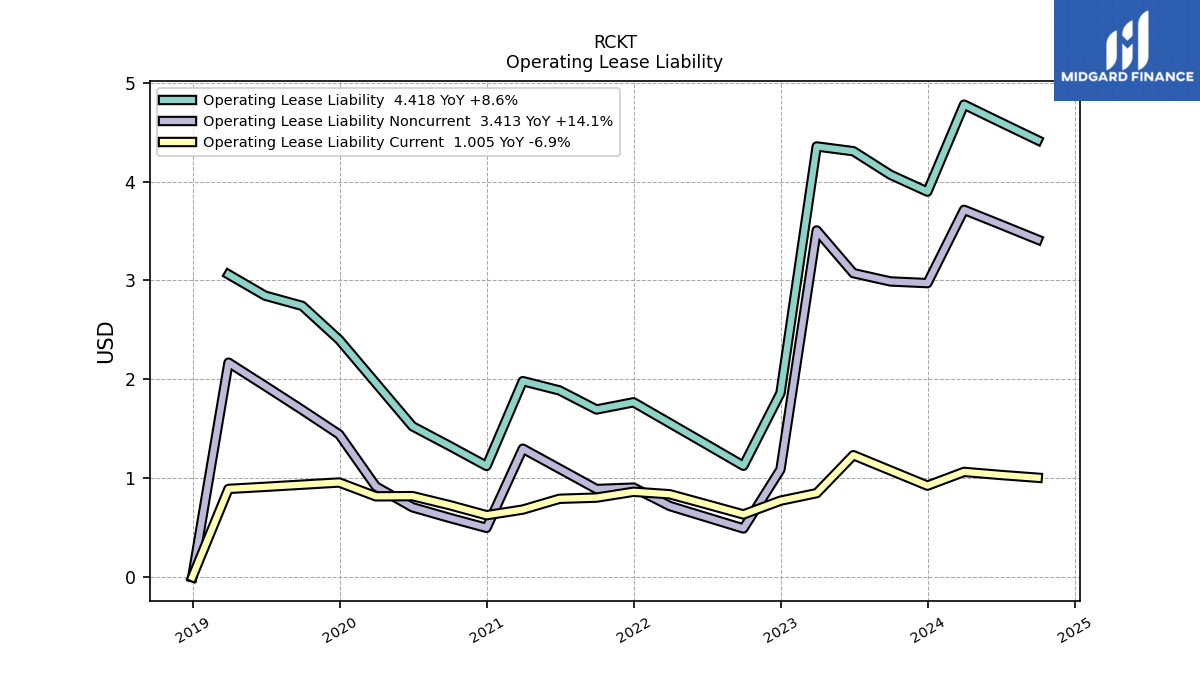
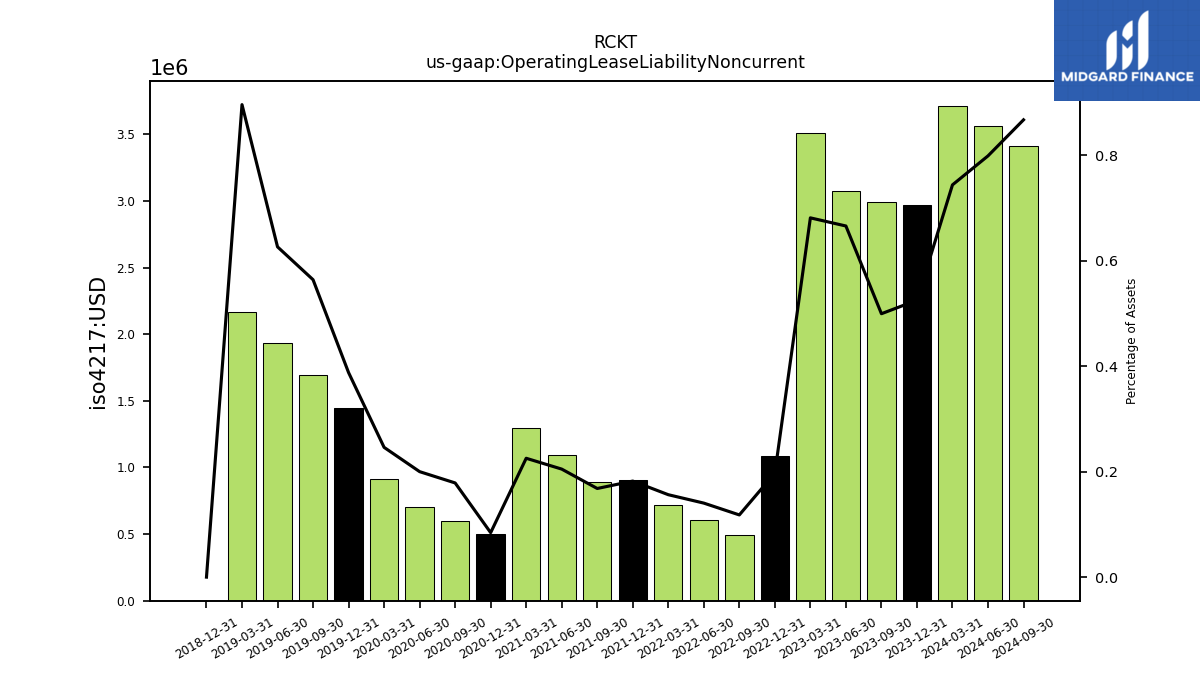
| Operating Lease Liability Noncurrent | 2.99 | 3.07 | 3.51 | 1.09 | 0.49 | 0.61 | 0.72 | 0.91 | 0.89 | 1.10 | 1.30 | 0.50 | 0.60 | 0.71 | 0.92 | 1.44 | 1.69 | 1.93 | 2.17 | 0.00 | NA | NA | NA | NA | NA | NA | NA | NA | NA | NA | NA | NA | NA | NA | NA | NA |
| 2023-09-30 | 2023-06-30 | 2023-03-31 | 2022-12-31 | 2022-09-30 | 2022-06-30 | 2022-03-31 | 2021-12-31 | 2021-09-30 | 2021-06-30 | 2021-03-31 | 2020-12-31 | 2020-09-30 | 2020-06-30 | 2020-03-31 | 2019-12-31 | 2019-09-30 | 2019-06-30 | 2019-03-31 | 2018-12-31 | 2018-09-30 | 2018-06-30 | 2018-03-31 | 2017-12-31 | 2017-09-30 | 2017-06-30 | 2017-03-31 | 2016-12-31 | 2016-09-30 | 2016-06-30 | 2016-03-31 | 2015-12-31 | 2015-09-30 | 2015-06-30 | 2015-03-31 | 2014-12-31 | ||
|---|---|---|---|---|---|---|---|---|---|---|---|---|---|---|---|---|---|---|---|---|---|---|---|---|---|---|---|---|---|---|---|---|---|---|---|---|---|
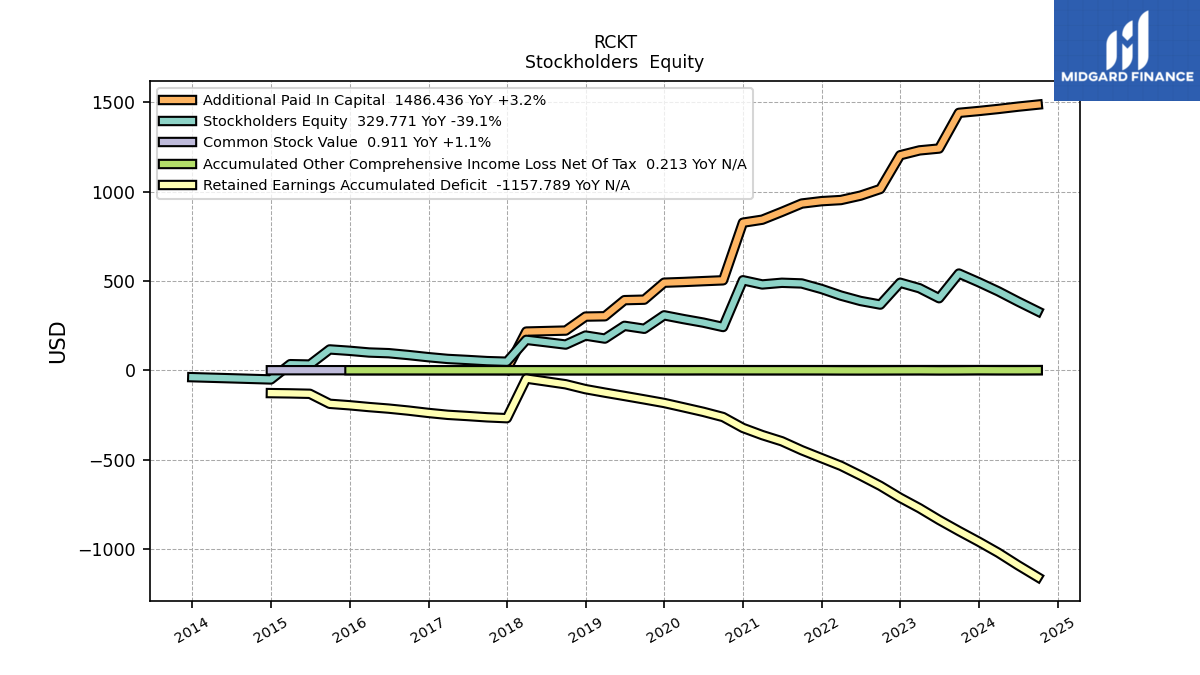
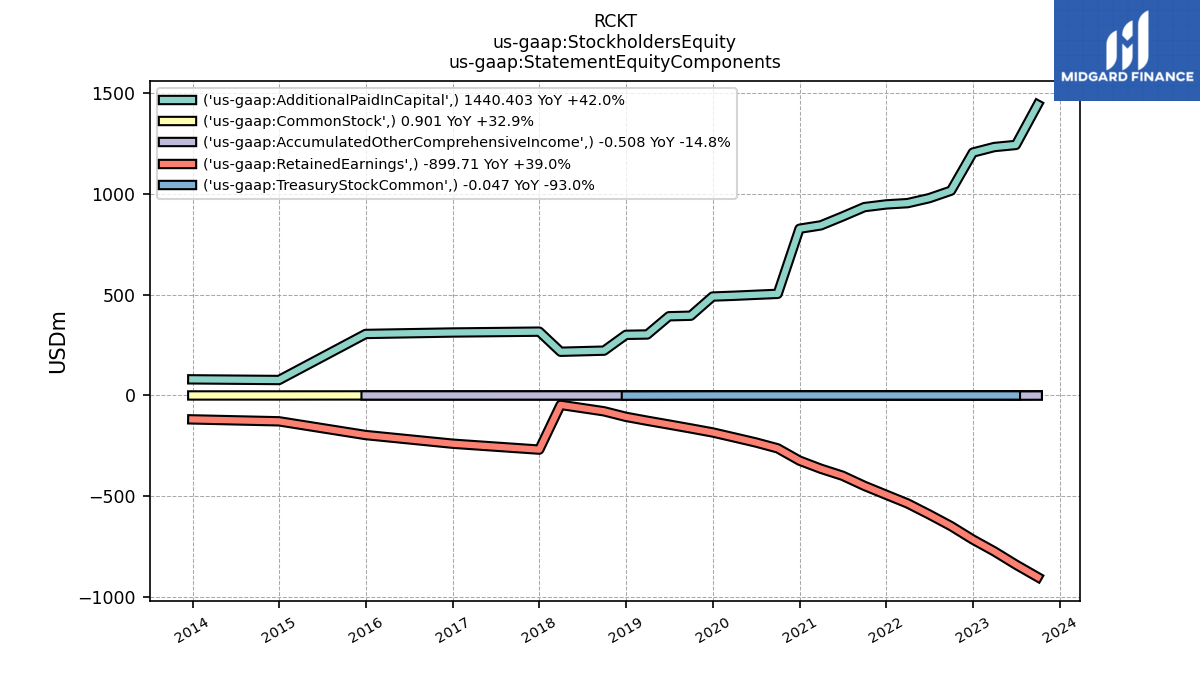
| Stockholders Equity | 541.09 | 402.97 | 458.88 | 489.69 | 367.31 | 387.70 | 417.62 | 454.72 | 485.66 | 489.44 | 480.00 | 503.52 | 241.84 | 266.52 | 286.05 | 307.30 | 231.92 | 248.50 | 177.08 | 194.04 | 143.62 | 157.08 | 170.15 | 47.76 | 51.08 | 57.53 | 63.26 | 73.17 | 85.05 | 95.44 | 99.24 | 108.81 | 116.47 | 31.72 | 33.95 | -51.56 | |
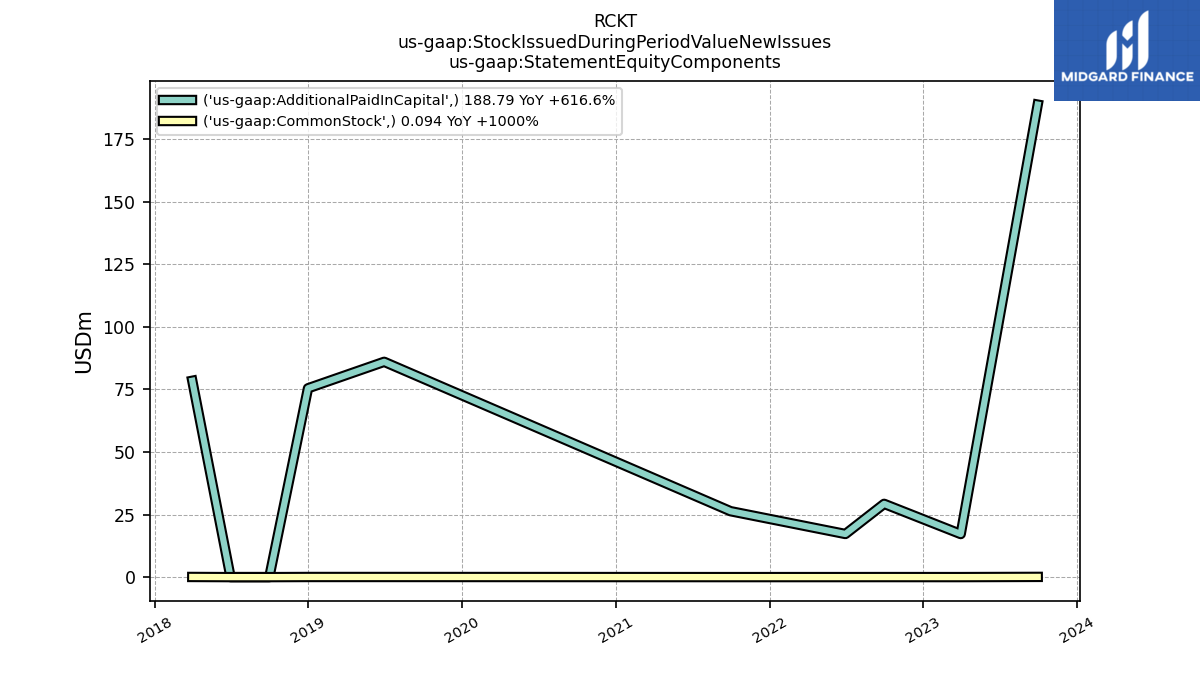
| Common Stock Value | 0.90 | 0.81 | 0.80 | 0.79 | 0.68 | 0.66 | 0.65 | 0.65 | 0.64 | 0.63 | 0.62 | 0.61 | 0.55 | 0.55 | 0.55 | 0.55 | 0.50 | 0.50 | 0.45 | 0.45 | 0.40 | 0.40 | 0.39 | 0.07 | 0.27 | 0.27 | 0.27 | 0.27 | 0.27 | 0.27 | 0.26 | 0.26 | 0.26 | 0.16 | 0.16 | 0.01 | |
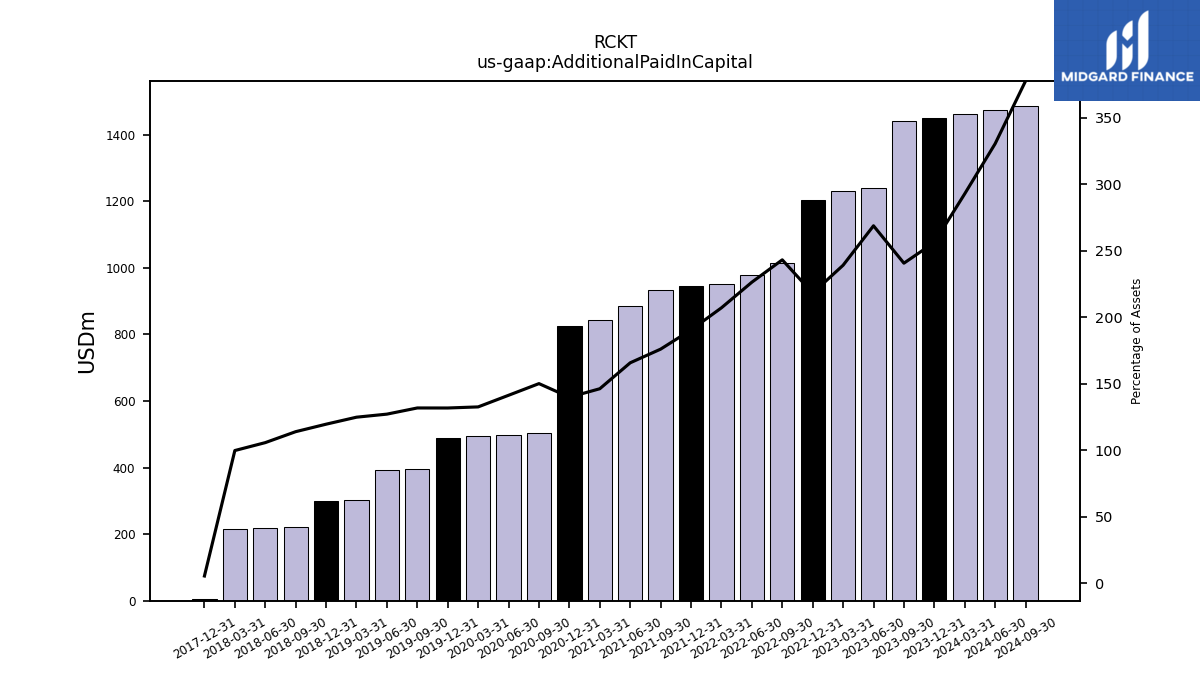
| Additional Paid In Capital | 1440.40 | 1240.74 | 1230.32 | 1203.07 | 1014.28 | 977.10 | 952.50 | 946.15 | 932.78 | 886.43 | 842.48 | 825.79 | 503.22 | 498.59 | 493.81 | 489.93 | 394.93 | 392.20 | 302.04 | 300.25 | 221.98 | 219.22 | 216.44 | 5.41 | NA | NA | NA | NA | NA | NA | NA | NA | NA | NA | NA | NA | |
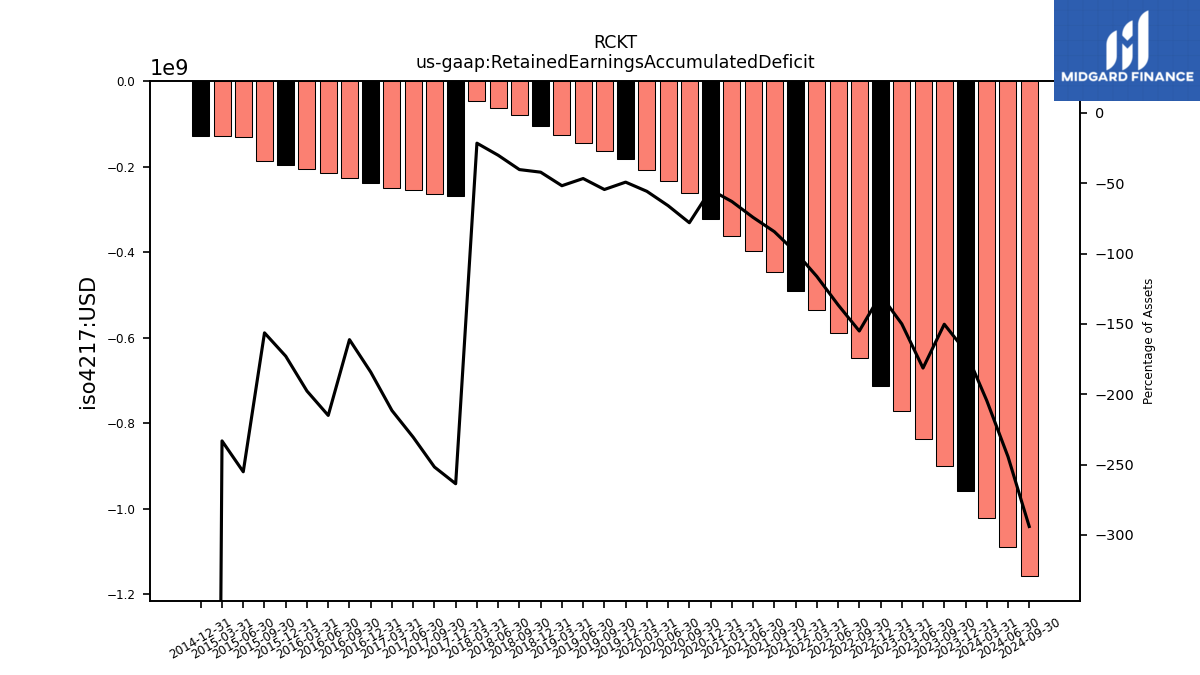
| Retained Earnings Accumulated Deficit | -899.71 | -837.81 | -772.11 | -713.77 | -647.05 | -589.30 | -534.89 | -491.91 | -447.67 | -397.55 | -363.02 | -322.84 | -261.93 | -232.85 | -207.81 | -183.14 | -163.29 | -144.00 | -125.32 | -105.87 | -78.55 | -62.47 | -46.70 | -268.37 | -263.50 | -256.11 | -249.55 | -238.88 | -225.90 | -214.78 | -206.09 | -196.02 | -187.85 | -131.89 | -129.50 | -128.04 | |
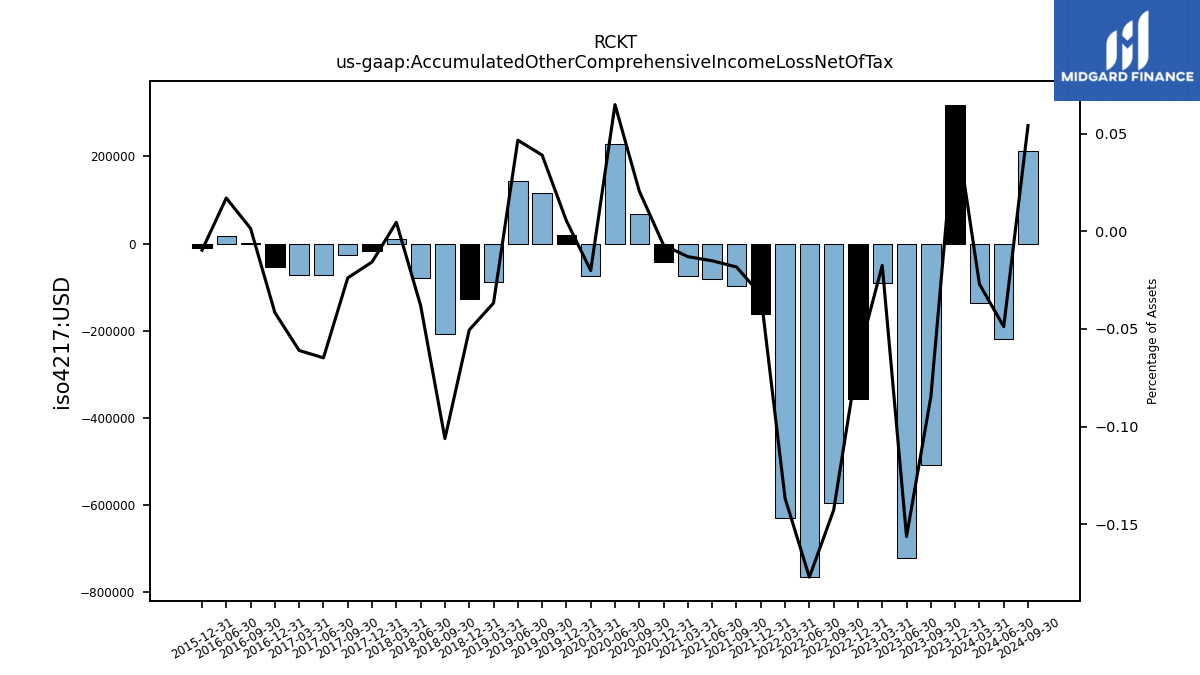
| Accumulated Other Comprehensive Income Loss Net Of Tax | -0.51 | -0.72 | -0.09 | -0.36 | -0.60 | -0.77 | -0.63 | -0.16 | -0.10 | -0.08 | -0.07 | -0.04 | 0.07 | 0.23 | -0.07 | 0.02 | 0.12 | 0.14 | -0.09 | -0.13 | -0.21 | -0.08 | 0.01 | -0.02 | -0.03 | -0.07 | -0.07 | -0.05 | 0.00 | 0.02 | NA | -0.01 | NA | NA | NA | NA | |
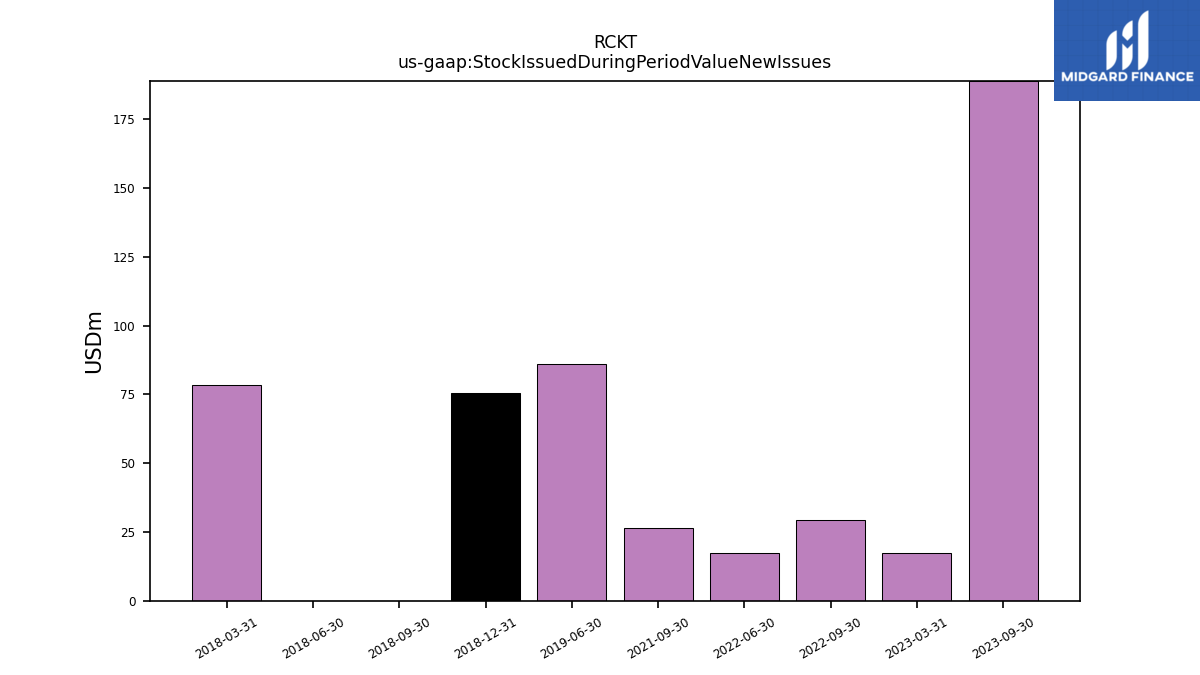
| Stock Issued During Period Value New Issues | 188.88 | NA | 17.22 | NA | 29.30 | 17.24 | NA | NA | 26.35 | NA | NA | NA | NA | NA | NA | NA | NA | 86.08 | NA | 75.50 | 0.00 | 0.00 | 78.52 | NA | NA | NA | NA | NA | NA | NA | NA | NA | NA | NA | NA | NA | |
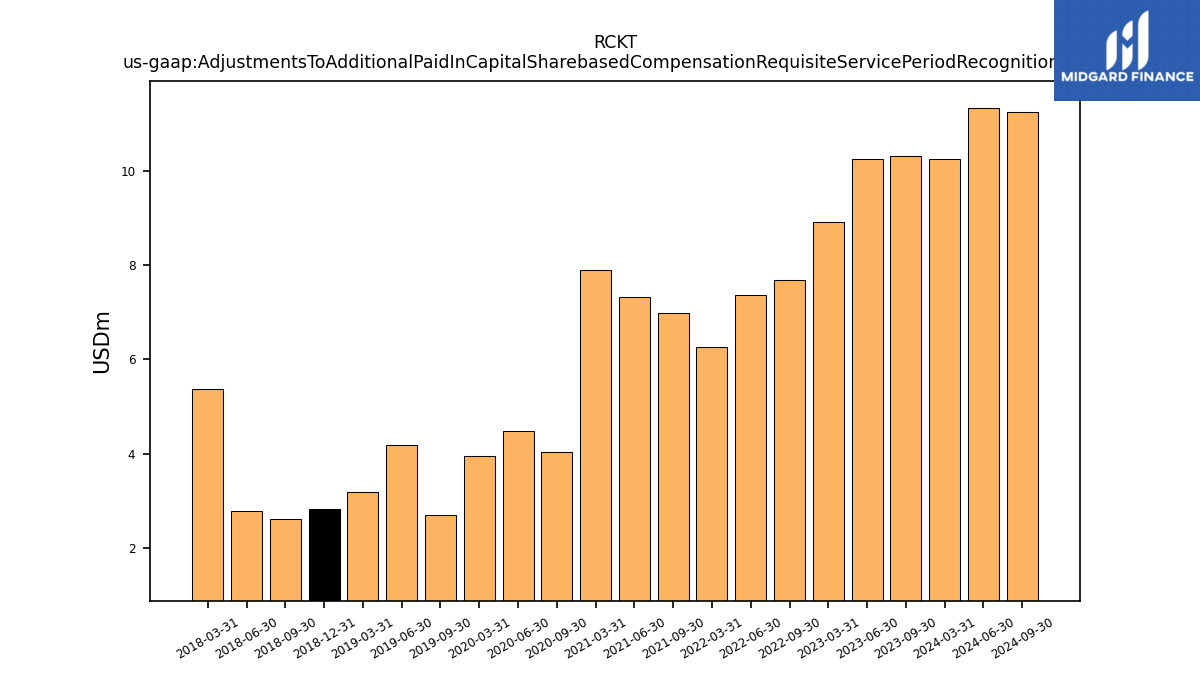
| Adjustments To Additional Paid In Capital Sharebased Compensation Requisite Service Period Recognition Value | 10.32 | 10.24 | 8.91 | NA | 7.68 | 7.37 | 6.27 | NA | 6.99 | 7.31 | 7.90 | NA | 4.05 | 4.49 | 3.96 | NA | 2.69 | 4.18 | 3.18 | 2.82 | 2.61 | 2.79 | 5.38 | NA | NA | NA | NA | NA | NA | NA | NA | NA | NA | NA | NA | NA |
| 2023-09-30 | 2023-06-30 | 2023-03-31 | 2022-12-31 | 2022-09-30 | 2022-06-30 | 2022-03-31 | 2021-12-31 | 2021-09-30 | 2021-06-30 | 2021-03-31 | 2020-12-31 | 2020-09-30 | 2020-06-30 | 2020-03-31 | 2019-12-31 | 2019-09-30 | 2019-06-30 | 2019-03-31 | 2018-12-31 | 2018-09-30 | 2018-06-30 | 2018-03-31 | 2017-12-31 | 2017-09-30 | 2017-06-30 | 2017-03-31 | 2016-12-31 | 2016-09-30 | 2016-06-30 | 2016-03-31 | 2015-12-31 | 2015-09-30 | 2015-06-30 | 2015-03-31 | 2014-12-31 | ||
|---|---|---|---|---|---|---|---|---|---|---|---|---|---|---|---|---|---|---|---|---|---|---|---|---|---|---|---|---|---|---|---|---|---|---|---|---|---|
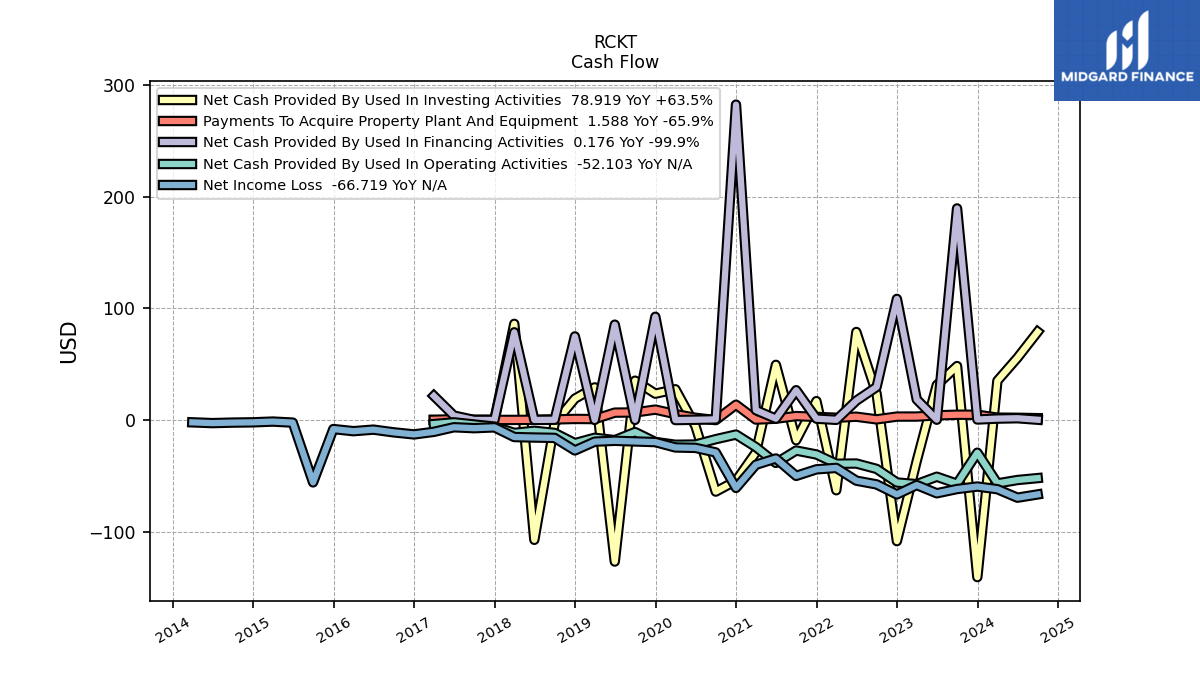
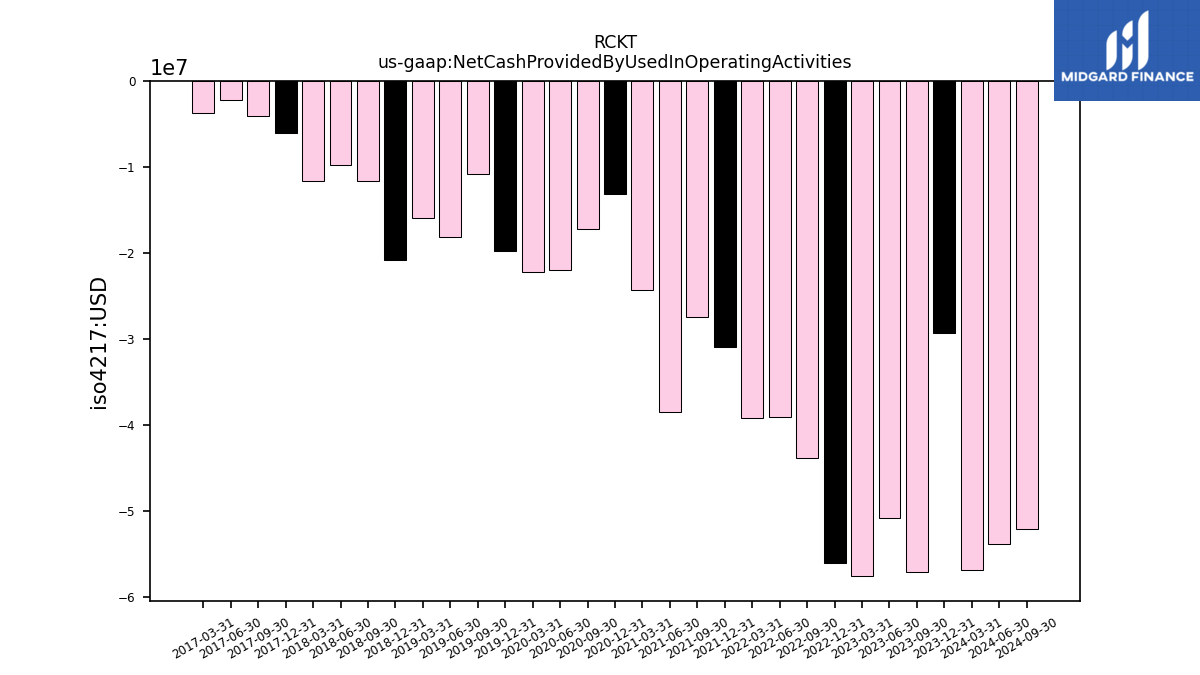
| Net Cash Provided By Used In Operating Activities | -57.15 | -50.87 | -57.56 | -56.02 | -43.86 | -39.04 | -39.22 | -30.94 | -27.41 | -38.53 | -24.28 | -13.11 | -17.25 | -22.03 | -22.25 | -19.73 | -10.85 | -18.10 | -15.98 | -20.81 | -11.63 | -9.74 | -11.60 | -5.99 | -4.09 | -2.16 | -3.72 | NA | NA | NA | NA | NA | NA | NA | NA | NA | |
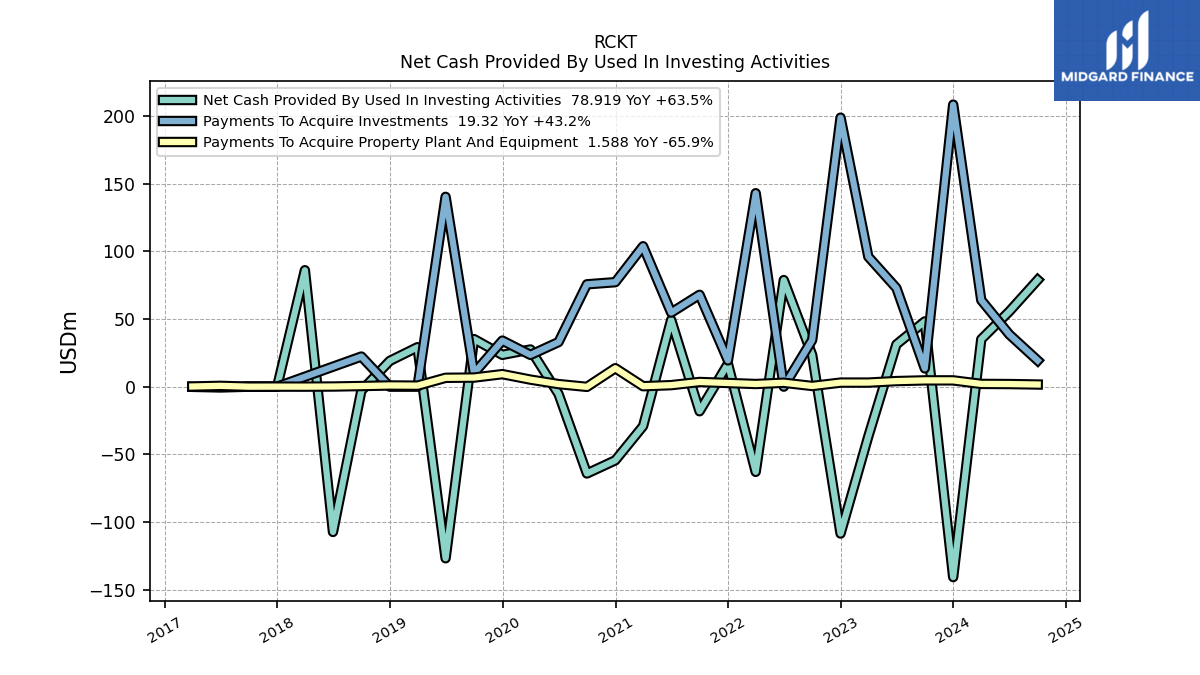
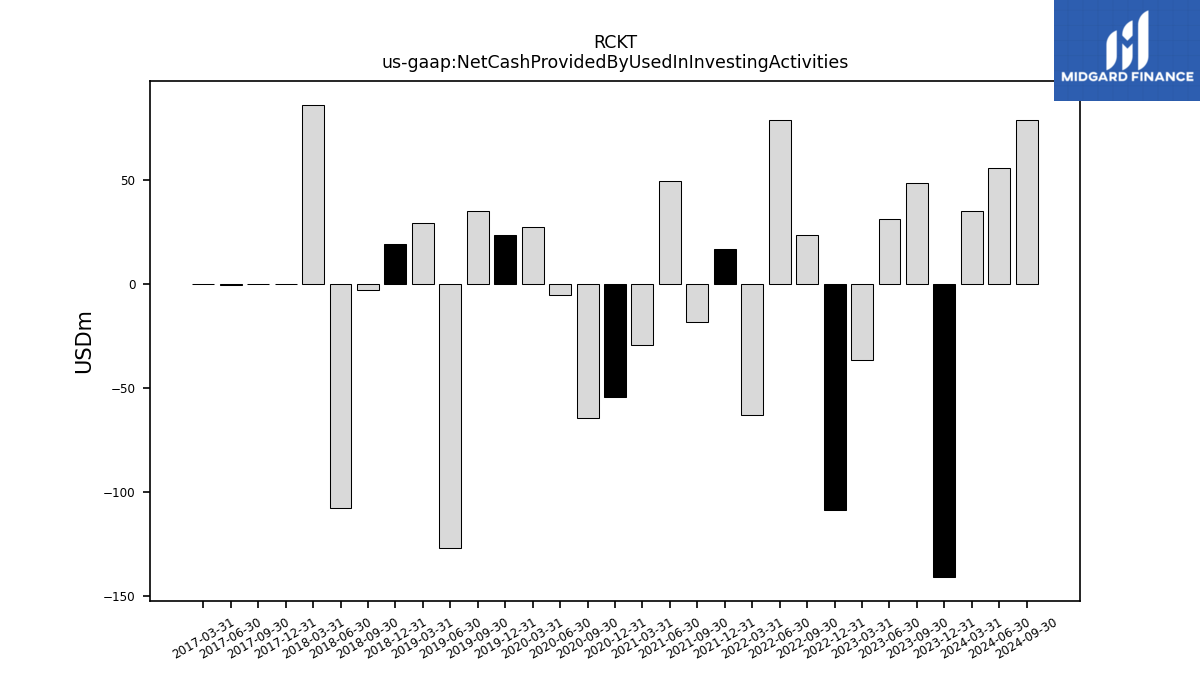
| Net Cash Provided By Used In Investing Activities | 48.25 | 31.21 | -36.72 | -108.58 | 23.46 | 78.79 | -62.99 | 16.86 | -18.19 | 49.35 | -29.17 | -54.46 | -64.19 | -5.43 | 27.50 | 23.51 | 35.18 | -126.88 | 29.18 | 19.05 | -2.98 | -107.41 | 86.08 | -0.03 | -0.00 | -0.60 | -0.13 | NA | NA | NA | NA | NA | NA | NA | NA | NA | |
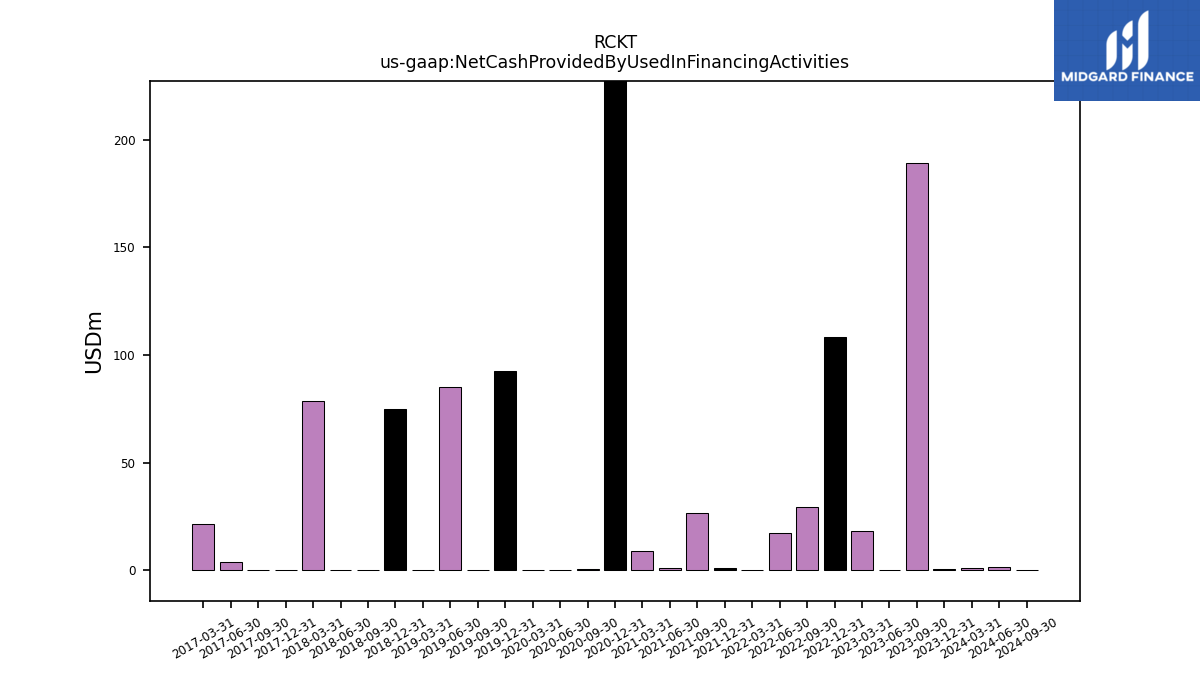
| Net Cash Provided By Used In Financing Activities | 189.49 | 0.18 | 18.34 | 108.44 | 29.53 | 17.25 | 0.08 | 1.14 | 26.64 | 1.11 | 8.79 | 282.44 | 0.51 | 0.15 | -0.12 | 92.41 | 0.03 | 85.35 | 0.00 | 74.83 | 0.15 | 0.00 | 78.52 | 0.00 | -0.04 | 3.90 | 21.55 | NA | NA | NA | NA | NA | NA | NA | NA | NA |
| 2023-09-30 | 2023-06-30 | 2023-03-31 | 2022-12-31 | 2022-09-30 | 2022-06-30 | 2022-03-31 | 2021-12-31 | 2021-09-30 | 2021-06-30 | 2021-03-31 | 2020-12-31 | 2020-09-30 | 2020-06-30 | 2020-03-31 | 2019-12-31 | 2019-09-30 | 2019-06-30 | 2019-03-31 | 2018-12-31 | 2018-09-30 | 2018-06-30 | 2018-03-31 | 2017-12-31 | 2017-09-30 | 2017-06-30 | 2017-03-31 | 2016-12-31 | 2016-09-30 | 2016-06-30 | 2016-03-31 | 2015-12-31 | 2015-09-30 | 2015-06-30 | 2015-03-31 | 2014-12-31 | ||
|---|---|---|---|---|---|---|---|---|---|---|---|---|---|---|---|---|---|---|---|---|---|---|---|---|---|---|---|---|---|---|---|---|---|---|---|---|---|
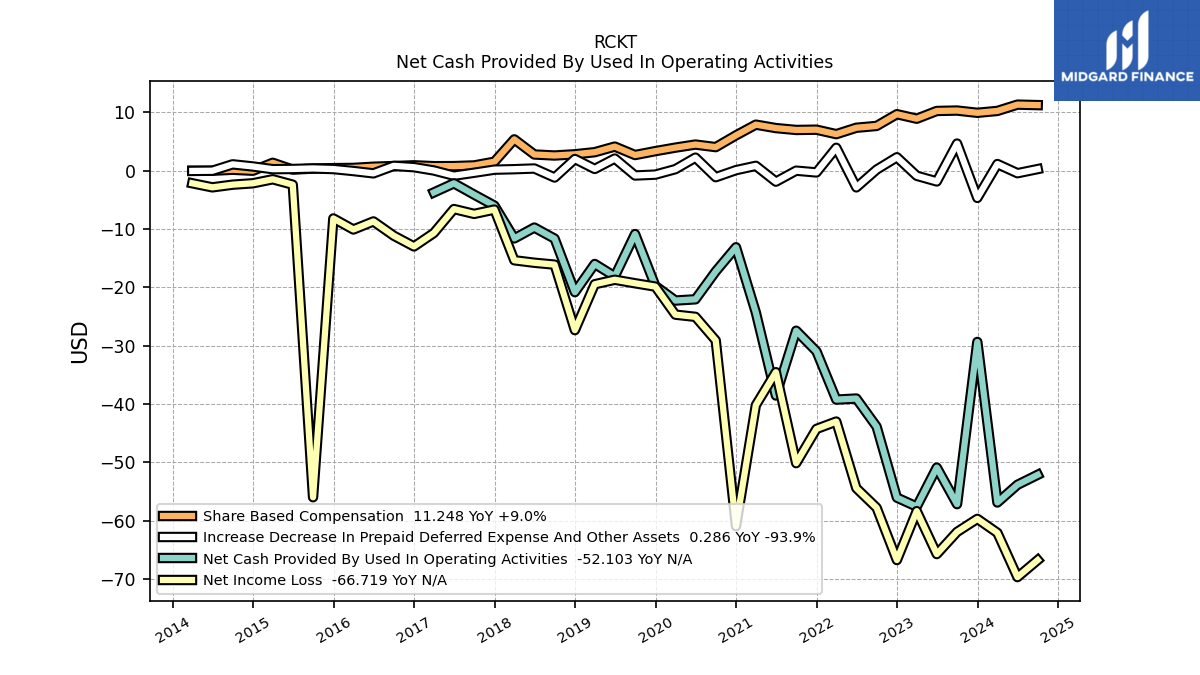
| Net Cash Provided By Used In Operating Activities | -57.15 | -50.87 | -57.56 | -56.02 | -43.86 | -39.04 | -39.22 | -30.94 | -27.41 | -38.53 | -24.28 | -13.11 | -17.25 | -22.03 | -22.25 | -19.73 | -10.85 | -18.10 | -15.98 | -20.81 | -11.63 | -9.74 | -11.60 | -5.99 | -4.09 | -2.16 | -3.72 | NA | NA | NA | NA | NA | NA | NA | NA | NA | |
| Net Income Loss | -61.90 | -65.70 | -58.34 | -66.72 | -57.76 | -54.40 | -42.98 | -44.25 | -50.12 | -34.52 | -40.18 | -60.92 | -29.08 | -25.04 | -24.66 | -19.86 | -19.28 | -18.68 | -19.45 | -27.32 | -16.09 | -15.77 | -15.34 | -6.66 | -7.39 | -6.56 | -10.67 | -12.97 | -11.13 | -8.68 | -10.07 | -8.17 | -55.96 | -2.39 | -1.46 | -2.15 | |
| Share Based Compensation | 10.32 | 10.24 | 8.91 | 9.69 | 7.68 | 7.37 | 6.27 | 7.04 | 6.99 | 7.31 | 7.90 | 6.07 | 4.05 | 4.49 | 3.96 | 3.36 | 2.69 | 4.14 | 3.18 | 2.82 | 2.61 | 2.79 | 5.38 | 1.55 | 0.91 | 0.79 | 0.78 | 0.93 | 0.81 | 0.69 | 0.49 | 0.45 | 0.37 | 0.19 | 1.36 | 0.00 |
| 2023-09-30 | 2023-06-30 | 2023-03-31 | 2022-12-31 | 2022-09-30 | 2022-06-30 | 2022-03-31 | 2021-12-31 | 2021-09-30 | 2021-06-30 | 2021-03-31 | 2020-12-31 | 2020-09-30 | 2020-06-30 | 2020-03-31 | 2019-12-31 | 2019-09-30 | 2019-06-30 | 2019-03-31 | 2018-12-31 | 2018-09-30 | 2018-06-30 | 2018-03-31 | 2017-12-31 | 2017-09-30 | 2017-06-30 | 2017-03-31 | 2016-12-31 | 2016-09-30 | 2016-06-30 | 2016-03-31 | 2015-12-31 | 2015-09-30 | 2015-06-30 | 2015-03-31 | 2014-12-31 | ||
|---|---|---|---|---|---|---|---|---|---|---|---|---|---|---|---|---|---|---|---|---|---|---|---|---|---|---|---|---|---|---|---|---|---|---|---|---|---|
| Net Cash Provided By Used In Investing Activities | 48.25 | 31.21 | -36.72 | -108.58 | 23.46 | 78.79 | -62.99 | 16.86 | -18.19 | 49.35 | -29.17 | -54.46 | -64.19 | -5.43 | 27.50 | 23.51 | 35.18 | -126.88 | 29.18 | 19.05 | -2.98 | -107.41 | 86.08 | -0.03 | -0.00 | -0.60 | -0.13 | NA | NA | NA | NA | NA | NA | NA | NA | NA | |
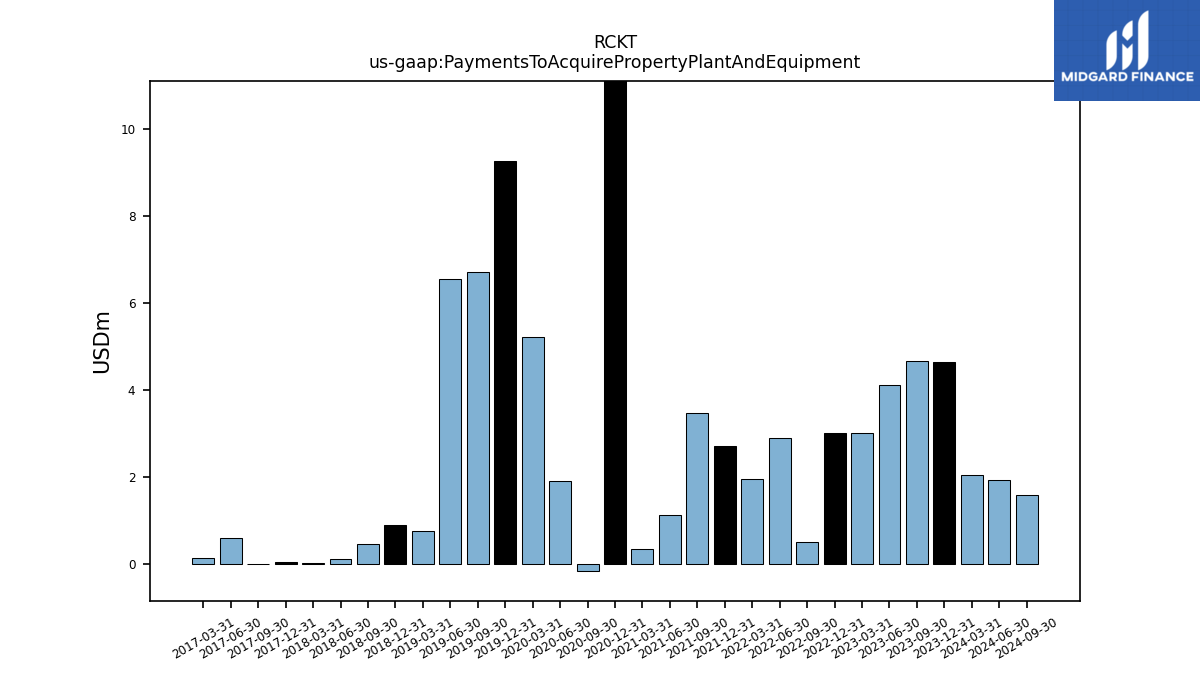
| Payments To Acquire Property Plant And Equipment | 4.66 | 4.12 | 3.02 | 3.00 | 0.50 | 2.90 | 1.96 | 2.71 | 3.46 | 1.12 | 0.33 | 13.65 | -0.16 | 1.91 | 5.21 | 9.25 | 6.71 | 6.54 | 0.76 | 0.88 | 0.45 | 0.11 | 0.01 | 0.03 | 0.00 | 0.60 | 0.13 | NA | NA | NA | NA | NA | NA | NA | NA | NA | |
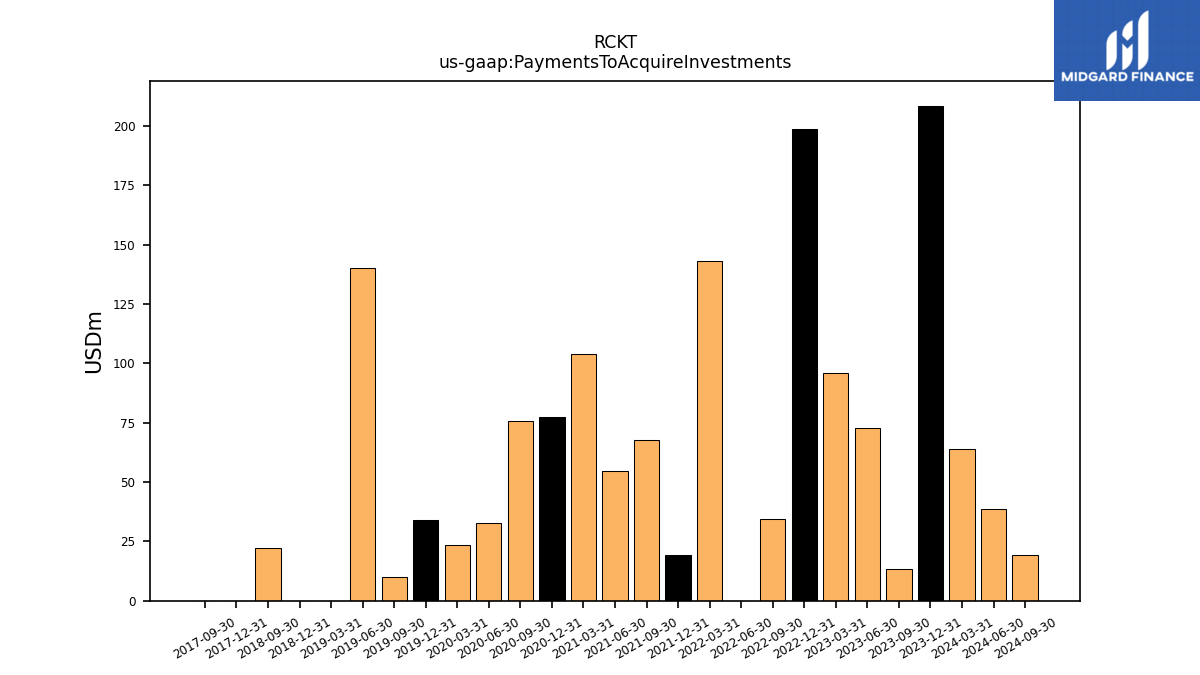
| Payments To Acquire Investments | 13.49 | 72.90 | 96.03 | 198.87 | 34.44 | 0.00 | 143.02 | 19.39 | 67.91 | 54.76 | 103.81 | 77.24 | 75.67 | 32.95 | 23.48 | 34.05 | 9.91 | 140.34 | 0.00 | 0.00 | 22.27 | NA | NA | 0.00 | 0.00 | NA | NA | NA | NA | NA | NA | NA | NA | NA | NA | NA |
| 2023-09-30 | 2023-06-30 | 2023-03-31 | 2022-12-31 | 2022-09-30 | 2022-06-30 | 2022-03-31 | 2021-12-31 | 2021-09-30 | 2021-06-30 | 2021-03-31 | 2020-12-31 | 2020-09-30 | 2020-06-30 | 2020-03-31 | 2019-12-31 | 2019-09-30 | 2019-06-30 | 2019-03-31 | 2018-12-31 | 2018-09-30 | 2018-06-30 | 2018-03-31 | 2017-12-31 | 2017-09-30 | 2017-06-30 | 2017-03-31 | 2016-12-31 | 2016-09-30 | 2016-06-30 | 2016-03-31 | 2015-12-31 | 2015-09-30 | 2015-06-30 | 2015-03-31 | 2014-12-31 | ||
|---|---|---|---|---|---|---|---|---|---|---|---|---|---|---|---|---|---|---|---|---|---|---|---|---|---|---|---|---|---|---|---|---|---|---|---|---|---|
| Net Cash Provided By Used In Financing Activities | 189.49 | 0.18 | 18.34 | 108.44 | 29.53 | 17.25 | 0.08 | 1.14 | 26.64 | 1.11 | 8.79 | 282.44 | 0.51 | 0.15 | -0.12 | 92.41 | 0.03 | 85.35 | 0.00 | 74.83 | 0.15 | 0.00 | 78.52 | 0.00 | -0.04 | 3.90 | 21.55 | NA | NA | NA | NA | NA | NA | NA | NA | NA |
