
| 2023-12-31 | 2023-09-30 | 2023-06-30 | 2023-03-31 | 2022-12-31 | 2022-09-30 | 2022-06-30 | 2022-03-31 | 2021-12-31 | 2021-09-30 | 2021-06-30 | 2021-03-31 | 2020-12-31 | 2020-09-30 | 2020-06-30 | 2020-03-31 | 2019-12-31 | 2019-09-30 | 2019-06-30 | 2019-03-31 | 2018-12-31 | 2018-09-30 | 2018-06-30 | 2018-03-31 | 2017-12-31 | 2017-09-30 | 2017-06-30 | 2017-03-31 | 2016-12-31 | 2016-09-30 | 2016-06-30 | 2016-03-31 | 2015-12-31 | 2015-09-30 | 2015-06-30 | 2015-03-31 | 2014-12-31 | 2014-09-30 | 2014-06-30 | 2014-03-31 | 2013-12-31 | 2013-09-30 | 2013-06-30 | 2013-03-31 | 2012-12-31 | 2012-09-30 | 2012-06-30 | 2012-03-31 | 2011-12-31 | 2011-09-30 | 2011-06-30 | 2011-03-31 | 2010-12-31 | 2010-09-30 | 2010-06-30 | 2010-03-31 | ||
|---|---|---|---|---|---|---|---|---|---|---|---|---|---|---|---|---|---|---|---|---|---|---|---|---|---|---|---|---|---|---|---|---|---|---|---|---|---|---|---|---|---|---|---|---|---|---|---|---|---|---|---|---|---|---|---|---|---|
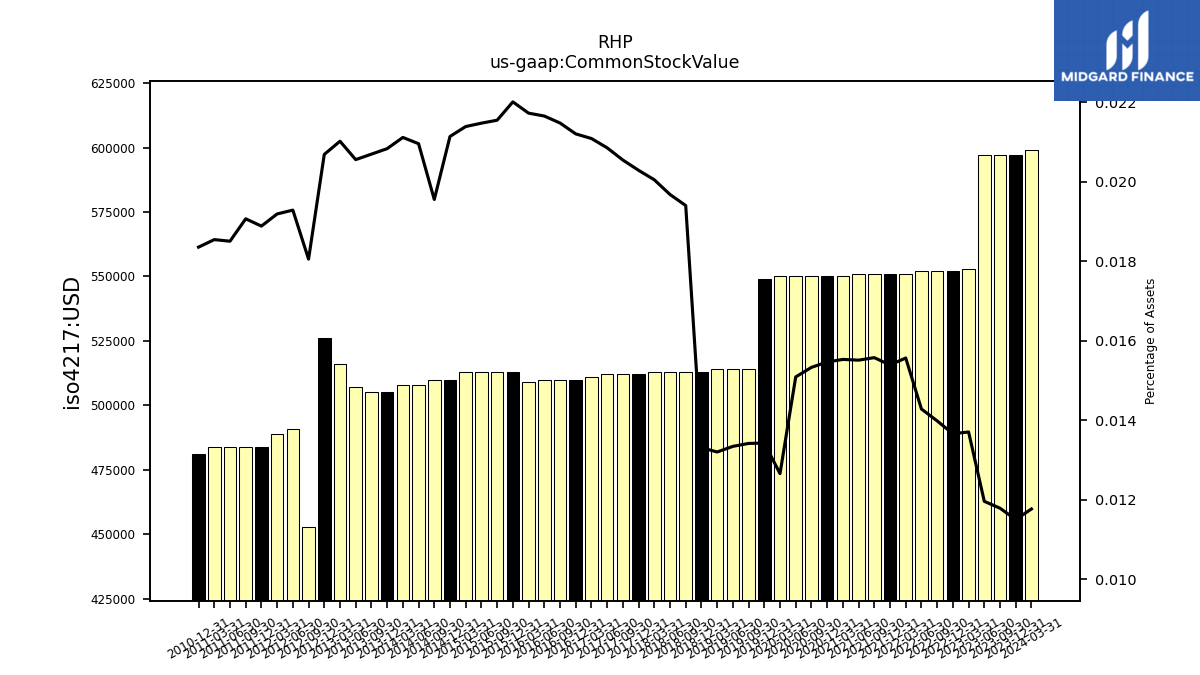
| Common Stock Value | 0.60 | 0.60 | 0.60 | 0.55 | 0.55 | 0.55 | 0.55 | 0.55 | 0.55 | 0.55 | 0.55 | 0.55 | 0.55 | 0.55 | 0.55 | 0.55 | 0.55 | 0.51 | 0.51 | 0.51 | 0.51 | 0.51 | 0.51 | 0.51 | 0.51 | 0.51 | 0.51 | 0.51 | 0.51 | 0.51 | 0.51 | 0.51 | 0.51 | 0.51 | 0.51 | 0.51 | 0.51 | 0.51 | 0.51 | 0.51 | 0.51 | 0.51 | 0.51 | 0.52 | 0.53 | 0.45 | 0.49 | 0.49 | 0.48 | 0.48 | 0.48 | 0.48 | 0.48 | NA | NA | NA | |
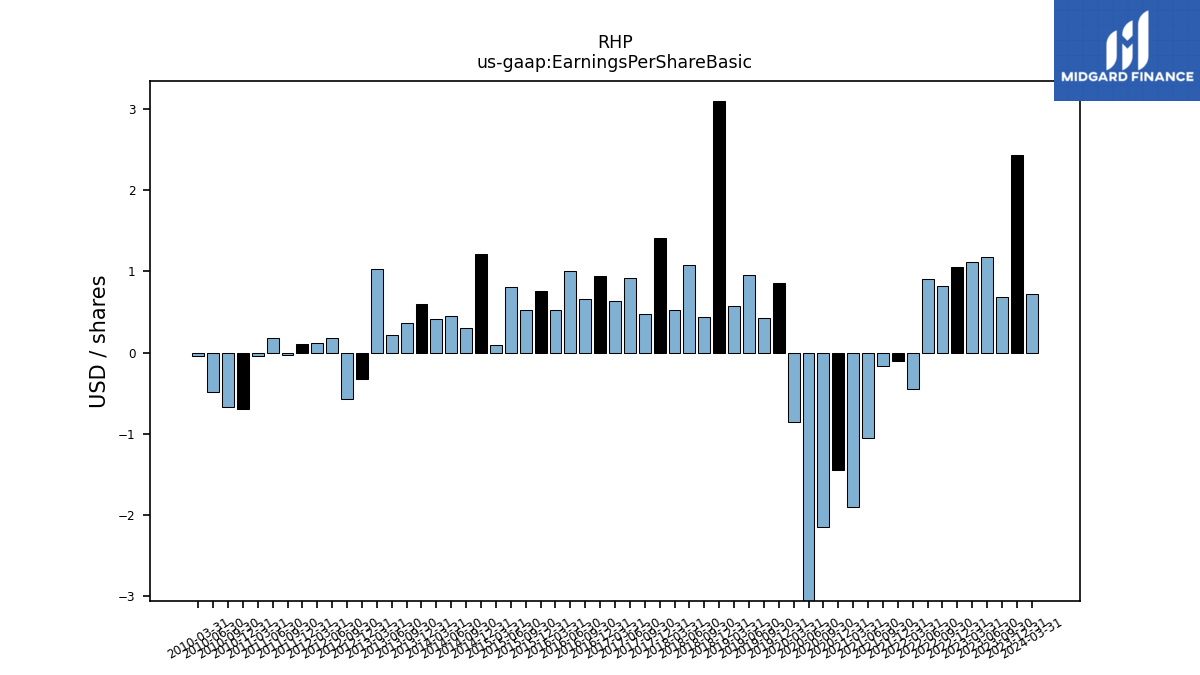
| Earnings Per Share Basic | 2.43 | 0.69 | 1.18 | 1.11 | 1.05 | 0.82 | 0.91 | -0.45 | -0.10 | -0.16 | -1.05 | -1.90 | -1.45 | -2.14 | -3.16 | -0.85 | 0.86 | 0.43 | 0.96 | 0.57 | 3.10 | 0.44 | 1.08 | 0.53 | 1.41 | 0.47 | 0.92 | 0.64 | 0.94 | 0.66 | 1.01 | 0.52 | 0.76 | 0.52 | 0.81 | 0.09 | 1.22 | 0.30 | 0.45 | 0.41 | 0.60 | 0.36 | 0.22 | 1.03 | -0.32 | -0.57 | 0.18 | 0.12 | 0.11 | -0.03 | 0.18 | -0.04 | -0.69 | -0.67 | -0.48 | -0.04 | |
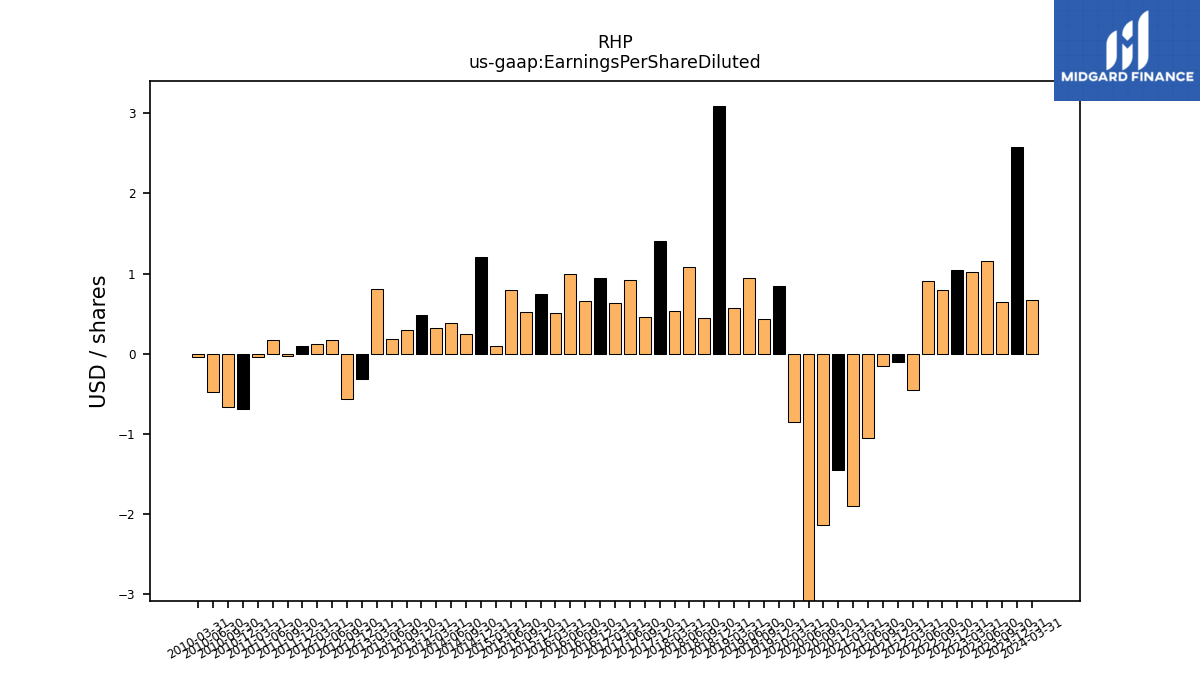
| Earnings Per Share Diluted | 2.58 | 0.64 | 1.15 | 1.02 | 1.05 | 0.79 | 0.91 | -0.45 | -0.10 | -0.16 | -1.05 | -1.90 | -1.45 | -2.14 | -3.16 | -0.85 | 0.85 | 0.43 | 0.95 | 0.57 | 3.09 | 0.44 | 1.08 | 0.53 | 1.41 | 0.46 | 0.92 | 0.63 | 0.94 | 0.66 | 1.00 | 0.51 | 0.75 | 0.52 | 0.80 | 0.09 | 1.21 | 0.25 | 0.38 | 0.32 | 0.48 | 0.30 | 0.18 | 0.81 | -0.32 | -0.57 | 0.17 | 0.12 | 0.10 | -0.03 | 0.17 | -0.04 | -0.69 | -0.67 | -0.48 | -0.04 |
| 2023-12-31 | 2023-09-30 | 2023-06-30 | 2023-03-31 | 2022-12-31 | 2022-09-30 | 2022-06-30 | 2022-03-31 | 2021-12-31 | 2021-09-30 | 2021-06-30 | 2021-03-31 | 2020-12-31 | 2020-09-30 | 2020-06-30 | 2020-03-31 | 2019-12-31 | 2019-09-30 | 2019-06-30 | 2019-03-31 | 2018-12-31 | 2018-09-30 | 2018-06-30 | 2018-03-31 | 2017-12-31 | 2017-09-30 | 2017-06-30 | 2017-03-31 | 2016-12-31 | 2016-09-30 | 2016-06-30 | 2016-03-31 | 2015-12-31 | 2015-09-30 | 2015-06-30 | 2015-03-31 | 2014-12-31 | 2014-09-30 | 2014-06-30 | 2014-03-31 | 2013-12-31 | 2013-09-30 | 2013-06-30 | 2013-03-31 | 2012-12-31 | 2012-09-30 | 2012-06-30 | 2012-03-31 | 2011-12-31 | 2011-09-30 | 2011-06-30 | 2011-03-31 | 2010-12-31 | 2010-09-30 | 2010-06-30 | 2010-03-31 | ||
|---|---|---|---|---|---|---|---|---|---|---|---|---|---|---|---|---|---|---|---|---|---|---|---|---|---|---|---|---|---|---|---|---|---|---|---|---|---|---|---|---|---|---|---|---|---|---|---|---|---|---|---|---|---|---|---|---|---|
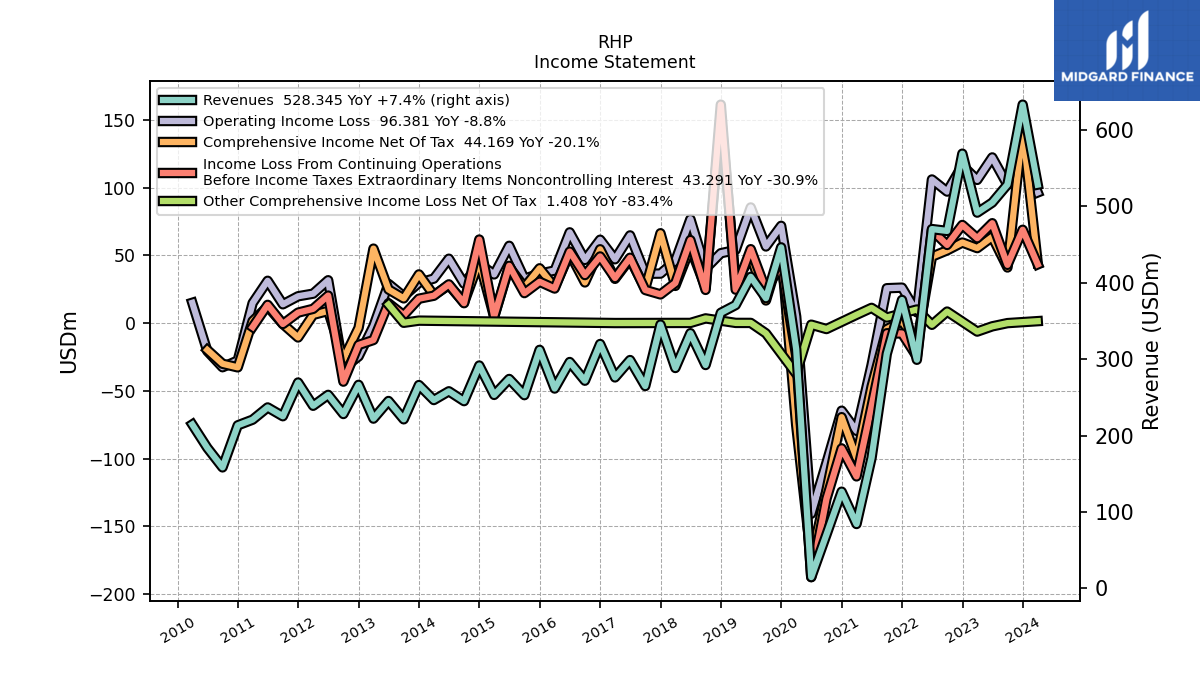
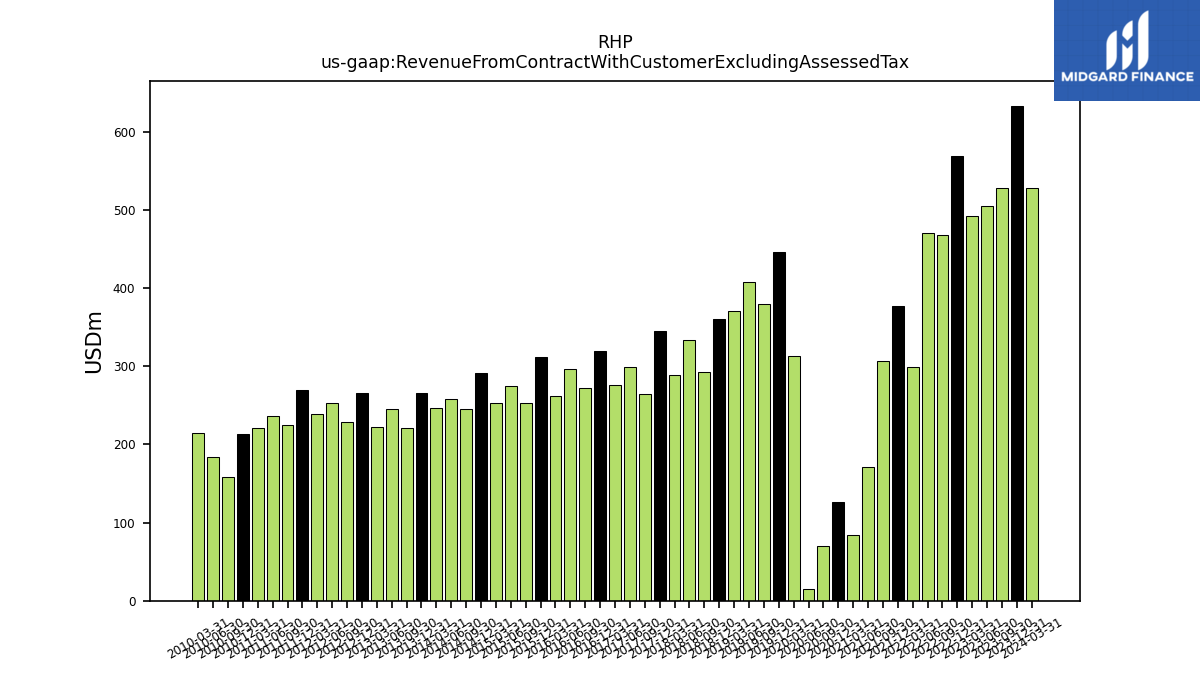
| Revenue From Contract With Customer Excluding Assessed Tax | 633.06 | 528.51 | 504.84 | 491.72 | 568.88 | 467.75 | 470.20 | 299.13 | 377.43 | 306.91 | 170.86 | 84.17 | 126.52 | 70.25 | 14.68 | 313.03 | 446.29 | 379.79 | 407.72 | 370.77 | 360.56 | 292.25 | 333.93 | 288.37 | 345.18 | 264.72 | 298.78 | 276.04 | 319.77 | 271.72 | 296.21 | 261.50 | 312.12 | 252.82 | 274.04 | 253.15 | 291.61 | 245.01 | 257.91 | 246.45 | 266.07 | 221.20 | 245.18 | 222.11 | 266.32 | 228.13 | 253.23 | 238.91 | 269.40 | 225.23 | 236.78 | 220.74 | 213.33 | 158.27 | 183.88 | 214.48 | |
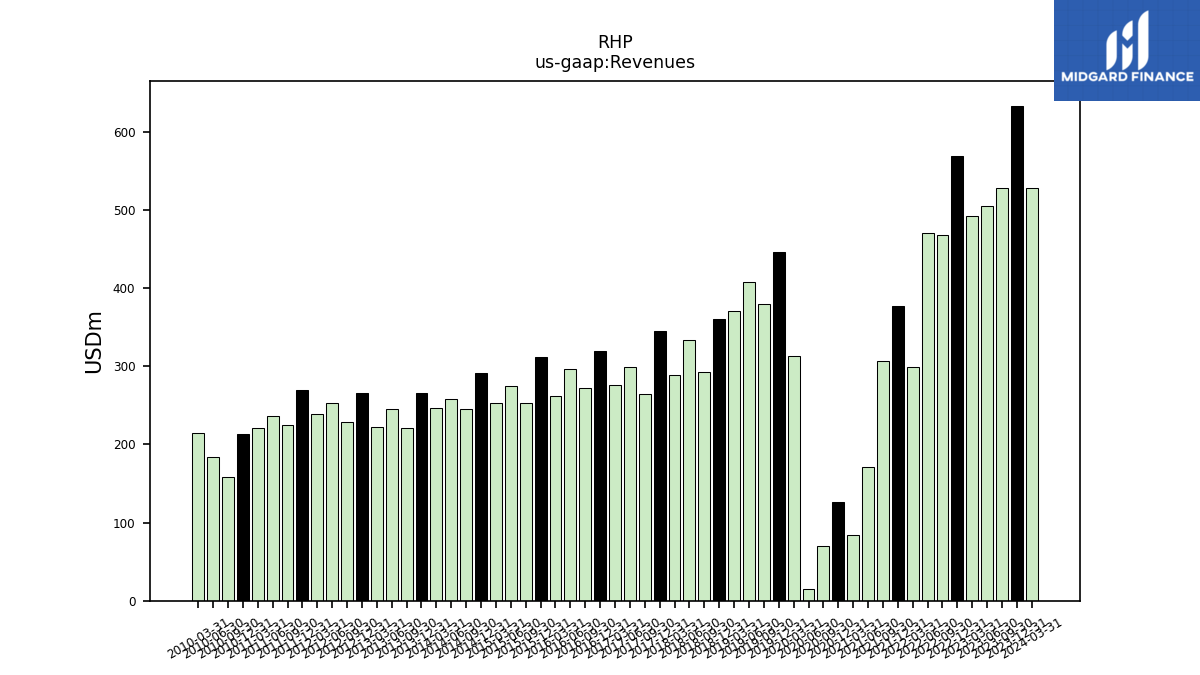
| Revenues | 633.06 | 528.51 | 504.84 | 491.72 | 568.88 | 467.75 | 470.20 | 299.13 | 377.43 | 306.91 | 170.86 | 84.17 | 126.52 | 70.25 | 14.68 | 313.03 | 446.29 | 379.79 | 407.72 | 370.77 | 360.56 | 292.25 | 333.93 | 288.37 | 345.18 | 264.72 | 298.78 | 276.04 | 319.77 | 271.72 | 296.21 | 261.50 | 312.12 | 252.82 | 274.04 | 253.15 | 291.61 | 245.01 | 257.91 | 246.45 | 266.07 | 221.20 | 245.18 | 222.11 | 266.32 | 228.13 | 253.23 | 238.91 | 269.40 | 225.23 | 236.78 | 220.74 | 213.33 | 158.27 | 183.88 | 214.48 | |
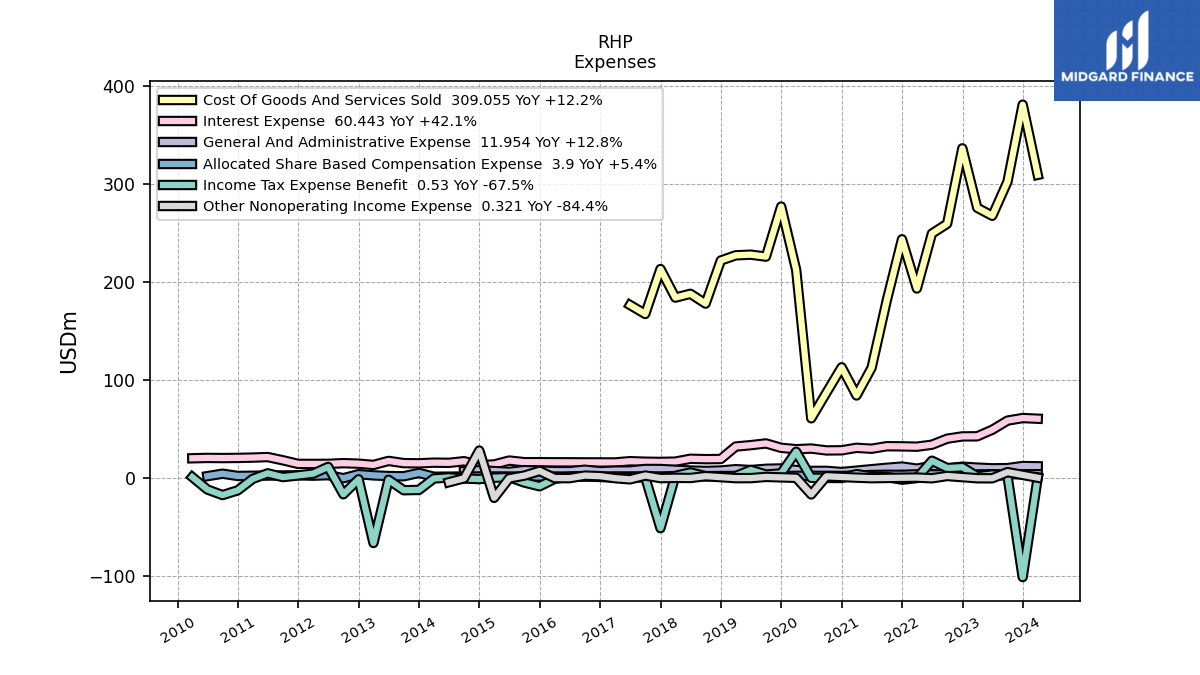
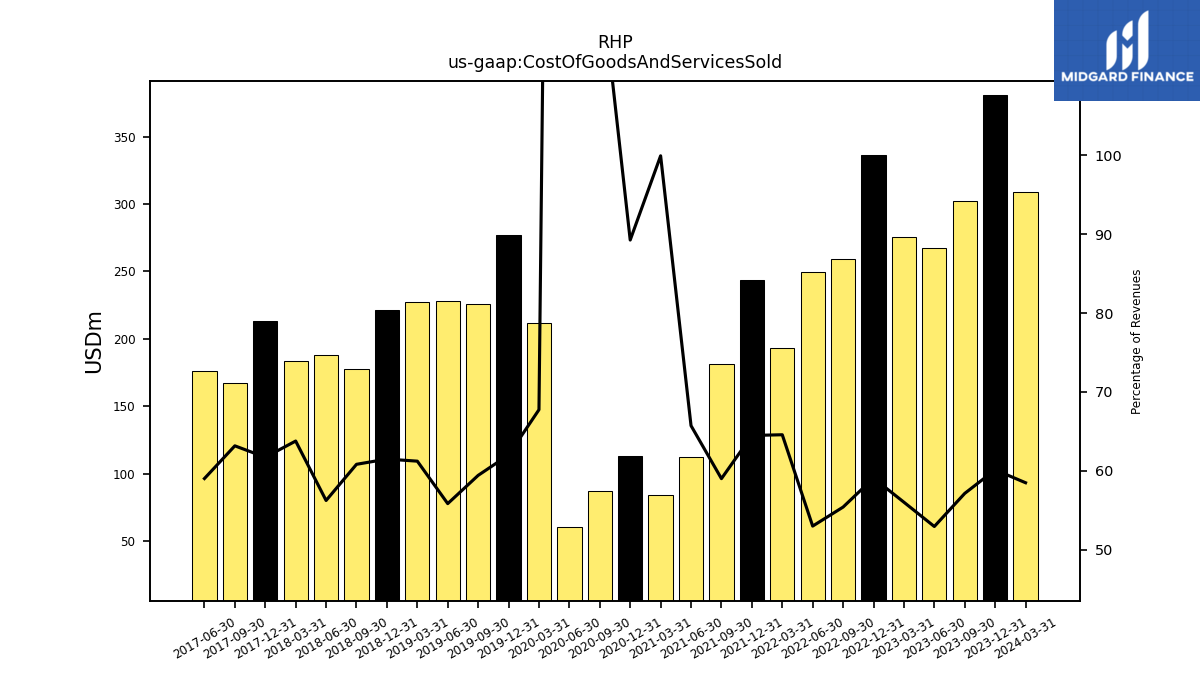
| Cost Of Goods And Services Sold | 380.66 | 302.01 | 267.31 | 275.49 | 336.11 | 259.18 | 249.21 | 193.17 | 243.39 | 181.12 | 112.30 | 84.12 | 112.92 | 86.99 | 60.84 | 212.09 | 276.75 | 225.70 | 227.71 | 227.02 | 221.72 | 177.78 | 187.82 | 183.92 | 213.06 | 167.23 | 176.36 | NA | NA | NA | NA | NA | NA | NA | NA | NA | NA | NA | NA | NA | NA | NA | NA | NA | NA | NA | NA | NA | NA | NA | NA | NA | NA | NA | NA | NA | |
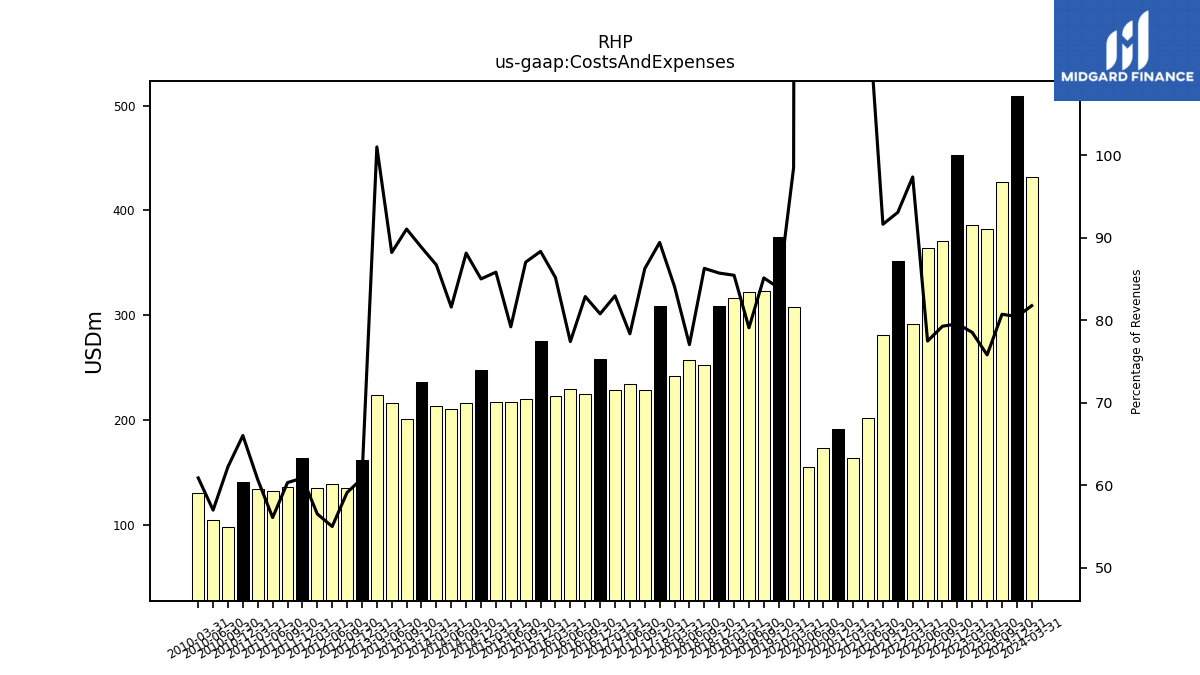
| Costs And Expenses | 509.19 | 426.59 | 382.60 | 386.07 | 452.57 | 370.75 | 364.24 | 291.26 | 351.30 | 281.21 | 201.81 | 163.73 | 191.19 | 173.41 | 155.42 | 308.28 | 374.54 | 323.28 | 322.40 | 316.81 | 309.04 | 252.15 | 257.24 | 242.43 | 308.69 | 228.31 | 234.09 | 228.98 | 258.28 | 225.15 | 229.27 | 222.70 | 275.73 | 220.05 | 217.02 | 217.26 | 247.87 | 215.93 | 210.43 | 213.65 | 236.34 | 201.39 | 216.28 | 224.36 | 161.88 | 134.82 | 139.22 | 134.98 | 163.95 | 135.82 | 132.75 | 133.88 | 140.81 | 98.50 | 104.75 | 130.56 | |
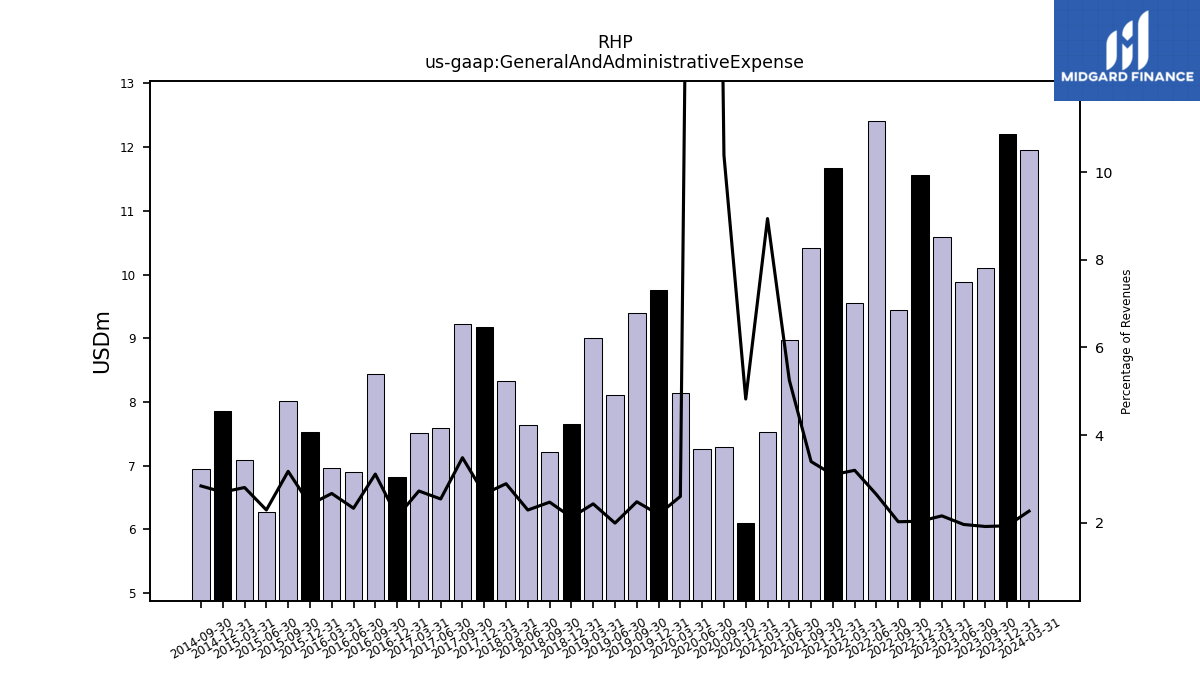
| General And Administrative Expense | 12.21 | 10.10 | 9.88 | 10.59 | 11.56 | 9.45 | 12.42 | 9.56 | 11.68 | 10.42 | 8.98 | 7.53 | 6.10 | 7.30 | 7.26 | 8.14 | 9.76 | 9.40 | 8.11 | 9.00 | 7.65 | 7.21 | 7.64 | 8.33 | 9.17 | 9.22 | 7.59 | 7.51 | 6.83 | 8.45 | 6.90 | 6.97 | 7.53 | 8.02 | 6.27 | 7.09 | 7.87 | 6.95 | NA | NA | NA | NA | NA | NA | NA | NA | NA | NA | NA | NA | NA | NA | NA | NA | NA | NA | |
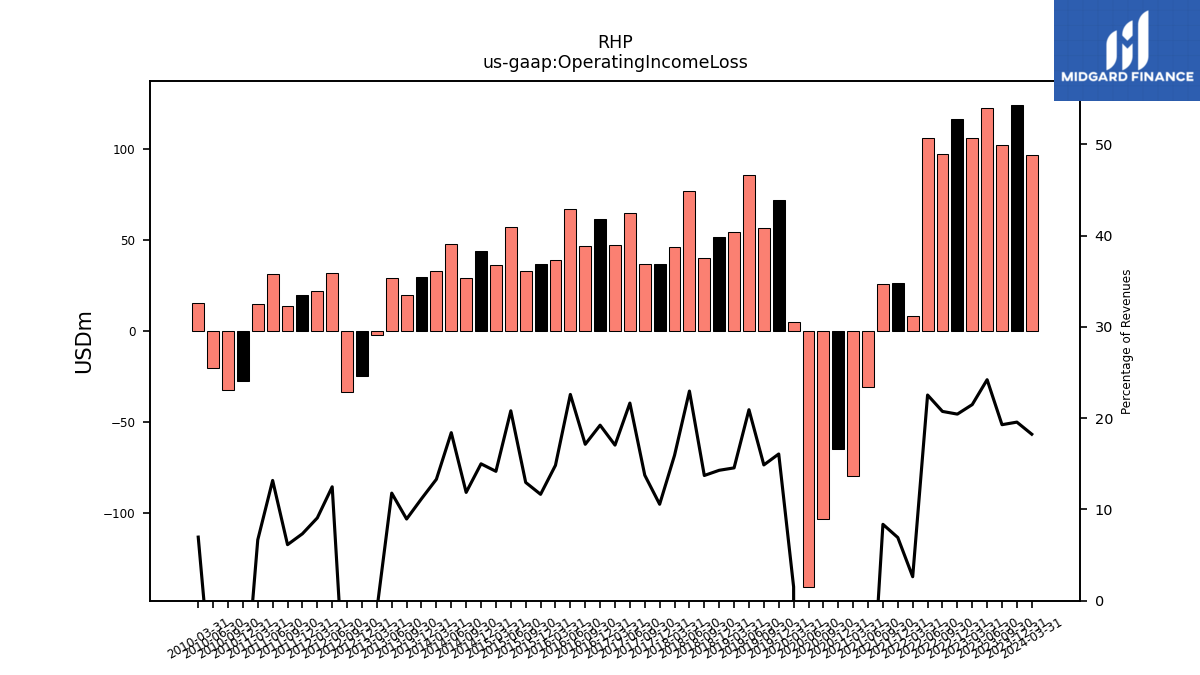
| Operating Income Loss | 123.87 | 101.92 | 122.24 | 105.65 | 116.30 | 97.00 | 105.97 | 7.87 | 26.13 | 25.70 | -30.95 | -79.56 | -64.68 | -103.17 | -140.74 | 4.75 | 71.75 | 56.50 | 85.32 | 53.96 | 51.53 | 40.10 | 76.70 | 45.94 | 36.49 | 36.41 | 64.69 | 47.06 | 61.50 | 46.57 | 66.94 | 38.79 | 36.39 | 32.77 | 57.02 | 35.89 | 43.74 | 29.08 | 47.49 | 32.80 | 29.73 | 19.80 | 28.90 | -2.24 | -24.60 | -33.45 | 31.61 | 21.68 | 19.77 | 13.84 | 31.20 | 14.73 | -27.63 | -32.62 | -20.69 | 14.95 | |
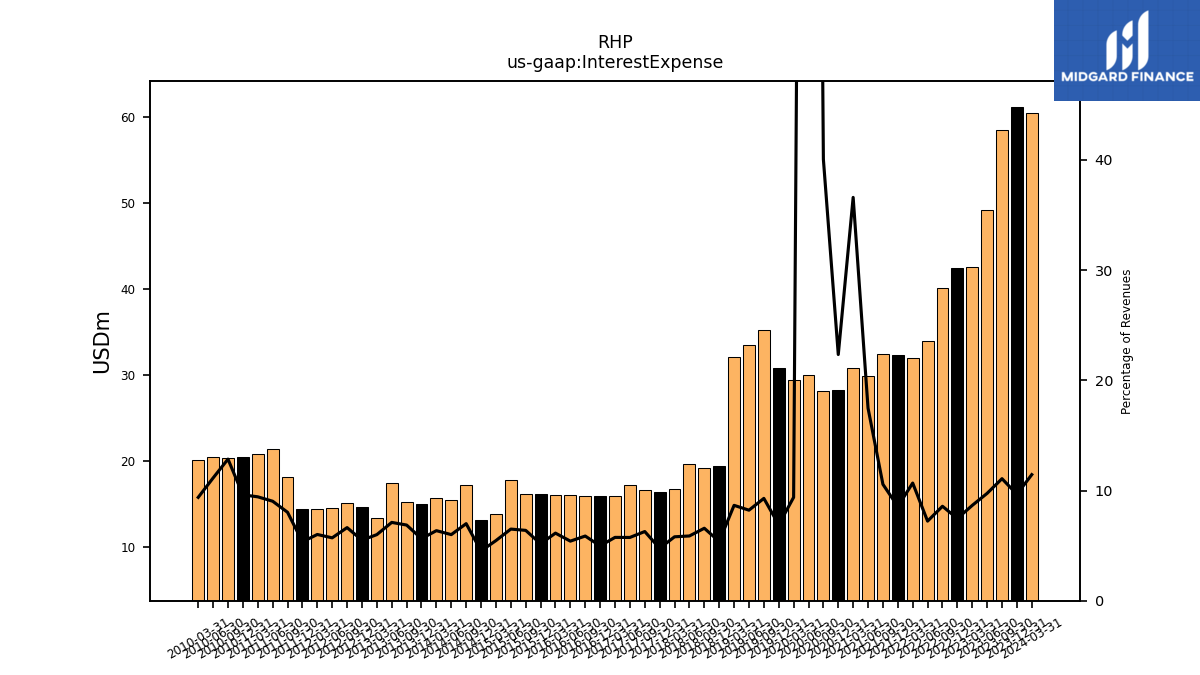
| Interest Expense | 61.14 | 58.52 | 49.18 | 42.53 | 42.42 | 40.09 | 33.96 | 31.94 | 32.29 | 32.41 | 29.85 | 30.80 | 28.26 | 28.13 | 30.04 | 29.36 | 30.78 | 35.26 | 33.49 | 32.09 | 19.39 | 19.22 | 19.62 | 16.73 | 16.41 | 16.62 | 17.16 | 15.86 | 15.90 | 15.95 | 16.02 | 16.04 | 16.14 | 16.14 | 17.81 | 13.81 | 13.17 | 17.14 | 15.47 | 15.67 | 14.98 | 15.19 | 17.42 | 13.32 | 14.63 | 15.14 | 14.45 | 14.36 | 14.41 | 18.07 | 21.38 | 20.81 | 20.50 | 20.33 | 20.48 | 20.11 | |
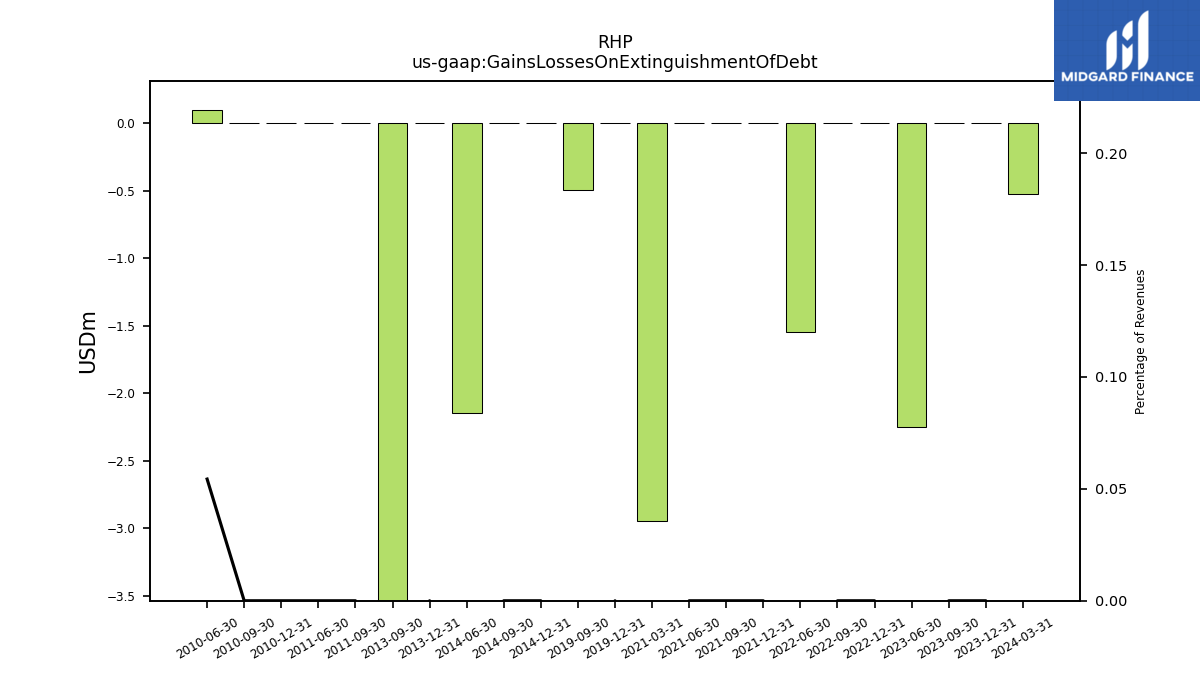
| Gains Losses On Extinguishment Of Debt | 0.00 | 0.00 | -2.25 | NA | 0.00 | 0.00 | -1.55 | NA | 0.00 | 0.00 | 0.00 | -2.95 | NA | NA | NA | NA | 0.00 | -0.49 | NA | NA | NA | NA | NA | NA | NA | NA | NA | NA | NA | NA | NA | NA | NA | NA | NA | NA | 0.00 | 0.00 | -2.15 | NA | 0.00 | -4.18 | NA | NA | NA | NA | NA | NA | NA | 0.00 | 0.00 | NA | 0.00 | 0.00 | 0.10 | NA | |
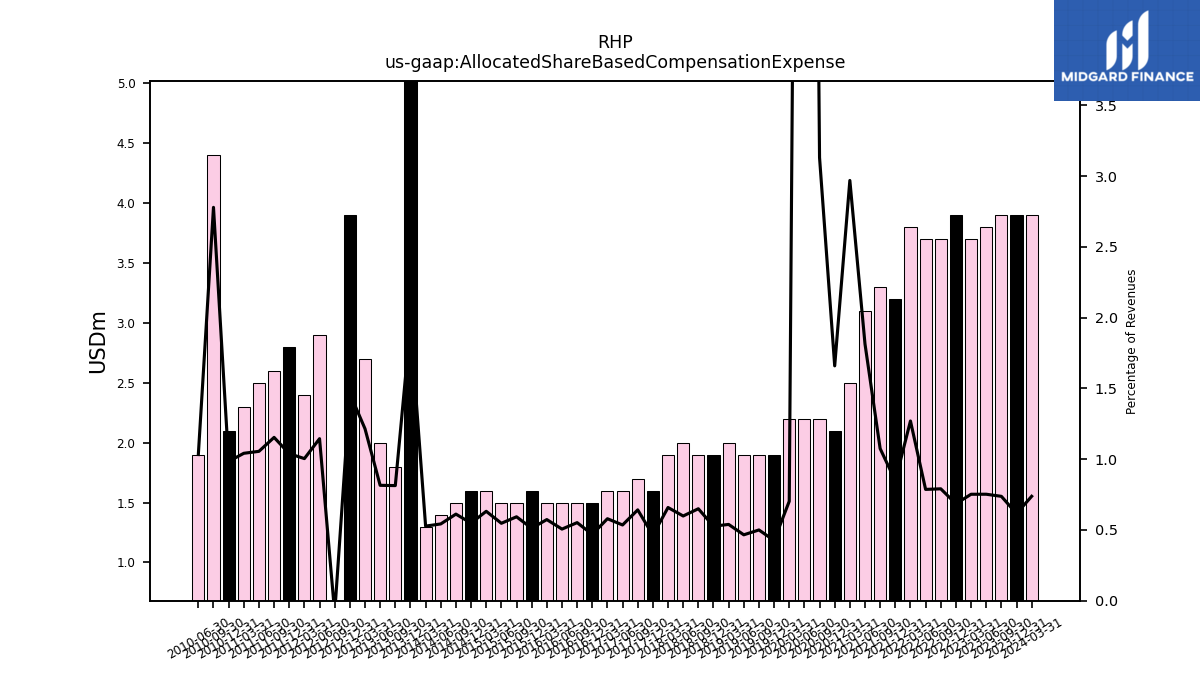
| Allocated Share Based Compensation Expense | 3.90 | 3.90 | 3.80 | 3.70 | 3.90 | 3.70 | 3.70 | 3.80 | 3.20 | 3.30 | 3.10 | 2.50 | 2.10 | 2.20 | 2.20 | 2.20 | 1.90 | 1.90 | 1.90 | 2.00 | 1.90 | 1.90 | 2.00 | 1.90 | 1.60 | 1.70 | 1.60 | 1.60 | 1.50 | 1.50 | 1.50 | 1.50 | 1.60 | 1.50 | 1.50 | 1.60 | 1.60 | 1.50 | 1.40 | 1.30 | 5.20 | 1.80 | 2.00 | 2.70 | 3.90 | -0.20 | 2.90 | 2.40 | 2.80 | 2.60 | 2.50 | 2.30 | 2.10 | 4.40 | 1.90 | NA | |
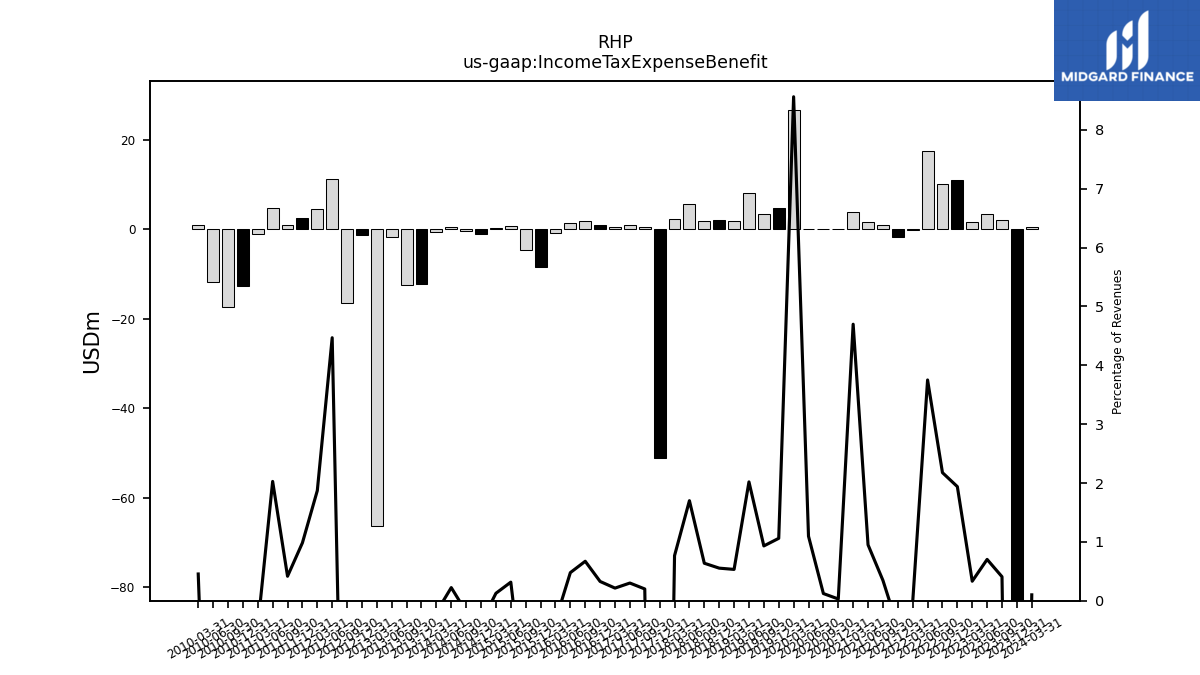
| Income Tax Expense Benefit | -101.03 | 2.16 | 3.54 | 1.63 | 11.03 | 10.18 | 17.63 | -0.07 | -1.68 | 1.06 | 1.62 | 3.95 | 0.04 | 0.09 | 0.16 | 26.80 | 4.73 | 3.54 | 8.23 | 1.97 | 2.00 | 1.86 | 5.68 | 2.21 | -51.18 | 0.53 | 0.90 | 0.59 | 1.05 | 1.82 | 1.42 | -0.89 | -8.43 | -4.61 | 0.87 | 0.32 | -1.10 | -0.46 | 0.58 | -0.48 | -12.14 | -12.45 | -1.78 | -66.29 | -1.24 | -16.58 | 11.31 | 4.47 | 2.65 | 0.94 | 4.80 | -0.97 | -12.59 | -17.40 | -11.70 | 0.97 | |
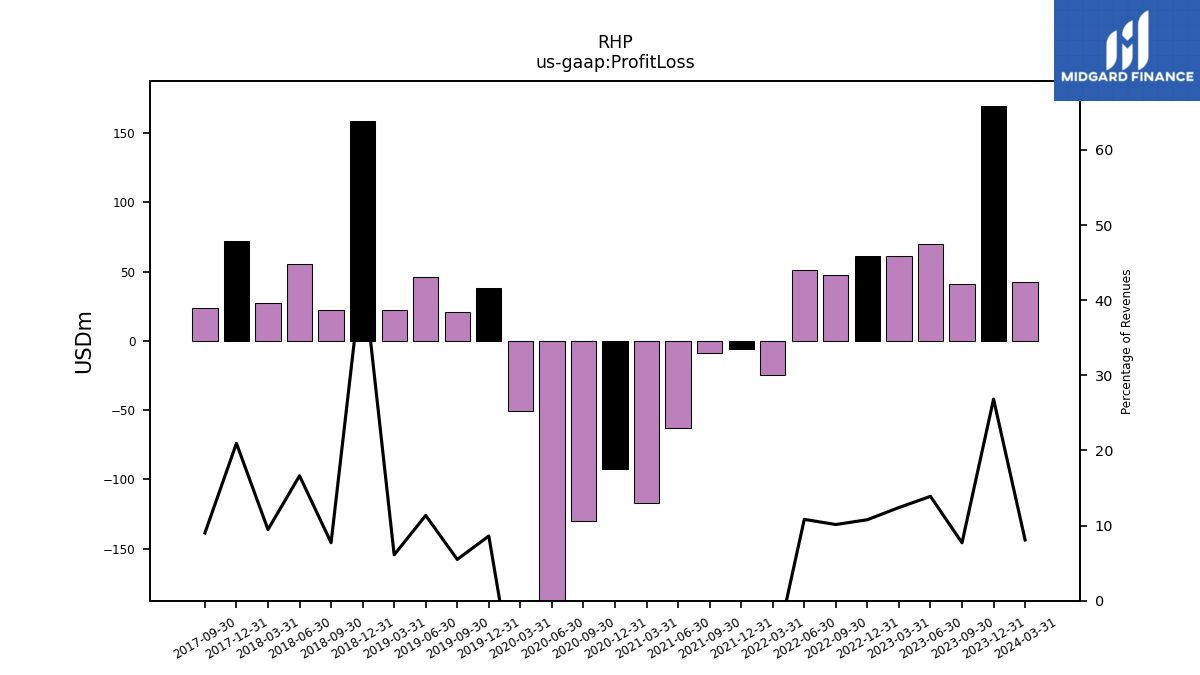
| Profit Loss | 169.88 | 40.78 | 70.14 | 60.99 | 61.37 | 47.45 | 50.92 | -24.80 | -6.02 | -8.61 | -63.05 | -117.12 | -92.55 | -129.88 | -187.66 | -50.74 | 38.45 | 20.89 | 46.28 | 22.67 | 159.19 | 22.59 | 55.55 | 27.34 | 72.32 | 23.87 | NA | NA | NA | NA | NA | NA | NA | NA | NA | NA | NA | NA | NA | NA | NA | NA | NA | NA | NA | NA | NA | NA | NA | NA | NA | NA | NA | NA | NA | NA | |
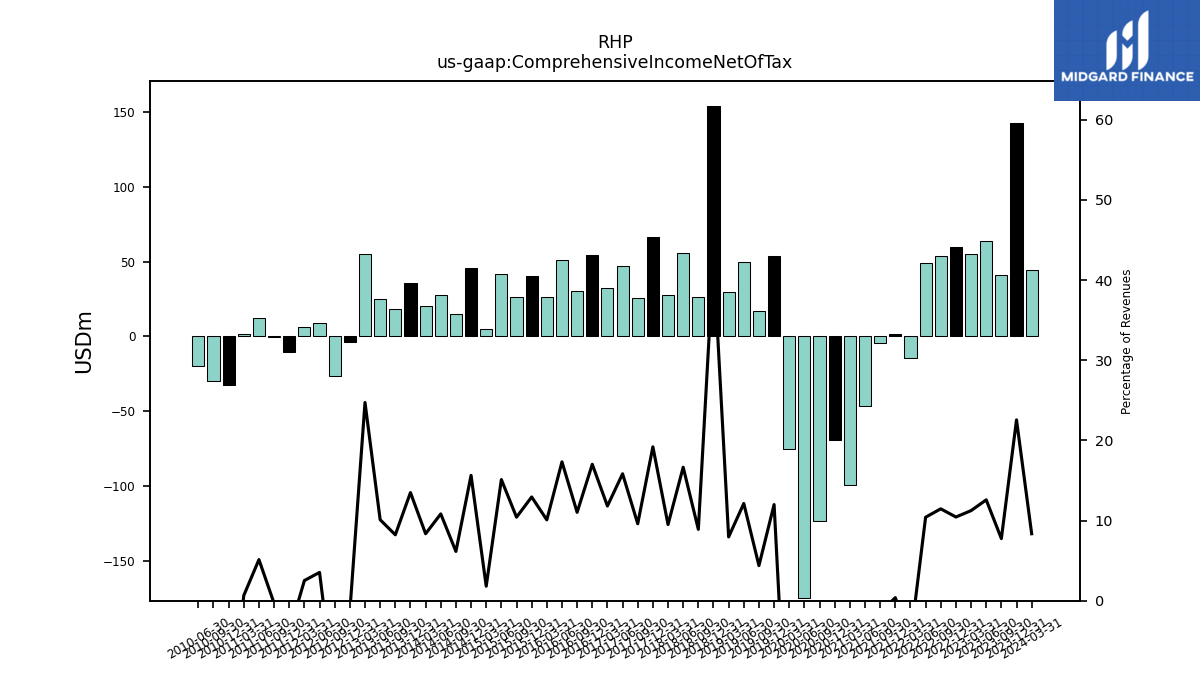
| Comprehensive Income Net Of Tax | 142.87 | 41.00 | 63.55 | 55.30 | 59.43 | 53.65 | 48.99 | -14.71 | 1.46 | -4.50 | -46.80 | -99.55 | -69.44 | -123.51 | -174.62 | -75.34 | 53.55 | 16.65 | 49.48 | 29.52 | 154.26 | 26.03 | 55.63 | 27.42 | 66.28 | 25.43 | 47.33 | 32.63 | 54.44 | 29.98 | 51.33 | 26.39 | 40.41 | 26.36 | 41.43 | 4.59 | 45.62 | 15.08 | 27.94 | 20.60 | 35.91 | 18.20 | 24.79 | 54.94 | -3.52 | -26.67 | 8.95 | 6.03 | -10.65 | -0.71 | 12.15 | 1.45 | -32.70 | -30.05 | -19.83 | NA | |
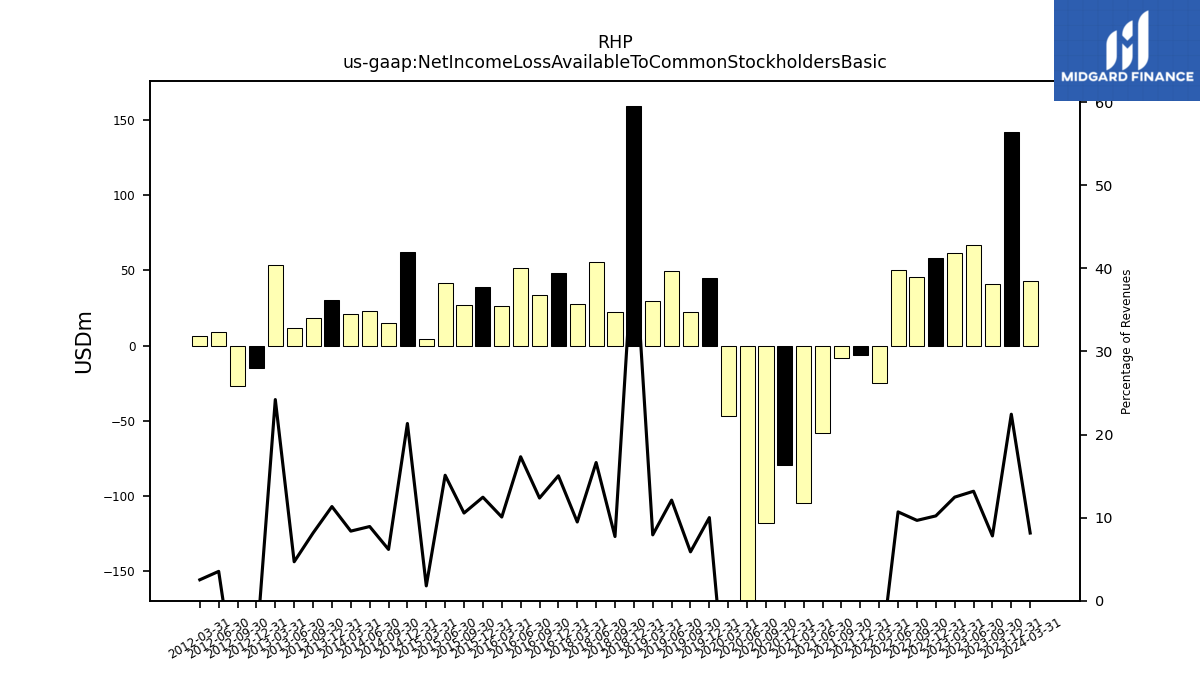
| Net Income Loss Available To Common Stockholders Basic | 142.13 | 41.23 | 66.54 | 61.32 | 58.09 | 45.24 | 50.28 | -24.62 | -5.98 | -8.55 | -57.92 | -104.52 | -79.72 | -117.66 | -173.49 | -46.52 | 44.65 | 22.35 | 49.38 | 29.41 | 159.19 | 22.59 | 55.55 | 27.34 | NA | NA | NA | NA | 48.10 | 33.59 | 51.33 | 26.35 | 38.90 | 26.69 | 41.39 | 4.53 | 62.21 | 15.13 | 23.04 | 20.65 | 30.16 | 18.03 | 11.51 | 53.78 | -14.95 | -26.67 | 8.95 | 6.03 | NA | NA | NA | NA | NA | NA | NA | NA |
| 2023-12-31 | 2023-09-30 | 2023-06-30 | 2023-03-31 | 2022-12-31 | 2022-09-30 | 2022-06-30 | 2022-03-31 | 2021-12-31 | 2021-09-30 | 2021-06-30 | 2021-03-31 | 2020-12-31 | 2020-09-30 | 2020-06-30 | 2020-03-31 | 2019-12-31 | 2019-09-30 | 2019-06-30 | 2019-03-31 | 2018-12-31 | 2018-09-30 | 2018-06-30 | 2018-03-31 | 2017-12-31 | 2017-09-30 | 2017-06-30 | 2017-03-31 | 2016-12-31 | 2016-09-30 | 2016-06-30 | 2016-03-31 | 2015-12-31 | 2015-09-30 | 2015-06-30 | 2015-03-31 | 2014-12-31 | 2014-09-30 | 2014-06-30 | 2014-03-31 | 2013-12-31 | 2013-09-30 | 2013-06-30 | 2013-03-31 | 2012-12-31 | 2012-09-30 | 2012-06-30 | 2012-03-31 | 2011-12-31 | 2011-09-30 | 2011-06-30 | 2011-03-31 | 2010-12-31 | 2010-09-30 | 2010-06-30 | 2010-03-31 | ||
|---|---|---|---|---|---|---|---|---|---|---|---|---|---|---|---|---|---|---|---|---|---|---|---|---|---|---|---|---|---|---|---|---|---|---|---|---|---|---|---|---|---|---|---|---|---|---|---|---|---|---|---|---|---|---|---|---|---|
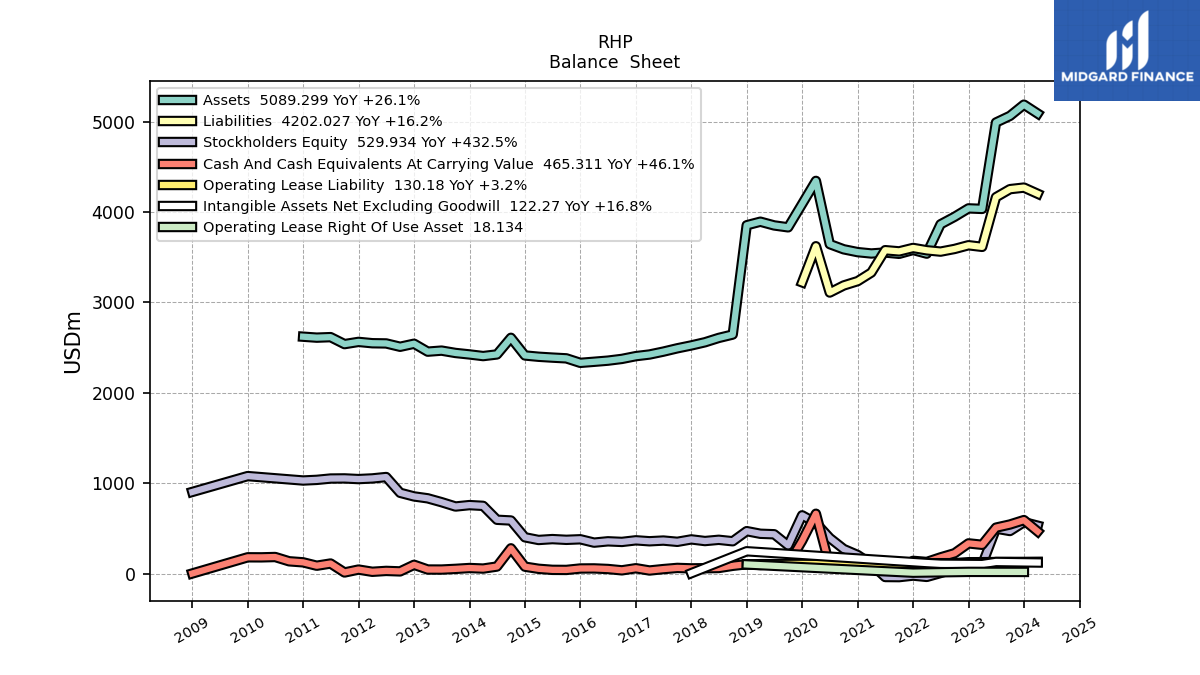
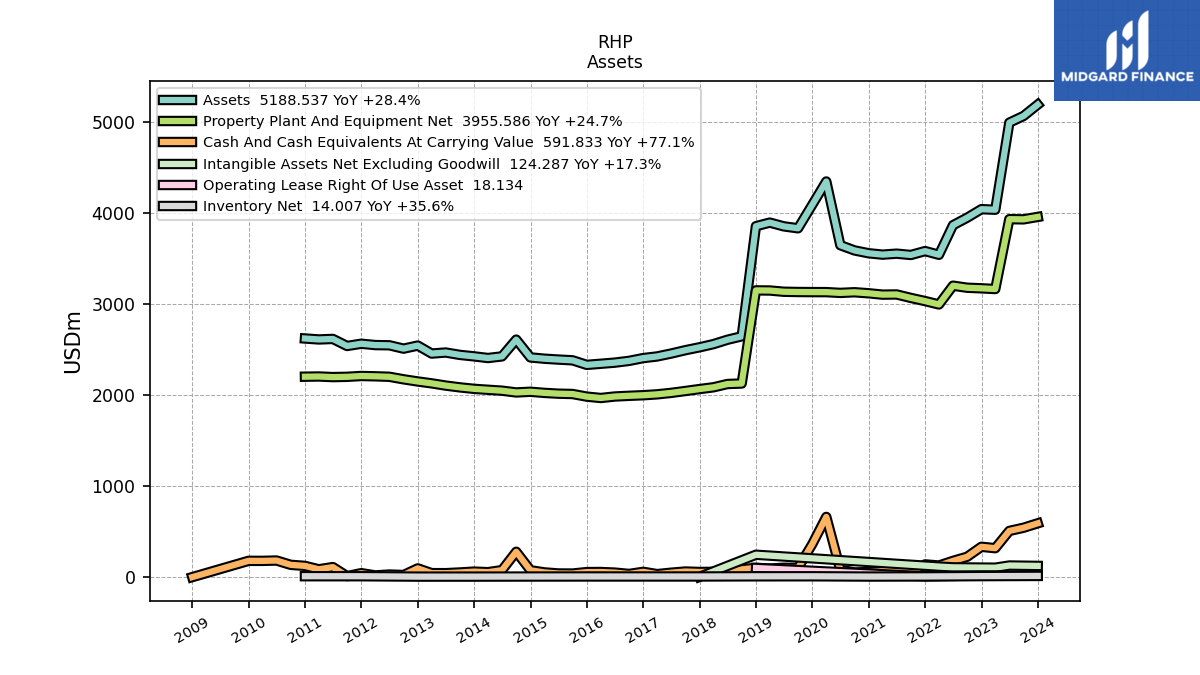
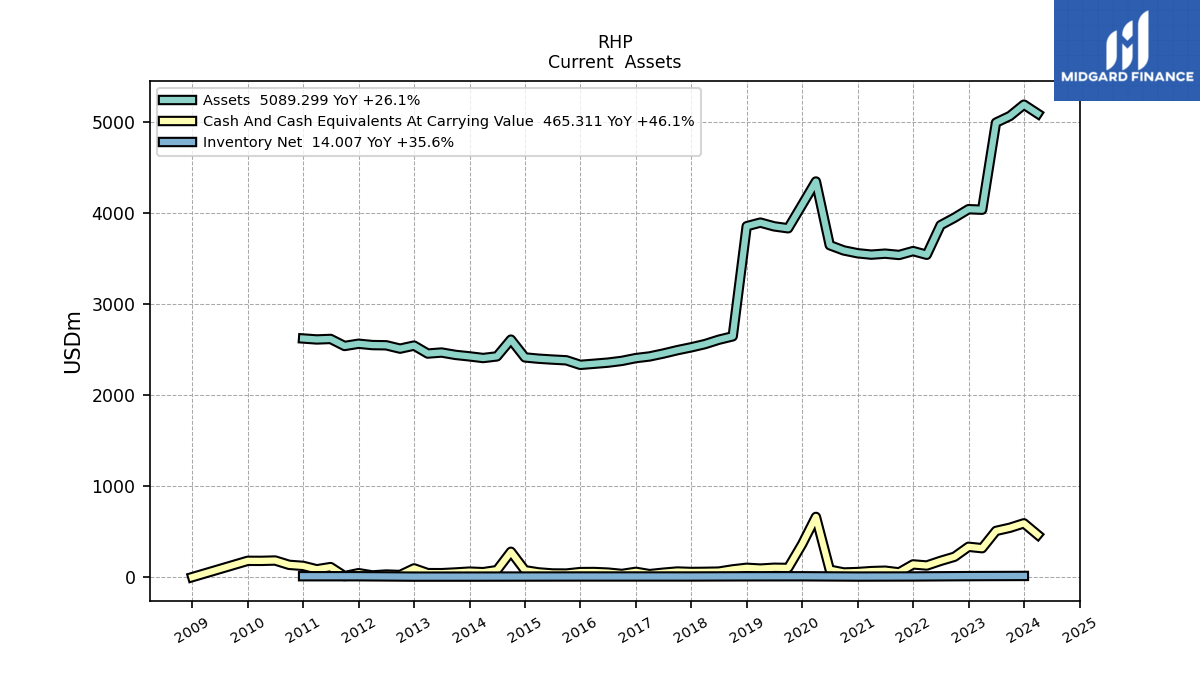
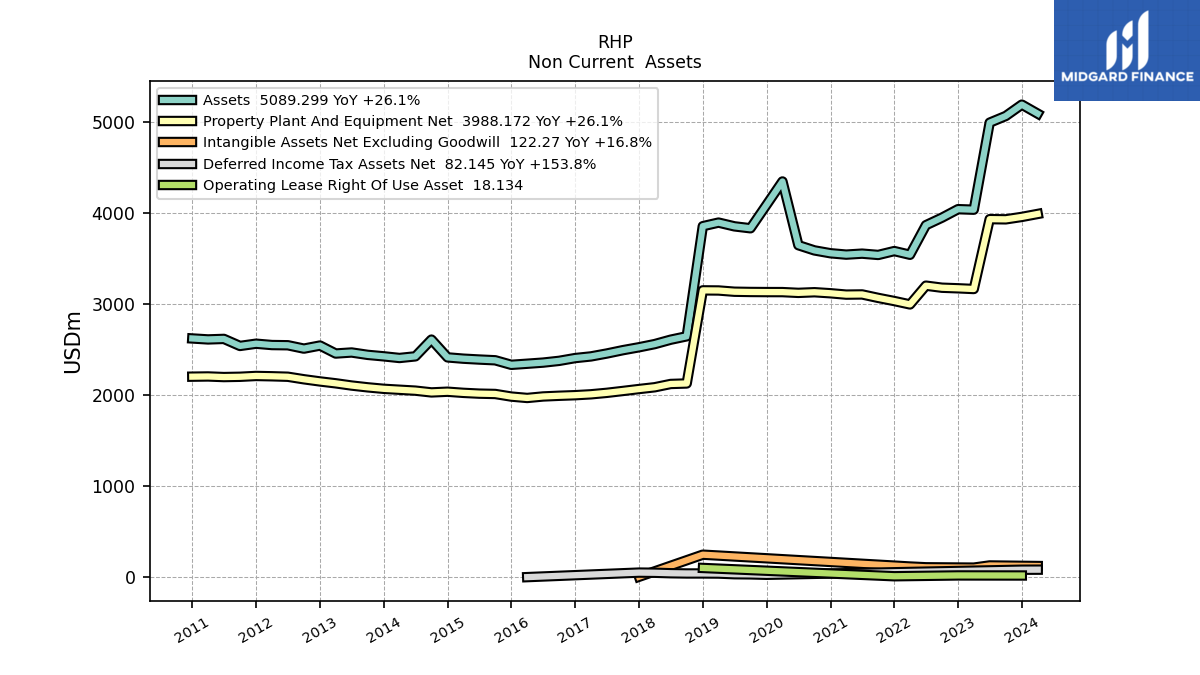
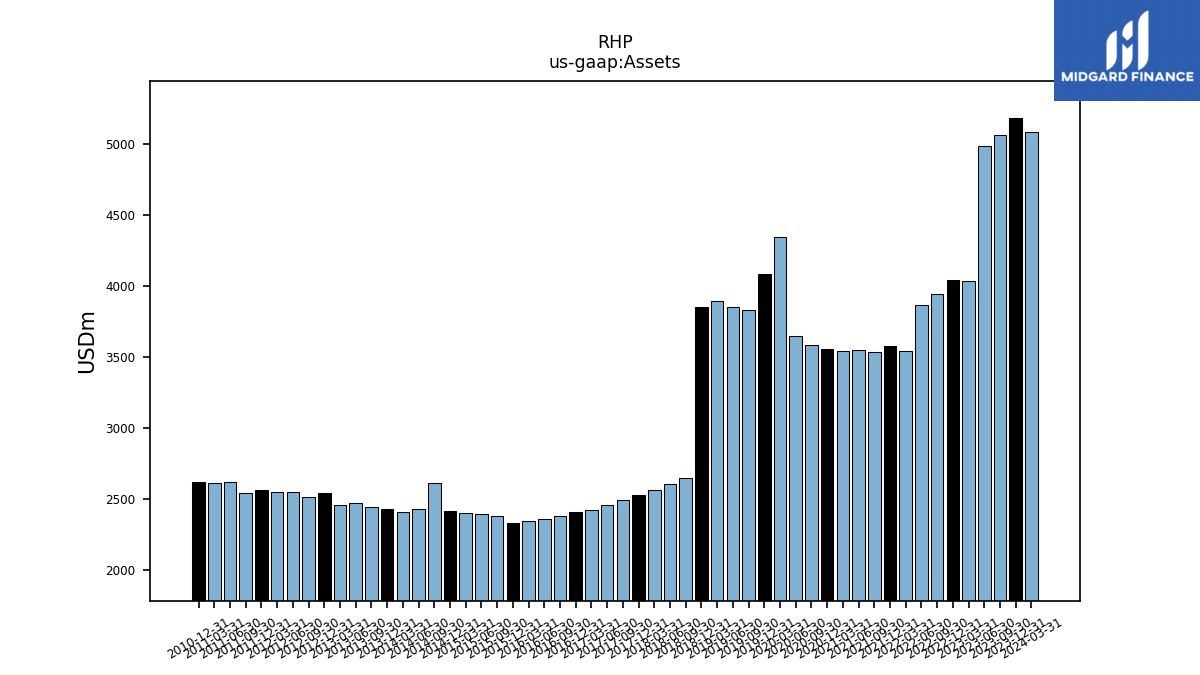
| Assets | 5188.54 | 5063.83 | 4990.65 | 4034.68 | 4040.62 | 3947.28 | 3864.70 | 3539.83 | 3580.53 | 3537.82 | 3552.30 | 3541.55 | 3556.49 | 3587.75 | 3644.95 | 4344.80 | 4088.47 | 3830.74 | 3851.92 | 3893.17 | 3853.88 | 2644.64 | 2607.30 | 2559.18 | 2524.23 | 2492.50 | 2455.77 | 2423.81 | 2405.75 | 2375.11 | 2355.89 | 2343.42 | 2331.43 | 2381.32 | 2389.54 | 2399.04 | 2413.15 | 2608.64 | 2424.55 | 2406.46 | 2424.63 | 2440.81 | 2466.89 | 2455.44 | 2543.14 | 2509.45 | 2546.35 | 2548.67 | 2563.40 | 2538.74 | 2616.06 | 2610.39 | 2620.93 | NA | NA | NA | |
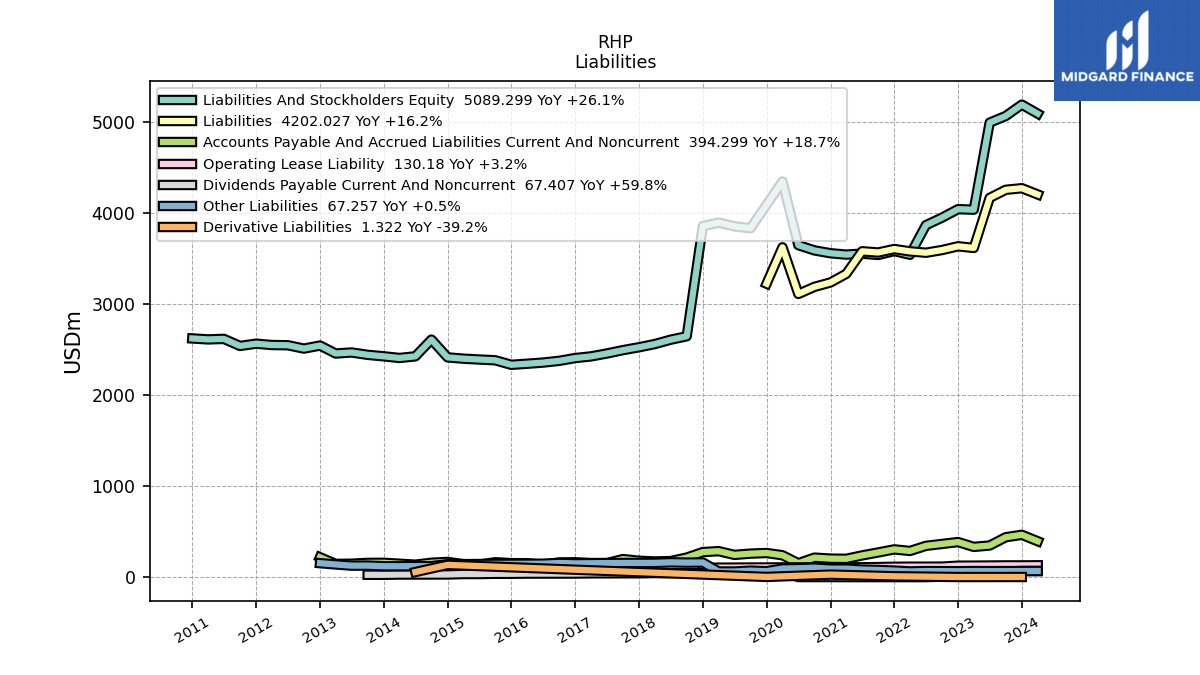
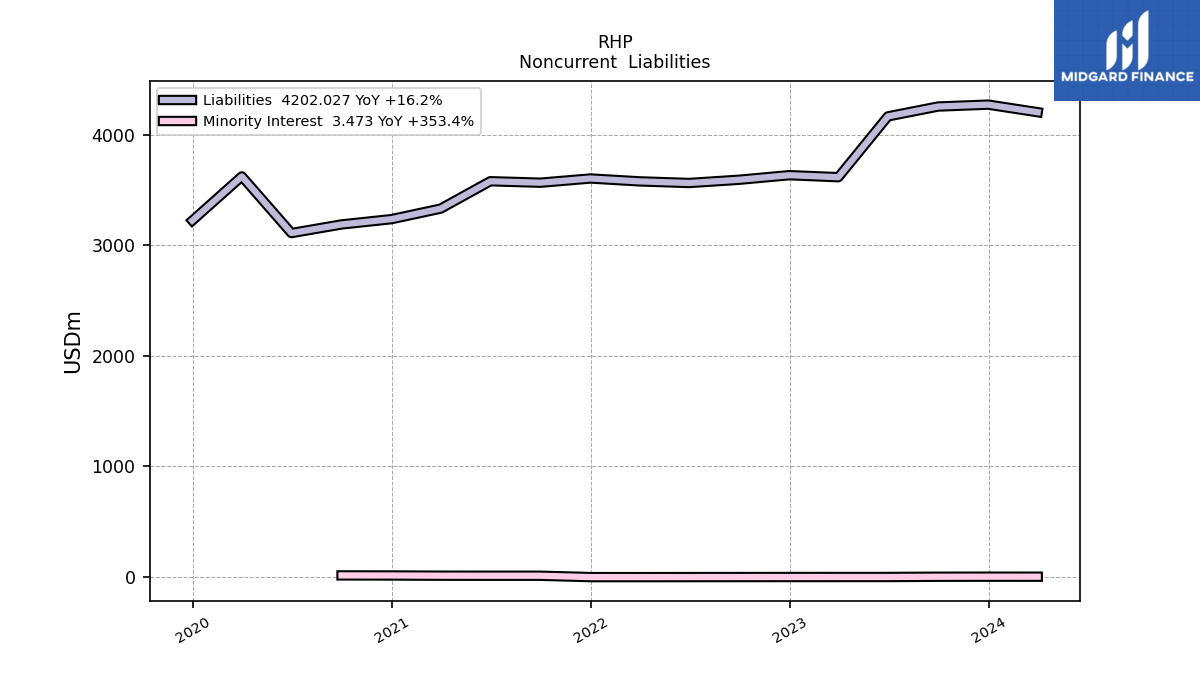
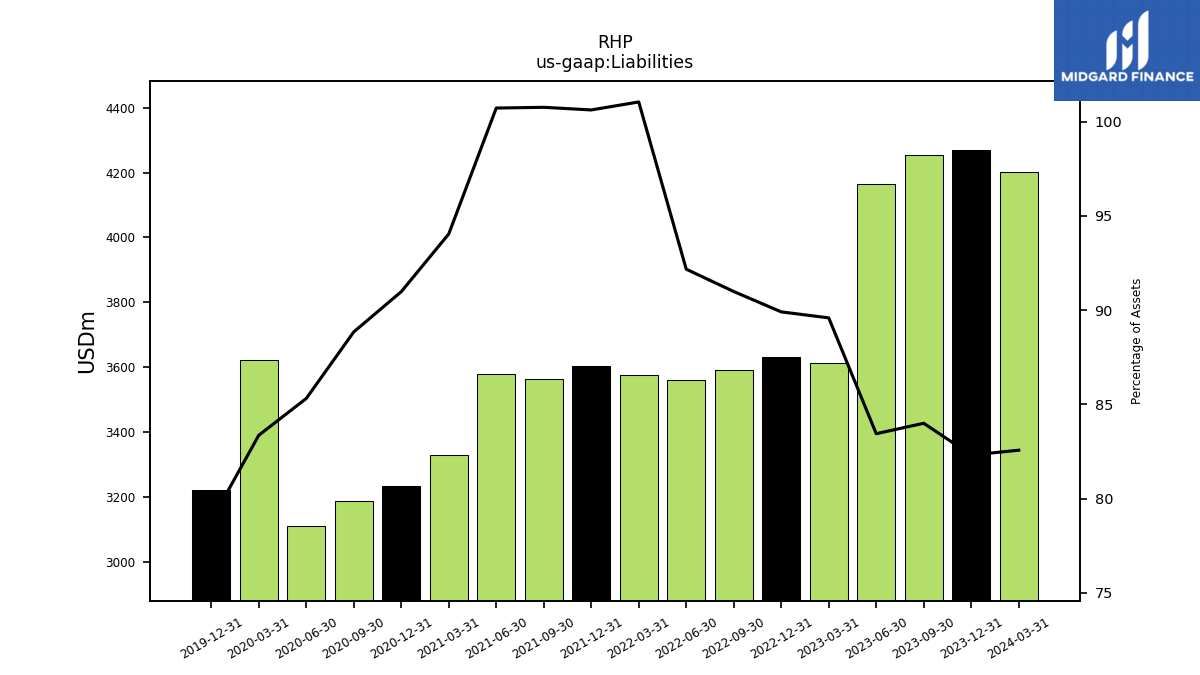
| Liabilities | 4270.63 | 4253.39 | 4164.29 | 3614.65 | 3632.86 | 3591.55 | 3562.23 | 3577.01 | 3602.92 | 3564.91 | 3578.12 | 3330.62 | 3235.71 | 3187.51 | 3109.55 | 3621.76 | 3222.23 | NA | NA | NA | NA | NA | NA | NA | NA | NA | NA | NA | NA | NA | NA | NA | NA | NA | NA | NA | NA | NA | NA | NA | NA | NA | NA | NA | NA | NA | NA | NA | NA | NA | NA | NA | NA | NA | NA | NA | |
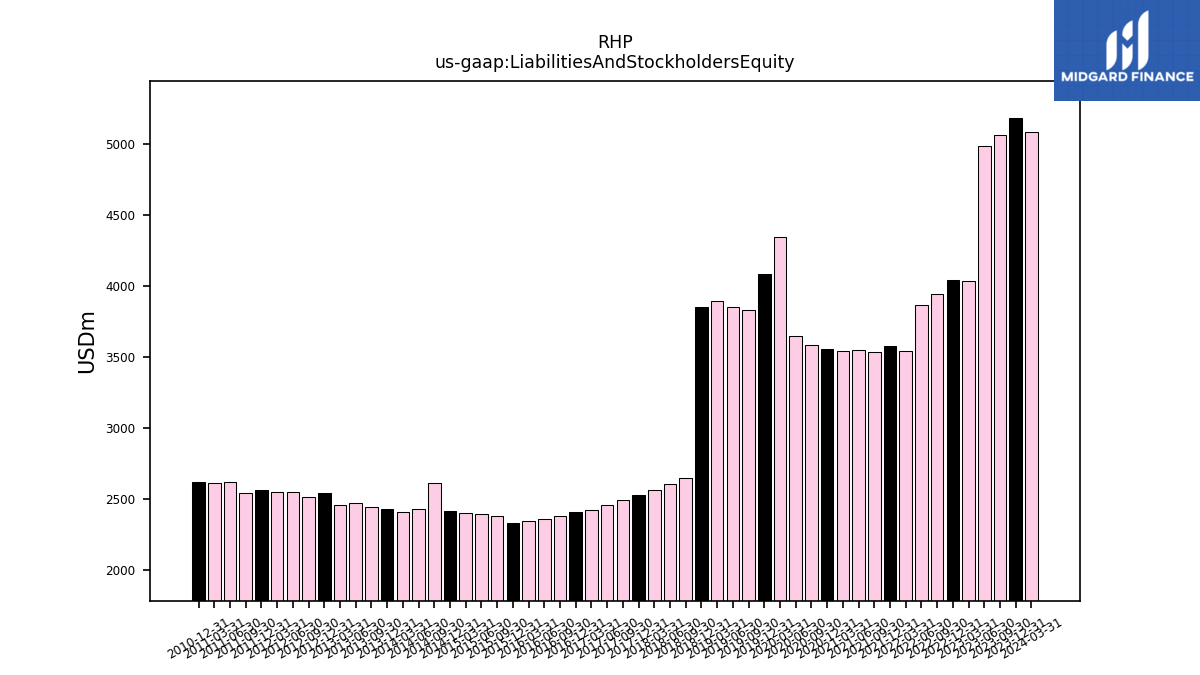
| Liabilities And Stockholders Equity | 5188.54 | 5063.83 | 4990.65 | 4034.68 | 4040.62 | 3947.28 | 3864.70 | 3539.83 | 3580.53 | 3537.82 | 3552.30 | 3541.55 | 3556.49 | 3587.75 | 3644.95 | 4344.80 | 4088.47 | 3830.74 | 3851.92 | 3893.17 | 3853.88 | 2644.64 | 2607.30 | 2559.18 | 2524.23 | 2492.50 | 2455.77 | 2423.81 | 2405.75 | 2375.11 | 2355.89 | 2343.42 | 2331.43 | 2381.32 | 2389.54 | 2399.04 | 2413.15 | 2608.64 | 2424.55 | 2406.46 | 2424.63 | 2440.81 | 2466.89 | 2455.44 | 2543.14 | 2509.45 | 2546.35 | 2548.67 | 2563.40 | 2538.74 | 2616.06 | 2610.39 | 2620.93 | NA | NA | NA | |
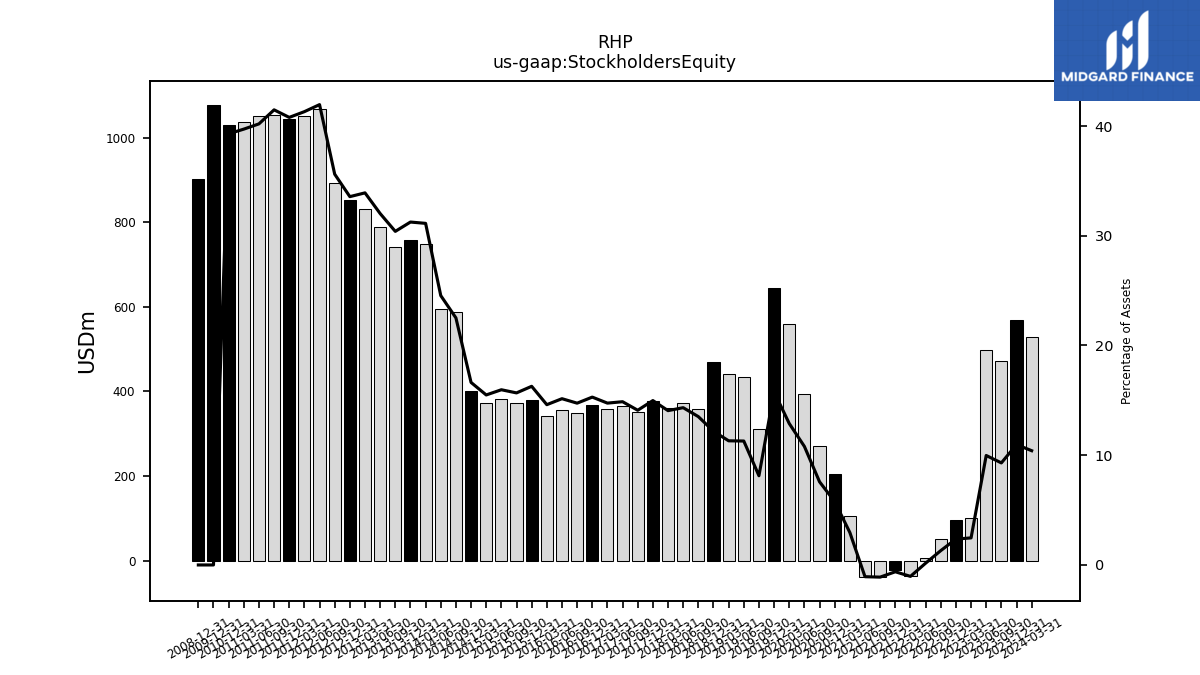
| Stockholders Equity | 569.15 | 470.94 | 497.88 | 99.51 | 95.28 | 51.58 | 6.21 | -36.84 | -22.23 | -39.23 | -38.02 | 104.70 | 205.30 | 271.93 | 393.70 | 560.02 | 644.73 | 311.48 | 435.02 | 440.46 | 469.58 | 357.50 | 373.69 | 359.92 | 378.16 | 351.40 | 365.33 | 357.48 | 368.00 | 350.20 | 356.96 | 342.30 | 379.56 | 373.39 | 381.53 | 371.67 | 401.41 | 587.39 | 595.22 | 749.14 | 757.70 | 742.01 | 790.01 | 832.64 | 853.60 | 893.67 | 1068.21 | 1052.85 | 1045.54 | 1052.95 | 1051.55 | 1036.78 | 1029.75 | NA | NA | NA |
| 2023-12-31 | 2023-09-30 | 2023-06-30 | 2023-03-31 | 2022-12-31 | 2022-09-30 | 2022-06-30 | 2022-03-31 | 2021-12-31 | 2021-09-30 | 2021-06-30 | 2021-03-31 | 2020-12-31 | 2020-09-30 | 2020-06-30 | 2020-03-31 | 2019-12-31 | 2019-09-30 | 2019-06-30 | 2019-03-31 | 2018-12-31 | 2018-09-30 | 2018-06-30 | 2018-03-31 | 2017-12-31 | 2017-09-30 | 2017-06-30 | 2017-03-31 | 2016-12-31 | 2016-09-30 | 2016-06-30 | 2016-03-31 | 2015-12-31 | 2015-09-30 | 2015-06-30 | 2015-03-31 | 2014-12-31 | 2014-09-30 | 2014-06-30 | 2014-03-31 | 2013-12-31 | 2013-09-30 | 2013-06-30 | 2013-03-31 | 2012-12-31 | 2012-09-30 | 2012-06-30 | 2012-03-31 | 2011-12-31 | 2011-09-30 | 2011-06-30 | 2011-03-31 | 2010-12-31 | 2010-09-30 | 2010-06-30 | 2010-03-31 | ||
|---|---|---|---|---|---|---|---|---|---|---|---|---|---|---|---|---|---|---|---|---|---|---|---|---|---|---|---|---|---|---|---|---|---|---|---|---|---|---|---|---|---|---|---|---|---|---|---|---|---|---|---|---|---|---|---|---|---|
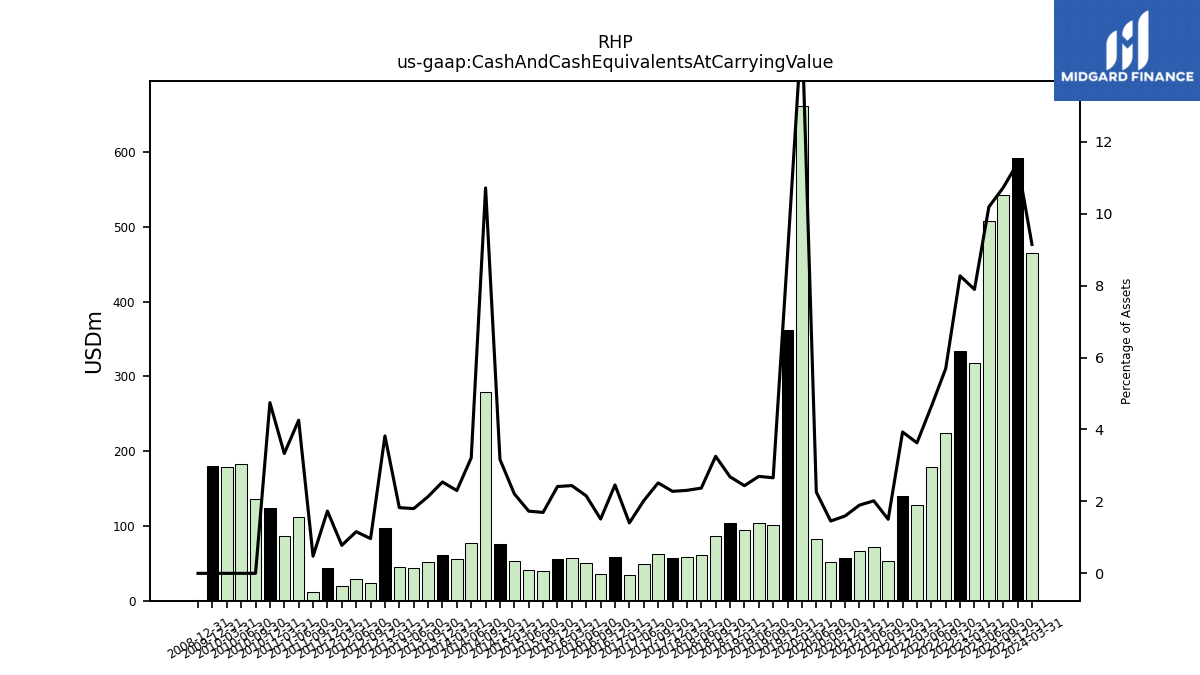
| Cash And Cash Equivalents At Carrying Value | 591.83 | 543.08 | 508.34 | 318.51 | 334.19 | 224.70 | 179.23 | 128.44 | 140.69 | 53.16 | 71.61 | 67.14 | 56.70 | 52.16 | 82.38 | 662.16 | 362.43 | 101.79 | 103.84 | 94.87 | 103.44 | 86.03 | 61.78 | 59.04 | 57.56 | 62.67 | 49.61 | 33.98 | 59.13 | 35.86 | 50.73 | 57.15 | 56.29 | 40.34 | 41.32 | 53.00 | 76.41 | 279.53 | 77.84 | 55.42 | 61.58 | 52.09 | 44.40 | 44.85 | 97.17 | 24.23 | 29.50 | 19.86 | 44.39 | 12.12 | 111.36 | 86.97 | 124.40 | 135.95 | 183.30 | 179.49 | |
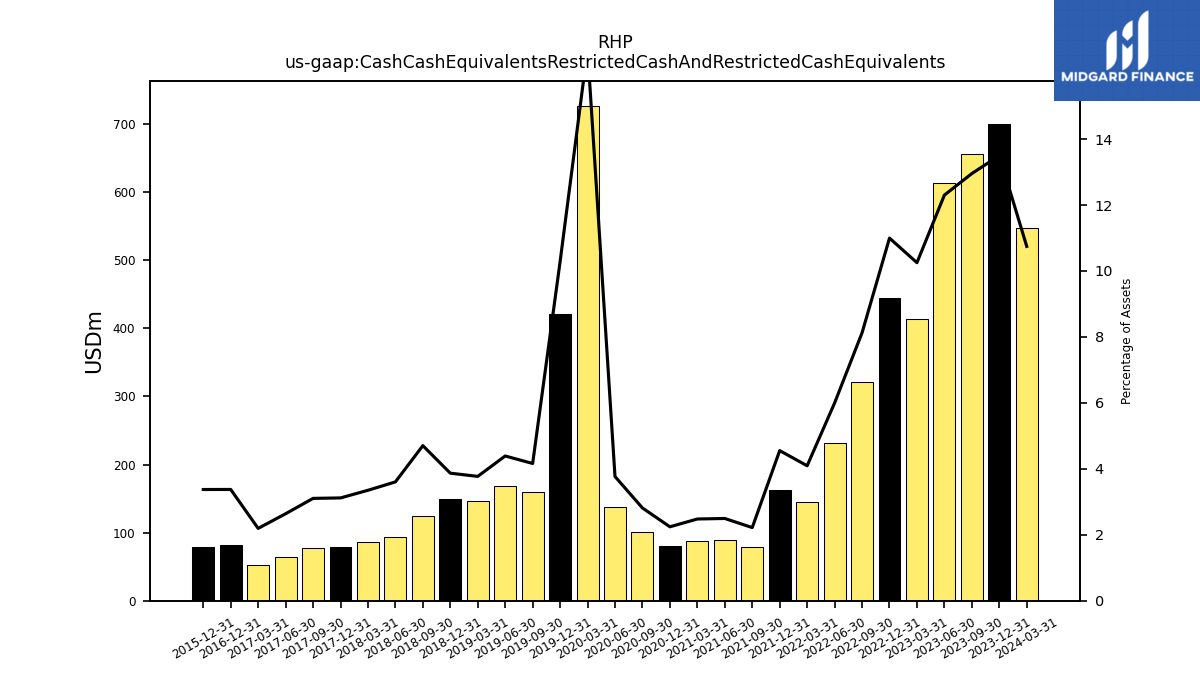
| Cash Cash Equivalents Restricted Cash And Restricted Cash Equivalents | 700.44 | 655.98 | 613.91 | 413.62 | 444.33 | 320.70 | 231.77 | 144.91 | 163.00 | 78.50 | 88.62 | 87.80 | 79.75 | 100.93 | 137.30 | 726.66 | 420.40 | 159.46 | 169.09 | 146.82 | 149.09 | 124.40 | 93.96 | 85.73 | 78.71 | 77.38 | 64.78 | 53.18 | 81.19 | NA | NA | NA | 78.65 | NA | NA | NA | NA | NA | NA | NA | NA | NA | NA | NA | NA | NA | NA | NA | NA | NA | NA | NA | NA | NA | NA | NA | |
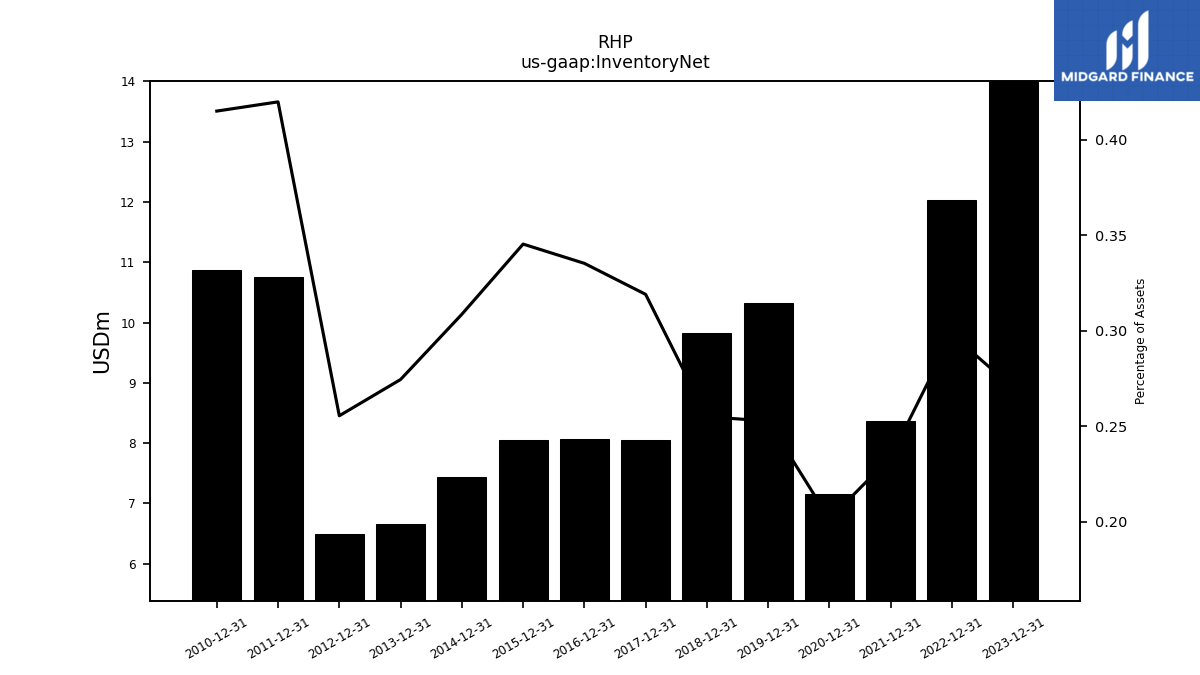
| Inventory Net | 14.01 | NA | NA | NA | 12.04 | NA | NA | NA | 8.37 | NA | NA | NA | 7.16 | NA | NA | NA | 10.33 | NA | NA | NA | 9.82 | NA | NA | NA | 8.05 | NA | NA | NA | 8.06 | NA | NA | NA | 8.05 | NA | NA | NA | 7.45 | NA | NA | NA | 6.65 | NA | NA | NA | 6.50 | NA | NA | NA | 10.76 | NA | NA | NA | 10.88 | NA | NA | NA |
| 2023-12-31 | 2023-09-30 | 2023-06-30 | 2023-03-31 | 2022-12-31 | 2022-09-30 | 2022-06-30 | 2022-03-31 | 2021-12-31 | 2021-09-30 | 2021-06-30 | 2021-03-31 | 2020-12-31 | 2020-09-30 | 2020-06-30 | 2020-03-31 | 2019-12-31 | 2019-09-30 | 2019-06-30 | 2019-03-31 | 2018-12-31 | 2018-09-30 | 2018-06-30 | 2018-03-31 | 2017-12-31 | 2017-09-30 | 2017-06-30 | 2017-03-31 | 2016-12-31 | 2016-09-30 | 2016-06-30 | 2016-03-31 | 2015-12-31 | 2015-09-30 | 2015-06-30 | 2015-03-31 | 2014-12-31 | 2014-09-30 | 2014-06-30 | 2014-03-31 | 2013-12-31 | 2013-09-30 | 2013-06-30 | 2013-03-31 | 2012-12-31 | 2012-09-30 | 2012-06-30 | 2012-03-31 | 2011-12-31 | 2011-09-30 | 2011-06-30 | 2011-03-31 | 2010-12-31 | 2010-09-30 | 2010-06-30 | 2010-03-31 | ||
|---|---|---|---|---|---|---|---|---|---|---|---|---|---|---|---|---|---|---|---|---|---|---|---|---|---|---|---|---|---|---|---|---|---|---|---|---|---|---|---|---|---|---|---|---|---|---|---|---|---|---|---|---|---|---|---|---|---|
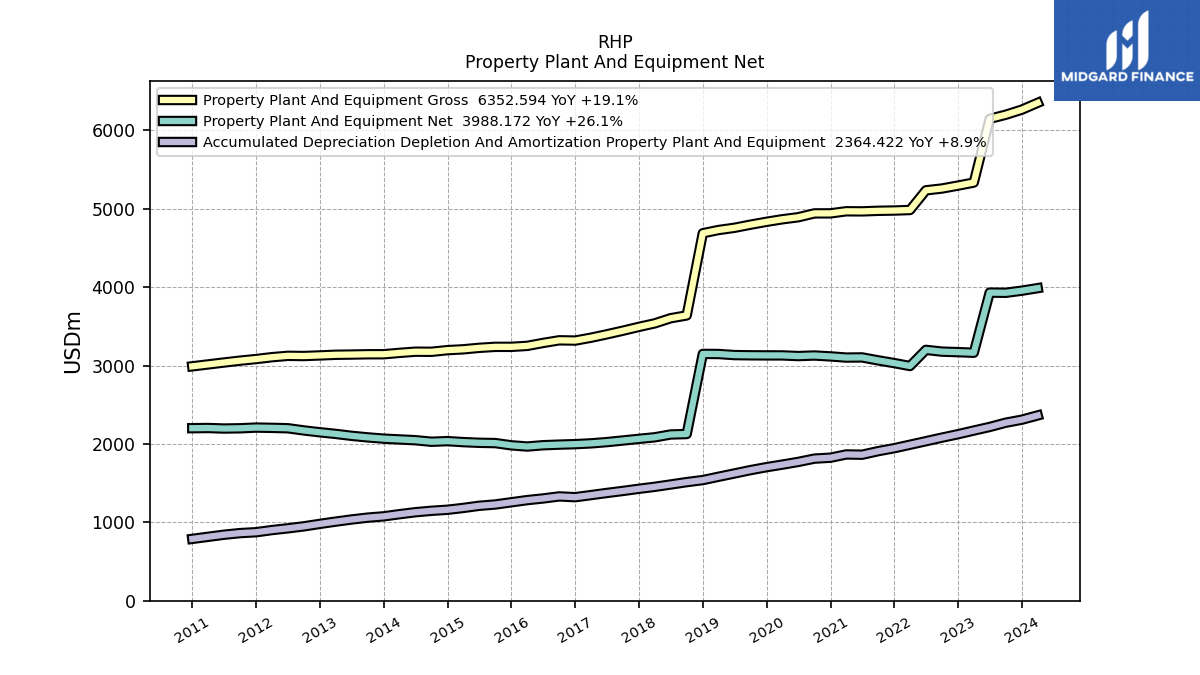
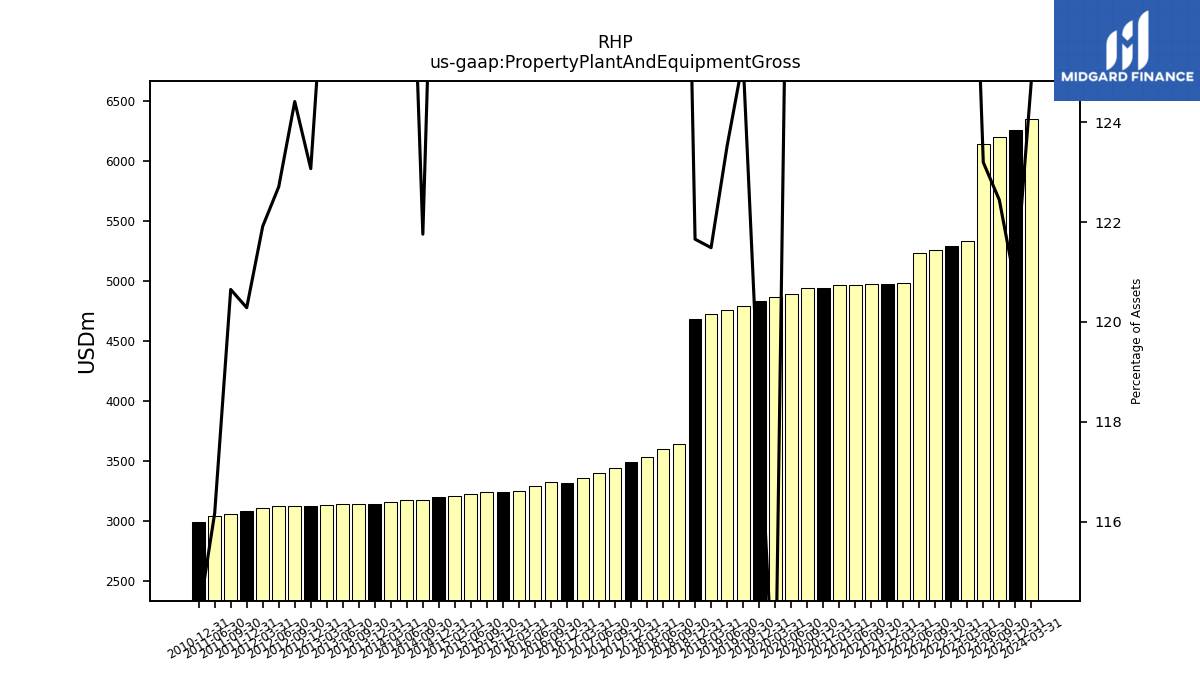
| Property Plant And Equipment Gross | 6265.29 | 6200.35 | 6148.20 | 5335.08 | 5296.44 | 5259.10 | 5236.12 | 4984.86 | 4978.11 | 4974.84 | 4967.40 | 4968.78 | 4942.20 | 4941.79 | 4892.84 | 4866.94 | 4834.54 | 4797.87 | 4757.92 | 4729.69 | 4688.52 | 3640.23 | 3604.27 | 3538.69 | 3494.21 | 3445.33 | 3399.02 | 3355.69 | 3319.32 | 3322.68 | 3288.96 | 3251.43 | 3239.14 | 3239.27 | 3226.55 | 3207.71 | 3197.07 | 3176.20 | 3177.35 | 3162.16 | 3144.97 | 3144.54 | 3140.75 | 3138.09 | 3129.79 | 3122.02 | 3124.52 | 3107.22 | 3083.41 | 3063.00 | 3039.23 | NA | 2990.66 | NA | NA | NA | |
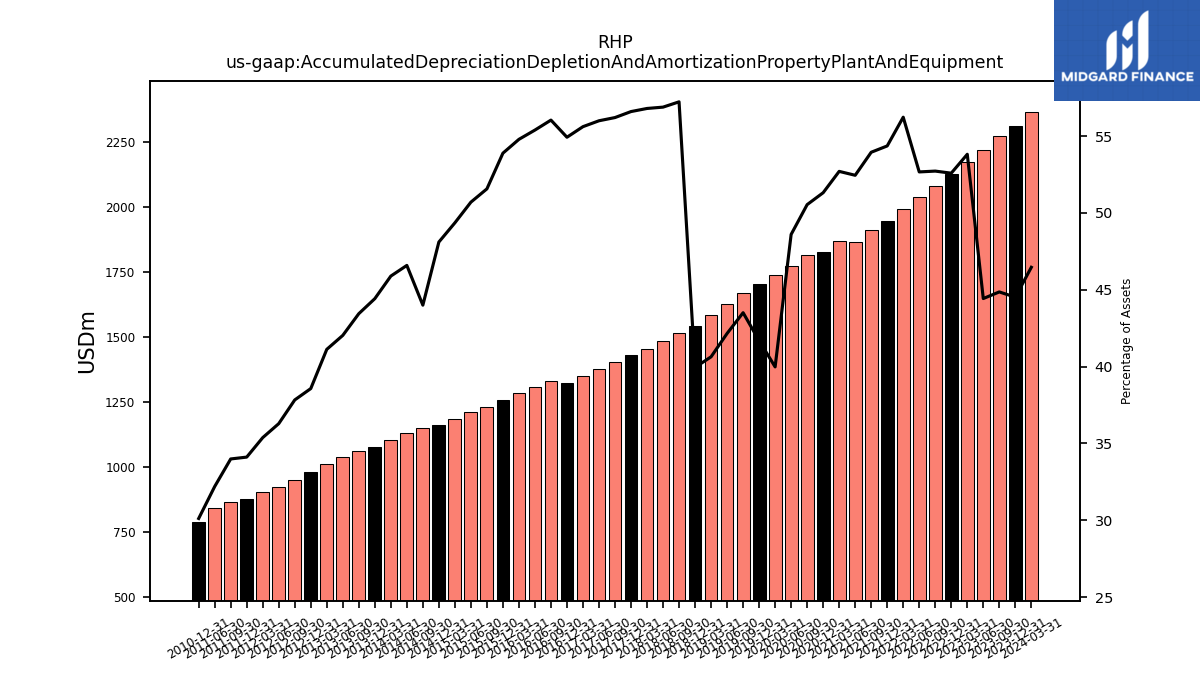
| Accumulated Depreciation Depletion And Amortization Property Plant And Equipment | 2309.70 | 2271.43 | 2217.12 | 2171.18 | 2124.73 | 2081.00 | 2035.39 | 1990.32 | 1946.27 | 1908.50 | 1863.07 | 1866.44 | 1824.95 | 1813.17 | 1771.40 | 1736.96 | 1704.29 | 1666.51 | 1623.71 | 1581.94 | 1539.42 | 1513.46 | 1483.11 | 1453.50 | 1428.56 | 1400.88 | 1375.11 | 1347.92 | 1321.31 | 1330.98 | 1304.92 | 1283.88 | 1256.32 | 1227.89 | 1211.45 | 1183.99 | 1160.81 | 1147.68 | 1129.39 | 1104.24 | 1076.97 | 1060.30 | 1036.78 | 1009.64 | 980.79 | 949.24 | 923.91 | 901.56 | 874.28 | 862.81 | 842.16 | NA | 789.21 | NA | NA | NA | |
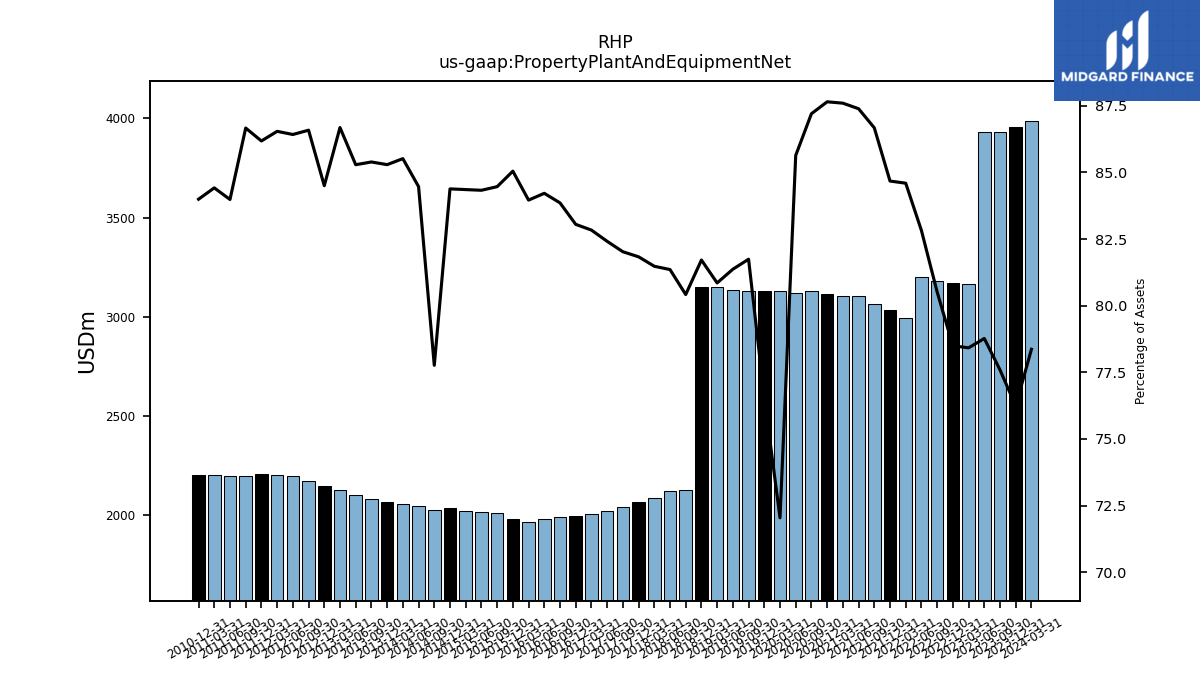
| Property Plant And Equipment Net | 3955.59 | 3928.92 | 3931.08 | 3163.90 | 3171.71 | 3178.10 | 3200.73 | 2994.54 | 3031.84 | 3066.34 | 3104.34 | 3102.34 | 3117.25 | 3128.62 | 3121.45 | 3129.98 | 3130.25 | 3131.36 | 3134.21 | 3147.75 | 3149.09 | 2126.76 | 2121.16 | 2085.19 | 2065.66 | 2044.44 | 2023.91 | 2007.77 | 1998.01 | 1991.69 | 1984.04 | 1967.55 | 1982.82 | 2011.38 | 2015.10 | 2023.72 | 2036.26 | 2028.52 | 2047.96 | 2057.93 | 2068.00 | 2084.25 | 2103.97 | 2128.45 | 2149.00 | 2172.79 | 2200.62 | 2205.66 | 2209.13 | 2200.19 | 2197.08 | 2203.68 | 2201.45 | NA | NA | NA | |
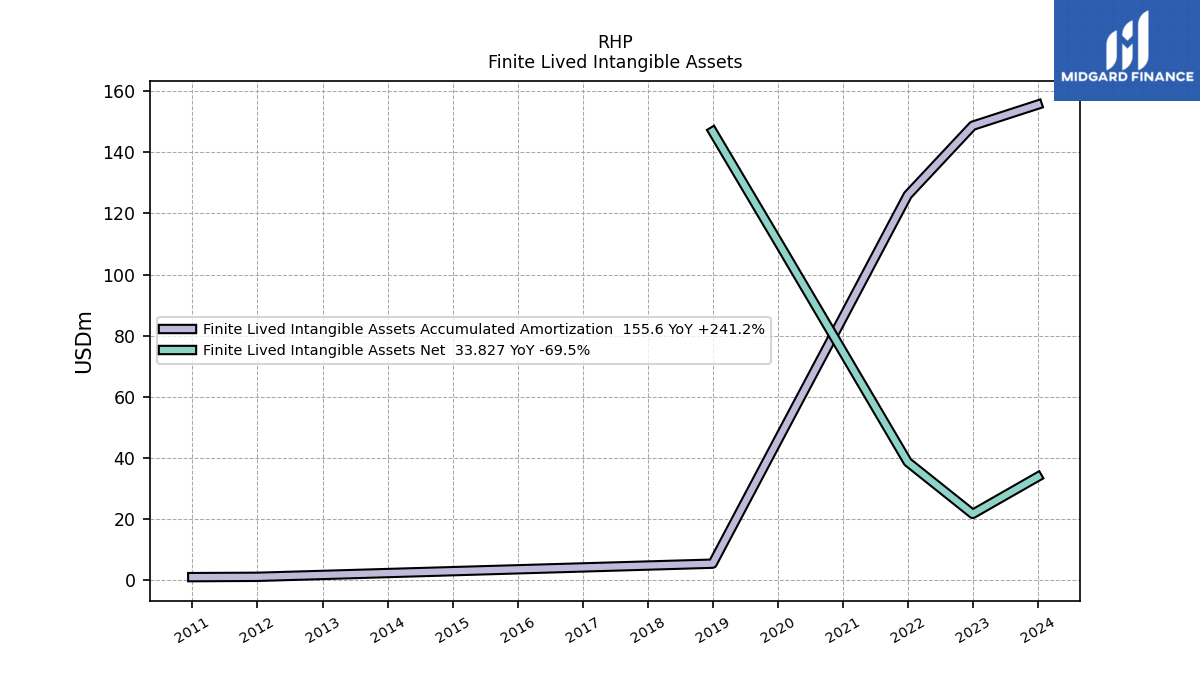
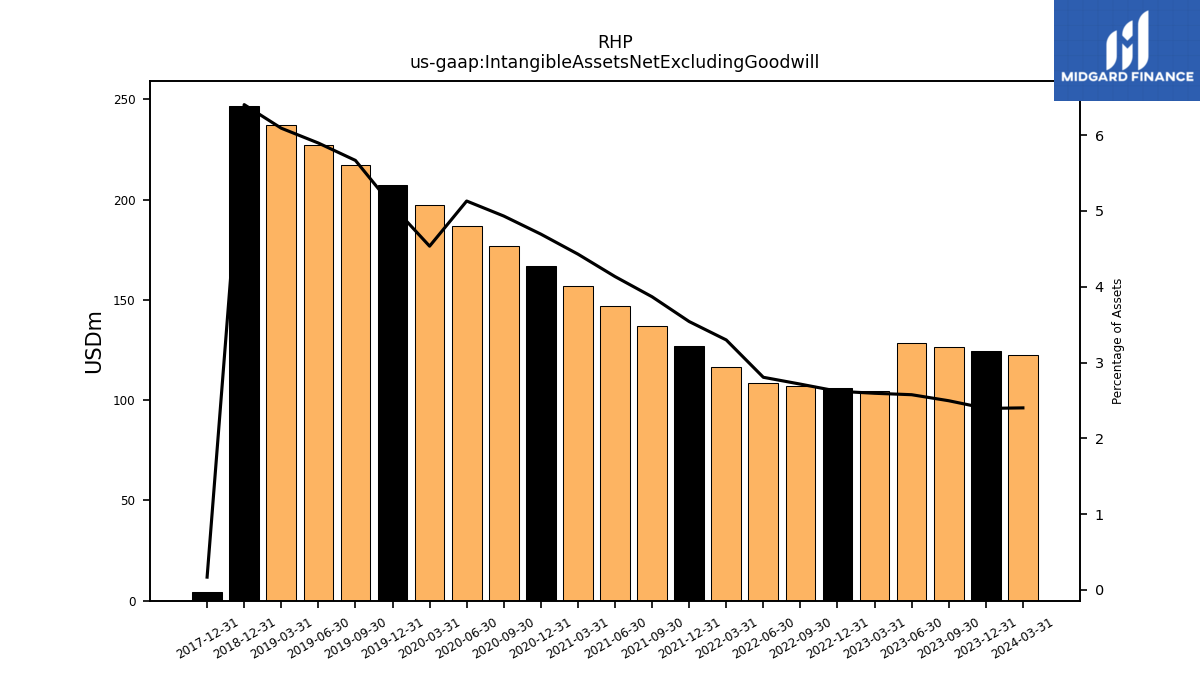
| Intangible Assets Net Excluding Goodwill | 124.29 | 126.43 | 128.57 | 104.71 | 105.95 | 107.20 | 108.45 | 116.77 | 126.80 | 136.85 | 146.88 | 156.93 | 166.97 | 177.00 | 187.03 | 197.08 | 207.11 | 217.09 | 227.13 | 237.18 | 246.77 | NA | NA | NA | 4.29 | NA | NA | NA | NA | NA | NA | NA | NA | NA | NA | NA | NA | NA | NA | NA | NA | NA | NA | NA | NA | NA | NA | NA | NA | NA | NA | NA | NA | NA | NA | NA | |
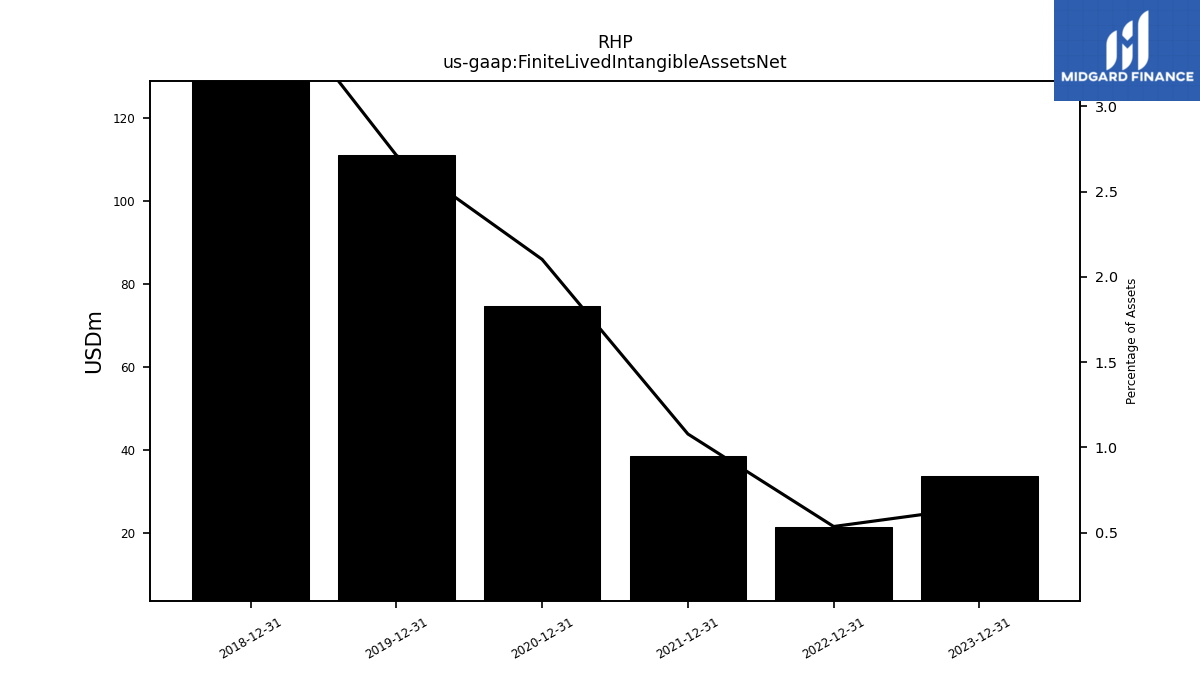
| Finite Lived Intangible Assets Net | 33.83 | NA | NA | NA | 21.68 | NA | NA | NA | 38.64 | NA | NA | NA | 74.80 | NA | NA | NA | 110.96 | NA | NA | NA | 146.84 | NA | NA | NA | NA | NA | NA | NA | NA | NA | NA | NA | NA | NA | NA | NA | NA | NA | NA | NA | NA | NA | NA | NA | NA | NA | NA | NA | NA | NA | NA | NA | NA | NA | NA | NA |
| 2023-12-31 | 2023-09-30 | 2023-06-30 | 2023-03-31 | 2022-12-31 | 2022-09-30 | 2022-06-30 | 2022-03-31 | 2021-12-31 | 2021-09-30 | 2021-06-30 | 2021-03-31 | 2020-12-31 | 2020-09-30 | 2020-06-30 | 2020-03-31 | 2019-12-31 | 2019-09-30 | 2019-06-30 | 2019-03-31 | 2018-12-31 | 2018-09-30 | 2018-06-30 | 2018-03-31 | 2017-12-31 | 2017-09-30 | 2017-06-30 | 2017-03-31 | 2016-12-31 | 2016-09-30 | 2016-06-30 | 2016-03-31 | 2015-12-31 | 2015-09-30 | 2015-06-30 | 2015-03-31 | 2014-12-31 | 2014-09-30 | 2014-06-30 | 2014-03-31 | 2013-12-31 | 2013-09-30 | 2013-06-30 | 2013-03-31 | 2012-12-31 | 2012-09-30 | 2012-06-30 | 2012-03-31 | 2011-12-31 | 2011-09-30 | 2011-06-30 | 2011-03-31 | 2010-12-31 | 2010-09-30 | 2010-06-30 | 2010-03-31 | ||
|---|---|---|---|---|---|---|---|---|---|---|---|---|---|---|---|---|---|---|---|---|---|---|---|---|---|---|---|---|---|---|---|---|---|---|---|---|---|---|---|---|---|---|---|---|---|---|---|---|---|---|---|---|---|---|---|---|---|
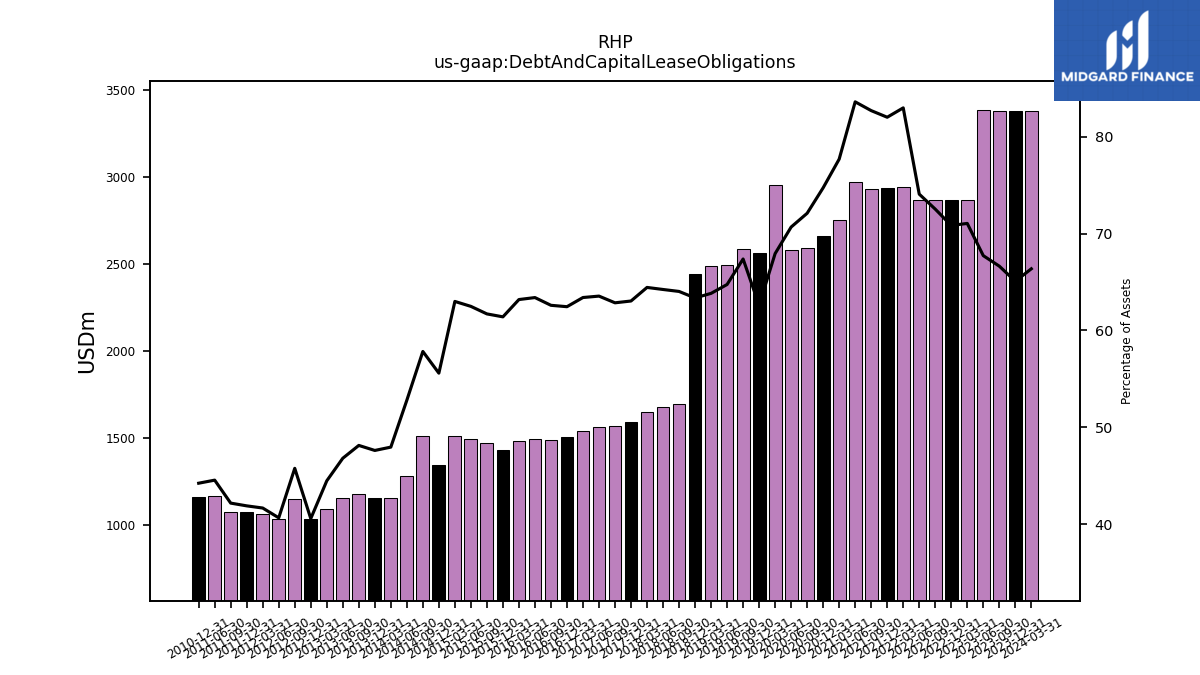
| Debt And Capital Lease Obligations | 3377.03 | 3374.79 | 3380.06 | 2866.90 | 2862.59 | 2863.08 | 2863.02 | 2937.66 | 2936.82 | 2925.97 | 2970.14 | 2751.65 | 2658.01 | 2586.97 | 2576.31 | 2951.89 | 2559.97 | 2581.31 | 2494.10 | 2485.18 | 2441.89 | 1693.43 | 1674.79 | 1649.30 | 1591.39 | 1566.75 | 1560.67 | 1536.81 | 1502.55 | 1486.84 | 1493.63 | 1480.92 | 1431.71 | 1469.58 | 1493.24 | 1511.40 | 1341.56 | 1508.68 | 1280.12 | 1154.05 | 1154.42 | 1174.81 | 1154.66 | 1092.08 | 1031.86 | 1148.46 | 1035.21 | 1061.94 | 1073.83 | 1070.70 | 1165.35 | NA | 1159.21 | NA | NA | NA | |
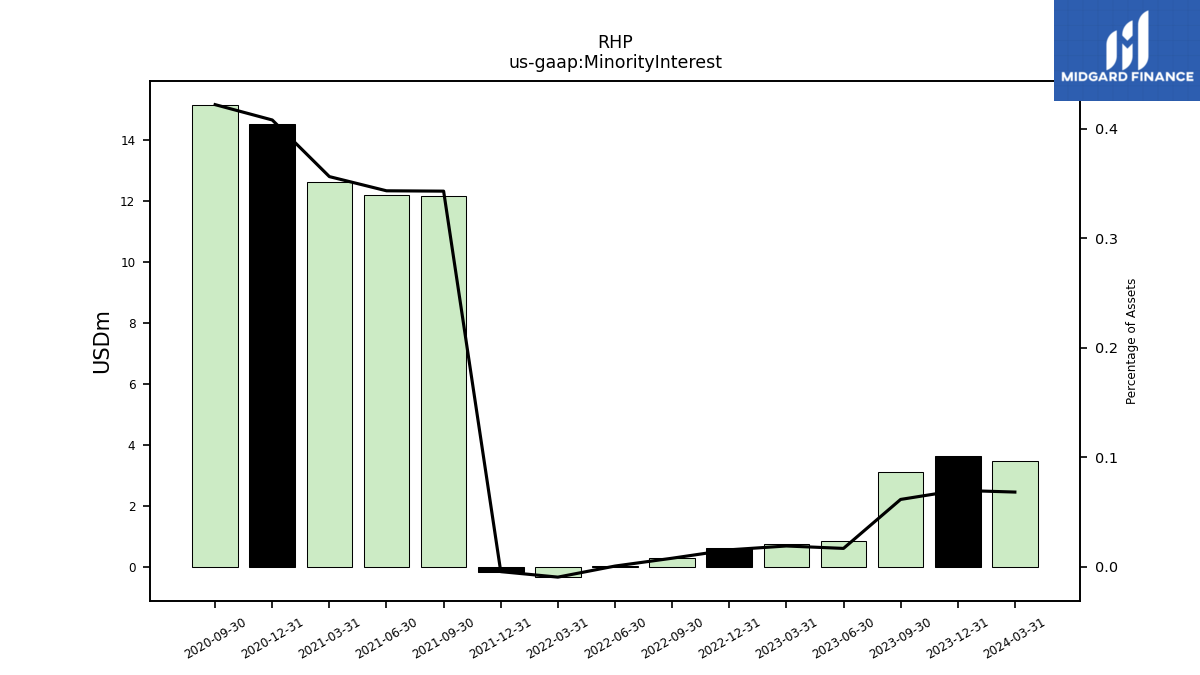
| Minority Interest | 3.62 | 3.12 | 0.84 | 0.77 | 0.62 | 0.31 | 0.03 | -0.34 | -0.16 | 12.14 | 12.20 | 12.62 | 14.52 | 15.15 | NA | NA | NA | NA | NA | NA | NA | NA | NA | NA | NA | NA | NA | NA | NA | NA | NA | NA | NA | NA | NA | NA | NA | NA | NA | NA | NA | NA | NA | NA | NA | NA | NA | NA | NA | NA | NA | NA | NA | NA | NA | NA |
| 2023-12-31 | 2023-09-30 | 2023-06-30 | 2023-03-31 | 2022-12-31 | 2022-09-30 | 2022-06-30 | 2022-03-31 | 2021-12-31 | 2021-09-30 | 2021-06-30 | 2021-03-31 | 2020-12-31 | 2020-09-30 | 2020-06-30 | 2020-03-31 | 2019-12-31 | 2019-09-30 | 2019-06-30 | 2019-03-31 | 2018-12-31 | 2018-09-30 | 2018-06-30 | 2018-03-31 | 2017-12-31 | 2017-09-30 | 2017-06-30 | 2017-03-31 | 2016-12-31 | 2016-09-30 | 2016-06-30 | 2016-03-31 | 2015-12-31 | 2015-09-30 | 2015-06-30 | 2015-03-31 | 2014-12-31 | 2014-09-30 | 2014-06-30 | 2014-03-31 | 2013-12-31 | 2013-09-30 | 2013-06-30 | 2013-03-31 | 2012-12-31 | 2012-09-30 | 2012-06-30 | 2012-03-31 | 2011-12-31 | 2011-09-30 | 2011-06-30 | 2011-03-31 | 2010-12-31 | 2010-09-30 | 2010-06-30 | 2010-03-31 | ||
|---|---|---|---|---|---|---|---|---|---|---|---|---|---|---|---|---|---|---|---|---|---|---|---|---|---|---|---|---|---|---|---|---|---|---|---|---|---|---|---|---|---|---|---|---|---|---|---|---|---|---|---|---|---|---|---|---|---|
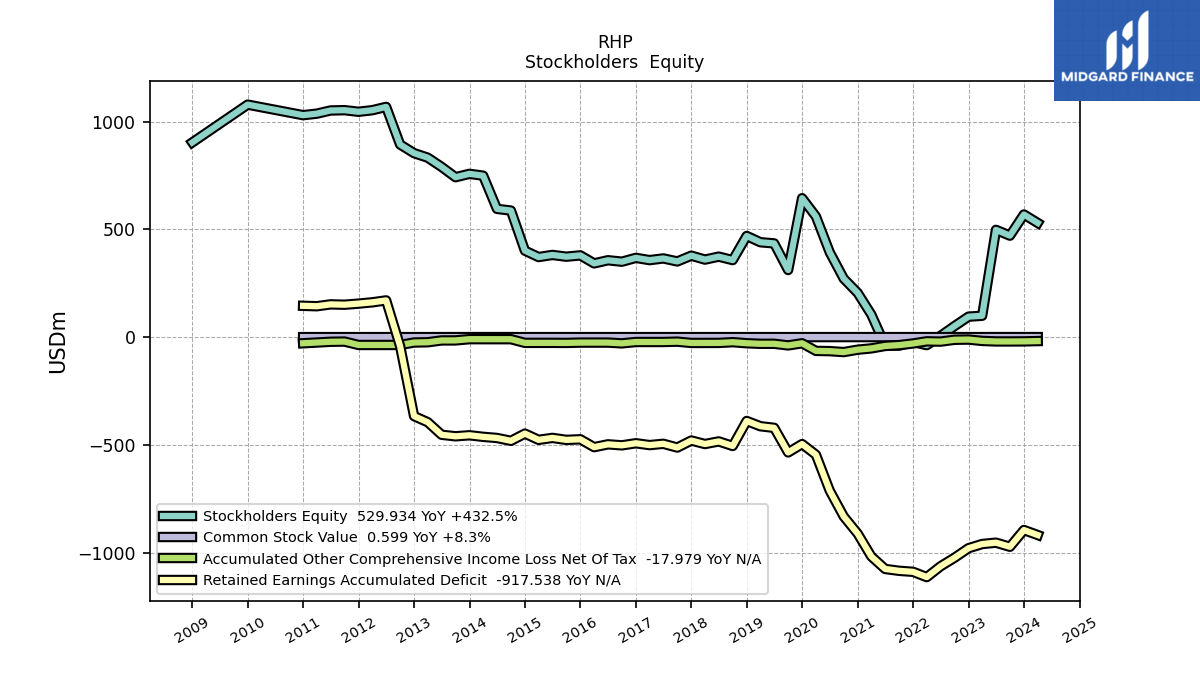
| Stockholders Equity | 569.15 | 470.94 | 497.88 | 99.51 | 95.28 | 51.58 | 6.21 | -36.84 | -22.23 | -39.23 | -38.02 | 104.70 | 205.30 | 271.93 | 393.70 | 560.02 | 644.73 | 311.48 | 435.02 | 440.46 | 469.58 | 357.50 | 373.69 | 359.92 | 378.16 | 351.40 | 365.33 | 357.48 | 368.00 | 350.20 | 356.96 | 342.30 | 379.56 | 373.39 | 381.53 | 371.67 | 401.41 | 587.39 | 595.22 | 749.14 | 757.70 | 742.01 | 790.01 | 832.64 | 853.60 | 893.67 | 1068.21 | 1052.85 | 1045.54 | 1052.95 | 1051.55 | 1036.78 | 1029.75 | NA | NA | NA | |
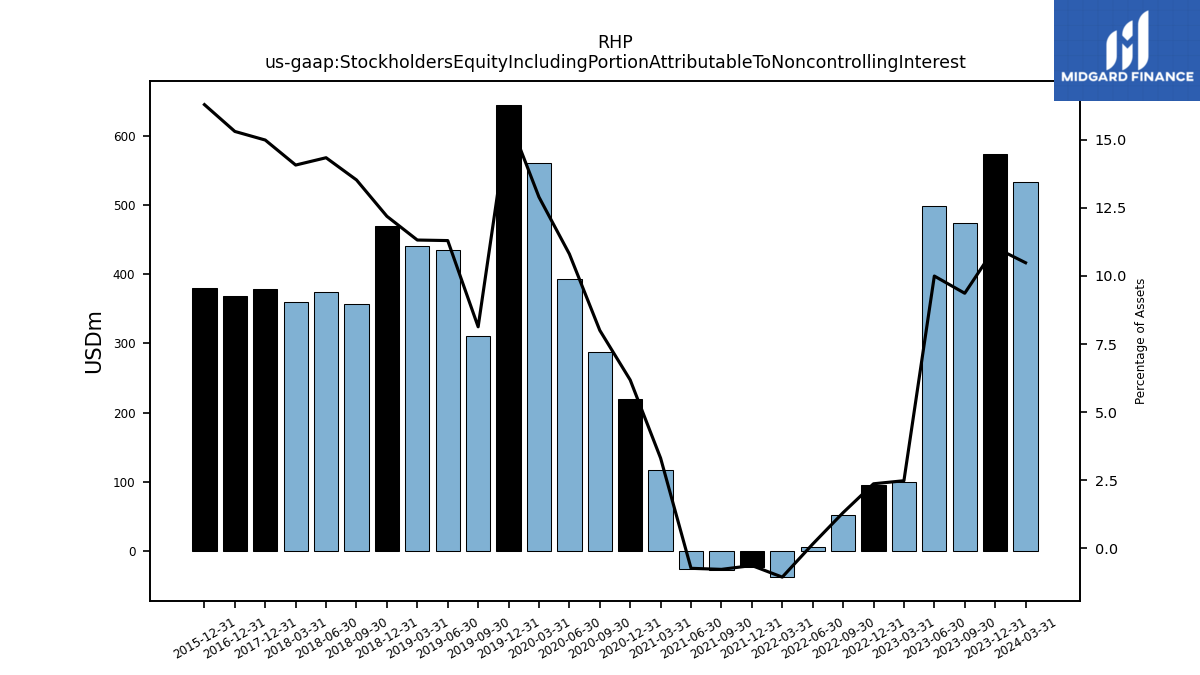
| Stockholders Equity Including Portion Attributable To Noncontrolling Interest | 572.78 | 474.06 | 498.72 | 100.28 | 95.90 | 51.89 | 6.23 | -37.18 | -22.39 | -27.09 | -25.82 | 117.33 | 219.82 | 287.07 | 393.70 | 560.02 | 644.73 | 311.48 | 435.02 | 440.46 | 469.58 | 357.50 | 373.69 | 359.92 | 378.16 | NA | NA | NA | 368.00 | NA | NA | NA | 379.56 | NA | NA | NA | NA | NA | NA | NA | NA | NA | NA | NA | NA | NA | NA | NA | NA | NA | NA | NA | NA | NA | NA | NA | |
| Common Stock Value | 0.60 | 0.60 | 0.60 | 0.55 | 0.55 | 0.55 | 0.55 | 0.55 | 0.55 | 0.55 | 0.55 | 0.55 | 0.55 | 0.55 | 0.55 | 0.55 | 0.55 | 0.51 | 0.51 | 0.51 | 0.51 | 0.51 | 0.51 | 0.51 | 0.51 | 0.51 | 0.51 | 0.51 | 0.51 | 0.51 | 0.51 | 0.51 | 0.51 | 0.51 | 0.51 | 0.51 | 0.51 | 0.51 | 0.51 | 0.51 | 0.51 | 0.51 | 0.51 | 0.52 | 0.53 | 0.45 | 0.49 | 0.49 | 0.48 | 0.48 | 0.48 | 0.48 | 0.48 | NA | NA | NA | |
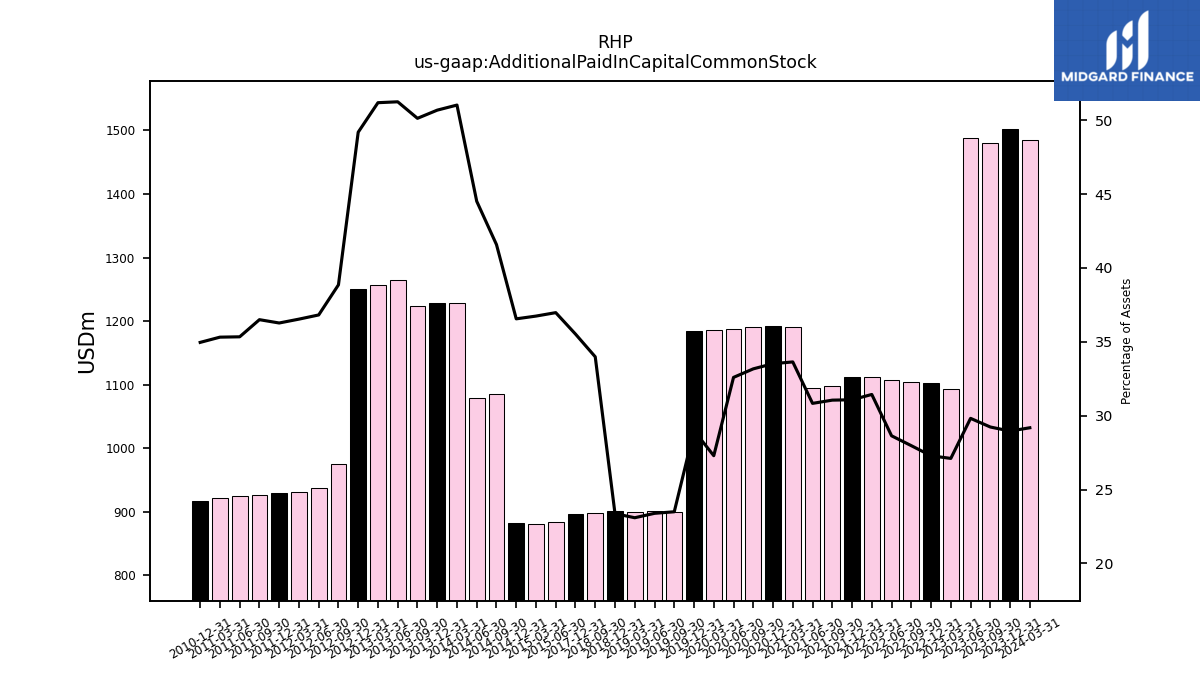
| Additional Paid In Capital Common Stock | 1502.71 | 1480.50 | 1488.33 | 1093.84 | 1102.73 | 1104.19 | 1106.95 | 1112.89 | 1112.87 | 1098.67 | 1095.41 | 1191.43 | 1192.26 | 1190.16 | 1188.05 | 1185.88 | 1185.17 | 900.25 | 901.13 | 899.16 | 900.79 | 898.85 | NA | NA | 896.76 | NA | NA | NA | NA | NA | NA | NA | NA | NA | 883.59 | 881.50 | 882.19 | 1084.75 | 1079.27 | 1227.91 | 1228.85 | 1223.55 | 1264.21 | 1256.85 | 1250.97 | 975.12 | 937.59 | 931.21 | 929.90 | 926.67 | 924.55 | 921.94 | 916.36 | NA | NA | NA | |
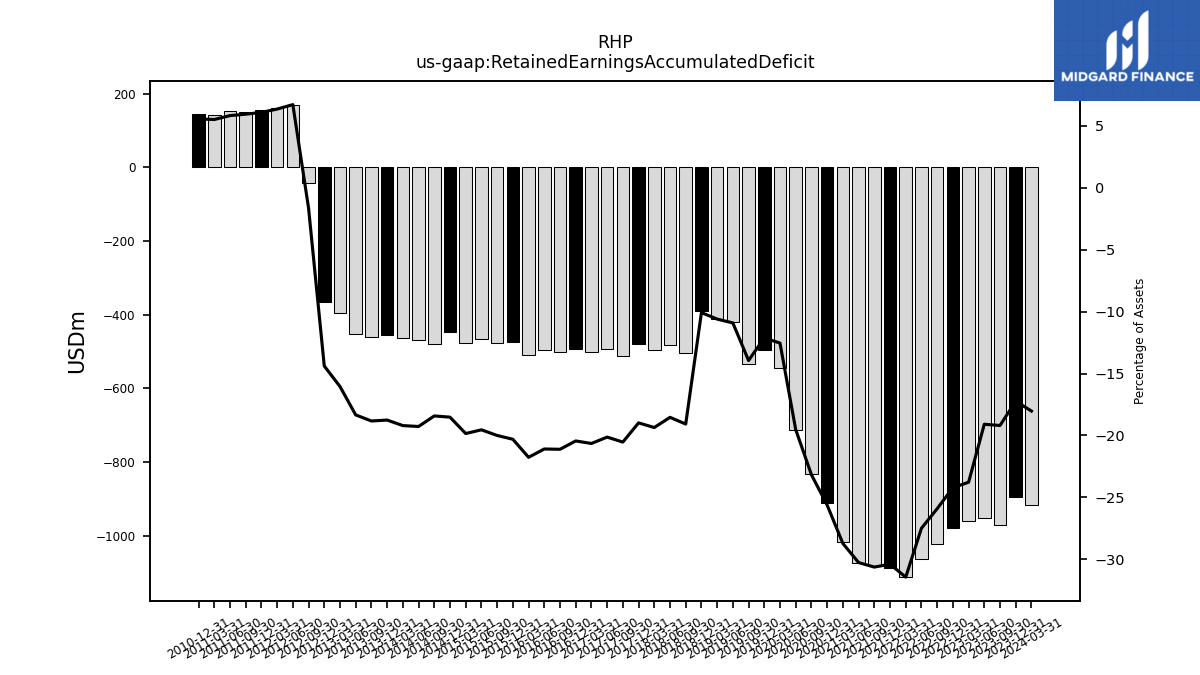
| Retained Earnings Accumulated Deficit | -894.26 | -972.00 | -952.94 | -959.20 | -978.62 | -1022.77 | -1062.44 | -1112.73 | -1088.11 | -1083.41 | -1074.87 | -1016.95 | -911.09 | -831.26 | -711.80 | -545.10 | -495.51 | -534.40 | -420.41 | -412.90 | -388.52 | -504.58 | -483.28 | -495.43 | -479.17 | -511.80 | -494.40 | -500.42 | -491.81 | -501.50 | -496.88 | -510.01 | -473.40 | -476.26 | -467.02 | -476.07 | -446.96 | -480.59 | -467.35 | -462.11 | -454.77 | -459.64 | -452.44 | -394.06 | -366.07 | -41.27 | 170.76 | 161.81 | 155.78 | 150.67 | 152.28 | 143.64 | 145.60 | NA | NA | NA | |
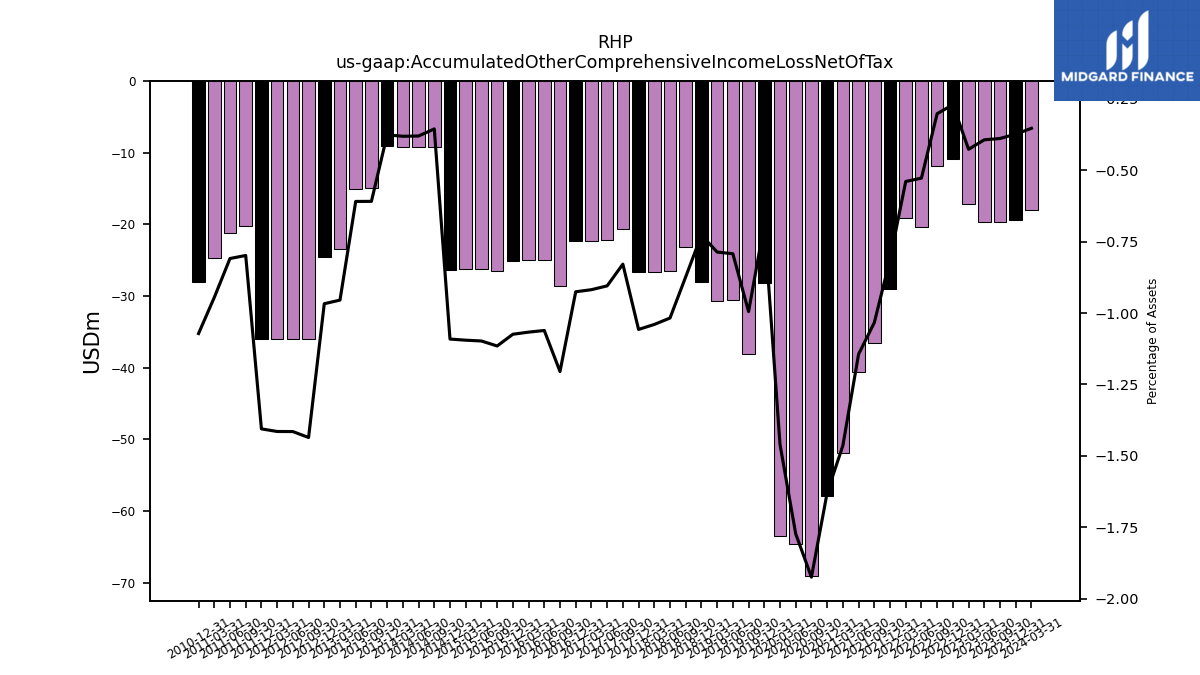
| Accumulated Other Comprehensive Income Loss Net Of Tax | -19.39 | -19.69 | -19.64 | -17.21 | -10.92 | -11.93 | -20.39 | -19.09 | -29.08 | -36.57 | -40.65 | -51.85 | -57.95 | -69.05 | -64.63 | -63.44 | -28.16 | -38.12 | -30.52 | -30.62 | -28.02 | -23.09 | -26.53 | -26.61 | -26.69 | -20.66 | -22.22 | -22.26 | -22.27 | -28.61 | -25.00 | -25.00 | -25.05 | -26.56 | -26.23 | -26.27 | -26.33 | -9.27 | -9.22 | -9.17 | -9.12 | -14.87 | -15.03 | -23.44 | -24.60 | -36.03 | -36.03 | -36.06 | -36.03 | -20.27 | -21.17 | -24.68 | -28.09 | NA | NA | NA | |
| Minority Interest | 3.62 | 3.12 | 0.84 | 0.77 | 0.62 | 0.31 | 0.03 | -0.34 | -0.16 | 12.14 | 12.20 | 12.62 | 14.52 | 15.15 | NA | NA | NA | NA | NA | NA | NA | NA | NA | NA | NA | NA | NA | NA | NA | NA | NA | NA | NA | NA | NA | NA | NA | NA | NA | NA | NA | NA | NA | NA | NA | NA | NA | NA | NA | NA | NA | NA | NA | NA | NA | NA |
| 2023-12-31 | 2023-09-30 | 2023-06-30 | 2023-03-31 | 2022-12-31 | 2022-09-30 | 2022-06-30 | 2022-03-31 | 2021-12-31 | 2021-09-30 | 2021-06-30 | 2021-03-31 | 2020-12-31 | 2020-09-30 | 2020-06-30 | 2020-03-31 | 2019-12-31 | 2019-09-30 | 2019-06-30 | 2019-03-31 | 2018-12-31 | 2018-09-30 | 2018-06-30 | 2018-03-31 | 2017-12-31 | 2017-09-30 | 2017-06-30 | 2017-03-31 | 2016-12-31 | 2016-09-30 | 2016-06-30 | 2016-03-31 | 2015-12-31 | 2015-09-30 | 2015-06-30 | 2015-03-31 | 2014-12-31 | 2014-09-30 | 2014-06-30 | 2014-03-31 | 2013-12-31 | 2013-09-30 | 2013-06-30 | 2013-03-31 | 2012-12-31 | 2012-09-30 | 2012-06-30 | 2012-03-31 | 2011-12-31 | 2011-09-30 | 2011-06-30 | 2011-03-31 | 2010-12-31 | 2010-09-30 | 2010-06-30 | 2010-03-31 | ||
|---|---|---|---|---|---|---|---|---|---|---|---|---|---|---|---|---|---|---|---|---|---|---|---|---|---|---|---|---|---|---|---|---|---|---|---|---|---|---|---|---|---|---|---|---|---|---|---|---|---|---|---|---|---|---|---|---|---|
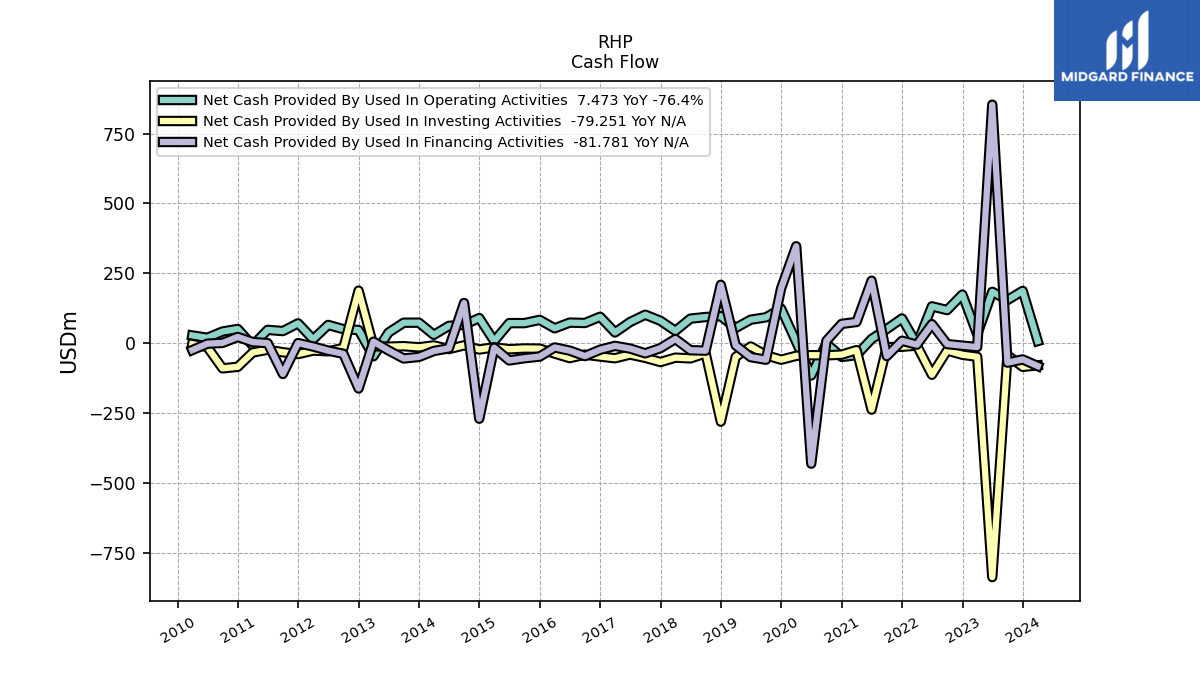
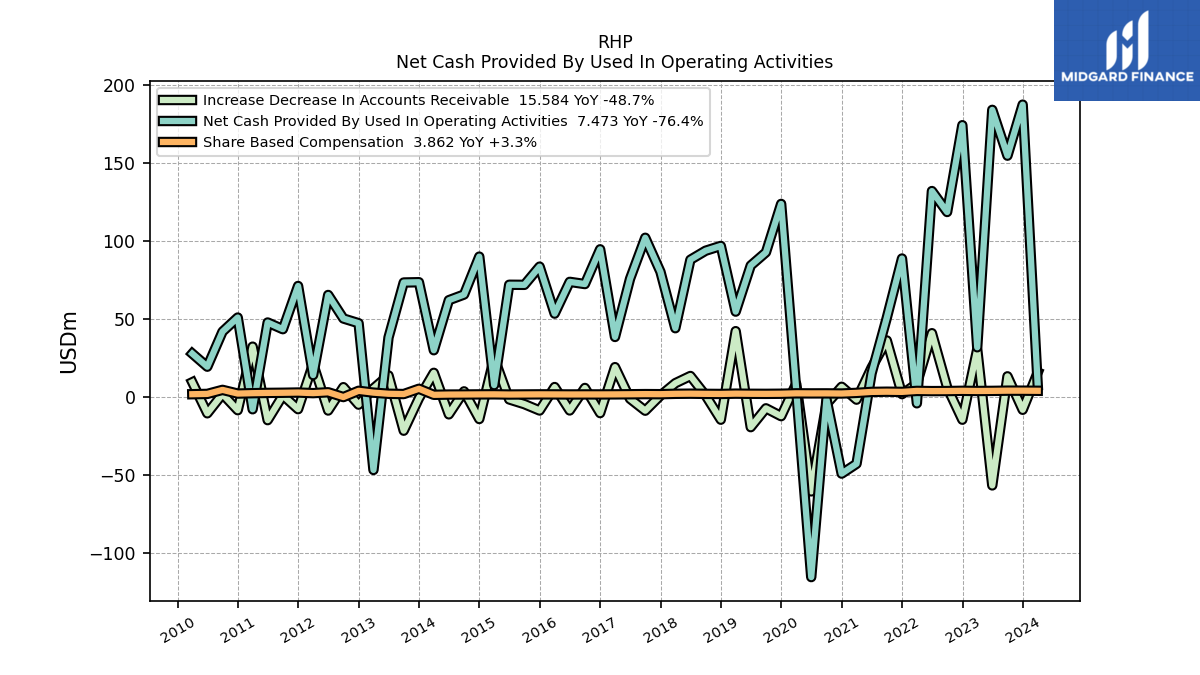
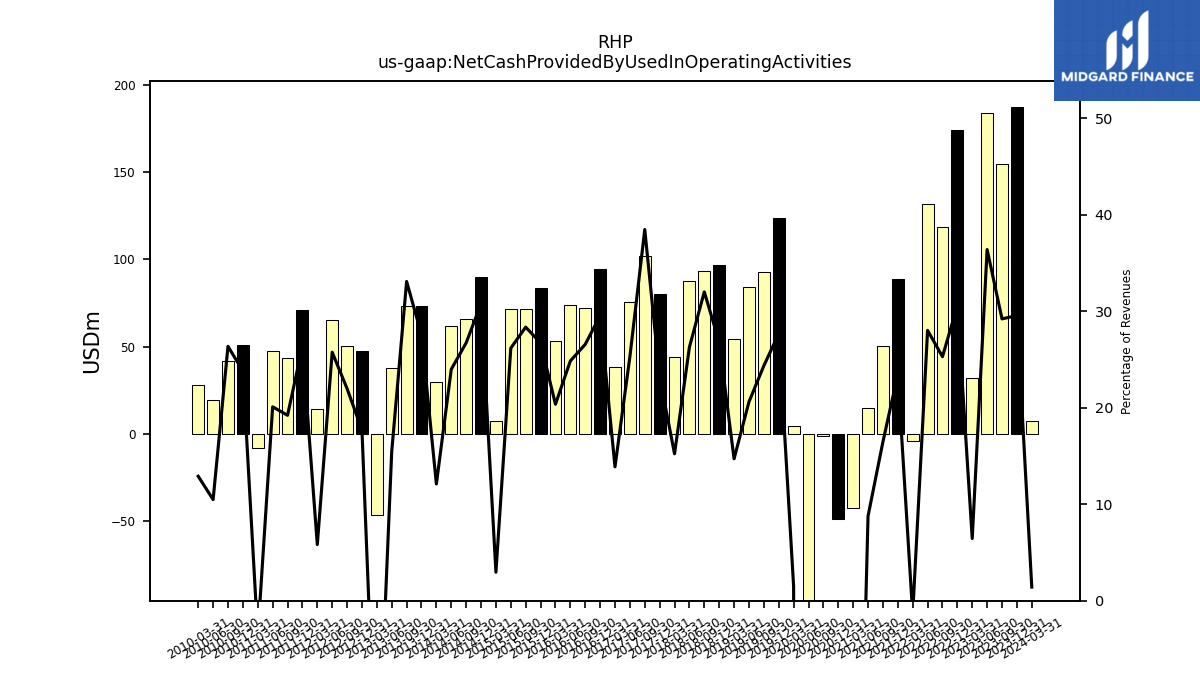
| Net Cash Provided By Used In Operating Activities | 187.13 | 154.43 | 183.79 | 31.71 | 173.96 | 118.36 | 131.79 | -4.17 | 88.58 | 50.56 | 14.99 | -42.89 | -49.19 | -1.53 | -115.47 | 4.67 | 123.55 | 92.52 | 84.06 | 54.56 | 96.64 | 93.56 | 87.79 | 43.93 | 80.06 | 101.86 | 75.59 | 38.32 | 94.48 | 72.21 | 73.63 | 53.27 | 83.39 | 71.71 | 71.77 | 7.49 | 89.79 | 65.50 | 61.88 | 29.83 | 73.40 | 73.21 | 37.95 | -46.86 | 47.16 | 50.16 | 65.23 | 13.91 | 71.00 | 43.30 | 47.60 | -7.98 | 50.78 | 41.74 | 19.29 | 27.67 | |
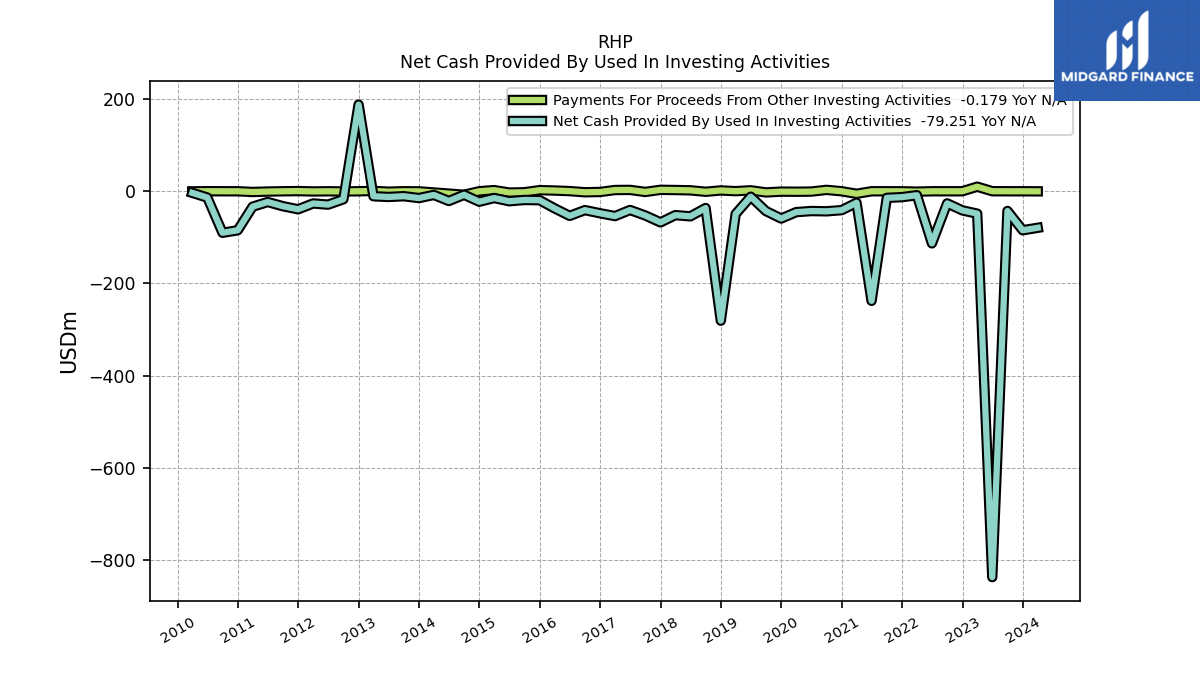
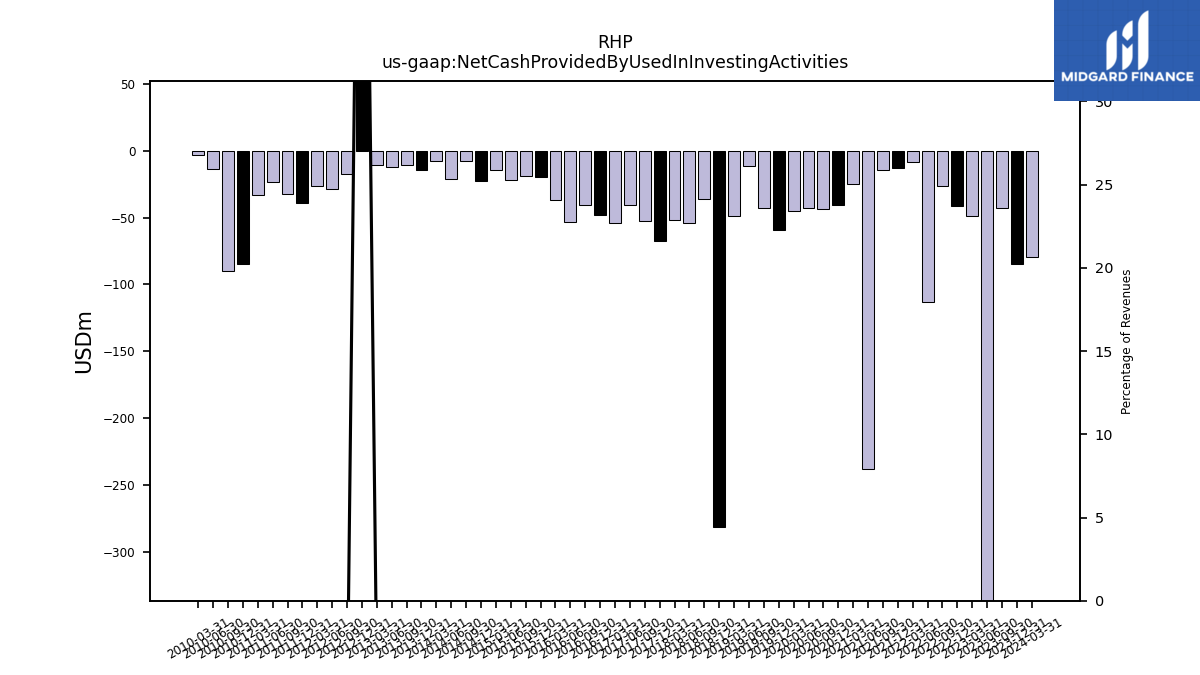
| Net Cash Provided By Used In Investing Activities | -84.61 | -42.71 | -836.96 | -48.54 | -41.45 | -26.27 | -113.03 | -8.56 | -12.73 | -14.35 | -237.71 | -24.94 | -40.99 | -43.48 | -42.92 | -45.25 | -59.16 | -42.97 | -11.81 | -49.10 | -280.77 | -36.35 | -54.38 | -51.80 | -67.46 | -52.54 | -40.66 | -53.85 | -47.78 | -40.91 | -53.39 | -37.16 | -19.37 | -18.93 | -21.64 | -14.70 | -22.68 | -7.67 | -21.13 | -7.97 | -14.78 | -10.74 | -12.37 | -10.85 | 187.91 | -17.36 | -29.01 | -26.49 | -39.10 | -32.41 | -23.30 | -33.46 | -84.61 | -90.06 | -13.66 | -3.46 | |
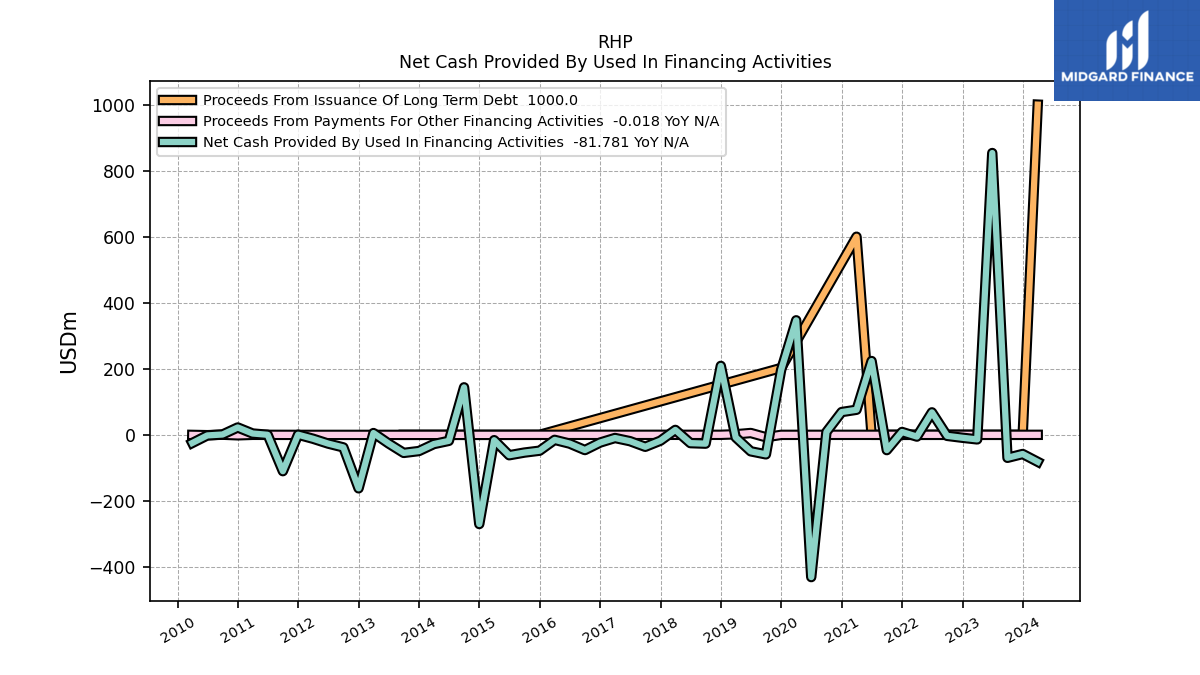
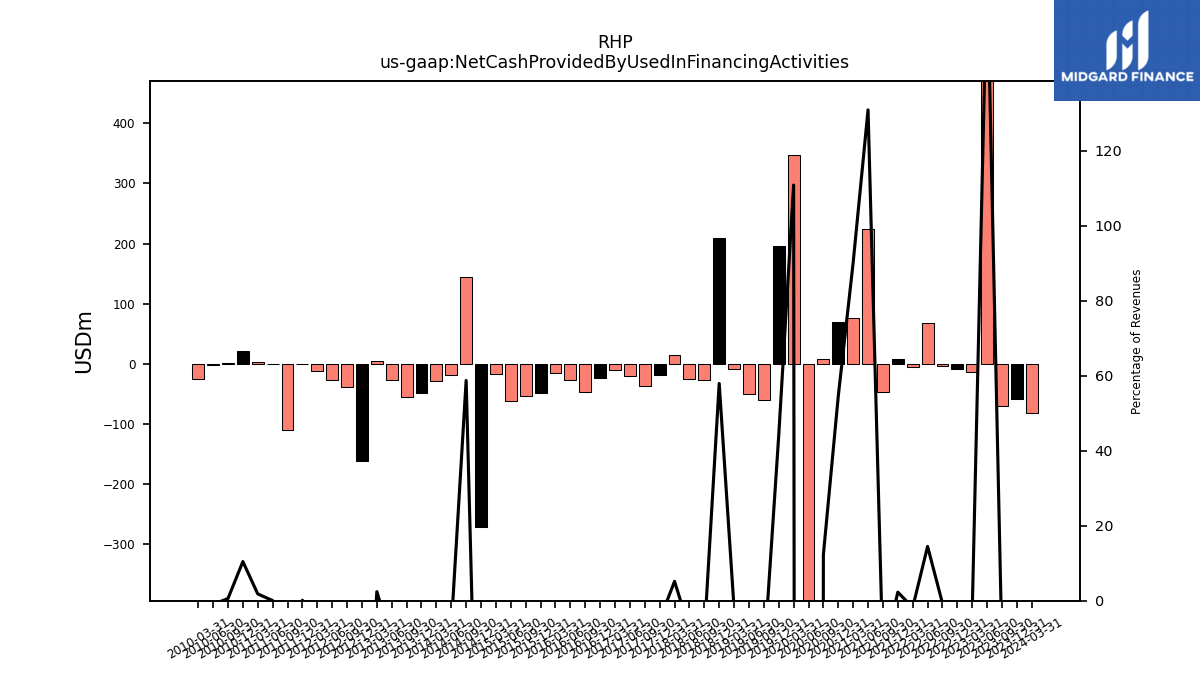
| Net Cash Provided By Used In Financing Activities | -58.06 | -69.64 | 853.45 | -13.87 | -8.88 | -3.16 | 68.11 | -5.35 | 8.65 | -46.33 | 223.55 | 75.87 | 69.00 | 8.65 | -430.96 | 346.84 | 196.55 | -59.18 | -49.98 | -7.73 | 208.82 | -26.77 | -25.17 | 14.89 | -17.72 | -36.26 | -19.29 | -9.62 | -23.43 | -46.18 | -26.66 | -15.26 | -48.07 | -53.77 | -61.81 | -16.20 | -270.23 | 143.86 | -18.32 | -28.02 | -49.13 | -54.78 | -26.03 | 5.39 | -162.13 | -38.07 | -26.59 | -11.96 | 0.37 | -110.13 | 0.10 | 4.01 | 22.27 | 0.97 | -1.81 | -24.75 |
| 2023-12-31 | 2023-09-30 | 2023-06-30 | 2023-03-31 | 2022-12-31 | 2022-09-30 | 2022-06-30 | 2022-03-31 | 2021-12-31 | 2021-09-30 | 2021-06-30 | 2021-03-31 | 2020-12-31 | 2020-09-30 | 2020-06-30 | 2020-03-31 | 2019-12-31 | 2019-09-30 | 2019-06-30 | 2019-03-31 | 2018-12-31 | 2018-09-30 | 2018-06-30 | 2018-03-31 | 2017-12-31 | 2017-09-30 | 2017-06-30 | 2017-03-31 | 2016-12-31 | 2016-09-30 | 2016-06-30 | 2016-03-31 | 2015-12-31 | 2015-09-30 | 2015-06-30 | 2015-03-31 | 2014-12-31 | 2014-09-30 | 2014-06-30 | 2014-03-31 | 2013-12-31 | 2013-09-30 | 2013-06-30 | 2013-03-31 | 2012-12-31 | 2012-09-30 | 2012-06-30 | 2012-03-31 | 2011-12-31 | 2011-09-30 | 2011-06-30 | 2011-03-31 | 2010-12-31 | 2010-09-30 | 2010-06-30 | 2010-03-31 | ||
|---|---|---|---|---|---|---|---|---|---|---|---|---|---|---|---|---|---|---|---|---|---|---|---|---|---|---|---|---|---|---|---|---|---|---|---|---|---|---|---|---|---|---|---|---|---|---|---|---|---|---|---|---|---|---|---|---|---|
| Net Cash Provided By Used In Operating Activities | 187.13 | 154.43 | 183.79 | 31.71 | 173.96 | 118.36 | 131.79 | -4.17 | 88.58 | 50.56 | 14.99 | -42.89 | -49.19 | -1.53 | -115.47 | 4.67 | 123.55 | 92.52 | 84.06 | 54.56 | 96.64 | 93.56 | 87.79 | 43.93 | 80.06 | 101.86 | 75.59 | 38.32 | 94.48 | 72.21 | 73.63 | 53.27 | 83.39 | 71.71 | 71.77 | 7.49 | 89.79 | 65.50 | 61.88 | 29.83 | 73.40 | 73.21 | 37.95 | -46.86 | 47.16 | 50.16 | 65.23 | 13.91 | 71.00 | 43.30 | 47.60 | -7.98 | 50.78 | 41.74 | 19.29 | 27.67 | |
| Profit Loss | 169.88 | 40.78 | 70.14 | 60.99 | 61.37 | 47.45 | 50.92 | -24.80 | -6.02 | -8.61 | -63.05 | -117.12 | -92.55 | -129.88 | -187.66 | -50.74 | 38.45 | 20.89 | 46.28 | 22.67 | 159.19 | 22.59 | 55.55 | 27.34 | 72.32 | 23.87 | NA | NA | NA | NA | NA | NA | NA | NA | NA | NA | NA | NA | NA | NA | NA | NA | NA | NA | NA | NA | NA | NA | NA | NA | NA | NA | NA | NA | NA | NA | |
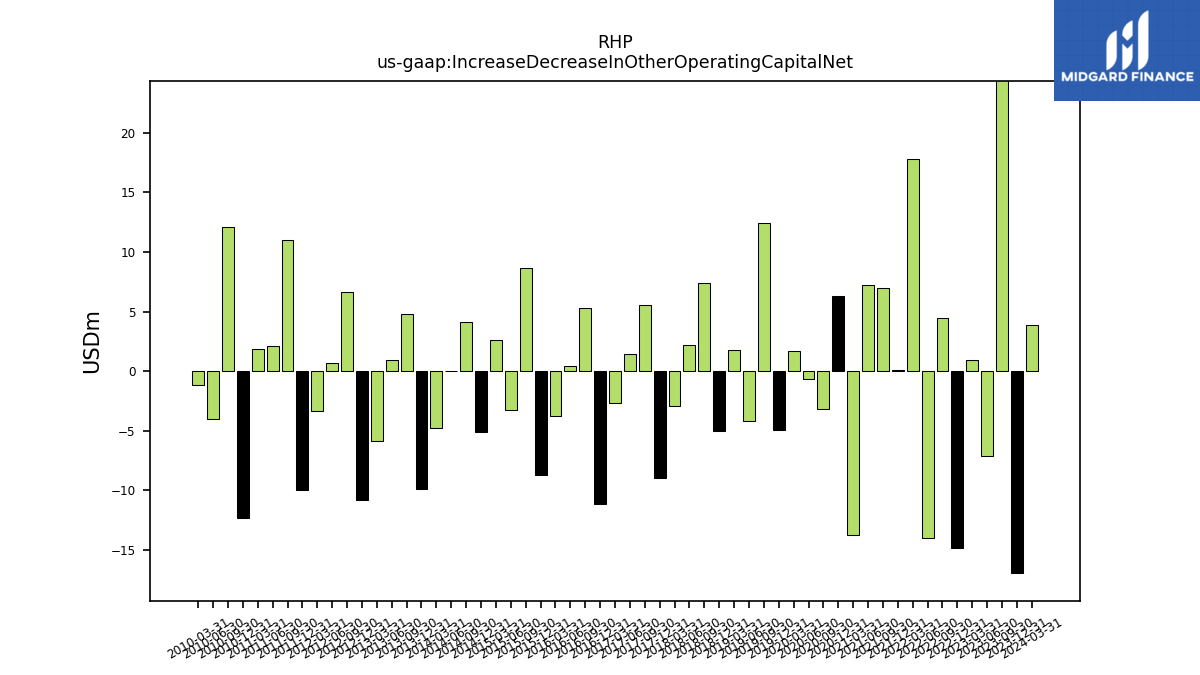
| Increase Decrease In Other Operating Capital Net | -16.93 | 29.73 | -7.14 | 0.95 | -14.87 | 4.43 | -13.97 | 17.81 | 0.12 | 6.97 | 7.21 | -13.76 | 6.33 | -3.16 | -0.69 | 1.70 | -4.92 | 12.41 | -4.21 | 1.75 | -4.99 | 7.43 | 2.20 | -2.92 | -8.93 | 5.59 | 1.44 | -2.70 | -11.10 | 5.31 | 0.47 | -3.79 | -8.67 | 8.70 | -3.22 | 2.64 | -5.11 | 4.13 | 0.03 | -4.77 | -9.90 | 4.77 | 0.90 | -5.85 | -10.82 | 6.68 | 0.72 | -3.32 | -9.97 | 10.97 | 2.12 | 1.88 | -12.32 | 12.11 | -4.03 | -1.12 | |
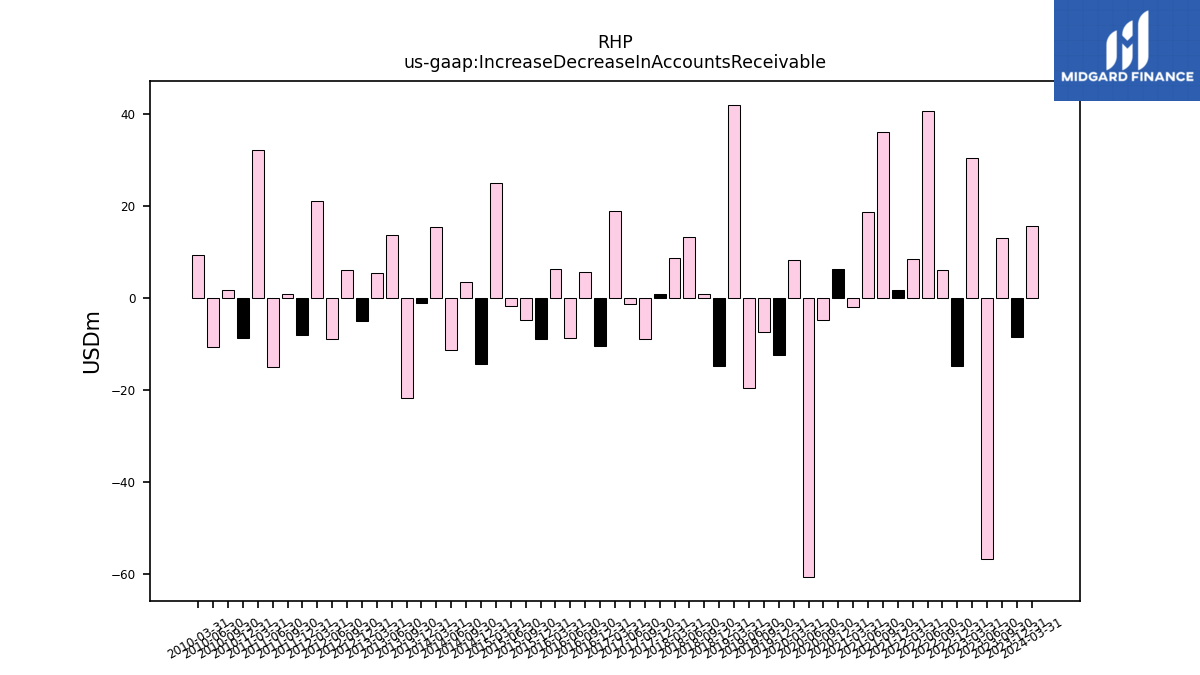
| Increase Decrease In Accounts Receivable | -8.32 | 13.14 | -56.75 | 30.38 | -14.66 | 6.10 | 40.76 | 8.49 | 1.71 | 36.10 | 18.65 | -1.82 | 6.45 | -4.71 | -60.58 | 8.35 | -12.40 | -7.37 | -19.44 | 42.05 | -14.65 | 0.90 | 13.34 | 8.73 | 0.84 | -8.89 | -1.26 | 19.02 | -10.44 | 5.68 | -8.74 | 6.27 | -8.77 | -4.71 | -1.65 | 24.98 | -14.23 | 3.50 | -11.24 | 15.37 | -0.96 | -21.70 | 13.71 | 5.40 | -5.03 | 6.17 | -8.78 | 21.04 | -7.93 | 0.89 | -14.95 | 32.13 | -8.59 | 1.77 | -10.58 | 9.32 | |
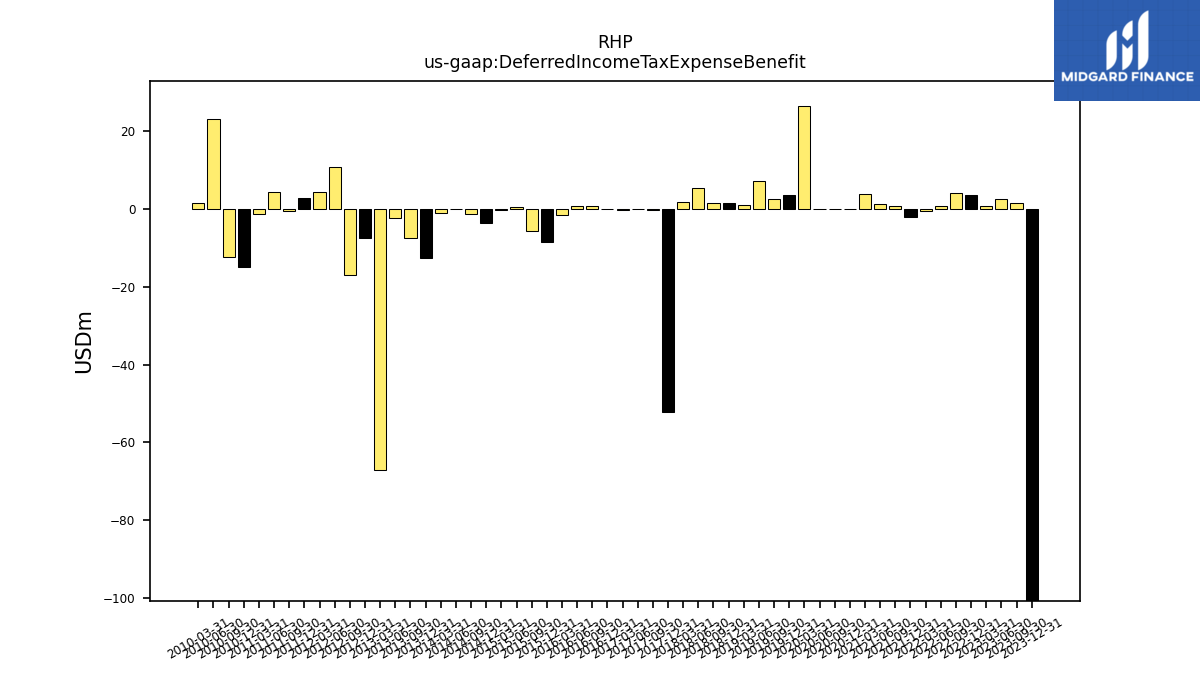
| Deferred Income Tax Expense Benefit | -100.72 | 1.46 | 2.66 | 0.77 | 3.70 | 4.25 | 0.71 | -0.41 | -1.99 | 0.82 | 1.39 | 3.78 | -0.08 | -0.03 | 0.08 | 26.56 | 3.55 | 2.68 | 7.09 | 1.10 | 1.60 | 1.53 | 5.29 | 1.78 | -52.14 | -0.37 | 0.06 | -0.19 | 0.04 | 0.88 | 0.86 | -1.46 | -8.54 | -5.55 | 0.48 | -0.24 | -3.62 | -1.17 | -0.02 | -1.07 | -12.65 | -7.39 | -2.39 | -67.11 | -7.50 | -16.96 | 10.88 | 4.48 | 2.92 | -0.60 | 4.42 | -1.35 | -14.91 | -12.22 | 23.10 | 1.46 | |
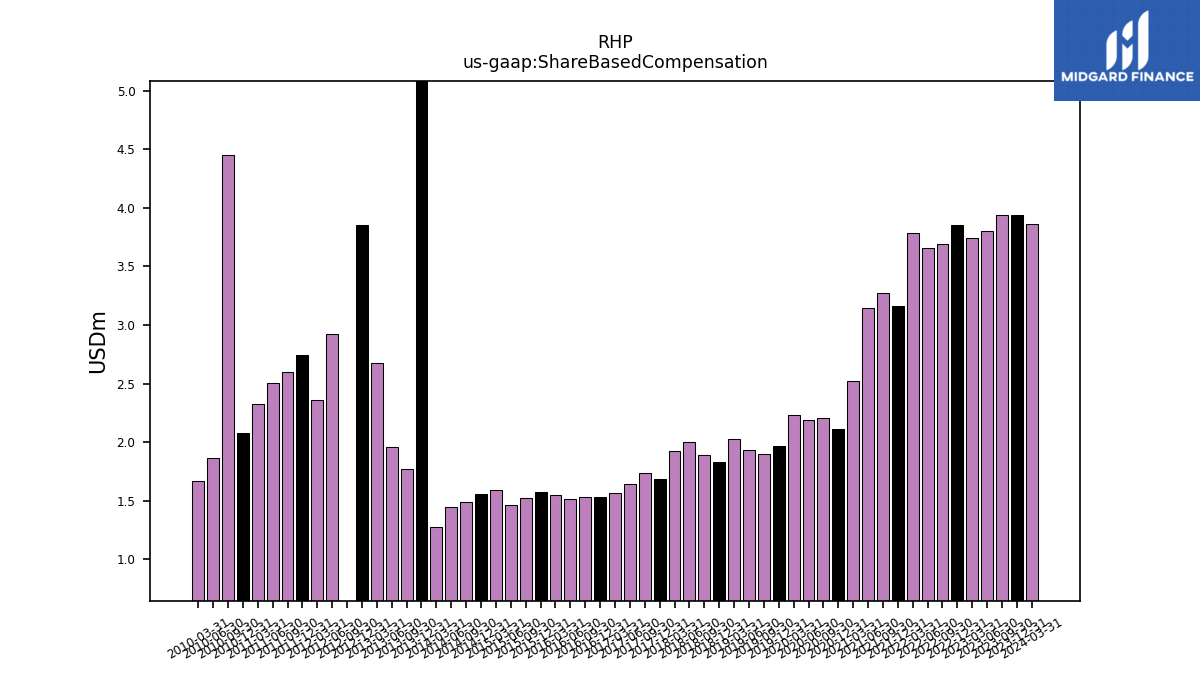
| Share Based Compensation | 3.94 | 3.94 | 3.80 | 3.74 | 3.85 | 3.69 | 3.65 | 3.79 | 3.16 | 3.28 | 3.15 | 2.52 | 2.11 | 2.20 | 2.19 | 2.23 | 1.97 | 1.90 | 1.94 | 2.03 | 1.83 | 1.90 | 2.01 | 1.92 | 1.69 | 1.74 | 1.64 | 1.57 | 1.53 | 1.53 | 1.51 | 1.55 | 1.58 | 1.52 | 1.47 | 1.59 | 1.56 | 1.49 | 1.45 | 1.28 | 5.15 | 1.77 | 1.96 | 2.68 | 3.86 | -0.17 | 2.92 | 2.36 | 2.75 | 2.60 | 2.50 | 2.32 | 2.08 | 4.45 | 1.87 | 1.67 | |
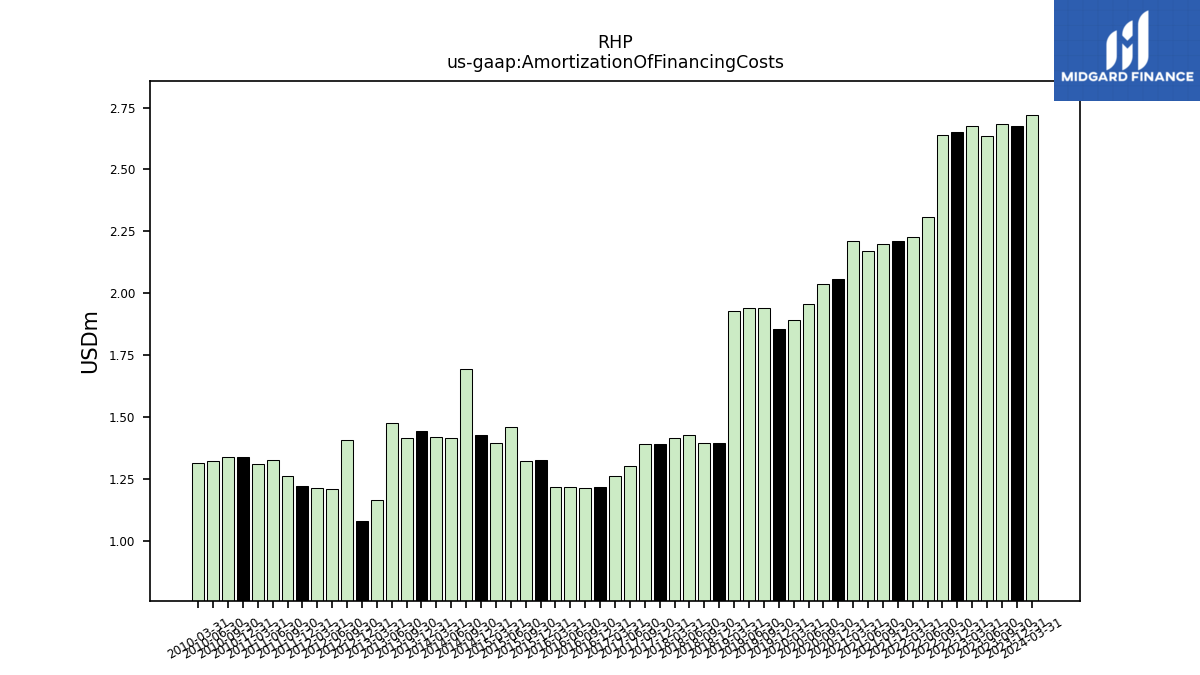
| Amortization Of Financing Costs | 2.67 | 2.68 | 2.63 | 2.67 | 2.65 | 2.64 | 2.31 | 2.23 | 2.21 | 2.20 | 2.17 | 2.21 | 2.06 | 2.04 | 1.96 | 1.89 | 1.86 | 1.94 | 1.94 | 1.93 | 1.40 | 1.40 | 1.43 | 1.42 | 1.39 | 1.39 | 1.30 | 1.26 | 1.22 | 1.22 | 1.22 | 1.22 | 1.33 | 1.32 | 1.46 | 1.40 | 1.43 | 1.70 | 1.42 | 1.42 | 1.44 | 1.42 | 1.48 | 1.17 | 1.08 | 1.41 | 1.21 | 1.21 | 1.22 | 1.26 | 1.33 | 1.31 | 1.34 | 1.34 | 1.32 | 1.31 |
| 2023-12-31 | 2023-09-30 | 2023-06-30 | 2023-03-31 | 2022-12-31 | 2022-09-30 | 2022-06-30 | 2022-03-31 | 2021-12-31 | 2021-09-30 | 2021-06-30 | 2021-03-31 | 2020-12-31 | 2020-09-30 | 2020-06-30 | 2020-03-31 | 2019-12-31 | 2019-09-30 | 2019-06-30 | 2019-03-31 | 2018-12-31 | 2018-09-30 | 2018-06-30 | 2018-03-31 | 2017-12-31 | 2017-09-30 | 2017-06-30 | 2017-03-31 | 2016-12-31 | 2016-09-30 | 2016-06-30 | 2016-03-31 | 2015-12-31 | 2015-09-30 | 2015-06-30 | 2015-03-31 | 2014-12-31 | 2014-09-30 | 2014-06-30 | 2014-03-31 | 2013-12-31 | 2013-09-30 | 2013-06-30 | 2013-03-31 | 2012-12-31 | 2012-09-30 | 2012-06-30 | 2012-03-31 | 2011-12-31 | 2011-09-30 | 2011-06-30 | 2011-03-31 | 2010-12-31 | 2010-09-30 | 2010-06-30 | 2010-03-31 | ||
|---|---|---|---|---|---|---|---|---|---|---|---|---|---|---|---|---|---|---|---|---|---|---|---|---|---|---|---|---|---|---|---|---|---|---|---|---|---|---|---|---|---|---|---|---|---|---|---|---|---|---|---|---|---|---|---|---|---|
| Net Cash Provided By Used In Investing Activities | -84.61 | -42.71 | -836.96 | -48.54 | -41.45 | -26.27 | -113.03 | -8.56 | -12.73 | -14.35 | -237.71 | -24.94 | -40.99 | -43.48 | -42.92 | -45.25 | -59.16 | -42.97 | -11.81 | -49.10 | -280.77 | -36.35 | -54.38 | -51.80 | -67.46 | -52.54 | -40.66 | -53.85 | -47.78 | -40.91 | -53.39 | -37.16 | -19.37 | -18.93 | -21.64 | -14.70 | -22.68 | -7.67 | -21.13 | -7.97 | -14.78 | -10.74 | -12.37 | -10.85 | 187.91 | -17.36 | -29.01 | -26.49 | -39.10 | -32.41 | -23.30 | -33.46 | -84.61 | -90.06 | -13.66 | -3.46 |
| 2023-12-31 | 2023-09-30 | 2023-06-30 | 2023-03-31 | 2022-12-31 | 2022-09-30 | 2022-06-30 | 2022-03-31 | 2021-12-31 | 2021-09-30 | 2021-06-30 | 2021-03-31 | 2020-12-31 | 2020-09-30 | 2020-06-30 | 2020-03-31 | 2019-12-31 | 2019-09-30 | 2019-06-30 | 2019-03-31 | 2018-12-31 | 2018-09-30 | 2018-06-30 | 2018-03-31 | 2017-12-31 | 2017-09-30 | 2017-06-30 | 2017-03-31 | 2016-12-31 | 2016-09-30 | 2016-06-30 | 2016-03-31 | 2015-12-31 | 2015-09-30 | 2015-06-30 | 2015-03-31 | 2014-12-31 | 2014-09-30 | 2014-06-30 | 2014-03-31 | 2013-12-31 | 2013-09-30 | 2013-06-30 | 2013-03-31 | 2012-12-31 | 2012-09-30 | 2012-06-30 | 2012-03-31 | 2011-12-31 | 2011-09-30 | 2011-06-30 | 2011-03-31 | 2010-12-31 | 2010-09-30 | 2010-06-30 | 2010-03-31 | ||
|---|---|---|---|---|---|---|---|---|---|---|---|---|---|---|---|---|---|---|---|---|---|---|---|---|---|---|---|---|---|---|---|---|---|---|---|---|---|---|---|---|---|---|---|---|---|---|---|---|---|---|---|---|---|---|---|---|---|
| Net Cash Provided By Used In Financing Activities | -58.06 | -69.64 | 853.45 | -13.87 | -8.88 | -3.16 | 68.11 | -5.35 | 8.65 | -46.33 | 223.55 | 75.87 | 69.00 | 8.65 | -430.96 | 346.84 | 196.55 | -59.18 | -49.98 | -7.73 | 208.82 | -26.77 | -25.17 | 14.89 | -17.72 | -36.26 | -19.29 | -9.62 | -23.43 | -46.18 | -26.66 | -15.26 | -48.07 | -53.77 | -61.81 | -16.20 | -270.23 | 143.86 | -18.32 | -28.02 | -49.13 | -54.78 | -26.03 | 5.39 | -162.13 | -38.07 | -26.59 | -11.96 | 0.37 | -110.13 | 0.10 | 4.01 | 22.27 | 0.97 | -1.81 | -24.75 | |
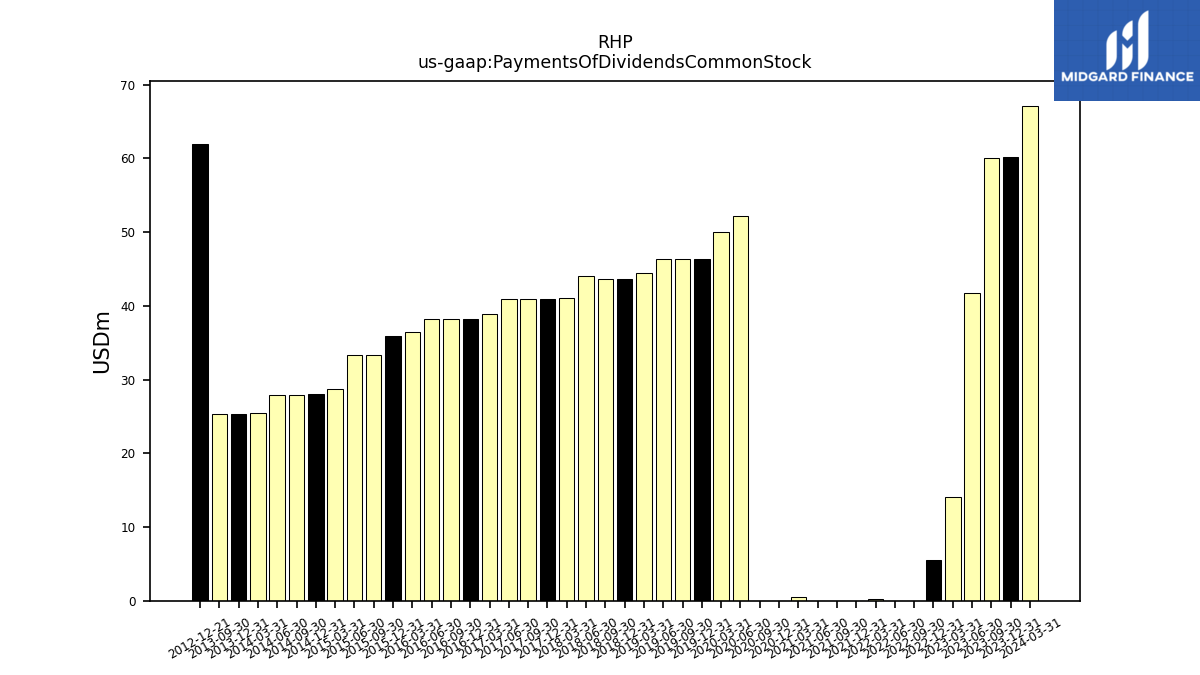
| Payments Of Dividends Common Stock | 60.14 | 60.12 | 41.74 | 14.01 | 5.56 | 0.01 | 0.01 | 0.28 | 0.00 | 0.00 | 0.01 | 0.49 | 0.01 | 0.01 | 52.24 | 50.08 | 46.31 | 46.31 | 46.30 | 44.42 | 43.65 | 43.66 | 44.11 | 41.00 | 40.97 | 40.95 | 40.89 | 38.90 | 38.26 | 38.25 | 38.22 | 36.43 | 35.90 | 33.33 | 33.31 | 28.76 | 28.06 | 27.96 | 27.93 | 25.46 | 25.26 | 25.34 | NA | NA | NA | NA | NA | NA | NA | NA | NA | NA | NA | NA | NA | NA |
| 2023-12-31 | 2023-09-30 | 2023-06-30 | 2023-03-31 | 2022-12-31 | 2022-09-30 | 2022-06-30 | 2022-03-31 | 2021-12-31 | 2021-09-30 | 2021-06-30 | 2021-03-31 | 2020-12-31 | 2020-09-30 | 2020-06-30 | 2020-03-31 | 2019-12-31 | 2019-09-30 | 2019-06-30 | 2019-03-31 | 2018-12-31 | 2018-09-30 | 2018-06-30 | 2018-03-31 | 2017-12-31 | 2017-09-30 | 2017-06-30 | 2017-03-31 | 2016-12-31 | 2016-09-30 | 2016-06-30 | 2016-03-31 | 2015-12-31 | 2015-09-30 | 2015-06-30 | 2015-03-31 | 2014-12-31 | 2014-09-30 | 2014-06-30 | 2014-03-31 | 2013-12-31 | 2013-09-30 | 2013-06-30 | 2013-03-31 | 2012-12-31 | 2012-09-30 | 2012-06-30 | 2012-03-31 | 2011-12-31 | 2011-09-30 | 2011-06-30 | 2011-03-31 | 2010-12-31 | 2010-09-30 | 2010-06-30 | 2010-03-31 | ||
|---|---|---|---|---|---|---|---|---|---|---|---|---|---|---|---|---|---|---|---|---|---|---|---|---|---|---|---|---|---|---|---|---|---|---|---|---|---|---|---|---|---|---|---|---|---|---|---|---|---|---|---|---|---|---|---|---|---|
| Revenues | 633.06 | 528.51 | 504.84 | 491.72 | 568.88 | 467.75 | 470.20 | 299.13 | 377.43 | 306.91 | 170.86 | 84.17 | 126.52 | 70.25 | 14.68 | 313.03 | 446.29 | 379.79 | 407.72 | 370.77 | 360.56 | 292.25 | 333.93 | 288.37 | 345.18 | 264.72 | 298.78 | 276.04 | 319.77 | 271.72 | 296.21 | 261.50 | 312.12 | 252.82 | 274.04 | 253.15 | 291.61 | 245.01 | 257.91 | 246.45 | 266.07 | 221.20 | 245.18 | 222.11 | 266.32 | 228.13 | 253.23 | 238.91 | 269.40 | 225.23 | 236.78 | 220.74 | 213.33 | 158.27 | 183.88 | 214.48 | |
| Revenue From Contract With Customer Excluding Assessed Tax | 633.06 | 528.51 | 504.84 | 491.72 | 568.88 | 467.75 | 470.20 | 299.13 | 377.43 | 306.91 | 170.86 | 84.17 | 126.52 | 70.25 | 14.68 | 313.03 | 446.29 | 379.79 | 407.72 | 370.77 | 360.56 | 292.25 | 333.93 | 288.37 | 345.18 | 264.72 | 298.78 | 276.04 | 319.77 | 271.72 | 296.21 | 261.50 | 312.12 | 252.82 | 274.04 | 253.15 | 291.61 | 245.01 | 257.91 | 246.45 | 266.07 | 221.20 | 245.18 | 222.11 | 266.32 | 228.13 | 253.23 | 238.91 | 269.40 | 225.23 | 236.78 | 220.74 | 213.33 | 158.27 | 183.88 | 214.48 | |
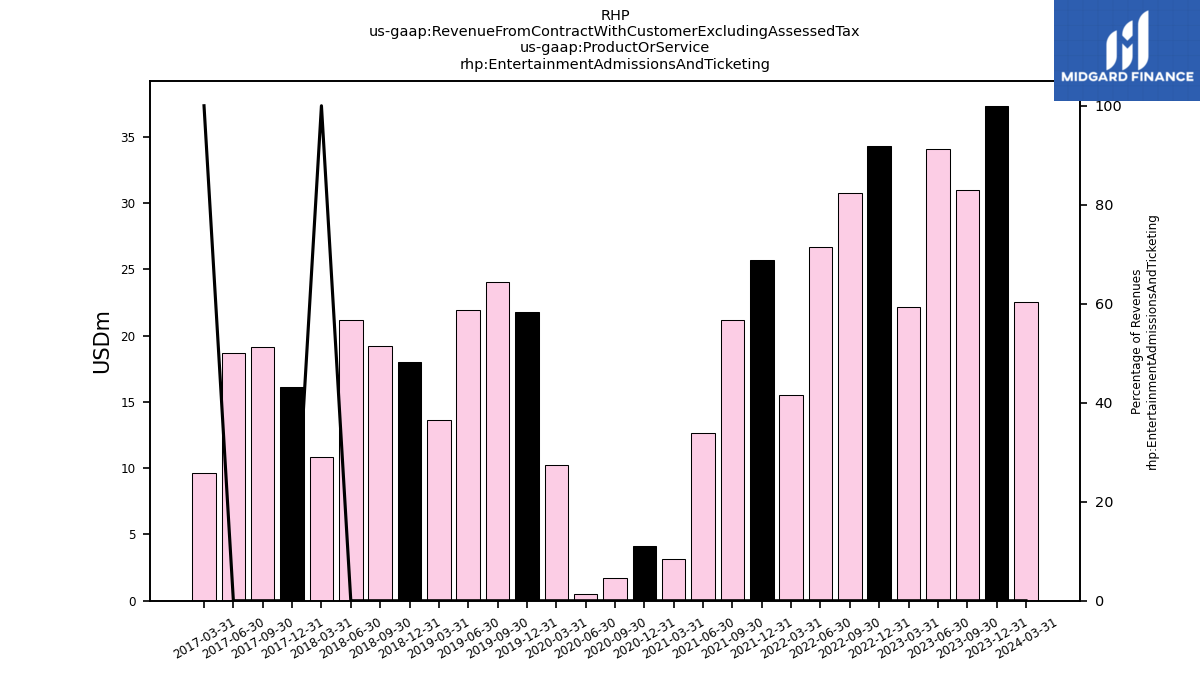
| Entertainment Admissions And Ticketing | 37.36 | 31.03 | 34.10 | 22.16 | 34.29 | 30.80 | 26.73 | 15.55 | 25.75 | 21.21 | 12.65 | 3.16 | 4.11 | 1.69 | 0.49 | 10.28 | 21.78 | 24.07 | 21.96 | 13.62 | 18.01 | 19.21 | 21.21 | 10.86 | 16.12 | 19.17 | 18.68 | 9.62 | NA | NA | NA | NA | NA | NA | NA | NA | NA | NA | NA | NA | NA | NA | NA | NA | NA | NA | NA | NA | NA | NA | NA | NA | NA | NA | NA | NA | |
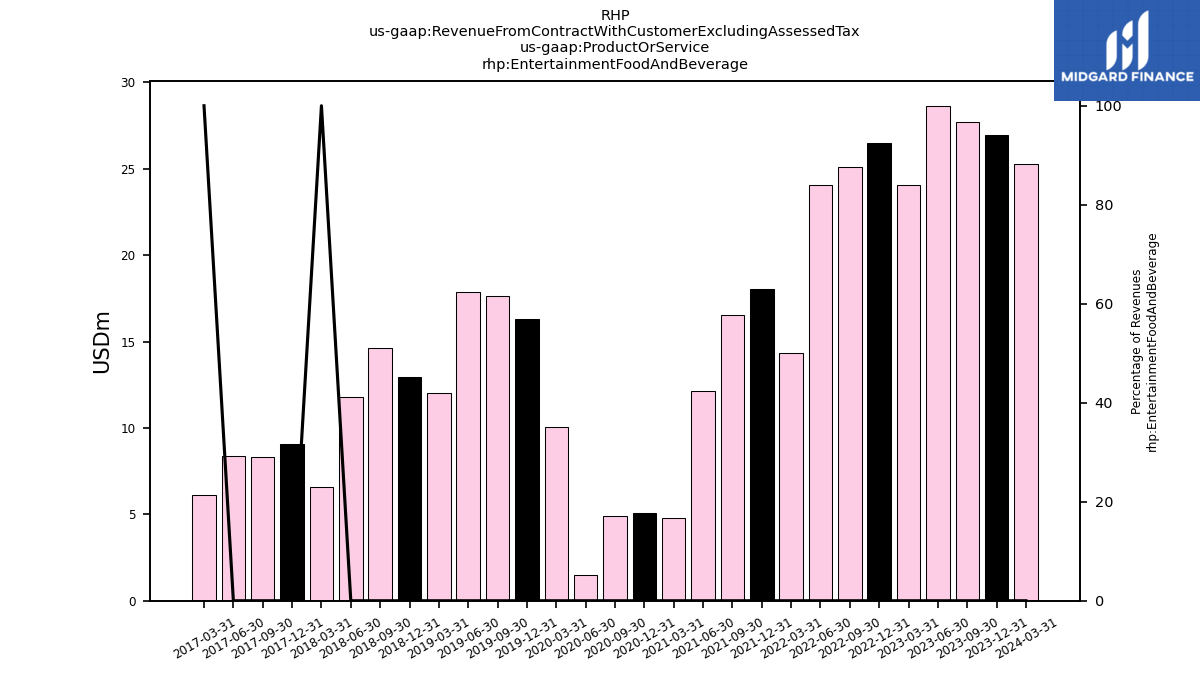
| Entertainment Food And Beverage | 26.92 | 27.71 | 28.64 | 24.07 | 26.46 | 25.07 | 24.04 | 14.36 | 18.05 | 16.51 | 12.16 | 4.80 | 5.08 | 4.90 | 1.50 | 10.03 | 16.31 | 17.62 | 17.85 | 12.04 | 12.96 | 14.61 | 11.81 | 6.58 | 9.08 | 8.30 | 8.39 | 6.12 | NA | NA | NA | NA | NA | NA | NA | NA | NA | NA | NA | NA | NA | NA | NA | NA | NA | NA | NA | NA | NA | NA | NA | NA | NA | NA | NA | NA | |
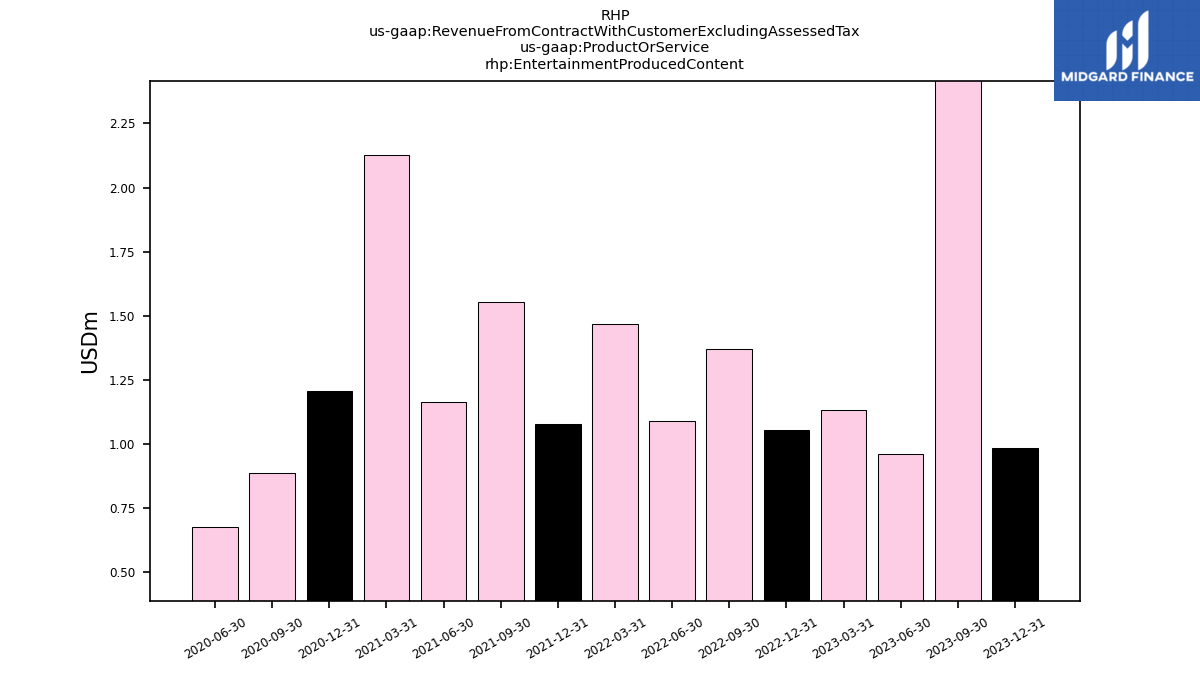
| Entertainment Produced Content | 0.98 | 2.69 | 0.96 | 1.13 | 1.05 | 1.37 | 1.09 | 1.47 | 1.08 | 1.55 | 1.17 | 2.13 | 1.21 | 0.89 | 0.68 | NA | NA | NA | NA | NA | NA | NA | NA | NA | NA | NA | NA | NA | NA | NA | NA | NA | NA | NA | NA | NA | NA | NA | NA | NA | NA | NA | NA | NA | NA | NA | NA | NA | NA | NA | NA | NA | NA | NA | NA | NA | |
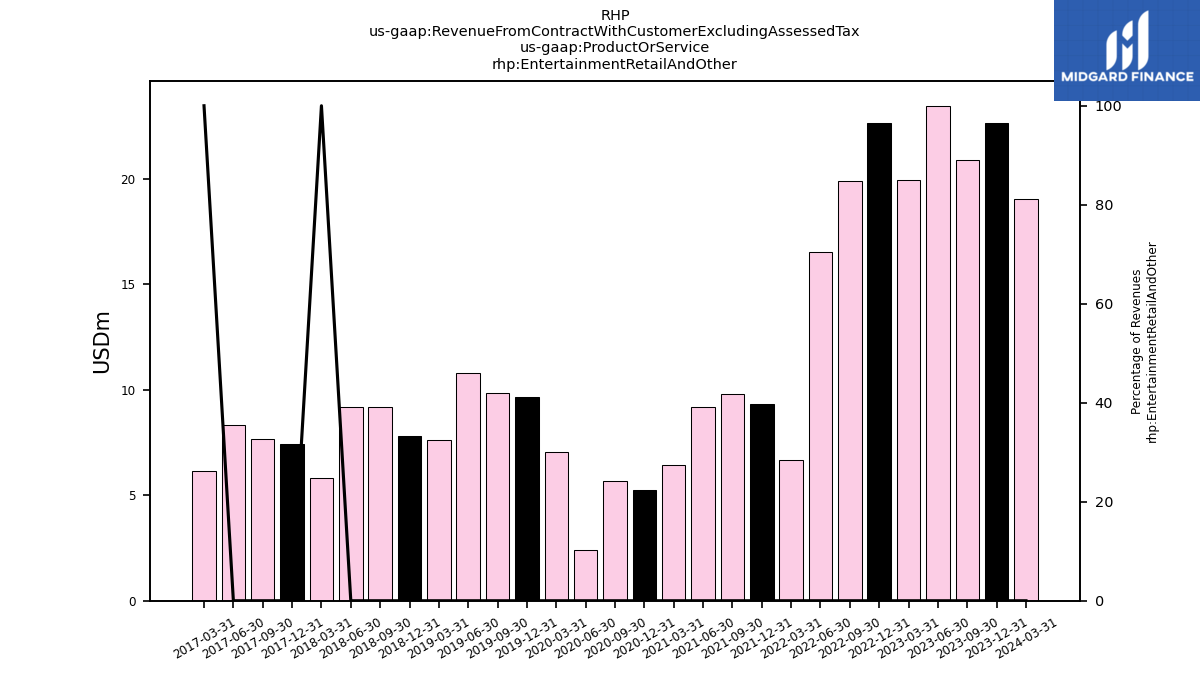
| Entertainment Retail And Other | 22.64 | 20.89 | 23.45 | 19.92 | 22.61 | 19.90 | 16.54 | 6.65 | 9.32 | 9.78 | 9.19 | 6.42 | 5.24 | 5.68 | 2.39 | 7.05 | 9.65 | 9.84 | 10.78 | 7.60 | 7.80 | 9.19 | 9.16 | 5.82 | 7.43 | 7.66 | 8.33 | 6.14 | NA | NA | NA | NA | NA | NA | NA | NA | NA | NA | NA | NA | NA | NA | NA | NA | NA | NA | NA | NA | NA | NA | NA | NA | NA | NA | NA | NA | |
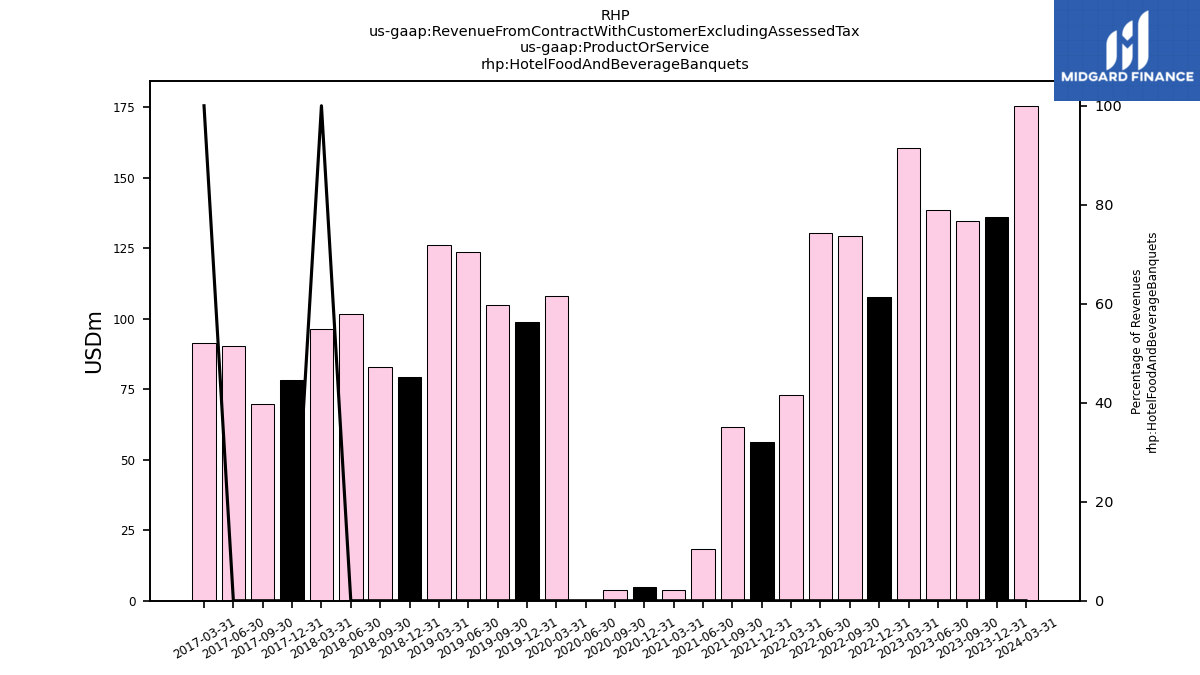
| Hotel Food And Beverage Banquets | 136.14 | 134.50 | 138.66 | 160.50 | 107.58 | 129.45 | 130.51 | 72.82 | 56.30 | 61.67 | 18.25 | 3.97 | 4.72 | 3.65 | 0.08 | 108.17 | 98.93 | 104.96 | 123.52 | 126.20 | 79.45 | 82.74 | 101.72 | 96.27 | 78.29 | 69.82 | 90.34 | 91.20 | NA | NA | NA | NA | NA | NA | NA | NA | NA | NA | NA | NA | NA | NA | NA | NA | NA | NA | NA | NA | NA | NA | NA | NA | NA | NA | NA | NA | |
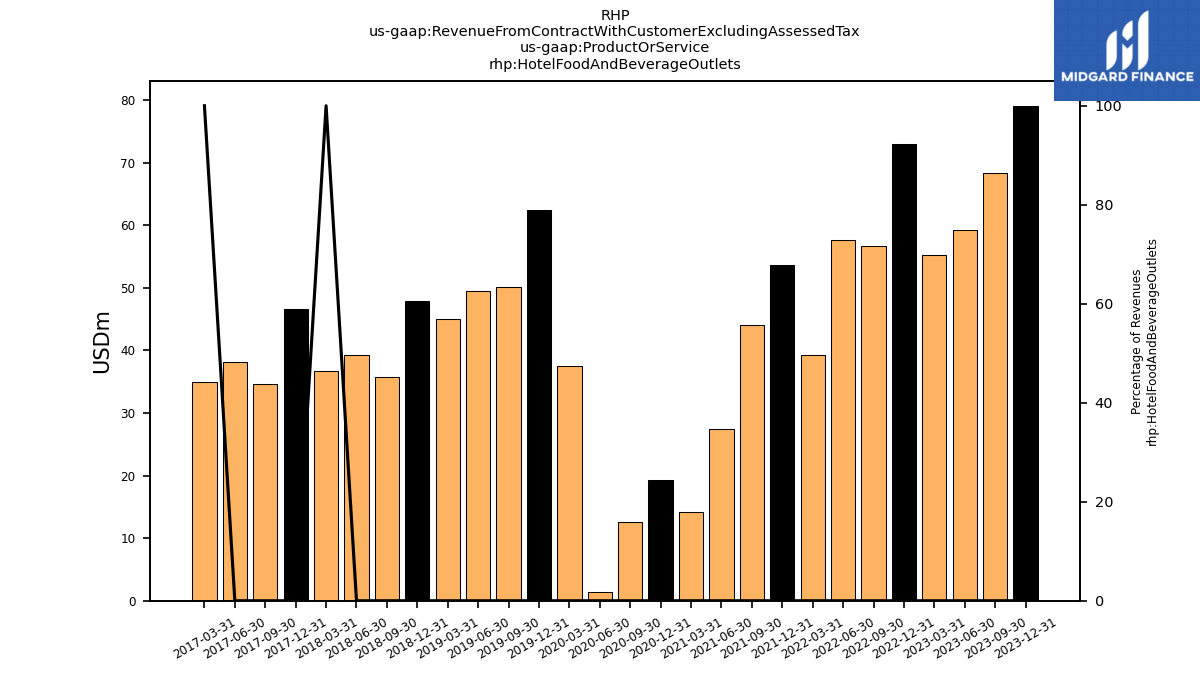
| Hotel Food And Beverage Outlets | 79.09 | 68.35 | 59.25 | 55.30 | 73.04 | 56.74 | 57.57 | 39.29 | 53.59 | 44.13 | 27.37 | 14.21 | 19.34 | 12.56 | 1.43 | 37.58 | 62.49 | 50.21 | 49.51 | 44.95 | 47.90 | 35.75 | 39.33 | 36.67 | 46.60 | 34.62 | 38.10 | 34.97 | NA | NA | NA | NA | NA | NA | NA | NA | NA | NA | NA | NA | NA | NA | NA | NA | NA | NA | NA | NA | NA | NA | NA | NA | NA | NA | NA | NA | |
| Hotel Group Rooms | 106.20 | 115.63 | 120.33 | 120.51 | 91.48 | 100.42 | 110.46 | 62.48 | 48.45 | 58.36 | 20.08 | 4.51 | 3.00 | 2.75 | 0.15 | 82.71 | 85.81 | 93.17 | 106.07 | 102.69 | 70.56 | 69.26 | 89.33 | 83.22 | 66.29 | 66.76 | 80.49 | 80.75 | NA | NA | NA | NA | NA | NA | NA | NA | NA | NA | NA | NA | NA | NA | NA | NA | NA | NA | NA | NA | NA | NA | NA | NA | NA | NA | NA | NA | |
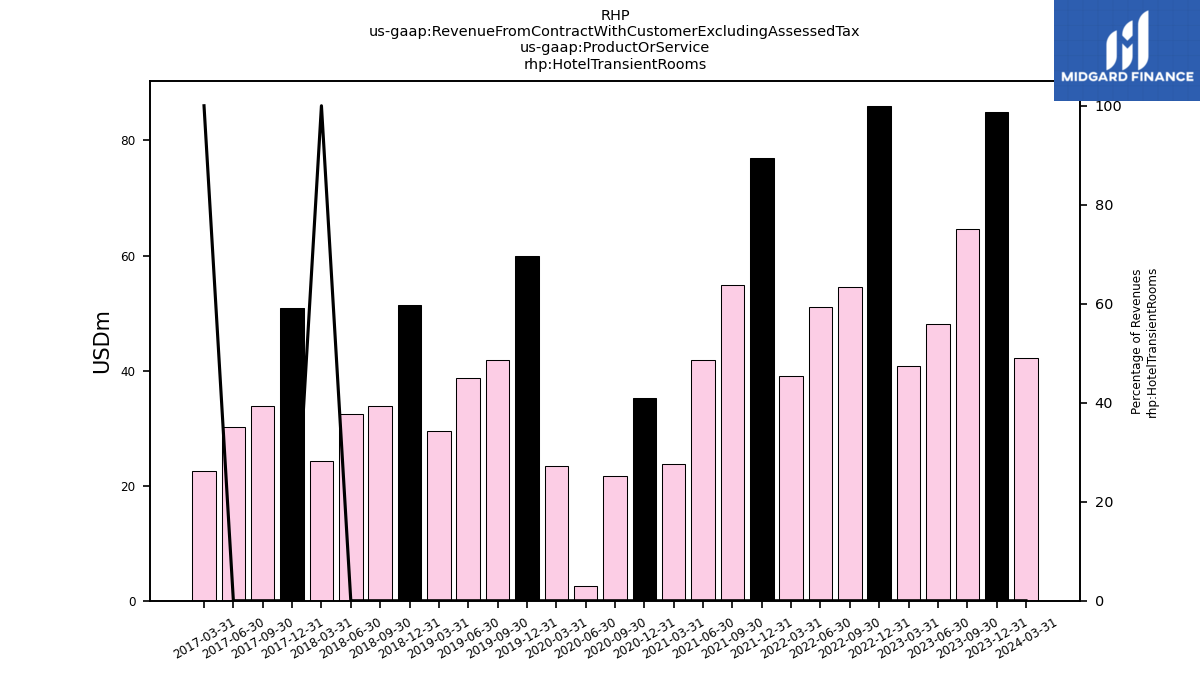
| Hotel Transient Rooms | 84.89 | 64.68 | 48.16 | 40.74 | 86.03 | 54.52 | 51.04 | 39.12 | 77.03 | 54.83 | 41.89 | 23.72 | 35.31 | 21.74 | 2.65 | 23.42 | 59.89 | 41.78 | 38.64 | 29.52 | 51.32 | 33.92 | 32.42 | 24.35 | 50.90 | 33.78 | 30.19 | 22.62 | NA | NA | NA | NA | NA | NA | NA | NA | NA | NA | NA | NA | NA | NA | NA | NA | NA | NA | NA | NA | NA | NA | NA | NA | NA | NA | NA | NA | |
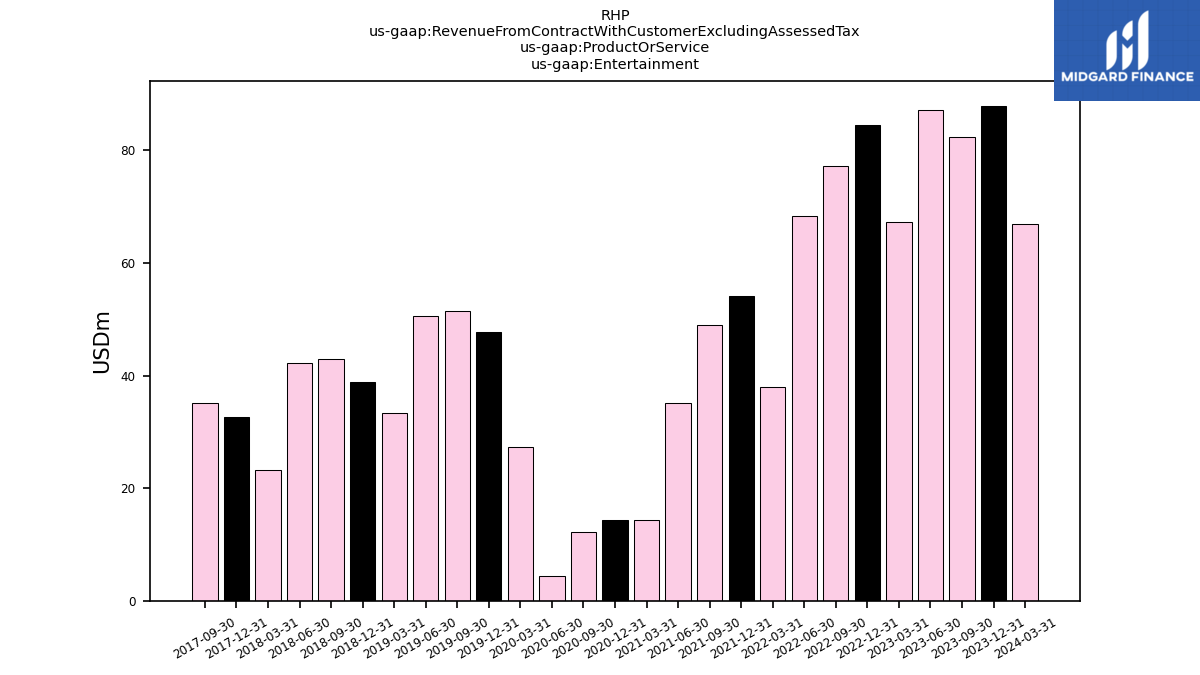
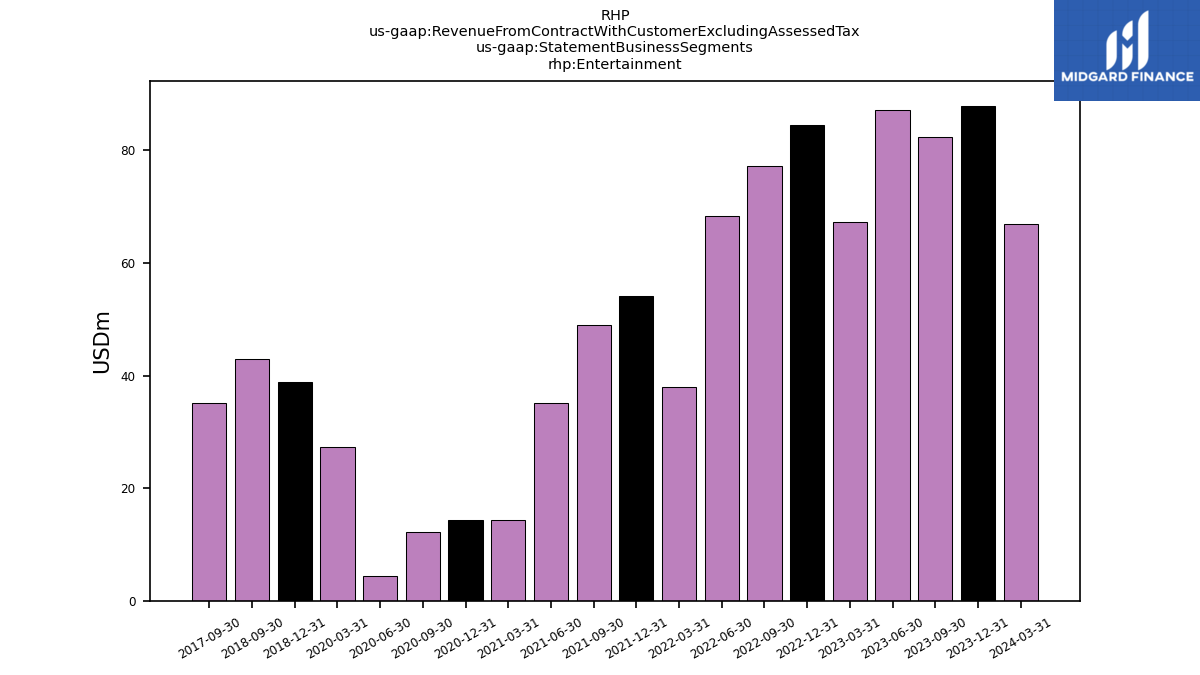
| Entertainment | 87.91 | 82.31 | 87.16 | 67.28 | 84.42 | 77.15 | 68.40 | 38.02 | 54.19 | 49.05 | 35.17 | 14.37 | 14.42 | 12.27 | 4.38 | 27.36 | 47.73 | 51.53 | 50.59 | 33.27 | 38.77 | 43.01 | 42.18 | 23.26 | 32.63 | 35.13 | NA | NA | NA | NA | NA | NA | NA | NA | NA | NA | NA | NA | NA | NA | NA | NA | NA | NA | NA | NA | NA | NA | NA | NA | NA | NA | NA | NA | NA | NA | |
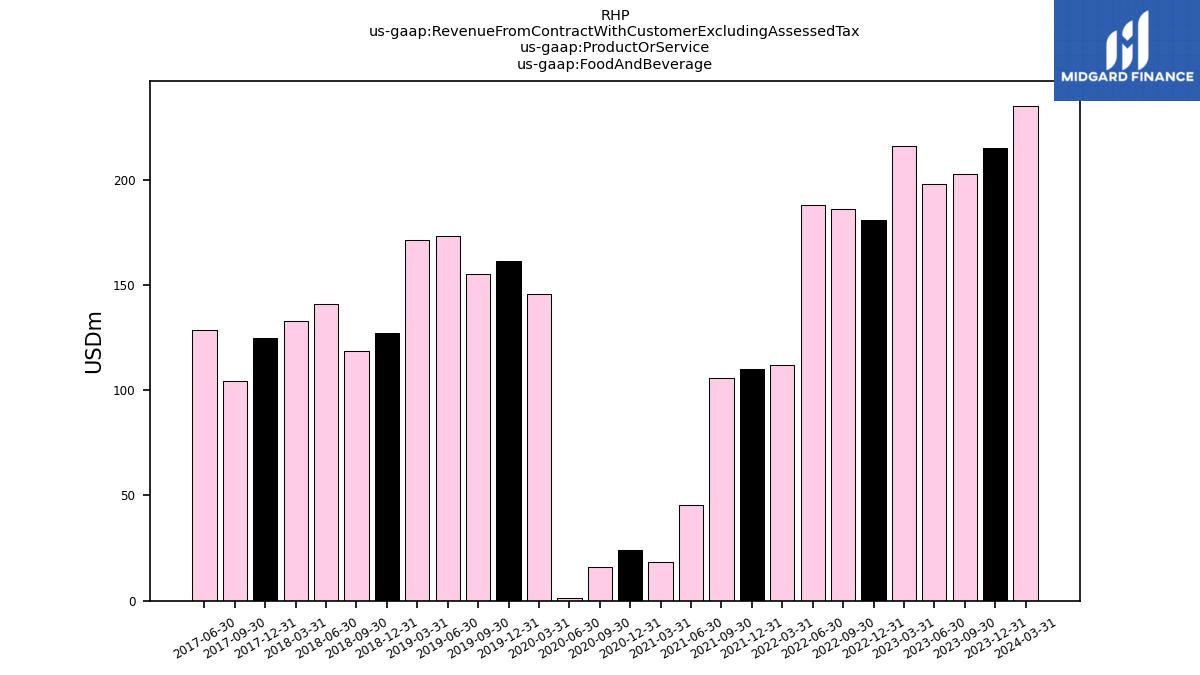
| Food And Beverage | 215.23 | 202.85 | 197.91 | 215.80 | 180.62 | 186.19 | 188.08 | 112.12 | 109.89 | 105.80 | 45.62 | 18.18 | 24.06 | 16.22 | 1.51 | 145.75 | 161.42 | 155.17 | 173.03 | 171.14 | 127.36 | 118.50 | 141.05 | 132.94 | 124.90 | 104.44 | 128.44 | NA | NA | NA | NA | NA | NA | NA | NA | NA | NA | NA | NA | NA | NA | NA | NA | NA | NA | NA | NA | NA | NA | NA | NA | NA | NA | NA | NA | NA | |
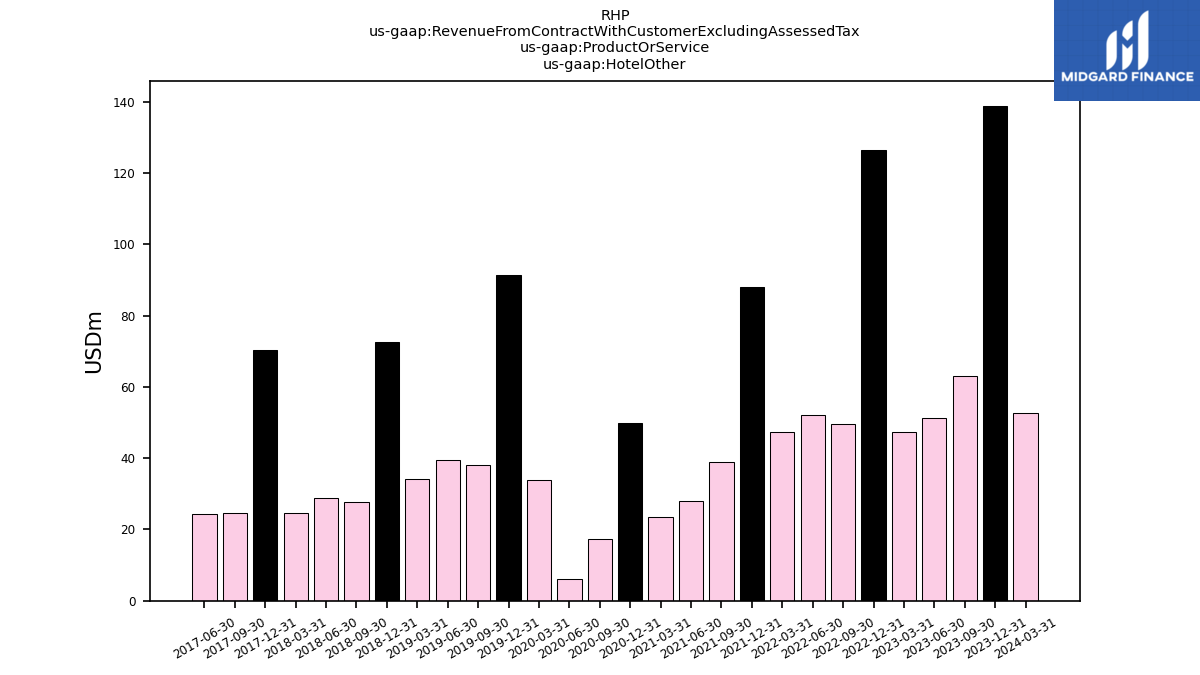
| Hotel Other | 138.84 | 63.04 | 51.28 | 47.38 | 126.33 | 49.47 | 52.21 | 47.40 | 87.86 | 38.86 | 28.10 | 23.40 | 49.73 | 17.27 | 5.99 | 33.79 | 91.43 | 38.13 | 39.40 | 34.16 | 72.56 | 27.56 | 28.96 | 24.61 | 70.45 | 24.62 | 24.26 | NA | NA | NA | NA | NA | NA | NA | NA | NA | NA | NA | NA | NA | NA | NA | NA | NA | NA | NA | NA | NA | NA | NA | NA | NA | NA | NA | NA | NA | |
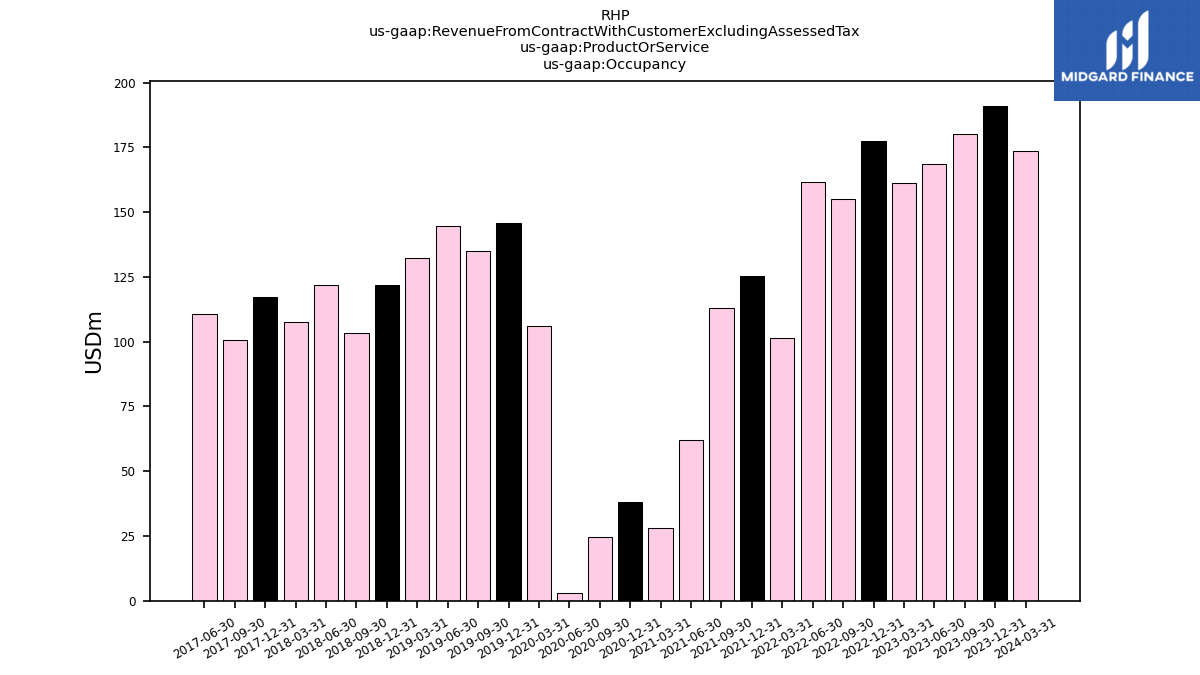
| Occupancy | 191.09 | 180.31 | 168.49 | 161.25 | 177.50 | 154.94 | 161.51 | 101.59 | 125.48 | 113.19 | 61.97 | 28.23 | 38.30 | 24.49 | 2.80 | 106.13 | 145.70 | 134.95 | 144.70 | 132.21 | 121.88 | 103.18 | 121.75 | 107.56 | 117.19 | 100.53 | 110.67 | NA | NA | NA | NA | NA | NA | NA | NA | NA | NA | NA | NA | NA | NA | NA | NA | NA | NA | NA | NA | NA | NA | NA | NA | NA | NA | NA | NA | NA | |
| Entertainment | 87.91 | 82.31 | 87.16 | 67.28 | 84.42 | 77.15 | 68.40 | 38.02 | 54.19 | 49.05 | 35.17 | 14.37 | 14.42 | 12.27 | 4.38 | 27.36 | NA | NA | NA | NA | 38.77 | 43.01 | NA | NA | NA | 35.13 | NA | NA | NA | NA | NA | NA | NA | NA | NA | NA | NA | NA | NA | NA | NA | NA | NA | NA | NA | NA | NA | NA | NA | NA | NA | NA | NA | NA | NA | NA | |
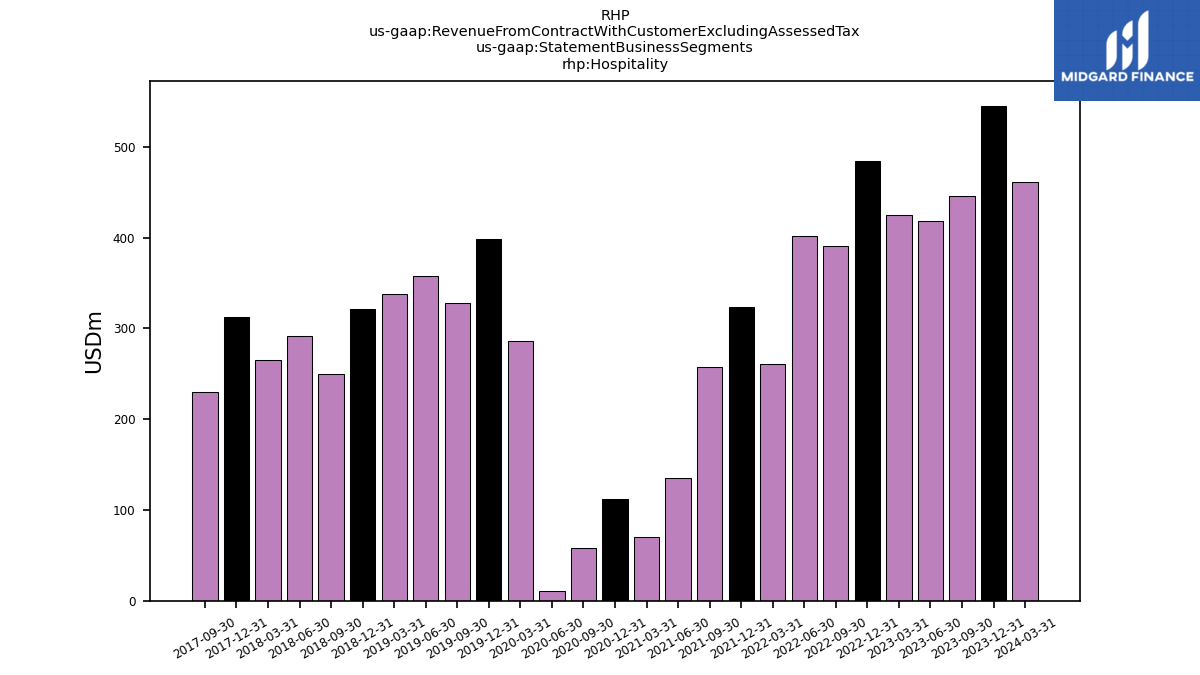
| Hospitality | 545.16 | 446.20 | 417.69 | 424.44 | 484.46 | 390.60 | 401.80 | 261.11 | 323.24 | 257.85 | 135.69 | 69.80 | 112.09 | 57.98 | 10.30 | 285.67 | 398.55 | 328.26 | 357.13 | 337.51 | 321.80 | 249.24 | 291.76 | 265.11 | 312.54 | 229.59 | NA | NA | NA | NA | NA | NA | NA | NA | NA | NA | NA | NA | NA | NA | NA | NA | NA | NA | NA | NA | NA | NA | NA | NA | NA | NA | NA | NA | NA | NA |