
| 2023-12-31 | 2023-09-30 | 2023-06-30 | 2023-03-31 | 2022-12-31 | 2022-09-30 | 2022-06-30 | 2022-03-31 | 2021-12-31 | 2021-09-30 | 2021-06-30 | 2021-03-31 | 2020-06-30 | 2020-03-31 | 2019-12-31 | 2019-09-30 | 2019-06-30 | 2019-03-31 | 2018-12-31 | 2018-09-30 | 2018-06-30 | 2018-03-31 | 2017-12-31 | 2017-09-30 | 2017-06-30 | 2017-03-31 | ||
|---|---|---|---|---|---|---|---|---|---|---|---|---|---|---|---|---|---|---|---|---|---|---|---|---|---|---|---|
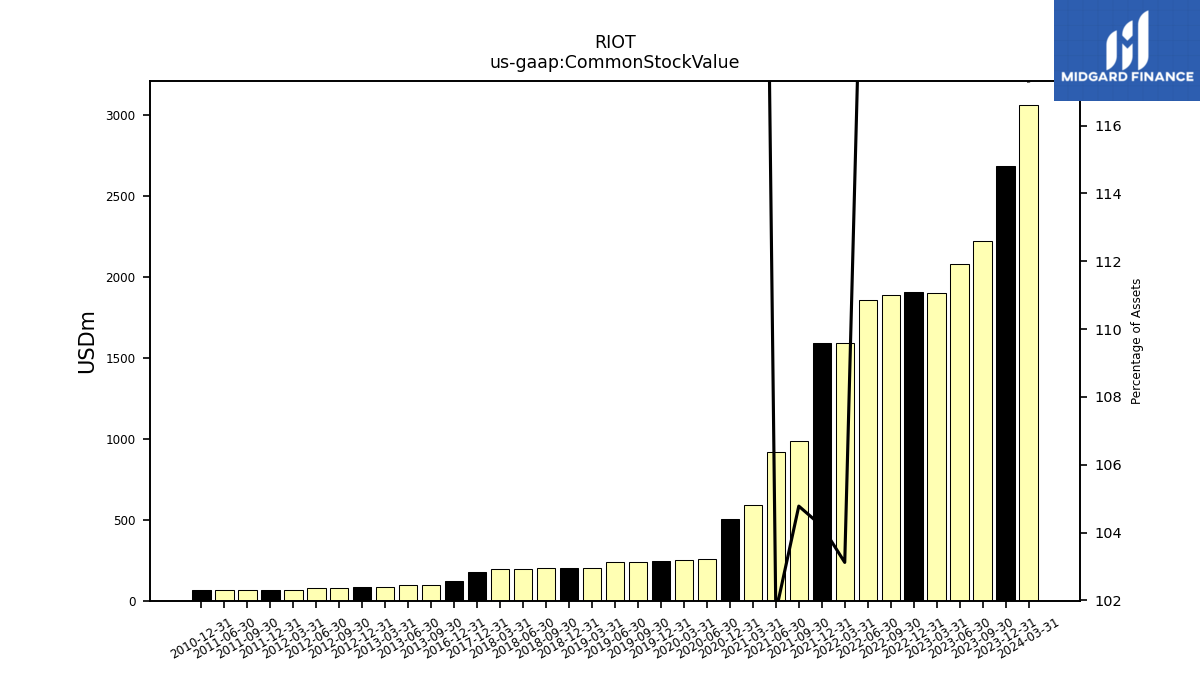
| Common Stock Value | 2687.69 | 2225.74 | 2080.63 | 1904.17 | 1907.78 | 1890.98 | 1857.11 | 1589.89 | 1595.15 | 988.69 | 917.20 | 590.19 | 259.90 | 254.73 | 243.46 | 241.97 | 238.08 | 203.41 | 202.92 | 201.79 | 196.40 | 193.34 | 180.39 | NA | NA | NA | |
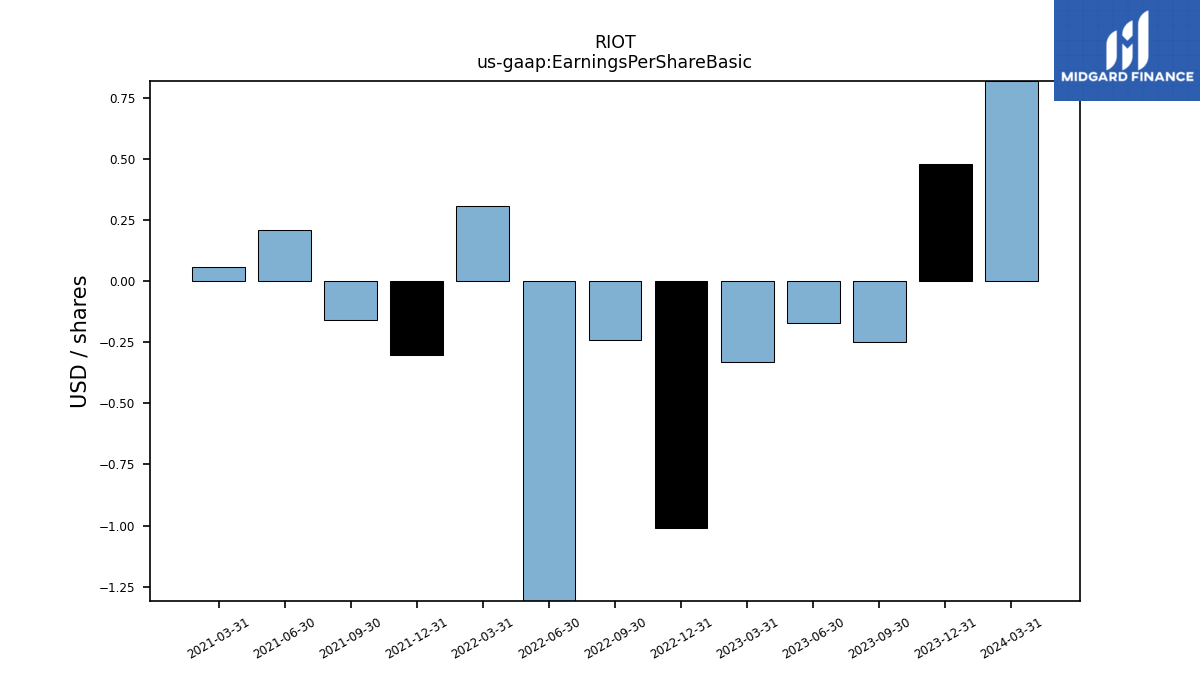
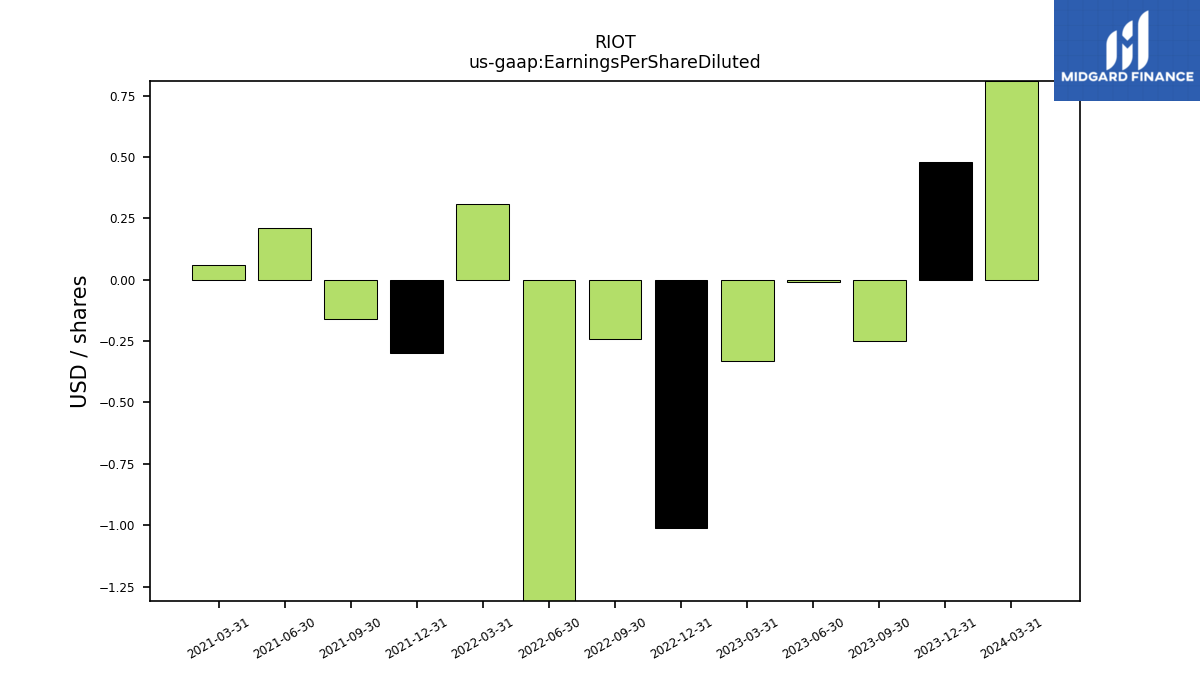
| Earnings Per Share Basic | 0.48 | -0.25 | -0.17 | -0.33 | -1.01 | -0.24 | -2.71 | 0.31 | -0.30 | -0.16 | 0.21 | 0.06 | NA | NA | NA | NA | NA | NA | NA | NA | NA | NA | NA | NA | NA | NA | |
| Earnings Per Share Diluted | 0.48 | -0.25 | -0.01 | -0.33 | -1.01 | -0.24 | -2.71 | 0.31 | -0.30 | -0.16 | 0.21 | 0.06 | NA | NA | NA | NA | NA | NA | NA | NA | NA | NA | NA | NA | NA | NA |
| 2023-12-31 | 2023-09-30 | 2023-06-30 | 2023-03-31 | 2022-12-31 | 2022-09-30 | 2022-06-30 | 2022-03-31 | 2021-12-31 | 2021-09-30 | 2021-06-30 | 2021-03-31 | 2020-06-30 | 2020-03-31 | 2019-12-31 | 2019-09-30 | 2019-06-30 | 2019-03-31 | 2018-12-31 | 2018-09-30 | 2018-06-30 | 2018-03-31 | 2017-12-31 | 2017-09-30 | 2017-06-30 | 2017-03-31 | ||
|---|---|---|---|---|---|---|---|---|---|---|---|---|---|---|---|---|---|---|---|---|---|---|---|---|---|---|---|
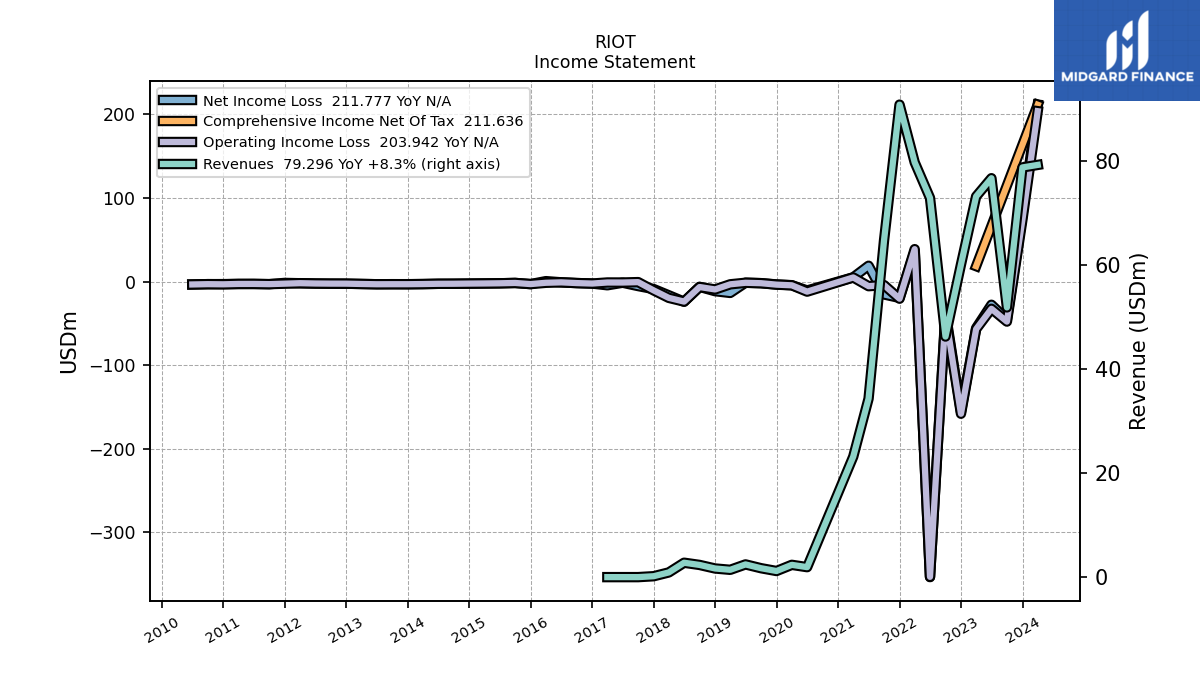
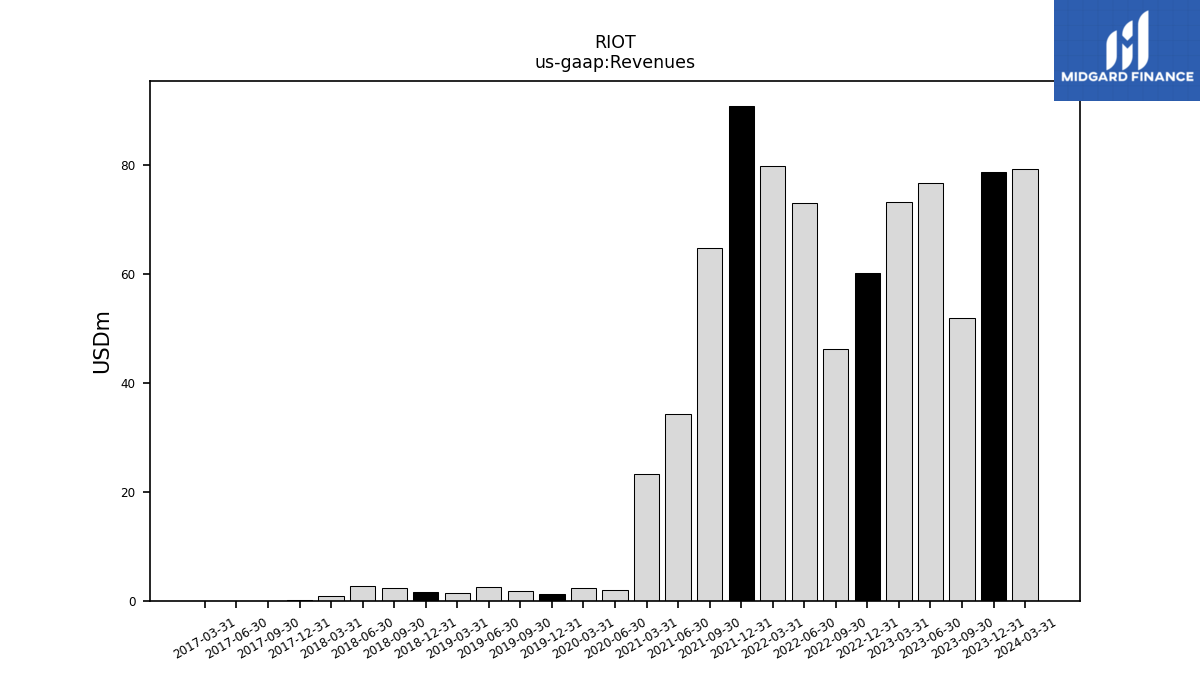
| Revenues | 78.81 | 51.89 | 76.74 | 73.24 | 60.15 | 46.29 | 72.95 | 79.79 | 90.89 | 64.81 | 34.35 | 23.20 | 1.94 | 2.39 | 1.20 | 1.74 | 2.47 | 1.43 | 1.69 | 2.37 | 2.79 | 0.93 | 0.20 | 0.02 | 0.02 | 0.02 | |
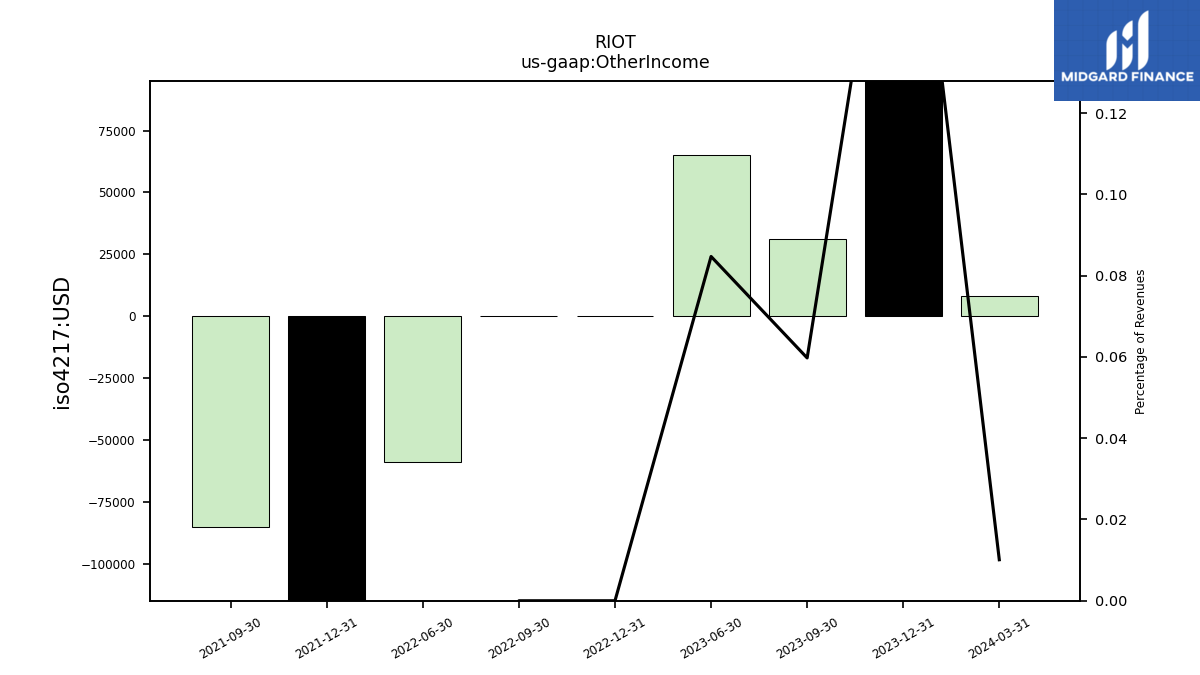
| Other Income | 0.16 | 0.03 | 0.07 | NA | 0.00 | 0.00 | -0.06 | NA | -0.72 | -0.09 | NA | NA | NA | NA | NA | NA | NA | NA | NA | NA | NA | NA | NA | NA | NA | NA | |
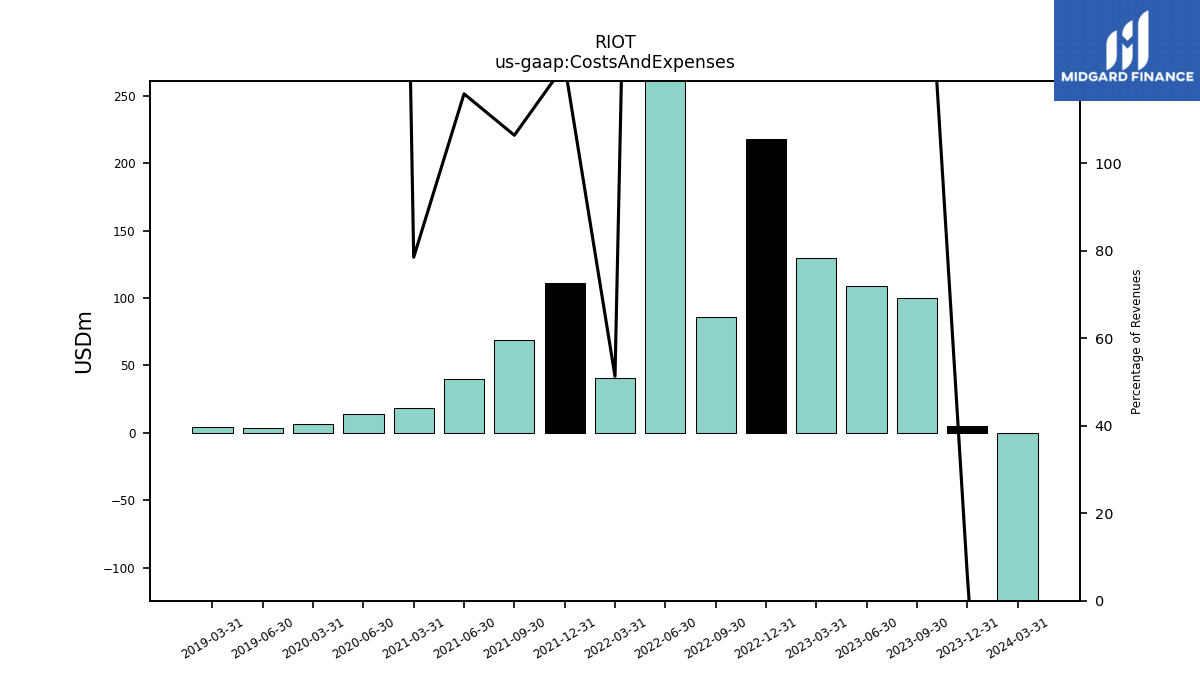
| Costs And Expenses | 4.72 | 99.72 | 109.22 | 130.06 | 218.23 | 86.30 | 426.19 | 40.93 | 111.33 | 68.95 | 39.80 | 18.22 | 13.91 | 6.79 | NA | NA | 3.84 | 4.65 | NA | NA | NA | NA | NA | NA | NA | NA | |
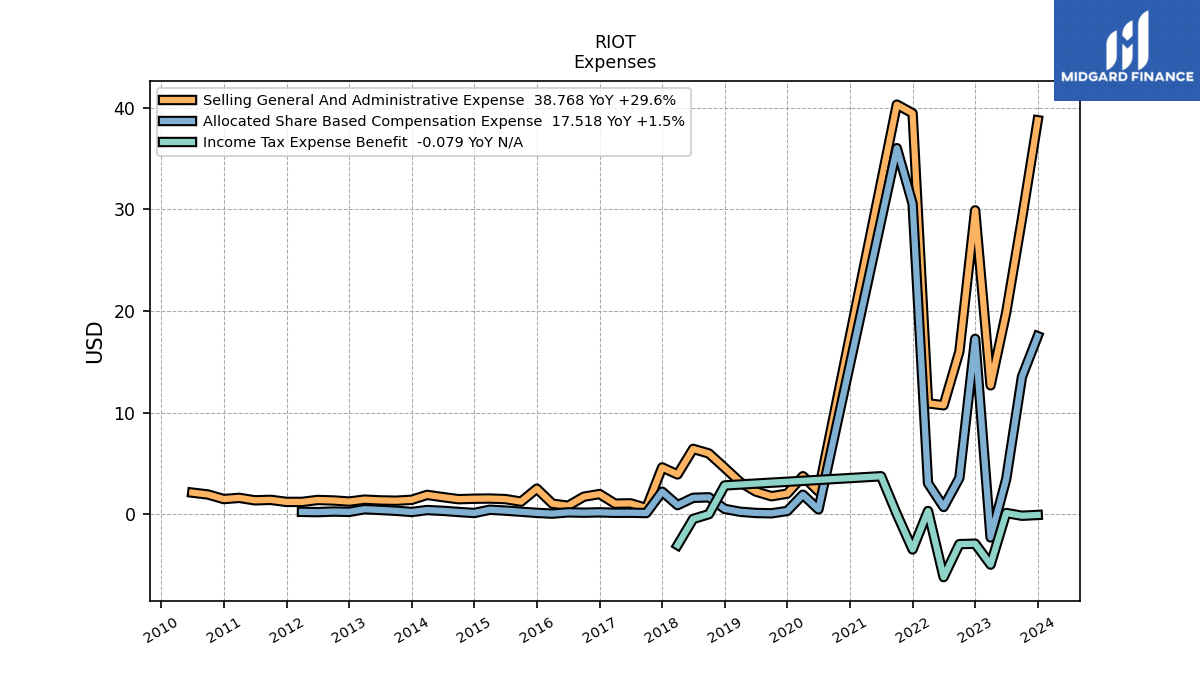
| Selling General And Administrative Expense | 38.77 | 29.07 | 19.84 | 12.68 | 29.90 | 16.00 | 10.71 | 10.91 | 39.46 | 40.31 | NA | NA | 2.23 | 3.73 | 2.02 | 1.76 | 2.23 | 3.15 | 4.56 | 5.97 | 6.42 | 3.91 | 4.60 | 0.60 | 1.06 | 1.03 | |
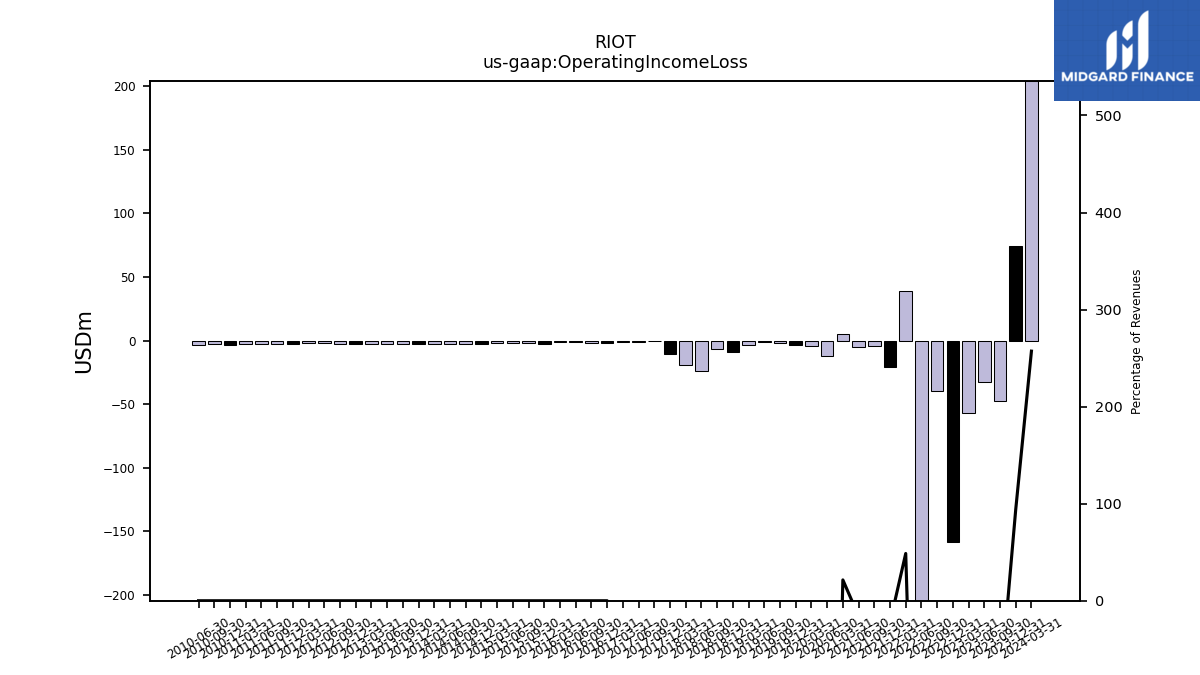
| Operating Income Loss | 74.09 | -47.83 | -32.48 | -56.83 | -158.09 | -40.01 | -353.24 | 38.86 | -20.45 | -4.15 | -5.45 | 4.98 | -11.97 | -4.41 | -3.60 | -1.89 | -1.37 | -3.22 | -9.36 | -6.46 | -23.88 | -19.44 | -10.47 | -0.59 | -1.07 | -1.03 | |
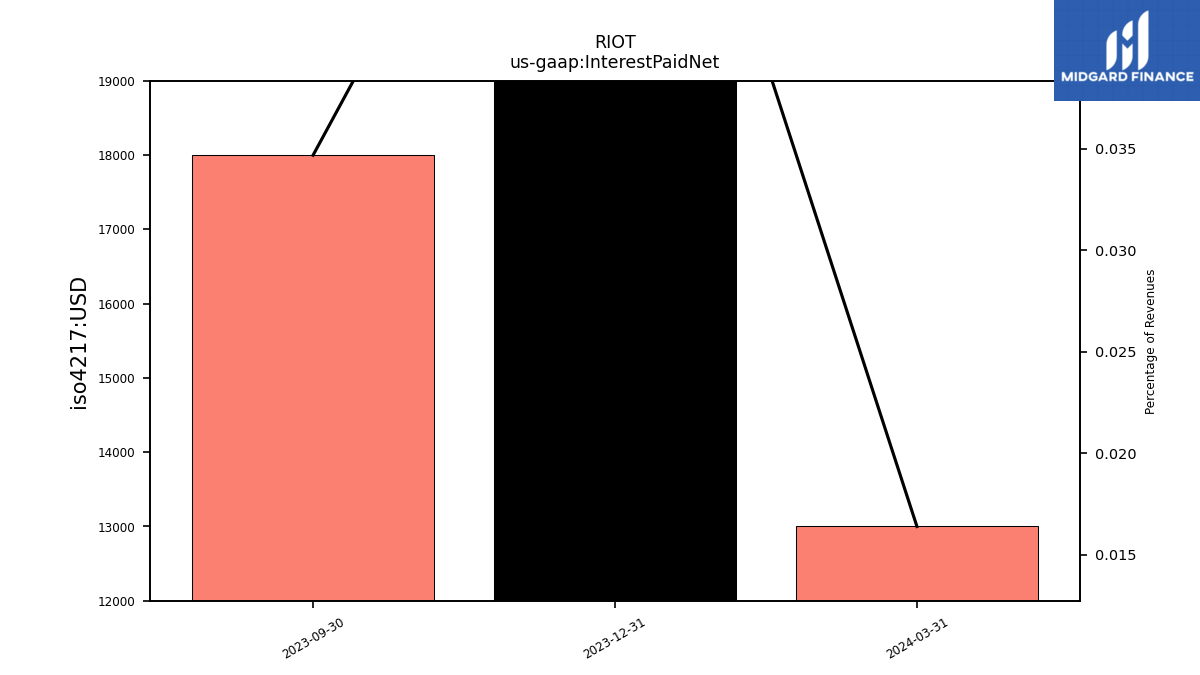
| Interest Paid Net | 0.05 | 0.02 | NA | NA | NA | NA | NA | NA | NA | NA | NA | NA | NA | NA | NA | NA | NA | NA | NA | NA | NA | NA | NA | NA | NA | NA | |
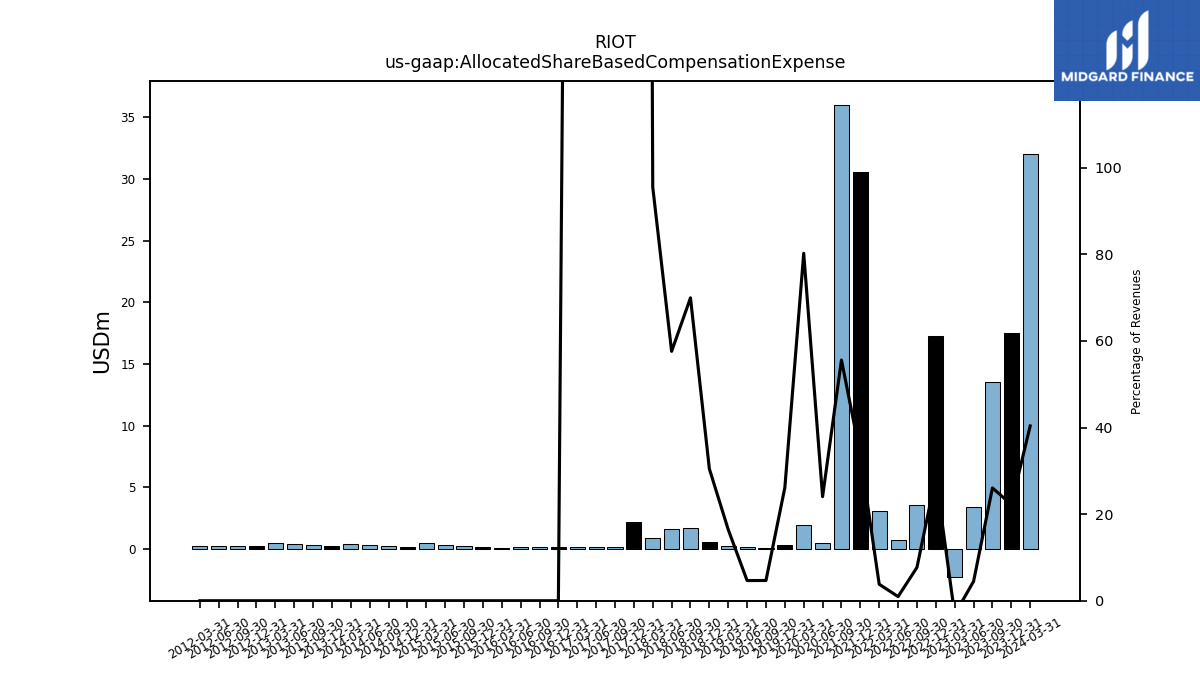
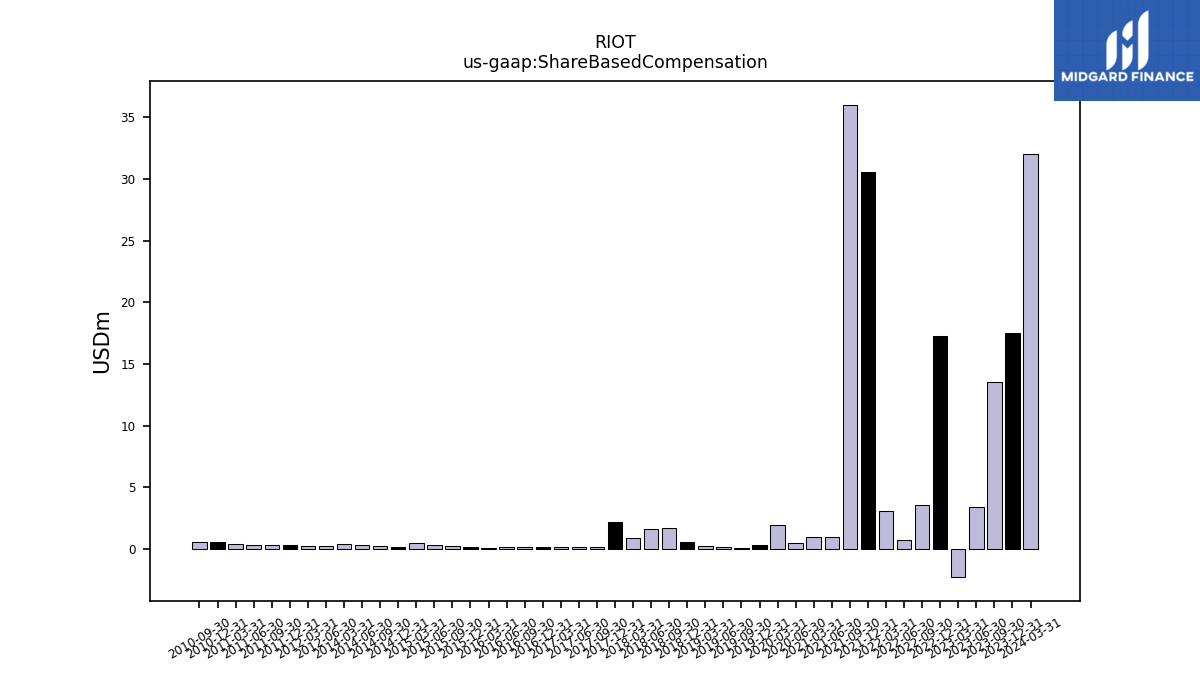
| Allocated Share Based Compensation Expense | 17.52 | 13.52 | 3.43 | -2.30 | 17.25 | 3.56 | 0.70 | 3.04 | 30.56 | 36.02 | NA | NA | 0.47 | 1.91 | 0.31 | 0.08 | 0.12 | 0.24 | 0.51 | 1.66 | 1.61 | 0.88 | 2.21 | 0.11 | 0.14 | 0.13 | |
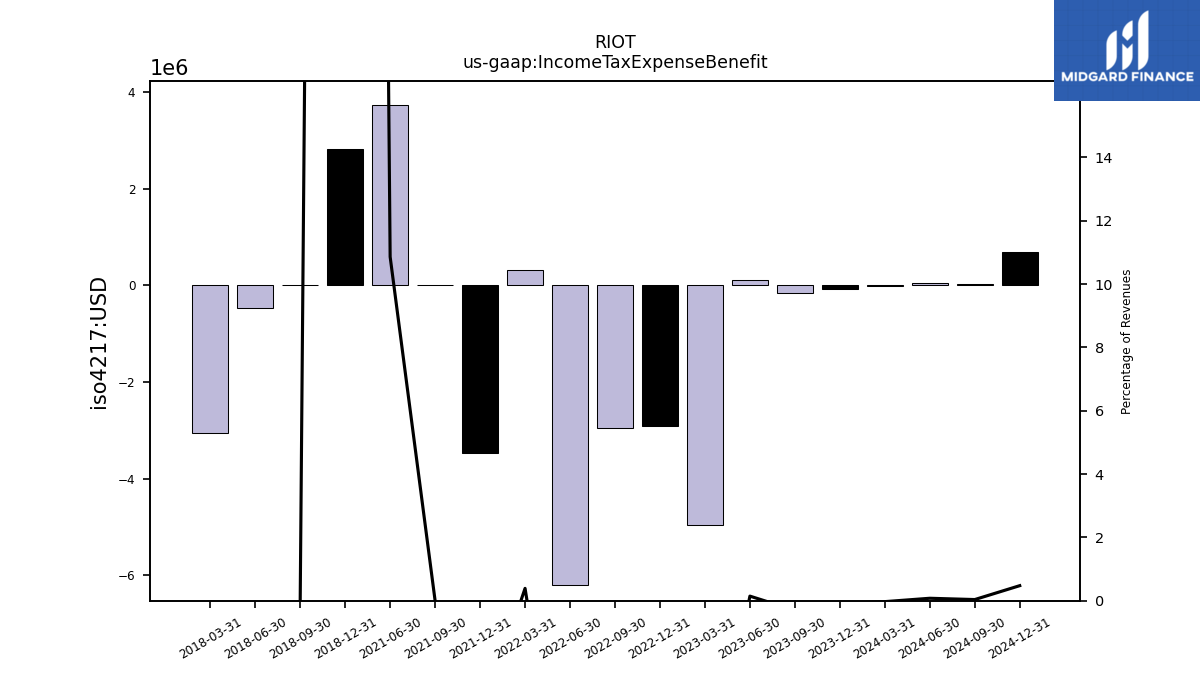
| Income Tax Expense Benefit | -0.08 | -0.16 | 0.11 | -4.97 | -2.91 | -2.95 | -6.20 | 0.31 | -3.48 | 0.00 | 3.73 | NA | NA | NA | NA | NA | NA | NA | 2.83 | 0.00 | -0.47 | -3.05 | NA | NA | NA | NA | |
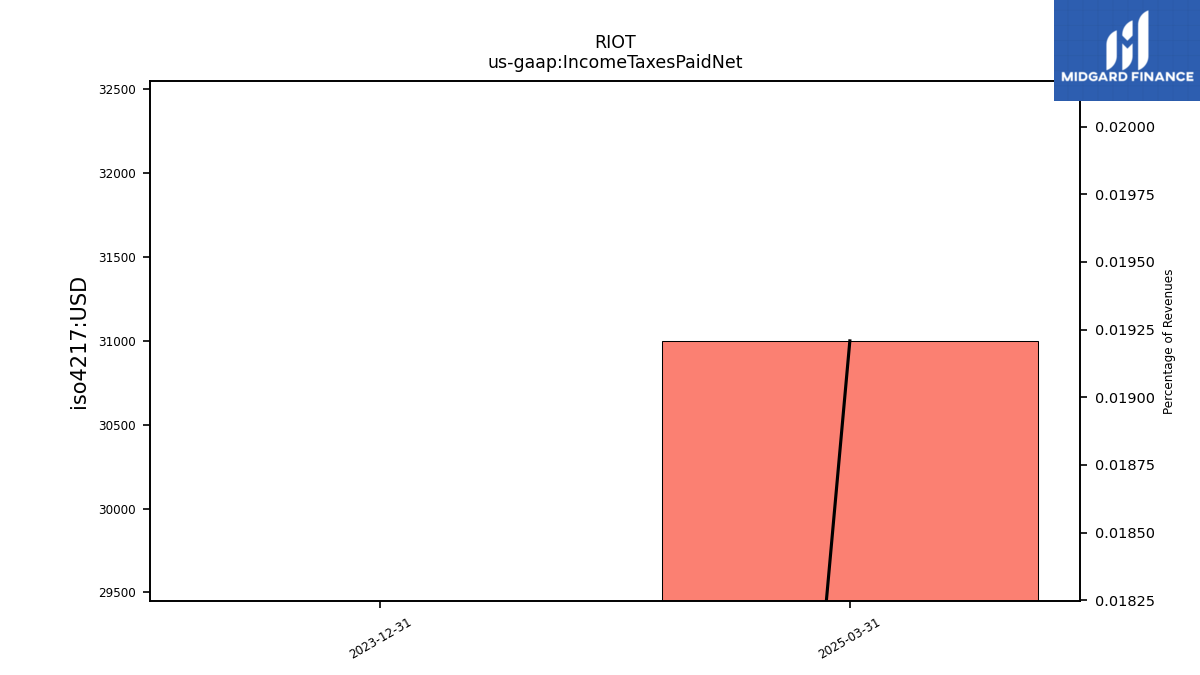
| Income Taxes Paid Net | 0.00 | NA | NA | NA | NA | NA | NA | NA | NA | NA | NA | NA | NA | NA | NA | NA | NA | NA | NA | NA | NA | NA | NA | NA | NA | NA | |
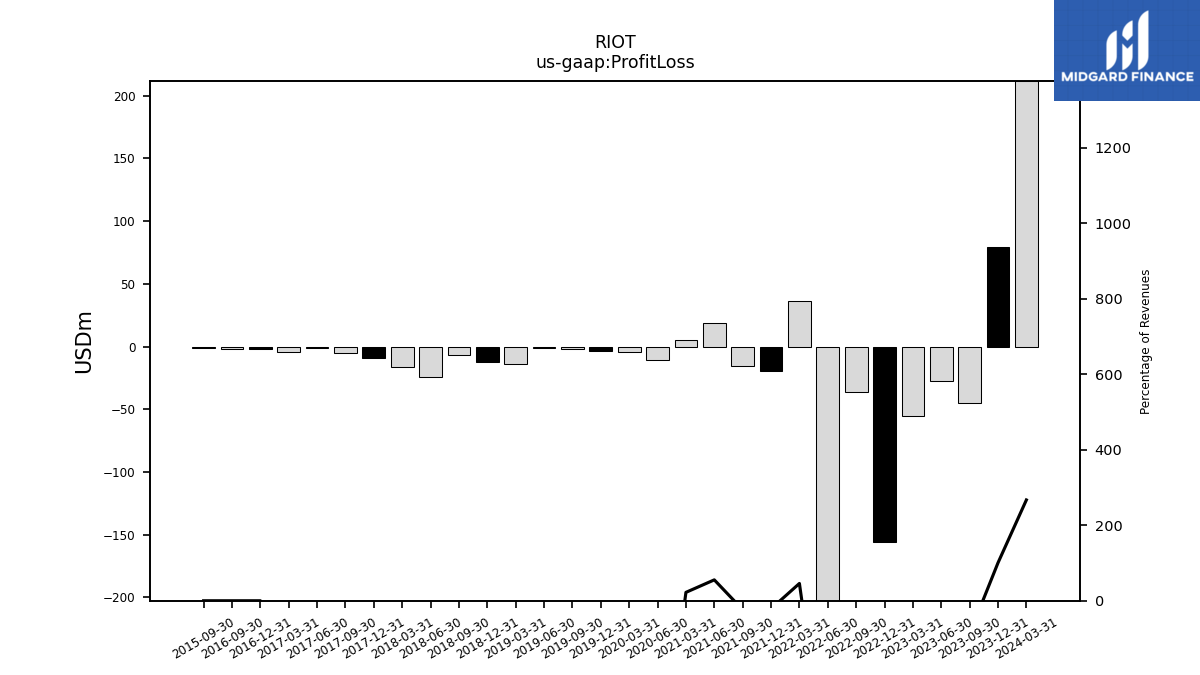
| Profit Loss | 79.23 | -45.33 | -27.69 | -55.69 | -155.78 | -36.57 | -353.56 | 36.58 | -19.45 | -15.34 | 19.01 | 5.16 | -10.59 | -4.28 | -3.44 | -1.83 | -1.28 | -13.75 | -12.69 | -6.53 | -24.43 | -16.57 | -9.00 | -5.30 | -1.31 | -4.35 | |
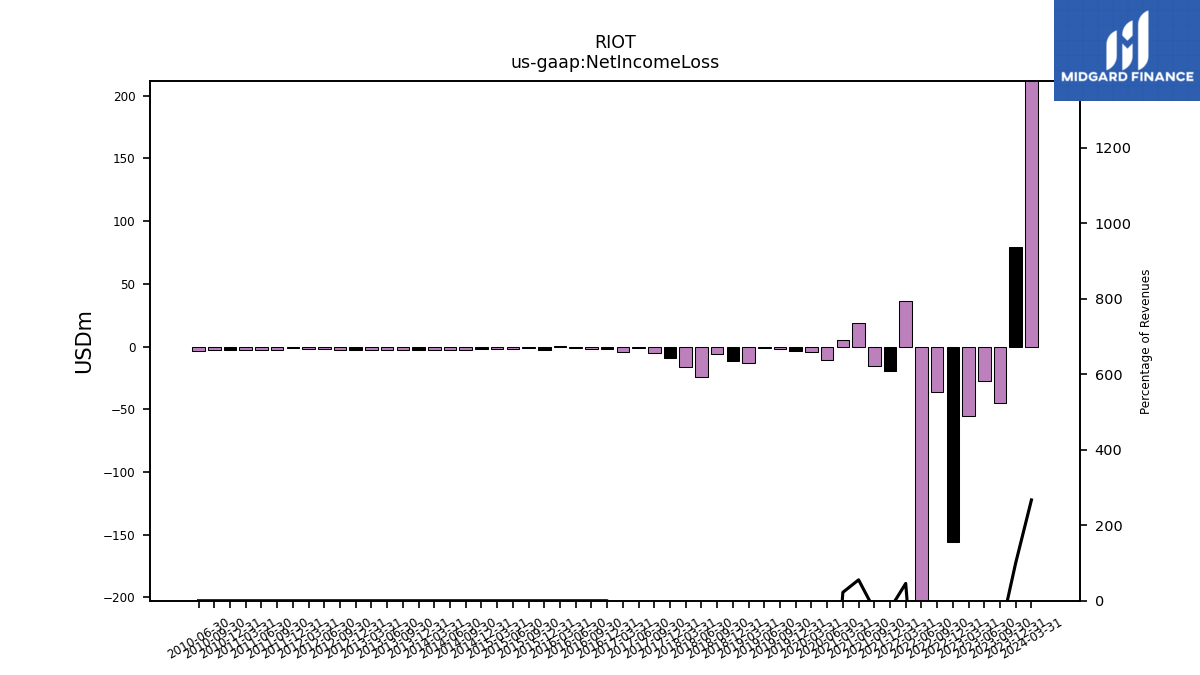
| Net Income Loss | 79.23 | -45.33 | -27.69 | -55.69 | -155.78 | -36.57 | -353.56 | 36.58 | -19.45 | -15.34 | 19.01 | 5.16 | -10.59 | -4.28 | -3.40 | -1.83 | -1.28 | -13.53 | -11.41 | -6.23 | -24.02 | -16.35 | -8.88 | -5.30 | -1.31 | -4.35 |
| 2023-12-31 | 2023-09-30 | 2023-06-30 | 2023-03-31 | 2022-12-31 | 2022-09-30 | 2022-06-30 | 2022-03-31 | 2021-12-31 | 2021-09-30 | 2021-06-30 | 2021-03-31 | 2020-06-30 | 2020-03-31 | 2019-12-31 | 2019-09-30 | 2019-06-30 | 2019-03-31 | 2018-12-31 | 2018-09-30 | 2018-06-30 | 2018-03-31 | 2017-12-31 | 2017-09-30 | 2017-06-30 | 2017-03-31 | ||
|---|---|---|---|---|---|---|---|---|---|---|---|---|---|---|---|---|---|---|---|---|---|---|---|---|---|---|---|
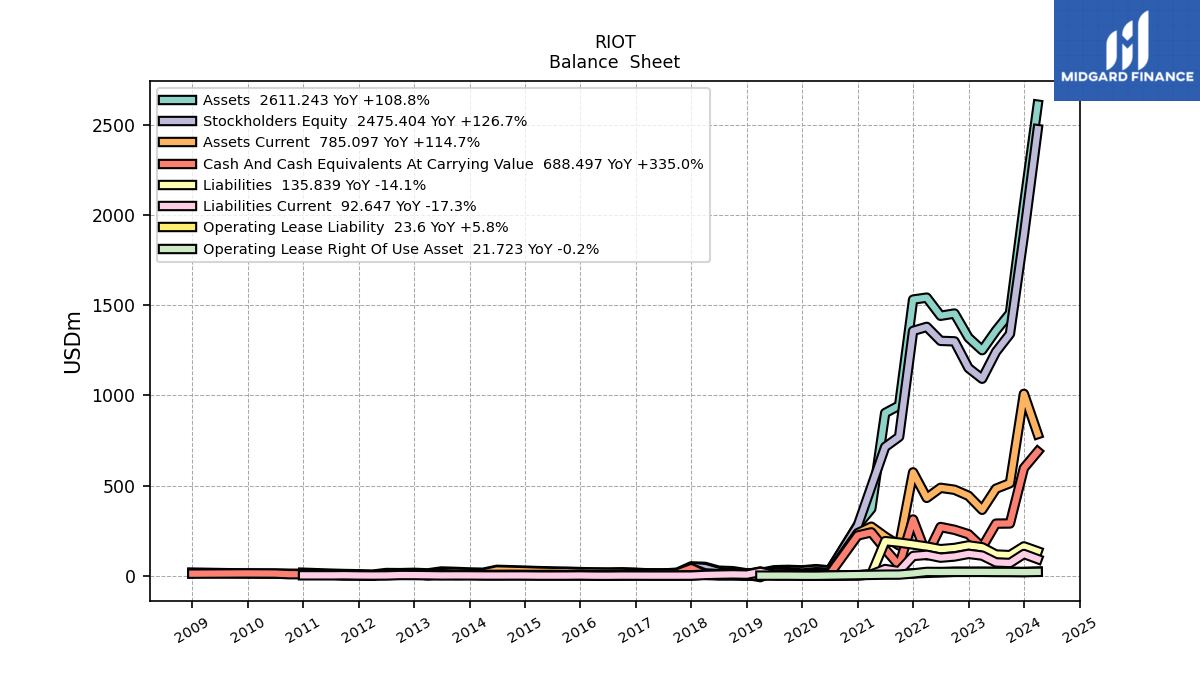
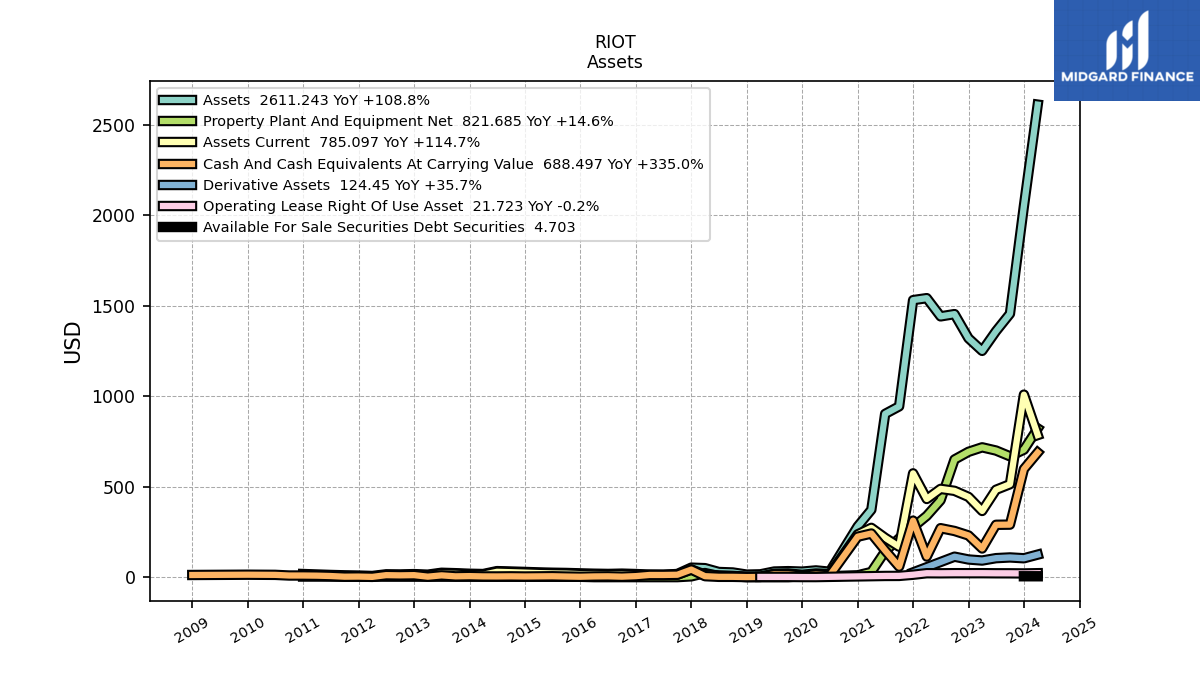
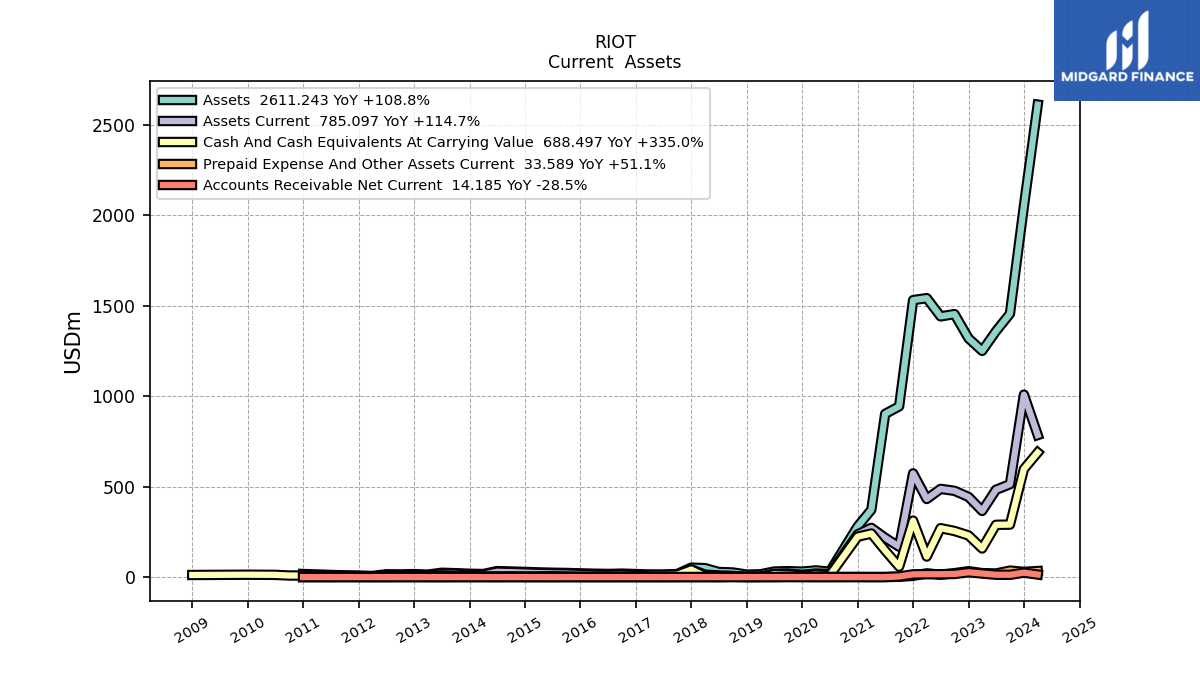
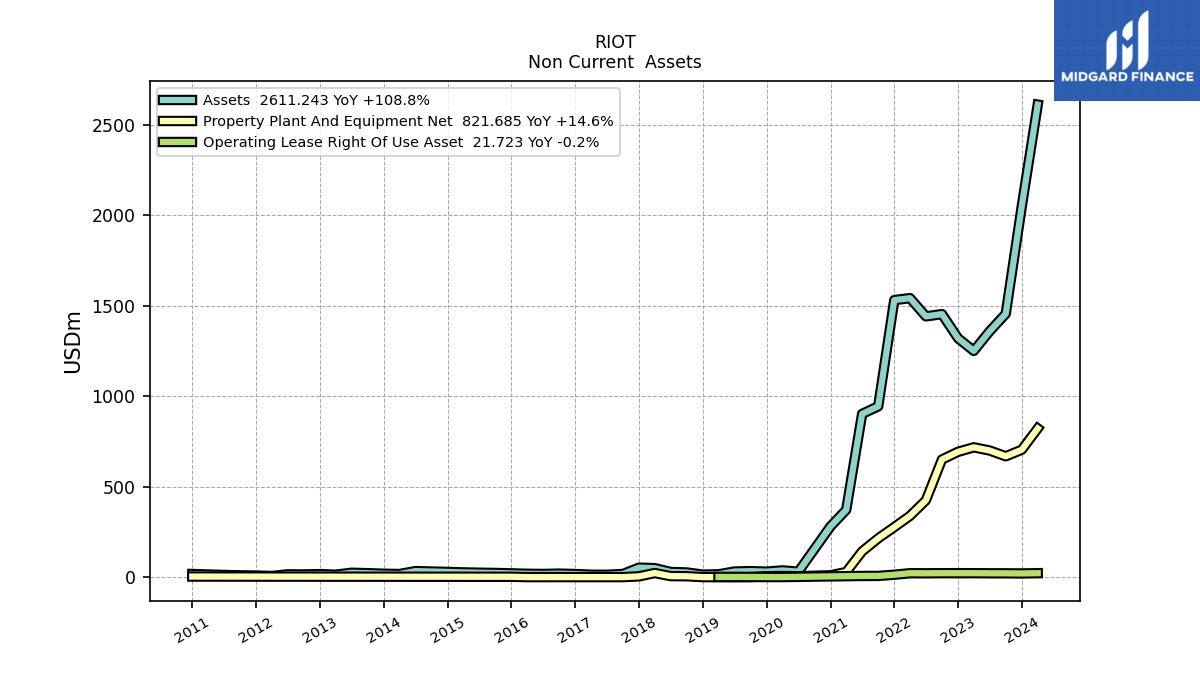
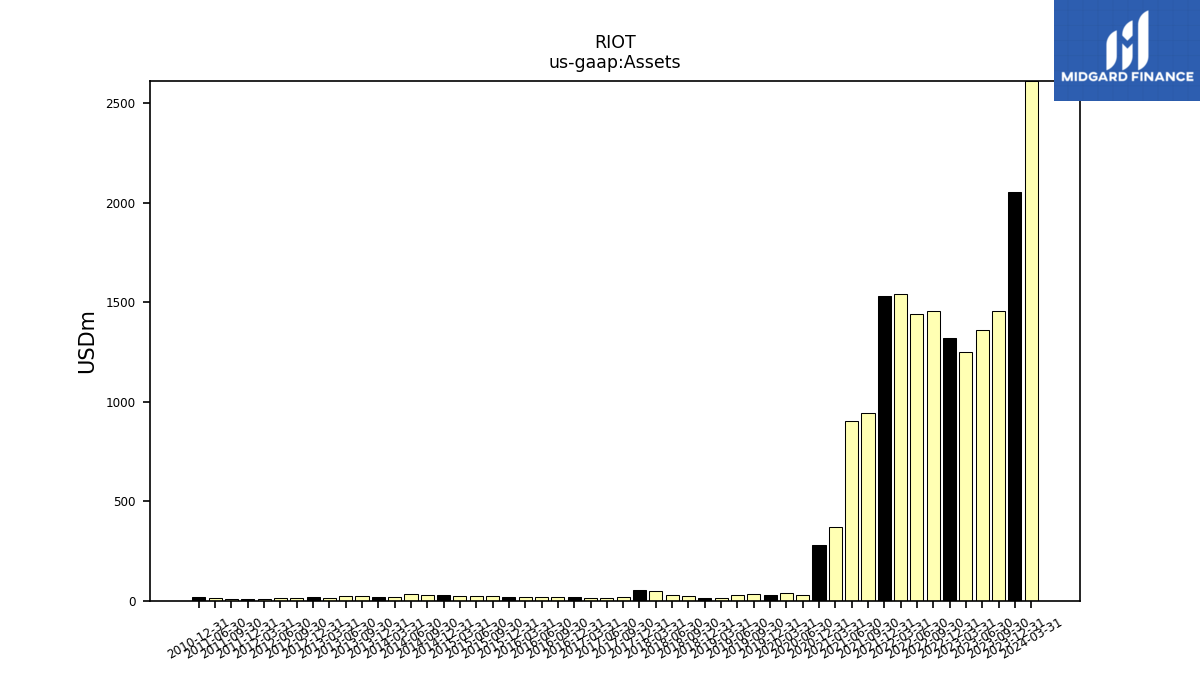
| Assets | 2051.08 | 1455.38 | 1358.93 | 1250.32 | 1319.96 | 1453.62 | 1441.00 | 1541.75 | 1530.94 | 943.57 | 902.23 | 372.09 | 29.87 | 37.07 | 30.38 | 32.99 | 30.97 | 15.45 | 13.86 | 25.70 | 28.39 | 49.58 | 52.34 | 17.35 | 12.91 | 13.32 | |
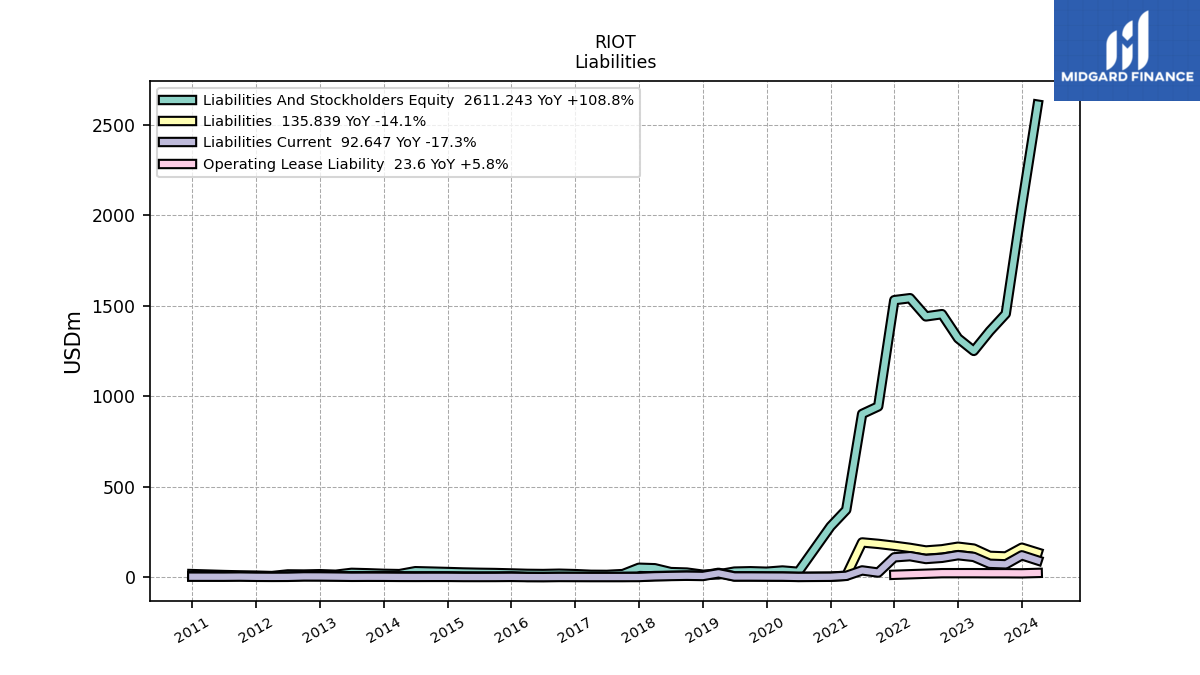
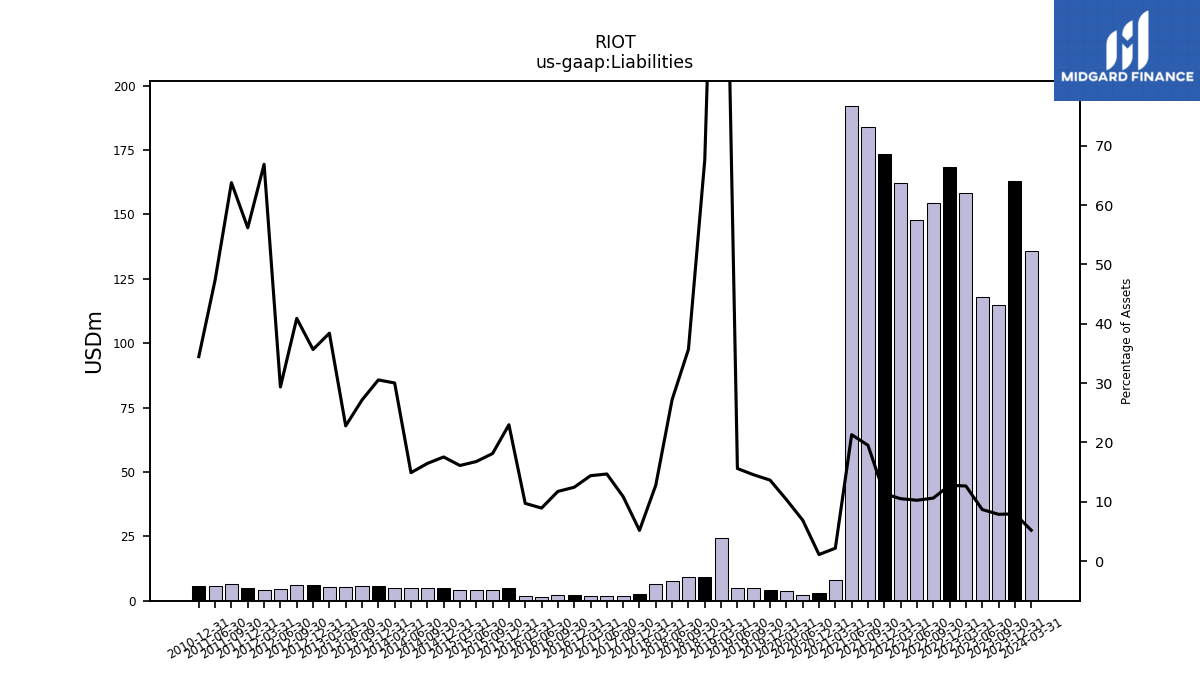
| Liabilities | 163.06 | 114.68 | 118.02 | 158.17 | 168.52 | 154.25 | 147.66 | 162.07 | 173.62 | 184.09 | 192.21 | 8.09 | 2.06 | 3.84 | 4.14 | 4.79 | 4.83 | 24.22 | 9.37 | 9.17 | 7.73 | 6.35 | 2.71 | 1.88 | 1.89 | 1.92 | |
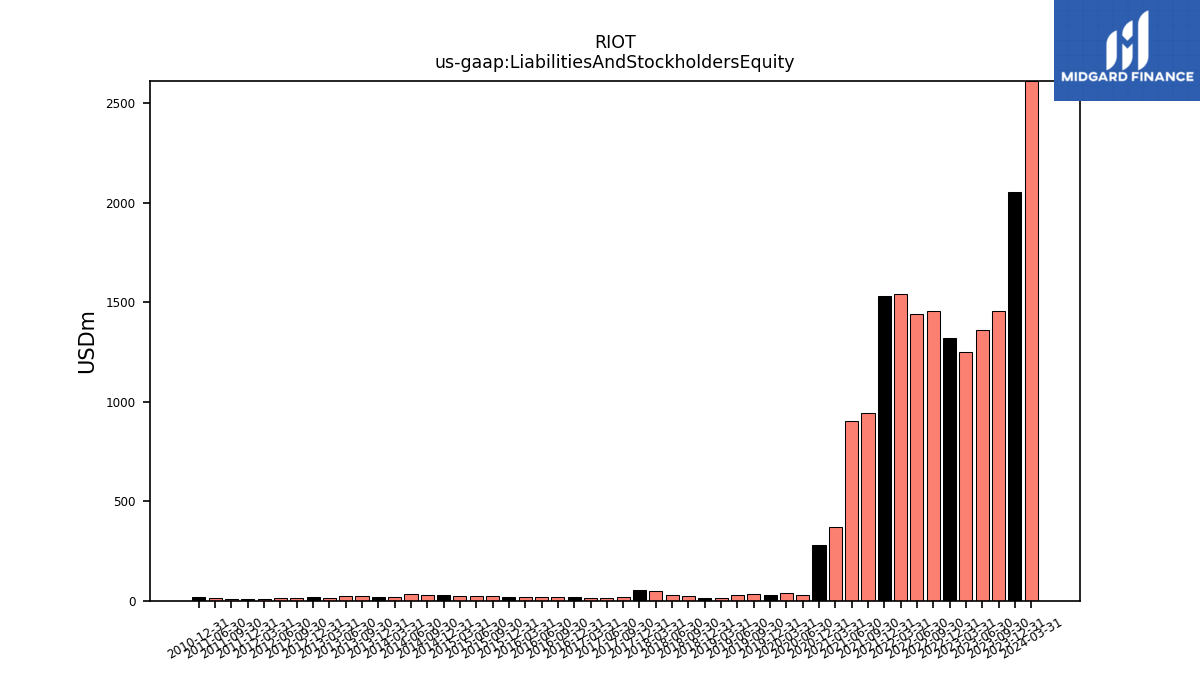
| Liabilities And Stockholders Equity | 2051.08 | 1455.38 | 1358.93 | 1250.32 | 1319.96 | 1453.62 | 1441.00 | 1541.75 | 1530.94 | 943.57 | 902.23 | 372.09 | 29.87 | 37.07 | 30.38 | 32.99 | 30.97 | 15.45 | 13.86 | 25.70 | 28.39 | 49.58 | 52.34 | 17.35 | 12.91 | 13.32 | |
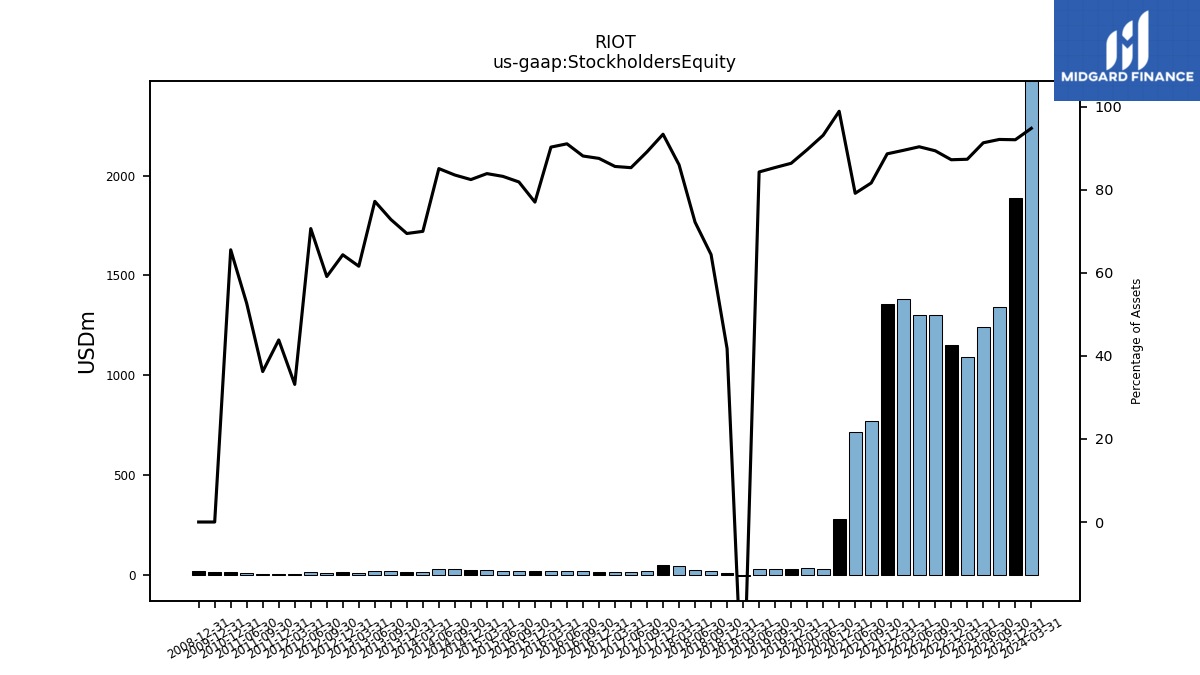
| Stockholders Equity | 1888.02 | 1340.70 | 1240.91 | 1092.14 | 1151.44 | 1299.37 | 1302.07 | 1379.68 | 1357.32 | 770.32 | 714.16 | NA | 27.82 | 33.24 | 26.24 | 28.16 | 26.10 | -7.25 | 5.79 | 16.55 | 20.50 | 42.65 | 48.87 | 15.47 | 11.01 | 11.41 |
| 2023-12-31 | 2023-09-30 | 2023-06-30 | 2023-03-31 | 2022-12-31 | 2022-09-30 | 2022-06-30 | 2022-03-31 | 2021-12-31 | 2021-09-30 | 2021-06-30 | 2021-03-31 | 2020-06-30 | 2020-03-31 | 2019-12-31 | 2019-09-30 | 2019-06-30 | 2019-03-31 | 2018-12-31 | 2018-09-30 | 2018-06-30 | 2018-03-31 | 2017-12-31 | 2017-09-30 | 2017-06-30 | 2017-03-31 | ||
|---|---|---|---|---|---|---|---|---|---|---|---|---|---|---|---|---|---|---|---|---|---|---|---|---|---|---|---|
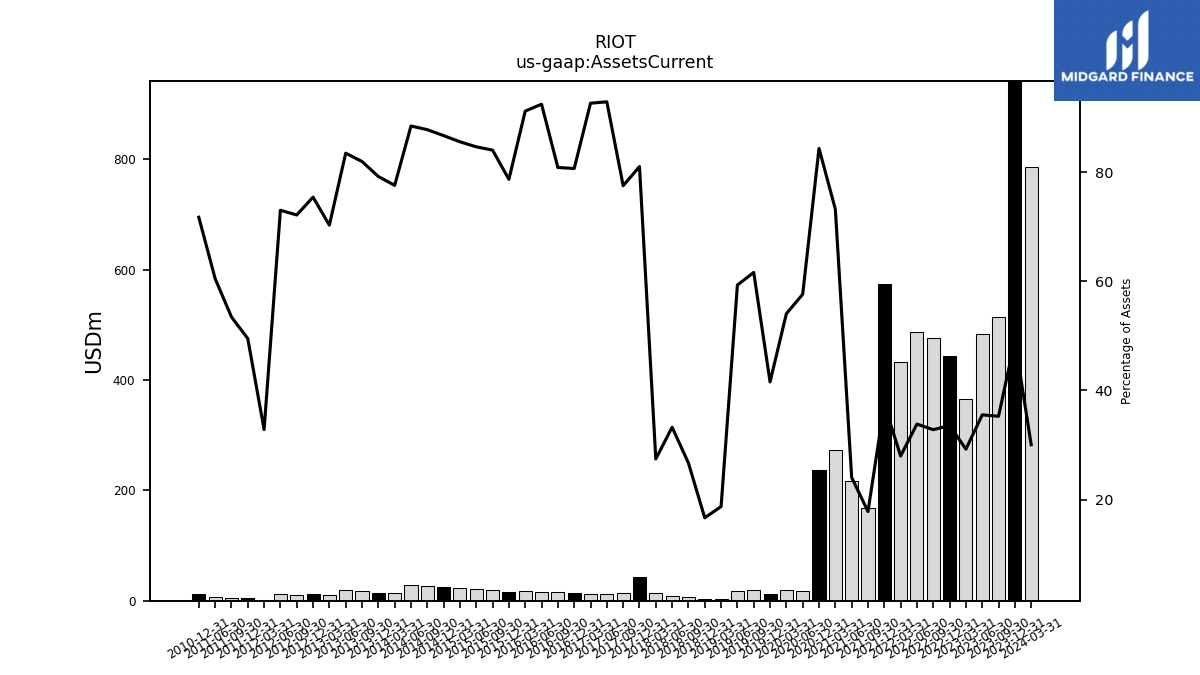
| Assets Current | 1008.57 | 513.39 | 482.75 | 365.68 | 443.38 | 476.89 | 487.70 | 431.70 | 573.54 | 168.19 | 217.18 | 272.39 | 17.21 | 20.04 | 12.63 | 20.32 | 18.37 | 2.89 | 2.31 | 6.86 | 9.45 | 13.61 | 42.39 | 13.45 | 11.99 | 12.34 | |
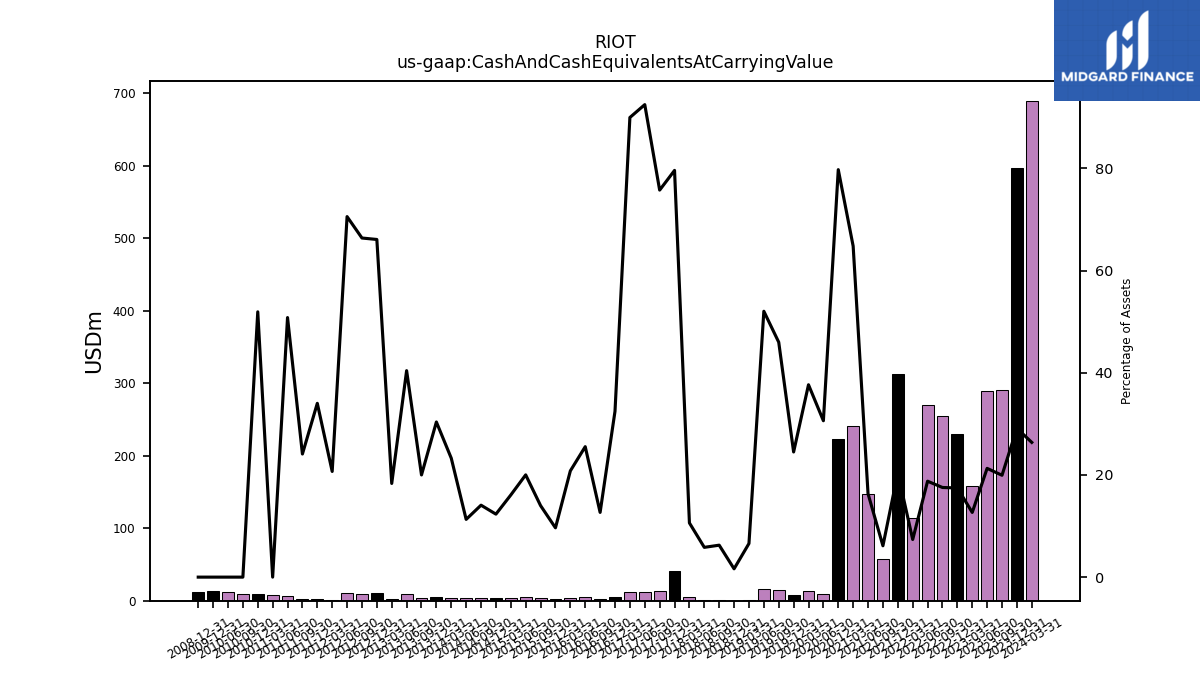
| Cash And Cash Equivalents At Carrying Value | 597.17 | 290.11 | 289.18 | 158.27 | 230.33 | 254.97 | 270.48 | 113.58 | 312.31 | 57.88 | 147.18 | 241.01 | 9.14 | 13.96 | 7.44 | 15.16 | 16.11 | 1.02 | 0.23 | 1.61 | 1.65 | 5.26 | 41.65 | 13.14 | 11.93 | 11.98 | |
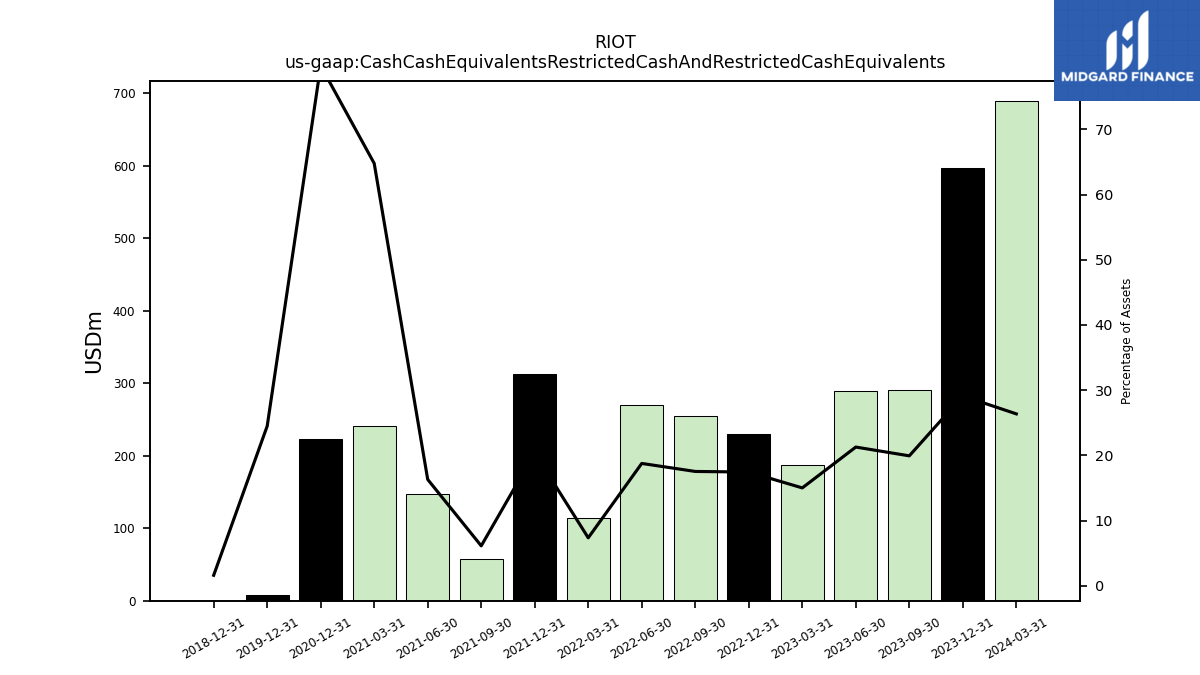
| Cash Cash Equivalents Restricted Cash And Restricted Cash Equivalents | 597.17 | 290.11 | 289.18 | 187.77 | 230.33 | 254.97 | 270.48 | 113.58 | 312.31 | 57.88 | 147.18 | 241.01 | NA | NA | 7.44 | NA | NA | NA | 0.23 | NA | NA | NA | NA | NA | NA | NA | |
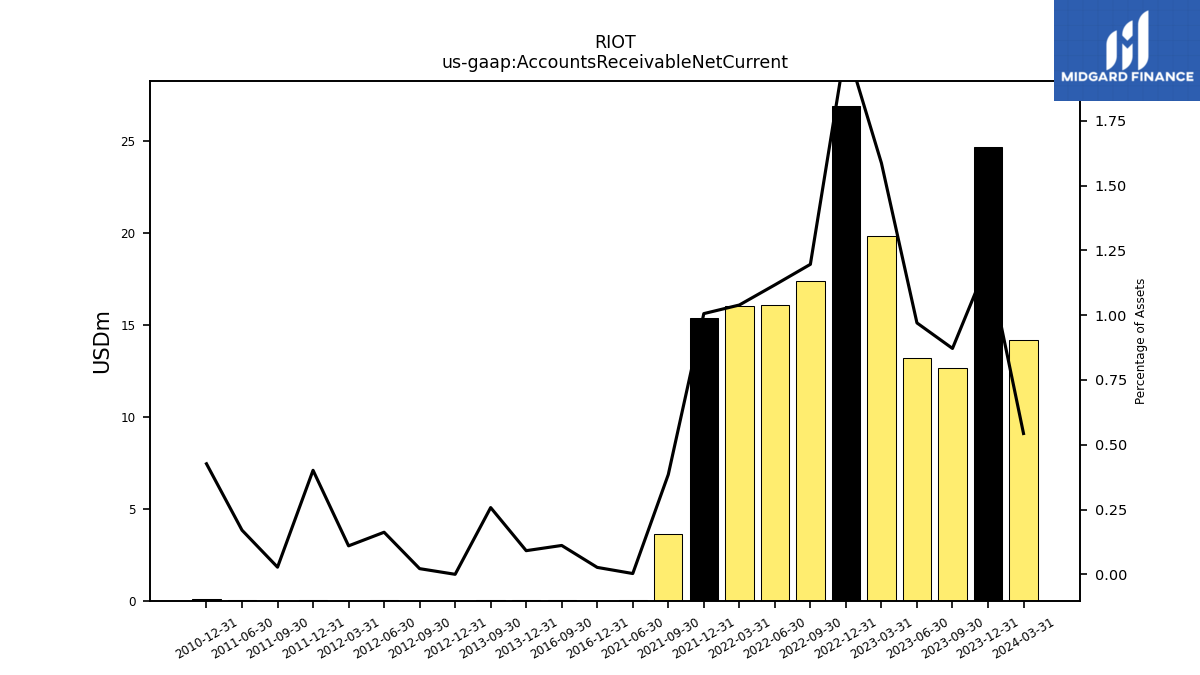
| Accounts Receivable Net Current | 24.71 | 12.68 | 13.18 | 19.84 | 26.93 | 17.39 | 16.09 | 16.02 | 15.40 | 3.63 | 0.03 | NA | NA | NA | NA | NA | NA | NA | NA | NA | NA | NA | NA | NA | NA | NA | |
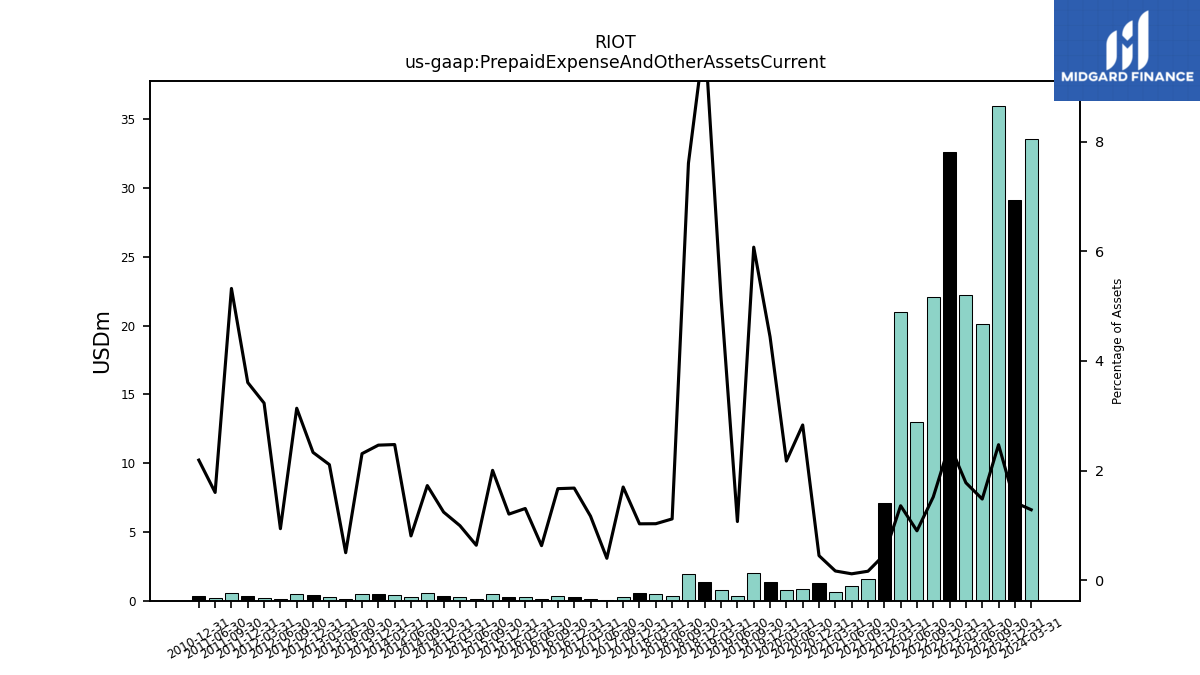
| Prepaid Expense And Other Assets Current | 29.11 | 35.99 | 20.13 | 22.23 | 32.66 | 22.10 | 13.00 | 20.96 | 7.13 | 1.55 | 1.06 | 0.63 | 0.85 | 0.81 | 1.35 | 2.00 | 0.33 | 0.79 | 1.38 | 1.96 | 0.32 | 0.51 | 0.54 | 0.30 | 0.05 | 0.16 | |
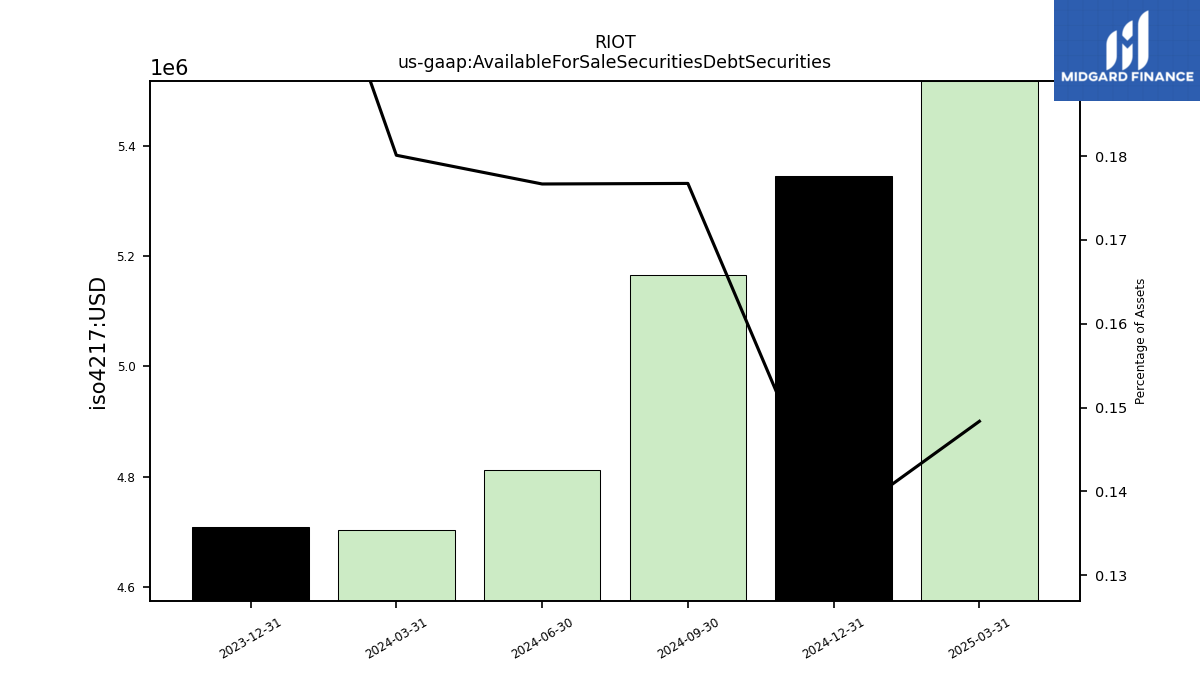
| Available For Sale Securities Debt Securities | 4.71 | NA | NA | NA | NA | NA | NA | NA | NA | NA | NA | NA | NA | NA | NA | NA | NA | NA | NA | NA | NA | NA | NA | NA | NA | NA |
| 2023-12-31 | 2023-09-30 | 2023-06-30 | 2023-03-31 | 2022-12-31 | 2022-09-30 | 2022-06-30 | 2022-03-31 | 2021-12-31 | 2021-09-30 | 2021-06-30 | 2021-03-31 | 2020-06-30 | 2020-03-31 | 2019-12-31 | 2019-09-30 | 2019-06-30 | 2019-03-31 | 2018-12-31 | 2018-09-30 | 2018-06-30 | 2018-03-31 | 2017-12-31 | 2017-09-30 | 2017-06-30 | 2017-03-31 | ||
|---|---|---|---|---|---|---|---|---|---|---|---|---|---|---|---|---|---|---|---|---|---|---|---|---|---|---|---|
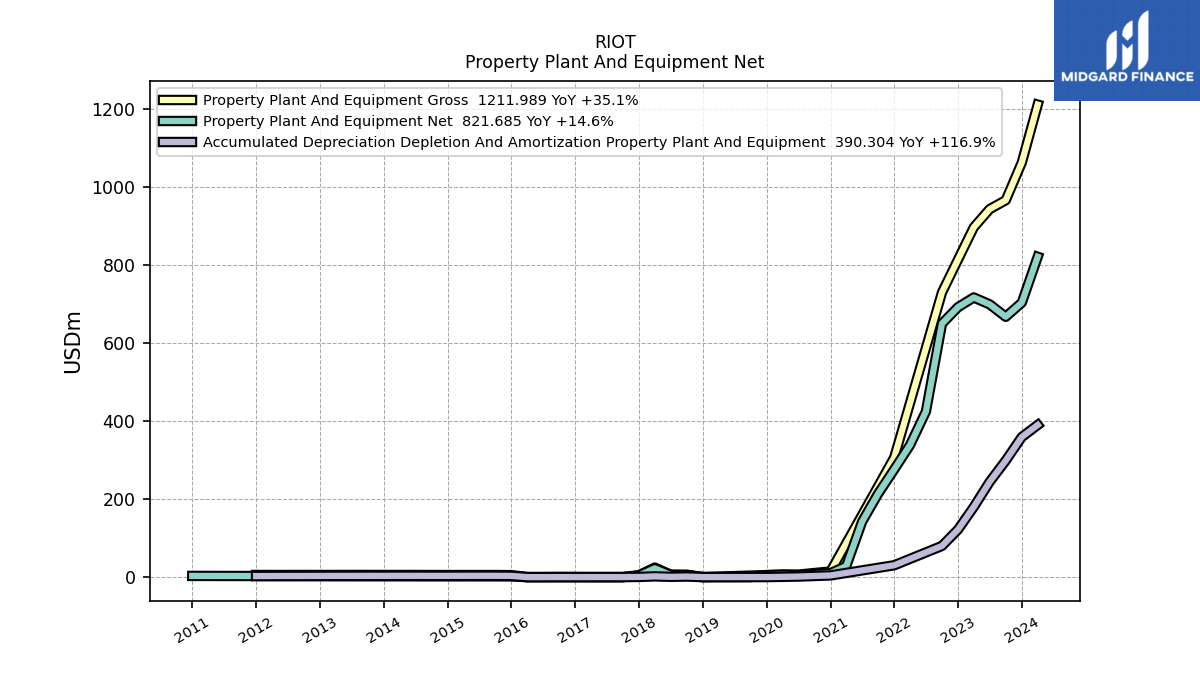
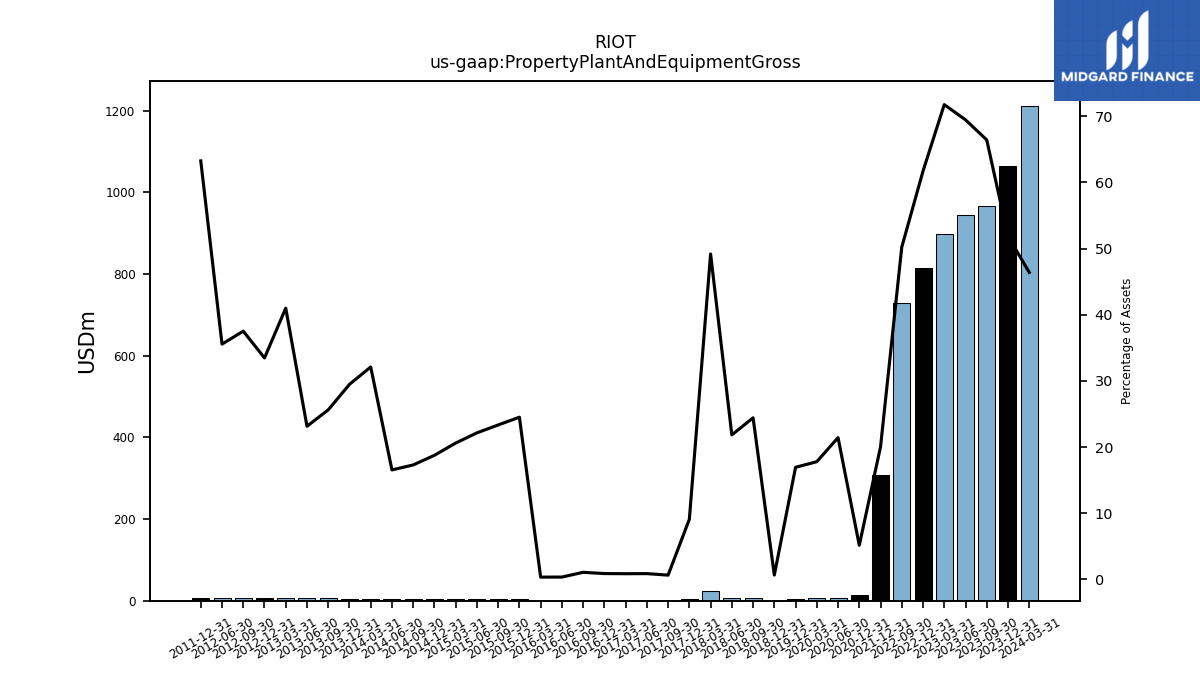
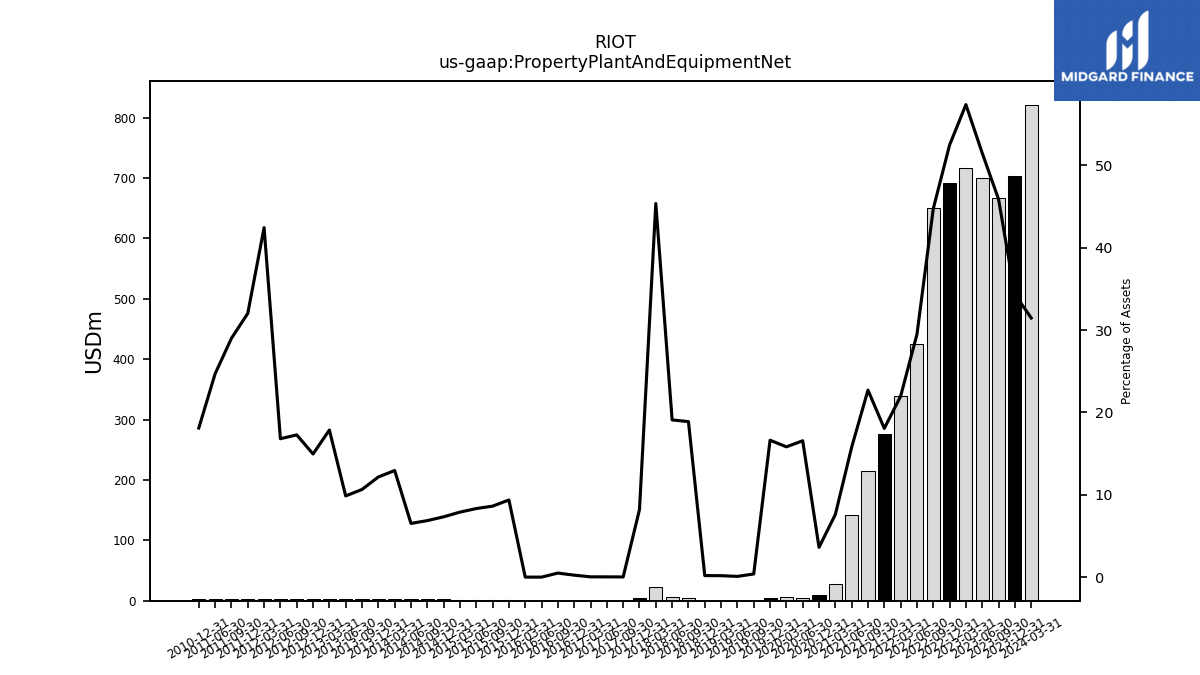
| Property Plant And Equipment Gross | 1063.64 | 966.81 | 944.01 | 897.27 | 814.74 | 730.22 | NA | NA | 306.95 | NA | NA | NA | 6.40 | 6.60 | 5.15 | NA | NA | NA | 0.09 | 6.28 | 6.20 | 24.39 | 4.76 | 0.11 | 0.11 | 0.12 | |
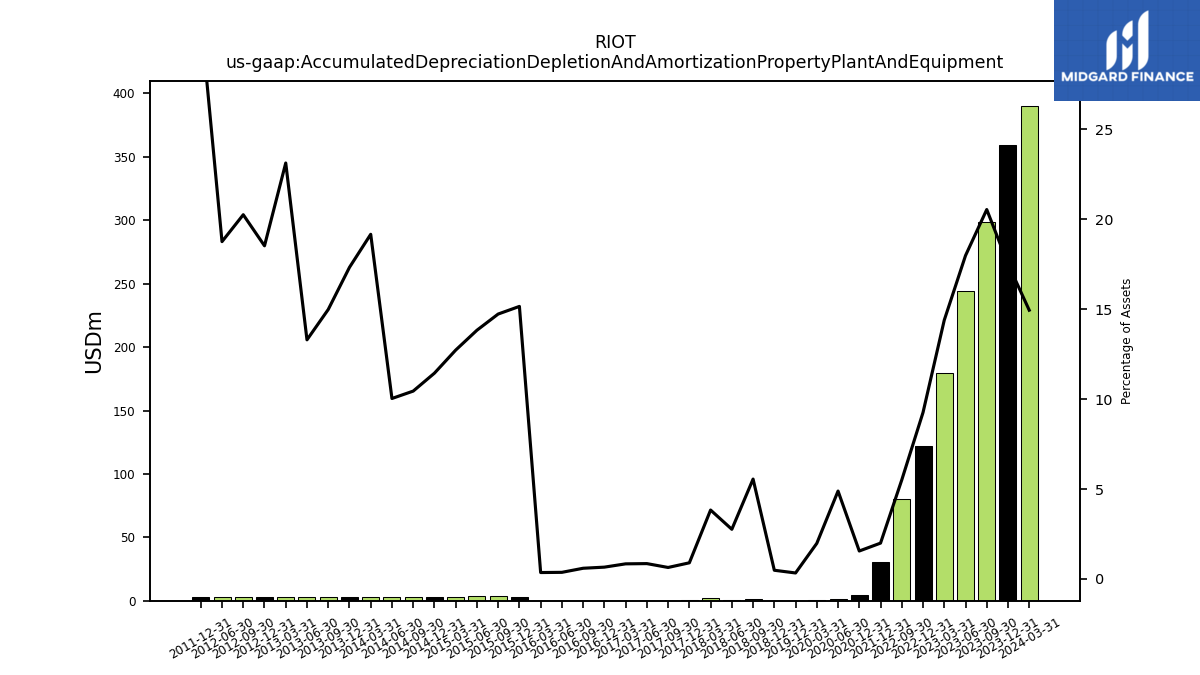
| Accumulated Depreciation Depletion And Amortization Property Plant And Equipment | 359.44 | 299.00 | 244.37 | 179.96 | 122.18 | 80.03 | NA | NA | 30.47 | NA | NA | NA | 1.46 | 0.73 | 0.10 | NA | NA | NA | 0.07 | 1.43 | 0.78 | 1.90 | 0.47 | 0.11 | 0.11 | 0.11 | |
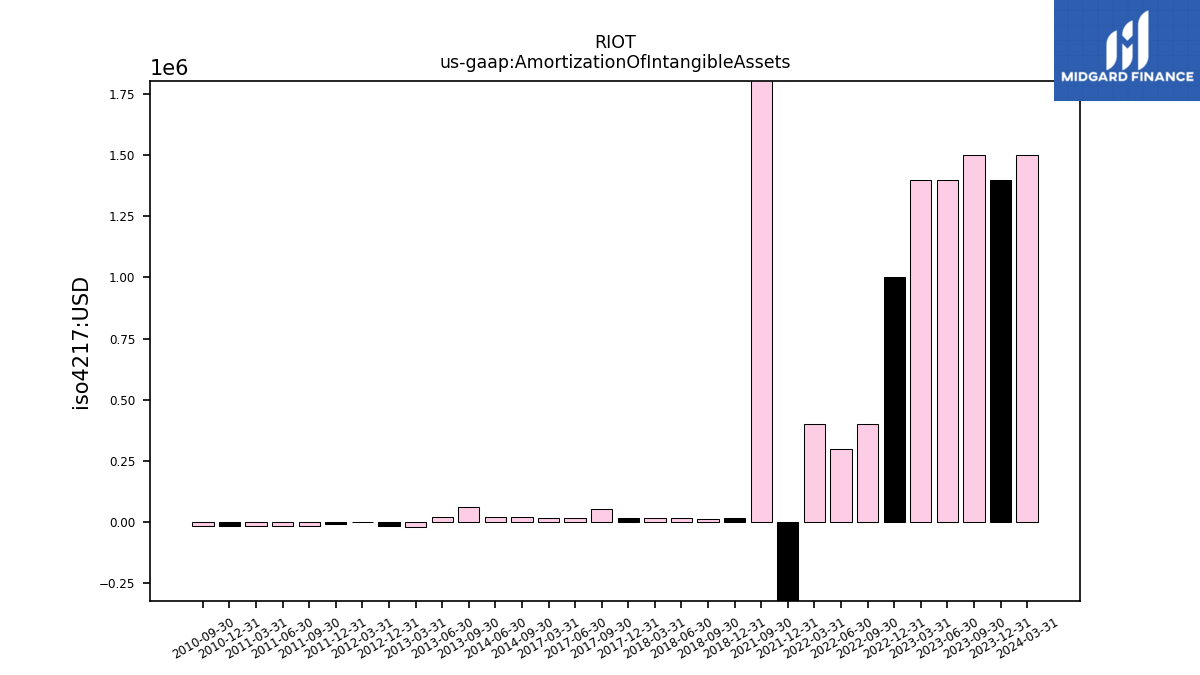
| Amortization Of Intangible Assets | 1.40 | 1.50 | 1.40 | 1.40 | 1.00 | 0.40 | 0.30 | 0.40 | -5.60 | 4.90 | NA | NA | NA | NA | NA | NA | NA | NA | 0.02 | 0.01 | 0.01 | 0.01 | 0.01 | 0.05 | 0.02 | 0.02 | |
| Property Plant And Equipment Net | 704.19 | 667.81 | 699.64 | 717.31 | 692.55 | 650.19 | 424.74 | 338.63 | 276.48 | 214.25 | 142.31 | 28.31 | 4.95 | 5.87 | 5.05 | 0.13 | 0.03 | 0.03 | 0.03 | 4.85 | 5.42 | 22.49 | 4.29 | 0.00 | 0.00 | 0.01 | |
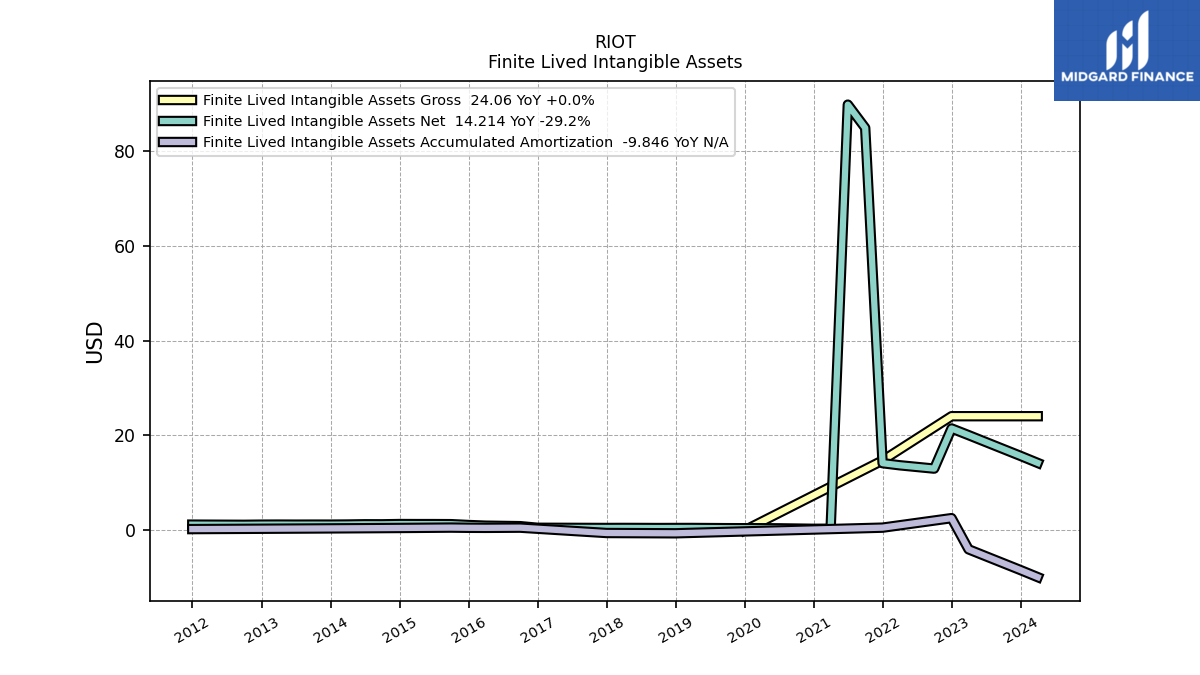
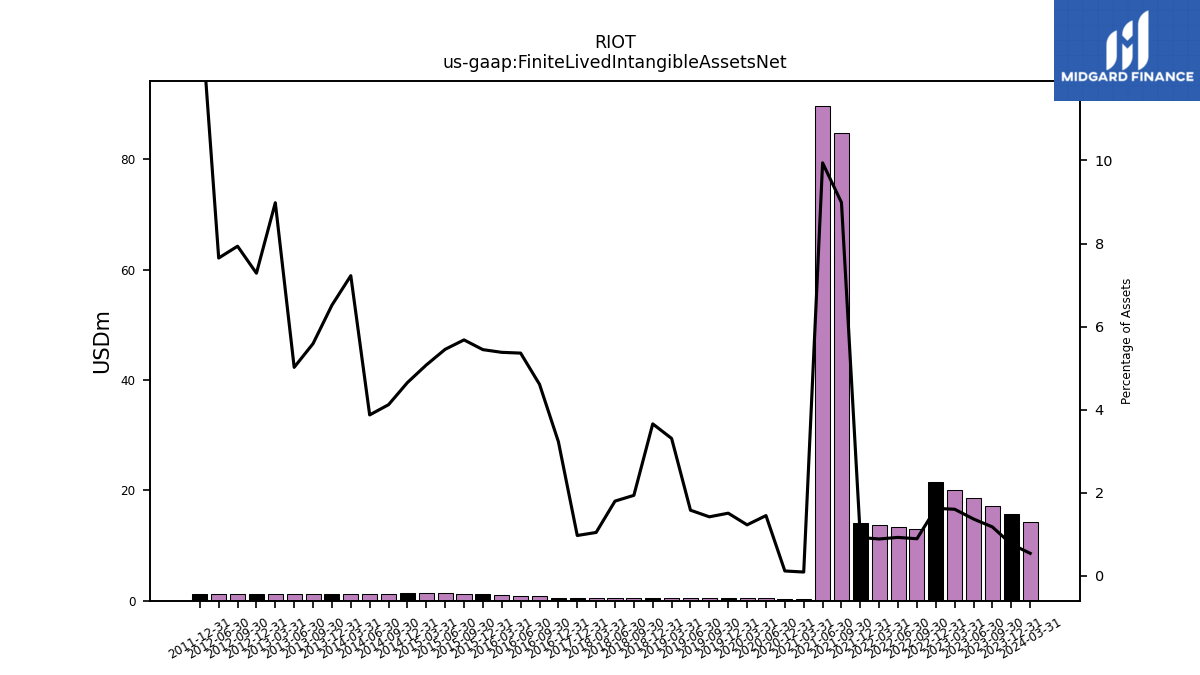
| Finite Lived Intangible Assets Net | 15.70 | 17.16 | 18.62 | 20.07 | 21.48 | 13.02 | 13.37 | 13.72 | 14.16 | 84.81 | 89.71 | 0.35 | 0.43 | 0.46 | 0.46 | 0.47 | 0.49 | 0.51 | 0.51 | 0.50 | 0.51 | 0.52 | 0.51 | NA | NA | NA |
| 2023-12-31 | 2023-09-30 | 2023-06-30 | 2023-03-31 | 2022-12-31 | 2022-09-30 | 2022-06-30 | 2022-03-31 | 2021-12-31 | 2021-09-30 | 2021-06-30 | 2021-03-31 | 2020-06-30 | 2020-03-31 | 2019-12-31 | 2019-09-30 | 2019-06-30 | 2019-03-31 | 2018-12-31 | 2018-09-30 | 2018-06-30 | 2018-03-31 | 2017-12-31 | 2017-09-30 | 2017-06-30 | 2017-03-31 | ||
|---|---|---|---|---|---|---|---|---|---|---|---|---|---|---|---|---|---|---|---|---|---|---|---|---|---|---|---|
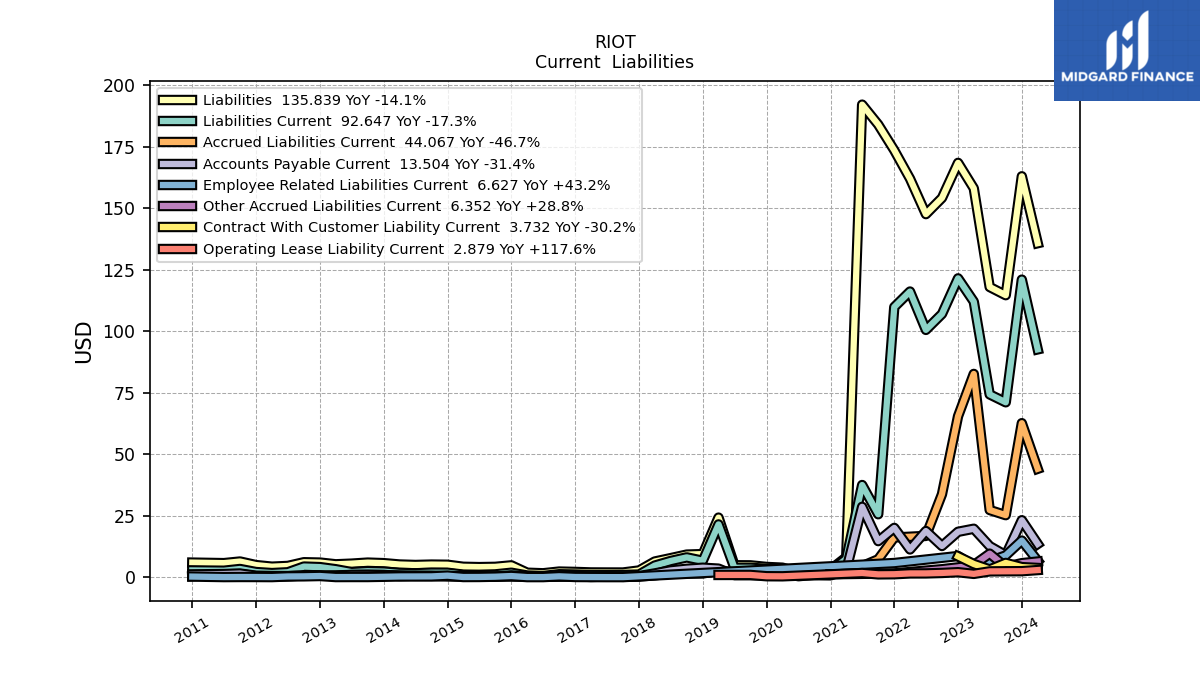
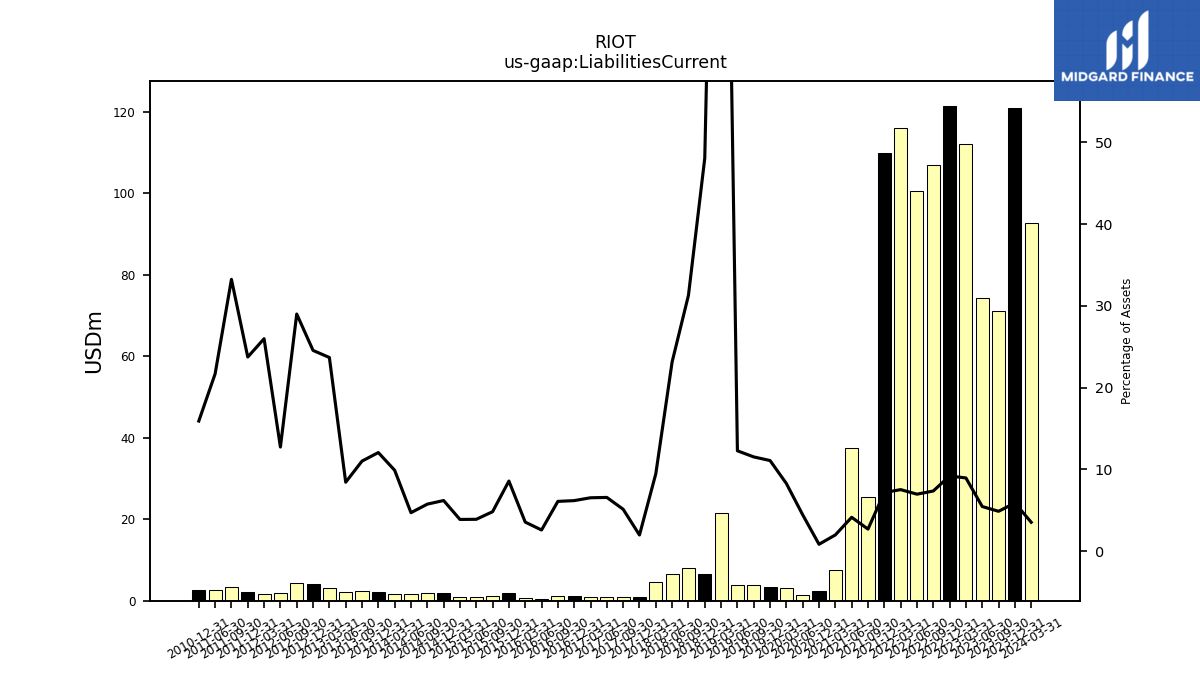
| Liabilities Current | 121.02 | 71.11 | 74.33 | 112.07 | 121.54 | 107.06 | 100.57 | 116.18 | 109.88 | 25.57 | 37.48 | 7.43 | 1.33 | 3.07 | 3.37 | 3.80 | 3.80 | 21.46 | 6.66 | 8.04 | 6.57 | 4.70 | 1.04 | 0.89 | 0.85 | 0.87 | |
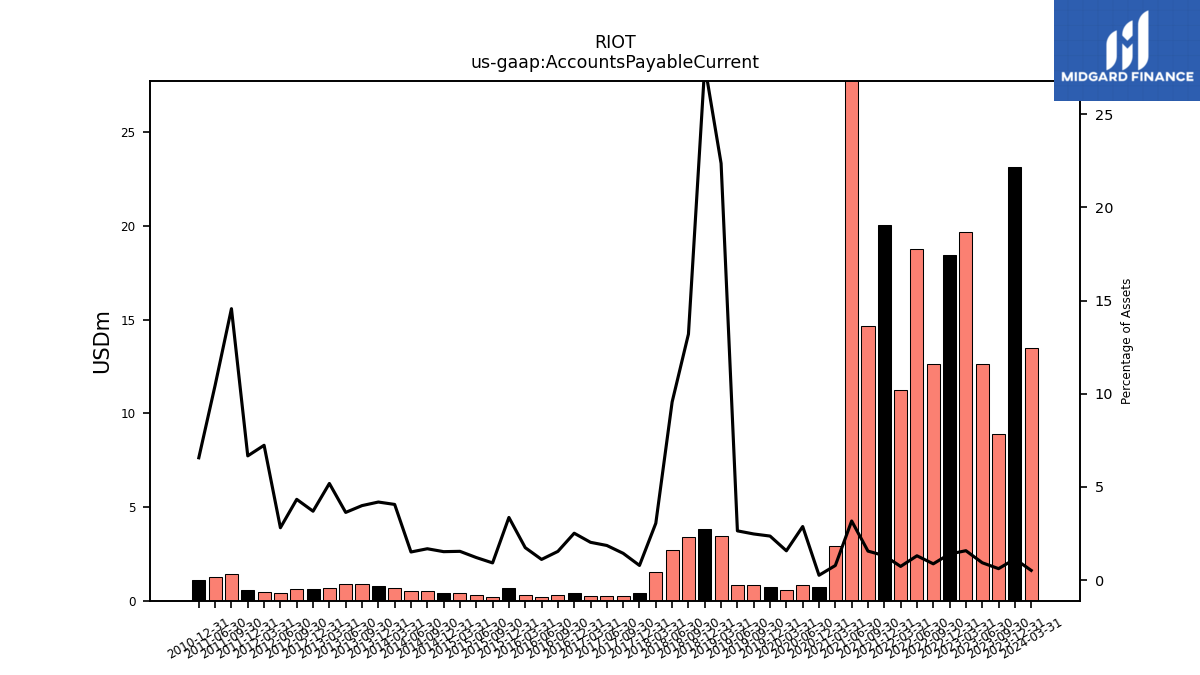
| Accounts Payable Current | 23.16 | 8.90 | 12.62 | 19.68 | 18.45 | 12.66 | 18.76 | 11.27 | 20.04 | 14.65 | 28.61 | 2.90 | 0.86 | 0.58 | 0.72 | 0.82 | 0.82 | 3.46 | 3.83 | 3.39 | 2.71 | 1.51 | 0.41 | 0.25 | 0.24 | 0.27 | |
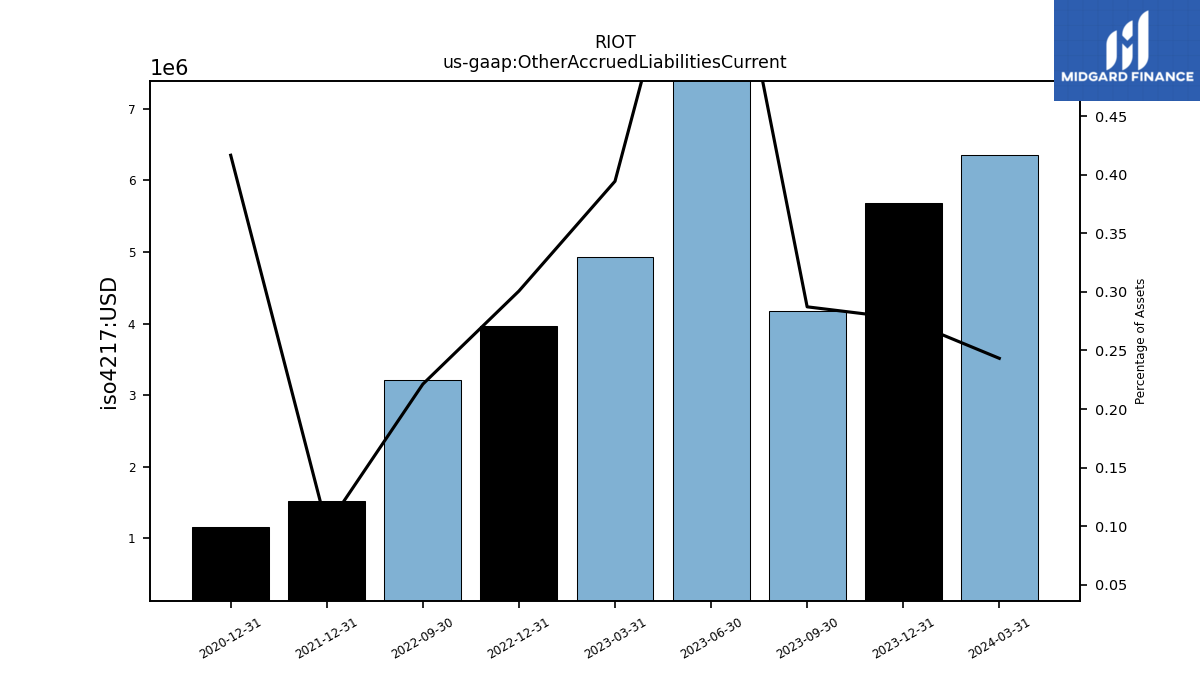
| Other Accrued Liabilities Current | 5.68 | 4.18 | 9.55 | 4.93 | 3.97 | 3.22 | NA | NA | 1.53 | NA | NA | NA | NA | NA | NA | NA | NA | NA | NA | NA | NA | NA | NA | NA | NA | NA | |
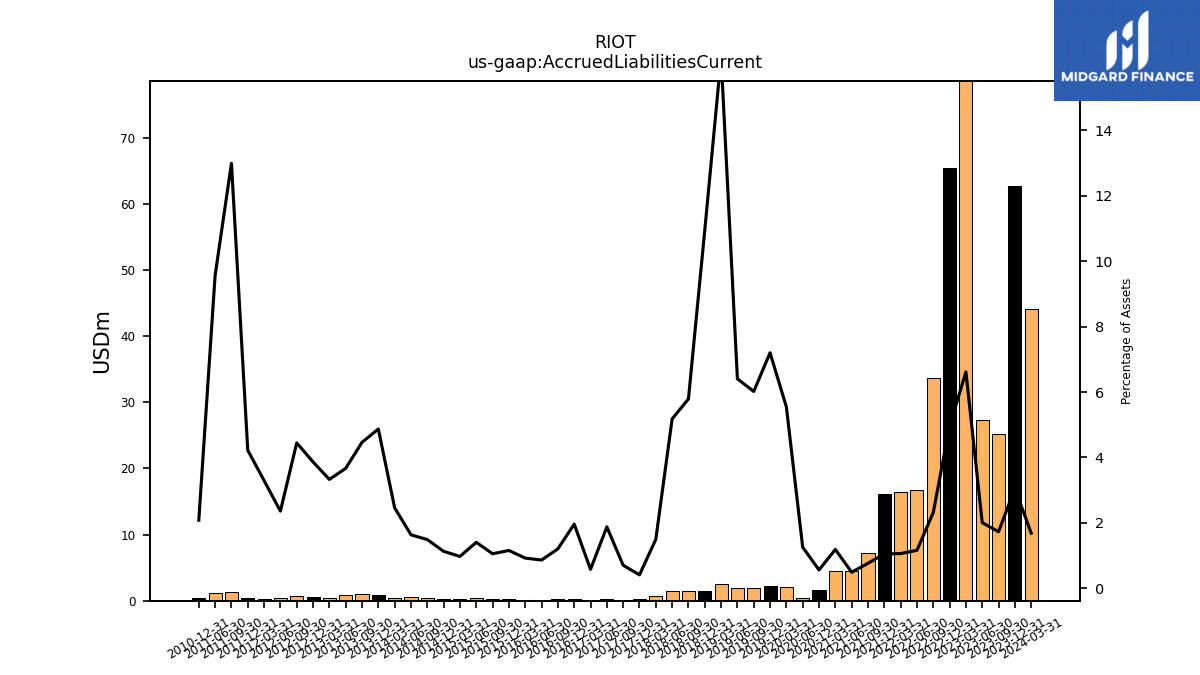
| Accrued Liabilities Current | 62.63 | 25.20 | 27.31 | 82.67 | 65.46 | 33.73 | 16.77 | 16.43 | 16.14 | 7.25 | 4.46 | 4.43 | 0.38 | 2.06 | 2.19 | 1.98 | 1.98 | 2.51 | 1.52 | 1.49 | 1.47 | 0.74 | 0.22 | 0.12 | 0.24 | 0.08 | |
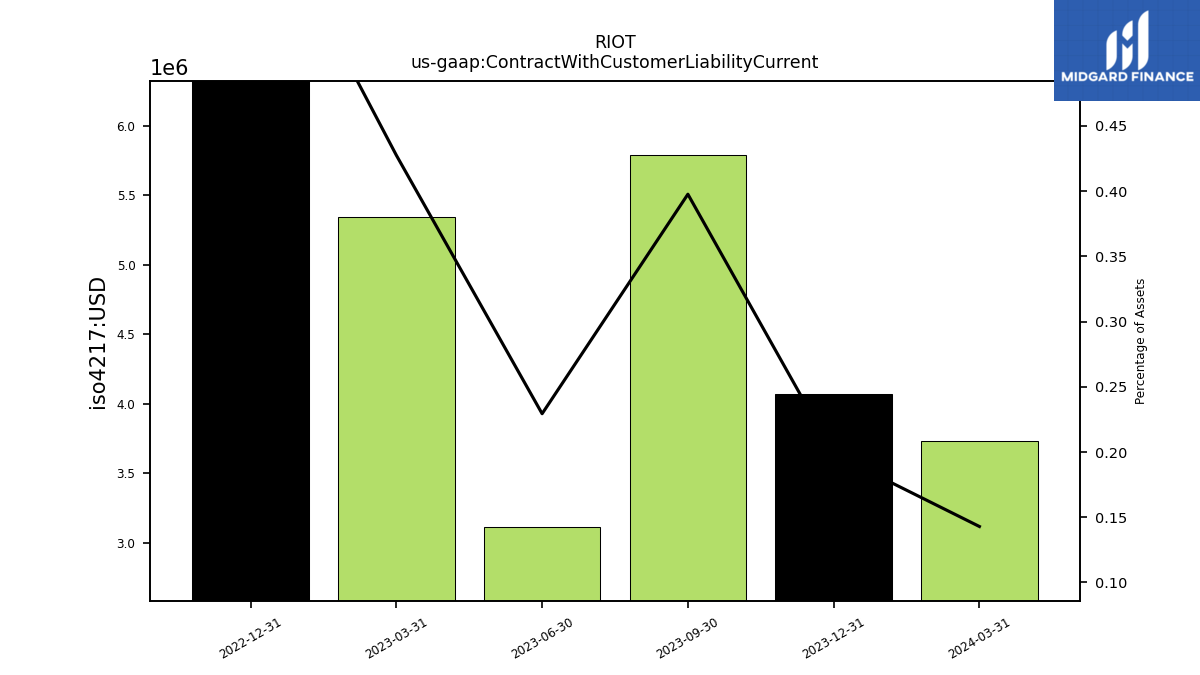
| Contract With Customer Liability Current | 4.07 | 5.79 | 3.12 | 5.34 | 8.45 | NA | NA | NA | NA | NA | NA | NA | NA | NA | NA | NA | NA | NA | NA | NA | NA | NA | NA | NA | NA | NA | |
| Line Of Credit | 0.00 | 0.00 | NA | 0.30 | NA | NA | NA | NA | NA | NA | NA | NA | NA | NA | NA | NA | NA | NA | NA | NA | NA | NA | NA | NA | NA | NA |
| 2023-12-31 | 2023-09-30 | 2023-06-30 | 2023-03-31 | 2022-12-31 | 2022-09-30 | 2022-06-30 | 2022-03-31 | 2021-12-31 | 2021-09-30 | 2021-06-30 | 2021-03-31 | 2020-06-30 | 2020-03-31 | 2019-12-31 | 2019-09-30 | 2019-06-30 | 2019-03-31 | 2018-12-31 | 2018-09-30 | 2018-06-30 | 2018-03-31 | 2017-12-31 | 2017-09-30 | 2017-06-30 | 2017-03-31 | ||
|---|---|---|---|---|---|---|---|---|---|---|---|---|---|---|---|---|---|---|---|---|---|---|---|---|---|---|---|
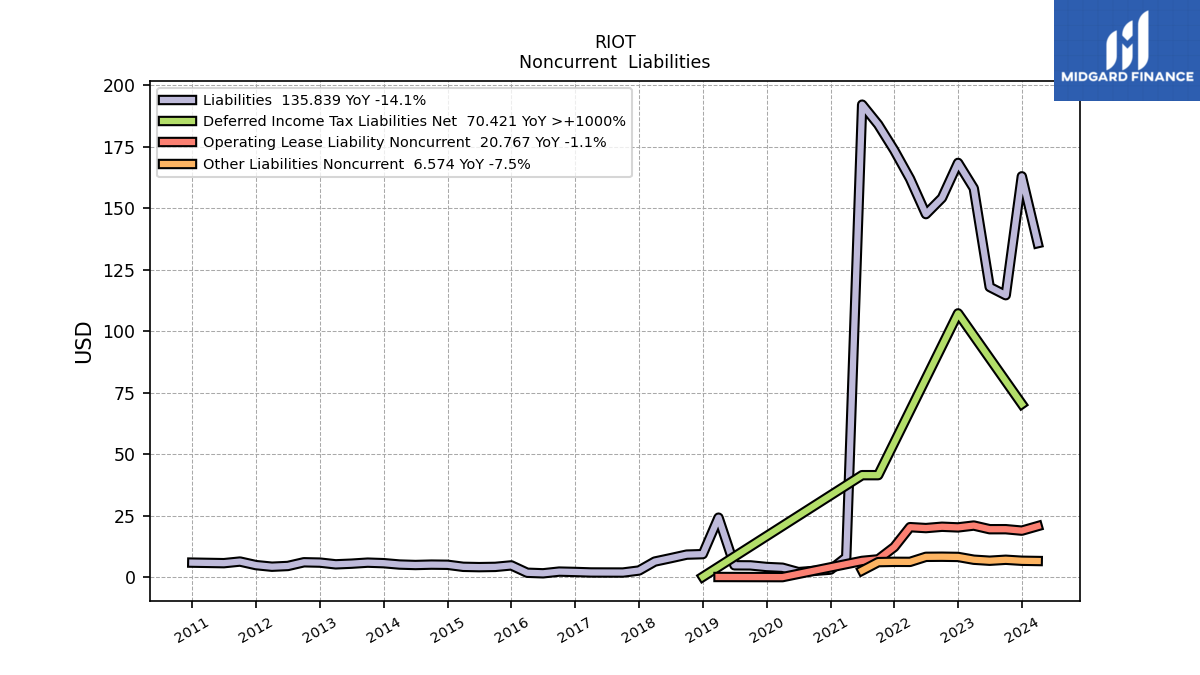
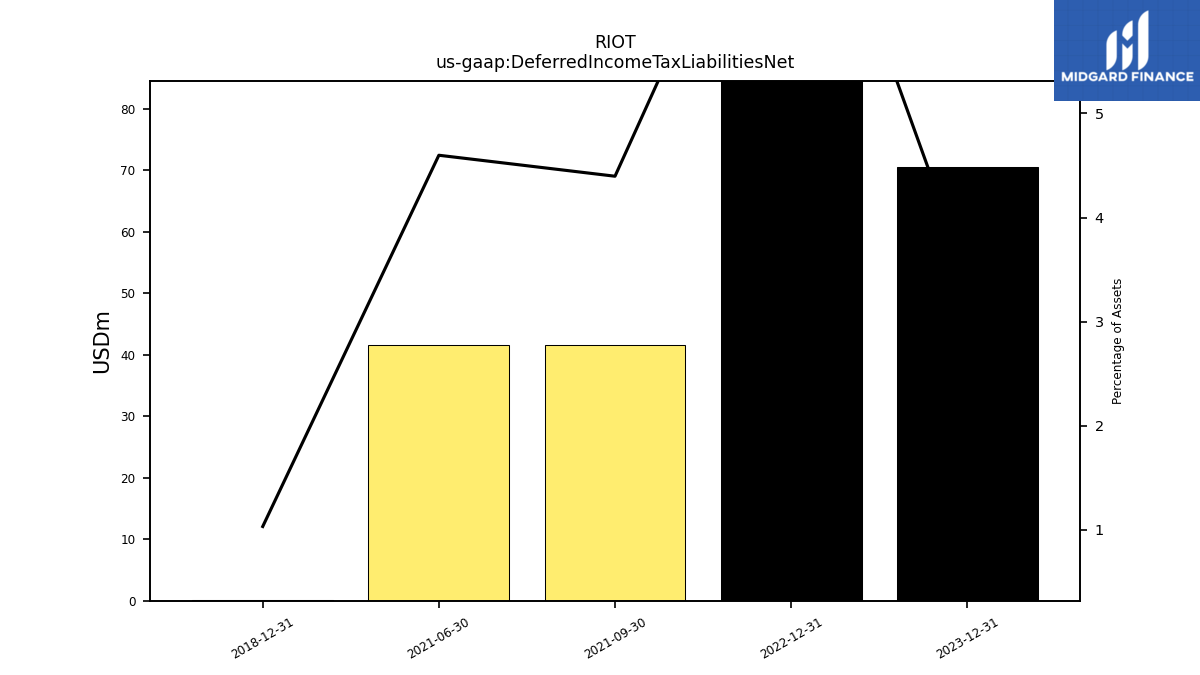
| Deferred Income Tax Liabilities Net | 70.42 | NA | NA | NA | 107.31 | NA | NA | NA | NA | 41.49 | 41.49 | NA | NA | NA | NA | NA | NA | NA | 0.14 | NA | NA | NA | NA | NA | NA | NA | |
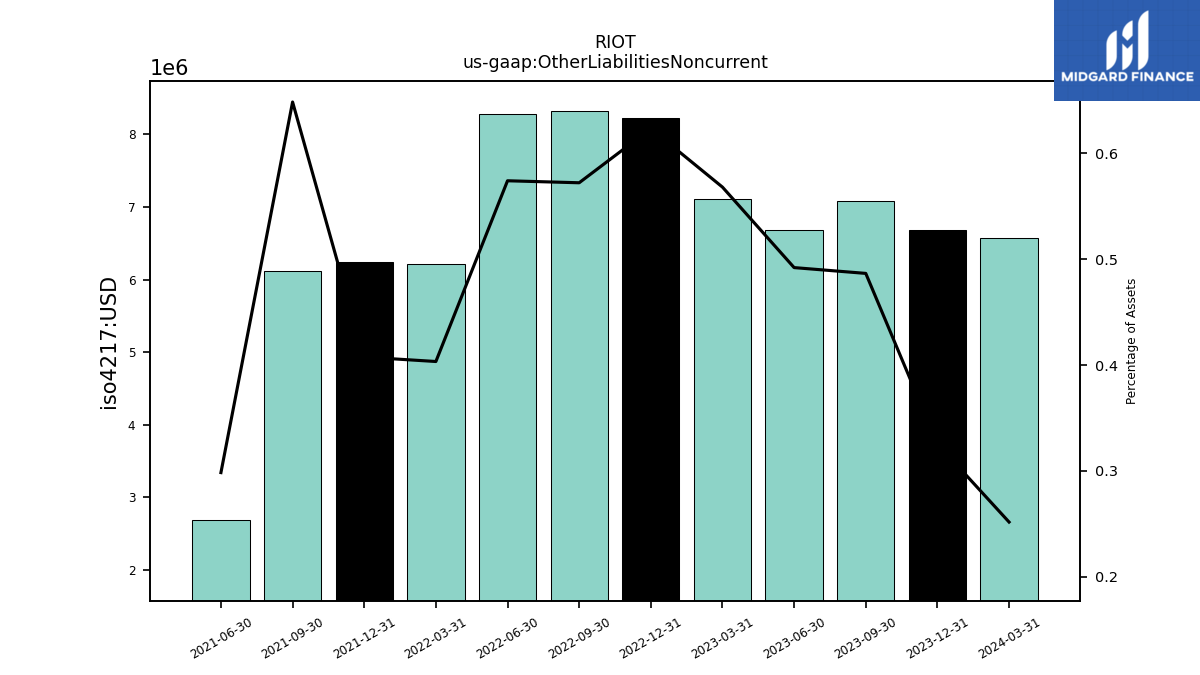
| Other Liabilities Noncurrent | 6.68 | 7.08 | 6.69 | 7.10 | 8.23 | 8.32 | 8.27 | 6.22 | 6.24 | 6.12 | 2.69 | NA | NA | NA | NA | NA | NA | NA | NA | NA | NA | NA | NA | NA | NA | NA | |
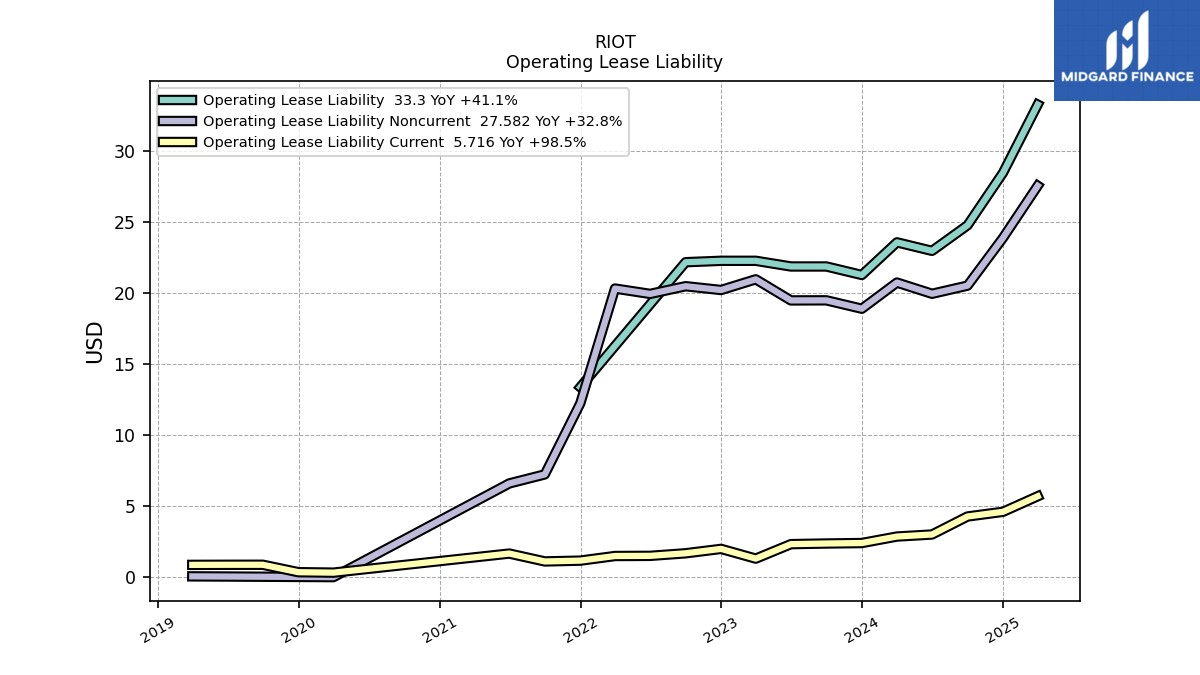
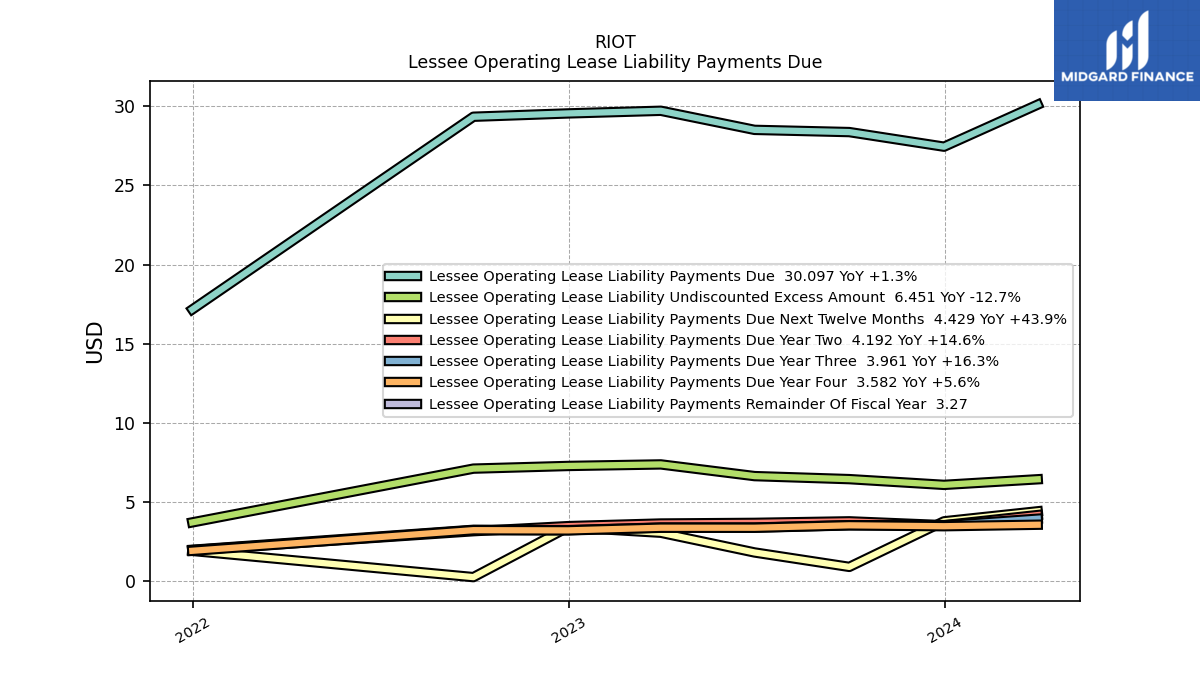
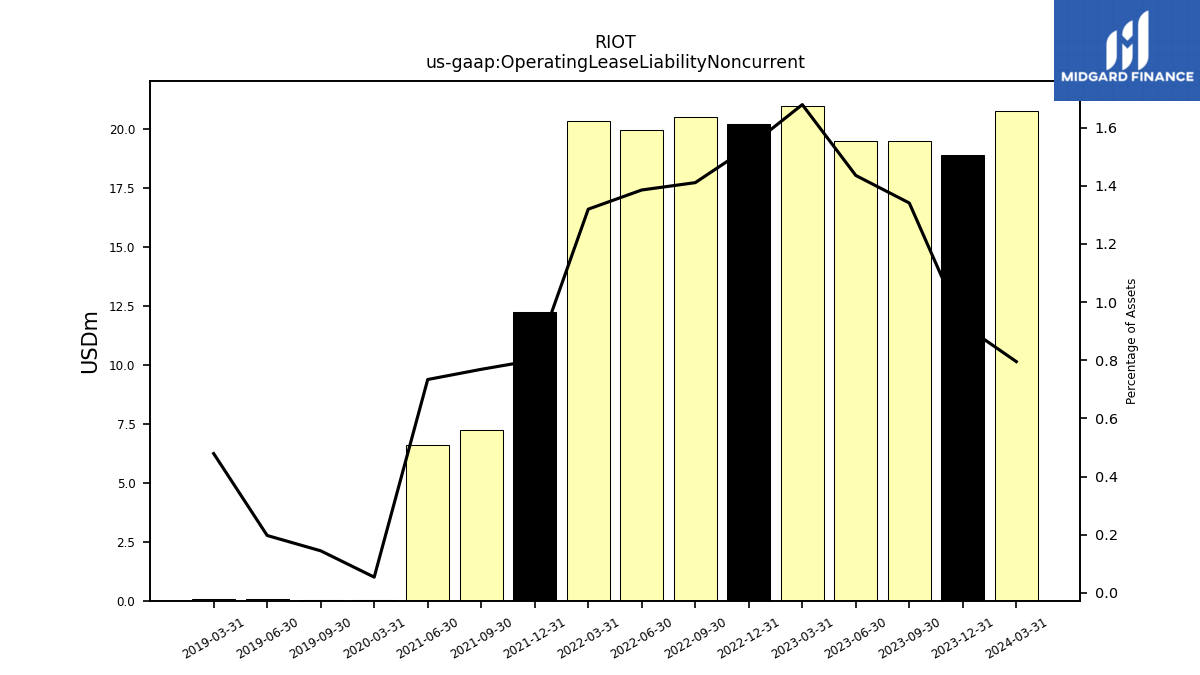
| Operating Lease Liability Noncurrent | 18.92 | 19.52 | 19.51 | 21.00 | 20.24 | 20.51 | 19.97 | 20.35 | 12.26 | 7.25 | 6.62 | NA | NA | 0.02 | NA | 0.05 | 0.06 | 0.07 | NA | NA | NA | NA | NA | NA | NA | NA |
| 2023-12-31 | 2023-09-30 | 2023-06-30 | 2023-03-31 | 2022-12-31 | 2022-09-30 | 2022-06-30 | 2022-03-31 | 2021-12-31 | 2021-09-30 | 2021-06-30 | 2021-03-31 | 2020-06-30 | 2020-03-31 | 2019-12-31 | 2019-09-30 | 2019-06-30 | 2019-03-31 | 2018-12-31 | 2018-09-30 | 2018-06-30 | 2018-03-31 | 2017-12-31 | 2017-09-30 | 2017-06-30 | 2017-03-31 | ||
|---|---|---|---|---|---|---|---|---|---|---|---|---|---|---|---|---|---|---|---|---|---|---|---|---|---|---|---|
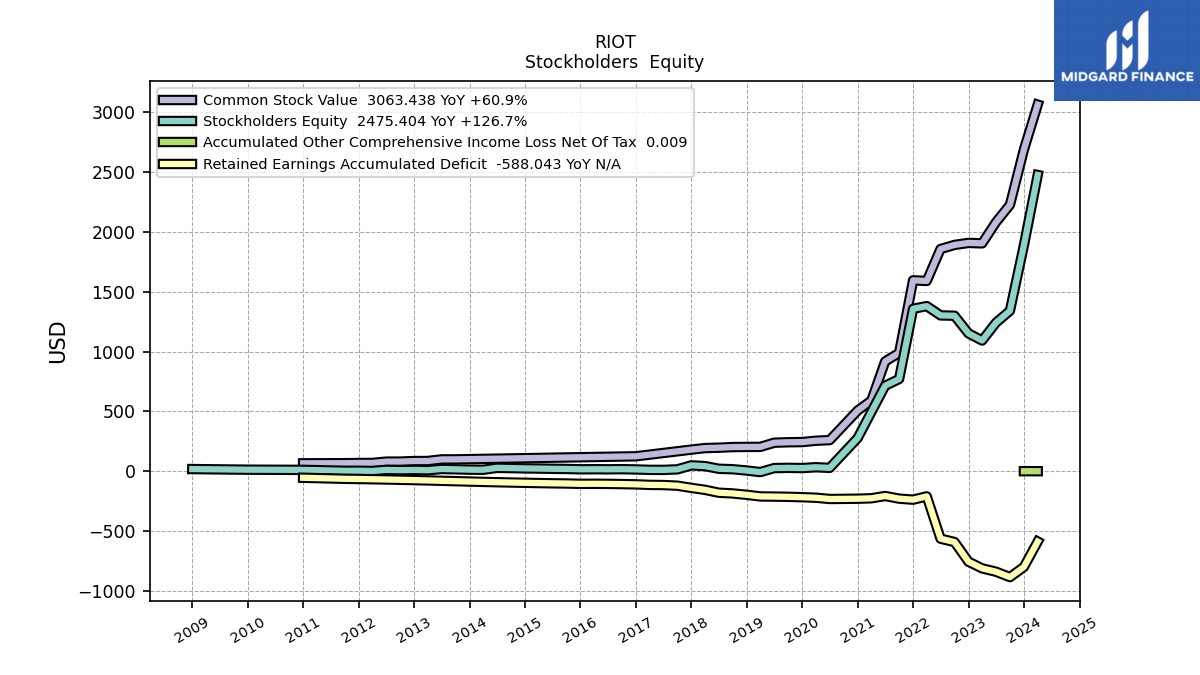
| Stockholders Equity | 1888.02 | 1340.70 | 1240.91 | 1092.14 | 1151.44 | 1299.37 | 1302.07 | 1379.68 | 1357.32 | 770.32 | 714.16 | NA | 27.82 | 33.24 | 26.24 | 28.16 | 26.10 | -7.25 | 5.79 | 16.55 | 20.50 | 42.65 | 48.87 | 15.47 | 11.01 | 11.41 | |
| Common Stock Value | 2687.69 | 2225.74 | 2080.63 | 1904.17 | 1907.78 | 1890.98 | 1857.11 | 1589.89 | 1595.15 | 988.69 | 917.20 | 590.19 | 259.90 | 254.73 | 243.46 | 241.97 | 238.08 | 203.41 | 202.92 | 201.79 | 196.40 | 193.34 | 180.39 | NA | NA | NA | |
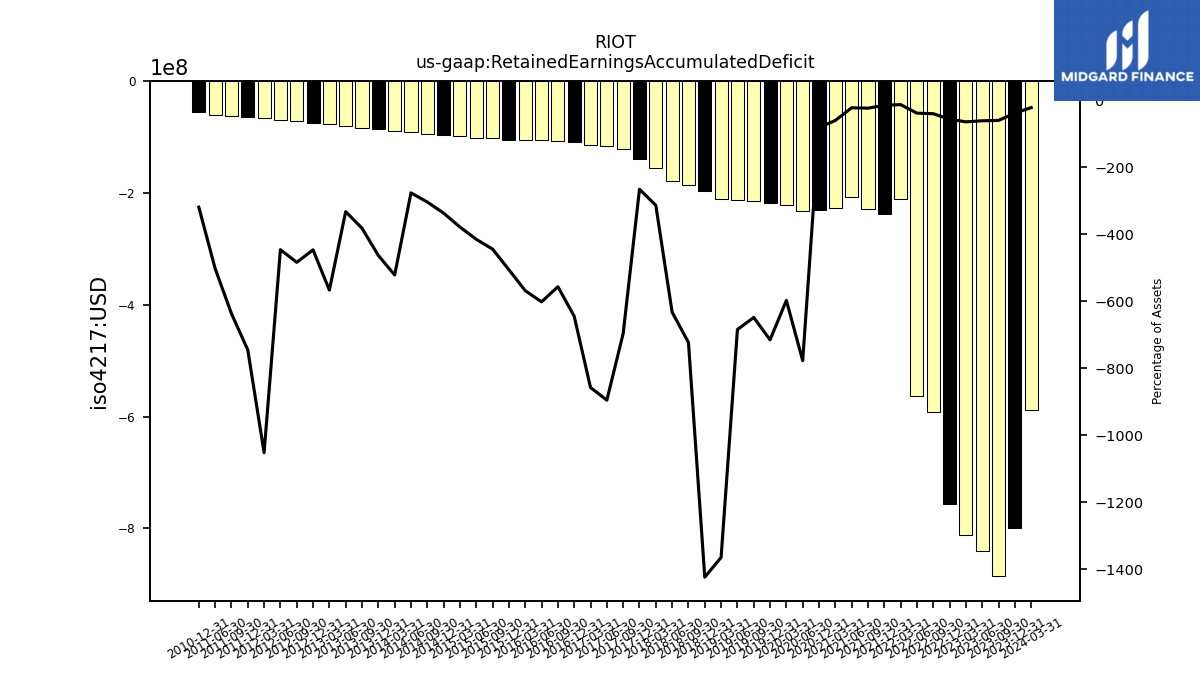
| Retained Earnings Accumulated Deficit | -799.82 | -885.04 | -839.72 | -812.03 | -756.34 | -591.61 | -563.77 | -210.21 | -237.84 | -229.22 | -207.19 | -226.20 | -232.10 | -221.51 | -217.24 | -213.84 | -212.01 | -210.73 | -197.20 | -185.80 | -179.63 | -155.61 | -139.26 | -120.82 | -115.52 | -114.21 | |
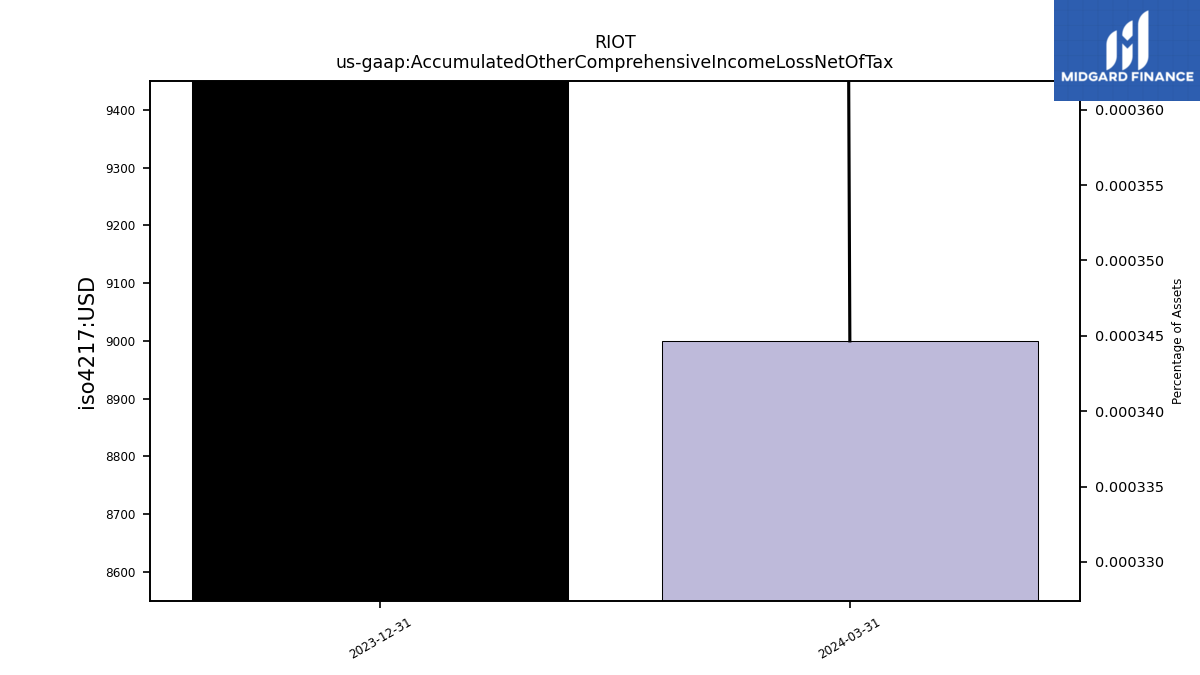
| Accumulated Other Comprehensive Income Loss Net Of Tax | 0.15 | NA | NA | NA | NA | NA | NA | NA | NA | NA | NA | NA | NA | NA | NA | NA | NA | NA | NA | NA | NA | NA | NA | NA | NA | NA | |
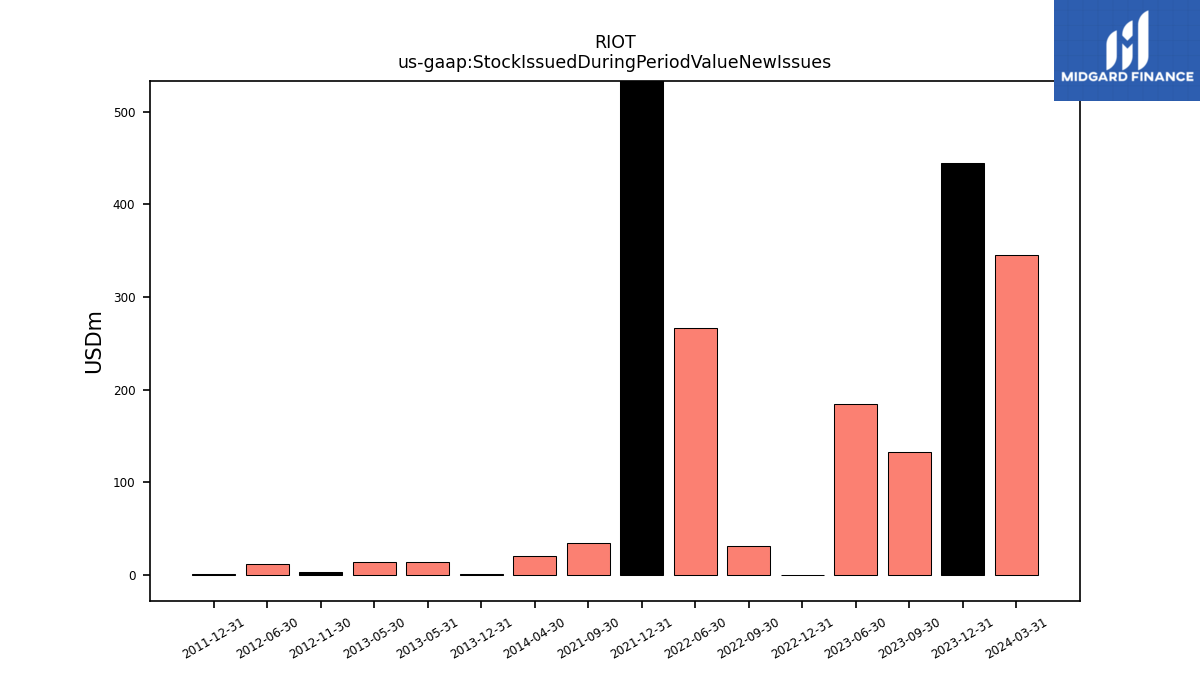
| Stock Issued During Period Value New Issues | 444.54 | 132.57 | 184.66 | NA | -0.18 | 31.37 | 267.02 | NA | 552.45 | 34.79 | NA | NA | NA | NA | NA | NA | NA | NA | NA | NA | NA | NA | NA | NA | NA | NA |
| 2023-12-31 | 2023-09-30 | 2023-06-30 | 2023-03-31 | 2022-12-31 | 2022-09-30 | 2022-06-30 | 2022-03-31 | 2021-12-31 | 2021-09-30 | 2021-06-30 | 2021-03-31 | 2020-06-30 | 2020-03-31 | 2019-12-31 | 2019-09-30 | 2019-06-30 | 2019-03-31 | 2018-12-31 | 2018-09-30 | 2018-06-30 | 2018-03-31 | 2017-12-31 | 2017-09-30 | 2017-06-30 | 2017-03-31 | ||
|---|---|---|---|---|---|---|---|---|---|---|---|---|---|---|---|---|---|---|---|---|---|---|---|---|---|---|---|
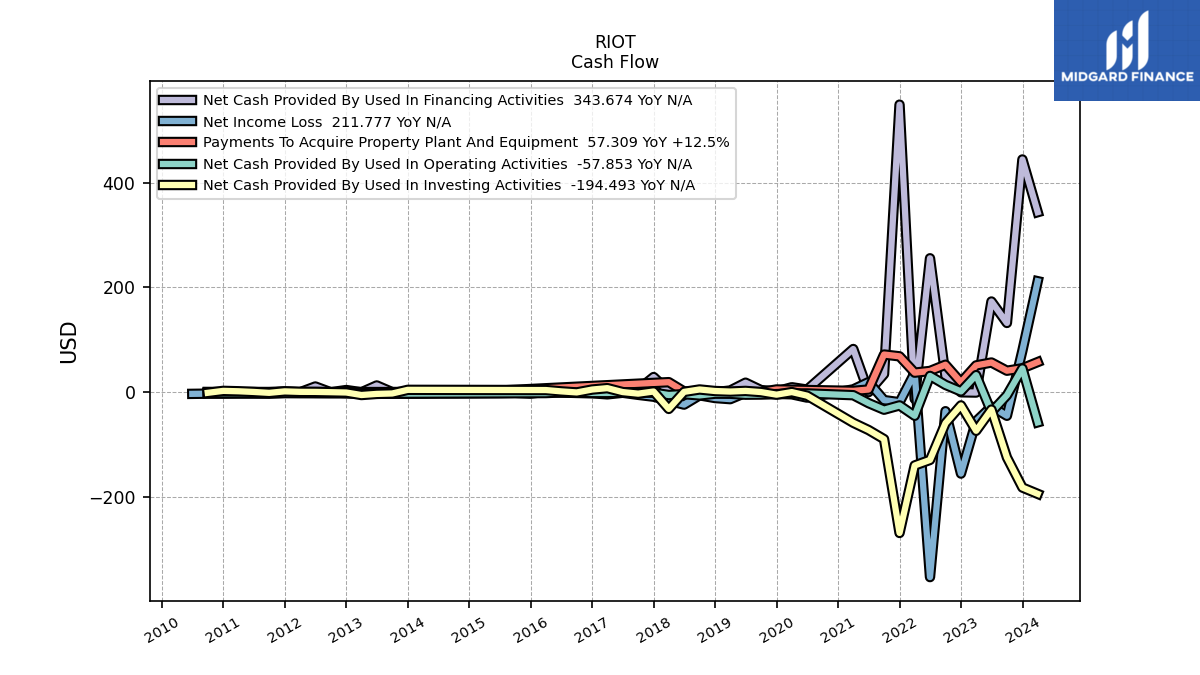
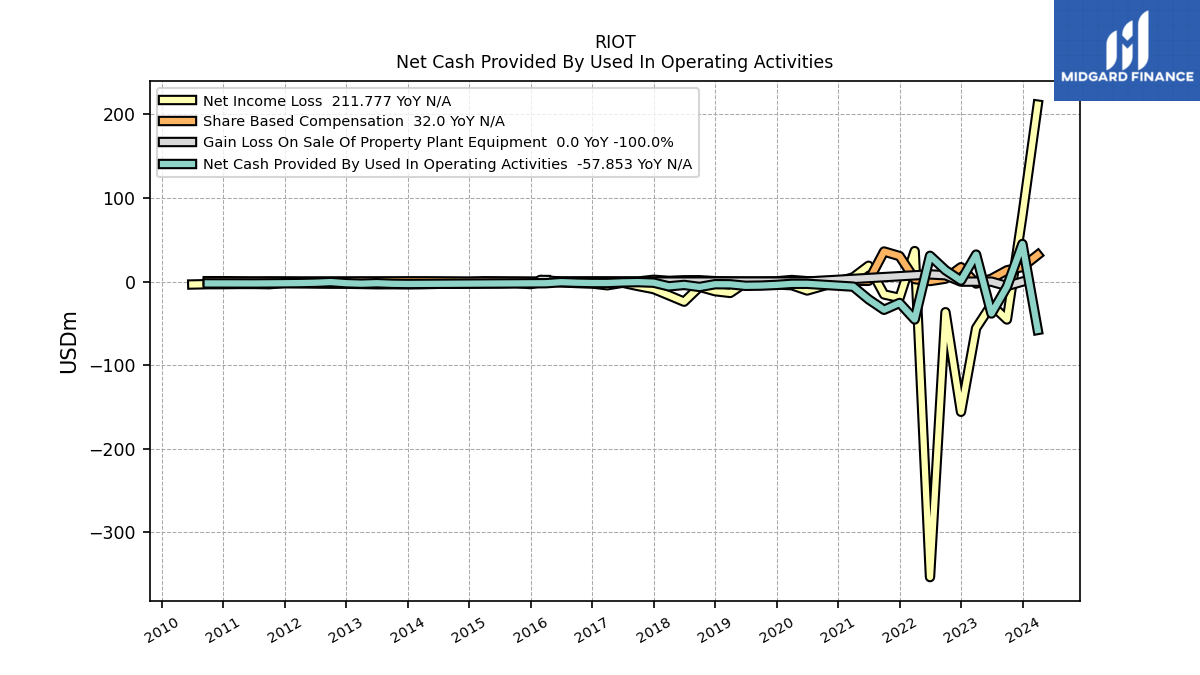
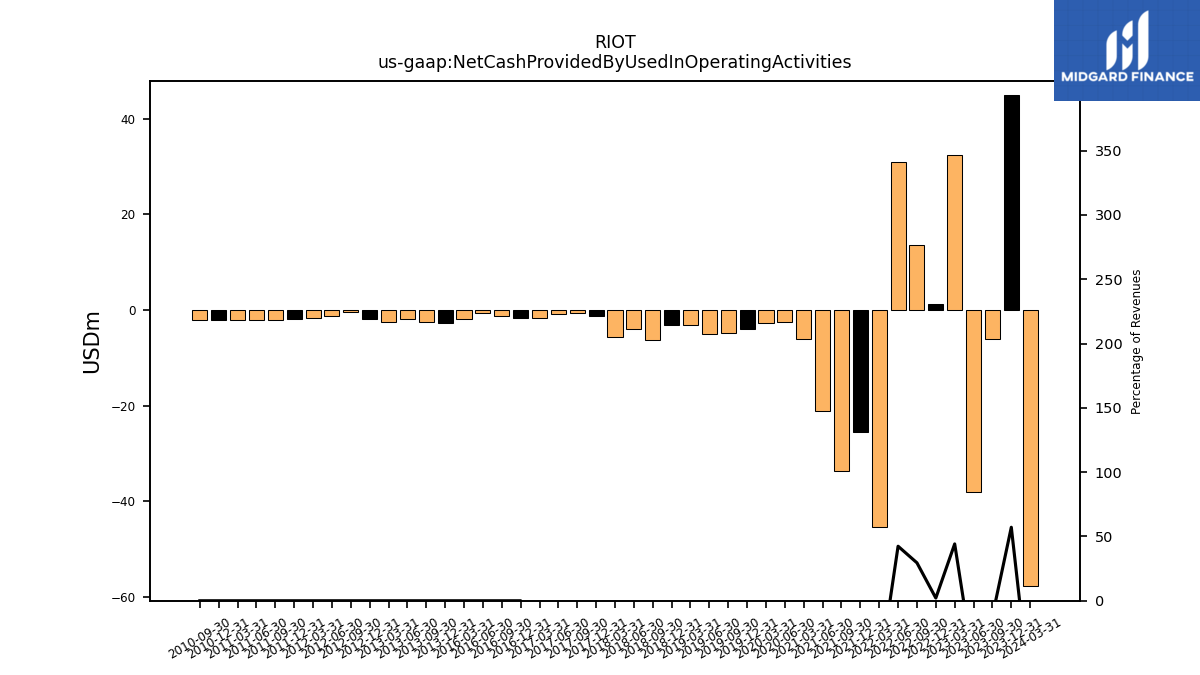
| Net Cash Provided By Used In Operating Activities | 45.03 | -6.17 | -38.15 | 32.36 | 1.27 | 13.65 | 30.93 | -45.32 | -25.50 | -33.71 | -21.17 | -5.99 | -2.63 | -2.66 | -3.93 | -4.75 | -5.00 | -3.18 | -3.09 | -6.38 | -3.95 | -5.63 | -1.28 | -0.59 | -0.91 | -1.66 | |
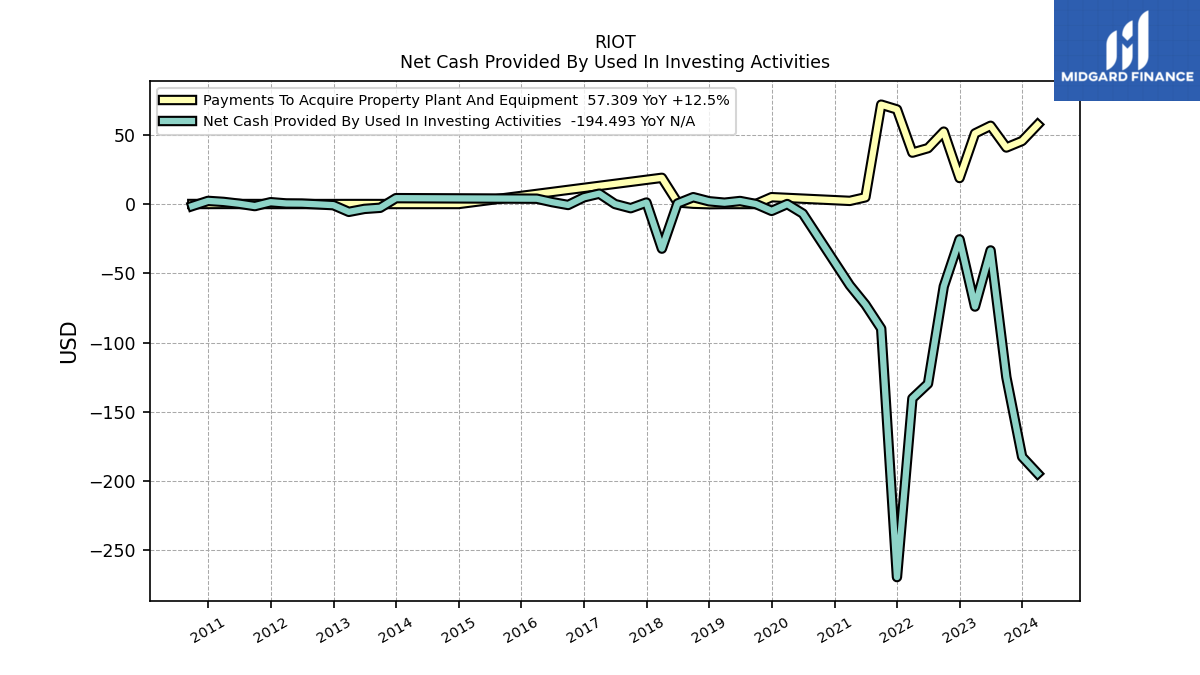
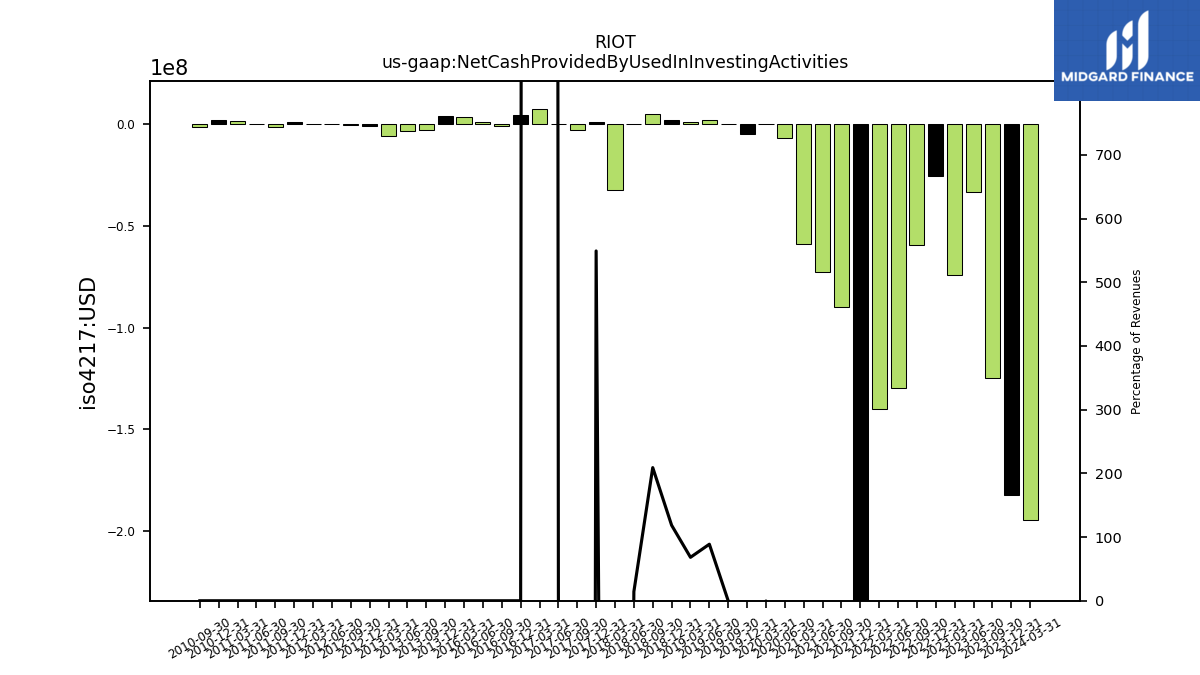
| Net Cash Provided By Used In Investing Activities | -182.38 | -124.93 | -33.47 | -73.99 | -25.47 | -59.48 | -129.66 | -140.27 | -269.22 | -89.90 | -72.55 | -58.66 | -6.89 | -0.01 | -4.96 | -0.00 | 2.19 | 0.98 | 2.00 | 4.95 | 0.40 | -32.21 | 1.08 | -3.00 | 0.00 | 7.49 | |
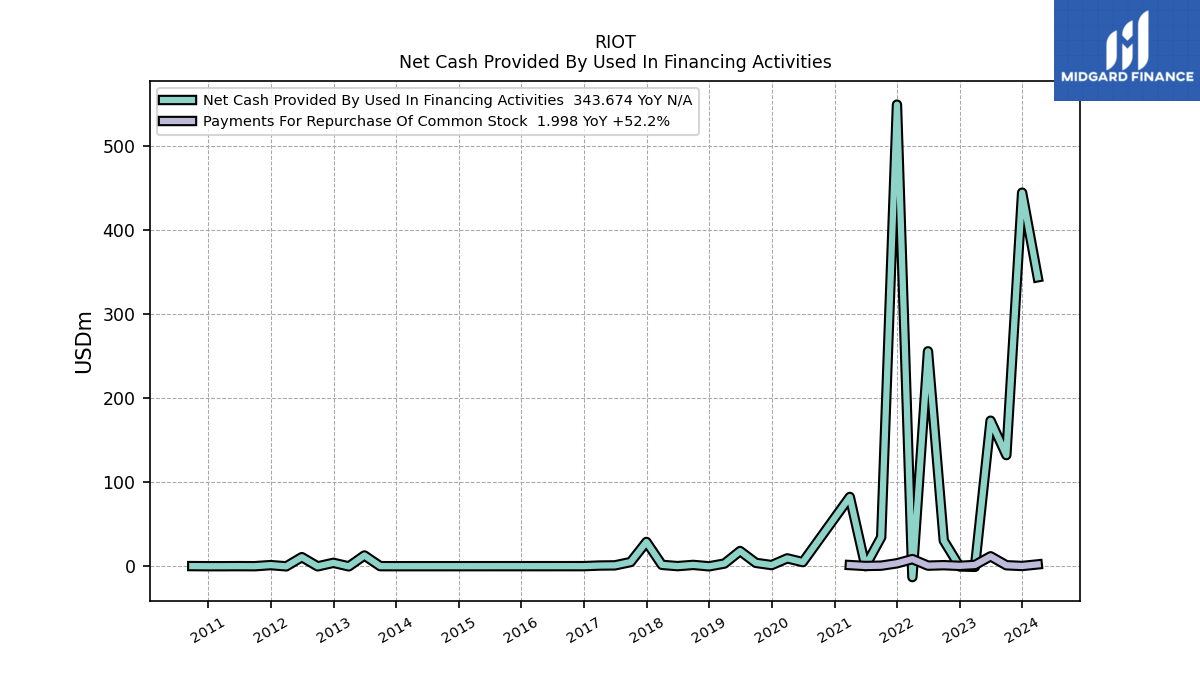
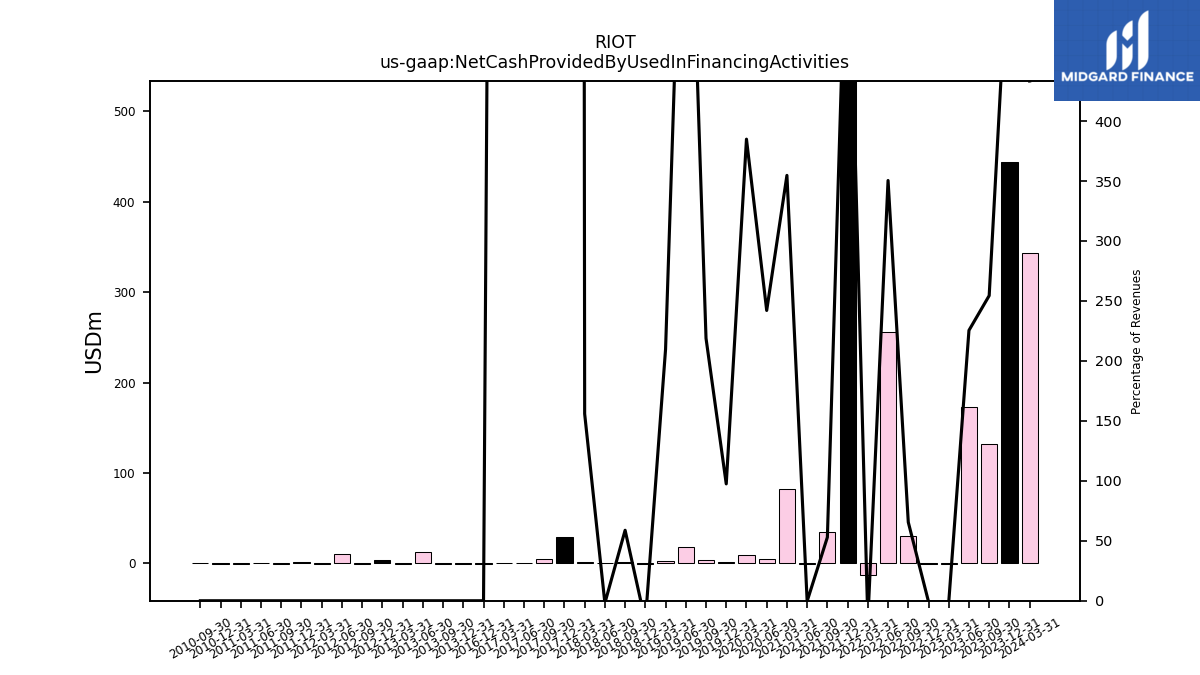
| Net Cash Provided By Used In Financing Activities | 444.41 | 132.03 | 173.02 | -0.93 | -0.45 | 30.31 | 255.63 | -13.15 | 549.16 | 34.31 | -0.11 | 82.28 | 4.70 | 9.18 | 1.17 | 3.81 | 17.90 | 3.00 | -0.29 | 1.39 | -0.05 | 1.44 | 28.71 | 4.80 | 0.86 | 0.62 |
| 2023-12-31 | 2023-09-30 | 2023-06-30 | 2023-03-31 | 2022-12-31 | 2022-09-30 | 2022-06-30 | 2022-03-31 | 2021-12-31 | 2021-09-30 | 2021-06-30 | 2021-03-31 | 2020-06-30 | 2020-03-31 | 2019-12-31 | 2019-09-30 | 2019-06-30 | 2019-03-31 | 2018-12-31 | 2018-09-30 | 2018-06-30 | 2018-03-31 | 2017-12-31 | 2017-09-30 | 2017-06-30 | 2017-03-31 | ||
|---|---|---|---|---|---|---|---|---|---|---|---|---|---|---|---|---|---|---|---|---|---|---|---|---|---|---|---|
| Net Cash Provided By Used In Operating Activities | 45.03 | -6.17 | -38.15 | 32.36 | 1.27 | 13.65 | 30.93 | -45.32 | -25.50 | -33.71 | -21.17 | -5.99 | -2.63 | -2.66 | -3.93 | -4.75 | -5.00 | -3.18 | -3.09 | -6.38 | -3.95 | -5.63 | -1.28 | -0.59 | -0.91 | -1.66 | |
| Net Income Loss | 79.23 | -45.33 | -27.69 | -55.69 | -155.78 | -36.57 | -353.56 | 36.58 | -19.45 | -15.34 | 19.01 | 5.16 | -10.59 | -4.28 | -3.40 | -1.83 | -1.28 | -13.53 | -11.41 | -6.23 | -24.02 | -16.35 | -8.88 | -5.30 | -1.31 | -4.35 | |
| Profit Loss | 79.23 | -45.33 | -27.69 | -55.69 | -155.78 | -36.57 | -353.56 | 36.58 | -19.45 | -15.34 | 19.01 | 5.16 | -10.59 | -4.28 | -3.44 | -1.83 | -1.28 | -13.75 | -12.69 | -6.53 | -24.43 | -16.57 | -9.00 | -5.30 | -1.31 | -4.35 | |
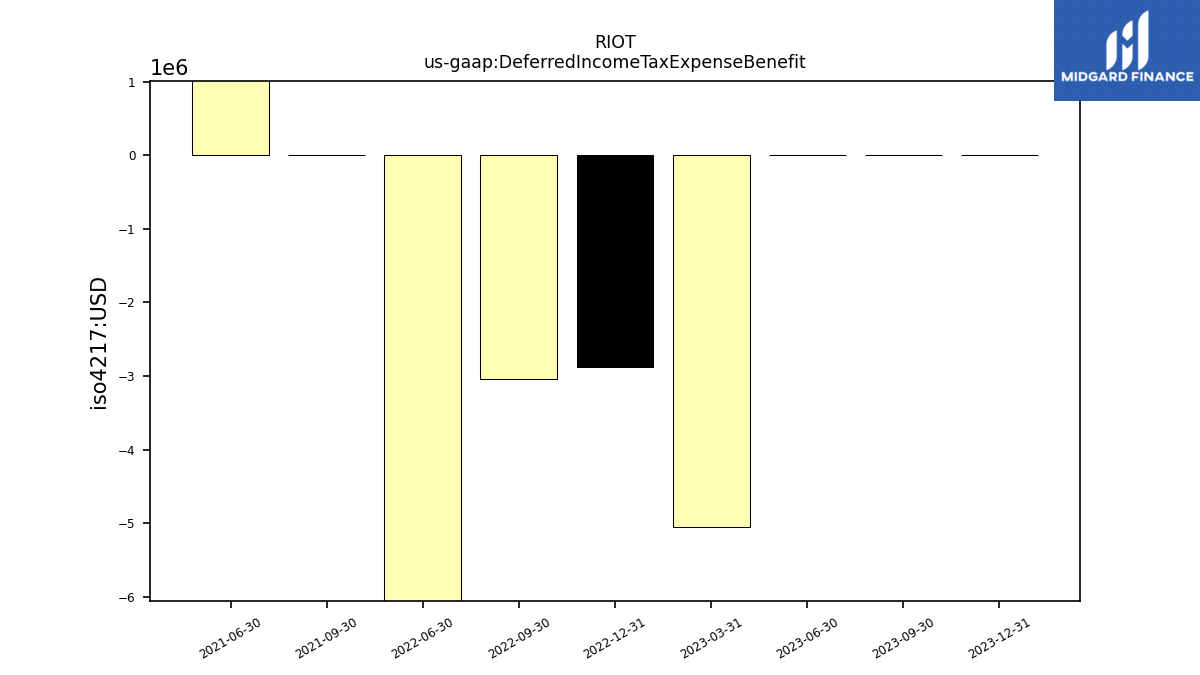
| Deferred Income Tax Expense Benefit | 0.00 | 0.00 | 0.00 | -5.04 | -2.87 | -3.04 | -6.63 | NA | NA | 0.00 | 3.73 | NA | NA | NA | NA | NA | NA | NA | NA | NA | NA | NA | NA | NA | NA | NA | |
| Share Based Compensation | 17.52 | 13.52 | 3.43 | -2.30 | 17.25 | 3.56 | 0.70 | 3.04 | 30.56 | 36.02 | 0.97 | 0.94 | 0.47 | 1.91 | 0.31 | 0.08 | 0.12 | 0.24 | 0.51 | 1.66 | 1.61 | 0.88 | 2.21 | 0.11 | 0.14 | 0.13 |
| 2023-12-31 | 2023-09-30 | 2023-06-30 | 2023-03-31 | 2022-12-31 | 2022-09-30 | 2022-06-30 | 2022-03-31 | 2021-12-31 | 2021-09-30 | 2021-06-30 | 2021-03-31 | 2020-06-30 | 2020-03-31 | 2019-12-31 | 2019-09-30 | 2019-06-30 | 2019-03-31 | 2018-12-31 | 2018-09-30 | 2018-06-30 | 2018-03-31 | 2017-12-31 | 2017-09-30 | 2017-06-30 | 2017-03-31 | ||
|---|---|---|---|---|---|---|---|---|---|---|---|---|---|---|---|---|---|---|---|---|---|---|---|---|---|---|---|
| Net Cash Provided By Used In Investing Activities | -182.38 | -124.93 | -33.47 | -73.99 | -25.47 | -59.48 | -129.66 | -140.27 | -269.22 | -89.90 | -72.55 | -58.66 | -6.89 | -0.01 | -4.96 | -0.00 | 2.19 | 0.98 | 2.00 | 4.95 | 0.40 | -32.21 | 1.08 | -3.00 | 0.00 | 7.49 | |
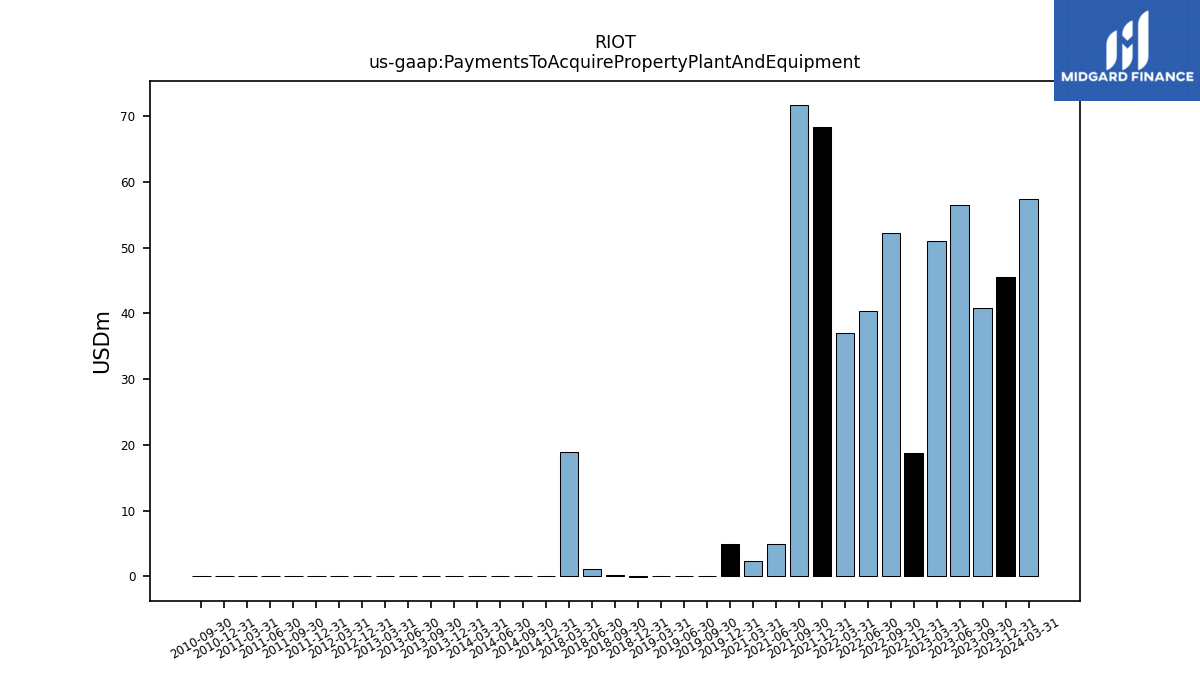
| Payments To Acquire Property Plant And Equipment | 45.49 | 40.78 | 56.47 | 50.95 | 18.74 | 52.27 | 40.32 | 37.08 | 68.26 | 71.73 | 4.86 | 2.27 | NA | NA | 4.95 | 0.00 | 0.00 | 0.00 | -0.12 | 0.23 | 1.16 | 18.92 | NA | NA | NA | NA |
| 2023-12-31 | 2023-09-30 | 2023-06-30 | 2023-03-31 | 2022-12-31 | 2022-09-30 | 2022-06-30 | 2022-03-31 | 2021-12-31 | 2021-09-30 | 2021-06-30 | 2021-03-31 | 2020-06-30 | 2020-03-31 | 2019-12-31 | 2019-09-30 | 2019-06-30 | 2019-03-31 | 2018-12-31 | 2018-09-30 | 2018-06-30 | 2018-03-31 | 2017-12-31 | 2017-09-30 | 2017-06-30 | 2017-03-31 | ||
|---|---|---|---|---|---|---|---|---|---|---|---|---|---|---|---|---|---|---|---|---|---|---|---|---|---|---|---|
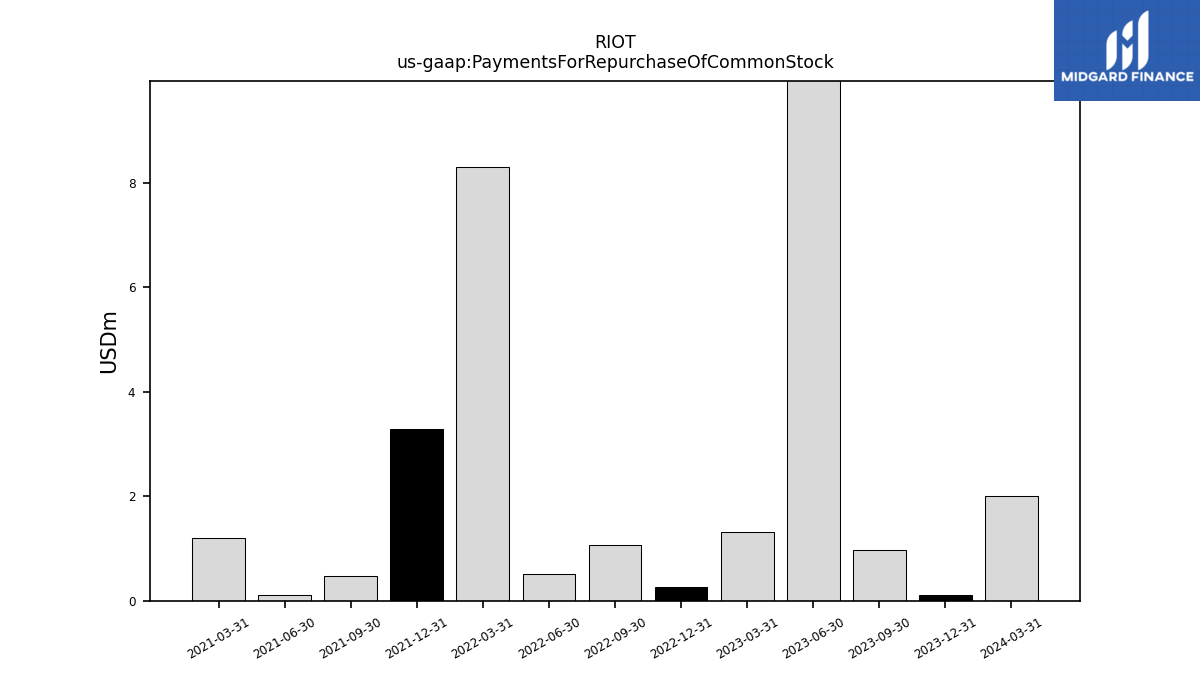
| Net Cash Provided By Used In Financing Activities | 444.41 | 132.03 | 173.02 | -0.93 | -0.45 | 30.31 | 255.63 | -13.15 | 549.16 | 34.31 | -0.11 | 82.28 | 4.70 | 9.18 | 1.17 | 3.81 | 17.90 | 3.00 | -0.29 | 1.39 | -0.05 | 1.44 | 28.71 | 4.80 | 0.86 | 0.62 | |
| Payments For Repurchase Of Common Stock | 0.11 | 0.97 | 11.64 | 1.31 | 0.27 | 1.06 | 0.51 | 8.31 | 3.29 | 0.48 | 0.11 | 1.21 | NA | NA | NA | NA | NA | NA | NA | NA | NA | NA | NA | NA | NA | NA |
| 2023-12-31 | 2023-09-30 | 2023-06-30 | 2023-03-31 | 2022-12-31 | 2022-09-30 | 2022-06-30 | 2022-03-31 | 2021-12-31 | 2021-09-30 | 2021-06-30 | 2021-03-31 | 2020-06-30 | 2020-03-31 | 2019-12-31 | 2019-09-30 | 2019-06-30 | 2019-03-31 | 2018-12-31 | 2018-09-30 | 2018-06-30 | 2018-03-31 | 2017-12-31 | 2017-09-30 | 2017-06-30 | 2017-03-31 | ||
|---|---|---|---|---|---|---|---|---|---|---|---|---|---|---|---|---|---|---|---|---|---|---|---|---|---|---|---|
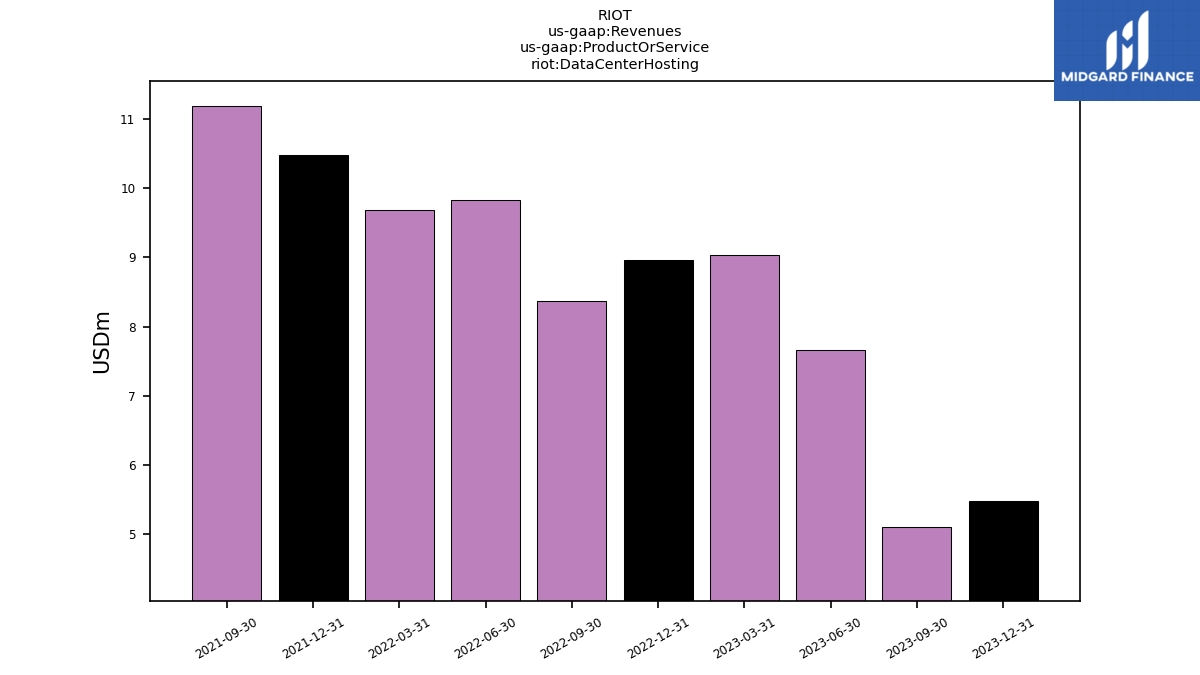
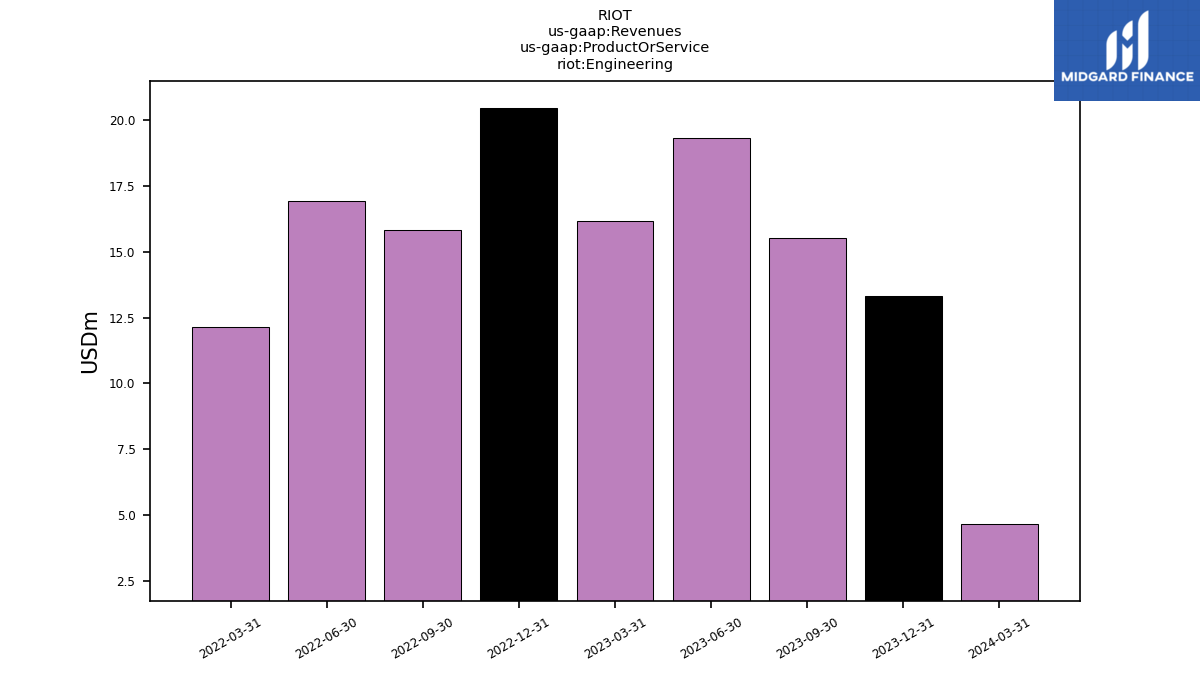
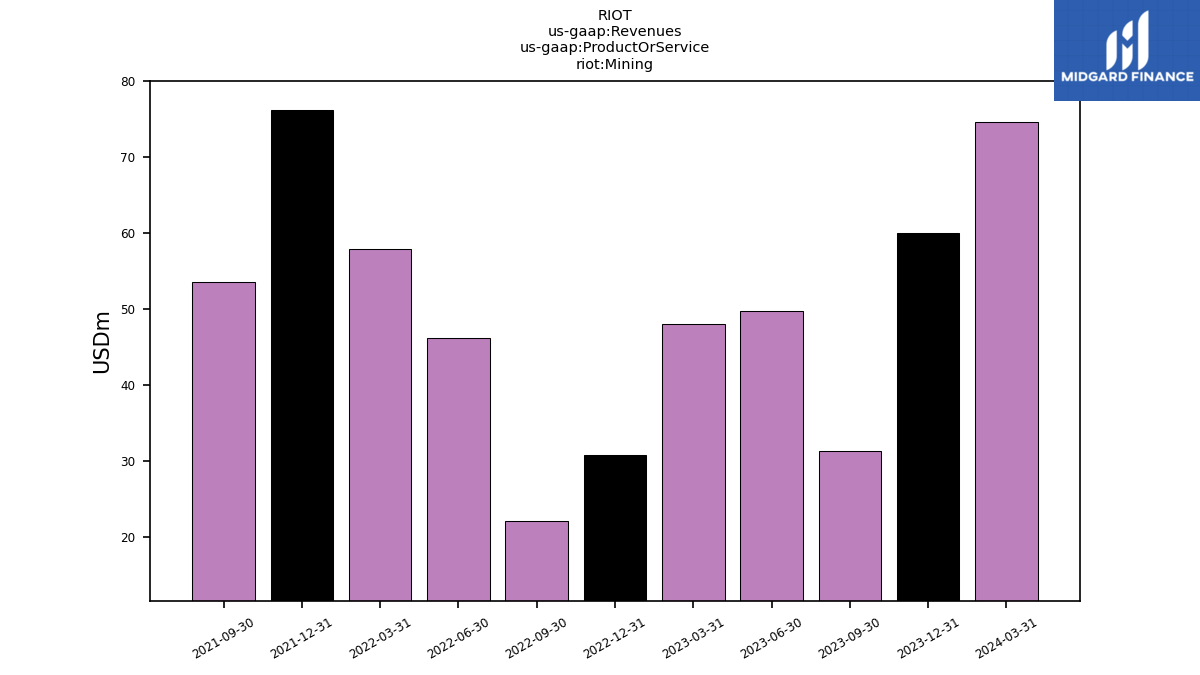
| Revenues | 78.81 | 51.89 | 76.74 | 73.24 | 60.15 | 46.29 | 72.95 | 79.79 | 90.89 | 64.81 | 34.35 | 23.20 | 1.94 | 2.39 | 1.20 | 1.74 | 2.47 | 1.43 | 1.69 | 2.37 | 2.79 | 0.93 | 0.20 | 0.02 | 0.02 | 0.02 | |
| Data Center Hosting | 5.47 | 5.11 | 7.66 | 9.04 | 8.96 | 8.37 | 9.83 | 9.69 | 10.48 | 11.19 | NA | NA | NA | NA | NA | NA | NA | NA | NA | NA | NA | NA | NA | NA | NA | NA | |
| Engineering | 13.31 | 15.54 | 19.31 | 16.15 | 20.46 | 15.82 | 16.94 | 12.12 | NA | NA | NA | NA | NA | NA | NA | NA | NA | NA | NA | NA | NA | NA | NA | NA | NA | NA | |
| Mining | 60.01 | 31.22 | 49.74 | 48.02 | 30.70 | 22.07 | 46.15 | 57.95 | 76.21 | 53.59 | NA | NA | NA | NA | NA | NA | NA | NA | NA | NA | NA | NA | NA | NA | NA | NA | |
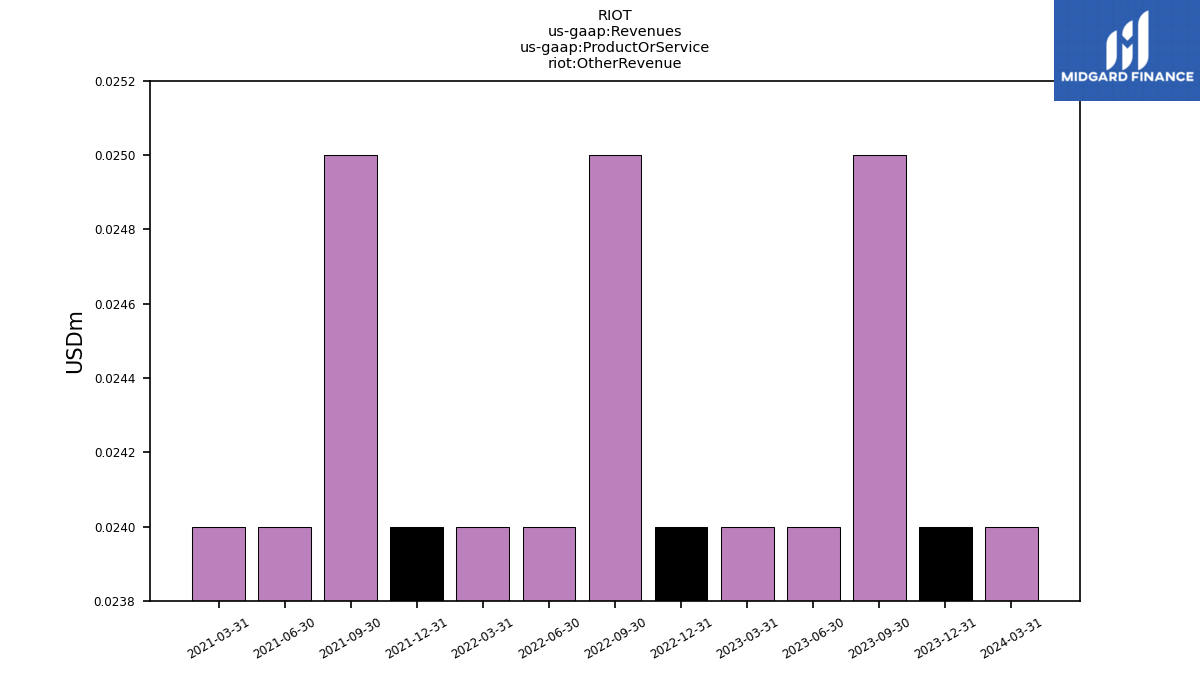
| Other Revenue | 0.02 | 0.03 | 0.02 | 0.02 | 0.02 | 0.03 | 0.02 | 0.02 | 0.02 | 0.03 | 0.02 | 0.02 | NA | NA | NA | NA | NA | NA | NA | NA | NA | NA | NA | NA | NA | NA |