
| 2023-09-30 | 2023-06-30 | 2023-03-31 | 2022-12-31 | 2022-09-30 | 2022-06-30 | 2022-03-31 | 2021-12-31 | 2021-09-30 | ||
|---|---|---|---|---|---|---|---|---|---|---|
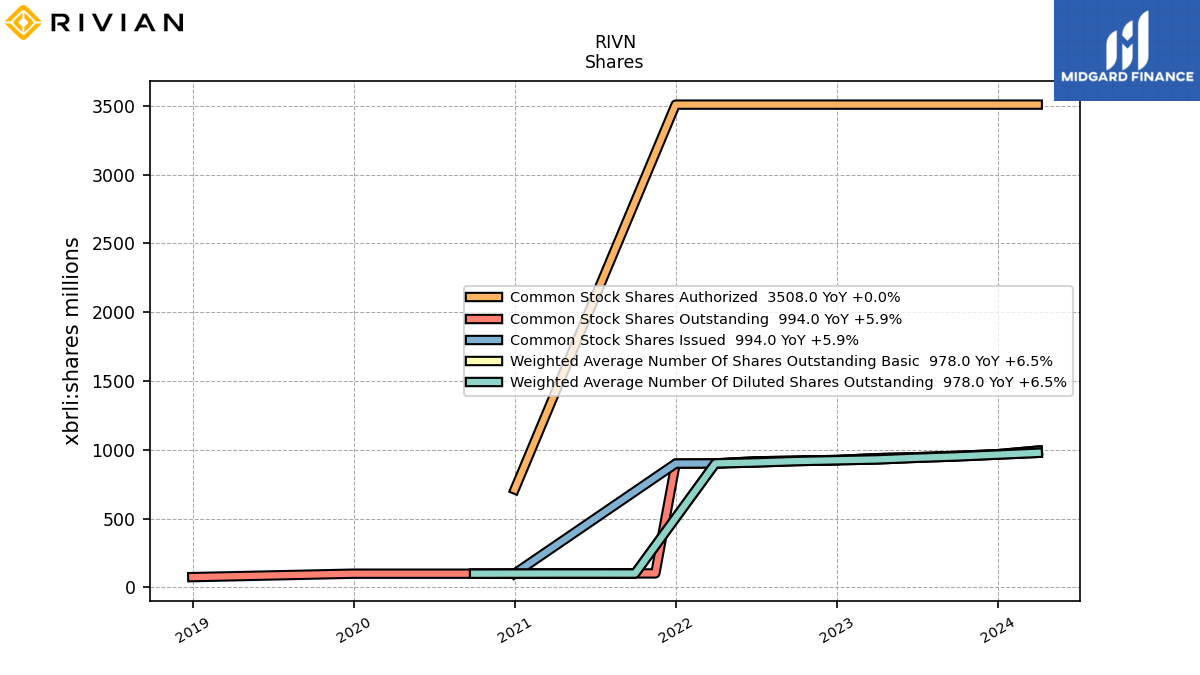
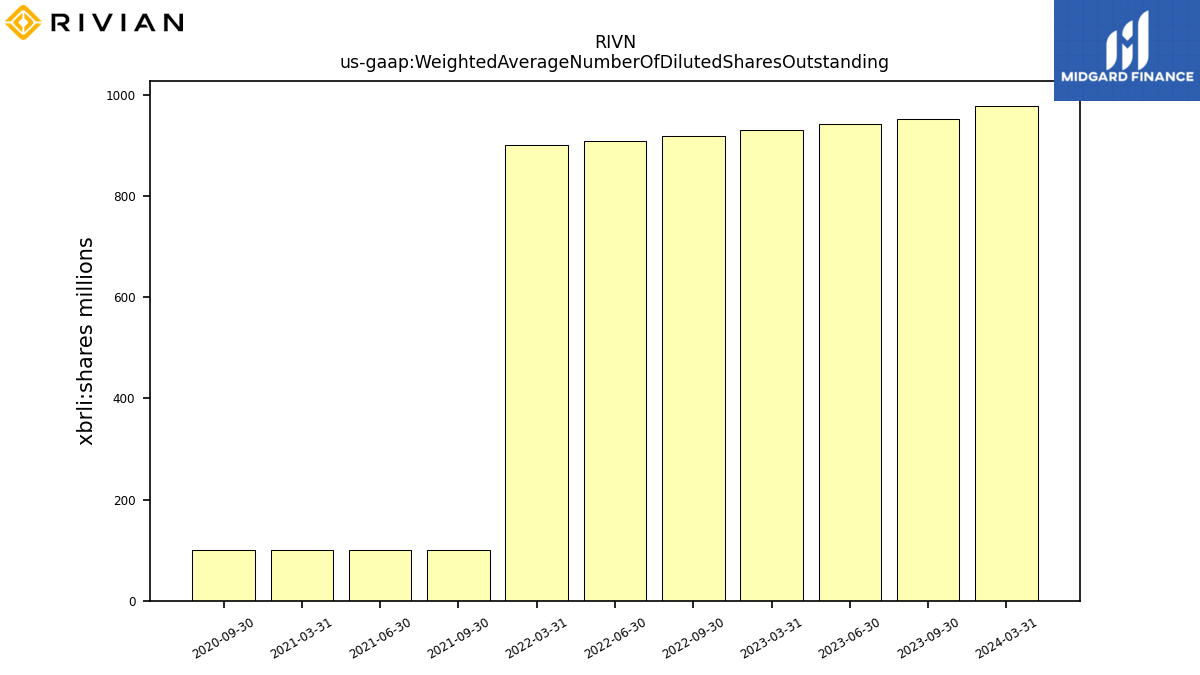
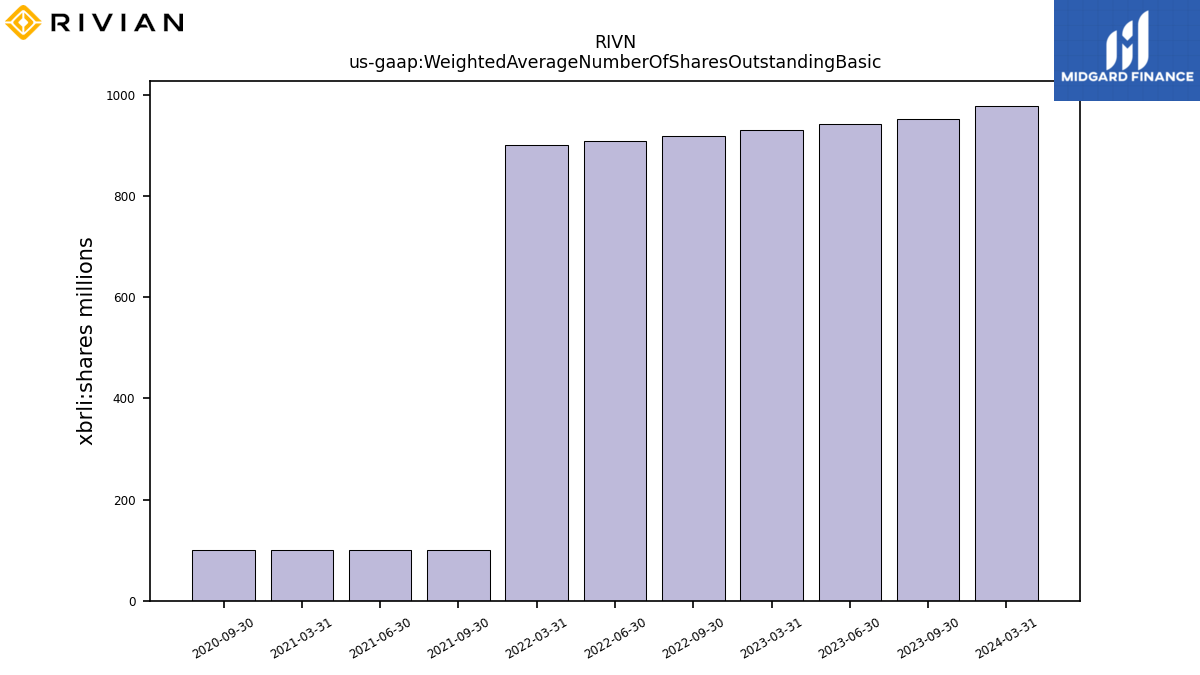
| Weighted Average Number Of Diluted Shares Outstanding | 952.00 | 942.00 | 930.00 | NA | 918.00 | 908.00 | 901.00 | NA | 101.00 | |
| Weighted Average Number Of Shares Outstanding Basic | 952.00 | 942.00 | 930.00 | NA | 918.00 | 908.00 | 901.00 | NA | 101.00 | |
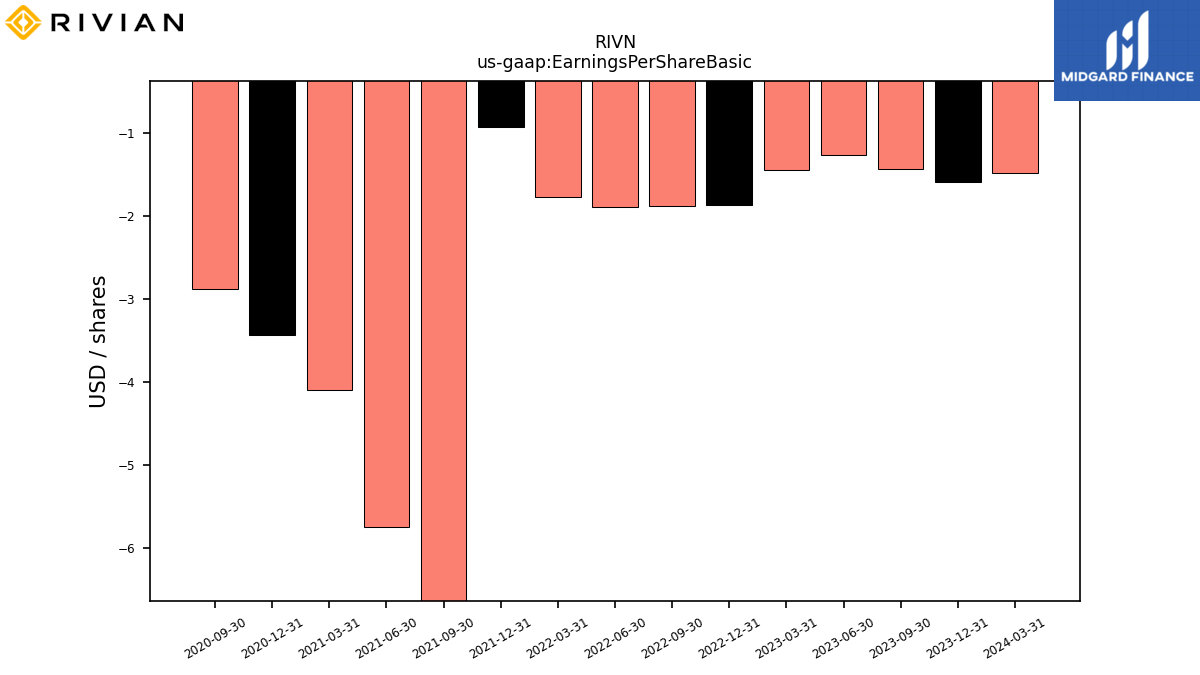
| Earnings Per Share Basic | -1.44 | -1.27 | -1.45 | -1.87 | -1.88 | -1.89 | -1.77 | -0.93 | -12.21 | |
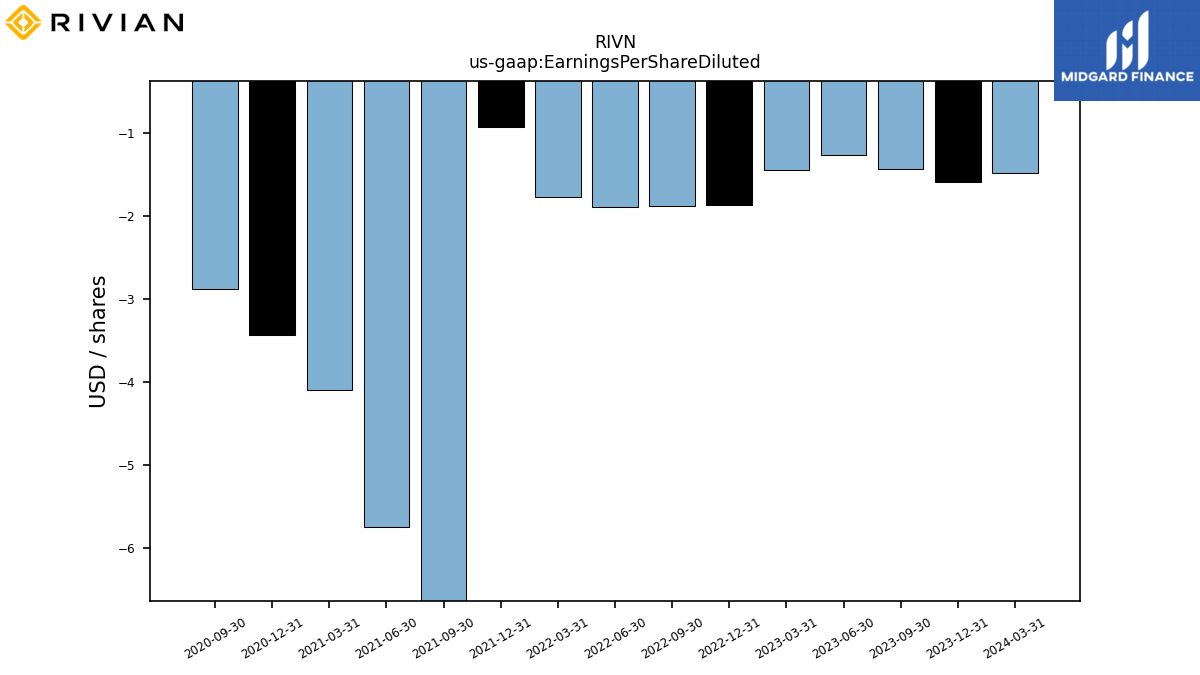
| Earnings Per Share Diluted | -1.44 | -1.27 | -1.45 | -1.87 | -1.88 | -1.89 | -1.77 | -0.93 | -12.21 |
| 2023-09-30 | 2023-06-30 | 2023-03-31 | 2022-12-31 | 2022-09-30 | 2022-06-30 | 2022-03-31 | 2021-12-31 | 2021-09-30 | ||
|---|---|---|---|---|---|---|---|---|---|---|
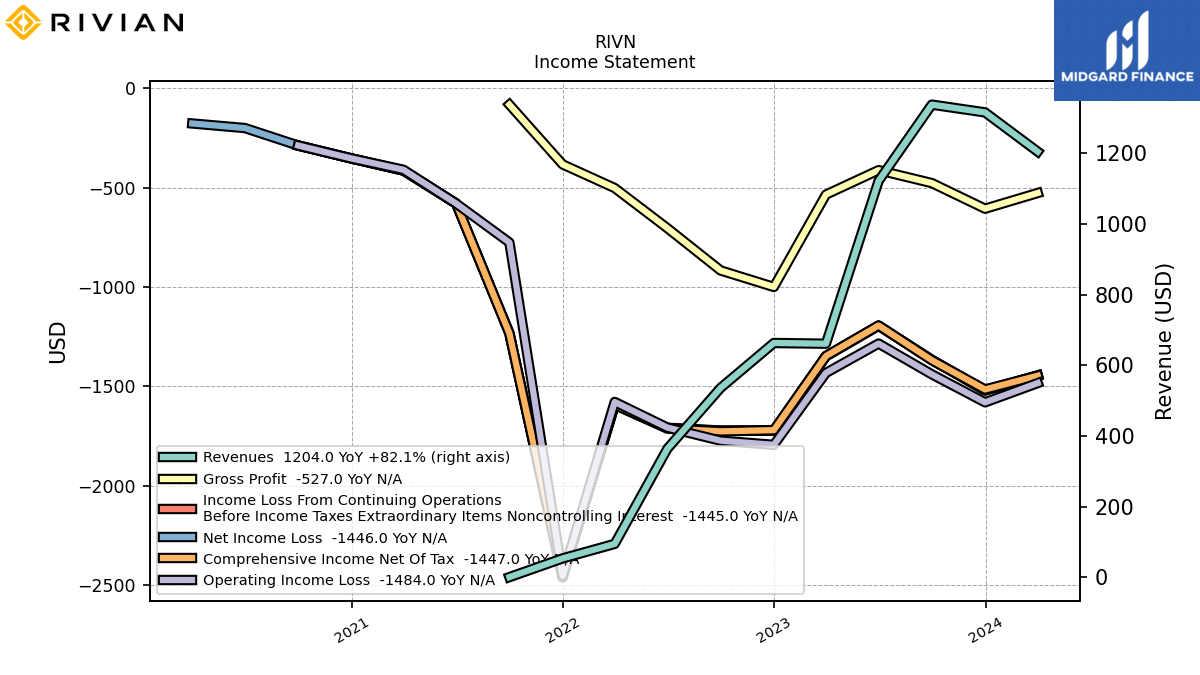
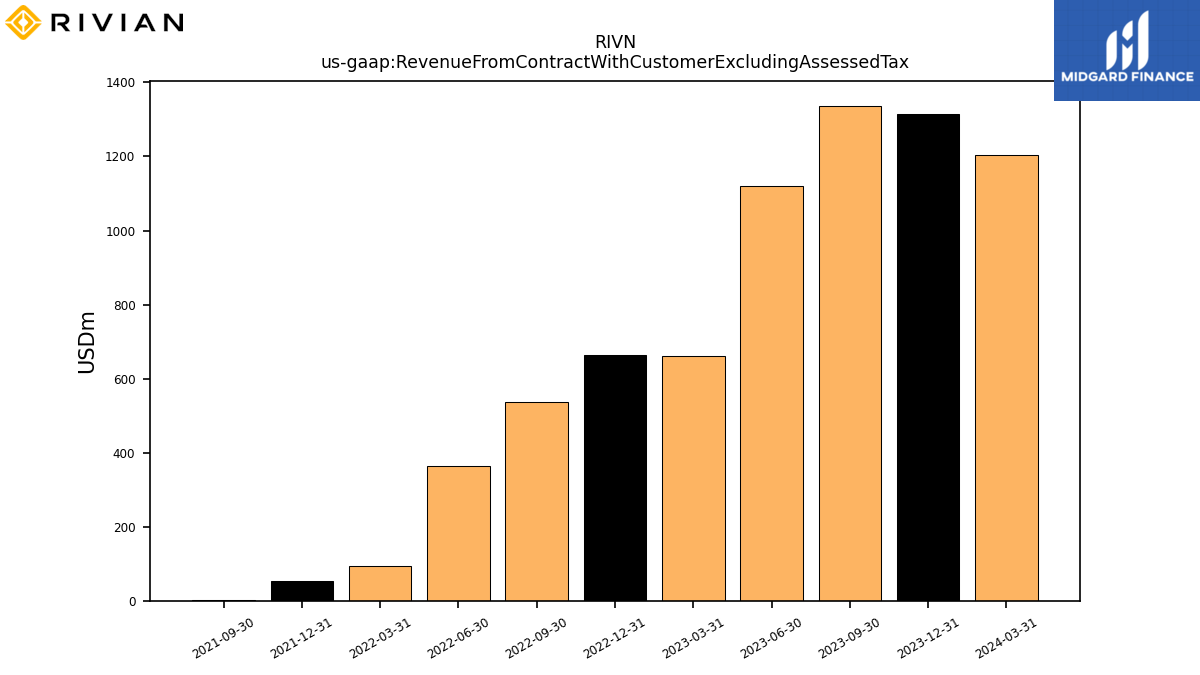
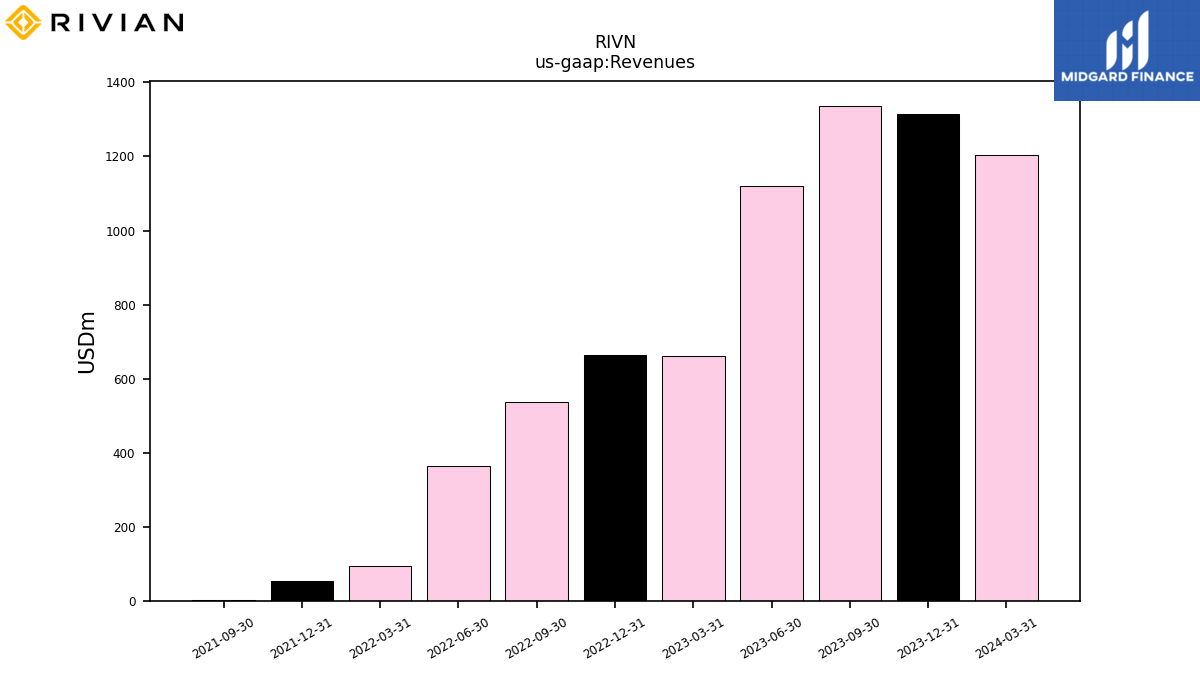
| Revenue From Contract With Customer Excluding Assessed Tax | 1337.00 | 1121.00 | 661.00 | 663.00 | 536.00 | 364.00 | 95.00 | 54.00 | 1.00 | |
| Revenues | 1337.00 | 1121.00 | 661.00 | 663.00 | 536.00 | 364.00 | 95.00 | 54.00 | 1.00 | |
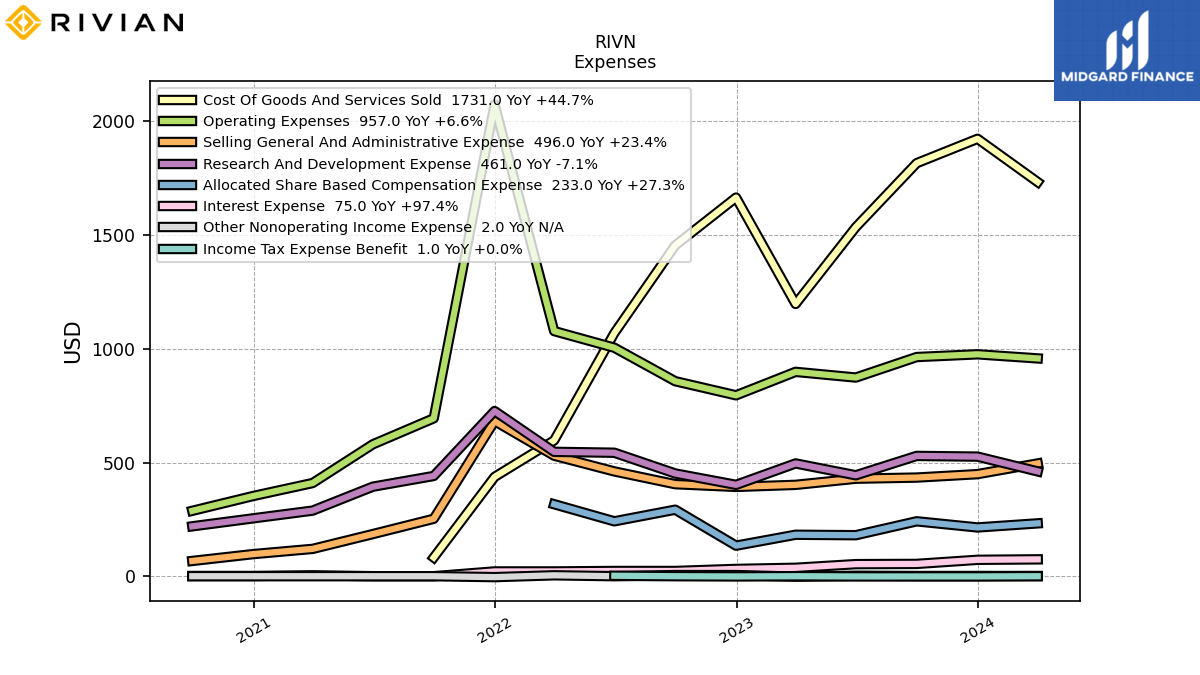
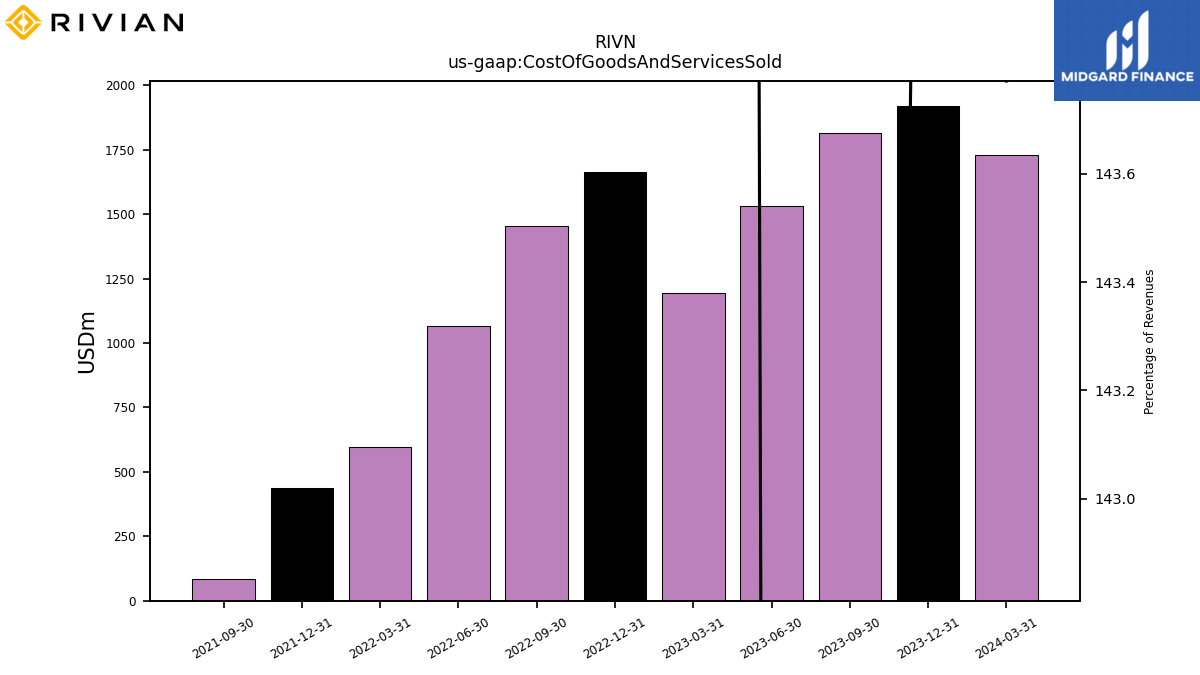
| Cost Of Goods And Services Sold | 1814.00 | 1533.00 | 1196.00 | 1663.00 | 1453.00 | 1068.00 | 597.00 | 437.00 | 83.00 | |
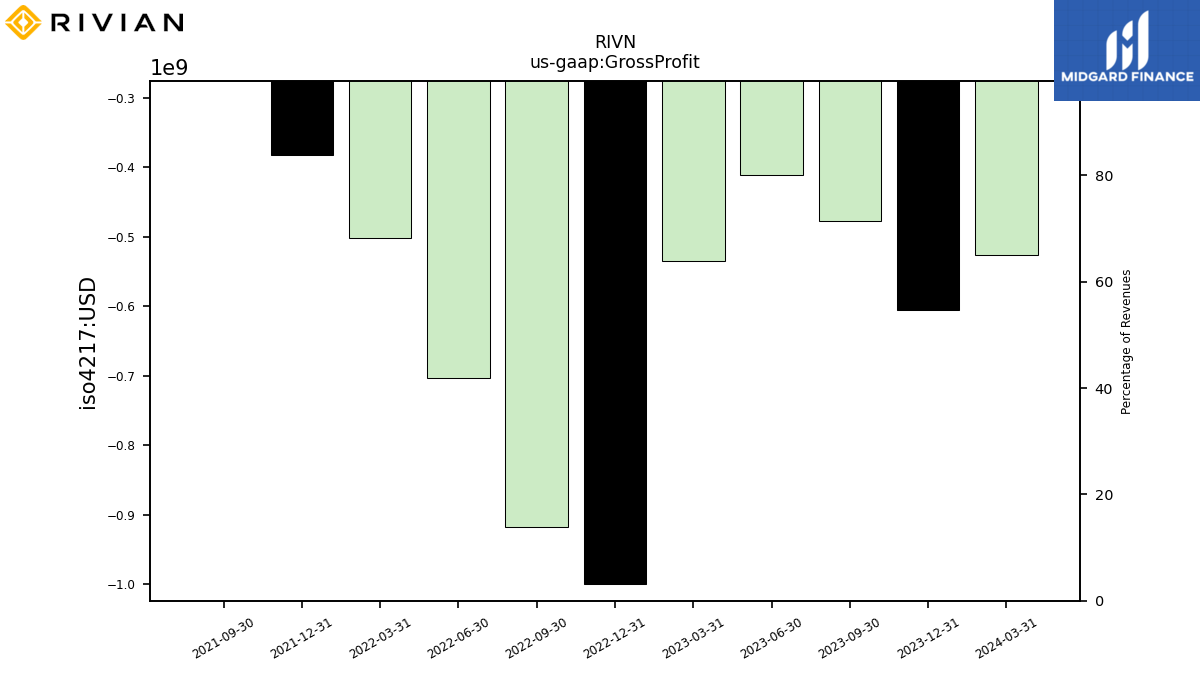
| Gross Profit | -477.00 | -412.00 | -535.00 | -1000.00 | -917.00 | -704.00 | -502.00 | -383.00 | -82.00 | |
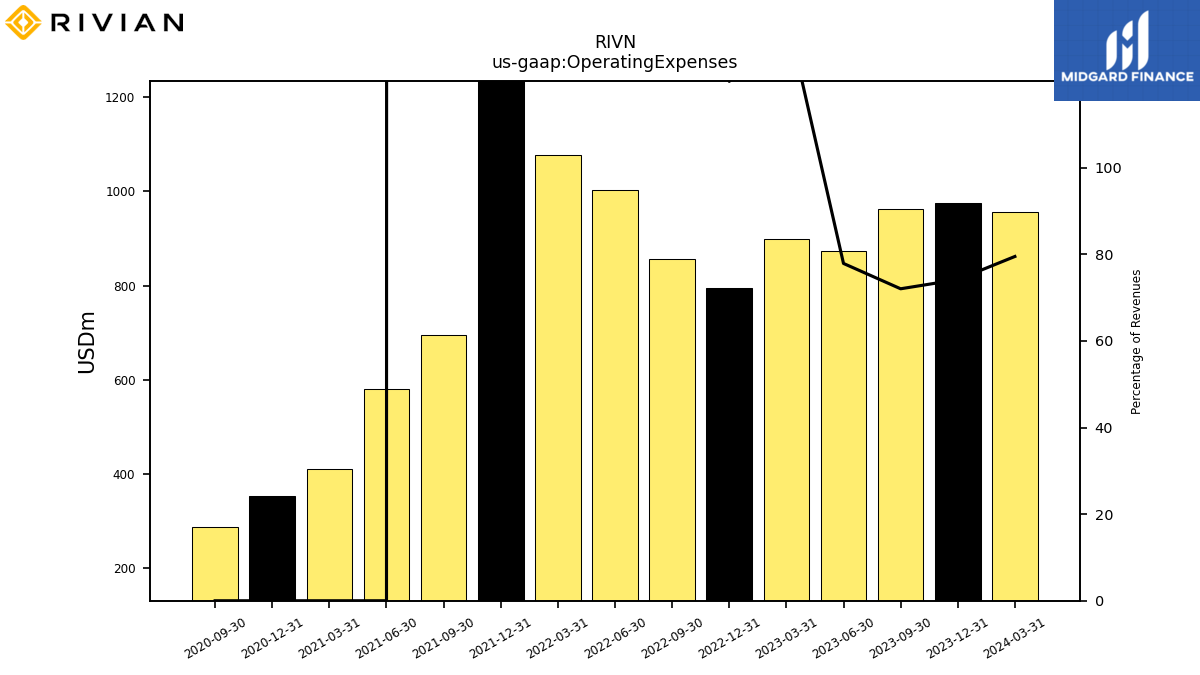
| Operating Expenses | 963.00 | 873.00 | 898.00 | 795.00 | 857.00 | 1004.00 | 1077.00 | 2071.00 | 694.00 | |
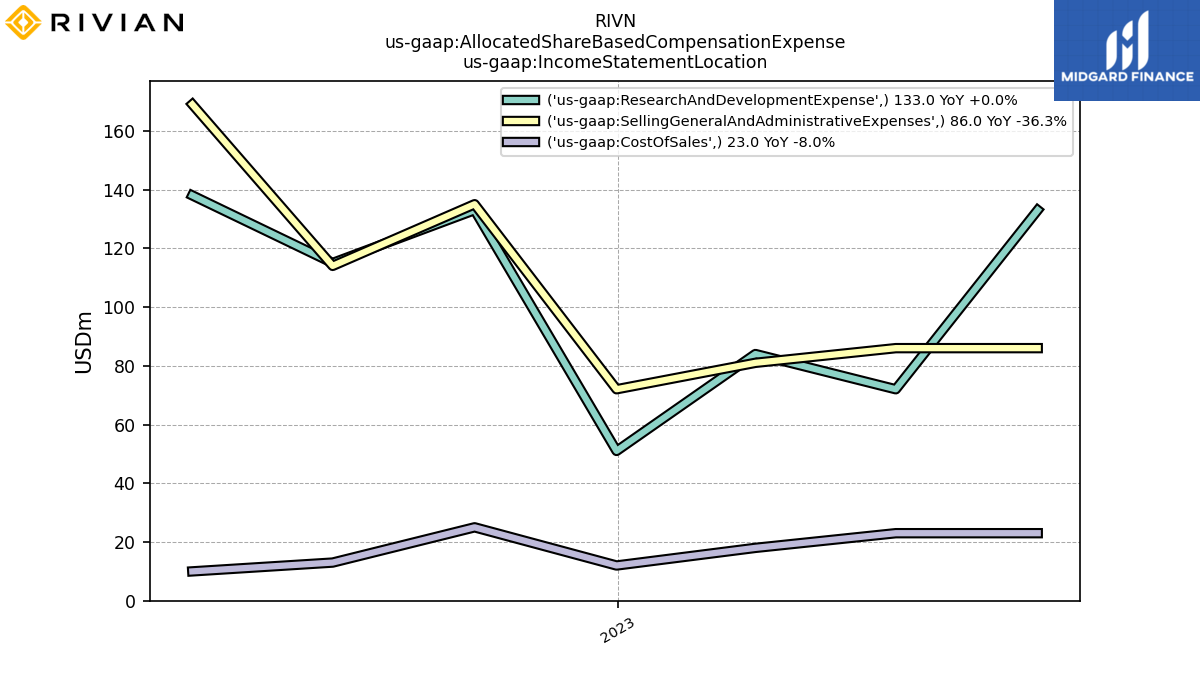
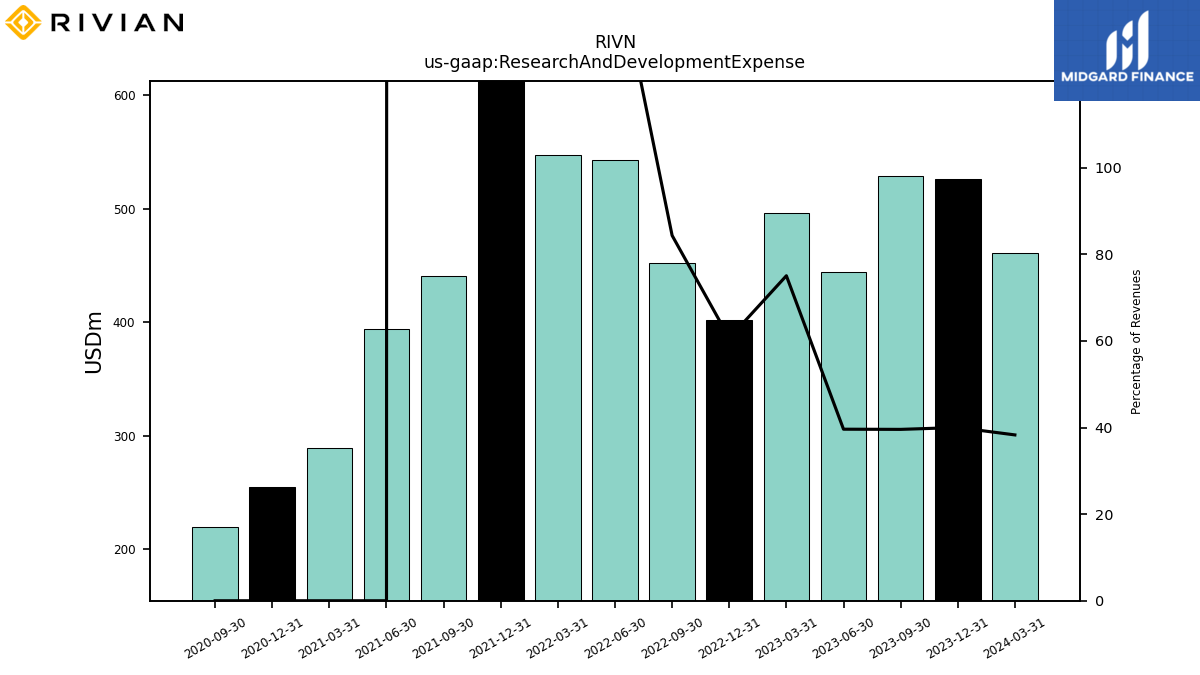
| Research And Development Expense | 529.00 | 444.00 | 496.00 | 402.00 | 452.00 | 543.00 | 547.00 | 726.00 | 441.00 | |
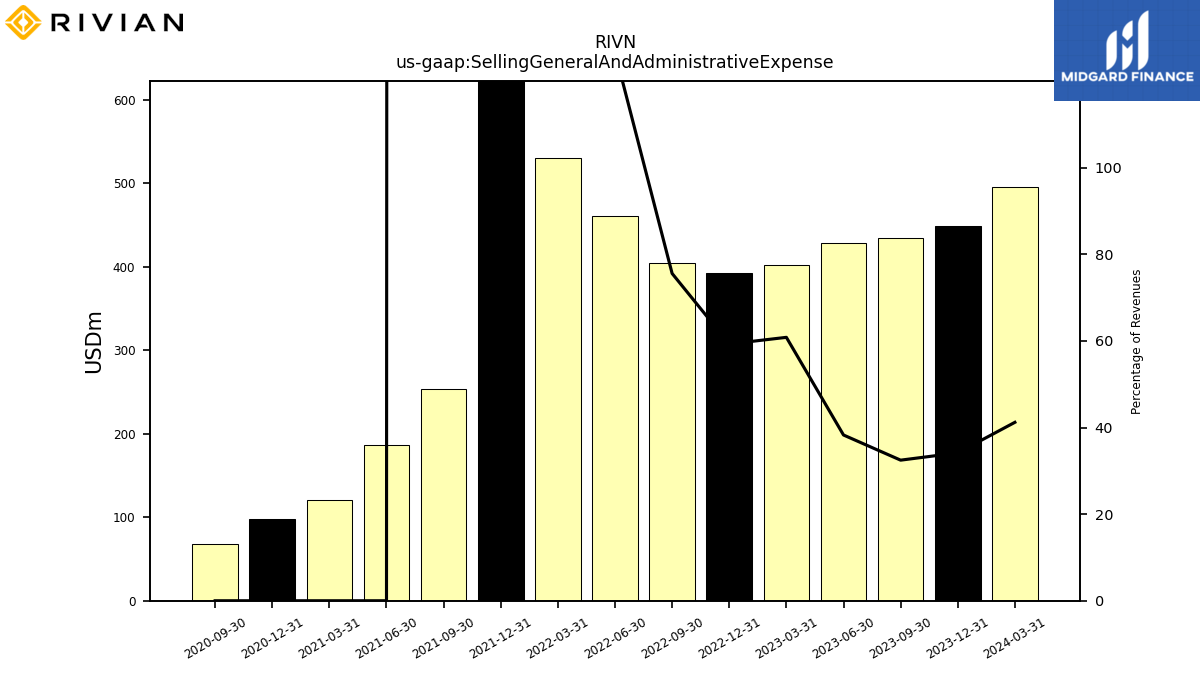
| Selling General And Administrative Expense | 434.00 | 429.00 | 402.00 | 393.00 | 405.00 | 461.00 | 530.00 | 682.00 | 253.00 | |
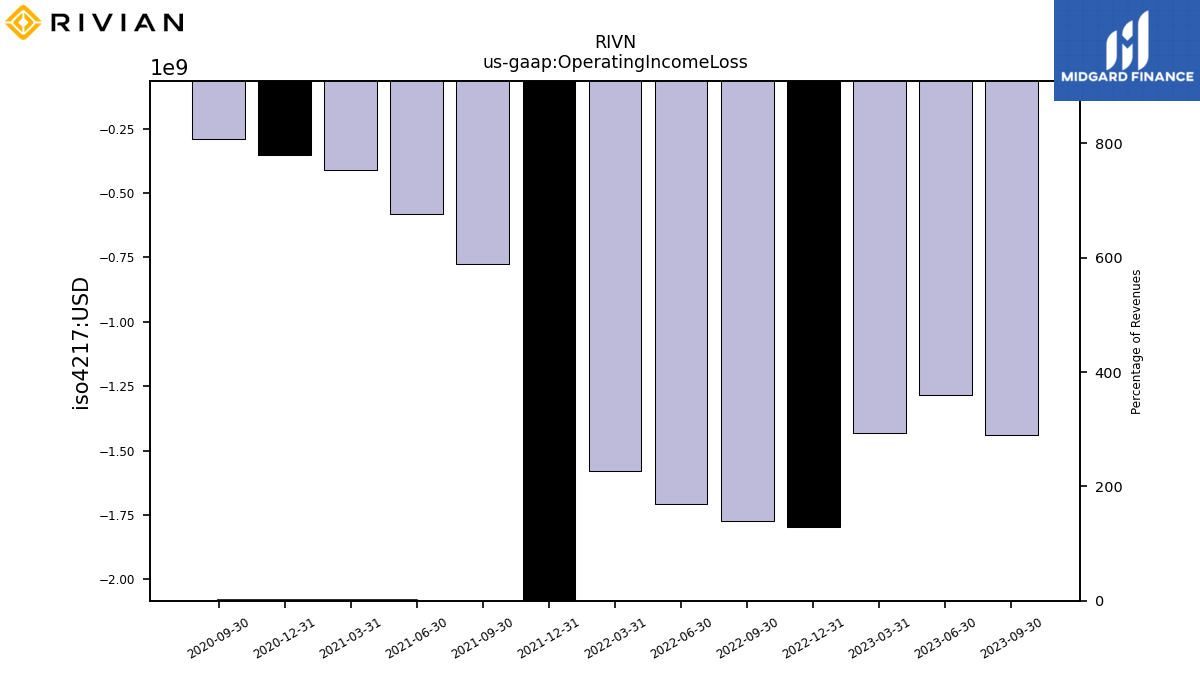
| Operating Income Loss | -1440.00 | -1285.00 | -1433.00 | -1795.00 | -1774.00 | -1708.00 | -1579.00 | -2454.00 | -776.00 | |
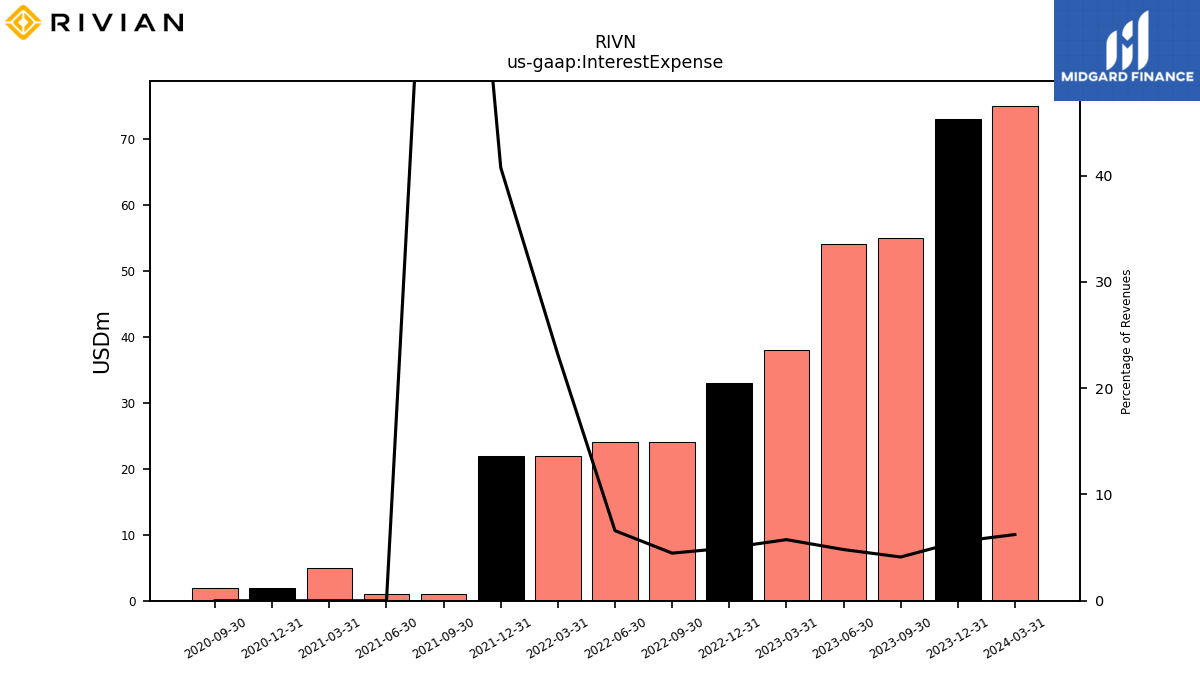
| Interest Expense | 55.00 | 54.00 | 38.00 | 33.00 | 24.00 | 24.00 | 22.00 | 22.00 | 1.00 | |
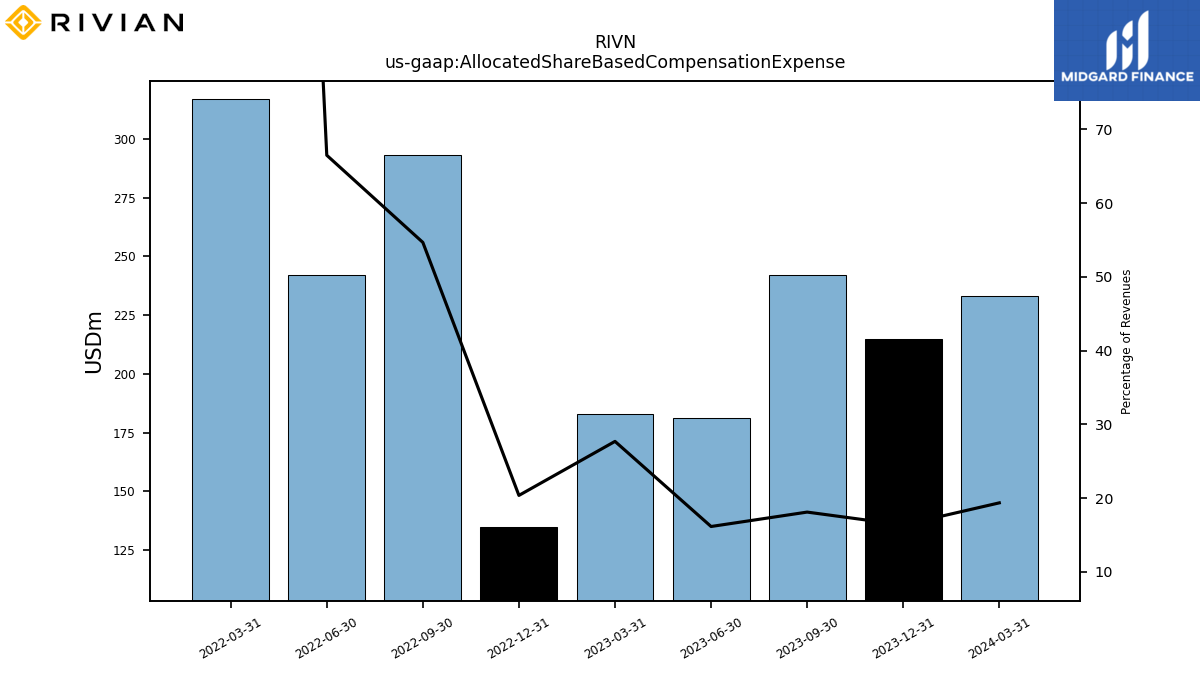
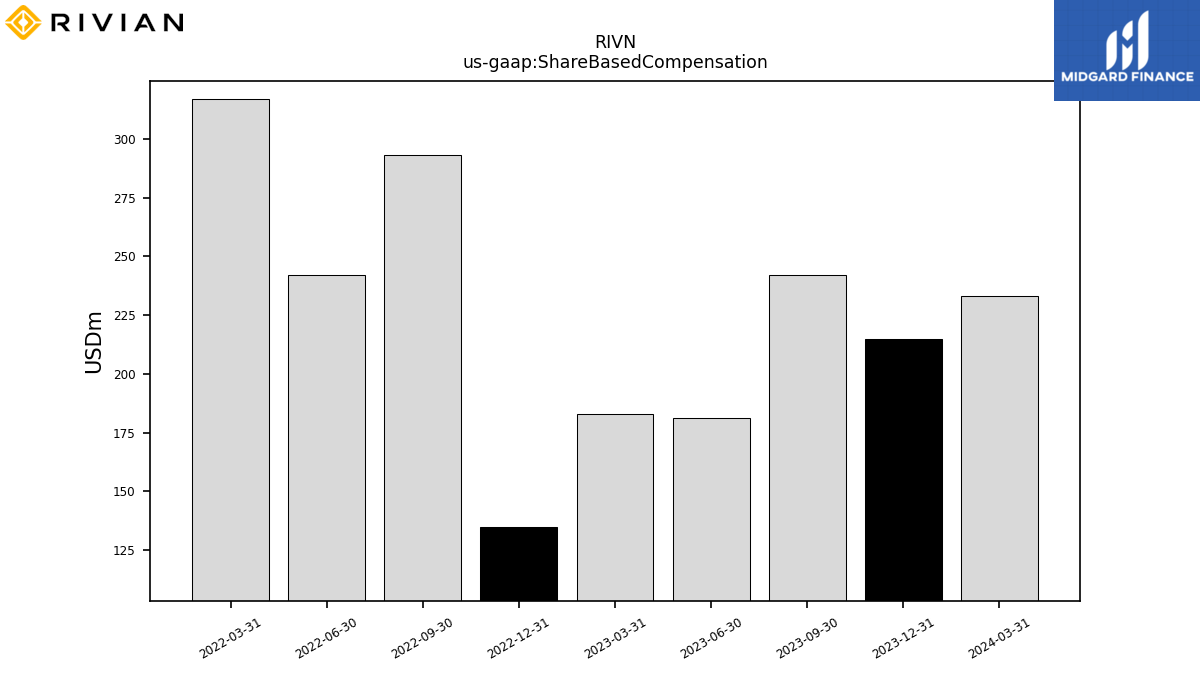
| Allocated Share Based Compensation Expense | 242.00 | 181.00 | 183.00 | 135.00 | 293.00 | 242.00 | 317.00 | NA | NA | |
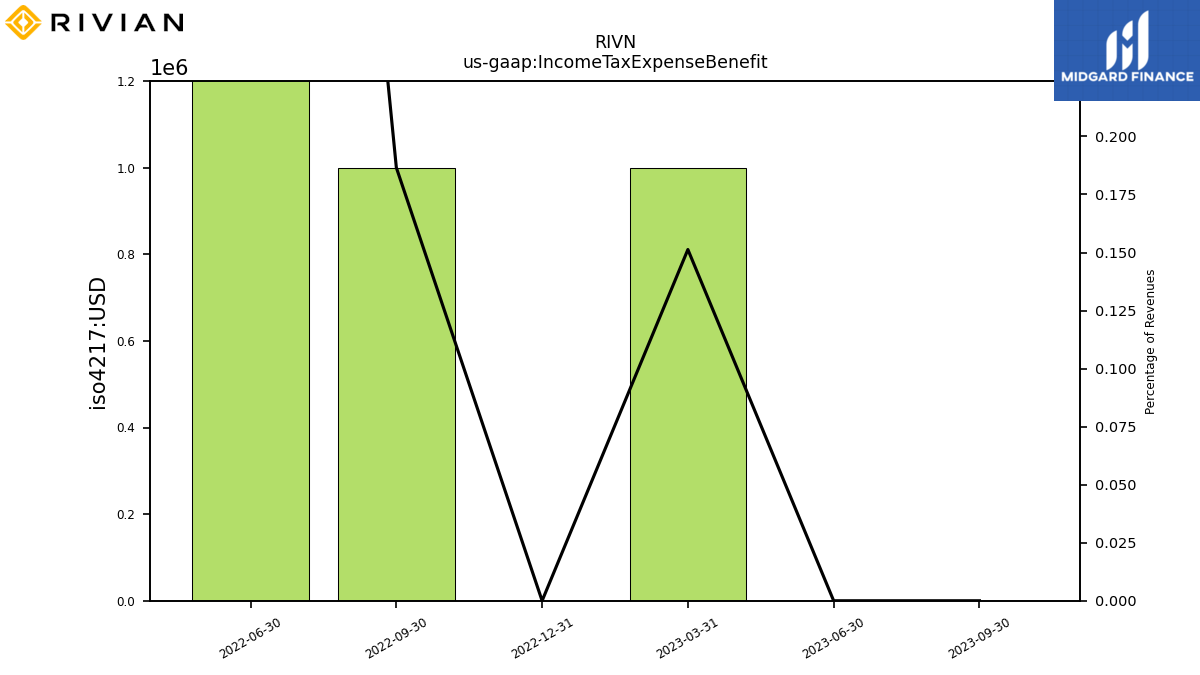
| Income Tax Expense Benefit | 0.00 | 0.00 | 1.00 | 0.00 | 1.00 | 3.00 | NA | NA | NA | |
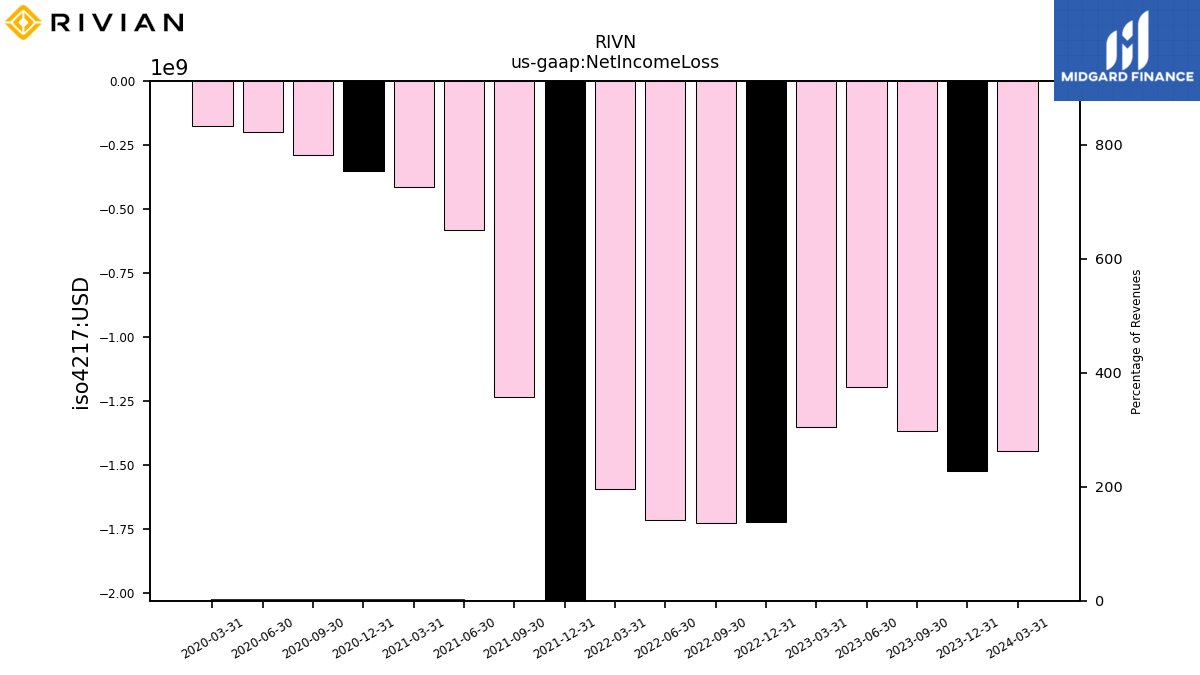
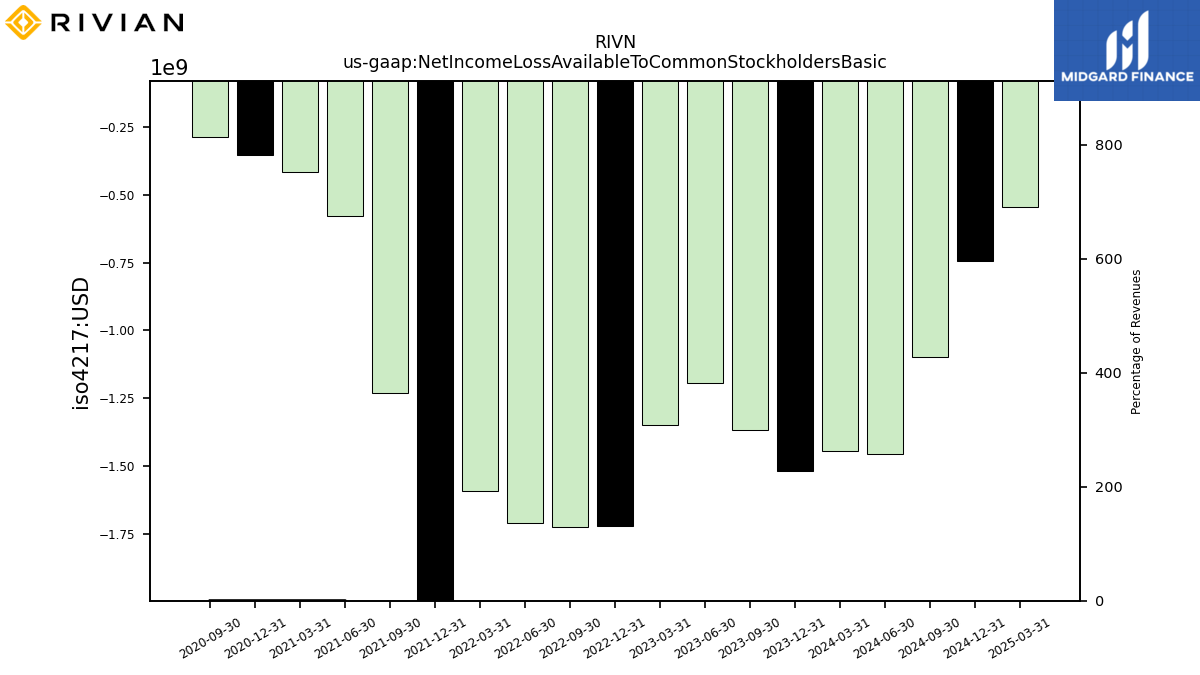
| Net Income Loss | -1367.00 | -1195.00 | -1349.00 | -1723.00 | -1724.00 | -1712.00 | -1593.00 | -2461.00 | -1233.00 | |
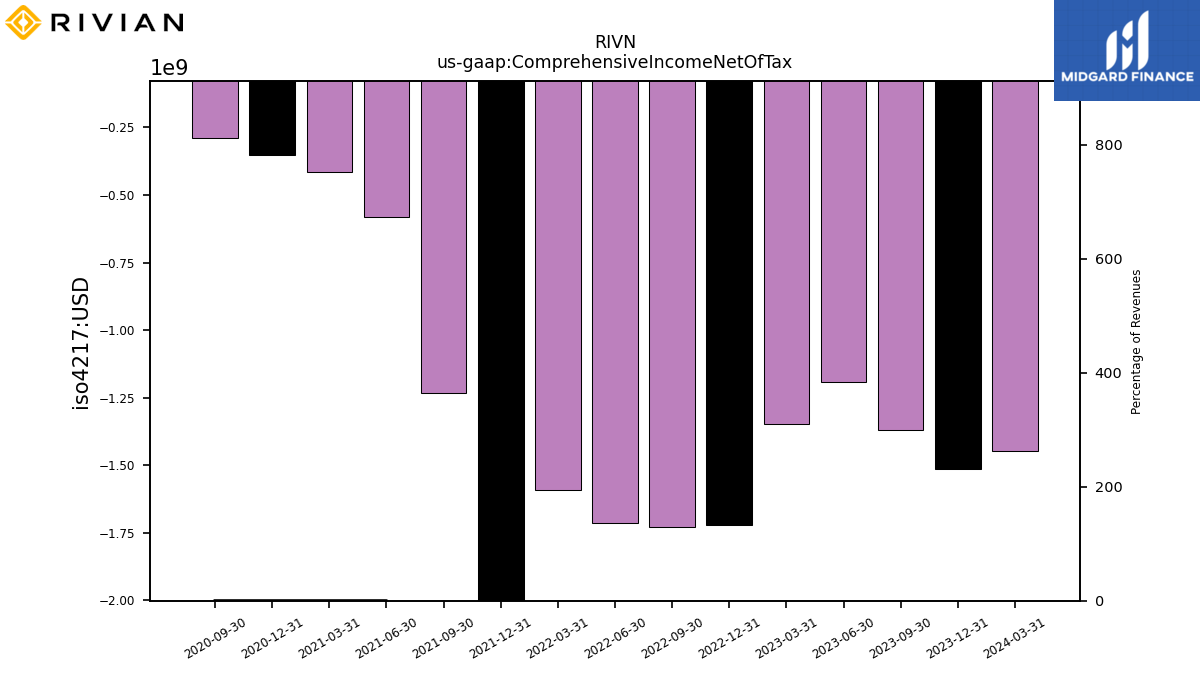
| Comprehensive Income Net Of Tax | -1369.00 | -1194.00 | -1348.00 | -1721.00 | -1727.00 | -1713.00 | -1593.00 | -2461.00 | -1233.00 | |
| Net Income Loss Available To Common Stockholders Basic | -1367.00 | -1195.00 | -1349.00 | -1723.00 | -1724.00 | -1712.00 | -1593.00 | -2461.00 | -1233.00 | |
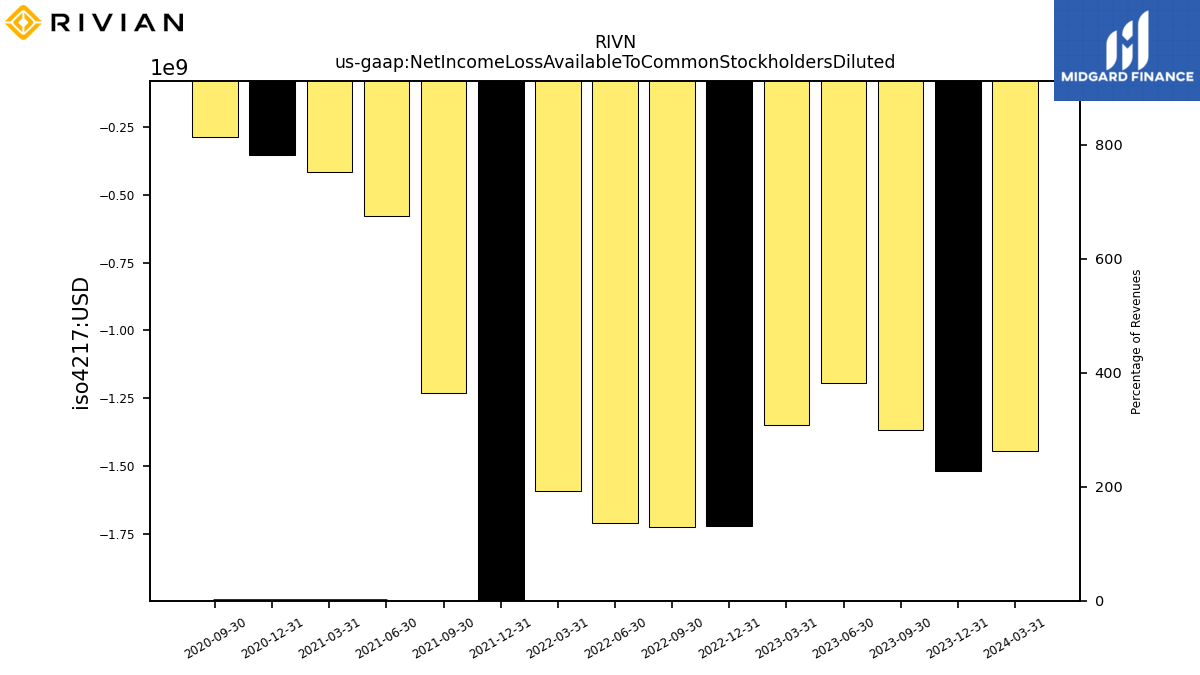
| Net Income Loss Available To Common Stockholders Diluted | -1367.00 | -1195.00 | -1349.00 | -1723.00 | -1724.00 | -1712.00 | -1593.00 | -2461.00 | -1233.00 |
| 2023-09-30 | 2023-06-30 | 2023-03-31 | 2022-12-31 | 2022-09-30 | 2022-06-30 | 2022-03-31 | 2021-12-31 | 2021-09-30 | ||
|---|---|---|---|---|---|---|---|---|---|---|
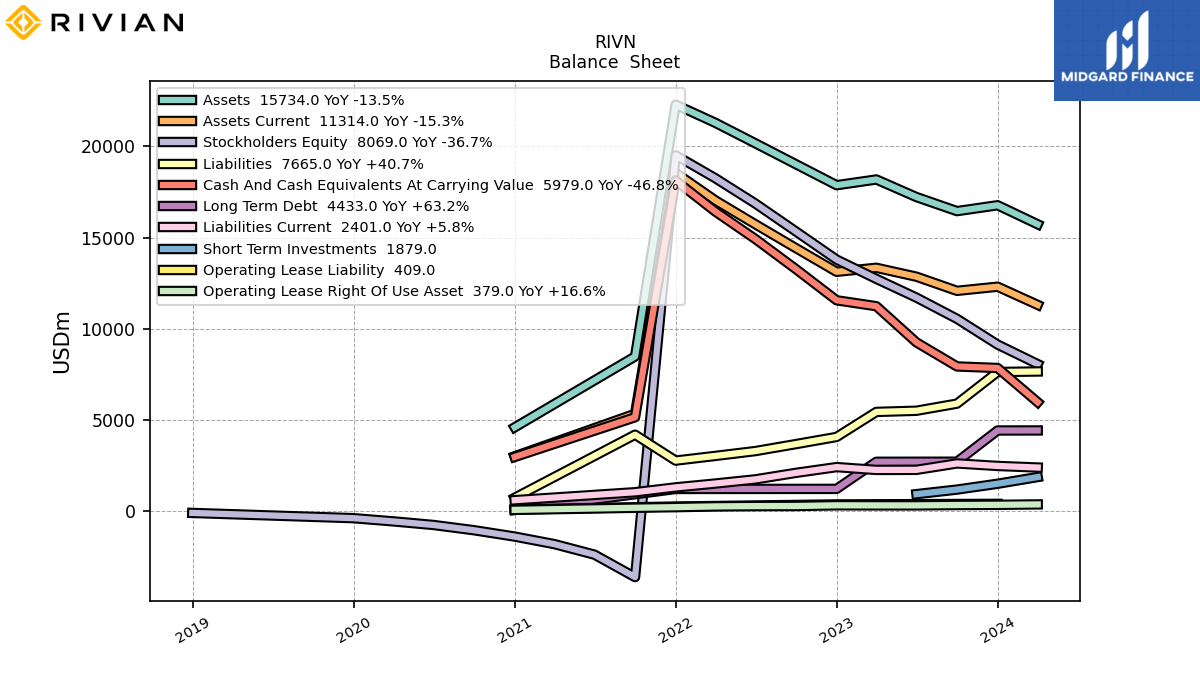
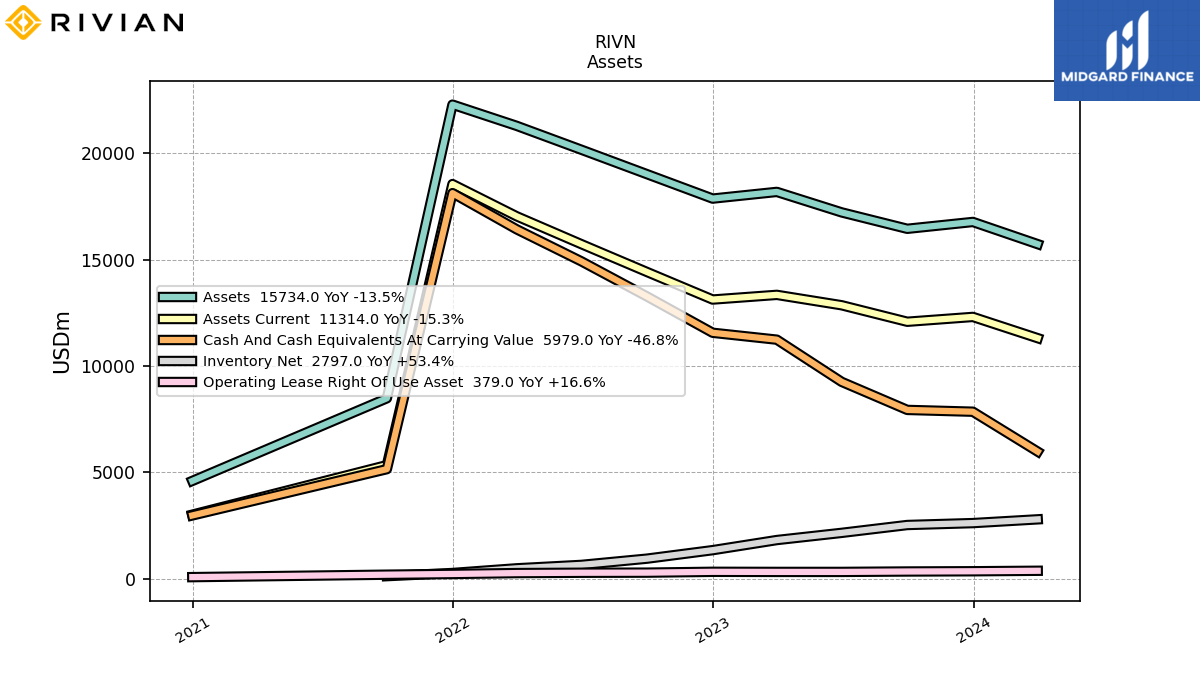
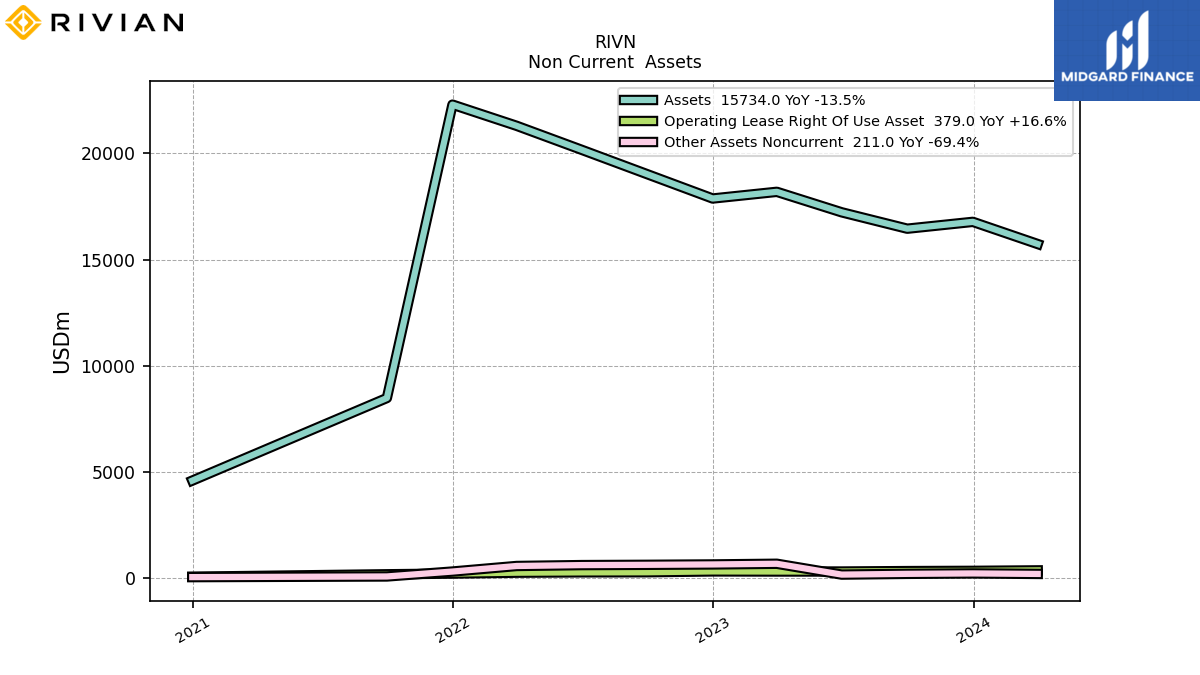
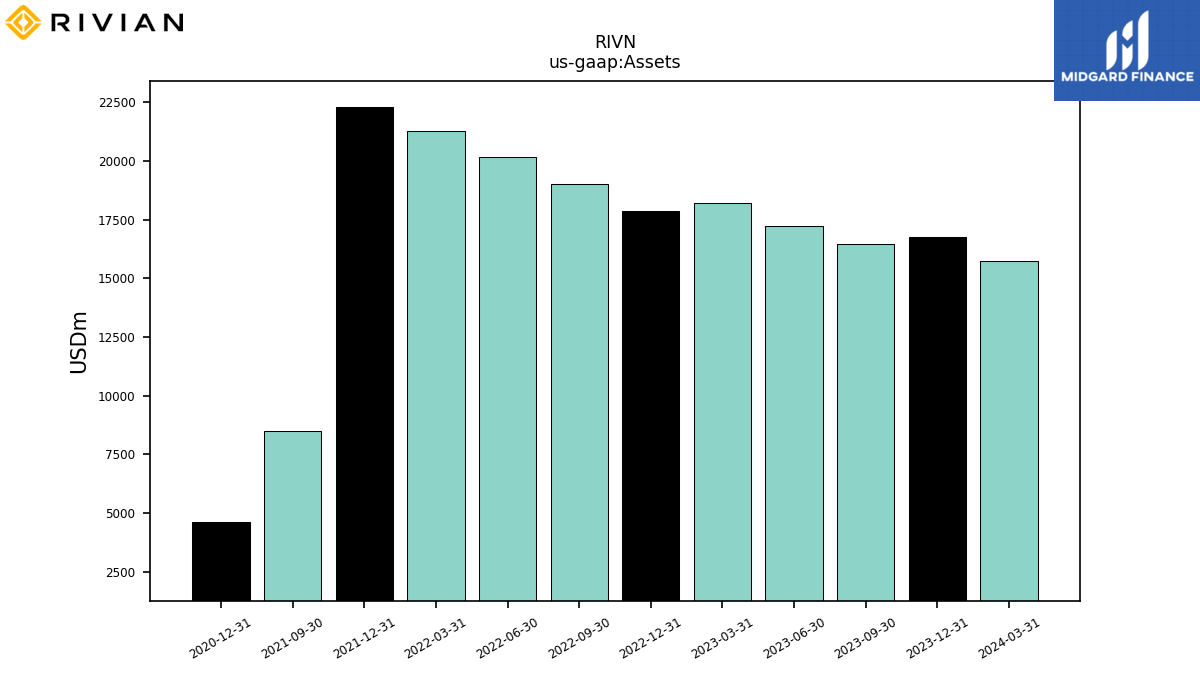
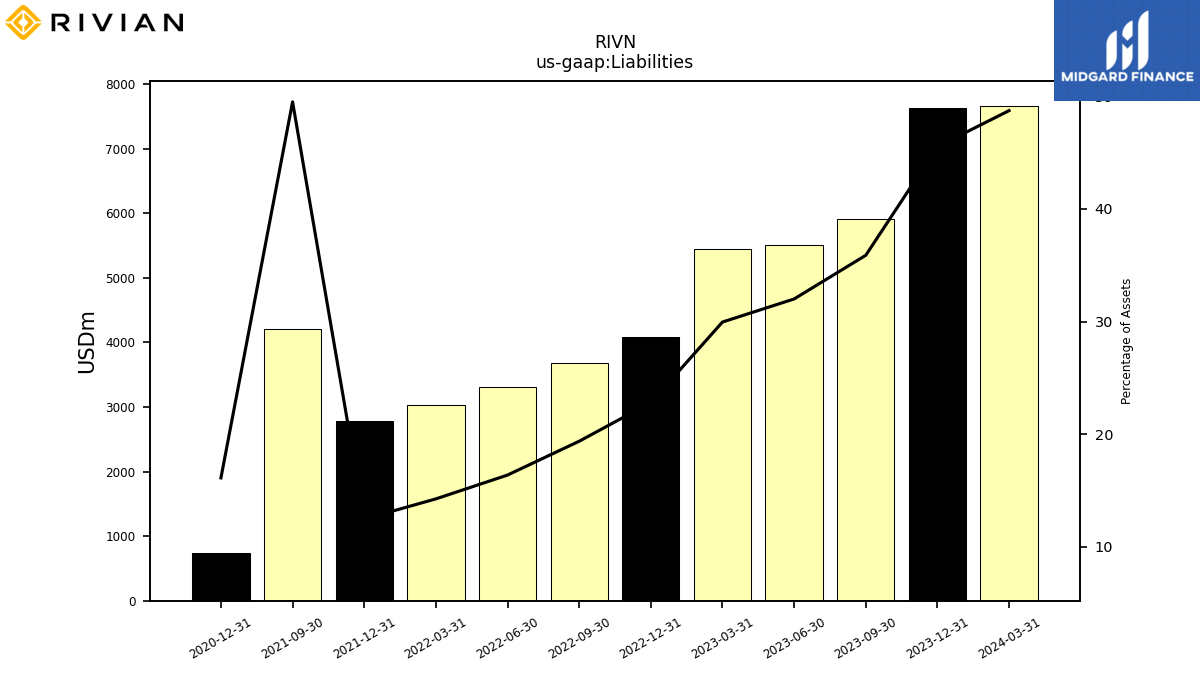
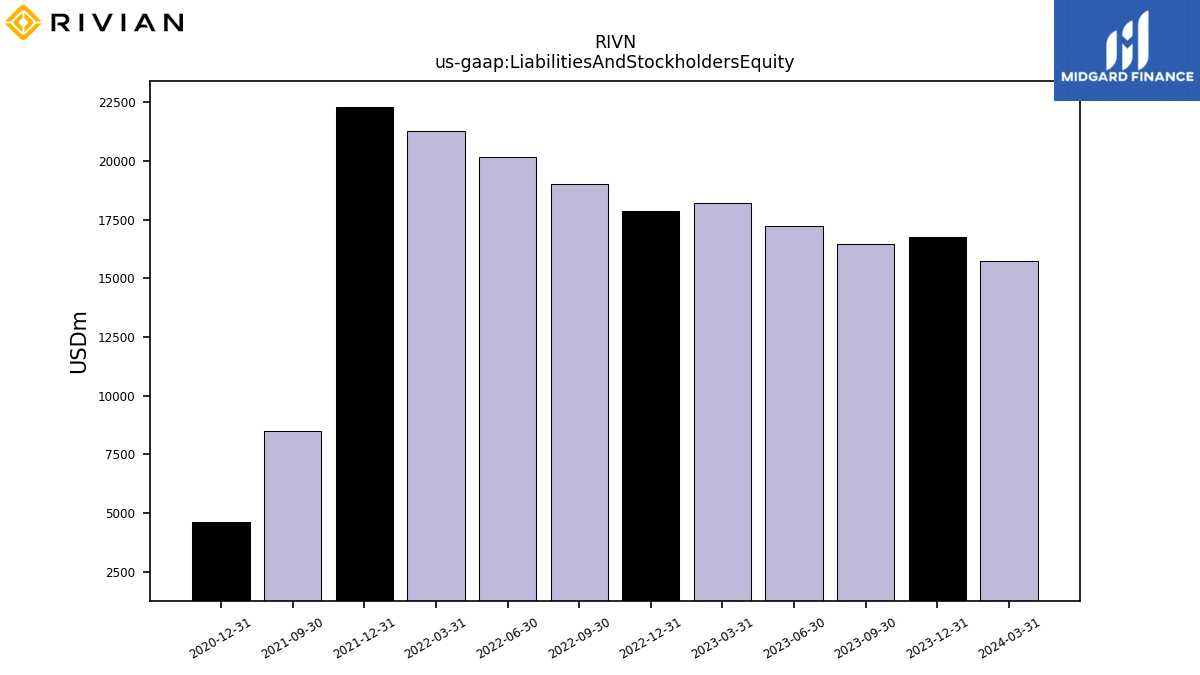
| Assets | 16456.00 | 17227.00 | 18191.00 | 17876.00 | 19023.00 | 20171.00 | 21297.00 | 22294.00 | 8488.00 | |
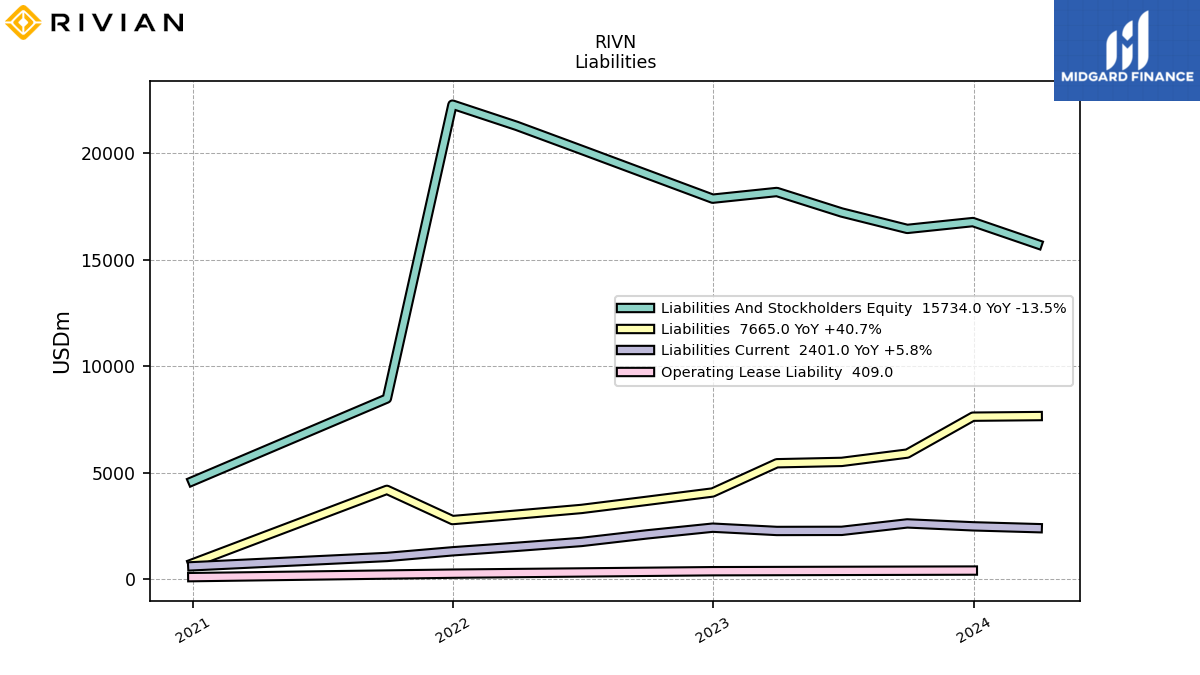
| Liabilities | 5904.00 | 5513.00 | 5449.00 | 4077.00 | 3686.00 | 3303.00 | 3037.00 | 2780.00 | 4201.00 | |
| Liabilities And Stockholders Equity | 16456.00 | 17227.00 | 18191.00 | 17876.00 | 19023.00 | 20171.00 | 21297.00 | 22294.00 | 8488.00 | |
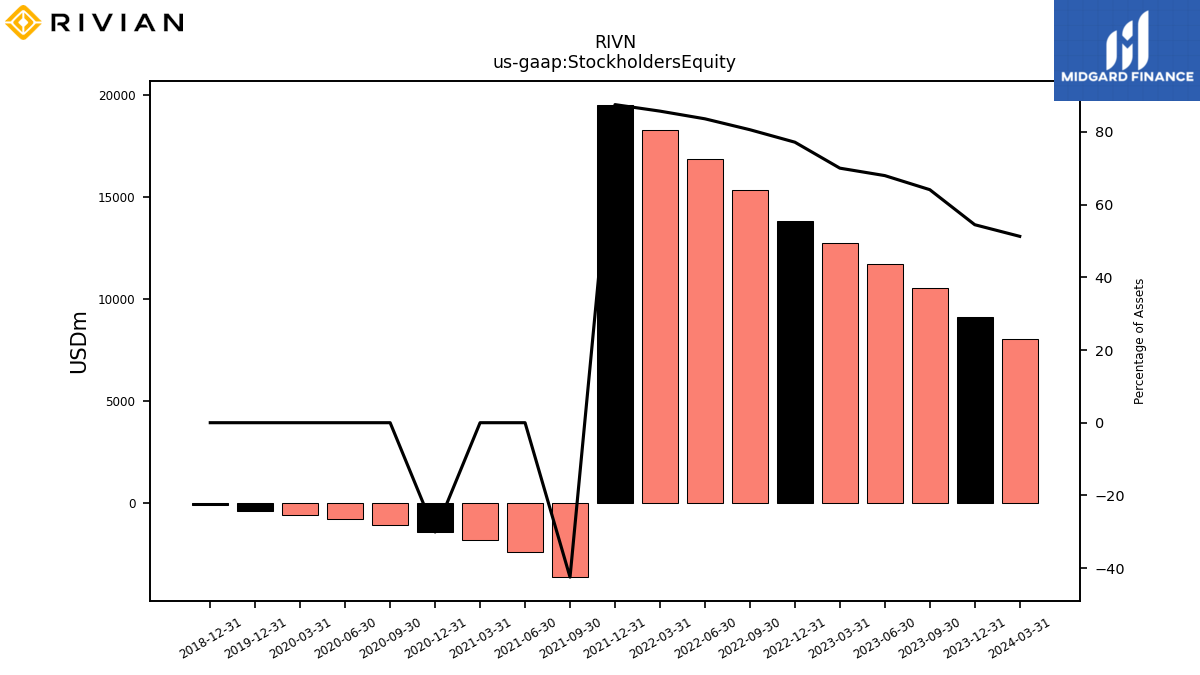
| Stockholders Equity | 10552.00 | 11714.00 | 12742.00 | 13799.00 | 15337.00 | 16868.00 | 18260.00 | 19514.00 | -3607.00 |
| 2023-09-30 | 2023-06-30 | 2023-03-31 | 2022-12-31 | 2022-09-30 | 2022-06-30 | 2022-03-31 | 2021-12-31 | 2021-09-30 | ||
|---|---|---|---|---|---|---|---|---|---|---|
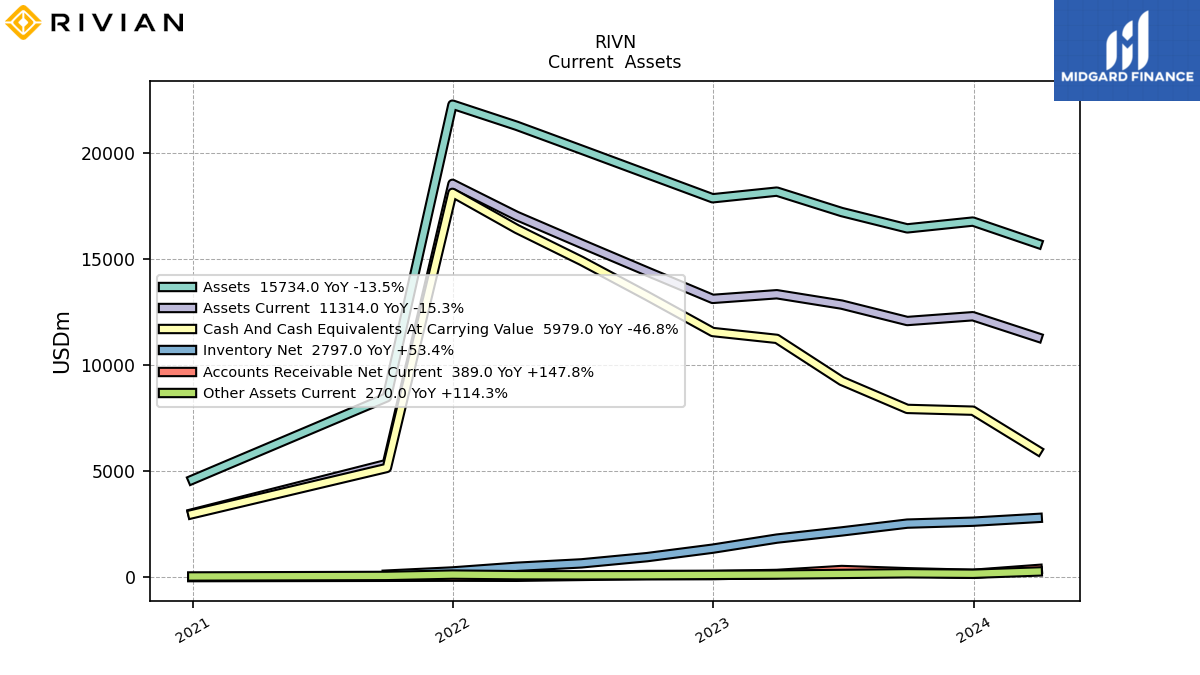
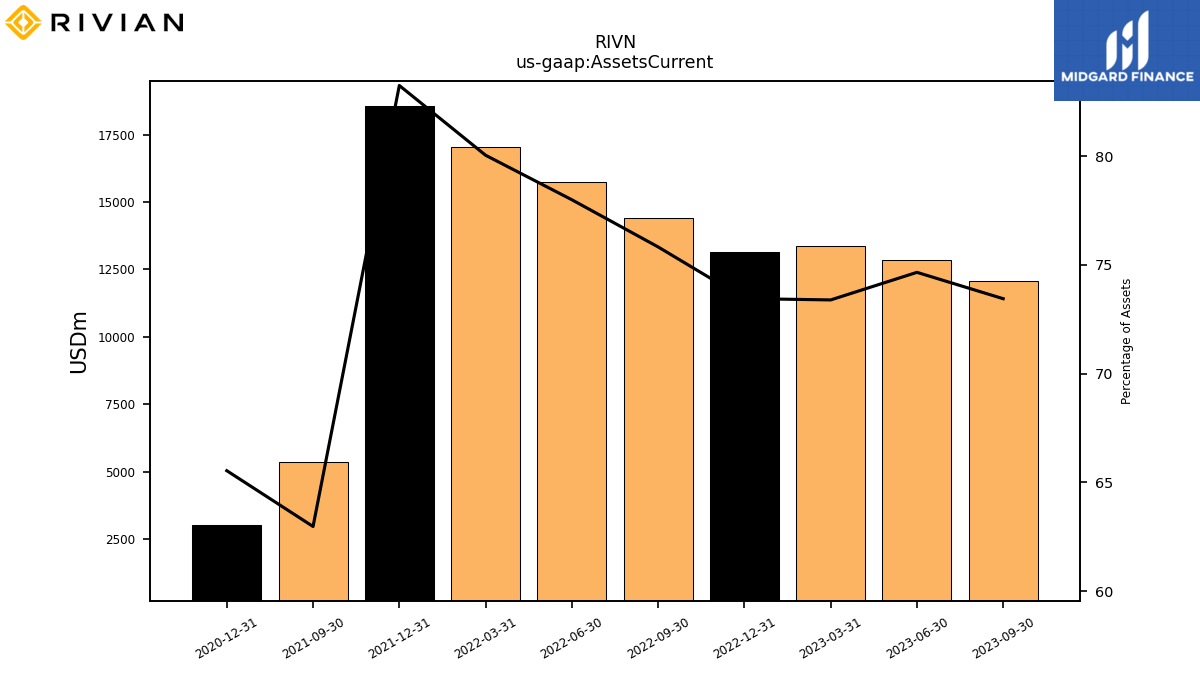
| Assets Current | 12086.00 | 12861.00 | 13350.00 | 13130.00 | 14424.00 | 15732.00 | 17046.00 | 18559.00 | 5345.00 | |
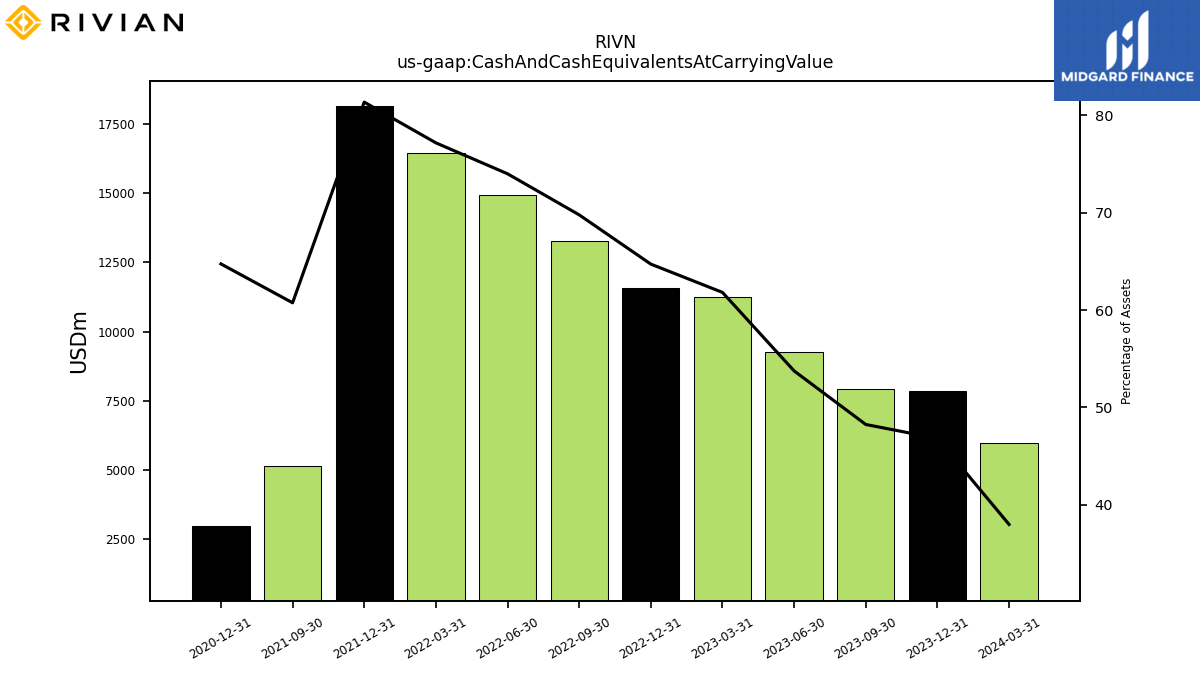
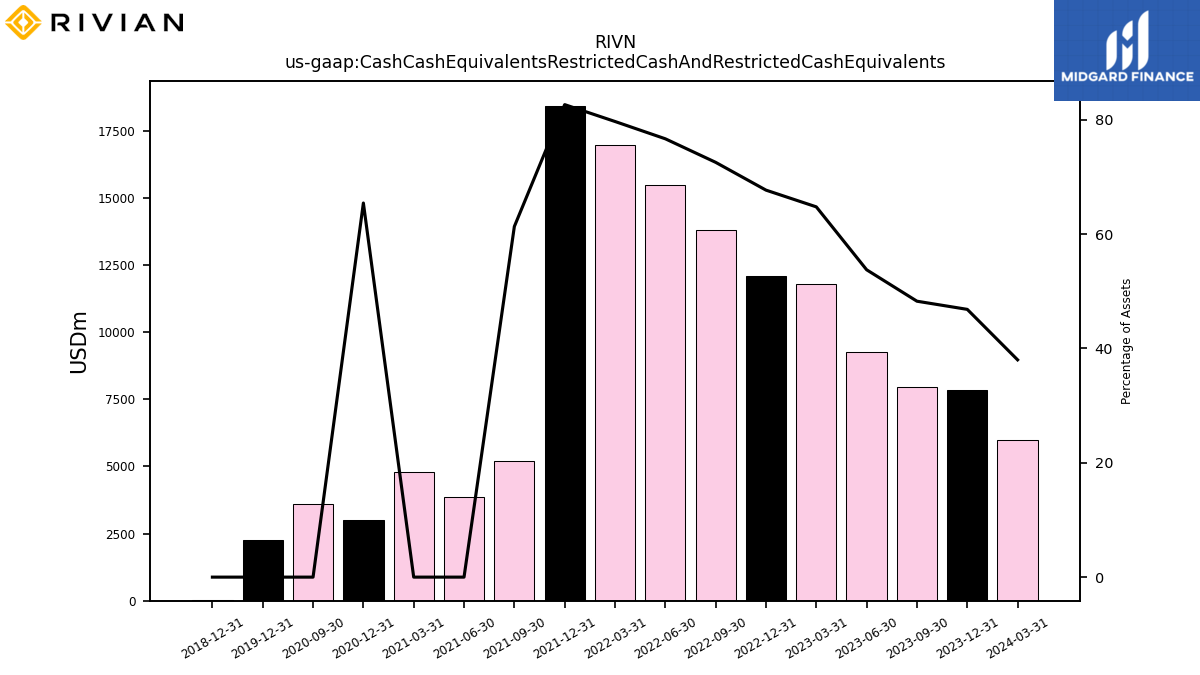
| Cash And Cash Equivalents At Carrying Value | 7941.00 | 9260.00 | 11244.00 | 11568.00 | 13272.00 | 14923.00 | 16432.00 | 18133.00 | 5156.00 | |
| Cash Cash Equivalents Restricted Cash And Restricted Cash Equivalents | 7941.00 | 9260.00 | 11780.00 | 12099.00 | 13800.00 | 15463.00 | 16971.00 | 18423.00 | 5205.00 | |
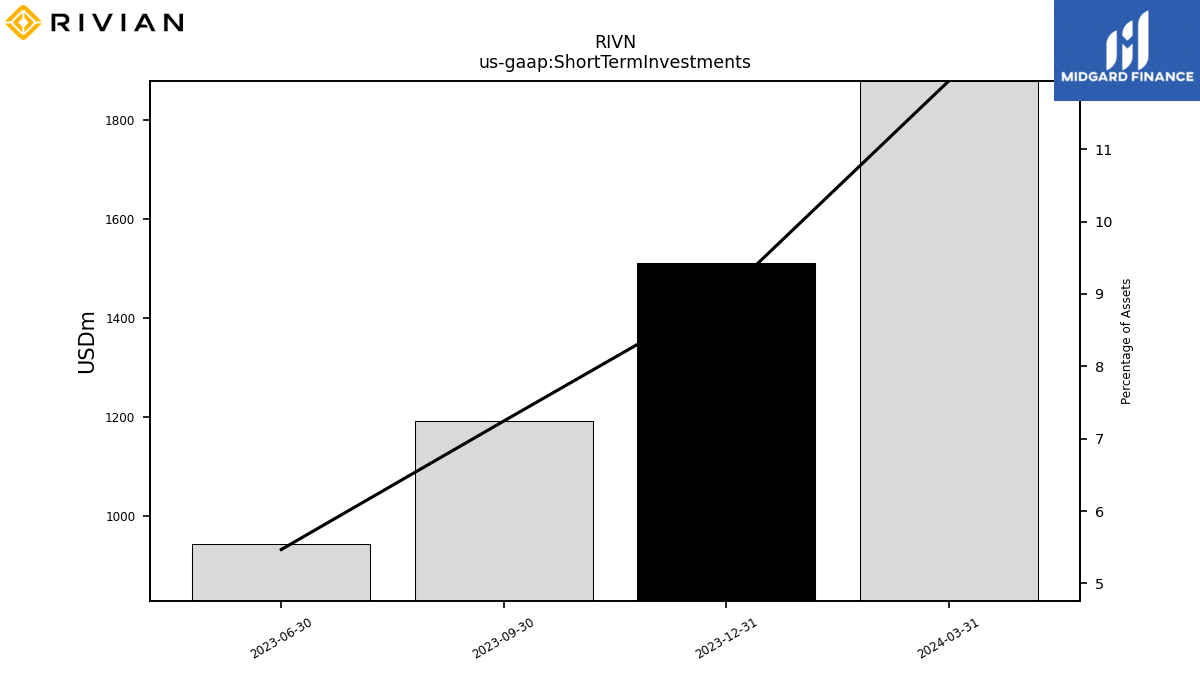
| Short Term Investments | 1192.00 | 942.00 | NA | NA | NA | NA | NA | NA | NA | |
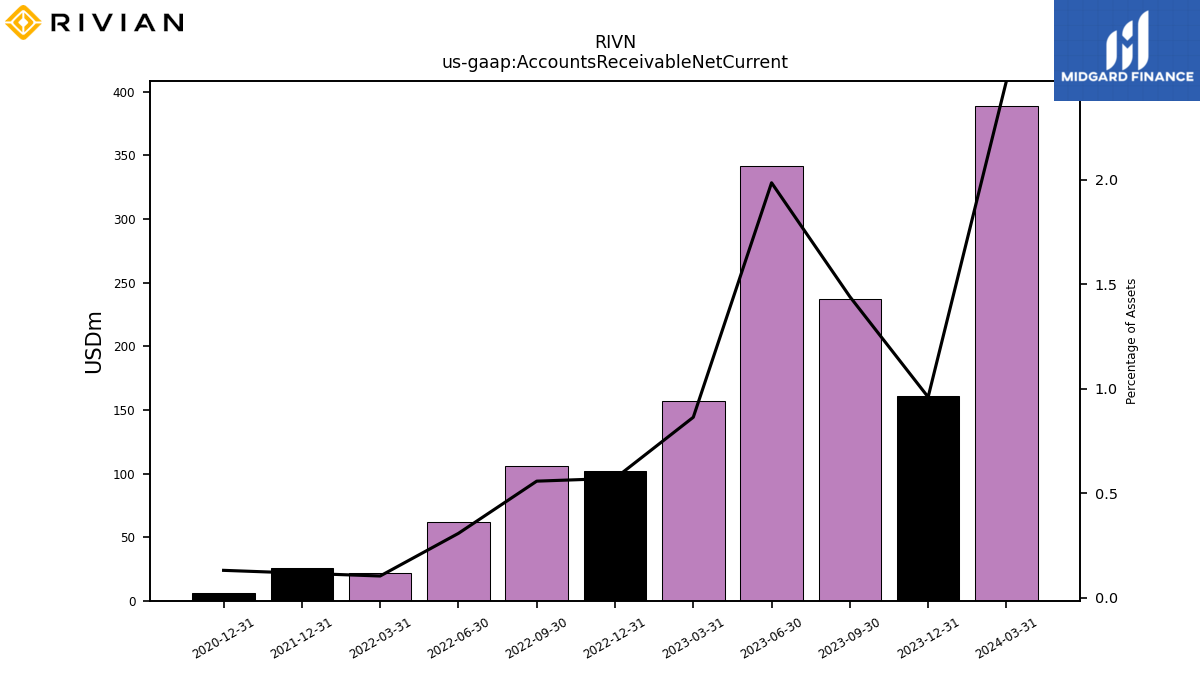
| Accounts Receivable Net Current | 237.00 | 342.00 | 157.00 | 102.00 | 106.00 | 62.00 | 22.00 | 26.00 | NA | |
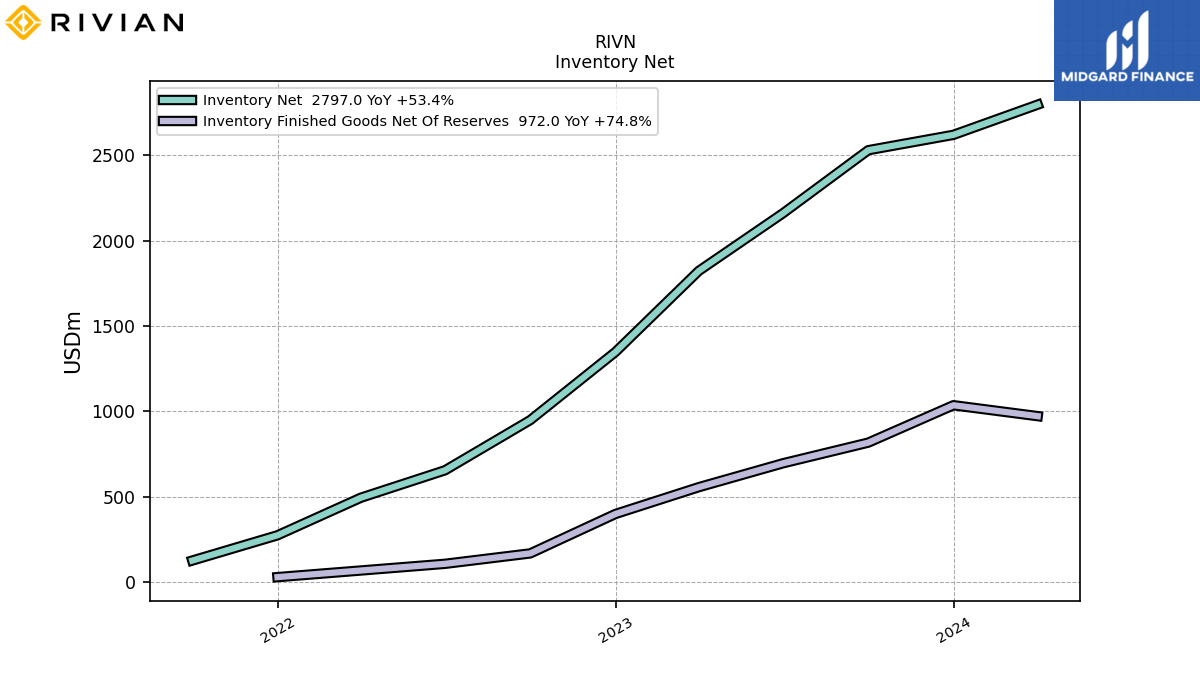
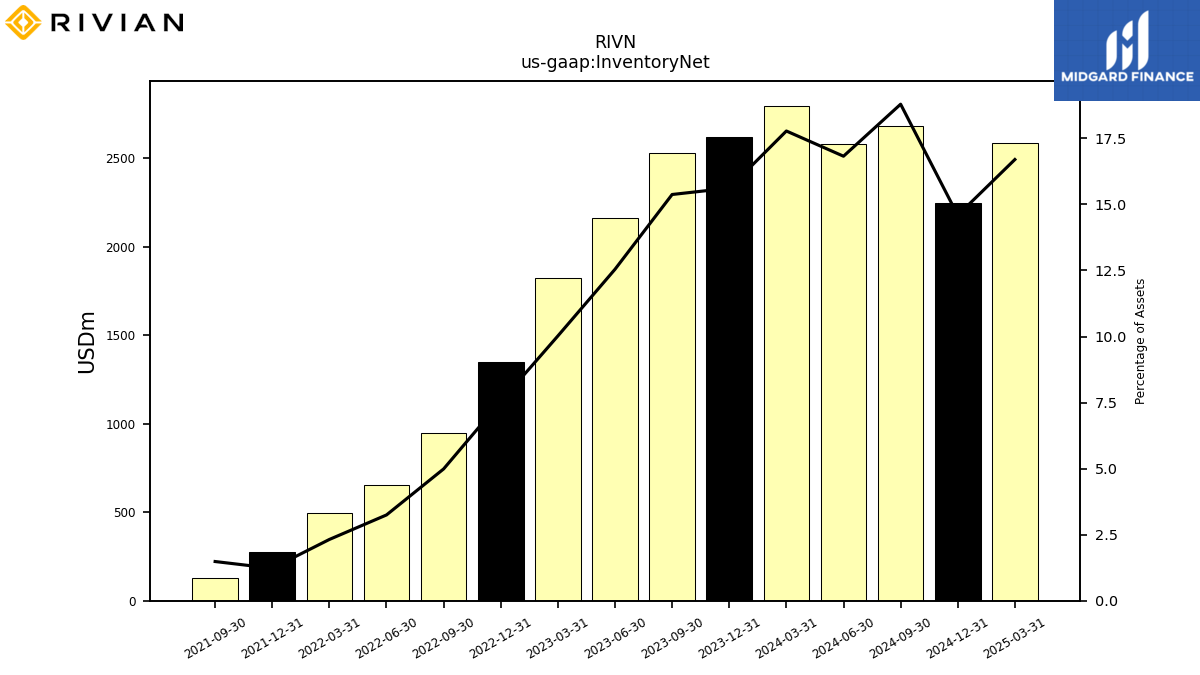
| Inventory Net | 2530.00 | 2161.00 | 1823.00 | 1348.00 | 949.00 | 655.00 | 494.00 | 274.00 | 126.00 | |
| Other Assets Current | 186.00 | 156.00 | 126.00 | 112.00 | 97.00 | 92.00 | 98.00 | 126.00 | 63.00 |
| 2023-09-30 | 2023-06-30 | 2023-03-31 | 2022-12-31 | 2022-09-30 | 2022-06-30 | 2022-03-31 | 2021-12-31 | 2021-09-30 | ||
|---|---|---|---|---|---|---|---|---|---|---|
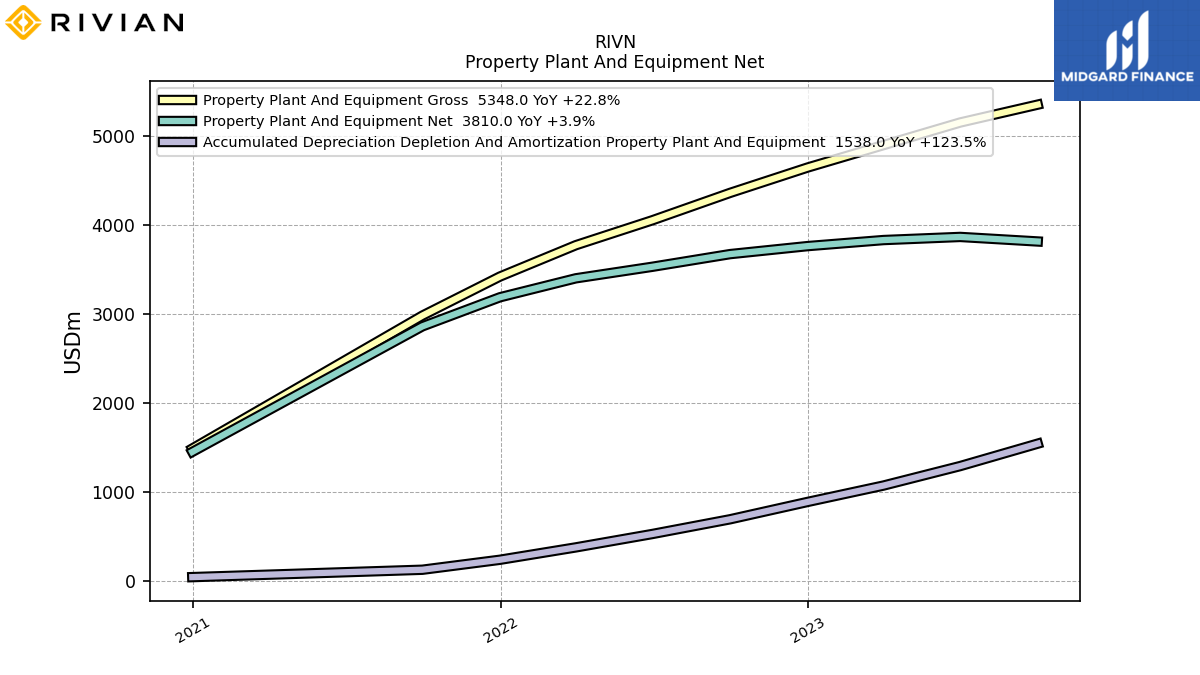
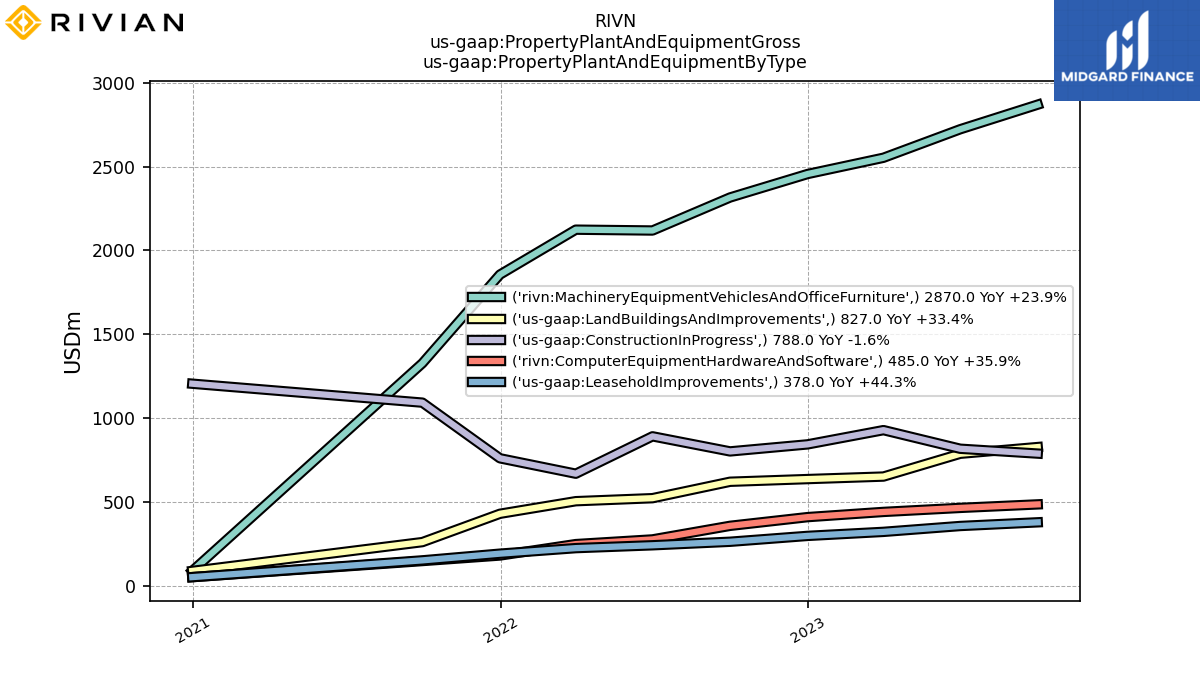
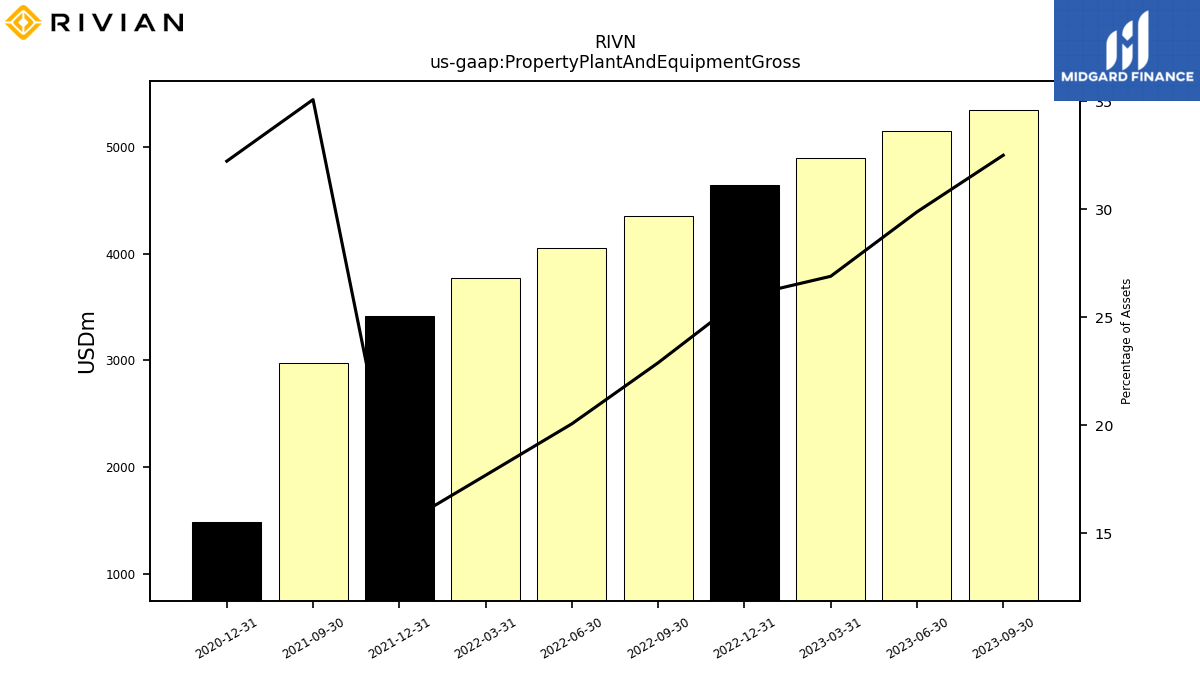
| Property Plant And Equipment Gross | 5348.00 | 5147.00 | 4893.00 | 4641.00 | 4356.00 | 4049.00 | 3768.00 | 3416.00 | 2977.00 | |
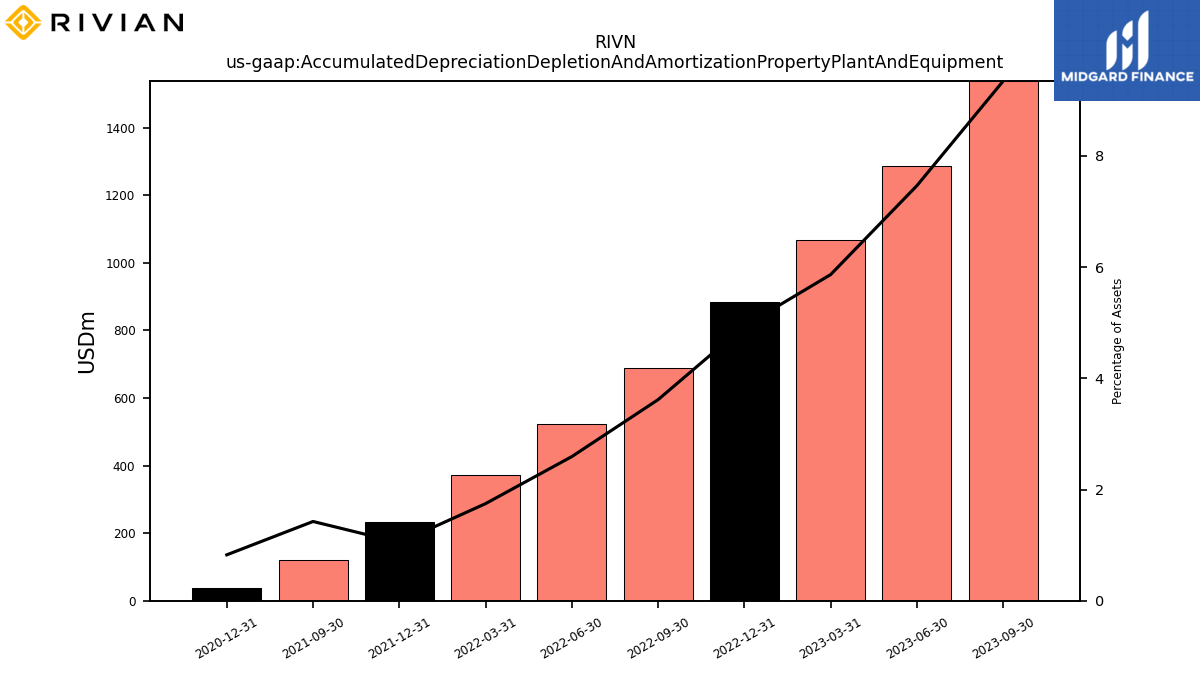
| Accumulated Depreciation Depletion And Amortization Property Plant And Equipment | 1538.00 | 1286.00 | 1067.00 | 883.00 | 688.00 | 523.00 | 372.00 | 233.00 | 121.00 | |
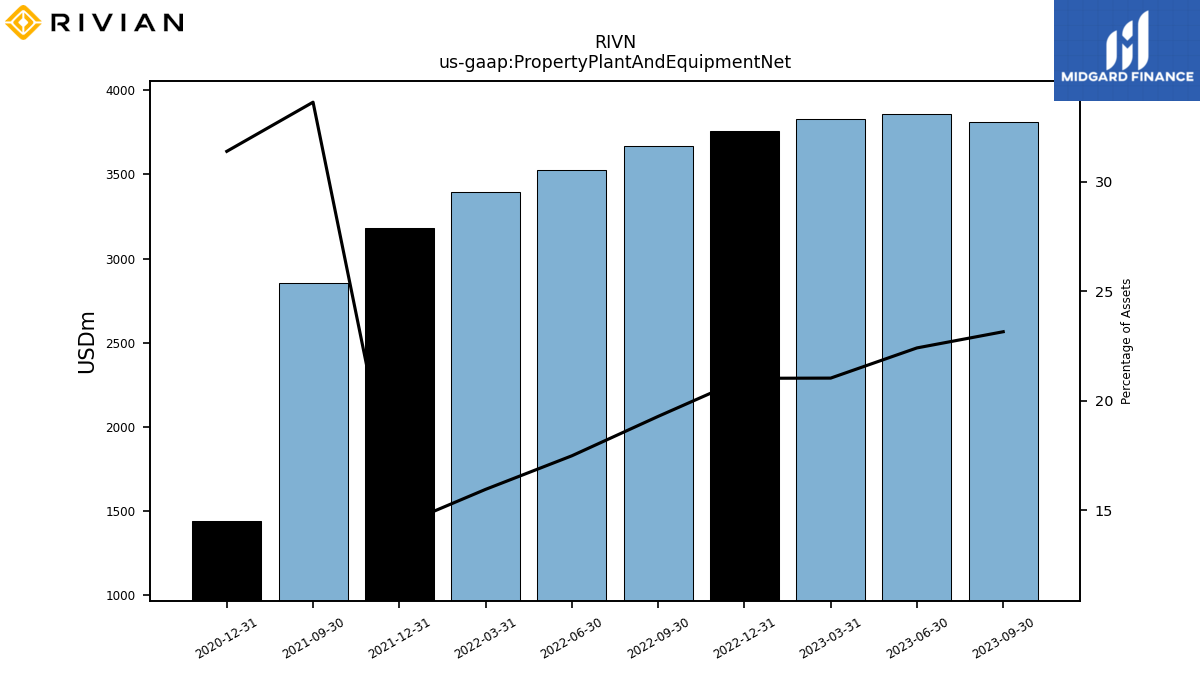
| Property Plant And Equipment Net | 3810.00 | 3861.00 | 3826.00 | 3758.00 | 3668.00 | 3526.00 | 3396.00 | 3183.00 | 2856.00 | |
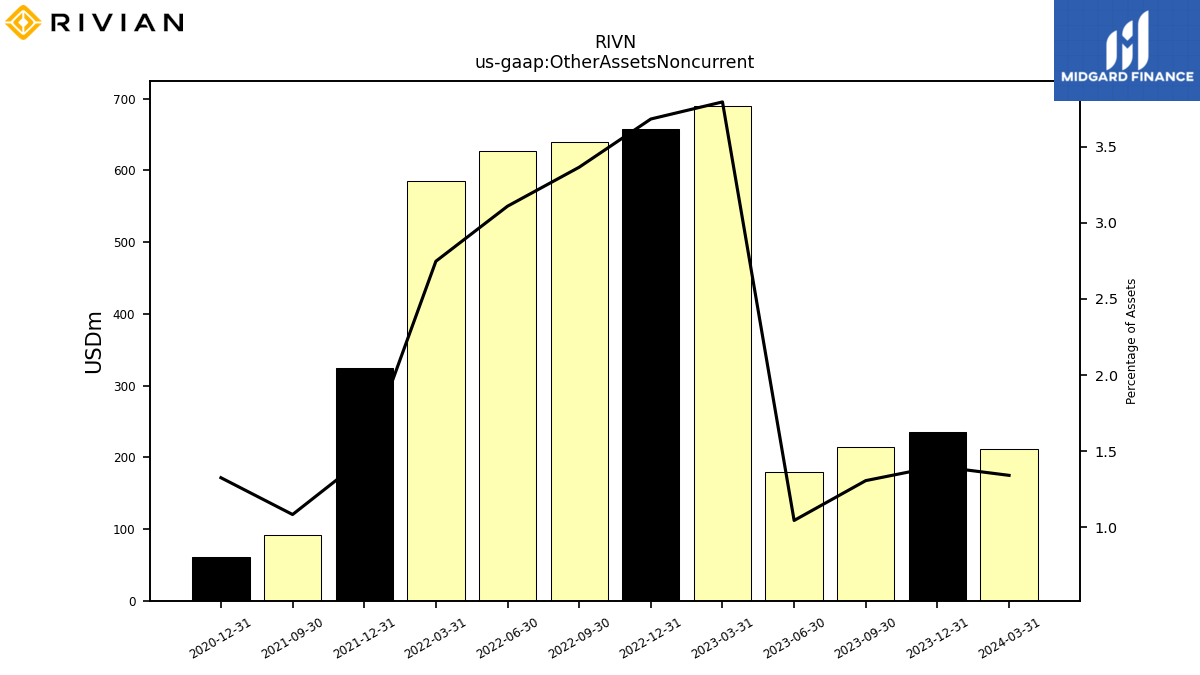
| Other Assets Noncurrent | 215.00 | 180.00 | 690.00 | 658.00 | 640.00 | 627.00 | 585.00 | 324.00 | 92.00 |
| 2023-09-30 | 2023-06-30 | 2023-03-31 | 2022-12-31 | 2022-09-30 | 2022-06-30 | 2022-03-31 | 2021-12-31 | 2021-09-30 | ||
|---|---|---|---|---|---|---|---|---|---|---|
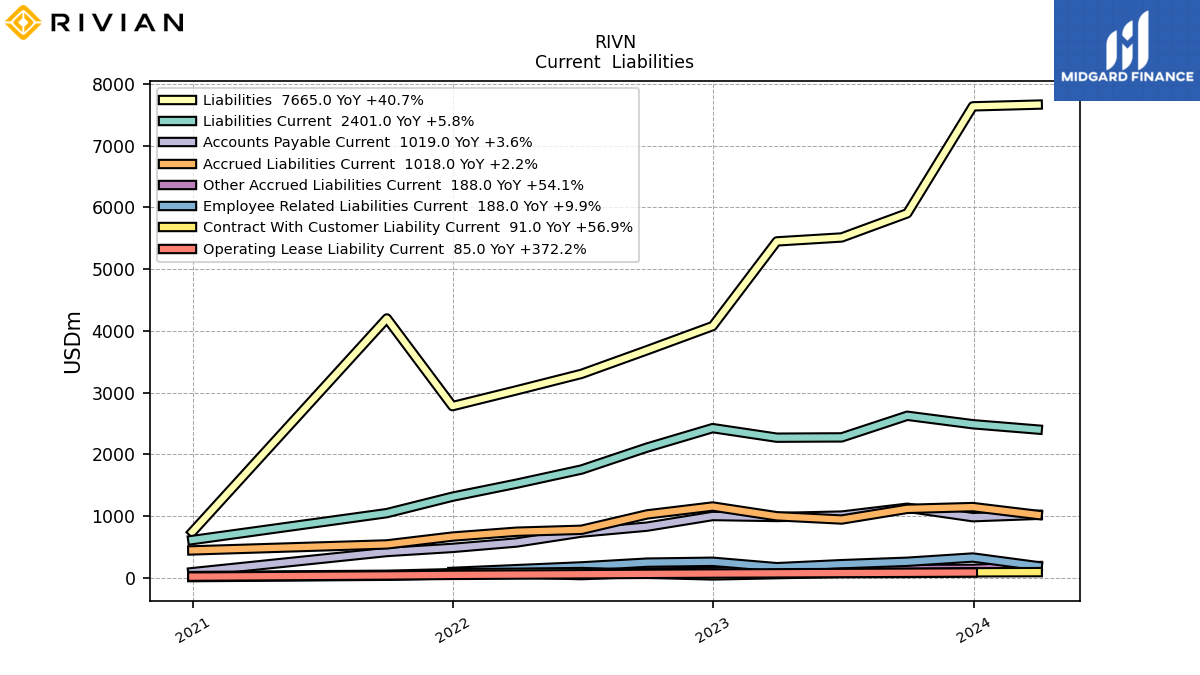
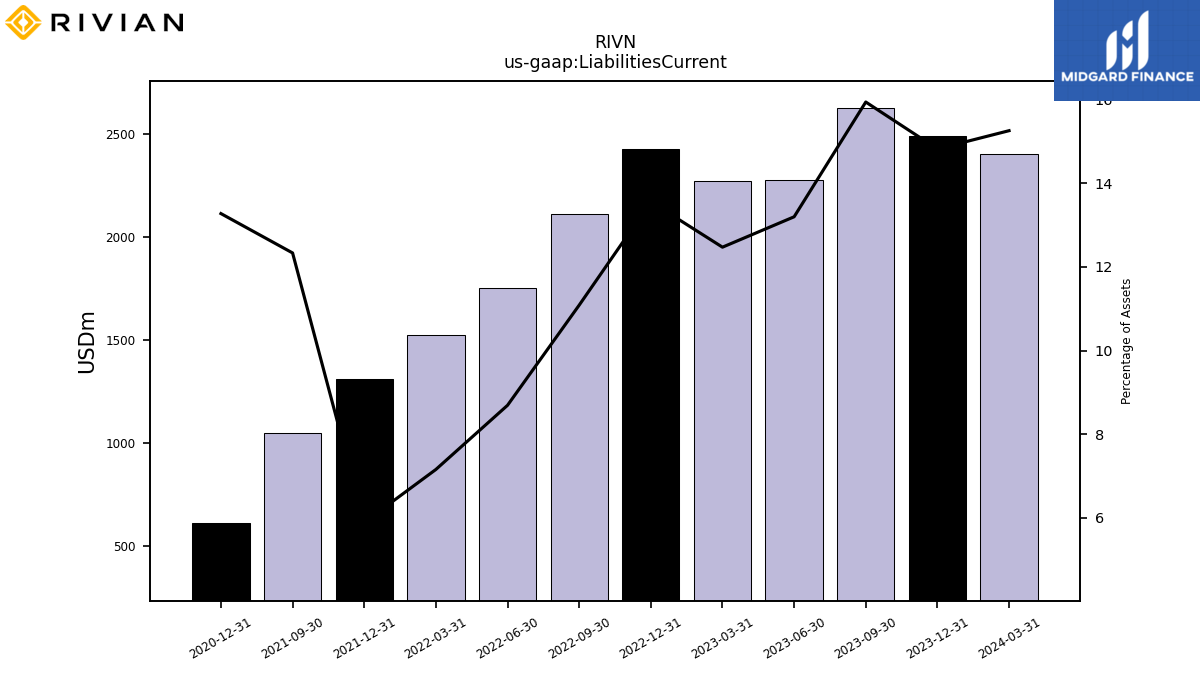
| Liabilities Current | 2624.00 | 2274.00 | 2269.00 | 2424.00 | 2109.00 | 1753.00 | 1524.00 | 1313.00 | 1047.00 | |
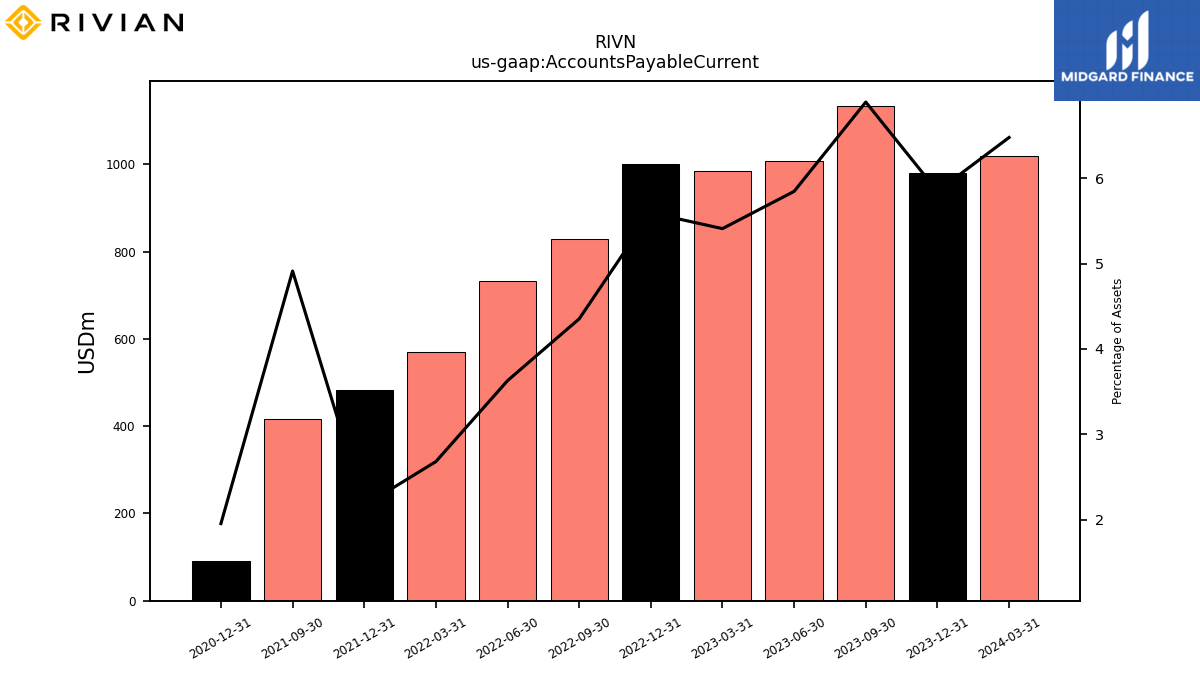
| Accounts Payable Current | 1134.00 | 1007.00 | 984.00 | 1000.00 | 828.00 | 732.00 | 571.00 | 483.00 | 417.00 | |
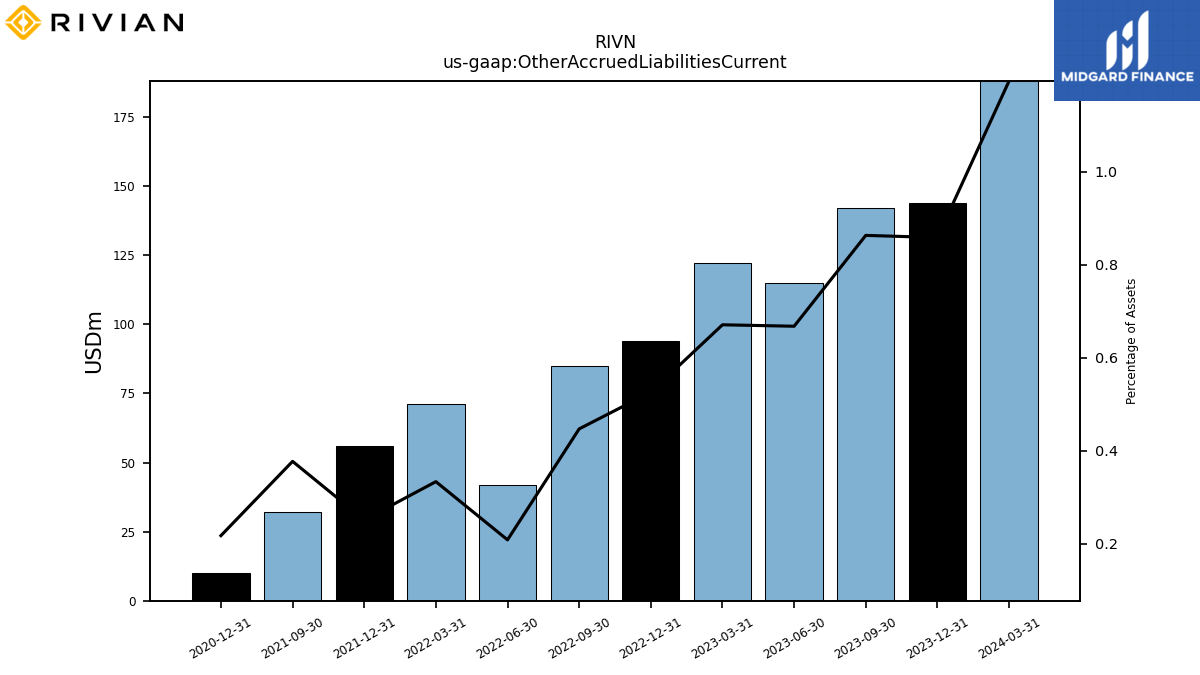
| Other Accrued Liabilities Current | 142.00 | 115.00 | 122.00 | 94.00 | 85.00 | 42.00 | 71.00 | 56.00 | 32.00 | |
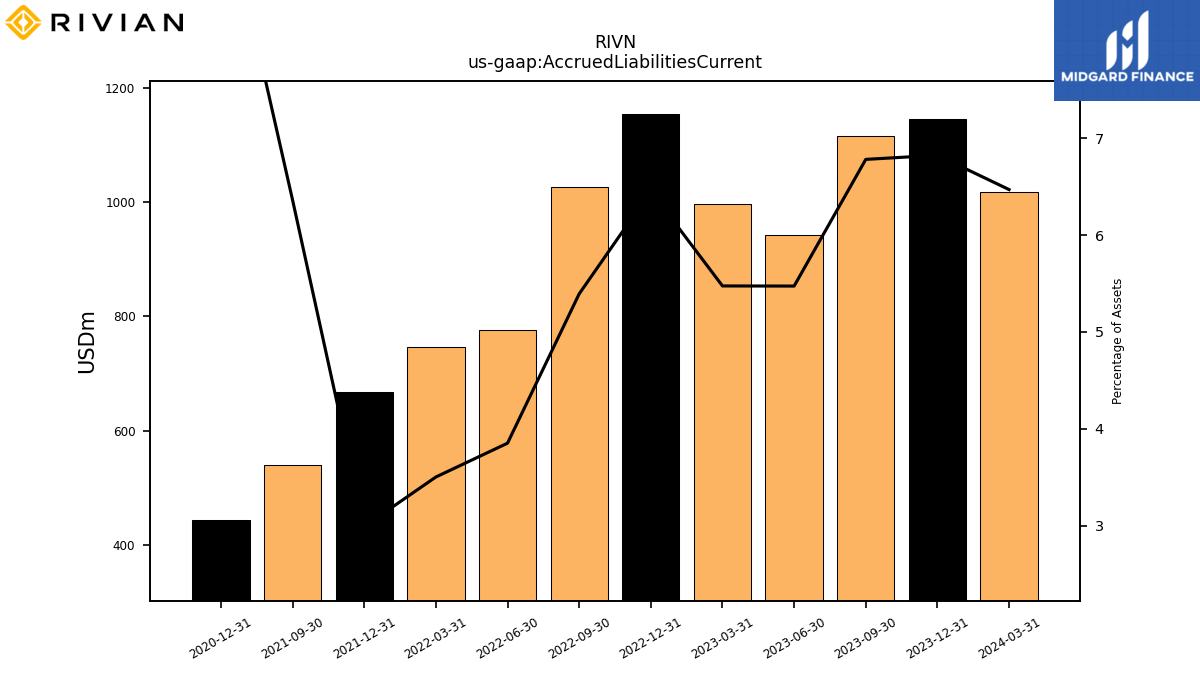
| Accrued Liabilities Current | 1116.00 | 943.00 | 996.00 | 1154.00 | 1026.00 | 777.00 | 746.00 | 667.00 | 540.00 | |
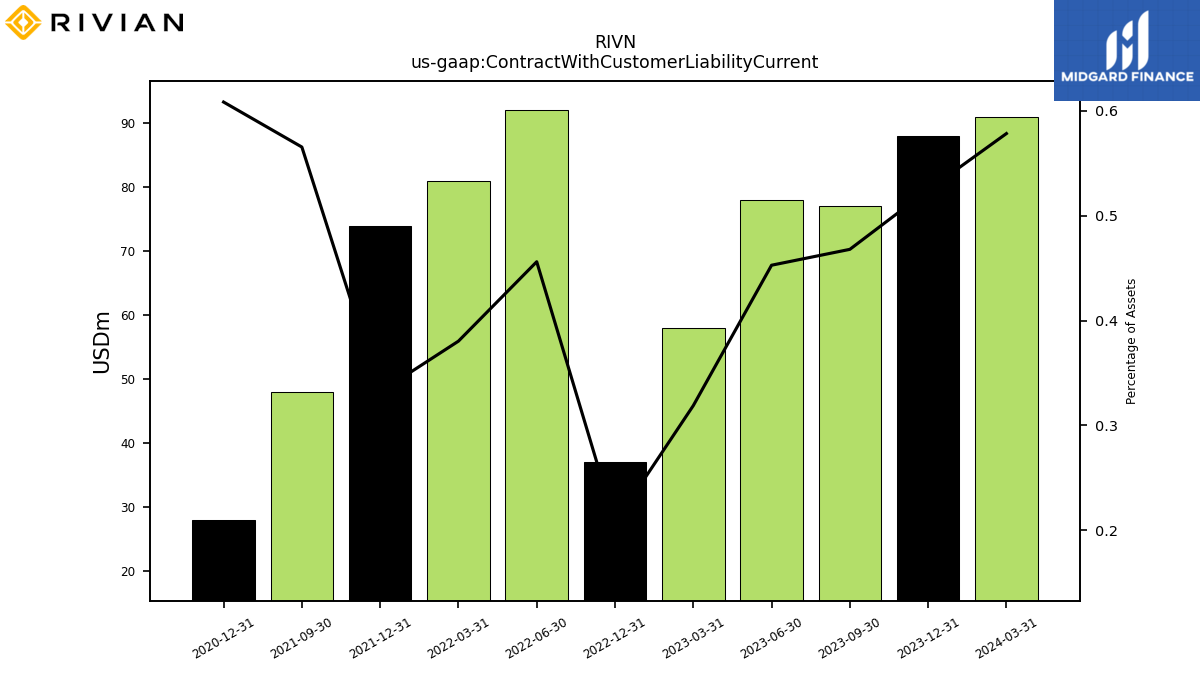
| Contract With Customer Liability Current | 77.00 | 78.00 | 58.00 | NA | NA | 92.00 | 81.00 | 74.00 | 48.00 |
| 2023-09-30 | 2023-06-30 | 2023-03-31 | 2022-12-31 | 2022-09-30 | 2022-06-30 | 2022-03-31 | 2021-12-31 | 2021-09-30 | ||
|---|---|---|---|---|---|---|---|---|---|---|
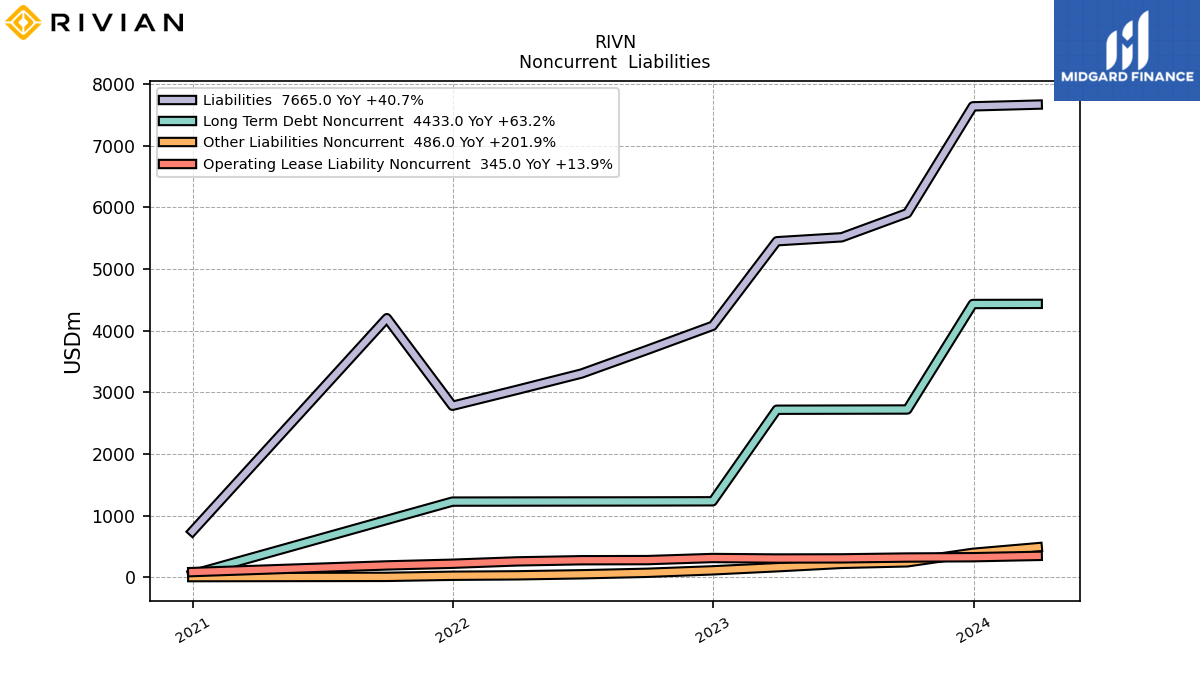
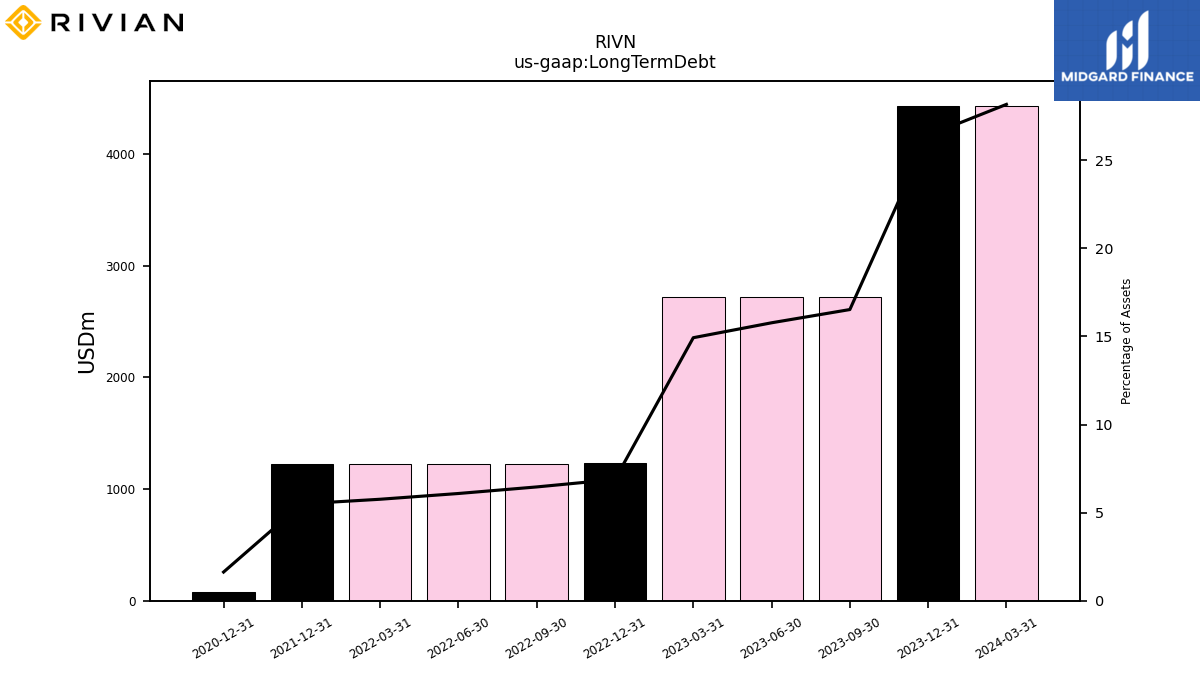
| Long Term Debt | 2720.00 | 2718.00 | 2716.00 | 1231.00 | 1229.00 | 1228.00 | 1227.00 | 1226.00 | NA | |
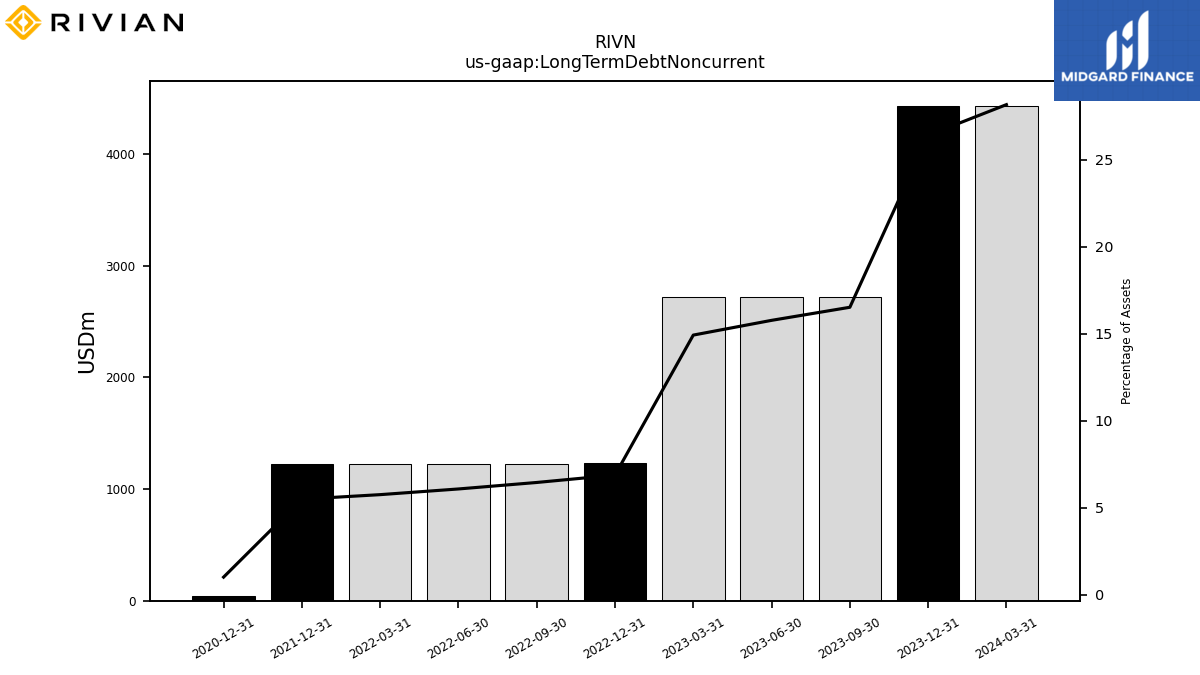
| Long Term Debt Noncurrent | 2720.00 | 2718.00 | 2716.00 | 1231.00 | 1229.00 | 1228.00 | 1227.00 | 1226.00 | NA | |
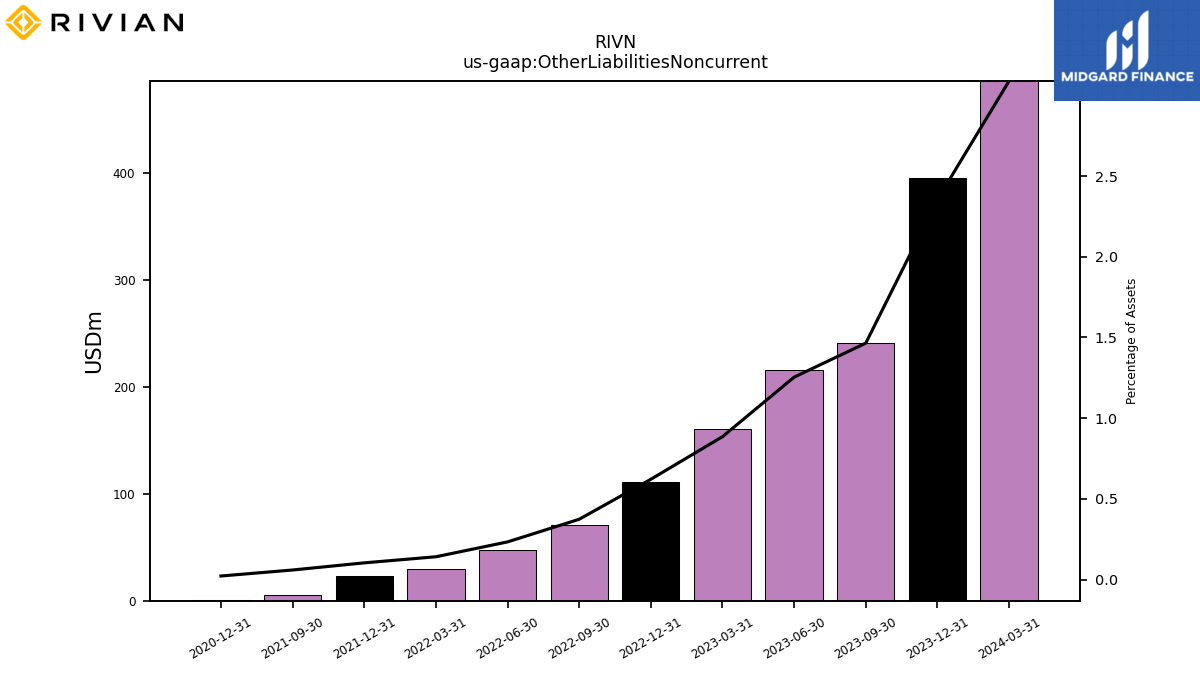
| Other Liabilities Noncurrent | 241.00 | 216.00 | 161.00 | 111.00 | 71.00 | 47.00 | 30.00 | 23.00 | 5.00 | |
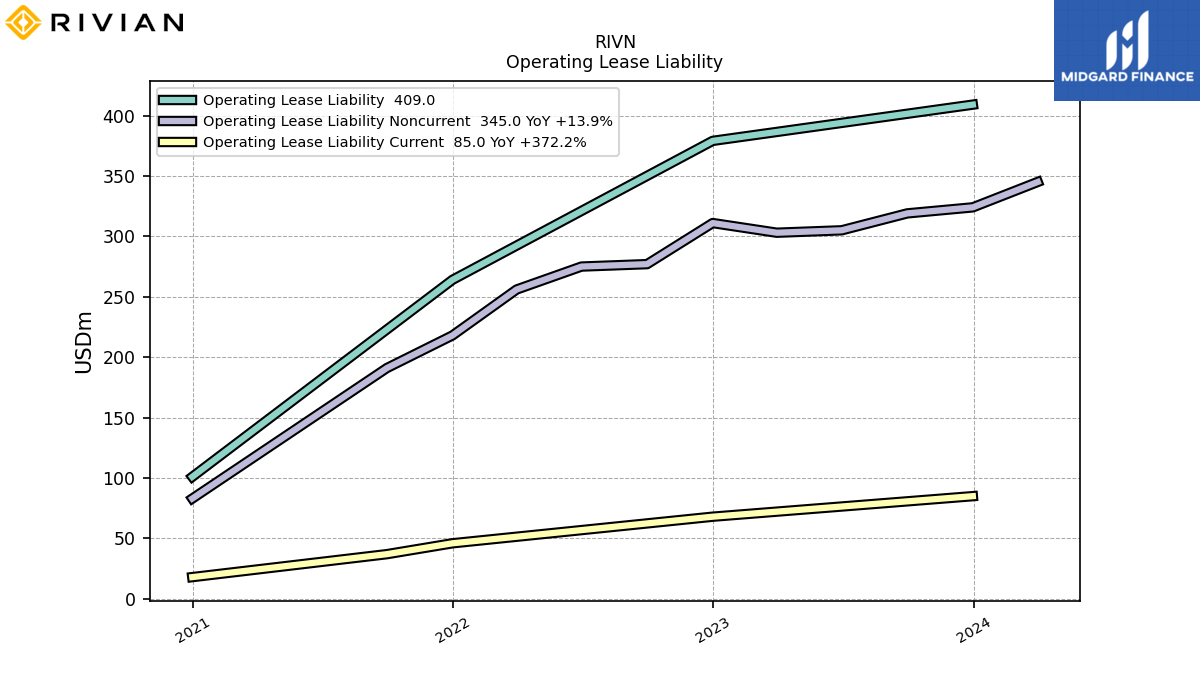
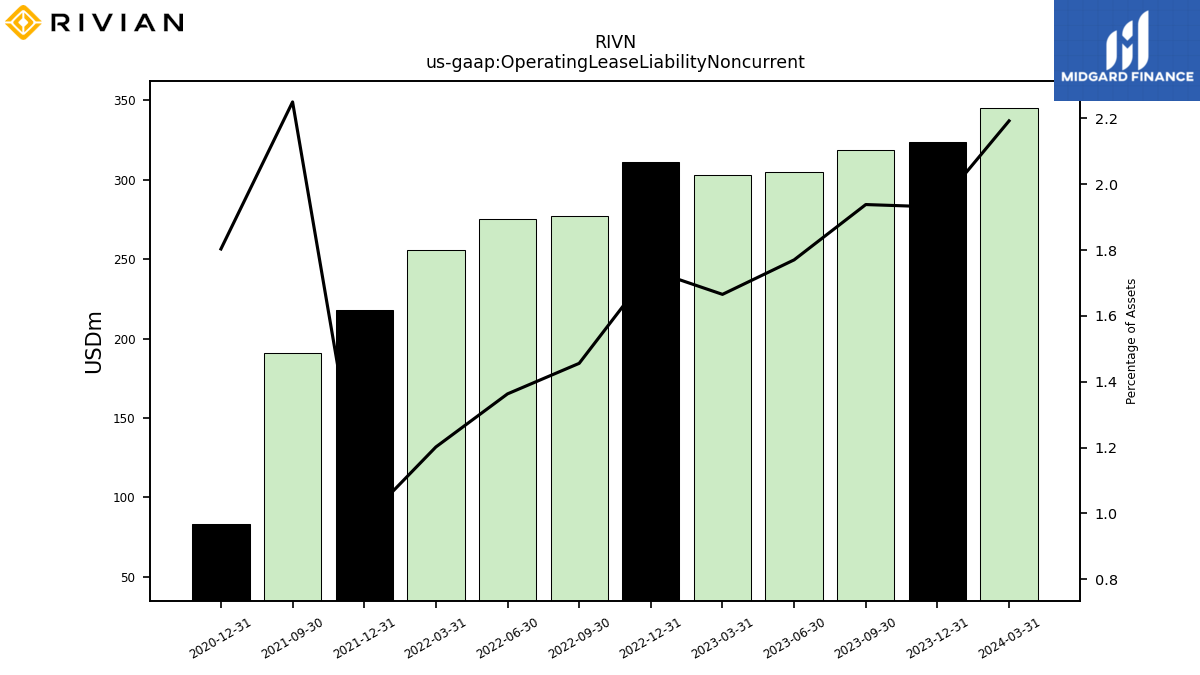
| Operating Lease Liability Noncurrent | 319.00 | 305.00 | 303.00 | 311.00 | 277.00 | 275.00 | 256.00 | 218.00 | 191.00 |
| 2023-09-30 | 2023-06-30 | 2023-03-31 | 2022-12-31 | 2022-09-30 | 2022-06-30 | 2022-03-31 | 2021-12-31 | 2021-09-30 | ||
|---|---|---|---|---|---|---|---|---|---|---|
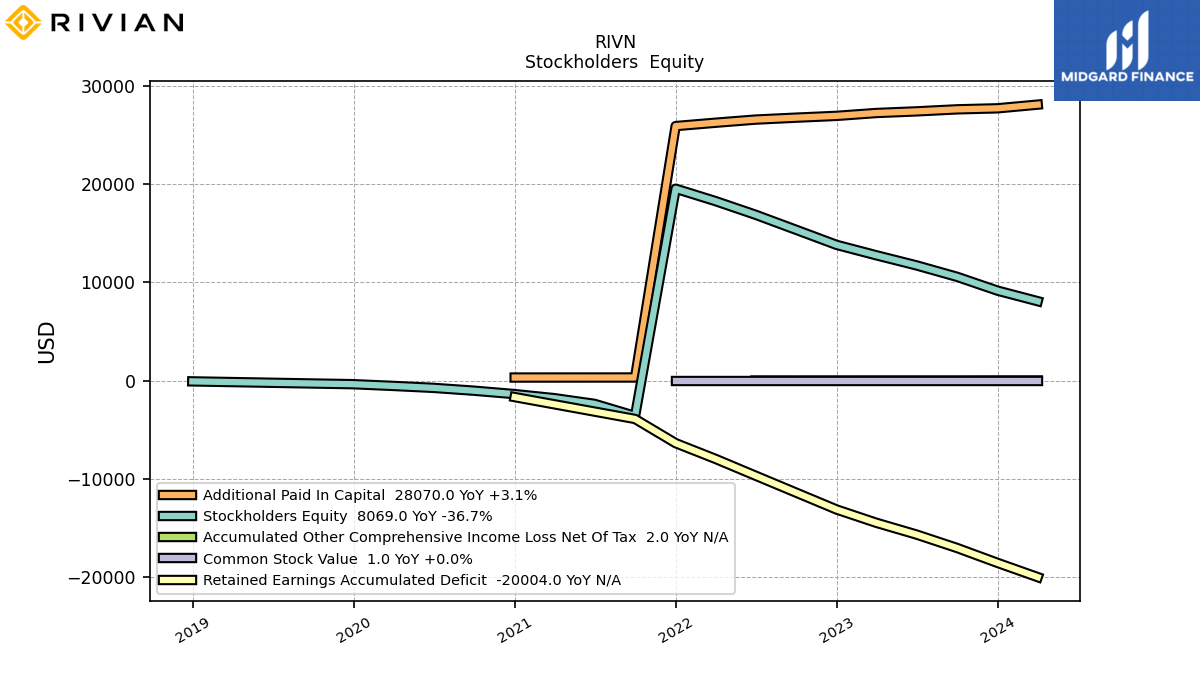
| Stockholders Equity | 10552.00 | 11714.00 | 12742.00 | 13799.00 | 15337.00 | 16868.00 | 18260.00 | 19514.00 | -3607.00 | |
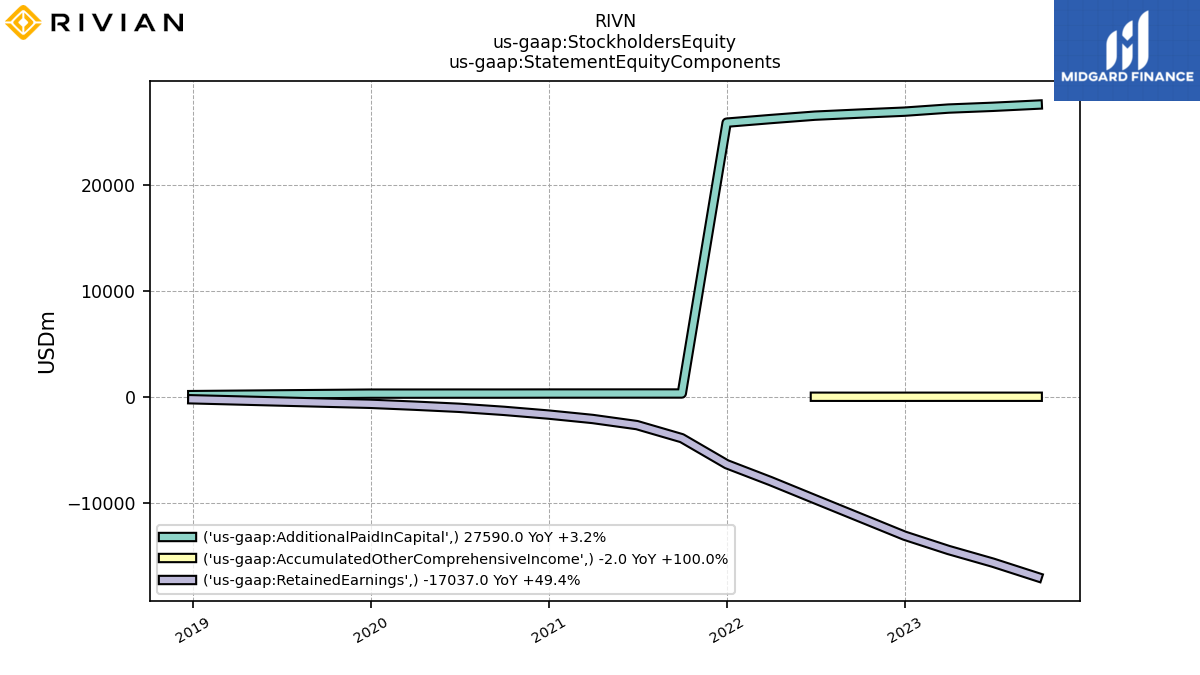
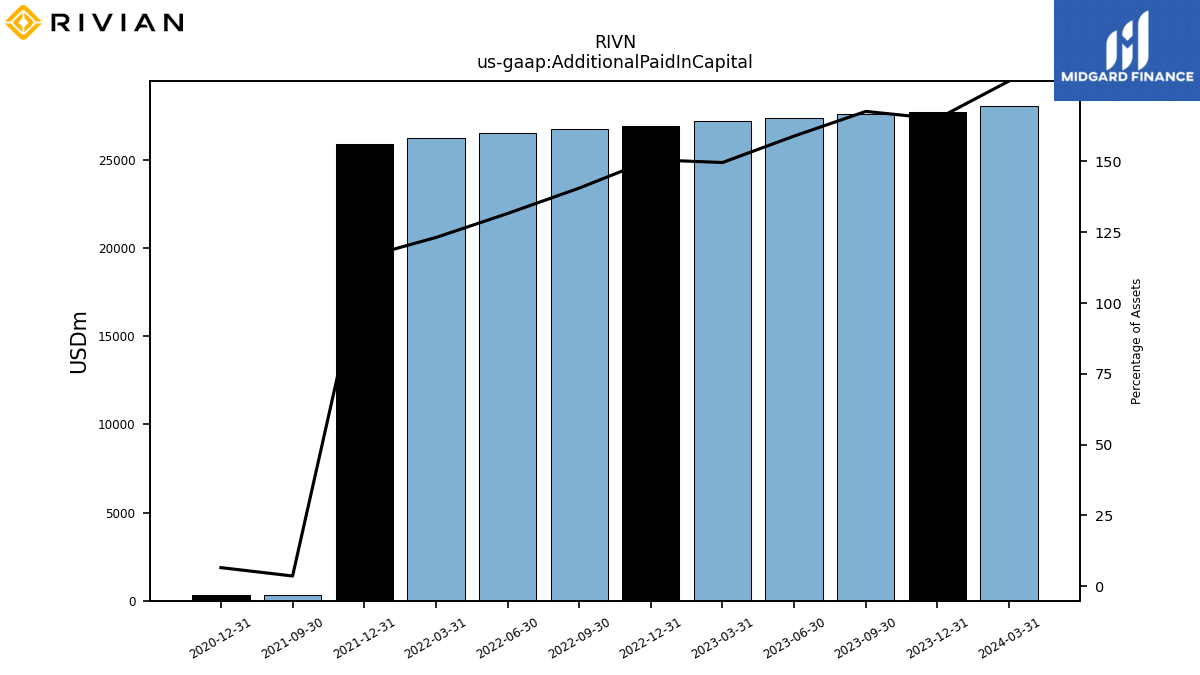
| Additional Paid In Capital | 27590.00 | 27383.00 | 27217.00 | 26926.00 | 26743.00 | 26547.00 | 26226.00 | 25887.00 | 306.00 | |
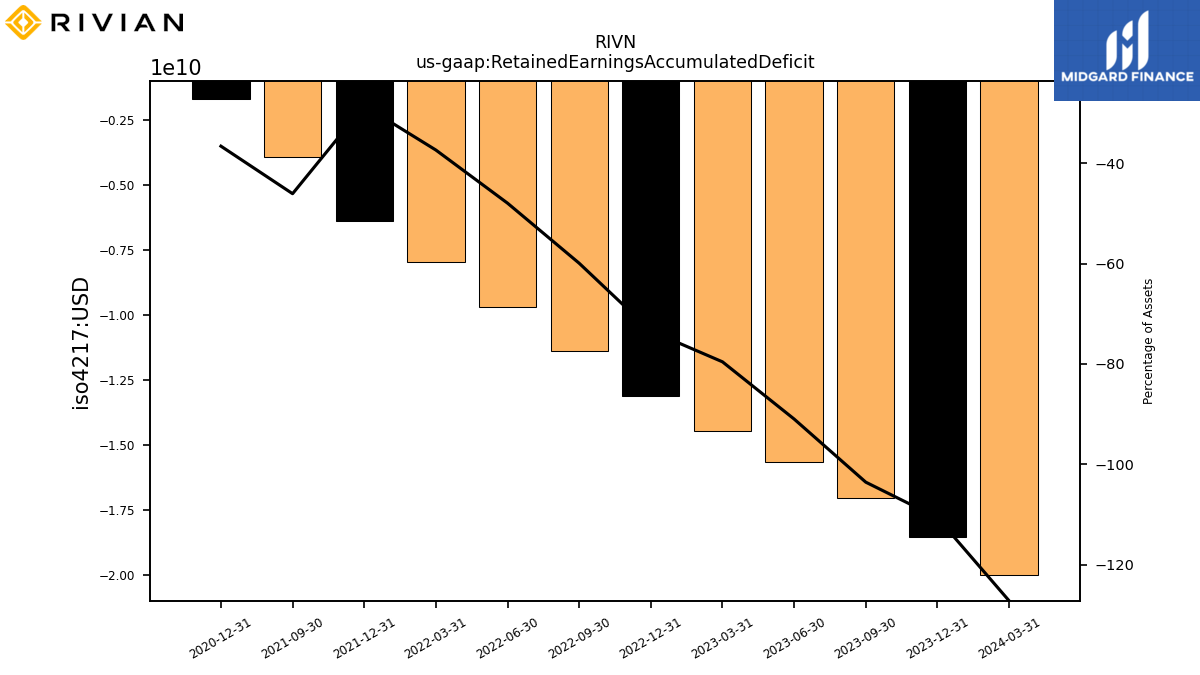
| Retained Earnings Accumulated Deficit | -17037.00 | -15670.00 | -14475.00 | -13126.00 | -11403.00 | -9679.00 | -7967.00 | -6374.00 | -3913.00 | |
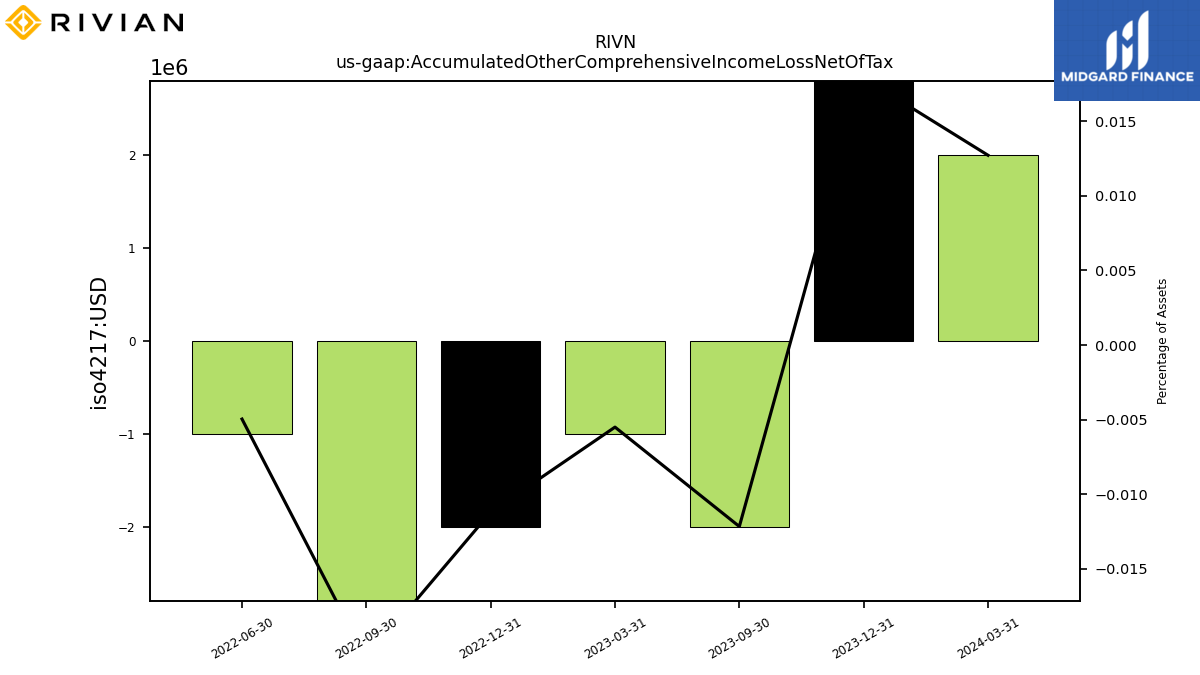
| Accumulated Other Comprehensive Income Loss Net Of Tax | -2.00 | NA | -1.00 | -2.00 | -4.00 | -1.00 | NA | NA | NA | |
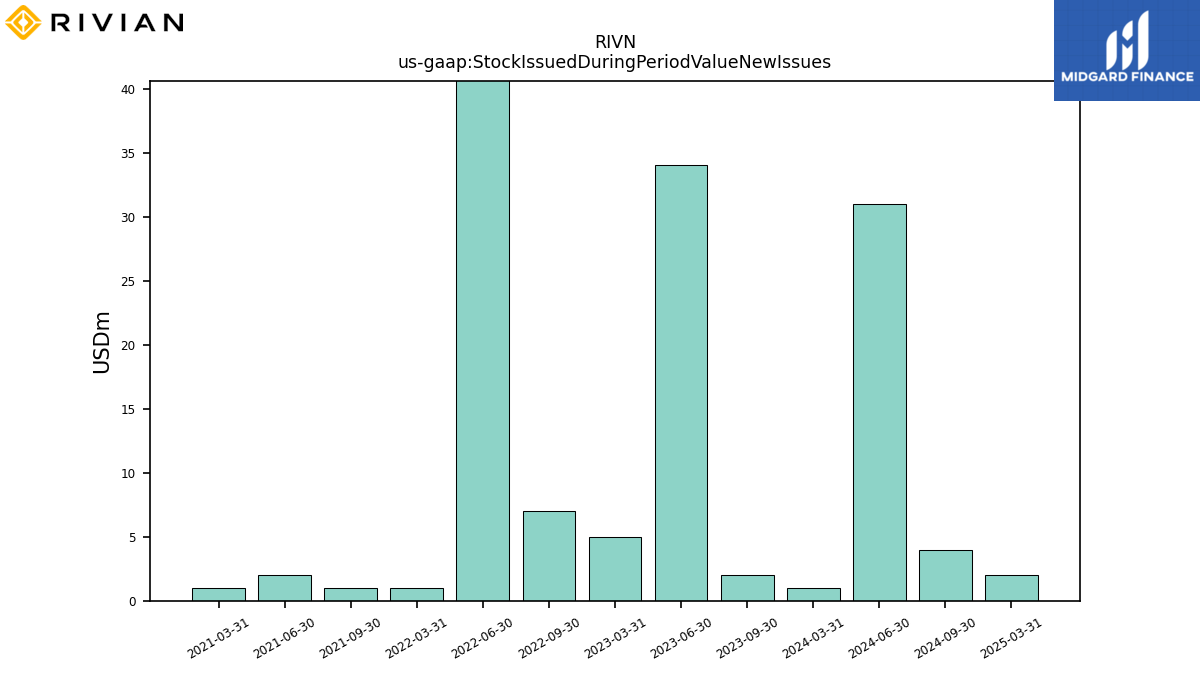
| Stock Issued During Period Value New Issues | 2.00 | 34.00 | 5.00 | NA | 7.00 | 57.00 | 1.00 | NA | 1.00 | |
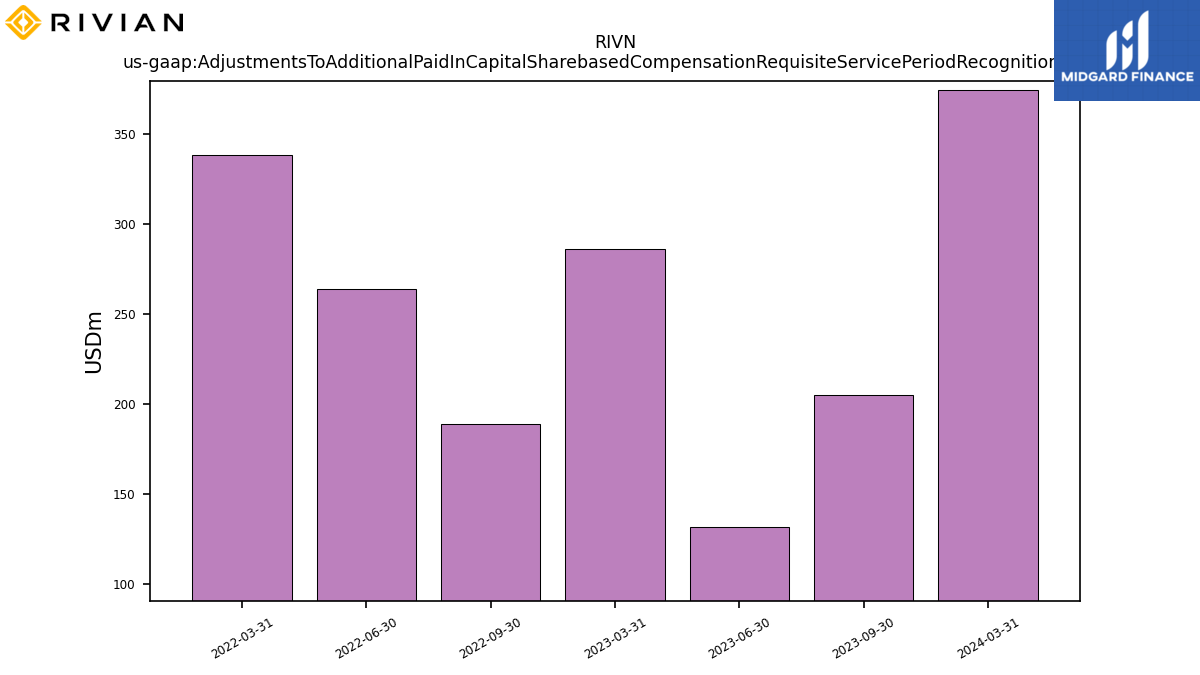
| Adjustments To Additional Paid In Capital Sharebased Compensation Requisite Service Period Recognition Value | 205.00 | 132.00 | 286.00 | NA | 189.00 | 264.00 | 338.00 | NA | NA |
| 2023-09-30 | 2023-06-30 | 2023-03-31 | 2022-12-31 | 2022-09-30 | 2022-06-30 | 2022-03-31 | 2021-12-31 | 2021-09-30 | ||
|---|---|---|---|---|---|---|---|---|---|---|
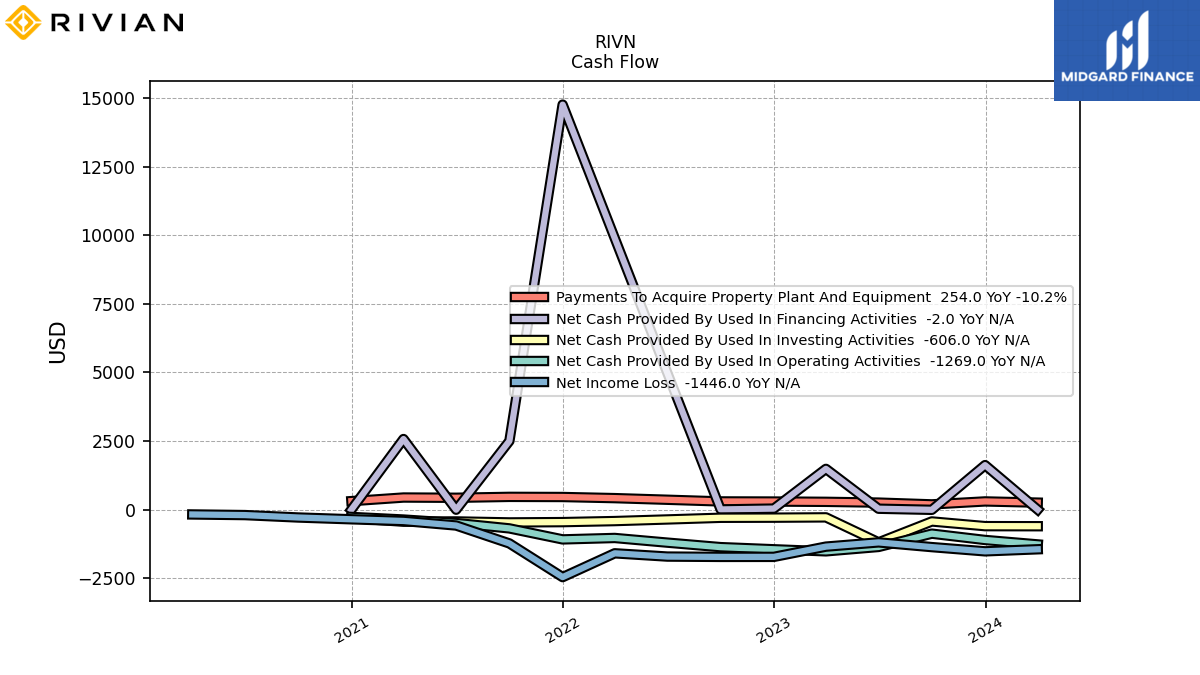
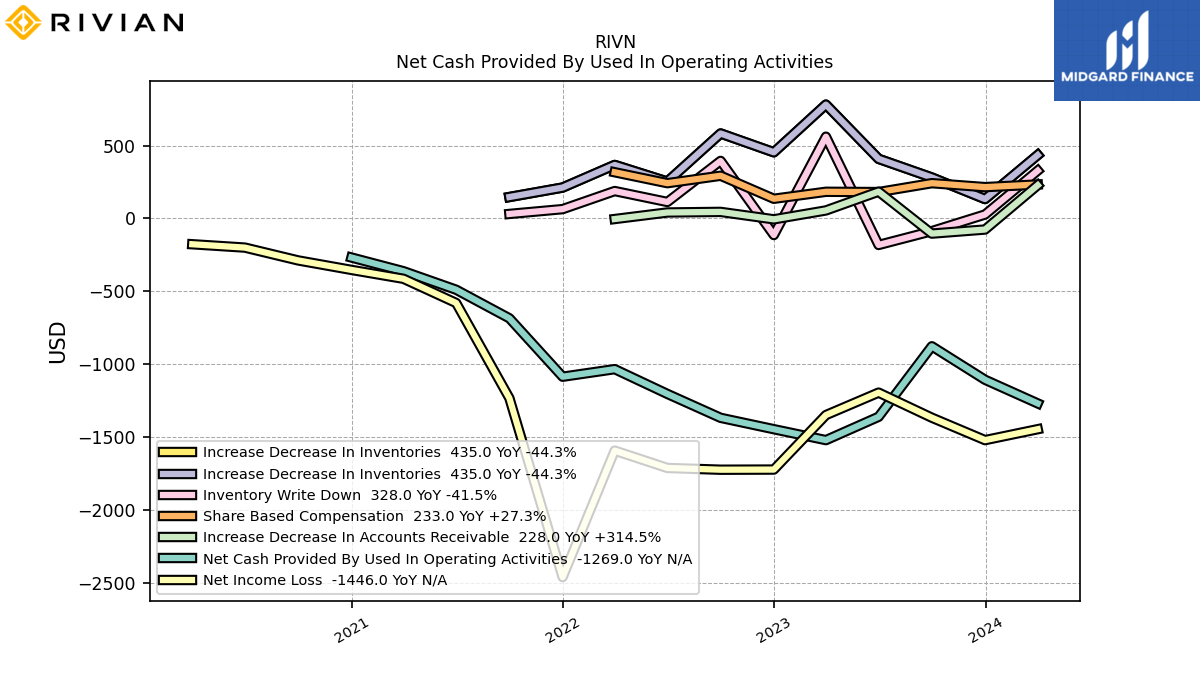
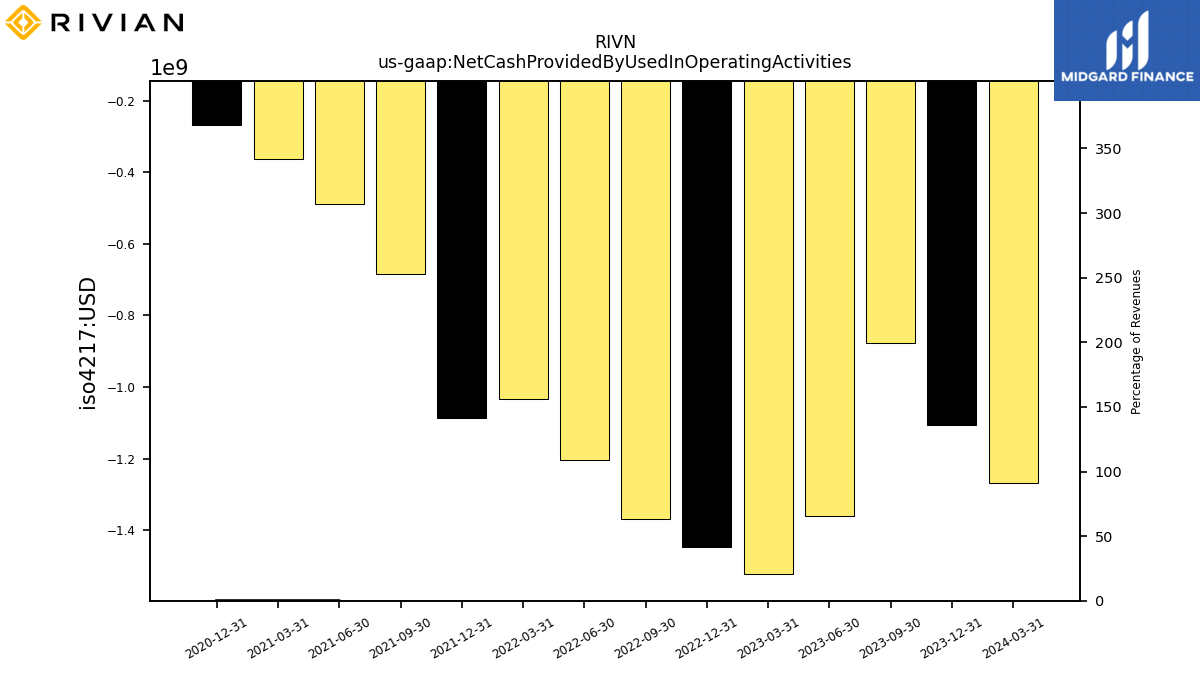
| Net Cash Provided By Used In Operating Activities | -877.00 | -1361.00 | -1521.00 | -1446.00 | -1368.00 | -1204.00 | -1034.00 | -1086.00 | -685.00 | |
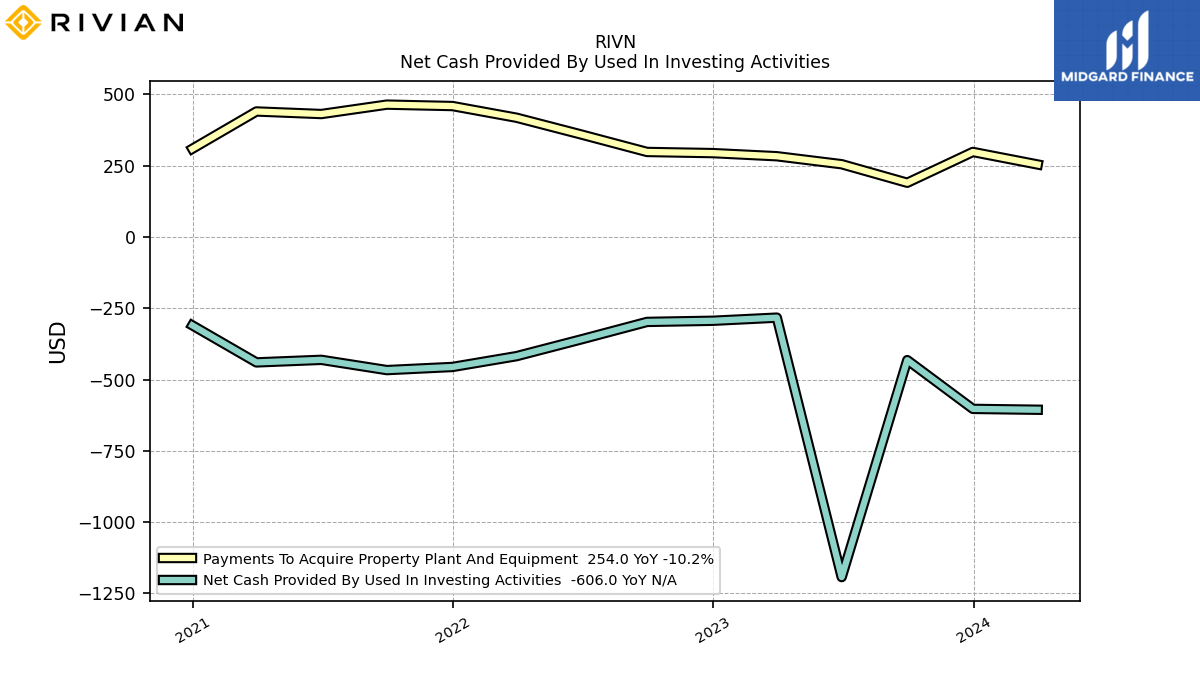
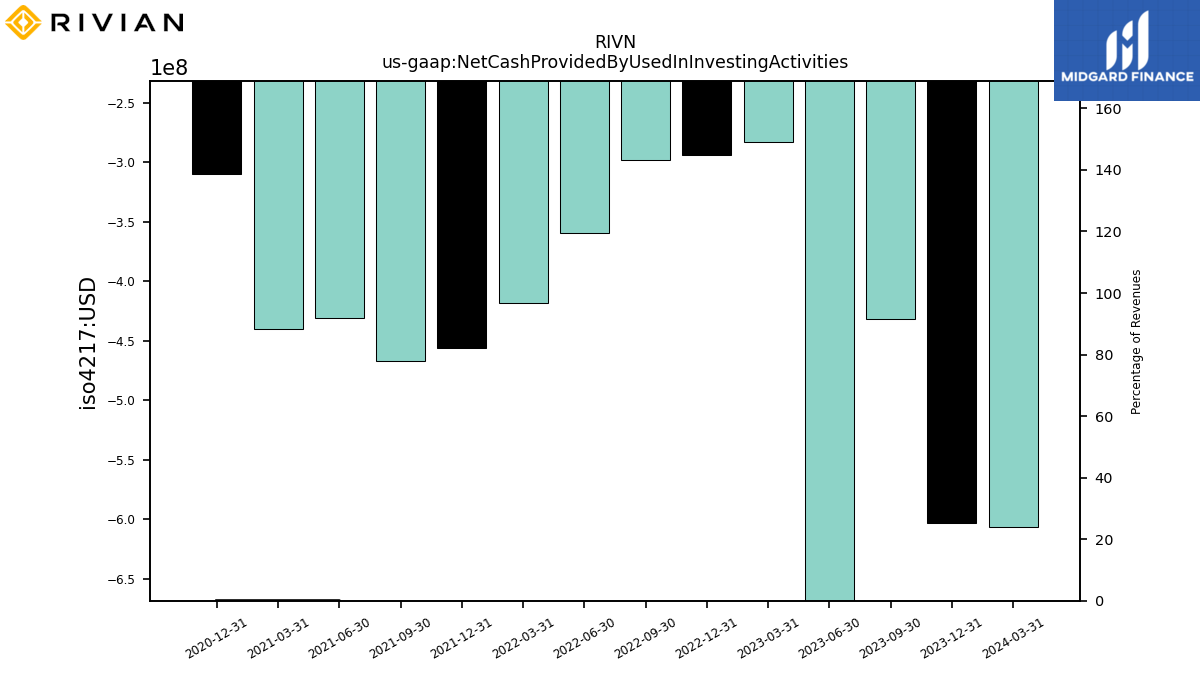
| Net Cash Provided By Used In Investing Activities | -432.00 | -1193.00 | -283.00 | -294.00 | -298.00 | -359.00 | -418.00 | -456.00 | -467.00 | |
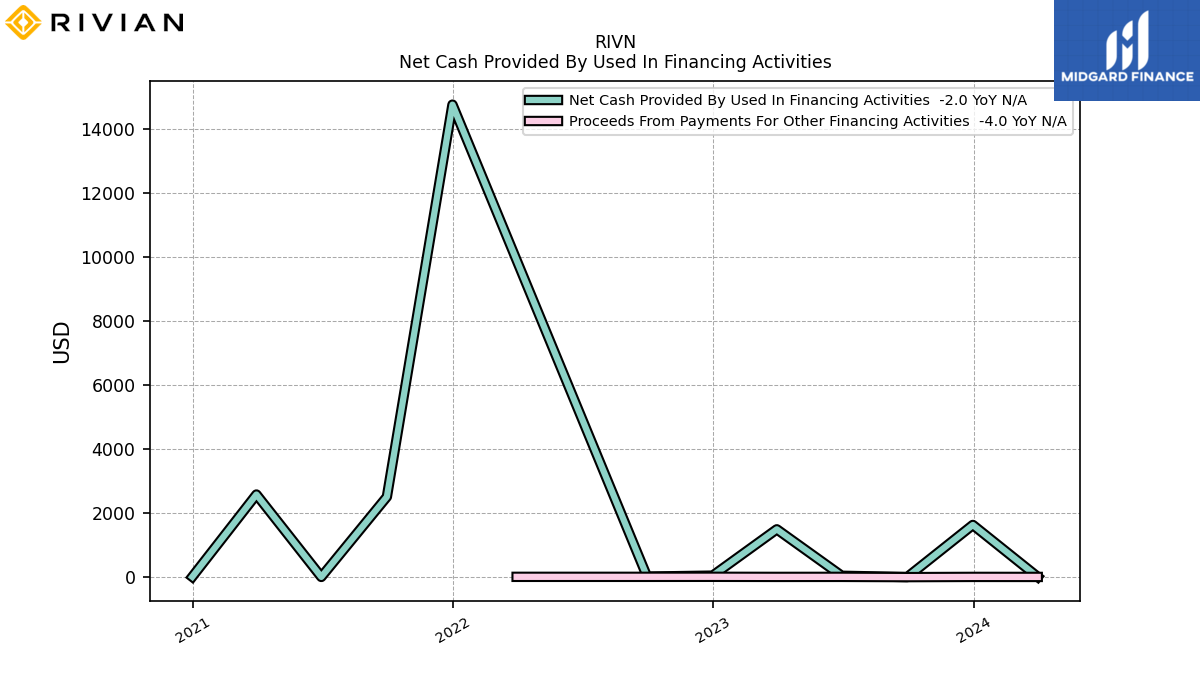
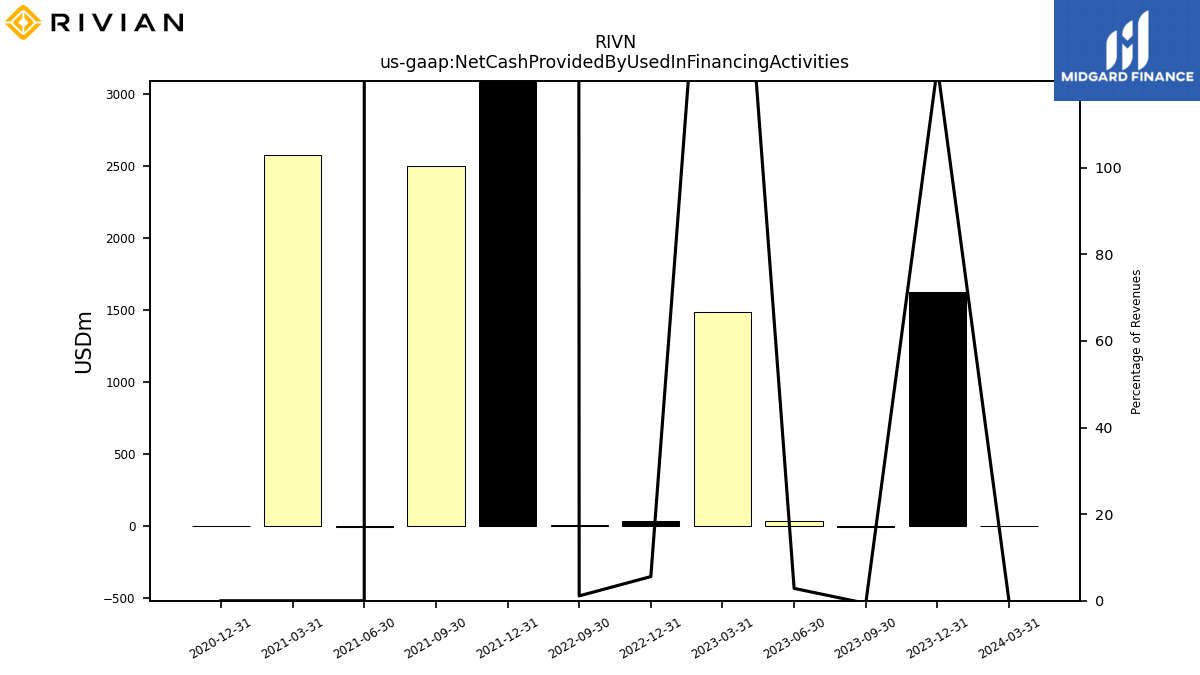
| Net Cash Provided By Used In Financing Activities | -8.00 | 32.00 | 1485.00 | 37.00 | 6.00 | NA | NA | 14760.00 | 2500.00 |
| 2023-09-30 | 2023-06-30 | 2023-03-31 | 2022-12-31 | 2022-09-30 | 2022-06-30 | 2022-03-31 | 2021-12-31 | 2021-09-30 | ||
|---|---|---|---|---|---|---|---|---|---|---|
| Net Cash Provided By Used In Operating Activities | -877.00 | -1361.00 | -1521.00 | -1446.00 | -1368.00 | -1204.00 | -1034.00 | -1086.00 | -685.00 | |
| Net Income Loss | -1367.00 | -1195.00 | -1349.00 | -1723.00 | -1724.00 | -1712.00 | -1593.00 | -2461.00 | -1233.00 | |
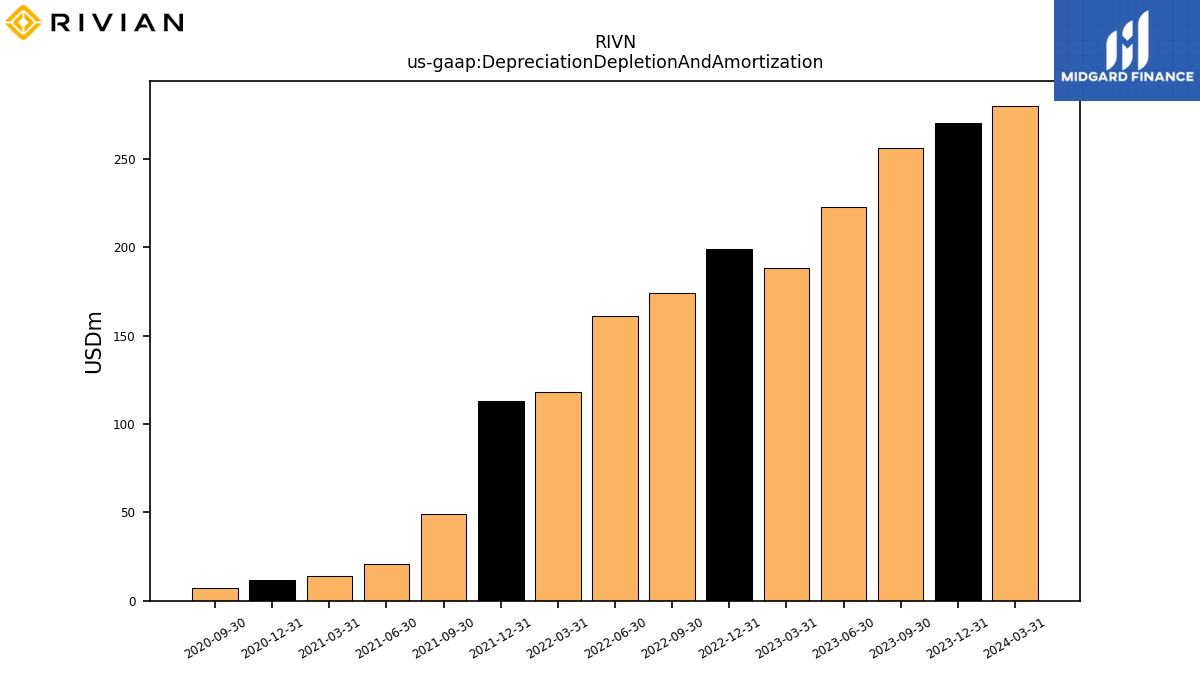
| Depreciation Depletion And Amortization | 256.00 | 223.00 | 188.00 | 199.00 | 174.00 | 161.00 | 118.00 | 113.00 | 49.00 | |
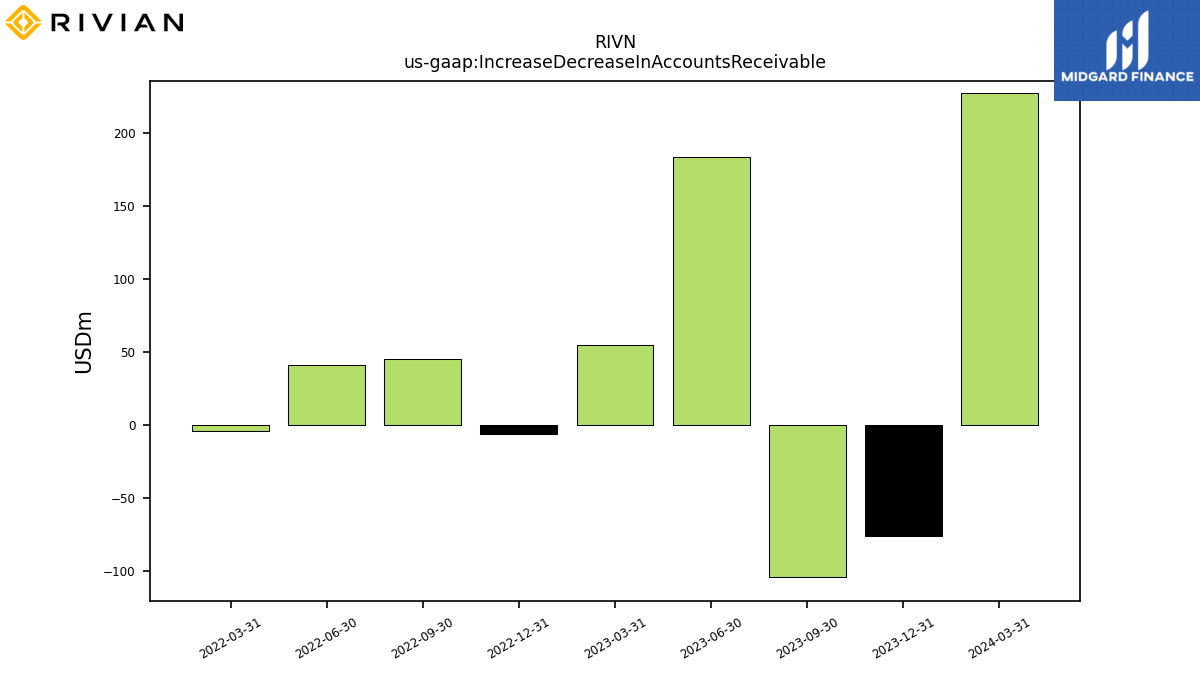
| Increase Decrease In Accounts Receivable | -104.00 | 184.00 | 55.00 | -6.00 | 45.00 | 41.00 | -4.00 | NA | NA | |
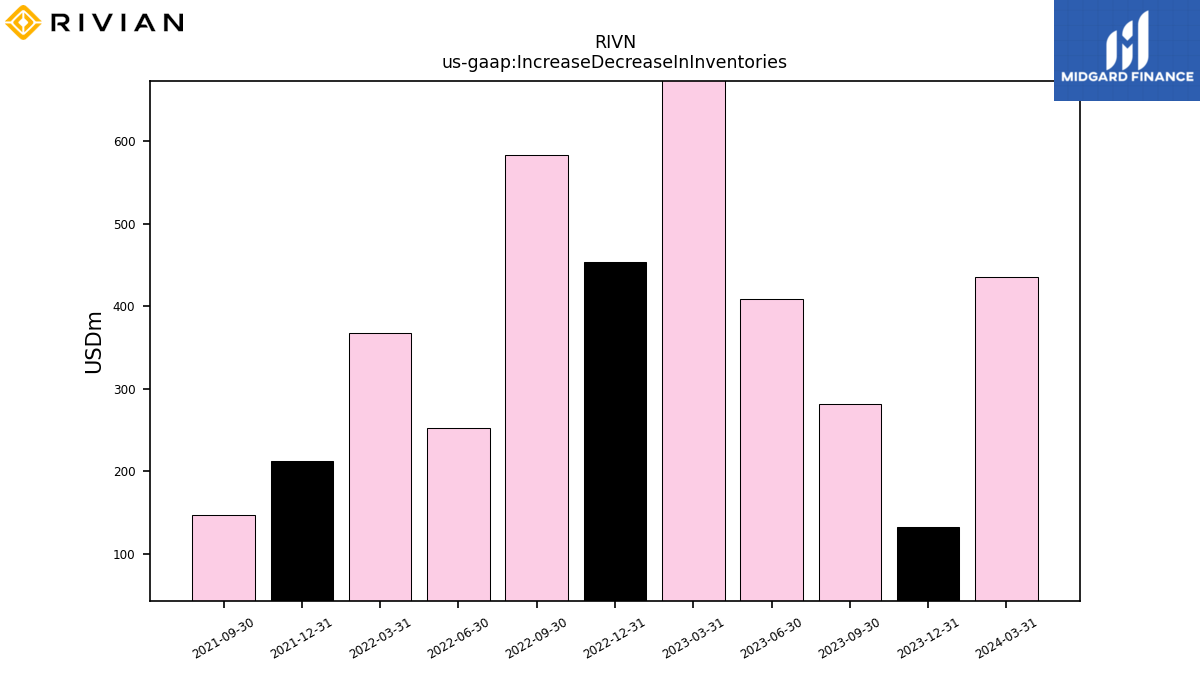
| Increase Decrease In Inventories | 281.00 | 409.00 | 781.00 | 454.00 | 583.00 | 253.00 | 367.00 | 212.00 | 147.00 | |
| Share Based Compensation | 242.00 | 181.00 | 183.00 | 135.00 | 293.00 | 242.00 | 317.00 | NA | NA |
| 2023-09-30 | 2023-06-30 | 2023-03-31 | 2022-12-31 | 2022-09-30 | 2022-06-30 | 2022-03-31 | 2021-12-31 | 2021-09-30 | ||
|---|---|---|---|---|---|---|---|---|---|---|
| Net Cash Provided By Used In Investing Activities | -432.00 | -1193.00 | -283.00 | -294.00 | -298.00 | -359.00 | -418.00 | -456.00 | -467.00 | |
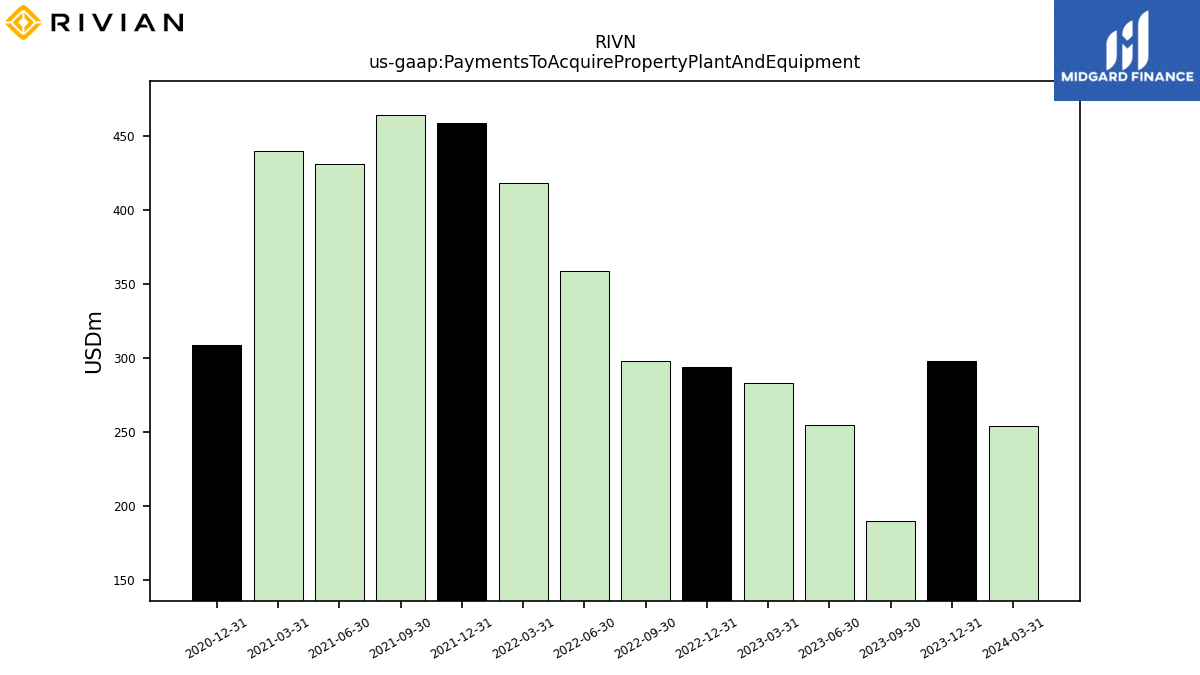
| Payments To Acquire Property Plant And Equipment | 190.00 | 255.00 | 283.00 | 294.00 | 298.00 | 359.00 | 418.00 | 459.00 | 464.00 |
| 2023-09-30 | 2023-06-30 | 2023-03-31 | 2022-12-31 | 2022-09-30 | 2022-06-30 | 2022-03-31 | 2021-12-31 | 2021-09-30 | ||
|---|---|---|---|---|---|---|---|---|---|---|
| Net Cash Provided By Used In Financing Activities | -8.00 | 32.00 | 1485.00 | 37.00 | 6.00 | NA | NA | 14760.00 | 2500.00 |
| 2023-09-30 | 2023-06-30 | 2023-03-31 | 2022-12-31 | 2022-09-30 | 2022-06-30 | 2022-03-31 | 2021-12-31 | 2021-09-30 | ||
|---|---|---|---|---|---|---|---|---|---|---|
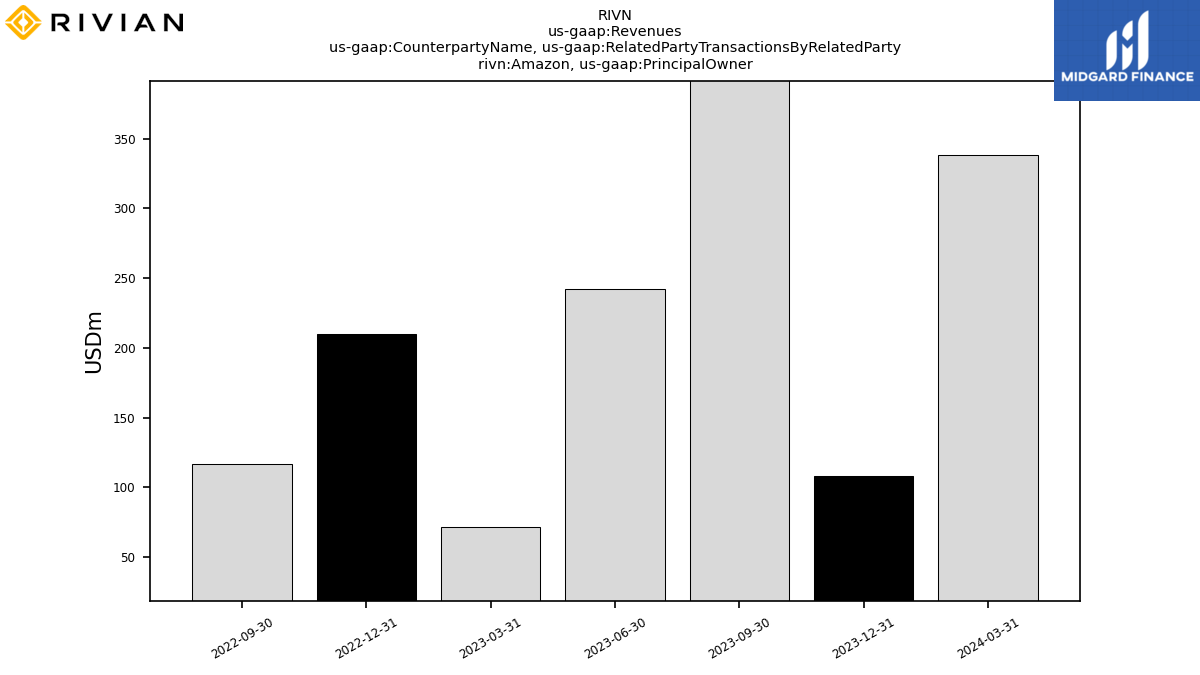
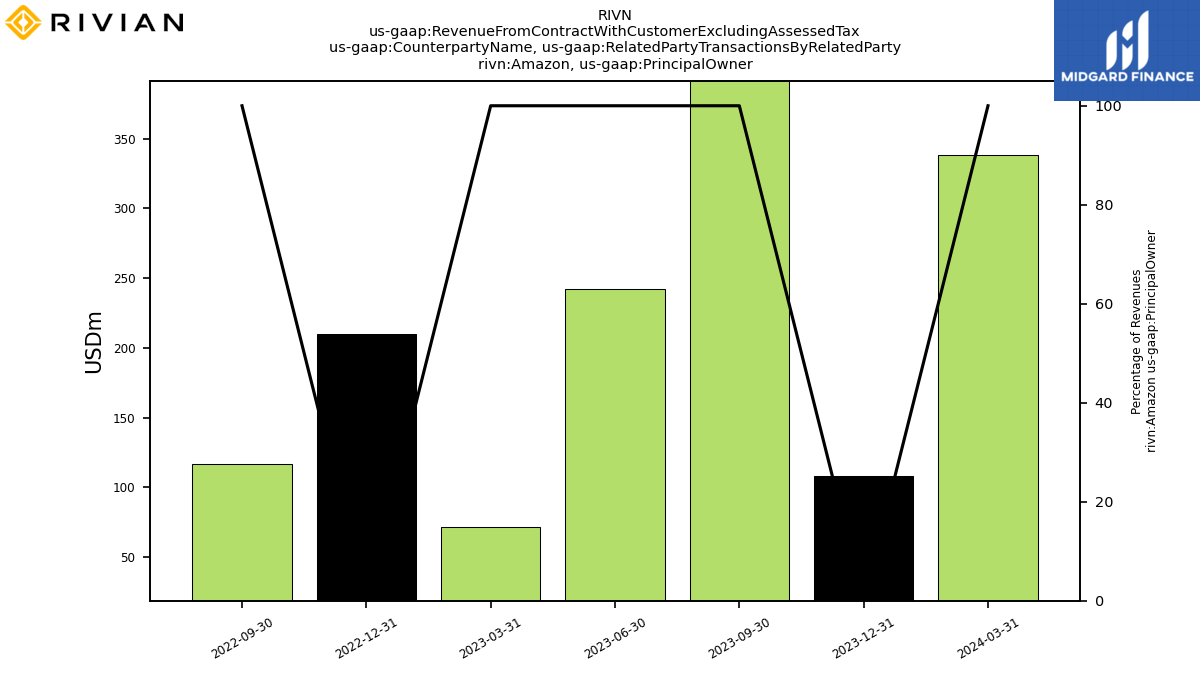
| Revenues | 1337.00 | 1121.00 | 661.00 | 663.00 | 536.00 | 364.00 | 95.00 | 54.00 | 1.00 | |
| Amazon, Principal Owner | 401.00 | 242.00 | 72.00 | 210.00 | 117.00 | NA | NA | NA | NA | |
| Revenue From Contract With Customer Excluding Assessed Tax | 1337.00 | 1121.00 | 661.00 | 663.00 | 536.00 | 364.00 | 95.00 | 54.00 | 1.00 | |
| Amazon, Principal Owner | 401.00 | 242.00 | 72.00 | 210.00 | 117.00 | NA | NA | NA | NA |